UNITED STATES
SECURITIES AND EXCHANGE COMMISSION
Washington, D.C. 20549
FORM N-CSR
CERTIFIED SHAREHOLDER REPORT OF REGISTERED MANAGEMENT INVESTMENT COMPANIES
Investment Company Act file number:
Fund Address: c/o BlackRock Fund Advisors, 400 Howard Street, San Francisco, CA 94105
Name and address of agent for service: The Corporation Trust Company, 1209 Orange Street, Wilmington, DE 19801
Registrant's telephone number, including area code:
Date of reporting period:
Item 1 — Report to Stockholders
(a) The Report to Shareholders is attached herewith
iShares Bloomberg Roll Select Commodity Strategy ETF
CMDY | NYSE Arca
Annual Shareholder Report — October 31, 2024
This annual shareholder report contains important information about iShares Bloomberg Roll Select Commodity Strategy ETF (the “Fund”) for the period of November 1, 2023 to October 31, 2024. You can find additional information about the Fund at blackrock.com/fundreports. You can also request this information by contacting us at 1‑800‑iShares (1‑800‑474‑2737).
What were the Fund costs for the last year ?
(based on a hypothetical $10,000 investment)
| Fund name | Costs of a $10,000
investment | Costs paid as a percentage of a
$10,000 investment |
| iShares Bloomberg Roll Select Commodity Strategy ETF | $28 | 0.28% |
How did the Fund perform last year?
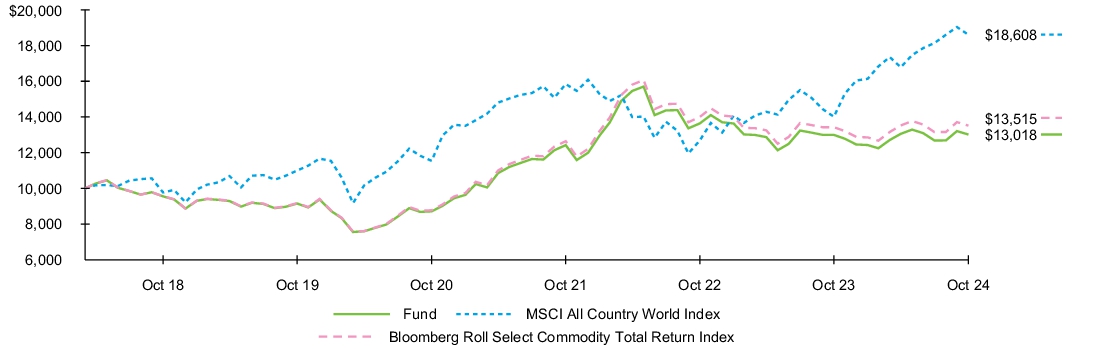
For the reporting period ended October 31, 2024, the Fund returned 0.17%.
For the same period, the MSCI All Country World Index returned 32.79% and the Bloomberg Roll Select Commodity Total Return Index returned 0.65%.
What contributed to performance?
The Fund’s exposure to gold was the largest positive performance driver for the reporting period. The period was marked by economic uncertainty, including concerns over a potential recession and fluctuating bond yields. High real yields and a strong U.S. dollar initially pressured gold, but subsequent economic uncertainty and market volatility supported its rise. Central bank purchase activity and interest rate decisions also pushed gold prices higher. Ongoing geopolitical tensions in the Middle East and Russia, as well as global trade and currency shifts, continue to encourage gold buying and restrain gold selling.
What detracted from performance?
Exposure to natural gas was the largest detractor from performance during the reporting period. Unseasonably warm weather in the U.S. during the winter months reduced heating demand, leading to lower prices. High levels of natural gas production, coupled with fluctuating demand, created volatility in the market. Facility maintenance and pipeline disruptions also influenced supply levels. Geopolitical tensions had mixed impacts on natural gas prices as some events led to temporary price spikes due to fears of supply disruptions, other events had limited long-term effects.
The views expressed reflect the opinions of BlackRock as of the date of this report and are subject to change based on changes in market, economic or other conditions. These views are not intended to be a forecast of future events and are no guarantee of future results.
Fund performance
Cumulative performance: April 3, 2018 through October 31, 2024
Initial investment of $10,000
See “Average annual total returns” for additional information on fund performance.
| Average annual total returns | | | | | | |
| 1 Year | | 5 Years | | Since Fund
Inception | |
| Fund NAV | 0.17 | % | 7.30 | % | 4.09 | % |
| MSCI All Country World Index | 32.79 | | 11.08 | | 9.91 | |
| Bloomberg Roll Select Commodity Total Return Index | 0.65 | | 8.05 | | 4.69 | |
| Key Fund statistics | |
| Net Assets | $282,620,997 |
| Number of Portfolio Holdings | 53 |
| Net Investment Advisory Fees | $702,819 |
| Portfolio Turnover Rate | 0% |
The Fund has added the MSCI All Country World Index in response to new regulatory requirements.
The inception date of the Fund was April 3, 2018.
Past performance is not an indication of future results. Performance results do not reflect the deduction of taxes that a shareholder would pay on fund distributions or on the redemption or sale of fund shares. Visit iShares.com for more recent performance information.
What did the Fund invest in?
(as of October 31, 2024)
| Asset Type | Percent of
Net Assets | |
| Commercial Paper | 50.4 | % |
| U.S. Treasury Obligations | 41.9 | % |
| Futures | 3.9 | % |
| Money Market Funds | 3.3 | % |
| Cash | 5.2 | % |
| Other assets, less liabilities | (4.7 | )% |
| Sector Exposure(a) | Percent of
Exposure | |
| Energy Futures | 27.6 | % |
| Agriculture Futures | 26.8 | % |
| Precious Metals Futures | 24.0 | % |
| Industrial Metals Futures | 16.0 | % |
| Livestock Futures | 5.6 | % |
(a) | Represents the sector allocation of the Bloomberg Roll Select Commodity Total Return Index. |
Additional information
If you wish to view additional information about the Fund, including but not limited to financial statements, the Fund’s prospectus, and proxy voting policies and procedures, please visit blackrock.com/fundreports. For proxy voting records, visit blackrock.com/proxyrecords.
Householding
Householding is an option available to certain fund investors. Householding is a method of delivery, based on the preference of the individual investor, in which a single copy of certain shareholder documents can be delivered to investors who share the same address, even if their accounts are registered under different names. Please contact your broker-dealer if you are interested in enrolling in householding and receiving a single copy of prospectuses and other shareholder documents, or if you are currently enrolled in householding and wish to change your householding status.
The Fund is not sponsored, endorsed, issued, sold, or promoted by MSCI Inc., Bloomberg Index Services Limited and their respective affiliates, nor do these companies make any representation regarding the advisability of investing in the Fund. BlackRock is not affiliated with the companies listed above.
©2024 BlackRock, Inc. or its affiliates. All rights reserved. iSHARES and BLACKROCK are registered trademarks of BlackRock, Inc. or its affiliates. All other trademarks are those of their respective owners.
iShares Bloomberg Roll Select Commodity Strategy ETF
Annual Shareholder Report — October 31, 2024
CMDY-10/24-AR
iShares Commodity Curve Carry Strategy ETF
CCRV | NYSE Arca
Annual Shareholder Report — October 31, 2024
This annual shareholder report contains important information about iShares Commodity Curve Carry Strategy ETF (the “Fund”) for the period of November 1, 2023 to October 31, 2024. You can find additional information about the Fund at blackrock.com/fundreports. You can also request this information by contacting us at 1‑800‑iShares (1‑800‑474‑2737).
This report describes changes to the Fund that occurred during the reporting period.
What were the Fund costs for the last year ?
(based on a hypothetical $10,000 investment)
| Fund name | Costs of a $10,000
investment | Costs paid as a percentage of a
$10,000 investment |
| iShares Commodity Curve Carry Strategy ETF | $38 | 0.38% |
How did the Fund perform last year?
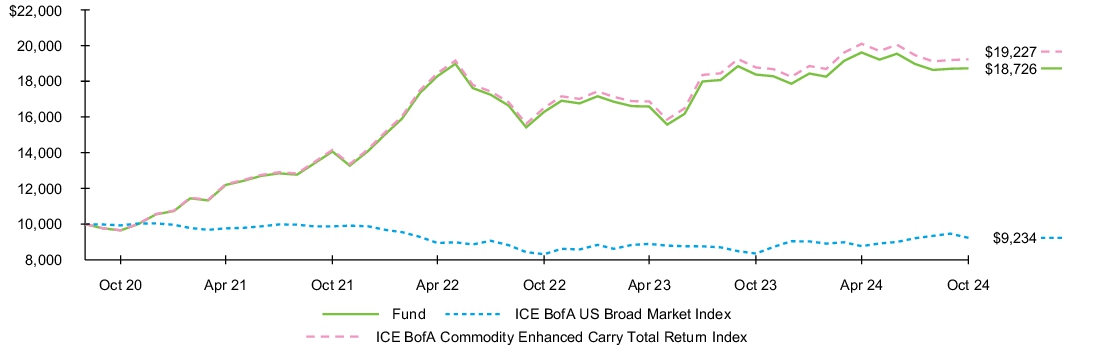
For the reporting period ended October 31, 2024, the Fund returned 1.92%.
For the same period, the ICE BofA US Broad Market Index returned 10.55% and the ICE BofA Commodity Enhanced Carry Total Return Index returned 2.43%.
What contributed to performance?
During the reporting period, the Fund benefited from exposure via futures to copper. Prices of the metal surged due to increased demand from the renewable energy sector and electric vehicles, coupled with supply disruptions in major copper production countries. Renewed industrial activity and investment in green technology were also contributors. Futures exposure to brent crude oil prices experienced notable fluctuations, influenced by factors including global oil production levels, geopolitical events, and market sentiment. The performance of these futures was characterized by periods of both backwardation and contango, indicating shifts in market supply and demand dynamics. (Contango describes an upward-sloping curve where the prices for future delivery are higher than the spot price, while Backwardation describes a downward-sloping curve where the prices for future delivery are lower than the spot price.)
What detracted from performance?
During the reporting period there were no significant detractors from the Fund’s return.
The views expressed reflect the opinions of BlackRock as of the date of this report and are subject to change based on changes in market, economic or other conditions. These views are not intended to be a forecast of future events and are no guarantee of future results.
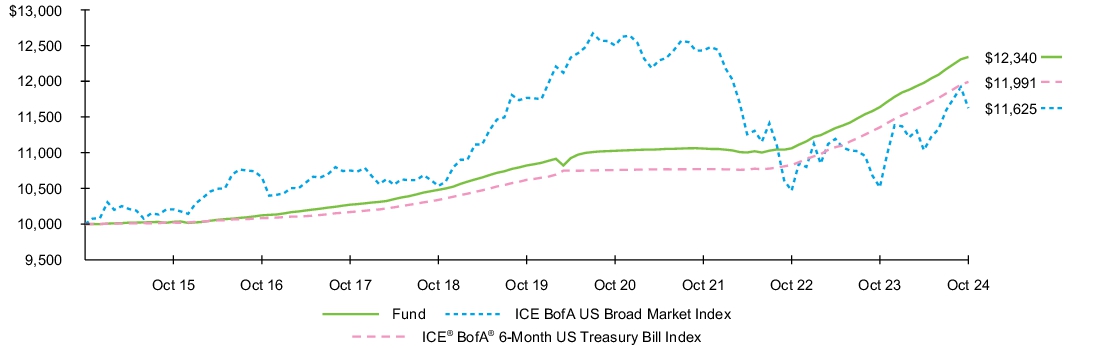
Fund performance
Cumulative performance: September 1, 2020 through October 31, 2024
Initial investment of $10,000
See “Average annual total returns” for additional information on fund performance.
| Average annual total returns | | | | |
| 1 Year | | Since Fund
Inception | |
| Fund NAV | 1.92 | % | 16.25 | % |
| ICE BofA US Broad Market Index | 10.55 | | (1.89 | ) |
| ICE BofA Commodity Enhanced Carry Total Return Index | 2.43 | | 17.00 | |
| Key Fund statistics | |
| Net Assets | $43,622,270 |
| Number of Portfolio Holdings | 91 |
| Net Investment Advisory Fees | $156,086 |
| Portfolio Turnover Rate | 0% |
The Fund has added the ICE BofA US Broad Market Index in response to new regulatory requirements.
The inception date of the Fund was September 1, 2020.
Past performance is not an indication of future results. Performance results do not reflect the deduction of taxes that a shareholder would pay on fund distributions or on the redemption or sale of fund shares. Visit iShares.com for more recent performance information.
What did the Fund invest in?
(as of October 31, 2024)
| Asset Type | Percent of
Net Assets | |
| Commercial Paper | 55.3 | % |
| Money Market Funds | 25.3 | % |
| U.S. Treasury Obligations | 10.3 | % |
| Certificates of Deposit | 8.8 | % |
| Total Return Commodity Index Swaps | 0.5 | % |
| Cash | 0.2 | % |
| Other assets, less liabilities | (0.4 | )% |
| Security(a) | Percent of
Net Assets | |
| U.S. Treasury Bill, 4.14%, 10/02/25 | 3.3 | % |
| National Bank of Canada, 4.61%, 06/12/25 | 1.3 | % |
| Citigroup Global Markets Inc., 5.02%, 01/24/25 | 1.1 | % |
| Lime Funding LLC, 4.83%, 11/01/24 | 1.1 | % |
| Brookfield Corporate Treasury Ltd., 5.16%, 11/01/24 | 1.1 | % |
(a) | Excludes money market funds. |
Material Fund Changes
This is a summary of certain changes to the Fund since October 31, 2023. For more complete information, you may review the Fund’s next prospectus, which we expect to be available approximately 120 days after October 31, 2024 at blackrock.com/fundreports or upon request by contacting us at 1-800-iShares (1-800-474-2737).
The contractual fee waiver has been extended through March 1, 2025.
Additional information
If you wish to view additional information about the Fund, including but not limited to financial statements, the Fund’s prospectus, and proxy voting policies and procedures, please visit blackrock.com/fundreports. For proxy voting records, visit blackrock.com/proxyrecords.
Householding
Householding is an option available to certain fund investors. Householding is a method of delivery, based on the preference of the individual investor, in which a single copy of certain shareholder documents can be delivered to investors who share the same address, even if their accounts are registered under different names. Please contact your broker-dealer if you are interested in enrolling in householding and receiving a single copy of prospectuses and other shareholder documents, or if you are currently enrolled in householding and wish to change your householding status.
The Fund is not sponsored, endorsed, issued, sold, or promoted by ICE Data Indices, LLC and its affiliates, nor does this company make any representation regarding the advisability of investing in the Fund. BlackRock is not affiliated with the company listed above.
©2024 BlackRock, Inc. or its affiliates. All rights reserved. iSHARES and BLACKROCK are registered trademarks of BlackRock, Inc. or its affiliates. All other trademarks are those of their respective owners.
iShares Commodity Curve Carry Strategy ETF
Annual Shareholder Report — October 31, 2024
CCRV-10/24-AR
iShares GSCI Commodity Dynamic Roll Strategy ETF
COMT | NASDAQ
Annual Shareholder Report — October 31, 2024
This annual shareholder report contains important information about iShares GSCI Commodity Dynamic Roll Strategy ETF (the “Fund”) for the period of November 1, 2023 to October 31, 2024. You can find additional information about the Fund at blackrock.com/fundreports. You can also request this information by contacting us at 1‑800‑iShares (1‑800‑474‑2737).
This report describes changes to the Fund that occurred during the reporting period.
What were the Fund costs for the last year ?
(based on a hypothetical $10,000 investment)
| Fund name | Costs of a $10,000
investment | Costs paid as a percentage of a
$10,000 investment |
| iShares GSCI Commodity Dynamic Roll Strategy ETF | $46 | 0.47% |
How did the Fund perform last year?
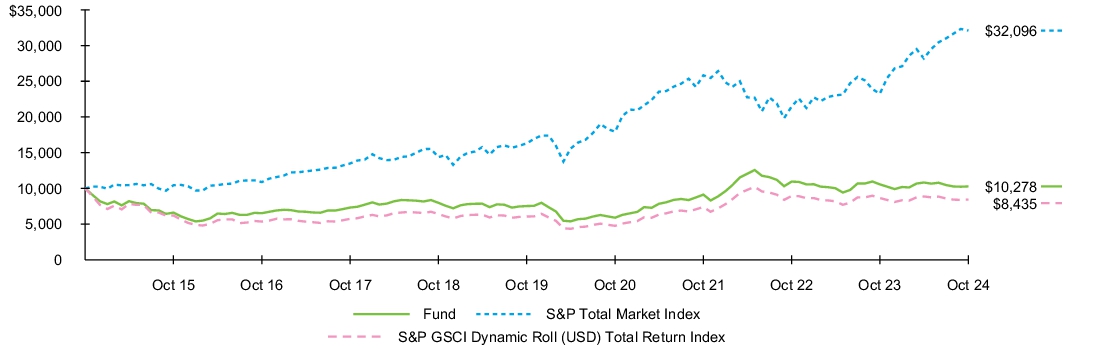
For the reporting period ended October 31, 2024, the Fund returned -2.74%.
For the same period, the S&P Total Market Index returned 37.99% and the S&P GSCI Dynamic Roll (USD) Total Return Index returned -2.49%.
What contributed to performance?
Amid worries about growth prospects, the European Central Bank cut rates three times, while the United States economy stayed strong, prompting the U.S. Federal Reserve Bank to wait until September before decreasing short-term interest rates for the first since 2020. In contrast, Japan ended its negative interest rate regime and raised rates. Exposure via futures to commodities, such as gold and cocoa, had the largest positive impact on the Fund’s performance during the reporting period. Gold futures rose amid inflationary concerns and geopolitical tensions, while weather conditions were the biggest factor supporting cocoa futures.
What detracted from performance?
Exposure to natural gas and corn via futures had the largest negative impact on the Fund’s return during the reporting period. Amid high storage levels and abundant supplies, natural gas prices have trended lower. Corn prices were also under pressure from poor supply-demand dynamics.
The views expressed reflect the opinions of BlackRock as of the date of this report and are subject to change based on changes in market, economic or other conditions. These views are not intended to be a forecast of future events and are no guarantee of future results.
Fund performance
Cumulative performance: November 1, 2014 through October 31, 2024
Initial investment of $10,000
See “Average annual total returns” for additional information on fund performance.
| Average annual total returns | | | | | | |
| 1 Year | | 5 Years | | 10 Years | |
| Fund NAV | (2.74 | )% | 6.42 | % | 0.27 | % |
| S&P Total Market Index | 37.99 | | 14.51 | | 12.37 | |
| S&P GSCI Dynamic Roll (USD) Total Return Index | (2.49 | ) | 6.83 | | (1.69 | ) |
| Key Fund statistics | |
| Net Assets | $858,649,444 |
| Number of Portfolio Holdings | 138 |
| Net Investment Advisory Fees | $3,837,132 |
| Portfolio Turnover Rate | 0% |
The Fund has added the S&P Total Market Index in response to new regulatory requirements.
The performance of the S&P GSCI Dynamic Roll (USD) Total Return Index in this report reflects the performance of the S&P GSCI Dynamic Roll Reduced Energy 70/30 Futures/Equity Blend Total Return Index through January 30, 2020 and, beginning January 31, 2020, the performance of the S&P GSCI Dynamic Roll (USD) Total Return Index.
Past performance is not an indication of future results. Performance results do not reflect the deduction of taxes that a shareholder would pay on fund distributions or on the redemption or sale of fund shares. Visit iShares.com for more recent performance information.
What did the Fund invest in?
(as of October 31, 2024)
| Asset Type | Percent of
Net Assets | |
| Commercial Paper | 53.1 | % |
| Certificates of Deposit | 16.1 | % |
| U.S. Treasury Obligations | 12.8 | % |
| Money Market Funds | 10.1 | % |
| Cash | 8.7 | % |
| Futures | (3.5 | )% |
| Other assets, less liabilities | 2.7 | % |
| Sector Exposure(a) | Percent of
Net Assets | |
| Energy Futures | 34.0 | % |
| Industrial Metals Futures | 32.3 | % |
| Agriculture Futures | 17.0 | % |
| Livestock Futures | 9.1 | % |
| Gold Futures | 6.9 | % |
| Precious Metals Futures | 0.7 | % |
(a) | Exposures are calculated as the current notional value of the futures contracts as a percentage of net assets. |
Material Fund Changes
This is a summary of certain changes to the Fund since October 31, 2023. For more complete information, you may review the Fund’s next prospectus, which we expect to be available approximately 120 days after October 31, 2024 at blackrock.com/fundreports or upon request by contacting us at 1-800-iShares (1-800-474-2737).
The contractual fee waiver has been extended through February 28, 2029.
Additional information
If you wish to view additional information about the Fund, including but not limited to financial statements, the Fund’s prospectus, and proxy voting policies and procedures, please visit blackrock.com/fundreports. For proxy voting records, visit blackrock.com/proxyrecords.
Householding
Householding is an option available to certain fund investors. Householding is a method of delivery, based on the preference of the individual investor, in which a single copy of certain shareholder documents can be delivered to investors who share the same address, even if their accounts are registered under different names. Please contact your broker-dealer if you are interested in enrolling in householding and receiving a single copy of prospectuses and other shareholder documents, or if you are currently enrolled in householding and wish to change your householding status.
The Fund is not sponsored, endorsed, issued, sold, or promoted by S&P Dow Jones Indices LLC and its affiliates, nor does this company make any representation regarding the advisability of investing in the Fund. BlackRock is not affiliated with the company listed above.
©2024 BlackRock, Inc. or its affiliates. All rights reserved. iSHARES and BLACKROCK are registered trademarks of BlackRock, Inc. or its affiliates. All other trademarks are those of their respective owners.
iShares GSCI Commodity Dynamic Roll Strategy ETF
Annual Shareholder Report — October 31, 2024
COMT-10/24-AR
iShares Inflation Hedged Corporate Bond ETF
LQDI | Cboe BZX Exchange
Annual Shareholder Report — October 31, 2024
This annual shareholder report contains important information about iShares Inflation Hedged Corporate Bond ETF (the “Fund”) for the period of November 1, 2023 to October 31, 2024. You can find additional information about the Fund at blackrock.com/fundreports. You can also request this information by contacting us at 1‑800‑iShares (1‑800‑474‑2737).
What were the Fund costs for the last year ?
(based on a hypothetical $10,000 investment)
| Fund name | Costs of a $10,000
investment | Costs paid as a percentage of a
$10,000 investment |
| iShares Inflation Hedged Corporate Bond ETF | $5(a) | 0.05%(a) |
(a) | Excludes fees and expenses incurred indirectly as a result of investments in underlying funds. |
How did the Fund perform last year?
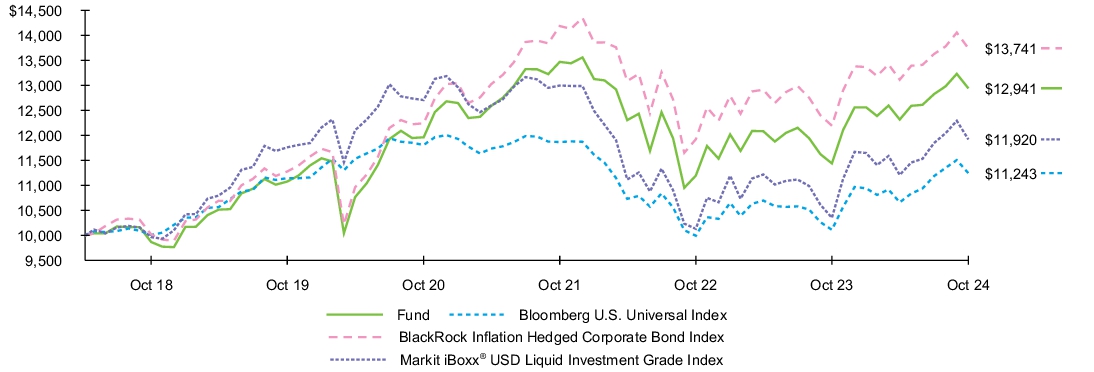
For the reporting period ended October 31, 2024, the Fund returned 13.14%.
For the same period, the Bloomberg U.S. Universal Index returned 11.20% and the BlackRock Inflation Hedged Corporate Bond Index returned 12.70%.
What contributed to performance?
Bond returns were supported by an environment of slowing pricing pressures and steady growth in the United States during the reporting period. Inflation measures in the United States trended lower toward the Central Banks’s 2% target, leading the U.S. Federal Reserve’s to lower short-term interest rates by a 50 basis point cut, its first rate reduction since March 2020.
What detracted from performance?
The Fund uses zero coupon swaps (no cash flows exchange hands until maturity) across multiple points across the curve. If inflation runs below the fixed rate on the consumer price index (CPI) swaps, the swaps will be ‘out of the money’ and this will flow through to the NAV. During the reporting period, lower-than-expected inflation readings, as measured by the CPI, weighed on the Fund’s return.
The views expressed reflect the opinions of BlackRock as of the date of this report and are subject to change based on changes in market, economic or other conditions. These views are not intended to be a forecast of future events and are no guarantee of future results.
Fund performance
Cumulative performance: May 8, 2018 through October 31, 2024
Initial investment of $10,000
See “Average annual total returns” for additional information on fund performance.
| Average annual total returns | | | | | | |
| 1 Year | | 5 Years | | Since Fund
Inception | |
| Fund NAV | 13.14 | % | 3.16 | % | 4.06 | % |
| Bloomberg U.S. Universal Index | 11.20 | | 0.18 | | 1.83 | |
| BlackRock Inflation Hedged Corporate Bond Index | 12.70 | | 4.03 | | 5.03 | |
| Markit iBoxx® USD Liquid Investment Grade Index | 15.16 | | 0.27 | | 2.75 | |
| Key Fund statistics | |
| Net Assets | $53,535,218 |
| Number of Portfolio Holdings | 123 |
| Net Investment Advisory Fees | $24,172 |
| Portfolio Turnover Rate | 6% |
The Fund has added the Bloomberg U.S. Universal Index in response to new regulatory requirements.
The inception date of the Fund was May 8, 2018.
The performance of the BlackRock Inflation Hedge Corporate Bond Index in this report reflects the performance of the Markit iBoxx® USD Liquid Investment Grade Inflation Hedged Index through November 30, 2021 and, beginning on December 1, 2021, the performance of the BlackRock Inflation Hedge Corporate Bond Index.
Past performance is not an indication of future results. Performance results do not reflect the deduction of taxes that a shareholder would pay on fund distributions or on the redemption or sale of fund shares. Visit iShares.com for more recent performance information.
What did the Fund invest in?
(as of October 31, 2024)
| Asset Type | Percent of
Net Assets | |
| Investment Companies | 94.7 | % |
| Short-term Investments | 46.3 | % |
| Swaps, net cumulative appreciation | 4.2 | % |
| Other assets less liabilities | (45.2 | )% |
| Credit quality allocation (of the underlying fund)(a) |
| Credit Rating(b) | Percent of Total
Investments(c) | |
| Aaa | 2.4 | % |
| Aa | 5.8 | % |
| A | 46.7 | % |
| Baa | 42.3 | % |
| Ba | 2.4 | % |
| Not Rated | 0.4 | % |
(a) | The underlying fund is iShares iBoxx $ Investment Grade Corporate Bond ETF. |
(b) | Credit quality ratings shown reflect the ratings assigned by Moody’s Investors Service (“Moody’s”), a widely used independent, nationally recognized statistical rating organization. Moody’s credit ratings are opinions of the credit quality of individual obligations or of an issuer’s general creditworthiness. Investment grade ratings are credit ratings of Baa or higher. Below investment grade ratings are credit ratings of Ba or lower. Unrated investments do not necessarily indicate low credit quality. Credit quality ratings are subject to change. |
(c) | Excludes money market funds. |
Additional information
If you wish to view additional information about the Fund, including but not limited to financial statements, the Fund’s prospectus, and proxy voting policies and procedures, please visit blackrock.com/fundreports. For proxy voting records, visit blackrock.com/proxyrecords.
Householding
Householding is an option available to certain fund investors. Householding is a method of delivery, based on the preference of the individual investor, in which a single copy of certain shareholder documents can be delivered to investors who share the same address, even if their accounts are registered under different names. Please contact your broker-dealer if you are interested in enrolling in householding and receiving a single copy of prospectuses and other shareholder documents, or if you are currently enrolled in householding and wish to change your householding status.
The Fund is not sponsored, endorsed, issued, sold, or promoted by Bloomberg Index Services Limited, BlackRock Index Services, LLC, Markit Indices Limited and their respective affiliates, nor do these companies make any representation regarding the advisability of investing in the Fund. BlackRock is not affiliated with Bloomberg Index Services Limited or Markit Indices Limited but is affiliated with BlackRock Index Services, LLC.
©2024 BlackRock, Inc. or its affiliates. All rights reserved. iSHARES and BLACKROCK are registered trademarks of BlackRock, Inc. or its affiliates. All other trademarks are those of their respective owners.
iShares Inflation Hedged Corporate Bond ETF
Annual Shareholder Report — October 31, 2024
LQDI-10/24-AR
iShares Inflation Hedged High Yield Bond ETF
HYGI | NYSE Arca
Annual Shareholder Report — October 31, 2024
This annual shareholder report contains important information about iShares Inflation Hedged High Yield Bond ETF (the “Fund”) for the period of November 1, 2023 to October 31, 2024. You can find additional information about the Fund at blackrock.com/fundreports. You can also request this information by contacting us at 1‑800‑iShares (1‑800‑474‑2737).
What were the Fund costs for the last year ?
(based on a hypothetical $10,000 investment)
| Fund name | Costs of a $10,000
investment | Costs paid as a percentage of a
$10,000 investment |
| iShares Inflation Hedged High Yield Bond ETF | $5(a) | 0.05%(a) |
(a) | Excludes fees and expenses incurred indirectly as a result of investments in underlying funds. |
How did the Fund perform last year?
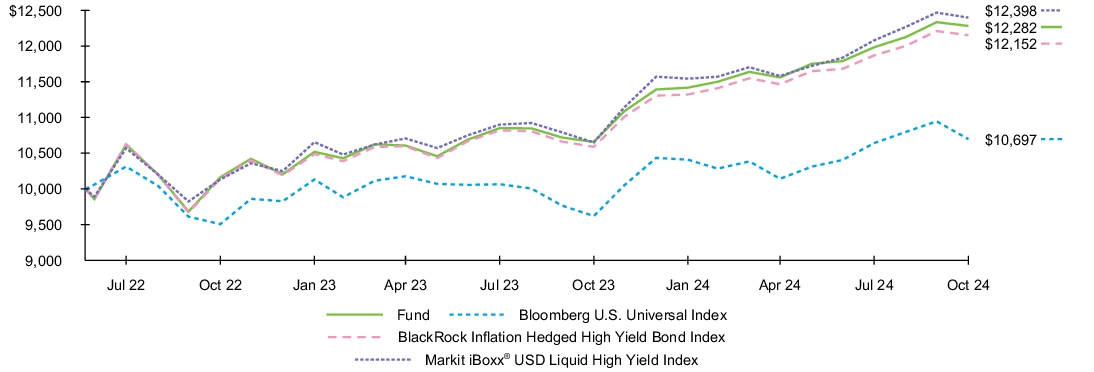
For the reporting period ended October 31, 2024, the Fund returned 15.24%.
For the same period, the Bloomberg U.S. Universal Index returned 11.20% and the BlackRock Inflation Hedged High Yield Bond Index returned 14.76%.
What contributed to performance?
Bond returns were supported by an environment of slowing pricing pressures and steady growth in the United States during the reporting period. Inflation measures in the United States trended lower toward the U.S. Federal Reserve Bank’s 2% target, leading the U.S. Federal Reserve to lower short-term interest rates by a 50 basis point cut, its first rate reduction since March 2020.
What detracted from performance?
The Fund uses zero coupon swaps (no cash flows exchange hands until maturity) across multiple points across the curve. If inflation runs below the fixed rate on the consumer price index (CPI) swaps, the swaps will be ‘out of the money’ and this will flow through to the NAV. During the reporting period, lower-than-expected inflation readings, as measured by the CPI, weighed on the Fund’s return.
The views expressed reflect the opinions of BlackRock as of the date of this report and are subject to change based on changes in market, economic or other conditions. These views are not intended to be a forecast of future events and are no guarantee of future results.
Fund performance
Cumulative performance: June 22, 2022 through October 31, 2024
Initial investment of $10,000
See “Average annual total returns” for additional information on fund performance.
| Average annual total returns | | | | |
| 1 Year | | Since Fund
Inception | |
| Fund NAV | 15.24 | % | 9.09 | % |
| Bloomberg U.S. Universal Index | 11.20 | | 2.90 | |
| BlackRock Inflation Hedged High Yield Bond Index | 14.76 | | 8.63 | |
| Markit iBoxx® USD Liquid High Yield Index | 16.41 | | 9.55 | |
| Key Fund statistics | |
| Net Assets | $2,666,893 |
| Number of Portfolio Holdings | 41 |
| Net Investment Advisory Fees | $1,303 |
| Portfolio Turnover Rate | 0% |
The Fund has added the Bloomberg U.S. Universal Index in response to new regulatory requirements.
The inception date of the Fund was June 22, 2022.
Past performance is not an indication of future results. Performance results do not reflect the deduction of taxes that a shareholder would pay on fund distributions or on the redemption or sale of fund shares. Visit iShares.com for more recent performance information.
What did the Fund invest in?
(as of October 31, 2024)
| Asset Type | Percent of
Net Assets | |
| Investment Companies | 95.2 | % |
| Short-term Investments | 48.6 | % |
| Swaps, net cumulative appreciation | 0.4 | % |
| Other assets less liabilities | (44.2 | )% |
| Credit quality allocation (of the underlying fund)(a) |
| Credit Rating(b) | Percent of Total
Investments(c) | |
| Baa | 1.0 | % |
| Ba | 40.5 | % |
| B | 42.8 | % |
| Caa | 12.8 | % |
| Ca | 1.1 | % |
| Not Rated | 1.8 | % |
(a) | The underlying fund is iShares iBoxx $ High Yield Corporate Bond ETF. |
(b) | Credit quality ratings shown reflect the ratings assigned by Moody’s Investors Service (“Moody’s”), a widely used independent, nationally recognized statistical rating organization. Moody’s credit ratings are opinions of the credit quality of individual obligations or of an issuer’s general creditworthiness. Investment grade ratings are credit ratings of Baa or higher. Below investment grade ratings are credit ratings of Ba or lower. Unrated investments do not necessarily indicate low credit quality. Credit quality ratings are subject to change. |
(c) | Excludes money market funds. |
Additional information
If you wish to view additional information about the Fund, including but not limited to financial statements, the Fund’s prospectus, and proxy voting policies and procedures, please visit blackrock.com/fundreports. For proxy voting records, visit blackrock.com/proxyrecords.
Householding
Householding is an option available to certain fund investors. Householding is a method of delivery, based on the preference of the individual investor, in which a single copy of certain shareholder documents can be delivered to investors who share the same address, even if their accounts are registered under different names. Please contact your broker-dealer if you are interested in enrolling in householding and receiving a single copy of prospectuses and other shareholder documents, or if you are currently enrolled in householding and wish to change your householding status.
The Fund is not sponsored, endorsed, issued, sold, or promoted by Bloomberg Index Services Limited, BlackRock Index Services, LLC, Markit Indices Limited and their respective affiliates, nor do these companies make any representation regarding the advisability of investing in the Fund. BlackRock is not affiliated with Bloomberg Index Services Limited or Markit Indices Limited but is affiliated with BlackRock Index Services, LLC.
©2024 BlackRock, Inc. or its affiliates. All rights reserved. iSHARES and BLACKROCK are registered trademarks of BlackRock, Inc. or its affiliates. All other trademarks are those of their respective owners.
iShares Inflation Hedged High Yield Bond ETF
Annual Shareholder Report — October 31, 2024
HYGI-10/24-AR
iShares Inflation Hedged U.S. Aggregate Bond ETF
AGIH | NYSE Arca
Annual Shareholder Report — October 31, 2024
This annual shareholder report contains important information about iShares Inflation Hedged U.S. Aggregate Bond ETF (the “Fund”) for the period of November 1, 2023 to October 31, 2024. You can find additional information about the Fund at blackrock.com/fundreports. You can also request this information by contacting us at 1‑800‑iShares (1‑800‑474‑2737).
What were the Fund costs for the last year ?
(based on a hypothetical $10,000 investment)
| Fund name | Costs of a $10,000
investment | Costs paid as a percentage of a
$10,000 investment |
| iShares Inflation Hedged U.S. Aggregate Bond ETF | $10(a) | 0.10%(a) |
(a) | Excludes fees and expenses incurred indirectly as a result of investments in underlying funds. |
How did the Fund perform last year?
For the reporting period ended October 31, 2024, the Fund returned 9.29%.
For the same period, the Bloomberg U.S. Universal Index returned 11.20% and the BlackRock Inflation Hedged U.S. Aggregate Bond Index returned 9.18%.
What contributed to performance?
Bond returns were supported by an environment of slowing pricing pressures and steady growth in the United States during the reporting period. Inflation measures in the United States trended lower toward the U.S. Federal Reserve Bank’s 2% target, leading the U.S. Federal Reserve to lower short-term interest rates by a 50 basis point cut, its first-rate reduction since March 2020.
What detracted from performance?
The Fund uses zero coupon swaps (no cash flows exchange hands until maturity) across multiple points across the curve. If inflation runs below the fixed rate on the consumer price index (CPI) swaps, the swaps will be ‘out of the money’ and this will flow through to the NAV. During the reporting period, lower-than-expected inflation readings, as measured by the CPI, weighed on the Fund’s return.
The views expressed reflect the opinions of BlackRock as of the date of this report and are subject to change based on changes in market, economic or other conditions. These views are not intended to be a forecast of future events and are no guarantee of future results.
Fund performance
Cumulative performance: June 22, 2022 through October 31, 2024
Initial investment of $10,000
See “Average annual total returns” for additional information on fund performance.
| Average annual total returns | | | | |
| 1 Year | | Since Fund
Inception | |
| Fund NAV | 9.29 | % | 2.11 | % |
| Bloomberg U.S. Universal Index | 11.20 | | 2.90 | |
| BlackRock Inflation Hedged U.S. Aggregate Bond Index | 9.18 | | 2.12 | |
| Bloomberg U.S. Aggregate Bond Index | 10.55 | | 2.15 | |
| Key Fund statistics | |
| Net Assets | $2,462,635 |
| Number of Portfolio Holdings | 49 |
| Net Investment Advisory Fees | $2,447 |
| Portfolio Turnover Rate | 2% |
The Fund has added the Bloomberg U.S. Universal Index in response to new regulatory requirements.
The inception date of the Fund was June 22, 2022.
Past performance is not an indication of future results. Performance results do not reflect the deduction of taxes that a shareholder would pay on fund distributions or on the redemption or sale of fund shares. Visit iShares.com for more recent performance information.
What did the Fund invest in?
(as of October 31, 2024)
| Asset Type | Percent of
Net Assets | |
| Investment Companies | 95.8 | % |
| Short-term Investments | 1.2 | % |
| Swaps, net cumulative appreciation | 0.6 | % |
| Other assets less liabilities | 2.4 | % |
| Credit quality allocation (of the underlying fund)(a) |
| Credit Rating(b) | Percent of Total
Investments(c) | |
| Aaa | 70.8 | % |
| Aa | 2.3 | % |
| A | 13.6 | % |
| Baa | 11.9 | % |
| Ba | 0.5 | % |
| Not Rated | 0.9 | % |
(a) | The underlying fund is iShares Core U.S. Aggregate Bond ETF. |
(b) | Credit quality ratings shown reflect the ratings assigned by Moody’s Investors Service (“Moody’s”), a widely used independent, nationally recognized statistical rating organization. Moody’s credit ratings are opinions of the credit quality of individual obligations or of an issuer’s general creditworthiness. Investment grade ratings are credit ratings of Baa or higher. Below investment grade ratings are credit ratings of Ba or lower. Unrated investments do not necessarily indicate low credit quality. Credit quality ratings are subject to change. |
(c) | Excludes money market funds. |
Additional information
If you wish to view additional information about the Fund, including but not limited to financial statements, the Fund’s prospectus, and proxy voting policies and procedures, please visit blackrock.com/fundreports. For proxy voting records, visit blackrock.com/proxyrecords.
Householding
Householding is an option available to certain fund investors. Householding is a method of delivery, based on the preference of the individual investor, in which a single copy of certain shareholder documents can be delivered to investors who share the same address, even if their accounts are registered under different names. Please contact your broker-dealer if you are interested in enrolling in householding and receiving a single copy of prospectuses and other shareholder documents, or if you are currently enrolled in householding and wish to change your householding status.
The Fund is not sponsored, endorsed, issued, sold, or promoted by Bloomberg Index Services Limited, BlackRock Index Services, LLC and their respective affiliates, nor do these companies make any representation regarding the advisability of investing in the Fund. BlackRock is not affiliated with Bloomberg Index Services Limited but is affiliated with BlackRock Index Services, LLC.
©2024 BlackRock, Inc. or its affiliates. All rights reserved. iSHARES and BLACKROCK are registered trademarks of BlackRock, Inc. or its affiliates. All other trademarks are those of their respective owners.
iShares Inflation Hedged U.S. Aggregate Bond ETF
Annual Shareholder Report — October 31, 2024
AGIH-10/24-AR
iShares Interest Rate Hedged Corporate Bond ETF
LQDH | NYSE Arca
Annual Shareholder Report — October 31, 2024
This annual shareholder report contains important information about iShares Interest Rate Hedged Corporate Bond ETF (the “Fund”) for the period of November 1, 2023 to October 31, 2024. You can find additional information about the Fund at blackrock.com/fundreports. You can also request this information by contacting us at 1‑800‑iShares (1‑800‑474‑2737).
What were the Fund costs for the last year ?
(based on a hypothetical $10,000 investment)
| Fund name | Costs of a $10,000
investment | Costs paid as a percentage of a
$10,000 investment |
| iShares Interest Rate Hedged Corporate Bond ETF | $11(a) | 0.10%(a) |
(a) | Excludes fees and expenses incurred indirectly as a result of investments in underlying funds. |
How did the Fund perform last year?
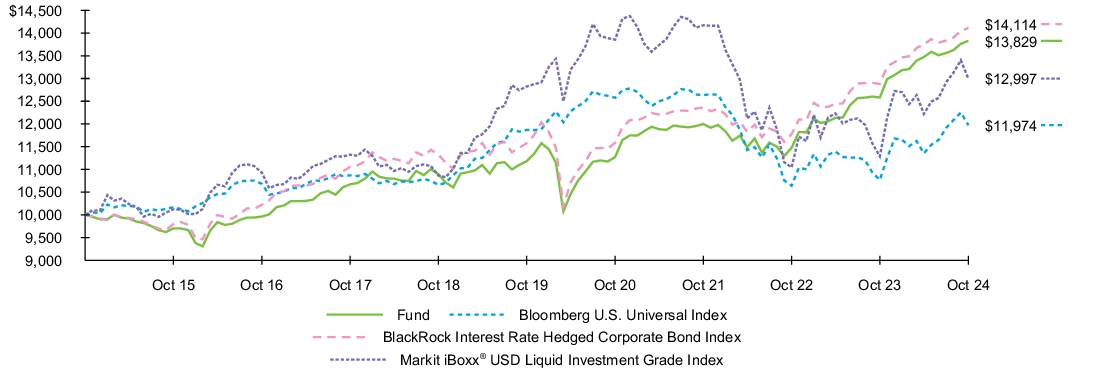
For the reporting period ended October 31, 2024, the Fund returned 9.91%.
For the same period, the Bloomberg U.S. Universal Index returned 11.20% and the BlackRock Interest Rate Hedged Corporate Bond Index returned 9.58%.
What contributed to performance?
Bond returns were supported by an environment of slowing pricing pressures and steady growth in the United States during the reporting period. Expectations for interest rate cuts grew, and those hopes were realized in September 2024 when the U.S. Federal Reserve lowered short-term interest rates by a 50 basis point cut, its first-rate reduction since March 2020. In anticipation of rate cuts, the yield curve (the difference between a shorter-term bond and a longer-term bond, most often gauged by the 2-year Treasury note and the 10-year Treasury note) steepened during the reporting period. Bond yields and prices move in opposite directions.
What detracted from performance?
The yield on the 10-year Treasury decreased from 4.93% to 4.28% during the reporting period, leading the Fund’s hedged interest rate positions to detract from performance.
The views expressed reflect the opinions of BlackRock as of the date of this report and are subject to change based on changes in market, economic or other conditions. These views are not intended to be a forecast of future events and are no guarantee of future results.
Fund performance
Cumulative performance: November 1, 2014 through October 31, 2024
Initial investment of $10,000
See “Average annual total returns” for additional information on fund performance.
| Average annual total returns | | | | | | |
| 1 Year | | 5 Years | | 10 Years | |
| Fund NAV | 9.91 | % | 4.34 | % | 3.30 | % |
| Bloomberg U.S. Universal Index | 11.20 | | 0.18 | | 1.82 | |
| BlackRock Interest Rate Hedged Corporate Bond Index | 9.58 | | 4.04 | | 3.51 | |
| Markit iBoxx® USD Liquid Investment Grade Index | 15.16 | | 0.27 | | 2.66 | |
| Key Fund statistics | |
| Net Assets | $427,186,829 |
| Number of Portfolio Holdings | 186 |
| Net Investment Advisory Fees | $331,843 |
| Portfolio Turnover Rate | 9% |
The Fund has added the Bloomberg U.S. Universal Index in response to new regulatory requirements.
The performance of the BlackRock Interest Rate Hedged Corporate Bond Index in this report reflects the performance of the Markit iBoxx® USD Liquid Investment Grade Interest Rate Hedged Swaps Index through November 30, 2021 and, beginning on December 1, 2021, the performance of the BlackRock Interest Rate Hedged Corporate Bond Index.
Past performance is not an indication of future results. Performance results do not reflect the deduction of taxes that a shareholder would pay on fund distributions or on the redemption or sale of fund shares. Visit iShares.com for more recent performance information.
What did the Fund invest in?
(as of October 31, 2024)
| Asset Type | Percent of
Net Assets | |
| Investment Companies | 94.6 | % |
| Short-term Investments | 51.4 | % |
| Swaps, net cumulative appreciation | 3.4 | % |
| Other assets less liabilities | (49.4 | )% |
| Credit quality allocation (of the underlying fund)(a) |
| Credit Rating(b) | Percent of Total
Investments(c) | |
| Aaa | 2.4 | % |
| Aa | 5.8 | % |
| A | 46.7 | % |
| Baa | 42.3 | % |
| Ba | 2.4 | % |
| Not Rated | 0.4 | % |
(a) | The underlying fund is iShares iBoxx $ Investment Grade Corporate Bond ETF. |
(b) | Credit quality ratings shown reflect the ratings assigned by Moody’s Investors Service (“Moody’s”), a widely used independent, nationally recognized statistical rating organization. Moody’s credit ratings are opinions of the credit quality of individual obligations or of an issuer’s general creditworthiness. Investment grade ratings are credit ratings of Baa or higher. Below investment grade ratings are credit ratings of Ba or lower. Unrated investments do not necessarily indicate low credit quality. Credit quality ratings are subject to change. |
(c) | Excludes money market funds. |
Additional information
If you wish to view additional information about the Fund, including but not limited to financial statements, the Fund’s prospectus, and proxy voting policies and procedures, please visit blackrock.com/fundreports. For proxy voting records, visit blackrock.com/proxyrecords.
Householding
Householding is an option available to certain fund investors. Householding is a method of delivery, based on the preference of the individual investor, in which a single copy of certain shareholder documents can be delivered to investors who share the same address, even if their accounts are registered under different names. Please contact your broker-dealer if you are interested in enrolling in householding and receiving a single copy of prospectuses and other shareholder documents, or if you are currently enrolled in householding and wish to change your householding status.
The Fund is not sponsored, endorsed, issued, sold, or promoted by Bloomberg Index Services Limited, BlackRock Index Services, LLC, Markit Indices Limited and their respective affiliates, nor do these companies make any representation regarding the advisability of investing in the Fund. BlackRock is not affiliated with Bloomberg Index Services Limited or Markit Indices Limited but is affiliated with BlackRock Index Services, LLC.
©2024 BlackRock, Inc. or its affiliates. All rights reserved. iSHARES and BLACKROCK are registered trademarks of BlackRock, Inc. or its affiliates. All other trademarks are those of their respective owners.
iShares Interest Rate Hedged Corporate Bond ETF
Annual Shareholder Report — October 31, 2024
LQDH-10/24-AR
iShares Interest Rate Hedged High Yield Bond ETF
HYGH | NYSE Arca
Annual Shareholder Report — October 31, 2024
This annual shareholder report contains important information about iShares Interest Rate Hedged High Yield Bond ETF (the “Fund”) for the period of November 1, 2023 to October 31, 2024. You can find additional information about the Fund at blackrock.com/fundreports. You can also request this information by contacting us at 1‑800‑iShares (1‑800‑474‑2737).
What were the Fund costs for the last year ?
(based on a hypothetical $10,000 investment)
| Fund name | Costs of a $10,000
investment | Costs paid as a percentage of a
$10,000 investment |
| iShares Interest Rate Hedged High Yield Bond ETF | $5(a) | 0.05%(a) |
(a) | Excludes fees and expenses incurred indirectly as a result of investments in underlying funds. |
How did the Fund perform last year?
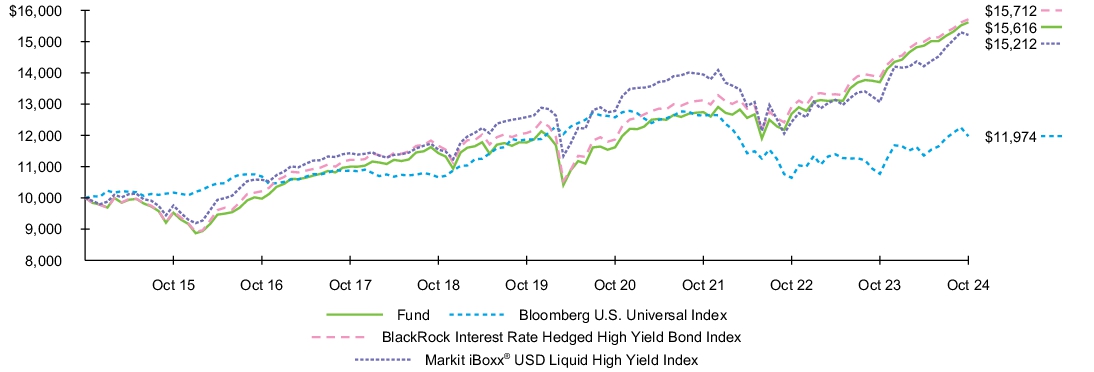
For the reporting period ended October 31, 2024, the Fund returned 13.99%.
For the same period, the Bloomberg U.S. Universal Index returned 11.20% and the BlackRock Interest Rate Hedged High Yield Bond Index returned 13.41%.
What contributed to performance?
Bond returns were supported by an environment of slowing pricing pressures and steady growth in the United States during the reporting period. Expectations for interest rate cuts grew, and those hopes were realized in September 2024 when the U.S. Federal Reserve lowered short-term interest rates by a 50 basis point cut, its first rate reduction since March 2020. In anticipation of rate cuts, the yield curve (the difference between a shorter-term bond and a longer-term bond, most often gauged by the 2-year Treasury note and the 10-year Treasury note) steepened during the reporting period. Bond yields and prices move in opposite directions.
What detracted from performance?
The yield on the 10-year Treasury declined from 4.93% to 4.28% during the reporting period, and the impact of hedging interest rates negatively affected the Fund’s total return.
The views expressed reflect the opinions of BlackRock as of the date of this report and are subject to change based on changes in market, economic or other conditions. These views are not intended to be a forecast of future events and are no guarantee of future results.
Fund performance
Cumulative performance: November 1, 2014 through October 31, 2024
Initial investment of $10,000
See “Average annual total returns” for additional information on fund performance.
| Average annual total returns | | | | | | |
| 1 Year | | 5 Years | | 10 Years | |
| Fund NAV | 13.99 | % | 5.82 | % | 4.56 | % |
| Bloomberg U.S. Universal Index | 11.20 | | 0.18 | | 1.82 | |
| BlackRock Interest Rate Hedged High Yield Bond Index | 13.41 | | 5.41 | | 4.62 | |
| Markit iBoxx® USD Liquid High Yield Index | 16.41 | | 3.87 | | 4.28 | |
| Key Fund statistics | |
| Net Assets | $335,786,291 |
| Number of Portfolio Holdings | 150 |
| Net Investment Advisory Fees | $124,033 |
| Portfolio Turnover Rate | 1% |
The Fund has added the Bloomberg U.S. Universal Index in response to new regulatory requirements.
The performance of the BlackRock Interest Rate Hedged High Yield Bond Index in this report reflects the performance of the Markit iBoxx® USD Liquid High Yield Interest Rate Hedged Swaps Index through November 30, 2021 and, beginning on December 1, 2021, the performance of the BlackRock Interest Rate Hedged High Yield Bond Index.
Past performance is not an indication of future results. Performance results do not reflect the deduction of taxes that a shareholder would pay on fund distributions or on the redemption or sale of fund shares. Visit iShares.com for more recent performance information.
What did the Fund invest in?
(as of October 31, 2024)
| Asset Type | Percent of
Net Assets | |
| Investment Companies | 94.3 | % |
| Short-term Investments | 47.7 | % |
| Swaps, net cumulative appreciation | 0.6 | % |
| Other assets less liabilities | (42.6 | )% |
| Credit quality allocation (of the underlying fund)(a) |
| Credit Rating(b) | Percent of Total
Investments(c) | |
| Baa | 1.0 | % |
| Ba | 40.5 | % |
| B | 42.8 | % |
| Caa | 12.8 | % |
| Ca | 1.1 | % |
| Not Rated | 1.8 | % |
(a) | The underlying fund is iShares iBoxx $ High Yield Corporate Bond ETF. |
(b) | Credit quality ratings shown reflect the ratings assigned by Moody’s Investors Service (“Moody’s”), a widely used independent, nationally recognized statistical rating organization. Moody’s credit ratings are opinions of the credit quality of individual obligations or of an issuer’s general creditworthiness. Investment grade ratings are credit ratings of Baa or higher. Below investment grade ratings are credit ratings of Ba or lower. Unrated investments do not necessarily indicate low credit quality. Credit quality ratings are subject to change. |
(c) | Excludes money market funds. |
Additional information
If you wish to view additional information about the Fund, including but not limited to financial statements, the Fund’s prospectus, and proxy voting policies and procedures, please visit blackrock.com/fundreports. For proxy voting records, visit blackrock.com/proxyrecords.
Householding
Householding is an option available to certain fund investors. Householding is a method of delivery, based on the preference of the individual investor, in which a single copy of certain shareholder documents can be delivered to investors who share the same address, even if their accounts are registered under different names. Please contact your broker-dealer if you are interested in enrolling in householding and receiving a single copy of prospectuses and other shareholder documents, or if you are currently enrolled in householding and wish to change your householding status.
The Fund is not sponsored, endorsed, issued, sold, or promoted by Bloomberg Index Services Limited, BlackRock Index Services, LLC, Markit Indices Limited and their respective affiliates, nor do these companies make any representation regarding the advisability of investing in the Fund. BlackRock is not affiliated with Bloomberg Index Services Limited or Markit Indices Limited but is affiliated with BlackRock Index Services, LLC.
©2024 BlackRock, Inc. or its affiliates. All rights reserved. iSHARES and BLACKROCK are registered trademarks of BlackRock, Inc. or its affiliates. All other trademarks are those of their respective owners.
iShares Interest Rate Hedged High Yield Bond ETF
Annual Shareholder Report — October 31, 2024
HYGH-10/24-AR
iShares Interest Rate Hedged Long-Term Corporate Bond ETF
IGBH | NYSE Arca
Annual Shareholder Report — October 31, 2024
This annual shareholder report contains important information about iShares Interest Rate Hedged Long-Term Corporate Bond ETF (the “Fund”) for the period of November 1, 2023 to October 31, 2024. You can find additional information about the Fund at blackrock.com/fundreports. You can also request this information by contacting us at 1‑800‑iShares (1‑800‑474‑2737).
What were the Fund costs for the last year ?
(based on a hypothetical $10,000 investment)
| Fund name | Costs of a $10,000
investment | Costs paid as a percentage of a
$10,000 investment |
| iShares Interest Rate Hedged Long-Term Corporate Bond ETF | $11(a) | 0.10%(a) |
(a) | Excludes fees and expenses incurred indirectly as a result of investments in underlying funds. |
How did the Fund perform last year?
For the reporting period ended October 31, 2024, the Fund returned 10.15%.
For the same period, the ICE BofA US Broad Market Index returned 10.55% and the BlackRock Interest Rate Hedged Long-Term Corporate Bond Index returned 10.48%.
What contributed to performance?
Bond returns were supported by an environment of slowing pricing pressures and steady growth in the United States during the reporting period. Expectations for interest rate cuts grew, and those hopes were realized in September 2024 when the U.S. Federal Reserve lowered short-term interest rates by a 50 basis point cut, its first rate reduction since March 2020. In anticipation of rate cuts, the yield curve (the difference between a shorter-term bond and a longer-term bond, most often gauged by the 2-year Treasury note and the 10-year Treasury note) steepened during the reporting period. Bond yields and prices move in opposite directions.
What detracted from performance?
The yield on the 10-year Treasury declined from 4.93% to 4.28% during the reporting period, leading the Fund’s hedged interest rate positions to detract from performance.
The views expressed reflect the opinions of BlackRock as of the date of this report and are subject to change based on changes in market, economic or other conditions. These views are not intended to be a forecast of future events and are no guarantee of future results.
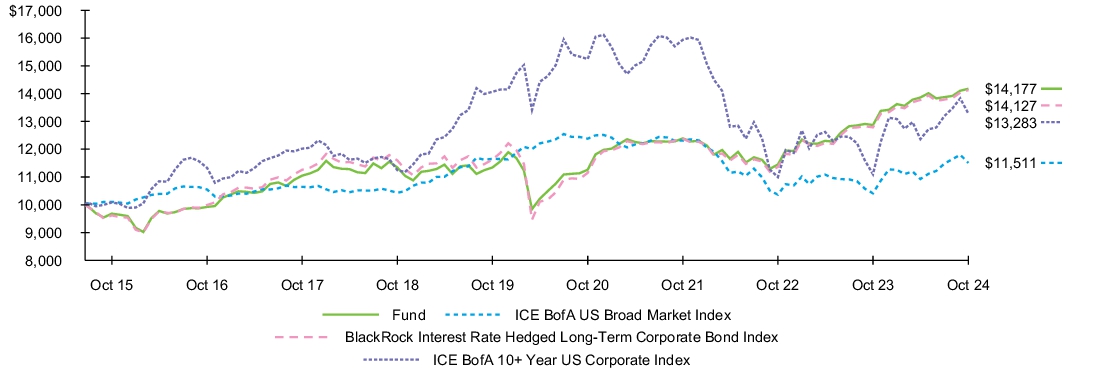
Fund performance
Cumulative performance: July 22, 2015 through October 31, 2024
Initial investment of $10,000
See “Average annual total returns” for additional information on fund performance.
| Average annual total returns | | | | | | |
| 1 Year | | 5 Years | | Since Fund
Inception | |
| Fund NAV | 10.15 | % | 4.57 | % | 3.83 | % |
| ICE BofA US Broad Market Index | 10.55 | | (0.24 | ) | 1.53 | |
| BlackRock Interest Rate Hedged Long-Term Corporate Bond Index | 10.48 | | 3.97 | | 3.80 | |
| ICE BofA 10+ Year US Corporate Index | 19.68 | | (1.14 | ) | 3.11 | |
| Key Fund statistics | |
| Net Assets | $93,279,495 |
| Number of Portfolio Holdings | 128 |
| Net Investment Advisory Fees | $106,085 |
| Portfolio Turnover Rate | 13% |
The Fund has added the ICE BofA US Broad Market Index in response to new regulatory requirements.
The inception date of the Fund was July 22, 2015.
The performance of the BlackRock Interest Rate Hedged Long-Term Corporate Bond Index in this report reflects the performance of the ICE Q70A Custom Index through November 30, 2021 and, beginning on December 1, 2021, the performance of the BlackRock Interest Rate Hedged Long-Term Corporate Bond Index.
Past performance is not an indication of future results. Performance results do not reflect the deduction of taxes that a shareholder would pay on fund distributions or on the redemption or sale of fund shares. Visit iShares.com for more recent performance information.
What did the Fund invest in?
(as of October 31, 2024)
| Asset Type | Percent of
Net Assets | |
| Investment Companies | 91.5 | % |
| Short-term Investments | 45.2 | % |
| Swaps, net cumulative appreciation | 4.2 | % |
| Other assets less liabilities | (40.9 | )% |
| Credit quality allocation (of the underlying fund)(a) |
| Credit Rating(b) | Percent of Total
Investments(c) | |
| Aaa | 3.0 | % |
| Aa | 9.0 | % |
| A | 42.6 | % |
| Baa | 42.5 | % |
| Ba | 1.5 | % |
| Not Rated | 1.4 | % |
(a) | The underlying fund is iShares 10+ Year Investment Grade Corporate Bond ETF. |
(b) | Credit quality ratings shown reflect the ratings assigned by Moody’s Investors Service (“Moody’s”), a widely used independent, nationally recognized statistical rating organization. Moody’s credit ratings are opinions of the credit quality of individual obligations or of an issuer’s general creditworthiness. Investment grade ratings are credit ratings of Baa or higher. Below investment grade ratings are credit ratings of Ba or lower. Unrated investments do not necessarily indicate low credit quality. Credit quality ratings are subject to change. |
(c) | Excludes money market funds. |
Additional information
If you wish to view additional information about the Fund, including but not limited to financial statements, the Fund’s prospectus, and proxy voting policies and procedures, please visit blackrock.com/fundreports. For proxy voting records, visit blackrock.com/proxyrecords.
Householding
Householding is an option available to certain fund investors. Householding is a method of delivery, based on the preference of the individual investor, in which a single copy of certain shareholder documents can be delivered to investors who share the same address, even if their accounts are registered under different names. Please contact your broker-dealer if you are interested in enrolling in householding and receiving a single copy of prospectuses and other shareholder documents, or if you are currently enrolled in householding and wish to change your householding status.
The Fund is not sponsored, endorsed, issued, sold, or promoted by ICE Data Indices, LLC, BlackRock Index Services, LLC and their respective affiliates, nor do these companies make any representation regarding the advisability of investing in the Fund. BlackRock is not affiliated with ICE Data Indices, LLC but is affiliated with BlackRock Index Services, LLC.
©2024 BlackRock, Inc. or its affiliates. All rights reserved. iSHARES and BLACKROCK are registered trademarks of BlackRock, Inc. or its affiliates. All other trademarks are those of their respective owners.
iShares Interest Rate Hedged Long-Term Corporate Bond ETF
Annual Shareholder Report — October 31, 2024
IGBH-10/24-AR
iShares Interest Rate Hedged U.S. Aggregate Bond ETF
AGRH | NYSE Arca
Annual Shareholder Report — October 31, 2024
This annual shareholder report contains important information about iShares Interest Rate Hedged U.S. Aggregate Bond ETF (the “Fund”) for the period of November 1, 2023 to October 31, 2024. You can find additional information about the Fund at blackrock.com/fundreports. You can also request this information by contacting us at 1‑800‑iShares (1‑800‑474‑2737).
What were the Fund costs for the last year ?
(based on a hypothetical $10,000 investment)
| Fund name | Costs of a $10,000
investment | Costs paid as a percentage of a
$10,000 investment |
| iShares Interest Rate Hedged U.S. Aggregate Bond ETF | $10(a) | 0.10%(a) |
(a) | Excludes fees and expenses incurred indirectly as a result of investments in underlying funds. |
How did the Fund perform last year?
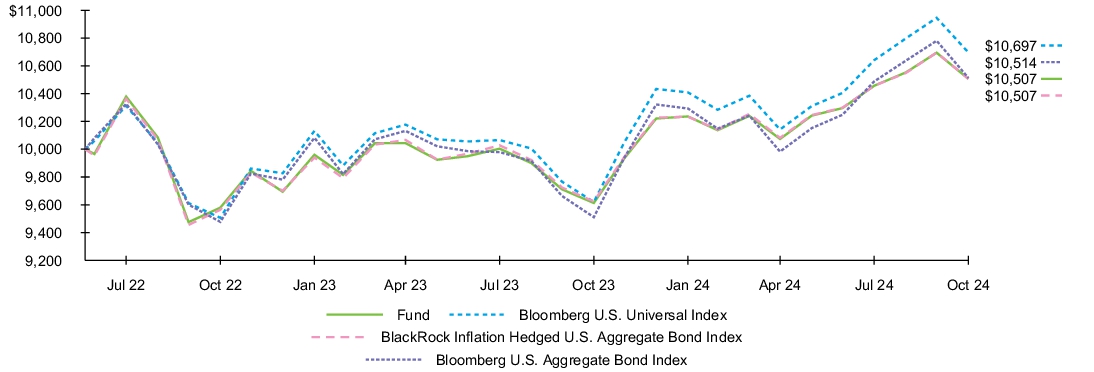
For the reporting period ended October 31, 2024, the Fund returned 7.10%.
For the same period, the Bloomberg U.S. Universal Index returned 11.20% and the BlackRock Interest Rate Hedged U.S. Aggregate Bond Index returned 6.95%.
What contributed to performance?
Bond returns were supported by an environment of slowing pricing pressures and steady growth in the United States during the reporting period. Expectations for interest rate cuts grew, and those hopes were realized in September 2024 when the U.S. Federal Reserve lowered short-term interest rates by a 50 basis point cut, its first-rate reduction since March 2020. In anticipation of rate cuts, the yield curve (the difference between a shorter-term bond and a longer-term bond, most often gauged by the 2-year Treasury note and the 10-year Treasury note) steepened during the reporting period. The two-year U.S. Treasury note fell from 5.09% to 4.17%, while the ten-year Treasury decreased from 4.93% to 4.28% during the reporting period. (Bond yields and prices move in opposite directions.)
What detracted from performance?
As the yield on the 10-year Treasury declined during the reporting period, the Fund’s hedged interest rate positions detracted from performance.
The views expressed reflect the opinions of BlackRock as of the date of this report and are subject to change based on changes in market, economic or other conditions. These views are not intended to be a forecast of future events and are no guarantee of future results.
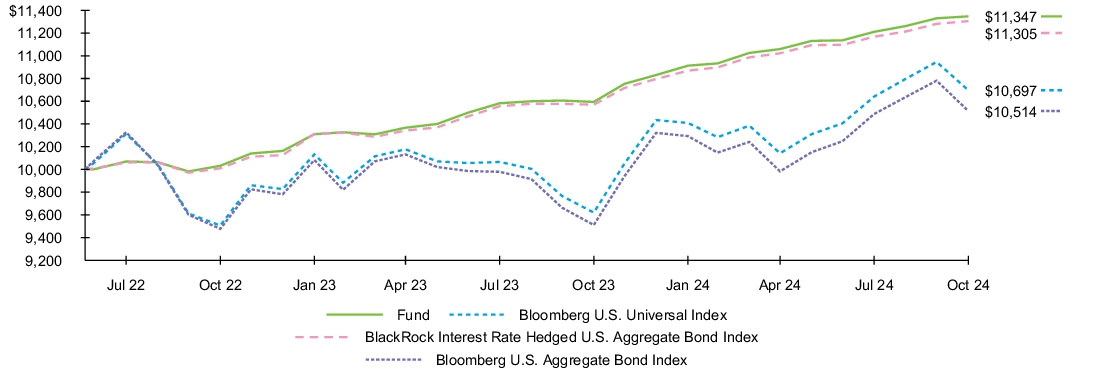
Fund performance
Cumulative performance: June 22, 2022 through October 31, 2024
Initial investment of $10,000
See “Average annual total returns” for additional information on fund performance.
| Average annual total returns | | | | |
| 1 Year | | Since Fund
Inception | |
| Fund NAV | 7.10 | % | 5.50 | % |
| Bloomberg U.S. Universal Index | 11.20 | | 2.90 | |
| BlackRock Interest Rate Hedged U.S. Aggregate Bond Index | 6.95 | | 5.34 | |
| Bloomberg U.S. Aggregate Bond Index | 10.55 | | 2.15 | |
| Key Fund statistics | |
| Net Assets | $5,178,765 |
| Number of Portfolio Holdings | 87 |
| Net Investment Advisory Fees | $5,169 |
| Portfolio Turnover Rate | 2% |
The Fund has added the Bloomberg U.S. Universal Index in response to new regulatory requirements.
The inception date of the Fund was June 22, 2022.
Past performance is not an indication of future results. Performance results do not reflect the deduction of taxes that a shareholder would pay on fund distributions or on the redemption or sale of fund shares. Visit iShares.com for more recent performance information.
What did the Fund invest in?
(as of October 31, 2024)
| Asset Type | Percent of
Net Assets | |
| Investment Companies | 92.7 | % |
| Short-term Investments | 3.7 | % |
| Swaps, net cumulative appreciation | 2.7 | % |
| Other assets less liabilities | 0.9 | % |
| Credit quality allocation (of the underlying fund)(a) |
| Credit Rating(b) | Percent of Total
Investments(c) | |
| Aaa | 70.8 | % |
| Aa | 2.3 | % |
| A | 13.6 | % |
| Baa | 11.9 | % |
| Ba | 0.5 | % |
| Not Rated | 0.9 | % |
(a) | The underlying fund is iShares Core U.S. Aggregate Bond ETF. |
(b) | Credit quality ratings shown reflect the ratings assigned by Moody’s Investors Service (“Moody’s”), a widely used independent, nationally recognized statistical rating organization. Moody’s credit ratings are opinions of the credit quality of individual obligations or of an issuer’s general creditworthiness. Investment grade ratings are credit ratings of Baa or higher. Below investment grade ratings are credit ratings of Ba or lower. Unrated investments do not necessarily indicate low credit quality. Credit quality ratings are subject to change. |
(c) | Excludes money market funds. |
Additional information
If you wish to view additional information about the Fund, including but not limited to financial statements, the Fund’s prospectus, and proxy voting policies and procedures, please visit blackrock.com/fundreports. For proxy voting records, visit blackrock.com/proxyrecords.
Householding
Householding is an option available to certain fund investors. Householding is a method of delivery, based on the preference of the individual investor, in which a single copy of certain shareholder documents can be delivered to investors who share the same address, even if their accounts are registered under different names. Please contact your broker-dealer if you are interested in enrolling in householding and receiving a single copy of prospectuses and other shareholder documents, or if you are currently enrolled in householding and wish to change your householding status.
The Fund is not sponsored, endorsed, issued, sold, or promoted by Bloomberg Index Services Limited, BlackRock Index Services, LLC and their respective affiliates, nor do these companies make any representation regarding the advisability of investing in the Fund. BlackRock is not affiliated with Bloomberg Index Services Limited but is affiliated with BlackRock Index Services, LLC.
©2024 BlackRock, Inc. or its affiliates. All rights reserved. iSHARES and BLACKROCK are registered trademarks of BlackRock, Inc. or its affiliates. All other trademarks are those of their respective owners.
iShares Interest Rate Hedged U.S. Aggregate Bond ETF
Annual Shareholder Report — October 31, 2024
AGRH-10/24-AR
iShares Short Duration Bond Active ETF
NEAR | Cboe BZX Exchange
Annual Shareholder Report — October 31, 2024
This annual shareholder report contains important information about iShares Short Duration Bond Active ETF (the “Fund”) (formerly known as BlackRock Short Maturity Bond ETF) for the period of November 1, 2023 to October 31, 2024. You can find additional information about the Fund at blackrock.com/fundreports. You can also request this information by contacting us at 1‑800‑iShares (1‑800‑474‑2737).
This report describes changes to the Fund that occurred during the reporting period.
What were the Fund costs for the last year ?
(based on a hypothetical $10,000 investment)
| Fund name | Costs of a $10,000
investment | Costs paid as a percentage of a
$10,000 investment |
| iShares Short Duration Bond Active ETF | $26 | 0.25% |
How did the Fund perform last year?
For the reporting period ended October 31, 2024, the Fund returned 7.10%.
For the same period, the Bloomberg U.S. Universal Index returned 11.20% and the Bloomberg U.S. 1-3 Year Government/Credit Bond Index returned 6.25%.
What contributed to performance?
During the reporting period, the largest contributors to the Fund’s performance were allocations to asset-backed securities, primarily auto and student loans. Also contributing positively to performance was an allocation to investment grade credit, specifically the banking sector. Additionally, commercial mortgage-backed securities, collateralized loan obligations, non-agency mortgages, U.S. high-yield credit, and agency residential mortgage-back securities allocations were additive. The Fund’s duration and curve positioning also contributed positively to performance. (Duration is a measure of a bond's interest rate risk, or how sensitive a bond's price is to changes in interest rates.)
What detracted from performance?
During the reporting period, there were no significant detractors from the Fund’s returns.
The views expressed reflect the opinions of BlackRock as of the date of this report and are subject to change based on changes in market, economic or other conditions. These views are not intended to be a forecast of future events and are no guarantee of future results.
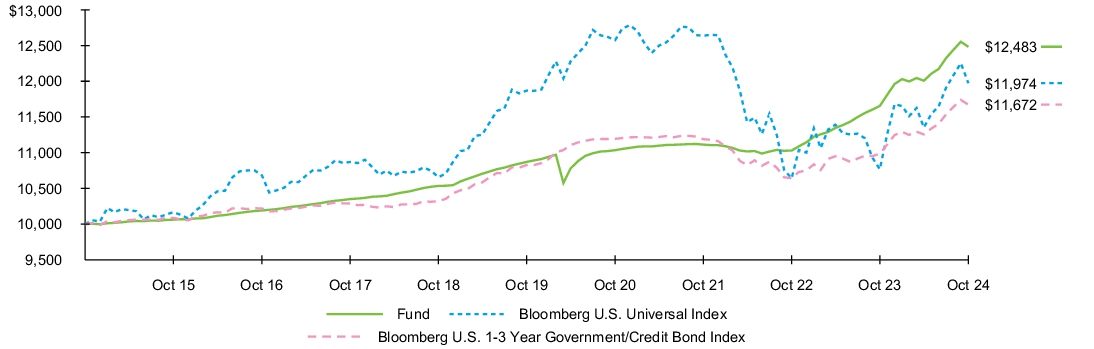
Fund performance
Cumulative performance: November 1, 2014 through October 31, 2024
Initial investment of $10,000
See “Average annual total returns” for additional information on fund performance.
| Average annual total returns | | | | | | |
| 1 Year | | 5 Years | | 10 Years | |
| Fund NAV | 7.10 | % | 2.80 | % | 2.24 | % |
| Bloomberg U.S. Universal Index | 11.20 | | 0.18 | | 1.82 | |
| Bloomberg U.S. 1-3 Year Government/Credit Bond Index | 6.25 | | 1.51 | | 1.56 | |
| Key Fund statistics | |
| Net Assets | $2,915,952,889 |
| Number of Portfolio Holdings | 1,040 |
| Net Investment Advisory Fees | $7,450,565 |
| Portfolio Turnover Rate | 164% |
The Fund has added the Bloomberg U.S. Universal Index in response to new regulatory requirements.
Past performance is not an indication of future results. Performance results do not reflect the deduction of taxes that a shareholder would pay on fund distributions or on the redemption or sale of fund shares. Visit iShares.com for more recent performance information.
What did the Fund invest in?
(as of October 31, 2024)
| Investment Type | Percent of Total
Investments(a) | |
| U.S. Government & Agency Obligations | 40.8 | % |
| Corporate Bonds & Notes | 28.9 | % |
| Asset-Backed Securities | 17.5 | % |
| Collateralized Mortgage Obligations | 12.7 | % |
| Municipal Debt Obligations | 0.1 | % |
Credit quality allocation
| Moody's Credit Rating* | Percent of Total
Investments(a) | |
| Aaa | 55.0 | % |
| Aa | 1.3 | % |
| A | 13.8 | % |
| Baa | 13.5 | % |
| Ba | 2.8 | % |
| B | 1.2 | % |
| Caa | 0.1 | % |
| Not Rated | 12.3 | % |
(a) | Excludes money market funds. |
* | Credit quality ratings shown reflect the ratings assigned by Moody’s Investors Service (“Moody’s”), a widely used independent, nationally recognized statistical rating organization. Moody’s credit ratings are opinions of the credit quality of individual obligations or of an issuer’s general creditworthiness. Investment grade ratings are credit ratings of Baa or higher. Below investment grade ratings are credit ratings of Ba or lower. Unrated investments do not necessarily indicate low credit quality. Credit quality ratings are subject to change. |
Material Fund Changes
This is a summary of certain changes to the Fund since October 31, 2023. For more complete information, you may review the Fund’s next prospectus, which we expect to be available approximately 120 days after October 31, 2024 at blackrock.com/fundreports or upon request by contacting us at 1-800-iShares (1-800-474-2737).
Effective November 1, 2023, the Fund: (i) changed its name from BlackRock Short Maturity Bond ETF to BlackRock Short Duration Bond ETF; (ii) revised its investment objective to provide that the Fund seeks total return in excess of the reference benchmark; (iii) updated its principal investment strategy, establishing that the effective duration of the Fund's portfolio is expected to be three years or less; (iv) replaced its current benchmark with a new reference benchmark, the Bloomberg U.S. 1-3 Year Government/Credit Bond Index; and (v) added a prospectus risk factor related to the Fund’s use of derivatives.
Effective October 10, 2024, the name of the Fund was changed from BlackRock Short Duration Bond ETF to iShares Short Duration Bond Active ETF.
Additional information
If you wish to view additional information about the Fund, including but not limited to financial statements, the Fund’s prospectus, and proxy voting policies and procedures, please visit blackrock.com/fundreports. For proxy voting records, visit blackrock.com/proxyrecords.
Householding
Householding is an option available to certain fund investors. Householding is a method of delivery, based on the preference of the individual investor, in which a single copy of certain shareholder documents can be delivered to investors who share the same address, even if their accounts are registered under different names. Please contact your broker-dealer if you are interested in enrolling in householding and receiving a single copy of prospectuses and other shareholder documents, or if you are currently enrolled in householding and wish to change your householding status.
The Fund is not sponsored, endorsed, issued, sold, or promoted by Bloomberg Index Services Limited and its affiliates, nor does this company make any representation regarding the advisability of investing in the Fund. BlackRock is not affiliated with the company listed above.
©2024 BlackRock, Inc. or its affiliates. All rights reserved. iSHARES and BLACKROCK are registered trademarks of BlackRock, Inc. or its affiliates. All other trademarks are those of their respective owners.
iShares Short Duration Bond Active ETF
Annual Shareholder Report — October 31, 2024
NEAR-10/24-AR
iShares Transition-Enabling Metals ETF
TMET | NASDAQ
Annual Shareholder Report — October 31, 2024
This annual shareholder report contains important information about iShares Transition-Enabling Metals ETF (the “Fund”) for the period of November 1, 2023 to October 31, 2024. You can find additional information about the Fund at blackrock.com/fundreports. You can also request this information by contacting us at 1‑800‑iShares (1‑800‑474‑2737).
What were the Fund costs for the last year ?
(based on a hypothetical $10,000 investment)
| Fund name | Costs of a $10,000
investment | Costs paid as a percentage of a
$10,000 investment |
| iShares Transition-Enabling Metals ETF | $50 | 0.46% |
How did the Fund perform last year?
For the reporting period ended October 31, 2024, the Fund returned 19.36%.
For the same period, the ICE BofA US Broad Market Index returned 10.55% and the ICE Clean Energy Transition Metals Index returned 20.02%.
What contributed to performance?
Commodity futures in silver, copper, and aluminum were the largest contributors to the Fund’s performance during the reporting period. Amid worries about growth prospects, the European Central Bank cut rates three times, while the United States economy stayed strong, prompting the U.S. Federal Reserve Bank to wait until September before decreasing short-term interest rates for the first since 2020. Exposure to copper and aluminum via futures benefited from both interest rate cuts and from China’s efforts to stimulate their lagging economy during the reporting period. Silver futures were driven higher as inflation remained elevated in certain regions.
What detracted from performance?
Exposure to nickel futures had the largest negative impact on the Fund’s performance during the reporting period. Nickel is a major component for low carbon technologies; however, the metal suffered from oversupply and weak demand, particularly from China.
The views expressed reflect the opinions of BlackRock as of the date of this report and are subject to change based on changes in market, economic or other conditions. These views are not intended to be a forecast of future events and are no guarantee of future results.
Fund performance
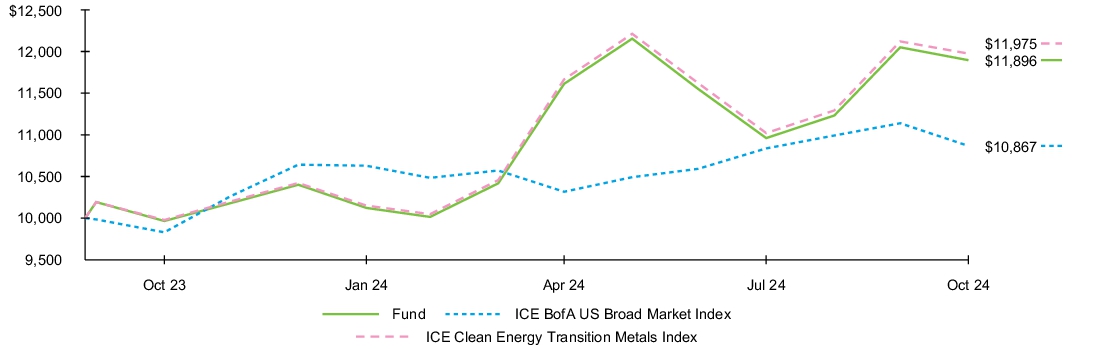
Cumulative performance: September 26, 2023 through October 31, 2024
Initial investment of $10,000
See “Average annual total returns” for additional information on fund performance.
| Average annual total returns | | | | |
| 1 Year | | Since Fund
Inception | |
| Fund NAV | 19.36 | % | 17.12 | % |
| ICE BofA US Broad Market Index | 10.55 | | 7.89 | |
| ICE Clean Energy Transition Metals Index | 20.02 | | 17.90 | |
| Key Fund statistics | |
| Net Assets | $11,773,901 |
| Number of Portfolio Holdings | 47 |
| Net Investment Advisory Fees | $56,800 |
| Portfolio Turnover Rate | 0% |
The Fund has added the ICE BofA US Broad Market Index in response to new regulatory requirements.
The inception date of the Fund was September 26, 2023.
Past performance is not an indication of future results. Performance results do not reflect the deduction of taxes that a shareholder would pay on fund distributions or on the redemption or sale of fund shares. Visit iShares.com for more recent performance information.
What did the Fund invest in?
(as of October 31, 2024)
| Asset Type | Percent of
Net Assets | |
| Commercial Paper | 54.6 | % |
| Certificates of Deposit | 21.3 | % |
| Money Market Funds | 10.9 | % |
| U.S. Treasury Obligations | 8.3 | % |
| Cash | 4.1 | % |
| Futures | (0.6 | )% |
| Other assets, less liabilities | 1.4 | % |
| Sector Exposure(a) | Percent of
Net Assets | |
| Industrial Metals Futures | 73.0 | % |
| Precious Metals Futures | 27.3 | % |
(a) | Exposures are calculated as the current notional value of the futures contracts as a percentage of net assets. |
Additional information
If you wish to view additional information about the Fund, including but not limited to financial statements, the Fund’s prospectus, and proxy voting policies and procedures, please visit blackrock.com/fundreports. For proxy voting records, visit blackrock.com/proxyrecords.
Householding
Householding is an option available to certain fund investors. Householding is a method of delivery, based on the preference of the individual investor, in which a single copy of certain shareholder documents can be delivered to investors who share the same address, even if their accounts are registered under different names. Please contact your broker-dealer if you are interested in enrolling in householding and receiving a single copy of prospectuses and other shareholder documents, or if you are currently enrolled in householding and wish to change your householding status.
The Fund is not sponsored, endorsed, issued, sold, or promoted by ICE Data Indices, LLC and its affiliates, nor does this company make any representation regarding the advisability of investing in the Fund. BlackRock is not affiliated with the company listed above.
©2024 BlackRock, Inc. or its affiliates. All rights reserved. iSHARES and BLACKROCK are registered trademarks of BlackRock, Inc. or its affiliates. All other trademarks are those of their respective owners.
iShares Transition-Enabling Metals ETF
Annual Shareholder Report — October 31, 2024
TMET-10/24-AR
iShares Ultra Short-Term Bond Active ETF
ICSH | Cboe BZX Exchange
Annual Shareholder Report — October 31, 2024
This annual shareholder report contains important information about iShares Ultra Short-Term Bond Active ETF (the “Fund”) (formerly known as BlackRock Ultra Short-Term Bond ETF) for the period of November 1, 2023 to October 31, 2024. You can find additional information about the Fund at blackrock.com/fundreports. You can also request this information by contacting us at 1‑800‑iShares (1‑800‑474‑2737).
This report describes changes to the Fund that occurred during the reporting period.
What were the Fund costs for the last year ?
(based on a hypothetical $10,000 investment)
| Fund name | Costs of a $10,000
investment | Costs paid as a percentage of a
$10,000 investment |
| iShares Ultra Short-Term Bond Active ETF | $8 | 0.08% |
How did the Fund perform last year?
For the reporting period ended October 31, 2024, the Fund returned 6.02%.
For the same period, the ICE BofA US Broad Market Index returned 10.55% and the ICE® BofA® 6-Month US Treasury Bill Index returned 5.60%.
What contributed to performance?
During the reporting period, duration and curve positioning contributed to the Fund’s return, supported by the expected path of the U.S. Federal Reserve Bank’s monetary policy and the commencement of the easing cycle. (Duration is a measure of a bond's interest rate risk, or how sensitive a bond's price is to changes in interest rates.) Sector allocation positively contributed to the Fund’s performance, particularly among financial bonds which were supported by the prospect of lower interest rates. Commercial paper, high credit quality investment-grade bonds (rated Aa by Moody’s), and certificates of deposit also contributed to the Fund’s return during the reporting period.
What detracted from performance?
During the reporting period, the Fund’s maximum average maturity of 180 days, which is shorter than the benchmarks average maturity, detracted from the Fund’s return.
The views expressed reflect the opinions of BlackRock as of the date of this report and are subject to change based on changes in market, economic or other conditions. These views are not intended to be a forecast of future events and are no guarantee of future results.
Fund performance
Cumulative performance: November 1, 2014 through October 31, 2024
Initial investment of $10,000
See “Average annual total returns” for additional information on fund performance.
| Average annual total returns | | | | | | |
| 1 Year | | 5 Years | | 10 Years | |
| Fund NAV | 6.03 | % | 2.66 | % | 2.12 | % |
| ICE BofA US Broad Market Index | 10.55 | | (0.24 | ) | 1.52 | |
| ICE® BofA® 6-Month US Treasury Bill Index | 5.60 | | 2.46 | | 1.83 | |
| Key Fund statistics | |
| Net Assets | $5,521,604,891 |
| Number of Portfolio Holdings | 358 |
| Net Investment Advisory Fees | $4,570,473 |
| Portfolio Turnover Rate | 59% |
The Fund has added the ICE BofA US Broad Market Index in response to new regulatory requirements.
On December 1, 2023, the Fund began to compare its performance to the standard pricing time of the ICE® BofA® 6-Month US Treasury Bill Index (the “Index”). Index data prior to March 1, 2021 is for the Index's standard pricing time of 3 pm. Index data from March 1, 2021 through November 30, 2023 is for a custom 4pm pricing variant of the Index. Index returns beginning on December 1, 2023 reflect the Index's new standard pricing time of 4 pm. The change of the Index's standard pricing time from 3 pmto 4 pmresulted in the discontinuation of the custom 4pm pricing variant used from March 1, 2021 through November 30, 2023.
Past performance is not an indication of future results. Performance results do not reflect the deduction of taxes that a shareholder would pay on fund distributions or on the redemption or sale of fund shares. Visit iShares.com for more recent performance information.
What did the Fund invest in?
(as of October 31, 2024)
| Investment Type | Percent of Total
Investments(a) | |
| Corporate Bonds & Notes | 35.9 | % |
| Commercial Paper | 34.3 | % |
| Certificates of Deposit | 14.7 | % |
| Repurchase Agreements | 7.5 | % |
| Asset-Backed Securities | 4.9 | % |
| U.S. Government & Agency Obligations | 2.5 | % |
| Municipal Debt Obligations | 0.2 | % |
Credit quality allocation
| Moody's Credit Rating* | Percent of Total
Investments(a) | |
| Aaa | 6.9 | % |
| Aa | 29.6 | % |
| A | 32.7 | % |
| Baa | 6.2 | % |
| Not Rated | 24.6 | % |
(a) | Excludes money market funds. |
* | Credit quality ratings shown reflect the ratings assigned by Moody’s Investors Service (“Moody’s”), a widely used independent, nationally recognized statistical rating organization. Moody’s credit ratings are opinions of the credit quality of individual obligations or of an issuer’s general creditworthiness. Investment grade ratings are credit ratings of Baa or higher. Below investment grade ratings are credit ratings of Ba or lower. Unrated investments do not necessarily indicate low credit quality. Credit quality ratings are subject to change. |
Material Fund Changes
This is a summary of certain changes to the Fund since October 31, 2023. For more complete information, you may review the Fund’s next prospectus, which we expect to be available approximately 120 days after October 31, 2024 at blackrock.com/fundreports or upon request by contacting us at 1-800-iShares (1-800-474-2737).
Effective October 10, 2024, the name of the Fund was changed from BlackRock Ultra Short-Term Bond ETF to iShares Ultra Short-Term Bond Active ETF.
Additional information
If you wish to view additional information about the Fund, including but not limited to financial statements, the Fund’s prospectus, and proxy voting policies and procedures, please visit blackrock.com/fundreports. For proxy voting records, visit blackrock.com/proxyrecords.
Householding
Householding is an option available to certain fund investors. Householding is a method of delivery, based on the preference of the individual investor, in which a single copy of certain shareholder documents can be delivered to investors who share the same address, even if their accounts are registered under different names. Please contact your broker-dealer if you are interested in enrolling in householding and receiving a single copy of prospectuses and other shareholder documents, or if you are currently enrolled in householding and wish to change your householding status.
The Fund is not sponsored, endorsed, issued, sold, or promoted by ICE Data Indices, LLC and its affiliates, nor does this company make any representation regarding the advisability of investing in the Fund. BlackRock is not affiliated with the company listed above.
©2024 BlackRock, Inc. or its affiliates. All rights reserved. iSHARES and BLACKROCK are registered trademarks of BlackRock, Inc. or its affiliates. All other trademarks are those of their respective owners.
iShares Ultra Short-Term Bond Active ETF
Annual Shareholder Report — October 31, 2024
ICSH-10/24-AR
(b) Not applicable
| Item 2 – | Code of Ethics – The registrant has adopted a code of ethics, as of the end of the period covered by this report, applicable to the registrant’s principal executive officer, principal financial officer, principal accounting officer or controller, or persons performing similar functions. During the period covered by this report, the registrant has not amended the code of ethics and there have been no waivers granted under the code of ethics. The registrant undertakes to provide a copy of the code of ethics to any person upon request, without charge, by calling 1-800-474-2737. |
| Item 3 – | Audit Committee Financial Expert – The registrant’s board of trustees (the “board of trustees”), has determined that (i) the registrant has the following audit committee financial experts serving on its audit committee and (ii) each audit committee financial expert is independent: |
Richard L. Fagnani
Madhav V. Rajan
Under applicable securities laws, a person determined to be an audit committee financial expert will not be deemed an “expert” for any purpose, including without limitation for the purposes of Section 11 of the Securities Act of 1933, as a result of being designated or identified as an audit committee financial expert. The designation or identification of a person as an audit committee financial expert does not impose on such person any duties, obligations, or liabilities greater than the duties, obligations, and liabilities imposed on such person as a member of the audit committee and board of trustees in the absence of such designation or identification. The designation or identification of a person as an audit committee financial expert does not affect the duties, obligations, or liability of any other member of the audit committee or board of trustees.
| Item 4 – | Principal Accountant Fees and Services. |
The principal accountant fees disclosed in items 4(a), 4(b), 4(c), 4(d) and 4(g) are for the thirteen series of the registrant for which the fiscal year-end is October 31, 2024 (the “Funds”), and whose annual financial statements are reported in Item 7.
(a) Audit Fees – The aggregate fees billed for each of the last two fiscal years for professional services rendered by the principal accountant for the audit of the Funds’ annual financial statements or services that are normally provided by the accountant in connection with statutory and regulatory filings or engagements for those fiscal years were $227,200 for the fiscal year ended October 31, 2023 and $187,300 for the fiscal year ended October 31, 2024.
(b) Audit-Related Fees – There were no fees billed for the fiscal years ended October 31, 2023 and October 31, 2024 for assurance and related services by the principal accountant that were reasonably related to the performance of the audit of the Funds’ financial statements and are not reported under (a) of this Item.
(c) Tax Fees – The aggregate fees billed in each of the last two fiscal years for professional services rendered by the principal accountant for tax compliance, tax advice and tax planning for the Funds were $145,500 for the fiscal year ended October 31, 2023 and $126,100 for the fiscal year ended October 31, 2024. These services related to the review of the Funds’ tax returns and excise tax calculations.
(d) All Other Fees – There were no other fees billed in each of the fiscal years ended October 31, 2023 and October 31, 2024 for products and services provided by the principal accountant, other than the services reported in (a) through (c) of this Item.
(e)(1) Audit Committee Pre-Approval Policies and Procedures – The registrant’s audit committee charter, as amended, provides that the audit committee is responsible for the approval, prior to appointment, of the engagement of the principal accountant to annually audit and provide their opinion on the registrant’s financial statements. The audit committee must also approve, prior to appointment, the engagement of the principal accountant to provide non-audit services to the registrant or to any entity controlling, controlled by or under common control with the registrant’s investment adviser (“Adviser Affiliate”) that provides ongoing services to the registrant, if the engagement relates directly to the operations and financial reporting of the registrant.
(e)(2) None of the services described in each of Items 4(b) through (d) were approved by the audit committee pursuant to paragraph (c)(7)(i)(C) of Rule 2-01 of Regulation S-X.
(f) Not applicable
(g) The aggregate non-audit fees billed by the registrant’s principal accountant for services rendered to the Funds, and rendered to the registrant’s investment adviser, and any Adviser Affiliate that provides ongoing services to the registrant for the last two fiscal years were $145,500 for the fiscal year ended October 31, 2023 and $126,100 for the fiscal year ended October 31, 2024.
(h) The registrant’s audit committee has considered whether the provision of non-audit services rendered to the registrant’s investment adviser and any Adviser Affiliate that provides ongoing services to the registrant that were not pre-approved pursuant to paragraph (c)(7)(ii) of Rule 2-01 of Regulation S-X, if any, is compatible with maintaining the principal accountant’s independence, and has determined that the provision of these services, if any, does not compromise the principal accountant’s independence.
(i) Not applicable
(j) Not applicable
| Item 5 – | Audit Committee of Listed Registrant |
(a) The following individuals are members of the registrant’s separately designated standing Committee established in accordance with Section 3(a)(58)(A) of the Securities Exchange Act of 1934 (15 U.S.C. 78c(a)(58)(A)):
Richard L. Fagnani
Laura F. Fergerson
Cecilia H. Herbert
Madhav V. Rajan
(b) Not applicable
(a) The registrant’s Schedule of Investments is included as part of the Financial Statements and Financial Highlights for Open-End Management Investment Companies filed under Item 7 of this Form.
(b) Not applicable due to no such divestments during the semi-annual period covered since the previous Form N-CSR filing.
| Item 7 – | Financial Statements and Financial Highlights for Open-End Management Investment Companies |
(a) The registrant’s Financial Statements are attached herewith.
(b) The registrant’s Financial Highlights are attached herewith.
2024 Annual Financial Statements and Additional Information |
|
• iShares Inflation Hedged Corporate Bond ETF | LQDI | Cboe BZX Exchange |
• iShares Inflation Hedged High Yield Bond ETF | HYGI | NYSE Arca |
• iShares Inflation Hedged U.S. Aggregate Bond ETF | AGIH | NYSE Arca |
• iShares Interest Rate Hedged Corporate Bond ETF | LQDH | NYSE Arca |
• iShares Interest Rate Hedged High Yield Bond ETF | HYGH | NYSE Arca |
• iShares Interest Rate Hedged Long-Term Corporate Bond ETF | IGBH | NYSE Arca |
• iShares Interest Rate Hedged U.S. Aggregate Bond ETF | AGRH | NYSE Arca |
|
Schedule of InvestmentsOctober 31, 2024
iShares® Inflation Hedged Corporate Bond ETF(Percentages shown are based on Net Assets)
| | |
|
Exchange-Traded Funds — 94.7% |
iShares iBoxx $ Investment Grade Corporate Bond ETF(a)(b) | | |
Total Investment Companies
(Cost: $53,517,459) | |
|
Money Market Funds — 46.3% |
BlackRock Cash Funds: Institutional, SL Agency Shares,
5.01%(a)(c)(d) | | |
BlackRock Cash Funds: Treasury, SL Agency Shares,
4.83%(a)(c) | | |
Total Short-Term Securities — 46.3%
(Cost: $24,799,892) | |
Total Investments in Securities — 141.0%
(Cost: $78,317,351) | |
Liabilities in Excess of Other Assets — (41.0)% | |
| |
| |
| All or a portion of this security is on loan. |
| Annualized 7-day yield as of period end. |
| All or a portion of this security was purchased with the cash collateral from loaned securities. |
Affiliates
Investments in issuers considered to be affiliate(s) of the Fund during the year ended October 31, 2024 for purposes of Section 2(a)(3) of the Investment Company Act of 1940, as amended, were as follows:
| | | | | Change in
Unrealized
Appreciation
(Depreciation) | | | | Capital
Gain
Distributions
from
Underlying
Funds |
BlackRock Cash Funds: Institutional, SL Agency Shares | | | | | | | | | |
BlackRock Cash Funds: Treasury, SL Agency Shares | | | | | | | | | |
iShares iBoxx $ Investment Grade Corpo- rate Bond ETF | | | | | | | | | |
| | | | | | | | | |
| Represents net amount purchased (sold). |
| All or a portion represents securities lending income earned from the reinvestment of cash collateral from loaned securities, net of fees and collateral investment expenses, and other payments to and from borrowers of securities. |
32024 iShares Annual Financial Statements and Additional Information
Schedule of Investments (continued)October 31, 2024
iShares® Inflation Hedged Corporate Bond ETF
Derivative Financial Instruments Outstanding as of Period End
Centrally Cleared Inflation Swaps
| | | | | | Upfront
Premium
Paid
(Received) | Unrealized
Appreciation
(Depreciation) |
| | | | |
| | U.S. CPI Urban Consumers NSA | | | | | | | | |
| | U.S. CPI Urban Consumers NSA | | | | | | | | |
| | U.S. CPI Urban Consumers NSA | | | | | | | | |
| | U.S. CPI Urban Consumers NSA | | | | | | | | |
| | U.S. CPI Urban Consumers NSA | | | | | | | | |
| | U.S. CPI Urban Consumers NSA | | | | | | | | |
| | U.S. CPI Urban Consumers NSA | | | | | | | | |
| | U.S. CPI Urban Consumers NSA | | | | | | | | |
| | U.S. CPI Urban Consumers NSA | | | | | | | | |
| | U.S. CPI Urban Consumers NSA | | | | | | | | |
| | U.S. CPI Urban Consumers NSA | | | | | | | | |
| | U.S. CPI Urban Consumers NSA | | | | | | | | |
| | U.S. CPI Urban Consumers NSA | | | | | | | | |
| | U.S. CPI Urban Consumers NSA | | | | | | | | |
| | U.S. CPI Urban Consumers NSA | | | | | | | | |
| | U.S. CPI Urban Consumers NSA | | | | | | | | |
| | U.S. CPI Urban Consumers NSA | | | | | | | | |
| | U.S. CPI Urban Consumers NSA | | | | | | | | |
Schedule of Investments (continued)October 31, 2024
iShares® Inflation Hedged Corporate Bond ETF
Centrally Cleared Inflation Swaps (continued)
| | | | | | Upfront Premium Paid (Received) | Unrealized Appreciation (Depreciation) |
| | | | |
| | U.S. CPI Urban Consumers NSA | | | | | | | | |
| | U.S. CPI Urban Consumers NSA | | | | | | | | |
| | U.S. CPI Urban Consumers NSA | | | | | | | | |
| | U.S. CPI Urban Consumers NSA | | | | | | | | |
| | U.S. CPI Urban Consumers NSA | | | | | | | | |
| | U.S. CPI Urban Consumers NSA | | | | | | | | |
| | U.S. CPI Urban Consumers NSA | | | | | | | | |
| | U.S. CPI Urban Consumers NSA | | | | | | | | |
| | U.S. CPI Urban Consumers NSA | | | | | | | | |
| | U.S. CPI Urban Consumers NSA | | | | | | | | |
| | U.S. CPI Urban Consumers NSA | | | | | | | | |
| | U.S. CPI Urban Consumers NSA | | | | | | | | |
| | U.S. CPI Urban Consumers NSA | | | | | | | | |
| | U.S. CPI Urban Consumers NSA | | | | | | | | |
| | U.S. CPI Urban Consumers NSA | | | | | | | | |
| | U.S. CPI Urban Consumers NSA | | | | | | | | |
| | U.S. CPI Urban Consumers NSA | | | | | | | | |
| | U.S. CPI Urban Consumers NSA | | | | | | | | |
| | U.S. CPI Urban Consumers NSA | | | | | | | | |
52024 iShares Annual Financial Statements and Additional Information
Schedule of Investments (continued)October 31, 2024
iShares® Inflation Hedged Corporate Bond ETF
Centrally Cleared Inflation Swaps (continued)
| | | | | | Upfront Premium Paid (Received) | Unrealized Appreciation (Depreciation) |
| | | | |
| | U.S. CPI Urban Consumers NSA | | | | | | | | |
| | U.S. CPI Urban Consumers NSA | | | | | | | | |
| | U.S. CPI Urban Consumers NSA | | | | | | | | |
| | U.S. CPI Urban Consumers NSA | | | | | | | | |
| | U.S. CPI Urban Consumers NSA | | | | | | | | |
| | U.S. CPI Urban Consumers NSA | | | | | | | | |
| | U.S. CPI Urban Consumers NSA | | | | | | | | |
| | U.S. CPI Urban Consumers NSA | | | | | | | | |
| | U.S. CPI Urban Consumers NSA | | | | | | | | |
| | U.S. CPI Urban Consumers NSA | | | | | | | | |
| | U.S. CPI Urban Consumers NSA | | | | | | | | |
| | U.S. CPI Urban Consumers NSA | | | | | | | | |
| | U.S. CPI Urban Consumers NSA | | | | | | | | |
| | U.S. CPI Urban Consumers NSA | | | | | | | | |
| | U.S. CPI Urban Consumers NSA | | | | | | | | |
| | U.S. CPI Urban Consumers NSA | | | | | | | | |
| | U.S. CPI Urban Consumers NSA | | | | | | | | |
| | U.S. CPI Urban Consumers NSA | | | | | | | | |
| | U.S. CPI Urban Consumers NSA | | | | | | | | |
72024 iShares Annual Financial Statements and Additional Information
Schedule of Investments (continued)October 31, 2024
iShares® Inflation Hedged Corporate Bond ETF
Centrally Cleared Inflation Swaps (continued)
| | | | | | Upfront Premium Paid (Received) | Unrealized Appreciation (Depreciation) |
| | | | |
| | U.S. CPI Urban Consumers NSA | | | | | | | | |
| | U.S. CPI Urban Consumers NSA | | | | | | | | |
| | U.S. CPI Urban Consumers NSA | | | | | | | | |
| | U.S. CPI Urban Consumers NSA | | | | | | | | |
| | U.S. CPI Urban Consumers NSA | | | | | | | | |
| | U.S. CPI Urban Consumers NSA | | | | | | | | |
| | U.S. CPI Urban Consumers NSA | | | | | | | | |
| | U.S. CPI Urban Consumers NSA | | | | | | | | |
| | U.S. CPI Urban Consumers NSA | | | | | | | | |
| | U.S. CPI Urban Consumers NSA | | | | | | | | |
| | U.S. CPI Urban Consumers NSA | | | | | | | | |
| | U.S. CPI Urban Consumers NSA | | | | | | | | |
| | U.S. CPI Urban Consumers NSA | | | | | | | | |
| | U.S. CPI Urban Consumers NSA | | | | | | | | |
| | U.S. CPI Urban Consumers NSA | | | | | | | | |
| | U.S. CPI Urban Consumers NSA | | | | | | | | |
| | U.S. CPI Urban Consumers NSA | | | | | | | | |
| | U.S. CPI Urban Consumers NSA | | | | | | | | |
| | U.S. CPI Urban Consumers NSA | | | | | | | | |
Schedule of Investments (continued)October 31, 2024
iShares® Inflation Hedged Corporate Bond ETF
Centrally Cleared Inflation Swaps (continued)
| | | | | | Upfront Premium Paid (Received) | Unrealized Appreciation (Depreciation) |
| | | | |
| | U.S. CPI Urban Consumers NSA | | | | | | | | |
| | U.S. CPI Urban Consumers NSA | | | | | | | | |
| | U.S. CPI Urban Consumers NSA | | | | | | | | |
| | U.S. CPI Urban Consumers NSA | | | | | | | | |
| | U.S. CPI Urban Consumers NSA | | | | | | | | |
| | U.S. CPI Urban Consumers NSA | | | | | | | | |
| | U.S. CPI Urban Consumers NSA | | | | | | | | |
| | U.S. CPI Urban Consumers NSA | | | | | | | | |
| | U.S. CPI Urban Consumers NSA | | | | | | | | |
| | U.S. CPI Urban Consumers NSA | | | | | | | | |
| | U.S. CPI Urban Consumers NSA | | | | | | | | |
| | U.S. CPI Urban Consumers NSA | | | | | | | | |
| | U.S. CPI Urban Consumers NSA | | | | | | | | |
| | U.S. CPI Urban Consumers NSA | | | | | | | | |
| | U.S. CPI Urban Consumers NSA | | | | | | | | |
| | U.S. CPI Urban Consumers NSA | | | | | | | | |
| | U.S. CPI Urban Consumers NSA | | | | | | | | |
| | | | | | | | | | |
92024 iShares Annual Financial Statements and Additional Information
Schedule of Investments (continued)October 31, 2024
iShares® Inflation Hedged Corporate Bond ETF
Centrally Cleared Interest Rate Swaps
| | | | | | | Upfront
Premium
Paid
(Received) | Unrealized
Appreciation
(Depreciation) |
| | | |
| | | | | | | | | | |
| | | | | | | | | | |
| | | | | | | | | | |
| | | | | | | | | | |
| | | | | | | | | | |
| | | | | | | | | | |
| | | | | | | | | | |
| | | | | | | | | | |
| | | | | | | | | | |
| | | | | | | | | | |
Balances Reported in the Statements of Assets and Liabilities for Centrally Cleared Swaps
| | | | |
Centrally Cleared Swaps(a) | | | | |
| Includes cumulative appreciation (depreciation) on centrally cleared swaps, as reported in the Schedule of Investments. Only current day’s variation margin is reported within the Statements of Assets and Liabilities and is net of any previously paid (received) swap premium amounts. |
Derivative Financial Instruments Categorized by Risk Exposure
As of period end, the fair values of derivative financial instruments located in the Statements of Assets and Liabilities were as follows:
| | | | Foreign
Currency
Exchange
Contracts | | | |
Assets—Derivative Financial Instruments | | | | | | | |
Swaps — centrally cleared | | | | | | | |
Unrealized appreciation on centrally cleared swaps(a) | | | | | | | |
Liabilities—Derivative Financial Instruments | | | | | | | |
Swaps — centrally cleared | | | | | | | |
Unrealized depreciation on centrally cleared swaps(a) | | | | | | | |
| Net cumulative unrealized appreciation (depreciation) on centrally cleared swaps are reported in the Schedule of Investments. In the Statements of Assets and Liabilities, only current day's variation margin is reported in receivables or payables and the net cumulative unrealized appreciation (depreciation) is included in accumulated earnings (loss). |
Schedule of Investments10
Schedule of Investments (continued)October 31, 2024
iShares® Inflation Hedged Corporate Bond ETF
For the period ended October 31, 2024, the effect of derivative financial instruments in the Statements of Operations was as follows:
| | | | Foreign
Currency
Exchange
Contracts | | | |
Net Realized Gain (Loss) from | | | | | | | |
| | | | | | | |
Net Change in Unrealized Appreciation (Depreciation) on | | | | | | | |
| | | | | | | |
Average Quarterly Balances of Outstanding Derivative Financial Instruments
| |
Average notional value — pays fixed rate | |
Average notional value — receives fixed rate | |
| |
Average notional value – pays fixed rate | |
Average notional value – receives fixed rate | |
| Derivative not held at quarter-end. The risk expoure table serves as an indicator of activity during the period. |
For more information about the Fund’s investment risks regarding derivative financial instruments, refer to the Notes to Financial Statements.
Fair Value Hierarchy as of Period End
Various inputs are used in determining the fair value of financial instruments at the measurement date. For a description of the input levels and information about the Fund’s policy regarding valuation of financial instruments, refer to the Notes to Financial Statements.
The following table summarizes the Fund’s financial instruments categorized in the fair value hierarchy. The breakdown of the Fund’s financial instruments into major categories is disclosed in the Schedule of Investments above.
| | | | |
| | | | |
| | | | |
| | | | |
| | | | |
| | | | |
| | | | |
| | | | |
Derivative Financial Instruments(a) | | | | |
| | | | |
Inflation Linked Contracts | | | | |
| | | | |
| | | | |
Inflation Linked Contracts | | | | |
| | | | |
| | | | |
| Derivative financial instruments are swaps. Swaps are valued at the unrealized appreciation (depreciation) on the instrument. |
See notes to financial statements.
112024 iShares Annual Financial Statements and Additional Information
Schedule of InvestmentsOctober 31, 2024
iShares® Inflation Hedged High Yield Bond ETF(Percentages shown are based on Net Assets)
| | |
|
Exchange-Traded Funds — 95.2% |
iShares iBoxx $ High Yield Corporate Bond ETF(a)(b) | | |
Total Investment Companies
(Cost: $2,372,166) | |
|
Money Market Funds — 48.6% |
BlackRock Cash Funds: Institutional, SL Agency Shares,
5.01%(a)(c)(d) | | |
BlackRock Cash Funds: Treasury, SL Agency Shares,
4.83%(a)(c) | | |
Total Short-Term Securities — 48.6%
(Cost: $1,297,246) | |
Total Investments in Securities — 143.8%
(Cost: $3,669,412) | |
Liabilities in Excess of Other Assets — (43.8)% | |
| |
| |
| All or a portion of this security is on loan. |
| Annualized 7-day yield as of period end. |
| All or a portion of this security was purchased with the cash collateral from loaned securities. |
Affiliates
Investments in issuers considered to be affiliate(s) of the Fund during the year ended October 31, 2024 for purposes of Section 2(a)(3) of the Investment Company Act of 1940, as amended, were as follows:
| | | | | Change in
Unrealized
Appreciation
(Depreciation) | | | | Capital
Gain
Distributions
from
Underlying
Funds |
BlackRock Cash Funds: Institutional, SL Agency Shares | | | | | | | | | |
BlackRock Cash Funds: Treasury, SL Agency Shares | | | | | | | | | |
iShares iBoxx $ High Yield Corporate Bond ETF | | | | | | | | | |
| | | | | | | | | |
| Represents net amount purchased (sold). |
| All or a portion represents securities lending income earned from the reinvestment of cash collateral from loaned securities, net of fees and collateral investment expenses, and other payments to and from borrowers of securities. |
Schedule of Investments12
Schedule of Investments (continued)October 31, 2024
iShares® Inflation Hedged High Yield Bond ETF
Derivative Financial Instruments Outstanding as of Period End
Centrally Cleared Inflation Swaps
| | | | | | Upfront
Premium
Paid
(Received) | Unrealized
Appreciation
(Depreciation) |
| | | | |
| | U.S. CPI Urban Consumers NSA | | | | | | | | |
| | U.S. CPI Urban Consumers NSA | | | | | | | | |
| | U.S. CPI Urban Consumers NSA | | | | | | | | |
| | U.S. CPI Urban Consumers NSA | | | | | | | | |
| | U.S. CPI Urban Consumers NSA | | | | | | | | |
| | U.S. CPI Urban Consumers NSA | | | | | | | | |
| | U.S. CPI Urban Consumers NSA | | | | | | | | |
| | U.S. CPI Urban Consumers NSA | | | | | | | | |
| | U.S. CPI Urban Consumers NSA | | | | | | | | |
| | U.S. CPI Urban Consumers NSA | | | | | | | | |
| | U.S. CPI Urban Consumers NSA | | | | | | | | |
| | U.S. CPI Urban Consumers NSA | | | | | | | | |
| | U.S. CPI Urban Consumers NSA | | | | | | | | |
| | U.S. CPI Urban Consumers NSA | | | | | | | | |
| | U.S. CPI Urban Consumers NSA | | | | | | | | |
| | U.S. CPI Urban Consumers NSA | | | | | | | | |
| | U.S. CPI Urban Consumers NSA | | | | | | | | |
| | U.S. CPI Urban Consumers NSA | | | | | | | | |
132024 iShares Annual Financial Statements and Additional Information
Schedule of Investments (continued)October 31, 2024
iShares® Inflation Hedged High Yield Bond ETF
Centrally Cleared Inflation Swaps (continued)
| | | | | | Upfront Premium Paid (Received) | Unrealized Appreciation (Depreciation) |
| | | | |
| | U.S. CPI Urban Consumers NSA | | | | | | | | |
| | U.S. CPI Urban Consumers NSA | | | | | | | | |
| | U.S. CPI Urban Consumers NSA | | | | | | | | |
| | U.S. CPI Urban Consumers NSA | | | | | | | | |
| | U.S. CPI Urban Consumers NSA | | | | | | | | |
| | U.S. CPI Urban Consumers NSA | | | | | | | | |
| | U.S. CPI Urban Consumers NSA | | | | | | | | |
| | U.S. CPI Urban Consumers NSA | | | | | | | | |
| | U.S. CPI Urban Consumers NSA | | | | | | | | |
| | U.S. CPI Urban Consumers NSA | | | | | | | | |
| | U.S. CPI Urban Consumers NSA | | | | | | | | |
| | U.S. CPI Urban Consumers NSA | | | | | | | | |
| | U.S. CPI Urban Consumers NSA | | | | | | | | |
| | U.S. CPI Urban Consumers NSA | | | | | | | | |
| | U.S. CPI Urban Consumers NSA | | | | | | | | |
| | U.S. CPI Urban Consumers NSA | | | | | | | | |
| | U.S. CPI Urban Consumers NSA | | | | | | | | |
| | | | | | | | | | |
Schedule of Investments14
Schedule of Investments (continued)October 31, 2024
iShares® Inflation Hedged High Yield Bond ETF
Centrally Cleared Interest Rate Swaps
| | | | | | | Upfront
Premium
Paid
(Received) | Unrealized
Appreciation
(Depreciation) |
| | | |
| | | | | | | | | | |
| | | | | | Upfront
Premium
Paid
(Received) | Unrealized
Appreciation
(Depreciation) |
| | | | |
| | U.S. CPI Urban Consumers NAS | | Goldman Sachs International | | | | | | |
| | U.S. CPI Urban Consumers NAS | | Goldman Sachs International | | | | | | |
| | | | | | | | | | |
Balances Reported in the Statements of Assets and Liabilities for Centrally Cleared Swaps and OTC Swaps
| | | | |
Centrally Cleared Swaps(a) | | | | |
| | | | |
| Includes cumulative appreciation (depreciation) on centrally cleared swaps, as reported in the Schedule of Investments. Only current day’s variation margin is reported within the Statements of Assets and Liabilities and is net of any previously paid (received) swap premium amounts. |
Derivative Financial Instruments Categorized by Risk Exposure
As of period end, the fair values of derivative financial instruments located in the Statements of Assets and Liabilities were as follows:
| | | | Foreign
Currency
Exchange
Contracts | | | |
Assets—Derivative Financial Instruments | | | | | | | |
Swaps — centrally cleared | | | | | | | |
Unrealized appreciation on centrally cleared swaps(a) | | | | | | | |
| | | | | | | |
Unrealized appreciation on OTC swaps; Swap premiums paid | | | | | | | |
| | | | | | | |
Liabilities—Derivative Financial Instruments | | | | | | | |
Swaps — centrally cleared | | | | | | | |
Unrealized depreciation on centrally cleared swaps(a) | | | | | | | |
| | | | | | | |
Unrealized depreciation on OTC swaps; Swap premiums received | | | | | | | |
| | | | | | | |
| Net cumulative unrealized appreciation (depreciation) on centrally cleared swaps are reported in the Schedule of Investments. In the Statements of Assets and Liabilities, only current day's variation margin is reported in receivables or payables and the net cumulative unrealized appreciation (depreciation) is included in accumulated earnings (loss). |
152024 iShares Annual Financial Statements and Additional Information
Schedule of Investments (continued)October 31, 2024
iShares® Inflation Hedged High Yield Bond ETF
For the period ended October 31, 2024, the effect of derivative financial instruments in the Statements of Operations was as follows:
| | | | Foreign
Currency
Exchange
Contracts | | | |
Net Realized Gain (Loss) from | | | | | | | |
| | | | | | | |
Net Change in Unrealized Appreciation (Depreciation) on | | | | | | | |
| | | | | | | |
Average Quarterly Balances of Outstanding Derivative Financial Instruments
| |
Average notional value — pays fixed rate | |
| |
Average notional value – pays fixed rate | |
For more information about the Fund’s investment risks regarding derivative financial instruments, refer to the Notes to Financial Statements.
Derivative Financial Instruments - Offsetting as of Period End
The Fund's derivative assets and liabilities (by type) were as follows:
| | |
Derivative Financial Instruments: | | |
Swaps - centrally cleared | | |
| | |
Total derivative assets and liabilities in the Statement of Assets and Liabilities | | |
Derivatives not subject to a Master Netting Agreement or similar agreement ("MNA") | | |
Total derivative assets and liabilities subject to an MNA | | |
| Includes unrealized appreciation (depreciation) on OTC swaps and swap premiums (paid/received) in the Statements of Assets and Liabilities. |
The following tables present the Fund’s derivative assets and liabilities by counterparty net of amounts available for offset under an MNA and net of the related collateral received and pledged by the Fund:
| Derivative
Assets
Subject to
an MNA by
Counterparty | | Non-Cash
Collateral
Received | | |
Goldman Sachs International | | | | | |
| Derivative
Liabilities
Subject to
an MNA by
Counterparty | | Non-Cash
Collateral
Pledged | | Net Amount
of Derivative
Liabilities |
Goldman Sachs International | | | | | |
| The amount of derivatives available for offset is limited to the amount of derivative assets and/or liabilities that are subject to an MNA. |
| Net amount represents the net amount receivable from the counterparty in the event of default. |
Schedule of Investments16
Schedule of Investments (continued)October 31, 2024
iShares® Inflation Hedged High Yield Bond ETF
Fair Value Hierarchy as of Period End
Various inputs are used in determining the fair value of financial instruments at the measurement date. For a description of the input levels and information about the Fund’s policy regarding valuation of financial instruments, refer to the Notes to Financial Statements.
The following table summarizes the Fund’s financial instruments categorized in the fair value hierarchy. The breakdown of the Fund’s financial instruments into major categories is disclosed in the Schedule of Investments above.
| | | | |
| | | | |
| | | | |
| | | | |
| | | | |
| | | | |
| | | | |
| | | | |
Derivative Financial Instruments(a) | | | | |
| | | | |
Inflation Linked Contracts | | | | |
| | | | |
| | | | |
Inflation Linked Contracts | | | | |
| | | | |
| Derivative financial instruments are swaps. Swaps are valued at the unrealized appreciation (depreciation) on the instrument. |
See notes to financial statements.
172024 iShares Annual Financial Statements and Additional Information
Schedule of InvestmentsOctober 31, 2024
iShares® Inflation Hedged U.S. Aggregate Bond ETF(Percentages shown are based on Net Assets)
| | |
|
Exchange-Traded Funds — 95.8% |
iShares Core U.S. Aggregate Bond ETF(a) | | |
Total Investment Companies
(Cost: $2,407,629) | |
|
Money Market Funds — 1.2% |
BlackRock Cash Funds: Treasury, SL Agency Shares,
4.83%(a)(b) | | |
Total Short-Term Securities — 1.2%
(Cost: $30,000) | |
Total Investments in Securities — 97.0%
(Cost: $2,437,629) | |
Other Assets Less Liabilities — 3.0% | |
| |
| |
| Annualized 7-day yield as of period end. |
Affiliates
Investments in issuers considered to be affiliate(s) of the Fund during the year ended October 31, 2024 for purposes of Section 2(a)(3) of the Investment Company Act of 1940, as amended, were as follows:
| | | | | Change in
Unrealized
Appreciation
(Depreciation) | | | | Capital
Gain
Distributions
from
Underlying
Funds |
BlackRock Cash Funds: Institutional, SL Agency Shares(a) | | | | | | | | | |
BlackRock Cash Funds: Treasury, SL Agency Shares | | | | | | | | | |
iShares Core U.S. Aggregate Bond ETF | | | | | | | | | |
| | | | | | | | | |
| As of period end, the entity is no longer held. |
| Represents net amount purchased (sold). |
| All or a portion represents securities lending income earned from the reinvestment of cash collateral from loaned securities, net of fees and collateral investment expenses, and other payments to and from borrowers of securities. |
Derivative Financial Instruments Outstanding as of Period End
Centrally Cleared Inflation Swaps
| | | | | | Upfront
Premium
Paid
(Received) | Unrealized
Appreciation
(Depreciation) |
| | | | |
| | U.S. CPI Urban Consumers NSA | | | | | | | | |
| | U.S. CPI Urban Consumers NSA | | | | | | | | |
| | U.S. CPI Urban Consumers NSA | | | | | | | | |
Schedule of Investments18
Schedule of Investments (continued)October 31, 2024
iShares® Inflation Hedged U.S. Aggregate Bond ETF
Centrally Cleared Inflation Swaps (continued)
| | | | | | Upfront Premium Paid (Received) | Unrealized Appreciation (Depreciation) |
| | | | |
| | U.S. CPI Urban Consumers NSA | | | | | | | | |
| | U.S. CPI Urban Consumers NSA | | | | | | | | |
| | U.S. CPI Urban Consumers NSA | | | | | | | | |
| | U.S. CPI Urban Consumers NSA | | | | | | | | |
| | U.S. CPI Urban Consumers NSA | | | | | | | | |
| | U.S. CPI Urban Consumers NSA | | | | | | | | |
| | U.S. CPI Urban Consumers NSA | | | | | | | | |
| | U.S. CPI Urban Consumers NSA | | | | | | | | |
| | U.S. CPI Urban Consumers NSA | | | | | | | | |
| | U.S. CPI Urban Consumers NSA | | | | | | | | |
| | U.S. CPI Urban Consumers NSA | | | | | | | | |
| | U.S. CPI Urban Consumers NSA | | | | | | | | |
| | U.S. CPI Urban Consumers NSA | | | | | | | | |
| | U.S. CPI Urban Consumers NSA | | | | | | | | |
| | U.S. CPI Urban Consumers NSA | | | | | | | | |
| | U.S. CPI Urban Consumers NSA | | | | | | | | |
| | U.S. CPI Urban Consumers NSA | | | | | | | | |
| | U.S. CPI Urban Consumers NSA | | | | | | | | |
| | U.S. CPI Urban Consumers NSA | | | | | | | | |
192024 iShares Annual Financial Statements and Additional Information
Schedule of Investments (continued)October 31, 2024
iShares® Inflation Hedged U.S. Aggregate Bond ETF
Centrally Cleared Inflation Swaps (continued)
| | | | | | Upfront Premium Paid (Received) | Unrealized Appreciation (Depreciation) |
| | | | |
| | U.S. CPI Urban Consumers NSA | | | | | | | | |
| | U.S. CPI Urban Consumers NSA | | | | | | | | |
| | U.S. CPI Urban Consumers NSA | | | | | | | | |
| | U.S. CPI Urban Consumers NSA | | | | | | | | |
| | U.S. CPI Urban Consumers NSA | | | | | | | | |
| | U.S. CPI Urban Consumers NSA | | | | | | | | |
| | U.S. CPI Urban Consumers NSA | | | | | | | | |
| | U.S. CPI Urban Consumers NSA | | | | | | | | |
| | U.S. CPI Urban Consumers NSA | | | | | | | | |
| | U.S. CPI Urban Consumers NSA | | | | | | | | |
| | U.S. CPI Urban Consumers NSA | | | | | | | | |
| | U.S. CPI Urban Consumers NSA | | | | | | | | |
| | U.S. CPI Urban Consumers NSA | | | | | | | | |
| | U.S. CPI Urban Consumers NSA | | | | | | | | |
| | U.S. CPI Urban Consumers NSA | | | | | | | | |
| | U.S. CPI Urban Consumers NSA | | | | | | | | |
| | U.S. CPI Urban Consumers NSA | | | | | | | | |
| | U.S. CPI Urban Consumers NSA | | | | | | | | |
Schedule of Investments20
Schedule of Investments (continued)October 31, 2024
iShares® Inflation Hedged U.S. Aggregate Bond ETF
Centrally Cleared Inflation Swaps (continued)
| | | | | | Upfront Premium Paid (Received) | Unrealized Appreciation (Depreciation) |
| | | | |
| | U.S. CPI Urban Consumers NSA | | | | | | | | |
| | U.S. CPI Urban Consumers NSA | | | | | | | | |
| | | | | | | | | | |
Centrally Cleared Interest Rate Swaps
| | | | | | | Upfront
Premium
Paid
(Received) | Unrealized
Appreciation
(Depreciation) |
| | | |
| | | | | | | | | | |
| | | | | | | | | | |
| | | | | | | | | | |
| | | | | | Upfront
Premium
Paid
(Received) | Unrealized
Appreciation
(Depreciation) |
| | | | |
| | U.S. CPI Urban Consumers NAS | | Goldman Sachs International | | | | | | |
| | U.S. CPI Urban Consumers NAS | | Goldman Sachs International | | | | | | |
| | U.S. CPI Urban Consumers NAS | | Goldman Sachs International | | | | | | |
| | | | | | | | | | |
Balances Reported in the Statements of Assets and Liabilities for Centrally Cleared Swaps and OTC Swaps
| | | | |
Centrally Cleared Swaps(a) | | | | |
| | | | |
| Includes cumulative appreciation (depreciation) on centrally cleared swaps, as reported in the Schedule of Investments. Only current day’s variation margin is reported within the Statements of Assets and Liabilities and is net of any previously paid (received) swap premium amounts. |
212024 iShares Annual Financial Statements and Additional Information
Schedule of Investments (continued)October 31, 2024
iShares® Inflation Hedged U.S. Aggregate Bond ETF
Derivative Financial Instruments Categorized by Risk Exposure
As of period end, the fair values of derivative financial instruments located in the Statements of Assets and Liabilities were as follows:
| | | | Foreign
Currency
Exchange
Contracts | | | |
Assets—Derivative Financial Instruments | | | | | | | |
Swaps — centrally cleared | | | | | | | |
Unrealized appreciation on centrally cleared swaps(a) | | | | | | | |
| | | | | | | |
Unrealized appreciation on OTC swaps; Swap premiums paid | | | | | | | |
| | | | | | | |
Liabilities—Derivative Financial Instruments | | | | | | | |
Swaps — centrally cleared | | | | | | | |
Unrealized depreciation on centrally cleared swaps(a) | | | | | | | |
| Net cumulative unrealized appreciation (depreciation) on centrally cleared swaps are reported in the Schedule of Investments. In the Statements of Assets and Liabilities, only current day's variation margin is reported in receivables or payables and the net cumulative unrealized appreciation (depreciation) is included in accumulated earnings (loss). |
For the period ended October 31, 2024, the effect of derivative financial instruments in the Statements of Operations was as follows:
| | | | Foreign
Currency
Exchange
Contracts | | | |
Net Realized Gain (Loss) from | | | | | | | |
| | | | | | | |
Net Change in Unrealized Appreciation (Depreciation) on | | | | | | | |
| | | | | | | |
Average Quarterly Balances of Outstanding Derivative Financial Instruments
| |
Average notional value — pays fixed rate | |
| |
Average notional value – pays fixed rate | |
For more information about the Fund’s investment risks regarding derivative financial instruments, refer to the Notes to Financial Statements.
Derivative Financial Instruments - Offsetting as of Period End
The Fund's derivative assets and liabilities (by type) were as follows:
| | |
Derivative Financial Instruments: | | |
Swaps - centrally cleared | | |
| | |
Total derivative assets and liabilities in the Statement of Assets and Liabilities | | |
Derivatives not subject to a Master Netting Agreement or similar agreement ("MNA") | | |
Total derivative assets and liabilities subject to an MNA | | |
| Includes unrealized appreciation (depreciation) on OTC swaps and swap premiums (paid/received) in the Statements of Assets and Liabilities. |
Schedule of Investments22
Schedule of Investments (continued)October 31, 2024
iShares® Inflation Hedged U.S. Aggregate Bond ETF
The following table presents the Fund’s derivative assets by counterparty net of amounts available for offset under an MNA and net of the related collateral received by the Fund:
| Derivative
Assets
Subject to
an MNA by
Counterparty | Derivatives
Available
for Offset | Non-Cash
Collateral
Received | | |
Goldman Sachs International | | | | | |
| Net amount represents the net amount receivable from the counterparty in the event of default. |
Fair Value Hierarchy as of Period End
Various inputs are used in determining the fair value of financial instruments at the measurement date. For a description of the input levels and information about the Fund’s policy regarding valuation of financial instruments, refer to the Notes to Financial Statements.
The following table summarizes the Fund’s financial instruments categorized in the fair value hierarchy. The breakdown of the Fund’s financial instruments into major categories is disclosed in the Schedule of Investments above.
| | | | |
| | | | |
| | | | |
| | | | |
| | | | |
| | | | |
| | | | |
| | | | |
Derivative Financial Instruments(a) | | | | |
| | | | |
Inflation Linked Contracts | | | | |
| | | | |
| | | | |
Inflation Linked Contracts | | | | |
| | | | |
| | | | |
| Derivative financial instruments are swaps. Swaps are valued at the unrealized appreciation (depreciation) on the instrument. |
See notes to financial statements.
232024 iShares Annual Financial Statements and Additional Information
Schedule of InvestmentsOctober 31, 2024
iShares® Interest Rate Hedged Corporate Bond ETF(Percentages shown are based on Net Assets)
| | |
|
Exchange-Traded Funds — 94.6% |
iShares iBoxx $ Investment Grade Corporate Bond ETF(a)(b)(c) | | |
Total Investment Companies
(Cost: $398,270,856) | |
|
Money Market Funds — 51.4% |
BlackRock Cash Funds: Institutional, SL Agency Shares,
5.01%(a)(d)(e) | | |
BlackRock Cash Funds: Treasury, SL Agency Shares,
4.83%(a)(d) | | |
Total Short-Term Securities — 51.4%
(Cost: $219,538,689) | |
Total Investments in Securities — 146.0%
(Cost: $617,809,545) | |
Liabilities in Excess of Other Assets — (46.0)% | |
| |
| |
| All or a portion of the security has been pledged in connection with outstanding centrally cleared swaps. |
| All or a portion of this security is on loan. |
| Annualized 7-day yield as of period end. |
| All or a portion of this security was purchased with the cash collateral from loaned securities. |
Affiliates
Investments in issuers considered to be affiliate(s) of the Fund during the year ended October 31, 2024 for purposes of Section 2(a)(3) of the Investment Company Act of 1940, as amended, were as follows:
| | | | | Change in
Unrealized
Appreciation
(Depreciation) | | | | Capital
Gain
Distributions
from
Underlying
Funds |
BlackRock Cash Funds: Institu- tional, SL Agency Shares | | | | | | | | | |
BlackRock Cash Funds: Treasury, SL Agency Shares | | | | | | | | | |
iShares iBoxx $ Investment Grade Corporate Bond ETF | | | | | | | | | |
| | | | | | | | | |
| Represents net amount purchased (sold). |
| All or a portion represents securities lending income earned from the reinvestment of cash collateral from loaned securities, net of fees and collateral investment expenses, and other payments to and from borrowers of securities. |
Schedule of Investments24
Schedule of Investments (continued)October 31, 2024
iShares® Interest Rate Hedged Corporate Bond ETF
Derivative Financial Instruments Outstanding as of Period End
Centrally Cleared Interest Rate Swaps
| | | | | | | Upfront
Premium
Paid
(Received) | Unrealized
Appreciation
(Depreciation) |
| | | |
| | | | | | | | | | |
| | | | | | | | | | |
| | | | | | | | | | |
| | | | | | | | | | |
| | | | | | | | | | |
| | | | | | | | | | |
| | | | | | | | | | |
| | | | | | | | | | |
| | | | | | | | | | |
| | | | | | | | | | |
| | | | | | | | | | |
| | | | | | | | | | |
| | | | | | | | | | |
| | | | | | | | | | |
| | | | | | | | | | |
| | | | | | | | | | |
| | | | | | | | | | |
| | | | | | | | | | |
| | | | | | | | | | |
| | | | | | | | | | |
| | | | | | | | | | |
| | | | | | | | | | |
| | | | | | | | | | |
| | | | | | | | | | |
| | | | | | | | | | |
| | | | | | | | | | |
| | | | | | | | | | |
| | | | | | | | | | |
252024 iShares Annual Financial Statements and Additional Information
Schedule of Investments (continued)October 31, 2024
iShares® Interest Rate Hedged Corporate Bond ETF
Centrally Cleared Interest Rate Swaps (continued)
| | | | | | | Upfront Premium Paid (Received) | Unrealized Appreciation (Depreciation) |
| | | |
| | | | | | | | | | |
| | | | | | | | | | |
| | | | | | | | | | |
| | | | | | | | | | |
| | | | | | | | | | |
| | | | | | | | | | |
| | | | | | | | | | |
| | | | | | | | | | |
| | | | | | | | | | |
| | | | | | | | | | |
| | | | | | | | | | |
| | | | | | | | | | |
| | | | | | | | | | |
| | | | | | | | | | |
| | | | | | | | | | |
| | | | | | | | | | |
| | | | | | | | | | |
| | | | | | | | | | |
| | | | | | | | | | |
| | | | | | | | | | |
| | | | | | | | | | |
| | | | | | | | | | |
| | | | | | | | | | |
| | | | | | | | | | |
| | | | | | | | | | |
| | | | | | | | | | |
| | | | | | | | | | |
| | | | | | | | | | |
| | | | | | | | | | |
Schedule of Investments26
Schedule of Investments (continued)October 31, 2024
iShares® Interest Rate Hedged Corporate Bond ETF
Centrally Cleared Interest Rate Swaps (continued)
| | | | | | | Upfront Premium Paid (Received) | Unrealized Appreciation (Depreciation) |
| | | |
| | | | | | | | | | |
| | | | | | | | | | |
| | | | | | | | | | |
| | | | | | | | | | |
| | | | | | | | | | |
| | | | | | | | | | |
| | | | | | | | | | |
| | | | | | | | | | |
| | | | | | | | | | |
| | | | | | | | | | |
| | | | | | | | | | |
| | | | | | | | | | |
| | | | | | | | | | |
| | | | | | | | | | |
| | | | | | | | | | |
| | | | | | | | | | |
| | | | | | | | | | |
| | | | | | | | | | |
| | | | | | | | | | |
| | | | | | | | | | |
| | | | | | | | | | |
| | | | | | | | | | |
| | | | | | | | | | |
| | | | | | | | | | |
| | | | | | | | | | |
| | | | | | | | | | |
| | | | | | | | | | |
| | | | | | | | | | |
| | | | | | | | | | |
272024 iShares Annual Financial Statements and Additional Information
Schedule of Investments (continued)October 31, 2024
iShares® Interest Rate Hedged Corporate Bond ETF
Centrally Cleared Interest Rate Swaps (continued)
| | | | | | | Upfront Premium Paid (Received) | Unrealized Appreciation (Depreciation) |
| | | |
| | | | | | | | | | |
| | | | | | | | | | |
| | | | | | | | | | |
| | | | | | | | | | |
| | | | | | | | | | |
| | | | | | | | | | |
| | | | | | | | | | |
| | | | | | | | | | |
| | | | | | | | | | |
| | | | | | | | | | |
| | | | | | | | | | |
| | | | | | | | | | |
| | | | | | | | | | |
| | | | | | | | | | |
| | | | | | | | | | |
| | | | | | | | | | |
| | | | | | | | | | |
| | | | | | | | | | |
| | | | | | | | | | |
| | | | | | | | | | |
| | | | | | | | | | |
| | | | | | | | | | |
| | | | | | | | | | |
| | | | | | | | | | |
| | | | | | | | | | |
| | | | | | | | | | |
| | | | | | | | | | |
| | | | | | | | | | |
| | | | | | | | | | |
Schedule of Investments28
Schedule of Investments (continued)October 31, 2024
iShares® Interest Rate Hedged Corporate Bond ETF
Centrally Cleared Interest Rate Swaps (continued)
| | | | | | | Upfront Premium Paid (Received) | Unrealized Appreciation (Depreciation) |
| | | |
| | | | | | | | | | |
| | | | | | | | | | |
| | | | | | | | | | |
| | | | | | | | | | |
| | | | | | | | | | |
| | | | | | | | | | |
| | | | | | | | | | |
| | | | | | | | | | |
| | | | | | | | | | |
| | | | | | | | | | |
| | | | | | | | | | |
| | | | | | | | | | |
| | | | | | | | | | |
| | | | | | | | | | |
| | | | | | | | | | |
| | | | | | | | | | |
| | | | | | | | | | |
| | | | | | | | | | |
| | | | | | | | | | |
| | | | | | | | | | |
| | | | | | | | | | |
| | | | | | | | | | |
| | | | | | | | | | |
| | | | | | | | | | |
| | | | | | | | | | |
| | | | | | | | | | |
| | | | | | | | | | |
| | | | | | | | | | |
| | | | | | | | | | |
292024 iShares Annual Financial Statements and Additional Information
Schedule of Investments (continued)October 31, 2024
iShares® Interest Rate Hedged Corporate Bond ETF
Centrally Cleared Interest Rate Swaps (continued)
| | | | | | | Upfront Premium Paid (Received) | Unrealized Appreciation (Depreciation) |
| | | |
| | | | | | | | | | |
| | | | | | | | | | |
| | | | | | | | | | |
| | | | | | | | | | |
| | | | | | | | | | |
| | | | | | | | | | |
| | | | | | | | | | |
| | | | | | | | | | |
| | | | | | | | | | |
| | | | | | | | | | |
| | | | | | | | | | |
| | | | | | | | | | |
| | | | | | | | | | |
| | | | | | | | | | |
| | | | | | | | | | |
| | | | | | | | | | |
| | | | | | | | | | |
| | | | | | | | | | |
| | | | | | | | | | |
| | | | | | | | | | |
| | | | | | | | | | |
| | | | | | | | | | |
| | | | | | | | | | |
| | | | | | | | | | |
| | | | | | | | | | |
| | | | | | | | | | |
| | | | | | | | | | |
| | | | | | | | | | |
| | | | | | | | | | |
Schedule of Investments30
Schedule of Investments (continued)October 31, 2024
iShares® Interest Rate Hedged Corporate Bond ETF
Centrally Cleared Interest Rate Swaps (continued)
| | | | | | | Upfront Premium Paid (Received) | Unrealized Appreciation (Depreciation) |
| | | |
| | | | | | | | | | |
| | | | | | | | | | |
| | | | | | | | | | |
| | | | | | | | | | |
| | | | | | | | | | |
| | | | | | | | | | |
| | | | | | | | | | |
| | | | | | | | | | |
| | | | | | | | | | |
| | | | | | | | | | |
| | | | | | | | | | |
Balances Reported in the Statements of Assets and Liabilities for Centrally Cleared Swaps
| | | | |
Centrally Cleared Swaps(a) | | | | |
| Includes cumulative appreciation (depreciation) on centrally cleared swaps, as reported in the Schedule of Investments. Only current day’s variation margin is reported within the Statements of Assets and Liabilities and is net of any previously paid (received) swap premium amounts. |
Derivative Financial Instruments Categorized by Risk Exposure
As of period end, the fair values of derivative financial instruments located in the Statements of Assets and Liabilities were as follows:
| | | | Foreign
Currency
Exchange
Contracts | | | |
Assets—Derivative Financial Instruments | | | | | | | |
Swaps — centrally cleared | | | | | | | |
Unrealized appreciation on centrally cleared swaps(a) | | | | | | | |
Liabilities—Derivative Financial Instruments | | | | | | | |
Swaps — centrally cleared | | | | | | | |
Unrealized depreciation on centrally cleared swaps(a) | | | | | | | |
| Net cumulative unrealized appreciation (depreciation) on centrally cleared swaps are reported in the Schedule of Investments. In the Statements of Assets and Liabilities, only current day's variation margin is reported in receivables or payables and the net cumulative unrealized appreciation (depreciation) is included in accumulated earnings (loss). |
312024 iShares Annual Financial Statements and Additional Information
Schedule of Investments (continued)October 31, 2024
iShares® Interest Rate Hedged Corporate Bond ETF
For the period ended October 31, 2024, the effect of derivative financial instruments in the Statements of Operations was as follows:
| | | | Foreign
Currency
Exchange
Contracts | | | |
Net Realized Gain (Loss) from | | | | | | | |
| | | | | | | |
Net Change in Unrealized Appreciation (Depreciation) on | | | | | | | |
| | | | | | | |
Average Quarterly Balances of Outstanding Derivative Financial Instruments
| |
Average notional value — pays fixed rate | |
For more information about the Fund’s investment risks regarding derivative financial instruments, refer to the Notes to Financial Statements.
Fair Value Hierarchy as of Period End
Various inputs are used in determining the fair value of financial instruments at the measurement date. For a description of the input levels and information about the Fund’s policy regarding valuation of financial instruments, refer to the Notes to Financial Statements.
The following table summarizes the Fund’s financial instruments categorized in the fair value hierarchy. The breakdown of the Fund’s financial instruments into major categories is disclosed in the Schedule of Investments above.
| | | | |
| | | | |
| | | | |
| | | | |
| | | | |
| | | | |
| | | | |
| | | | |
Derivative Financial Instruments(a) | | | | |
| | | | |
| | | | |
| | | | |
| | | | |
| | | | |
| Derivative financial instruments are swaps. Swaps are valued at the unrealized appreciation (depreciation) on the instrument. |
See notes to financial statements.
Schedule of Investments32
Schedule of InvestmentsOctober 31, 2024
iShares® Interest Rate Hedged High Yield Bond ETF(Percentages shown are based on Net Assets)
| | |
|
Exchange-Traded Funds — 94.3% |
iShares iBoxx $ High Yield Corporate Bond ETF(a)(b) | | |
Total Investment Companies
(Cost: $306,995,897) | |
|
Money Market Funds — 47.7% |
BlackRock Cash Funds: Institutional, SL Agency Shares,
5.01%(a)(c)(d) | | |
BlackRock Cash Funds: Treasury, SL Agency Shares,
4.83%(a)(c) | | |
Total Short-Term Securities — 47.7%
(Cost: $160,260,225) | |
Total Investments in Securities — 142.0%
(Cost: $467,256,122) | |
Liabilities in Excess of Other Assets — (42.0)% | |
| |
| |
| All or a portion of this security is on loan. |
| Annualized 7-day yield as of period end. |
| All or a portion of this security was purchased with the cash collateral from loaned securities. |
Affiliates
Investments in issuers considered to be affiliate(s) of the Fund during the year ended October 31, 2024 for purposes of Section 2(a)(3) of the Investment Company Act of 1940, as amended, were as follows:
| | | | | Change in
Unrealized
Appreciation
(Depreciation) | | | | Capital
Gain
Distributions
from
Underlying
Funds |
BlackRock Cash Funds: Institu- tional, SL Agency Shares | | | | | | | | | |
BlackRock Cash Funds: Treasury, SL Agency Shares | | | | | | | | | |
iShares iBoxx $ High Yield Corpo- rate Bond ETF | | | | | | | | | |
| | | | | | | | | |
| Represents net amount purchased (sold). |
| All or a portion represents securities lending income earned from the reinvestment of cash collateral from loaned securities, net of fees and collateral investment expenses, and other payments to and from borrowers of securities. |
Derivative Financial Instruments Outstanding as of Period End
Centrally Cleared Interest Rate Swaps
| | | | | | | Upfront
Premium
Paid
(Received) | Unrealized
Appreciation
(Depreciation) |
| | | |
| | | | | | | | | | |
| | | | | | | | | | |
| | | | | | | | | | |
332024 iShares Annual Financial Statements and Additional Information
Schedule of Investments (continued)October 31, 2024
iShares® Interest Rate Hedged High Yield Bond ETF
Centrally Cleared Interest Rate Swaps (continued)
| | | | | | | Upfront Premium Paid (Received) | Unrealized Appreciation (Depreciation) |
| | | |
| | | | | | | | | | |
| | | | | | | | | | |
| | | | | | | | | | |
| | | | | | | | | | |
| | | | | | | | | | |
| | | | | | | | | | |
| | | | | | | | | | |
| | | | | | | | | | |
| | | | | | | | | | |
| | | | | | | | | | |
| | | | | | | | | | |
| | | | | | | | | | |
| | | | | | | | | | |
| | | | | | | | | | |
| | | | | | | | | | |
| | | | | | | | | | |
| | | | | | | | | | |
| | | | | | | | | | |
| | | | | | | | | | |
| | | | | | | | | | |
| | | | | | | | | | |
| | | | | | | | | | |
| | | | | | | | | | |
| | | | | | | | | | |
| | | | | | | | | | |
| | | | | | | | | | |
| | | | | | | | | | |
| | | | | | | | | | |
| | | | | | | | | | |
Schedule of Investments34
Schedule of Investments (continued)October 31, 2024
iShares® Interest Rate Hedged High Yield Bond ETF
Centrally Cleared Interest Rate Swaps (continued)
| | | | | | | Upfront Premium Paid (Received) | Unrealized Appreciation (Depreciation) |
| | | |
| | | | | | | | | | |
| | | | | | | | | | |
| | | | | | | | | | |
| | | | | | | | | | |
| | | | | | | | | | |
| | | | | | | | | | |
| | | | | | | | | | |
| | | | | | | | | | |
| | | | | | | | | | |
| | | | | | | | | | |
| | | | | | | | | | |
| | | | | | | | | | |
| | | | | | | | | | |
| | | | | | | | | | |
| | | | | | | | | | |
| | | | | | | | | | |
| | | | | | | | | | |
| | | | | | | | | | |
| | | | | | | | | | |
| | | | | | | | | | |
| | | | | | | | | | |
| | | | | | | | | | |
| | | | | | | | | | |
| | | | | | | | | | |
| | | | | | | | | | |
| | | | | | | | | | |
| | | | | | | | | | |
| | | | | | | | | | |
| | | | | | | | | | |
352024 iShares Annual Financial Statements and Additional Information
Schedule of Investments (continued)October 31, 2024
iShares® Interest Rate Hedged High Yield Bond ETF
Centrally Cleared Interest Rate Swaps (continued)
| | | | | | | Upfront Premium Paid (Received) | Unrealized Appreciation (Depreciation) |
| | | |
| | | | | | | | | | |
| | | | | | | | | | |
| | | | | | | | | | |
| | | | | | | | | | |
| | | | | | | | | | |
| | | | | | | | | | |
| | | | | | | | | | |
| | | | | | | | | | |
| | | | | | | | | | |
| | | | | | | | | | |
| | | | | | | | | | |
| | | | | | | | | | |
| | | | | | | | | | |
| | | | | | | | | | |
| | | | | | | | | | |
| | | | | | | | | | |
| | | | | | | | | | |
| | | | | | | | | | |
| | | | | | | | | | |
| | | | | | | | | | |
| | | | | | | | | | |
| | | | | | | | | | |
| | | | | | | | | | |
| | | | | | | | | | |
| | | | | | | | | | |
| | | | | | | | | | |
| | | | | | | | | | |
| | | | | | | | | | |
| | | | | | | | | | |
Schedule of Investments36
Schedule of Investments (continued)October 31, 2024
iShares® Interest Rate Hedged High Yield Bond ETF
Centrally Cleared Interest Rate Swaps (continued)
| | | | | | | Upfront Premium Paid (Received) | Unrealized Appreciation (Depreciation) |
| | | |
| | | | | | | | | | |
| | | | | | | | | | |
| | | | | | | | | | |
| | | | | | | | | | |
| | | | | | | | | | |
| | | | | | | | | | |
| | | | | | | | | | |
| | | | | | | | | | |
| | | | | | | | | | |
| | | | | | | | | | |
| | | | | | | | | | |
| | | | | | | | | | |
| | | | | | | | | | |
| | | | | | | | | | |
| | | | | | | | | | |
| | | | | | | | | | |
| | | | | | | | | | |
| | | | | | | | | | |
| | | | | | | | | | |
| | | | | | | | | | |
| | | | | | | | | | |
| | | | | | | | | | |
| | | | | | | | | | |
| | | | | | | | | | |
| | | | | | | | | | |
| | | | | | | | | | |
| | | | | | | | | | |
| | | | | | | | | | |
| | | | | | | | | | |
372024 iShares Annual Financial Statements and Additional Information
Schedule of Investments (continued)October 31, 2024
iShares® Interest Rate Hedged High Yield Bond ETF
Centrally Cleared Interest Rate Swaps (continued)
| | | | | | | Upfront Premium Paid (Received) | Unrealized Appreciation (Depreciation) |
| | | |
| | | | | | | | | | |
| | | | | | | | | | |
| | | | | | | | | | |
| | | | | | | | | | |
| | | | | | | | | | |
| | | | | | | | | | |
| | | | | | | | | | |
| | | | | | | | | | |
| | | | | | | | | | |
| | | | | | | | | | |
| | | | | | | | | | |
| | | | | | | | | | |
| | | | | | | | | | |
| | | | | | | | | | |
| | | | | | | | | | |
| | | | | | | | | | |
| | | | | | | | | | |
| | | | | | | | | | |
| | | | | | | | | | |
| | | | | | | | | | |
| | | | | | | | | | |
| | | | | | | | | | |
| | | | | | | | | | |
| | | | | | | | | | |
| | | | | | | | | | |
| | | | | | | | | | |
| | | | | | | | | | |
| | | | | | | | | | |
| | | | | | | | | | |
Schedule of Investments38
Schedule of Investments (continued)October 31, 2024
iShares® Interest Rate Hedged High Yield Bond ETF
Balances Reported in the Statements of Assets and Liabilities for Centrally Cleared Swaps
| | | | |
Centrally Cleared Swaps(a) | | | | |
| Includes cumulative appreciation (depreciation) on centrally cleared swaps, as reported in the Schedule of Investments. Only current day’s variation margin is reported within the Statements of Assets and Liabilities and is net of any previously paid (received) swap premium amounts. |
Derivative Financial Instruments Categorized by Risk Exposure
As of period end, the fair values of derivative financial instruments located in the Statements of Assets and Liabilities were as follows:
| | | | Foreign
Currency
Exchange
Contracts | | | |
Assets—Derivative Financial Instruments | | | | | | | |
Swaps — centrally cleared | | | | | | | |
Unrealized appreciation on centrally cleared swaps(a) | | | | | | | |
Liabilities—Derivative Financial Instruments | | | | | | | |
Swaps — centrally cleared | | | | | | | |
Unrealized depreciation on centrally cleared swaps(a) | | | | | | | |
| Net cumulative unrealized appreciation (depreciation) on centrally cleared interest rate swaps contracts are reported in the Schedule of Investments. In the Statements of Assets and Liabilities, only current day's variation margin is reported in receivables or payables and the net cumulative unrealized appreciation (depreciation) is included in accumulated earnings (loss). |
For the period ended October 31, 2024, the effect of derivative financial instruments in the Statements of Operations was as follows:
| | | | Foreign
Currency
Exchange
Contracts | | | |
Net Realized Gain (Loss) from | | | | | | | |
| | | | | | | |
Net Change in Unrealized Appreciation (Depreciation) on | | | | | | | |
| | | | | | | |
Average Quarterly Balances of Outstanding Derivative Financial Instruments
| |
Average notional value — pays fixed rate | |
For more information about the Fund’s investment risks regarding derivative financial instruments, refer to the Notes to Financial Statements.
Fair Value Hierarchy as of Period End
Various inputs are used in determining the fair value of financial instruments at the measurement date. For a description of the input levels and information about the Fund’s policy regarding valuation of financial instruments, refer to the Notes to Financial Statements.
The following table summarizes the Fund’s financial instruments categorized in the fair value hierarchy. The breakdown of the Fund’s financial instruments into major categories is disclosed in the Schedule of Investments above.
392024 iShares Annual Financial Statements and Additional Information
Schedule of Investments (continued)October 31, 2024
iShares® Interest Rate Hedged High Yield Bond ETF
Fair Value Hierarchy as of Period End (continued)
| | | | |
Derivative Financial Instruments(a) | | | | |
| | | | |
| | | | |
| | | | |
| | | | |
| | | | |
| Derivative financial instruments are swaps. Swaps are valued at the unrealized appreciation (depreciation) on the instrument. |
See notes to financial statements.
Schedule of Investments40
Schedule of InvestmentsOctober 31, 2024
iShares® Interest Rate Hedged Long-Term Corporate Bond ETF(Percentages shown are based on Net Assets)
| | |
|
Exchange-Traded Funds — 91.5% |
iShares 10+ Year Investment Grade Corporate Bond ETF(a)(b) | | |
Total Investment Companies
(Cost: $83,824,570) | |
|
Money Market Funds — 45.2% |
BlackRock Cash Funds: Institutional, SL Agency Shares,
5.01%(a)(c)(d) | | |
BlackRock Cash Funds: Treasury, SL Agency Shares,
4.83%(a)(c) | | |
Total Short-Term Securities — 45.2%
(Cost: $42,118,545) | |
Total Investments in Securities — 136.7%
(Cost: $125,943,115) | |
Liabilities in Excess of Other Assets — (36.7)% | |
| |
| |
| All or a portion of this security is on loan. |
| Annualized 7-day yield as of period end. |
| All or a portion of this security was purchased with the cash collateral from loaned securities. |
Affiliates
Investments in issuers considered to be affiliate(s) of the Fund during the year ended October 31, 2024 for purposes of Section 2(a)(3) of the Investment Company Act of 1940, as amended, were as follows:
| | | | | Change in
Unrealized
Appreciation
(Depreciation) | | | | Capital
Gain
Distributions
from
Underlying
Funds |
BlackRock Cash Funds: Institutional, SL Agency Shares | | | | | | | | | |
BlackRock Cash Funds: Treasury, SL Agency Shares | | | | | | | | | |
iShares 10+ Year Investment Grade Corporate Bond ETF | | | | | | | | | |
| | | | | | | | | |
| Represents net amount purchased (sold). |
| All or a portion represents securities lending income earned from the reinvestment of cash collateral from loaned securities, net of fees and collateral investment expenses, and other payments to and from borrowers of securities. |
Derivative Financial Instruments Outstanding as of Period End
Centrally Cleared Interest Rate Swaps
| | | | | | | Upfront
Premium
Paid
(Received) | Unrealized
Appreciation
(Depreciation) |
| | | |
| | | | | | | | | | |
| | | | | | | | | | |
| | | | | | | | | | |
412024 iShares Annual Financial Statements and Additional Information
Schedule of Investments (continued)October 31, 2024
iShares® Interest Rate Hedged Long-Term Corporate Bond ETF
Centrally Cleared Interest Rate Swaps (continued)
| | | | | | | Upfront Premium Paid (Received) | Unrealized Appreciation (Depreciation) |
| | | |
| | | | | | | | | | |
| | | | | | | | | | |
| | | | | | | | | | |
| | | | | | | | | | |
| | | | | | | | | | |
| | | | | | | | | | |
| | | | | | | | | | |
| | | | | | | | | | |
| | | | | | | | | | |
| | | | | | | | | | |
| | | | | | | | | | |
| | | | | | | | | | |
| | | | | | | | | | |
| | | | | | | | | | |
| | | | | | | | | | |
| | | | | | | | | | |
| | | | | | | | | | |
| | | | | | | | | | |
| | | | | | | | | | |
| | | | | | | | | | |
| | | | | | | | | | |
| | | | | | | | | | |
| | | | | | | | | | |
| | | | | | | | | | |
| | | | | | | | | | |
| | | | | | | | | | |
| | | | | | | | | | |
| | | | | | | | | | |
| | | | | | | | | | |
Schedule of Investments42
Schedule of Investments (continued)October 31, 2024
iShares® Interest Rate Hedged Long-Term Corporate Bond ETF
Centrally Cleared Interest Rate Swaps (continued)
| | | | | | | Upfront Premium Paid (Received) | Unrealized Appreciation (Depreciation) |
| | | |
| | | | | | | | | | |
| | | | | | | | | | |
| | | | | | | | | | |
| | | | | | | | | | |
| | | | | | | | | | |
| | | | | | | | | | |
| | | | | | | | | | |
| | | | | | | | | | |
| | | | | | | | | | |
| | | | | | | | | | |
| | | | | | | | | | |
| | | | | | | | | | |
| | | | | | | | | | |
| | | | | | | | | | |
| | | | | | | | | | |
| | | | | | | | | | |
| | | | | | | | | | |
| | | | | | | | | | |
| | | | | | | | | | |
| | | | | | | | | | |
| | | | | | | | | | |
| | | | | | | | | | |
| | | | | | | | | | |
| | | | | | | | | | |
| | | | | | | | | | |
| | | | | | | | | | |
| | | | | | | | | | |
| | | | | | | | | | |
| | | | | | | | | | |
432024 iShares Annual Financial Statements and Additional Information
Schedule of Investments (continued)October 31, 2024
iShares® Interest Rate Hedged Long-Term Corporate Bond ETF
Centrally Cleared Interest Rate Swaps (continued)
| | | | | | | Upfront Premium Paid (Received) | Unrealized Appreciation (Depreciation) |
| | | |
| | | | | | | | | | |
| | | | | | | | | | |
| | | | | | | | | | |
| | | | | | | | | | |
| | | | | | | | | | |
| | | | | | | | | | |
| | | | | | | | | | |
| | | | | | | | | | |
| | | | | | | | | | |
| | | | | | | | | | |
| | | | | | | | | | |
| | | | | | | | | | |
| | | | | | | | | | |
| | | | | | | | | | |
| | | | | | | | | | |
| | | | | | | | | | |
| | | | | | | | | | |
| | | | | | | | | | |
| | | | | | | | | | |
| | | | | | | | | | |
| | | | | | | | | | |
| | | | | | | | | | |
| | | | | | | | | | |
| | | | | | | | | | |
| | | | | | | | | | |
| | | | | | | | | | |
| | | | | | | | | | |
| | | | | | | | | | |
| | | | | | | | | | |
Schedule of Investments44
Schedule of Investments (continued)October 31, 2024
iShares® Interest Rate Hedged Long-Term Corporate Bond ETF
Centrally Cleared Interest Rate Swaps (continued)
| | | | | | | Upfront Premium Paid (Received) | Unrealized Appreciation (Depreciation) |
| | | |
| | | | | | | | | | |
| | | | | | | | | | |
| | | | | | | | | | |
| | | | | | | | | | |
| | | | | | | | | | |
| | | | | | | | | | |
| | | | | | | | | | |
| | | | | | | | | | |
| | | | | | | | | | |
| | | | | | | | | | |
| | | | | | | | | | |
| | | | | | | | | | |
| | | | | | | | | | |
| | | | | | | | | | |
| | | | | | | | | | |
| | | | | | | | | | |
| | | | | | | | | | |
| | | | | | | | | | |
| | | | | | | | | | |
| | | | | | | | | | |
| | | | | | | | | | |
| | | | | | | | | | |
| | | | | | | | | | |
| | | | | | | | | | |
| | | | | | | | | | |
| | | | | | | | | | |
| | | | | | | | | | |
| | | | | | | | | | |
| | | | | | | | | | |
452024 iShares Annual Financial Statements and Additional Information
Schedule of Investments (continued)October 31, 2024
iShares® Interest Rate Hedged Long-Term Corporate Bond ETF
Centrally Cleared Interest Rate Swaps (continued)
| | | | | | | Upfront Premium Paid (Received) | Unrealized Appreciation (Depreciation) |
| | | |
| | | | | | | | | | |
| | | | | | | | | | |
| | | | | | | | | | |
| | | | | | | | | | |
| | | | | | | | | | |
| | | | | | | | | | |
| | | | | | | | | | |
Balances Reported in the Statements of Assets and Liabilities for Centrally Cleared Swaps
| | | | |
Centrally Cleared Swaps(a) | | | | |
| Includes cumulative appreciation (depreciation) on centrally cleared swaps, as reported in the Schedule of Investments. Only current day’s variation margin is reported within the Statements of Assets and Liabilities and is net of any previously paid (received) swap premium amounts. |
Derivative Financial Instruments Categorized by Risk Exposure
As of period end, the fair values of derivative financial instruments located in the Statements of Assets and Liabilities were as follows:
| | | | Foreign
Currency
Exchange
Contracts | | | |
Assets—Derivative Financial Instruments | | | | | | | |
Swaps — centrally cleared | | | | | | | |
Unrealized appreciation on centrally cleared swaps(a) | | | | | | | |
Liabilities—Derivative Financial Instruments | | | | | | | |
Swaps — centrally cleared | | | | | | | |
Unrealized depreciation on centrally cleared swaps(a) | | | | | | | |
| Net cumulative unrealized appreciation (depreciation) on centrally cleared swaps are reported in the Schedule of Investments. In the Statements of Assets and Liabilities, only current day's variation margin is reported in receivables or payables and the net cumulative unrealized appreciation (depreciation) is included in accumulated earnings (loss). |
For the period ended October 31, 2024, the effect of derivative financial instruments in the Statements of Operations was as follows:
| | | | Foreign
Currency
Exchange
Contracts | | | |
Net Realized Gain (Loss) from | | | | | | | |
| | | | | | | |
Net Change in Unrealized Appreciation (Depreciation) on | | | | | | | |
| | | | | | | |
Schedule of Investments46
Schedule of Investments (continued)October 31, 2024
iShares® Interest Rate Hedged Long-Term Corporate Bond ETF
Average Quarterly Balances of Outstanding Derivative Financial Instruments
| |
Average notional value — pays fixed rate | |
For more information about the Fund’s investment risks regarding derivative financial instruments, refer to the Notes to Financial Statements.
Fair Value Hierarchy as of Period End
Various inputs are used in determining the fair value of financial instruments at the measurement date. For a description of the input levels and information about the Fund’s policy regarding valuation of financial instruments, refer to the Notes to Financial Statements.
The following table summarizes the Fund’s financial instruments categorized in the fair value hierarchy. The breakdown of the Fund’s financial instruments into major categories is disclosed in the Schedule of Investments above.
| | | | |
| | | | |
| | | | |
| | | | |
| | | | |
| | | | |
| | | | |
| | | | |
Derivative Financial Instruments(a) | | | | |
| | | | |
| | | | |
| | | | |
| | | | |
| | | | |
| Derivative financial instruments are swaps. Swaps are valued at the unrealized appreciation (depreciation) on the instrument. |
See notes to financial statements.
472024 iShares Annual Financial Statements and Additional Information
Schedule of InvestmentsOctober 31, 2024
iShares® Interest Rate Hedged U.S. Aggregate Bond ETF(Percentages shown are based on Net Assets)
| | |
|
Exchange-Traded Funds — 92.7% |
iShares Core U.S. Aggregate Bond ETF(a) | | |
Total Investment Companies
(Cost: $4,808,136) | |
|
Money Market Funds — 3.7% |
BlackRock Cash Funds: Treasury, SL Agency Shares,
4.83%(a)(b) | | |
Total Short-Term Securities — 3.7%
(Cost: $190,000) | |
Total Investments in Securities — 96.4%
(Cost: $4,998,136) | |
Other Assets Less Liabilities — 3.6% | |
| |
| |
| Annualized 7-day yield as of period end. |
Affiliates
Investments in issuers considered to be affiliate(s) of the Fund during the year ended October 31, 2024 for purposes of Section 2(a)(3) of the Investment Company Act of 1940, as amended, were as follows:
| | | | | Change in
Unrealized
Appreciation
(Depreciation) | | | | Capital
Gain
Distributions
from
Underlying
Funds |
BlackRock Cash Funds: Institutional, SL Agency Shares(a) | | | | | | | | | |
BlackRock Cash Funds: Treasury, SL Agency Shares | | | | | | | | | |
iShares Core U.S. Aggregate Bond ETF | | | | | | | | | |
| | | | | | | | | |
| As of period end, the entity is no longer held. |
| Represents net amount purchased (sold). |
| All or a portion represents securities lending income earned from the reinvestment of cash collateral from loaned securities, net of fees and collateral investment expenses, and other payments to and from borrowers of securities. |
Derivative Financial Instruments Outstanding as of Period End
Centrally Cleared Interest Rate Swaps
| | | | | | | Upfront
Premium
Paid
(Received) | Unrealized
Appreciation
(Depreciation) |
| | | |
| | | | | | | | | | |
| | | | | | | | | | |
| | | | | | | | | | |
| | | | | | | | | | |
| | | | | | | | | | |
Schedule of Investments48
Schedule of Investments (continued)October 31, 2024
iShares® Interest Rate Hedged U.S. Aggregate Bond ETF
Centrally Cleared Interest Rate Swaps (continued)
| | | | | | | Upfront Premium Paid (Received) | Unrealized Appreciation (Depreciation) |
| | | |
| | | | | | | | | | |
| | | | | | | | | | |
| | | | | | | | | | |
| | | | | | | | | | |
| | | | | | | | | | |
| | | | | | | | | | |
| | | | | | | | | | |
| | | | | | | | | | |
| | | | | | | | | | |
| | | | | | | | | | |
| | | | | | | | | | |
| | | | | | | | | | |
| | | | | | | | | | |
| | | | | | | | | | |
| | | | | | | | | | |
| | | | | | | | | | |
| | | | | | | | | | |
| | | | | | | | | | |
| | | | | | | | | | |
| | | | | | | | | | |
| | | | | | | | | | |
| | | | | | | | | | |
| | | | | | | | | | |
| | | | | | | | | | |
| | | | | | | | | | |
| | | | | | | | | | |
| | | | | | | | | | |
| | | | | | | | | | |
| | | | | | | | | | |
492024 iShares Annual Financial Statements and Additional Information
Schedule of Investments (continued)October 31, 2024
iShares® Interest Rate Hedged U.S. Aggregate Bond ETF
Centrally Cleared Interest Rate Swaps (continued)
| | | | | | | Upfront Premium Paid (Received) | Unrealized Appreciation (Depreciation) |
| | | |
| | | | | | | | | | |
| | | | | | | | | | |
| | | | | | | | | | |
| | | | | | | | | | |
| | | | | | | | | | |
| | | | | | | | | | |
| | | | | | | | | | |
| | | | | | | | | | |
| | | | | | | | | | |
| | | | | | | | | | |
| | | | | | | | | | |
| | | | | | | | | | |
| | | | | | | | | | |
| | | | | | | | | | |
| | | | | | | | | | |
| | | | | | | | | | |
| | | | | | | | | | |
| | | | | | | | | | |
| | | | | | | | | | |
| | | | | | | | | | |
| | | | | | | | | | |
| | | | | | | | | | |
| | | | | | | | | | |
| | | | | | | | | | |
| | | | | | | | | | |
| | | | | | | | | | |
| | | | | | | | | | |
| | | | | | | | | | |
| | | | | | | | | | |
Schedule of Investments50
Schedule of Investments (continued)October 31, 2024
iShares® Interest Rate Hedged U.S. Aggregate Bond ETF
Centrally Cleared Interest Rate Swaps (continued)
| | | | | | | Upfront Premium Paid (Received) | Unrealized Appreciation (Depreciation) |
| | | |
| | | | | | | | | | |
| | | | | | | | | | |
| | | | | | | | | | |
| | | | | | | | | | |
| | | | | | | | | | |
| | | | | | | | | | |
| | | | | | | | | | |
| | | | | | | | | | |
| | | | | | | | | | |
| | | | | | | | | | |
| | | | | | | | | | |
| | | | | | | | | | |
| | | | | | | | | | |
| | | | | | | | | | |
| | | | | | | | | | |
| | | | | | | | | | |
| | | | | | | | | | |
| | | | | | | | | | |
| | | | | | | | | | |
| | | | | | | | | | |
| | | | | | | | | | |
| | | | | | | | | | |
| | | | | | | | | | |
Balances Reported in the Statements of Assets and Liabilities for Centrally Cleared Swaps
| | | | |
Centrally Cleared Swaps(a) | | | | |
| Includes cumulative appreciation (depreciation) on centrally cleared swaps, as reported in the Schedule of Investments. Only current day’s variation margin is reported within the Statements of Assets and Liabilities and is net of any previously paid (received) swap premium amounts. |
512024 iShares Annual Financial Statements and Additional Information
Schedule of Investments (continued)October 31, 2024
iShares® Interest Rate Hedged U.S. Aggregate Bond ETF
Derivative Financial Instruments Categorized by Risk Exposure
As of period end, the fair values of derivative financial instruments located in the Statements of Assets and Liabilities were as follows:
| | | | Foreign
Currency
Exchange
Contracts | | | |
Assets—Derivative Financial Instruments | | | | | | | |
Swaps — centrally cleared | | | | | | | |
Unrealized appreciation on centrally cleared swaps(a) | | | | | | | |
Liabilities—Derivative Financial Instruments | | | | | | | |
Swaps — centrally cleared | | | | | | | |
Unrealized depreciation on centrally cleared swaps(a) | | | | | | | |
| Net cumulative unrealized appreciation (depreciation) on centrally cleared swaps are reported in the Schedule of Investments. In the Statements of Assets and Liabilities, only current day's variation margin is reported in receivables or payables and the net cumulative unrealized appreciation (depreciation) is included in accumulated earnings (loss). |
For the period ended October 31, 2024, the effect of derivative financial instruments in the Statements of Operations was as follows:
| | | | Foreign
Currency
Exchange
Contracts | | | |
Net Realized Gain (Loss) from | | | | | | | |
| | | | | | | |
Net Change in Unrealized Appreciation (Depreciation) on | | | | | | | |
| | | | | | | |
Average Quarterly Balances of Outstanding Derivative Financial Instruments
| |
Average notional value — pays fixed rate | |
For more information about the Fund’s investment risks regarding derivative financial instruments, refer to the Notes to Financial Statements.
Fair Value Hierarchy as of Period End
Various inputs are used in determining the fair value of financial instruments at the measurement date. For a description of the input levels and information about the Fund’s policy regarding valuation of financial instruments, refer to the Notes to Financial Statements.
The following table summarizes the Fund’s financial instruments categorized in the fair value hierarchy. The breakdown of the Fund’s financial instruments into major categories is disclosed in the Schedule of Investments above.
| | | | |
| | | | |
| | | | |
| | | | |
| | | | |
| | | | |
| | | | |
| | | | |
Derivative Financial Instruments(a) | | | | |
| | | | |
| | | | |
| | | | |
| | | | |
| | | | |
| Derivative financial instruments are swaps. Swaps are valued at the unrealized appreciation (depreciation) on the instrument. |
See notes to financial statements.
Schedule of Investments52
Statements of Assets and LiabilitiesOctober 31, 2024
| iShares
Inflation Hedged Corporate Bond ETF | iShares
Inflation Hedged High Yield Bond ETF | iShares
Inflation Hedged U.S. Aggregate Bond ETF | iShares
Interest Rate Hedged Corporate Bond ETF |
| | | | |
Investments, at value—affiliated(a)(b) | | | | |
| | | | |
Cash pledged for centrally cleared swaps | | | | |
| | | | |
Securities lending income—affiliated | | | | |
| | | | |
Variation margin on centrally cleared swaps | | | | |
Unrealized appreciation on OTC swaps | | | | |
| | | | |
| | | | |
Collateral on securities loaned, at value | | | | |
| | | | |
| | | | |
Variation margin on centrally cleared swaps | | | | |
Unrealized depreciation on OTC swaps | | | | |
| | | | |
Commitments and contingent liabilities | | | | |
| | | | |
| | | | |
| | | | |
Accumulated earnings (loss) | | | | |
| | | | |
| | | | |
| | | | |
| | | | |
| | | | |
| | | | |
(a) Investments, at cost—affiliated | | | | |
(b) Securities loaned, at value | | | | |
See notes to financial statements.
532024 iShares Annual Financial Statements and Additional Information
Statements of Assets and Liabilities (continued)October 31, 2024
| iShares
Interest Rate Hedged High Yield Bond ETF | iShares
Interest Rate Hedged Long-Term Corporate Bond ETF | iShares
Interest Rate Hedged U.S. Aggregate Bond ETF |
| | | |
Investments, at value—affiliated(a)(b) | | | |
| | | |
Cash pledged for centrally cleared swaps | | | |
| | | |
Securities lending income—affiliated | | | |
| | | |
Variation margin on centrally cleared swaps | | | |
| | | |
| | | |
Collateral on securities loaned, at value | | | |
| | | |
| | | |
Variation margin on centrally cleared swaps | | | |
| | | |
Commitments and contingent liabilities | | | |
| | | |
| | | |
| | | |
Accumulated earnings (loss) | | | |
| | | |
| | | |
| | | |
| | | |
| | | |
| | | |
(a) Investments, at cost—affiliated | | | |
(b) Securities loaned, at value | | | |
See notes to financial statements.
Statements of Assets and Liabilities54
Statements of OperationsYear Ended October 31, 2024
| iShares
Inflation Hedged Corporate Bond ETF | iShares
Inflation Hedged High Yield Bond ETF | iShares
Inflation Hedged U.S. Aggregate Bond ETF | iShares
Interest Rate Hedged Corporate Bond ETF |
| | | | |
| | | | |
| | | | |
Securities lending income—affiliated—net | | | | |
| | | | |
| | | | |
| | | | |
| | | | |
| | | | |
| | | | |
Investment advisory fees waived | | | | |
Total expenses after fees waived | | | | |
| | | | |
REALIZED AND UNREALIZED GAIN (LOSS) | | | | |
Net realized gain (loss) from: | | | | |
| | | | |
In-kind redemptions—affiliated(a) | | | | |
| | | | |
| | | | |
Net change in unrealized appreciation (depreciation) on: | | | | |
| | | | |
| | | | |
| | | | |
Net realized and unrealized gain | | | | |
NET INCREASE IN NET ASSETS RESULTING FROM OPERATIONS | | | | |
(a) See Note 2 of the Notes to Financial Statements. |
See notes to financial statements.
552024 iShares Annual Financial Statements and Additional Information
Statements of Operations (continued)Year Ended October 31, 2024
| iShares
Interest Rate Hedged High Yield Bond ETF | iShares
Interest Rate Hedged Long-Term Corporate Bond ETF | iShares
Interest Rate Hedged U.S. Aggregate Bond ETF |
| | | |
| | | |
| | | |
Securities lending income—affiliated—net | | | |
| | | |
| | | |
| | | |
| | | |
| | | |
| | | |
Investment advisory fees waived | | | |
Total expenses after fees waived | | | |
| | | |
REALIZED AND UNREALIZED GAIN (LOSS) | | | |
Net realized gain (loss) from: | | | |
| | | |
In-kind redemptions—affiliated(a) | | | |
| | | |
| | | |
Net change in unrealized appreciation (depreciation) on: | | | |
| | | |
| | | |
| | | |
Net realized and unrealized gain | | | |
NET INCREASE IN NET ASSETS RESULTING FROM OPERATIONS | | | |
(a) See Note 2 of the Notes to Financial Statements. |
See notes to financial statements.
Statements of Operations56
Statements of Changes in Net Assets
| iShares
Inflation Hedged Corporate Bond ETF | iShares
Inflation Hedged High Yield Bond ETF |
| | | | |
INCREASE (DECREASE) IN NET ASSETS | | | | |
| | | | |
| | | | |
| | | | |
Net change in unrealized appreciation (depreciation) | | | | |
Net increase in net assets resulting from operations | | | | |
DISTRIBUTIONS TO SHAREHOLDERS(a) | | | | |
Decrease in net assets resulting from distributions to shareholders | | | | |
CAPITAL SHARE TRANSACTIONS | | | | |
Net increase (decrease) in net assets derived from capital share transactions | | | | |
| | | | |
Total increase (decrease) in net assets | | | | |
| | | | |
| | | | |
| Distributions for annual periods determined in accordance with U.S. federal income tax regulations. |
See notes to financial statements.
572024 iShares Annual Financial Statements and Additional Information
Statements of Changes in Net Assets(continued)
| iShares
Inflation Hedged U.S. Aggregate Bond ETF | iShares
Interest Rate Hedged Corporate Bond ETF |
| | | | |
INCREASE (DECREASE) IN NET ASSETS | | | | |
| | | | |
| | | | |
| | | | |
Net change in unrealized appreciation (depreciation) | | | | |
Net increase in net assets resulting from operations | | | | |
DISTRIBUTIONS TO SHAREHOLDERS(a) | | | | |
Decrease in net assets resulting from distributions to shareholders | | | | |
CAPITAL SHARE TRANSACTIONS | | | | |
Net increase (decrease) in net assets derived from capital share transactions | | | | |
| | | | |
Total increase (decrease) in net assets | | | | |
| | | | |
| | | | |
| Distributions for annual periods determined in accordance with U.S. federal income tax regulations. |
See notes to financial statements.
Statements of Changes in Net Assets58
Statements of Changes in Net Assets(continued)
| iShares
Interest Rate Hedged High Yield Bond ETF | iShares
Interest Rate Hedged Long-Term Corporate Bond ETF |
| | | | |
INCREASE (DECREASE) IN NET ASSETS | | | | |
| | | | |
| | | | |
| | | | |
Net change in unrealized appreciation (depreciation) | | | | |
Net increase in net assets resulting from operations | | | | |
DISTRIBUTIONS TO SHAREHOLDERS(a) | | | | |
Decrease in net assets resulting from distributions to shareholders | | | | |
CAPITAL SHARE TRANSACTIONS | | | | |
Net increase (decrease) in net assets derived from capital share transactions | | | | |
| | | | |
Total increase (decrease) in net assets | | | | |
| | | | |
| | | | |
| Distributions for annual periods determined in accordance with U.S. federal income tax regulations. |
See notes to financial statements.
592024 iShares Annual Financial Statements and Additional Information
Statements of Changes in Net Assets(continued)
| iShares
Interest Rate Hedged U.S. Aggregate Bond ETF |
| | |
INCREASE (DECREASE) IN NET ASSETS | | |
| | |
| | |
| | |
Net change in unrealized appreciation (depreciation) | | |
Net increase in net assets resulting from operations | | |
DISTRIBUTIONS TO SHAREHOLDERS(a) | | |
Decrease in net assets resulting from distributions to shareholders | | |
CAPITAL SHARE TRANSACTIONS | | |
Net increase in net assets derived from capital share transactions | | |
| | |
Total increase in net assets | | |
| | |
| | |
| Distributions for annual periods determined in accordance with U.S. federal income tax regulations. |
See notes to financial statements.
Statements of Changes in Net Assets60
Financial Highlights(For a share outstanding throughout each period)
| iShares Inflation Hedged Corporate Bond ETF |
| | | | | |
Net asset value, beginning of year | | | | | |
| | | | | |
Net realized and unrealized gain (loss)(b) | | | | | |
Net increase (decrease) from investment operations | | | | | |
| | | | | |
From net investment income | | | | | |
| | | | | |
| | | | | |
Net asset value, end of year | | | | | |
| | | | | |
| | | | | |
Ratios to Average Net Assets(f) | | | | | |
| | | | | |
Total expenses after fees waived | | | | | |
| | | | | |
| | | | | |
Net assets, end of year (000) | | | | | |
Portfolio turnover rate(g) | | | | | |
(a) Based on average shares outstanding. |
(b) The amounts reported for a share outstanding may not accord with the change in aggregate gains and losses in securities for the fiscal period due to the timing of capital share transactions in relation to the fluctuating market values of the Fund’s underlying securities. |
(c) Distributions for annual periods determined in accordance with U.S. federal income tax regulations. |
(d) Where applicable, assumes the reinvestment of distributions. |
(e) Includes payment received from an affiliate, which had no impact on the Fund’s total return. |
(f) Excludes fees and expenses incurred indirectly as a result of investments in underlying funds. |
(g) Portfolio turnover rate excludes in-kind transactions, if any. |
See notes to financial statements.
612024 iShares Annual Financial Statements and Additional Information
Financial Highlights(continued)(For a share outstanding throughout each period)
| iShares Inflation Hedged High Yield Bond ETF |
| | | |
Net asset value, beginning of period | | | |
| | | |
Net realized and unrealized gain (loss)(c) | | | |
Net increase from investment operations | | | |
Distributions from net investment income(d) | | | |
Net asset value, end of period | | | |
| | | |
| | | |
Ratios to Average Net Assets(g) | | | |
| | | |
Total expenses after fees waived | | | |
| | | |
| | | |
Net assets, end of period (000) | | | |
Portfolio turnover rate(i) | | | |
(a) Commencement of operations. |
(b) Based on average shares outstanding. |
(c) The amounts reported for a share outstanding may not accord with the change in aggregate gains and losses in securities for the fiscal period due to the timing of capital share transactions in relation to the fluctuating market values of the Fund’s underlying securities. |
(d) Distributions for annual periods determined in accordance with U.S. federal income tax regulations. |
(e) Where applicable, assumes the reinvestment of distributions. |
|
(g) Excludes fees and expenses incurred indirectly as a result of investments in underlying funds. |
|
(i) Portfolio turnover rate excludes in-kind transactions, if any. |
See notes to financial statements.
Financial Highlights(continued)(For a share outstanding throughout each period)
| iShares Inflation Hedged U.S. Aggregate Bond ETF |
| | | |
Net asset value, beginning of period | | | |
| | | |
Net realized and unrealized gain (loss)(c) | | | |
Net increase (decrease) from investment operations | | | |
Distributions from net investment income(d) | | | |
Net asset value, end of period | | | |
| | | |
| | | |
Ratios to Average Net Assets(g) | | | |
| | | |
Total expenses after fees waived | | | |
| | | |
| | | |
Net assets, end of period (000) | | | |
Portfolio turnover rate(i) | | | |
(a) Commencement of operations. |
(b) Based on average shares outstanding. |
(c) The amounts reported for a share outstanding may not accord with the change in aggregate gains and losses in securities for the fiscal period due to the timing of capital share transactions in relation to the fluctuating market values of the Fund’s underlying securities. |
(d) Distributions for annual periods determined in accordance with U.S. federal income tax regulations. |
(e) Where applicable, assumes the reinvestment of distributions. |
|
(g) Excludes fees and expenses incurred indirectly as a result of investments in underlying funds. |
|
(i) Portfolio turnover rate excludes in-kind transactions, if any. |
See notes to financial statements.
632024 iShares Annual Financial Statements and Additional Information
Financial Highlights(continued)(For a share outstanding throughout each period)
| iShares Interest Rate Hedged Corporate Bond ETF |
| | | | | |
Net asset value, beginning of year | | | | | |
| | | | | |
Net realized and unrealized gain (loss)(b) | | | | | |
Net increase (decrease) from investment operations | | | | | |
Distributions from net investment income(c) | | | | | |
Net asset value, end of year | | | | | |
| | | | | |
| | | | | |
Ratios to Average Net Assets(e) | | | | | |
| | | | | |
Total expenses after fees waived | | | | | |
| | | | | |
| | | | | |
Net assets, end of year (000) | | | | | |
Portfolio turnover rate(f) | | | | | |
(a) Based on average shares outstanding. |
(b) The amounts reported for a share outstanding may not accord with the change in aggregate gains and losses in securities for the fiscal period due to the timing of capital share transactions in relation to the fluctuating market values of the Fund’s underlying securities. |
(c) Distributions for annual periods determined in accordance with U.S. federal income tax regulations. |
(d) Where applicable, assumes the reinvestment of distributions. |
(e) Excludes fees and expenses incurred indirectly as a result of investments in underlying funds. |
(f) Portfolio turnover rate excludes in-kind transactions, if any. |
See notes to financial statements.
Financial Highlights(continued)(For a share outstanding throughout each period)
| iShares Interest Rate Hedged High Yield Bond ETF |
| | | | | |
Net asset value, beginning of year | | | | | |
| | | | | |
Net realized and unrealized gain (loss)(b) | | | | | |
Net increase (decrease) from investment operations | | | | | |
| | | | | |
From net investment income | | | | | |
| | | | | |
| | | | | |
Net asset value, end of year | | | | | |
| | | | | |
| | | | | |
Ratios to Average Net Assets(e) | | | | | |
| | | | | |
Total expenses after fees waived | | | | | |
| | | | | |
| | | | | |
Net assets, end of year (000) | | | | | |
Portfolio turnover rate(f) | | | | | |
(a) Based on average shares outstanding. |
(b) The amounts reported for a share outstanding may not accord with the change in aggregate gains and losses in securities for the fiscal period due to the timing of capital share transactions in relation to the fluctuating market values of the Fund’s underlying securities. |
(c) Distributions for annual periods determined in accordance with U.S. federal income tax regulations. |
(d) Where applicable, assumes the reinvestment of distributions. |
(e) Excludes fees and expenses incurred indirectly as a result of investments in underlying funds. |
(f) Portfolio turnover rate excludes in-kind transactions, if any. |
See notes to financial statements.
652024 iShares Annual Financial Statements and Additional Information
Financial Highlights(continued)(For a share outstanding throughout each period)
| iShares Interest Rate Hedged Long-Term Corporate Bond ETF |
| | | | | |
Net asset value, beginning of year | | | | | |
| | | | | |
Net realized and unrealized gain (loss)(b) | | | | | |
Net increase (decrease) from investment operations | | | | | |
| | | | | |
From net investment income | | | | | |
| | | | | |
| | | | | |
Net asset value, end of year | | | | | |
| | | | | |
| | | | | |
Ratios to Average Net Assets(e) | | | | | |
| | | | | |
Total expenses after fees waived | | | | | |
| | | | | |
| | | | | |
Net assets, end of year (000) | | | | | |
Portfolio turnover rate(f) | | | | | |
(a) Based on average shares outstanding. |
(b) The amounts reported for a share outstanding may not accord with the change in aggregate gains and losses in securities for the fiscal period due to the timing of capital share transactions in relation to the fluctuating market values of the Fund’s underlying securities. |
(c) Distributions for annual periods determined in accordance with U.S. federal income tax regulations. |
(d) Where applicable, assumes the reinvestment of distributions. |
(e) Excludes fees and expenses incurred indirectly as a result of investments in underlying funds. |
(f) Portfolio turnover rate excludes in-kind transactions, if any. |
See notes to financial statements.
Financial Highlights(continued)(For a share outstanding throughout each period)
| iShares Interest Rate Hedged U.S. Aggregate Bond ETF |
| | | |
Net asset value, beginning of period | | | |
| | | |
Net realized and unrealized gain (loss)(c) | | | |
Net increase from investment operations | | | |
Distributions from net investment income(d) | | | |
Net asset value, end of period | | | |
| | | |
| | | |
Ratios to Average Net Assets(g) | | | |
| | | |
Total expenses after fees waived | | | |
| | | |
| | | |
Net assets, end of period (000) | | | |
Portfolio turnover rate(i) | | | |
(a) Commencement of operations. |
(b) Based on average shares outstanding. |
(c) The amounts reported for a share outstanding may not accord with the change in aggregate gains and losses in securities for the fiscal period due to the timing of capital share transactions in relation to the fluctuating market values of the Fund’s underlying securities. |
(d) Distributions for annual periods determined in accordance with U.S. federal income tax regulations. |
(e) Where applicable, assumes the reinvestment of distributions. |
|
(g) Excludes fees and expenses incurred indirectly as a result of investments in underlying funds. |
|
(i) Portfolio turnover rate excludes in-kind transactions, if any. |
See notes to financial statements.
672024 iShares Annual Financial Statements and Additional Information
Notes to Financial Statements
1. ORGANIZATION
iShares U.S. ETF Trust (the “Trust”) is registered under the Investment Company Act of 1940, as amended (the “1940 Act”), as an open-end management investment company. The Trust is organized as a Delaware statutory trust and is authorized to have multiple series or portfolios.
These financial statements relate only to the following funds (each, a “Fund” and collectively, the “Funds”):
| Diversification
Classification |
Inflation Hedged Corporate Bond | |
Inflation Hedged High Yield Bond | |
Inflation Hedged U.S. Aggregate Bond | |
Interest Rate Hedged Corporate Bond | |
Interest Rate Hedged High Yield Bond | |
Interest Rate Hedged Long-Term Corporate Bond | |
Interest Rate Hedged U.S. Aggregate Bond | |
Currently each Fund seeks to achieve its investment objective by investing a substantial portion of its assets in an iShares fund (an “underlying fund”). The financial statements, including the accounting policies, and schedules of investments for the underlying funds are available on iShares.com and should be read in conjunction with the Funds’ financial statements.
2. SIGNIFICANT ACCOUNTING POLICIES
The financial statements are prepared in conformity with accounting principles generally accepted in the United States of America (“U.S. GAAP”), which may require management to make estimates and assumptions that affect the reported amounts of assets and liabilities in the financial statements, disclosure of contingent assets and liabilities at the date of the financial statements and the reported amounts of increases and decreases in net assets from operations during the reporting period. Actual results could differ from those estimates. Each Fund is considered an investment company under U.S. GAAP and follows the accounting and reporting guidance applicable to investment companies. Below is a summary of significant accounting policies:
Investment Transactions and Income Recognition: For financial reporting purposes, investment transactions are recorded on the dates the transactions are executed. Realized gains and losses on investment transactions are determined using the specific identification method. Dividend income and capital gain distributions from the underlying funds, if any, are recorded on the ex-dividend date. Interest income is recognized daily on an accrual basis.
Bank Overdraft: Certain Funds had outstanding cash disbursements exceeding deposited cash amounts at the custodian during the reporting period. The Funds are obligated to repay the custodian for any overdraft, including any related costs or expenses, where applicable. For financial reporting purposes, overdraft fees, if any, are included in interest expense in the Statements of Operations.
Collateralization: If required by an exchange or counterparty agreement, the Funds may be required to deliver/deposit cash and/or securities to/with an exchange, or broker-dealer or custodian as collateral for certain investments.
In-kind Redemptions: For financial reporting purposes, in-kind redemptions are treated as sales of securities resulting in realized capital gains or losses to the Funds. Because such gains or losses are not taxable to the Funds and are not distributed to existing Fund shareholders, the gains or losses are reclassified from accumulated net realized gain (loss) to paid-in capital at the end of the Funds’ tax year. These reclassifications have no effect on net assets or net asset value (“NAV”) per share.
Distributions: Dividends and distributions paid by each Fund are recorded on the ex-dividend dates. Distributions are determined on a tax basis and may differ from net investment income and net realized capital gains for financial reporting purposes. Dividends and distributions are paid in U.S. dollars and cannot be automatically reinvested in additional shares of the Funds.
Indemnifications: In the normal course of business, each Fund enters into contracts that contain a variety of representations that provide general indemnification. The Funds’ maximum exposure under these arrangements is unknown because it involves future potential claims against the Funds, which cannot be predicted with any certainty.
3. INVESTMENT VALUATION AND FAIR VALUE MEASUREMENTS
Investment Valuation Policies: Each Fund’s investments are valued at fair value (also referred to as “market value” within the financial statements) each day that the Fund’s listing exchange is open and, for financial reporting purposes, as of the report date. U.S. GAAP defines fair value as the price a fund would receive to sell an asset or pay to transfer a liability in an orderly transaction between market participants at the measurement date. The Board of Trustees of the Trust (the “Board”) of each Fund has approved the designation of BlackRock Fund Advisors (“BFA”), the Funds' investment adviser, as the valuation designee for each Fund. Each Fund determines the fair values of its financial instruments using various independent dealers or pricing services under BFA’s policies. If a security’s market price is not readily available or does not otherwise accurately represent the fair value of the security, the security will be valued in accordance with BFA’s policies and procedures as reflecting fair value. BFA has formed a committee (the “Valuation Committee”) to develop pricing policies and procedures and to oversee the pricing function for all financial instruments, with assistance from other BlackRock pricing committees.
Notes to Financial Statements68
Notes to Financial Statements (continued)
Fair Value Inputs and Methodologies: The following methods and inputs are used to establish the fair value of each Fund’s assets and liabilities:
• Exchange-traded funds and closed-end funds traded on a recognized securities exchange are valued at that day’s official closing price, as applicable, on the exchange where the fund is primarily traded. Funds traded on a recognized exchange for which there were no sales on that day may be valued at the last traded price.
• Investments in open-end U.S. mutual funds (including money market funds) are valued at that day’s NAV.
• Swap agreements are valued utilizing quotes received daily by independent pricing services or through brokers, which are derived using daily swap curves and models that incorporate a number of market data factors, such as discounted cash flows, trades and values of the underlying reference instruments.
If events (e.g., market volatility, company announcement or a natural disaster) occur that are expected to materially affect the value of such investment, or in the event that application of these methods of valuation results in a price for an investment that is deemed not to be representative of the market value of such investment, or if a price is not available, the investment will be valued by the Valuation Committee in accordance with BFA’s policies and procedures as reflecting fair value (“Fair Valued Investments”). The fair valuation approaches that may be used by the Valuation Committee include market approach, income approach and cost approach. Valuation techniques such as discounted cash flow, use of market comparables and matrix pricing are types of valuation approaches and are typically used in determining fair value. When determining the price for Fair Valued Investments, the Valuation Committee seeks to determine the price that each Fund might reasonably expect to receive or pay from the current sale or purchase of that asset or liability in an arm’s-length transaction. Fair value determinations shall be based upon all available factors that the Valuation Committee deems relevant and consistent with the principles of fair value measurement as of the measurement date.
Fair value pricing could result in a difference between the prices used to calculate a fund’s NAV and the prices used by the fund’s underlying index, which in turn could result in a difference between the fund’s performance and the performance of the fund’s underlying index.
Fair Value Hierarchy: Various inputs are used in determining the fair value of financial instruments at the measurement date. These inputs to valuation techniques are categorized into a fair value hierarchy consisting of three broad levels for financial reporting purposes as follows:
• Level 1 – Unadjusted price quotations in active markets/exchanges that each Fund has the ability to access for identical assets or liabilities;
• Level 2 – Inputs other than quoted prices included within level 1 that are observable for the asset or liability, either directly or indirectly; and
• Level 3 – Inputs that are unobservable and significant to the entire fair value measurement for the asset or liability (including the Valuation Committee’s assumptions used in determining the fair value of financial instruments).
The hierarchy gives the highest priority to unadjusted quoted prices in active markets for identical assets or liabilities (Level 1 measurements) and the lowest priority to unobservable inputs (Level 3 measurements). Accordingly, the degree of judgment exercised in determining fair value is greatest for instruments categorized in Level 3. The inputs used to measure fair value may fall into different levels of the fair value hierarchy. In such cases, for disclosure purposes, the fair value hierarchy classification is determined based on the lowest level input that is significant to the fair value measurement in its entirety. Investments classified within Level 3 have significant unobservable inputs used by the Valuation Committee in determining the price for Fair Valued Investments. Level 3 investments include equity or debt issued by privately held companies or funds that may not have a secondary market and/or may have a limited number of investors. The categorization of a value determined for financial instruments is based on the pricing transparency of the financial instruments and is not necessarily an indication of the risks associated with investing in those securities.
4. SECURITIES AND OTHER INVESTMENTS
Securities Lending: Each Fund may lend its securities to approved borrowers, such as brokers, dealers and other financial institutions. The borrower pledges and maintains with the Fund collateral consisting of cash, an irrevocable letter of credit issued by an approved bank, or securities issued or guaranteed by the U.S. government. The initial collateral received by each Fund is required to have a value of at least 102% of the current market value of the loaned securities for securities traded on U.S. exchanges and a value of at least 105% for all other securities. The collateral is maintained thereafter at a value equal to at least 100% of the current value of the securities on loan. The market value of the loaned securities is determined at the close of each business day of the Fund and any additional required collateral is delivered to the Fund or excess collateral is returned by the Fund, on the next business day. During the term of the loan, each Fund is entitled to all distributions made on or in respect of the loaned securities but does not receive interest income on securities received as collateral. Loans of securities are terminable at any time and the borrower, after notice, is required to return borrowed securities within the standard time period for settlement of securities transactions.
As of period end, any securities on loan were collateralized by cash and/or U.S. Government obligations. Cash collateral invested in money market funds managed by BFA, or its affiliates is disclosed in the Schedule of Investments. Any non-cash collateral received cannot be sold, re-invested or pledged by the Fund, except in the event of borrower default. The securities on loan, if any, are also disclosed in each Fund’s Schedule of Investments. The market value of any securities on loan and the value of any related cash collateral are disclosed in the Statements of Assets and Liabilities.
Securities lending transactions are entered into by the Funds under Master Securities Lending Agreements (each, an “MSLA”) which provide the right, in the event of default (including bankruptcy or insolvency) for the non-defaulting party to liquidate the collateral and calculate a net exposure to the defaulting party or request additional collateral. In the event that a borrower defaults, the Funds, as lender, would offset the market value of the collateral received against the market value of the securities loaned. When the value of the collateral is greater than that of the market value of the securities loaned, the lender is left with a net amount payable to the defaulting party. However, bankruptcy or insolvency laws of a particular jurisdiction may impose restrictions on or prohibitions against such a right of offset in the event of an MSLA counterparty’s bankruptcy or insolvency. Under the MSLA, absent an event of default, the borrower can resell or re-pledge the loaned securities, and the Funds can reinvest cash collateral
692024 iShares Annual Financial Statements and Additional Information
Notes to Financial Statements (continued)
received in connection with loaned securities. Upon an event of default, the parties’ obligations to return the securities or collateral to the other party are extinguished, and the parties can resell or re-pledge the loaned securities or the collateral received in connection with the loaned securities in order to satisfy the defaulting party’s net payment obligation for all transactions under the MSLA. The defaulting party remains liable for any deficiency.
As of period end, the following table is a summary of the securities on loan by counterparty which are subject to offset under an MSLA:
iShares ETF and Counterparty | Securities Loaned
at Value | | Non-Cash Collateral
Received, at Fair Value(a) | |
Inflation Hedged Corporate Bond | | | | |
Citigroup Global Markets, Inc. | | | | |
| | | | |
| | | | |
Inflation Hedged High Yield Bond | | | | |
Citigroup Global Markets, Inc. | | | | |
| | | | |
| | | | |
Interest Rate Hedged Corporate Bond | | | | |
Citigroup Global Markets, Inc. | | | | |
| | | | |
Mizuho Securities USA LLC | | | | |
| | | | |
| | | | |
| | | | |
Interest Rate Hedged High Yield Bond | | | | |
| | | | |
| | | | |
| | | | |
Citigroup Global Markets, Inc. | | | | |
| | | | |
| | | | |
Mizuho Securities USA LLC | | | | |
| | | | |
| | | | |
| | | | |
Interest Rate Hedged Long-Term Corporate Bond | | | | |
J.P. Morgan Securities LLC | | | | |
| Collateral received, if any, in excess of the market value of securities on loan is not presented in this table. The total cash collateral received by each Fund is disclosed in the Fund’s Statements of Assets and Liabilities. |
The risks of securities lending include the risk that the borrower may not provide additional collateral when required or may not return the securities when due. To mitigate these risks, each Fund benefits from a borrower default indemnity provided by BlackRock Finance, Inc. BlackRock Finance, Inc.'s indemnity allows for full replacement of the securities loaned to the extent the collateral received does not cover the value of the securities loaned in the event of borrower default. Each Fund could incur a loss if the value of an investment purchased with cash collateral falls below the market value of the loaned securities or if the value of an investment purchased with cash collateral falls below the value of the original cash collateral received. Such losses are borne entirely by each Fund.
5. DERIVATIVE FINANCIAL INSTRUMENTS
Swaps: Swap contracts are entered into to manage exposure to issuers, markets and securities. Such contracts are agreements between the Funds and a counterparty to make periodic net payments on a specified notional amount or a net payment upon termination. Swap agreements are privately negotiated in the OTC market and may be entered into as a bilateral contract (“OTC swaps”) or centrally cleared (“centrally cleared swaps”).
For OTC swaps, any upfront premiums paid and any upfront fees received are shown as swap premiums paid and swap premiums received, respectively, in the Statements of Assets and Liabilities and amortized over the term of the contract. The daily fluctuation in market value is recorded as unrealized appreciation (depreciation) on OTC Swaps in the Statements of Assets and Liabilities. Payments received or paid are recorded in the Statements of Operations as realized gains or losses, respectively. When an OTC swap is terminated, a realized gain or loss is recorded in the Statements of Operations equal to the difference between the proceeds from (or cost of) the closing transaction and the Funds’ basis in the contract, if any. Generally, the basis of the contract is the premium received or paid.
In a centrally cleared swap, immediately following execution of the swap agreement, the swap agreement is novated to a central counterparty (“CCP”) and the CCP becomes the Fund's counterparty on the swap. Each Fund is required to interface with the CCP through a broker. Upon entering into a centrally cleared swap, each Fund
Notes to Financial Statements70
Notes to Financial Statements (continued)
is required to deposit initial margin with the broker in the form of cash or securities in an amount that varies depending on the size and risk profile of the particular swap. Securities deposited as initial margin are designated on the Schedule of Investments and cash deposited is shown as cash pledged for centrally cleared swaps on the Statements of Assets and Liabilities. Amounts pledged, which are considered restricted cash, are included in cash pledged for centrally cleared swaps in the Statements of Assets and Liabilities. Pursuant to the contract, each Fund agrees to receive from or pay to the broker an amount of cash equal to the daily fluctuation in market value of the contract (“variation margin”). Variation margin is recorded as unrealized appreciation (depreciation) and shown as variation margin receivable (or payable) on centrally cleared swaps in the Statements of Assets and Liabilities. Payments received from (paid to) the counterparty are amortized over the term of the contract and recorded as realized gains (losses) in the Statements of Operations, including those at termination.
Interest rate swaps are entered into to gain or reduce exposure to interest rates or to manage duration, the yield curve or interest rate (interest rate risk).
Interest rate swaps are agreements in which one party pays a stream of interest payments, either fixed or floating, in exchange for another party’s stream of interest payments, either fixed or floating, on the same notional amount for a specified period of time. In more complex interest rate swaps, the notional principal amount may decline (or amortize) over time.
Inflation swaps are entered into to gain or reduce exposure to inflation (inflation risk). In an inflation swap, one party makes fixed interest payments on a notional principal amount in exchange for another party’s variable payments based on an inflation index, such as the Consumer Price Index.
The iShares Inflation Hedged Corporate Bond ETF, iShares Inflation Hedged High Yield Bond ETF and iShares Inflation Hedged U.S. Aggregate Bond ETF use inflation swaps to mitigate the potential impact of inflation on the performance of the bonds held by the Fund or its underlying fund. The iShares Interest Rate Hedged Corporate Bond ETF, iShares Interest Rate Hedged High Yield Bond ETF, iShares Interest Rate Hedged Long-Term Corporate Bond ETF and iShares Interest Rate Hedged U.S. Aggregate Bond ETF use interest rate swaps to mitigate the potential impact of interest rates on the performance of the bonds held by each Fund or its underlying fund.
Swap transactions involve, to varying degrees, elements of interest rate, credit and market risks in excess of the amounts recognized in the Statements of Assets and Liabilities. Such risks involve the possibility that there will be no liquid market for these agreements, that the counterparty to the agreements may default on its obligation to perform or disagree as to the meaning of the contractual terms in the agreements, and that there may be unfavorable changes in interest rates and/or market values associated with these transactions.
Master Netting Arrangements: In order to define its contractual rights and to secure rights that will help mitigate its counterparty risk, a Fund may enter into an International Swaps and Derivatives Association, Inc. Master Agreement (“ISDA Master Agreement”) or similar agreement with its derivative contract counterparties. An ISDA Master Agreement is a bilateral agreement between a Fund and a counterparty that governs certain OTC derivatives and typically contains, among other things, collateral posting terms and netting provisions in the event of a default and/or termination event. Under an ISDA Master Agreement, a Fund may, under certain circumstances, offset with the counterparty certain derivative financial instruments’ payables and/or receivables with collateral held and/or posted and create one single net payment. The provisions of the ISDA Master Agreement typically permit a single net payment in the event of default including the bankruptcy or insolvency of the counterparty. However, bankruptcy or insolvency laws of a particular jurisdiction may impose restrictions on or prohibitions against the right of offset in bankruptcy, insolvency, or other events.
For derivatives traded under an ISDA Master Agreement, the collateral requirements are typically calculated by netting the mark-to-market amount for each transaction under such agreement, and comparing that amount to the value of any collateral currently pledged by a fund and the counterparty.
Cash collateral that has been pledged to cover obligations of the Funds and cash collateral received from the counterparty, if any, is reported separately in the Statements of Assets and Liabilities as cash pledged as collateral and cash received as collateral, respectively. Non-cash collateral pledged by the Funds, if any, is noted in the Schedules of Investments. Generally, the amount of collateral due from or to a counterparty is subject to a certain minimum transfer amount threshold before a transfer is required, which is determined at the close of business of the Funds. Any additional required collateral is delivered to/pledged by the Funds on the next business day. Typically, the counterparty is not permitted to sell, re-pledge or use cash and non-cash collateral it receives. A fund generally agrees not to use non-cash collateral that it receives but may, absent default or certain other circumstances defined in the underlying ISDA Master Agreement, be permitted to use cash collateral received. In such cases, interest may be paid pursuant to the collateral arrangement with the counterparty. To the extent amounts due to the Funds from the counterparty are not fully collateralized, each Fund bears the risk of loss from counterparty non-performance. Likewise, to the extent the Funds have delivered collateral to a counterparty and stand ready to perform under the terms of their agreement with such counterparty, each Fund bears the risk of loss from a counterparty in the amount of the value of the collateral in the event the counterparty fails to return such collateral. Based on the terms of agreements, collateral may not be required for all derivative contracts.
For financial reporting purposes, each Fund does not offset derivative assets and derivative liabilities that are subject to netting arrangements, if any, in the Statements of Assets and Liabilities.
6. INVESTMENT ADVISORY AGREEMENT AND OTHER TRANSACTIONS WITH AFFILIATES
Investment Advisory Fees: Pursuant to an Investment Advisory Agreement with the Trust, BFA manages the investment of each Fund’s assets. BFA is a California corporation indirectly owned by BlackRock. Under the Investment Advisory Agreement, BFA is responsible for substantially all expenses of the Funds, except (i) interest and taxes; (ii) brokerage commissions and other expenses connected with the execution of portfolio transactions; (iii) distribution fees; (iv) the advisory fee payable to BFA; and (v) litigation expenses and any extraordinary expenses (in each case as determined by a majority of the independent trustees).
712024 iShares Annual Financial Statements and Additional Information
Notes to Financial Statements (continued)
For its investment advisory services to each of the following Funds, BFA is entitled to an annual investment advisory fee, accrued daily and paid monthly by the Funds, based on the average daily net assets of each Fund as follows:
| |
Inflation Hedged Corporate Bond | |
Inflation Hedged High Yield Bond | |
Inflation Hedged U.S. Aggregate Bond | |
Interest Rate Hedged Corporate Bond | |
Interest Rate Hedged High Yield Bond | |
Interest Rate Hedged Long-Term Corporate Bond | |
Interest Rate Hedged U.S. Aggregate Bond | |
Expense Waivers: A fund may incur its pro rata share of fees and expenses attributable to its investments in other investment companies (“acquired fund fees and expenses”). The total of the investment advisory fee and acquired fund fees and expenses, if any, is a fund’s total annual operating expenses. Total expenses as shown in the Statements of Operations does not include acquired fund fees and expenses.
For the iShares Inflation Hedged Corporate Bond ETF, BFA has contractually agreed to waive a portion of its investment advisory fee for the Fund through February 29, 2028 so that the Fund’s total annual operating expenses after fee waiver is equal to the acquired fund fees and expenses attributable to the Fund’s investment in the iShares iBoxx $ Investment Grade Corporate Bond ETF (“LQD”), after taking into account any fee waivers by LQD, plus 0.05%.
For the iShares Inflation Hedged High Yield Bond ETF, BFA has contractually agreed to waive a portion of its investment advisory fee for the Fund through February 29, 2028 so that the Fund’s total annual operating expenses after fee waiver is equal to the acquired fund fees and expenses attributable to the Fund’s investment in the iShares iBoxx $ High Yield Corporate Bond ETF (“HYG”), after taking into account any fee waivers by HYG, plus 0.05%.
For the iShares Inflation Hedged U.S. Aggregate Bond ETF, BFA has contractually agreed to waive a portion of its investment advisory fee for the Fund through February 29, 2028 so that the Fund’s total annual operating expenses after fee waiver is equal to the acquired fund fees and expenses attributable to the Fund’s investment in the iShares Core U.S. Aggregate Bond ETF (“AGG”), after taking into account any fee waivers by AGG, plus 0.10%.
For the iShares Interest Rate Hedged Corporate Bond ETF, BFA has contractually agreed to waive a portion of its investment advisory fee for the Fund through February 28, 2027 so that the Fund’s total annual operating expenses after fee waiver is equal to the acquired fund fees and expenses attributable to the Fund’s investment in LQD, after taking into account any fee waivers by LQD, plus 0.10%.
For the iShares Interest Rate Hedged High Yield Bond ETF, BFA has contractually agreed to waive a portion of its investment advisory fee for the Fund through February 28, 2027 so that the Fund’s total annual operating expenses after fee waiver is equal to the acquired fund fees and expenses attributable to the Fund’s investment in HYG, after taking into account any fee waivers by HYG, plus 0.05%.
For the iShares Interest Rate Hedged Long-Term Corporate Bond ETF, BFA has contractually agreed to waive a portion of its investment advisory fee for the Fund through February 28, 2027 so that the Fund’s total annual operating expenses after fee waiver is equal to the acquired fund fees and expenses attributable to the Fund’s investment in the iShares 10+ Year Investment Grade Corporate Bond ETF (“IGLB”), after taking into account any fee waivers by IGLB, plus 0.10%.
For the iShares Interest Rate Hedged U.S. Aggregate Bond ETF, BFA has contractually agreed to waive a portion of its investment advisory fee for the Fund through February 29, 2028 so that the Fund’s total annual operating expenses after fee waiver is equal to the acquired fund fees and expenses attributable to the Fund’s investment in AGG, after taking into account any fee waivers by AGG, plus 0.10%.
These amounts are included in investment advisory fees waived in the Statements of Operations. For the year ended October 31, 2024, the amounts waived in investment advisory fees pursuant to these arrangements were as follows:
| |
Inflation Hedged Corporate Bond | |
Inflation Hedged High Yield Bond | |
Inflation Hedged U.S. Aggregate Bond | |
Interest Rate Hedged Corporate Bond | |
Interest Rate Hedged High Yield Bond | |
Interest Rate Hedged Long-Term Corporate Bond | |
Interest Rate Hedged U.S. Aggregate Bond | |
Distributor: BlackRock Investments, LLC ("BRIL"), an affiliate of BFA, is the distributor for each Fund. Pursuant to the distribution agreement, BFA is responsible for any fees or expenses for distribution services provided to the Funds.
Notes to Financial Statements72
Notes to Financial Statements (continued)
ETF Servicing Fees: Each Fund has entered into an ETF Services Agreement with BRIL to perform certain order processing, Authorized Participant communications, and related services in connection with the issuance and redemption of Creation Units (“ETF Services”). BRIL is entitled to a transaction fee from Authorized Participants on each creation or redemption order for the ETF Services provided. The Funds do not pay BRIL for ETF Services.
Prior to January 08, 2024 (date of conversion for iShares Inflation Hedged Corporate Bond ETF and iShares Interest Rate Hedged Corporate Bond ETF), ETF Services were performed by State Street Bank and Trust Company.
Prior to January 26, 2024 (date of conversion for iShares Inflation Hedged High Yield Bond ETF, iShares Inflation Hedged U.S. Aggregate Bond ETF, iShares Interest Rate Hedged High Yield Bond ETF, iShares Interest Rate Hedged Long-Term Corporate Bond ETF and iShares Interest Rate Hedged U.S. Aggregate Bond ETF ), ETF Services were performed by State Street Bank and Trust Company.
Index Provider: BlackRock Index Services, LLC, an affiliate of BFA, created, sponsors and publishes the underlying index used by each Fund. Each Fund uses its underlying index at no charge pursuant to a license agreement between BlackRock Index Services, LLC (or one or more of its affiliates) and the Trust, on behalf of the Funds.
Securities Lending: The U.S. Securities and Exchange Commission (the “SEC”) has issued an exemptive order which permits BlackRock Institutional Trust Company, N.A. (“BTC”), an affiliate of BFA, to serve as securities lending agent for the Funds, subject to applicable conditions. As securities lending agent, BTC bears all operational costs directly related to securities lending, including any custodial costs. Each Fund is responsible for fees in connection with the investment of cash collateral received for securities on loan (the “collateral investment fees”). The cash collateral is invested in a money market fund, BlackRock Cash Funds: Institutional or BlackRock Cash Funds: Treasury, managed by BFA, or its affiliates. However, BTC has agreed to reduce the amount of securities lending income it receives in order to effectively limit the collateral investment fees each Fund bears to an annual rate of 0.04%. The SL Agency Shares of such money market fund will not be subject to a sales load, distribution fee or service fee. BlackRock Cash Funds: Institutional may impose a discretionary liquidity fee of up to 2% on all redemptions. Discretionary liquidity fees may be imposed or terminated at any time at the discretion of the board of directors of the money market fund, or its delegate, if it is determined that such fee would be, or would not be, respectively, in the best interest of the money market fund. Additionally, BlackRock Cash Funds: Institutional will impose a mandatory liquidity fee if the money market fund's total net redemptions on a single day exceed 5% of the money market fund's net assets, unless the amount of the fee is less than 0.01% of the value of the shares redeemed. BlackRock Cash Funds: Institutional will determine the size of the mandatory liquidity fee by making a good faith estimate of certain costs the money market fund would incur if it were to sell a pro rata amount of each security in the portfolio to satisfy the amount of net redemptions on that day. There is no limit to the size of a mandatory liquidity fee. If BlackRock Cash Funds: Institutional cannot estimate the costs of selling a pro rata amount of each portfolio security in good faith and supported by data, it is required to apply a default liquidity fee of 1% on the value of shares redeemed on that day.
Securities lending income is generally equal to the total of income earned from the reinvestment of cash collateral (and excludes collateral investment fees), and any fees or other payments to and from borrowers of securities. Each Fund retains a portion of the securities lending income and remits the remaining portion to BTC as compensation for its services as securities lending agent.
Pursuant to the current securities lending agreement, each Fund retains 82% of securities lending income (which excludes collateral investment fees) and the amount retained can never be less than 70% of the total of securities lending income plus the collateral investment fees.
In addition, commencing the business day following the date that the aggregate securities lending income plus the collateral investment fees generated across all 1940 Act iShares exchange-traded funds (the “iShares ETF Complex”) in that calendar year exceeds a specified threshold, each Fund, pursuant to the securities lending agreement, will retain for the remainder of that calendar year 85% of securities lending income (which excludes collateral investment fees), and the amount retained can never be less than 70% of the total of securities lending income plus the collateral investment fees.
The share of securities lending income earned by each Fund is shown as securities lending income – affiliated – net in its Statements of Operations. For the year ended October 31, 2024, the Funds paid BTC the following amounts for securities lending agent services:
| |
Inflation Hedged Corporate Bond | |
Inflation Hedged High Yield Bond | |
Inflation Hedged U.S. Aggregate Bond | |
Interest Rate Hedged Corporate Bond | |
Interest Rate Hedged High Yield Bond | |
Interest Rate Hedged Long-Term Corporate Bond | |
Interest Rate Hedged U.S. Aggregate Bond | |
Officers and Trustees: Certain officers and/or trustees of the Trust are officers and/or trustees of BlackRock or its affiliates.
Other Transactions: Each Fund may invest its positive cash balances in certain money market funds managed by BFA or an affiliate. The income earned on these temporary cash investments is shown as dividends – affiliated in the Statements of Operations.
732024 iShares Annual Financial Statements and Additional Information
Notes to Financial Statements (continued)
7. PURCHASES AND SALES
For the year ended October 31, 2024, purchases and sales of investments, excluding short-term securities and in-kind transactions, were as follows:
| | |
Inflation Hedged Corporate Bond | | |
Inflation Hedged High Yield Bond | | |
Inflation Hedged U.S. Aggregate Bond | | |
Interest Rate Hedged Corporate Bond | | |
Interest Rate Hedged High Yield Bond | | |
Interest Rate Hedged Long-Term Corporate Bond | | |
Interest Rate Hedged U.S. Aggregate Bond | | |
For the year ended October 31, 2024, in-kind transactions were as follows:
| | |
Inflation Hedged Corporate Bond | | |
Interest Rate Hedged Corporate Bond | | |
Interest Rate Hedged High Yield Bond | | |
Interest Rate Hedged Long-Term Corporate Bond | | |
8. INCOME TAX INFORMATION
Each Fund is treated as an entity separate from the Trust’s other funds for federal income tax purposes. It is each Fund’s policy to comply with the requirements of the Internal Revenue Code of 1986, as amended, applicable to regulated investment companies, and to distribute substantially all of its taxable income to its shareholders. Therefore, no U.S. federal income tax provision is required.
Management has analyzed tax laws and regulations and their application to the Funds as of October 31, 2024, inclusive of the open tax return years, and does not believe that there are any uncertain tax positions that require recognition of a tax liability in the Funds’ financial statements. Management’s analysis is based on the tax laws and judicial and administrative interpretations thereof in effect as of the date of these financial statements, all of which are subject to change, possibly with retroactive effect, which may impact the Funds’ NAV.
U.S. GAAP requires that certain components of net assets be adjusted to reflect permanent differences between financial and tax reporting. These reclassifications have no effect on net assets or NAV per share. As of October 31, 2024, permanent differences attributable to realized gains (losses) from in-kind redemptions were reclassified to the following accounts:
| | Accumulated
Earnings (Loss) |
Interest Rate Hedged Corporate Bond | | |
Interest Rate Hedged Long-Term Corporate Bond | | |
The tax character of distributions paid was as follows:
| | |
Inflation Hedged Corporate Bond | | |
| | |
Inflation Hedged High Yield Bond | | |
| | |
Inflation Hedged U.S. Aggregate Bond | | |
| | |
Interest Rate Hedged Corporate Bond | | |
| | |
Interest Rate Hedged High Yield Bond | | |
| | |
Interest Rate Hedged Long-Term Corporate Bond | | |
| | |
Interest Rate Hedged U.S. Aggregate Bond | | |
| | |
Notes to Financial Statements74
Notes to Financial Statements (continued)
As of October 31, 2024, the tax components of accumulated net earnings (losses) were as follows:
| Undistributed
Ordinary Income | | | |
Inflation Hedged Corporate Bond | | | | |
Inflation Hedged High Yield Bond | | | | |
Inflation Hedged U.S. Aggregate Bond | | | | |
Interest Rate Hedged Corporate Bond | | | | |
Interest Rate Hedged High Yield Bond | | | | |
Interest Rate Hedged Long-Term Corporate Bond | | | | |
Interest Rate Hedged U.S. Aggregate Bond | | | | |
| Amounts available to offset future realized capital gains. |
| The difference between book-basis and tax-basis unrealized gains (losses) was attributable primarily to the tax deferral of losses on wash sales and the timing and recognition of realized gains/losses for tax purposes. |
For the year ended October 31, 2024, the iShares Inflation Hedged U.S. Aggregate Bond ETF utilized $458 of its capital loss carryforwards.
As of October 31, 2024, gross unrealized appreciation and depreciation based on cost of investments (including short positions and derivatives, if any) for U.S. federal income tax purposes were as follows:
| | Gross Unrealized
Appreciation | Gross Unrealized
Depreciation | Net Unrealized
Appreciation
(Depreciation) |
Inflation Hedged Corporate Bond | | | | |
Inflation Hedged High Yield Bond | | | | |
Inflation Hedged U.S. Aggregate Bond | | | | |
Interest Rate Hedged Corporate Bond | | | | |
Interest Rate Hedged High Yield Bond | | | | |
Interest Rate Hedged Long-Term Corporate Bond | | | | |
Interest Rate Hedged U.S. Aggregate Bond | | | | |
In the normal course of business, each Fund invests in securities or other instruments and may enter into certain transactions, and such activities subject the Fund to various risks, including, among others, fluctuations in the market (market risk) or failure of an issuer to meet all of its obligations. The value of securities or other instruments may also be affected by various factors, including, without limitation: (i) the general economy; (ii) the overall market as well as local, regional or global political and/or social instability; (iii) regulation, taxation or international tax treaties between various countries; or (iv) currency, interest rate or price fluctuations. Local, regional or global events such as war, acts of terrorism, the spread of infectious illness or other public health issues, recessions, or other events could have a significant impact on the Funds and their investments. Each Fund’s prospectus provides details of the risks to which the Fund is subject.
BFA uses an indexing approach to try to achieve each Fund’s investment objective. The Fund is not actively managed, and BFA generally does not attempt to take defensive positions under any market conditions, including declining markets.
The Funds may be exposed to additional risks when reinvesting cash collateral in money market funds that do not seek to maintain a stable NAV per share of $1.00, which may be subject to mandatory and discretionary liquidity fees under certain circumstances.
Valuation Risk: The market values of equities, such as common stocks and preferred securities or equity related investments, such as futures and options, may decline due to general market conditions which are not specifically related to a particular company. They may also decline due to factors which affect a particular industry or industries. A fund may invest in illiquid investments. An illiquid investment is any investment that a fund reasonably expects cannot be sold or disposed of in current market conditions in seven calendar days or less without the sale or disposition significantly changing the market value of the investment. A fund may experience difficulty in selling illiquid investments in a timely manner at the price that it believes the investments are worth. Prices may fluctuate widely over short or extended periods in response to company, market or economic news. Markets also tend to move in cycles, with periods of rising and falling prices. This volatility may cause a fund’s NAV to experience significant increases or decreases over short periods of time. If there is a general decline in the securities and other markets, the NAV of a fund may lose value, regardless of the individual results of the securities and other instruments in which a fund invests. Each Fund’s ability to value its investments may also be impacted by technological issues and/or errors by pricing services or other third-party service providers.
Counterparty Credit Risk: The Funds may be exposed to counterparty credit risk, or the risk that an entity may fail to or be unable to perform on its commitments related to unsettled or open transactions, including making timely interest and/or principal payments or otherwise honoring its obligations. The Funds manage counterparty credit risk by entering into transactions only with counterparties that BFA believes have the financial resources to honor their obligations and by monitoring the financial stability of those counterparties. Financial assets, which potentially expose the Funds to market, issuer and counterparty credit risks, consist principally of financial instruments and
752024 iShares Annual Financial Statements and Additional Information
Notes to Financial Statements (continued)
receivables due from counterparties. The extent of the Funds’ exposure to market, issuer and counterparty credit risks with respect to these financial assets is approximately their value recorded in the Statements of Assets and Liabilities, less any collateral held by the Funds.
A derivative contract may suffer a mark-to-market loss if the value of the contract decreases due to an unfavorable change in the market rates or values of the underlying instrument. Losses can also occur if the counterparty does not perform under the contract.
With centrally cleared swaps, there is less counterparty credit risk to the Funds since the exchange or clearinghouse, as counterparty to such instruments, guarantees against a possible default. The clearinghouse stands between the buyer and the seller of the contract; therefore, credit risk is limited to failure of the clearinghouse. While offset rights may exist under applicable law, a Fund does not have a contractual right of offset against a clearing broker or clearinghouse in the event of a default (including the bankruptcy or insolvency). Additionally, credit risk exists in centrally cleared swaps with respect to initial and variation margin that is held in a clearing broker’s customer accounts. While clearing brokers are required to segregate customer margin from their own assets, in the event that a clearing broker becomes insolvent or goes into bankruptcy and at that time there is a shortfall in the aggregate amount of margin held by the clearing broker for all its clients, typically the shortfall would be allocated on a pro rata basis across all the clearing broker’s customers, potentially resulting in losses to the Funds.
Geographic/Asset Class Risk: A diversified portfolio, where this is appropriate and consistent with a fund’s objectives, minimizes the risk that a price change of a particular investment will have a material impact on the NAV of a fund. The investment concentrations within each Fund’s portfolio are disclosed in its Schedule of Investments.
The Funds invest a significant portion of their assets in securities of issuers located in the United States. A decrease in imports or exports, changes in trade regulations, inflation and/or an economic recession in the United States may have a material adverse effect on the U.S. economy and the securities listed on U.S. exchanges. Proposed and adopted policy and legislative changes in the United States may also have a significant effect on U.S. markets generally, as well as on the value of certain securities. Governmental agencies project that the United States will continue to maintain elevated public debt levels for the foreseeable future which may constrain future economic growth. Circumstances could arise that could prevent the timely payment of interest or principal on U.S. government debt, such as reaching the legislative “debt ceiling.” Such non-payment would result in substantial negative consequences for the U.S. economy and the global financial system. If U.S. relations with certain countries deteriorate, it could adversely affect issuers that rely on the United States for trade. The United States has also experienced increased internal unrest and discord. If these trends were to continue, they may have an adverse impact on the U.S. economy and the issuers in which the Funds invest.
Significant Shareholder Redemption Risk: Certain shareholders may own or manage a substantial amount of fund shares and/or hold their fund investments for a limited period of time. Large redemptions of fund shares by these shareholders may force a fund to sell portfolio securities, which may negatively impact the fund’s NAV, increase the fund’s brokerage costs, and/or accelerate the realization of taxable income/gains and cause the fund to make additional taxable distributions to shareholders.
10. CAPITAL SHARE TRANSACTIONS
Capital shares are issued and redeemed by each Fund only in aggregations of a specified number of shares or multiples thereof (“Creation Units”) at NAV. Except when aggregated in Creation Units, shares of each Fund are not redeemable.
Transactions in capital shares were as follows:
| | |
| | | | |
Inflation Hedged Corporate Bond | | | | |
| | | | |
| | | | |
| | | | |
Interest Rate Hedged Corporate Bond | | | | |
| | | | |
| | | | |
| | | | |
Interest Rate Hedged High Yield Bond | | | | |
| | | | |
| | | | |
| | | | |
Interest Rate Hedged Long-Term Corporate Bond | | | | |
| | | | |
| | | | |
| | | | |
Interest Rate Hedged U.S. Aggregate Bond | | | | |
| | | | |
Notes to Financial Statements76
Notes to Financial Statements (continued)
The consideration for the purchase of Creation Units of a fund in the Trust generally consists of the in-kind deposit of a designated portfolio of securities and a specified amount of cash. Certain funds in the Trust may be offered in Creation Units solely or partially for cash in U.S. dollars. Authorized Participants purchasing and redeeming Creation Units may pay a purchase transaction fee and a redemption transaction fee directly to BRIL, to offset transfer and other transaction costs associated with the issuance and redemption of Creation Units, including Creation Units for cash. Authorized Participants transacting in Creation Units for cash may also pay an additional variable charge to compensate the relevant fund for certain transaction costs (i.e., stamp taxes, taxes on currency or other financial transactions, and brokerage costs) and market impact expenses relating to investing in portfolio securities. Such variable charges, if any, are included in shares sold in the table above.
To the extent applicable, to facilitate the timely settlement of orders for the Funds using a clearing facility outside of the continuous net settlement process, the Funds, at their sole discretion, may permit an Authorized Participant to post cash as collateral in anticipation of the delivery of all or a portion of the applicable Deposit Securities or Fund Securities, as further described in the applicable Authorized Participant Agreement. The collateral process is subject to a Control Agreement among the Authorized Participant, each Funds’ custodian, and the Funds. In the event that the Authorized Participant fails to deliver all or a portion of the applicable Deposit Securities or Fund Securities, the Funds may exercise control over such collateral pursuant to the terms of the Control Agreement in order to purchase the applicable Deposit Securities or Fund Securities.
From time to time, settlement of securities related to in-kind contributions or in-kind redemptions may be delayed. In such cases, securities related to in-kind transactions are reflected as a receivable or a payable in the Statements of Assets and Liabilities.
Management has evaluated the impact of all subsequent events on the Funds through the date the financial statements were available to be issued and has determined that there were no subsequent events requiring adjustment or additional disclosure in the financial statements.
772024 iShares Annual Financial Statements and Additional Information
Report of Independent Registered Public Accounting Firm
To the Board of Trustees of
iShares U.S. ETF Trust and Shareholders of each of the seven funds listed in the table below
Opinions on the Financial Statements
We have audited the accompanying statements of assets and liabilities, including the schedules of investments, of each of the funds listed in the table below (seven of the funds constituting iShares U.S. ETF Trust, hereafter collectively referred to as the "Funds") as of October 31, 2024, the related statements of operations for the year ended October 31, 2024, the statements of changes in net assets for each of the two years in the period ended October 31, 2024, including the related notes, and the financial highlights for each of the periods indicated therein (collectively referred to as the “financial statements”). In our opinion, the financial statements present fairly, in all material respects, the financial position of each of the Funds listed in the table below as of October 31, 2024, the results of each of their operations for the year then ended, the changes in each of their net assets for each of the two years in the period ended October 31, 2024 and each of the financial highlights for each of the periods indicated therein in conformity with accounting principles generally accepted in the United States of America.
iShares Inflation Hedged Corporate Bond ETF |
iShares Inflation Hedged High Yield Bond ETF |
iShares Inflation Hedged U.S. Aggregate Bond ETF |
iShares Interest Rate Hedged Corporate Bond ETF |
iShares Interest Rate Hedged High Yield Bond ETF |
iShares Interest Rate Hedged Long-Term Corporate Bond ETF |
iShares Interest Rate Hedged U.S. Aggregate Bond ETF |
These financial statements are the responsibility of the Funds’ management. Our responsibility is to express an opinion on the Funds’ financial statements based on our audits. We are a public accounting firm registered with the Public Company Accounting Oversight Board (United States) (PCAOB) and are required to be independent with respect to the Funds in accordance with the U.S. federal securities laws and the applicable rules and regulations of the Securities and Exchange Commission and the PCAOB.
We conducted our audits of these financial statements in accordance with the standards of the PCAOB. Those standards require that we plan and perform the audit to obtain reasonable assurance about whether the financial statements are free of material misstatement, whether due to error or fraud.
Our audits included performing procedures to assess the risks of material misstatement of the financial statements, whether due to error or fraud, and performing procedures that respond to those risks. Such procedures included examining, on a test basis, evidence regarding the amounts and disclosures in the financial statements. Our audits also included evaluating the accounting principles used and significant estimates made by management, as well as evaluating the overall presentation of the financial statements. Our procedures included confirmation of securities owned as of October 31, 2024 by correspondence with the custodian, transfer agent and brokers. We believe that our audits provide a reasonable basis for our opinions.
/s/PricewaterhouseCoopers LLP
Philadelphia, Pennsylvania
December 20, 2024
We have served as the auditor of one or more BlackRock investment companies since 2000.
Report of Independent Registered Public Accounting Firm78
Important Tax Information (unaudited)
The Funds hereby designate the following amounts, or maximum amounts allowable by law, of distributions from direct federal obligation interest for the fiscal year ended October 31, 2024:
| Federal Obligation
Interest |
Inflation Hedged Corporate Bond | |
Inflation Hedged High Yield Bond | |
Inflation Hedged U.S. Aggregate Bond | |
Interest Rate Hedged Corporate Bond | |
Interest Rate Hedged High Yield Bond | |
Interest Rate Hedged Long-Term Corporate Bond | |
Interest Rate Hedged U.S. Aggregate Bond | |
The law varies in each state as to whether and what percent of ordinary income dividends attributable to federal obligations is exempt from state income tax. Shareholders are advised to check with their tax advisers to determine if any portion of the dividends received is exempt from state income tax.
The Funds hereby designate the following amounts, or maximum amounts allowable by law, as interest income eligible to be treated as a Section 163(j) interest dividend for the fiscal year ended October 31, 2024:
| |
Inflation Hedged Corporate Bond | |
Inflation Hedged High Yield Bond | |
Inflation Hedged U.S. Aggregate Bond | |
Interest Rate Hedged Corporate Bond | |
Interest Rate Hedged High Yield Bond | |
Interest Rate Hedged Long-Term Corporate Bond | |
Interest Rate Hedged U.S. Aggregate Bond | |
The Funds hereby designate the following amounts, or maximum amounts allowable by law, as interest-related dividends eligible for exemption from U.S. withholding tax for nonresident aliens and foreign corporations for the fiscal year ended October 31, 2024:
| Interest-Related
Dividends |
Inflation Hedged Corporate Bond | |
Inflation Hedged High Yield Bond | |
Inflation Hedged U.S. Aggregate Bond | |
Interest Rate Hedged Corporate Bond | |
Interest Rate Hedged High Yield Bond | |
Interest Rate Hedged Long-Term Corporate Bond | |
Interest Rate Hedged U.S. Aggregate Bond | |
792024 iShares Annual Financial Statements and Additional Information
Premium/Discount Information
Information on the Fund's net asset value, market price, premiums and discounts, and bid-ask spreads can be found at iShares.com.
Shareholders can sign up for e-mail notifications announcing that the shareholder report or prospectus has been posted on the iShares website at iShares.com. Once you have enrolled, you will no longer receive prospectuses and shareholder reports in the mail.
To enroll in electronic delivery:
• Go to icsdelivery.com.
• If your brokerage firm is not listed, electronic delivery may not be available. Please contact your broker-dealer or financial advisor.
Changes in and Disagreements with Accountants
Remuneration Paid to Trustees, Officers, and Others
Because BFA has agreed in the Investment Advisory Agreements to cover all operating expenses of the Funds, subject to certain exclusions as provided for therein, BFA pays the compensation to each Independent Trustee for services to the Funds from BFA's investment advisory fees.
Availability of Portfolio Holdings Information
A description of the Company’s policies and procedures with respect to the disclosure of the Fund’s portfolio securities is available in the Fund Prospectus. The Fund discloses its portfolio holdings daily and provides information regarding its top holdings in Fund fact sheets, when available, at iShares.com.
Board Review and Approval of Investment Advisory Contract
iShares Inflation Hedged Corporate Bond ETF, iShares Inflation Hedged U.S. Aggregate Bond ETF, iShares Interest Rate Hedged U.S. Aggregate Bond ETF (each the “Fund”)
Under Section 15(c) of the Investment Company Act of 1940 (the “1940 Act”), the Trust's Board of Trustees (the “Board”), including a majority of Board Members who are not “interested persons” of the Trust (as that term is defined in the 1940 Act) (the “Independent Board Members”), is required annually to consider the approval of the Investment Advisory Agreement between the Trust and BFA (the “Advisory Agreement”) on behalf of the Fund. The Board’s consideration entails a year-long process whereby the Board and its committees (composed solely of Independent Board Members) assess BlackRock’s services to the Fund, including investment management; fund accounting; administrative and shareholder services; oversight of the Fund’s service providers; risk management and oversight; and legal and compliance services; including the ability to meet applicable legal and regulatory requirements. The Independent Board Members requested, and BFA provided, such information as the Independent Board Members, with advice from independent counsel, deemed reasonably necessary to evaluate the Advisory Agreement. At meetings held on May 6, 2024 and May 17, 2024, a committee composed of all of the Independent Board Members (the “15(c) Committee”), with independent counsel, met with management and reviewed and discussed information provided in response to initial requests of the 15(c) Committee and/or its independent counsel. Prior to and in preparation for the meeting, the Board received and reviewed materials specifically relating to matters relevant to the renewal of the Advisory Agreement. Following discussion, the 15(c) Committee subsequently requested certain additional information, which management agreed to provide. At a meeting held on June 4-5, 2024, the Board, including the Independent Board Members, reviewed the additional information provided by management in response to these requests.
After extensive discussions and deliberations, the Board, including all of the Independent Board Members, approved the continuance of the Advisory Agreement for the Fund, based on a review of qualitative and quantitative information provided by BFA and their cumulative experience as Board Members. The Board noted its satisfaction with the extent and quality of information provided and its frequent interactions with management, as well as the detailed responses and other information provided by BFA. The Independent Board Members were advised by their independent counsel throughout the process, including about the legal standards applicable to their review. In approving the continuance of the Advisory Agreement for the Fund, the Board, including the Independent Board Members, considered various factors, including: (i) the expenses and performance of the Fund; (ii) the nature, extent and quality of the services provided by BFA; (iii) the costs of services provided to the Fund and profits realized by BFA and its affiliates; (iv) potential economies of scale and the sharing of related benefits; (v) the fees and services provided for other comparable funds/accounts managed by BFA and its affiliates; and (vi) other benefits to BFA and/or its affiliates. The Board Members did not identify any particular information or any single factor as determinative, and each Board Member may have attributed different weights to the various matters and factors considered. The material factors, considerations and conclusions that formed the basis for the Board, including the Independent Board Members, to approve the continuance of the Advisory Agreement are discussed below.
Expenses and Performance of the Fund: The Board reviewed statistical information prepared by Broadridge Financial Solutions, Inc. (“Broadridge”), an independent provider of investment company data, regarding the expense ratio components, including gross and net total expenses, fees and expenses of other fund(s) in which the Fund invests (if applicable), and waivers/reimbursements (if applicable) of the Fund in comparison with the same information for other ETFs, objectively selected by Broadridge as comprising the Fund’s applicable expense peer group pursuant to Broadridge’s proprietary ETF methodology (the “Peer Group”). The Board was provided with a detailed description of the proprietary ETF methodology used by Broadridge to determine the Fund’s Peer Group. The Board noted that, due to the limitations in providing comparable funds in the Peer Group, the statistical information provided in Broadridge’s report may or may not provide meaningful direct comparisons to the Fund in all instances. The Board also noted that the investment advisory fee rate and overall expenses (net of any waivers and reimbursements) for the Fund were within range of the median of the investment advisory fee rates and overall expenses (net of any waivers and reimbursements) of the funds in its Peer Group, excluding iShares funds.
In addition, to the extent that any of the comparison funds included in the Peer Group, excluding iShares funds, track the same index as the Fund, Broadridge also provided, and the Board reviewed, a comparison of the Fund’s performance for the one-year, three-year, five-year, ten-year, and since inception periods, as applicable, and for the quarter ended December 31, 2023, to that of such relevant comparison fund(s) for the same periods. The Board noted that the Fund seeks to track its specified underlying index and that, during the year, the Board received periodic reports on the Fund’s short- and longer-term performance in comparison with its underlying index. Such periodic comparative performance information, including additional detailed information as requested by the Board, was also considered. The Board noted that the Fund generally performed in line with its underlying index over the relevant periods.
Based on this review, the other relevant factors and information considered at the meeting, and their general knowledge of ETF pricing, the Board concluded that the investment advisory fee rate and expense level and the historical performance of the Fund supported the Board’s approval of the continuance of the Advisory Agreement for the coming year.
Nature, Extent and Quality of Services Provided: Based on management’s representations, including information about ongoing enhancements and initiatives with respect to the iShares product line and BFA’s business, including with respect to capital markets support and analysis, technology, portfolio management, product design and quality, compliance and risk management, global public policy and other services, the Board expected that there would be no diminution in the scope of services required of or provided by BFA under the Advisory Agreement for the coming year as compared with the scope of services provided by BFA during prior years. In reviewing the scope of these services, the Board considered BFA’s investment philosophy and experience, noting that BFA and its affiliates have committed significant resources over time, including during the past year, to support the iShares funds and their shareholders and have made significant investments into the iShares business. The Board also considered BFA’s compliance program and its compliance record with respect to the Fund, including related programs implemented pursuant to regulatory requirements. In that regard, the Board noted that BFA reports to the Board about portfolio management and compliance matters on a periodic basis in connection with regularly scheduled meetings of the Board, and on other occasions as necessary and appropriate, and has provided information and made relevant officers and other employees of BFA (and its affiliates) available as needed to provide further assistance with these matters. The Board also reviewed the background and experience of the persons responsible for the day-to-day management of the Fund, as well as the resources available to them in managing the Fund. In addition to the above considerations, the Board reviewed and considered detailed presentations regarding BFA’s investment performance, investment and risk management processes and strategies provided at the May 6, 2024
812024 iShares Annual Financial Statements and Additional Information
Board Review and Approval of Investment Advisory Contract (continued)
meeting and throughout the year, and matters related to BFA’s portfolio compliance program and other compliance programs and services, as well as BlackRock’s continued investments in its ETF business.
Based on review of this information, and the performance information discussed above, the Board concluded that the nature, extent and quality of services provided to the Fund under the Advisory Agreement supported the Board’s approval of the continuance of the Advisory Agreement for the coming year.
Costs of Services Provided to the Fund and Profits Realized by BFA and its Affiliates: The Board reviewed information about the estimated profitability to BlackRock in managing the Fund, based on the fees payable to BFA and its affiliates (including fees under the Advisory Agreement), and other sources of revenue and expense to BFA and its affiliates from the Fund’s operations for the last calendar year. The Board reviewed BlackRock’s methodology for calculating estimated profitability of the iShares funds, noting that the 15(c) Committee and the Board had focused on the methodology and profitability presentation. The Board recognized that profitability may be affected by numerous factors, including, among other things, fee waivers by BFA, the types of funds managed, expense allocations and business mix. The Board thus recognized that calculating and comparing profitability at individual fund levels is challenging. The Board discussed with management the sources of direct and ancillary revenue, including the revenues to BTC, a BlackRock affiliate, from securities lending by the Fund. The Board also discussed BFA’s estimated profit margin as reflected in the Fund’s profitability analysis and reviewed information regarding potential economies of scale (as discussed below).
Based on this review, the Board concluded that the information considered with respect to the profits realized by BFA and its affiliates under the Advisory Agreement and from other relationships between the Fund and BFA and/or its affiliates, if any, and related costs of the services provided as well as the other factors considered at the meeting, supported the Board’s approval of the continuance of the Advisory Agreement for the coming year.
Economies of Scale: The Board reviewed information and considered the extent to which economies of scale might be realized as the assets of the Fund increase, noting that the issue of potential economies of scale had been focused on by the 15(c) Committee and the Board during their meetings and addressed by management. The 15(c) Committee and the Board received information regarding BlackRock’s historical estimated profitability (as discussed above), including BFA’s and its affiliates’ estimated costs in providing services. The estimated cost information distinguished, among other things, between fixed and variable costs, and showed how the level and nature of fixed and variable costs may impact the existence or size of scale benefits, with the Board recognizing that potential economies of scale are difficult to measure. The 15(c) Committee and the Board reviewed information provided by BFA regarding the sharing of scale benefits with the iShares funds through various means, including, as applicable, through breakpoints, waivers, or other fee reductions, as well as through additional investment in the iShares business, including enhancements to or the provision of additional infrastructure and services to the iShares funds and their shareholders and, with respect to New Funds, set management fees at levels that anticipate scale over time. The Board noted that the Advisory Agreement for the Fund did not provide for breakpoints in the Fund’s investment advisory fee rate as the assets of the Fund increase. However, the Board noted that it would continue to assess the appropriateness of adding breakpoints in the future.
The Board concluded that this review of potential economies of scale and the sharing of related benefits, as well as the other factors considered at the meeting, supported the Board’s approval of the continuance of the Advisory Agreement for the coming year.
Fees and Services Provided for Other Comparable Funds/Accounts Managed by BFA and its Affiliates: The Board received and considered information regarding the investment advisory/management fee rates for other funds/accounts in the U.S. for which BFA (or its affiliates) provides investment advisory/management services, including open-end funds registered under the 1940 Act (including sub-advised funds), collective trust funds and institutional separate accounts (collectively, the “Other Accounts”).
The Board received detailed information regarding how the Other Accounts generally differ from the Fund, including in terms of the types of services and generally more extensive character and scope of services provided to the Fund, as well as other significant differences. In that regard, the Board considered that the pricing of services to institutional clients is typically based on a number of factors beyond the nature and extent of the specific services to be provided and often depends on the overall relationship between the client and its affiliates and the adviser and its affiliates. In addition, the Board considered the relative complexity and inherent risks and challenges of managing and providing other services to the Fund, as a publicly traded investment vehicle, as compared to the Other Accounts, particularly those that are institutional clients, in light of differing regulatory requirements and client-imposed mandates. The Board acknowledged BFA’s representation that the iShares funds are fundamentally different investment vehicles from the Other Accounts in its consideration of relevant qualitative and quantitative comparative information provided. The Board noted that BFA and its affiliates do not manage Other Accounts with substantially the same investment objective and strategy as the Fund and that track the same index as the Fund. The Board also acknowledged management’s assertion that, for certain iShares funds, and for client segmentation purposes, BlackRock has launched an iShares fund that may provide a similar investment exposure at a lower investment advisory fee rate.
The Board considered the “all-inclusive” nature of the Fund’s advisory fee structure, and the Fund’s expenses borne by BFA under this arrangement and noted that the investment advisory fee rate under the Advisory Agreement for the Fund was generally higher than the investment advisory/management fee rates for certain of the Other Accounts (particularly institutional clients) and concluded that the differences appeared to be consistent with the factors discussed.
Other Benefits to BFA and/or its Affiliates: The Board reviewed other benefits or ancillary revenue received by BFA and/or its affiliates in connection with the services provided to the Fund by BFA, both direct and indirect, including, but not limited to, payment of revenue to BTC, the Fund’s securities lending agent, for loaning portfolio securities, as applicable (which was included in the profit margins reviewed by the Board pursuant to BFA’s estimated profitability methodology), payment of advisory fees or other fees to BFA (or its affiliates) in connection with any investments by the Fund in other funds (including cash sweep vehicles) for which BFA (or its affiliates) provides investment advisory services or other services, and BlackRock’s profile in the investment community. The Board further considered other direct benefits that might accrue to BFA, including actual and potential reductions in the Fund’s expenses that are borne by BFA under the “all-inclusive” management fee arrangement, due in part to the size and scope of BFA’s investment operations servicing the Fund (and other funds in the iShares complex) as well as in response to a changing market environment. The Board also reviewed and considered information provided by BFA concerning authorized participant primary market order processing services that are provided by BlackRock Investments, LLC (“BRIL”), an affiliate of BFA, and paid for by authorized participants under the ETF Servicing Platform. The Board also noted the revenue
Board Review and Approval of Investment Advisory Contract82
Board Review and Approval of Investment Advisory Contract (continued)
received by BFA and/or its affiliates pursuant to an agreement that permits a service provider to use certain portions of BlackRock’s technology platform to service accounts managed by BFA and/or its affiliates, including the iShares funds. The Board noted that BFA generally does not use soft dollars or consider the value of research or other services that may be provided to BFA (including its affiliates) in selecting brokers for portfolio transactions for the Fund. The Board concluded that any such ancillary benefits would not be disadvantageous to the Fund and thus would not alter the Board’s conclusion with respect to the appropriateness of approving the continuance of the Advisory Agreement for the coming year.
Conclusion: Based on a review of the factors described above, as well as such other factors as deemed appropriate by the Board, the Board, including all of the Independent Board Members, determined that the Fund’s investment advisory fee rate under the Advisory Agreement does not constitute a fee that is so disproportionately large as to bear no reasonable relationship to the services rendered and that could not have been the product of arm’s-length bargaining, and concluded to approve the continuance of the Advisory Agreement for the coming year.
iShares Inflation Hedged High Yield Bond ETF, iShares Interest Rate Hedged Corporate Bond ETF, iShares Interest Rate Hedged High Yield Bond ETF (each the “Fund”)
Under Section 15(c) of the Investment Company Act of 1940 (the “1940 Act”), the Trust's Board of Trustees (the “Board”), including a majority of Board Members who are not “interested persons” of the Trust (as that term is defined in the 1940 Act) (the “Independent Board Members”), is required annually to consider the approval of the Investment Advisory Agreement between the Trust and BFA (the “Advisory Agreement”) on behalf of the Fund. The Board’s consideration entails a year-long process whereby the Board and its committees (composed solely of Independent Board Members) assess BlackRock’s services to the Fund, including investment management; fund accounting; administrative and shareholder services; oversight of the Fund’s service providers; risk management and oversight; and legal and compliance services; including the ability to meet applicable legal and regulatory requirements. The Independent Board Members requested, and BFA provided, such information as the Independent Board Members, with advice from independent counsel, deemed reasonably necessary to evaluate the Advisory Agreement. At meetings held on May 6, 2024 and May 17, 2024, a committee composed of all of the Independent Board Members (the “15(c) Committee”), with independent counsel, met with management and reviewed and discussed information provided in response to initial requests of the 15(c) Committee and/or its independent counsel. Prior to and in preparation for the meeting, the Board received and reviewed materials specifically relating to matters relevant to the renewal of the Advisory Agreement. Following discussion, the 15(c) Committee subsequently requested certain additional information, which management agreed to provide. At a meeting held on June 4-5, 2024, the Board, including the Independent Board Members, reviewed the additional information provided by management in response to these requests.
After extensive discussions and deliberations, the Board, including all of the Independent Board Members, approved the continuance of the Advisory Agreement for the Fund, based on a review of qualitative and quantitative information provided by BFA and their cumulative experience as Board Members. The Board noted its satisfaction with the extent and quality of information provided and its frequent interactions with management, as well as the detailed responses and other information provided by BFA. The Independent Board Members were advised by their independent counsel throughout the process, including about the legal standards applicable to their review. In approving the continuance of the Advisory Agreement for the Fund, the Board, including the Independent Board Members, considered various factors, including: (i) the expenses and performance of the Fund; (ii) the nature, extent and quality of the services provided by BFA; (iii) the costs of services provided to the Fund and profits realized by BFA and its affiliates; (iv) potential economies of scale and the sharing of related benefits; (v) the fees and services provided for other comparable funds/accounts managed by BFA and its affiliates; and (vi) other benefits to BFA and/or its affiliates. The Board Members did not identify any particular information or any single factor as determinative, and each Board Member may have attributed different weights to the various matters and factors considered. The material factors, considerations and conclusions that formed the basis for the Board, including the Independent Board Members, to approve the continuance of the Advisory Agreement are discussed below.
Expenses and Performance of the Fund: The Board reviewed statistical information prepared by Broadridge Financial Solutions, Inc. (“Broadridge”), an independent provider of investment company data, regarding the expense ratio components, including gross and net total expenses, fees and expenses of other fund(s) in which the Fund invests (if applicable), and waivers/reimbursements (if applicable) of the Fund in comparison with the same information for other ETFs, objectively selected by Broadridge as comprising the Fund’s applicable expense peer group pursuant to Broadridge’s proprietary ETF methodology (the “Peer Group”). The Board was provided with a detailed description of the proprietary ETF methodology used by Broadridge to determine the Fund’s Peer Group. The Board noted that, due to the limitations in providing comparable funds in the Peer Group, the statistical information provided in Broadridge’s report may or may not provide meaningful direct comparisons to the Fund in all instances. The Board also noted that the investment advisory fee rate and overall expenses (net of any waivers and reimbursements) for the Fund were higher than the median of the investment advisory fee rates and overall expenses (net of any waivers and reimbursements) of the funds in its Peer Group, excluding iShares funds.
In addition, to the extent that any of the comparison funds included in the Peer Group, excluding iShares funds, track the same index as the Fund, Broadridge also provided, and the Board reviewed, a comparison of the Fund’s performance for the one-year, three-year, five-year, ten-year, and since inception periods, as applicable, and for the quarter ended December 31, 2023, to that of such relevant comparison fund(s) for the same periods. The Board noted that the Fund seeks to track its specified underlying index and that, during the year, the Board received periodic reports on the Fund’s short- and longer-term performance in comparison with its underlying index. Such periodic comparative performance information, including additional detailed information as requested by the Board, was also considered. The Board noted that the Fund generally performed in line with its underlying index over the relevant periods.
Based on this review, the other relevant factors and information considered at the meeting, and their general knowledge of ETF pricing, the Board concluded that the investment advisory fee rate and expense level and the historical performance of the Fund supported the Board’s approval of the continuance of the Advisory Agreement for the coming year.
Nature, Extent and Quality of Services Provided: Based on management’s representations, including information about ongoing enhancements and initiatives with respect to the iShares product line and BFA’s business, including with respect to capital markets support and analysis, technology, portfolio management, product design and quality, compliance and risk management, global public policy and other services, the Board expected that there would be no diminution in the scope of services required of or provided by BFA under the Advisory Agreement for the coming year as compared with the scope of services provided by BFA during prior years. In reviewing
832024 iShares Annual Financial Statements and Additional Information
Board Review and Approval of Investment Advisory Contract (continued)
the scope of these services, the Board considered BFA’s investment philosophy and experience, noting that BFA and its affiliates have committed significant resources over time, including during the past year, to support the iShares funds and their shareholders and have made significant investments into the iShares business. The Board also considered BFA’s compliance program and its compliance record with respect to the Fund, including related programs implemented pursuant to regulatory requirements. In that regard, the Board noted that BFA reports to the Board about portfolio management and compliance matters on a periodic basis in connection with regularly scheduled meetings of the Board, and on other occasions as necessary and appropriate, and has provided information and made relevant officers and other employees of BFA (and its affiliates) available as needed to provide further assistance with these matters. The Board also reviewed the background and experience of the persons responsible for the day-to-day management of the Fund, as well as the resources available to them in managing the Fund. In addition to the above considerations, the Board reviewed and considered detailed presentations regarding BFA’s investment performance, investment and risk management processes and strategies provided at the May 6, 2024 meeting and throughout the year, and matters related to BFA’s portfolio compliance program and other compliance programs and services, as well as BlackRock’s continued investments in its ETF business.
Based on review of this information, and the performance information discussed above, the Board concluded that the nature, extent and quality of services provided to the Fund under the Advisory Agreement supported the Board’s approval of the continuance of the Advisory Agreement for the coming year.
Costs of Services Provided to the Fund and Profits Realized by BFA and its Affiliates: The Board reviewed information about the estimated profitability to BlackRock in managing the Fund, based on the fees payable to BFA and its affiliates (including fees under the Advisory Agreement), and other sources of revenue and expense to BFA and its affiliates from the Fund’s operations for the last calendar year. The Board reviewed BlackRock’s methodology for calculating estimated profitability of the iShares funds, noting that the 15(c) Committee and the Board had focused on the methodology and profitability presentation. The Board recognized that profitability may be affected by numerous factors, including, among other things, fee waivers by BFA, the types of funds managed, expense allocations and business mix. The Board thus recognized that calculating and comparing profitability at individual fund levels is challenging. The Board discussed with management the sources of direct and ancillary revenue, including the revenues to BTC, a BlackRock affiliate, from securities lending by the Fund. The Board also discussed BFA’s estimated profit margin as reflected in the Fund’s profitability analysis and reviewed information regarding potential economies of scale (as discussed below).
Based on this review, the Board concluded that the information considered with respect to the profits realized by BFA and its affiliates under the Advisory Agreement and from other relationships between the Fund and BFA and/or its affiliates, if any, and related costs of the services provided as well as the other factors considered at the meeting, supported the Board’s approval of the continuance of the Advisory Agreement for the coming year.
Economies of Scale: The Board reviewed information and considered the extent to which economies of scale might be realized as the assets of the Fund increase, noting that the issue of potential economies of scale had been focused on by the 15(c) Committee and the Board during their meetings and addressed by management. The 15(c) Committee and the Board received information regarding BlackRock’s historical estimated profitability (as discussed above), including BFA’s and its affiliates’ estimated costs in providing services. The estimated cost information distinguished, among other things, between fixed and variable costs, and showed how the level and nature of fixed and variable costs may impact the existence or size of scale benefits, with the Board recognizing that potential economies of scale are difficult to measure. The 15(c) Committee and the Board reviewed information provided by BFA regarding the sharing of scale benefits with the iShares funds through various means, including, as applicable, through breakpoints, waivers, or other fee reductions, as well as through additional investment in the iShares business, including enhancements to or the provision of additional infrastructure and services to the iShares funds and their shareholders and, with respect to New Funds, set management fees at levels that anticipate scale over time. The Board noted that the Advisory Agreement for the Fund did not provide for breakpoints in the Fund’s investment advisory fee rate as the assets of the Fund increase. However, the Board noted that it would continue to assess the appropriateness of adding breakpoints in the future.
The Board concluded that this review of potential economies of scale and the sharing of related benefits, as well as the other factors considered at the meeting, supported the Board’s approval of the continuance of the Advisory Agreement for the coming year.
Fees and Services Provided for Other Comparable Funds/Accounts Managed by BFA and its Affiliates: The Board received and considered information regarding the investment advisory/management fee rates for other funds/accounts in the U.S. for which BFA (or its affiliates) provides investment advisory/management services, including open-end funds registered under the 1940 Act (including sub-advised funds), collective trust funds and institutional separate accounts (collectively, the “Other Accounts”).
The Board received detailed information regarding how the Other Accounts generally differ from the Fund, including in terms of the types of services and generally more extensive character and scope of services provided to the Fund, as well as other significant differences. In that regard, the Board considered that the pricing of services to institutional clients is typically based on a number of factors beyond the nature and extent of the specific services to be provided and often depends on the overall relationship between the client and its affiliates and the adviser and its affiliates. In addition, the Board considered the relative complexity and inherent risks and challenges of managing and providing other services to the Fund, as a publicly traded investment vehicle, as compared to the Other Accounts, particularly those that are institutional clients, in light of differing regulatory requirements and client-imposed mandates. The Board acknowledged BFA’s representation that the iShares funds are fundamentally different investment vehicles from the Other Accounts in its consideration of relevant qualitative and quantitative comparative information provided. The Board noted that BFA and its affiliates do not manage Other Accounts with substantially the same investment objective and strategy as the Fund and that track the same index as the Fund. The Board also acknowledged management’s assertion that, for certain iShares funds, and for client segmentation purposes, BlackRock has launched an iShares fund that may provide a similar investment exposure at a lower investment advisory fee rate.
The Board considered the “all-inclusive” nature of the Fund’s advisory fee structure, and the Fund’s expenses borne by BFA under this arrangement and noted that the investment advisory fee rate under the Advisory Agreement for the Fund was generally higher than the investment advisory/management fee rates for certain of the Other Accounts (particularly institutional clients) and concluded that the differences appeared to be consistent with the factors discussed.
Board Review and Approval of Investment Advisory Contract84
Board Review and Approval of Investment Advisory Contract (continued)
Other Benefits to BFA and/or its Affiliates: The Board reviewed other benefits or ancillary revenue received by BFA and/or its affiliates in connection with the services provided to the Fund by BFA, both direct and indirect, including, but not limited to, payment of revenue to BTC, the Fund’s securities lending agent, for loaning portfolio securities, as applicable (which was included in the profit margins reviewed by the Board pursuant to BFA’s estimated profitability methodology), payment of advisory fees or other fees to BFA (or its affiliates) in connection with any investments by the Fund in other funds (including cash sweep vehicles) for which BFA (or its affiliates) provides investment advisory services or other services, and BlackRock’s profile in the investment community. The Board further considered other direct benefits that might accrue to BFA, including actual and potential reductions in the Fund’s expenses that are borne by BFA under the “all-inclusive” management fee arrangement, due in part to the size and scope of BFA’s investment operations servicing the Fund (and other funds in the iShares complex) as well as in response to a changing market environment. The Board also reviewed and considered information provided by BFA concerning authorized participant primary market order processing services that are provided by BlackRock Investments, LLC (“BRIL”), an affiliate of BFA, and paid for by authorized participants under the ETF Servicing Platform. The Board also noted the revenue received by BFA and/or its affiliates pursuant to an agreement that permits a service provider to use certain portions of BlackRock’s technology platform to service accounts managed by BFA and/or its affiliates, including the iShares funds. The Board noted that BFA generally does not use soft dollars or consider the value of research or other services that may be provided to BFA (including its affiliates) in selecting brokers for portfolio transactions for the Fund. The Board concluded that any such ancillary benefits would not be disadvantageous to the Fund and thus would not alter the Board’s conclusion with respect to the appropriateness of approving the continuance of the Advisory Agreement for the coming year.
Conclusion: Based on a review of the factors described above, as well as such other factors as deemed appropriate by the Board, the Board, including all of the Independent Board Members, determined that the Fund’s investment advisory fee rate under the Advisory Agreement does not constitute a fee that is so disproportionately large as to bear no reasonable relationship to the services rendered and that could not have been the product of arm’s-length bargaining, and concluded to approve the continuance of the Advisory Agreement for the coming year.
iShares Interest Rate Hedged Long-Term Corporate Bond ETF (the “Fund”)
Under Section 15(c) of the Investment Company Act of 1940 (the “1940 Act”), the Trust's Board of Trustees (the “Board”), including a majority of Board Members who are not “interested persons” of the Trust (as that term is defined in the 1940 Act) (the “Independent Board Members”), is required annually to consider the approval of the Investment Advisory Agreement between the Trust and BFA (the “Advisory Agreement”) on behalf of the Fund. The Board’s consideration entails a year-long process whereby the Board and its committees (composed solely of Independent Board Members) assess BlackRock’s services to the Fund, including investment management; fund accounting; administrative and shareholder services; oversight of the Fund’s service providers; risk management and oversight; and legal and compliance services; including the ability to meet applicable legal and regulatory requirements. The Independent Board Members requested, and BFA provided, such information as the Independent Board Members, with advice from independent counsel, deemed reasonably necessary to evaluate the Advisory Agreement. At meetings held on May 6, 2024 and May 17, 2024, a committee composed of all of the Independent Board Members (the “15(c) Committee”), with independent counsel, met with management and reviewed and discussed information provided in response to initial requests of the 15(c) Committee and/or its independent counsel. Prior to and in preparation for the meeting, the Board received and reviewed materials specifically relating to matters relevant to the renewal of the Advisory Agreement. Following discussion, the 15(c) Committee subsequently requested certain additional information, which management agreed to provide. At a meeting held on June 4-5, 2024, the Board, including the Independent Board Members, reviewed the additional information provided by management in response to these requests.
After extensive discussions and deliberations, the Board, including all of the Independent Board Members, approved the continuance of the Advisory Agreement for the Fund, based on a review of qualitative and quantitative information provided by BFA and their cumulative experience as Board Members. The Board noted its satisfaction with the extent and quality of information provided and its frequent interactions with management, as well as the detailed responses and other information provided by BFA. The Independent Board Members were advised by their independent counsel throughout the process, including about the legal standards applicable to their review. In approving the continuance of the Advisory Agreement for the Fund, the Board, including the Independent Board Members, considered various factors, including: (i) the expenses and performance of the Fund; (ii) the nature, extent and quality of the services provided by BFA; (iii) the costs of services provided to the Fund and profits realized by BFA and its affiliates; (iv) potential economies of scale and the sharing of related benefits; (v) the fees and services provided for other comparable funds/accounts managed by BFA and its affiliates; and (vi) other benefits to BFA and/or its affiliates. The Board Members did not identify any particular information or any single factor as determinative, and each Board Member may have attributed different weights to the various matters and factors considered. The material factors, considerations and conclusions that formed the basis for the Board, including the Independent Board Members, to approve the continuance of the Advisory Agreement are discussed below.
Expenses and Performance of the Fund: The Board reviewed statistical information prepared by Broadridge Financial Solutions, Inc. (“Broadridge”), an independent provider of investment company data, regarding the expense ratio components, including gross and net total expenses, fees and expenses of other fund(s) in which the Fund invests (if applicable), and waivers/reimbursements (if applicable) of the Fund in comparison with the same information for other ETFs, objectively selected by Broadridge as comprising the Fund’s applicable expense peer group pursuant to Broadridge’s proprietary ETF methodology (the “Peer Group”). The Board was provided with a detailed description of the proprietary ETF methodology used by Broadridge to determine the Fund’s Peer Group. The Board noted that, due to the limitations in providing comparable funds in the Peer Group, the statistical information provided in Broadridge’s report may or may not provide meaningful direct comparisons to the Fund in all instances. The Board also noted that the investment advisory fee rate and overall expenses (net of any waivers and reimbursements) for the Fund were lower than the median of the investment advisory fee rates and overall expenses (net of any waivers and reimbursements) of the funds in its Peer Group, excluding iShares funds.
In addition, to the extent that any of the comparison funds included in the Peer Group, excluding iShares funds, track the same index as the Fund, Broadridge also provided, and the Board reviewed, a comparison of the Fund’s performance for the one-year, three-year, five-year, ten-year, and since inception periods, as applicable, and for the quarter ended December 31, 2023, to that of such relevant comparison fund(s) for the same periods. The Board noted that the Fund seeks to track its specified underlying index and that, during the year, the Board received periodic reports on the Fund’s short- and longer-term performance in comparison with its underlying index. Such periodic comparative performance information, including additional detailed information as requested by the Board, was also considered. The Board noted that the Fund generally performed in line with its underlying index over the relevant periods.
852024 iShares Annual Financial Statements and Additional Information
Board Review and Approval of Investment Advisory Contract (continued)
Based on this review, the other relevant factors and information considered at the meeting, and their general knowledge of ETF pricing, the Board concluded that the investment advisory fee rate and expense level and the historical performance of the Fund supported the Board’s approval of the continuance of the Advisory Agreement for the coming year.
Nature, Extent and Quality of Services Provided: Based on management’s representations, including information about ongoing enhancements and initiatives with respect to the iShares product line and BFA’s business, including with respect to capital markets support and analysis, technology, portfolio management, product design and quality, compliance and risk management, global public policy and other services, the Board expected that there would be no diminution in the scope of services required of or provided by BFA under the Advisory Agreement for the coming year as compared with the scope of services provided by BFA during prior years. In reviewing the scope of these services, the Board considered BFA’s investment philosophy and experience, noting that BFA and its affiliates have committed significant resources over time, including during the past year, to support the iShares funds and their shareholders and have made significant investments into the iShares business. The Board also considered BFA’s compliance program and its compliance record with respect to the Fund, including related programs implemented pursuant to regulatory requirements. In that regard, the Board noted that BFA reports to the Board about portfolio management and compliance matters on a periodic basis in connection with regularly scheduled meetings of the Board, and on other occasions as necessary and appropriate, and has provided information and made relevant officers and other employees of BFA (and its affiliates) available as needed to provide further assistance with these matters. The Board also reviewed the background and experience of the persons responsible for the day-to-day management of the Fund, as well as the resources available to them in managing the Fund. In addition to the above considerations, the Board reviewed and considered detailed presentations regarding BFA’s investment performance, investment and risk management processes and strategies provided at the May 6, 2024 meeting and throughout the year, and matters related to BFA’s portfolio compliance program and other compliance programs and services, as well as BlackRock’s continued investments in its ETF business.
Based on review of this information, and the performance information discussed above, the Board concluded that the nature, extent and quality of services provided to the Fund under the Advisory Agreement supported the Board’s approval of the continuance of the Advisory Agreement for the coming year.
Costs of Services Provided to the Fund and Profits Realized by BFA and its Affiliates: The Board reviewed information about the estimated profitability to BlackRock in managing the Fund, based on the fees payable to BFA and its affiliates (including fees under the Advisory Agreement), and other sources of revenue and expense to BFA and its affiliates from the Fund’s operations for the last calendar year. The Board reviewed BlackRock’s methodology for calculating estimated profitability of the iShares funds, noting that the 15(c) Committee and the Board had focused on the methodology and profitability presentation. The Board recognized that profitability may be affected by numerous factors, including, among other things, fee waivers by BFA, the types of funds managed, expense allocations and business mix. The Board thus recognized that calculating and comparing profitability at individual fund levels is challenging. The Board discussed with management the sources of direct and ancillary revenue, including the revenues to BTC, a BlackRock affiliate, from securities lending by the Fund. The Board also discussed BFA’s estimated profit margin as reflected in the Fund’s profitability analysis and reviewed information regarding potential economies of scale (as discussed below).
Based on this review, the Board concluded that the information considered with respect to the profits realized by BFA and its affiliates under the Advisory Agreement and from other relationships between the Fund and BFA and/or its affiliates, if any, and related costs of the services provided as well as the other factors considered at the meeting, supported the Board’s approval of the continuance of the Advisory Agreement for the coming year.
Economies of Scale: The Board reviewed information and considered the extent to which economies of scale might be realized as the assets of the Fund increase, noting that the issue of potential economies of scale had been focused on by the 15(c) Committee and the Board during their meetings and addressed by management. The 15(c) Committee and the Board received information regarding BlackRock’s historical estimated profitability (as discussed above), including BFA’s and its affiliates’ estimated costs in providing services. The estimated cost information distinguished, among other things, between fixed and variable costs, and showed how the level and nature of fixed and variable costs may impact the existence or size of scale benefits, with the Board recognizing that potential economies of scale are difficult to measure. The 15(c) Committee and the Board reviewed information provided by BFA regarding the sharing of scale benefits with the iShares funds through various means, including, as applicable, through breakpoints, waivers, or other fee reductions, as well as through additional investment in the iShares business, including enhancements to or the provision of additional infrastructure and services to the iShares funds and their shareholders and, with respect to New Funds, set management fees at levels that anticipate scale over time. The Board noted that the Advisory Agreement for the Fund did not provide for breakpoints in the Fund’s investment advisory fee rate as the assets of the Fund increase. However, the Board noted that it would continue to assess the appropriateness of adding breakpoints in the future.
The Board concluded that this review of potential economies of scale and the sharing of related benefits, as well as the other factors considered at the meeting, supported the Board’s approval of the continuance of the Advisory Agreement for the coming year.
Fees and Services Provided for Other Comparable Funds/Accounts Managed by BFA and its Affiliates: The Board received and considered information regarding the investment advisory/management fee rates for other funds/accounts in the U.S. for which BFA (or its affiliates) provides investment advisory/management services, including open-end funds registered under the 1940 Act (including sub-advised funds), collective trust funds and institutional separate accounts (collectively, the “Other Accounts”).
The Board received detailed information regarding how the Other Accounts generally differ from the Fund, including in terms of the types of services and generally more extensive character and scope of services provided to the Fund, as well as other significant differences. In that regard, the Board considered that the pricing of services to institutional clients is typically based on a number of factors beyond the nature and extent of the specific services to be provided and often depends on the overall relationship between the client and its affiliates and the adviser and its affiliates. In addition, the Board considered the relative complexity and inherent risks and challenges of managing and providing other services to the Fund, as a publicly traded investment vehicle, as compared to the Other Accounts, particularly those that are institutional clients, in light of differing regulatory requirements and client-imposed mandates. The Board acknowledged BFA’s representation that the iShares funds are fundamentally different investment vehicles from the Other Accounts in its consideration of relevant qualitative and quantitative comparative information provided. The Board noted that BFA and its affiliates do not manage Other Accounts with substantially the same investment objective and strategy as the Fund and that track the same index as the Fund.
Board Review and Approval of Investment Advisory Contract86
Board Review and Approval of Investment Advisory Contract (continued)
The Board also acknowledged management’s assertion that, for certain iShares funds, and for client segmentation purposes, BlackRock has launched an iShares fund that may provide a similar investment exposure at a lower investment advisory fee rate.
The Board considered the “all-inclusive” nature of the Fund’s advisory fee structure, and the Fund’s expenses borne by BFA under this arrangement and noted that the investment advisory fee rate under the Advisory Agreement for the Fund was generally higher than the investment advisory/management fee rates for certain of the Other Accounts (particularly institutional clients) and concluded that the differences appeared to be consistent with the factors discussed.
Other Benefits to BFA and/or its Affiliates: The Board reviewed other benefits or ancillary revenue received by BFA and/or its affiliates in connection with the services provided to the Fund by BFA, both direct and indirect, including, but not limited to, payment of revenue to BTC, the Fund’s securities lending agent, for loaning portfolio securities, as applicable (which was included in the profit margins reviewed by the Board pursuant to BFA’s estimated profitability methodology), payment of advisory fees or other fees to BFA (or its affiliates) in connection with any investments by the Fund in other funds (including cash sweep vehicles) for which BFA (or its affiliates) provides investment advisory services or other services, and BlackRock’s profile in the investment community. The Board further considered other direct benefits that might accrue to BFA, including actual and potential reductions in the Fund’s expenses that are borne by BFA under the “all-inclusive” management fee arrangement, due in part to the size and scope of BFA’s investment operations servicing the Fund (and other funds in the iShares complex) as well as in response to a changing market environment. The Board also reviewed and considered information provided by BFA concerning authorized participant primary market order processing services that are provided by BlackRock Investments, LLC (“BRIL”), an affiliate of BFA, and paid for by authorized participants under the ETF Servicing Platform. The Board also noted the revenue received by BFA and/or its affiliates pursuant to an agreement that permits a service provider to use certain portions of BlackRock’s technology platform to service accounts managed by BFA and/or its affiliates, including the iShares funds. The Board noted that BFA generally does not use soft dollars or consider the value of research or other services that may be provided to BFA (including its affiliates) in selecting brokers for portfolio transactions for the Fund. The Board concluded that any such ancillary benefits would not be disadvantageous to the Fund and thus would not alter the Board’s conclusion with respect to the appropriateness of approving the continuance of the Advisory Agreement for the coming year.
Conclusion: Based on a review of the factors described above, as well as such other factors as deemed appropriate by the Board, the Board, including all of the Independent Board Members, determined that the Fund’s investment advisory fee rate under the Advisory Agreement does not constitute a fee that is so disproportionately large as to bear no reasonable relationship to the services rendered and that could not have been the product of arm’s-length bargaining, and concluded to approve the continuance of the Advisory Agreement for the coming year.
872024 iShares Annual Financial Statements and Additional Information
Glossary of Terms Used in this Report
|
| |
| Secured Overnight Financing Rate |
Glossary of Terms Used in this Report88
Additional Financial Information
Schedules of Investments (Unaudited)
October 31, 2024
Statements of Assets and Liabilities (Unaudited)
October 31, 2024
|
iShares 10+ Year Investment Grade Corporate Bond ETF | IGLB | NYSE Arca |
iShares Core U.S. Aggregate Bond ETF | AGG | NYSE Arca |
iShares iBoxx $ High Yield Corporate Bond ETF | HYG | NYSE Arca |
iShares iBoxx $ Investment Grade Corporate Bond ETF | LQD | NYSE Arca |
|
Schedule of Investments (unaudited)October 31, 2024
iShares® 10+ Year Investment Grade Corporate Bond ETF(Percentages shown are based on Net Assets)
| | |
|
|
Interpublic Group of Companies Inc. (The) | | |
| | |
| | |
| | |
Aerospace & Defense — 2.6% |
Airbus SE, 3.95%, 04/10/47(a)(b) | | |
BAE Systems Holdings Inc., 4.75%, 10/07/44(a)(b) | | |
| | |
| | |
| | |
| | |
| | |
| | |
| | |
| | |
| | |
| | |
| | |
| | |
| | |
| | |
| | |
| | |
| | |
| | |
| | |
| | |
| | |
| | |
| | |
| | |
| | |
| | |
GE Capital International Funding Co. Unlimited Co., 4.42%, 11/15/35 | | |
| | |
| | |
| | |
| | |
| | |
| | |
| | |
| | |
| | |
| | |
| | |
Howmet Aerospace Inc., 5.95%, 02/01/37(a) | | |
L3Harris Technologies Inc. | | |
| | |
| | |
| | |
| | |
| | |
| | |
| | |
| | |
| | |
| | |
| | |
| | |
Aerospace & Defense (continued) |
| | |
| | |
| | |
| | |
| | |
| | |
| | |
| | |
| | |
Series B, 6.15%, 09/01/36 | | |
| | |
| | |
| | |
| | |
| | |
| | |
| | |
| | |
| | |
| | |
| | |
| | |
| | |
| | |
| | |
| | |
| | |
| | |
| | |
| | |
| | |
| | |
| | |
| | |
| | |
| | |
| | |
| | |
| | |
| | |
| | |
|
| | |
| | |
| | |
| | |
| | |
| | |
| | |
| | |
| | |
| | |
| | |
| | |
Archer-Daniels-Midland Co. | | |
| | |
| | |
| | |
| | |
| | |
| | |
Schedule of Investments (unaudited)(continued)October 31, 2024
iShares® 10+ Year Investment Grade Corporate Bond ETF(Percentages shown are based on Net Assets)
| | |
|
| | |
| | |
| | |
| | |
| | |
| | |
| | |
| | |
| | |
| | |
| | |
| | |
| | |
| | |
| | |
| | |
Philip Morris International Inc. | | |
| | |
| | |
| | |
| | |
| | |
| | |
| | |
| | |
| | |
| | |
| | |
| | |
| | |
|
| | |
| | |
| | |
| | |
| | |
| | |
| | |
Auto Manufacturers — 0.5% |
| | |
| | |
| | |
| | |
| | |
| | |
| | |
| | |
| | |
| | |
| | |
| | |
| | |
| | |
| | |
| | |
| | |
| | |
Auto Parts & Equipment — 0.2% |
| | |
| | |
| | |
Auto Parts & Equipment (continued) |
| | |
| | |
Aptiv PLC/Aptiv Corp., 4.15%, 05/01/52(a) | | |
Aptiv PLC/Aptiv Global Financing DAC, 5.75%, 09/13/54 | | |
BorgWarner Inc., 4.38%, 03/15/45 | | |
| | |
| | |
| | |
| | |
|
| | |
2.68%, 06/19/41, (1-day SOFR + 1.930%)(d) | | |
2.83%, 10/24/51, (1-day SOFR + 1.880%)(d) | | |
2.97%, 07/21/52, (1-day SOFR + 1.560%)(a)(d) | | |
3.31%, 04/22/42, (1-day SOFR + 1.580%)(d) | | |
3.95%, 01/23/49, (3-mo. CME Term SOFR + 1.452%)(d) | | |
4.08%, 04/23/40, (3-mo. CME Term SOFR + 1.582%)(d) | | |
4.08%, 03/20/51, (3-mo. CME Term SOFR + 3.412%)(d) | | |
4.24%, 04/24/38, (3-mo. CME Term SOFR + 2.076%)(d) | | |
4.33%, 03/15/50, (3-mo. CME Term SOFR + 1.782%)(d) | | |
4.44%, 01/20/48, (3-mo. CME Term SOFR + 2.252%)(d) | | |
| | |
| | |
| | |
| | |
| | |
Series L, 4.75%, 04/21/45 | | |
Series N, 3.48%, 03/13/52, (1-day SOFR + 1.650%)(d) | | |
Bank of America NA, 6.00%, 10/15/36 | | |
| | |
3.33%, 11/24/42, (1-year CMT + 1.300%)(d) | | |
3.81%, 03/10/42, (1-year CMT + 1.700%)(a)(d) | | |
| | |
| | |
6.04%, 03/12/55, (1-day SOFR + 2.420%)(d) | | |
BNP Paribas SA, 2.82%, 01/26/41(a)(b) | | |
BPCE SA, 3.58%, 10/19/42, (1-day SOFR + 1.952%)(a)(b)(d) | | |
| | |
2.90%, 11/03/42, (1-day SOFR + 1.379%)(a)(d) | | |
3.88%, 01/24/39, (3-mo. CME Term SOFR + 1.430%)(d) | | |
4.28%, 04/24/48, (3-mo. CME Term SOFR + 2.101%)(d) | | |
| | |
| | |
| | |
| | |
5.32%, 03/26/41, (1-day SOFR + 4.548%)(d) | | |
| | |
| | |
| | |
| | |
Schedule of Investments (unaudited)(continued)October 31, 2024
iShares® 10+ Year Investment Grade Corporate Bond ETF(Percentages shown are based on Net Assets)
| | |
|
| | |
| | |
Commonwealth Bank of Australia | | |
| | |
| | |
| | |
| | |
| | |
| | |
| | |
| | |
| | |
Credit Agricole SA, 2.81%, 01/11/41(a)(b) | | |
Fifth Third Bancorp, 8.25%, 03/01/38(a) | | |
Goldman Sachs Group Inc. (The) | | |
2.91%, 07/21/42, (1-day SOFR + 1.472%)(d) | | |
3.21%, 04/22/42, (1-day SOFR + 1.513%)(d) | | |
3.44%, 02/24/43, (1-day SOFR + 1.632%)(d) | | |
4.02%, 10/31/38, (3-mo. CME Term SOFR + 1.635%)(d) | | |
4.41%, 04/23/39, (3-mo. CME Term SOFR + 1.692%)(d) | | |
| | |
| | |
| | |
| | |
| | |
| | |
HSBC Bank USA NA, 7.00%, 01/15/39 | | |
HSBC Bank USA NA/New York, 5.63%, 08/15/35 | | |
| | |
| | |
| | |
6.33%, 03/09/44, (1-day SOFR + 2.650%)(d) | | |
| | |
| | |
| | |
| | |
| | |
HSBC USA Inc., 7.20%, 07/15/97(a) | | |
| | |
7.78%, 06/20/54, (1-year CMT + 3.900%)(b)(d) | | |
| | |
| | |
2.53%, 11/19/41, (3-mo. CME Term SOFR + 1.510%)(d) | | |
3.11%, 04/22/41, (3-mo. CME Term SOFR + 2.460%)(d) | | |
3.11%, 04/22/51, (1-day SOFR + 2.440%)(a)(d) | | |
3.16%, 04/22/42, (1-day SOFR + 1.460%)(d) | | |
3.33%, 04/22/52, (1-day SOFR + 1.580%)(a)(d) | | |
3.88%, 07/24/38, (3-mo. CME Term SOFR + 1.622%)(d) | | |
3.90%, 01/23/49, (3-mo. CME Term SOFR + 1.482%)(d) | | |
3.96%, 11/15/48, (3-mo. CME Term SOFR + 1.642%)(d) | | |
4.03%, 07/24/48, (3-mo. CME Term SOFR + 1.722%)(d) | | |
4.26%, 02/22/48, (3-mo. CME Term SOFR + 1.842%)(d) | | |
| | |
|
| | |
| | |
| | |
| | |
| | |
| | |
| | |
| | |
3.37%, 12/14/46, (5-year CMT + 1.500%)(d) | | |
| | |
| | |
Mitsubishi UFJ Financial Group Inc. | | |
| | |
| | |
| | |
| | |
2.80%, 01/25/52, (1-day SOFR + 1.430%)(a)(d) | | |
3.22%, 04/22/42, (1-day SOFR + 1.485%)(d) | | |
| | |
| | |
| | |
4.46%, 04/22/39, (3-mo. CME Term SOFR + 1.693%)(d) | | |
5.60%, 03/24/51, (1-day SOFR + 4.840%)(a)(d) | | |
| | |
MUFG Bank Ltd., 4.70%, 03/10/44(b) | | |
National Australia Bank Ltd., 2.65%, 01/14/41(a)(b) | | |
Regions Bank/Birmingham AL, 6.45%, 06/26/37 | | |
Regions Financial Corp., 7.38%, 12/10/37 | | |
Royal Bank of Canada, 6.35%, 11/24/84, (5-year CMT + 2.257%)(d) | | |
Santander U.K. Group Holdings PLC, 5.63%, 09/15/45(b) | | |
| | |
| | |
4.03%, 01/21/43, (1-year CMT + 1.900%)(b)(d) | | |
| | |
7.13%, 01/19/55, (1-year CMT + 2.950%)(b)(d) | | |
| | |
| | |
| | |
| | |
Sumitomo Mitsui Financial Group Inc. | | |
| | |
| | |
| | |
| | |
| | |
UBS AG/London, 4.50%, 06/26/48(a) | | |
| | |
3.18%, 02/11/43, (1-year CMT + 1.100%)(b)(d) | | |
| | |
5.38%, 09/06/45, (1-year USD ICE Swap + 1.860%)(b)(d) | | |
| | |
| | |
| | |
| | |
3.07%, 04/30/41, (1-day SOFR + 2.530%)(d) | | |
| | |
| | |
Schedule of Investments (unaudited)(continued)October 31, 2024
iShares® 10+ Year Investment Grade Corporate Bond ETF(Percentages shown are based on Net Assets)
| | |
|
4.61%, 04/25/53, (1-day SOFR + 2.130%)(d) | | |
| | |
| | |
| | |
5.01%, 04/04/51, (3-mo. CME Term SOFR + 4.502%)(d) | | |
| | |
| | |
| | |
| | |
| | |
| | |
| | |
| | |
| | |
| | |
| | |
| | |
| | |
|
Anheuser-Busch Companies LLC/Anheuser-Busch InBev Worldwide Inc. | | |
| | |
| | |
Anheuser-Busch InBev Finance Inc. | | |
| | |
| | |
| | |
| | |
Anheuser-Busch InBev Worldwide Inc. | | |
| | |
| | |
| | |
| | |
| | |
| | |
| | |
| | |
| | |
| | |
| | |
| | |
| | |
| | |
| | |
| | |
| | |
| | |
Bacardi Ltd./Bacardi-Martini BV, 5.90%, 06/15/43(a)(b) | | |
| | |
| | |
| | |
| | |
| | |
| | |
| | |
| | |
| | |
| | |
| | |
| | |
|
| | |
| | |
| | |
| | |
Coca-Cola Femsa SAB de CV, 5.25%, 11/26/43 | | |
Constellation Brands Inc. | | |
| | |
| | |
| | |
| | |
| | |
| | |
| | |
| | |
| | |
| | |
Fomento Economico Mexicano SAB de CV, 3.50%, 01/16/50(a) | | |
| | |
| | |
| | |
| | |
| | |
| | |
| | |
| | |
| | |
| | |
Molson Coors Beverage Co. | | |
| | |
| | |
| | |
| | |
| | |
| | |
| | |
| | |
| | |
| | |
| | |
| | |
| | |
| | |
| | |
| | |
| | |
| | |
| | |
| | |
| | |
| | |
Pernod Ricard International Finance LLC, 2.75%, 10/01/50(b) | | |
Pernod Ricard SA, 5.50%, 01/15/42(b) | | |
| | |
|
| | |
| | |
| | |
| | |
| | |
Schedule of Investments (unaudited)(continued)October 31, 2024
iShares® 10+ Year Investment Grade Corporate Bond ETF(Percentages shown are based on Net Assets)
| | |
Biotechnology (continued) |
| | |
| | |
| | |
| | |
| | |
| | |
| | |
| | |
| | |
| | |
| | |
| | |
| | |
| | |
| | |
| | |
| | |
Baxalta Inc., 5.25%, 06/23/45(a) | | |
| | |
| | |
| | |
| | |
| | |
| | |
| | |
| | |
| | |
| | |
| | |
| | |
| | |
| | |
| | |
| | |
| | |
| | |
| | |
| | |
Regeneron Pharmaceuticals Inc., 2.80%, 09/15/50 | | |
| | |
| | |
| | |
| | |
| | |
| | |
Building Materials — 0.5% |
| | |
| | |
| | |
| | |
| | |
| | |
| | |
CRH America Inc., 5.13%, 05/18/45(b) | | |
Fortune Brands Innovations Inc., 4.50%, 03/25/52 | | |
Holcim Finance U.S. LLC, 4.75%, 09/22/46(b) | | |
Holcim U.S. Finance Luxembourg SA | | |
| | |
| | |
Johnson Controls International PLC | | |
| | |
| | |
Building Materials (continued) |
| | |
| | |
| | |
| | |
Lafarge SA, 7.13%, 07/15/36(a) | | |
Martin Marietta Materials Inc. | | |
| | |
| | |
| | |
| | |
| | |
| | |
| | |
| | |
| | |
| | |
| | |
Trane Technologies Financing Ltd. | | |
| | |
| | |
Trane Technologies Global Holding Co. Ltd. | | |
| | |
| | |
Votorantim Cimentos International SA, 7.25%, 04/05/41(b) | | |
| | |
| | |
| | |
| | |
|
Air Liquide Finance SA, 3.50%, 09/27/46(b) | | |
Air Products and Chemicals Inc. | | |
| | |
| | |
| | |
| | |
| | |
| | |
| | |
| | |
| | |
| | |
| | |
| | |
| | |
| | |
| | |
| | |
| | |
| | |
| | |
| | |
| | |
| | |
| | |
| | |
| | |
| | |
| | |
| | |
| | |
Schedule of Investments (unaudited)(continued)October 31, 2024
iShares® 10+ Year Investment Grade Corporate Bond ETF(Percentages shown are based on Net Assets)
| | |
|
| | |
| | |
| | |
| | |
International Flavors & Fragrances Inc. | | |
| | |
| | |
| | |
| | |
| | |
| | |
| | |
LYB International Finance BV | | |
| | |
| | |
LYB International Finance III LLC | | |
| | |
| | |
| | |
| | |
| | |
LyondellBasell Industries NV, 4.63%, 02/26/55(a) | | |
| | |
| | |
| | |
| | |
| | |
| | |
| | |
| | |
| | |
| | |
| | |
| | |
| | |
Orbia Advance Corp. SAB de CV | | |
| | |
| | |
| | |
PPG Industries Inc., 5.50%, 11/15/40 | | |
| | |
| | |
| | |
Sherwin-Williams Co. (The) | | |
| | |
| | |
| | |
| | |
| | |
| | |
Sociedad Quimica y Minera de Chile SA | | |
| | |
| | |
| | |
| | |
| | |
| | |
| | |
| | |
| | |
| | |
Commercial Services — 1.6% |
Adani Ports & Special Economic Zone Ltd., 5.00%, 08/02/41(a)(b) | | |
American University (The), Series 2019, 3.67%, 04/01/49(a) | | |
Brown University, Series A, 2.92%, 09/01/50(a) | | |
California Endowment (The), Series 2021, 2.50%, 04/01/51 | | |
California Institute of Technology | | |
| | |
| | |
| | |
Case Western Reserve University, 5.41%, 06/01/2122(a) | | |
Claremont Mckenna College, 3.78%, 01/01/2122 | | |
DP World Ltd./United Arab Emirates | | |
| | |
| | |
| | |
| | |
| | |
| | |
Series 2020, 2.68%, 10/01/44 | | |
Series 2020, 2.76%, 10/01/50 | | |
Series 2020, 2.83%, 10/01/55 | | |
Emory University, Series 2020, 2.97%, 09/01/50 | | |
Equifax Inc., 7.00%, 07/01/37(a) | | |
| | |
| | |
| | |
| | |
| | |
| | |
| | |
Series 2017, 3.86%, 06/01/47(a) | | |
Series 2020, 2.42%, 06/01/50 | | |
Series 2020, 2.82%, 06/01/70 | | |
George Washington University (The) | | |
| | |
Series 2014, 4.30%, 09/15/44 | | |
Series 2016, 3.55%, 09/15/46 | | |
Series 2018, 4.13%, 09/15/48(a) | | |
Georgetown University (The) | | |
| | |
Series 20A, 2.94%, 04/01/50 | | |
| | |
Series B, 4.32%, 04/01/49 | | |
| | |
| | |
| | |
Howard University, 5.21%, 10/01/52 | | |
ITR Concession Co. LLC, 5.18%, 07/15/35(b) | | |
| | |
Series 2013, 4.08%, 07/01/53 | | |
Series A, 2.81%, 01/01/60 | | |
Leland Stanford Junior University (The) | | |
| | |
| | |
| | |
Massachusetts Institute of Technology | | |
| | |
| | |
Schedule of Investments (unaudited)(continued)October 31, 2024
iShares® 10+ Year Investment Grade Corporate Bond ETF(Percentages shown are based on Net Assets)
| | |
Commercial Services (continued) |
| | |
| | |
| | |
Series F, 2.99%, 07/01/50 | | |
Series G, 2.29%, 07/01/51(a) | | |
Metropolitan Museum of Art (The), Series 2015, 3.40%, 07/01/45 | | |
| | |
| | |
| | |
| | |
| | |
| | |
| | |
| | |
Northeastern University, Series 2020, 2.89%, 10/01/50(a) | | |
| | |
| | |
| | |
| | |
Series 2017, 3.66%, 12/01/57(a) | | |
Series 2020, 2.64%, 12/01/50(a) | | |
| | |
| | |
| | |
| | |
| | |
Pelabuhan Indonesia Persero PT, 5.38%, 05/05/45(a)(b) | | |
President and Fellows of Harvard College | | |
| | |
| | |
| | |
| | |
| | |
| | |
| | |
Series ., 4.61%, 02/15/35(a) | | |
Quanta Services Inc., 3.05%, 10/01/41 | | |
Rockefeller Foundation (The), Series 2020, 2.49%, 10/01/50 | | |
| | |
| | |
| | |
| | |
| | |
| | |
| | |
Thomas Jefferson University, 3.85%, 11/01/57(a) | | |
Trustees of Boston College | | |
| | |
| | |
Trustees of Boston University, Series CC, 4.06%, 10/01/48(a) | | |
Trustees of Dartmouth College, 3.47%, 06/01/46(a) | | |
Trustees of Princeton University (The) | | |
| | |
| | |
Series 2020, 2.52%, 07/01/50(a) | | |
| | |
Commercial Services (continued) |
Trustees of the University of Pennsylvania (The) | | |
| | |
| | |
Series 2020, 2.40%, 10/01/50 | | |
Trustees of Tufts College | | |
| | |
Series 2012, 5.02%, 04/15/2112(a) | | |
University of Chicago (The) | | |
| | |
Series 20B, 2.76%, 04/01/45(a) | | |
Series C, 2.55%, 04/01/50(a) | | |
University of Miami, 4.06%, 04/01/52 | | |
University of Notre Dame du Lac | | |
Series 2015, 3.44%, 02/15/45 | | |
Series 2017, 3.39%, 02/15/48 | | |
University of Southern California | | |
| | |
| | |
| | |
| | |
Series 2017, 3.84%, 10/01/47 | | |
Series 21A, 2.95%, 10/01/51 | | |
Series A, 3.23%, 10/01/2120(a) | | |
| | |
| | |
| | |
Washington University (The) | | |
| | |
| | |
Wesleyan University, 4.78%, 07/01/2116(a) | | |
William Marsh Rice University | | |
| | |
| | |
Yale University, Series 2020, 2.40%, 04/15/50 | | |
| | |
|
| | |
| | |
| | |
| | |
| | |
| | |
| | |
| | |
| | |
| | |
| | |
| | |
| | |
| | |
| | |
| | |
| | |
| | |
| | |
| | |
| | |
| | |
| | |
Schedule of Investments (unaudited)(continued)October 31, 2024
iShares® 10+ Year Investment Grade Corporate Bond ETF(Percentages shown are based on Net Assets)
| | |
|
| | |
| | |
| | |
Dell International LLC/EMC Corp. | | |
| | |
| | |
| | |
| | |
| | |
Hewlett Packard Enterprise Co. | | |
| | |
| | |
| | |
HP Inc., 6.00%, 09/15/41(a) | | |
IBM International Capital Pte Ltd. | | |
| | |
| | |
International Business Machines Corp. | | |
| | |
| | |
| | |
| | |
| | |
| | |
| | |
| | |
| | |
| | |
| | |
Kyndryl Holdings Inc., 4.10%, 10/15/41(a) | | |
| | |
Cosmetics & Personal Care — 0.4% |
| | |
| | |
| | |
Estee Lauder Companies Inc. (The) | | |
| | |
| | |
| | |
| | |
| | |
| | |
Haleon U.S. Capital LLC, 4.00%, 03/24/52(a) | | |
| | |
| | |
| | |
| | |
Procter & Gamble Co. (The) | | |
| | |
| | |
| | |
| | |
Unilever Capital Corp., Series 30Y, 2.63%, 08/12/51(a) | | |
| | |
Distribution & Wholesale — 0.1% |
| | |
| | |
| | |
| | |
Distribution & Wholesale (continued) |
| | |
| | |
Diversified Financial Services — 1.2% |
AerCap Ireland Capital DAC/AerCap Global Aviation Trust, 3.85%, 10/29/41 | | |
American Express Co., 4.05%, 12/03/42(a) | | |
Apollo Global Management Inc., 5.80%, 05/21/54 | | |
Ares Finance Co. IV LLC, 3.65%, 02/01/52(b) | | |
Ares Management Corp., 5.60%, 10/11/54 | | |
Blackstone Holdings Finance Co. LLC | | |
| | |
| | |
| | |
| | |
| | |
| | |
| | |
| | |
Blue Owl Finance LLC, 4.13%, 10/07/51(a) | | |
| | |
| | |
| | |
| | |
| | |
| | |
Brookfield Finance LLC/Brookfield Finance Inc., 3.45%, 04/15/50 | | |
CI Financial Corp., 4.10%, 06/15/51(a) | | |
| | |
| | |
| | |
| | |
| | |
| | |
| | |
Franklin Resources Inc., 2.95%, 08/12/51 | | |
Invesco Finance PLC, 5.38%, 11/30/43 | | |
Jefferies Financial Group Inc. | | |
| | |
| | |
| | |
KKR Group Finance Co. II LLC, 5.50%, 02/01/43(a)(b) | | |
Legg Mason Inc., 5.63%, 01/15/44 | | |
LSEGA Financing PLC, 3.20%, 04/06/41(b) | | |
| | |
| | |
| | |
| | |
| | |
| | |
| | |
| | |
| | |
| | |
| | |
| | |
Neuberger Berman Group LLC/Neuberger Berman Finance Corp., 4.88%, 04/15/45(a)(b) | | |
Schedule of Investments (unaudited)(continued)October 31, 2024
iShares® 10+ Year Investment Grade Corporate Bond ETF(Percentages shown are based on Net Assets)
| | |
Diversified Financial Services (continued) |
Raymond James Financial Inc. | | |
| | |
| | |
| | |
| | |
| | |
| | |
| | |
| | |
| | |
| | |
| | |
| | |
| | |
| | |
| | |
|
Abu Dhabi National Energy Co. PJSC | | |
| | |
| | |
| | |
| | |
| | |
| | |
| | |
Series G, 4.15%, 05/01/49 | | |
Series H, 3.45%, 01/15/50 | | |
| | |
| | |
| | |
| | |
| | |
| | |
| | |
| | |
Series M, 3.65%, 04/01/50 | | |
Series N, 2.75%, 08/15/51 | | |
| | |
| | |
| | |
| | |
| | |
| | |
| | |
| | |
| | |
| | |
| | |
| | |
Series 11-C, 5.20%, 06/01/41(a) | | |
Series A, 4.30%, 07/15/48(a) | | |
Series B, 3.70%, 12/01/47 | | |
Alfa Desarrollo SpA, 4.55%, 09/27/51(b) | | |
| | |
| | |
| | |
| | |
| | |
| | |
| | |
| | |
| | |
|
| | |
| | |
American Electric Power Co. Inc. | | |
| | |
6.95%, 12/15/54, (5-year CMT + 2.675%)(d) | | |
American Transmission Systems Inc., 5.00%, 09/01/44(b) | | |
| | |
| | |
| | |
| | |
Series L, 5.80%, 10/01/35(a) | | |
Series P, 6.70%, 08/15/37 | | |
Series Y, 4.50%, 03/01/49 | | |
Series Z, 3.70%, 05/01/50 | | |
Arizona Public Service Co. | | |
| | |
| | |
| | |
| | |
| | |
| | |
| | |
| | |
| | |
| | |
| | |
Atlantica Transmision Sur SA, 6.88%, 04/30/43(b) | | |
| | |
| | |
| | |
Baltimore Gas & Electric Co. | | |
| | |
| | |
| | |
| | |
| | |
| | |
| | |
| | |
| | |
Basin Electric Power Cooperative, 4.75%, 04/26/47(b) | | |
Berkshire Hathaway Energy Co. | | |
| | |
| | |
| | |
| | |
| | |
| | |
| | |
| | |
| | |
| | |
| | |
| | |
| | |
Buffalo Energy Mexico Holdings/Buffalo Energy Infrastructure/Buffalo Energy, 7.88%, 02/15/39(b) | | |
Schedule of Investments (unaudited)(continued)October 31, 2024
iShares® 10+ Year Investment Grade Corporate Bond ETF(Percentages shown are based on Net Assets)
| | |
|
Celeo Redes Operacion Chile SA, 5.20%, 06/22/47(b) | | |
CenterPoint Energy Houston Electric LLC | | |
| | |
| | |
| | |
| | |
| | |
Series AC, 4.25%, 02/01/49 | | |
Series AD, 2.90%, 07/01/50 | | |
Series AF, 3.35%, 04/01/51 | | |
Series AJ, 4.85%, 10/01/52 | | |
| | |
| | |
Series B, 6.85%, 02/15/55, (5-year CMT + 2.946%)(d) | | |
CEZ A/S, 5.63%, 04/03/42(b) | | |
Cleco Corporate Holdings LLC, 4.97%, 05/01/46 | | |
| | |
| | |
| | |
Cleveland Electric Illuminating Co. (The), 5.95%, 12/15/36 | | |
| | |
| | |
| | |
Cometa Energia SA de CV, 6.38%, 04/24/35(b) | | |
Comision Federal de Electricidad | | |
| | |
| | |
| | |
| | |
| | |
| | |
| | |
| | |
| | |
| | |
| | |
| | |
| | |
| | |
| | |
| | |
| | |
Series 123, 3.75%, 08/15/47 | | |
Series 127, 3.20%, 11/15/49 | | |
Series 130, 3.13%, 03/15/51 | | |
Series 131, 2.75%, 09/01/51 | | |
Series 133, 3.85%, 03/15/52 | | |
Connecticut Light and Power Co. (The) | | |
| | |
| | |
| | |
| | |
Series A, 4.15%, 06/01/45 | | |
Consolidated Edison Co. of New York Inc. | | |
| | |
| | |
| | |
| | |
| | |
|
| | |
| | |
| | |
| | |
| | |
| | |
| | |
| | |
| | |
Series 05-A, 5.30%, 03/01/35 | | |
Series 06-A, 5.85%, 03/15/36(a) | | |
Series 06-B, 6.20%, 06/15/36 | | |
Series 06-E, 5.70%, 12/01/36 | | |
Series 07-A, 6.30%, 08/15/37 | | |
Series 08-B, 6.75%, 04/01/38 | | |
Series 09-C, 5.50%, 12/01/39 | | |
Series 12-A, 4.20%, 03/15/42 | | |
Series 2017, 3.88%, 06/15/47 | | |
Series 20B, 3.95%, 04/01/50 | | |
Series A, 4.13%, 05/15/49 | | |
Series C, 3.00%, 12/01/60 | | |
Series C, 4.00%, 11/15/57(a) | | |
Series C, 4.30%, 12/01/56 | | |
Series E, 4.65%, 12/01/48 | | |
Consorcio Transmantaro SA, 5.20%, 04/11/38(b) | | |
Constellation Energy Generation LLC | | |
| | |
| | |
| | |
| | |
| | |
| | |
| | |
| | |
| | |
| | |
| | |
| | |
| | |
| | |
| | |
| | |
| | |
| | |
Dayton Power & Light Co. (The), 3.95%, 06/15/49 | | |
Delmarva Power & Light Co. | | |
| | |
| | |
| | |
| | |
| | |
| | |
Series A, 4.60%, 03/15/49 | | |
Series B, 3.30%, 04/15/41 | | |
Series B, 5.95%, 06/15/35 | | |
Series C, 4.05%, 09/15/42 | | |
Series C, 4.90%, 08/01/41 | | |
Dominion Energy South Carolina Inc. | | |
| | |
| | |
| | |
Schedule of Investments (unaudited)(continued)October 31, 2024
iShares® 10+ Year Investment Grade Corporate Bond ETF(Percentages shown are based on Net Assets)
| | |
|
| | |
| | |
| | |
| | |
| | |
| | |
| | |
| | |
| | |
| | |
| | |
| | |
Series A, 4.00%, 04/01/43 | | |
Series A, 4.05%, 05/15/48 | | |
Series A, 6.63%, 06/01/36 | | |
Series B, 3.25%, 04/01/51 | | |
Series B, 3.65%, 03/01/52 | | |
Duke Energy Carolinas LLC | | |
| | |
| | |
| | |
| | |
| | |
| | |
| | |
| | |
| | |
| | |
| | |
| | |
| | |
| | |
| | |
| | |
| | |
| | |
| | |
| | |
| | |
| | |
| | |
| | |
| | |
| | |
| | |
| | |
| | |
| | |
| | |
| | |
| | |
| | |
| | |
| | |
| | |
| | |
| | |
| | |
| | |
| | |
Series UUU, 4.20%, 03/15/42 | | |
| | |
|
Series WWW, 4.90%, 07/15/43 | | |
Series YYY, 3.25%, 10/01/49 | | |
| | |
| | |
| | |
| | |
| | |
| | |
| | |
| | |
| | |
| | |
| | |
| | |
| | |
| | |
| | |
| | |
| | |
| | |
E.ON International Finance BV, 6.65%, 04/30/38(a)(b) | | |
| | |
| | |
| | |
| | |
| | |
| | |
| | |
| | |
| | |
| | |
| | |
| | |
| | |
| | |
| | |
Elm Road Generating Station Supercritical LLC, 6.09%, 02/11/40(a)(b) | | |
Emera U.S. Finance LP, 4.75%, 06/15/46 | | |
Enel Finance America LLC, 2.88%, 07/12/41(b) | | |
Enel Finance International NV | | |
| | |
| | |
| | |
| | |
| | |
| | |
| | |
| | |
| | |
| | |
| | |
Entergy Corp., 3.75%, 06/15/50 | | |
| | |
| | |
| | |
| | |
| | |
| | |
| | |
Schedule of Investments (unaudited)(continued)October 31, 2024
iShares® 10+ Year Investment Grade Corporate Bond ETF(Percentages shown are based on Net Assets)
| | |
|
| | |
| | |
| | |
| | |
| | |
| | |
| | |
| | |
| | |
| | |
| | |
| | |
Evergy Kansas Central Inc. | | |
| | |
| | |
| | |
| | |
| | |
| | |
| | |
Evergy Kansas South Inc., 4.30%, 07/15/44(b) | | |
| | |
| | |
| | |
| | |
Series 2019, 4.13%, 04/01/49 | | |
Series B, 6.05%, 11/15/35 | | |
Eversource Energy, 3.45%, 01/15/50 | | |
| | |
| | |
| | |
| | |
| | |
| | |
| | |
| | |
FIEMEX Energia - Banco Actinver SA Institucion de Banca Multiple, 7.25%, 01/31/41(b) | | |
| | |
Series C, 3.40%, 03/01/50 | | |
Series C, 4.85%, 07/15/47 | | |
FirstEnergy Pennsylvania Electric Co., 6.15%, 10/01/38 | | |
FirstEnergy Transmission LLC | | |
| | |
| | |
Florida Power & Light Co. | | |
| | |
| | |
| | |
| | |
| | |
| | |
| | |
| | |
| | |
| | |
| | |
| | |
| | |
| | |
| | |
|
| | |
| | |
| | |
| | |
| | |
| | |
| | |
| | |
| | |
| | |
Series 10-C, 4.75%, 09/01/40 | | |
Series A, 3.25%, 03/15/51 | | |
Series B, 3.70%, 01/30/50 | | |
Great River Energy, 6.25%, 07/01/38(b) | | |
Iberdrola International BV, 6.75%, 07/15/36(a) | | |
| | |
| | |
| | |
| | |
Series K, 4.20%, 03/01/48 | | |
Indiana Michigan Power Co. | | |
| | |
| | |
| | |
| | |
Series K, 4.55%, 03/15/46 | | |
Series L, 3.75%, 07/01/47 | | |
Indianapolis Power & Light Co. | | |
| | |
| | |
| | |
Infraestructura Energetica Nova SAPI de CV | | |
| | |
| | |
Interchile SA, 4.50%, 06/30/56(b) | | |
International Transmission Co., 4.63%, 08/15/43(a) | | |
Interstate Power & Light Co. | | |
| | |
| | |
| | |
| | |
| | |
Interstate Power and Light Co., 5.45%, 09/30/54(a) | | |
ITC Holdings Corp., 5.30%, 07/01/43 | | |
Jersey Central Power & Light Co., 6.15%, 06/01/37(a) | | |
| | |
| | |
| | |
| | |
Series 1, 4.65%, 11/15/43 | | |
LLPL Capital Pte Ltd., 6.88%, 02/04/39(b) | | |
Louisville Gas & Electric Co. | | |
| | |
| | |
| | |
| | |
Majapahit Holding BV, 7.88%, 06/29/37(b) | | |
Massachusetts Electric Co. | | |
| | |
| | |
Schedule of Investments (unaudited)(continued)October 31, 2024
iShares® 10+ Year Investment Grade Corporate Bond ETF(Percentages shown are based on Net Assets)
| | |
|
| | |
| | |
| | |
| | |
| | |
| | |
| | |
| | |
| | |
| | |
| | |
| | |
| | |
| | |
Minejesa Capital BV, 5.63%, 08/10/37(a)(b) | | |
| | |
Series 12-A, 4.25%, 03/15/42 | | |
Series B, 3.10%, 07/30/51 | | |
Monongahela Power Co., 5.40%, 12/15/43(a)(b) | | |
Narragansett Electric Co. (The) | | |
| | |
| | |
National Grid USA, 5.80%, 04/01/35(a) | | |
National Rural Utilities Cooperative Finance Corp. | | |
| | |
| | |
| | |
| | |
| | |
| | |
| | |
Series EE, 3.13%, 08/01/50 | | |
Series N, 6.65%, 04/01/36 | | |
Series R, 6.75%, 07/01/37 | | |
| | |
| | |
| | |
| | |
New York State Electric & Gas Corp., 3.30%, 09/15/49(b) | | |
NextEra Energy Capital Holdings Inc. | | |
| | |
| | |
| | |
Niagara Mohawk Power Corp. | | |
| | |
| | |
| | |
| | |
Northern States Power Co./MN | | |
| | |
| | |
| | |
| | |
| | |
| | |
| | |
| | |
| | |
| | |
| | |
| | |
|
| | |
| | |
| | |
| | |
| | |
Northern States Power Co./WI, 5.65%, 06/15/54 | | |
NorthWestern Corp., 4.18%, 11/15/44 | | |
| | |
| | |
| | |
| | |
| | |
| | |
| | |
| | |
| | |
| | |
| | |
| | |
| | |
| | |
| | |
| | |
| | |
| | |
| | |
| | |
| | |
| | |
| | |
| | |
Series F, 5.85%, 10/01/35 | | |
Series R, 2.90%, 10/01/51 | | |
Oklahoma Gas & Electric Co. | | |
| | |
| | |
| | |
| | |
| | |
| | |
| | |
| | |
Oncor Electric Delivery Co. LLC | | |
| | |
| | |
| | |
| | |
| | |
| | |
| | |
| | |
| | |
| | |
| | |
| | |
| | |
| | |
| | |
Pacific Gas and Electric Co. | | |
| | |
| | |
Schedule of Investments (unaudited)(continued)October 31, 2024
iShares® 10+ Year Investment Grade Corporate Bond ETF(Percentages shown are based on Net Assets)
| | |
|
| | |
| | |
| | |
| | |
| | |
| | |
| | |
| | |
| | |
| | |
| | |
| | |
| | |
| | |
| | |
| | |
| | |
| | |
| | |
| | |
| | |
| | |
| | |
| | |
| | |
| | |
| | |
| | |
| | |
| | |
| | |
| | |
| | |
| | |
| | |
| | |
| | |
| | |
| | |
| | |
| | |
| | |
| | |
| | |
Perusahaan Perseroan Persero PT Perusahaan Listrik Negara | | |
| | |
| | |
| | |
| | |
| | |
| | |
| | |
Potomac Electric Power Co. | | |
| | |
| | |
| | |
| | |
PPL Electric Utilities Corp. | | |
| | |
| | |
| | |
|
| | |
| | |
| | |
| | |
| | |
| | |
| | |
Progress Energy Inc., 6.00%, 12/01/39 | | |
Public Service Co. of Colorado | | |
| | |
| | |
| | |
| | |
| | |
| | |
| | |
| | |
| | |
| | |
| | |
| | |
Series 17, 6.25%, 09/01/37 | | |
Series 34, 3.20%, 03/01/50(a) | | |
Series 36, 2.70%, 01/15/51 | | |
Public Service Co. of New Hampshire | | |
| | |
| | |
Public Service Co. of Oklahoma | | |
Series G, 6.63%, 11/15/37 | | |
Series K, 3.15%, 08/15/51 | | |
Public Service Electric & Gas Co. | | |
| | |
| | |
| | |
| | |
| | |
| | |
| | |
| | |
| | |
| | |
| | |
| | |
| | |
| | |
| | |
| | |
| | |
| | |
| | |
| | |
| | |
Series D, 5.25%, 07/01/35 | | |
Series I, 4.00%, 06/01/44 | | |
Series K, 4.05%, 05/01/45 | | |
| | |
| | |
| | |
| | |
| | |
| | |
Schedule of Investments (unaudited)(continued)October 31, 2024
iShares® 10+ Year Investment Grade Corporate Bond ETF(Percentages shown are based on Net Assets)
| | |
|
| | |
| | |
| | |
| | |
| | |
| | |
| | |
| | |
| | |
Ruwais Power Co. PJSC, 6.00%, 08/31/36(a)(b) | | |
RWE Finance U.S. LLC, 6.25%, 04/16/54(b) | | |
San Diego Gas & Electric Co. | | |
| | |
| | |
| | |
| | |
| | |
| | |
| | |
| | |
| | |
| | |
Series FFF, 6.13%, 09/15/37 | | |
Series RRR, 3.75%, 06/01/47 | | |
Series TTT, 4.10%, 06/15/49 | | |
Series UUU, 3.32%, 04/15/50 | | |
Series WWW, 2.95%, 08/15/51 | | |
Saudi Electricity Global Sukuk Co. 2, 5.06%, 04/08/43(a)(b) | | |
Saudi Electricity Global Sukuk Co. 3, 5.50%, 04/08/44(b) | | |
| | |
| | |
| | |
| | |
| | |
| | |
Series P, 6.75%, 07/01/37(a) | | |
Solar Star Funding LLC, 5.38%, 06/30/35(b) | | |
Southern California Edison Co. | | |
| | |
| | |
| | |
| | |
| | |
| | |
| | |
| | |
| | |
| | |
| | |
| | |
| | |
Series 04-G, 5.75%, 04/01/35 | | |
Series 05-B, 5.55%, 01/15/36 | | |
Series 05-E, 5.35%, 07/15/35 | | |
Series 06-E, 5.55%, 01/15/37 | | |
Series 08-A, 5.95%, 02/01/38 | | |
Series 13-A, 3.90%, 03/15/43 | | |
Series 20A, 2.95%, 02/01/51 | | |
Series B, 4.88%, 03/01/49 | | |
| | |
|
Series C, 3.60%, 02/01/45 | | |
Series C, 4.13%, 03/01/48 | | |
Series E, 5.45%, 06/01/52 | | |
Series H, 3.65%, 06/01/51 | | |
| | |
| | |
| | |
| | |
| | |
| | |
| | |
Series F, 4.95%, 12/15/46 | | |
Southwestern Electric Power Co. | | |
| | |
| | |
Series J, 3.90%, 04/01/45(a) | | |
Series L, 3.85%, 02/01/48 | | |
Southwestern Public Service Co. | | |
| | |
| | |
| | |
| | |
| | |
| | |
Series 6, 4.40%, 11/15/48 | | |
Series 8, 3.15%, 05/01/50 | | |
Star Energy Geothermal Darajat II/Star Energy Geothermal Salak, 4.85%, 10/14/38(b) | | |
State Grid Overseas Investment 2013 Ltd., 4.38%, 05/22/43(a)(b) | | |
State Grid Overseas Investment 2014 Ltd., 4.85%, 05/07/44(b) | | |
State Grid Overseas Investment BVI Ltd., 4.00%, 05/04/47(a)(b) | | |
| | |
| | |
| | |
| | |
| | |
| | |
| | |
| | |
| | |
| | |
| | |
Tierra Mojada Luxembourg II SARL, 5.75%, 12/01/40(b) | | |
Toledo Edison Co. (The), 6.15%, 05/15/37(a) | | |
Tri-State Generation & Transmission Association Inc. | | |
| | |
| | |
Tucson Electric Power Co. | | |
| | |
| | |
| | |
| | |
| | |
| | |
| | |
| | |
Schedule of Investments (unaudited)(continued)October 31, 2024
iShares® 10+ Year Investment Grade Corporate Bond ETF(Percentages shown are based on Net Assets)
| | |
|
| | |
| | |
| | |
| | |
| | |
| | |
| | |
| | |
Virginia Electric & Power Co. | | |
| | |
| | |
| | |
| | |
| | |
| | |
| | |
| | |
| | |
| | |
| | |
| | |
Series A, 6.00%, 05/15/37 | | |
Series B, 3.80%, 09/15/47 | | |
Series B, 4.20%, 05/15/45 | | |
Series B, 6.00%, 01/15/36 | | |
Series C, 4.00%, 11/15/46 | | |
Series C, 4.63%, 05/15/52 | | |
Series D, 4.65%, 08/15/43 | | |
Wisconsin Electric Power Co. | | |
| | |
| | |
| | |
| | |
| | |
| | |
Wisconsin Power and Light Co. | | |
| | |
| | |
| | |
| | |
Wisconsin Public Service Corp. | | |
| | |
| | |
| | |
| | |
| | |
| | |
| | |
| | |
| | |
Electrical Components & Equipment — 0.1% |
| | |
| | |
| | |
| | |
| | |
| | |
|
Amphenol Corp., 5.38%, 11/15/54 | | |
Fortive Corp., 4.30%, 06/15/46 | | |
| | |
|
Honeywell International Inc. | | |
| | |
| | |
| | |
| | |
| | |
| | |
| | |
| | |
Tyco Electronics Group SA, 7.13%, 10/01/37 | | |
| | |
Energy - Alternate Sources — 0.0% |
Sweihan PV Power Co. PJSC, 3.63%, 01/31/49(a)(b) | | |
Engineering & Construction — 0.2% |
Aeropuerto Internacional de Tocumen SA | | |
| | |
| | |
Cellnex Finance Co. SA, 3.88%, 07/07/41(b) | | |
LBJ Infrastructure Group LLC, 3.80%, 12/31/57(a)(b) | | |
Mexico City Airport Trust | | |
| | |
| | |
| | |
|
Warnermedia Holdings Inc. | | |
| | |
| | |
| | |
| | |
Environmental Control — 0.2% |
Nature Conservancy (The), Series A, 3.96%, 03/01/52 | | |
| | |
| | |
| | |
| | |
| | |
| | |
| | |
| | |
| | |
| | |
| | |
| | |
| | |
| | |
| | |
|
| | |
| | |
| | |
| | |
| | |
| | |
| | |
| | |
Cencosud SA, 6.63%, 02/12/45(b) | | |
Schedule of Investments (unaudited)(continued)October 31, 2024
iShares® 10+ Year Investment Grade Corporate Bond ETF(Percentages shown are based on Net Assets)
| | |
|
| | |
| | |
| | |
| | |
| | |
| | |
| | |
| | |
| | |
| | |
| | |
| | |
| | |
| | |
| | |
| | |
| | |
Hormel Foods Corp., 3.05%, 06/03/51 | | |
| | |
| | |
| | |
| | |
| | |
| | |
| | |
| | |
| | |
| | |
JBS USA Holding Lux SARL/JBS USA Food Co./JBS Lux Co. SARL | | |
| | |
| | |
| | |
| | |
| | |
| | |
Koninklijke Ahold Delhaize NV, 5.70%, 10/01/40 | | |
| | |
| | |
| | |
| | |
| | |
| | |
| | |
| | |
| | |
| | |
| | |
| | |
| | |
| | |
| | |
| | |
| | |
| | |
| | |
| | |
| | |
| | |
| | |
| | |
|
| | |
| | |
| | |
| | |
| | |
| | |
| | |
| | |
McCormick & Co. Inc./MD, 4.20%, 08/15/47 | | |
Mondelez International Inc., 2.63%, 09/04/50 | | |
Nestle Capital Corp., 5.10%, 03/12/54(a)(b) | | |
| | |
| | |
| | |
| | |
| | |
| | |
| | |
| | |
| | |
| | |
| | |
| | |
| | |
| | |
| | |
Tesco PLC, 6.15%, 11/15/37(a)(b) | | |
| | |
| | |
| | |
| | |
| | |
Forest Products & Paper — 0.2% |
Celulosa Arauco y Constitucion SA | | |
| | |
| | |
| | |
| | |
| | |
| | |
| | |
| | |
| | |
| | |
| | |
Suzano Austria GmbH, 7.00%, 03/16/47(b) | | |
| | |
|
| | |
| | |
| | |
| | |
| | |
| | |
| | |
| | |
| | |
| | |
| | |
| | |
Schedule of Investments (unaudited)(continued)October 31, 2024
iShares® 10+ Year Investment Grade Corporate Bond ETF(Percentages shown are based on Net Assets)
| | |
|
| | |
| | |
| | |
| | |
| | |
Brooklyn Union Gas Co. (The) | | |
| | |
| | |
| | |
| | |
CenterPoint Energy Resources Corp. | | |
| | |
| | |
| | |
Centrica PLC, 5.38%, 10/16/43(b) | | |
East Ohio Gas Co. (The), 3.00%, 06/15/50(b) | | |
| | |
| | |
| | |
Korea Gas Corp., 6.25%, 01/20/42(a)(b) | | |
Mega Advance Investments Ltd., 6.38%, 05/12/41(b) | | |
| | |
| | |
| | |
| | |
| | |
| | |
| | |
| | |
| | |
6.38%, 03/31/55, (5-year CMT + 2.527%)(a)(d) | | |
| | |
| | |
| | |
Piedmont Natural Gas Co. Inc. | | |
| | |
| | |
| | |
| | |
| | |
Southern California Gas Co. | | |
| | |
| | |
| | |
| | |
| | |
| | |
Series KK, 5.75%, 11/15/35(a) | | |
Series UU, 4.13%, 06/01/48 | | |
Series VV, 4.30%, 01/15/49 | | |
Series WW, 3.95%, 02/15/50(a) | | |
Southern Co. Gas Capital Corp. | | |
| | |
| | |
| | |
| | |
Series 21A, 3.15%, 09/30/51 | | |
| | |
| | |
| | |
| | |
|
| | |
Spire Inc., 4.70%, 08/15/44(a) | | |
Spire Missouri Inc., 3.30%, 06/01/51(a) | | |
| | |
| | |
Series K, 3.80%, 09/15/46(a) | | |
| | |
Hand & Machine Tools — 0.1% |
| | |
| | |
| | |
Stanley Black & Decker Inc. | | |
| | |
| | |
| | |
| | |
Health Care - Products — 1.1% |
| | |
| | |
| | |
| | |
| | |
| | |
| | |
| | |
| | |
| | |
Baxter International Inc. | | |
| | |
| | |
| | |
| | |
| | |
| | |
| | |
| | |
| | |
Covidien International Finance SA, 6.55%, 10/15/37 | | |
| | |
| | |
| | |
| | |
DH Europe Finance II SARL | | |
| | |
| | |
GE HealthCare Technologies Inc., 6.38%, 11/22/52 | | |
| | |
| | |
| | |
| | |
| | |
| | |
| | |
Revvity Inc., 3.63%, 03/15/51 | | |
| | |
| | |
| | |
Schedule of Investments (unaudited)(continued)October 31, 2024
iShares® 10+ Year Investment Grade Corporate Bond ETF(Percentages shown are based on Net Assets)
| | |
Health Care - Products (continued) |
STERIS Irish FinCo Unlimited Co., 3.75%, 03/15/51(a) | | |
| | |
| | |
| | |
| | |
| | |
Thermo Fisher Scientific Inc. | | |
| | |
| | |
| | |
| | |
Zimmer Biomet Holdings Inc. | | |
| | |
| | |
| | |
| | |
Health Care - Services — 4.8% |
AdventHealth Obligated Group, Series E, 2.80%, 11/15/51 | | |
Adventist Health System/West, 3.63%, 03/01/49(a) | | |
Advocate Health & Hospitals Corp. | | |
| | |
| | |
Series 2020, 3.01%, 06/15/50 | | |
| | |
| | |
| | |
| | |
| | |
| | |
| | |
| | |
| | |
Series 2021, 2.78%, 07/01/51 | | |
| | |
| | |
| | |
Series 2019, 3.89%, 04/15/49 | | |
| | |
| | |
| | |
Series B, 3.11%, 11/15/39 | | |
| | |
| | |
| | |
Series 2020, 3.18%, 01/01/50(a) | | |
Baptist Health South Florida Inc., Series 2017, 4.34%, 11/15/41 | | |
Baptist Health South Florida Obligated Group, Series 2021, 3.12%, 11/15/71(a) | | |
Baptist Healthcare System Obligated Group, Series 20B, 3.54%, 08/15/50 | | |
BayCare Health System Inc., Series 2020, 3.83%, 11/15/50 | | |
Baylor Scott & White Holdings | | |
| | |
| | |
Series 2021, 2.84%, 11/15/50 | | |
Beth Israel Lahey Health Inc., Series L, 3.08%, 07/01/51 | | |
| | |
Health Care - Services (continued) |
Bon Secours Mercy Health Inc., Series 20-2, 3.21%, 06/01/50(a) | | |
Catholic Health Services of Long Island Obligated Group, Series 2020, 3.37%, 07/01/50 | | |
Children's Health System of Texas, 2.51%, 08/15/50 | | |
Children's Hospital Corp. (The) | | |
Series 2017, 4.12%, 01/01/47(a) | | |
Series 2020, 2.59%, 02/01/50 | | |
Children's Hospital Medical Center/Cincinnati OH, 4.27%, 05/15/44 | | |
Children's Hospital of Philadelphia (The), Series 2020, 2.70%, 07/01/50 | | |
Children's Hospital/DC, Series 2020, 2.93%, 07/15/50 | | |
| | |
| | |
| | |
| | |
| | |
| | |
| | |
| | |
| | |
| | |
| | |
| | |
Series 2013, 5.62%, 11/15/43(a) | | |
Series 2018, 4.38%, 08/15/48 | | |
Cleveland Clinic Foundation (The), 4.86%, 01/01/2114(a) | | |
| | |
| | |
| | |
| | |
| | |
| | |
| | |
Community Health Network Inc., Series 20-A, 3.10%, 05/01/50(a) | | |
Corewell Health Obligated Group, Series 19A, 3.49%, 07/15/49 | | |
Cottage Health Obligated Group, Series 2020, 3.30%, 11/01/49 | | |
Dartmouth-Hitchcock Health, Series B, 4.18%, 08/01/48 | | |
| | |
| | |
| | |
Duke University Health System Inc., Series 2017, 3.92%, 06/01/47(a) | | |
| | |
| | |
| | |
| | |
| | |
| | |
| | |
| | |
| | |
| | |
Schedule of Investments (unaudited)(continued)October 31, 2024
iShares® 10+ Year Investment Grade Corporate Bond ETF(Percentages shown are based on Net Assets)
| | |
Health Care - Services (continued) |
| | |
| | |
| | |
| | |
| | |
| | |
| | |
| | |
| | |
| | |
Franciscan Missionaries of Our Lady Health System Inc., Series B, 3.91%, 07/01/49(a) | | |
Fred Hutchinson Cancer Center, 4.97%, 01/01/52 | | |
Hackensack Meridian Health Inc. | | |
| | |
| | |
Series 2020, 2.68%, 09/01/41 | | |
Series 2020, 2.88%, 09/01/50 | | |
Hartford HealthCare Corp., 3.45%, 07/01/54 | | |
| | |
| | |
| | |
| | |
| | |
| | |
| | |
| | |
| | |
| | |
| | |
Health Care Service Corp. A Mutual Legal Reserve Co. | | |
| | |
| | |
Hoag Memorial Hospital Presbyterian, 3.80%, 07/15/52(a) | | |
| | |
| | |
| | |
| | |
| | |
| | |
| | |
| | |
Indiana University Health Inc. Obligated Group | | |
| | |
Series 2021, 2.85%, 11/01/51 | | |
Inova Health System Foundation, 4.07%, 05/15/52(a) | | |
Integris Baptist Medical Center Inc., Series A, 3.88%, 08/15/50 | | |
Iowa Health System, Series 2020, 3.67%, 02/15/50 | | |
Johns Hopkins Health System Corp. (The), 3.84%, 05/15/46 | | |
Kaiser Foundation Hospitals | | |
| | |
| | |
Series 2019, 3.27%, 11/01/49 | | |
Series 2021, 2.81%, 06/01/41 | | |
Series 2021, 3.00%, 06/01/51 | | |
| | |
Health Care - Services (continued) |
Laboratory Corp. of America Holdings, 4.70%, 02/01/45(a) | | |
Mass General Brigham Inc. | | |
Series 2017, 3.77%, 07/01/48 | | |
Series 2020, 3.19%, 07/01/49 | | |
Series 2020, 3.34%, 07/01/60 | | |
| | |
| | |
Series 2013, 4.00%, 11/15/47 | | |
Series 2016, 4.13%, 11/15/52(a) | | |
Series 2021, 3.20%, 11/15/61(a) | | |
McLaren Health Care Corp., Series A, 4.39%, 05/15/48 | | |
MedStar Health Inc., Series 20A, 3.63%, 08/15/49 | | |
Memorial Health Services, 3.45%, 11/01/49 | | |
Memorial Sloan-Kettering Cancer Center | | |
| | |
| | |
Series 2015, 4.20%, 07/01/55 | | |
Series 2020, 2.96%, 01/01/50 | | |
Methodist Hospital (The), Series 20A, 2.71%, 12/01/50(a) | | |
Montefiore Obligated Group | | |
| | |
Series 18-C, 5.25%, 11/01/48 | | |
Mount Nittany Medical Center Obligated Group, 3.80%, 11/15/52(a) | | |
Mount Sinai Hospital (The) | | |
Series 2017, 3.98%, 07/01/48(a) | | |
Series 2019, 3.74%, 07/01/49(a) | | |
Series 2020, 3.39%, 07/01/50 | | |
MultiCare Health System, 2.80%, 08/15/50 | | |
MyMichigan Health, Series 2020, 3.41%, 06/01/50(a) | | |
Nationwide Children's Hospital Inc., 4.56%, 11/01/52(a) | | |
New York and Presbyterian Hospital (The) | | |
| | |
| | |
| | |
| | |
| | |
| | |
| | |
Northwell Healthcare Inc. | | |
| | |
| | |
| | |
| | |
Northwestern Memorial Healthcare Obligated Group, Series 2021, 2.63%, 07/15/51(a) | | |
| | |
| | |
| | |
| | |
| | |
NY Society for Relief of Ruptured & Crippled Maintaining Hosp Special Surgery, Series 2020, 2.67%, 10/01/50 | | |
| | |
| | |
Schedule of Investments (unaudited)(continued)October 31, 2024
iShares® 10+ Year Investment Grade Corporate Bond ETF(Percentages shown are based on Net Assets)
| | |
Health Care - Services (continued) |
Series 2020, 3.38%, 07/01/55 | | |
Ochsner Clinic Foundation, 5.90%, 05/15/45 | | |
| | |
| | |
Series 2020, 3.04%, 11/15/50(a) | | |
Orlando Health Obligated Group | | |
| | |
| | |
PeaceHealth Obligated Group | | |
Series 2018, 4.79%, 11/15/48 | | |
Series 2020, 3.22%, 11/15/50 | | |
| | |
| | |
Series 2042, 2.72%, 01/01/42 | | |
Presbyterian Healthcare Services, 4.88%, 08/01/52 | | |
Providence St. Joseph Health Obligated Group | | |
Series 21A, 2.70%, 10/01/51(a) | | |
Series A, 3.93%, 10/01/48 | | |
Series I, 3.74%, 10/01/47 | | |
Queen's Health Systems (The), 4.81%, 07/01/52 | | |
Quest Diagnostics Inc., 4.70%, 03/30/45 | | |
Rady Children's Hospital-San Diego, Series 21A, 3.15%, 08/15/51 | | |
| | |
| | |
| | |
| | |
| | |
Seattle Children's Hospital, Series 2021, 2.72%, 10/01/50(a) | | |
Sentara Health, 2.93%, 11/01/51(a) | | |
Sharp HealthCare, Series 20B, 2.68%, 08/01/50(a) | | |
Southern Baptist Hospital of Florida Inc., 4.86%, 07/15/45(a) | | |
| | |
| | |
Series 2018, 3.80%, 11/15/48 | | |
Summa Health, 3.51%, 11/15/51 | | |
| | |
| | |
Series 2018, 4.09%, 08/15/48 | | |
Series 20A, 3.16%, 08/15/40 | | |
Series 20A, 3.36%, 08/15/50 | | |
| | |
| | |
| | |
Toledo Hospital (The), 5.75%, 11/15/38 | | |
| | |
| | |
Series 2019, 3.43%, 12/01/48(a) | | |
Series 2021, 2.63%, 12/01/40 | | |
UMass Memorial Health Care Obligated Group, 5.36%, 07/01/52(a) | | |
| | |
| | |
| | |
| | |
| | |
| | |
| | |
| | |
Health Care - Services (continued) |
| | |
| | |
| | |
| | |
| | |
| | |
| | |
| | |
| | |
| | |
| | |
| | |
| | |
| | |
| | |
| | |
| | |
| | |
| | |
| | |
| | |
| | |
| | |
| | |
| | |
| | |
| | |
| | |
| | |
| | |
| | |
WakeMed, Series A, 3.29%, 10/01/52 | | |
West Virginia United Health System Obligated Group, Series 2020, 3.13%, 06/01/50 | | |
Willis-Knighton Medical Center | | |
Series 2018, 4.81%, 09/01/48 | | |
Series 2021, 3.07%, 03/01/51 | | |
Yale-New Haven Health Services Corp., Series 2020, 2.50%, 07/01/50 | | |
| | |
Holding Companies - Diversified — 0.1% |
Alfa SAB de CV, 6.88%, 03/25/44(a)(b) | | |
CK Hutchison International 19 II Ltd., 3.38%, 09/06/49(a)(b) | | |
| | |
| | |
| | |
| | |
|
| | |
| | |
| | |
PulteGroup Inc., 6.00%, 02/15/35(a) | | |
| | |
|
Leggett & Platt Inc., 3.50%, 11/15/51 | | |
| | |
| | |
| | |
Schedule of Investments (unaudited)(continued)October 31, 2024
iShares® 10+ Year Investment Grade Corporate Bond ETF(Percentages shown are based on Net Assets)
| | |
Home Furnishings (continued) |
| | |
| | |
Household Products & Wares — 0.2% |
| | |
| | |
| | |
| | |
| | |
| | |
| | |
| | |
| | |
| | |
| | |
| | |
| | |
| | |
| | |
| | |
|
| | |
| | |
| | |
| | |
| | |
| | |
| | |
| | |
| | |
| | |
| | |
| | |
| | |
| | |
| | |
| | |
| | |
| | |
| | |
6.50%, 05/15/67, (3-mo. LIBOR US + 2.120%)(d) | | |
American Financial Group Inc./OH, 4.50%, 06/15/47 | | |
American International Group Inc. | | |
| | |
| | |
| | |
| | |
| | |
| | |
AmFam Holdings Inc., 3.83%, 03/11/51(b) | | |
Aon Corp., 6.25%, 09/30/40(a) | | |
Aon Corp./Aon Global Holdings PLC | | |
| | |
| | |
| | |
| | |
| | |
| | |
| | |
| | |
|
Aon North America Inc., 5.75%, 03/01/54(a) | | |
Arch Capital Finance LLC, 5.03%, 12/15/46 | | |
Arch Capital Group Ltd., 3.64%, 06/30/50 | | |
Arch Capital Group U.S. Inc., 5.14%, 11/01/43 | | |
| | |
| | |
| | |
| | |
| | |
| | |
Assured Guaranty Municipal Holdings Inc., 6.40%, 12/15/66, (1mo. LIBOR US + 2.215%)(a)(b)(d) | | |
Assured Guaranty U.S. Holdings Inc., 3.60%, 09/15/51(a) | | |
| | |
| | |
| | |
| | |
Augustar Life Insurance Co., 6.88%, 06/15/42(b) | | |
AXA SA, 6.38%, (1-day SOFR Index + 2.256%)(b)(d)(e) | | |
Axis Specialty Finance PLC, 5.15%, 04/01/45(a) | | |
Beacon Funding Trust, 6.27%, 08/15/54(b) | | |
Berkshire Hathaway Finance Corp. | | |
| | |
| | |
| | |
| | |
| | |
| | |
| | |
| | |
Berkshire Hathaway Inc., 4.50%, 02/11/43(a) | | |
Brighthouse Financial Inc. | | |
| | |
| | |
Brown & Brown Inc., 4.95%, 03/17/52 | | |
| | |
| | |
Series 1, 6.50%, 05/15/38 | | |
| | |
| | |
| | |
| | |
| | |
| | |
Cincinnati Financial Corp., 6.13%, 11/01/34 | | |
Corebridge Financial Inc. | | |
| | |
| | |
Empower Finance 2020 LP, 3.08%, 09/17/51(a)(b) | | |
Equitable Holdings Inc., 5.00%, 04/20/48(a) | | |
Everest Reinsurance Holdings Inc. | | |
| | |
| | |
| | |
Fairfax Financial Holdings Ltd. | | |
| | |
| | |
Farmers Insurance Exchange, 4.75%, 11/01/57, (3-mo. LIBOR US + 3.231%)(a)(b)(d) | | |
Schedule of Investments (unaudited)(continued)October 31, 2024
iShares® 10+ Year Investment Grade Corporate Bond ETF(Percentages shown are based on Net Assets)
| | |
|
Fidelity National Financial Inc., 3.20%, 09/17/51 | | |
Five Corners Funding Trust IV, 6.00%, 02/15/53(b) | | |
Global Atlantic Fin Co., 6.75%, 03/15/54(b) | | |
Great-West Lifeco Finance 2018 LP, 4.58%, 05/17/48(b) | | |
Great-West Lifeco Finance Delaware LP, 4.15%, 06/03/47(b) | | |
Guardian Life Insurance Co. of America (The) | | |
| | |
| | |
| | |
Hartford Financial Services Group Inc. (The) | | |
| | |
| | |
| | |
| | |
| | |
| | |
| | |
Hill City Funding Trust, 4.05%, 08/15/41(a)(b) | | |
Jackson Financial Inc., 4.00%, 11/23/51 | | |
Liberty Mutual Group Inc. | | |
| | |
| | |
| | |
| | |
| | |
| | |
Liberty Mutual Insurance Co., 7.70%, 10/15/97(b) | | |
| | |
| | |
| | |
| | |
| | |
| | |
| | |
| | |
Manulife Financial Corp., 5.38%, 03/04/46 | | |
Maple Grove Funding Trust I, 4.16%, 08/15/51(b) | | |
| | |
| | |
| | |
| | |
| | |
| | |
| | |
| | |
Marsh & McLennan Companies Inc. | | |
| | |
| | |
| | |
| | |
| | |
| | |
| | |
| | |
| | |
| | |
| | |
Massachusetts Mutual Life Insurance Co. | | |
| | |
| | |
|
| | |
| | |
| | |
| | |
5.08%, 02/15/69, (3-mo. LIBOR US + 3.191%)(a)(b)(d) | | |
| | |
| | |
MetLife Capital Trust IV, 7.88%, 12/15/67(b) | | |
| | |
| | |
| | |
| | |
| | |
| | |
| | |
| | |
| | |
| | |
| | |
| | |
| | |
| | |
Mutual of Omaha Insurance Co. | | |
6.14%, 01/16/64, (10-year CMT + 2.950%)(a)(b)(d) | | |
| | |
National Life Insurance Co., 5.25%, 07/19/68, (3-mo. LIBOR US + 3.314%)(a)(b)(d) | | |
Nationwide Financial Services Inc. | | |
| | |
| | |
| | |
Nationwide Mutual Insurance Co. | | |
| | |
| | |
| | |
New York Life Insurance Co. | | |
| | |
| | |
| | |
Northwestern Mutual Life Insurance Co. (The) | | |
| | |
| | |
| | |
| | |
Old Republic International Corp., 3.85%, 06/11/51 | | |
OneAmerica Financial Partners Inc., 4.25%, 10/15/50(a)(b) | | |
Pacific Life Insurance Co. | | |
4.30%, 10/24/67, (3-mo. LIBOR US + 2.796%)(b)(d) | | |
| | |
| | |
| | |
| | |
| | |
Penn Mutual Life Insurance Co. (The), 3.80%, 04/29/61(a)(b) | | |
Pine Street Trust II, 5.57%, 02/15/49(b) | | |
Pine Street Trust III, 6.22%, 05/15/54(a)(b) | | |
Schedule of Investments (unaudited)(continued)October 31, 2024
iShares® 10+ Year Investment Grade Corporate Bond ETF(Percentages shown are based on Net Assets)
| | |
|
Principal Financial Group Inc. | | |
| | |
| | |
| | |
| | |
| | |
| | |
| | |
| | |
| | |
| | |
| | |
| | |
Protective Life Corp., 5.35%, 08/10/52(b) | | |
Prudential Financial Inc. | | |
| | |
| | |
| | |
| | |
| | |
| | |
| | |
| | |
| | |
| | |
Securian Financial Group Inc., 4.80%, 04/15/48(a)(b) | | |
Selective Insurance Group Inc., 5.38%, 03/01/49 | | |
Swiss Re Treasury U.S. Corp., 4.25%, 12/06/42(a)(b) | | |
Teachers Insurance & Annuity Association of America | | |
| | |
| | |
| | |
| | |
Transatlantic Holdings Inc., 8.00%, 11/30/39 | | |
Travelers Companies Inc. (The) | | |
| | |
| | |
| | |
| | |
| | |
| | |
| | |
| | |
| | |
| | |
| | |
| | |
Trinity Acquisition PLC, 6.13%, 08/15/43 | | |
| | |
| | |
| | |
| | |
| | |
| | |
| | |
| | |
| | |
| | |
| | |
|
Western & Southern Life Insurance Co. (The) | | |
| | |
| | |
Willis North America Inc. | | |
| | |
| | |
| | |
WR Berkley Corp., 6.25%, 02/15/37 | | |
XL Group Ltd., 5.25%, 12/15/43 | | |
| | |
|
Alibaba Group Holding Ltd. | | |
| | |
| | |
| | |
| | |
| | |
| | |
| | |
| | |
| | |
| | |
| | |
| | |
| | |
| | |
| | |
| | |
| | |
| | |
| | |
| | |
| | |
| | |
| | |
| | |
| | |
| | |
| | |
JD.com Inc., 4.13%, 01/14/50 | | |
| | |
| | |
| | |
| | |
| | |
| | |
| | |
Netflix Inc., 5.40%, 08/15/54 | | |
| | |
| | |
| | |
| | |
| | |
| | |
| | |
| | |
| | |
| | |
| | |
| | |
Schedule of Investments (unaudited)(continued)October 31, 2024
iShares® 10+ Year Investment Grade Corporate Bond ETF(Percentages shown are based on Net Assets)
| | |
|
Uber Technologies Inc., 5.35%, 09/15/54(a) | | |
| | |
|
| | |
| | |
| | |
| | |
GUSAP III LP, 7.25%, 04/16/44(b) | | |
| | |
| | |
| | |
| | |
| | |
| | |
Reliance Inc., 6.85%, 11/15/36(a) | | |
Steel Dynamics Inc., 3.25%, 10/15/50(a) | | |
| | |
| | |
| | |
| | |
Vale SA, 5.63%, 09/11/42(a) | | |
| | |
|
Brunswick Corp., 5.10%, 04/01/52(a) | | |
Harley-Davidson Inc., 4.63%, 07/28/45(a) | | |
| | |
|
Marriott International Inc./MD, 5.35%, 03/15/35 | | |
|
ABB Finance USA Inc., 4.38%, 05/08/42 | | |
| | |
| | |
| | |
| | |
| | |
| | |
| | |
| | |
| | |
| | |
| | |
| | |
| | |
| | |
| | |
| | |
| | |
Ingersoll Rand Inc., 5.70%, 06/15/54(a) | | |
| | |
| | |
| | |
| | |
| | |
| | |
| | |
Xylem Inc./New York, 4.38%, 11/01/46 | | |
| | |
| | |
|
| | |
| | |
| | |
| | |
| | |
| | |
| | |
| | |
| | |
| | |
| | |
| | |
| | |
| | |
| | |
| | |
| | |
| | |
| | |
| | |
| | |
Siemens Financieringsmaatschappij NV | | |
| | |
| | |
| | |
| | |
| | |
|
Charter Communications Operating LLC/Charter Communications Operating Capital | | |
| | |
| | |
| | |
| | |
| | |
| | |
| | |
| | |
| | |
| | |
| | |
| | |
| | |
| | |
| | |
| | |
| | |
| | |
| | |
| | |
| | |
| | |
| | |
| | |
| | |
| | |
| | |
| | |
| | |
| | |
| | |
Schedule of Investments (unaudited)(continued)October 31, 2024
iShares® 10+ Year Investment Grade Corporate Bond ETF(Percentages shown are based on Net Assets)
| | |
|
| | |
| | |
| | |
| | |
| | |
| | |
| | |
| | |
| | |
| | |
| | |
| | |
| | |
| | |
| | |
| | |
| | |
| | |
| | |
| | |
| | |
| | |
| | |
| | |
| | |
| | |
| | |
| | |
| | |
| | |
Discovery Communications LLC | | |
| | |
| | |
| | |
| | |
| | |
| | |
| | |
| | |
| | |
| | |
| | |
| | |
| | |
| | |
| | |
| | |
| | |
| | |
| | |
| | |
| | |
| | |
| | |
| | |
| | |
| | |
| | |
| | |
Sky Group Finance Ltd., 6.50%, 10/15/35(a)(b) | | |
| | |
|
| | |
| | |
| | |
| | |
| | |
| | |
| | |
| | |
| | |
| | |
| | |
TWDC Enterprises 18 Corp. | | |
| | |
| | |
| | |
| | |
Series E, 4.13%, 12/01/41 | | |
| | |
| | |
| | |
| | |
| | |
| | |
| | |
| | |
| | |
| | |
| | |
| | |
| | |
| | |
| | |
| | |
| | |
| | |
Metal Fabricate & Hardware — 0.1% |
Precision Castparts Corp. | | |
| | |
| | |
| | |
| | |
| | |
| | |
| | |
|
Anglo American Capital PLC | | |
| | |
| | |
| | |
| | |
| | |
| | |
Barrick International Barbados Corp., 6.35%, 10/15/36(b) | | |
Barrick North America Finance LLC | | |
| | |
| | |
| | |
Barrick PD Australia Finance Pty. Ltd., 5.95%, 10/15/39 | | |
Schedule of Investments (unaudited)(continued)October 31, 2024
iShares® 10+ Year Investment Grade Corporate Bond ETF(Percentages shown are based on Net Assets)
| | |
|
BHP Billiton Finance USA Ltd. | | |
| | |
| | |
| | |
Corp. Nacional del Cobre de Chile | | |
| | |
| | |
| | |
| | |
| | |
| | |
| | |
| | |
| | |
| | |
| | |
Freeport Indonesia PT, 6.20%, 04/14/52(b) | | |
| | |
| | |
| | |
Fresnillo PLC, 4.25%, 10/02/50(b) | | |
Glencore Canada Corp., 6.20%, 06/15/35 | | |
Glencore Finance Canada Ltd. | | |
| | |
| | |
| | |
| | |
| | |
| | |
| | |
Indonesia Asahan Aluminium PT/Mineral Industri Indonesia Persero PT | | |
| | |
| | |
Industrias Penoles SAB de CV | | |
| | |
| | |
Kinross Gold Corp., 6.88%, 09/01/41 | | |
Minera Mexico SA de CV, 4.50%, 01/26/50(b) | | |
| | |
| | |
| | |
| | |
| | |
Newmont Corp./Newcrest Finance Pty. Ltd. | | |
| | |
| | |
Rio Tinto Alcan Inc., 5.75%, 06/01/35 | | |
Rio Tinto Finance USA Ltd. | | |
| | |
| | |
Rio Tinto Finance USA PLC | | |
| | |
| | |
| | |
| | |
| | |
| | |
| | |
| | |
| | |
| | |
|
Adnoc Murban Rsc Ltd., 5.13%, 09/11/54(b) | | |
Aker BP ASA, 5.80%, 10/01/54(b) | | |
| | |
| | |
| | |
| | |
| | |
| | |
BG Energy Capital PLC, 5.13%, 10/15/41(b) | | |
BP Capital Markets America Inc. | | |
| | |
| | |
| | |
| | |
| | |
| | |
| | |
| | |
Burlington Resources LLC, 5.95%, 10/15/36 | | |
Canadian Natural Resources Ltd. | | |
| | |
| | |
| | |
| | |
| | |
| | |
| | |
| | |
| | |
| | |
| | |
| | |
| | |
| | |
| | |
| | |
| | |
CNOOC Finance 2011 Ltd., 5.75%, 01/26/41(b) | | |
CNOOC Finance 2012 Ltd., 5.00%, 05/02/42(b) | | |
| | |
| | |
| | |
CNOOC Finance 2014 ULC, 4.88%, 04/30/44(a) | | |
CNOOC Finance 2015 Australia Pty. Ltd., 4.20%, 05/05/45 | | |
CNPC HK Overseas Capital Ltd., 5.95%, 04/28/41(a)(b) | | |
| | |
| | |
| | |
| | |
| | |
| | |
| | |
| | |
| | |
| | |
| | |
| | |
Continental Resources Inc./OK, 4.90%, 06/01/44(a) | | |
Schedule of Investments (unaudited)(continued)October 31, 2024
iShares® 10+ Year Investment Grade Corporate Bond ETF(Percentages shown are based on Net Assets)
| | |
|
| | |
| | |
| | |
| | |
| | |
| | |
| | |
| | |
| | |
| | |
| | |
Empresa Nacional del Petroleo, 4.50%, 09/14/47(a)(b) | | |
| | |
| | |
| | |
| | |
| | |
| | |
| | |
| | |
| | |
| | |
| | |
| | |
| | |
| | |
| | |
| | |
| | |
| | |
| | |
| | |
| | |
| | |
| | |
Helmerich & Payne Inc., 5.50%, 12/01/34(a)(b) | | |
| | |
| | |
| | |
| | |
KazMunayGas National Co. JSC | | |
| | |
| | |
| | |
| | |
| | |
| | |
| | |
| | |
| | |
| | |
| | |
Motiva Enterprises LLC, 6.85%, 01/15/40(b) | | |
Occidental Petroleum Corp. | | |
| | |
| | |
| | |
| | |
| | |
| | |
| | |
|
| | |
| | |
| | |
| | |
| | |
| | |
| | |
| | |
| | |
| | |
| | |
| | |
| | |
| | |
| | |
| | |
| | |
| | |
| | |
| | |
| | |
| | |
| | |
| | |
| | |
| | |
| | |
| | |
| | |
| | |
| | |
| | |
| | |
| | |
PTT Treasury Center Co. Ltd., 3.70%, 07/16/70(a)(b) | | |
PTTEP Treasury Center Co. Ltd. | | |
| | |
| | |
| | |
| | |
| | |
Raizen Fuels Finance SA, 6.95%, 03/05/54(a)(b) | | |
| | |
| | |
| | |
| | |
| | |
| | |
| | |
| | |
| | |
| | |
| | |
| | |
| | |
| | |
| | |
| | |
| | |
Schedule of Investments (unaudited)(continued)October 31, 2024
iShares® 10+ Year Investment Grade Corporate Bond ETF(Percentages shown are based on Net Assets)
| | |
|
Shell International Finance BV | | |
| | |
| | |
| | |
| | |
| | |
| | |
| | |
Sinopec Capital 2013 Ltd., 4.25%, 04/24/43(b) | | |
Sinopec Group Overseas Development 2012 Ltd., 4.88%, 05/17/42(a)(b) | | |
Sinopec Group Overseas Development 2013 Ltd., 5.38%, 10/17/43(a)(b) | | |
Sinopec Group Overseas Development 2015 Ltd., 4.10%, 04/28/45(b) | | |
Sinopec Group Overseas Development 2016 Ltd., 4.25%, 05/03/46(b) | | |
Sinopec Group Overseas Development 2017 Ltd. | | |
| | |
| | |
Sinopec Group Overseas Development 2018 Ltd. | | |
| | |
| | |
| | |
| | |
| | |
| | |
| | |
| | |
| | |
| | |
| | |
Thaioil Treasury Center Co. Ltd. | | |
| | |
| | |
| | |
TotalEnergies Capital International SA | | |
| | |
| | |
| | |
| | |
| | |
| | |
| | |
| | |
| | |
| | |
| | |
| | |
| | |
| | |
Woodside Finance Ltd., 5.70%, 09/12/54 | | |
XTO Energy Inc., 6.75%, 08/01/37 | | |
| | |
Oil & Gas Services — 0.3% |
Baker Hughes Holdings LLC, 5.13%, 09/15/40 | | |
Baker Hughes Holdings LLC/Baker Hughes Co-Obligor Inc., 4.08%, 12/15/47 | | |
| | |
| | |
| | |
| | |
Oil & Gas Services (continued) |
| | |
| | |
| | |
| | |
NOV Inc., 3.95%, 12/01/42 | | |
| | |
Packaging & Containers — 0.1% |
Packaging Corp. of America | | |
| | |
| | |
Smurfit Kappa Treasury ULC, 5.78%, 04/03/54(b) | | |
Sonoco Products Co., 5.75%, 11/01/40(a) | | |
Stora Enso OYJ, 7.25%, 04/15/36(a)(b) | | |
| | |
|
| | |
| | |
| | |
| | |
| | |
| | |
| | |
| | |
| | |
| | |
| | |
| | |
| | |
| | |
| | |
| | |
| | |
| | |
| | |
| | |
| | |
| | |
| | |
Bayer U.S. Finance II LLC | | |
| | |
| | |
| | |
| | |
| | |
| | |
| | |
Bayer U.S. Finance LLC, 6.88%, 11/21/53(a)(b) | | |
| | |
| | |
| | |
| | |
| | |
| | |
| | |
| | |
| | |
| | |
| | |
| | |
| | |
Schedule of Investments (unaudited)(continued)October 31, 2024
iShares® 10+ Year Investment Grade Corporate Bond ETF(Percentages shown are based on Net Assets)
| | |
Pharmaceuticals (continued) |
| | |
| | |
| | |
| | |
| | |
| | |
| | |
| | |
| | |
| | |
| | |
| | |
| | |
| | |
| | |
| | |
| | |
| | |
| | |
| | |
| | |
| | |
| | |
| | |
| | |
| | |
| | |
| | |
| | |
| | |
| | |
| | |
| | |
| | |
| | |
| | |
| | |
| | |
| | |
| | |
| | |
| | |
| | |
| | |
| | |
| | |
| | |
| | |
| | |
GlaxoSmithKline Capital Inc. | | |
| | |
| | |
| | |
| | |
| | |
| | |
| | |
| | |
| | |
| | |
| | |
| | |
Pharmaceuticals (continued) |
| | |
| | |
| | |
| | |
| | |
| | |
| | |
McKesson Corp., 4.88%, 03/15/44(a) | | |
Mead Johnson Nutrition Co. | | |
| | |
| | |
| | |
| | |
| | |
| | |
| | |
| | |
| | |
| | |
| | |
| | |
| | |
| | |
| | |
| | |
Merck Sharp & Dohme Corp. | | |
| | |
| | |
| | |
| | |
| | |
| | |
| | |
| | |
| | |
| | |
| | |
| | |
| | |
| | |
| | |
| | |
| | |
| | |
| | |
| | |
| | |
| | |
| | |
| | |
Pfizer Investment Enterprises Pte Ltd. | | |
| | |
| | |
| | |
Takeda Pharmaceutical Co. Ltd. | | |
| | |
| | |
| | |
| | |
| | |
| | |
Schedule of Investments (unaudited)(continued)October 31, 2024
iShares® 10+ Year Investment Grade Corporate Bond ETF(Percentages shown are based on Net Assets)
| | |
Pharmaceuticals (continued) |
Utah Acquisition Sub Inc., 5.25%, 06/15/46 | | |
| | |
| | |
| | |
| | |
| | |
| | |
| | |
| | |
| | |
| | |
| | |
| | |
|
Abu Dhabi Crude Oil Pipeline LLC, 4.60%, 11/02/47(b) | | |
| | |
| | |
| | |
| | |
Cheniere Corpus Christi Holdings LLC, 2.74%, 12/31/39 | | |
| | |
| | |
| | |
| | |
Columbia Pipeline Group Inc., 5.80%, 06/01/45(a) | | |
Columbia Pipelines Operating Co. LLC | | |
| | |
| | |
| | |
| | |
DCP Midstream Operating LP | | |
| | |
| | |
| | |
Eastern Energy Gas Holdings LLC, 5.65%, 10/15/54 | | |
Eastern Gas Transmission & Storage Inc. | | |
| | |
| | |
| | |
| | |
| | |
| | |
Enbridge Energy Partners LP | | |
| | |
| | |
Series B, 7.50%, 04/15/38 | | |
| | |
| | |
| | |
| | |
| | |
| | |
| | |
| | |
| | |
| | |
| | |
| | |
| | |
|
| | |
| | |
| | |
| | |
| | |
| | |
| | |
| | |
| | |
| | |
| | |
| | |
| | |
| | |
| | |
| | |
| | |
| | |
Series 20Y, 5.80%, 06/15/38 | | |
EnLink Midstream Partners LP | | |
| | |
| | |
| | |
Enterprise Products Operating LLC | | |
| | |
| | |
| | |
| | |
| | |
| | |
| | |
| | |
| | |
| | |
| | |
| | |
| | |
| | |
| | |
| | |
| | |
| | |
| | |
| | |
Series J, 5.75%, 03/01/35 | | |
Fermaca Enterprises S de RL de CV, 6.38%, 03/30/38(b) | | |
Flex Intermediate Holdco LLC, 4.32%, 12/30/39(b) | | |
FLNG Liquefaction 2 LLC, 4.13%, 03/31/38(b) | | |
Galaxy Pipeline Assets Bidco Ltd. | | |
| | |
| | |
| | |
Greensaif Pipelines Bidco SARL | | |
| | |
| | |
Gulfstream Natural Gas System LLC, 5.95%, 10/15/45(a)(b) | | |
Kinder Morgan Energy Partners LP | | |
| | |
| | |
Schedule of Investments (unaudited)(continued)October 31, 2024
iShares® 10+ Year Investment Grade Corporate Bond ETF(Percentages shown are based on Net Assets)
| | |
|
| | |
| | |
| | |
| | |
| | |
| | |
| | |
| | |
| | |
| | |
| | |
| | |
| | |
| | |
| | |
| | |
| | |
| | |
| | |
| | |
| | |
| | |
| | |
| | |
| | |
| | |
| | |
| | |
| | |
NGPL PipeCo LLC, 7.77%, 12/15/37(b) | | |
| | |
| | |
| | |
| | |
| | |
| | |
| | |
| | |
| | |
| | |
| | |
| | |
| | |
| | |
| | |
| | |
| | |
| | |
| | |
| | |
| | |
| | |
| | |
| | |
| | |
| | |
| | |
| | |
Plains All American Pipeline LP/PAA Finance Corp. | | |
| | |
| | |
| | |
|
| | |
| | |
| | |
Sabal Trail Transmission LLC | | |
| | |
| | |
Sabine Pass Liquefaction LLC, 5.90%, 09/15/37(a) | | |
South Bow USA Infrastructure Holdings LLC, 6.18%, 10/01/54(b) | | |
Southern Natural Gas Co. LLC, 4.80%, 03/15/47(b) | | |
Spectra Energy Partners LP | | |
| | |
| | |
| | |
| | |
| | |
| | |
| | |
Tennessee Gas Pipeline Co. LLC, 7.63%, 04/01/37(a) | | |
Texas Eastern Transmission LP, 4.15%, 01/15/48(b) | | |
TransCanada PipeLines Ltd. | | |
| | |
| | |
| | |
| | |
| | |
| | |
Transcontinental Gas Pipe Line Co. LLC | | |
| | |
| | |
| | |
| | |
Western Midstream Operating LP | | |
| | |
| | |
| | |
| | |
Williams Companies Inc. (The) | | |
| | |
| | |
| | |
| | |
| | |
| | |
| | |
| | |
| | |
| | |
| | |
|
Apollo Management Holdings LP, 5.00%, 03/15/48(b) | | |
Carlyle Finance LLC, 5.65%, 09/15/48(b) | | |
Carlyle Holdings II Finance LLC, 5.63%, 03/30/43(a)(b) | | |
KKR Group Finance Co. III LLC, 5.13%, 06/01/44(a)(b) | | |
KKR Group Finance Co. VII LLC, 3.63%, 02/25/50(b) | | |
Schedule of Investments (unaudited)(continued)October 31, 2024
iShares® 10+ Year Investment Grade Corporate Bond ETF(Percentages shown are based on Net Assets)
| | |
Private Equity (continued) |
KKR Group Finance Co. VIII LLC, 3.50%, 08/25/50(b) | | |
KKR Group Finance Co. X LLC, 3.25%, 12/15/51(a)(b) | | |
| | |
|
Sinochem Overseas Capital Co. Ltd., 6.30%, 11/12/40(a)(b) | | |
Real Estate Investment Trusts — 1.4% |
Alexandria Real Estate Equities Inc. | | |
| | |
| | |
| | |
| | |
| | |
| | |
| | |
| | |
| | |
| | |
| | |
| | |
| | |
| | |
| | |
AvalonBay Communities Inc. | | |
| | |
| | |
| | |
Boston Properties LP, 5.75%, 01/15/35 | | |
Brixmor Operating Partnership LP, 5.75%, 02/15/35 | | |
Camden Property Trust, 3.35%, 11/01/49(a) | | |
| | |
| | |
| | |
| | |
| | |
| | |
| | |
| | |
| | |
| | |
| | |
| | |
| | |
| | |
| | |
| | |
| | |
| | |
| | |
| | |
| | |
GLP Capital LP/GLP Financing II Inc., 6.25%, 09/15/54 | | |
Goodman U.S. Finance Four LLC, 4.50%, 10/15/37(a)(b) | | |
Healthpeak OP LLC, 6.75%, 02/01/41 | | |
Host Hotels & Resorts LP, 5.50%, 04/15/35(a) | | |
| | |
Real Estate Investment Trusts (continued) |
Kilroy Realty LP, 6.25%, 01/15/36(a) | | |
| | |
| | |
| | |
| | |
| | |
| | |
Mid-America Apartments LP, 2.88%, 09/15/51(a) | | |
| | |
| | |
| | |
| | |
| | |
| | |
| | |
| | |
| | |
| | |
| | |
| | |
| | |
Public Storage Operating Co., 5.35%, 08/01/53 | | |
| | |
| | |
| | |
| | |
| | |
| | |
| | |
| | |
| | |
| | |
| | |
| | |
| | |
| | |
| | |
| | |
| | |
| | |
| | |
UDR Inc., 3.10%, 11/01/34 | | |
| | |
| | |
| | |
| | |
| | |
| | |
| | |
| | |
WEA Finance LLC, 4.63%, 09/20/48(a)(b) | | |
WEA Finance LLC/Westfield U.K. & Europe Finance PLC, 4.75%, 09/17/44(b) | | |
| | |
| | |
| | |
| | |
Weyerhaeuser Co., 4.00%, 03/09/52(a) | | |
| | |
Schedule of Investments (unaudited)(continued)October 31, 2024
iShares® 10+ Year Investment Grade Corporate Bond ETF(Percentages shown are based on Net Assets)
| | |
|
| | |
| | |
| | |
Alimentation Couche-Tard Inc. | | |
| | |
| | |
| | |
| | |
| | |
CK Hutchison International 20 Ltd., 3.38%, 05/08/50(a)(b) | | |
CK Hutchison International 21 Ltd., 3.13%, 04/15/41(a)(b) | | |
Darden Restaurants Inc., 4.55%, 02/15/48 | | |
Dick's Sporting Goods Inc., 4.10%, 01/15/52 | | |
| | |
| | |
| | |
Dollar Tree Inc., 3.38%, 12/01/51 | | |
| | |
| | |
| | |
| | |
| | |
| | |
| | |
| | |
| | |
| | |
| | |
| | |
| | |
| | |
| | |
| | |
| | |
| | |
| | |
| | |
| | |
| | |
| | |
| | |
| | |
| | |
| | |
| | |
| | |
| | |
| | |
| | |
| | |
| | |
| | |
| | |
| | |
| | |
| | |
| | |
| | |
| | |
| | |
|
| | |
| | |
| | |
| | |
| | |
| | |
| | |
| | |
| | |
| | |
| | |
| | |
| | |
| | |
| | |
| | |
| | |
| | |
| | |
| | |
| | |
| | |
| | |
| | |
| | |
| | |
| | |
| | |
| | |
Tiffany & Co., 4.90%, 10/01/44(a) | | |
TJX Companies Inc. (The), 4.50%, 04/15/50(a) | | |
| | |
| | |
| | |
| | |
| | |
| | |
| | |
| | |
| | |
| | |
| | |
| | |
| | |
| | |
| | |
| | |
| | |
| | |
| | |
|
Advanced Micro Devices Inc., 4.39%, 06/01/52(a) | | |
| | |
| | |
| | |
| | |
| | |
| | |
| | |
| | |
| | |
Schedule of Investments (unaudited)(continued)October 31, 2024
iShares® 10+ Year Investment Grade Corporate Bond ETF(Percentages shown are based on Net Assets)
| | |
Semiconductors (continued) |
| | |
| | |
| | |
| | |
| | |
| | |
| | |
| | |
| | |
| | |
| | |
| | |
| | |
| | |
| | |
| | |
| | |
| | |
| | |
| | |
| | |
| | |
| | |
| | |
| | |
| | |
| | |
| | |
| | |
| | |
| | |
| | |
| | |
| | |
| | |
| | |
| | |
| | |
| | |
| | |
| | |
| | |
| | |
| | |
| | |
| | |
| | |
| | |
NXP BV/NXP Funding LLC/NXP USA Inc. | | |
| | |
| | |
| | |
| | |
| | |
| | |
| | |
| | |
| | |
| | |
| | |
| | |
| | |
Semiconductors (continued) |
| | |
| | |
| | |
| | |
| | |
| | |
| | |
| | |
| | |
| | |
| | |
|
Electronic Arts Inc., 2.95%, 02/15/51 | | |
Fidelity National Information Services Inc. | | |
| | |
| | |
| | |
Series 30Y, 4.75%, 05/15/48(a) | | |
Fiserv Inc., 4.40%, 07/01/49 | | |
Intuit Inc., 5.50%, 09/15/53(a) | | |
| | |
| | |
| | |
| | |
| | |
| | |
| | |
| | |
| | |
| | |
| | |
| | |
| | |
| | |
| | |
| | |
| | |
| | |
| | |
| | |
| | |
| | |
| | |
| | |
| | |
| | |
| | |
| | |
| | |
| | |
| | |
| | |
| | |
| | |
| | |
| | |
| | |
| | |
| | |
| | |
| | |
Schedule of Investments (unaudited)(continued)October 31, 2024
iShares® 10+ Year Investment Grade Corporate Bond ETF(Percentages shown are based on Net Assets)
| | |
|
| | |
| | |
| | |
| | |
| | |
| | |
| | |
| | |
| | |
Telecommunications — 5.6% |
| | |
| | |
| | |
| | |
| | |
| | |
| | |
| | |
| | |
| | |
| | |
| | |
| | |
| | |
| | |
| | |
| | |
| | |
| | |
| | |
| | |
| | |
| | |
| | |
| | |
| | |
| | |
| | |
| | |
| | |
| | |
| | |
| | |
| | |
| | |
| | |
| | |
| | |
| | |
| | |
| | |
| | |
Bell Telephone Co. of Canada or Bell Canada | | |
| | |
| | |
| | |
| | |
Series US-4, 3.65%, 03/17/51 | | |
Series US-6, 3.20%, 02/15/52(a) | | |
British Telecommunications PLC, 4.25%, 11/08/49(b) | | |
| | |
Telecommunications (continued) |
| | |
| | |
| | |
| | |
| | |
| | |
| | |
| | |
| | |
| | |
| | |
| | |
| | |
| | |
| | |
Deutsche Telekom AG, 3.63%, 01/21/50(b) | | |
Deutsche Telekom International Finance BV | | |
| | |
| | |
Juniper Networks Inc., 5.95%, 03/15/41 | | |
Motorola Solutions Inc., 5.50%, 09/01/44 | | |
Nokia OYJ, 6.63%, 05/15/39 | | |
Ooredoo International Finance Ltd., 4.50%, 01/31/43(b) | | |
| | |
| | |
| | |
Rogers Communications Inc. | | |
| | |
| | |
| | |
| | |
| | |
| | |
| | |
| | |
| | |
SES Global Americas Holdings Inc., 5.30%, 03/25/44(b) | | |
SES SA, 5.30%, 04/04/43(b) | | |
| | |
| | |
| | |
| | |
| | |
| | |
| | |
| | |
| | |
| | |
| | |
| | |
| | |
| | |
| | |
| | |
| | |
| | |
| | |
| | |
| | |
Schedule of Investments (unaudited)(continued)October 31, 2024
iShares® 10+ Year Investment Grade Corporate Bond ETF(Percentages shown are based on Net Assets)
| | |
Telecommunications (continued) |
| | |
| | |
Verizon Communications Inc. | | |
| | |
| | |
| | |
| | |
| | |
| | |
| | |
| | |
| | |
| | |
| | |
| | |
| | |
| | |
| | |
| | |
| | |
| | |
| | |
| | |
| | |
| | |
| | |
| | |
| | |
| | |
| | |
| | |
| | |
| | |
| | |
| | |
| | |
| | |
| | |
| | |
| | |
| | |
| | |
Xiaomi Best Time International Ltd., 4.10%, 07/14/51(b) | | |
| | |
Toys, Games & Hobbies — 0.1% |
| | |
| | |
| | |
| | |
| | |
| | |
| | |
|
Burlington Northern Santa Fe LLC | | |
| | |
| | |
| | |
| | |
| | |
| | |
Transportation (continued) |
| | |
| | |
| | |
| | |
| | |
| | |
| | |
| | |
| | |
| | |
| | |
| | |
| | |
| | |
| | |
| | |
| | |
| | |
| | |
| | |
Canadian National Railway Co. | | |
| | |
| | |
| | |
| | |
| | |
| | |
| | |
| | |
| | |
| | |
| | |
Canadian Pacific Railway Co. | | |
| | |
| | |
| | |
| | |
| | |
| | |
| | |
| | |
| | |
| | |
| | |
| | |
Central Japan Railway Co., 4.25%, 11/24/45(b) | | |
| | |
| | |
| | |
| | |
| | |
| | |
| | |
| | |
| | |
| | |
| | |
| | |
| | |
| | |
| | |
Schedule of Investments (unaudited)(continued)October 31, 2024
iShares® 10+ Year Investment Grade Corporate Bond ETF(Percentages shown are based on Net Assets)
| | |
Transportation (continued) |
| | |
| | |
| | |
| | |
| | |
| | |
Empresa de los Ferrocarriles del Estado | | |
| | |
| | |
Empresa de Transporte de Pasajeros Metro SA | | |
| | |
| | |
| | |
ENA Master Trust, 4.00%, 05/19/48(b) | | |
| | |
| | |
| | |
| | |
| | |
| | |
| | |
| | |
| | |
| | |
| | |
| | |
| | |
| | |
| | |
| | |
| | |
| | |
| | |
| | |
| | |
| | |
| | |
| | |
| | |
| | |
| | |
| | |
| | |
| | |
| | |
| | |
| | |
| | |
Polar Tankers Inc., 5.95%, 05/10/37(a)(b) | | |
| | |
| | |
| | |
| | |
| | |
| | |
| | |
| | |
| | |
| | |
| | |
| | |
| | |
Transportation (continued) |
| | |
| | |
| | |
| | |
| | |
| | |
| | |
| | |
| | |
| | |
| | |
| | |
| | |
| | |
| | |
| | |
| | |
| | |
| | |
| | |
| | |
| | |
| | |
United Parcel Service Inc. | | |
| | |
| | |
| | |
| | |
| | |
| | |
| | |
| | |
| | |
| | |
| | |
| | |
| | |
Trucking & Leasing — 0.0% |
| | |
| | |
| | |
| | |
| | |
| | |
|
American Water Capital Corp. | | |
| | |
| | |
| | |
| | |
| | |
| | |
| | |
| | |
| | |
| | |
| | |
| | |
| | |
Schedule of Investments (unaudited)(continued)October 31, 2024
iShares® 10+ Year Investment Grade Corporate Bond ETF(Percentages shown are based on Net Assets)
| | |
|
| | |
| | |
Total Long-Term Investments — 97.6%
(Cost: $3,046,348,107) | |
| | |
|
Money Market Funds — 12.5% |
BlackRock Cash Funds: Institutional, SL Agency Shares, 5.01%(g)(h)(i) | | |
BlackRock Cash Funds: Treasury, SL Agency Shares, 4.83%(g)(h) | | |
Total Short-Term Securities — 12.5%
(Cost: $341,217,116) | |
Total Investments — 110.1%
(Cost: $3,387,565,223) | |
Liabilities in Excess of Other Assets — (10.1)% | |
| |
| All or a portion of this security is on loan. |
| Security exempt from registration pursuant to Rule 144A under the Securities Act of 1933, as amended. These securities may be resold in transactions exempt from registration to qualified institutional investors. |
| Step coupon security. Coupon rate will either increase (step-up bond) or decrease (step-down bond) at regular intervals until maturity. Interest rate shown reflects the rate currently in effect. |
| Variable rate security. Interest rate resets periodically. The rate shown is the effective interest rate as of period end. Security description also includes the reference rate and spread if published and available. |
| Perpetual security with no stated maturity date. |
| |
| |
| Annualized 7-day yield as of period end. |
| All or a portion of this security was purchased with the cash collateral from loaned securities. |
Fair Value Hierarchy as of Period End
Various inputs are used in determining the fair value of financial instruments at the measurement of the date. These inputs to valuation techniques are categorized into a fair value hierarchy consisting of three broad levels for financial reporting purposes as follows:
• Level 1 – Unadjusted price quotations in active markets/exchanges that the Fund has the ability to access for identical assets or liabilities;
• Level 2 – Inputs other than quoted prices included within level 1 that are observable for the asset or liability, either directly or indirectly; and
• Level 3 – Inputs that are unobservable and significant to the entire fair value measurement for the asset or liability (including the Valuation Committee’s assumptions used in determining the fair value of financial instruments).
The hierarchy gives the highest priority to unadjusted quoted prices in active markets for identical assets or liabilities (Level 1 measurements) and the lowest priority to unobservable inputs (Level 3 measurements). Accordingly, the degree of judgment exercised in determining fair value is greatest for instruments categorized in Level 3. The inputs used to measure fair value may fall into different levels of the fair value hierarchy. In such cases, for disclosure purposes, the fair value hierarchy classification is determined based on the lowest level input that is significant to the fair value measurement in its entirety. Investments classified within Level 3 have significant unobservable inputs used by the Valuation Committee in determining the price for Fair Valued Investments. Level 3 investments include equity or debt issued by privately held companies or funds. There may not be a secondary market, and/or there are a limited number of investors. The categorization of a value determined for financial instruments is based on the pricing transparency of the financial instruments and is not necessarily an indication of the risks associated with investing in those securities. For information about the Fund’s policy regarding valuation of financial instruments, refer to its most recent financial statements.
The following table summarizes the Fund’s financial instruments categorized in the fair value hierarchy. The breakdown of the Fund’s financial instruments into major categories is disclosed in the Schedule of Investments above.
Schedule of Investments (unaudited)October 31, 2024
iShares® Core U.S. Aggregate Bond ETF(Percentages shown are based on Net Assets)
| | |
|
Ally Auto Receivables Trust, 4.14%, 07/16/29 | | |
American Express Credit Account Master Trust | | |
| | |
| | |
| | |
| | |
AmeriCredit Automobile Receivables Trust, 5.62%, 11/18/27 | | |
BA Credit Card Trust, 4.98%, 11/15/28 | | |
BMW Vehicle Lease Trust, 5.98%, 02/25/27 | | |
Capital One Multi-Asset Execution Trust | | |
| | |
Class A2, 1.39%, 07/15/30 | | |
| | |
| | |
| | |
| | |
Carvana Auto Receivables Trust, 4.26%, 10/10/29 | | |
| | |
| | |
| | |
| | |
Citibank Credit Card Issuance Trust, 3.96%, 10/13/30 | | |
| | |
| | |
| | |
Discover Card Execution Note Trust, 3.56%, 07/15/27 | | |
Drive Auto Receivables Trust | | |
| | |
| | |
Exeter Automobile Receivables Trust | | |
| | |
| | |
| | |
| | |
Ford Credit Auto Lease Trust | | |
| | |
| | |
Ford Credit Auto Owner Trust, 4.07%, 07/15/29 | | |
GM Financial Automobile Leasing Trust, 5.39%, 07/20/27 | | |
GM Financial Consumer Automobile Receivables Trust | | |
| | |
| | |
| | |
| | |
| | |
| | |
| | |
Honda Auto Receivables Owner Trust | | |
| | |
| | |
Hyundai Auto Receivables Trust | | |
| | |
| | |
| | |
| | |
| | |
| | |
| | |
| | |
| | |
Nissan Auto Lease Trust, 4.91%, 04/15/27 | | |
Santander Drive Auto Receivables Trust | | |
| | |
| | |
| | |
| | |
| | |
| | |
| | |
Synchrony Card Funding LLC, 5.04%, 03/15/30 | | |
Verizon Master Trust, 4.17%, 08/20/30 | | |
Verizon Master Trust Series, 5.21%, 06/20/29 | | |
Volkswagen Auto Loan Enhanced Trust | | |
| | |
| | |
World Omni Auto Receivables Trust, 5.09%, 12/17/29 | | |
Total Asset-Backed Securities — 0.5%
(Cost: $535,246,808) | |
Collateralized Mortgage Obligations |
Mortgage-Backed Securities — 0.9% |
3650R 2021-PF1 Commercial Mortgage Trust, 5.29%, 11/15/55(a) | | |
| | |
| | |
| | |
| | |
| | |
Series 2017-BNK8, Class A3, 3.23%, 11/15/50 | | |
Series 2018-BN15, Class A4, 4.41%, 11/15/61(a) | | |
Series 2019-BN21, Class A5, 2.85%, 10/17/52 | | |
Series 2020, Class A5, 2.65%, 01/15/63 | | |
Series 2020-BN27, Class A5, 2.14%, 04/15/63 | | |
Series 2020-BN29, Class A4, 2.00%, 11/15/53 | | |
Series 21-BN36, Class A5, 2.47%, 09/15/64 | | |
| | |
| | |
| | |
| | |
| | |
| | |
| | |
| | |
| | |
| | |
Barclays Commercial Mortgage Trust, Series 2019-C4, Class A5, 2.92%, 08/15/52 | | |
Schedule of Investments (unaudited)(continued)October 31, 2024
iShares® Core U.S. Aggregate Bond ETF(Percentages shown are based on Net Assets)
| | |
Mortgage-Backed Securities (continued) |
| | |
| | |
| | |
| | |
| | |
| | |
| | |
| | |
| | |
| | |
| | |
| | |
| | |
| | |
| | |
| | |
| | |
| | |
| | |
| | |
| | |
| | |
| | |
| | |
| | |
| | |
| | |
Series 2017-C1, Class A4, 3.67%, 02/15/50 | | |
Series 2020-C6, Class A4, 2.64%, 02/15/53 | | |
Series 2020-C7, Class A5, 2.04%, 04/15/53 | | |
Series 2021-C11, Class A5, 2.32%, 09/15/54 | | |
Series 2022-C15, Class A5, 3.66%, 04/15/55(a) | | |
BBCMS Trust, Series 2021-C10, Class A5, 2.49%, 07/15/54 | | |
| | |
| | |
| | |
| | |
| | |
| | |
| | |
| | |
| | |
| | |
| | |
| | |
| | |
Series 2018-B2, Class A5, 3.88%, 02/15/51(a) | | |
Series 2018-B3, Class A5, 4.03%, 04/10/51 | | |
Series 2018-B5, Class A4, 4.21%, 07/15/51 | | |
Series 2018-B7, Class A4, 4.51%, 05/15/53(a) | | |
Series 2018-B7, Class B, 4.84%, 05/15/53(a) | | |
Series 2018-B8, Class A5, 4.23%, 01/15/52 | | |
Series 2019-B11, Class A4, 3.28%, 05/15/52 | | |
| | |
Mortgage-Backed Securities (continued) |
Series 2019-B11, Class A5, 3.54%, 05/15/52 | | |
Series 2020-B19, Class B, 2.35%, 09/15/53 | | |
Series 2020-B21, Class A4, 1.70%, 12/17/53 | | |
Series 2020-B21, Class A5, 1.98%, 12/17/53 | | |
Series 2020-B23, Class A5, 2.07%, 02/15/54 | | |
Series 2023-B38, Class A2, 5.63%, 04/15/56 | | |
| | |
| | |
| | |
| | |
| | |
| | |
| | |
| | |
| | |
| | |
| | |
| | |
| | |
| | |
| | |
| | |
Series 2017-CD3, Class A4, 3.63%, 02/10/50 | | |
Citigroup Commercial Mortgage Trust | | |
| | |
Series 2016-GC37, Class A4, 3.31%, 04/10/49 | | |
Series 2016-P5, Class A4, 2.94%, 10/10/49 | | |
Series 2017-P7, Class A4, 3.71%, 04/14/50 | | |
Series 2017-P8, Class A3, 3.20%, 09/15/50 | | |
Series 2018-B2, Class A4, 4.01%, 03/10/51 | | |
Commission Mortgage Trust | | |
Series 2016-CR28, Class A4, 3.76%, 02/10/49 | | |
Series 2016-DC2, Class A5, 3.77%, 02/10/49 | | |
CSAIL Commercial Mortgage Trust | | |
Series 2015-C4, Class A4, 3.81%, 11/15/48 | | |
Series 2016-C7, Class A5, 3.50%, 11/15/49 | | |
Series 2018-CX11, Class A5, 4.03%, 04/15/51(a) | | |
Series 2019-C18, Class A4, 2.97%, 12/15/52 | | |
| | |
| | |
Series 2016-C3, Class A5, 2.89%, 08/10/49 | | |
Federal Home Loan Mortgage Corp. Multifamily Structured Pass-Through Certificates | | |
| | |
| | |
| | |
| | |
| | |
| | |
Schedule of Investments (unaudited)(continued)October 31, 2024
iShares® Core U.S. Aggregate Bond ETF(Percentages shown are based on Net Assets)
| | |
Mortgage-Backed Securities (continued) |
| | |
| | |
| | |
| | |
| | |
| | |
| | |
| | |
| | |
| | |
| | |
Federal National Mortgage Association-ACES | | |
| | |
| | |
| | |
GS Mortgage Securities Trust | | |
| | |
| | |
Series 2017-GS7, Class A3, 3.17%, 08/10/50 | | |
Series 2018-GS10, Class A5, 4.16%, 07/10/51(a) | | |
Series 2018-GS9, Class A4, 3.99%, 03/10/51(a) | | |
Series 2019-GC38, Class A4, 3.97%, 02/10/52 | | |
Morgan Stanley Bank of America Merrill Lynch Trust | | |
Series 2016-C28, Class A4, 3.54%, 01/15/49 | | |
Series 2016-C28, Class AS, 3.95%, 01/15/49 | | |
Series 2016-C32, Class A3, 3.46%, 12/15/49 | | |
Morgan Stanley Capital I Trust | | |
| | |
| | |
Series 2015-UBS8, Class A4, 3.81%, 12/15/48 | | |
Series 2017-H1, Class A5, 3.53%, 06/15/50 | | |
Series 2018, Class A3, 4.14%, 10/15/51 | | |
Series 2018-H3, Class A4, 3.91%, 07/15/51 | | |
Series 2019-H6, Class A4, 3.42%, 06/15/52 | | |
Series 2020-L4, Class A3, 2.70%, 02/15/53 | | |
Series 2021-L7, Class A5, 2.57%, 10/15/54 | | |
UBS Commercial Mortgage Trust | | |
| | |
Series 2018-C08, Class A4, 3.98%, 02/15/51 | | |
Wells Fargo Commercial Mortgage Trust | | |
| | |
| | |
| | |
| | |
| | |
Class A4, 2.34%, 08/15/54 | | |
Series 2020-C56, Class A5, 2.45%, 06/15/53 | | |
Series 2020-C58, Class A4, 2.09%, 07/15/53 | | |
| | |
Mortgage-Backed Securities (continued) |
Series 2021-C59, Class A5, 2.63%, 04/15/54 | | |
| | |
Total Collateralized Mortgage Obligations — 0.9%
(Cost: $1,180,524,937) | |
|
|
Interpublic Group of Companies Inc. (The) | | |
| | |
| | |
| | |
| | |
| | |
| | |
| | |
| | |
| | |
| | |
| | |
Omnicom Group Inc./Omnicom Capital Inc., 3.60%, 04/15/26 | | |
| | |
Aerospace & Defense — 0.5% |
| | |
| | |
| | |
| | |
| | |
| | |
| | |
| | |
| | |
| | |
| | |
| | |
| | |
| | |
| | |
| | |
| | |
| | |
| | |
| | |
| | |
| | |
| | |
| | |
| | |
| | |
| | |
| | |
| | |
| | |
| | |
| | |
| | |
| | |
| | |
Schedule of Investments (unaudited)(continued)October 31, 2024
iShares® Core U.S. Aggregate Bond ETF(Percentages shown are based on Net Assets)
| | |
Aerospace & Defense (continued) |
| | |
| | |
| | |
| | |
| | |
GE Capital Funding LLC, 4.55%, 05/15/32 | | |
GE Capital International Funding Co. Unlimited Co. | | |
| | |
| | |
| | |
| | |
| | |
| | |
| | |
| | |
| | |
| | |
| | |
| | |
| | |
| | |
| | |
| | |
| | |
| | |
| | |
| | |
| | |
| | |
| | |
Hexcel Corp., 4.20%, 02/15/27 | | |
| | |
| | |
| | |
| | |
| | |
| | |
L3Harris Technologies Inc. | | |
| | |
| | |
| | |
| | |
| | |
| | |
| | |
| | |
| | |
| | |
| | |
| | |
| | |
| | |
| | |
| | |
| | |
| | |
| | |
| | |
| | |
| | |
| | |
Aerospace & Defense (continued) |
| | |
| | |
| | |
| | |
| | |
| | |
| | |
| | |
| | |
| | |
| | |
| | |
| | |
| | |
| | |
| | |
Series B, 6.15%, 09/01/36 | | |
| | |
| | |
| | |
| | |
| | |
| | |
| | |
| | |
| | |
| | |
| | |
| | |
| | |
| | |
| | |
| | |
| | |
| | |
| | |
| | |
| | |
| | |
| | |
| | |
| | |
| | |
| | |
| | |
| | |
| | |
| | |
| | |
| | |
| | |
| | |
| | |
| | |
| | |
| | |
| | |
| | |
| | |
| | |
| | |
Schedule of Investments (unaudited)(continued)October 31, 2024
iShares® Core U.S. Aggregate Bond ETF(Percentages shown are based on Net Assets)
| | |
Aerospace & Defense (continued) |
| | |
| | |
| | |
| | |
| | |
| | |
| | |
|
| | |
| | |
| | |
| | |
| | |
| | |
| | |
| | |
| | |
| | |
| | |
| | |
| | |
| | |
| | |
| | |
| | |
| | |
Archer-Daniels-Midland Co. | | |
| | |
| | |
| | |
| | |
| | |
| | |
| | |
| | |
| | |
| | |
| | |
| | |
| | |
| | |
| | |
| | |
| | |
| | |
| | |
| | |
| | |
| | |
| | |
| | |
| | |
| | |
| | |
| | |
| | |
| | |
| | |
| | |
| | |
| | |
| | |
|
BAT International Finance PLC | | |
| | |
| | |
| | |
| | |
| | |
| | |
| | |
| | |
| | |
| | |
Philip Morris International Inc. | | |
| | |
| | |
| | |
| | |
| | |
| | |
| | |
| | |
| | |
| | |
| | |
| | |
| | |
| | |
| | |
| | |
| | |
| | |
| | |
| | |
| | |
| | |
| | |
| | |
| | |
| | |
| | |
| | |
| | |
| | |
| | |
| | |
| | |
| | |
| | |
| | |
| | |
| | |
| | |
|
American Airlines Pass-Through Trust | | |
Series 2014-1, Class A, 3.70%, 04/01/28 | | |
Series 2015-1, Class A, 3.38%, 11/01/28(c) | | |
Series 2015-2, Class AA, 3.60%, 03/22/29 | | |
Series 2016-1, Class AA, 3.58%, 07/15/29 | | |
Series 2016-2, Class AA, 3.20%, 12/15/29 | | |
Series 2016-3, Class AA, 3.00%, 04/15/30(c) | | |
Series 2017-1, Class AA, 3.65%, 02/15/29 | | |
Schedule of Investments (unaudited)(continued)October 31, 2024
iShares® Core U.S. Aggregate Bond ETF(Percentages shown are based on Net Assets)
| | |
|
Series 2017-2, Class AA, 3.35%, 04/15/31 | | |
Series 2019-1, Class AA, 3.15%, 08/15/33 | | |
Series A, Class A, 2.88%, 01/11/36 | | |
| | |
| | |
| | |
Delta Air Lines Pass-Through Trust, Series 2020, Class AA, 2.00%, 12/10/29 | | |
JetBlue Pass-Through Trust | | |
Series 1A, Class A, 4.00%, 05/15/34(c) | | |
Series 2019-1, Class AA, 2.75%, 11/15/33 | | |
| | |
| | |
| | |
| | |
| | |
United Airlines Pass-Through Trust | | |
| | |
Series 2014-1, Class A, 4.00%, 10/11/27 | | |
Series 2014-2, Class A, 3.75%, 03/03/28(c) | | |
Series 2016-1, Class AA, 3.10%, 01/07/30 | | |
Series 2016-2, Class AA, 2.88%, 04/07/30 | | |
Series 2018-1, Class AA, 3.50%, 09/01/31 | | |
Series 2019, Class AA, 4.15%, 02/25/33 | | |
Series 2019-2, Class AA, 2.70%, 11/01/33 | | |
Series 2020-1, 5.88%, 04/15/29 | | |
Series 24-A, 5.88%, 08/15/38 | | |
Series AA, 5.45%, 08/15/38 | | |
| | |
|
| | |
| | |
| | |
| | |
| | |
| | |
| | |
| | |
| | |
Ralph Lauren Corp., 2.95%, 06/15/30 | | |
| | |
| | |
| | |
| | |
| | |
| | |
| | |
| | |
| | |
Auto Manufacturers — 0.5% |
American Honda Finance Corp. | | |
| | |
| | |
| | |
| | |
| | |
| | |
| | |
| | |
| | |
| | |
Auto Manufacturers (continued) |
| | |
| | |
| | |
| | |
| | |
| | |
| | |
| | |
| | |
| | |
| | |
| | |
| | |
| | |
| | |
| | |
| | |
| | |
| | |
| | |
| | |
| | |
| | |
| | |
| | |
| | |
| | |
| | |
| | |
| | |
| | |
| | |
Ford Motor Credit Co. LLC | | |
| | |
| | |
| | |
| | |
| | |
| | |
| | |
| | |
| | |
| | |
| | |
| | |
| | |
| | |
| | |
| | |
| | |
| | |
| | |
| | |
| | |
| | |
| | |
| | |
| | |
| | |
| | |
| | |
Schedule of Investments (unaudited)(continued)October 31, 2024
iShares® Core U.S. Aggregate Bond ETF(Percentages shown are based on Net Assets)
| | |
Auto Manufacturers (continued) |
| | |
| | |
| | |
| | |
| | |
| | |
| | |
| | |
| | |
| | |
| | |
| | |
| | |
| | |
| | |
General Motors Financial Co. Inc. | | |
| | |
| | |
| | |
| | |
| | |
| | |
| | |
| | |
| | |
| | |
| | |
| | |
| | |
| | |
| | |
| | |
| | |
| | |
| | |
| | |
| | |
| | |
| | |
| | |
| | |
| | |
| | |
| | |
| | |
| | |
| | |
| | |
| | |
| | |
| | |
Mercedes-Benz Finance North America LLC, 8.50%, 01/18/31 | | |
| | |
| | |
| | |
| | |
| | |
| | |
| | |
| | |
| | |
Auto Manufacturers (continued) |
| | |
| | |
| | |
| | |
| | |
| | |
| | |
| | |
| | |
| | |
| | |
| | |
| | |
Toyota Motor Credit Corp. | | |
| | |
| | |
| | |
| | |
| | |
| | |
| | |
| | |
| | |
| | |
| | |
| | |
| | |
| | |
| | |
| | |
| | |
| | |
| | |
| | |
| | |
| | |
| | |
| | |
| | |
| | |
| | |
| | |
| | |
| | |
| | |
| | |
| | |
| | |
| | |
| | |
Series B, 5.00%, 03/19/27 | | |
| | |
Auto Parts & Equipment — 0.0% |
| | |
| | |
| | |
| | |
| | |
| | |
| | |
| | |
Schedule of Investments (unaudited)(continued)October 31, 2024
iShares® Core U.S. Aggregate Bond ETF(Percentages shown are based on Net Assets)
| | |
Auto Parts & Equipment (continued) |
Aptiv PLC/Aptiv Global Financing DAC | | |
| | |
| | |
| | |
6.88%, 12/15/54, (5-year CMT + 3.385%)(a) | | |
| | |
| | |
| | |
| | |
| | |
| | |
| | |
| | |
| | |
| | |
| | |
| | |
| | |
| | |
| | |
| | |
| | |
| | |
|
Associated Banc-Corp, 6.46%, 08/29/30, (1-day SOFR +3.030%)(a) | | |
Australia & New Zealand Banking Group Ltd. | | |
| | |
| | |
Australia & New Zealand Banking Group Ltd./New York | | |
| | |
| | |
| | |
| | |
Banco Bilbao Vizcaya Argentaria SA | | |
| | |
6.03%, 03/13/35, (1-year CMT + 1.950%)(a) | | |
6.14%, 09/14/28, (1-year CMT + 2.700%)(a) | | |
7.88%, 11/15/34, (1-year CMT + 3.300%)(a) | | |
| | |
1.72%, 09/14/27, (1-year CMT + 0.900%)(a) | | |
| | |
| | |
| | |
3.23%, 11/22/32, (1-year CMT + 1.600%)(a) | | |
| | |
| | |
| | |
4.18%, 03/24/28, (1-year CMT + 2.000%)(a) | | |
| | |
| | |
| | |
| | |
5.37%, 07/15/28, (1-year CMT + 0.950%)(a) | | |
| | |
5.54%, 03/14/30, (1-year CMT + 1.450%)(a) | | |
5.55%, 03/14/28, (1-year CMT + 1.250%)(a) | | |
| | |
| | |
6.53%, 11/07/27, (1-year CMT + 1.650%)(a) | | |
| | |
|
| | |
| | |
| | |
| | |
1.73%, 07/22/27, (1-day SOFR + 0.960%)(a) | | |
1.90%, 07/23/31, (1-day SOFR + 1.530%)(a) | | |
1.92%, 10/24/31, (1-day SOFR + 1.370%)(a) | | |
2.09%, 06/14/29, (1-day SOFR + 1.060%)(a) | | |
2.30%, 07/21/32, (1-day SOFR + 1.220%)(a) | | |
2.48%, 09/21/36, (5-year CMT + 1.200%)(a) | | |
2.50%, 02/13/31, (3-mo. CME Term SOFR + 1.252%)(a) | | |
2.55%, 02/04/28, (1-day SOFR + 1.050%)(a) | | |
2.57%, 10/20/32, (1-day SOFR + 1.210%)(a) | | |
2.59%, 04/29/31, (1-day SOFR + 2.150%)(a) | | |
2.68%, 06/19/41, (1-day SOFR + 1.930%)(a) | | |
2.69%, 04/22/32, (1-day SOFR + 1.320%)(a) | | |
2.83%, 10/24/51, (1-day SOFR + 1.880%)(a) | | |
2.88%, 10/22/30, (3-mo. CME Term SOFR + 1.452%)(a) | | |
2.97%, 02/04/33, (1-day SOFR + 1.330%)(a) | | |
2.97%, 07/21/52, (1-day SOFR + 1.560%)(a) | | |
3.19%, 07/23/30, (3-mo. CME Term SOFR + 1.442%)(a) | | |
| | |
3.31%, 04/22/42, (1-day SOFR + 1.580%)(a) | | |
3.42%, 12/20/28, (3-mo. CME Term SOFR + 1.302%)(a) | | |
| | |
3.56%, 04/23/27, (3-mo. CME Term SOFR + 1.322%)(a) | | |
3.59%, 07/21/28, (3-mo. CME Term SOFR + 1.632%)(a) | | |
3.71%, 04/24/28, (3-mo. CME Term SOFR + 1.774%)(a) | | |
3.82%, 01/20/28, (3-mo. CME Term SOFR + 1.837%)(a) | | |
3.85%, 03/08/37, (5-year CMT + 2.000%)(a) | | |
3.95%, 01/23/49, (3-mo. CME Term SOFR + 1.452%)(a) | | |
3.97%, 03/05/29, (3-mo. CME Term SOFR + 1.332%)(a) | | |
3.97%, 02/07/30, (3-mo. CME Term SOFR + 1.472%)(a) | | |
4.08%, 04/23/40, (3-mo. CME Term SOFR + 1.582%)(a) | | |
Schedule of Investments (unaudited)(continued)October 31, 2024
iShares® Core U.S. Aggregate Bond ETF(Percentages shown are based on Net Assets)
| | |
|
4.08%, 03/20/51, (3-mo. CME Term SOFR + 3.412%)(a) | | |
4.24%, 04/24/38, (3-mo. CME Term SOFR + 2.076%)(a) | | |
| | |
4.27%, 07/23/29, (3-mo. CME Term SOFR + 1.572%)(a) | | |
4.33%, 03/15/50, (3-mo. CME Term SOFR + 1.782%)(a) | | |
4.38%, 04/27/28, (1-day SOFR + 1.580%)(a) | | |
4.44%, 01/20/48, (3-mo. CME Term SOFR + 2.252%)(a) | | |
| | |
4.57%, 04/27/33, (1-day SOFR + 1.830%)(a) | | |
| | |
4.95%, 07/22/28, (1-day SOFR + 2.040%)(a) | | |
| | |
5.02%, 07/22/33, (1-day SOFR + 2.160%)(a) | | |
5.08%, 01/20/27, (1-day SOFR + 1.290%)(a) | | |
5.20%, 04/25/29, (1-day SOFR + 1.630%)(a) | | |
5.29%, 04/25/34, (1-day SOFR + 1.910%)(a) | | |
5.43%, 08/15/35, (1-day SOFR +1.913%)(a) | | |
5.47%, 01/23/35, (1-day SOFR + 1.650%)(a) | | |
5.52%, 10/25/35, (1-day SOFR + 1.738%)(a) | | |
5.82%, 09/15/29, (1-day SOFR + 1.570%)(a) | | |
5.87%, 09/15/34, (1-day SOFR + 1.840%)(a) | | |
| | |
5.93%, 09/15/27, (1-day SOFR + 1.340%)(a) | | |
| | |
6.20%, 11/10/28, (1-day SOFR + 1.990%)(a) | | |
| | |
| | |
Series L, 4.18%, 11/25/27 | | |
Series L, 4.75%, 04/21/45 | | |
Series N, 1.66%, 03/11/27, (1-day SOFR + 0.910%)(a) | | |
Series N, 2.65%, 03/11/32, (1-day SOFR + 1.220%)(a) | | |
Series N, 3.48%, 03/13/52, (1-day SOFR + 1.650%)(a) | | |
| | |
| | |
| | |
| | |
0.95%, 01/22/27, (1-day SOFR + 0.603%)(a) | | |
| | |
| | |
| | |
|
3.09%, 01/10/37, (5-year CMT + 1.400%)(a) | | |
3.80%, 12/15/32, (5-year USD Swap + 1.432%)(a) | | |
4.64%, 09/10/30, (1-day SOFR + 1.250%)(a) | | |
| | |
| | |
| | |
| | |
| | |
| | |
Series f2f, 4.57%, 09/10/27, (1-day SOFR + 0.880%)(a) | | |
Series H, 4.70%, 09/14/27 | | |
Bank of New York Mellon Corp. (The) | | |
| | |
| | |
| | |
| | |
| | |
| | |
| | |
| | |
| | |
| | |
| | |
| | |
| | |
3.44%, 02/07/28, (3-mo. CME Term SOFR + 1.331%)(a) | | |
| | |
| | |
| | |
3.99%, 06/13/28, (1-day SOFR + 1.151%)(a) | | |
4.29%, 06/13/33, (1-day SOFR + 1.418%)(a) | | |
4.54%, 02/01/29, (1-day SOFR + 1.169%)(a) | | |
4.60%, 07/26/30, (1-day SOFR + 1.755%)(a) | | |
4.71%, 02/01/34, (1-day SOFR + 1.512%)(a) | | |
4.89%, 07/21/28, (1-day SOFR +0.840%)(a) | | |
4.95%, 04/26/27, (1-day SOFR + 1.026%)(a) | | |
4.97%, 04/26/34, (1-day SOFR + 1.606%)(a) | | |
4.98%, 03/14/30, (1-day SOFR +1.085%)(a) | | |
5.06%, 07/22/32, (1-day SOFR + 1.230%)(a) | | |
5.19%, 03/14/35, (1-day SOFR + 1.418%)(a) | | |
5.61%, 07/21/39, (1-day SOFR + 1.770%)(a) | | |
5.80%, 10/25/28, (1-day SOFR Index + 1.802%)(a) | | |
5.83%, 10/25/33, (1-day SOFR Index + 2.074%)(a) | | |
6.32%, 10/25/29, (1-day SOFR + 1.598%)(a) | | |
Schedule of Investments (unaudited)(continued)October 31, 2024
iShares® Core U.S. Aggregate Bond ETF(Percentages shown are based on Net Assets)
| | |
|
6.47%, 10/25/34, (1-day SOFR + 1.845%)(a) | | |
Series J, 1.90%, 01/25/29 | | |
Bank of Nova Scotia (The) | | |
| | |
| | |
| | |
| | |
| | |
| | |
| | |
| | |
4.40%, 09/08/28, (1-day SOFR + 1.000%)(a) | | |
| | |
4.59%, 05/04/37, (5-year CMT + 2.050%)(a) | | |
4.74%, 11/10/32, (1-day SOFR + 1.440%)(a)(c) | | |
| | |
| | |
| | |
| | |
| | |
| | |
| | |
Bank OZK, 2.75%, 10/01/31, (3-mo. CME Term SOFR + 2.090%)(a) | | |
| | |
| | |
| | |
| | |
2.28%, 11/24/27, (1-year CMT + 1.050%)(a) | | |
2.65%, 06/24/31, (1-year CMT + 1.900%)(a) | | |
2.67%, 03/10/32, (1-year CMT + 1.200%)(a) | | |
2.89%, 11/24/32, (1-year CMT + 1.300%)(a) | | |
3.33%, 11/24/42, (1-year CMT + 1.300%)(a) | | |
3.56%, 09/23/35, (5-year CMT + 2.900%)(a) | | |
3.81%, 03/10/42, (1-year CMT + 1.700%)(a)(c) | | |
| | |
| | |
| | |
4.84%, 09/10/28, (1-day SOFR + 1.340%)(a) | | |
4.94%, 09/10/30, (1-day SOFR + 1.560%)(a) | | |
| | |
4.97%, 05/16/29, (3-mo. LIBOR US + 1.902%)(a) | | |
5.09%, 06/20/30, (3-mo. LIBOR US + 3.054%)(a) | | |
| | |
| | |
5.34%, 09/10/35, (1-day SOFR + 1.910%)(a) | | |
5.50%, 08/09/28, (1-year CMT + 2.650%)(a) | | |
5.67%, 03/12/28, (1-day SOFR +1.490%)(a) | | |
5.69%, 03/12/30, (1-day SOFR +1.740%)(a) | | |
5.75%, 08/09/33, (1-year CMT + 3.000%)(a) | | |
5.83%, 05/09/27, (1-day SOFR + 2.210%)(a) | | |
| | |
|
6.04%, 03/12/55, (1-day SOFR + 2.420%)(a) | | |
6.22%, 05/09/34, (1-day SOFR + 2.980%)(a) | | |
6.49%, 09/13/29, (1-day SOFR + 2.220%)(a) | | |
6.50%, 09/13/27, (1-day SOFR + 1.880%)(a) | | |
6.69%, 09/13/34, (1-day SOFR + 2.620%)(a) | | |
7.12%, 06/27/34, (1-day SOFR + 3.570%)(a) | | |
7.33%, 11/02/26, (1-year CMT + 3.050%)(a) | | |
7.39%, 11/02/28, (1-year CMT + 3.300%)(a) | | |
7.44%, 11/02/33, (1-year CMT + 3.500%)(a) | | |
| | |
Canadian Imperial Bank of Commerce | | |
| | |
| | |
| | |
4.51%, 09/11/27, (1-day SOFR + 0.930%)(a) | | |
4.63%, 09/11/30, (1-day SOFR + 1.335%)(a) | | |
| | |
| | |
| | |
| | |
| | |
| | |
| | |
| | |
| | |
| | |
| | |
| | |
| | |
| | |
| | |
1.12%, 01/28/27, (1-day SOFR + 0.765%)(a) | | |
1.46%, 06/09/27, (1-day SOFR + 0.770%)(a) | | |
2.52%, 11/03/32, (1-day SOFR + 1.177%)(a) | | |
2.56%, 05/01/32, (1-day SOFR + 1.167%)(a) | | |
2.57%, 06/03/31, (1-day SOFR + 2.107%)(a) | | |
2.67%, 01/29/31, (1-day SOFR + 1.146%)(a) | | |
2.90%, 11/03/42, (1-day SOFR + 1.379%)(a) | | |
2.98%, 11/05/30, (1-day SOFR + 1.422%)(a) | | |
3.06%, 01/25/33, (1-day SOFR + 1.351%)(a) | | |
3.07%, 02/24/28, (1-day SOFR + 1.280%)(a) | | |
| | |
| | |
Schedule of Investments (unaudited)(continued)October 31, 2024
iShares® Core U.S. Aggregate Bond ETF(Percentages shown are based on Net Assets)
| | |
|
3.52%, 10/27/28, (3-mo. CME Term SOFR + 1.413%)(a) | | |
3.67%, 07/24/28, (3-mo. CME Term SOFR + 1.652%)(a) | | |
| | |
3.79%, 03/17/33, (1-day SOFR + 1.939%)(a) | | |
3.88%, 01/24/39, (3-mo. CME Term SOFR + 1.430%)(a) | | |
3.89%, 01/10/28, (3-mo. CME Term SOFR + 1.825%)(a) | | |
3.98%, 03/20/30, (3-mo. CME Term SOFR + 1.600%)(a) | | |
4.08%, 04/23/29, (3-mo. CME Term SOFR + 1.454%)(a) | | |
| | |
4.28%, 04/24/48, (3-mo. CME Term SOFR + 2.101%)(a) | | |
| | |
4.41%, 03/31/31, (1-day SOFR + 3.914%)(a) | | |
| | |
4.54%, 09/19/30, (1-day SOFR + 1.338%)(a) | | |
| | |
| | |
| | |
4.66%, 05/24/28, (1-day SOFR + 1.887%)(a) | | |
| | |
4.91%, 05/24/33, (1-day SOFR + 2.086%)(a) | | |
5.17%, 02/13/30, (1-day SOFR + 1.364%)(a) | | |
| | |
5.32%, 03/26/41, (1-day SOFR + 4.548%)(a) | | |
5.41%, 09/19/39, (5-year CMT + 1.730%)(a) | | |
5.45%, 06/11/35, (1-day SOFR + 1.447%)(a) | | |
5.83%, 02/13/35, (1-day SOFR + 2.056%)(a) | | |
| | |
| | |
| | |
| | |
6.17%, 05/25/34, (1-day SOFR + 2.661%)(a) | | |
6.27%, 11/17/33, (1-day SOFR + 2.338%)(a) | | |
| | |
| | |
| | |
| | |
Citizens Bank NA, 4.58%, 08/09/28, (1-day SOFR + 2.000%)(a) | | |
Citizens Bank NA/Providence RI, 3.75%, 02/18/26 | | |
Citizens Financial Group Inc. | | |
| | |
| | |
| | |
|
| | |
| | |
| | |
5.64%, 05/21/37, (5-year CMT + 2.750%)(a) | | |
5.72%, 07/23/32, (1-day SOFR + 1.910%)(a) | | |
5.84%, 01/23/30, (1-day SOFR + 2.010%)(a) | | |
6.65%, 04/25/35, (1-day SOFR +2.325%)(a) | | |
Comerica Bank, 5.33%, 08/25/33, (1-day SOFR + 2.610%)(a) | | |
| | |
| | |
5.98%, 01/30/30, (1-day SOFR + 2.155%)(a) | | |
Commonwealth Bank of Australia/New York, 5.32%, 03/13/26 | | |
| | |
| | |
| | |
| | |
| | |
Cooperatieve Rabobank UA/New York | | |
| | |
| | |
| | |
| | |
| | |
| | |
Deutsche Bank AG, 4.10%, 01/13/26 | | |
Deutsche Bank AG/New York | | |
| | |
2.13%, 11/24/26, (1-day SOFR + 1.870%)(a) | | |
2.31%, 11/16/27, (1-day SOFR + 1.219%)(a) | | |
2.55%, 01/07/28, (1-day SOFR + 1.318%)(a) | | |
3.04%, 05/28/32, (1-day SOFR + 1.718%)(a) | | |
3.55%, 09/18/31, (1-day SOFR + 3.043%)(a) | | |
3.73%, 01/14/32, (1-day SOFR + 2.757%)(a) | | |
3.74%, 01/07/33, (1-day SOFR + 2.257%)(a) | | |
| | |
4.88%, 12/01/32, (5-year USD ICE Swap + 2.553%)(a) | | |
5.00%, 09/11/30, (1-day SOFR + 1.700%)(a) | | |
| | |
5.40%, 09/11/35, (1-day SOFR + 2.050%)(a) | | |
| | |
5.71%, 02/08/28, (1-day SOFR + 1.594%)(a) | | |
5.88%, 07/08/31, (1-day SOFR + 5.438%)(a) | | |
6.72%, 01/18/29, (1-day SOFR + 3.180%)(a) | | |
Schedule of Investments (unaudited)(continued)October 31, 2024
iShares® Core U.S. Aggregate Bond ETF(Percentages shown are based on Net Assets)
| | |
|
6.82%, 11/20/29, (1-day SOFR + 2.510%)(a) | | |
7.08%, 02/10/34, (1-day SOFR + 3.650%)(a) | | |
7.15%, 07/13/27, (1-day SOFR + 2.520%)(a) | | |
| | |
| | |
| | |
| | |
| | |
| | |
1.71%, 11/01/27, (1-day SOFR + 0.685%)(a) | | |
| | |
| | |
4.06%, 04/25/28, (1-day SOFR + 1.355%)(a) | | |
4.34%, 04/25/33, (1-day SOFR + 1.660%)(a) | | |
4.77%, 07/28/30, (1-day SOFR Index + 2.127%)(a) | | |
4.90%, 09/06/30, (1-day SOFR + 1.486%)(a) | | |
5.63%, 01/29/32, (1-day SOFR + 1.840%)(a) | | |
6.34%, 07/27/29, (1-day SOFR + 2.340%)(a) | | |
6.36%, 10/27/28, (1-day SOFR Index + 2.192%)(a) | | |
| | |
| | |
| | |
| | |
First Horizon Bank, 5.75%, 05/01/30(c) | | |
First-Citizens Bank & Trust Co., 6.13%, 03/09/28 | | |
Goldman Sachs Bank USA/New York | | |
5.28%, 03/18/27, (1-day SOFR +0.777%)(a) | | |
5.41%, 05/21/27, (1-day SOFR +0.750%)(a) | | |
Goldman Sachs Capital I, 6.35%, 02/15/34 | | |
Goldman Sachs Group Inc. (The) | | |
1.09%, 12/09/26, (1-day SOFR + 0.789%)(a) | | |
1.43%, 03/09/27, (1-day SOFR + 0.798%)(a) | | |
1.54%, 09/10/27, (1-day SOFR + 0.818%)(a) | | |
1.95%, 10/21/27, (1-day SOFR + 0.913%)(a) | | |
1.99%, 01/27/32, (1-day SOFR + 1.090%)(a) | | |
2.38%, 07/21/32, (1-day SOFR + 1.248%)(a) | | |
| | |
2.62%, 04/22/32, (1-day SOFR + 1.281%)(a) | | |
2.64%, 02/24/28, (1-day SOFR + 1.114%)(a) | | |
2.65%, 10/21/32, (1-day SOFR + 1.264%)(a) | | |
| | |
|
2.91%, 07/21/42, (1-day SOFR + 1.472%)(a) | | |
3.10%, 02/24/33, (1-day SOFR + 1.410%)(a) | | |
3.21%, 04/22/42, (1-day SOFR + 1.513%)(a) | | |
3.44%, 02/24/43, (1-day SOFR + 1.632%)(a) | | |
| | |
3.62%, 03/15/28, (1-day SOFR + 1.846%)(a) | | |
3.69%, 06/05/28, (3-mo. CME Term SOFR + 1.772%)(a) | | |
| | |
| | |
3.81%, 04/23/29, (3-mo. CME Term SOFR + 1.420%)(a) | | |
| | |
4.02%, 10/31/38, (3-mo. CME Term SOFR + 1.635%)(a) | | |
4.22%, 05/01/29, (3-mo. CME Term SOFR + 1.563%)(a) | | |
4.39%, 06/15/27, (1-day SOFR + 1.510%)(a) | | |
4.41%, 04/23/39, (3-mo. CME Term SOFR + 1.692%)(a) | | |
4.48%, 08/23/28, (1-day SOFR + 1.725%)(a) | | |
4.69%, 10/23/30, (1-day SOFR + 1.135%)(a) | | |
| | |
| | |
5.02%, 10/23/35, (1-day SOFR + 1.420%)(a) | | |
5.05%, 07/23/30, (1-day SOFR + 1.210%)(a) | | |
| | |
5.33%, 07/23/35, (1-day SOFR + 1.550%)(a) | | |
5.73%, 04/25/30, (1-day SOFR +1.265%)(a) | | |
5.85%, 04/25/35, (1-day SOFR + 1.552%)(a) | | |
| | |
| | |
| | |
| | |
6.48%, 10/24/29, (1-day SOFR + 1.770%)(a) | | |
6.56%, 10/24/34, (1-day SOFR + 1.950%)(a) | | |
| | |
HSBC Bank USA NA, 7.00%, 01/15/39 | | |
HSBC Bank USA NA/New York | | |
| | |
| | |
| | |
1.59%, 05/24/27, (1-day SOFR + 1.290%)(a) | | |
2.01%, 09/22/28, (1-day SOFR + 1.732%)(a) | | |
Schedule of Investments (unaudited)(continued)October 31, 2024
iShares® Core U.S. Aggregate Bond ETF(Percentages shown are based on Net Assets)
| | |
|
2.21%, 08/17/29, (1-day SOFR + 1.285%)(a) | | |
2.25%, 11/22/27, (1-day SOFR + 1.100%)(a) | | |
2.36%, 08/18/31, (1-day SOFR + 1.947%)(a) | | |
2.80%, 05/24/32, (1-day SOFR + 1.187%)(a) | | |
2.85%, 06/04/31, (1-day SOFR + 2.387%)(a) | | |
2.87%, 11/22/32, (1-day SOFR + 1.410%)(a) | | |
| | |
3.97%, 05/22/30, (3-mo. CME Term SOFR + 1.872%)(a) | | |
4.04%, 03/13/28, (3-mo. CME Term SOFR + 1.808%)(a) | | |
| | |
| | |
4.58%, 06/19/29, (3-mo. CME Term SOFR + 1.796%)(a) | | |
4.76%, 06/09/28, (1-day SOFR + 2.110%)(a) | | |
4.76%, 03/29/33, (1-day SOFR + 2.530%)(a) | | |
| | |
5.21%, 08/11/28, (1-day SOFR + 2.610%)(a) | | |
| | |
5.40%, 08/11/33, (1-day SOFR + 2.870%)(a) | | |
5.55%, 03/04/30, (1-day SOFR + 1.460%)(a) | | |
5.60%, 05/17/28, (1-day SOFR + 1.060%)(a) | | |
5.72%, 03/04/35, (1-day SOFR + 1.780%)(a)(c) | | |
5.73%, 05/17/32, (1-day SOFR + 1.520%)(a) | | |
5.89%, 08/14/27, (1-day SOFR + 1.570%)(a) | | |
| | |
6.16%, 03/09/29, (1-day SOFR + 1.970%)(a) | | |
6.25%, 03/09/34, (1-day SOFR + 2.390%)(a) | | |
6.33%, 03/09/44, (1-day SOFR + 2.650%)(a) | | |
| | |
| | |
6.55%, 06/20/34, (1-day SOFR + 2.980%)(a) | | |
| | |
7.34%, 11/03/26, (1-day SOFR + 3.030%)(a) | | |
7.39%, 11/03/28, (1-day SOFR + 3.350%)(a) | | |
7.40%, 11/13/34, (1-day SOFR + 3.020%)(a) | | |
8.11%, 11/03/33, (1-day SOFR + 4.250%)(a) | | |
| | |
|
HSBC USA Inc., 5.29%, 03/04/27 | | |
Huntington Bancshares Inc./Ohio | | |
2.49%, 08/15/36, (5-year CMT + 1.170%)(a) | | |
| | |
4.44%, 08/04/28, (1-day SOFR + 1.970%)(a) | | |
5.02%, 05/17/33, (1-day SOFR + 2.050%)(a) | | |
5.71%, 02/02/35, (1-day SOFR Index + 1.870%)(a) | | |
6.21%, 08/21/29, (1-day SOFR + 2.020%)(a) | | |
Huntington National Bank (The) | | |
4.55%, 05/17/28, (1-day SOFR Index + 1.650%)(a) | | |
| | |
Industrial & Commercial Bank of China Ltd./New York, 3.54%, 11/08/27 | | |
| | |
1.73%, 04/01/27, (1-day SOFR + 1.005%)(a) | | |
2.73%, 04/01/32, (1-day SOFR + 1.316%)(a) | | |
| | |
4.02%, 03/28/28, (1-day SOFR + 1.830%)(a) | | |
| | |
4.25%, 03/28/33, (1-day SOFR + 2.070%)(a) | | |
| | |
5.34%, 03/19/30, (1-day SOFR + 1.440%)(a) | | |
5.55%, 03/19/35, (1-day SOFR + 1.770%)(a) | | |
6.08%, 09/11/27, (1-day SOFR + 1.560%)(a) | | |
6.11%, 09/11/34, (1-day SOFR + 2.090%)(a) | | |
| | |
1.04%, 02/04/27, (3-mo. CME Term SOFR + 0.695%)(a) | | |
1.05%, 11/19/26, (1-day SOFR + 0.800%)(a) | | |
1.47%, 09/22/27, (1-day SOFR + 0.765%)(a) | | |
1.58%, 04/22/27, (1-day SOFR + 0.885%)(a) | | |
1.76%, 11/19/31, (3-mo. CME Term SOFR + 1.105%)(a) | | |
1.95%, 02/04/32, (1-day SOFR + 1.065%)(a) | | |
2.07%, 06/01/29, (1-day SOFR + 1.015%)(a) | | |
2.18%, 06/01/28, (1-day SOFR + 1.890%)(a) | | |
2.52%, 04/22/31, (1-day SOFR + 2.040%)(a) | | |
2.53%, 11/19/41, (3-mo. CME Term SOFR + 1.510%)(a) | | |
2.55%, 11/08/32, (1-day SOFR + 1.180%)(a) | | |
Schedule of Investments (unaudited)(continued)October 31, 2024
iShares® Core U.S. Aggregate Bond ETF(Percentages shown are based on Net Assets)
| | |
|
2.58%, 04/22/32, (3-mo. CME Term SOFR + 1.250%)(a) | | |
2.74%, 10/15/30, (3-mo. CME Term SOFR + 1.510%)(a) | | |
| | |
2.95%, 02/24/28, (1-day SOFR + 1.170%)(a) | | |
2.96%, 05/13/31, (3-mo. CME Term SOFR + 2.515%)(a) | | |
2.96%, 01/25/33, (1-day SOFR + 1.260%)(a) | | |
3.11%, 04/22/41, (3-mo. CME Term SOFR + 2.460%)(a) | | |
3.11%, 04/22/51, (1-day SOFR + 2.440%)(a) | | |
3.16%, 04/22/42, (1-day SOFR + 1.460%)(a) | | |
| | |
| | |
3.33%, 04/22/52, (1-day SOFR + 1.580%)(a) | | |
3.51%, 01/23/29, (3-mo. CME Term SOFR + 1.207%)(a) | | |
3.54%, 05/01/28, (3-mo. CME Term SOFR + 1.642%)(a) | | |
| | |
3.70%, 05/06/30, (3-mo. CME Term SOFR + 1.422%)(a) | | |
3.78%, 02/01/28, (3-mo. CME Term SOFR + 1.599%)(a) | | |
3.88%, 07/24/38, (3-mo. CME Term SOFR + 1.622%)(a) | | |
3.90%, 01/23/49, (3-mo. CME Term SOFR + 1.482%)(a) | | |
3.96%, 01/29/27, (3-mo. CME Term SOFR + 1.507%)(a) | | |
3.96%, 11/15/48, (3-mo. CME Term SOFR + 1.642%)(a) | | |
4.01%, 04/23/29, (3-mo. CME Term SOFR + 1.382%)(a) | | |
4.03%, 07/24/48, (3-mo. CME Term SOFR + 1.722%)(a) | | |
| | |
4.20%, 07/23/29, (3-mo. CME Term SOFR + 1.522%)(a) | | |
| | |
4.26%, 02/22/48, (3-mo. CME Term SOFR + 1.842%)(a) | | |
4.32%, 04/26/28, (1-day SOFR + 1.560%)(a) | | |
4.45%, 12/05/29, (3-mo. CME Term SOFR + 1.592%)(a) | | |
4.49%, 03/24/31, (3-mo. CME Term SOFR + 3.790%)(a) | | |
4.51%, 10/22/28, (1-day SOFR + 0.860%)(a) | | |
4.57%, 06/14/30, (1-day SOFR + 1.750%)(a) | | |
4.59%, 04/26/33, (1-day SOFR + 1.800%)(a) | | |
| | |
|
4.60%, 10/22/30, (1-day SOFR + 1.040%)(a) | | |
4.85%, 07/25/28, (1-day SOFR + 1.990%)(a) | | |
| | |
4.91%, 07/25/33, (1-day SOFR + 2.080%)(a) | | |
4.95%, 10/22/35, (1-day SOFR + 1.340%)(a) | | |
| | |
4.98%, 07/22/28, (1-day SOFR + 0.930%)(a) | | |
5.00%, 07/22/30, (1-day SOFR +1.125%)(a) | | |
5.01%, 01/23/30, (1-day SOFR + 1.310%)(a) | | |
5.04%, 01/23/28, (1-day SOFR + 1.190%)(a) | | |
5.29%, 07/22/35, (1-day SOFR + 1.460%)(a) | | |
5.30%, 07/24/29, (1-day SOFR + 1.450%)(a) | | |
5.34%, 01/23/35, (1-day SOFR + 1.620%)(a) | | |
5.35%, 06/01/34, (1-day SOFR + 1.845%)(a) | | |
| | |
| | |
5.57%, 04/22/28, (1-day SOFR + 0.930%)(a) | | |
5.58%, 04/22/30, (1-day SOFR +1.160%)(a) | | |
| | |
| | |
5.72%, 09/14/33, (1-day SOFR + 2.580%)(a) | | |
5.77%, 04/22/35, (1-day SOFR + 1.490%)(a) | | |
6.07%, 10/22/27, (1-day SOFR + 1.330%)(a) | | |
6.09%, 10/23/29, (1-day SOFR + 1.570%)(a) | | |
6.25%, 10/23/34, (1-day SOFR + 1.810%)(a) | | |
| | |
| | |
| | |
| | |
JPMorgan Chase Bank NA, 5.11%, 12/08/26 | | |
| | |
| | |
| | |
| | |
| | |
| | |
| | |
| | |
| | |
| | |
| | |
| | |
| | |
| | |
Schedule of Investments (unaudited)(continued)October 31, 2024
iShares® Core U.S. Aggregate Bond ETF(Percentages shown are based on Net Assets)
| | |
|
4.79%, 06/01/33, (1-day SOFR Index + 2.060%)(a) | | |
6.40%, 03/06/35, (1-day SOFR Index + 2.420%)(a) | | |
Korea Development Bank (The) | | |
| | |
| | |
| | |
| | |
| | |
| | |
| | |
Kreditanstalt fuer Wiederaufbau | | |
| | |
| | |
| | |
| | |
| | |
| | |
| | |
| | |
| | |
| | |
| | |
| | |
| | |
| | |
| | |
| | |
| | |
| | |
| | |
Landwirtschaftliche Rentenbank | | |
| | |
| | |
| | |
| | |
| | |
| | |
| | |
Series 37, 2.50%, 11/15/27 | | |
| | |
1.63%, 05/11/27, (1-year CMT + 0.850%)(a) | | |
3.37%, 12/14/46, (5-year CMT + 1.500%)(a) | | |
3.57%, 11/07/28, (3-mo. LIBOR US + 1.205%)(a) | | |
| | |
3.75%, 03/18/28, (1-year CMT + 1.800%)(a) | | |
| | |
| | |
| | |
| | |
| | |
4.98%, 08/11/33, (1-year CMT + 2.300%)(a) | | |
| | |
5.46%, 01/05/28, (1-year CMT + 1.375%)(a) | | |
5.68%, 01/05/35, (1-year CMT + 1.750%)(a) | | |
5.72%, 06/05/30, (1-year CMT + 1.070%)(a) | | |
5.87%, 03/06/29, (1-year CMT + 1.700%)(a) | | |
5.99%, 08/07/27, (1-year CMT + 1.480%)(a) | | |
7.95%, 11/15/33, (1-year CMT + 3.750%)(a) | | |
| | |
|
| | |
4.55%, 08/16/28, (1-day SOFR Index + 1.780%)(a) | | |
5.05%, 01/27/34, (1-day SOFR + 1.850%)(a) | | |
6.08%, 03/13/32, (1-day SOFR + 2.260%)(a) | | |
7.41%, 10/30/29, (1-day SOFR + 2.800%)(a) | | |
Manufacturers & Traders Trust Co. | | |
| | |
| | |
| | |
| | |
Mitsubishi UFJ Financial Group Inc. | | |
1.54%, 07/20/27, (1-year CMT + 0.750%)(a) | | |
1.64%, 10/13/27, (1-year CMT + 0.670%)(a) | | |
| | |
2.31%, 07/20/32, (1-year CMT + 0.950%)(a) | | |
2.34%, 01/19/28, (1-year CMT + 0.830%)(a) | | |
2.49%, 10/13/32, (1-year CMT + 0.970%)(a) | | |
| | |
| | |
2.85%, 01/19/33, (1-year CMT + 1.100%)(a) | | |
| | |
| | |
| | |
| | |
| | |
| | |
| | |
| | |
4.08%, 04/19/28, (1-year CMT + 1.300%)(a) | | |
| | |
| | |
4.32%, 04/19/33, (1-year CMT + 1.550%)(a) | | |
5.02%, 07/20/28, (1-year CMT + 1.950%)(a) | | |
5.13%, 07/20/33, (1-year CMT + 2.125%)(a) | | |
5.24%, 04/19/29, (1-year CMT + 1.700%)(a) | | |
5.26%, 04/17/30, (1-year CMT + 0.820%)(a) | | |
5.35%, 09/13/28, (1-year CMT + 1.900%)(a)(c) | | |
5.41%, 04/19/34, (1-year CMT + 1.970%)(a)(c) | | |
5.42%, 02/22/29, (1-year CMT + 1.380%)(a) | | |
5.43%, 04/17/35, (1-year CMT + 1.000%)(a) | | |
5.44%, 02/22/34, (1-year CMT + 1.630%)(a) | | |
5.47%, 09/13/33, (1-year CMT + 2.125%)(a) | | |
5.48%, 02/22/31, (1-year CMT + 1.530%)(a) | | |
Mizuho Financial Group Inc. | | |
1.23%, 05/22/27, (1-year CMT + 0.670%)(a) | | |
1.55%, 07/09/27, (1-year CMT + 0.750%)(a) | | |
1.98%, 09/08/31, (3-mo. CME Term SOFR + 1.532%)(a) | | |
2.17%, 05/22/32, (1-year CMT + 0.870%)(a) | | |
2.20%, 07/10/31, (3-mo. CME Term SOFR + 1.772%)(a) | | |
2.26%, 07/09/32, (1-year CMT + 0.900%)(a) | | |
| | |
2.59%, 05/25/31, (3-mo. CME Term SOFR + 1.332%)(a) | | |
Schedule of Investments (unaudited)(continued)October 31, 2024
iShares® Core U.S. Aggregate Bond ETF(Percentages shown are based on Net Assets)
| | |
|
| | |
2.87%, 09/13/30, (3-mo. CME Term SOFR + 1.572%)(a) | | |
3.15%, 07/16/30, (3-mo. CME Term SOFR + 1.392%)(a) | | |
| | |
3.26%, 05/22/30, (1-year CMT + 1.250%)(a) | | |
| | |
| | |
4.25%, 09/11/29, (3-mo. CME Term SOFR + 1.532%)(a) | | |
5.38%, 05/26/30, (1-year CMT + 1.120%)(a) | | |
5.38%, 07/10/30, (1-year CMT + 1.080%)(a) | | |
5.41%, 09/13/28, (1-year CMT + 2.050%)(a) | | |
5.58%, 05/26/35, (1-year CMT + 1.300%)(a) | | |
5.59%, 07/10/35, (1-year CMT + 1.300%)(a) | | |
5.67%, 05/27/29, (1-year CMT + 1.500%)(a) | | |
5.67%, 09/13/33, (1-year CMT + 2.400%)(a) | | |
5.74%, 05/27/31, (1-year CMT + 1.650%)(a) | | |
5.75%, 05/27/34, (1-year CMT + 1.800%)(a) | | |
5.75%, 07/06/34, (1-year CMT + 1.900%)(a) | | |
5.78%, 07/06/29, (1-year CMT + 1.650%)(a) | | |
| | |
0.99%, 12/10/26, (1-day SOFR + 0.720%)(a) | | |
1.51%, 07/20/27, (1-day SOFR + 0.858%)(a) | | |
1.59%, 05/04/27, (1-day SOFR + 0.879%)(a) | | |
1.79%, 02/13/32, (1-day SOFR + 1.034%)(a) | | |
1.93%, 04/28/32, (1-day SOFR + 1.020%)(a) | | |
2.24%, 07/21/32, (1-day SOFR + 1.178%)(a) | | |
2.48%, 01/21/28, (1-day SOFR + 1.000%)(a) | | |
2.48%, 09/16/36, (1-day SOFR + 1.360%)(a) | | |
2.51%, 10/20/32, (1-day SOFR + 1.200%)(a) | | |
2.70%, 01/22/31, (1-day SOFR + 1.143%)(a) | | |
2.80%, 01/25/52, (1-day SOFR + 1.430%)(a) | | |
2.94%, 01/21/33, (1-day SOFR + 1.290%)(a) | | |
| | |
3.22%, 04/22/42, (1-day SOFR + 1.485%)(a) | | |
| | |
3.62%, 04/01/31, (1-day SOFR + 3.120%)(a) | | |
| | |
3.77%, 01/24/29, (3-mo. CME Term SOFR + 1.402%)(a) | | |
| | |
| | |
| | |
4.21%, 04/20/28, (1-day SOFR + 1.610%)(a) | | |
| | |
|
| | |
| | |
| | |
4.43%, 01/23/30, (3-mo. CME Term SOFR + 1.89%)(a) | | |
4.46%, 04/22/39, (3-mo. CME Term SOFR + 1.693%)(a) | | |
4.65%, 10/18/30, (1-day SOFR +1.100%)(a) | | |
4.89%, 07/20/33, (1-day SOFR + 2.076%)(a) | | |
| | |
5.04%, 07/19/30, (1-day SOFR +1.215%)(a) | | |
5.05%, 01/28/27, (1-day SOFR + 1.295%)(a) | | |
5.12%, 02/01/29, (1-day SOFR + 1.730%)(a) | | |
5.16%, 04/20/29, (1-day SOFR + 1.590%)(a) | | |
5.17%, 01/16/30, (1-day SOFR + 1.450%)(a) | | |
5.25%, 04/21/34, (1-day SOFR + 1.870%)(a) | | |
5.30%, 04/20/37, (1-day SOFR + 2.620%)(a) | | |
5.32%, 07/19/35, (1-day SOFR +1.555%)(a) | | |
5.42%, 07/21/34, (1-day SOFR + 1.880%)(a) | | |
5.45%, 07/20/29, (1-day SOFR + 1.630%)(a) | | |
5.47%, 01/18/35, (1-day SOFR + 1.730%)(a) | | |
5.60%, 03/24/51, (1-day SOFR + 4.840%)(a) | | |
5.65%, 04/13/28, (1-day SOFR +1.010%)(a) | | |
5.66%, 04/18/30, (1-day SOFR +1.260%)(a) | | |
5.83%, 04/19/35, (1-day SOFR +1.580%)(a) | | |
5.94%, 02/07/39, (5-year CMT + 1.800%)(a) | | |
5.95%, 01/19/38, (5-year CMT + 2.430%)(a) | | |
| | |
6.30%, 10/18/28, (1-day SOFR + 2.240%)(a) | | |
6.34%, 10/18/33, (1-day SOFR + 2.560%)(a) | | |
| | |
6.41%, 11/01/29, (1-day SOFR + 1.830%)(a) | | |
6.63%, 11/01/34, (1-day SOFR + 2.050%)(a) | | |
| | |
| | |
4.45%, 10/15/27, (1-day SOFR + 0.680%)(a) | | |
| | |
4.95%, 01/14/28, (1-day SOFR + 1.080%)(a) | | |
4.97%, 07/14/28, (1-day SOFR +0.930%)(a) | | |
5.50%, 05/26/28, (1-day SOFR +0.865%)(a) | | |
| | |
National Australia Bank Ltd./New York | | |
| | |
| | |
Schedule of Investments (unaudited)(continued)October 31, 2024
iShares® Core U.S. Aggregate Bond ETF(Percentages shown are based on Net Assets)
| | |
|
| | |
| | |
| | |
| | |
| | |
| | |
| | |
| | |
| | |
5.60%, 07/02/27, (1-day SOFR +1.036%)(a) | | |
| | |
| | |
1.64%, 06/14/27, (1-year CMT + 0.900%)(a) | | |
3.03%, 11/28/35, (5-year CMT + 2.350%)(a) | | |
3.07%, 05/22/28, (1-year CMT + 2.550%)(a) | | |
4.45%, 05/08/30, (3-mo. LIBOR US + 1.871%)(a) | | |
| | |
4.89%, 05/18/29, (3-mo. LIBOR US + 1.754%)(a) | | |
4.96%, 08/15/30, (1-year CMT + 1.220%)(a) | | |
5.08%, 01/27/30, (3-mo. LIBOR US + 1.905%)(a) | | |
5.52%, 09/30/28, (1-year CMT + 2.270%)(a) | | |
5.58%, 03/01/28, (1-year CMT + 1.100%)(a) | | |
5.78%, 03/01/35, (1-year CMT + 1.500%)(a) | | |
5.81%, 09/13/29, (1-year CMT + 1.950%)(a) | | |
5.85%, 03/02/27, (1-year CMT + 1.350%)(a) | | |
6.02%, 03/02/34, (1-year CMT + 2.100%)(a) | | |
6.48%, 06/01/34, (5-year CMT + 2.200%)(a) | | |
7.47%, 11/10/26, (1-year CMT + 2.850%)(a) | | |
| | |
| | |
| | |
3.38%, 05/08/32, (3-mo. LIBOR US + 1.131%)(a) | | |
| | |
| | |
| | |
Oesterreichische Kontrollbank AG | | |
| | |
| | |
| | |
| | |
| | |
| | |
| | |
| | |
| | |
| | |
| | |
| | |
| | |
| | |
| | |
PNC Financial Services Group Inc. (The) | | |
| | |
2.31%, 04/23/32, (1-day SOFR + 0.979%)(a) | | |
| | |
| | |
| | |
|
| | |
| | |
4.63%, 06/06/33, (1-day SOFR Index + 1.850%)(a) | | |
4.76%, 01/26/27, (1-day SOFR Index + 1.085%)(a) | | |
4.81%, 10/21/32, (1-day SOFR +1.259%)(a) | | |
5.07%, 01/24/34, (1-day SOFR + 1.933%)(a) | | |
5.10%, 07/23/27, (1-day SOFR +0.796%)(a) | | |
5.30%, 01/21/28, (1-day SOFR + 1.342%)(a) | | |
5.35%, 12/02/28, (1-day SOFR + 1.620%)(a) | | |
5.40%, 07/23/35, (1-day SOFR +1.599%)(a) | | |
5.49%, 05/14/30, (1-day SOFR + 1.198%)(a) | | |
5.58%, 06/12/29, (1-day SOFR + 1.841%)(a) | | |
5.68%, 01/22/35, (1-day SOFR + 1.902%)(a) | | |
5.94%, 08/18/34, (1-day SOFR + 1.946%)(a) | | |
6.04%, 10/28/33, (1-day SOFR Index + 2.140%)(a) | | |
6.62%, 10/20/27, (1-day SOFR Index + 1.730%)(a)(c) | | |
6.88%, 10/20/34, (1-day SOFR + 2.284%)(a) | | |
Regions Bank/Birmingham AL, 6.45%, 06/26/37 | | |
| | |
| | |
5.50%, 09/06/35, (1-day SOFR +2.060%)(a) | | |
5.72%, 06/06/30, (1-day SOFR +1.490%)(a)(c) | | |
| | |
| | |
| | |
| | |
| | |
| | |
| | |
| | |
| | |
| | |
| | |
4.51%, 10/18/27, (1-day SOFR Index + 0.720%)(a) | | |
4.52%, 10/18/28, (1-day SOFR Index + 0.860%)(a) | | |
| | |
4.65%, 10/18/30, (1-day SOFR Index + 1.080%)(a) | | |
| | |
| | |
| | |
| | |
4.97%, 08/02/30, (1-day SOFR +1.000%)(a) | | |
| | |
| | |
Schedule of Investments (unaudited)(continued)October 31, 2024
iShares® Core U.S. Aggregate Bond ETF(Percentages shown are based on Net Assets)
| | |
|
5.07%, 07/23/27, (1-day SOFR +0.790%)(a) | | |
| | |
| | |
| | |
| | |
Santander Holdings USA Inc. | | |
2.49%, 01/06/28, (1-day SOFR + 1.249%)(a) | | |
| | |
| | |
5.35%, 09/06/30, (1-day SOFR + 1.940%)(a) | | |
6.12%, 05/31/27, (1-day SOFR +1.232%)(a) | | |
6.17%, 01/09/30, (1-day SOFR + 2.500%)(a) | | |
6.34%, 05/31/35, (1-day SOFR + 2.138%)(a) | | |
6.50%, 03/09/29, (1-day SOFR + 2.356%)(a) | | |
6.57%, 06/12/29, (1-day SOFR + 2.700%)(a) | | |
7.66%, 11/09/31, (1-day SOFR + 3.280%)(a) | | |
Santander U.K. Group Holdings PLC | | |
1.67%, 06/14/27, (1-day SOFR + 0.989%)(a)(c) | | |
2.47%, 01/11/28, (1-day SOFR + 1.220%)(a) | | |
2.90%, 03/15/32, (1-day SOFR + 1.475%)(a) | | |
3.82%, 11/03/28, (3-mo. LIBOR US + 1.400%)(a) | | |
4.86%, 09/11/30, (1-day SOFR Index + 1.554%)(a) | | |
6.53%, 01/10/29, (1-day SOFR + 2.600%)(a) | | |
6.83%, 11/21/26, (1-day SOFR + 2.749%)(a) | | |
| | |
1.68%, 11/18/27, (1-day SOFR + 0.560%)(a) | | |
2.20%, 02/07/28, (1-day SOFR + 0.730%)(a) | | |
| | |
| | |
2.62%, 02/07/33, (1-day SOFR + 1.002%)(a) | | |
| | |
3.03%, 11/01/34, (1-day SOFR + 1.490%)(a) | | |
3.15%, 03/30/31, (1-day SOFR + 2.650%)(a) | | |
4.14%, 12/03/29, (3-mo. CME Term SOFR + 1.292%)(a) | | |
4.16%, 08/04/33, (1-day SOFR + 1.726%)(a) | | |
| | |
4.42%, 05/13/33, (1-day SOFR + 1.605%)(a) | | |
4.53%, 02/20/29, (1-day SOFR +1.018%)(a) | | |
4.68%, 10/22/32, (1-day SOFR +1.050%)(a) | | |
| | |
|
4.82%, 01/26/34, (1-day SOFR + 1.567%)(a) | | |
| | |
5.16%, 05/18/34, (1-day SOFR + 1.890%)(a)(c) | | |
| | |
5.68%, 11/21/29, (1-day SOFR + 1.484%)(a) | | |
5.75%, 11/04/26, (1-day SOFR + 1.353%)(a) | | |
5.82%, 11/04/28, (1-day SOFR + 1.715%)(a) | | |
6.12%, 11/21/34, (1-day SOFR + 1.958%)(a) | | |
Sumitomo Mitsui Financial Group Inc. | | |
| | |
| | |
| | |
| | |
| | |
| | |
| | |
| | |
| | |
| | |
| | |
| | |
| | |
| | |
| | |
| | |
| | |
| | |
| | |
| | |
| | |
| | |
| | |
| | |
| | |
| | |
| | |
| | |
| | |
| | |
| | |
| | |
| | |
| | |
| | |
| | |
| | |
| | |
| | |
| | |
Synchrony Bank, 5.63%, 08/23/27 | | |
Synovus Bank, 5.63%, 02/15/28 | | |
Toronto-Dominion Bank (The) | | |
| | |
| | |
| | |
Schedule of Investments (unaudited)(continued)October 31, 2024
iShares® Core U.S. Aggregate Bond ETF(Percentages shown are based on Net Assets)
| | |
|
| | |
| | |
| | |
| | |
| | |
3.63%, 09/15/31, (5-year USD Swap + 2.205%)(a) | | |
| | |
| | |
| | |
| | |
| | |
| | |
5.15%, 09/10/34, (5-year CMT + 1.500%)(a) | | |
| | |
| | |
| | |
| | |
| | |
| | |
| | |
| | |
| | |
| | |
| | |
1.27%, 03/02/27, (1-day SOFR + 0.609%)(a) | | |
1.89%, 06/07/29, (1-day SOFR + 0.862%)(a) | | |
| | |
| | |
4.12%, 06/06/28, (1-day SOFR + 1.368%)(a) | | |
4.87%, 01/26/29, (1-day SOFR + 1.435%)(a) | | |
4.92%, 07/28/33, (1-day SOFR + 2.240%)(a) | | |
5.12%, 01/26/34, (1-day SOFR + 1.852%)(a) | | |
5.15%, 08/05/32, (1-day SOFR + 1.571%)(a) | | |
5.44%, 01/24/30, (1-day SOFR + 1.620%)(a) | | |
5.71%, 01/24/35, (1-day SOFR + 1.922%)(a) | | |
5.87%, 06/08/34, (1-day SOFR + 2.361%)(a) | | |
6.05%, 06/08/27, (1-day SOFR + 2.050%)(a) | | |
6.12%, 10/28/33, (1-day SOFR + 2.300%)(a) | | |
7.16%, 10/30/29, (1-day SOFR + 2.446%)(a) | | |
| | |
| | |
2.22%, 01/27/28, (1-day SOFR + 0.730%)(a) | | |
2.49%, 11/03/36, (5-year CMT + 0.950%)(a) | | |
2.68%, 01/27/33, (1-day SOFR + 1.020%)(a) | | |
| | |
| | |
|
| | |
| | |
| | |
4.55%, 07/22/28, (1-day SOFR + 1.660%)(a) | | |
4.65%, 02/01/29, (1-day SOFR + 1.230%)(a) | | |
4.84%, 02/01/34, (1-day SOFR + 1.600%)(a) | | |
4.97%, 07/22/33, (1-day SOFR + 2.110%)(a) | | |
5.10%, 07/23/30, (1-day SOFR +1.250%)(a) | | |
5.38%, 01/23/30, (1-day SOFR + 1.560%)(a) | | |
5.68%, 01/23/35, (1-day SOFR + 1.860%)(a) | | |
5.78%, 06/12/29, (1-day SOFR + 2.020%)(a) | | |
5.84%, 06/12/34, (1-day SOFR + 2.260%)(a) | | |
5.85%, 10/21/33, (1-day SOFR + 2.090%)(a) | | |
6.79%, 10/26/27, (1-day SOFR + 1.880%)(a) | | |
Series V, 2.38%, 07/22/26 | | |
Series X, 3.15%, 04/27/27 | | |
U.S. Bank NA/Cincinnati OH, 4.51%, 10/22/27, (1-day SOFR + 0.690%)(a) | | |
| | |
| | |
| | |
| | |
| | |
| | |
| | |
| | |
| | |
| | |
| | |
| | |
| | |
| | |
Webster Financial Corp., 4.10%, 03/25/29 | | |
| | |
2.39%, 06/02/28, (1-day SOFR + 2.100%)(a) | | |
2.57%, 02/11/31, (3-mo. CME Term SOFR + 1.262%)(a) | | |
2.88%, 10/30/30, (3-mo. CME Term SOFR + 1.432%)(a) | | |
| | |
| | |
3.07%, 04/30/41, (1-day SOFR + 2.530%)(a) | | |
3.20%, 06/17/27, (3-mo. CME Term SOFR + 1.432%)(a) | | |
3.35%, 03/02/33, (1-day SOFR + 1.500%)(a) | | |
3.53%, 03/24/28, (1-day SOFR + 1.510%)(a) | | |
Schedule of Investments (unaudited)(continued)October 31, 2024
iShares® Core U.S. Aggregate Bond ETF(Percentages shown are based on Net Assets)
| | |
|
3.58%, 05/22/28, (3-mo. CME Term SOFR + 1.572%)(a) | | |
| | |
| | |
| | |
| | |
| | |
4.48%, 04/04/31, (3-mo. CME Term SOFR + 4.032%)(a) | | |
4.61%, 04/25/53, (1-day SOFR + 2.130%)(a) | | |
| | |
| | |
4.81%, 07/25/28, (1-day SOFR + 1.980%)(a) | | |
4.90%, 07/25/33, (1-day SOFR + 2.100%)(a) | | |
| | |
5.01%, 04/04/51, (3-mo. CME Term SOFR + 4.502%)(a) | | |
5.20%, 01/23/30, (1-day SOFR + 1.500%)(a) | | |
| | |
| | |
5.39%, 04/24/34, (1-day SOFR + 2.020%)(a) | | |
5.50%, 01/23/35, (1-day SOFR + 1.780%)(a)(c) | | |
5.56%, 07/25/34, (1-day SOFR + 1.990%)(a) | | |
5.57%, 07/25/29, (1-day SOFR + 1.740%)(a) | | |
| | |
5.71%, 04/22/28, (1-day SOFR +1.070%)(a) | | |
| | |
6.30%, 10/23/29, (1-day SOFR + 1.790%)(a) | | |
6.49%, 10/23/34, (1-day SOFR + 2.060%)(a) | | |
Series B, 7.95%, 11/15/29 | | |
| | |
| | |
| | |
| | |
| | |
| | |
| | |
| | |
| | |
| | |
| | |
| | |
2.67%, 11/15/35, (5-year CMT + 1.750%)(a) | | |
| | |
| | |
| | |
3.02%, 11/18/36, (5-year CMT + 1.530%)(a) | | |
| | |
| | |
| | |
| | |
| | |
|
4.11%, 07/24/34, (5-year CMT + 2.000%)(a) | | |
4.32%, 11/23/31, (5-year USD ICE Swap + 2.236%)(a) | | |
| | |
| | |
| | |
5.41%, 08/10/33, (1-year CMT + 2.680%)(a) | | |
| | |
| | |
| | |
| | |
Wintrust Financial Corp., 4.85%, 06/06/29 | | |
Zions Bancorp NA, 3.25%, 10/29/29 | | |
| | |
|
Anheuser-Busch Companies LLC/Anheuser-Busch InBev Worldwide Inc. | | |
| | |
| | |
| | |
Anheuser-Busch InBev Finance Inc. | | |
| | |
| | |
| | |
| | |
Anheuser-Busch InBev Worldwide Inc. | | |
| | |
| | |
| | |
| | |
| | |
| | |
| | |
| | |
| | |
| | |
| | |
| | |
| | |
| | |
| | |
| | |
| | |
| | |
| | |
| | |
| | |
| | |
| | |
| | |
| | |
| | |
| | |
| | |
| | |
| | |
| | |
| | |
| | |
| | |
Schedule of Investments (unaudited)(continued)October 31, 2024
iShares® Core U.S. Aggregate Bond ETF(Percentages shown are based on Net Assets)
| | |
|
| | |
| | |
| | |
| | |
| | |
| | |
| | |
| | |
| | |
| | |
| | |
| | |
| | |
| | |
Coca-Cola Consolidated Inc. | | |
| | |
| | |
| | |
Coca-Cola Femsa SAB de CV | | |
| | |
| | |
| | |
Constellation Brands Inc. | | |
| | |
| | |
| | |
| | |
| | |
| | |
| | |
| | |
| | |
| | |
| | |
| | |
| | |
| | |
| | |
| | |
| | |
| | |
| | |
| | |
| | |
| | |
| | |
| | |
| | |
| | |
| | |
| | |
| | |
| | |
| | |
| | |
Fomento Economico Mexicano SAB de CV | | |
| | |
| | |
| | |
| | |
| | |
| | |
|
| | |
| | |
| | |
| | |
| | |
| | |
| | |
| | |
| | |
| | |
| | |
| | |
| | |
| | |
| | |
Series 10, 5.20%, 03/15/31 | | |
Molson Coors Beverage Co. | | |
| | |
| | |
| | |
| | |
| | |
| | |
| | |
| | |
| | |
| | |
| | |
| | |
| | |
| | |
| | |
| | |
| | |
| | |
| | |
| | |
| | |
| | |
| | |
| | |
| | |
| | |
| | |
| | |
| | |
| | |
| | |
| | |
| | |
| | |
| | |
| | |
| | |
| | |
| | |
| | |
| | |
Pepsico Singapore Financing I Pte Ltd. | | |
| | |
| | |
Schedule of Investments (unaudited)(continued)October 31, 2024
iShares® Core U.S. Aggregate Bond ETF(Percentages shown are based on Net Assets)
| | |
|
| | |
| | |
|
| | |
| | |
| | |
| | |
| | |
| | |
| | |
| | |
| | |
| | |
| | |
| | |
| | |
| | |
| | |
| | |
| | |
| | |
| | |
| | |
| | |
| | |
| | |
| | |
| | |
| | |
| | |
| | |
| | |
| | |
| | |
| | |
| | |
| | |
| | |
| | |
Baxalta Inc., 5.25%, 06/23/45 | | |
| | |
| | |
| | |
| | |
| | |
Bio-Rad Laboratories Inc. | | |
| | |
| | |
| | |
| | |
| | |
| | |
| | |
| | |
| | |
| | |
| | |
| | |
| | |
| | |
| | |
| | |
Biotechnology (continued) |
| | |
| | |
| | |
| | |
| | |
| | |
| | |
| | |
Regeneron Pharmaceuticals Inc. | | |
| | |
| | |
| | |
| | |
| | |
| | |
| | |
| | |
| | |
| | |
| | |
| | |
| | |
Building Materials — 0.1% |
| | |
| | |
| | |
| | |
| | |
| | |
| | |
| | |
CRH America Finance Inc., 5.40%, 05/21/34 | | |
CRH SMW Finance DAC, 5.20%, 05/21/29 | | |
Eagle Materials Inc., 2.50%, 07/01/31 | | |
Fortune Brands Innovations Inc. | | |
| | |
| | |
| | |
| | |
Johnson Controls International PLC | | |
| | |
| | |
| | |
| | |
| | |
Johnson Controls International PLC/Tyco Fire & Security Finance SCA | | |
| | |
| | |
| | |
| | |
Lafarge SA, 7.13%, 07/15/36 | | |
Lennox International Inc. | | |
| | |
| | |
Martin Marietta Materials Inc. | | |
| | |
| | |
| | |
| | |
| | |
Schedule of Investments (unaudited)(continued)October 31, 2024
iShares® Core U.S. Aggregate Bond ETF(Percentages shown are based on Net Assets)
| | |
Building Materials (continued) |
| | |
| | |
Series CB, 2.50%, 03/15/30 | | |
| | |
| | |
| | |
| | |
| | |
| | |
| | |
| | |
| | |
| | |
| | |
| | |
| | |
| | |
| | |
| | |
| | |
| | |
| | |
| | |
Trane Technologies Financing Ltd. | | |
| | |
| | |
| | |
| | |
| | |
| | |
Trane Technologies Global Holding Co. Ltd. | | |
| | |
| | |
| | |
| | |
| | |
| | |
| | |
| | |
| | |
|
Air Products and Chemicals Inc. | | |
| | |
| | |
| | |
| | |
| | |
| | |
| | |
| | |
| | |
| | |
| | |
| | |
| | |
| | |
| | |
| | |
Celanese U.S. Holdings LLC | | |
| | |
| | |
Schedule of Investments (unaudited)(continued)October 31, 2024
iShares® Core U.S. Aggregate Bond ETF(Percentages shown are based on Net Assets)
| | |
|
Huntsman International LLC | | |
| | |
| | |
| | |
International Flavors & Fragrances Inc. | | |
| | |
| | |
| | |
| | |
| | |
| | |
| | |
| | |
| | |
Lubrizol Corp. (The), 6.50%, 10/01/34 | | |
LYB International Finance BV | | |
| | |
| | |
LYB International Finance II BV, 3.50%, 03/02/27 | | |
LYB International Finance III LLC | | |
| | |
| | |
| | |
| | |
| | |
| | |
| | |
| | |
LyondellBasell Industries NV, 4.63%, 02/26/55 | | |
| | |
| | |
| | |
| | |
| | |
| | |
NewMarket Corp., 2.70%, 03/18/31 | | |
| | |
| | |
| | |
| | |
| | |
| | |
| | |
| | |
| | |
| | |
| | |
| | |
| | |
| | |
| | |
| | |
| | |
| | |
| | |
| | |
| | |
| | |
Rohm & Haas Co., 7.85%, 07/15/29 | | |
| | |
|
| | |
| | |
| | |
| | |
| | |
| | |
Sherwin-Williams Co. (The) | | |
| | |
| | |
| | |
| | |
| | |
| | |
| | |
| | |
| | |
| | |
| | |
| | |
| | |
| | |
| | |
| | |
| | |
| | |
| | |
| | |
| | |
| | |
Commercial Services — 0.3% |
American University (The), Series 2019, 3.67%, 04/01/49(c) | | |
Automatic Data Processing Inc. | | |
| | |
| | |
| | |
| | |
| | |
| | |
Brown University, Series A, 2.92%, 09/01/50 | | |
California Endowment (The), Series 2021, 2.50%, 04/01/51 | | |
California Institute of Technology | | |
| | |
| | |
| | |
Case Western Reserve University, 5.41%, 06/01/2122 | | |
| | |
| | |
| | |
Claremont Mckenna College, 3.78%, 01/01/2122 | | |
Cornell University, 4.84%, 06/15/34(c) | | |
| | |
Series 2020, 2.68%, 10/01/44 | | |
Series 2020, 2.76%, 10/01/50 | | |
Series 2020, 2.83%, 10/01/55 | | |
| | |
Series 2020, 2.14%, 09/01/30 | | |
Series 2020, 2.97%, 09/01/50 | | |
Schedule of Investments (unaudited)(continued)October 31, 2024
iShares® Core U.S. Aggregate Bond ETF(Percentages shown are based on Net Assets)
| | |
Commercial Services (continued) |
| | |
| | |
| | |
| | |
| | |
| | |
| | |
| | |
Series 2020, 2.42%, 06/01/50 | | |
Series 2020, 2.82%, 06/01/70(c) | | |
George Washington University (The) | | |
| | |
Series 2014, 4.30%, 09/15/44 | | |
Series 2018, 4.13%, 09/15/48 | | |
Georgetown University (The) | | |
| | |
Series 20A, 2.94%, 04/01/50 | | |
| | |
Series B, 4.32%, 04/01/49 | | |
| | |
| | |
| | |
| | |
| | |
| | |
| | |
| | |
| | |
| | |
| | |
| | |
| | |
| | |
| | |
| | |
| | |
| | |
Howard University, 5.21%, 10/01/52 | | |
| | |
| | |
Series 2013, 4.08%, 07/01/53 | | |
Series A, 2.81%, 01/01/60 | | |
Leland Stanford Junior University (The) | | |
| | |
| | |
| | |
Massachusetts Institute of Technology | | |
| | |
| | |
| | |
| | |
| | |
Series F, 2.99%, 07/01/50 | | |
Series G, 2.29%, 07/01/51(c) | | |
| | |
| | |
| | |
| | |
| | |
| | |
| | |
| | |
Commercial Services (continued) |
| | |
| | |
| | |
| | |
| | |
Northeastern University, Series 2020, 2.89%, 10/01/50(c) | | |
| | |
| | |
Series 2017, 3.66%, 12/01/57 | | |
Series 2020, 2.64%, 12/01/50 | | |
| | |
| | |
| | |
| | |
| | |
| | |
| | |
| | |
| | |
| | |
| | |
President and Fellows of Harvard College | | |
| | |
| | |
| | |
| | |
| | |
| | |
| | |
| | |
| | |
| | |
| | |
| | |
| | |
| | |
| | |
Rockefeller Foundation (The), Series 2020, 2.49%, 10/01/50 | | |
| | |
| | |
| | |
| | |
| | |
| | |
| | |
| | |
| | |
| | |
| | |
| | |
| | |
| | |
Thomas Jefferson University, 3.85%, 11/01/57 | | |
Triton Container International Ltd./TAL International Container Corp., 3.25%, 03/15/32 | | |
Trustees of Boston College, 3.13%, 07/01/52 | | |
Trustees of Boston University, Series CC, 4.06%, 10/01/48 | | |
Schedule of Investments (unaudited)(continued)October 31, 2024
iShares® Core U.S. Aggregate Bond ETF(Percentages shown are based on Net Assets)
| | |
Commercial Services (continued) |
Trustees of Columbia University in the City of New York (The), Series 2024, 4.36%, 10/01/35 | | |
Trustees of Princeton University (The) | | |
| | |
| | |
Series 2020, 2.52%, 07/01/50(c) | | |
Trustees of the University of Pennsylvania (The) | | |
| | |
| | |
Series 2020, 2.40%, 10/01/50 | | |
UL Solutions Inc., 6.50%, 10/20/28(b) | | |
University of Chicago (The) | | |
| | |
Series 20B, 2.76%, 04/01/45 | | |
Series C, 2.55%, 04/01/50(c) | | |
University of Miami, 4.06%, 04/01/52(c) | | |
University of Notre Dame du Lac | | |
Series 2015, 3.44%, 02/15/45 | | |
Series 2017, 3.39%, 02/15/48 | | |
University of Southern California | | |
| | |
| | |
| | |
| | |
Series 2017, 3.84%, 10/01/47 | | |
Series 21A, 2.95%, 10/01/51 | | |
Series A, 3.23%, 10/01/2120 | | |
| | |
| | |
| | |
| | |
| | |
| | |
Washington University (The) | | |
| | |
| | |
William Marsh Rice University | | |
| | |
| | |
| | |
Series 2020, 1.48%, 04/15/30 | | |
Series 2020, 2.40%, 04/15/50 | | |
| | |
|
| | |
| | |
| | |
| | |
| | |
Amdocs Ltd., 2.54%, 06/15/30 | | |
| | |
| | |
| | |
| | |
| | |
| | |
| | |
| | |
| | |
| | |
|
| | |
| | |
| | |
| | |
| | |
| | |
| | |
| | |
| | |
| | |
| | |
| | |
| | |
| | |
| | |
| | |
| | |
| | |
| | |
| | |
| | |
| | |
| | |
| | |
| | |
| | |
| | |
| | |
| | |
| | |
| | |
| | |
| | |
| | |
| | |
Booz Allen Hamilton Inc., 5.95%, 08/04/33 | | |
| | |
| | |
| | |
| | |
| | |
| | |
Dell International LLC/EMC Corp. | | |
| | |
| | |
| | |
| | |
| | |
| | |
| | |
| | |
| | |
| | |
| | |
| | |
| | |
| | |
| | |
| | |
| | |
Schedule of Investments (unaudited)(continued)October 31, 2024
iShares® Core U.S. Aggregate Bond ETF(Percentages shown are based on Net Assets)
| | |
|
| | |
| | |
| | |
Genpact Luxembourg SARL/Genpact USA Inc. | | |
| | |
| | |
Hewlett Packard Enterprise Co. | | |
| | |
| | |
| | |
| | |
| | |
| | |
| | |
| | |
| | |
| | |
| | |
| | |
| | |
| | |
| | |
| | |
| | |
| | |
| | |
| | |
IBM International Capital Pte Ltd. | | |
| | |
| | |
| | |
| | |
| | |
| | |
| | |
International Business Machines Corp. | | |
| | |
| | |
| | |
| | |
| | |
| | |
| | |
| | |
| | |
| | |
| | |
| | |
| | |
| | |
| | |
| | |
| | |
| | |
| | |
| | |
| | |
| | |
| | |
| | |
| | |
| | |
|
| | |
| | |
| | |
| | |
| | |
| | |
| | |
| | |
| | |
| | |
| | |
| | |
| | |
| | |
| | |
Teledyne FLIR LLC, 2.50%, 08/01/30 | | |
| | |
| | |
| | |
| | |
Cosmetics & Personal Care — 0.2% |
| | |
| | |
| | |
| | |
| | |
| | |
| | |
| | |
Conopco Inc., Series E, 7.25%, 12/15/26 | | |
Estee Lauder Companies Inc. (The) | | |
| | |
| | |
| | |
| | |
| | |
| | |
| | |
| | |
| | |
| | |
| | |
| | |
| | |
| | |
| | |
| | |
| | |
| | |
| | |
| | |
| | |
| | |
| | |
| | |
| | |
Procter & Gamble Co. (The) | | |
| | |
| | |
| | |
| | |
Schedule of Investments (unaudited)(continued)October 31, 2024
iShares® Core U.S. Aggregate Bond ETF(Percentages shown are based on Net Assets)
| | |
Cosmetics & Personal Care (continued) |
| | |
| | |
| | |
| | |
| | |
| | |
| | |
| | |
| | |
| | |
| | |
| | |
| | |
| | |
| | |
| | |
| | |
| | |
| | |
| | |
| | |
| | |
| | |
| | |
| | |
| | |
| | |
| | |
| | |
| | |
Series 30Y, 2.63%, 08/12/51 | | |
| | |
Distribution & Wholesale — 0.0% |
| | |
| | |
| | |
| | |
| | |
| | |
| | |
| | |
| | |
Diversified Financial Services — 0.9% |
AerCap Ireland Capital DAC/AerCap Global Aviation Trust | | |
| | |
| | |
| | |
| | |
| | |
| | |
| | |
| | |
| | |
| | |
| | |
| | |
| | |
| | |
| | |
| | |
Diversified Financial Services (continued) |
| | |
| | |
| | |
6.95%, 03/10/55, (5-year CMT + 2.720%)(a) | | |
Affiliated Managers Group Inc. | | |
| | |
| | |
| | |
| | |
| | |
| | |
| | |
| | |
| | |
| | |
| | |
| | |
| | |
| | |
| | |
| | |
| | |
| | |
| | |
| | |
Aircastle Ltd., 4.25%, 06/15/26 | | |
| | |
| | |
| | |
6.18%, 07/26/35, (1-day SOFR + 2.290%)(a) | | |
6.85%, 01/03/30, (1-day SOFR + 2.282%)(a) | | |
6.99%, 06/13/29, (1-day SOFR + 3.260%)(a) | | |
| | |
| | |
| | |
| | |
| | |
| | |
| | |
| | |
| | |
| | |
4.42%, 08/03/33, (1-day SOFR + 1.760%)(a) | | |
| | |
4.99%, 05/26/33, (1-day SOFR + 2.255%)(a) | | |
5.04%, 07/26/28, (1-day SOFR +0.930%)(a) | | |
5.04%, 05/01/34, (1-day SOFR + 1.835%)(a) | | |
5.10%, 02/16/28, (1-day SOFR + 1.000%)(a) | | |
5.28%, 07/27/29, (1-day SOFR Index + 1.280%)(a) | | |
5.28%, 07/26/35, (1-day SOFR +1.420%)(a) | | |
5.39%, 07/28/27, (1-day SOFR + 0.970%)(a) | | |
Schedule of Investments (unaudited)(continued)October 31, 2024
iShares® Core U.S. Aggregate Bond ETF(Percentages shown are based on Net Assets)
| | |
Diversified Financial Services (continued) |
5.53%, 04/25/30, (1-day SOFR Index + 1.090%)(a) | | |
5.63%, 07/28/34, (1-day SOFR + 1.930%)(a) | | |
5.65%, 04/23/27, (1-day SOFR Index + 0.750%)(a) | | |
| | |
5.92%, 04/25/35, (1-day SOFR +1.630%)(a) | | |
6.49%, 10/30/31, (1-day SOFR + 1.940%)(a) | | |
American Express Credit Corp., 3.30%, 05/03/27 | | |
Ameriprise Financial Inc. | | |
| | |
| | |
| | |
| | |
Andrew W Mellon Foundation (The), Series 2020, 0.95%, 08/01/27 | | |
Apollo Global Management Inc. | | |
| | |
| | |
| | |
| | |
| | |
| | |
| | |
| | |
Blue Owl Finance LLC, 6.25%, 04/18/34 | | |
Brookfield Capital Finance LLC, 6.09%, 06/14/33 | | |
Brookfield Finance I U.K. PLC/Brookfield Finance Inc., 2.34%, 01/30/32 | | |
| | |
| | |
| | |
| | |
| | |
| | |
| | |
| | |
| | |
| | |
| | |
| | |
Brookfield Finance LLC/Brookfield Finance Inc., 3.45%, 04/15/50 | | |
Capital One Financial Corp. | | |
1.88%, 11/02/27, (1-day SOFR + 0.855%)(a) | | |
2.36%, 07/29/32, (1-day SOFR + 1.337%)(a) | | |
2.62%, 11/02/32, (1-day SOFR + 1.265%)(a) | | |
3.27%, 03/01/30, (1-day SOFR + 1.790%)(a) | | |
| | |
| | |
| | |
| | |
| | |
Diversified Financial Services (continued) |
4.93%, 05/10/28, (1-day SOFR + 2.057%)(a) | | |
5.25%, 07/26/30, (1-day SOFR + 2.600%)(a) | | |
5.27%, 05/10/33, (1-day SOFR + 2.370%)(a) | | |
5.46%, 07/26/30, (1-day SOFR +1.560%)(a) | | |
5.47%, 02/01/29, (1-day SOFR + 2.080%)(a) | | |
5.70%, 02/01/30, (1-day SOFR + 1.905%)(a) | | |
5.82%, 02/01/34, (1-day SOFR + 2.600%)(a) | | |
5.88%, 07/26/35, (1-day SOFR +1.990%)(a) | | |
6.05%, 02/01/35, (1-day SOFR + 2.260%)(a) | | |
6.31%, 06/08/29, (1-day SOFR + 2.640%)(a) | | |
6.38%, 06/08/34, (1-day SOFR + 2.860%)(a) | | |
7.15%, 10/29/27, (1-day SOFR + 2.440%)(a) | | |
7.62%, 10/30/31, (1-day SOFR + 3.070%)(a) | | |
| | |
| | |
| | |
| | |
Charles Schwab Corp. (The) | | |
| | |
| | |
| | |
| | |
| | |
| | |
| | |
| | |
| | |
| | |
| | |
| | |
| | |
| | |
| | |
| | |
5.64%, 05/19/29, (1-day SOFR + 2.210%)(a) | | |
5.85%, 05/19/34, (1-day SOFR + 2.500%)(a) | | |
| | |
6.14%, 08/24/34, (1-day SOFR + 2.010%)(a) | | |
6.20%, 11/17/29, (1-day SOFR + 1.878%)(a) | | |
| | |
| | |
| | |
| | |
| | |
| | |
| | |
Schedule of Investments (unaudited)(continued)October 31, 2024
iShares® Core U.S. Aggregate Bond ETF(Percentages shown are based on Net Assets)
| | |
Diversified Financial Services (continued) |
| | |
Credit Suisse USA LLC, 7.13%, 07/15/32 | | |
Discover Financial Services | | |
| | |
| | |
| | |
7.96%, 11/02/34, (1-day SOFR Index + 3.370%)(a) | | |
Eaton Vance Corp., 3.50%, 04/06/27 | | |
Enact Holdings Inc., 6.25%, 05/28/29 | | |
| | |
| | |
| | |
Intercontinental Exchange Inc. | | |
| | |
| | |
| | |
| | |
| | |
| | |
| | |
| | |
| | |
| | |
| | |
| | |
| | |
| | |
| | |
| | |
| | |
| | |
| | |
Janus Henderson U.S. Holdings Inc., 5.45%, 09/10/34(b) | | |
Jefferies Financial Group Inc. | | |
| | |
| | |
| | |
| | |
| | |
| | |
| | |
| | |
| | |
| | |
| | |
| | |
| | |
| | |
| | |
| | |
| | |
| | |
| | |
| | |
| | |
Marex Group PLC, 6.40%, 11/04/29 | | |
| | |
| | |
| | |
| | |
Diversified Financial Services (continued) |
| | |
| | |
| | |
| | |
| | |
| | |
| | |
| | |
| | |
| | |
| | |
| | |
| | |
| | |
| | |
| | |
| | |
| | |
| | |
| | |
| | |
| | |
| | |
| | |
| | |
| | |
| | |
| | |
| | |
| | |
| | |
| | |
| | |
| | |
| | |
| | |
| | |
| | |
| | |
| | |
| | |
| | |
| | |
| | |
Oaktree Strategic Credit Fund | | |
| | |
| | |
| | |
| | |
| | |
| | |
| | |
| | |
| | |
| | |
| | |
| | |
Raymond James Financial Inc. | | |
| | |
| | |
| | |
Schedule of Investments (unaudited)(continued)October 31, 2024
iShares® Core U.S. Aggregate Bond ETF(Percentages shown are based on Net Assets)
| | |
Diversified Financial Services (continued) |
Stifel Financial Corp., 4.00%, 05/15/30 | | |
| | |
| | |
| | |
| | |
| | |
5.94%, 08/02/30, (1-day SOFR Index + 2.130%)(a)(c) | | |
TPG Operating Group II LP, 5.88%, 03/05/34 | | |
| | |
| | |
| | |
| | |
| | |
| | |
| | |
| | |
| | |
| | |
| | |
| | |
| | |
| | |
4.70%, 01/23/48, (3-mo. LIBOR US + 2.084%)(a) | | |
| | |
| | |
| | |
| | |
| | |
| | |
| | |
| | |
|
| | |
| | |
| | |
| | |
| | |
| | |
| | |
| | |
| | |
Series G, 4.15%, 05/01/49 | | |
Series H, 3.45%, 01/15/50 | | |
Series I, 2.10%, 07/01/30 | | |
| | |
| | |
| | |
| | |
| | |
| | |
| | |
| | |
| | |
| | |
Series M, 3.65%, 04/01/50 | | |
Series N, 2.75%, 08/15/51 | | |
| | |
| | |
| | |
| | |
|
| | |
| | |
| | |
| | |
| | |
| | |
| | |
| | |
| | |
| | |
| | |
| | |
| | |
| | |
| | |
Series 20-A, 1.45%, 09/15/30 | | |
Series A, 4.30%, 07/15/48 | | |
Series B, 3.70%, 12/01/47 | | |
Algonquin Power & Utilities Corp., 5.37%, 06/15/26(e) | | |
| | |
| | |
| | |
| | |
| | |
| | |
| | |
| | |
| | |
| | |
| | |
| | |
| | |
| | |
| | |
| | |
| | |
| | |
| | |
American Electric Power Co. Inc. | | |
| | |
| | |
| | |
3.88%, 02/15/62, (5-year CMT + 2.675%)(a) | | |
| | |
| | |
| | |
| | |
6.95%, 12/15/54, (5-year CMT + 2.675%)(a)(c) | | |
7.05%, 12/15/54, (5-year CMT + 2.750%)(a)(c) | | |
Series J, 4.30%, 12/01/28 | | |
Series N, 1.00%, 11/01/25 | | |
| | |
| | |
| | |
| | |
| | |
| | |
Series AA, 2.70%, 04/01/31 | | |
Schedule of Investments (unaudited)(continued)October 31, 2024
iShares® Core U.S. Aggregate Bond ETF(Percentages shown are based on Net Assets)
| | |
|
Series X, 3.30%, 06/01/27 | | |
Series Y, 4.50%, 03/01/49 | | |
Series Z, 3.70%, 05/01/50 | | |
Arizona Public Service Co. | | |
| | |
| | |
| | |
| | |
| | |
| | |
| | |
| | |
| | |
| | |
| | |
| | |
| | |
| | |
| | |
Atlantic City Electric Co. | | |
| | |
| | |
Avangrid Inc., 3.80%, 06/01/29 | | |
| | |
| | |
| | |
Baltimore Gas & Electric Co. | | |
| | |
| | |
| | |
| | |
| | |
| | |
| | |
| | |
| | |
| | |
| | |
| | |
Berkshire Hathaway Energy Co. | | |
| | |
| | |
| | |
| | |
| | |
| | |
| | |
| | |
| | |
| | |
| | |
| | |
| | |
| | |
| | |
| | |
| | |
| | |
| | |
| | |
| | |
| | |
|
| | |
| | |
CenterPoint Energy Houston Electric LLC | | |
| | |
| | |
| | |
| | |
| | |
| | |
| | |
| | |
| | |
Series AA, 3.00%, 02/01/27 | | |
Series AC, 4.25%, 02/01/49 | | |
Series AD, 2.90%, 07/01/50 | | |
Series AE, 2.35%, 04/01/31 | | |
Series AF, 3.35%, 04/01/51 | | |
Series AG, 3.00%, 03/01/32 | | |
Series ai., 4.45%, 10/01/32 | | |
Series AJ, 4.85%, 10/01/52 | | |
Series K2, 6.95%, 03/15/33 | | |
Series Z, 2.40%, 09/01/26 | | |
| | |
| | |
| | |
| | |
| | |
| | |
| | |
Series A, 7.00%, 02/15/55, (5-year CMT + 3.254%)(a) | | |
Series B, 6.85%, 02/15/55, (5-year CMT + 2.946%)(a) | | |
Cleco Corporate Holdings LLC | | |
| | |
| | |
Cleveland Electric Illuminating Co. (The), 5.95%, 12/15/36 | | |
| | |
| | |
| | |
3.75%, 12/01/50, (5-year CMT + 2.900%)(a) | | |
4.75%, 06/01/50, (5-year CMT + 4.116%)(a) | | |
| | |
| | |
| | |
| | |
| | |
| | |
| | |
| | |
| | |
| | |
| | |
| | |
| | |
| | |
| | |
| | |
| | |
| | |
Schedule of Investments (unaudited)(continued)October 31, 2024
iShares® Core U.S. Aggregate Bond ETF(Percentages shown are based on Net Assets)
| | |
|
| | |
| | |
| | |
Series 122, 2.95%, 08/15/27 | | |
Series 123, 3.75%, 08/15/47 | | |
Series 127, 3.20%, 11/15/49 | | |
Series 130, 3.13%, 03/15/51 | | |
Series 131, 2.75%, 09/01/51 | | |
Series 133, 3.85%, 03/15/52 | | |
Connecticut Light and Power Co. (The) | | |
| | |
| | |
| | |
| | |
| | |
| | |
Series A, 0.75%, 12/01/25 | | |
Series A, 2.05%, 07/01/31 | | |
Series A, 3.20%, 03/15/27 | | |
Series A, 4.15%, 06/01/45 | | |
Consolidated Edison Co. of New York Inc. | | |
| | |
| | |
| | |
| | |
| | |
| | |
| | |
| | |
| | |
| | |
| | |
| | |
| | |
| | |
| | |
| | |
| | |
| | |
Series 05-A, 5.30%, 03/01/35 | | |
Series 06-A, 5.85%, 03/15/36 | | |
Series 06-B, 6.20%, 06/15/36 | | |
Series 07-A, 6.30%, 08/15/37 | | |
Series 08-B, 6.75%, 04/01/38 | | |
Series 09-C, 5.50%, 12/01/39 | | |
Series 12-A, 4.20%, 03/15/42 | | |
Series 2017, 3.88%, 06/15/47 | | |
Series 20A, 3.35%, 04/01/30 | | |
Series 20B, 3.95%, 04/01/50 | | |
Series A, 4.13%, 05/15/49 | | |
Series B, 3.13%, 11/15/27 | | |
Series C, 3.00%, 12/01/60 | | |
Series C, 4.00%, 11/15/57 | | |
Series C, 4.30%, 12/01/56 | | |
Series D, 4.00%, 12/01/28 | | |
Series E, 4.65%, 12/01/48 | | |
Constellation Energy Generation LLC | | |
| | |
| | |
| | |
| | |
| | |
|
| | |
| | |
| | |
| | |
| | |
| | |
| | |
| | |
| | |
| | |
| | |
| | |
| | |
| | |
| | |
| | |
| | |
| | |
| | |
| | |
| | |
| | |
| | |
Dayton Power & Light Co. (The), 3.95%, 06/15/49 | | |
Delmarva Power & Light Co., 4.15%, 05/15/45 | | |
| | |
| | |
| | |
| | |
| | |
| | |
| | |
Series A, 1.45%, 04/15/26 | | |
Series A, 4.60%, 03/15/49 | | |
Series A, 6.88%, 02/01/55, (5-year CMT + 2.386%)(a) | | |
Series B, 3.30%, 04/15/41 | | |
Series B, 3.60%, 03/15/27 | | |
Series B, 5.95%, 06/15/35 | | |
Series B, 7.00%, 06/01/54, (5-year CMT + 2.511%)(a) | | |
Series C, 2.25%, 08/15/31 | | |
Series C, 3.38%, 04/01/30 | | |
Series C, 4.05%, 09/15/42 | | |
Series C, 4.90%, 08/01/41 | | |
Series D, 2.85%, 08/15/26 | | |
Series E, 6.30%, 03/15/33 | | |
Series F, 5.25%, 08/01/33 | | |
Dominion Energy South Carolina Inc. | | |
| | |
| | |
| | |
| | |
| | |
| | |
| | |
Series A, 2.30%, 12/01/31 | | |
| | |
| | |
| | |
Schedule of Investments (unaudited)(continued)October 31, 2024
iShares® Core U.S. Aggregate Bond ETF(Percentages shown are based on Net Assets)
| | |
|
| | |
| | |
| | |
| | |
| | |
| | |
| | |
| | |
| | |
Series A, 1.90%, 04/01/28 | | |
Series A, 3.00%, 03/01/32 | | |
Series A, 4.00%, 04/01/43 | | |
Series A, 4.05%, 05/15/48 | | |
Series B, 3.25%, 04/01/51 | | |
Series B, 3.65%, 03/01/52 | | |
Series C, 2.63%, 03/01/31 | | |
| | |
| | |
| | |
| | |
| | |
| | |
| | |
Series C, 3.40%, 06/15/29 | | |
Duke Energy Carolinas LLC | | |
| | |
| | |
| | |
| | |
| | |
| | |
| | |
| | |
| | |
| | |
| | |
| | |
| | |
| | |
| | |
| | |
| | |
| | |
| | |
| | |
| | |
| | |
| | |
| | |
Series A, 6.00%, 12/01/28(c) | | |
| | |
| | |
| | |
| | |
| | |
3.25%, 01/15/82, (5-year CMT + 2.321%)(a) | | |
| | |
| | |
| | |
| | |
| | |
| | |
|
| | |
| | |
| | |
| | |
| | |
| | |
| | |
| | |
| | |
| | |
| | |
| | |
| | |
6.45%, 09/01/54, (5-year CMT + 2.588%)(a) | | |
| | |
| | |
| | |
| | |
| | |
| | |
| | |
| | |
| | |
| | |
| | |
| | |
| | |
| | |
| | |
| | |
Duke Energy Florida Project Finance LLC | | |
Series 2032, 2.86%, 03/01/33(c) | | |
Series 2035, 3.11%, 09/01/38(c) | | |
| | |
| | |
| | |
| | |
| | |
| | |
| | |
| | |
Series WWW, 4.90%, 07/15/43 | | |
Series YYY, 3.25%, 10/01/49 | | |
| | |
| | |
| | |
| | |
| | |
| | |
| | |
| | |
| | |
| | |
| | |
| | |
| | |
| | |
| | |
| | |
| | |
| | |
Schedule of Investments (unaudited)(continued)October 31, 2024
iShares® Core U.S. Aggregate Bond ETF(Percentages shown are based on Net Assets)
| | |
|
| | |
| | |
| | |
| | |
| | |
| | |
| | |
| | |
| | |
| | |
| | |
| | |
| | |
| | |
| | |
| | |
| | |
| | |
| | |
| | |
| | |
| | |
| | |
Enel Americas SA, 4.00%, 10/25/26 | | |
Enel Chile SA, 4.88%, 06/12/28 | | |
| | |
| | |
| | |
| | |
| | |
| | |
| | |
| | |
| | |
| | |
| | |
| | |
| | |
| | |
| | |
| | |
7.13%, 12/01/54, (5-year CMT + 2.670%)(a) | | |
| | |
| | |
| | |
| | |
| | |
| | |
| | |
| | |
| | |
| | |
| | |
| | |
| | |
| | |
| | |
| | |
| | |
| | |
| | |
| | |
|
| | |
| | |
| | |
| | |
| | |
| | |
| | |
| | |
| | |
| | |
| | |
| | |
Evergy Inc., 2.90%, 09/15/29 | | |
Evergy Kansas Central Inc. | | |
| | |
| | |
| | |
| | |
| | |
| | |
| | |
| | |
| | |
| | |
| | |
| | |
| | |
| | |
| | |
Series 2019, 4.13%, 04/01/49 | | |
Series 2020, 2.25%, 06/01/30 | | |
| | |
| | |
| | |
| | |
| | |
| | |
| | |
| | |
| | |
| | |
| | |
| | |
| | |
| | |
Series M, 3.30%, 01/15/28 | | |
Series O, 4.25%, 04/01/29 | | |
Series R, 1.65%, 08/15/30 | | |
Series U, 1.40%, 08/15/26 | | |
| | |
| | |
| | |
| | |
| | |
| | |
| | |
| | |
| | |
| | |
| | |
| | |
Schedule of Investments (unaudited)(continued)October 31, 2024
iShares® Core U.S. Aggregate Bond ETF(Percentages shown are based on Net Assets)
| | |
|
| | |
| | |
| | |
| | |
| | |
| | |
Series A, 1.60%, 01/15/26 | | |
Series B, 2.25%, 09/01/30 | | |
Series B, 3.90%, 07/15/27 | | |
Series C, 3.40%, 03/01/50 | | |
Series C, 4.85%, 07/15/47 | | |
FirstEnergy Transmission LLC | | |
| | |
| | |
Florida Power & Light Co. | | |
| | |
| | |
| | |
| | |
| | |
| | |
| | |
| | |
| | |
| | |
| | |
| | |
| | |
| | |
| | |
| | |
| | |
| | |
| | |
| | |
| | |
| | |
| | |
| | |
| | |
| | |
| | |
| | |
| | |
| | |
Series A, 3.30%, 05/30/27 | | |
Fortis Inc./Canada, 3.06%, 10/04/26 | | |
| | |
| | |
| | |
| | |
| | |
| | |
| | |
| | |
| | |
| | |
| | |
Series 10-C, 4.75%, 09/01/40 | | |
Series A, 3.25%, 03/15/51 | | |
Series B, 2.65%, 09/15/29 | | |
| | |
|
Series B, 3.70%, 01/30/50 | | |
Iberdrola International BV, 6.75%, 07/15/36 | | |
| | |
| | |
| | |
| | |
Series K, 4.20%, 03/01/48 | | |
Indiana Michigan Power Co. | | |
| | |
| | |
| | |
| | |
| | |
Series K, 4.55%, 03/15/46 | | |
Series L, 3.75%, 07/01/47 | | |
Interstate Power & Light Co. | | |
| | |
| | |
| | |
| | |
| | |
| | |
| | |
| | |
Interstate Power and Light Co. | | |
| | |
| | |
| | |
| | |
| | |
| | |
| | |
| | |
| | |
John Sevier Combined Cycle Generation LLC, 4.63%, 01/15/42 | | |
| | |
| | |
| | |
| | |
| | |
Louisville Gas & Electric Co. | | |
| | |
| | |
| | |
| | |
| | |
| | |
| | |
| | |
| | |
| | |
| | |
| | |
| | |
| | |
| | |
| | |
| | |
| | |
| | |
Schedule of Investments (unaudited)(continued)October 31, 2024
iShares® Core U.S. Aggregate Bond ETF(Percentages shown are based on Net Assets)
| | |
|
| | |
| | |
Series 12-A, 4.25%, 03/15/42 | | |
Series B, 3.10%, 07/30/51 | | |
| | |
| | |
| | |
| | |
National Grid USA, 5.80%, 04/01/35 | | |
National Rural Utilities Cooperative Finance Corp. | | |
| | |
| | |
| | |
| | |
| | |
| | |
| | |
| | |
| | |
| | |
| | |
| | |
| | |
| | |
| | |
| | |
| | |
| | |
| | |
| | |
| | |
| | |
| | |
| | |
5.25%, 04/20/46, (3-mo. LIBOR US + 3.630%)(a) | | |
| | |
| | |
7.13%, 09/15/53, (5-year CMT + 3.533%)(a) | | |
Series C, 8.00%, 03/01/32 | | |
| | |
| | |
| | |
Series CC, 3.70%, 05/01/29 | | |
Series DD, 2.40%, 05/01/30 | | |
Series EE, 3.13%, 08/01/50(c) | | |
Series N, 6.65%, 04/01/36 | | |
Series R, 6.75%, 07/01/37 | | |
NextEra Energy Capital Holdings Inc. | | |
| | |
| | |
| | |
| | |
| | |
| | |
| | |
| | |
3.80%, 03/15/82, (5-year CMT + 2.547%)(a) | | |
| | |
| | |
|
4.80%, 12/01/77, (3-mo. LIBOR US + 2.409%)(a) | | |
| | |
| | |
| | |
| | |
| | |
| | |
| | |
| | |
| | |
5.65%, 05/01/79, (3-mo. LIBOR US + 3.156%)(a) | | |
6.70%, 09/01/54, (5-year CMT + 2.364%)(a) | | |
6.75%, 06/15/54, (5-year CMT + 2.457%)(a) | | |
Northern States Power Co./MN | | |
| | |
| | |
| | |
| | |
| | |
| | |
| | |
| | |
| | |
| | |
| | |
| | |
| | |
| | |
| | |
Northern States Power Co./WI, 5.65%, 06/15/54 | | |
NorthWestern Corp., 4.18%, 11/15/44 | | |
| | |
| | |
| | |
| | |
| | |
| | |
| | |
| | |
| | |
| | |
| | |
OGE Energy Corp., 5.45%, 05/15/29 | | |
| | |
| | |
| | |
| | |
| | |
| | |
| | |
| | |
| | |
Ohio Edison Co., 6.88%, 07/15/36 | | |
| | |
| | |
| | |
| | |
| | |
Schedule of Investments (unaudited)(continued)October 31, 2024
iShares® Core U.S. Aggregate Bond ETF(Percentages shown are based on Net Assets)
| | |
|
Series P, 2.60%, 04/01/30 | | |
Series Q, 1.63%, 01/15/31 | | |
Series R, 2.90%, 10/01/51 | | |
Oklahoma Gas & Electric Co. | | |
| | |
| | |
| | |
| | |
| | |
| | |
| | |
Oncor Electric Delivery Co. LLC | | |
| | |
| | |
| | |
| | |
| | |
| | |
| | |
| | |
| | |
| | |
| | |
| | |
| | |
| | |
| | |
| | |
| | |
| | |
| | |
| | |
| | |
| | |
| | |
| | |
Pacific Gas and Electric Co. | | |
| | |
| | |
| | |
| | |
| | |
| | |
| | |
| | |
| | |
| | |
| | |
| | |
| | |
| | |
| | |
| | |
| | |
| | |
| | |
| | |
| | |
| | |
| | |
| | |
| | |
|
| | |
| | |
| | |
| | |
| | |
| | |
| | |
| | |
| | |
| | |
| | |
| | |
| | |
| | |
| | |
| | |
| | |
| | |
| | |
| | |
| | |
| | |
| | |
| | |
| | |
| | |
| | |
| | |
| | |
| | |
| | |
| | |
| | |
| | |
| | |
| | |
| | |
| | |
| | |
| | |
| | |
| | |
| | |
| | |
| | |
| | |
| | |
| | |
PG&E Recovery Funding LLC | | |
| | |
Series A-1, 4.84%, 06/01/35 | | |
Series A-2, 5.23%, 06/01/42 | | |
Series A-3, 5.53%, 06/01/51 | | |
PG&E Wildfire Recovery Funding LLC | | |
Series A-1, 4.02%, 06/01/33 | | |
Series A-2, 4.26%, 06/01/38 | | |
Series A-4, 4.45%, 12/01/49 | | |
Series A-4, 5.21%, 12/01/49 | | |
Potomac Electric Power Co. | | |
| | |
| | |
Schedule of Investments (unaudited)(continued)October 31, 2024
iShares® Core U.S. Aggregate Bond ETF(Percentages shown are based on Net Assets)
| | |
|
| | |
| | |
| | |
| | |
| | |
| | |
PPL Electric Utilities Corp. | | |
| | |
| | |
| | |
| | |
| | |
| | |
| | |
| | |
| | |
| | |
| | |
| | |
| | |
| | |
Public Service Co. of Colorado | | |
| | |
| | |
| | |
| | |
| | |
| | |
| | |
| | |
| | |
| | |
| | |
| | |
| | |
Series 17, 6.25%, 09/01/37 | | |
Series 34, 3.20%, 03/01/50 | | |
Series 35, 1.90%, 01/15/31 | | |
Series 36, 2.70%, 01/15/51 | | |
Public Service Co. of New Hampshire | | |
| | |
| | |
| | |
Series V, 2.20%, 06/15/31 | | |
Public Service Co. of Oklahoma | | |
| | |
Series J, 2.20%, 08/15/31 | | |
Series K, 3.15%, 08/15/51 | | |
Public Service Electric & Gas Co. | | |
| | |
| | |
| | |
| | |
| | |
| | |
| | |
| | |
| | |
| | |
| | |
| | |
| | |
|
| | |
| | |
| | |
| | |
| | |
| | |
| | |
| | |
| | |
| | |
| | |
| | |
| | |
| | |
| | |
| | |
| | |
| | |
| | |
| | |
Public Service Enterprise Group Inc. | | |
| | |
| | |
| | |
| | |
| | |
| | |
| | |
| | |
| | |
| | |
| | |
| | |
| | |
| | |
| | |
| | |
| | |
| | |
| | |
| | |
| | |
| | |
| | |
San Diego Gas & Electric Co. | | |
| | |
| | |
| | |
| | |
| | |
| | |
| | |
| | |
Series RRR, 3.75%, 06/01/47 | | |
Series TTT, 4.10%, 06/15/49 | | |
Series UUU, 3.32%, 04/15/50 | | |
Series VVV, 1.70%, 10/01/30 | | |
Series WWW, 2.95%, 08/15/51 | | |
Series XXX, 3.00%, 03/15/32 | | |
| | |
| | |
Schedule of Investments (unaudited)(continued)October 31, 2024
iShares® Core U.S. Aggregate Bond ETF(Percentages shown are based on Net Assets)
| | |
|
| | |
| | |
| | |
| | |
4.13%, 04/01/52, (5-year CMT + 2.868%)(a) | | |
| | |
| | |
| | |
6.40%, 10/01/54, (5-year CMT + 2.632%)(a) | | |
6.88%, 10/01/54, (5-year CMT + 2.789%)(a) | | |
| | |
| | |
| | |
Southern California Edison Co. | | |
| | |
| | |
| | |
| | |
| | |
| | |
| | |
| | |
| | |
| | |
| | |
| | |
| | |
| | |
| | |
| | |
| | |
| | |
| | |
| | |
| | |
| | |
| | |
| | |
| | |
| | |
| | |
| | |
Series 04-G, 5.75%, 04/01/35 | | |
Series 05-E, 5.35%, 07/15/35 | | |
Series 06-E, 5.55%, 01/15/37 | | |
Series 08-A, 5.95%, 02/01/38 | | |
Series 13-A, 3.90%, 03/15/43 | | |
Series 2020-C, 1.20%, 02/01/26 | | |
Series 20A, 2.95%, 02/01/51 | | |
Series A, 4.20%, 03/01/29 | | |
Series B, 3.65%, 03/01/28 | | |
Series B, 4.88%, 03/01/49 | | |
Series C, 3.60%, 02/01/45 | | |
Series C, 4.13%, 03/01/48 | | |
Series D, 4.70%, 06/01/27 | | |
Series E, 5.45%, 06/01/52 | | |
Series G, 2.50%, 06/01/31 | | |
Series H, 3.65%, 06/01/51 | | |
| | |
| | |
| | |
| | |
|
| | |
| | |
| | |
| | |
| | |
| | |
| | |
| | |
Series 21-A, 3.75%, 09/15/51, (5-year CMT + 2.915%)(a) | | |
Series 21-B, 1.75%, 03/15/28 | | |
Series A, 3.70%, 04/30/30 | | |
Series B, 4.00%, 01/15/51, (5-year CMT + 3.733%)(a) | | |
| | |
| | |
| | |
| | |
| | |
Series F, 4.95%, 12/15/46 | | |
Southwestern Electric Power Co. | | |
| | |
| | |
| | |
Series J, 3.90%, 04/01/45 | | |
Series K, 2.75%, 10/01/26 | | |
Series L, 3.85%, 02/01/48 | | |
Series M, 4.10%, 09/15/28 | | |
Series N, 1.65%, 03/15/26(c) | | |
Southwestern Public Service Co. | | |
| | |
| | |
| | |
| | |
| | |
Series 6, 4.40%, 11/15/48 | | |
Series 8, 3.15%, 05/01/50 | | |
System Energy Resources Inc., 6.00%, 04/15/28 | | |
| | |
| | |
| | |
| | |
| | |
| | |
| | |
| | |
| | |
| | |
Toledo Edison Co. (The), 6.15%, 05/15/37 | | |
Tucson Electric Power Co. | | |
| | |
| | |
| | |
| | |
| | |
| | |
| | |
| | |
| | |
| | |
Schedule of Investments (unaudited)(continued)October 31, 2024
iShares® Core U.S. Aggregate Bond ETF(Percentages shown are based on Net Assets)
| | |
|
| | |
| | |
| | |
| | |
| | |
| | |
| | |
| | |
| | |
| | |
| | |
| | |
| | |
| | |
Virginia Electric & Power Co. | | |
| | |
| | |
| | |
| | |
| | |
| | |
| | |
| | |
| | |
| | |
| | |
| | |
| | |
| | |
| | |
| | |
| | |
| | |
Series A, 2.88%, 07/15/29 | | |
Series A, 3.15%, 01/15/26 | | |
Series A, 3.50%, 03/15/27 | | |
Series A, 3.80%, 04/01/28 | | |
Series A, 6.00%, 05/15/37 | | |
Series B, 2.95%, 11/15/26 | | |
Series B, 3.75%, 05/15/27 | | |
Series B, 3.80%, 09/15/47 | | |
Series B, 4.20%, 05/15/45 | | |
Series B, 6.00%, 01/15/36 | | |
Series C, 4.00%, 11/15/46 | | |
Series C, 4.63%, 05/15/52 | | |
Series D, 4.65%, 08/15/43 | | |
Virginia Power Fuel Securitization LLC, Series A-2, 4.88%, 05/01/33 | | |
| | |
| | |
| | |
| | |
| | |
| | |
| | |
| | |
Wisconsin Electric Power Co. | | |
| | |
| | |
| | |
| | |
| | |
|
| | |
| | |
| | |
| | |
Wisconsin Power and Light Co. | | |
| | |
| | |
| | |
| | |
| | |
| | |
| | |
| | |
Wisconsin Public Service Corp. | | |
| | |
| | |
| | |
| | |
| | |
| | |
| | |
| | |
| | |
| | |
| | |
| | |
| | |
| | |
| | |
| | |
| | |
| | |
Electrical Components & Equipment — 0.0% |
Acuity Brands Lighting Inc., 2.15%, 12/15/30 | | |
| | |
| | |
| | |
| | |
| | |
| | |
| | |
| | |
| | |
| | |
|
Allegion PLC, 3.50%, 10/01/29 | | |
Allegion U.S. Holding Co. Inc. | | |
| | |
| | |
| | |
| | |
| | |
| | |
| | |
| | |
| | |
| | |
| | |
| | |
| | |
Schedule of Investments (unaudited)(continued)October 31, 2024
iShares® Core U.S. Aggregate Bond ETF(Percentages shown are based on Net Assets)
| | |
|
| | |
| | |
| | |
| | |
| | |
| | |
| | |
| | |
| | |
| | |
| | |
| | |
| | |
| | |
| | |
| | |
| | |
| | |
| | |
Honeywell International Inc. | | |
| | |
| | |
| | |
| | |
| | |
| | |
| | |
| | |
| | |
| | |
| | |
| | |
| | |
| | |
| | |
| | |
| | |
| | |
| | |
| | |
| | |
| | |
| | |
| | |
| | |
| | |
| | |
| | |
| | |
| | |
| | |
| | |
| | |
| | |
Keysight Technologies Inc. | | |
| | |
| | |
| | |
| | |
| | |
| | |
| | |
|
| | |
| | |
| | |
| | |
| | |
Tyco Electronics Group SA | | |
| | |
| | |
| | |
| | |
| | |
| | |
| | |
| | |
| | |
| | |
| | |
Engineering & Construction — 0.0% |
Jacobs Engineering Group Inc. | | |
| | |
| | |
MasTec Inc., 5.90%, 06/15/29 | | |
Ste Transcore Holdings Inc., 4.13%, 05/23/26(f) | | |
| | |
|
Warnermedia Holdings Inc. | | |
| | |
| | |
| | |
| | |
| | |
| | |
| | |
| | |
Environmental Control — 0.1% |
Nature Conservancy (The), Series A, 3.96%, 03/01/52 | | |
| | |
| | |
| | |
| | |
| | |
| | |
| | |
| | |
| | |
| | |
| | |
| | |
| | |
| | |
| | |
| | |
| | |
| | |
| | |
| | |
| | |
Schedule of Investments (unaudited)(continued)October 31, 2024
iShares® Core U.S. Aggregate Bond ETF(Percentages shown are based on Net Assets)
| | |
Environmental Control (continued) |
| | |
| | |
| | |
| | |
| | |
| | |
| | |
| | |
| | |
| | |
| | |
| | |
| | |
| | |
| | |
| | |
| | |
| | |
| | |
| | |
| | |
| | |
| | |
| | |
| | |
| | |
| | |
| | |
| | |
| | |
| | |
| | |
| | |
|
Ahold Finance USA LLC, 6.88%, 05/01/29 | | |
| | |
| | |
| | |
| | |
| | |
| | |
| | |
| | |
| | |
| | |
| | |
| | |
| | |
| | |
| | |
| | |
| | |
| | |
| | |
| | |
| | |
| | |
| | |
| | |
| | |
| | |
| | |
|
| | |
| | |
| | |
| | |
| | |
| | |
| | |
| | |
| | |
| | |
| | |
| | |
| | |
| | |
| | |
| | |
| | |
| | |
| | |
| | |
| | |
| | |
| | |
| | |
| | |
| | |
| | |
| | |
| | |
| | |
| | |
| | |
| | |
| | |
| | |
| | |
| | |
| | |
| | |
| | |
JBS USA Holding Lux SARL/JBS USA Food Co./JBS Lux Co. SARL | | |
| | |
| | |
| | |
| | |
| | |
| | |
| | |
| | |
| | |
| | |
| | |
| | |
| | |
| | |
| | |
| | |
| | |
| | |
| | |
Schedule of Investments (unaudited)(continued)October 31, 2024
iShares® Core U.S. Aggregate Bond ETF(Percentages shown are based on Net Assets)
| | |
|
| | |
Series B, 7.45%, 04/01/31 | | |
Koninklijke Ahold Delhaize NV, 5.70%, 10/01/40 | | |
| | |
| | |
| | |
| | |
| | |
| | |
| | |
| | |
| | |
| | |
| | |
| | |
| | |
| | |
| | |
| | |
| | |
| | |
| | |
| | |
| | |
| | |
| | |
| | |
| | |
| | |
| | |
| | |
| | |
| | |
| | |
| | |
| | |
| | |
| | |
| | |
| | |
| | |
| | |
| | |
| | |
| | |
| | |
| | |
| | |
| | |
| | |
| | |
Mondelez International Inc. | | |
| | |
| | |
| | |
| | |
| | |
| | |
| | |
| | |
| | |
|
| | |
| | |
| | |
| | |
| | |
| | |
| | |
| | |
| | |
| | |
| | |
| | |
| | |
| | |
| | |
| | |
| | |
| | |
| | |
| | |
| | |
| | |
| | |
| | |
| | |
| | |
| | |
| | |
| | |
| | |
| | |
| | |
| | |
Forest Products & Paper — 0.0% |
Celulosa Arauco y Constitucion SA | | |
| | |
| | |
| | |
| | |
| | |
| | |
| | |
| | |
| | |
| | |
| | |
| | |
| | |
| | |
| | |
| | |
| | |
| | |
| | |
Suzano International Finance BV, 5.50%, 01/17/27 | | |
| | |
|
| | |
| | |
Schedule of Investments (unaudited)(continued)October 31, 2024
iShares® Core U.S. Aggregate Bond ETF(Percentages shown are based on Net Assets)
| | |
|
| | |
| | |
| | |
| | |
| | |
| | |
| | |
| | |
| | |
| | |
| | |
| | |
| | |
| | |
CenterPoint Energy Resources Corp. | | |
| | |
| | |
| | |
| | |
| | |
| | |
| | |
| | |
| | |
| | |
| | |
| | |
| | |
| | |
| | |
| | |
| | |
| | |
| | |
| | |
| | |
| | |
| | |
| | |
| | |
| | |
| | |
| | |
| | |
| | |
6.95%, 11/30/54, (5-year CMT + 2.451%)(a) | | |
| | |
| | |
| | |
| | |
| | |
| | |
Piedmont Natural Gas Co. Inc. | | |
| | |
| | |
| | |
| | |
| | |
| | |
| | |
| | |
| | |
|
Southern California Gas Co. | | |
| | |
| | |
| | |
| | |
| | |
| | |
| | |
| | |
Series TT, 2.60%, 06/15/26(c) | | |
Series UU, 4.13%, 06/01/48 | | |
Series VV, 4.30%, 01/15/49 | | |
Series WW, 3.95%, 02/15/50 | | |
Series XX, 2.55%, 02/01/30 | | |
Southern Co. Gas Capital Corp. | | |
| | |
| | |
| | |
| | |
| | |
| | |
| | |
| | |
Series 2020-A, 1.75%, 01/15/31 | | |
Series 21A, 3.15%, 09/30/51 | | |
| | |
| | |
| | |
| | |
| | |
| | |
| | |
| | |
| | |
Spire Inc., 5.30%, 03/01/26 | | |
| | |
| | |
| | |
Series 2034, 5.15%, 08/15/34 | | |
| | |
| | |
Series K, 3.80%, 09/15/46 | | |
| | |
Hand & Machine Tools — 0.0% |
| | |
| | |
| | |
| | |
| | |
| | |
| | |
| | |
| | |
| | |
| | |
| | |
Stanley Black & Decker Inc. | | |
| | |
| | |
| | |
| | |
Schedule of Investments (unaudited)(continued)October 31, 2024
iShares® Core U.S. Aggregate Bond ETF(Percentages shown are based on Net Assets)
| | |
Hand & Machine Tools (continued) |
| | |
| | |
| | |
| | |
| | |
Health Care - Products — 0.3% |
| | |
| | |
| | |
| | |
| | |
| | |
| | |
| | |
| | |
| | |
Agilent Technologies Inc. | | |
| | |
| | |
| | |
| | |
| | |
| | |
Baxter International Inc. | | |
| | |
| | |
| | |
| | |
| | |
| | |
| | |
| | |
| | |
| | |
| | |
| | |
| | |
| | |
| | |
| | |
| | |
| | |
| | |
Dentsply Sirona Inc., 3.25%, 06/01/30 | | |
DH Europe Finance II SARL | | |
| | |
| | |
| | |
Edwards Lifesciences Corp., 4.30%, 06/15/28 | | |
GE HealthCare Technologies Inc. | | |
| | |
| | |
| | |
| | |
| | |
| | |
| | |
| | |
| | |
| | |
Health Care - Products (continued) |
Medtronic Global Holdings SCA | | |
| | |
| | |
| | |
| | |
| | |
| | |
| | |
| | |
| | |
| | |
| | |
| | |
| | |
| | |
| | |
| | |
| | |
| | |
| | |
| | |
| | |
| | |
| | |
STERIS Irish FinCo Unlimited Co. | | |
| | |
| | |
| | |
| | |
| | |
| | |
| | |
| | |
| | |
| | |
| | |
| | |
| | |
| | |
Thermo Fisher Scientific Inc. | | |
| | |
| | |
| | |
| | |
| | |
| | |
| | |
| | |
| | |
| | |
| | |
| | |
| | |
| | |
| | |
Zimmer Biomet Holdings Inc. | | |
| | |
| | |
| | |
| | |
| | |
Schedule of Investments (unaudited)(continued)October 31, 2024
iShares® Core U.S. Aggregate Bond ETF(Percentages shown are based on Net Assets)
| | |
Health Care - Products (continued) |
| | |
| | |
Health Care - Services — 1.0% |
AdventHealth Obligated Group, Series E, 2.80%, 11/15/51 | | |
Adventist Health System/West | | |
| | |
| | |
| | |
Advocate Health & Hospitals Corp. | | |
| | |
| | |
| | |
Series 2020, 2.21%, 06/15/30 | | |
Series 2020, 3.01%, 06/15/50 | | |
| | |
| | |
| | |
| | |
| | |
| | |
| | |
| | |
| | |
Series 2021, 2.78%, 07/01/51 | | |
| | |
| | |
Series 2019, 3.89%, 04/15/49 | | |
| | |
| | |
| | |
Series B, 2.53%, 11/15/29 | | |
Series B, 3.11%, 11/15/39 | | |
| | |
| | |
| | |
| | |
| | |
Series 2020, 3.18%, 01/01/50 | | |
Baptist Health South Florida Obligated Group, Series 2021, 3.12%, 11/15/71(c) | | |
Baptist Healthcare System Obligated Group, Series 20B, 3.54%, 08/15/50 | | |
BayCare Health System Inc., Series 2020, 3.83%, 11/15/50 | | |
Baylor Scott & White Holdings | | |
| | |
| | |
Series 2021, 1.78%, 11/15/30 | | |
Series 2021, 2.84%, 11/15/50 | | |
Beth Israel Lahey Health Inc., Series L, 3.08%, 07/01/51 | | |
Bon Secours Mercy Health Inc. | | |
| | |
Series 2018, 4.30%, 07/01/28 | | |
Series 20-2, 2.10%, 06/01/31 | | |
Series 20-2, 3.21%, 06/01/50 | | |
Catholic Health Services of Long Island Obligated Group, Series 2020, 3.37%, 07/01/50 | | |
| | |
Health Care - Services (continued) |
Cedars-Sinai Health System, Series 2021, 2.29%, 08/15/31(c) | | |
| | |
| | |
| | |
| | |
| | |
| | |
| | |
| | |
Children's Health System of Texas, 2.51%, 08/15/50 | | |
Children's Hospital Corp. (The) | | |
Series 2017, 4.12%, 01/01/47 | | |
Series 2020, 2.59%, 02/01/50 | | |
Children's Hospital Medical Center/Cincinnati OH, 4.27%, 05/15/44 | | |
Children's Hospital of Philadelphia (The), Series 2020, 2.70%, 07/01/50 | | |
Children's Hospital/DC, Series 2020, 2.93%, 07/15/50 | | |
CHRISTUS Health, Series C, 4.34%, 07/01/28(c) | | |
| | |
| | |
| | |
| | |
| | |
| | |
| | |
| | |
| | |
| | |
| | |
| | |
| | |
| | |
| | |
| | |
| | |
| | |
| | |
| | |
| | |
| | |
| | |
| | |
Series 2013, 5.62%, 11/15/43 | | |
Series 2018, 4.38%, 08/15/48 | | |
Cleveland Clinic Foundation (The), 4.86%, 01/01/2114(c) | | |
| | |
| | |
| | |
| | |
| | |
| | |
| | |
| | |
| | |
| | |
Schedule of Investments (unaudited)(continued)October 31, 2024
iShares® Core U.S. Aggregate Bond ETF(Percentages shown are based on Net Assets)
| | |
Health Care - Services (continued) |
| | |
| | |
Community Health Network Inc., Series 20-A, 3.10%, 05/01/50 | | |
Corewell Health Obligated Group, Series 19A, 3.49%, 07/15/49 | | |
Cottage Health Obligated Group, Series 2020, 3.30%, 11/01/49 | | |
Dartmouth-Hitchcock Health, Series B, 4.18%, 08/01/48 | | |
| | |
| | |
| | |
Duke University Health System Inc., Series 2017, 3.92%, 06/01/47 | | |
| | |
| | |
| | |
| | |
| | |
| | |
| | |
| | |
| | |
| | |
| | |
| | |
| | |
| | |
| | |
| | |
| | |
| | |
| | |
| | |
| | |
| | |
| | |
| | |
| | |
| | |
| | |
| | |
| | |
| | |
| | |
| | |
| | |
| | |
| | |
Franciscan Missionaries of Our Lady Health System Inc., Series B, 3.91%, 07/01/49 | | |
Fred Hutchinson Cancer Center, 4.97%, 01/01/52 | | |
Hackensack Meridian Health Inc. | | |
| | |
| | |
Series 2020, 2.68%, 09/01/41 | | |
Series 2020, 2.88%, 09/01/50 | | |
Hartford HealthCare Corp., 3.45%, 07/01/54 | | |
| | |
Health Care - Services (continued) |
| | |
| | |
| | |
| | |
| | |
| | |
| | |
| | |
| | |
| | |
| | |
| | |
| | |
| | |
| | |
| | |
| | |
| | |
| | |
| | |
| | |
| | |
| | |
| | |
| | |
| | |
| | |
| | |
Hoag Memorial Hospital Presbyterian, 3.80%, 07/15/52(c) | | |
| | |
| | |
| | |
| | |
| | |
| | |
| | |
| | |
| | |
| | |
| | |
| | |
| | |
| | |
| | |
| | |
| | |
| | |
| | |
| | |
| | |
| | |
| | |
Indiana University Health Inc. Obligated Group | | |
| | |
Series 2021, 2.85%, 11/01/51 | | |
Inova Health System Foundation, 4.07%, 05/15/52(c) | | |
Integris Baptist Medical Center Inc., Series A, 3.88%, 08/15/50 | | |
Schedule of Investments (unaudited)(continued)October 31, 2024
iShares® Core U.S. Aggregate Bond ETF(Percentages shown are based on Net Assets)
| | |
Health Care - Services (continued) |
Iowa Health System, Series 2020, 3.67%, 02/15/50 | | |
| | |
| | |
| | |
Johns Hopkins Health System Corp. (The), 3.84%, 05/15/46 | | |
Kaiser Foundation Hospitals | | |
| | |
| | |
| | |
Series 2019, 3.27%, 11/01/49 | | |
Series 2021, 2.81%, 06/01/41 | | |
Series 2021, 3.00%, 06/01/51 | | |
Laboratory Corp. of America Holdings | | |
| | |
| | |
| | |
| | |
| | |
| | |
| | |
| | |
Mass General Brigham Inc. | | |
Series 2015, 4.12%, 07/01/55 | | |
Series 2017, 3.77%, 07/01/48(c) | | |
Series 2020, 3.19%, 07/01/49 | | |
Series 2020, 3.34%, 07/01/60 | | |
| | |
| | |
Series 2016, 4.13%, 11/15/52 | | |
Series 2021, 3.20%, 11/15/61 | | |
McLaren Health Care Corp., Series A, 4.39%, 05/15/48 | | |
MedStar Health Inc., Series 20A, 3.63%, 08/15/49(c) | | |
Memorial Health Services, 3.45%, 11/01/49 | | |
Memorial Sloan-Kettering Cancer Center | | |
| | |
| | |
Series 2015, 4.20%, 07/01/55 | | |
Series 2020, 2.96%, 01/01/50 | | |
Methodist Hospital (The), Series 20A, 2.71%, 12/01/50 | | |
Montefiore Obligated Group | | |
| | |
Series 18-C, 5.25%, 11/01/48 | | |
Mount Nittany Medical Center Obligated Group, 3.80%, 11/15/52 | | |
Mount Sinai Hospital (The) | | |
Series 2017, 3.98%, 07/01/48 | | |
Series 2019, 3.74%, 07/01/49 | | |
Series 2020, 3.39%, 07/01/50 | | |
MultiCare Health System, 2.80%, 08/15/50 | | |
MyMichigan Health, Series 2020, 3.41%, 06/01/50 | | |
Nationwide Children's Hospital Inc., 4.56%, 11/01/52 | | |
New York and Presbyterian Hospital (The) | | |
| | |
| | |
| | |
Health Care - Services (continued) |
| | |
| | |
| | |
Northwell Healthcare Inc. | | |
| | |
| | |
| | |
Northwestern Memorial Healthcare Obligated Group, Series 2021, 2.63%, 07/15/51(c) | | |
| | |
| | |
| | |
| | |
NY Society for Relief of Ruptured & Crippled Maintaining Hosp Special Surgery, Series 2020, 2.67%, 10/01/50 | | |
| | |
| | |
| | |
Series 2020, 3.04%, 11/15/50 | | |
Orlando Health Obligated Group | | |
| | |
| | |
PeaceHealth Obligated Group | | |
Series 2018, 4.79%, 11/15/48 | | |
Series 2020, 1.38%, 11/15/25 | | |
Series 2020, 3.22%, 11/15/50 | | |
| | |
| | |
| | |
Series 2042, 2.72%, 01/01/42(c) | | |
Presbyterian Healthcare Services, 4.88%, 08/01/52 | | |
Providence St. Joseph Health Obligated Group | | |
| | |
Series 19A, 2.53%, 10/01/29 | | |
Series 21A, 2.70%, 10/01/51(c) | | |
Series A, 3.93%, 10/01/48 | | |
Series H, 2.75%, 10/01/26 | | |
Series I, 3.74%, 10/01/47 | | |
Queen's Health Systems (The), 4.81%, 07/01/52 | | |
| | |
| | |
| | |
| | |
| | |
| | |
| | |
| | |
| | |
| | |
Rady Children's Hospital-San Diego, Series 21A, 3.15%, 08/15/51 | | |
Rush Obligated Group, Series 2020, 3.92%, 11/15/29 | | |
Seattle Children's Hospital, Series 2021, 2.72%, 10/01/50(c) | | |
Sentara Health, 2.93%, 11/01/51 | | |
Sharp HealthCare, Series 20B, 2.68%, 08/01/50 | | |
Schedule of Investments (unaudited)(continued)October 31, 2024
iShares® Core U.S. Aggregate Bond ETF(Percentages shown are based on Net Assets)
| | |
Health Care - Services (continued) |
| | |
| | |
Series A, 3.82%, 06/01/27 | | |
| | |
| | |
Series 2018, 3.80%, 11/15/48 | | |
Series 2020, 3.31%, 08/15/30 | | |
Summa Health, 3.51%, 11/15/51 | | |
| | |
| | |
Series 2018, 3.70%, 08/15/28 | | |
Series 2018, 4.09%, 08/15/48 | | |
Series 20A, 2.29%, 08/15/30 | | |
Series 20A, 3.16%, 08/15/40 | | |
Series 20A, 3.36%, 08/15/50 | | |
| | |
| | |
| | |
Toledo Hospital (The), 5.75%, 11/15/38 | | |
| | |
| | |
Series 2019, 3.43%, 12/01/48 | | |
Series 2021, 2.63%, 12/01/40 | | |
UMass Memorial Health Care Obligated Group, 5.36%, 07/01/52 | | |
| | |
| | |
| | |
| | |
| | |
| | |
| | |
| | |
| | |
| | |
| | |
| | |
| | |
| | |
| | |
| | |
| | |
| | |
| | |
| | |
| | |
| | |
| | |
| | |
| | |
| | |
| | |
| | |
| | |
| | |
| | |
| | |
| | |
| | |
| | |
| | |
| | |
Health Care - Services (continued) |
| | |
| | |
| | |
| | |
| | |
| | |
| | |
| | |
| | |
| | |
| | |
| | |
| | |
| | |
| | |
| | |
| | |
| | |
| | |
| | |
| | |
| | |
| | |
| | |
| | |
| | |
| | |
| | |
| | |
Universal Health Services Inc. | | |
| | |
| | |
| | |
| | |
| | |
| | |
| | |
| | |
Series 2021, 1.80%, 04/15/26 | | |
WakeMed, Series A, 3.29%, 10/01/52 | | |
West Virginia United Health System Obligated Group, Series 2020, 3.13%, 06/01/50 | | |
Willis-Knighton Medical Center | | |
Series 2018, 4.81%, 09/01/48 | | |
Series 2021, 3.07%, 03/01/51 | | |
Yale-New Haven Health Services Corp., Series 2020, 2.50%, 07/01/50 | | |
| | |
Holding Companies - Diversified — 0.1% |
Apollo Debt Solutions BDC | | |
| | |
| | |
| | |
| | |
| | |
| | |
| | |
| | |
| | |
| | |
| | |
Schedule of Investments (unaudited)(continued)October 31, 2024
iShares® Core U.S. Aggregate Bond ETF(Percentages shown are based on Net Assets)
| | |
Holding Companies - Diversified (continued) |
Ares Strategic Income Fund | | |
| | |
| | |
Bain Capital Specialty Finance Inc. | | |
| | |
| | |
| | |
| | |
| | |
Blackstone Private Credit Fund | | |
| | |
| | |
| | |
| | |
| | |
| | |
Blackstone Secured Lending Fund | | |
| | |
| | |
| | |
| | |
| | |
| | |
| | |
| | |
| | |
| | |
| | |
Blue Owl Capital Corp. II, 8.45%, 11/15/26 | | |
Blue Owl Capital Corp. III, 3.13%, 04/13/27 | | |
Blue Owl Credit Income Corp. | | |
| | |
| | |
| | |
| | |
| | |
| | |
| | |
| | |
Blue Owl Technology Finance Corp., 2.50%, 01/15/27 | | |
Blue Owl Technology Finance Corp. II, 6.75%, 04/04/29(b) | | |
Franklin BSP Capital Corp., 7.20%, 06/15/29(b) | | |
| | |
| | |
| | |
| | |
| | |
| | |
| | |
| | |
| | |
| | |
| | |
| | |
| | |
| | |
| | |
| | |
Holding Companies - Diversified (continued) |
Golub Capital Private Credit Fund, 5.80%, 09/12/29(b) | | |
HA Sustainable Infrastructure Capital Inc., 6.38%, 07/01/34(b) | | |
HPS Corporate Lending Fund | | |
| | |
| | |
Main Street Capital Corp. | | |
| | |
| | |
| | |
Morgan Stanley Direct Lending Fund | | |
| | |
| | |
New Mountain Finance Corp. | | |
| | |
| | |
Oaktree Specialty Lending Corp. | | |
| | |
| | |
| | |
| | |
| | |
| | |
Sixth Street Lending Partners | | |
| | |
| | |
Sixth Street Specialty Lending Inc. | | |
| | |
| | |
| | |
| | |
|
| | |
| | |
| | |
| | |
| | |
| | |
| | |
| | |
| | |
| | |
| | |
| | |
| | |
Meritage Homes Corp., 5.13%, 06/06/27 | | |
NVR Inc., 3.00%, 05/15/30 | | |
| | |
| | |
| | |
| | |
| | |
Toll Brothers Finance Corp. | | |
| | |
| | |
| | |
| | |
| | |
Schedule of Investments (unaudited)(continued)October 31, 2024
iShares® Core U.S. Aggregate Bond ETF(Percentages shown are based on Net Assets)
| | |
|
| | |
| | |
| | |
| | |
| | |
| | |
| | |
| | |
| | |
| | |
| | |
| | |
| | |
Household Products & Wares — 0.1% |
| | |
| | |
| | |
| | |
| | |
| | |
| | |
| | |
| | |
| | |
| | |
| | |
| | |
| | |
| | |
| | |
| | |
| | |
| | |
| | |
| | |
| | |
| | |
| | |
| | |
| | |
| | |
| | |
| | |
| | |
| | |
|
ACE Capital Trust II, Series N, 9.70%, 04/01/30 | | |
Aegon Ltd., 5.50%, 04/11/48, (6-mo. LIBOR US + 3.540%)(a) | | |
| | |
| | |
| | |
| | |
| | |
| | |
| | |
| | |
| | |
| | |
| | |
|
| | |
| | |
| | |
| | |
| | |
| | |
| | |
| | |
| | |
| | |
| | |
| | |
6.50%, 05/15/67, (3-mo. LIBOR US + 2.120%)(a) | | |
American Financial Group Inc./OH | | |
| | |
| | |
American International Group Inc. | | |
| | |
| | |
| | |
| | |
| | |
| | |
| | |
| | |
| | |
Series A-9, 5.75%, 04/01/48, (3-mo. LIBOR US + 2.868%)(a) | | |
American National Group Inc. | | |
| | |
| | |
| | |
| | |
| | |
| | |
| | |
| | |
Aon Corp./Aon Global Holdings PLC | | |
| | |
| | |
| | |
| | |
| | |
| | |
| | |
| | |
| | |
| | |
| | |
| | |
| | |
| | |
| | |
| | |
| | |
| | |
| | |
| | |
| | |
| | |
Schedule of Investments (unaudited)(continued)October 31, 2024
iShares® Core U.S. Aggregate Bond ETF(Percentages shown are based on Net Assets)
| | |
|
| | |
Arch Capital Group U.S. Inc., 5.14%, 11/01/43 | | |
| | |
| | |
| | |
| | |
| | |
| | |
| | |
| | |
| | |
| | |
| | |
| | |
| | |
| | |
Assured Guaranty U.S. Holdings Inc. | | |
| | |
| | |
| | |
| | |
| | |
| | |
| | |
| | |
| | |
| | |
| | |
6.63%, 10/15/54, (5-year CMT + 2.607%)(a) | | |
| | |
| | |
Axis Specialty Finance LLC | | |
| | |
4.90%, 01/15/40, (5-year CMT + 3.186%)(a) | | |
Axis Specialty Finance PLC, 4.00%, 12/06/27 | | |
Berkshire Hathaway Finance Corp. | | |
| | |
| | |
| | |
| | |
| | |
| | |
| | |
| | |
| | |
| | |
| | |
| | |
| | |
| | |
| | |
Brighthouse Financial Inc. | | |
| | |
| | |
| | |
| | |
| | |
| | |
| | |
| | |
| | |
| | |
|
| | |
| | |
| | |
Series 1, 6.50%, 05/15/38 | | |
| | |
| | |
| | |
| | |
| | |
| | |
| | |
| | |
| | |
| | |
Cincinnati Financial Corp. | | |
| | |
| | |
| | |
| | |
| | |
| | |
| | |
| | |
| | |
| | |
| | |
| | |
Corebridge Financial Inc. | | |
| | |
| | |
| | |
| | |
| | |
| | |
| | |
6.88%, 12/15/52, (5-year CMT + 3.846%)(a) | | |
Enstar Finance LLC, 5.50%, 01/15/42, (5-year CMT + 4.006%)(a) | | |
| | |
| | |
| | |
| | |
| | |
| | |
| | |
Essent Group Ltd., 6.25%, 07/01/29 | | |
Everest Reinsurance Holdings Inc. | | |
| | |
| | |
| | |
F&G Annuities & Life Inc. | | |
| | |
| | |
| | |
Fairfax Financial Holdings Ltd. | | |
| | |
| | |
| | |
| | |
| | |
| | |
Schedule of Investments (unaudited)(continued)October 31, 2024
iShares® Core U.S. Aggregate Bond ETF(Percentages shown are based on Net Assets)
| | |
|
| | |
Fidelity National Financial Inc. | | |
| | |
| | |
| | |
| | |
First American Financial Corp. | | |
| | |
| | |
| | |
| | |
| | |
| | |
| | |
| | |
Hanover Insurance Group Inc. (The) | | |
| | |
| | |
Hartford Financial Services Group Inc. (The) | | |
| | |
| | |
| | |
| | |
| | |
| | |
| | |
Horace Mann Educators Corp., 7.25%, 09/15/28 | | |
| | |
| | |
| | |
| | |
| | |
| | |
| | |
| | |
| | |
| | |
| | |
| | |
| | |
| | |
| | |
| | |
| | |
| | |
| | |
| | |
| | |
| | |
| | |
| | |
| | |
| | |
| | |
4.06%, 02/24/32, (5-year USD ICE Swap + 1.647%)(a) | | |
| | |
| | |
| | |
| | |
| | |
|
| | |
| | |
| | |
| | |
| | |
| | |
| | |
Marsh & McLennan Companies Inc. | | |
| | |
| | |
| | |
| | |
| | |
| | |
| | |
| | |
| | |
| | |
| | |
| | |
| | |
| | |
| | |
| | |
| | |
| | |
| | |
| | |
| | |
| | |
| | |
Mercury General Corp., 4.40%, 03/15/27 | | |
| | |
| | |
| | |
| | |
| | |
| | |
| | |
| | |
| | |
| | |
| | |
| | |
| | |
| | |
| | |
| | |
| | |
| | |
MGIC Investment Corp., 5.25%, 08/15/28 | | |
Munich Re America Corp., Series B, 7.45%, 12/15/26 | | |
Nationwide Financial Services Inc., 6.75%, 05/15/87 | | |
NMI Holdings Inc., 6.00%, 08/15/29 | | |
Old Republic International Corp. | | |
| | |
| | |
| | |
Schedule of Investments (unaudited)(continued)October 31, 2024
iShares® Core U.S. Aggregate Bond ETF(Percentages shown are based on Net Assets)
| | |
|
| | |
| | |
4.50%, 10/01/50, (5-year CMT + 3.815%)(a) | | |
Primerica Inc., 2.80%, 11/19/31 | | |
Principal Financial Group Inc. | | |
| | |
| | |
| | |
| | |
| | |
| | |
| | |
| | |
| | |
| | |
| | |
| | |
| | |
| | |
| | |
| | |
| | |
| | |
| | |
| | |
| | |
| | |
| | |
| | |
Prudential Financial Inc. | | |
| | |
| | |
| | |
3.70%, 10/01/50, (5-year CMT + 3.035%)(a) | | |
| | |
| | |
| | |
| | |
| | |
| | |
4.50%, 09/15/47, (3-mo. LIBOR US + 2.380%)(a)(c) | | |
| | |
5.13%, 03/01/52, (5-year CMT + 3.162%)(a) | | |
| | |
5.70%, 09/15/48, (3-mo. LIBOR US + 2.665%)(a) | | |
| | |
6.00%, 09/01/52, (5-year CMT + 3.234%)(a) | | |
6.50%, 03/15/54, (5-year CMT + 2.404%)(a) | | |
| | |
| | |
6.75%, 03/01/53, (5-year CMT + 2.848%)(a) | | |
Prudential Funding Asia PLC | | |
| | |
| | |
Reinsurance Group of America Inc. | | |
| | |
| | |
| | |
| | |
| | |
|
| | |
RenaissanceRe Finance Inc., 3.45%, 07/01/27 | | |
RenaissanceRe Holdings Ltd. | | |
| | |
| | |
Selective Insurance Group Inc., 5.38%, 03/01/49 | | |
SiriusPoint Ltd., 7.00%, 04/05/29 | | |
Stewart Information Services Corp., 3.60%, 11/15/31 | | |
Transatlantic Holdings Inc., 8.00%, 11/30/39 | | |
Travelers Companies Inc. (The) | | |
| | |
| | |
| | |
| | |
| | |
| | |
| | |
| | |
| | |
| | |
| | |
| | |
Travelers Property Casualty Corp., 6.38%, 03/15/33 | | |
Trinity Acquisition PLC, 4.40%, 03/15/26 | | |
| | |
| | |
| | |
| | |
| | |
| | |
| | |
| | |
| | |
| | |
| | |
Willis North America Inc. | | |
| | |
| | |
| | |
| | |
| | |
| | |
| | |
XL Group Ltd., 5.25%, 12/15/43 | | |
| | |
|
Alibaba Group Holding Ltd. | | |
| | |
| | |
| | |
| | |
| | |
| | |
| | |
| | |
| | |
Schedule of Investments (unaudited)(continued)October 31, 2024
iShares® Core U.S. Aggregate Bond ETF(Percentages shown are based on Net Assets)
| | |
|
| | |
| | |
| | |
| | |
| | |
| | |
| | |
| | |
| | |
| | |
| | |
| | |
| | |
| | |
| | |
| | |
| | |
| | |
| | |
| | |
| | |
| | |
| | |
| | |
| | |
| | |
| | |
Tencent Music Entertainment Group, 2.00%, 09/03/30 | | |
| | |
| | |
| | |
| | |
| | |
| | |
| | |
Weibo Corp., 3.38%, 07/08/30(c) | | |
| | |
|
| | |
| | |
| | |
| | |
| | |
| | |
| | |
| | |
| | |
| | |
| | |
| | |
| | |
| | |
| | |
| | |
| | |
| | |
| | |
Reliance Inc., 2.15%, 08/15/30 | | |
| | |
| | |
Schedule of Investments (unaudited)(continued)October 31, 2024
iShares® Core U.S. Aggregate Bond ETF(Percentages shown are based on Net Assets)
| | |
|
| | |
| | |
| | |
| | |
| | |
| | |
| | |
| | |
| | |
| | |
| | |
| | |
| | |
| | |
|
| | |
| | |
| | |
| | |
Brunswick Corp./DE, 5.85%, 03/18/29(c) | | |
Harley-Davidson Inc., 4.63%, 07/28/45(c) | | |
Polaris Inc., 6.95%, 03/15/29 | | |
| | |
|
Choice Hotels International Inc. | | |
| | |
| | |
| | |
| | |
| | |
| | |
| | |
| | |
| | |
| | |
| | |
| | |
| | |
| | |
| | |
| | |
Marriott International Inc./MD | | |
| | |
| | |
| | |
| | |
| | |
| | |
| | |
Series AA, 4.65%, 12/01/28 | | |
Series FF, 4.63%, 06/15/30 | | |
Series GG, 3.50%, 10/15/32 | | |
Series HH, 2.85%, 04/15/31 | | |
Series II, 2.75%, 10/15/33 | | |
Series R, 3.13%, 06/15/26 | | |
Series X, 4.00%, 04/15/28 | | |
| | |
| | |
| | |
| | |
| | |
|
| | |
| | |
| | |
| | |
|
| | |
| | |
| | |
| | |
| | |
| | |
Caterpillar Financial Services Corp. | | |
| | |
| | |
| | |
| | |
| | |
| | |
| | |
| | |
| | |
| | |
| | |
| | |
| | |
| | |
| | |
| | |
| | |
| | |
| | |
| | |
| | |
| | |
| | |
| | |
| | |
| | |
| | |
| | |
CNH Industrial Capital LLC | | |
| | |
| | |
| | |
| | |
| | |
| | |
CNH Industrial NV, 3.85%, 11/15/27 | | |
| | |
| | |
| | |
| | |
| | |
| | |
| | |
| | |
| | |
| | |
| | |
| | |
Schedule of Investments (unaudited)(continued)October 31, 2024
iShares® Core U.S. Aggregate Bond ETF(Percentages shown are based on Net Assets)
| | |
|
| | |
| | |
| | |
| | |
| | |
| | |
| | |
| | |
| | |
| | |
| | |
| | |
| | |
| | |
| | |
| | |
| | |
| | |
| | |
| | |
| | |
| | |
| | |
| | |
| | |
| | |
| | |
| | |
| | |
| | |
| | |
| | |
| | |
| | |
| | |
| | |
| | |
| | |
| | |
| | |
| | |
| | |
| | |
| | |
| | |
| | |
| | |
| | |
| | |
| | |
| | |
| | |
| | |
| | |
| | |
Series 1, 5.05%, 06/12/34 | | |
| | |
| | |
| | |
| | |
| | |
|
| | |
| | |
| | |
| | |
| | |
| | |
| | |
| | |
| | |
| | |
| | |
| | |
| | |
| | |
| | |
| | |
| | |
| | |
Westinghouse Air Brake Technologies Corp. | | |
| | |
| | |
| | |
| | |
| | |
| | |
| | |
| | |
| | |
|
| | |
| | |
| | |
| | |
| | |
| | |
| | |
| | |
| | |
| | |
| | |
| | |
| | |
| | |
| | |
| | |
| | |
| | |
| | |
| | |
| | |
| | |
| | |
| | |
| | |
| | |
| | |
| | |
| | |
| | |
| | |
| | |
Schedule of Investments (unaudited)(continued)October 31, 2024
iShares® Core U.S. Aggregate Bond ETF(Percentages shown are based on Net Assets)
| | |
Manufacturing (continued) |
| | |
| | |
| | |
| | |
| | |
| | |
| | |
| | |
| | |
| | |
| | |
Teledyne Technologies Inc. | | |
| | |
| | |
| | |
| | |
| | |
| | |
| | |
| | |
| | |
| | |
| | |
| | |
|
Charter Communications Operating LLC/Charter Communications Operating Capital | | |
| | |
| | |
| | |
| | |
| | |
| | |
| | |
| | |
| | |
| | |
| | |
| | |
| | |
| | |
| | |
| | |
| | |
| | |
| | |
| | |
| | |
| | |
| | |
| | |
| | |
| | |
| | |
| | |
| | |
| | |
| | |
| | |
| | |
| | |
|
| | |
| | |
| | |
| | |
| | |
| | |
| | |
| | |
| | |
| | |
| | |
| | |
| | |
| | |
| | |
| | |
| | |
| | |
| | |
| | |
| | |
| | |
| | |
| | |
| | |
| | |
| | |
| | |
| | |
| | |
| | |
| | |
| | |
| | |
| | |
| | |
| | |
| | |
| | |
| | |
| | |
| | |
| | |
| | |
| | |
| | |
| | |
| | |
| | |
| | |
Discovery Communications LLC | | |
| | |
| | |
| | |
| | |
| | |
| | |
| | |
| | |
| | |
Schedule of Investments (unaudited)(continued)October 31, 2024
iShares® Core U.S. Aggregate Bond ETF(Percentages shown are based on Net Assets)
| | |
|
FactSet Research Systems Inc. | | |
| | |
| | |
| | |
| | |
| | |
| | |
| | |
| | |
| | |
| | |
| | |
| | |
| | |
| | |
| | |
| | |
| | |
| | |
| | |
| | |
| | |
| | |
| | |
| | |
| | |
| | |
| | |
| | |
| | |
| | |
| | |
| | |
| | |
| | |
| | |
| | |
| | |
| | |
| | |
| | |
| | |
| | |
| | |
| | |
Time Warner Cable Enterprises LLC, 8.38%, 07/15/33 | | |
| | |
| | |
| | |
| | |
| | |
| | |
| | |
TWDC Enterprises 18 Corp. | | |
| | |
| | |
| | |
| | |
| | |
| | |
| | |
|
| | |
Series B, 7.00%, 03/01/32 | | |
Series E, 4.13%, 12/01/41 | | |
| | |
| | |
| | |
| | |
| | |
| | |
| | |
| | |
| | |
| | |
| | |
| | |
| | |
| | |
| | |
| | |
| | |
| | |
| | |
| | |
| | |
| | |
| | |
| | |
| | |
| | |
Metal Fabricate & Hardware — 0.0% |
Precision Castparts Corp. | | |
| | |
| | |
| | |
| | |
| | |
| | |
| | |
| | |
| | |
|
AngloGold Ashanti Holdings PLC | | |
| | |
| | |
| | |
| | |
| | |
Barrick North America Finance LLC | | |
| | |
| | |
Barrick PD Australia Finance Pty. Ltd., 5.95%, 10/15/39 | | |
BHP Billiton Finance USA Ltd. | | |
| | |
| | |
| | |
| | |
| | |
| | |
| | |
Schedule of Investments (unaudited)(continued)October 31, 2024
iShares® Core U.S. Aggregate Bond ETF(Percentages shown are based on Net Assets)
| | |
|
| | |
| | |
| | |
| | |
| | |
| | |
| | |
| | |
| | |
| | |
| | |
| | |
| | |
| | |
| | |
| | |
| | |
| | |
| | |
| | |
| | |
| | |
| | |
| | |
Newmont Corp./Newcrest Finance Pty. Ltd. | | |
| | |
| | |
| | |
| | |
| | |
| | |
| | |
| | |
| | |
Rio Tinto Finance USA Ltd. | | |
| | |
| | |
| | |
Rio Tinto Finance USA PLC | | |
| | |
| | |
| | |
| | |
| | |
| | |
| | |
| | |
| | |
Yamana Gold Inc., 2.63%, 08/15/31 | | |
| | |
|
African Development Bank, 4.13%, 02/25/27 | | |
Asian Infrastructure Investment Bank (The), 4.13%, 01/18/29 | | |
International Bank for Reconstruction & Development | | |
| | |
| | |
| | |
| | |
| | |
Office & Business Equipment — 0.0% |
CDW LLC/CDW Finance Corp. | | |
| | |
| | |
| | |
| | |
| | |
| | |
| | |
| | |
|
| | |
| | |
| | |
| | |
| | |
| | |
| | |
| | |
BP Capital Markets America Inc. | | |
| | |
| | |
| | |
| | |
| | |
| | |
| | |
| | |
| | |
| | |
| | |
| | |
| | |
| | |
| | |
| | |
| | |
| | |
| | |
| | |
| | |
| | |
| | |
| | |
| | |
| | |
| | |
| | |
| | |
| | |
Canadian Natural Resources Ltd. | | |
| | |
| | |
| | |
| | |
| | |
| | |
| | |
| | |
| | |
| | |
| | |
Schedule of Investments (unaudited)(continued)October 31, 2024
iShares® Core U.S. Aggregate Bond ETF(Percentages shown are based on Net Assets)
| | |
|
| | |
| | |
| | |
| | |
| | |
| | |
| | |
| | |
| | |
| | |
| | |
| | |
| | |
| | |
| | |
| | |
| | |
| | |
| | |
| | |
| | |
| | |
CNOOC Finance 2015 Australia Pty. Ltd., 4.20%, 05/05/45 | | |
CNOOC Finance 2015 USA LLC, 4.38%, 05/02/28 | | |
CNOOC Petroleum North America ULC, 7.88%, 03/15/32 | | |
Conoco Funding Co., 7.25%, 10/15/31 | | |
| | |
| | |
| | |
| | |
| | |
| | |
| | |
| | |
| | |
| | |
| | |
| | |
| | |
| | |
| | |
Continental Resources Inc./OK | | |
| | |
| | |
| | |
| | |
| | |
| | |
| | |
| | |
| | |
| | |
| | |
| | |
| | |
| | |
| | |
| | |
| | |
|
| | |
| | |
| | |
| | |
| | |
| | |
| | |
| | |
| | |
| | |
| | |
| | |
| | |
| | |
| | |
Eni USA Inc., 7.30%, 11/15/27 | | |
| | |
| | |
| | |
| | |
| | |
| | |
| | |
| | |
| | |
| | |
| | |
| | |
| | |
| | |
| | |
| | |
| | |
| | |
| | |
| | |
| | |
| | |
| | |
| | |
| | |
| | |
| | |
| | |
| | |
| | |
| | |
| | |
| | |
| | |
| | |
| | |
| | |
| | |
| | |
| | |
| | |
| | |
| | |
| | |
| | |
Schedule of Investments (unaudited)(continued)October 31, 2024
iShares® Core U.S. Aggregate Bond ETF(Percentages shown are based on Net Assets)
| | |
|
| | |
| | |
| | |
| | |
| | |
| | |
| | |
| | |
| | |
| | |
| | |
| | |
| | |
| | |
| | |
| | |
| | |
| | |
| | |
| | |
| | |
| | |
| | |
| | |
| | |
| | |
| | |
| | |
| | |
Occidental Petroleum Corp. | | |
| | |
| | |
| | |
| | |
| | |
| | |
| | |
| | |
| | |
| | |
| | |
| | |
| | |
| | |
| | |
| | |
| | |
| | |
| | |
| | |
| | |
| | |
| | |
| | |
| | |
| | |
| | |
| | |
| | |
| | |
| | |
| | |
|
Patterson-UTI Energy Inc. | | |
| | |
| | |
| | |
| | |
| | |
| | |
| | |
| | |
| | |
| | |
| | |
| | |
| | |
| | |
| | |
| | |
| | |
| | |
| | |
| | |
| | |
| | |
| | |
Pioneer Natural Resources Co. | | |
| | |
| | |
| | |
| | |
| | |
| | |
| | |
| | |
| | |
| | |
| | |
| | |
| | |
Shell International Finance BV | | |
| | |
| | |
| | |
| | |
| | |
| | |
| | |
| | |
| | |
| | |
| | |
| | |
| | |
| | |
| | |
| | |
| | |
Tosco Corp., 8.13%, 02/15/30 | | |
TotalEnergies Capital International SA | | |
| | |
| | |
| | |
Schedule of Investments (unaudited)(continued)October 31, 2024
iShares® Core U.S. Aggregate Bond ETF(Percentages shown are based on Net Assets)
| | |
|
| | |
| | |
| | |
| | |
| | |
| | |
| | |
| | |
| | |
| | |
| | |
| | |
| | |
| | |
| | |
| | |
| | |
| | |
| | |
| | |
| | |
| | |
| | |
| | |
| | |
| | |
Oil & Gas Services — 0.1% |
Baker Hughes Holdings LLC, 5.13%, 09/15/40 | | |
Baker Hughes Holdings LLC/Baker Hughes Co-Obligor Inc. | | |
| | |
| | |
| | |
| | |
| | |
| | |
| | |
| | |
| | |
| | |
| | |
| | |
| | |
| | |
| | |
| | |
| | |
Schlumberger Investment SA | | |
| | |
| | |
| | |
| | |
| | |
Packaging & Containers — 0.1% |
| | |
| | |
| | |
| | |
Amcor Flexibles North America Inc. | | |
| | |
| | |
Packaging & Containers (continued) |
| | |
Amcor Group Finance PLC, 5.45%, 05/23/29 | | |
AptarGroup Inc., 3.60%, 03/15/32 | | |
| | |
| | |
| | |
| | |
| | |
| | |
Packaging Corp. of America | | |
| | |
| | |
| | |
| | |
| | |
Smurfit Kappa Treasury ULC | | |
| | |
| | |
| | |
| | |
| | |
| | |
| | |
| | |
| | |
| | |
| | |
| | |
| | |
| | |
| | |
| | |
| | |
| | |
| | |
| | |
| | |
| | |
| | |
|
| | |
| | |
| | |
| | |
| | |
| | |
| | |
| | |
| | |
| | |
| | |
| | |
| | |
| | |
| | |
| | |
| | |
| | |
| | |
| | |
| | |
Schedule of Investments (unaudited)(continued)October 31, 2024
iShares® Core U.S. Aggregate Bond ETF(Percentages shown are based on Net Assets)
| | |
Pharmaceuticals (continued) |
| | |
| | |
| | |
| | |
| | |
| | |
| | |
| | |
| | |
| | |
| | |
| | |
| | |
| | |
| | |
| | |
| | |
| | |
| | |
| | |
| | |
| | |
| | |
| | |
| | |
| | |
| | |
| | |
| | |
| | |
| | |
| | |
| | |
| | |
| | |
| | |
| | |
| | |
| | |
| | |
| | |
| | |
| | |
| | |
| | |
| | |
| | |
| | |
| | |
| | |
| | |
| | |
| | |
| | |
| | |
| | |
| | |
| | |
| | |
| | |
| | |
| | |
Pharmaceuticals (continued) |
| | |
| | |
| | |
| | |
| | |
| | |
| | |
| | |
| | |
| | |
| | |
| | |
| | |
| | |
| | |
| | |
| | |
| | |
| | |
| | |
| | |
| | |
| | |
| | |
| | |
| | |
| | |
| | |
| | |
| | |
| | |
| | |
| | |
| | |
| | |
| | |
| | |
| | |
| | |
| | |
| | |
| | |
| | |
| | |
| | |
| | |
| | |
| | |
| | |
| | |
| | |
| | |
| | |
| | |
| | |
| | |
| | |
| | |
| | |
| | |
| | |
Schedule of Investments (unaudited)(continued)October 31, 2024
iShares® Core U.S. Aggregate Bond ETF(Percentages shown are based on Net Assets)
| | |
Pharmaceuticals (continued) |
| | |
| | |
| | |
| | |
| | |
| | |
| | |
| | |
| | |
| | |
| | |
| | |
| | |
| | |
| | |
| | |
| | |
| | |
| | |
| | |
| | |
| | |
| | |
| | |
| | |
| | |
GlaxoSmithKline Capital Inc. | | |
| | |
| | |
| | |
| | |
GlaxoSmithKline Capital PLC, 3.38%, 06/01/29 | | |
| | |
| | |
| | |
| | |
| | |
| | |
| | |
| | |
| | |
| | |
| | |
| | |
| | |
| | |
| | |
| | |
| | |
| | |
| | |
| | |
| | |
| | |
| | |
| | |
| | |
| | |
| | |
| | |
Pharmaceuticals (continued) |
| | |
| | |
| | |
| | |
| | |
| | |
| | |
Mead Johnson Nutrition Co. | | |
| | |
| | |
| | |
| | |
| | |
| | |
| | |
| | |
| | |
| | |
| | |
| | |
| | |
| | |
| | |
| | |
| | |
| | |
| | |
| | |
| | |
| | |
| | |
| | |
| | |
| | |
| | |
Merck Sharp & Dohme Corp. | | |
| | |
| | |
| | |
| | |
| | |
| | |
| | |
| | |
| | |
| | |
| | |
| | |
| | |
| | |
| | |
| | |
| | |
| | |
| | |
| | |
| | |
| | |
| | |
| | |
| | |
Schedule of Investments (unaudited)(continued)October 31, 2024
iShares® Core U.S. Aggregate Bond ETF(Percentages shown are based on Net Assets)
| | |
Pharmaceuticals (continued) |
| | |
| | |
| | |
| | |
| | |
| | |
| | |
| | |
| | |
| | |
| | |
| | |
| | |
| | |
Pfizer Investment Enterprises Pte Ltd. | | |
| | |
| | |
| | |
| | |
| | |
| | |
| | |
Pharmacia LLC, 6.60%, 12/01/28 | | |
Sanofi SA, 3.63%, 06/19/28 | | |
Shire Acquisitions Investments Ireland DAC, 3.20%, 09/23/26 | | |
Takeda Pharmaceutical Co. Ltd. | | |
| | |
| | |
| | |
| | |
| | |
| | |
| | |
| | |
| | |
Utah Acquisition Sub Inc. | | |
| | |
| | |
| | |
| | |
| | |
| | |
| | |
| | |
| | |
| | |
| | |
| | |
| | |
| | |
| | |
| | |
| | |
| | |
| | |
| | |
| | |
| | |
| | |
| | |
|
| | |
| | |
| | |
| | |
| | |
| | |
| | |
Cheniere Corpus Christi Holdings LLC | | |
| | |
| | |
| | |
| | |
| | |
| | |
Cheniere Energy Partners LP | | |
| | |
| | |
| | |
| | |
| | |
Columbia Pipeline Group Inc., 5.80%, 06/01/45 | | |
DCP Midstream Operating LP | | |
| | |
| | |
| | |
| | |
| | |
Eastern Energy Gas Holdings LLC, 5.65%, 10/15/54 | | |
Eastern Gas Transmission & Storage Inc. | | |
| | |
| | |
| | |
Enbridge Energy Partners LP | | |
| | |
| | |
Series B, 7.50%, 04/15/38 | | |
| | |
| | |
| | |
| | |
| | |
| | |
| | |
| | |
| | |
| | |
| | |
| | |
| | |
| | |
| | |
| | |
| | |
| | |
| | |
7.20%, 06/27/54, (5-year CMT + 2.970%)(a) | | |
7.38%, 03/15/55, (5-year CMT + 3.122%)(a) | | |
| | |
| | |
Schedule of Investments (unaudited)(continued)October 31, 2024
iShares® Core U.S. Aggregate Bond ETF(Percentages shown are based on Net Assets)
| | |
|
| | |
| | |
| | |
| | |
| | |
| | |
| | |
| | |
| | |
| | |
| | |
| | |
| | |
| | |
| | |
| | |
| | |
| | |
| | |
| | |
| | |
| | |
| | |
| | |
| | |
| | |
| | |
| | |
| | |
| | |
| | |
| | |
| | |
| | |
| | |
| | |
| | |
| | |
| | |
| | |
| | |
Series 20Y, 5.80%, 06/15/38 | | |
| | |
| | |
| | |
EnLink Midstream Partners LP | | |
| | |
| | |
| | |
| | |
Enterprise Products Operating LLC | | |
| | |
| | |
| | |
| | |
| | |
| | |
| | |
| | |
| | |
| | |
| | |
|
| | |
| | |
| | |
| | |
| | |
| | |
| | |
| | |
| | |
| | |
| | |
| | |
| | |
5.38%, 02/15/78, (3-mo. CME Term SOFR + 2.832%)(a) | | |
| | |
| | |
| | |
| | |
| | |
| | |
Series D, 6.88%, 03/01/33 | | |
Series E, 5.25%, 08/16/77, (3-mo. CME Term SOFR + 3.295%)(a) | | |
Series H, 6.65%, 10/15/34 | | |
Kinder Morgan Energy Partners LP | | |
| | |
| | |
| | |
| | |
| | |
| | |
| | |
| | |
| | |
| | |
| | |
| | |
| | |
| | |
| | |
| | |
| | |
| | |
| | |
| | |
| | |
| | |
| | |
| | |
| | |
| | |
| | |
| | |
| | |
| | |
| | |
| | |
| | |
| | |
| | |
Schedule of Investments (unaudited)(continued)October 31, 2024
iShares® Core U.S. Aggregate Bond ETF(Percentages shown are based on Net Assets)
| | |
|
| | |
| | |
| | |
| | |
| | |
| | |
| | |
| | |
| | |
| | |
| | |
| | |
| | |
| | |
| | |
| | |
| | |
| | |
Northwest Pipeline LLC, 4.00%, 04/01/27 | | |
| | |
| | |
| | |
| | |
| | |
| | |
| | |
| | |
| | |
| | |
| | |
| | |
| | |
| | |
| | |
| | |
| | |
| | |
| | |
| | |
| | |
| | |
| | |
| | |
| | |
| | |
| | |
| | |
| | |
| | |
| | |
| | |
| | |
| | |
| | |
| | |
| | |
| | |
Plains All American Pipeline LP/PAA Finance Corp. | | |
| | |
| | |
| | |
|
| | |
| | |
| | |
| | |
| | |
| | |
| | |
Sabine Pass Liquefaction LLC | | |
| | |
| | |
| | |
| | |
| | |
South Bow USA Infrastructure Holdings LLC | | |
| | |
| | |
| | |
| | |
Spectra Energy Partners LP | | |
| | |
| | |
| | |
| | |
| | |
| | |
| | |
| | |
| | |
| | |
| | |
| | |
| | |
Targa Resources Partners LP/Targa Resources Partners Finance Corp. | | |
| | |
| | |
| | |
| | |
| | |
| | |
TC PipeLines LP, 3.90%, 05/25/27 | | |
Tennessee Gas Pipeline Co. LLC | | |
| | |
| | |
| | |
Texas Eastern Transmission LP, 7.00%, 07/15/32 | | |
TransCanada PipeLines Ltd. | | |
| | |
| | |
| | |
| | |
| | |
| | |
| | |
| | |
| | |
| | |
| | |
Transcontinental Gas Pipe Line Co. LLC | | |
| | |
Schedule of Investments (unaudited)(continued)October 31, 2024
iShares® Core U.S. Aggregate Bond ETF(Percentages shown are based on Net Assets)
| | |
|
| | |
| | |
| | |
| | |
| | |
| | |
Valero Energy Partners LP, 4.50%, 03/15/28 | | |
Western Midstream Operating LP | | |
| | |
| | |
| | |
| | |
| | |
| | |
| | |
| | |
| | |
| | |
| | |
Williams Companies Inc. (The) | | |
| | |
| | |
| | |
| | |
| | |
| | |
| | |
| | |
| | |
| | |
| | |
| | |
| | |
| | |
| | |
| | |
| | |
| | |
| | |
| | |
| | |
Series A, 7.50%, 01/15/31 | | |
| | |
|
| | |
| | |
| | |
| | |
| | |
Jones Lang LaSalle Inc., 6.88%, 12/01/28 | | |
| | |
Real Estate Investment Trusts — 1.0% |
| | |
| | |
| | |
| | |
| | |
| | |
Alexandria Real Estate Equities Inc. | | |
| | |
| | |
Real Estate Investment Trusts (continued) |
| | |
| | |
| | |
| | |
| | |
| | |
| | |
| | |
| | |
| | |
| | |
| | |
| | |
| | |
| | |
| | |
| | |
| | |
| | |
| | |
| | |
| | |
| | |
| | |
| | |
| | |
| | |
| | |
| | |
| | |
| | |
| | |
| | |
| | |
| | |
| | |
| | |
| | |
| | |
| | |
| | |
| | |
| | |
| | |
| | |
| | |
| | |
| | |
| | |
| | |
| | |
| | |
| | |
| | |
| | |
| | |
| | |
| | |
| | |
| | |
| | |
Schedule of Investments (unaudited)(continued)October 31, 2024
iShares® Core U.S. Aggregate Bond ETF(Percentages shown are based on Net Assets)
| | |
Real Estate Investment Trusts (continued) |
Americold Realty Operating Partnership LP, 5.41%, 09/12/34 | | |
AvalonBay Communities Inc. | | |
| | |
| | |
| | |
| | |
| | |
| | |
| | |
| | |
| | |
| | |
| | |
| | |
| | |
| | |
| | |
| | |
| | |
| | |
| | |
| | |
| | |
| | |
| | |
| | |
| | |
| | |
| | |
| | |
Brixmor Operating Partnership LP | | |
| | |
| | |
| | |
| | |
| | |
| | |
| | |
| | |
Broadstone Net Lease LLC, 2.60%, 09/15/31 | | |
| | |
| | |
| | |
| | |
| | |
| | |
| | |
COPT Defense Properties LP | | |
| | |
| | |
| | |
| | |
Cousins Properties LP, 5.88%, 10/01/34 | | |
| | |
| | |
| | |
| | |
| | |
| | |
| | |
| | |
Real Estate Investment Trusts (continued) |
| | |
| | |
| | |
| | |
| | |
| | |
| | |
| | |
| | |
| | |
| | |
| | |
| | |
| | |
| | |
| | |
| | |
| | |
| | |
| | |
| | |
| | |
| | |
| | |
| | |
| | |
| | |
| | |
| | |
| | |
| | |
| | |
| | |
| | |
| | |
| | |
| | |
| | |
| | |
| | |
| | |
| | |
| | |
Equinix Europe 2 Financing Corp. LLC, 5.50%, 06/15/34 | | |
| | |
| | |
| | |
| | |
| | |
| | |
| | |
| | |
| | |
| | |
| | |
| | |
| | |
| | |
| | |
| | |
Schedule of Investments (unaudited)(continued)October 31, 2024
iShares® Core U.S. Aggregate Bond ETF(Percentages shown are based on Net Assets)
| | |
Real Estate Investment Trusts (continued) |
| | |
| | |
| | |
| | |
| | |
| | |
| | |
| | |
| | |
Essential Properties LP, 2.95%, 07/15/31 | | |
| | |
| | |
| | |
| | |
| | |
| | |
| | |
| | |
| | |
| | |
| | |
| | |
| | |
| | |
| | |
| | |
| | |
| | |
| | |
| | |
| | |
| | |
| | |
| | |
| | |
| | |
| | |
| | |
| | |
| | |
| | |
| | |
| | |
GLP Capital LP/GLP Financing II Inc. | | |
| | |
| | |
| | |
| | |
| | |
| | |
| | |
| | |
| | |
Healthcare Realty Holdings LP | | |
| | |
| | |
| | |
| | |
| | |
| | |
| | |
| | |
Real Estate Investment Trusts (continued) |
| | |
| | |
| | |
| | |
| | |
| | |
| | |
| | |
| | |
| | |
| | |
| | |
| | |
| | |
| | |
| | |
Series F, 4.50%, 02/01/26 | | |
Series H, 3.38%, 12/15/29 | | |
Series I, 3.50%, 09/15/30 | | |
Series J, 2.90%, 12/15/31 | | |
Invitation Homes Operating Partnership LP | | |
| | |
| | |
| | |
| | |
| | |
| | |
| | |
| | |
| | |
| | |
| | |
| | |
| | |
| | |
| | |
| | |
| | |
| | |
| | |
| | |
| | |
| | |
| | |
| | |
| | |
| | |
| | |
| | |
| | |
| | |
| | |
| | |
Kite Realty Group Trust, 4.75%, 09/15/30 | | |
| | |
| | |
| | |
| | |
Mid-America Apartments LP | | |
| | |
| | |
Schedule of Investments (unaudited)(continued)October 31, 2024
iShares® Core U.S. Aggregate Bond ETF(Percentages shown are based on Net Assets)
| | |
Real Estate Investment Trusts (continued) |
| | |
| | |
| | |
| | |
| | |
| | |
| | |
| | |
National Health Investors Inc., 3.00%, 02/01/31 | | |
| | |
| | |
| | |
| | |
| | |
| | |
| | |
| | |
| | |
| | |
| | |
| | |
Omega Healthcare Investors Inc. | | |
| | |
| | |
| | |
| | |
| | |
| | |
Phillips Edison Grocery Center Operating Partnership I LP | | |
| | |
| | |
| | |
Piedmont Operating Partnership LP | | |
| | |
| | |
| | |
| | |
| | |
| | |
| | |
| | |
| | |
| | |
| | |
| | |
| | |
| | |
| | |
| | |
| | |
| | |
| | |
| | |
| | |
| | |
| | |
| | |
| | |
| | |
| | |
Real Estate Investment Trusts (continued) |
| | |
| | |
| | |
| | |
| | |
Public Storage Operating Co. | | |
| | |
| | |
| | |
| | |
| | |
| | |
| | |
| | |
| | |
| | |
| | |
Rayonier LP, 2.75%, 05/17/31 | | |
| | |
| | |
| | |
| | |
| | |
| | |
| | |
| | |
| | |
| | |
| | |
| | |
| | |
| | |
| | |
| | |
| | |
| | |
| | |
| | |
| | |
| | |
| | |
| | |
| | |
| | |
| | |
| | |
| | |
| | |
| | |
| | |
| | |
| | |
| | |
| | |
| | |
| | |
Retail Opportunity Investments Partnership LP, 6.75%, 10/15/28 | | |
Rexford Industrial Realty LP | | |
| | |
| | |
Schedule of Investments (unaudited)(continued)October 31, 2024
iShares® Core U.S. Aggregate Bond ETF(Percentages shown are based on Net Assets)
| | |
Real Estate Investment Trusts (continued) |
| | |
| | |
| | |
| | |
| | |
| | |
| | |
| | |
| | |
| | |
| | |
| | |
| | |
| | |
| | |
| | |
| | |
| | |
| | |
| | |
| | |
| | |
| | |
| | |
| | |
| | |
| | |
| | |
| | |
| | |
| | |
| | |
| | |
| | |
| | |
| | |
| | |
Sun Communities Operating LP | | |
| | |
| | |
| | |
| | |
| | |
| | |
| | |
| | |
| | |
| | |
| | |
| | |
| | |
| | |
| | |
| | |
| | |
| | |
| | |
| | |
| | |
| | |
| | |
| | |
Real Estate Investment Trusts (continued) |
| | |
| | |
| | |
| | |
| | |
| | |
| | |
| | |
| | |
| | |
| | |
| | |
| | |
| | |
| | |
| | |
| | |
| | |
| | |
| | |
| | |
| | |
| | |
| | |
| | |
| | |
| | |
| | |
| | |
| | |
| | |
| | |
| | |
| | |
| | |
| | |
| | |
| | |
| | |
| | |
| | |
| | |
| | |
| | |
| | |
| | |
| | |
| | |
|
| | |
| | |
| | |
| | |
| | |
| | |
| | |
| | |
| | |
| | |
| | |
| | |
Schedule of Investments (unaudited)(continued)October 31, 2024
iShares® Core U.S. Aggregate Bond ETF(Percentages shown are based on Net Assets)
| | |
|
| | |
| | |
| | |
| | |
| | |
| | |
| | |
| | |
| | |
| | |
| | |
| | |
| | |
| | |
| | |
| | |
| | |
| | |
| | |
| | |
| | |
| | |
| | |
Dick's Sporting Goods Inc. | | |
| | |
| | |
| | |
| | |
| | |
| | |
| | |
| | |
| | |
| | |
| | |
| | |
| | |
| | |
| | |
| | |
| | |
| | |
| | |
| | |
| | |
| | |
| | |
| | |
| | |
| | |
| | |
| | |
| | |
| | |
| | |
| | |
| | |
| | |
| | |
| | |
| | |
Schedule of Investments (unaudited)(continued)October 31, 2024
iShares® Core U.S. Aggregate Bond ETF(Percentages shown are based on Net Assets)
| | |
|
| | |
| | |
| | |
| | |
| | |
| | |
| | |
| | |
| | |
| | |
| | |
| | |
| | |
| | |
| | |
| | |
| | |
| | |
| | |
| | |
| | |
| | |
| | |
| | |
| | |
| | |
| | |
| | |
| | |
| | |
| | |
| | |
| | |
| | |
| | |
| | |
| | |
| | |
| | |
| | |
| | |
| | |
| | |
| | |
| | |
| | |
| | |
| | |
| | |
| | |
| | |
| | |
| | |
|
Advanced Micro Devices Inc. | | |
| | |
| | |
| | |
| | |
| | |
| | |
Schedule of Investments (unaudited)(continued)October 31, 2024
iShares® Core U.S. Aggregate Bond ETF(Percentages shown are based on Net Assets)
| | |
Semiconductors (continued) |
| | |
| | |
| | |
| | |
| | |
| | |
| | |
| | |
| | |
| | |
| | |
| | |
| | |
| | |
Broadcom Corp./Broadcom Cayman Finance Ltd. | | |
| | |
| | |
| | |
| | |
| | |
| | |
| | |
| | |
| | |
| | |
| | |
| | |
| | |
| | |
| | |
| | |
| | |
| | |
| | |
| | |
| | |
| | |
| | |
| | |
| | |
| | |
| | |
| | |
Series ., 4.55%, 02/15/32 | | |
| | |
| | |
| | |
| | |
| | |
| | |
| | |
| | |
| | |
| | |
| | |
| | |
| | |
| | |
| | |
| | |
| | |
Semiconductors (continued) |
| | |
| | |
| | |
| | |
| | |
| | |
| | |
| | |
| | |
| | |
| | |
| | |
| | |
| | |
| | |
| | |
| | |
| | |
| | |
| | |
| | |
| | |
| | |
| | |
| | |
| | |
| | |
| | |
| | |
| | |
| | |
| | |
| | |
| | |
| | |
| | |
| | |
| | |
| | |
| | |
| | |
| | |
| | |
| | |
Microchip Technology Inc., 5.05%, 03/15/29 | | |
| | |
| | |
| | |
| | |
| | |
| | |
| | |
| | |
| | |
| | |
| | |
| | |
| | |
| | |
| | |
| | |
Schedule of Investments (unaudited)(continued)October 31, 2024
iShares® Core U.S. Aggregate Bond ETF(Percentages shown are based on Net Assets)
| | |
Semiconductors (continued) |
| | |
| | |
| | |
| | |
| | |
| | |
| | |
| | |
NXP BV/NXP Funding LLC/NXP USA Inc. | | |
| | |
| | |
| | |
| | |
| | |
| | |
| | |
| | |
| | |
| | |
| | |
Qorvo Inc., 4.38%, 10/15/29 | | |
| | |
| | |
| | |
| | |
| | |
| | |
| | |
| | |
| | |
| | |
| | |
| | |
| | |
| | |
| | |
| | |
| | |
| | |
| | |
| | |
| | |
| | |
| | |
| | |
| | |
| | |
| | |
| | |
| | |
| | |
| | |
| | |
| | |
| | |
| | |
| | |
| | |
| | |
| | |
| | |
| | |
Semiconductors (continued) |
| | |
| | |
| | |
| | |
Xilinx Inc., 2.38%, 06/01/30 | | |
| | |
|
Huntington Ingalls Industries Inc. | | |
| | |
| | |
| | |
| | |
|
| | |
| | |
| | |
| | |
| | |
| | |
| | |
| | |
| | |
| | |
| | |
| | |
| | |
Broadridge Financial Solutions Inc. | | |
| | |
| | |
| | |
Cadence Design Systems Inc. | | |
| | |
| | |
| | |
| | |
| | |
| | |
| | |
| | |
| | |
| | |
| | |
Fidelity National Information Services Inc. | | |
| | |
| | |
| | |
| | |
| | |
| | |
| | |
| | |
| | |
| | |
| | |
| | |
| | |
| | |
| | |
| | |
| | |
Schedule of Investments (unaudited)(continued)October 31, 2024
iShares® Core U.S. Aggregate Bond ETF(Percentages shown are based on Net Assets)
| | |
|
| | |
| | |
| | |
| | |
| | |
| | |
| | |
| | |
| | |
| | |
| | |
| | |
| | |
| | |
| | |
| | |
| | |
| | |
| | |
| | |
| | |
| | |
| | |
| | |
| | |
| | |
| | |
| | |
| | |
| | |
| | |
| | |
| | |
| | |
| | |
| | |
| | |
ServiceNow Inc., 1.40%, 09/01/30 | | |
Take-Two Interactive Software Inc. | | |
| | |
| | |
| | |
| | |
| | |
| | |
| | |
| | |
| | |
| | |
| | |
| | |
| | |
| | |
| | |
| | |
| | |
| | |
Telecommunications — 1.1% |
| | |
| | |
| | |
Schedule of Investments (unaudited)(continued)October 31, 2024
iShares® Core U.S. Aggregate Bond ETF(Percentages shown are based on Net Assets)
| | |
Telecommunications (continued) |
| | |
| | |
| | |
| | |
| | |
| | |
| | |
| | |
| | |
| | |
| | |
| | |
| | |
| | |
| | |
| | |
| | |
| | |
| | |
| | |
| | |
| | |
| | |
| | |
| | |
| | |
| | |
| | |
| | |
| | |
| | |
| | |
| | |
| | |
| | |
| | |
| | |
| | |
| | |
| | |
| | |
| | |
| | |
| | |
| | |
| | |
| | |
| | |
| | |
| | |
| | |
| | |
| | |
| | |
| | |
| | |
Bell Telephone Co. of Canada or Bell Canada | | |
| | |
| | |
| | |
| | |
| | |
Telecommunications (continued) |
| | |
| | |
Series US-4, 3.65%, 03/17/51 | | |
Series US-5, 2.15%, 02/15/32 | | |
Series US-6, 3.20%, 02/15/52 | | |
British Telecommunications PLC | | |
| | |
| | |
| | |
| | |
| | |
| | |
| | |
| | |
| | |
| | |
| | |
| | |
| | |
| | |
| | |
| | |
| | |
| | |
| | |
| | |
| | |
| | |
| | |
Deutsche Telekom International Finance BV | | |
| | |
| | |
| | |
| | |
| | |
| | |
| | |
Koninklijke KPN NV, 8.38%, 10/01/30 | | |
| | |
| | |
| | |
| | |
| | |
| | |
| | |
| | |
| | |
| | |
| | |
| | |
| | |
| | |
| | |
| | |
Rogers Communications Inc. | | |
| | |
| | |
| | |
| | |
| | |
| | |
Schedule of Investments (unaudited)(continued)October 31, 2024
iShares® Core U.S. Aggregate Bond ETF(Percentages shown are based on Net Assets)
| | |
Telecommunications (continued) |
| | |
| | |
| | |
| | |
| | |
| | |
| | |
| | |
| | |
| | |
| | |
| | |
Sprint LLC, 7.63%, 03/01/26 | | |
| | |
| | |
| | |
| | |
| | |
| | |
| | |
Telefonica Europe BV, 8.25%, 09/15/30 | | |
| | |
| | |
| | |
| | |
| | |
| | |
| | |
| | |
| | |
| | |
| | |
| | |
| | |
| | |
| | |
| | |
| | |
| | |
| | |
| | |
| | |
| | |
| | |
| | |
| | |
| | |
| | |
| | |
| | |
| | |
| | |
| | |
| | |
| | |
| | |
| | |
| | |
| | |
| | |
| | |
| | |
Telecommunications (continued) |
| | |
| | |
| | |
| | |
Verizon Communications Inc. | | |
| | |
| | |
| | |
| | |
| | |
| | |
| | |
| | |
| | |
| | |
| | |
| | |
| | |
| | |
| | |
| | |
| | |
| | |
| | |
| | |
| | |
| | |
| | |
| | |
| | |
| | |
| | |
| | |
| | |
| | |
| | |
| | |
| | |
| | |
| | |
| | |
| | |
| | |
| | |
| | |
| | |
| | |
| | |
| | |
| | |
| | |
| | |
| | |
| | |
| | |
| | |
| | |
| | |
| | |
| | |
| | |
Schedule of Investments (unaudited)(continued)October 31, 2024
iShares® Core U.S. Aggregate Bond ETF(Percentages shown are based on Net Assets)
| | |
Telecommunications (continued) |
| | |
| | |
| | |
| | |
| | |
Toys, Games & Hobbies — 0.0% |
| | |
| | |
| | |
| | |
| | |
| | |
| | |
Mattel Inc., 5.45%, 11/01/41 | | |
| | |
|
BNSF Funding Trust I, 6.61%, 12/15/55, (3-mo. LIBOR US + 2.350%)(a)(c) | | |
Burlington Northern Santa Fe LLC | | |
| | |
| | |
| | |
| | |
| | |
| | |
| | |
| | |
| | |
| | |
| | |
| | |
| | |
| | |
| | |
| | |
| | |
| | |
| | |
| | |
| | |
| | |
| | |
| | |
| | |
| | |
| | |
Canadian National Railway Co. | | |
| | |
| | |
| | |
| | |
| | |
| | |
| | |
| | |
| | |
| | |
| | |
| | |
| | |
| | |
Transportation (continued) |
| | |
Canadian Pacific Railway Co. | | |
| | |
| | |
| | |
| | |
| | |
| | |
| | |
| | |
| | |
| | |
| | |
| | |
| | |
| | |
| | |
| | |
| | |
CH Robinson Worldwide Inc., 4.20%, 04/15/28 | | |
| | |
| | |
| | |
| | |
| | |
| | |
| | |
| | |
| | |
| | |
| | |
| | |
| | |
| | |
| | |
| | |
| | |
| | |
| | |
| | |
| | |
| | |
| | |
| | |
| | |
| | |
| | |
| | |
| | |
| | |
| | |
| | |
| | |
| | |
| | |
| | |
| | |
| | |
| | |
| | |
Schedule of Investments (unaudited)(continued)October 31, 2024
iShares® Core U.S. Aggregate Bond ETF(Percentages shown are based on Net Assets)
| | |
Transportation (continued) |
| | |
| | |
| | |
| | |
| | |
| | |
| | |
| | |
| | |
FedEx Corp. Pass-Through Trust, Series 2020-1, Class AA, 1.88%, 08/20/35 | | |
JB Hunt Transport Services Inc., 3.88%, 03/01/26 | | |
Kirby Corp., 4.20%, 03/01/28 | | |
| | |
| | |
| | |
| | |
| | |
| | |
| | |
| | |
| | |
| | |
| | |
| | |
| | |
| | |
| | |
| | |
| | |
| | |
| | |
| | |
| | |
| | |
| | |
| | |
| | |
| | |
| | |
| | |
| | |
| | |
| | |
| | |
| | |
| | |
| | |
| | |
| | |
| | |
| | |
| | |
| | |
| | |
| | |
| | |
| | |
| | |
| | |
| | |
Transportation (continued) |
| | |
| | |
| | |
| | |
| | |
| | |
| | |
| | |
| | |
| | |
| | |
| | |
| | |
| | |
| | |
| | |
| | |
| | |
| | |
| | |
| | |
| | |
| | |
| | |
| | |
| | |
| | |
| | |
| | |
| | |
| | |
| | |
| | |
| | |
| | |
| | |
United Parcel Service Inc. | | |
| | |
| | |
| | |
| | |
| | |
| | |
| | |
| | |
| | |
| | |
| | |
| | |
| | |
| | |
| | |
| | |
| | |
| | |
| | |
| | |
| | |
| | |
| | |
Schedule of Investments (unaudited)(continued)October 31, 2024
iShares® Core U.S. Aggregate Bond ETF(Percentages shown are based on Net Assets)
| | |
Transportation (continued) |
| | |
| | |
Trucking & Leasing — 0.0% |
| | |
| | |
| | |
| | |
| | |
| | |
| | |
| | |
| | |
| | |
| | |
| | |
| | |
| | |
| | |
| | |
| | |
| | |
|
| | |
| | |
| | |
| | |
|
American Water Capital Corp. | | |
| | |
| | |
| | |
| | |
| | |
| | |
| | |
| | |
| | |
| | |
| | |
| | |
| | |
| | |
| | |
| | |
| | |
| | |
| | |
| | |
| | |
| | |
| | |
| | |
| | |
| | |
United Utilities PLC, 6.88%, 08/15/28 | | |
| | |
Total Corporate Bonds & Notes — 25.4%
(Cost: $32,313,504,735) | |
| | |
Foreign Government Obligations(g) |
|
Canada Government International Bond | | |
| | |
| | |
| | |
Export Development Canada | | |
| | |
| | |
| | |
| | |
| | |
| | |
| | |
Series HH, 8.50%, 12/01/29 | | |
Series HK, 9.38%, 04/15/30 | | |
Province of Alberta Canada | | |
| | |
| | |
| | |
Province of British Columbia Canada | | |
| | |
| | |
| | |
| | |
| | |
| | |
| | |
| | |
| | |
Province of Manitoba Canada | | |
| | |
| | |
| | |
| | |
Province of New Brunswick Canada, 3.63%, 02/24/28 | | |
Province of Ontario Canada | | |
| | |
| | |
| | |
| | |
| | |
| | |
| | |
| | |
| | |
| | |
| | |
| | |
| | |
Province of Quebec Canada | | |
| | |
| | |
| | |
| | |
| | |
| | |
| | |
| | |
Series PD, 7.50%, 09/15/29 | | |
Schedule of Investments (unaudited)(continued)October 31, 2024
iShares® Core U.S. Aggregate Bond ETF(Percentages shown are based on Net Assets)
| | |
|
Province of Saskatchewan Canada, 3.25%, 06/08/27 | | |
| | |
|
Chile Government International Bond | | |
| | |
| | |
| | |
| | |
| | |
| | |
| | |
| | |
| | |
| | |
| | |
| | |
| | |
| | |
| | |
| | |
| | |
| | |
| | |
|
Finland Government International Bond, 6.95%, 02/15/26 | | |
|
Hong Kong Government International Bond, 1.75%, 11/24/31(f) | | |
|
Hungary Government International Bond, 7.63%, 03/29/41 | | |
|
Indonesia Government International Bond | | |
| | |
| | |
| | |
| | |
| | |
| | |
| | |
| | |
| | |
| | |
| | |
| | |
| | |
| | |
| | |
| | |
| | |
| | |
| | |
| | |
| | |
| | |
| | |
| | |
|
| | |
| | |
| | |
| | |
| | |
| | |
| | |
| | |
|
Israel Government International Bond | | |
| | |
| | |
| | |
| | |
| | |
| | |
| | |
| | |
| | |
| | |
| | |
| | |
| | |
| | |
| | |
|
Republic of Italy Government International Bond | | |
| | |
| | |
| | |
| | |
| | |
| | |
|
Japan Bank for International Cooperation | | |
| | |
| | |
| | |
| | |
| | |
| | |
| | |
| | |
| | |
| | |
| | |
| | |
| | |
| | |
| | |
| | |
| | |
| | |
| | |
| | |
| | |
Japan International Cooperation Agency | | |
| | |
| | |
Schedule of Investments (unaudited)(continued)October 31, 2024
iShares® Core U.S. Aggregate Bond ETF(Percentages shown are based on Net Assets)
| | |
|
| | |
| | |
| | |
| | |
| | |
| | |
|
Mexico Government International Bond | | |
| | |
| | |
| | |
| | |
| | |
| | |
| | |
| | |
| | |
| | |
| | |
| | |
| | |
| | |
| | |
| | |
| | |
| | |
| | |
| | |
| | |
| | |
| | |
| | |
| | |
| | |
| | |
| | |
| | |
| | |
| | |
| | |
|
Panama Government International Bond | | |
| | |
| | |
| | |
| | |
| | |
| | |
| | |
| | |
| | |
| | |
| | |
| | |
| | |
| | |
| | |
| | |
| | |
| | |
| | |
|
| | |
| | |
| | |
|
Peruvian Government International Bond | | |
| | |
| | |
| | |
| | |
| | |
| | |
| | |
| | |
| | |
| | |
| | |
| | |
| | |
| | |
| | |
| | |
| | |
|
Bangko Sentral ng Pilipinas International Bond, 8.60%, 06/15/27(c) | | |
Philippine Government International Bond | | |
| | |
| | |
| | |
| | |
| | |
| | |
| | |
| | |
| | |
| | |
| | |
| | |
| | |
| | |
| | |
| | |
| | |
| | |
| | |
| | |
| | |
| | |
| | |
| | |
| | |
| | |
| | |
| | |
| | |
| | |
| | |
| | |
Schedule of Investments (unaudited)(continued)October 31, 2024
iShares® Core U.S. Aggregate Bond ETF(Percentages shown are based on Net Assets)
| | |
|
Republic of Poland Government International Bond | | |
| | |
| | |
| | |
| | |
| | |
| | |
| | |
| | |
| | |
|
Export-Import Bank of Korea | | |
| | |
| | |
| | |
| | |
| | |
| | |
| | |
| | |
| | |
| | |
| | |
| | |
| | |
| | |
| | |
| | |
| | |
| | |
| | |
| | |
| | |
| | |
| | |
Korea Development Bank (The) | | |
| | |
| | |
| | |
| | |
| | |
| | |
| | |
| | |
| | |
| | |
| | |
| | |
| | |
| | |
| | |
| | |
| | |
| | |
| | |
| | |
| | |
| | |
|
| | |
| | |
| | |
| | |
| | |
| | |
5.75%, , (5-year CMT + 1.575%)(a)(h) | | |
Arab Petroleum Investments Corp., 1.48%, 10/06/26(b) | | |
| | |
| | |
| | |
| | |
| | |
| | |
| | |
| | |
| | |
| | |
| | |
| | |
| | |
| | |
| | |
| | |
| | |
| | |
| | |
| | |
| | |
| | |
| | |
| | |
| | |
| | |
| | |
| | |
| | |
| | |
| | |
| | |
| | |
| | |
Asian Infrastructure Investment Bank (The) | | |
| | |
| | |
| | |
| | |
| | |
| | |
| | |
| | |
Council of Europe Development Bank | | |
| | |
| | |
| | |
| | |
| | |
European Bank for Reconstruction & Development | | |
| | |
Schedule of Investments (unaudited)(continued)October 31, 2024
iShares® Core U.S. Aggregate Bond ETF(Percentages shown are based on Net Assets)
| | |
Supranational (continued) |
| | |
| | |
| | |
| | |
| | |
| | |
| | |
| | |
| | |
| | |
| | |
| | |
| | |
| | |
| | |
| | |
| | |
| | |
| | |
| | |
| | |
| | |
| | |
| | |
| | |
| | |
| | |
| | |
| | |
| | |
Inter-American Development Bank | | |
| | |
| | |
| | |
| | |
| | |
| | |
| | |
| | |
| | |
| | |
| | |
| | |
| | |
| | |
| | |
| | |
| | |
| | |
| | |
| | |
| | |
| | |
Inter-American Investment Corp. | | |
| | |
| | |
| | |
| | |
International Bank for Reconstruction & Development | | |
| | |
| | |
Supranational (continued) |
| | |
| | |
| | |
| | |
| | |
| | |
| | |
| | |
| | |
| | |
| | |
| | |
| | |
| | |
| | |
| | |
| | |
| | |
| | |
| | |
| | |
| | |
| | |
| | |
| | |
| | |
| | |
| | |
| | |
Series GDIF, 1.62%, 03/11/30 | | |
International Finance Corp. | | |
| | |
| | |
| | |
| | |
| | |
| | |
| | |
| | |
| | |
| | |
| | |
| | |
|
| | |
| | |
| | |
| | |
| | |
| | |
| | |
| | |
| | |
|
Oriental Republic of Uruguay, 5.25%, 09/10/60 | | |
Uruguay Government International Bond | | |
| | |
| | |
| | |
Schedule of Investments (unaudited)(continued)October 31, 2024
iShares® Core U.S. Aggregate Bond ETF(Percentages shown are based on Net Assets)
| | |
|
| | |
| | |
| | |
| | |
| | |
Total Foreign Government Obligations — 2.0%
(Cost: $2,593,769,990) | |
Municipal Debt Obligations |
|
Alabama Federal Aid Highway Finance Authority RB, 2.65%, 09/01/37 | | |
|
Salt River Project Agricultural Improvement & Power District RB BAB, 4.84%, 01/01/41 | | |
|
Bay Area Toll Authority RB, 3.13%, 04/01/55 | | |
Bay Area Toll Authority RB BAB | | |
Series F-2, 6.26%, 04/01/49 | | |
Series S-1, 7.04%, 04/01/50 | | |
Series S-3, 6.91%, 10/01/50 | | |
California Earthquake Authority RB, 5.60%, 07/01/27 | | |
California Health Facilities Financing Authority RB | | |
| | |
| | |
California State University RB | | |
| | |
| | |
| | |
| | |
Series E, 2.90%, 11/01/51 | | |
City of Los Angeles Department of Airports Customer Facility Charge Revenue RB, 4.24%, 05/15/48 (AGM) | | |
City of San Francisco California Public Utilities Commission Water Revenue RB BAB, Series B, 6.00%, 11/01/40 | | |
East Bay Municipal Utility District Water System Revenue RB BAB, Series B, 5.87%, 06/01/40 | | |
Foothill-Eastern Transportation Corridor Agency RB | | |
| | |
Series A, 4.09%, 01/15/49 | | |
Golden State Tobacco Securitization Corp. RB | | |
| | |
| | |
| | |
| | |
| | |
| | |
| | |
| | |
Los Angeles Community College District/California GO BAB, 6.75%, 08/01/49 | | |
| | |
|
Los Angeles County Public Works Financing Authority RB BAB, 7.62%, 08/01/40 | | |
Los Angeles Department of Water & Power RB BAB | | |
Series A, 6.60%, 07/01/50(c) | | |
Series D, 6.57%, 07/01/45 | | |
Regents of the University of California Medical Center Pooled Revenue RB | | |
| | |
Class A, 3.71%, 05/15/20(c) | | |
| | |
| | |
Series N, Class A, 3.26%, 05/15/60(c) | | |
Regents of the University of California Medical Center Pooled Revenue RB BAB | | |
Series H, Class H, 6.55%, 05/15/48 | | |
Series F, 6.58%, 05/15/49 | | |
San Diego County Regional Transportation Commission RB BAB, 5.91%, 04/01/48 | | |
San Diego County Water Authority RB BAB, Series B, 6.14%, 05/01/49 | | |
San Francisco City & County Public Utilities Commission Wastewater Revenue RB, 4.66%, 10/01/27 | | |
San Joaquin Hills Transportation Corridor Agency RB, 3.49%, 01/15/50 | | |
| | |
| | |
| | |
| | |
| | |
| | |
| | |
| | |
| | |
| | |
| | |
| | |
| | |
Series A, 3.05%, 04/01/29 | | |
State of California GO BAB | | |
| | |
| | |
| | |
| | |
| | |
| | |
University of California RB | | |
Series AD, 4.86%, 12/31/99 | | |
Series AQ, 4.77%, 12/31/99 | | |
Series BD, 3.35%, 07/01/29(c) | | |
Series BG, 1.32%, 05/15/27 | | |
Series BG, 1.61%, 05/15/30 | | |
Series BG, 3.07%, 05/15/51 | | |
| | |
|
Regional Transportation District Sales Tax Revenue RB BAB, Series B, 5.84%, 11/01/50 | | |
Schedule of Investments (unaudited)(continued)October 31, 2024
iShares® Core U.S. Aggregate Bond ETF(Percentages shown are based on Net Assets)
| | |
|
State of Connecticut GO, Series A, 5.85%, 03/15/32 | | |
District of Columbia — 0.0% |
District of Columbia Water & Sewer Authority RB, 4.81%, 10/01/14 | | |
Metropolitan Washington Airports Authority Dulles Toll Road Revenue RB BAB, 7.46%, 10/01/46 | | |
| | |
|
County of Broward Florida Airport System Revenue RB, 3.48%, 10/01/43 | | |
County of Miami-Dade Florida Aviation Revenue RB, Series C, 4.28%, 10/01/41 | | |
County of Miami-Dade Florida Transit System RB, Series B, 2.60%, 07/01/42 | | |
County of Miami-Dade Seaport Department RB, 6.22%, 11/01/55 | | |
State Board of Administration Finance Corp. RB | | |
| | |
| | |
| | |
| | |
|
City of Atlanta Georgia Water & Wastewater Revenue RB, 2.26%, 11/01/35 | | |
Municipal Electric Authority of Georgia RB BAB | | |
Project J, Series 2010-A, 6.64%, 04/01/57 | | |
Project M, Series 2010-A, 6.66%, 04/01/57 | | |
Project P, Series 2010-A, 7.06%, 04/01/57 | | |
| | |
|
Idaho Energy Resources Authority RB, 2.86%, 09/01/46 | | |
|
Chicago O'Hare International Airport RB | | |
Series C, 4.47%, 01/01/49(c) | | |
Series C, 4.57%, 01/01/54(c) | | |
Chicago O'Hare International Airport RB BAB, Series B, 6.40%, 01/01/40(c) | | |
Chicago Transit Authority Sales & Transfer Tax Receipts Revenue RB | | |
Series A, 6.90%, 12/01/40 | | |
Series B, 6.90%, 12/01/40(c) | | |
Illinois State Toll Highway Authority RB BAB, Series A, 6.18%, 01/01/34 | | |
Sales Tax Securitization Corp. RB | | |
| | |
| | |
| | |
State of Illinois GO, 5.10%, 06/01/33 | | |
State of Illinois GO BAB, Series 5, 7.35%, 07/01/35 | | |
| | |
|
Indiana Finance Authority RB, 3.05%, 01/01/51 | | |
| | |
|
Kansas Development Finance Authority RB, 2.77%, 05/01/51 | | |
|
Louisiana Local Government Environmental Facilities & Community Development Authority, 4.28%, 02/01/36 | | |
Louisiana Local Government Environmental Facilities & Community Development Authority RB | | |
| | |
| | |
| | |
| | |
| | |
| | |
State of Louisiana Gasoline & Fuels Tax Revenue RB, 2.95%, 05/01/41 | | |
| | |
|
Maryland Economic Development Corp. RB | | |
| | |
| | |
Maryland Health & Higher Educational Facilities Authority RB, Class D, 3.05%, 07/01/40 | | |
| | |
|
Commonwealth of Massachusetts GOL, 2.90%, 09/01/49 | | |
Commonwealth of Massachusetts GOL BAB | | |
| | |
Series E, 5.46%, 12/01/39 | | |
Commonwealth of Massachusetts RB, 3.77%, 07/15/29 | | |
Commonwealth of Massachusetts Transportation Fund Revenue RB BAB, Series A, 5.73%, 06/01/40 | | |
Massachusetts School Building Authority RB | | |
| | |
Series B, 1.75%, 08/15/30 | | |
Massachusetts School Building Authority RB BAB, Series B, 5.72%, 08/15/39 | | |
| | |
|
Michigan Finance Authority RB | | |
| | |
| | |
Michigan State University RB, 4.17%, 08/15/22 | | |
Michigan Strategic Fund RB, 3.23%, 09/01/47 | | |
University of Michigan RB | | |
| | |
| | |
| | |
| | |
Series B, 2.44%, 04/01/40 | | |
| | |
Schedule of Investments (unaudited)(continued)October 31, 2024
iShares® Core U.S. Aggregate Bond ETF(Percentages shown are based on Net Assets)
| | |
|
University of Minnesota RB, 4.05%, 04/01/52(c) | | |
|
State of Mississippi GO BAB, Series F, 5.25%, 11/01/34 | | |
|
Health & Educational Facilities Authority of the State of Missouri RB, Series A, 3.65%, 08/15/57 | | |
|
University of Nebraska Facilities Corp. (The) RB, Series A, Class A, 3.04%, 10/01/49 | | |
|
County of Clark Department of Aviation RB BAB, Series C, 6.82%, 07/01/45 | | |
|
New Jersey Economic Development Authority RB, Series A, 7.43%, 02/15/29 (NPFGC) | | |
New Jersey State Turnpike Authority RB BAB, Series F, 7.41%, 01/01/40(c) | | |
New Jersey Transportation Trust Fund Authority RB BAB | | |
Series B, 6.56%, 12/15/40 | | |
Series C, 5.75%, 12/15/28 | | |
New Jersey Turnpike Authority RB BAB, Series A, 7.10%, 01/01/41 | | |
Rutgers The State University of New Jersey RB | | |
| | |
Series P, 3.92%, 05/01/19(c) | | |
Rutgers The State University of New Jersey RB BAB, Class H, 5.67%, 05/01/40 | | |
| | |
|
| | |
| | |
| | |
| | |
| | |
| | |
Series A-2, 5.21%, 10/01/31 | | |
Series C-1, 5.52%, 10/01/37 | | |
Series F1, 6.27%, 12/01/37 | | |
City of New York GOL, 4.61%, 09/01/37 | | |
Empire State Development Corp. RB, 3.90%, 03/15/33 | | |
Empire State Development Corp. RB BABA, 5.77%, 03/15/39 | | |
Metropolitan Transportation Authority Dedicated Tax Fund RB BAB, 7.34%, 11/15/39 | | |
Metropolitan Transportation Authority RB BAB | | |
Series 2010-A, 6.67%, 11/15/39 | | |
Series B, 6.65%, 11/15/39 | | |
Series E, 6.81%, 11/15/40 | | |
New York City Municipal Water Finance Authority RB, 5.88%, 06/15/44 | | |
| | |
|
New York City Municipal Water Finance Authority RB BAB | | |
| | |
| | |
| | |
New York City Transitional Finance Authority Future Tax Secured Revenue RB BAB | | |
| | |
| | |
New York State Dormitory Authority RB BAB | | |
Series D, 5.60%, 03/15/40(c) | | |
Series F, 5.63%, 03/15/39(c) | | |
Port Authority of New York & New Jersey RB | | |
| | |
| | |
| | |
| | |
| | |
Series 164, 5.65%, 11/01/40(c) | | |
Series 165, 5.65%, 11/01/40 | | |
Series 168, 4.93%, 10/01/51 | | |
Series 174, 4.46%, 10/01/62 | | |
Series 181, 4.96%, 08/01/46(c) | | |
Series 182, 5.31%, 08/01/46 | | |
Series 192, 4.81%, 10/15/65 | | |
Series 225, 3.18%, 07/15/60 | | |
| | |
|
Charlotte-Mecklenburg Hospital Authority (The) RB, 3.20%, 01/15/51 | | |
|
American Municipal Power Inc. RB, Series B, 8.08%, 02/15/50 | | |
JobsOhio Beverage System RB | | |
| | |
| | |
Series B, 4.53%, 01/01/35 | | |
Ohio State University (The) RB, Series A, 4.80%, 06/01/11 | | |
Ohio State University (The) RB BAB, Series C, 4.91%, 06/01/40 | | |
Ohio Turnpike & Infrastructure Commission RB, Series A, Class A, 3.22%, 02/15/48 | | |
| | |
|
Oklahoma Development Finance Authority RB | | |
| | |
| | |
| | |
| | |
| | |
|
Oregon School Boards Association GOL | | |
Series B, 5.55%, 06/30/28 (NPFGC) | | |
Series B, 5.68%, 06/30/28 (NPFGC) | | |
Oregon State University RB, 3.42%, 03/01/60 (BAM) | | |
State of Oregon GO, 5.89%, 06/01/27 | | |
| | |
Schedule of Investments (unaudited)(continued)October 31, 2024
iShares® Core U.S. Aggregate Bond ETF(Percentages shown are based on Net Assets)
| | |
|
City of Philadelphia PA Water & Wastewater Revenue RB, 2.93%, 07/01/45 | | |
Commonwealth Financing Authority RB | | |
Class A, 2.99%, 06/01/42(c) | | |
| | |
Series A, 4.14%, 06/01/38 | | |
Pennsylvania State University (The) RB | | |
| | |
| | |
Pennsylvania Turnpike Commission RB BAB, Series B, 5.51%, 12/01/45(c) | | |
University of Pittsburgh-of the Commonwealth System of Higher Education RB, 3.56%, 09/15/19(c) | | |
| | |
|
South Carolina Public Service Authority RB BAB, Series C, 6.45%, 01/01/50 | | |
|
Metropolitan Government Nashville & Davidson County Health & Educational Facilities Board RB, Series 2016B, 4.05%, 07/01/26 | | |
|
Board of Regents of the University of Texas System RB, Series B, 2.44%, 08/15/49 | | |
Board of Regents of the University of Texas System RB BAB, Series C, 4.79%, 08/15/46 | | |
City of San Antonio Texas Electric & Gas Systems Revenue RB BAB | | |
| | |
Series C, 5.99%, 02/01/39 | | |
Dallas Area Rapid Transit RB, 2.61%, 12/01/48(c) | | |
Dallas Area Rapid Transit RB BAB | | |
| | |
Series B, 6.00%, 12/01/44(c) | | |
Dallas Convention Center Hotel Development Corp. RB BAB, 7.09%, 01/01/42 | | |
Dallas County Hospital District GOL BAB, Series C, 5.62%, 08/15/44 | | |
Dallas Fort Worth International Airport RB | | |
| | |
| | |
| | |
| | |
Series A, Class A, 3.14%, 11/01/45(c) | | |
Series C, Class C, 2.92%, 11/01/50(c) | | |
Series C, Class C, 3.09%, 11/01/40 | | |
Dallas Independent School District GO BAB, Series C, 6.45%, 02/15/35 (PSF) | | |
Grand Parkway Transportation Corp. RB, 3.24%, 10/01/52 | | |
North Texas Tollway Authority RB BAB, Series B, 6.72%, 01/01/49 | | |
Permanent University Fund - Texas A&M University System RB, Series B, 3.66%, 07/01/47 | | |
| | |
|
Permanent University Fund - University of Texas System RB, Series A, 3.38%, 07/01/47 | | |
| | |
| | |
Series A, 4.63%, 04/01/33 | | |
Series A, 4.68%, 04/01/40 | | |
Texas Department of Transportation State Highway Fund RB, First Class, 5.18%, 04/01/30 | | |
Texas Natural Gas Securitization Finance Corp. RB | | |
| | |
| | |
Texas Private Activity Bond Surface Transportation Corp. RB, Series B, 3.92%, 12/31/49 | | |
Texas Transportation Commission GO, 2.47%, 10/01/44 | | |
| | |
|
University of Virginia RB | | |
| | |
| | |
Series A, 3.23%, 12/31/99(c) | | |
Series C, 4.18%, 09/01/17 | | |
| | |
|
Central Puget Sound Regional Transit Authority Sales & Rental Car Taxes Revenue RB BAB, 5.49%, 11/01/39 | | |
|
| | |
Series A, 5.70%, 05/01/26 | | |
Series C, 3.15%, 05/01/27 | | |
| | |
Total Municipal Debt Obligations — 0.5%
(Cost: $617,248,187) | |
U.S. Government & Agency Obligations |
Mortgage-Backed Securities — 25.7% |
Federal Home Loan Mortgage Corp. | | |
| | |
| | |
| | |
| | |
| | |
| | |
| | |
| | |
| | |
| | |
| | |
| | |
| | |
| | |
| | |
| | |
Schedule of Investments (unaudited)(continued)October 31, 2024
iShares® Core U.S. Aggregate Bond ETF(Percentages shown are based on Net Assets)
| | |
Mortgage-Backed Securities (continued) |
| | |
| | |
| | |
| | |
| | |
| | |
| | |
| | |
| | |
| | |
| | |
| | |
| | |
| | |
| | |
| | |
| | |
| | |
| | |
| | |
| | |
| | |
| | |
| | |
| | |
| | |
| | |
| | |
| | |
| | |
| | |
| | |
| | |
| | |
| | |
| | |
| | |
| | |
| | |
| | |
| | |
| | |
| | |
| | |
| | |
| | |
| | |
| | |
| | |
| | |
| | |
| | |
| | |
| | |
| | |
| | |
| | |
| | |
| | |
| | |
| | |
| | |
Mortgage-Backed Securities (continued) |
| | |
| | |
| | |
| | |
| | |
| | |
| | |
| | |
| | |
| | |
| | |
| | |
| | |
| | |
| | |
| | |
| | |
| | |
| | |
| | |
| | |
| | |
| | |
| | |
| | |
| | |
| | |
| | |
| | |
| | |
| | |
| | |
| | |
| | |
| | |
| | |
| | |
| | |
| | |
| | |
| | |
| | |
| | |
| | |
| | |
| | |
| | |
| | |
| | |
| | |
| | |
| | |
| | |
| | |
| | |
| | |
| | |
| | |
| | |
| | |
| | |
Schedule of Investments (unaudited)(continued)October 31, 2024
iShares® Core U.S. Aggregate Bond ETF(Percentages shown are based on Net Assets)
| | |
Mortgage-Backed Securities (continued) |
| | |
| | |
| | |
| | |
| | |
| | |
| | |
| | |
| | |
| | |
| | |
| | |
| | |
| | |
| | |
| | |
| | |
| | |
| | |
| | |
| | |
| | |
| | |
| | |
| | |
| | |
| | |
| | |
| | |
| | |
| | |
| | |
| | |
| | |
| | |
| | |
| | |
| | |
| | |
| | |
| | |
| | |
| | |
| | |
| | |
| | |
| | |
| | |
| | |
| | |
| | |
| | |
| | |
| | |
| | |
| | |
| | |
| | |
| | |
| | |
| | |
| | |
Mortgage-Backed Securities (continued) |
| | |
| | |
| | |
| | |
| | |
| | |
| | |
| | |
| | |
| | |
| | |
| | |
| | |
| | |
| | |
| | |
| | |
| | |
| | |
| | |
| | |
| | |
| | |
| | |
| | |
| | |
| | |
| | |
| | |
| | |
| | |
| | |
| | |
| | |
| | |
| | |
| | |
| | |
| | |
| | |
6.03%, 11/01/40, (12-mo. LIBOR US + 1.775%)(a) | | |
6.15%, 11/01/40, (12-mo. LIBOR US + 1.900%)(a) | | |
6.15%, 01/01/42, (12-mo. LIBOR US + 1.900%)(a) | | |
6.35%, 11/01/40, (12-mo. LIBOR US + 1.910%)(a) | | |
6.84%, 12/01/38, (12-mo. LIBOR US + 1.768%)(a) | | |
6.94%, 08/01/41, (12-mo. LIBOR US + 1.709%)(a) | | |
6.94%, 05/01/42, (12-mo. LIBOR US + 1.799%)(a) | | |
7.38%, 09/01/41, (12-mo. LIBOR US + 1.880%)(a) | | |
7.65%, 11/01/41, (12-mo. LIBOR US + 1.900%)(a) | | |
Schedule of Investments (unaudited)(continued)October 31, 2024
iShares® Core U.S. Aggregate Bond ETF(Percentages shown are based on Net Assets)
| | |
Mortgage-Backed Securities (continued) |
Federal Home Loan Mortgage Corp. Multifamily Structured Pass-Through Certificates | | |
| | |
Series K046, Class A2, 3.21%, 03/25/25 | | |
Series K048, Class A2, 3.28%, 06/25/25(a) | | |
Series K053, Class A2, 3.00%, 12/25/25 | | |
Series K059, Class A2, 3.12%, 09/25/26(a) | | |
Series K063, Class A2, 3.43%, 01/25/27(a) | | |
Series K066, Class A2, 3.12%, 06/25/27 | | |
Series K069, Class A2, 3.19%, 09/25/27(a) | | |
Series K070, Class A2, 3.30%, 11/25/27(a) | | |
Series K072, Class A2, 3.44%, 12/25/27 | | |
Series K074, Class A2, 3.60%, 01/25/28 | | |
Series K076, Class A2, 3.90%, 04/25/28 | | |
Series K081, Class A2, 3.90%, 08/25/28(a) | | |
Series K085, Class A2, 4.06%, 10/25/28(a) | | |
Series K086, Class A2, 3.86%, 11/25/28, (1-day SOFR + 2.127%)(a) | | |
Series K089, Class A2, 3.56%, 01/25/29 | | |
Series K100, Class A2, 2.67%, 09/25/29 | | |
Series K101, Class A2, 2.52%, 10/25/29 | | |
Series K105, Class A2, 1.87%, 01/25/30 | | |
Series K108, Class A2, 1.52%, 03/25/30 | | |
Series K110, Class A2, 1.48%, 04/25/30 | | |
Series K111, Class A2, 1.35%, 05/25/30 | | |
Series K117, Class A2, 1.41%, 08/25/30 | | |
Series K120, Class A2, 1.50%, 10/25/30 | | |
Series K124, Class A2, 1.66%, 12/25/30 | | |
Series K126, Class A2, 2.07%, 01/25/31 | | |
Series K135, CLASS A2, 2.15%, 10/25/31(a) | | |
Series K1510, Class A3, 3.79%, 01/25/34 | | |
Series K-1512, Class A2, 2.99%, 05/25/31 | | |
Series K-1512, Class A3, 3.06%, 04/25/34 | | |
Series K-1514, Class A2, 2.86%, 10/25/34 | | |
Series K154, Class A2, 3.42%, 04/25/32 | | |
Series K739, Class A2, 1.34%, 09/25/27 | | |
Federal National Mortgage Association | | |
| | |
| | |
| | |
| | |
| | |
| | |
6.28%, 02/01/42, (12-mo. LIBOR US + 1.805%)(a) | | |
6.34%, 04/01/44, (12-mo. LIBOR US + 1.590%)(a) | | |
7.25%, 10/01/41, (12-mo. LIBOR US + 1.815%)(a) | | |
7.53%, 08/01/41, (12-mo. LIBOR US + 1.750%)(a) | | |
Federal National Mortgage Association-ACES | | |
Series 2015-M10, Class A2, 3.09%, 04/25/27(a) | | |
Series 2016-M6, Class A2, 2.49%, 05/25/26 | | |
Series 2017, Class A2, 2.96%, 09/25/27(a) | | |
Series 2017-M4, Class A2, 2.55%, 12/25/26(a) | | |
| | |
Mortgage-Backed Securities (continued) |
Series 2017-M7, Class A2, 2.96%, 02/25/27(a) | | |
Series 2017-M8, Class A2, 3.06%, 05/25/27(a) | | |
Series 2018-M10, Class A2, 3.36%, 07/25/28(a) | | |
Series 2018-M12, Class A2, 3.63%, 08/25/30(a) | | |
Series 2018-M13, Class A2, 3.74%, 09/25/30(a) | | |
Series 2018-M2, Class A2, 2.91%, 01/25/28(a) | | |
Series 2019-M2, Class A2, 3.62%, 11/25/28(a) | | |
Series 2019-M22, Class A2, 2.52%, 08/25/29 | | |
Series 2019-M5, Class A2, 3.27%, 02/25/29 | | |
Series 2019-M9, Class A2, 2.94%, 06/25/29 | | |
Series 2021-M13, Class A2, 1.60%, 04/25/31(a) | | |
Series 2021-M17, Class A2, 1.71%, 07/25/31(a) | | |
Series 2022-M1, Class A2, 1.67%, 10/25/31(a) | | |
Government National Mortgage Association | | |
| | |
| | |
| | |
| | |
| | |
| | |
| | |
| | |
| | |
| | |
| | |
| | |
| | |
| | |
| | |
| | |
| | |
| | |
| | |
| | |
| | |
| | |
| | |
| | |
| | |
| | |
| | |
| | |
| | |
| | |
| | |
| | |
| | |
| | |
Schedule of Investments (unaudited)(continued)October 31, 2024
iShares® Core U.S. Aggregate Bond ETF(Percentages shown are based on Net Assets)
| | |
Mortgage-Backed Securities (continued) |
| | |
| | |
| | |
| | |
| | |
| | |
| | |
| | |
| | |
| | |
| | |
| | |
| | |
| | |
| | |
| | |
| | |
| | |
| | |
| | |
| | |
| | |
| | |
| | |
| | |
| | |
| | |
| | |
| | |
| | |
| | |
| | |
| | |
| | |
| | |
| | |
| | |
| | |
| | |
| | |
| | |
| | |
| | |
| | |
| | |
| | |
| | |
| | |
| | |
| | |
| | |
| | |
| | |
| | |
| | |
| | |
| | |
| | |
| | |
| | |
| | |
| | |
Mortgage-Backed Securities (continued) |
| | |
| | |
| | |
| | |
| | |
| | |
| | |
| | |
| | |
| | |
| | |
| | |
| | |
| | |
| | |
| | |
| | |
| | |
| | |
| | |
| | |
| | |
| | |
| | |
| | |
| | |
| | |
| | |
| | |
| | |
| | |
| | |
| | |
| | |
| | |
| | |
| | |
| | |
| | |
| | |
| | |
| | |
| | |
| | |
| | |
| | |
| | |
| | |
| | |
| | |
| | |
| | |
| | |
| | |
| | |
| | |
| | |
| | |
| | |
| | |
| | |
Schedule of Investments (unaudited)(continued)October 31, 2024
iShares® Core U.S. Aggregate Bond ETF(Percentages shown are based on Net Assets)
| | |
Mortgage-Backed Securities (continued) |
| | |
| | |
| | |
| | |
| | |
| | |
| | |
| | |
| | |
| | |
| | |
Uniform Mortgage-Backed Securities | | |
| | |
| | |
| | |
| | |
| | |
| | |
| | |
| | |
| | |
| | |
| | |
| | |
| | |
| | |
| | |
| | |
| | |
| | |
| | |
| | |
| | |
| | |
| | |
| | |
| | |
| | |
| | |
| | |
| | |
| | |
| | |
| | |
| | |
| | |
| | |
| | |
| | |
| | |
| | |
| | |
| | |
| | |
| | |
| | |
| | |
| | |
| | |
| | |
| | |
| | |
Mortgage-Backed Securities (continued) |
| | |
| | |
| | |
| | |
| | |
| | |
| | |
| | |
| | |
| | |
| | |
| | |
| | |
| | |
| | |
| | |
| | |
| | |
| | |
| | |
| | |
| | |
| | |
| | |
| | |
| | |
| | |
| | |
| | |
| | |
| | |
| | |
| | |
| | |
| | |
| | |
| | |
| | |
| | |
| | |
| | |
| | |
| | |
| | |
| | |
| | |
| | |
| | |
| | |
| | |
| | |
| | |
| | |
| | |
| | |
| | |
| | |
| | |
| | |
| | |
| | |
Schedule of Investments (unaudited)(continued)October 31, 2024
iShares® Core U.S. Aggregate Bond ETF(Percentages shown are based on Net Assets)
| | |
Mortgage-Backed Securities (continued) |
| | |
| | |
| | |
| | |
| | |
| | |
| | |
| | |
| | |
| | |
| | |
| | |
| | |
| | |
| | |
| | |
| | |
| | |
| | |
| | |
| | |
| | |
| | |
| | |
| | |
| | |
| | |
| | |
| | |
| | |
| | |
| | |
| | |
| | |
| | |
| | |
| | |
| | |
| | |
| | |
| | |
| | |
| | |
| | |
| | |
| | |
| | |
| | |
| | |
| | |
| | |
| | |
| | |
| | |
| | |
| | |
| | |
| | |
| | |
| | |
| | |
| | |
Mortgage-Backed Securities (continued) |
| | |
| | |
| | |
| | |
| | |
| | |
| | |
| | |
| | |
| | |
| | |
| | |
| | |
| | |
| | |
| | |
| | |
| | |
| | |
| | |
| | |
| | |
| | |
| | |
| | |
| | |
| | |
| | |
| | |
| | |
| | |
| | |
| | |
| | |
| | |
| | |
| | |
| | |
| | |
| | |
| | |
| | |
| | |
| | |
| | |
| | |
| | |
| | |
| | |
| | |
| | |
| | |
| | |
| | |
| | |
| | |
| | |
| | |
| | |
| | |
| | |
Schedule of Investments (unaudited)(continued)October 31, 2024
iShares® Core U.S. Aggregate Bond ETF(Percentages shown are based on Net Assets)
| | |
Mortgage-Backed Securities (continued) |
| | |
| | |
| | |
| | |
| | |
| | |
| | |
| | |
| | |
| | |
| | |
| | |
| | |
| | |
| | |
| | |
| | |
| | |
| | |
| | |
| | |
| | |
| | |
| | |
| | |
| | |
| | |
| | |
| | |
| | |
| | |
| | |
| | |
| | |
| | |
| | |
| | |
| | |
| | |
| | |
| | |
| | |
| | |
| | |
| | |
U.S. Government Agency Obligations — 0.2% |
| | |
| | |
| | |
| | |
| | |
| | |
| | |
| | |
| | |
Federal Home Loan Mortgage Corp. | | |
| | |
| | |
Federal National Mortgage Association | | |
| | |
| | |
| | |
U.S. Government Agency Obligations (continued) |
| | |
| | |
| | |
| | |
| | |
| | |
| | |
| | |
Tennessee Valley Authority | | |
| | |
| | |
| | |
| | |
| | |
| | |
| | |
| | |
| | |
Series B, 4.70%, 07/15/33 | | |
Series E, 6.75%, 11/01/25 | | |
| | |
U.S. Government Obligations — 43.8% |
| | |
| | |
| | |
| | |
| | |
| | |
| | |
| | |
| | |
| | |
| | |
| | |
| | |
| | |
| | |
| | |
| | |
| | |
| | |
| | |
| | |
| | |
| | |
| | |
| | |
| | |
| | |
| | |
| | |
| | |
| | |
| | |
| | |
| | |
| | |
| | |
| | |
| | |
| | |
Schedule of Investments (unaudited)(continued)October 31, 2024
iShares® Core U.S. Aggregate Bond ETF(Percentages shown are based on Net Assets)
| | |
U.S. Government Obligations (continued) |
| | |
| | |
| | |
| | |
| | |
| | |
| | |
| | |
| | |
| | |
| | |
| | |
| | |
| | |
| | |
| | |
| | |
| | |
| | |
| | |
| | |
| | |
| | |
| | |
| | |
| | |
| | |
| | |
| | |
| | |
| | |
| | |
| | |
| | |
| | |
| | |
| | |
| | |
| | |
| | |
| | |
| | |
| | |
| | |
| | |
| | |
| | |
| | |
| | |
| | |
| | |
| | |
| | |
| | |
| | |
| | |
| | |
| | |
| | |
| | |
| | |
| | |
U.S. Government Obligations (continued) |
| | |
| | |
| | |
| | |
| | |
| | |
| | |
| | |
| | |
| | |
| | |
| | |
| | |
| | |
| | |
| | |
| | |
| | |
| | |
| | |
| | |
| | |
| | |
| | |
| | |
| | |
| | |
| | |
| | |
| | |
| | |
| | |
| | |
| | |
| | |
| | |
| | |
| | |
| | |
| | |
| | |
| | |
| | |
| | |
| | |
| | |
| | |
| | |
| | |
| | |
| | |
| | |
| | |
| | |
| | |
| | |
| | |
| | |
| | |
| | |
| | |
Schedule of Investments (unaudited)(continued)October 31, 2024
iShares® Core U.S. Aggregate Bond ETF(Percentages shown are based on Net Assets)
| | |
U.S. Government Obligations (continued) |
| | |
| | |
| | |
| | |
| | |
Total U.S. Government & Agency Obligations — 69.7%
(Cost: $89,138,905,106) | |
Total Long-Term Investments — 99.0%
(Cost: $126,379,199,763) | |
| | |
|
Money Market Funds — 3.8% |
BlackRock Cash Funds: Institutional, SL Agency Shares, 5.01%(j)(k)(l) | | |
BlackRock Cash Funds: Treasury, SL Agency Shares, 4.83%(j)(k)(m) | | |
Total Short-Term Securities — 3.8%
(Cost: $4,555,914,962) | |
Total Investments Before TBA Sales Commitments — 102.8%
(Cost: $130,935,114,725) | |
| | |
|
Mortgage-Backed Securities — (0.2)% |
Government National Mortgage Association, 2.00%, 11/20/54 | | |
| | |
Mortgage-Backed Securities (continued) |
Uniform Mortgage-Backed Securities | | |
| | |
| | |
| | |
| | |
Total TBA Sales Commitments — (0.2)%
(Proceeds: $(182,205,086)) | |
Total Investments, Net of TBA Sales Commitments — 102.6%
(Cost: $130,752,909,639) | |
Liabilities in Excess of Other Assets — (2.6)% | |
| |
| Variable rate security. Interest rate resets periodically. The rate shown is the effective interest rate as of period end. Security description also includes the reference rate and spread if published and available. |
| Security exempt from registration pursuant to Rule 144A under the Securities Act of 1933, as amended. These securities may be resold in transactions exempt from registration to qualified institutional investors. |
| All or a portion of this security is on loan. |
| |
| Step coupon security. Coupon rate will either increase (step-up bond) or decrease (step-down bond) at regular intervals until maturity. Interest rate shown reflects the rate currently in effect. |
| This security may be resold to qualified foreign investors and foreign institutional buyers under Regulation S of the Securities Act of 1933. |
| U.S. dollar denominated security issued by foreign domiciled entity. |
| Perpetual security with no stated maturity date. |
| Represents or includes a TBA transaction. |
| |
| Annualized 7-day yield as of period end. |
| All or a portion of this security represents an investment of TBA cash collateral. |
| All or a portion of this security was purchased with the cash collateral from loaned securities. |
Fair Value Hierarchy as of Period End
Various inputs are used in determining the fair value of financial instruments at the measurement of the date. These inputs to valuation techniques are categorized into a fair value hierarchy consisting of three broad levels for financial reporting purposes as follows:
• Level 1 – Unadjusted price quotations in active markets/exchanges that the Fund has the ability to access for identical assets or liabilities;
• Level 2 – Inputs other than quoted prices included within level 1 that are observable for the asset or liability, either directly or indirectly; and
• Level 3 – Inputs that are unobservable and significant to the entire fair value measurement for the asset or liability (including the Valuation Committee’s assumptions used in determining the fair value of financial instruments).
The hierarchy gives the highest priority to unadjusted quoted prices in active markets for identical assets or liabilities (Level 1 measurements) and the lowest priority to unobservable inputs (Level 3 measurements). Accordingly, the degree of judgment exercised in determining fair value is greatest for instruments categorized in Level 3. The inputs used to measure fair value may fall into different levels of the fair value hierarchy. In such cases, for disclosure purposes, the fair value hierarchy classification is determined based on the lowest level input that is significant to the fair value measurement in its entirety. Investments classified within Level 3 have significant unobservable inputs used by the Valuation Committee in determining the price for Fair Valued Investments. Level 3 investments include equity or debt issued by privately held companies or funds. There may not be a secondary market, and/or there are a limited number of investors. The categorization of a value determined for financial instruments is based on the pricing transparency of the financial instruments and is not necessarily an indication of the risks associated with investing in those securities. For information about the Fund’s policy regarding valuation of financial instruments, refer to its most recent financial statements.
Schedule of Investments (unaudited)(continued)October 31, 2024
iShares® Core U.S. Aggregate Bond ETF
Fair Value Hierarchy as of Period End (continued)
The following table summarizes the Fund’s financial instruments categorized in the fair value hierarchy. The breakdown of the Fund’s financial instruments into major categories is disclosed in the Schedule of Investments above.
| | | | |
| | | | |
| | | | |
| | | | |
| | | | |
Collateralized Mortgage Obligations | | | | |
| | | | |
Foreign Government Obligations | | | | |
Municipal Debt Obligations | | | | |
U.S. Government & Agency Obligations | | | | |
| | | | |
| | | | |
| | | | |
| | | | |
| | | | |
| | | | |
Schedule of Investments (unaudited)October 31, 2024
iShares® iBoxx $ High Yield Corporate Bond ETF(Percentages shown are based on Net Assets)
| | |
|
|
Clear Channel Outdoor Holdings Inc. | | |
| | |
| | |
| | |
| | |
| | |
CMG Media Corp., 8.88%, 12/15/27(a) | | |
| | |
| | |
| | |
| | |
| | |
Neptune Bidco U.S. Inc., 9.29%, 04/15/29(a) | | |
Outfront Media Capital LLC/Outfront Media Capital Corp. | | |
| | |
| | |
| | |
| | |
Stagwell Global LLC, 5.63%, 08/15/29(a)(b) | | |
| | |
Aerospace & Defense — 2.2% |
| | |
| | |
| | |
| | |
| | |
| | |
| | |
| | |
| | |
| | |
| | |
| | |
| | |
| | |
| | |
| | |
| | |
| | |
| | |
| | |
| | |
| | |
Triumph Group Inc., 9.00%, 03/15/28(a)(b) | | |
| | |
|
| | |
| | |
| | |
Vector Group Ltd., 10.50%, 11/01/26(a) | | |
| | |
|
Air Canada, 3.88%, 08/15/26(a)(b) | | |
| | |
| | |
| | |
| | |
|
American Airlines Inc./AAdvantage Loyalty IP Ltd. | | |
| | |
| | |
| | |
| | |
| | |
| | |
JetBlue Airways Corp./JetBlue Loyalty LP, 9.88%, 09/20/31(a)(b) | | |
| | |
| | |
| | |
VistaJet Malta Finance PLC/Vista Management Holding Inc. | | |
| | |
| | |
| | |
| | |
|
| | |
| | |
| | |
| | |
| | |
| | |
| | |
Auto Manufacturers — 0.4% |
Allison Transmission Inc. | | |
| | |
| | |
| | |
Aston Martin Capital Holdings Ltd., 10.00%, 03/31/29(a)(b) | | |
Jaguar Land Rover Automotive PLC | | |
| | |
| | |
| | |
| | |
| | |
Auto Parts & Equipment — 1.6% |
Adient Global Holdings Ltd. | | |
| | |
| | |
| | |
American Axle & Manufacturing Inc. | | |
| | |
| | |
| | |
Clarios Global LP/Clarios U.S. Finance Co. | | |
| | |
| | |
| | |
| | |
| | |
| | |
| | |
Goodyear Tire & Rubber Co. (The) | | |
| | |
| | |
Schedule of Investments (unaudited)(continued)October 31, 2024
iShares® iBoxx $ High Yield Corporate Bond ETF(Percentages shown are based on Net Assets)
| | |
Auto Parts & Equipment (continued) |
| | |
| | |
| | |
| | |
| | |
6.38%, 05/15/29, (6.38% cash)(a)(c) | | |
7.75%, 11/15/30, (7.75% cash and 8.50% PIK)(a)(c) | | |
8.00%, 11/15/32, (8.00% cash and 8.75% PIK)(a)(b)(c) | | |
Tenneco Inc., 8.00%, 11/17/28(a)(b) | | |
ZF North America Capital Inc. | | |
| | |
| | |
| | |
| | |
| | |
|
| | |
| | |
| | |
| | |
| | |
| | |
4.20%, 06/01/32, (1-year CMT + 2.600%)(a)(b)(d) | | |
| | |
| | |
5.46%, 06/30/35, (5-year CMT + 4.750%)(a)(d) | | |
5.86%, 06/19/32, (5-year USD ICE Swap + 3.703%)(a)(b)(d) | | |
7.30%, 04/02/34, (5-year USD ICE Swap + 4.914%)(a)(b)(d) | | |
| | |
Building Materials — 1.7% |
Builders FirstSource Inc. | | |
| | |
| | |
| | |
| | |
Camelot Return Merger Sub Inc., 8.75%, 08/01/28(a)(b) | | |
Cornerstone Building Brands Inc., 9.50%, 08/15/29(a)(b) | | |
EMRLD Borrower LP/Emerald Co-Issuer Inc. | | |
| | |
| | |
Miter Brands Acquisition Holdco Inc./MIWD Borrower LLC, 6.75%, 04/01/32(a)(b) | | |
MIWD Holdco II LLC/MIWD Finance Corp., 5.50%, 02/01/30(a)(b) | | |
Smyrna Ready Mix Concrete LLC | | |
| | |
| | |
Standard Industries Inc./New York | | |
| | |
| | |
| | |
| | |
| | |
Building Materials (continued) |
| | |
Summit Materials LLC/Summit Materials Finance Corp. | | |
| | |
| | |
| | |
|
Asp Unifrax Hld New Money, 0.00%, 12/31/49(e) | | |
ASP Unifrax Holdings Inc. | | |
7.10%, 09/30/29, (5.85% cash and 1.25% PIK)(a)(c) | | |
11.18%, 09/30/29, (10.43% cash and 11.18% PIK)(a)(c) | | |
| | |
| | |
| | |
Axalta Coating Systems Dutch Holding B BV, 7.25%, 02/15/31(a)(b) | | |
Axalta Coating Systems LLC, 3.38%, 02/15/29(a)(b) | | |
Axalta Coating Systems LLC/Axalta Coating Systems Dutch Holding B BV, 4.75%, 06/15/27(a)(b) | | |
| | |
| | |
| | |
| | |
| | |
| | |
| | |
| | |
| | |
| | |
| | |
| | |
| | |
| | |
| | |
| | |
| | |
| | |
| | |
Olympus Water U.S. Holding Corp. | | |
| | |
| | |
| | |
| | |
| | |
| | |
| | |
Tronox Inc., 4.63%, 03/15/29(a)(b) | | |
| | |
| | |
| | |
| | |
Commercial Services — 4.8% |
ADT Security Corp. (The), 4.13%, 08/01/29(a)(b) | | |
Schedule of Investments (unaudited)(continued)October 31, 2024
iShares® iBoxx $ High Yield Corporate Bond ETF(Percentages shown are based on Net Assets)
| | |
Commercial Services (continued) |
Albion Financing 1 SARL/Aggreko Holdings Inc., 6.13%, 10/15/26(a) | | |
Albion Financing 2 SARL, 8.75%, 04/15/27(a)(b) | | |
Allied Universal Holdco LLC, 7.88%, 02/15/31(a) | | |
Allied Universal Holdco LLC/Allied Universal Finance Corp. | | |
| | |
| | |
Allied Universal Holdco LLC/Allied Universal Finance Corp./Atlas Luxco 4 SARL, 4.63%, 06/01/28(a)(b) | | |
APX Group Inc., 5.75%, 07/15/29(a)(b) | | |
Avis Budget Car Rental LLC/Avis Budget Finance Inc. | | |
| | |
| | |
| | |
| | |
| | |
Belron U.K. Finance PLC, 5.75%, 10/15/29(a)(b) | | |
| | |
| | |
| | |
| | |
Boost Newco Borrower LLC, 7.50%, 01/15/31(a) | | |
| | |
| | |
| | |
| | |
| | |
| | |
| | |
| | |
Garda World Security Corp. | | |
| | |
| | |
| | |
| | |
| | |
| | |
| | |
| | |
| | |
| | |
| | |
| | |
| | |
| | |
| | |
| | |
Prime Security Services Borrower LLC/Prime Finance Inc. | | |
| | |
| | |
| | |
Raven Acquisition Holdings LLC, 6.88%, 11/15/31(a) | | |
| | |
Commercial Services (continued) |
| | |
| | |
| | |
Service Corp. International/U.S. | | |
| | |
| | |
| | |
| | |
| | |
Shift4 Payments LLC/Shift4 Payments Finance Sub Inc. | | |
| | |
| | |
Sotheby's, 7.38%, 10/15/27(a)(b) | | |
United Rentals North America Inc. | | |
| | |
| | |
| | |
| | |
| | |
| | |
| | |
| | |
Wand NewCo 3 Inc., 7.63%, 01/30/32(a)(b) | | |
| | |
| | |
| | |
| | |
| | |
|
Amentum Holdings Inc., 7.25%, 08/01/32(a)(b) | | |
Fortress Intermediate 3 Inc., 7.50%, 06/01/31(a)(b) | | |
McAfee Corp., 7.38%, 02/15/30(a)(b) | | |
NCR Atleos Corp., 9.50%, 04/01/29(a)(b) | | |
| | |
| | |
| | |
| | |
| | |
| | |
| | |
| | |
| | |
Vericast Corp., 12.41%, 06/15/30(d) | | |
Western Digital Corp., 4.75%, 02/15/26 | | |
| | |
Cosmetics & Personal Care — 0.5% |
Coty Inc., 5.00%, 04/15/26(a)(b) | | |
Coty Inc./HFC Prestige Products Inc./HFC Prestige International U.S. LLC | | |
| | |
| | |
Edgewell Personal Care Co. | | |
| | |
| | |
Perrigo Finance Unlimited Co. | | |
| | |
| | |
Schedule of Investments (unaudited)(continued)October 31, 2024
iShares® iBoxx $ High Yield Corporate Bond ETF(Percentages shown are based on Net Assets)
| | |
Cosmetics & Personal Care (continued) |
| | |
| | |
| | |
| | |
Distribution & Wholesale — 0.4% |
American Builders & Contractors Supply Co. Inc. | | |
| | |
| | |
H&E Equipment Services Inc., 3.88%, 12/15/28(a)(b) | | |
Ritchie Bros Holdings Inc. | | |
| | |
| | |
Wesco Aircraft Holdings Inc. | | |
| | |
9.00%, 11/15/26(a)(b)(g)(h) | | |
| | |
Diversified Financial Services — 4.7% |
AG Issuer LLC, 6.25%, 03/01/28(a) | | |
AG TTMT Escrow Issuer LLC, 8.63%, 09/30/27(a)(b) | | |
| | |
| | |
| | |
| | |
| | |
| | |
Burford Capital Global Finance LLC | | |
| | |
| | |
| | |
| | |
| | |
| | |
| | |
| | |
Encore Capital Group Inc. | | |
| | |
| | |
Focus Financial Partners LLC, 6.75%, 09/15/31(a)(b) | | |
Freedom Mortgage Holdings LLC | | |
| | |
| | |
| | |
| | |
| | |
| | |
| | |
| | |
Global Aircraft Leasing Co. Ltd., 8.75%, 09/01/27(a)(b) | | |
| | |
| | |
| | |
Series 144*, 6.88%, 05/15/30(a) | | |
Jane Street Group/JSG Finance Inc. | | |
| | |
| | |
| | |
Diversified Financial Services (continued) |
| | |
Jefferies Finance LLC/JFIN Co-Issuer Corp. | | |
| | |
| | |
Macquarie Airfinance Holdings Ltd. | | |
| | |
| | |
| | |
Midcap Financial Issuer Trust | | |
| | |
| | |
Nationstar Mortgage Holdings Inc. | | |
| | |
| | |
| | |
| | |
| | |
| | |
| | |
| | |
| | |
| | |
| | |
| | |
| | |
| | |
| | |
| | |
| | |
| | |
| | |
| | |
| | |
| | |
| | |
| | |
| | |
| | |
PennyMac Financial Services Inc. | | |
| | |
| | |
| | |
| | |
| | |
| | |
| | |
| | |
Rocket Mortgage LLC/Rocket Mortgage Co-Issuer Inc. | | |
| | |
| | |
| | |
| | |
| | |
| | |
| | |
Synchrony Financial, 7.25%, 02/02/33(b) | | |
United Wholesale Mortgage LLC | | |
| | |
| | |
Schedule of Investments (unaudited)(continued)October 31, 2024
iShares® iBoxx $ High Yield Corporate Bond ETF(Percentages shown are based on Net Assets)
| | |
Diversified Financial Services (continued) |
| | |
| | |
|
AES Corp. (The), 7.60%, 01/15/55, (5-year CMT + 3.201%)(d) | | |
Alpha Generation LLC, 6.75%, 10/15/32(a)(b) | | |
California Buyer Ltd./Atlantica Sustainable Infrastructure PLC, 6.38%, 02/15/32(a) | | |
| | |
| | |
| | |
| | |
| | |
| | |
| | |
Clearway Energy Operating LLC | | |
| | |
| | |
DPL Inc., 4.35%, 04/15/29(b) | | |
| | |
7.88%, 06/15/54, (5-year CMT + 3.658%)(d) | | |
8.13%, 06/15/53, (5-year CMT + 3.864%)(d) | | |
Electricite de France SA, 9.13%, (5-year CMT + 5.411%)(a)(d)(i) | | |
Emera Inc., Series 16-A, 6.75%, 06/15/76, (3-mo. LIBOR US + 5.440%)(b)(d) | | |
EUSHI Finance Inc., 7.63%, 12/15/54, (5-year CMT + 3.136%)(a)(b)(d) | | |
Lightning Power LLC, 7.25%, 08/15/32(a) | | |
NextEra Energy Operating Partners LP | | |
| | |
| | |
| | |
| | |
| | |
| | |
| | |
| | |
| | |
| | |
| | |
| | |
| | |
| | |
| | |
7.38%, 03/15/55, (5-year CMT + 3.883%)(d) | | |
| | |
| | |
| | |
Talen Energy Supply LLC, 8.63%, 06/01/30(a) | | |
Vistra Operations Co. LLC | | |
| | |
| | |
| | |
| | |
| | |
| | |
|
| | |
| | |
Electrical Components & Equipment — 0.4% |
| | |
| | |
| | |
| | |
| | |
| | |
| | |
| | |
|
Imola Merger Corp., 4.75%, 05/15/29(a)(b) | | |
| | |
| | |
| | |
Sensata Technologies Inc. | | |
| | |
| | |
| | |
| | |
Energy - Alternate Sources — 0.1% |
TerraForm Power Operating LLC | | |
| | |
| | |
| | |
Engineering & Construction — 0.2% |
| | |
| | |
| | |
Brand Industrial Services Inc., 10.38%, 08/01/30(a)(b) | | |
| | |
|
AMC Entertainment Holdings Inc. | | |
| | |
10.00%, 06/15/26, (10.00% Cash or 12.00% PIK)(a)(b)(c) | | |
Caesars Entertainment Inc. | | |
| | |
| | |
| | |
| | |
| | |
Cedar Fair LP/Canada's Wonderland Co./Magnum Management Corp./Millennium Op | | |
| | |
| | |
| | |
| | |
| | |
| | |
| | |
| | |
| | |
| | |
International Game Technology PLC | | |
| | |
| | |
Schedule of Investments (unaudited)(continued)October 31, 2024
iShares® iBoxx $ High Yield Corporate Bond ETF(Percentages shown are based on Net Assets)
| | |
Entertainment (continued) |
| | |
Light & Wonder International Inc. | | |
| | |
| | |
| | |
Live Nation Entertainment Inc. | | |
| | |
| | |
| | |
Merlin Entertainments Group U.S. Holdings Inc., 7.38%, 02/15/31(a)(b) | | |
Merlin Entertainments Ltd., 5.75%, 06/15/26(a) | | |
Mohegan Tribal Gaming Authority, 8.00%, 02/01/26(a)(b) | | |
Motion Bondco DAC, 6.63%, 11/15/27(a)(b) | | |
Odeon Finco PLC, 12.75%, 11/01/27(a)(b) | | |
Premier Entertainment Sub LLC/Premier Entertainment Finance Corp. | | |
| | |
| | |
Resorts World Las Vegas LLC/RWLV Capital Inc. | | |
| | |
| | |
Six Flags Entertainment Corp./DE | | |
| | |
| | |
Six Flags Entertainment Corp./Six Flags Theme Parks Inc., 6.63%, 05/01/32(a)(b) | | |
WMG Acquisition Corp., 3.00%, 02/15/31(a)(b) | | |
Wynn Resorts Finance LLC/Wynn Resorts Capital Corp. | | |
| | |
| | |
| | |
| | |
Environmental Control — 0.8% |
| | |
| | |
| | |
| | |
| | |
| | |
| | |
| | |
| | |
| | |
| | |
| | |
| | |
| | |
| | |
| | |
| | |
Wrangler Holdco Corp., 6.63%, 04/01/32(a)(b) | | |
| | |
| | |
|
Albertsons Companies Inc./Safeway Inc./New Albertsons LP/Albertsons LLC | | |
| | |
| | |
| | |
| | |
| | |
| | |
| | |
| | |
| | |
| | |
Chobani Holdco II LLC, 8.75%, 10/01/29, (8.75% cash and 9.5% PIK)(a)(b)(c) | | |
KeHE Distributors LLC/KeHE Finance Corp./NextWave Distribution Inc., 9.00%, 02/15/29(a)(b) | | |
Lamb Weston Holdings Inc. | | |
| | |
| | |
| | |
Performance Food Group Inc. | | |
| | |
| | |
| | |
| | |
| | |
| | |
| | |
| | |
| | |
| | |
| | |
| | |
| | |
| | |
| | |
| | |
| | |
| | |
| | |
| | |
| | |
| | |
| | |
|
Aramark Services Inc., 5.00%, 02/01/28(a)(b) | | |
| | |
| | |
| | |
| | |
Forest Products & Paper — 0.2% |
| | |
| | |
| | |
Mercer International Inc. | | |
| | |
| | |
| | |
Schedule of Investments (unaudited)(continued)October 31, 2024
iShares® iBoxx $ High Yield Corporate Bond ETF(Percentages shown are based on Net Assets)
| | |
|
AmeriGas Partners LP/AmeriGas Finance Corp. | | |
| | |
| | |
| | |
| | |
| | |
Health Care - Products — 1.4% |
| | |
| | |
| | |
Bausch & Lomb Corp., 8.38%, 10/01/28(a) | | |
| | |
| | |
| | |
| | |
| | |
| | |
Medline Borrower LP/Medline Co-Issuer Inc., 6.25%, 04/01/29(a)(b) | | |
| | |
| | |
| | |
| | |
Health Care - Services — 4.4% |
Catalent Pharma Solutions Inc. | | |
| | |
| | |
| | |
Charles River Laboratories International Inc. | | |
| | |
| | |
| | |
CHS/Community Health Systems Inc. | | |
| | |
| | |
| | |
| | |
| | |
| | |
| | |
| | |
| | |
| | |
| | |
| | |
| | |
| | |
| | |
| | |
| | |
| | |
| | |
| | |
| | |
| | |
| | |
| | |
| | |
| | |
| | |
Health Care - Services (continued) |
| | |
| | |
| | |
| | |
| | |
MPH Acquisition Holdings LLC | | |
| | |
| | |
Prime Healthcare Services Inc., 9.38%, 09/01/29(a)(b) | | |
| | |
7.78%, 01/31/29, (4.28% Cash and 3.50% PIK)(a)(b)(c) | | |
9.78%, 02/15/30, (9.78% PIK)(a)(b)(c) | | |
Select Medical Corp., 6.25%, 08/15/26(a)(b) | | |
Star Parent Inc., 9.00%, 10/01/30(a)(b) | | |
| | |
| | |
| | |
| | |
| | |
| | |
| | |
| | |
| | |
| | |
Holding Companies - Diversified — 0.7% |
Compass Group Diversified Holdings LLC, 5.25%, 04/15/29(a) | | |
Icahn Enterprises LP/Icahn Enterprises Finance Corp. | | |
| | |
| | |
| | |
| | |
| | |
| | |
| | |
| | |
| | |
|
Ashton Woods USA LLC/Ashton Woods Finance Co., 4.63%, 04/01/30(a) | | |
Brookfield Residential Properties Inc./Brookfield Residential U.S. LLC | | |
| | |
| | |
| | |
| | |
| | |
| | |
| | |
| | |
Taylor Morrison Communities Inc. | | |
| | |
| | |
| | |
| | |
Schedule of Investments (unaudited)(continued)October 31, 2024
iShares® iBoxx $ High Yield Corporate Bond ETF(Percentages shown are based on Net Assets)
| | |
|
Tempur Sealy International Inc. | | |
| | |
| | |
| | |
Hotels, Restaurants & Leisure — 0.1% |
1011778 BC ULC/New Red Finance Inc., 6.13%, 06/15/29(a) | | |
Household Products & Wares — 0.2% |
| | |
| | |
| | |
Kronos Acquisition Holdings Inc. | | |
| | |
| | |
| | |
|
| | |
| | |
| | |
| | |
Scotts Miracle-Gro Co. (The) | | |
| | |
| | |
| | |
| | |
|
Acrisure LLC/Acrisure Finance Inc. | | |
| | |
| | |
| | |
| | |
| | |
Alliant Holdings Intermediate LLC/Alliant Holdings Co-Issuer | | |
| | |
| | |
| | |
| | |
| | |
| | |
| | |
| | |
| | |
| | |
Ardonagh Finco Ltd., 7.75%, 02/15/31(a) | | |
Ardonagh Group Finance Ltd., 8.88%, 02/15/32(a) | | |
| | |
| | |
| | |
FWD Group Holdings Ltd., 8.40%, 04/05/29(a)(b) | | |
| | |
4.70%, 10/15/51, (5-year CMT + 3.796%)(a)(b)(d) | | |
7.95%, 10/15/54, (5-year CMT + 3.608%)(a)(b)(d) | | |
| | |
|
Howden U.K. Refinance PLC/Howden U.K. Refinance 2 PLC/Howden U.S. Refinance LLC | | |
| | |
| | |
| | |
| | |
| | |
| | |
Jones Deslauriers Insurance Management Inc. | | |
| | |
| | |
Liberty Mutual Group Inc. | | |
4.13%, 12/15/51, (5-year CMT + 3.315%)(a)(d) | | |
| | |
Panther Escrow Issuer LLC, 7.13%, 06/01/31(a) | | |
| | |
| | |
| | |
| | |
|
| | |
| | |
| | |
Cogent Communications Group LLC | | |
| | |
| | |
| | |
| | |
| | |
Go Daddy Operating Co. LLC/GD Finance Co. Inc. | | |
| | |
| | |
ION Trading Technologies SARL | | |
| | |
| | |
Match Group Holdings II LLC | | |
| | |
| | |
| | |
| | |
Newfold Digital Holdings Group Inc. | | |
| | |
| | |
| | |
5.13%, (5-year CMT + 4.578%)(a)(b)(d)(i) | | |
6.25%, (5-year CMT + 4.956%)(a)(b)(d)(i) | | |
| | |
| | |
| | |
| | |
| | |
| | |
| | |
| | |
Schedule of Investments (unaudited)(continued)October 31, 2024
iShares® iBoxx $ High Yield Corporate Bond ETF(Percentages shown are based on Net Assets)
| | |
|
ATI Inc., 7.25%, 08/15/30(b) | | |
| | |
| | |
| | |
| | |
| | |
| | |
| | |
| | |
| | |
| | |
| | |
| | |
|
Carnival Holdings Bermuda Ltd., 10.38%, 05/01/28(a) | | |
| | |
| | |
| | |
| | |
| | |
| | |
| | |
| | |
| | |
NCL Finance Ltd., 6.13%, 03/15/28(a)(b) | | |
| | |
| | |
| | |
| | |
| | |
| | |
| | |
VOC Escrow Ltd., 5.00%, 02/15/28(a) | | |
| | |
|
| | |
| | |
| | |
Hilton Domestic Operating Co. Inc. | | |
| | |
| | |
| | |
| | |
| | |
| | |
| | |
| | |
Hilton Grand Vacations Borrower Escrow LLC/Hilton Grand Vacations Borrower Esc | | |
| | |
| | |
| | |
Hilton Worldwide Finance LLC/Hilton Worldwide Finance Corp., 4.88%, 04/01/27(b) | | |
Melco Resorts Finance Ltd. | | |
| | |
| | |
| | |
|
| | |
| | |
| | |
| | |
| | |
| | |
| | |
MGM Resorts International | | |
| | |
| | |
| | |
| | |
| | |
| | |
| | |
| | |
| | |
| | |
| | |
| | |
| | |
| | |
| | |
| | |
| | |
| | |
| | |
| | |
| | |
| | |
|
| | |
| | |
| | |
Husky Injection Molding Systems Ltd./Titan Co-Borrower LLC, 9.00%, 02/15/29(a)(b) | | |
| | |
| | |
| | |
TK Elevator Holdco GmbH, 7.63%, 07/15/28(a)(b) | | |
TK Elevator U.S. Newco Inc., 5.25%, 07/15/27(a) | | |
| | |
|
| | |
| | |
| | |
Hillenbrand Inc., 6.25%, 02/15/29(b) | | |
| | |
|
| | |
| | |
| | |
CCO Holdings LLC/CCO Holdings Capital Corp. | | |
| | |
| | |
| | |
| | |
Schedule of Investments (unaudited)(continued)October 31, 2024
iShares® iBoxx $ High Yield Corporate Bond ETF(Percentages shown are based on Net Assets)
| | |
|
| | |
| | |
| | |
| | |
| | |
| | |
| | |
| | |
| | |
| | |
| | |
| | |
| | |
| | |
| | |
| | |
| | |
| | |
| | |
| | |
| | |
| | |
Directv Financing LLC, 8.88%, 02/01/30(a)(b) | | |
Directv Financing LLC/Directv Financing Co-Obligor Inc., 5.88%, 08/15/27(a)(b) | | |
| | |
| | |
| | |
| | |
| | |
| | |
DISH Network Corp., 11.75%, 11/15/27(a) | | |
| | |
| | |
| | |
| | |
| | |
iHeartCommunications Inc. | | |
| | |
| | |
| | |
| | |
LCPR Senior Secured Financing DAC | | |
| | |
| | |
McGraw-Hill Education Inc. | | |
| | |
| | |
| | |
| | |
| | |
| | |
| | |
| | |
| | |
| | |
6.25%, 02/28/57, (3-mo. LIBOR US + 3.899%)(b)(d) | | |
6.38%, 03/30/62, (5-year CMT + 3.999%)(b)(d) | | |
| | |
|
Radiate Holdco LLC/Radiate Finance Inc. | | |
| | |
| | |
Scripps Escrow II Inc., 3.88%, 01/15/29(a)(b) | | |
Scripps Escrow Inc., 5.88%, 07/15/27(a)(b) | | |
Sinclair Television Group Inc. | | |
| | |
| | |
| | |
| | |
| | |
| | |
| | |
| | |
| | |
Sunrise FinCo I BV, 4.88%, 07/15/31(a) | | |
Sunrise HoldCo IV BV, 5.50%, 01/15/28(a)(b) | | |
| | |
| | |
| | |
| | |
Telenet Finance Luxembourg Notes SARL, 5.50%, 03/01/28(a) | | |
Univision Communications Inc. | | |
| | |
| | |
| | |
| | |
| | |
Virgin Media Finance PLC, 5.00%, 07/15/30(a)(b) | | |
Virgin Media Secured Finance PLC | | |
| | |
| | |
Virgin Media Vendor Financing Notes IV DAC, 5.00%, 07/15/28(a)(b) | | |
VZ Secured Financing BV, 5.00%, 01/15/32(a) | | |
| | |
| | |
| | |
Ziggo BV, 4.88%, 01/15/30(a) | | |
| | |
|
Alcoa Nederland Holding BV | | |
| | |
| | |
| | |
| | |
| | |
| | |
| | |
Constellium SE, 3.75%, 04/15/29(a)(b) | | |
FMG Resources August 2006 Pty. Ltd. | | |
| | |
| | |
FMG Resources August Pty. Ltd. | | |
| | |
| | |
| | |
| | |
| | |
Schedule of Investments (unaudited)(continued)October 31, 2024
iShares® iBoxx $ High Yield Corporate Bond ETF(Percentages shown are based on Net Assets)
| | |
|
| | |
| | |
| | |
| | |
| | |
Office & Business Equipment — 0.1% |
| | |
| | |
| | |
| | |
|
Aethon United BR LP/Aethon United Finance Corp., 7.50%, 10/01/29(a) | | |
| | |
| | |
| | |
Ascent Resources Utica Holdings LLC/ARU Finance Corp. | | |
| | |
| | |
| | |
| | |
| | |
| | |
California Resources Corp. | | |
| | |
| | |
| | |
| | |
| | |
| | |
| | |
| | |
| | |
| | |
| | |
| | |
| | |
| | |
| | |
| | |
| | |
| | |
| | |
Crescent Energy Finance LLC | | |
| | |
| | |
| | |
| | |
| | |
| | |
Encino Acquisition Partners Holdings LLC | | |
| | |
| | |
Energian Israel Finance Ltd. | | |
| | |
| | |
| | |
| | |
| | |
|
| | |
| | |
| | |
| | |
| | |
Hilcorp Energy I LP/Hilcorp Finance Co. | | |
| | |
| | |
| | |
| | |
| | |
| | |
| | |
| | |
| | |
| | |
| | |
| | |
| | |
| | |
| | |
Murphy Oil Corp., 6.00%, 10/01/32(b) | | |
| | |
| | |
| | |
| | |
Noble Finance II LLC, 8.00%, 04/15/30(a) | | |
| | |
| | |
| | |
| | |
| | |
| | |
| | |
| | |
PBF Holding Co. LLC/PBF Finance Corp. | | |
| | |
| | |
Permian Resources Operating LLC | | |
| | |
| | |
| | |
| | |
| | |
| | |
| | |
| | |
| | |
| | |
| | |
| | |
| | |
| | |
| | |
| | |
| | |
Sunoco LP/Sunoco Finance Corp. | | |
| | |
| | |
| | |
| | |
Schedule of Investments (unaudited)(continued)October 31, 2024
iShares® iBoxx $ High Yield Corporate Bond ETF(Percentages shown are based on Net Assets)
| | |
|
| | |
| | |
| | |
| | |
| | |
| | |
| | |
| | |
| | |
Transocean Titan Financing Ltd., 8.38%, 02/01/28(a) | | |
Valaris Ltd., 8.38%, 04/30/30(a) | | |
Vital Energy Inc., 7.88%, 04/15/32(a)(b) | | |
| | |
Oil & Gas Services — 0.5% |
Archrock Partners LP/Archrock Partners Finance Corp. | | |
| | |
| | |
| | |
USA Compression Partners LP/USA Compression Finance Corp. | | |
| | |
| | |
Weatherford International Ltd., 8.63%, 04/30/30(a) | | |
| | |
Packaging & Containers — 2.6% |
Ardagh Metal Packaging Finance USA LLC/Ardagh Metal Packaging Finance PLC | | |
| | |
| | |
| | |
Ardagh Packaging Finance PLC/Ardagh Holdings USA Inc. | | |
| | |
| | |
| | |
| | |
| | |
| | |
| | |
Berry Global Inc., 5.63%, 07/15/27(a)(b) | | |
Clydesdale Acquisition Holdings Inc. | | |
| | |
| | |
| | |
Crown Americas LLC, 5.25%, 04/01/30(b) | | |
Crown Americas LLC/Crown Americas Capital Corp. V, 4.25%, 09/30/26(b) | | |
Crown Americas LLC/Crown Americas Capital Corp. VI, 4.75%, 02/01/26 | | |
Graphic Packaging International LLC | | |
| | |
| | |
| | |
| | |
| | |
| | |
| | |
Packaging & Containers (continued) |
| | |
| | |
Mauser Packaging Solutions Holding Co. | | |
| | |
| | |
OI European Group BV, 4.75%, 02/15/30(a) | | |
Owens-Brockway Glass Container Inc. | | |
| | |
| | |
Pactiv Evergreen Group Issuer Inc./Pactiv Evergreen Group Issuer LLC, 4.00%, 10/15/27(a)(b) | | |
Pactiv Evergreen Group Issuer LLC/Pactiv Evergreen Group Issuer Inc., 4.38%, 10/15/28(a)(b) | | |
| | |
| | |
| | |
| | |
Sealed Air Corp./Sealed Air Corp. U.S. | | |
| | |
| | |
Silgan Holdings Inc., 4.13%, 02/01/28(b) | | |
Trivium Packaging Finance BV | | |
| | |
| | |
| | |
|
| | |
| | |
| | |
Bausch Health Americas Inc. | | |
| | |
| | |
Bausch Health Companies Inc. | | |
| | |
| | |
| | |
| | |
| | |
| | |
| | |
| | |
| | |
| | |
| | |
Endo Finance Holdings Inc., 8.50%, 04/15/31(a)(b) | | |
HLF Financing SARL LLC/Herbalife International Inc. | | |
| | |
| | |
Jazz Securities DAC, 4.38%, 01/15/29(a)(b) | | |
Organon & Co./Organon Foreign Debt Co-Issuer BV | | |
| | |
| | |
| | |
| | |
Schedule of Investments (unaudited)(continued)October 31, 2024
iShares® iBoxx $ High Yield Corporate Bond ETF(Percentages shown are based on Net Assets)
| | |
Pharmaceuticals (continued) |
| | |
| | |
| | |
Teva Pharmaceutical Finance Netherlands III BV | | |
| | |
| | |
| | |
| | |
| | |
| | |
| | |
|
Antero Midstream Partners LP/Antero Midstream Finance Corp. | | |
| | |
| | |
| | |
| | |
Blue Racer Midstream LLC/Blue Racer Finance Corp. | | |
| | |
| | |
| | |
| | |
| | |
| | |
| | |
CQP Holdco LP/BIP-V Chinook Holdco LLC | | |
| | |
| | |
Delek Logistics Partners LP/Delek Logistics Finance Corp. | | |
| | |
| | |
| | |
| | |
| | |
| | |
7.13%, 10/01/54, (5-year CMT + 2.829%)(b)(d) | | |
8.00%, 05/15/54, (5-year CMT + 4.020%)(b)(d) | | |
EQM Midstream Partners LP | | |
| | |
| | |
| | |
| | |
| | |
| | |
| | |
| | |
Genesis Energy LP/Genesis Energy Finance Corp. | | |
| | |
| | |
| | |
| | |
| | |
| | |
|
Global Partners LP/GLP Finance Corp. | | |
| | |
| | |
| | |
| | |
| | |
Hess Midstream Operations LP | | |
| | |
| | |
| | |
| | |
| | |
Howard Midstream Energy Partners LLC | | |
| | |
| | |
ITT Holdings LLC, 6.50%, 08/01/29(a)(b) | | |
| | |
| | |
| | |
| | |
| | |
| | |
| | |
NGL Energy Operating LLC/NGL Energy Finance Corp. | | |
| | |
| | |
| | |
| | |
| | |
| | |
| | |
Rockies Express Pipeline LLC, 4.95%, 07/15/29(a) | | |
South Bow Canadian Infrastructure Holdings Ltd. | | |
7.50%, 03/01/55, (5-year CMT + 3.667%)(a)(d) | | |
7.63%, 03/01/55, (5-year CMT + 3.949%)(a)(d) | | |
Tallgrass Energy Partners LP/Tallgrass Energy Finance Corp. | | |
| | |
| | |
| | |
| | |
| | |
Venture Global Calcasieu Pass LLC | | |
| | |
| | |
| | |
| | |
| | |
| | |
| | |
| | |
| | |
| | |
| | |
Schedule of Investments (unaudited)(continued)October 31, 2024
iShares® iBoxx $ High Yield Corporate Bond ETF(Percentages shown are based on Net Assets)
| | |
|
Anywhere Real Estate Group LLC/Anywhere Co-Issuer Corp., 7.00%, 04/15/30(a)(b) | | |
Anywhere Real Estate Group LLC/Realogy Co-Issuer Corp. | | |
| | |
| | |
Cushman & Wakefield U.S. Borrower LLC | | |
| | |
| | |
Howard Hughes Corp. (The) | | |
| | |
| | |
| | |
| | |
| | |
| | |
| | |
| | |
Real Estate Investment Trusts — 3.5% |
Brandywine Operating Partnership LP | | |
| | |
| | |
Brookfield Property REIT Inc./BPR Cumulus LLC/BPR Nimbus LLC/GGSI Sellco LLC | | |
| | |
| | |
Diversified Healthcare Trust | | |
| | |
| | |
Hudson Pacific Properties LP | | |
| | |
| | |
| | |
| | |
| | |
| | |
| | |
| | |
| | |
| | |
| | |
| | |
Iron Mountain Information Management Services Inc., 5.00%, 07/15/32(a)(b) | | |
Ladder Capital Finance Holdings LLLP/Ladder Capital Finance Corp. | | |
| | |
| | |
| | |
MPT Operating Partnership LP/MPT Finance Corp. | | |
| | |
| | |
| | |
| | |
Park Intermediate Holdings LLC/PK Domestic Property LLC/PK Finance Co-Issuer | | |
| | |
| | |
| | |
Real Estate Investment Trusts (continued) |
| | |
RHP Hotel Properties LP/RHP Finance Corp. | | |
| | |
| | |
| | |
| | |
Rithm Capital Corp., 8.00%, 04/01/29(a) | | |
| | |
| | |
| | |
| | |
| | |
| | |
| | |
| | |
| | |
| | |
| | |
| | |
| | |
| | |
| | |
| | |
Starwood Property Trust Inc. | | |
| | |
| | |
| | |
| | |
Uniti Group LP/Uniti Fiber Holdings Inc./CSL Capital LLC, 6.00%, 01/15/30(a)(b) | | |
Uniti Group LP/Uniti Group Finance 2019 Inc./CSL Capital LLC | | |
| | |
| | |
| | |
XHR LP, 6.38%, 08/15/25(a) | | |
| | |
|
1011778 BC ULC/New Red Finance Inc. | | |
| | |
| | |
| | |
| | |
| | |
Advance Auto Parts Inc., 3.90%, 04/15/30(b) | | |
Asbury Automotive Group Inc. | | |
| | |
| | |
| | |
| | |
| | |
| | |
| | |
| | |
BCPE Ulysses Intermediate Inc., 7.75%, 04/01/27, (7.75% PIK)(a)(b)(c) | | |
Beacon Roofing Supply Inc., 6.50%, 08/01/30(a)(b) | | |
| | |
12.00%, 12/01/28, (12.00% PIK)(a)(c) | | |
13.00%, 06/01/30, (13.00% PIK)(a)(c) | | |
Schedule of Investments (unaudited)(continued)October 31, 2024
iShares® iBoxx $ High Yield Corporate Bond ETF(Percentages shown are based on Net Assets)
| | |
|
14.00%, 06/01/31, (14.00% PIK)(a)(b)(c) | | |
eG Global Finance PLC, 12.00%, 11/30/28(a) | | |
Ferrellgas LP/Ferrellgas Finance Corp. | | |
| | |
| | |
Fertitta Entertainment LLC/Fertitta Entertainment Finance Co. Inc. | | |
| | |
| | |
| | |
| | |
| | |
| | |
| | |
| | |
| | |
Global Auto Holdings Ltd./AAG FH U.K. Ltd. | | |
| | |
| | |
| | |
| | |
| | |
KFC Holding Co./Pizza Hut Holdings LLC/Taco Bell of America LLC, 4.75%, 06/01/27(a)(b) | | |
LBM Acquisition LLC, 6.25%, 01/15/29(a)(b) | | |
LCM Investments Holdings II LLC | | |
| | |
| | |
| | |
| | |
| | |
| | |
Macy's Retail Holdings LLC | | |
| | |
| | |
| | |
Michaels Companies Inc. (The) | | |
| | |
| | |
| | |
| | |
| | |
NMG Holding Co. Inc./Neiman Marcus Group LLC, 8.50%, 04/01/26(a) | | |
| | |
| | |
| | |
PetSmart Inc./PetSmart Finance Corp. | | |
| | |
| | |
QVC Inc., 6.88%, 04/15/29(a)(b) | | |
| | |
| | |
| | |
| | |
| | |
| | |
Suburban Propane Partners LP/Suburban Energy Finance Corp., 5.00%, 06/01/31(a)(b) | | |
| | |
|
Walgreens Boots Alliance Inc. | | |
| | |
| | |
| | |
| | |
| | |
| | |
| | |
| | |
| | |
|
| | |
| | |
| | |
| | |
| | |
| | |
|
AthenaHealth Group Inc., 6.50%, 02/15/30(a)(b) | | |
Central Parent Inc./CDK Global Inc., 7.25%, 06/15/29(a)(b) | | |
Central Parent LLC/CDK Global II LLC/CDK Financing Co. Inc., 8.00%, 06/15/29(a) | | |
Clarivate Science Holdings Corp. | | |
| | |
| | |
Cloud Software Group Inc. | | |
| | |
| | |
| | |
| | |
| | |
| | |
Helios Software Holdings Inc./ION Corporate Solutions Finance SARL, 8.75%, 05/01/29(a) | | |
| | |
| | |
| | |
| | |
| | |
| | |
ROBLOX Corp., 3.88%, 05/01/30(a)(b) | | |
| | |
| | |
| | |
| | |
| | |
| | |
| | |
| | |
| | |
UKG Inc., 6.88%, 02/01/31(a)(b) | | |
Veritas U.S. Inc./Veritas Bermuda Ltd., 7.50%, 09/01/25(a) | | |
| | |
Schedule of Investments (unaudited)(continued)October 31, 2024
iShares® iBoxx $ High Yield Corporate Bond ETF(Percentages shown are based on Net Assets)
| | |
Telecommunications — 5.3% |
| | |
| | |
| | |
| | |
| | |
| | |
| | |
| | |
| | |
| | |
| | |
| | |
British Telecommunications PLC | | |
4.25%, 11/23/81, (5-year CMT + 2.985%)(a)(b)(d) | | |
4.88%, 11/23/81, (5-year CMT + 3.493%)(a)(b)(d) | | |
| | |
| | |
| | |
| | |
| | |
CommScope Technologies LLC, 5.00%, 03/15/27(a)(b) | | |
Connect Finco SARL/Connect U.S. Finco LLC, 9.00%, 09/15/29(a)(b) | | |
Consolidated Communications Inc. | | |
| | |
| | |
Frontier Communications Holdings LLC | | |
| | |
| | |
| | |
| | |
| | |
| | |
| | |
Hughes Satellite Systems Corp. | | |
| | |
| | |
| | |
| | |
| | |
| | |
Intelsat Jackson Holdings SA, 6.50%, 03/15/30(a)(b) | | |
| | |
| | |
| | |
| | |
| | |
| | |
| | |
| | |
| | |
| | |
| | |
| | |
| | |
| | |
| | |
| | |
Telecommunications (continued) |
| | |
Series 2033, 6.38%, 11/15/33(a)(b) | | |
Series 2034, 6.00%, 09/30/34(a)(b) | | |
Series 2036, 7.20%, 07/18/36(a) | | |
Series 2038, 7.72%, 06/04/38(a) | | |
Rogers Communications Inc., 5.25%, 03/15/82, (5-year CMT + 3.590%)(a)(d) | | |
| | |
| | |
| | |
| | |
| | |
| | |
Vmed O2 U.K. Financing I PLC | | |
| | |
| | |
| | |
| | |
3.25%, 06/04/81, (5-year CMT + 2.447%)(d) | | |
4.13%, 06/04/81, (5-year CMT + 2.767%)(b)(d) | | |
7.00%, 04/04/79, (5-year USD Swap + 4.873%)(d) | | |
Windstream Services LLC/Windstream Escrow Finance Corp. | | |
| | |
| | |
| | |
| | |
| | |
| | |
|
Brightline East LLC, 11.00%, 01/31/30(a)(b) | | |
| | |
| | |
| | |
| | |
Trucking & Leasing — 0.3% |
Fortress Transportation and Infrastructure Investors LLC | | |
| | |
| | |
| | |
| | |
| | |
| | |
Total Corporate Bonds & Notes — 98.1%
(Cost: $14,612,247,618) | |
Schedule of Investments (unaudited)(continued)October 31, 2024
iShares® iBoxx $ High Yield Corporate Bond ETF(Percentages shown are based on Net Assets)
| | |
|
|
Office Properties Income Trust, NVS | | |
Total Common Stocks — 0.0%
(Cost $0) | |
Total Long-Term Investments — 98.1%
(Cost: $14,612,247,618) | |
|
Money Market Funds — 19.1% |
BlackRock Cash Funds: Institutional, SL Agency Shares, 5.01%(k)(l)(m) | | |
BlackRock Cash Funds: Treasury, SL Agency Shares, 4.83%(k)(l) | | |
Total Short-Term Securities — 19.1%
(Cost: $2,693,774,555) | |
Total Investments — 117.2%
(Cost: $17,306,022,173) | |
Liabilities in Excess of Other Assets — (17.2)% | |
| |
| Security exempt from registration pursuant to Rule 144A under the Securities Act of 1933, as amended. These securities may be resold in transactions exempt from registration to qualified institutional investors. |
| All or a portion of this security is on loan. |
| Payment-in-kind security which may pay interest/dividends in additional par/shares and/or in cash. Rates shown are the current rate and possible payment rates. |
| Variable rate security. Interest rate resets periodically. The rate shown is the effective interest rate as of period end. Security description also includes the reference rate and spread if published and available. |
| |
| Rounds to less than 1,000. |
| Issuer filed for bankruptcy and/or is in default. |
| Non-income producing security. |
| Perpetual security with no stated maturity date. |
| This security may be resold to qualified foreign investors and foreign institutional buyers under Regulation S of the Securities Act of 1933. |
| |
| Annualized 7-day yield as of period end. |
| All or a portion of this security was purchased with the cash collateral from loaned securities. |
Fair Value Hierarchy as of Period End
Various inputs are used in determining the fair value of financial instruments at the measurement of the date. These inputs to valuation techniques are categorized into a fair value hierarchy consisting of three broad levels for financial reporting purposes as follows:
• Level 1 – Unadjusted price quotations in active markets/exchanges that the Fund has the ability to access for identical assets or liabilities;
• Level 2 – Inputs other than quoted prices included within level 1 that are observable for the asset or liability, either directly or indirectly; and
• Level 3 – Inputs that are unobservable and significant to the entire fair value measurement for the asset or liability (including the Valuation Committee’s assumptions used in determining the fair value of financial instruments).
The hierarchy gives the highest priority to unadjusted quoted prices in active markets for identical assets or liabilities (Level 1 measurements) and the lowest priority to unobservable inputs (Level 3 measurements). Accordingly, the degree of judgment exercised in determining fair value is greatest for instruments categorized in Level 3. The inputs used to measure fair value may fall into different levels of the fair value hierarchy. In such cases, for disclosure purposes, the fair value hierarchy classification is determined based on the lowest level input that is significant to the fair value measurement in its entirety. Investments classified within Level 3 have significant unobservable inputs used by the Valuation Committee in determining the price for Fair Valued Investments. Level 3 investments include equity or debt issued by privately held companies or funds. There may not be a secondary market, and/or there are a limited number of investors. The categorization of a value determined for financial instruments is based on the pricing transparency of the financial instruments and is not necessarily an indication of the risks associated with investing in those securities. For information about the Fund’s policy regarding valuation of financial instruments, refer to its most recent financial statements.
The following table summarizes the Fund’s financial instruments categorized in the fair value hierarchy. The breakdown of the Fund’s financial instruments into major categories is disclosed in the Schedule of Investments above.
Schedule of Investments (unaudited)October 31, 2024
iShares® iBoxx $ Investment Grade Corporate Bond ETF(Percentages shown are based on Net Assets)
| | |
|
|
Omnicom Group Inc., 2.60%, 08/01/31(a) | | |
Aerospace & Defense — 2.5% |
| | |
| | |
| | |
| | |
| | |
| | |
| | |
| | |
| | |
| | |
| | |
| | |
| | |
| | |
| | |
| | |
| | |
| | |
| | |
GE Capital International Funding Co. Unlimited Co., 4.42%, 11/15/35(a) | | |
| | |
| | |
| | |
| | |
| | |
| | |
| | |
| | |
L3Harris Technologies Inc. | | |
| | |
| | |
| | |
| | |
| | |
| | |
| | |
| | |
| | |
| | |
| | |
| | |
| | |
| | |
| | |
| | |
| | |
| | |
| | |
| | |
| | |
| | |
| | |
| | |
| | |
| | |
| | |
| | |
Aerospace & Defense (continued) |
| | |
| | |
| | |
| | |
| | |
| | |
| | |
| | |
| | |
| | |
| | |
| | |
| | |
| | |
| | |
| | |
| | |
| | |
| | |
| | |
| | |
| | |
| | |
|
| | |
| | |
| | |
| | |
| | |
| | |
| | |
| | |
| | |
| | |
| | |
| | |
Archer-Daniels-Midland Co. | | |
| | |
| | |
| | |
| | |
| | |
| | |
| | |
| | |
| | |
| | |
| | |
| | |
| | |
| | |
| | |
| | |
| | |
BAT International Finance PLC | | |
| | |
| | |
| | |
| | |
| | |
| | |
Schedule of Investments (unaudited)(continued)October 31, 2024
iShares® iBoxx $ Investment Grade Corporate Bond ETF(Percentages shown are based on Net Assets)
| | |
|
Philip Morris International Inc. | | |
| | |
| | |
| | |
| | |
| | |
| | |
| | |
| | |
| | |
| | |
| | |
| | |
| | |
| | |
| | |
| | |
| | |
| | |
| | |
| | |
| | |
| | |
| | |
| | |
| | |
|
| | |
| | |
| | |
| | |
| | |
| | |
| | |
| | |
| | |
| | |
Auto Manufacturers — 2.3% |
American Honda Finance Corp. | | |
| | |
| | |
| | |
| | |
| | |
| | |
| | |
| | |
| | |
| | |
| | |
| | |
| | |
| | |
| | |
| | |
| | |
Ford Motor Credit Co. LLC | | |
| | |
| | |
| | |
| | |
Auto Manufacturers (continued) |
| | |
| | |
| | |
| | |
| | |
| | |
| | |
| | |
| | |
| | |
| | |
| | |
| | |
| | |
| | |
| | |
| | |
| | |
| | |
| | |
| | |
| | |
| | |
| | |
| | |
General Motors Financial Co. Inc. | | |
| | |
| | |
| | |
| | |
| | |
| | |
| | |
| | |
| | |
| | |
| | |
| | |
| | |
| | |
| | |
| | |
| | |
| | |
Honda Motor Co. Ltd., 2.97%, 03/10/32(a) | | |
Mercedes-Benz Finance North America LLC, 8.50%, 01/18/31(a) | | |
Toyota Motor Credit Corp. | | |
| | |
| | |
| | |
| | |
| | |
| | |
| | |
| | |
| | |
| | |
| | |
| | |
| | |
Schedule of Investments (unaudited)(continued)October 31, 2024
iShares® iBoxx $ Investment Grade Corporate Bond ETF(Percentages shown are based on Net Assets)
| | |
Auto Parts & Equipment — 0.1% |
Aptiv PLC, 3.10%, 12/01/51 | | |
| | |
| | |
| | |
| | |
|
Banco Bilbao Vizcaya Argentaria SA | | |
| | |
6.03%, 03/13/35, (1-year CMT + 1.950%)(c) | | |
| | |
| | |
| | |
| | |
| | |
| | |
| | |
| | |
5.54%, 03/14/30, (1-year CMT + 1.450%)(a)(c) | | |
| | |
| | |
| | |
| | |
| | |
| | |
1.90%, 07/23/31, (1-day SOFR + 1.530%)(c) | | |
1.92%, 10/24/31, (1-day SOFR + 1.370%)(c) | | |
2.09%, 06/14/29, (1-day SOFR + 1.060%)(c) | | |
2.30%, 07/21/32, (1-day SOFR + 1.220%)(c) | | |
2.50%, 02/13/31, (3-mo. CME Term SOFR + 1.252%)(c) | | |
2.57%, 10/20/32, (1-day SOFR + 1.210%)(c) | | |
2.59%, 04/29/31, (1-day SOFR + 2.150%)(c) | | |
2.68%, 06/19/41, (1-day SOFR + 1.930%)(c) | | |
2.69%, 04/22/32, (1-day SOFR + 1.320%)(c) | | |
2.83%, 10/24/51, (1-day SOFR + 1.880%)(c) | | |
2.88%, 10/22/30, (3-mo. CME Term SOFR + 1.452%)(c) | | |
2.97%, 02/04/33, (1-day SOFR + 1.330%)(a)(c) | | |
2.97%, 07/21/52, (1-day SOFR + 1.560%)(a)(c) | | |
3.19%, 07/23/30, (3-mo. CME Term SOFR + 1.442%)(c) | | |
3.31%, 04/22/42, (1-day SOFR + 1.580%)(c) | | |
3.42%, 12/20/28, (3-mo. CME Term SOFR + 1.302%)(c) | | |
3.95%, 01/23/49, (3-mo. CME Term SOFR + 1.452%)(c) | | |
3.97%, 03/05/29, (3-mo. CME Term SOFR + 1.332%)(c) | | |
3.97%, 02/07/30, (3-mo. CME Term SOFR + 1.472%)(a)(c) | | |
4.08%, 04/23/40, (3-mo. CME Term SOFR + 1.582%)(c) | | |
4.08%, 03/20/51, (3-mo. CME Term SOFR + 3.412%)(c) | | |
4.24%, 04/24/38, (3-mo. CME Term SOFR + 2.076%)(c) | | |
4.27%, 07/23/29, (3-mo. CME Term SOFR + 1.572%)(c) | | |
| | |
|
4.33%, 03/15/50, (3-mo. CME Term SOFR + 1.782%)(c) | | |
4.44%, 01/20/48, (3-mo. CME Term SOFR + 2.252%)(a)(c) | | |
4.57%, 04/27/33, (1-day SOFR + 1.830%)(a)(c) | | |
| | |
5.02%, 07/22/33, (1-day SOFR + 2.160%)(c) | | |
5.20%, 04/25/29, (1-day SOFR + 1.630%)(c) | | |
5.29%, 04/25/34, (1-day SOFR + 1.910%)(a)(c) | | |
5.47%, 01/23/35, (1-day SOFR + 1.650%)(c) | | |
5.82%, 09/15/29, (1-day SOFR + 1.570%)(c) | | |
5.87%, 09/15/34, (1-day SOFR + 1.840%)(a)(c) | | |
| | |
| | |
6.20%, 11/10/28, (1-day SOFR + 1.990%)(c) | | |
| | |
Series N, 2.65%, 03/11/32, (1-day SOFR + 1.220%)(a)(c) | | |
Series N, 3.48%, 03/13/52, (1-day SOFR + 1.650%)(c) | | |
Bank of America NA, 6.00%, 10/15/36 | | |
| | |
4.64%, 09/10/30, (1-day SOFR + 1.250%)(a)(c) | | |
| | |
| | |
| | |
Bank of New York Mellon Corp. (The) | | |
| | |
| | |
| | |
Bank of Nova Scotia (The) | | |
| | |
| | |
| | |
| | |
| | |
2.65%, 06/24/31, (1-year CMT + 1.900%)(c) | | |
2.67%, 03/10/32, (1-year CMT + 1.200%)(c) | | |
2.89%, 11/24/32, (1-year CMT + 1.300%)(c) | | |
3.33%, 11/24/42, (1-year CMT + 1.300%)(c) | | |
4.94%, 09/10/30, (1-day SOFR + 1.560%)(c) | | |
| | |
4.97%, 05/16/29, (3-mo. LIBOR US + 1.902%)(a)(c) | | |
| | |
5.34%, 09/10/35, (1-day SOFR + 1.910%)(a)(c) | | |
5.69%, 03/12/30, (1-day SOFR +1.740%)(c) | | |
5.75%, 08/09/33, (1-year CMT + 3.000%)(a)(c) | | |
6.04%, 03/12/55, (1-day SOFR + 2.420%)(c) | | |
6.22%, 05/09/34, (1-day SOFR + 2.980%)(c) | | |
6.49%, 09/13/29, (1-day SOFR + 2.220%)(c) | | |
6.69%, 09/13/34, (1-day SOFR + 2.620%)(a)(c) | | |
7.39%, 11/02/28, (1-year CMT + 3.300%)(c) | | |
7.44%, 11/02/33, (1-year CMT + 3.500%)(c) | | |
Schedule of Investments (unaudited)(continued)October 31, 2024
iShares® iBoxx $ Investment Grade Corporate Bond ETF(Percentages shown are based on Net Assets)
| | |
|
Canadian Imperial Bank of Commerce | | |
| | |
4.63%, 09/11/30, (1-day SOFR + 1.335%)(c) | | |
| | |
| | |
| | |
| | |
| | |
| | |
| | |
| | |
2.52%, 11/03/32, (1-day SOFR + 1.177%)(c) | | |
2.56%, 05/01/32, (1-day SOFR + 1.167%)(c) | | |
2.57%, 06/03/31, (1-day SOFR + 2.107%)(c) | | |
2.67%, 01/29/31, (1-day SOFR + 1.146%)(c) | | |
2.90%, 11/03/42, (1-day SOFR + 1.379%)(a)(c) | | |
2.98%, 11/05/30, (1-day SOFR + 1.422%)(c) | | |
3.06%, 01/25/33, (1-day SOFR + 1.351%)(c) | | |
3.79%, 03/17/33, (1-day SOFR + 1.939%)(c) | | |
3.88%, 01/24/39, (3-mo. CME Term SOFR + 1.430%)(c) | | |
3.98%, 03/20/30, (3-mo. CME Term SOFR + 1.600%)(c) | | |
4.08%, 04/23/29, (3-mo. CME Term SOFR + 1.454%)(c) | | |
| | |
4.28%, 04/24/48, (3-mo. CME Term SOFR + 2.101%)(c) | | |
4.41%, 03/31/31, (1-day SOFR + 3.914%)(c) | | |
4.54%, 09/19/30, (1-day SOFR + 1.338%)(a)(c) | | |
| | |
| | |
| | |
4.91%, 05/24/33, (1-day SOFR + 2.086%)(a)(c) | | |
5.17%, 02/13/30, (1-day SOFR + 1.364%)(c) | | |
| | |
5.32%, 03/26/41, (1-day SOFR + 4.548%)(c) | | |
5.45%, 06/11/35, (1-day SOFR + 1.447%)(a)(c) | | |
| | |
6.27%, 11/17/33, (1-day SOFR + 2.338%)(c) | | |
| | |
| | |
| | |
Citizens Financial Group Inc. | | |
| | |
5.72%, 07/23/32, (1-day SOFR + 1.910%)(c) | | |
5.84%, 01/23/30, (1-day SOFR + 2.010%)(c) | | |
6.65%, 04/25/35, (1-day SOFR +2.325%)(a)(c) | | |
| | |
| | |
| | |
| | |
Cooperatieve Rabobank UA/New York, 4.49%, 10/17/29 | | |
| | |
|
Deutsche Bank AG/New York | | |
3.04%, 05/28/32, (1-day SOFR + 1.718%)(a)(c) | | |
3.55%, 09/18/31, (1-day SOFR + 3.043%)(c) | | |
5.00%, 09/11/30, (1-day SOFR + 1.700%)(c) | | |
5.40%, 09/11/35, (1-day SOFR + 2.050%)(a)(c) | | |
| | |
6.72%, 01/18/29, (1-day SOFR + 3.180%)(a)(c) | | |
6.82%, 11/20/29, (1-day SOFR + 2.510%)(a)(c) | | |
Discover Bank, 4.65%, 09/13/28 | | |
| | |
4.77%, 07/28/30, (1-day SOFR Index + 2.127%)(c) | | |
4.90%, 09/06/30, (1-day SOFR + 1.486%)(a)(c) | | |
5.63%, 01/29/32, (1-day SOFR + 1.840%)(c) | | |
6.34%, 07/27/29, (1-day SOFR + 2.340%)(c) | | |
| | |
Goldman Sachs Capital I, 6.35%, 02/15/34 | | |
Goldman Sachs Group Inc. (The) | | |
1.99%, 01/27/32, (1-day SOFR + 1.090%)(c) | | |
2.38%, 07/21/32, (1-day SOFR + 1.248%)(c) | | |
| | |
2.62%, 04/22/32, (1-day SOFR + 1.281%)(c) | | |
2.65%, 10/21/32, (1-day SOFR + 1.264%)(c) | | |
2.91%, 07/21/42, (1-day SOFR + 1.472%)(c) | | |
3.10%, 02/24/33, (1-day SOFR + 1.410%)(a)(c) | | |
3.21%, 04/22/42, (1-day SOFR + 1.513%)(c) | | |
3.44%, 02/24/43, (1-day SOFR + 1.632%)(c) | | |
| | |
3.81%, 04/23/29, (3-mo. CME Term SOFR + 1.420%)(c) | | |
4.02%, 10/31/38, (3-mo. CME Term SOFR + 1.635%)(c) | | |
4.22%, 05/01/29, (3-mo. CME Term SOFR + 1.563%)(c) | | |
4.41%, 04/23/39, (3-mo. CME Term SOFR + 1.692%)(c) | | |
4.69%, 10/23/30, (1-day SOFR + 1.135%)(c) | | |
| | |
| | |
5.02%, 10/23/35, (1-day SOFR + 1.420%)(c) | | |
5.05%, 07/23/30, (1-day SOFR + 1.210%)(a)(c) | | |
| | |
5.33%, 07/23/35, (1-day SOFR + 1.550%)(c) | | |
5.73%, 04/25/30, (1-day SOFR +1.265%)(c) | | |
5.85%, 04/25/35, (1-day SOFR + 1.552%)(c) | | |
| | |
| | |
6.48%, 10/24/29, (1-day SOFR + 1.770%)(a)(c) | | |
6.56%, 10/24/34, (1-day SOFR + 1.950%)(c) | | |
| | |
| | |
2.21%, 08/17/29, (1-day SOFR + 1.285%)(a)(c) | | |
Schedule of Investments (unaudited)(continued)October 31, 2024
iShares® iBoxx $ Investment Grade Corporate Bond ETF(Percentages shown are based on Net Assets)
| | |
|
2.36%, 08/18/31, (1-day SOFR + 1.947%)(c) | | |
2.80%, 05/24/32, (1-day SOFR + 1.187%)(c) | | |
2.85%, 06/04/31, (1-day SOFR + 2.387%)(c) | | |
2.87%, 11/22/32, (1-day SOFR + 1.410%)(a)(c) | | |
3.97%, 05/22/30, (3-mo. CME Term SOFR + 1.872%)(c) | | |
4.58%, 06/19/29, (3-mo. CME Term SOFR + 1.796%)(c) | | |
| | |
| | |
5.40%, 08/11/33, (1-day SOFR + 2.870%)(a)(c) | | |
5.55%, 03/04/30, (1-day SOFR + 1.460%)(c) | | |
5.72%, 03/04/35, (1-day SOFR + 1.780%)(a)(c) | | |
5.73%, 05/17/32, (1-day SOFR + 1.520%)(c) | | |
| | |
6.16%, 03/09/29, (1-day SOFR + 1.970%)(a)(c) | | |
6.25%, 03/09/34, (1-day SOFR + 2.390%)(a)(c) | | |
6.33%, 03/09/44, (1-day SOFR + 2.650%)(a)(c) | | |
| | |
| | |
| | |
7.39%, 11/03/28, (1-day SOFR + 3.350%)(c) | | |
Huntington Bancshares Inc./Ohio | | |
| | |
5.71%, 02/02/35, (1-day SOFR Index + 1.870%)(c) | | |
6.21%, 08/21/29, (1-day SOFR + 2.020%)(c) | | |
Huntington National Bank (The), 5.65%, 01/10/30(a) | | |
| | |
2.73%, 04/01/32, (1-day SOFR + 1.316%)(a)(c) | | |
| | |
4.25%, 03/28/33, (1-day SOFR + 2.070%)(c) | | |
| | |
5.34%, 03/19/30, (1-day SOFR + 1.440%)(a)(c) | | |
5.55%, 03/19/35, (1-day SOFR + 1.770%)(c) | | |
6.11%, 09/11/34, (1-day SOFR + 2.090%)(a)(c) | | |
| | |
1.76%, 11/19/31, (3-mo. CME Term SOFR + 1.105%)(c) | | |
1.95%, 02/04/32, (1-day SOFR + 1.065%)(c) | | |
2.07%, 06/01/29, (1-day SOFR + 1.015%)(c) | | |
2.52%, 04/22/31, (1-day SOFR + 2.040%)(c) | | |
2.53%, 11/19/41, (3-mo. CME Term SOFR + 1.510%)(a)(c) | | |
2.55%, 11/08/32, (1-day SOFR + 1.180%)(c) | | |
2.58%, 04/22/32, (3-mo. CME Term SOFR + 1.250%)(c) | | |
2.74%, 10/15/30, (3-mo. CME Term SOFR + 1.510%)(c) | | |
2.96%, 01/25/33, (1-day SOFR + 1.260%)(c) | | |
| | |
|
3.11%, 04/22/41, (3-mo. CME Term SOFR + 2.460%)(c) | | |
3.11%, 04/22/51, (1-day SOFR + 2.440%)(a)(c) | | |
3.16%, 04/22/42, (1-day SOFR + 1.460%)(c) | | |
3.33%, 04/22/52, (1-day SOFR + 1.580%)(a)(c) | | |
3.51%, 01/23/29, (3-mo. CME Term SOFR + 1.207%)(a)(c) | | |
3.70%, 05/06/30, (3-mo. CME Term SOFR + 1.422%)(a)(c) | | |
3.88%, 07/24/38, (3-mo. CME Term SOFR + 1.622%)(a)(c) | | |
3.90%, 01/23/49, (3-mo. CME Term SOFR + 1.482%)(c) | | |
3.96%, 11/15/48, (3-mo. CME Term SOFR + 1.642%)(c) | | |
4.01%, 04/23/29, (3-mo. CME Term SOFR + 1.382%)(c) | | |
4.03%, 07/24/48, (3-mo. CME Term SOFR + 1.722%)(c) | | |
4.20%, 07/23/29, (3-mo. CME Term SOFR + 1.522%)(c) | | |
4.26%, 02/22/48, (3-mo. CME Term SOFR + 1.842%)(c) | | |
4.45%, 12/05/29, (3-mo. CME Term SOFR + 1.592%)(a)(c) | | |
4.49%, 03/24/31, (3-mo. CME Term SOFR + 3.790%)(a)(c) | | |
4.57%, 06/14/30, (1-day SOFR + 1.750%)(c) | | |
4.59%, 04/26/33, (1-day SOFR + 1.800%)(c) | | |
4.60%, 10/22/30, (1-day SOFR + 1.040%)(c) | | |
| | |
4.91%, 07/25/33, (1-day SOFR + 2.080%)(c) | | |
4.95%, 10/22/35, (1-day SOFR + 1.340%)(c) | | |
| | |
5.00%, 07/22/30, (1-day SOFR +1.125%)(c) | | |
5.01%, 01/23/30, (1-day SOFR + 1.310%)(c) | | |
5.29%, 07/22/35, (1-day SOFR + 1.460%)(a)(c) | | |
5.30%, 07/24/29, (1-day SOFR + 1.450%)(c) | | |
5.34%, 01/23/35, (1-day SOFR + 1.620%)(c) | | |
5.35%, 06/01/34, (1-day SOFR + 1.845%)(c) | | |
| | |
| | |
5.58%, 04/22/30, (1-day SOFR +1.160%)(c) | | |
| | |
| | |
5.77%, 04/22/35, (1-day SOFR + 1.490%)(c) | | |
6.09%, 10/23/29, (1-day SOFR + 1.570%)(c) | | |
6.25%, 10/23/34, (1-day SOFR + 1.810%)(c) | | |
| | |
KeyBank NA, 5.00%, 01/26/33(a) | | |
KeyBank NA/Cleveland OH, 4.90%, 08/08/32(a) | | |
| | |
| | |
| | |
4.79%, 06/01/33, (1-day SOFR Index + 2.060%)(a)(c) | | |
6.40%, 03/06/35, (1-day SOFR Index + 2.420%)(a)(c) | | |
Schedule of Investments (unaudited)(continued)October 31, 2024
iShares® iBoxx $ Investment Grade Corporate Bond ETF(Percentages shown are based on Net Assets)
| | |
|
| | |
3.57%, 11/07/28, (3-mo. LIBOR US + 1.205%)(c) | | |
| | |
| | |
| | |
4.98%, 08/11/33, (1-year CMT + 2.300%)(a)(c) | | |
| | |
5.68%, 01/05/35, (1-year CMT + 1.750%)(c) | | |
5.72%, 06/05/30, (1-year CMT + 1.070%)(a)(c) | | |
5.87%, 03/06/29, (1-year CMT + 1.700%)(a)(c) | | |
| | |
5.05%, 01/27/34, (1-day SOFR + 1.850%)(c) | | |
6.08%, 03/13/32, (1-day SOFR + 2.260%)(c) | | |
7.41%, 10/30/29, (1-day SOFR + 2.800%)(c) | | |
Manufacturers & Traders Trust Co., 4.70%, 01/27/28 | | |
Mitsubishi UFJ Financial Group Inc. | | |
| | |
2.31%, 07/20/32, (1-year CMT + 0.950%)(c) | | |
2.49%, 10/13/32, (1-year CMT + 0.970%)(c) | | |
| | |
2.85%, 01/19/33, (1-year CMT + 1.100%)(c) | | |
| | |
| | |
| | |
| | |
| | |
5.13%, 07/20/33, (1-year CMT + 2.125%)(c) | | |
5.26%, 04/17/30, (1-year CMT + 0.820%)(c) | | |
5.41%, 04/19/34, (1-year CMT + 1.970%)(a)(c) | | |
5.42%, 02/22/29, (1-year CMT + 1.380%)(a)(c) | | |
5.43%, 04/17/35, (1-year CMT + 1.000%)(a)(c) | | |
5.44%, 02/22/34, (1-year CMT + 1.630%)(a)(c) | | |
5.47%, 09/13/33, (1-year CMT + 2.125%)(a)(c) | | |
Mizuho Financial Group Inc. | | |
1.98%, 09/08/31, (3-mo. CME Term SOFR + 1.532%)(a)(c) | | |
2.20%, 07/10/31, (3-mo. CME Term SOFR + 1.772%)(c) | | |
| | |
3.15%, 07/16/30, (3-mo. CME Term SOFR + 1.392%)(c) | | |
| | |
4.25%, 09/11/29, (3-mo. CME Term SOFR + 1.532%)(a)(c) | | |
5.38%, 05/26/30, (1-year CMT + 1.120%)(c) | | |
5.38%, 07/10/30, (1-year CMT + 1.080%)(a)(c) | | |
5.58%, 05/26/35, (1-year CMT + 1.300%)(a)(c) | | |
5.67%, 05/27/29, (1-year CMT + 1.500%)(c) | | |
5.67%, 09/13/33, (1-year CMT + 2.400%)(c) | | |
| | |
|
5.75%, 05/27/34, (1-year CMT + 1.800%)(c) | | |
5.75%, 07/06/34, (1-year CMT + 1.900%)(c) | | |
5.78%, 07/06/29, (1-year CMT + 1.650%)(c) | | |
| | |
1.79%, 02/13/32, (1-day SOFR + 1.034%)(c) | | |
1.93%, 04/28/32, (1-day SOFR + 1.020%)(c) | | |
2.24%, 07/21/32, (1-day SOFR + 1.178%)(a)(c) | | |
2.51%, 10/20/32, (1-day SOFR + 1.200%)(a)(c) | | |
2.70%, 01/22/31, (1-day SOFR + 1.143%)(c) | | |
2.80%, 01/25/52, (1-day SOFR + 1.430%)(a)(c) | | |
2.94%, 01/21/33, (1-day SOFR + 1.290%)(a)(c) | | |
3.22%, 04/22/42, (1-day SOFR + 1.485%)(a)(c) | | |
3.62%, 04/01/31, (1-day SOFR + 3.120%)(c) | | |
3.77%, 01/24/29, (3-mo. CME Term SOFR + 1.402%)(c) | | |
| | |
| | |
| | |
4.43%, 01/23/30, (3-mo. CME Term SOFR + 1.89%)(c) | | |
4.46%, 04/22/39, (3-mo. CME Term SOFR + 1.693%)(c) | | |
4.65%, 10/18/30, (1-day SOFR +1.100%)(c) | | |
4.89%, 07/20/33, (1-day SOFR + 2.076%)(c) | | |
5.04%, 07/19/30, (1-day SOFR +1.215%)(c) | | |
5.12%, 02/01/29, (1-day SOFR + 1.730%)(c) | | |
5.16%, 04/20/29, (1-day SOFR + 1.590%)(c) | | |
5.17%, 01/16/30, (1-day SOFR + 1.450%)(c) | | |
5.25%, 04/21/34, (1-day SOFR + 1.870%)(c) | | |
5.32%, 07/19/35, (1-day SOFR +1.555%)(c) | | |
5.42%, 07/21/34, (1-day SOFR + 1.880%)(c) | | |
5.45%, 07/20/29, (1-day SOFR + 1.630%)(c) | | |
5.47%, 01/18/35, (1-day SOFR + 1.730%)(c) | | |
5.60%, 03/24/51, (1-day SOFR + 4.840%)(a)(c) | | |
5.66%, 04/18/30, (1-day SOFR +1.260%)(c) | | |
5.83%, 04/19/35, (1-day SOFR +1.580%)(c) | | |
6.34%, 10/18/33, (1-day SOFR + 2.560%)(c) | | |
| | |
6.41%, 11/01/29, (1-day SOFR + 1.830%)(c) | | |
6.63%, 11/01/34, (1-day SOFR + 2.050%)(c) | | |
| | |
National Australia Bank Ltd./New York | | |
| | |
| | |
| | |
| | |
| | |
| | |
4.45%, 05/08/30, (3-mo. LIBOR US + 1.871%)(c) | | |
4.89%, 05/18/29, (3-mo. LIBOR US + 1.754%)(a)(c) | | |
4.96%, 08/15/30, (1-year CMT + 1.220%)(c) | | |
5.08%, 01/27/30, (3-mo. LIBOR US + 1.905%)(a)(c) | | |
Schedule of Investments (unaudited)(continued)October 31, 2024
iShares® iBoxx $ Investment Grade Corporate Bond ETF(Percentages shown are based on Net Assets)
| | |
|
5.78%, 03/01/35, (1-year CMT + 1.500%)(a)(c) | | |
5.81%, 09/13/29, (1-year CMT + 1.950%)(c) | | |
6.02%, 03/02/34, (1-year CMT + 2.100%)(a)(c) | | |
| | |
| | |
| | |
| | |
| | |
| | |
PNC Financial Services Group Inc. (The) | | |
2.31%, 04/23/32, (1-day SOFR + 0.979%)(a)(c) | | |
| | |
| | |
4.81%, 10/21/32, (1-day SOFR +1.259%)(c) | | |
5.07%, 01/24/34, (1-day SOFR + 1.933%)(c) | | |
5.35%, 12/02/28, (1-day SOFR + 1.620%)(c) | | |
5.40%, 07/23/35, (1-day SOFR +1.599%)(c) | | |
5.49%, 05/14/30, (1-day SOFR + 1.198%)(c) | | |
5.58%, 06/12/29, (1-day SOFR + 1.841%)(a)(c) | | |
5.68%, 01/22/35, (1-day SOFR + 1.902%)(c) | | |
5.94%, 08/18/34, (1-day SOFR + 1.946%)(a)(c) | | |
6.04%, 10/28/33, (1-day SOFR Index + 2.140%)(c) | | |
6.88%, 10/20/34, (1-day SOFR + 2.284%)(c) | | |
| | |
5.50%, 09/06/35, (1-day SOFR +2.060%)(c) | | |
5.72%, 06/06/30, (1-day SOFR +1.490%)(a)(c) | | |
| | |
| | |
| | |
4.65%, 10/18/30, (1-day SOFR Index + 1.080%)(c) | | |
| | |
4.97%, 08/02/30, (1-day SOFR +1.000%)(a)(c) | | |
| | |
| | |
| | |
| | |
Santander Holdings USA Inc. | | |
5.35%, 09/06/30, (1-day SOFR + 1.940%)(c) | | |
6.17%, 01/09/30, (1-day SOFR + 2.500%)(c) | | |
6.34%, 05/31/35, (1-day SOFR + 2.138%)(a)(c) | | |
6.50%, 03/09/29, (1-day SOFR + 2.356%)(c) | | |
Santander U.K. Group Holdings PLC | | |
3.82%, 11/03/28, (3-mo. LIBOR US + 1.400%)(c) | | |
4.86%, 09/11/30, (1-day SOFR Index + 1.554%)(c) | | |
6.53%, 01/10/29, (1-day SOFR + 2.600%)(a)(c) | | |
| | |
| | |
| | |
| | |
|
Sumitomo Mitsui Financial Group Inc. | | |
| | |
| | |
| | |
| | |
| | |
| | |
| | |
| | |
| | |
| | |
| | |
| | |
| | |
| | |
| | |
| | |
| | |
| | |
| | |
| | |
Toronto-Dominion Bank (The) | | |
| | |
| | |
| | |
| | |
| | |
Truist Bank, 2.25%, 03/11/30 | | |
| | |
1.89%, 06/07/29, (1-day SOFR + 0.862%)(a)(c) | | |
| | |
4.87%, 01/26/29, (1-day SOFR + 1.435%)(c) | | |
5.12%, 01/26/34, (1-day SOFR + 1.852%)(c) | | |
5.15%, 08/05/32, (1-day SOFR + 1.571%)(c) | | |
5.44%, 01/24/30, (1-day SOFR + 1.620%)(c) | | |
5.71%, 01/24/35, (1-day SOFR + 1.922%)(c) | | |
5.87%, 06/08/34, (1-day SOFR + 2.361%)(c) | | |
6.12%, 10/28/33, (1-day SOFR + 2.300%)(c) | | |
7.16%, 10/30/29, (1-day SOFR + 2.446%)(c) | | |
| | |
| | |
2.68%, 01/27/33, (1-day SOFR + 1.020%)(a)(c) | | |
| | |
| | |
4.65%, 02/01/29, (1-day SOFR + 1.230%)(a)(c) | | |
4.84%, 02/01/34, (1-day SOFR + 1.600%)(c) | | |
5.10%, 07/23/30, (1-day SOFR +1.250%)(a)(c) | | |
5.38%, 01/23/30, (1-day SOFR + 1.560%)(c) | | |
5.68%, 01/23/35, (1-day SOFR + 1.860%)(a)(c) | | |
5.78%, 06/12/29, (1-day SOFR + 2.020%)(c) | | |
5.84%, 06/12/34, (1-day SOFR + 2.260%)(c) | | |
5.85%, 10/21/33, (1-day SOFR + 2.090%)(c) | | |
| | |
| | |
| | |
UBS AG/Stamford CT, 7.50%, 02/15/28 | | |
Schedule of Investments (unaudited)(continued)October 31, 2024
iShares® iBoxx $ Investment Grade Corporate Bond ETF(Percentages shown are based on Net Assets)
| | |
|
UBS Group AG, 4.88%, 05/15/45 | | |
Wachovia Corp., 5.50%, 08/01/35(a) | | |
| | |
2.57%, 02/11/31, (3-mo. CME Term SOFR + 1.262%)(c) | | |
2.88%, 10/30/30, (3-mo. CME Term SOFR + 1.432%)(c) | | |
3.07%, 04/30/41, (1-day SOFR + 2.530%)(c) | | |
3.35%, 03/02/33, (1-day SOFR + 1.500%)(c) | | |
| | |
| | |
| | |
4.48%, 04/04/31, (3-mo. CME Term SOFR + 4.032%)(c) | | |
4.61%, 04/25/53, (1-day SOFR + 2.130%)(a)(c) | | |
| | |
| | |
4.90%, 07/25/33, (1-day SOFR + 2.100%)(c) | | |
| | |
5.01%, 04/04/51, (3-mo. CME Term SOFR + 4.502%)(c) | | |
5.20%, 01/23/30, (1-day SOFR + 1.500%)(c) | | |
| | |
5.39%, 04/24/34, (1-day SOFR + 2.020%)(c) | | |
5.50%, 01/23/35, (1-day SOFR + 1.780%)(a)(c) | | |
5.56%, 07/25/34, (1-day SOFR + 1.990%)(c) | | |
5.57%, 07/25/29, (1-day SOFR + 1.740%)(c) | | |
| | |
6.30%, 10/23/29, (1-day SOFR + 1.790%)(c) | | |
6.49%, 10/23/34, (1-day SOFR + 2.060%)(c) | | |
| | |
| | |
| | |
| | |
| | |
| | |
| | |
| | |
| | |
| | |
| | |
| | |
| | |
| | |
| | |
| | |
|
Anheuser-Busch Companies LLC/Anheuser-Busch InBev Worldwide Inc. | | |
| | |
| | |
Anheuser-Busch InBev Finance Inc. | | |
| | |
| | |
Anheuser-Busch InBev Worldwide Inc. | | |
| | |
| | |
| | |
| | |
|
| | |
| | |
| | |
| | |
| | |
| | |
| | |
| | |
| | |
| | |
| | |
| | |
| | |
| | |
| | |
| | |
| | |
| | |
| | |
| | |
| | |
| | |
| | |
| | |
| | |
| | |
| | |
| | |
| | |
| | |
| | |
| | |
| | |
Constellation Brands Inc. | | |
| | |
| | |
| | |
| | |
| | |
| | |
| | |
| | |
| | |
| | |
| | |
| | |
| | |
| | |
| | |
| | |
| | |
Molson Coors Beverage Co. | | |
| | |
| | |
| | |
| | |
| | |
| | |
| | |
| | |
| | |
Schedule of Investments (unaudited)(continued)October 31, 2024
iShares® iBoxx $ Investment Grade Corporate Bond ETF(Percentages shown are based on Net Assets)
| | |
|
| | |
| | |
| | |
| | |
| | |
| | |
| | |
| | |
| | |
| | |
| | |
|
| | |
| | |
| | |
| | |
| | |
| | |
| | |
| | |
| | |
| | |
| | |
| | |
| | |
| | |
| | |
| | |
| | |
| | |
| | |
| | |
| | |
| | |
| | |
| | |
| | |
| | |
| | |
| | |
| | |
| | |
| | |
| | |
| | |
| | |
| | |
| | |
| | |
| | |
| | |
| | |
| | |
| | |
| | |
Regeneron Pharmaceuticals Inc. | | |
| | |
| | |
| | |
| | |
| | |
| | |
Biotechnology (continued) |
| | |
| | |
Building Materials — 0.3% |
| | |
| | |
| | |
| | |
| | |
| | |
CRH America Finance Inc., 5.40%, 05/21/34 | | |
CRH SMW Finance DAC, 5.20%, 05/21/29 | | |
Martin Marietta Materials Inc. | | |
| | |
| | |
| | |
| | |
Owens Corning, 5.70%, 06/15/34(a) | | |
Trane Technologies Financing Ltd., 3.80%, 03/21/29 | | |
| | |
|
Air Products and Chemicals Inc. | | |
| | |
| | |
| | |
| | |
| | |
Celanese U.S. Holdings LLC | | |
| | |
| | |
| | |
| | |
| | |
| | |
| | |
| | |
| | |
| | |
| | |
| | |
| | |
| | |
| | |
| | |
| | |
| | |
| | |
| | |
| | |
| | |
| | |
| | |
Ecolab Inc., 2.70%, 12/15/51 | | |
International Flavors & Fragrances Inc., 5.00%, 09/26/48(a) | | |
LYB International Finance BV | | |
| | |
| | |
LYB International Finance III LLC | | |
| | |
Schedule of Investments (unaudited)(continued)October 31, 2024
iShares® iBoxx $ Investment Grade Corporate Bond ETF(Percentages shown are based on Net Assets)
| | |
|
| | |
| | |
| | |
| | |
LyondellBasell Industries NV, 4.63%, 02/26/55(a) | | |
| | |
| | |
| | |
| | |
| | |
Sherwin-Williams Co. (The) | | |
| | |
| | |
| | |
Commercial Services — 0.7% |
Automatic Data Processing Inc. | | |
| | |
| | |
| | |
Equifax Inc., 2.35%, 09/15/31(a) | | |
| | |
| | |
| | |
| | |
| | |
| | |
| | |
Massachusetts Institute of Technology, 5.60%(a) | | |
| | |
| | |
| | |
| | |
| | |
| | |
| | |
President and Fellows of Harvard College, Series ., 4.61%, 02/15/35(a) | | |
Quanta Services Inc., 2.90%, 10/01/30(a) | | |
| | |
| | |
| | |
| | |
| | |
| | |
| | |
| | |
| | |
| | |
|
| | |
| | |
| | |
| | |
| | |
| | |
| | |
| | |
| | |
| | |
|
| | |
| | |
| | |
| | |
| | |
| | |
| | |
| | |
| | |
| | |
| | |
| | |
| | |
| | |
| | |
| | |
| | |
| | |
| | |
| | |
| | |
| | |
| | |
| | |
| | |
| | |
| | |
| | |
Dell International LLC/EMC Corp. | | |
| | |
| | |
| | |
| | |
| | |
| | |
| | |
| | |
Hewlett Packard Enterprise Co. | | |
| | |
| | |
| | |
| | |
| | |
| | |
| | |
| | |
| | |
| | |
| | |
IBM International Capital Pte Ltd. | | |
| | |
| | |
| | |
International Business Machines Corp. | | |
| | |
| | |
| | |
| | |
| | |
| | |
| | |
Schedule of Investments (unaudited)(continued)October 31, 2024
iShares® iBoxx $ Investment Grade Corporate Bond ETF(Percentages shown are based on Net Assets)
| | |
|
| | |
| | |
| | |
| | |
| | |
| | |
| | |
| | |
Cosmetics & Personal Care — 0.5% |
| | |
| | |
| | |
| | |
| | |
| | |
| | |
| | |
| | |
| | |
| | |
Procter & Gamble Co. (The) | | |
| | |
| | |
| | |
| | |
| | |
| | |
| | |
| | |
| | |
| | |
| | |
| | |
| | |
| | |
Diversified Financial Services — 2.5% |
AerCap Ireland Capital DAC/AerCap Global Aviation Trust | | |
| | |
| | |
| | |
| | |
| | |
| | |
| | |
| | |
| | |
| | |
| | |
| | |
| | |
| | |
| | |
| | |
| | |
| | |
Ameriprise Financial Inc., 5.15%, 05/15/33 | | |
Apollo Global Management Inc., 5.80%, 05/21/54 | | |
| | |
Diversified Financial Services (continued) |
| | |
| | |
| | |
| | |
| | |
| | |
Capital One Financial Corp., 3.80%, 01/31/28(a) | | |
Charles Schwab Corp. (The) | | |
| | |
| | |
| | |
| | |
| | |
| | |
| | |
| | |
Discover Financial Services, 6.70%, 11/29/32 | | |
Intercontinental Exchange Inc. | | |
| | |
| | |
| | |
| | |
| | |
| | |
| | |
| | |
| | |
| | |
| | |
| | |
Jefferies Financial Group Inc. | | |
| | |
| | |
| | |
| | |
| | |
| | |
| | |
| | |
| | |
| | |
| | |
| | |
| | |
| | |
| | |
| | |
| | |
| | |
| | |
| | |
| | |
| | |
| | |
| | |
| | |
| | |
| | |
| | |
| | |
Schedule of Investments (unaudited)(continued)October 31, 2024
iShares® iBoxx $ Investment Grade Corporate Bond ETF(Percentages shown are based on Net Assets)
| | |
Diversified Financial Services (continued) |
Raymond James Financial Inc. | | |
| | |
| | |
Synchrony Financial, 2.88%, 10/28/31 | | |
| | |
| | |
| | |
| | |
| | |
| | |
| | |
| | |
| | |
|
| | |
| | |
| | |
Ameren Corp., 3.50%, 01/15/31(a) | | |
American Electric Power Co. Inc. | | |
| | |
| | |
Berkshire Hathaway Energy Co. | | |
| | |
| | |
| | |
| | |
| | |
| | |
| | |
| | |
| | |
Commonwealth Edison Co., 4.00%, 03/01/48 | | |
Connecticut Light and Power Co. (The), 4.00%, 04/01/48 | | |
Consolidated Edison Co. of New York Inc. | | |
| | |
| | |
| | |
| | |
| | |
| | |
Series 20B, 3.95%, 04/01/50 | | |
Constellation Energy Generation LLC | | |
| | |
| | |
| | |
| | |
| | |
| | |
| | |
Series C, 2.25%, 08/15/31 | | |
Series C, 3.38%, 04/01/30 | | |
| | |
| | |
| | |
| | |
Duke Energy Carolinas LLC | | |
| | |
| | |
| | |
| | |
| | |
|
| | |
| | |
| | |
| | |
| | |
| | |
| | |
| | |
| | |
| | |
| | |
| | |
| | |
Duke Energy Florida LLC, 6.40%, 06/15/38 | | |
Emera U.S. Finance LP, 4.75%, 06/15/46 | | |
Entergy Louisiana LLC, 4.20%, 09/01/48 | | |
| | |
| | |
| | |
| | |
| | |
| | |
| | |
| | |
| | |
| | |
| | |
FirstEnergy Corp., Series C, 3.40%, 03/01/50 | | |
Florida Power & Light Co. | | |
| | |
| | |
| | |
| | |
| | |
| | |
| | |
| | |
| | |
| | |
| | |
| | |
| | |
| | |
| | |
| | |
| | |
| | |
Series A, 3.25%, 03/15/51 | | |
| | |
| | |
| | |
| | |
| | |
| | |
| | |
NextEra Energy Capital Holdings Inc. | | |
| | |
| | |
| | |
| | |
| | |
Schedule of Investments (unaudited)(continued)October 31, 2024
iShares® iBoxx $ Investment Grade Corporate Bond ETF(Percentages shown are based on Net Assets)
| | |
|
| | |
| | |
| | |
| | |
| | |
| | |
Northern States Power Co./MN, 5.10%, 05/15/53(a) | | |
Oncor Electric Delivery Co. LLC | | |
| | |
| | |
| | |
Pacific Gas and Electric Co. | | |
| | |
| | |
| | |
| | |
| | |
| | |
| | |
| | |
| | |
| | |
| | |
| | |
| | |
| | |
| | |
| | |
| | |
| | |
| | |
| | |
| | |
| | |
| | |
| | |
| | |
PPL Capital Funding Inc., 5.25%, 09/01/34 | | |
PPL Electric Utilities Corp., 5.25%, 05/15/53(a) | | |
Public Service Co. of Colorado | | |
| | |
| | |
| | |
Public Service Enterprise Group Inc. | | |
| | |
| | |
San Diego Gas & Electric Co. | | |
| | |
Series VVV, 1.70%, 10/01/30(a) | | |
Series WWW, 2.95%, 08/15/51(a) | | |
| | |
| | |
| | |
| | |
| | |
Southern California Edison Co. | | |
| | |
| | |
| | |
| | |
| | |
|
| | |
| | |
| | |
Series 20A, 2.95%, 02/01/51 | | |
Series C, 4.13%, 03/01/48 | | |
| | |
| | |
| | |
| | |
| | |
| | |
| | |
Series A, 3.70%, 04/30/30 | | |
Series B, 4.00%, 01/15/51, (5-year CMT + 3.733%)(c) | | |
Virginia Electric & Power Co. | | |
| | |
| | |
| | |
| | |
| | |
| | |
| | |
| | |
Electrical Components & Equipment — 0.1% |
| | |
| | |
| | |
| | |
| | |
|
| | |
| | |
| | |
| | |
Honeywell International Inc. | | |
| | |
| | |
| | |
| | |
| | |
| | |
| | |
| | |
| | |
| | |
| | |
|
Warnermedia Holdings Inc. | | |
| | |
| | |
| | |
| | |
| | |
| | |
Environmental Control — 0.4% |
| | |
| | |
| | |
| | |
Schedule of Investments (unaudited)(continued)October 31, 2024
iShares® iBoxx $ Investment Grade Corporate Bond ETF(Percentages shown are based on Net Assets)
| | |
Environmental Control (continued) |
| | |
| | |
| | |
| | |
| | |
| | |
| | |
| | |
| | |
| | |
| | |
| | |
| | |
| | |
| | |
| | |
| | |
|
| | |
| | |
| | |
| | |
| | |
| | |
| | |
| | |
| | |
| | |
| | |
| | |
| | |
| | |
| | |
| | |
| | |
| | |
| | |
JBS USA Holding Lux SARL/JBS USA Food Co./JBS Lux Co. SARL | | |
| | |
| | |
| | |
| | |
| | |
| | |
| | |
| | |
| | |
| | |
| | |
| | |
| | |
| | |
| | |
| | |
| | |
| | |
| | |
| | |
| | |
| | |
| | |
|
| | |
| | |
Mondelez International Inc. | | |
| | |
| | |
| | |
| | |
| | |
| | |
| | |
| | |
| | |
| | |
| | |
| | |
| | |
|
Atmos Energy Corp., 4.13%, 10/15/44(a) | | |
CenterPoint Energy Resources Corp., 5.25%, 03/01/28(a) | | |
| | |
| | |
| | |
| | |
| | |
| | |
| | |
| | |
| | |
Hand & Machine Tools — 0.1% |
| | |
| | |
| | |
| | |
Stanley Black & Decker Inc. | | |
| | |
| | |
| | |
Health Care - Products — 1.0% |
| | |
| | |
| | |
Agilent Technologies Inc., 2.30%, 03/12/31(a) | | |
Baxter International Inc. | | |
| | |
| | |
| | |
| | |
| | |
| | |
DH Europe Finance II SARL | | |
| | |
| | |
| | |
GE HealthCare Technologies Inc. | | |
| | |
| | |
| | |
| | |
Schedule of Investments (unaudited)(continued)October 31, 2024
iShares® iBoxx $ Investment Grade Corporate Bond ETF(Percentages shown are based on Net Assets)
| | |
Health Care - Products (continued) |
Medtronic Global Holdings SCA | | |
| | |
| | |
| | |
| | |
| | |
| | |
| | |
| | |
| | |
| | |
| | |
| | |
| | |
| | |
| | |
Thermo Fisher Scientific Inc. | | |
| | |
| | |
| | |
| | |
| | |
| | |
| | |
Zimmer Biomet Holdings Inc., 2.60%, 11/24/31 | | |
| | |
Health Care - Services — 4.3% |
| | |
| | |
| | |
| | |
| | |
Series B, 2.53%, 11/15/29(a) | | |
| | |
| | |
| | |
| | |
| | |
| | |
| | |
| | |
| | |
| | |
| | |
| | |
| | |
| | |
| | |
| | |
| | |
| | |
| | |
| | |
| | |
| | |
| | |
| | |
| | |
| | |
| | |
| | |
Health Care - Services (continued) |
| | |
| | |
| | |
| | |
| | |
| | |
| | |
| | |
| | |
| | |
| | |
| | |
| | |
| | |
| | |
| | |
| | |
| | |
| | |
| | |
| | |
| | |
| | |
| | |
| | |
| | |
| | |
| | |
| | |
| | |
| | |
| | |
| | |
| | |
| | |
| | |
| | |
| | |
| | |
| | |
| | |
| | |
| | |
| | |
| | |
| | |
| | |
| | |
| | |
| | |
| | |
| | |
ICON Investments Six DAC, 5.85%, 05/08/29 | | |
| | |
| | |
| | |
Kaiser Foundation Hospitals | | |
| | |
Series 2019, 3.27%, 11/01/49(a) | | |
Series 2021, 2.81%, 06/01/41 | | |
Series 2021, 3.00%, 06/01/51(a) | | |
Schedule of Investments (unaudited)(continued)October 31, 2024
iShares® iBoxx $ Investment Grade Corporate Bond ETF(Percentages shown are based on Net Assets)
| | |
Health Care - Services (continued) |
Laboratory Corp. of America Holdings | | |
| | |
| | |
Providence St. Joseph Health Obligated Group, Series 21A, 2.70%, 10/01/51(a) | | |
| | |
| | |
| | |
| | |
| | |
| | |
| | |
| | |
| | |
| | |
| | |
| | |
| | |
| | |
| | |
| | |
| | |
| | |
| | |
| | |
| | |
| | |
| | |
| | |
| | |
| | |
| | |
| | |
| | |
| | |
| | |
| | |
| | |
| | |
| | |
| | |
| | |
| | |
| | |
| | |
| | |
| | |
| | |
| | |
| | |
| | |
| | |
| | |
| | |
| | |
Universal Health Services Inc., 2.65%, 10/15/30(a) | | |
| | |
Holding Companies - Diversified — 0.2% |
| | |
| | |
| | |
Holding Companies - Diversified (continued) |
| | |
| | |
Blue Owl Capital Corp., 2.88%, 06/11/28(a) | | |
Blue Owl Credit Income Corp. | | |
| | |
| | |
FS KKR Capital Corp., 3.13%, 10/12/28(a) | | |
| | |
Household Products & Wares — 0.0% |
Kimberly-Clark Corp., 3.10%, 03/26/30 | | |
|
Allstate Corp. (The), 5.25%, 03/30/33(a) | | |
American International Group Inc. | | |
| | |
| | |
| | |
| | |
| | |
| | |
| | |
Aon Corp./Aon Global Holdings PLC | | |
| | |
| | |
| | |
| | |
| | |
| | |
Arch Capital Group Ltd., 3.64%, 06/30/50 | | |
Arthur J Gallagher & Co., 3.50%, 05/20/51(a) | | |
| | |
| | |
| | |
Berkshire Hathaway Finance Corp. | | |
| | |
| | |
| | |
| | |
| | |
| | |
| | |
| | |
Berkshire Hathaway Inc., 4.50%, 02/11/43(a) | | |
Brighthouse Financial Inc., 4.70%, 06/22/47(a) | | |
Chubb Corp. (The), 6.00%, 05/11/37(a) | | |
| | |
| | |
| | |
| | |
| | |
Corebridge Financial Inc. | | |
| | |
| | |
| | |
| | |
| | |
| | |
| | |
Everest Reinsurance Holdings Inc. | | |
| | |
| | |
Schedule of Investments (unaudited)(continued)October 31, 2024
iShares® iBoxx $ Investment Grade Corporate Bond ETF(Percentages shown are based on Net Assets)
| | |
|
Fairfax Financial Holdings Ltd. | | |
| | |
| | |
| | |
Hartford Financial Services Group Inc. (The), 3.60%, 08/19/49 | | |
| | |
| | |
| | |
Marsh & McLennan Companies Inc. | | |
| | |
| | |
| | |
| | |
| | |
| | |
| | |
| | |
| | |
| | |
| | |
| | |
| | |
| | |
| | |
| | |
| | |
| | |
| | |
| | |
| | |
Progressive Corp. (The), 4.13%, 04/15/47 | | |
Prudential Financial Inc. | | |
| | |
| | |
| | |
| | |
| | |
| | |
Travelers Companies Inc. (The) | | |
| | |
| | |
| | |
| | |
Willis North America Inc. | | |
| | |
| | |
| | |
|
| | |
| | |
| | |
| | |
| | |
| | |
| | |
| | |
| | |
| | |
| | |
| | |
| | |
|
| | |
| | |
| | |
| | |
| | |
| | |
| | |
| | |
| | |
| | |
| | |
| | |
| | |
| | |
Booking Holdings Inc., 4.63%, 04/13/30 | | |
| | |
| | |
| | |
| | |
| | |
| | |
| | |
| | |
| | |
| | |
| | |
| | |
| | |
| | |
| | |
| | |
| | |
| | |
| | |
| | |
| | |
| | |
| | |
| | |
| | |
| | |
| | |
| | |
| | |
| | |
| | |
| | |
| | |
|
ArcelorMittal SA, 6.80%, 11/29/32(a) | | |
|
Las Vegas Sands Corp., 3.90%, 08/08/29(a) | | |
Marriott International Inc./MD | | |
| | |
| | |
| | |
Series FF, 4.63%, 06/15/30(a) | | |
Series GG, 3.50%, 10/15/32 | | |
Series HH, 2.85%, 04/15/31 | | |
Schedule of Investments (unaudited)(continued)October 31, 2024
iShares® iBoxx $ Investment Grade Corporate Bond ETF(Percentages shown are based on Net Assets)
| | |
|
Sands China Ltd., 5.40%, 08/08/28(a) | | |
| | |
|
| | |
| | |
| | |
| | |
| | |
| | |
| | |
| | |
| | |
| | |
| | |
| | |
| | |
| | |
| | |
| | |
| | |
| | |
| | |
| | |
| | |
| | |
| | |
Series 1, 5.05%, 06/12/34(a) | | |
| | |
| | |
| | |
| | |
| | |
Westinghouse Air Brake Technologies Corp., 4.70%, 09/15/28 | | |
| | |
|
| | |
| | |
| | |
| | |
| | |
| | |
| | |
| | |
Illinois Tool Works Inc., 3.90%, 09/01/42 | | |
| | |
| | |
| | |
| | |
Teledyne Technologies Inc., 2.75%, 04/01/31 | | |
| | |
|
Charter Communications Operating LLC/Charter Communications Operating Capital | | |
| | |
| | |
| | |
| | |
| | |
Schedule of Investments (unaudited)(continued)October 31, 2024
iShares® iBoxx $ Investment Grade Corporate Bond ETF(Percentages shown are based on Net Assets)
| | |
|
| | |
| | |
| | |
| | |
Discovery Communications LLC | | |
| | |
| | |
| | |
| | |
| | |
| | |
| | |
| | |
| | |
| | |
| | |
| | |
| | |
| | |
| | |
| | |
Time Warner Cable Enterprises LLC, 8.38%, 07/15/33 | | |
| | |
| | |
| | |
| | |
| | |
| | |
| | |
TWDC Enterprises 18 Corp., 4.13%, 06/01/44 | | |
| | |
| | |
| | |
| | |
| | |
| | |
| | |
| | |
| | |
| | |
| | |
| | |
| | |
| | |
|
Barrick North America Finance LLC | | |
| | |
| | |
Barrick PD Australia Finance Pty. Ltd., 5.95%, 10/15/39 | | |
BHP Billiton Finance USA Ltd. | | |
| | |
| | |
| | |
| | |
| | |
| | |
| | |
Freeport-McMoRan Inc., 5.45%, 03/15/43(a) | | |
| | |
|
| | |
| | |
| | |
| | |
| | |
Newmont Corp./Newcrest Finance Pty. Ltd., 5.35%, 03/15/34(a) | | |
Rio Tinto Alcan Inc., 6.13%, 12/15/33 | | |
Rio Tinto Finance USA Ltd. | | |
| | |
| | |
| | |
Rio Tinto Finance USA PLC | | |
| | |
| | |
| | |
Office & Business Equipment — 0.0% |
CDW LLC/CDW Finance Corp., 3.57%, 12/01/31(a) | | |
|
BP Capital Markets America Inc. | | |
| | |
| | |
| | |
| | |
| | |
| | |
| | |
| | |
| | |
| | |
| | |
| | |
| | |
| | |
| | |
| | |
| | |
BP Capital Markets PLC, 3.72%, 11/28/28 | | |
Canadian Natural Resources Ltd. | | |
| | |
| | |
Cenovus Energy Inc., 3.75%, 02/15/52(a) | | |
| | |
| | |
| | |
Chevron USA Inc., 2.34%, 08/12/50(a) | | |
| | |
| | |
| | |
| | |
| | |
| | |
| | |
| | |
| | |
| | |
Continental Resources Inc./OK, 4.38%, 01/15/28 | | |
Schedule of Investments (unaudited)(continued)October 31, 2024
iShares® iBoxx $ Investment Grade Corporate Bond ETF(Percentages shown are based on Net Assets)
| | |
|
| | |
| | |
| | |
| | |
| | |
| | |
| | |
| | |
| | |
| | |
| | |
| | |
| | |
| | |
| | |
| | |
| | |
| | |
EQT Corp., 5.75%, 02/01/34(a) | | |
| | |
| | |
| | |
| | |
| | |
| | |
| | |
| | |
| | |
Expand Energy Corp., 4.75%, 02/01/32 | | |
| | |
| | |
| | |
| | |
| | |
| | |
| | |
| | |
| | |
| | |
| | |
| | |
| | |
| | |
Marathon Oil Corp., 6.60%, 10/01/37 | | |
| | |
| | |
| | |
Occidental Petroleum Corp. | | |
| | |
| | |
| | |
| | |
| | |
| | |
| | |
| | |
| | |
| | |
| | |
| | |
| | |
| | |
|
| | |
| | |
| | |
| | |
| | |
| | |
| | |
| | |
Pioneer Natural Resources Co. | | |
| | |
| | |
| | |
| | |
| | |
| | |
| | |
| | |
| | |
| | |
| | |
Shell International Finance BV | | |
| | |
| | |
| | |
| | |
| | |
| | |
| | |
| | |
| | |
TotalEnergies Capital International SA | | |
| | |
| | |
| | |
| | |
| | |
| | |
| | |
| | |
| | |
| | |
| | |
| | |
| | |
| | |
| | |
| | |
| | |
| | |
| | |
| | |
| | |
Oil & Gas Services — 0.2% |
Baker Hughes Holdings LLC, 5.13%, 09/15/40 | | |
Baker Hughes Holdings LLC/Baker Hughes Co-Obligor Inc., 4.08%, 12/15/47(a) | | |
| | |
| | |
| | |
| | |
| | |
Schedule of Investments (unaudited)(continued)October 31, 2024
iShares® iBoxx $ Investment Grade Corporate Bond ETF(Percentages shown are based on Net Assets)
| | |
Oil & Gas Services (continued) |
| | |
| | |
Schlumberger Investment SA, 2.65%, 06/26/30(a) | | |
| | |
Packaging & Containers — 0.2% |
Amcor Flexibles North America Inc., 2.69%, 05/25/31(a) | | |
| | |
| | |
| | |
Smurfit Kappa Treasury ULC | | |
| | |
| | |
| | |
WRKCo Inc., 4.90%, 03/15/29(a) | | |
| | |
|
| | |
| | |
| | |
| | |
| | |
| | |
| | |
| | |
| | |
| | |
| | |
| | |
| | |
| | |
| | |
| | |
| | |
| | |
| | |
| | |
| | |
| | |
| | |
| | |
| | |
| | |
| | |
| | |
| | |
| | |
| | |
| | |
| | |
| | |
| | |
| | |
| | |
| | |
| | |
| | |
| | |
| | |
Pharmaceuticals (continued) |
| | |
| | |
| | |
| | |
| | |
| | |
| | |
| | |
| | |
| | |
| | |
| | |
| | |
| | |
| | |
| | |
| | |
| | |
| | |
| | |
| | |
| | |
| | |
Cencora Inc., 2.70%, 03/15/31(a) | | |
| | |
| | |
| | |
| | |
| | |
| | |
| | |
| | |
| | |
| | |
| | |
| | |
| | |
| | |
| | |
| | |
| | |
| | |
| | |
| | |
| | |
| | |
| | |
| | |
| | |
| | |
| | |
| | |
| | |
| | |
| | |
| | |
| | |
| | |
| | |
| | |
| | |
Schedule of Investments (unaudited)(continued)October 31, 2024
iShares® iBoxx $ Investment Grade Corporate Bond ETF(Percentages shown are based on Net Assets)
| | |
Pharmaceuticals (continued) |
| | |
| | |
| | |
| | |
| | |
| | |
GlaxoSmithKline Capital Inc. | | |
| | |
| | |
GlaxoSmithKline Capital PLC, 3.38%, 06/01/29(a) | | |
| | |
| | |
| | |
| | |
| | |
| | |
| | |
| | |
| | |
| | |
| | |
| | |
| | |
| | |
| | |
| | |
| | |
| | |
| | |
| | |
| | |
| | |
| | |
| | |
| | |
| | |
| | |
| | |
| | |
| | |
| | |
| | |
| | |
| | |
| | |
| | |
| | |
| | |
| | |
| | |
| | |
| | |
| | |
| | |
| | |
| | |
| | |
| | |
| | |
| | |
| | |
Pharmaceuticals (continued) |
| | |
| | |
| | |
| | |
| | |
| | |
| | |
| | |
| | |
| | |
| | |
| | |
| | |
| | |
Pfizer Investment Enterprises Pte Ltd. | | |
| | |
| | |
| | |
| | |
| | |
| | |
Takeda Pharmaceutical Co. Ltd. | | |
| | |
| | |
| | |
| | |
| | |
| | |
| | |
Utah Acquisition Sub Inc., 5.25%, 06/15/46 | | |
| | |
| | |
| | |
| | |
| | |
| | |
| | |
| | |
| | |
| | |
| | |
| | |
|
Cheniere Corpus Christi Holdings LLC, 3.70%, 11/15/29 | | |
| | |
| | |
| | |
Cheniere Energy Partners LP | | |
| | |
| | |
| | |
| | |
| | |
Eastern Energy Gas Holdings LLC, 5.65%, 10/15/54 | | |
| | |
| | |
| | |
| | |
| | |
Schedule of Investments (unaudited)(continued)October 31, 2024
iShares® iBoxx $ Investment Grade Corporate Bond ETF(Percentages shown are based on Net Assets)
| | |
|
| | |
| | |
| | |
| | |
| | |
| | |
| | |
| | |
| | |
| | |
| | |
| | |
| | |
| | |
| | |
| | |
| | |
| | |
| | |
| | |
| | |
| | |
| | |
| | |
| | |
| | |
| | |
| | |
| | |
| | |
Enterprise Products Operating LLC | | |
| | |
| | |
| | |
| | |
| | |
| | |
| | |
| | |
| | |
| | |
| | |
| | |
| | |
| | |
| | |
| | |
| | |
| | |
| | |
| | |
Kinder Morgan Energy Partners LP | | |
| | |
| | |
| | |
| | |
| | |
| | |
| | |
| | |
| | |
| | |
|
| | |
| | |
| | |
| | |
| | |
| | |
| | |
| | |
| | |
| | |
| | |
| | |
| | |
| | |
| | |
| | |
| | |
| | |
| | |
| | |
| | |
| | |
| | |
| | |
| | |
| | |
| | |
| | |
| | |
| | |
| | |
| | |
| | |
Plains All American Pipeline LP/PAA Finance Corp. | | |
| | |
| | |
Sabine Pass Liquefaction LLC | | |
| | |
| | |
South Bow USA Infrastructure Holdings LLC | | |
| | |
| | |
| | |
| | |
| | |
| | |
| | |
| | |
| | |
| | |
Targa Resources Partners LP/Targa Resources Partners Finance Corp. | | |
| | |
| | |
| | |
TransCanada PipeLines Ltd. | | |
| | |
| | |
| | |
| | |
Schedule of Investments (unaudited)(continued)October 31, 2024
iShares® iBoxx $ Investment Grade Corporate Bond ETF(Percentages shown are based on Net Assets)
| | |
|
| | |
| | |
| | |
Western Midstream Operating LP | | |
| | |
| | |
| | |
| | |
Williams Companies Inc. (The) | | |
| | |
| | |
| | |
| | |
| | |
| | |
| | |
| | |
| | |
| | |
| | |
| | |
| | |
|
CBRE Services Inc., 5.95%, 08/15/34(a) | | |
Real Estate Investment Trusts — 1.9% |
Alexandria Real Estate Equities Inc. | | |
| | |
| | |
| | |
| | |
| | |
| | |
| | |
| | |
| | |
| | |
| | |
| | |
| | |
| | |
| | |
| | |
| | |
| | |
| | |
| | |
| | |
| | |
| | |
| | |
| | |
Brixmor Operating Partnership LP | | |
| | |
| | |
| | |
| | |
| | |
| | |
| | |
| | |
| | |
Real Estate Investment Trusts (continued) |
| | |
| | |
| | |
| | |
| | |
Digital Realty Trust LP, 3.60%, 07/01/29(a) | | |
Equinix Europe 2 Financing Corp. LLC, 5.50%, 06/15/34 | | |
| | |
| | |
| | |
| | |
| | |
ERP Operating LP, 4.50%, 07/01/44 | | |
GLP Capital LP/GLP Financing II Inc. | | |
| | |
| | |
| | |
Healthcare Realty Holdings LP, 2.00%, 03/15/31(a) | | |
| | |
| | |
| | |
Host Hotels & Resorts LP, Series I, 3.50%, 09/15/30 | | |
| | |
| | |
| | |
| | |
| | |
| | |
| | |
| | |
| | |
Public Storage Operating Co., 5.35%, 08/01/53 | | |
| | |
| | |
| | |
| | |
| | |
| | |
| | |
| | |
| | |
| | |
| | |
Ventas Realty LP, 4.40%, 01/15/29 | | |
| | |
| | |
| | |
| | |
| | |
| | |
| | |
| | |
| | |
| | |
| | |
| | |
| | |
Schedule of Investments (unaudited)(continued)October 31, 2024
iShares® iBoxx $ Investment Grade Corporate Bond ETF(Percentages shown are based on Net Assets)
| | |
|
| | |
| | |
| | |
| | |
| | |
| | |
| | |
| | |
| | |
| | |
| | |
| | |
| | |
| | |
| | |
| | |
O'Reilly Automotive Inc., 4.70%, 06/15/32 | | |
| | |
| | |
| | |
| | |
| | |
| | |
| | |
| | |
| | |
| | |
| | |
| | |
| | |
| | |
| | |
| | |
| | |
| | |
| | |
| | |
| | |
| | |
| | |
| | |
| | |
| | |
| | |
| | |
| | |
| | |
| | |
|
| | |
| | |
| | |
| | |
| | |
| | |
| | |
| | |
| | |
Broadcom Corp./Broadcom Cayman Finance Ltd., 3.50%, 01/15/28 | | |
Schedule of Investments (unaudited)(continued)October 31, 2024
iShares® iBoxx $ Investment Grade Corporate Bond ETF(Percentages shown are based on Net Assets)
| | |
Semiconductors (continued) |
| | |
| | |
| | |
| | |
| | |
| | |
| | |
| | |
| | |
| | |
| | |
| | |
| | |
| | |
| | |
| | |
| | |
| | |
| | |
| | |
| | |
Series ., 4.55%, 02/15/32 | | |
| | |
| | |
| | |
| | |
| | |
| | |
| | |
| | |
| | |
| | |
| | |
| | |
| | |
| | |
| | |
| | |
| | |
| | |
| | |
| | |
| | |
| | |
| | |
| | |
| | |
| | |
| | |
| | |
| | |
| | |
| | |
| | |
| | |
| | |
| | |
| | |
| | |
| | |
| | |
| | |
Semiconductors (continued) |
| | |
| | |
| | |
| | |
| | |
| | |
| | |
| | |
| | |
| | |
| | |
| | |
| | |
| | |
| | |
| | |
| | |
| | |
| | |
NXP BV/NXP Funding LLC/NXP USA Inc. | | |
| | |
| | |
| | |
| | |
| | |
| | |
| | |
| | |
| | |
| | |
| | |
| | |
| | |
| | |
| | |
| | |
| | |
| | |
| | |
| | |
| | |
| | |
| | |
| | |
| | |
|
| | |
| | |
| | |
| | |
Autodesk Inc., 2.40%, 12/15/31 | | |
Broadridge Financial Solutions Inc. | | |
| | |
| | |
Cadence Design Systems Inc. | | |
| | |
| | |
Fidelity National Information Services Inc. | | |
| | |
| | |
| | |
Schedule of Investments (unaudited)(continued)October 31, 2024
iShares® iBoxx $ Investment Grade Corporate Bond ETF(Percentages shown are based on Net Assets)
| | |
|
| | |
| | |
| | |
| | |
| | |
| | |
| | |
| | |
| | |
| | |
| | |
| | |
Take-Two Interactive Software Inc., 4.95%, 03/28/28(a) | | |
| | |
| | |
| | |
| | |
| | |
| | |
| | |
| | |
Telecommunications — 6.3% |
| | |
| | |
| | |
| | |
| | |
| | |
| | |
| | |
| | |
| | |
| | |
| | |
| | |
| | |
| | |
| | |
| | |
| | |
| | |
| | |
| | |
| | |
| | |
| | |
| | |
| | |
Bell Telephone Co. of Canada or Bell Canada | | |
| | |
| | |
| | |
| | |
British Telecommunications PLC, 9.63%, 12/15/30 | | |
| | |
| | |
| | |
| | |
| | |
Schedule of Investments (unaudited)(continued)October 31, 2024
iShares® iBoxx $ Investment Grade Corporate Bond ETF(Percentages shown are based on Net Assets)
| | |
Telecommunications (continued) |
| | |
| | |
| | |
| | |
| | |
| | |
Deutsche Telekom International Finance BV, 8.75%, 06/15/30 | | |
| | |
| | |
| | |
| | |
| | |
| | |
| | |
| | |
| | |
Rogers Communications Inc. | | |
| | |
| | |
| | |
| | |
| | |
| | |
| | |
| | |
| | |
| | |
| | |
| | |
| | |
| | |
| | |
| | |
| | |
Telefonica Europe BV, 8.25%, 09/15/30(a) | | |
| | |
| | |
| | |
| | |
| | |
| | |
| | |
| | |
| | |
| | |
| | |
| | |
| | |
| | |
| | |
| | |
| | |
| | |
| | |
| | |
| | |
| | |
| | |
| | |
| | |
| | |
Telecommunications (continued) |
| | |
| | |
| | |
| | |
| | |
| | |
| | |
| | |
| | |
Verizon Communications Inc. | | |
| | |
| | |
| | |
| | |
| | |
| | |
| | |
| | |
| | |
| | |
| | |
| | |
| | |
| | |
| | |
| | |
| | |
| | |
| | |
| | |
| | |
| | |
| | |
| | |
| | |
| | |
| | |
| | |
| | |
| | |
| | |
| | |
| | |
| | |
| | |
| | |
| | |
| | |
| | |
| | |
| | |
Toys, Games & Hobbies — 0.0% |
Hasbro Inc., 3.90%, 11/19/29 | | |
|
Burlington Northern Santa Fe LLC | | |
| | |
| | |
| | |
| | |
| | |
Schedule of Investments (unaudited)(continued)October 31, 2024
iShares® iBoxx $ Investment Grade Corporate Bond ETF(Percentages shown are based on Net Assets)
| | |
Transportation (continued) |
| | |
| | |
| | |
| | |
| | |
| | |
| | |
| | |
| | |
Canadian National Railway Co. | | |
| | |
| | |
Canadian Pacific Railway Co. | | |
| | |
| | |
| | |
| | |
| | |
| | |
| | |
| | |
| | |
| | |
| | |
| | |
| | |
| | |
| | |
| | |
| | |
| | |
| | |
| | |
| | |
| | |
| | |
| | |
| | |
| | |
| | |
| | |
| | |
| | |
| | |
| | |
| | |
| | |
| | |
| | |
| | |
| | |
| | |
| | |
| | |
| | |
| | |
| | |
Transportation (continued) |
| | |
| | |
United Parcel Service Inc. | | |
| | |
| | |
| | |
| | |
| | |
| | |
| | |
| | |
| | |
| | |
| | |
| | |
| | |
| | |
|
American Water Capital Corp. | | |
| | |
| | |
| | |
| | |
Total Long-Term Investments — 97.5%
(Cost: $31,766,318,726) | |
| | |
|
Money Market Funds — 9.1% |
BlackRock Cash Funds: Institutional, SL Agency Shares, 5.01%(d)(e)(f) | | |
BlackRock Cash Funds: Treasury, SL Agency Shares, 4.83%(d)(e) | | |
Total Short-Term Securities — 9.1%
(Cost: $2,670,295,340) | |
Total Investments — 106.6%
(Cost: $34,436,614,066) | |
Liabilities in Excess of Other Assets — (6.6)% | |
| |
| All or a portion of this security is on loan. |
| Security exempt from registration pursuant to Rule 144A under the Securities Act of 1933, as amended. These securities may be resold in transactions exempt from registration to qualified institutional investors. |
| Variable rate security. Interest rate resets periodically. The rate shown is the effective interest rate as of period end. Security description also includes the reference rate and spread if published and available. |
| |
| Annualized 7-day yield as of period end. |
| All or a portion of this security was purchased with the cash collateral from loaned securities. |
Schedule of Investments (unaudited)(continued)October 31, 2024
iShares® iBoxx $ Investment Grade Corporate Bond ETF
Fair Value Hierarchy as of Period End
Various inputs are used in determining the fair value of financial instruments at the measurement of the date. These inputs to valuation techniques are categorized into a fair value hierarchy consisting of three broad levels for financial reporting purposes as follows:
• Level 1 – Unadjusted price quotations in active markets/exchanges that the Fund has the ability to access for identical assets or liabilities;
• Level 2 – Inputs other than quoted prices included within level 1 that are observable for the asset or liability, either directly or indirectly; and
• Level 3 – Inputs that are unobservable and significant to the entire fair value measurement for the asset or liability (including the Valuation Committee’s assumptions used in determining the fair value of financial instruments).
The hierarchy gives the highest priority to unadjusted quoted prices in active markets for identical assets or liabilities (Level 1 measurements) and the lowest priority to unobservable inputs (Level 3 measurements). Accordingly, the degree of judgment exercised in determining fair value is greatest for instruments categorized in Level 3. The inputs used to measure fair value may fall into different levels of the fair value hierarchy. In such cases, for disclosure purposes, the fair value hierarchy classification is determined based on the lowest level input that is significant to the fair value measurement in its entirety. Investments classified within Level 3 have significant unobservable inputs used by the Valuation Committee in determining the price for Fair Valued Investments. Level 3 investments include equity or debt issued by privately held companies or funds. There may not be a secondary market, and/or there are a limited number of investors. The categorization of a value determined for financial instruments is based on the pricing transparency of the financial instruments and is not necessarily an indication of the risks associated with investing in those securities. For information about the Fund’s policy regarding valuation of financial instruments, refer to its most recent financial statements.
The following table summarizes the Fund’s financial instruments categorized in the fair value hierarchy. The breakdown of the Fund’s financial instruments into major categories is disclosed in the Schedule of Investments above.
Statements of Assets and Liabilities (unaudited)October 31, 2024
| iShares
10+ Year Investment Grade Corporate Bond ETF | iShares
Core U.S. Aggregate Bond ETF | iShares
iBoxx $ High Yield Corporate Bond ETF | iShares
iBoxx $ Investment Grade Corporate Bond ETF |
| | | | |
Investments, at value—unaffiliated(a)(b) | | | | |
Investments, at value—affiliated(c) | | | | |
| | | | |
Cash pledged as collateral for TBA commitments | | | | |
Foreign currency, at value(d) | | | | |
| | | | |
| | | | |
Securities lending income—affiliated | | | | |
| | | | |
| | | | |
| | | | |
| | | | |
| | | | |
| | | | |
| | | | |
| | | | |
Collateral on securities loaned, at value | | | | |
TBA sales commitments, at value(e) | | | | |
| | | | |
| | | | |
| | | | |
| | | | |
| | | | |
Commitments and contingent liabilities | | | | |
| | | | |
| | | | |
| | | | |
| | | | |
| | | | |
| | | | |
| | | | |
| | | | |
| | | | |
| | | | |
(a) Investments, at cost—unaffiliated | | | | |
(b) Securities loaned, at value | | | | |
(c) Investments, at cost—affiliated | | | | |
(d) Foreign currency, at cost | | | | |
(e) Proceeds from TBA sales commitments | | | | |
Glossary of Terms Used in this Report
|
| Assured Guaranty Municipal Corp. |
| |
| Build America Mutual Assurance Co. |
| Constant Maturity Treasury |
| |
| General Obligation Limited |
| |
| London Interbank Offered Rate |
| National Public Finance Guarantee Corp. |
| |
| |
| Public Joint Stock Company |
| |
| |
| Real Estate Investment Trust |
| Subject to Appropriations |
| Svenska Celluosa Aktiebolaget |
| Secured Overnight Financing Rate |
| |
THIS PAGE INTENTIONALLY LEFT BLANK.
Want to know more?
iShares.com | 1-800-474-2737
This report is intended for the Funds’ shareholders. It may not be distributed to prospective investors unless it is preceded or accompanied by the current prospectus.
Investing involves risk, including possible loss of principal.
The iShares Funds are distributed by BlackRock Investments, LLC (together with its affiliates, “BlackRock”).
The iShares Funds are not sponsored, endorsed, issued, sold or promoted by BlackRock Index Services LLC, nor does this company make any representation regarding the advisability of investing in the iShares Funds. BlackRock is affiliated with the company listed above.
©2024 BlackRock, Inc. All rights reserved. iSHARES and BLACKROCK are registered trademarks of BlackRock, Inc. or its subsidiaries. All other marks are the property of their respective owners.
2024 Annual Financial Statements and Additional Information |
|
• iShares Short Duration Bond Active ETF | NEAR | Cboe BZX Exchange |
• iShares Ultra Short-Term Bond Active ETF | ICSH | Cboe BZX Exchange |
|
Schedule of InvestmentsOctober 31, 2024
iShares® Short Duration Bond Active ETF(Percentages shown are based on Net Assets)
| | |
|
Aimco CLO 12 Ltd., 6.35%, 01/17/32, (3-mo. CME Term SOFR + 1.700%)(a)(b) | | |
American Express Credit Account Master Trust, 5.15%, 09/15/30 | | |
AMMC CLO 21 Ltd., 7.18%, 11/02/30, (3-mo. CME Term SOFR + 1.942%)(a)(b) | | |
Anchorage Capital CLO 7 Ltd., 6.18%, 04/28/37, (3-mo. CME Term SOFR + 1.560%)(a)(b) | | |
ARI Fleet Lease Trust, 5.54%, 04/15/33(a) | | |
| | |
5.95%, 09/16/31, (1-day SONIA + 1.000%)(b)(c) | | |
6.31%, 09/16/31, (1-day SONIA + 1.350%)(b)(c) | | |
6.90%, 09/16/31, (1-day SONIA + 1.950%)(b)(c) | | |
Asset-Backed European Securitisation Transaction Twenty-Three SARL | | |
1.00%, 03/21/34, (1-mo. EURIBOR + 1.600%)(b)(c) | | |
5.03%, 03/21/34, (1-mo. EURIBOR + 1.900%)(b)(c) | | |
1.00%, 03/21/34, (1-mo. EURIBOR + 2.400%)(b)(c) | | |
Auto ABS Italian Stella Loans SRL | | |
5.08%, 12/29/36, (1-mo. EURIBOR + 1.700%)(b)(c) | | |
5.43%, 12/29/36, (1-mo. EURIBOR + 2.300%)(b)(c) | | |
Auto ABS Spanish Loans FT, 4.20%, 09/28/38, (1-mo. EURIBOR + 0.850%)(b)(c) | | |
| | |
3.83%, 12/24/44, (1-mo. EURIBOR + 0.700%)(b)(c) | | |
3.88%, 12/24/44, (1-mo. EURIBOR + 0.750%)(b)(c) | | |
AutoFlorence 3 SRL, 5.46%, 12/25/46, (1-mo. EURIBOR + 2.350%)(b)(c) | | |
Autonoria Spain FT, 5.11%, 01/26/40, (1-mo. EURIBOR + 2.000%)(b)(c) | | |
Azure Finance No. 3 PLC, 5.75%, 06/20/34, (1-day SONIA + 0.800%)(b)(c) | | |
BA Credit Card Trust, 4.98%, 11/15/28 | | |
Bain Capital CLO Ltd. Series 2024-1A, Class A1, 6.20%, 04/16/37, (3-mo. CME Term SOFR + 1.550%)(a)(b) | | |
Bain Capital Credit CLO Ltd., 1.00%, 10/20/34, (3-mo. CME Term SOFR + 1.200%)(a)(b) | | |
Barings CLO Ltd., 5.95%, 04/20/31, (3-mo. CME Term SOFR + 1.332%)(a)(b) | | |
Bavarian Sky SA - Compartment German Auto Loans 13, 3.60%, 03/20/32, (1-mo. EURIBOR + 0.430%)(b)(c) | | |
Benefit Street Partners CLO VIII Ltd. Series 2015-8A, Class A1AR, 5.98%, 01/20/31, (3-mo. CME Term SOFR + 1.362%)(a)(b) | | |
Blueberry Park CLO Ltd., 6.48%, 10/20/37, (3-mo. CME Term SOFR + 1.350%)(a)(b) | | |
| | |
BPCE Consumer Loans FCT, 4.08%, 10/31/42, (1-mo. EURIBOR + 0.700%)(b)(c) | | |
Brex Commercial Charge Card Master Trust, 6.05%, 07/15/27(a) | | |
Brignole Co., 5.37%, 02/24/42, (1-mo. EURIBOR + 2.000%)(b)(c) | | |
Bryant Park Funding Ltd., 6.28%, 04/15/37, (3-mo. CME Term SOFR + 1.620%)(a)(b) | | |
Cardiff Auto Receivables Securitisation PLC | | |
| | |
7.55%, 08/20/31, (1-day SONIA + 2.600%)(b)(c) | | |
6.35%, 08/20/31, (1-day SONIA + 1.400%)(b)(c) | | |
Carlyle C17 CLO Ltd. Series C17A, Class A1AR, 5.88%, 04/30/31, (3-mo. CME Term SOFR + 1.292%)(a)(b) | | |
Carlyle Global Market Strategies CLO Ltd. Series 2014-1A, Class A1R2, 5.88%, 04/17/31, (3-mo. CME Term SOFR + 1.232%)(a)(b) | | |
CarMax Auto Owner Trust, 4.92%, 10/16/28 | | |
CarVal CLO II Ltd., 6.38%, 04/20/32, (3-mo. CME Term SOFR + 1.762%)(a)(b) | | |
CarVal CLO IX-C Ltd., 6.30%, 04/20/37, (3-mo. CME Term SOFR + 1.680%)(a)(b) | | |
Carval CLO X-C Ltd., 6.75%, 07/20/37, (3-mo. CME Term SOFR + 1.460%)(a)(b) | | |
Cbam Ltd. Series 2018-7A, Class A, 5.98%, 07/20/31, (3-mo. CME Term SOFR + 1.362%)(a)(b) | | |
Chesapeake Funding II LLC, 5.52%, 05/15/36(a) | | |
| | |
6.17%, 04/21/37, (3-mo. CME Term SOFR + 1.550%)(a)(b) | | |
6.06%, 07/17/37, (3-mo. CME Term SOFR + 1.410%)(a)(b) | | |
6.82%, 07/23/37, (3-mo. CME Term SOFR + 1.650%)(a)(b) | | |
6.02%, 10/20/37, (3-mo. CME Term SOFR + 1.370%)(a)(b) | | |
Series 2018-1A, Class A, 5.89%, 04/18/31, (3-mo. CME Term SOFR + 1.262%)(a)(b) | | |
Citibank Credit Card Issuance Trust, 5.69%, 05/14/29, (3-mo. CME Term SOFR + 0.884%)(b) | | |
CNH Equipment Trust, 4.77%, 06/15/29 | | |
College Ave Student Loans LLC Series 2021-A, Class A1, 5.95%, 07/25/51, (3-mo. CME Term SOFR + 1.214%)(a)(b) | | |
Compartment BL Consumer Credit | | |
4.01%, 09/25/41, (1-mo. EURIBOR + 0.900%)(b) | | |
3.74%, 09/25/41, (1-mo. EURIBOR + 0.630%)(b) | | |
Delamare Cards MTN Issuer PLC, 5.75%, 04/19/31, (1-day SONIA + 0.800%)(b)(c) | | |
Dilosk Rmbs No. 9 Dac, 3.77%, 01/25/63, (3-mo. EURIBOR + 0.680%)(b)(c) | | |
32024 iShares Annual Financial Statements and Additional Information
Schedule of Investments (continued)October 31, 2024
iShares® Short Duration Bond Active ETF(Percentages shown are based on Net Assets)
| | |
| | |
6.70%, 01/20/29, (1-day SONIA + 1.750%)(b)(c) | | |
7.65%, 08/20/29, (1-day SONIA + 2.700%)(b)(c) | | |
6.55%, 08/20/31, (1-day SONIA + 1.600%)(b)(c) | | |
7.30%, 08/20/31, (1-day SONIA + 2.350%)(b)(c) | | |
Dryden 68 CLO Ltd., 6.09%, 07/15/35, (3-mo. CME Term SOFR + 1.432%)(a)(b) | | |
Dryden 77 CLO Ltd. Series 2020-77A, Class XR, 6.39%, 05/20/34, (3-mo. CME Term SOFR + 1.262%)(a)(b) | | |
Dryden XXVI Senior Loan Fund, 6.37%, 04/15/29, (3-mo. CME Term SOFR + 1.712%)(a)(b) | | |
Dutch Property Finance BV | | |
4.44%, 10/28/59, (3-mo. EURIBOR + 0.750%)(b)(c) | | |
Series 2021-2, Class A, 3.77%, 04/28/59, (3-mo. EURIBOR + 0.700%)(b)(c) | | |
Edenbrook Mortgage Funding PLC | | |
6.91%, 03/22/57, (1-day SONIA + 1.950%)(b)(c) | | |
7.51%, 03/22/57, (1-day SONIA + 2.550%)(b)(c) | | |
Elmwood CLO 26 Ltd., 6.13%, 04/18/37, (3-mo. CME Term SOFR + 1.500%)(a)(b) | | |
Elmwood CLO II Ltd., 1.00%, 10/20/37, (3-mo. CME Term SOFR + 1.700%)(a)(b) | | |
Elmwood CLO III Ltd., 6.23%, 07/18/37, (3-mo. CME Term SOFR + 1.600%)(a)(b) | | |
Elvet Mortgages PLC Series 2021-1, 5.32%, 10/22/63, (1-day SONIA + 0.370%)(b)(c) | | |
Enterprise Fleet Financing LLC | | |
| | |
| | |
| | |
| | |
| | |
| | |
| | |
Ford Credit Auto Owner Trust | | |
5.50%, 06/15/26, (30-day Avg SOFR + 0.490%)(b) | | |
| | |
| | |
| | |
Ford Credit Floorplan Master Owner Trust A | | |
6.26%, 05/15/28, (30-day Avg SOFR + 1.250%)(a)(b) | | |
| | |
Fortuna Consumer Loan ABS DAC | | |
4.56%, 02/18/34, (1-mo. EURIBOR + 1.350%)(b)(c) | | |
5.51%, 02/18/34, (1-mo. EURIBOR + 2.300%)(b)(c) | | |
4.57%, 10/18/34, (1-mo. EURIBOR + 1.300%)(b) | | |
4.92%, 10/18/34, (1-mo. EURIBOR + 1.650%)(b) | | |
| | |
Foundation Finance Trust, 5.50%, 12/15/49(a) | | |
| | |
| | |
| | |
Galaxy XV CLO Ltd. Series 2013-15A, Class ARR, 5.89%, 10/15/30, (3-mo. CME Term SOFR + 1.232%)(a)(b) | | |
GAMMA Sociedade de Titularizacao de Creditos, 4.25%, 02/26/34, (3-mo. EURIBOR + 0.900%)(b)(c) | | |
Ginkgo Personal Loans, 4.19%, 09/23/44, (1-mo. EURIBOR + 0.790%)(b)(c) | | |
GM Financial Revolving Receivables Trust | | |
| | |
| | |
| | |
Golden Bar Securitisation SRL, 4.93%, 09/22/43, (3-mo. EURIBOR + 1.500%)(b)(c) | | |
Golden Ray SA - Compartment 1 | | |
1.00%, 12/27/57, (1-mo. EURIBOR + 2.000%)(b)(c) | | |
1.00%, 12/27/57, (1-mo. EURIBOR + 0.800%)(b)(c) | | |
1.00%, 12/27/57, (1-mo. EURIBOR + 1.500%)(b)(c) | | |
GoldenTree Loan Management U.S. CLO 8 Ltd., 5.82%, 10/20/34, (3-mo. CME Term SOFR + 1.150%)(a)(b)(e) | | |
GreatAmerica Leasing Receivables Funding LLC Series, 5.28%, 03/15/27(a) | | |
| | |
7.30%, 04/21/33, (1-day SONIA + 2.350%)(b)(c) | | |
6.55%, 04/21/33, (1-day SONIA + 1.600%)(b)(c) | | |
| | |
5.26%, 02/18/32, (1-mo. EURIBOR + 2.050%)(b)(c) | | |
6.41%, 02/18/32, (1-mo. EURIBOR + 3.200%)(b)(c) | | |
3.93%, 10/18/32, (1-mo. EURIBOR + 0.720%)(b)(c) | | |
5.16%, 10/18/32, (1-mo. EURIBOR + 1.950%)(b)(c) | | |
| | |
6.82%, 04/21/56, (1-day SONIA + 1.700%)(b)(c) | | |
7.42%, 04/21/56, (1-day SONIA + 2.300%)(b)(c) | | |
6.00%, 04/21/56, (1-day SONIA + 0.880%)(b)(c) | | |
6.42%, 04/21/56, (1-day SONIA + 1.300%)(b)(c) | | |
Hyundai Auto Receivables Trust | | |
| | |
| | |
John Deere Owner Trust, 4.96%, 11/15/28 | | |
KKR CLO 21 Ltd., 5.92%, 04/15/31, (3-mo. CME Term SOFR + 1.262%)(a)(b) | | |
LCM 29 Ltd. Series 29A, Class AR, 5.99%, 04/15/31, (3-mo. CME Term SOFR + 1.332%)(a)(b) | | |
Schedule of Investments (continued)October 31, 2024
iShares® Short Duration Bond Active ETF(Percentages shown are based on Net Assets)
| | |
| | |
| | |
6.35%, 03/28/34, (1-day SONIA + 1.400%)(b)(c) | | |
8.40%, 03/28/34, (1-day SONIA + 3.450%)(b)(c) | | |
Lt Autorahoitus IV DAC, 3.90%, 07/18/33, (1-mo. EURIBOR + 0.700%)(b)(c) | | |
Madison Park Funding L Ltd., 6.02%, 04/19/34, (3-mo. CME Term SOFR + 1.402%)(a)(b) | | |
Madison Park Funding LVII Ltd., 5.90%, 07/27/34, (3-mo. CME Term SOFR + 1.280%)(a)(b) | | |
Madison Park Funding XVII Ltd. Series 2015-17A, Class AR2, 5.88%, 07/21/30, (3-mo. CME Term SOFR + 1.262%)(a)(b) | | |
Mariner CLO LLC, 6.22%, 01/23/37, (3-mo. CME Term SOFR + 1.590%)(a)(b) | | |
Marzio Finance SRL, 3.98%, 05/28/49, (1-mo. EURIBOR + 0.880%)(b)(c) | | |
MMAF Equipment Finance LLC, 4.95%, 07/14/31(a) | | |
Molossus BTL PLC, 5.90%, 04/18/61, (1-day SONIA + 0.950%)(b)(c) | | |
Navient Private Education Loan Trust, 5.64%, 12/15/59, (3-mo. CME Term SOFR + 0.834%)(a)(b) | | |
Navient Private Education Refi Loan Trust | | |
Series 2020-IA, Class A1B, 5.92%, 04/15/69, (3-mo. CME Term SOFR + 1.114%)(a)(b) | | |
Series 2021-BA, Class A, 0.94%, 07/15/69(a) | | |
Series 2021-DA, Class A, 6.01%, 04/15/60, (PRIME - 1.990%)(a)(b) | | |
Navient Student Loan Trust, 6.71%, 03/15/72, (30-day Avg SOFR + 1.700%)(a)(b) | | |
Navistar Financial Dealer Note Master Owner Trust, 5.59%, 04/25/29(a) | | |
Nelnet Student Loan Trust | | |
5.61%, 04/20/62, (3-mo. CME Term SOFR + 0.854%)(a)(b) | | |
5.56%, 04/20/62, (3-mo. CME Term SOFR + 0.804%)(a)(b) | | |
| | |
Series 2021-A, Class A1, 5.67%, 04/20/62, (3-mo. CME Term SOFR + 0.914%)(a)(b) | | |
Series 2021-BA, Class AFL, 5.65%, 04/20/62, (3-mo. CME Term SOFR + 0.894%)(a)(b) | | |
Neuberger Berman CLO XIV Ltd. Series 2013-14A, Class AR2, 5.91%, 01/28/30, (3-mo. CME Term SOFR + 1.292%)(a)(b) | | |
Neuberger Berman Loan Advisers CLO 35 Ltd., 5.92%, 01/19/33, (3-mo. CME Term SOFR + 1.300%)(a)(b) | | |
| | |
6.61%, 03/15/32, (1-day SONIA + 1.650%)(b)(c) | | |
7.36%, 03/15/32, (1-day SONIA + 2.400%)(b)(c) | | |
Newday Funding Master Issuer PLC | | |
6.46%, 11/15/31, (1-day SONIA + 1.500%)(b)(c) | | |
| | |
7.61%, 07/15/32, (1-day SONIA + 2.650%)(b)(c) | | |
6.86%, 07/15/32, (1-day SONIA + 1.900%)(b)(c) | | |
6.36%, 07/15/32, (1-day SONIA + 1.400%)(b)(c) | | |
1.00%, 11/15/32, (1-day SONIA + 1.600%)(b)(c) | | |
Niagara Park CLO Ltd., 5.91%, 07/17/32, (3-mo. CME Term SOFR + 1.262%)(a)(b) | | |
Noria DE, 5.00%, 02/25/43, (1-mo. EURIBOR + 1.650%)(b) | | |
Oaktree CLO Ltd., 6.17%, 04/20/37, (3-mo. CME Term SOFR + 1.550%)(a)(b) | | |
Octagon Investment Partners XVII Ltd. Series 2013-1A, Class A1R2, 5.89%, 01/25/31, (3-mo. CME Term SOFR + 1.262%)(a)(b) | | |
OHA Loan Funding Ltd., 6.32%, 07/20/37, (3-mo. CME Term SOFR + 1.700%)(a)(b) | | |
OneMain Direct Auto Receivables Trust, 6.61%, 03/14/29, (30-day Avg SOFR + 1.600%)(a)(b) | | |
OneMain Financial Issuance Trust, 6.51%, 09/15/36, (30-day Avg SOFR + 1.500%)(a)(b) | | |
| | |
6.32%, 10/20/37, (3-mo. CME Term SOFR + 1.700%)(a)(b) | | |
Series 2015-2, 5.98%, 07/20/30, (3-mo. CME Term SOFR + 1.362%)(a)(b) | | |
Series 2021-3A, Class A1, 6.07%, 01/15/35, (3-mo. CME Term SOFR + 1.412%)(a)(b) | | |
| | |
5.86%, 07/16/29, (1-day SONIA + 0.900%)(b)(c) | | |
6.26%, 07/16/29, (1-day SONIA + 1.300%)(b)(c) | | |
| | |
6.14%, 05/15/28, (1-day SONIA + 1.180%)(b)(c) | | |
7.46%, 05/15/28, (1-day SONIA + 2.500%)(b)(c) | | |
PFS Financing Corp., 6.16%, 08/15/27, (30-day Avg SOFR + 1.150%)(a)(b) | | |
Pikes Peak CLO 1 Series 2018-1A, Class A, 6.08%, 07/24/31, (3-mo. CME Term SOFR + 1.442%)(a)(b) | | |
Pikes Peak CLO 16 Ltd., 6.78%, 07/25/37, (3-mo. CME Term SOFR + 1.460%)(a)(b) | | |
Pony SA Compartment German Auto Loans, 4.46%, 01/14/33, (1-mo. EURIBOR + 1.200%)(b)(c) | | |
Porsche Financial Auto Securitization Trust, 5.79%, 01/22/29(a) | | |
Post CLO Ltd., 6.22%, 04/20/37, (3-mo. CME Term SOFR + 1.600%)(a)(b) | | |
Prodigy Finance DAC Series 2021-1A, Class A, 6.10%, 07/25/51, (3-mo. CME Term SOFR + 1.364%)(a)(b) | | |
Provident Funding Mortgage Trust, 2.50%, 11/25/51(a)(b) | | |
Quarzo SRL, 5.78%, 06/15/41, (3-mo. EURIBOR + 2.300%)(b)(c) | | |
52024 iShares Annual Financial Statements and Additional Information
Schedule of Investments (continued)October 31, 2024
iShares® Short Duration Bond Active ETF(Percentages shown are based on Net Assets)
| | |
Rad CLO 7 Ltd., 6.00%, 04/17/36, (3-mo. CME Term SOFR + 1.350%)(a)(b) | | |
Red & Black Auto Germany 8 UG, Class B, 4.00%, 09/15/30, (1-mo. EURIBOR + 0.750%)(b)(c) | | |
Red & Black Auto Italy SRL | | |
4.33%, 07/28/36, (1-mo. EURIBOR + 1.100%)(b)(c) | | |
Class A, 3.80%, 12/28/31, (1-mo. EURIBOR + 0.700%)(b)(c) | | |
Regatta VIII Funding Ltd., 6.20%, 04/17/37, (3-mo. CME Term SOFR + 1.550%)(a)(b) | | |
Regatta XXVII Funding Ltd., 6.15%, 04/26/37, (3-mo. CME Term SOFR + 1.530%)(a)(b) | | |
Regional Management Issuance Trust, 5.83%, 07/15/36(a) | | |
Romark WM-R Ltd. Series 2018-1A, Class A1, 5.91%, 04/20/31, (3-mo. CME Term SOFR + 1.292%)(a)(b) | | |
| | |
5.85%, 01/17/31, (1-day SONIA + 0.900%)(b)(c) | | |
7.00%, 01/17/31, (1-day SONIA + 2.050%)(b)(c) | | |
6.20%, 01/17/31, (1-day SONIA + 1.250%)(b)(c) | | |
SC Germany SA Compartment Consumer | | |
4.26%, 01/14/38, (1-mo. EURIBOR + 1.000%)(b)(c) | | |
4.56%, 01/14/38, (1-mo. EURIBOR + 1.300%)(b)(c) | | |
1.00%, 05/14/38, (1-mo. EURIBOR + 1.700%)(b)(c) | | |
1.00%, 05/14/38, (1-mo. EURIBOR + 1.400%)(b)(c) | | |
SCF Rahoituspalvelut XIII DAC, 4.51%, 06/25/34, (1-mo. EURIBOR + 1.400%)(b)(c) | | |
SFS Auto Receivables Securitization Trust, 5.89%, 03/22/27(a) | | |
Silverstone Master Issuer PLC, 5.24%, 01/21/70, (1-day SONIA + 0.290%)(b)(c) | | |
Sixth Street CLO XX Ltd., 6.53%, 10/20/34, (3-mo. CME Term SOFR + 1.912%)(a)(b) | | |
SLM Private Credit Student Loan Trust | | |
Series 2004-A, Class A3, 5.61%, 06/15/33, (3-mo. CME Term SOFR + 0.662%)(b) | | |
Series 2005-A, Class A4, 5.52%, 12/15/38, (3-mo. CME Term SOFR + 0.572%)(b) | | |
Series 2005-B, Class A4, 5.54%, 06/15/39, (3-mo. CME Term SOFR + 0.592%)(b) | | |
Series 2006-A, Class A5, 5.50%, 06/15/39, (3-mo. CME Term SOFR + 0.552%)(b) | | |
Series 2006-B, Class A5, 5.48%, 12/15/39, (3-mo. CME Term SOFR + 0.532%)(b) | | |
SMB Private Education Loan Trust | | |
6.46%, 02/16/55, (30-day Avg SOFR + 1.450%)(a)(b) | | |
6.86%, 05/16/50, (30-day Avg SOFR + 1.850%)(a)(b) | | |
6.81%, 10/15/58, (30-day Avg SOFR + 1.800%)(a)(b) | | |
| | |
5.92%, 06/15/37, (3-mo. CME Term SOFR + 1.114%)(a)(b) | | |
6.81%, 10/16/56, (30-day Avg SOFR + 1.800%)(a)(b) | | |
6.54%, 11/15/52, (30-day Avg SOFR + 1.550%)(a)(b) | | |
Series 2017-A, Class A2B, 5.82%, 09/15/34, (3-mo. CME Term SOFR + 1.014%)(a)(b) | | |
SoFi Personal Loan Trust, 6.06%, 02/12/31(a) | | |
SoFi Professional Loan Program LLC | | |
| | |
| | |
| | |
TAGUS - Sociedade de Titularizacao de Creditos SA/Ulisses Finance No. 2, 3.85%, 09/23/38, (1-mo. EURIBOR + 0.700%)(b)(c) | | |
TAGUS - Sociedade de Titularizacao de Creditos SA/Viriato Finance No. 1, 4.05%, 10/28/40, (1-mo. EURIBOR + 0.950%)(b)(c) | | |
TAGUS-Sociedade de Titularizacao de Creditos SA/Vasco Finance No. 2 | | |
5.77%, 10/27/42, (1-mo. EURIBOR + 2.600%)(b)(c) | | |
4.97%, 10/27/42, (1-mo. EURIBOR + 1.800%)(b)(c) | | |
| | |
5.94%, 10/13/32, (3-mo. CME Term SOFR + 1.282%)(a)(b) | | |
5.85%, 07/15/30, (3-mo. CME Term SOFR + 1.192%)(a)(b) | | |
TICP CLO VII Ltd., 6.55%, 04/15/33, (3-mo. CME Term SOFR + 1.900%)(a)(b) | | |
TICP CLO XI Ltd., 6.16%, 04/25/37, (3-mo. CME Term SOFR + 1.530%)(a)(b) | | |
Together Asset-Backed Securitisation PLC, 5.66%, 07/12/63, (1-day SONIA + 0.700%)(b)(c) | | |
| | |
| | |
| | |
6.17%, 05/20/66, (1-day SONIA + 1.200%)(b)(c) | | |
6.57%, 05/20/66, (1-day SONIA + 1.600%)(b)(c) | | |
| | |
Toyota Auto Receivables Owner Trust, 5.54%, 08/15/28 | | |
Trestles CLO V Ltd., 6.05%, 10/20/34, (3-mo. CME Term SOFR + 1.432%)(a)(b) | | |
Trinitas CLO XXIII Ltd., 6.42%, 10/20/36, (3-mo. CME Term SOFR + 1.800%)(a)(b) | | |
Vantage Data Centers Jersey Borrower Spv Ltd., 6.17%, 05/28/39(c) | | |
| | |
| | |
| | |
Volkswagen Auto Loan Enhanced Trust, 5.48%, 12/20/28 | | |
Voya CLO Series 2017-2A, Class A1R, 5.90%, 06/07/30, (3-mo. CME Term SOFR + 1.242%)(a)(b) | | |
Schedule of Investments (continued)October 31, 2024
iShares® Short Duration Bond Active ETF(Percentages shown are based on Net Assets)
| | |
Voya Ltd. Series 2012-4, 5.92%, 10/15/30, (3-mo. CME Term SOFR + 1.262%)(a)(b) | | |
Westlake Automobile Receivables Trust | | |
5.76%, 07/15/26, (30-day Avg SOFR + 0.750%)(a)(b) | | |
| | |
| | |
3.99%, 04/20/34, (1-mo. EURIBOR + 0.880%)(b)(c) | | |
4.81%, 04/20/34, (1-mo. EURIBOR + 1.700%)(b)(c) | | |
Total Asset-Backed Securities — 18.1%
(Cost: $524,559,018) | |
Collateralized Mortgage Obligations |
Asset-Backed Securities — 0.0% |
Lanebrook Mortgage Transaction PLC, 5.76%, 03/15/61, (1-day SONIA + 0.800%)(b)(c) | | |
| | |
6.36%, 12/20/66, (1-day SONIA + 1.400%)(b)(c) | | |
6.86%, 12/20/66, (1-day SONIA + 1.900%)(b)(c) | | |
| | |
Mortgage-Backed Securities — 13.1% |
280 Park Avenue Mortgage Trust, Series 2017-280P, Class A, 6.00%, 09/15/34, (3-mo. CME Term SOFR + 1.180%)(a)(b) | | |
A&D Mortgage Trust, 6.20%, 02/25/69(a)(d) | | |
ACRA Trust, 5.61%, 10/25/64(a)(d) | | |
| | |
| | |
| | |
| | |
| | |
6.25%, 09/20/61, (1-day SONIA + 1.300%)(b)(c) | | |
6.50%, 09/20/61, (1-day SONIA + 1.550%)(b)(c) | | |
7.15%, 09/20/61, (1-day SONIA + 2.200%)(b)(c) | | |
Auburn 15 PLC, 6.05%, 07/20/45, (1-day SONIA + 1.100%)(b)(c) | | |
| | |
| | |
| | |
| | |
| | |
| | |
| | |
Series 2018-TALL, Class A, 5.72%, 03/15/37, (3-mo. CME Term SOFR + 0.919%)(a)(b) | | |
Beast Mortgage Trust, 5.67%, 04/15/36, (3-mo. CME Term SOFR + 0.864%)(a)(b) | | |
Benchmark Mortgage Trust, 5.81%, 01/10/57 | | |
BFLD Commercial Mortgage Trust | | |
1.00%, 11/15/29, (3-mo. CME Term SOFR + 1.842%)(a)(b) | | |
| | |
Mortgage-Backed Securities (continued) |
6.26%, 11/15/29, (3-mo. CME Term SOFR + 1.493%)(a)(b) | | |
BFLD Mortgage Trust, 6.30%, 08/15/26, (3-mo. CME Term SOFR + 1.492%)(a)(b) | | |
| | |
| | |
| | |
| | |
Brass No. 11 PLC, 5.73%, 11/16/70, (1-day SONIA + 0.750%)(b)(c) | | |
BRAVO Residential Funding Trust | | |
| | |
| | |
BX Commercial Mortgage Trust | | |
6.25%, 02/15/39, (3-mo. CME Term SOFR + 1.442%)(a)(b) | | |
6.50%, 08/15/39, (3-mo. CME Term SOFR + 1.691%)(a)(b) | | |
6.94%, 08/15/39, (3-mo. CME Term SOFR + 2.141%)(a)(b) | | |
7.88%, 10/15/41, (3-mo. CME Term SOFR + 2.880%)(a)(b) | | |
| | |
5.72%, 02/15/36, (3-mo. CME Term SOFR + 0.914%)(a)(b) | | |
6.30%, 07/15/29, (3-mo. CME Term SOFR + 1.491%)(a)(b) | | |
6.89%, 03/15/41, (3-mo. CME Term SOFR + 2.090%)(a)(b) | | |
7.84%, 03/15/41, (3-mo. CME Term SOFR + 3.039%)(a)(b) | | |
Series 2019-CALM, Class A, 5.79%, 11/15/32, (3-mo. CME Term SOFR + 0.990%)(a)(b) | | |
CEDR Commercial Mortgage Trust, 5.77%, 02/15/39, (3-mo. CME Term SOFR + 0.988%)(a)(b) | | |
CENT Trust, 7.42%, 09/15/38, (3-mo. CME Term SOFR + 2.620%)(a)(b) | | |
CFCRE Commercial Mortgage Trust, 3.84%, 12/10/54 | | |
Chase Home Lending Mortgage Trust, Series 2019-ATR2, Class A11, 5.75%, 07/25/49, (3-mo. CME Term SOFR + 1.014%)(a)(b) | | |
| | |
1.00%, 04/28/60, (1-day SONIA + 1.020%)(b)(c) | | |
1.00%, 04/28/60, (1-day SONIA + 1.450%)(b)(c) | | |
1.00%, 04/28/60, (1-day SONIA + 1.750%)(b)(c) | | |
1.00%, 04/28/60, (1-day SONIA + 2.450%)(b)(c) | | |
COAST Commercial Mortgage Trust, 7.40%, 08/15/36, (3-mo. CME Term SOFR + 2.591%)(a)(b) | | |
COLT Mortgage Loan Trust, 5.84%, 02/25/69(a)(d) | | |
CONE Trust, 6.45%, 08/15/41, (3-mo. CME Term SOFR + 1.642%)(a)(b) | | |
Cross Mortgage Trust, 6.09%, 12/25/68(a)(d) | | |
72024 iShares Annual Financial Statements and Additional Information
Schedule of Investments (continued)October 31, 2024
iShares® Short Duration Bond Active ETF(Percentages shown are based on Net Assets)
| | |
Mortgage-Backed Securities (continued) |
Domi BV, 4.66%, 02/15/55, (3-mo. EURIBOR + 1.120%)(b)(c) | | |
| | |
6.36%, 12/27/55, (1-day SONIA + 1.400%)(b)(c) | | |
6.66%, 12/27/55, (1-day SONIA + 1.700%)(b)(c) | | |
6.96%, 12/27/55, (1-day SONIA + 2.000%)(b)(c) | | |
| | |
| | |
| | |
Elstree Funding No. 4 PLC, 6.07%, 10/21/55, (1-day SONIA + 1.120%)(b)(c) | | |
EQT Trust, 5.33%, 07/05/41(a)(b) | | |
| | |
5.84%, 03/25/94, (1-day SONIA + 0.880%)(b)(c) | | |
6.86%, 03/25/94, (1-day SONIA + 1.900%)(b)(c) | | |
7.76%, 03/25/94, (1-day SONIA + 2.800%)(b)(c) | | |
Federal Home Loan Mortgage Corp., 3.50%, 02/01/35(f) | | |
Federal Home Loan Mortgage Corp. REMICS | | |
| | |
| | |
6.31%, 03/25/54, (30-day Avg SOFR + 1.450%)(b) | | |
6.31%, 04/25/54, (30-day Avg SOFR + 1.450%)(b) | | |
Federal National Mortgage Association REMICS | | |
| | |
5.27%, 12/25/48, (30-day SOFR + 0.414%)(b) | | |
6.05%, 12/25/54, (30-day Avg SOFR + 1.200%)(b) | | |
GCAT Trust, 3.34%, 02/25/67(a)(b) | | |
GS Mortgage Securities Corp. Trust | | |
| | |
5.87%, 10/15/36, (3-mo. CME Term SOFR + 1.064%)(a)(b) | | |
7.59%, 03/15/28, (3-mo. CME Term SOFR + 2.790%)(a)(b) | | |
HONO Mortgage Trust, 6.07%, 10/15/36, (3-mo. CME Term SOFR + 1.264%)(a)(b) | | |
JP Morgan Chase Commercial Mortgage Securities Trust | | |
| | |
6.41%, 03/15/39, (30-day Avg SOFR + 1.400%)(a)(b) | | |
Series 2019-BKWD, Class A, 6.42%, 09/15/29, (3-mo. CME Term SOFR + 1.614%)(a)(b) | | |
| | |
| | |
| | |
| | |
| | |
Mortgage-Backed Securities (continued) |
Jupiter Mortgage No. 1 PLC | | |
6.65%, 07/20/55, (1-day SONIA + 1.700%)(b)(c) | | |
7.20%, 07/20/55, (1-day SONIA + 2.250%)(b)(c) | | |
7.95%, 07/20/55, (1-day SONIA + 3.000%)(b)(c) | | |
Lanark Master Issuer PLC, 5.47%, 12/22/69, (1-day SONIA + 0.500%)(b)(c) | | |
Lanebrook Mortgage Transaction PLC, 6.15%, 08/20/60, (1-day SONIA + 1.180%)(b)(c) | | |
Last Mile Securities PE DAC, 4.45%, 08/17/31, (3-mo. EURIBOR + 0.900%)(b)(c) | | |
LBA Trust, 6.25%, 10/15/41, (3-mo. CME Term SOFR + 1.443%)(a)(b) | | |
LUX, 7.49%, 08/15/40, (3-mo. CME Term SOFR + 2.690%)(a)(b) | | |
Miltonia Mortgage Finance SRL, 4.37%, 04/28/62, (3-mo. EURIBOR + 1.300%)(b)(c) | | |
Morgan Stanley Bank of America Merrill Lynch Trust, Series 2015-C23, Class A4, 3.72%, 07/15/50 | | |
Morgan Stanley Capital I Trust | | |
| | |
Series 2018-BOP, Class A, 5.70%, 08/15/33, (3-mo. CME Term SOFR + 0.897%)(a)(b) | | |
| | |
1.00%, 09/22/67, (1-day SONIA + 0.830%)(b)(c) | | |
1.00%, 09/22/67, (1-day SONIA + 1.150%)(b)(c) | | |
1.00%, 09/22/67, (1-day SONIA + 1.550%)(b)(c) | | |
1.00%, 09/22/67, (1-day SONIA + 2100%)(b)(c) | | |
MSWF Commercial Mortgage Trust, 6.01%, 12/15/56(b) | | |
OPEN Trust, 7.89%, 10/15/28, (1-mo. CME Term SOFR + 3.089%)(a)(b) | | |
| | |
5.98%, 02/26/61, (1-day SONIA + 1.030%)(b)(c) | | |
6.30%, 02/26/61, (1-day SONIA + 1.350%)(b)(c) | | |
6.65%, 02/26/61, (1-day SONIA + 1.700%)(b)(c) | | |
7.65%, 02/26/61, (1-day SONIA + 2.700%)(b)(c) | | |
8.95%, 02/26/61, (1-day SONIA + 4.000%)(b)(c) | | |
PRPM LLC, 4.00%, 01/25/54(a)(d) | | |
PRPM Trust, 6.33%, 06/25/69(a)(d) | | |
PSMC Trust, 2.50%, 03/25/51(a)(b) | | |
RCKT Mortgage Trust, 2.50%, 06/25/51(a)(b) | | |
RIAL Issuer Ltd., 7.04%, 01/19/37, (3-mo. CME Term SOFR + 2.250%)(a)(b) | | |
| | |
| | |
| | |
Schedule of Investments (continued)October 31, 2024
iShares® Short Duration Bond Active ETF(Percentages shown are based on Net Assets)
| | |
Mortgage-Backed Securities (continued) |
SMRT Commercial Mortgage Trust, 5.80%, 01/15/39, (3-mo. CME Term SOFR + 1.000%)(a)(b) | | |
Stratton Mortgage Funding PLC | | |
5.86%, 06/28/50, (1-day SONIA + 0.900%)(b)(c) | | |
6.31%, 06/25/49, (1-day SONIA + 1.350%)(b)(c) | | |
6.46%, 06/25/49, (1-day SONIA + 1.500%)(b)(c) | | |
6.46%, 06/28/50, (1-day SONIA + 1.500%)(b)(c) | | |
Taubman Centers Commercial Mortgage Trust, 6.99%, 05/15/37, (3-mo. CME Term SOFR + 2.186%)(a)(b) | | |
| | |
3.09%, 11/17/36, (3-mo. EURIBOR + 1.500%)(b)(c) | | |
3.09%, 11/17/36, (3-mo. EURIBOR + 2.050%)(b)(c) | | |
5.69%, 11/17/36, (3-mo. EURIBOR + 2.550%)(b)(c) | | |
Together Asset-Backed Securitisation PLC | | |
5.91%, 08/15/64, (1-day SONIA + 0.950%)(b)(c) | | |
6.65%, 08/20/55, (1-day SONIA + 1.700%)(b)(c) | | |
7.45%, 08/20/55, (1-day SONIA + 2.500%)(b)(c) | | |
Trinity Square PLC, 5.86%, 07/15/59(c) | | |
TYSN Mortgage Trust, 6.58%, 12/10/33(a)(b) | | |
U.K. Logistics DAC, 6.63%, 05/17/34, (1-day SONIA + 1.650%)(b)(c) | | |
Vita Scientia DAC, 4.84%, 02/27/33, (3-mo. EURIBOR + 1.300%)(b)(c) | | |
Wells Fargo Commercial Mortgage Trust | | |
Series 2017-SMP, Class A, 5.73%, 12/15/34, (3-mo. CME Term SOFR + 0.921%)(a)(b) | | |
Series 2018-C48, Class A5, 4.30%, 01/15/52 | | |
| | |
| | |
1.00%, 10/21/56, (1-day SONIA + 1.200%)(b)(c) | | |
1.00%, 10/21/56, (1-day SONIA + 2.000%)(b)(c) | | |
6.50%, 10/21/56, (1-day SONIA + 1.550%)(b)(c) | | |
| | |
Total Collateralized Mortgage Obligations — 13.1%
(Cost: $381,050,355) | |
|
|
Clear Channel Outdoor Holdings Inc. | | |
| | |
| | |
| | |
Neptune Bidco U.S. Inc., 9.29%, 04/15/29(a) | | |
| | |
|
Outfront Media Capital LLC/Outfront Media Capital Corp. | | |
| | |
| | |
| | |
| | |
Aerospace & Defense — 1.4% |
AAR Escrow Issuer LLC, 6.75%, 03/15/29(a) | | |
| | |
| | |
| | |
| | |
| | |
| | |
| | |
| | |
L3Harris Technologies Inc. | | |
| | |
| | |
| | |
Lockheed Martin Corp., 4.50%, 02/15/29 | | |
| | |
| | |
| | |
| | |
| | |
| | |
| | |
| | |
| | |
| | |
| | |
| | |
| | |
|
| | |
| | |
| | |
| | |
| | |
| | |
| | |
BAT International Finance PLC | | |
| | |
| | |
Reynolds American Inc., 4.45%, 06/12/25 | | |
| | |
|
Air Canada, 3.88%, 08/15/26(a) | | |
American Airlines Inc., 8.50%, 05/15/29(a) | | |
AS Mileage Plan IP Ltd., 5.02%, 10/20/29(a) | | |
| | |
| | |
| | |
| | |
|
Crocs Inc., 4.25%, 03/15/29(a) | | |
Hanesbrands Inc., 4.88%, 05/15/26(a) | | |
William Carter Co. (The), 5.63%, 03/15/27(a) | | |
| | |
92024 iShares Annual Financial Statements and Additional Information
Schedule of Investments (continued)October 31, 2024
iShares® Short Duration Bond Active ETF(Percentages shown are based on Net Assets)
| | |
Auto Manufacturers — 1.0% |
BMW U.S. Capital LLC, 4.65%, 08/13/29(a)(g) | | |
Ford Motor Credit Co. LLC | | |
| | |
| | |
| | |
General Motors Financial Co. Inc. | | |
| | |
| | |
| | |
Nissan Motor Acceptance Co. LLC | | |
| | |
| | |
Toyota Motor Credit Corp., 4.55%, 08/09/29 | | |
Traton Finance Luxembourg SA, 3.75%, 03/27/27(c) | | |
Volkswagen Bank GmbH, 2.50%, 07/31/26(c) | | |
Wabash National Corp., 4.50%, 10/15/28(a) | | |
| | |
Auto Parts & Equipment — 0.0% |
Clarios Global LP/Clarios U.S. Finance Co. | | |
| | |
| | |
Tenneco Inc., 8.00%, 11/17/28(a) | | |
| | |
|
| | |
3.59%, 07/21/28, (3-mo. CME Term SOFR + 1.632%)(b) | | |
4.83%, 07/22/26, (1-day SOFR + 1.750%)(b) | | |
5.08%, 01/20/27, (1-day SOFR + 1.290%)(b) | | |
5.20%, 04/25/29, (1-day SOFR + 1.630%)(b) | | |
5.82%, 09/15/29, (1-day SOFR + 1.570%)(b) | | |
5.93%, 09/15/27, (1-day SOFR + 1.340%)(b) | | |
| | |
5.67%, 03/12/28, (1-day SOFR +1.490%)(b) | | |
5.69%, 03/12/30, (1-day SOFR +1.740%)(b) | | |
| | |
1.12%, 01/28/27, (1-day SOFR + 0.765%)(b) | | |
| | |
4.54%, 09/19/30, (1-day SOFR + 1.338%)(b) | | |
5.17%, 02/13/30, (1-day SOFR + 1.364%)(b) | | |
5.61%, 09/29/26, (1-day SOFR + 1.546%)(b) | | |
Freedom Mortgage Corp., 12.25%, 10/01/30(a) | | |
Goldman Sachs Bank USA/New York, 5.41%, 05/21/27, (1-day SOFR +0.750%)(b) | | |
Goldman Sachs Group Inc. (The) | | |
1.54%, 09/10/27, (1-day SOFR + 0.818%)(b) | | |
1.95%, 10/21/27, (1-day SOFR + 0.913%)(b) | | |
2.64%, 02/24/28, (1-day SOFR + 1.114%)(b) | | |
3.69%, 06/05/28, (3-mo. CME Term SOFR + 1.772%)(b) | | |
4.48%, 08/23/28, (1-day SOFR + 1.725%)(b) | | |
4.69%, 10/23/30, (1-day SOFR + 1.135%)(b) | | |
5.05%, 07/23/30, (1-day SOFR + 1.210%)(b)(g) | | |
5.73%, 04/25/30, (1-day SOFR +1.265%)(b) | | |
| | |
1.05%, 11/19/26, (1-day SOFR + 0.800%)(b) | | |
2.08%, 04/22/26, (1-day SOFR + 1.850%)(b) | | |
| | |
|
2.74%, 10/15/30, (3-mo. CME Term SOFR + 1.510%)(b) | | |
4.51%, 10/22/28, (1-day SOFR + 0.860%)(b) | | |
4.85%, 07/25/28, (1-day SOFR + 1.990%)(b) | | |
4.98%, 07/22/28, (1-day SOFR + 0.930%)(b) | | |
5.00%, 07/22/30, (1-day SOFR +1.125%)(b) | | |
5.04%, 01/23/28, (1-day SOFR + 1.190%)(b) | | |
5.30%, 07/24/29, (1-day SOFR + 1.450%)(b) | | |
5.55%, 12/15/25, (1-day SOFR + 1.070%)(b) | | |
5.57%, 04/22/28, (1-day SOFR + 0.930%)(b) | | |
6.09%, 10/23/29, (1-day SOFR + 1.570%)(b) | | |
| | |
0.41%, 10/29/27, (3-mo. EURIBOR + 0.698%)(b) | | |
5.04%, 07/19/30, (1-day SOFR +1.215%)(b) | | |
5.66%, 04/18/30, (1-day SOFR +1.260%)(b) | | |
6.30%, 10/18/28, (1-day SOFR + 2.240%)(b) | | |
| | |
4.45%, 10/15/27, (1-day SOFR + 0.680%)(b) | | |
4.97%, 07/14/28, (1-day SOFR +0.930%)(b) | | |
5.50%, 05/26/28, (1-day SOFR +0.865%)(b) | | |
| | |
| | |
| | |
Truist Financial Corp., 5.44%, 01/24/30, (1-day SOFR + 1.620%)(b) | | |
| | |
| | |
2.22%, 01/27/28, (1-day SOFR + 0.730%)(b) | | |
5.38%, 01/23/30, (1-day SOFR + 1.560%)(b) | | |
6.79%, 10/26/27, (1-day SOFR + 1.880%)(b) | | |
| | |
1.49%, 08/10/27, (1-year CMT + 0.850%)(a)(b) | | |
4.63%, 03/17/28, (1-year EURIBOR ICE Swap + 1.150%)(b)(c) | | |
| | |
3.58%, 05/22/28, (3-mo. CME Term SOFR + 1.572%)(b) | | |
4.54%, 08/15/26, (1-day SOFR + 1.560%)(b) | | |
5.20%, 01/23/30, (1-day SOFR + 1.500%)(b) | | |
5.71%, 04/22/28, (1-day SOFR +1.070%)(b) | | |
6.30%, 10/23/29, (1-day SOFR + 1.790%)(b) | | |
| | |
|
| | |
| | |
| | |
| | |
| | |
| | |
Building Materials — 0.0% |
Camelot Return Merger Sub Inc., 8.75%, 08/01/28(a)(g) | | |
EMRLD Borrower LP/Emerald Co-Issuer Inc., 6.63%, 12/15/30(a) | | |
New Enterprise Stone & Lime Co. Inc., 5.25%, 07/15/28(a) | | |
Smyrna Ready Mix Concrete LLC, 6.00%, 11/01/28(a) | | |
Schedule of Investments10
Schedule of Investments (continued)October 31, 2024
iShares® Short Duration Bond Active ETF(Percentages shown are based on Net Assets)
| | |
Building Materials (continued) |
Standard Industries Inc./New York | | |
| | |
| | |
Summit Materials LLC/Summit Materials Finance Corp., 7.25%, 01/15/31(a) | | |
| | |
|
Axalta Coating Systems LLC, 3.38%, 02/15/29(a) | | |
Axalta Coating Systems LLC/Axalta Coating Systems Dutch Holding B BV, 4.75%, 06/15/27(a) | | |
| | |
| | |
| | |
| | |
Element Solutions Inc., 3.88%, 09/01/28(a) | | |
Herens Holdco SARL, 4.75%, 05/15/28(a) | | |
Olympus Water U.S. Holding Corp., 9.75%, 11/15/28(a) | | |
WR Grace Holdings LLC, 4.88%, 06/15/27(a) | | |
| | |
Commercial Services — 0.3% |
Allied Universal Holdco LLC, 7.88%, 02/15/31(a) | | |
Allied Universal Holdco LLC/Allied Universal Finance Corp./Atlas Luxco 4 SARL | | |
| | |
| | |
Block Inc., 2.75%, 06/01/26 | | |
Boost Newco Borrower LLC, 7.50%, 01/15/31(a) | | |
Champions Financing Inc., 8.75%, 02/15/29(a)(g) | | |
Garda World Security Corp. | | |
| | |
| | |
| | |
| | |
| | |
| | |
| | |
| | |
Herc Holdings Inc., 5.50%, 07/15/27(a) | | |
Korn Ferry, 4.63%, 12/15/27(a) | | |
Prime Security Services Borrower LLC/Prime Finance Inc. | | |
| | |
| | |
Shift4 Payments LLC/Shift4 Payments Finance Sub Inc., 4.63%, 11/01/26(a) | | |
Sotheby's, 7.38%, 10/15/27(a) | | |
Williams Scotsman Inc., 6.13%, 06/15/25(a) | | |
Worldline SA/France, 4.13%, 09/12/28(c) | | |
| | |
|
Dell International LLC/EMC Corp., 5.25%, 02/01/28 | | |
NCR Atleos Corp., 9.50%, 04/01/29(a)(g) | | |
| | |
|
Seagate HDD Cayman, 8.25%, 12/15/29(g) | | |
| | |
Cosmetics & Personal Care — 0.0% |
Coty Inc./HFC Prestige Products Inc./HFC Prestige International U.S. LLC, 6.63%, 07/15/30(a) | | |
Distribution & Wholesale — 0.0% |
American Builders & Contractors Supply Co. Inc., 3.88%, 11/15/29(a) | | |
IMCD NV, 3.63%, 04/30/30(c) | | |
| | |
Diversified Financial Services — 0.5% |
Capital One Financial Corp., 4.99%, 07/24/26, (1-day SOFR + 2.160%)(b) | | |
Charles Schwab Corp. (The), 6.20%, 11/17/29, (1-day SOFR + 1.878%)(b) | | |
Freedom Mortgage Holdings LLC, 9.25%, 02/01/29(a) | | |
| | |
| | |
| | |
| | |
Jefferies Finance LLC/JFIN Co-Issuer Corp., 5.00%, 08/15/28(a) | | |
Jefferies GmbH, 4.04%, 07/22/26(b)(c) | | |
Macquarie Airfinance Holdings Ltd. | | |
| | |
| | |
| | |
Midcap Financial Issuer Trust, 6.50%, 05/01/28(a) | | |
Nationstar Mortgage Holdings Inc. | | |
| | |
| | |
| | |
Navient Corp., 9.38%, 07/25/30 | | |
| | |
| | |
| | |
| | |
| | |
| | |
PennyMac Financial Services Inc., 7.88%, 12/15/29(a) | | |
Rocket Mortgage LLC/Rocket Mortgage Co-Issuer Inc., 2.88%, 10/15/26(a) | | |
SLM Corp., 3.13%, 11/02/26 | | |
TER Finance Jersey Ltd., Series 22, 0.00%, 10/02/25(h) | | |
| | |
|
AEP Texas Inc., 5.45%, 05/15/29 | | |
Calpine Corp., 5.13%, 03/15/28(a) | | |
Clearway Energy Operating LLC, 4.75%, 03/15/28(a) | | |
| | |
| | |
| | |
| | |
112024 iShares Annual Financial Statements and Additional Information
Schedule of Investments (continued)October 31, 2024
iShares® Short Duration Bond Active ETF(Percentages shown are based on Net Assets)
| | |
|
| | |
| | |
| | |
| | |
| | |
| | |
| | |
Series O, 4.25%, 04/01/29 | | |
| | |
| | |
| | |
FirstEnergy Corp., Series B, 3.90%, 07/15/27 | | |
FirstEnergy Transmission LLC, 4.55%, 01/15/30(a) | | |
Florida Power & Light Co. | | |
| | |
| | |
NextEra Energy Capital Holdings Inc. | | |
| | |
| | |
NextEra Energy Operating Partners LP, 7.25%, 01/15/29(a)(g) | | |
Pacific Gas and Electric Co., 5.95%, 09/04/25, (1-day SOFR Index + 0.950%)(b) | | |
Pattern Energy Operations LP/Pattern Energy Operations Inc., 4.50%, 08/15/28(a) | | |
| | |
| | |
| | |
Southern California Edison Co. | | |
| | |
Series D, 4.70%, 06/01/27 | | |
Southern Co. (The), 5.50%, 03/15/29 | | |
Talen Energy Supply LLC, 8.63%, 06/01/30(a) | | |
Virginia Electric & Power Co., Series A, 3.10%, 05/15/25(g) | | |
Vistra Operations Co. LLC, 5.63%, 02/15/27(a) | | |
| | |
Electrical Components & Equipment — 0.0% |
WESCO Distribution Inc., 6.38%, 03/15/29(a) | | |
|
Imola Merger Corp., 4.75%, 05/15/29(a) | | |
Sensata Technologies Inc., 4.38%, 02/15/30(a) | | |
| | |
Engineering & Construction — 0.0% |
Arcosa Inc., 4.38%, 04/15/29(a) | | |
Brand Industrial Services Inc., 10.38%, 08/01/30(a) | | |
Dycom Industries Inc., 4.50%, 04/15/29(a) | | |
| | |
|
Boyne USA Inc., 4.75%, 05/15/29(a) | | |
Caesars Entertainment Inc., 7.00%, 02/15/30(a) | | |
| | |
| | |
| | |
| | |
Live Nation Entertainment Inc. | | |
| | |
| | |
Entertainment (continued) |
| | |
| | |
Raptor Acquisition Corp./Raptor Co-Issuer LLC, 4.88%, 11/01/26(a) | | |
Scientific Games Holdings LP/Scientific Games U.S. FinCo Inc., 6.63%, 03/01/30(a) | | |
Six Flags Entertainment Corp./DE, 5.50%, 04/15/27(a) | | |
Wynn Resorts Finance LLC/Wynn Resorts Capital Corp. | | |
| | |
| | |
| | |
Environmental Control — 0.0% |
| | |
| | |
| | |
| | |
| | |
| | |
| | |
|
Albertsons Companies Inc./Safeway Inc./New Albertsons LP/Albertsons LLC | | |
| | |
| | |
| | |
| | |
Chobani LLC/Chobani Finance Corp. Inc., 4.63%, 11/15/28(a) | | |
Fiesta Purchaser Inc., 7.88%, 03/01/31(a) | | |
Lamb Weston Holdings Inc. | | |
| | |
| | |
Performance Food Group Inc. | | |
| | |
| | |
Post Holdings Inc., 4.63%, 04/15/30(a) | | |
Simmons Foods Inc./Simmons Prepared Foods Inc./Simmons Pet Food Inc./Simmons Feed, 4.63%, 03/01/29(a) | | |
| | |
| | |
| | |
| | |
| | |
|
Aramark Services Inc., 5.00%, 02/01/28(a) | | |
|
AmeriGas Partners LP/AmeriGas Finance Corp., 9.38%, 06/01/28(a) | | |
National Grid North America Inc., 4.15%, 09/12/27(c) | | |
| | |
Health Care - Products — 0.2% |
Avantor Funding Inc., 4.63%, 07/15/28(a) | | |
Bausch & Lomb Corp., 8.38%, 10/01/28(a) | | |
| | |
| | |
Schedule of Investments12
Schedule of Investments (continued)October 31, 2024
iShares® Short Duration Bond Active ETF(Percentages shown are based on Net Assets)
| | |
Health Care - Products (continued) |
| | |
Medline Borrower LP/Medline Co-Issuer Inc., 6.25%, 04/01/29(a) | | |
Sartorius Finance BV, 4.25%, 09/14/26(c) | | |
Teleflex Inc., 4.25%, 06/01/28(a) | | |
| | |
Health Care - Services — 1.2% |
Catalent Pharma Solutions Inc. | | |
| | |
| | |
| | |
Charles River Laboratories International Inc., 4.25%, 05/01/28(a) | | |
CHS/Community Health Systems Inc. | | |
| | |
| | |
| | |
| | |
| | |
| | |
| | |
| | |
| | |
| | |
Fortrea Holdings Inc., 7.50%, 07/01/30(a) | | |
| | |
| | |
| | |
| | |
| | |
| | |
| | |
| | |
HealthEquity Inc., 4.50%, 10/01/29(a)(g) | | |
| | |
| | |
| | |
| | |
IQVIA Inc., 5.00%, 05/15/27(a) | | |
| | |
| | |
| | |
Molina Healthcare Inc., 4.38%, 06/15/28(a) | | |
Star Parent Inc., 9.00%, 10/01/30(a) | | |
| | |
| | |
| | |
| | |
Holding Companies - Diversified — 0.0% |
Icahn Enterprises LP/Icahn Enterprises Finance Corp. | | |
| | |
| | |
| | |
| | |
|
Beazer Homes USA Inc., 7.50%, 03/15/31(a)(g) | | |
Brookfield Residential Properties Inc./Brookfield Residential U.S. LLC, 5.00%, 06/15/29(a) | | |
Empire Communities Corp., 9.75%, 05/01/29(a) | | |
| | |
Home Builders (continued) |
LGI Homes Inc., 8.75%, 12/15/28(a) | | |
Mattamy Group Corp., 4.63%, 03/01/30(a) | | |
New Home Co. Inc. (The), 9.25%, 10/01/29(a) | | |
STL Holding Co. LLC, 8.75%, 02/15/29(a) | | |
Tri Pointe Homes Inc., 5.25%, 06/01/27 | | |
| | |
|
Tempur Sealy International Inc., 4.00%, 04/15/29(a) | | |
Household Products & Wares — 0.0% |
Central Garden & Pet Co., 5.13%, 02/01/28 | | |
Spectrum Brands Inc., 3.88%, 03/15/31(a) | | |
| | |
|
Alliant Holdings Intermediate LLC/Alliant Holdings Co-Issuer | | |
| | |
| | |
| | |
| | |
| | |
| | |
Aon North America Inc., 5.15%, 03/01/29 | | |
Ardonagh Finco Ltd., 7.75%, 02/15/31(a) | | |
Howden U.K. Refinance PLC/Howden U.K. Refinance 2 PLC/Howden U.S. Refinance LLC, 7.25%, 02/15/31(a) | | |
HUB International Ltd., 7.25%, 06/15/30(a) | | |
Jones Deslauriers Insurance Management Inc., 8.50%, 03/15/30(a) | | |
Panther Escrow Issuer LLC, 7.13%, 06/01/31(a) | | |
Ryan Specialty LLC, 4.38%, 02/01/30(a)(g) | | |
| | |
|
Acuris Finance U.S. Inc./Acuris Finance SARL, 5.00%, 05/01/28(a) | | |
ANGI Group LLC, 3.88%, 08/15/28(a)(g) | | |
Gen Digital Inc., 6.75%, 09/30/27(a) | | |
Match Group Holdings II LLC, 4.63%, 06/01/28(a) | | |
Rakuten Group Inc., 9.75%, 04/15/29(a) | | |
Uber Technologies Inc., 4.30%, 01/15/30 | | |
| | |
|
| | |
| | |
| | |
Carpenter Technology Corp., 6.38%, 07/15/28 | | |
| | |
|
Acushnet Co., 7.38%, 10/15/28(a) | | |
| | |
| | |
| | |
| | |
Carnival Holdings Bermuda Ltd., 10.38%, 05/01/28(a) | | |
Life Time Inc., 5.75%, 01/15/26(a) | | |
132024 iShares Annual Financial Statements and Additional Information
Schedule of Investments (continued)October 31, 2024
iShares® Short Duration Bond Active ETF(Percentages shown are based on Net Assets)
| | |
|
Lindblad Expeditions Holdings Inc., 9.00%, 05/15/28(a) | | |
Lindblad Expeditions LLC, 6.75%, 02/15/27(a)(g) | | |
| | |
| | |
| | |
Royal Caribbean Cruises Ltd. | | |
| | |
| | |
Sabre GLBL Inc., 8.63%, 06/01/27(a)(g) | | |
Viking Ocean Cruises Ship VII Ltd., 5.63%, 02/15/29(a) | | |
| | |
|
Hilton Domestic Operating Co. Inc. | | |
| | |
| | |
| | |
| | |
| | |
Melco Resorts Finance Ltd., 5.38%, 12/04/29(a) | | |
Station Casinos LLC, 4.50%, 02/15/28(a) | | |
Wynn Las Vegas LLC/Wynn Las Vegas Capital Corp., 5.25%, 05/15/27(a) | | |
| | |
| | |
| | |
| | |
|
| | |
| | |
| | |
Esab Corp., 6.25%, 04/15/29(a) | | |
Husky Injection Molding Systems Ltd./Titan Co-Borrower LLC, 9.00%, 02/15/29(a) | | |
Mueller Water Products Inc., 4.00%, 06/15/29(a) | | |
Terex Corp., 5.00%, 05/15/29(a) | | |
TK Elevator U.S. Newco Inc., 5.25%, 07/15/27(a)(g) | | |
Vertiv Group Corp., 4.13%, 11/15/28(a) | | |
| | |
|
Enpro Inc., 5.75%, 10/15/26 | | |
|
Cable One Inc., 4.00%, 11/15/30(a) | | |
CCO Holdings LLC/CCO Holdings Capital Corp. | | |
| | |
| | |
| | |
| | |
| | |
| | |
Charter Communications Operating LLC/Charter Communications Operating Capital | | |
| | |
| | |
|
| | |
| | |
Directv Financing LLC/Directv Financing Co-Obligor Inc., 5.88%, 08/15/27(a) | | |
GCI LLC, 4.75%, 10/15/28(a) | | |
Gray Television Inc., 10.50%, 07/15/29(a)(g) | | |
Informa PLC, 2.13%, 10/06/25(c) | | |
LCPR Senior Secured Financing DAC, 6.75%, 10/15/27(a) | | |
| | |
| | |
| | |
Univision Communications Inc., 6.63%, 06/01/27(a) | | |
Virgin Media Vendor Financing Notes IV DAC, 5.00%, 07/15/28(a) | | |
Ziggo Bond Co. BV, 6.00%, 01/15/27(a) | | |
| | |
Metal Fabricate & Hardware — 0.0% |
Advanced Drainage Systems Inc. | | |
| | |
| | |
| | |
|
Anglo American Capital PLC, 3.75%, 06/15/29(c) | | |
Arsenal AIC Parent LLC, 8.00%, 10/01/30(a) | | |
| | |
| | |
| | |
| | |
| | |
| | |
| | |
| | |
Kaiser Aluminum Corp., 4.63%, 03/01/28(a) | | |
New Gold Inc., 7.50%, 07/15/27(a) | | |
| | |
| | |
| | |
| | |
|
Ascent Resources Utica Holdings LLC/ARU Finance Corp. | | |
| | |
| | |
Baytex Energy Corp., 8.50%, 04/30/30(a) | | |
BP Capital Markets America Inc., 3.94%, 09/21/28 | | |
| | |
| | |
| | |
| | |
| | |
| | |
| | |
| | |
| | |
Diamond Foreign Asset Co./Diamond Finance LLC, 8.50%, 10/01/30(a) | | |
Schedule of Investments14
Schedule of Investments (continued)October 31, 2024
iShares® Short Duration Bond Active ETF(Percentages shown are based on Net Assets)
| | |
|
| | |
| | |
| | |
Encino Acquisition Partners Holdings LLC, 8.75%, 05/01/31(a) | | |
| | |
| | |
| | |
| | |
Expand Energy Corp., 5.50%, 02/01/26(a)(g) | | |
Hilcorp Energy I LP/Hilcorp Finance Co. | | |
| | |
| | |
Magnolia Oil & Gas Operating LLC/Magnolia Oil & Gas Finance Corp., 6.00%, 08/01/26(a) | | |
Matador Resources Co., 6.88%, 04/15/28(a) | | |
| | |
| | |
| | |
Northern Oil & Gas Inc., 8.13%, 03/01/28(a) | | |
Occidental Petroleum Corp., 5.00%, 08/01/27 | | |
PBF Holding Co. LLC/PBF Finance Corp., 7.88%, 09/15/30(a)(g) | | |
Permian Resources Operating LLC | | |
| | |
| | |
Precision Drilling Corp., 6.88%, 01/15/29(a) | | |
Sitio Royalties Operating Partnership LP/Sitio Finance Corp., 7.88%, 11/01/28(a) | | |
| | |
| | |
| | |
| | |
| | |
| | |
TGNR Intermediate Holdings LLC, 5.50%, 10/15/29(a) | | |
Transocean Aquila Ltd., 8.00%, 09/30/28(a) | | |
Transocean Inc., 8.75%, 02/15/30(a) | | |
Transocean Titan Financing Ltd., 8.38%, 02/01/28(a) | | |
Valaris Ltd., 8.38%, 04/30/30(a) | | |
Vermilion Energy Inc., 6.88%, 05/01/30(a) | | |
Wintershall Dea Finance BV, 3.83%, 10/03/29(c) | | |
| | |
Oil & Gas Services — 0.0% |
Archrock Partners LP/Archrock Partners Finance Corp. | | |
| | |
| | |
Enerflex Ltd., 9.00%, 10/15/27(a) | | |
Kodiak Gas Services LLC, 7.25%, 02/15/29(a) | | |
USA Compression Partners LP/USA Compression Finance Corp. | | |
| | |
| | |
Weatherford International Ltd., 8.63%, 04/30/30(a) | | |
| | |
| | |
Packaging & Containers — 0.2% |
Ardagh Metal Packaging Finance USA LLC/Ardagh Metal Packaging Finance PLC | | |
| | |
| | |
Ardagh Packaging Finance PLC/Ardagh Holdings USA Inc., 4.13%, 08/15/26(a) | | |
Clydesdale Acquisition Holdings Inc., 6.63%, 04/15/29(a) | | |
| | |
| | |
| | |
Mauser Packaging Solutions Holding Co., 7.88%, 04/15/27(a)(g) | | |
| | |
| | |
| | |
Sealed Air Corp./Sealed Air Corp. U.S., 6.13%, 02/01/28(a) | | |
WRKCo Inc., 4.90%, 03/15/29 | | |
| | |
|
| | |
| | |
| | |
Bayer AG, 0.75%, 01/06/27(c) | | |
Endo Finance Holdings Inc., 8.50%, 04/15/31(a)(g) | | |
Jazz Securities DAC, 4.38%, 01/15/29(a) | | |
Organon & Co./Organon Foreign Debt Co-Issuer BV, 4.13%, 04/30/28(a) | | |
Pfizer Investment Enterprises Pte Ltd., 4.45%, 05/19/28 | | |
Teva Pharmaceutical Finance Netherlands III BV | | |
| | |
| | |
| | |
|
Antero Midstream Partners LP/Antero Midstream Finance Corp. | | |
| | |
| | |
Buckeye Partners LP, 4.50%, 03/01/28(a) | | |
Cheniere Energy Partners LP | | |
| | |
| | |
DT Midstream Inc., 4.13%, 06/15/29(a) | | |
| | |
| | |
| | |
| | |
| | |
| | |
| | |
EQM Midstream Partners LP, 6.38%, 04/01/29(a) | | |
Genesis Energy LP/Genesis Energy Finance Corp. | | |
| | |
152024 iShares Annual Financial Statements and Additional Information
Schedule of Investments (continued)October 31, 2024
iShares® Short Duration Bond Active ETF(Percentages shown are based on Net Assets)
| | |
|
| | |
| | |
Howard Midstream Energy Partners LLC, 8.88%, 07/15/28(a) | | |
Kinder Morgan Inc., 1.75%, 11/15/26 | | |
Kinetik Holdings LP, 6.63%, 12/15/28(a)(g) | | |
| | |
| | |
| | |
| | |
| | |
NGL Energy Operating LLC/NGL Energy Finance Corp., 8.13%, 02/15/29(a)(g) | | |
NuStar Logistics LP, 5.75%, 10/01/25 | | |
| | |
| | |
| | |
Prairie Acquiror LP, 9.00%, 08/01/29(a) | | |
Rockies Express Pipeline LLC, 4.95%, 07/15/29(a) | | |
Sabine Pass Liquefaction LLC | | |
| | |
| | |
| | |
Tallgrass Energy Partners LP/Tallgrass Energy Finance Corp. | | |
| | |
| | |
| | |
| | |
| | |
Targa Resources Partners LP/Targa Resources Partners Finance Corp., 5.50%, 03/01/30 | | |
TransCanada PipeLines Ltd., 4.25%, 05/15/28 | | |
Venture Global Calcasieu Pass LLC, 3.88%, 08/15/29(a) | | |
Venture Global LNG Inc., 9.50%, 02/01/29(a) | | |
Williams Companies Inc. (The) | | |
| | |
| | |
| | |
|
Anywhere Real Estate Group LLC/Anywhere Co-Issuer Corp., 7.00%, 04/15/30(a) | | |
CoreLogic Inc., 4.50%, 05/01/28(a) | | |
HAT Holdings I LLC/HAT Holdings II LLC, 8.00%, 06/15/27(a)(g) | | |
Howard Hughes Corp. (The), 5.38%, 08/01/28(a) | | |
| | |
Real Estate Investment Trusts — 2.8% |
| | |
| | |
| | |
| | |
| | |
| | |
| | |
| | |
Real Estate Investment Trusts (continued) |
Brookfield Property REIT Inc./BPR Cumulus LLC/BPR Nimbus LLC/GGSI Sellco LLC, 4.50%, 04/01/27(a) | | |
| | |
| | |
| | |
| | |
| | |
| | |
| | |
| | |
| | |
| | |
| | |
Global Net Lease Inc./Global Net Lease Operating Partnership LP, 3.75%, 12/15/27(a) | | |
GLP Capital LP/GLP Financing II Inc. | | |
| | |
| | |
HAT Holdings I LLC/HAT Holdings II LLC, 3.38%, 06/15/26(a) | | |
Iron Mountain Inc., 7.00%, 02/15/29(a) | | |
Ladder Capital Finance Holdings LLLP/Ladder Capital Finance Corp., 4.25%, 02/01/27(a) | | |
MPT Operating Partnership LP/MPT Finance Corp., 5.25%, 08/01/26(g) | | |
RHP Hotel Properties LP/RHP Finance Corp. | | |
| | |
| | |
| | |
RLJ Lodging Trust LP, 3.75%, 07/01/26(a) | | |
| | |
| | |
| | |
Starwood Property Trust Inc. | | |
| | |
| | |
Uniti Group LP/Uniti Group Finance 2019 Inc./CSL Capital LLC, 10.50%, 02/15/28(a)(g) | | |
VICI Properties LP, 4.75%, 02/15/28 | | |
VICI Properties LP/VICI Note Co. Inc. | | |
| | |
| | |
| | |
|
1011778 BC ULC/New Red Finance Inc. | | |
| | |
| | |
Asbury Automotive Group Inc., 4.75%, 03/01/30 | | |
Beacon Roofing Supply Inc. | | |
| | |
| | |
Fertitta Entertainment LLC/Fertitta Entertainment Finance Co. Inc., 4.63%, 01/15/29(a)(g) | | |
GYP Holdings III Corp., 4.63%, 05/01/29(a)(g) | | |
Home Depot Inc. (The), 4.75%, 06/25/29 | | |
| | |
| | |
Schedule of Investments16
Schedule of Investments (continued)October 31, 2024
iShares® Short Duration Bond Active ETF(Percentages shown are based on Net Assets)
| | |
|
| | |
Raising Cane's Restaurants LLC, 9.38%, 05/01/29(a)(g) | | |
| | |
|
| | |
| | |
| | |
| | |
| | |
| | |
| | |
Microchip Technology Inc. | | |
| | |
| | |
NXP BV/NXP Funding LLC/NXP USA Inc. | | |
| | |
| | |
Synaptics Inc., 4.00%, 06/15/29(a) | | |
| | |
|
Camelot Finance SA, 4.50%, 11/01/26(a) | | |
Capstone Borrower Inc., 8.00%, 06/15/30(a) | | |
Central Parent Inc./CDK Global Inc., 7.25%, 06/15/29(a) | | |
Central Parent LLC/CDK Global II LLC/CDK Financing Co. Inc., 8.00%, 06/15/29(a) | | |
Clarivate Science Holdings Corp. | | |
| | |
| | |
Cloud Software Group Inc., 6.50%, 03/31/29(a) | | |
Dun & Bradstreet Corp. (The), 5.00%, 12/15/29(a)(g) | | |
Fair Isaac Corp., 4.00%, 06/15/28(a) | | |
Fidelity National Information Services Inc., 1.65%, 03/01/28 | | |
| | |
| | |
| | |
| | |
SS&C Technologies Inc., 5.50%, 09/30/27(a) | | |
Twilio Inc., 3.63%, 03/15/29 | | |
UKG Inc., 6.88%, 02/01/31(a) | | |
| | |
| | |
| | |
| | |
Workday Inc., 3.70%, 04/01/29 | | |
| | |
Telecommunications — 2.1% |
| | |
| | |
| | |
Frontier Communications Holdings LLC | | |
| | |
| | |
| | |
| | |
Iliad Holding SASU, 7.00%, 10/15/28(a) | | |
Motorola Solutions Inc., 4.60%, 05/23/29 | | |
| | |
Telecommunications (continued) |
| | |
| | |
| | |
| | |
Rogers Communications Inc. | | |
| | |
| | |
| | |
Sprint LLC, 7.63%, 03/01/26 | | |
| | |
| | |
| | |
| | |
| | |
| | |
| | |
| | |
| | |
| | |
| | |
Verizon Communications Inc. | | |
| | |
| | |
| | |
Viavi Solutions Inc., 3.75%, 10/01/29(a) | | |
| | |
|
Norfolk Southern Corp., 2.90%, 06/15/26 | | |
| | |
| | |
| | |
| | |
| | |
| | |
| | |
Trucking & Leasing — 0.4% |
Fortress Transportation and Infrastructure Investors LLC | | |
| | |
| | |
| | |
Penske Truck Leasing Co. LP/PTL Finance Corp., 5.75%, 05/24/26(a)(g) | | |
| | |
Total Corporate Bonds & Notes — 29.7%
(Cost: $860,119,977) | |
Municipal Debt Obligations |
|
Massachusetts Educational Financing Authority RB, 6.35%, 07/01/49 | | |
Total Municipal Debt Obligations — 0.0%
(Cost: $1,410,000) | |
172024 iShares Annual Financial Statements and Additional Information
Schedule of Investments (continued)October 31, 2024
iShares® Short Duration Bond Active ETF(Percentages shown are based on Net Assets)
| | |
U.S. Government & Agency Obligations |
Mortgage-Backed Securities — 4.1% |
Federal National Mortgage Association, 5.81%, 06/01/31 | | |
Uniform Mortgage-Backed Securities | | |
| | |
| | |
| | |
| | |
| | |
| | |
U.S. Government Obligations — 37.9% |
| | |
| | |
| | |
| | |
| | |
| | |
| | |
| | |
| | |
| | |
| | |
| | |
| | |
| | |
| | |
Total U.S. Government & Agency Obligations — 42.0%
(Cost: $1,219,208,068) | |
Total Long-Term Investments — 102.9%
(Cost: $2,986,347,418) | |
| | |
|
Money Market Funds — 8.6% |
BlackRock Cash Funds: Institutional, SL Agency Shares, 5.01%(j)(k)(l) | | |
| | |
Money Market Funds (continued) |
BlackRock Cash Funds: Treasury, SL Agency Shares, 4.83%(j)(k) | | |
Total Short-Term Securities — 8.6%
(Cost: $249,107,594) | |
Total Investments — 111.5%
(Cost: $3,235,455,012) | |
Liabilities in Excess of Other Assets — (11.5)% | |
| |
| Security exempt from registration pursuant to Rule 144A under the Securities Act of 1933, as amended. These securities may be resold in transactions exempt from registration to qualified institutional investors. |
| Variable rate security. Interest rate resets periodically. The rate shown is the effective interest rate as of period end. Security description also includes the reference rate and spread if published and available. |
| This security may be resold to qualified foreign investors and foreign institutional buyers under Regulation S of the Securities Act of 1933. |
| Step coupon security. Coupon rate will either increase (step-up bond) or decrease (step-down bond) at regular intervals until maturity. Interest rate shown reflects the rate currently in effect. |
| Security is valued using significant unobservable inputs and is classified as Level 3 in the fair value hierarchy. |
| All or a portion of the security has been pledged as collateral in connection with outstanding TBA commitments. |
| All or a portion of this security is on loan. |
| |
| Represents or includes a TBA transaction. |
| |
| Annualized 7-day yield as of period end. |
| All or a portion of this security was purchased with the cash collateral from loaned securities. |
Schedule of Investments18
Schedule of Investments (continued)October 31, 2024
iShares® Short Duration Bond Active ETF
Affiliates
Investments in issuers considered to be affiliate(s) of the Fund during the year ended October 31, 2024 for purposes of Section 2(a)(3) of the Investment Company Act of 1940, as amended, were as follows:
| | | | | Change in
Unrealized
Appreciation
(Depreciation) | | | | Capital
Gain
Distributions
from
Underlying
Funds |
BlackRock Cash Funds: Institu- tional, SL Agency Shares | | | | | | | | | |
BlackRock Cash Funds: Treasury, SL Agency Shares | | | | | | | | | |
| | | | | | | | | |
| Represents net amount purchased (sold). |
| All or a portion represents securities lending income earned from the reinvestment of cash collateral from loaned securities, net of fees and collateral investment expenses, and other payments to and from borrowers of securities. |
Derivative Financial Instruments Outstanding as of Period End
| | | | Value/
Unrealized
Appreciation
(Depreciation) |
| | | | |
| | | | |
2-Year U.S. Treasury Note | | | | |
| | | | |
| | | | |
| | | | |
| | | | |
| | | | |
| | | | |
10-Year U.S. Treasury Note | | | | |
10-Year U.S. Ultra Long Treasury Note | | | | |
| | | | |
5-Year U.S. Treasury Note | | | | |
| | | | |
| | | | |
Forward Foreign Currency Exchange Contracts
| | | | Unrealized
Appreciation
(Depreciation) |
| | | | | | |
| | | | | | |
| | | | Deutsche Bank Securities Inc. | | |
| | | | | | |
| | | | Morgan Stanley & Co. International PLC | | |
| | | | State Street Bank & Trust Company | | |
| | | | Deutsche Bank Securities Inc. | | |
| | | | | | |
| | | | | | |
| | | | | | |
192024 iShares Annual Financial Statements and Additional Information
Schedule of Investments (continued)October 31, 2024
iShares® Short Duration Bond Active ETF
Forward Foreign Currency Exchange Contracts (continued)
| | | | Unrealized Appreciation (Depreciation) |
| | | | | | |
| | | | | | |
| | | | Deutsche Bank Securities Inc. | | |
| | | | State Street Bank & Trust Company | | |
| | | | | | |
| | | | | | |
| | | | | | |
Centrally Cleared Credit Default Swaps — Buy Protection
Reference Obligation/Index | Financing
Rate Received
by the Fund | | | | | | Upfront
Premium
Paid
(Received) | Unrealized
Appreciation
(Depreciation) |
| | | | | | | | | |
| | | | | | | | | |
| | | | | | | | | |
Centrally Cleared Interest Rate Swaps
| | | | | | | Upfront
Premium
Paid
(Received) | Unrealized
Appreciation
(Depreciation) |
| | | |
| | | | | | | | | | |
Balances Reported in the Statements of Assets and Liabilities for Centrally Cleared Swaps
Derivative Financial Instruments Categorized by Risk Exposure
As of period end, the fair values of derivative financial instruments located in the Statements of Assets and Liabilities were as follows:
| | | | Foreign
Currency
Exchange
Contracts | | | |
Assets—Derivative Financial Instruments | | | | | | | |
| | | | | | | |
Unrealized appreciation on futures contracts(a) | | | | | | | |
Forward foreign currency exchange contracts | | | | | | | |
Unrealized appreciation on forward foreign currency exchange con- tracts | | | | | | | |
Swaps — centrally cleared | | | | | | | |
Unrealized appreciation on centrally cleared swaps(a) | | | | | | | |
| | | | | | | |
Schedule of Investments20
Schedule of Investments (continued)October 31, 2024
iShares® Short Duration Bond Active ETF
Derivative Financial Instruments Categorized by Risk Exposure (continued)
| | | | Foreign Currency Exchange Contracts | | | |
Liabilities—Derivative Financial Instruments | | | | | | | |
| | | | | | | |
Unrealized depreciation on futures contracts(a) | | | | | | | |
Forward foreign currency exchange contracts | | | | | | | |
Unrealized depreciation on forward foreign currency exchange con- tracts | | | | | | | |
| | | | | | | |
| Net cumulative unrealized appreciation (depreciation) on futures contracts and centrally cleared swaps, if any, are reported in the Schedule of Investments. In the Statements of Assets and Liabilities, only current day's variation margin is reported in receivables or payables and the net cumulative unrealized appreciation (depreciation) is included in accumulated earnings (loss). |
For the period ended October 31, 2024, the effect of derivative financial instruments in the Statements of Operations was as follows:
| | | | Foreign
Currency
Exchange
Contracts | | | |
Net Realized Gain (Loss) from | | | | | | | |
| | | | | | | |
Forward foreign currency exchange contracts | | | | | | | |
| | | | | | | |
| | | | | | | |
Net Change in Unrealized Appreciation (Depreciation) on | | | | | | | |
| | | | | | | |
Forward foreign currency exchange contracts | | | | | | | |
| | | | | | | |
| | | | | | | |
Average Quarterly Balances of Outstanding Derivative Financial Instruments
| |
Average notional value of contracts — long | |
Average notional value of contracts — short | |
Forward foreign currency exchange contracts: | |
Average amounts purchased — in USD | |
Average amounts sold — in USD | |
| |
Average notional value — buy protection | |
Average notional value — sell protection | |
| |
Average notional value — pays fixed rate | |
| Derivative not held at quarter-end. The amounts shown in the Statement of Operations serve as an indicator of volume activity during the period. |
For more information about the Fund’s investment risks regarding derivative financial instruments, refer to the Notes to Financial Statements.
212024 iShares Annual Financial Statements and Additional Information
Schedule of Investments (continued)October 31, 2024
iShares® Short Duration Bond Active ETF
Derivative Financial Instruments - Offsetting as of Period End
The Fund's derivative assets and liabilities (by type) were as follows:
| | |
Derivative Financial Instruments: | | |
| | |
Forward foreign currency exchange contracts | | |
Swaps - centrally cleared | | |
Total derivative assets and liabilities in the Statement of Assets and Liabilities | | |
Derivatives not subject to a Master Netting Agreement or similar agreement ("MNA") | | |
Total derivative assets and liabilities subject to an MNA | | |
The following tables present the Fund’s derivative assets and liabilities by counterparty net of amounts available for offset under an MNA and net of the related collateral received and pledged by the Fund:
| Derivative
Assets
Subject to
an MNA by
Counterparty | | Non-Cash
Collateral
Received | | |
| | | | | |
Deutsche Bank Securities Inc. | | | | | |
| | | | | |
| | | | | |
Morgan Stanley & Co. International PLC | | | | | |
State Street Bank & Trust Company | | | | | |
| | | | | |
| Derivative
Liabilities
Subject to
an MNA by
Counterparty | | Non-Cash
Collateral
Pledged | | |
| | | | | |
Deutsche Bank Securities Inc. | | | | | |
| | | | | |
| | | | | |
State Street Bank & Trust Company | | | | | |
| | | | | |
| The amount of derivatives available for offset is limited to the amount of derivative assets and/or liabilities that are subject to an MNA. |
| Net amount represents the net amount receivable from the counterparty in the event of default. |
| Net amount may also include forward foreign currency exchange contracts that are not required to be collateralized. |
| Net amount represents the net amount payable due to the counterparty in the event of default. |
Fair Value Hierarchy as of Period End
Various inputs are used in determining the fair value of financial instruments at the measurement date. For a description of the input levels and information about the Fund’s policy regarding valuation of financial instruments, refer to the Notes to Financial Statements.
The following table summarizes the Fund’s financial instruments categorized in the fair value hierarchy. The breakdown of the Fund’s financial instruments into major categories is disclosed in the Schedule of Investments above.
| | | | |
| | | | |
| | | | |
| | | | |
| | | | |
Collateralized Mortgage Obligations | | | | |
| | | | |
Municipal Debt Obligations | | | | |
U.S. Government & Agency Obligations | | | | |
Schedule of Investments22
Schedule of Investments (continued)October 31, 2024
iShares® Short Duration Bond Active ETF
Fair Value Hierarchy as of Period End (continued)
| | | | |
| | | | |
| | | | |
| | | | |
Derivative Financial Instruments(a) | | | | |
| | | | |
| | | | |
Foreign Currency Exchange Contracts | | | | |
| | | | |
| | | | |
Foreign Currency Exchange Contracts | | | | |
| | | | |
| | | | |
| Derivative financial instruments are swaps, futures contracts and forward foreign currency exchange contracts. Swaps, futures contracts and forward foreign currency exchange contracts are valued at the unrealized appreciation (depreciation) on the instrument. |
See notes to financial statements.
232024 iShares Annual Financial Statements and Additional Information
Schedule of InvestmentsOctober 31, 2024
iShares® Ultra Short-Term Bond Active ETF(Percentages shown are based on Net Assets)
| | |
|
American Express Credit Account Master Trust, Class A, 4.95%, 10/15/27 | | |
| | |
5.26%, 07/27/26, (30-day Avg SOFR + 0.400%)(a) | | |
| | |
BMW Vehicle Owner Trust, 5.20%, 02/25/27, (30-day Avg SOFR + 0.340%)(a) | | |
| | |
5.61%, 11/16/26, (30-day Avg SOFR + 0.600%)(a) | | |
5.81%, 12/15/26, (30-day Avg SOFR + 0.800%)(a) | | |
5.86%, 06/15/26, (30-day Avg SOFR + 0.850%)(a) | | |
| | |
Chase Issuance Trust, 3.97%, 09/15/27 | | |
Citibank Credit Card Issuance Trust, 5.23%, 12/08/27 | | |
| | |
| | |
5.41%, 10/15/27, (30-day Avg SOFR + 0.400%)(a) | | |
| | |
Ford Credit Auto Lease Trust | | |
| | |
| | |
Ford Credit Auto Owner Trust | | |
5.35%, 01/15/27, (30-day Avg SOFR + 0.360%)(a) | | |
| | |
Honda Auto Receivables Owner Trust | | |
| | |
| | |
| | |
Hyundai Auto Lease Securitization Trust | | |
5.46%, 10/15/26, (30-day Avg SOFR + 0.450%)(a)(b) | | |
| | |
| | |
5.76%, 09/15/25, (30-day Avg SOFR + 0.750%)(a)(b) | | |
Hyundai Auto Receivables Trust | | |
| | |
5.38%, 06/15/27, (30-day Avg SOFR + 0.370%)(a) | | |
Mercedes-Benz Auto Lease Trust, 5.24%, 11/17/25 | | |
Mercedes-Benz Auto Receivables Trust, 5.92%, 11/16/26 | | |
Nissan Auto Receivables Owner Trust | | |
| | |
5.66%, 02/17/26, (30-day Avg SOFR + 0.650%)(a) | | |
Toyota Auto Receivables Owner Trust | | |
| | |
| | |
5.36%, 12/15/26, (30-day Avg SOFR + 0.350%)(a) | | |
| | |
5.53%, 05/15/26, (30-day Avg SOFR + 0.520%)(a) | | |
5.56%, 11/16/26, (30-day Avg SOFR + 0.550%)(a) | | |
Toyota Lease Owner Trust, 5.29%, 07/20/26, (30-day Avg SOFR + 0.400%)(a)(b) | | |
| | |
| | |
| | |
Volkswagen Auto Lease Trust, 5.87%, 01/20/26 | | |
Total Asset-Backed Securities — 4.9%
(Cost: $271,160,167) | |
|
Bank of America NA, 5.08%, 02/14/25 | | |
Bank of Montreal, 5.50%, 06/11/25 | | |
Bank of Montreal/Chicago IL, 5.07%, 02/18/25, (1-day SOFR + 0.260%)(a) | | |
Bank of Nova Scotia/Houston | | |
5.06%, 03/04/25, (1-day SOFR + 0.250%)(a) | | |
5.11%, 02/21/25, (1-day SOFR + 0.300%)(a) | | |
BNP Paribas SA/New York, 5.10%, 07/30/25 | | |
Canadian Imperial Bank of Commerce, 4.50%, 10/09/25 | | |
Canadian Imperial Bank of Commerce/New York | | |
5.07%, 02/20/25, (1-day SOFR + 0.260%)(a) | | |
| | |
Citibank NA, 5.16%, 09/19/25 | | |
Credit Agricole Corporate & Investment Bank SA | | |
| | |
| | |
| | |
| | |
Credit Agricole Corporate and Investment Bank/New York, 5.10%, 06/20/25 | | |
Credit Industriel et Commercial | | |
| | |
| | |
Deutsche Bank AG/New York | | |
5.22%, 05/22/25, (1-day SOFR + 0.400%)(a) | | |
5.65%, 03/03/25, (1-day SOFR + 0.330%)(a) | | |
| | |
5.11%, 02/20/25, (1-day SOFR + 0.300%)(a) | | |
5.13%, 03/12/25, (1-day SOFR + 0.320%)(a)(c) | | |
| | |
| | |
| | |
Mitsubishi UFJ Trust & Banking Corp., 5.03%, 04/28/25 | | |
Mizuho Bank Ltd./New York | | |
5.05%, 11/13/24, (1-day SOFR + 0.230%)(a) | | |
| | |
| | |
MUFG Bank Ltd./New York, 5.06%, 02/20/25 | | |
Natixis SA, 5.55%, 05/30/25 | | |
Royal Bank of Canada, 4.50%, 10/07/25 | | |
Sumitomo Mitsui Banking Corp./New York, 5.05%, 11/07/24, (1-day SOFR + 0.240%)(a) | | |
Svenska Handelsbanken/New York, 5.02%, 04/11/25 | | |
Schedule of Investments24
Schedule of Investments (continued)October 31, 2024
iShares® Ultra Short-Term Bond Active ETF(Percentages shown are based on Net Assets)
| | |
Toronto-Dominion Bank (The) | | |
| | |
| | |
| | |
| | |
Wells Fargo Bank NA, 5.15%, 01/30/25, (1-day SOFR + 0.340%)(a) | | |
Westpac Banking Corp., 5.35%, 01/28/25 | | |
Total Certificates of Deposit — 14.7%
(Cost: $809,584,999) | |
|
Alinghi Funding Co. LLC, 4.65%, 04/16/25 | | |
American Honda Finance Corp. | | |
| | |
| | |
| | |
Aquitaine Funding Co. LLC | | |
| | |
| | |
ASB Bank Ltd., 5.07%, 03/13/25 | | |
Australia & New Zealand Banking Group Ltd., 4.55%, 06/26/25 | | |
Banco Santander SA, 4.98%, 01/07/25, (1-day SOFR + 0.460%)(a)(b) | | |
Bank of Montreal, 5.27%, 09/11/25 | | |
Bank of Nova Scotia (The), 4.95%, 02/06/25, (1-day SOFR + 0.290%)(a)(b) | | |
| | |
4.95%, 12/02/24, (1-day SOFR + 0.240%)(a)(b) | | |
| | |
| | |
5.06%, 02/14/25, (1-day SOFR + 0.300%)(a)(b) | | |
Bell Telephone Co. of Canada or Bell Canada (The) | | |
| | |
| | |
| | |
| | |
| | |
| | |
| | |
| | |
| | |
| | |
| | |
| | |
4.97%, 02/07/25, (1-day SOFR + 0.300%)(a)(b) | | |
Brookfield BRP Holdings Canada Inc. | | |
| | |
| | |
| | |
| | |
| | |
| | |
| | |
| | |
Citigroup Global Markets Inc., 4.65%, 06/03/25 | | |
| | |
Concord Minutemen Capital Co. LLC | | |
| | |
| | |
| | |
| | |
| | |
DNB Bank ASA, 4.61%, 04/01/25 | | |
| | |
| | |
| | |
| | |
| | |
| | |
| | |
| | |
4.98%, 02/10/25, (1-day SOFR + 0.300%)(a)(b) | | |
JP Morgan Securities LLC, 5.07%, 02/03/25 | | |
Jupiter Securitization Co. LLC, 5.05%, 03/06/25 | | |
| | |
| | |
| | |
Komatsu Finance America Inc., 4.68%, 01/16/25 | | |
LVMH Moet Hennessy Louis Vuitton SE, 4.69%, 01/09/25 | | |
| | |
| | |
| | |
5.18%, 06/24/25, (1-day SOFR + 0.400%)(a)(b) | | |
Marubeni Finance America LLC, 5.05%, 11/07/24 | | |
Microchip Technology Inc. | | |
| | |
| | |
| | |
| | |
| | |
| | |
MUFG Bank Ltd./New York, 4.67%, 12/11/24 | | |
National Australia Bank Ltd. | | |
4.98%, 02/18/25, (1-day SOFR + 0.250%)(a)(b) | | |
5.00%, 02/21/25, (1-day SOFR + 0.250%)(a)(b) | | |
| | |
| | |
| | |
| | |
| | |
| | |
| | |
NatWest Markets PLC, 4.55%, 06/24/25 | | |
Norfina Ltd., 4.65%, 03/10/25 | | |
| | |
| | |
| | |
Paradelle Funding LLC, 4.61%, 05/30/25 | | |
Penske Truck Leasing Co. LP | | |
| | |
| | |
PPG Industries Inc., 4.85%, 12/16/24 | | |
Province of Quebec Canada, 4.58%, 03/04/25 | | |
Queensland Treasury Corp., 4.61%, 03/18/25 | | |
Reckitt Benckiser Treasury Services PLC, 5.00%, 12/18/24 | | |
Ridgefield Funding Co. LLC, 4.64%, 03/21/25 | | |
252024 iShares Annual Financial Statements and Additional Information
Schedule of Investments (continued)October 31, 2024
iShares® Ultra Short-Term Bond Active ETF(Percentages shown are based on Net Assets)
| | |
Ryder System Inc., 4.93%, 11/06/24 | | |
| | |
| | |
| | |
| | |
Svenska Handelsbanken AB, 5.17%, 07/18/25 | | |
| | |
4.93%, 12/09/24, (1-day SOFR + 0.240%)(a)(b) | | |
| | |
Telstra Group Ltd., 4.77%, 12/17/24 | | |
Toyota Industries Commercial Finance Inc., 4.69%, 03/19/25 | | |
UBS AG/London, 5.20%, 08/06/25 | | |
Volkswagen Financial Services | | |
| | |
| | |
| | |
| | |
| | |
Vulcan Materials Co., 4.94%, 11/12/24 | | |
Washington Morgan Capital Co. LLC | | |
| | |
| | |
Western Union Co. (The), 4.97%, 11/01/24 | | |
Westpac Securities NZ Ltd., 4.97%, 01/31/25(a)(b) | | |
Total Commercial Paper — 34.3%
(Cost: $1,891,449,451) | |
|
Aerospace & Defense — 0.3% |
General Dynamics Corp., 3.50%, 04/01/27(d) | | |
Lockheed Martin Corp., 4.95%, 10/15/25 | | |
RTX Corp., 5.00%, 02/27/26(d) | | |
| | |
|
| | |
| | |
| | |
Philip Morris International Inc., 5.13%, 11/15/24 | | |
| | |
Auto Manufacturers — 6.8% |
American Honda Finance Corp. | | |
| | |
5.34%, 01/12/26, (1-day SOFR + 0.500%)(a)(d) | | |
5.51%, 01/10/25, (1-day SOFR Index + 0.670%)(a)(d) | | |
5.71%, 08/14/25, (1-day SOFR + 0.600%)(a)(d) | | |
5.72%, 10/05/26, (1-day SOFR Index + 0.720%)(a) | | |
| | |
| | |
5.92%, 08/13/26, (1-day SOFR Index + 0.800%)(a)(b) | | |
Daimler Trucks Finance North America LLC | | |
| | |
| | |
| | |
| | |
| | |
| | |
| | |
Auto Manufacturers (continued) |
| | |
| | |
5.89%, 09/24/27, (1-day SOFR + 1.030%)(a)(b) | | |
| | |
| | |
6.30%, 08/04/25, (1-day SOFR + 1.150%)(a)(b) | | |
Mercedes-Benz Finance North America LLC | | |
| | |
| | |
| | |
5.51%, 01/09/26, (1-day SOFR + 0.670%)(a)(b) | | |
Toyota Motor Credit Corp. | | |
| | |
| | |
| | |
5.29%, 04/10/26, (1-day SOFR Index + 0.450%)(a)(d) | | |
Volkswagen Group of America Finance LLC | | |
5.70%, 03/20/26, (1-day SOFR + 0.830%)(a)(b)(d) | | |
| | |
| | |
|
Australia & New Zealand Banking Group Ltd. | | |
| | |
| | |
5.60%, 07/03/25, (1-day SOFR + 0.750%)(a)(b) | | |
Australia & New Zealand Banking Group Ltd./New York | | |
| | |
| | |
Bank of Montreal/Chicago, 5.11%, 02/11/25, (1-day SOFR + 0.300%)(a) | | |
Bank of New York Mellon (The), 5.39%, 03/13/26, (1-day SOFR + 0.450%)(a) | | |
Banque Federative du Credit Mutuel SA | | |
| | |
| | |
Barclays Bank PLC/New York, 5.20%, 02/06/25, (1-day SOFR + 0.380%)(a) | | |
| | |
| | |
| | |
| | |
| | |
5.66%, 09/29/25, (1-day SOFR + 0.805%)(a)(d) | | |
5.85%, 08/06/26, (1-day SOFR + 0.708%)(a)(d) | | |
Citigroup Inc., 3.11%, 04/08/26, (1-day SOFR + 2.842%)(a) | | |
Commonwealth Bank of Australia, 5.67%, 03/14/25, (1-day SOFR + 0.740%)(a)(b) | | |
Commonwealth Bank of Australia/New York | | |
| | |
| | |
Cooperatieve Rabobank UA/New York, 5.50%, 07/18/25(d) | | |
Deutsche Bank AG/New York, 4.16%, 05/13/25 | | |
Goldman Sachs Bank USA/New York | | |
5.28%, 03/18/27, (1-day SOFR +0.777%)(a) | | |
5.66%, 03/18/27, (1-day SOFR + 0.770%)(a) | | |
Schedule of Investments26
Schedule of Investments (continued)October 31, 2024
iShares® Ultra Short-Term Bond Active ETF(Percentages shown are based on Net Assets)
| | |
|
Goldman Sachs Group Inc. (The), 3.75%, 05/22/25(d) | | |
| | |
2.08%, 04/22/26, (1-day SOFR + 1.850%)(a) | | |
5.55%, 12/15/25, (1-day SOFR + 1.070%)(a) | | |
JPMorgan Chase Bank NA, 5.11%, 12/08/26(d) | | |
KeyBank NA, 4.70%, 01/26/26 | | |
KeyBank NA/Cleveland OH, 4.15%, 08/08/25(d) | | |
Macquarie Bank Ltd., 5.39%, 12/07/26(b)(d) | | |
Mitsubishi UFJ Financial Group Inc. | | |
| | |
5.72%, 02/20/26, (1-year CMT + 1.080%)(a) | | |
Morgan Stanley Bank NA, 5.48%, 07/16/25 | | |
National Australia Bank Ltd., 5.38%, 01/29/26, (1-day SOFR + 0.550%)(a)(b) | | |
National Australia Bank Ltd./New York | | |
| | |
| | |
| | |
National Securities Clearing Corp., 5.15%, 05/30/25(b) | | |
| | |
| | |
| | |
Societe Generale SA, 4.35%, 06/13/25(b)(d) | | |
Sumitomo Mitsui Financial Group Inc., 5.46%, 01/13/26 | | |
Sumitomo Mitsui Trust Bank Ltd. | | |
| | |
| | |
| | |
Svenska Handelsbanken AB, 3.65%, 06/10/25(b)(d) | | |
Toronto-Dominion Bank (The), 5.55%, 08/29/25, (1-day SOFR + 0.480%)(a)(d) | | |
UBS AG, 5.89%, 09/11/25, (1-day SOFR + 0.930%)(a) | | |
| | |
| | |
| | |
| | |
| | |
| | |
5.55%, 01/15/26, (1-day SOFR + 0.710%)(a) | | |
| | |
| | |
5.40%, 11/18/24, (1-day SOFR + 0.300%)(a) | | |
5.82%, 11/17/25, (1-day SOFR + 0.720%)(a) | | |
| | |
|
| | |
| | |
5.52%, 11/12/24, (1-day SOFR Index + 0.400%)(a) | | |
| | |
|
Linde Inc./CT, 4.80%, 12/05/24 | | |
|
Accenture Capital Inc., 3.90%, 10/04/27(d) | | |
| | |
Diversified Financial Services — 0.9% |
| | |
5.58%, 04/23/27, (1-day SOFR + 0.750%)(a) | | |
5.96%, 03/04/25, (1-day SOFR Index + 0.930%)(a)(d) | | |
6.34%, 10/30/26, (1-day SOFR + 1.330%)(a) | | |
CDP Financial Inc., 4.50%, 02/13/26(b)(d) | | |
| | |
|
Florida Power & Light Co., 4.45%, 05/15/26(d) | | |
National Rural Utilities Cooperative Finance Corp., 5.83%, 05/07/25, (1-day SOFR + 0.700%)(a) | | |
NextEra Energy Capital Holdings Inc. | | |
5.59%, 01/29/26, (1-day SOFR Index + 0.760%)(a)(d) | | |
| | |
| | |
| | |
| | |
| | |
Wisconsin Public Service Corp., 5.35%, 11/10/25(d) | | |
| | |
|
| | |
| | |
| | |
| | |
Environmental Control — 0.2% |
Waste Management Inc., 4.95%, 07/03/27(d) | | |
|
Nestle Holdings Inc., 4.00%, 09/12/25(b)(d) | | |
Walmart Inc., 3.90%, 09/09/25(d) | | |
| | |
Health Care - Products — 0.2% |
Thermo Fisher Scientific Inc., 5.00%, 12/05/26(d) | | |
Health Care - Services — 0.3% |
Roche Holdings Inc., 5.27%, 11/13/26(b)(d) | | |
UnitedHealth Group Inc., 4.75%, 07/15/26(d) | | |
| | |
|
MassMutual Global Funding II | | |
| | |
5.82%, 07/10/26, (1-day SOFR + 0.980%)(a)(b) | | |
Metropolitan Life Global Funding I, 5.00%, 01/06/26(b)(d) | | |
New York Life Global Funding | | |
| | |
5.42%, 01/16/26, (1-day SOFR Index + 0.580%)(a)(b) | | |
5.64%, 06/13/25, (1-day SOFR + 0.700%)(a)(b) | | |
Northwestern Mutual Global Funding | | |
| | |
5.64%, 06/13/25, (1-day SOFR + 0.700%)(a)(b) | | |
Pacific Life Global Funding II, 5.79%, 06/16/25, (1-day SOFR Index + 0.860%)(a)(b) | | |
Pricoa Global Funding I, 4.40%, 08/27/27(b)(d) | | |
Principal Life Global Funding II, 4.60%, 08/19/27(b)(d) | | |
272024 iShares Annual Financial Statements and Additional Information
Schedule of Investments (continued)October 31, 2024
iShares® Ultra Short-Term Bond Active ETF(Percentages shown are based on Net Assets)
| | |
|
Protective Life Global Funding | | |
| | |
| | |
| | |
|
Amazon.com Inc., 3.00%, 04/13/25 | | |
eBay Inc., 5.90%, 11/22/25 | | |
| | |
|
Caterpillar Financial Services Corp. | | |
| | |
5.56%, 11/14/24, (1-day SOFR + 0.450%)(a) | | |
| | |
| | |
| | |
| | |
| | |
5.32%, 10/22/25, (1-day SOFR + 0.480%)(a)(d) | | |
| | |
|
Bristol-Myers Squibb Co., 5.58%, 02/20/26, (1-day SOFR + 0.490%)(a) | | |
Merck & Co. Inc., 2.75%, 02/10/25 | | |
Pfizer Investment Enterprises Pte Ltd., 4.65%, 05/19/25(d) | | |
| | |
|
Enterprise Products Operating LLC, 5.05%, 01/10/26(d) | | |
Real Estate Investment Trusts — 0.2% |
Public Storage Operating Co., 5.43%, 07/25/25, (1-day SOFR Index + 0.600%)(a) | | |
|
| | |
| | |
| | |
| | |
| | |
| | |
Starbucks Corp., 4.85%, 02/08/27 | | |
| | |
|
Intuit Inc., 5.25%, 09/15/26 | | |
Telecommunications — 0.5% |
NBN Co. Ltd., 4.00%, 10/01/27(b) | | |
Total Corporate Bonds & Notes — 35.9%
(Cost: $1,975,482,482) | |
Municipal Debt Obligations |
|
State of Illinois GO, 5.25%, 05/01/25 | | |
| | |
|
Taxable Municipal Funding Trust RB | | |
VRDN, 5.15%, 11/07/24(b)(e) | | |
VRDN, 5.15%, 12/05/24(b)(e) | | |
| | |
Total Municipal Debt Obligations — 0.1%
(Cost $7,725,000) | |
Repurchase Agreements(a)(f) |
Bank of America Securities Inc., 5.15%, 11/01/24 (Purchased on 10/31/24 to be repurchased at $54,757,832, collateralized by non-agency mortgage-backed security, 2.25% to 6.86%, due 07/20/36 to 01/25/69, par and fair value of $72,456,759 and $58,582,500, respectively) | | |
Bank of America Securities Inc., 5.33%, 11/01/24 (Purchased on 10/30/24 to be repurchased at $10,001,481, collateralized by non-agency mortgage-backed security, 3.59% to 12.35%, due 09/27/32 to 12/16/41, par and fair value of $20,524,790 and $10,845,337, respectively) | | |
BNP Paribas, 5.18%, 11/01/24 (Purchased on 10/30/24 to be repurchased at $46,756,727, collateralized by non-agency mortgage-backed security, 3.50% to 11.50%, due 12/01/24 to 12/31/79, par and fair value of $53,870,317 and $51,364,615, respectively) | | |
Citigroup Global Markets Inc, 5.12%, 11/31/24 (Purchased on 10/31/24 to be repurchased at $9,001,280, collateralized by non-agency mortgage-backed security, 2.83% to 8.55%, due 01/15/32 to 03/25/44, par and fair value of $11,360,405 and $10,732,040, respectively) | | |
Citigroup Global Markets Inc, 5.14%, 11/30/24 (Purchased on 10/31/24 to be repurchased at $12,001,713, collateralized by non-agency mortgage-backed security, 2.50% to 8.55%, due 10/25/29 to 04/26/55, par and fair value of $21,682,100 and $13,812,961, respectively) | | |
Duetsche Bank Co. LLC, 5.28%, 11/01/24 (Purchased on 10/30/24 to be repurchased at $30,004,400, collateralized by U.S. Government Agency and non-agency mortgage-backed security, 1.65% to 12.62%, due 08/04/25 to 12/31/79, par and fair value of $32,671,000,and $31,500,429, respectively) | | |
Goldman Sachs & Co. LLC, 5.87%, 11/01/23 (Purchased on 10/31/23 to be repurchased at $90,013,325, collateralized by U.S. Government Agency and non-agency mortgage-backed security, 3.00% to 08.61%, due 04/11/26 to 07/16/40, par and fair value of $ 111,241,520 and $94,500,001, respectively) | | |
Mizuho Securities USA Inc., 5.28%, 11/01/24 (Purchased on 10/30/24 to be repurchased at $6,000,880, collateralized by non-agency mortgage-backed security, 6.32% to 9.45, due 10/20/28 to 09/10/30, par and fair value of $8,216,881 and $6,300,001 respectively) | | |
Schedule of Investments28
Schedule of Investments (continued)October 31, 2024
iShares® Ultra Short-Term Bond Active ETF(Percentages shown are based on Net Assets)
| | |
Mizuho Securities USA Inc., 5.38%, 10/31/24 (Purchased on 10/30/24 to be repurchased at $30,004,483, collateralized by non-agency mortgage-backed security, 5.21% to 05.60, due 05/15/31 to 07/25/49, par and fair value of $32,861,000 and $32,544,638, respectively) | | |
Morgan Stanley Co. LLC, 5.36%, 11/01/24 (Purchased on 10/30/24 to be repurchased at $30,005,211, collateralized by U.S. Government Agency and non-agency mortgage-backed security, 3.00% to 11.80%, due 04/20/31 to 08/25/67, par and fair value of $49,784,973,and $38,497,828, respectively) | | |
Wells Fargo Securities, 5.23%, 11/01/24 (Purchased on 10/31/24 to be repurchased at $90,013,075, collateralized by non-agency mortgage-backed security, 0.73% to 9.60%, due 12/15/36 to 11/25/68, par and fair value of $126,157,194 and $98,378,601, respectively) | | |
Total Repurchase Agreements — 7.5%
(Cost: $413,500,000) | |
U.S. Government Obligations |
U.S. Government Obligations — 2.5% |
| | |
| | |
| | |
| | |
| | |
| | |
| | |
| | |
Total U.S. Government Obligations — 2.5%
(Cost: $135,065,336) | |
| | |
|
BlackRock Cash Funds: Institutional, SL Agency Shares, 5.01%(g)(h)(i) | | |
Total Money Market Funds — 1.9%
(Cost: $105,127,774) | |
Total Investments — 101.8%
(Cost: $5,609,095,209) | |
Liabilities in Excess of Other Assets — (1.8)% | |
| |
| Variable rate security. Interest rate resets periodically. The rate shown is the effective interest rate as of period end. Security description also includes the reference rate and spread if published and available. |
| Security exempt from registration pursuant to Rule 144A under the Securities Act of 1933, as amended. These securities may be resold in transactions exempt from registration to qualified institutional investors. |
| This security may be resold to qualified foreign investors and foreign institutional buyers under Regulation S of the Securities Act of 1933. |
| All or a portion of this security is on loan. |
| Variable rate security. Rate as of period end and maturity is the date the principal owed can be recovered through demand. |
| Maturity date represents next reset date. |
| |
| Annualized 7-day yield as of period end. |
| All or a portion of this security was purchased with the cash collateral from loaned securities. |
Affiliates
Investments in issuers considered to be affiliate(s) of the Fund during the year ended October 31, 2024 for purposes of Section 2(a)(3) of the Investment Company Act of 1940, as amended, were as follows:
| | | | | Change in
Unrealized
Appreciation
(Depreciation) | | | | Capital
Gain
Distributions
from
Underlying
Funds |
BlackRock Cash Funds: Institutional, SL Agency Shares | | | | | | | | | |
BlackRock Cash Funds: Treasury, SL Agency Shares(c) | | | | | | | | | |
| | | | | | | | | |
| Represents net amount purchased (sold). |
| All or a portion represents securities lending income earned from the reinvestment of cash collateral from loaned securities, net of fees and collateral investment expenses, and other payments to and from borrowers of securities. |
| As of period end, the entity is no longer held. |
292024 iShares Annual Financial Statements and Additional Information
Schedule of Investments (continued)October 31, 2024
iShares® Ultra Short-Term Bond Active ETF
Fair Value Hierarchy as of Period End
Various inputs are used in determining the fair value of financial instruments at the measurement date. For a description of the input levels and information about the Fund’s policy regarding valuation of financial instruments, refer to the Notes to Financial Statements.
The following table summarizes the Fund’s financial instruments categorized in the fair value hierarchy. The breakdown of the Fund’s financial instruments into major categories is disclosed in the Schedule of Investments above.
| | | | |
| | | | |
| | | | |
| | | | |
| | | | |
| | | | |
| | | | |
| | | | |
Municipal Debt Obligations | | | | |
| | | | |
U.S. Government & Agency Obligations | | | | |
| | | | |
| | | | |
See notes to financial statements.
Schedule of Investments30
Statements of Assets and LiabilitiesOctober 31, 2024
| iShares
Short Duration Bond Active ETF | iShares
Ultra Short-Term Bond Active ETF |
| | |
Investments, at value—unaffiliated(a)(b) | | |
Investments, at value—affiliated(c) | | |
| | |
| | |
| | |
| | |
Foreign currency, at value(d) | | |
Repurchase agreements, at value—unaffiliated(e) | | |
| | |
| | |
Securities lending income—affiliated | | |
| | |
| | |
Variation margin on futures contracts | | |
Variation margin on centrally cleared swaps | | |
Unrealized appreciation on forward foreign currency exchange contracts | | |
| | |
| | |
Collateral on securities loaned, at value | | |
| | |
| | |
| | |
| | |
Unrealized depreciation on forward foreign currency exchange contracts | | |
| | |
Commitments and contingent liabilities | | |
| | |
| | |
| | |
Accumulated earnings (loss) | | |
| | |
| | |
| | |
| | |
| | |
| | |
(a) Investments, at cost—unaffiliated | | |
(b) Securities loaned, at value | | |
(c) Investments, at cost—affiliated | | |
(d) Foreign currency, at cost | | |
(e) Repurchase agreements, at cost—unaffiliated | | |
See notes to financial statements.
312024 iShares Annual Financial Statements and Additional Information
Statements of OperationsYear Ended October 31, 2024
| iShares
Short Duration Bond Active ETF | iShares
Ultra Short-Term Bond Active ETF |
| | |
| | |
| | |
Securities lending income—affiliated—net | | |
Other income—unaffiliated | | |
| | |
| | |
| | |
| | |
| | |
| | |
| | |
Investment advisory fees waived | | |
Total expenses after fees waived | | |
| | |
REALIZED AND UNREALIZED GAIN (LOSS) | | |
Net realized gain (loss) from: | | |
| | |
| | |
Forward foreign currency exchange contracts | | |
Foreign currency transactions | | |
| | |
In-kind redemptions—unaffiliated(a) | | |
| | |
| | |
Net change in unrealized appreciation (depreciation) on: | | |
| | |
| | |
Forward foreign currency exchange contracts | | |
Foreign currency translations | | |
| | |
| | |
| | |
Net realized and unrealized gain | | |
NET INCREASE IN NET ASSETS RESULTING FROM OPERATIONS | | |
(a) See Note 2 of the Notes to Financial Statements. |
See notes to financial statements.
Statements of Operations32
Statements of Changes in Net Assets
| iShares
Short Duration Bond Active ETF | iShares
Ultra Short-Term Bond Active ETF |
| | | | |
INCREASE (DECREASE) IN NET ASSETS | | | | |
| | | | |
| | | | |
| | | | |
Net change in unrealized appreciation (depreciation) | | | | |
Net increase in net assets resulting from operations | | | | |
DISTRIBUTIONS TO SHAREHOLDERS(a) | | | | |
Decrease in net assets resulting from distributions to shareholders | | | | |
CAPITAL SHARE TRANSACTIONS | | | | |
Net decrease in net assets derived from capital share transactions | | | | |
| | | | |
Total decrease in net assets | | | | |
| | | | |
| | | | |
| Distributions for annual periods determined in accordance with U.S. federal income tax regulations. |
See notes to financial statements.
332024 iShares Annual Financial Statements and Additional Information
Financial Highlights(For a share outstanding throughout each period)
| iShares Short Duration Bond Active ETF |
| | | | | |
Net asset value, beginning of year | | | | | |
| | | | | |
Net realized and unrealized gain (loss)(b) | | | | | |
Net increase (decrease) from investment operations | | | | | |
Distributions from net investment income(c) | | | | | |
Net asset value, end of year | | | | | |
| | | | | |
| | | | | |
Ratios to Average Net Assets(e) | | | | | |
| | | | | |
Total expenses after fees waived | | | | | |
| | | | | |
| | | | | |
Net assets, end of year (000) | | | | | |
Portfolio turnover rate(f) | | | | | |
(a) Based on average shares outstanding. |
(b) The amounts reported for a share outstanding may not accord with the change in aggregate gains and losses in securities for the fiscal period due to the timing of capital share transactions in relation to the fluctuating market values of the Fund’s underlying securities. |
(c) Distributions for annual periods determined in accordance with U.S. federal income tax regulations. |
(d) Where applicable, assumes the reinvestment of distributions. |
(e) Excludes fees and expenses incurred indirectly as a result of investments in underlying funds. |
(f) Portfolio turnover rate excludes in-kind transactions, if any. |
(g) Includes mortgage dollar roll transactions (“MDRs”). |
See notes to financial statements.
Financial Highlights(continued)(For a share outstanding throughout each period)
| iShares Ultra Short-Term Bond Active ETF |
| | | | | |
Net asset value, beginning of year | | | | | |
| | | | | |
Net realized and unrealized gain (loss)(b) | | | | | |
Net increase from investment operations | | | | | |
Distributions from net investment income(c) | | | | | |
Net asset value, end of year | | | | | |
| | | | | |
| | | | | |
Ratios to Average Net Assets(e) | | | | | |
| | | | | |
| | | | | |
| | | | | |
Net assets, end of year (000) | | | | | |
Portfolio turnover rate(f) | | | | | |
(a) Based on average shares outstanding. |
(b) The amounts reported for a share outstanding may not accord with the change in aggregate gains and losses in securities for the fiscal period due to the timing of capital share transactions in relation to the fluctuating market values of the Fund’s underlying securities. |
(c) Distributions for annual periods determined in accordance with U.S. federal income tax regulations. |
(d) Where applicable, assumes the reinvestment of distributions. |
(e) Excludes fees and expenses incurred indirectly as a result of investments in underlying funds. |
(f) Portfolio turnover rate excludes in-kind transactions, if any. |
See notes to financial statements.
352024 iShares Annual Financial Statements and Additional Information
Notes to Financial Statements
1. ORGANIZATION
iShares U.S. ETF Trust (the “Trust”) is registered under the Investment Company Act of 1940, as amended (the “1940 Act”), as an open-end management investment company. The Trust is organized as a Delaware statutory trust and is authorized to have multiple series or portfolios.
These financial statements relate only to the following funds (each, a “Fund” and collectively, the “Funds”):
| Diversification
Classification |
Short Duration Bond Active(a) | |
Ultra Short-Term Bond Active(b) | |
| Formerly the BlackRock Short Duration Bond ETF |
| Formerly the BlackRock Ultra Short-Term Bond ETF. |
2. SIGNIFICANT ACCOUNTING POLICIES
The financial statements are prepared in conformity with accounting principles generally accepted in the United States of America (“U.S. GAAP”), which may require management to make estimates and assumptions that affect the reported amounts of assets and liabilities in the financial statements, disclosure of contingent assets and liabilities at the date of the financial statements and the reported amounts of increases and decreases in net assets from operations during the reporting period. Actual results could differ from those estimates. Each Fund is considered an investment company under U.S. GAAP and follows the accounting and reporting guidance applicable to investment companies. Below is a summary of significant accounting policies:
Investment Transactions and Income Recognition: For financial reporting purposes, investment transactions are recorded on the dates the transactions are executed (the "trade dates"). Realized gains and losses on investment transactions are determined using the specific identification method. Dividend income and capital gain distributions, if any, are recorded on the ex-dividend date. Non-cash dividends, if any, are recorded on the ex-dividend date at fair value. Interest income, including amortization and accretion of premiums and discounts on debt securities, is recognized daily on an accrual basis.
Foreign Currency Translation: Each Fund's books and records are maintained in U.S. dollars. Securities and other assets and liabilities denominated in foreign currencies are translated into U.S. dollars using prevailing market rates as quoted by one or more data service providers. Purchases and sales of investments are recorded at the rates of exchange prevailing on the respective dates of such transactions. Generally, when the U.S. dollar rises in value against a foreign currency, the investments denominated in that currency will lose value; the opposite effect occurs if the U.S. dollar falls in relative value.
Each Fund does not isolate the effect of fluctuations in foreign exchange rates from the effect of fluctuations in the market prices of investments for financial reporting purposes. Accordingly, the effects of changes in exchange rates on investments are not segregated in the Statements of Operations from the effects of changes in market prices of those investments, but are included as a component of net realized and unrealized gain (loss) from investments. Each Fund reports realized currency gains (losses) on foreign currency related transactions as components of net realized gain (loss) for financial reporting purposes, whereas such components are generally treated as ordinary income for U.S. federal income tax purposes.
Foreign Taxes: The Funds may be subject to foreign taxes (a portion of which may be reclaimable) on income, stock dividends, capital gains on investments, or certain foreign currency transactions. All foreign taxes are recorded in accordance with the applicable foreign tax regulations and rates that exist in the foreign jurisdictions in which each Fund invests. These foreign taxes, if any, are paid by each Fund and are reflected in its Statements of Operations as follows: foreign taxes withheld at source are presented as a reduction of income, foreign taxes on securities lending income are presented as a reduction of securities lending income, foreign taxes on stock dividends are presented as “Other foreign taxes”, and foreign taxes on capital gains from sales of investments and foreign taxes on foreign currency transactions are included in their respective net realized gain (loss) categories. Foreign taxes payable or deferred as of October 31, 2024, if any, are disclosed in the Statements of Assets and Liabilities.
The Funds file withholding tax reclaims in certain jurisdictions to recover a portion of amounts previously withheld. The Funds may record a reclaim receivable based on collectability, which includes factors such as the jurisdiction’s applicable laws, payment history and market convention. The Statements of Operations include tax reclaims recorded as well as professional and other fees, if any, associated with recovery of foreign withholding taxes.
Bank Overdraft: Certain Funds had outstanding cash disbursements exceeding deposited cash amounts at the custodian during the reporting period. The Funds are obligated to repay the custodian for any overdraft, including any related costs or expenses, where applicable. For financial reporting purposes, overdraft fees, if any, are included in interest expense in the Statements of Operations.
Collateralization: If required by an exchange or counterparty agreement, the Funds may be required to deliver/deposit cash and/or securities to/with an exchange, or broker-dealer or custodian as collateral for certain investments.
In-kind Redemptions: For financial reporting purposes, in-kind redemptions are treated as sales of securities resulting in realized capital gains or losses to the Funds. Because such gains or losses are not taxable to the Funds and are not distributed to existing Fund shareholders, the gains or losses are reclassified from accumulated net realized gain (loss) to paid-in capital at the end of the Funds’ tax year. These reclassifications have no effect on net assets or net asset value (“NAV”) per share.
Notes to Financial Statements36
Notes to Financial Statements (continued)
Distributions: Dividends and distributions paid by each Fund are recorded on the ex-dividend dates. Distributions are determined on a tax basis and may differ from net investment income and net realized capital gains for financial reporting purposes. Dividends and distributions are paid in U.S. dollars and cannot be automatically reinvested in additional shares of the Funds.
Indemnifications: In the normal course of business, each Fund enters into contracts that contain a variety of representations that provide general indemnification. The Funds’ maximum exposure under these arrangements is unknown because it involves future potential claims against the Funds, which cannot be predicted with any certainty.
3. INVESTMENT VALUATION AND FAIR VALUE MEASUREMENTS
Investment��Valuation Policies: Each Fund’s investments are valued at fair value (also referred to as “market value” within the financial statements) each day that the Fund’s listing exchange is open and, for financial reporting purposes, as of the report date. U.S. GAAP defines fair value as the price a fund would receive to sell an asset or pay to transfer a liability in an orderly transaction between market participants at the measurement date. The Board of Trustees of the Trust (the “Board”) of each Fund has approved the designation of BlackRock Fund Advisors (“BFA”), the Funds' investment adviser, as the valuation designee for each Fund. Each Fund determines the fair values of its financial instruments using various independent dealers or pricing services under BFA’s policies. If a security’s market price is not readily available or does not otherwise accurately represent the fair value of the security, the security will be valued in accordance with BFA’s policies and procedures as reflecting fair value. BFA has formed a committee (the “Valuation Committee”) to develop pricing policies and procedures and to oversee the pricing function for all financial instruments, with assistance from other BlackRock pricing committees.
Fair Value Inputs and Methodologies: The following methods and inputs are used to establish the fair value of each Fund’s assets and liabilities:
• Fixed-income investments for which market quotations are readily available are generally valued using the last available bid price or current market quotations provided by independent dealers or third-party pricing services. Pricing services generally value fixed income securities assuming orderly transactions of an institutional round lot size, but a fund may hold or transact in such securities in smaller, odd lot sizes. Odd lots may trade at lower prices than institutional round lots. The pricing services may use matrix pricing or valuation models that utilize certain inputs and assumptions to derive values, including transaction data (e.g., recent representative bids and offers), market data, credit quality information, perceived market movements, news, and other relevant information. Certain fixed-income securities, including asset-backed and mortgage related securities may be valued based on valuation models that consider the estimated cash flows of each tranche of the entity, establish a benchmark yield and develop an estimated tranche specific spread to the benchmark yield based on the unique attributes of the tranche. The amortized cost method of valuation may be used with respect to debt obligations with sixty days or less remaining to maturity unless BFA determines such method does not represent fair value.
• Investments in open-end U.S. mutual funds (including money market funds) are valued at that day’s NAV.
• Futures contracts are valued based on that day’s last reported settlement or trade price on the exchange where the contract is traded.
• Forward foreign currency exchange contracts are valued at the mean between the bid and ask prices and are determined as of the close of trading on the New York Stock Exchange (“NYSE”) based on that day’s prevailing forward exchange rate for the underlying currencies.
• Swap agreements are valued utilizing quotes received daily by independent pricing services or through brokers, which are derived using daily swap curves and models that incorporate a number of market data factors, such as discounted cash flows, trades and values of the underlying reference instruments.
• Repurchase agreements are valued at amortized cost, which approximates market value.
If events (e.g., market volatility, company announcement or a natural disaster) occur that are expected to materially affect the value of such investment, or in the event that application of these methods of valuation results in a price for an investment that is deemed not to be representative of the market value of such investment, or if a price is not available, the investment will be valued by the Valuation Committee in accordance with BFA’s policies and procedures as reflecting fair value (“Fair Valued Investments”). The fair valuation approaches that may be used by the Valuation Committee include market approach, income approach and cost approach. Valuation techniques such as discounted cash flow, use of market comparables and matrix pricing are types of valuation approaches and are typically used in determining fair value. When determining the price for Fair Valued Investments, the Valuation Committee seeks to determine the price that each Fund might reasonably expect to receive or pay from the current sale or purchase of that asset or liability in an arm’s-length transaction. Fair value determinations shall be based upon all available factors that the Valuation Committee deems relevant and consistent with the principles of fair value measurement as of the measurement date.
Fair Value Hierarchy: Various inputs are used in determining the fair value of financial instruments at the measurement date. These inputs to valuation techniques are categorized into a fair value hierarchy consisting of three broad levels for financial reporting purposes as follows:
• Level 1 – Unadjusted price quotations in active markets/exchanges that each Fund has the ability to access for identical assets or liabilities;
• Level 2 – Inputs other than quoted prices included within level 1 that are observable for the asset or liability, either directly or indirectly; and
• Level 3 – Inputs that are unobservable and significant to the entire fair value measurement for the asset or liability (including the Valuation Committee’s assumptions used in determining the fair value of financial instruments).
372024 iShares Annual Financial Statements and Additional Information
Notes to Financial Statements (continued)
The hierarchy gives the highest priority to unadjusted quoted prices in active markets for identical assets or liabilities (Level 1 measurements) and the lowest priority to unobservable inputs (Level 3 measurements). Accordingly, the degree of judgment exercised in determining fair value is greatest for instruments categorized in Level 3. The inputs used to measure fair value may fall into different levels of the fair value hierarchy. In such cases, for disclosure purposes, the fair value hierarchy classification is determined based on the lowest level input that is significant to the fair value measurement in its entirety. Investments classified within Level 3 have significant unobservable inputs used by the Valuation Committee in determining the price for Fair Valued Investments. Level 3 investments include equity or debt issued by privately held companies or funds that may not have a secondary market and/or may have a limited number of investors. The categorization of a value determined for financial instruments is based on the pricing transparency of the financial instruments and is not necessarily an indication of the risks associated with investing in those securities.
4. SECURITIES AND OTHER INVESTMENTS
Asset-Backed and Mortgage-Backed Securities: Asset-backed securities are generally issued as pass-through certificates or as debt instruments. Asset-backed securities issued as pass-through certificates represent undivided fractional ownership interests in an underlying pool of assets. Asset-backed securities issued as debt instruments, which are also known as collateralized obligations, are typically issued as the debt of a special purpose entity organized solely for the purpose of owning such assets and issuing such debt. Asset-backed securities are often backed by a pool of assets representing the obligations of a number of different parties. The yield characteristics of certain asset-backed securities may differ from traditional debt securities. One such major difference is that all or a principal part of the obligations may be prepaid at any time because the underlying assets (i.e., loans) may be prepaid at any time. As a result, a decrease in interest rates in the market may result in increases in the level of prepayments as borrowers, particularly mortgagors, refinance and repay their loans. An increased prepayment rate with respect to an asset-backed security will have the effect of shortening the maturity of the security. In addition, a fund may subsequently have to reinvest the proceeds at lower interest rates. If a fund has purchased such an asset-backed security at a premium, a faster than anticipated prepayment rate could result in a loss of principal to the extent of the premium paid.
For mortgage pass-through securities (the “Mortgage Assets”) there are a number of important differences among the agencies and instrumentalities of the U.S. Government that issue mortgage-related securities and among the securities that they issue. For example, mortgage-related securities guaranteed by Ginnie Mae are guaranteed as to the timely payment of principal and interest by Ginnie Mae and such guarantee is backed by the full faith and credit of the United States. However, mortgage-related securities issued by Freddie Mac and Fannie Mae, including Freddie Mac and Fannie Mae guaranteed mortgage pass-through certificates, which are solely the obligations of Freddie Mac and Fannie Mae, are not backed by or entitled to the full faith and credit of the United States, but are supported by the right of the issuer to borrow from the U.S. Treasury.
Non-agency mortgage-backed securities are securities issued by non-governmental issuers and have no direct or indirect government guarantees of payment and are subject to various risks. Non-agency mortgage loans are obligations of the borrowers thereunder only and are not typically insured or guaranteed by any other person or entity. The ability of a borrower to repay a loan is dependent upon the income or assets of the borrower. A number of factors, including a general economic downturn, acts of God, terrorism, social unrest and civil disturbances, may impair a borrower’s ability to repay its loans.
Zero-Coupon Bonds: Zero-coupon bonds are normally issued at a significant discount from face value and do not provide for periodic interest payments. These bonds may experience greater volatility in market value than other debt obligations of similar maturity which provide for regular interest payments.
TBA Commitments: TBA commitments are forward agreements for the purchase or sale of securities, including mortgage-backed securities for a fixed price, with payment and delivery on an agreed upon future settlement date. The specific securities to be delivered are not identified at the trade date. However, delivered securities must meet specified terms, including issuer, rate and mortgage terms. When entering into TBA commitments, a fund may take possession of or deliver the underlying mortgage-backed securities but can extend the settlement or roll the transaction. TBA commitments involve a risk of loss if the value of the security to be purchased or sold declines or increases, respectively, prior to settlement date, if there are expenses or delays in connection with the TBA transactions, or if the counterparty fails to complete the transaction.
Repurchase Agreements: Repurchase agreements are commitments to purchase a security from a counterparty who agrees to repurchase the same security at a mutually agreed upon date and price. On a daily basis, the counterparty is required to maintain collateral subject to the agreement and in value no less than the agreed upon repurchase amount. Repurchase agreements may be traded bilaterally, in a tri-party arrangement or may be centrally cleared through a sponsoring agent. Subject to the custodial undertaking associated with a tri-party repurchase arrangement and for centrally cleared agreements, a third party custodian maintains accounts to hold collateral for a fund and its counterparties. Typically, a fund and counterparty are not permitted to sell, re-pledge or use the collateral absent a default by the counterparty or the fund. In the event the counterparty defaults and the fair value of the collateral declines, a fund could experience losses, delays and costs in liquidating the collateral.
Repurchase agreements are entered into by a fund under Master Repurchase Agreements (each, an “MRA”). The MRA permits the fund, under certain circumstances including an event of default (such as bankruptcy or insolvency), to offset payables and/or receivables with collateral held by and/or posted to the counterparty. As a result, one single net payment is created. Bankruptcy or insolvency laws of a particular jurisdiction may impose restrictions on or prohibitions against such a right of offset in the event of the MRA counterparty’s bankruptcy or insolvency. Based on the terms of the MRA, the fund receives securities as collateral with a market value in excess of the repurchase price at maturity. Upon a bankruptcy or insolvency of the MRA counterparty, the fund would recognize a liability with respect to such excess collateral. The liability reflects the fund’s obligation under bankruptcy law to return the excess to the counterparty.
Notes to Financial Statements38
Notes to Financial Statements (continued)
The following table summarizes the open repurchase agreements as of October 31, 2024 which are subject to offset under an MRA:
iShares ETF and Counterparty | Market Value of
Repurchase
Agreements | Cash
Collateral
Received at value | Non-Cash
Collateral
Received
| |
Ultra Short-Term Bond Active | | | | |
Bank of America Securities Inc. | | | | |
| | | | |
Citigroup Global Markets Inc. | | | | |
| | | | |
| | | | |
Mizuho Securities USA Inc. | | | | |
| | | | |
| | | | |
| | | | |
| Collateral received in excess of the market value of repurchase agreements is not presented in this table. |
Securities Lending: Each Fund may lend its securities to approved borrowers, such as brokers, dealers and other financial institutions. The borrower pledges and maintains with the Fund collateral consisting of cash, an irrevocable letter of credit issued by an approved bank, or securities issued or guaranteed by the U.S. government. The initial collateral received by each Fund is required to have a value of at least 102% of the current market value of the loaned securities for securities traded on U.S. exchanges and a value of at least 105% for all other securities. The collateral is maintained thereafter at a value equal to at least 100% of the current value of the securities on loan. The market value of the loaned securities is determined at the close of each business day of the Fund and any additional required collateral is delivered to the Fund or excess collateral is returned by the Fund, on the next business day. During the term of the loan, each Fund is entitled to all distributions made on or in respect of the loaned securities but does not receive interest income on securities received as collateral. Loans of securities are terminable at any time and the borrower, after notice, is required to return borrowed securities within the standard time period for settlement of securities transactions.
As of period end, any securities on loan were collateralized by cash and/or U.S. Government obligations. Cash collateral invested in money market funds managed by BFA, or its affiliates is disclosed in the Schedule of Investments. Any non-cash collateral received cannot be sold, re-invested or pledged by the Fund, except in the event of borrower default. The securities on loan, if any, are also disclosed in each Fund’s Schedule of Investments. The market value of any securities on loan and the value of any related cash collateral are disclosed in the Statements of Assets and Liabilities.
Securities lending transactions are entered into by the Funds under Master Securities Lending Agreements (each, an “MSLA”) which provide the right, in the event of default (including bankruptcy or insolvency) for the non-defaulting party to liquidate the collateral and calculate a net exposure to the defaulting party or request additional collateral. In the event that a borrower defaults, the Funds, as lender, would offset the market value of the collateral received against the market value of the securities loaned. When the value of the collateral is greater than that of the market value of the securities loaned, the lender is left with a net amount payable to the defaulting party. However, bankruptcy or insolvency laws of a particular jurisdiction may impose restrictions on or prohibitions against such a right of offset in the event of an MSLA counterparty’s bankruptcy or insolvency. Under the MSLA, absent an event of default, the borrower can resell or re-pledge the loaned securities, and the Funds can reinvest cash collateral received in connection with loaned securities. Upon an event of default, the parties’ obligations to return the securities or collateral to the other party are extinguished, and the parties can resell or re-pledge the loaned securities or the collateral received in connection with the loaned securities in order to satisfy the defaulting party’s net payment obligation for all transactions under the MSLA. The defaulting party remains liable for any deficiency.
392024 iShares Annual Financial Statements and Additional Information
Notes to Financial Statements (continued)
As of period end, the following table is a summary of the securities on loan by counterparty which are subject to offset under an MSLA:
iShares ETF and Counterparty | Securities Loaned
at Value | | Non-Cash Collateral
Received, at Fair Value(a) | |
Short Duration Bond Active | | | | |
| | | | |
| | | | |
| | | | |
| | | | |
Citigroup Global Markets, Inc. | | | | |
Deutsche Bank Securities, Inc. | | | | |
| | | | |
HSBC Securities (USA), Inc. | | | | |
J.P. Morgan Securities LLC | | | | |
| | | | |
| | | | |
| | | | |
Scotia Capital (USA), Inc. | | | | |
State Street Bank & Trust Co. | | | | |
| | | | |
| | | | |
| | | | |
| | | | |
Ultra Short-Term Bond Active | | | | |
| | | | |
| | | | |
BMO Capital Markets Corp. | | | | |
| | | | |
| | | | |
| | | | |
HSBC Securities (USA), Inc. | | | | |
J.P. Morgan Securities LLC | | | | |
| | | | |
Nomura Securities International, Inc. | | | | |
| | | | |
| | | | |
| | | | |
Wells Fargo Securities LLC | | | | |
| | | | |
| Collateral received, if any, in excess of the market value of securities on loan is not presented in this table. The total cash collateral received by each Fund is disclosed in the Fund’s Statements of Assets and Liabilities. |
The risks of securities lending include the risk that the borrower may not provide additional collateral when required or may not return the securities when due. To mitigate these risks, each Fund benefits from a borrower default indemnity provided by BlackRock Finance, Inc. BlackRock Finance, Inc.'s indemnity allows for full replacement of the securities loaned to the extent the collateral received does not cover the value of the securities loaned in the event of borrower default. Each Fund could incur a loss if the value of an investment purchased with cash collateral falls below the market value of the loaned securities or if the value of an investment purchased with cash collateral falls below the value of the original cash collateral received. Such losses are borne entirely by each Fund.
5. DERIVATIVE FINANCIAL INSTRUMENTS
Futures Contracts: Futures contracts are purchased or sold to gain exposure to, or manage exposure to, changes in interest rates (interest rate risk) and changes in the value of equity securities (equity risk) or foreign currencies (foreign currency exchange rate risk).
Futures contracts are exchange-traded agreements between the Funds and a counterparty to buy or sell a specific quantity of an underlying instrument at a specified price and on a specified date. Depending on the terms of a contract, it is settled either through physical delivery of the underlying instrument on the settlement date or by payment of a cash amount on the settlement date. Upon entering into a futures contract, the Funds are required to deposit initial margin with the broker in the form of cash or securities in an amount that varies depending on a contract’s size and risk profile. The initial margin deposit must then be maintained at an established level over the life of the contract. Amounts pledged, which are considered restricted, are included in cash pledged for futures contracts in the Statements of Assets and Liabilities.
Securities deposited as initial margin are designated in the Schedule of Investments and cash deposited, if any, are shown as cash pledged for futures contracts in the Statements of Assets and Liabilities. Pursuant to the contract, the Funds agree to receive from or pay to the broker an amount of cash equal to the daily fluctuation in market value of the contract (“variation margin”). Variation margin is recorded as unrealized appreciation (depreciation) and, if any, shown as variation margin receivable (or
Notes to Financial Statements40
Notes to Financial Statements (continued)
payable) on futures contracts in the Statements of Assets and Liabilities. When the contract is closed, a realized gain or loss is recorded in the Statements of Operations equal to the difference between the notional amount of the contract at the time it was opened and the notional amount at the time it was closed. The use of futures contracts involves the risk of an imperfect correlation in the movements in the price of futures contracts and interest rates, foreign currency exchange rates or underlying assets.
Forward Foreign Currency Exchange Contracts: Forward foreign currency exchange contracts are entered into to gain or reduce exposure to foreign currencies (foreign currency exchange rate risk).
A forward foreign currency exchange contract is an agreement between two parties to buy and sell a currency at a set exchange rate on a specified date. These contracts help to manage the overall exposure to the currencies in which some of the investments held by the Funds are denominated and in some cases, may be used to obtain exposure to a particular market.The contracts are traded over-the-counter (“OTC”) and not on an organized exchange.
The contract is marked-to-market daily and the change in market value is recorded as unrealized appreciation or depreciation in the Statements of Assets and Liabilities. When the contract is closed, a realized gain or loss is recorded in the Statements of Operations equal to the difference between the value at the time it was opened and the value at the time it was closed. Non-deliverable forward foreign currency exchange contracts are settled with the counterparty in cash without the delivery of foreign currency. The use of forward foreign currency exchange contracts involves the risk that the value of a contract changes unfavorably due to movements in the value of the referenced foreign currencies, and such value may exceed the amount(s) reflected in the Statements of Assets and Liabilities. Cash amounts pledged for forward foreign currency exchange contracts are considered restricted and are included in cash pledged as collateral for OTC derivatives in the Statements of Assets and Liabilities. A fund’s risk of loss from counterparty credit risk on OTC derivatives is generally limited to the aggregate unrealized gain netted against any collateral held by the Fund.
Swaps: Swap contracts are entered into to manage exposure to issuers, markets and securities. Such contracts are agreements between the Funds and a counterparty to make periodic net payments on a specified notional amount or a net payment upon termination. Swap agreements are privately negotiated in the OTC market and may be entered into as a bilateral contract (“OTC swaps”) or centrally cleared (“centrally cleared swaps”).
In a centrally cleared swap, immediately following execution of the swap agreement, the swap agreement is novated to a central counterparty (“CCP”) and the CCP becomes the Fund's counterparty on the swap. Each Fund is required to interface with the CCP through a broker. Upon entering into a centrally cleared swap, each Fund is required to deposit initial margin with the broker in the form of cash or securities in an amount that varies depending on the size and risk profile of the particular swap. Securities deposited as initial margin are designated on the Schedule of Investments and cash deposited is shown as cash pledged for centrally cleared swaps on the Statements of Assets and Liabilities. Amounts pledged, which are considered restricted cash, are included in cash pledged for centrally cleared swaps in the Statements of Assets and Liabilities. Pursuant to the contract, each Fund agrees to receive from or pay to the broker an amount of cash equal to the daily fluctuation in market value of the contract (“variation margin”). Variation margin is recorded as unrealized appreciation (depreciation) and shown as variation margin receivable (or payable) on centrally cleared swaps in the Statements of Assets and Liabilities. Payments received from (paid to) the counterparty are amortized over the term of the contract and recorded as realized gains (losses) in the Statements of Operations, including those at termination.
Swap transactions involve, to varying degrees, elements of interest rate, credit and market risks in excess of the amounts recognized in the Statements of Assets and Liabilities. Such risks involve the possibility that there will be no liquid market for these agreements, that the counterparty to the agreements may default on its obligation to perform or disagree as to the meaning of the contractual terms in the agreements, and that there may be unfavorable changes in interest rates and/or market values associated with these transactions.
Master Netting Arrangements: In order to define its contractual rights and to secure rights that will help mitigate its counterparty risk, a Fund may enter into an International Swaps and Derivatives Association, Inc. Master Agreement (“ISDA Master Agreement”) or similar agreement with its derivative contract counterparties. An ISDA Master Agreement is a bilateral agreement between a Fund and a counterparty that governs certain OTC derivatives and typically contains, among other things, collateral posting terms and netting provisions in the event of a default and/or termination event. Under an ISDA Master Agreement, a Fund may, under certain circumstances, offset with the counterparty certain derivative financial instruments’ payables and/or receivables with collateral held and/or posted and create one single net payment. The provisions of the ISDA Master Agreement typically permit a single net payment in the event of default including the bankruptcy or insolvency of the counterparty. However, bankruptcy or insolvency laws of a particular jurisdiction may impose restrictions on or prohibitions against the right of offset in bankruptcy, insolvency, or other events.
For derivatives traded under an ISDA Master Agreement, the collateral requirements are typically calculated by netting the mark-to-market amount for each transaction under such agreement, and comparing that amount to the value of any collateral currently pledged by a fund and the counterparty.
Cash collateral that has been pledged to cover obligations of the Funds and cash collateral received from the counterparty, if any, is reported separately in the Statements of Assets and Liabilities as cash pledged as collateral and cash received as collateral, respectively. Non-cash collateral pledged by the Funds, if any, is noted in the Schedules of Investments. Generally, the amount of collateral due from or to a counterparty is subject to a certain minimum transfer amount threshold before a transfer is required, which is determined at the close of business of the Funds. Any additional required collateral is delivered to/pledged by the Funds on the next business day. Typically, the counterparty is not permitted to sell, re-pledge or use cash and non-cash collateral it receives. A fund generally agrees not to use non-cash collateral that it receives but may, absent default or certain other circumstances defined in the underlying ISDA Master Agreement, be permitted to use cash collateral received. In such cases, interest may be paid pursuant to the collateral arrangement with the counterparty. To the extent amounts due to the Funds from the counterparty are not fully collateralized, each Fund bears the risk of loss from counterparty non-performance. Likewise, to the extent the Funds have delivered collateral to a counterparty and stand ready to perform under the terms of their agreement with such counterparty, each Fund bears the risk of loss from a counterparty in the amount of the value of the collateral in the event the counterparty fails to return such collateral. Based on the terms of agreements, collateral may not be required for all derivative contracts.
For financial reporting purposes, each Fund does not offset derivative assets and derivative liabilities that are subject to netting arrangements, if any, in the Statements of Assets and Liabilities.
412024 iShares Annual Financial Statements and Additional Information
Notes to Financial Statements (continued)
6. INVESTMENT ADVISORY AGREEMENT AND OTHER TRANSACTIONS WITH AFFILIATES
Investment Advisory Fees: Pursuant to an Investment Advisory Agreement with the Trust, BFA manages the investment of each Fund’s assets. BFA is a California corporation indirectly owned by BlackRock. Under the Investment Advisory Agreement, BFA is responsible for substantially all expenses of the Funds, except (i) interest and taxes; (ii) brokerage commissions and other expenses connected with the execution of portfolio transactions; (iii) distribution fees; (iv) the advisory fee payable to BFA; and (v) litigation expenses and any extraordinary expenses (in each case as determined by a majority of the independent trustees).
For its investment advisory services to each of the following Funds, BFA is entitled to an annual investment advisory fee, accrued daily and paid monthly by the Funds, based on the average daily net assets of each Fund as follows:
| |
Short Duration Bond Active | |
Ultra Short-Term Bond Active | |
Expense Waivers: A fund may incur its pro rata share of fees and expenses attributable to its investments in other investment companies (“acquired fund fees and expenses”). The total of the investment advisory fee and acquired fund fees and expenses, if any, is a fund’s total annual operating expenses. Total expenses as shown in the Statements of Operations does not include acquired fund fees and expenses.
For the iShares Short Duration Bond Active ETF, BFA has contractually agreed to waive a portion of its investment advisory fees for the Fund through February 28, 2025 in an amount equal to the acquired fund fees and expenses, if any, attributable to the Fund’s investments in other registered investment companies advised by BFA or its affiliates.
This amount is included in investment advisory fees waived in the Statement of Operations. For the year ended October 31, 2024, the amounts waived in investment advisory fees pursuant to this arrangement were as follows:
| |
Short Duration Bond Active | |
Sub-Adviser: BFA has entered into a sub-advisory agreement with BlackRock International Limited (the “Sub-Adviser”), an affiliate of BFA, under which BFA pays the Sub-Adviser for services it provides to BlackRock Ultra Short-Term Bond ETF.
Distributor: BlackRock Investments, LLC ("BRIL"), an affiliate of BFA, is the distributor for each Fund. Pursuant to the distribution agreement, BFA is responsible for any fees or expenses for distribution services provided to the Funds.
ETF Servicing Fees: Each Fund has entered into an ETF Services Agreement with BRIL to perform certain order processing, Authorized Participant communications, and related services in connection with the issuance and redemption of Creation Units (“ETF Services”). BRIL is entitled to a transaction fee from Authorized Participants on each creation or redemption order for the ETF Services provided. The Funds do not pay BRIL for ETF Services.
Prior to January 08, 2024 (date of conversion for respective funds), ETF Services were performed by State Street Bank and Trust Company.
Securities Lending: The U.S. Securities and Exchange Commission (the “SEC”) has issued an exemptive order which permits BlackRock Institutional Trust Company, N.A. (“BTC”), an affiliate of BFA, to serve as securities lending agent for the Funds, subject to applicable conditions. As securities lending agent, BTC bears all operational costs directly related to securities lending, including any custodial costs. Each Fund is responsible for fees in connection with the investment of cash collateral received for securities on loan (the “collateral investment fees”). The cash collateral is invested in a money market fund, BlackRock Cash Funds: Institutional or BlackRock Cash Funds: Treasury, managed by BFA, or its affiliates. However, BTC has agreed to reduce the amount of securities lending income it receives in order to effectively limit the collateral investment fees each Fund bears to an annual rate of 0.04%. The SL Agency Shares of such money market fund will not be subject to a sales load, distribution fee or service fee. BlackRock Cash Funds: Institutional may impose a discretionary liquidity fee of up to 2% on all redemptions. Discretionary liquidity fees may be imposed or terminated at any time at the discretion of the board of directors of the money market fund, or its delegate, if it is determined that such fee would be, or would not be, respectively, in the best interest of the money market fund. Additionally, BlackRock Cash Funds: Institutional will impose a mandatory liquidity fee if the money market fund's total net redemptions on a single day exceed 5% of the money market fund's net assets, unless the amount of the fee is less than 0.01% of the value of the shares redeemed. BlackRock Cash Funds: Institutional will determine the size of the mandatory liquidity fee by making a good faith estimate of certain costs the money market fund would incur if it were to sell a pro rata amount of each security in the portfolio to satisfy the amount of net redemptions on that day. There is no limit to the size of a mandatory liquidity fee. If BlackRock Cash Funds: Institutional cannot estimate the costs of selling a pro rata amount of each portfolio security in good faith and supported by data, it is required to apply a default liquidity fee of 1% on the value of shares redeemed on that day.
Securities lending income is generally equal to the total of income earned from the reinvestment of cash collateral (and excludes collateral investment fees), and any fees or other payments to and from borrowers of securities. Each Fund retains a portion of the securities lending income and remits the remaining portion to BTC as compensation for its services as securities lending agent.
Pursuant to the current securities lending agreement, each Fund retains 82% of securities lending income (which excludes collateral investment fees), and the amount retained can never be less than 70% of the total of securities lending income plus the collateral investment fees.
Notes to Financial Statements42
Notes to Financial Statements (continued)
In addition, commencing the business day following the date that the aggregate securities lending income plus the collateral investment fees generated across all 1940 Act iShares exchange-traded funds (the “iShares ETF Complex”) in that calendar year exceeds a specified threshold, each Fund, pursuant to the securities lending agreement, will retain for the remainder of that calendar year 85% of securities lending income (which excludes collateral investment fees) and the amount retained can never be less than 70% of the total of securities lending income plus the collateral investment fees.
The share of securities lending income earned by each Fund is shown as securities lending income – affiliated – net in its Statements of Operations. For the year ended October 31, 2024, the Funds paid BTC the following amounts for securities lending agent services:
| |
Short Duration Bond Active | |
Ultra Short-Term Bond Active | |
Officers and Trustees: Certain officers and/or trustees of the Trust are officers and/or trustees of BlackRock or its affiliates.
Other Transactions: Each Fund may invest its positive cash balances in certain money market funds managed by BFA or an affiliate. The income earned on these temporary cash investments is shown as dividends – affiliated in the Statements of Operations.
For the year ended October 31, 2024, purchases and sales of investments, excluding short-term securities and in-kind transactions, were as follows:
| U.S. Government Securities | |
| | | | |
Short Duration Bond Active | | | | |
Ultra Short-Term Bond Active | | | | |
For the year ended October 31, 2024, in-kind transactions were as follows:
| | |
Short Duration Bond Active | | |
8. INCOME TAX INFORMATION
Each Fund is treated as an entity separate from the Trust’s other funds for federal income tax purposes. It is each Fund’s policy to comply with the requirements of the Internal Revenue Code of 1986, as amended, applicable to regulated investment companies, and to distribute substantially all of its taxable income to its shareholders. Therefore, no U.S. federal income tax provision is required.
Management has analyzed tax laws and regulations and their application to the Funds as of October 31, 2024, inclusive of the open tax return years, and does not believe that there are any uncertain tax positions that require recognition of a tax liability in the Funds’ financial statements. Management’s analysis is based on the tax laws and judicial and administrative interpretations thereof in effect as of the date of these financial statements, all of which are subject to change, possibly with retroactive effect, which may impact the Funds’ NAV.
U.S. GAAP requires that certain components of net assets be adjusted to reflect permanent differences between financial and tax reporting. These reclassifications have no effect on net assets or NAV per share. As of October 31, 2024, permanent differences attributable to realized gains (losses) from in-kind redemptions were reclassified to the following accounts:
| | Accumulated
Earnings (Loss) |
Short Duration Bond Active | | |
The tax character of distributions paid was as follows:
| | |
Short Duration Bond Active | | |
| | |
Ultra Short-Term Bond Active | | |
| | |
432024 iShares Annual Financial Statements and Additional Information
Notes to Financial Statements (continued)
As of October 31, 2024, the tax components of accumulated net earnings (losses) were as follows:
| Undistributed
Ordinary Income | | | |
Short Duration Bond Active | | | | |
Ultra Short-Term Bond Active | | | | |
| Amounts available to offset future realized capital gains. |
| The difference between book-basis and tax-basis unrealized gains (losses) was attributable primarily to the tax deferral of losses on wash sales, realization for tax purposes of unrealized gains (losses) on certain foreign currency contracts and futures contracts and amortization methods for premiums and discounts on fixed income securities. |
For the year ended October 31, 2024, the Funds listed below utilized the following amounts of their respective capital loss carryforwards:
| |
Short Duration Bond Active | |
Ultra Short-Term Bond Active | |
As of October 31, 2024, gross unrealized appreciation and depreciation based on cost of investments (including short positions and derivatives, if any) for U.S. federal income tax purposes were as follows:
| | Gross Unrealized
Appreciation | Gross Unrealized
Depreciation | Net Unrealized
Appreciation
(Depreciation) |
Short Duration Bond Active | | | | |
Ultra Short-Term Bond Active | | | | |
In the normal course of business, each Fund invests in securities or other instruments and may enter into certain transactions, and such activities subject the Fund to various risks, including, among others, fluctuations in the market (market risk) or failure of an issuer to meet all of its obligations. The value of securities or other instruments may also be affected by various factors, including, without limitation: (i) the general economy; (ii) the overall market as well as local, regional or global political and/or social instability; (iii) regulation, taxation or international tax treaties between various countries; or (iv) currency, interest rate or price fluctuations. Local, regional or global events such as war, acts of terrorism, the spread of infectious illness or other public health issues, recessions, or other events could have a significant impact on the Funds and their investments. Each Fund’s prospectus provides details of the risks to which the Fund is subject.
The Funds may be exposed to additional risks when reinvesting cash collateral in money market funds that do not seek to maintain a stable NAV per share of $1.00, which may be subject to mandatory and discretionary liquidity fees under certain circumstances.
Market Risk: Each Fund may be exposed to prepayment risk, which is the risk that borrowers may exercise their option to prepay principal earlier than scheduled during periods of declining interest rates, which would force each Fund to reinvest in lower yielding securities. Each Fund may also be exposed to reinvestment risk, which is the risk that income from each Fund’s portfolio will decline if each Fund invests the proceeds from matured, traded or called fixed-income securities at market interest rates that are below each Fund portfolio’s current earnings rate.
Municipal securities are subject to the risk that litigation, legislation or other political events, local business or economic conditions, credit rating downgrades, or the bankruptcy of the issuer could have a significant effect on an issuer’s ability to make payments of principal and/or interest or otherwise affect the value of such securities. Municipal securities can be significantly affected by political or economic changes, including changes made in the law after issuance of the securities, as well as uncertainties in the municipal market related to, taxation, legislative changes or the rights of municipal security holders, including in connection with an issuer insolvency. Municipal securities backed by current or anticipated revenues from a specific project or specific assets can be negatively affected by the discontinuance of the tax benefits supporting the project or assets or the inability to collect revenues for the project or from the assets. Municipal securities may be less liquid than taxable bonds, and there may be less publicly available information on the financial condition of municipal security issuers than for issuers of other securities.
Valuation Risk: The price each Fund could receive upon the sale of any particular portfolio investment may differ from each Fund’s valuation of the investment, particularly for securities that trade in thin or volatile markets or that are valued using a fair valuation technique or a price provided by an independent pricing service. Changes to significant unobservable inputs and assumptions (i.e., publicly traded company multiples, growth rate, time to exit) due to the lack of observable inputs may significantly impact the resulting fair value and therefore each Fund’s results of operations. As a result, the price received upon the sale of an investment may be less than the value ascribed by each Fund, and each Fund could realize a greater than expected loss or lesser than expected gain upon the sale of the investment.
Counterparty Credit Risk: The Funds may be exposed to counterparty credit risk, or the risk that an entity may fail to or be unable to perform on its commitments related to unsettled or open transactions, including making timely interest and/or principal payments or otherwise honoring its obligations. The Funds manage counterparty credit risk by entering into transactions only with counterparties that BFA believes have the financial resources to honor their obligations and by monitoring the financial stability of those counterparties. Financial assets, which potentially expose the Funds to market, issuer and counterparty credit risks, consist principally of financial instruments and
Notes to Financial Statements44
Notes to Financial Statements (continued)
receivables due from counterparties. The extent of the Funds’ exposure to market, issuer and counterparty credit risks with respect to these financial assets is approximately their value recorded in the Statements of Assets and Liabilities, less any collateral held by the Funds.
A derivative contract may suffer a mark-to-market loss if the value of the contract decreases due to an unfavorable change in the market rates or values of the underlying instrument. Losses can also occur if the counterparty does not perform under the contract.
With exchange-traded futures, there is less counterparty credit risk to the Funds since the exchange or clearinghouse, as counterparty to such instruments, guarantees against a possible default. The clearinghouse stands between the buyer and the seller of the contract; therefore, credit risk is limited to failure of the clearinghouse. While offset rights may exist under applicable law, a Fund does not have a contractual right of offset against a clearing broker or clearinghouse in the event of a default (including the bankruptcy or insolvency). Additionally, credit risk exists in exchange-traded futures with respect to initial and variation margin that is held in a clearing broker’s customer accounts. While clearing brokers are required to segregate customer margin from their own assets, in the event that a clearing broker becomes insolvent or goes into bankruptcy and at that time there is a shortfall in the aggregate amount of margin held by the clearing broker for all its clients, typically the shortfall would be allocated on a pro rata basis across all the clearing broker’s customers, potentially resulting in losses to the Funds.
Geographic/Asset Class Risk: A diversified portfolio, where this is appropriate and consistent with a fund’s objectives, minimizes the risk that a price change of a particular investment will have a material impact on the NAV of a fund. The investment concentrations within each Fund’s portfolio are disclosed in its Schedule of Investments.
The Funds invest a significant portion of their assets in securities of issuers located in the United States. A decrease in imports or exports, changes in trade regulations, inflation and/or an economic recession in the United States may have a material adverse effect on the U.S. economy and the securities listed on U.S. exchanges. Proposed and adopted policy and legislative changes in the United States may also have a significant effect on U.S. markets generally, as well as on the value of certain securities. Governmental agencies project that the United States will continue to maintain elevated public debt levels for the foreseeable future which may constrain future economic growth. Circumstances could arise that could prevent the timely payment of interest or principal on U.S. government debt, such as reaching the legislative “debt ceiling.” Such non-payment would result in substantial negative consequences for the U.S. economy and the global financial system. If U.S. relations with certain countries deteriorate, it could adversely affect issuers that rely on the United States for trade. The United States has also experienced increased internal unrest and discord. If these trends were to continue, they may have an adverse impact on the U.S. economy and the issuers in which the Funds invest.
Certain Funds invest a significant portion of their assets in high yield securities. High yield securities that are rated below investment-grade (commonly referred to as “junk bonds”) or are unrated may be deemed speculative, involve greater levels of risk than higher-rated securities of similar maturity and are more likely to default. High yield securities may be issued by less creditworthy issuers, and issuers of high yield securities may be unable to meet their interest or principal payment obligations. High yield securities are subject to extreme price fluctuations, may be less liquid than higher rated fixed-income securities, even under normal economic conditions, and frequently have redemption features.
The Funds invest a significant portion of their assets in fixed-income securities and/or use derivatives tied to the fixed-income markets. Changes in market interest rates or economic conditions may affect the value and/or liquidity of such investments. Interest rate risk is the risk that prices of bonds and other fixed-income securities will decrease as interest rates rise and increase as interest rates fall. The Funds may be subject to a greater risk of rising interest rates during a period of historically low interest rates. The Federal Reserve has raised the federal funds rate as part of its efforts to address inflation. Changing interest rates may have unpredictable effects on markets, may result in heightened market volatility, and could negatively impact the Funds' performance.
Significant Shareholder Redemption Risk: Certain shareholders may own or manage a substantial amount of fund shares and/or hold their fund investments for a limited period of time. Large redemptions of fund shares by these shareholders may force a fund to sell portfolio securities, which may negatively impact the fund’s NAV, increase the fund’s brokerage costs, and/or accelerate the realization of taxable income/gains and cause the fund to make additional taxable distributions to shareholders.
10. CAPITAL SHARE TRANSACTIONS
Capital shares are issued and redeemed by each Fund only in aggregations of a specified number of shares or multiples thereof (“Creation Units”) at NAV. Except when aggregated in Creation Units, shares of each Fund are not redeemable.
Transactions in capital shares were as follows:
| | |
| | | | |
Short Duration Bond Active | | | | |
| | | | |
| | | | |
| | | | |
Ultra Short-Term Bond Active | | | | |
| | | | |
| | | | |
| | | | |
452024 iShares Annual Financial Statements and Additional Information
Notes to Financial Statements (continued)
The consideration for the purchase of Creation Units of a fund in the Trust generally consists of the in-kind deposit of a designated portfolio of securities and a specified amount of cash. Certain funds in the Trust may be offered in Creation Units solely or partially for cash in U.S. dollars. Authorized Participants purchasing and redeeming Creation Units may pay a purchase transaction fee and a redemption transaction fee directly to BRIL, to offset transfer and other transaction costs associated with the issuance and redemption of Creation Units, including Creation Units for cash. Authorized Participants transacting in Creation Units for cash may also pay an additional variable charge to compensate the relevant fund for certain transaction costs (i.e., stamp taxes, taxes on currency or other financial transactions, and brokerage costs) and market impact expenses relating to investing in portfolio securities. Such variable charges, if any, are included in shares sold in the table above.
To the extent applicable, to facilitate the timely settlement of orders for the Funds using a clearing facility outside of the continuous net settlement process, the Funds, at their sole discretion, may permit an Authorized Participant to post cash as collateral in anticipation of the delivery of all or a portion of the applicable Deposit Securities or Fund Securities, as further described in the applicable Authorized Participant Agreement. The collateral process is subject to a Control Agreement among the Authorized Participant, each Funds’ custodian, and the Funds. In the event that the Authorized Participant fails to deliver all or a portion of the applicable Deposit Securities or Fund Securities, the Funds may exercise control over such collateral pursuant to the terms of the Control Agreement in order to purchase the applicable Deposit Securities or Fund Securities.
From time to time, settlement of securities related to in-kind contributions or in-kind redemptions may be delayed. In such cases, securities related to in-kind transactions are reflected as a receivable or a payable in the Statements of Assets and Liabilities.
Management has evaluated the impact of all subsequent events on the Funds through the date the financial statements were available to be issued and has determined that there were no subsequent events requiring adjustment or additional disclosure in the financial statements.
Notes to Financial Statements46
Report of Independent Registered Public Accounting Firm
To the Board of Trustees of
iShares U.S. ETF Trust and Shareholders of each of the two funds listed in the table below
Opinions on the Financial Statements
We have audited the accompanying statements of assets and liabilities, including the schedules of investments, of each of the funds listed in the table below (two of the funds constituting iShares U.S. ETF Trust, hereafter collectively referred to as the "Funds") as of October 31, 2024, the related statements of operations for the year ended October 31, 2024, the statements of changes in net assets for each of the two years in the period ended October 31, 2024, including the related notes, and the financial highlights for each of the five years in the period ended October 31, 2024 (collectively referred to as the “financial statements”). In our opinion, the financial statements present fairly, in all material respects, the financial position of each of the Funds listed in the table below as of October 31, 2024, the results of each of their operations for the year then ended, the changes in each of their net assets for each of the two years in the period ended October 31, 2024 and each of the financial highlights for each of the five years in the period ended October 31, 2024 in conformity with accounting principles generally accepted in the United States of America.
iShares Short Duration Bond Active ETF |
iShares Ultra Short-Term Bond Active ETF |
These financial statements are the responsibility of the Funds’ management. Our responsibility is to express an opinion on the Funds’ financial statements based on our audits. We are a public accounting firm registered with the Public Company Accounting Oversight Board (United States) (PCAOB) and are required to be independent with respect to the Funds in accordance with the U.S. federal securities laws and the applicable rules and regulations of the Securities and Exchange Commission and the PCAOB.
We conducted our audits of these financial statements in accordance with the standards of the PCAOB. Those standards require that we plan and perform the audit to obtain reasonable assurance about whether the financial statements are free of material misstatement, whether due to error or fraud.
Our audits included performing procedures to assess the risks of material misstatement of the financial statements, whether due to error or fraud, and performing procedures that respond to those risks. Such procedures included examining, on a test basis, evidence regarding the amounts and disclosures in the financial statements. Our audits also included evaluating the accounting principles used and significant estimates made by management, as well as evaluating the overall presentation of the financial statements. Our procedures included confirmation of securities owned as of October 31, 2024 by correspondence with the custodian, transfer agent and brokers; when replies were not received from brokers, we performed other auditing procedures. We believe that our audits provide a reasonable basis for our opinions.
/s/PricewaterhouseCoopers LLP
Philadelphia, Pennsylvania
December 20, 2024
We have served as the auditor of one or more BlackRock investment companies since 2000.
472024 iShares Annual Financial Statements and Additional Information
Important Tax Information (unaudited)
The Funds hereby designate the following amounts, or maximum amounts allowable by law, of distributions from direct federal obligation interest for the fiscal year ended October 31, 2024:
| Federal Obligation
Interest |
Short Duration Bond Active | |
Ultra Short-Term Bond Active | |
The law varies in each state as to whether and what percent of ordinary income dividends attributable to federal obligations is exempt from state income tax. Shareholders are advised to check with their tax advisers to determine if any portion of the dividends received is exempt from state income tax.
The Funds hereby designate the following amounts, or maximum amounts allowable by law, as interest income eligible to be treated as a Section 163(j) interest dividend for the fiscal year ended October 31, 2024:
| |
Short Duration Bond Active | |
Ultra Short-Term Bond Active | |
The Funds hereby designate the following amount(s), or maximum amount(s) allowable by law, as interest-related dividends eligible for exemption from U.S. withholding tax for nonresident aliens and foreign corporations for the fiscal year ended October 31, 2024:
| Interest-Related
Dividends |
Short Duration Bond Active | |
Ultra Short-Term Bond Active | |
Important Tax Information48
Premium/Discount Information
Information on the Fund's net asset value, market price, premiums and discounts, and bid-ask spreads can be found at iShares.com.
Shareholders can sign up for e-mail notifications announcing that the shareholder report or prospectus has been posted on the iShares website at iShares.com. Once you have enrolled, you will no longer receive prospectuses and shareholder reports in the mail.
To enroll in electronic delivery:
• Go to icsdelivery.com.
• If your brokerage firm is not listed, electronic delivery may not be available. Please contact your broker-dealer or financial advisor.
Changes in and Disagreements with Accountants
Remuneration Paid to Trustees, Officers, and Others
Because BFA has agreed in the Investment Advisory Agreements to cover all operating expenses of the Funds, subject to certain exclusions as provided for therein, BFA pays the compensation to each Independent Trustee for services to the Funds from BFA's investment advisory fees.
Availability of Portfolio Holdings Information
A description of the Company’s policies and procedures with respect to the disclosure of the Fund’s portfolio securities is available in the Fund Prospectus. The Fund discloses its portfolio holdings daily and provides information regarding its top holdings in Fund fact sheets, when available, at iShares.com.
492024 iShares Annual Financial Statements and Additional Information
Board Review and Approval of Investment Advisory Contract
iShares Short Duration Bond Active ETF (the “Fund”)
Under Section 15(c) of the Investment Company Act of 1940 (the “1940 Act”), the Trust's Board of Trustees (the “Board”), including a majority of Board Members who are not “interested persons” of the Trust (as that term is defined in the 1940 Act) (the “Independent Board Members”), is required annually to consider the approval of the Investment Advisory Agreement between the Trust and BFA (the “Advisory Agreement”) on behalf of the Fund. The Board’s consideration entails a year-long process whereby the Board and its committees (composed solely of Independent Board Members) assess BlackRock’s services to the Fund, including investment management; fund accounting; administrative and shareholder services; oversight of the Fund’s service providers; risk management and oversight; and legal and compliance services; including the ability to meet applicable legal and regulatory requirements. The Independent Board Members requested, and BFA provided, such information as the Independent Board Members, with advice from independent counsel, deemed reasonably necessary to evaluate the Advisory Agreement. At meetings held on May 6, 2024 and May 17, 2024, a committee composed of all of the Independent Board Members (the “15(c) Committee”), with independent counsel, met with management and reviewed and discussed information provided in response to initial requests of the 15(c) Committee and/or its independent counsel. Prior to and in preparation for the meeting, the Board received and reviewed materials specifically relating to matters relevant to the renewal of the Advisory Agreement. Following discussion, the 15(c) Committee subsequently requested certain additional information, which management agreed to provide. At a meeting held on June 4-5, 2024, the Board, including the Independent Board Members, reviewed the additional information provided by management in response to these requests.
After extensive discussions and deliberations, the Board, including all of the Independent Board Members, approved the continuance of the Advisory Agreement for the Fund, based on a review of qualitative and quantitative information provided by BFA and their cumulative experience as Board Members. The Board noted its satisfaction with the extent and quality of information provided and its frequent interactions with management, as well as the detailed responses and other information provided by BFA. The Independent Board Members were advised by their independent counsel throughout the process, including about the legal standards applicable to their review. In approving the continuance of the Advisory Agreement for the Fund, the Board, including the Independent Board Members, considered various factors, including: (i) the expenses and performance of the Fund; (ii) the nature, extent and quality of the services provided by BFA; (iii) the costs of services provided to the Fund and profits realized by BFA and its affiliates; (iv) potential economies of scale and the sharing of related benefits; (v) the fees and services provided for other comparable funds/accounts managed by BFA and its affiliates; and (vi) other benefits to BFA and/or its affiliates. The Board Members did not identify any particular information or any single factor as determinative, and each Board Member may have attributed different weights to the various matters and factors considered. The material factors, considerations and conclusions that formed the basis for the Board, including the Independent Board Members, to approve the continuance of the Advisory Agreement are discussed below.
Expenses and Performance of the Fund: The Board reviewed statistical information prepared by Broadridge Financial Solutions, Inc. (“Broadridge”), an independent provider of investment company data, regarding the expense ratio components, including gross and net total expenses, fees and expenses of other fund(s) in which the Fund invests (if applicable), and waivers/reimbursements (if applicable) of the Fund in comparison with the same information for other ETFs, objectively selected by Broadridge as comprising the Fund’s applicable expense peer group pursuant to Broadridge’s proprietary ETF methodology (the “Peer Group”). The Board was provided with a detailed description of the proprietary ETF methodology used by Broadridge to determine the Fund’s Peer Group. The Board noted that, due to the limitations in providing comparable funds in the Peer Group, the statistical information provided in Broadridge’s report may or may not provide meaningful direct comparisons to the Fund in all instances. The Board also noted that the investment advisory fee rate and overall expenses (net of any waivers and reimbursements) for the Fund were lower than the median of the investment advisory fee rates and overall expenses (net of any waivers and reimbursements) of the funds in its Peer Group, excluding iShares funds.
The Board noted that the Fund is an actively managed ETF that does not seek to track the performance of a specified index and that the management team for the Fund manages the Fund’s portfolio in accordance with its investment objective. The Board further noted that, during the year, the Board received periodic reports on the Fund’s short- and longer-term performance in comparison with its reference benchmark. Such periodic comparative performance information, including additional detailed information as requested by the Board, was also considered. The Board noted that the Fund generally performed in line with expectations relative to the Fund’s peer group (where applicable) and reference benchmark or stated investment objective.
Based on this review, the other relevant factors and information considered at the meeting, and their general knowledge of ETF pricing, the Board concluded that the investment advisory fee rate and expense level and the historical performance of the Fund supported the Board’s approval of the continuance of the Advisory Agreement for the coming year.
Nature, Extent and Quality of Services Provided: Based on management’s representations, including information about ongoing enhancements and initiatives with respect to the iShares product line and BFA’s business, including with respect to capital markets support and analysis, technology, portfolio management, product design and quality, compliance and risk management, global public policy and other services, the Board expected that there would be no diminution in the scope of services required of or provided by BFA under the Advisory Agreement for the coming year as compared with the scope of services provided by BFA during prior years. In reviewing the scope of these services, the Board considered BFA’s investment philosophy and experience, noting that BFA and its affiliates have committed significant resources over time, including during the past year, to support the iShares funds and their shareholders and have made significant investments into the iShares business. The Board also considered BFA’s compliance program and its compliance record with respect to the Fund, including related programs implemented pursuant to regulatory requirements. In that regard, the Board noted that BFA reports to the Board about portfolio management and compliance matters on a periodic basis in connection with regularly scheduled meetings of the Board, and on other occasions as necessary and appropriate, and has provided information and made relevant officers and other employees of BFA (and its affiliates) available as needed to provide further assistance with these matters. The Board also reviewed the background and experience of the persons responsible for the day-to-day management of the Fund, as well as the resources available to them in managing the Fund. In addition to the above considerations, the Board reviewed and considered detailed presentations regarding BFA’s investment performance, investment and risk management processes and strategies provided at the May 6, 2024 meeting and throughout the year, and matters related to BFA’s portfolio compliance program and other compliance programs and services, as well as BlackRock’s continued investments in its ETF business.
Based on review of this information, and the performance information discussed above, the Board concluded that the nature, extent and quality of services provided to the Fund under the Advisory Agreement supported the Board’s approval of the continuance of the Advisory Agreement for the coming year.
Board Review and Approval of Investment Advisory Contract50
Board Review and Approval of Investment Advisory Contract (continued)
Costs of Services Provided to the Fund and Profits Realized by BFA and its Affiliates: The Board reviewed information about the estimated profitability to BlackRock in managing the Fund, based on the fees payable to BFA and its affiliates (including fees under the Advisory Agreement), and other sources of revenue and expense to BFA and its affiliates from the Fund’s operations for the last calendar year. The Board reviewed BlackRock’s methodology for calculating estimated profitability of the iShares funds, noting that the 15(c) Committee and the Board had focused on the methodology and profitability presentation. The Board recognized that profitability may be affected by numerous factors, including, among other things, fee waivers by BFA, the types of funds managed, expense allocations and business mix. The Board thus recognized that calculating and comparing profitability at individual fund levels is challenging. The Board discussed with management the sources of direct and ancillary revenue, including the revenues to BTC, a BlackRock affiliate, from securities lending by the Fund. The Board also discussed BFA’s estimated profit margin as reflected in the Fund’s profitability analysis and reviewed information regarding potential economies of scale (as discussed below).
Based on this review, the Board concluded that the information considered with respect to the profits realized by BFA and its affiliates under the Advisory Agreement and from other relationships between the Fund and BFA and/or its affiliates, if any, and related costs of the services provided as well as the other factors considered at the meeting, supported the Board’s approval of the continuance of the Advisory Agreement for the coming year.
Economies of Scale: The Board reviewed information and considered the extent to which economies of scale might be realized as the assets of the Fund increase, noting that the issue of potential economies of scale had been focused on by the 15(c) Committee and the Board during their meetings and addressed by management. The 15(c) Committee and the Board received information regarding BlackRock’s historical estimated profitability (as discussed above), including BFA’s and its affiliates’ estimated costs in providing services. The estimated cost information distinguished, among other things, between fixed and variable costs, and showed how the level and nature of fixed and variable costs may impact the existence or size of scale benefits, with the Board recognizing that potential economies of scale are difficult to measure. The 15(c) Committee and the Board reviewed information provided by BFA regarding the sharing of scale benefits with the iShares funds through various means, including, as applicable, through breakpoints, waivers, or other fee reductions, as well as through additional investment in the iShares business, including enhancements to or the provision of additional infrastructure and services to the iShares funds and their shareholders and, with respect to New Funds, set management fees at levels that anticipate scale over time. The Board noted that the Advisory Agreement for the Fund did not provide for breakpoints in the Fund’s investment advisory fee rate as the assets of the Fund increase. However, the Board noted that it would continue to assess the appropriateness of adding breakpoints in the future.
The Board concluded that this review of potential economies of scale and the sharing of related benefits, as well as the other factors considered at the meeting, supported the Board’s approval of the continuance of the Advisory Agreement for the coming year.
Fees and Services Provided for Other Comparable Funds/Accounts Managed by BFA and its Affiliates: The Board received and considered information regarding the investment advisory/management fee rates for other funds/accounts in the U.S. for which BFA (or its affiliates) provides investment advisory/management services, including open-end funds registered under the 1940 Act (including sub-advised funds), collective trust funds and institutional separate accounts (collectively, the “Other Accounts”).
The Board received detailed information regarding how the Other Accounts generally differ from the Fund, including in terms of the types of services and generally more extensive character and scope of services provided to the Fund, as well as other significant differences. In that regard, the Board considered that the pricing of services to institutional clients is typically based on a number of factors beyond the nature and extent of the specific services to be provided and often depends on the overall relationship between the client and its affiliates and the adviser and its affiliates. In addition, the Board considered the relative complexity and inherent risks and challenges of managing and providing other services to the Fund, as a publicly traded investment vehicle, as compared to the Other Accounts, particularly those that are institutional clients, in light of differing regulatory requirements and client-imposed mandates. The Board acknowledged BFA’s representation that the iShares funds are fundamentally different investment vehicles from the Other Accounts in its consideration of relevant qualitative and quantitative comparative information provided. The Board noted that BFA and its affiliates manage Other Accounts with a similar investment strategy or investment mandate as the Fund. The Board also acknowledged management’s assertion that, for certain iShares funds, and for client segmentation purposes, BlackRock has launched an iShares fund that may provide a similar investment exposure at a lower investment advisory fee rate.
The Board considered the “all-inclusive” nature of the Fund’s advisory fee structure, and the Fund’s expenses borne by BFA under this arrangement and noted that the investment advisory fee rate under the Advisory Agreement for the Fund was generally higher than the investment advisory/management fee rates for certain of the Other Accounts (particularly institutional clients) and concluded that the differences appeared to be consistent with the factors discussed.
Other Benefits to BFA and/or its Affiliates: The Board reviewed other benefits or ancillary revenue received by BFA and/or its affiliates in connection with the services provided to the Fund by BFA, both direct and indirect, including, but not limited to, payment of revenue to BTC, the Fund’s securities lending agent, for loaning portfolio securities, as applicable (which was included in the profit margins reviewed by the Board pursuant to BFA’s estimated profitability methodology), payment of advisory fees or other fees to BFA (or its affiliates) in connection with any investments by the Fund in other funds (including cash sweep vehicles) for which BFA (or its affiliates) provides investment advisory services or other services, and BlackRock’s profile in the investment community. The Board further considered other direct benefits that might accrue to BFA, including actual and potential reductions in the Fund’s expenses that are borne by BFA under the “all-inclusive” management fee arrangement, due in part to the size and scope of BFA’s investment operations servicing the Fund (and other funds in the iShares complex) as well as in response to a changing market environment. The Board also reviewed and considered information provided by BFA concerning authorized participant primary market order processing services that are provided by BlackRock Investments, LLC (“BRIL”), an affiliate of BFA, and paid for by authorized participants under the ETF Servicing Platform. The Board also noted the revenue received by BFA and/or its affiliates pursuant to an agreement that permits a service provider to use certain portions of BlackRock’s technology platform to service accounts managed by BFA and/or its affiliates, including the iShares funds. The Board noted that BFA generally does not use soft dollars or consider the value of research or other services that may be provided to BFA (including its affiliates) in selecting brokers for portfolio transactions for the Fund. The Board concluded that any such ancillary benefits would not be disadvantageous to the Fund and thus would not alter the Board’s conclusion with respect to the appropriateness of approving the continuance of the Advisory Agreement for the coming year.
512024 iShares Annual Financial Statements and Additional Information
Board Review and Approval of Investment Advisory Contract (continued)
Conclusion: Based on a review of the factors described above, as well as such other factors as deemed appropriate by the Board, the Board, including all of the Independent Board Members, determined that the Fund’s investment advisory fee rate under the Advisory Agreement does not constitute a fee that is so disproportionately large as to bear no reasonable relationship to the services rendered and that could not have been the product of arm’s-length bargaining, and concluded to approve the continuance of the Advisory Agreement for the coming year.
iShares Ultra Short-Term Bond Active ETF (the “Fund”)
Under Section 15(c) of the Investment Company Act of 1940 (the “1940 Act”), the Trust's Board of Trustees (the “Board”), including a majority of Board Members who are not “interested persons” of the Trust (as that term is defined in the 1940 Act) (the “Independent Board Members”), is required annually to consider the approval of the Investment Advisory Agreement between the Trust and BFA (the “Advisory Agreement”), and the Sub-Advisory Agreement between BFA and BlackRock International Limited, (together the “Advisory Agreements”), on behalf of the Fund. The Board’s consideration entails a year-long process whereby the Board and its committees (composed solely of Independent Board Members) assess BlackRock’s services to the Fund, including investment management; fund accounting; administrative and shareholder services; oversight of the Fund’s service providers; risk management and oversight; and legal and compliance services; including the ability to meet applicable legal and regulatory requirements. The Independent Board Members requested, and BFA provided, such information as the Independent Board Members, with advice from independent counsel, deemed reasonably necessary to evaluate the Advisory Agreements. At meetings held on May 6, 2024 and May 17, 2024, a committee composed of all of the Independent Board Members (the “15(c) Committee”), with independent counsel, met with management and reviewed and discussed information provided in response to initial requests of the 15(c) Committee and/or its independent counsel. Prior to and in preparation for the meeting, the Board received and reviewed materials specifically relating to matters relevant to the renewal of the Advisory Agreement. Following discussion, the 15(c) Committee subsequently requested certain additional information, which management agreed to provide. At a meeting held on June 4-5, 2024, the Board, including the Independent Board Members, reviewed the additional information provided by management in response to these requests.
After extensive discussions and deliberations, the Board, including all of the Independent Board Members, approved the continuance of the Advisory Agreements for the Fund, based on a review of qualitative and quantitative information provided by BFA and their cumulative experience as Board Members. The Board noted its satisfaction with the extent and quality of information provided and its frequent interactions with management, as well as the detailed responses and other information provided by BFA. The Independent Board Members were advised by their independent counsel throughout the process, including about the legal standards applicable to their review. In approving the continuance of the Advisory Agreements for the Fund, the Board, including the Independent Board Members, considered various factors, including: (i) the expenses and performance of the Fund; (ii) the nature, extent and quality of the services provided by BFA and BlackRock International Limited; (iii) the costs of services provided to the Fund and profits realized by BFA and its affiliates; (iv) potential economies of scale and the sharing of related benefits; (v) the fees and services provided for other comparable funds/accounts managed by BFA and its affiliates; and (vi) other benefits to BFA and/or its affiliates. The Board Members did not identify any particular information or any single factor as determinative, and each Board Member may have attributed different weights to the various matters and factors considered. The material factors, considerations and conclusions that formed the basis for the Board, including the Independent Board Members, to approve the continuance of the Advisory Agreements are discussed below.
Expenses and Performance of the Fund: The Board reviewed statistical information prepared by Broadridge Financial Solutions, Inc. (“Broadridge”), an independent provider of investment company data, regarding the expense ratio components, including gross and net total expenses, fees and expenses of other fund(s) in which the Fund invests (if applicable), and waivers/reimbursements (if applicable) of the Fund in comparison with the same information for other ETFs, objectively selected by Broadridge as comprising the Fund’s applicable expense peer group pursuant to Broadridge’s proprietary ETF methodology (the “Peer Group”). The Board was provided with a detailed description of the proprietary ETF methodology used by Broadridge to determine the Fund’s Peer Group. The Board noted that, due to the limitations in providing comparable funds in the Peer Group, the statistical information provided in Broadridge’s report may or may not provide meaningful direct comparisons to the Fund in all instances. The Board also noted that the investment advisory fee rate and overall expenses (net of any waivers and reimbursements) for the Fund were lower than the median of the investment advisory fee rates and overall expenses (net of any waivers and reimbursements) of the funds in its Peer Group, excluding iShares funds. The Board further noted that BFA pays BlackRock International Limited for sub-advisory services, and that there are no additional fees imposed on the Fund in respect of the services provided under the Sub-Advisory Agreement(s).
The Board noted that the Fund is an actively managed ETF that does not seek to track the performance of a specified index and that the management team for the Fund manages the Fund’s portfolio in accordance with its investment objective. The Board further noted that, during the year, the Board received periodic reports on the Fund’s short- and longer-term performance in comparison with its reference benchmark. Such periodic comparative performance information, including additional detailed information as requested by the Board, was also considered. The Board noted that the Fund generally performed in line with expectations relative to the Fund’s peer group (where applicable) and reference benchmark or stated investment objective.
Based on this review, the other relevant factors and information considered at the meeting, and their general knowledge of ETF pricing, the Board concluded that the investment advisory fee rate and expense level and the historical performance of the Fund supported the Board’s approval of the continuance of the Advisory Agreements for the coming year.
Nature, Extent and Quality of Services Provided: Based on management’s representations, including information about ongoing enhancements and initiatives with respect to the iShares product line and BFA’s business, including with respect to capital markets support and analysis, technology, portfolio management, product design and quality, compliance and risk management, global public policy and other services, the Board expected that there would be no diminution in the scope of services required of or provided by BFA and BlackRock International Limited under the Advisory Agreements for the coming year as compared with the scope of services provided by BFA during prior years. In reviewing the scope of these services, the Board considered BFA’s investment philosophy and experience, noting that BFA and its affiliates have committed significant resources over time, including during the past year, to support the iShares funds and their shareholders and have made significant investments into the iShares business. The Board also considered BFA’s compliance program and its compliance record with respect to the Fund, including related programs implemented pursuant to regulatory requirements. In that regard, the Board noted that BFA reports to the Board about portfolio management and compliance matters on
Board Review and Approval of Investment Advisory Contract52
Board Review and Approval of Investment Advisory Contract (continued)
a periodic basis in connection with regularly scheduled meetings of the Board, and on other occasions as necessary and appropriate, and has provided information and made relevant officers and other employees of BFA (and its affiliates) available as needed to provide further assistance with these matters. The Board also reviewed the background and experience of the persons responsible for the day-to-day management of the Fund, including those of the Sub-Advisor(s), as well as the resources available to them in managing the Fund. In addition to the above considerations, the Board reviewed and considered detailed presentations regarding investment performance, investment and risk management processes and strategies for BFA and BlackRock International Limited, which were provided at the May 6, 2024 meeting and throughout the year and matters related to BFA’s portfolio compliance program and other compliance programs and services, as well as BlackRock’s continued investments in its ETF business.
Based on review of this information, and the performance information discussed above, the Board concluded that the nature, extent and quality of services provided to the Fund under the Advisory Agreements supported the Board’s approval of the continuance of the Advisory Agreements for the coming year.
Costs of Services Provided to the Fund and Profits Realized by BFA and its Affiliates: The Board reviewed information about the estimated profitability to BlackRock in managing the Fund, based on the fees payable to BFA and its affiliates (including fees under the Advisory Agreement), and other sources of revenue and expense to BFA and its affiliates from the Fund’s operations for the last calendar year. The Board reviewed BlackRock’s methodology for calculating estimated profitability of the iShares funds, noting that the 15(c) Committee and the Board had focused on the methodology and profitability presentation. The Board recognized that profitability may be affected by numerous factors, including, among other things, fee waivers by BFA, the types of funds managed, expense allocations and business mix. The Board thus recognized that calculating and comparing profitability at individual fund levels is challenging. The Board discussed with management the sources of direct and ancillary revenue, including the revenues to BTC, a BlackRock affiliate, from securities lending by the Fund. The Board also discussed BFA’s estimated profit margin as reflected in the Fund’s profitability analysis and reviewed information regarding potential economies of scale (as discussed below).
Based on this review, the Board concluded that the information considered with respect to the profits realized by BFA and its affiliates under the Advisory Agreements and from other relationships between the Fund and BFA and/or its affiliates, if any, and related costs of the services provided as well as the other factors considered at the meeting, supported the Board’s approval of the continuance of the Advisory Agreements for the coming year.
Economies of Scale: The Board reviewed information and considered the extent to which economies of scale might be realized as the assets of the Fund increase, noting that the issue of potential economies of scale had been focused on by the 15(c) Committee and the Board during their meetings and addressed by management. The 15(c) Committee and the Board received information regarding BlackRock’s historical estimated profitability (as discussed above), including BFA’s and its affiliates’ estimated costs in providing services. The estimated cost information distinguished, among other things, between fixed and variable costs, and showed how the level and nature of fixed and variable costs may impact the existence or size of scale benefits, with the Board recognizing that potential economies of scale are difficult to measure. The 15(c) Committee and the Board reviewed information provided by BFA regarding the sharing of scale benefits with the iShares funds through various means, including, as applicable, through breakpoints, waivers or other fee reductions, as well as through additional investment in the iShares business, including enhancements to or the provision of additional infrastructure and services to the iShares funds and their shareholders and, with respect to New Funds, set management fees at levels that anticipate scale over time. The Board noted that the Advisory Agreement for the Fund did not provide for breakpoints in the Fund’s investment advisory fee rate as the assets of the Fund increase. However, the Board noted that it would continue to assess the appropriateness of adding breakpoints in the future.
The Board concluded that this review of potential economies of scale and the sharing of related benefits, as well as the other factors considered at the meeting, supported the Board’s approval of the continuance of the Advisory Agreements for the coming year.
Fees and Services Provided for Other Comparable Funds/Accounts Managed by BFA and its Affiliates: The Board received and considered information regarding the investment advisory/management fee rates for other funds/accounts in the U.S. for which BFA (or its affiliates) provides investment advisory/management services, including open-end funds registered under the 1940 Act (including sub-advised funds), collective trust funds and institutional separate accounts (collectively, the “Other Accounts”).
The Board received detailed information regarding how the Other Accounts generally differ from the Fund, including in terms of the types of services and generally more extensive character and scope of services provided to the Fund, as well as other significant differences. In that regard, the Board considered that the pricing of services to institutional clients is typically based on a number of factors beyond the nature and extent of the specific services to be provided and often depends on the overall relationship between the client and its affiliates and the adviser and its affiliates. In addition, the Board considered the relative complexity and inherent risks and challenges of managing and providing other services to the Fund, as a publicly traded investment vehicle, as compared to the Other Accounts, particularly those that are institutional clients, in light of differing regulatory requirements and client-imposed mandates. The Board acknowledged BFA’s representation that the iShares funds are fundamentally different investment vehicles from the Other Accounts in its consideration of relevant qualitative and quantitative comparative information provided. The Board noted that BFA and its affiliates manage Other Accounts with a similar investment strategy or investment mandate as the Fund. The Board also acknowledged management’s assertion that, for certain iShares funds, and for client segmentation purposes, BlackRock has launched an iShares fund that may provide a similar investment exposure at a lower investment advisory fee rate.
The Board considered the “all-inclusive” nature of the Fund’s advisory fee structure, and the Fund’s expenses borne by BFA under this arrangement and noted that the investment advisory fee rate under the Advisory Agreement for the Fund was generally higher than the investment advisory/management fee rates for certain of the Other Accounts (particularly institutional clients) and concluded that the differences appeared to be consistent with the factors discussed.
Other Benefits to BFA and/or its Affiliates: The Board reviewed other benefits or ancillary revenue received by BFA and/or its affiliates in connection with the services provided to the Fund by BFA, both direct and indirect, including, but not limited to, payment of revenue to BTC, the Fund’s securities lending agent, for loaning portfolio securities, as applicable (which was included in the profit margins reviewed by the Board pursuant to BFA’s estimated profitability methodology), payment of advisory fees or other fees to BFA (or its affiliates) in connection with any investments by the Fund in other funds (including cash sweep vehicles) for which BFA (or its affiliates) provides
532024 iShares Annual Financial Statements and Additional Information
Board Review and Approval of Investment Advisory Contract (continued)
investment advisory services or other services, and BlackRock’s profile in the investment community. The Board further considered other direct benefits that might accrue to BFA, including the actual and potential reductions in the Fund’s expenses that are borne by BFA under the “all-inclusive” management fee arrangement, due in part to the size and scope of BFA’s investment operations servicing the Fund (and other funds in the iShares complex) as well as in response to a changing market environment. The Board also reviewed and considered information provided by BFA concerning authorized participant primary market order processing services that are provided by BlackRock Investments, LLC (“BRIL”), an affiliate of BFA, and paid for by authorized participants under the ETF Servicing Platform. The Board also noted the revenue received by BFA and/or its affiliates pursuant to an agreement that permits a service provider to use certain portions of BlackRock’s technology platform to service accounts managed by BFA and/or its affiliates, including the iShares funds. The Board noted that BFA generally does not use soft dollars or consider the value of research or other services that may be provided to BFA (including its affiliates) in selecting brokers for portfolio transactions for the Fund. The Board concluded that any such ancillary benefits would not be disadvantageous to the Fund and thus would not alter the Board’s conclusion with respect to the appropriateness of approving the continuance of the Advisory Agreements for the coming year.
Conclusion: Based on a review of the factors described above, as well as such other factors as deemed appropriate by the Board, the Board, including all of the Independent Board Members, determined that the Fund’s investment advisory fee rate under the Advisory Agreement does not constitute a fee that is so disproportionately large as to bear no reasonable relationship to the services rendered and that could not have been the product of arm’s-length bargaining, and concluded to approve the continuance of the Advisory Agreements for the coming year.
Board Review and Approval of Investment Advisory Contract54
Glossary of Terms Used in this Report
|
| Collateralized Loan Obligation |
| Constant Maturity Treasury |
| Euro Interbank Offered Rate |
| |
| |
| Real Estate Investment Trust |
| Secured Overnight Financing Rate |
| Sterling Overnight Interbank Average Rate |
552024 iShares Annual Financial Statements and Additional Information
THIS PAGE INTENTIONALLY LEFT BLANK.
THIS PAGE INTENTIONALLY LEFT BLANK.
THIS PAGE INTENTIONALLY LEFT BLANK.
Want to know more?
iShares.com | 1-800-474-2737
This report is intended for the Funds’ shareholders. It may not be distributed to prospective investors unless it is preceded or accompanied by the current prospectus.
Investing involves risk, including possible loss of principal.
The iShares Funds are distributed by BlackRock Investments, LLC (together with its affiliates, “BlackRock”).
©2024 BlackRock, Inc. All rights reserved. iSHARES and BLACKROCK are registered trademarks of BlackRock, Inc. or its subsidiaries. All other marks are the property of their respective owners.
2024 Annual Financial Statements and Additional Information |
|
• iShares Bloomberg Roll Select Commodity Strategy ETF | CMDY | NYSE Arca |
• iShares Commodity Curve Carry Strategy ETF | CCRV | NYSE Arca |
• iShares GSCI Commodity Dynamic Roll Strategy ETF | COMT | NASDAQ |
• iShares Transition-Enabling Metals ETF | TMET | NASDAQ |
|
Consolidated Schedule of InvestmentsOctober 31, 2024
iShares® Bloomberg Roll Select Commodity Strategy ETF(Percentages shown are based on Net Assets)
| | |
|
American Honda Finance Corp., 4.86%, 01/06/25 | | |
Aquitaine Funding Co. LLC, 4.86%, 11/01/24 | | |
| | |
Bay Square Funding LLC, 4.75%, 01/28/25 | | |
Bell Telephone Co. of Canada or Bell Canada (The) | | |
| | |
| | |
| | |
Britannia Funding Co. LLC, 4.83%, 11/25/24 | | |
Brookfield Corporate Treasury Ltd., 5.16%, 11/01/24 | | |
| | |
| | |
| | |
| | |
| | |
| | |
Enel Finance America LLC, 4.87%, 12/06/24 | | |
GTA Funding LLC, 4.75%, 01/03/25 | | |
| | |
| | |
| | |
Koch Companies LLC, 4.80%, 11/05/24 | | |
Lime Funding LLC, 4.83%, 11/01/24 | | |
LSEGA Financing PLC, 4.79%, 01/14/25 | | |
LVMH Moet Hennessy Louis Vuitton Inc., 4.72%, 12/11/24 | | |
Microchip Technology Inc., 5.05%, 11/21/24 | | |
Mitsubishi Corp. Americas, 4.75%, 11/25/24 | | |
Mitsubishi HC Finance America LLC, 4.97%, 11/05/24 | | |
Mont Blanc Capital Corp., 4.84%, 11/05/24 | | |
Nutrien Ltd., 4.94%, 11/22/24 | | |
Overwatch Alpha Funding LLC | | |
| | |
| | |
PACCAR Financial Corp., 4.79%, 01/16/25 | | |
Penske Truck Leasing Co. LP | | |
| | |
| | |
| | |
| | |
| | |
Pure Grove Funding, 4.82%, 11/20/24 | | |
Reckitt Benckiser Treasury Services PLC, 5.00%, 12/18/24 | | |
| | |
RTX Corp., 4.95%, 11/15/24 | | |
Sanofi SA, 4.70%, 12/23/24 | | |
Spire Inc., 4.92%, 11/15/24 | | |
United Overseas Bank Ltd., 4.75%, 11/26/24 | | |
Versailles Commercial Paper LLC, 4.78%, 12/20/24 | | |
Volkswagen Financial Services | | |
| | |
| | |
Volvo Treasury North America LP, 4.85%, 01/06/25 | | |
Total Commercial Paper — 50.4%
(Cost: $142,352,203) | |
U.S. Treasury Obligations(a) |
| | |
| | |
| | |
| | |
| | |
| | |
| | |
| | |
| | |
Total U.S. Treasury Obligations — 41.9%
(Cost: $118,327,985) | |
| | |
|
BlackRock Cash Funds: Treasury, SL Agency Shares, 4.83%(b)(c) | | |
Total Money Market Funds — 3.3%
(Cost: $9,410,000) | |
Total Investments — 95.6%
(Cost: $270,090,188) | |
Other Assets Less Liabilities — 4.4% | |
| |
| Rates are discount rates or a range of discount rates as of period end. |
| |
| Annualized 7-day yield as of period end. |
Affiliates
Investments in issuers considered to be affiliate(s) of the Fund during the year ended October 31, 2024 for purposes of Section 2(a)(3) of the Investment Company Act of 1940, as amended, were as follows:
| | | | | Change in
Unrealized
Appreciation
(Depreciation) | | | | Capital
Gain
Distributions
from
Underlying
Funds |
BlackRock Cash Funds: Treasury, SL Agency Shares | | | | | | | | | |
| Represents net amount purchased (sold). |
32024 iShares Annual Financial Statements and Additional Information
Consolidated Schedule of Investments (continued)October 31, 2024
iShares® Bloomberg Roll Select Commodity Strategy ETF
Derivative Financial Instruments Outstanding as of Period End
| | | | Value/
Unrealized
Appreciation
(Depreciation) |
| | | | |
Bloomberg Roll Select Commodity Index | | | | |
Derivative Financial Instruments Categorized by Risk Exposure
As of period end, the fair values of derivative financial instruments located in the Consolidated Statements of Assets and Liabilities were as follows:
| | | | Foreign
Currency
Exchange
Contracts | | | |
Assets—Derivative Financial Instruments | | | | | | | |
| | | | | | | |
Unrealized appreciation on futures contracts(a) | | | | | | | |
| Net cumulative unrealized appreciation (depreciation) on futures contracts are reported in the Consolidated Schedule of Investments. In the Consolidated Statements of Assets and Liabilities, only current day's variation margin is reported in receivables or payables and the net cumulative unrealized appreciation (depreciation) is included in accumulated earnings (loss). |
For the period ended October 31, 2024, the effect of derivative financial instruments in the Consolidated Statements of Operations was as follows:
| | | | Foreign
Currency
Exchange
Contracts | | | |
Net Realized Gain (Loss) from | | | | | | | |
| | | | | | | |
Net Change in Unrealized Appreciation (Depreciation) on | | | | | | | |
| | | | | | | |
Average Quarterly Balances of Outstanding Derivative Financial Instruments
| |
Average notional value of contracts — long | |
For more information about the Fund’s investment risks regarding derivative financial instruments, refer to the Notes to Consolidated Financial Statements.
Fair Value Hierarchy as of Period End
Various inputs are used in determining the fair value of financial instruments at the measurement date. For a description of the input levels and information about the Fund’s policy regarding valuation of financial instruments, refer to the Notes to Consolidated Financial Statements.
The following table summarizes the Fund’s financial instruments categorized in the fair value hierarchy. The breakdown of the Fund’s financial instruments into major categories is disclosed in the Schedule of Investments above.
| | | | |
| | | | |
| | | | |
| | | | |
| | | | |
U.S. Treasury Obligations | | | | |
| | | | |
| | | | |
Consolidated Schedule of Investments4
Consolidated Schedule of Investments (continued)October 31, 2024
iShares® Bloomberg Roll Select Commodity Strategy ETF
Fair Value Hierarchy as of Period End (continued)
| | | | |
Derivative Financial Instruments(a) | | | | |
| | | | |
| | | | |
| Derivative financial instruments are futures contracts. Futures contracts are valued at the unrealized appreciation (depreciation) on the instrument. |
See notes to Consolidated Financial Statements
52024 iShares Annual Financial Statements and Additional Information
Consolidated Schedule of InvestmentsOctober 31, 2024
iShares® Commodity Curve Carry Strategy ETF(Percentages shown are based on Net Assets)
| | |
|
Bank of Montreal, 5.50%, 12/09/24 | | |
BNP Paribas SA/New York, 4.20%, 10/02/25 | | |
Cooperatieve Rabobank UA, 5.27%, 02/05/25 | | |
Credit Agricole Corporate and Investment Bank/New York, 5.10%, 06/20/25 | | |
Credit Industriel et Commercial, 5.20%, 02/04/25 | | |
Lloyds Bank Corporate, 5.10%, 07/25/25 | | |
Mitsubishi UFJ Trust & Banking Corp./New York, 5.21%, 07/01/25, (1-day SOFR + 0.400%)(a) | | |
Mizuho Bank Ltd./New York, 5.22%, 01/10/25, (1-day SOFR + 0.400%)(a) | | |
| | |
| | |
| | |
Standard Chartered Bank, 5.20%, 01/08/25 | | |
Sumitomo Mitsui Banking Corp./New York, 5.05%, 11/07/24, (1-day SOFR + 0.240%)(a) | | |
Svenska Handelsbanken/New York, 5.11%, 02/06/25, (1-day SOFR + 0.300%)(a) | | |
Westpac Banking Corp., 5.35%, 01/28/25 | | |
Total Certificates of Deposit — 8.8%
(Cost: $3,850,188) | |
|
Alinghi Funding Co. LLC, 4.74%, 01/08/25 | | |
American Honda Finance Corp., 4.86%, 01/06/25 | | |
ANZ New Zealand International Ltd./London, 4.84%, 11/04/24(a)(b) | | |
Australia & New Zealand Banking Group Ltd. | | |
| | |
| | |
Bank of Nova Scotia (The), 4.95%, 02/06/25, (1-day SOFR + 0.290%)(a)(b) | | |
| | |
Bell Telephone Co. of Canada or Bell Canada (The) | | |
| | |
| | |
BofA Securities Inc., 4.61%, 07/25/25 | | |
Britannia Funding Co. LLC, 4.83%, 11/25/24 | | |
Brookfield Corporate Treasury Ltd., 5.16%, 11/01/24 | | |
Citigroup Global Markets Inc., 5.02%, 01/24/25(a)(b) | | |
Commonwealth Bank of Australia | | |
| | |
4.91%, 11/07/24, (1-day SOFR + 0.200%)(a)(b) | | |
CRH America Finance Inc., 4.93%, 11/07/24 | | |
DNB Bank ASA, 4.49%, 10/08/25 | | |
Duke Energy Corp., 4.87%, 11/13/24 | | |
Enel Finance America LLC, 4.87%, 12/06/24 | | |
| | |
| | |
| | |
| | |
ING U.S. Funding LLC, 4.92%, 11/25/24(a)(b) | | |
Ionic Funding LLC, 4.67%, 11/25/24 | | |
Koch Companies LLC, 4.80%, 11/05/24 | | |
Komatsu Finance America Inc., 4.68%, 01/16/25 | | |
Korea Development Bank/New York, 4.59%, 04/09/25 | | |
Lime Funding LLC, 4.83%, 11/01/24 | | |
| | |
Lloyds Bank Corporate Markets PLC/New York, 4.69%, 02/03/25 | | |
LSEGA Financing PLC, 4.79%, 01/14/25 | | |
LVMH Moet Hennessy Louis Vuitton SE | | |
| | |
| | |
| | |
| | |
5.04%, 03/03/25, (1-day SOFR + 0.280%)(a)(b) | | |
Mars Inc., 4.70%, 12/19/24 | | |
Microchip Technology Inc., 5.05%, 11/21/24 | | |
Mitsubishi Corp. Americas, 4.75%, 11/25/24 | | |
Mitsubishi HC Finance America LLC, 4.97%, 11/05/24 | | |
| | |
| | |
| | |
NatWest Markets PLC, 4.55%, 06/24/25 | | |
Nestle Finance International Ltd., 4.68%, 12/16/24 | | |
Overwatch Alpha Funding LLC, 4.79%, 12/05/24 | | |
PACCAR Financial Corp., 4.79%, 01/16/25 | | |
| | |
| | |
| | |
Penske Truck Leasing Co. LP | | |
| | |
| | |
| | |
| | |
| | |
Podium Funding Trust, 4.62%, 06/16/25 | | |
Procter & Gamble Co. (The), 4.57%, 03/26/25 | | |
| | |
| | |
| | |
Queensland Treasury Corp., 4.61%, 03/18/25 | | |
Reckitt Benckiser Treasury Services PLC, 5.00%, 12/18/24 | | |
RTX Corp., 4.95%, 11/15/24 | | |
Sanofi SA, 4.70%, 12/23/24 | | |
| | |
4.96%, 02/05/25, (1-day SOFR + 0.300%)(a)(b) | | |
| | |
Telstra Group Ltd., 4.77%, 12/17/24 | | |
Toyota Industries Commercial Finance Inc., 4.78%, 11/22/24 | | |
Volkswagen Financial Services, 4.92%, 11/14/24 | | |
Washington Morgan Capital Co. LLC, 4.70%, 02/14/25 | | |
Westpac Securities NZ Ltd., 4.71%, 01/24/25 | | |
Total Commercial Paper — 55.3%
(Cost: $24,124,722) | |
U.S. Treasury Obligations(c) |
| | |
| | |
| | |
| | |
| | |
| | |
| | |
| | |
Consolidated Schedule of Investments6
Consolidated Schedule of Investments (continued)October 31, 2024
iShares® Commodity Curve Carry Strategy ETF(Percentages shown are based on Net Assets)
| | |
| | |
Total U.S. Treasury Obligations — 10.3%
(Cost: $4,464,704) | |
| | |
|
BlackRock Cash Funds: Treasury, SL Agency Shares, 4.83%(d)(e) | | |
Total Money Market Funds — 25.3%
(Cost: $11,020,000) | |
Total Investments — 99.7%
(Cost: $43,459,614) | |
Other Assets Less Liabilities — 0.3% | |
| |
| Variable rate security. Interest rate resets periodically. The rate shown is the effective interest rate as of period end. Security description also includes the reference rate and spread if published and available. |
| Security exempt from registration pursuant to Rule 144A under the Securities Act of 1933, as amended. These securities may be resold in transactions exempt from registration to qualified institutional investors. |
| Rates are discount rates or a range of discount rates as of period end. |
| |
| Annualized 7-day yield as of period end. |
Affiliates
Investments in issuers considered to be affiliate(s) of the Fund during the year ended October 31, 2024 for purposes of Section 2(a)(3) of the Investment Company Act of 1940, as amended, were as follows:
| | | | | Change in
Unrealized
Appreciation
(Depreciation) | | | | Capital
Gain
Distributions
from
Underlying
Funds |
BlackRock Cash Funds: Treasury, SL Agency Shares | | | | | | | | | |
| Represents net amount purchased (sold). |
72024 iShares Annual Financial Statements and Additional Information
Consolidated Schedule of Investments (continued)October 31, 2024
iShares® Commodity Curve Carry Strategy ETF
OTC Total Return Swaps
| | | | | | | | | |
| | | | | | | | | Upfront
Premiums
Paid
(Received) | Unrealized
Appreciation
(Depreciation) |
| | ICE BofA Commodity Enhanced Carry Total Return Index | | | | | | | | | |
| | ICE BofA Commodity Enhanced Carry Total Return Index | | Merrill Lynch International | | | | | | | |
| | ICE BofA Commodity Enhanced Carry Total Return Index | | Merrill Lynch International | | | | | | | |
| | | | | | | | | | | |
| Represents 3-month Treasury Bill. Rate shown is the rate in effect as of period-end. |
| Please refer to the Reference Entity below for more details. |
The ICE BofA Commodity Enhanced Carry Total Return Index consists of futures contracts under each counterparty. The following table represents the individual long positions and related weighting of the future contracts underlying the ICE BofA Commodity Enhanced Carry Total Return Index as of October 31, 2024.
Balances Reported in the Statements of Assets and Liabilities for Total Return Swaps
Derivative Financial Instruments Categorized by Risk Exposure
As of period end, the fair values of derivative financial instruments located in the Consolidated Statements of Assets and Liabilities were as follows:
| | | | Foreign
Currency
Exchange
Contracts | | | |
Assets—Derivative Financial Instruments | | | | | | | |
| | | | | | | |
Unrealized appreciation on OTC swaps; Swap premiums paid | | | | | | | |
Liabilities—Derivative Financial Instruments | | | | | | | |
| | | | | | | |
Unrealized depreciation on OTC swaps; Swap premiums received | | | | | | | |
Consolidated Schedule of Investments8
Consolidated Schedule of Investments (continued)October 31, 2024
iShares® Commodity Curve Carry Strategy ETF
Derivative Financial Instruments Categorized by Risk Exposure (continued)
For the period ended October 31, 2024, the effect of derivative financial instruments in the Consolidated Statements of Operations was as follows:
| | | | Foreign
Currency
Exchange
Contracts | | | |
Net Realized Gain (Loss) from | | | | | | | |
| | | | | | | |
Net Change in Unrealized Appreciation (Depreciation) on | | | | | | | |
| | | | | | | |
Average Quarterly Balances of Outstanding Derivative Financial Instruments
For more information about the Fund’s investment risks regarding derivative financial instruments, refer to the Notes to Consolidated Financial Statements.
Derivative Financial Instruments - Offsetting as of Period End
The Fund's derivative assets and liabilities (by type) were as follows:
| | |
Derivative Financial Instruments: | | |
| | |
Total derivative assets and liabilities in the Statement of Assets and Liabilities | | |
Derivatives not subject to a Master Netting Agreement or similar agreement ("MNA") | | |
Total derivative assets and liabilities subject to an MNA | | |
| Includes unrealized appreciation (depreciation) on OTC swaps and swap premiums (paid/received) in the Statements of Assets and Liabilities. |
The following tables present the Fund’s derivative assets and liabilities by counterparty net of amounts available for offset under an MNA and net of the related collateral received and pledged by the Fund:
| Derivative
Assets
Subject to
an MNA by
Counterparty | | | | |
| | | | | |
Merrill Lynch International | | | | | |
| | | | | |
| Derivative
Liabilities
Subject to
an MNA by
Counterparty | | | | |
| | | | | |
Merrill Lynch International | | | | | |
| | | | | |
| The amount of derivatives available for offset is limited to the amount of derivative assets and/or liabilities that are subject to an MNA. |
| Excess of collateral received/pledged, if any, from the individual counterparty is not shown for financial reporting purposes. |
| Net amount represents the net amount receivable from the counterparty in the event of default. |
| Net amount may also include forward foreign currency exchange contracts that are not required to be collateralized. |
| Net amount represents the net amount payable due to the counterparty in the event of default. |
92024 iShares Annual Financial Statements and Additional Information
Consolidated Schedule of Investments (continued)October 31, 2024
iShares® Commodity Curve Carry Strategy ETF
Fair Value Hierarchy as of Period End
Various inputs are used in determining the fair value of financial instruments at the measurement date. For a description of the input levels and information about the Fund’s policy regarding valuation of financial instruments, refer to the Notes to Consolidated Financial Statements.
The following table summarizes the Fund’s financial instruments categorized in the fair value hierarchy. The breakdown of the Fund’s financial instruments into major categories is disclosed in the Schedule of Investments above.
| | | | |
| | | | |
| | | | |
| | | | |
| | | | |
| | | | |
U.S. Treasury Obligations | | | | |
| | | | |
| | | | |
Derivative Financial Instruments(a) | | | | |
| | | | |
| | | | |
| | | | |
| | | | |
| | | | |
| Derivative financial instruments are swaps. Swaps are valued at the unrealized appreciation (depreciation) on the instrument. |
See notes to Consolidated Financial Statements
Consolidated Schedule of Investments10
Consolidated Schedule of InvestmentsOctober 31, 2024
iShares® GSCI Commodity Dynamic Roll Strategy ETF(Percentages shown are based on Net Assets)
| | |
|
Bank of America NA, 5.75%, 11/07/24 | | |
Bank of Montreal, 5.80%, 11/08/24 | | |
Bank of Montreal/Chicago IL, 5.07%, 02/18/25, (1-day SOFR + 0.260%)(a) | | |
Bank of Nova Scotia (The), 5.80%, 11/08/24 | | |
BNP Paribas SA/New York, 4.20%, 10/02/25 | | |
Canadian Imperial Bank of Commerce, 4.50%, 10/09/25 | | |
Citibank NA, 5.16%, 09/19/25 | | |
Commonwealth Bank of Australia/New York, 5.70%, 11/27/24 | | |
Cooperatieve Rabobank UA, 5.27%, 02/05/25 | | |
Credit Agricole Corporate & Investment Bank SA, 5.50%, 06/02/25 | | |
Credit Agricole Corporate and Investment Bank/New York, 5.10%, 06/20/25 | | |
Deutsche Bank AG/New York | | |
5.11%, 11/07/24, (1-day SOFR + 0.290%)(a) | | |
5.22%, 05/22/25, (1-day SOFR + 0.400%)(a) | | |
HSBC Bank USA NA, 5.79%, 11/25/24 | | |
Lloyds Bank Corporate, 5.10%, 07/25/25 | | |
Mizuho Bank Ltd./New York | | |
| | |
5.22%, 01/10/25, (1-day SOFR + 0.400%)(a) | | |
MUFG Bank Ltd./New York, 5.06%, 02/20/25 | | |
Oversea-Chinese Banking Corp. Ltd./New York | | |
5.04%, 11/26/24, (1-day SOFR + 0.230%)(a) | | |
5.04%, 12/09/24, (1-day SOFR + 0.230%)(a) | | |
Sumitomo Mitsui Banking Corp./New York | | |
5.05%, 11/07/24, (1-day SOFR + 0.240%)(a) | | |
5.15%, 03/18/25, (1-day SOFR + 0.340%)(a) | | |
Sumitomo Mitsui Trust Bank Ltd./New York, 5.15%, 06/02/25 | | |
Svenska Handelsbanken/New York, 5.08%, 02/05/25, (1-day SOFR + 0.270%)(a) | | |
Toronto-Dominion Bank (The), 5.00%, 01/16/25 | | |
Westpac Banking Corp., 5.40%, 04/09/25 | | |
Total Certificates of Deposit — 16.1%
(Cost: $138,499,930) | |
|
Alinghi Funding Co. LLC, 4.74%, 01/08/25 | | |
American Honda Finance Corp., 4.86%, 01/06/25 | | |
Australia & New Zealand Banking Group Ltd. | | |
| | |
| | |
| | |
Bell Telephone Co. of Canada or Bell Canada (The) | | |
| | |
| | |
| | |
| | |
| | |
| | |
Brookfield Corporate Treasury Ltd., 5.16%, 11/01/24 | | |
CDP Financial Inc., 4.67%, 02/04/25 | | |
Commonwealth Bank of Australia, 4.96%, 01/21/25 | | |
Concord Minutemen Capital Co. LLC, 4.79%, 12/06/24 | | |
| | |
| | |
| | |
| | |
| | |
| | |
| | |
Duke Energy Corp., 4.83%, 12/04/24 | | |
Enel Finance America LLC, 4.87%, 12/06/24 | | |
Equinor ASA, 4.67%, 01/24/25 | | |
European Investment Bank, 4.61%, 04/30/25 | | |
GTA Funding LLC, 4.83%, 11/01/24 | | |
| | |
| | |
| | |
| | |
| | |
| | |
| | |
| | |
| | |
Ionic Funding LLC, 4.91%, 12/03/24 | | |
JP Morgan Securities LLC, 5.07%, 02/03/25 | | |
Jupiter Securitization Co. LLC, 5.05%, 03/06/25 | | |
Korea Development Bank (The), 4.81%, 11/01/24 | | |
Lloyds Bank Corporate Markets PLC/New York, 4.69%, 02/03/25 | | |
LVMH Moet Hennessy Louis Vuitton SE, 4.80%, 11/12/24 | | |
| | |
| | |
| | |
5.04%, 03/03/25, (1-day SOFR + 0.280%)(a)(b) | | |
| | |
Mars Inc., 4.70%, 12/19/24 | | |
Microchip Technology Inc., 5.05%, 11/21/24 | | |
| | |
| | |
| | |
Natixis SA/New York, 4.81%, 11/06/24 | | |
NatWest Markets PLC, 4.55%, 06/24/25 | | |
Nestle Finance International Ltd., 4.68%, 12/16/24 | | |
Nutrien Ltd., 4.94%, 11/22/24 | | |
Old Line Funding LLC, 4.56%, 07/15/25 | | |
Overwatch Alpha Funding LLC | | |
| | |
| | |
Penske Truck Leasing Co. LP | | |
| | |
| | |
Pfizer Inc., 4.70%, 01/07/25 | | |
| | |
| | |
| | |
| | |
| | |
| | |
Queensland Treasury Corp., 4.61%, 03/18/25 | | |
Reckitt Benckiser Treasury Services PLC, 5.00%, 12/18/24 | | |
Royal Bank of Canada, 4.49%, 10/03/25 | | |
Sanofi SA, 4.70%, 12/23/24 | | |
Spire Inc., 4.92%, 11/15/24 | | |
112024 iShares Annual Financial Statements and Additional Information
Consolidated Schedule of Investments (continued)October 31, 2024
iShares® GSCI Commodity Dynamic Roll Strategy ETF(Percentages shown are based on Net Assets)
| | |
Swedbank AB, 5.29%, 10/01/25 | | |
| | |
| | |
| | |
Toyota Industries Commercial Finance Inc., 4.78%, 11/22/24 | | |
Toyota Motor Credit Corp., 4.82%, 11/04/24 | | |
Volkswagen Financial Services | | |
| | |
| | |
Volvo Treasury North America LP, 4.92%, 11/15/24 | | |
Washington Morgan Capital Co. LLC, 4.70%, 02/14/25 | | |
Westpac Banking Corp., 4.81%, 11/07/24 | | |
Westpac Securities NZ Ltd., 4.71%, 01/02/25 | | |
Total Commercial Paper — 53.1%
(Cost: $456,023,142) | |
U.S. Treasury Obligations(c) |
| | |
| | |
| | |
| | |
| | |
| | |
| | |
| | |
| | |
| | |
| | |
| | |
| | |
| | |
| | |
Total U.S. Treasury Obligations — 12.8%
(Cost: $109,717,999) | |
| | |
|
BlackRock Cash Funds: Treasury, SL Agency Shares, 4.83%(d)(e) | | |
Total Money Market Funds — 10.1%
(Cost: $86,382,360) | |
Total Investments — 92.1%
(Cost: $790,623,431) | |
Other Assets Less Liabilities — 7.9% | |
| |
| Variable rate security. Interest rate resets periodically. The rate shown is the effective interest rate as of period end. Security description also includes the reference rate and spread if published and available. |
| Security exempt from registration pursuant to Rule 144A under the Securities Act of 1933, as amended. These securities may be resold in transactions exempt from registration to qualified institutional investors. |
| Rates are discount rates or a range of discount rates as of period end. |
| |
| Annualized 7-day yield as of period end. |
Affiliates
Investments in issuers considered to be affiliate(s) of the Fund during the year ended October 31, 2024 for purposes of Section 2(a)(3) of the Investment Company Act of 1940, as amended, were as follows:
| | | | | Change in
Unrealized
Appreciation
(Depreciation) | | | | Capital
Gain
Distributions
from
Underlying
Funds |
BlackRock Cash Funds: Treasury, SL Agency Shares | | | | | | | | | |
| Represents net amount purchased (sold). |
Derivative Financial Instruments Outstanding as of Period End
| | | | Value/
Unrealized
Appreciation
(Depreciation) |
| | | | |
| | | | |
| | | | |
| | | | |
| | | | |
Consolidated Schedule of Investments12
Consolidated Schedule of Investments (continued)October 31, 2024
iShares® GSCI Commodity Dynamic Roll Strategy ETF
Futures Contracts (continued)
| | | | Value/ Unrealized Appreciation (Depreciation) |
| | | | |
| | | | |
| | | | |
| | | | |
| | | | |
| | | | |
| | | | |
| | | | |
| | | | |
NY Harbor ULSD (Heat Oil) | | | | |
| | | | |
| | | | |
| | | | |
| | | | |
| | | | |
| | | | |
| | | | |
| | | | |
| | | | |
| | | | |
| | | | |
Derivative Financial Instruments Categorized by Risk Exposure
As of period end, the fair values of derivative financial instruments located in the Consolidated Statements of Assets and Liabilities were as follows:
| | | | Foreign
Currency
Exchange
Contracts | | | |
Assets—Derivative Financial Instruments | | | | | | | |
| | | | | | | |
Unrealized appreciation on futures contracts(a) | | | | | | | |
Liabilities—Derivative Financial Instruments | | | | | | | |
| | | | | | | |
Unrealized depreciation on futures contracts(a) | | | | | | | |
| Net cumulative unrealized appreciation (depreciation) on futures contracts are reported in the Consolidated Schedule of Investments. In the Consolidated Statements of Assets and Liabilities, only current day's variation margin is reported in receivables or payables and the net cumulative unrealized appreciation (depreciation) is included in accumulated earnings (loss). |
For the period ended October 31, 2024, the effect of derivative financial instruments in the Consolidated Statements of Operations was as follows:
| | | | Foreign
Currency
Exchange
Contracts | | | |
Net Realized Gain (Loss) from | | | | | | | |
| | | | | | | |
Net Change in Unrealized Appreciation (Depreciation) on | | | | | | | |
| | | | | | | |
Average Quarterly Balances of Outstanding Derivative Financial Instruments
| |
Average notional value of contracts — long | |
132024 iShares Annual Financial Statements and Additional Information
Consolidated Schedule of Investments (continued)October 31, 2024
iShares® GSCI Commodity Dynamic Roll Strategy ETF
For more information about the Fund’s investment risks regarding derivative financial instruments, refer to the Notes to Consolidated Financial Statements.
Fair Value Hierarchy as of Period End
Various inputs are used in determining the fair value of financial instruments at the measurement date. For a description of the input levels and information about the Fund’s policy regarding valuation of financial instruments, refer to the Notes to Consolidated Financial Statements.
The following table summarizes the Fund’s financial instruments categorized in the fair value hierarchy. The breakdown of the Fund’s financial instruments into major categories is disclosed in the Schedule of Investments above.
| | | | |
| | | | |
| | | | |
| | | | |
| | | | |
| | | | |
U.S. Treasury Obligations | | | | |
| | | | |
| | | | |
Derivative Financial Instruments(a) | | | | |
| | | | |
| | | | |
| | | | |
| | | | |
| | | | |
| Derivative financial instruments are futures contracts. Futures contracts are valued at the unrealized appreciation (depreciation) on the instrument. |
See notes to Consolidated Financial Statements
Consolidated Schedule of Investments14
Consolidated Schedule of InvestmentsOctober 31, 2024
iShares® Transition-Enabling Metals ETF(Percentages shown are based on Net Assets)
| | |
|
Bank of Montreal/Chicago IL, 5.07%, 02/18/25, (1-day SOFR + 0.260%)(a) | | |
Credit Agricole Corporate and Investment Bank/New York, 5.09%, 06/13/25 | | |
Credit Industriel et Commercial, 5.50%, 05/23/25 | | |
Deutsche Bank AG/New York, 5.22%, 05/22/25, (1-day SOFR + 0.400%)(a) | | |
HSBC Bank USA NA, 5.16%, 05/20/25, (1-day SOFR + 0.350%)(a) | | |
Lloyds Bank Corporate, 5.10%, 07/25/25 | | |
Sumitomo Mitsui Banking Corp./New York, 5.15%, 03/18/25, (1-day SOFR + 0.340%)(a) | | |
Sumitomo Mitsui Trust Bank Ltd./New York, 5.15%, 06/02/25 | | |
Toronto-Dominion Bank (The), 5.17%, 09/22/25 | | |
Wells Fargo Bank NA, 5.80%, 11/12/24 | | |
Total Certificates of Deposit — 21.3%
(Cost: $2,500,000) | |
|
American Honda Finance Corp., 4.86%, 01/06/25 | | |
Aquitaine Funding Co. LLC, 4.86%, 11/01/24 | | |
Bell Telephone Co. of Canada or Bell Canada (The), 4.82%, 12/09/24 | | |
CRH America Finance Inc., 4.88%, 11/29/24 | | |
Falcon Asset Funding LLC, 4.74%, 01/15/25 | | |
JP Morgan Securities LLC, 5.07%, 02/03/25 | | |
Keurig Dr Pepper Inc., 4.93%, 11/06/24 | | |
Komatsu Finance America Inc., 4.68%, 01/16/25 | | |
Korea Development Bank/New York, 4.59%, 04/09/25 | | |
LVMH Moet Hennessy Louis Vuitton SE, 4.76%, 11/25/24 | | |
Macquarie Bank Ltd., 4.55%, 07/24/25 | | |
Mitsubishi Corp. Americas, 4.82%, 11/04/24 | | |
Norfina Ltd., 4.65%, 03/10/25 | | |
NRW Bank, 4.60%, 04/08/25 | | |
Nutrien Ltd., 4.93%, 11/25/24 | | |
Penske Truck Leasing Co. LP, 5.01%, 11/05/24 | | |
Pure Grove Funding, 4.59%, 09/26/25 | | |
Queensland Treasury Corp., 4.61%, 03/18/25 | | |
| | |
Royal Bank of Canada, 4.49%, 10/03/25 | | |
Sanofi SA, 4.70%, 12/23/24 | | |
Santander U.K. PLC, 4.72%, 01/02/25 | | |
Telstra Group Ltd., 4.77%, 12/17/24 | | |
Toyota Industries Commercial Finance Inc., 4.78%, 11/22/24 | | |
Volkswagen Financial Services, 4.85%, 01/06/25 | | |
Walt Disney Co. (The), 4.77%, 01/09/25 | | |
Westpac Banking Corp., 4.81%, 11/07/24 | | |
Total Commercial Paper — 54.6%
(Cost: $6,430,732) | |
U.S. Treasury Obligations(b) |
| | |
| | |
| | |
| | |
Total U.S. Treasury Obligations — 8.3%
(Cost: $982,662) | |
| | |
|
BlackRock Cash Funds: Treasury, SL Agency Shares, 4.83%(c)(d) | | |
Total Money Market Funds — 10.9%
(Cost: $1,280,000) | |
Total Investments — 95.1%
(Cost: $11,193,394) | |
Other Assets Less Liabilities — 4.9% | |
| |
| Variable rate security. Interest rate resets periodically. The rate shown is the effective interest rate as of period end. Security description also includes the reference rate and spread if published and available. |
| Rates are discount rates or a range of discount rates as of period end. |
| |
| Annualized 7-day yield as of period end. |
Affiliates
Investments in issuers considered to be affiliate(s) of the Fund during the year ended October 31, 2024 for purposes of Section 2(a)(3) of the Investment Company Act of 1940, as amended, were as follows:
| | | | | Change in
Unrealized
Appreciation
(Depreciation) | | | | Capital
Gain
Distributions
from
Underlying
Funds |
BlackRock Cash Funds: Treasury, SL Agency Shares | | | | | | | | | |
| Represents net amount purchased (sold). |
152024 iShares Annual Financial Statements and Additional Information
Consolidated Schedule of Investments (continued)October 31, 2024
iShares® Transition-Enabling Metals ETF
Derivative Financial Instruments Outstanding as of Period End
| | | | Value/
Unrealized
Appreciation
(Depreciation) |
| | | | |
| | | | |
| | | | |
| | | | |
| | | | |
| | | | |
| | | | |
| | | | |
| | | | |
Derivative Financial Instruments Categorized by Risk Exposure
As of period end, the fair values of derivative financial instruments located in the Statements of Assets and Liabilities were as follows:
| | | | Foreign
Currency
Exchange
Contracts | | | |
Assets—Derivative Financial Instruments | | | | | | | |
| | | | | | | |
Unrealized appreciation on futures contracts(a) | | | | | | | |
Liabilities—Derivative Financial Instruments | | | | | | | |
| | | | | | | |
Unrealized depreciation on futures contracts(a) | | | | | | | |
| Net cumulative unrealized appreciation (depreciation) on futures contracts are reported in the Consolidated Schedule of Investments. In the Consolidated Statements of Assets and Liabilities, only current day's variation margin is reported in receivables or payables and the net cumulative unrealized appreciation (depreciation) is included in accumulated earnings (loss). |
For the period ended October 31, 2024, the effect of derivative financial instruments in the Statements of Operations was as follows:
| | | | Foreign
Currency
Exchange
Contracts | | | |
Net Realized Gain (Loss) from | | | | | | | |
| | | | | | | |
Net Change in Unrealized Appreciation (Depreciation) on | | | | | | | |
| | | | | | | |
Average Quarterly Balances of Outstanding Derivative Financial Instruments
| |
Average notional value of contracts — long | |
For more information about the Fund’s investment risks regarding derivative financial instruments, refer to the Notes to Financial Statements.
Consolidated Schedule of Investments16
Consolidated Schedule of Investments (continued)October 31, 2024
iShares® Transition-Enabling Metals ETF
Fair Value Hierarchy as of Period End
Various inputs are used in determining the fair value of financial instruments at the measurement date. For a description of the input levels and information about the Fund’s policy regarding valuation of financial instruments, refer to the Notes to Financial Statements.
The following table summarizes the Fund’s financial instruments categorized in the fair value hierarchy. The breakdown of the Fund’s financial instruments into major categories is disclosed in the Schedule of Investments above.
| | | | |
| | | | |
| | | | |
| | | | |
| | | | |
| | | | |
U.S. Treasury Obligations | | | | |
| | | | |
| | | | |
Derivative Financial Instruments(a) | | | | |
| | | | |
| | | | |
| | | | |
| | | | |
| | | | |
| Derivative financial instruments are futures contracts. Futures contracts are valued at the unrealized appreciation (depreciation) on the instrument. |
See notes to Consolidated Financial Statements
172024 iShares Annual Financial Statements and Additional Information
Consolidated Statements of Assets and LiabilitiesOctober 31, 2024
| iShares
Bloomberg Roll Select Commodity Strategy ETF | iShares
Commodity Curve Carry Strategy ETF | iShares
GSCI Commodity Dynamic Roll Strategy ETF | iShares
Transition-Enabling Metals ETF |
| | | | |
Investments, at value—unaffiliated(a) | | | | |
Investments, at value—affiliated(b) | | | | |
| | | | |
| | | | |
Collateral — OTC derivatives | | | | |
| | | | |
| | | | |
| | | | |
| | | | |
| | | | |
Variation margin on futures contracts | | | | |
Unrealized appreciation on OTC swaps | | | | |
| | | | |
| | | | |
| | | | |
| | | | |
| | | | |
Variation margin on futures contracts | | | | |
| | | | |
Unrealized depreciation on OTC swaps | | | | |
| | | | |
Commitments and contingent liabilities | | | | |
| | | | |
| | | | |
| | | | |
Accumulated earnings (loss) | | | | |
| | | | |
| | | | |
| | | | |
| | | | |
| | | | |
| | | | |
(a) Investments, at cost—unaffiliated | | | | |
(b) Investments, at cost—affiliated | | | | |
See notes to Consolidated Financial Statements
Consolidated Statements of Assets and Liabilities18
Consolidated Statements of OperationsYear Ended October 31, 2024
| iShares
Bloomberg Roll Select Commodity Strategy ETF | iShares
Commodity Curve Carry Strategy ETF | iShares
GSCI Commodity Dynamic Roll Strategy ETF | iShares
Transition-Enabling Metals ETF |
| | | | |
| | | | |
| | | | |
| | | | |
| | | | |
| | | | |
| | | | |
| | | | |
| | | | |
Investment advisory fees waived | | | | |
Total expenses after fees waived | | | | |
| | | | |
REALIZED AND UNREALIZED GAIN (LOSS) | | | | |
Net realized gain (loss) from: | | | | |
| | | | |
| | | | |
| | | | |
| | | | |
Net change in unrealized appreciation (depreciation) on: | | | | |
| | | | |
| | | | |
| | | | |
| | | | |
Net realized and unrealized gain (loss) | | | | |
NET INCREASE (DECREASE) IN NET ASSETS RESULTING FROM OPERATIONS | | | | |
See notes to Consolidated Financial Statements
192024 iShares Annual Financial Statements and Additional Information
Consolidated Statements of Changes in Net Assets
| iShares
Bloomberg Roll Select Commodity Strategy ETF | iShares
Commodity Curve Carry Strategy ETF |
| | | | |
INCREASE (DECREASE) IN NET ASSETS | | | | |
| | | | |
| | | | |
| | | | |
Net change in unrealized appreciation (depreciation) | | | | |
Net increase (decrease) in net assets resulting from operations | | | | |
DISTRIBUTIONS TO SHAREHOLDERS(a) | | | | |
Decrease in net assets resulting from distributions to shareholders | | | | |
CAPITAL SHARE TRANSACTIONS | | | | |
Net increase (decrease) in net assets derived from capital share transactions | | | | |
| | | | |
Total increase (decrease) in net assets | | | | |
| | | | |
| | | | |
| Distributions for annual periods determined in accordance with U.S. federal income tax regulations. |
See notes to Consolidated Financial Statements
Consolidated Statements of Changes in Net Assets20
Consolidated Statements of Changes in Net Assets(continued)
| iShares
GSCI Commodity Dynamic Roll Strategy ETF | iShares
Transition-Enabling Metals ETF |
| | | | |
INCREASE (DECREASE) IN NET ASSETS | | | | |
| | | | |
| | | | |
| | | | |
Net change in unrealized appreciation (depreciation) | | | | |
Net increase (decrease) in net assets resulting from operations | | | | |
DISTRIBUTIONS TO SHAREHOLDERS(b) | | | | |
Decrease in net assets resulting from distributions to shareholders | | | | |
CAPITAL SHARE TRANSACTIONS | | | | |
Net increase (decrease) in net assets derived from capital share transactions | | | | |
| | | | |
Total increase (decrease) in net assets | | | | |
| | | | |
| | | | |
| Commencement of operations. |
| Distributions for annual periods determined in accordance with U.S. federal income tax regulations. |
See notes to Consolidated Financial Statements
212024 iShares Annual Financial Statements and Additional Information
Consolidated Financial Highlights(For a share outstanding throughout each period)
| iShares Bloomberg Roll Select Commodity Strategy ETF |
| | | | | |
Net asset value, beginning of year | | | | | |
Net investment income (loss)(a) | | | | | |
Net realized and unrealized gain (loss)(b) | | | | | |
Net increase (decrease) from investment operations | | | | | |
Distributions from net investment income(c) | | | | | |
Net asset value, end of year | | | | | |
| | | | | |
| | | | | |
Ratios to Average Net Assets(e) | | | | | |
| | | | | |
Total expenses after fees waived | | | | | |
Net investment income (loss) | | | | | |
| | | | | |
Net assets, end of year (000) | | | | | |
Portfolio turnover rate(f) | | | | | |
(a) Based on average shares outstanding. |
(b) The amounts reported for a share outstanding may not accord with the change in aggregate gains and losses in securities for the fiscal period due to the timing of capital share transactions in relation to the fluctuating market values of the Fund’s underlying securities. |
(c) Distributions for annual periods determined in accordance with U.S. federal income tax regulations. |
(d) Where applicable, assumes the reinvestment of distributions. |
(e) Excludes fees and expenses incurred indirectly as a result of investments in underlying funds. |
(f) Portfolio turnover rate excludes in-kind transactions, if any. |
See notes to Consolidated Financial Statements
Consolidated Financial Highlights22
Consolidated Financial Highlights(continued)(For a share outstanding throughout each period)
| iShares Commodity Curve Carry Strategy ETF |
| | | | | |
Net asset value, beginning of period | | | | | |
Net investment income (loss)(b) | | | | | |
Net realized and unrealized gain (loss)(c) | | | | | |
Net increase (decrease) from investment operations | | | | | |
Distributions from net investment income(d) | | | | | |
Net asset value, end of period | | | | | |
| | | | | |
| | | | | |
Ratios to Average Net Assets(g) | | | | | |
| | | | | |
Total expenses after fees waived | | | | | |
Net investment income (loss) | | | | | |
| | | | | |
Net assets, end of period (000) | | | | | |
Portfolio turnover rate(i) | | | | | |
(a) Commencement of operations. |
(b) Based on average shares outstanding. |
(c) The amounts reported for a share outstanding may not accord with the change in aggregate gains and losses in securities for the fiscal period due to the timing of capital share transactions in relation to the fluctuating market values of the Fund’s underlying securities. |
(d) Distributions for annual periods determined in accordance with U.S. federal income tax regulations. |
(e) Where applicable, assumes the reinvestment of distributions. |
|
(g) Excludes fees and expenses incurred indirectly as a result of investments in underlying funds. |
|
(i) Portfolio turnover rate excludes in-kind transactions, if any. |
See notes to Consolidated Financial Statements
232024 iShares Annual Financial Statements and Additional Information
Consolidated Financial Highlights(continued)(For a share outstanding throughout each period)
| iShares GSCI Commodity Dynamic Roll Strategy ETF |
| | | | | |
Net asset value, beginning of year | | | | | |
Net investment income (loss)(a) | | | | | |
Net realized and unrealized gain (loss)(b) | | | | | |
Net increase (decrease) from investment operations | | | | | |
Distributions from net investment income(c) | | | | | |
Net asset value, end of year | | | | | |
| | | | | |
| | | | | |
Ratios to Average Net Assets(e) | | | | | |
| | | | | |
Total expenses after fees waived | | | | | |
Net investment income (loss) | | | | | |
| | | | | |
Net assets, end of year (000) | | | | | |
Portfolio turnover rate(f) | | | | | |
(a) Based on average shares outstanding. |
(b) The amounts reported for a share outstanding may not accord with the change in aggregate gains and losses in securities for the fiscal period due to the timing of capital share transactions in relation to the fluctuating market values of the Fund’s underlying securities. |
(c) Distributions for annual periods determined in accordance with U.S. federal income tax regulations. |
(d) Where applicable, assumes the reinvestment of distributions. |
(e) Excludes fees and expenses incurred indirectly as a result of investments in underlying funds. |
(f) Portfolio turnover rate excludes in-kind transactions, if any. |
See notes to Consolidated Financial Statements
Consolidated Financial Highlights24
Consolidated Financial Highlights(continued)(For a share outstanding throughout each period)
| iShares Transition-Enabling Metals ETF |
| | |
Net asset value, beginning of period | | |
| | |
Net realized and unrealized gain (loss)(c) | | |
Net increase (decrease) from investment operations | | |
Distributions from net investment income | | |
Net asset value, end of period | | |
| | |
| | |
Ratios to Average Net Assets(f) | | |
| | |
Total expenses after fees waived | | |
| | |
| | |
Net assets, end of period (000) | | |
Portfolio turnover rate(h) | | |
(a) Commencement of operations. |
(b) Based on average shares outstanding. |
(c) The amounts reported for a share outstanding may not accord with the change in aggregate gains and losses in securities for the fiscal period due to the timing of capital share transactions in relation to the fluctuating market values of the Fund’s underlying securities. |
(d) Where applicable, assumes the reinvestment of distributions. |
|
(f) Excludes fees and expenses incurred indirectly as a result of investments in underlying funds. |
|
(h) Portfolio turnover rate excludes in-kind transactions, if any. |
See notes to Consolidated Financial Statements
252024 iShares Annual Financial Statements and Additional Information
Notes to Consolidated Financial Statements
1. ORGANIZATION
iShares U.S. ETF Trust (the “Trust”) is registered under the Investment Company Act of 1940, as amended (the “1940 Act”), as an open-end management investment company. The Trust is organized as a Delaware statutory trust and is authorized to have multiple series or portfolios.
These consolidated financial statements relate only to the following funds (each, a “Fund” and collectively, the “Funds”):
| Diversification
Classification |
Bloomberg Roll Select Commodity Strategy | |
Commodity Curve Carry Strategy | |
GSCI Commodity Dynamic Roll Strategy | |
Transition-Enabling Metals | |
Basis of Consolidation: The accompanying consolidated financial statements for each Fund include the accounts of its wholly-owned subsidiary in the Cayman Islands (each, a “Subsidiary”) that invests in certain “commodity-linked instruments” and cash and cash equivalents in accordance with each Fund’s investment objective. In compliance with Sub-chapter M of the Internal Revenue Code of 1986, as amended, each Fund may invest up to 25% of its total assets in its Subsidiary. Intercompany accounts and transactions, if any, have been eliminated. Each Fund’s commodity-linked instruments held in its Subsidiary are intended to provide the Fund with exposure to applicable commodity markets or commodities consistent with current U.S. federal income tax laws applicable to investment companies such as the Fund. Each Subsidiary has the same investment objective as its Fund.
2. SIGNIFICANT ACCOUNTING POLICIES
The financial statements are prepared in conformity with accounting principles generally accepted in the United States of America (“U.S. GAAP”), which may require management to make estimates and assumptions that affect the reported amounts of assets and liabilities in the financial statements, disclosure of contingent assets and liabilities at the date of the financial statements and the reported amounts of increases and decreases in net assets from operations during the reporting period. Actual results could differ from those estimates. Each Fund is considered an investment company under U.S. GAAP and follows the accounting and reporting guidance applicable to investment companies. Below is a summary of significant accounting policies:
Investment Transactions and Income Recognition: For financial reporting purposes, investment transactions are recorded on the dates the transactions are executed. Realized gains and losses on investment transactions are determined using the specific identification method. Dividend income and capital gain distributions, if any, are recorded on the ex-dividend date. Non-cash dividends, if any, are recorded on the ex-dividend date at fair value. Interest income, including amortization and accretion of premiums and discounts on debt securities, is recognized daily on an accrual basis.
Bank Overdraft: Certain Funds had outstanding cash disbursements exceeding deposited cash amounts at the custodian during the reporting period. The Funds are obligated to repay the custodian for any overdraft, including any related costs or expenses, where applicable. For financial reporting purposes, overdraft fees, if any, are included in interest expense in the Consolidated Statements of Operations.
Collateralization: If required by an exchange or counterparty agreement, the Funds may be required to deliver/deposit cash and/or securities to/with an exchange, or broker-dealer or custodian as collateral for certain investments.
In-kind Redemptions: For financial reporting purposes, in-kind redemptions are treated as sales of securities resulting in realized capital gains or losses to the Funds. Because such gains or losses are not taxable to the Funds and are not distributed to existing Fund shareholders, the gains or losses are reclassified from accumulated net realized gain (loss) to paid-in capital at the end of the Funds’ tax year. These reclassifications have no effect on net assets or net asset value (“NAV”) per share.
Distributions: Dividends and distributions paid by each Fund are recorded on the ex-dividend dates. Distributions are determined on a tax basis and may differ from net investment income and net realized capital gains for financial reporting purposes. Dividends and distributions are paid in U.S. dollars and cannot be automatically reinvested in additional shares of the Funds.
Net income and realized gains from investments held by each Subsidiary are treated as ordinary income for tax purposes. If a net loss is realized by the Subsidiary in any taxable year, the loss will generally not be available to offset the Fund’s ordinary income and/or capital gains for that year.
Indemnifications: In the normal course of business, each Fund enters into contracts that contain a variety of representations that provide general indemnification. The Funds’ maximum exposure under these arrangements is unknown because it involves future potential claims against the Funds, which cannot be predicted with any certainty.
3. INVESTMENT VALUATION AND FAIR VALUE MEASUREMENTS
Investment Valuation Policies: Each Fund’s investments are valued at fair value (also referred to as “market value” within the financial statements) each day that the Fund’s listing exchange is open and, for financial reporting purposes, as of the report date. U.S. GAAP defines fair value as the price a fund would receive to sell an asset or pay to transfer a liability in an orderly transaction between market participants at the measurement date. The Board of Trustees of the Trust (the “Board”) of each Fund has approved the designation of BlackRock Fund Advisors (“BFA”), the Funds' investment adviser, as the valuation designee for each Fund. Each Fund determines the fair
Notes to Consolidated Financial Statements26
Notes to Consolidated Financial Statements (continued)
values of its financial instruments using various independent dealers or pricing services under BFA’s policies. If a security’s market price is not readily available or does not otherwise accurately represent the fair value of the security, the security will be valued in accordance with BFA’s policies and procedures as reflecting fair value. BFA has formed a committee (the “Valuation Committee”) to develop pricing policies and procedures and to oversee the pricing function for all financial instruments, with assistance from other BlackRock pricing committees.
Fair Value Inputs and Methodologies: The following methods and inputs are used to establish the fair value of each Fund’s assets and liabilities:
• Equity investments traded on a recognized securities exchange are valued at that day’s official closing price, as applicable, on the exchange where the stock is primarily traded. Equity investments traded on a recognized exchange for which there were no sales on that day are valued at the last traded price.
• Fixed-income investments for which market quotations are readily available are generally valued using the last available bid price or current market quotations provided by independent dealers or third-party pricing services. Pricing services generally value fixed income securities assuming orderly transactions of an institutional round lot size, but a fund may hold or transact in such securities in smaller, odd lot sizes. Odd lots may trade at lower prices than institutional round lots. The pricing services may use matrix pricing or valuation models that utilize certain inputs and assumptions to derive values, including transaction data (e.g., recent representative bids and offers), market data, credit quality information, perceived market movements, news, and other relevant information. Certain fixed-income securities, including asset-backed and mortgage related securities may be valued based on valuation models that consider the estimated cash flows of each tranche of the entity, establish a benchmark yield and develop an estimated tranche specific spread to the benchmark yield based on the unique attributes of the tranche. The amortized cost method of valuation may be used with respect to debt obligations with sixty days or less remaining to maturity unless BFA determines such method does not represent fair value.
• Investments in open-end U.S. mutual funds (including money market funds) are valued at that day’s NAV.
• Futures contracts are valued based on that day’s last reported settlement or trade price on the exchange where the contract is traded.
• Swap agreements are valued utilizing quotes received daily by independent pricing services or through brokers, which are derived using daily swap curves and models that incorporate a number of market data factors, such as discounted cash flows, trades and values of the underlying reference instruments.
If events (e.g., market volatility, company announcement or a natural disaster) occur that are expected to materially affect the value of such investment, or in the event that application of these methods of valuation results in a price for an investment that is deemed not to be representative of the market value of such investment, or if a price is not available, the investment will be valued by the Valuation Committee in accordance with BFA’s policies and procedures as reflecting fair value (“Fair Valued Investments”). The fair valuation approaches that may be used by the Valuation Committee include market approach, income approach and cost approach. Valuation techniques such as discounted cash flow, use of market comparables and matrix pricing are types of valuation approaches and are typically used in determining fair value. When determining the price for Fair Valued Investments, the Valuation Committee seeks to determine the price that each Fund might reasonably expect to receive or pay from the current sale or purchase of that asset or liability in an arm’s-length transaction. Fair value determinations shall be based upon all available factors that the Valuation Committee deems relevant and consistent with the principles of fair value measurement as of the measurement date.
Fair value pricing could result in a difference between the prices used to calculate a fund’s NAV and the prices used by the fund’s underlying index, which in turn could result in a difference between the fund’s performance and the performance of the fund’s underlying index.
Fair Value Hierarchy: Various inputs are used in determining the fair value of financial instruments at the measurement date. These inputs to valuation techniques are categorized into a fair value hierarchy consisting of three broad levels for financial reporting purposes as follows:
• Level 1 – Unadjusted price quotations in active markets/exchanges that each Fund has the ability to access for identical assets or liabilities;
• Level 2 – Inputs other than quoted prices included within level 1 that are observable for the asset or liability, either directly or indirectly; and
• Level 3 – Inputs that are unobservable and significant to the entire fair value measurement for the asset or liability (including the Valuation Committee’s assumptions used in determining the fair value of financial instruments).
The hierarchy gives the highest priority to unadjusted quoted prices in active markets for identical assets or liabilities (Level 1 measurements) and the lowest priority to unobservable inputs (Level 3 measurements). Accordingly, the degree of judgment exercised in determining fair value is greatest for instruments categorized in Level 3. The inputs used to measure fair value may fall into different levels of the fair value hierarchy. In such cases, for disclosure purposes, the fair value hierarchy classification is determined based on the lowest level input that is significant to the fair value measurement in its entirety. Investments classified within Level 3 have significant unobservable inputs used by the Valuation Committee in determining the price for Fair Valued Investments. Level 3 investments include equity or debt issued by privately held companies or funds that may not have a secondary market and/or may have a limited number of investors. The categorization of a value determined for financial instruments is based on the pricing transparency of the financial instruments and is not necessarily an indication of the risks associated with investing in those securities.
4. DERIVATIVE FINANCIAL INSTRUMENTS
Futures Contracts: Futures contracts are purchased or sold to gain exposure to, or manage exposure to, changes in interest rates (interest rate risk) and changes in the value of equity securities (equity risk) or foreign currencies (foreign currency exchange rate risk) or to the applicable commodities market (commodities price risk).
272024 iShares Annual Financial Statements and Additional Information
Notes to Consolidated Financial Statements (continued)
Futures contracts are exchange-traded agreements between the Funds and a counterparty to buy or sell a specific quantity of an underlying instrument at a specified price and on a specified date. Depending on the terms of a contract, it is settled either through physical delivery of the underlying instrument on the settlement date or by payment of a cash amount on the settlement date. Upon entering into a futures contract, the Funds are required to deposit initial margin with the broker in the form of cash or securities in an amount that varies depending on a contract’s size and risk profile. The initial margin deposit must then be maintained at an established level over the life of the contract. Amounts pledged, which are considered restricted, are included in cash pledged for futures contracts in the Consolidated Statements of Assets and Liabilities.
Securities deposited as initial margin are designated in the Consolidated Schedule of Investments and cash deposited, if any, are shown as cash pledged for futures contracts in the Consolidated Statements of Assets and Liabilities. Pursuant to the contract, the Funds agree to receive from or pay to the broker an amount of cash equal to the daily fluctuation in market value of the contract (“variation margin”). Variation margin is recorded as unrealized appreciation (depreciation) and, if any, shown as variation margin receivable (or payable) on futures contracts in the Consolidated Statements of Assets and Liabilities. When the contract is closed, a realized gain or loss is recorded in the Consolidated Statements of Operations equal to the difference between the notional amount of the contract at the time it was opened and the notional amount at the time it was closed. The use of futures contracts involves the risk of an imperfect correlation in the movements in the price of futures contracts and interest rates, foreign currency exchange rates or underlying assets.
Swaps: Swap contracts are entered into to manage exposure to issuers, markets and securities. Such contracts are agreements between the Funds and a counterparty to make periodic net payments on a specified notional amount or a net payment upon termination. Swap agreements are privately negotiated in the OTC market and may be entered into as a bilateral contract (“OTC swaps”) or centrally cleared (“centrally cleared swaps”). For OTC swaps, any upfront premiums paid and any upfront fees received are shown as swap premiums paid and swap premiums received, respectively, in the statement of assets and liabilities and amortized over the term of the contract. The daily fluctuation in market value is recorded as unrealized appreciation (depreciation) on OTC Swaps in the statement of assets and liabilities. Payments received or paid are recorded in the statement of operations as realized gains or losses, respectively. When an OTC swap is terminated, a realized gain or loss is recorded in the statement of operations equal to the difference between the proceeds from (or cost of) the closing transaction and the Funds’ basis in the contract, if any. Generally, the basis of the contract is the premium received or paid.
Total return swaps are entered into by the iShares Commodity Curve Carry Strategy ETF to obtain exposure to a security or market without owning such security or investing directly in such market or to exchange the risk/return of one security or market (e.g., fixed-income) with another security or market (e.g., equity or commodity prices) (equity risk, commodity price risk and/or interest rate risk).
Total return swaps are agreements in which there is an exchange of cash flows whereby one party commits to make payments based on the total return (distributions plus capital gains/losses) of an underlying instrument, or basket or underlying instruments, in exchange for fixed or floating rate interest payments. If the total return of the instruments or index underlying the transaction exceeds or falls short of the offsetting fixed or floating interest rate obligation, the Fund receives payment from or makes a payment to the counterparty.
Certain total return swaps are designed to function as a portfolio of direct investments in long and short equity positions. This means that the Fund has the ability to trade in and out of these long and short positions within the swap and will receive the economic benefits and risks equivalent to direct investment in these positions, subject to certain adjustments due to events related to the counterparty. Benefits and risks include capital appreciation (depreciation), corporate actions and dividends received and paid, all of which are reflected in the swap’s market value. The market value also includes interest charges and credits (“financing fees”) related to the notional values of the long and short positions and cash balances within the swap. These interest charges and credits are based on a specified benchmark rate plus or minus a specified spread determined based upon the country and/or currency of the positions in the portfolio.
Positions within the swap and financing fees are reset periodically. During a reset, any unrealized appreciation (depreciation) on positions and accrued financing fees become available for cash settlement between the Fund and the counterparty. The amounts that are available for cash settlement are recorded as realized gains or losses in the Statement of Operations. Cash settlement in and out of the swap may occur at a reset date or any other date, at the discretion of the Fund and the counterparty, over the life of the agreement. Certain swaps have no stated expiration and can be terminated by either party at any time.
Swap transactions involve, to varying degrees, elements of interest rate, credit and market risks in excess of the amounts recognized in the Statements of Assets and Liabilities. Such risks involve the possibility that there will be no liquid market for these agreements, that the counterparty to the agreements may default on its obligation to perform or disagree as to the meaning of the contractual terms in the agreements, and that there may be unfavorable changes in interest rates and/or market values associated with these transactions.
Master Netting Arrangements: In order to define its contractual rights and to secure rights that will help mitigate its counterparty risk, a Fund may enter into an International Swaps and Derivatives Association, Inc. Master Agreement (“ISDA Master Agreement”) or similar agreement with its derivative contract counterparties. An ISDA Master Agreement is a bilateral agreement between a Fund and a counterparty that governs certain OTC derivatives and typically contains, among other things, collateral posting terms and netting provisions in the event of a default and/or termination event. Under an ISDA Master Agreement, a Fund may, under certain circumstances, offset with the counterparty certain derivative financial instruments’ payables and/or receivables with collateral held and/or posted and create one single net payment. The provisions of the ISDA Master Agreement typically permit a single net payment in the event of default including the bankruptcy or insolvency of the counterparty. However, bankruptcy or insolvency laws of a particular jurisdiction may impose restrictions on or prohibitions against the right of offset in bankruptcy, insolvency, or other events.
For derivatives traded under an ISDA Master Agreement, the collateral requirements are typically calculated by netting the mark-to-market amount for each transaction under such agreement, and comparing that amount to the value of any collateral currently pledged by a fund and the counterparty.
Cash collateral that has been pledged to cover obligations of the Funds and cash collateral received from the counterparty, if any, is reported separately in the Statements of Assets and Liabilities as cash pledged as collateral and cash received as collateral, respectively. Non-cash collateral pledged by the Funds, if any, is noted in the
Notes to Consolidated Financial Statements28
Notes to Consolidated Financial Statements (continued)
Schedules of Investments. Generally, the amount of collateral due from or to a counterparty is subject to a certain minimum transfer amount threshold before a transfer is required, which is determined at the close of business of the Funds. Any additional required collateral is delivered to/pledged by the Funds on the next business day. Typically, the counterparty is not permitted to sell, re-pledge or use cash and non-cash collateral it receives. A fund generally agrees not to use non-cash collateral that it receives but may, absent default or certain other circumstances defined in the underlying ISDA Master Agreement, be permitted to use cash collateral received. In such cases, interest may be paid pursuant to the collateral arrangement with the counterparty. To the extent amounts due to the Funds from the counterparty are not fully collateralized, each Fund bears the risk of loss from counterparty non-performance. Likewise, to the extent the Funds have delivered collateral to a counterparty and stand ready to perform under the terms of their agreement with such counterparty, each Fund bears the risk of loss from a counterparty in the amount of the value of the collateral in the event the counterparty fails to return such collateral. Based on the terms of agreements, collateral may not be required for all derivative contracts.
For financial reporting purposes, the Fund does not offset derivative assets and derivative liabilities that are subject to netting arrangements, if any, in the Consolidated Statements of Assets and Liabilities.
5. INVESTMENT ADVISORY AGREEMENT AND OTHER TRANSACTIONS WITH AFFILIATES
Investment Advisory Fees: Pursuant to an Investment Advisory Agreement with the Trust, BlackRock Fund Advisors (“BFA”) manages the investment of each Fund’s assets. BFA is a California corporation indirectly owned by BlackRock, Inc. (“BlackRock”). Under the Investment Advisory Agreement, BFA is responsible for substantially all expenses of the Funds, except (i) interest and taxes; (ii) brokerage commissions and other expenses connected with the execution of portfolio transactions; (iii) distribution fees; (iv) the advisory fee payable to BFA; and (v) litigation expenses and any extraordinary expenses (in each case as determined by a majority of the independent trustees).
For its investment advisory services to each of the following Funds, BFA is entitled to an annual investment advisory fee, accrued daily and paid monthly by the Funds, based on the average daily net assets of each Fund as follows:
| |
Bloomberg Roll Select Commodity Strategy | |
Commodity Curve Carry Strategy | |
GSCI Commodity Dynamic Roll Strategy | |
Transition-Enabling Metals | |
Expense Waivers: A fund may incur its pro rata share of fees and expenses attributable to its investments in other investment companies (“acquired fund fees and expenses”). The total of the investment advisory fee and acquired fund fees and expenses, if any, is a fund’s total annual operating expenses. Total expenses as shown in the Statements of Operations does not include acquired fund fees and expenses.
BFA has contractually agreed to waive a portion of its investment advisory fee for the iShares Bloomberg Roll Select Commodity Strategy ETF, iShares Commodity Curve Carry Strategy ETF and iShares GSCI Commodity Dynamic Roll Strategy ETF through February 28, 2025, March 1, 2025 and February 28, 2029, respectively, in an amount equal to the acquired fund fees and expenses, if any, attributable to the Fund’s investments in other registered investment companies advised by BFA or its affiliates.
BFA has contractually agreed to waive a portion of its investment advisory fee for the iShares Transition-Enabling Metals ETF through February 29, 2028 in an amount equal to the acquired fund fees and expenses, if any, attributable to investments by the Fund in other funds advised by BFA or its affiliates.
These amounts are included in investment advisory fees waived in the Consolidated Statements of Operations. For the year ended October 31, 2024, the amounts waived in investment advisory fees pursuant to these arrangements were as follows:
| |
Bloomberg Roll Select Commodity Strategy | |
Commodity Curve Carry Strategy | |
GSCI Commodity Dynamic Roll Strategy | |
Transition-Enabling Metals | |
Each Subsidiary has entered into a separate contract with BFA under which BFA provides investment advisory services to the Subsidiary but does not receive separate compensation from the Subsidiary for providing it with such services. Each Subsidiary has also entered into separate arrangements that provide for the provision of other services to the Subsidiary (including administrative, custody, transfer agency and other services), and BFA pays the costs and expenses related to the provision of those services.
Sub-Adviser: BFA has entered into a sub-advisory agreement with BlackRock International Limited (the “Sub-Adviser”), an affiliate of BFA, under which BFA pays the Sub-Adviser for services it provides to the iShares GSCI Commodity Dynamic Roll Strategy ETF and its Subsidiary.
Distributor: BlackRock Investments, LLC, an affiliate of BFA, is the distributor for each Fund. Pursuant to the distribution agreement, BFA is responsible for any fees or expenses for distribution services provided to the Funds.
Officers and Trustees: Certain officers and/or trustees of the Trust are officers and/or trustees of BlackRock or its affiliates.
292024 iShares Annual Financial Statements and Additional Information
Notes to Consolidated Financial Statements (continued)
Other Transactions: Each Fund may invest its positive cash balances in certain money market funds managed by BFA or an affiliate. The income earned on these temporary cash investments is shown as dividends – affiliated in the Consolidated Statements of Operations.
A fund, in order to improve its portfolio liquidity and its ability to track its underlying index, may invest in shares of other iShares funds that invest in securities in the fund’s underlying index.
For the year ended October 31, 2024, purchases and sales of investments, excluding short-term securities and in-kind transactions, were as follows:
| |
Commodity Curve Carry Strategy | |
There were no in-kind transactions for the year ended October 31, 2024.
7. INCOME TAX INFORMATION
Each Fund is treated as an entity separate from the Trust’s other funds for federal income tax purposes. It is each Fund’s policy to comply with the requirements of the Internal Revenue Code of 1986, as amended, applicable to regulated investment companies, and to distribute substantially all of its taxable income to its shareholders. Therefore, no U.S. federal income tax provision is required.
Management has analyzed tax laws and regulations and their application to the Funds as of October 31, 2024, inclusive of the open tax return years, and does not believe that there are any uncertain tax positions that require recognition of a tax liability in the Funds’consolidated financial statements. Management’s analysis is based on the tax laws and judicial and administrative interpretations thereof in effect as of the date of these financial statements, all of which are subject to change, possibly with retroactive effect, which may impact the Funds’ NAV.
U.S. GAAP requires that certain components of net assets be adjusted to reflect permanent differences between financial and tax reporting. These reclassifications have no effect on net assets or NAV per share. As of October 31, 2024, permanent differences attributable to nondeductible expenses and income recognized from the Fund's wholly owned subsidiary were reclassified to the following accounts:
| | Accumulated
Earnings (Loss) |
Bloomberg Roll Select Commodity Strategy | | |
Commodity Curve Carry Strategy | | |
GSCI Commodity Dynamic Roll Strategy | | |
Transition-Enabling Metals | | |
The tax character of distributions paid was as follows:
| | |
Bloomberg Roll Select Commodity Strategy | | |
| | |
Commodity Curve Carry Strategy | | |
| | |
GSCI Commodity Dynamic Roll Strategy | | |
| | |
| | |
Transition-Enabling Metals | | |
| | |
Notes to Consolidated Financial Statements30
Notes to Consolidated Financial Statements (continued)
As of October 31, 2024, the tax components of accumulated net earnings (losses) were as follows:
| Undistributed
Ordinary Income | | Net Unrealized
Gains (Losses) | |
Bloomberg Roll Select Commodity Strategy | | | | |
Commodity Curve Carry Strategy | | | | |
GSCI Commodity Dynamic Roll Strategy | | | | |
Transition-Enabling Metals | | | | |
| Amounts available to offset future realized capital gains. |
For the year ended October 31, 2024, the iShares GSCI Commodity Dynamic Roll Strategy ETF utilized $5,107 of its capital loss carryforwards.
A fund may own shares in certain foreign investment entities, referred to, under U.S. tax law, as “passive foreign investment companies.” Such fund may elect to mark-to-market annually the shares of each passive foreign investment company and would be required to distribute to shareholders any such marked-to-market gains.
As of October 31, 2024, gross unrealized appreciation and depreciation based on cost of investments (including short positions and derivatives, if any) for U.S. federal income tax purposes were as follows:
| | Gross Unrealized
Appreciation | Gross Unrealized
Depreciation | Net Unrealized
Appreciation
(Depreciation) |
Bloomberg Roll Select Commodity Strategy | | | | |
Commodity Curve Carry Strategy | | | | |
GSCI Commodity Dynamic Roll Strategy | | | | |
Transition-Enabling Metals | | | | |
In the normal course of business, each Fund invests in securities or other instruments and may enter into certain transactions, and such activities subject the Fund to various risks, including, among others, fluctuations in the market (market risk) or failure of an issuer to meet all of its obligations. The value of securities or other instruments may also be affected by various factors, including, without limitation: (i) the general economy; (ii) the overall market as well as local, regional or global political and/or social instability; (iii) regulation, taxation or international tax treaties between various countries; or (iv) currency, interest rate or price fluctuations. Local, regional or global events such as war, acts of terrorism, the spread of infectious illness or other public health issues, recessions, or other events could have a significant impact on the Funds and their investments. Each Fund’s prospectus provides details of the risks to which the Fund is subject.
BFA uses an indexing approach to try to achieve each Fund’s investment objective. The Fund is not actively managed, and BFA generally does not attempt to take defensive positions under any market conditions, including declining markets.
Market Risk: Each Fund may be exposed to prepayment risk, which is the risk that borrowers may exercise their option to prepay principal earlier than scheduled during periods of declining interest rates, which would force each Fund to reinvest in lower yielding securities. Each Fund may also be exposed to reinvestment risk, which is the risk that income from each Fund’s portfolio will decline if each Fund invests the proceeds from matured, traded or called fixed-income securities at market interest rates that are below each Fund portfolio’s current earnings rate.
Counterparty Credit Risk: The Funds may be exposed to counterparty credit risk, or the risk that an entity may fail to or be unable to perform on its commitments related to unsettled or open transactions, including making timely interest and/or principal payments or otherwise honoring its obligations. The Funds manage counterparty credit risk by entering into transactions only with counterparties that BFA believes have the financial resources to honor their obligations and by monitoring the financial stability of those counterparties. Financial assets, which potentially expose the Funds to market, issuer and counterparty credit risks, consist principally of financial instruments and receivables due from counterparties. The extent of the Funds’ exposure to market, issuer and counterparty credit risks with respect to these financial assets is approximately their value recorded in the Consolidated Statements of Assets and Liabilities, less any collateral held by the Funds.
A derivative contract may suffer a mark-to-market loss if the value of the contract decreases due to an unfavorable change in the market rates or values of the underlying instrument. Losses can also occur if the counterparty does not perform under the contract.
With exchange-traded futures, there is less counterparty credit risk to the Funds since the exchange or clearinghouse, as counterparty to such instruments, guarantees against a possible default. The clearinghouse stands between the buyer and the seller of the contract; therefore, credit risk is limited to failure of the clearinghouse. While offset rights may exist under applicable law, a Fund does not have a contractual right of offset against a clearing broker or clearinghouse in the event of a default (including the bankruptcy or insolvency). Additionally, credit risk exists in exchange-traded futures with respect to initial and variation margin that is held in a clearing broker’s customer accounts. While clearing brokers are required to segregate customer margin from their own assets, in the event that a clearing broker becomes insolvent or goes into bankruptcy and at that time there is a shortfall in the aggregate amount of margin held by the clearing broker for all its clients, typically the shortfall would be allocated on a pro rata basis across all the clearing broker’s customers, potentially resulting in losses to the Funds.
312024 iShares Annual Financial Statements and Additional Information
Notes to Consolidated Financial Statements (continued)
Geographic/Asset Class Risk: A diversified portfolio, where this is appropriate and consistent with a fund’s objectives, minimizes the risk that a price change of a particular investment will have a material impact on the NAV of a fund. The investment concentrations within each Fund’s portfolio are disclosed in its Consolidated Schedule of Investments.
The Funds invest a significant portion of their assets in securities of issuers located in the United States. A decrease in imports or exports, changes in trade regulations, inflation and/or an economic recession in the United States may have a material adverse effect on the U.S. economy and the securities listed on U.S. exchanges. Proposed and adopted policy and legislative changes in the United States may also have a significant effect on U.S. markets generally, as well as on the value of certain securities. Governmental agencies project that the United States will continue to maintain elevated public debt levels for the foreseeable future which may constrain future economic growth. Circumstances could arise that could prevent the timely payment of interest or principal on U.S. government debt, such as reaching the legislative “debt ceiling.” Such non-payment would result in substantial negative consequences for the U.S. economy and the global financial system. If U.S. relations with certain countries deteriorate, it could adversely affect issuers that rely on the United States for trade. The United States has also experienced increased internal unrest and discord. If these trends were to continue, they may have an adverse impact on the U.S. economy and the issuers in which the Funds invest.
Certain Funds a significant portion of their assets in fixed-income securities and/or use derivatives tied to the fixed-income markets. Changes in market interest rates or economic conditions may affect the value and/or liquidity of such investments. Interest rate risk is the risk that prices of bonds and other fixed-income securities will decrease as interest rates rise and increase as interest rates fall. The Funds may be subject to a greater risk of rising interest rates during a period of historically low interest rates. The Federal Reserve has raised the federal funds rate as part of its efforts to address inflation. Changing interest rates may have unpredictable effects on markets, may result in heightened market volatility, and could negatively impact the Funds' performance.
Certain Funds have substantial exposure to certain commodity markets through investments in commodity-linked instruments and through commodity-related equities. Any negative changes in commodity markets that may be due to changes in supply and demand for the commodities, market events, regulatory developments or other factors that the Funds cannot control could have an adverse impact on the Funds’ portfolios.
Significant Shareholder Redemption Risk: Certain shareholders may own or manage a substantial amount of fund shares and/or hold their fund investments for a limited period of time. Large redemptions of fund shares by these shareholders may force a fund to sell portfolio securities, which may negatively impact the fund’s NAV, increase the fund’s brokerage costs, and/or accelerate the realization of taxable income/gains and cause the fund to make additional taxable distributions to shareholders.
9. CAPITAL SHARE TRANSACTIONS
Capital shares are issued and redeemed by each Fund only in aggregations of a specified number of shares or multiples thereof (“Creation Units”) at NAV. Except when aggregated in Creation Units, shares of each Fund are not redeemable.
Transactions in capital shares were as follows:
| | |
| | | | |
Bloomberg Roll Select Commodity Strategy | | | | |
| | | | |
| | | | |
| | | | |
Commodity Curve Carry Strategy | | | | |
| | | | |
| | | | |
| | | | |
GSCI Commodity Dynamic Roll Strategy | | | | |
| | | | |
| | | | |
| | | | |
| | |
| | | | |
Transition-Enabling Metals | | | | |
| | | | |
| | | | |
| | | | |
| The Fund commenced operations on September 26, 2023. |
Notes to Consolidated Financial Statements32
Notes to Consolidated Financial Statements (continued)
The consideration for the purchase of Creation Units of a fund in the Trust generally consists of the in-kind deposit of a designated portfolio of securities and a specified amount of cash. Certain funds in the Trust may be offered in Creation Units solely or partially for cash in U.S. dollars. Authorized Participants purchasing and redeeming Creation Units may pay a purchase transaction fee and a redemption transaction fee directly to State Street Bank and Trust Company, the Trust’s administrator, to offset transfer and other transaction costs associated with the issuance and redemption of Creation Units, including Creation Units for cash. Authorized Participants transacting in Creation Units for cash may also pay an additional variable charge to compensate the relevant fund for certain transaction costs (i.e., stamp taxes, taxes on currency or other financial transactions, and brokerage costs) and market impact expenses relating to investing in portfolio securities. Such variable charges, if any, are included in shares sold in the table above.
To the extent applicable, to facilitate the timely settlement of orders for the Funds using a clearing facility outside of the continuous net settlement process, the Funds, at their sole discretion, may permit an Authorized Participant to post cash as collateral in anticipation of the delivery of all or a portion of the applicable Deposit Securities or Fund Securities, as further described in the applicable Authorized Participant Agreement. The collateral process is subject to a Control Agreement among the Authorized Participant, each Funds’ custodian, and the Funds. In the event that the Authorized Participant fails to deliver all or a portion of the applicable Deposit Securities or Fund Securities, the Funds may exercise control over such collateral pursuant to the terms of the Control Agreement in order to purchase the applicable Deposit Securities or Fund Securities.
From time to time, settlement of securities related to in-kind contributions or in-kind redemptions may be delayed. In such cases, securities related to in-kind transactions are reflected as a receivable or a payable in the Consolidated Statements of Assets and Liabilities.
Management has evaluated the impact of all subsequent events on the Funds through the date the consolidated financial statements were available to be issued and has determined that there were no subsequent events requiring adjustment or additional disclosure in the consolidated financial statements.
332024 iShares Annual Financial Statements and Additional Information
Report of Independent Registered Public Accounting Firm
To the Board of Trustees of
iShares U.S. ETF Trust and Shareholders of each of the five funds listed in the table below
Opinions on the Consolidated Financial Statements
We have audited the accompanying consolidated statements of assets and liabilities, including the consolidated schedules of investments, of each of the funds listed in the table below and their subsidiaries (four of the funds constituting iShares U.S. ETF Trust, hereafter collectively referred to as the "Funds") as of October 31, 2024, the related consolidated statements of operations and of changes in net assets for each of the periods indicated in the table below, including the related notes, and the consolidated financial highlights for each of the periods indicated therein (collectively referred to as the “consolidated financial statements”). In our opinion, the consolidated financial statements present fairly, in all material respects, the financial position of each of the Funds listed in the table below as of October 31, 2024, the results of each of their operations and the changes in each of their net assets for the periods indicated in the table below and each of the financial highlights for each of the periods indicated therein, in conformity with accounting principles generally accepted in the United States of America.
iShares Bloomberg Roll Select Commodity Strategy ETF(1) |
iShares Commodity Curve Carry Strategy ETF(1) |
iShares GSCI Commodity Dynamic Roll Strategy ETF(1) |
iShares Transition-Enabling Metals ETF(2) |
(1) Consolidated statement of operations for the year ended October 31, 2024 and consolidated statement of changes in net assets for each of the two years in the period ended October 31, 2024
(2) Consolidated statement of operations for the year ended October 31, 2024 and consolidated statement of changes in net assets for the year ended October 31, 2024 and the period September 26, 2023 (commencement of operations) through October 31, 2023
These consolidated financial statements are the responsibility of the Funds’ management. Our responsibility is to express an opinion on the Funds’ consolidated financial statements based on our audits. We are a public accounting firm registered with the Public Company Accounting Oversight Board (United States) (PCAOB) and are required to be independent with respect to the Funds in accordance with the U.S. federal securities laws and the applicable rules and regulations of the Securities and Exchange Commission and the PCAOB.
We conducted our audits of these consolidated financial statements in accordance with the standards of the PCAOB. Those standards require that we plan and perform the audit to obtain reasonable assurance about whether the consolidated financial statements are free of material misstatement, whether due to error or fraud.
Our audits included performing procedures to assess the risks of material misstatement of the consolidated financial statements, whether due to error or fraud, and performing procedures that respond to those risks. Such procedures included examining, on a test basis, evidence regarding the amounts and disclosures in the consolidated financial statements. Our audits also included evaluating the accounting principles used and significant estimates made by management, as well as evaluating the overall presentation of the consolidated financial statements. Our procedures included confirmation of securities owned as of October 31, 2024 by correspondence with the custodian, transfer agent and brokers; when replies were not received from brokers, we performed other auditing procedures. We believe that our audits provide a reasonable basis for our opinions.
/s/PricewaterhouseCoopers LLP
Philadelphia, Pennsylvania
December 20, 2024
We have served as the auditor of one or more BlackRock investment companies since 2000.
Report of Independent Registered Public Accounting Firm34
Important Tax Information (unaudited)
The Funds hereby designate the following amounts, or maximum amounts allowable by law, of distributions from direct federal obligation interest for the fiscal year ended October 31, 2024:
| Federal Obligation
Interest |
Bloomberg Roll Select Commodity Strategy | |
Commodity Curve Carry Strategy | |
GSCI Commodity Dynamic Roll Strategy | |
Transition-Enabling Metals | |
The law varies in each state as to whether and what percent of ordinary income dividends attributable to federal obligations is exempt from state income tax. Shareholders are advised to check with their tax advisers to determine if any portion of the dividends received is exempt from state income tax.
The Funds hereby designate the following amounts, or maximum amounts allowable by law, as interest income eligible to be treated as a Section 163(j) interest dividend for the fiscal year ended October 31, 2024:
| |
Bloomberg Roll Select Commodity Strategy | |
Commodity Curve Carry Strategy | |
GSCI Commodity Dynamic Roll Strategy | |
Transition-Enabling Metals | |
The Funds hereby designate the following amounts, or maximum amounts allowable by law, as interest-related dividends eligible for exemption from U.S. withholding tax for nonresident aliens and foreign corporations for the fiscal year ended October 31, 2024:
| Interest-Related
Dividends |
Bloomberg Roll Select Commodity Strategy | |
Commodity Curve Carry Strategy | |
GSCI Commodity Dynamic Roll Strategy | |
Transition-Enabling Metals | |
352024 iShares Annual Financial Statements and Additional Information
Premium/Discount Information
Information on the Fund's net asset value, market price, premiums and discounts, and bid-ask spreads can be found at iShares.com.
Shareholders can sign up for e-mail notifications announcing that the shareholder report or prospectus has been posted on the iShares website at iShares.com. Once you have enrolled, you will no longer receive prospectuses and shareholder reports in the mail.
To enroll in electronic delivery:
• Go to icsdelivery.com.
• If your brokerage firm is not listed, electronic delivery may not be available. Please contact your broker-dealer or financial advisor.
Changes in and Disagreements with Accountants
Remuneration Paid to Trustees, Officers, and Others
Because BFA has agreed in the Investment Advisory Agreements to cover all operating expenses of the Funds, subject to certain exclusions as provided for therein, BFA pays the compensation to each Independent Trustee for services to the Funds from BFA's investment advisory fees.
Availability of Portfolio Holdings Information
A description of the Company’s policies and procedures with respect to the disclosure of the Fund’s portfolio securities is available in the Fund Prospectus. The Fund discloses its portfolio holdings daily and provides information regarding its top holdings in Fund fact sheets, when available, at iShares.com.
Board Review and Approval of Investment Advisory Contract
iShares Bloomberg Roll Select Commodity Strategy ETF (the “Fund”)
Under Section 15(c) of the Investment Company Act of 1940 (the “1940 Act”), the Trust's Board of Trustees (the “Board”), including a majority of Board Members who are not “interested persons” of the Trust (as that term is defined in the 1940 Act) (the “Independent Board Members”), is required annually to consider the approval of the Investment Advisory Agreement between the Trust and BFA (the “Advisory Agreement”) on behalf of the Fund. The Board’s consideration entails a year-long process whereby the Board and its committees (composed solely of Independent Board Members) assess BlackRock’s services to the Fund, including investment management; fund accounting; administrative and shareholder services; oversight of the Fund’s service providers; risk management and oversight; and legal and compliance services; including the ability to meet applicable legal and regulatory requirements. The Independent Board Members requested, and BFA provided, such information as the Independent Board Members, with advice from independent counsel, deemed reasonably necessary to evaluate the Advisory Agreement. At meetings held on May 6, 2024 and May 17, 2024, a committee composed of all of the Independent Board Members (the “15(c) Committee”), with independent counsel, met with management and reviewed and discussed information provided in response to initial requests of the 15(c) Committee and/or its independent counsel. Prior to and in preparation for the meeting, the Board received and reviewed materials specifically relating to matters relevant to the renewal of the Advisory Agreement. Following discussion, the 15(c) Committee subsequently requested certain additional information, which management agreed to provide. At a meeting held on June 4-5, 2024, the Board, including the Independent Board Members, reviewed the additional information provided by management in response to these requests.
After extensive discussions and deliberations, the Board, including all of the Independent Board Members, approved the continuance of the Advisory Agreement for the Fund, based on a review of qualitative and quantitative information provided by BFA and their cumulative experience as Board Members. The Board noted its satisfaction with the extent and quality of information provided and its frequent interactions with management, as well as the detailed responses and other information provided by BFA. The Independent Board Members were advised by their independent counsel throughout the process, including about the legal standards applicable to their review. In approving the continuance of the Advisory Agreement for the Fund, the Board, including the Independent Board Members, considered various factors, including: (i) the expenses and performance of the Fund; (ii) the nature, extent and quality of the services provided by BFA; (iii) the costs of services provided to the Fund and profits realized by BFA and its affiliates; (iv) potential economies of scale and the sharing of related benefits; (v) the fees and services provided for other comparable funds/accounts managed by BFA and its affiliates; and (vi) other benefits to BFA and/or its affiliates. The Board Members did not identify any particular information or any single factor as determinative, and each Board Member may have attributed different weights to the various matters and factors considered. The material factors, considerations and conclusions that formed the basis for the Board, including the Independent Board Members, to approve the continuance of the Advisory Agreement are discussed below.
Expenses and Performance of the Fund: The Board reviewed statistical information prepared by Broadridge Financial Solutions, Inc. (“Broadridge”), an independent provider of investment company data, regarding the expense ratio components, including gross and net total expenses, fees and expenses of other fund(s) in which the Fund invests (if applicable), and waivers/reimbursements (if applicable) of the Fund in comparison with the same information for other ETFs, objectively selected by Broadridge as comprising the Fund’s applicable expense peer group pursuant to Broadridge’s proprietary ETF methodology (the “Peer Group”). The Board was provided with a detailed description of the proprietary ETF methodology used by Broadridge to determine the Fund’s Peer Group. The Board noted that, due to the limitations in providing comparable funds in the Peer Group, the statistical information provided in Broadridge’s report may or may not provide meaningful direct comparisons to the Fund in all instances. The Board also noted that the investment advisory fee rate and overall expenses (net of any waivers and reimbursements) for the Fund were lower than the median of the investment advisory fee rates and overall expenses (net of any waivers and reimbursements) of the funds in its Peer Group, excluding iShares funds.
In addition, to the extent that any of the comparison funds included in the Peer Group, excluding iShares funds, track the same index as the Fund, Broadridge also provided, and the Board reviewed, a comparison of the Fund’s performance for the one-year, three-year, five-year, ten-year, and since inception periods, as applicable, and for the quarter ended December 31, 2023, to that of such relevant comparison fund(s) for the same periods. The Board noted that the Fund seeks to track its specified underlying index and that, during the year, the Board received periodic reports on the Fund’s short- and longer-term performance in comparison with its underlying index. Such periodic comparative performance information, including additional detailed information as requested by the Board, was also considered. The Board noted that the Fund generally performed in line with its underlying index over the relevant periods.
Based on this review, the other relevant factors and information considered at the meeting, and their general knowledge of ETF pricing, the Board concluded that the investment advisory fee rate and expense level and the historical performance of the Fund supported the Board’s approval of the continuance of the Advisory Agreement for the coming year.
Nature, Extent and Quality of Services Provided: Based on management’s representations, including information about ongoing enhancements and initiatives with respect to the iShares product line and BFA’s business, including with respect to capital markets support and analysis, technology, portfolio management, product design and quality, compliance and risk management, global public policy and other services, the Board expected that there would be no diminution in the scope of services required of or provided by BFA under the Advisory Agreement for the coming year as compared with the scope of services provided by BFA during prior years. In reviewing the scope of these services, the Board considered BFA’s investment philosophy and experience, noting that BFA and its affiliates have committed significant resources over time, including during the past year, to support the iShares funds and their shareholders and have made significant investments into the iShares business. The Board also considered BFA’s compliance program and its compliance record with respect to the Fund, including related programs implemented pursuant to regulatory requirements. In that regard, the Board noted that BFA reports to the Board about portfolio management and compliance matters on a periodic basis in connection with regularly scheduled meetings of the Board, and on other occasions as necessary and appropriate, and has provided information and made relevant officers and other employees of BFA (and its affiliates) available as needed to provide further assistance with these matters. The Board also reviewed the background and experience of the persons responsible for the day-to-day management of the Fund, as well as the resources available to them in managing the Fund. In addition to the above considerations, the Board reviewed and considered detailed presentations regarding BFA’s investment performance, investment and risk management processes and strategies provided at the May 6, 2024
372024 iShares Annual Financial Statements and Additional Information
Board Review and Approval of Investment Advisory Contract (continued)
meeting and throughout the year, and matters related to BFA’s portfolio compliance program and other compliance programs and services, as well as BlackRock’s continued investments in its ETF business.
Based on review of this information, and the performance information discussed above, the Board concluded that the nature, extent and quality of services provided to the Fund under the Advisory Agreement supported the Board’s approval of the continuance of the Advisory Agreement for the coming year.
Costs of Services Provided to the Fund and Profits Realized by BFA and its Affiliates: The Board reviewed information about the estimated profitability to BlackRock in managing the Fund, based on the fees payable to BFA and its affiliates (including fees under the Advisory Agreement), and other sources of revenue and expense to BFA and its affiliates from the Fund’s operations for the last calendar year. The Board reviewed BlackRock’s methodology for calculating estimated profitability of the iShares funds, noting that the 15(c) Committee and the Board had focused on the methodology and profitability presentation. The Board recognized that profitability may be affected by numerous factors, including, among other things, fee waivers by BFA, the types of funds managed, expense allocations and business mix. The Board thus recognized that calculating and comparing profitability at individual fund levels is challenging. The Board discussed with management the sources of direct and ancillary revenue, including the revenues to BTC, a BlackRock affiliate, from securities lending by the Fund. The Board also discussed BFA’s estimated profit margin as reflected in the Fund’s profitability analysis and reviewed information regarding potential economies of scale (as discussed below).
Based on this review, the Board concluded that the information considered with respect to the profits realized by BFA and its affiliates under the Advisory Agreement and from other relationships between the Fund and BFA and/or its affiliates, if any, and related costs of the services provided as well as the other factors considered at the meeting, supported the Board’s approval of the continuance of the Advisory Agreement for the coming year.
Economies of Scale: The Board reviewed information and considered the extent to which economies of scale might be realized as the assets of the Fund increase, noting that the issue of potential economies of scale had been focused on by the 15(c) Committee and the Board during their meetings and addressed by management. The 15(c) Committee and the Board received information regarding BlackRock’s historical estimated profitability (as discussed above), including BFA’s and its affiliates’ estimated costs in providing services. The estimated cost information distinguished, among other things, between fixed and variable costs, and showed how the level and nature of fixed and variable costs may impact the existence or size of scale benefits, with the Board recognizing that potential economies of scale are difficult to measure. The 15(c) Committee and the Board reviewed information provided by BFA regarding the sharing of scale benefits with the iShares funds through various means, including, as applicable, through breakpoints, waivers, or other fee reductions, as well as through additional investment in the iShares business, including enhancements to or the provision of additional infrastructure and services to the iShares funds and their shareholders and, with respect to New Funds, set management fees at levels that anticipate scale over time. The Board noted that the Advisory Agreement for the Fund did not provide for breakpoints in the Fund’s investment advisory fee rate as the assets of the Fund increase. However, the Board noted that it would continue to assess the appropriateness of adding breakpoints in the future.
The Board concluded that this review of potential economies of scale and the sharing of related benefits, as well as the other factors considered at the meeting, supported the Board’s approval of the continuance of the Advisory Agreement for the coming year.
Fees and Services Provided for Other Comparable Funds/Accounts Managed by BFA and its Affiliates: The Board received and considered information regarding the investment advisory/management fee rates for other funds/accounts in the U.S. for which BFA (or its affiliates) provides investment advisory/management services, including open-end funds registered under the 1940 Act (including sub-advised funds), collective trust funds and institutional separate accounts (collectively, the “Other Accounts”).
The Board received detailed information regarding how the Other Accounts generally differ from the Fund, including in terms of the types of services and generally more extensive character and scope of services provided to the Fund, as well as other significant differences. In that regard, the Board considered that the pricing of services to institutional clients is typically based on a number of factors beyond the nature and extent of the specific services to be provided and often depends on the overall relationship between the client and its affiliates and the adviser and its affiliates. In addition, the Board considered the relative complexity and inherent risks and challenges of managing and providing other services to the Fund, as a publicly traded investment vehicle, as compared to the Other Accounts, particularly those that are institutional clients, in light of differing regulatory requirements and client-imposed mandates. The Board acknowledged BFA’s representation that the iShares funds are fundamentally different investment vehicles from the Other Accounts in its consideration of relevant qualitative and quantitative comparative information provided. The Board noted that BFA and its affiliates manage Other Accounts with substantially the same investment objective and strategy as the Fund and that track the same index as the Fund. The Board also acknowledged management’s assertion that, for certain iShares funds, and for client segmentation purposes, BlackRock has launched an iShares fund that may provide a similar investment exposure at a lower investment advisory fee rate.
The Board considered the “all-inclusive” nature of the Fund’s advisory fee structure, and the Fund’s expenses borne by BFA under this arrangement and noted that the investment advisory fee rate under the Advisory Agreement for the Fund was generally higher than the investment advisory/management fee rates for certain of the Other Accounts (particularly institutional clients) and concluded that the differences appeared to be consistent with the factors discussed.
Other Benefits to BFA and/or its Affiliates: The Board reviewed other benefits or ancillary revenue received by BFA and/or its affiliates in connection with the services provided to the Fund by BFA, both direct and indirect, including, but not limited to, payment of revenue to BTC, the Fund’s securities lending agent, for loaning portfolio securities, as applicable (which was included in the profit margins reviewed by the Board pursuant to BFA’s estimated profitability methodology), payment of advisory fees or other fees to BFA (or its affiliates) in connection with any investments by the Fund in other funds (including cash sweep vehicles) for which BFA (or its affiliates) provides investment advisory services or other services, and BlackRock’s profile in the investment community. The Board further considered other direct benefits that might accrue to BFA, including actual and potential reductions in the Fund’s expenses that are borne by BFA under the “all-inclusive” management fee arrangement, due in part to the size and scope of BFA’s investment operations servicing the Fund (and other funds in the iShares complex) as well as in response to a changing market environment. The Board also reviewed and considered information provided by BFA concerning authorized participant primary market order processing services that are provided by BlackRock Investments, LLC (“BRIL”), an affiliate of BFA, and paid for by authorized participants under the ETF Servicing Platform. The Board also noted the revenue
Board Review and Approval of Investment Advisory Contract38
Board Review and Approval of Investment Advisory Contract (continued)
received by BFA and/or its affiliates pursuant to an agreement that permits a service provider to use certain portions of BlackRock’s technology platform to service accounts managed by BFA and/or its affiliates, including the iShares funds. The Board noted that BFA generally does not use soft dollars or consider the value of research or other services that may be provided to BFA (including its affiliates) in selecting brokers for portfolio transactions for the Fund. The Board concluded that any such ancillary benefits would not be disadvantageous to the Fund and thus would not alter the Board’s conclusion with respect to the appropriateness of approving the continuance of the Advisory Agreement for the coming year.
Conclusion: Based on a review of the factors described above, as well as such other factors as deemed appropriate by the Board, the Board, including all of the Independent Board Members, determined that the Fund’s investment advisory fee rate under the Advisory Agreement does not constitute a fee that is so disproportionately large as to bear no reasonable relationship to the services rendered and that could not have been the product of arm’s-length bargaining, and concluded to approve the continuance of the Advisory Agreement for the coming year.
iShares Commodity Curve Carry Strategy ETF (the “Fund”)
Under Section 15(c) of the Investment Company Act of 1940 (the “1940 Act”), the Trust's Board of Trustees (the “Board”), including a majority of Board Members who are not “interested persons” of the Trust (as that term is defined in the 1940 Act) (the “Independent Board Members”), is required annually to consider the approval of the Investment Advisory Agreement between the Trust and BFA (the “Advisory Agreement”) on behalf of the Fund. The Board’s consideration entails a year-long process whereby the Board and its committees (composed solely of Independent Board Members) assess BlackRock’s services to the Fund, including investment management; fund accounting; administrative and shareholder services; oversight of the Fund’s service providers; risk management and oversight; and legal and compliance services; including the ability to meet applicable legal and regulatory requirements. The Independent Board Members requested, and BFA provided, such information as the Independent Board Members, with advice from independent counsel, deemed reasonably necessary to evaluate the Advisory Agreement. At meetings held on May 6, 2024 and May 17, 2024, a committee composed of all of the Independent Board Members (the “15(c) Committee”), with independent counsel, met with management and reviewed and discussed information provided in response to initial requests of the 15(c) Committee and/or its independent counsel. Prior to and in preparation for the meeting, the Board received and reviewed materials specifically relating to matters relevant to the renewal of the Advisory Agreement. Following discussion, the 15(c) Committee subsequently requested certain additional information, which management agreed to provide. At a meeting held on June 4-5, 2024, the Board, including the Independent Board Members, reviewed the additional information provided by management in response to these requests.
After extensive discussions and deliberations, the Board, including all of the Independent Board Members, approved the continuance of the Advisory Agreement for the Fund, based on a review of qualitative and quantitative information provided by BFA and their cumulative experience as Board Members. The Board noted its satisfaction with the extent and quality of information provided and its frequent interactions with management, as well as the detailed responses and other information provided by BFA. The Independent Board Members were advised by their independent counsel throughout the process, including about the legal standards applicable to their review. In approving the continuance of the Advisory Agreement for the Fund, the Board, including the Independent Board Members, considered various factors, including: (i) the expenses and performance of the Fund; (ii) the nature, extent and quality of the services provided by BFA; (iii) the costs of services provided to the Fund and profits realized by BFA and its affiliates; (iv) potential economies of scale and the sharing of related benefits; (v) the fees and services provided for other comparable funds/accounts managed by BFA and its affiliates; and (vi) other benefits to BFA and/or its affiliates. The Board Members did not identify any particular information or any single factor as determinative, and each Board Member may have attributed different weights to the various matters and factors considered. The material factors, considerations and conclusions that formed the basis for the Board, including the Independent Board Members, to approve the continuance of the Advisory Agreement are discussed below.
Expenses and Performance of the Fund: The Board reviewed statistical information prepared by Broadridge Financial Solutions, Inc. (“Broadridge”), an independent provider of investment company data, regarding the expense ratio components, including gross and net total expenses, fees and expenses of other fund(s) in which the Fund invests (if applicable), and waivers/reimbursements (if applicable) of the Fund in comparison with the same information for other ETFs, objectively selected by Broadridge as comprising the Fund’s applicable expense peer group pursuant to Broadridge’s proprietary ETF methodology (the “Peer Group”). The Board was provided with a detailed description of the proprietary ETF methodology used by Broadridge to determine the Fund’s Peer Group. The Board noted that, due to the limitations in providing comparable funds in the Peer Group, the statistical information provided in Broadridge’s report may or may not provide meaningful direct comparisons to the Fund in all instances. The Board also noted that the investment advisory fee rate and overall expenses (net of any waivers and reimbursements) for the Fund were lower than the median of the investment advisory fee rates and overall expenses (net of any waivers and reimbursements) of the funds in its Peer Group, excluding iShares funds.
In addition, to the extent that any of the comparison funds included in the Peer Group, excluding iShares funds, track the same index as the Fund, Broadridge also provided, and the Board reviewed, a comparison of the Fund’s performance for the one-year, three-year, five-year, ten-year, and since inception periods, as applicable, and for the quarter ended December 31, 2023, to that of such relevant comparison fund(s) for the same periods. The Board noted that the Fund seeks to track its specified underlying index and that, during the year, the Board received periodic reports on the Fund’s short- and longer-term performance in comparison with its underlying index. Such periodic comparative performance information, including additional detailed information as requested by the Board, was also considered. The Board noted that the Fund generally performed in line with its underlying index over the relevant periods.
Based on this review, the other relevant factors and information considered at the meeting, and their general knowledge of ETF pricing, the Board concluded that the investment advisory fee rate and expense level and the historical performance of the Fund supported the Board’s approval of the continuance of the Advisory Agreement for the coming year.
Nature, Extent and Quality of Services Provided: Based on management’s representations, including information about ongoing enhancements and initiatives with respect to the iShares product line and BFA’s business, including with respect to capital markets support and analysis, technology, portfolio management, product design and quality, compliance and risk management, global public policy and other services, the Board expected that there would be no diminution in the scope of services required of or provided by BFA under the Advisory Agreement for the coming year as compared with the scope of services provided by BFA during prior years. In reviewing the scope of these services, the Board considered BFA’s investment philosophy and experience, noting that BFA and its affiliates have committed significant resources over
392024 iShares Annual Financial Statements and Additional Information
Board Review and Approval of Investment Advisory Contract (continued)
time, including during the past year, to support the iShares funds and their shareholders and have made significant investments into the iShares business. The Board also considered BFA’s compliance program and its compliance record with respect to the Fund, including related programs implemented pursuant to regulatory requirements. In that regard, the Board noted that BFA reports to the Board about portfolio management and compliance matters on a periodic basis in connection with regularly scheduled meetings of the Board, and on other occasions as necessary and appropriate, and has provided information and made relevant officers and other employees of BFA (and its affiliates) available as needed to provide further assistance with these matters. The Board also reviewed the background and experience of the persons responsible for the day-to-day management of the Fund, as well as the resources available to them in managing the Fund. In addition to the above considerations, the Board reviewed and considered detailed presentations regarding BFA’s investment performance, investment and risk management processes and strategies provided at the May 6, 2024 meeting and throughout the year, and matters related to BFA’s portfolio compliance program and other compliance programs and services, as well as BlackRock’s continued investments in its ETF business.
Based on review of this information, and the performance information discussed above, the Board concluded that the nature, extent and quality of services provided to the Fund under the Advisory Agreement supported the Board’s approval of the continuance of the Advisory Agreement for the coming year.
Costs of Services Provided to the Fund and Profits Realized by BFA and its Affiliates: The Board reviewed information about the estimated profitability to BlackRock in managing the Fund, based on the fees payable to BFA and its affiliates (including fees under the Advisory Agreement), and other sources of revenue and expense to BFA and its affiliates from the Fund’s operations for the last calendar year. The Board reviewed BlackRock’s methodology for calculating estimated profitability of the iShares funds, noting that the 15(c) Committee and the Board had focused on the methodology and profitability presentation. The Board recognized that profitability may be affected by numerous factors, including, among other things, fee waivers by BFA, the types of funds managed, expense allocations and business mix. The Board thus recognized that calculating and comparing profitability at individual fund levels is challenging. The Board discussed with management the sources of direct and ancillary revenue, including the revenues to BTC, a BlackRock affiliate, from securities lending by the Fund. The Board also discussed BFA’s estimated profit margin as reflected in the Fund’s profitability analysis and reviewed information regarding potential economies of scale (as discussed below).
Based on this review, the Board concluded that the information considered with respect to the profits realized by BFA and its affiliates under the Advisory Agreement and from other relationships between the Fund and BFA and/or its affiliates, if any, and related costs of the services provided as well as the other factors considered at the meeting, supported the Board’s approval of the continuance of the Advisory Agreement for the coming year.
Economies of Scale: The Board reviewed information and considered the extent to which economies of scale might be realized as the assets of the Fund increase, noting that the issue of potential economies of scale had been focused on by the 15(c) Committee and the Board during their meetings and addressed by management. The 15(c) Committee and the Board received information regarding BlackRock’s historical estimated profitability (as discussed above), including BFA’s and its affiliates’ estimated costs in providing services. The estimated cost information distinguished, among other things, between fixed and variable costs, and showed how the level and nature of fixed and variable costs may impact the existence or size of scale benefits, with the Board recognizing that potential economies of scale are difficult to measure. The 15(c) Committee and the Board reviewed information provided by BFA regarding the sharing of scale benefits with the iShares funds through various means, including, as applicable, through breakpoints, waivers, or other fee reductions, as well as through additional investment in the iShares business, including enhancements to or the provision of additional infrastructure and services to the iShares funds and their shareholders and, with respect to New Funds, set management fees at levels that anticipate scale over time. The Board noted that the Advisory Agreement for the Fund did not provide for breakpoints in the Fund’s investment advisory fee rate as the assets of the Fund increase. However, the Board noted that it would continue to assess the appropriateness of adding breakpoints in the future.
The Board concluded that this review of potential economies of scale and the sharing of related benefits, as well as the other factors considered at the meeting, supported the Board’s approval of the continuance of the Advisory Agreement for the coming year.
Fees and Services Provided for Other Comparable Funds/Accounts Managed by BFA and its Affiliates: The Board received and considered information regarding the investment advisory/management fee rates for other funds/accounts in the U.S. for which BFA (or its affiliates) provides investment advisory/management services, including open-end funds registered under the 1940 Act (including sub-advised funds), collective trust funds and institutional separate accounts (collectively, the “Other Accounts”).
The Board received detailed information regarding how the Other Accounts generally differ from the Fund, including in terms of the types of services and generally more extensive character and scope of services provided to the Fund, as well as other significant differences. In that regard, the Board considered that the pricing of services to institutional clients is typically based on a number of factors beyond the nature and extent of the specific services to be provided and often depends on the overall relationship between the client and its affiliates and the adviser and its affiliates. In addition, the Board considered the relative complexity and inherent risks and challenges of managing and providing other services to the Fund, as a publicly traded investment vehicle, as compared to the Other Accounts, particularly those that are institutional clients, in light of differing regulatory requirements and client-imposed mandates. The Board acknowledged BFA’s representation that the iShares funds are fundamentally different investment vehicles from the Other Accounts in its consideration of relevant qualitative and quantitative comparative information provided. The Board noted that BFA and its affiliates do not manage Other Accounts with substantially the same investment objective and strategy as the Fund and that track the same index as the Fund. The Board also acknowledged management’s assertion that, for certain iShares funds, and for client segmentation purposes, BlackRock has launched an iShares fund that may provide a similar investment exposure at a lower investment advisory fee rate.
The Board considered the “all-inclusive” nature of the Fund’s advisory fee structure, and the Fund’s expenses borne by BFA under this arrangement and noted that the investment advisory fee rate under the Advisory Agreement for the Fund was generally higher than the investment advisory/management fee rates for certain of the Other Accounts (particularly institutional clients) and concluded that the differences appeared to be consistent with the factors discussed.
Other Benefits to BFA and/or its Affiliates: The Board reviewed other benefits or ancillary revenue received by BFA and/or its affiliates in connection with the services provided to the Fund by BFA, both direct and indirect, including, but not limited to, payment of revenue to BTC, the Fund’s securities lending agent, for loaning portfolio
Board Review and Approval of Investment Advisory Contract40
Board Review and Approval of Investment Advisory Contract (continued)
securities, as applicable (which was included in the profit margins reviewed by the Board pursuant to BFA’s estimated profitability methodology), payment of advisory fees or other fees to BFA (or its affiliates) in connection with any investments by the Fund in other funds (including cash sweep vehicles) for which BFA (or its affiliates) provides investment advisory services or other services, and BlackRock’s profile in the investment community. The Board further considered other direct benefits that might accrue to BFA, including actual and potential reductions in the Fund’s expenses that are borne by BFA under the “all-inclusive” management fee arrangement, due in part to the size and scope of BFA’s investment operations servicing the Fund (and other funds in the iShares complex) as well as in response to a changing market environment. The Board also reviewed and considered information provided by BFA concerning authorized participant primary market order processing services that are provided by BlackRock Investments, LLC (“BRIL”), an affiliate of BFA, and paid for by authorized participants under the ETF Servicing Platform. The Board also noted the revenue received by BFA and/or its affiliates pursuant to an agreement that permits a service provider to use certain portions of BlackRock’s technology platform to service accounts managed by BFA and/or its affiliates, including the iShares funds. The Board noted that BFA generally does not use soft dollars or consider the value of research or other services that may be provided to BFA (including its affiliates) in selecting brokers for portfolio transactions for the Fund. The Board concluded that any such ancillary benefits would not be disadvantageous to the Fund and thus would not alter the Board’s conclusion with respect to the appropriateness of approving the continuance of the Advisory Agreement for the coming year.
Conclusion: Based on a review of the factors described above, as well as such other factors as deemed appropriate by the Board, the Board, including all of the Independent Board Members, determined that the Fund’s investment advisory fee rate under the Advisory Agreement does not constitute a fee that is so disproportionately large as to bear no reasonable relationship to the services rendered and that could not have been the product of arm’s-length bargaining, and concluded to approve the continuance of the Advisory Agreement for the coming year.
iShares GSCI Commodity Dynamic Roll Strategy ETF, iShares Transition-Enabling Metals ETF (each the “Fund”)
Under Section 15(c) of the Investment Company Act of 1940 (the “1940 Act”), the Trust's Board of Trustees (the “Board”), including a majority of Board Members who are not “interested persons” of the Trust (as that term is defined in the 1940 Act) (the “Independent Board Members”), is required annually to consider the approval of the Investment Advisory Agreement between the Trust and BFA (the “Advisory Agreement”), and the Sub-Advisory Agreement between BFA and BlackRock International Limited, (together the “Advisory Agreements”), on behalf of the Fund. The Board’s consideration entails a year-long process whereby the Board and its committees (composed solely of Independent Board Members) assess BlackRock’s services to the Fund, including investment management; fund accounting; administrative and shareholder services; oversight of the Fund’s service providers; risk management and oversight; and legal and compliance services; including the ability to meet applicable legal and regulatory requirements. The Independent Board Members requested, and BFA provided, such information as the Independent Board Members, with advice from independent counsel, deemed reasonably necessary to evaluate the Advisory Agreements. At meetings held on May 6, 2024 and May 17, 2024, a committee composed of all of the Independent Board Members (the “15(c) Committee”), with independent counsel, met with management and reviewed and discussed information provided in response to initial requests of the 15(c) Committee and/or its independent counsel. Prior to and in preparation for the meeting, the Board received and reviewed materials specifically relating to matters relevant to the renewal of the Advisory Agreement. Following discussion, the 15(c) Committee subsequently requested certain additional information, which management agreed to provide. At a meeting held on June 4-5, 2024, the Board, including the Independent Board Members, reviewed the additional information provided by management in response to these requests.
After extensive discussions and deliberations, the Board, including all of the Independent Board Members, approved the continuance of the Advisory Agreements for the Fund, based on a review of qualitative and quantitative information provided by BFA and their cumulative experience as Board Members. The Board noted its satisfaction with the extent and quality of information provided and its frequent interactions with management, as well as the detailed responses and other information provided by BFA. The Independent Board Members were advised by their independent counsel throughout the process, including about the legal standards applicable to their review. In approving the continuance of the Advisory Agreements for the Fund, the Board, including the Independent Board Members, considered various factors, including: (i) the expenses and performance of the Fund; (ii) the nature, extent and quality of the services provided by BFA and BlackRock International Limited; (iii) the costs of services provided to the Fund and profits realized by BFA and its affiliates; (iv) potential economies of scale and the sharing of related benefits; (v) the fees and services provided for other comparable funds/accounts managed by BFA and its affiliates; and (vi) other benefits to BFA and/or its affiliates. The Board Members did not identify any particular information or any single factor as determinative, and each Board Member may have attributed different weights to the various matters and factors considered. The material factors, considerations and conclusions that formed the basis for the Board, including the Independent Board Members, to approve the continuance of the Advisory Agreements are discussed below.
Expenses and Performance of the Fund: The Board reviewed statistical information prepared by Broadridge Financial Solutions, Inc. (“Broadridge”), an independent provider of investment company data, regarding the expense ratio components, including gross and net total expenses, fees and expenses of other fund(s) in which the Fund invests (if applicable), and waivers/reimbursements (if applicable) of the Fund in comparison with the same information for other ETFs, objectively selected by Broadridge as comprising the Fund’s applicable expense peer group pursuant to Broadridge’s proprietary ETF methodology (the “Peer Group”). The Board was provided with a detailed description of the proprietary ETF methodology used by Broadridge to determine the Fund’s Peer Group. The Board noted that, due to the limitations in providing comparable funds in the Peer Group, the statistical information provided in Broadridge’s report may or may not provide meaningful direct comparisons to the Fund in all instances. The Board also noted that the investment advisory fee rate and overall expenses (net of any waivers and reimbursements) for the Fund were lower than the median of the investment advisory fee rates and overall expenses (net of any waivers and reimbursements) of the funds in its Peer Group, excluding iShares funds. The Board further noted that BFA pays BlackRock International Limited for sub-advisory services, and that there are no additional fees imposed on the Fund in respect of the services provided under the Sub-Advisory Agreement(s).
In addition, to the extent that any of the comparison funds included in the Peer Group, excluding iShares funds, track the same index as the Fund, Broadridge also provided, and the Board reviewed, a comparison of the Fund’s performance for the one-year, three-year, five-year, ten-year, and since inception periods, as applicable, and for the quarter ended December 31, 2023, to that of such relevant comparison fund(s) for the same periods. The Board noted that the Fund seeks to track its specified underlying index and that, during the year, the Board received periodic reports on the Fund’s short- and longer-term performance in comparison with its underlying index. Such periodic
412024 iShares Annual Financial Statements and Additional Information
Board Review and Approval of Investment Advisory Contract (continued)
comparative performance information, including additional detailed information as requested by the Board, was also considered. The Board noted that the Fund generally performed in line with its underlying index over the relevant periods.
Based on this review, the other relevant factors and information considered at the meeting, and their general knowledge of ETF pricing, the Board concluded that the investment advisory fee rate and expense level and the historical performance of the Fund supported the Board’s approval of the continuance of the Advisory Agreements for the coming year.
Nature, Extent and Quality of Services Provided: Based on management’s representations, including information about ongoing enhancements and initiatives with respect to the iShares product line and BFA’s business, including with respect to capital markets support and analysis, technology, portfolio management, product design and quality, compliance and risk management, global public policy and other services, the Board expected that there would be no diminution in the scope of services required of or provided by BFA and BlackRock International Limited under the Advisory Agreements for the coming year as compared with the scope of services provided by BFA during prior years. In reviewing the scope of these services, the Board considered BFA’s investment philosophy and experience, noting that BFA and its affiliates have committed significant resources over time, including during the past year, to support the iShares funds and their shareholders and have made significant investments into the iShares business. The Board also considered BFA’s compliance program and its compliance record with respect to the Fund, including related programs implemented pursuant to regulatory requirements. In that regard, the Board noted that BFA reports to the Board about portfolio management and compliance matters on a periodic basis in connection with regularly scheduled meetings of the Board, and on other occasions as necessary and appropriate, and has provided information and made relevant officers and other employees of BFA (and its affiliates) available as needed to provide further assistance with these matters. The Board also reviewed the background and experience of the persons responsible for the day-to-day management of the Fund, including those of the Sub-Advisor(s), as well as the resources available to them in managing the Fund. In addition to the above considerations, the Board reviewed and considered detailed presentations regarding investment performance, investment and risk management processes and strategies for BFA and BlackRock International Limited, which were provided at the May 6, 2024 meeting and throughout the year and matters related to BFA’s portfolio compliance program and other compliance programs and services, as well as BlackRock’s continued investments in its ETF business.
Based on review of this information, and the performance information discussed above, the Board concluded that the nature, extent and quality of services provided to the Fund under the Advisory Agreements supported the Board’s approval of the continuance of the Advisory Agreements for the coming year.
Costs of Services Provided to the Fund and Profits Realized by BFA and its Affiliates: The Board reviewed information about the estimated profitability to BlackRock in managing the Fund, based on the fees payable to BFA and its affiliates (including fees under the Advisory Agreement), and other sources of revenue and expense to BFA and its affiliates from the Fund’s operations for the last calendar year. The Board reviewed BlackRock’s methodology for calculating estimated profitability of the iShares funds, noting that the 15(c) Committee and the Board had focused on the methodology and profitability presentation. The Board recognized that profitability may be affected by numerous factors, including, among other things, fee waivers by BFA, the types of funds managed, expense allocations and business mix. The Board thus recognized that calculating and comparing profitability at individual fund levels is challenging. The Board discussed with management the sources of direct and ancillary revenue, including the revenues to BTC, a BlackRock affiliate, from securities lending by the Fund. The Board also discussed BFA’s estimated profit margin as reflected in the Fund’s profitability analysis and reviewed information regarding potential economies of scale (as discussed below).
Based on this review, the Board concluded that the information considered with respect to the profits realized by BFA and its affiliates under the Advisory Agreements and from other relationships between the Fund and BFA and/or its affiliates, if any, and related costs of the services provided as well as the other factors considered at the meeting, supported the Board’s approval of the continuance of the Advisory Agreements for the coming year.
Economies of Scale: The Board reviewed information and considered the extent to which economies of scale might be realized as the assets of the Fund increase, noting that the issue of potential economies of scale had been focused on by the 15(c) Committee and the Board during their meetings and addressed by management. The 15(c) Committee and the Board received information regarding BlackRock’s historical estimated profitability (as discussed above), including BFA’s and its affiliates’ estimated costs in providing services. The estimated cost information distinguished, among other things, between fixed and variable costs, and showed how the level and nature of fixed and variable costs may impact the existence or size of scale benefits, with the Board recognizing that potential economies of scale are difficult to measure. The 15(c) Committee and the Board reviewed information provided by BFA regarding the sharing of scale benefits with the iShares funds through various means, including, as applicable, through breakpoints, waivers or other fee reductions, as well as through additional investment in the iShares business, including enhancements to or the provision of additional infrastructure and services to the iShares funds and their shareholders and, with respect to New Funds, set management fees at levels that anticipate scale over time. The Board noted that the Advisory Agreement for the Fund did not provide for breakpoints in the Fund’s investment advisory fee rate as the assets of the Fund increase. However, the Board noted that it would continue to assess the appropriateness of adding breakpoints in the future.
The Board concluded that this review of potential economies of scale and the sharing of related benefits, as well as the other factors considered at the meeting, supported the Board’s approval of the continuance of the Advisory Agreements for the coming year.
Fees and Services Provided for Other Comparable Funds/Accounts Managed by BFA and its Affiliates: The Board received and considered information regarding the investment advisory/management fee rates for other funds/accounts in the U.S. for which BFA (or its affiliates) provides investment advisory/management services, including open-end funds registered under the 1940 Act (including sub-advised funds), collective trust funds and institutional separate accounts (collectively, the “Other Accounts”).
The Board received detailed information regarding how the Other Accounts generally differ from the Fund, including in terms of the types of services and generally more extensive character and scope of services provided to the Fund, as well as other significant differences. In that regard, the Board considered that the pricing of services to institutional clients is typically based on a number of factors beyond the nature and extent of the specific services to be provided and often depends on the overall relationship between the client and its affiliates and the adviser and its affiliates. In addition, the Board considered the relative complexity and inherent risks and challenges
Board Review and Approval of Investment Advisory Contract42
Board Review and Approval of Investment Advisory Contract (continued)
of managing and providing other services to the Fund, as a publicly traded investment vehicle, as compared to the Other Accounts, particularly those that are institutional clients, in light of differing regulatory requirements and client-imposed mandates. The Board acknowledged BFA’s representation that the iShares funds are fundamentally different investment vehicles from the Other Accounts in its consideration of relevant qualitative and quantitative comparative information provided. The Board noted that BFA and its affiliates do not manage Other Accounts with substantially the same investment objective and strategy as the Fund and that track the same index as the Fund. The Board also acknowledged management’s assertion that, for certain iShares funds, and for client segmentation purposes, BlackRock has launched an iShares fund that may provide a similar investment exposure at a lower investment advisory fee rate.
The Board considered the “all-inclusive” nature of the Fund’s advisory fee structure, and the Fund’s expenses borne by BFA under this arrangement and noted that the investment advisory fee rate under the Advisory Agreement for the Fund was generally higher than the investment advisory/management fee rates for certain of the Other Accounts (particularly institutional clients) and concluded that the differences appeared to be consistent with the factors discussed.
Other Benefits to BFA and/or its Affiliates: The Board reviewed other benefits or ancillary revenue received by BFA and/or its affiliates in connection with the services provided to the Fund by BFA, both direct and indirect, including, but not limited to, payment of revenue to BTC, the Fund’s securities lending agent, for loaning portfolio securities, as applicable (which was included in the profit margins reviewed by the Board pursuant to BFA’s estimated profitability methodology), payment of advisory fees or other fees to BFA (or its affiliates) in connection with any investments by the Fund in other funds (including cash sweep vehicles) for which BFA (or its affiliates) provides investment advisory services or other services, and BlackRock’s profile in the investment community. The Board further considered other direct benefits that might accrue to BFA, including the actual and potential reductions in the Fund’s expenses that are borne by BFA under the “all-inclusive” management fee arrangement, due in part to the size and scope of BFA’s investment operations servicing the Fund (and other funds in the iShares complex) as well as in response to a changing market environment. The Board also reviewed and considered information provided by BFA concerning authorized participant primary market order processing services that are provided by BlackRock Investments, LLC (“BRIL”), an affiliate of BFA, and paid for by authorized participants under the ETF Servicing Platform. The Board also noted the revenue received by BFA and/or its affiliates pursuant to an agreement that permits a service provider to use certain portions of BlackRock’s technology platform to service accounts managed by BFA and/or its affiliates, including the iShares funds. The Board noted that BFA generally does not use soft dollars or consider the value of research or other services that may be provided to BFA (including its affiliates) in selecting brokers for portfolio transactions for the Fund. The Board concluded that any such ancillary benefits would not be disadvantageous to the Fund and thus would not alter the Board’s conclusion with respect to the appropriateness of approving the continuance of the Advisory Agreements for the coming year.
Conclusion: Based on a review of the factors described above, as well as such other factors as deemed appropriate by the Board, the Board, including all of the Independent Board Members, determined that the Fund’s investment advisory fee rate under the Advisory Agreement does not constitute a fee that is so disproportionately large as to bear no reasonable relationship to the services rendered and that could not have been the product of arm’s-length bargaining, and concluded to approve the continuance of the Advisory Agreements for the coming year.
432024 iShares Annual Financial Statements and Additional Information
Glossary of Terms Used in this Report
|
| Secured Overnight Financing Rate |
Glossary of Terms Used in this Report44
THIS PAGE INTENTIONALLY LEFT BLANK.
THIS PAGE INTENTIONALLY LEFT BLANK.
THIS PAGE INTENTIONALLY LEFT BLANK.
Want to know more?
iShares.com | 1-800-474-2737
This report is intended for the Funds’ shareholders. It may not be distributed to prospective investors unless it is preceded or accompanied by the current prospectus.
Investing involves risk, including possible loss of principal.
The iShares Funds are distributed by BlackRock Investments, LLC (together with its affiliates, “BlackRock”).
The iShares Funds are not sponsored, endorsed, issued, sold or promoted by Bloomberg Index Services Limited, S&P Dow Jones Indices LLC, or ICE Data Indices, LLC, nor do these companies make any representation regarding the advisability of investing in the iShares Funds. BlackRock is not affiliated with the companies listed above.
©2024 BlackRock, Inc. All rights reserved. iSHARES and BLACKROCK are registered trademarks of BlackRock, Inc. or its subsidiaries. All other marks are the property of their respective owners.
| Item 8 – | Changes in and Disagreements with Accountants for Open-End Management Investment Companies – See Item 7 |
| Item 9 – | Proxy Disclosures for Open-End Management Investment Companies – See Item 7 |
| Item 10 – | Remuneration Paid to Directors, Officers, and Others of Open-End Management Investment Companies – See Item 7 |
| Item 11 – | Statement Regarding Basis for Approval of Investment Advisory Contract – See Item 7 |
| Item 12 – | Disclosure of Proxy Voting Policies and Procedures for Closed-End Management Investment Companies – Not Applicable |
| Item 13 – | Portfolio Managers of Closed-End Management Investment Companies – Not Applicable |
| Item 14 – | Purchases of Equity Securities by Closed-End Management Investment Company and Affiliated Purchasers – Not Applicable |
| Item 15 – | Submission of Matters to a Vote of Security Holders – There have been no material changes to these procedures. |
| Item 16 – | Controls and Procedures |
(a) The registrant’s principal executive and principal financial officers, or persons performing similar functions, have concluded that the registrant’s disclosure controls and procedures (as defined in Rule 30a-3(c) under the Investment Company Act of 1940, as amended (the “1940 Act”)) are effective as of a date within 90 days of the filing date of this report based on the evaluation of these controls and procedures required by Rule 30a-3(b) under the 1940 Act and Rule 13a-15(b) or 15d-15(b) under the Securities Exchange Act of 1934, as amended.
(b) There were no changes in the registrant’s internal control over financial reporting (as defined in Rule 30a-3(d) under the 1940 Act) that occurred during the period covered by this report that have materially affected, or are reasonably likely to materially affect, the registrant’s internal control over financial reporting.
| Item 17 – | Disclosure of Securities Lending Activities for Closed-End Management Investment Companies – Not Applicable |
| Item 18 – | Recovery of Erroneously Awarded Compensation – Not Applicable |
| Item 19 – | Exhibits attached hereto |
(a)(1) Code of Ethics – See Item 2
(a)(2) Any policy required by the listing standards adopted pursuant to Rule 10D-1 under the Exchange Act (17 CFR 240.10D-1) by the registered national securities exchange or registered national securities association upon which the registrant’s securities are listed – Not Applicable
(a)(3) Section 302 Certifications are attached
(a)(4) Any written solicitation to purchase securities under Rule 23c-1 – Not Applicable
(a)(5) Change in registrant’s independent public accountant – Not Applicable
(b) Section 906 Certifications are attached
Pursuant to the requirements of the Securities Exchange Act of 1934 and the Investment Company Act of 1940, the registrant has duly caused this report to be signed on its behalf by the undersigned, thereunto duly authorized.
iShares U.S. ETF Trust
| | | | |
| | By: | | /s/ Jessica Tan |
| | | | Jessica Tan |
| | | | President (principal executive officer) of |
| | | | iShares U.S. ETF Trust |
Date: December 20, 2024
Pursuant to the requirements of the Securities Exchange Act of 1934 and the Investment Company Act of 1940, this report has been signed below by the following persons on behalf of the registrant and in the capacities and on the dates indicated.
| | | | |
| | By: | | /s/ Jessica Tan |
| | | | Jessica Tan |
| | | | President (principal executive officer) of |
| | | | iShares U.S. ETF Trust |
Date: December 20, 2024
| | | | |
| | By: | | /s/ Trent Walker |
| | | | Trent Walker |
| | | | Treasurer and Chief Financial Officer (principal financial officer) of |
| | | | iShares U.S. ETF Trust |
Date: December 20, 2024