UNITED STATES
SECURITIES AND EXCHANGE COMMISSION
Washington, D.C. 20549
FORM N-CSR
CERTIFIED SHAREHOLDER REPORT OF REGISTERED MANAGEMENT INVESTMENT COMPANIES
Investment Company Act file number: 811-22649
Name of Fund: iShares U.S. ETF Trust
Fund Address: c/o BlackRock Fund Advisors, 400 Howard Street, San Francisco, CA 94105
Name and address of agent for service: The Corporation Trust Company, 1209 Orange Street, Wilmington, DE 19801
Registrant’s telephone number, including area code: (415) 670-2000
Date of fiscal year end: 10/31/2024
Date of reporting period: 10/31/2024
Item 1 – Reports to Stockholders
(a) The Reports to Shareholders are attached herewith.
iShares Short Maturity Municipal Bond Active ETF
Annual Shareholder Report — October 31, 2024
This annual shareholder report contains important information about iShares Short Maturity Municipal Bond Active ETF (the “Fund”) (Formerly known as BlackRock Short Maturity Municipal Bond ETF) for the period of November 1, 2023 to October 31, 2024. You can find additional information about the Fund at blackrock.com/fundreports. You can also request this information by contacting us at 1-800-iShares (1-800-474-2737).
This report describes changes to the Fund that occurred during the reporting period.
What were the Fund costs for the last year?
(based on a hypothetical $10,000 investment)
| Fund name | Costs of a $10,000 investment | Costs paid as a percentage of a $10,000 investment |
|---|
| iShares Short Maturity Municipal Bond Active ETF | $26 | 0.25% |
How did the Fund perform last year?
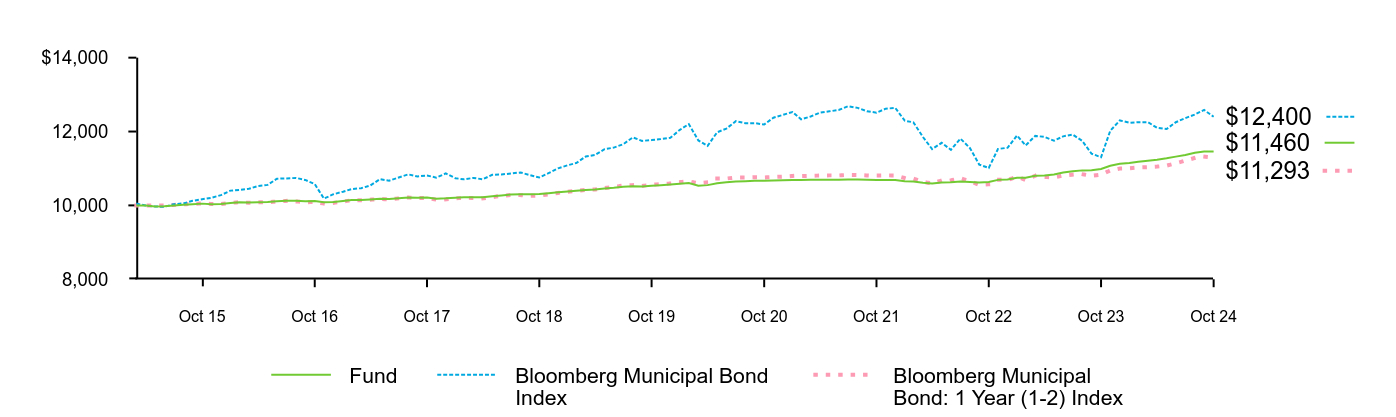
For the reporting period ended October 31, 2024, the Fund returned 4.30%.
For the same period, the Bloomberg Municipal Bond Index returned 9.70% and the Bloomberg Municipal Bond: 1 Year (1-2) Index returned 4.42%.
What contributed to performance?
During the reporting period, a combination of moderating inflation levels and a softening labor market contributed to the U.S. Federal Reserve’s decision to loosen monetary policy with a 50-basis point target policy rate cut in September. Amid a volatile overall rate market, the investment adviser’s selective approach to the timing of duration extension trades was a positive contributor to the Fund’s performance. Variable rate demand note (“VRDN”) securities provided price protection from adverse market pricing changes because the securities traded at par while capturing increases in yields with daily or weekly rate adjustments and contributed to performance. A selective overweight to the 2-5year part of the yield curve also contributed to performance. From a credit perspective, A and BBB rated municipal bonds were additive.
What detracted from performance?
Detracting from the Fund’s performance during the reporting period were underweights to the tax-backed states, utilities and transportation sectors, and an underweight allocation to the one-two-year part of the yield curve.
The views expressed reflect the opinions of BlackRock as of the date of this report and are subject to change based on changes in market, economic or other conditions. These views are not intended to be a forecast of future events and are no guarantee of future results.
Cumulative performance: March 3, 2015 through October 31, 2024
Initial Investment of $10,000
| Fund | Bloomberg Municipal Bond Index | Bloomberg Municipal Bond: 1 Year (1-2) Index |
|---|
| Mar 15 | $9,998 | $10,050 | $10,000 |
| Apr 15 | $9,994 | $9,998 | $10,000 |
| May 15 | $9,972 | $9,970 | $10,000 |
| Jun 15 | $9,978 | $9,961 | $10,000 |
| Jul 15 | $9,999 | $10,033 | $10,013 |
| Aug 15 | $10,017 | $10,053 | $10,030 |
| Sep 15 | $10,034 | $10,125 | $10,042 |
| Oct 15 | $10,048 | $10,166 | $10,052 |
| Nov 15 | $10,034 | $10,206 | $10,040 |
| Dec 15 | $10,036 | $10,278 | $10,038 |
| Jan 16 | $10,062 | $10,400 | $10,069 |
| Feb 16 | $10,084 | $10,417 | $10,085 |
| Mar 16 | $10,076 | $10,450 | $10,071 |
| Apr 16 | $10,087 | $10,527 | $10,082 |
| May 16 | $10,092 | $10,555 | $10,087 |
| Jun 16 | $10,111 | $10,723 | $10,104 |
| Jul 16 | $10,125 | $10,730 | $10,122 |
| Aug 16 | $10,126 | $10,744 | $10,107 |
| Sep 16 | $10,111 | $10,690 | $10,085 |
| Oct 16 | $10,118 | $10,578 | $10,092 |
| Nov 16 | $10,086 | $10,184 | $10,049 |
| Dec 16 | $10,095 | $10,303 | $10,068 |
| Jan 17 | $10,119 | $10,371 | $10,105 |
| Feb 17 | $10,145 | $10,443 | $10,138 |
| Mar 17 | $10,149 | $10,466 | $10,138 |
| Apr 17 | $10,161 | $10,542 | $10,154 |
| May 17 | $10,177 | $10,709 | $10,173 |
| Jun 17 | $10,173 | $10,671 | $10,165 |
| Jul 17 | $10,192 | $10,757 | $10,189 |
| Aug 17 | $10,215 | $10,839 | $10,212 |
| Sep 17 | $10,210 | $10,784 | $10,200 |
| Oct 17 | $10,213 | $10,810 | $10,201 |
| Nov 17 | $10,183 | $10,752 | $10,155 |
| Dec 17 | $10,193 | $10,865 | $10,161 |
| Jan 18 | $10,209 | $10,737 | $10,190 |
| Feb 18 | $10,220 | $10,705 | $10,207 |
| Mar 18 | $10,223 | $10,744 | $10,200 |
| Apr 18 | $10,223 | $10,706 | $10,190 |
| May 18 | $10,247 | $10,828 | $10,224 |
| Jun 18 | $10,269 | $10,838 | $10,260 |
| Jul 18 | $10,293 | $10,864 | $10,281 |
| Aug 18 | $10,300 | $10,892 | $10,278 |
| Sep 18 | $10,299 | $10,821 | $10,258 |
| Oct 18 | $10,310 | $10,755 | $10,267 |
| Nov 18 | $10,331 | $10,874 | $10,299 |
| Dec 18 | $10,354 | $11,004 | $10,338 |
| Jan 19 | $10,377 | $11,087 | $10,370 |
| Feb 19 | $10,396 | $11,146 | $10,394 |
| Mar 19 | $10,416 | $11,323 | $10,422 |
| Apr 19 | $10,428 | $11,365 | $10,430 |
| May 19 | $10,456 | $11,522 | $10,469 |
| Jun 19 | $10,476 | $11,564 | $10,501 |
| Jul 19 | $10,504 | $11,658 | $10,536 |
| Aug 19 | $10,519 | $11,842 | $10,550 |
| Sep 19 | $10,513 | $11,747 | $10,528 |
| Oct 19 | $10,533 | $11,768 | $10,559 |
| Nov 19 | $10,546 | $11,797 | $10,577 |
| Dec 19 | $10,564 | $11,833 | $10,592 |
| Jan 20 | $10,585 | $12,046 | $10,630 |
| Feb 20 | $10,605 | $12,201 | $10,651 |
| Mar 20 | $10,531 | $11,759 | $10,598 |
| Apr 20 | $10,549 | $11,611 | $10,623 |
| May 20 | $10,598 | $11,980 | $10,728 |
| Jun 20 | $10,625 | $12,079 | $10,728 |
| Jul 20 | $10,649 | $12,282 | $10,755 |
| Aug 20 | $10,657 | $12,225 | $10,756 |
| Sep 20 | $10,670 | $12,227 | $10,764 |
| Oct 20 | $10,668 | $12,191 | $10,756 |
| Nov 20 | $10,677 | $12,375 | $10,769 |
| Dec 20 | $10,681 | $12,450 | $10,779 |
| Jan 21 | $10,690 | $12,529 | $10,797 |
| Feb 21 | $10,687 | $12,330 | $10,793 |
| Mar 21 | $10,693 | $12,406 | $10,801 |
| Apr 21 | $10,697 | $12,510 | $10,808 |
| May 21 | $10,696 | $12,548 | $10,813 |
| Jun 21 | $10,695 | $12,582 | $10,812 |
| Jul 21 | $10,703 | $12,686 | $10,826 |
| Aug 21 | $10,701 | $12,640 | $10,823 |
| Sep 21 | $10,694 | $12,549 | $10,812 |
| Oct 21 | $10,689 | $12,512 | $10,810 |
| Nov 21 | $10,689 | $12,618 | $10,813 |
| Dec 21 | $10,688 | $12,639 | $10,812 |
| Jan 22 | $10,651 | $12,293 | $10,740 |
| Feb 22 | $10,646 | $12,249 | $10,726 |
| Mar 22 | $10,616 | $11,852 | $10,637 |
| Apr 22 | $10,594 | $11,524 | $10,594 |
| May 22 | $10,621 | $11,695 | $10,675 |
| Jun 22 | $10,627 | $11,504 | $10,678 |
| Jul 22 | $10,650 | $11,808 | $10,736 |
| Aug 22 | $10,636 | $11,549 | $10,650 |
| Sep 22 | $10,622 | $11,105 | $10,558 |
| Oct 22 | $10,634 | $11,013 | $10,572 |
| Nov 22 | $10,691 | $11,528 | $10,694 |
| Dec 22 | $10,704 | $11,561 | $10,688 |
| Jan 23 | $10,751 | $11,893 | $10,778 |
| Feb 23 | $10,749 | $11,624 | $10,687 |
| Mar 23 | $10,802 | $11,882 | $10,802 |
| Apr 23 | $10,812 | $11,855 | $10,770 |
| May 23 | $10,834 | $11,752 | $10,758 |
| Jun 23 | $10,889 | $11,870 | $10,810 |
| Jul 23 | $10,923 | $11,917 | $10,833 |
| Aug 23 | $10,948 | $11,746 | $10,844 |
| Sep 23 | $10,953 | $11,401 | $10,800 |
| Oct 23 | $10,988 | $11,304 | $10,831 |
| Nov 23 | $11,075 | $12,022 | $10,947 |
| Dec 23 | $11,128 | $12,301 | $10,998 |
| Jan 24 | $11,151 | $12,239 | $11,005 |
| Feb 24 | $11,181 | $12,254 | $11,026 |
| Mar 24 | $11,209 | $12,254 | $11,035 |
| Apr 24 | $11,235 | $12,102 | $11,050 |
| May 24 | $11,275 | $12,067 | $11,076 |
| Jun 24 | $11,321 | $12,252 | $11,139 |
| Jul 24 | $11,365 | $12,363 | $11,212 |
| Aug 24 | $11,423 | $12,461 | $11,286 |
| Sep 24 | $11,461 | $12,584 | $11,321 |
| Oct 24 | $11,460 | $12,400 | $11,293 |
See “Average annual total returns” for additional information on fund performance.
Average annual total returns
| Average Annual Total Returns | 1 Year | 5 Years | Since Fund Inception |
|---|
Fund NAV........................................................................................................................................................................................................................................................................................................................................................................................................................................................................................................................................................................................................................................................................................................................................................................................................................................................................................................................................................................................................................................ | 4.30% | 1.70% | 1.42% |
Bloomberg Municipal Bond Index........................................................................................................................................................................................................................................................................................................................................................................................................................................................................................................................................................................................................................................................................................................................................................................................................................................................................................................................................................................................................................................ | 9.70 | 1.05 | 2.25 |
Bloomberg Municipal Bond: 1 Year (1-2) Index........................................................................................................................................................................................................................................................................................................................................................................................................................................................................................................................................................................................................................................................................................................................................................................................................................................................................................................................................................................................................................................ | 4.42 | 1.38 | 1.28 |
Net Assets........................................................................................................................................................................................................................................................................................................................................................................................................................................................................................................................................................................................................................................................................................................................................................................................................................................................................................................................................................................................................................................ | $682,282,883 |
Number of Portfolio Holdings........................................................................................................................................................................................................................................................................................................................................................................................................................................................................................................................................................................................................................................................................................................................................................................................................................................................................................................................................................................................................................................ | 220 |
Net Investment Advisory Fees........................................................................................................................................................................................................................................................................................................................................................................................................................................................................................................................................................................................................................................................................................................................................................................................................................................................................................................................................................................................................................................ | $1,630,132 |
Portfolio Turnover Rate........................................................................................................................................................................................................................................................................................................................................................................................................................................................................................................................................................................................................................................................................................................................................................................................................................................................................................................................................................................................................................................ | 91% |
The Fund has added the Bloomberg Municipal Bond Index in response to new regulatory requirements.
The inception date of the Fund was March 3, 2015.
Past performance is not an indication of future results. Performance results do not reflect the deduction of taxes that a shareholder would pay on fund distributions or on the redemption or sale of fund shares. Visit iShares.com for more recent performance information.
What did the Fund invest in?
Credit quality allocation
S&P Credit RatingFootnote Reference* | Percent of Total InvestmentsFootnote Reference(a) |
|---|
AAA........................................................................................................................................................................................................................................................................................................................................................................................................................................................................................................................................................................................................................................................................................................................................................................................................................................................................................................................................................................................................................................ | 3.3% |
AA+........................................................................................................................................................................................................................................................................................................................................................................................................................................................................................................................................................................................................................................................................................................................................................................................................................................................................................................................................................................................................................................ | 26.5 |
AA........................................................................................................................................................................................................................................................................................................................................................................................................................................................................................................................................................................................................................................................................................................................................................................................................................................................................................................................................................................................................................................ | 7.2 |
AA-........................................................................................................................................................................................................................................................................................................................................................................................................................................................................................................................................................................................................................................................................................................................................................................................................................................................................................................................................................................................................................................ | 5.1 |
A+........................................................................................................................................................................................................................................................................................................................................................................................................................................................................................................................................................................................................................................................................................................................................................................................................................................................................................................................................................................................................................................ | 4.3 |
A........................................................................................................................................................................................................................................................................................................................................................................................................................................................................................................................................................................................................................................................................................................................................................................................................................................................................................................................................................................................................................................ | 3.6 |
A-........................................................................................................................................................................................................................................................................................................................................................................................................................................................................................................................................................................................................................................................................................................................................................................................................................................................................................................................................................................................................................................ | 13.6 |
BBB+........................................................................................................................................................................................................................................................................................................................................................................................................................................................................................................................................................................................................................................................................................................................................................................................................................................................................................................................................................................................................................................ | 4.4 |
BBB........................................................................................................................................................................................................................................................................................................................................................................................................................................................................................................................................................................................................................................................................................................................................................................................................................................................................................................................................................................................................................................ | 0.5 |
Not Rated........................................................................................................................................................................................................................................................................................................................................................................................................................................................................................................................................................................................................................................................................................................................................................................................................................................................................................................................................................................................................................................ | 31.5 |
| State | Percent of TotaI InvestmentsFootnote Reference(a) |
|---|
Texas ........................................................................................................................................................................................................................................................................................................................................................................................................................................................................................................................................................................................................................................................................................................................................................................................................................................................................................................................................................................................................................................ | 11.5% |
Iowa ........................................................................................................................................................................................................................................................................................................................................................................................................................................................................................................................................................................................................................................................................................................................................................................................................................................................................................................................................................................................................................................ | 8.9 |
New York ........................................................................................................................................................................................................................................................................................................................................................................................................................................................................................................................................................................................................................................................................................................................................................................................................................................................................................................................................................................................................................................ | 7.7 |
Tennessee ........................................................................................................................................................................................................................................................................................................................................................................................................................................................................................................................................................................................................................................................................................................................................................................................................................................................................................................................................................................................................................................ | 7.2 |
New Jersey ........................................................................................................................................................................................................................................................................................................................................................................................................................................................................................................................................................................................................................................................................................................................................................................................................................................................................................................................................................................................................................................ | 5.8 |
Alabama ........................................................................................................................................................................................................................................................................................................................................................................................................................................................................................................................................................................................................................................................................................................................................................................................................................................................................................................................................................................................................................................ | 5.7 |
Louisiana ........................................................................................................................................................................................................................................................................................................................................................................................................................................................................................................................................................................................................................................................................................................................................................................................................................................................................................................................................................................................................................................ | 5.3 |
Illinois ........................................................................................................................................................................................................................................................................................................................................................................................................................................................................................................................................................................................................................................................................................................................................................................................................................................................................................................................................................................................................................................ | 3.9 |
Wisconsin ........................................................................................................................................................................................................................................................................................................................................................................................................................................................................................................................................................................................................................................................................................................................................................................................................................................................................................................................................................................................................................................ | 3.9 |
Kentucky ........................................................................................................................................................................................................................................................................................................................................................................................................................................................................................................................................................................................................................................................................................................................................................................................................................................................................................................................................................................................................................................ | 3.7 |
|
| Footnote | Description |
Footnote* | Credit quality ratings shown reflect the ratings assigned by S&P Global Ratings, a widely used independent, nationally recognized statistical rating organization. S&P credit ratings are opinions of the credit quality of individual obligations or of an issuer’s general creditworthiness. Investment grade ratings are credit ratings of BBB or higher. Below investment grade ratings are credit ratings of BB or lower. Unrated investments do not necessarily indicate low credit quality. Credit quality ratings are subject to change. |
Footnote(a) | Excludes money market funds. |
This is a summary of certain changes to the Fund since October 31, 2023. For more complete information, you may review the Fund's next prospectus, which we expect to be available approximately 120 days after October 31, 2024 at blackrock.com/fundreports or upon request by contacting us at 1-800-iShares (1-800-474-2737).
Effective October 10, 2024, the name of the Fund was changed from BlackRock Short Maturity Municipal Bond ETF to iShares Short Maturity Municipal Bond Active ETF.
If you wish to view additional information about the Fund, including but not limited to financial statements, the Fund’s prospectus, and proxy voting policies and procedures, please visit blackrock.com/fundreports. For proxy voting records, visit blackrock.com/proxyrecords.
Householding is an option available to certain fund investors. Householding is a method of delivery, based on the preference of the individual investor, in which a single copy of certain shareholder documents can be delivered to investors who share the same address, even if their accounts are registered under different names. Please contact your broker-dealer if you are interested in enrolling in householding and receiving a single copy of prospectuses and other shareholder documents, or if you are currently enrolled in householding and wish to change your householding status.
The Fund is not sponsored, endorsed, issued, sold or promoted by Bloomberg Index Services Limited and its affiliates, nor does this company make any representation regarding the advisability of investing in the Fund. BlackRock is not affiliated with the company listed above.
©2024 BlackRock, Inc or its affiliates. All rights reserved. iSHARES and BLACKROCK are registered trademarks of BlackRock, Inc. or its affiliates. All other trademarks are those of their respective owners.
iShares Short Maturity Municipal Bond Active ETF
Annual Shareholder Report — October 31, 2024
(b) Not Applicable
Item 2 – Code of Ethics – The registrant has adopted a code of ethics, as of the end of the period covered by this report, applicable to the registrant’s principal executive officer, principal financial officer, principal accounting officer or controller, or persons performing similar functions. During the period covered by this report, the registrant has not amended the code of ethics and there have been no waivers granted under the code of ethics. The registrant undertakes to provide a copy of the code of ethics to any person upon request, without charge, by calling 1-800-474-2737.
Item 3 – Audit Committee Financial Expert – The registrant’s board of trustees (the “board of trustees”), has determined that (i) the registrant has the following audit committee financial experts serving on its audit committee and (ii) each audit committee financial expert is independent:
Richard L. Fagnani
Madhav V. Rajan
Under applicable securities laws, a person determined to be an audit committee financial expert will not be deemed an “expert” for any purpose, including without limitation for the purposes of Section 11 of the Securities Act of 1933, as a result of being designated or identified as an audit committee financial expert. The designation or identification of a person as an audit committee financial expert does not impose on such person any duties, obligations, or liabilities greater than the duties, obligations, and liabilities imposed on such person as a member of the audit committee and board of trustees in the absence of such designation or identification. The designation or identification of a person as an audit committee financial expert does not affect the duties, obligations, or liability of any other member of the audit committee or board of trustees.
Item 4 – Principal Accountant Fees and Services
The principal accountant fees disclosed in items 4(a), 4(b), 4(c), 4(d) and 4(g) are for the one series of the registrant for which the fiscal year-end is October 31, 2024 (the “Fund”), and whose annual financial statements are reported in Item 1.
(a) Audit Fees – The aggregate fees billed for each of the last two fiscal years for professional services rendered by the principal accountant for the audit of the Fund’s annual financial statements or services that are normally provided by the accountant in connection with statutory and regulatory filings or engagements for those fiscal years were $13,850 for the fiscal year ended October 31, 2023 and $13,850 for the fiscal year ended October 31, 2024.
(b) Audit-Related Fees – There were no fees billed for the fiscal years ended October 31, 2023 and October 31, 2024 for assurance and related services by the principal accountant that were reasonably related to the performance of the audit of the Fund’s financial statements and are not reported under (a) of this Item.
(c) Tax Fees – The aggregate fees billed in each of the last two fiscal years for professional services rendered by the principal accountant for tax compliance, tax advice and tax planning for the Fund were $9,700 for the fiscal year ended October 31, 2023 and $9,700 for the fiscal year ended October 31, 2024. These services related to the review of the Fund’s tax returns and excise tax calculations.
(d) All Other Fees – There were no other fees billed in each of the fiscal years ended October 31, 2023 and October 31, 2024 for products and services provided by the principal accountant, other than the services reported in (a) through (c) of this Item.
(e)(1) Audit Committee Pre-Approval Policies and Procedures:
The registrant’s audit committee charter, as amended, provides that the audit committee is responsible for the approval, prior to appointment, of the engagement of the principal accountant to annually audit and provide their opinion on the registrant’s financial statements. The audit committee must also approve, prior to appointment, the engagement of the principal accountant to provide non-audit services to the registrant or to any entity controlling, controlled by or under common control with the registrant’s investment adviser (“Adviser Affiliate”) that provides ongoing services to the registrant, if the engagement relates directly to the operations and financial reporting of the registrant.
(e)(2) None of the services described in each of Items 4(b) through (d) were approved by the audit committee pursuant to paragraph (c)(7)(i)(C) of Rule 2-01 of Regulation S-X.
(f) Not Applicable
(g) The aggregate non-audit fees billed by the registrant’s principal accountant for services rendered to the Fund, and rendered to the registrant’s investment adviser, and any Adviser Affiliate that provides ongoing services to the registrant for the last two fiscal years were $9,700 for the fiscal year ended October 31, 2023 and $9,700 for the fiscal year ended October 31, 2024.
(h) The registrant’s audit committee has considered whether the provision of non-audit services rendered to the registrant’s investment adviser and any Adviser Affiliate that provides ongoing services to the registrant that were not pre-approved pursuant to paragraph (c)(7)(ii) of Rule 2-01 of Regulation S-X, if any, is compatible with maintaining the principal accountant’s independence, and has determined that the provision of these services, if any, does not compromise the principal accountant’s independence.
(i) – Not Applicable
(j) – Not Applicable
Item 5 – Audit Committee of Listed Registrant
(a) The following individuals are members of the registrant’s separately designated standing Committee established in accordance with Section 3(a)(58)(A) of the Securities Exchange Act of 1934 (15 U.S.C. 78c(a)(58)(A)):
Richard L. Fagnani
Laura F. Fergerson
Cecilia H. Herbert
Madhav V. Rajan
(b) Not Applicable
Item 6 – Investments
(a) The registrant’s Schedule of Investments is included as part of the Financial Statements and Financial Highlights for Open-End Management Investment Companies filed under Item 7 of this Form.
(b) Not Applicable due to no such divestments during the semi-annual period covered since the previous Form N-CSR filing.
Item 7 – Financial Statements and Financial Highlights for Open-End Management Investment Companies
(a) The registrant’s Financial Statements are attached herewith.
(b) The registrant’s Financial Highlights are attached herewith.
2024
Annual
Financial
Statements
and
Additional
Information
iShares
U.S.
ETF
Trust
iShares
Short
Maturity
Municipal
Bond
Active
ETF
|
MEAR
|
Cboe
BZX
Exchange
Schedules
of
Investments
.................................................................................................
3
Statement
of
Assets
and
Liabilities
............................................................................................
8
Statement
of
Operations
..................................................................................................
9
Statements
of
Changes
in
Net
Assets
..........................................................................................
10
Financial
Highlights
.....................................................................................................
11
Notes
to
Financial
Statements
...............................................................................................
12
Report
of
Independent
Registered
Public
Accounting
Firm
..............................................................................
17
Important
Tax
Information
.................................................................................................
18
Additional
Information
....................................................................................................
19
Board
Review
and
Approval
of
Investment
Advisory
Contract
............................................................................
20
Glossary
of
Terms
Used
in
this
Report
..........................................................................................
22
Schedule
of
Investments
October
31,
2024
iShares
®
Short
Maturity
Municipal
Bond
Active
ETF
(Formerly,
BlackRock
Short
Maturity
Bond
ETF)
(Percentages
shown
are
based
on
Net
Assets)
Security
Par
(000)
Par
(000)
Value
Municipal
Bonds
Alabama
—
5.8%
Black
Belt
Energy
Gas
District
Series
2021B
,
RB
,
4.00
%
,
12/01/24
.....
USD
1,250
$
1,249,611
Series
2022C-1
,
RB
,
5.25
%
,
12/01/24
....
630
630,546
Series
2022F
,
RB
,
5.25
%
,
12/01/24
.....
2,745
2,746,944
Series
2022C-1
,
RB
,
5.25
%
,
06/01/25
....
615
619,598
Series
2023C
,
RB
,
5.50
%
,
06/01/26
.....
1,000
1,025,308
Series
2024C
,
RB
,
5.00
%
,
07/01/27
.....
935
964,794
Series
2024C
,
RB
,
5.00
%
,
07/01/28
.....
1,480
1,542,185
Series
2022E
,
RB
,
VRDN
5.00
%
,
06/01/28
(a)
5,000
5,201,561
Energy
Southeast
A
Cooperative
District
Series
2023B-1
,
RB
,
5.50
%
,
11/01/26
....
800
830,398
Series
2024B
,
RB
,
5.00
%
,
12/01/26
.....
100
102,950
Series
2023B-1
,
RB
,
5.50
%
,
05/01/27
....
1,570
1,643,549
Series
2024B
,
RB
,
5.00
%
,
06/01/27
.....
115
119,143
Series
2024B
,
RB
,
5.00
%
,
12/01/27
.....
100
104,208
Series
2024B
,
RB
,
5.00
%
,
06/01/28
.....
240
251,148
Series
2024B
,
RB
,
5.00
%
,
12/01/28
.....
250
262,585
Southeast
Alabama
Gas
Supply
District
(The)
Series
2024B
,
RB
,
5.00
%
,
11/01/24
.....
815
815,000
Series
2024A
,
RB
,
5.00
%
,
04/01/25
.....
3,500
3,511,975
Series
2024B
,
RB
,
5.00
%
,
05/01/25
.....
965
969,710
Series
2024B
,
RB
,
5.00
%
,
05/01/26
.....
800
814,823
Southeast
Energy
Authority
A
Cooperative
District
Series
2023B
,
RB
,
(
Royal
Bank
of
Canada
LIQ
),
5.00
%
,
06/01/25
............
170
170,801
Series
2023A
,
RB
,
5.00
%
,
07/01/25
.....
650
654,239
Series
2023B
,
RB
,
(
Royal
Bank
of
Canada
LIQ
),
5.00
%
,
06/01/26
............
185
188,384
Series
2024C
,
RB
,
5.00
%
,
11/01/26
.....
1,000
1,026,345
Series
2023B
,
RB
,
(
Royal
Bank
of
Canada
LIQ
),
5.00
%
,
06/01/27
............
1,000
1,034,302
Series
2024C
,
RB
,
5.00
%
,
11/01/27
.....
1,000
1,040,160
Series
2024C
,
RB
,
5.00
%
,
11/01/28
.....
1,000
1,050,197
Series
2022B-1
,
RB
,
VRDN
5.00
%
,
08/01/28
(a)
...............
10,500
10,951,381
39,521,845
Arizona
—
0.8%
Arizona
Health
Facilities
Authority
Series
2015B
,
RB
,
VRDN
3.49
%
,
11/07/24
,
(SIFMA
Municipal
Swap
Index)
(a)
(b)
....
3,600
3,592,296
City
of
Phoenix
Civic
Improvement
Corp.,
Series
2017A,
RB,
AMT,
5.00%, 07/01/29
......
1,700
1,757,432
5,349,728
California
—
1.7%
City
of
Los
Angeles,
Series
2024,
RB,
5.00%, 06/26/25
.................
10,000
10,124,306
State
of
California,
Series
2021,
GO,
5.00%, 12/01/24
.................
1,190
1,191,667
11,315,973
Colorado
—
0.7%
Colorado
School
of
Mines,
Series
2022D,
RB,
VRDN,
4.11%, 11/07/24,
(SIFMA
Municipal
Swap
Index)
(a)
(b)
.................
4,860
4,896,374
Connecticut
—
1.7%
Connecticut
State
Health
&
Educational
Facilities
Authority
Series
2024A
,
RB
,
5.00
%
,
07/01/25
.....
550
555,272
Series
2024A
,
RB
,
5.00
%
,
07/01/26
.....
2,050
2,115,128
Security
Par
(000)
Par
(000)
Value
Connecticut
(continued)
State
of
Connecticut
Series
2013A
,
GO
,
VRDN
4.23
%
,
11/07/24
,
(SIFMA
Municipal
Swap
Index)
(a)
(b)
....
USD
4,600
$
4,601,388
Series
2023B
,
GO
,
5.00
%
,
08/01/25
.....
4,575
4,636,653
11,908,441
District
of
Columbia
—
0.0%
Metropolitan
Washington
Airports
Authority,
Tender
Option
Bond
Trust
Receipts/
Certificates,
Series
2019-XG0267,
RB,
VRDN
(Bank
of
America
NA
LOC),
3.29%, 11/07/24
(a)
(
c)
(d)
.........................
220
220,000
Florida
—
3.1%
County
of
Miami-Dade,
Series
2024A,
RB,
AMT,
5.00%, 10/01/28
.................
1,760
1,857,500
County
of
Miami-Dade
Water
&
Sewer
System,
Series
2015,
RB,
5.00%, 10/01/26
......
1,515
1,538,773
Hillsborough
County
Aviation
Authority
Series
2024B
,
RB,
AMT
,
5.00
%
,
10/01/27
.
330
344,026
Series
2024B
,
RB,
AMT
,
5.00
%
,
10/01/28
.
3,200
3,374,581
Monroe
County
School
District,
RB,
4.00%, 05/29/25
.................
7,000
7,035,812
School
Board
of
Miami-Dade
County
(The),
RB,
4.50%, 01/07/25
.................
5,000
5,009,270
Tender
Option
Bond
Trust
Receipts,
Series
2024-XG0577,
RB,
VRDN
(Barclays
Bank
plc
LOC),
3.29%, 11/07/24
(AGM)
(a)
(c)
(d)
.....
2,215
2,215,000
21,374,962
Georgia
—
2.8%
Development
Authority
of
Burke
County
(The),
Series
2013-1,
RB,
VRDN,
3.38%, 03/12/27
(a)
3,750
3,762,605
Main
Street
Natural
Gas,
Inc.
Series
2023D
,
RB
,
5.00
%
,
12/01/24
.....
300
300,213
Series
2024A
,
RB
,
5.00
%
,
03/01/25
.....
555
556,536
Series
2023B
,
RB
,
5.00
%
,
03/01/25
.....
290
290,803
Series
2023A
,
RB
,
5.00
%
,
06/01/25
.....
750
754,776
Series
2023B
,
RB
,
5.00
%
,
09/01/25
.....
260
262,373
Series
2024B
,
RB
,
5.00
%
,
09/01/25
.....
245
247,237
Series
2024A
,
RB
,
5.00
%
,
09/01/25
.....
500
504,564
Series
2023D
,
RB
,
5.00
%
,
12/01/25
.....
550
557,545
Series
2024B
,
RB
,
5.00
%
,
03/01/26
.....
350
355,900
Series
2024A
,
RB
,
5.00
%
,
03/01/26
.....
680
691,462
Series
2019A
,
RB
,
5.00
%
,
05/15/26
.....
5,695
5,805,738
Series
2024B
,
RB
,
5.00
%
,
09/01/26
.....
200
205,170
Series
2023D
,
RB
,
5.00
%
,
12/01/26
.....
1,000
1,029,277
Series
2024B
,
RB
,
5.00
%
,
03/01/27
.....
490
506,976
Series
2022B
,
RB
,
5.00
%
,
06/01/27
.....
1,750
1,812,318
Series
2024C
,
RB
,
5.00
%
,
12/01/27
.....
750
781,080
Series
2024C
,
RB
,
5.00
%
,
12/01/28
.....
925
970,487
19,395,060
Hawaii
—
0.5%
State
of
Hawaii,
Series
EY,
GO,
5.00%, 10/01/27
3,405
3,460,062
Illinois
—
4.0%
Chicago
Midway
International
Airport
Series
2024A
,
RB,
AMT
,
5.00
%
,
01/01/25
.
450
450,692
Series
2024A
,
RB,
AMT
,
5.00
%
,
01/01/26
.
1,350
1,371,059
Series
2024A
,
RB,
AMT
,
5.00
%
,
01/01/27
.
1,000
1,029,802
Chicago
O'Hare
International
Airport
Series
2022C
,
RB,
AMT
,
5.00
%
,
01/01/26
.
1,400
1,422,005
Series
2024C
,
RB,
AMT
,
5.00
%
,
01/01/26
.
6,000
6,093,835
Series
2024C
,
RB,
AMT
,
5.00
%
,
01/01/29
.
10,000
10,540,774
2024
iShares
Annual
Financial
Statements
and
Additional
Information
Schedule
of
Investments
(continued)
October
31,
2024
iShares
®
Short
Maturity
Municipal
Bond
Active
ETF
(Formerly,
BlackRock
Short
Maturity
Bond
ETF)
(Percentages
shown
are
based
on
Net
Assets)
Security
Par
(000)
Par
(000)
Value
Illinois
(continued)
Illinois
Finance
Authority
Series
2024
,
RB
,
5.00
%
,
08/01/25
......
USD
325
$
327,777
Series
2024
,
RB
,
5.00
%
,
08/01/26
......
400
409,217
Series
2024
,
RB
,
5.00
%
,
08/01/27
......
425
440,561
State
of
Illinois
Series
2024B
,
GO
,
5.00
%
,
05/01/25
.....
1,000
1,006,632
Series
2024B
,
GO
,
5.00
%
,
05/01/26
.....
2,300
2,355,632
Series
2024B
,
GO
,
5.00
%
,
05/01/28
.....
1,600
1,693,592
27,141,578
Indiana
—
2.7%
Indiana
Finance
Authority
Series
2024
,
RB
,
5.00
%
,
03/01/27
......
275
286,124
Series
2024
,
RB
,
5.00
%
,
03/01/28
......
900
950,569
Series
2024
,
RB
,
5.00
%
,
03/01/29
......
765
817,512
Series
2010A
,
RB,
AMT
,
VRDN
3.95
%
,
12/02/24
(a)
...............
9,500
9,468,864
Series
2021B
,
RB
,
VRDN
3.54
%
,
11/07/24
,
(SIFMA
Municipal
Swap
Index)
(a)
(b)
....
880
874,856
Tender
Option
Bond
Trust
Receipts,
Series
2016-XL0019,
RB,
VRDN
(Barclays
Bank
plc
LIQ),
3.39%, 11/07/24
(a)
(c)
(d)
...........
6,000
6,000,000
18,397,925
Iowa
—
9.0%
(a)
Iowa
Finance
Authority
Series
2021
,
RB
,
VRDN
(
Korea
Development
Bank
LOC
),
3.40
%
,
11/07/24
(d)
.......
29,600
29,600,000
Series
2021
,
RB,
AMT
,
VRDN
(
Citibank
NA
LOC
),
3.88
%
,
04/01/26
............
7,000
6,988,383
PEFA,
Inc.,
Series
2019,
RB,
VRDN,
5.00%, 09/01/26
.................
24,140
24,593,052
61,181,435
Kansas
—
1.9%
City
of
Burlington
(a)
Series
2007A
,
RB
,
VRDN
3.45
%
,
11/06/24
4,000
4,000,000
Series
2007B
,
RB
,
VRDN
3.45
%
,
11/06/24
9,000
9,000,000
13,000,000
Kentucky
—
3.7%
County
of
Meade
(a)
Series
2021B-1
,
RB
,
VRDN
4.50
%
,
11/01/24
6,105
6,105,000
Series
2021A-1
,
RB,
AMT
,
VRDN
4.60
%
,
11/01/24
................
5,000
5,000,000
Kentucky
Economic
Development
Financing
Authority,
Tender
Option
Bond
Trust
Receipts/
Certificates,
Series
2018-XG0161,
RB,
VRDN
(Bank
of
America
NA
LOC),
3.27%, 11/08/24
(AGM)
(a)
(c)
(d)
....................
500
500,000
Kentucky
Public
Energy
Authority
Series
2024A
,
RB
,
5.00
%
,
07/01/25
.....
315
316,723
Series
2024B
,
RB
,
5.00
%
,
08/01/25
.....
375
377,794
Series
2024A
,
RB
,
5.00
%
,
07/01/26
.....
375
381,664
Series
2024A
,
RB
,
5.00
%
,
07/01/27
.....
425
437,687
Series
2024B
,
RB
,
5.00
%
,
08/01/27
.....
865
894,041
Series
2023A-1
,
RB
,
5.00
%
,
08/01/28
....
490
510,330
Series
2024B
,
RB
,
5.00
%
,
08/01/28
.....
920
958,170
Series
2018C-1
,
RB
,
VRDN
4.00
%
,
06/01/25
(a)
...............
4,000
3,998,413
Kentucky
State
Property
&
Building
Commission
Series
A
,
RB
,
5.00
%
,
11/01/24
.........
300
300,000
Series
2024B
,
RB
,
5.00
%
,
11/01/25
.....
5,250
5,353,813
Security
Par
(000)
Par
(000)
Value
Kentucky
(continued)
Series
A
,
RB
,
5.00
%
,
11/01/25
.........
USD
375
$
382,192
25,515,827
Louisiana
—
5.4%
(a)
Lake
Charles
Harbor
&
Terminal
District,
Series
2021,
RB,
AMT,
VRDN,
1.00%, 12/01/24
..
4,325
4,313,418
Louisiana
Local
Government
Environmental
Facilities
&
Community
Development
Auth,
Series
2002,
RB,
VRDN,
3.70%, 11/07/24
.
6,000
6,000,000
Parish
of
St
James,
Series
2010B-1,
RB,
VRDN,
3.47%, 11/06/24
.................
26,500
26,500,000
36,813,418
Maine
—
1.5%
Maine
State
Housing
Authority,
Series
2024E,
RB,
VRDN,
3.25%, 11/15/25
(a)
.........
10,000
9,981,325
Maryland
—
0.7%
County
of
Montgomery
TECP
,
3.30
%
,
11/05/24
.............
1,000
999,984
TECP
,
3.28
%
,
11/06/24
.............
4,000
3,999,989
4,999,973
Massachusetts
—
1.3%
Massachusetts
Bay
Transportation
Authority,
TECP,
3.20%, 11/05/24
.............
5,200
5,199,885
Massachusetts
Bay
Transportation
Authority
Sales
Tax
Revenue,
TECP,
3.20%, 11/01/24
3,000
2,999,983
Town
of
Sharon,
GO,
4.50%, 02/27/25
.....
1,000
1,004,514
9,204,382
Michigan
—
0.7%
Michigan
Strategic
Fund,
Series
2001,
RB,
0.58%, 08/01/27
.................
2,700
2,740,065
Okemos
Public
Schools,
Series
2024II,
GO,
5.00%, 05/01/26
(Q-SBLF)
..........
1,200
1,237,023
Walled
Lake
Consolidated
School
District
Series
2024
,
GO
,
5.00
%
,
05/01/25
(
Q-SBLF
)
405
408,596
Series
2024
,
GO
,
5.00
%
,
05/01/26
(
Q-SBLF
)
475
489,655
4,875,339
Minnesota
—
0.4%
Minneapolis-St
Paul
Metropolitan
Airports
Commission,
Series
2024B,
RB,
AMT,
5.00%, 01/01/28
.................
2,850
2,989,421
Missouri
—
0.3%
Missouri
State
Health
&
Education
Facilities
Authority,
Tender
Option
Bond
Trust
Receipts/Certificates,
Series
2018C-16,
RB,
VRDN
(Royal
Bank
of
Canada
LOC),
3.29%, 11/07/24
(a)
(c)
(d)
..............
2,000
2,000,000
Nebraska
—
2.5%
County
of
Douglas,
Series
2021B,
RB,
VRDN,
3.77%, 11/07/24,
(SIFMA
Municipal
Swap
Index)
(a)
(b)
.....................
3,400
3,372,166
Lincoln
Nebraska
Electric,
TECP,
3.28%, 11/13/24
.................
13,350
13,349,712
16,721,878
Nevada
—
0.1%
Reno-Tahoe
Airport
Authority,
Series
2024A,
RB,
AMT,
5.00%, 07/01/29
.............
580
613,311
Schedule
of
Investments
(continued)
October
31,
2024
iShares
®
Short
Maturity
Municipal
Bond
Active
ETF
(Formerly,
BlackRock
Short
Maturity
Bond
ETF)
(Percentages
shown
are
based
on
Net
Assets)
Security
Par
(000)
Par
(000)
Value
New
Hampshire
—
3.1%
(a)
New
Hampshire
Business
Finance
Authority,
Series
2018A,
RB,
AMT,
VRDN,
4.50%, 07/01/25
.................
USD
15,000
$
15,016,326
New
Hampshire
Housing
Finance
Authority,
Series
2024D,
RB,
VRDN,
3.58%, 07/01/25
(GNMA/FNMA/FHLMC)
............
5,950
5,944,873
20,961,199
New
Jersey
—
5.8%
Borough
of
Haledon,
GO,
4.00%, 09/25/25
..
3,338
3,350,972
Borough
of
Manasquan,
GO,
4.00%, 10/01/25
2,711
2,725,050
Borough
of
Pompton
Lakes,
GO,
4.50%, 06/06/25
.................
700
705,675
Essex
County
Improvement
Authority,
Series
2024,
RB,
5.00%, 06/18/25
(GTD)
......
8,295
8,380,330
Jersey
City
Municipal
Utilities
Authority,
Series
2024B,
RB,
5.00%, 05/01/25
(GTD)
.....
3,550
3,570,837
New
Jersey
Economic
Development
Authority,
Series
B,
RB,
5.00%, 11/01/24
........
1,010
1,010,000
New
Jersey
Higher
Education
Student
Assistance
Authority
Series
2022A
,
RB
,
5.00
%
,
12/01/24
.....
500
500,332
Series
2024B
,
RB,
AMT
,
5.00
%
,
12/01/27
.
1,600
1,656,515
New
Jersey
Transportation
Trust
Fund
Authority,
Series
2018A,
RB,
5.00%, 12/15/24
.....
1,000
1,001,699
Township
of
Bordentown,
GO,
4.50%, 04/01/25
1,000
1,005,388
Township
of
Egg
Harbor,
GO,
4.00%, 08/07/25
900
904,309
Township
of
Little
Falls,
GO,
5.00%, 12/13/24
.
1,530
1,531,775
Township
of
Maplewood,
GO,
4.00%, 10/07/25
5,100
5,126,081
Township
of
Montville,
GO,
5.00%, 11/06/24
.
1,300
1,300,262
Township
of
Mount
Holly,
GO,
4.00%, 09/24/25
3,417
3,430,404
Township
of
Pemberton,
GO,
4.50%, 05/27/25
3,477
3,506,305
39,705,934
New
Mexico
—
0.1%
New
Mexico
Mortgage
Finance
Authority,
Series
2023,
RB,
VRDN,
5.00%, 09/01/25
(a)
.....
970
975,889
New
York
—
7.8%
Babylon
Union
Free
School
District,
GO,
4.00%, 06/24/25
(SAW)
............
3,100
3,113,510
Battery
Park
City
Authority,
Series
2019D-1,
RB,
VRDN
(TD
Bank
NA
SBPA),
3.90%, 11/01/24
(a)
4,600
4,600,000
Hempstead
Town
Local
Development
Corp.,
Series
2021A,
RB,
5.00%, 07/01/25
.....
520
525,569
Lafayette
Central
School
District,
Series
2024,
GO,
4.50%, 06/20/25
(SAW)
.........
1,000
1,006,750
Monroe
County
Industrial
Development
Corp.,
Series
2023B-1,
RB,
VRDN,
5.00%, 07/01/27
(a)
................
4,000
4,159,654
New
York
City
Transitional
Finance
Authority
Series
2025D
,
RB
,
5.00
%
,
05/01/26
.....
4,450
4,584,747
Series
2025D
,
RB
,
5.00
%
,
05/01/29
.....
2,500
2,726,440
Onondaga
County
Resource
Recovery
Agency,
Series
2015A,
RB,
AMT,
5.00%, 05/01/27
(AGM)
.......................
2,830
2,850,815
Palmyra
Macedon
Central
School
District,
GO,
4.50%, 06/17/25
(SAW)
............
4,320
4,344,272
Schodack
Central
School
District,
GO,
4.00%, 07/15/25
(SAW)
............
1,200
1,205,990
Town
of
Ossining,
GO,
4.50%, 08/01/25
....
3,536
3,576,583
Triborough
Bridge
&
Tunnel
Authority,
Series
2022E-2A,
RB,
VRDN,
4.28%, 11/01/24
,(1-
day
SOFR
+
1.05%)
(a)
(b)
............
11,000
11,001,835
Union
Endicott
Central
School
District,
GO,
4.50%, 06/27/25
(SAW)
............
4,800
4,834,563
Security
Par
(000)
Par
(000)
Value
New
York
(continued)
Webutuck
Central
School
District,
GO,
4.50%, 06/20/25
(SAW)
............
USD
4,700
$
4,726,981
53,257,709
North
Carolina
—
0.9%
Durham
Capital
Financing
Corp.,
Series
2016,
RB,
5.00%, 12/01/28
..............
1,000
1,037,874
North
Carolina
Capital
Facilities
Finance
Agency,
Series
2010-A,
RB,
VRDN,
3.50%, 12/02/24
(a)
4,500
4,498,413
North
Carolina
Housing
Finance
Agency,
Series
56,
RB,
VRDN,
3.38%, 07/15/25
(GNMA/
FNMA/FHLMC)
(a)
................
655
653,157
6,189,444
Ohio
—
1.4%
Ohio
Air
Quality
Development
Authority,
Series
2005C,
RB,
AMT,
3.70%, 04/01/28
......
3,250
3,225,882
Ohio
Higher
Educational
Facility
Commission,
Series
2021B,
RB,
VRDN,
3.47%, 11/07/24,
(SIFMA
Municipal
Swap
Index)
(a)
(b)
......
6,500
6,405,950
9,631,832
Oklahoma
—
0.9%
Garfield
County
Industrial
Authority,
Series
2024A,
RB,
VRDN,
3.40%, 11/06/24
(a)
....
5,400
5,400,000
Oklahoma
Industries
Authority,
Series
2024,
RB,
5.00%, 04/01/26
.................
400
410,973
University
of
Oklahoma
(The),
Series
2024A,
RB,
5.00%, 07/01/25
(BAM)
..........
300
303,284
6,114,257
Pennsylvania
—
2.8%
Allegheny
County
Hospital
Development
Authority,
Series
2017D-2
,
Sub-Series
D,
RB,
VRDN,
3.82%, 11/07/24,
(SIFMA
Municipal
Swap
Index)
(a)
(b)
.................
1,000
997,859
Allegheny
County
Sanitary
Authority
Series
2024
,
RB
,
5.00
%
,
12/01/24
......
2,315
2,317,733
Series
2024
,
RB
,
5.00
%
,
12/01/25
......
1,650
1,683,630
General
Authority
of
Southcentral
Pennsylvania,
Series
2015,
RB,
5.00%, 12/01/25
......
1,530
1,559,933
Luzerne
County
Industrial
Development
Authority,
Series
2017,
RB,
5.00%, 12/15/27
(AGM)
.......................
1,000
1,017,164
Pennsylvania
Economic
Development
Financing
Authority
(a)
Series
2019A
,
RB,
AMT
,
VRDN
3.85
%
,
01/15/25
................
4,000
3,996,486
Series
2019A
,
RB,
AMT
,
VRDN
4.25
%
,
08/01/25
................
7,000
7,022,067
Series
2019B-2
,
RB,
AMT
,
VRDN
4.15
%
,
01/15/25
................
480
476,181
19,071,053
South
Carolina
—
0.4%
South
Carolina
Public
Service
Authority
Series
2024A
,
RB
,
5.00
%
,
12/01/26
.....
675
702,200
Series
2024A
,
RB
,
5.00
%
,
12/01/27
.....
485
513,699
Series
2024A
,
RB
,
5.00
%
,
12/01/28
.....
485
521,286
2024
iShares
Annual
Financial
Statements
and
Additional
Information
Schedule
of
Investments
(continued)
October
31,
2024
iShares
®
Short
Maturity
Municipal
Bond
Active
ETF
(Formerly,
BlackRock
Short
Maturity
Bond
ETF)
(Percentages
shown
are
based
on
Net
Assets)
Security
Par
(000)
Par
(000)
Value
South
Carolina
(continued)
South
Carolina
Public
Service
Authority,
Tender
Option
Bond
Trust
Receipts/Certificates,
Series
2022-XG0398,
RB,
VRDN
(Barclays
Bank
plc
LIQ),
3.36%, 11/07/24
(BAM-
TCRS)
(a)
(c)
(d)
....................
USD
1,000
$
1,000,000
2,737,185
Tennessee
—
7.3%
Metropolitan
Government
of
Nashville
&
Davidson
County
TECP
,
3.55
%
,
12/04/24
.............
10,000
10,000,910
TECP
,
3.60
%
,
12/12/24
.............
5,000
4,999,998
TECP
,
3.45
%
,
12/16/24
.............
11,000
11,001,354
TECP
,
3.60
%
,
12/16/24
.............
7,000
6,999,463
Tennergy
Corp.
Series
2022A
,
RB
,
5.25
%
,
12/01/24
.....
575
575,356
Series
2022A
,
RB
,
5.25
%
,
12/01/25
.....
575
582,313
Series
2024A
,
RB
,
5.00
%
,
06/01/28
.....
210
220,477
Series
2024A
,
RB
,
5.00
%
,
06/01/29
.....
625
661,026
Tennessee
Energy
Acquisition
Corp.
Series
2006A
,
RB
,
5.25
%
,
09/01/26
.....
3,355
3,416,203
Series
2006B
,
RB
,
5.63
%
,
09/01/26
.....
5,925
6,122,133
Series
2023A-1
,
RB
,
VRDN
5.00
%
,
05/01/28
(a)
...............
5,000
5,196,616
49,775,849
Texas
—
11.7%
Board
of
Regents
of
the
University
of
Texas
System
TECP
,
3.20
%
,
01/08/25
.............
8,000
7,999,768
TECP
,
3.15
%
,
01/14/25
.............
8,000
7,999,818
TECP
,
3.32
%
,
01/14/25
.............
6,000
6,000,000
TECP
,
3.20
%
,
02/05/25
.............
5,000
5,001,046
TECP
,
3.28
%
,
02/05/25
.............
4,000
4,000,377
TECP
,
3.10
%
,
02/13/25
.............
5,000
4,999,861
TECP
,
3.12
%
,
05/12/25
.............
6,500
6,500,000
City
of
Austin,
3.55%, 12/05/24
.........
5,000
5,001,714
City
of
Galveston
Series
2024A
,
RB,
AMT
,
5.00
%
,
08/01/26
.
625
637,794
Series
2024A
,
RB,
AMT
,
5.00
%
,
08/01/27
.
650
670,904
Series
2024A
,
RB,
AMT
,
5.00
%
,
08/01/28
.
725
754,616
Comal
Independent
School
District,
Series
2024,
GO,
5.00%, 02/15/26
(PSF)
(e)
.........
2,500
2,561,776
El
Paso
Electric
Co.
TECP
,
3.55
%
,
12/09/24
.............
3,200
3,200,112
TECP
,
3.50
%
,
12/16/24
.............
3,200
3,200,142
Mission
Economic
Development
Corp.,
Series
2020B,
RB,
AMT,
VRDN,
4.00%, 12/02/24
(a)
1,000
998,231
Port
of
Arthur
Navigation
District
Industrial
Development
Corp.,
Series
2011,
RB,
VRDN,
3.26%, 11/06/24
(a)
................
3,000
3,000,000
Tarrant
County
Cultural
Education
Facilities
Finance
Corp.,
Series
2024B,
RB,
5.00%, 07/01/26
.................
875
901,638
Tarrant
Regional
Water
District
Water
Supply
System,
Series
2015,
RB,
5.00%, 03/01/28
1,260
1,266,245
Texas
Municipal
Gas
Acquisition
&
Supply
Corp.
III
Series
2021
,
RB
,
5.00
%
,
12/15/25
......
4,690
4,748,655
Series
2021
,
RB
,
5.00
%
,
12/15/26
......
1,850
1,899,295
Texas
Municipal
Gas
Acquisition
&
Supply
Corp.
IV,
Series
2023A,
RB,
5.25%, 01/01/25
...
970
971,982
Texas
State
University
System,
Series
2024,
RB,
5.00%, 03/15/25
.................
2,755
2,772,051
Security
Par
(000)
Par
(000)
Value
Texas
(continued)
Tomball
Independent
School
District,
Series
2024,
GO,
5.00%, 02/15/26
(PSF)
(e)
.....
USD
4,250
$
4,351,565
79,437,590
Virginia
—
0.2%
Winchester
Economic
Development
Authority,
Series
2024A,
RB,
5.00%, 01/01/28
.....
1,090
1,156,297
Washington
—
3.1%
County
of
Spokane
(e)
Series
2024B
,
RB,
AMT
,
5.00
%
,
01/01/26
.
720
730,601
Series
2024B
,
RB,
AMT
,
5.00
%
,
01/01/27
.
1,600
1,648,524
Series
2024B
,
RB,
AMT
,
5.00
%
,
01/01/28
.
1,625
1,694,348
Series
2024B
,
RB,
AMT
,
5.00
%
,
01/01/29
.
1,760
1,851,814
Port
of
Seattle,
Series
2024B,
RB,
AMT,
5.00%, 07/01/28
.................
6,250
6,550,627
State
of
Washington,
Series
R-2024C,
GO,
5.00%, 08/01/25
.................
8,000
8,104,725
Washington
Health
Care
Facilities
Authority,
Series
2019B-2,
RB,
VRDN,
5.00%, 08/01/25
(a)
................
800
804,068
21,384,707
West
Virginia
—
0.1%
West
Virginia
Economic
Development
Authority,
Series
2015A,
RB,
VRDN,
3.38%, 06/15/28
(a)
1,000
994,478
Wisconsin
—
4.1%
State
of
Wisconsin
Series
2022A
,
GO
,
VRDN
3.66
%
,
11/07/24
,
(SIFMA
Municipal
Swap
Index)
(a)
(b)
....
17,905
17,903,530
Series
2024-2
,
GO
,
5.00
%
,
05/01/26
.....
7,000
7,209,849
Wisconsin
Health
&
Educational
Facilities
Authority,
Series
2018C-2,
RB,
VRDN,
3.42%, 11/07/24,
(SIFMA
Municipal
Swap
Index)
(a)
(b)
.....................
2,000
1,971,537
27,084,916
Total
Long-Term
Investments
—
101
.0
%
(Cost:
$
687,825,472
)
..............................
689,356,596
Shares
Shares
Short-Term
Securities
Money
Market
Funds
—
0.0%
BlackRock
Liquidity
MuniCash
Funds:
Institutional
Shares
,
3.07
%
(f)
(g)
.........
192,930
192,950
Total
Short-Term
Securities
—
0.0
%
(Cost:
$
192,950
)
.................................
192,950
Total
Investments
—
101
.0
%
(Cost:
$
688,018,422
)
..............................
689,549,546
Liabilities
in
Excess
of
Other
Assets
—
(
1.0
)
%
.............
(
7,266,663
)
Net
Assets
—
100.0%
...............................
$
682,282,883
Schedule
of
Investments
(continued)
October
31,
2024
iShares
®
Short
Maturity
Municipal
Bond
Active
ETF
(Formerly,
BlackRock
Short
Maturity
Bond
ETF)
(Percentages
shown
are
based
on
Net
Assets)
Affiliates
Investments
in
issuers
considered
to
be
affiliate(s)
of
the
Fund
during
the year
ended
October
31,
2024
for
purposes
of
Section
2(a)(3)
of
the
Investment
Company
Act
of
1940,
as
amended,
were
as
follows:
Fair
Value
Hierarchy
as
of Period
End
Various
inputs
are
used
in
determining
the
fair
value
of
financial
instruments
at
the
measurement
date.
For
a
description
of
the
input
levels
and
information
about
the
Fund’s
policy
regarding
valuation
of
financial
instruments,
refer
to
the
Notes
to
Financial
Statements.
The
following
table
summarizes
the
Fund’s
financial
instruments
categorized
in
the
fair
value
hierarchy.
The
breakdown
of
the
Fund's
financial
instruments
into
major
categories
is
disclosed
in
the
Schedule
of
Investments
above.
See
notes
to
financial
statements.
(a)
Variable
rate
security.
Rate
as
of
period
end
and
maturity
is
the
date
the
principal
owed
can
be
recovered
through
demand.
(b)
Variable
rate
security.
Interest
rate
resets
periodically.
The
rate
shown
is
the
effective
interest
rate
as
of
period
end.
Security
description
also
includes
the
reference
rate
and
spread
if
published
and
available.
(c)
These
securities
are
short-term
floating
rate
certificates
issued
by
tender
option
bond
trusts
and
are
secured
by
the
underlying
municipal
bond
securities.
(d)
Security
exempt
from
registration
pursuant
to
Rule
144A
under
the
Securities
Act
of
1933,
as
amended.
These
securities
may
be
resold
in
transactions
exempt
from
registration
to
qualified
institutional
investors.
(e)
When-issued
security.
(f)
Affiliate
of
the
Fund.
(g)
Annualized
7-day
yield
as
of
period
end.
Affiliated
Issuer
Value
at
10/31/23
Purchases
at
Cost
Proceeds
from
Sales
Net
Realized
Gain
(Loss)
Change
in
Unrealized
Appreciation
(Depreciation)
Value
at
10/31/24
Shares
Held
at
10/31/24
Income
Capital
Gain
Distributions
from
Underlying
Funds
BlackRock
Liquidity
MuniCash
Funds:
Institutional
Shares
$
91,129
$
101,821
(a)
$
—
$
—
$
—
$
192,950
192,930
$
48,906
$
—
—
—
(a)
Represents
net
amount
purchased
(sold).
Level
1
Level
2
Level
3
Total
Assets
Investments
Long-Term
Investments
Municipal
Bonds
.........................................
$
—
$
689,356,596
$
—
$
689,356,596
Short-Term
Securities
Money
Market
Funds
......................................
192,950
—
—
192,950
$
192,950
$
689,356,596
$
—
$
689,549,546
Statement
of
Assets
and
Liabilities
October
31,
2024
2024
iShares
Annual
Financial
Statements
and
Additional
Information
See
notes
to
financial
statements.
iShares
Short
Maturity
Municipal
Bond
Active
ETF
ASSETS
Investments,
at
value
—
unaffiliated
(a)
........................................................................................
$
689,356,596
Investments,
at
value
—
affiliated
(b)
..........................................................................................
192,950
Receivables:
–
Dividends
—
affiliated
.................................................................................................
1,171
Interest
—
unaffiliated
.................................................................................................
5,755,080
Total
a
ssets
.........................................................................................................
695,305,797
LIABILITIES
Bank
overdraft
........................................................................................................
7,132
Payables:
–
Investments
purchased
................................................................................................
12,870,090
Investment
advisory
fees
...............................................................................................
145,692
Total
li
abilities
........................................................................................................
13,022,914
Commitments
and
contingent
liabilities
—
NET
ASSETS
........................................................................................................
$
682,282,883
NET
ASSETS
CONSIST
OF:
Paid-in
capital
........................................................................................................
$
678,817,951
Accumulated
earnings
..................................................................................................
3,464,932
NET
ASSETS
........................................................................................................
$
682,282,883
NET
ASSET
VALUE
Shares
outstanding
....................................................................................................
13,600,000
Net
asset
value
.......................................................................................................
$
50.17
Shares
authorized
.....................................................................................................
Unlimited
Par
value
...........................................................................................................
None
(a)
Investments,
at
cost
—
unaffiliated
.................................................................................
$
687,825,472
(b)
Investments,
at
cost
—
affiliated
...................................................................................
$
192,950
Statement
of
Operations
Year
Ended
October
31,
2024
iShares
Short
Maturity
Municipal
Bond
Active
ETF
INVESTMENT
INCOME
–
Dividends
—
affiliated
.................................................................................................
$
48,906
Interest
—
unaffiliated
.................................................................................................
24,354,147
Total
investment
income
.................................................................................................
24,403,053
EXPENSES
Investment
advisory
..................................................................................................
1,630,132
Interest
expense
....................................................................................................
24,558
Total
expenses
.......................................................................................................
1,654,690
Net
investment
income
..................................................................................................
22,748,363
REALIZED
AND
UNREALIZED
GAIN
(LOSS)
$
4,397,509
Net
realized
gain
from:
Investments
—
unaffiliated
...........................................................................................
$
87,059
Net
change
in
unrealized
appreciation
(depreciation)
on:
Investments
—
unaffiliated
...........................................................................................
4,310,450
Net
realized
and
unrealized
gain
...........................................................................................
4,397,509
NET
INCREASE
IN
NET
ASSETS
RESULTING
FROM
OPERATIONS
..................................................................
$
27,145,872
See
notes
to
financial
statements.
Statements
of
Changes
in
Net
Assets
2024
iShares
Annual
Financial
Statements
and
Additional
Information
See
notes
to
financial
statements.
iShares
Short
Maturity
Municipal
Bond
Active
ETF
Year
Ended
10/31/24
Year
Ended
10/31/23
INCREASE
(DECREASE)
IN
NET
ASSETS
OPERATIONS
Net
investment
income
..............................................................................
$
22,748,363
$
15,801,319
Net
realized
gain
..................................................................................
87,059
871
Net
change
in
unrealized
appreciation
(depreciation)
..........................................................
4,310,450
1,028,194
Net
increase
in
net
assets
resulting
from
operations
.............................................................
27,145,872
16,830,384
DISTRIBUTIONS
TO
SHAREHOLDERS
(a)
Decrease
in
net
assets
resulting
from
distributions
to
shareholders
...................................................
(22,639,189)
(14,761,848)
CAPITAL
SHARE
TRANSACTIONS
$
–
$
–
Net
increase
in
net
assets
derived
from
capital
share
transactions
...................................................
72,573,365
82,174,684
NET
ASSETS
Total
increase
in
net
assets
.............................................................................
77,080,048
84,243,220
Beginning
of
year
....................................................................................
605,202,835
520,959,615
End
of
year
........................................................................................
$
682,282,883
$
605,202,835
(a)
Distributions
for
annual
periods
determined
in
accordance
with
U.S.
federal
income
tax
regulations.
Financial
Highlights
(For
a
share
outstanding
throughout
each
period)
iShares
Short
Maturity
Municipal
Bond
Active
ETF
Year
Ended
10/31/24
Year
Ended
10/31/23
Year
Ended
10/31/22
Year
Ended
10/31/21
Year
Ended
10/31/20
Net
asset
value,
beginning
of
year
.................................
$
49.81
$
49.62
$
50.11
$
50.19
$
50.13
Net
investment
income
(a)
........................................
1
.75
1
.51
0
.37
0
.17
0
.51
Net
realized
and
unrealized
gain
(loss)
(b)
..............................
0.36
0.11
(0.62
)
(0.07
)
0.13
Net
increase
(decrease)
from
investment
operations
.......................
2.11
1.62
(0.25
)
0.10
0.64
Distributions
from
net
investment
income
(c)
...........................
(1.75
)
(1.43
)
(0.24
)
(0.18
)
(0.58
)
Net
asset
value,
end
of
year
......................................
$
50.17
$
49.81
$
49.62
$
50.11
$
50.19
Total
Return
(d)
Based
on
net
asset
value
.........................................
4.30
%
3.32
%
(0.51
)%
0.19
%
1.29
%
Ratios
to
Average
Net
Assets
(e)
Total
expen
ses
................................................
0.25
%
0.25
%
0.25
%
0.25
%
0.25
%
Net
investment
income
...........................................
3.49
%
3.04
%
0.75
%
0.34
%
1.02
%
Supplemental
Data
Net
assets,
end
of
year
(000)
.......................................
$
682,283
$
605,203
$
520,960
$
293,169
$
291,091
Portfolio
turnover
rate
(f)
...........................................
91
%
195
%
98
%
52
%
108
%
(a)
Based
on
average
shares
outstanding.
(b)
The
amounts
reported
for
a
share
outstanding
may
not
accord
with
the
change
in
aggregate
gains
and
losses
in
securities
for
the
fiscal
period
due
to
the
timing
of
capital
share
transactions
in
relation
to
the
fluctuating
market
values
of
the
Fund’s
underlying
securities.
(c)
Distributions
for
annual
periods
determined
in
accordance
with
U.S.
federal
income
tax
regulations.
(d)
Where
applicable,
assumes
the
reinvestment
of
distributions.
(e)
Excludes
fees
and
expenses
incurred
indirectly
as
a
result
of
investments
in
underlying
funds.
(f)
Portfolio
turnover
rate
excludes
in-kind
transactions,
if
any.
See
notes
to
financial
statements.
Notes
to
Financial
Statements
2024
iShares
Annual
Financial
Statements
and
Additional
Information
1.
ORGANIZATION
iShares
U.S.
ETF
Trust
(the
“Trust”)
is
registered
under
the
Investment
Company
Act
of
1940,
as
amended
(the
“1940
Act”),
as
an
open-end
management
investment
company.
The
Trust
is
organized
as
a
Delaware
statutory
trust
and
is
authorized
to
have
multiple
series
or
portfolios.
These
financial
statements
relate
only
to
the
following
fund
(the
“Fund”):
2.
Significant
Accounting
Policies
The
financial
statements
are
prepared
in
conformity
with
accounting
principles
generally
accepted
in
the
United
States
of
America
(“U.S.
GAAP”),
which
may
require
management
to
make
estimates
and
assumptions
that
affect
the
reported
amounts
of
assets
and
liabilities
in
the
financial
statements,
disclosure
of
contingent
assets
and
liabilities
at
the
date
of
the
financial
statements
and
the
reported
amounts
of
increases
and
decreases
in
net
assets
from
operations
during
the
reporting
period.
Actual
results
could
differ
from
those
estimates.
The
Fund
is
considered
an
investment
company
under
U.S.
GAAP
and
follows
the
accounting
and
reporting
guidance
applicable
to
investment
companies.
Below
is
a
summary
of
significant
accounting
policies:
Investment Transactions
and
Income
Recognition:
For
financial
reporting
purposes,
investment
transactions
are
recorded
on
the
dates
the
transactions
are
executed.
Realized
gains
and
losses
on
investment
transactions
are
determined
using
the
specific
identification
method.
Dividend
income
and
capital
gain
distributions,
if
any,
are
recorded
on
the
ex-dividend
date.
Non-cash
dividends,
if
any,
are
recorded
on
the
ex-dividend
date
at
fair
value.
Interest
income,
including
amortization
and
accretion
of
premiums
and
discounts
on
debt
securities,
is
recognized
daily
on
an
accrual
basis.
Bank
Overdraft:
The
Fund
had
outstanding
cash
disbursements
exceeding
deposited
cash
amounts
at
the
custodian
during
the
reporting
period.
The
Fund
is
obligated
to
repay
the
custodian
for
any
overdraft,
including
any
related
costs
or
expenses,
where
applicable.
For
financial
reporting
purposes,
overdraft
fees,
if
any,
are
included
in
interest
expense
in
the
Statement
of
Operations.
In-kind
Redemptions:
For
financial
reporting
purposes,
in-kind
redemptions
are
treated
as
sales
of
securities
resulting
in
realized
capital
gains
or
losses
to
the
Fund.
Because
such
gains
or
losses
are
not
taxable
to
the
Fund
and
are
not
distributed
to
existing
Fund
shareholders,
the
gains
or
losses
are
reclassified
from
accumulated
net
realized
gain
(loss)
to
paid-in
capital
at
the
end
of
the
Fund’s
tax
year.
These
reclassifications
have
no
effect
on
net
assets
or
net
asset
value
(“NAV”)
per
share.
Distributions:
Dividends
and
distributions
paid
by
the
Fund
are
recorded
on
the
ex-dividend
dates.
Distributions
are
determined
on
a
tax
basis
and
may
differ
from
net
investment
income
and
net
realized
capital
gains
for
financial
reporting
purposes.
Dividends
and
distributions
are
paid
in
U.S.
dollars
and
cannot
be
automatically
reinvested
in
additional
shares
of
the
Fund.
Indemnifications:
In
the
normal
course
of
business,
the
Fund
enters
into
contracts
that
contain
a
variety
of
representations
that
provide
general
indemnification.
The
Fund’s
maximum
exposure
under
these
arrangements
is
unknown
because
it
involves
future
potential
claims
against
the
Fund,
which
cannot
be
predicted
with
any
certainty.
3.
Investment
Valuation
and
Fair
Value
Measurements
Investment
Valuation
Policies:
The
Fund’s
investments
are
valued
at
fair
value
(also
referred
to
as
“market
value”
within
the
financial
statements)
each
day
that
the
Fund’s
listing
exchange
is
open
and,
for
financial
reporting
purposes,
as
of
the
report
date.
U.S.
GAAP
defines
fair
value
as
the
price
a
fund
would
receive
to
sell
an
asset
or
pay
to
transfer
a
liability
in
an
orderly
transaction
between
market
participants
at
the
measurement
date.
The
Board
of
Trustees
of
the
Trust
(the
“Board”)
of
the
Fund
has
approved
the
designation
of
BlackRock
Fund
Advisors
(“BFA”),
the
Fund’s
investment
adviser,
as
the
valuation
designee
for
the
Fund.
The
Fund
determines
the
fair
values
of
its
financial
instruments
using
various
independent
dealers
or
pricing
services
under BFA’s
policies.
If
a
security’s
market
price
is
not
readily
available
or
does
not
otherwise
accurately
represent
the
fair
value
of
the
security,
the
security
will
be
valued
in
accordance
with BFA’s policies
and
procedures as
reflecting
fair
value.
BFA
has
formed
a
committee
(the
"Valuation
Committee")
to
develop pricing
policies
and
procedures
and
to
oversee
the
pricing
function
for
all
financial
instruments,
with
assistance
from
other
BlackRock
pricing
committees.
Fair
Value
Inputs
and
Methodologies:
The
following
methods
and
inputs
are
used
to
establish
the
fair
value
of
the
Fund’s
assets
and
liabilities:
Fixed-income
investments
for
which
market
quotations
are
readily
available
are
generally
valued
using
the
last
available
bid
price
or
current
market
quotations
provided
by
independent
dealers
or
third-party
pricing
services. Pricing
services
generally
value
fixed
income
securities
assuming
orderly
transactions
of
an
institutional
round
lot
size,
but
a
fund
may
hold
or
transact
in
such
securities
in
smaller,
odd
lot
sizes.
Odd
lots
may
trade
at
lower
prices
than
institutional
round
lots.
The
pricing
services
may
use
matrix
pricing
or
valuation
models
that
utilize
certain
inputs
and
assumptions
to
derive
values,
including
transaction
data
(e.g.,
recent
representative
bids
and
offers),
market
data,
credit
quality
information,
perceived
market
movements,
news,
and
other
relevant
information.
Certain
fixed-income
securities,
including
asset-
backed
and
mortgage
related
securities
may
be
valued
based
on
valuation
models
that
consider
the
estimated
cash
flows
of
each
tranche
of
the
entity,
establish
a
benchmark
yield
and
develop
an
estimated
tranche
specific
spread
to
the
benchmark
yield
based
on
the
unique
attributes
of
the
tranche.
The
amortized
cost
method
of
valuation
may
be
used
with
respect
to
debt
obligations
with
sixty
days
or
less
remaining
to
maturity
unless BFA
determines
such
method
does
not
represent
fair
value.
Investments
in
open-end
U.S.
mutual
funds
(including
money
market
funds)
are
valued
at
that
day’s
NAV.
If
events
(e.g.,
market
volatility,
company
announcement
or
a
natural
disaster)
occur
that
are
expected
to
materially
affect
the
value
of
such
investment,
or
in
the
event
that
application
of
these
methods
of
valuation
results
in
a
price
for
an
investment
that
is
deemed
not
to
be
representative
of
the
market
value
of
such
investment,
or
if
a
price
is
iShares
ETF
Diversification
Classification
Short
Maturity
Municipal
Bond
Active
(a)
......................................................................................
Diversified
(a)
Formerly
the
BlackRock
Short
Maturity
Municipal
Bond
ETF.
Notes
to
Financial
Statements
(continued)
Notes
to
Financial
Statements
not
available,
the
investment
will
be
valued
by
the Valuation
Committee
in
accordance
with
BFA’s
policies
and
procedures as
reflecting
fair
value
(“Fair
Valued
Investments”).
The
fair
valuation
approaches
that
may
be
used
by
the Valuation
Committee
include
market
approach,
income
approach
and
cost
approach.
Valuation
techniques
such
as
discounted
cash
flow,
use
of
market
comparables
and
matrix
pricing
are
types
of
valuation
approaches
and
are
typically
used
in
determining
fair
value.
When
determining
the
price
for
Fair
Valued
Investments,
the Valuation
Committee
seeks
to
determine
the
price
that
the
Fund
might
reasonably
expect
to
receive
or
pay
from
the
current
sale
or
purchase
of
that
asset
or
liability
in
an
arm’s-length
transaction.
Fair
value
determinations
shall
be
based
upon
all
available
factors
that
the Valuation
Committee
deems
relevant
and
consistent
with
the
principles
of
fair
value
measurement
as
of
the
measurement
date.
Fair
Value
Hierarchy:
Various
inputs
are
used
in
determining
the
fair
value
of
financial
instruments
at
the
measurement
date.
These
inputs
to
valuation
techniques
are
categorized
into
a
fair
value
hierarchy
consisting
of
three
broad
levels
for
financial
reporting
purposes
as
follows:
Level
1
–
Unadjusted
price
quotations
in
active
markets/exchanges
that
the
Fund
has
the
ability
to
access
for
identical
assets
or
liabilities;
Level
2
–
Inputs
other
than
quoted
prices
included
within
level
1
that
are
observable
for
the
asset
or
liability,
either
directly
or
indirectly;
and
Level
3
–
Inputs
that
are
unobservable
and
significant
to
the
entire
fair
value
measurement
for
the
asset
or
liability
(including
the Valuation
Committee’s
assumptions
used
in
determining
the
fair
value
of
financial
instruments).
The
hierarchy
gives
the
highest
priority
to
unadjusted
quoted
prices
in
active
markets
for
identical
assets
or
liabilities
(Level
1
measurements)
and
the
lowest
priority
to
unobservable
inputs
(Level
3
measurements).
Accordingly,
the
degree
of
judgment
exercised
in
determining
fair
value
is
greatest
for
instruments
categorized
in
Level
3.
The
inputs
used
to
measure
fair
value
may
fall
into
different
levels
of
the
fair
value
hierarchy.
In
such
cases,
for
disclosure
purposes,
the
fair
value
hierarchy
classification
is
determined
based
on
the
lowest
level
input
that
is
significant
to
the
fair
value
measurement
in
its
entirety.
Investments
classified
within
Level
3
have
significant
unobservable
inputs
used
by
the Valuation
Committee
in
determining
the
price
for
Fair
Valued
Investments.
Level
3
investments
include
equity
or
debt
issued
by
privately
held
companies
or
funds
that
may
not
have
a
secondary
market
and/or
may
have
a
limited
number
of
investors.
The
categorization
of
a
value
determined
for
financial
instruments
is
based
on
the
pricing
transparency
of
the
financial
instruments
and
is
not
necessarily
an
indication
of
the
risks
associated
with
investing
in
those
securities.
4.
Investment
Advisory
Agreement
and
Other
Transactions
with
Affiliates
Investment
Advisory
Fees:
Pursuant
to
an
Investment
Advisory
Agreement
with
the
Trust
,
BFA
manages
the
investment
of
the
Fund’s
assets.
BFA
is
a
California
corporation
indirectly
owned
by
BlackRock. Under
the
Investment
Advisory
Agreement,
BFA
is
responsible
for
substantially
all
expenses
of
the
Fund,
except
(i)
interest
and
taxes;
(ii)
brokerage
commissions
and
other
expenses
connected
with
the
execution
of
portfolio
transactions;
(iii)
distribution
fees;
(iv)
the
advisory
fee
payable
to
BFA;
and
(v)
litigation
expenses
and
any
extraordinary
expenses
(in
each
case
as
determined
by
a
majority
of
the
independent
trustees
).
For
its
investment
advisory
services
to the
Fund,
BFA
is
entitled
to
an
annual
investment
advisory
fee,
accrued
daily
and
paid
monthly
by
the
Fund,
based
on
the
average
daily
net
assets
of the
Fund
as
follows:
Distributor:
BlackRock
Investments,
LLC
(“BRIL”),
an
affiliate
of
BFA,
is
the
distributor
for
the
Fund.
Pursuant
to
the
distribution
agreement,
BFA
is
responsible
for
any
fees
or
expenses
for
distribution
services
provided
to
the
Fund.
ETF
Servicing
Fees:
The
Fund
has
entered
into
an
ETF
Services
Agreement
with
BRIL
to
perform
certain
order
processing,
Authorized
Participant
communications,
and
related
services
in
connection
with
the
issuance
and
redemption
of
Creation
Units
(“ETF
Services”).
BRIL
is
entitled
to
a
transaction
fee
from
Authorized
Participants
on
each
creation
or
redemption
order
for
the
ETF
Services
provided.
The
Fund
does
not
pay
BRIL
for
ETF
Services.
Prior
to January
8,
2024,
ETF
Services
were
performed
by
State
Street
Bank
and
Trust
Company.
Officers
and
Trustees:
Certain
officers
and/or
trustees
of
the
Trust
are
officers
and/or
trustees
of
BlackRock
or
its
affiliates.
Other
Transactions:
Cross
trading
is
the
buying
or
selling
of
portfolio
securities
between
funds
to
which
BFA
(or
an
affiliate)
serves
as
investment
adviser.
At
its
regularly
scheduled
quarterly
meetings,
the
Board
reviews
such
transactions
as
of
the
most
recent
calendar
quarter
for
compliance
with
the
requirements
and
restrictions
set
forth
by
Rule
17a-7.
For
the year ended October
31,
2024,
transactions
executed
by
the
Fund
pursuant
to
Rule
17a-7
under
the
1940
Act
were
as
follows:
The
Fund
may
invest
its
positive
cash
balances
in
certain
money
market
funds
managed
by
BFA
or
an
affiliate.
The
income
earned
on
these
temporary
cash
investments
is
shown
as
dividends
–
affiliated
in
the
Statement
of
Operations.
iShares
ETF
Investment
Advisory
Fees
Short
Maturity
Municipal
Bond
Active
.....................................................................................
0
.25
%
iShares
ETF
Purchases
Sales
Net
Realized
Gain
(Loss)
Short
Maturity
Municipal
Bond
Active
.........................................................
$
64,127,252
$
83,652,595
$
—
Notes
to
Financial
Statements
(continued)
2024
iShares
Annual
Financial
Statements
and
Additional
Information
5.
Purchases
and
Sales
For
the year ended
October
31,
2024,
purchases
and
sales
of
investments,
excluding
short-term securities
and
in-kind
transactions,
were
as
follows:
There
were
no
in-kind
transactions
for
the year ended
October
31,
2024.
6.
Income
Tax
Information
The
Fund
is
treated
as
an
entity
separate
from
the Trust’s
other
funds
for
federal
income
tax
purposes.
It
is
the
Fund’s
policy
to
comply
with
the
requirements
of
the
Internal
Revenue
Code
of
1986,
as
amended,
applicable
to
regulated
investment
companies,
and
to
distribute
substantially
all
of
its
taxable
income
to
its
shareholders.
Therefore,
no
U.S.
federal
income
tax
provision
is
required.
Management
has
analyzed
tax
laws
and
regulations
and
their
application
to
the
Fund
as
of
October
31,
2024,
inclusive
of
the
open
tax
return
years,
and
does
not
believe
that
there
are
any
uncertain
tax
positions
that
require
recognition
of
a
tax
liability
in
the
Fund’s
financial
statements.
Management’s
analysis
is
based
on
the
tax
laws
and
judicial
and
administrative
interpretations
thereof
in
effect
as
of
the
date
of
these
financial
statements,
all
of
which
are
subject
to
change,
possibly
with
retroactive
effect,
which
may
impact
the
Fund’s
NAV.
The
tax
character
of
distributions
paid
was
as
follows:
As
of
October
31,
2024,
the
tax
components
of
accumulated
net
earnings
(losses)
were
as
follows:
(a)
Amounts
available
to
offset
future
realized
capital
gains.
(b)
The
difference
between
book-basis
and
tax-basis
net
unrealized
gains
(losses)
was
attributable
primarily
to
the
tax
deferral
of
losses
on
wash
sales.
For
the
year
ended October
31,
2024,
the
Fund
utilized
$86,890
of
its
capital
loss
carryforwards.
As
of
October
31,
2024,
gross
unrealized
appreciation
and
depreciation
based
on
cost
of
investments
(including
short
positions
and
derivatives,
if
any)
for
U.S.
federal
income
tax
purposes
were
as
follows:
7.
Principal
Risks
In
the
normal
course
of
business,
the
Fund
invests
in
securities
or
other
instruments
and
may
enter
into
certain
transactions,
and
such
activities
subject
the
Fund
to
various
risks,
including,
among
others,
fluctuations
in
the
market
(market
risk)
or
failure
of
an
issuer
to
meet
all
of
its
obligations.
The
value
of
securities
or
other
instruments
may
also
be
affected
by
various
factors,
including,
without
limitation:
(i)
the
general
economy;
(ii)
the
overall
market
as
well
as
local,
regional
or
global
political
and/or
social
instability;
(iii)
regulation,
taxation
or
international
tax
treaties
between
various
countries;
or
(iv)
currency,
interest
rate
or
price
fluctuations.
Local,
regional
or
global
events
such
as
war,
acts
of
terrorism,
the
spread
of
infectious
illness
or
other
public
health
issues,
recessions,
or
other
events
could
have
a
significant
impact
on
the
Fund
and
its
investments.
The
Fund’s
prospectus
provides
details
of
the
risks
to
which
the
Fund
is
subject.
Market
Risk:
The
Fund
may
be
exposed
to
prepayment
risk,
which
is
the
risk
that
borrowers
may
exercise
their
option
to
prepay
principal
earlier
than
scheduled
during
periods
of
declining
interest
rates,
which
would
force the
Fund
to
reinvest
in
lower
yielding
securities. The
Fund
may
also
be
exposed
to
reinvestment
risk,
which
is
the
risk
that
income
from the
Fund’s
portfolio
will
decline
if the
Fund
invests
the
proceeds
from
matured,
traded
or
called
fixed-income
securities
at
market
interest
rates
that
are
below the
Fund
portfolio’s
current
earnings
rate.
Municipal
securities
are
subject
to
the
risk
that
litigation,
legislation
or
other
political
events,
local
business
or
economic
conditions,
credit
rating
downgrades,
or
the
bankruptcy
of
the
issuer
could
have
a
significant
effect
on
an
issuer’s
ability
to
make
payments
of
principal
and/or
interest
or
otherwise
affect
the
value
of
such
securities.
Municipal
securities
can
be
significantly
affected
by
political
or
economic
changes,
including
changes
made
in
the
law
after
issuance
of
the
securities,
as
well
as
uncertainties
in
the
municipal
market
related
to,
taxation,
legislative
changes
or
the
rights
of
municipal
security
holders,
including
in
connection
with
an
issuer
insolvency.
Municipal
securities
backed
by
current
or
anticipated
revenues
from
a
specific
project
or
specific
assets
can
be
negatively
affected
by
the
discontinuance
of
the
tax
benefits
supporting
iShares
ETF
Purchases
Sales
Short
Maturity
Municipal
Bond
Active
.........................................................................
$
426,480,530
$
306,533,020
iShares
ETF
Year
Ended
10/31/24
Year
Ended
10/31/23
Short
Maturity
Municipal
Bond
Active
Tax-exempt
income
....................................................................................
$
22,628,587
$
14,748,544
Ordinary
income
......................................................................................
10,602
13,304
$
22,639,189
$
14,761,848
iShares
ETF
Undistributed
Ordinary
Income
Non-Expiring
Capital
Loss
Carryforwards
(a)
Net
Unrealized
Gains
(Losses)
(b)
Total
Short
Maturity
Municipal
Bond
Active
..........................................
$
1,966,623
$
(
32,764
)
$
1,531,073
$
3,464,932
iShares
ETF
Tax
Cost
Gross
Unrealized
Appreciation
Gross
Unrealized
Depreciation
Net
Unrealized
Appreciation
(Depreciation)
Short
Maturity
Municipal
Bond
Active
....................................
$
688,018,473
$
2,000,151
$
(
469,078
)
$
1,531,073
Notes
to
Financial
Statements
(continued)
Notes
to
Financial
Statements
the
project
or
assets
or
the
inability
to
collect
revenues
for
the
project
or
from
the
assets.
Municipal
securities
may
be
less
liquid
than
taxable
bonds,
and
there
may
be
less
publicly
available
information
on
the
financial
condition
of
municipal
security
issuers
than
for
issuers
of
other
securities.
Counterparty
Credit
Risk:
The
Fund
may
be
exposed
to
counterparty
credit
risk,
or
the
risk
that
an
entity
may
fail
to
or
be
unable
to
perform
on
its
commitments
related
to
unsettled
or
open
transactions,
including
making
timely
interest
and/or
principal
payments
or
otherwise
honoring
its
obligations.
The
Fund
manages
counterparty
credit
risk
by
entering
into
transactions
only
with
counterparties
that BFA
believes
have
the
financial
resources
to
honor
their
obligations
and
by
monitoring
the
financial
stability
of
those
counterparties.
Financial
assets,
which
potentially
expose
the
Fund
to
market,
issuer
and
counterparty
credit
risks,
consist
principally
of
financial
instruments
and
receivables
due
from
counterparties.
The
extent
of
the
Fund’s
exposure
to
market,
issuer
and
counterparty
credit
risks
with
respect
to
these
financial
assets
is
approximately
their
value
recorded
in
the
Statement
of
Assets
and
Liabilities,
less
any
collateral
held
by
the
Fund.
Geographic/Asset
Class
Risk:
A
diversified
portfolio,
where
this
is
appropriate
and
consistent
with
a
fund’s
objectives,
minimizes
the
risk
that
a
price
change
of
a
particular
investment
will
have
a
material
impact
on
the
NAV
of
a
fund.
The
investment
concentrations
within
the
Fund’s
portfolio
are
disclosed
in
its
Schedule
of
Investments
.
The
Fund
invests
a
significant
portion
of
its
assets
in
securities
of
issuers
located
in
the
United
States.
A
decrease
in
imports
or
exports,
changes
in
trade
regulations,
inflation
and/or
an
economic
recession
in
the
United
States
may
have
a
material
adverse
effect
on
the
U.S.
economy
and
the
securities
listed
on
U.S.
exchanges.
Proposed
and
adopted
policy
and
legislative
changes
in
the
United
States
may
also
have
a
significant
effect
on
U.S.
markets
generally,
as
well
as
on
the
value
of
certain
securities.
Governmental
agencies
project
that
the
United
States
will
continue
to
maintain
elevated
public
debt
levels
for
the
foreseeable
future
which
may
constrain
future
economic
growth.
Circumstances
could
arise
that
could
prevent
the
timely
payment
of
interest
or
principal
on
U.S.
government
debt,
such
as
reaching
the
legislative
“debt
ceiling.”
Such
non-payment
would
result
in
substantial
negative
consequences
for
the
U.S.
economy
and
the
global
financial
system.
If
U.S.
relations
with
certain
countries
deteriorate,
it
could
adversely
affect
issuers
that
rely
on
the
United
States
for
trade.
The
United
States
has
also
experienced
increased
internal
unrest
and
discord.
If
these
trends
were
to
continue,
they
may
have
an
adverse
impact
on
the
U.S.
economy
and
the
issuers
in
which
the
Fund
invests.
The
Fund
invests
a
significant
portion
of
its
assets
in
fixed-income
securities
and/or
uses
derivatives
tied
to
the
fixed-income
markets.
Changes
in
market
interest
rates
or
economic
conditions
may
affect
the
value
and/or
liquidity
of
such
investments.
Interest
rate
risk
is
the
risk
that
prices
of
bonds
and
other
fixed-income
securities
will
decrease
as
interest
rates
rise
and
increase
as
interest
rates
fall.
The
Fund
may
be
subject
to
a
greater
risk
of
rising
interest
rates
during
a
period
of
historically
low
interest
rates.
The
Federal
Reserve
has
raised
the
federal
funds
rate
as
part
of
its
efforts
to
address
inflation.
Changing
interest
rates
may
have
unpredictable
effects
on
markets,
may
result
in
heightened
market
volatility,
and
could
negatively
impact
the
Fund's
performance.
Significant
Shareholder
Redemption
Risk:
Certain
shareholders
may
own
or
manage
a
substantial
amount
of
fund
shares
and/or
hold
their
fund
investments
for
a
limited
period
of
time.
Large
redemptions
of
fund
shares
by
these
shareholders
may
force
a
fund
to
sell
portfolio
securities,
which
may
negatively
impact
the
fund’s
NAV,
increase
the
fund’s
brokerage
costs,
and/or
accelerate
the
realization
of
taxable
income/gains
and
cause
the
fund
to
make
additional
taxable
distributions
to
shareholders.
8.
Capital
Share
Transactions
Capital
shares
are
issued
and
redeemed
by
the
Fund
only
in
aggregations
of
a
specified
number
of
shares
or
multiples
thereof
(“Creation
Units”)
at
NAV.
Except
when
aggregated
in
Creation
Units,
shares
of
the
Fund
are
not
redeemable.
Transactions
in
capital
shares
were
as
follows:
The
consideration
for
the
purchase
of
Creation
Units
of
a
fund
in
the Trust
generally
consists
of
the
in-kind
deposit
of
a
designated
portfolio
of
securities
and
a
specified
amount
of
cash.
Certain
funds
in
the Trust
may
be
offered
in
Creation
Units
solely
or
partially
for
cash
in
U.S.
dollars. Authorized
Participants purchasing
and
redeeming
Creation
Units
may
pay
a
purchase
transaction
fee
and
a
redemption
transaction
fee
directly
to
BRIL,
to
offset
transfer
and
other
transaction
costs
associated
with
the
issuance
and
redemption
of
Creation
Units,
including
Creation
Units
for
cash.
Authorized
Participants
transacting
in
Creation
Units
for
cash
may
also
pay
an
additional
variable
charge
to
compensate
the
relevant
fund
for
certain
transaction
costs
(i.e.,
stamp
taxes,
taxes
on
currency
or
other
financial
transactions,
and
brokerage
costs)
and
market
impact
expenses
relating
to
investing
in
portfolio
securities.
Such
variable
charges,
if
any,
are
included
in
shares
sold
in
the
table
above.
To
the
extent
applicable,
to
facilitate
the
timely
settlement
of
orders
for
the
Fund
using
a
clearing
facility
outside
of
the
continuous
net
settlement
process,
the
Fund,
at
its
sole
discretion,
may
permit
an
Authorized
Participant
to
post
cash
as
collateral
in
anticipation
of
the
delivery
of
all
or
a
portion
of
the
applicable
Deposit
Securities
or
Fund
Securities,
as
further
described
in
the
applicable
Authorized
Participant
Agreement.
The
collateral
process
is
subject
to
a
Control
Agreement
among
the
Authorized
Participant,
the
Fund’s
custodian,
and
the
Fund.
In
the
event
that
the
Authorized
Participant
fails
to
deliver
all
or
a
portion
of
the
applicable
Deposit
Securities
or
Fund
Securities,
the
Fund
may
exercise
control
over
such
collateral
pursuant
to
the
terms
of
the
Control
Agreement
in
order
to
purchase
the
applicable
Deposit
Securities
or
Fund
Securities.
From
time
to
time,
settlement
of
securities
related
to
in-kind
contributions
or
in-kind
redemptions
may
be
delayed.
In
such
cases,
securities
related
to
in-kind
transactions
are
reflected
as
a
receivable
or
a
payable
in
the
Statement
of
Assets
and
Liabilities.
Year
Ended
10/31/24
Year
Ended
10/31/23
iShares
ETF
Shares
Amount
Shares
Amount
Short
Maturity
Municipal
Bond
Active
Shares
sold
3,800,000
$
190,315,274
4,550,000
$
226,690,029
Shares
redeemed
(
2,350,000
)
(
117,741,909
)
(
2,900,000
)
(
144,515,345
)
1,450,000
$
72,573,365
1,650,000
$
82,174,684
Notes
to
Financial
Statements
(continued)
2024
iShares
Annual
Financial
Statements
and
Additional
Information
9.
Subsequent
Events
Management
has
evaluated
the
impact
of
all
subsequent
events
on
the
Fund
through
the
date
the
financial
statements
were
available
to
be
issued
and
has
determined
that
there
were
no
subsequent
events
requiring
adjustment
or
additional
disclosure
in
the
financial
statements.
Report
of
Independent
Registered
Public
Accounting
Firm
Report
of
Independent
Registered
Public
Accounting
Firm
To
the
Board
of
Trustees
of
iShares
U.S.
ETF
Trust
and
Shareholders
of
iShares
Short
Maturity
Municipal
Bond
Active
ETF
Opinion
on
the
Financial
Statements
We
have
audited
the
accompanying
statement
of
assets
and
liabilities,
including
the
schedule
of
investments,
of
iShares
Short
Maturity
Municipal
Bond
Active
ETF
(one
of
the
funds
constituting
iShares
U.S.
ETF
Trust,
referred
to
hereafter
as
the
“Fund”)
as
of
October
31,
2024,
the
related
statement
of
operations
for
the
year
ended
October
31,
2024,
the
statement
of
changes
in
net
assets
for
each
of
the
two
years
in
the
period
ended
October
31,
2024,
including
the
related
notes,
and
the
financial
highlights
for
each
of
the
five
years
in
the
period
ended
October
31,
2024 (collectively
referred
to
as
the
“financial
statements”).
In
our
opinion,
the
financial
statements
present
fairly,
in
all
material
respects,
the
financial
position
of
the
Fund
as
of
October
31,
2024,
the
results
of
its
operations
for
the
year
then
ended,
the
changes
in
its
net
assets
for
each
of
the
two
years
in
the
period
ended
October
31,
2024
and the
financial
highlights
for
each
of
the
five
years
in
the
period
ended
October
31,
2024 in
conformity
with
accounting
principles
generally
accepted
in
the
United
States
of
America.
Basis
for
Opinion
These
financial
statements
are
the
responsibility
of
the
Fund’s
management.
Our
responsibility
is
to
express
an
opinion
on
the
Fund’s
financial
statements
based
on
our
audits.
We
are
a
public
accounting
firm
registered
with
the
Public
Company
Accounting
Oversight
Board
(United
States)
(PCAOB)
and
are
required
to
be
independent
with
respect
to
the
Fund
in
accordance
with
the
U.S.
federal
securities
laws
and
the
applicable
rules
and
regulations
of
the
Securities
and
Exchange
Commission
and
the
PCAOB.
We
conducted
our
audits
of
these
financial
statements
in
accordance
with
the
standards
of
the
PCAOB.
Those
standards
require
that
we
plan
and
perform
the
audit
to
obtain
reasonable
assurance
about
whether
the
financial
statements
are
free
of
material
misstatement,
whether
due
to
error
or
fraud.
Our
audits
included
performing
procedures
to
assess
the
risks
of
material
misstatement
of
the
financial
statements,
whether
due
to
error
or
fraud,
and
performing
procedures
that
respond
to
those
risks.
Such
procedures
included
examining,
on
a
test
basis,
evidence
regarding
the
amounts
and
disclosures
in
the
financial
statements.
Our
audits
also
included
evaluating
the
accounting
principles
used
and
significant
estimates
made
by
management,
as
well
as
evaluating
the
overall
presentation
of
the
financial
statements.
Our
procedures
included
confirmation
of
securities
owned
as
of October
31,
2024
by
correspondence
with
the
custodian,
transfer
agent
and
brokers;
when
replies
were
not
received
from
brokers,
we
performed
other
auditing
procedures. We
believe
that
our
audits
provide
a
reasonable
basis
for
our
opinion.
/s/PricewaterhouseCoopers
LLP
Philadelphia,
Pennsylvania
December
20,
2024
We
have
served
as
the
auditor
of
one
or
more
BlackRock
investment
companies
since
2000.
Important
Tax
Information
(unaudited)
2024
iShares
Annual
Financial
Statements
and
Additional
Information
The
Fund
hereby
designates
the
following
amount,
or
maximum
amount
allowable
by
law,
as
interest
income
eligible
to
be
treated
as
a
Section
163(j)
interest
dividend
for
the
fiscal
year
ended
October
31,
2024:
The
Fund
hereby
designates
the
following
amount,
or
maximum
amount
allowable
by
law,
as
interest-related
dividends
eligible
for
exemption
from
U.S.
withholding
tax
for
nonresident
aliens
and
foreign
corporations
for
the
fiscal
year
ended October
31,
2024:
iShares
ETF
Interest
Dividends
Short
Maturity
Municipal
Bond
Active
......................................................................................
$
10,602
iShares
ETF
Interest-Related
Dividends
Short
Maturity
Municipal
Bond
Active
......................................................................................
$
10,602
Premium/Discount
Information
Information
on
the
Fund’s
net
asset
value,
market
price,
premiums
and
discounts,
and
bid-ask
spreads
can
be
found
at
iShares.com
.
Electronic
Delivery
Shareholders
can
sign
up
for
e-mail
notifications
announcing
that
the
shareholder
report
or
prospectus
has
been
posted
on
the
iShares
website
at
iShares.com
.
Once
you
have
enrolled,
you
will
no
longer
receive
prospectuses
and
shareholder
reports
in
the
mail.
To
enroll
in
electronic
delivery:
•
Go
to
icsdelivery.com
.
•
If
your
brokerage
firm
is
not
listed,
electronic
delivery
may
not
be
available.
Please
contact
your
broker-dealer
or
financial
advisor.
Changes
in
and
Disagreements
with
Accountants
Not
applicable.
Proxy
Results
Not
applicable.
Remuneration
Paid
to
Trustees,
Officers,
and
Others
Because
BFA
has
agreed
in
the
Investment
Advisory
Agreements
to
cover
all
operating
expenses
of
the
Funds,
subject
to
certain
exclusions
as
provided
for
therein,
BFA
pays
the
compensation
to
each
Independent
Trustee
for
services
to
the
Funds
from
BFA's
investment
advisory
fees.
Availability
of
Portfolio
Holdings
Information
A
description
of
the
Trust's
policies
and
procedures
with
respect
to
the
disclosure
of
the
Fund’s
portfolio
securities
is
available
in
the
Fund
Prospectus.
The
Fund
discloses
its
portfolio
holdings
daily
and
provides
information
regarding
its
top
holdings
in
Fund
fact
sheets,
when
available, at
iShares.com
.
Board
Review
and
Approval
of
Investment
Advisory
Contract
2024
iShares
Annual
Financial
Statements
and
Additional
Information
iShares
Short
Maturity
Municipal
Bond
Active
ETF
(the
“Fund”)
Under
Section
15(c)
of
the
Investment
Company
Act
of
1940
(the
“1940
Act”),
the
Trust's
Board
of
Trustees
(the
“Board”),
including
a
majority
of
Board
Members
who
are
not
“interested
persons”
of
the
Trust
(as
that
term
is
defined
in
the
1940
Act)
(the
“Independent
Board
Members”),
is
required
annually
to
consider
the
approval
of
the
Investment
Advisory
Agreement
between
the
Trust
and
BFA
(the
“Advisory
Agreement”)
on
behalf
of
the
Fund.
The
Board’s
consideration
entails
a
year-long
process
whereby
the
Board
and
its
committees
(composed
solely
of
Independent
Board
Members)
assess
BlackRock’s
services
to
the
Fund,
including
investment
management;
fund
accounting;
administrative
and
shareholder
services;
oversight
of
the
Fund’s
service
providers;
risk
management
and
oversight;
and
legal
and
compliance
services;
including
the
ability
to
meet
applicable
legal
and
regulatory
requirements.
The
Independent
Board
Members
requested,
and
BFA
provided,
such
information
as
the
Independent
Board
Members,
with
advice
from
independent
counsel,
deemed
reasonably
necessary
to
evaluate
the
Advisory
Agreement.
At
meetings
held
on
May
6,
2024
and
May
17,
2024,
a
committee
composed
of
all
of
the
Independent
Board
Members
(the
“15(c)
Committee”),
with
independent
counsel,
met
with
management
and
reviewed
and
discussed
information
provided
in
response
to
initial
requests
of
the
15(c)
Committee
and/or
its
independent
counsel.
Prior
to
and
in
preparation
for
the
meeting,
the
Board
received
and
reviewed
materials
specifically
relating
to
matters
relevant
to
the
renewal
of
the
Advisory
Agreement.
Following
discussion,
the
15(c)
Committee
subsequently
requested
certain
additional
information,
which
management
agreed
to
provide.
At
a
meeting
held
on
June
4-5,
2024,
the
Board,
including
the
Independent
Board
Members,
reviewed
the
additional
information
provided
by
management
in
response
to
these
requests.
After
extensive
discussions
and
deliberations,
the
Board,
including
all
of
the
Independent
Board
Members,
approved
the
continuance
of
the
Advisory
Agreement
for
the
Fund,
based
on
a
review
of
qualitative
and
quantitative
information
provided
by
BFA
and
their
cumulative
experience
as
Board
Members.
The
Board
noted
its
satisfaction
with
the
extent
and
quality
of
information
provided
and
its
frequent
interactions
with
management,
as
well
as
the
detailed
responses
and
other
information
provided
by
BFA.
The
Independent
Board
Members
were
advised
by
their
independent
counsel
throughout
the
process,
including
about
the
legal
standards
applicable
to
their
review.
In
approving
the
continuance
of
the
Advisory
Agreement
for
the
Fund,
the
Board,
including
the
Independent
Board
Members,
considered
various
factors,
including:
(i)
the
expenses
and
performance
of
the
Fund;
(ii)
the
nature,
extent
and
quality
of
the
services
provided
by
BFA;
(iii)
the
costs
of
services
provided
to
the
Fund
and
profits
realized
by
BFA
and
its
affiliates;
(iv)
potential
economies
of
scale
and
the
sharing
of
related
benefits;
(v)
the
fees
and
services
provided
for
other
comparable
funds/accounts
managed
by
BFA
and
its
affiliates;
and
(vi)
other
benefits
to
BFA
and/or
its
affiliates.
The
Board
Members
did
not
identify
any
particular
information
or
any
single
factor
as
determinative,
and
each
Board
Member
may
have
attributed
different
weights
to
the
various
matters
and
factors
considered.
The
material
factors,
considerations
and
conclusions
that
formed
the
basis
for
the
Board,
including
the
Independent
Board
Members,
to
approve
the
continuance
of
the
Advisory
Agreement
are
discussed
below.
Expenses
and
Performance
of
the
Fund
:
The
Board
reviewed
statistical
information
prepared
by
Broadridge
Financial
Solutions,
Inc.
(“Broadridge”),
an
independent
provider
of
investment
company
data,
regarding
the
expense
ratio
components,
including
gross
and
net
total
expenses,
fees
and
expenses
of
other
fund(s)
in
which
the
Fund
invests
(if
applicable),
and
waivers/reimbursements
(if
applicable)
of
the
Fund
in
comparison
with
the
same
information
for
other
ETFs,
objectively
selected
by
Broadridge
as
comprising
the
Fund’s
applicable
expense
peer
group
pursuant
to
Broadridge’s
proprietary
ETF
methodology
(the
“Peer
Group”).
The
Board
was
provided
with
a
detailed
description
of
the
proprietary
ETF
methodology
used
by
Broadridge
to
determine
the
Fund’s
Peer
Group.
The
Board
noted
that,
due
to
the
limitations
in
providing
comparable
funds
in
the
Peer
Group,
the
statistical
information
provided
in
Broadridge’s
report
may
or
may
not
provide
meaningful
direct
comparisons
to
the
Fund
in
all
instances.
The
Board
also
noted
that
the
investment
advisory
fee
rate
and
overall
expenses
(net
of
any
waivers
and
reimbursements)
for
the
Fund
were
lower
than
the
median
of
the
investment
advisory
fee
rates
and
overall
expenses
(net
of
any
waivers
and
reimbursements)
of
the
funds
in
its
Peer
Group,
excluding
iShares
funds.
The
Board
noted
that
the
Fund
is
an
actively
managed
ETF
that
does
not
seek
to
track
the
performance
of
a
specified
index
and
that
the
management
team
for
the
Fund
manages
the
Fund’s
portfolio
in
accordance
with
its
investment
objective.
The
Board
further
noted
that,
during
the
year,
the
Board
received
periodic
reports
on
the
Fund’s
short- and
longer-term
performance
in
comparison
with
its
reference
benchmark.
Such
periodic
comparative
performance
information,
including
additional
detailed
information
as
requested
by
the
Board,
was
also
considered.
The
Board
noted
that
the
Fund
generally
performed
in
line
with
expectations
relative
to
the
Fund’s
peer
group
(where
applicable)
and
reference
benchmark
or
stated
investment
objective.
Based
on
this
review,
the
other
relevant
factors
and
information
considered
at
the
meeting,
and
their
general
knowledge
of
ETF
pricing,
the
Board
concluded
that
the
investment
advisory
fee
rate
and
expense
level
and
the
historical
performance
of
the
Fund
supported
the
Board’s
approval
of
the
continuance
of
the
Advisory
Agreement
for
the
coming
year.
Nature,
Extent
and
Quality
of
Services
Provided
:
Based
on
management’s
representations,
including
information
about
ongoing
enhancements
and
initiatives
with
respect
to
the
iShares
product
line
and
BFA’s
business,
including
with
respect
to
capital
markets
support
and
analysis,
technology,
portfolio
management,
product
design
and
quality,
compliance
and
risk
management,
global
public
policy
and
other
services,
the
Board
expected
that
there
would
be
no
diminution
in
the
scope
of
services
required
of
or
provided
by
BFA
under
the
Advisory
Agreement
for
the
coming
year
as
compared
with
the
scope
of
services
provided
by
BFA
during
prior
years.
In
reviewing
the
scope
of
these
services,
the
Board
considered
BFA’s
investment
philosophy
and
experience,
noting
that
BFA
and
its
affiliates
have
committed
significant
resources
over
time,
including
during
the
past
year,
to
support
the
iShares
funds
and
their
shareholders
and
have
made
significant
investments
into
the
iShares
business.
The
Board
also
considered
BFA’s
compliance
program
and
its
compliance
record
with
respect
to
the
Fund,
including
related
programs
implemented
pursuant
to
regulatory
requirements.
In
that
regard,
the
Board
noted
that
BFA
reports
to
the
Board
about
portfolio
management
and
compliance
matters
on
a
periodic
basis
in
connection
with
regularly
scheduled
meetings
of
the
Board,
and
on
other
occasions
as
necessary
and
appropriate,
and
has
provided
information
and
made
relevant
officers
and
other
employees
of
BFA
(and
its
affiliates)
available
as
needed
to
provide
further
assistance
with
these
matters.
The
Board
also
reviewed
the
background
and
experience
of
the
persons
responsible
for
the
day-to-day
management
of
the
Fund,
as
well
as
the
resources
available
to
them
in
managing
the
Fund.
In
addition
to
the
above
considerations,
the
Board
reviewed
and
considered
detailed
presentations
regarding
BFA’s
investment
performance,
investment
and
risk
management
processes
and
strategies
provided
at
the
May
6,
2024
meeting
and
throughout
the
year,
and
matters
related
to
BFA’s
portfolio
compliance
program
and
other
compliance
programs
and
services,
as
well
as
BlackRock’s
continued
investments
in
its
ETF
business.
Based
on
review
of
this
information,
and
the
performance
information
discussed
above,
the
Board
concluded
that
the
nature,
extent
and
quality
of
services
provided
to
the
Fund
under
the
Advisory
Agreement
supported
the
Board’s
approval
of
the
continuance
of
the
Advisory
Agreement
for
the
coming
year.
Costs
of
Services
Provided
to
the
Fund
and
Profits
Realized
by
BFA
and
its
Affiliates
:
The
Board
reviewed
information
about
the
estimated
profitability
to
BlackRock
in
managing
the
Fund,
based
on
the
fees
payable
to
BFA
and
its
affiliates
(including
fees
under
the
Advisory
Agreement),
and
other
sources
of
revenue
and
expense
to
BFA
Board
Review
and
Approval
of
Investment
Advisory
Contract
(continued)
Board
Review
and
Approval
of
Investment
Advisory
Contract
and
its
affiliates
from
the
Fund’s
operations
for
the
last
calendar
year.
The
Board
reviewed
BlackRock’s
methodology
for
calculating
estimated
profitability
of
the
iShares
funds,
noting
that
the
15(c)
Committee
and
the
Board
had
focused
on
the
methodology
and
profitability
presentation.
The
Board
recognized
that
profitability
may
be
affected
by
numerous
factors,
including,
among
other
things,
fee
waivers
by
BFA,
the
types
of
funds
managed,
expense
allocations
and
business
mix.
The
Board
thus
recognized
that
calculating
and
comparing
profitability
at
individual
fund
levels
is
challenging.
The
Board
discussed
with
management
the
sources
of
direct
and
ancillary
revenue,
including
the
revenues
to
BTC,
a
BlackRock
affiliate,
from
securities
lending
by
the
Fund.
The
Board
also
discussed
BFA’s
estimated
profit
margin
as
reflected
in
the
Fund’s
profitability
analysis
and
reviewed
information
regarding
potential
economies
of
scale
(as
discussed
below).
Based
on
this
review,
the
Board
concluded
that
the
information
considered
with
respect
to
the
profits
realized
by
BFA
and
its
affiliates
under
the
Advisory
Agreement
and
from
other
relationships
between
the
Fund
and
BFA
and/or
its
affiliates,
if
any,
and
related
costs
of
the
services
provided
as
well
as
the
other
factors
considered
at
the
meeting,
supported
the
Board’s
approval
of
the
continuance
of
the
Advisory
Agreement
for
the
coming
year.
Economies
of
Scale
:
The
Board
reviewed
information
and
considered
the
extent
to
which
economies
of
scale
might
be
realized
as
the
assets
of
the
Fund
increase,
noting
that
the
issue
of
potential
economies
of
scale
had
been
focused
on
by
the
15(c)
Committee
and
the
Board
during
their
meetings
and
addressed
by
management.
The
15(c)
Committee
and
the
Board
received
information
regarding
BlackRock’s
historical
estimated
profitability
(as
discussed
above),
including
BFA’s
and
its
affiliates’
estimated
costs
in
providing
services.
The
estimated
cost
information
distinguished,
among
other
things,
between
fixed
and
variable
costs,
and
showed
how
the
level
and
nature
of
fixed
and
variable
costs
may
impact
the
existence
or
size
of
scale
benefits,
with
the
Board
recognizing
that
potential
economies
of
scale
are
difficult
to
measure.
The
15(c)
Committee
and
the
Board
reviewed
information
provided
by
BFA
regarding
the
sharing
of
scale
benefits
with
the
iShares
funds
through
various
means,
including,
as
applicable,
through
breakpoints,
waivers,
or
other
fee
reductions,
as
well
as
through
additional
investment
in
the
iShares
business,
including
enhancements
to
or
the
provision
of
additional
infrastructure
and
services
to
the
iShares
funds
and
their
shareholders
and,
with
respect
to
New
Funds,
set
management
fees
at
levels
that
anticipate
scale
over
time.
The
Board
noted
that
the
Advisory
Agreement
for
the
Fund
did
not
provide
for
breakpoints
in
the
Fund’s
investment
advisory
fee
rate
as
the
assets
of
the
Fund
increase.
However,
the
Board
noted
that
it
would
continue
to
assess
the
appropriateness
of
adding
breakpoints
in
the
future.
The
Board
concluded
that
this
review
of
potential
economies
of
scale
and
the
sharing
of
related
benefits,
as
well
as
the
other
factors
considered
at
the
meeting,
supported
the
Board’s
approval
of
the
continuance
of
the
Advisory
Agreement
for
the
coming
year.
Fees
and
Services
Provided
for
Other
Comparable
Funds/Accounts
Managed
by
BFA
and
its
Affiliates
:
The
Board
received
and
considered
information
regarding
the
investment
advisory/management
fee
rates
for
other
funds/accounts
in
the
U.S.
for
which
BFA
(or
its
affiliates)
provides
investment
advisory/management
services,
including
open-end
funds
registered
under
the
1940
Act
(including
sub-advised
funds),
collective
trust
funds
and
institutional
separate
accounts
(collectively,
the
“Other
Accounts”).
The
Board
received
detailed
information
regarding
how
the
Other
Accounts
generally
differ
from
the
Fund,
including
in
terms
of
the
types
of
services
and
generally
more
extensive
character
and
scope
of
services
provided
to
the
Fund,
as
well
as
other
significant
differences.
In
that
regard,
the
Board
considered
that
the
pricing
of
services
to
institutional
clients
is
typically
based
on
a
number
of
factors
beyond
the
nature
and
extent
of
the
specific
services
to
be
provided
and
often
depends
on
the
overall
relationship
between
the
client
and
its
affiliates
and
the
adviser
and
its
affiliates.
In
addition,
the
Board
considered
the
relative
complexity
and
inherent
risks
and
challenges
of
managing
and
providing
other
services
to
the
Fund,
as
a
publicly
traded
investment
vehicle,
as
compared
to
the
Other
Accounts,
particularly
those
that
are
institutional
clients,
in
light
of
differing
regulatory
requirements
and
client-imposed
mandates.
The
Board
acknowledged
BFA’s
representation
that
the
iShares
funds
are
fundamentally
different
investment
vehicles
from
the
Other
Accounts
in
its
consideration
of
relevant
qualitative
and
quantitative
comparative
information
provided.
The
Board
noted
that
BFA
and
its
affiliates
manage
Other
Accounts
with
a
similar
investment
strategy
or
investment
mandate
as
the
Fund.
The
Board
also
acknowledged
management’s
assertion
that,
for
certain
iShares
funds,
and
for
client
segmentation
purposes,
BlackRock
has
launched
an
iShares
fund
that
may
provide
a
similar
investment
exposure
at
a
lower
investment
advisory
fee
rate.
The
Board
considered
the
“all-inclusive”
nature
of
the
Fund’s
advisory
fee
structure,
and
the
Fund’s
expenses
borne
by
BFA
under
this
arrangement
and
noted
that
the
investment
advisory
fee
rate
under
the
Advisory
Agreement
for
the
Fund
was
generally
higher
than
the
investment
advisory/management
fee
rates
for
certain
of
the
Other
Accounts
(particularly
institutional
clients)
and
concluded
that
the
differences
appeared
to
be
consistent
with
the
factors
discussed.
Other
Benefits
to
BFA
and/or
its
Affiliates
:
The
Board
reviewed
other
benefits
or
ancillary
revenue
received
by
BFA
and/or
its
affiliates
in
connection
with
the
services
provided
to
the
Fund
by
BFA,
both
direct
and
indirect,
including,
but
not
limited
to,
payment
of
revenue
to
BTC,
the
Fund’s
securities
lending
agent,
for
loaning
portfolio
securities,
as
applicable
(which
was
included
in
the
profit
margins
reviewed
by
the
Board
pursuant
to
BFA’s
estimated
profitability
methodology),
payment
of
advisory
fees
or
other
fees
to
BFA
(or
its
affiliates)
in
connection
with
any
investments
by
the
Fund
in
other
funds
(including
cash
sweep
vehicles)
for
which
BFA
(or
its
affiliates)
provides
investment
advisory
services
or
other
services,
and
BlackRock’s
profile
in
the
investment
community.
The
Board
further
considered
other
direct
benefits
that
might
accrue
to
BFA,
including
actual
and
potential
reductions
in
the
Fund’s
expenses
that
are
borne
by
BFA
under
the
“all-inclusive”
management
fee
arrangement,
due
in
part
to
the
size
and
scope
of
BFA’s
investment
operations
servicing
the
Fund
(and
other
funds
in
the
iShares
complex)
as
well
as
in
response
to
a
changing
market
environment.
The
Board
also
reviewed
and
considered
information
provided
by
BFA
concerning
authorized
participant
primary
market
order
processing
services
that
are
provided
by
BlackRock
Investments,
LLC
(“BRIL”),
an
affiliate
of
BFA,
and
paid
for
by
authorized
participants
under
the
ETF
Servicing
Platform.
The
Board
also
noted
the
revenue
received
by
BFA
and/or
its
affiliates
pursuant
to
an
agreement
that
permits
a
service
provider
to
use
certain
portions
of
BlackRock’s
technology
platform
to
service
accounts
managed
by
BFA
and/or
its
affiliates,
including
the
iShares
funds.
The
Board
noted
that
BFA
generally
does
not
use
soft
dollars
or
consider
the
value
of
research
or
other
services
that
may
be
provided
to
BFA
(including
its
affiliates)
in
selecting
brokers
for
portfolio
transactions
for
the
Fund.
The
Board
concluded
that
any
such
ancillary
benefits
would
not
be
disadvantageous
to
the
Fund
and
thus
would
not
alter
the
Board’s
conclusion
with
respect
to
the
appropriateness
of
approving
the
continuance
of
the
Advisory
Agreement
for
the
coming
year.
Conclusion
:
Based
on
a
review
of
the
factors
described
above,
as
well
as
such
other
factors
as
deemed
appropriate
by
the
Board,
the
Board,
including
all
of
the
Independent
Board
Members,
determined
that
the
Fund’s
investment
advisory
fee
rate
under
the
Advisory
Agreement
does
not
constitute
a
fee
that
is
so
disproportionately
large
as
to
bear
no
reasonable
relationship
to
the
services
rendered
and
that
could
not
have
been
the
product
of
arm’s-length
bargaining,
and
concluded
to
approve
the
continuance
of
the
Advisory
Agreement
for
the
coming
year.
Glossary
of
Terms
Used
in
this
Report
2024
iShares
Annual
Financial
Statements
and
Additional
Information
Currency
Abbreviation
USD
United
States
Dollar
Portfolio
Abbreviation
AGM
Assured
Guaranty
Municipal
Corp.
AMT
Alternative
Minimum
Tax
BAM
Build
America
Mutual
Assurance
Co.
BAM-TCRS
Build
America
Mutual
Assurance
Co.
-
Transferable
Custodial
Receipts
FHLMC
Federal
Home
Loan
Mortgage
Corp.
FNMA
Federal
National
Mortgage
Association
GNMA
Government
National
Mortgage
Association
GO
General
Obligation
Bonds
GTD
Guaranteed
PSF
Permanent
School
Fund
Q-SBLF
Qualified
School
Bond
Loan
Fund
RB
Revenue
Bonds
SAW
State
Aid
Withholding
SOFR
Secured
Overnight
Financing
Rate
TECP
Tax-Exempt
Commercial
Paper
VRDN
Variable
Rate
Demand
Notes
Want
to
know
more?
iShares.com
|
1-800-474-2737
This
report
is
intended
for
the
Fund’s
shareholders.
It
may
not
be
distributed
to
prospective
investors
unless
it
is
preceded
or
accompanied
by
the
current
prospectus.
Investing
involves
risk,
including
possible
loss
of
principal.
The
iShares
Funds
are
distributed
by
BlackRock
Investments,
LLC
(together
with
its
affiliates,
“BlackRock”).
©2024
BlackRock,
Inc.
All
rights
reserved.
iSHARES
and
BLACKROCK
are
registered
trademarks
of
BlackRock,
Inc.
or
its
subsidiaries.
All
other
marks
are
the
property
of
their
respective
owners.
Item 8 – Changes in and Disagreements with Accountants for Open-End Management Investment Companies – See Item 7
Item 9 – Proxy Disclosures for Open-End Management Investment Companies – See Item 7
Item 10 – Remuneration Paid to Directors, Officers, and Others of Open-End Management Investment Companies – See Item 7
Item 11 – Statement Regarding Basis for Approval of Investment Advisory Contract – See Item 7
Item 12 – Disclosure of Proxy Voting Policies and Procedures for Closed-End Management Investment Companies – Not Applicable
Item 13 – Portfolio Managers of Closed-End Management Investment Companies – Not Applicable
Item 14 – Purchases of Equity Securities by Closed-End Management Investment Company and Affiliated Purchasers – Not Applicable
Item 15 – Submission of Matters to a Vote of Security Holders – There have been no material changes to these procedures.
Item 16 – Controls and Procedures
(a) The registrant’s principal executive and principal financial officers, or persons performing similar functions, have concluded that the registrant’s disclosure controls and procedures (as defined in Rule 30a-3(c) under the Investment Company Act of 1940, as amended (the “1940 Act”)) are effective as of a date within 90 days of the filing date of this report based on the evaluation of these controls and procedures required by Rule 30a-3(b) under the 1940 Act and Rule 13a-15(b) or 15d-15(b) under the Securities Exchange Act of 1934, as amended.
(b) There were no changes in the registrant’s internal control over financial reporting (as defined in Rule 30a-3(d) under the 1940 Act) that occurred during the period covered by this report that have materially affected, or are reasonably likely to materially affect, the registrant’s internal control over financial reporting.
Item 17 – Disclosure of Securities Lending Activities for Closed-End Management Investment Companies –Not Applicable
Item 18 – Recovery of Erroneously Awarded Compensation – Not Applicable
Item 19 – Exhibits attached hereto
(a)(2) Any policy required by the listing standards adopted pursuant to Rule 10D-1 under the Exchange Act (17 CFR 240.10D-1) by the registered national securities exchange or registered national securities association upon which the registrant’s securities are listed – Not Applicable
(a)(4) Any written solicitation to purchase securities under Rule 23c-1 – Not Applicable
(a)(5) Change in registrant’s independent public accountant – Not Applicable
Pursuant to the requirements of the Securities Exchange Act of 1934 and the Investment Company Act of 1940, the registrant has duly caused this report to be signed on its behalf by the undersigned, thereunto duly authorized.
iShares U.S. ETF Trust
By: /s/ Jessica Tan
Jessica Tan
President (principal executive officer) of
iShares U.S. ETF Trust
Date: December 20, 2024
Pursuant to the requirements of the Securities Exchange Act of 1934 and the Investment Company Act of 1940, this report has been signed below by the following persons on behalf of the registrant and in the capacities and on the dates indicated.
By: /s/ Jessica Tan
Jessica Tan
President (principal executive officer) of
iShares U.S. ETF Trust
Date: December 20, 2024
By: /s/ Trent Walker
Trent Walker
Treasurer and Chief Financial Officer (principal financial officer) of
iShares U.S. ETF Trust
Date: December 20, 2024