WASHINGTON, D.C. 20549
Midas Perpetual Portfolio, Inc.
John F. Ramírez, Esq.
Form N-CSR is to be used by management investment companies to file reports with the Commission not later than 10 days after the transmission to stockholders of any report that is required to be transmitted to stockholders under Rule 30e-1 under the Investment Company Act of 1940 (17 CFR 270.30e-1). The Commission may use the information provided on Form N-CSR in its regulatory, disclosure review, inspection, and policy making roles.
Item 1. Report to Stockholders.
MIDAS I N V E S T I N G P H I L O S O P H Y We believe that employing a flexible, quality investing approach can be an important advantage in seeking a superior strategy in volatile markets. We also believe that while adapting to evolving markets can be a challenging process, personal investment planning for the future can be successful by following three simple rules. Commit to a long term investing approach. Follow a regular monthly investment plan. Manage your investment risk by diversifying among the three Midas Funds. |
| MIDAS Fund | MIDAS Magic | MIDAS Perpetual Portfolio |
(Ticker: MIDSX) | (Ticker: MISEX) | (Ticker: MPERX) |
| Seeks capital appreciation and protec-ion against inflation and, secondarily, current income through investments primarily in precious metals and natural resource companies and gold, silver, and platinum bullion. | Seeks capital appreciation by investing in any security type in any industry sector and in domestic and foreign companies of any size. | Seeks to preserve and increase the purchasing power value of its shares over the long term by investing in gold, silver, Swiss franc assets, hard asset securities, large Capitalization growth stocks, and dollar assets. |
December 31 2011ANNUAL REPORT
| 1 |
| | |
PORTFOLIO COMMENTARY | |
| 2 |
| 3 |
| 4 |
| 5 |
| 6 |
| 7 |
| | |
FINANCIAL STATEMENTS | |
| Schedule of Portfolio Investments | |
| 8 |
| 10 |
| 12 |
| 16 |
| 17 |
| 18 |
| 19 |
| 20 |
| 28 |
| 30 |
| |
| | |
SUPPLEMENTAL INFORMATION | |
| 31 |
| 33 |
| | |
OPENING YOUR ACCOUNT | |
| 34 |
| New Account Application | 35 |
At Midas, we consider the following an important investment calculation: 0.26 – 3.0 = – 2.74. The first number, 0.26%, is the yield offered one year ago by U.S. Treasury securities maturing in one year, from which we subtract 3.0%, the inflation rate for the most recent one year period, as each was calculated by the U.S. Federal Reserve Board and the U.S. Bureau of Labor Statistics. Now, we derive the important calculation: there was a negative real rate of return, -2.74%, on “riskless” U.S. Treasury securities. Today, the yield on one year Treasuries has dropped to about 0.13%, and we expect inflation to increase and the negative real returns on Treasuries to worsen.
| The point? We believe at Midas that whether one is planning for financial needs anticipated next year, or for much later, potential returns of income, and the protection and growth of one’s capital, should be considered after accounting for inflation. That is why Midas Fund seeks primarily capital appreciation and protection against inflation and, secondarily, current income; Midas Perpetual Portfolio seeks to preserve and increase the purchasing power value of its shares; and Midas Magic seeks solely capital appreciation. Fund shares are not, however, federally or FDIC insured, are not deposits or obligations of, or guaranteed by, any financial institution and involve investment risk, including possible loss of principal and fluctuation in value. | “At Midas, we attempt to cope with market turbulence, risk, and economic changes by emphasizing quality investing over the long term.” |
Risk, Planning, and Discovering Opportunities
Investors also should understand their ability to accept volatility and risk. At Midas, we attempt to cope with market turbulence, risk, and economic changes by emphasizing quality investing over the long term. Midas Fund seeks mining companies offering financial features. Midas Magic concentrates its portfolio in some of the world’s strongest companies with global operations in insurance, technology, banking, and other industries. Midas Perpetual Portfolio invests in gold and silver, stocks, and bonds, and employs a target asset allocation strategy. This strategy is intended to result in the Fund rebalancing – reducing its exposure to asset categories that may have enjoyed recent, but potentially temporary, investor enthusiasm, and increasing investment in currently out of favor but, hopefully, better value categories.
You are most cordially invited to read the following annual reports to shareholders of the Funds in the Midas Family to learn more about their investing results and risks. We then suggest you formulate your own investing goals and take positive steps to implement a plan to seek those goals. Positive steps might include regularly adding to your Midas account pursuant to a long term plan and contributing to a tax advantaged retirement account. In this connection, we suggest you consider one or more of the Midas Funds and the tax advantaged Midas Traditional, Roth, SEP, and SIMPLE IRA. Midas also offers Health Savings Accounts as well as Education Savings Accounts. Forms for all of these plans may be found at www.MidasFunds.com.
Sign Up for Electronic Delivery
Midas shareholders can also sign up for electronic delivery of their account statements, confirmations, annual and semi annual reports, prospectuses, and other updates. With electronic delivery you get all your Midas information more quickly and conveniently, and it’s stored on the site for up to four years where you can view or print them at any time.
Go to www.MidasFunds.com/edelivery for more information. Thank you for investing with Midas!
Sincerely,
Thomas B. Winmill
President
Portfolio Commentary
Midas Annual Report 2011 - 1
MIDAS Fund
Midas Fund invests in gold, silver, platinum, and other natural resources companies in seeking its investment objectives of primarily capital appreciation and protection against inflation and, secondarily, current income. We are pleased to submit this 2011 Annual Report and to welcome new shareholders attracted to its investment objectives and policies who have invested in the Fund directly or through one of the many brokerage firms making the Fund available to its customers.
Market Review, Strategies and Outlook
In our Semi-Annual report to shareholders, we suggested that gold had the potential to spike as high as $1,700 per ounce by year end due to favorable seasonal and fundamental supply and demand factors. In fact, gold reached a high in the second half of the year of $1,895 per ounce, but probably more due to the U.S. debt ceiling impasse and European sovereign default scare – “fear factors” increasing safe haven demand for bullion. But spikes based on fear factors can reverse as sharply as they rise, and by year end the gold price had dropped over $350, ending the year at $1,531. For all of 2011, gold prices averaged about $1,571 (all prices based on the London pm fix). The gold price has recently continued to strengthen to over $1,700, boosted by the Federal Reserve’s recent hint of ultra-low interest rates until at least 2014.
In 2012, we anticipate continued volatility for gold, and investor sentiment to exhibit correspondingly wide swings, but for the overall price direction for 2012 to remain positive. Our view is that intractable U.S. and European fiscal and monetary woes will continue to lead to political crises and currency devaluation, which will outweigh somewhat bearish fundamental supply and demand factors. In brief, while we anticipate bullish demand from foreign central banks buying significantly more gold in response to the U.S. Federal Reserve’s “quantitative easing” – code for U.S. dollar debasement-jewelry and industrial demand is down (bearish), mine supply is up (bearish), and scrap supplies are probably going to remain robust (bearish). But more important than supply and demand, in our estimation, are recent declines in investor confidence and eroding trust in global financial systems and government policies, which could drive more investors to seek gold as an “alternative currency” to store value. We note that, conversely, resurging investor confidence could lead to lower gold prices. At Midas, we seek to monitor the risks inherent in the precious metals sector and position Midas Fund to benefit by seeking quality investments with the potential for capital appreciation.
The year witnessed much market volatility, and mining stocks generally underperformed the metal. The Fund’s performance was (35.97)% in 2011, a disappointing result particularly after achieving positive gains of 47.91% in 2010 and 83.88% in 2009. Midas Fund’s strategy in the year was to increase its focus on gold producing companies, reduce leverage, and eliminate a number of platinum, copper, and uranium companies. Our focus on quality and long term investing has been rewarded in the first month of 2012, and we expect more should the valuations of mining companies come back in balance with metal prices. Midas expects to continue emphasizing mining companies offering financial strength, expanding production profiles, increasing cash flow, promising exploration potential, and/or other special growth features. As economic and market conditions and concerns unfold over 2012, the Fund expects its leveraged posture to result in further volatility, but with its portfolio of what we believe to be strong companies at attractive valuations, we believe we can take a long term view to seek capital appreciation.
TOP |
| | 10 HOLDINGS As of December 31, 2011 |
| | |
| 1 | Goldcorp Inc. |
| 2 | Jaguar Mining, Inc. |
| 3 | Avocet Mining PLC |
| 4 | Newmont Mining Corp. |
| 5 | Centerra Gold Inc. |
| 6 | Eldorado Gold Corp. Ltd. |
| 7 | AngloGold Ashanti Ltd. |
| 8 | Kinross Gold Corp. |
| 9 | Alamos Gold Inc. |
| 10 | IAMGOLD Corp. |
| |
| Top Ten Holdings comprise approximately 66% of total assets. |
| |
Midas Annual Report 2011 - 2
We are pleased to submit this 2011 Annual Report for Midas Magic (formerly Midas Special Fund), which seeks its objective of capital appreciation by investing in quality companies with unique combinations of strength in operations, products, and finances that can potentially offer growth in addition to value. The Fund’s flexible “go anywhere” investment policies permit it to invest in any security type (i.e., common and preferred stocks, bonds, convertible securities, etc.) and in any industry sector, in domestic or foreign companies, and in companies of any size. The Fund may also invest in fixed income securities of any issuers without limitation as to credit quality or maturity. In seeking to enhance returns, the Fund may use futures, options, and short sales and may (and currently does) use considerable leverage. In seeking to even further enhance potential returns by earning fee income, the Fund lends its portfolio securities to brokers, dealers, and other financial institutions.
Market and Economic Report
Stock market performance for the year ended December 31, 2011 was positive, although volatile. Including the reinvestment of dividends in the one year period, the S&P 500 Index returned 2.11%, according to Morningstar, while the Fund enjoyed a total return of 8.62%. The index is unmanaged and is not available for direct investment.
In the calendar year 2011, real gross domestic product (GDP), or the output of goods and services produced by labor and property located in the United States, increased only 1.6%, as compared to an increase of 3.1% in 2010, according to a recent report of the U.S. Bureau of Economic Analysis. In an announcement well received by financial markets, to support the moderately expanding economy, the Federal Open Market Committee (FOMC) has indicated that it will keep the target range for the federal funds interest rate at 0% to 0.25% in the near term. While the FOMC has noted that there appears to be some improvement in overall labor market conditions, it seems to view the unemployment rate as elevated and, although household spending has continued to advance, it observes that growth in business fixed investment has slowed and the housing sector remains depressed.
Focused, Steady Investment Strategies for the Long Term
In these uncertain market conditions, the Fund’s strategy was generally to stay the course, maintain a disciplined but aggressively leveraged investment posture, and concentrate its portfolio in quality companies with attractive valuations. At December 31, 2011, the Fund held shares in just 11 companies and its top ten holdings comprised approximately 98% of its total assets, with over 27% of its common stock portfolio in one holding, Berkshire Hathaway, Inc. The Fund holds predominantly blue chip and other well known companies in its portfolio, including some of the strongest companies with global operations in insurance, technology, and banking. As the Fund pursues its capital appreciation objective, its holdings and allocations are subject to substantial change at any time.
TOP |
| | 10 HOLDINGS As of December 31, 2011 |
| | |
| 1 | Berkshire Hathaway, Inc. Class B |
| 2 | MasterCard, Inc. |
| 3 | Google Inc. |
| 4 | Apple Inc. |
| 5 | Costco Wholesale Corp. |
| 6 | Canadian Natural Resources Ltd. |
| 7 | Johnson & Johnson |
| 8 | JPMorgan Chase & Co. |
| 9 | General Electric Company |
| 10 | The Travelers Companies, Inc. |
| |
| Top Ten Holdings comprise approximately 98% of total assets. |
| |
Contact Us for Information and Services
Midas Magic’s aggressive approach to quality investing makes it an attractive vehicle for a financial planning program with long term objectives. For a strategy with retirement goals, we believe the Fund can be appropriate for tax advantaged accounts, such as the Midas Traditional, Roth, SEP, or SIMPLE IRA, as well as the Midas Health Savings Account and the Midas Education Savings Account. Forms for all of these tax advantaged plans may be found at www.MidasFunds.com. For more information simply give us a call toll free at 1-800-400-MIDAS (6432).
Midas Annual Report 2011 - 3
It is a pleasure to submit this 2011 Annual Report for Midas Perpetual Portfolio and we are delighted to welcome our new shareholders who have invested in the Fund. It is gratifying to see such a welcoming response to the Fund’s objective of preserving and increasing the purchasing power value of its shares over the long term, as well as its track record of past performance and its no charge shareholder services.
Economic Report and Fund Strategies
Although the U.S. economy was able to show positive growth for 2011, the Federal Open Market Committee (FOMC) has indicated that it anticipates subdued economic conditions, including low rates of resource utilization, to likely warrant exceptionally low levels for the federal funds interest rate at least through late 2014. In these times of low yields, we are particularly pleased to report that while inflation, as measured by the Consumer Price Index, in 2009, 2010, and 2011 increased 2.72%, 1.50%, and 2.96%, Midas Perpetual Portfolio advanced 17.03%, 13.04%, and 0.96%, in each of these respective years.
In 2011, Midas Perpetual Portfolio remained true to its core asset allocation strategy in seeking to preserve and increase the value of its overall portfolio in view of these challenging circumstances. This core asset allocation strategy means the Fund generally seeks to invest a “Target Percentage” of its total assets of each of the following categories, consistent with tax planning and monitoring portfolio turnover:
| Investment Category | Target Percentage |
| Gold | 20% |
| Silver | 5% |
| Swiss Franc Assets | 10% |
| Hard Asset Securities | 15% |
| Large Capitalization Growth Stocks | 15% |
| Dollar Assets | 35% |
| Total | 100% |
As a result, during the year, the Fund maintained its focus on investments in gold and silver (through exchange traded funds and mining shares), Swiss franc denominated bonds of the federal government of Switzerland, shares of real estate and natural resource companies, large capitalization growth stocks, and U.S. money market funds.
For 2012, the U.S. Congressional Budget Office is projecting modest GDP growth of 2% and unemployment over 8%. The U.S. economic outlook appears to be for a slow economy and a challenging job market, with low interest rates and inflation.
TOP |
| | 10 HOLDINGS As of December 31, 2011 |
| | |
| 1 | SSgA Money Market Fund |
| 2 | SPDR Gold Trust |
| 3 | Switzerland Government, 2.5% Notes, due 3/12/16 |
| 4 | iShares Silver Trust |
| 5 | Switzerland Government, 2.25% Notes, due 7/6/20 |
| 6 | Comcast Corp. |
| 7 | Companhia de Bebidas das Americas - AMBEV |
| 8 | Apple Inc. |
| 9 | Newmont Mining Corp. |
| 10 | Anglo American PLC |
| |
| Top Ten Holdings comprise approximately 72% of total assets. |
| |
Globally, we are concerned by a further slowing of the Chinese economy and the Eurozone’s sovereign debt and banking issues. Nevertheless, we are encouraged by the potential for strength in financial markets derived in part by an accommodative monetary policy and a perception that an economic recovery may occur. The outlook for many of the world’s economies reinforces our view of the potential benefits and risks of the Fund’s investment in a number of different asset categories.
Contact Us for Information and Services
Since the Fund’s strategies reflect longer term wealth building goals, we believe that it can be especially appropriate for a program of steady monthly investing. To make regular investing in the Fund as easy, convenient, and affordable as possible, we offer the Midas Bank Transfer Plan. For information, simply visit www.MidasFunds.com or give us a call toll free at 1-800-400-MIDAS (6432) and we will be delighted to provide such information to you, a friend, or a relative.
Midas Annual Report 2011 - 4
Portfolio Commentary
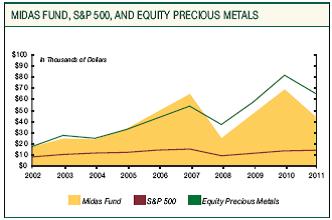
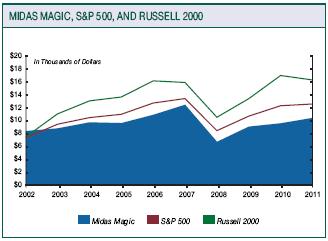
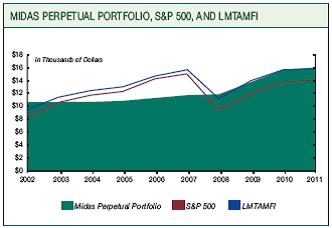
Results of $10,000 Investment
January 1, 2002 Through December 31, 2011
The performance graphs show returns of an initial investment of $10,000 in Midas Fund, Midas Magic, and Midas Perpetual Portfolio from 1/1/02 to 12/31/11. Midas Fund is compared to the S&P 500 and the Morningstar Category of Equity Precious Metals funds, an index of 80 funds, 41 of which have been in existence since 12/31/02. Midas Magic is compared to the S&P 500 and the Russell 2000. Midas Perpetual Portfolio is compared to the S&P 500 and Lipper Mixed-Asset Target Allocation Moderate Funds Index (“LMTAMFI”). Results in each case reflect reinvestment of dividends, interest, and distributions but do not reflect a deduction for, if any, short term redemption fees, account expenses, or shareholder taxes. The S&P 500, a broad equity index, and the Russell 2000, a small company index, are unmanaged and fully invested in common stocks. The LMTAMFI is an equally weighted average of the managed mixed-asset target allocation moderate funds tracked by Lipper which reflects certain of the market sectors in which the Fund may invest. You cannot invest directly in an index.
Past performance is not predictive of future performance.
Prior to December 29, 2008, Midas Perpetual Portfolio (formerly known as Midas Dollar Reserves, Inc.) operated as a money market fund and invested exclusively in securities issued by the U.S. Government, its agencies and instrumentalities. On December 29, 2008, the Fund began operating as a fluctuating net asset value fund pursuant to its current investment objective and policies. The performance included in the table and chart below for the periods commencing on or after January 1, 2002 reflects the Fund’s performance as a money market fund up to December 28, 2008 and thereafter as a fluctuating net asset value fund. The performance information shown also reflects the fees and expenses of the Fund as a money market fund.
Results of $10,000 Investment January 1, 2002 Through December 31, 2011 | |
| | | Value as of 12/31/11 | | | % Aggregate Total Return*† | | | % Avg. Annual Return*† | |
| |
| Midas Fund | | $ | 40,670 | | | | 306.70 | % | | | 15.06 | % |
| Midas Magic | | $ | 11,073 | | | | 10.73 | % | | | 1.02 | % |
| Midas Perpetual Portfolio | | $ | 15,012 | | | | 50.12 | % | | | 4.15 | % |
| Equity Precious Metals | | $ | 59,756 | | | | 497.56 | % | | | 19.57 | % |
| Russell 2000 | | $ | 17,276 | | | | 72.76 | % | | | 5.62 | % |
| LMTAMFI | | $ | 14,891 | | | | 48.91 | % | | | 4.06 | % |
| S&P 500 | | $ | 13,335 | | | | 33.35 | % | | | 2.92 | % |
| Average Annual Total Return for the Periods Ended December 31, 2011* | |
| | | 1 Year | | | 5 Years | | | 10 Years | |
| Midas Fund | | | (35.97 | )% | | | (2.15 | )% | | | 15.06 | % |
| Midas Magic | | | 8.62 | % | | | (0.90 | )% | | | 1.02 | % |
| Midas Perpetual Portfolio | | | 0.96 | % | | | 7.05 | % | | | 4.15 | % |
* The returns shown do not reflect the deduction of taxes if any, that a shareholder would pay on Fund distributions or the redemption of Fund shares. † For the 10 year period ended December 31, 2011. | |
Midas Annual Report 2011 - 5
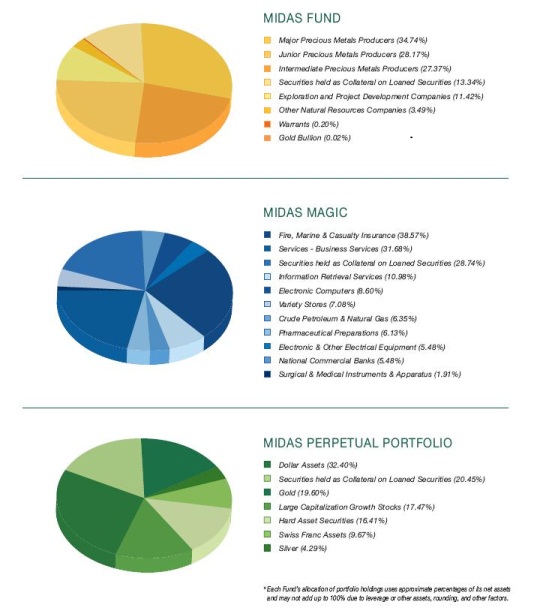
Portfolio Commentary
| | * Each Fund’s allocation of portfolio holdings uses approximate percentages of its net assets and may not add up to 100% due to leverage or other assets, rounding, and other factors. |
Midas Annual Report 2011 - 6
Portfolio Commentary
Fund shareholders may incur two types of costs: (1) transaction costs, including redemption or small account fees; and (2) ongoing costs, including management fees, distribution and service 12b-1 fees, and other fund expenses. This example is intended to help you understand your ongoing costs (in dollars) of investing in your Fund and to compare these costs with the ongoing cost of investing in other mutual funds. The example is based on an investment of $1,000 made at the beginning of the period and held for the entire period from July 1, 2011 to December 31, 2011.
Actual Expenses
The table provides information about actual account values and actual expenses for each Fund. You may use the information, together with the amount you invested, to estimate the expenses that you paid over the period. First, identify the Fund you own. Then simply divide your account value by $1,000 (for example, an $8,600 account value divided by $1,000 = 8.6), then multiply the result by the number under the heading “Expenses Paid During Period” to estimate the expenses you paid on your account during this period. The Fund may charge you a $20 annual small balance account fee if the value of those shares is less than $500. We will redeem shares automatically in one of your accounts to pay the $20 fee. In determining your total eligible investment amount, we will include your investments in all personal accounts registered under your Social Security number. Personal accounts include individual accounts, joint accounts, UGMA/UTMA accounts, personal trusts, Coverdell Education Savings Accounts, and IRAs (including traditional, Roth, Rollover, SEP, SARSEP, and SIMPLE-IRAs), and certain other retirement accounts.
Hypothetical Example for Comparison Purposes
The table also provides information about hypothetical account values and hypothetical expenses based on the actual expense ratio of each Fund and an assumed rate of return of 5% per year before expenses, which is not the actual return of a Fund. The hypothetical account values and expenses may not be used to estimate the actual ending account balance or expenses you paid for the period. You may use this information to compare the ongoing costs of investing in your Fund and other funds. To do so, compare this 5% hypothetical example with the 5% hypothetical examples that appear in the shareholder reports of the other funds.
| EXPENSE ANALYSIS TABLE | | | | | | | | | | |
| | | Beginning Account Value July 1, 2011 | | | Ending Account Value December 31, 2011 | | | Expenses Paid During Period July 1, 2011-December 31, 2011(a) | | | Annualized Expense Ratio | |
| |
| | | | | | | | | | | | | |
| Midas Fund | | | | | | | | | | | | |
| Actual | | $ | 1,000.00 | | | $ | 640.30 | | | $ | 9.55 | | | | 2.31 | % |
Hypothetical (b) | | $ | 1,000.00 | | | $ | 1,013.56 | | | $ | 11.72 | | | | 2.31 | % |
| | | | | | | | | | | | | | | | | |
| Midas Magic | | | | | | | | | | | | | | | | |
| Actual | | $ | 1,000.00 | | | $ | 1,086.22 | | | $ | 21.88 | | | | 4.16 | % |
Hypothetical (b) | | $ | 1,000.00 | | | $ | 1,004.23 | | | $ | 21.02 | | | | 4.16 | % |
| | | | | | | | | | | | | | | | | |
| Midas Perpetual Portfolio | | | | | | | | | | | | | | | | |
| Actual | | $ | 1,000.00 | | | $ | 1,009.57 | | | $ | 9.37 | | | | 1.85 | % |
Hypothetical (b) | | $ | 1,000.00 | | | $ | 1,015.88 | | | $ | 9.40 | | | | 1.85 | % |
(a) Expenses are equal to the Fund’s annualized expense ratio multiplied by the average account value over the period, multiplied by 184, the number of days in the most recent fiscal half year, divided by 365, to reflect the one half year period. (b) Assumes 5% total return before expenses. | |
Midas Annual Report 2011 - 7
Financial Statements
| MIDAS Fund | Schedule of Portfolio Investments - December 31, 2011 |
Common Stocks (105.19%) Shares | | Cost | | | Value |
| Major Precious Metals Producers (34.74%) | | | | | |
| | 100,000 | | AngloGold Ashanti Ltd. ADR (a) | | $ | 4,479,423 | | | $ | 4,245,000 |
| | 190,000 | | Goldcorp Inc. (a) | | | 9,416,419 | | | | 8,407,500 |
| | 319,369 | | Kinross Gold Corp. (a) | | | 6,409,617 | | | | 3,640,807 |
| | 100,761 | | Newcrest Mining Ltd. (b) | | | 2,220,703 | | | | 3,057,694 |
| | 100,000 | | Newmont Mining Corp. (a) | | | 5,940,870 | | | | 6,001,000 |
| | | | | | | 28,467,032 | | | | 25,352,001 |
| Intermediate Precious Metals Producers (27.37%) | | | | | | | |
| | 350,000 | | African Barrick Gold plc | | | 3,061,809 | | | | 2,495,571 |
| | 275,400 | | Centerra Gold Inc. (a) | | | 2,833,774 | | | | 4,868,352 |
| | 325,000 | | Eldorado Gold Corp. Ltd. (a) | | | 5,655,700 | | | | 4,455,750 |
| | 200,000 | | IAMGOLD Corp. (a) | | | 3,671,460 | | | | 3,170,000 |
| | 30,000 | | Randgold Resources Ltd. ADR (b) | | | 2,403,978 | | | | 3,063,000 |
| | 300,000 | | Silvercorp Metals, Inc. (a) | | | 1,941,191 | | | | 1,920,000 |
| | | | | | | 19,567,912 | | | | 19,972,673 |
| Junior Precious Metals Producers (28.17%) | | | | | | | |
| | 200,000 | | Alamos Gold Inc. (a) | | | 2,506,500 | | | | 3,447,091 |
| | 135,000 | | Aurizon Mines Ltd. (c) | | | 797,838 | | | | 665,550 |
| | 2,100,000 | | Avocet Mining PLC | | | 3,548,756 | | | | 6,021,353 |
| | 600,000 | | CGA Mining Ltd. (c) | | | 895,814 | | | | 1,207,955 |
| | 1,000,000 | | Great Basin Gold Ltd. (b) (c) | | | 2,816,753 | | | | 910,975 |
| | 1,000,000 | | Jaguar Mining, Inc. (b) (c) | | | 4,985,274 | | | | 6,379,966 |
| | 1,145,001 | | Resolute Mining Ltd. (c) | | | 1,438,257 | | | | 1,925,121 |
| | | | | | | 16,989,191 | | | | 20,558,011 |
| Exploration and Project Development Companies (11.42%) | | | | | | | |
| | 250,000 | | Corvus Gold Inc. (b) (c) | | | 290,236 | | | | 137,491 |
| | 85,000 | | Detour Gold Corp. (a) (c) | | | 1,266,311 | | | | 2,099,435 |
| | 500,000 | | Geomark Exploration Ltd. (c) | | | 174,406 | | | | 387,920 |
| | 12,000 | | Ivanhoe Mines Ltd. (b) (c) | | | 214,541 | | | | 212,640 |
| | 188,495 | | Ivanplats Ltd. (c) (d) | | | 0 | | | | 113,097 |
| | 500,000 | | Northern Dynasty Minerals Ltd. (b) (c) | | | 6,315,719 | | | | 3,020,000 |
| | 1,500,000 | | Platinum Group Metals Ltd. (b) (c) | | | 3,159,430 | | | | 1,305,000 |
| | 1,000,000 | | Romarco Minerals Inc. (c) | | | 1,998,208 | | | | 1,060,643 |
| | | | | | | 13,418,851 | | | | 8,336,226 |
Financial Statements
| MIDAS Fund | Schedule of Portfolio Investments - December 31, 2011 continued |
| Other Natural Resources Companies (3.49%) | | | | | | | |
| | 175,000 | | HudBay Minerals Inc. | | $ | 2,861,250 | | | $ | 1,727,250 |
| | 550,000 | | Mercator Minerals Ltd. (c) | | | 2,891,248 | | | | 815,615 |
| | | | | | | 5,752,498 | | | | 2,542,865 |
| | | | | | | | |
| Total common stocks | | | 84,195,484 | | | | 76,761,776 |
| | | | | | | | |
Warrants (0.20%) (c) | | | | | | | |
| | 142,900 | | Kinross Gold Corp., expiring 9/03/13 | | | 577,052 | | | | 134,725 |
| | 7,150 | | Kinross Gold Corp., expiring 9/17/14 (b) | | | - | | | | 10,182 |
| | | | | | | | | | |
| Total warrants | | | | | 577,052 | | | | 144,907 |
| | | | | | | | |
Bullion Ounces (0.02%) (c) | | | | | | | |
| | 10 | | Gold | | | 9,643 | | | | 15,635 |
| Securities held as Collateral on Loaned Securities (13.34%) | | | | | | | |
| | 9,736,200 | | State Street Navigator Securities Lending Prime Portfolio | | | 9,736,200 | | | | 9,736,200 |
| | | | | | | | | | | |
Total investments (118.75%) | | $ | 94,518,379 | | | | 86,658,518 |
| | | | | | | | | | |
| Liabilities in excess of other assets (-18.75%) | | | | | | | (13,685,641 |
| | | | | | | | | | | |
| Net assets (100.00%) | | | | | | $ | 72,972,877 |
| | | | | | | | | | | |
(a) Fully or partially pledged as collateral on bank credit facility. (b) All or a portion of this security was on loan. (c) Non-income producing. (d) Illiquid and/or restricted security that has been fair valued. ADR means “American Depositary Receipt.” | | | | | | | |
See notes to financial statements.
Midas Annual Report 2011 - 9
Financial Statements
| MIDAS Magic | Schedule of Portfolio Investments - December 31, 2011 |
Common Stocks (122.26%) Shares | | Cost | | | Value |
| Crude Petroleum & Natural Gas (6.35%) | | | | | |
| | 20,000 | | Canadian Natural Resources Ltd. | | $ | 522,599 | | | $ | 747,400 |
| | | | | | | | |
| Electronic Computers (8.60%) | | | | | | | |
| | 2,500 | | Apple Inc. (a) (b) | | | 477,375 | | | | 1,012,500 |
| | | | | | | | |
| Electronic & Other Electrical Equipment (5.48%) | | | | | | | |
| | 36,000 | | General Electric Company (a) | | | 435,510 | | | | 644,760 |
| | | | | | | | |
| Fire, Marine & Casualty Insurance (38.57%) | | | | | | | |
| | 52,500 | | Berkshire Hathaway, Inc. Class B (a) (b) (c) | | | 1,744,890 | | | | 4,005,750 |
| | 9,000 | | The Travelers Companies, Inc. | | | 416,182 | | | | 532,530 |
| | | | | | | 2,161,072 | | | | 4,538,280 |
| Information Retrieval Services (10.98%) | | | | | | | |
| | 2,000 | | Google, Inc. (a) (b) | | | 758,730 | | | | 1,291,800 |
| | | | | | | | |
| National Commercial Banks (5.48%) | | | | | | | |
| | 19,400 | | JP Morgan Chase & Co. (a) | | | 691,858 | | | | 645,050 |
| | | | | | | | |
| Pharmaceutical Preparations (6.13%) | | | | | | | |
| | 11,000 | | Johnson & Johnson (a) | | | 669,169 | | | | 721,380 |
| | | | | | | | |
| Services - Business Services (31.68%) | | | | | | | |
| | 10,000 | | MasterCard, Inc. (a) | | | 937,175 | | | | 3,728,200 |
| | | | | | | | |
| Surgical & Medical Instruments & Apparatus (1.91%) | | | | | | | |
| | 3,000 | | Becton, Dickinson and Company | | | 210,947 | | | | 224,160 |
Midas Annual Report 2011 - 10
Financial Statements
| MIDAS Magic | Schedule of Portfolio Investments - December 31, 2011 continued |
| Variety Stores (7.08%) | | | | | | | | |
| | 10,000 | | Costco Wholesale Corp. (a) | | $ | 692,696 | | | $ | 833,200 | |
| Total common stocks | | | 7,557,131 | | | | 14,386,730 | |
| | | | | | | | | |
| | | | | | | | | |
| Securities held as Collateral on Loaned Securities (28.74%) | | | | | | | | |
| | 3,382,643 | | State Street Navigator Securities Lending Prime Portfolio | | | 3,382,643 | | | | 3,382,643 | |
| | | | | | | | | |
| | | | | | | | | |
| Total investments (151.00%) | | $ | 10,939,774 | | | | 17,769,373 | |
| | | | | | | | | |
| Liabilities in excess of other assets (-51.00%) | | | | | | | (6,001,385) | |
| | | | | | | | | |
| Net assets (100.00)% | | | | | | $ | 11,767,988 | |
(a) Fully or partially pledged as collateral on bank credit facility. (b) Non-income producing. (c) All or a portion of this security was on loan. | | | | | | | | |
See notes to financial statements.
Midas Annual Report 2011 - 11
Financial Statements
| Shares | | | | Cost | | | Value | |
| | | | | | |
| | 3,700 | | Newmont Mining Corp. | | $ | 224,766 | | | $ | 222,037 | |
| | 18,471 | | SPDR Gold Trust (a) | | | 1,821,139 | | | | 2,807,407 | |
| | | | | | | 2,045,905 | | | | 3,029,444 | |
| | | | | | | | |
| | 24,643 | | iShares Silver Trust (a) (b) | | | 302,396 | | | | 663,882 | |
| | | | | | | | | |
Swiss Franc Assets (9.67%) (c) | | | | | | | | |
| | 907,000 | | Switzerland Government 2.50% Notes, due 3/12/16 | | | 954,047 | | | | 1,067,376 | |
| | 350,000 | | Switzerland Government 2.25% Notes, due 7/06/20 | | | 480,287 | | | | 427,089 | |
| | | | | | | 1,434,334 | | | | 1,494,465 | |
| Hard Asset Securities (16.41%) | | | | | | | | |
| Agricultural Chemicals (1.02%) | | | | | | | | |
| | 2,678 | | Syngenta AG | | | 170,440 | | | | 157,841 | |
| | | | | | | | | |
| Crude Petroleum & Natural Gas (3.84%) | | | | | | | | |
| | 750 | | CNOOC Limited | | | 145,128 | | | | 131,010 | |
| | 2,717 | | Contango Oil & Gas Company (a) (b) | | | 157,155 | | | | 158,075 | |
| | 1,600 | | EOG Resources, Inc. (b) | | | 151,590 | | | | 157,616 | |
| | 1,182 | | PetroChina Company Limited (b) | | | 141,065 | | | | 146,934 | |
| | | | | | | 594,938 | | | | 593,635 | |
| Metal Mining (4.86%) | | | | | | | | |
| | 11,000 | | Anglo American PLC ADR (b) | | | 205,452 | | | | 199,650 | |
| | 1,800 | | BHP Billiton Ltd. | | | 147,390 | | | | 127,134 | |
| | 10,000 | | First Quantum Minerals Ltd. | | | 215,450 | | | | 196,907 | |
| | 2,249 | | Rio Tinto Ltd. (b) | | | 159,432 | | | | 110,021 | |
| | 5,500 | | Vale S.A. (b) | | | 147,761 | | | | 117,975 | |
| | | | | | | 875,485 | | | | 751,687 | |
| Mining & Quarrying of Nonmetallic Minerals (0.94%) | | | | | | | | |
| | 2,694 | | Sociedad Quimica Y Minera De Chile S.A. | | | 154,921 | | | | 145,072 | |
Midas Annual Report 2011 - 12
| | Shares | | | | | Cost | | | | Value | |
| Miscellaneous Metal Ores (0.45%) | | | | | | | | |
| | 3,898 | | Cameco Corp. | | $ | 155,237 | | | $ | 70,359 | |
| | | | | | | | | |
| Petroleum Refining (1.14%) | | | | | | | | |
| | 2,079 | | Exxon Mobil Corp. (b) | | $ | 155,237 | | | $ | 70,359 | |
| | | | | | | | | |
| Railroads, Line - Haul Operating (1.07%) | | | | | | | | |
| | 2,100 | | Canadian National Railway Company | | | 150,279 | | | | 164,976 | |
| | | | | | | | | |
| Real Estate Investment Trusts (2.19%) | | | 141,090 | | | | 181,585 | |
| | 3,330 | | Health Care REIT, Inc. (b) | | | 165,852 | | | | 156,590 | |
| | 2,825 | | PS Business Parks, Inc. (b) | | | 306,942 | | | | 338,175 | |
| | | | | | | | | |
| Steel Works, Blast Furnaces & Rolling Mills (0.90%) | | | | | | | | |
| | 3,519 | | Nucor Corp. (b) | | | 160,522 | | | | 139,247 | |
| Total hard asset securities | | | 2,730,647 | | | | 2,537.208 | |
| | | | | | | | | |
| Large Capitalization Growth Stocks (17.47%) | | | | | | | | |
| Beverages (1.56%) | | | | | | | | |
| | 6,692 | | Companhia de Bebidas das Americas-AMBEV (b) | | | 196,126 | | | | 241,514 | |
| | | | | | | | | |
| Cable and Other Pay Television Services (1.69%) | | | | | | | | |
| | 11,000 | | Comcast Corp. | | | 221,855 | | | | 260,810 | |
| | | | | | | | | |
| Cigarettes (1.22%) | | | | | | | | |
| | 2,400 | | Philip Morris International Inc. | | | 163,238 | | | | 188,352 | |
| | | | | | | | | |
| Communications Equipment (1.10%) | | | | | | | | |
| | 9,422 | | Cisco Systems, Inc. | | | 172,573 | | | | 170,350 | |
Midas Annual Report 2011 - 13
| | Shares | | | | | Cost | | | | Value | |
| Electronic Computers (2.23%) | | | | | | | | |
| | 575 | | Apple Inc. (a) | | | 214,352 | | | | 232,875 | |
| | 4,331 | | Hewlett-Packard Company | | | 181,161 | | | | 111,567 | |
| | | | 395,513 | | | | 344,442 | |
| Hospital and Medical Service Plans (1.15%) | | | | | | | | |
| | 3,500 | | UnitedHealth Group Inc. (b) | | | 157,271 | | | | 177,380 | |
| | | | | | | | | |
| Life Insurance (0.76%) | | | | | | | | |
| | 3,180 | | China Life Insurance Company Ltd. ADR (b) | | | 191,727 | | | | 117,565 | |
| | | | | | | | | |
| National Commercial Banks (1.09%) | | | | | | | | |
| | 6,140 | | Wells Fargo & Company | | | 196,956 | | | | 169,218 | |
| | | | | | | | | |
| Pharmaceutical Preparations (1.11%) | | | | | | | | |
| | 3,000 | | Novartis AG | | | 167,147 | | | | 171,510 | |
| | | | | | | | | |
| Services-Prepackaged Software (2.17%) | | | | | | | | |
| | 6,994 | | Microsoft Corp. (b) | | | 181,291 | | | | 181,564 | |
| | 6,000 | | Oracle Corp. | | | 165,038 | | | | 153,900 | |
| | | | 346,329 | | | | 335,464 | |
| State Commercial Banks (2.16%) | | | | | | | | |
| | 9,672 | | Banco Bradesco S.A. (b) | | | 196,953 | | | | 161,329 | |
| | 9,300 | | Itau Unibanco Holding S.A. (b) | | | 160,941 | | | | 172,608 | |
| | | | 357,894 | | | | 333,937 | |
| Telephone Communications (1.23%) | | | | | | | | |
| | 3,935 | | China Mobile Ltd. ADR (b) | | | 199,078 | | | | 190,808 | |
| Total large capitalization growth stocks | | | 2,765,707 | | | | 2,701,350 | |
| | | | | | | | | |
Midas Annual Report 2011 - 14
Financial Statements
| MIDAS Perpetual Portfolio | Schedule of Portfolio Investments - December 31, 2011 concluded |
| | Shares | | | | | Cost | | | | Value | |
| Dollar Assets (32.40%) | | | | | | | | |
| Money Market Fund | | | | | | | | |
| | 5,008,730 | | SSgA Money Market Fund, 7 day annualized yield 0.01% | | | $5,008,730 | | | | $5,008,730 | |
| | | | | | | | | |
| Securities held as Collateral on Loaned Securities (20.45%) | | | | | | | | |
| | 3,160,644 | | State Street Navigator Securities Lending Prime Portfolio | | | 3,160,644 | | | | 3,160,644 | |
| | | | | | | | | |
| Total investments (120.29%) | | | $17,448,363 | | | | 18,595,723 | |
| | | | | | | | | |
| Liabilities in excess of other assets (-20.29%) | | | | | | | (3,137,049 | ) |
| Net assets (100.00%) | | | | | | | $15,458,674 | |
| | | | | | | | | |
| | | | | | | | | |
(a) Non-income producing. (b) All or a portion of this security was on loan. (c) Principal amount denominated in Swiss Francs. ADR means “American Depositary Receipt.” | | | | | | | | |
See notes to financial statements.
Midas Annual Report 2011 - 15
| December 31, 2011 | | MIDAS Fund | | | MIDAS Magic | | | MIDAS Perpetual Portfolio | |
| | | | | | | | | | |
| Assets | | | | | | | | | |
| Investments, at cost | | $ | 94,518,379 | | | $ | 10,939,774 | | | $ | 17,448,363 | |
| | | | | | | | | | | | | |
| Investments, at value (including $9,736,200, $3,382,643, | | | | | | | | | | | | |
| and $3,160,644 for securities loaned, respectively) | | $ | 86,658,518 | | | $ | 17,769,373 | | | $ | 18,595,723 | |
| Receivables | | | | | | | | | | | | |
| Dividends | | | 27,511 | | | | 7,623 | | | | 10,298 | |
| Fund shares sold | | | 23,561 | | | | - | | | | 33,880 | |
| Securities sold | | | 12,441 | | | | - | | | | - | |
| Income from securities loaned | | | 3,604 | | | | 287 | | | | 795 | |
| Interest | | | - | | | | - | | | | 15,388 | |
| Foreign withholding taxes reclaimed | | | - | | | | - | | | | 37,055 | |
| Other assets | | | 43,945 | | | | 6,667 | | | | 9,292 | |
| | | | | | | | | | | | | |
| Total assets | | | 86,769,580 | | | | 17,783,950 | | | | 18,702,431 | |
| | | | | | | | | | | | | |
| Liabilities | | | | | | | | | | | | |
| Collateral on securities loaned, at value | | | 9,736,200 | | | | 3,382,643 | | | | 3,160,644 | |
| Bank line of credit | | | 3,708,399 | | | | 2,542,885 | | | | - | |
| Payables | | | | | | | | | | | | |
| Accrued expenses | | | 213,460 | | | | 66,854 | | | | 57,224 | |
| Investment management fees | | | 62,167 | | | | 9,115 | | | | - | |
| Fund shares redeemed | | | 38,075 | | | | 2,892 | | | | 18,686 | |
| Administrative services | | | 21,027 | | | | 1,663 | | | | 3,912 | |
| Distribution fees | | | 17,375 | | | | 9,910 | | | | 3,291 | |
| | | | | | | | | | | | | |
| Total liabilities | | | 13,796,703 | | | | 6,015,962 | | | | 3,243,757 | |
| | | | | | | | | | | | | |
| Net assets | | $ | 72,972,877 | | | $ | 11,767,988 | | | $ | 15,458,674 | |
| | | | | | | | | | | | | |
| Shares outstanding, $0.01 par value | | | 20,435,102 | | | | 735,294 | | | | 12,700,320 | |
| | | | | | | | | | | | | |
| Net asset value, offering, and redemption price per share | | $ | 3.57 | | | $ | 16.00 | | | $ | 1.22 | |
| | | | | | | | | | | | | |
| Net assets consist of | | | | | | | | | | | | |
| Paid in capital | | $ | 97,557,818 | | | $ | 8,057,223 | | | $ | 14,310,972 | |
| Accumulated undistributed net investment loss | | | (2,765,326 | ) | | | - | | | | (3 | ) |
| Accumulated net realized gain (loss) | | | (13,959,778 | ) | | | (3,118,868 | ) | | | - | |
| Net unrealized appreciation (depreciation) on investments | | | | | | | | | | | | |
| and foreign currencies | | | (7,859,837 | ) | | | 6,829,633 | | | | 1,147,705 | |
| | | | | | | | | | | | | |
| | | $ | 72,972,877 | | | $ | 11,767,988 | | | $ | 15,458,674 | |
| | | | | | | | | | | | | |
| | | | | | | | | | | | | |
See notes to financial statements.
Midas Annual Report 2011 - 16
| For the Year Ended December 31, 2011 | | MIDAS Fund | | | MIDAS Magic | | | MIDAS Perpetual Portfolio | |
| | | | | | | | | | |
| Investment income | | | | | | | | | |
| Dividends | | $ | 1,047,889 | | | $ | 110,548 | | | $ | 109,627 | |
| Income from securities loaned | | | 71,094 | | | | 2,088 | | | | 8,318 | |
| Foreign tax withholding | | | (69,796 | ) | | | (1,135 | ) | | | (6,763 | ) |
| Interest | | | - | | | | - | | | | 18,877 | |
| | | | | | | | | | | | | |
| Total investment income | | | 1,049,187 | | | | 111,501 | | | | 130,059 | |
| | | | | | | | | | | | | |
| Expenses | | | | | | | | | | | | |
| Investment management | | | 1,037,279 | | | | 111,348 | | | | 76,363 | |
| Transfer agent | | | 378,200 | | | | 66,965 | | | | 36,835 | |
| Distribution | | | 259,319 | | | | 112,981 | | | | 38,181 | |
| Interest and fees on bank credit facility | | | 157,162 | | | | 36,548 | | | | - | |
| Legal | | | 143,025 | | | | 23,310 | | | | 17,850 | |
| Administrative services | | | 125,160 | | | | 12,260 | | | | 20,065 | |
| Bookkeeping and pricing | | | 65,075 | | | | 22,855 | | | | 23,915 | |
| Printing and postage | | | 58,280 | | | | 13,815 | | | | 13,352 | |
| Directors | | | 45,875 | | | | 10,220 | | | | 4,581 | |
| Registration | | | 40,325 | | | | 26,450 | | | | 26,200 | |
| Insurance | | | 28,470 | | | | 5,225 | | | | 1,610 | |
| Auditing | | | 27,310 | | | | 22,097 | | | | 18,550 | |
| Custodian | | | 19,910 | | | | 3,689 | | | | 3,943 | |
| Other | | | 6,179 | | | | 1,796 | | | | 608 | |
| | | | | | | | | | | | | |
| Total expenses | | | 2,391,569 | | | | 469,559 | | | | 282,053 | |
| Less contractual investment management fee waiver | | | - | | | | - | | | | (76,363 | ) |
| | | | | | | | | | | | | |
| Net expenses | | | 2,391,569 | | | | 469,559 | | | | 205,690 | |
| | | | | | | | | | | | | |
| Net investment loss | | | (1,342,382 | ) | | | (358,058 | ) | | | (75,631 | ) |
| Realized and Unrealized Gain (Loss) | | | | | | | | | | | | |
| Net realized gain (loss) on | | | | | | | | | | | | |
| Investments | | | 489,038 | | | | (552,861 | ) | | | 939,745 | |
| Foreign currencies | | | 208,545 | | | | 58 | | | | 19,368 | |
| Unrealized appreciation (depreciation) on | | | | | | | | | | | | |
| Investments | | | (42,637,445 | ) | | | 1,921,981 | | | | (699,465 | ) |
| Translation of assets and liabilities in foreign currencies | | | (1,212,264 | ) | | | 34 | | | | (170,207 | ) |
| | | | | | | | | | | | | |
| Net realized and unrealized gain (loss) | | | (43,152,126 | ) | | | 1,369,212 | | | | 89,441 | |
| Net increase (decrease) in net assets resulting | | | | | | | | | | | | |
| from operations | | $ | (44,494,508 | ) | | $ | 1,011,154 | | | $ | 13,810 | |
| | | | | | | | | | | | | |
| | | | | | | | | | | | | |
See notes to financial statements.
Midas Annual Report 2011 - 17
For the Years Ended December 31, 2011 and 2010 | | MIDAS Fund | | | MIDAS Magic | | | MIDAS Perpetual Portfolio | |
| | | 2011 | | | 2010 | | | 2011 | | | | | | 2011 | | | 2010 | |
| Operations | | | | | | | | | | | | | | | | | | |
| Net investment loss | | $ | (1,342,382 | ) | | $ | (1,811,559 | ) | | $ | (358,058 | ) | | $ | (379,956 | ) | | $ | (75,631 | ) | | $ | (90,997 | ) |
| Net realized gain (loss) | | | 697,583 | | | | 17,273,383 | | | | (552,803 | ) | | | (664,083 | ) | | | 959,113 | | | | 161,056 | |
| Unrealized appreciation (depreciation) | | | (43,849,709 | ) | | | 31,005,965 | | | | 1,922,015 | | | | 1,687,394 | | | | (869,672 | ) | | | 1,012,057 | |
| | | | | | | | | | | | | | | | | | | | | | | | | |
| Net increase (decrease) in net assets | | | | | | | | | | | | | | | | | | | | | | | | |
| resulting from operations | | | (44,494,508 | ) | | | 46,467,789 | | | | 1,011,154 | | | | 643,355 | | | | 13,810 | | | | 1,082,116 | |
| | | | | | | | | | | | | | | | | | | | | | | | | |
| Distributions to shareholders | | | | | | | | | | | | | | | | | | | | | | | | |
| Ordinary income | | | (1,287,150 | ) | | | - | | | | - | | | | - | | | | (102,869 | ) | | | - | |
| Net realized gains | | | - | | | | - | | | | - | | | | - | | | | (942,091 | ) | | | - | |
| | | | | | | | | | | | | | | | | | | | | | | | | |
| Total distributions | | | (1,287,150 | ) | | | - | | | | - | | | | - | | | | (1,044,960 | ) | | | - | |
| | | | | | | | | | | | | | | | | | | | | | | | | |
| Capital share transactions | | | | | | | | | | | | | | | | | | | | | | | | |
| Change in net assets resulting from | | | | | | | | | | | | | | | | | | | | | | | | |
capital share transactions (a) | | | (20,897,338 | ) | | | (23,146,852 | ) | | | (1,483,279 | ) | | | 13,884 | | | | 5,863,978 | | | | 1,222,457 | |
| Redemption fees | | | 8,190 | | | | 11,801 | | | | 530 | | | | 626 | | | | 6,335 | | | | 4,281 | |
| | | | | | | | | | | | | | | | | | | | | | | | | |
| Increase (decrease) in net assets resulting | | | | | | | | | | | | | | | | | | | | | | | | |
| from capital share transactions | | | (20,889,148 | ) | | | (23,135,051 | ) | | | (1,482,749 | ) | | | 14,510 | | | | 5,870,313 | | | | 1,226,738 | |
| | | | | | | | | | | | | | | | | | | | | | | | | |
| Total change in net assets | | | (66,670,806 | ) | | | 23,332,738 | | | | (471,595 | ) | | | 657,865 | | | | 4,839,163 | | | | 2,308,854 | |
| | | | | | | | | | | | | | | | | | | | | | | | | |
| Net assets | | | | | | | | | | | | | | | | | | | | | | | | |
| Beginning of period | | | 139,643,683 | | | | 116,310,945 | | | | 12,239,583 | | | | 11,581,718 | | | | 10,619,511 | | | | 8,310,657 | |
| | | | | | | | | | | | | | | | | | | | | | | | | |
End of period (b) | | $ | 72,972,877 | | | $ | 139,643,683 | | | $ | 11,767,988 | | | $ | 12,239,583 | | | $ | 15,458,674 | | | $ | 10,619,511 | |
| | | | | | | | | | | | | | | | | | | | | | | | | |
(a) Capital share transactions were as follows: | | | | | | | | | | | | | | | | | | | | | | | | |
| Value | | | | | | | | | | | | | | | | | | | | | | | | |
| Shares sold | | $ | 15,210,763 | | | $ | 25,448,976 | | | $ | 869,429 | | | $ | 1,309,859 | | | $ | 17,781,674 | | | $ | 4,131,103 | |
| Shares issued in reinvestment of distributions | | | 1,187,301 | | | | - | | | | - | | | | - | | | | 1,008,096 | | | | - | |
| Shares redeemed | | | (37,295,402 | ) | | | (48,595,828 | ) | | | (2,352,708 | ) | | | (1,295,975 | ) | | | (12,925,792 | ) | | | (2,908,646 | ) |
| | | | | | | | | | | | | | | | | | | | | | | | | |
| Net increase (decrease) | | $ | (20,897,338 | ) | | $ | (23,146,852 | ) | | $ | (1,483,279 | ) | | $ | 13,884 | | | $ | 5,863,978 | | | $ | 1,222,457 | |
| | | | | | | | | | | | | | | | | | | | | | | | | |
| Number | | | | | | | | | | | | | | | | | | | | | | | | |
| Shares sold | | | 3,132,591 | | | | 5,795,951 | | | | 57,906 | | | | 91,033 | | | | 13,518,556 | | | | 3,456,412 | |
| Shares issued in reinvestment of distributions | | | 264,432 | | | | - | | | | - | | | | - | | | | 818,253 | | | | - | |
| Shares redeemed | | | (7,666,918 | ) | | | (11,539,586 | ) | | | (153,274 | ) | | | (91,222 | ) | | | (9,828,051 | | | | (2,468,976 | ) |
| | | | | | | | | | | | | | | | | | | | | | | | | |
| Net increase (decrease) | | | (4,269,895 | ) | �� | | (5,743,635 | ) | | | (95,368 | ) | | | (189 | ) | | | 4,508,758 | | | | 987,436 | |
| | | | | | | | | | | | | | | | | | | | | | | | | |
(b) End of period net assets include | | | | | | | | | | | | | | | | | | | | | | | | |
| undistributed net investment loss | | $ | (2,765,326 | ) | | $ | (1,997,833 | ) | | $ | - | | | $ | - | | | $ | (3 | ) | | $ | - | |
| | | | | | | | | | | | | | | | | | | | | | | | | |
| | | | | | | | | | | | | | | | | | | | | | | | | |
See notes to financial statements.
Midas Annual Report 2011 - 18
| For the Year Ended December 31, 2011 | | MIDAS Fund | | | MIDAS Magic | | | MIDAS Perpetual Portfolio | |
| | | | | | | | | | |
| Cash flows from operating activities | | | | | | | | | |
| Net (decrease) increase in net assets resulting from operations | | $ | (44,494,508 | ) | | $ | 1,011,154 | | | $ | 13,810 | |
| Adjustments to reconcile change in net assets resulting from | | | | | | | | | | | | |
| operations to net cash provided by (used in) operating activities: | | | | | | | | | | | | |
| Proceeds from sales of long term investments | | | 89,703,796 | | | | 1,329,604 | | | | 4,406,047 | |
| Purchase of long term investments | | | (51,035,761 | ) | | | (572,587 | ) | | | (7,704,796 | ) |
| Unrealized depreciation (appreciation) of investments | | | | | | | | | | | | |
| and foreign currencies | | | 43,849,709 | | | | (1,922,015 | ) | | | 869,672 | |
| Net realized (gain) loss on sales of investments | | | | | | | | | | | | |
| and foreign currencies | | | (697,583 | ) | | | 552,803 | | | | (959,113 | ) |
| Net sales (purchases) of short term investments | | | 208,545 | | | | 58 | | | | (1,374,427 | ) |
| Amortization of premium of investment securities | | | - | | | | - | | | | 15,359 | |
| Decrease (increase) in collateral for securities loaned | | | 8,816,421 | | | | (2,456,348 | ) | | | (188,079 | ) |
| Increase in dividends receivable | | | (8,788 | ) | | | (1,274 | ) | | | (7,768 | ) |
| Increase in receivable for investments sold | | | (12,441 | ) | | | - | | | | - | |
| Increase in securities lending income receivable | | | (2,076 | ) | | | (64 | ) | | | (416 | ) |
| Decrease in interest receivable | | | - | | | | - | | | | 1,006 | |
| Increase in foreign withholding taxes reclaimed | | | - | | | | - | | | | (14,309 | ) |
| (Increase) decrease other assets | | | (260 | ) | | | 1,938 | | | | (2,158 | ) |
| (Decrease) increase in payable upon return of securities loaned | | | (8,816,421 | ) | | | 2,456,348 | | | | 188,079 | |
| Decrease in payable for investments purchased | | | - | | | | - | | | | (117,101 | ) |
| (Decrease) increase in accrued expenses | | | (19,652 | ) | | | (9,045 | ) | | | 807 | |
| Decrease in investment management fees payable | | | (48,138 | ) | | | (940 | ) | | | - | |
| (Decrease) increase in distribution fees payable | | | (12,035 | ) | | | (375 | ) | | | 1,098 | |
| Increase (decrease) in administrative services payable | | | 6,197 | | | | (696 | ) | | | 2,874 | |
| | | | | | | | | | | | | |
| Net cash provided by (used in) operating activities | | | 37,437,005 | | | | 388,561 | | | | (4,869,415 | ) |
| | | | | | | | | | | | | |
| Cash flows from financing activities | | | | | | | | | | | | |
| Net shares (redeemed) sold | | | (22,052,283 | ) | | | (1,443,168 | ) | | | 4,906,279 | |
| (Repayment) borrowing on bank line of credit | | | (15,284,873 | ) | | | 1,048,772 | | | | - | |
| Cash distributions paid to shareholders | | | (99,849 | ) | | | - | | | | (36,864 | ) |
| | | | | | | | | | | | | |
| Net cash (used in) provided by financing activities | | | (37,437,005 | ) | | | (394,396 | ) | | | 4,869,415 | |
| | | | | | | | | | | | | |
| Net change in cash | | | - | | | | (5,835 | ) | | | - | |
| | | | | | | | | | | | | |
| Cash | | | | | | | | | | | | |
| Beginning of period | | | - | | | | 5,835 | | | | - | |
| | | | | | | | | | | | | |
| End of period | | $ | - | | | $ | - | | | $ | - | |
| | | | | | | | | | | | | |
| Supplemental disclosure of cash flow information | | | | | | | | | | | | |
| Cash paid for interest and fees on bank line of credit | | $ | 185,894 | | | $ | 36,013 | | | $ | - | |
| Noncash financing activities consisting of reinvestment | | | | | | | | | | | | |
| of distributions | | $ | 1,187,301 | | | $ | - | | | $ | 1,008,096 | |
| | | | | | | | | | | | | |
See notes to financial statements.
Midas Annual Report 2011 - 19
1 ORGANIZATION AND SIGNIFICANT ACCOUNTING POLICIES The Midas Funds are Maryland corporations registered under the Investment Company Act of 1940, as amended (the “Act”), as open end management investment companies. The investment objectives of Midas Fund are primarily capital appreciation and protection against inflation and, secondarily, current income, and it invests primarily in precious metals and natural resource companies and bullion. Midas Magic’s (formerly Midas Special Fund) investment objective is capital appreciation, which it seeks by investing aggressively in any security type in any industry sector and in domestic and foreign companies of any size. The investment objective of Midas Perpetual Portfolio (formerly Midas Dollar Reserves) is to preserve and increase the purchasing power value of its shares over the long term with a policy of investing a fixed target percentage of its total assets in gold, silver, Swiss franc assets, hard asset securities, large capitalization growth stocks, and dollar assets. On December 29, 2008, the Fund changed its name to Midas Perpetual Portfolio, ceased operating as a money market fund, and began operating as a fluctuating net asset value fund pursuant to its current investment objective and policies. The Funds retain Midas Management Corporation as their Investment Manager.
Midas Fund and Midas Perpetual Portfolio each has authorized capital of one billion shares of common stock, par value $0.01 per share. Midas Magic has authorized capital of 500 million shares of common stock, par value $0.01. Each Fund offers only one class of shares. Each Fund’s shareholders are entitled to one vote for each whole share owned and a fractional vote for each fraction of a share owned. Voting rights are not cumulative. All shares of a Fund are fully paid and non-assessable and have no preemptive or conversion rights.
The Funds impose a short term trading redemption fee on any Fund shares that are redeemed or exchanged within 30 days following their purchase date. The redemption fee is 1% of the amount redeemed. Such fees are retained by the Funds for the benefit of the remaining shareholders and are accounted for as an addition to paid in capital.
The following is a summary of significant accounting policies followed by the Funds:
Valuation of Investments – Portfolio securities are valued by various methods depending on the primary market or exchange on which they trade. Most equity securities for which the primary market is in the United States are valued at the official closing price, last sale price or, if no sale has occurred, at the closing bid price. Most equity securities for which the primary market is outside the United States are valued using the official closing price or the last sale price in the principal market in which they are traded. If the last sale price on the local exchange is unavailable, the last evaluated quote or closing bid price normally is used. Gold and silver bullion is valued at 4:00 p.m. ET, at the mean between the last bid and asked quotations of the Bloomberg Composite (NY) Spot Price for that metal. Debt obligations with remaining maturities of 60 days or less are valued at cost adjusted for amortization of premiums and accretion of discounts. Other debt securities may be priced through pricing services that may utilize a matrix pricing system which takes into consideration factors such as yields, prices, maturities, call features, and ratings on comparable securities or according to prices quoted by a securities dealer that offers pricing services. Open end investment companies are valued at their net asset value. Foreign securities markets may be open on days when the U.S. markets are closed. For this reason, the value of any foreign securities owned by a Fund could change on a day when stockholders cannot buy or sell shares of the Fund. Securities for which market quotations are not readily available or reliable and other assets may be valued as determined in good faith by the Investment Manager under the direction of or pursuant to procedures approved by a Fund’s Board of Directors, called “fair value pricing.” Due to the inherent uncertainty of valuation, fair value pricing values may differ from the values that would have been used had a readily available market for the securities existed. These differences in valuation could be material. A security’s valuation may differ depending on the method used for determining value. The use of fair value pricing by a Fund may cause the net asset value of its shares to differ from the net asset value that would be calculated using market prices.
Investments in Other Investment Companies – Each Fund may invest in shares of other investment companies (the “Acquired Funds”) in accordance with the Act and related rules. Shareholders in each Fund bear the pro rata portion of the fees and expenses of the Acquired Funds in addition to the Fund’s expenses. Expenses incurred by each Fund that are disclosed in the Statement of Operations do not include fees and expenses incurred by the Acquired Funds. The fees and expenses of the Acquired Funds are reflected in each Fund’s total returns.
Foreign Currency Translation – Securities denominated in foreign currencies are translated into U.S. dollars at prevailing exchange rates. Realized gain or loss on sales of such investments in local currency terms is reported separately from gain or loss attributable to a change in foreign exchange rates for those investments.
Midas Annual Report 2011 - 20
Foreign Currency Contracts – Forward foreign currency contracts are marked to market and the change in market value is recorded by a Fund as an unrealized gain or loss. When a contract is closed, a Fund records a realized gain or loss equal to the difference between the value of the contract at the time it was opened and the value at the time it was closed. A Fund could be exposed to risk if a counterparty is unable to meet the terms of the contract or if the value of the currency changes unfavorably.
Derivatives – Midas Fund and Midas Magic may use derivatives for a variety of reasons, such as to attempt to protect against possible changes in the value of their portfolio holdings or to generate potential gain. Derivatives are financial contracts that derive their values from other securities or commodities, or that are based on indices. Derivatives are marked to market with the change in value reflected in unrealized appreciation or depreciation. Upon disposition, a realized gain or loss is recognized accordingly, except when taking delivery of the asset underlying a contract in which case the recognition of gain or loss is postponed until the disposal of the asset. The Funds risk loss if counterparties fail to meet the terms of the contract. Derivative contracts include, among other things, options, futures, forward currency contracts, and swap agreements.
Short Sales – Midas Fund and Midas Magic may sell a security short it does not own in anticipation of a decline in the value of the security. When a Fund sells a security short, it must borrow the security sold short and deliver it to the broker/dealer through which it made the short sale. A Fund is liable for any dividends or interest paid on securities sold short. A gain, limited to the price at which a Fund sold the security short, or a loss, unlimited in size, will be recognized upon the termination of the short sale. Securities sold short result in off balance sheet risk as a Fund’s ultimate obligation to satisfy the terms of the sale of securities sold short may exceed the amount recognized in the Statement of Assets and Liabilities.
Investment Transactions – Investment transactions are accounted for on the trade date (the date the order to buy or sell is executed). Realized gains or losses are determined by specifically identifying the cost basis of the investment sold.
Investment Income – Interest income is recorded on the accrual basis. Amortization of premium and accretion of discount on debt securities are included in interest income. Dividend income is recorded on the ex-dividend date or in the case of certain foreign securities, as soon as a Fund is notified. Taxes withheld on income from foreign securities have been provided for in accordance with a Fund’s understanding of the applicable country’s tax rules and rates.
Expenses – Expenses deemed by the Investment Manager to have been incurred solely by a Fund are charged to that Fund. Expenses deemed by the Investment Manager to have been incurred jointly by a Fund and one or more of the other investment companies for which the Investment Manager or its affiliates serve as investment manager (the “Fund Complex”) or other entities are allocated on the basis of relative net assets, except where a more appropriate allocation can be made fairly in the judgment of the Investment Manager.
Expense Reduction Arrangement – Through arrangements with the Funds’ custodian and cash management bank, credits realized as a result of uninvested cash balances are used to reduce custodian and transfer agent expenses. No credits were realized by the Funds during the periods covered by this report.
Distributions to Shareholders – Distributions to shareholders are determined in accordance with income tax regulations and recorded on the ex-dividend date.
Income Taxes – No provision has been made for U.S. income taxes because each Fund intends to qualify as a regulated investment company under the Internal Revenue Code (the “IRC”) and to distribute to its shareholders substantially all of its taxable income and net realized gains. Foreign securities held by a Fund may be subject to foreign taxation. Foreign taxes, if any, are recorded based on the tax regulations and rates that exist in the foreign markets in which a Fund invests. The Funds recognize the tax benefits of uncertain tax positions only where the position is “more likely than not” to be sustained assuming examination by tax authorities. The Funds have reviewed their tax positions and have concluded that no liability for unrecognized tax benefits should be recorded related to uncertain tax position taken on federal, state, and local income tax returns for all open tax years (2008 - 2010) or expected to be taken in the Funds’ 2011 tax returns.
Use of Estimates – In preparing financial statements in conformity with accounting principles generally accepted in the United States of America (“GAAP”), management makes estimates and assumptions that affect the reported amounts of assets and liabilities at the date of the financial statements, as well as the reported amounts of revenues and expenses during the reporting period. Actual results could differ from those estimates.
Midas Annual Report 2011 - 21
Recent Accounting Standards Update – In May 2011, the Financial Accounting Standards Board issued Accounting Standards Update (“ASU”) 2011-04 “Amendments to Achieve Common Fair Value Measurement and Disclosure Requirements in U.S. GAAP and IFRSs (“International Financial Reporting Standards”)”. ASU 2011-04 includes common requirements for measurement of and disclosure about fair value between GAAP and IFRS. ASU 2011-04 will require disclosure of the following information for fair value measurements categorized within level 3 of the fair value hierarchy: quantitative information about the unobservable inputs used in the fair value measurement, the valuation processes used by a Fund, and a narrative description of the sensitivity of the fair value measurement to changes in unobservable inputs and the interrelationships between those unobservable inputs. In addition, ASU 2011-04 will require disclosures about amounts and reasons for all transfers in and out of level 1 and level 2 fair value measurements. ASU 2011-04 is effective for interim and annual reporting periods beginning after December 15, 2011. The Funds have concluded that upon adoption of ASU 2011-04 the Funds’ financial statements and accompanying notes will fully comply with the required new and revised disclosures.
In December 2011, FASB issued ASU 2011-11 “Disclosures about Offsetting Assets and Liabilities.” The amendments in ASU 2011-11 will require the Funds to disclose information about offsetting and related arrangements to enable users of its financial statements to understand the effect of those arrangements on its financial position. ASU 2011-11 is effective for annual reporting periods beginning on or after January 1, 2013, and interim periods within those annual periods. ASU 2011-11 requires retrospective application for all comparative periods presented. The Funds are evaluating ASU 2011-11 and the impact it may have to its financial statement disclosures.
2 FEES AND TRANSACTIONS WITH RELATED PARTIESUnder the investment management agreement of Midas Fund, the Investment Manager receives a management fee, payable monthly, based on the average daily net assets of the Fund at the annual rate of 1% on the first $200 million, .95% from $200 million to $400 million, .90% from $400 million to $600 million, .85% from $600 million to $800 million, .80% from $800 million to $1 billion, and .75% over $1 billion. Under the investment management agreement of Midas Magic, the Investment Manager receives a management fee, payable monthly, based on the average daily net assets of the Fund at the annual rate of 1% on the first $10 million, 7/8 of 1% from $10 million to $30 million, 3/4 of 1% from $30 million to $150 million, 5/8 of 1% from $150 million to $500 million, and 1/2 of 1% over $500 million. Under the investment management agreement of Midas Perpetual Portfolio, the Investment Manager receives a management fee, payable monthly, based on the average daily net assets of the Fund at the annual rate of .50% of the first $250 million, .45% from $250 million to $500 million, and .40% over $500 million.
The Investment Manager contractually agreed with Midas Perpetual Portfolio to waive its fee for the period from January 1, 2011 to April 29, 2012. The fee waiver agreement may only be amended or terminated with the approval of the Fund’s Board of Directors.
Each Fund has adopted a plan of distribution pursuant to Rule 12b-1 under the Act. Under the plans, each Fund pays the Distributor, Midas Securities Group, Inc., an affiliate of the Investment Manager, a fee of .25% (Midas Fund and Midas Perpetual Portfolio) or 1.00% (Midas Magic) for distribution and shareholder services. The shareholder service fee is intended to cover personal services provided to the shareholders of the Funds and the maintenance of shareholder accounts. The distribution fee is to cover all other activities and expenses primarily intended to result in the sale of the Funds’ shares. In addition, Midas Fund, Midas Magic, and Midas Perpetual Portfolio each reimbursed the Distributor $107,242, $1,045, and $6,484, respectively, for payments made to certain brokers for record keeping services for the year ended December 31, 2011.
Certain officers and directors of the Funds are officers and directors of the Investment Manager and the Distributor.
Pursuant to the investment management agreements, the Funds reimburse the Investment Manager for providing certain administrative services at cost comprised of compliance and accounting services. For the year ended December 31, 2011, the Funds incurred administrative services expenses as follows:
| | | MIDAS Fund | | | MIDAS Magic | | | MIDAS Perpetual Portfolio | |
| Compliance | | $ | 90,965 | | | $ | 8,860 | | | $ | 14,420 | |
| Accounting | | | 34,195 | | | | 3,400 | | | | 5,645 | |
| Total | | $ | 125,160 | | | $ | 12,260 | | | $ | 20,065 | |
Midas Annual Report 2011 - 22
3 DISTRIBUTIONS TO SHAREHOLDERS AND DISTRIBUTABLE EARNINGS During the year ended December 31, 2011, Midas Fund paid a distribution of $1,287,150 comprised of ordinary income and Midas Perpetual Portfolio paid a distribution $1,044,960 comprised of $214,689 of ordinary income and $830,271 of long term capital gains.
The Funds paid no distributions for the year ended December 31, 2010.
At December 31, 2011, the components of distributable earnings on a tax basis were as follows:
| | | MIDAS Fund | | | MIDAS Magic | | | MIDAS Perpetual Portfolio | |
| Accumulated net realized loss on investments | | $ | (11,313,505 | ) | | $ | (3,118,868 | ) | | $ | - | |
| Net unrealized appreciation (depreciation) | | | (9,633,572 | ) | | | 6,829,633 | | | | 1,147,705 | |
| Post-October losses | | | (3,637,864 | ) | | | - | | | | (3 | ) |
| Total | | $ | (24,584,941 | ) | | $ | 3,710,765 | | | $ | 1,147,702 | |
Federal income tax regulations permit post-October net capital losses, if any, to be deferred and recognized on the tax return of the next succeeding taxable year.
GAAP requires certain components of net assets to be classified differently for financial reporting than for tax reporting purposes. These differences have no effect on net assets or net asset value per share. These differences, which may result in distribution reclassifications, are primarily due to Passive Foreign Investment Company (“PFIC”) mark to market adjustments and the expiration of capital loss carryovers. As of December 31, 2011, the Funds recorded the following financial reporting adjustments to the identified accounts to reflect those differences.
| | | MIDAS Fund | | | MIDAS Magic | | | MIDAS Perpetual Portfolio | |
| Decrease in accumulated undistributed net investment loss | | $ | 1,862,039 | | | $ | 358,058 | | | $ | 178,497 | |
| (Increase) decrease in accumulated net realized gain (loss) on investments | | $ | (971,492 | ) | | $ | 1,823,687 | | | $ | (178,418 | ) |
Decrease in unrealized appreciation | | $ | - | | | $ | - | | | $ | (6,304 | ) |
| Decrease in paid in capital | | $ | (890,547 | ) | | $ | (2,181,745 | ) | | $ | 6,225 | |
At December 31, 2011, Midas Fund had net a capital loss carryover of $11,313,505 expiring in 2017 that may be used to offset future realized capital gains for federal income tax purposes.
At December 31, 2011, Midas Magic had net a capital loss carryover of $3,118,868, of which $340,513, $1,154,753, $406,657, and $664,083 expire in 2014, 2016, 2017, and 2018, respectively, that may be used to offset future realized capital gains for federal income tax purposes. In addition, $552,862 of long term capital losses may be carried forward indefinitely.
4 FAIR VALUE MEASUREMENTS GAAP establishes a hierarchy that prioritizes inputs to valuation methods. The three levels of inputs are:
• | Level 1 - | unadjusted quoted prices in active markets for identical assets or liabilities including securities actively traded on a securities exchange. |
• | Level 2 - | observable inputs other than quoted prices included in level 1 that are observable for the asset or liability which may include quoted prices for similar instruments, interest rates, prepayment speeds, credit risk, yield curves, default rates, and similar data |
• | Level 3 - | unobservable inputs for the asset or liability including the Fund’s own assumptions about the assumptions a market participant would use in valuing the asset or liability. |
The availability of observable inputs can vary from security to security and is affected by a wide variety of factors, including, for example the type of security, whether the security is new and not yet established in the marketplace, the liquidity of markets, and other characteristics particular to the security. To the extent that valuation is based on models or inputs that are less observable or unobservable in the market, the determination of fair value requires more judgment. Accordingly, the degree of judgment exercised in determining fair value is greatest for investments categorized in level 3.
Midas Annual Report 2011 - 23
The inputs used to measure fair value may fall into different levels of the fair value hierarchy. In such cases, the level in the fair value hierarchy, within which the fair value measurement falls in its entirety, is determined based on the lowest level input that is significant to the fair value measurement in its entirety.
The inputs and methodology used for valuing investments are not an indication of the risk associated with investing in those securities.
The following is a description of the valuation techniques applied to a Fund’s major categories of assets and liabilities measured at fair value on a recurring basis:
Equity Securities (common and preferred stock) – Equity securities traded on a national securities exchange or market are stated normally at the official closing price, last sale price or, if no sale has occurred, at the closing bid price on the day of valuation. To the extent these securities are actively traded and valuation adjustments are not applied, they may be categorized in level 1 of the fair value hierarchy. Preferred stock and other equities on inactive markets or valued by reference to similar instruments may be categorized in level 2.
Bonds – The fair value of bonds is estimated using various techniques, which may consider, among other things, recently executed transactions in securities of the issuer or comparable issuers, market price quotations (where observable), bond spreads, and fundamental data relating to the issuer. Although most bonds may be categorized in level 2 of the fair value hierarchy, in instances where lower relative consideration is placed on transaction prices, quotations, or similar observable inputs, they may be categorized in level 3.
Restricted and/or Illiquid Securities – Restricted and/or illiquid securities for which quotations are not readily available or reliable may be valued as determined in good faith by the Investment Manager under the direction of or pursuant to procedures approved by a Fund’s Board of Directors. Restricted securities issued by publicly traded companies are generally valued at a discount to similar publicly traded securities. Restricted or illiquid securities issued by nonpublic entities may be valued by reference to comparable public entities or fundamental data relating to the issuer or both or similar inputs. Depending on the relative significance of valuation inputs, these instruments may be classified in either level 2 or level 3 of the fair value hierarchy.
The following is a summary of the December 31, 2011 valuation of each Fund’s assets and liabilities carried at fair value. Refer to each Fund’s Schedule of Portfolio Investments for detailed information on specific investments.
| MIDAS FUND | | Level 1 | | Level 2 | | Level 3 | | | Total | |
Assets Investments, at value | | | | | | | | | | |
| Common stocks | | $ | 76,648,679 | | $ | - | | $ | 113,097 | | | $ | 76,761,776 | |
| Warrants | | | 144,907 | | | - | | | - | | | | 144,907 | |
| Bullion | | | 15,635 | | | - | | | - | | | | 15,635 | |
| Securities held as collateral on loaned securities | | | 9,736,200 | | | - | | | - | | | | 9,736,200 | |
| Total investments, at value | | $ | 86,545,421 | | $ | - | | $ | 113,097 | | | $ | 86,658,518 | |
| MIDAS MAGIC | | Level 1 | | Level 2 | | Level 3 | | | Total | |
Assets Investments, at value | | | | | | | | | | |
| Common stocks | | $ | 14,386,730 | | $ | - | | $ | - | | | $ | 14,386,730 | |
| Securities held as collateral on loaned securities | | | 3,382,643 | | | - | | | - | | | | 3,382,643 | |
| Total investments, at value | | $ | 17,769,373 | | $ | - | | $ | - | | | $ | 17,769,373 | |
Midas Annual Report 2011 - 24
| MIDAS PERPETUAL PORTFOLIO | | Level 1 | | Level 2 | | Level 3 | | | Total | |
Assets Investments, at value | | | | | | | | | | |
| Gold | | $ | 3,029,444 | | $ | - | | $ | - | | | $ | 3,029,444 | |
| Silver | | | 663,882 | | | - | | | - | | | | 663,882 | |
| Swiss franc assets | | | | | | 1,494,465 | | | | | | | 1,494,465 | |
| Hard asset securities | | | 2,537,208 | | | - | | | - | | | | 2,537,208 | |
| Large capitalization growth stocks | | | 2,701,350 | | | - | | | - | | | | 2,701,350 | |
| Dollar assets | | | 5,008,730 | | | - | | | - | | | | 5,008,730 | |
| Securities held as collateral on loaned securities | | | 3,160,644 | | | - | | | - | | | | 3,160,644 | |
| Total investments, at value | | $ | 17,101,258 | | $ | 1,494,465 | | $ | - | | | $ | 18,595,723 | |
There were no transfers between level 1 and level 2 by any of the Funds during the year ended December 31, 2011.
The following is a reconciliation of level 3 investments for which significant unobservable inputs were used to determine fair value:
| MIDAS FUND | | Common Stocks | |
| Balance at December 31, 2010 | | $ | 0 | |
| Change in unrealized depreciation | | | 113,097 | |
| Purchases or (sales) | | | - | |
| Net realized gain (loss) | | | - | |
| Transfers in or (out) of level 3 | | | - | |
| Balance at December 31, 2011 | | $ | 113,097 | |
5 INVESTMENT TRANSACTIONS At December 31, 2011, the aggregate gross unrealized appreciation and depreciation of investments, based on cost for federal income tax purposes, are summarized as follows:
| | | | | | Gross Unrealized | | | Net Unrealized Appreciation | |
| | | | Tax Cost | | | | Appreciation | | | | (Depreciation) | | | | (Depreciation) | |
| Midas Fund | | $ | 96,292,113 | | | $ | 8,599,781 | | | $ | (18,233,376 | ) | | $ | (9,633,595 | ) |
| Midas Magic | | $ | 10,939,774 | | | $ | 6,876,407 | | | $ | (46,808 | ) | | $ | 6,829,599 | |
| Midas Perpetual Portfolio | | $ | 17,448,363 | | | $ | 1,707,829 | | | $ | (560,469 | ) | | $ | 1,147,360 | |
Midas Annual Report 2011 - 25
Purchases and proceeds from sales of investment securities, excluding short term securities, for the year ended December 31, 2011 were as follows:
| | | MIDAS Fund | | | MIDAS Magic | | | MIDAS Perpetual Portfolio | |
| Purchases | | $ | 51,035,761 | | | $ | 572,587 | | | $ | 7,704,796 | |
| Proceeds | | $ | 89,703,796 | | | $ | 1,329,604 | | | $ | 4,406,047 | |
6 ILLIQUID AND RESTRICTED SECURITIESMidas Fund owns securities which have a limited trading market and/or certain restrictions on trading and, therefore, may be illiquid and/or restricted. Such securities have been valued at fair value. Due to the inherent uncertainty of valuation, fair value pricing values may differ from the values that would have been used had a readily available market for the securities existed. These differences in valuation could be material. Illiquid and/or restricted securities owned at December 31, 2011 were as follows:
| | Acquisition Date | | Cost | | | Value | |
| Ivanplats Ltd. | 4/30/97 | | $ | 0 | | | $ | 113,097 | |
| Percent of net assets | | | | 0.0 | % | | | 0.2 | % |
7 BANK CREDIT FACILITIESEffective April 1, 2011, the Funds (except Midas Perpetual Portfolio) and the other funds in the Fund Complex (the “Borrowers”) entered into a committed secured line of credit facility, which is subject to annual renewal, with State Street Bank and Trust Company (“SSB”), the Funds’ custodian. The aggregate amount of the credit facility is $30,000,000. The borrowing of each Borrower is collateralized by the underlying investments of such Borrower. SSB will make revolving loans to a Borrower not to exceed in the aggregate outstanding at any time with respect to any one Borrower the least of 30% of the total net assets (as defined in the line of credit facility) of a Borrower, the maximum amount permitted pursuant to each Borrower’s investment policies, or as permitted under the Act. The commitment fee on this facility is 0.15% per annum. All loans under this facility will be available at the Borrower’s option of (i) overnight Federal funds or (ii) LIBOR (30, 60, 90 days), each as in effect from time to time, plus 1.10% per annum. Prior to April 1, 2011, the aggregate amount of the credit facility was $10,000,000 available at the Borrower’s option of (i) overnight Federal funds or (ii) LIBOR (30, 60, 90 days), plus 1.50% per annum.
The Funds have also entered into an uncommitted secured redemption facility, which is subject to annual renewal, with SSB with an aggregate amount available of $30,000,000. The borrowing of each Borrower is collateralized by the underlying investments of such Borrower. This facility carries no legal obligation on the part of SSB to lend any amount of money to the Funds at any time and the Borrower does not pay a commitment fee under this facility. SSB may make revolving loans to a Borrower not to exceed in the aggregate outstanding at any time with respect to any one Borrower the least of $30,000,000, the maximum amount permitted pursuant to the Borrower’s investment policies, or as permitted under the Act. All loans under this facility will be available at the higher of LIBOR and overnight Federal funds rates, each as in effect from time to time, plus 1.25% per annum.
The outstanding loan balance and the value of eligible collateral investments at December 31, 2011, and the average daily amount outstanding and weighted average interest rate under the committed and uncommitted facilities for the year ended December 31, 2011 were as follows:
| | | MIDAS Fund | | | MIDAS Magic | | | MIDAS Perpetual Portfolio | |
| Outstanding balance | | $ | 3,708,399 | | | $ | 2,542,885 | | | $ | 0 | |
| Value of eligible collateral | | $ | 40,542,879 | | | $ | 8,892,415 | | | $ | 0 | |
| Average daily amount outstanding | | $ | 10,838,297 | | | $ | 2,564,264 | | | $ | 0 | |
| Weighted average interest rate | | | 1.36 | % | | | 1.36 | % | | | 0.00 | % |
Midas Annual Report 2011 - 26
8 SECURITIES LENDING The Funds may lend their securities to qualified financial institutions. The Funds receive compensation in the form of fees, or retain a portion of the returns on the investment of any cash received as collateral. The Funds receive as collateral cash, U.S. Government securities, or bank letters of credit valued greater than the value of the securities on loan. Cash is invested in a money market fund. The value of the loaned securities is determined based upon the most recent closing prices and any additional required collateral is to be delivered to the Funds on the next business day. Any increase or decrease in the value of the securities loaned that might occur and any interest earned or dividends declared on those securities during the term of the loan is retained by the Funds. The Funds have the right under the lending agreement to recover the loaned securities from the borrower on demand. As with other extensions of credit, the Funds bear the risk of delay on recovery or loss of rights in the collateral should the borrower of the securities default.
The value of loaned securities and related collateral outstanding at December 31, 2011 were as follows:
| | | MIDAS Fund | | | MIDAS Magic | | | MIDAS Perpetual Portfolio | |
| Value of securities loaned | | $ | 9,560,043 | | | $ | 3,287,843 | | | $ | 3,088,347 | |
| Value of related collateral | | $ | 9,736,200 | | | $ | 3,382,643 | | | $ | 3,160,644 | |
9 PORTFOLIO CONCENTRATION Each Fund operates as a “non-diversified” investment company, which means that the portion of the Fund’s assets that may be invested in the securities of a single issuer is not limited by the Act and the amount of the outstanding voting securities of a particular issuer held by a Fund is not limited. Each Fund, however, currently intends to continue to conduct its operations so as to qualify as a “regulated investment company” for purposes of the Internal Revenue Code, which currently requires that, at the end of each quarter of the taxable year, with respect to 50% of a Fund’s total assets, the Fund limits to 5% the portion of its total assets invested in the securities of a single issuer. There are no such limitations with respect to the balance of a Fund’s portfolio, although no single investment can exceed 25% of a Fund’s total assets at the time of purchase. A more concentrated portfolio may cause a Fund’s net asset value to be more volatile and thus may subject stockholders to more risk. As of December 31, 2011, Midas Magic held approximately 34% and 32% of its net assets in Berkshire Hathaway, Inc. and MasterCard Inc., respectively, primarily as a result of market appreciation since the time of purchase. Thus, the volatility of the Fund’s net assets value and its performance in general, depends disproportionately more on the respective performance of a single issuer than that of a more diversified fund.
10 FOREIGN SECURITIES RISK Investments in the securities of foreign issuers involve special risks which include changes in foreign exchange rates and the possibility of future adverse political and economic developments, which could adversely affect the value of such securities. Moreover, securities in foreign issuers and markets may be less liquid and their prices more volatile than those of U.S. issuers and markets.
11 CONTINGENCIES The Funds indemnify officers and directors for certain liabilities that might arise from their performance of their duties for the Funds. Additionally, in the normal course of business, the Funds enter into contracts that contain a variety of representations and warranties and which may provide general indemnifications. The Funds’ maximum exposure under these arrangements is unknown, as it involves future claims that may be made against the Funds under circumstances that have not occurred.
12 SUBSEQUENT EVENTS The Funds have evaluated subsequent events through the date the financial statements were issued and determined that no subsequent events have occurred that require additional disclosure in the financial statements.
Midas Annual Report 2011 - 27
| | | For the Year Ended December 31, | |
| MIDAS FUND | | 2011 | | | 2010 | | | 2009 | | | 2008 | | | 2007 | |
| Per Share Data (for a share outstanding throughout each period) | | | | | | | | | | | | | | | |
| Net asset value, beginning of period | | $ | 5.65 | | | $ | 3.82 | | | $ | 2.11 | | | $ | 5.64 | | | $ | 4.29 | |
| Income (loss) from investment operations: | | | | | | | | | | | | | | | | | | | | |
Net investment loss (1) | | | (0.06 | ) | | | (0.07 | ) | | | (0.05 | ) | | | (0.06 | ) | | | (0.08 | ) |
| Net realized and unrealized gain (loss) on investments | | | (1.96 | ) | | | 1.90 | | | | 1.80 | | | | (3.36 | ) | | | 1.44 | |
| Total from investment operations | | | (2.02 | ) | | | 1.83 | | | | 1.75 | | | | (3.42 | ) | | | 1.36 | |
| Less distributions: | | | | | | | | | | | | | | | | | | | | |
| Net investment income | | | (0.06 | ) | | | - | | | | (0.04 | ) | | | (0.11 | ) | | | (0.01 | ) |
| Tax return of capital | | | - | | | | - | | | | - | | | | - | | | | - | |
| Total distributions | | | (0.06 | ) | | | - | | | | (0.04 | ) | | | (0.11 | ) | | | (0.01 | ) |
| Net asset value, end of period | | $ | 3.57 | | | $ | 5.65 | | | $ | 3.82 | | | $ | 2.11 | | | $ | 5.64 | |
| | | | | | | | | | | | | | | | | | | | | |
| Total Return | | | (35.97 | )% | | | 47.91 | % | | | 83.88 | % | | | (60.89 | )% | | | 31.70 | % |
| | | | | | | | | | | | | | | | | | | | | |
| Ratios/Supplemental Data | | | | | | | | | | | | | | | | | | | | |
| Net assets at end of period (000s omitted) | | $ | 72,973 | | | $ | 139,644 | | | $ | 116,311 | | | $ | 77,502 | | | $ | 251,394 | |
| Ratio of total expenses to average net assets | | | 2.31 | % | | | 2.29 | % | | | 2.39 | % | | | 2.37 | % | | | 2.43 | % |
| Ratio of net expenses to average net assets | | | 2.31 | % | | | 2.29 | % | | | 2.39 | % | | | 2.37 | % | | | 2.43 | % |
| Ratio of net expenses excluding loan interest and | | | | | | | | | | | | | | | | | | | | |
| fees to average net assets | | | 2.16 | % | | | 2.14 | % | | | 2.29 | % | | | 2.02 | % | | | 1.87 | % |
| Ratio of net investment loss to average net assets | | | (1.30 | )% | | | (1.58 | )% | | | (1.67 | )% | | | (1.42 | )% | | | (1.58 | )% |
| Portfolio turnover rate | | | 44 | % | | | 63 | % | | | 82 | % | | | 129 | % | | | 126 | % |
| | | | | | | | | | | | | | | | | | |
| (1) Average shares outstanding during the period are used to calculate per share data. | | | | | | | | | | | | | | | | | |
| | | For the Year Ended December 31, | |
| MIDAS MAGIC | | 2011 | | | 2010 | | | 2009 | | | 2008 | | | 2007 | |
| Per Share Data (for a share outstanding throughout each period) | | | | | | | | | | | | | | | |
| Net asset value, beginning of period | | $ | 14.73 | | | $ | 13.94 | | | $ | 10.36 | | | $ | 19.13 | | | $ | 16.74 | |
| Income (loss) from investment operations: | | | | | | | | | | | | | | | | | | | | |
Net investment loss (1) | | | (0.48 | ) | | | (0.48 | ) | | | (0.37 | ) | | | (0.43 | ) | | | (0.50 | ) |
| Net realized and unrealized gain (loss) on investments | | | 1.75 | | | | 1.27 | | | | 3.95 | | | | (8.34 | ) | | | 2.89 | |
| Total from investment operations | | | 1.27 | | | | 0.79 | | | | 3.58 | | | | (8.77 | ) | | | 2.39 | |
| Net asset value, end of period | | $ | 16.00 | | | $ | 14.73 | | | $ | 13.94 | | | $ | 10.36 | | | $ | 19.13 | |
| Total Return | | | 8.62 | % | | | 5.67 | % | | | 34.56 | % | | | (45.84 | )% | | | 14.28 | % |
| Ratios/Supplemental Data | | | | | | | | | | | | | | | | | | | | |
| Net assets at end of period (000s omitted) | | $ | 11,768 | | | $ | 12,240 | | | $ | 11,582 | | | $ | 8,911 | | | $ | 17,334 | |
| Ratio of total expenses to average net assets | | | 4.16 | % | | | 4.22 | % | | | 4.46 | % | | | 3.89 | % | | | 4.06 | % |
| Ratio of net expenses to average net assets | | | 4.16 | % | | | 4.22 | % | | | 4.46 | % | | | 3.89 | % | | | 4.06 | % |
| Ratio of net expenses excluding loan interest and | | | | | | | | | | | | | | | | | | | | |
| Fees to average net assets | | | 3.83 | % | | | 3.84 | % | | | 4.11 | % | | | 3.32 | % | | | 3.22 | % |
| Ratio of net investment loss to average net assets | | | (3.17 | )% | | | (3.39 | )% | | | (3.23 | )% | | | (2.71 | )% | | | (2.85 | )% |
| Portfolio turnover rate | | | 4 | % | | | 0 | % | | | 9 | % | | | 13 | % | | | 36 | % |
| (1) Average shares outstanding during the period are used to calculate per share data. | | | | | | | | | | | | | | | | | |
See notes to financial statements.
Midas Annual Report 2011 - 28
Financial Statements
| | | For the Year Ended December 31, | |
| MIDAS PERPETUAL PORTFOLIO | | 2011 | | | 2010 | | | 2009(1) | | | 2008(1) | | | 2007(1) | |
| Per Share Data (for a share outstanding throughout each period) | | | | | | | | | | | | | | | |
| Net asset value, beginning of period | | $ | 1.30 | | | $ | 1.15 | | | $ | 1.00 | | | $ | 1.000 | | | $ | 1.000 | |
| Income (loss) from investment operations: | | | | | | | | | | | | | | | | | | | | |
Net investment income (loss) (2) | | | (0.01 | ) | | | (0.01 | ) | | | (0.01 | ) | | | 0.012 | | | | 0.039 | |
| Net realized and unrealized gain on investments | | | 0.02 | | | | 0.16 | | | | 0.18 | | | | - | | | | - | |
| Total from investment operations | | | 0.01 | | | | 0.15 | | | | 0.17 | | | | - | | | | - | |
| Less distributions: | | | | | | | | | | | | | | | | | | | | |
| Net investment income | | | (0.01 | ) | | | - | | | | - | | | | (0.012 | ) | | | (0.039 | ) |
| Realized gains | | | (0.08 | ) | | | - | | | | (0.02 | ) | | | - | | | | - | |
| Total distributions | | | (0.09 | ) | | | - | | | | (0.02 | ) | | | (0.012 | ) | | | (0.039 | ) |
| Net asset value, end of period | | $ | 1.22 | | | $ | 1.30 | | | $ | 1.15 | | | $ | 1.000 | | | $ | 1.000 | |
| | | | | | | | | | | | | | | | | | | | | |
Total Return (3) | | | 0.96 | % | | | 13.04 | % | | | 17.03 | % | | | 1.22 | % | | | 4.00 | % |
| | | | | | | | | | | | | | | | | | | | | |
| Ratios/Supplemental Data | | | | | | | | | | | | | | | | | | | | |
| Net assets at end of period (000s omitted) | | $ | 15,459 | | | $ | 10,620 | | | $ | 8,311 | | | $ | 7,191 | | | $ | 14,516 | |
Ratio of total expenses to average net assets (4) | | | 1.85 | % | | | 2.51 | % | | | 2.98 | % | | | 1.77 | % | | | 1.91 | % |
Ratio of net expenses to average net assets (3) (5) | | | 1.35 | % | | | 1.93 | % | | | 2.23 | % | | | 1.21 | % | | | 1.16 | % |
| Ratio of net expenses excluding loan interest and | | | | | | | | | | | | | | | | | | | | |
| fees to average net assets | | | 1.35 | % | | | 1.90 | % | | | 2.22 | % | | | - | | | | - | |
Ratio of net investment income (loss) to average net assets (3) | | | (0.45 | )% | | | (1.03 | )% | | | (1.29 | )% | | | 1.22 | % | | | 3.92 | % |
| Portfolio turnover rate | | | 44 | % | | | 4 | % | | | 24 | % | | | 0 | % | | | 0 | % |
| | |
(1) These financial highlights reflect the Fund’s operation as a money market fund up to December 28, 2008. On December 29, 2008, the Fund changed its name to Midas Perpetual Portfolio, Inc. from Midas Dollar Reserves, Inc., ceased operating as a money market fund, and began operating as a fluctuating net asset value fund pursuant to its current investment objective and policies. (2) Average shares outstanding during the period are used to calculate per share data. (3) Fees contractually waived by the Investment Manager and Distributor reduced the ratio of expenses to average net assets by 0.50%, 0.58%, and 0.75% for the years ended December 31, 2011, 2010, and 2009, respectively. Fees voluntarily waived by the Investment Manager and Distributor reduced the ratio of net expenses to average net assets by 0.24% and 0.75% for the years ended December 31, 2008 and 2007, respectively. In addition, the Investment Manager voluntarily reimbursed the Fund for certain operating expenses which further reduced the ratio of net expenses to average net assets by 0.32%, for the year ended December 31, 2008. The impact of the fee waivers and reimbursements is reflected in both the total return and the ratio of net investment income (loss) to average net assets. (4) “Total expenses” are the expenses of the Fund as presented in the Statement of Operations before fee waivers. (5) “Net expenses” are the expenses of the Fund as presented in the Statement of Operations after fee waivers. | |
See notes to financial statements.
Midas Annual Report 2011 - 29
Financial Statements
To the Shareholders and Boards of Directors of
MIDAS FUND, INC.
MIDAS MAGIC, INC.
MIDAS PERPETUAL PORTFOLIO, INC.
We have audited the accompanying statements of assets and liabilities, including the schedule of portfolio investments, of Midas Fund, Inc., Midas Magic, Inc., and Midas Perpetual Portfolio, Inc. as of December 31, 2011, the related statements of operations and of cash flows for the year then ended, the statements of changes in net assets for each of the two years in the period then ended, and the financial highlights for each of the five years in the period then ended. These financial statements and financial highlights are the responsibility of the Funds’ management. Our responsibility is to express an opinion on these financial statements and financial highlights based on our audits.
We conducted our audits in accordance with auditing standards of the Public Company Accounting Oversight Board (United States). Those standards require that we plan and perform the audit to obtain reasonable assurance about whether the financial statements and financial highlights are free of material misstatement. The Funds are not required to have, nor were we engaged to perform, an audit of their internal control over financial reporting. Our audits included considerations of internal control over financial reporting as a basis for designing audit procedures that are appropriate in the circumstances, but not for the purpose of expressing an opinion on the effectiveness of the Funds’ internal control over financial reporting. Accordingly, we express no such opinion. An audit includes examining, on a test basis, evidence supporting the amounts and disclosures in the financial statements. Our procedures included confirmation of securities owned as of December 31, 2011, by correspondence with the custodian. An audit also includes assessing the accounting principles used and significant estimates made by management, as well as evaluating the overall financial statement presentation. We believe that our audits provide a reasonable basis for our opinion.
In our opinion, the financial statements and financial highlights referred to above present fairly, in all material respects, the financial position of Midas Fund, Inc., Midas Magic, Inc., and Midas Perpetual Portfolio, Inc. as of December 31, 2011, the results of their operations and cash flows for the year then ended, the changes in their net assets for each of the two years in the period then ended, and the financial highlights for each of the five years presented in conformity with accounting principles generally accepted in the United States of America.
TAIT, WELLER & BAKER LLP
Philadelphia, Pennsylvania
February 24, 2012
Midas Annual Report 2011 - 30
Supplemental Information
The Funds’ Statement of Additional Information includes additional information about the directors and is available, without charge, upon request by calling the Funds toll-free at 1-800-472-4160 and at www.MidasFunds.com.
| INDEPENDENT DIRECTORS | | | |
| Name, Title | Director | Funds in | Principal Occupation, Business Experience | Other |
| Address | Since (1) | Complex | for the Past Five Years | Director- |
| Date of Birth | | Overseen (2) | | ships Held (3) |
| | | | | |
| Bruce B. Huber | 1995 Midas Fund | 6 | Retired. He is a former Financial Representative | None |
| CLU, ChFC, SFS. | 1986 Midas Magic | | with New England Financial, specializing in | |
| 11 Hanover Square | 1981 Midas Perpetual | | financial, estate and insurance matters. He is a | |
| New York, NY 10005 | Portfolio | | member of the Board, emeritus, of the Millbrook | |
| February 7, 1930 | | | School, and Chairman of the Endowment Board | |
| | | | of the Community YMCA of Red Bank, NJ. | |
| | | | | |
| James E. Hunt | 1995 Midas Fund | 6 | Limited Partner of Hunt Howe Partners LLC | None |
| 11 Hanover Square | 1986 Midas Magic | | (executive recruiting consultants). | |
| New York, NY 10005 | 1980 Midas Perpetual | | | |
| December 14,1930 | Portfolio | | | |
| | | | | |
| | | | | |
| Peter K. Werner | 2004 All Funds | 6 | Since 1996, he has taught, directed and coached | None |
| 11 Hanover Square | | | many programs at The Governor’s Academy, of | |
| New York, NY 10005 | | | Byfield MA. Currently, he serves as chair of the | |
| August 16, 1959 | | | History Department. Previously, he held the | |
| | | | position of Vice President in the Fixed Income | |
| | | | Departments of Lehman Brothers and First | |
| | | | Boston. His responsibilities included trading | |
| | | | sovereign debt instruments, currency arbitrage, | |
| | | | syndication, medium term note trading, and | |
| | | | money market trading. | |
| | | | | |
| INTERESTED DIRECTOR | | | |
| Name, Title | Director | Funds in | Principal Occupation, Business Experience | Other |
| Address | Since (1) | Complex | for the Past Five Years | Director- |
| Date of Birth | | Overseen (2) | | ships Held (3) |
| | | | | |
Thomas B.Winmill, Esq.(4) | 1995 Midas Fund | 6 | Since 1999, President of the Fund Complex, | Eagle Bulk |
| Chief Executive Officer, | 1997 Midas Magic | | the Investment Manager, the Distributor, | Shipping |
| President, and General | 1993 Midas Perpetual | | and their affiliates. He is Chairman of the | Inc. |
| Counsel. | Portfolio | | Investment Policy Committee (“IPC”) of the | |
| 11 Hanover Square | | | Investment Manager. He is the son of | |
| New York, NY 10005 | | | Bassett S. Winmill. | |
| June 25, 1959 | | | | |
| | | | | |
(1) Directors not elected annually shall be deemed to be continuing in office until after the time at which an annual meeting is required to be held under Maryland law, a Fund’s Charter or Bylaws, the Act, or other applicable law. (2) The “Fund Complex” is comprised of the Midas Funds, Dividend and Income Fund, Inc., Foxby Corp., and Global Income Fund, Inc. Dividend and Income Fund, Inc., Foxby Corp., and Global Income Fund, Inc. are advised by affiliates of the Investment Manager. (3) Refers to directorships held by a director in any company with a class of securities registered pursuant to Section 12 of the Securities Exchange Act of 1934 or any company registered as an investment company under the Act. (4) Thomas B. Winmill is an “interested person” of the Funds as defined by the Act because of his position with the Investment Manager. |
Midas Annual Report 2011 - 31
| OFFICERS OF THE FUNDS | |
| Name | Title and | Principal Occupation, Business Experience |
| Date of Birth | Officer Since | for the Past Five Years |
| | | |
| Thomas B.Winmill, Esq. | Chief Executive Officer, President, | See biographical information on previous page. |
| June 25, 1959 | and General Counsel since 1999. | |
| | | |
| Bassett S. Winmill | Chief Investment Strategist | Chief Investment Strategist of the Investment Manager and |
| February 10, 1930 | since 1999. | the Chairman of the Board of the Investment Manager’s |
| | | and Distributor’s parent and their affiliates, and of two |
| | | investment companies in the Fund Complex. He is a member |
| | | of the IPC and the New York Society of Security Analysts, |
| | | the Association for Investment Management and Research, |
| | | and the International Society of Financial Analysts. He is the |
| | | father of Thomas B. Winmill. |
| | | |
| | | |
| Thomas O’Malley | CAO, CFO, Treasurer and | Chief Accounting Officer, Chief Financial Officer, |
| July 22, 1958 | Vice President since 2005. | Treasurer and Vice President since 2005. He also is Chief |
| | | Accounting Officer, Chief Financial Officer, Treasurer |
| | | and Vice President of the Fund Complex, the Investment |
| | | Manager, the Distributor, and their affiliates. He is a |
| | | certified public accountant. |
| | | |
| | | |
| Heidi Keating | Vice President since 1988. | Vice President of the Investment Manager since 1988. |
| March 28, 1959 | | |
| | | |
| | | |
| John F. Ramirez, Esq. | Chief Compliance Officer, | CCO, AML Officer, VP, and Secretary since 2005 and |
| April 29, 1977 | AML Officer, Vice President, | Associate General Counsel since 2008. He is also CCO, |
| | and Secretary since 2005 and | AML Officer, VP, Associate General Counsel, and Secretary |
| | Associate General Counsel | of the Fund Complex, the Investment Manager, the Distributor, |
| | since 2008. | and their affiliates. He is a member of the CCO Committee |
| | | and the Compliance Advisory Committee of the Investment |
| | | Company Institute, and the New York State Bar. |
| | | |
| Officers hold their positions with a Fund until a successor has been duly elected and qualifies. Officers are generally elected annually at the December meeting of the Board of Directors. The officers were last elected on December 14, 2011. |
Midas Annual Report 2011 - 32
Supplemental Information
Quarterly Schedules of Portfolio Holdings
The Funds file their complete schedule of portfolio holdings with the Securities and Exchange Commission (“SEC”) for the first and third quarters of each fiscal year on Form N-Q. The Funds’ Forms N-Q are available on the SEC’s website at www.sec.gov and may be reviewed and copied at the SEC’s Public Reference Room in Washington, D.C. Information on the operation of the Public Reference Room may be obtained by calling 1-800-SEC-0330. The Funds’ quarterly reports on Form N-Q are also available on the Funds’ website at www.MidasFunds.com.
Proxy Voting Policies and Procedures
A description of the policies and procedures that the Funds use to determine how to vote proxies relating to portfolio securities is available, without charge, by calling 1-800-400-MIDAS (6432) and on the website of the SEC at www.sec.gov. Information regarding how the Funds voted proxies relating to portfolio securities during the most recent 12 month period ended June 30 is available without charge, by calling 1-800-400-MIDAS (6432), on the website of the SEC at www.sec.gov, and on the Funds’ website at www.MidasFunds.com.
| MIDAS FUNDS OFFER |
| • | Regular Accounts |
| • | IRA Retirement Accounts, including Traditional, Roth, Self-Employed, and Small Business (SEP, SIMPLE) |
| • | Education Savings Accounts |
| • | Health Savings Accounts |
| • | Online and toll free telephone account access |
| • | Electronic delivery of account statements, reports, and prospectus, etc. |
| Only $1,000 minimum to open a Midas Funds account, with subsequent minimum investments of $100. |
| There is NO FEE to open an account. |
| Join our free and automatic Midas Bank Transfer Plan and open an account for only $100, and make subsequent monthly investments of $100 or more. |
SIGN UP FOR ELECTRONIC DELIVERY |
Midas shareholders can now sign up for electronic delivery of their account statements, confirmations, annual and semi-annual reports, prospectuses, and other material to receive Midas information more quickly and conveniently. It is fast and easy to sign up for electronic delivery. Just follow these three simple steps: |
| (1) go to www.MidasFunds.com and log into THE MIDAS TOUCH® - Account Access |
| (2) after logging in, at the Portfolio Summary, click on an account number and then select Account Detail from the left side menu, and |
| (3) click on Electronic Document Delivery. On this page you can choose to have either account and confirmation statements or regulatory items, such as annual and semi-annual reports and prospectuses, or both, sent to any e- mail address you wish. That’s it! |
Midas Annual Report 2011 - 33
MIDAS REGULAR ACCOUNT APPLICATION
| 1 | REGISTRATION If there is more than one owner of the account, the registration will be “Joint Tenants with Right of Survivorship” unless you specify “Tenants in Common.” If this is a Uniform Gift/Transfer to a Minor, please enter all information requested for the minor. |
| 2 | MAILING AND E-MAIL ADDRESSES, TELEPHONE NUMBER, AND CITIZENSHIP If you are a non-U.S. citizen residing in the United States, in addition to this Account Application, you will be required to attach a Form W-8 BEN, which can be obtained from the IRS website at www.irs.gov or calling 1-800-829-3676. If this is a Uniform Gift/Transfer to a Minor, please enter all information for the Custodian, including the custodian’s physical address. |
| 3 | CHOOSE FUND(S) AND AMOUNT INVESTED Indicate the Fund(s) in which you are opening an account. The opening minimum for a Fund is $1,000 ($100 for Midas Automatic Investment Programs – see Section 7 of the Account Application). The minimum subsequent investment is $100. |
| 4 | DISTRIBUTIONS Your dividends and distributions will be reinvested in additional shares of the Fund unless you instruct Midas otherwise. |
| 5 | SHAREHOLDER COMMUNICATIONS Check the method of shareholder communications you would prefer (electronic or paper copies). Electronic communications for account and confirmation statements and regulatory items, such as annual and semi-annual reports and prospectuses, will be sent to the e-mail address provided in Section 2 of the Account Application. |
| 6 | COST BASIS Check the method of cost basis you would prefer. Mutual funds are required to report cost basis to the IRS. The cost basis of the different shares you own is used to calculate the gain or loss of the shares sold. Cost basis is the original price paid for your shares. The default cost basis for each of the Midas Funds is the Average Cost method. Under the Average Cost method, all of the share purchase costs are added together in an aggregate cost amount. The cost per share is then determined by dividing the aggregate cost amount by the total shares in the account. Other cost basis calculation methods permitted by the IRS are available.Visit www.MidasFunds.com/Tax-Planning for additional information on cost basis. |
| 7 | MIDAS SHAREHOLDER SERVICES - MIDAS BANK TRANSFER PLAN/THE MIDAS TOUCH ® With the free Midas Bank Transfer Plan (BTP), you can establish a convenient and affordable long term investment program. The $1,000 minimum investment requirement is waived since the Midas BTP is designed to facilitate an automatic monthly investment of $100 or more into your Fund account(s). Please specify the total amount you want to invest each month, the Fund and when you’d like to start |
| | All shareholders can obtain information about their account 24 hours a day, every day, at www.MidasFunds.com and by automated telephone response at 1-800-400-MIDAS (6432). Only with THE MIDAS TOUCH® can you manage your account by purchasing or redeeming Fund shares using electronic funds transfer, initiate Fund to Fund transfers among the three Midas Funds, and perform transactions through a Shareholder Services Representative. |
| | To activate these features, please indicate your bank routing and account numbers or attach a voided check. |
| 8 | SIGNATURE AND CERTIFICATION TO AVOID BACKUP WITHHOLDING After reading this section, please sign and date the Account Application. |
SEND BY MAIL Mail your completed Account Application to Midas Funds, P.O. Box 6110, Indianapolis, IN 46206-6110. Checks must be payable to Midas Funds in U.S. dollars. Third party checks and money orders (other than money orders issued by a bank) cannot be accepted.
SEND BY WIRE Call 1-800-400-MIDAS (6432) between 8 a.m. and 6 p.m. ET, on business days to speak with a Shareholder Services Representative. A completed Account Application, the name of the bank sending the wire, and the amount to be wired are required before the wired funds can be accepted. The completed Account Application should be faxed to 1-317-937-3014, Attn: Midas Funds. You will then be assigned a Fund account number and receive wiring address information. Your account number and name(s) must be specified in the wire as they are to appear on the account registration. You should then enter your account number on your completed Account Application and promptly mail it to Midas Funds, P.O. Box 6110, Indianapolis, IN 46206-6110. This service is not available on days when the Federal Reserve wire system is closed.
IF YOU NEED ANY ASSISTANCE IN COMPLETING THE ACCOUNT APPLICATION,
PLEASE CALL A SHAREHOLDER SERVICES REPRESENTATIVE AT 1-800-400-MIDAS (6432)
BETWEEN THE HOURS OF 8 A.M. AND 6 P.M. ET.
Midas Annual Report 2011 - 34
Midas Annual Report 2011 - 35
Midas Annual Report 2011 - 36
WITH THE MIDAS TOUCH®, YOU ENJOY ENHANCED ACCESS AT ANY TIME, ONLINE AT WWW.MIDASFUNDS.COM OR BY TELEPHONE 1-800-400-MIDAS (6432), TO
| | o | Monitor your investments |
| | o | Retrieve your account history |
| | o | Review recent transactions |
| | o | Check your account balances and account activity |
| | o | Obtain prospectuses, shareholder reports, and account applications, as well as IRA transfer forms and Automatic Investment Program forms for regular monthly investing |
| | o | Purchase or redeem Fund shares using electronic funds transfer to move money to or from your authorized bank account |
| | o | Initiate account transactions, such as Fund to Fund transfers among the three Midas Funds |
| | o | Perform transactions through a Shareholder Services Representative Monday through Friday, from 8 a.m. to 6 p.m. ET |
MIDAS FUNDS
P.O. BOX 6110
INDIANAPOLIS, IN 46206-6110
1-800-400-MIDAS (6432) FOR INVESTMENT INFORMATION
Past performance does not guarantee future results. Investment return will fluctuate, so shares when redeemed may be worth more or less than their cost. Dollar cost averaging does not assure a profit or protect against loss in a declining market and investors should consider their ability to make purchases when prices are low. One of Midas’ guiding principles is that we will communicate with our shareholders as candidly as possible because we believe shareholders benefit from understanding our investment philosophy and approach. Our views and opinions regarding the prospects of our portfolio holdings, Funds, and the economy are “forward looking statements” which may or may not be accurate and may be materially different over future periods. We disclaim any obligation to update or alter any forward looking statements, whether as a result of new information, future events, or otherwise. Thus, you should not place undue reliance on forward looking statements, which also speak only as of the date of this Report. Current performance may be lower or higher than the performance quoted herein. This Report and the financial statements it contains are submitted for the general information of the shareholders of the Midas Funds. The Report is not authorized for distribution to prospective investors in the Funds unless preceded or accompanied by an effective Prospectus which contains more complete information, including charges, risks and expenses. Please read it carefully before you invest or send money.
Midas Securities Group, Inc., Distributor. Member, FINRA.