UNITED STATES
SECURITIES AND EXCHANGE COMMISSION
WASHINGTON, D.C. 20549
FORM N-CSR/A
CERTIFIED SHAREHOLDER REPORT OF REGISTERED
MANAGEMENT INVESTMENT COMPANIES
| Investment Company Act file number: | 811-02474 |
Midas Perpetual Portfolio, Inc.
(Exact name of registrant as specified in charter)
| 11 Hanover Square, New York, NY | 10005 |
| (Address of principal executive offices) | (Zipcode) |
John F. Ramírez, Esq.
11 Hanover Square
New York, NY 10005
(Name and address of agent for service)
Registrant's telephone number, including area code: 1-212-480-6432
Date of fiscal year end: 12/31
Date of reporting period: 1/1/10 - 12/31/10
The Commission may use the information provided on Form N-CSR/A in its regulatory, disclosure review, inspection, and policy making roles.
A registrant is required to disclose the information specified by Form N-CSR/A and the Commission will make this information public. A registrant is not required to respond to the collection of information contained in Form N-CSR/A unless the Form displays a current valid Office of Management and Budget ("OMB") control number. Please direct comments concerning the accuracy of the information collection burden estimate and any suggestions for reducing the burden to Secretary, Securities and Exchange Commission, 450 Fifth Street, NW, Washington, DC 20549-0609. The OMB has reviewed this collection of information under clearance requirements of 44 U.S.C. sec. 3507.
Item 1. Report to Stockholders.
December 31
2010
ANNUAL REPORT
| |
| |
| | |
| Portfolio Commentary | |
| | |
| |
| | |
| |
| | |
| |
| | |
| |
| | |
| Financial Statements | |
| | |
| Schedule of Portfolio Investments | |
| | |
| |
| | |
| |
| | |
| |
| | |
| |
| | |
| |
| | |
| |
| | |
| |
| | |
| |
| | |
| |
| | |
| 26 |
| | |
| Supplemental Information | |
| | |
| |
| | |
| |
| | |
| |
| | |
| |
| | |
| Opening Your Account | |
| | |
| |
| | |
| New Account Application | 37 |
| Midas Fund (Ticker: MIDSX) | | Midas Special Fund (Ticker: MISEX) | | Midas Perpetual Portfolio (Ticker: MPERX) |
| Seeks capital appreciation and protection against inflation and secondarily current income through investments primarily in precious metals and natural resource companies and bullion. | | Invests aggressively for capital appreciation in any security in any sector. | | Seeks to preserve and increase the purchasing power value of its shares over the long term by investing in gold, silver, Swiss franc assets, hard asset securities, large capitalization growth stocks, and dollar assets. |
| Got fiscal discipline? The Congressional Budget Office now estimates that the U.S. fiscal deficit for 2011 will reach $1.5 trillion. To deal with this problem, the U.S. government recently announced a plan for budget cuts of almost $500 billion. But, didn’t the same U.S. lawmakers also just approve a $858 billion tax cut? Does this mean the national debt of $14.1 trillion (about equal to our nation’s annual production of goods and services) is going $358 billion in the wrong direction? It shouldn’t. After World War II, Congress created debt ceiling legislation which currently limits our national debt to $14.3 trillion. Or does it? Consider that Congress also has raised the debt ceiling six times in the last three years. About three years ago, the debt limit was under $9 trillion. |  |
START REGULAR INVESTING NOW ... AND BUILD FOR YOUR FUTURE
Notwithstanding disarray in Washington, many Americans can and are doing something to provide for their long term financial goals. We were very pleased to read that, according to the U.S. Bureau of Economic Analysis, personal saving by Americans as a percentage of disposable personal income was 5.8% percent in 2010. From 1982 when it stood at about 11%, the U.S. savings rate had been in a fairly steady decline through 2005 when it hit bottom at 1.2%. Is this a positive trend in savings towards our longer term average of 7.1%?
In this connection, Midas offers an excellent free service to make regular investing fast and convenient. Sign up for the free Midas Bank Transfer Plan, and each month a fixed amount of money will be transferred from your bank account to the Midas fund you designate. You should then periodically review your overall portfolio. Known as “dollar cost averaging,” this steady plan can reduce the anxiety of investing in a rising or falling market or buying all your shares at market highs. This strategy cannot assure a profit or protect against loss in a declining market and you should consider your financial ability to continue your purchases through periods of low and volatile price levels. Volatility in markets highlights the importance of diversifying your portfolio across the Midas family of mutual funds to balance the returns offered by the different market sectors in which they invest.
DISCOVERING OPPORTUNITIES FOR LONG TERM PLANNING WITH MIDAS
Reasons for careful investment planning are compelling. Retirement is longer as life expectancies increase, and the promises of pensions, retirement plans, and even Social Security are becoming less reliable. During our working careers, we are being asked to pay a greater share of health insurance, more tuition costs, and sometimes for the care of elderly parents. Even with these challenges, we believe personal investment planning can be successful by following three simple steps. First, commit to a long term investing approach. Second, follow a regular investment plan as described above. Third, manage your investing risk by diversifying among the three Midas funds: Midas Special Fund for longer term, stock market oriented objectives, Midas Perpetual Portfolio, seeking to preserve and increase the purchasing power value of its shares over the long term, and Midas Fund for potential precious metals capital appreciation and a hedge against inflation.
It is with great sadness we announce the recent passing of Robert D. Anderson, Vice Chairman and a founder of the Midas funds family. His leadership, integrity, perseverance, and humor will be missed. He was a lifelong advocate of the Midas quality investing approach, careful personal financial planning, and the highest standards of shareholder service and communication.
As always, please call us at 1-800-400-MIDAS (6432) if you have any questions or would like further information, and we will be happy to speak with you with no obligation on your part. Thank you for investing with Midas.
Sincerely,
Thomas B. Winmill
President
We are very pleased to report that Midas Fund’s net asset value rose 47.91% in 2010, a gratifying result, especially on top of a total return of 83.88% in 2009. We credit these returns to our quality, “growth in gold and resources” investment approach, particularly given the relatively lackluster return for gold bullion in the same period of about 29% in 2010 and 25% in 2009. We are also delighted to welcome new shareholders attracted to Midas Fund by its track record of past performance, its policy of investing in securities of companies principally involved in mining, processing, distributing or otherwise dealing in gold, silver, platinum, or other natural resources, and its no charge shareholder services.
PRECIOUS METALS AND FINANCIAL MARKETS
In 2010, gold prices fluctuated between $1,058 and $1,421 per ounce, averaging about $1,225, and ending the period at $1,405 (all prices are based on the London p.m. fix). The strength of gold’s price in 2010 was remarkable given the U.S. Bureau of Labor Statistics reported only a 1.5% increase in the consumer price index (a measure of inflation). Recently, however, with increasing investor complacency over reports of continuing strength in the U.S. and other world economies, the gold price plunged over $86 per ounce to $1,319, until spreading political upheavals and violence in the Middle East appeared to propel the gold price back upwards.
We expect continuing volatility in the gold price in 2011, as offsetting and often contradictory economic information is received by investors. While unsettling geo-political events – what we call the “fear factor” – may drive future short term swings, we believe that the gold price has the potential to reach $1,600 by year end due to longer term factors: fundamental supply/demand and, more importantly, fiscal and monetary policies pursued by governments around the world. These government policies currently appear to have the potential to solidify gold’s role as an “alternative currency,” particularly to the currencies of nations with large debt and entitlement obligations. For example, official U.S. public debt is now about $14.1 trillion, or 96% of U.S. annual gross domestic product; including entitlement obligations, such as Medicare, the total debt probably exceeds $60 trillion. Furthermore, to battle deflation and unemployment, the Federal Reserve has kept interest rates low, which may exacerbate future inflation and currency debasement concerns.
INVESTMENT STRATEGIES AND OUTLOOK
With this economic and market backdrop in 2010, Midas Fund strategically re-balanced its portfolio towards higher quality senior and intermediate precious metals producers. As gold and silver prices increased, well managed producing mining companies showed dramatic earnings and cash flow growth, boosting their stock prices. Midas Fund particularly benefited from high acquisition bids for a number of portfolio holdings in the year. Disappointing mine production or reserve addition by a company in the Fund’s portfolio typically detracted from Fund performance. For the balance of 2011, Midas Fund expects to be invested in a global portfolio of primarily large and medium sized gold, silver, and platinum miners offering attractive valuations, and smaller companies with promising exploration potential, expanding production profiles, increasing cash flow, and/or other special growth features, although it may seek a more defensive position at times. Currently, the Fund is emphasizing global mining companies with production of gold, silver, and other metals, including copper, deemed to have both reasonable valuations and compelling quality and growth prospects.
TOP10 HOLDINGS AS OF DECEMBER 31, 2010
|
1 Northern Dynasty Minerals Ltd. 2 Barrick Gold Corp. 3 Avocet Mining PLC 4 Fresnillo plc 5 Freeport-McMoRan Copper & Gold, Inc. 6 Northgate Minerals Corp. 7 Newmont Mining Corp. 8 Kinross Gold Corp. 9 Eldorado Gold Corp. Ltd. 10 Impala Platinum Holdings Ltd.
Top Ten Holdings comprise approximately 39% of total assets. |
Portfolio Commentary
We are pleased to submit this 2010 Annual Report for Midas Special Fund and to welcome our new shareholders attracted to the Fund’s approach of seeking capital appreciation in quality companies. While the Fund’s investment policies permit it to invest in any security type and in any industry sector, in domestic or foreign companies, and in companies of any size to seek its investment objective, the Fund currently is focused on those companies with unique combinations of strength in operations, products, and finances that can potentially offer growth in addition to value. Interestingly, the Fund may invest defensively as well as employ speculative investment techniques such as borrowing money for investment purposes, a practice known as leveraging.
ECONOMIC AND FINANCIAL TRENDS
The Federal Reserve Open Market Committee (FOMC) recently noted that U.S. economic activity has been increasing at a moderate rate. Specifically, the pace of consumer spending picked up in the fourth quarter, exports rose, and the recovery in some business spending, particularly for computers and software, appeared to be continuing. In contrast, the FOMC sees residential and non-residential construction activity as still depressed. Encouragingly, manufacturing production appears to be showing gains and non-farm businesses adding workers, while inflation expectations and trends are viewed by the FOMC as relatively benign. Unemployment levels, however, remain high.
In other economies, the strength of recovery in 2010 was mixed. The world’s second largest economy, China, is estimated to have had GDP growth of around 10% and appears set to enjoy another year of strong growth in 2011. Yet, China currently also has problems with rising inflation and is suspected to be suffering from widespread non performing debt at local levels. Meanwhile, Japan, the world’s third largest economy, also showed healthy, if not as dramatic, recovery with 2010 GDP growth estimated at approximately 3%. Europe appears to be recovering slowly, although painfully. According to Eurostat, the European Union’s statistics agency, the 16 country euro area is estimated to have had relatively weak 1.7% GDP growth in 2010 and unemployment recently stood at 10.1%. Giving cause for some optimism, however, in November 2010 compared with October 2010, industrial new orders were up by 2.1% in the euro area.
INVESTMENT STRATEGY AND OUTLOOK
Given this comparatively benign economic environment, the Fund’s strategy in 2010 included maintaining its focus on larger, quality companies with attractive valuations, using fewer, but more concentrated, individual positions. At December 31, 2010, the Fund’s top ten holdings comprised approximately 87% of its total assets, with 28% of total assets in just one holding, Berkshire Hathaway, Inc. The Fund holds predominantly blue chip and other well known companies in its portfolio, including some of the strongest companies with global operations in insurance, technology, and banking. The Fund enjoyed a total return of 5.67% in 2010.
The current outlook, according to the International Monetary Fund (IMF), is for global output to expand by about 4.5% in 2011. Importantly, however, the IMF believes that the advanced economies’ growth will slow to 2.5% from 3.0% last year, while emerging markets may see 6.5% growth, down from 7.1% in 2010. As economic and financial news continue to suggest investment potential, the Fund may seek to employ its flexible investment strategy to enhance returns with leverage (borrowing at year end was slightly over 12% of net assets) and other speculative techniques, or may seek a defensive investment position.
TOP10 HOLDINGS AS OF DECEMBER 31, 2010 |
1 Berkshire Hathaway, Inc. Class B |
2 MasterCard, Inc. |
3 Google, Inc. |
4 Canadian Natural Resources Ltd |
5 JPMorgan Chase & Co. |
6 Apple Inc. |
7 Costco Wholesale Corp. |
8 Johnson & Johnson |
9 General Electric Company. |
10 The Goldman Sachs Group, Inc. |
| Top Ten Holdings comprise approximately 87% of total assets. |
We are delighted to submit this 2010 Annual Report for Midas Perpetual Portfolio and to welcome our new shareholders who have invested in the Fund directly or through one of the growing number of brokerage firms making the Fund available to their customers.
Investors who wish to invest all or a portion of their capital in a way that does not depend on any particular outcome for the economy should consider purchasing shares of the Fund. While the Fund’s objective is to preserve and increase the purchasing power value of its shares over the long term, the investment strategy of Midas Perpetual Portfolio acknowledges a broad range of economic possibilities and investing outlooks, and seeks to incorporate investments appropriate for each of them. Key to the pursuit of its investment objective, the Fund seeks to invest a fixed “Target Percentage” of its total assets of each of the following categories:
| Investment Category | Target Percentage |
| Gold | 20% |
| Silver | 5% |
| Swiss Franc Assets | 10% |
| Hard Asset Securities | 15% |
| Large Capitalization Growth Stocks | 15% |
| Dollar Assets | 35% |
| Total | 100% |
These investment categories, although subject to the risk of potential loss, have been chosen and weighted with the goal of providing downside protection to the overall portfolio in most foreseeable economic conditions. As a category outperforms the others and becomes overweighted, its weighting may be reduced back towards its target. This “re-balancing” activity normally may cause the Fund to reduce its exposure to sectors with potentially unsustainable investor enthusiasm, and increase its investment in sectors which might hold greater relative, although currently underappreciated, value for investors.
STRATEGIES AND OUTLOOK
Concerns over the weakness of the U.S. and global economic recoveries were accompanied by strength in silver and gold prices, and the Fund’s strategic allocations to those categories benefited significantly, while large capitalization growth stock prices stalled. The Fund’s holdings of Swiss franc assets and hard asset securities performed well as the U.S. dollar weakened. Defensively invested in money market funds, dollar asset holdings in the Fund avoided losses and potential depreciation from a scenario of rising interest rates. The outlook for potentially slowing growth in most of the world’s economies reinforces our view of the potential benefits, as well as challenges, of investing in a number of different investment categories.
CONTACT US FOR INFORMATION AND SERVICES
Since the Fund’s strategies reflect longer term wealth building goals, we believe that it can be especially appropriate for a program of steady monthly investing. To make regular investing in the Fund as easy, convenient, and affordable as possible, we offer the Midas Bank Transfer Plan. Midas Perpetual Portfolio’s long term investment objective also makes it attractive for investment through our Traditional or Roth IRAs, Health Savings Accounts, and also our Education Savings Accounts. For information, simply give us a call toll free at 1-800-400-MIDAS (6432) and we will be delighted to provide such information to you, a friend, or relative.
TOP 10 HOLDINGS AS OF DECEMBER 31, 2010 |
| 1 SSgA Money Market Fund |
| 2 SPDR Gold Trust |
| 3 Switzerland Government, 2.5% Notes, due 3/12/16 |
| 4 iShares Silver Trust |
| 5 Comcast Corp. |
| 6 Roche-Holding AG ADR |
| 7 Oracle Corp. |
| 8 E.I. du Pont de Nemours and Company |
| 9 Schlumberger Limited |
| 10 Rio Tinto Ltd. |
| Top Ten Holdings comprise approximately 61% of total assets. |
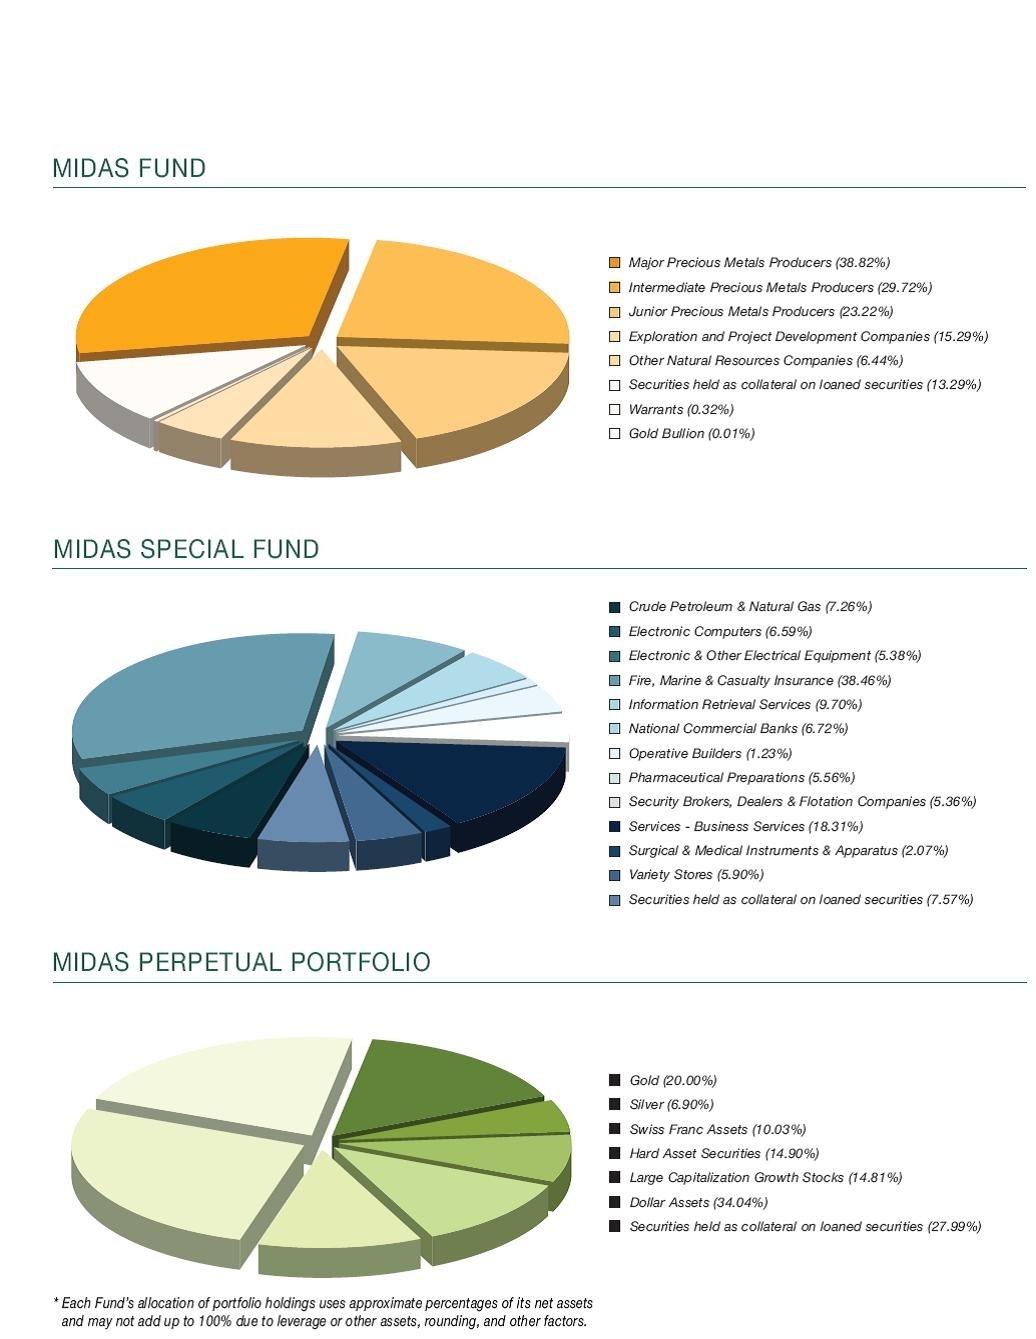
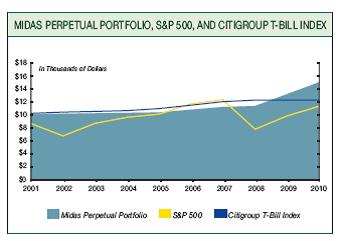
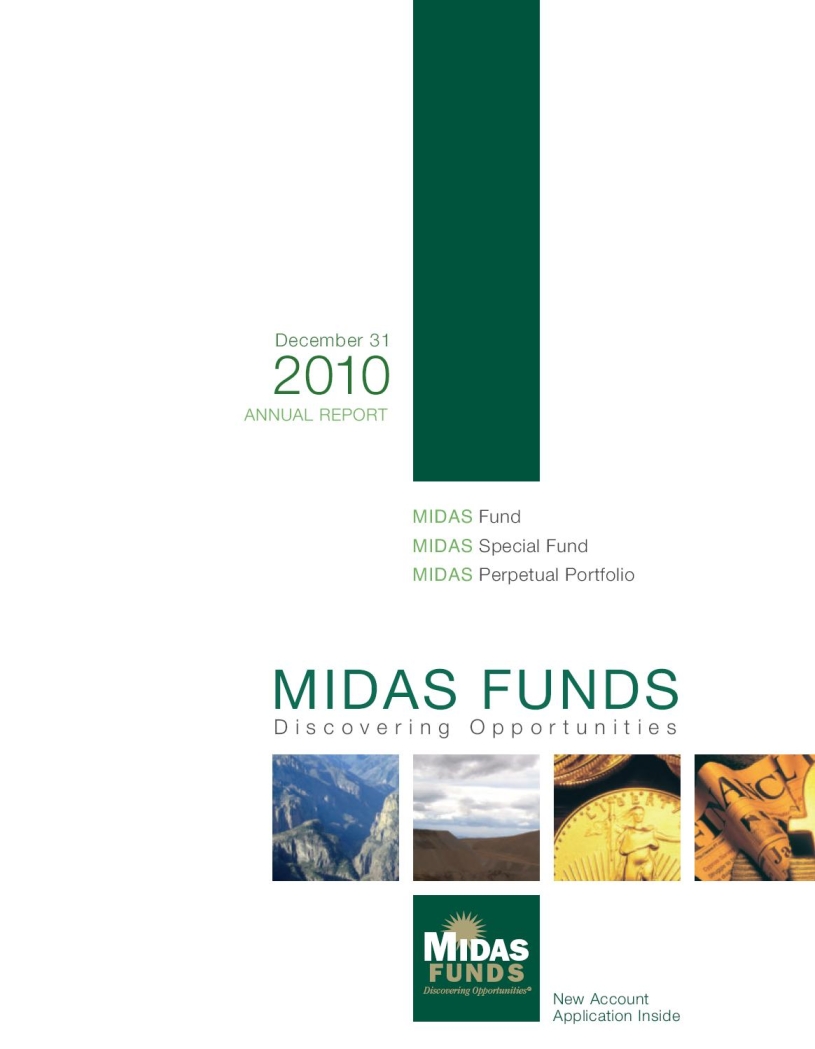
| Allocation of Portfolio Holdings* | December 31, 2010 (Unaudited) |
Table of Contents
| MIDAS Fund | Schedule of Portfolio Investments - December 31, 2010 |
| Common Stocks (113.49%) | | | | | | |
| Shares | | | | Cost | | | Value | |
| Major Precious Metals Producers (38.82%) | | | | | | |
| | 100,000 | | AngloGold Ashanti Ltd. ADR (a) | | $ | 4,479,423 | | | $ | 4,923,000 | |
| | 150,000 | | Barrick Gold Corp. (b) | | | 6,187,628 | | | | 7,977,000 | |
| | 60,000 | | Freeport-McMoRan Copper & Gold, Inc. (b) | | | 5,054,576 | | | | 7,205,400 | |
| | 291,453 | | Fresnillo plc (b) | | | 587,289 | | | | 7,611,335 | |
| | 90,000 | | Goldcorp Inc. | | | 3,796,193 | | | | 4,138,200 | |
| | 170,000 | | Impala Platinum Holdings Ltd. (b) | | | 5,222,171 | | | | 5,986,200 | |
| | 319,369 | | Kinross Gold Corp. (b) | | | 6,409,617 | | | | 6,055,236 | |
| | 100,755 | | Newcrest Mining Ltd. (a) | | | 2,220,469 | | | | 4,176,609 | |
| | 100,000 | | Newmont Mining Corp. | | | 5,940,870 | | | | 6,143,000 | |
| | | | | | | 39,898,236 | | | | 54,215,980 | |
| | | | | | | | | | | | |
| Intermediate Precious Metals Producers (29.72%) | | | | | | | | |
| | 350,000 | | African Barrick Gold plc | | | 3,061,809 | | | | 3,348,155 | |
| | 50,000 | | Agnico-Eagle Mines Ltd. | | | 3,557,835 | | | | 3,835,000 | |
| | 919,000 | | Aquarius Platinum Ltd. | | | 6,288,476 | | | | 5,064,709 | |
| | 275,400 | | Centerra Gold Inc. | | | 2,833,774 | | | | 5,498,854 | |
| | 325,000 | | Eldorado Gold Corp. Ltd. (b) | | | 5,655,700 | | | | 6,035,250 | |
| | 850,000 | | Golden Star Resources Ltd. (a) (c) | | | 3,999,471 | | | | 3,901,500 | |
| | 200,000 | | IAMGOLD Corp. (a) | | | 3,671,460 | | | | 3,560,000 | |
| | 575,000 | | Northam Platinum Ltd. | | | 1,552,969 | | | | 3,937,195 | |
| | 30,000 | | Randgold Resources Ltd. ADR (a) | | | 2,403,978 | | | | 2,469,900 | |
| | 300,000 | | Silvercorp Metals, Inc. (b) | | | 1,941,192 | | | | 3,849,000 | |
| | | | | | | 34,966,664 | | | | 41,499,563 | |
| | | | | | | | | | | | |
| Junior Precious Metals Producers (23.22%) | | | | | | | | |
| | 200,000 | | Alamos Gold Inc. (b) | | | 2,506,500 | | | | 3,808,182 | |
| | 135,000 | | Aurizon Mines Ltd. (c) | | | 797,838 | | | | 988,200 | |
| | 2,100,000 | | Avocet Mining PLC (c) | | | 3,548,756 | | | | 7,784,049 | |
| | 600,000 | | CGA Mining Ltd. (c) | | | 895,814 | | | | 1,871,886 | |
| | 500,000 | | Gold Wheaton Gold Corp. (c) | | | 1,723,593 | | | | 2,586,424 | |
| | 1,000,000 | | Great Basin Gold Ltd. (a) (c) | | | 2,816,753 | | | | 2,959,996 | |
| | 800,000 | | Jaguar Mining, Inc. (a) (c) | | | 3,972,073 | | | | 5,703,980 | |
| | 2,100,000 | | Northgate Minerals Corp. (a) (c) | | | 6,007,060 | | | | 6,720,000 | |
| | | | | | | 22,268,387 | | | | 32,422,717 | |
| | | | | | | | | | | | |
| Exploration and Project Development Companies (15.29%) | | | | | | | | |
| | 250,000 | | Corvus Gold Inc. (a) (c) | | | 290,236 | | | | 198,762 | |
| | 85,000 | | Detour Gold Corp. (b) (c) | | | 1,266,311 | | | | 2,497,006 | |
| | 500,000 | | Geomark Exploration Ltd. (c) | | | 174,406 | | | | 593,770 | |
| | 500,000 | | International Tower Hill Mines Ltd. (c) | | | 2,657,727 | | | | 5,035,000 | |
| | 37,699 | | Ivanhoe Nickel & Platinum Ltd. (c) (d) | | | 0 | | | | 0 | |
| | 600,000 | | Northern Dynasty Minerals Ltd. (a) (c) | | | 7,605,098 | | | | 8,574,000 | |
| | 1,500,000 | | Platinum Group Metals Ltd. (a) (c) | | | 3,159,430 | | | | 3,990,000 | |
| | 81,600 | | Sabina Gold & Silver Corp. (c) | | | 272,025 | | | | 460,701 | |
| | | | | | | 15,425,233 | | | | 21,349,239 | |
See notes to financial statements.
| MIDAS Fund | Schedule of Portfolio Investments continued |
| | Common Stocks - continued | | | | | | |
| | Shares | | | | Cost | | | Value | |
| | Other Natural Resources Companies (6.44%) | | | | | | |
| | | | | | | | | | | | | |
| | | 6,815,000 | | Farallon Mining Ltd. (c) | | $ | 4,812,369 | | | $ | 5,418,256 | |
| | | 445,000 | | Forsys Metals Corp. (c) | | | 2,112,343 | | | | 1,379,500 | |
| | | 550,000 | | Mercator Minerals Ltd. (a) (c) | | | 2,891,248 | | | | 2,197,454 | |
| | | | | | | | 9,815,960 | | | | 8,995,210 | |
| | Total common stocks | | | 122,374,480 | | | | 158,482,709 | |
| | | | | | | | | | |
| | Warrants (0.32%) (c) | | | | | | | | |
| | Units | | | | | | | | |
| | | 100,000 | | Kinross Gold Corp., expiring 9/07/11 | | | 105,450 | | | | - | |
| | | 142,900 | | Kinross Gold Corp., expiring 9/03/13 | | | 314,951 | | | | 577,052 | |
| | | 7,150 | | Kinross Gold Corp., expiring 9/17/14 (a) | | | 33,748 | | | | - | |
| | Total warrants | | | 577,052 | | | | 454,149 | |
| | | | | | | | | | |
| | Bullion Ounces (0.01%) (c) | | | | | | | | |
| | | 10 | | Gold | | | 14,189 | | | | 9,643 | |
| | Securities held as Collateral on Loaned Securities (13.29%) | | | | | | | | |
| | | 18,552,621 | | State Street Navigator Securities Lending Prime Portfolio | | | 18,552,621 | | | | 18,552,621 | |
| | | | | | | | | | | | | |
| | Total investments (127.11%) | | $ | 141,513,796 | | | | 177,503,668 | |
| | | | | | | | | | |
| | Liabilities in excess of other assets (-27.11%) | | | | | | | (37,859,985 | ) |
| | | | | | | | | | |
| | Net assets (100.00%) | | | | | | $ | 139,643,683 | |
| | | | | | | | | | |
| | (a) All or a portion of this security was on loan. | | | | | | | | |
| | (b) Fully or partially pledged as collateral on bank credit facility. | | | | | | | | |
| | (c) Non-income producing. | | | | | | | | |
| | (d) Illiquid and/or restricted security that has been fair valued. | | | | | | | | |
| | ADR means “American Depositary Receipt.” | | | | | | | | |
See notes to financial statements.
Table of Contents| Common Stocks (112.54%) | | | | |
| Shares | | Cost | | Value | |
| Crude Petroleum & Natural Gas (7.26%) | | | | |
| | | | | | | | | |
| | 20,000 | Canadian Natural Resources Ltd. | $ | 522,599 | | $ | 888,400 | |
| | | | | | | | | |
| Electronic Computers (6.59%) | | | | | | |
| | | | | | | | | |
| | 2,500 | Apple Inc. (a) (b) | | 477,375 | | | 806,400 | |
| | | | | | | | | |
| Electronic & Other Electrical Equipment (5.38%) | | | | | | |
| | | | | | | | | |
| | 36,000 | General Electric Company | | 435,510 | | | 658,440 | |
| | | | | | | | | |
| Fire, Marine & Casualty Insurance (38.46%) | | | | | | |
| | | | | | | | | |
| | 52,500 | Berkshire Hathaway, Inc. Class B (a) (b) | | 1,744,890 | | | 4,205,775 | |
| | 9,000 | The Travelers Companies, Inc. (c) | | 416,182 | | | 501,390 | |
| | | | | 2,161,072 | | | 4,707,165 | |
| | | | | | | | | |
| Information Retrieval Services (9.70%) | | | | | | |
| | | | | | | | | |
| | 2,000 | Google, Inc. - Class A (a) (b) | | 758,730 | | | 1,187,940 | |
| | | | | | | | | |
| National Commercial Banks (6.72%) | | | | | | |
| | | | | | | | | |
| | 19,400 | JPMorgan Chase & Co. (b) | | 691,858 | | | 822,948 | |
| | | | | | | | | |
| Operative Builders (1.23%) | | | | | | |
| | | | | | | | | |
| | 20,000 | PulteGroup, Inc. (a) (c) | | 444,535 | | | 150,400 | |
| | | | | | | | | |
| Pharmaceutical Preparations (5.56%) | | | | | | |
| | | | | | | | | |
| | 11,000 | Johnson & Johnson (b) | | 669,169 | | | 680,350 | |
| | | | | | | | | |
| Security Brokers, Dealers & Flotation Companies (5.36%) | | | | | | |
| | | | | | | | | |
| | 3,900 | The Goldman Sachs Group, Inc. (b) | | 865,343 | | | 655,824 | |
| | | | | | | | | |
| Services - Business Services (18.31%) | | | | | | |
| | | | | | | | | |
| | 10,000 | MasterCard, Inc. (b) | | 937,175 | | | 2,241,100 | |
| | | | | | | | | |
See notes to financial statements.
Table of Contents
| MIDAS Special Fund | Schedule of Portfolio Investments continued |
| Common Stocks - continued | | | | | | |
| Shares | | | | Cost | | | Value | |
| Surgical & Medical Instruments & Apparatus (2.07%) | | | | | | |
| | | | | | | | | | | | |
| | 3,000 | | Becton, Dickinson and Company (c) | | $ | 210,947 | | | $ | 253,560 | |
| | | | | | | | | | | | |
| Variety Stores (5.90%) | | | | | | | | |
| | | | | | | | | | | | |
| | 10,000 | | Costco Wholesale Corp. (b) | | | 692,696 | | | | 722,100 | |
| | | | | | | | | | | | |
| Total common stocks | | | 8,867,009 | | | | 13,774,627 | |
| | | | | | | | | |
| Securities held as Collateral on Loaned Securities (7.57%) | | | | | | | | |
| | | | | | | | | | | | |
| | 665,750 | | State Street Navigator Securities Lending Prime Portfolio | | | 665,750 | | | | 665,750 | |
| | 261,000 | | U.S. Government and U.S. Government Agency .44% - 4.00% | | | | | | | | |
| | | | due 4/30/11 - 12/28/12 | | | 260,545 | | | | 260,545 | |
| | | | | | | 926,295 | | | | 926,295 | |
| | | | | | | | | | | | |
| Total investments (120.11%) | | $ | 9,793,304 | | | | 14,700,922 | |
| | | | | | | | | | | | |
| Liabilities in excess of other assets (-20.11%) | | | | | | | (2,461,339 | ) |
| | | | | | | | | | | | |
| Net assets (100.00%) | | | | | | $ | 12,239,583 | |
(a) Non-income producing. (b) Fully or partially pledged as collateral on bank credit facility. (c) All or a portion of this security was on loan. | | | | | | | | |
See notes to financial statements.
| Shares | | | | Cost | | | Value | |
| Gold (20.00%) | | | | | | | | |
| | 15,310 | | SPDR Gold Trust (a) (b) | | $ | 1,326,145 | | | $ | 2,123,803 | |
| Silver (6.90%) | | | | | | | | | | |
| | 24,264 | | iShares Silver Trust (a) (b) | | | 272,282 | | | | 732,288 | |
| Swiss Franc Assets (10.03%) | | | | | | | | |
| | 932,000 | | Switzerland Government 2.50% Notes, due 3/12/16 (c) | | | 877,566 | | | | 1,065,510 | |
| Hard Asset Securities (14.90%) | | | | | | | | |
| Crude Petroleum & Natural Gas (2.59%) | | | | | | | | |
| | 1,219 | | Occidental Petroleum Corp. (b) | | | 73,137 | | | | 119,584 | |
| | 654 | | PetroChina Company Limited | | | 68,566 | | | | 85,994 | |
| | 1,838 | | Petroleo Brasileiro S.A. (b) | | | 67,908 | | | | 69,550 | |
| | | | | | | 209,611 | | | | 275,128 | |
| Gold Ores (2.06%) | | | | | | | | | | |
| | 2,051 | | Barrick Gold Corp. | | | 75,431 | | | | 109,072 | |
| | 2,385 | | Goldcorp Inc. | | | 75,217 | | | | 109,662 | |
| | | | | | | 150,648 | | | | 218,734 | |
| Industrial Gases (1.11%) | | | | | | | | |
| | 1,231 | | Praxair, Inc. (b) | | | 73,081 | | | | 117,524 | |
| Metal Mining (2.28%) | | | | | | | | |
| | 1,700 | | Rio Tinto Ltd. (b) | | | 120,006 | | | | 121,822 | |
| | 3,500 | | Vale S.A. ADR (b) | | | 121,959 | | | | 120,995 | |
| | | | | | | 241,965 | | | | 242,817 | |
| Petroleum Refining (1.53%) | | | | | | | | |
| | 1,408 | | ConocoPhillips | | | 72,945 | | | | 95,885 | |
| | 915 | | Exxon Mobil Corp. | | | 73,051 | | | | 66,905 | |
| | | | | | | 145,996 | | | | 162,790 | |
| Plastic Materials, Resins & Nonvulcanelastomers (1.37%) | | | | | | | | |
| | 2,907 | | E.I. du Pont de Nemours and Company (b) | | | 73,569 | | | | 145,001 | |
| Real Estate Investment Trusts (2.60%) | | | | | | | | |
| | 1,213 | | Federal Realty Investment Trust (b) | | | 75,091 | | | | 94,529 | |
| | 1,778 | | Health Care REIT, Inc. (b) | | | 74,180 | | | | 84,704 | |
| | 958 | | Public Storage (b) | | | 76,168 | | | | 97,160 | |
| | | | | | | 225,439 | | | | 276,393 | |
| Soybean Oil Mills (0.72%) | | | | | | | | |
| | 2,525 | | Archer-Daniels-Midland Company | | | 72,815 | | | | 75,952 | |
| Steel Works, Blast Furnaces & Rolling Mills (Coke Ovens) (0.64%) | | | | | | | | |
| | 1,558 | | Nucor Corp. (b) | | | 71,991 | | | | 68,272 | |
| Total hard asset securities | | | 1,265,115 | | | | 1,582,611 | |
See notes to financial statements.
Table of Contents
| MIDAS Perpetual Portfolio | Schedule of Portfolio Investments continued |
| Shares | | | | Cost | | | Value | |
| Large Capitalization Growth Stocks (14.81%) | | | | | | |
| Cable & Other Pay Television Services (1.57%) | | | | | | |
| | 8,000 | | Comcast Corp. (b) | | $ | 161,288 | | | $ | 166,480 | |
| Communications Equipment (1.06%) | | | | | | | | |
| | 5,559 | | Cisco Systems, Inc. (a) | | | 90,765 | | | | 112,459 | |
| Electronic Computers (0.79%) | | | | | | | | |
| | 2,000 | | Hewlett-Packard Company | | | 75,060 | | | | 84,200 | |
| Fire, Marine & Casualty Insurance (1.13%) | | | | | | | | |
| | 1,500 | | Berkshire Hathaway Inc. Class B (a) | | | 96,440 | | | | 120,165 | |
| Information Retrieval Services (1.03%) | | | | | | | | |
| | 184 | | Google, Inc. (a) | | | 75,235 | | | | 109,290 | |
| Life Insurance (0.76%) | | | | | | | | |
| | 1,316 | | China Life Insurance Company Ltd. ADR | | | 74,580 | | | | 80,500 | |
| Oil & Gas Field Services (1.20%) | | | | | | | | |
| | 1,533 | | Schlumberger Ltd. | | | 64,903 | | | | 128,005 | |
| Pharmaceutical Preparations (2.42%) | | | | | | | | |
| | 4,500 | | Roche-Holding AG ADR | | | 161,994 | | | | 164,925 | |
| | 2,851 | | Sanofi-Aventis ADR | | | 91,709 | | | | 91,888 | |
| | | | | | | 253,703 | | | | 256,813 | |
| Radio & TV Communications Equipment (0.77%) | | | | | | | | |
| | 1,667 | | QUALCOMM Inc. | | | 75,052 | | | | 82,500 | |
| Services-Prepackaged Software (2.36%) | | | | | | | | |
| | 3,261 | | Microsoft Corp. | | | 75,582 | | | | 91,047 | |
| | 5,096 | | Oracle Corp. | | | 90,696 | | | | 159,505 | |
| | | | | | | 166,278 | | | | 250,552 | |
| Telephone Communications (1.72%) | | | | | | | | |
| | 1,799 | | China Mobile Ltd. ADR (b) | | | 91,493 | | | | 89,266 | |
| | 1,359 | | Telefonica, S.A. ADR | | | 91,593 | | | | 92,983 | |
| | | | | | | 183,086 | | | | 182,249 | |
| Total large capitalization growth stocks | | | 1,316,390 | | | | 1,573,213 | |
| Dollar Assets (34.04%) | | | | | | | | |
| Money Market Fund | | | | | | | | |
| | 3,614,394 | | SSgA Money Market Fund, 0.01% (d) | | | 3,614,394 | | | | 3,614,394 | |
| SECURITIES HELD AS COLLATERAL ON LOANED SECURITIES (27.99%) | | | | | | | | |
| | 2,972,564 | | State Street Navigator Securities Lending Prime Portfolio | | | 2,972,564 | | | | 2,972,564 | |
| | | | | | | | | | | | |
| Total investments (128.67%) | | $ | 11,644,456 | | | | 13,664,383 | |
| | | | | | | | | | | | |
| Liabilities in excess of other assets (-28.67%) | | | | | | | (3,044,872 | ) |
| Net assets (100.00%) | | | | | | $ | 10,619,511 | |
| | | | | | | | | | | | |
(a) Non-income producing. | | | | | | | | |
| (b) All or a portion of this security was on loan. | | | | | | | | |
| (c) Principal amount denominated in Swiss Francs. | | | | | | | | |
| (d) Rate represents the 7 day annualized yield at December 31, 2010. | | | | | | | | |
| ADR means “American Depositary Receipt.” | | | | | | | |
See notes to financial statements.
Table of Contents
| December 31, 2010 | | Midas Fund | | | Midas Special Fund | | Midas Perpetual Portfolio | |
| Assets | | | | | | | | | |
| Investments at cost | | $ | 141,513,796 | | | $ | 9,793,304 | | | $ | 11,644,456 | |
| | | | |
| Investments at value | | $ | 177,503,668 | | | $ | 14,700,922 | | | $ | 13,664,383 | |
| Cash | | | - | | | | 5,835 | | | | - | |
| Receivables | | | | | | | | | | | | |
| Fund shares sold | | | 135,611 | | | | 38,987 | | | | 79,749 | |
| Dividends | | | 18,700 | | | | 6,315 | | | | 2,531 | |
| Income from securities loaned | | | 1,528 | | | | 223 | | | | 379 | |
| Interest | | | - | | | | - | | | | 13,883 | |
| Foreign withholding taxes reclaimed | | | - | | | | - | | | | 21,259 | |
| Other assets | | | 43,685 | | | | 8,605 | | | | 7,134 | |
| | | | |
| Total assets | | | 177,703,192 | | | | 14,760,887 | | | | 13,789,318 | |
| Liabilities | | | | | | | | | | | | |
| Bank line of credit | | | 18,993,272 | | | | 1,494,113 | | | | - | |
| Collateral on securities loaned, at value | | | 18,552,621 | | | | 926,295 | | | | 2,972,564 | |
| Payables | | | | | | | | | | | | |
| Accrued expenses | | | 233,112 | | | | 75,899 | | | | 56,419 | |
| Fund shares redeemed | | | 125,959 | | | | 2,298 | | | | 20,493 | |
| Investment management fees | | | 110,305 | | | | 10,055 | | | | - | |
| Distribution fees | | | 29,410 | | | | 10,285 | | | | 2,193 | |
| Administrative services | | | 14,830 | | | | 2,359 | | | | 1,037 | |
| Securities purchased | | | - | | | | - | | | | 117,101 | |
| | | | |
| Total liabilities | | | 38,059,509 | | | | 2,521,304 | | | | 3,169,807 | |
| | | | |
| Net assets | | $ | 139,643,683 | | | $ | 12,239,583 | | | $ | 10,619,511 | |
| | | | |
| Shares outstanding, $0.01 par value | | | 24,704,997 | | | | 830,662 | | | | 8,191,562 | |
| | | | | | | | | | | | | |
| Net asset value, offering, and redemption price per share | | $ | 5.65 | | | $ | 14.73 | | | $ | 1.30 | |
| | | | | | | | | | | | | |
| Net assets consist of | | | | | | | | | | | | |
| Paid in capital | | $ | 119,337,513 | | | $ | 11,721,716 | | | $ | 8,434,433 | |
| Accumulated undistributed net investment loss | | | (1,997,833 | ) | | | - | | | | - | |
| Accumulated net realized gain (loss) | | | (13,685,869 | ) | | | (4,389,751 | ) | | | 161,397 | |
| Net unrealized appreciation on investments | | | | | | | | | | | | |
| and foreign currencies | | | 35,989,872 | | | | 4,907,618 | | | | 2,023,681 | |
| | | | |
| | | $ | 139,643,683 | | | $ | 12,239,583 | | | $ | 10,619,511 | |
| | | | | | | | | | | | | |
See notes to financial statements.
Table of Contents
| | | Midas | | | Midas | | | Midas | |
| For the Year Ended December 31, 2010 | | Fund | | | Special Fund | | | Perpetual Portfolio | |
| Investment income | | | | | | | | | |
| Dividends | | $ | 815,192 | | | $ | 90,513 | | | $ | 64,667 | |
| Income from securities loaned | | | 58,821 | | | | 3,928 | | | | 3,201 | |
| Foreign tax withholding | | | (55,936 | ) | | | (1,374 | ) | | | (2,808 | ) |
| Interest | | | - | | | | - | | | | 14,398 | |
| | | | | | | | | | | | | |
| Total investment income | | | 818,077 | | | | 93,067 | | | | 79,458 | |
| | | | | | | | | | | | | |
| Expenses | | | | | | | | | | | | |
| Investment management | | | 1,145,898 | | | | 110,504 | | | | 44,078 | |
| Transfer agent | | | 431,700 | | | | 76,438 | | | | 40,603 | |
| Distribution | | | 286,474 | | | | 112,011 | | | | 22,039 | |
| Interest and fees on bank credit facility | | | 171,005 | | | | 42,643 | | | | 3,001 | |
| Administrative services | | | 129,915 | | | | 13,000 | | | | 8,599 | |
| Printing and postage | | | 82,759 | | | | 11,407 | | | | 11,224 | |
| Bookkeeping and pricing | | | 75,301 | | | | 24,069 | | | | 26,401 | |
| Legal | | | 70,029 | | | | 9,221 | | | | 4,910 | |
| Directors | | | 51,410 | | | | 12,236 | | | | 4,650 | |
| Interest and fees related to short sales | | | 47,834 | | | | - | | | | - | |
| Custodian | | | 39,281 | | | | 7,664 | | | | 1,930 | |
| Registration | | | 38,150 | | | | 29,890 | | | | 31,880 | |
| Insurance | | | 32,110 | | | | 3,182 | | | | 3,357 | |
| Auditing | | | 22,271 | | | | 19,387 | | | | 18,250 | |
| Other | | | 5,499 | | | | 1,371 | | | | 494 | |
| | | | | | | | | | | | | |
| Total expenses | | | 2,629,636 | | | | 473,023 | | | | 221,416 | |
| Less contractual fee waivers | | | | | | | | | | | | |
| Investment management | | | - | | | | - | | | | (44,078 | ) |
| Distribution | | | - | | | | - | | | | (6,883 | ) |
| | | | | | | | | | | | | |
| Net expenses | | | 2,629,636 | | | | 473,023 | | | | 170,455 | |
| | | | | | | | | | | | | |
| Net investment loss | | | (1,811,559 | ) | | | (379,956 | ) | | | (90,997 | ) |
| | | | | | | | | | | | | |
| Realized and Unrealized Gain (Loss) | | | | | | | | | | | | |
| Net realized gain (loss) on | | | | | | | | | | | | |
| Investments | | | 17,253,574 | | | | (664,083 | ) | | | 161,397 | |
| Foreign currencies | | | 106,232 | | | | - | | | | (341 | ) |
| Securities sold short | | | (86,423 | ) | | | - | | | | - | |
| Unrealized appreciation on | | | | | | | | | | | | |
| Investments | | | 28,951,224 | | | | 1,687,394 | | | | 913,265 | |
| Translation of assets and liabilities in foreign currencies | | | 1,779,227 | | | | - | | | | 98,792 | |
| Securities sold short | | | 275,514 | | | | - | | | | - | |
| | | | | | | | | | | | | |
| Net realized and unrealized gain | | | 48,279,348 | | | | 1,023,311 | | | | 1,173,113 | |
| | | | | | | | | | | | | |
| Net increase in net assets resulting from operations | | $ | 46,467,789 | | | $ | 643,355 | | | $ | 1,082,116 | |
| | | | | | | | | | | | | |
See notes to financial statements.
For The Years Ended December 31, 2010 and 2009 | | Midas Fund | | | Midas Special Fund | | | Midas Perpetual Portfolio | |
| | | 2010 | | | 2009 | | | 2010 | | | 2009 | | | 2010 | | | 2009 | |
| Operations | | | | | | | | | | | | | | | | | | |
| Net investment loss | | $ | (1,811,559 | ) | | $ | (1,563,178 | ) | | $ | (379,956 | ) | | $ | (313,847 | ) | | $ | (90,997 | ) | | $ | (92,745 | ) |
| Net realized gain (loss) | | | 17,273,383 | | | | 6,557,484 | | | | (664,083 | ) | | | (406,657 | ) | | | 161,056 | | | | 214,585 | |
| Unrealized appreciation | | | 31,005,965 | | | | 51,642,270 | | | | 1,687,394 | | | | 3,755,833 | | | | 1,012,057 | | | | 1,017,414 | |
| | | | | | | | | | | | | | | | | | | | | | | | | |
| Net increase in net assets | | | | | | | | | | | | | | | | | | | | | | | | |
| resulting from operations | | | 46,467,789 | | | | 56,636,576 | | | | 643,355 | | | | 3,035,329 | | | | 1,082,116 | | | | 1,139,254 | |
| | | | | | | | | | | | | | | | | | | | | | | | | |
| Distributions to shareholders | | | | | | | | | | | | | | | | | | | | | | | | |
| Ordinary income | | | - | | | | (1,403,657 | ) | | | - | | | | - | | | | - | | | | - | |
| Net realized gains | | | - | | | | - | | | | - | | | | - | | | | - | | | | (135,764 | ) |
| | | | | | | | | | | | | | | | | | | | | | | | | |
| Total distributions | | | - | | | | (1,403,657 | ) | | | - | | | | - | | | | - | | | | (135,764 | ) |
| | | | | | | | | | | | | | | | | | | | | | | | | |
| Capital share transactions | | | | | | | | | | | | | | | | | | | | | | | | |
| Change in net assets resulting from | | | | | | | | | | | | | | | | | | | | | | | | |
capital share transactions (a) | | | (23,146,852 | ) | | | (16,447,053 | ) | | | 13,884 | | | | (365,286 | ) | | | 1,222,457 | | | | 113,439 | |
| Redemption fees | | | 11,801 | | | | 23,190 | | | | 626 | | | | 914 | | | | 4,281 | | | | 2,657 | |
| | | | | | | | | | | | | | | | | | | | | | | | | |
| Decrease in net assets resulting from | | | | | | | | | | | | | | | | | | | | | | | | |
| capital share transactions | | | (23,135,051 | ) | | | (16,423,863 | ) | | | 14,510 | | | | (364,372 | ) | | | 1,226,738 | | | | 116,096 | |
| | | | | | | | | | | | | | | | | | | | | | | | | |
| Total change in net assets | | | 23,332,738 | | | | 38,809,056 | | | | 657,865 | | | | 2,670,957 | | | | 2,308,854 | | | | 1,119,586 | |
| | | | | | | | | | | | | | | | | | | | | | | | | |
| Net assets | | | | | | | | | | | | | | | | | | | | | | | | |
| Beginning of year | | | 116,310,945 | | | | 77,501,889 | | | | 11,581,718 | | | | 8,910,761 | | | | 8,310,657 | | | | 7,191,071 | |
| | | | | | | | | | | | | | | | | | | | | | | | | |
End of year (b) | | $ | 139,643,683 | | | $ | 116,310,945 | | | $ | 12,239,583 | | | $ | 11,581,718 | | | $ | 10,619,511 | | | $ | 8,310,657 | |
| | | | | | | | | | | | | | | | | | | | | | | | | |
(a) Capital share transactions were as follows: | | | | | | | | | | | | | | | | | | | | | | | | |
| Value | | | | | | | | | | | | | | | | | | | | | | | | |
| Shares sold | | $ | 25,448,976 | | | $ | 22,434,540 | | | $ | 1,309,859 | | | $ | 542,044 | | | $ | 4,131,103 | | | $ | 2,087,424 | |
| Shares issued in reinvestment of distributions | | | - | | | | 1,302,755 | | | | - | | | | - | | | | - | | | | 133,543 | |
| Shares redeemed | | | (48,595,828 | ) | | | (40,184,348 | ) | | | (1,295,975 | ) | | | (907,330 | ) | | | (2,908,646 | ) | | | (2,107,528 | ) |
| | | | | | | | | | | | | | | | | | | | | | | | | |
| Net increase (decrease) | | $ | (23,146,852 | ) | | $ | (16,447,053 | ) | | $ | 13,884 | | | $ | (365,286 | ) | | $ | 1,222,457 | | | $ | 113,439 | |
| | | | | | | | | | | | | | | | | | | | | | | | | |
| Number | | | | | | | | | | | | | | | | | | | | | | | | |
| Shares sold | | | 5,795,951 | | | | 7,680,094 | | | | 91,033 | | | | 49,797 | | | | 3,456,412 | | | | 1,864,840 | |
| Shares issued in reinvestment of distributions | | | - | | | | 489,199 | | | | - | | | | - | | | | - | | | | 119,860 | |
| Shares redeemed | | | (11,539,586 | ) | | | (14,517,372 | ) | | | (91,222 | ) | | | (79,232 | ) | | | (2,468,976 | ) | | | (1,969,285 | ) |
| | | | | | | | | | | | | | | | | | | | | | | | | |
| Net increase (decrease) | | | (5,743,635 | ) | | | (6,348,079 | ) | | | (189 | ) | | | (29,435 | ) | | | 987,436 | | | | 15,415 | |
| | | | | | | | | | | | | | | | | | | | | | | | | |
(b) Undistributed net investment loss | | | | | | | | | | | | | | | | | | | | | | | | |
included in net assets | | $ | (1,997,833 | ) | | $ | (723,745 | ) | | $ | - | | | $ | - | | | $ | - | | | $ | - | |
| | | | | | | | | | | | | | | | | | | | | | | | | |
See notes to financial statements.
Table of Contents
For The Year Ended December 31, 2010 | | Midas Fund | | | Midas Special Fund | | Midas Perpetual Portfolio | |
Cash flows from operating activities | | | | | | | | | |
Net increase in net assets resulting from operations | | $ | 46,467,789 | | | $ | 643,355 | | | $ | 1,082,116 | |
Adjustments to reconcile change in net assets | | | | | | | | | | | | |
resulting from operations to net cash provided | | | | | | | | | | | | |
by (used in) operating activities: | | | | | | | | | | | | |
Proceeds from sales of long term investments | | | 99,209,363 | | | | 913,518 | | | | 248,692 | |
Purchase of long term investments | | | (79,074,719 | ) | | | - | | | | (786,866 | ) |
Buy to cover investments held short | | | (11,425,957 | ) | | | - | | | | - | |
Proceeds from short sale of investments | | | 7,019,996 | | | | - | | | | - | |
Unrealized appreciation of investments and foreign currencies | | | (31,005,965 | ) | | | (1,687,394 | ) | | | (1,012,057 | ) |
Net realized (gain) loss on sales of investments, | | | | | | | | | | | | |
short sales, and foreign currencies | | | (17,273,383 | ) | | | 664,083 | | | | (161,056 | ) |
Net sales (purchases) of short term investments | | | 106,232 | | | | 5,199 | | | | (659,954 | ) |
Amortization of premium of investment securities | | | - | | | | - | | | | 5,996 | |
Increase in collateral for securities loaned | | | (1,585,762 | ) | | | (194,017 | ) | | | (2,972,564 | ) |
Decrease in receivable for investments sold | | | 1,330,847 | | | | - | | | | - | |
Decrease (increase) in dividends receivable | | | 40,732 | | | | (620 | ) | | | 3,835 | |
Decrease (increase) in securities lending income receivable | | | 8,519 | | | | 138 | | | | (379 | ) |
Increase in interest receivable | | | - | | | | - | | | | (283 | ) |
Increase in foreign withholding taxes reclaimed | | | - | | | | - | | | | (15,645 | ) |
| | | 3,487 | | | | 375 | | | | 1,070 | |
Increase in payable upon return of securities loaned | | | 1,585,762 | | | | 194,017 | | | | 2,972,564 | |
Increase in payable for investments purchased | | | - | | | | - | | | | 117,101 | |
(Decrease) increase in accrued expenses | | | (2,096 | ) | | | 3,487 | | | | 5,984 | |
Increase in investment management fees payable | | | 14,462 | | | | 526 | | | | - | |
Increase in distribution fees payable | | | 3,615 | | | | 608 | | | | 2,193 | |
Increase (decrease) in administrative services payable | | | 2,830 | | | | 394 | | | | (1,241 | ) |
| | | | |
Net cash provided by (used in) operating activities | | | 15,425,752 | | | | 543,669 | | | | (1,170,494 | ) |
| | | | |
Cash flows from financing activities | | | | | | | | | | | | |
Net shares (redeemed) sold | | | (23,152,543 | ) | | | (22,179 | ) | | | 1,169,532 | |
Borrowing on (repayment of) bank line of credit | | | 7,726,791 | | | | (515,655 | ) | | | - | |
| | | | |
Net cash (used in) provided by financing activities | | | (15,425,752 | ) | | | (537,834 | ) | | | 1,169,532 | |
| | | - | | | | 5,835 | | | | (962 | ) |
| | | | | | | | | | | | | |
| | | | | | | | | | | | |
| | | - | | | | - | | | | 962 | |
| | | | |
| | $ | - | | | $ | 5,835 | | | $ | - | |
| | | | | | | | | | | | | |
Supplemental disclosure of cash flow information: | | | | | | | | | | | | |
Cash paid for interest and fees on bank line of credit | | | | | | | | | | | | |
| | $ | 218,506 | | | $ | 42,888 | | | $ | 447 | |
| | | | | | | | | | | | | |
See notes to financial statements.
| NOTES to Financial Statements | December 31, 2010 |
1 ORGANIZATION AND SIGNIFICANT ACCOUNTING POLICIES The Midas Funds are Maryland corporations registered under the Investment Company Act of 1940, as amended (the “Act”), as open end management investment companies. The investment objectives of Midas Fund are primarily capital appreciation and protection against inflation and, secondarily, current income, and it invests primarily in precious metals and natural resource companies and bullion. Midas Special Fund’s investment objective is capital appreciation, which it seeks by investing aggressively in any security in any sector. The investment objective of Midas Perpetual Portfolio (formerly Midas Dollar Reserves) is to preserve and increase the purchasing power value of its shares over the long term with a policy of investing a fixed target percentage of its total assets in gold, silver, Swiss franc assets, hard asset securities, large capitalization growth stocks, and dollar assets. Prior to December 12, 2008, Midas Perpetual Portfolio operated as a money market fund. On December 29, 2008, the Fund changed its name to Midas Perpetual Portfolio, ceased operating as a money market fund, and began operating as a fluctuating net asset value fund pursuant to its current investment objective and policies. The Funds retain Midas Management Corporation as their Investment Manager.
Midas Fund and Midas Perpetual Portfolio each has authorized capital of one billion shares of common stock, par value $0.01 per share. Midas Special Fund has authorized capital of 500 million shares of common stock, par value $0.01. Each Fund offers only one class of shares. Each Fund’s shareholders are entitled to one vote for each whole share owned and a fractional vote for each fraction of a share owned. Voting rights are not cumulative. All shares of a Fund are fully paid and non-assessable and have no preemptive or conversion rights.
The Funds impose a short term trading redemption fee on any Fund shares that are redeemed or exchanged within 30 days following their purchase date. The redemption fee is 1% of the amount redeemed. Such fees are retained by the Funds for the benefit of the remaining shareholders and are accounted for as an addition to paid in capital.
The following is a summary of significant accounting policies consistently followed by each Fund in the preparation of its financial statements.
Valuation of Investments – Portfolio securities are valued by various methods depending on the primary market or exchange on which they trade. Most equity securities for which the primary market is the United States are valued at the official closing price, last sale price or, if no sale has occurred, at the closing bid price. Most equity securities for which the primary market is outside the United States are valued using the official closing price or the last sale price in the principal market in which they are traded. If the last sale price on the local exchange is unavailable, the last evaluated quote or closing bid price normally is used. Gold and silver bullion is valued at 4:00 p.m. ET, at the mean between the last bid and asked quotations of the Bloomberg Composite (NY) Spot Price for that metal. Debt obligations with remaining maturities of 60 days or less are valued at cost adjusted for amortization of premiums and accretion of discounts. Certain of the securities in which the Funds may invest are priced through pricing services that may utilize a matrix pricing system which takes into consideration factors such as yields, prices, maturities, call features, and ratings on comparable securities. Bonds may be valued according to prices quoted by a bond dealer that offers pricing services. Open end investment companies are valued at their net asset value. Foreign securities markets may be open on days when the U.S. markets are closed. For this reason, the value of any foreign securities owned by a Fund could change on a day when stockholders cannot buy or sell shares of the Fund. Securities for which market quotations are not readily available or reliable and other assets may be valued as determined in good faith by the Investment Manager under the direction of and pursuant to procedures established by a Fund’s Board of Directors. Due to the inherent uncertainty of valuation, these values may differ from the values that would have been used had a readily available market for the securities existed. These differences in valuation could be material. A security’s valuation may differ depending on the method used for determining value. The use of fair value pricing by a Fund may cause the net asset value of its shares to differ from the net asset value that would be calculated using market prices.
Foreign Currency Translation – Securities denominated in foreign currencies are translated into U.S. dollars at prevailing exchange rates. Realized gain or loss on sales of such investments in local currency terms is reported separately from gain or loss attributable to the change in foreign exchange rates for those investments.
Table of Contents
| NOTES to Financial Statements | continued |
Foreign Currency Contracts – Forward foreign currency contracts are marked to market and the change in market value is recorded by a Fund as an unrealized gain or loss. When a contract is closed, a Fund records a realized gain or loss equal to the difference between the value of the contract at the time it was opened and the value at the time it was closed. A Fund could be exposed to risk if the counterparties are unable to meet the terms of the contracts or if the value of the currency changes unfavorably.
Derivatives – Midas Fund and Midas Special Fund may use derivatives for a variety of reasons, such as to attempt to protect against possible changes in the value of their portfolio holdings or to generate potential gain. Derivatives are financial instruments that derive their values from other securities or commodities, or that are based on indices. Derivative instruments are marked to market with the change in value reflected in unrealized appreciation or depreciation. Upon disposition, a realized gain or loss is recognized accordingly, except when taking delivery of a security underlying a contract. In these instances, the recognition of gain or loss is postponed until the disposal of the security underlying the contract. Risk may arise as a result of the potential inability of the counterparties to meet the terms of their contracts. Derivative instruments include written options, purchased options, futures contracts, forward foreign currency exchange contracts, and swap agreements. For the year ended December 31, 2010, the Funds did not invest in any derivative instruments.
Short Sales – Midas Fund and Midas Special Fund may sell a security it does not own in anticipation of a decline in the market value of the security. When a Fund sells a security short, it must borrow the security sold short and deliver it to the broker/dealer through which it made the short sale. A Fund is liable for any dividends or interest paid on securities sold short. A gain, limited to the price at which a Fund sold the security short, or a loss, unlimited in size, will be recognized upon the termination of a short sale. Securities sold short result in off balance sheet risk as a Fund’s ultimate obligation to satisfy the terms of the sale of securities sold short may exceed the amount recognized in the Statement of Assets and Liabilities.
Investment Transactions – Investment transactions are accounted for on the trade date (the date the order to buy or sell is executed). Realized gains or losses are determined by specifically identifying the cost basis of the security sold.
Investment Income – Interest income is recorded on the accrual basis. Amortization of premium and accretion of discount on debt securities are included in interest income. Dividend income is recorded on the ex-dividend date or in the case of certain foreign securities, as soon as a Fund is notified. Taxes withheld on foreign dividends have been provided for in accordance with a Fund’s understanding of the applicable country’s tax rules and rates.
Expenses – Estimated expenses are accrued daily. Expenses directly attributable to a Fund are charged to that Fund. Expenses borne by the complex of related investment companies, which includes open end and closed end investment companies for which the Investment Manager and its affiliates serve as investment manager, that are not directly attributed to a Fund, are allocated among the Fund and the other investment companies in the complex on the basis of relative net assets, except where a more appropriate allocation of expenses can otherwise be made fairly.
Expense Reduction Arrangement – Through arrangements with the Funds’ custodian and cash management bank, credits realized as a result of uninvested cash balances are used to reduce custodian and transfer agent expenses. No credits were realized by the Funds during the period.
Distributions – Distributions to shareholders, are determined in accordance with income tax regulations, and recorded on the ex-dividend date.
Income Taxes – No provision has been made for U.S. income taxes because each Fund intends to qualify as a regulated investment company under the Internal Revenue Code and to distribute to shareholders substantially all taxable income and net realized gains. Foreign securities held by a Fund may be subject to foreign taxation. Foreign taxes, if any, are recorded based on the tax regulations and rates that exist in the foreign markets in which a Fund invests. The Funds recognize the tax benefits of uncertain tax positions only where the position is “more likely than not” to be sustained assuming examination by tax authorities. The Funds have reviewed their tax positions and have concluded that no liability for unrecognized tax benefits should be recorded related to uncertain tax position taken on federal, state, and local income tax returns for all open tax years (2007 - 2009) or expected to be taken in the Funds’ 2010 tax returns.
Table of Contents
| NOTES to Financial Statements | continued |
Use of Estimates – In preparing financial statements in conformity with accounting principles generally accepted in the United States of America (“GAAP”), management makes estimates and assumptions that affect the reported amounts of assets and liabilities at the date of the financial statements, as well as the reported amounts of revenues and expenses during the reporting period. Actual results could differ from those estimates.
Indemnifications – The Funds indemnify officers and directors for certain liabilities that might arise from their performance of their duties for the Funds. Additionally, in the normal course of business the Funds enter into contracts that contain a variety of representations and warranties and which may provide general indemnifications. The Funds’ maximum exposure under these arrangements is unknown, as it involves future claims that may be made against the Funds under circumstances that have not occurred.
Recently Issued Accounting Standards Updates – In January 2010, the Financial Accounting Standard Board released Accounting Standards Update (“ASU”) No. 2010-06, Improving Disclosures about Fair Value Measurements. Among the new disclosures and clarifications of existing disclosures the ASU requires the Funds to disclose separately the amounts of significant transfers in and out of Level 1 and Level 2 fair value measurements and to describe the reasons for the transfers. Significance shall be judged with respect to total earnings and total assets or total liabilities. The ASU requires the Level 3 roll forward reconciliation of beginning and ending balances to be prepared on a gross basis, in particular separately presenting information about purchases, sales, issuances, and settlements. The ASU also requires disclosure of the reasons for significant transfers in and out of Level 3. The Funds adopted the ASU on January 1, 2010, except for the Level 3 gross basis roll forward reconciliation which is effective for fiscal years beginning after December 15, 2010 and for interim periods within those fiscal years.
2 FEES AND TRANSACTIONS WITH RELATED PARTIES Under the investment management agreement of Midas Fund, the Investment Manager receives a management fee, payable monthly, based on the average daily net assets of the Fund at the annual rate of 1% on the first $200 million, .95% from $200 million to $400 million, .90% from $400 million to $600 million, .85% from $600 million to $800 million, .80% from $800 million to $1 billion, and .75% over $1 billion. Under the investment management agreement of Midas Special Fund, the Investment Manager receives a management fee, payable monthly, based on the average daily net assets of the Fund at the annual rate of 1% on the first $10 million, 7/8 of 1% from $10 million to $30 million, 3/4 of 1% from $30 million to $150 million, 5/8 of 1% from $150 million to $500 million, and 1/2 of 1% over $500 million. Under the investment management agreement of Midas Perpetual Portfolio, the Investment Manager receives a management fee, payable monthly, based on the average daily net assets of the Fund at the annual rate of .50% of the first $250 million, .45% from $250 million to $500 million, and .40% over $500 million.
The Investment Manager contractually agreed with Midas Perpetual Portfolio to waive its fee for the periods April 29, 2009 through April 29, 2010 and April 29, 2010 to December 31, 2010, and further contractually agreed to waive its fee for the year ending December 31, 2011.
Each Fund has adopted a plan of distribution pursuant to Rule 12b-1 under the Act. Under each plan, each Fund pays the Distributor, Midas Securities Group, Inc., an affiliate of the Investment Manager, a fee of .25% (Midas Fund and Midas Perpetual Portfolio) or 1.00% (Midas Special Fund) for distribution and shareholder services. A contractual fee waiver between the Distributor and Midas Perpetual Portfolio expired on April 29, 2010 and, subsequent to April 29, 2010, the Distributor began receiving the 0.25% fee from the Fund for distribution and shareholder services. The shareholder service fee is intended to cover personal services provided to the shareholders of the Funds and the maintenance of shareholder accounts. The distribution fee is to cover all other activities and expenses primarily intended to result in the sale of the Funds’ shares. In addition, Midas Fund, Midas Special Fund, and Midas Perpetual Portfolio each reimbursed the Distributor $140,193, $1,054, and $1,408, respectively, for payments made to certain brokers for record keeping services for the year ended December 31, 2010.
Certain officers and directors of the Funds are officers and directors of the Investment Manager and the Distributor.
| NOTES to Financial Statements | continued |
Pursuant to the investment management agreements, the Funds reimburse the Investment Manager for providing certain administrative services at cost comprised of compliance and accounting services. For the year ended December 31, 2010, the Funds incurred administrative services expenses as follows:
| | | Midas Fund | | Midas Special Fund | | Midas Perpetual Portfolio | |
| Compliance | | $ | 92,295 | | $ | 3,942 | | $ | 1,979 | |
| Accounting | | | 37,620 | | | 9,058 | | | 6,620 | |
| Total | | $ | 129,915 | | $ | 13,000 | | $ | 8,599 | |
3 DISTRIBUTIONS TO SHAREHOLDERS AND DISTRIBUTABLE EARNINGS The Funds paid no distributions for the year ended December 31, 2010. For the year ended December 31, 2009, Midas Fund paid a distribution of $1,403,657 comprised of ordinary income and Midas Perpetual Portfolio paid a distribution of $135,764 comprised of net realized gains. There was no distribution paid by Midas Special Fund for the year ended December 31, 2009.
At December 31, 2010, the components of distributable earnings on a tax basis were as follows:
| | | Midas Fund | | | Midas Special Fund | | | Midas Perpetual Portfolio | |
| Accumulated net investment income | | $ | 1,140,431 | | | $ | - | | | $ | - | |
| Accumulated net realized gain (loss) on investments | | | (13,685,848 | ) | | | (4,389,751 | ) | | | 161,397 | |
| Net unrealized appreciation | | | 32,851,587 | | | | 4,907,618 | | | | 2,023,681 | |
| Total | | $ | 20,306,170 | | | $ | 517,867 | | | $ | 2,185,078 | |
Federal income tax regulations permit post-October net capital losses, if any, to be deferred and recognized on the tax return of the next succeeding taxable year. The differences between book basis and tax basis unrealized appreciation is attributable primarily to the Passive Foreign Investment Company (“PFIC”) mark to market adjustments. GAAP requires certain components of net assets to be reclassified between financial and tax reporting. These reclassifications have no effect on net assets or net asset value per share. At December 31, 2010, permanent differences between book and tax accounting have been reclassified to paid in capital as follows:
| | | Midas Fund | | | Midas Special Fund | | | Midas Perpetual Portfolio | |
| Decrease in accumulated undistributed net investment loss | | $ | 537,471 | | | $ | 379,956 | | | $ | 90,997 | |
| (Increase) decrease in accumulated net realized gain (loss) on investments | | $ | (537,471 | ) | | $ | - | | | $ | 341 | |
| Decrease in paid in capital | | $ | - | | | $ | (379,956 | ) | | $ | (91,338 | ) |
Table of Contents
| NOTES to Financial Statements | continued |
At December 31, 2010, Midas Fund had net capital loss carryovers that may be used to offset future realized capital gains for federal income tax purposes of $13,685,848 expiring in 2017.
At December 31, 2010, Midas Special Fund had net capital loss carryovers that may be used to offset future realized gains for federal income tax purposes of $4,389,751, of which $1,823,745, $340,513, $1,154,753, $406,657, and $664,083 expire in 2011, 2014, 2016, 2017, and 2018, respectively.
4 FAIR VALUE MEASUREMENTS The Funds use a three level hierarchy for fair value measurements based on the transparency of inputs to the valuation of an asset or liability. Inputs may be observable or unobservable and refer broadly to the assumptions that market participants would use in pricing the asset or liability. Observable inputs reflect the assumptions market participants would use in pricing the asset or liability based on market data obtained from sources independent of the Funds. Unobservable inputs reflect a Fund’s own assumptions about the assumptions that market participants would use in pricing the asset or liability developed based on the best information available under the circumstances. A Fund’s investment in its entirety is assigned a level based upon the inputs which are significant to the overall valuation. The inputs or methodology used for valuing investments are not an indication of the risk associated with investing in those investments. The hierarchy of inputs is summarized below.
| • | Level 1 - unadjusted quoted prices in active markets for identical assets or liabilities including securities actively traded on a securities exchange. |
| • | Level 2 - observable inputs other than quoted prices included in level 1 that are observable for the asset or liability which may include quoted prices for the identical instrument on an inactive market, prices for similar instruments, interest rates, prepayment speeds, credit risk, yield curves, default rates, and similar data. |
| • | Level 3 - unobservable inputs for the asset or liability including the Fund’s own assumptions about the assumptions a market participant would use in valuing the asset or liability. |
The following is a summary of the inputs used as of December 31, 2010 in valuing each Fund’s assets and liabilities carried at fair value. Refer to each Fund’s Schedule of Portfolio Investments for detailed information on specific investments.
| MIDAS FUND | | Level 1 | | | Level 2 | | | Level 3 | | | Total | |
| Assets | | | | | | | | | | | | |
| Common stocks | | $ | 158,482,709 | | | $ | - | | | $ | 0 | | | $ | 158,482,709 | |
| Warrants | | | 454,149 | | | | - | | | | - | | | | 454,149 | |
| Bullion | | | 14,189 | | | | - | | | | - | | | | 14,189 | |
| Securities held as collateral on loaned securities | | | 18,552,621 | | | | - | | | | - | | | | 18,552,621 | |
| Total investments | | $ | 177,503,668 | | | $ | - | | | $ | 0 | | | $ | 177,503,668 | |
| MIDAS SPECIAL FUND | | Level 1 | | | Level 2 | | | Level 3 | | | Total | |
| Assets | | | | | | | | | | | | |
| Common stocks | | $ | 13,774,627 | | | $ | - | | | $ | - | | | $ | 13,774,627 | |
| Securities held as collateral on loaned securities | | | 665,750 | | | | 260,545 | | | | - | | | | 926,295 | |
| Total investments | | $ | 14,440,317 | | | $ | 260,545 | | | $ | - | | | $ | 14,700,922 | |
| NOTES to Financial Statements | continued |
| MIDAS PERPETUAL PORTFOLIO | | Level 1 | | | Level 2 | | | Level 3 | | | Total | |
| Assets | | | | | | | | | | | | |
| Gold | | $ | 2,123,803 | | | $ | - | | | $ | - | | | $ | 2,123,803 | |
| Silver | | | 732,288 | | | | - | | | | - | | | | 732,288 | |
| Swiss Franc Assets | | | - | | | | 1,065,510 | | | | - | | | | 1,065,510 | |
| Hard Asset Securities | | | 1,582,611 | | | | - | | | | - | | | | 1,582,611 | |
| Large Capitalization Growth Stocks | | | 1,573,213 | | | | - | | | | - | | | | 1,573,213 | |
| Dollar Assets | | | 3,614,394 | | | | - | | | | - | | | | 3,614,394 | |
| Securities held as collateral on loaned securities | | | 2,972,564 | | | | - | | | | - | | | | 2,972,564 | |
| Total investments | | $ | 12,598,873 | | | $ | 1,065,510 | | | $ | - | | | $ | 13,664,383 | |
There were no transfers between Level 1 and Level 2 by the Funds during the year ended December 31, 2010.
There were no Level 3 investment purchases, sales, settlements, transfers in/out, or changes in unrealized appreciation/depreciation by the Funds for the year ended December 31, 2010. Midas Fund’s sole Level 3 investment consisted of Ivanhoe Nickel & Platinum Ltd. with a fair value of $0 as of December 31, 2010 and December 31, 2009, respectively.
5 INVESTMENT TRANSACTIONS At December 31, 2010, the aggregate gross unrealized appreciation and depreciation of investments, based on cost for federal income tax purposes, are summarized as follows:
| | | Federal Income | | | Gross Unrealized | | | Net Unrealized | |
| | | Tax Cost | | | Appreciation | | | Depreciation | | | Appreciation | |
| Midas Fund | | $ | 144,652,081 | | | $ | 36,419,399 | | | $ | (3,567,812 | ) | | $ | 32,851,587 | |
| Midas Special Fund | | $ | 9,793,304 | | | $ | 5,411,272 | | | $ | (503,654 | ) | | $ | 4,907,618 | |
| Midas Perpetual Portfolio | | $ | 11,644,456 | | | $ | 2,032,983 | | | $ | (13,056 | ) | | $ | 2,019,927 | |
Purchases and sales of securities, excluding short sale transactions and short term investments, for the year ended December 31, 2010 were as follows:
| | | Midas Fund | | | Midas Special Fund | | | Midas Perpetual Portfolio | |
| Purchases | | $ | 79,074,719 | | | $ | - | | | $ | 786,866 | |
| Proceeds | | $ | 99,209,363 | | | $ | 911,487 | | | $ | 248,692 | |
Table of Contents
| NOTES to Financial Statements | continued |
6 ILLIQUID AND RESTRICTED SECURITIES Midas Fund owns securities which have a limited trading market and/or certain restrictions on trading and, therefore, may be illiquid and/or restricted. Such securities have been valued at fair value in accordance with the procedures described in Note 1. Due to the inherent uncertainty of valuation, these values may differ from the values that would have been used had a readily available market for the securities existed. These differences in valuation could be material. Illiquid and/or restricted securities owned at December 31, 2010 were as follows:
| | Acquisition Date | | Cost | | | Value | |
| Ivanhoe Nickel & Platinum Ltd., common stock | 4/30/97 | | $ | 0 | | | $ | 0 | |
| Percent of net assets | | | | 0.0 | % | | | 0.0 | % |
7 BANK CREDIT FACILITIES The Funds (except Midas Perpetual Portfolio), Global Income Fund, Inc., and Foxby Corp. (the “Borrowers”) have entered into a committed secured line of credit facility, which is subject to annual renewal, with State Street Bank and Trust Company (“SSB”), the Funds’ custodian. Global Income Fund, Inc. and Foxby Corp. are closed end investment companies advised by an affiliate of the Investment Manager. The aggregate amount of the credit facility is $10,000,000. The borrowing of each Borrower is collateralized by the underlying investments of such Borrower. SSB will make revolving loans to a Borrower not to exceed in the aggregate outstanding at any time with respect to any one Borrower the least of $10,000,000, the maximum amount permitted pursuant to each Borrower’s investment policies, or as permitted under the Act. The commitment fee on this facility is 0.15% per annum on the unused portion of the commitment, based on a 360 day year. All loans under this facility will be available at the Borrower’s option of (i) overnight Federal funds or (ii) LIBOR (30, 60, 90 days), each as in effect from time to time, plus 1.50% per annum, calculated on the basis of actual days elapsed for a 360 day year.
The Funds have also entered into an uncommitted secured redemption facility, which is subject to annual renewal, with SSB with an aggregate amount available of $25,000,000. The borrowing of each Borrower is collateralized by the underlying investments of such Borrower. This facility carries no legal obligation on the part of SSB to lend any amount of money to the Funds at any time and the Borrower does not pay a commitment fee under this facility. SSB may make revolving loans to a Borrower not to exceed in the aggregate outstanding at any time with respect to any one Borrower the least of $25,000,000, the maximum amount permitted pursuant to the Borrower’s investment policies, or as permitted under the Act. All loans under this facility will be available at the overnight Federal Funds rate in effect from time to time plus 1.25%, calculated on the basis of actual days elapsed for a 360 day year.
The outstanding loan balance and the value of eligible collateral investments at December 31, 2010, and the weighted average interest rate and average daily amount outstanding under the committed and uncommitted facilities for the year ended December 31, 2010 were as follows:
| | | Midas Fund | | | Midas Special Fund | | | Midas Perpetual Portfolio | |
| Outstanding balance | | $ | 18,993,272 | | | $ | 1,494,113 | | | $ | 0 | |
| Value of eligible collateral | | $ | 48,703,336 | | | $ | 7,141,380 | | | $ | 0 | |
| Average daily amount outstanding | | $ | 8,485,613 | | | $ | 2,110,804 | | | $ | 0 | |
| Weighted average interest rate | | | 1.70 | % | | | 1.86 | % | | | 0.00 | % |
| NOTES to Financial Statements | continued |
8 SECURITIES LENDING The Funds may lend their securities to qualified financial institutions. The Funds receive compensation in the form of fees, or retain a portion of the returns on the investment of any cash received as collateral. The Funds receive as collateral cash deposits, U.S. Government securities, or bank letters of credit valued greater than the value of the securities on loan. Cash deposits are invested in a money market fund. The value of the loaned securities is determined based upon the most recent closing prices and any additional required collateral is delivered to the Funds on the next business day. Any increase or decrease in the value of the securities loaned that might occur and any interest earned or dividends declared on those securities during the term of the loan is retained by the Funds. The Funds have the right under the lending agreement to recover the securities from the borrower on demand. As with other extensions of credit, the Funds bear the risk of delay on recovery or loss of rights in the collateral should the borrower of the securities default.
The value of loaned securities and related collateral outstanding at December 31, 2010 were as follows:
| | | Midas Fund | | | Midas Special Fund | | | Midas Perpetual Portfolio | |
| Value of securities loaned | | $ | 17,987,269 | | | $ | 905,350 | | | $ | 2,934,549 | |
| Value of related collateral | | $ | 18,552,621 | | | $ | 926,295 | | | $ | 2,972,564 | |
9 PORTFOLIO CONCENTRATION Each of the Funds operates as a “non-diversified” investment company, which means that the portion of the Fund’s assets that may be invested in the securities of a single issuer is not limited by the Act and the amount of the outstanding voting securities of a particular issuer held by a Fund is not limited. Each Fund, however, currently intends to continue to conduct its operations so as to qualify as a “regulated investment company” for purposes of the Internal Revenue Code, which currently requires that, at the end of each quarter of the taxable year, with respect to 50% of a Fund’s total assets, the Fund limits to 5% the portion of its total assets invested in the securities of a single issuer. There are no such limitations with respect to the balance of a Fund’s portfolio, although no single investment can exceed 25% of a Fund’s total assets at the time of purchase. A more concentrated portfolio may cause a Fund’s net asset value to be more volatile and thus may subject stockholders to more risk. As of December 31, 2010, Midas Special Fund held approximately 34% of its net assets in Berkshire Hathaway, Inc., as a direct result of the market appreciation of the issuer since the time of purchase, and Midas Perpetual Portfolio held approximately 20% of its net assets in SPDR Gold Trust. Thus, the volatility of each Fund’s net assets value and its performance in general, depends disproportionately more on the respective performance of a single issuer than that of a more diversified fund.
10 SUBSEQUENT EVENTS The Funds have evaluated subsequent events through the date the financial statements were issued and determined that no subsequent events have occurred that require additional disclosure in the financial statements.
Financial Statements
| | | For the Year Ended December 31, | |
| MIDAS FUND | | 2010 | | | 2009 | | | 2008 | | | 2007 | | | 2006 | |
| Per Share Data | | | | | | | | | | | | | | | |
| (for a share outstanding throughout each period) | | | | | | | | | | | | | | | |
| Net asset value, beginning of period | | $ | 3.82 | | | $ | 2.11 | | | $ | 5.64 | | | $ | 4.29 | | | $ | 2.99 | |
| Income (loss) from investment operations: | | | | | | | | | | | | | | | | | | | | |
Net investment loss (1) | | | (0.07 | ) | | | (0.05 | ) | | | (0.06 | ) | | | (0.08 | ) | | | (0.08 | ) |
| Net realized and unrealized gain (loss) on investments | | | 1.90 | | | | 1.80 | | | | (3.36 | ) | | | 1.44 | | | | 1.39 | |
Total from investment operations | | | 1.83 | | | | 1.75 | | | | (3.42 | ) | | | 1.36 | | | | 1.31 | |
| Paid in capital from redemption fees | | | - | (2) | | | - | (2) | | | - | (2) | | | - | (2) | | | 0.01 | |
| Less distributions: | | | | | | | | | | | | | | | | | | | | |
| Dividends from net investment income | | | - | | | | (0.04 | ) | | | (0.11 | ) | | | (0.01 | ) | | | (0.02 | ) |
| Net asset value, end of period | | $ | 5.65 | | | $ | 3.82 | | | $ | 2.11 | | | $ | 5.64 | | | $ | 4.29 | |
| | | | | | | | | | | | | | | | | | | | | |
| Total Return | | | 47.91 | % | | | 83.88 | % | | | (60.89 | )% | | | 31.70 | % | | | 44.02 | % |
| | | | | | | | | | | | | | | | | | | | | |
| Ratios/Supplemental Data | | | | | | | | | | | | | | | | | | | | |
| Net assets at end of period (000s omitted) | | $ | 139,644 | | | $ | 116,311 | | | $ | 77,502 | | | $ | 251,394 | | | $ | 138,726 | |
| Ratio of total expenses to average net assets | | | 2.29 | % | | | 2.39 | % | | | 2.37 | % | | | 2.43 | % | | | 2.39 | % |
| Ratio of net expenses to average net assets | | | 2.29 | % | | | 2.39 | % | | | 2.37 | % | | | 2.43 | % | | | 2.38 | % |
| Ratio of net expenses excluding loan interest and | | | | | | | | | | | | | | | | | | | | |
| fees to average net assets | | | 2.14 | % | | | 2.29 | % | | | 2.02 | % | | | 1.87 | % | | | 1.96 | % |
| Ratio of net investment loss to average net assets | | | (1.58 | )% | | | (1.67 | )% | | | (1.42 | )% | | | (1.58 | )% | | | (1.96 | )% |
| Portfolio turnover rate | | | 63 | % | | | 82 | % | | | 129 | % | | | 126 | % | | | 118 | % |
| | | | | | | | | | | | | | | | | | |
| (1) Average shares outstanding during the period are used to calculate per share data. | | | | | | | | | | | | | | | | | |
| (2) Less than $.005 per share. | | | | | | | | | | | | | | | | | | | | |
| | | For the Year Ended December 31, | |
| MIDAS SPECIAL FUND | | 2010 | | | 2009 | | | 2008 | | | 2007 | | | 2006 | |
| Per Share Data | | | | | | | | | | | | | | | |
| (for a share outstanding throughout each period) | | | | | | | | | | | | | | | |
| Net asset value, beginning of period | | $ | 13.94 | | | $ | 10.36 | | | $ | 19.13 | | | $ | 16.74 | | | $ | 14.80 | |
| Income (loss) from investment operations: | | | | | | | | | | | | | | | | | | | | |
Net investment loss (1) | | | (0.48 | ) | | | (0.37 | ) | | | (0.43 | ) | | | (0.50 | ) | | | (0.35 | ) |
| Net realized and unrealized gain (loss) on investments | | | 1.27 | | | | 3.95 | | | | (8.34 | ) | | | 2.89 | | | | 2.29 | |
Total from investment operations | | | 0.79 | | | | 3.58 | | | | (8.77 | ) | | | 2.39 | | | | 1.94 | |
Paid in capital from redemption fees (2) | | | - | | | | - | | | | - | | | | - | | | | - | |
| Net asset value, end of period | | $ | 14.73 | | | $ | 13.94 | | | $ | 10.36 | | | $ | 19.13 | | | $ | 16.74 | |
| | | | | | | | | | | | | | | | | | | | | |
| Total Return | | | 5.67 | % | | | 34.56 | % | | | (45.84 | )% | | | 14.28 | % | | | 13.11 | % |
| | | | | | | | | | | | | | | | | | | | | |
| Ratios/Supplemental Data | | | | | | | | | | | | | | | | | | | | |
| Net assets at end of period (000s omitted) | | $ | 12,240 | | | $ | 11,582 | | | $ | 8,911 | | | $ | 17,334 | | | $ | 17,149 | |
| Ratio of total expenses to average net assets | | | 4.22 | % | | | 4.46 | % | | | 3.89 | % | | | 4.06 | % | | | 3.89 | % |
| Ratio of net expenses to average net assets | | | 4.22 | % | | | 4.46 | % | | | 3.89 | % | | | 4.06 | % | | | 3.88 | % |
| Ratio of net expenses excluding loan interest and | | | | | | | | | | | | | | | | | | | | |
| fees to average net assets | | | 3.84 | % | | | 4.11 | % | | | 3.32 | % | | | 3.22 | % | | | 3.39 | % |
| Ratio of net investment loss to average net assets | | | (3.39 | )% | | | (3.23 | )% | | | (2.71 | )% | | | (2.85 | )% | | | (2.32 | )% |
| Portfolio turnover rate | | | 0 | % | | | 9 | % | | | 13 | % | | | 36 | % | | | 73 | % |
| | | | | | | | | | | | | | | | | | |
| (1) Average shares outstanding during the period are used to calculate per share data. | | | | | | | | | | | | | | | | | |
| (2) Less than $.005 per share. | | | | | | | | | | | | | | | | | | | | |
See notes to financial statements.
Table of Contents
Financial Statements
FINANCIAL Highlights
| | | For the Year Ended December 31, | |
| MIDAS PERPETUAL PORTFOLIO | | 2010 | | | 2009 | | | 2008 (1) | | | 2007 (1) | | | 2006 (1) | |
| Per Share Data (for a share outstanding throughout each period) | | | | | | | | | | | | | | | |
| Net asset value, beginning of period | | $ | 1.15 | | | $ | 1.00 | | | $ | 1.000 | | | $ | 1.000 | | | $ | 1.000 | |
| Income (loss) from investment operations: | | | | | | | | | | | | | | | | | | | | |
Net investment income (loss)(2) | | | (0.01 | ) | | | (0.01 | ) | | | 0.012 | | | | 0.039 | | | | 0.039 | |
Net realized and unrealized gain on investments | | | 0.16 | | | | 0.18 | | | | - | | | | - | | | | - | |
Total from investment operations | | | 0.15 | | | | 0.17 | | | | - | | | | - | | | | - | |
Paid in capital from redemption fees (3) | | | - | | | | - | | | | - | | | | - | | | | - | |
| Less distributions: | | | | | | | | | | | | | | | | | | | | |
Dividends from net investment income | | | - | | | | - | | | | (0.012 | ) | | | (0.039 | ) | | | (0.039 | ) |
Distributions from realized gains | | | - | | | | (0.02 | ) | | | - | | | | - | | | | - | |
Total distributions | | | - | | | | (0.02 | ) | | | (0.012 | ) | | | (0.039 | ) | | | (0.039 | ) |
| Net asset value, end of period | | $ | 1.30 | | | $ | 1.15 | | | $ | 1.000 | | | $ | 1.000 | | | $ | 1.000 | |
Total Return(4) | | | 13.04 | % | | | 17.03 | % | | | 1.22 | % | | | 4.00 | % | | | 3.88 | % |
Ratios/Supplemental Data | | | | | | | | | | | | | | | | | | | | |
| Net assets at end of period (000's omitted) | | $ | 10,620 | | | $ | 8,311 | | | $ | 7,191 | | | $ | 14,516 | | | $ | 14,528 | |
| Ratio of expenses excluding fee waivers and expense reductions to average net assets | | | 2.51 | % | | | 2.98 | % | | | 1.77 | % | | | 1.91 | % | | | 1.83 | % |
Ratio of expenses including fee waivers and expense reductions to average net assets(4) | | | 1.93 | % | | | 2.23 | % | | | 1.21 | % | | | 1.15 | % | | | 1.08 | % |
| Ratio of expenses excluding fee waivers, expense reductions, and loan interest and fees to average net assets | | | 1.90 | % | | | 2.22 | % | | | - | | | | - | | | | - | |
Ratio of net investment income (loss) to average net assets(4) | | | (1.03 | )% | | | (1.29 | )% | | | 1.22 | % | | | 3.92 | % | | | 3.87 | % |
| Portfolio turnover rate | | | 4 | % | | | 24 | % | | | 0 | % | | | 0 | % | | | 0 | % |
| (1) | These financial highlights reflect the Fund’s operation as a money market fund up to December 28, 2008. On December 29, 2008, the Fund changed its name to Midas Perpetual Portfolio, Inc. from Midas Dollar Reserves, Inc., ceased operating as a money market fund and began operating as a fluctuating net asset value fund pursuant to its current investment objective and policies. |
| (2) | Average shares outstanding during the period are used to calculate per share data. |
| (3) | The Fund began imposing a redemption fee on December 29, 2008. The amount was less than $.005 per share for the years ended December 31, 2010, 2009, and 2008, respectively. |
| (4) | Fees contractually waived by the Investment Manager and Distributor reduced the ratio of expenses to average net assets by 0.58% and 0.75% for the years ended December 31, 2010 and 2009, respectively. Fees voluntarily waived by the Investment Manager and Distributor reduced the ratio of expenses to average net assets by 0.24%, 0.75%, and 0.75% for the years ended December 31, 2008, 2007, and 2006, respectively. In addition, the Investment Manager voluntarily reimbursed the Fund for certain operating expenses which further reduced the ratio of expenses to average net assets by 0.32%, for the year ended December 31, 2008. The impact of the fee waivers and reimbursements is reflected in both the total return and the ratio of net investment income to average net assets. |
See notes to financial statements.
REPORT of Independent Registered Public Accounting Firm
To the Shareholders and Boards of Directors of
Midas Fund, Inc.
Midas Special Fund, Inc.
Midas Perpetual Portfolio, Inc.
We have audited the accompanying statements of assets and liabilities, including the schedule of portfolio investments, of Midas Fund, Inc., Midas Special Fund, Inc., and Midas Perpetual Portfolio, Inc. as of December 31, 2010, the related statements of operations and of cash flows for the year then ended, the statements of changes in net assets for each of the two years in the period then ended, and the financial highlights for each of the five years in the period then ended. These financial statements and financial highlights are the responsibility of the Funds’ management. Our responsibility is to express an opinion on these financial statements and financial highlights based on our audits.
We conducted our audits in accordance with auditing standards of the Public Company Accounting Oversight Board (United States). Those standards require that we plan and perform the audit to obtain reasonable assurance about whether the financial statements and financial highlights are free of material misstatement. The Funds are not required to have, nor were we engaged to perform, an audit of their internal control over financial reporting. Our audits included considerations of internal control over financial reporting as a basis for designing audit procedures that are appropriate in the circumstances, but not for the purpose of expressing an opinion on the effectiveness of the Funds’ internal control over financial reporting. Accordingly, we express no such opinion. An audit includes examining, on a test basis, evidence supporting the amounts and disclosures in the financial statements. Our procedures included confirmation of securities owned as of December 31, 2010, by correspondence with the custodian and brokers. An audit also includes assessing the accounting principles used and significant estimates made by management, as well as evaluating the overall financial statement presentation. We believe that our audits provide a reasonable basis for our opinion.
In our opinion, the financial statements and financial highlights referred to above present fairly, in all material respects, the financial position of Midas Fund, Inc., Midas Special Fund, Inc., and Midas Perpetual Portfolio, Inc. as of December 31, 2010, the results of their operations and cash flows for the year then ended, the changes in their net assets for each of the two years in the period then ended, and the financial highlights for each of the five years presented in conformity with accounting principles generally accepted in the United States of America.
TAIT, WELLER & BAKER LLP
Philadelphia, Pennsylvania
February 25, 2011
RESULTS OF $10,000 INVESTMENT
JANUARY 1, 2001 THROUGH DECEMBER 31, 2010
The performance graphs show returns of an initial investment of $10,000 in Midas Fund, Midas Special Fund, and Midas Perpetual Portfolio from 1/1/01 to 12/31/10. Midas Fund is compared to the S&P 500 and the Morningstar Category of Equity Precious Metals funds, an index of 77 funds, 39 of which have been in existence since 12/31/00. Midas Special Fund is compared to the S&P 500 and the Russell 2000. Midas Perpetual Portfolio is compared to the S&P 500 and the Citigroup 3-Month U.S. Treasury Bill Index (“Citigroup T-Bill Index”). Results in each case reflect reinvestment of dividends, interest, and distributions but do not reflect a deduction for, if any, short term redemption fees, account expenses, or shareholder taxes. The S&P 500, a broad equity index, and the Russell 2000, a small company index, are unmanaged and fully invested in common stocks. The Citigroup T-Bill Index tracks the performance of U.S. Treasury bills with a remaining maturity of three months and is unmanaged. You cannot invest directly in an index. Past performance is not predictive of future performance.
Prior to December 29, 2008, Midas Perpetual Portfolio (formerly known as Midas Dollar Reserves, Inc.) operated as a money market fund and invested exclusively in securities issued by the U.S. Government, its agencies and instrumentalities. On December 29, 2008, the Fund began operating as a fluctuating net asset value fund pursuant to its current investment objective and policies. The performance included in the table and chart below for the periods commencing on or after January 1, 2001 reflects the Fund’s performance as a money market fund up to December 28, 2008 and thereafter as a fluctuating net asset value fund. The performance information shown also reflects the fees and expenses of the Fund as a money market fund.
| FUND NAME | | Value as of 12/31/10 | | | % Aggregate Total Return*† | | | % Avg. Annual Return*† | |
| Midas Fund | | $ | 71,834 | | | | 618.34 | % | | | 21.80 | % |
| Midas Special Fund | | $ | 7,358 | | | | (26.42 | )% | | | (3.02 | )% |
| Midas Perpetual Portfolio | | $ | 15,334 | | | | 53.34 | % | | | 4.37 | % |
| Equity Precious Metals | | $ | 89,332 | | | | 793.32 | % | | | 24.48 | % |
| Russell 2000 | | $ | 18,477 | | | | 84.77 | % | | | 6.33 | % |
| Citigroup T-Bill Index | | $ | 12,499 | | | | 24.99 | % | | | 2.26 | % |
| S&P 500 | | $ | 11,507 | | | | 15.07 | % | | | 1.41 | % |
| Average Annual Total Return for the Periods Ended December 31, 2010* |
| Midas Fund | 1 Year | 5 Years | 10 Years |
| 47.91% | 15.08% | 21.80% |
| Midas Special Fund | 5.67% | (0.09)% | (3.02)% |
| Midas Perpetual Portfolio | 13.04% | 7.67% | 4.37% |
* The returns shown do not reflect the deduction of taxes if any, that a shareholder would pay on Fund distributions or the redemption of Fund shares.
† For the 10 year period ended December 31, 2010.
Table of Contents
ABOUT Your Fund’s Expenses | (Unaudited) |
Fund shareholders may incur two types of costs: (1) transaction costs, including redemption or small account fees; and (2) ongoing costs, including management fees, distribution and service 12b-1 fees, and other fund expenses. This example is intended to help you understand your ongoing costs (in dollars) of investing in your Fund and to compare these costs with the ongoing cost of investing in other mutual funds. The example is based on an investment of $1,000 made at the beginning of the period and held for the entire period from July 1, 2010 to December 31, 2010.
ACTUAL EXPENSES
The table provides information about actual account values and actual expenses for each Fund. You may use the information, together with the amount you invested, to estimate the expenses that you paid over the period. First, identify the Fund you own. Then simply divide your account value by $1,000 (for example, an $8,600 account value divided by $1,000 = 8.6), then multiply the result by the number under the heading “Expenses Paid During Period” to estimate the expenses you paid on your account during this period. The Fund may charge you a $20 annual small balance account fee if the value of those shares is less than $500. We will redeem shares automatically in one of your accounts to pay the $20 fee. In determining your total eligible investment amount, we will include your investments in all personal accounts registered under your Social Security number. Personal accounts include individual accounts, joint accounts, UGMA/UTMA accounts, personal trusts, Coverdell Education Savings Accounts, and IRAs (including traditional, Roth, Rollover, SEP, SARSEP, and SIMPLE-IRAs), and certain other retirement accounts.
HYPOTHETICAL EXAMPLE FOR COMPARISON PURPOSES
The table also provides information about hypothetical account values and hypothetical expenses based on the actual expense ratio of each Fund and an assumed rate of return of 5% per year before expenses, which is not the actual return of a Fund. The hypothetical account values and expenses may not be used to estimate the actual ending account balance or expenses you paid for the period. You may use this information to compare the ongoing costs of investing in your Fund and other funds. To do so, compare this 5% hypothetical example with the 5% hypothetical examples that appear in the shareholder reports of the other funds.
| EXPENSE ANALYSIS TABLE | | | | | | | | | | |
| | | Beginning Account Value | | | Ending Account Value | | | Expenses Paid During Period | | | Annualized | |
| | | July 1, 2010 | | | December 31, 2010 | | | July 1, 2010-December 31, 2010 (a) | | | Expense Ratio | |
| Midas Fund | | | | | | | | | | | | |
| Actual | | $ | 1,000.00 | | | $ | 1,479.06 | | | $ | 14.31 | | | | 2.29 | % |
Hypothetical (b) | | $ | 1,000.00 | | | $ | 1,013.66 | | | $ | 11.62 | | | | 2.29 | % |
| Midas Special Fund | | | | | | | | | | | | | | | | |
| Actual | | $ | 1,000.00 | | | $ | 1,056.67 | | | $ | 21.88 | | | | 4.22 | % |
Hypothetical (b) | | $ | 1,000.00 | | | $ | 1,003.93 | | | $ | 21.32 | | | | 4.22 | % |
| Midas Perpetual Portfolio | | | | | | | | | | | | | | | | |
| Actual | | $ | 1,000.00 | | | $ | 1,130.43 | | | $ | 10.36 | | | | 1.93 | % |
Hypothetical (b) | | $ | 1,000.00 | | | $ | 1,015.48 | | | $ | 9.80 | | | | 1.93 | % |
(a) Expenses are equal to the Fund’s annualized expense ratio multiplied by the average account value over the period, multiplied by 184, the number of days in the most recent fiscal half year, divided by 365, to reflect the one half year period. (b) Assumes 5% total return before expenses. | |
The Funds’ Statement of Additional Information includes additional information about the directors and is available, without charge, upon request by calling the Funds toll-free at 1-800-472-4160.
INDEPENDENT DIRECTORS | | | | |
| | | | | |
| | | Principal Occupation, Business Experience for the Past Five Years | Other Director- ships Held (3) |
| | | | | |
| Bruce B. Huber | 1995 Midas Fund | 6 | Retired. He is a former Financial Representative | None |
| CLU, ChFC, SFS. | 1986 Special Fund | | with New England Financial, specializing in | |
| 11 Hanover Square | 1981 Perpetual Portfolio | | financial, estate and insurance matters. He is a | |
| New York, NY 10005 | | | member of the Board, emeritus, of the Millbrook | |
| February 7, 1930 | | | School, and Chairman of the Endowment Board | |
| | | | of the Community YMCA of Red Bank, NJ. | |
| | | | | |
| James E. Hunt | 1995 Midas Fund | 6 | Limited Partner of Hunt Howe Partners LLC | None |
| 11 Hanover Square | 1986 Special Fund | | (executive recruiting consultants). | |
| New York, NY 10005 | 1980 Perpetual Portfolio | | | |
| December 14,1930 | | | | |
| | | | | |
| | | | | |
| Peter K. Werner | 2004 All Funds | 6 | Since 1996, he has taught, directed and coached | None |
| 11 Hanover Square | | | many programs at The Governor’s Academy, of | |
| New York, NY 10005 | | | Byfield MA. Currently, he serves as chair of the | |
| August 16, 1959 | | | History Department. Previously, he held the | |
| | | | position of Vice President in the Fixed Income | |
| | | | Departments of Lehman Brothers and First | |
| | | | Boston. His responsibilities included trading | |
| | | | sovereign debt instruments, currency arbitrage, | |
| | | | syndication, medium term note trading, and | |
| | | | money market trading. | |
| | | | | |
| | | | | |
| INTERESTED DIRECTOR | | | |
| | | | | |
| Name, Title | | Funds in | | Other |
| Address | Director | Complex | Principal Occupation, Business Experience | Director- |
| Date of Birth | Since (1) | Overseen (2) | for the Past Five Years | ships Held (3) |
| | | | | |
Thomas B.Winmill, Esq.(4) | 1995 Midas Fund | 6 | Since 1999, President of the Investment | Eagle Bulk |
| Chief Executive Officer, | 1997 Special Fund | | Company Complex, the Investment Manager, | Shipping |
| President, and General | 1993 Perpetual Portfolio | | the Distributor, and their affiliates. He is | Inc. |
| Counsel. | | | Chairman of the Investment Policy Committee | |
| 11 Hanover Square | | | (“IPC”) of the Investment Manager. He is a | |
| New York, NY 10005 | | | member of the New York State Bar. He is the | |
| June 25, 1959 | | | son of Bassett S. Winmill. | |
| | | | | |
(1) Directors not elected annually shall be deemed to be continuing in office until after the time at which an annual meeting is required to be held under Maryland law, a Fund’s Charter or Bylaws, the Act, or other applicable law. (2) The “Investment Company Complex” is comprised of the Midas Funds, Dividend and Income Fund, Inc., Foxby Corp., and Global Income Fund, Inc. Dividend and Income Fund, Inc., Foxby Corp., and Global Income Fund, Inc. are advised by affiliates of the Investment Manager. (3) Refers to directorships held by a director in any company with a class of securities registered pursuant to Section 12 of the Securities Exchange Act of 1934 or any company registered as an investment company under the Act. (4) Thomas B. Winmill is an “interested person” of the Funds as defined by the Act because of his position with the Investment Manager.
|
| OFFICERS OF THE FUNDS | |
| Name | Title and | Principal Occupation, Business Experience |
| Date of Birth | Officer Since | for the Past Five Years |
| | | |
| Thomas B.Winmill, Esq. | Chief Executive Officer, President, | See biographical information on previous page. |
| June 25, 1959 | and General Counsel since 1999. | |
| | | |
| | | |
| Bassett S. Winmill | Chief Investment Strategist | Chief Investment Strategist of the Investment Manager and |
| February 10, 1930 | since 1999. | the Chairman of the Board of the Investment Manager’s and |
| | | Distributor’s parent and their affiliates, and of two investment |
| | | companies in the Investment Company Complex. He is a |
| | | member of the IPC and the New York Society of Security |
| | | Analysts, the Association for Investment Management and |
| | | Research, and the International Society of Financial Analysts. |
| | | He is the father of Thomas B. Winmill. |
| | | |
| | | |
| Thomas O’Malley | CAO, CFO, Treasurer and | Chief Accounting Officer, Chief Financial Officer, Treasurer |
| July 22, 1958 | Vice President since 2005. | and Vice President since 2005. He also is Chief Accounting |
| | | Officer, Chief Financial Officer, Treasurer and Vice President |
| | | of the Investment Company Complex, the Investment |
| | | Manager, the Distributor, and their affiliates. He is a certified |
| | | public accountant. |
| | | |
| | | |
| Heidi Keating | Vice President since 1988. | Vice President of the Investment Manager since 1988. |
| March 28, 1959 | | |
| | | |
| | | |
| John F. Ramirez, Esq. | Chief Compliance Officer, | CCO, VP, and Secretary since 2005 and Associate General |
| April 29, 1977 | Vice President, and Secretary | Counsel since 2009. He is also CCO, VP, Associate |
| | since 2005. | General Counsel, and Secretary of the Investment Company |
| | | Complex, the Investment Manager, the Distributor, and |
| | | their affiliates. He is a member of the CCO Committee and |
| | | the Compliance Advisory Committee of the Investment |
| | | Company Institute, and the New York State Bar. |
| | | |
| Officers hold their positions with a Fund until a successor has been duly elected and qualifies. Officers are generally elected annually at the December meeting of the Board of Directors. The officers were last elected on December 8, 2010. |
Table of Contents
QUARTERLY SCHEDULES OF PORTFOLIO HOLDINGSThe Funds file their complete schedule of portfolio holdings with the Securities and Exchange Commission (“SEC”) for the first and third quarters of each fiscal year on Form N-Q. The Funds’ Forms N-Q are available on the SEC’s website at www.sec.gov and may be reviewed and copied at the SEC’s Public Reference Room in Washington, D.C. Information on the operation of the Public Reference Room may be obtained by calling 1-800-SEC-0330. The Funds’ quarterly reports on Form N-Q are also available on the Funds’ website at www.MidasFunds.com.
PROXY VOTING POLICIES AND PROCEDURES
A description of the policies and procedures that the Funds use to determine how to vote proxies relating to portfolio securities is available, without charge, by calling 1-800-400-MIDAS (6432) and on the website of the SEC at www.sec.gov. Information regarding how the Funds voted proxies relating to portfolio securities during the most recent 12 month period ended June 30 is available without charge, by calling 1-800-400-MIDAS (6432), on the website of the SEC at www.sec.gov, and on the Funds’ website at www.MidasFunds.com.
| MIDAS FUNDS OFFER |
| | • | Regular Accounts |
| | • | IRA Retirement Accounts, including Traditional, Roth, Self-Employed, and Small Business (SEP, SIMPLE) |
| | • | Education Savings Accounts |
| | • | Health Savings Accounts |
| | • | Online account access |
| | • | Electronic delivery of account statements, reports, and prospectus, etc. |
| Only $1,000 minimum to open a Midas Funds account, with subsequent minimum investments of $100. |
| There is NO FEE to open an account. |
| Join our Automatic Investment Program, and open an account for only $100, and make subsequent monthly |
| investments of $100 or more. |
| SIGN UP FOR ELECTRONIC DELIVERY |
| Midas shareholders can now sign up for electronic delivery of their account statements, confirmations, annual |
| and semi-annual reports, prospectuses, and other information to get all your Midas information more quickly and |
| conveniently. It is fast and easy to sign up for electronic delivery: |
| 1. | Go to www.MidasFunds.com and log into “Account Access,” |
| 2. | Go to “Edit Profile,” and |
| 3. | From the drop-down menu found under the following question – |
| | “Would you like to have your Account Statements, Confirmations, and Fund Documents notifications |
| | delivered to you electronically?” – choose “Yes.” |
Table of Contents
GOLD’S Investment Attributes | An AAII Journal Interview with Thomas Winmill |
| • | The main role of gold, and other hard assets, is to appreciate as currency depreciates.
|
| • | Passive investors may want to allocate 5% to 10% to gold or other hard assets.
|
| • | Investing in mining companies provides both exposure to gold and operating leverage.
|
Thomas Winmill manages the Midas Fund, a gold sector mutual fund. We talked recently about investing in gold.
Charles Rotblut (CR): What role does gold play in a typical individual investor’s portfolio?
Thomas Winmill (TW): Gold has certain industrial attributes that make it desirable: It doesn’t tarnish, it’s very malleable, and it can be spun into very fine wires and flattened into very fine films. But most of the gold that has ever been mined is basically in bullion form, where it just sits around and “stores value” for governments, individuals, and institutions across the world.
I would say that its main investment role is to appreciate in currency terms. In other words, although currencies historically have depreciated as governments produce them in excess of the economy’s growth rate, hard assets such as land and gold have tended to maintain their value in constant currency terms. So that’s an important role for gold over long periods, because it has limited mining production and can’t be spun into existence the way a government can spin additional currency into existence.
A problem with gold is that there’s a carrying cost. If you borrow to buy gold, there’s interest cost, and there’s opportunity cost if you use cash on hand to buy gold because that cash could have been used to otherwise invest in interest-bearing securities or equities or some other asset class that has a current return. Gold bullion offers no current return and has a negative carrying cost.
I guess the question then for most investors is: When would you want to own gold, and in what amounts? To answer this, investors basically have to make a decision as to whether they are active or passive.
If they’re passive investors, I would say they would want to maintain a smaller position in gold, say 5% to 10% of total investment assets. However, some investors already have a sub-stantial exposure to hard assets relative to their overall net worth because they may own equity in a house.
For those of your members who are taking a more active approach to managing their portfolios and are considering the potential advantages of gold, I would say the first thing to estimate is “what is the growth rate of the economy relative to the expansion of the amount of currency?” If the rate of currency increase is at or less than the economy’s growth rate, they might seek less exposure to hard assets such as gold, and they might want to have more exposure to financial assets. On the other hand, if they estimate that the currency creation rate exceeds the economy’s growth rate, it would seem more likely than not that currency will start to lose its purchasing power.
In the last 10 years, gold has outpaced the inflation rate and we, at Midas, believe gold is going to continue to do so. Right now there’s apparently little inflation in the system, maybe due in part to declining house prices and the deflating effect of the de-leveraging process.
In our view, however, while there’s been a de-leveraging in the private sector there has also been a re-leveraging of the government sector. I think it’s a bit of a shell game in terms of whether the U.S. is actually de-leveraging. We believe, on the whole, that there is an enormous amount of continuing leverage in our system that has to be funded.
In these circumstances, we would favor hard assets. And among hard assets, I would say gold has a very positive role for U.S. investors because the holding of gold is not taxed. Real estate is taxed.
But generally speaking, because of the negative cost of carry, I’d say a person who is looking for retirement income should limit their investment in gold to, say, 5% of their investable assets. A younger person who can perhaps deal with the volatility
GOLD’S Investment Attributes | continued |
and lack of income inherent in owning gold could go up to 10% or 15% of their assets.
The Midas Perpetual Portfolio fund has a target asset allocation strategy: 20% to gold bullion, 5% to silver bullion, and allocations to Swiss-franc-denominated Swiss Confederation bonds, hard asset securities, large-cap growth stocks, and U.S. dollar assets. The fund provides instant diversification. It’s for investors who are seeking to invest in a way that can incorporate multiple foreseeable outcomes for the economy.
CR: If an investor is looking at bullion or mining companies, which is the better way to get exposure to gold?
TW: If they are well managed, gold mining companies can offer gold-like returns with a positive carry through sustainable dividends and operating leverage. Operating leverage means that if there’s an increase in the price of gold, then there will be a greater percentage increase in the operating earnings of the mining company.
For example, let’s say an investor bought gold at the price of $1,000 an ounce. And the price of gold goes from $1,000 an ounce to $1,100 an ounce. That’s a 10% increase in the price of gold and that’d be a 10% return on the investor’s money. To illustrate a mining company’s operating leverage, let’s again assume gold is $1,000 an ounce. And let’s say it costs our mining company $400 an ounce to produce an ounce of gold, so operating earnings would be $600 an ounce. Again, let’s assume the gold price went up $100, from $1,000 an ounce to $1,100 an ounce. Our mining company’s margin would go from $600 to $700, an increase of approximately 16%. Because you have an operating expense inherent in the mining company of $400, you would have inherent operating leverage. That is a good thing when the gold price is increasing: a 16% increase in operating earnings on a 10% gold price increase.
But in addition to that, our work suggests that the companies enjoying the best stock appreciation are those with growth profiles. Midas Fund seeks to invest in precious metals mining companies that offer growth, not only in revenue and margins that can come about from increases in the metal price, but also unit growth. We like to see unit growth in the ounces of production of gold and silver and unit growth in ounces of reserves.
Two final tidbits for those investors who may wish to take advantage of the operating leverage and growth inherent with good management teams in mining shares: first, diversify; second, employ net present value analysis.
You need to diversify because the mining business is a challenging one. Lots of things can make a promising mine go from profitable to unprofitable, and a lot of them are unforeseeable. They can be political problems, rock falls, rain, labor strikes, metallurgical issues, all kinds of things that are hard or impossible to detect or assess in the course of performing typical investment diligence. Therefore, diversification is very important.
Net present value analysis is key to valuing a mining business, unlike a typical industrial company such as, say, Coca-Cola. Coca-Cola can probably find enough water, sugar and caramel coloring to produce Coca-Cola from now until the end of time. They’re never going to run out of their basic ingredients. And you can apply such things as price-earnings ratios and so forth very successfully.
A mining business is different because a mine ends. You find a deposit and you mine all of the ore out of the deposit; then you close the mine and you don’t have a business anymore. Rather than put a price-earnings ratio to, say, the mine’s earnings the year before they close the mine, you have to say: “What is the present value of that one more year of extraction of ore versus the market price of that company’s stock?” With a multi-mine company, you should try to ‘net present value’ each of its major assets. That is a complicated process.
CR: If an individual wanted to try to ‘net present value’ a mining company, what information would they look for and where would they get it?
TW: The best places to get information are company statements found at the SEC website (www.sec.gov) and the Canadian equivalent website, called SEDAR (www.sedar.com). At SEDAR, look for the 43-101 statement. The 43-101 statement gives a more technical explanation of how the company has determined the amount of reserves and resources in their mining portfolio.
An ounce of gold goes into the reserve category when it is determined to be economically extractable. The closer the ounces are to the reserve category the more reliable, within certain limitations, your net present value of the ounces will be. The disclosures might say “well, to get these 100,000 ounces out of the ground will require $100 million of capital to develop the mine. And then sustaining capital each year will be X, Y and Z over these three years and we expect these current costs.” You would plug all of those things into your spreadsheet, assume a gold price, and apply a discount factor, and you would come up with a ballpark net present value.
Table of Contents
GOLD’S Investment Attributes | continued |
One of the things a lot of people new to the mining sector find very offputting about gold mining companies is that they will typically do a net present value of a company’s properties and then find that the company’s shares trade at a multiple—somewhere between one and two times, or even higher—of their net present value. And some would say, “Well, why would I ever invest in a company that has all these apparent risks inherent in mining yet whose market cap trades at a multiple of net present value?”
It’s because precious metals companies have a kind of ‘optionality’ in them. One type of ‘optionality’ reflects the fact that a company’s revenue and profit can increase simply by the price of gold increasing—without further capital investment by the company. So the market is also taking into account the “time value” of the company as an option on the gold price. In essence, a mining company could be viewed as a long-dated warrant on the price of the underlying metal. You might do kind of a Black-Scholes valuation of that optionality and add that to your net present value calculation.
CR: One of the problems I have with precious metals is how to value them. How do you know when it’s time to buy and when it’s time to sell?
TW: At Midas, we look at currency creation versus growth rate. At the moment currency creation seems to be, and could be for a while, much greater than the growth rate.
In the George W. Bush administration, the purchasing power of the dollar, in just that eight years, declined about 20%. And during that period the inflation rate was moderate. I’m sure your members know that 2% to 3% per year doesn’t sound like much until you compound it.
Whether you’re Chinese or Argentinean or Russian or South African, your society seems to ascribe value to gold. For whatever reason, when investors get uncomfortable with their currency—whether it’s rupees, rubles, yen, yuan, or dollars—they often bid for gold, causing its price to rise.
CR: In terms of currency creation, are there any key areas you look at to try to gauge?
TW: At Midas, we look at nonpartisan financial reports. I like the American Institute for Economic Research and the Peterson Institute, I think they both do a pretty good job. The Peterson Institute is headed up by the former head of the U.S. Office of Management and Budget (OMB). I also look at OMB information. The World Bank and the International Monetary Fund (IMF) also have good data. I try to triangulate data from different sources. We don’t tend to give as much weight to central bank figures, such as information from the central bank of Japan or the central bank of China, even the central bank of the United States. I like the Institute for Supply Management (ISM) because they seem to have pretty reliable data.
CR: You’re just really looking at the pace of the economic growth?
TW: Right. So look at the gross domestic product (GDP) figures as kind of a broad measure of overall economic activity. You could look at the creation of credit throughout an economy.
CR: What could cause the current longterm rally in gold to end?
TW: That is the question we get all of the time. We analyze gold on four factors. The factors start with the near-term factors and go to the longer term. Near term, I look at the fear factor generated by geopolitical events. The fear factor is the hardest way to make money because the gold price immediately shoots up. It’s very hard for individuals or institutions or anybody to make money because the gold price almost instantaneously reflects any news.
A medium-term factor would be fundamental supply and demand, covering items such as mine supply, central bank buying and selling, jewelry demand, and so on and so forth. And these we think can influence the price a month to six months out.
Longer-term factors are the fiscal situation in the United States and its monetary policies. We believe these factors are most important. We talked about the fiscal situation earlier. The monetary policy we haven’t talked about concerns interest rates. The Federal Reserve target rate of 0 to 25 basis points means that the opportunity cost in holding gold is small because borrowing is relatively cheap. And if you take the money you would otherwise invest in gold and put it in a bank account or a money market fund you get almost nothing. Current negative real interest rates—in other words, interest rates less the inflation rate—are very bullish for gold, we believe.
So, where is gold going to stop? If someone can tell me what, over the next six months to six years, will become of interest rates, economic growth rates, government fiscal deficits and government monetary policies, then I’d be able to answer that question. No one really knows. If we were to see significant cuts in the federal budget, I would say that the gold price could probably suffer as a result because it would show that there’s fiscal discipline in Washington D.C.
CR: There is an argument that gold, on an inflation-adjusted basis, is still well below its record highs. Any comments?
TW: The peak that gold reached of about $850 an ounce in 1980, some people said was about $2,300 an ounce in constant dollars. However, gold was at that peak for about two to three
Table of ContentsGOLD’S Investment Attributes | continued |
microseconds, or perhaps a little longer. I think not much later it was around $700 and then it was back to $600. In those terms, gold today is close to the levels it was in constant dollars or maybe it’s a little bit under those levels.
We do think it’s important to keep in the back of your mind what can happen when the crowd goes crazy, but we try to look at more fundamental factors. How much currency is out there? What is the economy’s growth? How much economic wealth is there divided by currency? Where could gold go?
Let’s decide which currency we’re talking about, and how much of the currency is being created.
Gold is a better way to not have to worry about this country and that country. Basically, most currencies over time lose their purchasing power. If you look over any 100-year period, almost all currencies lose purchasing power, period. It’s so easy for a government to meet a current obligation by just printing up more currency.
CR: If an investor is looking at gold compared to a currency exchange-traded fund (ETF) or a currency mutual fund, do they invest in both or weigh one versus the other? How do they make that choice?
TW: We think gold is better because it represents a basket approach to hedging. Gold can appreciate against all currencies. You could get the foreign country’s currency situation completely right, but you have to judge that currency versus the U.S. dollar and that can be frustrating.
CR: Switching gears and going back to the portfolio allocation: If someone’s looking at gold compared to another commodity—say, an oil fund, natural gas fund or even an agriculture fund—is there a situation where they should maybe consider both or do you think it’s one or the other?
TW: I don’t think gold does well relative to other commodities in a positive commodity-type environment because it doesn’t have industrial applications. If you’re thinking that there is going to be an uplift in economic activity then you might want to get exposure to other commodities after doing supply/demand research. If you want precious metals in a time of economic recovery, consider platinum, palladium, or silver, which all have industrial applications.
Gold could be said to have two sides: a commodity side and an alternative-currency side. So far in our conversation we’ve been talking about gold as an alternative currency. Gold as a commodity is concerned primarily with global supply and industrial and jewelry demand factors. When gold is being viewed primarily as a commodity, it often seems to underperform other commodities.
CR: One last question. Are mining stocks more likely to be influenced by gold or the market? Or, are they more of a hybrid in terms of how they actually act?
TW: They’re hybrid. In 2008, gold was up and gold stocks were down. Gold stocks should be assessed on the basis of stock market capitalization versus net present value. With companies mining ore deposits that will last 25 more years, you could probably meaningfully put a price-earnings ratio on them or a price to cash flow. In 2008, gold stock prices declined while gold held steady because of market compressions to multiples such as price to earnings and price to cash flows and so on or because of market demands for increases in the discount rates used in net present valuations. In these periods, gold mining stocks behave much more like general equities.
When multiples are stable for general equities, then gold stock prices tend to rise and fall on fluctuating gold prices. It depends what period you’re in.
Thomas Winmill manages the Midas Fund (MIDSX) and is chairman of the investment policy committee for the Midas Perpetual Portfolio fund (MPERX). Find out more about Thomas at www.aaii.com/authors/thomas-winmill.
Charles Rotblut is vice president at AAII and editor of the AAII Journal. Follow him on Twitter at twitter.com/charlesrotblut.
Reprinted with permission from the American Association of Individual Investors, www.aaii.com.
NEW ACCOUNT Application Instructions | |
MIDAS REGULAR ACCOUNT APPLICATION
| 1 | REGISTRATION If there is more than one owner of the account, the registration will be “Joint Tenants with Right of Survivor- ship” unless you specify “Tenants in Common.” If this is a Uniform Gift/Transfer to a Minor, please enter all information requested for the minor. |
| 2 | MAILING AND E-MAIL ADDRESSES, TELEPHONE NUMBER, AND CITIZENSHIP If you are a non-U.S. citizen residing in the United States, in addition to this Account Application, you will be required to attach a Form W-8 BEN, which can be ob- tained from the IRS website at www.irs.gov or calling 1-800-829-3676. If this is a Uniform Gift/Transfer to a Minor, please enter all information for the Custodian, including Custodian’s physical address. |
| 3 | CHOOSE FUND(S) AND AMOUNT INVESTED Indicate the Fund(s) in which you are opening an account. The opening minimum is $1,000 per Fund ($100 for Midas Automatic Investment Programs – see Section 6 of the Account Application). |
| | The minimum subsequent investment is $100. |
| 4 | DISTRIBUTIONS Your dividends and distributions will be reinvested in additional shares of the Fund unless you instruct Midas otherwise. |
| 5 | SHAREHOLDER COMMUNICATIONS Check the method of shareholder communications you would prefer (electronic or paper copies). Electronic communications will be sent to the e-mail address provided in Section 2. |
| 6 | MIDAS SHAREHOLDER SERVICES - MIDAS BANK TRANSFER PLAN/THE MIDAS TOUCH® With the Bank Transfer Plan (BTP), you can establish a convenient and affordable long term investment program. The $1,000 minimum investment requirement is waived since the BTP is designed to facilitate an automatic monthly investment of $100 or more into your Fund account(s). Please specify the total amount you want to invest each month, the frequency, and when you’d like to start your automatic investing. |
| | All shareholders can access their account 24 hours a day, every day, at www.MidasFunds.com and by automated telephone response at 1-800-400-MIDAS (6432). Only with The Midas Touch® can you manage your account by purchasing or redeeming Fund shares using Electronic Funds Transfer, initiate Fund to Fund transfers between the three Midas Funds, and perform transactions through a Shareholder Services Representative. |
| | To access these features, please indicate your bank routing and account numbers or attach a voided check. |
| 7 | SIGNATURE AND CERTIFICATION TO AVOID BACKUP WITHHOLDING After reading this section, please sign and date the Account Application. |
| | SEND BY MAIL Mail your completed Account Application to Midas Funds, P.O. Box 6110, Indianapolis, IN 46206-6110. |
| | Checks must be payable to Midas Funds in U.S. dollars. Third party checks and money orders cannot be accepted. |
| | SEND BY WIRE Call 1-800-400-MIDAS (6432) between 8 a.m. and 6 p.m. ET, on business days to speak with a Shareholder Services Representative. A completed Account Application, the name of the bank sending the wire, and the amount to be wired are required before the wired funds can be accepted. The completed Account Application should be faxed to 1-317-937-3014, Attn: Midas Funds. You will then be assigned a Fund account number and receive wiring address information. Your account number and name(s) must be specified in the wire as they are to appear on the account registration. You should then enter your account number on your completed Account Application and promptly mail it to Midas Funds, P.O. Box 6110, Indianapolis, IN 46206-6110. This service is not available on days when the Federal Reserve wire system is closed. |
IF YOU NEED ANY ASSISTANCE IN COMPLETING THE ACCOUNT APPLICATION,
PLEASE CALL A SHAREHOLDER SERVICES REPRESENTATIVE AT 1-800-400-MIDAS (6432)
BETWEEN THE HOURS OF 8 A.M. AND 6 P.M. ET.
Table of Contents
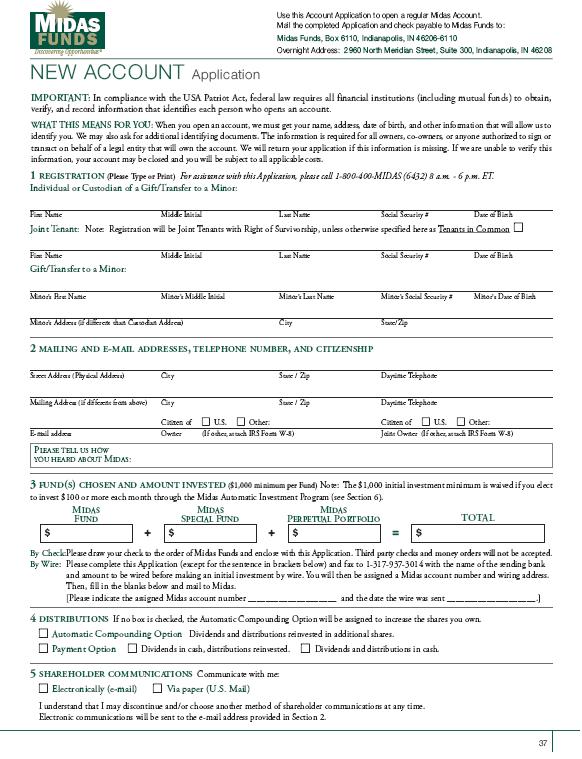


Item 2. Code of Ethics.
| | (a) | | The registrant has adopted a code of ethics (the "Code") that applies to its principal executive officer, principal financial officer, principal accounting officer or controller, or persons performing similar functions, regardless of whether these individuals are employed by the registrant or a third party. |
| | (b) | | No information need be disclosed pursuant to this paragraph. |
| | (f) | | The text of the Code can be found on the registrant's website, www.midasfunds.com, or a copy of the Code may be obtained free of charge by calling collect 1-212-480-6432. | |
Item 3. Audit Committee Financial Expert.
The registrant's Board of Directors has determined that it has three "audit committee financial experts" serving on its audit committee, each of whom are "independent" Directors: Bruce B. Huber, James E. Hunt, and Peter K. Werner. Under applicable securities laws, a person who is determined to be an audit committee financial expert will not be deemed an "expert" for any purpose, including without limitation for the purposes of Section 11 of the Securities Act of 1933, as a result of being designated or identified as an audit committee financial expert. The designation or identification of a person as an audit committee financial expert does not impose on such person any duties, obligations, or liabilities that are greater than the duties, obligations, and liabilities imposed on such person as a member of the audit committee and Board of Directors in the absence of such designation or identification. The designation or identification of a person as an audit committee financial expert pursuant to this Item does not affect the duties, obligations, or liability of any other member of the audit committee or board of directors.
Item 4. Principal Accountant Fees and Services.
| | (a) | | The aggregate fees billed for each of the last two fiscal years for professional services rendered by the principal accountant for the audit of the registrant's annual financial statements or services that are normally provided by the accountant in connection with statutory and regulatory filings or engagements for those fiscal years are as follows: |
| | | | |
| | | | AUDIT FEES |
| | | | 2010 - $15,000 |
| | | | |
| | | | |
| | | | |
| | (b) | | The aggregate fees billed in each of the last two fiscal years for assurance and related services by the principal accountant that are reasonably related to the performance of the audit of the registrant's financial statements and are not reported under paragraph (a) of this Item are as follows: |
| | | | |
| | | | AUDIT-RELATED FEES |
| | | | 2010 - $1,500 |
| | | | 2009 - $1,500 |
| | | | |
| | | | Audit related fees include amounts reasonably related to the performance of the audit of the registrant's financial statements, including the issuance of a report on internal controls and review of periodic reporting. |
| | | | |
| | | | |
| | (c) | | The aggregate fees billed in each of the last two fiscal years for professional services rendered by the principal accountant for tax compliance, tax advice, and tax planning. Registrants shall describe the nature of the services comprising the fees disclosed under this category are as follows: |
| | | | |
| | | | TAX FEES |
| | | | 2010- $1,500 |
| | | | 2009- $1,500 |
| | | | |
| | | | Tax fees include amounts related to tax compliance, tax planning, and tax advice. |
| | | | |
| | | | |
| | (d) | | The aggregate fees billed in each of the last two fiscal years for products and services provided by the principal accountant, other than the services reported in paragraphs (a) through (c) of this Item. Registrants shall describe the nature of the services comprising the fees disclosed under this category are as follows: |
| | | | |
| | | | ALL OTHER FEES |
| | | | 2010 - N/A |
| | | | 2009 - N/A |
| | | | |
| | | | |
| | (e) | | (1) Pursuant to the registrant's Audit Committee Charter, the Audit Committee shall consider for pre-approval any audit and non-audit services proposed to be provided by the auditors to the registrant, and any non-audit services proposed to be provided by such auditors to the registrant's Investment Manager, if the engagement relates directly to the registrant's operations or financial reporting. Such pre-approval of non-audit services proposed to be provided by the auditors to the registrant is not necessary, however, under the following circumstances: (1) all such services do not aggregate to more than 5% of total revenues paid by the registrant to the auditor in the fiscal year in which services are provided, (2) such services were not recognized as non-audit services at the time of the engagement, and (3) such services are brought to the attention of the Audit Committee, and approved by the Audit Committee, prior to the completion of the audit. |
| | | | |
| | | | (2) No services included in (b) - (d) above were approved pursuant to paragraph (c)(7)(i)(C) of Rule 2-01 of Regulation S-X. |
| | | | |
| | | | |
| | (f) | | Not applicable. |
| | | | |
| | | | |
| | (g) | | The aggregate non-audit fees billed by the registrant's accountant for services rendered to the registrant, and rendered to the registrant's investment adviser (not including any sub-adviser whose role is primarily portfolio management and is subcontracted with or overseen by another investment adviser), and any entity controlling, controlled by, or under common control with the adviser that provides ongoing services to the registrant for each of the last two fiscal years of the registrant were $23,500 and $23,000, respectively. |
| | | | |
| | | | |
| | (h) | | The registrant's audit committee has determined that the provision of non-audit services that were rendered by accountant to the registrant's investment adviser (not including any sub-adviser whose role is primarily portfolio management and is subcontracted with or overseen by another investment adviser), and any entity controlling, controlled by, or under common control with the investment adviser that provides ongoing services to the registrant that were not pre-approved pursuant to paragraph (c)(7)(ii) of Rule 2-01 of Regulation S-X is compatible with maintaining the principal accountant's independence. |
Item 5. Audit Committee of Listed Registrants.
The registrant has a standing audit committee. The members of the audit committee are Bruce B. Huber, James E. Hunt and Peter K. Werner.
Item 6. Schedule of Investments.
Included as part of the report to shareholders filed under Item 1 of this Form.
Item 7. Disclosure of Proxy Voting Policies and Procedures for Closed-End Management Investment Companies.
Not applicable.
Item 8. Portfolio Managers of Closed-End Management Investment Companies.
Not applicable.
Item 9. Purchases of Equity Securities by Closed-End Management Investment Company and Affiliated Purchasers.
Not applicable.
Item 10. Submission of Matters to a Vote of Security Holders.
There were no material changes to the procedures by which shareholders may recommend nominees to the registrant's board of directors made or implemented after the registrant last provided disclosure in response to the requirements of Item 407(c)(2)(iv) of Regulation S-K (17 CFR 229.407), or this Item.
Item 11. Controls and Procedures.
| | (a) | | The registrant's principal executive officer and principal financial officer have concluded that the registrant's disclosure controls and procedures (as defined in Rule 30a- 3(c) under the Investment Company Act of 1940, as amended (the "1940 Act")) are effective as of a date within 90 days of the filing date of this report that includes the disclosure required by this paragraph, based on their evaluation of the disclosure controls and procedures required by Rule 30a-3(b) under the 1940 Act and 15d-15(b) under the Securities Exchange Act of 1934. |
| | (b) | | There were no changes in the registrant's internal control over financial reporting (as defined in Rule 30a-3(d) under the 1940 Act) that occurred during the registrant's second fiscal quarter of the period covered by the report that have materially affected, or are likely to materially affect the registrant's internal control over financial reporting. |
Item 12. Exhibits.
| | (a) | | Certifications pursuant to Rule 30a-2(a) under the Investment Company Act of 1940(17 CFR 270.360a-2) attached hereto as Exhibits EX-31 and certifications pursuant to 18 U.S.C. Section 1350, as adopted pursuant to Section 906 of the Sarbanes-Oxley Act of 2002 attached hereto as Exhibit EX-32. |
SIGNATURES
Pursuant to the requirements of the Securities Exchange Act of 1934 and the Investment Company Act of 1940, the registrant has duly caused this report to be signed on its behalf by the undersigned, thereunto duly authorized.
May 31, 2011 | | Midas Perpetual Portfolio, Inc. By: /s/ Thomas B. Winmill —————————————— Thomas B. Winmill President |
| | Midas Perpetual Portfolio, Inc. By: /s/ Thomas O'Malley —————————————— Thomas O'Malley Chief Financial Officer |
Pursuant to the requirements of the Securities Exchange Act of 1934 and the Investment Company Act of 1940, the registrant has duly caused this report to be signed below by the following persons on behalf of the registrant and in the capacities and on the dates indicated.
| | Midas Perpetual Portfolio, Inc. By: /s/ Thomas B. Winmill —————————————— Thomas B. Winmill President |
| | Midas Perpetual Portfolio, Inc. By: /s/ Thomas O'Malley —————————————— Thomas O'Malley Chief Financial Officer |