UNITED STATES
SECURITIES AND EXCHANGE COMMISSION
Washington, D.C. 20549
FORM N-CSR
CERTIFIED SHAREHOLDER REPORT OF REGISTERED
MANAGEMENT INVESTMENT COMPANIES
| Investment Company Act file number: | 811-2474 |
|---|
| |
Midas Perpetual Portfolio, Inc.
(Exact name of registrant as specified in charter)
11 Hanover Square, New York, NY 10005
(Address of principal executive offices) (Zipcode)
Thomas B. Winmill, President
11 Hanover Square
New York, NY 10005
(Name and address of agent for service)
Registrant's telephone number, including area code: 1-212-480-6432
Date of fiscal year end: 12/31
Date of reporting period: 1/1/08 - 12/31/08
Form N-CSR is to be used by management investment companies to file reports with the Commission not later than 10 days after the transmission to stockholders of any report that is required to be transmitted to stockholders under Rule 30e-1 under the Investment Company Act of 1940 (17 CFR 270.30e-1). The Commission may use the information provided on Form N-CSR in its regulatory, disclosure review, inspection, and policy making roles.
A registrant is required to disclose the information specified by Form N-CSR and the Commission will make this information public. A registrant is not required to respond to the collection of information contained in Form N-CSR unless the Form displays a current valid Office of Management and Budget ("OMB") control number. Please direct comments concerning the accuracy of the information collection burden estimate and any suggestions for reducing the burden to Secretary, Securities and Exchange Commission, 450 Fifth Street, NW, Washington, DC 20549-0609. The OMB has reviewed this collection of information under clearance requirements of 44 U.S.C. sec. 3507.
Item 1. Report to Stockholders.
| • | | Midas Fund (Ticker: MIDSX) |
Seeks capital appreciation and protection against inflation and secondarily current income through investments primarily in precious metals and natural resources companies.
| • | | Midas Special Fund (Ticker: MISEX) |
Invests aggressively for capital appreciation in any security in any sector.
| • | | Midas Perpetual Portfolio (Ticker: MPERX) |
Seeks to preserve and increase the purchasing power value of its shares over the long term by investing in gold, silver, Swiss franc assets, hard asset securities, large capitalization growth stocks, and dollar assets.
To Our Shareholders
In 2008 we witnessed the most severe bear market decline since 1931, as measured by the 37% decline in the Standard & Poor’s 500 Index. Many U.S. households experienced significant drops in net worth, not only from the downturn in financial markets but also from declining home prices. Business confidence is down on anticipated slumps in earnings and problems in accessing credit. Media stories on the economy seem relentlessly pessimistic. So what is the best path ahead for investors today?
Coping with the Markets
Emotional reactions to market disappointments can upset well considered, long term, financial planning. At Midas, how we deal with negative financial news and inevitable market volatility reflects three key principles: first, we seek to invest in quality; second, we invest for the long term; and third, we offer three separate investment options to provide overall portfolio diversity. What does this do for us and our investors? More than a financial strategy, it helps sustain the critical emotional stamina we need to ride out market lows and pursue our investing goals.
Investing peace of mind can be achieved by holding quality securities because they are more likely to weather a temporary market or economic downturn. Likewise, with a long term investing outlook we can keep our disciplined focus on companies with combinations of strength in operations, finances, and products that we find most attractive, even through volatile markets. Although it does not eliminate the risk of potential loss, a disciplined and flexible analytical process can reward Fund shareholders with investments that offer the potential for gratifying returns, even as economic activity and markets evolve in unpredictable patterns.
Introducing . . . Midas Perpetual Portfolio
A lasting commitment to financial plans can also be assisted by portfolio diversification. For this reason, we offer three different Midas Funds: Midas Special Fund for a longer term, stock market oriented objective, Midas Fund for precious metals capital appreciation and as a hedge against inflation, and now . . . Midas Perpetual Portfolio (formerly Midas Dollar Reserves).
Midas Perpetual Portfolio seeks to preserve and increase the purchasing power value of its shares over the long term. The Fund invests a fixed target percentage of its total assets in set investment categories: gold, silver, Swiss franc assets, stocks of U.S. and foreign companies dealing primarily in real estate and natural resources, large capitalization growth stocks, and dollar assets. The investment strategy of the Fund acknowledges a broad range of economic possibilities and investment outlooks, and seeks to incorporate investments appropriate for each of them. Investors who wish to invest their capital for the long term that does not depend on any particular outcome for the economy should consider purchasing shares in Midas Perpetual Portfolio.
Discovering Opportunities Now For Your Future
Midas offers an excellent service - the Midas Bank Transfer Plan - which makes convenient regular investing to help you seek your future financial goals. With the free Midas Bank Transfer Plan, you decide now to invest a certain amount each month in the future for as long as you like, and Midas will transfer the money from your bank account for investment in your Midas Funds account. Periodically you should review your overall portfolio. For retirement investing goals, consider the tax-advantaged Midas Traditional, Roth, SEP, or SIMPLE IRA, as well as the Midas Education Savings Account. Forms for all of these plans may be found at www.midasfunds.com.
Investing the same amount regularly, known as “dollar cost averaging,” can reduce the anxiety of investing in a rising or falling market or buying all your shares at market highs. Although this strategy cannot assure a profit or protect against loss in a declining market, it can result in a lower average cost for your purchases. Of course, you should consider your financial ability to continue your purchases through periods of low price levels when undertaking such a strategy.

If you have any questions, we will be happy to assist you without any obligation on your part. We look forward to hearing from you. Please call us at 1-800-400-MIDAS (6432), or visit www.MidasFunds.com.
|
| Sincerely, |
|
 |
| Thomas B. Winmill |
| President |
1
Midas Fund
C O M M E N T A R Y
We are very pleased to welcome our new shareholders attracted to Midas Fund by its policy of investing primarily in securities of companies principally involved in mining, processing, fabricating, distributing or otherwise dealing in gold, silver, platinum, or other natural resources, and its no-charge shareholder services.
Market Review, Strategies, and Outlook
The U.S. economic situation is grim. The Labor Department recently reported that claims for unemployment benefits have climbed over 4 million, the highest level since 1982. Reflecting the worsening employment situation, the Mortgage Bankers Association reports a record one in ten American homeowners with a mortgage was either at least a month behind on their payments or in foreclosure at the end of the third quarter. One bright spot for consumers – but not for Midas Fund investors – was the sharp drop in commodity and energy prices in the second half of 2008, dampening prior concerns of a growing near term inflation risk. In fact, consumer prices dropped 1.7% in November, the largest amount since 1947.
Notwithstanding current deflationary trends, considering the U.S. Government’s extreme monetary and fiscal policies, it seems reasonable for investors to anticipate not only future inflation in the United States but also U.S. dollar weakness versus other currencies, both of which are normally positive for gold prices. By “extreme monetary policy,” we mean the Federal Reserve’s repeated target interest rate cuts to an unprecedented, essentially 0%, rate. “Extreme fiscal policy” may be found in the multi-billion dollar stimulus packages favored by the U.S. legislative and executive branches. We note that the U.S. federal budget deficit is expected to reach at least $1.2 trillion in 2009, a substantial sum given that the annual U.S. economy is estimated at about only $14 trillion.
Quality with Growth
Given this market environment, and using its core strategy of “quality, with growth,” Midas Fund focused on premier quality gold mining companies in 2008. As the price of gold stabilized, Midas increased its core holdings of the world’s largest gold producers. The Fund’s holdings of smaller natural resource companies hurt performance as the collapse of general equity and debt markets reduced their prospects for advantageous financing of existing operations and new projects. In anticipation of rebounding prices and profits, the Fund boosted its holdings of top-tier platinum producers after metals prices sank below the costs of production. Midas Fund’s net asset value declined 60.89% in 2008, a disappointing result after having achieved total return gains of 31.70% for 2007, 44.02% in 2006, and 39.72% in 2005. Currently, the Fund is leveraged and positioned for rising gold prices with an increasing emphasis on larger companies with attractive combinations of free cash flow, operations in more politically stable areas, stable or growing gold production profiles, sizeable resources, exploration potential, or other special features.
In 2008, gold prices (based on the London p.m. fix) swung between approximately $712 and $1,011, averaging about $872 and ending the year at $870. Gold’s 2008 average price represents a 25% increase over the 2007 average ($695/oz), the highest annual average ever, and the 7th consecutive average price increase. We anticipate investment demand potentially driving the gold price over $1,000 if the U.S. dollar weakens or greater inflation appears on the horizon. A U.S. depression or increases in U.S. interest rates could be negative for gold prices. By seeking quality investments with solid growth potential, we seek to address the risks inherent in the sector, yet position Midas Fund to benefit from positive trends. Already in 2009 we are seeing the beneficial role for gold investing for U.S. investors, as at this writing the gold price has already climbed over $900 per ounce.
| | |
TOP 10 HOLDINGS
AS OF DECEMBER 31, 2008 |
| |
| 1 | | Barrick Gold Corp. |
| 2 | | Eldorado Gold Corp. |
| 3 | | Kinross Gold Corp. |
| 4 | | Yamana Gold, Inc. |
| 5 | | Lihir Gold Limited |
| 6 | | Goldcorp Inc. |
| 7 | | Agnico-Eagle Mines Ltd. |
| 8 | | Compania de Minas Buenaventura ADR |
| 9 | | Newcrest Mining Ltd. |
| 10 | | BHP Billiton Ltd. ADR |
2
Midas Special Fund
C O M M E N T A R Y
It is a pleasure to submit this 2008 Annual Report for Midas Special Fund, and to welcome new shareholders who find the Fund’s aggressive and flexible investment approach attractive. Midas Special Fund invests aggressively for capital appreciation, using a flexible strategy in the selection of securities, and is not limited by the issuer’s location, size, or industry sector. The Fund may invest in equity and fixed income securities of both new and seasoned U.S. and foreign issuers with no minimum rating, including securities convertible into common stock, debt securities, futures, options, derivatives, and other instruments. The Fund also may employ speculative investment techniques, such as selling securities short and borrowing money for investment purposes, a practice known as “leveraging,” and may invest defensively.
Markets and the Fund’s Capital Appreciation Strategies
The global economic contraction seen in the first half of 2008 accelerated as the year wore on. Amidst distressed housing markets and frozen credit conditions, both consumers and businesses cut spending. The U.S. Commerce Department reported that factory orders dropped 5.1% in October, the largest decrease since 2000. As many businesses stumbled, employers cut 533,000 jobs in November, the most in 34 years, taking the unemployment rate to a 15 year high of 6.7%, accordingly to the U.S. Labor Department. In these market conditions, the Fund’s strategy was to de-emphasize food service, resource, and credit companies, increase leverage slightly, and concentrate its holdings in quality companies with attractive valuations. By year end, Midas Special Fund’s holdings included the stocks of some of the largest and best known U.S. companies in insurance, technology, banking, and finance. The Fund’s total return in 2008 was (45.84)%, compared to the S&P 500 Index, which returned (37.00)% in the year, according to Morningstar, Inc.
To achieve its objective, Midas Special Fund may use a seasonal investing strategy to invest the Fund’s assets. For example, the Fund may increase its investments in stocks during periods anticipated to be favorable for stocks based on patterns of investor behavior related to accounting periods, tax events, holidays, and other factors. During periods anticipated to be less favorable, the Fund may take a defensive position by buying high grade, short term, liquid securities and by selling securities short.
2009 Outlook and Investing Discipline
Looking ahead, we note that when the Federal Reserve Open Market Committee (FOMC) recently lowered the key federal funds interest rate to a range of 0% to 0.25%, it cited deteriorating labor market conditions and declining consumer spending, business investment, and industrial production, as well as strained financial markets and tight credit conditions, with the outlook for weak economic activity. Although it does not eliminate the risk of potential loss, we believe during 2009 the Fund’s investing discipline of flexible and quality portfolio selection may offer attractive potential.
Tax Advantaged Retirement Accounts
Midas Special Fund will pursue its capital appreciation objective aggressively as financial market conditions evolve, seeking to discover long term opportunities for attractive investment - whether due to a changing outlook for the prospects of a particular company or an industry sector generally. Since these strategies may reflect longer term wealth building goals, we believe the Fund can be especially appropriate for tax advantaged retirement accounts. Of course, we also would be very pleased to discuss with you any questions you may have. Just call us toll free at 1-800-400-MIDAS (6432) and a Shareholder Services Representative will be glad to assist you, as always, without obligation on your part.
| | |
TOP 10 HOLDINGS
AS OF DECEMBER 31 , 2008 |
| |
| 1 | | Berkshire Hathaway Inc. Class B |
| 2 | | MasterCard, Inc. |
| 3 | | Johnson & Johnson |
| 4 | | Google, Inc. |
| 5 | | JPMorgan Chase & Co. |
| 6 | | ConocoPhillips |
| 7 | | Costco Wholesale Corp. |
| 8 | | Procter & Gamble Company |
| 9 | | Lowe’s Companies, Inc. |
| 10 | | Canadian Natural Resources Ltd. |
3
Midas Perpetual Portfolio
C O M M E N T A R Y
We are pleased to announce that on December 29, 2008 Midas Dollar Reserves, Inc. changed its name to Midas Perpetual Portfolio, Inc. and transformed from a money market fund to a fluctuating net asset value fund investing a fixed target percentage of its total assets in the following investment categories: gold, silver, Swiss franc assets, stocks of U.S. and foreign companies dealing primarily in real estate and natural resources, large capitalization growth stocks, and dollar assets. Midas Perpetual Portfolio seeks to preserve and increase the purchasing power value of its shares over the long term and its all-weather approach makes it an attractive vehicle for a program of steady monthly investing. To make regular investing in the Fund as easy, convenient, and affordable as possible, we offer the Midas Bank Transfer Plan. For information on this free service simply give us a call toll free 1-800-400-MIDAS (6432). We look forward to helping you get started.
Investment Strategy, Review, and Outlook
To combat the appearance of what could be a prolonged and severe recession in the United States, over the 2008 year the Federal Reserve Open Market Committee (FOMC) lowered the key federal funds interest rate repeatedly, culminating in the unprecedented December 16th decision to lower the rate to a range of 0% to 0.25%. As a money market fund, in 2008 the strategy of the Fund was to invest in money market obligations of the U.S. Government, its agencies and instrumentalities, while maintaining an average maturity in the year through December 28, 2008 of approximately 38 days. The Fund’s 2008 return was a positive 1.22%.
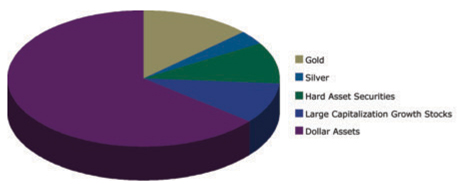
As Midas Perpetual Portfolio, the Fund has broadened its investment horizons to now target a fixed percentage of its total assets as follows: gold, 20%; silver, 5%; Swiss franc assets, 10%; hard asset securities, 15%; large capitalization growth stocks, 15%; and, U.S. dollar assets, 35%. Gold and silver investments include bullion, coins, and exchange traded funds. Swiss franc assets include Swiss franc denominated deposits and bonds of the federal government of Switzerland of any maturity. Hard asset securities include those of U.S. and foreign companies dealing primarily in real estate and natural resources. Large capitalization growth stocks normally include U.S. and foreign companies with market capitalizations over $50 billion with growth in revenues, earnings, or other similar measures and may include options, warrants, and similar derivatives on such stocks. Dollar assets include cash, U.S. Treasury bills, notes, and bonds, obligations of U.S. government agencies, instrumentalities, and sponsored enterprises, and U.S. dollar denominated high grade, short term corporate bonds and banker’s acceptances. The average length to maturity of the Fund’s dollar assets will not exceed fifteen years and corporate bonds will have a rating of “A” or higher by Standard & Poor’s and a remaining time to maturity of 24 months or less.
The investment strategy of the Fund acknowledges a broad range of economic possibilities and investing outlooks, and seeks to incorporate investments appropriate for each of them. Investors who wish to invest all or a portion of their capital in a way that does not depend on any particular outcome for the economy should consider purchasing shares in the Fund.
Contact Us for Information and Services
If you have any questions or would like further information on the Midas Funds Family, our Traditional or Roth IRAs, and also our Education Savings Accounts, we would be very pleased to hear from you and provide such information to you or a friend or relative. Just call 1-800-400-MIDAS (6432) and a Shareholder Service Representative, who is here to serve you, will be very glad to help, as always, without obligation on your part.
| | |
TOP 10 HOLDINGS
AS OF DECEMBER 31 , 2008 |
| |
| 1 | | Freddie Mac, due 1/26/09 |
| 2 | | Freddie Mac, due 2/27/09 |
| 3 | | SPDR Gold Trust |
| 4 | | Fannie Mae, due 2/17/09 |
| 5 | | Fannie Mae, due 1/28/09 |
| 6 | | SsgA Money Market Fund |
| 7 | | Federal Home Loan Bank, due 2/25/09 |
| 8 | | iShares Silver Trust |
| 9 | | Federal Home Loan Bank, due 2/27/09 |
| 10 | | Federal Home Loan Bank, due 2/17/09 |
4
Report of Independent Registered Public Accounting Firm
To the Shareholders and Boards of Directors of
Midas Fund, Inc.
Midas Special Fund, Inc.
Midas Perpetual Portfolio, Inc.
We have audited the accompanying statements of assets and liabilities, including the schedule of portfolio investments, of Midas Fund, Inc., Midas Special Fund, Inc., and Midas Perpetual Portfolio, Inc. (formerly Midas Dollar Reserves, Inc.) as of December 31, 2008, the related statements of operations and of cash flows for the year then ended, the statements of changes in net assets for each of the two years in the period then ended and the financial highlights for each of the five years in the period then ended. These financial statements and financial highlights are the responsibility of the Funds’ management. Our responsibility is to express an opinion on these financial statements and financial highlights based on our audits.
We conducted our audits in accordance with auditing standards of the Public Company Accounting Oversight Board (United States). Those standards require that we plan and perform the audit to obtain reasonable assurance about whether the financial statements and financial highlights are free of material misstatement. The Funds are not required to have, nor were we engaged to perform, an audit of their internal control over financial reporting. Our audits included considerations of internal control over financial reporting as a basis for designing audit procedures that are appropriate in the circumstances, but not for the purpose of expressing an opinion on the effectiveness of the Funds’ internal control over financial reporting. Accordingly, we express no such opinion. An audit includes examining, on a test basis, evidence supporting the amounts and disclosures in the financial statements. Our procedures included confirmation of securities owned as of December 31, 2008, by correspondence with the custodian and broker. An audit also includes assessing the accounting principles used and significant estimates made by management, as well as evaluating the overall financial statement presentation. We believe that our audits provide a reasonable basis for our opinion.
In our opinion, the financial statements and financial highlights referred to above present fairly, in all material respects, the financial position of Midas Fund, Inc., Midas Special Fund, Inc., and Midas Perpetual Portfolio, Inc. as of December 31, 2008, the results of their operations and cash flows for the year then ended, the changes in their net assets for each of the two years in the period then ended and the financial highlights for the five years presented in conformity with accounting principles generally accepted in the United States of America.
TAIT, WELLER & BAKER LLP
Philadelphia, Pennsylvania
February 26, 2009
5
Midas Fund
Schedule of Portfolio Investments - December 31, 2008
| | | | | | |
| Common Stocks (100.18%) | | | |
Shares | | | | Value | |
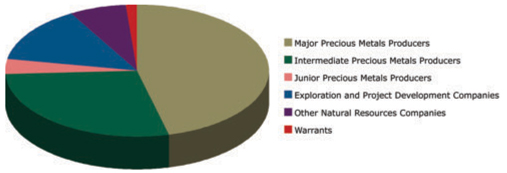
Major Precious Metals Producers (46.95%) | | | | |
| 85,000 | | AngloGold Ashanti Ltd. ADR | | $ | 2,355,350 | |
| 175,000 | | Barrick Gold Corp. | | | 6,434,750 | |
| 182,000 | | Compania De Minas Buenaventura ADR (a) | | | 3,625,440 | |
| 291,453 | | Fresnillo plc | | | 963,827 | |
| 125,000 | | Goldcorp Inc. (a) | | | 3,941,250 | |
| 150,000 | | Impala Platinum Holdings Ltd. | | | 2,190,373 | |
| 300,000 | | Kinross Gold Corp. (a) | | | 5,526,000 | |
| 65,000 | | Lonmin PLC | | | 851,402 | |
| 150,000 | | Newcrest Mining Ltd. | | | 3,544,238 | |
| 47,400 | | Newmont Mining Corp. | | | 1,929,180 | |
| 650,625 | | Yamana Gold, Inc. (a) | | | 5,022,825 | |
| | | | | | |
| | | | | 36,384,635 | |
Intermediate Precious Metals Producers (28.35%) | | | | |
| 75,000 | | Agnico-Eagle Mines Ltd. (a) | | | 3,849,750 | |
| 600,000 | | Centerra Gold Inc. (b) | | | 2,136,087 | |
| 800,000 | | Eldorado Gold Corp. (b) | | | 6,360,000 | |
| 171,178 | | Hochschild Mining PLC | | | 277,503 | |
| 36,000 | | IAMGold Corp. | | | 219,960 | |
| 2,000,000 | | Lihir Gold Limited (b) | | | 4,386,028 | |
| 60,000 | | Randgold Resources Limited ADR (a) | | | 2,635,200 | |
| 1,000,000 | | Silvercorp Metals, Inc. | | | 2,106,116 | |
| | | | | | |
| | | | | 21,970,644 | |
Junior Precious Metals Producers (3.75%) | | | | |
| 450,000 | | First Majestic Silver Corp. (b) | | | 772,782 | |
| 407,675 | | Jaguar Mining, Inc. (b) | | | 2,132,129 | |
| | | | | | |
| | | | | 2,904,911 | |
Exploration and Project Development Companies (14.10%) | | | | |
| 1,400,000 | | Andean Resources Ltd. (b) | | | 861,888 | |
| 500,000 | | Comaplex Minerals Corp. (b) | | | 1,237,343 | |
| 1,642,000 | | Etruscan Resources Inc. (b) | | | 691,648 | |
| 6,915,000 | | Farallon Resources Ltd. (b) | | | 840,219 | |
| 1,000,000 | | Great Basin Gold Ltd. (b) | | | 1,280,000 | |
| 180,000 | | Guyana Goldfields (b) | | | 271,203 | |
| 37,699 | | Ivanhoe Nickel & Platinum Ltd. (b) (c) | | | — | |
| 400,000 | | Minefinders Corporation Ltd. (a) (b) | | | 2,060,000 | |
| 600,000 | | Northern Dynasty Minerals Ltd. (a) (b) | | | 2,208,000 | |
| 364,500 | | Olympus Pacific Minerals, Inc. (b) | | | 21,407 | |
| 186,100 | | Pelangio Exploration Inc. (b) | | | 11,306 | |
| 186,100 | | PDX Resources Inc. (b) | | | 248,736 | |
| 2,530,000 | | Ridge Mining PLC (b) | | | 1,200,431 | |
| | | | | | |
| | | | | 10,932,181 | |
Other Natural Resources Companies (7.03%) | | | | |
| 450,000 | | Anvil Mining Ltd. (b) | | | 395,504 | |
| 76,000 | | BHP Billiton Ltd. ADR | | | 3,260,400 | |
| 894,000 | | Brilliant Mining Corp. (b) | | | 146,646 | |
| 150,000 | | Endeavour Financial Corp. | | | 210,207 | |
| 275,000 | | Forsys Metals Corp. (b) | | | 1,250,975 | |
| 550,000 | | Mercator Minerals Ltd. (b) | | | 186,230 | |
| | | | | | |
| | | | | 5,449,962 | |
| | | | | | |
Total common stocks (cost: $124,843,449) | | | 77,642,333 | |
Warrants (1.45%) (b) | | | | |
| 562,500 | | Etruscan Resources Inc., expiring 11/02/10 | | | 34,174 | |
| 258,500 | | Etruscan Resources Inc., expiring 8/06/11 | | | 32,456 | |
| 225,000 | | First Majestic Silver Corp., expiring 3/25/10 | | | 65,158 | |
| 300,000 | | Great Basin Gold Ltd., expiring 4/19/09 | | | 6,000 | |
| 100,000 | | Kinross Gold Corp., expiring 9/07/11 | | | 292,426 | |
| 142,900 | | Kinross Gold Corp., expiring 9/03/13 | | | 690,481 | |
| | | | | | |
Total warrants (cost: $577,052) | | | 1,120,695 | |
| |
Bullion Ounces (0.01%) | | | | |
| 10 | | Gold (cost: $9,643) (b) | | | 8,803 | |
| | | | | | |
Total investments (cost: $125,430,144) (101.64%) | | | 78,771,831 | |
Liabilities in excess of other assets (-1.64%) | | | (1,269,942 | ) |
| | | | | | |
Net assets (100.00%) | | $ | 77,501,889 | |
| | | | | | |
| (a) | Fully or partially pledged as collateral on bank credit facility. |
| (c) | Illiquid and/or restricted security that has been fair valued. ADR means “American Depositary Receipt.” |
| | | | |
| | 6 | | See notes to financial statements. |
Midas Special Fund
Schedule of Portfolio Investments - December 31, 2008
| | | | | | |
| Common Stocks (118.07%) | | | |
Shares | | | | Value | |
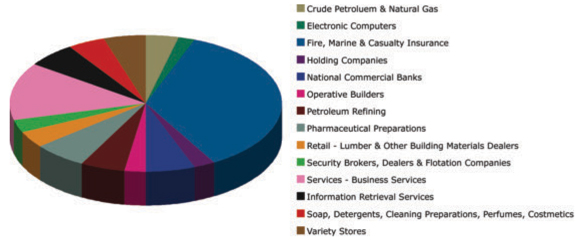
Crude Petroluem & Natural Gas (4.49%)
| | | | |
| 10,000 | | Canadian Natural Resources Ltd. | | $ | 399,800 | |
Electronic Computers (2.39%)
| | | | |
| 2,500 | | Apple Inc. (a) | | | 213,375 | |
Fire, Marine & Casualty Insurance (42.32%)
| | | | |
| 1,050 | | Berkshire Hathaway, Inc. Class B (a) (b) | | | 3,374,700 | |
| 20,000 | | Leucadia National Corporation (a) (b) | | | 396,000 | |
| | | | | | |
| | | | | 3,770,700 | |
Holding Companies (3.08%)
| | | | |
| 18,000 | | Brookfield Asset Management Inc. | | | 274,860 | |
Information Retrieval Services (6.91%)
| | | | |
| 2,000 | | Google, Inc. - Class A (a) (b) | | | 615,300 | |
National Commercial Banks (6.86%)
| | | | |
| 19,400 | | JP Morgan Chase & Co. (b) | | | 611,682 | |
Operative Builders (2.94%)
| | | | |
| 25,000 | | Hovnanian Enterprises, Inc. (a) | | | 43,000 | |
| 20,000 | | Pulte Homes, Inc. | | | 218,600 | |
| | | | | | |
| | | | | 261,600 | |
Petroleum Refining (6.28%)
| | | | |
| 10,800 | | ConocoPhillips (b) | | | 559,44 | |
Pharmaceutical Preparations (7.39%)
| | | | |
| 11,000 | | Johnson & Johnson (b) | | | 658,130 | |
Retail - Lumber & Other Building Materials Dealers (4.59%)
| | | | |
| 19,000 | | Lowe’s Companies, Inc. | | | 408,880 | |
Security Brokers, Dealers & Flotation Companies (3.69%)
| | | | |
| 3,900 | | The Goldman Sachs Group, Inc. | | | 329,121 | |
Services - Business Services (16.04%)
| | | | |
| 10,000 | | MasterCard, Inc. (b) | | | 1,429,300 | |
Soap, Detergents, Cleaning Preparations, Perfumes, Cosmetics (5.20%)
| | | | |
| 7,500 | | Procter & Gamble Company | | | 463,650 | |
Variety Stores (5.89%)
| | | | |
| 10,000 | | Costco Wholesale Corp. | | | 525,000 | |
| | | | | | |
Total investments (cost: $11,056,447) (118.07%) | | | 10,520,838 | |
Liabilities in excess of other assets (-18.07%) | | | (1,610,077 | ) |
| | | | | | |
Net assets (100.00%) | | $ | 8,910,761 | |
| | | | | | |
| (b) | Fully or partially pledged as collateral on bank credit facility. |
| | | | |
| See notes to financial statements. | | 7 | | |
Midas Perpetual Portfolio
Schedule of Portfolio Investments - December 31, 2008
| | | | | |
Shares | | | | Value |
Gold (20.68%) | | | |
Exchange Traded Fund (20.68%)
| | | |
| 17,185 | | SPDR Gold Trust (a) (cost: $1,488,352) | | $ | 1,486,846 |
Silver (5.28%)
| | | |
Exchange Traded Fund (5.28%)
| | | |
| 33,914 | | iShares Silver Trust (a) (cost: $382,516) | | | 379,837 |
Hard Asset Securities (15.40%)
| | | |
Copper Ores (1.02%)
| | | |
| 4,576 | | Southern Copper Corp. | | | 73,491 |
Crude Petroleum & Natural Gas (1.02%)
| | | |
| 1,219 | | Occidental Petroleum Corp. | | | 73,128 |
Gold Ores (2.10%)
| | | |
| 2,051 | | Barrick Gold Corp. | | | 75,415 |
| 2,385 | | Goldcorp Inc. | | | 75,199 |
| | | | | |
| | | | | 150,614 |
Industrial Gases (1.02%)
| | | |
| 1,231 | | Praxair, Inc. | | | 73,072 |
Metal Mining (1.02%)
| | | |
| 1,716 | | BHP Billiton Ltd. ADR | | | 73,616 |
Petroleum Refining (2.03%)
| | | |
| 1,408 | | ConocoPhillips | | | 72,934 |
| 915 | | Exxon Mobil Corp. | | | 73,044 |
| | | | | |
| | | | | 145,978 |
Plastic Materials, Resins & Nonvulcanelastomers (1.02%)
| | | |
| 2,907 | | E.I. du Pont De Nemours and Company | | | 73,547 |
Potash, Soda, & Borate Minerals (1.01%)
| | | |
| 966 | | Potash Corporation of Saskatchewan Inc. | | | 72,927 |
Real Estate Investment Trusts (3.15%)
| | | |
| 1,213 | | Federal Realty Investment Trust | | | 75,303 |
| 1,778 | | Health Care REIT, Inc. | | | 75,032 |
| 958 | | Public Storage | | | 76,161 |
| | | | | |
| | | | | 226,496 |
Soybean Oil Mills (1.01%)
| | | |
| 2,525 | | Archer-Daniels-Midland Company
| | | 72,796 |
| | | |
Steel Works, Blast Furnaces & Rolling Mills (Coke Ovens) (1.00%)
| | | |
| 1,588 | | Nucor Corp. | | | 71,980 |
| | | | | |
Total hard asset securities (cost: $1,107,847) | | | 1,107,645 |
| | | | | |
Large Capitalization Growth Stocks (15.26%)
| | | |
Communications Equipment (1.26%)
| | | |
| 5,559 | | Cisco Systems, Inc. (a) | | | 90,612 |
Electronic Computers (1.25%)
| | | |
| 1,051 | | Apple Inc. (a) | | | 89,703 |
Fire, Marine & Casualty Insurance (1.34%)
| | | |
| 30 | | Berkshire Hathaway, Inc. Class B (a) | | | 96,420 |
Information Retrieval Services (1.26%)
| | | |
| 294 | | Google, Inc. (a) | | | 90,449 |
Life Insurance (1.27%)
| | | |
| 1,971 | | China Life Insurance Company Ltd. ADR | | | 91,454 |
Oil & Gas Field Services (1.27%)
| | | |
| 2,158 | | Schlumberger Ltd. | | | 91,348 |
Pharmaceutical Preparations (2.54%)
| | | |
| 1,102 | | Genentech, Inc. (a) | | | 91,367 |
| 2,851 | | Sanofi-Aventis ADR | | | 91,688 |
| | | | | |
| | | | | 183,055 |
Services-Prepackaged Software (2.52%)
| | | |
| 4,667 | | Microsoft Corp. | | | 90,726 |
| 5,096 | | Oracle Corp. (a) | | | 90,352 |
| | | | | |
| | | | | 181,078 |
Telephone Communications (2.55%)
| | | |
| 1,799 | | China Mobile Ltd. ADR | | | 91,479 |
| 1,359 | | Telefonica, S.A. ADR | | | 91,583 |
| | | | | |
| | | | | 183,062 |
| | | | | |
Total large capitalization growth stocks (cost: $1,098,586) | | | 1,097,181 |
| | | | | |
| | | | |
| | 8 | | See notes to financial statements. |
Midas Perpetual Portfolio
Schedule of Portfolio Investments - December 31, 2008
| | | | | | | |
| | Dollar Assets (101.13%) | | | | |
Principal
Amount | | | | Value | |
| | U.S. Government Agency Obligations (92.88%) (b) | | | | |
| $ | 300,000 | | Federal Home Loan Bank, .20%, due 2/17/09 | | $ | 299,922 | |
| | 490,000 | | Federal Home Loan Bank, 1.00%, due 2/25/09 | | | 489,251 | |
| | 350,000 | | Federal Home Loan Bank, 1.75%, due 2/27/09 (c) | | | 349,027 | |
| | 700,000 | | Federal National Mortgage Association, 1.00%, due 1/28/09 (c) | | | 699,474 | |
| | 750,000 | | Federal National Mortgage Association, 1.05%, due 2/17/09 | | | 748,971 | |
| | 2,500,000 | | Freddie Mac Discount Note, 1.95%, due 1/26/09 (c) | | | 2,496,594 | |
| | 1,600,000 | | Freddie Mac Discount Note, 1.65%, due 2/27/09 (c) | | | 1,595,808 | |
| | | | | | | |
| | Total U.S. Government Agency Obligations (cost: $6,679,047) | | | 6,679,047 | |
| | |
Shares | | | | | |
| | Money Market Fund (8.25%) | | | | |
| | 593,250 | | SsgA Money Market Fund, 1.23% (d) (cost: $593,250) | | | 593,250 | |
| | | | | | | |
| | Total dollar assets (cost: $7,272,297) | | | 7,272,297 | |
| | | | | | | |
| | Total investments (cost: $11,349,596) (157.75%) | | | 11,343,806 | |
| | Liabilities in excess of other assets (-57.75%) | | | (4,152,735 | ) |
| | | | | | | |
| | Net assets (100.00%) | | $ | 7,191,071 | |
| | | | | | | |
| (b) | Rate represents the discount rate at the date of purchase. |
| (c) | Fully or partially pledged as collateral on bank credit facility. |
| (d) | Rate represents the 7 day annualized yield at December 31, 2008. ADR means “American Depositary Receipt.” |
| | | | |
| See notes to financial statements. | | 9 | | |
Midas Fund
Allocation of Portfolio Holdings on December 31, 2008
(UNAUDITED)
Midas Special Fund
Allocation of Portfolio Holdings on December 31, 2008
(UNAUDITED)
Midas Perpetual Portfolio
Allocation of Portfolio Holdings on December 31, 2008
(UNAUDITED)
Statements of Assets and Liabilities
| | | | | | | | | | | | |
December 31, 2008 | | Midas Fund | | | Midas Special
Fund | | | Midas Perpetual
Portfolio | |
Assets | | | | | | | | | | | | |
Investments at cost | | $ | 125,430,144 | | | $ | 11,056,447 | | | $ | 11,349,596 | |
| | | | | | | | | | | | |
Investments at value | | $ | 78,771,831 | | | $ | 10,520,838 | | | $ | 11,343,806 | |
Cash | | | 15,243 | | | | 136,024 | | | | — | |
Receivables: | | | | | | | | | | | | |
Fund shares sold | | | 291,789 | | | | — | | | | 12,976 | |
Dividends | | | 65,453 | | | | 1,635 | | | | — | |
Other assets | | | 48,215 | | | | 10,110 | | | | 9,360 | |
| | | | | | | | | | | | |
Total assets | | | 79,192,531 | | | | 10,668,607 | | | | 11,366,142 | |
| | | | | | | | | | | | |
Liabilities | | | | | | | | | | | | |
Bank line of credit | | | 716,200 | | | | 1,654,661 | | | | — | |
Payables: | | | | | | | | | | | | |
Distribution to shareholders | | | 341,280 | | | | — | | | | — | |
Fund shares redeemed | | | 317,585 | | | | 21,957 | | | | 38,070 | |
Accrued expenses | | | 239,598 | | | | 69,564 | | | | 58,691 | |
Investment management fees | | | 49,880 | | | | 4,050 | | | | — | |
Distribution fees | | | 14,304 | | | | 6,272 | | | | — | |
Administrative services | | | 11,795 | | | | 1,342 | | | | 1,010 | |
Investments purchased | | | — | | | | — | | | | 4,077,300 | |
| | | | | | | | | | | | |
Total liabilities | | | 1,690,642 | | | | 1,757,846 | | | | 4,175,071 | |
| | | | | | | | | | | | |
Net assets | | $ | 77,501,889 | | | $ | 8,910,761 | | | $ | 7,191,071 | |
| | | | | | | | | | | | |
Shares outstanding, $0.01 par value | | | 36,796,711 | | | | 860,286 | | | | 7,188,711 | |
Net asset value, offering, and redemption price per share | | $ | 2.11 | | | $ | 10.36 | | | $ | 1.00 | |
Net assets consist of: | | | | | | | | | | | | |
Paid in capital | | $ | 165,969,538 | | | $ | 16,081,450 | | | $ | 7,189,592 | |
Accumulated undistributed net investment income | | | 1,405,407 | | | | — | | | | — | |
Accumulated net realized loss on investments | | | (43,214,693 | ) | | | (6,635,080 | ) | | | 7,269 | |
Net unrealized depreciation on investments and foreign currencies | | | (46,658,363 | ) | | | (535,609 | ) | | | (5,790 | ) |
| | | | | | | | | | | | |
| | $ | 77,501,889 | | | $ | 8,910,761 | | | $ | 7,191,071 | |
| | | | | | | | | | | | |
| | | | |
| See notes to financial statements. | | 11 | | |
Statements of Operations
| | | | | | | | | | | | |
For the Year Ended December 31, 2008 | | Midas Fund | | | Midas Special
Fund | | | Midas Perpetual
Portfolio | |
Investment income | | | | | | | | | | | | |
Dividends - non-affiliates | | $ | 1,650,158 | | | $ | 162,779 | | | $ | — | |
Dividends - affiliates | | | 6,191 | | | | 6 | | | | — | |
Foreign tax withholding | | | (37,266 | ) | | | (1,377 | ) | | | — | |
Interest | | | 12,337 | | | | — | | | | 313,979 | |
Securities lending income | | | 8,300 | | | | 3,864 | | | | — | |
| | | | | | | | | | | | |
Total investment income | | | 1,639,720 | | | | 165,272 | | | | 313,979 | |
| | | | | | | | | | | | |
Expenses | | | | | | | | | | | | |
Investment management | | | 1,732,701 | | | | 135,270 | | | | 20,789 | |
Interest and fees on bank credit facility | | | 609,632 | | | | 79,178 | | | | 236 | |
Transfer agent | | | 590,007 | | | | 72,731 | | | | 40,908 | |
Distribution | | | 435,920 | | | | 140,621 | | | | 10,395 | |
Legal | | | 169,760 | | | | 8,120 | | | | 50,024 | |
Administrative services | | | 126,470 | | | | 10,904 | | | | 10,399 | |
Printing and postage | | | 95,395 | | | | 6,486 | | | | 4,464 | |
Bookkeeping and pricing | | | 80,790 | | | | 23,602 | | | | 25,895 | |
Registration | | | 66,967 | | | | 21,602 | | | | 29,305 | |
Custodian | | | 54,669 | | | | 5,760 | | | | 4,067 | |
Insurance | | | 42,272 | | | | 3,984 | | | | 3,415 | |
Directors | | | 35,182 | | | | 9,629 | | | | 6,120 | |
Auditing | | | 30,700 | | | | 25,155 | | | | 20,760 | |
Interest and fees related to short sales | | | 25,261 | | | | — | | | | — | |
Other | | | 21,098 | | | | 2,886 | | | | 2,694 | |
| | | | | | | | | | | | |
Total expenses | | | 4,116,824 | | | | 545,928 | | | | 229,471 | |
Expense reductions | | | (981 | ) | | | (66 | ) | | | (514 | ) |
Expenses reimbursed by investment manager | | | — | | | | — | | | | (41,398 | ) |
Fees waived by investment manager and distributor (Note 2) | | | — | | | | — | | | | (31,184 | ) |
| | | | | | | | | | | | |
Net expenses | | | 4,115,843 | | | | 545,862 | | | | 156,375 | |
| | | | | | | | | | | | |
Net investment income (loss) | | | (2,476,123 | ) | | | (380,590 | ) | | | 157,604 | |
| | | | | | | | | | | | |
Realized and Unrealized Gain (Loss) on Investments and Foreign Currencies | | | | | | | | | | | | |
Net realized gain (loss) on | | | | | | | | | | | | |
Unaffiliated issuers | | | (42,876,025 | ) | | | (886,143 | ) | | | 8,211 | |
Short sales | | | 1,835,928 | | | | — | | | | — | |
Non-controlled affiliates | | | 16,309,652 | | | | — | | | | — | |
Foreign currencies | | | (1,174,725 | ) | | | 3,736 | | | | — | |
Unrealized depreciation on | | | | | | | | | | | | |
Investments | | | (85,300,291 | ) | | | (6,419,430 | ) | | | (5,790 | ) |
Translation of assets and liabilities in foreign currencies | | | (14,158,926 | ) | | | (4,853 | ) | | | — | |
| | | | | | | | | | | | |
Net realized and unrealized gain (loss) on investments and foreign currencies | | | (125,364,387 | ) | | | (7,306,690 | ) | | | 2,421 | |
| | | | | | | | | | | | |
Net increase (decrease) in net assets resulting from operations | | $ | (127,840,510 | ) | | $ | (7,687,280 | ) | | $ | 160,025 | |
| | | | | | | | | | | | |
| | | | |
| | 12 | | See notes to financial statements. |
Statements of Changes in Net Assets
| | | | | | | | | | | | | | | | | | | | | | | | |
| | | Midas Fund | | | Midas Special Fund | | | Midas Perpetual Portfolio | |
For the Years Ended December 31, | | 2008 | | | 2007 | | | 2008 | | | 2007 | | | 2008 | | | 2007 | |
Operations | | | | | | | | | | | | | | | | | | | | | | | | |
Net investment income (loss) | | $ | (2,476,123 | ) | | $ | (3,048,302 | ) | | $ | (380,590 | ) | | $ | (473,358 | ) | | $ | 157,604 | | | $ | 536,079 | |
Net realized gain (loss) from sale of investments, short sales, and foreign currencies | | | (25,905,170 | ) | | | 40,287,946 | | | | (882,407 | ) | | | 2,749,314 | | | | 8,211 | | | | 327 | |
Unrealized appreciation (depreciation) of investments and foreign currencies | | | (99,459,217 | ) | | | 8,271,826 | | | | (6,424,283 | ) | | | (131,364 | ) | | | (5,790 | ) | | | — | |
| | | | | | | | | | | | | | | | | | | | | | | | |
Net increase (decrease) in net assets resulting from operations | | | (127,840,510 | ) | | | 45,511,470 | | | | (7,687,280 | ) | | | 2,144,592 | | | | 160,025 | | | | 536,406 | |
| | | | | | |
Distributions to shareholders | | | | | | | | | | | | | | | | | | | | | | | | |
Distributions from ordinary income | | | (3,921,447 | ) | | | (428,183 | ) | | | — | | | | — | | | | (158,511 | ) | | | (536,129 | ) |
| | | | | | |
Capital share transactions | | | | | | | | | | | | | | | | | | | | | | | | |
Change in net assets resulting from capital share transactions (a) | | | (42,201,714 | ) | | | 67,447,306 | | | | (737,226 | ) | | | (1,961,394 | ) | | | (7,326,676 | ) | | | (11,927 | ) |
Redemption fees | | | 71,475 | | | | 137,633 | | | | 1,441 | | | | 1,767 | | | | — | | | | — | |
| | | | | | | | | | | | | | | | | | | | | | | | |
Increase (decrease) in net assets resulting from capital share transactions | | | (42,130,239 | ) | | | 67,584,939 | | | | (735,785 | ) | | | (1,959,627 | ) | | | (7,326,676 | ) | | | (11,927 | ) |
| | | | | | | | | | | | | | | | | | | | | | | | |
Total change in net assets | | | (173,892,196 | ) | | | 112,668,226 | | | | (8,423,065 | ) | | | 184,965 | | | | (7,325,162 | ) | | | (11,650 | ) |
| | | | | | |
Net assets | | | | | | | | | | | | | | | | | | | | | | | | |
Beginning of year | | | 251,394,085 | | | | 138,725,859 | | | | 17,333,826 | | | | 17,148,861 | | | | 14,516,233 | | | | 14,527,883 | |
| | | | | | | | | | | | | | | | | | | | | | | | |
End of year (b) | | $ | 77,501,889 | | | $ | 251,394,085 | | | $ | 8,910,761 | | | $ | 17,333,826 | | | $ | 7,191,071 | | | $ | 14,516,233 | |
| | | | | | | �� | | | | | | | | | | | | | | | | | |
(a) Capital share transactions were as follows: | | | | | | | | | | | | | | | | | | | | | | | | |
Value | | | | | | | | | | | | | | | | | | | | | | | | |
Shares sold | | $ | 86,340,401 | | | $ | 184,044,970 | | | $ | 432,144 | | | $ | 821,189 | | | $ | 37,779,628 | | | $ | 23,573,730 | |
Shares issued and reinvestment of distributions | | | 3,509,980 | | | | 385,333 | | | | — | | | | — | | | | 155,107 | | | | 527,201 | |
Shares redeemed | | | (132,052,095 | ) | | | (116,982,997 | ) | | | (1,169,370 | ) | | | (2,782,583 | ) | | | (45,261,411 | ) | | | (24,112,858 | ) |
| | | | | | | | | | | | | | | | | | | | | | | | |
Net increase (decrease) | | $ | (42,201,714 | ) | | $ | 67,447,306 | | | $ | (737,226 | ) | | $ | (1,961,394 | ) | | $ | (7,326,676 | ) | | $ | (11,927 | ) |
| | | | | | | | | | | | | | | | | | | | | | | | |
| | | | | | |
Number | | | | | | | | | | | | | | | | | | | | | | | | |
Shares sold | | | 19,268,243 | | | | 36,048,415 | | | | 25,427 | | | | 48,234 | | | | 37,779,277 | | | | 23,573,730 | |
Shares issued and reinvestment of distributions | | | 1,466,673 | | | | 67,359 | | | | — | | | | — | | | | 155,089 | | | | 527,201 | |
Shares redeemed | | | (28,509,611 | ) | | | (23,895,005 | ) | | | (71,330 | ) | | | (166,363 | ) | | | (45,261,411 | ) | | | (24,112,858 | ) |
| | | | | | | | | | | | | | | | | | | | | | | | |
Net increase (decrease) | | | (7,774,695 | ) | | | 12,220,769 | | | | (45,903 | ) | | | (118,129 | ) | | | (7,327,045 | ) | | | (11,927 | ) |
| | | | | | | | | | | | | | | | | | | | | | | | |
(b) End of year net assets include undistributed net investment income (loss) | | $ | 1,405,407 | | | $ | (2,626,520 | ) | | $ | — | | | $ | (266 | ) | | $ | — | | | $ | 252 | |
| | | | | | | | | | | | | | | | | | | | | | | | |
| | | | |
| See notes to financial statements. | | 13 | | |
Statements of Cash Flows
| | | | | | | | | | | | |
For the Year Ended December 31, 2008 | | Midas Fund | | | Midas Special
Fund | | | Midas Perpetual
Portfolio | |
Cash flows from operating activities | | | | | | | | | | | | |
Net (decrease) increase in net assets resulting from operations | | $ | (127,840,510 | ) | | $ | (7,687,280 | ) | | $ | 160,025 | |
Adjustments to reconcile change in net assets resulting from operations to net cash provided by (used in) operating activities: | | | | | | | | | | | | |
Proceeds from sales of investments | | | 297,599,665 | | | | 4,460,772 | | | | — | |
Purchase of investments | | | (253,461,957 | ) | | | (2,215,261 | ) | | | (4,077,300 | ) |
Unrealized depreciation of investments and foreign currencies | | | 99,459,217 | | | | 6,424,283 | | | | 5,790 | |
Proceeds from short sale of investments | | | 37,340,259 | | | | — | | | | — | |
Buy to cover investments held short | | | (35,504,334 | ) | | | — | | | | — | |
Net realized loss (gain) on sales of investments, short sales, and foreign currencies | | | 25,905,170 | | | | 882,407 | | | | (8,211 | ) |
Net sales of short term investments | | | 913,792 | | | | 3,737 | | | | 6,884,747 | |
Decrease in management fees payable | | | (150,220 | ) | | | (6,685 | ) | | | — | |
Decrease in distribution fees payable | | | (38,012 | ) | | | (7,471 | ) | | | — | |
(Decrease) increase in accrued expenses | | | (23,794 | ) | | | (13,496 | ) | | | 16,751 | |
Decrease in receivable for investments sold | | | 22,112 | | | | — | | | | — | |
Decrease in administrative services payable | | | (16,504 | ) | | | (1,602 | ) | | | (1,728 | ) |
(Increase) decrease in dividends receivable | | | (14,682 | ) | | | 18,777 | | | | — | |
Decrease (increase) other assets | | | 5,344 | | | | (729 | ) | | | (634 | ) |
(Decrease) increase in payable for investments purchased | | | — | | | | (1,060,421 | ) | | | 4,077,300 | |
| | | | | | | | | | | | |
Net cash provided by operating activities | | | 44,195,546 | | | | 797,031 | | | | 7,056,740 | |
| | | | | | | | | | | | |
Cash flows from financing activities | | | | | | | | | | | | |
Net shares redeemed | | | (44,485,352 | ) | | | (714,485 | ) | | | (7,456,689 | ) |
Borrowing on bank line of credit | | | 716,200 | | | | 53,478 | | | | — | |
Cash distributions paid | | | (411,467 | ) | | | — | | | | (3,404 | ) |
| | | | | | | | | | | | |
Net cash used in financing activities | | | (44,180,619 | ) | | | (661,007 | ) | | | (7,460,093 | ) |
| | | | | | | | | | | | |
Net increase (decrease) in cash | | | 14,927 | | | | 136,024 | | | | (403,353 | ) |
| | | |
Cash | | | | | | | | | | | | |
Beginning of year | | | 316 | | | | — | | | | 403,353 | |
| | | | | | | | | | | | |
End of year | | $ | 15,243 | | | $ | 136,024 | | | $ | — | |
| | | | | | | | | | | | |
Supplemental disclosure of cash flow information: | | | | | | | | | | | | |
Cash paid for interest and fees on bank line of credit | | $ | 700,912 | | | $ | 84,366 | | | $ | 191 | |
Non cash financing activities not included herein consisted of reinvestment of distributions | | $ | 3,509,980 | | | $ | — | | | $ | 155,107 | |
| | | | |
| | 14 | | See notes to financial statements. |
Notes to Financial Statements
December 31, 2008
1 Organization and Significant Accounting Policies
The Midas Funds are Maryland corporations registered under the Investment Company Act of 1940, as amended (the “Act”), as open end management investment companies. Midas Fund’s investment objectives are primarily capital appreciation and protection against inflation and, secondarily, current income through investments primarily in precious metals and natural resource companies. Midas Special Fund’s investment objective is capital appreciation which it seeks by investing aggressively in any security in any sector. The investment objective of Midas Perpetual Portfolio (formerly Midas Dollar Reserves) is to preserve and increase the purchasing power value of its shares over the long term by investing a fixed target percentage of its total assets in gold, silver, Swiss franc assets, hard asset securities, large capitalization growth stocks, and dollar assets. Prior to December 12, 2008 Midas Perpetual Portfolio was a money market fund investing in securities issued by the U.S. Government, its agencies and instrumentalities. On December 29, 2008 Midas Dollar Reserves changed its name to Midas Perpetual Portfolio.
Midas Fund and Midas Perpetual Portfolio each has authorized capital of one billion shares of common stock, par value $0.01 per share. Midas Special Fund has authorized capital of 500 million shares of common stock, par value $0.01. The Funds each offer only one class of shares. Each Fund’s shareholders are entitled to one vote for each whole share owned and a fractional vote for each fraction of a share owned. Voting rights are not cumulative. All shares of a Fund are fully paid and non-assessable and have no preemptive or conversion rights.
The Funds impose a short term trading redemption fee on any Fund shares that are redeemed or exchanged within 30 days following their purchase date. The redemption fee is 1% of the amount redeemed. Such fees are retained by the Funds for the benefit of the remaining shareholders and are accounted for as an addition to paid in capital.
The following is a summary of significant accounting policies consistently followed by each Fund in the preparation of its financial statements.
Valuation of Investments - Securities traded on a U.S. national securities exchange (“USNSE”) are valued at the last reported sale price on the day the valuations are made. Securities traded primarily on the Nasdaq Stock Market (“Nasdaq”) are normally valued by the Funds at the Nasdaq Official Closing Price (“NOCP”) provided by Nasdaq each business day. The NOCP is the most recently reported price as of 4:00:02 p.m., ET, unless that price is outside the range of the “inside” bid and asked prices (i.e., the bid and asked prices that dealers quote to each other when trading for their own accounts); in that case, Nasdaq will adjust the price to equal the inside bid or asked price, whichever is closer. Because of delays in reporting trades, the NOCP may not be based on the price of the last trade to occur before the market closes. Securities that are not traded on a particular day, and securities traded in foreign and over-the-counter markets that are not also traded on a USNSE or Nasdaq, are valued at the mean between the last bid and asked prices. Gold and silver bullion is valued at 4:00 p.m., ET, at the mean between the last bid and asked quotations of the Bloomberg Composite (NY) Spot Price for that metal. Debt obligations with remaining maturities of 60 days or less are valued at cost adjusted for amortization of premiums and accretion of discounts. Certain of the securities in which the Funds may invest are priced through pricing services that may utilize a matrix pricing system which takes into consideration factors such as yields, prices, maturities, call features, and ratings on comparable securities. Bonds may be valued according to prices quoted by a bond dealer that offers pricing services. Open end investment companies are valued at their net asset value. Foreign securities markets may be open on days when the U.S. markets are closed. For this reason, the value of any foreign securities owned by the Fund could change on a day when stockholders cannot buy or sell shares of the Fund. Securities for which market quotations are not readily available or reliable and other assets may be valued as determined in good faith by the Investment Manager under the direction of or pursuant to procedures established by the Fund’s Board of Directors. Due to the inherent uncertainty of valuation, these values may differ from the values that would have been used had a readily available or reliable market quotation for the securities existed. These differences in valuation could be material. A security’s valuation may differ depending on the method used for determining value. The use of fair value pricing by a Fund may cause the net asset value of its shares to differ from the net asset value that would be calculated using market prices.
Foreign Currency Translation - Securities denominated in foreign currencies are translated into U.S. dollars at prevailing exchange rates. Realized gain or loss on sales of such investments in local currency terms is reported separately from gain or loss attributable to the change in foreign exchange rates for those investments.
15
Notes to Financial Statements
Foreign Currency Contracts - Forward foreign currency contracts are marked to market and the change in market value is recorded by the Fund as an unrealized gain or loss. When a contract is closed, the Fund records a realized gain or loss equal to the difference between the value of the contract at the time it was opened and the value at the time it was closed. The Fund could be exposed to risk if the counterparties are unable to meet the terms of the contract or if the value of the currency changes unfavorably.
Futures Contracts - The Funds may engage in transactions in futures contracts. Upon entering into a futures contract, the Fund provides the broker/dealer an amount of cash or securities at least equal to a certain percentage of the contract amount. This is known as “initial margin.” Subsequent payments (“variation margin”) are credited to or debited from the Fund each day, depending on the daily fluctuation of the value of the contract. The daily change in the contract is included in unrealized appreciation or depreciation on investments and futures contracts. The Fund recognizes a realized gain or loss when the contract is closed. Futures transactions sometimes may reduce returns or increase volatility. In addition, futures can be illiquid and highly sensitive to changes in their underlying security, interest rate, or index, and as a result can be highly volatile. A small investment in futures could have a large impact on a Fund’s performance.
Short Sales - Midas Fund and Midas Special Fund may sell a security it does not own in anticipation of a decline in the market value of the security. When a Fund sells a security short, it must borrow the security sold short and deliver it to the broker/dealer through which it made the short sale. The Fund is liable for any dividends or interest paid on securities sold short. A gain, limited to the price at which the Fund sold the security short, or a loss, unlimited in size, will be recognized upon the termination of a short sale.
Investment Transactions - Investment transactions are accounted for on the trade date (the date the order to buy or sell is executed). Realized gains or losses are determined by specifically identifying the security sold.
Investment Income - Interest income is recorded on the accrual basis. Amortization of premium and accretion of discount on debt securities are included in interest income. Dividend income is recorded on the ex-dividend date or in the case of certain foreign securities, as soon as the Fund is notified. Taxes witheld on foreign dividends have been provided for in accordance with a Fund’s understanding of the applicable country’s tax rules and rates.
Expenses - Estimated expenses are accrued daily. Expenses directly attributable to a Fund are charged to that Fund. Expenses borne by the complex of related investment companies, which includes open end and closed end investment companies for which Midas Management Corporation (the “Investment Manager”) and its affiliate serve as investment manager, that are not directly attributed to the Fund are allocated among the Fund and the other investment companies in the complex on the basis of relative net assets, except where a more appropriate allocation of expenses among investment companies in the complex can otherwise be made fairly.
Expense Reduction Arrangement - Through arrangements with the Funds’ custodian and transfer agent, credits realized as a result of uninvested cash balances were used to reduce custodian and transfer agent expenses for Midas Fund, Midas Special Fund, and Midas Perpetual Portfolio by $981, $66, and $514, respectively, during the period.
Distributions - Distributions to shareholders, which are determined in accordance with income tax regulations, are recorded on the ex-dividend date.
Income Taxes - No provision has been made for U.S. income taxes because each Fund intends to qualify as a regulated investment company under the Internal Revenue Code and to distribute to shareholders substantially all taxable income and net realized gains. Foreign securities held by a Fund may be subject to foreign taxation. Foreign taxes, if any, are recorded based on the tax regulations and rates that exist in the foreign markets in which the Fund invests.
The Funds have reviewed their tax positions taken on federal, state, and local income tax returns for all open tax years (tax years ended December 31, 2005 - 2008) and have concluded that no provisions for income taxes are required in the Funds’ financial statements.
Use of Estimates - In preparing financial statements in conformity with accounting principles generally accepted in the United States of America, management makes estimates and assumptions that affect the reported amounts of assets and liabilities at the date of the financial statements, as well as the reported amounts of revenues and expenses during the reporting period. Actual results could differ from those estimates.
16
Notes to Financial Statements
Indemnifications - The Funds indemnify officers and directors for certain liabilities that might arise from their performance of their duties for the Funds. Additionally, in the normal course of business the Funds enter into contracts that contain a variety of representations and warranties and which may provide general indemnifications. The Funds’ maximum exposure under these arrangements is unknown, as it involves future claims that may be made against the Funds under circumstances that have not occurred.
2 Fees and Transactions with Related Parties
Under the investment management agreement of Midas Fund, the Investment Manager receives a management fee, payable monthly, based on the average daily net assets of the Fund at the annual rate of 1% on the first $200 million, .95% from $200 million to $400 million, .90% from $400 million to $600 million, .85% from $600 million to $800 million, .80% from $800 million to $1 billion, and .75% over $1 billion. Under the investment management agreement of Midas Special Fund, the Investment Manager receives a management fee, payable monthly, based on the average daily net assets of the Fund at the annual rate of 1% on the first $10 million, 7/8 of 1% from $10 million to $30 million, 3/4 of 1% from $30 million to $150 million, 5/8 of 1% from $150 million to $500 million, and 1/2 of 1% over $500 million. Under the investment management agreement of Midas Perpetual Portfolio, the Investment Manager receives a management fee, payable monthly, based on the average daily net assets of the Fund, at the annual rate of .50 of 1% of the first $250 million, .45 of 1% from $250 million to $500 million, and .40 of 1% over $500 million.
Each Fund has adopted a plan of distribution pursuant to Rule 12b-1 under the Act. Under each plan, each Fund pays the Distributor, Investor Service Center, Inc., an affiliate of the Investment Manager, a fee of .25% (Midas Fund and Midas Perpetual Portfolio) or 1.00% (Midas Special Fund) for distribution and shareholder services. The shareholder service fee is intended to cover personal services provided to the shareholders of the Funds and the maintenance of shareholder accounts. The distribution fee is to cover all other activities and expenses primarily intended to result in the sale of the Funds’ shares. In addition, Midas Fund, Midas Special Fund, and Midas Perpetual Fund each reimbursed the Distributor $170,233, $1,453, and $6, respectively, for payments made to certain brokers for record keeping services for the year ended December 31, 2008.
The Investment Manager and the Distributor have each contractually agreed with Midas Perpetual Portfolio to waive their fees, respectively, for the period from April 29, 2008 to April 29, 2009. Prior to April 29, 2008, the Investment Manager and the Distributor voluntarily waived their fees. For the year ended December 31, 2008, the total fees waived through voluntary arrangements by the Investment Manager and the Distributor were $20,789 and $10,395, respectively. For the year ended December 31, 2008, the Investment Manager voluntarily reimbursed Midas Perpetual Portfolio in the amount of $41,398 for expenses incurred in connection with a special shareholder meeting.
Certain officers and directors of the Funds are officers and directors of the Investment Manager and Distributor.
Pursuant to the investment management agreements, the Funds reimburse the Investment Manager for providing certain administrative services at cost comprised of compliance and accounting services. For the year ended December 31, 2008, the Funds incurred administrative services expenses as follows:
| | | | | | | | | |
| | | Midas Fund | | Midas Special
Fund | | Midas Perpetual
Portfolio |
Compliance services | | $ | 77,795 | | $ | 7,260 | | $ | 6,489 |
Accounting services | | | 48,675 | | | 3,644 | | | 3,910 |
| | | | | | | | | |
Total administrative services | | $ | 126,470 | | $ | 10,904 | | $ | 10,399 |
| | | | | | | | | |
17
Notes to Financial Statements
3 Distributions to Shareholders and Distributable Earnings
The tax character of distributions paid by the Funds for the years ended December 31, 2008 and 2007 are summarized as follows:
| | | | | | | | | | | | |
| | | Midas Fund | | Midas Perpetual Portfolio |
| | | 2008 | | 2007 | | 2008 | | 2007 |
Distributions paid from ordinary income | | $ | 3,921,447 | | $ | 428,183 | | $ | 158,511 | | $ | 536,129 |
There were no distributions paid by Midas Special Fund for the years ended December 31, 2008 and 2007.
At December 31, 2008, the components of distributable earnings on a tax basis were as follows:
| | | | | | | | | | | | |
| | | Midas Fund | | | Midas Special
Fund | | | Midas Perpetual
Portfolio | |
Accumulated undistributed net investment income | | $ | 1,405,407 | | | $ | — | | | $ | — | |
Accumulated net realized gain (loss) on investments | | | (22,454,852 | ) | | | (6,635,080 | ) | | | 7,269 | |
Post-October losses | | | (15,235,031 | ) | | | — | | | | — | |
Net unrealized depreciation | | | (52,183,173 | ) | | | (535,609 | ) | | | (5,790 | ) |
| | | | | | | | | | | | |
| | $ | (88,467,649 | ) | | $ | (7,170,689 | ) | | $ | 1,479 | |
| | | | | | | | | | | | |
Federal income tax regulations permit post-October net capital losses to be deferred and recognized on the tax return of the next succeeding taxable year. The differences between book basis and tax basis unrealized appreciation is attributable primarily to the Passive Foreign Investment Company (“PFIC”) mark to market adjustments. Accounting principles generally accepted in the United States of America require certain components of net assets to be reclassified between financial and tax reporting. These reclassifications have no effect on net assets or net asset value per share. At December 31, 2008, permanent differences between book and tax accounting have been reclassified to paid in capital as follows:
| | | | | | | | | | | | |
| | | Midas Fund | | | Midas Special
Fund | | | Midas Perpetual
Portfolio | |
Decrease in accumulated undistributed net investment loss | | $ | 10,429,497 | | | $ | 380,856 | | | $ | 655 | |
Decrease (increase) in accumulated undistributed net realized gain (loss) on investments | | | 62,212,377 | | | | 127,829 | | | | (655 | ) |
(Decrease) increase in paid in capital | | | (72,641,874 | ) | | | (508,685 | ) | | | — | |
At December 31, 2008, Midas Fund had net capital loss carryovers that may be used to offset future realized capital gains for federal income tax purposes of $22,454,852, of which $6,800,444, $79,582, and $15,574,826 expire in 2009, 2010, and 2016, respectively.
At December 31, 2008, Midas Special Fund had net capital loss carryovers that may be used to offset future realized gains for federal income tax purposes of $6,635,080, of which $3,316,069, $1,823,745, $340,513, and $1,154,753 expire in 2009, 2011, 2014, and 2016, respectively.
18
Notes to Financial Statements
4 Fair Value Measurements
The Funds adopted Financial Accounting Standards Board (“FASB”) Statement of Financial Accounting Standards No. 157, “Fair Value Measurements” (“FAS 157”), on January 1, 2008. FAS 157 defines fair value as the price that the Fund would receive to sell an asset or pay to transfer a liability in an orderly transaction between market participants at the measurement date. FAS 157 establishes a framework for measuring fair value and a three level hierarchy for fair value measurements based on the transparency of inputs to the valuation of an asset or liability. Inputs may be observable or unobservable and refer broadly to the assumptions that market participants would use in pricing the asset or liability. Observable inputs reflect the assumptions market participants would use in pricing the asset or liability based on market data obtained from sources independent of the Funds. Unobservable inputs reflect a Fund’s own assumptions about the assumptions that market participants would use in pricing the asset or liability developed based on the best information available under the circumstances. A Fund’s investment in its entirety is assigned a level based upon the inputs which are significant to the overall valuation. The hierarchy of inputs is summarized below.
| | • | | Level 1 - quoted prices in active markets for identical investments. |
| | • | | Level 2 - other significant observable inputs (including quoted prices for similar investments, |
interest rates, prepayment speeds, credit risk, etc.)
| | • | | Level 3 - significant unobservable inputs (including a Fund’s own assumptions in determining fair value of investments). |
The inputs or methodology used for valuing investments are not an indication of the risk associated with investing in those investments.
The following is a summary of the inputs used as of December 31, 2008 in valuing the Funds’ investments:
| | | | | | | | | | | | | | |
| | | | | Valuation Inputs | | |
Fund | | Investment | | Level 1 | | Level 2 | | Level 3 | | Total |
Midas Fund | | Securities and gold bullion | | $ | 78,771,831 | | $ | — | | $ | — | | $ | 78,771,831 |
Midas Special Fund | | Securities | | | 10,520,838 | | | — | | | — | | | 10,520,838 |
Midas Perpetual Portfolio | | Securities | | | 4,664,759 | | | 6,679,047 | | | — | | | 11,343,806 |
5 Investment Transactions
At December 31, 2008, the aggregate gross unrealized appreciation and depreciation of investments, based on cost for federal income tax purposes, are summarized as follows:
| | | | | | | | | | | | | | |
| | | Federal Income
Tax Cost | | Gross Unrealized | | | Net Unrealized
Depreciation | |
| | | | Appreciation | | Depreciation | | |
Midas Fund | | $ | 130,954,954 | | $ | 8,070,519 | | $ | (60,253,642 | ) | | $ | (52,183,123 | ) |
Midas Special Fund | | | 11,056,447 | | | 2,121,935 | | | (2,657,544 | ) | | | (535,609 | ) |
Midas Perpetual Portfolio | | | 11,349,596 | | | — | | | (5,790 | ) | | | (5,790 | ) |
19
Notes to Financial Statements
Purchases and sales of securities, excluding short sale transactions and short term investments, for the year ended December 31, 2008 were as follows:
| | | | | | | | | |
| | | Midas Fund | | Midas Special
Fund | | Midas Perpetual
Portfolio |
Purchases | | $ | 253,461,957 | | $ | 2,215,261 | | $ | 4,077,300 |
Proceeds | | | 297,410,465 | | | 4,227,688 | | | — |
6 Illiquid and Restricted Securities
Midas Fund owns securities which have a limited trading market and/or certain restrictions on trading and, therefore, may be illiquid and/or restricted. Such securities have been valued at fair value in accordance with the procedures described in Note 1. Due to the inherent uncertainty of valuation, these values may differ from the values that would have been used had a readily available market for the securities existed. These differences in valuation could be material. Illiquid and/or restricted securities owned at December 31, 2008, were as follows:
| | | | | | | | | | |
| | | Acquisition Date | | Cost | | | Value | |
Ivanhoe Nickel & Platinum Ltd., common stock | |
4/30/1997 | | $ | — | | | $ |
— | |
Percent of net assets | | | | | 0.0 | % | | | 0.0 | % |
7 Affiliated Issuers
As defined under the Act, the Fund’s affiliates include, among others, companies in which the Funds have (a) direct or indirect ownership, control, or voting power over 5% or more of the outstanding voting shares of such company or (b) controls, is controlled by, or is under common control with such other company or person. Transactions with affiliates for the year ended December 31, 2008 were as follows:
Midas Fund
| | | | | | | | | | | | | | | | | | |
Name of Issuer | | Number of
Shares Held
December 31,
2007 | | Gross
Additions | | Gross
Reductions | | | Number of
Shares Held
December 31,
2008 | | Value
December 31,
2008 | | Dividend
Income | | Realized
Gains/
(Losses) |
Golden Cycle Gold Corp.* | | 1,964,500 | | — | | (1,964,500 | ) | | — | | $ | — | | $ | — | | $ | — |
Midas Perpetual Portfolio, Inc. | | 2,088,515 | | 20,268,543 | | (22,357,058 | ) | | — | | | — | | | 6,191 | | | — |
| | | | | | | | | | | | | | | | | | |
| | | | | | | | | | | $ | — | | $ | 6,191 | | $ | — |
| * | The reduction in shares was due to the receipt of 0.3123 shares of AngloGold Ashanti per share of Golden Cycle Gold Corp. in consideration for a merger transaction. Neither issuer was considered an affiliate at December 31, 2008. |
Midas Special Fund
| | | | | | | | | | | | | | | | | | |
Name of Issuer | | Number of
Shares Held
December 31,
2007 | | Gross
Additions | | Gross
Reductions | | | Number of
Shares Held
December 31,
2008 | | Value
December 31,
2008 | | Dividend
Income | | Realized
Gains/
(Losses) |
Midas Perpetual Portfolio, Inc. | | — | | 62,256 | | (62,256 | ) | | — | | $ | — | | $ | 6 | | $ | — |
20
Notes to Financial Statements
8 Bank Credit Facilities
The Funds (except Midas Perpetual Portfolio), Global Income Fund, Inc., and Foxby Corp. (the “Borrowers”) have entered into a committed secured line of credit facility with State Street Bank and Trust Company (“SSB”), the Funds’ custodian. Global Income Fund, Inc. and Foxby Corp. are closed end investment companies advised by CEF Advisers, Inc., an affiliate of the Investment Manager. The aggregate amount of the credit facility is $25,000,000. The borrowing of each Borrower is collateralized by the underlying investments of such Borrower. SSB will make revolving loans to a Borrower not to exceed in the aggregate outstanding at any time with respect to any one Borrower the least of $25,000,000, the maximum amount permitted pursuant to each Borrower’s investment policies, or as permitted under the Act. The commitment fee on this facility is 0.10% per annum on the unused portion of the commitment, based on a 360 day year. All loans under this facility will be available at the Borrower’s option of (i) overnight Federal funds or (ii) LIBOR (30, 60, 90 days), each as in effect from time to time, plus 0.75% per annum, calculated on the basis of actual days elapsed for a 360 day year.
The Funds have also entered into an uncommitted secured redemption facility with SSB with an aggregate amount available of $25,000,000. The borrowing of each Borrower is collateralized by the underlying investments of such Borrower. This facility carries no legal obligation on the part of SSB to lend any amount of money to the Funds at any time and the Borrower does not pay a commitment fee under this facility. SSB may make revolving loans to a Borrower not to exceed in the aggregate outstanding at any time with respect to any one Borrower the least of $25,000,000, the maximum amount permitted pursuant to the Borrower’s investment policies, or as permitted under the Act. All loans under this facility will be available at the overnight Federal Funds rate in effect from time to time plus a spread to be determined at the time of borrowing, calculated on the basis of actual days elapsed for a 360 day year.
The outstanding loan balance, the market value of eligible collateral investments at December 31, 2008, the weighted average interest rate, average daily amount outstanding under the committed and uncommitted facilities for the year ended December 31, 2008 were as follows:
| | | | | | | | | | | | |
| | | Midas Fund | | | Midas Special
Fund | | | Midas Perpetual
Portfolio | |
Outstanding balance | | $ | 716,200 | | | $ | 1,654,661 | | | $ | — | |
Value of eligible collateral | | | 24,946,611 | | | | 7,613,787 | | | | 5,140,902 | |
Average daily amount outstanding | | | 17,928,858 | | | | 2,595,318 | | | | 8,341 | |
Weighted average interest rate | | | 3.31 | % | | | 3.01 | % | | | 2.20 | % |
9 Securities Lending
The Funds may lend their securities through an agreement with SSB that became effective June 23, 2008. In accordance with the Funds’ security lending procedures, the loans are collateralized at all times with cash or securities or both with a value at least equal to the securities on loan. The value of the loaned securities is determined each business day at the close of business of the Funds, in accordance with the Funds’ valuation policies or, if applicable, by the valuation procedures established by the Funds’ Boards of Directors, and any additional required collateral is delivered to the Funds on the next business day. As with other extensions of credit, the Funds bear the risk of delay on recovery or loss of rights in the collateral should the borrower of the securities default. The Funds bear the risk of loss from the investment of collateral. Both the Funds and SSB receive compensation relating to the lending of the Funds’ securities. The Funds had no securities on loan at December 31, 2008.
21
Notes to Financial Statements
10 Off Balance Sheet Risks
Option contracts written and securities sold short result in off balance sheet risk as a Fund’s ultimate obligation to satisfy the terms of the contract or the sale of securities sold short may exceed the amount recognized in the Statement of Assets and Liabilities.
11 Recently Issued Accounting Standards
In March 2008, the FASB released Statement of Financial Accounting Standards No. 161, Disclosures about Derivative Instruments and Hedging Activities, an amendment of FASB statement No. 133 (“FAS 161”). FAS 161 requires qualitative disclosures about objectives and strategies for using derivatives, quantitative disclosures about fair value amounts of and gains and losses on derivative instruments, and disclosures about credit risk related contingent features in derivative agreements. The application of FAS 161 is required for fiscal years beginning after November 15, 2008 and interim periods within those fiscal years. The Funds do not expect FAS 161 to have a material impact on their financial statements.
In September 2008, Statement of Financial Accounting Standards No. 133-1, Disclosures about Credit Derivatives and Certain Guarantees (“FAS 133-1”) was issued and is effective for fiscal years ending after November 15, 2008. FAS 133-1 requires a seller of credit derivatives, including credit derivatives embedded in hybrid instruments, to provide certain disclosures for each credit derivative or group of credit derivatives presented on the Statement of Assets and Liabilities. The impact of FAS 133-1 on the Funds financial statement disclosures, if any, is currently being assessed.
22
Financial Highlights - Midas Fund
| | | | | | | | | | | | | | | | | | | | |
| | | For the Years Ended December 31, | |
| | | 2008 | | | 2007 | | | 2006 | | | 2005 | | | 2004 | |
Per Share Data (for a share outstanding throughout each period)* | | | | | | | | | | | | | | | | | | | | |
Net asset value, beginning of period | | $ | 5.64 | | | $ | 4.29 | | | $ | 2.99 | | | $ | 2.14 | | | $ | 2.20 | |
| | | | | | | | | | | | | | | | | | | | |
Income (loss) from investment operations: | | | | | | | | | | | | | | | | | | | | |
Net investment loss | | | (0.06 | ) | | | (0.08 | ) | | | (0.08 | ) | | | (0.05 | ) | | | (0.05 | ) |
Net realized and unrealized gain (loss) on investments | | | (3.36 | ) | | | 1.44 | | | | 1.39 | | | | 0.90 | | | | (0.01 | ) |
| | | | | | | | | | | | | | | | | | | | |
Total from investment operations | | | (3.42 | ) | | | 1.36 | | | | 1.31 | | | | 0.85 | | | | (0.06 | ) |
| | | | | | | | | | | | | | | | | | | | |
Paid-in capital from redemption fees | | | — | † | | | — | † | | | 0.01 | | | | — | † | | | — | † |
| | | | | | | | | | | | | | | | | | | | |
Less distributions: | | | | | | | | | | | | | | | | | | | | |
Dividends from net investment income | | | (0.11 | ) | | | (0.01 | ) | | | (0.02 | ) | | | — | | | | — | |
| | | | | | | | | | | | | | | | | | | | |
Total distributions | | | (0.11 | ) | | | (0.01 | ) | | | (0.02 | ) | | | — | | | | — | |
| | | | | | | | | | | | | | | | | | | | |
Net asset value, end of period | | $ | 2.11 | | | $ | 5.64 | | | $ | 4.29 | | | $ | 2.99 | | | $ | 2.14 | |
| | | | | | | | | | | | | | | | | | | | |
| | | | | |
Total Return | | | (60.89 | )% | | | 31.70 | % | | | 44.02 | % | | | 39.72 | % | | | (2.72 | )% |
| | | | | |
Ratios/Supplemental Data | | | | | | | | | | | | | | | | | | | | |
Net assets at end of period (000s omitted) | | $ | 77,502 | | | $ | 251,394 | | | $ | 138,726 | | | $ | 74,732 | | | $ | 56,770 | |
Ratio of total expenses to average net assets | | | 2.37 | % | | | 2.43 | % | | | 2.39 | % | | | 2.79 | % | | | 2.58 | % |
Ratio of net expenses to average net assets | | | 2.37 | % | | | 2.43 | % | | | 2.38 | % | | | 2.78 | % | | | 2.58 | % |
Ratio of net expenses excluding loan interest and
fees to average net assets | | | 2.02 | % | | | 1.87 | % | | | 1.96 | % | | | 2.44 | % | | | 2.39 | % |
Ratio of net investment loss to average net assets | | | (1.42 | )% | | | (1.58 | )% | | | (1.96 | )% | | | (2.39 | )% | | | (2.40 | )% |
Portfolio turnover rate | | | 129 | % | | | 126 | % | | | 118 | % | | | 63 | % | | | 34 | % |
| * | Average shares outstanding during the period are used to calculate per share data. † Less than $.005 per share. |
Financial Highlights - Midas Special Fund
| | | | | | | | | | | | | | | | | | | | |
| | | For the Year Ended December 31, | |
| | | 2008 | | | 2007 | | | 2006 | | | 2005 | | | 2004 | |
Per Share Data (for a share outstanding throughout each period)* | | | | | | | | | | | | | | | | | | | | |
Net asset value, beginning of period | | $ | 19.13 | | | $ | 16.74 | | | $ | 14.80 | | | $ | 14.98 | | | $ | 13.54 | |
| | | | | | | | | | | | | | | | | | | | |
Income (loss) from investment operations: | | | | | | | | | | | | | | | | | | | | |
Net investment loss | | | (0.43 | ) | | | (0.50 | ) | | | (0.35 | ) | | | (0.32 | ) | | | (0.26 | ) |
Net realized and unrealized gain (loss) on investments | | | (8.34 | ) | | | 2.89 | | | | 2.29 | | | | 0.14 | | | | 1.70 | |
| | | | | | | | | | | | | | | | | | | | |
Total from investment operations | | | (8.77 | ) | | | 2.39 | | | | 1.94 | | | | (0.18 | ) | | | 1.44 | |
| | | | | | | | | | | | | | | | | | | | |
Paid-in capital from redemption fees† | | | — | | | | — | | | | — | | | | — | | | | — | |
| | | | | | | | | | | | | | | | | | | | |
Net asset value, end of period | | $ | 10.36 | | | $ | 19.13 | | | $ | 16.74 | | | $ | 14.80 | | | $ | 14.98 | |
| | | | | | | | | | | | | | | | | | | | |
| | | | | |
Total Return | | | (45.84 | )% | | | 14.28 | % | | | 13.11 | % | | | (1.20 | )% | | | 10.63 | % |
| | | | | |
Ratios/Supplemental Data | | | | | | | | | | | | | | | | | | | | |
Net assets at end of period (000s omitted) | | $ | 8,911 | | | $ | 17,334 | | | $ | 17,149 | | | $ | 16,431 | | | $ | 18,110 | |
Ratio of total expenses to average net assets | | | 3.89 | % | | | 4.06 | % | | | 3.89 | % | | | 4.03 | % | | | 3.49 | % |
Ratio of net expenses to average net assets | | | 3.89 | % | | | 4.06 | % | | | 3.88 | % | | | 4.03 | % | | | 3.49 | % |
Ratio of net expenses excluding loan interest and
fees to average net assets | | | 3.32 | % | | | 3.22 | % | | | 3.39 | % | | | 3.83 | % | | | 3.39 | % |
Ratio of net investment loss to average net assets | | | (2.71 | )% | | | (2.85 | )% | | | (2.32 | )% | | | (2.15 | )% | | | (1.82 | )% |
Portfolio turnover rate | | | 13 | % | | | 36 | % | | | 73 | % | | | 118 | % | | | 9 | % |
| * | Average shares outstanding during the period are used to calculate per share data. † Less than $.005 per share. |
| | | | |
| See notes to financial statements. | | 23 | | |
Financial Highlights - Midas Perpetual Portfolio
Midas Perpetual Portfolio’s (formerly known as Midas Dollar Reserves, Inc.) last day of operations as a money market fund was December 28, 2008. On December 29, 2008, the Fund changed its name from Midas Dollar Reserves, Inc. to Midas Perpetual Portfolio, Inc. and began operating as a fluctuating net asset value fund with the investment objective, strategies, and risks described in the prospectus dated December 29, 2008. The financial highlights for Midas Perpetual Portfolio reflect the Fund’s operation as a money market fund up to December 28, 2008 and thereafter as a fluctuating net asset value fund.
| | | | | | | | | | | | | | | | | | | | |
| | | For the Year Ended December 31, | |
| | | 2008 | | | 2007 | | | 2006 | | | 2005 | | | 2004 | |
Per Share Data (for a share outstanding throughout each period) | | | | | | | | | | | | | | | | | | | | |
Net asset value, beginning of period | | $ | 1.000 | | | $ | 1.000 | | | $ | 1.000 | | | $ | 1.000 | | | $ | 1.000 | |
| | | | | | | | | | | | | | | | | | | | |
Income from investment operations: | | | | | | | | | | | | | | | | | | | | |
Net investment income | | | .012 | | | | .039 | | | | .039 | | | | .016 | | | | .003 | |
| | | | | | | | | | | | | | | | | | | | |
Less distributions: | | | | | | | | | | | | | | | | | | | | |
Dividends from net investment income | | | (.012 | ) | | | (.039 | ) | | | (.039 | ) | | | (.016 | ) | | | (.003 | ) |
| | | | | | | | | | | | | | | | | | | | |
Net asset value, end of period | | $ | 1.000 | | | $ | 1.000 | | | $ | 1.000 | | | $ | 1.000 | | | $ | 1.000 | |
| | | | | | | | | | | | | | | | | | | | |
| | | | | |
Total Return | | | 1.22 | % | | | 4.00 | % | | | 3.88 | % | | | 1.61 | % | | | 0.29 | % |
| | | | | |
Ratios/Supplemental Data | | | | | | | | | | | | | | | | | | | | |
Net assets at end of period (000s omitted) | | $ | 7,191 | | | $ | 14,516 | | | $ | 14,528 | | | $ | 12,889 | | | $ | 15,543 | |
Ratio of total expenses to average net assets | | | 1.77 | % | | | 1.91 | % | | | 1.83 | % | | | 2.34 | % | | | 1.97 | % |
Ratio of net expenses to average net assets | | | 1.21 | % | | | 1.15 | % | | | 1.08 | % | | | 1.59 | % | | | 1.12 | % |
Ratio of net investment income to average net assets | | | 1.22 | % | | | 3.92 | % | | | 3.87 | % | | | 1.58 | % | | | 0.24 | % |
Portfolio turnover rate | | | 0 | % | | | 0 | % | | | 0 | % | | | 0 | % | | | 0 | % |
Fees voluntarily waived by the Investment Manager and Distributor reduced the ratio of net expenses to average net assets by 0.24%, 0.75%, 0.75%, 0.75%, and 0.75% for the years ended December 31, 2008, 2007, 2006, 2005, and 2004, respectively. In addition, the Investment Manager voluntarily reimbursed the Fund for certain operating expenses which further reduced the ratio of net expenses to average net assets by 0.32%, 0.00%, 0.00%, 0.00%, and 0.10% for the years ended December 31, 2008, 2007, 2006, 2005, and 2004, respectively. The impact of the voluntary fee waivers and reimbursements is reflected in both the total return and the ratio of net investment income to average net assets.
Average shares outstanding during the period are used to calculate per share data.
| | | | |
| | 24 | | See notes to financial statements. |
Performance Graphs/Total Returns
(UNAUDITED)
Results of $10,000 Investment
January 1, 1999 through December 31, 2008
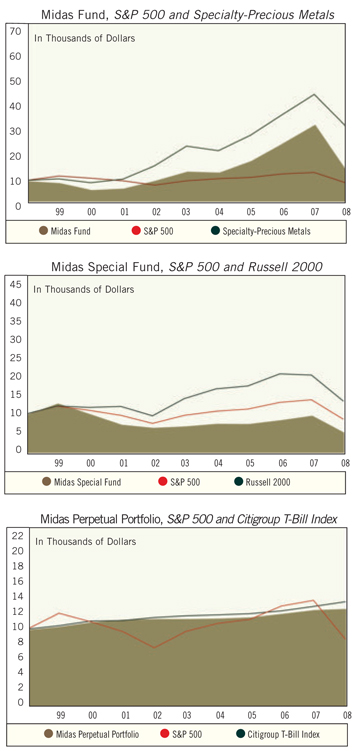
The performance graphs show returns of an initial investment of $10,000 in Midas Fund, Midas Special Fund, and Midas Perpetual Portfolio from 1/1/99 to 12/31/08. Midas Fund is compared to the S&P 500 and the Morningstar Specialty Fund-Precious Metals Average (“PMA”) of 72 funds, 36 of which have been in existence since 1999. Midas Special Fund is compared to the S&P 500 and the Russell 2000. Midas Perpetual Portfolio is compared to the S&P 500 and the Cit-igroup 3-Month U.S. Treasury Bill Index (“Citigroup T-Bill Index”). Results in each case reflect reinvestment of dividends, interest, and distributions but do not reflect a deduction for, if any, short term redemption fees, account expenses, or shareholder taxes. The S&P 500, a broad equity index, and the Russell 2000, a small company index, are unmanaged and fully invested in common stocks. The Citigroup T-Bill Index tracks the performance of U.S. Treasury bills with a remaining maturity of three months and is unmanaged. You cannot invest directly in an index. Past performance is not predictive of future performance.
Prior to December 29, 2008, Midas Perpetual Portfolio (formerly known as Midas Dollar Reserves, Inc.) operated as a money market fund and invested exclusively in securities issued by the U.S. Government, its agencies and instrumentalities. On December 29, 2008, the Fund changed its name from Midas Dollar Reserves, Inc. to Midas Perpetual Portfolio, Inc. and began operating as a fluctuating net asset value fund with the investment objective, strategies, and risks described in the prospectus dated December 29, 2008. The performance included in the table and chart below for the periods commencing on or after January 1, 1999 reflects Midas Perpetual Portfolio’s performance as a money market fund up to December 28, 2008 and thereafter as a fluctuating net asset value fund. The performance information shown also reflects the fees and expenses of the Fund as a money market fund.
| | | | | | | | | | |
Fund Name | | Value as of
12/31/08 | | | % Aggregate
Total Return*† | | | % Avg. Annual
Return*† | |
Midas Fund | | $ | 14,690 | | | 46.90 | % | | 3.92 | % |
Midas Special Fund | | $ | 5,326 | | | (46.74 | )% | | (6.11 | )% |
Midas Perpetual Portfolio | | $ | 12,792 | | | 27.92 | % | | 2.49 | % |
PMA | | $ | 36,292 | | | 262.92 | % | | 13.76 | % |
Russell 2000 | | $ | 13,469 | | | 34.69 | % | | 3.02 | % |
Citigroup T-Bill Index | | $ | 13,625 | | | 36.25 | % | | 3.46 | % |
S&P 500 | | $ | 8,700 | | | (13.00 | )% | | (1.38 | )% |
| |
| | | Average Annual Total Return
for the Periods Ended December 31, 2008* | |
| | | 1 Year | | | 5 Years | | | 10 Years | |
Midas Fund | | | (60.89 | )% | | 0.16 | % | | 3.92 | % |
Midas Special Fund | | | (45.84 | )% | | (5.21 | )% | | (6.11 | )% |
Midas Perpetual Portfolio | | | 1.22 | % | | 2.19 | % | | 2.49 | % |
| * | The returns shown do not reflect the deduction of taxes if any, that a shareholder would pay on Fund distributions or the redemption of Fund shares. |
| † | For 10 year period ended December 31, 2008. |
25
About Your Fund’s Expenses
(UNAUDITED)
Fund shareholders may incur two types of costs: (1) transaction costs, including redemption or small account fees; and (2) ongoing costs, including management fees, distribution and service 12b-1 fees, and other fund expenses. This example is intended to help you understand your ongoing costs (in dollars) of investing in your Fund and to compare these costs with the ongoing cost of investing in other mutual funds. The example is based on an investment of $1,000 made at the beginning of the period and held for the entire period from July 1, 2008 to December 31, 2008.
Actual Expenses
The table provides information about actual account values and actual expenses for each Fund. You may use the information, together with the amount you invested, to estimate the expenses that you paid over the period. First, identify the Fund you own. Then simply divide your account value by $1,000 (for example, an $8,600 account value divided by $1,000 = 8.6), then multiply the result by the number under the heading “Expenses Paid During Period” to estimate the expenses you paid on your account during this period. The Fund may charge you a $20 annual small balance account fee if the value of those shares is less than $500. We will redeem shares automatically in one of your accounts to pay the $20 fee. In determining your total eligible investment amount, we will include your investments in all personal accounts registered under your Social Security number. Personal accounts include individual accounts, joint accounts, UGMA/UTMA accounts, personal trusts, Coverdell Education Savings Accounts, and IRAs (including traditional, Roth, Rollover, SEP, SARSEP, and SIMPLE-IRAs), and certain other retirement accounts.
Hypothetical Example for Comparison Purposes
The table also provides information about hypothetical account values and hypothetical expenses based on the actual expense ratio of each Fund and an assumed rate of return of 5% per year before expenses, which is not the actual return of a Fund. The hypothetical account values and expenses may not be used to estimate the actual ending account balance or expenses you paid for the period. You may use this information to compare the ongoing costs of investing in your Fund and other funds. To do so, compare this 5% hypothetical example with the 5% hypothetical examples that appear in the shareholder reports of the other funds.
Expense Analysis Tables
| | | | | | | | | |
Midas Fund | | Beginning Account Value
July 1, 2008 | | Ending Account Value
December 31, 2008 | | Expenses Paid During Period
July 1, 2008-December 31, 2008(a) |
Actual | | $ | 1,000.00 | | $ | 391.15 | | $ | 8.29 |
Hypothetical (5% return before expenses) | | $ | 1,000.00 | | $ | 1,013.22 | | $ | 11.99 |
(a) | Expenses are equal to the Fund’s annualized expense ratio of 2.37%, multiplied by the average account value over the period, multiplied by 184/366 to reflect the one-half year period. |
| | | | | | | | | |
Midas Special Fund | | Beginning Account Value
July 1, 2008 | | Ending Account Value
December 31, 2008 | | Expenses Paid During Period
July 1, 2008-December 31, 2008(b) |
Actual | | $ | 1,000.00 | | $ | 541.56 | | $ | 15.09 |
Hypothetical (5% return before expenses) | | $ | 1,000.00 | | $ | 1,005.58 | | $ | 19.61 |
(b) | Expenses are equal to the Fund’s annualized expense ratio of 3.89%, multiplied by the average account value over the period, multiplied by 184/366 to reflect the one-half year period. |
| | | | | | | | | |
Midas Perpetual Portfolio | | Beginning Account Value
July 1, 2008 | | Ending Account Value
December 31, 2008 | | Expenses Paid During Period
July 1, 2008-December 31, 2008(c) |
Actual | | $ | 1,000.00 | | $ | 1,012.15 | | $ | 6.12 |
Hypothetical (5% return before expenses) | | $ | 1,000.00 | | $ | 1,019.05 | | $ | 6.14 |
(c) | Expenses are equal to the Fund’s annualized expense ratio of 1.21%, multiplied by the average account value over the period, multiplied by 184/366 to reflect the one-half year period. |
Additional Information
Quarterly Schedules of Portfolio Holdings
The Funds file their complete schedule of portfolio holdings with the Securities and Exchange Commission (“SEC”) for the first and third quarters of each fiscal year on Form N-Q. The Funds’ Forms N-Q are available on the SEC’s website at www.sec.gov and may be reviewed and copied at the SEC’s Public Reference Room in Washington, D.C. Information on the operation of the Public Reference Room may be obtained by calling 1-800-SEC-0330. The Funds’ quarterly reports on Form N-Q are also available on the Funds’ website at www.MidasFunds.com.
Proxy Voting Policies and Procedures
A description of the policies and procedures that the Funds use to determine how to vote proxies relating to portfolio securities is available, without charge, by calling 1-800-400-MIDAS (6432) and on the website of the SEC at www.sec.gov. Information regarding how the Fund voted proxies relating to portfolio securities during the most recent 12 month period ended June 30 is available without charge, by calling 1-800-400-MIDAS (6432), on the website of the SEC at www.sec.gov, and on the Funds’ website www.MidasFunds.com.
26
Directors of the Funds
(UNAUDITED)
Independent Directors
| | | | | | | | |
Name, Address, Date of Birth | | Director Since1 | | Funds
Over- seen | | Principal Occupation, Business Experience for Past Five
Years | | Other
Director-
ships Held2 |
| | | | |
Bruce B. Huber CLU, ChFC, MSFS 11 Hanover Square New York, NY 10005 Born February 7, 1930 | | 1995 (Midas Fund) 1986 (Special Fund) 1981 (Perpetual Portfolio) | | 5 | | Retired. He is a former Financial Representative with New England Financial, specializing in financial, estate and insurance matters. He is a member of the Board, emeritus, of the Millbrook School, and Chairman of the Endowment Board of the Community YMCA of Red Bank, NJ. | | None |
| | | | |
James E. Hunt 11 Hanover Square New York, NY 10005 Born December 14, 1930 | | 1995 (Midas Fund) 1986 (Special Fund) 1980 (Perpetual Portfolio) | | 5 | | Limited Partner of Hunt Howe Partners LLC (executive recruiting consultants). | | None |
| | | | |
Peter K. Werner 11 Hanover Square New York, NY 10005 Born August 16, 1959 | | 2004 (All Funds) | | 5 | | Since 1996, he has taught, directed and coached many programs at The Governor’s Academy, of Byfield MA. Currently, he serves as chair of the History Department. Previously, he held the position of Vice President in the Fixed Income Departments of Lehman Brothers and First Boston. His responsibilities included trading sovereign debt instruments, currency arbitrage, syndication, medium term note trading, and money market trading. | | None |
Interested Directors
| | | | | | | | |
Name, Address, Date of Birth | | Director Since1 | | Funds
Over- seen | | Principal Occupation, Business Experience for Past Five
Years | | Other
Director-
ships Held2 |
| | | | |
Robert D. Anderson3 Director and Vice Chairman. 11 Hanover Square New York, NY 10005 Born December 7, 1929 | | 2002 (Midas Fund) 1986 (Special Fund) 1980 (Perpetual Portfolio) | | 3 | | Since 1988, Vice Chairman of the Investment Manager and its affiliates. Other capacities since 1974. A former member of the District #12, District Business Conduct and Investment Company Committees of the NASD. | | None |
| | | | |
Thomas B. Winmill, Esq.3 Chief Executive Officer, President, and General Counsel. 11 Hanover Square New York, NY 10005 Born June 25, 1959 | | 1995 (Midas Fund) 1997 (Special Fund) 1993 (Perpetual Portfolio) | | 5 | | Since 1999, President of the Investment Manager and the Distributor, and of their affiliates. He is Chairman of the Investment Policy Committee (“IPC”) of the Investment Manager. Other capacities since 1988. He is a member of the New York State Bar. He is the son of Bassett S. Winmill. | | None |
| 1 | Directors not elected annually shall be deemed to be continuing in office until after the time at which an annual meeting is required to be held under Maryland law or a Fund’s Charter or Bylaws. |
| 2 | Refers to directorships held by a director in any company with a class of securities registered pursuant to Section 12 of the Securities Exchange Act of 1934 or any company registered as an investment company under the Investment Company Act. |
| 3 | Robert D. Anderson and Thomas B. Winmill are “interested persons” of the Funds as defined by the Investment Company Act because of their positions with the Investment Manager. |
27
Officers of the Funds
(UNAUDITED)
| | | | |
Name, Date of Birth | | Title and Officer Since | | Principal Occupation, Business Experience for Past Five Years |
| Thomas B. Winmill, Esq. Born June 25, 1959 | | Chief Executive Officer, President, and General Counsel since 1999. Other capacities since 1988. | | See biographical information on previous page. |
| | |
Robert D. Anderson Born December 7, 1929 | | Vice Chairman since 1985. Other capacities since 1974. | | See biographical information on previous page. |
| | |
Bassett S. Winmill Born February 10, 1930 | | Chief Investment Strategist since 1999. Other capacities since 1974. | | Chief Investment Strategist of the Investment Manager and the Chairman of the Board of the Investment Manager’s parent and its affiliates, and of two investment companies in the Investment Company Complex. He is a member of the IPC and the New York Society of Security Analysts, the Association for Investment Management and Research, and the International Society of Financial Analysts. He is the father of Thomas B. Winmill. |
| | |
Thomas O’Malley Born July 22, 1958 | | CAO, CFO, Treasurer and Vice President since 2005. | | Chief Accounting Officer, Chief Financial Officer, Treasurer and Vice President since 2005. He also is Chief Accounting Officer, Chief Financial Officer, Treasurer and Vice President of the Investment Company Complex, the Investment Manager, and WCI. Previously, he served as Assistant Controller of Reich & Tang Asset Management, LLC, Reich & Tang Services, Inc., and Reich & Tang Distributors, Inc. He is a certified public accountant. |
| | |
Heidi Keating Born March 28, 1959 | | Vice President since 1988. Other capacities since 1978. | | Vice President of the Investment Manager since 1988. Other capacities since 1978. |
| | |
John F. Ramirez Born April 29, 1977 | | Chief Compliance Officer, Vice President, and Secretary since 2005. Other capacities since 2000. | | CCO, VP, and Secretary since 2005. He is also CCO, VP and Secretary of the Investment Company Complex, the Investment Manager, and WCI. He previously served as Compliance Administrator and Assistant Secretary of the Investment Company Complex, the Investment Manager, and WCI. He is a member of the CCO Committee and the Compliance Advisory Committee of the Investment Company Institute. |
Officers hold their positions with a Fund until a successor has been duly elected and qualifies. Officers are generally elected annually at the December meeting of the Board of Directors. The officers were last elected on December 10, 2008.
28
MIDAS FUNDS OFFER
(UNAUDITED)
| | • | | IRA Retirement Accounts, including Traditional, Roth, Self-Employed, and Small Business (SEP, SIMPLE) |
| | • | | Education Savings Accounts |
| | • | | Electronic Funds Transfers |
| | • | | Automatic Investment Program |
Only $1,000 minimum to open a Midas Funds account, with subsequent minimum investments of $100.
There is NO FEE to open an account.
Join our Automatic Investment Program, and open an account for only $100, and make subsequent monthly investments of as little as $100.
RESULTS OF A SPECIAL MEETING
A Special Meeting of Stockholders was held on December 12, 2008 at the offices of Midas Perpetual Portfolio, Inc. (the “Fund”) at 11 Hanover Square, 12th Floor, New York, New York for the following purposes:
1. To elect to the Board of Directors the Nominee, Peter K. Werner, to serve as a Director until his successor is duly elected and qualifies.
| | | | | | | | | | |
For
| | 9,692,081.607 | | Withhold | | 596,315.420 | | | | |
|
| 2. To change the Fund’s current fundamental investment objective and reclassify its new investment objective as “non-fundamental,” which means that it can be changed without stockholder approval. The Fund’s new investment objective would be “to preserve and increase the purchasing power value of its shares over the long term.” |
| | | | | |
| For | | 9,028,165.310 | | Against | | 1,187,387.997 | | Abstain | | 72,843.380 |
|
3. To revise the Fund’s fundamental investment restriction on investments in commodities to permit the purchase of gold and silver. |
| | | | | |
| For | | 9,139,319.550 | | Against | | 1,101,703.097 | | Abstain | | 47,374.380 |
|
4. To eliminate the Fund’s fundamental investment restriction on diversification in order to provide the Fund greater investment flexibility. |
| | | | | |
| For | | 9,125,501.920 | | Against | | 1,104,380.857 | | Abstain | | 58,514.250 |
|
| Other directors whose term of office continued after the meeting are: Bruce B. Huber, James E. Hunt, Robert D. Anderson, and Thomas B. Winmill. |
29
MIDAS FUNDS REGULAR ACCOUNT APPLICATION INSTRUCTIONS
| 1. | Registration. If there is more than one owner of the account, the registration will be “Joint Tenants with Right of Survivorship” unless you specify “Tenants in Common.” If this is a Uniform Gift/Transfer to a Minor, please enter all information requested for the minor. |
| 2. | Mailing and E-mail Addresses, Telephone Number, and Citizenship. If you are a non-U.S. citizen residing in the U.S., in addition to this Account Application, you will be required to attach a Form W-8 BEN, which can be obtained from the IRS website at www.irs.gov or calling 1-800-829-3676. If this is a Uniform Gift/Transfer to a Minor, please enter all information for the Custodian, including Custodian’s physical address. |
| 3. | Choose Fund(s) and amount invested. Indicate the Fund(s) in which you are opening an account. The opening minimum is $1,000 per Fund ($100 for Midas Automatic Investment Programs – see Section 6 of the Account Application). The minimum subsequent investment is $100. |
| 4. | Distributions. Your dividends and distributions will be reinvested in additional shares of the Fund unless you instruct Midas otherwise. |
| 5. | Shareholder Communications. Check the method of shareholder communications you would prefer (electronic or paper copies). Electronic communications will be sent to the e-mail address provided in Section 2. |
6. | Midas Funds Bank Transfer Plan/TheMidas Touch®. With the Bank Transfer Plan (BTP), you can establish a convenient and affordable long term investment program. The $1,000 minimum investment requirement is waived since the BTP is designed to facilitate an automatic monthly investment of $100 or more into your Fund account(s). Please specify the total amount you want to invest each month, the frequency, and when you’d like to start your automatic investing. |
All shareholders can access their account 24 hours a day, every day, at www.MidasFunds.com and by automated telephone response at 1-800-400-MIDAS (6432). Only with The Midas Touch® can you manage your account by purchasing or redeeming Fund shares using Electronic Funds Transfer, initiate Fund to Fund transfers between the three Midas Funds, and perform transactions through a Shareholder Services Representative. To access these features, please indicate your bank routing and account numbers or attach a voided check.
| 7. | Signature and Certification to Avoid Backup Withholding. After reading this section, please sign and date the Account Application. |
Send By Mail. Mail your completed Account Application to Midas Funds, P.O. Box 6110, Indianapolis, IN 46206-6110. Checks must be payable to Midas Funds in U.S. dollars. Third party checks and money orders cannot be accepted.
Send By Wire. Call 1-800-400-MIDAS (6432) between 8 a.m. and 6 p.m., ET, on business days to speak with a Shareholder Services Representative. A completed Account Application, the name of the bank sending the wire, and the amount to be wired are required before the wired funds can be accepted. The completed Account Application should be faxed to 1-317-937-3014, Attn: Midas Funds. You will then be assigned a Fund account number and receive wiring address information. Your account number and name(s) must be specified in the wire as they are to appear on the account registration. You should then enter your account number on your completed Account Application and promptly mail it to Midas Funds, P.O. Box 6110, Indianapolis, IN 46206-6110. This service is not available on days when the Federal Reserve wire system is closed.
If you need any assistance in completing the Account Application, please
call a Shareholder Services Representative at 1-800-400-MIDAS (6432)
between the hours of 8 a.m. and 6 p.m., ET.
30
-

31
32
| | |
 | | With The Midas Touch®, you enjoy enhanced access at any time, online at www.MidasFunds.com or by telephone, 1-800-400-MIDAS (6432), to |
| | • | | Monitor your investments |
| | • | | Retrieve your account history |
| | • | | Review recent transactions |
| | • | | Obtain closing market information and Fund closing prices |
| | • | | Check your account balances and account activity |
| | • | | Obtain prospectuses, shareholder reports, and account applications, as well as IRA transfer forms and Automatic Investment Program forms for regular monthly investing |
| | • | | Purchase or redeem Fund shares using electronic funds transfer to move money to or from your authorized bank account |
| | • | | Initiate account transactions, such as Fund to Fund transfers among the three Midas Funds |
| | • | | Perform transactions through a Shareholder Services Representative Monday through Friday, from 8 a.m. to 6 p.m., ET |
Midas Funds
P.O. Box 6110
Indianapolis, IN 46206-6110
1-800-400-MIDAS (6432) for Investment Information
Past performance does not guarantee future results. Investment return will fluctuate, so shares when redeemed may be worth more or less than their cost. Dollar cost averaging does not assure a profit or protect against loss in a declining market and investors should consider their ability to make purchases when prices are low. One of Midas’ guiding principles is that we will communicate with our shareholders as candidly as possible because we believe shareholders benefit from understanding our investment philosophy and approach. Our views and opinions regarding the prospects of our portfolio holdings, Funds, and the economy are “forward looking statements” which may or may not be accurate and may be materially different over future periods. We disclaim any obligation to update or alter any forward looking statements, whether as a result of new information, future events, or otherwise. Thus, you should not place undue reliance on forward looking statements, which also speak only as of the date of this Report. Current performance may be lower or higher than the performance quoted herein. This Report and the financial statements it contains are submitted for the general information of the shareholders of the Midas Funds. The Report is not authorized for distribution to prospective investors in the Funds unless preceded or accompanied by an effective Prospectus which contains more complete information, including charges, risks and expenses. Please read it carefully before you invest or send money.
Investor Service Center, Inc., Distributor.

Item 2. Code of Ethics.
| | (a) | | The registrant has adopted a code of ethics (the "Code") that applies to its principal executive officer, principal financial officer, principal accounting officer or controller, or persons performing similar functions, regardless of whether these individuals are employed by the registrant or a third party. |
| | (b) | | No information need be disclosed pursuant to this paragraph. |
| | (f) | | The text of the Code can be found on the registrant's website, www.midasfunds.com, or a copy of the Code may be obtained free of charge by calling collect 1-212-480-6432. | |
Item 3. Audit Committee Financial Expert.
The registrant's Board of Directors has determined that it has three "audit committee financial experts" serving on its audit committee, each of whom are "independent" Directors: Bruce B. Huber, James E. Hunt, and Peter K. Werner. Under applicable securities laws, a person who is determined to be an audit committee financial expert will not be deemed an "expert" for any purpose, including without limitation for the purposes of Section 11 of the Securities Act of 1933, as a result of being designated or identified as an audit committee financial expert. The designation or identification of a person as an audit committee financial expert does not impose on such person any duties, obligations, or liabilities that are greater than the duties, obligations, and liabilities imposed on such person as a member of the audit committee and Board of Directors in the absence of such designation or identification. The designation or identification of a person as an audit committee financial expert pursuant to this Item does not affect the duties, obligations, or liability of any other member of the audit committee or board of directors.
Item 4. Principal Accountant Fees and Services.
| | (a) | | The aggregate fees billed for each of the last two fiscal years for professional services rendered by the principal accountant for the audit of the registrant's annual financial statements or services that are normally provided by the accountant in connection with statutory and regulatory filings or engagements for those fiscal years are as follows: |
| | | AUDIT FEES |
| | | |
| | | 2008 - $14,500 |
| | | 2007 - $14,000 |
| | (b) | | The aggregate fees billed in each of the last two fiscal years for assurance and related services by the principal accountant that are reasonably related to the performance of the audit of the registrant's financial statements and are not reported under paragraph (a) of this Item are as follows: |
| | | AUDIT RELATED FEES |
| | | |
| | | 2008 - $2,000 |
| | | 2007 - $1,500 |
| | Audit related fees include amounts reasonably related to the performance of the audit of the registrant's financial statements, including the issuance of a report on internal controls and review of periodic reporting. |
| | (c) | | The aggregate fees billed in each of the last two fiscal years for professional services rendered by the principal accountant for tax compliance, tax advice, and tax planning. Registrants shall describe the nature of the services comprising the fees disclosed under this category are as follows: |
| | Tax fees include amounts related to tax compliance, tax planning, and tax advice. |
| | (d) | | The aggregate fees billed in each of the last two fiscal years for products and services provided by the principal accountant, other than the services reported in paragraphs (a) through (c) of this Item. Registrants shall describe the nature of the services comprising the fees disclosed under this category are as follows: |
| | (e) | | (1) Pursuant to the registrant's Audit Committee Charter, the Audit Committee shall consider for pre-approval any audit and non-audit services proposed to be provided by the auditors to the registrant, and any non-audit services proposed to be provided by such auditors to the registrant's Investment Manager, if the engagement relates directly to the registrant's operations or financial reporting. Such pre-approval of non-audit services proposed to be provided by the auditors to the registrant is not necessary, however, under the following circumstances: (1) all such services do not aggregate to more than 5% of total revenues paid by the registrant to the auditor in the fiscal year in which services are provided, (2) such services were not recognized as non-audit services at the time of the engagement, and (3) such services are brought to the attention of the Audit Committee, and approved by the Audit Committee, prior to the completion of the audit. |
| | | | (2) No services included in (b) - (d) above were approved pursuant to paragraph (c)(7)(i)(C) of Rule 2-01 of Regulation S-X. |
| | (g) | | The aggregate non-audit fees billed by the registrant's accountant for services rendered to the registrant, and rendered to the registrant's investment adviser (not including any sub-adviser whose role is primarily portfolio management and is subcontracted with or overseen by another investment adviser), and any entity controlling, controlled by, or under common control with the adviser that provides ongoing services to the registrant for each of the last two fiscal years of the registrant were $22,500 and $23,500, respectively. |
| | (h) | | The registrant's audit committee has determined that the provision of non-audit services that were rendered by accountant to the registrant's investment adviser (not including any sub-adviser whose role is primarily portfolio management and is subcontracted with or overseen by another investment adviser), and any entity controlling, controlled by, or under common control with the investment adviser that provides ongoing services to the registrant that were not pre-approved pursuant to paragraph (c)(7)(ii) of Rule 2-01 of Regulation S-X is compatible with maintaining the principal accountant's independence. |
Item 5. Audit Committee of Listed Registrants.
The registrant has a standing audit committee. The members of the audit committee are Bruce B. Huber, James E. Hunt and Peter K. Werner.
Item 6. Schedule of Investments.
Included as part of the report to shareholders filed under Item 1 of this Form.
Item 7. Disclosure of Proxy Voting Policies and Procedures for Closed-End Management Investment Companies.
Not applicable.
Item 8. Portfolio Managers of Closed-End Management Investment Companies.
Not applicable.
Item 9. Purchases of Equity Securities by Closed-End Management Investment Company and Affiliated Purchasers.
Not applicable.
Item 10. Submission of Matters to a Vote of Security Holders.
There were no material changes to the procedures by which shareholders may recommend nominees to the registrant's board of directors made or implemented after the registrant last provided disclosure in response to the requirements of Item 7(d)(2)(ii)(G) of Schedule 14A (17 CFR 240.14a-101), or this Item.
Item 11. Controls and Procedures.
| | (a) | | The registrant's principal executive officer and principal financial officer have concluded that the registrant's disclosure controls and procedures (as defined in Rule 30a- 3(c) under the Investment Company Act of 1940, as amended (the "1940 Act")) are effective as of a date within 90 days of the filing date of this report that includes the disclosure required by this paragraph, based on their evaluation of the disclosure controls and procedures required by Rule 30a-3(b) under the 1940 Act and 15d-15(b) under the Securities Exchange Act of 1934. |
| | (b) | | There were no changes in the registrant's internal control over financial reporting (as defined in Rule 30a-3(d) under the 1940 Act) that occurred during the registrant's second fiscal quarter of the period covered by the report that have materially affected, or are likely to materially affect the registrant's internal control over financial reporting. |
Item 12. Exhibits.
| | (a) | | Certifications pursuant to Rule 30a-2(a) under the Investment Company Act of 1940(17 CFR 270.360a-2) attached hereto as Exhibits EX-31 and certifications pursuant to 18 U.S.C. Section 1350, as adopted pursuant to Section 906 of the Sarbanes-Oxley Act of 2002 attached hereto as Exhibit EX-32. |
SIGNATURES
Pursuant to the requirements of the Securities Exchange Act of 1934 and the Investment Company Act of 1940, the registrant has duly caused this report to be signed on its behalf by the undersigned, thereunto duly authorized.
March 10, 2009 | | Midas Perpetual Portfolio, Inc.
By: /s/ Thomas B. Winmill
——————————————
Thomas B. Winmill
President |
March 10, 2009 | | Midas Perpetual Portfolio, Inc.
By: /s/ Thomas O'Malley
——————————————
Thomas O'Malley
Chief Financial Officer |
Pursuant to the requirements of the Securities Exchange Act of 1934 and the Investment Company Act of 1940, the registrant has duly caused this report to be signed below by the following persons on behalf of the registrant and in the capacities and on the dates indicated.
March 10, 2009 | | Midas Perpetual Portfolio, Inc.
By: /s/ Thomas B. Winmill
——————————————
Thomas B. Winmill
President |
March 10, 2009 | | Midas Perpetual Portfolio, Inc.
By: /s/ Thomas O'Malley
——————————————
Thomas O'Malley
Chief Financial Officer |