WWW.GUGGENHEIMINVESTMENTS.COM/GEQ
. . .YOUR LINK TO THE LATEST, MOST UP-TO-DATE INFORMATION ABOUT GUGGENHEIM EQUAL WEIGHT ENHANCED EQUITY INCOME FUND
The shareholder report you are reading right now is just the beginning of the story. Online at www.guggenheiminvestments.com/geq, you will find:
| • | Daily, weekly and monthly data on share prices, net asset values, distributions and more |
| | |
| • | Portfolio overviews and performance analyses |
| | |
| • | Announcements, press releases and special notices |
| | |
| • | Fund and adviser contact information |
Guggenheim Partners Investment Management, LLC and Guggenheim Funds Investment Advisors, LLC are continually updating and expanding shareholder information services on the Fund’s website in an ongoing effort to provide you with the most current information about how your Fund’s assets are managed and the results of our efforts. It is just one more small way we are working to keep you better informed about your investment in the Fund.
DEAR SHAREHOLDER
We thank you for your investment in the Guggenheim Equal Weight Enhanced Equity Income Fund (the “Fund”). This report covers the Fund’s performance for the semiannual period ended June 30, 2013.
The Fund’s investment objective is to provide a high level of risk-adjusted total return with an emphasis on current income.
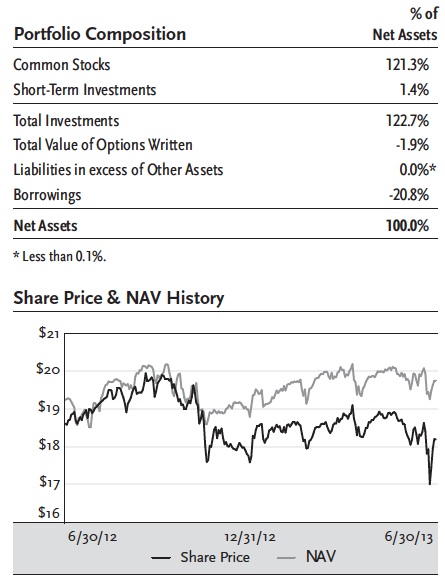
All Fund returns cited—whether based on net asset value (“NAV”) or market price—assume the reinvestment of all distributions. For the six-month period ended June 30, 2013, the Fund provided a total return on an NAV basis of 8.22% and a total return based on market price of 7.46%. The closing price of the Fund’s shares as of June 30, 2013, was $18.19, which represented a discount of 7.90% to the NAV of $19.75. The closing price of the Fund’s shares as of December 31, 2012, was $17.73, which represented a discount of 7.03% to the NAV of $19.07. Past performance does not guarantee future results. The market price of the Fund’s shares fluctuates from time to time, and at any given time it may be higher or lower than the Fund’s NAV. NAV performance data reflects fees and expenses of the Fund.
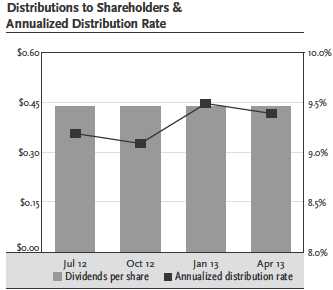
The Fund paid distributions of $0.4375 in January and April of 2013. The most recent distribution represents an annualized distribution rate of 9.62% based on the Fund’s last closing market price of $18.19 on June 30, 2013.
Guggenheim Funds Investment Advisors, LLC (“GFIA” or the “Adviser”) serves as the investment adviser to the Fund. Guggenheim Partners Investment Management, LLC serves as the Fund’s Options Strategy Sub-Adviser, responsible for the management of the Fund’s options strategy. Security Investors, LLC serves as the Equity Strategy Sub-Adviser, responsible for managing the underlying equity portfolio. Each of the Adviser and the two Sub-Advisers is an affiliate of Guggenheim Partners, LLC (“Guggenheim”), a global diversified financial services firm.
The Fund seeks to achieve its investment objective primarily through a two-part strategy. Under normal circumstances, the Fund invests substantially all of its managed assets in a portfolio of common stocks included in the S&P 500 Equal Weight™ Index in equal weight. In addition, the Fund utilizes a call option writing strategy to seek to generate current income and potentially mitigate overall portfolio volatility.
In connection with the implementation of its strategy, the Fund currently uses leverage through a credit facility provided by a large multi-national financial institution. As of June 30, 2013, the amount of leverage was approximately 17% of the Fund’s total assets (including the proceeds of leverage). Although the use of financial leverage by the Fund may create an opportunity for increased return for the common shares, it also results in additional risks and can magnify the effect of any losses. There can be no assurance that a leveraging strategy will be successful during any period during which it is employed.
We encourage shareholders to consider the opportunity to reinvest their distributions from the Fund through the Dividend Reinvestment Plan (“DRIP”), which is described in detail on page 27 of this report. When shares trade at a discount to NAV, the DRIP takes advantage of the discount by reinvesting the quarterly dividend distribution in common shares of the Fund purchased in the market at a price less than NAV. Conversely, when the market price of the Fund’s common shares is at a premium above NAV, the DRIP reinvests participants’ dividends in newly-issued common shares at the greater of NAV per share or 95% of the market price per share. The DRIP provides a cost effective means to accumulate additional shares and enjoy the potential benefits of compounding returns over time.
To learn more about the Fund’s performance and investment strategy for the period ended June 30, 2013, we encourage you to read the Questions & Answers section of the report, which begins on page 4.
We appreciate your investment and look forward to serving your investment needs in the future. For the most up-to-date information on your investment, please visit the Fund’s website at guggenheiminvestments.com/geq.
Sincerely,
Donald C. Cacciapaglia
Chief Executive Officer
Guggenheim Equal Weight Enhanced Equity Income Fund
|
| GEQ | GUGGENHEIM EQUAL WEIGHT ENHANCED EQUITY INCOME FUND SEMIANNUAL REPORT | 3 |
| QUESTIONS & ANSWERS | June 30, 2013 |
Guggenheim Equal Weight Enhanced Equity Income Fund (the “Fund”) is managed by a team of seasoned investment professionals. Guggenheim Funds Investment Advisors, LLC (the “Adviser”) is responsible for overall management of the Fund. Guggenheim Partners Investment Management, LLC (“GPIM”) is the Fund’s investment sub-adviser responsible for the management of the Fund’s options strategy (“Options Strategy Sub-Adviser”). The options strategy is managed by a team that includes Farhan Sharaff, Assistant Chief Investment Officer; Jayson Flowers, Senior Managing Director; and Jamal Pesaran, CFA, Portfolio Manager. Security Investors, LLC (“Security Investors”) is the sub-adviser responsible for managing the underlying equity portfolio (“Equity Strategy Sub-Adviser”). The team at Security Investors includes Ryan Harder, CFA, Portfolio Manager, and James R. King, CFA, Portfolio Manager.
The Adviser, the Options Strategy Sub-Adviser and the Equity Strategy Sub-Adviser are all affiliates of Guggenheim Partners, LLC (“Guggenheim”), a global diversified financial services firm. In the following interview, the investment team discusses the market environment and the Fund’s performance for the six-month period ended June 30, 2013.
Please describe the Fund’s investment objective and strategy.
The Fund’s investment objective is to provide a high level of risk-adjusted total return with an emphasis on current income. The Fund seeks to achieve its investment objective primarily through a two-part strategy. Under normal circumstances, the Fund invests substantially all of its managed assets in a portfolio of common stocks included in the S&P 500 Equal Weight™ Index (the “Index”) in equal weight. In addition, the Fund utilizes a call option writing strategy to seek to generate current income and potentially mitigate overall portfolio volatility.
The Index has the same constituents as the S&P 500® Index (“S&P 500”), a capitalization-weighted index comprised of 500 common stocks, chosen by Standard & Poor’s Financial Services LLC on a statistical basis, but each company in the Index is assigned an equal weight rather than a weight based on its relative market capitalization. The Fund’s equity portfolio is rebalanced quarterly so that each stock in the Fund’s portfolio has the same target weighting. While the Fund generally expects to invest in substantially all of the stocks included in the Index, the Fund may also seek to obtain exposure through investments in other investment funds, other securities and/or financial instruments that are intended to correlate with or replicate the characteristics of exposure to stocks included in the Index or the Index generally.
The Fund utilizes a call option writing strategy to seek to generate current income and potentially mitigate overall portfolio volatility. The Fund’s options strategy follows the Options Strategy Sub-Adviser’s proprietary dynamic rules-based methodology, GPIM’s “Portable Volatility Monetization Strategy”SM. The Options Strategy Sub-Adviser expects to implement the Fund’s options strategy by selling (i.e., writing) call options on securities indices, exchange-traded funds (“ETFs”) that track securities indices, baskets of securities and other instruments, which will include securities that are not held by the Fund. As this strategy involves uncovered option writing, it may result in less volatility mitigation than, and may be subject to more risks compared to, option strategies involving writing options on securities held by the Fund. There can be no assurance that the Fund’s use of call options will be successful.
The Fund currently employs leverage through a credit facility provided by a large multi-national financial institution. As of June 30, 2013, the amount of leverage was approximately 17% of the Fund’s total assets. Although financial leverage may create an opportunity for increased return for shareholders, it also results in additional risks and can magnify the effect of any losses. There is no assurance that the strategy will be successful. If income and gains earned on securities purchased with the financial leverage proceeds are greater than the cost of the financial leverage, common shareholders’ return will be greater than if financial leverage had not been used. Conversely, if the income or gains from the securities purchased with the proceeds of financial leverage are less than the cost of the financial leverage, common shareholders’ return will be less than if financial leverage had not been used.
Please provide an overview of the economic and market environment during the six months ended June 30, 2013.
Monetary accommodation from the world’s central banks and continued improvement in the U.S. housing and labor markets benefited the overall U.S. economy for the six months ended June 30, 2013. However, speculation about the end of quantitative easing in May and June, along with growing fundamental risk in Japan and China, led to a selloff in fixed income and equity markets. For most of the period, equity markets were strong and abundant liquidity and steady quantitative easing had produced a benign credit environment with low default rates.
Housing was the primary locomotive of U.S. economic growth in the period. Housing-related activity, including private residential investment, personal expenditures on household durable goods and utilities, as well as the wealth effect on consumption from home price appreciation, has contributed positively to GDP since 1Q2011. However, housing’s contribution remains dependent on the maintenance of extremely low mortgage rates, which have recently begun moving higher.
Overshadowing solid job gains in the period was slow improvement in the unemployment rate. The participation rate has been relatively flat over the past six months, and in general, has been declining. A bright spot has been the private sector, where the U.S. economy is currently adding jobs at a rate that is over 20% higher than that of the prior expansion.
4 | GEQ | GUGGENHEIM EQUAL WEIGHT ENHANCED EQUITY INCOME FUND SEMIANNUAL REPORT |
| QUESTIONS& ANSWERS continued | June 30, 2013 |
A number of global central banks implemented interest rate cuts during the period, owing to sluggish global economic growth and continuing weakness in commodity prices. The world is still in a deflationary environment, which has given policymakers a great deal of leeway to extend and expand accommodative monetary policies aimed at stimulating output.
The rise in volatility late in the period was in large part a result of shifting market sentiment, but, fundamentally, economic growth in the U.S. has not changed materially. With ongoing weakness in growth and inflation, global central banks are expected to maintain accommodative policies for the foreseeable future.
For the six-month period ended June 30, 2013, the return of the Standard & Poor’s 500 Index (the “S&P 500”) was 13.82%, and in mid-May reached an all-time high. The Chicago Board Options Exchange Market Volatility Index (the “VIX”) was down by 6.44% for the period. The VIX is a key measure of market expectations of near-term volatility conveyed by the S&P 500 stock index option prices. Remaining at multi-year lows, it touched its low of the period in March before spiking to a period high in June, when markets became unsettled.
How did the Fund perform for the six-month period ended June 30, 2013?
All Fund returns cited—whether based on net asset value (“NAV”) or market price—assume the reinvestment of all distributions. For the six-month period ended June 30, 2013, the Fund provided a total return on an NAV basis of 8.22% and a total return based on market price of 7.46%. The closing price of the Fund’s shares as of June 30, 2013, was $18.19, which represented a discount of 7.90% to the NAV of $19.75. The closing price of the Fund’s shares as of December 31, 2012, was $17.73, which represented a discount of 7.03% to the NAV of $19.07. The widening discount of the Fund over the period may be a reflection of lack of analyst coverage of the strategy. Past performance does not guarantee future results. The market price of the Fund’s shares fluctuates from time to time, and it may be higher or lower than the Fund’s NAV. NAV performance data reflects fees and expenses of the Fund.
The Fund paid distributions of $0.4375 in January and April of 2013. The most recent dividend represents an annualized distribution rate of 9.62% based on the Fund’s last closing market price of $18.19 on June 30, 2013. Past performance does not guarantee future results.
In comparison, the return of the S&P 500 Equal Weight Index was 16.20% and the return of the capitalization-weighted S&P 500 Index was 13.82% for the six months ended June 30, 2013. The outperformance of the Equal Weight Index versus the S&P 500 generally reflects the weaker performance of the largest stocks in the S&P 500 during the period.
What was the nature of the January and April 2013 distributions?
When the January and April 2013 distributions were paid, the majority of the distributions were characterized as return of capital. A final determination of the tax character of distributions paid by the Fund in 2013 will be reported to shareholders in January 2014 on Form 1099-DIV.
The Fund utilizes a strategy that writes calls against a dynamically levered long underlying exposure. As markets have been pushing higher over the past few quarters, the Fund has seen gains in the underlying holdings, which have not been realized, and at the same time realized some short-term capital losses in the call options, which results from paying more to repurchase call options that were previously sold. But on a total return basis, the Fund has sufficient unrealized gains via appreciation of underlying holdings to more than offset any losses on the call options and cover the distribution. It is expected that a portion of these gains in the underlying holdings could be realized over time.
What drove performance for the equal-weighted Index versus its capitalization-weighted version?
Because an equal-weighted index holds the same dollar amount of each member security, it will tend to underweight larger stocks and overweight smaller stocks when compared to a capitalization-weighted index with the same members. As a result, equal-weighted indices tend to outperform during periods when the very largest stocks underperform mid- and small-caps. This period was no exception.
The largest single contributor to the outperformance of the S&P 500 Equal Weight Index was Apple, Inc. During the first half of 2013, Apple’s stock suffered a loss of just over 25% and, as a result, was knocked from the top spot in the capitalization-weighted S&P 500. During those six months, the maker of iPhones and iPads had a substantial weighting of well over 3% of the capitalization-weighted S&P 500 Index and dragged down performance by nearly a full percent. Meanwhile, the Equal Weight S&P 500 Index held Apple in a much smaller weighting, and was largely unaffected by the steep drop in price.
Among sectors, consumer discretionary stocks were the best performers in the Equal Weight S&P 500 Index, and also contributed the most to outperformance versus the capitalization-weighted version. While the performance advantage was well distributed throughout the sector, a few stocks stood out. Best Buy, with a gain of 133%, and Netflix, up 127%, led the sector and the broader index for the six-month period. While neither gets much weight in the cap-weighted S&P 500, the equal-weighted version overweights them substantially, allowing the pair to contribute nearly 20 basis points each to performance.
On the other end of the spectrum, some of the biggest detractors from relative performance were the large pharmaceutical stocks. Compared to the cap-weighted S&P 500, the Equal Weight S&P 500 Index was
|
| GEQ | GUGGENHEIM EQUAL WEIGHT ENHANCED EQUITY INCOME FUND SEMIANNUAL REPORT | 5 |
| QUESTIONS& ANSWERS continued | June 30, 2013 |
substantially underweighted in health care giants Johnson & Johnson, Pfizer and Merck. Underweighted positions in these three largest health care companies collectively hurt the Equal Weight S&P 500's relative performance by over half a percent.
What role did the option strategy play in performance for the period?
The Fund writes call options on indices rather than individual stocks. Moreover, the option portfolio does not have to equal the full portfolio, but can be adjusted depending on GPIM’s view of market conditions.
Under normal market conditions, the Fund seeks overall portfolio volatility that, after taking into account the Fund’s option writing strategy and use of leverage, approximates that of the broad equity market. During the period, the options portfolio helped reduce the risk of the Fund, as measured by standard deviation of returns.
Markets with gradual drifts higher and low levels of implied volatility, as experienced during the most recent quarter, create the biggest challenges for the strategy. The strategy typically benefits from choppy, range-bound markets where uncertainty is present, causing call option premiums to rise.
How did the Fund’s leverage affect performance during this period?
The strong performance of the underlying index contributed to outperformance for the strategy for the period, with leverage also benefitting the strategy. To lower the risk of the strategy and the risk of leverage, GPIM aims to reduce leverage in strong up markets (accompanied by low implied volatility) or when the market is near its highs of the period, and may add leverage when the market is at period lows or selling off. The extreme underlying moves experienced over the quarter challenged the strategy, and GPIM’s management of the leverage, as described, protected the portfolio and lowered the risk of the strategy.
Index Definitions
Indices are unmanaged and reflect no expenses. It is not possible to invest directly in an index.
The Chicago Board Options Exchange Market Volatility Index is a key measure of market expectations of near-term volatility conveyed by the S&P 500 stock index option prices.
The Standard & Poor’s 500 Index is a capitalization-weighted index of 500 stocks. The index is designed to measure performance of the broad domestic economy through changes in the aggregate market value of 500 stocks representing all major industries.
The Standard & Poor’s 500 Equal Weight Index has the same constituents as the S&P 500, but each company is assigned a fixed equal weight.
Risks and Other Considerations
The views expressed in this report reflect those of the portfolio managers only through the report period as stated on the cover. These views are subject to change at any time, based on market and other conditions and should not be construed as a recommendation of any kind. The material may also include forward looking statements that involve risk and uncertainty, and there is no guarantee that any predictions will come to pass.
There can be no assurance that the Fund will achieve its investment objectives. The value of the Fund will fluctuate with the value of the underlying securities. Historically, closed-end funds often trade at a discount to their net asset value. Risk is inherent in all investing, including the loss of your entire principal. Therefore, before investing you should consider the risks carefully.
Please see guggenheiminvestments.com/geq for a detailed discussion about Fund risks and considerations.
6 | GEQ | GUGGENHEIM EQUAL WEIGHT ENHANCED EQUITY INCOME FUND SEMIANNUAL REPORT |
| | | |
Fund Statistics | | |
Share Price | | $18.19 |
Common Share Net Asset Value | | $19.75 |
Premium/(Discount) to NAV | | -7.90% |
Net Assets ($000) | | $173,215 |
| |
Total Returns | | |
(Inception 10/27/11) | Market | NAV |
Six Months | 7.46% | 8.22% |
One Year | 7.09% | 12.21% |
Since Inception - average annual | 2.56% | 10.47% |
Performance data quoted represents past performance, which is no guarantee of future results and current performance may be lower or higher than the figures shown. The NAV total returns reflect the Fund's total annual expenses. For the most recent month-end performance figures, please visit www.guggenheiminvestments.com/geq. The investment return and principal value of an investment will fluctuate with changes in the market conditions and other factors so that an investor's shares, when sold, may be worth more or less than their original cost.
| | |
Sector Breakdown* | % of Common Stocks |
Consumer, Non-cyclical | 19.9% |
Financial | 16.1% |
Consumer, Cyclical | 13.5% |
Industrial | 12.8% |
Technology | 9.8% |
Energy | 8.7% |
Communications | 8.1% |
Utilities | 6.1% |
Basic Materials | 4.8% |
Diversified | 0.2% |
*Securities are classified by sectors that represent broad groupings of industries.
Portfolio composition and sector breakdown are subject to change daily. For more information, please visit www.guggenheiminvestments.com/geq. The above summaries are provided for informational purposes only and should not be viewed as recommendations. Past performance does not guarantee future results.
|
| GEQ | GUGGENHEIM EQUAL WEIGHT ENHANCED EQUITY INCOME FUND SEMIANNUAL REPORT | 7 |
PORTFOLIO OF INVESTMENTS (Unaudited) | June 30, 2013 |
| | | | |
Number | | | |
of Shares | | Description | Value |
| | | Common Stocks – 121.3% | |
| | | Basic Materials – 5.9% | |
4,400 | | Air Products & Chemicals, Inc.(a) | $ 402,908 |
4,419 | | Airgas, Inc.(a) | 421,838 |
52,202 | | Alcoa, Inc.(a) | 408,220 |
15,329 | | Allegheny Technologies, Inc.(a) | 403,306 |
2,297 | | CF Industries Holdings, Inc.(a) | 393,936 |
23,894 | | Cliffs Natural Resources, Inc.(a) | 388,278 |
12,464 | | Dow Chemical Co.(a) | 400,967 |
5,968 | | Eastman Chemical Co.(a) | 417,820 |
5,044 | | Ecolab, Inc.(a) | 429,698 |
8,047 | | EI du Pont de Nemours & Co.(a) | 422,468 |
6,773 | | FMC Corp.(a) | 413,559 |
14,335 | | Freeport-McMoRan Copper & Gold, Inc.(a) | 395,789 |
5,402 | | International Flavors & Fragrances, Inc.(a) | 406,014 |
9,346 | | International Paper Co.(a) | 414,122 |
6,286 | | LyondellBasell Industries NV (Netherlands)(a) | 416,510 |
11,866 | | MeadWestvaco Corp.(a) | 404,749 |
4,012 | | Monsanto Co.(a) | 396,386 |
7,327 | | Mosaic Co.(a) | 394,266 |
12,771 | | Newmont Mining Corp.(a) | 382,491 |
9,482 | | Nucor Corp.(a) | 410,760 |
2,755 | | PPG Industries, Inc.(a) | 403,360 |
3,594 | | Praxair, Inc.(a) | 413,885 |
2,314 | | Sherwin-Williams Co.(a) | 408,652 |
5,203 | | Sigma-Aldrich Corp.(a) | 418,113 |
23,692 | | United States Steel Corp.(a) | 415,320 |
| | | | 10,183,415 |
| | | Communications – 9.8% | |
1,547 | | Amazon.com, Inc.(a) (b) | 429,587 |
11,803 | | AT&T, Inc.(a) | 417,826 |
28,874 | | Cablevision Systems Corp., Class A(a) | 485,661 |
8,882 | | CBS Corp., Class B(a) | 434,063 |
11,760 | | CenturyLink, Inc.(a) | 415,716 |
17,595 | | Cisco Systems, Inc.(a) | 427,734 |
10,667 | | Comcast Corp., Class A(a) | 446,734 |
28,410 | | Corning, Inc.(a) | 404,274 |
6,025 | | Crown Castle International Corp.(a) (b) | 436,150 |
6,837 | | Directtv(a) (b) | 421,296 |
5,548 | | Discovery Communications, Inc., Class A(a) (b) | 428,361 |
8,263 | | eBay, Inc.(a) (b) | 427,362 |
7,308 | | Expedia, Inc.(a) | 439,577 |
5,729 | | F5 Networks, Inc.(a) (b) | 394,155 |
100,443 | | Frontier Communications Corp.(a) | 406,794 |
16,961 | | Gannett Co., Inc.(a) | 414,866 |
485 | | Google, Inc., Class A(a) (b) | 426,979 |
8,507 | | Harris Corp.(a) | 418,970 |
29,213 | | Interpublic Group of Cos., Inc.(a) | 425,049 |
29,913 | | JDS Uniphase Corp.(a) (b) | 430,149 |
22,251 | | Juniper Networks, Inc.(a) (b) | 429,667 |
7,445 | | Motorola Solutions, Inc.(a) | 429,800 |
1,982 | | NetFlix, Inc.(a) (b) | 418,380 |
19,831 | | News Corp. Class A, Class A(a) (b) | 303,414 |
6,754 | | Omnicom Group, Inc.(a) | 424,624 |
519 | | priceline.com, Inc.(a) (b) | 429,281 |
6,369 | | Scripps Networks Interactive, Inc., Class A(a) | 425,194 |
57,905 | | Sprint Nextel Corp.(a) (b) | 406,493 |
18,958 | | Symantec Corp.(a) | 425,986 |
4,078 | | Time Warner Cable, Inc.(a) | 458,693 |
7,375 | | Time Warner, Inc.(a) | 426,423 |
6,648 | | TripAdvisor, Inc.(a) (b) | 404,664 |
1,825 | | Twenty-First Century Fox, Inc. | 52,907 |
13,547 | | Twenty-First Century Fox, Inc., Class A | 441,632 |
9,412 | | VeriSign, Inc.(a) (b) | 420,340 |
8,299 | | Verizon Communications, Inc.(a) | 417,772 |
6,347 | | Viacom, Inc., Class B(a) | 431,913 |
6,644 | | Walt Disney Co.(a) | 419,569 |
875 | | Washington Post Co., Class B(a) | 423,299 |
51,007 | | Windstream Corp.(a) | 393,264 |
16,128 | | Yahoo!, Inc.(a) (b) | 404,974 |
| | | | 16,919,592 |
| | | Consumer, Cyclical – 16.4% | |
8,694 | | Abercrombie & Fitch Co., Class A(a) | 393,404 |
9,618 | | AutoNation, Inc.(a) (b) | 417,325 |
1,000 | | AutoZone, Inc.(a) (b) | 423,690 |
5,964 | | Bed Bath & Beyond, Inc.(a) (b) | 422,848 |
15,774 | | Best Buy Co., Inc.(a) | 431,103 |
5,014 | | BorgWarner, Inc.(a) (b) | 431,956 |
9,132 | | CarMax, Inc.(a) (b) | 421,533 |
12,525 | | Carnival Corp. (Panama)(a) | 429,482 |
1,151 | | Chipotle Mexican Grill, Inc.(a) (b) | 419,367 |
9,302 | | Cintas Corp.(a) | 423,613 |
7,244 | | Coach, Inc.(a) | 413,560 |
3,819 | | Costco Wholesale Corp.(a) | 422,267 |
7,180 | | CVS Caremark Corp.(a) | 410,552 |
8,068 | | Darden Restaurants, Inc.(a) | 407,273 |
8,276 | | Delphi Automotive PLC (Jersey)(a) | 419,510 |
8,282 | | Dollar General Corp.(a) (b) | 417,661 |
8,630 | | Dollar Tree, Inc.(a) (b) | 438,749 |
17,743 | | DR Horton, Inc.(a) | 377,571 |
6,704 | | Family Dollar Stores, Inc.(a) | 417,726 |
8,889 | | Fastenal Co.(a) | 407,561 |
27,577 | | Ford Motor Co.(a) | 426,616 |
4,059 | | Fossil Group, Inc.(a) (b) | 419,335 |
See notes to financial statements.
8 | GEQ | GUGGENHEIM EQUAL WEIGHT ENHANCED EQUITY INCOME FUND SEMIANNUAL REPORT |
PORTFOLIO OF INVESTMENTS (Unaudited) continued | June 30, 2013 |
| | | | |
Number | | | |
of Shares | | Description | Value |
| | | Consumer, Cyclical (continued) | |
10,866 | | GameStop Corp., Class A(a) | $ 456,699 |
10,220 | | Gap, Inc.(a) | 426,481 |
12,362 | | General Motors Co.(a) (b) | 411,778 |
5,390 | | Genuine Parts Co.(a) | 420,797 |
27,685 | | Goodyear Tire & Rubber Co.(a) (b) | 423,304 |
7,977 | | Harley-Davidson, Inc.(a) | 437,299 |
8,208 | | Harman International Industries, Inc.(a) | 444,874 |
9,613 | | Hasbro, Inc.(a) | 430,951 |
5,534 | | Home Depot, Inc.(a) | 428,719 |
24,572 | | International Game Technology(a) | 410,598 |
24,387 | | JC Penney Co., Inc.(a) (b) | 416,530 |
11,281 | | Johnson Controls, Inc.(a) | 403,747 |
8,128 | | Kohl's Corp.(a) | 410,545 |
10,860 | | Lennar Corp., Class A(a) | 391,395 |
8,346 | | Limited Brands, Inc.(a) | 411,041 |
10,298 | | Lowe's Cos., Inc.(a) | 421,188 |
8,742 | | Macy's, Inc.(a) | 419,616 |
10,398 | | Marriott International, Inc., Class A(a) | 419,767 |
9,480 | | Mattel, Inc.(a) | 429,539 |
4,307 | | McDonald's Corp.(a) | 426,393 |
15,601 | | Newell Rubbermaid, Inc.(a) | 409,526 |
6,850 | | NIKE, Inc., Class B(a) | 436,208 |
7,191 | | Nordstrom, Inc.(a) | 431,029 |
3,800 | | O'Reilly Automotive, Inc.(a) (b) | 427,956 |
7,965 | | PACCAR, Inc.(a) | 427,402 |
6,123 | | PetSmart, Inc.(a) | 410,180 |
20,320 | | Pulte Group, Inc.(a) (b) | 385,470 |
3,438 | | PVH Corp.(a) | 429,922 |
2,448 | | Ralph Lauren Corp.(a) | 425,316 |
6,536 | | Ross Stores, Inc.(a) | 423,598 |
30,561 | | Southwest Airlines Co.(a) | 393,931 |
26,426 | | Staples, Inc.(a) | 419,116 |
6,462 | | Starbucks Corp.(a) | 423,196 |
6,388 | | Starwood Hotels & Resorts Worldwide, Inc.(a) | 403,658 |
6,140 | | Target Corp.(a) | 422,800 |
5,616 | | Tiffany & Co.(a) | 409,069 |
8,407 | | TJX Cos., Inc.(a) | 420,854 |
10,368 | | Urban Outfitters, Inc.(a) (b) | 417,001 |
2,266 | | VF Corp.(a) | 437,474 |
8,448 | | Walgreen Co.(a) | 373,402 |
5,661 | | Wal-Mart Stores, Inc.(a) | 421,688 |
3,281 | | Whirlpool Corp.(a) | 375,215 |
1,666 | | WW Grainger, Inc.(a) | 420,132 |
7,210 | | Wyndham Worldwide Corp.(a) | 412,628 |
3,137 | | Wynn Resorts Ltd.(a) | 401,536 |
5,962 | | Yum! Brands, Inc.(a) | 413,405 |
| | | | 28,405,675 |
| | | Consumer, Non-cyclical – 24.2% | |
11,514 | | Abbott Laboratories(a) | 401,608 |
9,810 | | Abbvie, Inc.(a) | 405,545 |
3,353 | | Actavis, Inc.(a) (b) | 423,216 |
10,756 | | Adt Corp.(a) | 428,627 |
7,003 | | Aetna, Inc.(a) | 444,944 |
4,597 | | Alexion Pharmaceuticals, Inc.(a) (b) | 424,027 |
4,190 | | Allergan, Inc.(a) | 352,966 |
11,913 | | Altria Group, Inc.(a) | 416,836 |
7,717 | | AmerisourceBergen Corp.(a) | 430,840 |
4,351 | | Amgen, Inc.(a) | 429,270 |
12,814 | | Archer-Daniels-Midland Co.(a) | 434,523 |
6,233 | | Automatic Data Processing, Inc.(a) | 429,204 |
9,849 | | Avery Dennison Corp.(a) | 421,144 |
18,542 | | Avon Products, Inc.(a) | 389,938 |
6,004 | | Baxter International, Inc.(a) | 415,897 |
6,485 | | Beam, Inc.(a) | 409,268 |
4,298 | | Becton Dickinson and Co.(a) | 424,771 |
1,999 | | Biogen IDEC, Inc.(a) (b) | 430,186 |
44,570 | | Boston Scientific Corp.(a) (b) | 413,164 |
9,058 | | Bristol-Myers Squibb Co.(a) | 404,802 |
6,061 | | Brown-Forman Corp., Class B(a) | 409,421 |
9,463 | | Campbell Soup Co.(a) | 423,848 |
8,861 | | Cardinal Health, Inc.(a) | 418,239 |
11,214 | | CareFusion Corp.(a) (b) | 413,236 |
3,552 | | Celgene Corp.(a) (b) | 415,264 |
6,218 | | Cigna Corp.(a) | 450,744 |
4,964 | | Clorox Co.(a) | 412,707 |
10,508 | | Coca-Cola Co.(a) | 421,476 |
11,729 | | Coca-Cola Enterprises, Inc.(a) | 412,392 |
7,206 | | Colgate-Palmolive Co.(a) | 412,832 |
12,434 | | ConAgra Foods, Inc.(a) | 434,320 |
8,149 | | Constellation Brands, Inc., Class A(a) (b) | 424,726 |
6,430 | | Covidien PLC (Ireland)(a) | 367,796 |
627 | | Covidien PLC (Ireland)(b) (c) | 35,864 |
3,817 | | CR Bard, Inc.(a) | 414,832 |
3,289 | | DaVita HealthCare Partners, Inc.(a) (b) | 397,311 |
10,336 | | DENTSPLY International, Inc.(a) | 423,363 |
9,033 | | Dr Pepper Snapple Group, Inc.(a) | 414,886 |
6,055 | | Edwards Lifesciences Corp.(a) (b) | 406,896 |
8,143 | | Eli Lilly & Co.(a) | 399,984 |
6,971 | | Equifax, Inc.(a) | 410,801 |
6,197 | | Estee Lauder Cos., Inc., Class A(a) | 407,577 |
6,843 | | Express Scripts Holding Co.(a) (b) | 422,145 |
10,319 | | Forest Laboratories, Inc.(a) (b) | 423,079 |
8,600 | | General Mills, Inc.(a) | 417,358 |
8,115 | | Gilead Sciences, Inc.(a) (b) | 415,569 |
14,806 | | H&R Block, Inc.(a) | 410,867 |
See notes to financial statements.
|
| GEQ | GUGGENHEIM EQUAL WEIGHT ENHANCED EQUITY INCOME FUND SEMIANNUAL REPORT | 9 |
PORTFOLIO OF INVESTMENTS (Unaudited) continued | June 30, 2013 |
| | | | |
Number | | | |
of Shares | | Description | Value |
| | | Consumer, Non-cyclical (continued) | |
4,754 | | Hershey Co.(a) | $ 424,437 |
10,563 | | Hormel Foods Corp.(a) | 407,521 |
11,697 | | Hospira, Inc.(a) (b) | 448,111 |
5,237 | | Humana, Inc.(a) | 441,898 |
850 | | Intuitive Surgical, Inc.(a) (b) | 430,593 |
14,651 | | Iron Mountain, Inc.(a) | 389,863 |
4,116 | | JM Smucker Co.(a) | 424,565 |
4,991 | | Johnson & Johnson(a) | 428,527 |
6,598 | | Kellogg Co.(a) | 423,790 |
4,332 | | Kimberly-Clark Corp.(a) | 420,810 |
7,613 | | Kraft Foods Group, Inc.(a) | 425,338 |
12,184 | | Kroger Co.(a) | 420,835 |
4,239 | | Laboratory Corp. of America Holdings(a) (b) | 424,324 |
5,716 | | Life Technologies Corp.(a) (b) | 423,041 |
9,658 | | Lorillard, Inc.(a) | 421,861 |
742 | | MasterCard, Inc., Class A(a) | 426,279 |
5,866 | | McCormick & Co., Inc.(a) | 412,732 |
7,744 | | McGraw-Hill Cos., Inc.(a) | 411,903 |
3,709 | | McKesson Corp.(a) | 424,681 |
5,211 | | Mead Johnson Nutrition Co.(a) | 412,868 |
8,009 | | Medtronic, Inc.(a) | 412,223 |
8,840 | | Merck & Co., Inc.(a) | 410,618 |
8,547 | | Molson Coors Brewing Co., Class B(a) | 409,059 |
14,219 | | Mondelez International, Inc.(a) | 405,668 |
7,153 | | Monster Beverage Corp.(a) (b) | 434,687 |
6,814 | | Moody's Corp.(a) | 415,177 |
13,379 | | Mylan, Inc.(a) (b) | 415,150 |
10,936 | | Patterson Cos., Inc.(a) | 411,194 |
11,413 | | Paychex, Inc.(a) | 416,803 |
5,161 | | PepsiCo, Inc.(a) | 422,118 |
3,573 | | Perrigo Co.(a) | 432,332 |
14,571 | | Pfizer, Inc.(a) | 408,134 |
4,601 | | Philip Morris International, Inc.(a) | 398,539 |
5,432 | | Procter & Gamble Co.(a) | 418,209 |
16,135 | | Quanta Services, Inc.(a) (b) | 426,932 |
6,769 | | Quest Diagnostics, Inc.(a) | 410,404 |
1,789 | | Regeneron Pharmaceuticals, Inc.(a) (b) | 402,310 |
8,755 | | Reynolds American, Inc.(a) | 423,479 |
12,619 | | Robert Half International, Inc.(a) | 419,329 |
17,400 | | Safeway, Inc.(a) | 411,684 |
31,076 | | SAIC, Inc.(a) | 432,889 |
9,408 | | St Jude Medical, Inc.(a) | 429,287 |
6,307 | | Stryker Corp.(a) | 407,937 |
12,296 | | Sysco Corp.(a) | 420,031 |
9,081 | | Tenet Healthcare Corp.(a) (b) | 418,634 |
18,067 | | Total System Services, Inc.(a) | 442,280 |
16,584 | | Tyson Foods, Inc., Class A(a) | 425,877 |
6,644 | | UnitedHealth Group, Inc.(a) | 435,049 |
6,155 | | Varian Medical Systems, Inc.(a) (b) | 415,155 |
5,423 | | WellPoint, Inc.(a) | 443,818 |
24,905 | | Western Union Co.(a) | 426,125 |
8,251 | | Whole Foods Market, Inc.(a) | 424,761 |
5,445 | | Zimmer Holdings, Inc.(a) | 408,048 |
13,663 | | Zoetis, Inc.(a) | 422,050 |
| | | | 41,848,276 |
| | | Diversified – 0.2% | |
15,270 | | Leucadia National Corp.(a) | 400,379 |
| | | Energy – 10.6% | |
4,923 | | Anadarko Petroleum Corp.(a) | 423,033 |
4,993 | | Apache Corp.(a) | 418,563 |
9,209 | | Baker Hughes, Inc.(a) | 424,811 |
6,095 | | Cabot Oil & Gas Corp., Class A(a) | 432,867 |
6,826 | | Cameron International Corp.(a) (b) | 417,478 |
20,496 | | Chesapeake Energy Corp.(a) | 417,708 |
3,524 | | Chevron Corp.(a) | 417,030 |
6,945 | | ConocoPhillips(a) | 420,173 |
13,267 | | Consol Energy, Inc.(a) | 359,536 |
23,786 | | Denbury Resources, Inc.(a) (b) | 411,974 |
7,803 | | Devon Energy Corp.(a) | 404,820 |
6,311 | | Diamond Offshore Drilling, Inc.(a) | 434,134 |
7,299 | | Ensco PLC, Class A (United Kingdom)(a) | 424,218 |
3,217 | | EOG Resources, Inc.(a) | 423,615 |
5,320 | | EQT Corp.(a) | 422,248 |
4,680 | | Exxon Mobil Corp.(a) | 422,838 |
7,621 | | FMC Technologies, Inc.(a) (b) | 424,337 |
9,874 | | Halliburton Co.(a) | 411,943 |
6,968 | | Helmerich & Payne, Inc.(a) | 435,152 |
6,426 | | Hess Corp.(a) | 427,265 |
11,033 | | Kinder Morgan, Inc.(a) | 420,909 |
12,328 | | Marathon Oil Corp.(a) | 426,302 |
5,324 | | Marathon Petroleum Corp.(a) | 378,323 |
6,723 | | Murphy Oil Corp.(a) | 409,363 |
26,659 | | Nabors Industries Ltd. (Bermuda)(a) | 408,149 |
6,091 | | National Oilwell Varco, Inc.(a) | 419,670 |
18,839 | | Newfield Exploration Co.(a) (b) | 450,065 |
11,288 | | Noble Corp. (Switzerland)(a) | 424,203 |
7,320 | | Noble Energy, Inc.(a) | 439,493 |
4,614 | | Occidental Petroleum Corp.(a) | 411,707 |
9,560 | | Oneok, Inc.(a) | 394,924 |
25,261 | | Peabody Energy Corp.(a) | 369,821 |
6,642 | | Phillips 66(a) | 391,280 |
2,891 | | Pioneer Natural Resources Co.(a) | 418,472 |
14,482 | | QEP Resources, Inc.(a) | 402,310 |
See notes to financial statements.
10 | GEQ | GUGGENHEIM EQUAL WEIGHT ENHANCED EQUITY INCOME FUND SEMIANNUAL REPORT |
PORTFOLIO OF INVESTMENTS (Unaudited) continued | June 30, 2013 |
| | | | |
Number | | | |
of Shares | | Description | Value |
| | | Energy (continued) | |
5,777 | | Range Resources Corp.(a) | $ 446,678 |
12,676 | | Rowan Companies PLC (United Kingdom)(a) (b) | 431,871 |
5,919 | | Schlumberger Ltd. (Curacao)(a) | 424,156 |
11,599 | | Southwestern Energy Co.(a) (b) | 423,711 |
12,343 | | Spectra Energy Corp.(a) | 425,339 |
7,416 | | Tesoro Corp.(a) | 388,005 |
11,152 | | Valero Energy Corp.(a) | 387,755 |
12,725 | | Williams Cos., Inc.(a) | 413,181 |
22,308 | | WPX Energy, Inc.(a) (b) | 422,514 |
| | | | 18,301,944 |
| | | Financial – 19.5% | |
4,788 | | ACE Ltd. (Switzerland)(a) | 428,430 |
7,371 | | Aflac, Inc.(a) | 428,403 |
9,043 | | Allstate Corp.(a) | 435,149 |
5,809 | | American Express Co.(a) | 434,281 |
9,340 | | American International Group, Inc.(a) (b) | 417,498 |
5,481 | | American Tower Corp., REIT(a) | 401,045 |
5,178 | | Ameriprise Financial, Inc.(a) | 418,797 |
6,532 | | AON PLC (United Kingdom)(a) | 420,334 |
14,651 | | Apartment Investment & Management Co., Class A, REIT(a) | 440,115 |
8,384 | | Assurant, Inc.(a) | 426,829 |
3,149 | | AvalonBay Communities, Inc., REIT(a) | 424,832 |
32,430 | | Bank of America Corp.(a) | 417,050 |
14,551 | | Bank of New York Mellon Corp.(a) | 408,156 |
12,930 | | BB&T Corp.(a) | 438,068 |
3,713 | | Berkshire Hathaway, Inc., Class B(a) (b) | 415,559 |
1,570 | | BlackRock, Inc.(a) | 403,255 |
3,851 | | Boston Properties, Inc., REIT(a) | 406,165 |
6,947 | | Capital One Financial Corp.(a) | 436,341 |
18,697 | | CBRE Group, Inc., Class A(a) (b) | 436,762 |
21,505 | | Charles Schwab Corp.(a) | 456,550 |
4,911 | | Chubb Corp.(a) | 415,716 |
9,179 | | Cincinnati Financial Corp.(a) | 421,316 |
8,611 | | Citigroup, Inc.(a) | 413,070 |
5,705 | | CME Group, Inc.(a) | 433,466 |
11,349 | | Comerica, Inc.(a) | 452,031 |
8,954 | | Discover Financial Services(a) | 426,569 |
37,053 | | E*Trade Financial Corp.(a) (b) | 469,090 |
7,524 | | Equity Residential, REIT(a) | 436,842 |
23,150 | | Fifth Third Bancorp(a) | 417,858 |
2,880 | | Franklin Resources, Inc.(a) | 391,738 |
38,534 | | Genworth Financial, Inc., Class A(a) (b) | 439,673 |
2,603 | | Goldman Sachs Group, Inc.(a) | 393,704 |
14,515 | | Hartford Financial Services Group, Inc.(a) | 448,805 |
9,226 | | HCP, Inc., REIT(a) | 419,229 |
6,292 | | Health Care REIT, Inc., REIT(a) | 421,753 |
24,614 | | Host Hotels & Resorts, Inc., REIT(a) | 415,238 |
51,129 | | Hudson City Bancorp, Inc.(a) | 468,341 |
56,290 | | Huntington Bancshares, Inc.(a) | 443,565 |
2,448 | | IntercontinentalExchange, Inc.(a) (b) | 435,155 |
12,646 | | Invesco Ltd. (Bermuda)(a) | 402,143 |
7,977 | | JPMorgan Chase & Co.(a) | 421,106 |
40,717 | | KeyCorp(a) | 449,516 |
19,259 | | Kimco Realty Corp., REIT(a) | 412,720 |
12,994 | | Legg Mason, Inc.(a) | 402,944 |
12,275 | | Lincoln National Corp.(a) | 447,669 |
9,507 | | Loews Corp.(a) | 422,111 |
4,135 | | M&T Bank Corp.(a) | 462,085 |
6,809 | | Macerich Co., REIT(a) | 415,145 |
10,609 | | Marsh & McLennan Cos., Inc.(a) | 423,511 |
9,641 | | MetLife, Inc.(a) | 441,172 |
16,410 | | Morgan Stanley(a) | 400,896 |
13,002 | | NASDAQ OMX Group, Inc.(a) | 426,336 |
7,420 | | Northern Trust Corp.(a) | 429,618 |
10,472 | | NYSE Euronext(a) | 433,541 |
30,805 | | People's United Financial, Inc.(a) | 458,995 |
8,965 | | Plum Creek Timber Co., Inc., REIT(a) | 418,397 |
5,970 | | PNC Financial Services Group, Inc.(a) | 435,332 |
11,144 | | Principal Financial Group, Inc.(a) | 417,343 |
17,160 | | Progressive Corp.(a) | 436,207 |
11,016 | | ProLogis, Inc., REIT(a) | 415,524 |
6,015 | | Prudential Financial, Inc.(a) | 439,275 |
2,793 | | Public Storage, REIT(a) | 428,251 |
47,202 | | Regions Financial Corp.(a) | 449,835 |
2,552 | | Simon Property Group, Inc., REIT(a) | 403,012 |
18,445 | | SLM Corp.(a) | 421,653 |
6,417 | | State Street Corp.(a) | 418,453 |
13,634 | | SunTrust Banks, Inc.(a) | 430,425 |
5,775 | | T Rowe Price Group, Inc.(a) | 422,441 |
6,555 | | Torchmark Corp.(a) | 426,993 |
5,161 | | Travelers Cos., Inc.(a) | 412,467 |
15,270 | | Unum Group(a) | 448,481 |
12,108 | | US Bancorp(a) | 437,704 |
6,019 | | Ventas, Inc., REIT(a) | 418,080 |
2,342 | | Visa, Inc., Class A(a) | 428,001 |
5,116 | | Vornado Realty Trust, REIT(a) | 423,861 |
10,554 | | Wells Fargo & Co.(a) | 435,564 |
14,984 | | Weyerhaeuser Co., REIT(a) | 426,894 |
13,647 | | XL Group PLC (Ireland)(a) | 413,777 |
15,721 | | Zions Bancorporation(a) | 454,022 |
| | | | 33,768,278 |
See notes to financial statements.
|
| GEQ | GUGGENHEIM EQUAL WEIGHT ENHANCED EQUITY INCOME FUND SEMIANNUAL REPORT | 11 |
PORTFOLIO OF INVESTMENTS (Unaudited) continued | June 30, 2013 |
| | | | |
Number | | | |
of Shares | | Description | Value |
| | | Industrial – 15.5% | |
3,817 | | 3M Co.(a) | $ 417,389 |
9,632 | | Agilent Technologies, Inc.(a) | 411,864 |
5,563 | | Amphenol Corp., Class A(a) | 433,580 |
9,781 | | Ball Corp.(a) | 406,303 |
10,749 | | Bemis Co., Inc.(a) | 420,716 |
4,162 | | Boeing Co.(a) | 426,355 |
5,055 | | Caterpillar, Inc.(a) | 416,987 |
7,503 | | CH Robinson Worldwide, Inc.(a) | 422,494 |
16,995 | | CSX Corp.(a) | 394,114 |
3,650 | | Cummins, Inc.(a) | 395,879 |
6,780 | | Danaher Corp.(a) | 429,174 |
4,993 | | Deere & Co.(a) | 405,681 |
5,394 | | Dover Corp.(a) | 418,898 |
6,564 | | Eaton Corp. PLC (Ireland)(a) | 431,977 |
7,551 | | Emerson Electric Co.(a) | 411,832 |
11,074 | | Expeditors International of Washington, Inc.(a) | 420,923 |
4,277 | | FedEx Corp.(a) | 421,627 |
17,343 | | FLIR Systems, Inc.(a) | 467,742 |
7,522 | | Flowserve Corp.(a) | 406,263 |
6,949 | | Fluor Corp.(a) | 412,145 |
12,570 | | Garmin Ltd. (Switzerland)(a) | 454,532 |
5,434 | | General Dynamics Corp.(a) | 425,645 |
18,021 | | General Electric Co.(a) | 417,907 |
5,421 | | Honeywell International, Inc.(a) | 430,102 |
6,034 | | Illinois Tool Works, Inc.(a) | 417,372 |
7,511 | | Ingersoll-Rand PLC (Ireland)(a) | 417,011 |
21,827 | | Jabil Circuit, Inc.(a) | 444,834 |
7,592 | | Jacobs Engineering Group, Inc.(a) (b) | 418,547 |
8,020 | | Joy Global, Inc.(a) | 389,211 |
3,832 | | Kansas City Southern(a) | 406,039 |
4,927 | | L-3 Communications Holdings, Inc.(a) | 422,441 |
13,132 | | Leggett & Platt, Inc.(a) | 408,274 |
3,936 | | Lockheed Martin Corp.(a) | 426,899 |
20,388 | | Masco Corp.(a) | 397,362 |
14,329 | | Molex, Inc.(a) | 420,412 |
5,565 | | Norfolk Southern Corp.(a) | 404,297 |
5,114 | | Northrop Grumman Corp.(a) | 423,439 |
15,264 | | Owens-Illinois, Inc.(a) (b) | 424,187 |
6,208 | | Pall Corp.(a) | 412,397 |
4,351 | | Parker Hannifin Corp.(a) | 415,085 |
7,098 | | Pentair Ltd. (Switzerland)(a) | 409,484 |
12,828 | | PerkinElmer, Inc.(a) | 416,910 |
1,926 | | Precision Castparts Corp.(a) | 435,295 |
6,288 | | Raytheon Co.(a) | 415,763 |
12,445 | | Republic Services, Inc.(a) | 422,383 |
4,889 | | Rockwell Automation, Inc.(a) | 406,471 |
6,574 | | Rockwell Collins, Inc.(a) | 416,857 |
3,518 | | Roper Industries, Inc.(a) | 437,007 |
6,826 | | Ryder System, Inc.(a) | 414,953 |
17,750 | | Sealed Air Corp.(a) | 425,113 |
4,656 | | Snap-On, Inc.(a) | 416,153 |
5,337 | | Stanley Black & Decker, Inc.(a) | 412,550 |
3,984 | | Stericycle, Inc.(a) (b) | 439,952 |
9,332 | | TE Connectivity Ltd. (Switzerland)(a) | 424,979 |
15,995 | | Textron, Inc.(a) | 416,670 |
4,980 | | Thermo Fisher Scientific, Inc.(a) | 421,457 |
12,725 | | Tyco International Ltd. (Switzerland)(a) | 419,289 |
2,700 | | Union Pacific Corp.(a) | 416,556 |
4,934 | | United Parcel Service, Inc., Class B(a) | 426,691 |
4,508 | | United Technologies Corp.(a) | 418,974 |
7,895 | | Vulcan Materials Co.(a) | 382,197 |
10,682 | | Waste Management, Inc.(a) | 430,805 |
4,298 | | Waters Corp.(a) (b) | 430,015 |
15,630 | | Xylem, Inc.(a) | 421,072 |
| | | | 26,825,532 |
| | | Technology – 11.9% | |
5,262 | | Accenture PLC, Class A (Ireland)(a) | 378,654 |
9,895 | | Adobe Systems, Inc.(a) (b) | 450,817 |
107,581 | | Advanced Micro Devices, Inc.(a) (b) | 438,931 |
9,959 | | Akamai Technologies, Inc.(a) (b) | 423,755 |
13,127 | | Altera Corp.(a) | 433,060 |
9,429 | | Analog Devices, Inc.(a) | 424,871 |
985 | | Apple, Inc.(a) | 390,139 |
27,507 | | Applied Materials, Inc.(a) | 410,129 |
12,080 | | Autodesk, Inc.(a) (b) | 409,995 |
9,397 | | BMC Software, Inc.(a) (b) | 424,181 |
12,544 | | Broadcom Corp., Class A(a) | 423,485 |
14,999 | | CA, Inc.(a) | 429,421 |
4,315 | | Cerner Corp.(a) (b) | 414,628 |
6,922 | | Citrix Systems, Inc.(a) (b) | 417,604 |
6,731 | | Cognizant Technology Solutions Corp., Class A(a) (b) | 421,428 |
9,448 | | Computer Sciences Corp.(a) | 413,539 |
31,657 | | Dell, Inc.(a) | 422,621 |
4,292 | | Dun & Bradstreet Corp.(a) | 418,255 |
19,434 | | Electronic Arts, Inc.(a) (b) | 446,399 |
17,120 | | EMC Corp.(a) | 404,374 |
9,713 | | Fidelity National Information Services, Inc.(a) | 416,105 |
9,480 | | First Solar, Inc.(a) (b) | 424,040 |
4,872 | | Fiserv, Inc.(a) (b) | 425,862 |
17,133 | | Hewlett-Packard Co.(a) | 424,898 |
17,010 | | Intel Corp.(a) | 411,982 |
2,096 | | International Business Machines Corp.(a) | 400,567 |
7,371 | | Intuit, Inc.(a) | 449,853 |
7,608 | | KLA-Tencor Corp.(a) | 423,994 |
See notes to financial statements.
12 | GEQ | GUGGENHEIM EQUAL WEIGHT ENHANCED EQUITY INCOME FUND SEMIANNUAL REPORT |
PORTFOLIO OF INVESTMENTS (Unaudited) continued | June 30, 2013 |
| | | | |
Number | | | |
of Shares | | Description | Value |
| | | Technology (continued) | |
9,003 | | Lam Research Corp.(a) (b) | $ 399,193 |
11,648 | | Linear Technology Corp.(a) | 429,112 |
57,986 | | LSI Corp.(a) (b) | 414,020 |
11,445 | | Microchip Technology, Inc.(a) | 426,326 |
33,219 | | Micron Technology, Inc.(a) (b) | 476,029 |
12,322 | | Microsoft Corp.(a) | 425,479 |
11,184 | | NetApp, Inc.(a) | 422,532 |
29,537 | | NVIDIA Corp.(a) | 414,404 |
12,551 | | Oracle Corp.(a) | 385,567 |
29,052 | | Pitney Bowes, Inc.(a) | 426,483 |
6,905 | | Qualcomm, Inc.(a) | 421,757 |
9,253 | | Red Hat, Inc.(a) (b) | 442,478 |
11,286 | | Salesforce.com, Inc.(a) (b) | 430,899 |
7,208 | | SanDisk Corp.(a) (b) | 440,408 |
9,696 | | Seagate Technology PLC (Ireland)(a) | 434,672 |
7,558 | | Teradata Corp.(a) (b) | 379,638 |
24,445 | | Teradyne, Inc.(a) (b) | 429,499 |
11,947 | | Texas Instruments, Inc.(a) | 416,592 |
6,636 | | Western Digital Corp.(a) | 412,029 |
46,579 | | Xerox Corp.(a) | 422,472 |
10,902 | | Xilinx, Inc.(a) | 431,828 |
| | | | 20,655,004 |
| | | Utilities – 7.3% | |
34,293 | | AES Corp.(a) | 411,173 |
9,861 | | AGL Resources, Inc.(a) | 422,642 |
12,430 | | Ameren Corp.(a) | 428,089 |
9,315 | | American Electric Power Co., Inc.(a) | 417,126 |
17,877 | | CenterPoint Energy, Inc.(a) | 419,931 |
15,469 | | CMS Energy Corp.(a) | 420,293 |
7,331 | | Consolidated Edison, Inc.(a) | 427,471 |
7,564 | | Dominion Resources, Inc.(a) | 429,786 |
6,339 | | DTE Energy Co.(a) | 424,776 |
6,267 | | Duke Energy Corp.(a) | 423,023 |
8,990 | | Edison International(a) | 432,958 |
6,191 | | Entergy Corp.(a) | 431,389 |
13,839 | | Exelon Corp.(a) | 427,348 |
11,059 | | FirstEnergy Corp.(a) | 412,943 |
7,373 | | Integrys Energy Group, Inc.(a) | 431,542 |
5,315 | | NextEra Energy, Inc.(a) | 433,066 |
14,560 | | NiSource, Inc.(a) | 416,998 |
10,061 | | Northeast Utilities(a) | 422,763 |
15,698 | | NRG Energy, Inc.(a) | 419,137 |
20,901 | | Pepco Holdings, Inc.(a) | 421,364 |
9,385 | | PG&E Corp.(a) | 429,176 |
7,365 | | Pinnacle West Capital Corp.(a) | 408,537 |
14,551 | | PPL Corp.(a) | 440,314 |
12,990 | | Public Service Enterprise Group, Inc.(a) | | 424,253 |
8,571 | | SCANA Corp.(a) | | | 420,836 |
5,275 | | Sempra Energy(a) | | | 431,285 |
9,526 | | Southern Co.(a) | | | 420,382 |
24,459 | | TECO Energy, Inc.(a) | | | 420,450 |
10,294 | | Wisconsin Energy Corp.(a) | | | 421,951 |
14,407 | | Xcel Energy, Inc.(a) | | | 408,294 |
| | | | | | 12,699,296 |
| | | Total Common Stocks – 121.3% | | | |
| | | (Cost $179,658,869) | | | 210,007,391 |
| | | Short Term Investments – 1.4% | | |
| | | Money Market Fund – 1.4% | | | |
2,488,749 | | Dreyfus Treasury Prime Cash Management Institutional | |
| | | Shares, 12/31/2050 | | | |
| | | (Cost $2,488,749) | | | 2,488,749 |
| | | Total Investments – 122.7% | | | |
| | | (Cost $182,147,618) | | | 212,496,140 |
| | | Liabilities in excess of Other Assets – 0.0%* | | (65,243) |
| | | Total Value of Options Written – (1.9%) (Premiums | |
| | | received $2,907,556) | | | (3,215,880) |
| | | Borrowings – (20.8% of Net Assets or 16.9% of Total | |
| | | Investments) | | | (36,000,000) |
| | | Net Assets – 100.0% | | | $173,215,017 |
| |
Contracts | | | | | |
(100 shares | | | Expiration | Exercise | |
per contract) | | Options Written (b) | Month | Price | Value |
| | | Call Options Written – (1.9%) | | | |
640 | | Energy Select Sector SPDR Fund | July 2013 | $ 79.00 | $ (63,360) |
2,616 | | Financial Select Sector SPDR Fund | July 2013 | 19.00 | (166,116) |
1,572 | | iShares Russell 2000 Index Fund | July 2013 | 96.00 | (316,758) |
1,180 | | Industrial Select Sector SPDR Fund | July 2013 | 42.00 | (125,670) |
1,412 | | Powershares QQQ Trust Series 1 | July 2013 | 72.00 | (86,838) |
632 | | S&P 500 Index | July 2013 | 1,605.00 | (1,390,400) |
1,359 | | SPDR Dow Jones Industrial | | | |
| | | Average ETF | July 2013 | 148.00 | (318,006) |
1,449 | | SPDR Midcap 400 ETF Trust | July 2013 | 210.00 | (514,395) |
661 | | SPDR S&P Retail ETF | July 2013 | 76.00 | (100,472) |
900 | | SPDR S&P Retail ETF | July 2013 | 77.00 | (97,280) |
1,626 | | Technology Select Sector SPDR | | | |
| | | Fund | July 2013 | 31.00 | (36,585) |
| | | Total Value of Call Options Written – (1.9%) | | |
| | | Premiums received ($2,907,556) | | | $(3,215,880) |
See notes to financial statements.
|
| GEQ | GUGGENHEIM EQUAL WEIGHT ENHANCED EQUITY INCOME FUND SEMIANNUAL REPORT | 13 |
PORTFOLIO OF INVESTMENTS (Unaudited) continued | June 30, 2013 |
NV – Publicly Traded Company
PLC – Public Limited Company
REIT – Real Estate Investment Trust
* Less than 0.1%.
(a) All or a portion of these securities have been physically segregated in connection with borrowings. As of June 30, 2013, the total amount segregated was $212,484,608.
(b) Non-income producing security.
(c) When-issued or delayed delivery security.
Securities are classified by sectors that represent broad grouping of industries.
See notes to financial statements.
14 | GEQ | GUGGENHEIM EQUAL WEIGHT ENHANCED EQUITY INCOME FUND SEMIANNUAL REPORT |
STATEMENT OF ASSETS AND LIABILITIES (Unaudited) | June 30, 2013 |
| | | |
Assets | | |
Investments, at value (cost $182,147,618) | $ | 212,496,140 | |
Receivable for securities sold | | 489,456 | |
Dividends receivable | | 241,863 | |
Other assets | | 7,118 | |
Total assets | | 213,234,577 | |
Liabilities | | | |
Borrowings | | 36,000,000 | |
Options written, at value (premiums received of $2,907,556) | | 3,215,880 | |
Payable for securities purchased | | 392,297 | |
Advisory fee payable | | 158,642 | |
Custodian bank | | 24,009 | |
Interest due on borrowings | | 21,328 | |
Administration fee payable | | 4,352 | |
Accrued expenses and other liabilities | | 203,052 | |
Total liabilities | | 40,019,560 | |
Net Assets | $ | 173,215,017 | |
Composition of Net Assets | | | |
Common shares, $.01 par value per share; unlimited number of shares authorized, | | | |
8,770,121 shares issued and outstanding | $ | 87,701 | |
Additional paid-in capital | | 156,387,971 | |
Accumulated net realized loss on investments and options | | (5,896,637 | ) |
Accumulated net unrealized appreciation on investments and options | | 30,040,198 | |
Distributions in excess of net investment income | | (7,404,216 | ) |
Net Assets | $ | 173,215,017 | |
Net Asset Value (based on 8,770,121 common shares outstanding) | $ | 19.75 | |
See notes to financial statements.
|
| GEQ | GUGGENHEIM EQUAL WEIGHT ENHANCED EQUITY INCOME FUND SEMIANNUAL REPORT | 15 |
STATEMENT OF OPERATIONS For the six months ended June 30, 2013 (Unaudited) | June 30, 2013 |
| | | | | | |
Investment Income | | | | | |
Dividends (net of foreign withholding taxes of $1,598) | $ | 1,675,495 | | | | |
Less return of capital distributions received | | (1,037 | ) | | | |
Total income | | | | | $ | 1,674,458 | |
Expenses | | | | | | | |
Advisory fee | | 984,025 | | | | | |
Interest expense | | 152,677 | | | | | |
Professional fees | | 63,680 | | | | | |
Custodian fee | | 36,794 | | | | | |
Fund accounting | | 35,871 | | | | | |
Trustees' fees and expenses | | 32,762 | | | | | |
Administrative fee | | 26,966 | | | | | |
Licensing fee | | 24,862 | | | | | |
Printing expense | | 16,441 | | | | | |
Insurance | | 10,935 | | | | | |
NYSE listing fee | | 10,498 | | | | | |
Transfer agent fee | | 8,874 | | | | | |
Miscellaneous | | 433 | | | | | |
Total expenses | | | | | | 1,404,818 | |
Net investment income | | | | | | 269,640 | |
Realized and Unrealized Gain (Loss) on Investments and Options | | | | | | | |
Net realized gain (loss) on: | | | | | | | |
Investments | | | | | | 15,614,326 | |
Options | | | | | | (14,579,519 | ) |
Net change in unrealized appreciation (depreciation) on: | | | | | | | |
Investments | | | | | | 12,860,257 | |
Options | | | | | | (492,466 | ) |
Net realized and unrealized gain on investments and options | | | | | | 13,402,598 | |
Net Increase in Net Assets Resulting from Operations | | | | | $ | 13,672,238 | |
See notes to financial statements.
16 | GEQ | GUGGENHEIM EQUAL WEIGHT ENHANCED EQUITY INCOME FUND SEMIANNUAL REPORT |
STATEMENTS OF CHANGES IN NET ASSETS | June 30, 2013 |
| | | | | | | | | |
| | | | | | | | For the Period | |
| For the Six Months | | | For the Period | | | October 27, 2011** | |
| Ended June 30, 2013 | | | Year Ended | | | through | |
| | (unaudited) | | | December 31, 2012* | | | June 30, 2012 | |
Increase in Net Assets Resulting from Operations | | | | | | | | |
Net investment income | $ | 269,640 | | | $ | 1,062,564 | | | $ | 757,920 | |
Net realized gain (loss) on investments and options | | 1,034,807 | | | | (6,890,949 | ) | | | 2,783,860 | |
Net change in unrealized appreciation on investments and options | | 12,367,791 | | | | 11,984,063 | | | | 5,688,344 | |
Net increase in net assets resulting from operations | | 13,672,238 | | | | 6,155,678 | | | | 9,230,124 | |
Distributions to Shareholders | | | | | | | | | | | |
From and in excess of net investment income | | (7,673,856 | ) | | | (962,285 | ) | | | (3,695,304 | ) |
Return of capital | | – | | | | (6,705,060 | ) | | | (3,965,531 | ) |
| | | (7,673,856 | ) | | | (7,667,345 | ) | | | (7,660,835 | ) |
Capital Share Transactions | | | | | | | | | | | |
Net proceeds from the issuance of common shares | | – | | | | – | | | | 167,125,000 | |
Reinvestment of dividends | | – | | | | 283,929 | | | | – | |
Common share offering costs charged to paid-in capital | | – | | | | – | | | | (350,000 | ) |
Net increase from capital share transactions | | – | | | | 283,929 | | | | 166,775,000 | |
Total increase (decrease) in net assets | | 5,998,382 | | | | (1,227,738 | ) | | | 168,344,289 | |
Net Assets: | | | | | | | | | | | |
Beginning of period | | 167,216,635 | | | | 168,444,373 | | | | 100,084 | |
End of period (including distributions in excess of net | | | | | | | | | | | |
investment income of $7,404,216, $0 and $0, respectively) | $ | 173,215,017 | | | $ | 167,216,635 | | | $ | 168,444,373 | |
| * | Fiscal year end changed from June 30 to December 31. |
| ** | Commencement of investment operations |
See notes to financial statements.
|
| GEQ | GUGGENHEIM EQUAL WEIGHT ENHANCED EQUITY INCOME FUND SEMIANNUAL REPORT | 17 |
STATEMENT OF CASH FLOWS For the six months ended June 30, 2013 (Unaudited) | June 30, 2013 |
| | | | |
Cash Flows from Operating Activities: | | | |
Net increase in net assets resulting from operations | | $ | 13,672,238 | |
Adjustments to Reconcile Net Increase in Net Assets Resulting from Operations to | | | | |
Net Cash Provided by Operating and Investing Activities: | | | | |
Net unrealized appreciation on investments | | | (12,860,257 | ) |
Net unrealized depreciation on options | | | 492,466 | |
Net realized gain on investments | | | (15,614,326 | ) |
Net realized loss on options | | | 14,579,519 | |
Purchase of long-term investments | | | (156,886,024 | ) |
Cost of written options closed | | | (29,642,617 | ) |
Premiums received on call options written | | | 16,029,715 | |
Proceeds from sale of long-term investments | | | 175,078,430 | |
Net purchases of short-term investments | | | (239,056 | ) |
Increase in dividends receivable | | | (36,065 | ) |
Increase in receivable for securities sold | | | (82,660 | ) |
Increase in other assets | | | (7,118 | ) |
Decrease in tax reclaims receivable | | | 1,308 | |
Decrease in investments purchased payable | | | (14,253 | ) |
Decrease in dividends payable | | | (761,936 | ) |
Decrease in advisory fee payable | | | (13,638 | ) |
Increase in custodian bank | | | 1,680 | |
Decrease in administration fee payable | | | (366 | ) |
Decrease in interest due on borrowings | | | (15,804 | ) |
Return of capital distributions received | | | 1,037 | |
Decrease in accrued expenses and other liabilities | | | (8,417 | ) |
Net Cash Provided by Operating and Investing Activities | | | 3,673,856 | |
Cash Flows From Financing Activities: | | | | |
Proceeds from borrowings | | | 45,500,000 | |
Payments made on borrowings | | | (41,500,000 | ) |
Distributions to shareholders | | | (7,673,856 | ) |
Net Cash Used in Financing Activities | | | (3,673,856 | ) |
Net change in cash | | | – | |
Cash at Beginning of Period | | | – | |
Cash at End of Period | | $ | – | |
Supplemental Disclosure of Cash Flow Information: Cash paid during the period for interest | | $ | 168,481 | |
Supplemental Disclosure of Non Cash Operating Activity: Options exercised during the period | | $ | 908,708 | |
See notes to financial statements.
18 | GEQ | GUGGENHEIM EQUAL WEIGHT ENHANCED EQUITY INCOME FUND SEMIANNUAL REPORT |
| | | | | | | | | | |
| | | | | | | | | For the Period | |
| | | For the Six Months | | | For the Period | | | October 27, 2011** | |
Per share operating performance | | Ended June 30, 2013 | | | Year Ended | | | through | |
for a common share outstanding throughout the period | | (unaudited) | | | December 31, 2012* | | | June 30, 2012 | |
Net asset value, beginning of period | | $ | 19.07 | | | $ | 19.24 | | | $ | 19.10 | (a) |
Investment operations | | | | | | | | | | | | |
Net investment income (b) | | | 0.03 | | | | 0.12 | | | | 0.09 | |
Net realized and unrealized gain on investments and options | | | 1.53 | | | | 0.59 | | | | 0.97 | |
Total from investment operations | | | 1.56 | | | | 0.71 | | | | 1.06 | |
Common shares’ offering expenses charged to paid-in-capital | | | – | | | | – | | | | (0.04 | ) |
Distributions to Shareholders | | | | | | | | | | | | |
From and in excess of net investment income | | | (0.88 | ) | | | (0.11 | ) | | | (0.42 | ) |
Return of capital | | | – | | | | (0.77 | ) | | | (0.46 | ) |
Total distributions to shareholders | | | (0.88 | ) | | | (0.88 | ) | | | (0.88 | ) |
Net asset value, end of period | | $ | 19.75 | | | $ | 19.07 | | | $ | 19.24 | |
Market value, end of period | | $ | 18.19 | | | $ | 17.73 | | | $ | 18.61 | |
Total investment return (c) | | | | | | | | | | | | |
Net asset value | | | 8.22 | % | | | 3.69 | % | | | 5.30 | % |
Market value | | | 7.46 | % | | | -0.35 | % | | | -2.57 | % |
Ratios and supplemental data | | | | | | | | | | | | |
Net assets end of period (thousands) | | $ | 173,215 | | | $ | 167,217 | | | $ | 168,444 | |
Ratios to Average Net Assets: | | | | | | | | | | | | |
Total expenses, excluding interest expense | | | 1.46 | %(d) | | | 1.54 | %(d) | | | 1.59 | %(d) |
Total expenses, including interest expense | | | 1.64 | %(d) | | | 1.78 | %(d) | | | 1.80 | %(d) |
Net investment income, including interest expense | | | 0.32 | %(d) | | | 1.25 | %(d) | | | 0.71 | %(d) |
Portfolio Turnover(e) | | | 79 | % | | | 54 | % | | | 31 | % |
Senior Indebtedness: | | | | | | | | | | | | |
Total Borrowings outstanding (in thousands) | | $ | 36,000 | | | $ | 32,000 | | | $ | 34,000 | |
Asset Coverage per $1,000 of indebtedness(f) | | $ | 5,812 | | | $ | 6,226 | | | $ | 5,954 | |
| * | Fiscal year end changed from June 30 to December 31. |
| ** | Commencement of investment operations. |
| (a) | Before deduction of offering expenses charged to capital. |
| (b) | Based on average shares outstanding. |
| (c) | Total investment return is calculated assuming a purchase of a common share at the beginning of the period and a sale on the last day of the period reported either at net asset value (NAV) or market price per share. Dividends and distributions are assumed to be reinvested at NAV for NAV returns or the prices obtained under the Fund's Dividend Reinvestment Plan market value returns. Total investment return does not reflect brokerage commissions. A return calculated for a period of less than one year is not annualized. |
| (d) | Annualized. |
| (e) | Portfolio turnover is not annualized for periods of less than one year. |
| (f) | Calculated by subtracting the Fund's total liabilities (not including borrowings) from the Fund's total assets and dividing by the total borrowings. |
See notes to financial statements.
|
| GEQ | GUGGENHEIM EQUAL WEIGHT ENHANCED EQUITY INCOME FUND SEMIANNUAL REPORT | 19 |
NOTES TO FINANCIAL STATEMENTS (Unaudited) | June 30, 2013 |
Note 1 – Organization:
Guggenheim Equal Weight Enhanced Equity Income Fund (the “Fund”) was organized as a Delaware statutory trust on July 11, 2011. The Fund is registered as a diversified, closed-end management investment company under the Investment Company Act of 1940, as amended (the “1940 Act”).
The Fund’s investment objective is to provide a high level of risk-adjusted total return with an emphasis on current income. There can be no assurance that the Fund will achieve its investment objectives. The Fund’s investment objective is considered fundamental and may not be changed without shareholder approval.
Note 2 – Accounting Policies:
The preparation of the financial statements in accordance with U.S. generally accepted accounting principles (“GAAP”) requires management to make estimates and assumptions that affect the reported amounts and disclosures in the financial statements. Actual results could differ from these estimates.
The following is a summary of significant accounting policies consistently followed by the Fund.
(a) Valuation of Investments
The Fund values equity securities at the last reported sale price on the principal exchange or in the principal over-the-counter (“OTC”) market in which such securities are traded, as of the close of regular trading on the New York Stock Exchange (“NYSE”) on the day the securities are being valued or, if there are no sales, at the mean between the last available bid and ask prices on that day. Securities traded on the NASDAQ are valued at the NASDAQ Official Closing Price. Preferred stocks are valued at their sales price as of the close of the exchange on which they are traded. Preferred stocks for which the last price is not available are valued at the mean between the last available bid and ask prices on that day. Equity index options are valued at the mean between the last available bid and ask prices on the primary exchange on which they are traded. Exchange-traded options are valued at the mean of the best bid and ask prices at the close on those exchanges on which they are traded. The Fund values money market funds at net asset value. Short-term securities with remaining maturities of 60 days or less, at the time of purchase, are valued at amortized cost, which approximated market value.
For those securities where quotations or prices are not available, the valuations are determined in accordance with procedures established in good faith by management and approved by the Board of Trustees (“Trustees”). A valuation committee consisting of representatives from investments, fund administration, legal and compliance is responsible for the oversight of the valuation process of the Fund and convenes monthly, or more frequently as needed. The valuation committee reviews monthly Level 3 fair valued securities methodology, price overrides, broker quoted securities price source changes, illiquid securities, unchanged valuations, halted securities, price challenges, fair valued securities sold and back testing trade prices in relation to prior day closing prices. On a quarterly basis, the valuations and methodologies of all Level 3 fair valued securities are presented to the Fund’s Trustees.
Valuations in accordance with these procedures are intended to reflect each security’s (or asset’s) “fair value.” Fair value is defined as the price that the Fund would receive to sell an investment or pay to transfer a liability in an orderly transaction with an independent buyer in the principal market, or in the absence of a principal market, the most advantageous market for the investment or liability. Each such determination is based on a consideration of all relevant factors, which are likely to vary from one pricing context to another. Examples of such factors may include, but are not limited to: (i) the type of security, (ii) the initial cost of the security, (iii) the existence of any contractual restrictions on the security’s disposition, (iv) the price and extent of public trading in similar securities of the issuer or of comparable companies, (v) quotations or evaluated prices from broker-dealers and/or pricing services, (vi) information obtained from the issuer, analysts, and/or the appropriate stock exchange (for exchange traded securities), (vii) an analysis of the company’s financial statements, and (viii) an evaluation of the forces that influence the issuer and the market(s) in which the security is purchased and sold (e.g. the existence of pending merger activity, public offerings or tender offers that might affect the value of the security).
There are three different categories for valuations. Level 1 valuations are those based upon quoted prices in active markets. Level 2 valuations are those based upon quoted prices in inactive markets or based upon significant observable inputs (e.g. yield curves; benchmark interest rates; indices). Level 3 valuations are those based upon unobservable inputs (e.g. discounted cash flow analysis; non-market based methods used to determine fair valuation).
The Fund values Level 1 securities using readily available market quotations in active markets. Money market funds are valued at net asset value. The fund values Level 2 fixed income securities using independent pricing providers who employ matrix pricing models utilizing market prices, broker quotes and prices of securities with comparable maturities and qualities. The Fund values Level 2 equity securities using various observable market inputs as described above. The Fund did not have any Level 2 or Level 3 securities during the six months ended June 30, 2013.
Transfers between valuation levels, if any, are in comparison to the valuation levels at the end of the previous fiscal year, and are effective as of the beginning of the period.
20 | GEQ | GUGGENHEIM EQUAL WEIGHT ENHANCED EQUITY INCOME FUND SEMIANNUAL REPORT |
NOTES TO FINANCIAL STATEMENTS (Unaudited) continued | June 30, 2013 |
The following table represents the Fund’s investments carried on the Statement of Assets and Liabilities by caption and by level within the fair value hierarchy at June 30, 2013.
| | | | | | | | | | | | | |
Description | | | | | | | | | | | | |
(value in $000s) | | Level 1 | | | Level 2 | | | Level 3 | | | Total | |
Assets: | | | | | | | | | | | | |
Common Stocks | | $ | 210,007 | | | $ | – | | | $ | – | | | $ | 210,007 | |
Money Market Fund | | | 2,489 | | | | – | | | | – | | | | 2,489 | |
Total | | $ | 212,496 | | | $ | – | | | $ | – | | | $ | 212,496 | |
Liabilities: | | | | | | | | | | | | | | | | |
Call Options Written | | $ | 3,216 | | | $ | – | | | $ | – | | | $ | 3,216 | |
Total | | $ | 3,216 | | | $ | – | | | $ | – | | | $ | 3,216 | |
During the six months ended June 30, 2013, there were no transfers between levels.
(b) Investment Transactions and Investment Income
Investment transactions are accounted for on the trade date. Realized gains and losses on investments are determined on the identified cost basis. Dividend income is recorded net of applicable withholding taxes on the ex-dividend date and interest income is recorded on an accrual basis. Discounts on debt securities purchased are accreted to interest income over the lives of the respective securities using the effective interest method. Premiums on debt securities purchased are amortized to interest income up to the next call date of the respective securities using the effective interest method.
(c) Options
The Fund will utilize a call option writing strategy to seek to generate current income and potentially mitigate overall portfolio volatility. The option strategy will include writing (i.e. selling) call options on securities indices, exchange-traded funds that track securities indices, baskets of securities and other instruments, which will include securities that are not held by the Fund.
An option on a security is a contract that gives the holder of the option, in return for a premium, the right to buy from (in the case of a call) or sell to (in the case of a put) the writer of the option the security underlying the option at a specific exercise or “strike” price. The writer of an option on a security has an obligation upon exercise of the option to deliver the underlying security upon payment of the exercise price (in the case of a call) or to pay the exercise price upon delivery of the underlying security (in the case of a put). When an option is written, the premium received is recorded as an asset with an equal liability and is subsequently marked to market to reflect the current market value of the option written. These liabilities are reflected as options written in the Statement of Assets and Liabilities. Premiums received from writing options which expire unexercised are recorded on the expiration date as a realized gain. The difference between the premium received and the amount paid on effecting a closing purchase transaction, including brokerage commissions, is also treated as a realized gain, or if the premium is less than the amount paid for the closing purchase transactions, as a realized loss. If an option is exercised, the premium is added to the cost of the purchase (in the case of a put) or proceeds from the sale of the underlying security (in case of a call) in determining whether there has been a realized gain or loss.
As the seller of an index call option, the Fund receives cash (the premium) from the purchaser. The purchaser of an index call option has the right to any appreciation in the value of the index over a fixed price (the exercise price) on or before a certain date in the future (the expiration date). The Fund, in effect, agrees to sell the potential appreciation in the value of the relevant index over the exercise price in exchange for the premium. If, at or before expiration, the purchaser exercises the call option sold by the Fund, the Fund will pay the purchaser the difference between the cash value of the index and the exercise price of the index option (the exercise settlement amount). The premium, the exercise price and the market value of the index determine the gain or loss realized by the Fund as the seller of the index call option.
Options on an index differ from options on securities because (i) the exercise of an index option requires cash payments and does not involve the actual purchase or sale of securities, (ii) the holder of an index call option has the right to receive cash (instead of securities) upon exercise of the option in an amount equal to the amount by which the level of the index exceeds the exercise price and (iii) index options reflect price-fluctuations in a group of securities or segments of the securities market rather than price fluctuations in a single security.
(d) Distributions
The Fund declares and pays quarterly distributions to shareholders. Any net realized long-term capital gains are distributed annually. Distributions to shareholders are recorded on the ex-dividend date. The amount and timing of distributions are determined in accordance with federal income tax regulations, which may differ from GAAP.
Note 3 – Investment Advisory Agreement, Sub-Advisory Agreement and Other Agreements:
Pursuant to an Investment Advisory Agreement between the Fund and Guggenheim Funds Investment Advisors, LLC (“GFIA” or the “Adviser”), the Adviser furnishes offices, necessary facilities and equipment, provides personnel, including certain officers required for the Fund’s administrative management and compensates the officers or trustees of the Fund who are affiliates of the Adviser. As compensation for these services, the Fund pays the Adviser a fee, payable monthly, in an amount equal to 1.00% of the Fund’s average daily managed assets (net assets plus any assets attributable to financial leverage).
|
| GEQ | GUGGENHEIM EQUAL WEIGHT ENHANCED EQUITY INCOME FUND SEMIANNUAL REPORT | 21 |
NOTES TO FINANCIAL STATEMENTS (Unaudited) continued | June 30, 2013 |
The Fund and the Adviser have entered into a Sub-Advisory Agreement (the “Options Strategy Sub-Advisory Agreement”) with Guggenheim Partners Investment Management, LLC (“GPIM”). GPIM is responsible for the management of the Fund’s options strategy. Under the terms of the Options Strategy Sub-Advisory Agreement, the Adviser pays monthly to GPIM a fee at the annual rate of 0.50% of the Fund’s average daily managed assets.
The Fund and the Adviser have also entered into a Sub-Advisory Agreement (the “Equity Portfolio Sub-Advisory Agreement”) with Security Investors, LLC (“Security Investors”). Security Investors is responsible for the management of the Fund’s portfolio of equity securities. Under the terms of the Equity Portfolio Sub-Advisory Agreement, the Adviser pays monthly to Security Investors a fee at the annual rate of 0.15% of the Fund’s average daily managed assets.
Certain officers and trustees of the Fund may also be officers, directors and/or employees of the Adviser, GPIM or Security Investors. The Fund does not compensate its officers or trustees who are officers, directors and/or employees of the aforementioned firms.
Prior to May 14, 2013, under a separate Fund Administration Agreement (the “Administration Agreement”), the Adviser provided fund administration services to the Fund. As compensation for services performed under the Administration Agreement, the Adviser received a fund administration fee payable monthly at the annual rate set forth below as a percentage of the average daily managed assets of the Fund.
| | |
Managed Assets | Rate |
First $200,000,000 | 0.0275% |
Next $300,000,000 | 0.0200% |
Next $500,000,000 | 0.0150% |
Over $1,000,000,000 | 0.0100% |
Effective May 14, 2013, the Trustees approved Rydex Fund Services, LLC (“RFS”) as the Administrator of the Fund. Both RFS and GFIA are affiliates of Guggenheim Partners, LLC, a global diversified financial services firm. There is no impact to the Fund as a result of this change.
For purposes of calculating the fees payable under the foregoing agreements, “average daily managed assets” means the average daily value of the Fund’s total assets minus the sum of its accrued liabilities. “Total assets” means all of the Fund’s assets and is not limited to its investment securities. “Accrued liabilities” means all of the Fund’s liabilities other than borrowings for investment purposes.
The Bank of New York Mellon (“BNY”) acts as the Fund’s custodian and accounting agent. As custodian, BNY is responsible for the custody of the Fund’s assets. As accounting agent, BNY is responsible for maintaining the books and records of the Fund’s securities and cash. On May 14, 2013, the Trustees approved RFS to replace BNY as the Fund’s accounting agent effective January 1, 2014.
Note 4 – Federal Income Taxes:
The Fund intends to comply with the requirements of Subchapter M of the Internal Revenue Code of 1986, as amended, applicable to regulated investment companies. Accordingly, no provision for U.S. federal income taxes is required. In addition, by distributing substantially all of its ordinary income and long-term capital gains, if any, during each calendar year, the Fund intends not to be subject to U.S. federal excise tax.
Information on the components of investments, excluding purchased and written options, and net assets as of June 30, 2013, is as follows:
| | | | | |
| | | | Net Tax | Net Tax |
Cost of | Gross Tax | Gross Tax | Unrealized | Unrealized |
Investments for | Unrealized | Unrealized | Appreciation | Depreciation on |
Tax Purposes | Appreciation | Depreciation | on Investments | Derivatives |
$182,335,931 | $35,302,230 | $(5,142,022) | $30,160,208 | $(308,324) |
The difference between book and tax basis unrealized appreciation (depreciation) is primarily attributable to the tax deferral of losses on wash sales.
Tax components of the following balances as of December 31, 2012, (the most recent fiscal year for federal income tax purposes) are as follows:
| | |
Undistributed Ordinary | Undistributed Long-Term |
Income/(Accumulated | Gains/(Accumulated |
Ordinary Loss) | Capital Loss) |
$(0) | $(7,024,409) |
For the period ended December 31, 2012, the tax character of distributions paid to shareholders as reflected in the Statement of Changes in Net Assets, was as follows:
| | |
Distributions paid from | 2012 |
Ordinary income | $ 962,285 |
Return of capital | 6,705,060 |
During the period ended June 30, 2013, distributions of $7,673,856 were paid to shareholders. The classification for these distributions for federal income tax purposes will be determined after December 31, 2013.
22 | GEQ | GUGGENHEIM EQUAL WEIGHT ENHANCED EQUITY INCOME FUND SEMIANNUAL REPORT |
NOTES TO FINANCIAL STATEMENTS (Unaudited) continued | June 30, 2013 |
For all open tax years and all major jurisdictions, management of the Fund has concluded that there are no significant uncertain tax positions that would require recognition in the financial statements. Uncertain tax positions are tax positions taken or expected to be taken in the course of preparing Fund’s tax returns that would not meet a more-likely-than-not threshold of being sustained by the applicable tax authority and would be recorded as a tax expense in the current year. Open tax years are those that are open for examination by taxing authorities (i.e. generally the last four tax year ends and the interim tax period since then). Furthermore, management of the Fund is also not aware of any tax positions for which it is reasonably possible that the total amounts of unrecognized tax benefits will significantly change in the next twelve months.
Note 5 – Investments in Securities:
During the six months ended June 30, 2013, the cost of purchases and proceeds from sales of investments, excluding written options with maturities of less than one year and short-term investments were $156,886,024 and $175,078,430, respectively.
Note 6 – Derivatives:
The Fund will utilize a call option writing strategy to seek to generate current income and potentially mitigate overall portfolio volatility. As this strategy involves uncovered option writing, it may result in less volatility mitigation than, and may be subject to more risks compared to, option strategies involving writing options on securities held by the Fund.
There are various risks associated with the Fund’s call option writing strategy. The purchaser of an index option written by the Fund has the right to any appreciation in the cash value of the index over the strike price on the expiration date. Therefore, as the writer of a covered index call option, the Fund forgoes the opportunity to profit from increases in the index over the strike price of the option. However, the Fund has retained the risk of loss (net of premiums received) should the price of the index decline. Similarly, as the writer of a covered call option on a security or basket of securities held in the Fund’s portfolio, the Fund forgoes, during the option’s life, the opportunity to profit from increases in the market value of the security or securities covering the call option above the sum of the premium and the exercise price of the call but has retained the risk of loss (net of premiums received) should the price of the underlying security decline.
There are special risks associated with uncovered option writing (i.e. writing options on securities not held in the Fund’s portfolio, on indices or on exchange traded funds comprised of such securities or that track such indices), which expose the Fund to potentially significant loss. As the writer of an uncovered call option, the Fund has no risk of loss should the price of the underlying security or index decline, but bears unlimited risk of loss should the price of the underlying security or index increase above the exercise price.
To the extent that the Fund purchases options, the Fund will be subject to the following additional risks. If a put or call option purchased by the Fund is not sold when it has remaining value, and if the market price of the underlying security remains equal to or greater than the exercise price (in the case of a put), or remains less than or equal to the exercise price (in the case of a call), the Fund will lose its entire investment in the option. Also, where a put or call option on a particular security is purchased to hedge against price movements in a related security, the price of the put or call option may move more or less than the price of the related security. If restrictions on exercise were imposed, the Fund might be unable to exercise an option it had purchased. If the Fund were unable to close out an option that it had purchased on a security, it would have to exercise the option in order to realize any profit or the option may expire worthless.
Transactions in written call option contracts for the six months ended June 30, 2013, were as follows:
| | | | | | | |
| | | Number of | | | Premiums | |
| | | Contracts | | | Received | |
Options outstanding, beginning of period | | | 11,243 | | | $ | 2,849,647 | |
Options written during the period | | | 122,907 | | | | 16,029,715 | |
Options expired during the period | | | (5,891 | ) | | | (708,581 | ) |
Options closed during the period | | | (105,021 | ) | | | (14,354,517 | ) |
Options exercised during the period | | | (9,191 | ) | | | (908,708 | ) |
Options outstanding, end of the period | | | 14,047 | | | $ | 2,907,556 | |
The following table presents the types of derivatives in the Fund by location as presented on the Statement of Assets Liabilities at June 30, 2013.
| | | | | | |
Statement of Assets and Liabilities Presentation of Fair Values of Derivatives (in $000s): |
| | Asset Derivatives | | Liability Derivatives |
| | Statement | | | Statement | |
| | of Assets | | | of Assets | |
| | and Liabilities | | | and Liabilities | |
| | Location | Fair Value | | Location | Fair Value |
Equity risk | – | $ – | | Options | |
| | | | | Written, | |
| | | | | at value | $ 3,216 |
Total | | $ – | | | $ 3,216 |
Summary of Derivatives Information
The following table presents the effect of Derivatives Instruments on the Statement of Operations for the six months ended June 30, 2013.
| | | |
| Effect of Derivative Instruments on the Statement of Operations (in $000s): |
| |
| | Amount of Net | Change in Net |
| | Realized Loss | Unrealized (Depreciation) |
| | on Derivatives | on Derivatives |
| | Options | Options |
Equity risk | $(14,580) | $(492) |
Total | $(14,580) | $(492) |
|
| GEQ | GUGGENHEIM EQUAL WEIGHT ENHANCED EQUITY INCOME FUND SEMIANNUAL REPORT | 23 |
NOTES TO FINANCIAL STATEMENTS (Unaudited) continued | June 30, 2013 |
Note 7 – Leverage:
Borrowings
On November 3, 2011, the Fund entered into a committed credit facility agreement with an approved counterparty (the “Counterparty”). The Counterparty has agreed to provide secured financing to the Fund up to a maximum of $50,000,000 and the Fund will provide pledged collateral to the Counterparty. Interest on the amount borrowed is based on the 1-month LIBOR plus 0.75%. An unused commitment fee of 0.10% is charged on the difference between the amount available to borrow under the credit agreement and the actual amount borrowed. At June 30, 2013, there was $36,000,000 outstanding in connection with the Fund’s credit facility. The average daily amount of borrowings on the credit facility during the six months ended June 30, 2013, was $25,693,370 with a related average interest rate of 0.95%. The maximum amount outstanding during the six months ended June 30, 2013 was $37,500,000. As of June 30, 2013, the market value of the securities segregated as collateral is $212,484,608.
The credit facility agreement includes usual and customary covenants. These covenants impose on the Fund asset coverage requirements, collateral requirements, investment strategy requirements, and certain financial obligations. These covenants place limits or restrictions on the Fund’s ability to (i) enter into additional indebtedness with a party other than the lender, (ii) change its fundamental investment policy, or (iii) pledge to any other party, other than to the lender, securities owned or held by the Fund over which BNY has a lien. In addition, the Fund is required to deliver financial information to the lender within established deadlines, maintain an asset coverage ratio (as defined in Section 18(g) of the 1940 Act) greater than 300%, comply with the rules of the stock exchange on which its share are listed, and maintain its classification as a “closed-end fund company” as defined in the 1940 Act.
Note 8 – Capital:
Common Shares
The Fund has an unlimited amount of common shares, $0.01 par value, authorized and 8,770,121 issued and outstanding.
Transactions in common shares were as follows:
| | | |
| | Six Months ended | Period ended |
| | June 30, 2013 | December 31, 2012 |
Beginning Shares | 8,770,121 | 8,755,240 |
Shares issued through dividend reinvestment | – | 14,881 |
Common shares issued through offering | – | – |
Ending Shares | 8,770,121 | 8,770,121 |
At June 30, 2013, Guggenheim Funds Distributors, LLC, an affiliate of the Adviser, owned 5,870 shares of the Fund.
Note 9 – Indemnifications:
In the normal course of business, the Fund enters into contracts that contain a variety of representations, which provide general indemnifications. The Fund’s maximum exposure under these arrangements is unknown, as this would require future claims that may be made against the Fund that have not yet occurred. However, the Fund expects the risk of loss to be remote.
Note 10 – Subsequent Event:
The Fund evaluated subsequent events through the date the financial statements were available for issue and determined there were no additional material events that would require disclosure in the Fund’s financial statements, except as noted below.
On July 1, 2013, the Fund declared a quarterly dividend in the amount of $0.4375 per share. The dividend was payable on July 31, 2013 to shareholders of record on July 15, 2013.
24 | GEQ | GUGGENHEIM EQUAL WEIGHT ENHANCED EQUITY INCOME FUND SEMIANNUAL REPORT |
SUPPLEMENTAL INFORMATION (Unaudited) | June 30, 2013 |
Federal Income Tax Information
In January 2014, you will be advised on IRS Form 1099 DIV or substitute 1099 DIV as to the federal tax status of the distributions received by you in the calendar year 2013.
Results of Shareholder Votes
The Annual Meeting of Shareholders of the Fund was held on April 3, 2013. Common shareholders voted on the election of Trustees.
With regards to the election of the following Trustees by common shareholders of the Fund:
| | | | |
| | # of Shares in Favor | # of Shares Against | # of Shares Withheld |
Donald C. Cacciapaglia | 7,757,706 | 33,812 | 198,442 |
Robert B. Karn III | 7,740,612 | 46,510 | 202,838 |
Ronald E. Toupin, Jr. | 7,743,489 | 46,002 | 200,469 |
The other Trustees of the Fund whose terms did not expire in 2013 are Randall C. Barnes, Roman Friedrich III and Ronald A. Nyberg.
Trustees
The Trustees of the Guggenheim Equal Weight Enhanced Equity Income Fund and their principal occupations during the past five years:
| | | | | |
Name, Address*, Year | | | Number of | |
of Birth and | Term of Office** | | Portfolios in the | |
Position(s) Held | and Length | Principal Occupations during the Past Five Years and | Fund Complex*** | Other Directorships |
with Registrant | of Time Served | Other Affiliations | Overseen by Trustee | Held by Trustee |
Independent Trustees: | | | | |
Randall C. Barnes | Since 2011 | Private Investor (2001-present). Formerly, Senior Vice President & | 50 | None. |
Year of Birth: 1951 | | Treasurer, PepsiCo., Inc. (1993-1997), President, Pizza Hut International | | |
Trustee | | (1991-1993) and Senior Vice President, Strategic Planning and New | | |
| | | Business Development of PepsiCo., Inc. (1987-1990). | | |
Roman Friedrich III | Since 2011 | Founder and President of Roman Friedrich & Company, a US and | 46 | Director of First Americas Gold |
Year of Birth: 1946 | | Canadian-based business, which provides investment banking to the | | Corp. (2012-present), Zincore |
Trustee | | mining industry (1998-present). Formerly, Senior Managing | | Metals, Inc. (2009–present). |
| | | Director of MLV & Co., LLC, an investment bank and institutional | | Previously, Director of Blue Sky |
| | | broker-dealer specializing in capital intensive industries such as energy, | | Uranium Corp. (formerly Windstorm |
| | | metals and mining (2010-2011). | | Resources Inc.) (April 2011–July |
| | | | | 2012); Director of Axiom Gold and |
| | | | | Silver Corp. (2011-2012), Stratagold |
| | | | | Corp.(2003-2009); Gateway Gold |
| | | | | Corp. (2004-2008) and GFM |
| | | | | Resources Ltd. (2005-2010). |
Robert B. Karn III | Since 2011 | Consultant (1998-present). Formerly, Arthur Andersen (1965-1997) and | 46 | Director of Peabody Energy |
Year of Birth: 1942 | | Managing Partner, Financial and Economic Consulting, St. Louis | | Company (2003-present), and GP |
Trustee | | office (1987-1997). | | Natural Resource Partners LLC |
| | | | | (2002-present). |
Ronald A. Nyberg | Since 2011 | Partner of Nyberg & Cassioppi, LLC, a law firm specializing in corporate | 52 | None. |
Year of Birth: 1953 | | law, estate planning and business transactions (2000-present). Formerly, | | |
Trustee | | Executive Vice President, General Counsel and Corporate Secretary of | | |
| | | Van Kampen Investments (1982-1999). | | |
Ronald E. Toupin, Jr. | Since 2011 | Portfolio Consultant (2010-present). Formerly, Vice President, Manager | 49 | Trustee, Bennett Group of Funds |
Year of Birth: 1958 | | and Portfolio Manager of Nuveen Asset Management (1998-1999), Vice | | (2011-present). |
Trustee | | President of Nuveen Investment Advisory Corp. (1992-1999), Vice President | | |
| | | and Manager of Nuveen Unit Investment Trusts (1991-1999), and Assistant | | |
| | | Vice President and Portfolio Manager of Nuveen Unit Investment Trusts | | |
| | | (1988-1999), each of John Nuveen & Co., Inc. (1982-1999). | | |
|
| GEQ | GUGGENHEIM EQUAL WEIGHT ENHANCED EQUITY INCOME FUND SEMIANNUAL REPORT | 25 |
SUPPLEMENTAL INFORMATION (Unaudited) continued | June 30, 2013 |
| | | | | |
Name, Address*, Year | | | Number of | |
of Birth and | Term of Office** | | Portfolios in the | |
Position(s) Held | and Length | Principal Occupations during the Past Five Years and | Fund Complex*** | Other Directorships |
with Registrant | of Time Served | Other Affiliations | Overseen by Trustee | Held by Trustee |
Interested Trustee: | | | | |
Donald C. Cacciapaglia† | Since 2012 | Senior Managing Director of Guggenheim Investments (2010-present); | 214 | Trustee, Rydex Dynamic Funds, |
Year of Birth: 1951 | | Chief Executive Officer of Guggenheim Funds Services, LLC (2012- | | Rydex ETF Trust, Rydex Series Funds |
Trustee, | | present); Chief Executive Officer (2012-present) and President (2010- | | and Rydex Variable Trust |
Chief Executive Officer | | present), Guggenheim Funds Distributors, LLC and Guggenheim Funds | | (2012-present); Independent Board |
| | | Investment Advisors, LLC; Chief Executive Officer of certain funds of the | | Member, Equitrust Life Insurance |
| | | Fund Complex (2012-present); President and Director of SBL Fund, | | Company, Guggenheim Life and |
| | | Security Equity Fund, Security Income Fund, Security Large Cap Value | | Annuity Company, and Paragon Life |
| | | Fund, and Security Mid Cap Growth Fund (2012-present); President, CEO | | Insurance Company of Indiana |
| | | and Trustee of Rydex Dynamic Funds, Rydex ETF Trust, Rydex Series Funds | | (2011-present). |
| | | and Rydex Variable Trust (2012-present). Formerly, Chairman and CEO of | | |
| | | Channel Capital Group Inc. and Channel Capital Group LLC (2002-2010). | | |
| * | Address for all Trustees: 2455 Corporate West Drive, Lisle, IL 60532 |
| ** | After a Trustee’s initial term, each Trustee is expected to serve a three-year term concurrent with the class of Trustees for which he serves: |
| - | Messrs. Barnes and Cacciapaglia are Class I Trustees. Class I Trustees are expected to stand for re-election at the Fund’s annual meeting of shareholders for the fiscal year ending December 31, 2014. |
| - | Messrs. Friedrich and Nyberg are Class II Trustees. Class II Trustees are expected to stand for re-election at the Fund’s annual meeting of shareholders for the fiscal year ending December 31, 2015. |
| - | Messrs. Karn and Toupin are Class III Trustees. Class III Trustees are expected to stand for re-election at the Fund’s annual meeting of shareholders for the fiscal year ending December 31, 2016. |
| *** | As of period end. The Guggenheim Investments Fund Complex consists of U.S. registered investment companies advised or serviced by Guggenheim Funds Investments Advisors, LLC or Guggenheim Funds Distributors, Inc. and/or its affiliates. The Guggenheim Investments Fund Complex is overseen by multiple Boards of Trustees. |
| † | Mr. Donald C. Cacciapaglia is an “interested person” (as defined in section 2(a)(19) of the 1940 Act) (“Interested Trustee”) of the Trust because of his position as the President and CEO of the Adviser. |
Principal Executive Officers
The Principal Executive Officers of the Guggenheim Equal Weight Enhanced Equity Income Fund who are not trustees, and their principal occupations during the past five years:
| | | |
Name, Address*, Year of Birth and | Term of Office** and | Principal Occupations During the Past Five Years and |
Position(s) Held with Registrant | Length of Time Served | Other Affiliations |
Amy J. Lee | Since 2013*** | Managing Director, Guggenheim Investments (2012-present); Senior Vice President & Secretary, Security Investors, LLC |
Year of Birth: 1961 | | (2010-present); Secretary & Chief Compliance Officer, Security Distributors, Inc. (1987-2012); Vice President, Associate |
Chief Legal Officer | | General Counsel & Assistant Secretary, Security Benefit Life Insurance Company and Security Benefit Corporation (1987- |
| | | 2012); Vice President & Secretary, Rydex Series Funds, Rydex ETF Trust, Rydex Dynamic Funds, and Rydex Variable Trust |
| | | (2008-present). Officer of certain funds in the Fund Complex (2012-present). |
John L. Sullivan | Since 2011 | Senior Managing Director – Fund Administration, Guggenheim Investments (2010-present). Chief Financial Officer, |
Year of Birth: 1955 | | Chief Accounting Officer and Treasurer of certain funds in the Fund Complex. Formerly, Chief Compliance Officer, |
Chief Financial | | Van Kampen Funds (2004-2010). Head of Fund Accounting, Morgan Stanley Investment Management (2002-2004). Chief |
Officer, Chief Accounting | | Financial Officer, Treasurer, Van Kampen Funds (1996-2004). |
Officer and Treasurer | | |
Joanna M. Catalucci | Since 2012 | Managing Director of Compliance and Fund Board Relations, Guggenheim Investments (2012-present). Formerly, Chief |
Year of birth: 1966 | | Compliance Officer & Secretary, SBL Fund; Security Equity Fund; Security Income Fund; Security Large Cap Value Fund |
Chief Compliance Officer | | & Security Mid Cap Growth Fund; Vice President, Rydex Holdings, LLC; Vice President, Security Benefit Asset |
| | | Management Holdings, LLC; and Senior Vice President & Chief Compliance Officer, Security Investors, LLC (2010-2012); |
| | | Security Global Investors, LLC, Senior Vice President (2010-2011); Rydex Advisors, LLC (f/k/a PADCO Advisors, Inc.) and |
| | | Rydex Advisors II, LLC (f/k/a PADCO Advisors II, Inc.), Chief Compliance Officer and Senior Vice President (2010-2011); |
| | | Rydex Capital Partners I, LLC & Rydex Capital Partners II, LLC, Chief Compliance Officer (2006-2007); and Rydex Fund |
| | | Services, LLC (f/k/a Rydex Fund Services, Inc.), Vice President (2001-2006). Chief Compliance Officer of certain funds in |
| | | the Fund Complex. |
Mark E. Mathiasen | Since 2011 | Director; Associate General Counsel of Guggenheim Funds Services, LLC (2007-present). Secretary of certain funds |
Year of Birth: 1978 | | in the Fund Complex. |
Secretary | | |
| * | Address for all Officers: 2455 Corporate West Drive, Lisle, IL 60532 |
| ** | Officers serve at the pleasure of the Board of Trustees and until his or her successor is appointed and qualified or until his or her earlier resignation or removal. |
| *** | Effective February 12, 2013. |
26 | GEQ | GUGGENHEIM EQUAL WEIGHT ENHANCED EQUITY INCOME FUND SEMIANNUAL REPORT |
DIVIDEND REINVESTMENT PLAN (Unaudited) | June 30, 2013 |
Unless the registered owner of common shares elects to receive cash by contacting the Plan Administrator, all dividends declared on common shares of the Fund will be automatically reinvested by Computershare Shareowner Services LLC (the “Plan Administrator”), Administrator for shareholders in the Fund’s Dividend Reinvestment Plan (the “Plan”), in additional common shares of the Fund. Participation in the Plan is completely voluntary and may be terminated or resumed at any time without penalty by notice if received and processed by the Plan Administrator prior to the dividend record date; otherwise such termination or resumption will be effective with respect to any subsequently declared dividend or other distribution. Some brokers may automatically elect to receive cash on your behalf and may re-invest that cash in additional common shares of the Fund for you. If you wish for all dividends declared on your common shares of the Fund to be automatically reinvested pursuant to the Plan, please contact your broker.
The Plan Administrator will open an account for each common shareholder under the Plan in the same name in which such common shareholder’s common shares are registered. Whenever the Fund declares a dividend or other distribution (together, a “Dividend”) payable in cash, non-participants in the Plan will receive cash and participants in the Plan will receive the equivalent in common shares. The common shares will be acquired by the Plan Administrator for the participants’ accounts, depending upon the circumstances described below, either (i) through receipt of additional unissued but authorized common shares from the Fund (“Newly Issued Common Shares”) or (ii) by purchase of outstanding common shares on the open market (“Open-Market Purchases”) on the New York Stock Exchange or elsewhere. If, on the payment date for any Dividend, the closing market price plus estimated brokerage commission per common share is equal to or greater than the net asset value per common share, the Plan Administrator will invest the Dividend amount in Newly Issued Common Shares on behalf of the participants. The number of Newly Issued Common Shares to be credited to each participant’s account will be determined by dividing the dollar amount of the Dividend by the net asset value per common share on the payment date; provided that, if the net asset value is less than or equal to 95% of the closing market value on the payment date, the dollar amount of the Dividend will be divided by 95% of the closing market price per common share on the payment date. If, on the payment date for any Dividend, the net asset value per common share is greater than the closing market value plus estimated brokerage commission, the Plan Administrator will invest the Dividend amount in common shares acquired on behalf of the participants in Open-Market Purchases.
If, before the Plan Administrator has completed its Open-Market Purchases, the market price per common share exceeds the net asset value per common share, the average per common share purchase price paid by the Plan Administrator may exceed the net asset value of the common shares, resulting in the acquisition of fewer common shares than if the Dividend had been paid in Newly Issued Common Shares on the Dividend payment date. Because of the foregoing difficulty with respect to Open-Market Purchases, the Plan provides that if the Plan Administrator is unable to invest the full Dividend amount in Open-Market Purchases during the purchase period or if the market discount shifts to a market premium during the purchase period, the Plan Administrator may cease making Open-Market Purchases and may invest the uninvested portion of the Dividend amount in Newly Issued Common Shares at net asset value per common share at the close of business on the Last Purchase Date provided that, if the net asset value is less than or equal to 95% of the then current market price per common share; the dollar amount of the Dividend will be divided by 95% of the market price on the payment date.
The Plan Administrator maintains all shareholders’ accounts in the Plan and furnishes written confirmation of all transactions in the accounts, including information needed by shareholders for tax records. Common shares in the account of each Plan participant will be held by the Plan Administrator on behalf of the Plan participant, and each shareholder proxy will include those shares purchased or received pursuant to the Plan. The Plan Administrator will forward all proxy solicitation materials to participants and vote proxies for shares held under the Plan in accordance with the instruction of the participants.
There will be no brokerage charges with respect to common shares issued directly by the Fund. However, each participant will pay a pro rata share of brokerage commission incurred in connection with Open-Market Purchases. The automatic reinvestment of Dividends will not relieve participants of any Federal, state or local income tax that may be payable (or required to be withheld) on such Dividends.
The Fund reserves the right to amend or terminate the Plan. There is no direct service charge to participants with regard to purchases in the Plan; however, the Fund reserves the right to amend the Plan to include a service charge payable by the participants.
All correspondence or questions concerning the Plan should be directed to the Plan Administrator, Computershare Shareowners Services, LLC, P.O. Box 358015, Pittsburgh, PA 15252-8015; Attention: Shareholder Services Department, Phone Number: (866) 488-3559.
|
| GEQ | GUGGENHEIM EQUAL WEIGHT ENHANCED EQUITY INCOME FUND SEMIANNUAL REPORT | 27 |
CONSIDERATIONS REGARDING INVESTMENT ADVISORY AGREEMENT AND INVESTMENT SUB-ADVISORY AGREEMENTS CONTRACT RE-APPROVAL | June 30, 2013 |
Guggenheim Equal Weight Enhanced Equity Income Fund (the “Fund”) was organized as a Delaware statutory trust on July 11, 2011 and is registered as a diversified, closed-end management investment company under the Investment Company Act of 1940, as amended (the “1940 Act”). Guggenheim Funds Investment Advisors, LLC (“GFIA” or the “Adviser”), an affiliate of Guggenheim Partners, LLC (“Guggenheim Partners” and referred to herein collectively with its subsidiaries and affiliates as “Guggenheim”), a diversified financial services firm, serves as the Fund’s investment adviser and provides certain administrative and other services pursuant to an investment advisory agreement between the Fund and GFIA (the “Investment Advisory Agreement”). Under the terms of the Investment Advisory Agreement, GFIA also is responsible for overseeing the activities of: (i) Guggenheim Partners Investment Management, LLC (“GPIM” or the “Options Strategy Sub-Adviser”), an indirect subsidiary of Guggenheim Partners, which serves as the Fund’s investment sub-adviser responsible for managing the Fund’s options strategy pursuant to an investment sub-advisory agreement by and among the Fund, the Adviser and GPIM (the “GPIM Sub-Advisory Agreement”); and (ii) Security Investors, LLC (“Security Investors” or the “Equity Portfolio Sub-Adviser” and together with GPIM, the “Sub-Advisers” and each, a “Sub-Adviser”) which serves as the Fund’s investment sub-adviser responsible for managing the Fund’s portfolio of equity securities pursuant to an investment sub-advisory agreement by and among the Fund, GFIA and Security Investors (the “Security Investors Sub-Advisory Agreement” and together with the GPIM Sub-Advisory Agreement, the “Sub-Advisory Agreements” and each, a “Sub-Advisory Agreement”). (The Sub-Advisory Agreements and the Investment Advisory Agreement are referred to herein collectively as, the “Advisory Agreements.”) Under the supervision of the Fund’s Board of Trustees (the “Board” and the members of the Board individually, the “Trustees”) and GFIA, Security Investors manages the equity portfolio of the Fund in accordance with its stated investment objective and policies, makes investment decisions for the Fund and places orders to purchase and sell securities on the Fund’s behalf, while GPIM implements the Fund’s options strategy and provides certain facilities and personnel related to such management. Security Investors is an affiliate of Guggenheim Partners.
At meetings held in person on April 18, 2013 (the “April Meeting”) and on May 14, 2013 (the “May Meeting”), the Contracts Review Committee of the Board (the “Committee”), consisting solely of those Trustees who are not “interested persons,” as defined by the 1940 Act, of the Fund (the “Independent Trustees”), met independently of Fund management to consider the renewal of the Advisory Agreements. As part of its review process, the Committee was represented by independent legal counsel to the Independent Trustees (“Independent Legal Counsel”). Independent Legal Counsel reviewed with the Committee various factors relevant to the consideration of advisory agreements and the legal responsibilities of the Trustees related to such consideration. The Committee took into account various materials received from the Adviser, the Sub-Advisers and Independent Legal Counsel. The Committee also considered the variety of written materials, reports and oral presentations it received (and received by the full Board) throughout the year regarding performance and operating results of the Fund.
In connection with the contract review process, Guggenheim engaged FUSE Research Network LLC (“FUSE”), an independent, third party research provider, to prepare advisory contract renewal reports for various boards of directors/trustees in the Guggenheim fund complex, designed specifically to help the boards of directors/trustees fulfill their advisory contract renewal responsibilities. The objective of the reports is to present the subject funds’ relative position regarding fees, expenses and total return performance, with peer group and universe comparisons. Guggenheim management determined to engage FUSE for this purpose in connection with other initiatives designed to improve efficiencies and implement a uniform, streamlined and enhanced 15(c) reporting process across its various product lines. Further to this end, Guggenheim management had multiple discussions with, and sought input from, Independent Legal Counsel, the Committee Chair and the Board Chair, in preparing a comprehensive presentation and delivery of information in connection with the contract review process. In addition, the Adviser, on behalf of itself and GFIA, provided information in response to requests for certain additional information following the April Meeting.
Among other things, the Adviser and Sub-Advisers provided organizational presentations, staffing reports and biographies of those key personnel of the Adviser and Sub-Advisers providing services to the Fund to assist the Committee in assessing the nature and quality of services provided by the Adviser and Sub-Advisers, information comparing the investment performance, advisory fees and total expenses of the Fund to other funds (including such information presented in the FUSE reports as well as supplemental information prepared by management), information about the profitability of the Adviser and Security Investors in connection with the Advisory Agreements and information about the compliance and risk management programs of the Adviser and the Sub-Advisers.
Following an analysis and discussion of the factors identified below, the Committee concluded that it was in the best interests of the Fund to recommend that the Board approve the renewal of all of the Advisory Agreements for an additional 12-month term (the “Renewal Term”).
Investment Advisory Agreement
Nature, Extent and Quality of Services Provided by the Adviser: With respect to the nature, extent and quality of services currently provided by the Adviser, the Committee noted that the Adviser had delegated responsibility for the investment and reinvestment of the Fund’s assets to the Sub-Advisers. The Committee considered the Adviser’s responsibility to oversee the Sub-Advisers and that the Adviser has similar oversight responsibilities for other registered investment companies for which GFIA serves as investment adviser (collectively, “Guggenheim Funds”). In this connection, the Committee took into account information provided by management describing the Adviser’s processes and activities for providing oversight of the Sub-Advisers’ investment strategies and compliance with investment restrictions, as well as information regarding the Adviser’s Sub-Advisory Oversight Committee. The Committee also
28 | GEQ | GUGGENHEIM EQUAL WEIGHT ENHANCED EQUITY INCOME FUND SEMIANNUAL REPORT |
CONSIDERATIONS REGARDING INVESTMENT ADVISORY AGREEMENT AND INVESTMENT SUB-ADVISORY AGREEMENTS CONTRACT RE-APPROVAL continued | June 30, 2013 |
considered the secondary market support services provided by the Adviser to the Fund. In addition, the Committee noted its various discussions with management concerning the experience and qualifications of the Adviser’s personnel, including those personnel providing compliance oversight. The Independent Trustees also took into account the various legal, compliance and risk management oversight and staffing initiatives undertaken by management, including, among other things, enhancements to risk management processes and restructuring of the legal and compliance departments in 2012, which management stated was designed to create a cohesive legal and compliance program with increased collaboration among compliance and legal professionals and with other departments across the Guggenheim organization. The Committee also considered management’s other initiatives intended to achieve greater enhancements and efficiencies in Guggenheim’s ability to provide services to the Guggenheim Funds (including the Fund), such as efforts to streamline and simplify the organizational structure of Guggenheim’s advisory business, as reflected by internal reorganizations of various management entities. Moreover, in connection with the Committee’s evaluation of the overall package of services provided by GFIA, the Committee considered the quality of the administrative services provided by GFIA and proposed to be provided during the Renewal Term by GFIA’s affiliate, Rydex Fund Services, LLC (“RFS”), utilizing the same Guggenheim personnel previously responsible for fund administration.
Further with respect to the Adviser’s resources and its ability to carry out its responsibilities under the Investment Advisory Agreement, the Committee considered its review of financial information concerning the Adviser, as well as its discussions with the Chief Financial Officer of GFIA.
The Committee also considered the acceptability of the terms of the Investment Advisory Agreement (including the relatively broad scope of services required to be performed by GFIA). Based on the foregoing, and based on other information received (both oral and written) at the April Meeting and at the May Meeting, as well as other considerations, the Committee concluded that the Adviser and its personnel were qualified to serve the Fund in such capacity.
Investment Performance: The Committee considered the Fund’s investment performance by reviewing the Fund’s total return on a net asset value (“NAV”) and market price basis for the one-year period ended December 31, 2012, noting the Fund’s relatively brief operating period since its inception in 2011. The Committee compared the Fund’s performance to the performance of a peer group of closed-end funds determined by the Adviser (the “peer group of funds”) for the same time periods. The Committee noted that the Adviser’s peer group selection methodology for the Fund starts with the entire U.S.-listed taxable closed-end fund universe, and excludes funds that, among other things, under normal market conditions, are less than 80% covered with options, are less than 80% domestic, primarily write options on individual equities or are sector-oriented. Consequently, the peer group of funds included other closed-end funds that generally invest a majority of their assets in equity securities with a similar covered call strategy. In assessing the peer group constituents and both the comparative performance and fee data presented (including in the FUSE reports), the Committee considered management’s discussion of the challenges of developing a relevant peer group for the Fund, in that the enhanced equity strategy implemented by GPIM for the Fund is not similarly replicated by any other non-Guggenheim managed closed-end fund.
The Committee noted that the Fund’s investment results were consistent with the Fund’s investment objective of seeking to provide a high level of risk-adjusted total return with an emphasis on current income. The Committee also considered that the Adviser does not directly manage the investment portfolio and implement the Fund’s investment strategies but had delegated such duties to the Equity Portfolio Sub-Adviser and the Options Strategy Sub-Adviser. The Committee also considered the Fund’s use of leverage, the cost of the leverage as of December 31, 2012, and information received at quarterly Board meetings regarding the impact of leverage. Based on the information provided, the Committee concluded that the Adviser had appropriately reviewed and monitored each Sub-Adviser’s investment performance.
Comparative Fees, Costs of Services Provided and the Profits Realized by the Adviser from its Relationship with the Fund: The Committee compared the Fund’s advisory fee (which includes the sub-advisory fees paid to the Sub-Advisers) and expense ratio to the peer group of funds. The Committee also reviewed the mean and median advisory fees and expense ratios of the peer group of funds. The Committee noted that while the Fund’s expense ratio was above the median expense ratio of the peer group of funds, none of the other funds within the peer group of funds employ leverage. In addition, the Committee noted the Fund’s relatively small size as compared to other funds in the peer group of funds and the impact of the size differential on the expense ratio related to fixed expenses. The Committee also took into account management’s view that because four of the Fund’s six peer funds are managed by the same asset management firm, with sizable closed-end fund assets under management, such asset management firm has been able to implement a unique fee pricing structure. The Committee also considered the complexity of the investment strategies employed by the Sub-Advisers and information provided by management comparing the Fund’s contractual advisory fee to the average advisory fee of the broader Morningstar covered call universe. The Committee also considered management’s explanation regarding the appropriateness of the Fund’s advisory fees as compared to Guggenheim Enhanced Equity Strategy Fund (“GGE”) and Guggenheim Enhanced Equity Income Fund (“GPM”), noting the investment strategy differences of the Fund as compared to GGE and GPM and that the decision to implement fee waivers for each of GPM and GGE was the result of a unique set of circumstances, which included the replacement of both unaffiliated investment sub-advisers with GPIM and changes in investment strategy.
With respect to the costs of services provided and profits realized by the Adviser from its relationship with the Fund, the Committee reviewed information regarding the revenues the Adviser received under the Investment Advisory Agreement as well as the estimated allocated direct
|
| GEQ | GUGGENHEIM EQUAL WEIGHT ENHANCED EQUITY INCOME FUND SEMIANNUAL REPORT | 29 |
CONSIDERATIONS REGARDING INVESTMENT ADVISORY AGREEMENT AND INVESTMENT SUB-ADVISORY AGREEMENTS CONTRACT RE-APPROVAL continued | June 30, 2013 |
and indirect costs the Adviser incurred in providing services to the Fund, including paying the sub-advisory fees to the Sub-Advisers.
The Committee considered other benefits available to the Adviser because of its relationship with the Fund and noted that the Adviser may be deemed to benefit from arrangements whereby its affiliates RFS and the Sub-Advisers, respectively, will receive administrative services fees from serving as administrator and receive sub-advisory fees for managing the investment portfolio. The Committee also noted the Adviser’s statement that it may benefit from marketing synergies arising from offering a broad spectrum of products, including the Fund. Based on all of the information provided, the Committee determined that the Adviser’s profitability from its relationship with the Fund was not unreasonable.
Economies of Scale to be Realized: The Committee noted that the advisory fee schedule does not contain breakpoints that reduce the fee rate on assets above specified levels. The Committee further noted that due to the Fund’s closed-end structure, new shares are not continuously offered. As a result, the Committee concluded that breakpoints were not warranted at this time.
Sub-Advisory Agreements
Nature, Extent and Quality of Services Provided by the Sub-Advisers: With respect to the nature, extent and quality of services provided by the Sub-Advisers, the Committee considered the qualifications, experience and skills of the Sub-Advisers’ portfolio management and other key personnel and information from the Sub-Advisers describing the scope of their services to the Fund. The Committee considered the Sub-Advisers’ resources and their ability to carry out their responsibilities under the Sub-Advisory Agreements, and the Committee reviewed the balance sheet and income statement of each Sub-Adviser.
The Committee also considered the acceptability of the terms of each Sub-Advisory Agreement. In addition, the Committee considered the Sub-Advisers’ efforts in pursuing the Fund’s investment objective of seeking to provide a high level of risk-adjusted total return with an emphasis on current income. Based on the foregoing, and based on other information received (both oral and written) at the April Meeting and at the May Meeting, the Committee concluded that each Sub-Adviser was qualified to provide the services under its respective Sub-Advisory Agreement.
Investment Performance: The Committee reviewed the performance of the Fund and the peer group of funds over different periods of time. The Committee observed that the Fund underperformed the average return of its peer group of funds for the one-year period ended December 31, 2012, on both a NAV and market price basis. The Committee took into account management’s explanation that the Fund’s strategy was hampered in 2012 by a market environment which generated two significant corrections, a 9.6% decline in the spring and a 7.3% decline in the fall, but wherein implied volatility generally was below historic averages, providing less of a cushion for these corrections. Also, the Committee considered, as noted, that the other funds in the peer group of funds do not employ leverage and thus, during the spring and fall market declines the Fund’s leverage caused it to experience a greater decline than the peer group’s decline. In this connection, the Committee noted management’s belief that leverage may enable the Fund to outperform the peer group during market advances, creating the potential for long-term outperformance. In addition, the Committee observed that the Fund’s performance on a NAV basis exceeded the return of the CBOE BuyWrite Index for the one-year period ended December 31, 2012, while lagging the return of the S&P 500 over the same period. The Committee also considered that the Fund’s limited time period during which it has operated introduces the possibility of greater market volatility and performance discrepancies and, therefore, the Sub-Advisers should be evaluated over a longer period and full market cycle.
The Committee also evaluated Fund information provided by management concerning the Fund’s price movement, premium/discount data, sector allocation and history, peer group overview and detailed performance analysis.
In light of all of the foregoing, the Committee determined that the Fund’s performance was acceptable.
Comparative Fees, Costs of Services Provided and the Profits Realized by each Sub-Adviser from its Relationship with the Fund: The Committee reviewed the level of sub-advisory fees payable to each of GPIM and Security Investors, noting that the fees would be paid by GFIA and do not impact the fees paid by the Fund. The Committee also reviewed the dollar amount of sub-advisory fees paid to each of GPIM and Security Investors for the twelve months ended December 31, 2012. The Committee compared the sub-advisory fee paid by the Adviser to each Sub-Adviser to the fees charged by the Sub-Adviser to other clients including other registered investment companies.
Economies of Scale to be Realized: The Committee recognized that, because the Sub-Advisers’ fees would be paid by the Adviser and not the Fund, the analysis of economies of scale was more appropriate in the context of the Committee’s consideration of the Investment Advisory Agreement, which was separately considered. (See “Investment Advisory Agreement – Economies of Scale to be Realized” above.)
Overall Conclusions
Based on the foregoing, the Committee determined at the May Meeting that the investment advisory fees are fair and reasonable in light of the extent and quality of the services provided and other benefits received and that the continuation of each Advisory Agreement is in the best interests of the Fund. In reaching this conclusion, no single factor was determinative. At the May Meeting, the Committee, constituting all of the Independent Trustees, recommended the renewal of each Advisory Agreement for an additional annual term. Further, at its May 14, 2013, meeting, upon the recommendation of the Committee, the Board, including all of the Independent Trustees, approved the renewal of each Advisory Agreement for an additional annual term.
30 | GEQ | GUGGENHEIM EQUAL WEIGHT ENHANCED EQUITY INCOME FUND SEMIANNUAL REPORT |
| | | |
Board of Trustees | Executive Officers | Investment Adviser |
Randall C. Barnes | Donald C. Cacciapaglia | Guggenheim Funds Investment |
| | Chief Executive Officer | Advisors, LLC |
Donald C. Cacciapaglia* | | Lisle, Illinois |
| | Amy J. Lee | |
Roman Friedrich III | Chief Legal Officer | Options Strategy Investment |
| | | Sub-Adviser |
Robert B. Karn III | John L. Sullivan | Guggenheim Partners |
| | Chief Financial Officer, Chief | Investment Management, LLC |
Ronald A. Nyberg | Accounting Officer, and Treasurer | Santa Monica, California |
| |
Ronald E. Toupin, Jr., | Joanna M. Catalucci | Equity Strategy Investment |
Chairperson | Chief Compliance Officer | Sub-Adviser |
| | | Security Investors, LLC |
* Trustee is an “interested person” | Mark E. Mathiasen | New York, New York |
(as defined in section 2(a)(19) | Secretary | |
of the 1940 Act) (“Interested | | Administrator |
Trustee”) of the Trust because | | Rydex Fund Services, LLC |
of his position as the President | | Rockville, Maryland |
and CEO of the Adviser. | | |
| | | Accounting Agent and Custodian |
| | | The Bank of New York Mellon |
| | | New York, New York |
| |
| | | Legal Counsel |
| | | Skadden, Arps, Slate, Meagher & |
| | | Flom LLP |
| | | New York, New York |
| |
| | | Independent Registered |
| | | Public Accounting Firm |
| | | Ernst & Young LLP |
| | | Chicago, Illinois |
Privacy Principles of the Fund
The Fund is committed to maintaining the privacy of its shareholders and to safeguarding their non-public personal information. The following information is provided to help you understand what personal information the Fund collects, how the Fund protects that information and why, in certain cases, the Fund may share information with select other parties.
Generally, the Fund does not receive any non-public personal information relating to its shareholders, although certain non-public personal information of its shareholders may become available to the Fund. The Fund does not disclose any non-public personal information about its shareholders or former shareholders to anyone, except as permitted by law or as is necessary in order to service shareholder accounts (for example, to a transfer agent or third party administrator).
The Fund restricts access to non-public personal information about its shareholders to employees of the Fund’s investment advisor and its affiliates with a legitimate business need for the information. The Fund maintains physical, electronic and procedural safeguards designed to protect the non-public personal information of its shareholders.
Questions concerning your shares of Guggenheim Equal Weight Enhanced Equity Income Fund?
| · | If your shares are held in a Brokerage Account, contact your Broker. |
| · | If you have physical possession of your shares in certificate form, contact the Fund’s Transfer Agent: |
| | Computershare Shareowner Services LLC, 480 Washington Blvd., Jersey City, NJ 07310; (866) 488-3559. |
This report is sent to shareholders of Guggenheim Equal Weight Enhanced Equity Income Fund for their information. It is not a Prospectus, circular or representation intended for use in the purchase or sale of shares of the Fund or of any securities mentioned in this report.
A description of the Fund’s proxy voting policies and procedures related to portfolio securities is available without charge, upon request, by calling the Fund at (866)274-2227.
Information regarding how the Fund voted proxies for portfolio securities, if applicable, during the most recent 12-month period ended June 30, is also available, without charge and upon request by calling (866)274-2227, by visiting the Fund’s website at www.guggenheiminvestments.com/geq or by accessing the Fund’s Form N-PX on the U.S. Securities and Exchange Commission’s (SEC) website at www.sec.gov.
The Fund files its complete schedule of portfolio holdings with the SEC for the first and third quarters of each fiscal year on Form N-Q. The Fund’s Form N-Q is available on the SEC website at www.sec.gov or by visiting the Fund’s website at www.guggenheiminvestments.com/geq. The Fund’s Form N-Q may also be viewed and copied at the SEC’s Public Reference Room in Washington, DC; information on the operation of the Public Reference Room may be obtained by calling (800) SEC-0330 or at www.sec.gov.
Notice to Shareholders
Notice is hereby give in accordance with Section 23(c) of the Investment Company Act of 1940, as amended, that the Fund from time to time may purchase shares of its common stock in the open market.
|
| GEQ | GUGGENHEIM EQUAL WEIGHT ENHANCED EQUITY INCOME FUND SEMIANNUAL REPORT | 31 |
Guggenheim Partners Investment Management, LLC
Guggenheim Partners Investment Management, LLC (“GPIM”) is an indirect subsidiary of Guggenheim Partners, LLC, a diversified financial services firm. The firm provides capital markets services, portfolio and risk management expertise, wealth management, and investment advisory services. Clients of Guggenheim Partners, LLC subsidiaries are an elite mix of individuals, family offices, endowments, foundations, insurance companies and other institutions.
Investment Philosophy
GPIM’s investment philosophy is predicated upon the belief that thorough research and independent thought are rewarded with performance that has the potential to outperform benchmark indexes with both lower volatility and lower correlation of returns over time as compared to such benchmark indexes.
Investment Process
GPIM’s investment process is a collaborative effort between various groups including the Portfolio Construction Group, which utilize proprietary portfolio construction and risk modeling tools to determine allocation of assets among a variety of sectors, and its Sector Specialists, who are responsible for security selection within these sectors and for implementing securities transactions, including the structuring of certain securities directly with the issuers or with investment banks and dealers involved in the origination of such securities.
Security Investors, LLC
Security Investors, LLC (“SI”) is a registered investment adviser. For more than 20 years, SI has been dedicated to helping investors and financial professionals navigate diverse market conditions with confidence. With approximately $20 billion in assets, SI offers institutional investors and financial intermediaries a range of four investment competencies for building well-diversified portfolios; Alternative Assets and Strategies; Fundamental Active Alpha Strategies (Equity and Fixed-Income); Target Beta Strategies; and Exchange Traded products (ETFs).
| | | |
Guggenheim Funds Distributors, LLC | | |
2455 Corporate West Drive | | |
Lisle, IL 60532 | | |
Member FINRA/SIPC (08/13) | | CEF -GEQ -SAR -0613 |
| NOT FDIC-INSURED l NOT BANK-GUARANTEED l MAY LOSE VALUE |
Item 2. Code of Ethics.
Not applicable for a semi-annual reporting period.
Item 3. Audit Committee Financial Expert.
Not applicable for a semi-annual reporting period.
Item 4. Principal Accountant Fees and Services.
Not applicable for a semi-annual reporting period.
Item 5. Audit Committee of Listed Registrants.
Not applicable for a semi-annual reporting period.
Item 6. Schedule of Investments.
The Schedule of Investments is included as part of Item 1.
Item 7. Disclosure of Proxy Voting Policies and Procedures for Closed-End Management Investment Companies.
Not applicable for a semi-annual reporting period.
Item 8. Portfolio Managers of Closed-End Management Investment Companies.
| (a) | Not applicable for a semi-annual reporting period. |
| (b) | There has been no change, as of the date of this filing, in the Portfolio Manager identified in response to paragraph (a)(1) of this Item in the registrant’s most recent annual report on Form N-CSR. |
Item 9. Purchases of Equity Securities by Closed-End Management Investment Company and Affiliated Purchasers.
None.
Item 10. Submission of Matters to a Vote of Security Holders.
The registrant has not made any material changes to the procedures by which shareholders may recommend nominees to the registrant’s Board of Trustees.
Item 11. Controls and Procedures.
(a) The registrant's principal executive officer and principal financial officer have evaluated the registrant's disclosure controls and procedures (as defined in Rule 30a-3(c) under the Investment Company Act) as of a date within 90 days of this filing and have concluded based on such evaluation, as required by Rule 30a-3(b) under the Investment Company Act, that the registrant's disclosure controls and procedures were effective, as of that date, in ensuring that information required to be disclosed by the registrant in this Form N-CSR was recorded, processed, summarized, and reported within the time periods specified in the Securities and Exchange Commission’s rules and forms.
(b) There were no changes in the registrant’s internal control over financial reporting (as defined in Rule 30a-3(d) under the Investment Company Act) that occurred during the registrant’s second fiscal quarter of the period covered by this report that have materially affected, or are reasonably likely to materially affect, the registrant’s internal control over financial reporting.
Item 12. Exhibits.
(a)(1) Not applicable.
(a)(2) Certifications of principal executive officer and principal financial officer pursuant to Rule 30a-2(a) under the Investment Company Act.
(a)(3) Not applicable.
(b) Certifications of principal executive officer and principal financial officer pursuant to Rule 30a-2(b) of the Investment Company Act and Section 906 of the Sarbanes-Oxley Act of 2002.
SIGNATURES
Pursuant to the requirements of the Securities Exchange Act of 1934 and the Investment Company Act of 1940, the registrant has duly caused this report to be signed on its behalf by the undersigned, thereunto duly authorized.
(Registrant) Guggenheim Equal Weight Enhanced Equity Income Fund
By: /s/ Donald C. Cacciapaglia
Name: Donald C. Cacciapaglia
Title: Chief Executive Officer
Date: September 4, 2013
Pursuant to the requirements of the Securities Exchange Act of 1934 and the Investment Company Act of 1940, this report has been signed by the following persons on behalf of the registrant and in the capacities and on the dates indicated.
By: /s/ Donald C. Cacciapaglia
Name: Donald C. Cacciapaglia
Title: Chief Executive Officer
By: /s/ John L. Sullivan
Name: John L. Sullivan
Title: Chief Financial Officer, Chief Accounting Officer and Treasurer