UNITED STATES
SECURITIES AND EXCHANGE COMMISSION
Washington, D.C. 20549
FORM N-CSR
CERTIFIED SHAREHOLDER REPORT OF REGISTERED MANAGEMENT
INVESTMENT COMPANIES
Investment Company Act file number 811-22584
Guggenheim Equal Weight Enhanced Equity Income Fund
(Exact name of registrant as specified in charter)
227 West Monroe Street, Chicago, IL 60606
(Address of principal executive offices) (Zip code)
Amy J. Lee
227 West Monroe Street, Chicago, IL 60606
(Name and address of agent for service)
Registrant's telephone number, including area code: (312) 827-0100
Date of fiscal year end: December 31
Date of reporting period: January 1, 2014 – June 30, 2014
Item 1. Reports to Stockholders.
The registrant's semi-annual report transmitted to shareholders pursuant to Rule 30e-1 under the Investment Company Act of 1940, as amended (the “Investment Company Act”), is as follows: [Provide full text of annual report.]
Guggenheim Equal Weight Enhanced Equity Income Fund’s (the “Fund”) reported amounts and sources of distributions are estimates and are not being provided for tax reporting purposes. The actual amounts and sources for tax reporting purposes will depend upon the Fund’s investment experience during the year and may be subject to changes based on the tax regulations. The Fund will provide a Form 1099-DIV each calendar year that will explain the character of these dividends and distributions for federal income tax purposes.
June 30, 2014 | |||||||||
| Total Cumulative Distribution For the Fiscal Year | % Breakdown of the Total Cumulative Distributions for the Fiscal Year | ||||||||
Net | Net | Net | Net | ||||||
Realized | Realized | Realized | Realized | ||||||
Net | Short-Term | Long-Term | Total per | Net | Short-Term | Long-Term | Total Per | ||
Investment | Capital | Capital | Return of | Common | Investment | Capital | Capital | Return of | Common |
Income | Gains | Gains | Capital | Share | Income | Gains | Gains | Capital | Share |
$0.0375 | $0.0000 | $0.8375 | $0.0000 | $0.8750 | 4.3% | 0.0% | 95.7% | 0.0% | 100.0% |
If the Fund estimates it has distributed more than its income and net realized capital gains, a portion of the distribution may be a return of capital. A return of capital may occur, for example, when some or all of a shareholder’s investment in a Fund is returned to the shareholder. A return of capital distribution does not necessarily reflect a Fund’s investment performance and should not be confused with “yield” or “income.”
Section 19(a) notices for the Fund are available on the Fund’s website at guggenheiminvestments.com/geq.
The Fund, acting pursuant to a Securities and Exchange Commission (“SEC”) exemptive order and with the approval of the Fund’s Board of Trustees (the “Board”), has adopted a plan, consistent with its investment objectives and policies to support a level distribution of income, capital gains and/or return of capital (the “Plan”). In accordance with the Plan, the Fund currently distributes a fixed amount per share, $0.437500, on a quarterly basis.
The fixed amounts distributed per share are subject to change at the discretion of the Fund’s Board. Under its Plan, the Fund will distribute all available investment income to its shareholders, consistent with its primary investment objectives and as required by the Internal Revenue Code of 1986, as amended (the “Code”). If sufficient investment income is not available on a quarterly basis, the Fund will distribute capital gains and/or return of capital to shareholders in order to maintain a level distribution. Each quarterly distribution to shareholders is expected to be at the fixed amount established by the Board, except for extraordinary distributions and potential distribution rate increases or decreases to enable the Fund to comply with the distribution requirements imposed by the Code.
Shareholders should not draw any conclusions about the Fund’s investment performance from the amount of these distributions or from the terms of the Plan. The Fund’s total return performance on net asset value is presented in its financial highlights table.
The Board may amend, suspend or terminate the Fund’s Plan without prior notice if it deems such actions to be in the best interests of the Fund or its shareholders. The suspension or termination of the Plan could have the effect of creating a trading discount (if the Fund’s stock is trading at or above net asset value) or widening an existing trading discount. The Fund is subject to risks that could have an adverse impact on its ability to maintain level distributions. Examples of potential risks include, but are not limited to, economic downturns impacting the markets, decreased market volatility, companies suspending or decreasing corporate dividend distributions and changes in the Code. Please refer to the Fund’s prospectus and its website, guggenheiminvestments.com/geq for a more complete description of its risks.
This Page Intentionally Left Blank.
GUGGENHEIMINVESTMENTS.COM/GEQ
. . .YOUR LINK TO THE LATEST, MOST UP-TO-DATE INFORMATION ABOUT GUGGENHEIM EQUAL
WEIGHT ENHANCED EQUITY INCOME FUND
The shareholder report you are reading right now is just the beginning of the story. Online at guggenheiminvestments.com/geq, you will find:
• Daily, weekly and monthly data on share prices, net asset values, distributions and more
• Portfolio overviews and performance analyses
• Announcements, press releases and special notices
• Fund and adviser contact information
Guggenheim Partners Investment Management, LLC, Security Investors, LLC and Guggenheim Funds Investment Advisors, LLC are continually updating and expanding shareholder information services on the Fund’s website in an ongoing effort to provide you with the most current information about how your Fund’s assets are managed and the results of our efforts. It is just one more small way we are working to keep you better informed about your investment in the Fund.
June 30, 2014
DEAR SHAREHOLDER
We thank you for your investment in the Guggenheim Equal Weight Enhanced Equity Income Fund (the “Fund”). This report covers the Fund’s performance for the six-month period ended June 30, 2014.
The Fund’s investment objective is to provide a high level of risk-adjusted total return with an emphasis on current income.
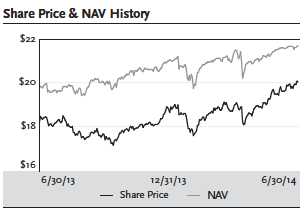
All Fund returns cited—whether based on net asset value (“NAV”) or market price—assume the reinvestment of all distributions. For the six months ended June 30, 2014, the Fund provided a total return based on market price of 11.17% and a total return net of fees based on NAV of 7.56%. The closing price of the Fund’s shares as of June 30, 2014, was $20.03, which represented a discount of 7.61% to the NAV of $21.68.
Past performance does not guarantee future results. The market price of the Fund’s shares fluctuates from time to time, and it may be higher or lower than the Fund’s NAV. NAV performance data reflects fees and expenses of the Fund.
The Fund paid distributions of $0.4375 in January and April 2014. The most recent distribution represents an annualized distribution rate of 8.74% based on the Fund’s closing market price of $20.03 on June 30, 2014. Distributions may include ordinary income, realized gains and/or return of capital. The final determination of the tax character of distributions paid by the Fund in 2014 will be reported to shareholders in January 2015.
Guggenheim Funds Investment Advisors, LLC (“GFIA” or the “Adviser”) serves as the investment adviser to the Fund. Guggenheim Partners Investment Management, LLC serves as the Fund’s Options Strategy Sub-Adviser, responsible for the management of the Fund’s options strategy. Security Investors, LLC serves as the Equity Strategy Sub-Adviser, responsible for managing the underlying equity portfolio. Each of the Adviser and the two Sub-Advisers is an affiliate of Guggenheim Partners, LLC (“Guggenheim”), a global diversified financial services firm.
The Fund seeks to achieve its investment objective primarily through a two-part strategy. Under normal circumstances, the Fund invests substantially all of its managed assets in a portfolio of common stocks included in the S&P 500 Equal Weight™ Index in equal weight. In addition, the Fund utilizes a call option writing strategy to seek to generate current income and potentially mitigate overall portfolio volatility.
In connection with the implementation of its strategy, the Fund currently uses leverage through a credit facility provided by a large multi-national financial institution. Although the use of financial leverage by the Fund may create an opportunity for increased return for the common shares, it also results in additional risks and can magnify the effect of any losses. There can be no assurance that a leveraging strategy will be successful during any period during which it is employed.
We encourage shareholders to consider the opportunity to reinvest their distributions from the Fund through the Dividend Reinvestment Plan (“DRIP”), which is described in detail on page 30 of this report. When shares trade at a discount to NAV, the DRIP takes advantage of the discount by reinvesting the quarterly dividend distribution in common shares of the Fund purchased in the market at a price less than NAV. Conversely, when the market price of the Fund’s common shares is at a premium above NAV, the DRIP reinvests participants’ dividends in newly-issued common shares at the greater of NAV per share or 95% of the market price per share. The DRIP provides a cost effective means to accumulate additional shares and enjoy the potential benefits of compounding returns over time.
To learn more about the Fund’s performance and investment strategy for the six-month period ended June 30, 2014, we encourage you to read the Questions & Answers section of the report, which begins on page 6.
We appreciate your investment and look forward to serving your investment needs in the future. For the most up-to-date information on your investment, please visit the Fund’s website at guggenheiminvestments.com/geq.
Sincerely,

Donald C. Cacciapaglia
Chief Executive Officer
Guggenheim Equal Weight Enhanced Equity Income Fund
July 31, 2014
GEQ l GUGGENHEIM EQUAL WEIGHT ENHANCED EQUITY INCOME FUND SEMIANNUAL REPORT l 5
QUESTIONS & ANSWERS | June 30, 2014 |
Guggenheim Equal Weight Enhanced Equity Income Fund (the “Fund”) is managed by a team of seasoned investment professionals. Guggenheim Funds Investment Advisors, LLC (the “Adviser”) is responsible for overall management of the Fund. Guggenheim Partners Investment Management, LLC (“GPIM” or the) is the Fund’s investment sub-adviser responsible for the management of the Fund’s options strategy “Options Strategy Sub-Adviser”. The options strategy is managed by a team that includes Farhan Sharaff, Assistant Chief Investment Officer, Equitius Jayson Flowers, Senior Managing Director; and Jamal Pesaran, CFA, Portfolio Manager. Security Investors, LLC (“Security Investors” or the) is the sub-adviser responsible for managing the underlying equity portfolio “Equity Strategy Sub-Adviser”. The team at Security Investors includes Ryan Harder, CFA, Portfolio Manager, and James R. King, CFA, Portfolio Manager. The Adviser, the Options Strategy Sub-Adviser and the Equity Strategy Sub-Adviser are all affiliates of Guggenheim Partners, LLC (“Guggenheim”), a global diversified financial services firm. In the following interview, the investment team discusses the market environment and the Fund’s performance for the six-month period ended June 30, 2014.
Please describe the Fund’s investment objective and strategy.
The Fund’s investment objective is to provide a high level of risk-adjusted total return with an emphasis on current income. The Fund seeks to achieve its investment objective primarily through a two-part strategy. Under normal circumstances, the Fund invests substantially all of its managed assets in a portfolio of common stocks included in the S&P 500 Equal Weight™ Index (the “Index”) in equal weight. In addition, the Fund utilizes a call option writing strategy to seek to generate current income and potentially mitigate overall portfolio volatility.
The Index has the same constituents as the S&P 500® Index (“S&P 500”), a capitalization-weighted index comprised of 500 common stocks, chosen by Standard & Poor’s Financial Services LLC on a statistical basis, but each company in the Index is assigned an equal weight rather than a weight based on its relative market capitalization. The Fund’s equity portfolio is rebalanced quarterly so that each stock in the Fund’s portfolio has the same target weighting. While the Fund generally expects to invest in substantially all of the stocks included in the Index, the Fund may also seek to obtain exposure through investments in other investment funds, other securities and/or financial instruments that are intended to correlate with or replicate the characteristics of exposure to stocks included in the Index or the Index generally.
The Fund utilizes a call option writing strategy to seek to generate current income and potentially mitigate overall portfolio volatility. The Fund’s options strategy follows the Options Strategy Sub-Adviser’s proprietary dynamic rules-based methodology, GPIM’s “Portable Volatility Monetization Strategy”SM. The Options Strategy Sub-Adviser expects to implement the Fund’s options strategy by selling (i.e., writing) call options on securities indices, exchange-traded funds (“ETFs”) that track securities indices, baskets of securities and other instruments, which will include securities that are not held by the Fund. As this strategy involves uncovered option writing, it may result in less volatility mitigation than, and may be subject to more risks compared to, option strategies involving writing options on securities held by the Fund. There can be no assurance that the Fund’s use of call options will be successful.
The Fund currently employs leverage through a credit facility provided by a large multi-national financial institution. As of June 30, 2014, the amount of leverage was approximately 18% of the Fund’s total assets.
Although financial leverage may create an opportunity for increased return for shareholders, it also results in additional risks and can magnify the effect of any losses. There is no assurance that the strategy will be successful. If income and gains earned on securities purchased with the financial leverage proceeds are greater than the cost of the financial leverage, common shareholders’ return will be greater than if financial leverage had not been used. Conversely, if the income or gains from the securities purchased with the proceeds of financial leverage are less than the cost of the financial leverage, common shareholders’ return will be less than if financial leverage had not been used.
Please provide an overview of the economic and market environment during the six months ended June 30, 2014.
Economic growth hit a winter soft patch in the first quarter of 2014, but strong underlying fundamentals helped the economy strengthen in the second quarter. The economy is adding an average of 214,000 jobs per month in 2014, while the housing market is being helped by an improving labor market, subdued mortgage rates and tight inventory. State and local government spending is positive for growth for the first time in five years. After the period end, minutes released from the U.S. Federal Reserve Board (the “Fed”) and Federal Open Market Committee June meeting indicated a clear end-date for its quantitative easing program—October 2014—following reductions that began in January of the Fed’s monthly purchases of U.S. Treasury securities and mortgage-backed securities.
Overseas political concerns, European monetary policy and devaluation of the Chinese currency combined in the period to help push global investors into U.S. Treasuries, driving rates lower. As growth accelerates in the U.S., rates are expected to climb, but the upward pressure on rates from economic growth could be offset by increasing overseas demand and falling debt issuance by the U.S. government, putting a cap on how far rates can rise before the Fed begins tightening.
Recent economic data suggest that growth is improving slowly in the euro zone core and even more so in the peripheral countries. The European Central Bank has enacted further monetary easing, which is expected to
QUESTIONS & ANSWERS continued | June 30, 2014 |
push both yields and the euro lower, supporting the recovery. Asia is seeking an export-led rebound, although more monetary accommodation may be needed to sustain Japan’s economic expansion. Recent reforms in China are having a positive effect, but policymakers continue to depreciate the currency to help maintain export competitiveness.
Global central banks continue to flood markets with abundant liquidity. A synchronous global expansion is beginning to take hold, creating a positive environment for risk assets. We are approaching the speculative phase of the bull market in both equity and credit. Equities continue to benefit from an improving economy and continued capital flows into the U.S. Credit spreads continue to remain tight in the near term. Historically, spreads don’t begin to widen until defaults rise, which typically takes place one to two years after the Fed begins a tightening cycle.
How did the Fund perform for the six months ended June 30, 2014?
All Fund returns cited—whether based on net asset value (“NAV”) or market price—assume the reinvestment of all distributions. For the six months ended June 30, 2014, the Fund provided a total return based on market price of 11.17% and a total return net of fees based on NAV of 7.56%. The closing price of the Fund’s shares as of June 30, 2014, was $20.03, which represented a discount of 7.61% to the NAV of $21.68. The discount narrowed over the first six months of 2014, as the closing price of the Fund’s shares as of December 31, 2013, was $18.89, which represented a discount of 10.13% to the NAV of $21.02.
Past performance does not guarantee future results. The market price of the Fund’s shares fluctuates from time to time, and it may be higher or lower than the Fund’s NAV. NAV performance data reflects fees and expenses of the Fund.
The Fund paid distributions of $0.4375 in January and April 2014. The most recent distribution represents an annualized distribution rate of 8.74% based on the Fund’s last closing market price of $20.03 on June 30, 2014. Distributions may include ordinary income, realized gains and/or return of capital. The final determination of the tax character of distributions paid by the Fund in 2014 will be reported to shareholders in January 2015. The distribution rate of the Fund exceeded the dividend rate of the S&P 500, which is approximately 2%.
The Fund delivered attractive returns with less-than-market risk. The Fund’s risk, as measured by the standard deviation of returns, was 9.9% during the period, compared with 10.8% for the S&P 500.
Compared with the Fund’s six-month market price return of 11.17%, the S&P 500 Index returned 7.14% and the S&P 500 Equal Weight Index returned 8.66%, with the benchmark for covered call strategies, the CBOE S&P 500 Buy Write Index, delivering 5.66%.
What role did the option strategy play in performance for the period?
The option strategy reduced the risk of the equity holdings over the period, delivering positive performance during market declines, but detracting from performance during moves higher.
The Fund had to contend with the combination of a steadily rising market with very low realized volatility. This led the level of equity implied volatility to drift dramatically lower over the period, with the VIX hitting a low of 10.34 in June 2014—its lowest level in seven years. Selling call options in such an environment is challenging for the strategy because low levels of implied volatility lead to low option premiums.
The low volatility environment came about despite the Fed starting to taper its program of asset purchases. Yields on Treasury securities remained low, with the U.S. Government 10-year rate falling from near 3% at the start of 2014 to near 2.5% by the end of the second quarter. It would appear that the attractiveness of U.S. yields relative to Europe and Asia outweighed the taper impact. A reduction in rates with a corresponding decline in rate volatility caused by excess liquidity led to a decrease in equity volatility.
What were the major contributors to performance?
The main driver of performance for the period was the return 8.66% of the underlying index, the S&P 500 Equal Weight Index, which outperformed the capitalization-weighted S&P 500 Index by 152 basis points. Such outperformance reflects broader strength across a variety of names rather than focused strength in the largest companies. Rebalancing the Index twice in the period also contributed to performance, as the “buy low, sell high” scenario occurred—profits were taken in stocks that had performed well and investments made in stocks that had performed poorly.
It is interesting to note that this underlying strength from the broader equal weight index, and outperformance over the S&P 500 Index, came despite notable weakness in small cap equities. The S&P 500 outperformed the Russell 2000 (small cap benchmark) by 388 basis points during the first half of 2014.
Derivative use detracted slightly from performance. This typically occurs whenever the market is moving steadily upward and some of the calls sold subsequently rise in value.
Leverage was also a positive contributor to performance for the period, as it typically is when the market is rising steadily. Our approach to leverage is dynamic, and we tend to increase leverage where implied volatility levels are attractive and decrease leverage when implied volatility is less attractive. Leverage at the end of the period was about 18% of the Fund’s total assets compared with about 11% six months earlier. The dynamic management of leverage helped lower the risk of the strategy over the period.
QUESTIONS & ANSWERS continued | June 30, 2014 |
Index Definitions
Indices are unmanaged and reflect no expenses. It is not possible to invest directly in an index.
The Chicago Board Options Exchange (CBOE) Volatility Index, often referred to as the VIX (its ticker symbol), the fear index or the fear gauge, is a measure of the implied volatility of S&P 500 Index options. It represents a measure of the market’s expectation of stock market volatility over the next 30 day period. Quoted in percentage points, the VIX represents the expected daily movement in the S&P 500 Index over the next 30-day period, which is then annualized.
The CBOE S&P 500 BuyWrite Index (BXM) is a benchmark index designed to show the hypothetical performance of a portfolio that purchases all the constituents of the S&P 500 Index and then sells at-the-money (meaning same as purchase price) calls of one-month duration against those positions.
The Russell 2000® Index measures the performance of the small-cap value segment of the U.S. equity universe.
The Standard & Poor’s (S&P) 500 Index is an unmanaged, capitalization-weighted index of 500 stocks. The index is designed to measure performance of the broad domestic economy through changes in the aggregate market value of 500 stocks representing all major industries.
The S&P 500 Equal Weight Index has the same constituents as the S&P 500, but each company is assigned a fixed equal weight.
Risks and Other Considerations
The views expressed in this report reflect those of the portfolio managers only through the report period as stated on the cover. These views are subject to change at any time, based on market and other conditions and should not be construed as a recommendation of any kind. The material may also include forward looking statements that involve risk and uncertainty, and there is no guarantee that any predictions will come to pass.
There can be no assurance that the Fund will achieve its investment objectives. The value of the Fund will fluctuate with the value of the underlying securities. Historically, closed-end funds often trade at a discount to their net asset value. Risk is inherent in all investing, including the loss of your entire principal. Therefore, before investing you should consider the risks carefully.
Please see guggenheiminvestments.com/geq for a detailed discussion about Fund risks and considerations.
FUND SUMMARY (Unaudited) | June 30, 2014 |
Fund Statistics | ||
Share Price | $20.03 | |
Common Share Net Asset Value | $21.68 | |
Premium/(Discount) to NAV | (7.61%) | |
Net Assets ($000) | $190,098 | |
Total Returns | ||
(Inception 10/27/11) | Market | NAV |
Six Month | 11.17% | 7.56% |
One Year | 21.12% | 19.54% |
Since Inception - average annual | 9.18% | 13.77% |
Performance data quoted represents past performance, which is no guarantee of future results and current performance may be lower or higher than the figures shown. NAV performance data reflects fees and expenses of the Fund. For the most recent month-end performance figures, please visit guggenheiminvestments.com/geq. The investment return and principal value of an investment will fluctuate with changes in the market conditions and other factors so that an investor’s shares, when sold, may be worth more or less than their original cost.
% of | |
Portfolio Composition | Net Assets |
Common Stocks | 122.5% |
Short-Term Investments | 0.2% |
Total Investments | 122.7% |
Total Value of Options Written | -0.5% |
Liabilities in excess of Other Assets | -0.1% |
Borrowings | -22.1% |
Net Assets | 100.0% |
Sector Breakdown* | % of Common Stocks |
Consumer, Non-cyclical | 20.0% |
Financial | 16.3% |
Consumer, Cyclical | 13.7% |
Industrial | 12.8% |
Energy | 9.1% |
Technology | 8.9% |
Communications | 8.0% |
Utilities | 6.2% |
Basic Materials | 4.8% |
Diversified | 0.2% |
*Securities are classified by sectors that represent broad groupings of industries.
Distributions to Shareholders & Annualized Distribution Rate
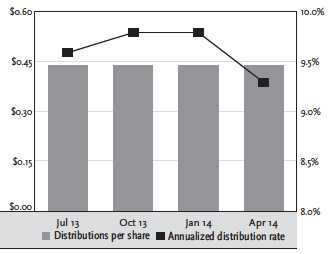
Portfolio composition and sector breakdown are subject to change daily. For more information, please visit guggenheiminvestments.com/geq. The above summaries are provided for informational purposes only and should not be viewed as recommendations. Past performance does not guarantee future results. All or a portion of the above distributions may be characterized as a return of capital. For the year ended December 31, 2013 approximately 61% of the distributions were characterized as return of capital. As of June 30, 2014, 0% of the distributions were estimated to be characterized as return of capital. The final determination of the tax character of the distributions paid by the Fund in 2014 will be reported to shareholders in January 2015.
PORTFOLIO OF INVESTMENTS (Unaudited) | June 30, 2014 |
Number | |||
of Shares | Description | Value | |
Total Investments – 122.7% | |||
Common Stocks – 122.5% | |||
Basic Materials – 5.9% | |||
3,773 | Air Products & Chemicals, Inc.(a) | $ 485,284 | |
4,306 | Airgas, Inc.(a) | 468,966 | |
31,473 | Alcoa, Inc.(a) | 468,633 | |
10,989 | Allegheny Technologies, Inc.(a) | 495,604 | |
1,941 | CF Industries Holdings, Inc.(a) | 466,869 | |
8,720 | Dow Chemical Co.(a) | 448,731 | |
5,144 | Eastman Chemical Co.(a) | 449,328 | |
4,226 | Ecolab, Inc.(a) | 470,523 | |
6,690 | EI du Pont de Nemours & Co.(a) | 437,794 | |
5,916 | FMC Corp.(a) | 421,160 | |
13,453 | Freeport-McMoRan Copper & Gold, Inc.(a) | 491,035 | |
4,533 | International Flavors & Fragrances, Inc.(a) | 472,701 | |
9,503 | International Paper Co.(a) | 479,616 | |
4,618 | LyondellBasell Industries NV, Class A (Netherlands)(a) | 450,948 | |
10,552 | MeadWestvaco Corp.(a) | 467,032 | |
3,819 | Monsanto Co.(a) | 476,382 | |
9,407 | Mosaic Co.(a) | 465,176 | |
19,529 | Newmont Mining Corp.(a) | 496,817 | |
8,988 | Nucor Corp.(a) | 442,659 | |
2,237 | PPG Industries, Inc.(a) | 470,106 | |
3,475 | Praxair, Inc.(a) | 461,619 | |
2,255 | Sherwin-Williams Co.(a) | 466,582 | |
4,567 | Sigma-Aldrich Corp.(a) | 463,459 | |
19,080 | United States Steel Corp.(a) | 496,843 | |
11,213,867 | |||
Communications – 9.8% | |||
1,401 | Amazon.com, Inc.(a) (b) | 455,017 | |
13,045 | AT&T, Inc.(a) | 461,271 | |
26,848 | Cablevision Systems Corp., Class A(a) | 473,867 | |
7,560 | CBS Corp., Class B(a) | 469,778 | |
12,367 | CenturyLink, Inc.(a) | 447,685 | |
18,501 | Cisco Systems, Inc.(a) | 459,750 | |
8,709 | Comcast Corp., Class A(a) | 467,499 | |
21,555 | Corning, Inc.(a) | 473,132 | |
5,501 | DIRECTV(a) (b) | 467,640 | |
5,879 | Discovery Communications, Inc., Class A(a) (b) | 436,692 | |
9,318 | eBay, Inc.(a) (b) | 466,459 | |
6,154 | Expedia, Inc.(a) | 484,689 | |
4,068 | F5 Networks, Inc.(a) (b) | 453,338 | |
7,086 | Facebook, Inc., Class A(a) (b) | 476,817 | |
81,022 | Frontier Communications Corp.(a) | 473,168 |
Number | |||
of Shares | Description | Value | |
15,905 | Gannett Co., Inc.(a) | $ 497,985 | |
815 | Google, Inc., Class A(a) (b) | 476,506 | |
829 | Google, Inc., Class C(a) (b) | 476,907 | |
655 | Graham Holdings Co., Class B(a) | 470,362 | |
6,014 | Harris Corp.(a) | 455,561 | |
23,363 | Interpublic Group of Cos., Inc.(a) | 455,812 | |
18,583 | Juniper Networks, Inc.(a) | 456,027 | |
6,843 | Motorola Solutions, Inc.(a) | 455,539 | |
1,069 | NetFlix, Inc.(a) (b) | 471,001 | |
26,521 | News Corp. Class A(a) (b) | 475,787 | |
9,851 | Nielsen NV (Netherlands)(a) | 476,887 | |
6,507 | Omnicom Group, Inc.(a) | 463,429 | |
385 | Priceline Group, Inc.(a) (b) | 463,155 | |
5,904 | Scripps Networks Interactive, Inc., Class A(a) | 479,051 | |
21,058 | Symantec Corp.(a) | 482,228 | |
3,212 | Time Warner Cable, Inc.(a) | 473,128 | |
6,735 | Time Warner, Inc.(a) | 473,134 | |
| 1 | Time, Inc.(a) (b) | 24 | |
4,480 | TripAdvisor, Inc.(a) (b) | 486,798 | |
12,864 | Twenty-First Century Fox, Inc., Class A(a) | 452,170 | |
8,993 | VeriSign, Inc.(a) (b) | 438,948 | |
9,293 | Verizon Communications, Inc.(a) | 454,706 | |
5,318 | Viacom, Inc., Class B(a) | 461,230 | |
5,520 | Walt Disney Co.(a) | 473,285 | |
46,628 | Windstream Holdings, Inc.(a) | 464,415 | |
12,370 | Yahoo!, Inc.(a) (b) | 434,558 | |
18,635,435 | |||
Consumer, Cyclical – 16.8% | |||
8,260 | AutoNation, Inc.(a) (b) | 492,957 | |
875 | Autozone, Inc.(a) (b) | 469,210 | |
7,587 | Bed Bath & Beyond, Inc.(a) (b) | 435,342 | |
15,955 | Best Buy Co., Inc.(a) | 494,765 | |
7,017 | BorgWarner, Inc.(a) | 457,438 | |
10,341 | CarMax, Inc.(a) (b) | 537,835 | |
11,740 | Carnival Corp. (Panama)(a) | 442,011 | |
776 | Chipotle Mexican Grill, Inc.(a) (b) | 459,788 | |
11,607 | Coach, Inc.(a) | 396,843 | |
3,963 | Costco Wholesale Corp.(a) | 456,379 | |
6,023 | CVS Caremark Corp.(a) | 453,954 | |
9,199 | Darden Restaurants, Inc.(a) | 425,638 | |
6,722 | Delphi Automotive PLC (Jersey)(a) | 462,070 | |
11,646 | Delta Air Lines, Inc.(a) | 450,933 | |
7,530 | Dollar General Corp.(a) (b) | 431,921 | |
8,475 | Dollar Tree, Inc.(a) (b) | 461,549 |
See notes to financial statements.
10 l GEQ l GUGGENHEIM EQUAL WEIGHT ENHANCED EQUITY INCOME FUND SEMIANNUAL REPORT
PORTFOLIO OF INVESTMENTS (Unaudited) continued | June 30, 2014 |
Number | |||
of Shares | Description | Value | |
Consumer, Cyclical (continued) | |||
19,494 | DR Horton, Inc.(a) | $ 479,162 | |
6,855 | Family Dollar Stores, Inc.(a) | 453,390 | |
9,219 | Fastenal Co.(a) | 456,248 | |
27,594 | Ford Motor Co.(a) | 475,720 | |
4,293 | Fossil Group, Inc.(a) (b) | 448,704 | |
12,354 | GameStop Corp., Class A(a) | 499,966 | |
11,117 | Gap, Inc.(a) | 462,134 | |
12,825 | General Motors Co.(a) | 465,548 | |
5,369 | Genuine Parts Co.(a) | 471,399 | |
17,416 | Goodyear Tire & Rubber Co.(a) | 483,816 | |
6,614 | Harley-Davidson, Inc.(a) | 461,988 | |
4,437 | Harman International Industries, Inc.(a) | 476,667 | |
8,723 | Hasbro, Inc.(a) | 462,755 | |
5,854 | Home Depot, Inc.(a) | 473,940 | |
9,206 | Johnson Controls, Inc.(a) | 459,656 | |
8,768 | Kohl’s Corp.(a) | 461,898 | |
11,374 | Lennar Corp., Class A(a) | 477,481 | |
7,967 | Limited Brands, Inc.(a) | 467,344 | |
10,055 | Lowe’s Cos., Inc.(a) | 482,539 | |
7,960 | Macy’s, Inc.(a) | 461,839 | |
7,445 | Marriott International, Inc., Class A(a) | 477,225 | |
11,877 | Mattel, Inc.(a) | 462,847 | |
4,547 | McDonald’s Corp.(a) | 458,065 | |
4,867 | Michael Kors Holdings Ltd. (British Virgin Islands)(a) (b) | 431,460 | |
3,457 | Mohawk Industries, Inc.(a) (b) | 478,241 | |
14,938 | Newell Rubbermaid, Inc.(a) | 462,929 | |
6,124 | NIKE, Inc., Class B(a) | 474,916 | |
6,731 | Nordstrom, Inc.(a) | 457,237 | |
3,056 | O’Reilly Automotive, Inc.(a) (b) | 460,234 | |
7,221 | PACCAR, Inc.(a) | 453,695 | |
7,848 | PetSmart, Inc.(a) | 469,310 | |
23,531 | Pulte Group, Inc.(a) | 474,385 | |
3,922 | PVH Corp. | 457,305 | |
2,976 | Ralph Lauren Corp.(a) | 478,214 | |
6,809 | Ross Stores, Inc.(a) | 450,279 | |
17,374 | Southwest Airlines Co.(a) | 466,666 | |
41,580 | Staples, Inc.(a) | 450,727 | |
6,117 | Starbucks Corp.(a) | 473,333 | |
5,781 | Starwood Hotels & Resorts Worldwide, Inc.(a) | 467,220 | |
7,985 | Target Corp.(a) | 462,731 | |
4,615 | Tiffany & Co.(a) | 462,654 | |
8,340 | TJX Cos., Inc.(a) | 443,271 | |
7,031 | Tractor Supply Co.(a) | 424,672 |
Number | |||
of Shares | Description | Value | |
7,947 | Under Armour, Inc., Class A(a) (b) | $ 472,767 | |
13,633 | Urban Outfitters, Inc.(a) (b) | 461,613 | |
7,413 | VF Corp.(a) | 467,019 | |
6,255 | Walgreen Co.(a) | 463,683 | |
6,069 | Wal-Mart Stores, Inc.(a) | 455,600 | |
3,306 | Whirlpool Corp.(a) | 460,261 | |
1,758 | WW Grainger, Inc.(a) | 447,007 | |
6,305 | Wyndham Worldwide Corp.(a) | 477,414 | |
2,273 | Wynn Resorts Ltd.(a) | 471,784 | |
5,767 | Yum! Brands, Inc.(a) | 468,280 | |
31,953,871 | |||
Consumer, Non-cyclical – 24.6% | |||
11,484 | Abbott Laboratories(a) | 469,696 | |
8,436 | AbbVie, Inc.(a) | 476,128 | |
2,186 | Actavis PLC (Ireland)(a) (b) | 487,588 | |
13,457 | ADT Corp.(a) | 470,188 | |
5,647 | Aetna, Inc.(a) | 457,859 | |
2,791 | Alexion Pharmaceuticals, Inc.(a) (b) | 436,094 | |
2,825 | Allergan, Inc.(a) | 478,046 | |
1,694 | Alliance Data Systems Corp.(a) (b) | 476,438 | |
11,024 | Altria Group, Inc. | 462,346 | |
6,367 | AmerisourceBergen Corp.(a) | 462,626 | |
3,938 | Amgen, Inc.(a) | 466,141 | |
10,424 | Archer Daniels Midland Co.(a) | 459,803 | |
5,799 | Automatic Data Processing, Inc.(a) | 459,745 | |
9,187 | Avery-Dennison Corp.(a) | 470,834 | |
31,109 | Avon Products, Inc.(a) | 454,502 | |
6,250 | Baxter International, Inc. | 451,875 | |
3,885 | Becton, Dickinson & Co.(a) | 459,596 | |
1,474 | Biogen Idec, Inc.(a) (b) | 464,767 | |
35,701 | Boston Scientific Corp.(a) (b) | 455,902 | |
9,705 | Bristol-Myers Squibb Co.(a) | 470,790 | |
4,881 | Brown-Forman Corp., Class B(a) | 459,644 | |
3,324 | C.R. Bard, Inc. | 475,365 | |
10,083 | Campbell Soup Co.(a) | 461,902 | |
6,745 | Cardinal Health, Inc.(a) | 462,437 | |
10,696 | CareFusion Corp.(a) (b) | 474,368 | |
5,714 | Celgene Corp.(a) (b) | 490,718 | |
5,021 | Cigna Corp.(a) | 461,781 | |
7,241 | Cintas Corp.(a) | 460,093 | |
5,073 | Clorox Co.(a) | 463,672 | |
11,319 | Coca-Cola Co.(a) | 479,473 | |
10,250 | Coca-Cola Enterprises, Inc.(a) | 489,744 | |
6,733 | Colgate-Palmolive Co.(a) | 459,055 |
See notes to financial statements.
GEQ l GUGGENHEIM EQUAL WEIGHT ENHANCED EQUITY INCOME FUND SEMIANNUAL REPORT l 11
PORTFOLIO OF INVESTMENTS (Unaudited) continued | June 30, 2014 |
Number | |||
of Shares | Description | Value | |
Consumer, Non-cyclical (continued) | |||
14,062 | ConAgra Foods, Inc.(a) | $ 417,360 | |
5,534 | Constellation Brands, Inc., Class A(a) (b) | 487,711 | |
6,344 | Covidien PLC (Ireland)(a) | 572,102 | |
6,456 | DaVita HealthCare Partners, Inc.(a) (b) | 466,898 | |
9,561 | DENTSPLY International, Inc.(a) | 452,713 | |
7,908 | Dr Pepper Snapple Group, Inc.(a) | 463,251 | |
5,831 | Edwards Lifesciences Corp.(a) (b) | 500,532 | |
7,759 | Eli Lilly & Co.(a) | 482,377 | |
6,376 | Equifax, Inc.(a) | 462,515 | |
5,975 | Estee Lauder Cos., Inc., Class A(a) | 443,704 | |
6,383 | Express Scripts Holding Co.(a) (b) | 442,533 | |
8,414 | General Mills, Inc.(a) | 442,072 | |
5,662 | Gilead Sciences, Inc.(a) (b) | 469,436 | |
14,064 | H&R Block, Inc.(a) | 471,425 | |
4,680 | Hershey Co.(a) | 455,692 | |
9,492 | Hormel Foods Corp.(a) | 468,430 | |
8,995 | Hospira, Inc.(a) (b) | 462,073 | |
3,665 | Humana, Inc.(a) | 468,094 | |
1,152 | Intuitive Surgical, Inc.(a) (b) | 474,394 | |
14,742 | Iron Mountain, Inc.(a) | 522,604 | |
4,343 | JM Smucker Co.(a) | 462,834 | |
4,457 | Johnson & Johnson(a) | 466,291 | |
6,800 | Kellogg Co.(a) | 446,760 | |
3,814 | Keurig Green Mountain, Inc.(a) | 475,263 | |
4,130 | Kimberly-Clark Corp.(a) | 459,339 | |
7,743 | Kraft Foods Group, Inc.(a) | 464,193 | |
9,691 | Kroger Co.(a) | 479,026 | |
4,490 | Laboratory Corp. of America Holdings(a) (b) | 459,776 | |
7,477 | Lorillard, Inc.(a) | 455,873 | |
6,017 | MasterCard, Inc., Class A(a) | 442,069 | |
6,371 | McCormick & Co., Inc.(a) | 456,100 | |
5,481 | McGraw-Hill Cos., Inc.(a) | 455,087 | |
2,502 | McKesson Corp.(a) | 465,897 | |
5,224 | Mead Johnson Nutrition Co.(a) | 486,720 | |
7,528 | Medtronic, Inc.(a) | 479,985 | |
7,846 | Merck & Co., Inc.(a) | 453,891 | |
6,415 | Molson Coors Brewing Co., Class B(a) | 475,736 | |
12,203 | Mondelez International, Inc., Class A(a) | 458,955 | |
6,635 | Monster Beverage Corp.(a) (b) | 471,284 | |
5,327 | Moody’s Corp.(a) | 466,965 | |
9,103 | Mylan, Inc.(a) (b) | 469,351 | |
11,804 | Patterson Cos., Inc.(a) | 466,376 | |
11,117 | Paychex, Inc.(a) | 462,023 |
Number | |||
of Shares | Description | Value | |
5,240 | PepsiCo, Inc.(a) | $ 468,142 | |
3,256 | Perrigo Co. PLC (Ireland)(a) | 474,595 | |
15,474 | Pfizer, Inc.(a) | 459,268 | |
5,167 | Philip Morris International, Inc.(a) | 435,630 | |
5,737 | Procter & Gamble Co.(a) | 450,871 | |
13,475 | Quanta Services, Inc.(a) (b) | 465,966 | |
7,718 | Quest Diagnostics, Inc.(a) | 452,969 | |
1,493 | Regeneron Pharmaceuticals, Inc.(a) (b) | 421,728 | |
7,649 | Reynolds American, Inc.(a) | 461,617 | |
9,645 | Robert Half International, Inc.(a) | 460,452 | |
13,405 | Safeway, Inc.(a) | 460,328 | |
7,022 | St. Jude Medical, Inc.(a) | 486,274 | |
5,476 | Stryker Corp.(a) | 461,736 | |
12,374 | Sysco Corp.(a) | 463,406 | |
9,730 | Tenet Healthcare Corp.(a) (b) | 456,726 | |
14,986 | Total System Services, Inc.(a) | 470,710 | |
12,899 | Tyson Foods, Inc., Class A(a) | 484,227 | |
5,772 | UnitedHealth Group, Inc.(a) | 471,861 | |
5,584 | Varian Medical Systems, Inc.(a) (b) | 464,254 | |
6,218 | Vertex Pharmaceuticals, Inc.(a) (b) | 588,720 | |
4,277 | WellPoint, Inc.(a) | 460,248 | |
28,400 | Western Union Co.(a) | 492,456 | |
10,850 | Whole Foods Market, Inc.(a) | 419,136 | |
4,329 | Zimmer Holdings, Inc.(a) | 449,610 | |
14,226 | Zoetis, Inc.(a) | 459,073 | |
46,674,929 | |||
Diversified – 0.2% | |||
17,732 | Leucadia National Corp.(a) | 464,933 | |
Energy – 11.1% | |||
4,178 | Anadarko Petroleum Corp.(a) | 457,366 | |
4,680 | Apache Corp.(a) | 470,902 | |
6,422 | Baker Hughes, Inc.(a) | 478,117 | |
13,180 | Cabot Oil & Gas Corp., Class A(a) | 449,965 | |
7,022 | Cameron International Corp.(a) (b) | 475,460 | |
881 | Chesapeake Energy Corp.(b) | 26,104 | |
14,998 | Chesapeake Energy Corp.(a) | 466,138 | |
3,590 | Chevron Corp.(a) | 468,675 | |
3,290 | Cimarex Energy Co.(a) | 471,983 | |
5,501 | ConocoPhillips(a) | 471,601 | |
9,915 | Consol Energy, Inc.(a) | 456,784 | |
25,847 | Denbury Resources, Inc.(a) | 477,136 | |
5,856 | Devon Energy Corp.(a) | 464,966 | |
9,215 | Diamond Offshore Drilling, Inc.(a) | 457,340 | |
8,576 | Ensco PLC, Class A (United Kingdom)(a) | 476,568 |
See notes to financial statements.
12 l GEQ l GUGGENHEIM EQUAL WEIGHT ENHANCED EQUITY INCOME FUND SEMIANNUAL REPORT
PORTFOLIO OF INVESTMENTS (Unaudited) continued | June 30, 2014 |
Number | |||
of Shares | Description | Value | |
Energy (continued) | |||
4,009 | EOG Resources, Inc.(a) | $ 468,492 | |
4,318 | EQT Corp.(a) | 461,594 | |
4,451 | Exxon Mobil Corp.(a) | 448,127 | |
7,766 | FMC Technologies, Inc.(a) (b) | 474,270 | |
6,763 | Halliburton Co.(a) | 480,241 | |
4,041 | Helmerich & Payne, Inc.(a) | 469,201 | |
4,762 | Hess Corp.(a) | 470,914 | |
12,986 | Kinder Morgan, Inc.(a) | 470,872 | |
11,692 | Marathon Oil Corp.(a) | 466,745 | |
5,289 | Marathon Petroleum Corp.(a) | 412,912 | |
7,001 | Murphy Oil Corp.(a) | 465,426 | |
16,617 | Nabors Industries Ltd. (Bermuda)(a) | 488,041 | |
5,893 | National Oilwell Varco, Inc.(a) | 485,288 | |
11,298 | Newfield Exploration Co.(a) (b) | 499,372 | |
13,778 | Noble Corp. PLC (United Kingdom)(a) | 462,390 | |
5,998 | Noble Energy, Inc.(a) | 464,605 | |
4,428 | Occidental Petroleum Corp.(a) | 454,446 | |
7,015 | Oneok, Inc.(a) | 477,581 | |
27,217 | Peabody Energy Corp.(a) | 444,998 | |
5,474 | Phillips 66(a) | 440,274 | |
2,012 | Pioneer Natural Resources Co.(a) | 462,378 | |
14,135 | QEP Resources, Inc.(a) | 487,658 | |
5,181 | Range Resources Corp.(a) | 450,488 | |
14,105 | Rowan Companies PLC, Class A (United Kingdom)(a) | 450,373 | |
4,222 | Schlumberger Ltd. (Curacao)(a) | 497,984 | |
9,975 | Southwestern Energy Co.(a) (b) | 453,763 | |
11,099 | Spectra Energy Corp.(a) | 471,486 | |
7,908 | Tesoro Corp.(a) | 463,962 | |
10,309 | Transocean Ltd. (Switzerland)(a) | 464,214 | |
8,503 | Valero Energy Corp.(a) | 426,000 | |
9,687 | Williams Cos., Inc.(a) | 563,880 | |
21,067,080 | |||
Financial – 20.0% | |||
4,398 | ACE Ltd. (Switzerland)(a) | 456,073 | |
2,361 | Affiliated Managers Group, Inc. (b) | 484,948 | |
7,374 | Aflac, Inc.(a) | 459,032 | |
7,743 | Allstate Corp.(a) | 454,669 | |
4,817 | American Express Co.(a) | 456,989 | |
8,354 | American International Group, Inc.(a) | 455,961 | |
5,167 | American Tower Corp., REIT(a) | 464,927 | |
3,938 | Ameriprise Financial, Inc.(a) | 472,560 | |
5,082 | Aon PLC (United Kingdom)(a) | 457,837 | |
14,249 | Apartment Investment & Management Co., Class A, REIT(a) | 459,815 |
Number | |||
of Shares | Description | Value | |
6,768 | Assurant, Inc.(a) | $ 443,642 | |
3,265 | AvalonBay Communities, Inc., REIT(a) | 464,250 | |
29,598 | Bank of America Corp. | 454,921 | |
12,924 | Bank of New York Mellon Corp.(a) | 484,392 | |
11,903 | BB&T Corp.(a) | 469,335 | |
3,610 | Berkshire Hathaway, Inc., Class B(a) (b) | 456,882 | |
1,477 | BlackRock, Inc.(a) | 472,049 | |
3,913 | Boston Properties, Inc., REIT(a) | 462,438 | |
5,678 | Capital One Financial Corp.(a) | 469,003 | |
14,964 | CBRE Group, Inc., Class A(a) (b) | 479,447 | |
17,569 | Charles Schwab Corp.(a) | 473,133 | |
4,888 | Chubb Corp.(a) | 450,527 | |
9,348 | Cincinnati Financial Corp.(a) | 449,078 | |
9,602 | Citigroup, Inc.(a) | 452,254 | |
6,397 | CME Group, Inc.(a) | 453,867 | |
9,121 | Comerica, Inc.(a) | 457,509 | |
6,193 | Crown Castle International Corp., REIT(a) | 459,892 | |
7,489 | Discover Financial Services(a) | 464,168 | |
22,656 | E*TRADE Financial Corp.(a) (b) | 481,667 | |
7,399 | Equity Residential, REIT(a) | 466,137 | |
2,548 | Essex Property Trust, Inc., REIT(a) | 471,151 | |
21,383 | Fifth Third Bancorp(a) | 456,527 | |
8,217 | Franklin Resources, Inc.(a) | 475,271 | |
19,437 | General Growth Properties, Inc., REIT | 457,936 | |
26,218 | Genworth Financial, Inc., Class A(a) (b) | 456,193 | |
2,754 | Goldman Sachs Group, Inc.(a) | 461,130 | |
12,789 | Hartford Financial Services Group, Inc.(a) | 457,974 | |
11,014 | HCP, Inc., REIT(a) | 455,759 | |
7,235 | Health Care REIT, Inc., REIT(a) | 453,417 | |
20,593 | Host Hotels & Resorts, Inc., REIT(a) | 453,252 | |
46,393 | Hudson City Bancorp, Inc.(a) | 456,043 | |
48,407 | Huntington Bancshares, Inc.(a) | 461,803 | |
2,364 | Intercontinental Exchange, Inc.(a) | 446,560 | |
12,271 | Invesco Ltd. (Bermuda)(a) | 463,230 | |
8,011 | JPMorgan Chase & Co.(a) | 461,594 | |
32,114 | KeyCorp(a) | 460,194 | |
20,140 | Kimco Realty Corp., REIT(a) | 462,817 | |
9,203 | Legg Mason, Inc.(a) | 472,206 | |
9,041 | Lincoln National Corp.(a) | 465,069 | |
10,499 | Loews Corp.(a) | 462,061 | |
3,725 | M&T Bank Corp.(a) | 462,086 | |
6,992 | Macerich Co., REIT(a) | 466,716 | |
8,993 | Marsh & McLennan Cos., Inc.(a) | 466,018 | |
8,388 | MetLife, Inc.(a) | 466,038 |
See notes to financial statements.
GEQ l GUGGENHEIM EQUAL WEIGHT ENHANCED EQUITY INCOME FUND SEMIANNUAL REPORT l 13
PORTFOLIO OF INVESTMENTS (Unaudited) continued | June 30, 2014 |
Number | |||
of Shares | Description | Value | |
Financial (continued) | |||
14,465 | Morgan Stanley(a) | $ 467,653 | |
12,441 | NASDAQ OMX Group, Inc.(a) | 480,471 | |
27,413 | Navient Corp.(a) | 485,485 | |
7,347 | Northern Trust Corp.(a) | 471,751 | |
30,834 | People’s United Financial, Inc.(a) | 467,752 | |
10,355 | Plum Creek Timber Co., Inc., REIT(a) | 467,011 | |
5,204 | PNC Financial Services Group, Inc.(a) | 463,416 | |
9,373 | Principal Financial Group, Inc.(a) | 473,150 | |
18,068 | Progressive Corp.(a) | 458,204 | |
11,170 | Prologis, Inc., REIT(a) | 458,975 | |
5,186 | Prudential Financial, Inc.(a) | 460,361 | |
2,695 | Public Storage, REIT(a) | 461,788 | |
42,668 | Regions Financial Corp.(a) | 453,134 | |
2,784 | Simon Property Group, Inc., REIT(a) | 462,924 | |
6,896 | State Street Corp.(a) | 463,825 | |
11,351 | SunTrust Banks, Inc.(a) | 454,721 | |
5,584 | T Rowe Price Group, Inc.(a) | 471,345 | |
5,609 | Torchmark Corp.(a) | 459,489 | |
4,789 | Travelers Cos., Inc.(a) | 450,501 | |
13,100 | Unum Group(a) | 455,356 | |
10,611 | US Bancorp(a) | 459,669 | |
7,180 | Ventas, Inc., REIT(a) | 460,238 | |
2,163 | Visa, Inc., Class A(a) | 455,766 | |
4,373 | Vornado Realty Trust, REIT(a) | 466,730 | |
8,805 | Wells Fargo & Co.(a) | 462,791 | |
14,817 | Weyerhaeuser Co., REIT(a) | 490,295 | |
13,929 | XL Group PLC (Ireland)(a) | 455,896 | |
15,428 | Zions Bancorporation(a) | 454,663 | |
37,951,807 | |||
Industrial – 15.6% | |||
3,187 | 3M Co.(a) | 456,506 | |
7,811 | Agilent Technologies, Inc.(a) | 448,664 | |
8,147 | Allegion PLC (Ireland)(a) | 461,772 | |
8,578 | AMETEK, Inc.(a) | 448,458 | |
4,721 | Amphenol Corp., Class A(a) | 454,821 | |
7,507 | Ball Corp.(a) | 470,539 | |
11,168 | Bemis Co., Inc.(a) | 454,091 | |
3,455 | Boeing Co.(a) | 439,580 | |
4,279 | Caterpillar, Inc.(a) | 464,999 | |
7,370 | CH Robinson Worldwide, Inc.(a) | 470,132 | |
15,057 | CSX Corp.(a) | 463,906 | |
2,928 | Cummins, Inc.(a) | 451,761 | |
5,694 | Danaher Corp.(a) | 448,289 | |
5,050 | Deere & Co.(a) | 457,278 |
Number | |||
of Shares | Description | Value | |
5,126 | Dover Corp.(a) | $ 466,210 | |
6,081 | Eaton Corp. PLC (Ireland)(a) | 469,331 | |
6,875 | Emerson Electric Co.(a) | 456,225 | |
10,229 | Expeditors International of Washington, Inc.(a) | 451,713 | |
3,258 | FedEx Corp.(a) | 493,195 | |
12,780 | FLIR Systems, Inc.(a) | 443,849 | |
5,914 | Flowserve Corp.(a) | 439,706 | |
5,886 | Fluor Corp.(a) | 452,634 | |
7,711 | Garmin Ltd. (Switzerland)(a) | 469,600 | |
3,835 | General Dynamics Corp.(a) | 446,969 | |
16,900 | General Electric Co.(a) | 444,132 | |
4,874 | Honeywell International, Inc.(a) | 453,038 | |
5,183 | Illinois Tool Works, Inc.(a) | 453,823 | |
7,335 | Ingersoll-Rand PLC (Ireland)(a) | 458,511 | |
23,091 | Jabil Circuit, Inc.(a) | 482,603 | |
8,347 | Jacobs Engineering Group, Inc.(a) (b) | 444,728 | |
7,480 | Joy Global, Inc.(a) | 460,618 | |
4,368 | Kansas City Southern(a) | 469,604 | |
3,640 | L-3 Communications Holdings, Inc.(a) | 439,530 | |
13,654 | Leggett & Platt, Inc.(a) | 468,058 | |
2,786 | Lockheed Martin Corp.(a) | 447,794 | |
20,914 | Masco Corp.(a) | 464,291 | |
4,517 | Norfolk Southern Corp.(a) | 465,387 | |
3,782 | Northrop Grumman Corp.(a) | 452,440 | |
13,732 | Owens-Illinois, Inc.(a) (b) | 475,675 | |
5,440 | Pall Corp.(a) | 464,522 | |
3,594 | Parker Hannifin Corp.(a) | 451,874 | |
6,078 | Pentair PLC (Ireland)(a) | 438,345 | |
9,847 | PerkinElmer, Inc.(a) | 461,233 | |
1,719 | Precision Castparts Corp.(a) | 433,876 | |
4,730 | Raytheon Co.(a) | 436,343 | |
12,448 | Republic Services, Inc.(a) | 472,651 | |
3,638 | Rockwell Automation, Inc.(a) | 455,332 | |
5,758 | Rockwell Collins, Inc.(a) | 449,930 | |
3,127 | Roper Industries, Inc.(a) | 456,573 | |
5,275 | Ryder System, Inc.(a) | 464,675 | |
13,727 | Sealed Air Corp.(a) | 469,052 | |
3,913 | Snap-On, Inc.(a) | 463,769 | |
5,243 | Stanley Black & Decker, Inc.(a) | 460,440 | |
3,858 | Stericycle, Inc.(a) (b) | 456,864 | |
7,436 | TE Connectivity Ltd. (Switzerland)(a) | 459,842 | |
11,598 | Textron, Inc.(a) | 444,087 | |
3,835 | Thermo Fisher Scientific, Inc.(a) | 452,530 | |
10,211 | Tyco International Ltd. (Switzerland)(a) | 465,622 | |
4,528 | Union Pacific Corp.(a) | 451,668 |
See notes to financial statements.
14 l GEQ l GUGGENHEIM EQUAL WEIGHT ENHANCED EQUITY INCOME FUND SEMIANNUAL REPORT
PORTFOLIO OF INVESTMENTS (Unaudited) continued | June 30, 2014 |
Number | |||
of Shares | Description | Value | |
Industrial (continued) | |||
4,524 | United Parcel Service, Inc., Class B(a) | $ 464,434 | |
3,913 | United Technologies Corp.(a) | 451,756 | |
7,058 | Vulcan Materials Co.(a) | 449,948 | |
10,385 | Waste Management, Inc.(a) | 464,521 | |
4,357 | Waters Corp.(a) (b) | 455,045 | |
11,839 | Xylem, Inc.(a) | 462,668 | |
29,718,060 | |||
Technology – 10.9% | |||
5,524 | Accenture PLC, Class A (Ireland)(a) | 446,560 | |
6,838 | Adobe Systems, Inc.(a) (b) | 494,799 | |
7,766 | Akamai Technologies, Inc.(a) (b) | 474,192 | |
13,441 | Altera Corp.(a) | 467,209 | |
8,217 | Analog Devices, Inc.(a) | 444,293 | |
5,007 | Apple, Inc.(a) | 465,301 | |
20,428 | Applied Materials, Inc.(a) | 460,651 | |
8,423 | Autodesk, Inc.(a) (b) | 474,889 | |
6,399 | Avago Technologies Ltd. (Singapore)(a) | 461,176 | |
11,916 | Broadcom Corp., Class A(a) | 442,322 | |
15,790 | CA, Inc.(a) | 453,805 | |
8,631 | Cerner Corp.(a) (b) | 445,187 | |
7,177 | Citrix Systems, Inc.(a) (b) | 448,921 | |
9,638 | Cognizant Technology Solutions Corp., Class A(a) (b) | 471,395 | |
7,221 | Computer Sciences Corp.(a) | 456,367 | |
4,396 | Dun & Bradstreet Corp.(a) | 484,439 | |
12,807 | Electronic Arts, Inc.(a) (b) | 459,387 | |
17,166 | EMC Corp.(a) | 452,152 | |
8,487 | Fidelity National Information Services, Inc.(a) | 464,578 | |
7,088 | First Solar, Inc.(a) (b) | 503,674 | |
7,628 | Fiserv, Inc.(a) (b) | 460,121 | |
12,997 | Hewlett-Packard Co.(a) | 437,739 | |
15,305 | Intel Corp.(a) | 472,925 | |
2,502 | International Business Machines Corp.(a) | 453,538 | |
5,785 | Intuit, Inc.(a) | 465,866 | |
6,664 | KLA-Tencor Corp.(a) | 484,073 | |
6,955 | Lam Research Corp.(a) | 470,019 | |
9,691 | Linear Technology Corp.(a) | 456,155 | |
9,300 | Microchip Technology, Inc.(a) | 453,933 | |
14,661 | Micron Technology, Inc.(a) | 483,080 | |
11,083 | Microsoft Corp.(a) | 462,161 | |
12,814 | NetApp, Inc.(a) | 467,967 | |
23,386 | NVIDIA Corp.(a) | 433,576 | |
10,845 | Oracle Corp.(a) | 439,548 | |
16,635 | Pitney Bowes, Inc.(a) | 459,459 | |
5,776 | QUALCOMM, Inc.(a) | 457,459 |
Number | |||
of Shares | Description | Value | |
8,801 | Red Hat, Inc.(a) (b) | $ 486,431 | |
8,414 | salesforce.com, Inc.(a) (b) | 488,685 | |
4,641 | SanDisk Corp.(a) | 484,659 | |
8,256 | Seagate Technology PLC (Ireland)(a) | 469,106 | |
10,524 | Teradata Corp.(a) (b) | 423,065 | |
9,455 | Texas Instruments, Inc.(a) | 451,854 | |
4,961 | Western Digital Corp.(a) | 457,900 | |
36,239 | Xerox Corp.(a) | 450,813 | |
9,774 | Xilinx, Inc.(a) | 462,408 | |
20,803,837 | |||
Utilities – 7.6% | |||
32,180 | AES Corp.(a) | 500,399 | |
8,633 | AGL Resources, Inc.(a) | 475,074 | |
11,900 | Ameren Corp.(a) | 486,472 | |
8,659 | American Electric Power Co., Inc.(a) | 482,912 | |
19,032 | CenterPoint Energy, Inc.(a) | 486,077 | |
15,458 | CMS Energy Corp.(a) | 481,517 | |
8,276 | Consolidated Edison, Inc.(a) | 477,856 | |
6,676 | Dominion Resources, Inc.(a) | 477,468 | |
6,136 | DTE Energy Co.(a) | 477,810 | |
6,452 | Duke Energy Corp.(a) | 478,674 | |
8,324 | Edison International(a) | 483,708 | |
5,843 | Entergy Corp.(a) | 479,652 | |
12,793 | Exelon Corp.(a) | 466,689 | |
13,370 | FirstEnergy Corp.(a) | 464,206 | |
7,919 | Integrys Energy Group, Inc.(a) | 563,278 | |
4,721 | NextEra Energy, Inc.(a) | 483,808 | |
12,287 | NiSource, Inc.(a) | 483,371 | |
10,073 | Northeast Utilities(a) | 476,151 | |
12,448 | NRG Energy, Inc.(a) | 463,066 | |
16,701 | Pepco Holdings, Inc.(a) | 458,943 | |
9,817 | PG&E Corp.(a) | 471,412 | |
8,427 | Pinnacle West Capital Corp.(a) | 487,418 | |
13,427 | PPL Corp.(a) | 477,061 | |
12,077 | Public Service Enterprise Group, Inc.(a) | 492,621 | |
9,016 | SCANA Corp.(a) | 485,151 | |
4,519 | Sempra Energy(a) | 473,184 | |
10,497 | Southern Co.(a) | 476,354 | |
26,278 | TECO Energy, Inc.(a) | 485,617 | |
10,140 | Wisconsin Energy Corp.(a) | 475,769 | |
14,890 | Xcel Energy, Inc.(a) | 479,905 | |
14,451,623 | |||
Total Common Stocks – 122.5% | |||
(Cost $191,897,708) | 232,935,442 |
See notes to financial statements.
GEQ l GUGGENHEIM EQUAL WEIGHT ENHANCED EQUITY INCOME FUND SEMIANNUAL REPORT l 15
PORTFOLIO OF INVESTMENTS (Unaudited) continued | June 30, 2014 |
Number | |||
of Shares | Description | Value | |
Short Term Investments – 0.2% | |||
Money Market Fund – 0.2% | |||
319,099 | Dreyfus Treasury Prime Cash Management | ||
Institutional Shares(a) | $ 319,099 | ||
(Cost $319,099) | |||
Total Investments – 122.7% | |||
(Cost $192,216,807) | 233,254,541 | ||
Liabilities in excess of Other Assets – (0.1%) | (116,585) | ||
Total Value of Options Written – (0.5%) (Premiums | |||
received $1,192,693) | (1,040,423) | ||
Borrowings – (22.1% of Net Assets or 18.0% of Total | |||
Investments) | (42,000,000) | ||
Net Assets – 100.0% | $190,097,533 | ||
Contracts | |||||
(100 shares | Expiration | Exercise | |||
per contract) | Options Written – (0.5%) (b) | Month | Price | Value | |
Call Options Written – (0.5%) | |||||
| 1,188 | Basic Industries Select | ||||
Sector SPDR Fund | July 2014 | $50.00 | $ (33,858) | ||
| 1,179 | Energy Select Sector SPDR Fund | July 2014 | 100.00 | (146,196) | |
| 2,582 | Financial Select Sector SPDR Fund | July 2014 | 23.00 | (30,984) | |
| 2,537 | Powershares QQQ Trust, Series 1 | July 2014 | 94.00 | (216,913) | |
| 1,021 | ProShares Ultra S&P 500 | July 2014 | 116.00 | (165,402) | |
722 | S&P 500 Index | July 2014 | 1,990.00 | (187,720) | |
910 | SPDR S&P MidCap 400 ETF | July 2014 | 260.00 | (259,350) | |
Total Value of Call Options Written – ( 0.5%) | |||||
Premiums received $1,192,693 | $ (1,040,423) | ||||
Country Breakdown* | |
United States | 94.4% |
Ireland | 2.0% |
Switzerland | 1.0% |
United Kingdom | 0.8% |
Bermuda | 0.4% |
Netherlands | 0.4% |
Curacao | 0.2% |
Jersey | 0.2% |
Singapore | 0.2% |
Panama | 0.2% |
British Virgin Islands | 0.2% |
| * | Subject to change daily. Based on common stock. |
NV – Publicly Traded Company
PLC – Public Limited Company
REIT – Real Estate Investment Trust
| (a) | All or a portion of these securities have been physically segregated in connection with borrowings. As of June 30, 2014, the total amount segregated was $233,214,932. |
| (b) | Non-income producing security. |
Securities are classified by sectors that represent broad groupings of industries.
See notes to financial statements.
16 l GEQ l GUGGENHEIM EQUAL WEIGHT ENHANCED EQUITY INCOME FUND SEMIANNUAL REPORT
STATEMENT OF ASSETS AND LIABILITIES (Unaudited) | June 30, 2014 |
Assets | |||
Investments, at value (cost $192,216,807) | $ | 233,254,541 | |
Cash | 441,072 | ||
Receivable for securities sold | 503,489 | ||
Dividends receivable | 95,350 | ||
Other assets | 16,126 | ||
Total assets | 234,310,578 | ||
Liabilities | |||
Borrowings | 42,000,000 | ||
Options written, at value (premiums received of $1,192,693) | 1,040,423 | ||
Payable for securities purchased | 536,238 | ||
Advisory fee payable | 184,528 | ||
Interest due on borrowings | 37,105 | ||
Fund accounting fee payable | 5,195 | ||
Administration fee payable | 4,923 | ||
Accrued expenses and other liabilities | 404,633 | ||
Total liabilities | 44,213,045 | ||
Net Assets | $ | 190,097,533 | |
Composition of Net Assets | |||
Common stock, $.01 par value per share; unlimited number of shares authorized, | |||
8,770,121 shares issued and outstanding | $ | 87,701 | |
Additional paid-in capital | 147,080,685 | ||
Accumulated net realized gain on investments and options | 9,083,264 | ||
Net unrealized appreciation on investments and options | 41,190,004 | ||
Distributions in excess of net investment income | (7,344,121 | ) | |
Net Assets | $ | 190,097,533 | |
Net Asset Value (based on 8,770,121 common shares outstanding) | $ | 21.68 | |
See notes to financial statements.
GEQ l GUGGENHEIM EQUAL WEIGHT ENHANCED EQUITY INCOME FUND SEMIANNUAL REPORT l 17
STATEMENT OF OPERATIONS For the six months ended June 30, 2014 (Unaudited) | June 30, 2014 |
Investment Income | ||||||
Dividends (net of foreign withholding taxes of $160) | $ | 2,002,073 | ||||
Total income | $ | 2,002,073 | ||||
Expenses | ||||||
Advisory fee | 1,081,721 | |||||
Interest expense | 168,928 | |||||
Custodian fee | 129,042 | |||||
Professional fees | 67,332 | |||||
Fund accounting | 43,773 | |||||
Printing expense | 41,811 | |||||
Trustees’ fees and expenses | 36,404 | |||||
Administrative fee | 29,073 | |||||
Licensing fee | 24,862 | |||||
Transfer agent fee | 17,919 | |||||
NYSE listing fee | 11,765 | |||||
Insurance | 9,184 | |||||
Miscellaneous | 11,494 | |||||
Total expenses | 1,673,308 | |||||
Net investment income | 328,765 | |||||
Realized and Unrealized Gain (Loss) on Investments and Options | ||||||
Net realized gain (loss) on: | ||||||
Investments | 16,210,408 | |||||
Written options | (5,632,986 | ) | ||||
Net change in unrealized appreciation (depreciation) on: | ||||||
Investments | (58,717 | ) | ||||
Written options | 2,586,920 | |||||
Net realized and unrealized gain on investments and options | 13,105,625 | |||||
Net Increase in Net Assets Resulting from Operations | $ | 13,434,390 | ||||
See notes to financial statements.
18 l GEQ l GUGGENHEIM EQUAL WEIGHT ENHANCED EQUITY INCOME FUND SEMIANNUAL REPORT
STATEMENTS OF CHANGES IN NET ASSETS | June 30, 2014 |
For the Six Months Ended June 30, 2014 (Unaudited) | For the Year Ended December 31, 2013 | |||||
Increase in Net Assets Resulting from Operations | ||||||
Net investment income | $ | 328,765 | $ | 579,541 | ||
Net realized gain on investments and options | 10,577,422 | 10,898,171 | ||||
Net change in unrealized appreciation on investments and options | 2,528,203 | 20,989,394 | ||||
Net increase in net assets resulting from operations | 13,434,390 | 32,467,106 | ||||
Distributions to Shareholders | ||||||
From and in excess of net investment income | (7,672,886 | ) | (415,054 | ) | ||
Return of capital | – | (9,308,314 | ) | |||
Capital gains | – | (5,624,344 | ) | |||
Total distributions | (7,672,886 | ) | (15,347,712 | ) | ||
Total increase in net assets | 5,761,504 | 17,119,394 | ||||
Net Assets: | ||||||
Beginning of period | 184,336,029 | 167,216,635 | ||||
End of period (including distributions in excess of net investment income of $7,344,121 and $0, respectively) | $ | 190,097,533 | $ | 184,336,029 | ||
See notes to financial statements.
GEQ l GUGGENHEIM EQUAL WEIGHT ENHANCED EQUITY INCOME FUND SEMIANNUAL REPORT l 19
STATEMENT OF CASH FLOWS For the six months ended June 30, 2014 (Unaudited) | June 30, 2014 |
Cash Flows from Operating Activities: | |||
Net increase in net assets resulting from operations | $ | 13,434,390 | |
Adjustments to Reconcile Net Increase in Net Assets Resulting from Operations to | |||
Net Cash Used in Operating and Investing Activities: | |||
Net change in unrealized depreciation on investments | 58,717 | ||
Net change in unrealized appreciation on options | (2,586,920 | ) | |
Net realized gain on investments | (16,210,408 | ) | |
Net realized loss on options | 5,632,986 | ||
Purchase of long-term investments | (158,127,455 | ) | |
Cost of written options closed | (24,560,705 | ) | |
Premiums received on call options written | 18,769,425 | ||
Proceeds from sale of long-term investments | 152,327,027 | ||
Net proceeds from sale of short-term investments | 23,611 | ||
Decrease in dividends receivable | 173,885 | ||
Increase in receivable for securities sold | (503,489 | ) | |
Increase in other assets | (14,875 | ) | |
Increase in investments purchased payable | 536,238 | ||
Increase in advisory fee payable | 17,501 | ||
Increase in administration fee payable | 341 | ||
Increase in interest due on borrowings | 16,238 | ||
Increase in fund accounting fee payable | 5,195 | ||
Increase in accrued expenses and other liabilities | 116,778 | ||
Net Cash Used in Operating and Investing Activities | (10,891,520 | ) | |
Cash Flows From Financing Activities: | |||
Proceeds from borrowings | 49,500,000 | ||
Payments made on borrowings | (30,500,000 | ) | |
Distributions to shareholders | (7,672,886 | ) | |
Net Cash Provided By Financing Activities | 11,327,114 | ||
Net change in cash | 435,594 | ||
Cash at Beginning of Period | 5,478 | ||
Cash at End of Period | $ | 441,072 | |
Supplemental Disclosure of Cash Flow Information: Cash paid during the period for interest | $ | 152,690 | |
Supplemental Disclosure of Non Cash Operating Activity: Options exercised during the period | $ | 915,950 | |
See notes to financial statements.
20 l GEQ l GUGGENHEIM EQUAL WEIGHT ENHANCED EQUITY INCOME FUND SEMIANNUAL REPORT
FINANCIAL HIGHLIGHTS | June 30, 2014 |
Per share operating performance for a common share outstanding throughout the period | For the Six Months Ended | For the Year Ended December 31, 2013 | For the Period Ended December 31, 2012* | For the Period October 27, 2011** | |||||||||||
Net asset value, beginning of period | $ | 21.02 | $ | 19.07 | $ | 19.24 | $ | 19.10 | (a) | ||||||
Investment operations | |||||||||||||||
Net investment income (b) | 0.04 | 0.07 | 0.12 | 0.09 | |||||||||||
Net realized and unrealized gain on | |||||||||||||||
investments and options | 1.50 | 3.63 | 0.59 | 0.97 | |||||||||||
Total from investment operations | 1.54 | 3.70 | 0.71 | 1.06 | |||||||||||
Common shares’ offering expenses charged to paid-in-capital | – | – | – | (0.04 | ) | ||||||||||
Distributions to Shareholders | |||||||||||||||
From and in excess of net investment income | (0.88 | ) | (0.05 | ) | (0.11 | ) | (0.42 | ) | |||||||
Return of capital | – | (1.06 | ) | (0.77 | ) | (0.46 | ) | ||||||||
Capital gains | – | (0.64 | ) | – | – | ||||||||||
Total distributions to shareholders | (0.88 | ) | (1.75 | ) | (0.88 | ) | (0.88 | ) | |||||||
Net asset value, end of period | $ | 21.68 | $ | 21.02 | $ | 19.07 | $ | 19.24 | |||||||
Market value, end of period | $ | 20.03 | $ | 18.89 | $ | 17.73 | $ | 18.61 | |||||||
Total investment return (c) | |||||||||||||||
Net asset value | 7.56 | % | 20.28 | % | 3.69 | % | 5.30 | % | |||||||
Market value | 11.17 | % | 17.12 | % | -0.35 | % | -2.57 | % | |||||||
Ratios and supplemental data | |||||||||||||||
Net assets end of period (thousands) | $ | 190,098 | $ | 184,336 | $ | 167,217 | $ | 168,444 | |||||||
Ratios to Average Net Assets: | |||||||||||||||
Total expenses, including interest expense(g) | 1.72 | %(d) | 1.68 | % | 1.78 | %(d) | 1.80 | %(d) | |||||||
Net investment income, including interest expense | 0.47 | %(d) | 0.33 | % | 1.25 | %(d) | 0.71 | %(d) | |||||||
Portfolio Turnover(e) | 69 | % | 154 | % | 54 | % | 31 | % | |||||||
Senior Indebtedness: | |||||||||||||||
Total Borrowings outstanding (in thousands) | $ | 42,000 | $ | 23,000 | $ | 32,000 | $ | 34,000 | |||||||
Asset Coverage per $1,000 of indebtedness(f) | $ | 5,526 | $ | 9,015 | $ | 6,226 | $ | 5,954 | |||||||
| * | Fiscal year end changed from June 30 to December 31. |
| ** | Commencement of investment operations. |
| (a) | Before deduction of offering expenses charged to capital. |
| (b) | Based on average shares outstanding. |
| (c) | Total investment return is calculated assuming a purchase of a share at the beginning of the period and a sale on the last day of the period reported either at net asset value (NAV) or market price per share. Dividends and distributions are assumed to be reinvested at NAV for NAV returns or the prices obtained under the Fund’s Dividend Reinvestment Plan market value returns. Total investment return does not reflect brokerage commissions. A return calculated for a period of less than one year is not annualized. |
| (d) | Annualized. |
| (e) | Portfolio turnover is not annualized for periods of less than one year. |
| (f) | Calculated by subtracting the Fund's total liabilities (not including borrowings) from the Fund’s total assets and dividing by the total borrowings. |
| (g) | Excluding interest expense, the operating expense ratio would be |
| For the | For the Period | |||||||
| Six Months Ended | October 27, 2011** | |||||||
| June 30, 2014 | For the Year Ended | For the Period Ended | through | |||||
| (Unaudited) | December 31, 2013 | December 31, 2012* | June 30, 2012 | |||||
| 1.53 | %(d) | 1.51 | % | 1.54 | %(d) | 1.59 | %(d) | |
See notes to financial statements.
GEQ l GUGGENHEIM EQUAL WEIGHT ENHANCED EQUITY INCOME FUND SEMIANNUAL REPORT l 21
NOTES TO FINANCIAL STATEMENTS (Unaudited) | June 30, 2014 |
Note 1 – Organization:
Guggenheim Equal Weight Enhanced Equity Income Fund (the “Fund”) was organized as a Delaware statutory trust on July 11, 2011. The Fund is registered as a diversified, closed-end management investment company under the Investment Company Act of 1940, as amended (the “1940 Act”).
The Fund’s investment objective is to provide a high level of risk-adjusted total return with an emphasis on current income. There can be no assurance that the Fund will achieve its investment objective. The Fund’s investment objective is considered fundamental and may not be changed without shareholder approval.
Note 2 – Accounting Policies:
The preparation of the financial statements in accordance with U.S. generally accepted accounting principles (“GAAP”) requires management to make estimates and assumptions that affect the reported amounts and disclosures in the financial statements. Actual results could differ from these estimates.
The following is a summary of significant accounting policies consistently followed by the Fund.
(a) Valuation of Investments
The Board of Trustees of the Fund (the “Board”) has adopted policies and procedures for the valuation of the Fund’s investments (the “Valuation Procedures”). Pursuant to the Valuation Procedures, the Board has delegated to a valuation committee, consisting of representatives from Guggenheim’s investment management, fund administration, legal and compliance departments (the “Valuation Committee”), the day-to-day responsibility for implementing the Valuation Procedures, including, under most circumstances, the responsibility for determining the fair value of the Fund’s securities or other assets.
Valuations of the Fund’s securities are supplied primarily by pricing services appointed pursuant to the processes set forth in the Valuation Procedures. The Valuation Committee convenes monthly, or more frequently as needed and will review the valuation of all assets which have been fair valued for reasonableness. The Fund’s officers, through the Valuation Committee and consistent with the monitoring and review responsibilities set forth in the Valuation Procedures, regularly review procedures used by, and valuations provided by, the pricing services.
Equity securities listed on an exchange (New York Stock Exchange (“NYSE”) or American Stock Exchange) are valued at the last quoted sales price as of the close of business on the NYSE, usually 4:00 p.m. on the valuation date. Equity securities listed on the NASDAQ market system are valued at the NASDAQ Official Closing Price on the valuation date, which may not necessarily represent the last sale price. If there has been no sale on such exchange or NASDAQ on such day, the security is valued at the mean of the most recent bid and asked prices on such day.
Open-end investment companies (“Mutual Funds”) are valued at their NAV as of the close of business on the valuation date. Exchange Traded Funds (“ETFs”) and closed-end investment companies are valued at the last quoted sales price.
Exchange traded options are valued between the bid and ask prices on the principal exchange on which they are traded.
Debt securities with a maturity of greater than 60 days at acquisition are valued at prices that reflect broker/dealer supplied valuations or are obtained from independent pricing services, which may consider the trade activity, treasury spreads, yields or price of bonds of comparable quality, coupon, maturity, and type, as well as prices quoted by dealers who make markets in such securities. Short-term debt securities with a maturity of 60 days or less at acquisition and repurchase agreements are valued at amortized cost, which approximates market value.
Generally, trading in foreign securities markets is substantially completed each day at various times prior to the close of the NYSE. The values of foreign securities are determined as of the close of such foreign markets or the close of the NYSE, if earlier. All investments quoted in foreign currency are valued in U.S. dollars on the basis of the foreign currency exchange rates prevailing at the close of U.S. business at 4:00 p.m. Investments in foreign securities may involve risks not present in domestic investments.
The Valuation Committee will determine the current value of such foreign securities by taking into consideration certain factors which may include those discussed above, as well as the following factors, among others: the value of the securities traded on other foreign markets, ADR trading, closed-end fund trading, foreign currency exchange activity, and the trading prices of financial products that are tied to foreign securities such as World Equity Benchmark Securities. In addition, under the Valuation Procedures, the Valuation Committee and the Adviser are authorized to use prices and other information supplied by a third party pricing vendor in valuing foreign securities.
Investments for which market quotations are not readily available are fair valued as determined in good faith by Guggenheim Funds Investment Advisors, LLC (“GFIA” or the “Adviser”), subject to review by the Valuation Committee, pursuant to methods established or ratified by the Board. Valuations in accordance with these methods are intended to reflect each security’s (or asset’s) “fair value.” Each such determination is based on a consideration of all relevant factors, which are likely to vary from one pricing context to another. Examples of such factors may include, but are not limited to: (i) the type of security, (ii) the initial cost of the security, (iii) the existence of any contractual restrictions on the security’s disposition, (iv) the price and extent of public trading in similar securities of the issuer or of comparable companies, (v) quotations or evaluated prices from broker-dealers and/or pricing services, (vi) information obtained from the issuer, analysts, and/or the appropriate stock exchange (for exchange traded securities), (vii) an analysis of the company’s financial statements, and (viii) an evaluation of the forces that influence the issuer and the market(s) in which the security is purchased and sold (e.g. the existence of pending merger activity, public offerings or tender offers that might affect the value of the security).
22 l GEQ l GUGGENHEIM EQUAL WEIGHT ENHANCED EQUITY INCOME FUND SEMIANNUAL REPORT
NOTES TO FINANCIAL STATEMENTS (Unaudited) continued | June 30, 2014 |
(b) Investment Transactions and Investment Income
Investment transactions are accounted for on the trade date. Realized gains and losses on investments are determined on the identified cost basis. Dividend income is recorded net of applicable withholding taxes on the ex-dividend date. Interest income, including the amortization of premiums and accretion of discount, is accrued daily.
(c) Options
The Fund will utilize a call option writing strategy to seek to generate current income and potentially mitigate overall portfolio volatility. The option strategy will include writing (i.e. selling) call options on securities indices, exchange-traded funds that track securities indices, baskets of securities and other instruments, which will include securities that are not held by the Fund.
An option on a security is a contract that gives the holder of the option, in return for a premium, the right to buy from (in the case of a call) or sell to (in the case of a put) the writer of the option the security underlying the option at a specific exercise or “strike” price. The writer of an option on a security has an obligation upon exercise of the option to deliver the underlying security upon payment of the exercise price (in the case of a call) or to pay the exercise price upon delivery of the underlying security (in the case of a put). When an option is written, the premium received is recorded as an asset with an equal liability and is subsequently marked to market to reflect the current market value of the option written. These liabilities are reflected as options written in the Statement of Assets and Liabilities. Premiums received from writing options which expire unexercised are recorded on the expiration date as a realized gain. The difference between the premium received and the amount paid on effecting a closing purchase transaction, including brokerage commissions, is also treated as a realized gain, or if the premium is less than the amount paid for the closing purchase transactions, as a realized loss. If an option is exercised, the premium is added to the cost of the purchase (in the case of a put) or proceeds from the sale of the underlying security (in case of a call) in determining whether there has been a realized gain or loss.
As the seller of an index call option, the Fund receives cash (the premium) from the purchaser. The purchaser of an index call option has the right to any appreciation in the value of the index over a fixed price (the exercise price) on or before a certain date in the future (the expiration date). The Fund, in effect, agrees to sell the potential appreciation in the value of the relevant index over the exercise price in exchange for the premium. If, at or before expiration, the purchaser exercises the call option sold by the Fund, the Fund will pay the purchaser the difference between the cash value of the index and the exercise price of the index option (the exercise settlement amount). The premium, the exercise price and the market value of the index determine the gain or loss realized by the Fund as the seller of the index call option.
Options on an index differ from options on securities because (i) the exercise of an index option requires cash payments and does not involve the actual purchase or sale of securities, (ii) the holder of an index call option has the right to receive cash (instead of securities) upon exercise of the option in an amount equal to the amount by which the level of the index exceeds the exercise price and (iii) index options reflect price-fluctuations in a group of securities or segments of the securities market rather than price fluctuations in a single security.
(d) Distributions
The Fund declares and pays quarterly distributions to shareholders. Distributions to shareholders are recorded on the ex-dividend date. The amount and timing of distributions are determined in accordance with federal income tax regulations, which may differ from GAAP.
The Fund adopted a managed distribution policy (the “Distribution Policy”) effective with the January 31, 2014 distribution. Under the terms of the Distribution Policy, the Fund will pay a quarterly distribution in a fixed amount until such amount is modified by the Board of Trustees. If sufficient net investment income is not available, the distribution will be supplemented by capital gains and, to the extent necessary, return of capital.
Note 3 – Investment Advisory Agreement, Sub-Advisory Agreement and Other Agreements:
Pursuant to an Investment Advisory Agreement between the Fund and the Adviser, the Adviser furnishes offices, necessary facilities and equipment, provides personnel, including certain officers required for the Fund’s administrative management and compensates the officers or trustees of the Fund who are affiliates of the Adviser. As compensation for these services, the Fund pays the Adviser a fee, payable monthly, in an amount equal to 1.00% of the Fund’s average daily managed assets (net assets plus any assets attributable to financial leverage).
The Fund and the Adviser have entered into a Sub-Advisory Agreement (the “Options Strategy Sub-Advisory Agreement”) with Guggenheim Partners Investment Management, LLC (“GPIM”). GPIM is responsible for the management of the Fund’s options strategy. Under the terms of the Options Strategy Sub-Advisory Agreement, the Adviser pays monthly to GPIM a fee at the annual rate of 0.50% of the Fund’s average daily managed assets.
The Fund and the Adviser have also entered into a Sub-Advisory Agreement (the “Equity Portfolio Sub-Advisory Agreement”) with Security Investors, LLC (“Security Investors”). Security Investors is responsible for the management of the Fund’s portfolio of equity securities. Under the terms of the Equity Portfolio Sub-Advisory Agreement, the Adviser pays monthly to Security Investors a fee at the annual rate of 0.15% of the Fund’s average daily managed assets.
Certain officers and trustees of the Fund may also be officers, directors and/or employees of the Adviser, GPIM or Security Investors. The Fund does not compensate its officers or trustees who are officers, directors and/or employees of the aforementioned firms.
GEQ l GUGGENHEIM EQUAL WEIGHT ENHANCED EQUITY INCOME FUND SEMIANNUAL REPORT l 23
NOTES TO FINANCIAL STATEMENTS (Unaudited) continued | June 30, 2014 |
Rydex Fund Services, LLC (“RFS”), an affiliate of the Adviser, GPIM and Security Investors, provides fund administration services to the Fund. As compensation for these services RFS receives a fund administration fee payable monthly at the annual rate set forth below as a percentage of the average daily managed assets of the Fund:
Managed Assets | Rate |
First $200,000,000 | 0.0275% |
Next $300,000,000 | 0.0200% |
Next $500,000,000 | 0.0150% |
Over $1,000,000,000 | 0.0100% |
RFS acts as the Fund’s accounting agent. As accounting agent, RFS is responsible for maintaining the books and records of the Fund’s securities and cash. RFS receives an accounting fee payable monthly at the annual rate set forth below as a percentage of the average daily managed assets of the Fund.
Managed Assets | Rate |
First $200,000,000 | 0.0300% |
Next $300,000,000 | 0.0150% |
Next $500,000,000 | 0.0100% |
Over $1,000,000,000 | 0.0075% |
Minimum annual charge | $50,000 |
Certain out-of-pocket charges | Varies |
For purposes of calculating the fees payable under the foregoing agreements, “average daily managed assets” means the average daily value of the Fund’s total assets minus the sum of its accrued liabilities. “Total assets” means all of the Fund’s assets and is not limited to its investment securities. “Accrued liabilities” means all of the Fund’s liabilities other than borrowings for investment purposes.
The Bank of New York Mellon (“BNY”) acts as the Fund’s custodian. As custodian, BNY is responsible for the custody of the Fund’s assets.
Note 4 – Fair Value Measurement:
In accordance with U.S. GAAP, fair value is defined as the price that the Fund would receive to sell an investment or pay to transfer a liability in an orderly transaction with an independent buyer in the principal market, or in the absence of a principal market, the most advantageous market for the investment or liability. U.S. GAAP establishes a three-tier fair value hierarchy based on the types of inputs used to value assets and liabilities and requires corresponding disclosure. The hierarchy and the corresponding inputs are summarized below:
Level 1 – quoted prices in active markets for identical assets or liabilities.
Level 2 – significant other observable inputs (for example quoted prices for securities that are similar based on characteristics such as interest rates, prepayment speeds, credit risk, etc.).
Level 3 – significant unobservable inputs based on the best information available under the circumstances, to the extent observable inputs are not available, which may include assumptions.
The types of inputs available depend on a variety of factors, such as the type of security and the characteristics of the markets in which it trades, if any. Fair valuation determinations that rely on fewer or no observable inputs require greater judgment. Accordingly, fair value determinations for Level 3 securities require the greatest amount of judgment.
The following table represents the Fund’s investments carried on the Statement of Assets and Liabilities by caption and by level within the fair value hierarchy at June 30, 2014.
Description | Level 1 | Level 2 | Level 3 | Total | |||||||
Assets: | |||||||||||
Common Stocks* | $ | 232,935,442 | $ | – | $ | – | $ | 232,935,442 | |||
Money Market Fund | 319,099 | – | – | 319,099 | |||||||
Total | $ | 233,254,541 | $ | – | $ | – | $ | 233,254,541 | |||
Liabilities: | |||||||||||
Call Options Written | $ | 1,040,423 | $ | – | $ | – | $ | 1,040,423 | |||
Total | $ | 1,040,423 | $ | – | $ | – | $ | 1,040,423 | |||
| * Refer to Portfolio of Investments for breakout by industry. | |||||||||||
Independent pricing services are used to value a majority of the Fund’s investments. When values are not available from a pricing service, they will be determined under the valuation policies that have been reviewed and approved by the Board of Trustees. In any event, values are determined using a variety of sources and techniques, including: market prices; broker quotes; and models which derive prices based on inputs such as prices of securities with comparable maturities and characteristics or based on inputs such as anticipated cash flows or collateral, spread over Treasuries, and other information and analysis.
The inputs or methodologies used for valuing securities are not necessarily an indication of the risk associated with investing in those securities. The suitability of the techniques and sources employed to determine fair valuation are regularly monitored and subject to change.
Transfers between investment levels may occur as the markets fluctuate and/or the availability of data used in an investment’s valuation changes. Transfers between valuation levels, if any, are in comparison to the valuation levels at the end of the previous fiscal year, and are effective using the fair value as of the end of the current fiscal period.
There were no transfers between levels for the period ended June 30, 2014.
Note 5 – Federal Income Taxes:
The Fund intends to comply with the requirements of Subchapter M of the Internal Revenue Code of 1986, as amended, applicable to regulated investment companies. Accordingly, no provision for U.S. federal income taxes is required. In addition, by distributing substantially all of its ordinary income and long-term capital gains, if any, during each calendar year, the Fund intends not to be subject to U.S. federal excise tax.
24 l GEQ l GUGGENHEIM EQUAL WEIGHT ENHANCED EQUITY INCOME FUND SEMIANNUAL REPORT
NOTES TO FINANCIAL STATEMENTS (Unaudited) continued | June 30, 2014 |
Information on the components of investments as of June 30, 2014, is as follows:
| Cost of | Net Tax | Net Tax | ||
| Investments | Gross Tax | Gross Tax | Unrealized | Unrealized |
| for Tax | Unrealized | Unrealized | Appreciation | Appreciation |
| Purposes | Appreciation | Depreciation | on Investments | on Derivatives |
| $192,453,999 | $42,888,567 | $(2,088,025) | $40,800,542 | $152,270 |
The difference between book and tax basis unrealized appreciation (depreciation) is primarily attributable to the tax deferral of losses on wash sales, non-real estate investments trust return of capital and REIT return of capital.
Tax components of the following balances as of December 31, 2013 (the most recent fiscal year for federal income tax purposes) are as follows:
Undistributed Long-Term Gains/ | |
Undistributed Ordinary Income | (Accumulated Capital Loss) |
$0 | $(2,504,338) |
For the year ended December 31, 2013, the tax character of distributions paid to shareholders as reflected in the Statements of Changes in Net Assets, was as follows:
Distributions paid from | 2013 |
Ordinary income | $ 415,054 |
Return of capital | 9,308,314 |
Capital gains | 5,624,344 |
During the period ended June 30, 2014, distributions of $7,672,886 were paid to shareholders. The classification of these distributions for federal income tax purposes will be determined after December 31, 2014.
For all open tax years and all major jurisdictions, management of the Fund has concluded that there are no significant uncertain tax positions that would require recognition in the financial statements. Uncertain tax positions are tax positions taken or expected to be taken in the course of preparing the Fund’s tax returns that would not meet a more-likely-than-not threshold of being sustained by the applicable tax authority and would be recorded as a tax expense in the current year. Open tax years are those that are open for examination by taxing authorities (i.e. generally the last four tax year ends and the interim tax period since then). Furthermore, management of the Fund is also not aware of any tax positions for which it is reasonably possible that the total amounts of unrecognized tax benefits will significantly change in the next twelve months.
Note 6 – Investments in Securities:
During the six months ended June 30, 2014, the cost of purchases and proceeds from sales of investments, excluding written options with maturities of less than one year and short-term investments were $158,127,455 and $152,327,027, respectively.
Note 7 – Derivatives:
The Fund will utilize a call option writing strategy to seek to generate current income and potentially mitigate overall portfolio volatility. As this strategy involves uncovered option writing (i.e. writing options on securities not held in the Fund’s portfolio, on indices or on exchange traded funds comprised of such securities or that track such indices), it may result in less volatility mitigation than, and may be subject to more risks compared to, option strategies involving writing options on securities held by the Fund.
There are various risks associated with the Fund’s call option writing strategy. The purchaser of an index option written by the Fund has the right to any appreciation in the cash value of the index over the strike price on the expiration date. Therefore, as the writer of a covered index call option, the Fund forgoes the opportunity to profit from increases in the index over the strike price of the option. However, the Fund has retained the risk of loss (net of premiums received) should the price of the index decline. Similarly, as the writer of a covered call option on a security or basket of securities held in the Fund’s portfolio, the Fund forgoes, during the option’s life, the opportunity to profit from increases in the market value of the security or securities covering the call option above the sum of the premium and the exercise price of the call but has retained the risk of loss (net of premiums received) should the price of the underlying security decline.
There are special risks associated with uncovered option writing, which expose the Fund to potentially significant loss. As the writer of an uncovered call option, the Fund has no risk of loss should the price of the underlying security or index decline, but bears unlimited risk of loss should the price of the underlying security or index increase above the exercise price.
To the extent that the Fund purchases options, the Fund will be subject to the following additional risks. If a put or call option purchased by the Fund is not sold when it has remaining value, and if the market price of the underlying security remains equal to or greater than the exercise price (in the case of a put), or remains less than or equal to the exercise price (in the case of a call), the Fund will lose its entire investment in the option. Also, where a put or call option on a particular security is purchased to hedge against price movements in a related security, the price of the put or call option may move more or less than the price of the related security. If restrictions on exercise were imposed, the Fund might be unable to exercise an option it had purchased. If the Fund were unable to close out an option that it had purchased on a security, it would have to exercise the option in order to realize any profit or the option may expire worthless.
GEQ l GUGGENHEIM EQUAL WEIGHT ENHANCED EQUITY INCOME FUND SEMIANNUAL REPORT l 25
NOTES TO FINANCIAL STATEMENTS (Unaudited) continued | June 30, 2014 |
Transactions in written call option contracts for the period ended June 30, 2014, were as follows:
| Number of | Premiums | ||||
| Contracts | Received | ||||
Options outstanding, beginning of period | 13,282 | $ | 2,358,267 | ||
Options written during the period | 94,354 | 18,769,425 | |||
Options closed during the period | (89,954 | ) | (19,019,049 | ) | |
Options exercised during the period | (7,543 | ) | (915,950 | ) | |
Options outstanding, end of the period | 10,139 | $ | 1,192,693 | ||
The following table presents the types of derivatives in the Fund by location as presented on the Statement of Assets Liabilities at June 30, 2014.
| Statement of Assets and Liabilities Presentation of Fair Values of Derivatives (in $000s): | ||||||||
| Asset Derivatives | Liability Derivatives | |||||||
| Statement | Statement | |||||||
| of Assets | of Assets | |||||||
| and Liabilities | and Liabilities | |||||||
| Location | Fair Value | Location | Fair Value | |||||
Equity risk | – | $ | – | Options | ||||
Written, | ||||||||
at value | $ | 1,040 | ||||||
Total | $ | – | $ | 1,040 | ||||
Summary of Derivatives Information
The following table presents the effect of Derivatives Instruments on the Statement of Operations for the six months ended June 30, 2014.
| Effect of Derivative Instruments on the Statement of Operations (in $000s): | ||
Amount of Net | Net Change in Net | |
Realized Loss | Unrealized Appreciation | |
on Derivatives | on Derivatives | |
Options | Options | |
Equity risk | $(5,633) | $2,587 |
Total | $(5,633) | $2,587 |
Note 8 – Leverage:
Borrowings
On November 3, 2011, the Fund entered into a committed credit facility agreement with an approved counterparty (the “Counterparty”). The Counterparty has agreed to provide secured financing to the Fund up to a maximum of $50,000,000 and the Fund will provide pledged collateral to the Counterparty. Interest on the amount borrowed is based on the 1-month LIBOR plus 0.75%. An unused commitment fee of 0.10% is charged on the difference between 60% of the amount available to borrow under the credit agreement and the actual amount borrowed. At June 30, 2014, there was $42,000,000 outstanding in connection with the Fund’s credit facility. The average daily amount of borrowings on the credit facility during the six months ended June 30, 2014, was $33,657,459 with a related average interest rate of 0.90%. The maximum amount outstanding during the six months ended June 30, 2014 was $42,500,000. As of June 30, 2014, the market value of the securities segregated as collateral is $233,214,932.
The credit facility agreement includes usual and customary covenants. These covenants impose on the Fund asset coverage requirements, collateral requirements, investment strategy requirements, and certain financial obligations. These covenants place limits or restrictions on the Fund’s ability to (i) enter into additional indebtedness with a party other than the lender, (ii) change its fundamental investment policy, or (iii) pledge to any other party, other than to the lender, securities owned or held by the Fund over which BNY has a lien. In addition, the Fund is required to deliver financial information to the lender within established deadlines, maintain an asset coverage ratio (as defined in Section 18(g) of the 1940 Act) greater than 300%, comply with the rules of the stock exchange on which its share are listed, and maintain its classification as a “closed-end fund company” as defined in the 1940 Act.
Note 9 – Capital:
Common Shares
The Fund has an unlimited amount of common shares, $0.01 par value, authorized and 8,770,121 issued and outstanding.
There were no transactions in common shares during the period ended June 30, 2014.
At June 30, 2014, Guggenheim Funds Distributors, LLC, an affiliate of the Adviser, owned 5,870 shares of the Fund.
Note 10 – Indemnifications:
In the normal course of business, the Fund enters into contracts that contain a variety of representations, which provide general indemnifications. The Fund’s maximum exposure under these arrangements is unknown, as this would require future claims that may be made against the Fund that have not yet occurred. However, the Fund expects the risk of loss to be remote.
Note 11 – Subsequent Event:
The Fund evaluated subsequent events through the date the financial statements were available for issue and determined there were no additional material events that would require disclosure in the Fund’s financial statements, except as noted below.
On July 1, 2014, the Fund declared a quarterly distribution in the amount of $0.4375 per share. The distribution was payable on July 31, 2014 to shareholders of record on July 15, 2014. Distributions may include ordinary income, realized gains and/or return of capital. The final determination of the tax character of distributions paid by the Fund in 2014 will be reported to shareholders in January 2015.
26 l GEQ l GUGGENHEIM EQUAL WEIGHT ENHANCED EQUITY INCOME FUND SEMIANNUAL REPORT
SUPPLEMENTAL INFORMATION (Unaudited) | June 30, 2014 |
Federal Income Tax Information
In January 2015, you will be advised on IRS Form 1099 DIV or substitute 1099 DIV as to the federal tax status of the distributions received by you in the calendar year 2014.
Results of Shareholder Votes
The Annual Meeting of Shareholders of the Fund was held on April 3, 2014. Common shareholders voted on the election of Trustees.
With regards to the election of the following Trustees by common shareholders of the Fund: | |||
# of Shares in Favor | # of Shares Against | # of Shares Withheld | |
Randall C. Barnes | 7,198,213 | 141,552 | 120,030 |
Donald C. Cacciapaglia | 7,199,188 | 146,175 | 114,432 |
Donald A. Chubb | 7,185,013 | 165,965 | 108,817 |
Jerry B. Farley | 7,178,226 | 173,875 | 107,694 |
Maynard F. Oliverius | 7,160,312 | 182,325 | 117,158 |
The other Trustees of the Fund whose terms did not expire in 2014 are Roman Friedrich III, Robert B. Karn III, Ronald A. Nyberg and Ronald E. Toupin, Jr.
Trustees(a)
The Trustees of the Guggenheim Equal Weight Enhanced Equity Income Fund and their principal occupations during the past five years:
Number of | |||||
Term of | Portfolios | ||||
Office ** | in | ||||
Position(s) | and Length | Fund | |||
Name, Address*, | Held with | of Time | Complex | Other Directorships | |
and Year of Birth | Trust | Served | Principal Occupation(s) During Past Five Years | Overseen | Held by Trustee |
Independent Trustees: | |||||
Randall C. Barnes (1951) | Trustee | Since 2011 | Current: Private Investor (2001-present). | 86 | None. |
| Former: Senior Vice President and Treasurer, PepsiCo, Inc. (1993-1997); President, Pizza Hut International (1991-1993); Senior Vice President, Strategic Planning and New Business Development, PepsiCo, Inc. (1987-1990). | |||||
Donald A. Chubb, Jr. (1946) | Trustee and Vice Chairman of the Board | Since 2014 | Current: Business broker and manager of commercial real estate, Griffith & Blair, Inc. (1997-present). | 82 | None. |
Jerry B. Farley (1946) | Trustee and Vice Chairman of the Audit Committee | Since 2014 | Current: President, Washburn University (1997-present). | 82 | Current: Westar Energy, Inc. (2004-present); CoreFirst Bank & Trust (2000-present). |
Roman Friedrich III (1946) | Trustee and Chairman of the Contracts Review Committee | Since 2011 | Current: Founder and President, Roman Friedrich & Company (1998-present). | 82 | Current: Mercator Minerals Ltd. (2013-present); Zincore Metals, Inc. (2009-present). |
Former: Senior Managing Director, MLV & Co. LLC (2010-2011). | Former: First Americas Gold Corp. (2012-2014); Blue Sky Uranium Corp. (2011-2012); Axiom Gold and Silver Corp. (2011-2012); Stratagold Corp. (2003-2009); GFM Resources Ltd. (2005-2010). | ||||
Robert B. Karn III | Trustee and | Since 2011 | Current: Consultant (1998-present). | 82 | Current: Peabody Energy Company |
(1942) | Chairman of | (2003-present); GP Natural | |||
the Audit | Former: Arthur Andersen (1965-1997) and Managing Partner, | Resource Partners, LLC (2002- | |||
Committee | Financial and Economic Consulting, St. Louis office (1987-1997). | present). | |||
Ronald A. Nyberg | Trustee and | Since 2011 | Current: Partner, Nyberg & Cassioppi, LLC (2000-present). | 88 | Current: Edward-Elmhurst |
(1953) | Chairman of | Healthcare System (2012-present). | |||
the Nominating | Former: Executive Vice President, General Counsel, and | ||||
and Governance | Corporate Secretary, Van Kampen Investments (1982-1999). | ||||
Committee |
GEQ l GUGGENHEIM EQUAL WEIGHT ENHANCED EQUITY INCOME FUND SEMIANNUAL REPORT l 27
SUPPLEMENTAL INFORMATION (Unaudited) continued | June 30, 2014 |
Number of | |||||
Term of | Portfolios | ||||
Office ** | in | ||||
Position(s) | and Length | Fund | |||
Name, Address*, | Held with | of Time | Complex | Other Directorships | |
and Year of Birth | Trust | Served | Principal Occupation(s) During Past Five Years | Overseen | Held by Trustee |
Independent Trustees (continued): | |||||
Maynard F. Oliverius | Trustee and | Since 2014 | Current: Retired. | 82 | None. |
(1943) | Vice Chairman | ||||
of the Contracts | Former: President and CEO, Stormont-Vail HealthCare | ||||
Review Committee | (1996-2012). | ||||
Ronald E. Toupin, Jr. | Trustee and | Since 2011 | Current: Portfolio Consultant (2010-present). | 85 | Former: Bennett Group of Funds |
(1958) | Chairman of the | (2011-2013). | |||
Board | Former: Vice President, Manager and Portfolio Manager, Nuveen | ||||
Asset Management (1998-1999); Vice President, Nuveen Investment | |||||
Advisory Corp. (1992-1999); Vice President and Manager, Nuveen | |||||
Unit Investment Trusts (1991-1999); and Assistant Vice President | |||||
and Portfolio Manager, Nuveen Unit Investment Trusts (1988-1999), | |||||
each of John Nuveen & Co., Inc. (1982-1999). | |||||
Interested Trustee: | |||||
Donald C. | President, Chief | Since 2012 | Current: President and CEO, certain other funds in the Fund | 214 | Current: Delaware Life (2013- |
Cacciapaglia*** | Executive Officer | Complex (2012-present); Vice Chairman, Guggenheim Investments | present); Guggenheim Life and | ||
(1951) | and Trustee | (2010-present). | Annuity Company (2011-present); | ||
Paragon Life Insurance Company of | |||||
Former: Chairman and CEO, Channel Capital Group, Inc. (2002-2010). | Indiana (2011-present). | ||||
| * | The business address of each Trustee is c/o Guggenheim Investments, 227 West Monroe Street, Chicago, IL 60606 |
| ** | This is the period for which the Trustee began serving the Fund. After a Trustee’s initial term, each Trustee is expected to serve a three year term concurrent with the class of Trustees for which he serves: |
| - | Messrs. Farley, Friedrich and Nyberg are Class II Trustees. Class II Trustees are expected to stand for re-election at the Fund’s annual meeting of shareholders for the fiscal year ended December 31, 2015. |
| - | Messrs. Karn, Oliverius and Toupin are Class III Trustees. Class III Trustees are expected to stand for re-election at the Fund’s annual meeting of shareholders for the fiscal year ended December 31, 2016. |
| - | Messrs. Barnes, Cacciapaglia and Chubb are Class I Trustees. Class I Trustees are expected to stand for re-election at the Fund’s annual meeting of shareholders for the fiscal year ended December 31, 2017. |
| *** | This Trustee is deemed to be an “interested person” of the Fund under the 1940 Act by reason of his position with the Fund’s Investment Manager and/or the parent of the Investment Manager. |
| (a) | As of April 3, 2014. At a special meeting of the shareholders held in April 2014, shareholders of the Trust elected the following individuals to serve as Trustees: Donald A. Chubb, Jerry B. Farley and Maynard F. Oliverius. |
Officers
The Officers of the Guggenheim Equal Weight Enhanced Equity Income Fund who are not trustees, and their principal occupations during the past five years:
Term of Office | |||
Name, Address*, | Position(s) Held | and Length of | |
and Year of Birth | with Trust | Time Served** | Principal Occupations During Past Five Years |
Joseph M. Arruda | Assistant Treasurer | Since 2014 | Current: Assistant Treasurer, certain other funds in the Fund Complex (2006-present); Vice President, Security |
(1966) | Investors, LLC (2010-present); CFO and Manager, Guggenheim Specialized Products, LLC (2009-present). | ||
Former: Vice President, Security Global Investors, LLC (2010-2011); Vice President, Rydex Advisors, LLC (2010); | |||
Vice President, Rydex Advisors II, LLC (2010). | |||
William H. Belden, III | Vice President | Since 2014 | Current: Vice President, certain other funds in the Fund Complex (2006-present); Managing Director, |
(1965) | Guggenheim Funds Investment Advisors, LLC (2005-present). | ||
Former: Vice President of Management, Northern Trust Global Investments (1999-2005). | |||
28 l GEQ l GUGGENHEIM EQUAL WEIGHT ENHANCED EQUITY INCOME FUND SEMIANNUAL REPORT
SUPPLEMENTAL INFORMATION (Unaudited) continued | June 30, 2014 |
Term of Office | |||
Name, Address*, | Position(s) Held | and Length of | |
and Year of Birth | with Trust | Time Served** | Principal Occupations During Past Five Years |
Officers (continued): | |||
Joanna M. Catalucci | Chief Compliance | Since 2012 | Current: Chief Compliance Officer, certain funds in the Fund Complex (2012-present); Managing Director, |
(1966) | Officer | Guggenheim Investments (2012-present). | |
Former: Chief Compliance Officer and Secretary, certain other funds in the Fund Complex (2008-2012); Senior | |||
Vice President & Chief Compliance Officer, Security Investors, LLC and certain affiliates (2010-2012); Chief | |||
Compliance Officer and Senior Vice President, Rydex Advisors, LLC and certain affiliates (2010-2011). | |||
Mark J. Furjanic | Assistant Treasurer | Since 2011 | Current: Vice President, Guggenheim Investments (2005-present); Assistant Treasurer, certain other funds in the |
(1959) | Fund Complex (2008-present). | ||
Former: Senior Manager, Ernst & Young LLP (1999-2005). | |||
James M. Howley | Assistant Treasurer | Since 2011 | Current: Director, Guggenheim Investments (2004-present); Assistant Treasurer, certain other funds in the Fund |
(1972) | Complex (2006-present). | ||
Former: Manager, Mutual Fund Administration, Van Kampen Investments, Inc. (1996-2004). | |||
Amy J. Lee | Chief Legal Officer | Since 2013 | Current: Chief Legal Officer, certain other funds in the Fund Complex (2012-present); Senior Managing Director, |
(1961) | Guggenheim Investments (2012-present). | ||
Former: Vice President, Associate General Counsel and Assistant Secretary, Security Benefit Life Insurance | |||
Company and Security Benefit Corporation (2004-2012). | |||
Derek D. Maltbie | Assistant Treasurer | Since 2011 | Current: Vice President, Guggenheim Investments (2012-present); Assistant Treasurer, certain other funds in the |
(1972) | Fund Complex (2011-present). | ||
Former: Assistant Vice President, Guggenheim Funds Investment Advisors, LLC (2005-2011); Supervisor, Mutual | |||
Fund Administration, Van Kampen Investments, Inc. (1995-2005). | |||
Mark E. Mathiasen | Secretary | Since 2011 | Current: Secretary, certain other funds in the Fund Complex (2007-present); Managing Director, Guggenheim |
(1978) | Investments (2007-present). | ||
Michael P. Megaris | Assistant Secretary | Since 2014 | Current: Assistant Secretary, certain other funds in the Fund Complex (April 2014-present); Associate, |
(1984) | Guggenheim Investments (2012-present). | ||
Former: J.D., University of Kansas School of Law (2009-2012). | |||
Kimberly J. Scott | Assistant Treasurer | Since 2012 | Current: Vice President, Guggenheim Investments (2012-present); Assistant Treasurer, certain other funds in the |
(1974) | Fund Complex (2012-present). | ||
Former: Financial Reporting Manager, Invesco, Ltd. (2010-2011); Vice President/Assistant Treasurer, Mutual | |||
Fund Administration, Van Kampen Investments, Inc./Morgan Stanley Investment Management (2009-2010); | |||
Manager of Mutual Fund Administration, Van Kampen Investments, Inc./Morgan Stanley Investment | |||
Management (2005-2009). | |||
Bryan Stone | Vice President | Since 2014 | Current: Vice President, certain other funds in the Fund Complex (April 2014-present); Director, Guggenheim |
(1979) | Investments (2013-present). | ||
Former: Senior Vice President, Neuberger Berman Group LLC (2009-2013); Vice President, Morgan Stanley | |||
(2002-2009). | |||
John L. Sullivan | Chief Financial | Since 2011 | Current: CFO, Chief Accounting Officer and Treasurer, certain other funds in the Fund Complex (2010-present); |
(1955) | Officer, Chief | Senior Managing Director, Guggenheim Investments (2010-present). | |
Accounting Officer | |||
and Treasurer | Former: Managing Director and CCO, each of the funds in the Van Kampen Investments fund complex (2004- | ||
2010); Managing Director and Head of Fund Accounting and Administration, Morgan Stanley Investment | |||
Management (2002-2004); CFO and Treasurer, Van Kampen Funds (1996-2004). | |||
| * | The business address of each officer is c/o Guggenheim Investments, 227 West Monroe Street, Chicago, IL 60606. |
| ** | Each officer serves an indefinite term, until his or her successor is duly elected and qualified. The date reflects the commencement date upon which the officer held any officer position with the Fund. |
GEQ l GUGGENHEIM EQUAL WEIGHT ENHANCED EQUITY INCOME FUND SEMIANNUAL REPORT l 29
DIVIDEND REINVESTMENT PLAN (Unaudited) | June 30, 2014 |
Unless the registered owner of common shares elects to receive cash by contacting Computershare Shareowner Services, LLC (the “Plan Administrator”), all dividends declared on common shares of the Fund will be automatically reinvested by the Plan Administrator, administrator for shareholders in the Fund’s Dividend Reinvestment Plan (the “Plan”), in additional common shares of the Fund. Participation in the Plan is completely voluntary and may be terminated or resumed at any time without penalty by notice if received and processed by the Plan Administrator prior to the dividend record date; otherwise such termination or resumption will be effective with respect to any subsequently declared dividend or other distribution. Some brokers may automatically elect to receive cash on your behalf and may re-invest that cash in additional common shares of the Fund for you. If you wish for all dividends declared on your common shares of the Fund to be automatically reinvested pursuant to the Plan, please contact your broker.
The Plan Administrator will open an account for each common shareholder under the Plan in the same name in which such common shareholder’s common shares are registered. Whenever the Fund declares a dividend or other distribution (together, a “Dividend”) payable in cash, non-participants in the Plan will receive cash and participants in the Plan will receive the equivalent in common shares. The common shares will be acquired by the Plan Administrator for the participants’ accounts, depending upon the circumstances described below, either (i) through receipt of additional unissued but authorized common shares from the Fund (“Newly Issued Common Shares”) or (ii) by purchase of outstanding common shares on the open market (“Open-Market Purchases”) on the New York Stock Exchange or elsewhere. If, on the payment date for any Dividend, the closing market price plus estimated brokerage commission per common share is equal to or greater than the net asset value per common share, the Plan Administrator will invest the Dividend amount in Newly Issued Common Shares on behalf of the participants. The number of Newly Issued Common Shares to be credited to each participant’s account will be determined by dividing the dollar amount of the Dividend by the net asset value per common share on the payment date; provided that, if the net asset value is less than or equal to 95% of the closing market value on the payment date, the dollar amount of the Dividend will be divided by 95% of the closing market price per common share on the payment date. If, on the payment date for any Dividend, the net asset value per common share is greater than the closing market value plus estimated brokerage commission, the Plan Administrator will invest the Dividend amount in common shares acquired on behalf of the participants in Open-Market Purchases.
If, before the Plan Administrator has completed its Open-Market Purchases, the market price per common share exceeds the net asset value per common share, the average per common share purchase price paid by the Plan Administrator may exceed the net asset value of the common shares, resulting in the acquisition of fewer common shares than if the Dividend had been paid in Newly Issued Common Shares on the Dividend payment date. Because of the foregoing difficulty with respect to Open-Market Purchases, the Plan provides that if the Plan Administrator is unable to invest the full Dividend amount in Open-Market Purchases during the purchase period or if the market discount shifts to a market premium during the purchase period, the Plan Administrator may cease making Open-Market Purchases and may invest the uninvested portion of the Dividend amount in Newly Issued Common Shares at net asset value per common share at the close of business on the Last Purchase Date provided that, if the net asset value is less than or equal to 95% of the then current market price per common share; the dollar amount of the Dividend will be divided by 95% of the market price on the payment date.
The Plan Administrator maintains all shareholders’ accounts in the Plan and furnishes written confirmation of all transactions in the accounts, including information needed by shareholders for tax records. Common shares in the account of each Plan participant will be held by the Plan Administrator on behalf of the Plan participant, and each shareholder proxy will include those shares purchased or received pursuant to the Plan. The Plan Administrator will forward all proxy solicitation materials to participants and vote proxies for shares held under the Plan in accordance with the instruction of the participants.
There will be no brokerage charges with respect to common shares issued directly by the Fund. However, each participant will pay a pro rata share of brokerage commission incurred in connection with Open-Market Purchases. The automatic reinvestment of Dividends will not relieve participants of any Federal, state or local income tax that may be payable (or required to be withheld) on such Dividends.
The Fund reserves the right to amend or terminate the Plan. There is no direct service charge to participants with regard to purchases in the Plan; however, the Fund reserves the right to amend the Plan to include a service charge payable by the participants.
All correspondence or questions concerning the Plan should be directed to the Plan Administrator, Computershare Shareowners Services, LLC, P.O. Box 30170, College Station, TX 77842-3170; Attention: Shareholder Services Department, Phone Number: (866) 488-3559.
30l GEQ l GUGGENHEIM EQUAL WEIGHT ENHANCED EQUITY INCOME FUND SEMIANNUAL REPORT
REPORT OF THE GUGGENHEIM EQUAL WEIGHT ENHANCED EQUITY INCOME FUND (GEQ) CONTRACTS REVIEW COMMITTEE | June 30, 2014 |
Guggenheim Equal Weight Enhanced Equity Income Fund (the “Fund”) was organized as a Delaware statutory trust on July 11, 2011, and is registered as a diversified, closed-end management investment company under the Investment Company Act of 1940, as amended (the “1940 Act”). Guggenheim Funds Investment Advisors, LLC (“GFIA” or the “Adviser”), a subsidiary of Guggenheim Funds Services, LLC (“GFS”), an indirect subsidiary of Guggenheim Partners, LLC, a global diversified financial services firm (“Guggenheim Partners”), serves as the Fund’s investment adviser and provides certain administrative and other services pursuant to an investment advisory agreement between the Fund and GFIA (the “Investment Advisory Agreement”) (Guggenheim Partners, GFIA, GFS, Guggenheim Partners Investment Management, LLC (“GPIM” or the “Options Strategy Sub-Adviser”), Security Investors, LLC (“Security Investors” or the “Equity Portfolio Sub-Adviser” and together with GPIM, the “Sub-Advisers” and each, a “Sub-Adviser”) and their affiliates may be referred to herein collectively as “Guggenheim”). Under the terms of the Investment Advisory Agreement, GFIA also is responsible for overseeing the activities of GPIM, an indirect subsidiary of Guggenheim Partners, which serves as the Fund’s investment sub-adviser responsible for managing the Fund’s options strategy pursuant to an investment sub-advisory agreement by and among the Fund, the Adviser and GPIM (the “GPIM Sub-Advisory Agreement”); and (ii) Security Investors, an affiliate of Guggenheim Partners, which serves as the Fund’s investment sub-adviser responsible for managing the Fund’s portfolio of equity securities pursuant to an investment sub-advisory agreement by and among the Fund, GFIA and Security Investors (the “Security Investors Sub-Advisory Agreement” and together with the GPIM Sub-Advisory Agreement, the “Sub-Advisory Agreements” and each, a “Sub-Advisory Agreement”) (The Sub-Advisory Agreements and the Investment Advisory Agreement are referred to herein collectively as, the “Advisory Agreements”). Under the supervision and oversight of GFIA and the Fund’s Board of Trustees (the “Board” and the members of the Board individually, the “Trustees”), Security Investors manages the equity portfolio of the Fund in accordance with its stated investment objective and policies, makes investment decisions for the Fund and places orders to purchase and sell securities on the Fund’s behalf, while GPIM implements the Fund’s options strategy and provides certain facilities and personnel related to such management.
At meetings held in person on April 17, 2014 (the “April Meeting”) and on May 12, 2014 (the “May Meeting”), the Contracts Review Committee of the Board (the “Committee”), consisting solely of those Trustees who are not “interested persons,” as defined by the 1940 Act, of the Fund (the “Independent Trustees”), met separately from Guggenheim to consider the renewal of the Advisory Agreements. As part of its review process, the Committee was represented by independent legal counsel to the Independent Trustees (“Independent Legal Counsel”). Independent Legal Counsel reviewed and discussed with the Committee various key aspects of the Trustees’ legal responsibilities relating to the proposed renewal of the Advisory Agreements and other principal contracts. In this connection, Independent Legal Counsel advised the Committee of: (i) the responsibilities of board members under applicable law; (ii) the standards for determining what constitutes an excessive fee as delineated by the courts and the factors the Trustees should consider in determining whether to approve the fee arrangements; and (iii) the disclosure requirements pertaining to these approvals, as required by the Securities and Exchange Commission. The Committee took into account various materials received from Guggenheim and Independent Legal Counsel. Recognizing that the evaluation process with respect to the services provided by each of GFIA, GPIM and Security Investors is an ongoing one, the Committee also considered the variety of written materials, reports and oral presentations it received (and received by the full Board) throughout the year regarding performance and operating results of the Fund.
In connection with the contract review process, FUSE Research Network LLC (“FUSE”), an independent, third-party research provider, was engaged to prepare advisory contract renewal reports designed specifically to help boards of directors/trustees fulfill their advisory contract renewal responsibilities. The objective of the reports is to present the subject funds’ relative position regarding fees, expenses and total return performance, with comparisons to a peer group identified by Guggenheim. Guggenheim prepared a comprehensive presentation in response to a formal request for information sent by Independent Legal Counsel on behalf of the Committee. In addition, Guggenheim made a detailed presentation at the April Meeting, which addressed areas identified for discussion by the Committee Chair and Vice Chair and Independent Legal Counsel. Throughout the process, the Committee asked questions of management and requested certain additional information which Guggenheim provided following the April Meeting (collectively with the foregoing reports and materials, the “Contract Materials”).
Among other things, Guggenheim provided: (i) organizational charts and presentations, staffing reports and biographies of those key personnel of the Adviser and Sub-Advisers providing services to the Fund; (ii) descriptions of various functions performed by Guggenheim for the Fund, such as portfolio trading practices, brokerage matters, trade allocation and best execution; (iii) information regarding each firm’s compliance and regulatory history, including its Form ADV; and (iv) information concerning the parent company and overall Guggenheim organization and strategic plans and goals, all to assist the Committee in assessing the nature, extent and quality of services provided by the Adviser and Sub-Advisers, respectively. In addition, Guggenheim’s response included information comparing the investment performance, advisory fees and total expenses of the Fund to other funds (including such information presented in the FUSE reports as well as supplemental information prepared by Guggenheim), charts showing revenues for Guggenheim by product line and with respect to the Fund, including a break-out of various expenses, a description of the expense allocation methodology and information about the profitability of the Fund to Guggenheim Investments (the investment management business of Guggenheim Partners), financial information for Guggenheim Investments (unaudited), audited financial statements of GFIA and information about Guggenheim’s compliance and risk management programs.
GEQ l GUGGENHEIM EQUAL WEIGHT ENHANCED EQUITY INCOME FUND SEMIANNUAL REPORT l 31
REPORT OF THE GUGGENHEIM EQUAL WEIGHT ENHANCED EQUITY INCOME FUND (GEQ) CONTRACTS REVIEW COMMITTEE continued | June 30, 2014 |
Following an analysis and discussion of the factors identified below, the Committee concluded that it was in the best interests of the Fund to recommend that the Board approve the renewal of all of the Advisory Agreements for an additional 12-month term.
Investment Advisory Agreement
Nature, Extent and Quality of Services Provided by the Adviser: With respect to the nature, extent and quality of services currently provided by the Adviser, the Committee noted that the Adviser delegated responsibility for the investment and reinvestment of the Fund’s assets to the Sub-Advisers. The Committee considered the Adviser’s responsibility to oversee the Sub-Advisers and that the Adviser has similar oversight responsibilities for other registered investment companies for which GFIA serves as investment adviser. The Committee took into account information provided by Guggenheim describing and illustrating the Adviser’s processes and activities for providing oversight of the Sub-Advisers’ investment strategies and compliance with investment restrictions, including analyses and monitoring of returns versus peer funds and relevant indices on both a market price and net asset value (“NAV”) basis, volatility, dividend yield, premium/discount and use of derivatives, as well as information regarding the Adviser’s Sub-Advisory Oversight Committee. The Committee also considered the secondary market support services provided by Guggenheim to the Fund and, in this regard, noted the materials describing the activities of Guggenheim’s dedicated Closed-End Fund Team, including with respect to communication with financial advisers, data dissemination and relationship management. In addition, the Committee considered the information provided by Guggenheim concerning the education, experience, professional affiliations, area of responsibility and duties of all key personnel performing services for the Fund, including those personnel providing compliance oversight. In this connection, the Committee considered Guggenheim’s resources and related efforts to retain, attract and motivate capable personnel to serve the Fund and noted Guggenheim’s report on recent additions and departures in personnel who work on matters relating to the Fund or are significant to the operations of the Adviser.
The Committee noted that on a regular basis the Board receives and reviews information from the Fund’s Chief Compliance Officer regarding compliance policies and procedures established pursuant to Rule 38a-1 under the 1940 Act. The Independent Trustees also took into account the various compliance and risk management initiatives undertaken by Guggenheim, including, among other things, the hiring of a new Chief Risk Officer, Portfolio Management, responsible for implementing various initiatives related to the risks associated with the investment process, the organization’s risk management infrastructure and critical activities. The Committee also considered Guggenheim’s other initiatives intended to achieve greater enhancements and efficiencies in Guggenheim’s ability to provide services to the Guggenheim Funds (including the Fund), such as efforts to streamline and simplify the organizational structure of Guggenheim’s advisory business, as reflected by the internal restructuring that consolidated the investment advisers, broker/dealers and other entities that comprise “Guggenheim Investments” under a new, single holding company, Guggenheim Partners Investment Management Holdings, LLC (“GPIMH”). In this regard, the Committee considered that while the restructuring neither impacted the services rendered on a day-today basis to the Fund nor changed the ultimate ownership of the various Guggenheim entities involved, which, through GPIMH, continue to be indirect subsidiaries of Guggenheim Capital, LLC, Guggenheim stated that the restructuring will allow the financial statements of the various entities to be consolidated and audited, thus providing a clearer view of Guggenheim Investments’ business within the broader Guggenheim organization. In connection with the Committee’s evaluation of the overall package of services provided by the Adviser, the Committee considered the Adviser’s role in monitoring and coordinating compliance responsibilities with the administrator, custodian and other service providers to the Fund.
With respect to the Adviser’s resources and its ability to carry out its responsibilities under the Investment Advisory Agreement, the Chief Financial Officer of Guggenheim Investments reviewed with the Committee certain unaudited financial information concerning GPIMH and the audited financial statements of GFIA (The Committee received the audited financial statements of GPIMH once available following the May Meeting).
The Committee also considered the acceptability of the terms of the Investment Advisory Agreement (including the scope of services required to be performed by GFIA). Based on the foregoing, and based on other information received (both oral and written) at the April Meeting and at the May Meeting, as well as other considerations, including the Committee’s knowledge of the Adviser’s quality of performance of its duties through Board meetings, discussions, and reports throughout the year, the Committee concluded that the Adviser and its personnel were qualified to serve the Fund in such capacity and may reasonably be expected to continue to provide a high quality of services under the Investment Advisory Agreement with respect to the Fund.
Investment Performance: The Fund commenced investment operations on October 27, 2011. The Committee considered the Fund’s investment performance by reviewing the Fund’s total return on a NAV and market price basis for the one-year and three-month periods ended December 31, 2013. The Committee compared the Fund’s performance to the performance of the Fund’s benchmark and to a peer group of closed-end funds determined by the Adviser (the “peer group of funds”) for the same time periods. The Committee noted that the Adviser’s peer group selection methodology for the Fund starts with the entire U.S.-listed taxable closed-end fund universe, and excludes funds that, among other things, under normal market conditions, are less than 80% covered with options, are less than 80% domestic, primarily write options on individual equities or are sector-oriented. Consequently, the peer group of funds included other closed-end funds that generally invest a majority of their assets in equity securities with a similar covered call strategy. In assessing the peer group
32l GEQ l GUGGENHEIM EQUAL WEIGHT ENHANCED EQUITY INCOME FUND SEMIANNUAL REPORT
REPORT OF THE GUGGENHEIM EQUAL WEIGHT ENHANCED EQUITY INCOME FUND (GEQ) CONTRACTS REVIEW COMMITTEE continued | June 30, 2014 |
constituents and both the comparative performance and fee data presented (including in the FUSE reports), the Committee considered management’s discussion of the challenges of developing relevant peer groups for the Fund.
The Committee noted that the Fund’s investment results were consistent with the Fund’s investment objective of seeking to provide a high level of risk-adjusted total return with an emphasis on current income. The Committee also considered that the Adviser does not directly manage the investment portfolio but delegated such duties to the Equity Portfolio Sub-Adviser and the Options Strategy Sub-Adviser. The Committee also considered the Fund’s structure and form of leverage, cost of the leverage and the aggregate leverage outstanding as of December 31, 2013, information concerning the common assets, leverage, managed assets and leverage rate as of December 31, 2012 and as of December 31, 2013, and the net yield on leverage assets and net impact on common assets due to leverage for the one-year period ended December 31, 2013. Based on the information provided, the Committee concluded that the Adviser had appropriately reviewed and monitored the Sub-Adviser’s investment performance.
Comparative Fees, Costs of Services Provided and the Profits Realized by the Adviser from its Relationship with the Fund: The Committee compared the Fund’s advisory fee (which includes the sub-advisory fees paid to the Sub-Advisers) and total net expense ratio to the peer group of funds and noted the Fund’s percentile rankings in this regard. The Committee also reviewed the average and median advisory fees and expense ratios, including expense ratio components (e.g., transfer agency fees, administration fees, other operating expenses and fee waivers/reimbursements) of the peer group of funds. The Committee noted that although the Fund’s total net expense ratio was above the median expense ratio of its peer group, none of the other unaffiliated funds within the peer group of funds employ leverage. In this connection, the Committee considered Guggenheim’s statement that when comparing the Fund’s advisory fees to the peer group on a total managed assets basis, as is the industry norm, the Fund’s annual advisory fees are competitive. In addition, the Committee noted the Fund’s relatively small size as compared to other unaffiliated funds in the peer group of funds and the impact of the size differential on the expense ratio related to fixed expenses. The Committee also took into account Guggenheim’s view that because four of the Fund’s six unaffiliated peer funds are managed by the same asset management firm, with sizable closed-end fund assets under management, such asset management firm has been able to implement a unique fee pricing structure. The Committee also considered the complexity of the investment strategies employed by the Sub-Advisers.
With respect to the costs of services provided and profits realized by Guggenheim from its relationship with the Fund, the Committee reviewed a profit and loss statement for Guggenheim Investments setting forth the revenues (gross advisory fees) received under the Investment Advisory Agreement, as well as the expenses incurred in providing services to the Fund, the pre-tax operating margin and profitability rate, the Fund’s average assets for the twelve months ended, and the ending assets under management as of, December 31, 2012 and December 31, 2013, respectively, and information with respect to Guggenheim’s allocation methodologies used in preparing the profitability data.
The Committee considered other benefits available to the Adviser because of its relationship with the Fund and noted that the Adviser may be deemed to benefit from arrangements whereby an affiliate, Rydex Fund Services, LLC, receives fees from the Fund for: (i) providing certain administrative services pursuant to an administration agreement; and (ii) maintaining the books and records of the Fund’s securities and cash pursuant to a fund accounting agreement; and that other affiliates, GPIM and Security Investors, receive sub-advisory fees for managing the investment portfolio. The Committee also noted the Adviser’s statement that it may benefit from marketing synergies arising from offering a broad spectrum of products, including the Fund. Based on all of the information provided and its review, the Committee determined that Guggenheim Investments’ profitability from its relationship with the Fund was not unreasonable.
Economies of Scale to be Realized: The Committee received and considered information regarding whether there have been economies of scale with respect to the management of the Fund as the Fund’s assets grow (primarily through the appreciation of the Fund’s investment portfolio), whether the Fund has appropriately benefited from any economies of scale, and whether there is potential for realization of any further economies of scale. The Committee considered whether economies of scale in the provision of services to the Fund were being passed along to the shareholders. In this respect, the Committee considered the Adviser’s view that advisory fee breakpoints generally are not relevant given the structural nature of closed-end funds, which do not continuously offer new shares. The Committee also took into account the Adviser’s view as to the competitiveness of the Fund’s advisory fee when compared to the peer group on a total managed assets basis and noted that to the extent the Fund’s assets increase over time, the Fund and its shareholders should realize economies of scale as certain expenses, such as fixed fund fees, become a smaller percentage of overall assets. In addition, the Committee considered the Adviser’s view that Guggenheim continues to add system resources as required to develop its infrastructure in response to the growth in the firm’s assets and there is an opportunity to optimize economies of scale across the firm’s array of products and product lines. Therefore, although Guggenheim may be realizing economies of scale and efficiencies due to its growth, it is concurrently realizing new costs and expenses associated with investment in its infrastructure.
Sub-Advisory Agreements
Nature, Extent and Quality of Services Provided by the Sub-Advisers: With respect to the nature, extent and quality of services provided by the Sub-Advisers, the Committee considered the qualifications, experience and skills of the Sub-Advisers’ portfolio management and other key personnel and information from the Sub-Advisers describing the scope of their services to the Fund. With respect to the Sub-Advisers’ resources and their ability to carry out their responsibilities under the Sub-Advisory
GEQ l GUGGENHEIM EQUAL WEIGHT ENHANCED EQUITY INCOME FUND SEMIANNUAL REPORT l 33
REPORT OF THE GUGGENHEIM EQUAL WEIGHT ENHANCED EQUITY INCOME FUND (GEQ) CONTRACTS REVIEW COMMITTEE continued | June 30, 2014 |
Agreements, the Committee recalled the review of certain unaudited financial information concerning GPIMH’s by the Chief Financial Officer of Guggenheim Investments.
The Committee also considered the acceptability of the terms of each Sub-Advisory Agreement. In addition, the Committee considered the Sub-Advisers’ efforts in pursuing the Fund’s investment objective of seeking to provide a high level of risk-adjusted total return with an emphasis on current income. Based on the foregoing, and based on other information received (both oral and written) at the April Meeting and at the May Meeting, as well as other considerations, including the Committee’s knowledge of each Sub-Adviser’s quality of performance of its duties through Board meetings, discussions and reports throughout the year, the Committee concluded that each Sub-Adviser and its personnel were qualified to serve the Fund in such capacity and may reasonably be expected to continue to provide a high quality of services under the applicable Sub-Advisory Agreement.
Investment Performance: The Committee reviewed the performance of the Fund and the peer group of funds over different periods of time. The Committee observed that the Fund outperformed the average and median return of its peer group of funds for the one-year period ended December 31, 2013, on a NAV basis. Although the Fund underperformed its peer group average on a market price basis, the Fund’s return on a market price basis for the one-year period was in line with the peer group median. In addition, the Committee observed that the Fund’s performance on a NAV basis exceeded the return of the CBOE BuyWrite Index for the one-year period ended December 31, 2013, while lagging the return of the S&P 500 over the same period. In light of the Fund’s relatively brief operating history, the Committee also took into account the Fund’s performance for three-month period ended December 31, 2013, and noted that the Fund outperformed the average and median return of its peer group of funds on both a NAV and market price basis for such period. The Committee also considered Guggenheim’s statement that, as experienced during the relevant period, strong upward movements in the broad market with low levels of implied volatility in the options market are challenging for enhanced equity strategies to keep pace with equity benchmarks.
The Committee also took into account Guggenheim’s belief that there is no single optimal performance metric, nor is there a single optimal time period over which to evaluate performance and that a thorough understanding of performance comes from analyzing measures of returns, risk and risk-adjusted returns, as well as evaluating strategies both relative to their market benchmarks as well as relative to peer groups of competitor strategies. Thus, the Committee also reviewed and considered the additional performance and risk metrics provided by Guggenheim, including the Fund’s standard deviation, tracking error, beta, Sharpe ratio, information ratio and alpha versus the Fund’s peers.
After reviewing the foregoing and related factors, the Committee concluded, within the context of its overall conclusions regarding the Advisory Agreements, that the Fund’s performance was acceptable.
Comparative Fees, Costs of Services Provided and the Profits Realized by each Sub-Adviser from its Relationship with the Fund: The Committee reviewed the level of sub-advisory fees payable to each of GPIM and Security Investors, noting that the fees would be paid by GFIA and do not impact the fees paid by the Fund. The Committee also reviewed the dollar amount of sub-advisory fees paid to each of GPIM and Security Investors for the twelve months ended December 31, 2013. In addition, the Committee compared the sub-advisory fee paid by the Adviser to each Sub-Adviser to the fees charged by the Sub-Adviser to other clients including other registered investment companies.
Economies of Scale to be Realized: The Committee recognized that, because the Sub-Advisers’ fees would be paid by the Adviser and not the Fund, the analysis of economies of scale was more appropriate in the context of the Committee’s consideration of the Investment Advisory Agreement, which was separately considered (See “Investment Advisory Agreement – Economies of Scale to be Realized” above).
Overall Conclusions
Based on the foregoing, the Committee determined that the investment advisory fees are fair and reasonable in light of the extent and quality of the services provided and other benefits received and that the continuation of each Advisory Agreement is in the best interests of the Fund. In reaching this conclusion, no single factor was determinative and each Committee member may attribute different weights to different factors. At the May Meeting, the Committee, constituting all of the Independent Trustees, recommended the renewal of each Advisory Agreement for an additional 12-month term.
34l GEQ l GUGGENHEIM EQUAL WEIGHT ENHANCED EQUITY INCOME FUND SEMIANNUAL REPORT
FUND INFORMATION | June 30, 2014 |
Board of Trustees | Principal Executive Officers | Equity Strategy Investment |
Randall C. Barnes | Donald C. Cacciapaglia | Sub-Adviser |
Chief Executive Officer | Security Investors, LLC | |
Donald C. Cacciapaglia* | New York, NY | |
Joanna M. Catalucci | ||
Donald A. Chubb | Chief Compliance Officer | Administrator and Accounting Agent |
Rydex Fund Services, LLC | ||
Jerry B. Farley | Amy J. Lee | Rockville, MD |
| Chief Legal Officer | ||
Roman Friedrich III | Custodian | |
Mark E. Mathiasen | The Bank of New York Mellon | |
Robert B. Karn III | Secretary | New York, NY |
Ronald A. Nyberg | John L. Sullivan | Legal Counsel |
Chief Financial Officer, | Skadden, Arps, Slate, Meagher & | |
Maynard F. Oliverius | Chief Accounting | Flom LLP |
Officer and Treasurer | New York, NY | |
Ronald E. Toupin, Jr., | ||
Chairperson | Investment Adviser | Independent Registered Public |
Guggenheim Funds Investment | Accounting Firm | |
* Trustee is an “interested person” | Advisors, LLC | Ernst & Young LLP |
(as defined in Section 2(a)(19) | Chicago, IL | McLean, VA |
of the 1940 Act) (“Interested | ||
Trustee”) of the Trust because | Options Strategy Investment | |
of his position as the President | Sub-Adviser | |
and CEO of the Investment | Security Investors, LLC | |
Adviser and Distributor. | New York, NY |
Privacy Principles of the Fund
The Fund is committed to maintaining the privacy of its shareholders and to safeguarding their non-public personal information. The following information is provided to help you understand what personal information the Fund collects, how the Fund protects that information and why, in certain cases, the Fund may share information with select other parties.
Generally, the Fund does not receive any non-public personal information relating to its shareholders, although certain non-public personal information of its shareholders may become available to the Fund. The Fund does not disclose any non-public personal information about its shareholders or former shareholders to anyone, except as permitted by law or as is necessary in order to service shareholder accounts (for example, to a transfer agent or third party administrator).
The Fund restricts access to non-public personal information about its shareholders to employees of the Fund’s investment adviser and its affiliates with a legitimate business need for the information. The Fund maintains physical, electronic and procedural safeguards designed to protect the non-public personal information of its shareholders.
Questions concerning your shares of Guggenheim Equal Weight Enhanced Equity Income Fund?
• If your shares are held in a Brokerage Account, contact your Broker.
• If you have physical possession of your shares in certificate form, contact the Fund’s Transfer Agent:
Computershare Shareowner Services LLC, P.O. Box 30170, College Station, TX 77842-3170; (866) 488-3559.
This report is sent to shareholders of Guggenheim Equal Weight Enhanced Equity Income Fund for their information. It is not a Prospectus, circular or representation intended for use in the purchase or sale of shares of the Fund or of any securities mentioned in this report.
A description of the Fund’s proxy voting policies and procedures related to portfolio securities is available without charge, upon request, by calling the Fund at (866) 274-2227.
Information regarding how the Fund voted proxies for portfolio securities, if applicable, during the most recent 12-month period ended December 31, is also available, without charge and upon request by calling (866)274-2227, by visiting the Fund’s website at guggenheiminvestments.com/geq or by accessing the Fund’s Form N-PX on the U.S. Securities and Exchange Commission’s (SEC) website at www.sec.gov.
The Fund files its complete schedule of portfolio holdings with the SEC for the first and third quarters of each fiscal year on Form N-Q. The Fund’s Form N-Q is available on the SEC website at www.sec.gov or by visiting the Fund’s website at guggenheiminvestments.com/geq. The Fund’s Form N-Q may also be viewed and copied at the SEC’s Public Reference Room in Washington, DC; information on the operation of the Public Reference Room may be obtained by calling (800) SEC-0330 or at www.sec.gov.
Notice to Shareholders
Notice is hereby give in accordance with Section 23(c) of the Investment Company Act of 1940, as amended, that the Fund from time to time may purchase shares of its common stock in the open market.
GEQ l GUGGENHEIM EQUAL WEIGHT ENHANCED EQUITY INCOME FUND SEMIANNUAL REPORT l 35
.
ABOUT THE FUND MANAGER
Guggenheim Partners Investment Management, LLC
Guggenheim Partners Investment Management, LLC (“GPIM”) is an indirect subsidiary of Guggenheim Partners, LLC, a diversified financial services firm. The firm provides capital markets services, portfolio and risk management expertise, wealth management, and investment advisory services. Clients of Guggenheim Partners, LLC subsidiaries are an elite mix of individuals, family offices, endowments, foundations, insurance companies and other institutions.
Investment Philosophy
GPIM’s investment philosophy is predicated upon the belief that thorough research and independent thought are rewarded with performance that has the potential to outperform benchmark indexes with both lower volatility and lower correlation of returns over time as compared to such benchmark indexes.
Investment Process
GPIM’s investment process is a collaborative effort between various groups including the Portfolio Construction Group, which utilize proprietary portfolio construction and risk modeling tools to determine allocation of assets among a variety of sectors, and its Sector Specialists, who are responsible for security selection within these sectors and for implementing securities transactions, including the structuring of certain securities directly with the issuers or with investment banks and dealers involved in the origination of such securities.
Security Investors, LLC
Security Investors, LLC (“SI”) is a registered investment adviser. For more than 20 years, SI has been dedicated to helping investors and financial professionals navigate diverse market conditions with confidence. With approximately $20 billion in assets, SI offers institutional investors and financial intermediaries a range of four investment competencies for building well-diversified portfolios; Alternative Assets and Strategies; Fundamental Active Alpha Strategies (Equity and Fixed-Income); Target Beta Strategies; and Exchange Traded products (ETFs).
Guggenheim Funds Distributors, LLC
227 West Monroe Street
Chicago, IL 60606
Member FINRA/SIPC (08/14)
NOT FDIC-INSURED l NOT BANK-GUARANTEED l MAY LOSE VALUE
CEF-GEQ-SAR-0614
Item 2. Code of Ethics.
Not applicable for a semi-annual reporting period.
Item 3. Audit Committee Financial Expert.
Not applicable for a semi-annual reporting period.
Item 4. Principal Accountant Fees and Services.
Not applicable for a semi-annual reporting period.
Item 5. Audit Committee of Listed Registrants.
Not applicable for a semi-annual reporting period.
Item 6. Schedule of Investments.
The Schedule of Investments is included as part of Item 1.
Item 7. Disclosure of Proxy Voting Policies and Procedures for Closed-End Management Investment Companies.
Not applicable for a semi-annual reporting period.
Item 8. Portfolio Managers of Closed-End Management Investment Companies.
| (a) | Not applicable for a semi-annual reporting period. |
| (b) |
Item 9. Purchases of Equity Securities by Closed-End Management Investment Company and Affiliated Purchasers.
None.
Item 10. Submission of Matters to a Vote of Security Holders.
The registrant has not made any material changes to the procedures by which shareholders may recommend nominees to the registrant’s Board of Trustees.
Item 11. Controls and Procedures.
(a) The registrant's principal executive officer and principal financial officer have evaluated the registrant's disclosure controls and procedures (as defined in Rule 30a-3(c) under the Investment Company Act) as of a date within 90 days of this filing and have concluded based on such evaluation, as required by Rule 30a-3(b) under the Investment Company Act, that the registrant's disclosure controls and procedures were effective, as of that date, in ensuring that information required to be disclosed by the registrant in this Form N-CSR was recorded, processed, summarized, and reported within the time periods specified in the Securities and Exchange Commission’s rules and forms.
(b) There were no changes in the registrant’s internal control over financial reporting (as defined in Rule 30a-3(d) under the Investment Company Act) that occurred during the registrant’s second fiscal quarter of the period covered by this report that have materially affected, or are reasonably likely to materially affect, the registrant’s internal control over financial reporting.
Item 12. Exhibits.
(a)(1) Not applicable.
(a)(2) Certifications of principal executive officer and principal financial officer pursuant to Rule 30a-2(a) under the Investment Company Act.
(a)(3) Not applicable.
(b) Certifications of principal executive officer and principal financial officer pursuant to Rule 30a-2(b) of the Investment Company Act and Section 906 of the Sarbanes-Oxley Act of 2002.
SIGNATURES
Pursuant to the requirements of the Securities Exchange Act of 1934 and the Investment Company Act of 1940, the registrant has duly caused this report to be signed on its behalf by the undersigned, thereunto duly authorized.
(Registrant) Guggenheim Equal Weight Enhanced Equity Income Fund
By: /s/ Donald C. Cacciapaglia
Name: Donald C. Cacciapaglia
Title: Chief Executive Officer
Date: September 3, 2014
Pursuant to the requirements of the Securities Exchange Act of 1934 and the Investment Company Act of 1940, this report has been signed by the following persons on behalf of the registrant and in the capacities and on the dates indicated.
By: /s/ Donald C. Cacciapaglia
Name: Donald C. Cacciapaglia
Title: Chief Executive Officer
Date: September 3, 2014
By: /s/ John L. Sullivan
Name: John L. Sullivan
Title: Chief Financial Officer, Chief Accounting Officer and Treasurer
Date: September 3, 2014