Exhibit 99.1

Global Net Lease First Quarter 2020 Investor Presentation
2 CORPORATE UPDATE □ Resilient Portfolio Built for Success: We believe the financial strength, creditworthiness of our tenants and diversity within our portfolio will offset the potential effects of this crisis in the short and long - term. Although we are likely still in the early stages of this economic c ycle, we're pleased with the resiliency our portfolio has shown through these uncertain times □ Across the portfolio, 67% of straight - line rent comes from Investment Grade or implied Investment Grade tenants (2) including 90% of our top 10 tenants (3) □ Corporate Response: Beginning in early March, our advisor took proactive steps to prepare for and actively mitigate the inevitable disruption COV ID - 19 would cause. Our advisor enacted safety measures, both required or recommended by local and federal authorities, including re mot e work policies, cooperation with localized closure or curfew directives, and social distancing measures □ Cross Border Approach with Positive Results: Our domestic and international teams have been in direct contact with our tenants since the crisis began, creating open dialogue and deepening the fundamental relationships that we have carefully developed through prior transaction s a nd historic operations. Thanks to these conversations and the strenuous due diligence and underwriting standards our team has adhered to over the las t s everal years, we’ve experienced tremendous success in our rent collection efforts during this pandemic □ GNL collected 98% of portfolio April Cash Rent due across the portfolio, including 100% of the April Cash Rent payable from our U.K. assets, 99% from our European tenants and 96% from our tenants located in the U.S □ We are in contact with the tenants that constitute the remaining 2% of rent and we continue to look to collect the outstandin g b alance □ Prudent Capital Management: In addition to shifting substantial resources to focus on working with tenants during the pandemic, GNL has taken additional steps to maximize the company’s financial flexibility and minimize the company's risk during this uncertain time. In March, we drew on our credit facility to enhance our cash position as the scope of the crisis became apparent. Additionally, the Board approved a change i n t he annual Common Stock dividend to $1.60 per share, from $2.13 per share previously. This change went into effect with the second quarter dividend. We believe that this action was prudent in the current environment and will strengthen GNL's cash flow by over $12 million per quarter x Net income attributable to common stockholders per share of $0.05 x First quarter AFFO per share of $0.44 (4) x New quarterly dividend per share of $0.40 GNL’s focused effort in response to the COVID - 19 crisis resulted in 98% of April Cash Rent (1) collected Note: April Cash Rent collection data as of April 30, 2020. Excludes April Cash Rent or Deferral Agreements executed or approved after April 30, 2020 that would apply to Ap ril Cash Rent. This information may not be indicative of any future period. The impact of the COVID - 19 pandemic in our rental revenue for the second quarter of 2020 and thereafter cannot be determined at present. The ultimate im pact on our future results of operations and liquidity will depend on the overall length and severity of the COVID - 19 pandemic, which management is unable to predict. 1. Represents total of all contractual rents on a cash basis due from tenants as stipulated in the originally executed lease agr eem ents at inception or any lease amendments thereafter prior to a Deferral Agreement. 2. Refer to Investment Grade Rating definition included in the footnotes on page 5. 3. Refer to page 8 for additional information on our top 10 tenants. 4. See “Non - GAAP measures” on pages 26 for a description of AFFO and pages 29 for a reconciliation of AFFO to net income, the most directly comparable GAAP Financial measure.
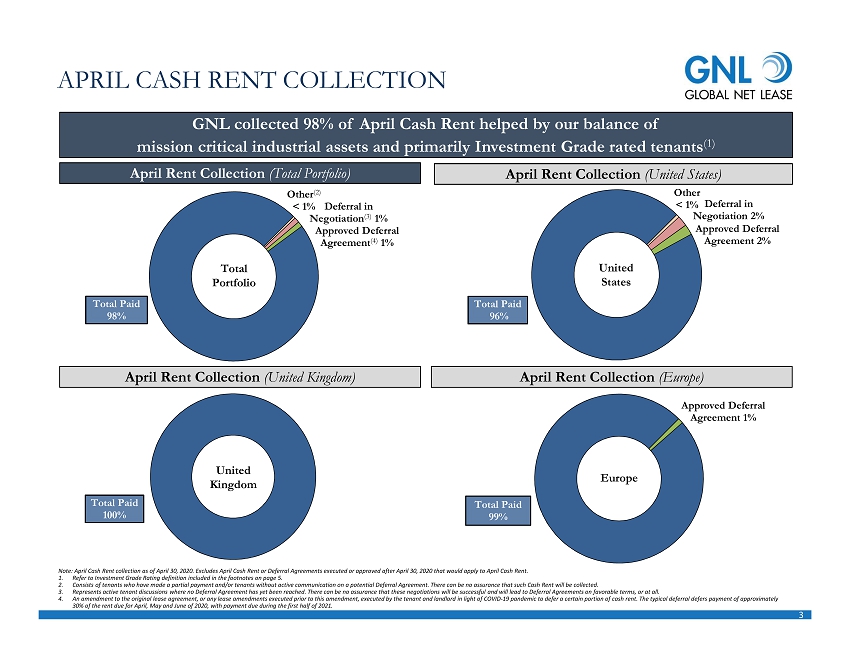
3 Approved Deferral Agreement 1% Total Paid … Other (2) < 1% Deferral in … Approved Deferral Agreement (4) 1% Total … Other < 1% Deferral in … Approved Deferral Agreement 2% Total … APRIL CASH RENT COLLECTION GNL collected 98% of April Cash Rent helped by our balance of mission critical industrial assets and primarily Investment Grade rated tenants (1) April Rent Collection (Total Portfolio) April Rent Collection (United Kingdom) April Rent Collection (United States) April Rent Collection (Europe) Total … Total Portfolio United States United Kingdom Europe Note: April Cash Rent collection as of April 30, 2020. Excludes April Cash Rent or Deferral Agreements executed or approved after April 30, 2020 that would apply to Ap ril Cash Rent. 1. Refer to Investment Grade Rating definition included in the footnotes on page 5. 2. Consists of tenants who have made a partial payment and/or tenants without active communication on a potential Deferral Agree men t. There can be no assurance that such Cash Rent will be collected. 3. Represents active tenant discussions where no Deferral Agreement has yet been reached. There can be no assurance that these n ego tiations will be successful and will lead to Deferral Agreements on favorable terms, or at all. 4. An amendment to the original lease agreement, or any lease amendments executed prior to this amendment, executed by the tenan t a nd landlord in light of COVID - 19 pandemic to defer a certain portion of cash rent. The typical deferral defers payment of approx imately 30% of the rent due for April, May and June of 2020, with payment due during the first half of 2021.
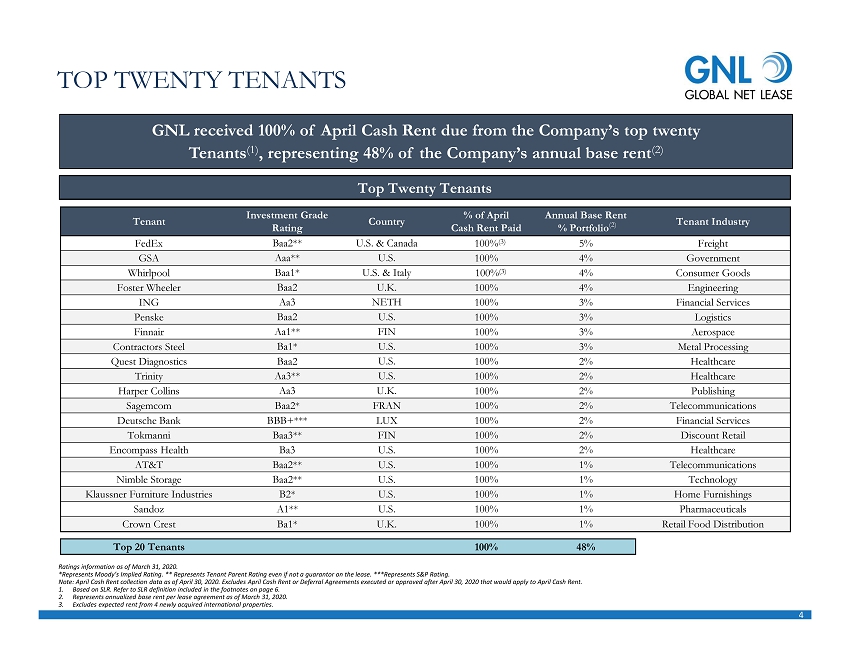
4 TOP TWENTY TENANTS GNL received 100% of April Cash Rent due from the Company’s top twenty Tenants (1) , representing 48% of the Company’s annual base rent (2) Top Twenty Tenants Tenant Investment Grade Rating Country % of April Cash Rent Paid Annual Base Rent % Portfolio (2) Tenant Industry FedEx Baa2** U.S. & Canada __ 100% (3) 5% Freight GSA Aaa** U.S. 100% 4% Government Whirlpool Baa1* U.S. & Italy __ 100% (3) 4% Consumer Goods Foster Wheeler Baa2 U.K. 100% 4% Engineering ING Aa3 NETH 100% 3% Financial Services Penske Baa2 U.S. 100% 3% Logistics Finnair Aa1** FIN 100% 3% Aerospace Contractors Steel Ba1* U.S. 100% 3% Metal Processing Quest Diagnostics Baa2 U.S. 100% 2% Healthcare Trinity Aa3** U.S. 100% 2% Healthcare Harper Collins Aa3 U.K. 100% 2% Publishing Sagemcom Baa2* FRAN 100% 2% Telecommunications Deutsche Bank BBB+*** LUX 100% 2% Financial Services Tokmanni Baa3** FIN 100% 2% Discount Retail Encompass Health Ba3 U.S. 100% 2% Healthcare AT&T Baa2** U.S. 100% 1% Telecommunications Nimble Storage Baa2** U.S. 100% 1% Technology Klaussner Furniture Industries B2* U.S. 100% 1% Home Furnishings Sandoz A1** U.S. 100% 1% Pharmaceuticals Crown Crest Ba1* U.K. 100% 1% Retail Food Distribution Top 20 Tenants 100% 48% Ratings information a s of March 31, 2020. *Represents Moody’s Implied Rating. ** Represents Tenant Parent Rating even if not a guarantor on the lease . ***Represents S&P Rating. Note: April Cash Rent collection data as of April 30, 2020. Excludes April Cash Rent or Deferral Agreements executed or appro ved after April 30, 2020 that would apply to April Cash Rent. 1. Based on SLR. Refer to SLR definition included in the footnotes on page 6. 2. Represents annualized base rent per lease agreement as of March 31, 2020. 3. Excludes expected rent from 4 newly acquired international properties.

5 OVERVIEW 1. As used herein, investment grade includes both actual investment grade ratings of the tenant or guarantor, if available, or i mpl ied investment grade. Implied investment grade may include actual ratings of tenant parent, guarantor parent (regardless of whether or not the parent has guaranteed the tenant’s obligation under the lease) or by using a proprie tar y Moody’s analytical tool, which generates an implied rating by measuring a company’s probability of default. Ratings information is as of March 31, 2020. For the first quarter 2020, GNL’s portfolio was 36% actual investment g rad e rated and 31% implied investment grade rated. Proactive Asset Management Program to Drive Long Term Portfolio Value Experienced Management Team Ability to Capitalize on Imbalance Between U.S. and European Markets to Deliver Superior Risk Adjusted Returns High - Quality, Mission Critical, Net Lease Focused Portfolio Long Duration Leases to Primarily Investment Grade Rated Tenants (1) Differentiated Strategy with International Diversification Strenuous Due Diligence and Underwriting Standards
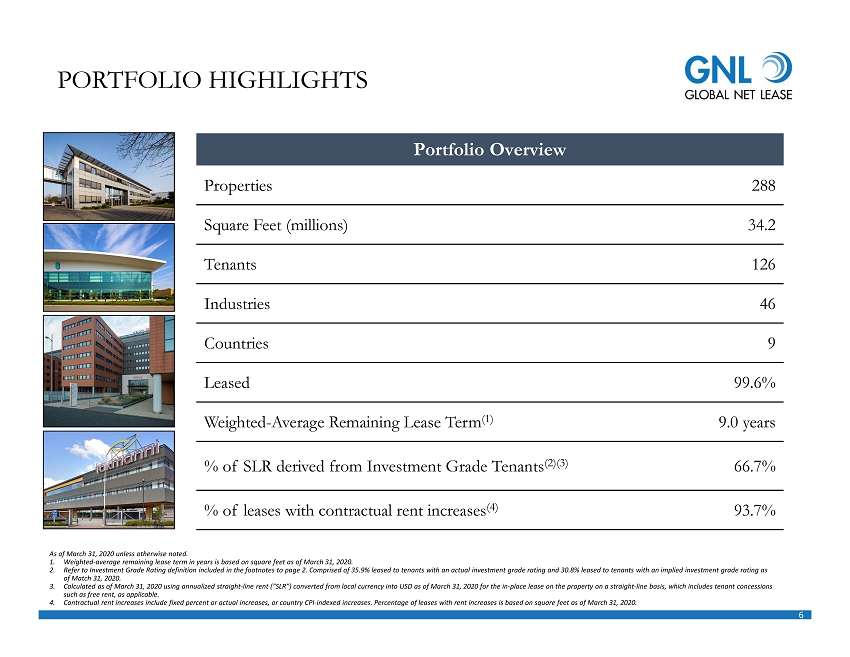
6 PORTFOLIO HIGHLIGHTS Properties 288 Square Feet (millions) 34.2 Tenants 126 Industries 46 Countries 9 Leased 99.6% Weighted - Average Remaining Lease Term (1) 9.0 years % of SLR derived from Investment Grade Tenants (2)(3) 66.7% % of leases with contractual rent increases (4) 93.7% Portfolio Overview As of March 31 , 2020 unless otherwise noted. 1. Weighted - average remaining lease term in years is based on square feet as of March 31, 2020. 2. Refer to Investment Grade Rating definition included in the footnotes to page 2. Comprised of 35.9 % leased to tenants with an actual investment grade rating and 30.8% leased to tenants with an implied investment grade ratin g a s of Match 31, 2020. 3. Calculated as of March 31, 2020 using annualized straight - line rent (“SLR”) converted from local currency into USD as of March 31, 2020 for the in - place lease o n the property on a straight - line basis, which includes tenant concessions such as free rent, as applicable. 4. Contractual rent increases include fixed percent or actual increases, or country CPI - indexed increases. Percentage of leases wit h rent increases is based on square feet as of March 31, 2020.
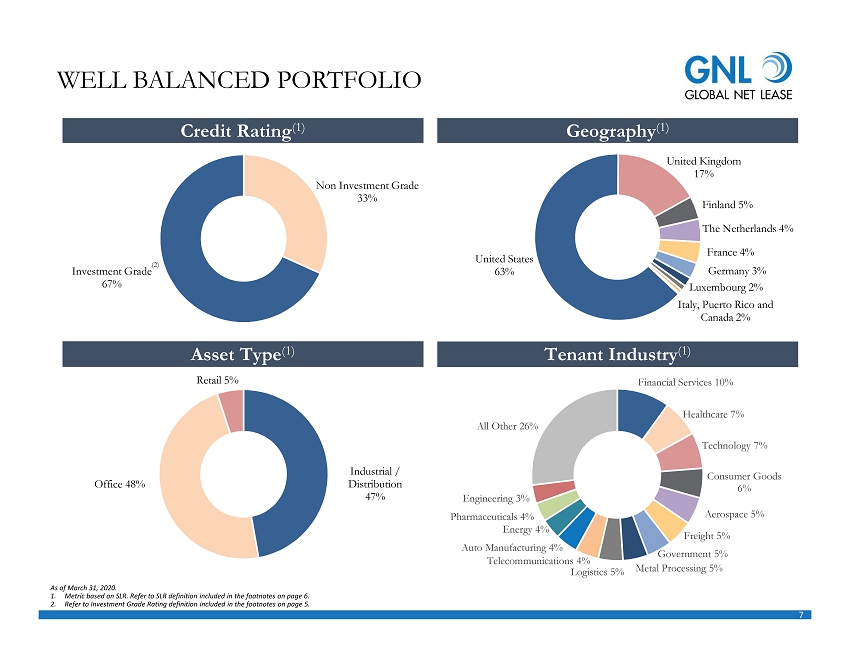
7 Non Investment Grade 33% Investment Grade 67% WELL BALANCED PORTFOLIO As of March 31, 2020. 1. Metric based on SLR . Refer to SLR definition included in the footnotes on page 6. 2. Refer to Investment Grade Rating definition included in the footnotes on page 5. Credit Rating (1) Tenant Industry (1) Geography (1) Asset Type (1) (2) United States 63% United … Finland 5% The Netherlands 4% France 4% Germany 3% Luxembourg 2% Italy , Puerto Rico and Canada 2% Industrial / Distribution 47% Office 48% Retail 5% Financial Services 10% Healthcare 7% Technology 7% Consumer Goods 6% Aerospace 5% Freight 5% Government 5% Metal Processing 5% Logistics 5% Telecommunications 4% Auto Manufacturing 4% Energy 4% Pharmaceuticals 4% Engineering 3% All Other 26%
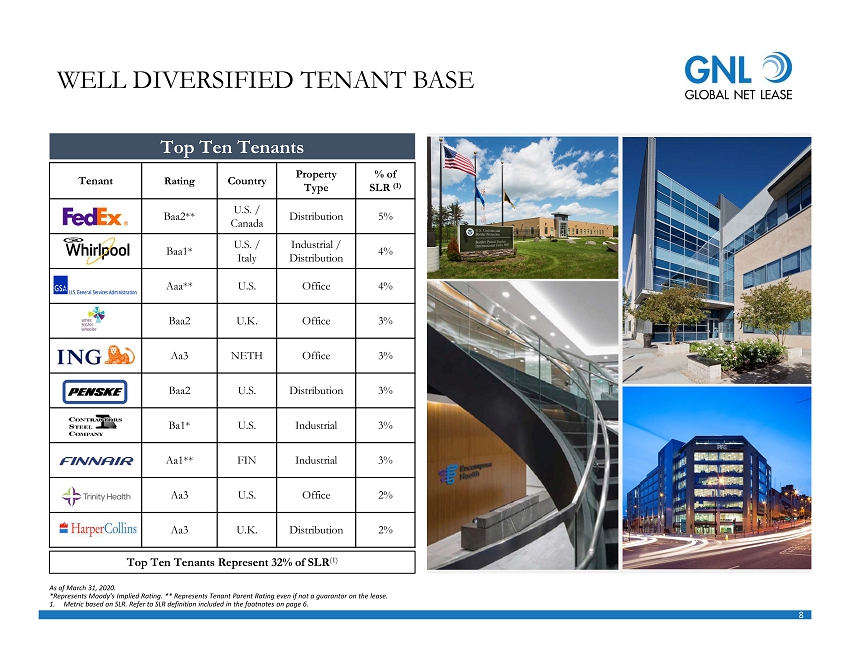
8 Tenant Rating Country Property Type % of SLR (1) Baa2** U.S. / Canada Distribution 5% Baa1* U.S. / Italy Industrial / Distribution 4% Aaa** U.S. Office 4% Baa2 U.K. Office 3% Aa3 NETH Office 3% Baa2 U.S. Distribution 3% Ba1* U.S. Industrial 3% Aa1** FIN Industrial 3% Aa3 U.S. Office 2% Aa3 U.K. Distribution 2% WELL DIVERSIFIED TENANT BASE Top Ten Tenants As of March 31, 2020. *Represents Moody’s Implied Rating. ** Represents Tenant Parent Rating even if not a guarantor on the lease. 1. Metric based on SLR. Refer to SLR definition included in the footnotes on page 6. Top Ten Tenants Represent 32% of SLR (1)
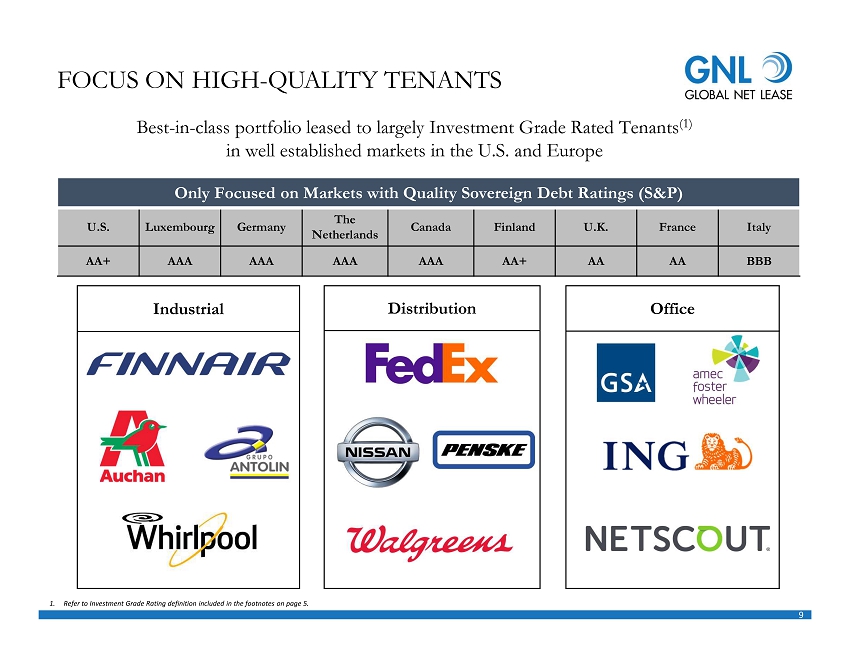
9 Office Distribution Industrial FOCUS ON HIGH - QUALITY TENANTS Only Focused on Markets with Quality Sovereign Debt Ratings (S&P) U.S. Luxembourg Germany The Netherlands Canada Finland U.K. France Italy AA+ AAA AAA AAA AAA AA+ AA AA BBB Best - in - class portfolio leased to largely Investment Grade Rated Tenants (1) in well established markets in the U.S. and Europe 1. Refer to Investment Grade Rating definition included in the footnotes on page 5.
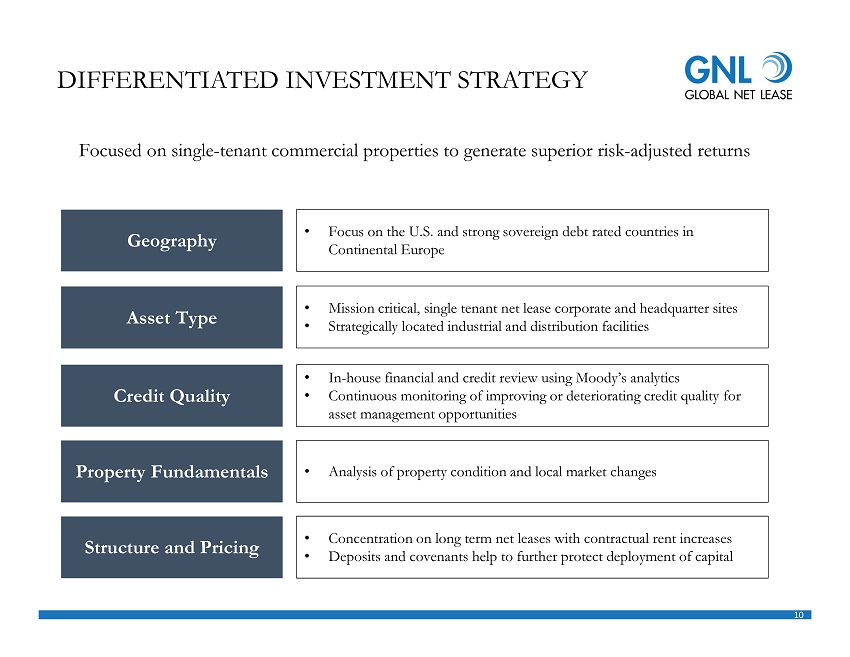
10 DIFFERENTIATED INVESTMENT STRATEGY Geography Asset Type Property Fundamentals Credit Quality Structure and Pricing Focused on single - tenant commercial properties to generate superior risk - adjusted returns • Focus on the U.S. and strong sovereign debt rated countries in Continental Europe • Mission critical, single tenant net lease corporate and headquarter sites • Strategically located industrial and distribution facilities • In - house financial and credit review using Moody’s analytics • Continuous monitoring of improving or deteriorating credit quality for asset management opportunities • Analysis of property condition and local market changes • Concentration on long term net leases with contractual rent increases • Deposits and covenants help to further protect deployment of capital
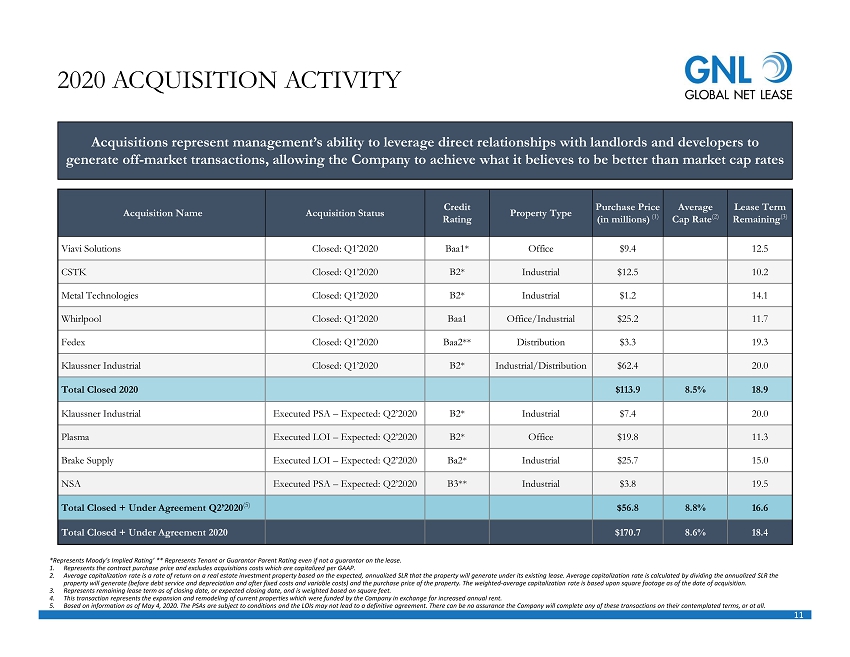
11 *Represents Moody’s Implied Rating’ ** Represents Tenant or Guarantor Parent Rating even if not a guarantor on the lease. 1. Represents the contract purchase price and excludes acquisitions costs which are capitalized per GAAP. 2. Average capitalization rate is a rate of return on a real estate investment property based on the expected, annualized SLR th at the property will generate under its existing lease. Average capitalization rate is calculated by dividing the annualized SLR th e property will generate (before debt service and depreciation and after fixed costs and variable costs) and the purchase price of the property. The weighted - average capitalization rate is based upon square footage as of the date of acquisition. 3. Represents remaining lease term as of closing date, or expected closing date, and is weighted based on square feet. 4. This transaction represents the expansion and remodeling of current properties which were funded by the Company in exchange f or increased annual rent. 5. Based on information as of May 4, 2020. The PSAs are subject to conditions and the LOIs may not lead to a definitive agreemen t. There can be no assurance the Company will complete any of these transactions on their contemplated terms, or at all. A cquisition Name A cquisition Status Credit Rating Property Type Purchase Price (in millions) (1) Average Cap Rate (2) Lease Term Remaining (3) Viavi Solutions Closed: Q1’2020 Baa1* Office $9.4 12.5 CSTK Closed: Q1’2020 B2* Industrial $12.5 10.2 Metal Technologies Closed: Q1’2020 B2* Industrial $1.2 14.1 Whirlpool Closed: Q1’2020 Baa1 Office/Industrial $25.2 11.7 Fedex Closed: Q1’2020 Baa2** Distribution $3.3 19.3 Klaussner Industrial Closed: Q1’2020 B2* Industrial/Distribution $62.4 20.0 Total Closed 2020 $113.9 8.5% 18.9 Klaussner Industrial Executed PSA – Expected: Q2’2020 B2* Industrial $7.4 20.0 Plasma Executed LOI – Expected: Q2’2020 B2* Office $19.8 11.3 Brake Supply Executed LOI – Expected: Q2’2020 Ba2* Industrial $25.7 15.0 NSA Executed PSA – Expected: Q2’2020 B3** Industrial $3.8 19.5 Total Closed + Under Agreement Q2’2020 (5) $56.8 8.8% 16.6 Total Closed + Under Agreement 2020 $170.7 8.6% 18.4 2020 ACQUISITION ACTIVITY Acquisitions represent management’s ability to leverage direct relationships with landlords and developers to generate off - market transactions, allowing the Company to achieve what it believes to be better than market cap rates

12 GEOGRAPHIC BALANCE (AS OF MARCH 31, 2020) 1. Refer to basis for metric calculation included in the footnotes on page 6. 2. Metric based on SLR. Refer to SLR definition included in the footnotes on page 6. U.S. and Canada Number of Assets: 223 Weighted - Average Remaining Lease Term: 9.5 years (1) % of GNL SLR: 64.6% (2) Europe Number of Assets: 65 Weighted - Average Remaining Lease Term: 7.7 years (1) % of GNL SLR: 35.4 % (2)
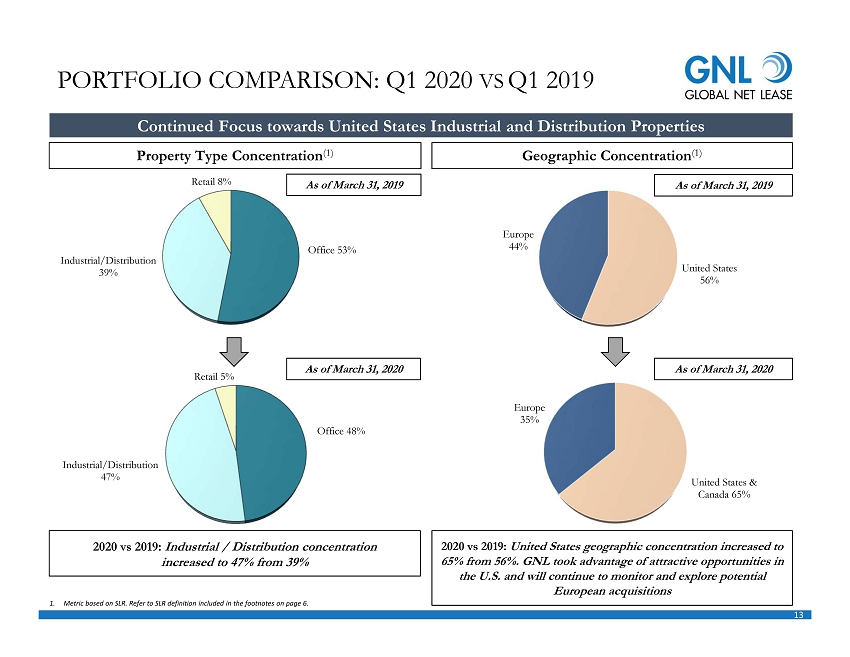
13 Office 48% Industrial/Distribution 47% Retail 5% PORTFOLIO COMPARISON: Q1 2020 VS Q1 2019 Continued Focus towards United States Industrial and Distribution Properties Office 53% Industrial/Distribution 39% Retail 8% United States 56% Europe 44% Property Type Concentration (1) Geographic Concentration (1) As of March 31, 2019 As of March 31, 2019 As of March 31, 2020 2020 vs 2019: Industrial / Distribution concentration increased to 47% from 39% United States & Canada 65% Europe 35% As of March 31, 2020 2020 vs 2019: United States geographic concentration increased to 65% from 56%. GNL took advantage of attractive opportunities in the U.S. and will continue to monitor and explore potential European acquisitions 1. Metric based on SLR. Refer to SLR definition included in the footnotes on page 6.
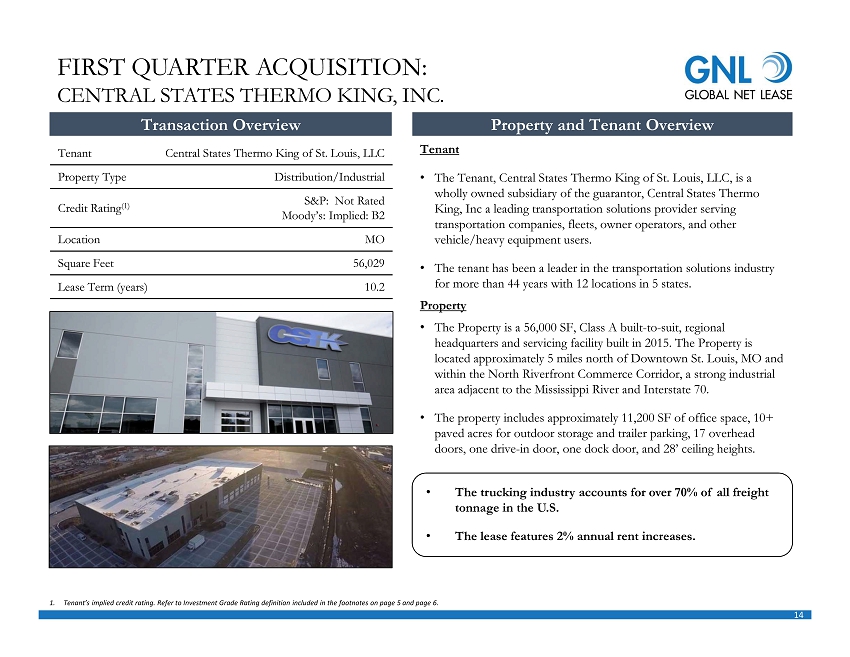
14 Transaction Overview FIRST QUARTER ACQUISITION: CENTRAL STATES THERMO KING, INC. Property and Tenant Overview Tenant Central States Thermo King of St. Louis, LLC Property Type Distribution/Industrial Credit Rating (1) S&P: Not Rated Moody’s: Implied: B2 Location MO Square Feet 56,029 Lease Term (years) 10.2 Tenant • The Tenant, Central States Thermo King of St. Louis, LLC, is a wholly owned subsidiary of the guarantor, Central States Thermo King, Inc a leading transportation solutions provider serving transportation companies, fleets, owner operators, and other vehicle/heavy equipment users. • The tenant has been a leader in the transportation solutions industry for more than 44 years with 12 locations in 5 states. Property • The Property is a 56,000 SF, Class A built - to - suit, regional headquarters and servicing facility built in 2015. The Property is located approximately 5 miles north of Downtown St. Louis, MO and within the North Riverfront Commerce Corridor, a strong industrial area adjacent to the Mississippi River and Interstate 70. • The property includes approximately 11,200 SF of office space, 10+ paved acres for outdoor storage and trailer parking, 17 overhead doors, one drive - in door, one dock door, and 28’ ceiling heights. • The trucking industry accounts for over 70% of all freight tonnage in the U.S. • The lease features 2% annual rent increases. 1. Tenant’s implied credit rating. Refer to Investment Grade Rating definition included in the footnotes on page 5 and page 6.
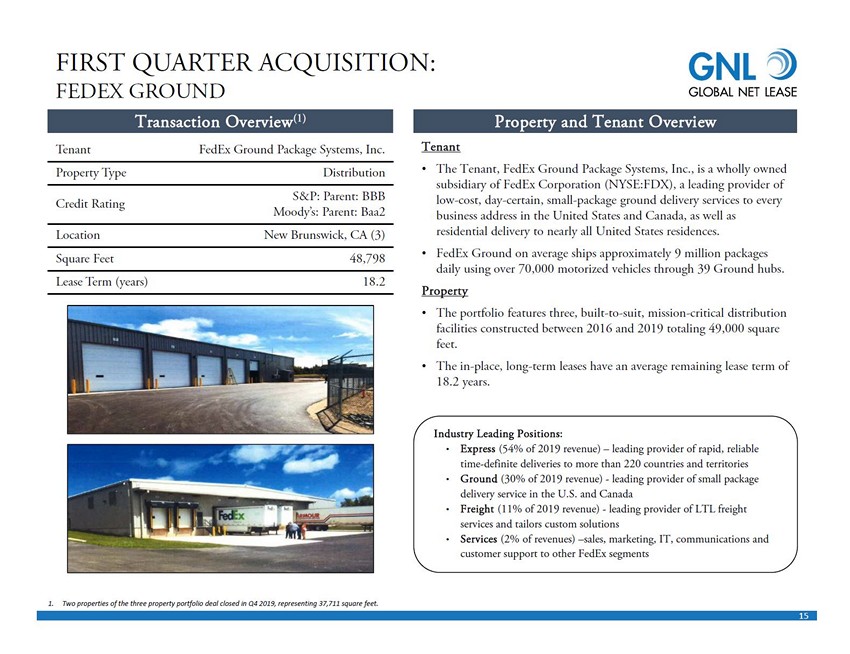
15 Transaction Overview (1) Tenant FedEx Ground Package Systems, Inc. Property Type Distribution Credit Rating S&P: Parent: BBB Moody’s: Parent: Baa2 Location New Brunswick, CA (3) Square Feet 48,798 Lease Term (years) 18.2 Tenant • The Tenant, FedEx Ground Package Systems, Inc., is a wholly owned subsidiary of FedEx Corporation (NYSE:FDX), a leading provider of low - cost, day - certain, small - package ground delivery services to every business address in the United States and Canada, as well as residential delivery to nearly all United States residences. • FedEx Ground on average ships approximately 9 million packages daily using over 70,000 motorized vehicles through 39 Ground hubs. Property • The portfolio features three, built - to - suit, mission - critical distribution facilities constructed between 2016 and 2019 totaling 49,000 square feet. • The in - place, long - term leases have an average remaining lease term of 18.2 years. FIRST QUARTER ACQUISITION: FEDEX GROUND Property and Tenant Overview Industry Leading Positions: • Express (54% of 2019 revenue) – leading provider of rapid, reliable time - definite deliveries to more than 220 countries and territories • Ground (30% of 2019 revenue) - leading provider of small package delivery service in the U.S. and Canada • Freight (11% of 2019 revenue) - leading provider of LTL freight services and tailors custom solutions • Services (2% of revenues) – sales, marketing, IT, communications and customer support to other FedEx segments 1. Two properties of the three property portfolio deal closed in Q4 2019, representing 37,711 square feet.
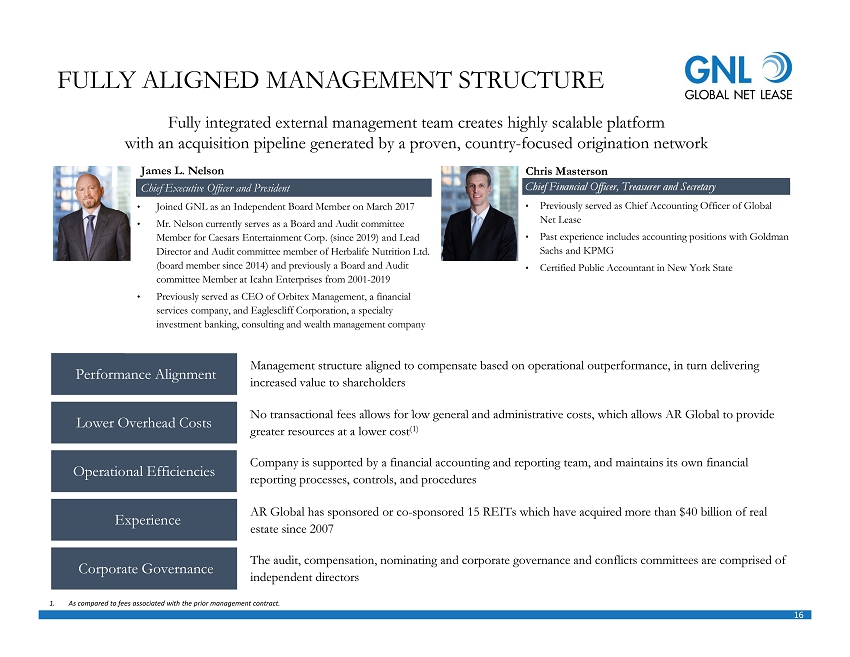
16 James L. Nelson Chris Masterson Chief Financial Officer, Treasurer and Secretary FULLY ALIGNED MANAGEMENT STRUCTURE No transactional fees allows for low general and administrative costs, which allows AR Global to provide greater resources at a lower cost (1) Lower Overhead Costs AR Global has sponsored or co - sponsored 15 REITs which have acquired more than $40 billion of real estate since 2007 Experience The audit, compensation, nominating and corporate governance and conflicts committees are comprised of independent directors Corporate Governance Performance Alignment Management structure aligned to compensate based on operational outperformance, in turn delivering increased value to shareholders Company is supported by a financial accounting and reporting team, and maintains its own financial reporting processes, controls, and procedures Operational Efficiencies • Previously served as Chief Accounting Officer of Global Net Lease • Past experience includes accounting positions with Goldman Sachs and KPMG • Certified Public Accountant in New York State 1. As compared to fees associated with the prior management contract. Fully integrated external management team creates highly scalable platform with an acquisition pipeline generated by a proven, country - focused origination network • Joined GNL as an Independent Board Member on March 2017 • Mr. Nelson currently serves as a Board and Audit committee Member for Caesars Entertainment Corp. (since 2019) and Lead Director and Audit committee member of Herbalife Nutrition Ltd. (board member since 2014) and previously a Board and Audit committee Member at Icahn Enterprises from 2001 - 2019 • Previously served as CEO of Orbitex Management, a financial services company, and Eaglescliff Corporation, a specialty investment banking, consulting and wealth management company Chief Executive Officer and President
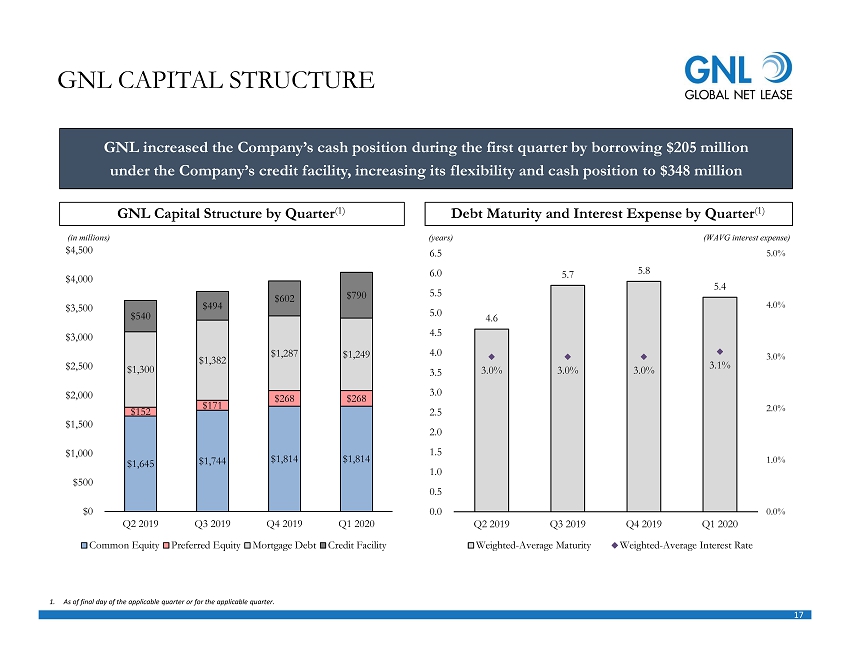
17 $1,645 $1,744 $1,814 $1,814 $152 $171 $268 $268 $1,300 $1,382 $1,287 $1,249 $540 $494 $602 $790 $0 $500 $1,000 $1,500 $2,000 $2,500 $3,000 $3,500 $4,000 $4,500 Q2 2019 Q3 2019 Q4 2019 Q1 2020 Common Equity Preferred Equity Mortgage Debt Credit Facility GNL CAPITAL STRUCTURE GNL increased the Company’s cash position during the first quarter by borrowing $205 million under the Company’s credit facility, increasing its flexibility and cash position to $348 million Debt Maturity and Interest Expense by Quarter (1) GNL Capital Structure by Quarter (1) (in millions) (years) (WAVG interest expense) 1. As of final day of the applicable quarter or for the applicable quarter . 4.6 5.7 5.8 5.4 3.0% 3.0% 3.0% 3.1% 0.0% 1.0% 2.0% 3.0% 4.0% 5.0% 0.0 0.5 1.0 1.5 2.0 2.5 3.0 3.5 4.0 4.5 5.0 5.5 6.0 6.5 Q2 2019 Q3 2019 Q4 2019 Q1 2020 Weighted-Average Maturity Weighted-Average Interest Rate
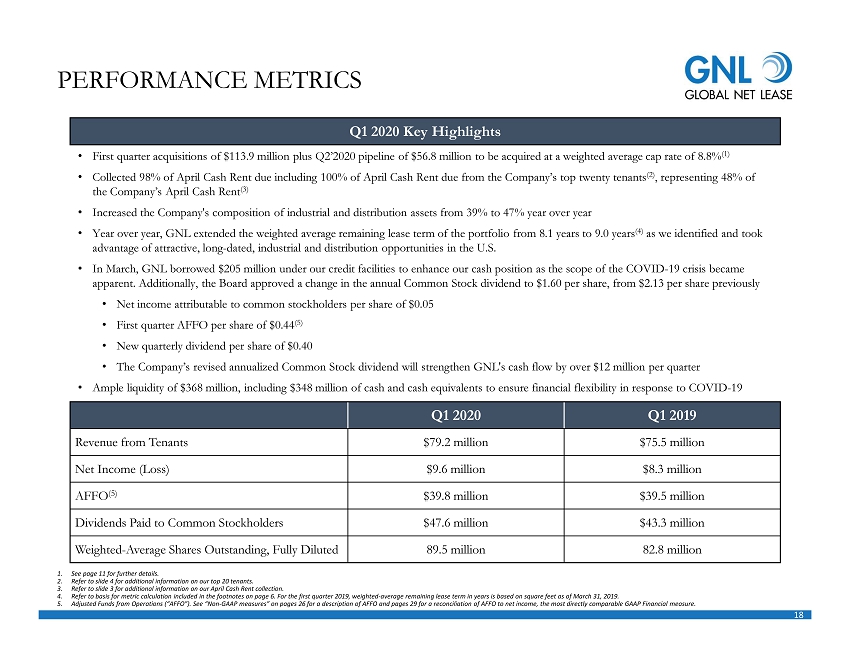
18 Q1 2020 Key Highlights • First quarter acquisitions of $113.9 million plus Q2’2020 pipeline of $56.8 million to be acquired at a weighted average cap rat e of 8.8% (1) • Collected 98% of April Cash Rent due including 100% of April Cash Rent due from the Company’s top twenty tenants (2) , representing 48% of the Company’s April Cash Rent (3) • Increased the Company's composition of industrial and distribution assets from 39% to 47% year over year • Year over year, GNL extended the weighted average remaining lease term of the portfolio from 8.1 years to 9.0 years (4) as we identified and took advantage of attractive, long - dated, industrial and distribution opportunities in the U.S. • In March, GNL borrowed $205 million under our credit facilities to enhance our cash position as the scope of the COVID - 19 crisis became apparent. Additionally, the Board approved a change in the annual Common Stock dividend to $1.60 per share, from $2.13 per sh are previously • Net income attributable to common stockholders per share of $0.05 • First quarter AFFO per share of $0.44 (5) • New quarterly dividend per share of $0.40 • The Company’s revised annualized Common Stock dividend will strengthen GNL's cash flow by over $12 million per quarter • Ample liquidity of $368 million, including $348 million of cash and cash equivalents to ensure financial flexibility in respo nse to COVID - 19 PERFORMANCE METRICS 1. See page 11 for further details. 2. Refer to slide 4 for additional information on our top 20 tenants. 3. Refer to slide 3 for additional information on our April Cash Rent collection. 4. Refer to basis for metric calculation included in the footnotes on page 6. For the first quarter 2019, weighted - average remainin g lease term in years is based on square feet as of March 31, 2019. 5. Adjusted Funds from Operations (“AFFO”). See “Non - GAAP measures” on pages 26 for a description of AFFO and pages 29 for a reconc iliation of AFFO to net income, the most directly comparable GAAP Financial measure. Q1 2020 Q1 2019 Revenue from Tenants $79.2 million $75.5 million Net Income (Loss) $9.6 million $8.3 million AFFO (5) $39.8 million $39.5 million Dividends Paid to Common Stockholders $47.6 million $43.3 million Weighted - Average Shares Outstanding, Fully Diluted 89.5 million 82.8 million
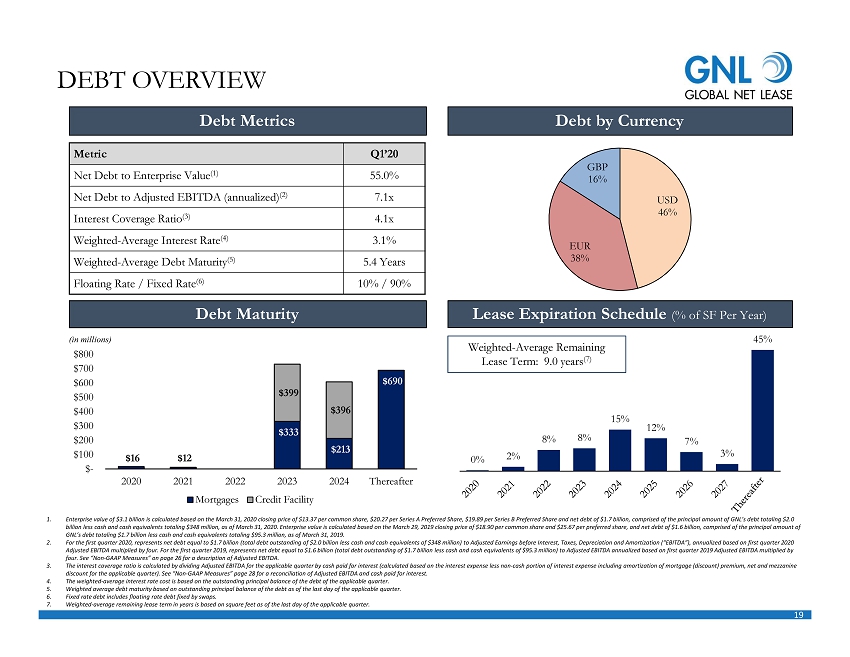
19 0% 2% 8% 8% 15% 12% 7% 3% 45% DEBT OVERVIEW Metric Q1’20 Net Debt to Enterprise Value (1) 55.0% Net Debt to Adjusted EBITDA (annualized) (2) 7.1x Interest Coverage Ratio (3) 4.1x Weighted - Average Interest Rate (4) 3.1% Weighted - Average Debt Maturity (5) 5.4 Years Floating Rate / Fixed Rate (6) 10% / 90% Debt Metrics Debt by Currency Debt Maturity 1. Enterprise value of $3.1 billion is calculated based on the March 31, 2020 closing price of $13.37 per common share, $20.27 p er Series A Preferred Share, $19.89 per Series B Preferred Share and net debt of $1.7 billion, comprised of the principal amount of GNL’s debt totaling $2.0 billion less cash and cash equivalents totaling $348 million, as of March 31, 2020. Enterprise value is calculated based on t he March 29, 2019 closing price of $18.90 per common share and $25.67 per preferred share, and net debt of $1.6 billion, compris ed of the principal amount of GNL’s debt totaling $1.7 billion less cash and cash equivalents totaling $95.3 million, as of March 31, 2019. 2. For the first quarter 2020, represents net debt equal to $1.7 billion (total debt outstanding of $2.0 billion less cash and c ash equivalents of $348 million) to Adjusted Earnings before Interest, Taxes, Depreciation and Amortization (“EBITDA”), annualize d based on first quarter 2020 Adjusted EBITDA multiplied by four. For the first quarter 2019, represents net debt equal to $1.6 billion (total debt outstan din g of $1.7 billion less cash and cash equivalents of $95.3 million) to Adjusted EBITDA annualized based on first quarter 2019 Adj usted EBITDA multiplied by four. See “Non - GAAP Measures” on page 26 for a description of Adjusted EBITDA. 3. The interest coverage ratio is calculated by dividing Adjusted EBITDA for the applicable quarter by cash paid for interest (c alc ulated based on the interest expense less non - cash portion of interest expense including amortization of mortgage (discount) pre mium, net and mezzanine discount for the applicable quarter). See “Non - GAAP Measures” page 28 for a reconciliation of Adjusted EBITDA and cash paid for interest. 4. The weighted - average interest rate cost is based on the outstanding principal balance of the debt of the applicable quarter. 5. Weighted average debt maturity based on outstanding principal balance of the debt as of the last day of the applicable quarte r. 6. Fixed rate debt includes floating rate debt fixed by swaps. 7. Weighted - average remaining lease term in years is based on square feet as of the last day of the applicable quarter. Weighted - Average Remaining Lease Term: 9.0 years (7) Lease Expiration Schedule (% of SF Per Year) (in millions) $16 $12 $333 $213 $690 $399 $396 $- $200 $400 $600 $800 2020 2021 2022 2023 2024 Thereafter Mortgages Credit Facility USD 46% EUR 38% GBP 16%
20 COMPREHENSIVE HEDGING PROGRAM Hedging Foreign Currency Exchange Risk • Provides protection against unfavorable movements in EUR and GBP versus the U.S. Dollar associated with the Company’s foreign property operations Interest Rate Swaps: Fixing Interest on Floating Rate Debt • Cost effective tools that mitigate against adverse fluctuations in interest rates; effectively acting to convert variable rate debt into fixed rate debt resulting in reduced exposure to variability in cash flows related to interest payments GNL continues to employ a comprehensive hedging program, with a number of components designed to limit the impact of currency and interest rate movements to its European portfolio

21 The statements in this presentation that are not historical facts may be forward - looking statements . These forward - looking statements involve risks and uncertainties that could cause actual results or events to be materially different . In addition, words such as “may,” “will,” “seeks,” “anticipates,” “believes,” “estimates,” “expects,” “plans,” “intends,” “would,” or similar expressions indicate a forward - looking statement, although not all forward - looking statements contain these identifying words . Any statements referring to the future value of an investment in GNL, as well as the success that GNL may have in executing its business plan, are also forward - looking statements . There are a number of risks, uncertainties and other important factors that could cause GNL’s actual results to differ materially from those contemplated by such forward - looking statements, including those risks, uncertainties and other important factors set forth in the “Risk Factors” and “Management’s Discussion and Analysis of Financial Condition and Results of Operations” sections of GNL’s Annual Report on Form 10 - K for the year ended December 31 , 2019 filed with the SEC on February 28 , 2020 , and all other filings with the SEC after that date, as such risks, uncertainties and other important factors may be updated from time to time in GNL’s subsequent reports . Further, forward looking statements speak only as of the date they are made, and GNL undertakes no obligation to update or revise forward - looking statements to reflect changed assumptions, the occurrence of unanticipated events or changes to future operating results over time, except as required by law . This presentation contains certain statements that are the Company’s and Management’s hopes, intentions, beliefs, expectations, or projections of the future and might be considered to be forward - looking statements under Federal Securities laws . Prospective investors are cautioned that any such forward - looking statements are not guarantees of future performance, and involve risks and uncertainties . The company’s actual future results may differ significantly from the matters discussed in these forward - looking statements, and we may not release revisions to these forward - looking statements to reflect changes after we’ve made the statements . The Company currently anticipates that the majority of the concessions granted to its tenants as a result of the COVID - 19 pandemic will be rent deferrals with the original lease term unchanged and collection of deferred rent deemed probable . The Company’s revenue recognition policy requires that it must be probable that the Company will collect virtually all of the lease payments due and does not provide for partial reserves, or the ability to assume partial recovery . In light of the COVID - 19 pandemic, the FASB and SEC agreed that for leases where the total lease cash flows will remain substantially the same or less than those after the COVID - 19 related effects, companies may choose to forgo the evaluation of the enforceable rights and obligations of the original lease contract as a practical expedient and account for rent concessions as if they were part of the enforceable rights and obligations of the parties under the existing lease contract . As a result, we do not expect rental revenue used to calculate Net Income and NAREIT FFO to be significantly impacted by deferrals . In addition, since we currently believe that these amounts are collectible, we would not plan to adjust from AFFO the amounts recognized under GAAP relating to rent deferrals . FORWARD LOOKING STATEMENTS
22 RISK FACTORS The following are some of the risks and uncertainties, although not all risks and uncertainties, that could cause our actual results to differ materially from those presented in our forward - looking statements . • All of our executive officers are also officers, managers, employees or holders of a direct or indirect controlling interest in the Advisor and other entities affiliated with AR Global Investments, LLC ("AR Global") . As a result, our executive officers, the Advisor and its affiliates face conflicts of interest, including significant conflicts created by the Advisor's compensation arrangements with us and other investment programs advised by AR Global affiliates and conflicts in allocating time among these investment programs and us . These conflicts could result in unanticipated actions . Because investment opportunities that are suitable for us may also be suitable for other investment programs advised by affiliates of AR Global, the Advisor and its affiliates face conflicts of interest relating to the purchase of properties and other investments and these conflicts may not be resolved in our favor . • We are obligated to pay fees which may be substantial to the Advisor and its affiliates . • We depend on tenants for our rental revenue and, accordingly, our rental revenue is dependent upon the success and economic viability of our tenants . • Increases in interest rates could increase the amount of our debt payments . • Adverse changes in exchange rates may reduce the net income and cash flow associated with our properties located outside of the United States ("U . S . ") . • The Advisor may not be able to identify a sufficient number of property acquisitions satisfying our investment objectives on a timely basis and on acceptable terms and prices, or at all . • We may be unable to continue to raise additional debt or equity financing on attractive terms, or at all, and there can be no assurance we will be able to fund future acquisitions . • We may be unable to repay, refinance, restructure or extend our indebtedness as it becomes due . • Provisions in our credit facility may limit our ability to pay dividends on our common stock, $ 0 . 01 par value per share (“Common Stock”), our 7 . 25 % Series A Cumulative Redeemable Preferred Stock, $ 0 . 01 par value per share (“Series A Preferred Stock”), our 6 . 875 % Series B Cumulative Redeemable Perpetual Preferred Stock, $ 0 . 01 par value per share (“Series B Preferred Stock”), or any other stock we may issue .
23 RISK FACTORS (CONTINUED) • If we are not able to increase the amount of cash we have available to pay dividends, including through additional cash flows we expect to generate from completing acquisitions, we may have to reduce dividend payments or identify other financing sources to fund the payment of dividends at their current levels . • There can be no assurance we will complete acquisitions on a timely basis or on acceptable terms and conditions, if at all . • We may be unable to pay or maintain cash dividends or increase dividends over time . • We may not generate cash flows sufficient to pay dividends to our stockholders or fund operations, and, as such, we may be forced to borrow at unfavorable rates to pay dividends to our stockholders or fund our operations . • Any dividends that we pay on our Common Stock, our Series A Preferred Stock, our Series B Preferred Stock, or any other stock we may issue may exceed cash flows from operations, reducing the amount of capital available to invest in properties . • We are subject to risks associated with our international investments, including risks associated with compliance with and changes in foreign laws, fluctuations in foreign currency exchange rates and inflation . • We are subject to risks associated with a pandemic, epidemic or outbreak of a contagious disease, such as the ongoing global COVID - 19 pandemic . • We are subject to risks associated with any dislocations or liquidity disruptions that may exist or occur in the credit markets of the U . S . , Canada and Europe from time to time, including disruptions and dislocations caused by the ongoing COVID - 19 pandemic . • We may fail to continue to qualify, as a real estate investment trust for U . S . federal income tax purposes ("REIT"), which would result in higher taxes, may adversely affect operations and would reduce the trading price of our Common Stock, Series A Preferred Stock, and Series B Preferred Stock, and our cash available for dividends or other distributions . • We may be exposed to risks due to a lack of tenant diversity, investment types and geographic diversity . • We are exposed to changes in general economic, business and political conditions, including the possibility of intensified international hostilities, acts of terrorism, and changes in conditions of U . S . or international lending, capital and financing markets, including as a result of the U . K . 's withdrawal from the European Union or any other events that create, or give the impression they could create, economic or political instability in Europe, which may cause the revenue derived from, and the market value of, properties located in the United Kingdom and continental Europe to decline .
24 PROJECTIONS • This presentation includes estimated projections of future operating results . These projections were not prepared in accordance with published guidelines of the SEC or the guidelines established by the American Institute of Certified Public Accountants for preparation and presentation of financial projections . This information is not fact and should not be relied upon as being necessarily indicative of future results ; the projections were prepared in good faith by management and are based on numerous assumptions that may prove to be wrong . Important factors that may affect actual results and cause the projections to not be achieved include, but are not limited to, risks and uncertainties relating to the company and other factors described in the “Risk Factors” and “Management’s Discussion and Analysis of Financial Condition and Results of Operations” sections of GNL’s Annual Report on Form 10 - K for the year ended December 31 , 2019 filed with the SEC on February 28 , 2020 , and subsequent Quarterly Reports on Form 10 - Q filed with the SEC . The projections also reflect assumptions as to certain business decisions that are subject to change . As a result, actual results may differ materially from those contained in the estimates . Accordingly, there can be no assurance that the estimates will be realized . • This presentation also contains estimates and information concerning our industry and tenants, including market position, market size, and growth rates of the markets in which we participate, that are based on industry publications and other third - party reports . This information involves a number of assumptions and limitations, and you are cautioned not to give undue weight to these estimates . We have not independently verified the accuracy or completeness of the data contained in these publications and reports . The industry in which we operate is subject to a high degree of uncertainty and risk due to variety of factors, including those described in the “Risk Factors” and “Management’s Discussion and Analysis of Financial Condition and Results of Operations” sections of GNL’s Annual Report on Form 10 - K for the year ended December 31 , 2019 filed with the SEC on February 28 , 2020 , and subsequent Quarterly Reports on Form 10 - Q filed with the SEC . These and other factors could cause results to differ materially from those expressed in these publications and reports .
25 DEFINITIONS • Due to certain unique operating characteristics of real estate companies, as discussed below, the National Association of Real Estate Investment Trusts ("NAREIT"), an industry trade group, has promulgated a measure known as funds from operations ("FFO"), which we believe to be an appropriate supplemental measure to reflect the operating performance of a REIT . FFO is not equivalent to net income or loss as determined under accounting principles generally accepted in the United States ("GAAP") . • We calculate FFO, a non - GAAP measure, consistent with the standards established over time by the Board of Governors of NAREIT, as restated in a White Paper approved by the Board of Governors of NAREIT effective in December 2018 (the "White Paper") . The White Paper defines FFO as net income or loss computed in accordance with GAAP, excluding depreciation and amortization related to real estate, gain and loss from the sale of certain real estate assets, gain and loss from change in control and impairment write - downs of certain real estate assets and investments in entities when the impairment is directly attributable to decreases in the value of depreciable real estate held by the entity . Our FFO calculation complies with NAREIT's definition . • The historical accounting convention used for real estate assets requires straight - line depreciation of buildings and improvements, and straight - line amortization of intangibles, which implies that the value of a real estate asset diminishes predictably over time . We believe that, because real estate values historically rise and fall with market conditions, including inflation, interest rates, unemployment and consumer spending, presentations of operating results for a REIT using historical accounting for depreciation and certain other items may be less informative . Historical accounting for real estate involves the use of GAAP . Any other method of accounting for real estate such as the fair value method cannot be construed to be any more accurate or relevant than the comparable methodologies of real estate valuation found in GAAP . Nevertheless, we believe that the use of FFO, which excludes the impact of real estate related depreciation and amortization, among other things, provides a more complete understanding of our performance to investors and to management, and, when compared year over year, reflects the impact on our operations from trends in occupancy rates, rental rates, operating costs, general and administrative expenses, and interest costs, which may not be immediately apparent from net income . However, FFO, core funds from operations ("Core FFO") and adjusted funds from operations (“AFFO”), as described below, should not be construed to be more relevant or accurate than the current GAAP methodology in calculating net income or in its applicability in evaluating our operating performance . The method utilized to evaluate the value and performance of real estate under GAAP should be construed as a more relevant measure of operational performance and considered more prominently than the non - GAAP FFO, Core FFO and AFFO measures and the adjustments to GAAP in calculating FFO, Core FFO and AFFO . Other REITs may not define FFO in accordance with the current NAREIT definition (as we do) or may interpret the current NAREIT definition differently than we do or calculate Core FFO or AFFO differently than we do . Consequently, our presentation of FFO, Core FFO and AFFO may not be comparable to other similarly titled measures presented by other REITs . Adjustments for unconsolidated partnerships and joint ventures are calculated to reflect the proportionate share of adjustments for non - controlling interest to arrive at FFO, Core FFO and AFFO, as applicable . • We consider FFO, Core FFO and AFFO useful indicators of our performance . Because FFO calculations exclude such factors as depreciation and amortization of real estate assets and gain or loss from sales of operating real estate assets (which can vary among owners of identical assets in similar conditions based on historical cost accounting and useful - life estimates), FFO facilitates comparisons of operating performance between periods and between other REITs .

26 DEFINITIONS (CONTINUED) • In calculating Core FFO, we start with FFO, then we exclude certain non - core items such as acquisition, transaction and other costs, as well as certain other costs that are considered to be non - core, such as debt extinguishment costs, fire loss and other costs related to damages at our properties . The purchase of properties, and the corresponding expenses associated with that process, is a key operational feature of our core business plan to generate operational income and cash flows in order to make dividend payments to stockholders . In evaluating investments in real estate, we differentiate the costs to acquire the investment from the subsequent operations of the investment . We also add back non - cash write - offs of deferred financing costs and prepayment penalties incurred with the early extinguishment of debt which are included in net income but are considered financing cash flows when paid in the statement of cash flows . We consider these write - offs and prepayment penalties to be capital transactions and not indicative of operations . By excluding expensed acquisition, transaction and other costs as well as non - core costs, we believe Core FFO provides useful supplemental information that is comparable for each type of real estate investment and is consistent with management's analysis of the investing and operating performance of our properties . • In calculating AFFO, we start with Core FFO, then we exclude certain income or expense items from AFFO that we consider more reflective of investing activities, other non - cash income and expense items and the income and expense effects of other activities that are not a fundamental attribute of our business plan . These items include early extinguishment of debt and other items excluded in Core FFO as well as unrealized gain and loss, which may not ultimately be realized, such as gain or loss on derivative instruments, gain or loss on foreign currency transactions, and gain or loss on investments . In addition, by excluding non - cash income and expense items such as amortization of above - market and below - market leases intangibles, amortization of deferred financing costs, straight - line rent and equity - based compensation from AFFO, we believe we provide useful information regarding income and expense items which have a direct impact on our ongoing operating performance . We also include the realized gain or loss on foreign currency exchange contracts for AFFO as such items are part of our ongoing operations and affect the current operating performance of the Company . By providing AFFO, we believe we are presenting useful information that can be used to better assess the sustainability of our ongoing operating performance without the impact of transactions or other items that are not related to the ongoing performance of our portfolio of properties . AFFO presented by us may not be comparable to AFFO reported by other REITs that define AFFO differently . • In calculating AFFO, we exclude certain expenses, which under GAAP are characterized as operating expenses in determining operating net income . All paid and accrued merger, acquisition, transaction and other costs (including prepayment penalties for debt extinguishments) and certain other expenses negatively impact our operating performance during the period in which expenses are incurred or properties are acquired will also have negative effects on returns to investors, but are not reflective of our on - going performance . Further, under GAAP, certain contemplated non - cash fair value and other non - cash adjustments are considered operating non - cash adjustments to net income . In addition, as discussed above, we view gain and loss from fair value adjustments as items which are unrealized and may not ultimately be realized and not reflective of ongoing operations and are therefore typically adjusted for when assessing operating performance .

27 DEFINITIONS (CONTINUED) • Excluding income and expense items detailed above from our calculation of AFFO provides information consistent with management's analysis of the operating performance of the Company . Additionally, fair value adjustments, which are based on the impact of current market fluctuations and underlying assessments of general market conditions, but can also result from operational factors such as rental and occupancy rates, may not be directly related or attributable to our current operating performance . By excluding such changes that may reflect anticipated and unrealized gain or loss, we believe AFFO provides useful supplemental information . • As a result, we believe that the use of FFO, Core FFO and AFFO, together with the required GAAP presentations, provide a more complete understanding of our performance including relative to our peers and a more informed and appropriate basis on which to make decisions involving operating, financing, and investing activities . • We believe that earnings before interest, taxes, depreciation and amortization (“EBITDA”) adjusted for acquisition, transaction and other costs, other non - cash items and including our pro - rata share from unconsolidated joint ventures ("Adjusted EBITDA") is an appropriate measure of our ability to incur and service debt . Adjusted EBITDA should not be considered as an alternative to cash flows from operating activities, as a measure of our liquidity or as an alternative to net income as an indicator of our operating activities . Other REITs may calculate Adjusted EBITDA differently and our calculation should not be compared to that of other REITs . • NOI is a non - GAAP financial measure equal to net income (loss), the most directly comparable GAAP financial measure, less discontinued operations, interest, other income and income from preferred equity investments and investment securities, plus corporate general and administrative expense, acquisition, transaction and other costs, depreciation and amortization, other non - cash expenses and interest expense . We use NOI internally as a performance measure and believe NOI provides useful information to investors regarding our financial condition and results of operations because it reflects only those income and expense items that are incurred at the property level . Therefore, we believe NOI is a useful measure for evaluating the operating performance of our real estate assets and to make decisions about resource allocations . Further, we believe NOI is useful to investors as a performance measure because, when compared across periods, NOI reflects the impact on operations from trends in occupancy rates, rental rates, operating costs and acquisition activity on an unlevered basis, providing perspective not immediately apparent from net income . NOI excludes certain components from net income in order to provide results that are more closely related to a property's results of operations . For example, interest expense is not necessarily linked to the operating performance of a real estate asset and is often incurred at the corporate level as opposed to the property level . In addition, depreciation and amortization, because of historical cost accounting and useful life estimates, may distort operating performance at the property level . NOI presented by us may not be comparable to NOI reported by other REITs that define NOI differently . We believe that in order to facilitate a clear understanding of our operating results, NOI should be examined in conjunction with net income (loss) as presented in our consolidated financial statements . NOI should not be considered as an alternative to net income (loss) as an indication of our performance or to cash flows as a measure of our liquidity . • Cash NOI, is a non - GAAP financial measure that is intended to reflect the performance of our properties . We define Cash NOI as net operating income (which is separately defined herein) excluding amortization of above/below market lease intangibles and straight - line adjustments that are included in GAAP lease revenues . We believe that Cash NOI is a helpful measure that both investors and management can use to evaluate the current financial performance of our properties and it allows for comparison of our operating performance between periods and to other REITs . Cash NOI should not be considered as an alternative to net income, as an indication of our financial performance, or to cash flows as a measure of liquidity or our ability to fund all needs . The method by which we calculate and present Cash NOI may not be directly comparable to the way other REITs present Cash NOI .
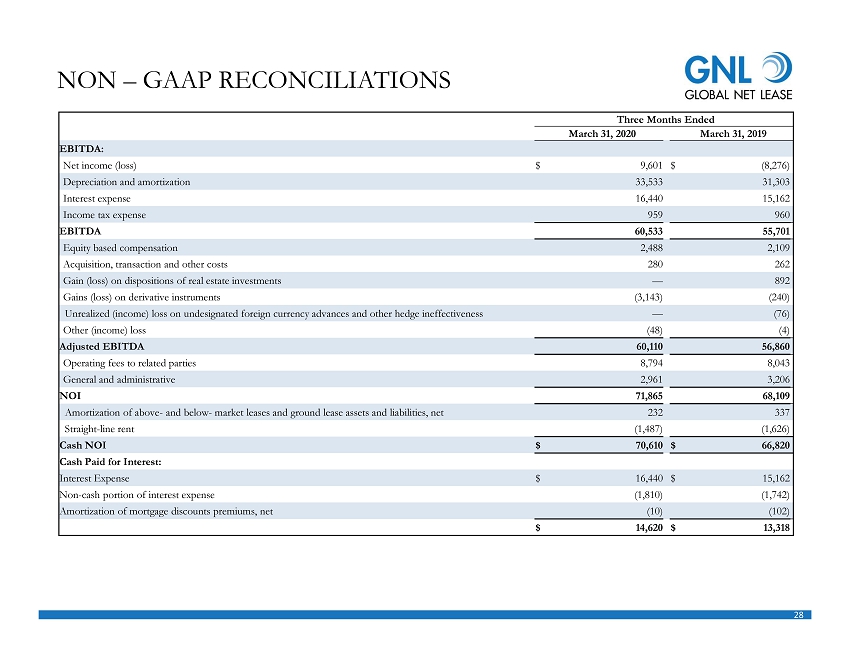
28 NON – GAAP RECONCILIATIONS Three Months Ended March 31, 2020 March 31, 2019 EBITDA: Net income (loss) $ 9,601 $ (8,276) Depreciation and amortization 33,533 31,303 Interest expense 16,440 15,162 Income tax expense 959 960 EBITDA 60,533 55,701 Equity based compensation 2,488 2,109 Acquisition, transaction and other costs 280 262 Gain (loss) on dispositions of real estate investments — 892 Gains (loss) on derivative instruments (3,143) (240) Unrealized (income) loss on undesignated foreign currency advances and other hedge ineffectiveness — (76) Other (income) loss (48) (4) Adjusted EBITDA 60,110 56,860 Operating fees to related parties 8,794 8,043 General and administrative 2,961 3,206 NOI 71,865 68,109 Amortization of above - and below - market leases and ground lease assets and liabilities, net 232 337 Straight - line rent (1,487) (1,626) Cash NOI $ 70,610 $ 66,820 Cash Paid for Interest: Interest Expense $ 16,440 $ 15,162 Non - cash portion of interest expense (1,810) (1,742) Amortization of mortgage discounts premiums, net (10) (102) $ 14,620 $ 13,318
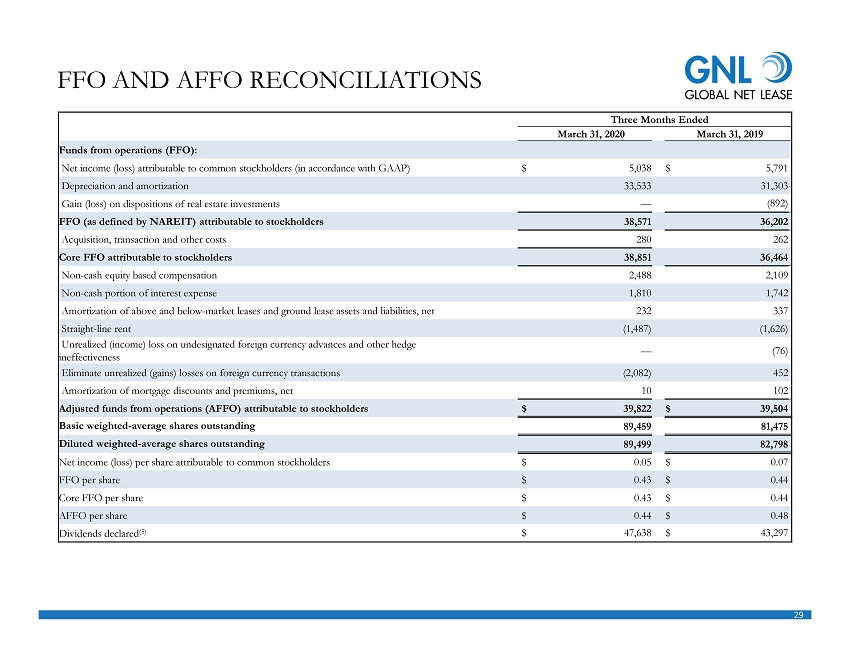
29 FFO AND AFFO RECONCILIATIONS Three Months Ended March 31, 2020 March 31, 2019 Funds from operations (FFO): Net income (loss) attributable to common stockholders (in accordance with GAAP) $ 5,038 $ 5,791 Depreciation and amortization 33,533 31,303 Gain (loss) on dispositions of real estate investments — (892) FFO (as defined by NAREIT) attributable to stockholders 38,571 36,202 Acquisition, transaction and other costs 280 262 Core FFO attributable to stockholders 38,851 36,464 Non - cash equity based compensation 2,488 2,109 Non - cash portion of interest expense 1,810 1,742 Amortization of above and below - market leases and ground lease assets and liabilities, net 232 337 Straight - line rent (1,487) (1,626) Unrealized (income) loss on undesignated foreign currency advances and other hedge ineffectiveness — (76) Eliminate unrealized (gains) losses on foreign currency transactions (2,082) 452 Amortization of mortgage discounts and premiums, net 10 102 Adjusted funds from operations (AFFO) attributable to stockholders $ 39,822 $ 39,504 Basic weighted - average shares outstanding 89,459 81,475 Diluted weighted - average shares outstanding 89,499 82,798 Net income (loss) per share attributable to common stockholders $ 0.05 $ 0.07 FFO per share $ 0.43 $ 0.44 Core FFO per share $ 0.43 $ 0.44 AFFO per share $ 0.44 $ 0.48 Dividends declared (5) $ 47,638 $ 43,297

INVESTOR INQUIRIES 1 - 866 - 902 - 0063 investorrelations@globalnetlease.com www.GlobalNetLease.com