united states
securities and exchange commission
washington, d.c. 20549
form n-csr
certified shareholder report of registered management
investment companies
Investment Company Act file number 811-22638
Arrow Investments Trust
(Exact name of registrant as specified in charter)
6100 Chevy Chase Drive Suite 100 , Laurel MD 20707
(Address of principal executive offices) (Zip code)
Corporation Service Company
251 Little Falls Drive
Wilmington, Delaware 19808
(Name and address of agent for service)
Registrant's telephone number, including area code: 631-470-2619
Date of fiscal year end: 7/31
Date of reporting period: 7/31/20
Item 1. Reports to Stockholders.
| |
 |
| |
| |
| |
| |
| |
| |
| Arrow DWA Balanced Fund |
| Arrow DWA Tactical Fund |
| Arrow Dynamic Income Fund |
| Arrow Managed Futures Strategy Fund |
| |
| |
| |
| |
| |
| |
| Annual Report |
| July 31, 2020 |
| |
| |
| |
| |
| |
| |
| 1-877-277-6933 |
| |
| Distributed by Archer Distributors, LLC |
| Member FINRA |
Beginning on January 1, 2021, as permitted by regulations adopted by the Securities and Exchange Commission, paper copies of the Funds’ shareholder reports like this one will no longer be sent by mail, unless you specifically request paper copies of the reports. Instead, the reports will be made available on the Funds’ website www.ArrowFunds.com, and you will be notified by mail each time a report is posted and provided with a website link to access the report.
If you already elected to receive shareholder reports electronically, you will not be affected by this change and you need not take any action. You may elect to receive shareholder reports and other communications from the Funds electronically by contacting your financial intermediary (such as a broker-dealer or bank) or, if you are a direct investor, by following the instructions included with paper Funds documents that have been mailed to you.
Dear Shareholder,
We are pleased to provide the annual report for the Arrow DWA Balanced Fund, Arrow DWA Tactical Fund, Arrow Dynamic Income Fund and Arrow Managed Futures Strategy Fund (each “a Fund” and collectively the “Funds”) for the one-year period ended July 31, 2020. During the past year, we have continued our ongoing client education efforts regarding the potential benefits of combining tactical asset allocation with alternative assets. All of the Funds continue to support this philosophy.
This reporting period for the Funds will be long remembered as the period the novel coronavirus/COVID-19 emerged and changed the face of the global economy in dramatic fashion. From July 31, 2019 through February 15, 2020 the equity and fixed income markets were performing rather well with the S&P 500 Index (“S&P 500”) up 14.68% and the Bloomberg Barclays US Aggregate Bond Index (“Bloomberg Agg Bond”) up 4.15% and the VIX Index living between the 12 and 18 index level range. This despite international trade tensions with China and the U.K.’s difficult exit from the European Union. The longest bull market in history had its challenges but was forging ahead as the start of 2020 saw an initial trade agreement between China and the U.S. as well as the U.S.-Mexico-Canada Agreement. 2020 began on a promising note. However, as the coronavirus pandemic became more pronounced, the S&P 500 dropped over 33% from February 14 to March 23, 2020 and the VIX Index spiked from 17 to an index level of over 80. On March 11, 2020, the World Health Organization acknowledged that the disease had reached pandemic proportions. In response, governments and central banks pledged trillions of dollars to address the mounting economic fallout of “stay-at-home” orders and other restrictions on non-essential activity. In the United States, the Federal Reserve cut interest rates to near zero and announced unlimited quantitative easing. In late March, the U.S. government declared a national emergency as unemployment claims increased by 22 million in a four-week period. The unemployment rate began the year at a very respectable 3.5% but by April 2020 it was 14.7%. To put that in perspective, you’d have to go back to the Dust Bowl / Great Depression Era of the early 1930’s to find U.S. unemployment at higher levels. This was the highest unemployment rate in the U.S. since the end of World War II. President Trump signed the CARES Act that provided a $2 trillion stimulus package with the promise of further aid to consumers and businesses. Investors responded favorably to these fiscal and monetary measures and the equity markets have gone on to recover significantly; by July 31, 2020, the S&P 500 was almost back at its pre-COVID highs. The uncertainty in the wake of the coronavirus pandemic caused wide disparity in performance across asset classes and investment strategies during this period and may well continue to do so for some time to come.
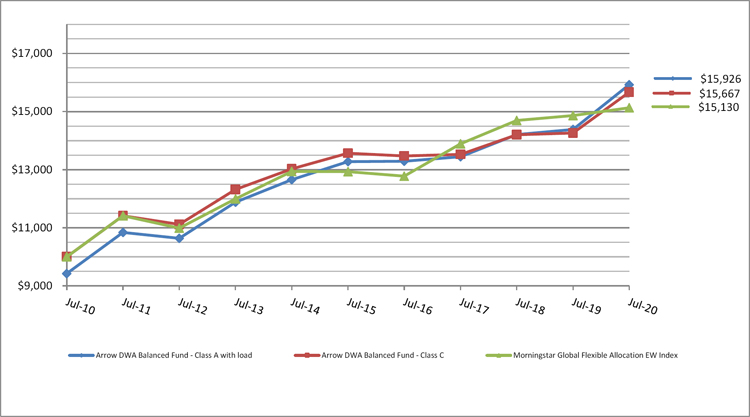
Arrow DWA Balanced Fund allows investors to gain exposure to sophisticated asset allocation strategies similar to those used by institutions and endowments. The Fund stays responsive to market conditions through a relative strength-based allocation process across a diverse array of market segments primarily through a combination of exchange traded products (“ETP”) and individual equities based on the DWA Balanced investment model. The Fund also provides exposure to managed futures using derivatives, such as swap agreements, with an additional expense that will reduce the overall performance. The Fund may also use derivatives and futures to gain exposure to some markets, such as commodities and currencies. This is done when trading efficiency and cost benefits to the Fund would have the potential for a net positive impact on overall performance by reducing acquired fund fees from holding an ETP. As conditions change, the tactical nature of the Fund allows it to seek new market leadership. The Fund’s net assets were more than $50 million at the end of July 2020. Since the Fund’s inception in August 2006 through the end of July 2020, the Fund’s annualized performance was 4.81% (Class A, without load), while the S&P 500 returned 9.23%, the Morningstar Global Flexible Allocation Equal Weight Index returned 3.51% and the Bloomberg Agg Bond returned 4.76% over the same time period. The Fund (Class A, without load) was up 10.72% for the one-year period through July 2020, lagging the S&P 500’s 11.96% return over the same period and outperformed the Morningstar Global Flexible Equal Weight
benchmark’s performance of 1.81%. Over the same one-year period, bonds were up 10.12%, as measured by the Bloomberg Agg Bond. The DWA Balanced Fund performed admirably well during the period with strong contributions to performance from its fixed income and alternative rotation strategies.
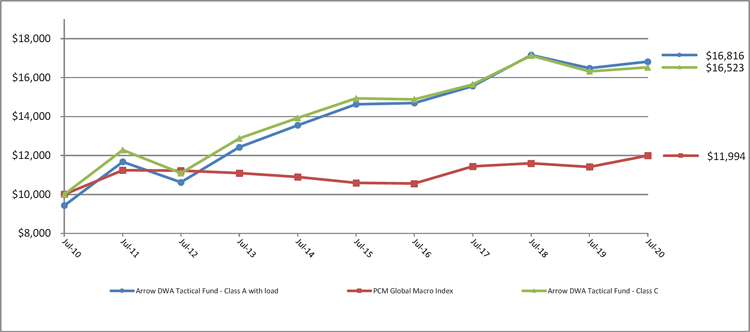
Arrow DWA Tactical Fund stays responsive to market conditions through a relative strength-based allocation process across a concentrated portfolio primarily consisting of exchange traded products based on the DWA Global Macro investment model. The Fund may also use derivatives and futures to gain exposure to some markets, such as commodities and currencies. This is done when trading efficiency and cost benefits to the Fund would have the potential for a net positive impact on overall performance by reducing acquired fund fees from holding an ETP. The Arrow DWA Tactical Fund’s net assets were at approximately $85 million through the end of July 2020. Since its inception in May 2008 through July 2020, the Fund’s Class A shares (without load) had an annualized return of 2.77% versus the broad domestic stock market’s return of 9.52% as measured by the S&P 500 and the PCM Global Macro Index’s return of 4.46%. The Bloomberg Agg Bond returned 4.53% over the same time period. Keep in mind that the performance since inception can be deceiving, considering the Fund was launched around the market peak shortly before the global financial crisis of 2008-09. It is important to remember that some of that performance occurred prior to the Fund’s current global macro approach went into effect on August 3, 2009. Choppy markets and frequent changes in market leadership tend to hinder relative strength-based strategies, particularly those with concentrated holdings exposure. Despite the timing of the Fund’s launch, returns since inception are positive and the strategy has had many periods where it has shined versus its peers. The Fund (Class A, without load) was 2.03% for the one-year period, trailing the S&P 500’s 11.96% and the PCM Global Macro’s 5.07% return. When compared to the bond market, the Fund underperformed the Bloomberg Agg Bond’s one-year return of 10.12%. The Fund’s one-year returns lagged the domestic equity markets primarily due to the extraordinary effects of the coronavirus pandemic on the markets combined with the S&P 500’s higher relative concentration in the Technology sector. Good contributions to performance during the period came from the Fund’s positions in precious metals.
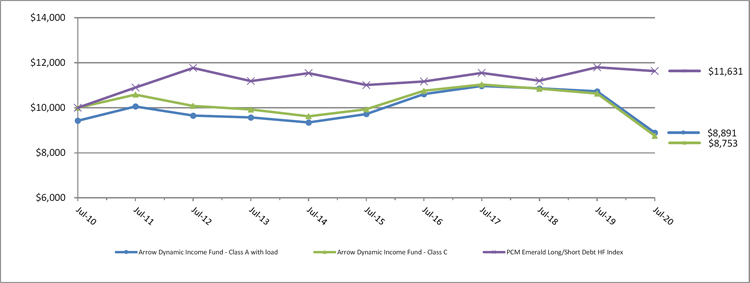
Arrow Dynamic Income Fund allows investors to gain exposure to four nontraditional bond strategies within a single portfolio. The Fund is designed to provide tactical long, flat and/or short exposure to distinct fixed income baskets of high yield, credit default, mortgage backed securities and government bonds. The Fund uses ETPs, mutual funds, as well as derivatives and futures contracts for positional exposure, or to create market neutral positions when bond market liquidity is a factor. The use of derivatives provides less transactional performance drag due to potential fixed income market liquidity premiums and constraints. The Fund’s focus on alternative fixed income follows four distinct systematic tactical strategies that act independently of one another and are unique to each market segment. The Fund’s net assets were more than $2.9 million at the end of July 2020. Since its inception in October 2007 through July 31, 2020, the Fund’s Class A shares (without load) had an annualized return of -1.77% versus the Bloomberg Agg Bond return of 4.58% over the same period and the PCM Emerald Long/Short Debt HF Index’s 3.32% return. It is important to remember that some of that performance occurred prior to the Fund’s current alternative fixed income approach, which went into effect on March 31, 2014. The Fund (Class A, without load) was -17.13% for the one-year period ended July 31, 2020, while the Bloomberg Agg Bond returned 10.12% and the PCM Emerald Long/Short Debt HF Index returned -1.41%. The volatility associated with the coronavirus pandemic was particularly hard on the Dynamic Income Fund. The sharp reversals caused losses across the Fund’s technical trend following strategies and the collapse of the mortgage backed securities market at the height of the coronavirus crisis caused losses as well.
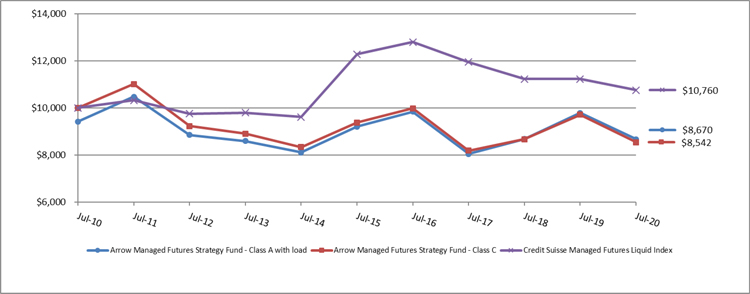
Arrow Managed Futures Strategy Fund follows a strategy that seeks to provide exposure to a wide range of global futures markets. In October 2015, the Fund began tracking the DUNN Capital World Monetary & Agricultural (“WMA”) Program, a systematic quantitative managed futures program overseen
by DUNN Capital Management, LLC (“DUNN”). With more than 40 years of experience, DUNN has received several awards and has been recognized as an industry leader. The DUNN WMA Program provides access to more than 50 global markets through the use of more than 100 proprietary trading models. The nature of managed futures generally requires direct or indirect exposure to the futures market, rather than holding physical commodities and financial instruments. In order to provide mutual fund access to the DUNN WMA Program, the Fund must use derivatives, such as swap agreements, with an additional expense that reduces the overall performance of the Fund. The market value of the swap makes up 100% of the notional value of the Fund. The Fund is intended to complement traditional portfolios due to the historically low correlation of managed futures relative to many other asset classes. The Fund’s net assets were more than $83 million at the end of July 2020. Since its inception at the end of April 2010 through the end of July 2020, the Fund (Class A, without load) has an annualized return of -1.26%, while the broad market S&P 500 has returned an annualized 12.70% and the Credit Suisse Managed Futures Liquid Index returned an annualized 0.65%. The Fund (Class A, without load) lost -11.47% in the one-year period ended July 31, 2020, while the S&P 500, Bloomberg Agg Bond and Credit Suisse Managed Futures Liquid Index returned 11.96%, 10.12% and lost -8.69%, respectively, over the same time period. The DUNN WMA Program has historically embraced a wider range of volatility than the managed futures strategies represented by the Credit Suisse Managed Futures Liquid Index. During the 12 months ended July 31, 2020, the Fund underperformed this benchmark as well as the S&P 500.
For more information, please visit our website at www.arrowfunds.com. We are grateful for your investment and for your continued confidence in our company.
Sincerely,

Joseph J. Barrato
Chief Executive Officer
Arrow Investment Advisors, LLC
August 2020
AD-092520
| Arrow DWA Balanced Fund |
| PORTFOLIO REVIEW (Unaudited) |
| July 31, 2020 |
The Fund’s performance figures* for the periods ended July 31, 2020, as compared to its benchmark:
| | | | | | Annualized |
| | | Annualized | Annualized Five | Annualized | Since Inception - |
| | One Year | Three Year | Year | Ten Year | July 31, 2020 |
| Arrow DWA Balanced Fund - Class A ** | 10.72% | 5.80% | 3.71% | 5.39% | 4.81% |
| Arrow DWA Balanced Fund - Class A with load ** | 4.33% | 3.75% | 2.49% | 4.76% | 4.37% |
| Arrow DWA Balanced Fund - Class C ** | 9.87% | 5.01% | 2.92% | 4.59% | 4.03% |
| Arrow DWA Balanced Fund - Institutional Class Shares *** | 11.02% | 6.06% | 3.97% | N/A | 5.07% |
| Morningstar Global Flexible Allocation EW Index | 1.81% | 2.89% | 3.19% | 4.23% | 3.51%** / 3.56%*** |
| * | The performance data quoted is historical. Past performance is no guarantee of future results. Current performance may be higher or lower than the performance data quoted. The principal value and investment return of an investment will fluctuate so that your shares, when redeemed, may be worth more or less than their original cost. The returns shown do not reflect the deduction of taxes that a shareholder would pay on Fund distributions or on the redemption of Fund shares. Performance figures for periods greater than one year are annualized. The Fund’s total annual operating expenses are 1.80% for Class A shares, 2.55% for Class C shares and 1.55% for the Institutional Class shares per the December 1, 2019 prospectus. Class A shares are subject to a maximum sales charge imposed on purchases of 5.75% and are subject to a maximum deferred sales charge of 1.00% of the original purchase price. Redemptions of any class of shares made within 30 days of purchase may be assessed a redemption fee of 1.00%. For performance information current to the most recent month-end, please call 1-877-277-6933. Updated information regarding the Fund’s expense ratios is available in the Financial Highlights. |
| ** | Inception date is August 7, 2006 for Class A and Class C shares. |
| *** | Inception date is March 21, 2012 for Institutional Class shares. |
The Morningstar Global Flexible Allocation EW Index offers exposure to all of the major asset classes globally, but does not have a specific target asset allocation, thus may invest in variable proportions of stocks, bonds or cash.
Comparison of the Change in Value of a $10,000 Investment
| Arrow DWA Balanced Fund |
| PORTFOLIO REVIEW (Unaudited)(Continued) |
| July 31, 2020 |
The Fund’s Holdings By Asset Class as of July 31, 2020 are as follows:
| Asset Class | | % of Net Assets | |
| Exchange Traded Funds | | | | |
| Fixed Income | | | 30.4 | % |
| Equity | | | 28.1 | % |
| Mixed Allocation | | | 5.0 | % |
| Common Stocks | | | | |
| Technology | | | 6.3 | % |
| Consumer Discretionary | | | 5.7 | % |
| Materials | | | 3.4 | % |
| Industrials | | | 2.1 | % |
| Communications | | | 2.1 | % |
| Consumer Staples | | | 0.8 | % |
| Health Care | | | 0.8 | % |
| Real Estate | | | 0.8 | % |
| Financials | | | 0.4 | % |
| Money Market Funds | | | 10.0 | % |
| Other Assets Less Liabilities | | | 4.1 | % |
| | | | 100.0 | % |
Please refer to the Consolidated Portfolio of Investments in this Annual Report for a detailed listing of the Fund’s holdings.
| Arrow DWA Tactical Fund |
| PORTFOLIO REVIEW (Unaudited) |
| July 31, 2020 |
The Fund’s performance figures* for the periods ended July 31, 2020, as compared to its benchmark:
| | | | | | Annualized |
| | | Annualized | Annualized | Annualized | Since Inception - |
| | One Year | Three Year | Five Year | Ten Year | July 31, 2020 |
| Arrow DWA Tactical Fund - Class A ** | 2.03% | 2.61% | 2.82% | 5.96% | 2.77% |
| Arrow DWA Tactical Fund - Class A with load ** | (3.87)% | 0.61% | 1.61% | 5.33% | 2.27% |
| Arrow DWA Tactical Fund - Class C ** | 1.24% | 1.83% | 2.05% | 5.15% | 2.00% |
| Arrow DWA Tactical Fund - Institutional Class Shares *** | 2.23% | 2.84% | 3.07% | N/A | 5.94% |
| PCM Global Macro Index | 5.07% | 1.58% | 2.52% | 1.83% | 4.46%** / 0.29%*** |
| * | The performance data quoted is historical. Past performance is no guarantee of future results. Current performance may be higher or lower than the performance data quoted. The principal value and investment return of an investment will fluctuate so that your shares, when redeemed, may be worth more or less than their original cost. The returns shown do not reflect the deduction of taxes that a shareholder would pay on Fund distributions or on the redemptions of Fund shares. Performance figures for periods greater than one year are annualized. The Fund’s total annual operating expenses are 1.84% for Class A shares, 2.59% for Class C shares and 1.59% for the Institutional Class shares per the December 1, 2019 prospectus. Class A shares are subject to a maximum sales charge imposed on purchases of 5.75% and are subject to a maximum deferred sales charge of 1.00% of the original purchase price. Redemptions of any class of shares made within 30 days of purchase may be assessed a redemption fee of 1.00%. For performance information current to the most recent month end, please call 1-877-277-6933. Updated information regarding the Fund’s expense ratios is available in the Financial Highlights. |
| ** | Inception date is May 30, 2008 for Class A and Class C shares. |
| *** | Inception date is March 21, 2012 for Institutional Class shares. |
The objective of the PCM Global Macro Index is total return through broad asset classes including global equities, fixed income, major currencies, precious metals, and commodity ETFs. By using inverse ETFs, PCM’s Risk Management Overlay may allow the capture of positive returns in periods of falling markets. The index may hold long and inverse (short) positions simultaneously. This creates a multi -directional strategy, making it possible to have gains when markets decline. This index may rotate on a monthly basis.
Comparison of the Change in Value of a $10,000 Investment
The Fund’s Holdings by Asset Class as of July 31, 2020 are as follows:
| Asset Class | | % of Net Assets | |
| Exchange Traded Funds | | | | |
| Equity | | | 62.8 | % |
| Fixed Income | | | 16.2 | % |
| Mixed Allocation | | | 0.1 | % |
| Money Market Fund | | | 13.8 | % |
| Other Assets Less Liabilities | | | 7.1 | % |
| | | | 100.0 | % |
Please refer to the Consolidated Portfolio of Investments in this Annual Report for a detailed listing of the Fund’s holdings.
| Arrow Dynamic Income Fund |
| PORTFOLIO REVIEW (Unaudited) |
| July 31, 2020 |
The Fund’s performance figures* for the periods ended July 31, 2020, as compared to its benchmark:
| | | | | | Annualized |
| | | Annualized | Annualized | Annualized | Since Inception - |
| | One Year | Three Year | Five Year | Ten Year | July 31, 2020 |
| Arrow Dynamic Income Fund - Class A ** | (17.13)% | (6.75)% | (1.77)% | (0.58)% | (1.77)% |
| Arrow Dynamic Income Fund - Class A with load ** | (21.94)% | (8.59)% | (2.93)% | (1.17)% | (2.22)% |
| Arrow Dynamic Income Fund - Class C ** | (17.65)% | (7.42)% | (2.49)% | (1.32)% | (2.48)% |
| Arrow Dynamic Income Fund - Institutional Class Shares *** | (16.72)% | (6.47)% | (1.50)% | N/A | (0.92)% |
| PCM Emerald Long/Short Debt HF Index | (1.41)% | 0.24% | 1.11% | 1.52% | 3.32%** / (0.01)%*** |
| * | The performance data quoted is historical. Past performance is no guarantee of future results. Current performance may be higher or lower than the performance data quoted. The principal value and investment return of an investment will fluctuate so that your shares, when redeemed, may be worth more or less than their original cost. All total returns as indicated above are calculated using the traded Net Asset Value on July 31, 2020. The returns shown do not reflect the deduction of taxes that a shareholder would pay on Fund distributions or on the redemption of Fund shares. The Fund’s total annual operating expenses are 2.02% for Class A shares, 2.77% for Class C shares and 1.77% for the Institutional Class shares per the December 1, 2019 prospectus. Class A shares are subject to a maximum sales charge imposed on purchases of 5.75% and are subject to a maximum deferred sales charge of 1.00% of the original purchase price. Performance figures for periods greater than one year are annualized. For performance information current to the most recent month-end, please call 1-877-277-6933. Updated information regarding the Fund’s expense ratios is available in the Financial Highlights. |
| ** | Inception date is October 31, 2007 for Class A and Class C shares. |
| *** | Inception date is March 21, 2012 for Institutional Class shares. |
The PCM Emerald Long/Short Debt HF Index uses an approach selecting the ETFs based upon a multi-factor quantitative approach.
Comparison of the Change in Value of a $10,000 Investment
The Fund’s Holdings by Asset Class as of July 31, 2020 are as follows:
| Asset Class | | % of Net Assets | |
| Exchange Traded Fund | | | | |
| Fixed Income | | | 84.8 | % |
| Money Market Fund | | | 9.8 | % |
| Other Assets Less Liabilities | | | 5.4 | % |
| | | | 100.0 | % |
Please refer to the Portfolio of Investments in this Annual Report for a detailed listing of the Fund’s holdings.
| Arrow Managed Futures Strategy Fund |
| PORTFOLIO REVIEW (Unaudited) |
| July 31, 2020 |
The Fund’s performance figures* for the periods ended July 31, 2020, as compared to its benchmark:
| | | | | | Annualized |
| | | Annualized | Annualized Five | Annualized | Since Inception- |
| | One Year | Three Year | Year | Ten Year | July 31, 2020 |
| Arrow Managed Futures Strategy Fund - Class A ** | (11.47)% | 2.48% | (1.19)% | (0.83)% | (1.26)% |
| Arrow Managed Futures Strategy Fund - Class A with load ** | (16.57)% | 0.48% | (2.36)% | (1.42)% | (1.83)% |
| Arrow Managed Futures Strategy Fund - Class C ** | (12.07)% | 1.43% | (1.86)% | (1.56)% | (1.97)% |
| Arrow Managed Futures Strategy Fund - Institutional Class Shares *** | (11.23)% | 2.70% | (0.94)% | N/A | (0.48)% |
| Credit Suisse Managed Futures Liquid Index | (8.69)% | (3.44)% | (2.62)% | 0.74% | 0.65%** / 0.69%*** |
| * | The performance data quoted is historical. Past performance is no guarantee of future results. Current performance may be higher or lower than the performance data quoted. The principal value and investment return of an investment will fluctuate so that your shares, when redeemed, may be worth more or less than their original cost. The returns shown do not reflect the deduction of taxes that a shareholder would pay on Fund distributions or on the redemptions of Fund shares. Performance figures for periods greater than one year are annualized. The Fund’s total annual operating expenses are 1.49% for Class A shares, 2.24% for Class C shares and 1.23% for the Institutional Class shares per the December 1, 2019 prospectus. Class A shares are subject to a maximum sales charge imposed on purchases of 5.75% and are subject to a maximum deferred sales charge of 1.00% of the original purchase price. Redemptions of any class of shares made within 30 days of purchase may be assessed a redemption fee of 1.00%. For performance information current to the most recent month-end, please call 1-877-277-6933. Updated information regarding the Fund’s expense ratios is available in the Financial Highlights. |
| ** | Inception date is April 30, 2010 for Class A and Class C shares. |
| *** | Inception date is March 21, 2012 for Institutional Class shares. |
The Credit Suisse Managed Futures Liquid Index seeks to gain broad exposure to the Credit Suisse Managed Futures strategy using a pre-defined quantitative methodology to invest in a range of asset classes including: equities, fixed income, commodities and currencies. The Managed Futures Liquid Index is also a factor within the Credit Suisse Global Strategies Liquid Index.
Comparison of the Change in Value of a $10,000 Investment
The Fund’s Holdings by Asset Class as of July 31, 2020 are as follows:
| Asset Class | | % of Net Assets | |
| Exchange Traded Fund | | | | |
| Mixed Allocation | | | 53.9 | % |
| Money Market Funds | | | 49.1 | % |
| Liabilities in Excess of Other Assets | | | (3.0 | )% |
| | | | 100.0 | % |
Please refer to the Consolidated Portfolio of Investments in this Annual Report for a detailed listing of the Fund’s holdings.
| Arrow DWA Balanced Fund |
| CONSOLIDATED PORTFOLIO OF INVESTMENTS |
| July 31, 2020 |
| Shares | | | | | Value | |
| | | | | COMMON STOCKS - 22.4% | | | | |
| | | | | APPAREL & TEXTILE PRODUCTS - 0.8% | | | | |
| | 4,337 | | | NIKE, Inc. | | $ | 423,335 | |
| | | | | | | | | |
| | | | | AUTOMOTIVE - 0.8% | | | | |
| | 2,550 | | | Aptiv PLC | | | 198,263 | |
| | 5,628 | | | BorgWarner, Inc. | | | 205,985 | |
| | | | | | | | 404,248 | |
| | | | | CHEMICALS - 1.7% | | | | |
| | 737 | | | Air Products and Chemicals, Inc. | | | 211,246 | |
| | 5,031 | | | Dow, Inc. | | | 206,573 | |
| | 867 | | | Linde PLC | | | 212,510 | |
| | 3,216 | | | LyondellBasell Industries NV | | | 201,064 | |
| | | | | | | | 831,393 | |
| | | | | COMMERCIAL SUPPORT SERVICES - 0.4% | | | | |
| | 696 | | | Cintas Corp. | | | 210,102 | |
| | | | | | | | | |
| | | | | E-COMMERCE DISCRETIONARY - 0.4% | | | | |
| | 34 | | | Amazon.com, Inc. * | | | 107,599 | |
| | 1,894 | | | eBay, Inc. | | | 104,700 | |
| | | | | | | | 212,299 | |
| | | | | HEALTH CARE FACILITIES & SERVICES - 0.1% | | | | |
| | 332 | | | IQVIA Holdings, Inc. * | | | 52,585 | |
| | | | | | | | | |
| | | | | HOME & OFFICE PRODUCTS - 0.8% | | | | |
| | 2,576 | | | Whirlpool Corp. | | | 420,197 | |
| | | | | | | | | |
| | | | | HOME CONSTRUCTION - 0.8% | | | | |
| | 1,589 | | | DR Horton, Inc. | | | 105,128 | |
| | 1,452 | | | Lennar Corp. | | | 105,052 | |
| | 27 | | | NVR, Inc. * | | | 106,114 | |
| | 2,393 | | | PulteGroup, Inc. | | | 104,335 | |
| | | | | | | | 420,629 | |
| | | | | INDUSTRIAL SUPPORT SERVICES - 0.8% | | | | |
| | 2,984 | | | Fastenal Co. | | | 140,367 | |
| | 889 | | | United Rentals, Inc. * | | | 138,124 | |
| | 412 | | | WW Grainger, Inc. | | | 140,710 | |
| | | | | | | | 419,201 | |
| | | | | INSTITUTIONAL FINANCIAL SERVICES - 0.4% | | | | |
| | 604 | | | Cboe Global Markets, Inc. | | | 52,971 | |
| | 306 | | | CME Group, Inc. | | | 50,851 | |
| | 520 | | | Intercontinental Exchange, Inc. | | | 50,326 | |
| | 400 | | | Nasdaq, Inc. | | | 52,524 | |
| | | | | | | | 206,672 | |
| | | | | INTERNET MEDIA & SERVICES - 1.2% | | | | |
| | 69 | | | Alphabet, Inc. * | | | 102,324 | |
| | 65 | | | Alphabet, Inc. * | | | 96,717 | |
| | 62 | | | Booking Holdings, Inc. * | | | 103,052 | |
| | 1,192 | | | Expedia Group, Inc. | | | 96,564 | |
| | 448 | | | Facebook, Inc. * | | | 113,644 | |
See accompanying notes to consolidated financial statements.
| Arrow DWA Balanced Fund |
| CONSOLIDATED PORTFOLIO OF INVESTMENTS (Continued) |
| July 31, 2020 |
| Shares | | | | | Value | |
| | | | | INTERNET MEDIA & SERVICES (continued) - 1.2% | | | | |
| | 2,859 | | | Twitter, Inc. * | | $ | 104,068 | |
| | | | | | | | 616,369 | |
| | | | | MEDICAL EQUIPMENT & DEVICES - 0.7% | | | | |
| | 547 | | | Agilent Technologies, Inc. | | | 52,693 | |
| | 98 | | | Bio-Rad Laboratories, Inc. * | | | 51,439 | |
| | 141 | | | Illumina, Inc. * | | | 53,885 | |
| | 59 | | | Mettler-Toledo International, Inc. * | | | 55,165 | |
| | 442 | | | PerkinElmer, Inc. | | | 52,558 | |
| | 128 | | | Thermo Fisher Scientific, Inc. | | | 52,986 | |
| | 247 | | | Waters Corp. * | | | 52,648 | |
| | | | | | | | 371,374 | |
| | | | | METALS & MINING - 1.7% | | | | |
| | 32,449 | | | Freeport-McMoRan, Inc. | | | 419,241 | |
| | 6,435 | | | Newmont Goldcorp Corp. | | | 445,302 | |
| | | | | | | | 864,543 | |
| | | | | REAL ESTATE INVESTMENT TRUST - 0.8% | | | | |
| | 5,253 | | | Duke Realty Corp. | | | 211,118 | |
| | 1,996 | | | Prologis, Inc. | | | 210,418 | |
| | | | | | | | 421,536 | |
| | | | | RETAIL - CONSUMER STAPLES - 0.8% | | | | |
| | 732 | | | Dollar General Corp. | | | 139,373 | |
| | 1,429 | | | Dollar Tree, Inc. * | | | 133,397 | |
| | 1,123 | | | Target Corp. | | | 141,363 | |
| | | | | | | | 414,133 | |
| | | | | RETAIL - DISCRETIONARY - 1.7% | | | | |
| | 4,198 | | | Best Buy Co., Inc. | | | 418,079 | |
| | 1,407 | | | Lowe’s Cos., Inc. | | | 209,516 | |
| | 793 | | | The Home Depot, Inc. | | | 210,534 | |
| | | | | | | | 838,129 | |
| | | | | SEMICONDUCTORS - 1.7% | | | | |
| | 413 | | | Advanced Micro Devices, Inc. * | | | 31,978 | |
| | 242 | | | Analog Devices, Inc. | | | 27,794 | |
| | 2,189 | | | Applied Materials, Inc. | | | 140,818 | |
| | 107 | | | Broadcom, Inc. | | | 33,892 | |
| | 673 | | | Intel Corp. | | | 32,122 | |
| | 701 | | | KLA-Tencor Corp. | | | 140,081 | |
| | 370 | | | Lam Research Corp. | | | 139,549 | |
| | 468 | | | Maxim Integrated Products, Inc. | | | 31,866 | |
| | 298 | | | Microchip Technology, Inc. | | | 30,316 | |
| | 580 | | | Micron Technology, Inc. * | | | 29,032 | |
| | 83 | | | NVIDIA Corp. | | | 35,241 | |
| | 251 | | | Qorvo, Inc. * | | | 32,166 | |
| | 301 | | | Qualcomm, Inc. | | | 31,789 | |
| | 227 | | | Skyworks Solutions, Inc. | | | 33,047 | |
| | 230 | | | Texas Instruments, Inc. | | | 29,336 | |
| | 299 | | | Xilinx, Inc. | | | 32,098 | |
| | | | | | | | 831,125 | |
See accompanying notes to consolidated financial statements.
| Arrow DWA Balanced Fund |
| CONSOLIDATED PORTFOLIO OF INVESTMENTS (Continued) |
| July 31, 2020 |
| Shares | | | | | Value | |
| | | | | SOFTWARE - 1.7% | | | | |
| | 101 | | | Adobe, Inc. * | | $ | 44,876 | |
| | 136 | | | ANSYS, Inc. * | | | 42,242 | |
| | 185 | | | Autodesk, Inc. * | | | 43,740 | |
| | 390 | | | Cadence Design Systems, Inc. * | | | 42,608 | |
| | 268 | | | Citrix Systems, Inc. | | | 38,260 | |
| | 614 | | | Fortinet, Inc. * | | | 84,916 | |
| | 145 | | | Intuit, Inc. | | | 44,424 | |
| | 402 | | | Microsoft Corp. | | | 82,414 | |
| | 4,007 | | | NortonLifeLock, Inc. | | | 85,950 | |
| | 1,520 | | | Oracle Corp. | | | 84,284 | |
| | 147 | | | Paycom Software, Inc. * | | | 41,802 | |
| | 225 | | | salesforce.com, Inc. * | | | 43,841 | |
| | 194 | | | ServiceNow, Inc. * | | | 85,205 | |
| | 211 | | | Synopsys, Inc. * | | | 42,035 | |
| | 120 | | | Tyler Technologies, Inc. * | | | 42,870 | |
| | | | | | | | 849,467 | |
| | | | | TECHNOLOGY HARDWARE - 1.7% | | | | |
| | 156 | | | Apple, Inc. | | | 66,306 | |
| | 4,198 | | | Garmin Ltd. | | | 413,881 | |
| | 6,235 | | | Hewlett Packard Enterprise Co. | | | 61,539 | |
| | 3,496 | | | HP, Inc. | | | 61,460 | |
| | 1,400 | | | NetApp, Inc. | | | 62,020 | |
| | 1,351 | | | Seagate Technology PLC | | | 61,092 | |
| | 1,403 | | | Western Digital Corp. | | | 60,469 | |
| | 3,676 | | | Xerox Holdings Corp. | | | 61,205 | |
| | | | | | | | 847,972 | |
| | | | | TECHNOLOGY SERVICES - 1.2% | | | | |
| | 263 | | | Automatic Data Processing, Inc. | | | 34,955 | |
| | 238 | | | Broadridge Financial Solutions, Inc. | | | 31,973 | |
| | 217 | | | Fidelity National Information Services, Inc. | | | 31,749 | |
| | 348 | | | Fiserv, Inc. * | | | 34,727 | |
| | 135 | | | FleetCor Technologies, Inc. * | | | 34,907 | |
| | 198 | | | Global Payments, Inc. | | | 35,248 | |
| | 174 | | | Jack Henry & Associates, Inc. | | | 31,024 | |
| | 98 | | | MarketAxess Holdings, Inc. | | | 50,637 | |
| | 99 | | | Mastercard, Inc. | | | 30,544 | |
| | 175 | | | Moody’s Corp. | | | 49,228 | |
| | 133 | | | MSCI, Inc. | | | 50,005 | |
| | 421 | | | Paychex, Inc. | | | 30,278 | |
| | 190 | | | PayPal Holdings, Inc. * | | | 37,253 | |
| | 152 | | | S&P Global, Inc. | | | 53,238 | |
| | 1,434 | | | The Western Union Co. | | | 34,818 | |
| | 154 | | | Visa, Inc. | | | 29,322 | |
| | | | | | | | 599,906 | |
| | | | | TELECOMMUNICATIONS - 0.9% | | | | |
| | 4,000 | | | T-Mobile US, Inc. * | | | 429,531 | |
See accompanying notes to consolidated financial statements.
| Arrow DWA Balanced Fund |
| CONSOLIDATED PORTFOLIO OF INVESTMENTS (Continued) |
| July 31, 2020 |
| Shares | | | | | Value | |
| | | | | TRANSPORTATION & LOGISTICS - 0.9% | | | | |
| | 1,627 | | | JB Hunt Transport Services, Inc. | | $ | 210,534 | |
| | 1,171 | | | Old Dominion Freight Line, Inc. | | | 214,082 | |
| | | | | | | | 424,616 | |
| | | | | WHOLESALE - DISCRETIONARY - 0.4% | | | | |
| | 2,264 | | | Copart, Inc. * | | | 211,118 | |
| | | | | | | | | |
| | | | | TOTAL COMMON STOCKS (Cost $8,962,507) | | | 11,320,480 | |
| | | | | | | | | |
| | | | | EXCHANGE TRADED FUNDS - 63.5% | | | | |
| | | | | EQUITY - 28.1% | | | | |
| | 337,617 | | | Arrow DWA Country Rotation ETF # ## | | | 9,187,808 | |
| | 110,000 | | | Arrow QVM Equity Factor ETF # ## | | | 2,261,226 | |
| | 6,623 | | | Vanguard Growth ETF | | | 1,439,642 | |
| | 7,690 | | | Vanguard Mid-Cap Growth ETF | | | 1,363,129 | |
| | | | | | | | 14,251,805 | |
| | | | | FIXED INCOME - 30.4% | | | | |
| | 30,476 | | | iShares 1-3 Year Treasury Bond ETF | | | 2,640,136 | |
| | 13,989 | | | iShares iBoxx $ Investment Grade Corporate Bond ETF | | | 1,935,378 | |
| | 22,729 | | | iShares iBoxx High Yield Corporate Bond ETF | | | 1,940,829 | |
| | 17,875 | | | iShares JP Morgan USD Emerging Markets Bond ETF | | | 2,021,484 | |
| | 21,754 | | | iShares TIPS Bond ETF | | | 2,737,958 | |
| | 31,693 | | | Schwab US TIPS ETF | | | 1,944,999 | |
| | 33,104 | | | SPDR Bloomberg Barclays Convertible Securities ETF | | | 2,148,119 | |
| | | | | | | | 15,368,903 | |
| | | | | MIXED ALLOCATION - 5.0% | | | | |
| | 25,026 | | | Arrow Reserve Capital Management ETF # | | | 2,514,487 | |
| | | | | | | | | |
| | | | | TOTAL EXCHANGE TRADED FUNDS (Cost $30,536,097) | | | 32,135,195 | |
| | | | | | | | | |
| | | | | SHORT-TERM INVESTMENTS - 10.0% | | | | |
| | | | | MONEY MARKET FUNDS - 10.0% | | | | |
| | 4,259,315 | | | Fidelity Investments Money Market Fund - Government Portfolio - Class I to yield 0.05% ^ + (a) | | | 4,259,315 | |
| | 822,786 | | | Morgan Stanley Institutional Liquidity Funds - Government Portfolio - Advisory Share Class to yield 0.01% ^ + (a) | | | 822,786 | |
| | | | | TOTAL SHORT-TERM INVESTMENTS (Cost $5,082,101) | | | 5,082,101 | |
| | | | | | | | | |
| | | | | TOTAL INVESTMENTS - 95.9% (Cost $44,580,705) | | $ | 48,537,776 | |
| | | | | OTHER ASSETS LESS LIABILITIES - 4.1% | | | 2,098,205 | |
| | | | | NET ASSETS - 100.0% | | $ | 50,635,981 | |
| * | Non-Income producing security. |
| ^ | Money market fund; interest rate reflects seven-day effective yield on July 31, 2020. |
| # | Affiliated Exchange Traded Fund |
| ## | Affiliated company - The Arrow DWA Balanced Fund holds in excess of 5% of the outstanding voting securities of this exchange traded fund. |
| + | All or a portion of this investment is a holding of the ADWAB Fund Limited. |
| (a) | All or a portion of this security is pledged as collateral for swap agreements. |
PLC - Public Limited Company
See accompanying notes to consolidated financial statements.
| Arrow DWA Balanced Fund |
| CONSOLIDATED PORTFOLIO OF INVESTMENTS (Continued) |
| July 31, 2020 |
FUTURES CONTRACTS
| Long | | | | | | | | Underlying Face | | | Unrealized | |
| Contracts | | Counterparty | | Open Long Futures Contracts ^ | | Expiration | | Amount at Value | | | Gain | |
| 17 | | Goldman Sachs & Co. LLC | | Gold 100 Oz Future ++ | | Feb-21 | | $ | 3,392,520 | | | $ | 676,470 | |
| | | Total Unrealized Gain from Open Long Future Contracts | | | $ | 676,470 | |
| ++ | All of these contracts are holdings of the ADWAB Fund Limited. |
| ^ | All collateral for open futures contracts consists of cash included as Deposits with brokers on the Consolidated Statement of Assets and Liabilities. |
See accompanying notes to consolidated financial statements.
| Arrow DWA Balanced Fund |
| CONSOLIDATED PORTFOLIO OF INVESTMENTS (Continued) |
| July 31, 2020 |
| Notional Value at | | | | | | | | | Variable Rate | | | | Unrealized | |
| July 31, 2020 | | | Description | | Counterparty | | Fixed Rate Paid | | Received | | Maturity Date | | Appreciation | |
| $ | 1,773,323 | | | Dunn WMA Financial
Index | | Morgan Stanley | | 0.60% of Notional | | Dunn WMA
Financial Index
program of Dunn
Capital Management,
LLC. (“Dunn”) | | 6/25/2021 | | $ | 17,198 | |
Additional Information — Financial Index Swap Contract
The following table represents the individual positions and related values within the financial index swap as of July 31, 2020.
| | | | | | | | | | | | | | Unrealized | |
| Open Long Future | | | | | | | | | | | | | Appreciation/ | |
| Contracts | | Description | | Expiration | | Counterparty | | Notional Amount | | | Weighted % + | | (Depreciation) | |
| 27 | | 2 YR T-Note | | Sep-20 | | Morgan Stanley | | $ | 6,024,033 | | | 9.46% | | $ | 5,183 | |
| 27 | | 5 YR T-Note | | Sep-20 | | Morgan Stanley | | | 3,345,538 | | | 5.25% | | | 13,628 | |
| 8 | | Aussie 10YR Bond | | Sep-20 | | Morgan Stanley | | | 816,655 | | | 1.28% | | | 5,870 | |
| 40 | | Aussie 3 YR Bond | | Sep-20 | | Morgan Stanley | | | 3,316,563 | | | 5.21% | | | (498 | ) |
| 3 | | Australian Dollar CME | | Sep-20 | | Morgan Stanley | | | 200,694 | | | 0.32% | | | (445 | ) |
| 1 | | British Pound CME | | Sep-20 | | Morgan Stanley | | | 63,707 | | | 0.10% | | | 89 | |
| 5 | | CFE VIX | | Nov-20 | | Morgan Stanley | | | 156,951 | | | 0.25% | | | (1,629 | ) |
| 0* | | CFE VIX | | Oct-20 | | Morgan Stanley | | | 11,103 | | | 0.02% | | | (63 | ) |
| 0* | | Dax Index | | Sep-20 | | Morgan Stanley | | | 94,354 | | | 0.15% | | | (4,444 | ) |
| 2 | | Emini NASDAQ | | Sep-20 | | Morgan Stanley | | | 414,025 | | | 0.65% | | | 28,937 | |
| 0* | | Emini S&P | | Sep-20 | | Morgan Stanley | | | 63,444 | | | 0.10% | | | 798 | |
| 2 | | Eur/Usd CME | | Sep-20 | | Morgan Stanley | | | 229,389 | | | 0.36% | | | 2 | |
| 2 | | Euro Bund | | Sep-20 | | Morgan Stanley | | | 443,023 | | | 0.70% | | | 3,731 | |
| 19 | | Eurodollars | | Dec-21 | | Morgan Stanley | | | 4,690,385 | | | 7.36% | | | 2,275 | |
| 4 | | Gilts | | Sep-20 | | Morgan Stanley | | | 745,156 | | | 1.17% | | | 3,665 | |
| 1 | | Mini DOW | | Sep-20 | | Morgan Stanley | | | 73,906 | | | 0.12% | | | 326 | |
| 1 | | OSK NIKKEI | | Sep-20 | | Morgan Stanley | | | 239,992 | | | 0.38% | | | (9,237 | ) |
| 49 | | Short Sterling | | Dec-21 | | Morgan Stanley | | | 8,090,618 | | | 12.70% | | | 5,870 | |
| 5 | | SWISS FRANC CME | | Sep-20 | | Morgan Stanley | | | 656,722 | | | 1.03% | | | 5,811 | |
| 1 | | TOPIX INDEX | | Sep-20 | | Morgan Stanley | | | 128,372 | | | 0.20% | | | (5,798 | ) |
| 11 | | US 10 YR Notes | | Sep-20 | | Morgan Stanley | | | 1,494,733 | | | 2.35% | | | 8,166 | |
| 3 | | US T.Bond | | Sep-20 | | Morgan Stanley | | | 535,485 | | | 0.84% | | | 9,371 | |
| | | | | | | | | | | | | | | $ | 71,608 | |
| | | | | | | | | | | | | | | | | |
| Open Short Future | | | | | | | | | | | | | | | | |
| Contracts | | | | | | | | | | | | | | | | |
| (2) | | CAC Index | | Aug-20 | | Morgan Stanley | | | (102,271 | ) | | 0.16% | | | 6,051 | |
| (4) | | Canadian Dollar CME | | Sep-20 | | Morgan Stanley | | | (300,204 | ) | | 0.47% | | | (2,036 | ) |
| (6) | | CFE VIX | | Aug-20 | | Morgan Stanley | | | (158,766 | ) | | 0.25% | | | 11,651 | |
| (103) | | ERX 2 Bund | | Sep-20 | | Morgan Stanley | | | (13,596,786 | ) | | 21.35% | | | (13,791 | ) |
| (8) | | ERX Bobl | | Sep-20 | | Morgan Stanley | | | (1,232,937 | ) | | 1.94% | | | (4,970 | ) |
| (32) | | Euribor | | Dec-21 | | Morgan Stanley | | | (9,392,576 | ) | | 14.75% | | | (2,155 | ) |
| (1) | | Euro Stoxx 50 | | Sep-20 | | Morgan Stanley | | | (38,907 | ) | | 0.06% | | | 822 | |
| (1) | | FTSE Index | | Sep-20 | | Morgan Stanley | | | (46,655 | ) | | 0.07% | | | 2,525 | |
| (3) | | Japan Govt Bond Ose | | Sep-20 | | Morgan Stanley | | | (4,045,645 | ) | | 6.35% | | | (3,252 | ) |
| (3) | | Japanese Yen CME | | Sep-20 | | Morgan Stanley | | | (388,229 | ) | | 0.61% | | | (5,711 | ) |
| (3) | | Mexican Peso CME | | Sep-20 | | Morgan Stanley | | | (69,582 | ) | | 0.11% | | | (79 | ) |
| (0)* | | SFE SPI 200 | | Sep-20 | | Morgan Stanley | | | (45,366 | ) | | 0.07% | | | 673 | |
| | | | | | | | | | | | | | | $ | (10,272 | ) |
| + | Above totals do not foot to 100% due to cash/foreign currency balances contained in the custom basket’s net assets representing 3.81%. |
See accompanying notes to consolidated financial statements.
| Arrow DWA Balanced Fund |
| CONSOLIDATED PORTFOLIO OF INVESTMENTS (Continued) |
| July 31, 2020 |
| Notional Value at | | | | | | | | | Variable Rate | | | | Unrealized
Appreciation/ | |
| July 31, 2020 | | | Description | | Counterparty | | Fixed Rate Paid | | Received | | Maturity Date | | (Depreciation) | |
| $ | 2,607,940 | | | Dunn WMA
Commodity Index | | Morgan Stanley | | 0.60% of Notional | | Dunn WMA
Commodity Index
program of Dunn
Capital Management,
LLC. | | 6/25/2021 | | $ | (15,836 | ) |
| | | | | Net Unrealized Appreciation on Swap Contracts | | $ | 1,362 | |
| ++ | All of these contracts are holdings of the ADWAB Fund Limited. |
Additional Information — Commodity Index Swap Contract
The following table represents the individual positions and related values within the commodity index swap as of July 31, 2020.
| | | | | | | | | | | | | | Unrealized | |
| Open Long Future | | | | | | | | | | | | | Appreciation/ | |
| Contracts | | Description | | Expiration | | Counterparty | | Notional Amount | | | Weighted % + | | (Depreciation) | |
| 2 | | Gold CMX | | Dec-20 | | Morgan Stanley | | $ | 350,236 | | | 6.35% | | $ | 1,572 | |
| 3 | | Hi Grade Copper | | Sep-20 | | Morgan Stanley | | | 230,587 | | | 4.18% | | | (4,614 | ) |
| 1 | | Silver CMX | | Sep-20 | | Morgan Stanley | | | 87,927 | | | 1.59% | | | 4,070 | |
| 2 | | Wheat | | Dec-20 | | Morgan Stanley | | | 67,069 | | | 1.22% | | | 215 | |
| | | | | | | | | | | | | | | $ | 1,243 | |
| | | | | | | | | | | | | | | | | |
| Open Short Future | | | | | | | | | | | | | | | | |
| Contracts | | | | | | | | | | | | | | | | |
| (5) | | Beanmeal | | Dec-20 | | Morgan Stanley | | | (141,875 | ) | | 2.57% | | | (1,265 | ) |
| (13) | | Beanoil | | Dec-20 | | Morgan Stanley | | | (235,503 | ) | | 4.27% | | | (15,400 | ) |
| (1) | | Brent Oil | | Oct-20 | | Morgan Stanley | | | (63,208 | ) | | 1.15% | | | (2,217 | ) |
| (3) | | Cocoa NY | | Sep-20 | | Morgan Stanley | | | (62,245 | ) | | 1.13% | | | (2,646 | ) |
| (3) | | Coffee NY | | Sep-20 | | Morgan Stanley | | | (113,375 | ) | | 2.06% | | | (20,575 | ) |
| (23) | | Corn | | Dec-20 | | Morgan Stanley | | | (384,185 | ) | | 6.97% | | | 14,410 | |
| (3) | | Cotton | | Dec-20 | | Morgan Stanley | | | (89,381 | ) | | 1.62% | | | (3,108 | ) |
| (2) | | Crude Oil | | Oct-20 | | Morgan Stanley | | | (65,237 | ) | | 1.18% | | | 1,122 | |
| (2) | | Gas Oil LDN | | Oct-20 | | Morgan Stanley | | | (65,606 | ) | | 1.19% | | | 1,521 | |
| (0)* | | Gasoline Blendstock | | Oct-20 | | Morgan Stanley | | | (21,580 | ) | | 0.39% | | | 1,314 | |
| (1) | | Heating Oil | | Oct-20 | | Morgan Stanley | | | (75,585 | ) | | 1.37% | | | 2,041 | |
| (5) | | KCBT Red Wheat | | Dec-20 | | Morgan Stanley | | | (110,438 | ) | | 2.00% | | | 1,664 | |
| (5) | | Lean Hogs | | Oct-20 | | Morgan Stanley | | | (89,579 | ) | | 1.62% | | | 1,142 | |
| (4) | | Live Cattle | | Oct-20 | | Morgan Stanley | | | (167,867 | ) | | 3.04% | | | (5,458 | ) |
| (6) | | Natural Gas | | Oct-20 | | Morgan Stanley | | | (110,647 | ) | | 2.01% | | | (5,397 | ) |
| (4) | | Soybeans | | Nov-20 | | Morgan Stanley | | | (178,235 | ) | | 3.23% | | | (1,463 | ) |
| (8) | | Sugar NY | | Oct-20 | | Morgan Stanley | | | (116,758 | ) | | 2.12% | | | (6,299 | ) |
| | | | | | | | | | | | | | | $ | (40,614 | ) |
| + | Above totals do not foot to 100% due to cash/foreign currency balances contained in the custom basket’s net assets representing 48.74%. |
See accompanying notes to consolidated financial statements.
| Arrow DWA Tactical Fund |
| CONSOLIDATED PORTFOLIO OF INVESTMENTS |
| July 31, 2020 |
| Shares | | | | | Value | |
| | | | | EXCHANGE TRADED FUNDS - 79.1% | | | | |
| | | | | EQUITY - 62.8% | | | | |
| | 51,494 | | | Consumer Discretionary Select Sector SPDR Fund | | $ | 7,054,678 | |
| | 85,612 | | | Health Care Select Sector SPDR Fund | | | 9,034,635 | |
| | 59,297 | | | iShares Edge MSCI USA Momentum Factor ETF | | | 8,312,847 | |
| | 38,508 | | | iShares S&P 500 Growth ETF | | | 8,559,558 | |
| | 107,882 | | | Technology Select Sector SPDR Fund | | | 11,913,409 | |
| | 70,426 | | | Vanguard Dividend Appreciation ETF | | | 8,663,102 | |
| | | | | | | | 53,538,229 | |
| | | | | FIXED INCOME - 16.2% | | | | |
| | 52,555 | | | iShares 7-10 Year Treasury Bond ETF | | | 6,453,754 | |
| | 43,044 | | | iShares 20+ Year Treasury Bond ETF | | | 7,360,524 | |
| | | | | | | | 13,814,278 | |
| | | | | MIXED ALLOCATION - 0.1% | | | | |
| | 1,200 | | | Arrow Reserve Capital Management ETF + | | | 120,570 | |
| | | | | | | | | |
| | | | | TOTAL EXCHANGE TRADED FUNDS (Cost $60,454,706) | | | 67,473,077 | |
| | | | | | | | | |
| | | | | SHORT-TERM INVESTMENT - 13.8% | | | | |
| | | | | MONEY MARKET FUND - 13.8% | | | | |
| | 11,742,127 | | | Fidelity Investments Money Market Fund - Government Portfolio - Class I to yield 0.05% * ++ (Cost $11,742,127) | | | 11,742,127 | |
| | | | | | | | | |
| | | | | TOTAL INVESTMENTS - 92.9% (Cost $72,196,833) | | $ | 79,215,204 | |
| | | | | OTHER ASSETS LESS LIABILITIES - 7.1% | | | 6,033,094 | |
| | | | | NET ASSETS - 100.0% | | $ | 85,248,298 | |
| * | Money market fund; interest rate reflects seven-day effective yield on July 31, 2020. |
| + | Affiliated Exchange Traded Fund |
| ++ | All or a portion of this investment is a holding of the ADWAT Fund Limited. |
See accompanying notes to consolidated financial statements.
| Arrow DWA Tactical Fund |
| CONSOLIDATED PORTFOLIO OF INVESTMENTS (Continued) |
| July 31, 2020 |
FUTURES CONTRACTS
| Long | | | | | | | | Underlying Face | | | Unrealized | |
| Contracts | | Counterparty | | Open Long Futures Contracts ^ | | Expiration | | Amount at Value | | | Gain | |
| 39 | | Goldman Sachs & Co. LLC | | Gold 100 Oz Future ++ | | Dec-20 | | $ | 7,745,010 | | | $ | 1,370,580 | |
| 39 | | Goldman Sachs & Co. LLC | | Gold 100 Oz Future ++ | | Feb-21 | | | 7,782,840 | | | | 1,231,750 | |
| 16 | | Goldman Sachs & Co. LLC | | Silver Future ++ | | May-21 | | | 1,991,920 | | | | 740,720 | |
| | | Total Unrealized Gain from Open Long Future Contracts | | | $ | 3,343,050 | |
| ++ | All of these contracts are holdings of the ADWAT Fund Limited. |
| ^ | All collateral for open futures contracts consists of cash included as Deposits with brokers on the Consolidated Statement of Assets and Liabilities. |
See accompanying notes to consolidated financial statements.
| Arrow Dynamic Income Fund |
| PORTFOLIO OF INVESTMENTS |
| July 31, 2020 |
| Shares | | | | | Value | |
| | | | | EXCHANGE TRADED FUNDS - 84.8% | | | | |
| | | | | FIXED INCOME - 84.8% | | | | |
| | 6,719 | | | iShares Convertible Bond ETF | | $ | 511,585 | |
| | 3,279 | | | iShares iBoxx $ Investment Grade Corporate Bond ETF | | | 453,650 | |
| | 4,193 | | | iShares JP Morgan USD Emerging Markets Bond ETF | | | 474,186 | |
| | 20,886 | | | SPDR PORTFOLIO TIPS ETF | | | 644,333 | |
| | 9,344 | | | Xtrackers USD High Yield Corporate Bond ETF | | | 457,295 | |
| | | | | TOTAL EXCHANGE TRADED FUNDS - (Cost $2,371,517) | | | 2,541,049 | |
| | | | | | | | | |
| | | | | SHORT TERM INVESTMENT - 9.8% | | | | |
| | | | | MONEY MARKET FUND - 9.8% | | | | |
| | 294,653 | | | Fidelity Investments Money Market Fund - Government Portfolio - Class I, to yield 0.05% ^ (Cost - $294,653) | | | 294,653 | |
| | | | | | | | | |
| | | | | TOTAL INVESTMENTS - 94.6% (Cost $2,666,170) | | $ | 2,835,702 | |
| | | | | OTHER ASSETS LESS LIABILITIES - 5.4% | | | 162,711 | |
| | | | | NET ASSETS - 100.0% | | $ | 2,998,413 | |
| ^ | Money market fund; interest rate reflects seven-day effective yield on July 31, 2020. |
See accompanying notes to consolidated financial statements.
| Arrow Dynamic Income Fund |
| PORTFOLIO OF INVESTMENTS (Continued) |
| July 31, 2020 |
FUTURES CONTRACT
| Long | | | | | | | | Underlying Face | | | Unrealized | |
| Contracts | | Counterparty | | Open Long Futures Contracts ^ | | Expiration | | Amount at Value | | | Gain | |
| 3 | | Goldman Sachs & Co. LLC | | US 2YR Note | | Sep-20 | | $ | 662,952 | | | $ | 1,172 | |
| | | Total Unrealized Gain from Long Futures Contracts | | | $ | 1,172 | |
| ^ | All collateral for open future/swap contracts consists of cash included as Deposits with brokers on the Statement of Assets and Liabilities. |
See accompanying notes to consolidated financial statements.
| Arrow Managed Futures Strategy Fund |
| CONSOLIDATED PORTFOLIO OF INVESTMENTS |
| July 31, 2020 |
| Shares | | | | | Value | |
| | | | | EXCHANGE TRADED FUND - 53.9% | | | | |
| | | | | MIXED ALLOCATION - 53.9% | | | | |
| | 449,577 | | | Arrow Reserve Capital Management ETF + ## (Cost $45,017,891) | | $ | 45,171,249 | |
| | | | | | | | | |
| | | | | SHORT-TERM INVESTMENTS - 49.1% | | | | |
| | | | | MONEY MARKET FUNDS - 49.1% | | | | |
| | 30,682,325 | | | Fidelity Investments Money Market Fund - Government Portfolio - Class I (a) to yield 0.05% * ++ | | | 30,682,325 | |
| | 10,445,833 | | | Morgan Stanley Institutional Liquidity Funds - Government Portfolio - Advisory Share Class to yield 0.01% * ++ | | | 10,445,833 | |
| | | | | TOTAL SHORT-TERM INVESTMENTS (Cost $41,128,158) | | | 41,128,158 | |
| | | | | | | | | |
| | | | | TOTAL INVESTMENTS - 103.0% (Cost $86,146,049) | | $ | 86,299,407 | |
| | | | | LIABILITIES IN EXCESS OF OTHER ASSETS - (3.0)% | | | (2,501,044 | ) |
| | | | | NET ASSETS - 100.0% | | $ | 83,798,363 | |
| * | Money market fund; interest rate reflects seven-day effective yield on July 31, 2020. |
| + | Affiliated Exchange Traded Fund |
| ++ | All or a portion of this investment is a holding of the Arrow MFT Fund Limited (the “MFT Fund”). |
| (a) | Pledged as collateral for swap agreements. |
| ## | Affiliated company - The Arrow Managed Futures Strategy Fund holds in excess of 5% of the outstanding voting securities of this exchange traded fund. |
See accompanying notes to consolidated financial statements.
| Arrow Managed Futures Strategy Fund |
| CONSOLIDATED PORTFOLIO OF INVESTMENTS (Continued) |
| July 31, 2020 |
| Notional Value at | | | | | | | | | Variable Rate | | Maturity | | Unrealized | |
| July 31, 2020 | | | Description | | Counterparty | | Fixed Rate Paid | | Received | | Date | | Appreciation | |
| $ | 37,828,702 | | | Dunn WMA Financial
Index | | Morgan Stanley | | 0.60% of Notional | | Dunn WMA Financial
Index program of
Dunn Capital
Management, LLC.
(“Dunn”) | | 6/25/2021 | | $ | 366,860 | |
Additional Information - Financial Index Swap Contract
The following table represents the individual positions and related values within the financial index swap as of July 31, 2020.
| | | | | | | | | | | | | | Unrealized | |
| Open Long Future | | | | | | | | | | | | | Appreciation/ | |
| Contracts | | Description | | Expiration | | Counterparty | | Notional Amount | | | Weighted % + | | (Depreciation) | |
| 604 | | 2 YR T-Note | | Sep-20 | | Morgan Stanley | | $ | 133,417,108 | | | 9.46% | | $ | 114,781 | |
| 587 | | 5 YR T-Note | | Sep-20 | | Morgan Stanley | | | 74,095,212 | | | 5.25% | | | 301,824 | |
| 169 | | Aussie 10YR Bond | | Sep-20 | | Morgan Stanley | | | 18,086,847 | | | 1.28% | | | 130,003 | |
| 878 | | Aussie 3 YR Bond | | Sep-20 | | Morgan Stanley | | | 73,453,494 | | | 5.21% | | | (11,026 | ) |
| 62 | | Australian Dollar CME | | Sep-20 | | Morgan Stanley | | | 4,444,856 | | | 0.32% | | | (9,855 | ) |
| 17 | | British Pound CME | | Sep-20 | | Morgan Stanley | | | 1,410,943 | | | 0.10% | | | 1,961 | |
| 116 | | CFE VIX | | Nov-20 | | Morgan Stanley | | | 3,476,074 | | | 0.25% | | | (36,076 | ) |
| 8 | | CFE VIX | | Oct-20 | | Morgan Stanley | | | 245,897 | | | 0.02% | | | (1,406 | ) |
| 6 | | Dax Index | | Sep-20 | | Morgan Stanley | | | 2,089,693 | | | 0.15% | | | (98,418 | ) |
| 42 | | Emini NASDAQ | | Sep-20 | | Morgan Stanley | | | 9,169,615 | | | 0.65% | | | 640,891 | |
| 9 | | Emini S&P | | Sep-20 | | Morgan Stanley | | | 1,405,131 | | | 0.10% | | | 17,677 | |
| 34 | | Eur/Usd CME | | Sep-20 | | Morgan Stanley | | | 5,080,386 | | | 0.36% | | | 48 | |
| 47 | | Euro Bund | | Sep-20 | | Morgan Stanley | | | 9,811,833 | | | 0.70% | | | 82,626 | |
| 416 | | Eurodollars | | Dec-21 | | Morgan Stanley | | | 103,880,177 | | | 7.36% | | | 50,387 | |
| 91 | | Gilts | | Sep-20 | | Morgan Stanley | | | 16,503,315 | | | 1.17% | | | 81,173 | |
| 12 | | Mini DOW | | Sep-20 | | Morgan Stanley | | | 1,636,829 | | | 0.12% | | | 7,219 | |
| 26 | | OSK NIKKEI | | Sep-20 | | Morgan Stanley | | | 5,315,227 | | | 0.38% | | | (204,568 | ) |
| 1,094 | | Short Sterling | | Dec-21 | | Morgan Stanley | | | 179,186,734 | | | 12.70% | | | 130,015 | |
| 106 | | SWISS FRANC CME | | Sep-20 | | Morgan Stanley | | | 14,544,728 | | | 1.03% | | | 128,689 | |
| 20 | | TOPIX INDEX | | Sep-20 | | Morgan Stanley | | | 2,843,120 | | | 0.20% | | | (128,421 | ) |
| 236 | | US 10 YR Notes | | Sep-20 | | Morgan Stanley | | | 33,104,564 | | | 2.35% | | | 180,866 | |
| 65 | | US T.Bond | | Sep-20 | | Morgan Stanley | | | 11,859,640 | | | 0.84% | | | 207,536 | |
| | | | | | | | | | | | | | | $ | 1,585,926 | |
| | | | | | | | | | | | | | | | | |
| Open Short Future | | | | | | | | | | | | | | | | |
| Contracts | | | | | | | | | | | | | | | | |
| (40) | | CAC Index | | Aug-20 | | Morgan Stanley | | | (2,265,034 | ) | | 0.16% | | $ | 134,017 | |
| (89) | | Canadian Dollar CME | | Sep-20 | | Morgan Stanley | | | (6,648,756 | ) | | 0.47% | | | (45,103 | ) |
| (131) | | CFE VIX | | Aug-20 | | Morgan Stanley | | | (3,516,259 | ) | | 0.25% | | | 258,049 | |
| (2,277) | | ERX 2 Bund | | Sep-20 | | Morgan Stanley | | | (301,134,455 | ) | | 21.35% | | | (305,444 | ) |
| (171) | | ERX Bobl | | Sep-20 | | Morgan Stanley | | | (27,306,433 | ) | | 1.94% | | | (110,070 | ) |
| (702) | | Euribor | | Dec-21 | | Morgan Stanley | | | (208,021,825 | ) | | 14.75% | | | (47,728 | ) |
| (23) | | Euro Stoxx 50 | | Sep-20 | | Morgan Stanley | | | (861,697 | ) | | 0.06% | | | 18,206 | |
| (13) | | FTSE Index | | Sep-20 | | Morgan Stanley | | | (1,033,300 | ) | | 0.07% | | | 55,921 | |
| (62) | | Japan Govt Bond Ose | | Sep-20 | | Morgan Stanley | | | (89,600,818 | ) | | 6.35% | | | (72,013 | ) |
| (73) | | Japanese Yen CME | | Sep-20 | | Morgan Stanley | | | (8,598,296 | ) | | 0.61% | | | (126,483 | ) |
| (69) | | Mexican Peso CME | | Sep-20 | | Morgan Stanley | | | (1,541,058 | ) | | 0.11% | | | (1,761 | ) |
| (10) | | SFE SPI 200 | | Sep-20 | | Morgan Stanley | | | (1,004,739 | ) | | 0.07% | | | 14,905 | |
| | | | | | | | | | | | | | | $ | (227,504 | ) |
| + | Above totals do not foot to 100% due to cash/foreign currency balances contained in the custom basket’s net assets representing 3.81%. |
See accompanying notes to consolidated financial statements.
| Arrow Managed Futures Strategy Fund |
| CONSOLIDATED PORTFOLIO OF INVESTMENTS (Continued) |
| July 31, 2020 |
| Notional Value at | | | | | | | | | Variable Rate | | Maturity | | Unrealized
Appreciation/ | |
| July 31, 2020 | | | Description | | Counterparty | | Fixed Rate Paid | | Received | | Date | | (Depreciation) | |
| $ | 45,868,668 | | | Dunn WMA
Commodity Index | | Morgan Stanley | | 0.60% of Notional | | Dunn WMA
Commodity Index
program of Dunn
Capital Management,
LLC. | | 6/25/2021 | | $ | (278,523 | ) |
| | | | | | | | | | | | | | | | | |
| | | | | Net Unrealized Appreciation on Swap Contracts | | $ | 88,337 | |
| ++ | All these contracts are holdings of the Arrow MFT Fund Limited. |
Additional Information - Commodity Index Swap Contract
The following table represents the individual positions and related values within the commodity index swap as of July 31, 2020.
| | | | | | | | | | | | | | Unrealized | |
| Open Long Future | | | | | | | | | | | | | Appreciation/ | |
| Contracts | | Description | | Expiration | | Counterparty | | Notional Amount | | | Weighted % + | | (Depreciation) | |
| 32 | | Gold CMX | | Dec-20 | | Morgan Stanley | | $ | 6,401,824 | | | 6.35% | | $ | 28,728 | |
| 59 | | Hi Grade Copper | | Sep-20 | | Morgan Stanley | | | 4,214,813 | | | 4.18% | | | (84,336 | ) |
| 13 | | Silver CMX | | Sep-20 | | Morgan Stanley | | | 1,607,193 | | | 1.59% | | | 74,400 | |
| 46 | | Wheat | | Dec-20 | | Morgan Stanley | | | 1,225,931 | | | 1.22% | | | 3,923 | |
| | | | | | | | | | | | | | | $ | 22,715 | |
| | | | | | | | | | | | | | | | | |
| Open Short Future | | | | | | | | | | | | | | | | |
| Contracts | | | | | | | | | | | | | | | | |
| (87) | | Beanmeal | | Dec-20 | | Morgan Stanley | | | (2,593,285 | ) | | 2.57% | | | (23,125 | ) |
| (233) | | Beanoil | | Dec-20 | | Morgan Stanley | | | (4,304,673 | ) | | 4.27% | | | (281,486 | ) |
| (27) | | Brent Oil | | Oct-20 | | Morgan Stanley | | | (1,155,352 | ) | | 1.15% | | | (40,533 | ) |
| (47) | | Cocoa NY | | Sep-20 | | Morgan Stanley | | | (1,137,755 | ) | | 1.13% | | | (48,364 | ) |
| (46) | | Coffee NY | | Sep-20 | | Morgan Stanley | | | (2,072,332 | ) | | 2.06% | | | (376,081 | ) |
| (430) | | Corn | | Dec-20 | | Morgan Stanley | | | (7,022,365 | ) | | 6.97% | | | 263,402 | |
| (52) | | Cotton | | Dec-20 | | Morgan Stanley | | | (1,633,769 | ) | | 1.62% | | | (56,812 | ) |
| (29) | | Crude Oil | | Oct-20 | | Morgan Stanley | | | (1,192,433 | ) | | 1.18% | | | 20,498 | |
| (32) | | Gas Oil LDN | | Oct-20 | | Morgan Stanley | | | (1,199,194 | ) | | 1.19% | | | 27,804 | |
| (9) | | Gasoline Blendstock | | Oct-20 | | Morgan Stanley | | | (394,447 | ) | | 0.39% | | | 24,024 | |
| (27) | | Heating Oil | | Oct-20 | | Morgan Stanley | | | (1,381,596 | ) | | 1.37% | | | 37,305 | |
| (89) | | KCBT Red Wheat | | Dec-20 | | Morgan Stanley | | | (2,018,662 | ) | | 2.00% | | | 30,423 | |
| (82) | | Lean Hogs | | Oct-20 | | Morgan Stanley | | | (1,637,371 | ) | | 1.62% | | | 20,878 | |
| (71) | | Live Cattle | | Oct-20 | | Morgan Stanley | | | (3,068,383 | ) | | 3.04% | | | (99,762 | ) |
| (103) | | Natural Gas | | Oct-20 | | Morgan Stanley | | | (2,022,483 | ) | | 2.01% | | | (98,643 | ) |
| (73) | | Soybeans | | Nov-20 | | Morgan Stanley | | | (3,257,890 | ) | | 3.23% | | | (26,749 | ) |
| (151) | | Sugar NY | | Oct-20 | | Morgan Stanley | | | (2,134,173 | ) | | 2.12% | | | (115,142 | ) |
| | | | | | | | | | | | | | | $ | (742,363 | ) |
| + | Above totals do not foot to 100% due to cash/foreign currency balances contained in the custom basket’s net assets representing 48.74%. |
See accompanying notes to consolidated financial statements.
| The Arrow Funds |
| STATEMENTS OF ASSETS AND LIABILITIES |
| July 31, 2020 |
| | | | | | | | | | | | Arrow Managed | |
| | | Arrow DWA | | | Arrow DWA | | | Arrow | | | Futures Strategy | |
| | | Balanced Fund | | | Tactical Fund | | | Dynamic | | | Fund | |
| | | (Consolidated) | | | (Consolidated) | | | Income Fund | | | (Consolidated) | |
| ASSETS | | | | | | | | | | | | | | | | |
| Investment securities: | | | | | | | | | | | | | | | | |
| Unaffiliated companies, At cost | | $ | 30,384,525 | | | $ | 72,076,703 | | | $ | 2,666,170 | | | $ | 41,128,158 | |
| Affiliated companies, At cost | | | 14,196,180 | | | | 120,130 | | | | — | | | | 45,017,891 | |
| Investments, At cost | | $ | 44,580,705 | | | $ | 72,196,833 | | | $ | 2,666,170 | | | $ | 86,146,049 | |
| Unaffiliated companies, At value | | $ | 34,574,255 | | | $ | 79,094,634 | | | $ | 2,835,702 | | | $ | 41,128,158 | |
| Affiliated companies, At value | | | 13,963,521 | | | | 120,570 | | | | — | | | | 45,171,249 | |
| Investments, At value | | $ | 48,537,776 | | | $ | 79,215,204 | | | $ | 2,835,702 | | | $ | 86,299,407 | |
| Deposits with brokers: | | | | | | | | | | | | | | | | |
| Futures - Goldman Sachs & Co. LLC | | | 563,863 | | | | 2,831,461 | | | | 172,693 | | | | — | |
| Options - Goldman Sachs & Co. LLC | | | 526,864 | | | | — | | | | — | | | | — | |
| Unrealized appreciation on swap contracts | | | 17,198 | | | | — | | | | — | | | | 366,860 | |
| Variation margin - due from broker | | | 676,470 | | | | 3,343,050 | | | | 1,172 | | | | — | |
| Receivable for swap contracts | | | — | | | | — | | | | — | | | | 13,926 | |
| Receivable for Fund shares sold | | | 23 | | | | 6,097 | | | | — | | | | 42,949 | |
| Receivable for securities sold | | | 1,735,358 | | | | — | | | | — | | | | — | |
| Dividends and interest receivable | | | 3,973 | | | | 1,721 | | | | 17 | | | | 21,284 | |
| Prepaid expenses and other assets | | | 42,706 | | | | 43,833 | | | | 22,991 | | | | 47,141 | |
| TOTAL ASSETS | | | 52,104,231 | | | | 85,441,366 | | | | 3,032,575 | | | | 86,791,567 | |
| | | | | | | | | | | | | | | | | |
| LIABILITIES | | | | | | | | | | | | | | | | |
| Due to broker: Swaps - Morgan Stanley | | | 134,620 | | | | — | | | | — | | | | 2,469,756 | |
| Payable for swap contracts | | | — | | | | — | | | | — | | | | 11,055 | |
| Unrealized depreciation on swap contracts | | | 15,836 | | | | — | | | | — | | | | 278,523 | |
| Payable for investments purchased | | | 1,136,622 | | | | — | | | | — | | | | — | |
| Payable for Fund shares repurchased | | | 77,466 | | | | 25,264 | | | | — | | | | 98,064 | |
| Investment advisory fees payable | | | 39,123 | | | | 70,735 | | | | 2,021 | | | | 61,496 | |
| Distribution (12b-1) fees payable | | | 14,775 | | | | 18,422 | | | | — | | | | 4,353 | |
| Payable to related parties | | | 19,880 | | | | 32,216 | | | | 2,740 | | | | 34,132 | |
| Accrued expenses and other liabilities | | | 29,928 | | | | 46,431 | | | | 29,401 | | | | 35,825 | |
| TOTAL LIABILITIES | | | 1,468,250 | | | | 193,068 | | | | 34,162 | | | | 2,993,204 | |
| NET ASSETS | | $ | 50,635,981 | | | $ | 85,248,298 | | | $ | 2,998,413 | | | $ | 83,798,363 | |
| | | | | | | | | | | | | | | | | |
| Net Assets Consist Of: | | | | | | | | | | | | | | | | |
| | | | | | | | | | | | | | | | | |
| Paid in capital | | $ | 42,947,721 | | | $ | 79,136,337 | | | $ | 5,195,168 | | | $ | 87,678,522 | |
| Accumulated Earnings (Deficit) | | | 7,688,260 | | | | 6,111,961 | | | | (2,196,755 | ) | | | (3,880,159 | ) |
| NET ASSETS | | $ | 50,635,981 | | | $ | 85,248,298 | | | $ | 2,998,413 | | | $ | 83,798,363 | |
| | | | | | | | | | | | | | | | | |
See accompanying notes to consolidated financial statements.
| The Arrow Funds |
| STATEMENTS OF ASSETS AND LIABILITIES (Continued) |
| July 31, 2020 |
| | | | | | | | | | | | Arrow | |
| | | | | | | | | | | | Managed | |
| | | Arrow DWA | | | Arrow DWA | | | Arrow | | | Futures Strategy | |
| | | Balanced Fund | | | Tactical Fund | | | Dynamic | | | Fund | |
| | | (Consolidated) | | | (Consolidated) | | | Income Fund | | | (Consolidated) | |
| Net Asset Value Per Share: | | | | | | | | | | | | | | | | |
| Class A Shares: | | | | | | | | | | | | | | | | |
| Net Assets | | $ | 25,288,693 | | | $ | 17,875,065 | | | $ | 705,897 | | | $ | 7,414,602 | |
| Shares of beneficial interest outstanding ($0 par value, unlimited shares authorized) | | | 1,957,464 | | | | 1,881,534 | | | | 117,822 | | | | 1,248,018 | |
| Net asset value (Net assets ÷ Shares outstanding), and redemption price per share (a) | | $ | 12.92 | | | $ | 9.50 | | | $ | 5.99 | | | $ | 5.94 | |
| Maximum offering price per share (maximum sales charges of 5.75%) (b) | | $ | 13.71 | | | $ | 10.08 | | | $ | 6.36 | | | $ | 6.30 | |
| | | | | | | | | | | | | | | | | |
| Class C Shares: | | | | | | | | | | | | | | | | |
| Net Assets | | $ | 18,612,503 | | | $ | 21,539,453 | | | $ | 820,899 | | | $ | 2,379,181 | |
| Shares of beneficial interest outstanding ($0 par value, unlimited shares authorized) | | | 1,565,024 | | | | 2,462,065 | | | | 145,334 | | | | 424,142 | |
| Net asset value (Net assets ÷ Shares outstanding), offering price and redemption price per share(a) | | $ | 11.89 | | | $ | 8.75 | | | $ | 5.65 | | | $ | 5.61 | |
| | | | | | | | | | | | | | | | | |
| Institutional Class Shares: | | | | | | | | | | | | | | | | |
| Net Assets | | $ | 6,734,785 | | | $ | 45,833,780 | | | $ | 1,471,617 | | | $ | 74,004,580 | |
| Shares of beneficial interest outstanding ($0 par value, unlimited shares authorized) | | | 512,128 | | | | 4,793,437 | | | | 242,481 | | | | 12,313,493 | |
| Net asset value (Net assets ÷ Shares outstanding), offering price and redemption price per share(a) | | $ | 13.15 | | | $ | 9.56 | | | $ | 6.07 | | | $ | 6.01 | |
| | | | | | | | | | | | | | | | | |
| (a) | For each of the Funds, except Arrow Dynamic Income Fund, redemptions of shares held less than 30 days may be assessed a redemption fee of 1.00%. |
| (b) | For certain purchases of $1 million or more, a 1% contingent deferred sales charge may apply to redemptions made within 18 months of purchase, where the maximum sales charge of 5.75% is waived at the time of purchase. |
See accompanying notes to consolidated financial statements.
| The Arrow Funds |
| STATEMENTS OF OPERATIONS |
| For the Year Ended July 31, 2020 |
| | | | | | | | | | | | Arrow Managed | |
| | | Arrow DWA | | | Arrow DWA | | | Arrow | | | Futures Strategy | |
| | | Balanced Fund | | | Tactical Fund | | | Dynamic | | | Fund | |
| | | (Consolidated) | | | (Consolidated) | | | Income Fund | | | (Consolidated) | |
| INVESTMENT INCOME | | | | | | | | | | | | | | | | |
| Dividends from unaffiliated companies | | $ | 688,641 | | | $ | 1,737,559 | | | $ | 156,000 | | | $ | — | |
| Dividends from affiliated companies | | | 224,632 | | | | 2,438 | | | | 47,317 | | | | 811,395 | |
| Interest | | | 63,679 | | | | 124,421 | | | | 22,756 | | | | 755,190 | |
| TOTAL INVESTMENT INCOME | | | 976,952 | | | | 1,864,418 | | | | 226,073 | | | | 1,566,585 | |
| | | | | | | | | | | | | | | | | |
| EXPENSES | | | | | | | | | | | | | | | | |
| Investment advisory fees | | | 545,828 | | | | 1,020,800 | | | | 56,683 | | | | 875,026 | |
| Distribution (12b-1) fees, Class C | | | 202,367 | | | | 264,070 | | | | 7,665 | | | | 33,836 | |
| Distribution (12b-1) fees, Class A | | | 64,932 | | | | 50,225 | | | | 2,855 | | | | 24,805 | |
| Administrative services fees | | | 62,070 | | | | 102,079 | | | | 13,045 | | | | 107,345 | |
| Registration fees | | | 55,149 | | | | 67,878 | | | | 48,596 | | | | 58,846 | |
| Third Party Administrative Servicing Fees | | | 48,607 | | | | 117,636 | | | | 6,852 | | | | 41,545 | |
| Transfer agent fees | | | 41,013 | | | | 69,849 | | | | 14,386 | | | | 75,654 | |
| Professional fees | | | 35,965 | | | | 40,361 | | | | 25,784 | | | | 42,267 | |
| Accounting services fees | | | 25,772 | | | | 48,270 | | | | 3,313 | | | | 50,842 | |
| Custodian fees | | | 20,227 | | | | 12,871 | | | | 9,586 | | | | 29,839 | |
| Printing and postage expenses | | | 15,088 | | | | 22,630 | | | | 4,278 | | | | 17,334 | |
| Compliance officer fees | | | 4,433 | | | | 8,363 | | | | 534 | | | | 8,693 | |
| Trustees’ fees and expenses | | | 3,647 | | | | 4,284 | | | | 5,236 | | | | 5,862 | |
| Insurance expense | | | 3,409 | | | | 6,517 | | | | 1,870 | | | | 4,502 | |
| Other expenses | | | 2,150 | | | | 2,931 | | | | 2,176 | | | | 2,990 | |
| TOTAL EXPENSES | | | 1,130,657 | | | | 1,838,764 | | | | 202,859 | | | | 1,379,386 | |
| Less: Fees waived | | | (7,192 | ) | | | (69 | ) | | | (1,102 | ) | | | (23,007 | ) |
| NET EXPENSES | | | 1,123,465 | | | | 1,838,695 | | | | 201,757 | | | | 1,356,379 | |
| | | | | | | | | | | | | | | | | |
| NET INVESTMENT INCOME (LOSS) | | | (146,513 | ) | | | 25,723 | | | | 24,316 | | | | 210,206 | |
| | | | | | | | | | | | | | | | | |
| REALIZED AND UNREALIZED GAIN (LOSS) | | | | | | | | | | | | | | | | |
| Net realized gain/(loss) from: | | | | | | | | | | | | | | | | |
| Security transactions, unaffiliated companies | | | 5,177,533 | | | | (2,780,998 | ) | | | (414,189 | ) | | | 19,977 | |
| Security transactions, affiliated companies | | | (1,614,649 | ) | | | 49 | | | | 12,836 | | | | (10,206 | ) |
| Futures contracts | | | 374,132 | | | | (246,363 | ) | | | 28,630 | | | | — | |
| Swap contracts | | | (574,697 | ) | | | — | | | | (284,954 | ) | | | (11,259,312 | ) |
| Written options | | | 57,650 | | | | — | | | | — | | | | — | |
| | | | 3,419,969 | | | | (3,027,312 | ) | | | (657,677 | ) | | | (11,249,541 | ) |
| Net change in unrealized appreciation/(depreciation) of: | | | | | | | | | | | | | | | | |
| Securities and foreign currency translations, Securities, unaffiliated companies | | | (269,934 | ) | | | (193,229 | ) | | | 147,285 | | | | 23,204 | |
| Securities, affiliated companies | | | 1,000,271 | | | | 159 | | | | (19,787 | ) | | | 93,239 | |
| Futures contracts | | | 516,952 | | | | 3,343,050 | | | | (40,078 | ) | | | — | |
| Swap contracts | | | (75,372 | ) | | | — | | | | 26,833 | | | | (1,235,463 | ) |
| Written Options | | | 311,580 | | | | — | | | | — | | | | — | |
| | | | 1,483,497 | | | | 3,149,980 | | | | 114,253 | | | | (1,119,020 | ) |
| | | | | | | | | | | | | | | | | |
| NET REALIZED AND UNREALIZED GAIN (LOSS) | | | 4,903,466 | | | | 122,668 | | | | (543,424 | ) | | | (12,368,561 | ) |
| | | | | | | | | | | | | | | | | |
| NET INCREASE (DECREASE) IN NET ASSETS RESULTING FROM OPERATIONS | | $ | 4,756,953 | | | $ | 148,391 | | | $ | (519,108 | ) | | $ | (12,158,355 | ) |
| | | | | | | | | | | | | | | | | |
See accompanying notes to consolidated financial statements.
| Arrow DWA Balanced Fund |
| CONSOLIDATED STATEMENTS OF CHANGES IN NET ASSETS |
| | | For the | | | For the | |
| | | Year Ended | | | Year Ended | |
| | | July 31, 2020 | | | July 31, 2019 | |
| FROM OPERATIONS | | | | | | | | |
| Net investment income (loss) | | $ | (146,513 | ) | | $ | 68,305 | |
| Net realized gain from securities, futures contracts, written options and swap contracts | | | 3,419,969 | | | | 2,271,006 | |
| Net change in unrealized appreciation (depreciation) of securities, futures contracts, written options and swap contracts | | | 1,483,497 | | | | (2,904,141 | ) |
| Net increase (decrease) in net assets resulting from operations | | | 4,756,953 | | | | (564,830 | ) |
| | | | | | | | | |
| DISTRIBUTIONS TO SHAREHOLDERS | | | | | | | | |
| Total Distributions Paid: | | | | | | | | |
| Class A | | | (531,470 | ) | | | (2,149,514 | ) |
| Class C | | | (182,787 | ) | | | (3,046,461 | ) |
| Institutional Class | | | (216,759 | ) | | | (1,046,865 | ) |
| Net decrease in net assets from distributions to shareholders | | | (931,016 | ) | | | (6,242,840 | ) |
| | | | | | | | | |
| FROM SHARES OF BENEFICIAL INTEREST | | | | | | | | |
| Proceeds from shares sold: | | | | | | | | |
| Class A | | | 2,064,278 | | | | 6,988,534 | |
| Class C | | | 691,912 | | | | 548,356 | |
| Institutional Class | | | 2,173,724 | | | | 6,808,430 | |
| Net asset value of shares issued in reinvestment of distributions: | | | | | | | | |
| Class A | | | 482,056 | | | | 1,888,758 | |
| Class C | | | 175,195 | | | | 2,768,528 | |
| Institutional Class | | | 205,590 | | | | 977,486 | |
| Redemption fee proceeds: | | | | | | | | |
| Class A | | | 1 | | | | 25 | |
| Class C | | | — | | | | 27 | |
| Institutional Class | | | — | | | | 8 | |
| Payments for shares redeemed: | | | | | | | | |
| Class A | | | (8,923,711 | ) | | | (14,874,033 | ) |
| Class C | | | (7,334,763 | ) | | | (19,049,638 | ) |
| Institutional Class | | | (6,795,969 | ) | | | (7,032,050 | ) |
| Net decrease in net assets from shares of beneficial interest | | | (17,261,687 | ) | | | (20,975,569 | ) |
| | | | | | | | | |
| TOTAL DECREASE IN NET ASSETS | | | (13,435,750 | ) | | | (27,783,239 | ) |
| | | | | | | | | |
| NET ASSETS | | | | | | | | |
| Beginning of Year | | | 64,071,731 | | | | 91,854,970 | |
| End of Year | | $ | 50,635,981 | | | $ | 64,071,731 | |
| | | | | | | | | |
See accompanying notes to consolidated financial statements.
| Arrow DWA Balanced Fund |
| CONSOLIDATED STATEMENTS OF CHANGES IN NET ASSETS (Continued) |
| | | For the | | | For the | |
| | | Year Ended | | | Year Ended | |
| | | July 31, 2020 | | | July 31, 2019 | |
| SHARE ACTIVITY - Class A | | | | | | | | |
| Shares Sold | | | 172,725 | | | | 594,355 | |
| Shares Reinvested | | | 41,664 | | | | 178,185 | |
| Shares Redeemed | | | (760,397 | ) | | | (1,247,334 | ) |
| Net decrease in shares of beneficial interest outstanding | | | (546,008 | ) | | | (474,794 | ) |
| | | | | | | | | |
| SHARE ACTIVITY - Class C | | | | | | | | |
| Shares Sold | | | 63,363 | | | | 51,755 | |
| Shares Reinvested | | | 16,373 | | | | 283,661 | |
| Shares Redeemed | | | (671,079 | ) | | | (1,764,659 | ) |
| Net decrease in shares of beneficial interest outstanding | | | (591,343 | ) | | | (1,429,243 | ) |
| | | | | | | | | |
| SHARE ACTIVITY - Institutional Class | | | | | | | | |
| Shares Sold | | | 179,756 | | | | 560,079 | |
| Shares Reinvested | | | 17,482 | | | | 90,760 | |
| Shares Redeemed | | | (568,293 | ) | | | (595,457 | ) |
| Net increase (decrease) in shares of beneficial interest outstanding | | | (371,055 | ) | | | 55,382 | |
| | | | | | | | | |
See accompanying notes to consolidated financial statements.
| Arrow DWA Tactical Fund |
| CONSOLIDATED STATEMENTS OF CHANGES IN NET ASSETS |
| | | For the | | | For the | |
| | | Year Ended | | | Year Ended | |
| | | July 31, 2020 | | | July 31, 2019 | |
| FROM OPERATIONS | | | | | | | | |
| Net investment income | | $ | 25,723 | | | $ | 266,261 | |
| Net realized gain (loss) from securities and futures contracts | | | (3,027,312 | ) | | | 419,309 | |
| Net change in unrealized appreciation (depreciation) of securities and futures contracts | | | 3,149,980 | | | | (9,719,978 | ) |
| Net increase (decrease) in net assets resulting from operations | | | 148,391 | | | | (9,034,408 | ) |
| | | | | | | | | |
| DISTRIBUTIONS TO SHAREHOLDERS | | | | | | | | |
| Total Distributions Paid: | | | | | | | | |
| Class A | | | (1,316,461 | ) | | | (1,100,038 | ) |
| Class C | | | (1,778,148 | ) | | | (1,530,685 | ) |
| Institutional Class | | | (4,263,848 | ) | | | (2,852,344 | ) |
| Net decrease in net assets from distributions to shareholders | | | (7,358,457 | ) | | | (5,483,067 | ) |
| | | | | | | | | |
| FROM SHARES OF BENEFICIAL INTEREST | | | | | | | | |
| Proceeds from shares sold: | | | | | | | | |
| Class A | | | 2,965,758 | | | | 3,969,127 | |
| Class C | | | 388,544 | | | | 1,350,894 | |
| Institutional Class | | | 8,811,388 | | | | 14,471,795 | |
| Net asset value of shares issued in reinvestment of distributions: | | | | | | | | |
| Class A | | | 1,129,944 | | | | 957,172 | |
| Class C | | | 1,695,730 | | | | 1,455,365 | |
| Institutional Class | | | 4,141,521 | | | | 2,775,833 | |
| Redemption fee proceeds: | | | | | | | | |
| Class A | | | 5,450 | | | | 154 | |
| Class C | | | 4 | | | | 6 | |
| Institutional Class | | | 197 | | | | 1,741 | |
| Payments for shares redeemed: | | | | | | | | |
| Class A | | | (10,645,723 | ) | | | (15,274,461 | ) |
| Class C | | | (10,363,742 | ) | | | (13,640,311 | ) |
| Institutional Class | | | (26,350,730 | ) | | | (36,376,017 | ) |
| Net decrease in net assets from shares of beneficial interest | | | (28,221,659 | ) | | | (40,308,702 | ) |
| | | | | | | | | |
| TOTAL DECREASE IN NET ASSETS | | | (35,431,725 | ) | | | (54,826,177 | ) |
| | | | | | | | | |
| NET ASSETS | | | | | | | | |
| Beginning of Year | | | 120,680,023 | | | | 175,506,200 | |
| End of Year | | $ | 85,248,298 | | | $ | 120,680,023 | |
| | | | | | | | | |
See accompanying notes to consolidated financial statements.
| Arrow DWA Tactical Fund |
| CONSOLIDATED STATEMENTS OF CHANGES IN NET ASSETS (Continued) |
| | | For the | | | For the | |
| | | Year Ended | | | Year Ended | |
| | | July 31, 2020 | | | July 31, 2019 | |
| SHARE ACTIVITY - Class A | | | | | | | | |
| Shares Sold | | | 325,467 | | | | 377,547 | |
| Shares Reinvested | | | 116,971 | | | | 107,849 | |
| Shares Redeemed | | | (1,112,934 | ) | | | (1,554,191 | ) |
| Net decrease in shares of beneficial interest outstanding | | | (670,496 | ) | | | (1,068,795 | ) |
| | | | | | | | | |
| SHARE ACTIVITY - Class C | | | | | | | | |
| Shares Sold | | | 43,690 | | | | 141,621 | |
| Shares Reinvested | | | 189,679 | | | | 176,390 | |
| Shares Redeemed | | | (1,213,032 | ) | | | (1,492,470 | ) |
| Net decrease in shares of beneficial interest outstanding | | | (979,663 | ) | | | (1,174,459 | ) |
| | | | | | | | | |
| SHARE ACTIVITY - Institutional Class | | | | | | | | |
| Shares Sold | | | 899,697 | | | | 1,455,224 | |
| Shares Reinvested | | | 426,521 | | | | 310,889 | |
| Shares Redeemed | | | (2,888,142 | ) | | | (3,726,184 | ) |
| Net decrease in shares of beneficial interest outstanding | | | (1,561,924 | ) | | | (1,960,071 | ) |
| | | | | | | | | |
See accompanying notes to consolidated financial statements.
| Arrow Dynamic Income Fund |
| STATEMENTS OF CHANGES IN NET ASSETS |
| | | For the | | | For the | |
| | | Year Ended | | | Year Ended | |
| | | July 31, 2020 | | | July 31, 2019 | |
| FROM OPERATIONS | | | | | | | | |
| Net investment income | | $ | 24,316 | | | $ | 702,001 | |
| Net realized loss from securities, futures contracts and swap contracts | | | (657,677 | ) | | | (1,341,718 | ) |
| Net change in unrealized appreciation of securities, futures contracts and swap contracts | | | 114,253 | | | | 335,106 | |
| Net decrease in net assets resulting from operations | | | (519,108 | ) | | | (304,611 | ) |
| | | | | | | | | |
| DISTRIBUTIONS TO SHAREHOLDERS | | | | | | | | |
| Total Distributions Paid: | | | | | | | | |
| Class A | | | (70,768 | ) | | | (42,255 | ) |
| Class C | | | (36,498 | ) | | | (23,911 | ) |
| Institutional Class | | | (310,868 | ) | | | (517,387 | ) |
| Net decrease in net assets from distributions to shareholders | | | (418,134 | ) | | | (583,553 | ) |
| | | | | | | | | |
| FROM SHARES OF BENEFICIAL INTEREST | | | | | | | | |
| Proceeds from shares sold: | | | | | | | | |
| Class A | | | 297,187 | | | | 560,808 | |
| Class C | | | 569,224 | | | | 70,722 | |
| Institutional Class | | | 458,557 | | | | 2,628,672 | |
| Net asset value of shares issued in reinvestment of distributions: | | | | | | | | |
| Class A | | | 63,759 | | | | 32,956 | |
| Class C | | | 32,282 | | | | 23,423 | |
| Class I | | | 298,502 | | | | 508,416 | |
| Payments for shares redeemed: | | | | | | | | |
| Class A | | | (923,854 | ) | | | (1,499,164 | ) |
| Class C | | | (953,241 | ) | | | (341,688 | ) |
| Institutional Class | | | (15,138,087 | ) | | | (12,128,808 | ) |
| Net decrease in net assets from shares of beneficial interest | | | (15,295,671 | ) | | | (10,144,663 | ) |
| | | | | | | | | |
| TOTAL DECREASE IN NET ASSETS | | | (16,232,913 | ) | | | (11,032,827 | ) |
| | | | | | | | | |
| NET ASSETS | | | | | | | | |
| Beginning of Year | | | 19,231,326 | | | | 30,264,153 | |
| End of Year | | $ | 2,998,413 | | | $ | 19,231,326 | |
| | | | | | | | | |
See accompanying notes to consolidated financial statements.
| Arrow Dynamic Income Fund |
| STATEMENTS OF CHANGES IN NET ASSETS (Continued) |
| | | For the | | | For the | |
| | | Year Ended | | | Year Ended | |
| | | July 31, 2020 | | | July 31, 2019 | |
| SHARE ACTIVITY - Class A | | | | | | | | |
| Shares Sold | | | 40,887 | | | | 71,358 | |
| Shares Reinvested | | | 8,359 | | | | 4,239 | |
| Shares Redeemed | | | (135,697 | ) | | | (191,668 | ) |
| Net decrease in shares of beneficial interest outstanding | | | (86,451 | ) | | | (116,071 | ) |
| | | | | | | | | |
| SHARE ACTIVITY - Class C | | | | | | | | |
| Shares Sold | | | 92,587 | | | | 9,437 | |
| Shares Reinvested | | | 4,466 | | | | 3,173 | |
| Shares Redeemed | | | (131,664 | ) | | | (46,113 | ) |
| Net decrease in shares of beneficial interest outstanding | | | (34,611 | ) | | | (33,503 | ) |
| | | | | | | | | |
| SHARE ACTIVITY - Institutional Class | | | | | | | | |
| Shares Sold | | | 58,944 | | | | 332,559 | |
| Shares Reinvested | | | 38,629 | | | | 64,779 | |
| Shares Redeemed | | | (1,976,351 | ) | | | (1,557,150 | ) |
| Net decrease in shares of beneficial interest outstanding | | | (1,878,778 | ) | | | (1,159,812 | ) |
| | | | | | | | | |
See accompanying notes to consolidated financial statements.
| Arrow Managed Futures Strategy Fund |
| CONSOLIDATED STATEMENTS OF CHANGES IN NET ASSETS |
| | | For the | | | For the | |
| | | Year Ended | | | Year Ended | |
| | | July 31, 2020 | | | July 31, 2019 | |
| FROM OPERATIONS | | | | | | | | |
| Net investment income | | $ | 210,206 | | | $ | 1,009,437 | |
| Net realized gain (loss) from securities and swap contracts | | | (11,249,541 | ) | | | 11,033,848 | |
| Net change in unrealized appreciation (depreciation) of securities and swap contracts | | | (1,119,020 | ) | | | 1,738,908 | |
| Net increase (decrease) in net assets resulting from operations | | | (12,158,355 | ) | | | 13,782,193 | |
| | | | | | | | | |
| DISTRIBUTIONS TO SHAREHOLDERS | | | | | | | | |
| Total Distributions Paid: | | | | | | | | |
| Class A | | | (1,200,178 | ) | | | (2,469,880 | ) |
| Class C | | | (430,061 | ) | | | (651,141 | ) |
| Class I | | | (10,713,448 | ) | | | (12,581,265 | ) |
| Net decrease in net assets from distributions to shareholders | | | (12,343,687 | ) | | | (15,702,286 | ) |
| | | | | | | | | |
| FROM SHARES OF BENEFICIAL INTEREST | | | | | | | | |
| Proceeds from shares sold: | | | | | | | | |
| Class A | | | 3,138,571 | | | | 7,608,195 | |
| Class C | | | 989,196 | | | | 579,392 | |
| Institutional Class | | | 39,163,676 | | | | 40,220,893 | |
| Net asset value of shares issued in reinvestment of distributions: | | | | | | | | |
| Class A | | | 1,184,086 | | | | 2,190,197 | |
| Class C | | | 382,481 | | | | 610,664 | |
| Class I | | | 10,143,343 | | | | 12,046,587 | |
| Redemption fee proceeds: | | | | | | | | |
| Class A | | | 778 | | | | 552 | |
| Class C | | | 52 | | | | — | |
| Institutional Class | | | 5,425 | | | | 775 | |
| Payments for shares redeemed: | | | | | | | | |
| Class A | | | (7,089,726 | ) | | | (21,657,437 | ) |
| Class C | | | (2,487,664 | ) | | | (2,237,400 | ) |
| Institutional Class | | | (64,619,653 | ) | | | (20,765,508 | ) |
| Net increase (decrease) in net assets from shares of beneficial interest | | | (19,189,435 | ) | | | 18,596,910 | |
| | | | | | | | | |
| TOTAL INCREASE (DECREASE) IN NET ASSETS | | | (43,691,477 | ) | | | 16,676,817 | |
| | | | | | | | | |
| NET ASSETS | | | | | | | | |
| Beginning of Year | | | 127,489,840 | | | | 110,813,023 | |
| End of Year | | $ | 83,798,363 | | | $ | 127,489,840 | |
| | | | | | | | | |
See accompanying notes to consolidated financial statements.
| Arrow Managed Futures Strategy Fund |
| CONSOLIDATED STATEMENTS OF CHANGES IN NET ASSETS (Continued) |
| | | For the | | | For the | |
| | | Year Ended | | | Year Ended | |
| | | July 31, 2020 | | | July 31, 2019 | |
| SHARE ACTIVITY - Class A | | | | | | | | |
| Shares Sold | | | 477,168 | | | | 1,171,057 | |
| Shares Reinvested | | | 160,621 | | | | 336,144 | |
| Shares Redeemed | | | (1,090,032 | ) | | | (3,145,118 | ) |
| Net decrease in shares of beneficial interest outstanding | | | (452,243 | ) | | | (1,637,917 | ) |
| | | | | | | | | |
| SHARE ACTIVITY - Class C | | | | | | | | |
| Shares Sold | | | 161,455 | | | | 86,596 | |
| Shares Reinvested | | | 54,562 | | | | 97,692 | |
| Shares Redeemed | | | (412,501 | ) | | | (334,243 | ) |
| Net decrease in shares of beneficial interest outstanding | | | (196,484 | ) | | | (149,955 | ) |
| | | | | | | | | |
| SHARE ACTIVITY - Institutional Class | | | | | | | | |
| Shares Sold | | | 5,901,955 | | | | 5,763,105 | |
| Shares Reinvested | | | 1,364,275 | | | | 1,823,991 | |
| Shares Redeemed | | | (9,826,868 | ) | | | (3,053,487 | ) |
| Net increase/(decrease) in shares of beneficial interest outstanding | | | (2,560,638 | ) | | | 4,533,609 | |
| | | | | | | | | |
See accompanying notes to consolidated financial statements.
| Arrow DWA Balanced Fund |
| CONSOLIDATED FINANCIAL HIGHLIGHTS |
| |
| Per Share Data and Ratios for a Share of Beneficial Interest Outstanding Throughout Each Year |
| | | Year | | | Year | | | Year | | | Year | | | Year | |
| | | Ended | | | Ended | | | Ended | | | Ended | | | Ended | |
| | | July 31, | | | July 31, | | | July 31, | | | July 31, | | | July 31, | |
| Class A Shares | | 2020 | | | 2019 | | | 2018 | | | 2017 | | | 2016 | |
| Net asset value, beginning of year | | $ | 11.91 | | | $ | 12.84 | | | $ | 13.03 | | | $ | 12.88 | | | $ | 13.59 | |
| Activity from investment operations: | | | | | | | | | | | | | | | | | | | | |
| Net investment income (loss) (1) | | | (0.00 | ) (3) | | | 0.04 | | | | 0.03 | | | | 0.02 | | | | 0.01 | |
| Net realized and unrealized gain (loss) on investments | | | 1.25 | | | | 0.00 | (3) | | | 0.71 | | | | 0.13 | (6) | | | (0.02 | ) |
| Total from investment operations | | | 1.25 | | | | 0.04 | | | | 0.74 | | | | 0.15 | | | | (0.01 | ) |
| Paid-in-capital from redemption fees (3) | | | 0.00 | | | | 0.00 | | | | 0.00 | | | | 0.00 | | | | 0.00 | |
| Less distributions from: | | | | | | | | | | | | | | | | | | | | |
| Net investment income | | | (0.15 | ) | | | — | | | | — | | | | — | | | | — | |
| Net realized gains | | | (0.09 | ) | | | (0.97 | ) | | | (0.93 | ) | | | — | | | | (0.70 | ) |
| Total distributions | | | (0.24 | ) | | | (0.97 | ) | | | (0.93 | ) | | | — | | | | (0.70 | ) |
| Net asset value, end of year | | $ | 12.92 | | | $ | 11.91 | | | $ | 12.84 | | | $ | 13.03 | | | $ | 12.88 | |
| Total return (2) | | | 10.72 | % | | | 1.22 | % | | | 5.69 | % | | | 1.16 | % | | | 0.12 | % |
| Net assets, end of year (000s) | | $ | 25,289 | | | $ | 29,818 | | | $ | 38,242 | | | $ | 47,343 | | | $ | 69,000 | |
| Ratio of gross expenses to average net assets (4)(7) | | | 1.83 | % | | | 1.73 | % | | | 1.60 | % | | | 1.56 | % | | | 1.55 | % |
| Ratio of net expenses to average net assets (4) | | | 1.82 | % | | | 1.72 | % | | | 1.57 | % | | | 1.51 | % | | | 1.55 | % |
| Ratio of net investment income (loss) to average net assets (4)(5) | | | (0.04 | )% | | | 0.34 | % | | | 0.19 | % | | | 0.17 | % | | | 0.70 | % |
| Portfolio Turnover Rate | | | 124 | % | | | 121 | % | | | 115 | % | | | 169 | % | | | 84 | % |
| | | | | | | | | | | | | | | | | | | | | |
| (1) | Per share amounts calculated using the average shares method, which more appropriately presents the per share data for the year. |
| (2) | Total returns shown exclude the effect of applicable sales loads/redemption fees. |
| (3) | Amount represents less than $0.01 per share. |
| (4) | Does not include the expenses of other investment companies in which the Fund invests. |
| (5) | Recognition of investment income by the Fund is affected by the timing and declaration of dividends by the underlying investment companies in which the Fund invests. |
| (6) | As required by SEC standard per share data calculation methodology, this represents a balancing figure derived from the other amounts in the financial highlights tables that captures all other changes affecting net asset value per share. This per share gain amount does not correlate to the aggregate of the net realized and unrealized gain in the Consolidated Statement of Operations for the year ended July 31, 2017, primarily due to the timing of sales and repurchases of the Fund’s shares in relation to fluctuating market values of the Fund’s portfolio. |
| (7) | Represents the ratio of expenses to average net assets absent fee waiver and/or expense reimbursements by the Arrow Investment Advisors, LLC. |
See accompanying notes to consolidated financial statements.
| Arrow DWA Balanced Fund |
| CONSOLIDATED FINANCIAL HIGHLIGHTS |
| |
| Per Share Data and Ratios for a Share of Beneficial Interest Outstanding Throughout Each Year |
| | | Year | | | Year | | | Year | | | Year | | | Year | |
| | | Ended | | | Ended | | | Ended | | | Ended | | | Ended | |
| | | July 31, | | | July 31, | | | July 31, | | | July 31, | | | July 31, | |
| Class C Shares | | 2020 | | | 2019 | | | 2018 | | | 2017 | | | 2016 | |
| Net asset value, beginning of year | | $ | 10.92 | | | $ | 11.95 | | | $ | 12.27 | | | $ | 12.22 | | | $ | 13.03 | |
| Activity from investment operations: | | | | | | | | | | | | | | | | | | | | |
| Net investment loss (1) | | | (0.09 | ) | | | (0.04 | ) | | | (0.07 | ) | | | (0.07 | ) | | | (0.08 | ) |
| Net realized and unrealized gain (loss) on investments | | | 1.16 | | | | (0.02 | ) | | | 0.68 | | | | 0.12 | (6) | | | (0.03 | ) |
| Total from investment operations | | | 1.07 | | | | (0.06 | ) | | | 0.61 | | | | 0.05 | | | | (0.11 | ) |
| Paid-in-capital from redemption fees | | | — | | | | 0.00 | (3) | | | 0.00 | (3) | | | 0.00 | (3) | | | 0.00 | (3) |
| Less distributions from: | | | | | | | | | | | | | | | | | | | | |
| Net investment income | | | (0.01 | ) | | | — | | | | — | | | | — | | | | — | |
| Net realized gains | | | (0.09 | ) | | | (0.97 | ) | | | (0.93 | ) | | | — | | | | (0.70 | ) |
| Total distributions | | | (0.10 | ) | | | (0.97 | ) | | | (0.93 | ) | | | — | | | | (0.70 | ) |
| Net asset value, end of year (000s) | | $ | 11.89 | | | $ | 10.92 | | | $ | 11.95 | | | $ | 12.27 | | | $ | 12.22 | |
| Total return (2) | | | 9.87 | % | | | 0.43 | % | | | 4.95 | % | | | 0.41 | % | | | (0.67 | )% |
| Net assets, end of year | | $ | 18,613 | | | $ | 23,547 | | | $ | 42,837 | | | $ | 55,091 | | | $ | 81,689 | |
| Ratio of gross expenses to average net assets (4)(7) | | | 2.58 | % | | | 2.48 | % | | | 2.35 | % | | | 2.31 | % | | | 2.30 | % |
| Ratio of net expenses to average net assets (4) | | | 2.57 | % | | | 2.47 | % | | | 2.32 | % | | | 2.26 | % | | | 2.30 | % |
| Ratio of net investment loss to average net assets (4)(5) | | | (0.79 | )% | | | (0.35 | )% | | | (0.55 | )% | | | (0.57 | )% | | | (0.66 | )% |
| Portfolio Turnover Rate | | | 124 | % | | | 121 | % | | | 115 | % | | | 169 | % | | | 84 | % |
| | | | | | | | | | | | | | | | | | | | | |
| (1) | Per share amounts calculated using the average shares method, which more appropriately presents the per share data for the year. |
| (2) | Total returns shown exclude the effect of applicable sales loads/redemption fees. |
| (3) | Amount represents less than $0.01 per share. |
| (4) | Does not include the expenses of other investment companies in which the Fund invests. |
| (5) | Recognition of investment income by the Fund is affected by the timing and declaration of dividends by the underlying investment companies in which the Fund invests. |
| (6) | As required by SEC standard per share data calculation methodology, this represents a balancing figure derived from the other amounts in the financial highlights tables that captures all other changes affecting net asset value per share. This per share gain amount does not correlate to the aggregate of the net realized and unrealized gain in the Consolidated Statement of Operations for the year ended July 31, 2017, primarily due to the timing of sales and repurchases of the Fund’s shares in relation to fluctuating market values of the Fund’s portfolio. |
| (7) | Represents the ratio of expenses to average net assets absent fee waiver and/or expense reimbursements by the Arrow Investment Advisors, LLC. |
See accompanying notes to consolidated financial statements.
| Arrow DWA Balanced Fund |
| CONSOLIDATED FINANCIAL HIGHLIGHTS |
| |
| Per Share Data and Ratios for a Share of Beneficial Interest Outstanding Throughout Each Year |
| | | Year | | | Year | | | Year | | | Year | | | Year | |
| | | Ended | | | Ended | | | Ended | | | Ended | | | Ended | |
| | | July 31, | | | July 31, | | | July 31, | | | July 31, | | | July 31, | |
| Institutional Class Shares | | 2020 | | | 2019 | | | 2018 | | | 2017 | | | 2016 | |
| Net asset value, beginning of year | | $ | 12.12 | | | $ | 13.02 | | | $ | 13.16 | | | $ | 12.98 | | | $ | 13.66 | |
| Activity from investment operations: | | | | | | | | | | | | | | | | | | | | |
| Net investment income (1) | | | 0.03 | | | | 0.09 | | | | 0.06 | | | | 0.05 | | | | 0.04 | |
| Net realized and unrealized gain (loss) on investments | | | 1.27 | | | | (0.02 | ) | | | 0.73 | | | | 0.13 | (6) | | | (0.02 | ) |
| Total from investment operations | | | 1.30 | | | | 0.07 | | | | 0.79 | | | | 0.18 | | | | 0.02 | |
| Paid-in-capital from redemption fees | | | — | | | | 0.00 | (3) | | | 0.00 | (3) | | | 0.00 | (3) | | | 0.00 | (3) |
| Less distributions from: | | | | | | | | | | | | | | | | | | | | |
| Net investment income | | | (0.18 | ) | | | — | | | | — | | | | — | | | | — | |
| Net realized gains | | | (0.09 | ) | | | (0.97 | ) | | | (0.93 | ) | | | — | | | | (0.70 | ) |
| Total distributions | | | (0.27 | ) | | | (0.97 | ) | | | (0.93 | ) | | | — | | | | (0.70 | ) |
| Net asset value, end of year | | $ | 13.15 | | | $ | 12.12 | | | $ | 13.02 | | | $ | 13.16 | | | $ | 12.98 | |
| Total return (2) | | | 11.02 | % | | | 1.44 | % | | | 6.02 | % | | | 1.39 | % | | | 0.35 | % |
| Net assets, end of year (000s) | | $ | 6,735 | | | $ | 10,707 | | | $ | 10,776 | | | $ | 14,699 | | | $ | 22,872 | |
| Ratio of gross expenses to average net assets (4)(7) | | | 1.58 | % | | | 1.48 | % | | | 1.35 | % | | | 1.31 | % | | | 1.30 | % |
| Ratio of net expenses to average net assets (4) | | | 1.57 | % | | | 1.47 | % | | | 1.32 | % | | | 1.26 | % | | | 1.30 | % |
| Ratio of net investment income to average net assets (4)(5) | | | 0.27 | % | | | 0.74 | % | | | 0.44 | % | | | 0.43 | % | | | 0.31 | % |
| Portfolio Turnover Rate | | | 124 | % | | | 121 | % | | | 115 | % | | | 169 | % | | | 84 | % |
| | | | | | | | | | | | | | | | | | | | | |
| (1) | Per share amounts calculated using the average shares method, which more appropriately presents the per share data for the year. |
| (2) | Total returns shown exclude the effect of applicable sales loads/redemption fees. |
| (3) | Amount represents less than $0.01 per share. |
| (4) | Does not include the expenses of other investment companies in which the Fund invests. |
| (5) | Recognition of investment income by the Fund is affected by the timing and declaration of dividends by the underlying investment companies in which the Fund invests. |
| (6) | As required by SEC standard per share data calculation methodology, this represents a balancing figure derived from the other amounts in the financial highlights tables that captures all other changes affecting net asset value per share. This per share gain amount does not correlate to the aggregate of the net realized and unrealized gain in the Consolidated Statement of Operations for the year ended July 31, 2017, primarily due to the timing of sales and repurchases of the Fund’s shares in relation to fluctuating market values of the Fund’s portfolio. |
| (7) | Represents the ratio of expenses to average net assets absent fee waiver and/or expense reimbursements by the Arrow Investment Advisors, LLC. |
See accompanying notes to consolidated financial statements.
| Arrow DWA Tactical Fund |
| CONSOLIDATED FINANCIAL HIGHLIGHTS |
| |
| Per Share Data and Ratios for a Share of Beneficial Interest Outstanding Throughout Each Year |
| | | Year | | | Year | | | Year | | | Year | | | Year | |
| | | Ended | | | Ended | | | Ended | | | Ended | | | Ended | |
| | | July 31, | | | July 31, | | | July 31, | | | July 31, | | | July 31, | |
| Class A Shares | | 2020 | | | 2019 | | | 2018 | | | 2017 | | | 2016 | |
| Net asset value, beginning of year | | $ | 9.94 | | | $ | 10.77 | | | $ | 10.70 | | | $ | 10.41 | | | $ | 11.01 | |
| Activity from investment operations: | | | | | | | | | | | | | | | | | | | | |
| Net investment income (1) | | | 0.01 | | | | 0.02 | | | | 0.00 | (3) | | | 0.06 | | | | 0.03 | |
| Net realized and unrealized gain (loss) on investments | | | 0.20 | | | | (0.49 | ) | | | 1.07 | | | | 0.54 | | | | (0.02 | ) |
| Total from investment operations | | | 0.21 | | | | (0.47 | ) | | | 1.07 | | | | 0.60 | | | | 0.01 | |
| Paid-in-capital from redemption fees (3) | | | 0.00 | | | | 0.00 | | | | 0.00 | | | | 0.00 | | | | 0.00 | |
| Less distributions from: | | | | | | | | | | | | | | | | | | | | |
| Net investment income | | | (0.09 | ) | | | — | | | | (0.01 | ) | | | (0.17 | ) | | | — | |
| Net realized gains | | | (0.56 | ) | | | (0.36 | ) | | | (0.99 | ) | | | (0.14 | ) | | | (0.61 | ) |
| Total distributions | | | (0.65 | ) | | | (0.36 | ) | | | (1.00 | ) | | | (0.31 | ) | | | (0.61 | ) |
| Net asset value, end of year | | $ | 9.50 | | | $ | 9.94 | | | $ | 10.77 | | | $ | 10.70 | | | $ | 10.41 | |
| Total return (2) | | | 2.03 | % | | | (3.93 | )% | | | 10.23 | % | | | 5.92 | % | | | 0.42 | % |
| Net assets, end of year (000s) | | $ | 17,875 | | | $ | 25,373 | | | $ | 39,007 | | | $ | 39,848 | | | $ | 54,137 | |
| Ratio of gross expenses to average net assets (4)(6) | | | 1.74 | % | | | 1.61 | % | | | 1.54 | % | | | 1.58 | % | | | 1.55 | % |
| Ratio of net expenses to average net assets (4) | | | 1.74 | % | | | 1.61 | % | | | 1.54 | % | | | 1.58 | % | | | 1.55 | % |
| Ratio of net investment income to average net assets (4)(5) | | | 0.07 | % | | | 0.22 | % | | | 0.01 | % | | | 0.56 | % | | | 0.30 | % |
| Portfolio Turnover Rate | | | 147 | % | | | 183 | % | | | 108 | % | | | 206 | % | | | 169 | % |
| | | | | | | | | | | | | | | | | | | | | |
| (1) | Per share amounts calculated using the average shares method, which more appropriately presents the per share data for the year. |
| (2) | Total returns shown exclude the effect of applicable sales loads/redemption fees. |
| (3) | Amount represents less than $0.01 per share. |
| (4) | Does not include the expenses of other investment companies in which the Fund invests. |
| (5) | Recognition of investment income by the Fund is affected by the timing and declaration of dividends by the underlying investment companies in which the Fund invests. |
| (6) | Represents the ratio of expenses to average net assets absent fee waiver and/or expense reimbursements by the Arrow Investment Advisors, LLC. |
See accompanying notes to consolidated financial statements.
| Arrow DWA Tactical Fund |
| CONSOLIDATED FINANCIAL HIGHLIGHTS |
| |
| Per Share Data and Ratios for a Share of Beneficial Interest Outstanding Throughout Each Year |
| | | Year | | | Year | | | Year | | | Year | | | Year | |
| | | Ended | | | Ended | | | Ended | | | Ended | | | Ended | |
| | | July 31, | | | July 31, | | | July 31, | | | July 31, | | | July 31, | |
| Class C Shares | | 2020 | | | 2019 | | | 2018 | | | 2017 | | | 2016 | |
| Net asset value, beginning of year | | $ | 9.20 | | | $ | 10.08 | | | $ | 10.13 | | | $ | 9.87 | | | $ | 10.55 | |
| Activity from investment operations: | | | | | | | | | | | | | | | | | | | | |
| Net investment loss (1) | | | (0.06 | ) | | | (0.05 | ) | | | (0.08 | ) | | | (0.02 | ) | | | (0.04 | ) |
| Net realized and unrealized gain (loss) on investments | | | 0.19 | | | | (0.47 | ) | | | 1.02 | | | | 0.51 | | | | (0.03 | ) |
| Total from investment operations | | | 0.13 | | | | (0.52 | ) | | | 0.94 | | | | 0.49 | | | | (0.07 | ) |
| Paid-in-capital from redemption fees (3) | | | 0.00 | | | | 0.00 | | | | 0.00 | | | | 0.00 | | | | 0.00 | |
| Less distributions from: | | | | | | | | | | | | | | | | | | | | |
| Net investment income | | | (0.02 | ) | | | — | | | | — | | | | (0.09 | ) | | | — | |
| Net realized gains | | | (0.56 | ) | | | (0.36 | ) | | | (0.99 | ) | | | (0.14 | ) | | | (0.61 | ) |
| Total distributions | | | (0.58 | ) | | | (0.36 | ) | | | (0.99 | ) | | | (0.23 | ) | | | (0.61 | ) |
| Net asset value, end of year | | $ | 8.75 | | | $ | 9.20 | | | $ | 10.08 | | | $ | 10.13 | | | $ | 9.87 | |
| Total return (2) | | | 1.24 | % | | | (4.71 | )% | | | 9.46 | % | | | 5.15 | % | | | (0.34 | )% |
| Net assets, end of year (000s) | | $ | 21,539 | | | $ | 31,671 | | | $ | 46,510 | | | $ | 52,682 | | | $ | 61,576 | |
| Ratio of gross expenses to average net assets (4)(6) | | | 2.49 | % | | | 2.36 | % | | | 2.29 | % | | | 2.33 | % | | | 2.30 | % |
| Ratio of net expenses to average net assets (4) | | | 2.49 | % | | | 2.36 | % | | | 2.29 | % | | | 2.33 | % | | | 2.30 | % |
| Ratio of net investment loss to average net assets (4)(5) | | | (0.67 | )% | | | (0.49 | )% | | | (0.80 | )% | | | (0.21 | )% | | | (0.40 | )% |
| Portfolio Turnover Rate | | | 147 | % | | | 183 | % | | | 108 | % | | | 206 | % | | | 169 | % |
| | | | | | | | | | | | | | | | | | | | | |
| (1) | Per share amounts calculated using the average shares method, which more appropriately presents the per share data for the year. |
| (2) | Total returns shown exclude the effect of applicable sales loads/redemption fees. |
| (3) | Amount represents less than $0.01 per share. |
| (4) | Does not include the expenses of other investment companies in which the Fund invests. |
| (5) | Recognition of investment income by the Fund is affected by the timing and declaration of dividends by the underlying investment companies in which the Fund invests. |
| (6) | Represents the ratio of expenses to average net assets absent fee waiver and/or expense reimbursements by the Arrow Investment Advisors, LLC. |
See accompanying notes to consolidated financial statements.
| Arrow DWA Tactical Fund |
| CONSOLIDATED FINANCIAL HIGHLIGHTS |
| |
| Per Share Data and Ratios for a Share of Beneficial Interest Outstanding Throughout Each Year |
| | | Year | | | Year | | | Year | | | Year | | | Year | |
| | | Ended | | | Ended | | | Ended | | | Ended | | | Ended | |
| | | July 31, | | | July 31, | | | July 31, | | | July 31, | | | July 31, | |
| Institutional Class Shares | | 2020 | | | 2019 | | | 2018 | | | 2017 | | | 2016 | |
| Net asset value, beginning of year | | $ | 10.01 | | | $ | 10.82 | | | $ | 10.75 | | | $ | 10.46 | | | $ | 11.03 | |
| Activity from investment operations: | | | | | | | | | | | | | | | | | | | | |
| Net investment income (1) | | | 0.03 | | | | 0.05 | | | | 0.02 | | | | 0.08 | | | | 0.07 | |
| Net realized and unrealized gain (loss) on investments | | | 0.20 | | | | (0.50 | ) | | | 1.08 | | | | 0.55 | | | | (0.03 | ) |
| Total from investment operations | | | 0.23 | | | | (0.45 | ) | | | 1.10 | | | | 0.63 | | | | 0.04 | |
| Paid-in-capital from redemption fees (5) | | | 0.00 | | | | 0.00 | | | | 0.00 | | | | 0.00 | | | | 0.00 | |
| Less distributions from: | | | | | | | | | | | | | | | | | | | | |
| Net investment income | | | (0.12 | ) | | | (0.00 | ) (5) | | | (0.04 | ) | | | (0.20 | ) | | | — | |
| Net realized gains | | | (0.56 | ) | | | (0.36 | ) | | | (0.99 | ) | | | (0.14 | ) | | | (0.61 | ) |
| Total distributions | | | (0.68 | ) | | | (0.36 | ) | | | (1.03 | ) | | | (0.34 | ) | | | (0.61 | ) |
| Net asset value, end of year | | $ | 9.56 | | | $ | 10.01 | | | $ | 10.82 | | | $ | 10.75 | | | $ | 10.46 | |
| Total return (2) | | | 2.23 | % | | | (3.69 | )% | | | 10.47 | % | | | 6.20 | % | | | 0.70 | % |
| Net assets, end of year (000s) | | $ | 45,834 | | | $ | 63,635 | | | $ | 89,990 | | | $ | 93,955 | | | $ | 115,506 | |
| Ratio of gross expenses to average net assets (3)(6) | | | 1.49 | % | | | 1.36 | % | | | 1.29 | % | | | 1.33 | % | | | 1.30 | % |
| Ratio of net expenses to average net assets (3) | | | 1.49 | % | | | 1.36 | % | | | 1.29 | % | | | 1.33 | % | | | 1.30 | % |
| Ratio of net investment income to average net assets (3)(4) | | | 0.34 | % | | | 0.51 | % | | | 0.22 | % | | | 0.77 | % | | | 0.64 | % |
| Portfolio Turnover Rate | | | 147 | % | | | 183 | % | | | 108 | % | | | 206 | % | | | 169 | % |
| | | | | | | | | | | | | | | | | | | | | |
| (1) | Per share amounts calculated using the average shares method, which more appropriately presents the per share data for the period. |
| (2) | Total returns shown exclude the effect of applicable sales loads/redemption fees. |
| (3) | Does not include the expenses of other investment companies in which the Fund invests. |
| (4) | Recognition of investment income by the Fund is affected by the timing and declaration of dividends by the underlying investment companies in which the Fund invests. |
| (5) | Amount represents less than $0.01 per share. |
| (6) | Represents the ratio of expenses to average net assets absent fee waiver and/or expense reimbursements by the Arrow Investment Advisors, LLC. |
See accompanying notes to consolidated financial statements.
| Arrow Dynamic Income Fund |
| CONSOLIDATED FINANCIAL HIGHLIGHTS |
| |
| Per Share Data and Ratios for a Share of Beneficial Interest Outstanding Throughout Each Year |
| | | Year | | | Year | | | Year | | | Year | | | | |
| | | Ended | | | Ended | | | Ended | | | Ended | | | Year | |
| | | July 31, | | | July 31, | | | July 31, | | | July 31, | | | Ended | |
| | | 2020 | | | 2019 | | | 2018 | | | 2017 | | | July 31, | |
| Class A Shares | | (Not Consolidated) | | | (Not Consolidated) | | | (Not Consolidated) | | | (Not Consolidated) | | | 2016 | |
| Net asset value, beginning of year | | $ | 7.64 | | | $ | 7.89 | | | $ | 8.80 | | | $ | 8.89 | | | $ | 8.19 | |
| Activity from investment operations: | | | | | | | | | | | | | | | | | | | | |
| Net investment income (loss) (1) | | | (0.02 | ) | | | 0.20 | | | | 0.17 | | | | 0.17 | | | | 0.03 | |
| Net realized and unrealized gain (loss) on investments | | | (1.20 | ) | | | (0.28 | ) | | | (0.27 | ) | | | 0.14 | | | | 0.71 | |
| Total from investment operations | | | (1.22 | ) | | | (0.08 | ) | | | (0.10 | ) | | | 0.31 | | | | 0.74 | |
| Paid-in-capital from redemption fees | | | — | | | | — | | | | — | | | | — | | | | 0.00 | (4) |
| Less distributions from: | | | | | | | | | | | | | | | | | | | | |
| Net investment income | | | (0.43 | ) | | | (0.17 | ) | | | (0.17 | ) | | | (0.37 | ) | | | (0.04 | ) |
| Net realized gains | | | — | | | | — | | | | (0.56 | ) | | | (0.03 | ) | | | — | |
| Return of capital | | | — | | | | — | | | | (0.08 | ) | | | — | | | | — | |
| Total distributions | | | (0.43 | ) | | | (0.17 | ) | | | (0.81 | ) | | | (0.40 | ) | | | (0.04 | ) |
| Net asset value, end of year | | $ | 5.99 | | | $ | 7.64 | | | $ | 7.89 | | | $ | 8.80 | | | $ | 8.89 | |
| Total return (2) | | | (17.13 | )% | | | (1.08 | )% | | | (1.09 | )% | | | 3.39 | % | | | 9.10 | % |
| Net assets, end of year (000s) | | $ | 706 | | | $ | 1,561 | | | $ | 2,528 | | | $ | 9,075 | | | $ | 14,835 | |
| Ratio of gross expenses to average net assets (3)(5) | | | 2.62 | % | | | 1.75 | % | | | 1.58 | % | | | 1.33 | % | | | 1.26 | % |
| Ratio of net expenses to average net assets (5) | | | 2.60 | % | | | 1.72 | % | | | 1.54 | % | | | 1.32 | % | | | 1.26 | % |
| Ratio of net investment income (loss) to average net assets (5)(6) | | | (0.29 | )% | | | 2.52 | % | | | 2.08 | % | | | 1.87 | % | | | 0.38 | % |
| Portfolio Turnover Rate | | | 411 | % | | | 307 | % | | | 279 | % | | | 263 | % | | | 71 | % |
| | | | | | | | | | | | | | | | | | | | | |
| (1) | Per share amounts calculated using the average shares method, which more appropriately presents the per share data for the year. |
| (2) | Total returns shown exclude the effect of applicable sales loads/redemption fees. |
| (3) | Represents the ratio of expenses to average net assets absent fee waiver and/or expense reimbursements by the Arrow Investment Advisors, LLC. |
| (4) | Amount represents less than $0.01 per share. |
| (5) | Does not include the expenses of other investment companies in which the Fund invests. |
| (6) | Recognition of investment income by the Fund is affected by the timing and declaration of dividends by the underlying investment companies in which the Fund invests. |
See accompanying notes to consolidated financial statements.
| Arrow Dynamic Income Fund |
| CONSOLIDATED FINANCIAL HIGHLIGHTS |
| |
| Per Share Data and Ratios for a Share of Beneficial Interest Outstanding Throughout Each Year |
| | | Year | | | Year | | | Year | | | Year | | | | |
| | | Ended | | | Ended | | | Ended | | | Ended | | | Year | |
| | | July 31, | | | July 31, | | | July 31, | | | July 31, | | | Ended | |
| | | 2020 | | | 2019 | | | 2018 | | | 2017 | | | July 31, | |
| Class C Shares | | (Not Consolidated) | | | (Not Consolidated) | | | (Not Consolidated) | | | (Not Consolidated) | | | 2016 | |
| Net asset value, beginning of year | | $ | 7.25 | | | $ | 7.50 | | | $ | 8.41 | | | $ | 8.52 | | | $ | 7.89 | |
| Activity from investment operations: | | | | | | | | | | | | | | | | | | | | |
| Net investment income (loss) (1) | | | (0.07 | ) | | | 0.13 | | | | 0.10 | | | | 0.11 | | | | (0.03 | ) |
| Net realized and unrealized gain (loss) on investments | | | (1.14 | ) | | | (0.26 | ) | | | (0.26 | ) | | | 0.11 | | | | 0.68 | |
| Total from investment operations | | | (1.21 | ) | | | (0.13 | ) | | | (0.16 | ) | | | 0.22 | | | | 0.65 | |
| Less distributions from: | | | | | | | | | | | | | | | | | | | | |
| Net investment income | | | (0.39 | ) | | | (0.12 | ) | | | (0.14 | ) | | | (0.30 | ) | | | (0.02 | ) |
| Net realized gains | | | — | | | | — | | | | (0.56 | ) | | | (0.03 | ) | | | — | |
| Return of capital | | | — | | | | — | | | | (0.05 | ) | | | — | | | | — | |
| Total distributions | | | (0.39 | ) | | | (0.12 | ) | | | (0.75 | ) | | | (0.33 | ) | | | (0.02 | ) |
| Net asset value, end of year | | $ | 5.65 | | | $ | 7.25 | | | $ | 7.50 | | | $ | 8.41 | | | $ | 8.52 | |
| Total return (2) | | | (17.77 | )% | | | (1.72 | )% | | | (1.81 | )% | | | 2.58 | % | | | 8.30 | % |
| Net assets, end of year (000s) | | $ | 821 | | | $ | 1,304 | | | $ | 1,601 | | | $ | 2,514 | | | $ | 2,277 | |
| Ratio of gross expenses to average net assets (3)(4) | | | 3.37 | % | | | 2.50 | % | | | 2.33 | % | | | 2.08 | % | | | 2.01 | % |
| Ratio of net expenses to average net assets (4) | | | 3.35 | % | | | 2.47 | % | | | 2.29 | % | | | 2.07 | % | | | 2.01 | % |
| Ratio of net investment income (loss) to average net assets (4)(5) | | | (1.13 | )% | | | 1.73 | % | | | 1.32 | % | | | 1.35 | % | | | (0.34 | )% |
| Portfolio Turnover Rate | | | 411 | % | | | 307 | % | | | 279 | % | | | 263 | % | | | 71 | % |
| | | | | | | | | | | | | | | | | | | | | |
| (1) | Per share amounts calculated using the average shares method, which more appropriately presents the per share data for the year. |
| (2) | Total returns shown exclude the effect of applicable sales loads/redemption fees. |
| (3) | Represents the ratio of expenses to average net assets absent fee waiver and/or expense reimbursements by the Arrow Investment Advisors, LLC. |
| (4) | Does not include the expenses of other investment companies in which the Fund invests. |
| (5) | Recognition of investment income by the Fund is affected by the timing and declaration of dividends by the underlying investment companies in which the Fund invests. |
See accompanying notes to consolidated financial statements.
| Arrow Dynamic Income Fund |
| CONSOLIDATED FINANCIAL HIGHLIGHTS |
| |
| Per Share Data and Ratios for a Share of Beneficial Interest Outstanding Throughout Each Year |
| | | Year | | | Year | | | Year | | | Year | | | | |
| | | Ended | | | Ended | | | Ended | | | Ended | | | Year | |
| | | July 31, | | | July 31, | | | July 31, | | | July 31, | | | Ended | |
| | | 2020 | | | 2019 | | | 2018 | | | 2017 | | | July 31, | |
| Institutional Class Shares | | (Not Consolidated) | | | (Not Consolidated) | | | (Not Consolidated) | | | (Not Consolidated) | | | 2016 | |
| Net asset value, beginning of year | | $ | 7.72 | | | $ | 7.97 | | | $ | 8.87 | | | $ | 8.96 | | | $ | 8.25 | |
| Activity from investment operations: | | | | | | | | | | | | | | | | | | | | |
| Net investment income (1) | | | 0.05 | | | | 0.22 | | | | 0.20 | | | | 0.19 | | | | 0.07 | |
| Net realized and unrealized gain (loss) on investments | | | (1.26 | ) | | | (0.28 | ) | | | (0.27 | ) | | | 0.14 | | | | 0.69 | |
| Total from investment operations | | | (1.21 | ) | | | (0.06 | ) | | | (0.07 | ) | | | 0.33 | | | | 0.76 | |
| Paid-in-capital from redemption fees | | | — | | | | — | | | | — | | | | — | | | | 0.00 | (3) |
| Less distributions from: | | | | | | | | | | | | | | | | | | | | |
| Net investment income | | | (0.44 | ) | | | (0.19 | ) | | | (0.18 | ) | | | (0.39 | ) | | | (0.05 | ) |
| Net realized gains | | | — | | | | — | | | | (0.56 | ) | | | (0.03 | ) | | | — | |
| Return of capital | | | — | | | | — | | | | (0.09 | ) | | | — | | | | — | |
| Total distributions | | | (0.44 | ) | | | (0.19 | ) | | | (0.83 | ) | | | (0.42 | ) | | | (0.05 | ) |
| Net asset value, end of year | | $ | 6.07 | | | $ | 7.72 | | | $ | 7.97 | | | $ | 8.87 | | | $ | 8.96 | |
| Total return (2) | | | (16.83 | )% | | | (0.82 | )% | | | (0.69 | )% | | | 3.63 | % | | | 9.24 | % |
| Net assets, end of year (000s) | | $ | 1,472 | | | $ | 16,367 | | | $ | 26,135 | | | $ | 110,676 | | | $ | 147,039 | |
| Ratio of gross expenses to average net assets (4)(6) | | | 2.37 | % | | | 1.50 | % | | | 1.33 | % | | | 1.08 | % | | | 1.01 | % |
| Ratio of net expenses to average net assets (4) | | | 2.35 | % | | | 1.47 | % | | | 1.29 | % | | | 1.07 | % | | | 1.01 | % |
| Ratio of net investment income to average net assets (4)(5) | | | 0.72 | % | | | 2.81 | % | | | 2.40 | % | | | 2.08 | % | | | 0.81 | % |
| Portfolio Turnover Rate | | | 411 | % | | | 307 | % | | | 279 | % | | | 263 | % | | | 71 | % |
| | | | | | | | | | | | | | | | | | | | | |
| (1) | Per share amounts calculated using the average shares method, which more appropriately presents the per share data for the year. |
| (2) | Total returns shown exclude the effect of applicable sales loads/redemption fees. |
| (3) | Amount represents less than $0.01 per share. |
| (4) | Does not include the expenses of other investment companies in which the Fund invests. |
| (5) | Recognition of investment income by the Fund is affected by the timing and declaration of dividends by the underlying investment companies in which the Fund invests. |
| (6) | Represents the ratio of expenses to average net assets absent fee waiver and/or expense reimbursements by the Arrow Investment Advisors, LLC. |
See accompanying notes to consolidated financial statements.
| Arrow Managed Futures Strategy Fund |
| CONSOLIDATED FINANCIAL HIGHLIGHTS |
| |
| Per Share Data and Ratios for a Share of Beneficial Interest Outstanding Throughout Each Year |
| | | Year | | | Year | | | Year | | | Year | | | Year | |
| | | Ended | | | Ended | | | Ended | | | Ended | | | Ended | |
| | | July 31, | | | July 31, | | | July 31, | | | July 31, | | | July 31, | |
| Class A Shares | | 2020 | | | 2019 | | | 2018 | | | 2017 | | | 2016 | |
| Net asset value, beginning of year | | $ | 7.37 | | | $ | 7.62 | | | $ | 7.23 | | | $ | 9.64 | | | $ | 9.12 | |
| Activity from investment operations: | | | | | | | | | | | | | | | | | | | | |
| Net investment income (loss) (1) | | | (0.00 | ) (4) | | | 0.06 | | | | (0.01 | ) | | | (0.07 | ) | | | (0.11 | ) |
| Net realized and unrealized gain (loss) on investments | | | (0.71 | ) | | | 0.73 | | | | 0.58 | | | | (1.64 | ) | | | 0.74 | |
| Total from investment operations | | | (0.71 | ) | | | 0.79 | | | | 0.57 | | | | (1.71 | ) | | | 0.63 | |
| Paid-in-capital from redemption fees (4) | | | 0.00 | | | | 0.00 | | | | 0.00 | | | | 0.00 | | | | 0.00 | |
| Less distributions from: | | | | | | | | | | | | | | | | | | | | |
| Net investment income | | | (0.72 | ) | | | (1.04 | ) | | | (0.18 | ) | | | (0.70 | ) | | | (0.11 | ) |
| Total distributions | | | (0.72 | ) | | | (1.04 | ) | | | (0.18 | ) | | | (0.70 | ) | | | (0.11 | ) |
| Net asset value, end of year | | $ | 5.94 | | | $ | 7.37 | | | $ | 7.62 | | | $ | 7.23 | | | $ | 9.64 | |
| Total return (2) | | | (11.47 | )% | | | 12.80 | % | | | 7.64 | % | | | (18.10 | )% | | | 5.70 | % |
| Net assets, end of year (000s) | | $ | 7,415 | | | $ | 12,524 | | | $ | 25,422 | | | $ | 49,728 | | | $ | 45,618 | |
| Ratio of gross expenses to average net assets (3)(5) | | | 1.53 | % | | | 1.47 | % | | | 1.40 | % | | | 1.37 | % | | | 1.40 | % |
| Ratio of net expenses to average net assets (5) | | | 1.51 | % | | | 1.43 | % | | | 1.38 | % | | | 1.37 | % | | | 1.40 | % |
| Ratio of net investment income (loss) to average net assets (5)(6) | | | 0.02 | % | | | 0.91 | % | | | (0.12 | )% | | | (0.88 | )% | | | (1.20 | )% |
| Portfolio Turnover Rate | | | 11 | % | | | 3 | % | | | 0 | % | | | 801 | % | | | 0 | % |
| | | | | | | | | | | | | | | | | | | | | |
| (1) | Per share amounts calculated using the average shares method, which more appropriately presents the per share data for the year. |
| (2) | Total returns shown exclude the effect of applicable sales loads/redemption fees. |
| (3) | Represents the ratio of expenses to average net assets absent fee waiver and/or expense reimbursements by the Arrow Investment Advisors, LLC. |
| (4) | Amount represents less than $0.01 per share. |
| (5) | Does not include the expenses of other investment companies in which the Fund invests. |
| (6) | Recognition of investment income by the Fund is affected by the timing and declaration of dividends by the underlying investment companies in which the Fund invests. |
See accompanying notes to consolidated financial statements.
| Arrow Managed Futures Strategy Fund |
| CONSOLIDATED FINANCIAL HIGHLIGHTS |
| |
| Per Share Data and Ratios for a Share of Beneficial Interest Outstanding Throughout Each Year |
| | | Year | | | Year | | | Year | | | Year | | | Year | |
| | | Ended | | | Ended | | | Ended | | | Ended | | | Ended | |
| | | July 31, | | | July 31, | | | July 31, | | | July 31, | | | July 31, | |
| Class C Shares | | 2020 | | | 2019 | | | 2018 | | | 2017 | | | 2016 | |
| Net asset value, beginning of year | | $ | 7.02 | | | $ | 7.28 | | | $ | 6.92 | | | $ | 9.29 | | | $ | 8.80 | |
| Activity from investment operations: | | | | | | | | | | | | | | | | | | | | |
| Net investment income (loss) (1) | | | (0.04 | ) | | | 0.01 | | | | (0.06 | ) | | | (0.13 | ) | | | (0.19 | ) |
| Net realized and unrealized gain (loss) on investments | | | (0.67 | ) | | | 0.70 | | | | 0.56 | | | | (1.57 | ) | | | 0.74 | |
| Total from investment operations | | | (0.71 | ) | | | 0.71 | | | | 0.50 | | | | (1.70 | ) | | | 0.55 | |
| Paid-in-capital from redemption fees (4) | | | 0.00 | | | | 0.00 | | | | 0.00 | | | | 0.00 | | | | 0.00 | |
| Less distributions from: | | | | | | | | | | | | | | | | | | | | |
| Net investment income | | | (0.70 | ) | | | (0.97 | ) | | | (0.14 | ) | | | (0.67 | ) | | | (0.06 | ) |
| Total distributions | | | (0.70 | ) | | | (0.97 | ) | | | (0.14 | ) | | | (0.67 | ) | | | (0.06 | ) |
| Net asset value, end of year | | $ | 5.61 | | | $ | 7.02 | | | $ | 7.28 | | | $ | 6.92 | | | $ | 9.29 | |
| Total return (2) | | | (12.07 | )% | | | 11.97 | % | | | 6.92 | % | | | (18.66 | )% | | | 5.57 | % |
| Net assets, end of year (000s) | | $ | 2,379 | | | $ | 4,356 | | | $ | 5,607 | | | $ | 5,272 | | | $ | 5,215 | |
| Ratio of gross expenses to average net assets (3)(5) | | | 2.28 | % | | | 2.22 | % | | | 2.15 | % | | | 2.12 | % | | | 2.15 | % |
| Ratio of net expenses to average net assets (5) | | | 2.26 | % | | | 2.18 | % | | | 2.13 | % | | | 2.12 | % | | | 2.15 | % |
| Ratio of net investment income (loss) to average net assets (5)(6) | | | (0.70 | )% | | | 0.10 | % | | | (0.83 | )% | | | (1.64 | )% | | | (1.95 | )% |
| Portfolio Turnover Rate | | | 11 | % | | | 3 | % | | | 0 | % | | | 801 | % | | | 0 | % |
| | | | | | | | | | | | | | | | | | | | | |
| (1) | Per share amounts calculated using the average shares method, which more appropriately presents the per share data for the year. |
| (2) | Total returns shown exclude the effect of applicable sales loads/redemption fees. |
| (3) | Represents the ratio of expenses to average net assets absent fee waiver and/or expense reimbursements by the Arrow Investment Advisors, LLC. |
| (4) | Amount represents less than $0.01 per share. |
| (5) | Does not include the expenses of other investment companies in which the Fund invests. |
| (6) | Recognition of investment income by the Fund is affected by the timing and declaration of dividends by the underlying investment companies in which the Fund invests. |
See accompanying notes to consolidated financial statements.
| Arrow Managed Futures Strategy Fund |
| CONSOLIDATED FINANCIAL HIGHLIGHTS |
| |
| Per Share Data and Ratios for a Share of Beneficial Interest Outstanding Throughout Each Year |
| | | Year | | | Year | | | Year | | | Year | | | Year | |
| | | Ended | | | Ended | | | Ended | | | Ended | | | Ended | |
| | | July 31, | | | July 31, | | | July 31, | | | July 31, | | | July 31, | |
| Institutional Class Shares | | 2020 | | | 2019 | | | 2018 | | | 2017 | | | 2016 | |
| Net asset value, beginning of year | | $ | 7.44 | | | $ | 7.72 | | | $ | 7.32 | | | $ | 9.74 | | | $ | 9.21 | |
| Activity from investment operations: | | | | | | | | | | | | | | | | | | | | |
| Net investment income (loss) (1) | | | 0.02 | | | | 0.07 | | | | 0.01 | | | | (0.05 | ) | | | (0.09 | ) |
| Net realized and unrealized gain (loss) on investments | | | (0.72 | ) | | | 0.75 | | | | 0.59 | | | | (1.66 | ) | | | 0.75 | |
| Total from investment operations | | | (0.70 | ) | | | 0.82 | | | | 0.60 | | | | (1.71 | ) | | | 0.66 | |
| Paid-in-capital from redemption fees (3) | | | 0.00 | | | | 0.00 | | | | 0.00 | | | | 0.00 | | | | 0.00 | |
| Less distributions from: | | | | | | | | | | | | | | | | | | | | |
| Net investment income | | | (0.73 | ) | | | (1.10 | ) | | | (0.20 | ) | | | (0.71 | ) | | | (0.13 | ) |
| Total distributions | | | (0.73 | ) | | | (1.10 | ) | | | (0.20 | ) | | | (0.71 | ) | | | (0.13 | ) |
| Net asset value, end of year | | $ | 6.01 | | | $ | 7.44 | | | $ | 7.72 | | | $ | 7.32 | | | $ | 9.74 | |
| Total return (2) | | | (11.23 | )% | | | 13.12 | % | | | 7.88 | % | | | (17.94 | )% | | | 5.75 | % |
| Net assets, end of year (000s) | | $ | 74,005 | | | $ | 110,610 | | | $ | 79,783 | | | $ | 67,565 | | | $ | 64,046 | |
| Ratio of gross expenses to average net assets (4)(5) | | | 1.28 | % | | | 1.21 | % | | | 1.15 | % | | | 1.12 | % | | | 1.15 | % |
| Ratio of net expenses to average net assets (5) | | | 1.26 | % | | | 1.18 | % | | | 1.13 | % | | | 1.12 | % | | | 1.15 | % |
| Ratio of net investment income (loss) to average net assets (5)(6) | | | 0.26 | % | | | 1.03 | % | | | 0.18 | % | | | (0.65 | )% | | | (0.95 | )% |
| Portfolio Turnover Rate | | | 11 | % | | | 3 | % | | | 0 | % | | | 801 | % | | | 0 | % |
| | | | | | | | | | | | | | | | | | | | | |
| (1) | Per share amounts calculated using the average shares method, which more appropriately presents the per share data for the year. |
| (2) | Total returns shown exclude the effect of applicable sales loads/redemption fees. |
| (3) | Amount represents less than $0.01 per share. |
| (4) | Represents the ratio of expenses to average net assets absent fee waiver and/or expense reimbursements by the Arrow Investment Advisors, LLC. |
| (5) | Does not include the expenses of other investment companies in which the Fund invests. |
| (6) | Recognition of investment income by the Fund is affected by the timing and declaration of dividends by the underlying investment companies in which the Fund invests. |
See accompanying notes to consolidated financial statements.
| The Arrow Funds |
| NOTES TO CONSOLIDATED FINANCIAL STATEMENTS |
| July 31, 2020 |
The Arrow DWA Balanced Fund (“ADBF”), the Arrow DWA Tactical Fund (“ADTF”), the Arrow Dynamic Income Fund (“ADIF”) and the Arrow Managed Futures Strategy Fund (“AMFSF”) (Each a “Fund” and collectively, the “Funds”) are each a series of shares of beneficial interest of Arrow Investments Trust (the “Trust”), a statutory trust organized under the laws of the State of Delaware on August 2, 2011, and are registered under the Investment Company Act of 1940, as amended (the “1940 Act”), as open-end management investment companies. The Funds are diversified funds. ADTF is a fund of funds. ADBF seeks to achieve an appropriate balance between long-term capital appreciation and capital preservation. ADTF seeks to achieve long-term capital appreciation with capital preservation as a secondary objective. ADIF seeks income and long term capital appreciation with an emphasis on absolute (positive) returns, low volatility and low correlation to the equity and fixed income markets. AMFSF seeks long-term capital appreciation and to achieve absolute returns.
Each Fund was reorganized on March 1, 2012 from a series of Northern Lights Fund Trust, a Delaware statutory trust, to a series of the Trust. As a series of the Trust, each Fund is a continuation of a predecessor fund that was a series of Northern Lights Fund Trust.
The Funds currently offer Class A shares, Class C shares and Institutional Class Shares. Class A shares are offered at net asset value plus a maximum sales charge of 5.75%. Class C and Institutional Class shares are offered at net asset value. Each class represents an interest in the same assets of a Fund and classes are identical except for differences in their sales charge structures and ongoing service and distribution charges. All classes of shares have equal voting privileges except that each class has exclusive voting rights with respect to its service and/or distribution plans. Each Funds’ income, expenses (other than class specific distribution fees) and realized and unrealized gains and losses are allocated proportionately each day based upon the relative net assets of each class.
| 2. | SIGNIFICANT ACCOUNTING POLICIES |
The following is a summary of significant accounting policies followed by the Funds in preparation of their financial statements. These policies are in conformity with accounting principles generally accepted in the United States of America (“GAAP”). The preparation of financial statements requires management to make estimates and assumptions that affect the reported amounts of assets and liabilities and disclosure of contingent assets and liabilities at the date of the financial statements and the reported amounts of income and expenses for the period. Actual results could differ from those estimates.
The Funds are each an investment company and accordingly follow the investment company accounting and reporting guidance of the Financial Accounting Standards Board (“FASB”) Accounting Standards Codification Topic 946 “Financial Services – Investment Companies” including FASB Accounting Standards Update (“ASU”) 2013-08.
| The Arrow Funds |
| NOTES TO CONSOLIDATED FINANCIAL STATEMENTS (Continued) |
| July 31, 2020 |
Securities valuation – Securities listed on an exchange (including exchange-traded funds (“ETFs”)) are valued at the last reported sale price at the close of the regular trading session of the exchange on the business day the value is being determined, or in the case of securities listed on NASDAQ at the NASDAQ Official Closing Price (“NOCP”). In the absence of a sale, such securities shall be valued at the last bid price on the day of valuation. Options and futures contracts listed on a securities exchange or board of trade for which market quotations are readily available shall be valued at the last quoted sales price or, in the absence of a sale, at the last reported bid price on the valuation date. Index options and options not listed on a security exchange or board of trade shall be valued at the last reported bid price on the valuation date. Swap transactions are valued through an independent pricing service or at fair value based on daily price reporting from the swap counterparty based on the proprietary index. Debt securities (other than short-term obligations) are valued each day by an independent pricing service approved by the Trust’s Board of Trustees (the “Board”) based on methods which include consideration of: yields or prices of securities of comparable quality, coupon, maturity and type, indications as to values from dealers, and general market conditions or market quotations from a major market maker in the securities. Investments valued in currencies other than the U.S. dollar are converted to U.S. dollars using exchange rates obtained from pricing services. Short -term debt obligations having 60 days or less remaining until maturity, at time of purchase, may be valued at amortized cost.
Valuation of Fund of Funds – The Funds may invest in portfolios of open- end or closed-end investment companies (the “Underlying Funds”). Underlying open-end funds (other than ETFs) are valued at their respective net asset values as reported by such investment companies. The Underlying Funds value securities in their portfolios for which market quotations are readily available at their market values (generally the last reported sale price) and all other securities and assets at their fair value by the methods established by the boards of the Underlying Funds. The shares of many closed- end investment companies, after their initial public offering, frequently trade at a price per share, which is different than the net asset value per share. The difference represents a market premium or market discount on such shares. There can be no assurances that the market discount or market premium on shares of any closed-end investment company purchased by the Funds will not change.
Exchange Traded Notes – The Funds may invest in exchange traded notes (“ETNs”). ETNs are generally a type of debt security that is linked to the performance of underlying securities. The risks of owning ETNs generally reflect the risks of owning the underlying securities they are designed to track. In addition, ETNs are subject to credit risk generally to the same extent as debt securities. There were no ETNs held during the year for any of the Funds.
Exchange Traded Funds – The Funds may invest in ETFs. ETFs are a type of fund bought and sold on a securities exchange. An ETF trades like common stock and represents a portfolio of securities. The risks of owning an ETF generally reflect the risks of owning the underlying securities they hold, although the lack of liquidity on an ETF could result in it being
| The Arrow Funds |
| NOTES TO CONSOLIDATED FINANCIAL STATEMENTS (Continued) |
| July 31, 2020 |
more volatile. Additionally, ETFs have fees and expenses that reduce their value.
In certain circumstances, securities may be valued at their fair value as determined in good faith by Arrow Investment Advisors, LLC (the “Advisor”) and in accordance with the Trust’s Portfolio Securities Valuation Procedures (the “Procedures”). The Board will review the fair value method in use for securities requiring a fair market value determination at least quarterly. The Procedures consider, among others, the following factors to determine a security’s fair value: the nature and pricing history (if any) of the security; whether any dealer quotations for the security are available; and possible valuation methodologies that could be used to determine the fair value of the security.
The Funds utilize various methods to measure the fair value of their investments on a recurring basis. GAAP establishes a hierarchy that prioritizes inputs to valuation methods. The three levels of input are:
Level 1 – Unadjusted quoted prices in active markets for identical assets and liabilities that the Funds have the ability to access.
Level 2 – Observable inputs other than quoted prices included in Level 1 that are observable for the asset or liability, either directly or indirectly. These inputs may include quoted prices for the identical instrument in an inactive market, prices for similar instruments, interest rates, prepayment speeds, credit risk, yield curves, default rates and similar data.
Level 3 – Unobservable inputs for the asset or liability, to the extent relevant observable inputs are not available, representing the Funds’ own assumptions about the assumptions a market participant would use in valuing the asset or liability, and would be based on the best information available.
The availability of observable inputs can vary from security to security and is affected by a wide variety of factors, including, for example, the type of security, whether the security is new and not yet established in the marketplace, the liquidity of markets, and other characteristics particular to the security. To the extent that valuation is based on models or inputs that are less observable or unobservable in the market, the determination of fair value requires more judgment. Accordingly, the degree of judgment exercised in determining fair value is greatest for instruments categorized in Level 3.
The inputs used to measure fair value may fall into different levels of the fair value hierarchy. In such cases, for disclosure purposes, the level in the fair value hierarchy within which the fair value measurement falls in its entirety, is determined based on the lowest level input that is significant to the fair value measurement in its entirety.
| The Arrow Funds |
| NOTES TO CONSOLIDATED FINANCIAL STATEMENTS (Continued) |
| July 31, 2020 |
The inputs or methodology used for valuing securities are not necessarily an indication of the risk associated with investing in those securities. The following tables summarize the inputs used as of July 31, 2020 for the Funds’ assets and liabilities measured at fair value:
| Arrow DWA Balanced Fund | | | | | | | | | | | | |
| | | | | | | | | | | | | |
| Assets | | Level 1 | | | Level 2 | | | Level 3 | | | Total | |
| Common Stocks | | $ | 11,320,480 | | | $ | — | | | $ | — | | | $ | 11,320,480 | |
| Exchange Traded Funds | | | 32,135,195 | | | | — | | | | — | | | | 32,135,195 | |
| Money Market Funds | | | 5,082,101 | | | | — | | | | — | | | | 5,082,101 | |
| Open Swap Contracts * | | | — | | | | 17,198 | | | | — | | | | 17,198 | |
| Variation Margin-Open Long Futures Contracts * | | | 676,470 | | | | — | | | | — | | | | 676,470 | |
| Total | | $ | 49,214,246 | | | $ | 17,198 | | | $ | — | | | $ | 49,231,444 | |
| Liabilities | | Level 1 | | | Level 2 | | | Level 3 | | | Total | |
| Open Swap Contracts * | | $ | — | | | $ | 15,836 | | | $ | — | | | $ | 15,836 | |
| Total | | $ | — | | | $ | 15,836 | | | $ | — | | | $ | 15,836 | |
| | | | | | | | | | | | | | | | | |
| Arrow DWA Tactical Fund | |
| | | | | | | | | | | | | |
| Assets | | Level 1 | | | Level 2 | | | Level 3 | | | Total | |
| Exchange Traded Funds | | $ | 67,473,077 | | | $ | — | | | $ | — | | | $ | 67,473,077 | |
| Money Market Fund | | | 11,742,127 | | | | — | | | | — | | | | 11,742,127 | |
| Variation Margin-Open Long Futures Contracts * | | | 3,343,050 | | | | — | | | | — | | | | 3,343,050 | |
| Total | | $ | 82,558,254 | | | $ | — | | | $ | — | | | $ | 82,558,254 | |
| | | | | | | | | | | | | | | | | |
| Arrow Dynamic Income Fund | |
| | | | | | | | | | | | | |
| Assets | | Level 1 | | | Level 2 | | | Level 3 | | | Total | |
| Exchange Traded Funds | | $ | 2,541,049 | | | $ | — | | | $ | — | | | $ | 2,541,049 | |
| Money Market Fund | | | 294,653 | | | | — | | | | — | | | | 294,653 | |
| Variation Margin-Open Long Future Contract * | | | 1,172 | | | | — | | | | — | | | | 1,172 | |
| Total | | $ | 2,836,874 | | | $ | — | | | $ | — | | | $ | 2,836,874 | |
| | | | | | | | | | | | | | | | | |
| Arrow Managed Futures Strategy Fund | |
| | | | | | | | | | | | | |
| Assets | | Level 1 | | | Level 2 | | | Level 3 | | | Total | |
| Exchange Traded Fund | | $ | 45,171,249 | | | $ | — | | | $ | — | | | $ | 45,171,249 | |
| Money Market Funds | | | 41,128,158 | | | | — | | | | — | | | | 41,128,158 | |
| Open Swap Contracts * | | | — | | | | 366,860 | | | | — | | | | 366,860 | |
| Total | | $ | 86,299,407 | | | $ | 366,860 | | | $ | — | | | $ | 86,666,267 | |
| Liabilities | | Level 1 | | | Level 2 | | | Level 3 | | | Total | |
| Open Swap Contracts * | | $ | — | | | $ | 278,523 | | | $ | — | | | $ | 278,523 | |
| Total | | $ | — | | | $ | 278,523 | | | $ | — | | | $ | 278,523 | |
The Funds did not hold any Level 3 securities at the end of the year.
| * | Derivatives instruments include cumulative net unrealized gain or loss on futures contracts and swaps open as of July 31, 2020. |
See Consolidated Portfolios of Investments for investments and derivatives segregated by industry, type and underlying exposure.
Consolidation of Subsidiaries – ADWAB Fund Limited (“ADB-CFC”), ADWAT Fund Limited (“ADT-CFC”), and Arrow MFT Fund Limited (“AMFS-CFC”) – The Consolidated Portfolios of Investments, Consolidated Statements of Asset and Liabilities, Consolidated Statements of Operations, Consolidated Statements of Changes in Net Assets
| The Arrow Funds |
| NOTES TO CONSOLIDATED FINANCIAL STATEMENTS (Continued) |
| July 31, 2020 |
and the Consolidated Financial Highlights of ADBF, ADTF, and AMFSF include the accounts of ADB-CFC, ADT-CFC, and AMFS-CFC, respectively, which are wholly-owned and controlled subsidiaries. ADIF’s prior years’ financial highlights were consolidated with Northern Lights SPC (AAS-CFC). All inter-company accounts and transactions have been eliminated in consolidation.
The Funds, except ADIF, may invest up to 25% of their total assets in a controlled foreign corporation (“CFC”), which acts as an investment vehicle in order to effect certain investments consistent with the Funds’ investment objectives and policies.
The CFCs utilize commodity-based derivative products to facilitate the Funds’ pursuit of their investment objectives. In accordance with their investment objectives and through their exposure to the aforementioned commodity-based derivative products, the Funds may have increased or decreased exposure to one or more of the following risk factors defined below:
Commodity Risk – The Funds’ exposure to the commodities markets may subject the Funds to greater volatility than investments in traditional securities. The value of commodity-linked derivative instruments, commodity-based exchange traded trusts and commodity-based exchange traded funds and notes may be affected by changes in overall market movements, commodity index volatility, changes in interest rates, or sectors affecting a particular industry or commodity, such as drought, floods, weather, livestock disease, embargoes, tariffs, and international economic, political and regulatory developments.
Credit Risk – There is a risk that issuers and counterparties will not make payments on securities and other investments held by a Fund, resulting in losses to the Funds. In addition, the credit quality of securities held by a Fund may be lowered if an issuer’s financial condition changes. Lower credit quality may lead to greater volatility in the price of a security and in shares of the Fund. Lower credit quality also may affect liquidity and make it difficult for a Fund to sell the security. The Funds may invest, directly or indirectly, in high yield fixed-income securities (also known as “junk bonds”), which are considered speculative with respect to the issuer’s capacity to pay interest and repay principal in accordance with the terms of the obligations. This means that, compared to issuers of higher rated securities, issuers of medium and lower rated securities are less likely to have the capacity to pay interest and repay principal when due in the event of adverse business, financial or economic conditions and/or may be in default or not current in the payment of interest or principal. The market values of medium- and lower-rated securities tend to be more sensitive to company-specific developments and changes in economic conditions than higher-rated securities. The companies that issue these securities often are highly leveraged, and their ability to service their debt obligations during an economic downturn or periods of rising interest rates may be impaired. In addition, these companies may not have access to more traditional methods of financing, and may be unable to repay debt at maturity by refinancing. The risk of loss due to default in payment of interest or principal by these issuers is significantly greater than with higher-rated securities because medium- and lower-rated securities generally are unsecured and subordinated to senior debt. Default, or the market’s perception that an issuer is likely to default, could reduce the value and liquidity of
| The Arrow Funds |
| NOTES TO CONSOLIDATED FINANCIAL STATEMENTS (Continued) |
| July 31, 2020 |
securities held by a Fund. In addition, default may cause a Fund to incur expenses in seeking recovery of principal or interest on its portfolio holdings.
Derivatives Risk – The Funds may use derivatives (including swaps, structured notes, options, futures and options on futures) to enhance returns or hedge against market declines. The Funds’ use of derivative instruments involves risks different from, or possibly greater than, the risks associated with investing directly in securities and other traditional investments. These risks include (i) the risk that the counterparty to a derivative transaction may not fulfill its contractual obligations; (ii) risk of mispricing or improper valuation; and (iii) the risk that changes in the value of the derivative may not correlate perfectly with the underlying asset, rate or index. These risks could cause a Fund to lose more than the principal amount invested. In addition, investments in derivatives may involve leverage, which means a small percentage of assets invested in derivatives can have a disproportionately large impact on the Funds.
Swap Counterparty Credit Risk – The Funds are subject to credit risk on the amount the Funds expect to receive from swap agreement counterparties. With certain exchange traded credit default swaps, there is minimal counterparty risk to a Fund in that the exchanges clearinghouse, as counter party, guarantees against default.
Fixed Income Risk – When a Fund invests in fixed income securities, the value of its investments in such securities will fluctuate with changes in interest rates. Typically, a rise in interest rates causes a decline in the value of fixed income securities owned by a Fund. In general, the market price of debt securities with longer maturities will increase or decrease more in response to changes in interest rates than shorter-term securities. Other risk factors include credit risk (the debtor may default) and prepayment risk (the debtor may pay its obligation early, reducing the amount of interest payments). These risks could affect the value of a particular investment by a Fund, possibly causing a Fund’s share price and total return to be reduced and fluctuate more than other types of investments.
Portfolio Turnover Risk – Portfolio turnover refers to the rate at which the securities held by the Funds are replaced. The higher the rate, the higher the transactional and brokerage costs associated with the turnover, which may reduce the Funds return unless the securities traded can be bought and sold without corresponding commission costs. Active trading of securities may also increase a Fund’s realized capital gains or losses, which may affect the taxes you pay as a Fund shareholder.
Taxation Risk – By investing in commodities indirectly through a CFC, the Funds will obtain exposure to the commodities markets within the federal tax requirements that apply to the Funds. However, any income received from the CFC will be passed through to each Fund as ordinary income, which may be taxed at less favorable rates than capital gains.
Wholly-Owned Subsidiary Risk – Each CFC will not be registered under the 1940 Act and will not be subject to all of the investor protections of the 1940 Act. Changes in the laws of the United
| The Arrow Funds |
| NOTES TO CONSOLIDATED FINANCIAL STATEMENTS (Continued) |
| July 31, 2020 |
States and/or the Cayman Islands, under which each Fund and CFC, respectively, are organized, could result in the inability of each Fund and/or CFC to operate as described in the Prospectus and could negatively affect each Fund and their shareholders. Your cost of investing in a Fund will be higher because you indirectly bear the expenses of its CFC.
A summary of the Funds’ investments in the CFCs are as follows:
| | | | | CFC Net Assets at | | | % of Total Net Assets at |
| | | Inception Date of CFC | | July 31, 2020 | | | July 31, 2020 |
| ADB-CFC | | 12/5/2012 | | $ | 2,025,914 | | | 4.00% |
| ADT-CFC | | 12/12/2011 | | | 6,524,332 | | | 7.65% |
| AMFS-CFC | | 7/23/2010 | | | 7,751,459 | | | 9.25% |
Security Transactions and Related Income – Security transactions are accounted for on the trade date. Interest income is recognized on an accrual basis. Discounts are accreted and premiums are amortized on securities purchased over the lives of the respective securities. Dividend income is recorded on the ex-dividend date. Realized gains or losses from sales of securities are determined by comparing the identified cost of the security lot sold with the net sales proceeds.
Dividends and Distributions to Shareholders – ADBF and ADTF intend to distribute substantially all of their net investment income at least annually and net capital gain annually. AMFSF intends to distribute substantially all of its investment income at least quarterly and net capital gain annually. ADIF intends to distribute substantially all of its investment income at least monthly and net capital gain annually. Dividends from net investment income and distributions from net realized gains are determined in accordance with federal income tax regulations, which may differ from GAAP. These “book/tax” differences are considered either temporary (e.g., deferred losses) or permanent in nature. To the extent these differences are permanent in nature, such amounts are reclassified within the composition of net assets based on their federal tax-basis treatment; temporary differences do not require reclassification. Dividends and distributions to shareholders are recorded on the ex-dividend date.
Federal Income Taxes – The Funds intend to continue to comply with the requirements of the Internal Revenue Code applicable to regulated investment companies and to distribute all of their taxable income to their shareholders. Therefore, no provision for federal income tax is required. The Funds recognize the tax benefits of uncertain tax positions only where the position is “more likely than not” to be sustained assuming examination by tax authorities. Management has analyzed the Funds’ tax positions, and has concluded that no liability for unrecognized tax benefits should be recorded related to uncertain tax positions taken on returns filed for open tax years July 31, 2017 – July 31, 2019, or expected to be taken in the Funds’ July 31, 2020 tax returns. The Funds identify their major tax jurisdictions as U.S. federal and foreign jurisdictions where the Funds make significant investments. The Funds are not aware of any tax positions for which it is reasonably possible that the total amounts of unrecognized tax benefits will change materially in the next twelve months.
| The Arrow Funds |
| NOTES TO CONSOLIDATED FINANCIAL STATEMENTS (Continued) |
| July 31, 2020 |
Foreign Currency – The accounting records of the Funds are maintained in U.S. dollars. Investment securities and other assets and liabilities denominated in a foreign currency, and income receipts and expense payments are translated into U.S. dollars using the prevailing exchange rate at the London market close. Purchases and sales of securities are translated into U.S. dollars at the contractual currency rates established at the approximate time of the trade. Net realized gains and losses on foreign currency transactions represent net gains and losses from currency realized between the trade and settlement dates on securities transactions and the difference between income accrued versus income received. The effects of changes in foreign currency exchange rates on investments in securities are included with the net realized and unrealized gain or loss on investment securities, if any.
Forward Currency Contracts – As foreign securities are purchased, a Fund generally enters into forward currency exchange contracts in order to hedge against foreign currency exchange rate risks. The market value of the contract fluctuates with changes in currency exchange rates. The contract is marked-to-market daily and the change in market value is recorded by a Fund as an unrealized gain or loss. As foreign securities are sold, a portion of the contract is generally closed and the Fund records a realized gain or loss equal to the difference between the value of the contract at the time it was opened and the value at the time it was closed. Realized gains and losses from contract transactions are included as a component of net realized gains (losses) from foreign currency transactions in the Consolidated Statements of Operations. There were no forward currency contracts held during the year for any Fund.
Futures Contracts – Each Fund is subject to equity price risk, interest rate risk, and foreign currency exchange rate risk in the normal course of pursuing their investment objectives. The Funds may purchase or sell futures contracts to gain exposure to, or hedge against, changes in the value of equities, interest rates, foreign currencies or commodities. Initial margin deposits required upon entering into futures contracts are satisfied by the segregation of specific securities or cash as collateral for the account of the broker (the Funds’ agent in acquiring the futures position). During the period the futures contracts are open, changes in the value of the contracts are recognized as unrealized gains or losses by “marking to market” on a daily basis to reflect the market value of the contracts at the end of each day’s trading. Variation margin payments are received or made depending upon whether unrealized gains or losses are incurred. When the contracts are closed, a Fund recognizes a realized gain or loss equal to the difference between the proceeds from, or cost of, the closing transaction and the Fund’s basis in the contract. If a Fund is unable to liquidate a futures contract and/or enter into an offsetting closing transaction, that Fund would continue to be subject to market risk with respect to the value of the contracts and continue to be required to maintain the margin deposits on the futures contracts. Each Fund segregates liquid securities having a value at least equal to the amount of the current obligation under any open futures contract. Risks may exceed amounts recognized in the Consolidated Statements of Assets and Liabilities. With futures, there is minimal counterparty credit risk to a Fund since futures are exchange traded and the exchange’s clearinghouse, as counterparty to all exchange traded futures, guarantees the futures against default.
| The Arrow Funds |
| NOTES TO CONSOLIDATED FINANCIAL STATEMENTS (Continued) |
| July 31, 2020 |
Options Transactions – Each Fund is subject to equity price risk in the normal course of pursuing its investment objective and may purchase or sell options to help hedge against this risk.
Each Fund may write call options only if it (i) owns an offsetting position in the underlying security or (ii) has an absolute or immediate right to acquire that security without additional cash consideration or exchange of other securities held in its portfolio.
When a Fund writes a call option, an amount equal to the premium received is included in the Consolidated Statement of Assets and Liabilities as a liability. The amount of the liability is subsequently marked-to-market to reflect the current market value of the option. If an option expires on its stipulated expiration date or if a Fund enters into a closing purchase transaction, a gain or loss is realized. If a written call option is exercised, a gain or loss is realized for the sale of the underlying security and the proceeds from the sale are increased by the premium originally received. As writer of an option, a Fund has no control over whether the option will be exercised and, as a result, retains the market risk of an unfavorable change in the price of the security underlying the written option. When a Fund purchases an option, an amount equal to the premium paid by a Fund is recorded as an investment and is subsequently adjusted to the current value of the option purchased. If an option expires on the stipulated expiration date or if a Fund enters into a closing sale transaction, a gain or loss is realized. If a call option is exercised, the cost of the security acquired is increased by the premium paid for the call. If a put option is exercised, a gain or loss is realized from the sale of the underlying security, and the proceeds from such a sale are decreased by the premium originally paid. Written and purchased options are non-income producing securities. With purchased options, there is minimal counterparty credit risk to the Funds since these options are exchange traded and the exchange’s clearinghouse, as counterparty to all exchange traded options, guarantees against a possible default.
Structured Notes – There are several risks associated with the use of structured notes. Structured notes are leveraged, thereby providing an exposure to the underlying benchmark greater than the face amount and increasing the volatility of each note relative to the change in the underlying linked financial instrument. A highly liquid secondary market may not exist for the structured notes a Fund invests in, which may make it difficult for that Fund to sell the structured notes it holds at an acceptable price or to accurately value them. In addition, structured notes are subject to the risk that the counterparty to the instrument, or issuer, might not pay interest when due or repay principal at maturity of the obligation. Although the Funds will not invest in any structured notes unless the Funds’ management believes that the issuer is creditworthy, a Fund does bear the risk of loss of the amount expected to be received in the event of the default or bankruptcy of the issuer.
Swap Agreements – The Funds may enter into swap agreements to manage their exposure to various risks. A total rate of return swap agreement is a derivative contract in which one party (the receiver) receives the total return of a specific index or a specific security on a
| The Arrow Funds |
| NOTES TO CONSOLIDATED FINANCIAL STATEMENTS (Continued) |
| July 31, 2020 |
notional amount of principal from a second party (the seller) in return for paying a funding cost, which is usually quoted in relation to the London Inter-Bank Offered Rate (“LIBOR”). During the life of the agreement, there are periodic exchanges of cash flows in which the index receiver pays the LIBOR-based interest on the notional principal amount and receives (or pays if the total return is negative or spreads widen) the index total return on the notional principal amount. A credit default swap is an agreement between a protection buyer and a protection seller whereby the buyer agrees to periodically pay the seller a premium, generally expressed in terms of interest on a notional principal amount, over a specified period in exchange for receiving compensation from the seller when an underlying reference debt obligation or index of reference debt obligations is subject to one or more specified adverse credit events (such as bankruptcy, failure to pay, acceleration of indebtedness, restructuring, or repudiation/ moratorium). A Fund will become a protection seller to take on credit risk in order to earn a premium. A Fund will usually enter into swaps on a net basis, i.e., the two payment streams are netted out, with a Fund receiving or paying, as the case may be, only the net amount of the two payments. Swaps are marked to market based upon quotations from market makers and the change, if any, along with an accrual for periodic payments due or owed is recorded as unrealized gain or loss in the Consolidated Statements of Operations. Net payments on swap agreements are included as part of realized gain/loss in the Consolidated Statements of Operations. Entering into these agreements involves, to varying degrees, elements of credit and market risk in excess of the amounts recognized in the Consolidated Statements of Assets and Liabilities. Such risks include the possibility that there will be no liquid market for these agreements, that the counterparty to the agreements may default on its obligation to perform, that there may be unfavorable changes in the fluctuation of interest rates or the occurrence of adverse credit events on reference debt obligations.
Derivatives Disclosure
| Fair Values of Derivative Instruments in ADBF as of July 31, 2020: | |
| | |
| | | Asset Derivatives | | | Liability Derivatives | |
| Contract Type/ | | | | | | | | | | |
| Primary Risk Exposure | | Balance Sheet Location | | Value | | | Balance Sheet Location | | Value | |
| Financial Index Swap: | | Unrealized appreciation on swap contracts | | $ | 17,198 | | | Unrealized depreciation on swap contracts | | $ | — | |
| Commodity Index Swap: | | Unrealized appreciation on swap contracts | | | — | | | Unrealized depreciation on swap contracts | | | 15,836 | |
| Futures - Commodity contracts: | | Variation margin - due from broker | | | 676,470 | | | Variation margin - due to broker | | | — | |
| | | | | | | | | | | | | |
| | | | | $ | 693,668 | | | | | $ | 15,836 | |
| The Arrow Funds |
| NOTES TO CONSOLIDATED FINANCIAL STATEMENTS (Continued) |
| July 31, 2020 |
| Fair Values of Derivative Instruments in ADTF as of July 31, 2020: |
| |
| | | Asset Derivatives | | Liability Derivatives |
| Contract Type/ | | | | | | | | | | |
| Primary Risk Exposure | | Balance Sheet Location | | Value | | | Balance Sheet Location | | Value | |
| Futures - Commodity contracts: | | Variation margin - due from broker | | $ | 3,343,050 | | | Variation margin - due to broker | | $ | — | |
| | | | | $ | 3,343,050 | | | | | $ | — | |
| | | | | | | | | | | | | |
| Fair Values of Derivative Instruments in ADIF as of July 31, 2020: |
| |
| | | Asset Derivatives | | | Liability Derivatives | |
| Contract Type/ | | | | | | | | | | |
| Primary Risk Exposure | | Balance Sheet Location | | Value | | | Balance Sheet Location | | Value | |
| Futures - Interest contracts: | | Variation margin - due from broker | | $ | 1,172 | | | Variation margin - due to broker | | $ | — | |
| | | | | $ | 1,172 | | | | | $ | — | |
| | | | | | | | | | | | | |
| Fair Values of Derivative Instruments in AMFSF as of July 31, 2020: |
| |
| | | Asset Derivatives | | | Liability Derivatives | |
| Contract Type/ | | | | | | | | | | |
| Primary Risk Exposure | | Balance Sheet Location | | Value | | | Balance Sheet Location | | Value | |
| Financial Index Swap: | | Unrealized appreciation on swap contracts | | $ | 366,860 | | | Unrealized depreciation on swap contracts | | $ | — | |
| Commodity Index Swap: | | Unrealized appreciation on swap contracts | | | — | | | Unrealized depreciation on swap contracts | | | 278,523 | |
| | | | | $ | 366,860 | | | | | $ | 278,523 | |
The amounts of realized and changes in unrealized gains and losses on derivative instruments during the year as disclosed in the Consolidated Statements of Operations serve as indicators of the volume of derivative activity for the Funds.
| The Arrow Funds |
| NOTES TO CONSOLIDATED FINANCIAL STATEMENTS (Continued) |
| July 31, 2020 |
The effect of Derivative Instruments on the Consolidated Statements of Operations for the year ended July 31, 2020:
| ADBF |
| |
| | | Commodity | | | Financial | | | Equity | | | | |
| Location | | Contracts | | | Contracts | | | Contracts | | | Total | |
| Net realized gain (loss) from: | | | | | | | | | | | | | | | | |
| Futures contracts | | $ | 374,132 | | | $ | — | | | $ | — | | | $ | 374,132 | |
| Swap contracts | | | (145,081 | ) | | | (429,616 | ) | | | — | | | | (574,697 | ) |
| Written Options | | | — | | | | — | | | | 57,650 | | | | 57,650 | |
| Total net realized gain (loss) | | $ | 229,051 | | | $ | (429,616 | ) | | $ | 57,650 | | | $ | (142,915 | ) |
| | | | | | | | | | | | | | | | | |
| Net change in unrealized appreciation (depreciation) of: | | | | | | | | | | | | | | | | |
| Futures contracts | | $ | 516,952 | | | $ | — | | | $ | — | | | $ | 516,952 | |
| Swap contracts | | | 5,221 | | | | (80,593 | ) | | | — | | | | (75,372 | ) |
| Written Options | | | — | | | | — | | | | 311,580 | | | | 311,580 | |
| Total net change in unrealized appreciation (depreciation) | | $ | 522,173 | | | $ | (80,593 | ) | | | 311,580 | | | $ | 753,160 | |
| | | | | | | | | | | | | | | | | |
| ADTF | | | | | | |
| | | | | | | |
| | | Commodity | | | | | | | | | | |
| Location | | Contracts | | | Total | | | | | | | |
| Net realized gain (loss) from: | | | | | | | | | | | | | | | | |
| Futures contracts | | $ | (246,363 | ) | | $ | (246,363 | ) | | | | | | | | |
| Total net realized gain (loss) | | $ | (246,363 | ) | | $ | (246,363 | ) | | | | | | | | |
| | | | | | | | | | | | | | | | | |
| Net change in unrealized appreciation (depreciation) of: | | | | | | | | | | | | | | | | |
| Futures contracts | | $ | 3,343,050 | | | $ | 3,343,050 | | | | | | | | | |
| Total net change in unrealized appreciation (depreciation) | | $ | 3,343,050 | | | $ | 3,343,050 | | | | | | | | | |
| The Arrow Funds |
| NOTES TO CONSOLIDATED FINANCIAL STATEMENTS (Continued) |
| July 31, 2020 |
| ADIF |
| |
| | | | | | Interest | | | | |
| Location | | Credit Contracts | | | Contracts | | | Total | |
| Net realized gain (loss) from: | | | | | | | | | | | | |
| Futures contracts | | $ | — | | | $ | 28,630 | | | $ | 28,630 | |
| Swap contracts | | | (284,954 | ) | | | — | | | | (284,954 | ) |
| Total net realized gain (loss) | | $ | (284,954 | ) | | $ | 28,630 | | | $ | (256,324 | ) |
| | | | | | | | | | | | | |
| Net change in unrealized appreciation (depreciation) of: | | | | | | | | | | | | |
| Futures contracts | | $ | — | | | $ | (40,078 | ) | | $ | (40,078 | ) |
| Swap contracts | | | 26,833 | | | | — | | | | 26,833 | |
| Total net change in unrealized appreciation (depreciation) | | $ | 26,833 | | | $ | (40,078 | ) | | $ | (13,245 | ) |
| | | | | | | | | | | | | |
| AMFSF |
| |
| | | Commodity | | | Financial | | | | |
| Location | | Contracts | | | Contracts | | | Total | |
| Net realized gain (loss) from: | | | | | | | | | | | | |
| Swap contracts | | $ | (2,432,804 | ) | | $ | (8,826,508 | ) | | $ | (11,259,312 | ) |
| Total net realized gain (loss) | | $ | (2,432,804 | ) | | $ | (8,826,508 | ) | | $ | (11,259,312 | ) |
| | | | | | | | | | | | | |
| Net change in unrealized appreciation (depreciation) of: | | | | | | | | | | | | |
| Swap contracts | | $ | 96,765 | | | $ | (1,332,228 | ) | | $ | (1,235,463 | ) |
| Total net change in unrealized appreciation (depreciation) | | $ | 96,765 | | | $ | (1,332,228 | ) | | $ | (1,235,463 | ) |
Credit Facility – The Funds have collectively entered into a $15 million secured Revolving Credit Agreement (the “Agreement”) with MUFG Union Bank, National Association. Under the terms of the Agreement, each Fund may not exceed the limit on borrowing money set forth in the Registration Statement of that Fund and the borrowing will be used only for temporary or emergency purposes including the financing of redemptions. Interest is charged to each Fund based on the prevailing market rates in effect at the time of the borrowing. The Funds will collateralize the borrowings with certain securities the Funds hold at the time of borrowing.
During the year ended July 31, 2020, the Funds did not incur any interest expense (including origination fees) related to the borrowings. At July 31, 2020, there were no outstanding borrowings.
| The Arrow Funds |
| NOTES TO CONSOLIDATED FINANCIAL STATEMENTS (Continued) |
| July 31, 2020 |
Expenses – Expenses of the Trust that are directly identifiable to a specific fund are charged to that fund. Expenses, which are not readily identifiable to a specific fund, are allocated in such a manner as deemed equitable (as determined by the Board), taking into consideration the nature and type of expense and the relative sizes of the funds in the Trust.
Indemnification – The Trust indemnifies its officers and trustees for certain liabilities that may arise from the performance of their duties to the Trust. Additionally, in the normal course of business, the Trust enters into contracts that contain a variety of representations and warranties and which provide general indemnities. The Trust’s maximum exposure under these arrangements is unknown, as this would involve future claims that may be made against the Trust that have not yet occurred. However, based on experience, the Trust expects the risk of loss due to these warranties and indemnities to be remote.
| 3. | OFFSETTING OF FINANCIAL ASSETS AND DERIVATIVE ASSETS |
Each Fund’s policy is to recognize a net asset or liability in the Consolidated Statements of Assets and Liabilities equal to the unrealized appreciation or depreciation for futures and swaps contracts. During the year ended July 31, 2020, each Fund was subject to a master netting arrangement for the futures and swaps. The following table shows additional information regarding the offsetting of assets and liabilities at July 31, 2020.
| | | | | | | | | | | | Gross Amounts Not Offset in the | | | | |
| Assets: | | | | | | | | | | | Statements of Assets & Liabilities | | | | |
| | | | | | Gross Amounts Offset in | | | Net Amounts of Assets | | | | | | | | | | |
| | | Gross Amounts of | | | the Statements of Assets | | | Presented in the Statements | | | Financial | | | Cash Collateral | | | | |
| | | Recognized Assets | | | & Liabilities | | | of Assets & Liabilities | | | Instruments | | | Received/(Pledged) | | | Net Amount | |
| ADBF | | | | | | | | | | | | | | | | | | | | | | | | |
| Swap Contracts - Morgan Stanley | | $ | 17,198 | | | $ | — | | | $ | 17,198 | | | $ | — | | | $ | — | | | $ | 17,198 | |
| Future Contracts - Goldman Sachs & Co. LLC | | | 676,470 | | | | — | | | | 676,470 | | | | — | | | | — | | | | 676,470 | |
| Total | | $ | 693,668 | | | $ | — | | | $ | 693,668 | | | $ | — | | | $ | — | | | $ | 693,668 | |
| | | | | | | | | | | | | | | | | | | | | | | | | |
| ADTF | | | | | | | | | | | | | | | | | | | | | | | | |
| Future Contracts - Goldman Sachs & Co. LLC | | $ | 3,343,050 | | | $ | — | | | $ | 3,343,050 | | | $ | — | | | $ | — | | | $ | 3,343,050 | |
| Total | | $ | 3,343,050 | | | | — | | | $ | 3,343,050 | | | $ | — | | | $ | — | | | $ | 3,343,050 | |
| | | | | | | | | | | | | | | | | | | | | | | | | |
| ADIF | | | | | | | | | | | | | | | | | | | | | | | | |
| Future Contracts - Goldman Sachs & Co. LLC | | $ | 1,172 | | | $ | — | | | $ | 1,172 | | | $ | — | | | $ | — | | | $ | 1,172 | |
| Total | | $ | 1,172 | | | | — | | | $ | 1,172 | | | $ | — | | | $ | — | | | $ | 1,172 | |
| | | | | | | | | | | | | | | | | | | | | | | | | |
| AMFSF | | | | | | | | | | | | | | | | | | | | | | | | |
| Swaps Contracts - Morgan Stanley | | $ | 366,860 | | | $ | — | | | $ | 366,860 | | | $ | — | | | $ | — | | | $ | 366,860 | |
| Total | | $ | 366,860 | | | $ | — | | | $ | 366,860 | | | $ | — | | | $ | — | | | $ | 366,860 | |
| The Arrow Funds |
| NOTES TO CONSOLIDATED FINANCIAL STATEMENTS (Continued) |
| July 31, 2020 |
| | | | | | | | | | | | Gross Amounts Not Offset in the | | | | |
| Liabilities: | | | | | | | | | | | Statements of Assets & Liabilities | | | | |
| | | | | | Gross Amounts Offset in | | | Net Amounts of Assets | | | | | | | | | | |
| | | Gross Amounts of | | | the Statements of Assets | | | Presented in the Statements | | | Financial | | | Cash Collateral | | | | |
| Description | | Recognized Liabilities | | | & Liabilities | | | of Assets & Liabilities | | | Instruments | | | Pledged (1) | | | Net Amount | |
| ADBF | | | | | | | | | | | | | | | | | | | | | | | | |
| Swap Contracts-Morgan Stanley | | $ | 15,836 | | | $ | — | | | $ | 15,836 | | | $ | 15,836 | | | $ | — | | | $ | — | |
| Total | | $ | 15,836 | | | $ | — | | | $ | 15,836 | | | $ | 15,836 | | | $ | — | | | $ | — | |
| | | | | | | | | | | | | | | | | | | | | | | | | |
| AMFSF | | | | | | | | | | | | | | | | | | | | | | | | |
| Swap Contracts - Morgan Stanley | | $ | 278,523 | | | $ | — | | | $ | 278,523 | | | $ | 278,523 | | | $ | — | | | $ | — | |
| Total | | $ | 278,523 | | | $ | — | | | $ | 278,523 | | | $ | 278,523 | | | $ | — | | | $ | — | |
| (1) | Collateral shown is limited to liability amount. |
| 4. | INVESTMENT TRANSACTIONS |
For the year ended July 31, 2020, the cost of purchases and proceeds from sales of portfolio securities, other than short-term investments, were as follows:
| Portfolio | | Purchases | | | Sales | |
| ADBF | | $ | 59,285,642 | | | $ | 78,909,307 | |
| ADTF | | | 128,537,661 | | | | 178,975,772 | |
| ADIF | | | 23,540,727 | | | | 37,988,640 | |
| AMFSF | | | 5,205,671 | | | | 7,156,184 | |
| 5. | INVESTMENT ADVISORY AGREEMENT AND TRANSACTIONS WITH RELATED PARTIES |
The business activities of the Funds are overseen by the Board, which is responsible for the overall management of the Funds. Arrow Investment Advisors, LLC, serves as the Funds’ investment advisor.
Pursuant to an advisory agreement with the Trust, with respect to each Fund, the Advisor, under the oversight of the Board, directs the daily operations of the Funds and supervises the performance of administrative and professional services provided by others. As compensation for its services and the related expenses borne by the Advisor, the Funds pay the Advisor a fee,
| The Arrow Funds |
| NOTES TO CONSOLIDATED FINANCIAL STATEMENTS (Continued) |
| July 31, 2020 |
computed and accrued daily and paid monthly, at an annual rate of 1.00% of ADBF and ADTF average daily net assets, 0.75% of ADIF average daily net assets, and 0.85% of AMFSF average daily net assets.
Pursuant to an exemptive order, each Fund may invest a portion of their assets in the other Funds managed by the Advisors. ADBF invested in Arrow Dogs of the World ETF (“DOGS”), Arrow QVM Equity Factor ETF (“QVM”), Arrow DWA Country Rotation ETF (“DWCR”) and Arrow Reserve Capital Management ETF (“ARCM”). During the year ended July 31, 2020, each Fund invested in ARCM. The Advisor has agreed to waive 0.05% of its advisory fee on the portion of ADBF’s assets that are invested in DOGS, DWCR and QVM. The Advisor has agreed to waive 0.05% of its advisory fee on the portion of ADBF, ADTF, ADIF and AMFSF’s assets that are invested in the ARCM. For the year ended July 31, 2020, the Advisor waived $7,192, $69, $1,102 and $23,007, in ADBF, ADTF, ADIF and AMFSF, respectively, pursuant to its agreement. As of July 31, 2020, ADBF is no longer invested in DOGS, which was liquidated on May 15, 2020, and ADIF is no longer invested in ARCM.
The Board has adopted a Distribution Plan and Agreement (the “Plan”) pursuant to Rule 12b-1 under the 1940 Act with respect to the Funds. The Plan provides that a monthly service and/or distribution fee is calculated by each Fund at an annual rate of 0.25% of its average daily net assets for Class A and an annual rate of 1.00% of its average daily net assets for Class C and is paid to Archer Distributors, LLC (the “Distributor”) to provide compensation for ongoing shareholder servicing and distribution-related activities or services and-or maintenance of the Funds’ shareholder accounts, not otherwise required to be provided by the Advisor. The Plan is a compensation plan, which means that compensation is provided regardless of 12b-1 expenses incurred.
The Distributor acts as the Funds’ principal underwriter in a continuous public offering of the Funds’ Class A and Class C shares. The Distributor is an affiliate of the Advisor. For the year ended July 31, 2020, the Distributor received $53,465, of which $7,679 was retained in commissions.
Gemini Fund Services, LLC (“GFS”) – GFS provides administration, fund accounting, and transfer agent services to the Trust. Pursuant to separate servicing agreements with GFS, each Fund pays GFS customary fees for providing administration, fund accounting and transfer agency services to the Fund. Certain officers of the Trust are also officers of GFS, and are not paid any fees directly by the Trust for serving in such capacities.
Blu Giant, LLC (“Blu Giant”) – Blu Giant, an affiliate of GFS, provides EDGAR conversion and filing services as well as print management services for each Fund on an ad-hoc basis. For the provision of these services, Blu Giant receives customary fees from the Funds.
Effective February 1, 2019, NorthStar Financial Services Group, LLC, the parent company of GFS and its affiliated companies including Blu Giant and Northern Lights Compliance Services,
| The Arrow Funds |
| NOTES TO CONSOLIDATED FINANCIAL STATEMENTS (Continued) |
| July 31, 2020 |
LLC (collectively, the “Gemini Companies”), sold its interest in the Gemini Companies to a third party private equity firm that contemporaneously acquired Ultimus Fund Solutions, LLC (an independent mutual fund administration firm) and its affiliates (collectively, the “Ultimus Companies”). As a result of these separate transactions, the Gemini Companies and the Ultimus Companies are now indirectly owned through a common parent entity, The Ultimus Group, LLC.
The Funds, except for ADIF, may assess a short-term redemption fee of 1.00% of the total redemption amount if a shareholder sells their shares after holding them for less than 30 days. The redemption fee is paid directly to the specific Fund in which the short- term redemption fee occurs. For the year ended July 31, 2020, ADBF, ADTF, ADIF and AMFSF assessed $1, $5,651, $0, and $6,255 respectively, in redemption fees.
| 7. | UNDERLYING INVESTMENT IN OTHER INVESTMENT COMPANIES |
ADBF, ADTF and AMFSF currently invest a portion of their assets in ARCM, a Fund advised by the Advisor. ARCM is registered under the 1940 Act, as an open-end management investment company. ARCM’s investment objective seeks to preserve capital while maximizing current income. ARCM’s securities valuation policies are similar to the Funds’ policies. Each Fund may sell or redeem their investment in ARCM at any time if the Advisor determines that it is in the best interest of each Fund and its shareholders to do so. Each Fund’s performance will be directly affected by the performance of ARCM. The financial statements of ARCM, including the portfolio of investments, can be found at ARCM’s website, www.arrowfunds.com, or the Securities and Exchange Commission’s (“SEC”) website, www.sec.gov, and should be read in conjunction with the Funds’ financial statements. As of July 31, 2020, ADBF owned 4.9%, ADTF owned 0.2% and AMFSF owned 88.2% of ARCM. As of July 31, 2020, the percentage of ADBF, ADTF and AMFSF’s net assets invested in ARCM was 5.0%, 0.1% and 53.9%, respectively.
ADBF currently invests a portion of its assets in DWCR. DWCR is registered under the 1940 Act, as an open- end management investment company. DWCR’s investment objective seeks long-term capital appreciation by tracking the investment results of the Dorsey Wright Country and Stock Momentum Index. DWCR’s securities valuation policies are similar to ADBF’s policies. ADBF may sell or redeem its investment in DWCR at any time if the Advisor determines that it is in the best interest of ADBF and its shareholders to do so. The performance of ADBF will be directly affected by the performance of DWCR. The financial statements of DWCR, including the portfolio of investments, can be found at DWCR’s website, www.arrowfunds.com, or the SEC’s website, www.sec.gov, and should be read in conjunction with the ADBF financial statements. As of July 31, 2020, ADBF owned 84.4% of DWCR. As of July 31, 2020, the percentage of ADBF’s net assets invested in DWCR was 18.1%.
ADBF currently invests a portion of its assets in QVM, a Fund advised by the Advisor. QVM is registered under the 1940 Act, as an open-end management investment company. QVM’s
| The Arrow Funds |
| NOTES TO CONSOLIDATED FINANCIAL STATEMENTS (Continued) |
| July 31, 2020 |
investment objective seeks to replicate the investment results that generally correspond, before fees and expenses, to the price and yield performance of the AI Quality Value Momentum Index. QVM’s securities valuation policies are similar to ADBF’s policies. ADBF may sell or redeem its investment in QVM at any time if the Advisor determines that it is in the best interest of ADBF and its shareholders to do so. The performance of ADBF will be directly affected by the performance of QVM. The financial statements of QVM, including the portfolio of investments, can be found at QVMs website, www.arrowfunds.com, or the SEC’s website, www.sec.gov, and should be read in conjunction with the ADBF financial statements. As of July 31, 2020, ADBF owned 44.0% of QVM. As of July 31, 2020, the percentage of ADBF’s net assets invested in QVM was 4.5%.
| 8. | INVESTMENTS IN AFFILIATED COMPANIES |
An affiliated company is a company in which a Fund has ownership of at least 5% of the voting securities or is under common control. Companies which are affiliates of a Fund at July 31, 2020 are noted in the Funds’ Consolidated Portfolios of Investments. Transactions during the year ended July 31, 2020 with companies which are affiliates are as follows:
| ADBF | |
| | | | | | | | | | | | | | | | | | | | | | | | Net Change in | | | | |
| | | | | | Value - | | | | | | | | | | | | Dividends | | | | | | Unrealized | | | | |
| | | | | | Beginning of | | | | | | | | | | | | Credited to | | | Value - End of | | | Appreciation/ | | | Shares - | |
| Cusip | | | Description | | Year | | | Purchases | | | Sales Proceeds | | | Realized Loss | | | Income | | | Year | | | (Depreciation) | | | End of Year | |
| | 042765776 | | | Arrow Reserve Capital Management ETF | | $ | 3,233,052 | | | $ | — | | | $ | (721,654 | ) | | $ | (1,095 | ) | | $ | 50,845 | | | $ | 2,514,487 | | | $ | 4,184 | | | | 25,026 | |
| | 042765685 | | | Arrow DWA Country Rotation ETF | | | 13,036,302 | | | | 1,287,900 | | | | (5,553,936 | ) | | | (717,929 | ) | | | 154,343 | | | | 9,187,808 | | | | 1,135,471 | | | | 337,617 | |
| | 042765693 | | | Arrow Dogs of the World ETF | | | 2,784,731 | | | | — | | | | (1,814,985 | ) | | | (895,625 | ) | | | 8,224 | | | | — | | | | (74,121 | ) | | | — | |
| | 042765784 | | | Arrow QVM Equity Factor ETF | | | — | | | | 2,326,489 | | | | — | | | | — | | | | 11,220 | | | | 2,261,226 | | | | (65,263 | ) | | | 110,000 | |
| | | | | | | $ | 19,054,085 | | | $ | 3,614,389 | | | $ | (8,090,575 | ) | | $ | (1,614,649 | ) | | $ | 224,632 | | | $ | 13,963,521 | | | $ | 1,000,271 | | | | | |
| | | | | | | | | | | | | | | | | | | | | | | | | | | | | | | | | | | | | |
| ADTF | |
| | | | | | | | | | | | | | | | | | | | | | | | Net Change in | | | | |
| | | | | | Value - | | | | | | | | | | | | Dividends | | | | | | Unrealized | | | | |
| | | | | | Beginning of | | | | | | | | | Realized | | | Credited to | | | Value - End of | | | Appreciation/ | | | Shares - | |
| Cusip | | | Description | | Year | | | Purchases | | | Sales Proceeds | | | Gain | | | Income | | | Year | | | (Depreciation) | | | End of Year | |
| | 042765776 | | | Arrow Reserve Capital Management ETF | | $ | 140,441 | | | $ | — | | | $ | (20,079 | ) | | $ | 49 | | | $ | 2,438 | | | $ | 120,570 | | | $ | 159 | | | | 1,200 | |
| | | | | | | | | | | | | | | | | | | | | | | | | | | | | | | | | | | | | |
| ADIF | |
| | | | | | | | | | | | | | | | | | | | | | | | Net Change in | | | | |
| | | | | | Value - | | | | | | | | | | | | Dividends | | | | | | Unrealized | | | | |
| | | | | | Beginning of | | | | | | | | | Realized | | | Credited to | | | Value - End of | | | Appreciation/ | | | Shares - | |
| Cusip | | | Description | | Year | | | Purchases | | | Sales Proceeds | | | Gain | | | Income | | | Year | | | (Depreciation) | | | End of Year | |
| | 042765776 | | | Arrow Reserve Capital Management ETF | | $ | 7,490,198 | | | $ | — | | | $ | (7,483,247 | ) | | $ | 12,836 | | | $ | 47,317 | | | $ | — | | | $ | (19,787 | ) | | | — | |
| | | | | | | | | | | | | | | | | | | | | | | | | | | | | | | | | | | | | |
| AMFSF | |
| | | | | | | | | | | | | | | | | | | | | | | | Net Change in | | | | |
| | | | | | Value - | | | | | | | | | | | | Dividends | | | | | | Unrealized | | | | |
| | | | | | Beginning of | | | | | | | | | | | | Credited to | | | Value - End of | | | Appreciation/ | | | Shares - | |
| Cusip | | | Description | | Year | | | Purchases | | | Sales Proceeds | | | Realized Loss | | | Income | | | Year | | | (Depreciation) | | | End of Year | |
| | 042765776 | | | Arrow Reserve Capital Management ETF | | $ | 47,038,729 | | | $ | 5,205,671 | | | $ | (7,156,184 | ) | | $ | (10,206 | ) | | $ | 811,395 | | | $ | 45,171,249 | | | $ | 93,239 | | | | 449,577 | |
| The Arrow Funds |
| NOTES TO CONSOLIDATED FINANCIAL STATEMENTS (Continued) |
| July 31, 2020 |
Cross trades for the year ended July 31, 2020 were executed by the Funds pursuant to procedures adopted by the Board to ensure compliance with Rule 17a-7 under the 1940 Act (the “17a-7 Procedures”). In general, cross trading is the buying or selling of portfolio securities between a Fund and other series of the Trust. The Board determines no less frequently than quarterly that such transactions were effected in compliance with the 17a-7 Procedures.
For the year ended July 31, 2020, pursuant to these Procedures, each Fund’s total cross trades transactions were as follows:
| Fund | | Purchase at Cost | | | Sales Proceeds | | | Net Realized Gain/ (Loss) | |
| ADIF | | $ | — | | | $ | 1,472,171 | | | $ | 4,760 | |
| AMFSF | | | 1,472,171 | | | | — | | | | — | |
Amounts designated as “-” are zero or have been rounded to zero.
| 9. | DISTRIBUTIONS TO SHAREHOLDERS AND TAX COMPONENTS OF CAPITAL |
The tax character of distributions paid for the years ended July 31, 2020 and July 31, 2019 was as follows:
| For the year ended July 31, 2020: | |
| | |
| | | Ordinary | | | Long-Term | | | Return of | | | | |
| | | Income | | | Capital Gains | | | Capital | | | Total | |
| ADBF | | $ | 498,968 | | | $ | 432,048 | | | $ | — | | | $ | 931,016 | |
| ADTF | | | 1,017,965 | | | | 6,340,492 | | | | — | | | | 7,358,457 | |
| ADIF | | | 418,134 | | | | — | | | | — | | | | 418,134 | |
| AMFSF | | | 12,343,687 | | | | — | | | | — | | | | 12,343,687 | |
| | | | | | | | | | | | | | | | | |
| For the year ended July 31, 2019: | |
| | |
| | | Ordinary | | | Long-Term | | | Return of | | | | |
| | | Income | | | Capital Gains | | | Capital | | | Total | |
| ADBF | | $ | 1,340,380 | | | $ | 4,902,460 | | | $ | — | | | $ | 6,242,840 | |
| ADTF | | | 1,342,444 | | | | 4,140,623 | | | | — | | | | 5,483,067 | |
| ADIF | | | 583,553 | | | | — | | | | — | | | | 583,553 | |
| AMFSF | | | 15,702,286 | | | | — | | | | — | | | | 15,702,286 | |
As of July 31, 2020, the components of accumulated earnings/ (deficit) on a tax basis were as follows:
| | | Undistributed | | | Undistributed | | | Post October Loss | | | Capital Loss | | | Other | | | | | | Total | |
| | | Ordinary | | | Long-Term | | | and | | | Carry | | | Book/Tax | | | Unrealized | | | Accumulated | |
| | | Income | | | Capital Gains | | | Late Year Loss | | | Forwards | | | Differences | | | Appreciation | | | Earnings/(Deficits) | |
| ADBF | | $ | 2,597,789 | | | $ | 1,286,364 | | | $ | — | | | $ | — | | | $ | — | | | $ | 3,804,107 | | | $ | 7,688,260 | |
| ADTF | | | 1,874,391 | | | | — | | | | — | | | | (2,707,783 | ) | | | — | | | | 6,945,353 | | | | 6,111,961 | |
| ADIF | | | 330,748 | | | | — | | | | (1,270,637 | ) | | | (1,426,395 | ) | | | — | | | | 169,529 | | | | (2,196,755 | ) |
| AMFSF | | | — | | | | — | | | | (3,150,126 | ) | | | (879,425 | ) | | | — | | | | 149,392 | | | | (3,880,159 | ) |
| The Arrow Funds |
| NOTES TO CONSOLIDATED FINANCIAL STATEMENTS (Continued) |
| July 31, 2020 |
The difference between book basis and tax basis unrealized appreciation (depreciation), accumulated net investment income (loss) and accumulated net realized gain (loss) from investments is primarily attributable to the tax deferral of losses on wash sales, and mark-to-market on open futures and swap contracts.
Late year losses incurred after December 31 within the fiscal year are deemed to arise on the first business day of the following fiscal year for tax purposes. The Fund incurred and elected to defer such late year losses as follows:
| | | Late Year | |
| | | Losses | |
| ADBF | | $ | — | |
| ADTF | | | — | |
| ADIF | | | — | |
| AMFSF | | | 3,150,126 | |
Capital losses incurred after October 31 within the fiscal year are deemed to arise on the first business day of the following fiscal year for tax purposes. The Funds incurred and elected to defer such capital losses as follows:
| | | Post October | |
| | | Losses | |
| ADBF | | $ | — | |
| ADTF | | | — | |
| ADIF | | | 1,270,637 | |
| AMFSF | | | — | |
At July 31, 2020, the Funds had capital loss carry forwards for federal income tax purposes available to offset future capital gains along with capital loss carryforwards utilized as follows:
| | | | | | | | | | | | Carry Forward | |
| | | Short-Term | | | Long-Term | | | Total | | | Utilized | |
| ADBF | | $ | — | | | $ | — | | | $ | — | | | $ | — | |
| ADTF | | | 2,707,783 | | | | — | | | | 2,707,783 | | | | — | |
| ADIF | | | 549,340 | | | | 877,055 | | | | 1,426,395 | | | | — | |
| AMFSF | | | 715,218 | | | | 164,207 | | | | 879,425 | | | | 13,800 | |
| The Arrow Funds |
| NOTES TO CONSOLIDATED FINANCIAL STATEMENTS (Continued) |
| July 31, 2020 |
Permanent book and tax differences, primarily attributable to the book/tax basis treatment of net operating losses, equalization debits, the reclassification of Fund distributions, and adjustments for the Funds’ wholly owned subsidiaries, resulted in reclassifications for the Funds for the fiscal year ended July 31, 2020 as follows:
| | | Paid | | | | |
| | | In | | | Accumulated | |
| | | Capital | | | Earnings (Deficit) | |
| ADBF | | $ | 607,669 | | | $ | (607,669 | ) |
| ADTF | | | 414,479 | | | | (414,479 | ) |
| ADIF | | | — | | | | — | |
| AMFSF | | | (9,510,242 | ) | | | 9,510,242 | |
| 10. | AGGREGATE UNREALIZED APPRECIATION AND DEPRECIATION – TAX BASIS |
| | | | | | Gross | | | Gross | | | Net Unrealized | |
| | | Tax | | | Unrealized | | | Unrealized | | | Appreciation/ | |
| | | Cost | | | Appreciation | | | Depreciation | | | (Depreciation) | |
| ADBF | | $ | 44,733,669 | | | $ | 4,299,497 | | | $ | (495,390 | ) | | $ | 3,804,107 | |
| ADTF | | | 72,269,851 | | | | 7,018,371 | | | | (73,018 | ) | | | 6,945,353 | |
| ADIF | | | 2,666,173 | | | | 169,532 | | | | (3 | ) | | | 169,529 | |
| AMFSF | | | 86,150,015 | | | | 153,358 | | | | (3,966 | ) | | | 149,392 | |
Subsequent events after the date of the Statements of Assets and Liabilities have been evaluated through the date the financial statements were issued.
Management has determined that no events or transactions occurred requiring adjustment or disclosure in the financial statements.

REPORT OF INDEPENDENT REGISTERED PUBLIC ACCOUNTING FIRM
To the Board of Trustees of Arrow Investments Trust
and the Shareholders of Arrow DWA Balanced Fund, Arrow DWA Tactical Fund, Arrow Dynamic Income Fund, and Arrow Managed Futures Strategy Fund
Opinion on the Financial Statements
We have audited the accompanying consolidated (where noted) statements of assets and liabilities of Arrow DWA Balanced Fund, Arrow DWA Tactical Fund, Arrow Dynamic Income Fund, and Arrow Managed Futures Strategy Fund, each a series of shares of beneficial interest in Arrow Investments Trust (the “Funds”), including the consolidated (where noted) portfolios of investments, as of July 31, 2020, and the related consolidated (where noted) statements of operations for the year then ended, the consolidated (where noted) statements of changes in net assets for each of the years in the two-year period then ended and the consolidated (where noted) financial highlights for each of the years in the five-year period then ended, and the related consolidated (where noted) notes (collectively referred to as the “financial statements” ). In our opinion, the financial statements present fairly, in all material respects, the consolidated (where noted) financial position of the Funds as of July 31, 2020, and the results of their consolidated (where noted) operations for the year then ended, the consolidated (where noted) changes in their net assets for each of the years in the two-year period then ended and their consolidated (where noted) financial highlights for each of the years in the five-year period then ended, in conformity with accounting principles generally accepted in the United States of America.
Basis for Opinion
These financial statements are the responsibility of the Funds’ management. Our responsibility is to express an opinion on the Funds’ financial statements based on our audits. We are a public accounting firm registered with the Public Company Accounting Oversight Board (United States) (“PCAOB”) and are required to be independent with respect to the Funds in accordance with the U.S. federal securities law and the applicable rules and regulations of the Securities and Exchange Commission and the PCAOB.
We conducted our audits in accordance with the standards of the PCAOB. Those standards require that we plan and perform the audits to obtain reasonable assurance about whether the financial statements are free of material misstatement, whether due to error or fraud. The Funds are not required to have, nor were we engaged to perform, an audit of their internal control over financial reporting. As part of our audits we are required to obtain an understanding of internal control over financial reporting but not for the purpose of expressing an opinion on the effectiveness of the Funds’ internal control over financial reporting. Accordingly, we express no such opinion.
Our audits included performing procedures to assess the risk of material misstatement of the financial statements, whether due to error or fraud, and performing procedures that respond to those risks. Such procedures included examining, on a test basis, evidence regarding the amounts and disclosures in the financial statements. Our procedures included confirmation of securities owned as of July 31, 2020 by correspondence with the custodian, counterparties and brokers. Our audits also included evaluating the accounting principles used and significant estimates made by management, as well as evaluating the overall presentation of the financial statements. We believe that our audits provide a reasonable basis for our opinion.

BBD, LLP
We have served as the auditor of one or more of the Funds in the Arrow Investments Trust since 2012. We also served as the auditor of one or more of the Funds in the Funds’ former trust from 2006 through 2012.
Philadelphia, Pennsylvania
September 28, 2020
| The Arrow Funds |
| EXPENSE EXAMPLES (Unaudited) |
| July 31, 2020 |
As a shareholder of the Arrow DWA Balanced Fund, the Arrow DWA Tactical Fund, the Arrow Dynamic Income Fund, or the Arrow Managed Futures Strategy Fund you incur two types of costs: (1) transaction costs, including sales charges (loads) on purchases, contingent deferred sales charges (CDSCs) and redemption fees; (2) ongoing costs, including management fees; distribution and/or service (12b-1) fees; and other Fund expenses. These examples are intended to help you understand your ongoing costs (in dollars) of investing in the Arrow Funds and to compare these costs with the ongoing costs of investing in other mutual funds.
These examples are based on an investment of $1,000 invested at the beginning of the period and held for the entire period from February 1, 2020 through July 31, 2020.
Actual Expenses
The “Actual” table below provides information about actual account values and actual expenses. You may use the information below, together with the amount you invested, to estimate the expenses that you paid over the period. Simply divide your account value by $1,000 (for example, an $8,600 account value divided by $1,000 = 8.6), then multiply the result by the number in the table under the heading entitled “Expenses Paid During Period” to estimate the expenses you paid on your account during this period.
Hypothetical Example for Comparison Purposes
The “Hypothetical” table below provides information about hypothetical account values and hypothetical expenses based on each of the Arrow Funds’ actual expense ratios and an assumed rate of return of 5% per year before expenses, which is not each Fund’s actual return. The hypothetical account values and expenses may not be used to estimate the actual ending account balances or expenses you paid for the period. You may use this information to compare this 5% hypothetical example with the 5% hypothetical examples that appear in the shareholder reports of other funds.
Please note that the expenses shown in the table are meant to highlight your ongoing costs only and do not reflect any transactional costs, such as sales charges (loads), or redemption fees. Therefore, the table is useful in comparing ongoing costs only, and will not help you determine the relative total costs of owning different funds. In addition, if these transactional costs were included, your costs would have been higher.
| | | Beginning | | | Ending | | | Expense Paid | | | Expense Ratio |
| | | Account Value | | | Account Value | | | During Period * | | | During Period** |
| Actual | | 2/1/2020 | | | 7/31/2020 | | | 2/1/2020 - 7/31/2020 | | | 2/1/2020 - 7/31/2020 |
| DWA Balanced - Class A | | $ | 1,000.00 | | | $ | 1,112.80 | | | $ | 9.77 | | | 1.86% |
| DWA Balanced - Class C | | | 1,000.00 | | | | 1,108.10 | | | | 13.68 | | | 2.61% |
| DWA Balanced - Institutional Class | | | 1,000.00 | | | | 1,114.40 | | | | 8.46 | | | 1.61% |
| | | | | | | | | | | | | | | |
| DWA Tactical - Class A | | | 1,000.00 | | | | 983.40 | | | | 9.07 | | | 1.84% |
| DWA Tactical - Class C | | | 1,000.00 | | | | 979.80 | | | | 12.75 | | | 2.59% |
| DWA Tactical - Institutional Class | | | 1,000.00 | | | | 984.60 | | | | 7.85 | | | 1.59% |
| | | | | | | | | | | | | | | |
| Dynamic Income - Class A | | | 1,000.00 | | | | 791.60 | | | | 15.80 | | | 3.55% |
| Dynamic Income - Class C | | | 1,000.00 | | | | 789.10 | | | | 19.87 | | | 4.47% |
| Dynamic Income - Institutional Class | | | 1,000.00 | | | | 792.90 | | | | 14.04 | | | 3.15% |
| | | | | | | | | | | | | | | |
| Managed Futures Strategy - Class A | | | 1,000.00 | | | | 935.40 | | | | 7.65 | | | 1.59% |
| Managed Futures Strategy - Class C | | | 1,000.00 | | | | 931.90 | | | | 11.24 | | | 2.34% |
| Managed Futures Strategy - Institutional Class | | | 1,000.00 | | | | 936.10 | | | | 6.45 | | | 1.34% |
| The Arrow Funds |
| EXPENSE EXAMPLES (Unaudited)(Continued) |
| July 31, 2020 |
| | | Beginning | | | Ending | | | Expense Paid | | | Expense Ratio |
| Hypothetical | | Account Value | | | Account Value | | | During Period * | | | During Period** |
| (5% return before expenses) | | 2/1/2020 | | | 7/31/2020 | | | 2/1/2020 - 7/31/2020 | | | 2/1/2020 - 7/31/2020 |
| DWA Balanced - Class A | | $ | 1,000.00 | | | $ | 1,015.61 | | | $ | 9.32 | | | 1.86% |
| DWA Balanced - Class C | | | 1,000.00 | | | | 1,011.88 | | | | 13.06 | | | 2.61% |
| DWA Balanced - Institutional Class | | | 1,000.00 | | | | 1,016.86 | | | | 8.07 | | | 1.61% |
| | | | | | | | | | | | | | | |
| DWA Tactical - Class A | | | 1,000.00 | | | | 1,015.71 | | | | 9.22 | | | 1.84% |
| DWA Tactical - Class C | | | 1,000.00 | | | | 1,011.98 | | | | 12.96 | | | 2.59% |
| DWA Tactical - Institutional Class | | | 1,000.00 | | | | 1,016.96 | | | | 7.97 | | | 1.59% |
| | | | | | | | | | | | | | | |
| Dynamic Income - Class A | | | 1,000.00 | | | | 1,007.23 | | | | 17.70 | | | 3.55% |
| Dynamic Income - Class C | | | 1,000.00 | | | | 1,002.65 | | | | 22.24 | | | 4.47% |
| Dynamic Income - Institutional Class | | | 1,000.00 | | | | 1,009.21 | | | | 15.73 | | | 3.15% |
| | | | | | | | | | | | | | | |
| Managed Futures Strategy - Class A | | | 1,000.00 | | | | 1,016.96 | | | | 7.98 | | | 1.59% |
| Managed Futures Strategy - Class C | | | 1,000.00 | | | | 1,013.23 | | | | 11.71 | | | 2.34% |
| Managed Futures Strategy - Institutional Class | | | 1,000.00 | | | | 1,018.20 | | | | 6.73 | | | 1.34% |
| * | Expenses are equal to the average account value over the period, multiplied by each Fund’s annualized expense ratio, multiplied by the number of days in the period (182) divided by the number of days in the fiscal year (366). |
| The Arrow Funds |
| SUPPLEMENTAL INFORMATION (Unaudited) |
| July 31, 2020 |
This chart provides information about the Trustees and Officers who oversee the Funds. Officers elected by the Trustees manage the day-to-day operations of the Funds and execute policies formulated by the Trustees. The address of each Trustee and Officer is 6100 Chevy Chase Drive, Suite 100, Laurel, Maryland 20707, unless otherwise noted.
Non-Interested Trustees
Name,
Address, and
Year of Birth | Position(s)/
Term of Office(1) | Principal Occupation(s)
During the Past 5 Years | Number of
Portfolios in
Fund Complex
Overseen by
Trustee(2) | Other
Directorships
Held by Trustee |
Robert S. Andrialis
Born in 1944 | Trustee since 2014 | Independent Consultant (2016 – present); Advisor, INDXX, LLC (2014 – 2016); President, Secured Growth Quantitative Research (2011–2014). | 9 | Arrow ETF Trust |
Paul Montgomery
Born in 1953 | Trustee since 2011 | Director of Research, Scotia Partners, LLC (2012 - present). | 9 | Arrow ETF Trust |
Thomas T. Sarkany
Born in 1946 | Trustee since 2014 | Founder and President, TTS Consultants, LLC (2010 – present). | 9 | Arrow ETF Trust, Northern Lights Fund Trust II, Northern Lights Fund Trust IV; Aquila Distributors |
| The Arrow Funds |
| SUPPLEMENTAL INFORMATION (Unaudited)(Continued) |
| July 31, 2020 |
Interested Trustees and Officers
Name,
Address, and
Year of Birth | Position(s)/
Term of Office(1) | Principal Occupation(s)
During the Past 5 Years | Number of
Funds in the
Fund Complex
Overseen by
Trustee(2) | Other
Directorships
Held by Trustee |
Joseph Barrato*
Born in
1965 | Chairman of the Board, Trustee, President, and Principal Executive Officer since 2011 | Founder and Chief Executive Officer, Arrow Investment Advisors, LLC (2006- present). | 9 | Arrow ETF Trust |
Sothara Chin
Born in
1966 | Chief Compliance Officer since 2018; Previously from 2011-2015 | Managing Partner of Fit Compliance, LLC (2017 - present); Chief Operations Officer and Chief Compliance Officer, ImpactUs Marketplace, LLC (2015-2017); Chief Compliance Officer, Arrow Investment Advisors, LLC (2011- 2015). | N/A | N/A |
Jake Griffith
Born in
1978 | Secretary since 2011 | Founder, President, and Director of Sales, Arrow Investment Advisors, LLC (2006- present). | N/A | N/A |
Sam Singh
80 Arkay
Dr. Hauppauge, NY
11788
Born in 1976 | Principal Financial Officer and Treasurer since 2013 | Vice President (2015 - present); Gemini Fund Services, LLC. | N/A | N/A |
| (1) | The term of office for each Trustee will continue indefinitely until the individual resigns or is removed. Officers of the Trust are elected annually. |
| (2) | The “Fund Complex” includes Arrow ETF Trust, a registered management investment company, in addition to the Trust. |
| * | Joseph Barrato is considered to be an “interested person” of the Arrow Trust, as that term is defined in the 1940 Act, because he is a controlling interest holder of the investment advisor to each Fund, Arrow Investment Advisors, LLC. |
The Funds’ Statement of Additional Information includes additional information about the Trustees and is available free of charge, upon request, by calling toll-free at 1-877-277-6933.
PRIVACY NOTICE
Arrow Investments Trust
| FACTS | WHAT DOES ARROW INVESTMENTS TRUST DO WITH YOUR PERSONAL INFORMATION? |
| Why? | Financial companies choose how they share your personal information. Federal law gives consumers the right to limit some, but not all sharing. Federal law also requires us to tell you how we collect, share, and protect your personal information. Please read this notice carefully to understand what we do. |
| What? | The types of personal information we collect and share depends on the product or service that you have with us. This information can include: ● Social Security number and wire transfer instructions ● account transactions and transaction history ● investment experience and purchase history When you are no longer our customer, we continue to share your information as described in this notice. |
| How? | All financial companies need to share customers’ personal information to run their everyday business. In the section below, we list the reasons financial companies can share their customers’ personal information; the reasons Arrow Investments Trust chooses to share; and whether you can limit this sharing. |
Reasons we can share your
personal information: | Does Arrow Investments
Trust share information? | Can you limit this
sharing? |
| For our everyday business purposes - such as to process your transactions, maintain your account(s), respond to court orders and legal investigations, or report to credit bureaus. | YES | NO |
| For our marketing purposes - to offer our products and services to you. | NO | We don’t share |
| For joint marketing with other financial companies. | NO | We don’t share |
| For our affiliates’ everyday business purposes - information about your transactions and records. | NO | We don’t share |
| For our affiliates’ everyday business purposes - information about your credit worthiness. | NO | We don’t share |
| For nonaffiliates to market to you | NO | We don’t share |
| QUESTIONS? | Call 1-877-277-6933 |
PRIVACY NOTICE
Arrow Investments Trust
| What we do: |
How does Arrow Investments Trust protect my personal information? | To protect your personal information from unauthorized access and use, we use security measures that comply with federal law. These measures include computer safeguards and secured files and buildings. Our service providers are held accountable for adhering to strict policies and procedures to prevent any misuse of your nonpublic personal information. |
How does Arrow Investments Trust collect my personal information? | We collect your personal information, for example, when you ● open an account or deposit money ● direct us to buy securities or direct us to sell your securities ● seek advice about your investments We also collect your personal information from others, such as credit bureaus, affiliates, or other companies. |
Why can’t I limit all sharing? | Federal law gives you the right to limit only: ● sharing for affiliates’ everyday business purposes – information about your creditworthiness. ● affiliates from using your information to market to you. ● sharing for nonaffiliates to market to you. State laws and individual companies may give you additional rights to limit sharing. |
| Definitions |
| Affiliates | Companies related by common ownership or control. They can be financial and nonfinancial companies. ● Arrow Investments Trust does not share with our affiliates. |
| Nonaffiliates | Companies not related by common ownership or control. They can be financial and nonfinancial companies. ● Arrow Investments Trust does not share with nonaffiliates so they can market to you. |
| Joint marketing | A formal agreement between nonaffiliated financial companies that together market financial products or services to you. ● Arrow Investments Trust does not jointly market. |
PROXY VOTING POLICY
Information regarding how the Funds voted proxies relating to portfolio securities for the most recent twelve month period ended June 30 as well as a description of the policies and procedures that the Funds use to determine how to vote proxies is available without charge, upon request, by calling 1-877-277-6933 or by referring to the Securities and Exchange Commission’s (“SEC”) website at http://www.sec.gov.
PORTFOLIO HOLDINGS
The Funds file a complete schedule of portfolio holdings with the SEC for the first and third quarters of each fiscal year as an exhibit to its reports on Form N-PORT, within sixty days after the end of the period. Form N-PORT reports are available at the SEC’s website at www.sec.gov.
| INVESTMENT ADVISOR |
| Arrow Investment Advisors, LLC |
| 6100 Chevy Chase Drive, Suite 100 |
| Laurel, MD 20707 |
| |
| ADMINISTRATOR |
| Gemini Fund Services, LLC |
| 4221 North 203rd Street, Suite 100 |
| Elkhorn, NE 68022-3474 |
Item 2. Code of Ethics.
(a) As of the end of the period covered by this report, the registrant has adopted a code of ethics that applies to the registrant's principal executive officer, principal financial officer, principal accounting officer or controller, or persons performing similar functions, regardless of whether these individuals are employed by the registrant or a third party.
(b) For purposes of this item, “code of ethics” means written standards that are reasonably designed to deter wrongdoing and to promote:
| (1) | Honest and ethical conduct, including the ethical handling of actual or apparent conflicts of interest between personal and professional relationships; |
| (2) | Full, fair, accurate, timely, and understandable disclosure in reports and documents that a registrant files with, or submits to, the Commission and in other public communications made by the registrant; |
(3) Compliance with applicable governmental laws, rules, and regulations;
| (4) | The prompt internal reporting of violations of the code to an appropriate person or persons identified in the code; and |
(5) Accountability for adherence to the code.
(c) Amendments: During the period covered by the report, there have not been any amendments to the provisions of the code of ethics.
(d) Waivers: During the period covered by the report, the registrant has not granted any express or implicit waivers from the provisions of the code of ethics.
(e) The Code of Ethics is not posted on Registrant’ website.
(f) A copy of the Code of Ethics is attached as an exhibit.
Item 3. Audit Committee Financial Expert.
(a)(1)ii The Registrant’s board of trustees has determined that Robert S. Andrialis is an audit committee financial expert, as defined in Item 3 of Form N-CSR. Mr. Andrialis is independent for purposes of this Item.
(a)(2) Not applicable.
(a)(3) In this regard, no member of the audit committee was identified as having all of the required technical attributes identified in instruction 2 (b) to item 3 of Form N-CSR to qualify as an “audit committee financial expert,” whether through the type of specialized education or experience required by that instruction. At this time, the board believes the experience provided by each member of the audit committee collectively offers the fund adequate oversight by its audit committee given the fund’s level of financial complexity. The board will from time to time reexamine such belief.
Item 4. Principal Accountant Fees and Services.
2020 - $69,000
2019 - $ 67,000
2020 – None
2019 – None
2020 - $ 10,300
2019 - $ 10,300
Preparation of Federal & State income tax returns, assistance with calculation of required income, capital gain and excise distributions and preparation of Federal excise tax returns.
2020 – None
2019 – None
| (e) | (1) Audit Committee’s Pre-Approval Policies |
The registrant’s Audit Committee is required to pre-approve all audit services and, when appropriate, any non-audit services (including audit-related, tax and all other services) to the registrant. The registrant’s Audit Committee also is required to pre-approve, when appropriate, any non-audit services (including audit-related, tax and all other services) to its adviser, or any entity controlling, controlled by or under common control with the adviser that provides ongoing services to the registrant, to the extent that the services may be determined to have an impact on the operations or financial reporting of the registrant. Services are reviewed on an engagement by engagement basis by the Audit Committee.
| (2) | Percentages of Services Approved by the Audit Committee |
2020 2019
Audit-Related Fees: 0.00% 0.00%
Tax Fees: 0.00% 0.00%
All Other Fees: 0.00% 0.00%
| (f) | During the audit of registrant's financial statements for the most recent fiscal year, less than 50 percent of the hours expended on the principal accountant's engagement were attributed to work performed by persons other than the principal accountant's full-time, permanent employees. |
| (g) | The aggregate non-audit fees billed by the registrant's accountant for services rendered to the registrant, and rendered to the registrant's investment adviser (not including any sub-adviser whose role is primarily portfolio management and is subcontracted with or overseen by another investment adviser), and any entity controlling, controlled by, or under common control with the adviser that provides ongoing services to the registrant: |
2020 - $10,300
2019 - $10,300
(h) The registrant's audit committee has considered whether the provision of non-audit services to the registrant's investment adviser (not including any sub-adviser whose role is primarily portfolio management and is subcontracted with or overseen by another investment adviser), and any entity controlling, controlled by, or under common control with the investment adviser that provides ongoing services to the registrant, that were not pre-approved pursuant to paragraph (c)(7)(ii) of Rule 2-01 of Regulation S-X, is compatible with maintaining the principal accountant's independence.
Item 5. Audit Committee of Listed Companies. Not applicable to open-end investment companies.
Item 6. Schedule of Investments. See Item 1.
Item 7. Disclosure of Proxy Voting Policies and Procedures for Closed-End Funds. Not applicable to open-end investment companies.
Item 8. Portfolio Managers of Closed-End Management Investment Companies. Not applicable to open-end investment companies.
Item 9. Purchases of Equity Securities by Closed-End Funds. Not applicable to open-end investment companies.
Item 10. Submission of Matters to a Vote of Security Holders. None
Item 11. Controls and Procedures.
(a) Based on an evaluation of the Registrant’s disclosure controls and procedures as of a date within 90 days of filing date of this Form N-CSR, the principal executive officer and principal financial officer of the Registrant have concluded that the disclosure controls and procedures of the Registrant are reasonably designed to ensure that the information required in filings on Form N-CSR is recorded, processed, summarized, and reported by the filing date, including that information required to be disclosed is accumulated and communicated to the Registrant’s management, including the Registrant’s principal executive officer and principal financial officer, as appropriate to allow timely decisions regarding required disclosure.
(b) There were no significant changes in the Registrant’s internal control over financial reporting that occurred during the Registrant’s last fiscal half-year that have materially affected, or are reasonably likely to materially affect, the Registrant’s internal control over financial reporting.
Item 12. Disclosure of Securities Lending Activities for Closed-End Management Investment Companies. - Not applicable to open-end investment companies.
Item 13. Exhibits.
(a)(1) Code of Ethics herewith.
(a)(2) Certifications required by Section 302 of the Sarbanes-Oxley Act of 2002 (and Item 11(a)(2) of Form N-CSR) are filed herewith.
(a)(3) Not applicable for open-end investment companies.
(b) Certifications required by Section 906 of the Sarbanes-Oxley Act of 2002 (and Item 11(b) of Form N-CSR) are filed herewith.
SIGNATURES
Pursuant to the requirements of the Securities Exchange Act of 1934 and the Investment Company Act of 1940, the registrant has duly caused this report to be signed on its behalf by the undersigned, thereunto duly authorized.
(Registrant) Arrow Investments Trust
By (Signature and Title)
/s/ Joseph Barrato
Joseph Barrato, Principal Executive Officer/President
Date 10/8/20
Pursuant to the requirements of the Securities Exchange Act of 1934 and the Investment Company Act of 1940, this report has been signed below by the following persons on behalf of the registrant and in the capacities and on the dates indicated.
By (Signature and Title)
/s/ Joseph Barrato
Joseph Barrato, Principal Executive Officer/President
Date 10/8/20
By (Signature and Title)
/s/ Sam Singh
Sam Singh, Principal Financial Officer/Treasurer
Date 10/8/20