united states
securities and exchange commission
washington, d.c. 20549
form n-csr
certified shareholder report of registered management
investment companies
Investment Company Act file number 811-22638
Arrow Investments Trust
(Exact name of registrant as specified in charter)
6100 Chevy Chase Drive Suite 100 , Laurel MD 20707
(Address of principal executive offices) (Zip code)
Corporation Service Company
251 Little Falls Drive
Wilmington, Delaware 19808
(Name and address of agent for service)
Registrant's telephone number, including area code: 631-470-2619
Date of fiscal year end: 1/31
Date of reporting period: 1/31/21
Item 1. Reports to Stockholders.
Arrow Reserve Capital Management ETF
ARCM
Annual Report
January 31, 2021
1-877-277-6933
1-877-ARROW-FD
www.ArrowFunds.com
Dear Shareholder:
We are pleased to present this annual report for the Arrow Reserve Capital Management ETF (“ARCM” or the “Fund”) for the year ended January 31, 2021. ARCM is a conservative ultra short-term fixed income fund that invests in a variety of investment grade fixed income securities with maturities generally ranging from zero to two years. The Fund is sub-advised by Halyard Asset Management, LLC, a leader in reserve capital and fixed income strategies.
ARCM is actively managed in an attempt to maximize income potential without substantially increasing portfolio risk. The Fund tries to identify holdings that offer an acceptable yield and return potential for a given level of credit risk and maturity.
Management’s Discussion of Fund Performance
All Fund performance herein is based on net asset value (“NAV”) and assumes the reinvestment of distributions, without regard to individual taxes or withholdings. Index returns assume reinvestment of distributions, but do not include fees. Individual performance will vary due to a number of factors, including, but not limited to, trading commissions, bid/ask spreads, premium/discounts relative to the NAV, time of trading and other potential market factors—please refer to the Fund’s prospectus for more information.
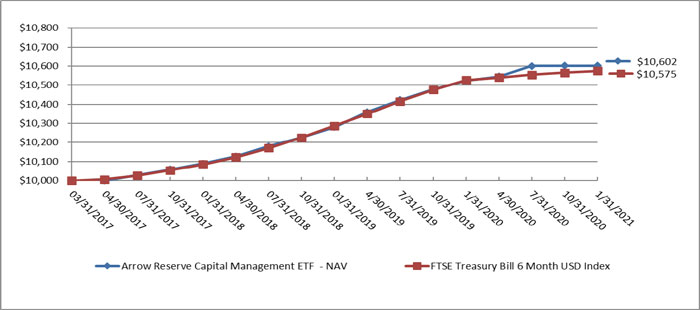
For the one-year period ended January 31, 2021, performance of ARCM was 0.76%. For a comparison, the FTSE Treasury Bill 6 Month USD Index was 0.65% for the same period. Since the Fund’s inception on March 31, 2017, the Fund has an annualized total return of 1.54% and the FTSE Treasury Bill 6 Month USD Index was up 1.52% for the same period. With a large mix of floating rate notes, the Fund performed well, recovering from losses of the COVID crisis low on March 23, 2020 by May 20, 2020.
Investment grade industrial paper such as Oracle Corp. 1.9% 9/15/2021 and Campbell Soup Co. 3.3% 3/15/2021 lead the performance contribution in ARCM for the one-year period ended January 31, 2021. Financial names such as JPMorgan Chase & Co. 2.295% 8/15/2021 and Morgan Stanley 5.5% 7/28/2021 also contributed positively to performance. Higher rated paper contributed less to overall performance as the sharp fall in yield offered in the fixed income space forced investors down the credit curve and into BBB and lower rated credits. Specific holdings that detracted from ARCM’s performance for the one-year period ended January 31, 2021 were Maine Health & Higher Educational Facilities Authority 5.0% 7/1/2021, Mylan N.V. 3.15% 6/15/2021, Town of Stratford CT 4.0% 7/1/2021 and Dominion Energy, Inc. 2.0% 8/15/2021.
Overall, interest rates declined during 2020 in response to the challenges to the economy presented by the COVID pandemic and the resulting increased demand for fixed income securities. As of January 31, 2021, the Fund’s 30-day U.S. Securities and Exchange Commission yield was -0.13% and the 12-month distribution rate was 0.71% which is down from 2.45% on January 31, 2020.
For more information about current performance, holdings, or historical premiums/discounts, please visit our website at www.arrowfunds.com. We are grateful for your continued confidence in our company.
Sincerely,

Joseph J. Barrato
Chief Executive Officer
Arrow Investment Advisors, LLC
March 2021
AD-031621
| Arrow Reserve Capital Management ETF |
| PORTFOLIO REVIEW (Unaudited) |
| January 31, 2021 |
The Fund’s performance figures* for the period ended January 31, 2021, as compared to its benchmark:
| | | | Annualized |
| | | Annualized | Since Inception** - |
| | One Year | Three Year | January 31, 2021 |
| Arrow Reserve Capital Management ETF - NAV | 0.76% | 1.67% | 1.54% |
| Arrow Reserve Capital Management ETF - Market Price | 0.63% | 1.59% | 1.13% |
| FTSE Treasury Bill 6 Month USD Index | 0.65% | 1.66% | 1.52% |
| * | The Fund’s past performance does not guarantee future results. The investment return and principal value of an investment in the Fund will fluctuate so that an investor’s shares, when redeemed, may be worth more or less than their original cost. The returns shown do not reflect the deduction of taxes that a shareholder would pay on Fund distributions or on the redemption of Fund shares. Current performance of the Fund may be lower or higher than the performance quoted. Performance data current to the most recent month end may be obtained by visiting www.arrowfunds.com or by calling 1-877-277-6933. |
The Fund’s per share net asset value or “NAV” is the value of one share of the Fund as calculated in accordance with the standard formula for valuing shares. The NAV return is based on the NAV of the Fund and the market return is based on the market price per share of the Fund. The price used to calculate market return (“Market Price”) is determined by using the market price or bid/ask as of close of market on the primary stock exchange on which shares of the Fund are listed for trading, as of the time that the Fund’s NAV is calculated. Market and NAV returns assume that dividends and capital gain distributions have been reinvested in the Fund at Market Price and NAV, respectively. Information detailing the number of days the Market Price of the Fund was greater than the Fund’s NAV and the number of days it was less than the Fund’s NAV can be obtained at www.arrowfunds.com. The Fund’s total annual operating expenses, before fee waivers and/or expense reimbursements are 0.54% per the June 1, 2020 prospectus. After fee waivers and/or expense reimbursements, the Fund’s total annual expenses are 0.50% per the June 1, 2020 prospectus. The Fund’s total return would have been lower had the investment advisor not waived a portion of the Fund’s expenses. Please see the Financial Highlights for a more recent expense ratio.
| ** | As of the close of business on the day of commencement of trading on March 31, 2017. |
The FTSE Treasury Bill 6 Month USD Index is a market value-weighted index of public obligations of the U.S. Treasury with maturities of six months. The Index reflects no deduction for fees, expenses or taxes. Investors cannot invest directly in an index.
Comparison of the Change in Value of a $10,000 Investment
| Arrow Reserve Capital Management ETF |
| PORTFOLIO REVIEW (Unaudited)(Continued) |
| January 31, 2021 |
The Fund’s Holdings by Asset Class as of January 31, 2021 are as follows:
| Asset Class | | % of Net Assets | |
| Corporate Bonds | | | 73.2 | % |
| Municipal Bonds | | | 14.6 | % |
| U.S. Treasury Notes | | | 13.1 | % |
| U.S. Treasury Bills | | | 0.0 | % * |
| Liabilities in Excess of Other Assets | | | (0.9 | )% |
| | | | 100.0 | % |
| * | Amount is less than 0.01% |
Please refer to the Portfolio of Investments in this Annual Report for a detailed listing of the Fund’s holdings.
| Arrow Reserve Capital Management ETF |
| PORTFOLIO OF INVESTMENTS |
| January 31, 2021 |
| Principal Amount ($) | | | | | Coupon Rate (%) | | Maturity | | Value | |
| | | | | CORPORATE BONDS - 73.2% | | | | | | | | |
| | | | | APPAREL & TEXTILE PRODUCTS - 2.2% | | | | | | | | |
| | 1,086,000 | | | Ralph Lauren Corp. | | 1.700 | | 6/15/2022 | | $ | 1,104,741 | |
| | | | | | | | | | | | | |
| | | | | AUTOMOTIVE - 4.5% | | | | | | | | |
| | 300,000 | | | General Motors Financial Co., Inc. | | 4.375 | | 9/25/2021 | | | 307,653 | |
| | 415,000 | | | General Motors Financial Co., Inc. | | 3.450 | | 1/14/2022 | | | 425,519 | |
| | 114,000 | | | General Motors Financial Co., Inc., 3 M Libor + 1.55% # | | 1.784 | | 1/14/2022 | | | 115,097 | |
| | 1,431,000 | | | Toyota Motor Credit Corp. | | 0.450 | | 7/22/2022 | | | 1,435,666 | |
| | | | | | | | | | | | 2,283,935 | |
| | | | | BANKING - 10.1% | | | | | | | | |
| | 943,000 | | | Bank of America Corp., 3M Libor + 1.42% # | | 1.643 | | 4/19/2021 | | | 945,872 | |
| | 452,000 | | | Citibank NA, 3M Libor + 0.57% # | | 0.788 | | 7/23/2021 | | | 452,976 | |
| | 200,000 | | | Citigroup, Inc. | | 2.900 | | 12/8/2021 | | | 204,045 | |
| | 492,000 | | | Citigroup, Inc., 3M Libor + 0.96% # | | 1.178 | | 4/25/2022 | | | 497,013 | |
| | 200,000 | | | Fifth Third Bancorp | | 3.500 | | 3/15/2022 | | | 206,594 | |
| | 250,000 | | | KeyBank NA, 3M Libor + 0.66% # | | 0.874 | | 2/1/2022 | | | 251,500 | |
| | 843,000 | | | Royal Bank of Canada, 3 M Libor + 0.39% # | | 0.604 | | 4/30/2021 | | | 843,776 | |
| | 268,000 | | | Synchrony Bank | | 3.650 | | 5/24/2021 | | | 269,994 | |
| | 250,000 | | | US Bank NA, 3M Libor + 0.18% # | | 0.404 | | 1/21/2022 | | | 250,360 | |
| | 133,000 | | | Wells Fargo & Co. | | 2.500 | | 3/4/2021 | | | 133,260 | |
| | 844,000 | | | Wells Fargo & Co., 3 M Libor + 1.34% # | | 1.571 | | 3/4/2021 | | | 844,979 | |
| | 150,000 | | | Wells Fargo & Co., 3 M Libor + 1.03% # | | 1.240 | | 7/26/2021 | | | 150,719 | |
| | 96,000 | | | Wells Fargo & Co. | | 3.500 | | 3/8/2022 | | | 99,373 | |
| | | | | | | | | | | | 5,150,461 | |
| | | | | BEVERAGES - 3.8% | | | | | | | | |
| | 1,060,000 | | | Constellation Brands, Inc. | | 2.650 | | 11/7/2022 | | | 1,099,089 | |
| | 822,000 | | | Keurig Dr. Pepper, Inc. | | 3.551 | | 5/25/2021 | | | 830,510 | |
| | | | | | | | | | | | 1,929,599 | |
| | | | | BIOTECHNOLOGY & PHARMACEUTICALS - 4.2% | | | | | | | | |
| | 832,000 | | | AbbVie, Inc. | | 2.300 | | 11/21/2022 | | | 859,937 | |
| | 218,000 | | | AbbVie, Inc. | | 3.250 | | 10/1/2022 | | | 226,607 | |
| | 1,037,000 | | | Mylan N.V. | | 3.150 | | 6/15/2021 | | | 1,045,095 | |
| | | | | | | | | | | | 2,131,639 | |
| | | | | CHEMICALS - 2.1% | | | | | | | | |
| | 1,022,000 | | | The Sherwin-Williams Co. | | 4.200 | | 1/15/2022 | | | 1,049,911 | |
| | | | | | | | | | | | | |
| | | | | ELECTRIC & GAS MARKETING & TRADING - 1.5% | | | | | | | | |
| | 784,000 | | | Con Edison Co. of NY, Inc., 3M Libor + 0.40% # | | 0.651 | | 6/25/2021 | | | 785,293 | |
| | | | | | | | | | | | | |
| | | | | ELECTRIC UTILITIES - 2.8% | | | | | | | | |
| | 301,000 | | | Dominion Energy, Inc. | | 2.000 | | 8/15/2021 | | | 303,322 | |
| | 803,000 | | | Duke Energy Florida LLC, 3M Libor + 0.25% # | | 0.482 | | 11/26/2021 | | | 804,340 | |
| | 265,000 | | | Duke Energy Progress LLC, 3M Libor + 0.18% # | | 0.400 | | 2/18/2022 | | | 265,025 | |
| | 35,000 | | | Virginia Electric & Power Co. | | 2.950 | | 1/15/2022 | | | 35,661 | |
| | | | | | | | | | | | 1,408,348 | |
| | | | | ENGINEERING & CONSTRUCTION - 0.3% | | | | | | | | |
| | 91,000 | | | Nature Conservancy | | 0.317 | | 7/1/2021 | | | 91,000 | |
| | 91,000 | | | Nature Conservancy | | 0.367 | | 7/1/2022 | | | 91,000 | |
| | | | | | | | | | | | 182,000 | |
| | | | | ENTERTAINMENT CONTENT - 2.0% | | | | | | | | |
| | 1,010,000 | | | TWDC Enterprises 18 Corp., 3M Libor + 0.39% # | | 0.620 | | 3/4/2022 | | | 1,014,188 | |
| | | | | | | | | | | | | |
| | | | | FOOD - 4.4% | | | | | | | | |
| | 1,006,000 | | | Campbell Soup Co. | | 3.300 | | 3/15/2021 | | | 1,009,679 | |
| | 113,000 | | | Campbell Soup Co., 3M Libor + 0.63% # | | 0.847 | | 3/15/2021 | | | 113,078 | |
| | 612,000 | | | General Mills, Inc. | | 3.200 | | 4/16/2021 | | | 615,780 | |
| | 533,000 | | | General Mills, Inc., 3M Libor + 0.54% # | | 0.763 | | 4/16/2021 | | | 533,570 | |
| | | | | | | | | | | | 2,272,107 | |
See accompanying notes to financial statements.
| Arrow Reserve Capital Management ETF |
| PORTFOLIO OF INVESTMENTS (Continued) |
| January 31, 2021 |
| Principal Amount ($) | | | | | Coupon Rate (%) | | Maturity | | Value | |
| | | | | HEALTH CARE FACILITIES & SERVICES - 4.3% | | | | | | | | |
| | 234,000 | | | Anthem, Inc. | | 3.125 | | 5/15/2022 | | $ | 242,230 | |
| | 958,000 | | | Laboratory Corp of America Holdings | | 3.200 | | 2/1/2022 | | | 984,949 | |
| | 972,000 | | | UnitedHealth Group, Inc., 3M Libor + 0.26% # | | 0.476 | | 6/15/2021 | | | 972,736 | |
| | | | | | | | | | | | 2,199,915 | |
| | | | | HOUSEHOLD PRODUCTS - 0.6% | | | | | | | | |
| | 299,000 | | | The Clorox Co. | | 3.800 | | 11/15/2021 | | | 307,230 | |
| | | | | | | | | | | | | |
| | | | | INSTITUTIONAL FINANCIAL SERVICES - 4.3% | | | | | | | | |
| | 37,000 | | | Goldman Sachs Group, Inc. | | 5.750 | | 1/24/2022 | | | 38,961 | |
| | 848,000 | | | Goldman Sachs Group, Inc. | | 3.000 | | 4/26/2022 | | | 853,356 | |
| | 251,000 | | | Goldman Sachs Group, Inc., 3M Libor + 1.11% # | | 1.325 | | 4/26/2022 | | | 251,618 | |
| | 849,000 | | | Morgan Stanley, 3M Libor + 1.40% # | | 1.624 | | 4/21/2021 | | | 851,411 | |
| | 201,000 | | | Morgan Stanley | | 5.500 | | 7/28/2021 | | | 206,125 | |
| | | | | | | | | | | | 2,201,471 | |
| | | | | INSURANCE - 2.6% | | | | | | | | |
| | 1,309,000 | | | Allstate Corp., 3M Libor + 0.43% # | | 0.681 | | 3/29/2021 | | | 1,310,011 | |
| | | | | | | | | | | | | |
| | | | | LEISURE FACILITIES & SERVICES - 1.1% | | | | | | | | |
| | 488,000 | | | Marriot International, 3M Libor + 0.65% # | | 0.876 | | 3/8/2021 | | | 488,134 | |
| | 70,000 | | | McDonald’s Corp. | | 3.625 | | 5/20/2021 | | | 70,712 | |
| | | | | | | | | | | | 558,846 | |
| | | | | MACHINERY - 1.5% | | | | | | | | |
| | 276,000 | | | Caterpillar Financial Services Corp., 3M Libor + 0.39% # | | 0.612 | | 5/17/2021 | | | 276,301 | |
| | 483,000 | | | Parker-Hannifin Corp. | | 3.500 | | 9/15/2022 | | | 506,976 | |
| | | | | | | | | | | | 783,277 | |
| | | | | OIL & GAS PRODUCERS - 2.0% | | | | | | | | |
| | 1,000,000 | | | Chevron USA, Inc., 3M Libor + 0.11% # | | 0.320 | | 8/12/2022 | | | 1,000,748 | |
| | | | | | | | | | | | | |
| | | | | RETAIL - DISCRETIONARY - 2.8% | | | | | | | | |
| | 150,000 | | | Home Depot, Inc., 3M Libor + 0.31% # | | 0.535 | | 3/1/2022 | | | 150,580 | |
| | 1,254,000 | | | Lowe’s Cos, Inc. | | 3.800 | | 11/15/2021 | | | 1,277,830 | |
| | | | | | | | | | | | 1,428,410 | |
| | | | | SOFTWARE - 2.1% | | | | | | | | |
| | 1,063,000 | | | Oracle Corp. | | 1.900 | | 9/15/2021 | | | 1,072,677 | |
| | | | | | | | | | | | | |
| | | | | SPECIALTY FINANCE - 4.8% | | | | | | | | |
| | 573,000 | | | American Express Co., 3M Libor + 0.53% # | | 0.747 | | 5/17/2021 | | | 573,613 | |
| | 814,000 | | | Capital One Financial Corp. | | 3.450 | | 4/30/2021 | | | 818,157 | |
| | 61,000 | | | Capital One Financial Corp., 3M Libor + 0.95% # | | 1.180 | | 3/9/2022 | | | 61,440 | |
| | 985,000 | | | Synchrony Financial | | 2.850 | | 7/25/2022 | | | 1,016,745 | |
| | | | | | | | | | | | 2,469,955 | |
| | | | | TECHNOLOGY HARDWARE - 0.6% | | | | | | | | |
| | 305,000 | | | Apple, Inc., 3M Libor + 0.50% # | | 0.713 | | 2/9/2022 | | | 306,489 | |
| | | | | | | | | | | | | |
| | | | | TELECOMMUNICATIONS - 2.8% | | | | | | | | |
| | 446,000 | | | AT&T, Inc., 3M Libor + 0.75% # | | 0.975 | | 6/1/2021 | | | 446,986 | |
| | 872,000 | | | AT&T, Inc., 3M Libor + 0.95% # | | 1.191 | | 7/15/2021 | | | 875,286 | |
| | 132,000 | | | Verizon Communications, Inc., 3M Libor + 1.00% # | | 1.219 | | 3/16/2022 | | | 133,449 | |
| | | | | | | | | | | | 1,455,721 | |
| | | | | TRANSPORTATION & LOGISTICS - 4.1% | | | | | | | | |
| | 504,000 | | | FedEx Corp. | | 3.400 | | 1/14/2022 | | | 518,895 | |
| | 160,000 | | | Penske Truck Leasing Co. LP 144A | | 4.875 | | 7/11/2022 | | | 169,821 | |
| | 704,000 | | | Penske Truck Leasing Co. LP 144A | | 3.300 | | 4/1/2021 | | | 705,715 | |
| | 283,000 | | | Ryder System, Inc. | | 3.450 | | 11/15/2021 | | | 289,465 | |
| | 411,000 | | | United Parcel Service, Inc., 3M Libor + 0.15% # | | 0.388 | | 4/1/2021 | | | 411,137 | |
| | | | | | | | | | | | 2,095,033 | |
| | | | | WHOLESALE - CONSUMER STAPLES - 1.7% | | | | | | | | |
| | 882,000 | | | PepsiCo., Inc., 3M Libor + 0.53% # | | 0.767 | | 10/6/2021 | | | 885,155 | |
| | | | | | | | | | | | | |
| | | | | TOTAL CORPORATE BONDS (Cost $37,332,942) | | | | | | | 37,387,160 | |
See accompanying notes to financial statements.
| Arrow Reserve Capital Management ETF |
| PORTFOLIO OF INVESTMENTS (Continued) |
| January 31, 2021 |
| Principal Amount ($) | | | | | Coupon Rate (%) | | Maturity | | Value | |
| | | | | MUNICIPAL BONDS - 14.6% | | | | | | | | |
| | | | | APPROPRIATION - 1.8% | | | | | | | | |
| | 700,000 | | | Kansas Development Finance Authority | | 5.000 | | 6/1/2021 | | $ | 711,095 | |
| | 225,000 | | | Michigan State Building Authority | | 0.391 | | 4/15/2022 | | | 225,290 | |
| | | | | | | | | | | | 936,385 | |
| | | | | BOND BANK - 0.9% | | | | | | | | |
| | 450,000 | | | Indiana Finance Authority | | 5.000 | | 2/1/2021 | | | 450,000 | |
| | | | | | | | | | | | | |
| | | | | CITY - 0.6% | | | | | | | | |
| | 215,000 | | | Port Authority of Houston of Harris County Texas | | 5.000 | | 10/1/2021 | | | 221,811 | |
| | 40,000 | | | Town of Stratford CT | | 4.000 | | 7/1/2021 | | | 40,624 | |
| | 50,000 | | | Town of Stratford CT | | 5.000 | | 7/1/2022 | | | 53,306 | |
| | | | | | | | | | | | 315,741 | |
| | | | | COUNTY - 3.7% | | | | | | | | |
| | 505,000 | | | County of Passaic NJ | | 2.000 | | 11/1/2021 | | | 512,242 | |
| | 75,000 | | | County of Passaic NJ | | 2.000 | | 11/1/2021 | | | 76,075 | |
| | 200,000 | | | County of Suffolk NY | | 2.000 | | 7/22/2021 | | | 201,604 | |
| | 635,000 | | | County of Westchester NY | | 2.500 | | 7/1/2022 | | | 654,622 | |
| | 400,000 | | | County of Westchester NY | | 2.500 | | 7/1/2023 | | | 420,076 | |
| | | | | | | | | | | | 1,864,619 | |
| | | | | ECONOMY & INDUSTRY DEVELOPMENT- 0.8% | | | | | | | | |
| | 190,000 | | | New York State Energy Research & Development Authority | | 1.524 | | 10/1/2021 | | | 190,266 | |
| | 205,000 | | | New York State Energy Research & Development Authority | | 1.624 | | 10/1/2022 | | | 205,752 | |
| | | | | | | | | | | | 396,018 | |
| | | | | GOVERNMENT LEASE - 0.5% | | | | | | | | |
| | 155,000 | | | County of Pima AZ | | 0.376 | | 12/1/2021 | | | 155,039 | |
| | 100,000 | | | County of Pima AZ | | 0.476 | | 12/1/2022 | | | 100,099 | |
| | | | | | | | | | | | 255,138 | |
| | | | | HIGHER EDUCATION - 0.9% | | | | | | | | |
| | 150,000 | | | Hempstead Town Local Development Corp. | | 5.000 | | 7/1/2022 | | | 152,870 | |
| | 75,000 | | | New York State Dormitory Authority | | 1.286 | | 7/1/2021 | | | 75,308 | |
| | 45,000 | | | Pennsylvania Higher Educational Facilities Authority | | 5.000 | | 5/1/2022 | | | 47,631 | |
| | 195,000 | | | Pennsylvania State University | | 1.090 | | 9/1/2021 | | | 196,008 | |
| | | | | | | | | | | | 471,817 | |
| | | | | HOSPITALS - 0.2% | | | | | | | | |
| | 70,000 | | | Maine Health & Higher Educational Facilities Authority | | 5.000 | | 7/1/2021 | | | 71,386 | |
| | 20,000 | | | Maine Health & Higher Educational Facilities Authority | | 5.000 | | 7/1/2021 | | | 20,390 | |
| | | | | | | | | | | | 91,776 | |
| | | | | INCOME TAX FINANCING - 1.2% | | | | | | | | |
| | 305,000 | | | New York State Dormitory Authority | | 5.000 | | 2/15/2021 | | | 305,546 | |
| | 330,000 | | | New York State Urban Development Corp. | | 0.397 | | 3/15/2021 | | | 330,026 | |
| | | | | | | | | | | | 635,572 | |
| | | | | SCHOOL DISTRICTS - 0.6% | | | | | | | | |
| | 30,000 | | | Amarillo Independent School District | | 0.267 | | 2/1/2022 | | | 30,044 | |
| | 50,000 | | | City of West Haven CT | | 3.000 | | 3/15/2021 | | | 50,138 | |
| | 50,000 | | | City of West Haven CT | | 3.000 | | 3/15/2022 | | | 51,286 | |
| | 85,000 | | | Clint Independent School District * | | 0.000 | | 2/15/2022 | | | 84,640 | |
| | 105,000 | | | El Paso Independent School District * | | 0.000 | | 8/15/2021 | | | 104,744 | |
| | | | | | | | | | | | 320,852 | |
| | | | | STATES - 0.9% | | | | | | | | |
| | 145,000 | | | State of Georgia | | 5.000 | | 2/1/2021 | | | 145,000 | |
| | 60,000 | | | State of Georgia | | 5.000 | | 7/1/2021 | | | 61,224 | |
| | 140,000 | | | State of Mississippi | | 5.000 | | 10/1/2027 | | | 144,589 | |
| | 95,000 | | | State of Washington | | 5.250 | | 2/1/2036 | | | 95,000 | |
| | | | | | | | | | | | 445,813 | |
| | | | | WATER & SEWER - 2.5% | | | | | | | | |
| | 260,000 | | | City of Irving TX Waterworks & Sewer System Revenue | | 5.000 | | 8/15/2021 | | | 266,856 | |
| | 255,000 | | | County of King WA Sewer Revenue | | 0.370 | | 1/1/2022 | | | 255,541 | |
| | 75,000 | | | Louisville and Jefferson County Metropolitan Sewer District | | 0.290 | | 5/15/2021 | | | 75,013 | |
| | 150,000 | | | Missouri State Environmental Improvement & Energy Resources | | 0.261 | | 7/1/2021 | | | 150,030 | |
| | 120,000 | | | Missouri State Environmental Improvement & Energy Resources | | 0.311 | | 1/1/2022 | | | 120,113 | |
See accompanying notes to financial statements.
| Arrow Reserve Capital Management ETF |
| PORTFOLIO OF INVESTMENTS (Continued) |
| January 31, 2021 |
| Principal Amount ($) | | | | | Coupon Rate (%) | | Maturity | | Value | |
| | | | | WATER & SEWER (continued) - 2.5% | | | | | | | | |
| | 100,000 | | | Missouri State Environmental Improvement & Energy Resources | | 0.381 | | 7/1/2022 | | $ | 100,159 | |
| | 115,000 | | | Soquel Creek Water District | | 0.253 | | 3/1/2021 | | | 115,005 | |
| | 170,000 | | | Soquel Creek Water District | | 0.303 | | 3/1/2022 | | | 170,206 | |
| | | | | | | | | | | | 1,252,923 | |
| | | | | | | | | | | | | |
| | | | | TOTAL MUNICIPAL BONDS (Cost $7,426,498) | | | | | | | 7,436,654 | |
| | | | | | | | | | | | | |
| | | | | U.S. TREASURY BILLS - 0.0% | | | | | | | | |
| | 5,000 | | | United States Treasury Bill * (Cost $4,999) | | 0.000 | | 4/8/2021 | | | 4,999 | |
| | | | | | | | | | | | | |
| | | | | U.S. TREASURY NOTES - 13.1% | | | | | | | | |
| | 575,000 | | | United States Treasury Note 3M Libor + 0.30% # | | 0.380 | | 10/31/2021 | | | 576,245 | |
| | 2,000,000 | | | United States Treasury Note 3M Libor + 0.11% # | | 0.194 | | 4/30/2022 | | | 2,002,263 | |
| | 4,100,000 | | | United States Treasury Note 3M Libor + 0.06% # | | 0.135 | | 7/31/2022 | | | 4,101,875 | |
| | | | | TOTAL U.S. TREASURY NOTES (Cost $6,678,317) | | | | | | | 6,680,383 | |
| | | | | | | | | | | | | |
| | | | | TOTAL INVESTMENTS - 100.9% (Cost - $51,442,756) | | | | | | $ | 51,509,196 | |
| | | | | LIABILITIES IN EXCESS OF OTHER ASSETS - (0.9)% | | | | | | | (454,744 | ) |
| | | | | NET ASSETS - 100.0% | | | | | | $ | 51,054,452 | |
144A - Security was purchased pursuant to Rule 144A under the Securities Act of 1933 and may not be resold subject to that rule, except to qualified institutional buyers. At January 31, 2021 144A securities amounted to $875,536 or 1.71% of net assets.
| # | Floating Rate Bond - Rate represented is as of January 31, 2021. |
3M Libor - A 3-month average of the LIBOR index.
LLC - Limited Liability Company
LP - Limited Partnership
See accompanying notes to financial statements.
| Arrow Reserve Capital Management ETF |
| STATEMENT OF ASSETS AND LIABILITIES |
| January 31, 2021 |
| ASSETS | | | | |
| Investment securities: | | | | |
| At cost | | $ | 51,442,756 | |
| At value | | $ | 51,509,196 | |
| Cash | | | 8,682 | |
| Receivable for investments sold | | | 634,932 | |
| Interest receivable | | | 198,829 | |
| Prepaid expenses and other assets | | | 1,387 | |
| TOTAL ASSETS | | | 52,353,026 | |
| | | | | |
| LIABILITIES | | | | |
| Payable for investments purchased | | | 1,231,543 | |
| Investment advisory fees payable | | | 19,175 | |
| Payable to related parties | | | 24,725 | |
| Accrued expenses and other liabilities | | | 23,131 | |
| TOTAL LIABILITIES | | | 1,298,574 | |
| NET ASSETS | | $ | 51,054,452 | |
| | | | | |
| Net Assets Consist Of: | | | | |
| Paid in capital | | $ | 50,988,012 | |
| Distributable earnings | | | 66,440 | |
| NET ASSETS | | $ | 51,054,452 | |
| | | | | |
| Net Asset Value Per Share: | | | | |
| Net Assets | | $ | 51,054,452 | |
| Shares of beneficial interest outstanding ($0 par value, unlimited shares authorized) | | | 510,000 | |
| Net asset value (Net Assets ÷ Shares Outstanding) | | $ | 100.11 | |
See accompanying notes to financial statements.
| Arrow Reserve Capital Management ETF |
| STATEMENT OF OPERATIONS |
| For the year ended January 31, 2021 |
| INVESTMENT INCOME | | | | |
| Dividends | | $ | 4,523 | |
| Interest | | | 537,152 | |
| TOTAL INVESTMENT INCOME | | | 541,675 | |
| | | | | |
| EXPENSES | | | | |
| Investment advisory fees | | | 154,314 | |
| Administrative services fees | | | 55,911 | |
| Legal fees | | | 14,560 | |
| Custodian fees | | | 12,719 | |
| Audit fees | | | 12,454 | |
| Transfer agent fees | | | 10,125 | |
| Printing and postage expenses | | | 6,572 | |
| Professional fees | | | 4,535 | |
| Trustees fees and expenses | | | 3,872 | |
| Insurance expense | | | 2,797 | |
| Other expenses | | | 4,239 | |
| TOTAL EXPENSES | | | 282,098 | |
| | | | | |
| Less: Fees waived/expenses reimbursed by the Advisor | | | (59,195 | ) |
| NET EXPENSES | | | 222,903 | |
| | | | | |
| NET INVESTMENT INCOME | | | 318,772 | |
| | | | | |
| REALIZED AND UNREALIZED GAIN ON INVESTMENTS | | | | |
| Net realized gain on investments | | | 39,496 | |
| Net change in unrealized appreciation on investments | | | 31,718 | |
| NET REALIZED AND UNREALIZED GAIN ON INVESTMENTS | | | 71,214 | |
| | | | | |
| NET INCREASE IN NET ASSETS RESULTING FROM OPERATIONS | | $ | 389,986 | |
See accompanying notes to financial statements.
| Arrow Reserve Capital Management ETF |
| STATEMENTS OF CHANGES IN NET ASSETS |
| | | For Year Ended | | | For Year Ended | |
| | | January 31, 2021 | | | January 31, 2020 | |
| FROM OPERATIONS | | | | | | | | |
| Net investment income | | $ | 318,772 | | | $ | 1,246,766 | |
| Net realized gain on investments | | | 39,496 | | | | 3,664 | |
| Net change in unrealized appreciation on investments | | | 31,718 | | | | 96,293 | |
| Net increase in net assets resulting from operations | | | 389,986 | | | | 1,346,723 | |
| | | | | | | | | |
| DISTRIBUTIONS TO SHAREHOLDERS | | | | | | | | |
| From return of capital | | | (4,507 | ) | | | (19,857 | ) |
| Total other distributions paid from distributable earnings | | | (356,063 | ) | | | (1,381,755 | ) |
| Net decrease in net assets resulting from distributions to shareholders | | | (360,570 | ) | | | (1,401,612 | ) |
| | | | | �� | | | | |
| FROM SHARES OF BENEFICIAL INTEREST | | | | | | | | |
| Proceeds from shares sold | | | — | | | | 5,006,081 | |
| Cost of shares redeemed | | | (5,008,658 | ) | | | (5,012,646 | ) |
| Net decrease in net assets resulting from shares of beneficial interest | | | (5,008,658 | ) | | | (6,565 | ) |
| | | | | | | | | |
| TOTAL DECREASE IN NET ASSETS | | | (4,979,242 | ) | | | (61,454 | ) |
| | | | | | | | | |
| NET ASSETS | | | | | | | | |
| Beginning of Year | | | 56,033,694 | | | | 56,095,148 | |
| End of Year | | $ | 51,054,452 | | | $ | 56,033,694 | |
| | | | | | | | | |
| SHARE ACTIVITY | | | | | | | | |
| Shares Sold | | | — | | | | 50,000 | |
| Shares Redeemed | | | (50,000 | ) | | | (50,000 | ) |
| Net decrease in shares of beneficial interest outstanding | | | (50,000 | ) | | | — | |
See accompanying notes to financial statements.
| Arrow Reserve Capital Management ETF |
| FINANCIAL HIGHLIGHTS |
Per Share Data and Ratios for a Share of Beneficial Interest Outstanding Throughout Each Period
| | | For the Year Ended | | | For the Year Ended | | | For the Year Ended | | | For the Period Ended | |
| | | January 31, 2021 | | | January 31, 2020 | | | January 31, 2019 | | | January 31, 2018 (1)(8) | |
| Net asset value, beginning of period | | $ | 100.06 | | | $ | 100.17 | | | $ | 100.19 | | | $ | 100.00 | |
| Activity from investment operations: | | | | | | | | | | | | | | | | |
| Net investment income (2) | | | 0.62 | | | | 2.16 | | | | 2.00 | | | | 0.80 | |
| Net realized and unrealized gain (loss) on investments | | | 0.14 | | | | 0.18 | | | | (0.12 | ) | | | 0.09 | |
| Total from investment operations | | | 0.76 | | | | 2.34 | | | | 1.88 | | | | 0.89 | |
| Less distributions from: | | | | | | | | | | | | | | | | |
| Net investment income | | | (0.64 | ) | | | (2.41 | ) | | | (1.90 | ) | | | (0.69 | ) |
| Net realized gains | | | (0.06 | ) | | | — | | | | — | | | | (0.01 | ) |
| Return of capital | | | (0.01 | ) | | | (0.04 | ) | | | — | | | | — | |
| Total distributions | | | (0.71 | ) | | | (2.45 | ) | | | (1.90 | ) | | | (0.70 | ) |
| Net asset value, end of period | | $ | 100.11 | | | $ | 100.06 | | | $ | 100.17 | | | $ | 100.19 | |
| Total return (6) | | | 0.76 | % | | | 2.37 | % | | | 1.90 | % | | | 0.89 | % (4) |
| Net assets, at end of period (000s) | | $ | 51,054 | | | $ | 56,034 | | | $ | 56,095 | | | $ | 76,145 | |
| Ratio of gross expenses to average net assets (7) | | | 0.55 | % | | | 0.54 | % | | | 0.50 | % | | | 0.52 | % (3) |
| Ratio of net expenses to average net assets | | | 0.43 | % | | | 0.42 | % | | | 0.42 | % | | | 0.42 | % (3) |
| Ratio of net investment income to average net assets | | | 0.62 | % | | | 2.16 | % | | | 1.99 | % | | | 0.94 | % (3) |
| Portfolio Turnover Rate (5) | | | 118 | % | | | 24 | % | | | 33 | % | | | 66 | % (4) |
| (1) | The Arrow Reserve Capital Management ETF commenced operations on March 30, 2017. |
| (2) | Per share amounts calculated using the average shares method, which more appropriately presents the per share data for the period. |
| (3) | Annualized for periods less than one year. |
| (4) | Not annualized for periods less than one year. |
| (5) | Portfolio turnover rate excludes portfolio securities received or delivered as a result of processing capital share transactions in Creation Units. |
| (6) | Total return is calculated assuming a purchase of shares at net asset value on the first day and a sale at net asset value on the last day of the period. Distributions are assumed, for the purpose of this calculation, to be reinvested at the ex-dividend date net asset value per share on their respective payment dates. Had Arrow Investment Advisors, LLC not waived fees or reimbursed a portion of the expenses, total returns would have been lower. |
| (7) | Represents the ratio of expenses to average net assets absent fee waivers and /or expense reimbursements by Arrow Investment Advisors, LLC. |
| (8) | Effective November 1, 2017, the Fund had a 1:5 reverse stock split. Per share amounts for the period have been adjusted to give effect to the 1:5 stock split. |
See accompanying notes to financial statements.
Arrow Reserve Capital Management ETF
NOTES TO FINANCIAL STATEMENTS
January 31, 2021
The Arrow Reserve Capital Management ETF (the “Fund”) is a diversified series of Arrow Investments Trust (“Trust”), a statutory trust organized under the laws of the State of Delaware on August 2, 2011, and is registered under the Investment Company Act of 1940, as amended (the “1940 Act”), as an open-end management investment company. The Fund’s investment objective is to seek to preserve capital while maximizing current income. The investment objective is non-fundamental. The Fund commenced operations on March 30, 2017.
| 2. | SIGNIFICANT ACCOUNTING POLICIES |
The following is a summary of significant accounting policies followed by the Fund in preparation of its financial statements. These policies are in conformity with accounting principles generally accepted in the United States of America (“GAAP”). The preparation of financial statements requires management to make estimates and assumptions that affect the reported amounts of assets and liabilities and disclosure of contingent assets and liabilities at the date of the financial statements and the reported amounts of income and expenses for the period. Actual results could differ from those estimates. The Fund is an investment company and accordingly follows the investment company accounting and reporting guidance of the Financial Accounting Standards Board (“FASB”) Accounting Standards Codification Topic 946 “Financial Services-Investment Companies” including FASB Accounting Standards Update (“ASU”) 2013-08.
Securities valuation – Securities listed on an exchange are valued at the last reported sale price at the close of the regular trading session of the exchange on the business day the value is being determined, or in the case of securities listed on NASDAQ at the NASDAQ Official Closing Price (“NOCP”). In the absence of a sale, such securities shall be valued at the last bid price on the day of valuation. Debt securities (other than short-term obligations) are valued each day by an independent pricing service approved by the Trust’s Board of Trustees (the “Board”) using methods which include current market quotations from a major market maker in the securities and based on methods which include the consideration of yields or prices of securities of comparable quality, coupon, maturity and type. Investments valued in currencies other than the U.S. dollar are converted to U.S. dollars using exchange rates obtained from pricing services. If market quotations are not readily available or if Arrow Investment Advisors, LLC (the “Advisor”) believes the market quotations are not reflective of market value, securities will be valued at their fair value as determined in good faith by the Advisor and in accordance with the Trust’s Portfolio Securities Valuation Procedures (the “Procedures”), subject to review by the Board. The Board will review the fair value method in use for securities requiring a fair market value determination and supporting documentation from the Advisor at least quarterly for consistency with the Procedures. The Procedures consider, among others, the following factors to determine a security’s fair value: the nature and pricing history (if any) of the security; whether any dealer quotations for the security are available; and possible valuation methodologies that could be used to determine the fair value of the security. Fair value may also be used by the Board if extraordinary events occur after the close of the relevant world market but prior to the NYSE close. Short-term debt obligations having 60 days or less remaining until maturity, at time of purchase, may be valued at amortized cost.
Arrow Reserve Capital Management ETF
NOTES TO FINANCIAL STATEMENTS (Continued)
January 31, 2021
The Fund utilizes various methods to measure the fair value of all of its investments on a recurring basis. GAAP establishes a hierarchy that prioritizes inputs to valuation methods. The three levels of input are:
Level 1 – Unadjusted quoted prices in active markets for identical assets and liabilities that the Fund has the ability to access.
Level 2 – Observable inputs other than quoted prices included in Level 1 that are observable for the asset or liability, either directly or indirectly. These inputs may include quoted prices for the identical instrument in an inactive market, prices for similar instruments, interest rates, prepayment speeds, credit risk, yield curves, default rates and similar data.
Level 3 – Unobservable inputs for the asset or liability, to the extent relevant observable inputs are not available, representing the Fund’s own assumptions about the assumptions a market participant would use in valuing the asset or liability, and would be based on the best information available.
The availability of observable inputs can vary from security to security and is affected by a wide variety of factors, including, for example, the type of security, whether the security is new and not yet established in the marketplace, the liquidity of markets, and other characteristics particular to the security. To the extent that valuation is based on models or inputs that are less observable or unobservable in the market, the determination of fair value requires more judgment. Accordingly, the degree of judgment exercised in determining fair value is greatest for instruments categorized in Level 3.
The inputs used to measure fair value may fall into different levels of the fair value hierarchy. In such cases, for disclosure purposes, the level in the fair value hierarchy within which the fair value measurement falls in its entirety, is determined based on the lowest level input that is significant to the fair value measurement in its entirety.
The inputs or methodology used for valuing securities are not necessarily an indication of the risk associated with investing in those securities. The following tables summarize the inputs used as of January 31, 2021 for the Fund’s assets measured at fair value:
| Assets * | | Level 1 | | | Level 2 | | | Level 3 | | | Total | |
| Corporate Bonds | | $ | — | | | $ | 37,387,160 | | | $ | — | | | $ | 37,387,160 | |
| Municipal Bonds | | | — | | | | 7,436,654 | | | | — | | | | 7,436,654 | |
| U.S. Treasury Bills | | | — | | | | 4,999 | | | | — | | | | 4,999 | |
| U.S. Treasury Notes | | | — | | | | 6,680,383 | | | | — | | | | 6,680,383 | |
| Total | | $ | — | | | $ | 51,509,196 | | | $ | — | | | $ | 51,509,196 | |
The Fund did not hold any Level 3 securities during the period.
| * | See Portfolio of Investments for classification. |
Arrow Reserve Capital Management ETF
NOTES TO FINANCIAL STATEMENTS (Continued)
January 31, 2021
Security transactions and related income – Security transactions are accounted for on the trade date. Interest income is recognized on an accrual basis. Discounts are accreted and premiums are amortized on securities purchased over the lives of the respective securities. Dividend income is recorded on the ex-dividend date. Realized gains or losses from sales of securities are determined by comparing the identified cost of the security lot sold with the net sales proceeds.
Dividends and distributions to shareholders – Dividends from net investment income, if any, are declared and paid monthly. Distributable net realized capital gains, if any, are declared and distributed annually. Dividends from net investment income and distributions from net realized gains are determined in accordance with federal income tax regulations, which may differ from GAAP. These “book/tax” differences are considered either temporary (e.g., deferred losses) or permanent in nature. To the extent these differences are permanent in nature, such amounts are reclassified within the composition of net assets based on their federal tax-basis treatment; temporary differences do not require reclassification. Dividends and distributions to shareholders are recorded on the ex-dividend date.
Federal Income Taxes – The Fund intends to continue to comply with the requirements of the Internal Revenue Code applicable to regulated investment companies and to distribute all of its taxable income to its shareholders. Therefore, no provision for federal income tax is required. The Fund recognizes the tax benefits of uncertain tax positions only where the position is “more likely than not” to be sustained assuming examination by tax authorities. Management has analyzed the Fund’s tax positions and has concluded that no liability for unrecognized tax benefits should be recorded related to uncertain tax positions taken on returns filed for open tax years ended January 31, 2018 to January 31, 2020, or expected to be taken in the Fund’s January 31, 2021 year-end tax return. The Fund identifies its major tax jurisdictions as U.S. federal and foreign jurisdictions where the Fund makes significant investments. The Fund is not aware of any tax positions for which it is reasonably possible that the total amounts of unrecognized tax benefits will change materially in the next twelve months.
Expenses – Expenses of the Trust that are directly identifiable to a specific fund are charged to that fund. Expenses that are not readily identifiable to a specific fund, are allocated in such a manner as deemed equitable (as determined by the Board), taking into consideration the nature and type of expenses and the relative sizes of the funds in the Trust.
Indemnification – The Trust indemnifies its officers and Trustees for certain liabilities that may arise from the performance of their duties to the Trust. Additionally, in the normal course of business, the Fund enters into contracts that contain a variety of representations and warranties and which provide general indemnities. The Fund’s maximum exposure under these arrangements is unknown, as this would involve future claims that may be made against the Fund that have not yet occurred. However, based on experience, the risk of loss due to these warranties and indemnities appears to be remote.
Time Deposits – Time deposits are issued by a depository institution in exchange for the deposit of funds. The issuer agrees to pay the amount deposited plus interest to the depositor on the date specified with respect to the deposit. Time deposits do not trade in the secondary market prior to
Arrow Reserve Capital Management ETF
NOTES TO FINANCIAL STATEMENTS (Continued)
January 31, 2021
maturity. However, some time deposits may be redeemable prior to maturity and may be subject to withdrawal penalties.
Market Risk – The net asset value of the Fund will fluctuate based on changes in the value of the individual securities and ETFs in which the Fund invests. The increasing interconnectivity between global economies and financial markets increases the likelihood that events or conditions in one region or financial market may adversely impact issuers in a different country, region or financial market. Securities in the Fund’s portfolio may underperform due to inflation (or expectations for inflation), interest rates, global demand for particular products or resources, natural disasters, pandemics, epidemics, terrorism, regulatory events and governmental or quasi-governmental actions. The occurrence of global events similar to those in recent years may result in market volatility and may have long term effects on both the U.S. and global financial markets. The current novel coronavirus (COVID-19) global pandemic and the aggressive responses taken by many governments, including closing borders, restricting international and domestic travel, and the imposition of prolonged quarantines or similar restrictions, as well as the forced or voluntary closure of, or operational changes to, many retail and other businesses, has had negative impacts, and in many cases severe negative impacts, on markets worldwide. It is not known how long such impacts, or any future impacts of other significant events described above, will or would last, but there could be a prolonged period of global economic slowdown, which may impact your Fund investment.
| 3. | INVESTMENT TRANSACTIONS |
For the year ended January 31, 2021, cost of purchases and proceeds from sales of portfolio securities (excluding in-kind transactions and short-term investments), amounted to $41,180,831 and $37,977,371.
For the year ended January 31, 2021, cost of purchases and proceeds from sales of portfolio securities for in-kind transactions, amounted to $0 and $0 respectively.
| 4. | INVESTMENT ADVISORY AGREEMENT AND TRANSACTIONS WITH RELATED PARTIES |
The business activities of the Fund are overseen by the Board, which is responsible for the overall management of the Fund. The Advisor serves as the Fund’s investment advisor pursuant to an investment advisory agreement with the Trust on behalf of the Fund (the “Advisory Agreement”). The Advisor has engaged Halyard Asset Management LLC as the sub-advisor (the “Sub-Advisor”) to the Fund. The Trust has entered into a Global Custody Agreement with Brown Brothers Harriman & Co. to serve as Custodian and to act as transfer and shareholder services agent.
The Trust has also entered into an ETF Distribution Agreement (the “Distribution Agreement”) with Northern Lights Distributors, LLC (the “Distributor”) to serve as the distributor for the Fund. Archer Distributors, LLC (“Archer”), an affiliate of the Advisor is also a party to the Distribution Agreement
Arrow Reserve Capital Management ETF
NOTES TO FINANCIAL STATEMENTS (Continued)
January 31, 2021
and provides marketing services to the Fund, including responsibility for all the Fund’s marketing and advertising materials.
Pursuant to the Advisory Agreement, the Advisor, under the oversight of the Board, directs the daily operations of the Fund and supervises the performance of administrative and professional services provided by others. As compensation for its services and the related expenses borne by the Advisor, the Fund pays the Advisor a fee, computed and accrued daily and paid monthly, at an annual rate of 0.30% of the Fund’s average daily net assets. The Sub-Advisor is paid by the Advisor, not the Fund. For the year ended January 31, 2021, the Fund incurred $154,314 in advisory fees. For the year ended January 31, 2021, the Sub-Advisor earned $51,436 in sub-advisory fees.
Pursuant to a written contract (the “Waiver Agreement”), the Advisor has agreed, at least until May 31, 2021 to waive a portion of its advisory fee and has agreed to reimburse the Fund for other expenses to the extent necessary so that total expenses incurred (exclusive of any front-end or contingent deferred sales loads, taxes, leverage interest, brokerage commissions, expenses incurred in connection with any merger or reorganization, dividend expense on securities sold short, underlying fund fees and expenses, foreign custody transaction costs and foreign account set up fees and extraordinary expenses such as litigation expenses) will not exceed 0.42%, herein referred to as the “Expense Limitation.” Effective December 1, 2020 until at least May 31, 2021, the Expense Limitation is 0.50% of average daily net assets.
If the Advisor waives any fee or reimburses any expenses pursuant to the Waiver Agreement, and the Fund’s operating expenses are subsequently lower than its applicable Expense Limitation, the Advisor, on a rolling three-year period (within three years after the fees have been waived or reimbursed), shall be entitled to reimbursement by the Fund provided that such reimbursement does not cause the Fund’s operating expense to exceed the lesser if the Expense Limitation in place at the time of waiver or recapture. If the Fund’s operating expenses subsequently exceed the applicable Expense Limitation, the reimbursements for the Fund shall be suspended. For the year ended January 31, 2021, the Advisor waived fees in the amount of $59,195 pursuant to the Waiver Agreement. The following amounts are subject to recapture by the Advisor through the following date:
| 1/31/2022 | | | 1/31/2023 | | | 1/31/2024 | |
| $ | 56,766 | | | $ | 71,845 | | | $ | 59,195 | |
The Advisor may seek reimbursement only for expenses that were waived or paid after the effective date of the Waiver Agreement (or any similar agreement). The Board may terminate this expense reimbursement arrangement at any time.
The Trust, with respect to the Fund, has adopted a distribution and service plan (“Plan”) pursuant to Rule 12b-1 under the 1940 Act. Under the Plan, the Fund is authorized to pay distribution fees to the Distributor and other firms that provide distribution and shareholder services (“Service Providers”). If
Arrow Reserve Capital Management ETF
NOTES TO FINANCIAL STATEMENTS (Continued)
January 31, 2021
a Service Provider provides these services, the Fund may pay fees at an annual rate not to exceed 0.25% of average daily net assets, pursuant to Rule 12b-1 under the 1940 Act.
No distribution or service fees are currently paid by the Fund and there are no current plans to impose these fees. In the event Rule 12b-1 fees were charged, over time they would increase the cost of an investment in the Fund.
Gemini Fund Services, LLC (“GFS”) – GFS, an affiliate of the Distributor, provides administration and fund accounting services to the Trust. Pursuant to separate servicing agreements with GFS the Fund pays GFS customary fees for providing administration and fund accounting services to the Fund. Certain officers of the Trust are also officers of GFS, and are not paid any fees directly by the Trust for serving in such capacities.
Blu Giant, LLC (“Blu Giant”) – Blu Giant, an affiliate of GFS and the Distributor, provides EDGAR conversion and filing services as well as print management services for the Fund on an ad-hoc basis. For the provision of these services, Blu Giant receives customary fees from the Fund.
| 5. | CAPITAL SHARE TRANSACTIONS |
Shares are not individually redeemable and may be redeemed by the Fund at NAV only in large blocks known as “Creation Units.” Shares are created and redeemed by the Fund only in Creation Unit size aggregations of 50,000 shares. Only Authorized Participants are permitted to purchase or redeem Creation Units from the Fund. An Authorized Participant is either (i) a broker-dealer or other participant in the clearing process through the Continuous Net Settlement System of the National Securities Clearing Corporation or (ii) a DTC participant and, in each case, must have executed a participant Agreement with the Distributor. Such transactions are generally permitted on an in-kind basis, with a balancing cash component to equate the transaction to the NAV per share of the Fund on the transaction date. Cash may be substituted equivalent to the value of certain securities generally when they are not available in sufficient quantity for delivery, not eligible for trading by the Authorized Participant or as a result of other market circumstances. In addition, the Fund may impose transaction fees on purchases and redemptions of Fund shares to cover the custodial and other costs incurred by the Fund in effecting trades. A fixed fee payable to the Custodian may be imposed on each creation and redemption transaction regardless of the number of Creation Units involved in the transaction (“Fixed Fee”). Transaction Fees may be used to cover the custodial and other costs incurred by the Fund or disclosed as capital shares for the Fund in the Statements of Changes in Net Assets.
The Transaction Fees for the Fund are listed in the table below:
Arrow Reserve Capital Management ETF
NOTES TO FINANCIAL STATEMENTS (Continued)
January 31, 2021
| 6. | DISTRIBUTIONS TO SHAREHOLDERS AND TAX COMPONENTS OF CAPITAL |
The tax character of Fund distributions paid for the periods ended January 31, 2021 and January 31, 2020 was as follows:
| | | Fiscal Year Ended | | | Fiscal Year Ended | |
| | | January 31, 2021 | | | January 31, 2020 | |
| Ordinary Income | | $ | 355,581 | | | $ | 1,381,755 | |
| Long-Term Capital Gain | | | 482 | | | | — | |
| Return of Capital | | | 4,507 | | | | 19,857 | |
| | | $ | 360,570 | | | $ | 1,401,612 | |
As of January 31, 2021, the components of accumulated earnings/(deficit) on a tax basis were as follows:
| Undistributed | | | Undistributed | | | Post October Loss | | | Capital Loss | | | Other | | | Unrealized | | | Total | |
| Ordinary | | | Long-Term | | | and | | | Carry | | | Book/Tax | | | Appreciation/ | | | Accumulated | |
| Income | | | Gains | | | Late Year Loss | | | Forwards | | | Differences | | | (Depreciation) | | | Earnings/(Deficits) | |
| $ | — | | | $ | — | | | $ | — | | | $ | — | | | $ | — | | | $ | 66,440 | | | $ | 66,440 | |
At January 31, 2021, the Fund utilized capital loss carry forwards as follows:
Non-Expiring
Short-Term | | | Non-Expiring
Long-Term | | | Total | | | CLCF
Utilized | |
| $ | — | | | $ | — | | | $ | — | | | $ | 2,205 | |
Permanent book and tax differences, primarily attributable to the book/tax basis treatment of overdistribution reclass, resulted in reclassifications for the year ended January 31, 2021 as follows:
| Paid | | | | |
| In | | | Distributable | |
| Capital | | | Earnings | |
| $ | — | | | $ | — | |
| 7. | AGGREGATE UNREALIZED APPRECIATION AND DEPRECIATION – TAX BASIS |
| | | | Gross Unrealized | | | Gross Unrealized | | | Net Unrealized | |
| Tax Cost | | | Appreciation | | | Depreciation | | | Appreciation/(Depreciation) | |
| $ | 51,442,756 | | | $ | 67,762 | | | $ | (1,322 | ) | | $ | 66,440 | |
Arrow Reserve Capital Management ETF
NOTES TO FINANCIAL STATEMENTS (Continued)
January 31, 2021
The beneficial ownership, either directly or indirectly, of more than 25% of the voting securities of the Fund creates presumption of the control of the Fund, under Section 2(a)(9) of the 1940 Act. As of January 31, 2021, Arrow Managed Futures Strategy Fund held 83.5% of the voting securities of the Fund.
Subsequent events after the date of the Statement of Assets and Liabilities have been evaluated through the date the financial statements were issued.
Management has determined that no events or transactions occurred requiring adjustment or disclosure in the financial statements, other than the following:
The Board declared the following distributions after January 31, 2021:
| Distribution Per Share | Ex Date | Record Date | Payable Date |
| $0.0041 | 2/26/2021 | 3/1/2021 | 3/8/2021 |

REPORT OF INDEPENDENT REGISTERED PUBLIC ACCOUNTING FIRM
To the Board of Trustees of Arrow Investments Trust
and the Shareholders of Arrow Reserve Capital Management ETF
Opinion on the Financial Statements
We have audited the accompanying statement of assets and liabilities of Arrow Reserve Capital Management ETF, a series of shares of beneficial interest in Arrow Investments Trust (the “Fund”), including the portfolio of investments, as of January 31, 2021, and the related statement of operations for the year then ended, the statements of changes in net assets for each of the years in the two-year period then ended, and the financial highlights for each of the years in the three-year period then ended and for the period from March 30, 2017 (commencement of operations) through January 31, 2018, and the related notes (collectively referred to as the “financial statements”). In our opinion, the financial statements present fairly, in all material respects, the financial position of the Fund as of January 31, 2021, and the results of its operations for the year then ended, the changes in its net assets for each of the years in the two-year period then ended and its financial highlights for each of the years in the three-year period then ended and for the period from March 30, 2017 through January 31, 2018, in conformity with accounting principles generally accepted in the United States of America.
Basis for Opinion
These financial statements are the responsibility of the Fund’s management. Our responsibility is to express an opinion on the Fund’s financial statements based on our audits. We are a public accounting firm registered with the Public Company Accounting Oversight Board (United States) (“PCAOB”) and are required to be independent with respect to the Fund in accordance with the U.S. federal securities law and the applicable rules and regulations of the Securities and Exchange Commission and the PCAOB.
We conducted our audits in accordance with the standards of the PCAOB. Those standards require that we plan and perform the audits to obtain reasonable assurance about whether the financial statements are free of material misstatement, whether due to error or fraud. The Fund is not required to have, nor were we engaged to perform, an audit of its internal control over financial reporting. As part of our audits we are required to obtain an understanding of internal control over financial reporting but not for the purpose of expressing an opinion on the effectiveness of the Fund’s internal control over financial reporting. Accordingly, we express no such opinion.
Our audits included performing procedures to assess the risk of material misstatement of the financial statements, whether due to error or fraud, and performing procedures that respond to those risks. Such procedures included examining, on a test basis, evidence regarding the amounts and disclosures in the financial statements. Our procedures included confirmation of securities owned as of January 31, 2021 by correspondence with the custodian and brokers, or by other appropriate auditing procedures where replies from brokers were not received. Our audits also included evaluating the accounting principles used and significant estimates made by management, as well as evaluating the overall presentation of the financial statements. We believe that our audits provide a reasonable basis for our opinion.

BBD, LLP
We have served as the auditor of one or more of the Funds in the Arrow Investments Trust since 2012. We also served as the auditor of one or more of the Funds in the Funds’ former trust from 2006 through 2012.
Philadelphia, Pennsylvania
March 31, 2021
Arrow Reserve Capital Management ETF
EXPENSE EXAMPLES (Unaudited)
January 31, 2021
As a shareholder of the Fund, you incur ongoing costs, including management fees and other Fund expenses. This example is intended to help you understand your ongoing costs (in dollars) of investing in the Fund and to compare these costs with the ongoing costs of investing in other exchange traded funds. This example does not take into account transaction costs, such as brokerage commissions that you may pay on your purchases and sales of shares of the Fund.
The example is based on an investment of $1,000 invested at the beginning of the period and held for the entire period from August 1, 2020 through January 31, 2021.
Actual Expenses
The “Actual” line in the table below provides information about actual account values and actual expenses. You may use the information below, together with the amount you invested, to estimate the expenses that you paid over the period. Simply divide your account value by $ 1,000 (for example, an $8,600 account value divided by $1,000 = 8.6), then multiply the result by the number in the table under the heading entitled “Expenses Paid During Period” to estimate the expenses you paid on your account during this period.
Hypothetical Example for Comparison Purposes
The “Hypothetical” line in the table below provides information about hypothetical account values and hypothetical expenses based on the Fund’s actual expense ratio and an assumed rate of return of 5% per year before expenses, which is not the Fund’s actual return. The hypothetical account values and expenses may not be used to estimate the actual ending account balances or expenses you paid for the period. You may use this information to compare this 5% hypothetical example with the 5% hypothetical examples that appear in the shareholder reports of other funds.
Please note that the expenses shown in the table are meant to highlight your ongoing costs only and do not reflect any transactional costs. Therefore, the table is useful in comparing ongoing costs only, and will not help you determine the relative total costs of owning different funds. In addition, if these transactional costs were included, your costs would have been higher.
| | | Beginning | | Ending | | Expenses Paid | | Expenses Paid |
| | | Account Value | | Account Value | | During Period* | | During Period** |
| | | 8/1/20 | | 1/31/21 | | 8/1/20 - 1/31/21 | | 8/1/20 - 1/31/21 |
| Actual | | $1,000.00 | | $1,003.00 | | $2.25 | | 0.45% |
| Hypothetical | | | | | | | | |
| (5% return before expenses) | | $1,000.00 | | $1,022.89 | | $2.27 | | 0.45% |
| * | “Actual” expense information for the Fund is for the period from August 1, 2020 to January 31, 2021. Actual expenses are equal to the Fund’s annualized net expense ratio multiplied by 184/366 (to reflect the period from August 1, 2020 to January 31, 2021). “Hypothetical” expense information for the Fund is presented on the basis of the full one-half year period to enable comparison to other funds. It is based on assuming the same net expense ratio and average account value over the period, but it is multiplied by 184/366 (to reflect the full half-year period). |
Arrow Reserve Capital Management ETF
SUPPLEMENTAL INFORMATION (Unaudited)
January 31, 2021
FACTORS CONSIDERED BY THE INDEPENDENT TRUSTEES IN APPROVING THE INVESTMENT ADVISORY AGREEMENT
At a meeting held September 10, 2020 (the “Meeting”), the Board of Trustees (the “Board”) including the Trustees who are not “interested persons”, as such term is defined under Section 2(a)(19) of the Investment Company Act of 1940, as amended (the “Independent Trustees”), considered the renewal of the investment advisory agreement (the “Advisory Agreement”) between the Arrow Investment Trust (the “Trust”), and Arrow Investment Advisors, LLC (the “Adviser”) with respect to the Arrow Reserve Capital Management ETF (the “Reserve Capital ETF” or the “Fund”).
The Board, including the Independent Trustees, unanimously approved continuance of the Advisory Agreement based upon its review of the written materials provided at the Meeting, the reports provided at each quarterly meeting of the Board and the Board’s discussions with key personnel of the Adviser. In their deliberations, the Trustees did not identify any particular information that was all-important or controlling, and individual Trustees may have attributed different weights to the various factors. Below is a summary of the Board’s conclusions regarding various factors relevant to approval of continuance of the Advisory Agreement:
Nature, Extent and Quality of Services. In considering the renewal of the Advisory Agreement, the Board considered the nature, extent, and quality of services that the Adviser provided to the Fund, including the Adviser’s personnel and resources, a description of the manner in which investment decisions are made and executed, and a review of the financial condition of the Adviser. The Board reviewed the services the Adviser provided, including the activities of the Adviser’s best execution committee and the caliber of the investment management and related services. They discussed the Adviser’s compliance infrastructure and resources. The Board also considered the Adviser’s management of service provider relationships and oversight of sub-advisers.
The Board found that the Adviser had consistently analyzed and evaluated various investment strategies in an effort to provide positive returns to shareholders. Further, the Board considered the experience and knowledge of the management team. The Board concluded that the Adviser had sufficient quality and depth of personnel, resources, investment methodologies and compliance policies and procedures to perform its duties under the Advisory Agreement and that the nature, overall quality and extent of the management services provided by the Adviser to the Fund were satisfactory.
Performance. The Board reviewed the Fund’s average total return compared to the average total returns of a group of funds selected by the Adviser that employed similar investment strategies as the Fund (“peer group”), Morningstar category average (Morningstar Ultra Short Term Bond) and benchmark index (Bank of America/Merrill Lynch U.S. 6 Month Treasury Bill Index). The Board noted that the Fund has been sub-advised by Halyard Asset Management, LLC since inception. The Board considered that the Fund underperformed its benchmark index for the year-to-date and one-year periods and that the Fund’s performance was in-line with its peer group for the year-to-date and one-year periods. The Board further considered that the Fund’s performance compares favorably with its peer group on a risk-adjusted basis. The Board concluded that the performance of the Fund was satisfactory.
Arrow Reserve Capital Management ETF
SUPPLEMENTAL INFORMATION (Unaudited)(Continued)
January 31, 2021
Advisory Fee. The Board reviewed the Fund’s advisory fee and expense ratio, taking into account the Fund’s average net assets, and reviewed information comparing the advisory fee and expense ratio to those of the Fund’s peer group and Morningstar category averages. The Board considered that the Fund’s advisory fee was in line with the average of its peer group and higher than the average of its Morningstar Category. They discussed the relative cost of the sub-advisory arrangement. The Board further considered that the Fund’s overall expense ratio was lower than the average of its peer group and higher than the average of its Morningstar Category. The Board noted that the Adviser’s fees appeared to be reasonably aligned based on the Fund’s particular investment strategy and the resources needed to implement that strategy. The Board noted that Funds considered to be “alternative strategies” may generally require enhanced oversight compared to more traditional asset classes and that such additional cost may be evident in the level of the advisory fee. The Board discussed the Adviser’s ongoing quantitative and qualitative analysis of the sub-adviser.
Economies of Scale. The Board considered the extent to which economies of scale would be realized as the Fund grows and whether fee levels reflect a reasonable sharing of economies of scale for the benefit of Fund investors. The Board noted the Fund had yet reached an asset level where the Adviser could likely realize meaningful economies of scale. The Board observed that economies of scale would be considered in the future as Fund asset levels grow.
Profitability. The Board reviewed the profitability of the Adviser with respect to the Fund, noting the Adviser did not realize a profit with respect to the Fund.
Fallout Benefits. Because of its relationship with the Funds, the Adviser and its affiliates may receive certain benefits. The Board reviewed materials provided by the Adviser as to any such benefits.
Conclusion. Based on all of the information considered and the conclusions reached, the Board determined that the terms of the Advisory Agreement was fair and reasonable, and that the continuation of the Advisory Agreement was in the best interests of the Fund.
Arrow Reserve Capital Management ETF
SUPPLEMENTAL INFORMATION (Unaudited)(Continued)
January 31, 2021
This chart provides information about the Trustees and Officers who oversee the Fund. Officers elected by the Trustees manage the day-to-day operations of the Fund and execute policies formulated by the Trustees. The address of each Trustee and Officer is 6100 Chevy Chase Drive, Suite 100, Laurel, Maryland 20707, unless otherwise noted.
Non-Interested Trustees
Name, Address, and
Year of Birth | Position(s)/Term of
Office(1) | Principal Occupation(s) During the
Past 5 Years | Number of
Portfolios
in Fund
Complex
Overseen
by
Trustee(2) | Other Directorships Held
by Trustee |
Robert S. Andrialis
Born in 1944 | Trustee since 2014 | Independent Consultant (2016 – present). | 8 | Arrow ETF Trust |
Paul Montgomery
Born in 1953 | Trustee since 2011 | Director of Research, Scotia Partners, LLC (2012 - present). | 8 | Arrow ETF Trust |
Thomas T. Sarkany
Born in 1946 | Trustee since 2014 | Founder and President, TTS Consultants, LLC (2010 – present). | 8 | Arrow ETF Trust, Northern Lights Fund Trust II, Northern Lights Fund Trust IV; Aquila Distributors. |
Interested Trustees and Officers
Name, Address, and
Year of Birth | Position(s)/Term of
Office(1) | Principal Occupation(s) During the
Past 5 Years | Number of
Funds in
the Fund
Complex
Overseen
by
Trustee(2) | Other Directorships Held
by Trustee |
Joseph Barrato*
Born in 1965 | Chairman of the Board, Trustee, President, and Principal Executive Officer since 2011 | Founder and Chief Executive Officer, Arrow Investment Advisors, LLC (2006- present). | 8 | Arrow ETF Trust |
Sothara Chin
Born in 1966 | Chief Compliance Officer since 2018; Previously from 2011-2015 | Managing Partner of Fit Compliance, LLC (2017 - present); Chief Operations Officer and Chief Compliance Officer, ImpactUs Marketplace, LLC (2015-2017). | N/A | N/A |
Timothy Burdick
4221 North 203rd
Street, Suite 100,
Elkhorn, Nebraska
68022-3474
Born in 1986 | Secretary since 2020 | Assistant Vice President, Gemini Fund Services, LLC (2019-present); Senior Program Compliance Manager, CJ Affiliate (2016-2019). | N/A | N/A |
Sam Singh
4221 North 203rd
Street, Suite 100,
Elkhorn, Nebraska
68022-3474
Born in 1976 | Principal Financial Officer and Treasurer since 2013 | Vice President (2015 - present); Gemini Fund Services, LLC. | N/A | N/A |
| (1) | The term of office for each Trustee will continue indefinitely until the individual resigns or is removed. Officers of the Trust are elected annually. |
| (2) | The “Fund Complex” includes Arrow ETF Trust, a registered management investment company, in addition to the Trust. |
| * | Joseph Barrato is considered to be an “interested person” of the Arrow Trust, as that term is defined in the 1940 Act, because he is a controlling interest holder of the investment advisor to each Fund, Arrow Investment Advisors, LLC. |
The Fund’s Statement of Additional Information includes additional information about the Trustees and is available free of charge, upon request, by calling toll-free at 1-877-277-6933.
PRIVACY NOTICE
Arrow Investments Trust
| FACTS | WHAT DOES ARROW INVESTMENTS TRUST DO WITH YOUR PERSONAL INFORMATION? |
| Why? | Financial companies choose how they share your personal information. Federal law gives consumers the right to limit some, but not all sharing. Federal law also requires us to tell you how we collect, share, and protect your personal information. Please read this notice carefully to understand what we do. |
| What? | The types of personal information we collect and share depends on the product or service that you have with us. This information can include: ● Social Security number and wire transfer instructions ● account transactions and transaction history ● investment experience and purchase history When you are no longer our customer, we continue to share your information as described in this notice. |
| How? | All financial companies need to share customers’ personal information to run their everyday business. In the section below, we list the reasons financial companies can share their customers’ personal information; the reasons Arrow Investments Trust chooses to share; and whether you can limit this sharing. |
Reasons we can share your
personal information: | Does Arrow Investments
Trust share information? | Can you limit this
sharing? |
| For our everyday business purposes - such as to process your transactions, maintain your account(s), respond to court orders and legal investigations, or report to credit bureaus. | YES | NO |
| For our marketing purposes - to offer our products and services to you. | NO | We don’t share |
| For joint marketing with other financial companies. | NO | We don’t share |
| For our affiliates’ everyday business purposes - information about your transactions and records. | NO | We don’t share |
| For our affiliates’ everyday business purposes - information about your credit worthiness. | NO | We don’t share |
| For nonaffiliates to market to you | NO | We don’t share |
| QUESTIONS? | Call 1-877-277-6933 |
PRIVACY NOTICE
Arrow Investments Trust
| What we do: |
How does Arrow Investments Trust protect my personal information? | To protect your personal information from unauthorized access and use, we use security measures that comply with federal law. These measures include computer safeguards and secured files and buildings. Our service providers are held accountable for adhering to strict policies and procedures to prevent any misuse of your nonpublic personal information. |
How does Arrow Investments Trust collect my personal information? | We collect your personal information, for example, when you ● open an account or deposit money ● direct us to buy securities or direct us to sell your securities ● seek advice about your investments We also collect your personal information from others, such as credit bureaus, affiliates, or other companies. |
Why can’t I limit all sharing? | Federal law gives you the right to limit only: ● sharing for affiliates’ everyday business purposes – information about your creditworthiness. ● affiliates from using your information to market to you. ● sharing for nonaffiliates to market to you. State laws and individual companies may give you additional rights to limit sharing. |
| Definitions |
| Affiliates | Companies related by common ownership or control. They can be financial and nonfinancial companies. ● Arrow Investments Trust does not share with our affiliates. |
| Nonaffiliates | Companies not related by common ownership or control. They can be financial and nonfinancial companies. ● Arrow Investments Trust does not share with nonaffiliates so they can market to you. |
| Joint marketing | A formal agreement between nonaffiliated financial companies that together market financial products or services to you. ● Arrow Investments Trust does not jointly market. |
PROXY VOTING POLICY
Information regarding how the Fund voted proxies relating to portfolio securities for the most recent twelve-month period ended June 30 as well as a description of the policies and procedures that the Fund uses to determine how to vote proxies is available without charge, upon request, by calling 1-877-277-6933 or by referring to the Securities and Exchange Commission’s (“SEC”) website at http://www.sec.gov.
PORTFOLIO HOLDINGS
The Fund files a complete schedule of portfolio holdings with the SEC for the first and third quarters of each fiscal year as an exhibit to its reports on Form N-PORT, within sixty days after the end of the period. Form N-PORT reports are available at the SEC’s website at www.sec.gov.
INVESTMENT ADVISOR
Arrow Investment Advisors, LLC
6100 Chevy Chase Drive
Suite 100
Laurel, MD 20707
INVESTMENT SUB-ADVISOR
Halyard Asset Management, LLC
707 Westchester Avenue
White Plains, NY 10604
ADMINISTRATOR
Gemini Fund Services, LLC
4221 North 203rd Street, Suite 100
Elkhorn, NE 68022-3474
ARCM-AR21
Item 2. Code of Ethics.
(a) As of the end of the period covered by this report, the registrant has adopted a code of ethics that applies to the registrant's principal executive officer, principal financial officer, principal accounting officer or controller, or persons performing similar functions, regardless of whether these individuals are employed by the registrant or a third party.
(b) For purposes of this item, “code of ethics” means written standards that are reasonably designed to deter wrongdoing and to promote:
| (1) | Honest and ethical conduct, including the ethical handling of actual or apparent conflicts of interest between personal and professional relationships; |
| (2) | Full, fair, accurate, timely, and understandable disclosure in reports and documents that a registrant files with, or submits to, the Commission and in other public communications made by the registrant; |
(3) Compliance with applicable governmental laws, rules, and regulations;
| (4) | The prompt internal reporting of violations of the code to an appropriate person or persons identified in the code; and |
(5) Accountability for adherence to the code.
(c) Amendments: During the period covered by the report, there have not been any amendments to the provisions of the code of ethics.
(d) Waivers: During the period covered by the report, the registrant has not granted any express or implicit waivers from the provisions of the code of ethics.
(e) The Code of Ethics is not posted on Registrant’ website.
(f) A copy of the Code of Ethics is attached as an exhibit.
Item 3. Audit Committee Financial Expert.
(a)(1)ii The Registrant’s board of trustees has determined that Robert S. Andrialis is an audit committee financial expert, as defined in Item 3 of Form N-CSR. Mr. Andrialis is independent for purposes of this Item 3.
Item 4. Principal Accountant Fees and Services.
2021 - $12,000
2020 - $12,000
2021 - None
2020 – None
2021 – $ 2,200
2020 - $ 2,200
Preparation of Federal & State income tax returns, assistance with calculation of required income, capital gain and excise distributions and preparation of Federal excise tax returns.
2021 – None
2020 – None
| (e) | (1) Audit Committee’s Pre-Approval Policies |
The registrant’s Audit Committee is required to pre-approve all audit services and, when appropriate, any non-audit services (including audit-related, tax and all other services) to the registrant. The registrant’s Audit Committee also is required to pre-approve, when appropriate, any non-audit services (including audit-related, tax and all other services) to its adviser, or any entity controlling, controlled by or under common control with the adviser that provides ongoing services to the registrant, to the extent that the services may be determined to have an impact on the operations or financial reporting of the registrant. Services are reviewed on an engagement by engagement basis by the Audit Committee.
| (2) | Percentages of Services Approved by the Audit Committee |
| | | 2021 | | 2020 |
| Audit-Related Fees: | | | 0.00 | % | | | 0.00 | % |
| Tax Fees: | | | 0.00 | % | | | 0.00 | % |
| All Other Fees: | | | 0.00 | % | | | 0.00 | % |
| (f) | During the audit of registrant's financial statements for the most recent fiscal year, less than 50 percent of the hours expended on the principal accountant's engagement were attributed to work performed by persons other than the principal accountant's full-time, permanent employees. |
| (g) | The aggregate non-audit fees billed by the registrant's accountant for services rendered to the registrant, and rendered to the registrant's investment adviser (not including any sub-adviser whose role is primarily portfolio management and is subcontracted with or overseen by another investment adviser), and any entity controlling, controlled by, or under common control with the adviser that provides ongoing services to the registrant: |
2021 - $2,200
2020 - $2,200
(h) The registrant's audit committee has considered whether the provision of non-audit services to the registrant's investment adviser (not including any sub-adviser whose role is primarily portfolio management and is subcontracted with or overseen by another investment adviser), and any entity controlling, controlled by, or under common control with the investment adviser that provides ongoing services to the registrant, that were not pre-approved pursuant to paragraph (c)(7)(ii) of Rule 2-01 of Regulation S-X, is compatible with maintaining the principal accountant's independence.
Item 5. Audit Committee of Listed Companies. The registrant is an issuer as defined in Rule 1 0A-3 under the Securities Exchange Act of 1934, as amended (the "Exchange Act") and has a separately-designated standing audit committee established in accordance with Section 3(a)(58)A of the Exchange Act. The registrant's audit committee members are Robert S. Andrialis, Paul Montgomery and Thomas T. Sarkany.
Item 6. Schedule of Investments. See Item 1.
Item 7. Disclosure of Proxy Voting Policies and Procedures for Closed-End Funds. Not applicable to open-end investment companies.
Item 8. Portfolio Managers of Closed-End Management Investment Companies. Not applicable to open-end investment companies.
Item 9. Purchases of Equity Securities by Closed-End Funds. Not applicable to open-end investment companies.
Item 10. Submission of Matters to a Vote of Security Holders. There were no material changes to the procedures by which Shareholders may recommend nominees to the registrant’s Board of Trustees.
Item 11. Controls and Procedures.
(a) Based on an evaluation of the Registrant’s disclosure controls and procedures as of a date within 90 days of filing date of this Form N-CSR, the principal executive officer and principal financial officer of the Registrant have concluded that the disclosure controls and procedures of the Registrant are reasonably designed to ensure that the information required in filings on Form N-CSR is recorded, processed, summarized, and reported by the filing date, including that information required to be disclosed is accumulated and communicated to the Registrant’s management, including the Registrant’s principal executive officer and principal financial officer, as appropriate to allow timely decisions regarding required disclosure.
(b) There were no significant changes in the Registrant’s internal control over financial reporting that occurred during the Registrant’s last fiscal half-year that have materially affected, or are reasonably likely to materially affect, the Registrant’s internal control over financial reporting.
Item 12. Disclosure of Securities Lending Activities for Closed-End Management Investment Companies. - Not applicable to open-end investment companies.
Item 13. Exhibits.
(a)(1) Code of Ethics herewith.
(a)(2) Certifications required by Section 302 of the Sarbanes-Oxley Act of 2002 (and Item 11(a)(2) of Form N-CSR) are filed herewith.
(a)(3) Not applicable for open-end investment companies.
(b) Certifications required by Section 906 of the Sarbanes-Oxley Act of 2002 (and Item 11(b) of Form N-CSR) are filed herewith.
SIGNATURES
Pursuant to the requirements of the Securities Exchange Act of 1934 and the Investment Company Act of 1940, the registrant has duly caused this report to be signed on its behalf by the undersigned, thereunto duly authorized.
(Registrant) Arrow Investments Trust
By (Signature and Title)
/s/ Joseph Barrato
Joseph Barrato, Principal Executive Officer/ President
Date 4/09/21
Pursuant to the requirements of the Securities Exchange Act of 1934 and the Investment Company Act of 1940, this report has been signed below by the following persons on behalf of the registrant and in the capacities and on the dates indicated.
By (Signature and Title)
/s/ Joseph Barrato
Joseph Barrato, Principal Executive Officer/ President
Date 4/09/21
By (Signature and Title)
/s/ Sam Singh
Sam Singh, Principal Financial Officer/ Treasurer
Date 4/09/21