UNITED STATES
SECURITIES AND EXCHANGE COMMISSION
Washington, D.C. 20549
FORM N-CSR
Certified Shareholder Report of
Registered Management Investment Companies
Investment Company Act File Number: 811-22605
Capital Group Emerging Markets Total Opportunities Fund
(Exact Name of Registrant as Specified in Charter)
6455 Irvine Center Drive
Irvine, California 92618
(Address of Principal Executive Offices)
Registrant's telephone number, including area code: (213) 486-9200
Date of fiscal year end: October 31
Date of reporting period: October 31, 2017
Courtney R. Taylor
Capital Group Emerging Markets Total Opportunities Fund
333 South Hope Street
Los Angeles, California 90071
(Name and Address of Agent for Service)
ITEM 1 – Reports to Stockholders
 | Capital Group Emerging Markets Total Opportunities FundSM Annual report
for the year ended
October 31, 2017 |

Capital Group Emerging Markets Total Opportunities Fund seeks long-term growth and preservation of capital with lower volatility of returns than emerging markets equities.
Fund results shown in this report are for past periods and are not predictive of results for future periods. The results shown are before taxes on fund distributions and sale of fund shares. Current and future results may be lower or higher than those shown. Share prices and returns will vary, so investors may lose money. Investing for short periods makes losses more likely. For current information and month-end results, please call (800) 421-4225, ext. 90.
Here are the average annual total returns on a $1,000 investment with all distributions reinvested for the period ended September 30, 2017 (the most recent calendar quarter-end):
| | | 1 year | | 5 years | | Lifetime
(since 1/27/12) |
| | | | | | | |
| Class F-3 shares* | | 11.84% | | 1.64% | | 2.24% |
| * | Class F-3 shares were first offered on September 1, 2017. Class F-3 share results prior to September 1, 2017 are based on the results of the original share class of the fund, which was closed as of September 1, 2017. |
The fund’s gross expense ratio is 1.09%, and the net expense ratio is 1.00% for Class F-3 shares as of the prospectus dated January 1, 2018 (unaudited).
Investment results assume all distributions are reinvested and reflect applicable fees and expenses. The investment advisor is currently reimbursing a portion of other expenses. This reimbursement will be in effect through at least January 1, 2019. The advisor may elect at its discretion to extend, modify or terminate the reimbursement at that time.
This report is for the information of shareholders of Capital Group Emerging Markets Total Opportunities Fund, but it also may be used as sales literature when preceded or accompanied by the current prospectus, which gives details about charges, expenses, investment objectives and operating policies of the fund. If used as sales material after December 31, 2017, this report must be accompanied by a statistical update for the most recently completed calendar quarter.
Investors should carefully read and consider the investment objectives, guidelines, risks, fees and expenses associated with Capital Group Emerging Markets Total Opportunities Fund (CGETOP) prior to investing. This and other important information is contained in CGETOP’s prospectus, which can be obtained from your relationship manager.
Investing in emerging markets involves risks, such as significant currency and price fluctuations, political instability, differing securities regulations and periods of illiquidity, which are detailed in the fund prospectus. Investments in emerging markets have been more volatile than investments in developed markets, reflecting the greater uncertainties of investing in less established economies. Individuals investing in emerging markets should have a long-term perspective and be able to tolerate potentially sharp declines in the value of their investments.
Investments are not FDIC-insured, nor are they deposits of or guaranteed by a bank or any other entity, so they may lose value.
Contents
| 1 | Letter to investors |
| 2 | 20 largest holdings |
| 3 | 15 largest country positions |
| 5 | The value of a $25,000 investment |
| 6 | Investment portfolio |
| 15 | Financial statements |
| 28 | Expense example |
| 30 | Board of trustees and other officers |
Fellow investors:
We’re pleased to present this annual report for Capital Group Emerging Markets Total Opportunities Fund (CGETOP) for the fiscal year ended October 31, 2017. The fund invests in the full spectrum of emerging markets debt and equity securities while seeking to limit the volatility typically associated with investments in the developing world.
The fund delivered solid returns with lower volatility than emerging markets equities. For the period, the fund advanced 12.29%, while the MSCI Emerging Markets Investable Markets Index (MSCI EM IMI) climbed 25.68%. The fund’s realized volatility was 6.82%, compared to 9.94% for the MSCI EM IMI.
Emerging markets stocks notched strong results for the 12-month period, extending a rebound that began in early 2016. The rally was supported by a weakening U.S. dollar, a strengthening global economy and rising prices for raw materials.
In fixed income markets, emerging markets bonds posted upbeat returns, though not as impressive as those recorded by equities. In a low interest
Unless otherwise indicated, equity returns are based on MSCI indexes and measured in U.S. dollars with net dividends reinvested.
This report, and any product, index or fund referred to herein, is not sponsored, endorsed or promoted in any way by J.P. Morgan or any of its affiliates who provide no warranties whatsoever, express or implied, and shall have no liability to any prospective investor, in connection with this report. J.P. Morgan disclaimer: http://www.jpmorgan.com/pages/jpmorgan/ib/girg.
Results at a glance
For periods ended October 31, 2017, with distributions reinvested
| | | Cumulative
total returns | | Average annual
total returns |
| | | 1 year | | 5 years | | Lifetime1 |
| | | | | | | |
| Capital Group Emerging Markets Total Opportunities Fund (Class F-3 shares)2 | | | 12.29 | % | | | 1.66 | % | | | 2.31 | % |
| MSCI Emerging Markets IMI3,4 | | | 25.68 | | | | 4.91 | | | | 4.39 | |
| J.P. Morgan GBI-EM Global Diversified3 | | | 5.18 | | | | –1.58 | | | | –0.51 | |
| J.P. Morgan EMBI Global3 | | | 5.89 | | | | 4.19 | | | | 5.99 | |
| Emerging markets blended market universe5 | | | 15.28 | | | | 3.20 | | | | 3.67 | |
Realized daily volatility
Annualized standard deviation of daily returns, for periods ended October 31, 20176
| | | 1 year | | 5 years | | Lifetime1 |
| | | | | | | |
| Capital Group Emerging Markets Total Opportunities Fund (Class F-3 shares)2 | | | 6.82 | % | | | 8.21 | % | | | 8.20 | % |
| MSCI Emerging Markets IMI3,4 | | | 9.94 | | | | 13.17 | | | | 13.40 | |
| 1 | Since 1/27/12. |
| 2 | Class F-3 shares were first offered on September 1, 2017. Class F-3 share results prior to September 1, 2017 are based on the results of the original share class of the fund, which was closed as of September 1, 2017. |
| 3 | The market indexes are unmanaged and, therefore, have no expenses. Investors cannot invest directly in an index. |
| 4 | Source: MSCI. |
| 5 | Emerging markets blended market universe combines the MSCI EM IMI, JPM EMBI Global and JPM GBI-EM Global Diversified indexes by weighting their cumulative total returns at 50%, 25% and 25%, respectively. This assumes the blend is rebalanced monthly. Information has been obtained from sources believed to be reliable but J.P. Morgan does not warrant its completeness or accuracy. The index is used with permission. The index may not be copied, used, or distributed without J.P. Morgan’s prior written approval. Copyright 2017, J.P. Morgan Chase & Co. All rights reserved. |
| 6 | Realized daily volatility is calculated using annualized standard deviation based on a 252-day factor, and is a measure of how returns over time have varied from the mean. A lower number signifies lower volatility. |
| Capital Group Emerging Markets Total Opportunities Fund | 1 |
20 largest holdings
| | | Percent of
net assets as
of 10/31/17 |
| Argentina government bonds | | | 3.4 | % |
| Russia federal bonds | | | 2.9 | |
| India government bonds | | | 2.8 | |
| Peru government bonds | | | 2.6 | |
| Mexico government bonds | | | 2.4 | |
| Turkey government bonds | | | 2.2 | |
| Brazil government bonds | | | 1.8 | |
| América Móvil | | | 1.7 | |
| Petróleo Brasileiro | | | 1.7 | |
| Indonesia government bonds | | | 1.7 | |
| Shanghai Fosun Pharmaceutical | | | 1.5 | |
| Taiwan Semiconductor Manufacturing | | | 1.4 | |
| Petróleos Mexicanos | | | 1.4 | |
| Sri Lanka government bonds | | | 1.4 | |
| ICICI Bank | | | 1.4 | |
| Naspers | | | 1.2 | |
| Bharti Airtel | | | 1.0 | |
| Dominican Republic government bonds | | | 1.0 | |
| Samsung Electronics | | | 1.0 | |
| National Savings Bank | | | 1.0 | |
| | | | 35.5 | % |
rate environment, the relatively high yields of emerging markets bonds were seen as attractive. The J.P. Morgan Emerging Markets Bond Index (EMBI) Global, which represents U.S. dollar-denominated debt, increased 5.89%. Local currency sovereign bonds also rose, with the J.P. Morgan Government Bond Index-Emerging Markets (GBI-EM) Global Diversified advancing 5.18%, as nearly all emerging markets currencies appreciated against the U.S. dollar.
In a period that produced competitive returns across a variety of emerging markets investments, the fund’s flexible mandate allowed it to tap into these diverse opportunities. However, efforts to moderate volatility also restrained results.
Given that emerging markets equities are by their nature volatile, the fund was created to deliver emerging market equity-like returns, but with lower volatility. The fund spreads the risk across asset classes with different characteristics, whereas a pure emerging markets equities approach could leave investors feeling the full force of any market downturn. Lowering volatility can help enhance total return over time. While the fund has tended to lag in market conditions in which emerging markets equities rose strongly (like the current reporting period), the portfolio is designed to offer a more risk-adjusted return.
Market review
Although returns across emerging markets assets were strong, differences across countries were wide. Chinese stocks rallied, as the MSCI China IMI gained 38.80%. Sentiment was helped by sustained government stimulus measures that spurred economic growth. Chinese authorities also stepped up measures to curb financial risks and debt excesses. Information technology stocks registered solid gains, bolstered by demand for components used in the next generation of smartphones and increasing use of internet services. Shares of Chinese internet giants surged.
The MSCI India IMI advanced 25.02% as data signaled that the country’s economy remains on firm footing despite an unexpected currency recall in late 2016 and sweeping changes to its tax code. Prime Minister Narendra Modi’s party also won support in key state elections, a result likely to give him more power to pursue his reform-minded agenda.
Despite volatility, the MSCI Mexico IMI inched up 1.18% on renewed optimism that the U.S. and Mexico will be able to renegotiate the North American Free Trade Agreement on amicable terms.
Brazilian stocks continued their gains from 2016, as the MSCI Brazil IMI rose 11.38% on hopes that fiscal and economic reforms will be enacted. The rally stalled in the summer months when political turmoil shook the country as President Michel Temer faced a criminal indictment for having encouraged political bribes. Sentiment rose in the third quarter after lawmakers voted against making Temer stand trial on corruption charges.
Stocks in Argentina soared, as the MSCI Argentina IMI was up 56.98%. The business-friendly government of President Mauricio Macri solidified its position with gains in October’s midterm elections. Most economic indicators continued to improve as the nation climbed out of its recession. The market was optimistic about the president’s ambitious agenda for tax, labor and pension reforms.
| 2 | Capital Group Emerging Markets Total Opportunities Fund |
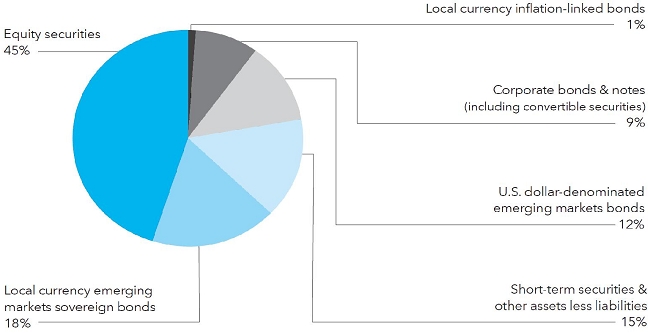
| Asset mix (percent of net assets) | as of October 31, 2017 |
| Top 5 equity sectors | | Percent of
net assets |
| Financials | | | 7.5 | % |
| Consumer discretionary | | | 6.5 | |
| Information technology | | | 6.4 | |
| Materials | | | 5.2 | |
| Industrials | | | 3.9 | |
15 largest country positions
| | | Percent of net assets
as of 10/31/17 |
| | | Equity
securities | | Bonds, notes & other
debt instruments | | Total |
| China (including Hong Kong) | | | 7.8 | % | | | | 1.6 | % | | | | 9.4 | % | |
| India | | | 5.6 | | | | | 2.8 | | | | | 8.4 | | |
| Mexico | | | 2.4 | | | | | 4.6 | | | | | 7.0 | | |
| Brazil | | | 4.1 | | | | | 2.2 | | | | | 6.3 | | |
| Russian Federation | | | 2.3 | | | | | 2.9 | | | | | 5.2 | | |
| Taiwan | | | 3.8 | | | | | — | | | | | 3.8 | | |
| United States* | | | 2.7 | | | | | 1.0 | | | | | 3.7 | | |
| Argentina | | | — | | | | | 3.6 | | | | | 3.6 | | |
| Peru | | | — | | | | | 2.9 | | | | | 2.9 | | |
| South Africa | | | 2.1 | | | | | .8 | | | | | 2.9 | | |
| Indonesia | | | .9 | | | | | 1.7 | | | | | 2.6 | | |
| Sri Lanka | | | — | | | | | 2.4 | | | | | 2.4 | | |
| Turkey | | | — | | | | | 2.3 | | | | | 2.3 | | |
| South Korea | | | 1.8 | | | | | .3 | | | | | 2.1 | | |
| United Kingdom* | | | 1.7 | | | | | — | | | | | 1.7 | | |
| | | | 35.2 | % | | | | 29.1 | % | | | | 64.3 | % | |
| * | Includes investments in companies listed in developed markets that have significant operations in emerging markets. |
| Capital Group Emerging Markets Total Opportunities Fund | 3 |
Portfolio review
Our strategy takes a highly selective approach that is diversified across more than 40 countries, with key positions in China/Hong Kong, India, Mexico, Brazil, Argentina and Russia. At the close of the fiscal year, the fund’s portfolio was essentially evenly split between bonds and stocks, with a healthy allocation to cash and short-term securities. Using a bottom-up approach and fundamental company-by-company research, security selection in pursuit of the fund’s objective drives the asset mix.
In Asia, a number of equity holdings boosted results. Korea–based smartphone and semiconductor maker Samsung Electronics shares advanced amid strong earnings powered by robust demand for memory chips. TSMC, a Taiwanese manufacturer of chips used in electronic devices, was lifted by Apple’s release of the iPhone 8 and X. Naspers, a South African media firm, benefited from its valuable ownership stake in Tencent, one of China’s leading internet companies. In the gaming industry, Wynn Macau contributed, as it posted solid revenue results. Shares of China’s Shanghai Fosun Pharmaceutical also enhanced returns.
A number of Russian equity holdings supported results, including internet giant Yandex. Industrial sector holdings were additive overall, with German shipping company Hapag-Lloyd among the strongest contributors.
The fund’s managers continue to find attractive opportunities across Latin America. Holdings in the region have climbed from 18% at the end of 2014 to more than 27% at the end of this fiscal year. MercadoLibre, an Argentine online marketplace, lifted returns.
The fund’s fixed income holdings were helpful, particularly sovereign government bonds. Top contributors included Brazilian local currency sovereign bonds and government inflation-linked bonds. These bonds benefited as commodity prices rebounded and the economy began its recovery from a deep recession. The current account deficit has begun to adjust to sustainable levels, and inflation is stabilizing at low levels. Local currency sovereign bonds issued by Russia were also a plus.
On a sector basis, energy holdings overall did not benefit from the oil rebound. On a regional basis, investments in Indonesian, Malaysian and U.S.-listed companies lagged. Both stock and bond holdings in oil producer Cobalt International Energy hurt results. Chinese seller of electrical distribution equipment Boer Power Holdings also detracted. The fund’s cash position was utilized to help mitigate volatility, but in a positive environment for risk assets, it hindered returns. Managing currency risk by hedging some local currency exposure into U.S. dollars proved detrimental as nearly all emerging markets currencies strengthened against the U.S. dollar.
Outlook
A pickup in the global economy, a sustained stimulus program in China and a weaker U.S. dollar have supported the rally in emerging markets. Economic growth rates in the developing world have varied by country, but on the whole are still stronger than those in developed nations. However, emerging markets could find it challenging if the U.S. dollar were to strengthen.
Within equities, corporate profits are recovering and cash flows for companies are also improving, which could increase the rate of positive earnings revisions. In addition, valuations in emerging markets remain attractive relative to U.S. equities and certain developed countries by several measures, including price-to-earnings and price-to-book.
Valuations within emerging markets debt remain reasonable. On the whole, U.S. dollar debt looks fairly valued. Policy tightening in the U.S. and China is a key risk, but many developing countries are at different stages in the monetary cycle and have room to react. While financial conditions overall are likely to become less accommodative, improving global economies and low benchmark U.S. Treasury yields provide a favorable backdrop. Local currency bonds in emerging markets are benefiting from lower inflation, although there is idiosyncratic behavior within the countries. Broadly speaking, we are finding value in Latin America. Asia looks more fully valued while countries in Eastern Europe, the Middle East and Africa are more mixed.
Despite year-to-date strength, many emerging markets currencies appear undervalued relative to the U.S. dollar, and are also supported by attractive bond yields and equity valuations. In the absence of any shocks, they should strengthen, or at the very least provide less of a headwind than in the past.
We continue to believe that the emerging markets universe offers a wide range of compelling long-term investment opportunities. We look forward to reporting to you again in six months.
Sincerely,

John S. Armour
President
December 19, 2017
| 4 | Capital Group Emerging Markets Total Opportunities Fund |
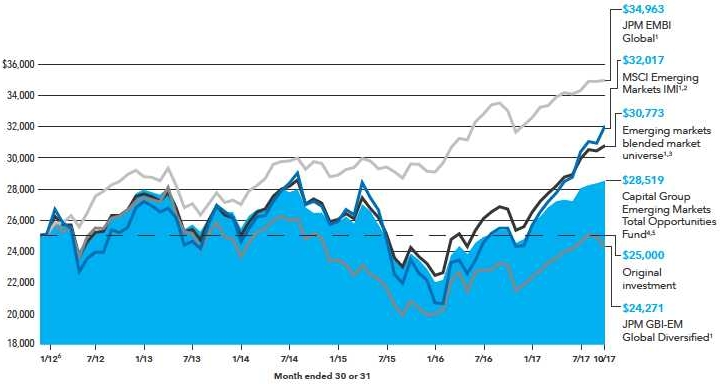
The value of a $25,000 investment
How a $25,000 investment has grown
(for the period January 27, 2012, to October 31, 2017, with all distributions reinvested)
Average annual total returns based on a $1,000 investment (periods ended October 31, 2017)
| | | 1 year | | 5 years | | Lifetime
(since 1/27/12) | |
| | | | | | | | |
| Class F-3 shares5 | | 12.29% | | 1.66% | | 2.31% | |
Investment results assume all distributions are reinvested and reflect applicable fees and expenses.
| 1 | The market indexes are unmanaged and, therefore, have no expenses. Investors cannot invest directly in an index. |
| 2 | Source: MSCI. |
| 3 | Emerging markets blended market universe combines the MSCI EM IMI, JPM EMBI Global and JPM GBI-EM Global Diversified indexes by weighting their cumulative total returns at 50%, 25% and 25%, respectively. This assumes the blend is rebalanced monthly. |
| 4 | Results are calculated with all distributions, if any, reinvested. |
| 5 | Class F-3 shares were first offered on September 1, 2017. Class F-3 share results prior to September 1, 2017, are based on the results of the original share class of the fund, which was closed as of September 1, 2017. |
| 6 | As of January 27, 2012, commencement of fund operations. |
Results are for past periods and are not predictive of results for future periods. The results shown are before taxes on fund distributions and sale of fund shares. Current and future results may be lower or higher than those shown. Share prices and returns will vary, so investors may lose money. Investing for short periods makes losses more likely. For current information and month-end results, please call (800) 421-4225, ext. 90.
| Capital Group Emerging Markets Total Opportunities Fund | 5 |
Investment portfolio October 31, 2017
| Industry sector diversification | Percent of net assets |
| Common stocks 44.88% | | Shares | | | Value
(000) | |
| Asia-Pacific 20.06% | | | | | | | | |
| China 5.07% | | | | | | | | |
| Alibaba Group Holding Ltd. (ADR)1 | | | 2,100 | | | $ | 388 | |
| Boer Power Holdings Ltd. | | | 919,000 | | | | 237 | |
| China Pacific Insurance (Group) Co., Ltd., Class H | | | 48,000 | | | | 237 | |
| China Resources Land Ltd. | | | 90,000 | | | | 268 | |
| China Unicom (Hong Kong) Ltd.1 | | | 234,000 | | | | 332 | |
| Ctrip.com International, Ltd. (ADR)1 | | | 12,300 | | | | 589 | |
| Haitian International Holdings Ltd. | | | 258,000 | | | | 772 | |
| Hutchison China MediTech Ltd. (ADR) | | | 7,912 | | | | 241 | |
| IMAX China Holding, Inc. | | | 87,170 | | | | 270 | |
| Longfor Properties Co. Ltd. | | | 296,000 | | | | 691 | |
| Midea Group Co., Ltd., Class A | | | 75,900 | | | | 584 | |
| Shanghai Fosun Pharmaceutical (Group) Co., Ltd. Class H | | | 430,500 | | | | 2,150 | |
| Shanghai Pharmaceutical (Group) Co., Ltd., Class H | | | 201,200 | | | | 520 | |
| | | | | | | | 7,279 | |
| | | | | | | | | |
| Hong Kong 2.76% | | | | | | | | |
| AIA Group Ltd. | | | 151,000 | | | | 1,136 | |
| Chow Sang Sang Holdings International Ltd. | | | 248,000 | | | | 541 | |
| CK Asset Holdings Ltd. | | | 26,000 | �� | | | 214 | |
| Sands China Ltd. | | | 265,200 | | | | 1,249 | |
| Wynn Macau, Ltd. | | | 323,600 | | | | 830 | |
| | | | | | | | 3,970 | |
| | | | | | | | | |
| India 4.73% | | | | | | | | |
| Bharti Airtel Ltd. | | | 194,722 | | | | 1,495 | |
| Godrej Consumer Products Ltd. | | | 8,200 | | | | 118 | |
| Housing Development Finance Corp. Ltd. | | | 10,554 | | | | 278 | |
| ICICI Bank Ltd. | | | 422,723 | | | | 1,958 | |
| IDFC Bank Ltd. | | | 837,636 | | | | 733 | |
| Info Edge (India) Ltd. | | | 44,627 | | | | 783 | |
| Steel Authority of India Ltd. | | | 697,257 | | | | 840 | |
| Torrent Power Ltd. | | | 138,756 | | | | 581 | |
| | | | | | | | 6,786 | |
| | | | | | | | | |
| Indonesia 0.89% | | | | | | | | |
| Astra International Tbk PT | | | 189,400 | | | | 112 | |
| Bank Central Asia Tbk PT | | | 372,000 | | | | 573 | |
| Matahari Department Store Tbk PT | | | 309,600 | | | | 196 | |
| PT Surya Citra Media Tbk | | | 2,450,700 | | | | 389 | |
| | | | | | | | 1,270 | |
| 6 | Capital Group Emerging Markets Total Opportunities Fund |
| | | | Shares | | | | Value
(000) | |
| Japan 0.17% | | | | | | | | |
| Murata Manufacturing Co., Ltd. | | | 1,600 | | | $ | 249 | |
| | | | | | | | | |
| Malaysia 0.16% | | | | | | | | |
| IJM Corp. Bhd. | | | 300,300 | | | | 226 | |
| | | | | | | | | |
| Singapore 0.72% | | | | | | | | |
| Oversea-Chinese Banking Corp. Ltd. | | | 118,500 | | | | 1,034 | |
| | | | | | | | | |
| South Korea 1.79% | | | | | | | | |
| Hankook Tire Co., Ltd.1 | | | 4,749 | | | | 229 | |
| Hyundai Motor Co. | | | 4,004 | | | | 575 | |
| Hyundai Motor Co., Series 2 | | | 2,979 | | | | 301 | |
| Samsung Electronics Co., Ltd. | | | 599 | | | | 1,472 | |
| | | | | | | | 2,577 | |
| | | | | | | | | |
| Taiwan 3.77% | | | | | | | | |
| AirTAC International Group | | | 34,932 | | | | 566 | |
| ASUSTeK Computer Inc. | | | 16,820 | | | | 145 | |
| CTCI Corp. (Taiwan) | | | 256,000 | | | | 397 | |
| Delta Electronics, Inc. | | | 132,781 | | | | 638 | |
| Ginko International Co., Ltd. | | | 65,000 | | | | 456 | |
| MediaTek Inc. | | | 100,000 | | | | 1,136 | |
| Taiwan Semiconductor Manufacturing Co., Ltd. | | | 258,000 | | | | 2,079 | |
| | | | | | | | 5,417 | |
| | | | | | | | | |
| | | | | | | | 28,808 | |
| | | | | | | | | |
| Other markets 10.26% | | | | | | | | |
| Australia 0.79% | | | | | | | | |
| Newcrest Mining Ltd. | | | 66,196 | | | | 1,135 | |
| | | | | | | | | |
| Canada 1.15% | | | | | | | | |
| Barrick Gold Corp. | | | 49,100 | | | | 709 | |
| First Quantum Minerals Ltd. | | | 32,600 | | | | 365 | |
| Potash Corp. of Saskatchewan Inc. (CAD denominated) | | | 29,700 | | | | 578 | |
| | | | | | | | 1,652 | |
| | | | | | | | | |
| Denmark 0.85% | | | | | | | | |
| Carlsberg A/S, Class B | | | 10,668 | | | | 1,218 | |
| | | | | | | | | |
| Germany 0.77% | | | | | | | | |
| Hapag-Lloyd AG | | | 25,148 | | | | 1,102 | |
| | | | | | | | | |
| Italy 0.32% | | | | | | | | |
| Tenaris SA (ADR) | | | 16,843 | | | | 459 | |
| | | | | | | | | |
| Netherlands 0.26% | | | | | | | | |
| Unilever NV, depository receipts | | | 6,446 | | | | 375 | |
| | | | | | | | | |
| Norway 0.68% | | | | | | | | |
| BW LPG Ltd. | | | 259,948 | | | | 976 | |
| | | | | | | | | |
| Portugal 0.61% | | | | | | | | |
| EDP - Energias de Portugal, SA | | | 245,000 | | | | 874 | |
| | | | | | | | | |
| Switzerland 0.45% | | | | | | | | |
| LafargeHolcim Ltd. | | | 11,589 | | | | 655 | |
| Capital Group Emerging Markets Total Opportunities Fund | 7 |
| Common stocks (continued) | | Shares | | | Value
(000) | |
| Other markets (continued) | | | | | | | | |
| United Kingdom 1.70% | | | | | | | | |
| British American Tobacco PLC | | | 17,100 | | | $ | 1,106 | |
| PZ Cussons PLC | | | 241,300 | | | | 1,059 | |
| Tullow Oil PLC1 | | | 117,342 | | | | 284 | |
| | | | | | | | 2,449 | |
| | | | | | | | | |
| United States 2.68% | | | | | | | | |
| AES Corp. | | | 64,700 | | | | 688 | |
| Cobalt International Energy, Inc.1 | | | 8,020 | | | | 8 | |
| Ensco PLC, Class A | | | 229,000 | | | | 1,234 | |
| MercadoLibre, Inc. | | | 4,675 | | | | 1,124 | |
| Nexa Resources SA1 | | | 43,600 | | | | 792 | |
| | | | | | | | 3,846 | |
| | | | | | | | | |
| | | | | | | | 14,741 | |
| | | | | | | | | |
| Latin America 7.49% | | | | | | | | |
| Brazil 4.08% | | | | | | | | |
| CCR SA, ordinary nominative | | | 139,974 | | | | 779 | |
| Hypermarcas SA, ordinary nominative | | | 58,400 | | | | 611 | |
| IRB Brasil Resseguros SA1 | | | 70,500 | | | | 707 | |
| Lojas Americanas SA, ordinary nominative | | | 21,600 | | | | 95 | |
| Lojas Americanas SA, preferred nominative | | | 92,200 | | | | 495 | |
| Petróleo Brasileiro SA (Petrobras), ordinary nominative (ADR)1 | | | 165,660 | | | | 1,764 | |
| Petróleo Brasileiro SA (Petrobras), preferred nominative (ADR)1 | | | 60,700 | | | | 622 | |
| Vale SA, ordinary nominative (ADR) | | | 79,874 | | | | 782 | |
| | | | | | | | 5,855 | |
| | | | | | | | | |
| Chile 1.02% | | | | | | | | |
| Enel Américas SA (ADR) | | | 54,614 | | | | 579 | |
| Inversiones La Construcción SA | | | 52,477 | | | | 891 | |
| | | | | | | | 1,470 | |
| | | | | | | | | |
| Mexico 2.39% | | | | | | | | |
| América Móvil, SAB de CV, Series L (ADR) | | | 141,900 | | | | 2,429 | |
| CEMEX, SAB de CV, ordinary participation certificates, units (ADR)1 | | | 53,877 | | | | 437 | |
| Fibra Uno Administración, SA de CV REIT | | | 201,800 | | | | 317 | |
| Grupo Sanborns, SAB de CV, Series B1 | | | 177,100 | | | | 198 | |
| Urbi Desarrollos Urbanos, SA de CV (Mexico)1 | | | 138,626 | | | | 50 | |
| | | | | | | | 3,431 | |
| | | | | | | | | |
| | | | | | | | 10,756 | |
| | | | | | | | | |
| Eastern Europe and Middle East 5.02% | | | | | | | | |
| Czech Republic 0.16% | | | | | | | | |
| MONETA Money Bank, AS, non-registered shares | | | 65,562 | | | | 224 | |
| | | | | | | | | |
| Greece 0.25% | | | | | | | | |
| Titan Cement Co. SA1 | | | 14,810 | | | | 357 | |
| | | | | | | | | |
| Kingdom of Saudi Arabia 0.16% | | | | | | | | |
| Savola Group Co. | | | 22,500 | | | | 235 | |
| | | | | | | | | |
| Russian Federation 2.29% | | | | | | | | |
| Alrosa PJSC | | | 663,229 | | | | 853 | |
| Global Ports Investments PLC (GDR) | | | 131,647 | | | | 500 | |
| Globaltrans Investment PLC (GDR) | | | 10,748 | | | | 99 | |
| Magnit PJSC | | | 672 | | | | 88 | |
| MegaFon PJSC | | | 39,302 | | | | 409 | |
| Sberbank of Russia PJSC (ADR) | | | 13,800 | | | | 198 | |
| Yandex NV, Class A1 | | | 33,900 | | | | 1,147 | |
| | | | | | | | 3,294 | |
| 8 | Capital Group Emerging Markets Total Opportunities Fund |
| | | Shares | | | Value
(000) | |
| Spain 0.84% | | | | | | | | |
| Banco Bilbao Vizcaya Argentaria, SA | | | 21,643 | | | $ | 189 | |
| Banco Santander, SA | | | 148,832 | | | | 1,010 | |
| | | | | | | | 1,199 | |
| | | | | | | | | |
| United Arab Emirates 1.32% | | | | | | | | |
| DP World Ltd. | | | 37,779 | | | | 897 | |
| First Abu Dhabi Bank PJSC, non-registered shares | | | 228,581 | | | | 644 | |
| Union National Bank PJSC | | | 306,974 | | | | 359 | |
| | | | | | | | 1,900 | |
| | | | | | | | | |
| | | | | | | | 7,209 | |
| | | | | | | | | |
| Africa 2.05% | | | | | | | | |
| South Africa 2.05% | | | | | | | | |
| Discovery Ltd. | | | 59,274 | | | | 614 | |
| Mr Price Group Ltd. | | | 54,903 | | | | 681 | |
| MTN Group Ltd. | | | 21,250 | | | | 185 | |
| Naspers Ltd., Class N | | | 6,029 | | | | 1,469 | |
| | | | | | | | 2,949 | |
| | | | | | | | | |
| Total common stocks (cost: $59,131,000) | | | | | | | 64,463 | |
| | | | | | | | | |
| Preferred securities 0.38% | | | | | | | | |
| Asia-Pacific 0.38% | | | | | | | | |
| India 0.38% | | | | | | | | |
| Zee Entertainment Enterprises Ltd., 6.00% preferred, expires 2022 | | | 3,514,582 | | | | 543 | |
| | | | | | | | | |
| Total preferred securities (cost: $487,000) | | | | | | | 543 | |
| | | | | | | | | |
| Rights & warrants 0.00% | | | | | | | | |
| Eastern Europe and Middle East 0.00% | | | | | | | | |
| Spain 0.00% | | | | | | | | |
| Banco Santander, SA, rights, expire 20171 | | | 148,832 | | | | 7 | |
| | | | | | | | | |
| Total rights & warrants (cost: $7,000) | | | | | | | 7 | |
| | | | | | | | | |
| Convertible stocks 0.53% | | | | | | | | |
| Asia-Pacific 0.53% | | | | | | | | |
| India 0.53% | | | | | | | | |
| Piramal Enterprises Ltd., convertible debenture, 7.80% 2019 | | | 452 | | | | 767 | |
| | | | | | | | | |
| Total convertible stocks (cost: $749,000) | | | | | | | 767 | |
| Convertible bonds 0.93% | | Principal amount
(000) | | | | |
| Other markets 0.93% | | | | | | | | |
| United States 0.93% | | | | | | | | |
| Cobalt International Energy, Inc., convertible notes, 2.625% 2019 | | $ | 332 | | | | 50 | |
| Cobalt International Energy, Inc., convertible notes, 3.125% 2024 | | | 2,051 | | | | 277 | |
| Weatherford International PLC 5.875% 2021 | | | 995 | | | | 1,006 | |
| | | | | | | | 1,333 | |
| | | | | | | | | |
| Total convertible bonds (cost: $2,606,000) | | | | | | | 1,333 | |
| | | | | | | | | |
| Bonds, notes & other debt instruments 38.54% | | | | | | | | |
| Latin America 17.39% | | | | | | | | |
| Argentina 3.60% | | | | | | | | |
| Argentine Republic (Argentina Central Bank 7D Repo Reference Rate) 26.25% 20202 | | ARS | 8,500 | | | | 517 | |
| Argentine Republic 2.50% 20213 | | | 15,198 | | | | 797 | |
| Argentine Republic 6.875% 2021 | | $ | 985 | | | | 1,076 | |
| Argentine Republic (Badlar Private Banks ARS Index + 2.00%) 22.548% 20222 | | ARS | 7,400 | | | | 434 | |
| Argentine Republic 16.00% 2023 | | | 2,158 | | | | 124 | |
| Argentine Republic 7.50% 2026 | | $ | 1,050 | | | | 1,189 | |
| Argentine Republic 15.50% 2026 | | ARS | 13,200 | | | | 786 | |
| Capital Group Emerging Markets Total Opportunities Fund | 9 |
| Bonds, notes & other debt instruments (continued) | | Principal amount
(000) | | | Value
(000) | |
| Latin America (continued) | | | | | | | | |
| Argentina (continued) | | | | | | | | |
| YPF SA 8.50% 2025 | | $ | 210 | | | $ | 245 | |
| | | | | | | | 5,168 | |
| | | | | | | | | |
| Brazil 2.18% | | | | | | | | |
| Brazil (Federative Republic of) 6.00% 20183 | | BRL | 750 | | | | 232 | |
| Brazil (Federative Republic of) 10.00% 2018 | | | 950 | | | | 292 | |
| Brazil (Federative Republic of) 0% 2020 | | | 1,400 | | | | 342 | |
| Brazil (Federative Republic of) 6.00% 20243 | | | 658 | | | | 213 | |
| Brazil (Federative Republic of) 10.00% 2025 | | | 4,340 | | | | 1,343 | |
| Brazil (Federative Republic of) 10.00% 2027 | | | 350 | | | | 108 | |
| Brazil (Federative Republic of) 6.00% 20503 | | | 276 | | | | 92 | |
| Odebrecht Offshore Drilling Finance Ltd. 6.75% 20224,5,6 | | $ | 575 | | | | 216 | |
| Vale SA 6.25% 2026 | | | 260 | | | | 300 | |
| | | | | | | | 3,138 | |
| | | | | | | | | |
| Chile 0.09% | | | | | | | | |
| Emgesa SA ESP 8.75% 2021 | | COP | 125,000 | | | | 43 | |
| Enersis Américas SA 4.00% 2026 | | $ | 85 | | | | 87 | |
| | | | | | | | 130 | |
| | | | | | | | | |
| Colombia 0.95% | | | | | | | | |
| Colombia (Republic of), Series B, 7.50% 2026 | | COP | 1,400,000 | | | | 489 | |
| Colombia (Republic of), Series B, 6.00% 2028 | | | 798,000 | | | | 249 | |
| Ecopetrol SA 5.875% 2023 | | $ | 215 | | | | 243 | |
| Ecopetrol SA 5.375% 2026 | | | 361 | | | | 387 | |
| | | | | | | | 1,368 | |
| | | | | | | | | |
| Dominican Republic 1.03% | | | | | | | | |
| Dominican Republic 5.50% 20256 | | | 248 | | | | 264 | |
| Dominican Republic 6.875% 20266 | | | 100 | | | | 115 | |
| Dominican Republic 5.95% 20276 | | | 363 | | | | 392 | |
| Dominican Republic 7.45% 2044 | | | 210 | | | | 250 | |
| Dominican Republic 6.85% 2045 | | | 410 | | | | 458 | |
| | | | | | | | 1,479 | |
| | | | | | | | | |
| Honduras 0.32% | | | | | | | | |
| Honduras (Republic of) 8.75% 2020 | | | 200 | | | | 228 | |
| Honduras (Republic of) 7.50% 20245 | | | 200 | | | | 228 | |
| | | | | | | | 456 | |
| | | | | | | | | |
| Mexico 4.63% | | | | | | | | |
| BBVA Bancomer SA 6.50% 2021 | | | 150 | | | | 165 | |
| Comision Federal de Electricidad 6.125% 20456 | | | 200 | | | | 219 | |
| Comision Federal de Electricidad, Series 2014-2 7.35% 2025 | | MXN | 2,480 | | | | 121 | |
| Elementia SAB de CV 5.50% 20256 | | $ | 200 | | | | 207 | |
| Petróleos Mexicanos 3.50% 2020 | | | 545 | | | | 554 | |
| Petróleos Mexicanos 6.375% 2021 | | | 140 | | | | 153 | |
| Petróleos Mexicanos 4.50% 2026 | | | 362 | | | | 358 | |
| Petróleos Mexicanos 7.47% 2026 | | MXN | 21,500 | | | | 1,005 | |
| Red de Carreteras de Occidente 9.00% 20285 | | | 7,000 | | | | 360 | |
| United Mexican States 4.50% 20253 | | | 1,460 | | | | 82 | |
| United Mexican States 4.00% 20403 | | | 6,251 | | | | 342 | |
| United Mexican States 6.05% 2040 | | $ | 266 | | | | 312 | |
| United Mexican States 5.55% 2045 | | | 100 | | | | 112 | |
| United Mexican States 4.60% 2046 | | | 389 | | | | 381 | |
| United Mexican States, Series M, 8.00% 2020 | | MXN | 4,700 | | | | 251 | |
| United Mexican States, Series M20, 10.00% 2024 | | | 7,550 | | | | 457 | |
| United Mexican States, Series M, 5.75% 2026 | | | 4,100 | | | | 194 | |
| United Mexican States, Series M, 7.50% 2027 | | | 26,000 | | | | 1,377 | |
| | | | | | | | 6,650 | |
| | | | | | | | | |
| Panama 0.59% | | | | | | | | |
| ENA Norte Trust 4.95% 20285 | | $ | 193 | | | | 202 | |
| Panama (Republic of) 7.125% 2026 | | | 200 | | | | 258 | |
| Panama (Republic of) 4.50% 20475 | | | 360 | | | | 381 | |
| | | | | | | | 841 | |
| 10 | Capital Group Emerging Markets Total Opportunities Fund |
| | | Principal amount
(000) | | | Value
(000) | |
| Paraguay 0.40% | | | | | | | | |
| Paraguay (Republic of) 4.70% 2027 | | $ | 550 | | | $ | 579 | |
| | | | | | | | | |
| Peru 2.87% | | | | | | | | |
| Banco de Crédito del Perú 6.875% 2026 | | | 350 | | | | 399 | |
| Peru (Republic of) 6.35% 2028 | | PEN | 4,500 | | | | 1,490 | |
| Peru (Republic of) 6.15% 2032 | | | 4,165 | | | | 1,346 | |
| Peru (Republic of) 6.90% 2037 | | | 2,600 | | | | 881 | |
| | | | | | | | 4,116 | |
| | | | | | | | | |
| Uruguay 0.73% | | | | | | | | |
| Uruguay (Oriental Republic of) 9.875% 2022 | | UYU | 17,486 | | | | 638 | |
| Uruguay (Oriental Republic of) 8.50% 2028 | | | 11,825 | | | | 413 | |
| | | | | | | | 1,051 | |
| | | | | | | | | |
| | | | | | | | 24,976 | |
| | | | | | | | | |
| Asia-Pacific 9.74% | | | | | | | | |
| China 1.58% | | | | | | | | |
| Bank of China Ltd. 1.875% 20195 | | $ | 450 | | | | 446 | |
| China Development Bank (3-month USD-LIBOR + 0.55%) 1.866% 20202 | | | 355 | | | | 355 | |
| Export-Import Bank of China (3-month USD-LIBOR + 0.60%) 1.917% 20202 | | | 680 | | | | 682 | |
| Industrial and Commercial Bank of China Ltd. 3.231% 2019 | | | 350 | | | | 355 | |
| State Grid Overseas Investment Ltd. 2.75% 2019 | | | 430 | | | | 434 | |
| | | | | | | | 2,272 | |
| | | | | | | | | |
| India 2.78% | | | | | | | | |
| India (Republic of) 8.83% 2023 | | INR | 12,300 | | | | 208 | |
| India (Republic of) 8.60% 2028 | | | 122,250 | | | | 2,077 | |
| India (Republic of) 7.61% 2030 | | | 65,930 | | | | 1,055 | |
| India (Republic of) 9.20% 2030 | | | 9,300 | | | | 166 | |
| India (Republic of) 7.73% 2034 | | | 30,000 | | | | 481 | |
| | | | | | | | 3,987 | |
| | | | | | | | | |
| Indonesia 1.65% | | | | | | | | |
| Indonesia (Republic of) 4.125% 20256 | | $ | 725 | | | | 761 | |
| Indonesia (Republic of) 4.75% 2026 | | | 510 | | | | 557 | |
| Indonesia (Republic of), Series 53, 8.25% 2021 | | IDR | 11,200,000 | | | | 876 | |
| Indonesia (Republic of), Series 70, 8.375% 2024 | | | 2,250,000 | | | | 180 | |
| | | | | | | | 2,374 | |
| | | | | | | | | |
| Islamic Republic of Pakistan 0.88% | | | | | | | | |
| Pakistan (Islamic Republic of) 6.75% 2019 | | $ | 620 | | | | 648 | |
| Pakistan (Islamic Republic of) 7.25% 2019 | | | 200 | | | | 209 | |
| Pakistan (Islamic Republic of) 5.50% 20216 | | | 200 | | | | 204 | |
| Pakistan (Islamic Republic of) 5.50% 2021 | | | 200 | | | | 204 | |
| | | | | | | | 1,265 | |
| | | | | | | | | |
| Philippines 0.18% | | | | | | | | |
| Philippines (Republic of the) 6.25% 2036 | | PHP | 12,000 | | | | 262 | |
| | | | | | | | | |
| South Korea 0.28% | | | | | | | | |
| KT Corp. 2.625% 2019 | | $ | 400 | | | | 401 | |
| | | | | | | | | |
| Sri Lanka 2.39% | | | | | | | | |
| National Savings Bank 8.875% 2018 | | | 1,312 | | | | 1,374 | |
| Sri Lanka (Democratic Socialist Republic of) 6.00% 2019 | | | 500 | | | | 516 | |
| Sri Lanka (Democratic Socialist Republic of) 5.875% 2022 | | | 340 | | | | 363 | |
| Sri Lanka (Democratic Socialist Republic of) 6.825% 2026 | | | 600 | | | | 667 | |
| Sri Lanka (Democratic Socialist Republic of) 6.20% 20276 | | | 475 | | | | 506 | |
| | | | | | | | 3,426 | |
| | | | | | | | | |
| | | | | | | | 13,987 | |
| Capital Group Emerging Markets Total Opportunities Fund | 11 |
| Bonds, notes & other debt instruments (continued) | | Principal amount
(000) | | | Value
(000) | |
| Eastern Europe and Middle East 8.14% | | | | | | | | |
| Armenia 0.24% | | | | | | | | |
| Armenia (Republic of) 6.00% 20206 | | $ | 325 | | | $ | 343 | |
| | | | | | | | | |
| Bahrain 0.15% | | | | | | | | |
| Bahrain (Kingdom of) 6.75% 20296 | | | 220 | | | | 219 | |
| | | | | | | | | |
| Hashemite Kingdom of Jordan 0.18% | | | | | | | | |
| Jordan (Hashemite Kingdom of) 7.375% 20476 | | | 250 | | | | 262 | |
| | | | | | | | | |
| Hungary 0.71% | | | | | | | | |
| Hungary 5.75% 2023 | | | 886 | | | | 1,020 | |
| | | | | | | | | |
| Kingdom of Saudi Arabia 0.64% | | | | | | | | |
| Saudi Arabia (Kingdom of) 3.25% 20266 | | | 585 | | | | 576 | |
| Saudi Arabia (Kingdom of) 4.625% 20476 | | | 330 | | | | 339 | |
| | | | | | | | 915 | |
| | | | | | | | | |
| Poland 0.27% | | | | | | | | |
| Poland (Republic of), Series 0922, 5.75% 2022 | | PLN | 970 | | | | 304 | |
| Poland (Republic of), Series 0726, 2.50% 2026 | | | 335 | | | | 86 | |
| | | | | | | | 390 | |
| | | | | | | | | |
| Russian Federation 2.89% | | | | | | | | |
| Russian Federation 7.50% 2018 | | RUB | 4,500 | | | | 77 | |
| Russian Federation 7.50% 2021 | | | 24,500 | | | | 421 | |
| Russian Federation 7.60% 2021 | | | 82,900 | | | | 1,432 | |
| Russian Federation 7.00% 2023 | | | 131,470 | | | | 2,219 | |
| | | | | | | | 4,149 | |
| | | | | | | | | |
| Slovenia 0.41% | | | | | | | | |
| Slovenia (Republic of) 4.75% 2018 | | $ | 580 | | | | 589 | |
| | | | | | | | | |
| Spain 0.33% | | | | | | | | |
| Banco Bilbao Vizcaya Argentaria (3-month EURIBOR + 0.60%) 0.271% 20222 | | € | 400 | | | | 471 | |
| | | | | | | | | |
| Turkey 2.32% | | | | | | | | |
| Akbank TAS 7.20% 20276 | | $ | 215 | | | | 222 | |
| Turkey (Republic of) 3.00% 20223 | | TRY | 2,838 | | | | 756 | |
| Turkey (Republic of) 6.25% 2022 | | $ | 500 | | | | 544 | |
| Turkey (Republic of) 9.50% 2022 | | TRY | 1,100 | | | | 268 | |
| Turkey (Republic of) 11.00% 2022 | | | 455 | | | | 116 | |
| Turkey (Republic of) 4.25% 2026 | | $ | 400 | | | | 379 | |
| Turkey (Republic of) 6.00% 2027 | | | 450 | | | | 475 | |
| Turkey (Republic of) 5.75% 2047 | | | 600 | | | | 573 | |
| | | | | | | | 3,333 | |
| | | | | | | | | |
| | | | | | | | 11,691 | |
| | | | | | | | | |
| Africa 2.14% | | | | | | | | |
| Federal Republic of Nigeria 0.41% | | | | | | | | |
| Nigeria (Republic of) 14.50% 2021 | | NGN | 213,170 | | | | 584 | |
| | | | | | | | | |
| Gabon 0.11% | | | | | | | | |
| Gabonese Republic 8.20% 2017 | | $ | 160 | | | | 161 | |
| 12 | Capital Group Emerging Markets Total Opportunities Fund |
| | | Principal amount
(000) | | | Value
(000) | |
| Republic of Kenya 0.43% | | | | | | | | |
| Kenya (Republic of) 5.875% 2019 | | $ | 600 | | | $ | 620 | |
| | | | | | | | | |
| South Africa 0.75% | | | | | | | | |
| Myriad International Holdings 5.50% 2025 | | | 200 | | | | 217 | |
| South Africa (Republic of) 4.875% 2026 | | | 252 | | | | 251 | |
| South Africa (Republic of), Series R-2023, 7.75% 2023 | | ZAR | 1,900 | | | | 131 | |
| South Africa (Republic of), Series R-209, 6.25% 2036 | | | 2,867 | | | | 140 | |
| South Africa (Republic of), Series R-214, 6.50% 2041 | | | 7,026 | | | | 339 | |
| | | | | | | | 1,078 | |
| | | | | | | | | |
| Zambia 0.44% | | | | | | | | |
| Zambia (Republic of) 11.00% 2021 | | ZMW | 3,200 | | | | 260 | |
| Zambia (Republic of) 13.00% 2026 | | | 2,500 | | | | 199 | |
| Zambia (Republic of) 13.00% 2026 | | | 1,125 | | | | 90 | |
| Zambia (Republic of) 14.00% 2032 | | | 1,125 | | | | 87 | |
| | | | | | | | 636 | |
| | | | | | | | | |
| | | | | | | | 3,079 | |
| | | | | | | | | |
| Other markets 1.13% | | | | | | | | |
| Netherlands 0.15% | | | | | | | | |
| IHS Netherlands Holdco BV 9.50% 2021 | | $ | 200 | | | | 213 | |
| | | | | | | | | |
| Portugal 0.90% | | | | | | | | |
| Portuguese Republic 5.65% 2024 | | € | 880 | | | | 1,297 | |
| | | | | | | | | |
| United States 0.08% | | | | | | | | |
| Weatherford International PLC 9.875% 2024 | | $ | 100 | | | | 107 | |
| | | | | | | | 1,617 | |
| | | | | | | | | |
| Total bonds, notes & other debt instruments (cost: $54,541,000) | | | | | | | 55,350 | |
| | | | | | | | | |
| Short-term securities 14.05% | | | | | | | | |
| Argentinian Treasury Bills 1.78%–2.71% due 11/10/2017–5/24/2018 | | | 3,697 | | | | 3,674 | |
| Bank of New York Mellon Corp. 1.00% due 11/1/2017 | | | 4,000 | | | | 3,999 | |
| Egyptian Treasury Bills 6.92%–19.82% due 11/14/2017–5/1/2018 | | EGP | 48,000 | | | | 2,586 | |
| Nigerian Treasury Bills 16.67%–16.79% due 7/26/2018–9/13/2018 | | NGN | 390,000 | | | | 931 | |
| Novartis Finance Corp. 1.14% due 11/14/20176 | | $ | 3,450 | | | | 3,448 | |
| Toyota Industries Commercial Finance, Inc. 1.17% due 11/13/20176 | | | 1,550 | | | | 1,549 | |
| Victory Receivables Corp. 1.26% due 12/7/20176 | | | 4,000 | | | | 3,995 | |
| | | | | | | | | |
| Total short-term securities (cost: $20,155,000) | | | | | | | 20,182 | |
| Total investment securities 99.31% (cost: $137,676,000) | | | | | | | 142,645 | |
| Other assets less liabilities 0.69% | | | | | | | 994 | |
| | | | | | | | | |
| Net assets 100.00% | | | | | | | 143,639 | |
| Capital Group Emerging Markets Total Opportunities Fund | 13 |
Forward currency contracts
| Contract amount | | | | | | Unrealized
appreciation
(depreciation) | |
Purchases
(000) | | Sales
(000) | | Counterparty | | Settlement date | | at 10/31/2017
(000) | |
| USD900 | | MXN16,471 | | JPMorgan Chase | | 11/6/2017 | | | $42 | |
| USD740 | | ZAR10,273 | | Citibank | | 11/13/2017 | | | 15 | |
| USD282 | | TWD8,514 | | Citibank | | 11/13/2017 | | | (1 | ) |
| USD269 | | KRW304,815 | | Citibank | | 11/13/2017 | | | (3 | ) |
| USD394 | | GBP301 | | Citibank | | 11/13/2017 | | | (6 | ) |
| USD569 | | GBP435 | | JPMorgan Chase | | 11/13/2017 | | | (9 | ) |
| USD1,967 | | BRL6,264 | | Citibank | | 11/16/2017 | | | 57 | |
| USD237 | | GBP179 | | Goldman Sachs | | 11/16/2017 | | | — | 7 |
| USD857 | | INR56,002 | | JPMorgan Chase | | 11/16/2017 | | | (6 | ) |
| CZK33,972 | | USD1,555 | | JPMorgan Chase | | 11/20/2017 | | | (11 | ) |
| USD793 | | BRL2,536 | | JPMorgan Chase | | 11/21/2017 | | | 20 | |
| USD501 | | BRL1,615 | | JPMorgan Chase | | 11/21/2017 | | | 9 | |
| USD203 | | KRW229,256 | | JPMorgan Chase | | 11/22/2017 | | | (2 | ) |
| USD189 | | TRY710 | | Goldman Sachs | | 11/27/2017 | | | 4 | |
| CZK14,151 | | USD650 | | JPMorgan Chase | | 11/27/2017 | | | (7 | ) |
| USD206 | | EUR175 | | JPMorgan Chase | | 11/30/2017 | | | 1 | |
| USD3,299 | | MXN63,649 | | Bank of America, N.A. | | 11/30/2017 | | | (3 | ) |
| USD519 | | CNH3,795 | | Bank of America, N.A. | | 1/3/2018 | | | (50 | ) |
| USD1,245 | | CNH9,095 | | JPMorgan Chase | | 1/3/2018 | | | (121 | ) |
| | | | | | | | | | $(71 | ) |
| 1 | Security did not produce income during the last 12 months. |
| 2 | Coupon rate may change periodically. |
| 3 | Index-linked bond whose principal amount moves with a government price index. |
| 4 | Scheduled interest and/or principal payment was not received. |
| 5 | Principal payments may be made periodically. Therefore, the effective maturity date may be earlier than the stated maturity date. |
| 6 | Acquired in a transaction exempt from registration under Rule 144A or Section 4(2) of the Securities Act of 1933. May be resold in the U.S. in transactions exempt from registration, normally to qualified institutional buyers. The total value of all such securities was $13,838,000, which represented 9.63% of the net assets of the fund. |
| 7 | Amount less than one thousand. |
Key to abbreviations and symbols
ADR = American Depositary Receipts
ARS = Argentine pesos
BRL = Brazilian reais
CAD = Canadian dollars
CNH = Chinese yuan renminbi
COP = Colombian pesos
CZK = Czech korunas
EUR/€ = Euros
E£ = Eygptian pounds
GBP = British pounds
GDR = Global Depositary Receipts
IDR = Indonesian rupiah
INR = Indian rupees
KRW = South Korean won
LIBOR = London Interbank Offered Rate
MXN = Mexican pesos
NGN = Nigerian naira
PEN = Peruvian nuevos soles
PHP = Philippine pesos
PLN = Polish zloty
RUB = Russian rubles
TRY = Turkish lira
TWD = New Taiwan dollars
USD/$ = U.S. dollars
UYU = Uruguayan pesos
ZAR = South African rand
ZMW = Zambian kwacha
See Notes to Financial Statements
| 14 | Capital Group Emerging Markets Total Opportunities Fund |
Financial statements
| Statement of assets and liabilities | |
| at October 31, 2017 | (dollars in thousands) |
| Assets: | | | | | | | | |
| Investment securities in unaffiliated issuers, at value (cost: $137,676) | | | | | | $ | 142,645 | |
| Cash | | | | | | | 565 | |
| Cash denominated in currencies other than U.S. dollars (cost: $234) | | | | | | | 234 | |
| Unrealized appreciation on open forward currency contracts | | | | | | | 148 | |
| Receivables for: | | | | | | | | |
| Sales of fund’s shares | | $ | 92 | | | | | |
| Dividends and interest | | | 1,105 | | | | | |
| Other | | | 4 | | | | 1,201 | |
| | | | | | | | 144,793 | |
| Liabilities: | | | | | | | | |
| Unrealized depreciation on open forward currency contracts | | | | | | | 219 | |
| Payables for: | | | | | | | | |
| Purchases of investments | | | 672 | | | | | |
| Repurchases of fund’s shares | | | 34 | | | | | |
| Closed forward currency contracts | | | 34 | | | | | |
| Investment advisory services | | | 107 | | | | | |
| Services provided by related parties | | | 6 | | | | | |
| Non-U.S. taxes | | | 59 | | | | | |
| Other | | | 23 | | | | 935 | |
| Net assets at October 31, 2017 | | | | | | $ | 143,639 | |
| | | | | | | | | |
| Net assets consist of: | | | | | | | | |
| Capital paid in on shares of beneficial interest | | | | | | $ | 154,986 | |
| Undistributed net investment income | | | | | | | 6,367 | |
| Accumulated net realized loss | | | | | | | (22,547 | ) |
| Net unrealized appreciation | | | | | | | 4,833 | |
| Net assets at October 31, 2017 | | | | | | $ | 143,639 | |
(dollars and shares in thousands, except per-share amounts)
Shares of beneficial interest issued and outstanding (no stated par value) —
unlimited shares authorized (12,091 total shares outstanding)
| | | Net assets | | | Shares
outstanding | | | Net asset
value per share | |
| Class F-2 | | $ | 10 | | | | 1 | | | $ | 11.88 | |
| Class F-3 | | | 85,001 | | | | 7,155 | | | | 11.88 | |
| Class R-6 | | | 58,628 | | | | 4,935 | | | | 11.88 | |
See Notes to Financial Statements
| Capital Group Emerging Markets Total Opportunities Fund | 15 |
| Statement of operations | |
| for the year ended October 31, 2017 | (dollars in thousands) |
| Investment income: | | | | | | | | |
| Income: | | | | | | | | |
| Interest (net of non-U.S. taxes of $39) | | $ | 6,807 | | | | | |
| Dividends (net of non-U.S. taxes of $109) | | | 1,482 | | | $ | 8,289 | |
| Fees and expenses*: | | | | | | | | |
| Investment advisory services | | | 1,623 | | | | | |
| Transfer agent services | | | 22 | | | | | |
| Administrative services | | | 12 | | | | | |
| Reports to shareholders | | | 10 | | | | | |
| Registration statement and prospectus | | | 40 | | | | | |
| Trustees’ compensation | | | 26 | | | | | |
| Auditing and legal | | | 118 | | | | | |
| Custodian | | | 34 | | | | | |
| Total fees and expenses before reimbursement | | | 1,885 | | | | | |
| Less miscellaneous fee reimbursement | | | 152 | | | | | |
| Total fees and expenses after reimbursement | | | | | | | 1,733 | |
| Net investment income | | | | | | | 6,556 | |
| | | | | | | | | |
| Net realized loss and unrealized appreciation: | | | | | | | | |
| Net realized loss on: | | | | | | | | |
| Investments in unaffiliated issuers (net of non-U.S. taxes of $80) | | | (1,688 | ) | | | | |
| Forward currency contracts | | | (1,014 | ) | | | | |
| Currency transactions | | | (305 | ) | | | (3,007 | ) |
| Net unrealized appreciation (depreciation) on: | | | | | | | | |
| Investments in unaffiliated issuers (net of non-U.S. taxes of $49) | | | 15,902 | | | | | |
| Forward currency contracts | | | (43 | ) | | | | |
| Currency translations | | | (18 | ) | | | 15,841 | |
| Net realized loss and unrealized appreciation | | | | | | | 12,834 | |
| | | | | | | | | |
| Net increase in net assets resulting from operations | | | | | | $ | 19,390 | |
| * | Additional information related to class-specific fees and expenses is included in the Notes to Financial Statements. |
| Statements of changes in net assets | |
| | (dollars in thousands) |
| | | Year ended October 31 | |
| | | 2017 | | | 2016 | |
| | | | | | | | | |
| Operations: | | | | | | | | |
| Net investment income | | $ | 6,556 | | | $ | 7,010 | |
| Net realized loss | | | (3,007 | ) | | | (18,586 | ) |
| Net unrealized appreciation | | | 15,841 | | | | 19,611 | |
| Net increase in net assets resulting from operations | | | 19,390 | | | | 8,035 | |
| | | | | | | | | |
| Net capital share transactions | | | (64,420 | ) | | | (106,710 | ) |
| | | | | | | | | |
| Total decrease in net assets | | | (45,030 | ) | | | (98,675 | ) |
| | | | | | | | | |
| Net assets: | | | | | | | | |
| Beginning of year | | | 188,669 | | | | 287,344 | |
| End of year (including undistributed net investment income: $6,367 and $—,respectively) | | $ | 143,639 | | | $ | 188,669 | |
See Notes to Financial Statements
| 16 | Capital Group Emerging Markets Total Opportunities Fund |
Notes to financial statements
1. Organization
Capital Group Emerging Markets Total Opportunities Fund (the “fund”) is registered under the Investment Company Act of 1940 as an open-end, diversified management investment company. The fund seeks long-term growth and preservation of capital with lower volatility of returns than emerging market equities.
The fund has three share classes consisting of two retail share classes (Classes F-2 and F-3), and one retirement plan share class (Class R-6). The retirement plan share class is generally offered only through eligible employer-sponsored retirement plans. The fund’s share classes are described further in the following table:
| Share class | | Initial sales
charge | | Contingent deferred sales
charge upon redemption | | Conversion feature |
| Classes F-2 and F-3 | | None | | None | | None |
| Class R-6 | | None | | None | | None |
Class F-2, F-3 and R-6 shares began investment operations on September 1, 2017. These share classes are available for sale pursuant to its registration statement filed with the U.S. Securities and Exchange Commission.
Effective September 1, 2017, the legacy share class (“Class M”) of the fund was closed and all exisitng shares were converted to either Class F-3 or R-6 shares.
Holders of all share classes have equal pro rata rights to the assets, dividends and liquidation proceeds of the fund. Each share class has identical voting rights, except for the exclusive right to vote on matters affecting only its class. Share classes have different fees and expenses (“class-specific fees and expenses”), primarily due to different arrangements for distribution, transfer agent and administrative services. Differences in class-specific fees and expenses will result in differences in net investment income and, therefore, the payment of different per-share dividends by each share class.
2. Significant accounting policies
The fund is an investment company that applies the accounting and reporting guidance issued in Topic 946 by the U.S. Financial Accounting Standards Board. The fund’s financial statements have been prepared to comply with U.S. generally accepted accounting principles (“U.S. GAAP”). These principles require the fund’s investment adviser to make estimates and assumptions that affect reported amounts and disclosures. Actual results could differ from those estimates. Subsequent events, if any, have been evaluated through the date of issuance in the preparation of the financial statements. The fund follows the significant accounting policies described in this section, as well as the valuation policies described in the next section on valuation.
Security transactions and related investment income — Security transactions are recorded by the fund as of the date the trades are executed with brokers. Realized gains and losses from security transactions are determined based on the specific identified cost of the securities. In the event a security is purchased with a delayed payment date, the fund will segregate liquid assets sufficient to meet its payment obligations. Dividend income is recognized on the ex-dividend date and interest income is recognized on an accrual basis. Market discounts, premiums and original issue discounts on fixed-income securities are amortized daily over the expected life of the security.
Class allocations — Income, fees and expenses (other than class-specific fees and expenses) and realized and unrealized gains and losses are allocated daily among the various share classes based on their relative net assets. Class-specific fees and expenses, such as distribution, transfer agent and administrative services, are charged directly to the respective share class.
Dividends and distributions to shareholders — Dividends and distributions to shareholders are recorded on the ex-dividend date.
Currency translation — Assets and liabilities, including investment securities, denominated in currencies other than U.S. dollars are translated into U.S. dollars at the exchange rates supplied by one or more pricing vendors on the valuation date. Purchases and sales of investment securities and income and expenses are translated into U.S. dollars at the exchange rates on the dates of such transactions. The effects of changes in exchange rates on investment securities are included with the net realized gain or loss and net unrealized appreciation or depreciation on investments in the fund’s statement of operations. The realized gain or loss and unrealized appreciation or depreciation resulting from all other transactions denominated in currencies other than U.S. dollars are disclosed separately.
| Capital Group Emerging Markets Total Opportunities Fund | 17 |
3. Valuation
Capital Guardian Trust Company (“CGTC”), the fund’s investment adviser, values the fund’s investments at fair value as defined by U.S. GAAP. The net asset value of each share class of the fund is generally determined as of approximately 4:00 p.m. New York time each day the New York Stock Exchange is open.
Methods and inputs — The fund’s investment adviser uses the following methods and inputs to establish the fair value of the fund’s assets and liabilities. Use of particular methods and inputs may vary over time based on availability and relevance as market and economic conditions evolve.
Equity securities are generally valued at the official closing price of, or the last reported sale price on, the exchange or market on which such securities are traded, as of the close of business on the day the securities are being valued or, lacking any sales, at the last available bid price. Prices for each security are taken from the principal exchange or market on which the security trades.
Fixed-income securities, including short-term securities, are generally valued at prices obtained from one or more pricing vendors. Vendors value such securities based on one or more of the inputs described in the following table. The table provides examples of inputs that are commonly relevant for valuing particular classes of fixed-income securities in which the fund is authorized to invest. However, these classifications are not exclusive, and any of the inputs may be used to value any other class of fixed-income security.
| Fixed-income class | | Examples of standard inputs |
| All | | Benchmark yields, transactions, bids, offers, quotations from dealers and trading systems, new issues, spreads and other relationships observed in the markets among comparable securities; and proprietary pricing models such as yield measures calculated using factors such as cash flows, financial or collateral performance and other reference data (collectively referred to as “standard inputs”) |
| Corporate bonds & notes; convertible securities | | Standard inputs and underlying equity of the issuer |
| Bonds & notes of governments & government agencies | | Standard inputs and interest rate volatilities |
When the fund’s investment adviser deems it appropriate to do so (such as when vendor prices are unavailable or deemed to be not representative), fixed-income securities will be valued in good faith at the mean quoted bid and ask prices that are reasonably and timely available (or bid prices, if ask prices are not available) or at prices for securities of comparable maturity, quality and type.
Securities with both fixed-income and equity characteristics, or equity securities traded principally among fixed-income dealers, are generally valued in the manner described for either equity or fixed-income securities, depending on which method is deemed most appropriate by the fund’s investment adviser. Forward currency contracts are valued at the mean of representative quoted bid and ask prices, generally based on prices supplied by one or more pricing vendors.
Securities and other assets for which representative market quotations are not readily available or are considered unreliable by the fund’s investment adviser are fair valued as determined in good faith under fair valuation guidelines adopted by authority of the fund’s board of trustees as further described. The investment adviser follows fair valuation guidelines, consistent with U.S. Securities and Exchange Commission rules and guidance, to consider relevant principles and factors when making fair value determinations. The investment adviser considers relevant indications of value that are reasonably and timely available to it in determining the fair value to be assigned to a particular security, such as the type and cost of the security; contractual or legal restrictions on resale of the security; relevant financial or business developments of the issuer; actively traded similar or related securities; conversion or exchange rights on the security; related corporate actions; significant events occurring after the close of trading in the security; and changes in overall market conditions. In addition, the closing prices of equity securities that trade in markets outside U.S. time zones may be adjusted to reflect significant events that occur after the close of local trading but before the net asset value of each share class of the fund is determined. Fair valuations and valuations of investments that are not actively trading involve judgment and may differ materially from valuations that would have been used had greater market activity occurred.
Processes and structure — The fund’s board of trustees has delegated authority to the fund’s investment adviser to make fair value determinations, subject to board oversight. The investment adviser has established a Joint Fair Valuation Committee (the “Fair Valuation Committee”) to administer, implement and oversee the fair valuation process, and to make fair value decisions. The Fair Valuation Committee regularly reviews its own fair value decisions, as well as decisions made under its standing instructions to the investment adviser’s valuation teams. The Fair Valuation Committee reviews changes in fair value measurements from period to period and may, as deemed appropriate, update the fair valuation guidelines to better reflect the results of back testing and address new or evolving issues.
| 18 | Capital Group Emerging Markets Total Opportunities Fund |
The Fair Valuation Committee reports any changes to the fair valuation guidelines to the board of trustees with supplemental information to support the changes. The fund’s board and audit committee also regularly review reports that describe fair value determinations and methods.
The fund’s investment adviser has also established a Fixed-Income Pricing Review Group to administer and oversee the fixed-income valuation process, including the use of fixed-income pricing vendors. This group regularly reviews pricing vendor information and market data. Pricing decisions, processes and controls over security valuation are also subject to additional internal reviews, including an annual control self-evaluation program facilitated by the investment adviser’s compliance group.
Classifications — The fund’s investment adviser classifies the fund’s assets and liabilities into three levels based on the inputs used to value the assets or liabilities. Level 1 values are based on quoted prices in active markets for identical securities. Level 2 values are based on significant observable market inputs, such as quoted prices for similar securities and quoted prices in inactive markets. Certain securities trading outside the U.S. may transfer between Level 1 and Level 2 due to valuation adjustments resulting from significant market movements following the close of local trading. Level 3 values are based on significant unobservable inputs that reflect the investment adviser’s determination of assumptions that market participants might reasonably use in valuing the securities. The valuation levels are not necessarily an indication of the risk or liquidity associated with the underlying investment. For example, U.S. government securities are reflected as Level 2 because the inputs used to determine fair value may not always be quoted prices in an active market. The following tables present the fund’s valuation levels as of October 31, 2017 (dollars in thousands):
| | | Investment securities |
| | | Level 1 | | | Level 2 | | | Level 3 | | | Total | |
| Assets: | | | | | | | | | | | | | | | | |
| Common stocks: | | | | | | | | | | | | | | | | |
| Asia-Pacific | | $ | 28,808 | | | $ | — | | | $ | — | | | $ | 28,808 | |
| Other markets | | | 14,741 | | | | — | | | | — | | | | 14,741 | |
| Latin America | | | 10,756 | | | | — | | | | — | | | | 10,756 | |
| Eastern Europe and Middle East | | | 7,209 | | | | — | | | | — | | | | 7,209 | |
| Africa | | | 2,949 | | | | — | | | | — | | | | 2,949 | |
| Preferred securities | | | 543 | | | | — | | | | — | | | | 543 | |
| Rights & warrants | | | 7 | | | | — | | | | — | | | | 7 | |
| Convertible stocks | | | 767 | | | | — | | | | — | | | | 767 | |
| Convertible bonds | | | — | | | | 1,333 | | | | — | | | | 1,333 | |
| Bonds, notes & other debt instruments | | | | | | | | | | | | | | | | |
| Latin America | | | — | | | | 24,976 | | | | — | | | | 24,976 | |
| Asia-Pacific | | | — | | | | 13,987 | | | | — | | | | 13,987 | |
| Eastern Europe and Middle East | | | — | | | | 11,691 | | | | — | | | | 11,691 | |
| Africa | | | — | | | | 3,079 | | | | — | | | | 3,079 | |
| Other markets | | | — | | | | 1,617 | | | | — | | | | 1,617 | |
| Short-term securities | | | — | | | | 20,182 | | | | — | | | | 20,182 | |
| Total | | $ | 65,780 | | | $ | 76,865 | | | $ | — | | | $ | 142,645 | |
| | | Other investments* |
| | | Level 1 | | | Level 2 | | | Level 3 | | | Total | |
| Assets: | | | | | | | | | | | | | | | | |
| Unrealized appreciation on open forward currency contracts | | $ | — | | | $ | 148 | | | $ | — | | | $ | 148 | |
| Liabilities: | | | | | | | | | | | | | | | | |
| Unrealized depreciation on open forward currency contracts | | | — | | | | (219 | ) | | | — | | | | (219 | ) |
| Total | | $ | — | | | $ | (71 | ) | | $ | — | | | $ | (71 | ) |
| * | Forward currency contracts are not included in the investment portfolio. |
| Capital Group Emerging Markets Total Opportunities Fund | 19 |
4. Risk factors
Investing in the fund may involve certain risks including, but not limited to, those described below.
Market conditions — The prices of, and the income generated by, the securities held by the fund may decline – sometimes rapidly or unpredictably – due to various factors, including events or conditions affecting the general economy or particular industries; overall market changes; local, regional or global political, social or economic instability; governmental or governmental agency responses to economic conditions; and currency exchange rate, interest rate and commodity price fluctuations.
Issuer risks — The prices of, and the income generated by, securities held by the fund may decline in response to various factors directly related to the issuers of such securities, including reduced demand for an issuer’s goods or services, poor management performance and strategic initiatives such as mergers, acquisitions or dispositions and the market response to any such initiatives.
Investing in growth-oriented stocks — Growth-oriented common stocks and other equity-type securities (such as preferred stocks, convertible preferred stocks and convertible bonds) may involve larger price swings and greater potential for loss than other types of investments. These risks may be even greater in the case of smaller capitalization stocks.
Investing in income-oriented stocks — Income provided by the fund may be reduced by changes in the dividend policies of, and the capital resources available for dividend payments at, the companies in which the fund invests.
Investing outside the U.S. — Securities of issuers domiciled outside the U.S., or with significant operations or revenues outside the U.S., may lose value because of adverse political, social, economic or market developments (including social instability, regional conflicts, terrorism and war) in the countries or regions in which the issuers operate or generate revenue. These securities may also lose value due to changes in foreign currency exchange rates against the U.S. dollar and/or currencies of other countries. Issuers of these securities may be more susceptible to actions of foreign governments, such as the imposition of price controls or punitive taxes, that could adversely impact the value of these securities. Securities markets in certain countries may be more volatile and/or less liquid than those in the U.S. Investments outside the U.S. may also be subject to different accounting practices and different regulatory, legal and reporting standards and practices, and may be more difficult to value, than those in the U.S. In addition, the value of investments outside the U.S. may be reduced by foreign taxes, including foreign withholding taxes on interest and dividends. Further, there may be increased risks of delayed settlement of securities purchased or sold by the fund. The risks of investing outside the U.S. may be heightened in connection with investments in emerging markets.
Investing in emerging markets — Investing in emerging markets may involve risks in addition to and greater than those generally associated with investing in the securities markets of developed countries. For instance, developing countries may have less developed legal and accounting systems than those in developed countries. The governments of these countries may be less stable and more likely to impose capital controls, nationalize a company or industry, place restrictions on foreign ownership and on withdrawing sale proceeds of securities from the country, and/or impose punitive taxes that could adversely affect the prices of securities. In addition, the economies of these countries may be dependent on relatively few industries that are more susceptible to local and global changes. Securities markets in these countries can also be relatively small and have substantially lower trading volumes. As a result, securities issued in these countries may be more volatile and less liquid, and may be more difficult to value, than securities issued in countries with more developed economies and/or markets. Less certainty with respect to security valuations may lead to additional challenges and risks in calculating the fund’s net asset value. Additionally, there may be increased settlement risks for transactions in local securities.
Investing in small companies — Investing in smaller companies may pose additional risks. For example, it is often more difficult to value or dispose of small company stocks and more difficult to obtain information about smaller companies than about larger companies. Furthermore, smaller companies often have limited product lines, operating histories, markets and/or financial resources, may be dependent on one or a few key persons for management, and can be more susceptible to losses. Moreover, the prices of their stocks may be more volatile than stocks of larger, more established companies.
Investing in debt instruments — The prices of, and the income generated by, bonds and other debt securities held by the fund may be affected by changing interest rates and by changes in the effective maturities and credit ratings of these securities.
Rising interest rates will generally cause the prices of bonds and other debt securities to fall. Falling interest rates may cause an issuer to redeem, call or refinance a debt security before its stated maturity, which may result in the fund having to reinvest the proceeds in lower yielding securities. Longer maturity debt securities generally have greater sensitivity to changes in interest rates and may be subject to greater price fluctuations than shorter maturity debt securities.
| 20 | Capital Group Emerging Markets Total Opportunities Fund |
Bonds and other debt securities are also subject to credit risk, which is the possibility that the credit strength of an issuer will weaken and/or an issuer of a debt security will fail to make timely payments of principal or interest and the security will go into default. Credit risk is gauged, in part, by the credit ratings of the debt securities in which the fund invests. However, ratings are only the opinions of the rating agencies issuing them and are not guarantees as to credit quality or an evaluation of market risk. The fund’s investment adviser relies on its own credit analysts to research issuers and issues in seeking to mitigate various credit and default risks.
Investing in lower rated debt instruments — Lower rated bonds and other lower rated debt securities generally have higher rates of interest and involve greater risk of default or price declines due to changes in the issuer’s creditworthiness than those of higher quality debt securities. The market prices of these securities may fluctuate more than the prices of higher quality debt securities and may decline significantly in periods of general economic difficulty. These risks may be increased with respect to investments in junk bonds.
Liquidity risk — Certain fund holdings may be deemed to be less liquid or illiquid because they cannot be readily sold without significantly impacting the value of the holdings. Liquidity risk may result from the lack of an active market for a holding, legal or contractual restrictions on resale, or the reduced number and capacity of market participants to make a market in such holding. Market prices for less liquid or illiquid holdings may be volatile, and reduced liquidity may have an adverse impact on the market price of such holdings. Additionally, the sale of less liquid or illiquid holdings may involve substantial delays (including delays in settlement) and additional costs and the fund may be unable to sell such holdings when necessary to meet its liquidity needs.
Management — The investment adviser to the fund actively manages the fund’s investments. Consequently, the fund is subject to the risk that the methods and analyses employed by the investment adviser in this process may not produce the desired results. This could cause the fund to lose value or its investment results to lag relevant benchmarks or other funds with similar objectives.
5. Certain investment techniques
Index-linked bonds — The fund has invested in index-linked bonds, which are fixed-income securities whose principal value is periodically adjusted to a government price index. Over the life of an index-linked bond, interest is paid on the adjusted principal value. Increases or decreases in the principal value of index-linked bonds are recorded as interest income in the fund’s statement of operations.
Forward currency contracts — The fund has entered into forward currency contracts, which represent agreements to exchange currencies on specific future dates at predetermined rates. The fund’s investment adviser uses forward currency contracts to manage the fund’s exposure to changes in exchange rates. Upon entering into these contracts, risks may arise from the potential inability of counterparties to meet the terms of their contracts and from possible movements in exchange rates.
On a daily basis, the fund’s investment adviser values forward currency contracts and records unrealized appreciation or depreciation for open forward currency contracts in the fund’s statement of assets and liabilities. Realized gains or losses are recorded at the time the forward currency contract is closed or offset by another contract with the same broker for the same settlement date and currency.
Closed forward currency contracts that have not reached their settlement date are included in the respective receivables or payables for closed forward currency contracts in the fund’s statement of assets and liabilities. Net realized gains or losses from closed forward currency contracts and net unrealized appreciation or depreciation from open forward currency contracts are recorded in the fund’s statement of operations. The average month-end notional amount of open forward currency contracts while held was $16,187,000.
| Capital Group Emerging Markets Total Opportunities Fund | 21 |
The following tables present the financial statement impacts resulting from the fund’s use of forward currency contracts as of, or for the year ended, October 31, 2017 (dollars in thousands):
| | | | | Assets | | | Liabilities | |
| Contract | | Risk type | | Location on statement of
assets and liabilities | | Value | | | Location on statement of
assets and liabilities | | Value | |
| Forward currency | | Currency | | Unrealized appreciation on open forward currency contracts | | $ | 148 | | | Unrealized depreciation on open forward currency contracts | | $ | 219 | |
| Forward currency | | Currency | | Receivables for closed forward currency contracts | | | — | | | Payables for closed forward currency contracts | | | 34 | |
| | | | | | | $ | 148 | | | | | $ | 253 | |
| | | | | Net realized loss | | | Net unrealized depreciation | |
| Contract | | Risk type | | Location on statement of operations | | Value | | | Location on statement of operations | | Value | |
| Forward currency | | Currency | | Net realized loss on forward currency contracts | | $ | (1,014 | ) | | Net unrealized depreciation on forward currency contracts | | $ | (43 | ) |
Rights of offset — The fund has entered into enforceable master netting agreements with certain counterparties for forward currency contracts, where on any date amounts payable by each party to the other (in the same currency with respect to the same transaction) may be closed or offset by each party’s payment obligation. If an early termination date occurs under these agreements following an event of default or termination event, all obligations of each party to its counterparty are settled net through a single payment in a single currency (“close-out netting”). For financial reporting purposes, the fund does not offset financial assets and financial liabilities that are subject to these master netting arrangements in the statement of assets and liabilities.
The following table presents the fund’s forward currency contracts by counterparty that are subject to master netting agreements but that are not offset in the fund’s statement of assets and liabilities. The net amount column shows the impact of offsetting on the fund’s statement of assets and liabilities as of October 31, 2017, if close-out netting was exercised (dollars in thousands):
| | | | | | Gross amounts not offset in the | | | | |
| | | Gross amounts | | | statement of assets and liabilities and | | | | |
| | | recognized in the | | | subject to a master netting agreement | | | | |
| | | statement of assets | | | Available | | | Non-cash | | | Cash | | | Net | |
| Counterparty | | and liabilities | | | to offset | | | collateral* | | | collateral | | | amount | |
| Assets: | | | | | | | | | | | | | | | | | | | | |
| Citibank | | $ | 72 | | | $ | (10 | ) | | $ | — | | | $ | — | | | $ | 62 | |
| Goldman Sachs | | | 3 | | | | — | | | | — | | | | — | | | | 3 | |
| JPMorgan Chase | | | 73 | | | | (73 | ) | | | — | | | | — | | | | — | |
| Total | | $ | 148 | | | $ | (83 | ) | | $ | — | | | $ | — | | | $ | 65 | |
| | | | | | | | | | | | | | | | | | | | | |
| Liabilities: | | | | | | | | | | | | | | | | | | | | |
| Bank of America, N.A. | | $ | 88 | | | $ | — | | | $ | — | | | $ | — | | | $ | 88 | |
| Citibank | | | 10 | | | | (10 | ) | | | — | | | | — | | | | — | |
| JPMorgan Chase | | | 155 | | | | (73 | ) | | | — | | | | — | | | | 82 | |
| Total | | $ | 253 | | | $ | (83 | ) | | $ | — | | | $ | — | | | $ | 170 | |
| * | Non-cash collateral is shown on a settlement basis. |
6. Taxation and distributions
Federal income taxation — The fund complies with the requirements under Subchapter M of the Internal Revenue Code applicable to mutual funds and intends to distribute substantially all of its net taxable income and net capital gains each year. The fund is not subject to income taxes to the extent such distributions are made. Therefore, no federal income tax provision is required.
As of and during the period ended October 31, 2017, the fund did not have a liability for any unrecognized tax benefits. The fund recognizes interest and penalties, if any, related to unrecognized tax benefits as income tax expense in the statement of operations. During the period, the fund did not incur any interest or penalties.
| 22 | Capital Group Emerging Markets Total Opportunities Fund |
The fund is not subject to examination by U.S. federal tax authorities for tax years before 2013, and by state tax authorities and tax authorities outside the U.S. for tax years before 2012, the year the fund commenced operations.
Non-U.S. taxation — Dividend and interest income are recorded net of non-U.S. taxes paid. The fund may file withholding tax reclaims in certain jurisdictions to recover a portion of amounts previously withheld. These reclaims are recorded when the amount is known and there are no significant uncertainties on collectability. Gains realized by the fund on the sale of securities in certain countries, if any, may be subject to non-U.S. taxes. If applicable, the fund records an estimated deferred tax liability based on unrealized gains to provide for potential non-U.S. taxes payable upon the sale of these securities.
Distributions — Distributions paid to shareholders are based on net investment income and net realized gains determined on a tax basis, which may differ from net investment income and net realized gains for financial reporting purposes. These differences are due primarily to different treatment for items such as currency gains and losses; short-term capital gains and losses; capital losses related to sales of certain securities within 30 days of purchase; cost of investments sold; net capital losses; non-U.S. taxes on capital gains and income on certain investments. The fiscal year in which amounts are distributed may differ from the year in which the net investment income and net realized gains are recorded by the fund for financial reporting purposes.
No distributions were paid to shareholders during the years ended October 31, 2016 and October 31, 2017.
During the year ended October 31, 2017, the fund reclassified $263,000 from undistributed net investment income to accumulated net realized loss and $74,000 from capital paid in on shares of beneficial interest to undistributed net investment income to align financial reporting with tax reporting.
As of October 31, 2017, the tax basis components of distributable earnings, unrealized appreciation (depreciation) and cost of investments were as follows (dollars in thousands):
| Undistributed ordinary income | | $ | 6,367 | |
| Capital loss carryforward* | | | (22,694 | ) |
| Gross unrealized appreciation on investments | | | 17,242 | |
| Gross unrealized depreciation on investments | | | (12,194 | ) |
| Net unrealized appreciation on investments | | | 5,048 | |
| Cost of investments | | | 137,526 | |
| * | The capital loss carryforward will be used to offset any capital gains realized by the fund in future years. The fund will not make distributions from capital gains while a capital loss carryforward remains. |
7. Fees and transactions with related parties
CGTC is the fund’s investment adviser. American Funds Distributors,® Inc. (“AFD”), the fund’s principal underwriter, and American Funds Service Company® (“AFS”), the fund’s transfer agent are affiliated with CGTC. CGTC, AFD and AFS are considered related parties to the fund.
Investment advisory services — The fund has an investment advisory and service agreement with CGTC that provides for monthly fees accrued daily. From November 1, 2016 to August 31, 2017, the fee was 1.00% of the average daily net assets of the fund. Effective September 1, 2017, the monthly fee was amended to an annualized rate of 0.85% of the average daily net assets of the fund.
Miscellaneous fee reimbursement — CGTC has agreed to reimburse a portion of miscellaneous fees and expenses of the fund. This reimbursement will be in effect through at least January 1, 2019. At its discretion, the adviser may elect to extend, modify or terminate the reimbursement. Fees and expenses in the statement of operations are presented gross of the reimbursement from CGTC. The amount reimbursed by CGTC is reflected as a reimbursement of miscellaneous fees and expenses.
Class-specific fees and expenses — Expenses that are specific to individual share classes are accrued directly to the respective share class. The principal class-specific fees and expenses are further described below:
Distribution services — American Funds Distributors®, Inc. (“AFD”), an affiliate of CGC, is the principal underwriter of the fund’s shares. AFD does not receive any compensation related to the sale of shares of the fund.
| Capital Group Emerging Markets Total Opportunities Fund | 23 |
Transfer agent services — The fund has a shareholder services agreement with AFS under which the fund compensates AFS for providing transfer agent services to each of the fund’s share classes. These services include recordkeeping, shareholder communications and transaction processing. In addition, the fund reimburses AFS for amounts paid to third parties for performing transfer agent services on behalf of fund shareholders.
Administrative services — The fund has an administrative services agreement with CGTC under which the fund compensates CGTC for providing administrative services to Class F-2, F-3 and R-6 shares. These services include, but are not limited to, coordinating, monitoring, assisting and overseeing third parties that provide services to fund shareholders. Under the agreement, Class F-2, Class F-3, and Class R-6 shares pay and annual fee of 0.05% of their respective average daily net assets.
For the year ended October 31, 2017, class-specific expenses under the agreements were as follows (dollars in thousands):
| | | Transfer agent | | | Administrative | |
| Share class | | services | | | services | |
| Class M1 | | $ | 22 | | | $ | — | |
| Class F-22 | | | — | 3 | | | — | 3 |
| Class F-32 | | | — | 3 | | | 7 | |
| Class R-62 | | | — | 3 | | | 5 | |
| Total class-specific expenses | | $ | 22 | | | $ | 12 | |
| 1 | Class M, the legacy share class, was fully liquidated on September 1, 2017. All existing shares were converted to either Class F-3 or R-6 shares. |
| 2 | Class F-2, F-3 and R-6 shares began investment operations on September 1, 2017. |
| 3 | Amount less than one thousand. |
Affiliated officers and trustees — Officers and certain trustees of the fund are or may be considered to be affiliated with CGTC, AFD and AFS. No affiliated officers or trustees received any compensation directly from the fund.
Security transactions with related funds — The fund may purchase from, or sell securities to, other funds managed by CGTC (or funds managed by certain affiliates of CGTC) under procedures adopted by the fund’s board of trustees. The funds involved in such transactions are considered related by virtue of having a common investment adviser (or affiliated investment advisers), common trustees and/or common officers. When such transactions occur, each transaction is executed at the current market price of the security and no brokerage commissions or fees are paid in accordance with Rule 17a-7 of the 1940 Act.
Interfund lending — Pursuant to an exemptive order issued by the SEC, the fund, along with other CGTC-managed funds (or funds managed by certain affiliates of CGTC), may participate in an interfund lending program. The program provides an alternate credit facility that permits the funds to lend or borrow cash for temporary purposes directly to or from one another, subject to the conditions of the exemptive order. The fund did not lend or borrow cash through the interfund lending program at any time during the year ended October 31, 2017.
8. Committed line of credit
The fund participates with other funds managed by CGTC (or funds managed by certain affiliates of CGTC) in a $1 billion credit facility (the “line of credit”) to be utilized for temporary purposes to support shareholder redemptions. The fund has agreed to pay commitment fees on its pro-rata portion of the line of credit, which are reflected in other expenses in the fund’s statement of operations. The fund did not borrow on this line of credit at any time during the year ended October 31, 2017.
| 24 | Capital Group Emerging Markets Total Opportunities Fund |
9. Capital share transactions
Capital share transactions in the fund were as follows (dollars and shares in thousands):
| | | Sales1 | | | Repurchases1 | | | Net (decrease)
increase |
| Share class | | Amount | | | Shares | | | Amount | | | Shares | | | Amount | | | Shares | |
| Year ended October 31, 2017 | | | | | | | | | | | | | | | | | | | | | | | | |
| Class M2 | | $ | 12,717 | | | | 1,159 | | | $ | (219,756 | ) | | | (18,997 | ) | | $ | (207,039 | ) | | | (17,838 | ) |
| Class F-23 | | | 10 | | | | 1 | | | | — | | | | — | | | | 10 | | | | 1 | |
| Class F-33 | | | 93,984 | | | | 7,965 | | | | (9,608 | ) | | | (810 | ) | | | 84,376 | | | | 7,155 | |
| Class R-63 | | | 100,468 | | | | 8,517 | | | | (42,235 | ) | | | (3,582 | ) | | | 58,233 | | | | 4,935 | |
| Total net increase (decrease) | | $ | 207,179 | | | | 17,642 | | | $ | (271,599 | ) | | | (23,389 | ) | | $ | (64,420 | ) | | | (5,747 | ) |
| | | | | | | | | | | | | | | | | | | | | | | | | |
| Year ended October 31, 2016 | | | | | | | | | | | | | | | | | | | | | | | | |
| Class M | | $ | 17,243 | | | | 1,759 | | | $ | (123,953 | ) | | | 12,868 | | | $ | (106,710 | ) | | | (11,109 | ) |
| 1 | Includes exchanges between share classes of the fund. |
| 2 | Class M, the legacy share class, was fully liquidated on September 1, 2017. All existing shares were converted to either Class F-3 or R-6 shares. |
| 3 | Class F-2, F-3 and R-6 shares began investment operations on September 1, 2017. |
10. Investment transactions
The fund made purchases and sales of investment securities, excluding short-term securities and U.S. government obligations, if any, of $89,457,000 and $156,436,000, respectively, during the year ended October 31, 2017.
| Capital Group Emerging Markets Total Opportunities Fund | 25 |
Financial highlights
| | | | | | Income from | | | | | | | | | | | | | | | | | | | |
| | | | | | investment operations1 | | | | | | | | | | | | | | | | | | | |
| | | | | | | | | | | | | | | | | | | | | | | | Ratio of | | | Ratio of | | | | |
| | | Net asset | | | | | | Net gains on | | | | | | | | | | | | | | | expenses to | | | expenses to | | | Ratio of | |
| | | value, | | | Net | | | securities (both | | | Total from | | | Net asset | | | | | | Net assets, | | | average net | | | average net | | | net income | |
| | | beginning | | | investment | | | realized and | | | investment | | | value, end | | | Total | | | end of period | | | assets before | | | assets after | | | to average | |
| Period ended | | of period | | | income | | | unrealized) | | | operations | | | of period | | | return2 | | | (in millions) | | | reimbursements | | | reimbursements2 | | | net assets2 | |
| Class M: | | | | | | | | | | | | | | | | | | | | | | | | | | | | | | | | | | | | | | | | |
| 9/1/20173,4 | | $ | 10.58 | | | $ | .36 | | | $ | .86 | | | $ | 1.22 | | | $ | 11.80 | | | | 11.53 | %5 | | $ | 152 | | | | 1.13 | %6 | | | 1.05 | %6 | | | 3.90 | %6 |
| 10/31/2016 | | | 9.93 | | | | .34 | | | | .31 | | | | .65 | | | | 10.58 | | | | 6.55 | | | | 189 | | | | 1.15 | | | | 1.10 | | | | 3.41 | |
| Class F-2: | | | | | | | | | | | | | | | | | | | | | | | | | | | | | | | | | | | | | | | | |
| 10/31/20173,7 | | | 11.80 | | | | .08 | | | | — | 8 | | | .08 | | | | 11.88 | | | | .68 | 5,9 | | | — | 10 | | | .21 | 5,9 | | | .18 | 5,9 | | | .68 | 5,9 |
| Class F-3: | | | | | | | | | | | | | | | | | | | | | | | | | | | | | | | | | | | | | | | | |
| 10/31/20173,7 | | | 11.80 | | | | .08 | | | | — | 8 | | | .08 | | | | 11.88 | | | | .68 | 5 | | | 85 | | | | .19 | 5 | | | .16 | 5 | | | .70 | 5 |
| Class R-6: | | | | | | | | | | | | | | | | | | | | | | | | | | | | | | | | | | | | | | | | |
| 10/31/20173,7 | | | 11.80 | | | | .08 | | | | — | 8 | | | .08 | | | | 11.88 | | | | .68 | 5 | | | 59 | | | | .20 | 5 | | | .16 | 5 | | | .70 | 5 |
| | | Year ended October 31 |
| | | 2017 | | | 2016 | |
| Portfolio turnover rate for all share classes | | | 61% | | | | 51% | |
| 1 | Based on average shares outstanding. |
| 2 | This column reflects the impact, if any, of certain reimbursements from CGTC. During some of the periods shown, CGTC reduced fees for investment advisory services and reimbursed a portion of miscellaneous fees and expenses. |
| 3 | Based on operations for the period shown and, accordingly, is not representative of a full year. |
| 4 | Class M, the legacy share class, was fully liquidated on September 1, 2017. All existing shares were converted to either Class F-3 or R-6 shares. |
| 5 | Not annualized. |
| 6 | Annualized. |
| 7 | Class F-2, F-3 and R-6 shares began investment operations on September 1, 2017. |
| 8 | Amount less than $.01. |
| 9 | All or a significant portion of assets in this class consisted of seed capital invested by CGTC and/or its affiliates. Fees for distribution services are not charged or accrued on these seed capital assets. If such fees were paid by the fund on seed capital assets, fund expenses would have been higher and net income and total return would have been lower. |
| 10 | Amount less than $1 million. |
See Notes to Financial Statements
| 26 | Capital Group Emerging Markets Total Opportunities Fund |
Report of Independent Registered Public Accounting Firm
To the Shareholders and Board of Trustees of Capital Group Emerging Markets Total Opportunities Fund:
We have audited the accompanying statement of assets and liabilities of Capital Group Emerging Markets Total Opportunities Fund (the “Fund”), including the investment portfolio, as of October 31, 2017, and the related statement of operations for the year then ended, the statements of changes in net assets for each of the two years in the period then ended, and the financial highlights for each of the periods presented. These financial statements and financial highlights are the responsibility of the Fund’s management. Our responsibility is to express an opinion on these financial statements and financial highlights based on our audits.
We conducted our audits in accordance with the standards of the Public Company Accounting Oversight Board (United States). Those standards require that we plan and perform the audit to obtain reasonable assurance about whether the financial statements and financial highlights are free of material misstatement. The Fund is not required to have, nor were we engaged to perform, an audit of its internal control over financial reporting. Our audits included consideration of internal control over financial reporting as a basis for designing audit procedures that are appropriate in the circumstances, but not for the purpose of expressing an opinion on the effectiveness of the Fund’s internal control over financial reporting. Accordingly, we express no such opinion. An audit also includes examining, on a test basis, evidence supporting the amounts and disclosures in the financial statements, assessing the accounting principles used and significant estimates made by management, as well as evaluating the overall financial statement presentation. Our procedures included confirmation of securities owned as of October 31, 2017, by correspondence with the custodian and brokers; when replies were not received from brokers, we performed other auditing procedures. We believe that our audits provide a reasonable basis for our opinion.
In our opinion, such financial statements and financial highlights referred to above present fairly, in all material respects, the financial position of Capital Group Emerging Markets Total Opportunities Fund as of October 31, 2017, the results of its operations for the year then ended, the changes in its net assets for each of the two years in the period then ended, and the financial highlights for each of the periods presented, in conformity with accounting principles generally accepted in the United States of America.
Deloitte & Touche LLP
Costa Mesa, California
December 19, 2017
| Capital Group Emerging Markets Total Opportunities Fund | 27 |
As a fund shareholder, you incur two types of costs: (1) transaction costs, such as initial sales charges on purchase payments and contingent deferred sales charges on redemptions (loads), and (2) ongoing costs, including management fees, distribution and service (12b-1) fees, and other expenses. This example is intended to help you understand your ongoing costs (in dollars) of investing in the fund so you can compare these costs with the ongoing costs of investing in other mutual funds. The example is based on an investment of $1,000 invested at the beginning of the period and held for the entire six-month period (May 1, 2017, through October 31, 2017).
Actual expenses:
The first line of each share class in the table on the following page provides information about actual account values and actual expenses. You may use the information in this line, together with the amount you invested, to estimate the expenses that you paid over the period. Simply divide your account value by $1,000 (for example, an $8,600 account value divided by $1,000 = 8.6), then multiply the result by the number in the first line under the heading titled “Expenses paid during period” to estimate the expenses you paid on your account during this period.
Hypothetical example for comparison purposes:
The second line of each share class in the table on the following page provides information about hypothetical account values and hypothetical expenses based on the actual expense ratio for the share class and an assumed rate of return of 5.00% per year before expenses, which is not the actual return of the share class. The hypothetical account values and expenses may not be used to estimate the actual ending account balance or expenses you paid for the period. You may use this information to compare the ongoing costs of investing in the fund and other funds. To do so, compare this 5.00% hypothetical example with the 5.00% hypothetical examples that appear in the shareholder reports of the other funds.
Notes:
Retirement plan participants may be subject to certain fees charged by the plan sponsor, and Class F-2 and F-3 shareholders may be subject to fees charged by financial intermediaries, typically ranging from 0.75% to 1.50% of assets annually depending on services offered. You can estimate the impact of these fees by adding the amount of the fees to the total estimated expenses you paid on your account during the period as calculated above. In addition, your ending account value would be lower by the amount of these fees.
Note that the expenses shown in the table on the following page are meant to highlight your ongoing costs only and do not reflect any transactional costs, such as sales charges (loads). Therefore, the second line of each share class in the table is useful in comparing ongoing costs only and will not help you determine the relative total costs of owning different funds. In addition, if these transactional costs were included, your costs would have been higher.
| 28 | Capital Group Emerging Markets Total Opportunities Fund |
| | | Beginning
account value
5/1/2017 | | | Ending
account value
10/31/2017 | | | Expenses paid
during period* | | | Annualized
expense ratio | |
| Class F-2 – actual return† | | $ | 1,000.00 | | | $ | 1,048.47 | | | $ | 1.82 | | | | 1.08 | % |
| Class F-2 – assumed 5% return† | | | 1,000.00 | | | | 1,019.76 | | | | 5.50 | | | | 1.08 | |
| Class F-3 – actual return† | | | 1,000.00 | | | | 1,048.91 | | | | 1.63 | | | | .97 | |
| Class F-3 – assumed 5% return† | | | 1,000.00 | | | | 1,020.32 | | | | 4.94 | | | | .97 | |
| Class R-6 – actual return† | | | 1,000.00 | | | | 1,048.91 | | | | 1.65 | | | | .98 | |
| Class R-6 – assumed 5% return† | | | 1,000.00 | | | | 1,020.27 | | | | 4.99 | | | | .98 | |
| * | The “expenses paid during period” are equal to the “annualized expense ratio,” multiplied by the average account value over the period, multiplied by the number of days in the period, and divided by 365 (to reflect the one-half year period). |
| † | The period for the “annualized expense ratio” and “actual return” line is based on the number of days since the share class began investment operations on September 1, 2017. The “assumed 5% return” line is based on 182 days. |
We are required to advise you of the federal tax status of certain distributions received by shareholders during the fiscal year. The fund hereby designates the following amounts for the fund’s fiscal year ended October 31, 2017:
| Foreign taxes | $0.01 per share |
| Foreign source income | $0.65 per share |
Individual shareholders should refer to their Form 1099 or other tax information, which will be mailed in January 2018, to determine the calendar year amounts to be included on their 2017 tax returns. Shareholders should consult their tax advisors.
| Capital Group Emerging Markets Total Opportunities Fund | 29 |
Board of trustees and other officers
Independent trustees1
| Name and year of birth | | Year first
elected
a trustee
of the fund2 | | | Principal occupation(s) during past five years | | Number of
portfolios
overseen
by trustee | | Other directorships3
held by trustee |
| Joseph C. Berenato, 1946 | | | 2015 | | | Former Chairman and CEO, Ducommun Incorporated (aerospace components manufacturer) | | | | 164 | | | None |
| Richard G. Capen Jr., 1934 | | | 2011 | | | Corporate director and author | | | | 10 | | | None |
| Vanessa C. L. Chang, 1952 | | | 2015 | | | Director, EL & EL Investments (real estate) | | | | 174 | | | Edison International; Sykes Enterprises; Transocean Ltd. |
| H. Frederick Christie, 1933 | | | 2011 | | | Private investor | | | | 10 | | | None |
Richard G. Newman, 1934
Chairman of the Board (Independent and Non-Executive) | | | 2011 | | | Founder and Chairman Emeritus, AECOM Technology Corporation (global engineering, consulting and professional technical services) | | | | 10 | | | None |
Interested trustee5
Name, year of birth
and position with fund | | Year first
elected
a trustee
or officer
of the fund2 | | | Principal occupation(s) during past five years
and positions held with affiliated entities or
the principal underwriter of the fund | | Number of
portfolios
overseen
by trustee | | Other directorships3
held by trustee |
Paul F. Roye, 1953
Vice Chairman of the Board | | | 2011 | | | Director, Capital Research and Management Company;6 Senior Vice President and Senior Counsel — Fund Business Management Group, Capital Research and Management Company6 | | | | 11 | | | None |
The fund’s statement of additional information includes further details about fund trustees and is available without charge upon request by calling your relationship manager at (800) 421-4225, ext. 90. The address for all trustees and officers of the fund is 333 South Hope Street, Los Angeles, CA 90071, Attention: Secretary.
| 30 | Capital Group Emerging Markets Total Opportunities Fund |
Other officers7
Name, year of birth
and position with fund | | Year first
elected
an officer
of the fund2 | | Principal occupation(s) during past five years and positions held with affiliated entities
or the principal underwriter of the fund |
John S. Armour, 1957
President | | 2013 | | Senior Vice President, Capital Guardian Trust Company;
President — Private Client Services Division, Capital Bank and Trust Company6 |
Shaw B. Wagener, 1959
Senior Vice President | | 2016 | | Chairman of the Board, Capital International, Inc.;6 Partner — Capital International Investors, Capital Research and Management Company;6 Chairman of the Board, Capital Group International, Inc.;6 Director, Capital Group Private Markets, Inc.6 |
Timothy W. McHale, 1978
Vice President | | 2011 | | Vice President and Senior Counsel — Fund Business Management Group, Capital Research and Management Company;6 Secretary, American Funds Distributors, Inc.6 |
Courtney R. Taylor, 1975
Secretary | | 2011 | | Assistant Vice President — Fund Business Management Group, Capital Research and Management Company6 |
Gregory F. Niland, 1971
Treasurer | | 2014 | | Vice President — Investment Operations, Capital Research and Management Company6 |
Susan K. Countess, 1966
Assistant Secretary | | 2012 | | Associate — Fund Business Management Group, Capital Research and Management Company6 |
Brian C. Janssen, 1972
Assistant Treasurer | | 2015 | | Vice President — Investment Operations, Capital Research and Management Company6 |
| 1 | The term independent trustee refers to a trustee who is not an “interested person” of the fund within the meaning of the Investment Company Act of 1940. |
| 2 | Trustees and officers of the fund serve until their resignation, removal or retirement. |
| 3 | This includes all directorships (other than the fund or other funds managed by Capital Guardian Trust Company or its affiliates) that are held by each trustee as a trustee or director of a public company or a registered investment company. Unless otherwise noted, all directorships are current. |
| 4 | Funds managed by Capital Guardian Trust Company or its affiliates. |
| 5 | The term interested trustee refers to a trustee who is an “interested person” of the fund within the meaning of the Investment Company Act of 1940, on the basis of his or her affiliation with the fund’s investment adviser, Capital Guardian Trust Company, or affiliated entities (including the fund’s principal underwriter). |
| 6 | Company affiliated with Capital Guardian Trust Company. |
| 7 | All of the officers listed are officers of one or more of the other funds for which Capital Guardian Trust Company serves as investment adviser. |
| Capital Group Emerging Markets Total Opportunities Fund | 31 |
This page was intentionally left blank.
| 32 | Capital Group Emerging Markets Total Opportunities Fund |
Office of the fund and of the investment adviser
Capital Guardian Trust Company
6455 Irvine Center Drive
Irvine, CA 92618-4518
Transfer agent for shareholder accounts
American Funds Services Company
(Write to the address near you.)
P.O. Box 6007
Indianapolis, IN 46206-6007
P.O. Box 2280
Norfolk, VA 23501-2280
Custodian of assets
JPMorgan Chase Bank
270 Park Avenue
New York, NY 10017-2070
Counsel
Morgan, Lewis & Bockius LLP
300 South Grand Avenue
22nd Floor
Los Angeles, CA 90071-3132
Independent registered public accounting firm
Deloitte & Touche LLP
695 Town Center Drive
Suite 1200
Costa Mesa, CA 92626-7188
Principal underwriter
American Funds Distributors, Inc.
333 South Hope Street
Los Angeles, CA 90071-1406
Investors should carefully consider investment objectives, risks, charges and expenses. This and other important information is contained in the fund prospectus, which can be obtained from Capital Guardian Trust Company by calling (800) 421-4225, ext. 90, and should be read carefully before investing. Fund shares offered through American Funds Distributors, Inc.
Capital Group Emerging Markets Total Opportunities Fund files a complete list of its portfolio holdings with the U.S. Securities and Exchange Commission (SEC) for the first and third quarters of each fiscal year on Form N-Q. This filing is available free of charge on the SEC website (www.sec.gov). You may also review or, for a fee, copy this filing at the SEC’s Public Reference Room in Washington, D.C. Additional information regarding the operation of the Public Reference Room may be obtained by calling the SEC’s Office of Investor Education and Advocacy at (800) SEC-0330. Additionally, the list of portfolio holdings is available by calling your relationship manager at (800) 421-4225, ext. 90.
The proxy voting procedures and policies of Capital Group Emerging Markets Total Opportunities Fund — which describe how we vote proxies relating to portfolio securities — are available upon request by calling your relationship manager. The fund files its proxy voting record with the SEC for the 12 months ended June 30 by August 31. The report also is available on the SEC website or by calling your relationship manager.
MSCI has not approved, reviewed or produced this report, makes no express or implied warranties or representations and is not liable whatsoever for any data in the report. You may not redistribute the MSCI data or use it as a basis for other indices or investment products.
Lit. No. MFGEARX-370-1217P Printed in USA TAG/CGIRV/10247-S61579
© 2017 Capital Group Emerging Markets Total Opportunities Fund
ITEM 2 – Code of Ethics
The Registrant has adopted a Code of Ethics that applies to its Principal Executive Officer and Principal Financial Officer. The Registrant undertakes to provide to any person without charge, upon request, a copy of the Code of Ethics. Such request can be made to American Funds Service Company at 800/421-9225 or to the Secretary of the Registrant, 6455 Irvine Center Drive, Irvine, California 92618.
ITEM 3 – Audit Committee Financial Expert
The Registrant’s board has determined that Vanessa C. L. Chang, a member of the Registrant’s audit committee, is an “audit committee financial expert” and "independent," as such terms are defined in this Item. This designation will not increase the designee’s duties, obligations or liability as compared to his or her duties, obligations and liability as a member of the audit committee and of the board, nor will it reduce the responsibility of the other audit committee members. There may be other individuals who, through education or experience, would qualify as "audit committee financial experts" if the board had designated them as such. Most importantly, the board believes each member of the audit committee contributes significantly to the effective oversight of the Registrant’s financial statements and condition.
ITEM 4 – Principal Accountant Fees and Services
| Registrant: |
| | a) Audit Fees: |
| | | 2016 | $59,000 |
| | | 2017 | $105,000 |
| | | |
| | b) Audit-Related Fees: |
| | | 2016 | None |
| | | 2017 | None |
| | | |
| | c) Tax Fees: |
| | | 2016 | $12,000 |
| | | 2017 | $5,000 |
| | | The tax fees consist of professional services relating to the preparation of the Registrant’s tax returns. |
| | | |
| | d) All Other Fees: |
| | | 2016 | None |
| | | 2017 | None |
| | | |
| | | Adviser and affiliates (includes only fees for non-audit services billed to the adviser and affiliates for engagements that relate directly to the operations and financial reporting of the Registrant and were subject to the pre-approval policies described below): |
| | a) Audit Fees: |
| | | Not Applicable |
| | | |
| | b) Audit-Related Fees: |
| | | 2016 | $78,000 |
| | | 2017 | $8,000 |
| | | The audit-related fees consist of assurance and related services relating to the examination of the Registrant’s transfer agent, principal underwriter and investment adviser conducted in accordance with Statement on Standards for Attestation Engagements Number 16 issued by the American Institute of Certified Public Accountants. |
| | | |
| | c) Tax Fees: |
| | | Not Applicable |
| | | | |
| | | | |
| | d) All Other Fees: |
| | | Not Applicable |
| | | | |
| | | The other fees consist of subscription services related to an accounting research tool. |
| | | |
| | | | |
| | | All audit and permissible non-audit services that the Registrant’s audit committee considers compatible with maintaining the independent registered public accounting firm’s independence are required to be pre-approved by the committee. The pre-approval requirement will extend to all non-audit services provided to the Registrant, the investment adviser, and any entity controlling, controlled by, or under common control with the investment adviser that provides ongoing services to the Registrant, if the engagement relates directly to the operations and financial reporting of the Registrant. The committee will not delegate its responsibility to pre-approve these services to the investment adviser. The committee may delegate to one or more committee members the authority to review and pre-approve audit and permissible non-audit services. Actions taken under any such delegation will be reported to the full committee at its next meeting. The pre-approval requirement is waived with respect to non-audit services if certain conditions are met. The pre-approval requirement was not waived for any of the non-audit services listed above provided to the Registrant, adviser and affiliates. |
| | | | |
| | | Aggregate non-audit fees paid to the Registrant’s auditors, including fees for all services billed to the Registrant, adviser and affiliates that provide ongoing services to the Registrant, were $163,000 for fiscal year 2016 and $58,000 for fiscal year 2017. The non-audit services represented by these amounts were brought to the attention of the committee and considered to be compatible with maintaining the auditors’ independence. |
ITEM 5 – Audit Committee of Listed Registrants
Not applicable to this Registrant, insofar as the Registrant is not a listed issuer as defined in Rule 10A-3 under the Securities Exchange Act of 1934.
ITEM 6 – Schedule of Investments
Not applicable, insofar as the schedule is included as part of the report to shareholders filed under Item 1 of this Form.
ITEM 7 – Disclosure of Proxy Voting Policies and Procedures for Closed-End Management Investment Companies
Not applicable to this Registrant, insofar as the Registrant is not a closed-end management investment company.
ITEM 8 – Portfolio Managers of Closed-End Management Investment Companies
Not applicable to this Registrant, insofar as the Registrant is not a closed-end management investment company.
ITEM 9 – Purchases of Equity Securities by Closed-End Management Investment Company and Affiliated Purchasers
Not applicable to this Registrant, insofar as the Registrant is not a closed-end management investment company.
ITEM 10 – Submission of Matters to a Vote of Security Holders
There have been no material changes to the procedures by which shareholders may recommend nominees to the Registrant’s board of trustees since the Registrant last submitted a proxy statement to its shareholders. The procedures are as follows. The Registrant has a nominating committee comprised solely of persons who are not considered ‘‘interested persons’’ of the Registrant within the meaning of the Investment Company Act of 1940, as amended. The committee periodically reviews such issues as the board’s composition, responsibilities, committees, compensation and other relevant issues, and recommends any appropriate changes to the full board of trustees. While the committee normally is able to identify from its own resources an ample number of qualified candidates, it will consider shareholder suggestions of persons to be considered as nominees to fill future vacancies on the board. Such suggestions must be sent in writing to the nominating committee of the Registrant, c/o the Registrant’s Secretary, and must be accompanied by complete biographical and occupational data on the prospective nominee, along with a written consent of the prospective nominee for consideration of his or her name by the nominating committee.
ITEM 11 – Controls and Procedures
| (a) | The Registrant’s Principal Executive Officer and Principal Financial Officer have concluded, based on their evaluation of the Registrant’s disclosure controls and procedures (as such term is defined in Rule 30a-3 under the Investment Company Act of 1940), that such controls and procedures are adequate and reasonably designed to achieve the purposes described in paragraph (c) of such rule. |
| | |
| (b) | There were no changes in the Registrant’s internal controls over financial reporting (as defined in Rule 30a-3(d) under the Investment Company Act of 1940) that occurred during the Registrant’s second fiscal quarter of the period covered by this report that has materially affected, or is reasonably likely to materially affect, the Registrant’s internal control over financial reporting. |
ITEM 12 – Exhibits
| (a)(1) | The Code of Ethics that is the subject of the disclosure required by Item 2 is attached as an exhibit hereto. |
| | |
| (a)(2) | The certifications required by Rule 30a-2 of the Investment Company Act of 1940 and Sections 302 and 906 of the Sarbanes-Oxley Act of 2002 are attached as exhibits hereto. |
SIGNATURES
Pursuant to the requirements of the Securities Exchange Act of 1934 and the Investment Company Act of 1940, the Registrant has duly caused this report to be signed on its behalf by the undersigned, thereunto duly authorized.
| | CAPITAL GROUP EMERGING MARKETS TOTAL OPPORTUNITIES FUND |
| | |
| | By /s/ John S. Armour |
| | John S. Armour, President and Principal Executive Officer |
| | |
| | Date: December 29, 2017 |
Pursuant to the requirements of the Securities Exchange Act of 1934 and the Investment Company Act of 1940, this report has been signed below by the following persons on behalf of the Registrant and in the capacities and on the dates indicated.
| By /s/ John S. Armour |
John S. Armour, President and Principal Executive Officer |
| |
| Date: December 29, 2017 |
| By /s/ Gregory F. Niland |
Gregory F. Niland, Treasurer and Principal Financial Officer |
| |
| Date: December 29, 2017 |