UNITED STATES
SECURITIES AND EXCHANGE COMMISSION
Washington, D.C. 20549
FORM N-CSR
Certified Shareholder Report of
Registered Management Investment Companies
Investment Company Act File Number: 811-22605
Capital Group Emerging Markets Total Opportunities Fund
(Exact Name of Registrant as Specified in Charter)
6455 Irvine Center Drive
Irvine, California 92618
(Address of Principal Executive Offices)
Registrant's telephone number, including area code: (949) 975-5000
Date of fiscal year end: October 31
Date of reporting period: October 31, 2014
Courtney R. Taylor
Capital Group Emerging Markets Total Opportunities Fund
6455 Irvine Center Drive
Irvine, California 92618
(Name and Address of Agent for Service)
Copies to:
Michael Glazer
Morgan, Lewis & Bockius LLP
355 South Grand Avenue, Suite 4400
Los Angeles, California 90071
(Counsel for the Registrant)
ITEM 1 – Reports to Stockholders
 | | Capital Group Emerging Markets
Total Opportunities FundSM Annual report
for the year ended
October 31, 2014 |

Capital Group Emerging Markets Total Opportunities Fund seeks long-term growth and preservation of capital with lower volatility of returns than emerging markets equities.
Fund results shown in this report are for past periods and are not predictive of results for future periods. The results shown are before taxes on fund distributions and sale of fund shares. Current and future results may be lower or higher than those shown. Share prices and returns will vary, so investors may lose money. Investing for short periods makes losses more likely. Investments are not FDIC-insured, nor are they deposits of or guaranteed by a bank or any other entity, so they may lose value. For current information and month-end results, please call (800) 266-9532.
Here are the average annual total returns on a $1,000 investment with all distributions reinvested for periods ended September 30, 2014 (the most recent calendar quarter-end):
| | | Lifetime |
| | 1 year | (since 1/27/2012) |
| | | |
| Average annual total returns | 2.78% | 2.63% |
The total annual fund operating expense ratio is 1.10% as of the most recent fiscal year-end, and as reflected in the prospectus dated January 1, 2015 (unaudited).
Investment results assume all distributions are reinvested and reflect applicable fees and expenses.
This report is for the information of shareholders of Capital Group Emerging Markets Total Opportunities Fund, but it also may be used as sales literature when preceded or accompanied by the current prospectus, which gives details about charges, expenses, investment objectives and operating policies of the fund. If used as sales material after December 31, 2014, this report must be accompanied by a statistical update for the most recently completed calendar quarter.
Investors should carefully read and consider the investment objectives, guidelines, risks, fees and expenses associated with Capital Group Emerging Markets Total Opportunities Fund (CGETOP) prior to investing. This and other important information is contained in CGETOP’s prospectus, which can be obtained from your relationship manager.
Investing in emerging markets involves risks, such as significant currency and price fluctuations, political instability, differing securities regulations and periods of illiquidity, which are detailed in the fund prospectus. Investments in emerging markets have been more volatile than investments in developed markets, reflecting the greater uncertainties of investing in less established economies. Individuals investing in emerging markets should have a long-term perspective and be able to tolerate potentially sharp declines in the value of their investments.
Contents
Fellow investors:
Capital Group Emerging Markets Total Opportunities Fund (CGETOP) invests in the full spectrum of emerging markets debt and equity securities. CGETOP does not have a benchmark but seeks to limit the volatility typically associated with investments in the developing world. The fund was started on January 27, 2012. Over its lifetime, CGETOP has risen 2.05% compared with 3.09% for the MSCI Emerging Markets (EM) Investable Market Index (IMI); fund volatility has been 8% during its lifetime through October 31, 2014, versus 13% for emerging markets equities.
The following report covers the period from November 1, 2013, through October 31, 2014. During this time, the MSCI EM IMI edged almost 1% higher as investors grappled with concerns about the end of quantitative easing in the U.S., slowing economic growth in Europe and China, and rising geopolitical tensions in the Middle East, Russia and Ukraine. Most world currencies fell against the U.S. dollar; the depreciation of emerging markets currencies undercut market gains in U.S. dollar terms, with the MSCI EM IMI rising 6% in local currency. Energy stocks posted sharp losses as oil prices slid against the backdrop of weak global demand; materials also registered double-digit declines. By contrast, the technology sector gained 12%, lifted by Asian internet firms and several large semiconductor firms.
Emerging markets U.S. dollar-denominated debt rallied as investors appeared to search for higher yields in the developing markets; the J.P. Morgan Emerging Markets Bond Index (EMBI) Global rose 7.2%. But local currency debt fell in U.S. dollar terms, weighed down by the sharp depreciation of most emerging markets currencies. The J.P. Morgan Government Bond Index Emerging Markets (GBI-EM) Global Diversified rose 7.0% in local currency, but declined 2.7% in U.S. dollar terms. In this environment, the fund fell 1.5% for the period. The realized volatility of the portfolio was 6%, compared with 10% for the MSCI EM IMI.
Market review
Most world currencies slid against the U.S. dollar during the 12-month period as investors struggled to understand the timing and extent of potentially higher interest rates in the U.S. Investors also seemed to weigh the likelihood of an improving global economy and the possible impact of geopolitical instability in several markets.
The Russian ruble fell 25% as tensions with Ukraine escalated and a rapid series of events rattled markets, including the ouster of Ukrainian Prime Minister Viktor Yanukovych in February. Russia’s subsequent annexation of Crimea triggered economic sanctions by the U.S. and Europe, further exacerbating
Results at a glance
For periods ended October 31, 2014, with distributions reinvested
| | | Cumulative | | Average annual |
| | | total returns | | total returns |
| | | 1 year | | Lifetime1 |
| | | | | |
| Capital Group Emerging Markets Total Opportunities Fund | | | -1.50 | % | | | 2.05 | % |
| MSCI Emerging Markets IMI2 | | | 0.95 | | | | 3.09 | |
| JP Morgan GBI-EM Global Diversified2 | | | -2.68 | | | | 0.24 | |
| JP Morgan EMBI Global2 | | | 7.20 | | | | 6.49 | |
| Emerging markets blended market universe3 | | | 1.61 | | | | 3.31 | |
| 1 | Since 1/27/2012. |
| 2 | The market indexes are unmanaged and, therefore, have no expenses. |
| 3 | The emerging markets blended market universe blends the MSCI EM IMI, JPM EMBI Global, and JPM GBI-EM Global Diversified indexes by weighting their cumulative total returns at 50%, 25%, and 25%, respectively. This assumes the blend is rebalanced monthly. |
Unless otherwise indicated, equity returns are based on MSCI indexes and measured in U.S. dollars with net dividends reinvested.
| Capital Group Emerging Markets Total Opportunities Fund | 1 |
| 20 largest holdings | |
| | Percent of
net assets as
of 10/31/14 |
| Mexican government bonds (MXN) | 2.5% |
| Brazilian inflation-linked bonds | 2.4 |
| Indian government bonds (INR) | 2.3 |
| Greek government bonds (EUR) | 2.1 |
| Mexican inflation-linked bonds | 2.1 |
| Taiwan Semiconductor Manufacturing | 1.9 |
| Colombian government bonds (COP) | 1.7 |
| Portuguese government bonds (EUR) | 1.5 |
| Infosys | 1.4 |
| Bharti Airtel | 1.4 |
| Indonesian government bonds (IDR) | 1.3 |
| Slovenian government bonds (USD) | 1.3 |
| South African government bonds (ZAR) | 1.3 |
| Minth Group | 1.2 |
| CEMEX | 1.1 |
| Zhuzhou CSR Times Electric | 1.1 |
| HKT Trust | 1.0 |
| China Everbright International | 1.0 |
| Lenovo Group | 1.0 |
| Standard Chartered | 1.0 |
| | 30.6% |
investor worries about the country’s financial markets and economy. The MSCI Russia IMI dropped 25%. Local bonds fell 28%, hurt by the depreciation of the ruble. By October 2014,Moody’s had cut the country’s sovereign debt rating by one notch to Baa2, its second-lowest investment-grade rating, following a downgrade by Standard & Poor’s in April; the ratings agency cited the depletion of Russia’s foreign exchange reserves and concerns about its restricted access to international markets.
Currency depreciation also weighed on Brazilian equities, with the real falling 9% against the U.S. dollar. The MSCI Brazil IMI declined 10% amid concerns about slowing economic growth and dramatic market swings in the run-up to October 2014 elections. Dilma Rousseff was narrowly re-elected, dampening investor hopes for reform. Brazilian local bonds were flat, held back by the slide of the real. Elsewhere in Latin America, Mexican stocks rose 7% as the government pressed ahead with reforms and the economy showed modest signs of recovery. Mexican U.S. dollar bonds gained 10%; local bonds rose 4%, despite the depreciation of the peso. Troubled markets in Argentina and Venezuela saw mixed results. Argentine dollar bonds gained almost 30% in aggregate despite ongoing issues related to the country’s default status and a controversial U.S. court ruling. On July 31, Standard & Poor’s declared Argentina in selective default after the sovereign could not reach an agreement with holdout creditors, despite attempting to make payments. But Venezuelan debt fell sharply as lower oil prices exacerbated concerns about a potential default.
Asian markets powered ahead. The MSCI China IMI advanced 7% as investors appeared to take in the Chinese government’s efforts to pursue reform objectives while trying to stabilize economic growth. Authorities unveiled new SOE reforms in 2014 and a series of targeted measures to support economic growth following last November’s sweeping reforms. Technology stocks posted some of the strongest gains. Telecommunications companies also rallied as investors seemed to cheer a tower-sharing venture among several large firms. But real estate stocks declined amid weakness in the property market; the government continued to ease mortgage lending restrictions during the period.
Several other Asian markets rebounded amid signs of political change and hopes for reform. Indian stocks jumped 33%, fueled by optimism surrounding Prime Minister Narendra Modi’s historic May election and better-than-expected economic growth. The country’s stock market bounced back from a mid-2013 rout spurred by concerns about slowing economic growth, rising inflation and a falling rupee. Indonesian equities advanced 7% over the 12-month period, with Joko Widodo winning Indonesia’s presidential election in late July. Thai stocks climbed 7% despite the December dissolution of the Thai parliament and a military-led coup in May; political uncertainty appeared to subside in the months following the coup.
Portfolio review*
The portfolio lost value in a broadly challenging environment for emerging markets assets. Investments in equities weighed on returns, particularly the
| * | Percentage of net assets for securities mentioned in the portfolio review are listed in the 20 largest holdings, except for Alrosa and Hyundai Motor, which each make up 0.9% of net assets, and First Quantum Minerals, which comprises 0.8% of net assets. |
| 2 | Capital Group Emerging Markets Total Opportunities Fund |
| Asset mix (percent of net assets) | as of October 31, 2014 |
| | |
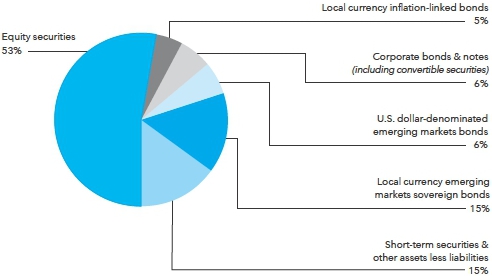 |
| Top 5 equity sectors | | percent of net assets |
| Industrials | | | 8.7 | % |
| Information technology | | | 7.7 | |
| Financials | | | 7.2 | |
| Consumer discretionary | | | 7.0 | |
| Materials | | | 6.1 | |
| 15 largest country positions | | | | | | | | | | | | |
| | | | | | | | | | | | | |
| | | Percent of net assets
as of 10/31/14 |
| | | Equity | | Bonds & notes | | Total |
| China (including Hong Kong) | | | 13.8 | % | | | 1.0 | % | | | 14.8 | % |
| Mexico | | | 2.2 | | | | 6.0 | | | | 8.2 | |
| India | | | 4.9 | | | | 2.3 | | | | 7.2 | |
| Taiwan | | | 5.1 | | | | — | | | | 5.1 | |
| Brazil | | | 1.6 | | | | 3.3 | | | | 4.9 | |
| Greece | | | 1.0 | | | | 2.1 | | | | 3.1 | |
| South Korea | | | 2.9 | | | | 0.1 | | | | 3.0 | |
| United Kingdom* | | | 2.8 | | | | 0.1 | | | | 2.9 | |
| United States of America* | | | 1.5 | | | | 0.5 | | | | 2.0 | |
| Malaysia | | | 2.0 | | | | — | | | | 2.0 | |
| Russia | | | 1.9 | | | | 0.1 | | | | 2.0 | |
| Colombia | | | — | | | | 1.8 | | | | 1.8 | |
| Indonesia | | | — | | | | 1.6 | | | | 1.6 | |
| Portugal | | | — | | | | 1.5 | | | | 1.5 | |
| Chile | | | 0.7 | | | | 0.6 | | | | 1.3 | |
| | | | 40.4 | % | | | 21.0 | % | | | 61.4 | % |
| * | Includes investments in companies listed in developed markets that have significant operations in emerging markets. |
| Capital Group Emerging Markets Total Opportunities Fund | 3 |
fund’s exposure to commodity-related firms and consumer discretionary stocks. Fixed-income investments rose in aggregate.
Investments in several oil services providers and energy exploration and production firms fell sharply amid lower oil prices, reduced capital expenditures and company-specific problems. Managers have tended to avoid the larger integrated oil companies, instead favoring a few smaller exploration and production companies with unique assets. They trimmed investments in several oil services stocks during the period but continue to invest in exploration and production firms that they believe are well-positioned in the industry. Investments in the materials sector also weighed on fund results, including metals conglomerate First Quantum Minerals and Russian diamond miner Alrosa, which lost ground along with the rest of the Russian market; investors also worried about a management shift at Alrosa after the firm’s CEO stepped down for health reasons. Investments in Russia detracted from returns overall. Managers reduced investments in several Russian securities during the period as economic and geopolitical conditions continued to deteriorate.
Stock selection in the consumer discretionary sector had a negative impact on portfolio results. Several automakers declined. Shares of Hyundai Motor dropped as investors reacted to the firm’s pricey acquisition of land for a new headquarters in Seoul’s Gangnam district. Hyundai also reported disappointing profits, hurt by a stronger won relative to the yen.
Investments in technology were a bright spot. Several investments in the sector rose sharply across a wide range of industries, from Chinese PC maker Lenovo Group to Indian software and outsourcing firm Infosys; both firms recorded robust earnings. Taiwan Semiconductor Manufacturing shares advanced, with the firm posting healthy sales of its 28-nanometer chips used in smartphones.
The fund’s fixed-income investments also supported results on the whole. Several peripheral European bond markets rallied, fueled by hopes for improvement following difficult periods and reduced risk of economic crisis. Investments in hard-currency bonds in Greece and Portugal posted strong gains. Managers took some profits in Greek bonds during the period. Currency hedging supported results overall as most currencies depreciated.
Outlook
Managers are concerned about the prospect of higher U.S. interest rates now that the Fed’s quantitative easing has officially ended, though rates may not climb as quickly as some investors have feared. Emerging markets currencies may experience increased volatility in the coming months given the likelihood of a stronger U.S. dollar. At the same time, central banks in other developed markets appear to be leaning toward more accommodative policies and China’s government seems to be focused on providing targeted stimulus and interest rate cuts to help stabilize economic growth. Several other Asian countries are also pressing ahead with reforms, such as India, where economic growth has improved in recent quarters. Portfolio managers continue to balance these macroeconomic factors with company-specific opportunities and the likelihood of an improving global economy over time.
About half of total portfolio assets are invested in equities. The portfolio emphasizes economically sensitive stocks, particularly industrials, financials and the commodity-related sectors. Managers are interested in a diversified range of financial companies, including select local banks as well as larger regional institutions in Asia that are likely to be supported by a combination of strong management and solid earnings growth. They are also attracted to companies that they believe should be supported by specific reforms in areas such as cleaner energy in China as well as firms that make niche industrial products. Furthermore, the fund invests in a number of firms that are likely to benefit from an increasingly sophisticated Asian consumer, with more than 10% of the portfolio’s assets invested in the consumer sectors. An additional 14% of assets are invested in technology and telecommunication services stocks.
The emerging markets debt universe also continues to offer diverse opportunities, with the fixed-income portion of the portfolio remaining dynamic. Managers have reduced investments in areas that are likely to be affected by increased uncertainty, such as Brazilian inflation-linked bonds and local Russian debt. Instead, they prefer markets like Mexico, which they expect to benefit from longer term improvements, as well as higher yielding opportunities in Africa or India that are likely to provide compensation for the risks involved. The fund’s managers are remaining nimble about currency hedging as some emerging markets currencies may experience increased volatility. The portfolio’s significant cash position should help provide some cushion against economically sensitive equity exposure and more aggressive bond investments.
We believe that the emerging markets universe offers a wide range of compelling investment opportunities and we look forward to reporting to you again in another six months.
Sincerely,

John S. Armour
President
December 17, 2014
| 4 | Capital Group Emerging Markets Total Opportunities Fund |
The value of a $25,000 investment
How a $25,0001 investment has grown
(for the period January 27, 2012, to October 31, 2014, with all distributions reinvested)
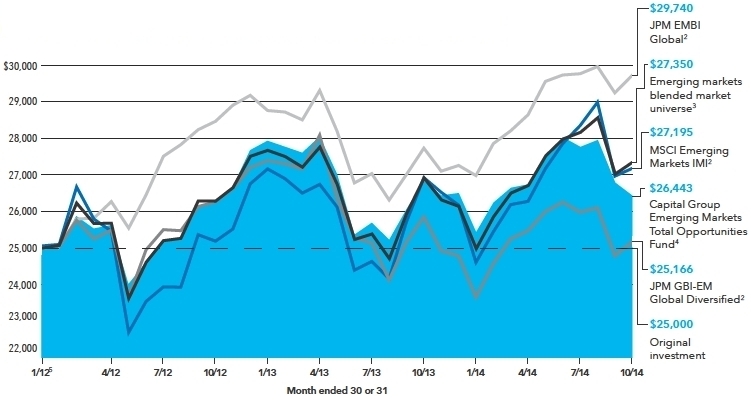
| | | |
| Average annual total returns based on a $1,000 investment | | Lifetime |
| (periods ended October 31, 2014) | 1 year | (since 1/27/12) |
| | | |
| | –1.50% | 2.05% |
Investment results assume all distributions are reinvested and reflect applicable fees and expenses.
| 1 | The minimum initial investment for the fund is $25,000. |
| 2 | The market indexes are unmanaged and, therefore, have no expenses. |
| 3 | The emerging markets blended market universe blends the MSCI EM IMI, JPM EMBI Global, and JPM GBI-EM Global Diversified indexes by weighting their cumulative total returns at 50%, 25%, and 25%, respectively. This assumes the blend is rebalanced monthly. |
| 4 | Results are calculated with all distributions, if any, reinvested. |
| 5 | The date the fund began operations, January 27, 2012. |
Fund results shown are for past results and are not predictive of results for future periods. The results shown are before taxes on fund distributions and sale of fund shares. Current and future results may be lower or higher than those shown. Share prices and returns will vary, so investors may lose money. Investing for short periods makes losses more likely. For current information and month-end results, please call (800) 266-9532.
| Capital Group Emerging Markets Total Opportunities Fund | 5 |
Investment portfolio October 31, 2014
| |
| Sector diversification | | | | | | | | | | | | |
| | | | | | | | | | | | | |
| | | | Equity securities | | | Bonds & notes | | Percent of net assets |
| Government | | | — | % | | | 26.3 | % | | | 26.3 | % |
| Industrials | | | 8.7 | | | | 0.5 | | | | 9.2 | |
| Financials | | | 7.2 | | | | 1.0 | | | | 8.2 | |
| Consumer discretionary | | | 7.0 | | | | 1.2 | | | | 8.2 | |
| Information technology | | | 7.7 | | | | — | | | | 7.7 | |
| Energy | | | 5.5 | | | | 1.1 | | | | 6.6 | |
| Telecommunication services | | | 5.0 | | | | 1.3 | | | | 6.3 | |
| Materials | | | 6.1 | | | | 0.1 | | | | 6.2 | |
| Consumer staples | | | 3.5 | | | | 0.1 | | | | 3.6 | |
| Utilities | | | 1.9 | | | | 0.1 | | | | 2.0 | |
| Health care | | | 0.4 | | | | — | | | | 0.4 | |
| | | | 53.0 | % | | | 31.7 | % | | | 84.7 | |
| | | | | | | | | | | | | |
| Short-term securities | | | | | | | | | | | 10.9 | |
| Other assets less liabilities (including forward currency contracts) | | | | | | | | 4.4 | |
| Net assets | | | | | | | | | | | 100.0 | % |
| | | |
| Equity securities | | | Shares | | | | Value
(000) | |
| Asia-Pacific 31.0% | | | | | | | | |
| China 10.5% | | | | | | | | |
| Anhui Conch Cement Co., Ltd. (Hong Kong) | | | 310,000 | | | $ | 1,015 | |
| Bank of China Ltd. (Hong Kong) | | | 5,702,511 | | | | 2,728 | |
| Baoxin Auto Group Ltd. (Hong Kong) | | | 3,104,500 | | | | 2,370 | |
| Beijing Enterprises Holdings Ltd. (Hong Kong) | | | 359,000 | | | | 2,930 | |
| Boer Power Holdings Ltd. (Hong Kong) | | | 1,100,000 | | | | 1,376 | |
| China Everbright International Ltd. (Hong Kong) | | | 3,110,000 | | | | 4,291 | |
| China High Speed Transmission Equipment Group Co., Ltd. (Hong Kong)1 | | | 1,682,000 | | | | 1,325 | |
| China Modern Dairy Holdings Ltd. (Hong Kong)1 | | | 1,536,000 | | | | 677 | |
| China Overseas Grand Oceans Group, Ltd. (Hong Kong) | | | 1,199,000 | | | | 632 | |
| China Pacific Insurance (Group) Co., Ltd. (Hong Kong) | | | 350,600 | | | | 1,311 | |
| China Resources Land Ltd. (Hong Kong) | | | 184,000 | | | | 438 | |
| China Unicom Ltd. (Hong Kong) | | | 1,624,000 | | | | 2,442 | |
| CSR Corp. Ltd. (Hong Kong) | | | 1,367,000 | | | | 1,530 | |
| First Tractor Co. Ltd. (Hong Kong) | | | 1,594,000 | | | | 1,020 | |
| Haitian International Holdings Ltd. (Hong Kong) | | | 1,235,000 | | | | 2,650 | |
| Honghua Group Ltd. (Hong Kong) | | | 2,820,000 | | | | 542 | |
| Industrial and Commercial Bank of China Ltd. (Hong Kong) | | | 1,057,000 | | | | 699 | |
| Lenovo Group Ltd. (Hong Kong) | | | 2,884,000 | | | | 4,247 | |
| Minth Group Ltd. (Hong Kong) | | | 2,714,000 | | | | 5,200 | |
| Nine Dragons Paper (Holdings) Ltd. (Hong Kong) | | | 1,210,000 | | | | 938 | |
| 6 | Capital Group Emerging Markets Total Opportunities Fund |
| | | Shares | | | Value
(000) | |
| Asia-Pacific (continued) | | | | | | | | |
| China (continued) | | | | | | | | |
| Shanghai Pharmaceutical (Group) Co., Ltd. (Hong Kong) | | | 245,400 | | | $ | 615 | |
| Zhongsheng Group Holdings Ltd. (Hong Kong) | | | 805,000 | | | | 827 | |
| Zhuzhou CSR Times Electric Co., Ltd. (Hong Kong) | | | 954,500 | | | | 4,515 | |
| | | | | | | | 44,318 | |
| | | | | | | | | |
| Hong Kong 3.3% | | | | | | | | |
| AIA Group Ltd. | | | 380,200 | | | | 2,120 | |
| Chow Sang Sang Holdings International Ltd. | | | 1,520,000 | | | | 3,755 | |
| Hilong Holding Ltd. | | | 4,575,000 | | | | 1,499 | |
| HKT Trust, units | | | 3,601,840 | | | | 4,389 | |
| Melco Crown Entertainment Ltd. (ADR) | | | 12,600 | | | | 342 | |
| Wynn Macau, Ltd. | | | 543,200 | | | | 1,961 | |
| | | | | | | | 14,066 | |
| | | | | | | | | |
| India 4.9% | | | | | | | | |
| Bharti Airtel Ltd. | | | 921,567 | | | | 5,987 | |
| DLF Ltd. | | | 183,000 | | | | 372 | |
| Emami Ltd. | | | 11,333 | | | | 150 | |
| Glenmark Pharmaceuticals Ltd. | | | 50,480 | | | | 590 | |
| Infosys Ltd. | | | 92,064 | | | | 6,074 | |
| Larsen & Toubro Ltd. | | | 19,000 | | | | 512 | |
| Steel Authority of India Ltd. | | | 1,354,209 | | | | 1,833 | |
| Sun Pharmaceutical Industries Ltd. | | | 34,550 | | | | 476 | |
| Tech Mahindra Ltd. | | | 54,208 | | | | 2,223 | |
| Thermax Ltd. | | | 123,837 | | | | 1,803 | |
| United Spirits Ltd.1 | | | 9,516 | | | | 428 | |
| | | | | | | | 20,448 | |
| | | | | | | | | |
| Malaysia 2.0% | | | | | | | | |
| Bumi Armada Bhd. | | | 5,231,100 | | | | 2,497 | |
| CIMB Group Holdings Bhd. | | | 570,229 | | | | 1,125 | |
| Genting Bhd | | | 679,700 | | | | 2,014 | |
| Genting Bhd, warrants, expires 12/18/181 | | | 228,825 | | | | 188 | |
| IJM Corp. Bhd. | | | 1,138,300 | | | | 2,395 | |
| | | | | | | | 8,219 | |
| | | | | | | | | |
| Philippines 0.5% | | | | | | | | |
| Ayala Land, Inc. | | | 2,437,500 | | | | 1,820 | |
| | | | | | | | | |
| Singapore 0.9% | | | | | | | | |
| KrisEnergy Ltd.1 | | | 896,000 | | | | 576 | |
| Mapletree Greater China Commercial Trust | | | 3,183,000 | | | | 2,341 | |
| Singapore Telecommunications Ltd. | | | 256,000 | | | | 753 | |
| | | | | | | | 3,670 | |
| South Korea 2.9% | | | | | | | | |
| Daum Communications Corp. | | | 2,191 | | | | 299 | |
| Hyundai Mobis Co., Ltd. | | | 9,003 | | | | 2,106 | |
| Hyundai Motor Co. | | | 23,272 | | | | 3,702 | |
| Korea Electric Power Corp. | | | 5,585 | | | | 243 | |
| OCI Co. Ltd.1 | | | 8,037 | | | | 692 | |
| Capital Group Emerging Markets Total Opportunities Fund | 7 |
| Equity securities (continued) | | Shares | | | Value
(000) | |
| Asia-Pacific (continued) | | | | | | | | |
| South Korea (continued) | | | | | | | | |
| Orion Corp. | | | 1,680 | | | $ | 1,297 | |
| Samsung Electronics Co., Ltd. | | | 2,872 | | | | 3,343 | |
| SK Telecom Co., Ltd. | | | 2,580 | | | | 644 | |
| | | | | | | | 12,326 | |
| | | | | | | | | |
| Taiwan 5.1% | | | | | | | | |
| AirTAC International Group | | | 269,290 | | | | 1,965 | |
| ASUSTeK Computer Inc. | | | 32,820 | | | | 335 | |
| CTCI Corp. | | | 819,000 | | | | 1,338 | |
| Delta Electronics, Inc. | | | 641,000 | | | | 3,836 | |
| MediaTek Inc. | | | 200,762 | | | | 2,858 | |
| Taiwan Cement Corp. | | | 1,736,000 | | | | 2,651 | |
| Taiwan Semiconductor Manufacturing Co. Ltd. | | | 1,882,000 | | | | 8,075 | |
| Yungtay Engineering Co., Ltd. | | | 178,000 | | | | 395 | |
| | | | | | | | 21,453 | |
| | | | | | | | | |
| Thailand 0.9% | | | | | | | | |
| Bangkok Bank PCL, nonvoting depository receipt | | | 641,400 | | | | 3,899 | |
| | | | | | | | | |
| Latin America 4.9% | | | | | | | | |
| Argentina 0.4% | | | | | | | | |
| YPF Sociedad Anónima, Class D (ADR) | | | 53,100 | | | | 1,867 | |
| | | | | | | | | |
| Brazil 1.6% | | | | | | | | |
| Gerdau SA (ADR) | | | 234,500 | | | | 1,062 | |
| Hypermarcas SA, ordinary nominative1 | | | 182,600 | | | | 1,276 | |
| Mills Estruturas e Serviços de Engenharia SA, ordinary nominative | | | 101,800 | | | | 663 | |
| TIM Participacoes SA, ordinary nominative | | | 121,200 | | | | 659 | |
| Usinas Siderúrgicas de Minas Gerais SA – Usiminas, Class A, preferred nominative1 | | | 152,200 | | | | 350 | |
| Vale SA, Class A, preferred nominative (ADR) | | | 92,900 | | | | 814 | |
| Vale SA, ordinary nominative | | | 132,000 | | | | 1,332 | |
| Vale SA, ordinary nominative (ADR) | | | 43,600 | | | | 440 | |
| | | | | | | | 6,596 | |
| | | | | | | | | |
| Chile 0.7% | | | | | | | | |
| Enersis SA (ADR) | | | 82,600 | | | | 1,304 | |
| Inversiones La Construccion SA | | | 98,000 | | | | 1,397 | |
| Ripley Corp SA | | | 726,000 | | | | 397 | |
| | | | | | | | 3,098 | |
| | | | | | | | | |
| Mexico 2.2% |
| CEMEX, SAB de CV, ordinary participation certificates, units (ADR)1 | | | 380,551 | | | | 4,681 | |
| Fibra Uno Administracion, SA de CV | | | 210,000 | | | | 730 | |
| Grupo Comercial Chedraui, SAB de CV, Class B | | | 87,100 | | | | 306 | |
| Grupo Sanborns, SAB de CV, Series B1 | | | 551,600 | | | | 883 | |
| Impulsora del Desarrollo y el Empleo en América Latina, SA de CV, Series B11 | | | 804,300 | | | | 2,543 | |
| | | | | | | | 9,143 | |
| 8 | Capital Group Emerging Markets Total Opportunities Fund |
| | | | Shares | | | | Value
(000) | |
| Eastern Europe and Middle East 3.9% | | | | | | | | |
| Greece 1.0% | | | | | | | | |
| Eurobank Ergasias SA1 | | | 6,060,000 | | | $ | 2,103 | |
| Jumbo SA | | | 54,898 | | | | 602 | |
| Titan Cement Co. SA | | | 77,313 | | | | 1,714 | |
| | | | | | | | 4,419 | |
| | | | | | | | | |
| Oman 0.4% | | | | | | | | |
| bankmuscat SAOG | | | 936,576 | | | | 1,713 | |
| | | | | | | | | |
| Russia 1.9% | | | | | | | | |
| Globaltrans Investment PLC (GDR) | | | 37,548 | | | | 278 | |
| OJSC Alrosa | | | 4,102,121 | | | | 3,672 | |
| OJSC Moscow Exchange | | | 143,831 | | | | 194 | |
| OJSC Rosneft Oil Co. (GDR) | | | 436,700 | | | | 2,433 | |
| Sberbank of Russia1 | | | 725,091 | | | | 1,285 | |
| | | | | | | | 7,862 | |
| | | | | | | | | |
| United Arab Emirates 0.6% | | | | | | | | |
| DP World Ltd. | | | 132,452 | | | | 2,538 | |
| | | | | | | | | |
| Other markets 8.6% | | | | | | | | |
| Australia 0.7% | | | | | | | | |
| Oil Search Ltd. | | | 394,060 | | | | 2,993 | |
| | | | | | | | | |
| Austria 0.3% | | | | | | | | |
| Vienna Insurance Group AG | | | 25,079 | | | | 1,205 | |
| | | | | | | | | |
| Canada 0.9% | | | | | | | | |
| Centerra Gold Inc. | | | 132,000 | | | | 515 | |
| First Quantum Minerals Ltd. | | | 231,100 | | | | 3,486 | |
| | | | | | | | 4,001 | |
| | | | | | | | | |
| France 0.5% | | | | | | | | |
| Casino, Guichard-Perrachon SA | | | 19,463 | | | | 1,995 | |
| | | | | | | | | |
| Italy 0.4% | | | | | | | | |
| Tenaris SA (ADR) | | | 43,643 | | | | 1,730 | |
| | | | | | | | | |
| Netherlands 0.9% | | | | | | | | |
| Fugro NV, depository receipts | | | 49,199 | | | | 679 | |
| Unilever NV, depository receipts | | | 78,310 | | | | 3,037 | |
| | | | | | | | 3,716 | |
| | | | | | | | | |
| Norway 0.6% | | | | | | | | |
| BW LPG Ltd. | | | 253,626 | | | | 2,403 | |
| | | | | | | | | |
| United Kingdom 2.8% | | | | | | | | |
| Glencore PLC1 | | | 56,200 | | | | 288 | |
| Global Ports Investments PLC (GDR) | | | 111,647 | | | | 692 | |
| Imperial Tobacco Group PLC | | | 17,046 | | | | 739 | |
| Ophir Energy PLC1 | | | 403,383 | | | | 1,196 | |
| SABMiller PLC | | | 62,100 | | | | 3,502 | |
| Standard Chartered PLC | | | 271,026 | | | | 4,102 | |
| Unilever PLC | | | 28,600 | | | | 1,150 | |
| | | | | | | | 11,669 | |
| Capital Group Emerging Markets Total Opportunities Fund | 9 |
| Equity securities (continued) | | Shares | | | Value
(000) | |
| Other markets (continued) | | | | | | | | |
| United States of America 1.5% | | | | | | | | |
| Arcos Dorados Holdings, Inc., Class A | | | 273,000 | | | $ | 1,682 | |
| Cobalt International Energy, Inc.1 | | | 248,900 | | | | 2,914 | |
| Ensco PLC, Class A | | | 47,700 | | | | 1,936 | |
| | | | | | | | 6,532 | |
| | | | | | | | | |
| Miscellaneous 4.6% | | | | | | | | |
| Equity securities in initial period of acquisition | | | | | | | 19,447 | |
| | | | | | | | | |
| Total equity securities (cost: $218,854,000) | | | | | | | 223,146 | |
| | | | | | | | | |
| Bonds & notes | | Principal amount
(000) | | | | | |
| Latin America 13.1% | | | | | | | | |
| Argentina 0.7% | | | | | | | | |
| Argentina (Republic of) 7.00% April 17, 2017 | | $ | 3,400 | | | | 2,996 | |
| | | | | | | | | |
| Brazil 3.3% | | | | | | | | |
| Banco Votorantim SA, 6.25% May 16, 20162 | | BRL | 1,000 | | | | 466 | |
| Brazil (Federal Republic of) Global 4.875% January 22, 2021 | | $ | 1,200 | | | | 1,299 | |
| Brazil Notas do Tesouro Nacional: | | | | | | | | |
| Series B, 6.00% August 15, 2018 – August 15, 20502 | | BRL | 6 | | | | 9,878 | |
| Series F, 10.00% January 1, 2017 | | | — | 3 | | | 1,384 | |
| Cosan Luxembourg SA 9.50% March 14, 2018 | | | 500 | | | | 184 | |
| Odebrecht Drilling Norbe VIII/IX Ltd. 6.35% June 30, 20214 | | $ | 144 | | | | 153 | |
| Odebrecht Offshore Drilling Finance Ltd. 6.75% October 1, 20224,5 | | | 663 | | | | 696 | |
| | | | | | | | 14,060 | |
| | | | | | | | | |
| Chile 0.6% | | | | | | | | |
| Chilean Government: | | | | | | | | |
| 3.00% March 1, 2018 – March 1, 20232 | | CLP | 49,000 | | | | 2,231 | |
| Emgesa SA ESP 8.75% January 25, 2021 | | COP | 598,000 | | | | 314 | |
| | | | | | | | 2,545 | |
| | | | | | | | | |
| Colombia 1.8% | | | | | | | | |
| Colombia (Republic of): | | | | | | | | |
| Series B, 5.00% November 21, 2018 | | | 7,830,000 | | | | 3,778 | |
| Series B, 7.00% May 4, 2022 | | | 695,000 | | | | 349 | |
| Series B, 10.00% July 24, 2024 | | | 1,680,000 | | | | 1,014 | |
| Series B, 6.00% April 28, 2028 | | | 4,890,000 | | | | 2,176 | |
| Financiera de Desarrollo Territorial 7.875% August 12, 2024 | | | 318,000 | | | | 158 | |
| | | | | | | | 7,475 | |
| | | | | | | | | |
| Mexico 6.0% | | | | | | | | |
| América Móvil, SAB de CV 3.625% March 30, 2015 | | $ | 162 | | | | 164 | |
| BBVA Bancomer SA 6.50% March 10, 2021 | | | 670 | | | | 747 | |
| Petroleos Mexicanos: | | | | | | | | |
| 7.375% December 15, 2014 | | | 670 | | | | 674 | |
| 4.875% March 15, 2015 | | | 600 | | | | 609 | |
| Red de Carreteras de Occidente 9.00% June 10, 20284 | | MXN | 15,500 | | | | 1,110 | |
| 10 | Capital Group Emerging Markets Total Opportunities Fund |
| | | Principal amount
(000) | | | Value
(000) | |
| Latin America (continued) | | | | | | | | |
| Mexico(continued) | | | | | | | | |
| United Mexican States Government: | | | | | | | | |
| Series MI10, 9.50% December 18, 2014 | | MXN | 29 | | | $ | 213 | |
| Series M10, 7.75% December 14, 2017 | | | 82 | | | | 673 | |
| 4.00% June 13, 20192 | | | 130 | | | | 1,070 | |
| 2.50% December 10, 20202 | | | 108 | | | | 821 | |
| Series M, 6.50% June 10, 2021 | | | 239 | | | | 1,878 | |
| Series M20, 10.00% December 5, 2024 | | | 811 | | | | 7,892 | |
| 4.50% December 4, 20252 | | | 208 | | | | 1,828 | |
| 4.00% November 15, 20402 | | | 625 | | | | 5,096 | |
| United Mexican States Government Global: | | | | | | | | |
| Series A, 6.05% January 11, 2040 | | $ | 880 | | | | 1,069 | |
| 5.55% January 21, 2045 | | | 390 | | | | 445 | |
| Urbi Desarrollos Urbanos SA de CV: | | | | | | | | |
| 8.50% April 19, 20166 | | | 1,425 | | | | 150 | |
| 8.50% April 19, 20165,6 | | | 560 | | | | 59 | |
| 9.50% January 21, 20206 | | | 2,400 | | | | 253 | |
| 9.50% January 21, 20205,6 | | | 230 | | | | 24 | |
| 9.75% February 3, 20226 | | | 990 | | | | 105 | |
| 9.75% February 3, 20225,6 | | | 1,655 | | | | 175 | |
| | | | | | | | 25,055 | |
| | | | | | | | | |
| Panama 0.1% | | | | | | | | |
| ENA Norte Trust: | | | | | | | | |
| 4.95% April 25, 20284 | | | 327 | | | | 338 | |
| 4.95% April 25, 20284,5 | | | 227 | | | | 234 | |
| | | | | | | | 572 | |
| | | | | | | | | |
| Peru 0.5% | | | | | | | | |
| Banco de Credito del Peru 6.875% September 16, 2026 | | | 1,300 | | | | 1,472 | |
| Peru Government 5.70% August 12, 2024 | | PEN | 42 | | | | 144 | |
| Transportadora de Gas Peru 4.25% April 30, 20284 | | $ | 430 | | | | 415 | |
| | | | | | | | 2,031 | |
| | | | | | | | | |
| Uruguay 0.1% | | | | | | | | |
| Uruguay (Republic of) 4.375% December 15, 20282,4 | | UYU | 13,047 | | | | 593 | |
| | | | | | | | | |
| Eastern Europe and Middle East 6.0% | | | | | | | | |
| Croatia 0.4% | | | | | | | | |
| Croatian Government: | | | | | | | | |
| 5.50% April 4, 20235 | | $ | 575 | | | | 605 | |
| 6.00% January 26, 20245 | | | 900 | | | | 978 | |
| | | | | | | | 1,583 | |
| | | | | | | | | |
| Greece 2.1% | | | | | | | | |
| Greek Government: | | | | | | | | |
| 2.00% February 24, 2023 – February 24, 2042 | | EUR | 12,760 | | | | 9,025 | |
| | | | | | | | | |
| Hungary 1.2% | | | | | | | | |
| Hungarian Government: | | | | | | | | |
| 4.125% February 19, 2018 | | $ | 180 | | | | 187 | |
| 4.00% March 25, 2019 | | | 210 | | | | 216 | |
| 6.25% January 29, 2020 | | | 555 | | | | 627 | |
| 5.75% November 22, 2023 | | | 2,440 | | | | 2,696 | |
| Series 25B, 5.50% June 24, 2025 | | HUF | 265,000 | | | | 1,227 | |
| | | | | | | | 4,953 | |
| Capital Group Emerging Markets Total Opportunities Fund | 11 |
| Bonds & notes (continued) | | Principal amount
(000) | | | Value
(000) | |
| Eastern Europe and Middle East (continued) | | | | | | | | |
| Oman 0.0% | | | | | | | | |
| bankmuscat SAOG 4.50% convertible March 20, 2017 | | OMR | 139 | | | $ | 38 | |
| | | | | | | | | |
| Poland 0.1% | | | | | | | | |
| Poland Government, Series 1023, 4.00% October 25, 2023 | | PLN | 1,995 | | | | 665 | |
| | | | | | | | | |
| Russia 0.1% | | | | | | | | |
| Brunswick Rail Finance Ltd. 6.50% November 1, 20175 | | $ | 300 | | | | 270 | |
| | | | | | | | | |
| Slovenia 1.3% | | | | | | | | |
| Slovenia (Republic of): | | | | | | | | |
| 4.125% February 18, 2019 | | | 1,820 | | | | 1,920 | |
| 4.125% February 18, 20195 | | | 200 | | | | 211 | |
| 5.50% October 26, 2022 | | | 2,995 | | | | 3,302 | |
| | | | | | | | 5,433 | |
| | | | | | | | | |
| Turkey 0.7% | | | | | | | | |
| Turkey (Republic of) 7.10% March 8, 2023 | | TRY | 7,530 | | | | 3,108 | |
| | | | | | | | | |
| United Arab Emirates 0.1% | | | | | | | | |
| Abu Dhabi National Energy Co. PJSC (TAQA) 4.125% March 13, 2017 | | $ | 300 | | | | 319 | |
| | | | | | | | | |
| Asia-Pacific 5.6% | | | | | | | | |
| China 0.6% | | | | | | | | |
| CNOOC Finance 2013 Ltd. 3.00% May 9, 2023 | | | 2,050 | | | | 1,947 | |
| Renhe Commercial Holdings Co. Ltd.: | | | | | | | | |
| 11.75% May 18, 2015 | | | 250 | | | | 206 | |
| 13.00% March 10, 2016 | | | 550 | | | | 391 | |
| | | | | | | | 2,544 | |
| | | | | | | | | |
| Hong Kong 0.4% | | | | | | | | |
| Wynn Macau, Ltd. 5.25% October 15, 20215 | | | 1,500 | | | | 1,508 | |
| | | | | | | | | |
| India 2.3% | | | | | | | | |
| India Government Bond: | | | | | | | | |
| 7.28% June 3, 2019 | | INR | 280,000 | | | | 4,413 | |
| 8.83% November 25, 2023 | | | 120,000 | | | | 2,018 | |
| 9.15% November 14, 2024 | | | 180,000 | | | | 3,094 | |
| | | | | | | | 9,525 | |
| | | | | | | | | |
| Indonesia 1.6% | | | | | | | | |
| Indonesia (Republic of): | | | | | | | | |
| 7.25% April 20, 2015 | | $ | 270 | | | | 278 | |
| 5.875% March 13, 2020 | | | 320 | | | | 360 | |
| 3.75% April 25, 2022 | | | 500 | | | | 500 | |
| Series FR71, 9.00% March 15, 2029 | | IDR | 10,000,000 | | | | 872 | |
| Series FR68, 8.375% March 15, 2034 | | | 57,230,000 | | | | 4,725 | |
| | | | | | | | 6,735 | |
| | | | | | | | | |
| Philippines 0.6% | | | | | | | | |
| Philippines (Republic of): | | | | | | | | |
| 4.95% January 15, 2021 | | PHP | 93,000 | | | | 2,145 | |
| 6.25% January 14, 2036 | | | 20,000 | | | | 490 | |
| | | | | | | | 2,635 | |
| | | | | | | | | |
| South Korea 0.1% | | | | | | | | |
| Export-Import Bank of Korea 1.085% September 17, 20167 | | $ | 620 | | | | 623 | |
| 12 | Capital Group Emerging Markets Total Opportunities Fund |
| | | Principal amount
(000) | | | Value
(000) | |
| Africa 3.4% | | | | | | | | |
| Ghana 0.7% | | | | | | | | |
| Ghana (Republic of): | | | | | | | | |
| 7.875% August 7, 2023 | | $ | 210 | | | $ | 212 | |
| 8.125% January 18, 20264,5 | | | 2,505 | | | | 2,524 | |
| | | | | | | | 2,736 | |
| | | | | | | | | |
| Kenya 0.9% | | | | | | | | |
| Kenya (Republic of): | | | | | | | | |
| 5.875% June 24, 2019 | | | 650 | | | | 675 | |
| 6.875% June 24, 20245 | | | 2,970 | | | | 3,174 | |
| | | | | | | | 3,849 | |
| | | | | | | | | |
| Nigeria 0.1% | | | | | | | | |
| Nigeria (Republic of) 6.375% July 12, 2023 | | | 500 | | | | 533 | |
| | | | | | | | | |
| South Africa 1.3% | | | | | | | | |
| South Africa (Republic of): | | | | | | | | |
| Series R-2023, 7.75% February 28, 2023 | | ZAR | 48,280 | | | | 4,399 | |
| Series R-209, 6.25% March 31, 2036 | | | 3,917 | | | | 277 | |
| Series R-214, 6.50% February 28, 2041 | | | 9,000 | | | | 636 | |
| | | | | | | | 5,312 | |
| | | | | | | | | |
| Zambia 0.4% | | | | | | | | |
| Zambia (Republic of) 5.375% September 20, 2022 | | $ | 1,750 | | | | 1,684 | |
| | | | | | | | | |
| Other markets 3.6% | | | | | | | | |
| Canada 0.1% | | | | | | | | |
| First Quantum Minerals Ltd. 7.00% February 15, 20215 | | | 482 | | | | 475 | |
| | | | | | | | | |
| Jamaica 0.7% | | | | | | | | |
| Digicel Group Ltd.: | | | | | | | | |
| 8.25% September 30, 2020 | | | 600 | | | | 630 | |
| 8.25% September 30, 20205 | | | 1,375 | | | | 1,444 | |
| 6.00% April 15, 2021 | | | 1,000 | | | | 1,012 | |
| | | | | | | | 3,086 | |
| | | | | | | | | |
| Portugal 1.5% | | | | | | | | |
| Portuguese Government: | | | | | | | | |
| 3.85% April 15, 2021 | | EUR | 970 | | | | 1,325 | |
| 5.65% February 15, 2024 | | | 3,340 | | | | 4,997 | |
| | | | | | | | 6,322 | |
| | | | | | | | | |
| Sweden 0.3% | | | | | | | | |
| Millicom International Cellular SA: | | | | | | | | |
| 6.625% October 15, 2021 | | $ | 550 | | | | 591 | |
| 6.625% October 15, 20215 | | | 500 | | | | 538 | |
| | | | | | | | 1,129 | |
| | | | | | | | | |
| Switzerland 0.4% | | | | | | | | |
| Dufry AG 2.00% convertible 0.00% June 18, 2015 | | CHF | 1,800 | | | | 1,703 | |
| | | | | | | | | |
| United Kingdom 0.1% | | | | | | | | |
| SABMiller Holdings Inc. 1.85% January 15, 20155 | | $ | 400 | | | | 401 | |
| | | | | | | | | |
| United States of America 0.5% | | | | | | | | |
| Arcos Dorados Holdings, Inc. 10.25% July 13, 20165 | | BRL | 2,600 | | | | 986 | |
| Trilogy International Partners, LLC 10.25% August 15, 20165 | | $ | 1,000 | | | | 1,019 | |
| | | | | | | | 2,005 | |
| | | | | | | | | |
| Total bonds & notes (cost: $140,551,000) | | | | | | | 133,526 | |
| Capital Group Emerging Markets Total Opportunities Fund | 13 |
| Short-term securities | | Principal amount
(000) | | | Value
(000) | |
| Commercial paper 9.1% | | | | | | | | |
| AstraZeneca PLC 0.08% due 11/12/145 | | $ | 2,300 | | | $ | 2,300 | |
| BASF SE 0.10% due 12/15/145 | | | 6,500 | | | | 6,499 | |
| Bank of Tokyo-Mitsubishi UFJ Ltd. 0.15% due 12/1/14 | | | 8,300 | | | | 8,299 | |
| EI du Pont de Nemours & Co. 0.08% due 11/19/145 | | | 4,700 | | | | 4,700 | |
| Gotham Funding Corp. 0.15% due 11/13/145 | | | 1,500 | | | | 1,500 | |
| National Australia Funding Delaware, Inc. 0.04% due 11/3/145 | | | 10,000 | | | | 10,000 | |
| Siemens Capital Co. LLC 0.08% due 11/03/14–11/13/145 | | | 5,100 | | | | 5,100 | |
| | | | | | | | 38,398 | |
| | | | | | | | | |
| Discount Notes 1.8% | | | | | | | | |
| Federal Home Loan Bank 0.05% due 11/5/14 | | | 2,400 | | | | 2,400 | |
| Federal National Mortgage Association 0.08% due 12/10/14 | | | 5,100 | | | | 5,100 | |
| | | | | | | | 7,500 | |
| | | | | | | | | |
| Total short-term securities (cost: $45,897,000) | | | | | | | 45,898 | |
| Total investment securities (cost: $405,302,000) | | | | | | | 402,570 | |
| Other assets less liabilities (including forward currency contracts) | | | | | | | 18,440 | |
| | | | | | | | | |
| Net assets | | | | | | $ | 421,010 | |
| 1 | Security did not produce income during the last 12 months. |
| 2 | Index-linked bond whose principal amount moves with a government retail price index. |
| 3 | Amount less than one thousand. |
| 4 | Principal payments may be made periodically. Therefore, the effective maturity date may be earlier than the stated maturity date. |
| 5 | Acquired in a transaction exempt from registration under Rule 144A or section 4(2) of the Securities Act of 1933 (not including purchases of securities that were publicly offered in the primary local market but were not registered under U.S. securities laws). May be resold in the U.S. in transactions exempt from registration, normally to qualified institutional buyers. The total value of all such securities was $45,420,000, which represented 10.79% of the net assets of the fund. |
| 6 | Scheduled interest and/or principal payment was not received. |
| 7 | Coupon rate may change periodically. |
Key to abbreviations
| Securities: |
| ADR — American Depositary Receipts |
| GDR — Global Depositary Receipts |
| Currency: |
| BRL — Brazilian real |
| CHF — Swiss franc |
| CLP — Chilean peso |
| COP — Colombian peso |
| EUR — Euro |
| HUF — Hungarian forint |
| IDR — Indonesian rupiah |
| INR — Indian rupee |
| MXN — Mexican peso |
| OMR — Omani rial |
| PEN — Peruvian nuevo sol |
| PHP — Philippine peso |
| PLN — Polish zloty |
| TRY — Turkish lira |
| UYU — Uruguayan peso |
| ZAR — South African rand |
| 14 | Capital Group Emerging Markets Total Opportunities Fund |
Financial statements
Statement of assets and liabilities
at October 31, 2014 | (dollars in thousands, except per-share amounts) |
| Assets: | | | | | | | | |
| Investment securities, at value (cost: $405,302) | | | | | | $ | 402,570 | |
| Cash | | | | | | | 215 | |
| Cash denominated in non-U.S. currency (cost: $2,550) | | | | | | | 2,998 | |
| Unrealized appreciation on open forward currency contracts | | | | | | | 932 | |
| Receivables for: | | | | | | | | |
| Sales of investments | | $ | 13,152 | | | | | |
| Sales of fund’s shares | | | 34 | | | | | |
| Dividends and interest | | | 2,528 | | | | | |
| Non-U.S. taxes | | | 2 | | | | 15,716 | |
| | | | | | | | 422,431 | |
| Liabilities: | | | | | | | | |
| Unrealized depreciation on open forward currency contracts | | | | | | | 143 | |
| Payables for: | | | | | | | | |
| Purchases of investments | | | 734 | | | | | |
| Investment advisory services | | | 386 | | | | | |
| Repurchases of fund’s shares | | | 12 | | | | | |
| Non-U.S. taxes | | | 37 | | | | | |
| Other accrued expenses | | | 109 | | | | 1,278 | |
| | | | | | | | 1,421 | |
| Net assets at October 31, 2014: | | | | | | | | |
| Equivalent to $11.13 per share on 37,819,398 shares of $0.01 par value capital stock outstanding (unlimited authorized shares) | | | | | | $ | 421,010 | |
| | | | | | | | | |
| Net assets consist of: | | | | | | | | |
| Capital paid in on shares of stock | | | | | | $ | 421,651 | |
| Undistributed net investment income | | | | | | | 379 | |
| Accumulated net realized gain | | | | | | | 1,027 | |
| Net unrealized depreciation | | | | | | | (2,047 | ) |
| Net assets at October 31, 2014 | | | | | | $ | 421,010 | |
See Notes to Financial Statements
| Capital Group Emerging Markets Total Opportunities Fund | 15 |
Statement of operations
for the year ended October 31, 2014 | (dollars in thousands) |
| Investment income: | | | | | | | | |
| Income: | | | | | | | | |
| Interest (net of non-U.S. withholding tax of $95) | | $ | 11,263 | | | | | |
| Dividends (net of non-U.S. withholding tax of $449) | | | 6,857 | | | $ | 18,120 | |
| | | | | | | | | |
| Fees and expenses: | | | | | | | | |
| Investment advisory services | | | 5,012 | | | | | |
| Custodian | | | 171 | | | | | |
| Registration statement and prospectus | | | 54 | | | | | |
| Auditing and legal | | | 88 | | | | | |
| Reports to shareholders | | | 22 | | | | | |
| Trustees’ compensation | | | 38 | | | | | |
| Other | | | 111 | | | | | |
| Total fees and expenses | | | | | | | 5,496 | |
| Net investment income | | | | | | | 12,624 | |
| | | | | | | | | |
| Net realized gain and unrealized depreciation on investments, forward currency contracts and currency: | | | | | | | | |
| Net realized gain (loss) on: | | | | | | | | |
| Investments (net of non-U.S. taxes of $20) | | | 982 | | | | | |
| Forward currency contracts | | | 2,248 | | | | | |
| Currency transactions | | | (342 | ) | | | 2,888 | |
| Net unrealized (depreciation) appreciation on: | | | | | | | | |
| Investments (net of non-U.S. taxes of $33) | | | (25,650 | ) | | | | |
| Forward currency contracts | | | 11 | | | | | |
| Currency translations | | | (72 | ) | | | (25,711 | ) |
| Net realized gain and unrealized depreciation on investments, forward currency contracts and currency | | | | | | | (22,823 | ) |
| | | | | | | | | |
| Net decrease in net assets resulting from operations | | | | | | $ | (10,199 | ) |
See Notes to Financial Statements
| 16 | Capital Group Emerging Markets Total Opportunities Fund |
| Statements of changes in net assets | |
| | | (dollars in thousands) |
| | | | |
| | | Year ended October 31 | |
| | | 2014 | | | 2013 | |
| Operations: | | | | | | | | |
| Net investment income | | $ | 12,624 | | | $ | 16,023 | |
| Net realized gain (loss) on investments, forward currency contracts and currency transactions | | | 2,888 | | | | (11,787 | ) |
| Net unrealized (depreciation) appreciation on investments, forward currency contracts and currency translations | | | (25,711 | ) | | | 4,741 | |
| Net (decrease) increase in net assets resulting from operations | | | (10,199 | ) | | | 8,977 | |
| | | | | | | | | |
| Dividends paid to shareholders: | | | | | | | | |
| Dividends from net investment income | | | (9,656 | ) | | | (14,914 | ) |
| | | | | | | | | |
| Capital share transactions: | | | | | | | | |
| Proceeds from shares sold: 8,160,725 and 13,906,574 shares, respectively | | | 92,891 | | | | 161,635 | |
| Proceeds from shares issued in reinvestment of net investment income dividends: 781,023 and 1,183,067 shares, respectively | | | 8,669 | | | | 13,854 | |
| Cost of shares repurchased: 23,612,134 and 7,324,412 shares, respectively | | | (264,867 | ) | | | (83,143 | ) |
| Net (decrease) increase in net assets resulting from capital share transactions | | | (163,307 | ) | | | 92,346 | |
| | | | | | | | | |
| Total (decrease) increase in net assets | | | (183,162 | ) | | | 86,409 | |
| | | | | | | | | |
| Net assets: | | | | | | | | |
| Beginning of year | | | 604,172 | | | | 517,763 | |
| End of year (including undistributed net investment income: $379 and $7,340, respectively) | | $ | 421,010 | | | $ | 604,172 | |
See Notes to Financial Statements
| Capital Group Emerging Markets Total Opportunities Fund | 17 |
Notes to financial statements
1. Organization
Capital Group Emerging Markets Total Opportunities Fund (the “fund”) is registered under the Investment Company Act of 1940, as an open-end, diversified management investment company. The fund seeks long-term growth and preservation of capital with lower volatility of returns than emerging market equities.
2. Significant accounting policies
The fund is an investment company that applies the accounting and reporting guidance issued in Topic 946 by the U.S. Financial Accounting Standards Board. The fund’s financial statements have been prepared to comply with U.S. generally accepted accounting principles (“U.S. GAAP”).These principles require management to make estimates and assumptions that affect reported amounts and disclosures. Actual results could differ from those estimates. The fund follows the significant accounting policies described below, as well as the valuation policies described in the next section on valuation.
Security transactions and related investment income — Security transactions are recorded by the fund as of the date the trades are executed with brokers. Realized gains and losses from security transactions are determined based on the specific identified cost of the securities. In the event a security is purchased with a delayed payment date, the fund will segregate liquid assets sufficient to meet its payment obligations. Dividend income is recognized on the ex-dividend date and interest income is recognized on an accrual basis. Market discounts, premiums and original issue discounts on fixed-income securities are amortized daily over the expected life of the security.
Dividends and distributions to shareholders — Dividends and distributions to shareholders are recorded on the ex-dividend date.
Currency translation — Assets and liabilities, including investment securities, denominated in currencies other than U.S. dollars are translated into U.S. dollars at the exchange rates supplied by one or more pricing vendors on the valuation date. Purchases and sales of investment securities and income and expenses are translated into U.S. dollars at the exchange rates on the dates of such transactions. The effects of changes in exchange rates on investment securities are included with the net realized gain or loss and net unrealized appreciation or depreciation on investments on the fund’s statement of operations. The realized gain or loss and unrealized appreciation or depreciation resulting from all other transactions denominated in currencies other than U.S. dollars are disclosed separately.
3. Valuation
Capital Guardian Trust Company (“CGTC”), the fund’s investment adviser, values the fund’s investments at fair value as defined by U.S. GAAP. The net asset value of the fund is generally determined as of approximately 4:00 p.m. New York time each day the New York Stock Exchange is open.
Methods and inputs — The fund’s investment adviser uses the following methods and inputs to establish the fair value of the fund’s assets and liabilities. Use of particular methods and inputs may vary over time based on availability and relevance as market and economic conditions evolve.
Equity securities are generally valued at the official closing price of, or the last reported sale price on, the exchange or market on which such securities are traded, as of the close of business on the day the securities are being valued or, lacking any sales, at the last available bid price. Prices for each security are taken from the principal exchange or market on which the security trades.
Fixed-income securities, including short-term securities, are generally valued at prices obtained from one or more pricing vendors. Vendors value such securities based on one or more of the inputs described in the following table. The table provides examples of inputs that are commonly relevant for valuing particular classes of fixed-income securities in which the fund is authorized to invest. However, these classifications are not exclusive and any of the inputs may be used to value any other class of fixed-income security.
| 18 | Capital Group Emerging Markets Total Opportunities Fund |
| Fixed-income class | | Examples of standard inputs |
| All | | Benchmark yields, transactions, bids, offers, quotations from dealers and trading systems, new issues, spreads and other relationships observed in the markets among comparable securities; and proprietary pricing models such as yield measures calculated using factors such as cash flows, financial or collateral performance and other reference data (collectively referred to as “standard inputs”) |
| Corporate bonds & notes; convertible securities | | Standard inputs and underlying equity of the issuer |
| Bonds & notes of governments & government agencies | | Standard inputs and interest rate volatilities |
When the fund’s investment adviser deems it appropriate to do so (such as when vendor prices are unavailable or not deemed to be representative), fixed-income securities will be valued in good faith at the mean quoted bid and ask prices that are reasonably and timely available (or bid prices, if ask prices are not available) or at prices for securities of comparable maturity, quality and type.
Securities with both fixed-income and equity characteristics, or equity securities traded principally among fixed-income dealers, are generally valued in the manner described for either equity or fixed-income securities, depending on which method is deemed most appropriate by the fund’s investment adviser. Forward currency contracts are valued at the mean of representative quoted bid and ask prices, generally based on prices supplied by one or more pricing vendors.
Securities and other assets for which representative market quotations are not readily available or are considered unreliable by the fund’s investment adviser are fair valued as determined in good faith under fair valuation guidelines adopted by authority of the fund’s board of trustees as further described. The investment adviser follows fair valuation guidelines, consistent with U.S. Securities and Exchange Commission rules and guidance, to consider relevant principles and factors when making fair value determinations. The investment adviser considers relevant indications of value that are reasonably and timely available to it in determining the fair value to be assigned to a particular security, such as the type and cost of the security; contractual or legal restrictions on resale of the security; relevant financial or business developments of the issuer; actively traded similar or related securities; conversion or exchange rights on the security; related corporate actions; significant events occurring after the close of trading in the security; and changes in overall market conditions. In addition, the closing prices of equity securities that trade in markets outside U.S. time zones may be adjusted to reflect significant events that occur after the close of local trading but before the net asset value of the fund is determined. Fair valuations and valuations of investments that are not actively trading involve judgment and may differ materially from valuations that would have been used had greater market activity occurred.
Processes and structure — The fund’s board of trustees has delegated authority to the fund’s investment adviser to make fair value determinations, subject to board oversight. The investment adviser has established a Joint Fair Valuation Committee (the “Fair Valuation Committee”) to administer, implement and oversee the fair valuation process, and to make fair value decisions. The Fair Valuation Committee regularly reviews its own fair value decisions, as well as decisions made under its standing instructions to the investment adviser’s valuation teams. The Fair Valuation Committee reviews changes in fair value measurements from period to period and may, as deemed appropriate, update the fair valuation guidelines to better reflect the results of back testing and address new or evolving issues. The Fair Valuation Committee reports any changes to the fair valuation guidelines to the board of trustees with supplemental information to support the changes. The fund’s board of trustees and audit committee also regularly review reports that describe fair value determinations and methods.
The fund’s investment adviser has also established a Fixed-Income Pricing Review Group to administer and oversee the fixed-income valuation process, including the use of fixed-income pricing vendors. This group regularly reviews pricing vendor information and market data. Pricing decisions, processes and controls over security valuation are also subject to additional internal reviews, including an annual control self-evaluation program facilitated by the investment adviser’s compliance group.
Classifications — The fund’s investment adviser classifies the fund’s assets and liabilities into three levels based on the inputs used to value the assets or liabilities. Level 1 values are based on quoted prices in active markets for identical securities. Level 2 values are based on significant observable market inputs, such as quoted prices for similar securities and quoted prices in inactive
| Capital Group Emerging Markets Total Opportunities Fund | 19 |
markets. Certain securities trading outside the U.S. may transfer between Level 1 and Level 2 due to valuation adjustments resulting from significant market movements following the close of local trading. Level 3 values are based on significant unobservable inputs that reflect the investment adviser’s determination of assumptions that market participants might reasonably use in valuing the securities. The valuation levels are not necessarily an indication of the risk or liquidity associated with the underlying investment. For example, U.S. government securities are reflected as Level 2 because the inputs used to determine fair value may not always be quoted prices in an active market. The following tables present the fund’s valuation levels as of October 31, 2014 (dollars in thousands):
| | | Investment securities |
| | | Level 11 | | | Level 21,2 | | | Level 3 | | | Total | |
| Assets: | | | | | | | | | | | | | | | | |
| Equity securities: | | | | | | | | | | | | | | | | |
| Asia-Pacific | | $ | 124,174 | | | $ | 6,045 | | | $ | — | | | $ | 130,219 | |
| Latin America | | | 20,704 | | | | — | | | | — | | | | 20,704 | |
| Other markets | | | 52,776 | | | | — | | | | — | | | | 52,776 | |
| Miscellaneous | | | 19,447 | | | | — | | | | — | | | | 19,447 | |
| Bonds & notes: | | | | | | | | | | | | | | | | |
| Latin America | | | — | | | | 55,327 | | | | — | | | | 55,327 | |
| Eastern Europe and Middle East | | | — | | | | 25,394 | | | | — | | | | 25,394 | |
| Asia-Pacific | | | — | | | | 23,570 | | | | — | | | | 23,570 | |
| Other markets | | | — | | | | 29,235 | | | | — | | | | 29,235 | |
| Short-term securities | | | — | | | | 45,898 | | | | — | | | | 45,898 | |
| Total | | $ | 217,101 | | | $ | 185,469 | | | $ | — | | | $ | 402,570 | |
| | | Other investments3 |
| | | Level 1 | | | Level 2 | | | Level 3 | | | Total | |
| Assets: | | | | | | | | | | | | | | | | |
| Unrealized appreciation on open forward currency contracts | | $ | — | | | $ | 932 | | | $ | — | | | $ | 932 | |
| Liabilities: | | | | | | | | | | | | | | �� | | |
| Unrealized depreciation on open forward currency contracts | | | — | | | | (143 | ) | | | — | | | | (143 | ) |
| Total | | $ | — | | | $ | 789 | | | $ | — | | | $ | 789 | |
| 1 | Securities with a value of $6,045,000, which represented 1.44% of the net assets of the fund, transferred from Level 1 to Level 2 since the prior fiscal year-end, primarily due to a lack of trading volume to support observable prices. |
| 2 | Level 2 includes investment securities with an aggregate value of $6,045,000, which represented 1.44% of the net assets of the fund, that were fair valued under guidelines adopted by authority of the fund’s board of trustees. |
| 3 | Forward currency contracts are not included in the investment portfolio. |
4. Risk factors
This section describes the principal risks associated with the fund’s principal investment strategies. You may lose money by investing in the fund. The likelihood of loss may be greater if you invest for a shorter period of time.
Market conditions — The prices of, and the income generated by, the securities held by the fund may decline – sometimes rapidly or unpredictably – due to various factors, including events or conditions affecting the general economy or particular industries; overall market changes; local, regional or global political, social or economic instability; governmental or governmental agency responses to economic conditions; and currency, interest rate and commodity price fluctuations.
Issuer risks — The prices of, and the income generated by, securities held by the fund may decline in response to various factors directly related to the issuers of such securities, including reduced demand for an issuer’s goods or services, poor management performance and strategic initiatives such as mergers, acquisitions or dispositions and the market response to any such initiatives.
Investing in growth-oriented stocks — Growth-oriented common stocks and other equity-type securities (such as preferred stocks, convertible preferred stocks and convertible bonds) may involve larger price swings and greater potential for loss than other types of investments. These risks may be even greater in the case of smaller capitalization stocks.
| 20 | Capital Group Emerging Markets Total Opportunities Fund |
Investing in income-oriented stocks — Income provided by the fund may be reduced by changes in the dividend policies of, and the capital resources available for dividend payments at, the companies in which the fund invests.
Investing outside the United States — Securities of issuers domiciled outside the United States, or with significant operations outside the United States, may lose value because of adverse political, social, economic or market developments (including social instability, regional conflicts, terrorism and war) in the countries or regions in which the issuers are domiciled or operate. These securities may also lose value due to changes in foreign currency exchange rates against the U.S. dollar and/or currencies of other countries. Securities markets in certain countries may be more volatile and/or less liquid than those in the United States. Investments outside the United States may also be subject to different accounting practices and different regulatory, legal and reporting standards and practices, and may be more difficult to value, than those in the United States. In addition, the value of investments outside the United States may be reduced by foreign taxes, including foreign withholding taxes on interest and dividends. Further, there may be increased risks of delayed settlement of securities purchased or sold by the fund. The risks of investing outside the United States may be heightened in connection with investments in emerging markets.
Investing in emerging markets — Investing in emerging markets may involve risks in addition to and greater than those generally associated with investing in the securities markets of developed countries. For instance, developing countries may have less developed legal and accounting systems than those in developed countries. The governments of these countries may be less stable and more likely to impose capital controls, nationalize a company or industry, place restrictions on foreign ownership and on withdrawing sale proceeds of securities from the country, and/or impose punitive taxes that could adversely affect the prices of securities. In addition, the economies of these countries may be dependent on relatively few industries that are more susceptible to local and global changes. Securities markets in these countries can also be relatively small and have substantially lower trading volumes. As a result, securities issued in these countries may be more volatile and less liquid, and may be more difficult to value, than securities issued in countries with more developed economies and/or markets. Less certainty with respect to security valuations may lead to additional challenges and risks in calculating the fund’s net asset value. Additionally, there may be increased settlement risks for transactions in local securities.
Investing in debt instruments — The prices of, and the income generated by, bonds and other debt securities held by the fund may be affected by changing interest rates and by changes in the effective maturities and credit ratings of these securities.
Rising interest rates will generally cause the prices of bonds and other debt securities to fall. Falling interest rates may cause an issuer to redeem, call or refinance a debt security before its stated maturity, which may result in the fund having to reinvest the proceeds in lower yielding securities. Longer maturity debt securities generally have greater sensitivity to changes in interest rates and may be subject to greater price fluctuations than shorter maturity debt securities.
Bonds and other debt securities are also subject to credit risk, which is the possibility that the credit strength of an issuer will weaken and/or an issuer of a debt security will fail to make timely payments of principal or interest and the security will go into default. Credit risk is gauged, in part, by the credit ratings of the debt securities in which the fund invests. However, ratings are only the opinions of the rating agencies issuing them and are not guarantees as to credit quality or an evaluation of market risk. The fund’s investment adviser relies on its own credit analysts to research issuers and issues in seeking to mitigate various credit and default risks.
Investing in lower rated debt instruments — Lower rated bonds and other lower rated debt securities generally have higher rates of interest and involve greater risk of default or price declines due to changes in the issuer’s creditworthiness than those of higher quality debt securities. The market prices of these securities may fluctuate more than the prices of higher quality debt securities and may decline significantly in periods of general economic difficulty. These risks may be increased with respect to investments in junk bonds.
Thinly traded securities — There may be little trading in the secondary market for particular bonds or other debt securities, which may make them more difficult to value, acquire or sell.
Management — The investment adviser to the fund actively manages the fund’s investments. Consequently, the fund is subject to the risk that the methods and analyses employed by the investment adviser in this process may not produce the desired results. This could cause the fund to lose value or its investment results to lag relevant benchmarks or other funds with similar objectives.
| Capital Group Emerging Markets Total Opportunities Fund | 21 |
5. Certain investment techniques
Forward currency contracts — The fund has entered into over-the-counter (“OTC”) forward currency contracts, which represent agreements to exchange currencies on specific future dates at predetermined rates. The fund’s investment adviser uses forward currency contracts to manage the fund’s exposure to changes in exchange rates. Upon entering into these contracts, risks may arise from the potential inability of counterparties to meet the terms of their contracts and from possible movements in exchange rates.
On a daily basis, forward currency contracts are valued and unrealized appreciation or depreciation for open forward currency contracts is recorded in the fund’s statement of assets and liabilities. Realized gains or losses are recorded at the time the forward currency contract is closed or offset by another contract with the same broker for the same settlement date and currency. Closed forward currency contracts that have not reached their settlement date are included in the respective receivables or payables for closed forward currency contracts in the fund’s statement of assets and liabilities. Net realized gains or losses from closed forward currency contracts and net unrealized appreciation or depreciation from open forward currency contracts are recorded in the fund’s statement of operations and statements of changes in net assets.
As of October 31, 2014, the fund had open OTC forward currency contracts to sell currencies, as shown in the following table. The average notional amount of open OTC forward currency contracts was $91,875,000 over the prior 12-month period.
| | | | | Notional amount
(000) | | | U.S. valuation
(000) | |
| | | Counterparty | | Non-U.S. | | U.S. | | | Amount | | | Unrealized
(depreciation)
appreciation | |
| Sales: | | | | | | | | | | | | | | | | |
| Australian dollar to U.S. dollar expiring 11/17/2014 | | Credit Suisse First Boston | | AUD574 | | $ | 500 | | | $ | 505 | | | $ | (5 | ) |
| Brazilian real to U.S. dollar expiring 11/14–12/5/2014 | | Citibank N.A. | | BRL13,653 | | | 5,579 | | | | 5,462 | | | | 117 | |
| Brazilian real to U.S. dollar expiring 11/14–12/5/2014 | | UBS AG | | BRL8,970 | | | 3,661 | | | | 3,592 | | | | 69 | |
| Brazilian real to U.S. dollar expiring 11/28/2014 | | UBS AG | | BRL10,782 | | | 4,232 | | | | 4,318 | | | | (86 | ) |
| British pound to U.S. dollar expiring 11/12/2014 | | Bank of New York Mellon | | GBP1,681 | | | 2,705 | | | | 2,689 | | | | 16 | |
| British pound to U.S. dollar expiring 11/14/2014 | | UBS AG | | GBP849 | | | 1,360 | | | | 1,358 | | | | 2 | |
| British pound to U.S. dollar expiring 11/17/2014 | | JPMorgan Chase | | GBP2,400 | | | 3,859 | | | | 3,839 | | | | 20 | |
| British pound to U.S. dollar expiring 11/17/2014 | | UBS AG | | GBP207 | | | 329 | | | | 331 | | | | (2 | ) |
| Chilean peso to U.S. dollar expiring 11/17/2014 | | UBS AG | | CLP405,064 | | | 680 | | | | 703 | | | | (23 | ) |
| Colombian peso to U.S. dollar expiring 11/14/2014 | | Citibank N.A. | | COP1,104,637 | | | 541 | | | | 537 | | | | 4 | |
| Colombian peso to U.S. dollar expiring 11/28/2014 | | JPMorgan Chase | | COP4,136,365 | | | 2,002 | | | | 2,004 | | | | (2 | ) |
| Euro to U.S. dollar expiring 11/12–11/17/2014 | | Bank of America | | EUR5,499 | | | 6,964 | | | | 6,892 | | | | 72 | |
| Euro to U.S. dollar expiring 11/14/2014 | | Citibank N.A. | | EUR4,182 | | | 5,348 | | | | 5,241 | | | | 107 | |
| Euro to U.S. dollar expiring 11/14/2014 | | Credit Suisse First Boston | | EUR4,300 | | | 5,455 | | | | 5,389 | | | | 66 | |
| Euro to U.S. dollar expiring 11/17–11/24/2014 | | UBS AG | | EUR5,772 | | | 7,366 | | | | 7,234 | | | | 132 | |
| Hungarian forint to U.S. dollar expiring 11/14/2014 | | UBS AG | | HUF27,228 | | | 112 | | | | 111 | | | | 1 | |
| Hungarian forint to U.S. dollar expiring 11/19/2014 | | Credit Suisse First Boston | | HUF43,658 | | | 181 | | | | 177 | | | | 4 | |
| Hungarian forint to U.S. dollar expiring 11/21/2014 | | JPMorgan Chase | | HUF171,609 | | | 715 | | | | 697 | | | | 18 | |
| Malaysian ringgit to U.S. dollar expiring 11/14/2014 | | Bank of America | | MYR6,865 | | | 2,112 | | | | 2,086 | | | | 26 | |
| Malaysian ringgit to U.S. dollar expiring 11/21/2014 | | JPMorgan Chase | | MYR2,891 | | | 881 | | | | 878 | | | | 3 | |
| Mexican peso to U.S. dollar expiring 11/18–12/3/2014 | | Bank of New York Mellon | | MXN84,626 | | | 6,258 | | | | 6,275 | | | | (17 | ) |
| Mexican peso to U.S. dollar expiring 11/18/2014 | | Credit Suisse First Boston | | MXN6,737 | | | 499 | | | | 500 | | | | (1 | ) |
| Mexican peso to U.S. dollar expiring 11/21/2014 | | JPMorgan Chase | | MXN18,054 | | | 1,332 | | | | 1,339 | | | | (7 | ) |
| Polish zloty to U.S. dollar expiring 12/5/2014 | | UBS AG | | PLN2,011 | | | 602 | | | | 596 | | | | 6 | |
| Russian ruble to U.S. dollar expiring 11/17–12/5/2014 | | Citibank N.A. | | RUB143,718 | | | 3,501 | | | | 3,326 | | | | 175 | |
| Singapore dollar to U.S. dollar expiring 11/14/2014 | | Bank of America | | SGD1,791 | | | 1,411 | | | | 1,394 | | | | 17 | |
| Singapore dollar to U.S. dollar expiring 11/17/2014 | | UBS AG | | SGD1,222 | | | 958 | | | | 951 | | | | 7 | |
| South Korean won to U.S. dollar expiring 11/10/2014 | | UBS AG | | KRW691,057 | | | 648 | | | | 647 | | | | 1 | |
| South Korean won to U.S. dollar expiring 11/14–11/28/2014 | | Citibank N.A. | | KRW9,046,866 | | | 8,529 | | | | 8,460 | | | | 69 | |
| | | | | | | | | | | | | | | | | |
| Forward currency contracts — net | | | | | | | | | | | | | | $ | 789 | |
| 22 | Capital Group Emerging Markets Total Opportunities Fund |
Rights of offset — The fund has entered into enforceable master netting agreements with certain counterparties for forward currency contracts, where amounts payable by each party to the other in the same currency with the same settlement date and with the same counterparty are settled net of each party’s payment obligation. For financial reporting purposes, the fund does not offset the financial assets and financial liabilities that are subject to netting arrangements in the statement of assets and liabilities.
The following table presents the fund’s forward currency contracts by counterparty, including those that are subject to potential offset on the statement of assets and liabilities as of October 31, 2014 (dollars in thousands):
| | | | | | | | Gross amounts not offset in the
statement of assets and liabilities and
subject to a master netting agreement | | | |
| | | Counterparty | | Gross amounts
recognized in the
statement of assets
and liabilities | | | Available
to offset | | | Non-cash
collateral* | | | Cash
collateral | | Net
amount |
| | | | | | | | | | | | | | | | | | | | | |
| Assets: | | | | | | | | | | | | | | | | | | | | |
| | | Bank of America | | $ | 115 | | | $ | — | | | $ | — | | | $ | — | | $ | 115 |
| | | Bank of New York Mellon | | | 16 | | | | (16 | ) | | | — | | | | — | | | — |
| | | Citibank N.A. | | | 472 | | | | — | | | | — | | | | — | | | 472 |
| | | Credit Suisse First Boston | | | 70 | | | | (6 | ) | | | — | | | | — | | | 64 |
| | | JPMorgan Chase | | | 41 | | | | (9 | ) | | | — | | | | — | | | 32 |
| | | UBS AG | | | 218 | | | | (111 | ) | | | — | | | | — | | | 107 |
| | | | | $ | 932 | | | | (142 | ) | | $ | — | | | $ | — | | $ | 790 |
| | | | | | | | | | | | | | | | | | | | | |
| Liabilities: | | | | | | | | | | | | | | | | | | | | |
| | | Bank of New York Mellon | | $ | (17 | ) | | $ | 16 | | | $ | — | | | $ | — | | $ | (1) |
| | | Credit Suisse First Boston | | | (6 | ) | | | 6 | | | | — | | | | — | | | — |
| | | JPMorgan Chase | | | (9 | ) | | | 9 | | | | — | | | | — | | | — |
| | | UBS AG | | | (111 | ) | | | 111 | | | | — | | | | — | | | — |
| | | | | $ | (143 | ) | | $ | 142 | | | $ | — | | | $ | — | | $ | (1) |
* Non-cash collateral is shown on a settlement basis.
6. Taxation and distributions
Federal income taxation — The fund complies with the requirements under Subchapter M of the Internal Revenue Code applicable to regulated investment companies and intends to distribute substantially all of its net taxable income and net capital gains each year. The fund is not subject to income taxes to the extent such distributions are made. Therefore, no federal income tax provision is required.
As of and during the year ended October 31, 2014, the fund did not have a liability for any unrecognized tax benefits. The fund recognizes interest and penalties, if any, related to unrecognized tax benefits as income tax expense in the statement of operations. During the period, the fund did not incur any interest or penalties.
The fund is not subject to examination by U.S. federal tax authorities, by state tax authorities and by tax authorities outside the U.S. for tax years before 2012, the year the fund commenced operations.
Non-U.S. taxation — Dividend and interest income are recorded net of non-U.S. taxes paid. Gains realized by the fund on the sale of securities in certain countries are subject to non-U.S. taxes. The fund records a liability based on unrealized gains to provide for potential non-U.S. taxes payable upon the sale of these securities.
| Capital Group Emerging Markets Total Opportunities Fund | 23 |
Distributions — Distributions paid to shareholders are based on net investment income and net realized gains determined on a tax basis, which may differ from net investment income and net realized gains for financial reporting purposes. These differences are due primarily to different treatment for items such as currency gains and losses; capital losses related to sales of certain securities within 30 days of purchase; net capital losses; short-term capital gains and losses; and cost of investments sold.
The fiscal year in which amounts are distributed may differ from the year in which the net investment income and net realized gains are recorded by the fund for financial reporting purposes. For the year ended October 31, 2014, the tax character of the distribution paid to shareholders was ordinary income in the amount of $9,656,000. For the year ended October 31, 2013, the tax character of the distribution paid to shareholders was ordinary income in the amount of $14,914,000. The fund may also designate a portion of the amount paid to redeeming shareholders as a distribution for tax purposes.
During the year ended October 31, 2014, the fund reclassified $8,338,000 from undistributed net investment income to accumulated net realized gain and $1,591,000 from undistributed net investment income to capital paid in on shares of capital stock to align financial reporting with tax reporting.
As of October 31, 2014, the tax basis components of distributable earnings were as follows (dollars in thousands):
| Undistributed ordinary income | | $ | 379 | |
| Undistributed long-term capital gain | | | 2,464 | |
As of October 31, 2014, the tax basis unrealized appreciation (depreciation) and cost of investment securities were as follows (dollars in thousands):
| Gross unrealized appreciation on investment securities | | $ | 35,968 | |
| Gross unrealized depreciation on investment securities | | | (39,612 | ) |
| Net unrealized depreciation on investment securities | | | (3,644 | ) |
| Cost of investment securities | | | 406,214 | |
7. Fees and transactions with related parties
CGTC, the fund’s investment adviser, is wholly owned by Capital Group International, Inc., which is wholly owned by The Capital Group Companies, Inc. (“CGC”). Expense limitations have been imposed through December 31, 2015, to limit the fund’s total annual fund operating expenses to 1.10% (as a percentage of average daily net assets).
Investment advisory services — The fund has an investment advisory and service agreement with CGTC that provides for monthly fees accrued daily. The fee is 1.00% of the average daily net assets of the fund.
Distribution services — American Funds Distributors®, Inc. (“AFD”), an affiliate of CGC, is the principal underwriter of the fund’s shares. AFD does not receive any compensation related to the sale of shares of the fund.
Affiliated officers and trustees — Officers and certain trustees of the fund are or may be considered to be affiliated with CGTC and AFD. No affiliated officers or trustees received any compensation directly from the fund.
8. Investment transactions
The fund made purchases and sales of investment securities, excluding short-term securities, of $242,646,000 and $384,815,000, respectively, during the year ended October 31, 2014.
| 24 | Capital Group Emerging Markets Total Opportunities Fund |
Financial highlights
| | | Year ended October 31 | | | For the
period
1/27/121
through | | | For the
period
1/1/12
through | | | Year ended | | | For the
period
3/1/103
through | |
| | | 2014 | | | 2013 | | | 10/31/122,6 | | | 1/26/122,6 | | | 12/31/112 | | | 12/31/102,6 | |
| Net asset value, beginning of period | | $ | 11.51 | | | $ | 11.58 | | | $ | 11.02 | | | $ | 10.45 | | | $ | 11.12 | | | $ | 10.00 | |
| Income (loss) from investment operations4: | | | | | | | | | | | | | | | | | | | | | | | | |
| Net investment income | | | .29 | | | | .32 | | | | .35 | | | | .03 | | | | .52 | | | | .45 | |
| Net realized and unrealized (loss) gain on investments | | | (.46 | ) | | | (.06 | ) | | | .21 | | | | .54 | | | | (1.19 | ) | | | .67 | |
| Total (loss) income from investment operations | | | (.17 | ) | | | .26 | | | | .56 | | | | .57 | | | | (.67 | ) | | | 1.12 | |
| Less dividends: | | | | | | | | | | | | | | | | | | | | | | | | |
| Dividends from net investment income | | | (.21 | ) | | | (.33 | ) | | | — | | | | — | | | | — | | | | — | |
| Net asset value, end of period | | $ | 11.13 | | | $ | 11.51 | | | $ | 11.58 | | | $ | 11.02 | | | $ | 10.45 | | | $ | 11.12 | |
| Total return | | | (1.50 | )% | | | 2.19 | % | | | 5.08 | % | | | 5.45 | % | | | (6.03 | )% | | | 11.20 | % |
| | | | | | | | | | | | | | | | | | | | | | | | | |
| Ratios/Supplemental data: | | | | | | | | | | | | | | | | | | | | | | | | |
| Net assets, end of period (in millions) | | $ | 421 | | | $ | 604 | | | $ | 518 | | | $ | 387 | | | $ | 381 | | | $ | 282 | |
| Ratio of expenses to average net assets | | | 1.10 | % | | | 1.10 | % | | | 1.10 | %5 | | | .05 | %5 | | | .04 | % | | | .08 | %5 |
| Ratio of net investment income to average net assets | | | 2.52 | % | | | 2.74 | % | | | 4.11 | %5 | | | 3.95 | %5 | | | 4.78 | % | | | 5.07 | %5 |
| Portfolio turnover rate | | | 56.13 | % | | | 63.85 | % | | | 42.49 | % | | | 7.00 | % | | | 59.52 | %7 | | | 69.40 | %7 |
| 1 | The fund commenced operations as a Registered Investment Company on January 27, 2012. |
| 2 | Capital Guardian Emerging Markets Total Opportunities Common Trust Fund (the Predecessor Fund) was reorganized into the Capital Group Emerging Markets Total Opportunities Fund effective January 27, 2012. In connection with the reorganization, the Predecessor Fund transferred all its assets and liabilities to the Capital Group Emerging Markets Total Opportunities Fund and changed its fiscal year-end from December 31 to October 31. |
| 3 | The Predecessor Fund commenced operations on March 1, 2010. |
| 4 | The per-share/unit data is based on average shares/units outstanding. |
| 5 | Annualized. |
| 6 | Based on operations for the period shown and, accordingly, is not representative of a full year. |
| 7 | Unaudited. |
| Capital Group Emerging Markets Total Opportunities Fund | 25 |
Report of Independent Registered Public Accounting Firm
To the Board of Trustees and Shareholders of Capital Group Emerging Markets Total Opportunities Fund:
We have audited the accompanying statement of assets and liabilities of Capital Group Emerging Markets Total Opportunities Fund (the “Fund”), including the investment portfolio, as of October 31, 2014, and the related statement of operations for the year then ended, the statements of changes in net assets for each of the two years in the period then ended, and the financial highlights for each of the two years in the period then ended, the period from January 27, 2012 (commencement of operations) to October 31, 2012, and the period from January 1, 2012 to January 26, 2012. These financial statements and financial highlights are the responsibility of the Fund’s management. Our responsibility is to express an opinion on these financial statements and financial highlights based on our audits. The financial highlights for the year ended December 31, 2011, and for the period March 1, 2010 through December 31, 2010 were audited by other auditors whose reports, dated March 5, 2012 and March 7, 2011, respectively, expressed an unqualified opinion on those statements.
We conducted our audits in accordance with the standards of the Public Company Accounting Oversight Board (United States). Those standards require that we plan and perform the audits to obtain reasonable assurance about whether the financial statements and financial highlights are free of material misstatement. The Fund is not required to have, nor were we engaged to perform, an audit of its internal control over financial reporting. Our audit included consideration of internal control over financial reporting as a basis for designing audit procedures that are appropriate in the circumstances, but not for the purpose of expressing an opinion on the effectiveness of the Fund’s internal control over financial reporting. Accordingly, we express no such opinion. An audit also includes examining, on a test basis, evidence supporting the amounts and disclosures in the financial statements, assessing the accounting principles used and significant estimates made by management, as well as evaluating the overall financial statement presentation. Our procedures included confirmation of securities owned as of October 31, 2014, by correspondence with the custodian and brokers; where replies were not received from brokers, we performed other auditing procedures. We believe that our audits provide a reasonable basis for our opinion.
In our opinion, such financial statements and financial highlights referred to above present fairly, in all material respects, the financial position of Capital Group Emerging Markets Total Opportunities Fund as of October 31, 2014, the results of its operations for the year then ended, the changes in its net assets for each of the two years in the period then ended, and the financial highlights for each of the two years in the period then ended, the period from January 27, 2012 (commencement of operations) to October 31, 2012, and the period from January 1, 2012 to January 26, 2012, in conformity with accounting principles generally accepted in the United States of America.
Deloitte & Touche LLP
Costa Mesa, California
December 17, 2014
| 26 | Capital Group Emerging Markets Total Opportunities Fund |
As a shareholder of the fund, you incur ongoing costs, including investment advisory services fees and other expenses. This example is intended to help you understand your ongoing costs (in dollars) of investing in the fund so you can compare these costs with the ongoing costs of investing in other mutual funds. The example is based on an investment of $1,000 invested at the beginning of the period and held for the entire period.
Actual expenses:
The first line of the table below provides information about actual account values and actual expenses. You may use the information in this line, together with the amount you invested, to estimate the expenses that you paid over the period. Simply divide your account value by $1,000 (for example, an $8,600 account value divided by $1,000 = 8.6), then multiply the result by the number in the first line under the heading entitled “Expenses paid during period” to estimate the expenses you paid on your account during this period.
Hypothetical example for comparison purposes:
The second line of the table below provides information about hypothetical account values and hypothetical expenses based on the fund’s actual expense ratio and an assumed rate of return of 5% per year before expenses, which is not the fund’s actual return. The hypothetical account values and expenses may not be used to estimate the actual ending account balance or expenses you paid for the period. You may use this information to compare the ongoing costs of investing in the fund and other funds. To do so, compare this 5% hypothetical example with the 5% hypothetical examples that appear in the shareholder reports of the other funds.
| | | Beginning | | Ending | | Expenses | | Annualized | |
| | | account value | | account value | | paid during | | expense | |
| | | 5/1/2014 | | 10/31/2014 | | period* | | ratio | |
| Actual return | | $ | 1,000.00 | | $ | 988.46 | | $ | 5.51 | | | 1.10 | % |
| Hypothetical 5% return before expenses | | | 1,000.00 | | | 1,019.66 | | | 5.60 | | | 1.10 | |
| * | The “expenses paid during period” are equal to the “annualized expense ratio,” multiplied by the average account value over the period, multiplied by the number of days in the period, and divided by 365 (to reflect the current period). |
We are required to advise you of the federal tax status of certain distributions received by shareholders during the fiscal year. The fund hereby designates the following amounts for the fund’s fiscal year ended October 31, 2014:
| Foreign taxes | $0.02 per share |
| Foreign source income | $0.48 per share |
| Qualified dividend income | $3,271,000 |
Individual shareholders should refer to their Form 1099 or other tax information, which will be mailed by February 15, 2015, to determine the calendar year amounts to be included on their 2014 tax returns. Shareholders should consult their tax advisors.
| Capital Group Emerging Markets Total Opportunities Fund | 27 |
Board of trustees and other officers
“Independent” trustees1
| Name and year of birth | | Year first
elected
a trustee
of the fund2 | | Principal occupation(s) during past five years | | Number of
portfolios
overseen
by trustee | | Other directorships3
held by trustee |
Richard G. Capen, Jr., 1934
(Lead independent trustee) | | 2011 | | Corporate director and author | | 9 | | None |
| H. Frederick Christie, 1933 | | 2011 | | Private investor | | 9 | | None |
| Richard G. Newman, 1934 | | 2011 | | Founder, Chairman Emeritus and Director, AECOM Technology Corporation (global engineering, consulting and professional technical services) | | 9 | | None |
Martin Fenton, a trustee of the fund since 2011, retired from the board on December 31, 2014. The trustees thank Mr. Fenton for his dedication and service to the fund.
“Interested” trustee4
Name, year of birth
and position with fund | | Year first
elected
a trustee
or officer
of the fund2 | | Principal occupation(s) during past five years
and positions held with affiliated entities or
the principal underwriter of the fund | | Number of
portfolios
overseen
by trustee | | Other directorships3
held by trustee |
Paul F. Roye, 1953
Chairman of the Board | | 2011 | | Senior Vice President — Fund Business Management Group, Capital Research and Management Company;6 Director, American Funds Service Company6 | | 9 | | 3 American Funds portfolios |
The fund’s statement of additional information includes further details about fund trustees and is available without charge upon request by calling your relationship manager at (800) 266-9532. The address for all trustees and officers of the fund is 333 South Hope Street, Los Angeles, CA 90071, Attention: Secretary.
| 28 | Capital Group Emerging Markets Total Opportunities Fund |
Other officers5
Name, year of birth
and position with fund | | Year first
elected
an officer
of the fund2 | | Principal occupation(s) during past five years and positions held with affiliated entities
or the principal underwriter of the fund |
John S. Armour, 1957
President | | 2013 | | Senior Vice President, Capital Guardian Trust Company;
President — Private Client Services Division, Capital Guardian Trust Company;
Chairman of the Board, Capital Guardian Trust Company, a Nevada Corporation6 |
David F. Holstein, 1955
Senior Vice President | | 2014 | | Vice President — Capital International Investors, Capital Research and Management Company;6
Senior Vice President, American Funds Distributors, Inc.6 |
Timothy W. McHale, 1978
Vice President | | 2011 | | Vice President and Associate Counsel — Fund Business Management Group, Capital Research and Management Company;6 Secretary, American Funds Distributors, Inc.6 |
Courtney R. Taylor, 1975
Secretary | | 2011 | | Assistant Vice President — Fund Business Management Group, Capital Research and Management Company6 |
Gregory F. Niland, 1971
Treasurer | | 2014 | | Vice President — Investment Operations, Capital Research and Management Company6 |
Susan K. Countess, 1966
Assistant Secretary | | 2012 | | Fund Boards Coordinator — Fund Business Management Group, Capital Research and Management Company6 |
Susan R. Sunga, 1955
Assistant Treasurer | | 2011 | | Vice President, Capital Research and Management Company;6
Tax Officer, Capital Guardian Trust Company, a Nevada Corporation6 |
| 1 | The term “independent” trustee refers to a trustee who is not an “interested person” of the fund within the meaning of the Investment Company Act of 1940. |
| 2 | Trustees and officers of the fund serve until their resignation, removal or retirement. |
| 3 | This includes all directorships (other than the fund) that are held by each trustee as a trustee or director of a public company or a registered investment company. Unless otherwise noted, all directorships are current. |
| 4 | The term “interested” trustee refers to a trustee who is an “interested person” of the fund within the meaning of the Investment Company Act of 1940, on the basis of his or her affiliation with the fund’s investment adviser, Capital Guardian Trust Company, or affiliated entities (including the fund’s principal underwriter). |
| 5 | All of the officers listed, except David F. Holstein, are officers of one or more of the other funds for which Capital Guardian Trust Company serves as investment adviser. |
| 6 | Company affiliated with Capital Guardian Trust Company. |
| Capital Group Emerging Markets Total Opportunities Fund | 29 |
Office of the fund and of the investment adviser
Capital Guardian Trust Company
6455 Irvine Center Drive
Irvine, CA 92618-4518
Transfer agent for shareholder accounts
J.P. Morgan Investor Services Company
One Beacon Street
Boston, MA 02108
Custodian of assets
JPMorgan Chase Bank
270 Park Avenue
New York, NY 10017-2070
Counsel
Morgan, Lewis & Bockius LLP
355 South Grand Avenue, Suite 4400
Los Angeles, CA 90071-3106
Independent registered public accounting firm
Deloitte & Touche LLP
695 Town Center Drive
Suite 1200
Costa Mesa, CA 92626-7188
Principal underwriter
American Funds Distributors, Inc.
333 South Hope Street
Los Angeles, CA 90071-1406
Investors should carefully consider investment objectives, risks, charges and expenses. This and other important information is contained in the fund prospectus, which can be obtained from Capital Guardian Trust Company by calling (800) 266-9532 and should be read carefully before investing.
Capital Group Emerging Markets Total Opportunities Fund files a complete list of its portfolio holdings with the U.S. Securities and Exchange Commission (SEC) for the first and third quarters of each fiscal year on Form N-Q. This filing is available free of charge on the SEC website (www.sec.gov). You may also review or, for a fee, copy this filing at the SEC’s Public Reference Room in Washington, D.C. Additional information regarding the operation of the Public Reference Room may be obtained by calling the SEC’s Office of Investor Education and Advocacy at (800) SEC-0330. Additionally, the list of portfolio holdings is available by calling your relationship manager at (800) 266-9532.
The proxy voting procedures and policies of Capital Group Emerging Markets Total Opportunities Fund — which describe how we vote proxies relating to portfolio securities — are available upon request by calling your relationship manager at (800) 266-9532. The fund files its proxy voting record with the SEC for the 12 months ended June 30 by August 31. The report also is available on the SEC website or by calling your relationship manager.

ITEM 2 – Code of Ethics
The Registrant has adopted a Code of Ethics that applies to its Principal Executive Officer and Principal Financial Officer. The Registrant undertakes to provide to any person without charge, upon request, a copy of the Code of Ethics. Such request can be made to American Funds Service Company at 800/421-9225 or to the Secretary of the Registrant, 6455 Irvine Center Drive, Irvine, California 92618.
ITEM 3 – Audit Committee Financial Expert
The Registrant’s board has determined that H. Frederick Christie, a member of the Registrant’s audit committee, is an “audit committee financial expert” and "independent," as such terms are defined in this Item. This designation will not increase the designee’s duties, obligations or liability as compared to his or her duties, obligations and liability as a member of the audit committee and of the board, nor will it reduce the responsibility of the other audit committee members. There may be other individuals who, through education or experience, would qualify as "audit committee financial experts" if the board had designated them as such. Most importantly, the board believes each member of the audit committee contributes significantly to the effective oversight of the Registrant’s financial statements and condition.
ITEM 4 – Principal Accountant Fees and Services
| | Registrant: |
| | | a) Audit Fees: |
| | | | 2013 | $41,085 |
| | | | 2014 | $39,979 |
| | | | |
| | | b) Audit-Related Fees: |
| | | | 2013 | None |
| | | | 2014 | None |
| | | | |
| | | |
| | | c) Tax Fees: |
| | | | 2013 | $7,905 |
| | | | 2014 | $7,246 |
| | | | The tax fees consist of professional services relating to the review of the Registrant’s tax returns. |
| | | |
| | | d) All Other Fees: |
| | | | 2013 | None |
| | | | 2014 | None |
| | | | The other fees consist of the review of the N1A annual update. |
| | | | |
| | Adviser and affiliates (includes only fees for non-audit services billed to the adviser and affiliates for engagements that relate directly to the operations and financial reporting of the Registrant and were subject to the pre-approval policies described below): |
| | | a) Audit Fees: |
| | | | Not Applicable |
| | | |
| | | b) Audit-Related Fees: |
| | | | 2013 | $263,740 |
| | | | 2014 | $288,925 |
| | | | The audit-related fees consist of assurance and related services relating to the examination of the Registrant’s transfer agent, principal underwriter and investment adviser conducted in accordance with Statement on Standards for Attestation Engagements Number 16 issued by the American Institute of Certified Public Accountants. |
| | | |
| | | c) Tax Fees: |
| | | | Not Applicable | |
| | | |
| | | d) All Other Fees: |
| | | | Not Applicable |
| | | | | | |
All audit and permissible non-audit services that the Registrant’s audit committee considers compatible with maintaining the independent registered public accounting firm’s independence are required to be pre-approved by the committee. The pre-approval requirement will extend to all non-audit services provided to the Registrant, the investment adviser, and any entity controlling, controlled by, or under common control with the investment adviser that provides ongoing services to the Registrant, if the engagement relates directly to the operations and financial reporting of the Registrant. The committee will not delegate its responsibility to pre-approve these services to the investment adviser. The committee may delegate to one or more committee members the authority to review and pre-approve audit and permissible non-audit services. Actions taken under any such delegation will be reported to the full committee at its next meeting. The pre-approval requirement is waived with respect to non-audit services if certain conditions are met. The pre-approval requirement was not waived for any of the non-audit services listed above provided to the Registrant, adviser and affiliates.
Aggregate non-audit fees paid to the Registrant’s auditors, including fees for all services billed to the Registrant, adviser and affiliates that provide ongoing services to the Registrant, were $385,000 for fiscal year 2013 and $185,000 for fiscal year 2014. The non-audit services represented by these amounts were brought to the attention of the committee and considered to be compatible with maintaining the auditors’ independence.
ITEM 5 – Audit Committee of Listed Registrants
Not applicable to this Registrant, insofar as the Registrant is not a listed issuer as defined in Rule 10A-3 under the Securities Exchange Act of 1934.
ITEM 6 – Schedule of Investments
Not applicable, insofar as the schedule is included as part of the report to shareholders filed under Item 1 of this Form.
ITEM 7 – Disclosure of Proxy Voting Policies and Procedures for Closed-End Management Investment Companies
Not applicable to this Registrant, insofar as the Registrant is not a closed-end management investment company.
ITEM 8 – Portfolio Managers of Closed-End Management Investment Companies
Not applicable to this Registrant, insofar as the Registrant is not a closed-end management investment company.
ITEM 9 – Purchases of Equity Securities by Closed-End Management Investment Company and Affiliated Purchasers
Not applicable to this Registrant, insofar as the Registrant is not a closed-end management investment company.
ITEM 10 – Submission of Matters to a Vote of Security Holders
There have been no material changes to the procedures by which shareholders may recommend nominees to the Registrant’s board of trustees since the Registrant last submitted a proxy statement to its shareholders. The procedures are as follows. The Registrant has a nominating committee comprised solely of persons who are not considered ‘‘interested persons’’ of the Registrant within the meaning of the Investment Company Act of 1940, as amended. The committee periodically reviews such issues as the board’s composition, responsibilities, committees, compensation and other relevant issues, and recommends any appropriate changes to the full board of trustees. While the committee normally is able to identify from its own resources an ample number of qualified candidates, it will consider shareholder suggestions of persons to be considered as nominees to fill future vacancies on the board. Such suggestions must be sent in writing to the nominating committee of the Registrant, c/o the Registrant’s Secretary, and must be accompanied by complete biographical and occupational data on the prospective nominee, along with a written consent of the prospective nominee for consideration of his or her name by the nominating committee.
ITEM 11 – Controls and Procedures
| (a) | The Registrant’s Principal Executive Officer and Principal Financial Officer have concluded, based on their evaluation of the Registrant’s disclosure controls and procedures (as such term is defined in Rule 30a-3 under the Investment Company Act of 1940), that such controls and procedures are adequate and reasonably designed to achieve the purposes described in paragraph (c) of such rule. |
| | |
| (b) | There were no changes in the Registrant’s internal controls over financial reporting (as defined in Rule 30a-3(d) under the Investment Company Act of 1940) that occurred during the Registrant’s second fiscal quarter of the period covered by this report that has materially affected, or is reasonably likely to materially affect, the Registrant’s internal control over financial reporting. |
ITEM 12 – Exhibits
| (a)(1) | The Code of Ethics that is the subject of the disclosure required by Item 2 is attached as an exhibit hereto. |
| | |
| (a)(2) | The certifications required by Rule 30a-2 of the Investment Company Act of 1940 and Sections 302 and 906 of the Sarbanes-Oxley Act of 2002 are attached as exhibits hereto. |
SIGNATURES
Pursuant to the requirements of the Securities Exchange Act of 1934 and the Investment Company Act of 1940, the Registrant has duly caused this report to be signed on its behalf by the undersigned, thereunto duly authorized.
| | CAPITAL GROUP EMERGING MARKETS TOTAL OPPORTUNITIES FUND |
| | |
| | By /s/ John S. Armour |
| | John S. Armour, President and Principal Executive Officer |
| | |
| | Date: December 31, 2014 |
Pursuant to the requirements of the Securities Exchange Act of 1934 and the Investment Company Act of 1940, this report has been signed below by the following persons on behalf of the Registrant and in the capacities and on the dates indicated.
| By /s/ John S. Armour |
John S. Armour, President and Principal Executive Officer |
| |
| Date: December 31, 2014 |
| By /s/ Gregory F. Niland |
Gregory F. Niland, Treasurer and Principal Financial Officer |
| |
| Date: December 31, 2014 |