UNITED STATES
SECURITIES AND EXCHANGE COMMISSION
Washington, D.C. 20549
FORM N-CSR
Certified Shareholder Report of
Registered Management Investment Companies
Investment Company Act File Number: 811-22605
Capital Group Emerging Markets Total Opportunities Fund
(Exact Name of Registrant as Specified in Charter)
6455 Irvine Center Drive
Irvine, California 92618
(Address of Principal Executive Offices)
Registrant's telephone number, including area code: (949) 975-5000
Date of fiscal year end: October 31
Date of reporting period: October 31, 2013
Courtney R. Taylor
Capital Group Emerging Markets Total Opportunities Fund
6455 Irvine Center Drive
Irvine, California 92618
(Name and Address of Agent for Service)
Copies to:
Michael Glazer
Bingham McCutchen LLP
355 South Grand Avenue, Suite 4400
Los Angeles, California 90071
(Counsel for the Registrant)
ITEM 1 – Reports to Stockholders
 | | Capital Group Emerging Markets
Total Opportunities FundSM
Annual report
for the year ended
October 31, 2013 |

Capital Group Emerging Markets Total Opportunities Fund seeks long-term growth and preservation of capital with lower volatility of returns than emerging markets equities.
Fund results shown in this report are for past periods and are not predictive of results for future periods. The results shown are before taxes on fund distributions and sale of fund shares. Current and future results may be lower or higher than those shown. Share prices and returns will vary, so investors may lose money. Investing for short periods makes losses more likely. Investments are not FDIC-insured, nor are they deposits of or guaranteed by a bank or any other entity, so they may lose value. For current information and month-end results, please call (800) 266-9532.
Here are the average annual total returns on a $1,000 investment with all distributions reinvested for periods ended September 30, 2013 (the most recent calendar quarter-end):
| | | | | Lifetime |
| | | 1 year | | (since 1/27/2012) |
| | | | | |
| Average annual total returns | | | –0.22% | | | | 2.54% | |
The total annual fund operating expense ratio is 1.10% as of the most recent fiscal year-end, and as reflected in the prospectus dated January 1, 2014 (unaudited).
Investment results assume all distributions are reinvested and reflect applicable fees and expenses.
This report is for the information of shareholders of Capital Group Emerging Markets Total Opportunities Fund, but it also may be used as sales literature when preceded or accompanied by the current prospectus, which gives details about charges, expenses, investment objectives and operating policies of the fund. If used as sales material after December 31, 2013, this report must be accompanied by a statistical update for the most recently completed calendar quarter.
Investors should carefully read and consider the investment objectives, guidelines, risks, fees and expenses associated with Capital Group Emerging Markets Total Opportunities Fund (CGETOP) prior to investing. This and other important information is contained in CGETOP’s prospectus, which can be obtained from your relationship manager.
Investing in emerging markets involves risks, such as significant currency and price fluctuations, political instability, differing securities regulations and periods of illiquidity, which are detailed in the fund prospectus. Investments in emerging markets have been more volatile than investments in developed markets, reflecting the greater uncertainties of investing in less established economies. Individuals investing in emerging markets should have a long-term perspective and be able to tolerate potentially sharp declines in the value of their investments.
Fellow investors:
Capital Group Emerging Markets Total Opportunities Fund invests in the full spectrum of emerging markets debt and equity securities while seeking to limit the volatility typically associated with investments in the developing world. The fund was started on January 27, 2012.
The following report covers the period from November 1, 2012, through October 31, 2013. During this time, global equities, as measured by the MSCI World Index,* posted double-digit gains, fueled by monetary stimulus in the developed world and signs of an improving global economy. The MSCI Emerging Markets (EM) Investable Market Index (IMI) rose 6.9%, lagging most developed markets amid concerns about sluggish economic growth in several emerging markets economies and fears about reduced liquidity due to the potential end of the U.S. quantitative easing program. Technology stocks nonetheless climbed more than 20%, supported by robust profits. Consumer discretionary stocks also rose sharply. But materials stocks declined as prices for metals slid, and energy stocks were flat.
Emerging markets debt sold off following double-digit gains in 2012, with yields in some markets climbing more than 100 basis points. Developing market currencies fell particularly hard during a rout from May to August as investors worried that the U.S. government would curtail its bond buying program sooner than expected. Commodity-related currencies and those of countries with large current account deficits posted some of the sharpest losses, with the South African rand and Indonesian rupiah falling 13% and 15%, respectively, for the period. The J.P. Morgan EMBI Global index fell 2.6%, while the local currency GBI-EM Global Diversified index shed 1.6% in U.S. dollar terms. Against this backdrop, the fund advanced 2.2%. The realized volatility of the portfolio was about 8% for the reporting period, compared with 12% for the MSCI EM IMI, 9% for local emerging markets bonds and 6% for emerging markets U.S. dollar debt.
Market review
Global stock markets rallied during the 12-month period. U.S. stocks were supported by monetary stimulus and an improving U.S. economy. U.S. equities also rallied after U.S. legislators were able to reach a last-minute deal on a package of tax hikes and spending cuts to avoid the fiscal cliff in early 2013. But concerns about a partial government shutdown in October curbed investor enthusiasm. The unmanaged Standard & Poor’s 500 Composite Index rose 27% for the period.
European equities climbed 28% as the central bank upheld its pledge to “do whatever it takes to preserve the euro” and the euro zone emerged from recession. The euro appreciated 5% against the U.S. dollar over the reporting period. Meanwhile,Japan’s stock market rose 34%; the Bank of Japan announced aggressive quantitative easing plans following Shinzo Abe’s election as prime minister in December, including a pledge to double the monetary base over the next two years to end deflation. The yen weakened considerably, losing 22% against the euro and about 19% versus the U.S. dollar for the 12-month period.
| * | The market indexes are unmanaged and, therefore, have no expenses. Unless otherwise indicated, equity returns are based on MSCI indexes and measured in U.S. dollars with net dividends reinvested. |
| Capital Group Emerging Markets Total Opportunities Fund | 1 |
Returns in Asia varied widely. The MSCI China IMI gained 11% despite concerns about sluggish economic data and worries about lending in China outside the traditional banking sector. By July, the government had announced several measures to help maintain its target growth rate of 7.5%, including increased spending to support the railway industry. Economic data in China showed signs of recovery late in the period: China’s third-quarter GDP expanded by an annualized rate of 7.8% compared with 7.5% in the previous quarter and manufacturing gained momentum. Bank stocks rose as several institutions reported healthy, albeit slower, profit growth even as provisions for bad loans increased. Property stocks also climbed against a backdrop of rising home sales. Housing prices reached their highest levels in two years by the end of the period, prompting concerns about renewed credit tightening in the property market. Elsewhere in Asia, South Korean stocks rose 12%, bolstered by improving economic growth. Technology stocks lifted equity markets in South Korea and Taiwan.
Asian countries with large current account deficits struggled, however. Indian stocks fell nearly 2%, weighed down by banks and infrastructure-related companies. Investors worried about the challenging combination of rising inflation, weak economic growth and a sharply depreciating rupee. As a result, the central bank, under the leadership of a new governor, raised interest rates for the first time in nearly two years, by a total of 50 basis points in September and October, to 7.75%. The rupee lost more than 12% against the U.S. dollar for the period. Meanwhile, worries about inflationary pressures, a record current account deficit and a depreciating currency weighed heavily on the Indonesian market. The MSCI Indonesia IMI declined 14%. Indonesian bonds also posted sharp losses, with local and U.S. dollar yields each rising more than 150 basis points. By contrast, stocks in several smaller Asian markets registered strong gains, supported by economic improvements.
In Latin America, Brazilian stocks lost more than 2%. Investors worried about tepid economic growth in Brazil over the period and the effectiveness of policy decisions. The country’s central bank raised the Selic rate by 225 basis points to 9.5% to fight inflation and help support the currency. Massive protest rallies also erupted in Brazil in June, spurred by a 10-cent hike in bus and subway fares in several major cities. Demonstrations quickly spread to a broader range of concerns, including high taxes and limited public services. The government employed a series of measures to help stem the depreciation of the real. Authorities removed a 6% IOF
20 largest holdings
| | | | Percent of
net assets as
of 10/31/13 | |
| Brazil inflation-linked bonds | | | 4.7 | % |
| Greek government bonds (EUR) | | | 3.4 | |
| Mexico inflation-linked bonds | | | 2.8 | |
| Mexico government bonds (MXN) | | | 2.2 | |
| Philippines government bonds (PHP) | | | 1.7 | |
| Taiwan Semiconductor Manufacturing | | | 1.7 | |
| Standard Chartered | | | 1.4 | |
| Bangkok Bank | | | 1.4 | |
| First Quantum Minerals | | | 1.4 | |
| Bharti Airtel | | | 1.3 | |
| MediaTek Inc. | | | 1.3 | |
| Hyundai Motor | | | 1.2 | |
| Ensco | | | 1.2 | |
| Sberbank of Russia | | | 1.1 | |
| RZD Capital | | | 1.1 | |
| SK Hynix | | | 1.1 | |
| Bank of China | | | 1.0 | |
| Brazil government bonds (BRL) | | | 1.0 | |
| South Africa government bonds (ZAR) | | | 1.0 | |
| Chilean inflation-linked bonds | | | 1.0 | |
| | | | 33.0 | % |
| 2 | Capital Group Emerging Markets Total Opportunities Fund |
| Asset mix (percent of net assets) | as of October 31, 2013 |
| Top 5 equity sectors | | percent of net assets |
| Financials | | | 10.2 | % |
| Consumer discretionary | | | 7.4 | |
| Materials | | | 7.3 | |
| Information technology | | | 7.2 | |
| Energy | | | 6.5 | |
15 largest country positions
| | | Percent of net assets
as of 10/31/13 |
| | | Equity | | | Bonds & notes | | | Total | |
| China (including Hong Kong) | | | 12.1 | % | | | 1.1 | % | | | 13.2 | % |
| Brazil | | | 1.9 | | | | 7.1 | | | | 9.0 | |
| Mexico | | | 1.3 | | | | 5.6 | | | | 6.9 | |
| Taiwan | | | 6.1 | | | | — | | | | 6.1 | |
| Russia | | | 2.5 | | | | 2.9 | | | | 5.4 | |
| United Kingdom* | | | 4.7 | | | | 0.1 | | | | 4.8 | |
| South Korea | | | 4.6 | | | | 0.1 | | | | 4.7 | |
| Greece | | | — | | | | 3.4 | | | | 3.4 | |
| United States of America* | | | 2.5 | | | | 0.6 | | | | 3.1 | |
| India | | | 2.2 | | | | 0.6 | | | | 2.8 | |
| Thailand | | | 2.2 | | | | — | | | | 2.2 | |
| Chile | | | 0.3 | | | | 1.8 | | | | 2.1 | |
| Netherlands | | | 1.8 | | | | — | | | | 1.8 | |
| Philippines | | | — | | | | 1.7 | | | | 1.7 | |
| Canada* | | | 1.5 | | | | 0.2 | | | | 1.7 | |
| | | | 43.7 | % | | | 25.2 | % | | | 68.9 | % |
| * | Includes investments in companies listed in developed markets that have significant operations in emerging markets. |
| Capital Group Emerging Markets Total Opportunities Fund | 3 |
tax on foreign investments in local bonds in June. By August, the government had announced a currency intervention program through year-end. The real lost 9% against the U.S. dollar over the period. Brazilian bonds fell sharply, with local bond yields climbing around 260 basis points, while U.S. dollar bond yields rose about 150 basis points.
Mexican equities rose only 2%. Weaker-than-expected economic data tempered investor enthusiasm about President Enrique Peña Nieto’s push for structural reforms in energy, education and telecommunication services after taking office in December. Mexico’s central bank surprised markets by reducing interest rates in 2013, bringing them to a record low of 3.5% by the end of the period. U.S. dollar bonds fell but local bonds in Mexico gained, supported by the slight rise of the peso, continued hopes for reform and the potential benefits of an improving U.S. economy.
Russian stocks climbed more than 10%, supported by energy stocks. Polish equities rallied 22%,buoyed by economic improvements and as the euro zone emerged from recession. Polish zloty bonds rallied sharply; the nation’s central bank lowered interest rates by 225 basis points. Hungarian local bonds were another bright spot in debt markets; Hungary’s central bank cut rates for the 15th consecutive month in October to 3.40% for a total of 360 basis points in reductions since the beginning of last August.
South African equities rose 6% despite double-digit declines in the mining sector. Fitch lowered South Africa’s credit rating following downgrades by Moody’s and Standard & Poor’s late last year. South African local bonds posted sharp losses in U.S. dollar terms, hurt by currency depreciation. Turkish equities fell 2% as violent anti-government protests aimed at Prime Minister Recep Tayyip Erdoğan erupted during the summer.
Turkish U.S. dollar and local bonds declined in U.S. dollar terms in an environment of rising inflation and a worse-than-expected trade deficit. The lira fell 10%.
Portfolio review
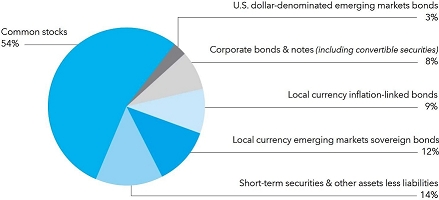
The fund’s equity investments rose sharply. During the period, managers continued to increase investments in equities, taking the fund’s exposure from 43% on November 1, 2012, to 54% as of October 31, 2013. By last November, managers had reduced exposure to U.S. dollar–denominated bonds, focusing more on local currency debt as U.S. dollar emerging markets bond spreads had narrowed. They continued to trim investments in fixed income during the reporting period, and increased cash in the portfolio. The fund’s fixed-income investments declined for the period, hurt by the bond market rout in mid-2013. Inflation-linked bonds in Brazil were the largest detractor.
A number of equity investments posted strong double-digit gains. Technology stocks were a bright spot in the portfolio. Shares of Delta Electronics continued to climb, gaining more than 50% during the period. The company, which has businesses in power supplies and industrial automation, benefited from stronger-than-expected earnings, largely attributed to cost-cutting measures and developments in its automation line. Shares of semiconductor firm SK Hynix rallied further as profits beat estimates and the company issued a more upbeat outlook on signs of improving chip prices.
The portfolio’s investments in the consumer discretionary sector also rose sharply, particularly automakers. Hyundai Motor’s profits beat expectations on robust sales in China. Multinational car dealer Inchcape reported strong first-half revenues, lifted by solid sales in Asia and other emerging markets.
In general, the fund’s emphasis on equities in China and Hong Kong had a strong positive impact on results. Investments in China and Hong Kong made up 13% of the portfolio as of October 31. Shares of Hong Kong–based Honghua Group – one of the world’s largest oil rig manufacturers – climbed from the end of 2012 through May on robust profits and as the firm continued to develop its capabilities in shale gas exploration. China’s Hilong, which makes drill pipes and other oil and gas-related products, also posted sharp gains.
Investments in industrial companies with exposure to Chinese demand further supported portfolio results. Shares of Haitian International, which has considerable business in China, climbed more than 100%; the firm makes plastic injection molding machines used in the manufacture of electronics and household products. Shares of AirTAC International, which produces pneumatics used in factory automation in China, also posted sharp gains.
In the fixed-income portion of the portfolio, investments in local sovereign bonds supported results. Investments in Greek bonds – a newer addition to the
| 4 | Capital Group Emerging Markets Total Opportunities Fund |
portfolio – rallied on signs of economic improvement and hopes that the country would be able to meet its funding needs following two bailouts. But Mexican inflation-linked bonds held back portfolio returns; inflation in Mexico continued to cool in the second half of the period. Inflation-linked bonds, which comprise about 9% of the fund’s assets, detracted from results on the whole as linkers sold off even more sharply than nominal bonds during the market decline from May to August. Brazilian inflation linkers fell most sharply. Managers trimmed investments in several inflation-linked bond markets during the period, including Poland, where the country’s inflation slowed to its lowest level in six years.
The portfolio’s small exposure to local currency Indian bonds further held back returns, as did investments in local South African bonds.
Investments in several commodity-related stocks also weighed on results. Shares of First Quantum Minerals fell amid weak profits. Metals and mining companies Anglo American and Norilsk Nickel declined as well. Gold producer Centerra Gold slid on worries about falling gold prices.
Outlook
At the beginning of last November, managers were finding attractive opportunities in both equities and local currency bonds in a lower volatility environment; at the same time, they were cautious about the potential for an increase in volatility and continued to focus on the need for downside protection. As we approach the beginning of 2014, a number of factors are contributing to a positive backdrop for equities and the likelihood of a challenging bond market. The global economy has continued to improve as Europe has emerged from recession, Japan recovers on the back of powerful monetary stimulus and the U.S. economy appears poised for modest growth. China’s economy also seems to be on the path toward more stable economic growth, and the country’s leadership continues to focus on ambitious social and economic reforms. Corporate profits in the emerging markets are likely to improve in the coming year, supported by a recovery in the global economy; equity valuations for developing market stocks are also attractive.
The world has already begun the process of adjusting to more normal monetary policy in the developed markets, but managers nonetheless remain sensitive to the potential for further adjustments. They continue to take a nimble approach to investing across the emerging markets spectrum. The fund emphasizes attractively valued small and mid-cap stocks that demonstrate the potential for strong long-term growth. At the same time, managers are finding fixed-income opportunities that offer the potential for higher yield and offer diversification in the portfolio. They are maintaining some currency hedges and holding significant levels of cash, which can be deployed as new opportunities arise and which can help provide some downside protection in the portfolio.
China- and Hong Kong-listed stocks remain major areas of investment. More broadly, managers are interested in Asian firms that are likely to benefit from rising incomes and increased consumer demand for goods and services – from automakers to gaming companies. They also favor select infrastructure firms that stand to profit from increased efficiency amid rising costs, including niche areas such as industrial automation. In addition, the portfolio features select technology firms that are well positioned to deliver in a competitive environment for low-cost smartphones and other products that meet a growing demand in the emerging markets. Financial stocks also make up a significant portion of the portfolio at about 10% of assets; managers remain focused on a few regional banks in Asia as well as several local banks that continue to expand into underpenetrated local markets.
The fund’s exposure to U.S. dollar-denominated bonds remains limited at less than 5% of the fund’s assets. Managers believe that cash, which constituted about 13% of the portfolio at the end of the reporting period, provides better protection than U.S. Treasuries against the potential for any further market adjustments. The fund features investments in local currency sovereign bonds and inflation-linked debt, which together make up about 21% of the portfolio. During the May-August period, correlations between local currency debt and U.S. dollar debt increased significantly as bond markets sold off; managers expect that a likely decoupling of local fixed-income markets and U.S. Treasuries in the coming months may provide new opportunities for additional yield and diversification within the portfolio. The fund has exposure to higher yielding markets such as Greece and Nigeria that have the potential for economic improvements following recent difficulties. The fund also continues to have a large exposure to the Brazilian local debt market, which can be challenging but nonetheless
| Capital Group Emerging Markets Total Opportunities Fund | 5 |
offers one of the highest yields in global bond markets. In addition, the fund has significant exposure to Mexico — one of the few emerging markets likely to benefit from ongoing structural reforms in the coming year.
In general, currency hedging increases the ability to manage volatility in the portfolio. Managers continue to actively hedge currency exposure and are likely to remain nimble about hedging in response to changing market conditions.
We are enthusiastic about opportunities in the emerging markets and look forward to reporting to you again in another six months.
Sincerely,

John S. Armour
President
December 23, 2013
| 6 | Capital Group Emerging Markets Total Opportunities Fund |
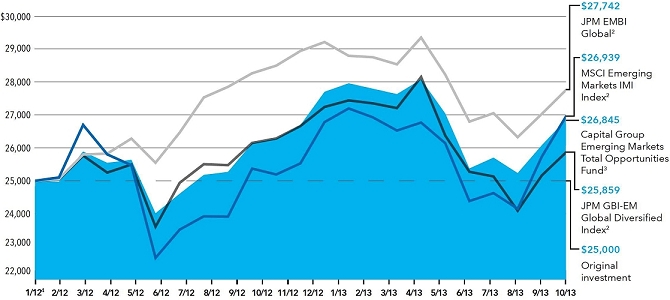
The value of a $25,000 investment
How a $25,0001 investment has grown
(for the period January 27, 2012, to October 31, 2013, with all distributions reinvested)
| Average annual total returns based on a $1,000 investment | | | Lifetime | |
| (periods ended October 31, 2013) | 1 year | | (since 1/27/12) | |
| | 2.19% | | 4.13% | |
Investment results assume all distributions are reinvested and reflect applicable fees and expenses.
| 1 | The minimum initial investment for the fund is $25,000. |
| 2 | The market indexes are unmanaged and, therefore, have no expenses. |
| 3 | Results are calculated with all distributions, if any, reinvested. |
| 4 | The date the fund began operations, January 27, 2012. |
Fund results shown are for past results and are not predictive of results for future periods. The results shown are before taxes on fund distributions and sale of fund shares. Current and future results may be lower or higher than those shown. Share prices and returns will vary, so investors may lose money. Investing for short periods makes losses more likely. For current information and month-end results, please call (800) 266-9532.
| Capital Group Emerging Markets Total Opportunities Fund | 7 |
Investment portfolio October 31, 2013
Sector diversification
| | | Equity securities | | Bonds & notes | | Percent of net assets |
| Government | | | — | % | | | 24.5 | % | | | 24.5 | % |
| Financials | | | 10.2 | | | | 1.9 | | | | 12.1 | |
| Energy | | | 6.5 | | | | 2.2 | | | | 8.7 | |
| Consumer discretionary | | | 7.4 | | | | 0.5 | | | | 7.9 | |
| Industrials | | | 6.1 | | | | 1.6 | | | | 7.7 | |
| Materials | | | 7.3 | | | | 0.3 | | | | 7.6 | |
| Information technology | | | 7.2 | | | | — | | | | 7.2 | |
| Consumer staples | | | 5.0 | | | | 0.2 | | | | 5.2 | |
| Telecommunication services | | | 3.2 | | | | 0.8 | | | | 4.0 | |
| Utilities | | | 0.7 | | | | 0.2 | | | | 0.9 | |
| Health care | | | 0.1 | | | | — | | | | 0.1 | |
| | | | 53.7 | % | | | 32.2 | % | | | 85.9 | |
| | | | | | | | | | | | | |
| Short-term securities | | | | | | | | | | | 13.7 | |
| Other assets less liabilities (including forward currency contracts) | | | | | | | | | | | 0.4 | |
| Net assets | | | | | | | | | | | 100.0 | % |
| Equity securities | | Shares | | | Value
(000) | | | Percent of
net assets | |
| Asia-Pacific 30.3% | | | | | | | | | |
| China 9.4% | | | | | | | | | | | | |
| Anhui Conch Cement Co. Ltd. (Hong Kong) | | | 629,000 | | | $ | 2,195 | | | | 0.4 | % |
| ANTA Sports Products Ltd. (Hong Kong) | | | 1,779,000 | | | | 2,552 | | | | 0.4 | |
| Bank of China Ltd. (Hong Kong) | | | 13,463,511 | | | | 6,304 | | | | 1.0 | |
| Beijing Enterprises Holdings Ltd. (Hong Kong) | | | 481,000 | | | | 3,949 | | | | 0.7 | |
| Beijing Enterprises Water Group Ltd. (Hong Kong) | | | 2,930,000 | | | | 1,304 | | | | 0.2 | |
| Boer Power Holdings Ltd. (Hong Kong) | | | 2,744,000 | | | | 2,088 | | | | 0.3 | |
| China High Speed Transmission Equipment Group Co., Ltd. (Hong Kong)1 | | | 3,464,000 | | | | 1,859 | | | | 0.3 | |
| China Overseas Grand Oceans Group, Ltd. (Hong Kong) | | | 1,499,000 | | | | 1,786 | | | | 0.3 | |
| China Petroleum & Chemical Corp. (Hong Kong) | | | 3,306,600 | | | | 2,700 | | | | 0.5 | |
| China Power International Development Ltd. (Hong Kong) | | | 1,751,000 | | | | 687 | | | | 0.1 | |
| China Resources Land Ltd. (Hong Kong) | | | 96,000 | | | | 278 | | | | 0.1 | |
| CSR Corp. Ltd. (Hong Kong) | | | 1,890,000 | | | | 1,575 | | | | 0.3 | |
| First Tractor Co. Ltd. (Hong Kong) | | | 1,594,000 | | | | 1,139 | | | | 0.2 | |
| Haitian International Holdings Ltd. (Hong Kong) | | | 1,813,000 | | | | 4,368 | | | | 0.7 | |
| Hilong Holding Ltd. (Hong Kong) | | | 6,739,000 | | | | 4,485 | | | | 0.7 | |
| Honghua Group Ltd. (Hong Kong) | | | 4,497,000 | | | | 1,369 | | | | 0.2 | |
| Industrial & Commercial Bank of China Ltd. (Hong Kong) | | | 388,000 | | | | 272 | | | | — | |
| Lenovo Group Ltd. (Hong Kong) | | | 3,990,000 | | | | 4,271 | | | | 0.7 | |
| Minth Group Ltd. (Hong Kong) | | | 1,664,000 | | | | 3,485 | | | | 0.6 | |
| Nine Dragons Paper (Holdings) Ltd. (Hong Kong) | | | 2,055,000 | | | | 1,696 | | | | 0.3 | |
| Shenguan Holdings (Group) Ltd. (Hong Kong) | | | 4,348,000 | | | | 1,940 | | | | 0.3 | |
| 8 | Capital Group Emerging Markets Total Opportunities Fund |
| | | | | | Value | | | Percent of | |
| | | Shares | | | (000) | | | net assets | |
| Asia-Pacific (continued) | | | | | | | | | | | | |
| China (continued) | | | | | | | | | | | | |
| Zhongsheng Group Holdings Ltd. (Hong Kong) | | | 740,000 | | | $ | 1,185 | | | | 0.2 | % |
| Zhuzhou CSR Times Electric Co., Ltd. (Hong Kong) | | | 1,564,000 | | | | 5,608 | | | | 0.9 | |
| | | | | | | | 57,095 | | | | 9.4 | |
| | | | | | | | | | | | | |
| Hong Kong 2.7% | | | | | | | | | | | | |
| AIA Group Ltd. | | | 692,200 | | | | 3,513 | | | | 0.6 | |
| Chow Sang Sang Holdings International Ltd. | | | 1,137,000 | | | | 3,688 | | | | 0.6 | |
| HKT Trust, units | | | 5,392,000 | | | | 5,000 | | | | 0.8 | |
| Melco Crown Entertainment Ltd. (ADR)1 | | | 12,000 | | | | 398 | | | | 0.1 | |
| SJM Holdings Ltd. | | | 1,060,000 | | | | 3,425 | | | | 0.6 | |
| Wynn Macau, Ltd. | | | 97,600 | | | | 375 | | | | — | |
| | | | | | | | 16,399 | | | | 2.7 | |
| | | | | | | | | | | | | |
| India 2.2% | | | | | | | | | | | | |
| Bharti Airtel Ltd. | | | 1,333,067 | | | | 7,963 | | | | 1.3 | |
| DLF Ltd. | | | 283,000 | | | | 698 | | | | 0.1 | |
| Jain Irrigation Systems Ltd. | | | 393,324 | | | | 428 | | | | 0.1 | |
| Sun Pharmaceutical Industries Ltd. | | | 19,750 | | | | 196 | | | | — | |
| Thermax Ltd. | | | 197,837 | | | | 2,053 | | | | 0.3 | |
| United Spirits Ltd. | | | 50,000 | | | | 2,094 | | | | 0.4 | |
| | | | | | | | 13,432 | | | | 2.2 | |
| | | | | | | | | | | | | |
| Malaysia 1.4% | | | | | | | | | | | | |
| Bumi Armada Bhd. | | | 2,242,900 | | | | 2,815 | | | | 0.5 | |
| CIMB Group Holdings Bhd. | | | 691,717 | | | | 1,638 | | | | 0.3 | |
| Genting Bhd. | | | 915,300 | | | | 3,040 | | | | 0.5 | |
| IJM Corp. Bhd. | | | 369,100 | | | | 678 | | | | 0.1 | |
| | | | | | | | 8,171 | | | | 1.4 | |
| | | | | | | | | | | | | |
| Singapore 1.7% | | | | | | | | | | | | |
| DBS Group Holdings Ltd. | | | 342,943 | | | | 4,621 | | | | 0.8 | |
| KrisEnergy Ltd.1 | | | 780,000 | | | | 772 | | | | 0.1 | |
| Mapletree Greater China Commercial Trust1 | | | 6,243,000 | | | | 4,624 | | | | 0.8 | |
| Singapore Telecommunications Ltd. | | | 111,000 | | | | 338 | | | | — | |
| | | | | | | | 10,355 | | | | 1.7 | |
| | | | | | | | | | | | | |
| South Korea 4.6% | | | | | | | | | | | | |
| Daum Communications Corp. | | | 3,000 | | | | 250 | | | | — | |
| Hyundai Engineering & Construction Co., Ltd. | | | 4,100 | | | | 235 | | | | — | |
| Hyundai Mobis Co., Ltd. | | | 13,703 | | | | 3,869 | | | | 0.6 | |
| Hyundai Motor Co. | | | 30,300 | | | | 7,227 | | | | 1.2 | |
| Korea Electric Power Corp.1 | | | 10,550 | | | | 282 | | | | 0.1 | |
| OCI Co. Ltd. | | | 26,071 | | | | 4,719 | | | | 0.8 | |
| Samsung Electronics Co. Ltd. | | | 3,092 | | | | 4,270 | | | | 0.7 | |
| SK hynix Inc.1 | | | 213,790 | | | | 6,440 | | | | 1.1 | |
| SK Telecom Co., Ltd. | | | 2,000 | | | | 428 | | | | 0.1 | |
| | | | | | | | 27,720 | | | | 4.6 | |
| | | | | | | | | | | | | |
| Taiwan 6.1% | | | | | | | | | | | | |
| AirTAC International Group | | | 371,290 | | | | 2,692 | | | | 0.4 | |
| ASUSTeK Computer Inc. | | | 410,820 | | | | 3,146 | | | | 0.5 | |
| CTCI Corp. | | | 1,379,000 | | | | 2,413 | | | | 0.4 | |
| Delta Electronics, Inc. | | | 940,000 | | | | 4,879 | | | | 0.8 | |
| Capital Group Emerging Markets Total Opportunities Fund | 9 |
| Equity securities (continued) | | | Shares | | | | Value
(000) | | | | Percent of
net assets | |
| Asia-Pacific (continued) | | | | | | | | | | | | |
| Taiwan (continued) | | | | | | | | | | | | |
| Hon Hai Precision Industry Co., Ltd. | | | 610,610 | | | $ | 1,548 | | | | 0.3 | % |
| MediaTek Inc. | | | 562,000 | | | | 7,690 | | | | 1.3 | |
| Taiwan Cement Corp. | | | 2,616,000 | | | | 3,806 | | | | 0.6 | |
| Taiwan Semiconductor Manufacturing Co. Ltd. | | | 2,677,000 | | | | 9,977 | | | | 1.7 | |
| Tripod Technology Corp. | | | 327,000 | | | | 647 | | | | 0.1 | |
| Yungtay Engineering Co., Ltd. | | | 42,000 | | | | 124 | | | | — | |
| | | | | | | | 36,922 | | | | 6.1 | |
| | | | | | | | | | | | | |
| Thailand 2.2% | | | | | | | | | | | | |
| Advanced Info Service PCL | | | 273,700 | | | | 2,242 | | | | 0.4 | |
| Bangkok Bank PCL, nonvoting depository receipt | | | 1,284,200 | | | | 8,500 | | | | 1.4 | |
| Shin Corp. PCL | | | 878,000 | | | | 2,377 | | | | 0.4 | |
| | | | | | | | 13,119 | | | | 2.2 | |
| | | | | | | | | | | | | |
| Latin America 3.5% | | | | | | | | | | | | |
| Brazil 1.9% | | | | | | | | | | | | |
| Banco Bradesco SA, preferred nominative (ADR) | | | 16,830 | | | | 243 | | | | — | |
| BRF SA, ordinary nominative | | | 16,400 | | | | 385 | | | | — | |
| BRF SA, ordinary nominative (ADR) | | | 72,100 | | | | 1,689 | | | | 0.3 | |
| Gerdau SA (ADR) | | | 416,300 | | | | 3,301 | | | | 0.6 | |
| Hypermarcas SA, ordinary nominative | | | 423,100 | | | | 3,692 | | | | 0.6 | |
| Marfrig Alimentos SA, ordinary nominative1 | | | 434,500 | | | | 883 | | | | 0.1 | |
| Mills Estruturas e Serviços de Engenharia SA, ordinary nominative | | | 52,000 | | | | 722 | | | | 0.1 | |
| Oi SA, ordinary nominative | | | 75,000 | | | | 134 | | | | — | |
| Oi SA, ordinary nominative (ADR) | | | 2,680 | | | | 5 | | | | — | |
| Oi SA, preferred nominative (ADR) | | | 116,622 | | | | 202 | | | | 0.1 | |
| Usinas Siderúgicas de Minas Gerais SA – USIMINAS, Class A, preferred nominative1 | | | 96,200 | | | | 510 | | | | 0.1 | |
| | | | | | | | 11,766 | | | | 1.9 | |
| | | | | | | | | | | | | |
| Chile 0.3% | | | | | | | | | | | | |
| Inversiones La Construcción SA | | | 98,000 | | | | 1,473 | | | | 0.2 | |
| Ripley Corp SA | | | 410,000 | | | | 360 | | | | 0.1 | |
| | | | | | | | 1,833 | | | | 0.3 | |
| | | | | | | | | | | | | |
| Mexico 1.3% | | | | | | | | | | | | |
| CEMEX, SAB de CV, ordinary participation certificates, units (ADR)1 | | | 439,953 | | | | 4,655 | | | | 0.8 | |
| Fibra Uno Administración, SAB de CV | | | 145,000 | | | | 451 | | | | 0.1 | |
| Grupo Comercial Chedraui, SAB de CV, Class B | | | 105,000 | | | | 328 | | | | — | |
| Grupo Sanborns, SAB de CV, Series B1 | | | 361,200 | | | | 749 | | | | 0.1 | |
| Impulsora del Desarrollo y el Empleo en América Latina, SAB de CV, Series B11 | | | 814,200 | | | | 1,630 | | | | 0.3 | |
| | | | | | | | 7,813 | | | | 1.3 | |
| | | | | | | | | | | | | |
| Eastern Europe and Middle East 3.5% | | | | | | | | | | | | |
| Oman 0.3% | | | | | | | | | | | | |
| bank muscat (SAOG) | | | 1,336,576 | | | | 2,076 | | | | 0.3 | |
| | | | | | | | | | | | | |
| Russia 2.5% | | | | | | | | | | | | |
| OAO Lukoil (ADR) | | | 29,529 | | | | 1,937 | | | | 0.3 | |
| OJSC Gazprom (ADR) | | | 430,532 | | | | 4,030 | | | | 0.7 | |
| OJSC Mining and Metallurgical Co. Norilsk Nickel (ADR) | | | 144,000 | | | | 2,180 | | | | 0.3 | |
| 10 | Capital Group Emerging Markets Total Opportunities Fund |
| Eastern Europe and Middle East (continued) | | Shares | | | Value
(000) | | | Percent of
net assets | |
| Russia (continued) | | | | | | | | | | | | |
| Sberbank of Russia | | | 1,484,264 | | | $ | 4,758 | | | | 0.8 | % |
| Sberbank of Russia (GDR)2 | | | 145,436 | | | | 1,857 | | | | 0.3 | |
| Yandex NV, Class A1 | | | 16,400 | | | | 604 | | | | 0.1 | |
| | | | | | | | 15,366 | | | | 2.5 | |
| | | | | | | | | | | | | |
| Turkey 0.1% | | | | | | | | | | | | |
| Türk Telekomünikasyon AŞ, Class D | | | 93,620 | | | | 324 | | | | 0.1 | |
| | | | | | | | | | | | | |
| United Arab Emirates 0.6% | | | | | | | | | | | | |
| DP World Ltd. | | | 195,452 | | | | 3,303 | | | | 0.6 | |
| | | | | | | | | | | | | |
| Other markets 11.8% | | | | | | | | | | | | |
| Australia 0.3% | | | | | | | | | | | | |
| Oil Search Ltd. | | | 195,210 | | | | 1,570 | | | | 0.3 | |
| | | | | | | | | | | | | |
| Austria 0.6% | | | | | | | | | | | | |
| Vienna Insurance Group | | | 63,879 | | | | 3,385 | | | | 0.6 | |
| | | | | | | | | | | | | |
| Canada 1.5% | | | | | | | | | | | | |
| Centerra Gold Inc. | | | 182,000 | | | | 728 | | | | 0.1 | |
| First Quantum Minerals Ltd. | | | 447,500 | | | | 8,489 | | | | 1.4 | |
| | | | | | | | 9,217 | | | | 1.5 | |
| Italy 0.4% | | | | | | | | | | | | |
| Tenaris SA (ADR) | | | 53,143 | | | | 2,488 | | | | 0.4 | |
| | | | | | | | | | | | | |
| Netherlands 1.8% | | | | | | | | | | | | |
| Fugro NV | | | 92,540 | | | | 5,790 | | | | 1.0 | |
| Unilever NV, depository receipts | | | 127,975 | | | | 5,069 | | | | 0.8 | |
| | | | | | | | 10,859 | | | | 1.8 | |
| | | | | | | | | | | | | |
| United Kingdom 4.7% | | | | | | | | | | | | |
| Anglo American PLC | | | 68,700 | | | | 1,636 | | | | 0.3 | |
| Glencore Xstrata PLC | | | 96,700 | | | | 527 | | | | 0.1 | |
| Global Ports Investments PLC (GDR) | | | 111,647 | | | | 1,563 | | | | 0.2 | |
| Imperial Tobacco Group PLC | | | 28,446 | | | | 1,062 | | | | 0.2 | |
| Inchcape PLC | | | 559,000 | | | | 5,700 | | | | 0.9 | |
| Mondi PLC | | | 25,058 | | | | 448 | | | | 0.1 | |
| Ophir Energy PLC1 | | | 311,683 | | | | 1,659 | | | | 0.3 | |
| SABMiller PLC | | | 111,300 | | | | 5,807 | | | | 1.0 | |
| Standard Chartered PLC | | | 362,857 | | | | 8,725 | | | | 1.4 | |
| Unilever PLC | | | 28,600 | | | | 1,158 | | | | 0.2 | |
| | | | | | | | 28,285 | | | | 4.7 | |
| | | | | | | | | | | | | |
| United States of America 2.5% | | | | | | | | | | | | |
| Arcos Dorados Holdings Inc., Class A | | | 455,000 | | | | 5,478 | | | | 0.9 | |
| Cobalt International Energy, Inc.1 | | | 121,800 | | | | 2,827 | | | | 0.4 | |
| Ensco PLC, Class A | | | 124,200 | | | | 7,160 | | | | 1.2 | |
| | | | | | | | 15,465 | | | | 2.5 | |
| | | | | | | | | | | | | |
| Miscellaneous 4.6% | | | | | | | | | | | | |
| Equity securities in initial period of acquisition | | | | | | | 27,681 | | | | 4.6 | |
| | | | | | | | | | | | | |
| Total equity securities (cost: $291,914,000) | | | | | | | 324,644 | | | | 53.7 | |
| Capital Group Emerging Markets Total Opportunities Fund | 11 |
| Bonds & notes | | | Principal
amount
(000) | | | | Value
(000) | | | | Percent of
net assets | |
| Latin America 16.9% | | | | | | | | | | | | |
| Argentina 0.3% | | | | | | | | | | | | |
| Provincia de Buenos Aires 10.875% January 26, 2021 | | $ | 1,675 | | | $ | 1,562 | | | | 0.3 | % |
| | | | | | | | | | | | | |
| Brazil 7.1% | | | | | | | | | | | | |
| Banco Votorantim SA 6.25% May 16, 20163 | | BRL | 1,000 | | | | 491 | | | | 0.1 | |
| Brazil (Federal Republic of) Global: | | | | | | | | | | | | |
| 4.875% January 22, 2021 | | $ | 2,000 | | | | 2,180 | | | | 0.4 | |
| 10.25% January 10, 2028 | | BRL | 1,961 | | | | 882 | | | | 0.1 | |
| Brazil Notas do Tesouro Nacional: | | | | | | | | | | | | |
| Series F, 10.00% January 1, 2014 – January 1, 2021 | | | 13 | | | | 5,393 | | | | 0.9 | |
| Series B, 6.00% May 15, 2015 – August 15, 20503 | | | 26 | | | | 27,853 | | | | 4.6 | |
| Cosan Luxembourg SA 9.50% March 14, 2018 | | | 500 | | | | 201 | | | | — | |
| Marfrig Holdings (Europe) BV 8.375% May 9, 2018 | | $ | 450 | | | | 427 | | | | 0.1 | |
| Marfrig Overseas Ltd.: | | | | | | | | | | | | |
| 9.50% May 4, 2020 | | | 105 | | | | 102 | | | | — | |
| 9.50% May 4, 20202 | | | 525 | | | | 512 | | | | 0.1 | |
| Odebrecht Drilling Norbe VIII/IX Ltd. 6.35% June 30, 2021 | | | 254 | | | | 269 | | | | — | |
| Odebrecht Offshore Drilling Finance Ltd. 6.75% October 1, 20222 | | | 4,630 | | | | 4,838 | | | | 0.8 | |
| | | | | | | | 43,148 | | | | 7.1 | |
| Chile 1.8% | | | | | | | | | | | | |
| Banco Santander Chile: | | | | | | | | | | | | |
| 2.265% February 14, 20142,4 | | | 2,450 | | | | 2,445 | | | | 0.4 | |
| 2.133% June 7, 20182,4 | | | 1,200 | | | | 1,205 | | | | 0.2 | |
| Chilean Government: | | | | | | | | | | | | |
| 3.00% March 1, 2018 – March 1, 20233 | | CLP | 129,000 | | | | 6,139 | | | | 1.0 | |
| Emgesa SA ESP 8.75% January 25, 2021 | | COP | 1,770,000 | | | | 995 | | | | 0.2 | |
| | | | | | | | 10,784 | | | | 1.8 | |
| Colombia 0.2% | | | | | | | | | | | | |
| Colombia (Republic of), Series B, 5.00% November 21, 2018 | | | 1,530,000 | | | | 786 | | | | 0.1 | |
| Transportadora de Gas Internacional 5.70% March 20, 20222 | | $ | 400 | | | | 419 | | | | 0.1 | |
| | | | | | | | 1,205 | | | | 0.2 | |
| Mexico 5.6% | | | | | | | | | | | | |
| BBVA Bancomer SA 6.50% March 10, 2021 | | | 250 | | | | 272 | | | | — | |
| CEMEX, SAB de CV 9.25% May 12, 2020 | | | 250 | | | | 274 | | | | 0.1 | |
| United Mexican States Government: | | | | | | | | | | | | |
| Series MI10, 9.50% December 18, 2014 | | MXN | 29 | | | | 233 | | | | — | |
| Series M10, 7.75% December 14, 2017 | | | 12 | | | | 105 | | | | — | |
| 2.50% December 10, 20203 | | | 78 | | | | 620 | | | | 0.1 | |
| Series M, 6.50% June 10, 2021 | | | 548 | | | | 4,424 | | | | 0.7 | |
| Series M20, 10.00% December 5, 2024 | | | 855 | | | | 8,653 | | | | 1.4 | |
| Series M30, 10.00% November 20, 2036 | | | 25 | | | | 249 | | | | 0.1 | |
| 4.00% November 15, 20403 | | | 1,979 | | | | 15,976 | | | | 2.7 | |
| United Mexican States Government Global, Series A, 6.05% January 11, 2040 | | $ | 1,550 | | | | 1,763 | | | | 0.3 | |
| 12 | Capital Group Emerging Markets Total Opportunities Fund |
| | | | Principal
amount
(000) | | | | Value
(000 | ) | | | Percent of
net assets | |
| Latin America (continued) | | | | | | | | | | | | |
| Mexico (continued) | | | | | | | | | | | | |
| Urbi, Desarrollos Urbanos SAB de CV: | | | | | | | | | | | | |
| 8.50% April 19, 20165 | | $ | 1,425 | | | $ | 242 | | | | — | % |
| 8.50% April 19, 20162,5 | | | 560 | | | | 95 | | | | — | |
| 9.50% January 21, 20205 | | | 2,400 | | | | 408 | | | | 0.1 | |
| 9.50% January 21, 20202,5 | | | 230 | | | | 39 | | | | — | |
| 9.75% February 3, 20225 | | | 990 | | | | 168 | | | | — | |
| 9.75% February 3, 20222,5 | | | 1,655 | | | | 282 | | | | 0.1 | |
| | | | | | | | 33,803 | | | | 5.6 | |
| Panama 0.0% | | | | | | | | | | | | |
| ENA Norte Trust 4.95% April 25, 20282 | | | 238 | | | | 238 | | | | — | |
| | | | | | | | | | | | | |
| Peru 0.8% | | | | | | | | | | | | |
| Banco de Crédito del Perú: | | | | | | | | | | | | |
| 4.75% March 16, 2016 | | | 465 | | | | 495 | | | | 0.1 | |
| 6.875% September 16, 2026 | | | 1,800 | | | | 1,974 | | | | 0.3 | |
| Perú (Republic of) 5.20% September 12, 2023 | | PEN | 100 | | | | 361 | | | | 0.1 | |
| Transportadora de Gas del Perú SA 4.25% April 30, 20282 | | $ | 2,115 | | | | 1,923 | | | | 0.3 | |
| | | | | | | | 4,753 | | | | 0.8 | |
| Uruguay 0.2% | | | | | | | | | | | | |
| Uruguay (Republic of): | | | | | | | | | | | | |
| 5.00% September 14, 20183 | | UYU | 5,167 | | | | 267 | | | | — | |
| 4.375% December 15, 20283 | | | 23,784 | | | | 1,215 | | | | 0.2 | |
| | | | | | | | 1,482 | | | | 0.2 | |
| Venezuela 0.9% | | | | | | | | | | | | |
| Venezuela (Republic of): | | | | | | | | | | | | |
| 9.25% September 15, 2027 – May 7, 2028 | | $ | 6,100 | | | | 5,050 | | | | 0.9 | |
| 9.375% January 13, 2034 | | | 225 | | | | 180 | | | | — | |
| | | | | | | | 5,230 | | | | 0.9 | |
| | | | | | | | | | | | | |
| Eastern Europe and Middle East 7.6% | | | | | | | | | | | | |
| Croatia 0.2% | | | | | | | | | | | | |
| Croatian Government: | | | | | | | | | | | | |
| 5.50% April 4, 2023 | | | 200 | | | | 199 | | | | — | |
| 5.50% April 4, 20232 | | | 1,175 | | | | 1,172 | | | | 0.2 | |
| | | | | | | | 1,371 | | | | 0.2 | |
| Greece 3.4% | | | | | | | | | | | | |
| Greek Government: | | | | | | | | | | | | |
| 2.00% February 24, 2023 – February 24, 2042 | | EUR | 27,420 | | | | 20,628 | | | | 3.4 | |
| | | | | | | | | | | | | |
| Hungary 0.1% | | | | | | | | | | | | |
| Hungarian Government: | | | | | | | | | | | | |
| 4.125% February 19, 2018 | | $ | 180 | | | | 181 | | | | — | |
| 6.25% January 29, 2020 | | | 305 | | | | 333 | | | | 0.1 | |
| | | | | | | | 514 | | | | 0.1 | |
| Poland 0.1% | | | | | | | | | | | | |
| Poland Government Bond 4.00% October 25, 2023 | | PLN | 1,931 | | | | 619 | | | | 0.1 | |
| Capital Group Emerging Markets Total Opportunities Fund | 13 |
| Bonds & notes (continued) | | | Principal
amount
(000) | | | | Value
(000) | | | | Percent of
net assets | |
| Eastern Europe and Middle East (continued) | | | | | | | | | | | | |
| Russia 2.9% | | | | | | | | | | | | |
| Brunswick Rail Finance Ltd. 6.50% November 1, 20172 | | $ | 750 | | | $ | 768 | | | | 0.1 | % |
| Gazprom OJSC 4.95% July 19, 20222 | | | 270 | | | | 268 | | | | — | |
| OJSC AK Transneft 5.67% March 5, 2014 | | | 495 | | | | 504 | | | | 0.1 | |
| Russian Federal Bond – OFZ 7.05% January 19, 2028 | | RUB | 158,500 | | | | 4,767 | | | | 0.8 | |
| Russian Foreign Bond – Eurobond 3.50% January 16, 20192 | | $ | 4,400 | | | | 4,530 | | | | 0.7 | |
| RZD Capital Ltd. 8.30% April 2, 2019 | | RUB | 206,200 | | | | 6,516 | | | | 1.1 | |
| Sberbank of Russia 5.717% June 16, 2021 | | $ | 300 | | | | 322 | | | | 0.1 | |
| | | | | | | | 17,675 | | | | 2.9 | |
| Slovenia 0.8% | | | | | | | | | | | | |
| Slovenia (Republic of): | | | | | | | | | | | | |
| 5.50% October 26, 2022 | | | 3,795 | | | | 3,643 | | | | 0.6 | |
| 5.85% May 10, 20232 | | | 865 | | | | 848 | | | | 0.2 | |
| | | | | | | | 4,491 | | | | 0.8 | |
| United Arab Emirates 0.1% | | | | | | | | | | | | |
| Abu Dhabi National Energy Co. PJSC (TAQA) 4.125% March 13, 2017 | | | 300 | | | | 318 | | | | 0.1 | |
| | | | | | | | | | | | | |
| Asia Pacific 3.5% | | | | | | | | | | | | |
| China 1.1% | | | | | | | | | | | | |
| CNOOC Finance 2013 Ltd.: | | | | | | | | | | | | |
| 1.75% May 9, 2018 | | | 400 | | | | 394 | | | | 0.1 | |
| 3.00% May 9, 2023 | | | 2,550 | | | | 2,326 | | | | 0.4 | |
| Longfor Properties Co. Ltd. 9.50% April 7, 2016 | | | 2,300 | | | | 2,465 | | | | 0.4 | |
| Renhe Commercial Holdings Co. Ltd.: | | | | | | | | | | | | |
| 11.75% May 18, 2015 | | | 1,275 | | | | 918 | | | | 0.1 | |
| 13.00% March 10, 2016 | | | 550 | | | | 374 | | | | 0.1 | |
| | | | | | | | 6,477 | | | | 1.1 | |
| India 0.6% | | | | | | | | | | | | |
| India Government Bond 9.15% November 14, 2024 | | INR | 230,000 | | | | 3,788 | | | | 0.6 | |
| | | | | | | | | | | | |
| Philippines 1.7% | | | | | | | | | | | | |
| Philippines (Republic of): | | | | | | | | | | | | |
| 4.95% January 15, 2021 | | PHP | 169,000 | | | | 4,341 | | | | 0.7 | |
| Series 1054, 6.375% January 19, 2022 | | | 157,481 | | | | 4,460 | | | | 0.7 | |
| 3.90% November 26, 2022 | | | 47,000 | | | | 1,120 | | | | 0.2 | |
| 6.25% January 14, 2036 | | | 23,000 | | | | 607 | | | | 0.1 | |
| | | | | | | | 10,528 | | | | 1.7 | |
| | | | | | | | | | | | | |
| South Korea 0.1% | | | | | | | | | | | | |
| Export-Import Bank of Korea 1.104% September 17, 20164 | | $ | 620 | | | | 620 | | | | 0.1 | |
| | | | | | | | | | | | |
| Africa 2.1% | | | | | | | | | | | | |
| Angola 0.0% | | | | | | | | | | | | |
| Republic of Angola, Series 2012-1, 7.00% August 16, 2019 | | | 250 | | | | 271 | | | | — | |
| | | | | | | | | | | | | |
| Nigeria 1.0% | | | | | | | | | | | | |
| Nigerian Government Bond 10.00% July 23, 2030 | | NGN | 1,140,800 | | | | 5,808 | | | | 1.0 | |
| | | | | | | | | | | | |
| 14 | Capital Group Emerging Markets Total Opportunities Fund |
| | | Principal
amount
(000) | | | Value
(000) | | | Percent
of net
assets | |
| Africa (continued) | | | | | | | | | |
| South Africa 1.1% | | | | | | | | | |
| South Africa (Republic of): | | | | | | | | | | | | |
| Series R-2023, 7.75% February 28, 2023 | | ZAR | 57,000 | | | $ | 5,739 | | | | 0.9 | % |
| Series 197, 5.50% December 7, 20233 | | | 3,141 | | | | 428 | | | | 0.1 | |
| Series R214, 6.50% February 28, 2041 | | | 7,000 | | | | 523 | | | | 0.1 | |
| | | | | | | | 6,690 | | | | 1.1 | |
| Other markets 1.7% | | | | | | | | | | | | |
| Canada 0.2% | | | | | | | | | | | | |
| Inmet Mining Corp.: | | | | | | | | | | | | |
| 0.2% 8.75% June 1, 2020 | | $ | 220 | | | | 244 | | | | — | |
| 7.50% June 1, 20212 | | | 955 | | | | 1,017 | | | | 0.2 | |
| | | | | | | | 1,261 | | | | 0.2 | |
| Jamaica 0.4% | | | | | | | | | | | | |
| Digicel Group Ltd. 8.25% September 30, 20202 | | | 2,375 | | | | 2,518 | | | | 0.4 | |
| | | | | | | | | | | | | |
| Sweden 0.1% | | | | | | | | | | | | |
| Millicom International Cellular SA 6.625% October 15, 20212 | | | 750 | | | | 774 | | | | 0.1 | |
| | | | | | | | | | | | | |
| Switzerland 0.3% | | | | | | | | | | | | |
| Transocean Inc. 6.375% December 15, 2021 | | | 1,700 | | | | 1,918 | | | | 0.3 | |
| | | | | | | | | | | | | |
| United Kingdom 0.1% | | | | | | | | | | | | |
| SABMiller Holdings, Inc. 1.85% January 15, 20152 | | | 400 | | | | 405 | | | | 0.1 | |
| | | | | | | | | | | | | |
| United States of America 0.6% | | | | | | | | | | | | |
| Arcos Dorados Holdings Inc. 10.25% July 13, 20162 | | BRL | 3,900 | | | | 1,717 | | | | 0.3 | |
| Trilogy International Partners, LLC 10.25% August 15, 20162 | | $ | 1,700 | | | | 1,692 | | | | 0.3 | |
| | | | | | | | 3,409 | | | | 0.6 | |
| Miscellaneous 0.4% | | | | | | | | | | | | |
| Bonds and notes in initial period of acquisition | | | | | | | 2,373 | | | | 0.4 | |
| | | | | | | | | | | | | |
| Total bonds and notes (cost: $204,507,000) | | | | | | | 194,661 | | | | 32.2 | |
| | | | | | | | | | | | | |
| Short-term securities | | | | | | | | | | | | |
| Commercial paper 11.9% | | | | | | | | | | | | |
| American Honda Finance Corp. 0.11% due 11/7/13 | | | 11,500 | | | | 11,500 | | | | 1.9 | |
| Bank of Nova Scotia 0.14% due 12/11/13 | | | 15,100 | | | | 15,098 | | | | 2.5 | |
| Mitsubishi UFJ Trust & Banking Corp. 0.17% due 11/4/132 | | | 8,700 | | | | 8,700 | | | | 1.4 | |
| National Australia Funding Delaware, Inc. 0.03% due 11/1/132 | | | 15,000 | | | | 15,000 | | | | 2.5 | |
| Sumitomo Mitsui Banking Corp. 0.16% due 12/2/132 | | | 3,300 | | | | 3,299 | | | | 0.6 | |
| Svenska Handelsbanken, Inc. 0.12% due 11/1/132 | | | 5,100 | | | | 5,100 | | | | 0.8 | |
| Toronto-Dominion Holdings USA, Inc. 0.12% due 11/5/132 | | | 8,900 | | | | 8,900 | | | | 1.5 | |
| Victory Receivables Corp. 0.15% due 11/8/132 | | | 4,000 | | | | 4,000 | | | | 0.7 | |
| | | | | | | | 71,597 | | | | 11.9 | |
| Capital Group Emerging Markets Total Opportunities Fund | 15 |
Short-term securities (continued)
Discount note 1.8% | | | Principal
amount
(000) | | | | Value
(000) | | | | Percent
of net
assets | |
| Federal Home Loan Mortgage Corp. 0.11% due 11/19/13 | | $ | 10,900 | | | $ | 10,900 | | | | 1.8 | % |
| | | | | | | | | | | | | |
| Total short-term securities (cost: $82,496,000) | | | | | | | 82,497 | | | | 13.7 | |
| Total investment securities (cost: $578,917,000) | | | | | | | 601,802 | | | | 99.6 | |
| Other assets less liabilities (including forward currency contracts) | | | | | | | 2,370 | | | | 0.4 | |
| | | | | | | | | | | | | |
| Net assets | | | | | | $ | 604,172 | | | | 100.0 | % |
| 1 | Security did not produce income during the last 12 months. |
| 2 | Acquired in a transaction exempt from registration under Rule 144A or section 4(2) of the Securities Act of 1933 (not including purchases of securities that were publicly offered in the primary local market but were not registered under U.S. securities laws). May be resold in the U.S. in transactions exempt from registration, normally to qualified institutional buyers.The total value of all such securities was $74,561,000, which represented 12.34% of the net assets of the fund. |
| 3 | Index-linked bond whose principal amount moves with a government retail price index. |
| 4 | Coupon rate may change periodically. |
| 5 | Scheduled interest and/or principal payment was not received. |
| |
Key to abbreviations
Securities: |
| ADR — American Depositary Receipts |
| GDR — Global Depositary Receipts |
| |
| Currency: |
| BRL — Brazilian real |
| CLP — Chilean peso |
| COP — Colombian peso |
| EUR — Euro |
| INR — Indian rupee |
| MXN — Mexican peso |
| NGN — Nigerian naira |
| PEN — Peruvian nuevo sol |
| PHP — Philippine peso |
| PLN — Polish zloty |
| RUB — Russian ruble |
| UYU — Uruguayan peso |
| ZAR — South African rand |
| 16 | Capital Group Emerging Markets Total Opportunities Fund |
| Financial statements | |
Statement of assets and liabilities
at October 31, 2013 | |
| | (dollars in thousands, except per-share data) |
| Assets: | | | | | | | | |
| Investment securities,at value: (cost: $578,917) | | | | | | $ | 601,802 | |
| Cash | | | | | | | 181 | |
| Unrealized appreciation on open forward currency contracts | | | | | | | 1,086 | |
| Receivables for: | | | | | | | | |
| Sales of fund’s shares | | $ | 15 | | | | | |
| Dividends and interest | | | 3,725 | | | | | |
| Other | | | 2 | | | | 3,742 | |
| | | | | | | | 606,811 | |
| Liabilities: | | | | | | | | |
| Unrealized depreciation on open forward currency contracts | | | | | | | 308 | |
| Payables for: | | | | | | | | |
| Purchases of investments | | | 437 | | | | | |
| Investment advisory services | | | 511 | | | | | |
| Repurchases of fund’s shares | | | 1,266 | | | | | |
| Other accrued expenses | | | 117 | | | | 2,331 | |
| | | | | | | | 2,639 | |
| Net assets at October 31, 2013: | | | | | | | | |
| Equivalent to $11.51 per share on 52,489,784 shares of $0.01 par value capital stock outstanding (unlimited authorized shares) | | | | | | $ | 604,172 | |
| | | | | | | | | |
| Net assets consist of: | | | | | | | | |
| Capital paid in on shares of stock | | | | | | $ | 583,367 | |
| Undistributed net investment income | | | | | | | 7,340 | |
| Accumulated net realized loss | | | | | | | (10,199 | ) |
| Net unrealized appreciation | | | | | | | 23,664 | |
| Net assets at October 31, 2013 | | | | | | $ | 604,172 | |
See Notes to Financial Statements
| Capital Group Emerging Markets Total Opportunities Fund | 17 |
Statement of operations
for the year ended October 31, 2013 | |
| | (dollars in thousands) |
| Investment income: | | | | | | | | |
| Income: | | | | | | | | |
| Interest (net of non-U.S. withholding tax of $150) | | $ | 15,158 | | | | | |
| Dividends (net of non-U.S. withholding tax of $589) | | | 7,273 | | | $ | 22,431 | |
| | | | | | | | | |
| Fees and expenses: | | | | | | | | |
| Investment advisory services | | | 5,846 | | | | | |
| Custodian | | | 193 | | | | | |
| Registration statement and prospectus | | | 142 | | | | | |
| Auditing and legal | | | 67 | | | | | |
| Reports to shareholders | | | 4 | | | | | |
| Trustees’ compensation | | | 65 | | | | | |
| Other | | | 91 | | | | | |
| Total fees and expenses | | | | | | | 6,408 | |
| Net investment income | | | | | | | 16,023 | |
| | | | | | | | | |
| Net realized loss and unrealized appreciation on investments, forward currency contracts and currency: | | | | | | | | |
| Net realized loss on: | | | | | | | | |
| Investments | | | (7,726 | ) | | | | |
| Forward currency contracts | | | (3,828 | ) | | | | |
| Currency transactions | | | (233 | ) | | | (11,787 | ) |
| Net unrealized appreciation on: | | | | | | | | |
| Investments (net of non-U.S. taxes of $(4)) | | | 3,970 | | | | | |
| Forward currency contracts | | | 756 | | | | | |
| Currency translations | | | 15 | | | | 4,741 | |
| Net realized loss and unrealized appreciation on investments,forward currency contracts and currency | | | | | | | (7,046 | ) |
| | | | | | | | | |
| Net increase in net assets resulting from operations | | | | | | $ | 8,977 | |
See Notes to Financial Statements
| 18 | Capital Group Emerging Markets Total Opportunities Fund |
| Statements of changes in net assets | |
| | (dollars in thousands) |
| | | Year ended | | | For the period | | | For the period | | | Year ended | |
| Operations: | | 10/31/13 | | | 1/27/12–10/31/121 | | | 1/1/12–1/26/122 | | | 12/31/112 | |
| Net investment income | | $ | 16,023 | | | $ | 14,212 | | | $ | 1,112 | | | $ | 15,787 | |
| Net realized loss on investments, forward currency contracts and currency transactions | | | (11,787 | ) | | | (4,132 | ) | | | (4,408 | ) | | | (5,404 | ) |
| Net unrealized appreciation (depreciation) on investments, forward currency contracts and currency translations | | | 4,741 | | | | 12,736 | | | | 23,664 | | | | (31,418 | ) |
| Net increase (decrease) in net assets resulting from operations | | | 8,977 | | | | 22,816 | | | | 20,368 | | | | (21,035 | ) |
| | | | | | | | | | | | | | | | | |
| Dividends paid to shareholders: | | | | | | | | | | | | | | | | |
| Dividends from net investment income | | | (14,914 | ) | | | — | | | | — | | | | — | |
| | | | | | | | | | | | | | | | | |
| Capital share transactions: | | | | | | | | | | | | | | | | |
| Proceeds from shares sold: 13,906,574, 11,008,378, 0 and 13,413,689 shares, respectively | | | 161,635 | | | | 123,646 | | | | — | | | | 145,154 | |
| Proceeds from shares issued in reinvestment of net investment income dividends: 1,183,067 and 0 shares, respectively | | | 13,854 | | | | — | | | | — | | | | — | |
| Cost of shares repurchased: 7,324,412, 1,397,615, 1,376,931 and 2,289,015 shares, respectively | | | (83,143 | ) | | | (15,695 | ) | | | (14,651 | ) | | | (24,860 | ) |
| | | | | | | | | | | | | | | | | |
| Net increase (decrease) in net assets resulting from capital share transactions | | | 92,346 | | | | 107,951 | | | | (14,651 | ) | | | 120,294 | |
| | | | | | | | | | | | | | | | | |
| Total increase in net assets | | | 86,409 | | | | 130,767 | | | | 5,717 | | | | 99,259 | |
| | | | | | | | | | | | | | | | | |
| Net assets: | | | | | | | | | | | | | | | | |
| Beginning of period | | | 517,763 | | | | 386,996 | | | | 381,279 | | | | 282,020 | |
| End of period (including undistributed net investment income: $7,340, $12,284, – and –, respectively) | | $ | 604,172 | | | $ | 517,763 | | | $ | 386,996 | | | $ | 381,279 | |
| 1 | The fund commenced operations as a Registered Investment Company on January 27, 2012. |
| 2 | Capital Guardian Emerging Markets Total Opportunities Common Trust Fund (the Predecessor Fund) was reorganized into the Capital Group Emerging Markets Total Opportunities Fund at the close of business effective January 27, 2012. In connection with the reorganization, the Predecessor Fund transferred all its assets and liabilities to the Capital Group Emerging Markets Total Opportunities Fund and changed its fiscal year-end from December to October. |
See Notes to Financial Statements
| Capital Group Emerging Markets Total Opportunities Fund | 19 |
Notes to financial statements
1. Organization
Capital Group Emerging Markets Total Opportunities Fund (the “fund”) was organized on November 18, 2011, as a Delaware statutory trust. The fund is registered under the Investment Company Act of 1940, as amended, as an open-end management investment company. The fund seeks long-term growth and preservation of capital with lower volatility of returns than emerging market equities by allocating a portion of its assets to bonds and other debt securities of emerging market issuers.
Capital Guardian Emerging Markets Total Opportunities Fund for Tax-Exempt Trusts (the “Predecessor Fund”) was reorganized and merged into Capital Group Emerging Markets Total Opportunities Fund, pursuant to the approval of the trustee of the Predecessor Fund and the board of trustees of the fund on October 26, 2011, and October 20, 2011, respectively. The Predecessor Fund transferred all of its assets and liabilities to the fund, effective at the close of business January 27, 2012. In connection with the reorganization, the fiscal year-end and tax year-end of the Predecessor Fund was changed from December 31 to October 31.
2. Significant accounting policies
The financial statements have been prepared to comply with accounting principles generally accepted in the United States of America. These principles require management to make estimates and assumptions that affect reported amounts and disclosures. Actual results could differ from those estimates. The fund follows the significant accounting policies described below, as well as the valuation policies described in the next section on valuation.
Security transactions and related investment income — Security transactions are recorded by the fund as of the date the trades are executed with brokers. Realized gains and losses from security transactions are determined based on the specific identified cost of the securities. In the event a security is purchased with a delayed payment date, the fund will segregate liquid assets sufficient to meet its payment obligations. Dividend income is recognized on the ex-dividend date and interest income is recognized on an accrual basis. Market discounts, premiums and original issue discounts on fixed-income securities are amortized daily over the expected life of the security.
Dividends and distributions to shareholders — Dividends and distributions to shareholders are recorded on the ex-dividend date.
Currency translation — Assets and liabilities, including investment securities, denominated in currencies other than U.S. dollars are translated into U.S. dollars at the exchange rates supplied by one or more pricing vendors on the valuation date. Purchases and sales of investment securities and income and expenses are translated into U.S. dollars at the exchange rates on the dates of such transactions. On the accompanying financial statements, the effects of changes in exchange rates on investment securities are included with the net realized gain or loss and net unrealized appreciation or depreciation on investments. The realized gain or loss and unrealized appreciation or depreciation resulting from all other transactions denominated in currencies other than U.S. dollars are disclosed separately.
3. Valuation
Capital Guardian Trust Company (“CGTC”), the fund’s investment adviser, values the fund’s investments at fair value as defined by accounting principles generally accepted in the United States of America. The net asset value of the fund is the value of a single share. The fund calculates its net asset value each day the New York Stock Exchange is open for trading as of approximately 4:00 p.m. New York time, the normal close of regular trading.
Methods and inputs — The fund’s investment adviser uses the following methods and inputs to establish the fair value of the fund’s assets and liabilities. Use of particular methods and inputs may vary over time based on availability and relevance as market and economic conditions evolve.
Equity securities are generally valued at the official closing price of, or the last reported sale price on, the exchange or market on which such securities are traded, as of the close of business on the day the securities are being valued or, lacking any sales, at the last available bid price. Prices for each security are taken from the principal exchange or market on which the security trades.
| 20 | Capital Group Emerging Markets Total Opportunities Fund |
Fixed-income securities, including short-term securities purchased with more than 60 days left to maturity, are generally valued at prices obtained from one or more pricing vendors. Vendors value such securities based on one or more of the inputs described in the following table. The table provides examples of inputs that are commonly relevant for valuing particular classes of fixed-income securities in which the fund is authorized to invest. However, these classifications are not exclusive and any of the inputs may be used to value any other class of fixed-income security.
| Fixed-income class | | Examples of standard inputs |
| All | | Benchmark yields, transactions, bids, offers, quotations from dealers and trading systems, new issues, spreads and other relationships observed in the markets among comparable securities; and proprietary pricing models such as yield measures calculated using factors such as cash flows, financial or collateral performance and other reference data (collectively referred to as “standard inputs”) |
| Corporate bonds & notes; convertible securities | | Standard inputs and underlying equity of the issuer |
| Bonds & notes of governments & government agencies | | Standard inputs and interest rate volatilities |
When the fund’s investment adviser deems it appropriate to do so (such as when vendor prices are unavailable or not deemed to be representative), fixed-income securities will be valued in good faith at the mean quoted bid and ask prices that are reasonably and timely available (or bid prices, if ask prices are not available) or at prices for securities of comparable maturity, quality and type.
Securities with both fixed-income and equity characteristics, or equity securities traded principally among fixed-income dealers, are generally valued in the manner described above for either equity or fixed-income securities, depending on which method is deemed most appropriate by the fund’s investment adviser. Short-term securities purchased within 60 days to maturity are valued at amortized cost, which approximates fair value. The value of short-term securities originally purchased with maturities greater than 60 days is determined based on an amortized value to par when they reach 60 days. Forward currency contracts are valued at the mean of representative quoted bid and ask prices, generally based on prices supplied by one or more vendors.
Securities and other assets for which representative market quotations are not readily available or are considered unreliable by the fund’s investment adviser are fair valued as determined in good faith under fair value guidelines adopted by authority of the fund’s board of trustees as further described below. The investment adviser follows fair valuation guidelines, consistent with U.S. Securities and Exchange Commission (“SEC”) rules and guidance, to consider relevant principles and factors when making fair value determinations. The investment adviser considers relevant indications of value that are reasonably and timely available to it in determining the fair value to be assigned to a particular security, such as the type and cost of the security; contractual or legal restrictions on resale of the security; relevant financial or business developments of the issuer; actively traded similar or related securities; conversion or exchange rights on the security; related corporate actions; significant events occurring after the close of trading in the security; and changes in overall market conditions. In addition, the closing prices of equity securities that trade in markets outside U.S. time zones may be adjusted to reflect significant events that occur after the close of local trading but before the net asset value of the fund is determined. Fair valuations and valuations of investments that are not actively trading involve judgment and may differ materially from valuations that would have been used had greater market activity occurred.
Processes and structure — The fund’s board of trustees has delegated authority to the fund’s investment adviser to make fair value determinations, subject to board oversight. The investment adviser has established a Joint Fair Valuation Committee (the “Fair Valuation Committee”) to administer, implement and oversee the fair valuation process, and to make fair value decisions. The Fair Valuation Committee regularly reviews its own fair value decisions, as well as decisions made under its standing instructions to the investment adviser’s valuation teams. The Fair Valuation Committee reviews changes in fair value measurements from period to period and may, as deemed appropriate, update the fair valuation guidelines to better reflect the results of back testing and address new or evolving issues. The Fair Valuation Committee reports any changes to the fair valuation guidelines to the board of trustees with supplemental information to support the changes. The fund’s board of trustees and audit committee also regularly review reports that describe fair value determinations and methods.
| Capital Group Emerging Markets Total Opportunities Fund | 21 |
The fund’s investment adviser has also established a Fixed-Income Pricing Review Group to administer and oversee the fixed-income valuation process, including the use of fixed-income pricing vendors. This group regularly reviews pricing vendor information and market data. Pricing decisions, processes and controls over security valuation are also subject to internal reviews, including an annual control self-evaluation program facilitated by the investment adviser’s compliance group.
Classifications — The fund’s investment adviser classifies the fund’s assets and liabilities into three levels based on the inputs used to value the assets or liabilities. Level 1 values are based on quoted prices in active markets for identical securities. Level 2 values are based on significant observable market inputs, such as quoted prices for similar securities and quoted prices in inactive markets. Certain securities trading outside the U.S. may transfer between Level 1 and Level 2 due to valuation adjustments resulting from significant market movements following the close of local trading. Level 3 values are based on significant unobservable inputs that reflect the investment adviser’s determination of assumptions that market participants might reasonably use in valuing the securities. The valuation levels are not necessarily an indication of the risk or liquidity associated with the underlying investment. For example, U.S. government securities are reflected as Level 2 because the inputs used to determine fair value may not always be quoted prices in an active market. The following tables present the fund’s valuation levels as of October 31, 2013 (dollars in thousands):
| | | Investment securities | |
| | | Level 1 | | | Level 2 | | | Level 3 | | | Total | |
| Assets: | | | | | | | | | | | | | | | | |
| Equity securities: | | | | | | | | | | | | | | | | |
| Asia-Pacific | | $ | 183,213 | | | $ | — | | | $ | — | | | $ | 183,213 | |
| Other markets | | | 113,750 | | | | — | | | | — | | | | 113,750 | |
| Bonds and notes: | | | | | | | | | | | | | | | | |
| Latin America | | | — | | | | 102,205 | | | | — | | | | 102,205 | |
| Eastern Europe and Middle East | | | — | | | | 45,616 | | | | — | | | | 45,616 | |
| Other markets | | | — | | | | 44,467 | | | | — | | | | 44,467 | |
| Miscellaneous | | | 27,681 | | | | 2,373 | | | | — | | | | 30,054 | |
| Short-term securities | | | — | | | | 82,497 | | | | — | | | | 82,497 | |
| Total | | $ | 324,644 | | | $ | 277,158 | | | $ | — | | | $ | 601,802 | |
| | | Other investments* | |
| | | Level 1 | | | Level 2 | | | Level 3 | | | Total | |
| Assets: | | | | | | | | | | | | | | | | |
| Unrealized appreciation on open forward currency contracts | | $ | — | | | $ | 1,086 | | | $ | — | | | $ | 1,086 | |
| Liabilities: | | | | | | | | | | | | | | | | |
| Unrealized depreciation on open forward currency contracts | | | — | | | | (308 | ) | | | — | | | | (308 | ) |
| Total | | $ | — | | | $ | 778 | | | $ | — | | | $ | 778 | |
*Forward currency contracts are not included in the investment portfolio.
4. Principal risks
This section describes the principal risks associated with the fund’s principal investment strategies. You may lose money by investing in the fund. The likelihood of loss may be greater if you invest for a shorter period of time.
Market conditions — The prices of, and the income generated by, the securities held by the fund may decline due to market conditions and other factors, including those directly involving the issuers of securities held by the fund.
Investing in growth-oriented stocks — Growth-oriented stocks may involve larger price swings and greater potential for loss than other types of investments. These risks may be even greater in the case of smaller capitalization stocks.
| 22 | Capital Group Emerging Markets Total Opportunities Fund |
Investing in income-oriented stocks — Income provided by the fund may be reduced by changes in the dividend policies of, and the capital resources available at, the companies in which the fund invests.
Investing outside the United States — Securities of issuers domiciled outside the United States, or with significant operations outside the United States, may lose value because of adverse political, social, economic or market developments in the countries or regions in which the issuers operate. These securities may also lose value due to changes in foreign currency exchange rates against the U.S. dollar and/or currencies of other countries. Securities markets in certain countries may be more volatile and/or less liquid than those in the United States. Investments outside the United States may also be subject to different settlement and accounting practices and different regulatory, legal and reporting standards, and may be more difficult to value, than those in the United States. The risks of investing outside the United States may be heightened in connection with investments in emerging markets.
Investing in emerging markets — Investing in emerging markets may involve risks in addition to and greater than those generally associated with investing in the securities markets of developed countries. For instance, developing countries may have less developed legal and accounting systems than those in developed countries. The governments of these countries may be less stable and more likely to impose capital controls, nationalize a company or industry, place restrictions on foreign ownership and on withdrawing sale proceeds of securities from the country, and/or impose punitive taxes that could adversely affect the prices of securities. In addition, the economies of these countries may be dependent on relatively few industries that are more susceptible to local and global changes. Securities markets in these countries can also be relatively small and have substantially lower trading volumes. As a result, securities issued in these countries may be more volatile and less liquid, and may be more difficult to value, than securities issued in countries with more developed economies and/or markets. Additionally, there may be increased settlement risks for transactions in local securities.
Investing in bonds — Rising interest rates will generally cause the prices of bonds and other debt securities to fall. Longer maturity debt securities may be subject to greater price fluctuations than shorter maturity debt securities. In addition, falling interest rates may cause an issuer to redeem, call or refinance a debt security before its stated maturity, which may result in the fund having to reinvest the proceeds in lower yielding securities.
Bonds and other debt securities are subject to credit risk, which is the possibility that the credit strength of an issuer will weaken and/or an issuer of a debt security will fail to make timely payments of principal or interest and the security will go into default. Credit risk is gauged, in part, by the credit ratings of the debt securities in which the fund invests. However, ratings are only the opinions of the rating agencies issuing them and are not guarantees as to credit quality or an evaluation of market risk. The fund’s investment adviser relies on its own credit analysts to research issuers and issues in seeking to mitigate various credit and default risks.
Investing in lower rated bonds — Lower rated bonds and other lower rated debt securities generally have higher rates of interest and involve greater risk of default or price declines due to changes in the issuer’s creditworthiness than those of higher quality debt securities. The market prices of these securities may fluctuate more than the prices of higher quality debt securities and may decline significantly in periods of general economic difficulty. These risks may be increased with respect to lower quality, higher yielding debt securities (rated Ba1 or below or BB+ or below by Nationally Recognized Statistical Rating Organizations designated by the fund’s investment adviser or unrated but determined to be of equivalent quality by the fund’s investment adviser). Such securities are sometimes referred to as “junk bonds.” Junk bonds are considered speculative.
Thinly traded securities — There may be little trading in the secondary market for particular bonds or other debt securities, which may make them more difficult to value, acquire or sell.
Management — The investment adviser to the fund actively manages the fund’s investments. Consequently, the fund is subject to the risk that the methods and analyses employed by the investment adviser in this process may not produce the desired results. This could cause the fund to lose value or its investment results to lag relevant benchmarks or other funds with similar objectives.
| Capital Group Emerging Markets Total Opportunities Fund | 23 |
5. Taxation and distributions
Federal income taxation — The fund complies with the requirements under Subchapter M of the Internal Revenue Code applicable to regulated investment companies and intends to distribute substantially all of its net taxable income and net capital gains each year. The fund is not subject to income taxes to the extent such distributions are made. Therefore, no federal income tax provision is required.
As of and during the year ended October 31, 2013, the fund did not have a liability for any unrecognized tax benefits. The fund recognizes interest and penalties, if any, related to unrecognized tax benefits as income tax expense in the statement of operations. During the period, the fund did not incur any interest or penalties.
The fund is not subject to examination by U.S. federal tax authorities, by state tax authorities and by tax authorities outside the U.S. for tax years before 2012, the year the fund commenced operations.
Non-U.S. taxation — Dividend and interest income are recorded net of non-U.S. taxes paid. Gains realized by the fund on the sale of securities in certain countries are subject to non-U.S. taxes. When the fund is taxed on either realized and/or unrealized capital gains, the fund will accrue for non-U.S. taxes as applicable. As of October 31, 2013, the fund did not accrue any liabilities for non-U.S. taxes on realized and unrealized gains.
Distributions — Distributions paid to shareholders are based on net investment income and net realized gains determined on a tax basis, which may differ from net investment income and net realized gains for financial reporting purposes. These differences are due primarily to different treatment for items such as currency gains and losses; capital losses related to sales of certain securities within 30 days of purchase; net capital losses; short-term capital gains and losses; and cost of investments sold.
The fiscal year in which amounts are distributed may differ from the year in which the net investment income and net realized gains are recorded by the fund for financial reporting purposes. For the year ended October 31, 2013, the tax character of the distribution paid to shareholders was ordinary income in the amount of $14,914,000. For the period from January 27, 2012 (commencement of operations), through October 31, 2012, there were no distributions paid to shareholders. The fund may designate a portion of the amount paid to redeeming shareholders as distribution for tax purposes.
During the year ended October 31, 2013, the fund reclassified $5,466,000 to accumulated net realized loss and $587,000 to capital paid in on shares of capital stock from undistributed net investment income to align financial reporting with tax reporting.
As of October 31, 2013, the components of distributable earnings on a tax basis were as follows (dollars in thousands):
| Undistributed ordinary income | | $ | 7,352 | |
| Capital loss carryforward* | | | (8,495 | ) |
| * | The capital loss carryforward will be used to offset any capital gains realized by the fund in future years. The fund will not make distributions from capital gains while a capital loss carryforward remains. |
As of October 31, 2013, the tax basis unrealized appreciation (depreciation) and cost of investments were as follows (dollars in thousands):
| Gross unrealized appreciation on investment securities | | $ | 53,608 | |
| Gross unrealized depreciation on investment securities | | | (31,721 | ) |
| Net unrealized appreciation on investment securities | | | 21,887 | |
| Cost of investment securities | | | 579,915 | |
| 24 | Capital Group Emerging Markets Total Opportunities Fund |
6. Fees and transactions with related parties
CGTC serves as investment adviser to the fund and other funds. CGTC is wholly owned by Capital Group International, Inc., which is wholly owned by The Capital Group Companies, Inc. Expense limitations have been imposed through December 31, 2013, to limit the fund’s total annual fund operating expenses to 1.10% (as a percentage of average daily net assets).
Investment advisory services fee — The Investment Advisory and Service Agreement with CGTC provides for monthly fees accrued daily. The fee is 1.00% of the average daily net assets of the fund.
Distribution services — American Funds Distributors®, Inc. (“AFD”) is the principal underwriter of the fund’s shares. AFD does not receive any compensation related to the sale of shares of the fund.
Affiliated officers and trustees — Officers and certain trustees of the fund are or may be considered to be affiliated with CGTC and AFD. No affiliated officers or trustees received any compensation directly from the fund.
7. Investment transactions and other disclosures
The fund made purchases and sales of investment securities, excluding short term securities, of $353,881,000 and $321,858,000, respectively, during the year ended October 31, 2013.
8. Fund merger
On January 27, 2012, the fund acquired all of the assets and assumed all of the liabilities of the Predecessor Fund pursuant to a plan of reorganization approved by the trustee of the Predecessor Fund and the board of trustees of the fund on October 26, 2011, and October 20, 2011, respectively. The fund began with a $100,000 seed investment. The acquisition was accomplished by a tax-free exchange as follows:
On the close of business on January 27, 2012, 35,113,792 shares of the Predecessor Fund, valued at $386,996,070, were outstanding. After the reorganization, the fund had 35,122,866 shares valued at $387,096,070.
The investment portfolio of the Predecessor Fund, with a value of $377,210,268 and identified cost of $370,087,014, was the principal asset acquired by the fund. For financial reporting purposes, assets received and shares issued by the fund were recorded at fair value; however, the cost basis of the investments received from the Predecessor Fund was carried forward to align ongoing reporting of the fund’s realized and unrealized gains and losses with amounts distributable to shareholders for tax purposes. Immediately prior to the merger, the net assets of the Predecessor Fund were $386,996,070.
Because the combined investment portfolios have been managed as a single integrated portfolio since the merger was completed, it is not practicable to separate the amounts of revenue and earnings of the Predecessor Fund that have been reflected in the statement of operations since January 27, 2012, for the fund.
| | | Before reorganization | | | After reorganization | |
| | | The Predecessor Fund | | | The fund | | | The fund | |
| Net assets | | $ | 386,996,070 | | | $ | 100,000 | | | $ | 387,096,070 | |
| Shares outstanding | | | 35,113,792 | | | | — | | | | 35,122,866 | |
| Net asset value per share | | $ | 11.02 | | | $ | — | | | $ | 11.02 | |
| Net unrealized appreciation | | $ | 6,187,269 | | | $ | — | | | $ | 6,187,269 | |
| Capital Group Emerging Markets Total Opportunities Fund | 25 |
9. Forward currency contracts
The fund has entered into forward currency contracts, which represent agreements to exchange currencies on specific future dates at predetermined rates. The fund’s investment adviser uses forward currency contracts to manage the fund’s exposure to changes in exchange rates. Upon entering into these contracts, risks may arise from the potential inability of counterparties to meet the terms of their contracts and from possible movements in exchange rates.
On a daily basis, the fund’s investment adviser values forward currency contracts based on the applicable exchange rates and records unrealized appreciation or depreciation for open forward currency contracts in the fund’s statement of assets and liabilities. Realized gains or losses are recorded at the time the forward contract is closed or offset by another contract with the same broker for the same settlement date and currency. Closed forward currency contracts that have not reached their settlement date are included in the respective receivables or payables for closed forward currency contracts in the fund’s statement of assets and liabilities. Net realized gains or losses from closed forward currency contracts and net unrealized appreciation or depreciation from open forward currency contracts are recorded in the fund’s statement of operations.
As of October 31, 2013, the fund had open forward currency contracts to sell currencies, as shown in the following table. The average notional amount of open forward currency contracts was $96,409,000 over the 12-month period ended, October 31, 2013.
| | | | | Notional amount
(000) | | | U.S. valuation
(000) | |
| | | Counterparty | | Non-U.S. | | U.S. | | | Amount | | | Unrealized
(depreciation)
appreciation | |
| Sales: | | | | | | | | | | | | | | | | |
| Australian dollar to U.S. dollar expiring 11/12/2013 | | Credit Suisse First Boston | | AUD189 | | $ | 178 | | | $ | 179 | | | $ | (1 | ) |
| Brazilian real to U.S. dollar expiring 11/12–11/18/2013 | | Credit Suisse First Boston | | BRL15,572 | | | 7,100 | | | | 6,929 | | | | 171 | |
| Brazilian real to U.S. dollar expiring 11/22/2013 | | Bank of America | | BRL41,057 | | | 18,813 | | | | 18,247 | | | | 566 | |
| British pound to U.S. dollar expiring 11/8/2013 | | JPMorgan Chase | | GBP737 | | | 1,188 | | | | 1,182 | | | | 6 | |
| British pound to U.S. dollar expiring 11/15/2013 | | Bank of New York Mellon | | GBP3,789 | | | 6,039 | | | | 6,074 | | | | (35 | ) |
| British pound to U.S. dollar expiring 11/20/2013 | | Bank of New York Mellon | | GBP908 | | | 1,469 | | | | 1,456 | | | | 13 | |
| British pound to U.S. dollar expiring 11/20/2013 | | UBS AG | | GBP2,173 | | | 3,509 | | | | 3,484 | | | | 25 | |
| British pound to U.S. dollar expiring 12/5/2013 | | Citibank N.A. | | GBP3,214 | | | 5,193 | | | | 5,152 | | | | 41 | |
| Canadian dollar to U.S. dollar expiring 11/25/2013 | | Credit Suisse First Boston | | CAD2,135 | | | 2,066 | | | | 2,046 | | | | 20 | |
| Chilean peso to U.S. dollar expiring 11/18/2013 | | UBS AG | | CLP817,517 | | | 1,650 | | | | 1,592 | | | | 58 | |
| Colombian peso to U.S. dollar expiring 11/18/2013 | | Bank of America | | COP610,767 | | | 323 | | | | 322 | | | | 1 | |
| Euro to U.S. dollar expiring 11/7–12/5/2013 | | Bank of New York Mellon | | EUR3,981 | | | 5,470 | | | | 5,406 | | | | 64 | |
| Euro to U.S. dollar expiring 11/7/2013 | | Citibank N.A. | | EUR12,661 | | | 17,228 | | | | 17,191 | | | | 37 | |
| Euro to U.S. dollar expiring 11/15/2013 | | Bank of New York Mellon | | EUR9,301 | | | 12,571 | | | | 12,628 | | | | (57 | ) |
| Euro to U.S. dollar expiring 11/25/2013 | | UBS AG | | EUR788 | | | 1,085 | | | | 1,070 | | | | 15 | |
| Euro to U.S. dollar expiring 12/6/2013 | | JPMorgan Chase | | EUR926 | | | 1,258 | | | | 1,257 | | | | 1 | |
| Malaysian ringgit to U.S. dollar expiring 11/18–11/25/2013 | | Bank of America | | MYR5,053 | | | 1,597 | | | | 1,600 | | | | (3 | ) |
| Mexican peso to U.S. dollar expiring 11/15/2013 | | UBS AG | | MXN98,916 | | | 7,520 | | | | 7,574 | | | | (54 | ) |
| Mexican peso to U.S. dollar expiring 11/22/2013 | | Citibank N.A. | | MXN5,255 | | | 410 | | | | 403 | | | | 7 | |
| Mexican peso to U.S. dollar expiring 12/5/2013 | | Bank of America | | MXN101,177 | | | 7,756 | | | | 7,736 | | | | 20 | |
| Polish zloty to U.S. dollar expiring 11/29/2013 | | Citibank N.A. | | PLN1,822 | | | 600 | | | | 591 | | | | 9 | |
| Russian ruble to U.S. dollar expiring 11/18/2013 | | Citibank N.A. | | RUB146,955 | | | 4,578 | | | | 4,571 | | | | 7 | |
| Singapore dollar to U.S. dollar expiring 11/8/2013 | | Credit Suisse First Boston | | SGD526 | | | 421 | | | | 423 | | | | (2 | ) |
| Singapore dollar to U.S. dollar expiring 11/20/2013 | | Bank of America | | SGD1,408 | | | 1,136 | | | | 1,134 | | | | 2 | |
| Singapore dollar to U.S. dollar expiring 12/5/2013 | | Citibank N.A. | | SGD425 | | | 343 | | | | 342 | | | | 1 | |
| South African rand to U.S. dollar expiring 11/15/2013 | | Citibank N.A. | | ZAR13,479 | | | 1,346 | | | | 1,340 | | | | 6 | |
| South African rand to U.S. dollar expiring 12/5–12/6/2013 | | UBS AG | | ZAR15,877 | | | 1,582 | | | | 1,574 | | | | 8 | |
| South Korean won to U.S. dollar expiring 11/18/2013 | | Citibank N.A. | | KRW12,865,184 | | | 11,965 | | | | 12,115 | | | | (150 | ) |
| South Korean won to U.S. dollar expiring 11/18/2013 | | JPMorgan Chase | | KRW577,296 | | | 538 | | | | 544 | | | | (6 | ) |
| South Korean won to U.S. dollar expiring 11/25–12/6/2013 | | Citibank N.A. | | KRW4,425,129 | | | 4,168 | | | | 4,163 | | | | 5 | |
| Taiwanese dollar to U.S. dollar expiring 11/22/2013 | | Bank of America | | TWD23,072 | | | 788 | | | | 786 | | | | 2 | |
| Turkish lira to U.S. dollar expiring 11/29/2013 | | UBS AG | | TRY488 | | | 245 | | | | 244 | | | | 1 | |
| Forward currency contracts – net | | | | | | | | | | | | | | $ | 778 | |
| 26 | Capital Group Emerging Markets Total Opportunities Fund |
Financial highlights
| | | Year ended
10/31/13 | | | For the period
1/27/12–10/31/121 | | | For the period
1/1/12–1/26/122 | | | Year ended
12/31/112 | | | For the period
3/1/103–12/31/102 | |
| Net asset value, beginning of period | | $ | 11.58 | | | $ | 11.02 | | | $ | 10.45 | | | $ | 11.12 | | | $ | 10.00 | |
| Income (loss) from investment operations4: | | | | | | | | | | | | | | | | | | | | |
| Net investment income | | | .32 | | | | .35 | | | | .03 | | | | .52 | | | | .45 | |
| Net realized and unrealized (loss) gain on investments | | | (.06 | ) | | | .21 | | | | .54 | | | | (1.19 | ) | | | .67 | |
| Total income (loss) from investment operations | | | .26 | | | | .56 | | | | .57 | | | | (.67 | ) | | | 1.12 | |
| Less dividends: | | | | | | | | | | | | | | | | | | | | |
| Dividends from net investment income | | | (.33 | ) | | | — | | | | — | | | | — | | | | — | |
| Net asset value, end of period | | $ | 11.51 | | | $ | 11.58 | | | $ | 11.02 | | | $ | 10.45 | | | $ | 11.12 | |
| Total return | | | 2.19 | % | | | 5.08 | % | | | 5.45 | % | | | (6.03 | )% | | | 11.20 | % |
| | | | | | | | | | | | | | | | | | | | | |
| Ratios/Supplemental data: | | | | | | | | | | | | | | | | | | | | |
| Net assets, end of period (in millions) | | $ | 604 | | | $ | 518 | | | $ | 387 | | | $ | 381 | | | $ | 282 | |
| Ratio of expenses to average net assets | | | 1.10 | % | | | 1.10 | %5 | | | .05 | %5 | | | .04 | % | | | .08 | %5 |
| Ratio of net investment income to average net assets | | | 2.74 | % | | | 4.11 | %5 | | | 3.95 | %5 | | | 4.78 | % | | | 5.07 | %5 |
| Portfolio turnover rate | | | 63.85 | % | | | 42.49 | %6 | | | 7.00 | %6 | | | 59.52 | %7 | | | 69.40 | %6,7 |
| 1 | The fund commenced operations as a Registered Investment Company on January 27, 2012. |
| 2 | Capital Guardian Emerging Markets Total Opportunities Common Trust Fund (the Predecessor Fund) was reorganized into the Capital Group Emerging Markets Total Opportunities Fund at the close of business effective January 27, 2012. In connection with the reorganization, the Predecessor Fund transferred all its assets and liabilities to the Capital Group Emerging Markets Total Opportunities Fund and changed its fiscal year-end from December to October. |
| 3 | The Predecessor Fund commenced operations on March 1, 2010. |
| 4 | The per-share/unit data is based on average shares/units outstanding. |
| 5 | Annualized. |
| 6 | Based on operations for the period shown (unless otherwise noted) and, accordingly, may not be representative of a full year. |
| 7 | Unaudited. |
| Capital Group Emerging Markets Total Opportunities Fund | 27 |
Report of Independent Registered Public Accounting Firm
To the Shareholders and Board of Trustees of Capital Group Emerging Markets Total Opportunities Fund:
We have audited the accompanying statement of assets and liabilities of Capital Group Emerging Markets Total Opportunities Fund (the “Fund”), including the schedule of investments, as of October 31, 2013, and the related statement of operations for the year then ended, the statement of changes in net assets, and the financial highlights for the year ended October 31, 2013, the period from January 27, 2012 (commencement of operations) to October 31, 2012, and the period from January 1, 2012 to January 26, 2012. These financial statements and financial highlights are the responsibility of the Fund’s management. Our responsibility is to express an opinion on these financial statements and financial highlights based on our audits. The statement of changes in net assets and the financial highlights for the year ended December 31, 2011 and the financial highlights for the period March 1, 2010 through December 31, 2010 were audited by other auditors whose reports, dated March 5, 2012 and March 7, 2011, respectively, expressed an unqualified opinion on those statements.
We conducted our audit in accordance with the standards of the Public Company Accounting Oversight Board (United States). Those standards require that we plan and perform the audit to obtain reasonable assurance about whether the financial statements and financial highlights are free of material misstatement. The Fund is not required to have, nor were we engaged to perform, an audit of its internal control over financial reporting. Our audit included consideration of internal control over financial reporting as a basis for designing audit procedures that are appropriate in the circumstances, but not for the purpose of expressing an opinion on the effectiveness of the Fund’s internal control over financial reporting. Accordingly, we express no such opinion. An audit also includes examining, on a test basis, evidence supporting the amounts and disclosures in the financial statements, assessing the accounting principles used and significant estimates made by management, as well as evaluating the overall financial statement presentation. Our procedures included confirmation of securities owned as of October 31, 2013, by correspondence with the custodian and brokers; where replies were not received from brokers, we performed other auditing procedures. We believe that our audit provides a reasonable basis for our opinion.
In our opinion, such financial statements and financial highlights referred to above present fairly, in all material respects, the financial position of Capital Group Emerging Markets Total Opportunities Fund as of October 31, 2013, the results of its operations for the year then ended, changes in its net assets, and the financial highlights for the year ended October 31, 2013, the period from January 27, 2012 (commencement of operations) to October 31, 2012, and the period from January 1, 2012 to January 26, 2012, in conformity with accounting principles generally accepted in the United States of America.
Deloitte & Touche LLP
Costa Mesa, California
December 23, 2013
| 28 | Capital Group Emerging Markets Total Opportunities Fund |
As a shareholder of the fund, you incur ongoing costs, including investment advisory services fees and other expenses. This example is intended to help you understand your ongoing costs (in dollars) of investing in the fund so you can compare these costs with the ongoing costs of investing in other mutual funds. The example is based on an investment of $1,000 invested at the beginning of the period and held for the entire period.
Actual expenses:
The first line of the table below provides information about actual account values and actual expenses. You may use the information in this line, together with the amount you invested, to estimate the expenses that you paid over the period. Simply divide your account value by $1,000 (for example, an $8,600 account value divided by $1,000 = 8.6), then multiply the result by the number in the first line under the heading entitled “Expenses paid during period” to estimate the expenses you paid on your account during this period.
Hypothetical example for comparison purposes:
The second line of the table below provides information about hypothetical account values and hypothetical expenses based on the fund’s actual expense ratio and an assumed rate of return of 5% per year before expenses, which is not the fund’s actual return. The hypothetical account values and expenses may not be used to estimate the actual ending account balance or expenses you paid for the period. You may use this information to compare the ongoing costs of investing in the fund and other funds. To do so, compare this 5% hypothetical example with the 5% hypothetical examples that appear in the shareholder reports of the other funds.
| | | Beginning
account value
5/1/2013 | | | Ending
account value
10/31/2013 | | | Expenses
paid during
period* | | | Annualized
expense
ratio | |
| Actual return | | $ | 1,000.00 | | | $ | 956.78 | | | $ | 5.43 | | | | 1.10 | % |
| Hypothetical 5% return before expenses | | | 1,000.00 | | | | 1,019.66 | | | | 5.60 | | | | 1.10 | |
| * | The “expenses paid during period” are equal to the “annualized expense ratio,” multiplied by the average account value over the period, multiplied by the number of days in the period, and divided by 365 (to reflect the one-half year). |
We are required to advise you of the federal tax status of certain distributions received by shareholders during the fiscal year. The fund hereby designates the following amounts for the fund’s fiscal year ended October 31, 2013:
| Foreign taxes | | $ | 0.02 per share |
| Foreign source income | | $ | 0.43 per share |
| Qualified dividend income | | | $3,914,000 |
Individual shareholders should refer to their Form 1099 or other tax information, which will be mailed in January 2014, to determine the calendar year amounts to be included on their 2013 tax returns. Shareholders should consult their tax advisors.
| Capital Group Emerging Markets Total Opportunities Fund | 29 |
Board of trustees and other officers
“Independent” trustees1
| Name and age | | Year first
elected
a trustee
of the fund2 | | Principal occupation(s) during past five years | | Number of
portfolios in fund
complex3 overseen
by trustee | | Other directorships4
held by trustee |
Richard G. Capen, Jr., 79
(Lead independent trustee) | | 2011 | | Corporate director and author | | 9 | | None |
| H. Frederick Christie, 80 | | 2011 | | Private investor | | 9 | | None |
| Martin Fenton, 78 | | 2011 | | Chairman, Senior Resource Group LLC (development and management of senior living communities) | | 9 | | None |
| Richard G. Newman, 79 | | 2011 | | Founder, Chairman Emeritus and Director, AECOM Technology Corporation (global engineering, consulting and professional technical services) | | 9 | | None | |
“Interested” trustee5
Name, age and
position with fund | | Year first
elected
a trustee
or officer
of the fund2 | | Principal occupation(s) during past five years
and positions held with affiliated entities or
the principal underwriter of the fund | | Number of
portfolios in fund
complex3 overseen
by trustee | | Other directorships4
held by trustee |
Paul F. Roye, 60
Chairman of the Board
|
| 2011
|
| Senior Vice President – Fund Business Management Group, Capital Research and Management Company; Chief Legal Officer, Capital Research and Management Company;7 Director, American Funds Service Company7 | | 9
|
| 3 American Funds
portfolios
|
The fund’s statement of additional information includes further details about fund trustees and is available without charge upon request by calling your relationship manager at (800) 266-9532. The address for all trustees and officers of the fund is 6455 Irvine Center Drive, Irvine, CA 92618, Attention: Secretary.
| 30 | Capital Group Emerging Markets Total Opportunities Fund |
Other officers6
Name, age and
position with fund | | Year first
elected
an officer
of the fund2 | | Principal occupation(s) during past five years and positions held with affiliated entities
or the principal underwriter of the fund |
John S. Armour, 56
President | | 2013 | | Senior Vice President, Capital Guardian Trust Company;
President — Private Client Services Division, Capital Guardian Trust Company;
Chairman of the Board, Capital Guardian Trust Company, a Nevada Corporation (CGTN)7 |
Shelby Notkin, 72
Senior Vice President | | 2011 | | Senior Vice President — Capital International Investors, Capital Guardian Trust Company;
Chairman of the Board — Private Client Services Division, Capital Guardian Trust Company;
Director, Capital Guardian Trust Company, a Nevada Corporation (CGTN);7
Senior Vice President — Capital International Investors, Capital Research and Management Company7 |
John R. Queen, 48
Senior Vice President | | 2011 | | Senior Vice President — Private Client Services Division, Capital Guardian Trust Company;
Vice President — Capital Fixed Income Investors, Capital Guardian Trust Company;
Vice President — Capital Fixed Income Investors, Capital Research and Management Company7 |
Timothy W. McHale, 35
Vice President | | 2011 | | Associate Counsel — Fund Business Management Group, Capital Research and Management Company;7 Secretary, American Funds Distributors, Inc.7 |
Courtney R. Taylor, 38
Secretary | | 2011 | | Assistant Vice President — Fund Business Management Group, Capital Research and Management Company7 |
Kevin M. Saks, 41
Treasurer | | 2011 | | Vice President, Capital Guardian Trust Company;
Senior Vice President — Private Client Services Division, Capital Guardian Trust Company;
Director, Capital Guardian Trust Company, a Nevada Corporation (CGTN)7 |
Susan K. Countess, 47
Assistant Secretary | | 2012 | | Associate — Fund Business Management Group, Capital Research and Management Company7 |
Susan R. Sunga, 58
Assistant Treasurer | | 2011 | | Vice President, Capital Guardian Trust Company;
Senior Manager — Private Client Services Division, Capital Guardian Trust Company;
Tax Officer, Capital Guardian Trust Company, a Nevada Corporation (CGTN)7 |
| 1 | The term “independent” trustee refers to a trustee who is not an “interested person” of the fund within the meaning of the Investment Company Act of 1940. |
| 2 | Trustees and officers of the fund serve until their resignation, removal or retirement. |
| 3 | Funds managed by Capital Guardian Trust Company, including Capital Group Emerging Markets Total Opportunities Fund and Capital Private Client Services Funds, and/or funds managed by an affiliate of Capital Guardian Trust Company. |
| 4 | This includes all directorships (other than those in Capital Group Emerging Markets Total Opportunities Fund) that are held by each trustee as a trustee or director of a public company or a registered investment company. Unless otherwise noted, all directorships are current. |
| 5 | “Interested persons” of the fund within the meaning of the Investment Company Act of 1940, on the basis of their affiliation with the fund’s investment adviser, Capital Guardian Trust Company, or affiliated entities (including the fund’s principal underwriter). |
| 6 | All of the officers listed are officers and/or directors/trustees of one or more of the other funds for which Capital Guardian Trust Company serves as investment adviser. |
| 7 | Company affiliated with Capital Guardian Trust Company. |
| Capital Group Emerging Markets Total Opportunities Fund | 31 |
Office of the fund and of the investment adviser
Capital Guardian Trust Company
6455 Irvine Center Drive
Irvine, CA 92618-4518
Transfer agent for shareholder accounts
J.P. Morgan Investor Services Company
One Beacon Street
Boston, MA 02108
Custodian of assets
JPMorgan Chase Bank
270 Park Avenue
New York, NY 10017-2070
Counsel
Bingham McCutchen LLP
355 South Grand Avenue, Suite 4400
Los Angeles, CA 90071-3106
Independent registered public accounting firm
Deloitte & Touche LLP
695 Town Center Drive
Suite 1200
Costa Mesa, CA 92626-7188
Principal underwriter
American Funds Distributors, Inc.
333 South Hope Street
Los Angeles, CA 90071-1406
Investors should carefully consider investment objectives, risks, charges and expenses. This and other important information is contained in the fund prospectus, which can be obtained from Capital Guardian Trust Company by calling (800) 266-9532 and should be read carefully before investing.
Capital Group Emerging Markets Total Opportunities Fund files a complete list of its portfolio holdings with the U.S. Securities and Exchange Commission (SEC) for the first and third quarters of each fiscal year on Form N-Q. This filing is available free of charge on the SEC website (www.sec.gov). You may also review or, for a fee, copy this filing at the SEC’s Public Reference Room in Washington, D.C. Additional information regarding the operation of the Public Reference Room may be obtained by calling the SEC’s Office of Investor Education and Advocacy at (800) SEC-0330. Additionally, the list of portfolio holdings is available by calling your relationship manager at (800) 266-9532.
The proxy voting procedures and policies of Capital Group Emerging Markets Total Opportunities Fund — which describe how we vote proxies relating to portfolio securities — are available upon request by calling your relationship manager at (800) 266-9532. The fund files its proxy voting record with the SEC for the 12 months ended June 30 by August 31. The report also is available on the SEC website or by calling your relationship manager.
Lit. No. MFGEARX-370-1213P Printed in USA TAG/CGIRV/10247-S36453
© 2013 Capital Group Emerging Markets Total Opportunities Fund
ITEM 2 – Code of Ethics
The Registrant has adopted a Code of Ethics that applies to its Principal Executive Officer and Principal Financial Officer. The Registrant undertakes to provide to any person without charge, upon request, a copy of the Code of Ethics. Such request can be made to American Funds Service Company at 800/421-9225 or to the Secretary of the Registrant, 6455 Irvine Center Drive, Irvine, California 92618.
ITEM 3 – Audit Committee Financial Expert
The Registrant’s board has determined that Martin Fenton, a member of the Registrant’s audit committee, is an “audit committee financial expert” and "independent," as such terms are defined in this Item. This designation will not increase the designee’s duties, obligations or liability as compared to his or her duties, obligations and liability as a member of the audit committee and of the board, nor will it reduce the responsibility of the other audit committee members. There may be other individuals who, through education or experience, would qualify as "audit committee financial experts" if the board had designated them as such. Most importantly, the board believes each member of the audit committee contributes significantly to the effective oversight of the Registrant’s financial statements and condition.
ITEM 4 – Principal Accountant Fees and Services
| | Registrant: |
| | | a) Audit Fees: |
| | | | 2012 | $37,500 |
| | | | 2013 | $41,085 |
| | | | |
| | | b) Audit-Related Fees: |
| | | | 2012 | None |
| | | | 2013 | None |
| | | |
| | | c) Tax Fees: |
| | | | 2012 | $6,800 |
| | | | 2013 | $7,905 |
| | | | The tax fees consist of professional services relating to the review of the Registrant’s tax returns. |
| | | |
| | | d) All Other Fees: |
| | | | 2012 | None |
| | | | 2013 | None |
| | | | |
| | Adviser and affiliates (includes only fees for non-audit services billed to the adviser and affiliates for engagements that relate directly to the operations and financial reporting of the Registrant and were subject to the pre-approval policies described below): |
| | | a) Audit Fees: |
| | | | Not Applicable |
| | | |
| | | b) Audit-Related Fees: |
| | | | Not Applicable | |
| | | |
| | | c) Tax Fees: |
| | | | Not Applicable | |
| | | |
| | | d) All Other Fees: |
| | | | Not Applicable |
All audit and permissible non-audit services that the Registrant’s audit committee considers compatible with maintaining the independent registered public accounting firm’s independence are required to be pre-approved by the committee. The pre-approval requirement will extend to all non-audit services provided to the Registrant, the investment adviser, and any entity controlling, controlled by, or under common control with the investment adviser that provides ongoing services to the Registrant, if the engagement relates directly to the operations and financial reporting of the Registrant. The committee will not delegate its responsibility to pre-approve these services to the investment adviser. The committee may delegate to one or more committee members the authority to review and pre-approve audit and permissible non-audit services. Actions taken under any such delegation will be reported to the full committee at its next meeting. The pre-approval requirement is waived with respect to non-audit services if certain conditions are met. The pre-approval requirement was not waived for any of the non-audit services listed above provided to the Registrant, adviser and affiliates.
ITEM 5 – Audit Committee of Listed Registrants
Not applicable to this Registrant, insofar as the Registrant is not a listed issuer as defined in Rule 10A-3 under the Securities Exchange Act of 1934.
ITEM 6 – Schedule of Investments
Not applicable, insofar as the schedule is included as part of the report to shareholders filed under Item 1 of this Form.
ITEM 7 – Disclosure of Proxy Voting Policies and Procedures for Closed-End Management Investment Companies
Not applicable to this Registrant, insofar as the Registrant is not a closed-end management investment company.
ITEM 8 – Portfolio Managers of Closed-End Management Investment Companies
Not applicable to this Registrant, insofar as the Registrant is not a closed-end management investment company.
ITEM 9 – Purchases of Equity Securities by Closed-End Management Investment Company and Affiliated Purchasers
Not applicable to this Registrant, insofar as the Registrant is not a closed-end management investment company.
ITEM 10 – Submission of Matters to a Vote of Security Holders
There have been no material changes to the procedures by which shareholders may recommend nominees to the Registrant’s board of trustees since the Registrant last submitted a proxy statement to its shareholders. The procedures are as follows. The Registrant has a nominating committee comprised solely of persons who are not considered ‘‘interested persons’’ of the Registrant within the meaning of the Investment Company Act of 1940, as amended. The committee periodically reviews such issues as the board’s composition, responsibilities, committees, compensation and other relevant issues, and recommends any appropriate changes to the full board of trustees. While the committee normally is able to identify from its own resources an ample number of qualified candidates, it will consider shareholder suggestions of persons to be considered as nominees to fill future vacancies on the board. Such suggestions must be sent in writing to the nominating committee of the Registrant, c/o the Registrant’s Secretary, and must be accompanied by complete biographical and occupational data on the prospective nominee, along with a written consent of the prospective nominee for consideration of his or her name by the nominating committee.
ITEM 11 – Controls and Procedures
| (a) | The Registrant’s Principal Executive Officer and Principal Financial Officer have concluded, based on their evaluation of the Registrant’s disclosure controls and procedures (as such term is defined in Rule 30a-3 under the Investment Company Act of 1940), that such controls and procedures are adequate and reasonably designed to achieve the purposes described in paragraph (c) of such rule. |
| | |
| (b) | There were no changes in the Registrant’s internal controls over financial reporting (as defined in Rule 30a-3(d) under the Investment Company Act of 1940) that occurred during the Registrant’s second fiscal quarter of the period covered by this report that has materially affected, or is reasonably likely to materially affect, the Registrant’s internal control over financial reporting. |
ITEM 12 – Exhibits
| (a)(1) | The Code of Ethics that is the subject of the disclosure required by Item 2 is attached as an exhibit hereto. |
| | |
| (a)(2) | The certifications required by Rule 30a-2 of the Investment Company Act of 1940 and Sections 302 and 906 of the Sarbanes-Oxley Act of 2002 are attached as exhibits hereto. |
SIGNATURES
Pursuant to the requirements of the Securities Exchange Act of 1934 and the Investment Company Act of 1940, the Registrant has duly caused this report to be signed on its behalf by the undersigned, thereunto duly authorized.
| | CAPITAL GROUP EMERGING MARKETS TOTAL OPPORTUNITIES FUND |
| | |
| | By /s/ John S. Armour |
| | John S. Armour, President and Principal Executive Officer |
| | |
| | Date: December 31, 2013 |
Pursuant to the requirements of the Securities Exchange Act of 1934 and the Investment Company Act of 1940, this report has been signed below by the following persons on behalf of the Registrant and in the capacities and on the dates indicated.
| By /s/ John S. Armour |
John S. Armour, President and Principal Executive Officer |
| |
| Date: December 31, 2013 |
| By /s/ Kevin M. Saks |
Kevin M. Saks, Treasurer and Principal Financial Officer |
| |
| Date: December 31, 2013 |