UNITED STATES
SECURITIES AND EXCHANGE COMMISSION
Washington, D.C. 20549
FORM N-CSR
Certified Shareholder Report of
Registered Management Investment Companies
Investment Company Act File Number: 811-22605
Capital Emerging Markets Total Opportunities Fund
(Exact Name of Registrant as Specified in Charter)
6455 Irvine Center Drive
Irvine, California 92618
(Address of Principal Executive Offices)
Registrant's telephone number, including area code: (949) 975-5000
Date of fiscal year end: October 31
Date of reporting period: October 31, 2012
Courtney R. Taylor
Capital Emerging Markets Total Opportunities Fund
6455 Irvine Center Drive
Irvine, California 92618
(Name and Address of Agent for Service)
Copies to:
Michael Glazer
Bingham McCutchen LLP
355 South Grand Avenue, Suite 4400
Los Angeles, California 90071
(Counsel for the Registrant)
ITEM 1 – Reports to Stockholders

Capital Emerging Markets
Total Opportunities Fund®

Capital Emerging Markets Total Opportunities Fund seeks long-term growth and preservation of capital with lower volatility of returns than emerging markets equities.
Fund results shown in this report are for past periods and are not predictive of results for future periods. The results shown are before taxes on fund distributions and sale of fund shares. Current and future results may be lower or higher than those shown. Share prices and returns will vary, so investors may lose money. Investing for short periods makes losses more likely. Investments are not FDIC-insured, nor are they deposits of or guaranteed by a bank or any other entity, so they may lose value. For current information and month-end results, please call 800/266-9532.
Here is the cumulative total return on a $1,000 investment with all distributions reinvested for the period ended September 30, 2012 (the most recent calendar quarter-end):
| | | | | |
|
|
|
|
|
| | | Lifetime (since 1/27/12 | ) |
|
|
|
|
| Cumulative total return | | | 4.54 | % |
|
|
|
|
|
The total annual fund operating expense ratio is 1.10% as of the prospectus dated January 1, 2013 (unaudited).
Investment results assume all distributions are reinvested and reflect applicable fees and expenses.
This report is for the information of shareholders of Capital Emerging Markets Total Opportunities Fund, but it also may be used as sales literature when preceded or accompanied by the current prospectus, which gives details about charges, expenses, investment objectives and operating policies of the fund. If used as sales material after December 31, 2012, this report must be accompanied by a statistical update for the most recently completed calendar quarter.
Investing in emerging markets involves risks, such as significant currency and price fluctuations, political instability, differing securities regulations and periods of illiquidity, which are detailed in the fund prospectus. Investments in emerging markets have been more volatile than investments in developed markets, reflecting the greater uncertainties of investing in less established economies. Individuals investing in emerging markets should have a long-term perspective and be able to tolerate potentially sharp declines in the value of their investments.
Fellow investors:
We are pleased to welcome you as a shareholder in Capital Emerging Markets Total Opportunities Fund. This fund invests in a full spectrum of emerging markets debt and equity securities while seeking to limit the volatility typically associated with investments in the developing world.
The following report covers the period from the start of the fund’s operations on January 27, 2012, through October 31, 2012. During this time, emerging markets stock returns were nearly flat against a backdrop of slow economic growth, lackluster corporate profits and unusually low volatility. Emerging markets bond returns were strong, however, with dollar-denominated debt posting double-digit gains as investors sought higher yielding assets in the developing world. The fund advanced 5.1%. The realized volatility of the portfolio was about 8% for the reporting period, compared with 15% for the MSCI Emerging Markets Investable Market Index (IMI).*
| |
| Market review |
| Investors vacillated between risk-on and risk-off sentiment for most of 2012. Global equity markets rallied in early 2012 but struggled in April and May as anxieties resurfaced about Europe’s debt crisis and the scope of reforms needed to address the region’s problems. Investors also grappled with concerns about decelerating economic growth in China and the implications of its change in political leadership scheduled for late 2012. |
But global markets regained momentum in the second half of the period as policymakers tried to assuage fears about the lingering debt crisis and slowing economic growth. Authorities in both developed and developing markets took a series of coordinated actions to help support the global economy and inject liquidity into financial markets. In July, the European Central Bank indicated that it would take any necessary measures to preserve the euro. Major emerging markets such as China, India and Brazil loosened monetary policy during the period in an effort to stem the deceleration in economic growth. The People’s Bank of China lowered interest rates for the first time since 2008. By September, China’s government had unveiled a package totaling more than 1 trillion yuan ($158 billion) to help spur infrastructure development in the country. Meanwhile, the U.S. Federal Reserve announced its third round of quantitative easing, further reducing uncertainty in the marketplace and assuring investors that it would support the U.S. economy. Japan also adopted additional quantitative easing measures in September and October.
Emerging markets equities posted muted gains in this environment, with the MSCI Emerging Markets IMI edging 0.8% higher. Sector and country returns varied widely. Materials and energy stocks registered double-digit losses as most commodity prices slid and several major firms reported lower-than-anticipated earnings. Meanwhile, technology stocks generally posted solid gains, spurred by rising smartphone sales and robust demand for new products. Financial stocks rose modestly, although banks in several markets struggled with an increase in nonperforming loans.
The MSCI China IMI advanced 3%. China’s economy continued to decelerate, expanding at an annualized rate of 7.4% in the third quarter. Industrial stocks slid amid sluggish corporate profits. Investors took heart from signs of life in the economy, however, as manufacturing and industrial production began to pick up. Financial stocks had mixed results. Banks retreated as nonperforming loans increased and profit growth slowed from last year’s robust levels. On the other hand, several property companies rose sharply against a backdrop of improving home sales.
Indian equities ended flat after experiencing dramatic swings throughout much of the period. The rupee declined 8% against the U.S. dollar, weighing heavily on the market. Investors worried about deteriorating financial conditions and higher inflation as January–March GDP growth slowed to an annualized 5.3% — considerably less than market expectations, and the lowest growth rate in nine years. The Reserve Bank of India reversed course by reducing its key interest rate by 50 basis points to 8% in April after raising rates 13 times since March 2010. The government announced a series of economic reforms in September, including plans to
| | | |
| * Realized daily volatility is annualized based on a 252-day factor. | Capital Emerging Markets Total Opportunities Fund | 1 |
allow foreign investors to buy larger stakes in supermarkets and airlines. Stocks rallied sharply in response. Elsewhere in Asia, technology heavyweights Samsung Electronics and Taiwan Semiconductor Manufacturing helped support equity markets in Taiwan and South Korea.
Commodity-rich markets such as Brazil and Russia fell sharply. The MSCI Brazil IMI shed 16%, with the country’s currency falling 14% against the U.S. dollar. Brazil’s central bank surprised the market by slashing the key interest rate to 7.25% — the 10th consecutive cut since August 2011 — but indicated that it planned to keep rates on hold through mid-2013. A combination of falling commodity prices and a depreciating currency sent Russian equities 6% lower. South African stocks edged higher. But several metals and mining stocks declined on fears about labor unrest following an incident at a competitor’s mine in August and as strikes halted production.
Meanwhile, Turkish equities climbed 29%, posting some of the world’s sharpest gains during the period. Stocks were bolstered, in part, by better balance-of-payment data and expectations for improving economic growth. Investors also anticipated that the country, which is a net importer of oil, would benefit from lower oil prices. Mexican stocks gained 13%, supported by stronger-than-expected economic growth and increased hopes for reform following the election of Enrique Peña Nieto as president on July 1.
Emerging markets U.S. dollar–denominated debt rallied sharply as investors searched for higher yield in an environment of lower-yielding U.S. Treasuries. The J.P. Morgan Emerging Markets Bond Index (EMBI) Global jumped 13.9%. The yield gap between the J.P. Morgan EMBI Global and U.S. Treasuries narrowed by 104 basis points to 228 basis points over the period.
Dollar–denominated bonds in Brazil and Mexico — which together make up about 20% of the index — both posted double-digit gains. Venezuelan bonds climbed ahead of October’s presidential election amid hopes that challenger Henrique Capriles might unseat Hugo Chávez. Bonds remained strong despite the re-election of Chávez on October 7. Argentine bonds struggled, however, hurt by growing political and economic uncertainty; in October a U.S. court ruled that the country must repay holders of its defaulted bonds. Standard & Poor’s also cut Argentina’s credit rating to B–, six levels below investment grade late in the period.
20 largest holdings
| | | | | |
| | | Percent of
net assets as
of 10/31/12 | |
| | | | | |
| Mexico government bonds (MXN) | | | 5.9 | % |
| | | | | |
| Brazil inflation-linked bonds | | | 4.4 | |
| | | | | |
| Mexico inflation-linked bonds | | | 3.5 | |
| | | | | |
| Hungary government bonds (HUF) | | | 3.5 | |
| | | | | |
| Brazil government bonds (BRL) | | | 3.3 | |
| | | | | |
| Turkey inflation-linked bonds | | | 2.1 | |
| | | | | |
| Turkey government bonds (TRY) | | | 1.9 | |
| | | | | |
| SK Hynix | | | 1.6 | |
| | | | | |
| Uruguay inflation-linked bonds | | | 1.6 | |
| | | | | |
| Venezuela government bonds (USD) | | | 1.6 | |
| | | | | |
| Argentina government bonds (USD) | | | 1.4 | |
| | | | | |
| Standard Chartered | | | 1.4 | |
| | | | | |
| Philippines government bonds (PHP) | | | 1.4 | |
| | | | | |
| Brazil government bonds (USD) | | | 1.3 | |
| | | | | |
| OJSC Gazprom | | | 1.3 | |
| | | | | |
| RZD Capital | | | 1.3 | |
| | | | | |
| HKT Trust | | | 1.3 | |
| | | | | |
| Poland inflation-linked bonds (PLN) | | | 1.3 | |
| | | | | |
| Taiwan Semiconductor Manufacturing | | | 1.2 | |
| | | | | |
| Delta Electronics | | | 1.2 | |
| | | | | |
| Total | | | 42.5 | % |
The local debt–based J.P. Morgan Government Bond Index–Emerging Markets Global Diversified gained 5.1%. Hungarian local currency bonds helped lead gains amid optimism that the heavily indebted country might secure an aid package from the International Monetary Fund despite delays. Turkish bonds rose sharply, spurred by hopes that Fitch Ratings would lift the country’s debt rating to investment grade on signs of economic progress (the agency upgraded Turkey’s rating in November). Meanwhile, Mexican local currency bonds posted solid gains against a backdrop of improving economic growth and the potential for government reform. On the other hand, the sharp depreciation of the Brazilian real eroded gains for U.S. dollar–based investors in the country’s local currency debt.
| | |
| 2 | Capital Emerging Markets Total Opportunities Fund |
Asset mix (percent of net assets)
As of October 31, 2012

Top five equity sectors
| | | | | |
| | | Percent of
net assets | |
| | | | | |
| Financials | | | 8.3 | % |
| | | | | |
| Information technology | | | 8.3 | |
| | | | | |
| Energy | | | 6.9 | |
| | | | | |
| Materials | | | 6.3 | |
| | | | | |
| Telecommunication services | | | 4.0 | |
15 largest country positions
| | | | | | | | | | | |
| | | Percent of net assets
as of 10/31/12 | |
| | |
| |
| | | Equity | | Bonds and notes | | Total | |
| | | | | | | | | | | |
| Brazil | | | 1.9 | % | | 11.0 | % | | 12.9 | % |
| | | | | | | | | | | |
| Mexico | | | 0.5 | | | 11.6 | | | 12.1 | |
| | | | | | | | | | | |
| China (including Hong Kong) | | | 9.3 | | | 1.0 | | | 10.3 | |
| | | | | | | | | | | |
| South Korea | | | 4.6 | | | 0.9 | | | 5.5 | |
| | | | | | | | | | | |
| Taiwan | | | 4.4 | | | — | | | 4.4 | |
| | | | | | | | | | | |
| Turkey | | | — | | | 4.2 | | | 4.2 | |
| | | | | | | | | | | |
| United Kingdom* | | | 3.5 | | | 0.1 | | | 3.6 | |
| | | | | | | | | | | |
| Hungary | | | — | | | 3.6 | | | 3.6 | |
| | | | | | | | | | | |
| Russia | | | 2.2 | | | 1.3 | | | 3.5 | |
| | | | | | | | | | | |
| South Africa | | | 1.1 | | | 2.3 | | | 3.4 | |
| | | | | | | | | | | |
| United States of America* | | | 2.2 | | | 0.9 | | | 3.1 | |
| | | | | | | | | | | |
| Malaysia | | | 1.4 | | | 0.9 | | | 2.3 | |
| | | | | | | | | | | |
| Poland | | | 0.1 | | | 1.8 | | | 1.9 | |
| | | | | | | | | | | |
| India | | | 1.7 | | | 0.1 | | | 1.8 | |
| | | | | | | | | | | |
| Argentina | | | — | | | 1.7 | | | 1.7 | |
| | | | | | | | | | | |
| Total net assets | | | 32.9 | % | | 41.4 | % | | 74.3 | % |
| | |
|
| |
|
| |
|
| |
| | |
| * | Includes investments in companies listed in developed markets that have significant operations in emerging markets. |
| | |
| Capital Emerging Markets Total Opportunities Fund | 3 |
Corporate bond issuance reached record levels as emerging markets companies sought to take advantage of strong investor demand and lower borrowing rates. A number of commodity-related firms issued bonds, including several Chinese gas producers that sold dollar bonds this year as they sought to expand operations in China’s fast-growing gas industry. Mexican state-owned oil company Pemex also issued $1 billion in bonds due in 2044 at a coupon of 5.5% in October, following a $1.75 billion issue of 32-year bonds in June. The firm indicated that it planned to use funds from the June sale to boost production after seven years of output declines. Meanwhile, Cemex sold $1.5 billion in 10-year bonds at a yield of 9.375%, with investors cheering the company’s improved financial outlook. Cemex, which has struggled with debt issues in recent years, will use funds from the sale to pay the first installment of its refinancing obligations in March 2013.
| |
| Portfolio review |
| Investments in equities and fixed income contributed to fund results. Bond investments had an especially strong impact. Inflation-linked bonds, or linkers, continue to be a major area of focus for managers, and the fund’s exposure to these securities substantially lifted returns. Managers are particularly interested in inflation-linked bonds in Brazil, Mexico and Turkey, given the increased potential for inflationary pressures in these markets stemming from more accommodative economic policies in Brazil, economic development in Turkey, and the effects of an improving U.S. economy on Mexican GDP growth. The fund also has significant holdings in Uruguayan inflation-linked bonds to gain exposure to the country’s favorable economic growth prospects. |
Investments in Mexican local currency bonds further supported returns, as did Mexican corporate bond investments in energy firm Pemex and construction materials producer Cemex. Local bond investments in markets such as Turkey and the Philippines also contributed to results. Managers invested in Philippine sovereign bonds over the period, based on their expectations for sustained economic development and increased demand for business process outsourcing from the developed world. In addition, managers remain interested in local Turkish bonds as the country appears likely to continue improving its longer term economic growth prospects.
Investments in technology stocks had a positive impact on results. Robust smartphone sales helped lift shares of Samsung Electronics, despite concerns after Apple was awarded more than $1 billion in damages in a U.S. patent lawsuit against the South Korean heavyweight in August. Taiwan Semiconductor Manufacturing benefited from higher profits, as did notebook power provider Delta Electronics. Personal computer maker Asustek rose on strong quarterly profits and a bright outlook for notebook and tablet sales. The fund continues to emphasize technology firms that managers believe are likely to be leaders in their respective markets — from industry heavyweights such as Samsung Electronics to manufacturers in smaller, niche businesses such as Delta Electronics and Asustek.
Hong Kong–based telecommunications provider HKT Trust was another significant contributor to returns. Shares of the company have risen sharply following its $1.2 billion initial public offering in late 2011, bolstered by healthy first-half profits. Managers continue to find value in the stock given its considerable growth potential in both broadband and mobile services. Meanwhile, China’s Honghua Group — one of the largest oil rig manufacturers in the world — climbed as the firm continued to develop its capabilities in shale gas exploration.
Several equity investments in the consumer sectors helped results. Brazil’s Hypermarcas advanced as the consumer goods conglomerate expanded its businesses in beauty products and pharmaceuticals. Indian beverage company United Spirits rebounded on reports that its competitor Diageo, the world’s largest distiller, was planning to buy a stake in the firm to establish its foothold in the Indian market (the deal became official in November).
The fund’s investments in the materials sector held back results. Metals conglomerate Anglo American dropped on profit losses resulting from rising costs and lower commodity prices as well as concerns about rising labor unrest in South Africa. Harmony Gold and AngloGold Ashanti also slid, as did Swiss-based commodity trading company Glencore International. Russian energy producer Gazprom declined as the heavyweight witnessed a reduction in gas exports to Europe. In addition, South Korea’s LG Chem fell after the petrochemicals firm reported a larger-than-anticipated profit decline attributed to waning Chinese demand for materials used to make plastic and synthetic rubber. Managers substantially reduced exposure to the stock based on concerns that demand for petrochemicals has been more sluggish than anticipated and could weigh on earnings growth for a considerable period of time.
| | |
| 4 | Capital Emerging Markets Total Opportunities Fund |
Bharti Airtel was another significant detractor to fund returns. The Indian wireless firm posted disappointing quarterly earnings due to the impact of intense competition and costs stemming from its expansion in India and Africa. Investments in Malaysian hotel and entertainment conglomerate Genting fell on concerns about slowing growth in the industry and licensing delays related to new projects in New York and Miami.
| |
| Outlook |
| While concerns about the European sovereign debt crisis and the U.S. fiscal cliff still loom in the background, stimulus measures in both developed and developing markets have boosted investor sentiment in recent months and have relieved some fears about the global economic environment. Investors have also taken comfort in signs of economic improvement in China, as well as the likelihood of a smooth political transition there. In addition, authorities in several major emerging markets such as Brazil have significantly reduced interest rates this year in an effort to stimulate economic growth, while India has responded to a slowing economy by implementing a series of new reforms. Emerging markets corporate earnings growth is generally expected to regain momentum against a backdrop of better economic growth, while stock valuations continue to look attractive, and market volatility remains fairly low. |
The fund’s managers have been willing to take on more volatility in this environment and adopt a more aggressive position in their investments as macroeconomic risks subside. Bond investments can be one way to accomplish that. Currently, a larger portion of the fund’s assets are invested in bonds than equities. Many of the fund’s fixed-income investments reflect a more positive view of local economies and offer the potential for higher yields. Managers continue to emphasize local currency bonds in markets such as Mexico and Turkey that exhibit solid fundamentals and seem poised to benefit from longer term economic improvements. Several managers have also been increasing investments in long duration local currency bonds, based on increased confidence in some economies and as a way to diversify the portfolio’s investments.
Managing currency is another important part of the fund’s investment process. Some emerging markets currencies have begun to show a lower correlation to European difficulties in recent months, differentiating themselves more in response to local dynamics. As a result, managers are adding to positions in currencies that appear to be supported by domestic economic fundamentals and seem undervalued.
Inflation-linked bonds are another key area of focus as managers expect inflationary pressures to ratchet higher in several markets over time. Managers are also investing in selected corporate bond issues. Some of the more recent investments in this area have included construction and commodity-related companies.
About 10% of the portfolio’s equity assets are invested in stocks in China and Hong Kong. On the whole, managers believe that China’s economy has been undergoing a process of stabilization on the path to somewhat slower — but more sustainable — growth over the long term. Stock valuations appear especially attractive against this backdrop. In particular, the portfolio continues to emphasize stocks in China and Hong Kong that are likely to benefit from increased natural gas usage in Asia over the long term — from exploration and production firms to equipment providers and distributors.
In general, managers are finding value in technology companies and telecommunication services providers that appear well prepared to meet demand for products in a competitive environment. Local banks that are expanding in underpenetrated markets and industries also feature prominently. In general, managers continue to search for equity opportunities that have the potential to capture any upswings as the overall market environment improves.
We look forward to reporting to you again in six months.
Sincerely,

Shaw B. Wagener
Portfolio manager

John B. Emerson
President
December 28, 2012
| | |
| Capital Emerging Markets Total Opportunities Fund | 5 |
The value of a $25,000 investment
How a $25,0001 investment has fared (for the period January 27, 2012, to October 31, 2012, with all distributions reinvested)
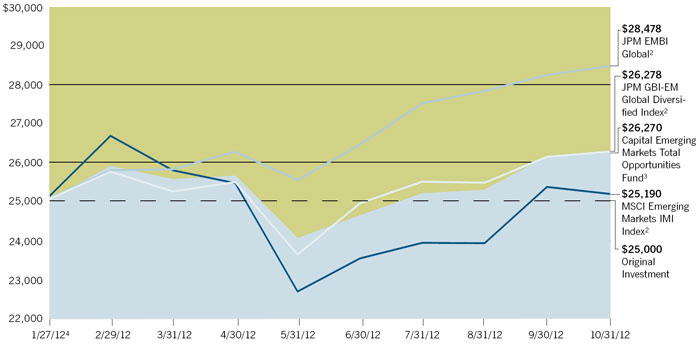
| |
| 1 The minimum initial investment for the fund is $25,000. |
| 2 The market indexes are unmanaged and, therefore, have no expenses. |
| 3 Results are calculated with all distributions, if any, reinvested. |
| 4 The date the fund began operations. |
| | | |
| Cumulative total return based on a $1,000 investment (for the period ended October 31, 2012) | | |
| | | Lifetime |
| | | (since 1/27/12) |
| | |
|
| | | 5.08% |
Investment results assume all distributions are reinvested and reflect applicable fees and expenses.
Fund results shown in this report are for past periods and are not predictive of results for future periods. The results shown are before taxes on fund distributions and sale of fund shares. Current and future results may be lower or higher than those shown. Share prices and returns will vary, so investors may lose money. Investing for short periods makes losses more likely. For current information and month-end results, please call 800/266-9532.
| | |
| 6 | Capital Emerging Markets Total Opportunities Fund |
| |
| Investment portfolio |
| October 31, 2012 |
| | | | | | | | | | | |
| | | Equity
securities | | Bonds
and notes | | Percent of
net assets | |
| Sector diversification | | | | | | | | | | |
| Government | | | — | % | | 39.69 | % | | 39.69 | % |
|
|
|
|
|
|
|
|
|
|
|
| Financials | | | 8.30 | | | 5.03 | | | 13.33 | |
|
|
|
|
|
|
|
|
|
|
|
| Information technology | | | 8.27 | | | .21 | | | 8.48 | |
|
|
|
|
|
|
|
|
|
|
|
| Energy | | | 6.89 | | | 1.30 | | | 8.19 | |
|
|
|
|
|
|
|
|
|
|
|
| Materials | | | 6.25 | | | 1.57 | | | 7.82 | |
|
|
|
|
|
|
|
|
|
|
|
| Telecommunication services | | | 3.98 | | | .99 | | | 4.97 | |
|
|
|
|
|
|
|
|
|
|
|
| Industrials | | | 2.45 | | | 1.96 | | | 4.41 | |
|
|
|
|
|
|
|
|
|
|
|
| Consumer staples | | | 2.94 | | | .12 | | | 3.06 | |
|
|
|
|
|
|
|
|
|
|
|
| Consumer discretionary | | | 2.14 | | | .90 | | | 3.04 | |
|
|
|
|
|
|
|
|
|
|
|
| Utilities | | | 1.16 | | | .39 | | | 1.55 | |
|
|
|
|
|
|
|
|
|
|
|
| Health care | | | .11 | | | — | | | .11 | |
|
|
|
|
|
|
|
|
|
|
|
| | | | 42.49 | % | | 52.16 | % | | 94.65 | |
| | |
|
| |
|
| | | | |
| | | | | | | | | | | |
| Short-term securities | | | | | | | | | 2.36 | |
|
|
|
|
|
|
|
|
|
|
|
| Other assets less liabilities (including forward currency contracts) | | | | | | | | | 2.99 | |
|
|
|
|
|
|
|
|
|
|
|
| Net assets | | | | | | | | | 100.00 | % |
| | | | | | | | |
|
| |
| | | | | | | | | | | |
| Bonds and notes | | Principal amount
(000) | | Value
(000) | | Percent of
net assets | |
| Latin America — 29.5% | | | | | | | | | | |
| Argentina — 1.7% | | | | | | | | | | |
| Argentina (Republic of) 7.00% October 3, 2015 | | $ | 8,961 | | $ | 7,449 | | | 1.4 | % |
|
|
|
|
|
�� |
|
|
|
|
|
| Provincia de Buenos Aires 10.875% January 26, 2021 | | | 1,965 | | | 1,317 | | | 0.3 | |
|
|
|
|
|
|
|
|
|
|
|
| | | | | | | 8,766 | | | 1.7 | |
| Brazil — 11.0% | | | | | | | | | | |
| Banco BMG SA 8.00% April 15, 2018 | | | 1,350 | | | 1,282 | | | 0.3 | |
|
|
|
|
|
|
|
|
|
|
|
| Banco do Brasil, junior subordinated 9.25% April 15, 20231 | | | 1,225 | | | 1,507 | | | 0.3 | |
|
|
|
|
|
|
|
|
|
|
|
| Banco Safra SA 10.25% August 8, 2016 | | BRL | 3,200 | | | 1,698 | | | 0.3 | |
|
|
|
|
|
|
|
|
|
|
|
| Banco Votorantim SA 6.25% May 16, 20162,3 | | | 4,500 | | | 2,509 | | | 0.5 | |
|
|
|
|
|
|
|
|
|
|
|
| Brazil (Federal Republic of) Global: | | | | | | | | | | |
| 4.875% January 22, 2021 | | $ | 2,000 | | | 2,405 | | | 0.5 | |
| 8.50% January 5, 2024 | | BRL | 126 | | | 7,304 | | | 1.4 | |
| 10.25% January 10, 2028 | | | 14,136 | | | 9,048 | | | 1.7 | |
| 11.00% August 17, 2040 | | $ | 3,530 | | | 4,483 | | | 0.9 | |
| Brazil Notas do Tesouro Nacional: | | | | | | | | | | |
| Series F, 10.00% January 1, 2014 – January 1, 2017 | | BRL | 2 | | | 989 | | | 0.2 | |
| Series B, 6.00% May 15, 2015 – May 15, 20452,3 | | | 17 | | | 22,868 | | | 4.4 | |
| Cia. de Energética SA 9.75% January 15, 20152,3 | | | 1,330 | | | 950 | | | 0.2 | |
|
|
|
|
|
|
|
|
|
|
|
| Itaú Unibanco Holding SA 6.20% December 21, 20211 | | $ | 600 | | | 657 | | | 0.1 | |
|
|
|
|
|
|
|
|
|
|
|
| Odebrecht Drilling Norbe VIII/IX Ltd. 6.35% June 30, 2021 | | | 142 | | | 164 | | | — | |
|
|
|
|
|
|
|
|
|
|
|
| Petrobras International Finance Co. – Pifco 5.375% January 27, 2021 | | | 1,120 | | | 1,275 | | | 0.2 | |
|
|
|
|
|
|
|
|
|
|
|
| | | | | | | 57,139 | | | 11.0 | |
| Chile — 1.0% | | | | | | | | | | |
| Banco Santander Chile 2.44% February 14, 20141,2 | | | 2,450 | | | 2,417 | | | 0.5 | |
|
|
|
|
|
|
|
|
|
|
|
| Chile (Republic of) 5.50% January 15, 2013 | | | 1,600 | | | 1,618 | | | 0.3 | |
|
|
|
|
|
|
|
|
|
|
|
| | |
| Capital Emerging Markets Total Opportunities Fund | 7 |
| | | | | | | | | | | |
| | | Principal amount
(000) | | Value
(000 | ) | Percent of
net assets | |
| | | | | | | | | | | |
| Latin America (continued) | | | | | | | | | | |
| Chile (continued) | | | | | | | | | | |
| Corp. Nacional del Cobre de Chile 6.375% November 30, 2012 | | $ | 385 | | $ | 387 | | | 0.1 | % |
|
|
|
|
|
|
|
|
|
|
|
| Emgesa SA ESP 8.75% January 25, 2021 | | COP | 1,200,000 | | | 743 | | | 0.1 | |
|
|
|
|
|
|
|
|
|
|
|
| | | | | | | 5,165 | | | 1.0 | |
| Colombia — 0.1% | | | | | | | | | | |
| Bancolombia SA 5.95% June 3, 2021 | | $ | 200 | | | 232 | | | — | |
|
|
|
|
|
|
|
|
|
|
|
| Transportadora de Gas Internacional 5.70% March 20, 20221 | | | 400 | | | 448 | | | 0.1 | |
|
|
|
|
|
|
|
|
|
|
|
| | | | | | | 680 | | | 0.1 | |
| Mexico — 11.6% | | | | | | | | | | |
| América Móvil, SAB de CV 3.50% February 8, 2015 | | CNY | 4,000 | | | 646 | | | 0.1 | |
|
|
|
|
|
|
|
|
|
|
|
| CEMEX Finance LLC 9.50% December 14, 2016 | | $ | 2,890 | | | 3,081 | | | 0.6 | |
|
|
|
|
|
|
|
|
|
|
|
| CEMEX, SAB de CV 9.00% January 11, 20181 | | | 1,000 | | | 1,043 | | | 0.2 | |
|
|
|
|
|
|
|
|
|
|
|
| Empresas ICA SAB de CV 8.375% July 24, 20171 | | | 675 | | | 722 | | | 0.1 | |
|
|
|
|
|
|
|
|
|
|
|
| Pemex Project Funding Master Trust 1.018% December 3, 20122 | | | 800 | | | 799 | | | 0.2 | |
|
|
|
|
|
|
|
|
|
|
|
| United Mexican States Government: | | | | | | | | | | |
| Series MI10, 9.50% December 18, 2014 | | MXN | 29 | | | 238 | | | — | |
| Series M10, 7.75% December 14, 2017 | | | 285 | | | 2,437 | | | 0.5 | |
| 2.50% December 10, 20202,3 | | | 76 | | | 630 | | | 0.1 | |
| Series M, 6.50% June 10, 2021 | | | 1,101 | | | 9,011 | | | 1.7 | |
| Series M20, 10.00% December 5, 2024 | | | 1,055 | | | 11,154 | | | 2.2 | |
| Series M30, 10.00% November 20, 2036 | | | 701 | | | 7,590 | | | 1.5 | |
| 4.00% November 15, 20402,3 | | | 1,824 | | | 17,698 | | | 3.4 | |
| United Mexican States Government Global: | | | | | | | | | | |
| Series A, 3.625% March 15, 2022 | | $ | 250 | | | 274 | | | 0.1 | |
| Series A, 6.05% January 11, 2040 | | | 2,450 | | | 3,264 | | | 0.6 | |
|
|
|
|
|
|
|
|
|
|
|
| Urbi Desarrollos Urbanos SAB de CV 8.50% April 19, 2016 | | | 1,425 | | | 1,347 | | | 0.3 | |
|
|
|
|
|
|
|
|
|
|
|
| | | | | | | 59,934 | | | 11.6 | |
| Panama — 0.3% | | | | | | | | | | |
| ENA Norte Trust 4.95% April 25, 20281 | | | 1,460 | | | 1,515 | | | 0.3 | |
|
|
|
|
|
|
|
|
|
|
|
| | | | | | | | | | | |
| Peru — 0.6% | | | | | | | | | | |
| Banco de Crédito del Perú 6.875% September 16, 2026 | | | 2,800 | | | 3,262 | | | 0.6 | |
|
|
|
|
|
|
|
|
|
|
|
| | | | | | | | | | | |
| Uruguay — 1.6% | | | | | | | | | | |
| Uruguay (Republic of): | | | | | | | | | | |
| 5.00% September 14, 20182,3 | | UYU | 15,674 | | | 914 | | | 0.2 | |
| 4.375% December 15, 20282,3 | | | 121,955 | | | 7,354 | | | 1.4 | |
|
|
|
|
|
|
|
|
|
|
|
| | | | | | | 8,268 | | | 1.6 | |
| Venezuela — 1.6% | | | | | | | | | | |
| Venezuela (Republic of): | | | | | | | | | | |
| 9.25% September 15, 2027 | | $ | 8,360 | | | 7,587 | | | 1.5 | |
| 7.00% March 31, 2038 | | | 875 | | | 630 | | | 0.1 | |
|
|
|
|
|
|
|
|
|
|
|
| | | | | | | 8,217 | | | 1.6 | |
| Eastern Europe and Middle East — 11.1% | | | | | | | | | | |
| Hungary — 3.6% | | | | | | | | | | |
| Hungarian Government: | | | | | | | | | | |
| Series 19/A, 6.50% June 24, 2019 | | HUF | 779,460 | | | 3,559 | | | 0.7 | |
| 6.25% January 29, 2020 | | $ | 305 | | | 339 | | | 0.1 | |
| Series 20/A, 7.50% November 12, 2020 | | HUF | 68,040 | | | 326 | | | 0.1 | |
| Series 22/A, 7.00% June 24, 2022 | | | 1,871,300 | | | 8,625 | | | 1.7 | |
| | |
| 8 | Capital Emerging Markets Total Opportunities Fund |
| | | | | | | | | | | |
| Bonds and notes | | Principal amount
(000) | | Value
(000) | | Percent of
net assets | |
| | | | | | | | | | | |
| Eastern Europe and Middle East (continued) | | | | | | | | | | |
| Hungary (continued) | | | | | | | | | | |
| Series 23/A, 6.00% November 24, 2023 | | HUF | 1,165,600 | | $ | 4,931 | | | 0.9 | % |
| Series 28/A, 6.75% October 22, 2028 | | | 160,600 | | | 714 | | | 0.1 | |
|
|
|
|
|
|
|
|
|
|
|
| | | | | | | 18,494 | | | 3.6 | |
| Kazakhstan — 0.1% | | | | | | | | | | |
| JSC Halyk Savings Bank of Kazakhstan 7.25% January 28, 2021 | | $ | 420 | | | 443 | | | 0.1 | |
|
|
|
|
|
|
|
|
|
|
|
| | | | | | | | | | | |
| Poland — 1.8% | | | | | | | | | | |
| Poland Government Bond: | | | | | | | | | | |
| Series 1021, 5.75% October 25, 2021 | | PLN | 9,150 | | | 3,131 | | | 0.6 | |
| 2.75% August 25, 20232,3 | | | 19,387 | | | 6,498 | | | 1.2 | |
|
|
|
|
|
|
|
|
|
|
|
| | | | | | | 9,629 | | | 1.8 | |
| Russia — 1.3% | | | | | | | | | | |
| Gazprom OJSC 4.95% July 19, 20221 | | | 270 | | | 287 | | | — | |
|
|
|
|
|
|
|
|
|
|
|
| RZD Capital Ltd. 8.30% April 2, 2019 | | RUB | 206,200 | | | 6,706 | | | 1.3 | |
|
|
|
|
|
|
|
|
|
|
|
| | | | | | | 6,993 | | | 1.3 | |
| Turkey — 4.2% | | | | | | | | | | |
| Turkey (Republic of): | | | | | | | | | | |
| 4.00% April 29, 2015 2,3 | | TRY | 816 | | | 498 | | | 0.1 | |
| 9.50% January 12, 2022 | | | 15,615 | | | 9,582 | | | 1.8 | |
| 3.00% February 23, 20222,3 | | | 16,454 | | | 10,199 | | | 2.0 | |
| 6.25% September 26, 2022 | | $ | 300 | | | 364 | | | 0.1 | |
|
|
|
|
|
|
|
|
|
|
|
| Yapı ve Kredi Bankası AŞ 6.75% February 8, 20171 | | $ | 1,000 | | | 1,089 | | | 0.2 | |
|
|
|
|
|
|
|
|
|
|
|
| | | | | | | 21,732 | | | 4.2 | |
| United Arab Emirates — 0.1% | | | | | | | | | | |
| Abu Dhabi National Energy Co. PJSC (TAQA) 4.125% March 13, 2017 | | | 300 | | | 321 | | | 0.1 | |
|
|
|
|
|
|
|
|
|
|
|
| | | | | | | | | | | |
| Asia-Pacific — 6.0% | | | | | | | | | | |
| China — 1.0% | | | | | | | | | | |
| Longfor Properties Co. Ltd. 9.50% April 7, 2016 | | | 3,100 | | | 3,449 | | | 0.7 | |
|
|
|
|
|
|
|
|
|
|
|
| Renhe Commercial Holdings Co. Ltd.: | | | | | | | | | | |
| 11.75% May 18, 2015 | | | 2,210 | | | 1,271 | | | 0.2 | |
| 13.00% March 10, 2016 | | | 1,050 | | | 556 | | | 0.1 | |
|
|
|
|
|
|
|
|
|
|
|
| | | | | | | 5,276 | | | 1.0 | |
| India — 0.1% | | | | | | | | | | |
| Reliance Holdings Ltd., 5.40% February 14, 20221 | | | 500 | | | 556 | | | 0.1 | |
|
|
|
|
|
|
|
|
|
|
|
| | | | | | | | | | | |
| Indonesia — 0.7% | | | | | | | | | | |
| Indonesia (Republic of): | | | | | | | | | | |
| Series FR33, 12.50% March 15, 2013 | | IDR | 2,830,000 | | | 303 | | | 0.1 | |
| Series OR17, 7.95% August 15, 2013 | | | 31,436,000 | | | 3,353 | | | 0.6 | |
|
|
|
|
|
|
|
|
|
|
|
| | | | | | | 3,656 | | | 0.7 | |
| Malaysia — 0.9% | | | | | | | | | | |
| Malaysian Government, Series 110, 3.835% August 12, 2015 | | MYR | 13,370 | | | 4,482 | | | 0.9 | |
|
|
|
|
|
|
|
|
|
|
|
| | | | | | | | | | | |
| Philippines — 1.4% | | | | | | | | | | |
| Philippines (Republic of): | | | | | | | | | | |
| 4.95% January 15, 2021 | | PHP | 10,000 | | | 268 | | | 0.1 | |
| Series 1054, 6.375% January 19, 2022 | | | 245,686 | | | 6,732 | | | 1.3 | |
|
|
|
|
|
|
|
|
|
|
|
| | | | | | | 7,000 | | | 1.4 | |
| | |
| Capital Emerging Markets Total Opportunities Fund | 9 |
| | | | | | | | | | | |
| | | Principal amount
(000) | | Value
(000) | | Percent of
net assets | |
| | | | | | | | | | | |
| Asia-Pacific (continued) | | | | | | | | | | |
| South Korea — 0.9% | | | | | | | | | | |
| Korea Development Bank 5.50% November 13, 2012 | | $ | 30 | | $ | 30 | | | — | % |
|
|
|
|
|
|
|
|
|
|
|
| Samsung Electronics America, Inc. 1.75% April 10, 20171 | | | 1,100 | | | 1,113 | | | 0.2 | |
|
|
|
|
|
|
|
|
|
|
|
| South Korean Government, Series 1609, 5.00% September 10, 2016 | | KRW | 3,497,300 | | | 3,462 | | | 0.7 | |
|
|
|
|
|
|
|
|
|
|
|
| | | | | | | 4,605 | | | 0.9 | |
| Sri Lanka — 0.6% | | | | | | | | | | |
| Democratic Socialist Republic of Sri Lanka 6.25% October 4, 2020 | | $ | 2,832 | | | 3,186 | | | 0.6 | |
|
|
|
|
|
|
|
|
|
|
|
| | | | | | | | | | | |
| Thailand — 0.4% | | | | | | | | | | |
| Thailand Government Bond 1.20% July 14, 20212,3 | | THB | 59,925 | | | 2,001 | | | 0.4 | |
|
|
|
|
|
|
|
|
|
|
|
| | | | | | | | | | | |
| Africa — 2.6% | | | | | | | | | | |
| Egypt — 0.3% | | | | | | | | | | |
| African Export-Import Bank 5.75% July 27, 2016 | | $ | 1,400 | | | 1,512 | | | 0.3 | |
|
|
|
|
|
|
|
|
|
|
|
| | | | | | | | | | | |
| South Africa — 2.3% | | | | | | | | | | |
| AngloGold Ashanti Holdings PLC 5.125% August 1, 2022 | | | 1,460 | | | 1,490 | | | 0.3 | |
|
|
|
|
|
|
|
|
|
|
|
| Sappi Ltd. 11.75% August 1, 2014 | | EUR | 318 | | | 441 | | | 0.1 | |
|
|
|
|
|
|
|
|
|
|
|
| South Africa (Republic of), Series R214, 6.50% February 28, 2041 | | ZAR | 65,400 | | | 5,920 | | | 1.2 | |
|
|
|
|
|
|
|
|
|
|
|
| Standard Bank PLC 8.125% December 2, 2019 | | $ | 2,400 | | | 2,724 | | | 0.5 | |
|
|
|
|
|
|
|
|
|
|
|
| Steinhoff International Holdings Ltd. 9.625% convertible debenture, July 20, 2015 | | ZAR | 8,000 | | | 1,239 | | | 0.2 | |
|
|
|
|
|
|
|
|
|
|
|
| | | | | | | 11,814 | | | 2.3 | |
| | | | | | | | | | | |
| Other markets — 2.0% | | | | | | | | | | |
| Australia — 0.2% | | | | | | | | | | |
| Santos Finance Ltd. 8.25% September 22, 2070 | | EUR | 850 | | | 1,157 | | | 0.2 | |
|
|
|
|
|
|
|
|
|
|
|
| | | | | | | | | | | |
| Canada — 0.3% | | | | | | | | | | |
| Inmet Mining Corp. 8.75% June 1, 20201 | | $ | 1,620 | | | 1,689 | | | 0.3 | |
|
|
|
|
|
|
|
|
|
|
|
| | | | | | | | | | | |
| Jamaica — 0.1% | | | | | | | | | | |
| Digicel Group Ltd. 12.00% April 1, 2014 | | | 420 | | | 466 | | | 0.1 | |
|
|
|
|
|
|
|
|
|
|
|
| | | | | | | | | | | |
| Switzerland — 0.4% | | | | | | | | | | |
| Transocean, Inc. 6.375% December 15, 2021 | | | 1,700 | | | 2,071 | | | 0.4 | |
|
|
|
|
|
|
|
|
|
|
|
| | | | | | | | | | | |
| United Kingdom — 0.1% | | | | | | | | | | |
| SABMiller Holdings, Inc. 1.85% January 15, 20151 | | | 400 | | | 410 | | | 0.1 | |
|
|
|
|
|
|
|
|
|
|
|
| | | | | | | | | | | |
| United States of America — 0.9% | | | | | | | | | | |
| Arcos Dorados Holdings Inc. 10.25% July 13, 2016 | | BRL | 3,900 | | | 2,074 | | | 0.4 | |
|
|
|
|
|
|
|
|
|
|
|
| Philip Morris International, Inc. 2.90% November 15, 2021 | | $ | 215 | | | 226 | | | — | |
|
|
|
|
|
|
|
|
|
|
|
| Trilogy International Partners LLC 10.25% August 15, 2016 | | | 1,700 | | | 1,419 | | | 0.3 | |
|
|
|
|
|
|
|
|
|
|
|
| U.S. Treasury 0.75% March 31, 2013 | | | 762 | | | 764 | | | 0.2 | |
|
|
|
|
|
|
|
|
|
|
|
| | | | | | | 4,483 | | | 0.9 | |
| | | | | | | | | | | |
| Miscellaneous — 1.0% | | | | | | | | | | |
| Bonds and notes in initial period of acquisition | | | | | | 5,188 | | | 1.0 | |
|
|
|
|
|
|
|
|
|
|
|
| Total bonds and notes (cost: $257,484,000) | | | | | | 270,110 | | | 52.2 | |
| | |
| 10 | Capital Emerging Markets Total Opportunities Fund |
| | | | | | | | | | | |
| Equity securities | | Shares | | Value
(000) | | Percent of
net assets | |
| Asia-Pacific — 23.2% | | | | | | | | | | |
| China — 7.3% | | | | | | | | | | |
| Anhui Conch Cement Co. Ltd. (Hong Kong) | | | 804,000 | | $ | 2,780 | | | 0.5 | % |
|
|
|
|
|
|
|
|
|
|
|
| Bank of China Ltd. (Hong Kong) | | | 10,963,511 | | | 4,513 | | | 0.9 | |
|
|
|
|
|
|
|
|
|
|
|
| Being Enterprises Water Group Ltd. (Hong Kong) | | | 4,680,000 | | | 1,075 | | | 0.2 | |
|
|
|
|
|
|
|
|
|
|
|
| China High Speed Transmission Equipment Group Co., Ltd. (Hong Kong)4 | | | 2,392,000 | | | 824 | | | 0.2 | |
|
|
|
|
|
|
|
|
|
|
|
| China Life Insurance Co. Ltd. (Hong Kong) | | | 927,000 | | | 2,739 | | | 0.5 | |
|
|
|
|
|
|
|
|
|
|
|
| China Longyuan Power Group Corp. Ltd. (Hong Kong) | | | 1,959,000 | | | 1,277 | | | 0.2 | |
|
|
|
|
|
|
|
|
|
|
|
| China Petroleum & Chemical Corp. (Hong Kong) | | | 3,582,000 | | | 3,804 | | | 0.7 | |
|
|
|
|
|
|
|
|
|
|
|
| China Shenhua Energy Co. Ltd. (Hong Kong) | | | 1,304,500 | | | 5,555 | | | 1.1 | |
|
|
|
|
|
|
|
|
|
|
|
| CSR Corp. Ltd. (Hong Kong) | | | 1,890,000 | | | 1,468 | | | 0.3 | |
|
|
|
|
|
|
|
|
|
|
|
| First Tractor Co. Ltd. (Hong Kong)4 | | | 1,594,000 | | | 1,331 | | | 0.3 | |
|
|
|
|
|
|
|
|
|
|
|
| Honghua Group Ltd. (Hong Kong) | | | 17,372,000 | | | 4,057 | | | 0.8 | |
|
|
|
|
|
|
|
|
|
|
|
| Lenovo Group Ltd. (Hong Kong) | | | 4,510,000 | | | 3,625 | | | 0.7 | |
|
|
|
|
|
|
|
|
|
|
|
| Minth Group Ltd. (Hong Kong) | | | 1,282,000 | | | 1,295 | | | 0.2 | |
|
|
|
|
|
|
|
|
|
|
|
| Zhongsheng Group Holdings Ltd. (Hong Kong) | | | 608,500 | | | 787 | | | 0.2 | |
|
|
|
|
|
|
|
|
|
|
|
| Zhuzhou CSR Times Electric Co., Ltd. (Hong Kong) | | | 854,000 | | | 2,512 | | | 0.5 | |
|
|
|
|
|
|
|
|
|
|
|
| | | | | | | 37,642 | | | 7.3 | |
| Hong Kong — 2.0% | | | | | | | | | | |
| AIA Group Ltd. | | | 420,200 | | | 1,665 | | | 0.3 | |
|
|
|
|
|
|
|
|
|
|
|
| HKT Trust, units | | | 7,014,000 | | | 6,507 | | | 1.3 | |
|
|
|
|
|
|
|
|
|
|
|
| SJM Holdings Ltd. | | | 1,046,000 | | | 2,278 | | | 0.4 | |
|
|
|
|
|
|
|
|
|
|
|
| | | | | | | 10,450 | | | 2.0 | |
| India — 1.7% | | | | | | | | | | |
| Bharti Airtel Ltd. | | | 946,585 | | | 4,745 | | | 0.9 | |
|
|
|
|
|
|
|
|
|
|
|
| DLF Ltd. | | | 283,000 | | | 1,067 | | | 0.2 | |
|
|
|
|
|
|
|
|
|
|
|
| ICICI Bank Ltd. | | | 93,600 | | | 1,827 | | | 0.4 | |
|
|
|
|
|
|
|
|
|
|
|
| United Spirits Ltd. | | | 50,000 | | | 1,093 | | | 0.2 | |
|
|
|
|
|
|
|
|
|
|
|
| | | | | | | 8,732 | | | 1.7 | |
| Malaysia — 1.4% | | | | | | | | | | |
| Bumi Armada Bhd. | | | 1,461,900 | | | 1,881 | | | 0.4 | |
|
|
|
|
|
|
|
|
|
|
|
| CIMB Group Holdings Bhd. | | | 698,100 | | | 1,749 | | | 0.3 | |
|
|
|
|
|
|
|
|
|
|
|
| Genting Bhd. | | | 1,165,300 | | | 3,386 | | | 0.7 | |
|
|
|
|
|
|
|
|
|
|
|
| | | | | | | 7,016 | | | 1.4 | |
| Philippines — 0.0% | | | | | | | | | | |
| Energy Development Corp. | | | 1,421,600 | | | 230 | | | — | |
|
|
|
|
|
|
|
|
|
|
|
| | | | | | | | | | | |
| Singapore — 0.9% | | | | | | | | | | |
| DBS Group Holdings Ltd. | | | 392,643 | | | 4,474 | | | 0.9 | |
|
|
|
|
|
|
|
|
|
|
|
| Olam International Ltd. | | | 177,000 | | | 286 | | | — | |
|
|
|
|
|
|
|
|
|
|
|
| | | | | | | 4,760 | | | 0.9 | |
| South Korea — 4.6% | | | | | | | | | | |
| Daum Communications Corp. | | | 3,000 | | | 258 | | | 0.1 | |
|
|
|
|
|
|
|
|
|
|
|
| Hana Financial Group Inc. | | | 185,130 | | | 5,390 | | | 1.0 | |
|
|
|
|
|
|
|
|
|
|
|
| Hyundai Mobis Co., Ltd. | | | 12,503 | | | 3,187 | | | 0.6 | |
|
|
|
|
|
|
|
|
|
|
|
| KT Corp. | | | 55,150 | | | 1,869 | | | 0.4 | |
|
|
|
|
|
|
|
|
|
|
|
| OCI Co. Ltd. | | | 7,471 | | | 1,055 | | | 0.2 | |
|
|
|
|
|
|
|
|
|
|
|
| Samsung Electronics Co. Ltd. | | | 2,930 | | | 3,519 | | | 0.7 | |
|
|
|
|
|
|
|
|
|
|
|
| SK Hynix, Inc.4 | | | 373,320 | | | 8,506 | | | 1.6 | |
|
|
|
|
|
|
|
|
|
|
|
| | | | | | | 23,784 | | | 4.6 | |
| | |
| Capital Emerging Markets Total Opportunities Fund | 11 |
| | | | | | | | | | | |
| | | Shares | | Value
(000) | | Percent of
net assets | |
| Asia-Pacific (continued) | | | | | | | | | | |
| Taiwan — 4.4% | | | | | | | | | | |
| ASUSTeK Computer Inc. | | | 489,820 | | $ | 5,248 | | | 1.0 | % |
|
|
|
|
|
|
|
|
|
|
|
| CTCI Corp. | | | 967,000 | | | 1,923 | | | 0.4 | |
|
|
|
|
|
|
|
|
|
|
|
| Delta Electronics, Inc. | | | 1,780,000 | | | 6,081 | | | 1.2 | |
|
|
|
|
|
|
|
|
|
|
|
| Hon Hai Precision Industry Co., Ltd. | | | 705,100 | | | 2,141 | | | 0.4 | |
|
|
|
|
|
|
|
|
|
|
|
| Taiwan Semiconductor Manufacturing Co. Ltd. | | | 2,107,000 | | | 6,398 | | | 1.2 | |
|
|
|
|
|
|
|
|
|
|
|
| Tripod Technology Corp. | | | 469,000 | | | 907 | | | 0.2 | |
|
|
|
|
|
|
|
|
|
|
|
| | | | | | | 22,698 | | | 4.4 | |
| Thailand — 0.9% | | | | | | | | | | |
| Advanced Info Service PCL | | | 208,700 | | | 1,345 | | | 0.3 | |
|
|
|
|
|
|
|
|
|
|
|
| Shin Corp. PCL, nonvoting depository receipt | | | 1,588,300 | | | 3,251 | | | 0.6 | |
|
|
|
|
|
|
|
|
|
|
|
| | | | | | | 4,596 | | | 0.9 | |
| Latin America — 3.2% | | | | | | | | | | |
| Brazil — 1.9% | | | | | | | | | | |
| BRF – Brasil Foods SA, ordinary nominative | | | 108,500 | | | 1,974 | | | 0.4 | |
| BRF – Brasil Foods SA, ordinary nominative (ADR) | | | 46,100 | | | 845 | | | 0.1 | |
|
|
|
|
|
|
|
|
|
|
|
| Cia. de Saneamento Básico do Estado de São Paulo – SABESP (ADR) | | | 18,800 | | | 1,579 | | | 0.3 | |
|
|
|
|
|
|
|
|
|
|
|
| Gerdau SA (ADR) | | | 339,300 | | | 2,983 | | | 0.6 | |
|
|
|
|
|
|
|
|
|
|
|
| Hypermarcas SA, ordinary nominative4 | | | 315,200 | | | 2,506 | | | 0.5 | |
|
|
|
|
|
|
|
|
|
|
|
| | | | | | | 9,887 | | | 1.9 | |
| Chile — 0.0% | | | | | | | | | | |
| Ripley Corp. SA | | | 185,000 | | | 174 | | | — | |
|
|
|
|
|
|
|
|
|
|
|
| | | | | | | | | | | |
| Colombia — 0.5% | | | | | | | | | | |
| Bancolombia SA | | | 71,469 | | | 1,118 | | | 0.2 | |
| Bancolombia SA, preferred nominative (ADR) | | | 21,209 | | | 1,358 | | | 0.3 | |
|
|
|
|
|
|
|
|
|
|
|
| | | | | | | 2,476 | | | 0.5 | |
| Mexico — 0.5% | | | | | | | | | | |
| Arca Continental, SAB de CV | | | 41,061 | | | 298 | | | 0.1 | |
|
|
|
|
|
|
|
|
|
|
|
| CEMEX, SAB de CV, ordinary participation certificates, units (ADR)4 | | | 122,194 | | | 1,105 | | | 0.2 | |
|
|
|
|
|
|
|
|
|
|
|
| Grupo Financiero Inbursa, SAB de CV | | | 53,800 | | | 143 | | | — | |
|
|
|
|
|
|
|
|
|
|
|
| Impulsora del Desarrollo y el Empleo en América Latina, SAB de CV, Series B14 | | | 536,400 | | | 914 | | | 0.2 | |
|
|
|
|
|
|
|
|
|
|
|
| | | | | | | 2,460 | | | 0.5 | |
| Peru — 0.3% | | | | | | | | | | |
| Cía. de Minas Buenaventura SAA (ADR) | | | 38,000 | | | 1,359 | | | 0.3 | |
|
|
|
|
|
|
|
|
|
|
|
| | | | | | | | | | | |
| Eastern Europe and Middle East — 3.0% | | | | | | | | | | |
| Czech Republic — 0.1% | | | | | | | | | | |
| ČEZ, a.s. | | | 9,900 | | | 365 | | | 0.1 | |
|
|
|
|
|
|
|
|
|
|
|
| | | | | | | | | | | |
| Oman — 0.3% | | | | | | | | | | |
| BankMuscat (SAOG) (GDR)1 | | | 306,433 | | | 1,751 | | | 0.3 | |
|
|
|
|
|
|
|
|
|
|
|
| | | | | | | | | | | |
| Poland — 0.1% | | | | | | | | | | |
| Telekomunikacja Polska SA | | | 200,456 | | | 757 | | | 0.1 | |
|
|
|
|
|
|
|
|
|
|
|
| | |
| 12 | Capital Emerging Markets Total Opportunities Fund |
| | | | | | | | | | | |
| Equity securities | | Shares | | Value
(000) | | Percent of
net assets | |
| Eastern Europe and Middle East (continued) | | | | | | | | | | |
| Russia — 2.2% | | | | | | | | | | |
| Etalon Group Ltd. (GDR)1,4 | | | 42,059 | | $ | 243 | | | 0.1 | % |
|
|
|
|
|
|
|
|
|
|
|
| OJSC Gazprom (ADR) | | | 734,396 | | | 6,709 | | | 1.3 | |
|
|
|
|
|
|
|
|
|
|
|
| Sberbank of Russia | | | 884,713 | | | 2,590 | | | 0.5 | |
| Sberbank of Russia (GDR)1 | | | 145,436 | | | 1,700 | | | 0.3 | |
|
|
|
|
|
|
|
|
|
|
|
| | | | | | | 11,242 | | | 2.2 | |
| United Arab Emirates — 0.3% | | | | | | | | | | |
| DP World Ltd. | | | 127,000 | | | 1,506 | | | 0.3 | |
|
|
|
|
|
|
|
|
|
|
|
| | | | | | | | | | | |
| Africa — 1.1% | | | | | | | | | | |
| South Africa — 1.1% | | | | | | | | | | |
| AngloGold Ashanti Ltd. | | | 39,092 | | | 1,301 | | | 0.3 | |
| AngloGold Ashanti Ltd. (ADR) | | | 21,400 | | | 727 | | | 0.1 | |
|
|
|
|
|
|
|
|
|
|
|
| Harmony Gold Mining Co. Ltd. | | | 132,004 | | | 1,081 | | | 0.2 | |
| Harmony Gold Mining Co. Ltd. (ADR) | | | 304,900 | | | 2,531 | | | 0.5 | |
|
|
|
|
|
|
|
|
|
|
|
| | | | | | | 5,640 | | | 1.1 | |
| Other markets — 8.2% | | | | | | | | | | |
| Australia — 0.5% | | | | | | | | | | |
| Oil Search Ltd. | | | 343,436 | | | 2,653 | | | 0.5 | |
|
|
|
|
|
|
|
|
|
|
|
| | | | | | | | | | | |
| Austria — 0.3% | | | | | | | | | | |
| Vienna Insurance Group | | | 40,379 | | | 1,734 | | | 0.3 | |
|
|
|
|
|
|
|
|
|
|
|
| | | | | | | | | | | |
| Canada — 0.7% | | | | | | | | | | |
| Barrick Gold Corp. | | | 36,300 | | | 1,470 | | | 0.3 | |
|
|
|
|
|
|
|
|
|
|
|
| First Quantum Minerals Ltd. | | | 94,500 | | | 2,124 | | | 0.4 | |
|
|
|
|
|
|
|
|
|
|
|
| | | | | | | 3,594 | | | 0.7 | |
| Italy — 0.3% | | | | | | | | | | |
| Tenaris SA (ADR) | | | 36,143 | | | 1,360 | | | 0.3 | |
|
|
|
|
|
|
|
|
|
|
|
| | | | | | | | | | | |
| Netherlands — 0.7% | | | | | | | | | | |
| Fugro NV | | | 57,600 | | | 3,894 | | | 0.7 | |
|
|
|
|
|
|
|
|
|
|
|
| | | | | | | | | | | |
| United Kingdom — 3.5% | | | | | | | | | | |
| Anglo American PLC | | | 68,700 | | | 2,110 | | | 0.4 | |
|
|
|
|
|
|
|
|
|
|
|
| Global Ports Investments PLC (GDR)1 | | | 92,647 | | | 1,135 | | | 0.2 | |
|
|
|
|
|
|
|
|
|
|
|
| Imperial Tobacco Group PLC | | | 92,815 | | | 3,505 | | | 0.7 | |
|
|
|
|
|
|
|
|
|
|
|
| Mondi PLC | | | 194,858 | | | 2,144 | | | 0.4 | |
|
|
|
|
|
|
|
|
|
|
|
| SABMiller PLC | | | 48,200 | | | 2,065 | | | 0.4 | |
|
|
|
|
|
|
|
|
|
|
|
| Standard Chartered PLC | | | 303,557 | | | 7,186 | | | 1.4 | |
|
|
|
|
|
|
|
|
|
|
|
| | | | | | | 18,145 | | | 3.5 | |
| United States of America — 2.2% | | | | | | | | | | |
| Ensco PLC, Class A | | | 99,300 | | | 5,741 | | | 1.1 | |
|
|
|
|
|
|
|
|
|
|
|
| Flextronics International Ltd.4 | | | 360,300 | | | 2,079 | | | 0.4 | |
|
|
|
|
|
|
|
|
|
|
|
| Freeport-McMoRan Copper & Gold Inc. | | | 86,700 | | | 3,371 | | | 0.7 | |
|
|
|
|
|
|
|
|
|
|
|
| | | | | | | 11,191 | | | 2.2 | |
| | |
| Capital Emerging Markets Total Opportunities Fund | 13 |
| | | | | | | | | | | |
| | | Shares | | Value
(000) | | Percent of
net assets | |
| Miscellaneous — 3.8% | | | | | | | | | | |
| Equity securities in initial period of acquisition | | | | | $ | 19,880 | | | 3.8 | % |
|
|
|
|
|
|
|
|
|
|
|
| | | | | | | | | | | |
| Total equity securities (cost: $213,687,000) | | | | | | 219,976 | | | 42.5 | |
| | | | | | | | | | | |
| Short-term securities | Principal amount
(000) | | | | | | | |
|
|
|
|
|
|
|
|
|
|
| Certificate of deposit — 0.3% | | | | | | | | | | |
|
|
|
|
|
|
|
|
|
|
|
| Itaú Unibanco Holding SA 1.05% due 2/19/13 | | $ | 1,600 | | | 1,604 | | | 0.3 | |
|
|
|
|
|
|
|
|
|
|
|
| | | | | | | | | | | |
| Commercial paper — 2.0% | | | | | | | | | | |
|
|
|
|
|
|
|
|
|
|
|
| Glaxosmithkline Finance PLC 0.14% due 11/8/121 | | | 10,600 | | | 10,600 | | | 2.0 | |
|
|
|
|
|
|
|
|
|
|
|
| | | | | | | | | | | |
| Total short-term securities (cost: $12,200,000) | | | | | | 12,204 | | | 2.3 | |
| | | | | | | | | | | |
| Total investment securities (cost: $483,371,000) | | | | | | 502,290 | | | 97.0 | |
| Other assets less liabilities (including forward currency contracts) | | | | | | 15,473 | | | 3.0 | |
| | | | | |
|
| |
|
| |
| | | | | | | | | | | |
| Net assets | | | | | $ | 517,763 | | | 100.0 | % |
| | | | | |
|
| |
|
| |
| | |
| 1 | Acquired in a transaction exempt from registration under Rule 144A or section 4(2) of the Securities Act of 1933 (not including purchases of securities that were publicly offered in the primary local market but were not registered under U.S. securities laws). May be resold in the U.S. in transactions exempt from registration, normally to qualified institutional buyers. The total value of all such securities was $28,882,000, which represented 5.58% of the net assets of the fund. |
| 2 | Coupon rate may change periodically. |
| 3 | Index-linked bond whose principal amount moves with a government retail price index. |
| 4 | Security did not produce income during the last 12 months. |
Abbreviations
Securities:
| | |
| ADR | — American Depositary Receipts |
| GDR | — Global Depositary Receipts |
| | |
| Currency: |
| BRL | — Brazilian real |
| COP | — Colombian peso |
| CNY | — Chinese renminbi |
| EUR | — Euro |
| HUF | — Hungarian forint |
| IDR | — Indonesian rupiah |
| KRW | — Korean won |
| MXN | — Mexican peso |
| MYR | — Malaysian ringgit |
| PHP | — Philippine peso |
| PLN | — Polish zloty |
| RUB | — Russian ruble |
| THB | — Thai baht |
| TRY | — Turkish lira |
| UYU | — Uruguayan peso |
| ZAR | — South African rand |
| | |
| 14 | Capital Emerging Markets Total Opportunities Fund |
| | | | | | | | |
| Statement of assets and liabilities at October 31, 2012 | (dollars in thousands, except per-share data) | |
|
|
|
| Assets: | | | | | | | |
| Investment securities, at value: (cost: $483,371) | | | | | $ | 502,290 | |
| Cash | | | | | | 8,863 | |
| Cash denominated in non-U.S. currency (cost: $9) | | | | | | 9 | |
| Unrealized appreciation on open forward currency contracts | | | | | | 136 | |
| Receivables for: | | | | | | | |
| Sales of investments | | $ | 3,258 | | | | |
| Dividends and interest | | | 4,719 | | | | |
| Other | | | 2 | | | 7,979 | |
| | |
|
| |
|
| |
| Total Assets | | | | | | 519,277 | |
| | | | | |
|
| |
| | | | | | | | |
| Liabilities: | | | | | | | |
| Unrealized depreciation on open forward currency contracts | | | | | | 114 | |
| Payables for: | | | | | | | |
| Purchases of investments | | | 863 | | | | |
| Investment advisory services | | | 435 | | | | |
| Repurchase of fund’s shares | | | 5 | | | | |
| Non-U.S. taxes | | | 4 | | | | |
| Other accrued expenses | | | 93 | | | 1,400 | |
| | |
|
| |
|
| |
| Total Liabilities | | | | | | 1,514 | |
| | | | | |
|
| |
| | | | | | | | |
| Net assets at October 31, 2012: | | | | | $ | 517,763 | |
| | | | | |
|
| |
| | | | | | | | |
| Net assets consist of: | | | | | | | |
| Capital paid in on shares of stock | | | | | $ | 490,434 | |
| Undistributed net investment income | | | | | | 12,284 | |
| Accumulated net realized loss | | | | | | (3,878 | ) |
| Net unrealized appreciation | | | | | | 18,923 | |
| | | | | |
|
| |
| | | | | | | | |
| Net assets at October 31, 2012: | | | | | $ | 517,763 | |
| | | | | |
|
| |
| | | | | | | | |
| Shares outstanding ($0.01 par value, unlimited authorized shares): | | | | | | 44,724,555 | |
| | | | | |
|
| |
| | | | | | | | |
| Net asset value per share: | | | | | $ | 11.58 | |
| | | | | |
|
| |
See Notes to Financial Statements
| | |
| Capital Emerging Markets Total Opportunities Fund | 15 |
| | | | | | | | |
| Statement of operations for the period January 27, 2012 (commencement of operations) through October 31, 2012 | (dollars in thousands) | |
|
| |
| Investment income: | | | | | | | |
| Income: | | | | | | | |
| Interest (net of non-U.S. taxes of $126) | | $ | 12,200 | | | | |
| Dividends (net of non-U.S. taxes of $328) | | | 5,800 | | $ | 18,000 | |
| | |
|
| | | | |
| Fees and expenses: | | | | | | | |
| Investment advisory services | | | 3,455 | | | | |
| Custodian | | | 107 | | | | |
| Registration statement and prospectus | | | 75 | | | | |
| Auditing and legal | | | 49 | | | | |
| Trustees’ compensation | | | 35 | | | | |
| Reports to shareholders | | | 3 | | | | |
| Other | | | 64 | | | | |
| | |
|
| | | | |
| Total fees and expenses | | | | | | 3,788 | |
| | | | | |
|
| |
| Net investment income | | | | | | 14,212 | |
| | | | | |
|
| |
| Net realized loss and unrealized appreciation on investments, forward currency contracts and currency: | | | | | | | |
| Net realized gain (loss) on: | | | | | | | |
| Investments | | | (3,317 | ) | | | |
| Forward currency contracts | | | (406 | ) | | | |
| Currency transactions | | | (409 | ) | | (4,132 | ) |
| | |
|
| | | | |
| Net unrealized appreciation (depreciation) on: | | | | | | | |
| Investments (net of non-U.S. taxes of $4) | | | 11,792 | | | | |
| Forward currency contracts | | | 1,111 | | | | |
| Currency translations | | | (167 | ) | | 12,736 | |
| | |
|
| |
|
| |
| Net realized loss and unrealized appreciation on investments, forward currency contracts and currency | | | | | | 8,604 | |
| | | | | |
|
| |
| Net increase in net assets resulting from operations | | | | | $ | 22,816 | |
| | | | | |
|
| |
| | | | | | | | | | | |
|
| Statements of changes in net assets | | | | (dollars in thousands) | |
|
|
|
|
|
|
| | | For the period
January 27, 2012
through
October 31, 20121 | | For the period
January 1, 2012
through
January 26, 20122 | | Year ended
December 31, 20112 | |
| | |
| |
| |
| |
| Operations: | | | | | | | | | | |
| Net investment income | | $ | 14,212 | | $ | 1,112 | | $ | 15,787 | |
| Net realized loss on investments, forward currency contracts and currency transactions | | | (4,132 | ) | | (4,408 | ) | | (5,404 | ) |
| Net unrealized appreciation/(depreciation) on investments, forward currency contracts and currency translations | | | 12,736 | | | 23,664 | | | (31,418 | ) |
| | |
|
| |
|
| |
|
| |
| Net increase (decrease) in net assets resulting from operations | | | 22,816 | | | 20,368 | | | (21,035 | ) |
| | |
|
| |
|
| |
|
| |
| Capital share transactions: | | | | | | | | | | |
| Proceeds from shares sold: 11,008,378, 0 and 13,413,689 shares, respectively | | | 123,646 | | | — | | | 145,154 | |
| Cost of shares repurchased: 1,397,615, 1,376,931 and 2,289,015 shares, respectively | | | (15,695 | ) | | (14,651 | ) | | (24,860 | ) |
| | |
|
| |
|
| |
|
| |
| Net increase in net assets resulting from capital share transactions | | | 107,951 | | | (14,651 | ) | | 120,294 | |
| | |
|
| |
|
| |
|
| |
| | | | | | | | | | | |
| Total increase in net assets | | | 130,767 | | | 5,717 | | | 99,259 | |
| | |
|
| |
|
| |
|
| |
| Net assets: | | | | | | | | | | |
| Beginning of period | | | 386,996 | | | 381,279 | | | 282,020 | |
| | |
|
| |
|
| |
|
| |
| End of period (including undistributed net investment income: $12,284, — and —, respectively) | | $ | 517,763 | | $ | 386,996 | | $ | 381,279 | |
| | |
|
| |
|
| |
|
| |
| | |
| 1 | The fund commenced operations as a Registered Investment Company on January 27, 2012. |
| 2 | Capital Guardian Emerging Markets Total Opportunities Common Trust Fund (the Predecessor Fund) was reorganized into the Capital Emerging Markets Total Opportunities Fund at the close of business effective January 26, 2012. In connection with the reorganization, the Predecessor Fund transferred all its assets and liabilities to the Capital Emerging Markets Total Opportunities Fund and changed its fiscal year-end from December to October. |
See Notes to Financial Statements
| | |
| 16 | Capital Emerging Markets Total Opportunities Fund |
Notes to financial statements
1. Organization
Capital Emerging Markets Total Opportunities Fund (the “fund”) was organized on November 18, 2011 as a Delaware statutory trust. The fund is registered under the Investment Company Act of 1940, as amended, as an open-end management investment company. The fund seeks long-term growth and preservation of capital with lower volatility of returns than emerging market equities by allocating a portion of its assets to bonds and other debt securities of emerging market issuers.
Capital Guardian Emerging Markets Total Opportunities Fund for Tax-Exempt Trusts (the “Predecessor Fund”) was reorganized and merged into Capital Emerging Markets Total Opportunities Fund, pursuant to the approval of the trustee of the Predecessor Fund and the board of trustees of the fund on October 26, 2011, and October 20, 2011, respectively. The Predecessor Fund transferred all of its assets and liabilities to the fund, effective at the close of business January 27, 2012. In connection with the reorganization, the fiscal year-end and tax year-end of the Predecessor Fund was changed from December 31 to October 31.
2. Significant accounting policies
The financial statements have been prepared to comply with accounting principles generally accepted in the United States of America. These principles require management to make estimates and assumptions that affect reported amounts and disclosures. Actual results could differ from those estimates. The fund follows the significant accounting policies described below, as well as the valuation policies described in the next section on valuation.
| | |
| | Security transactions and related investment income — Security transactions are recorded by the fund as of the date the trades are executed with brokers. Realized gains and losses from security transactions are determined based on the specific identified cost of the securities. In the event a security is purchased with a delayed payment date, the fund will segregate liquid assets sufficient to meet its payment obligations. Dividend income is recognized on the ex-dividend date and interest income is recognized on an accrual basis. Market discounts, premiums and original issue discounts on bonds, notes and short-term securities are amortized daily over the expected life of the security. |
| | |
| | Dividends and distributions to shareholders — Dividends and distributions paid to shareholders are recorded on the ex-dividend date. |
| | |
| | Currency translation — Assets and liabilities, including investment securities, denominated in currencies other than U.S. dollars are translated into U.S. dollars at the exchange rates supplied by one or more pricing vendors on the valuation date. Purchases and sales of investment securities and income and expenses are translated into U.S. dollars at the exchange rates on the dates of such transactions. On the accompanying financial statements, the effects of changes in exchange rates on investment securities are included with the net realized gain or loss and net unrealized appreciation or depreciation on investments. The realized gain or loss and unrealized appreciation or depreciation resulting from all other transactions denominated in currencies other than U.S. dollars are disclosed separately. |
3. Valuation
Capital Guardian Trust Company (“CGTC”), the fund’s investment adviser, values the fund’s investments at fair value as defined by accounting principles generally accepted in the United States of America. The net asset value of the fund is the value of a single share. The fund calculates its net asset value each day the New York Stock Exchange is open for trading as of approximately 4 p.m. New York time, the normal close of regular trading.
Methods and inputs — The fund’s investment adviser uses the following methods and inputs to establish the fair value of the fund’s assets and liabilities. Use of particular methods and inputs may vary over time based on availability and relevance as market and economic conditions evolve.
Equity securities, including depositary receipts, are generally valued at the official closing price of, or the last reported sale price on, the exchange or market on which such securities are traded, as of the close of business on the day the securities are being valued or, lacking any sales, at the last available bid price. Prices for each security are taken from the principal exchange or market on which the security trades.
Fixed-income securities, including short-term securities purchased with more than 60 days left to maturity, are generally valued at prices obtained from one or more pricing vendors. Vendors value such securities based on one or more of the inputs described in the following table. The table provides examples of inputs that are commonly relevant for valuing particular classes of fixed-income securities in which the fund is authorized to invest. However, these classifications are not exclusive and any of the inputs may be used to value any other class of fixed-income security.
| | |
| Capital Emerging Markets Total Opportunities Fund | 17 |
| | | |
| Fixed-income class | | Examples of standard inputs |
|
|
|
| All | | Benchmark yields, transactions, bids, offers, quotations from dealers and trading systems, new issues, spreads and other relationships observed in the markets among comparable securities; and proprietary pricing models such as yield measures calculated using factors such as cash flows, financial or collateral performance and other reference data (collectively referred to as “standard inputs”) |
|
|
|
| Corporate bonds & notes; convertible securities | | Standard inputs and underlying equity of the issuer |
|
|
|
| Bonds & notes of governments & government agencies | | Standard inputs and interest rate volatilities |
|
|
|
When the fund’s investment adviser deems it appropriate to do so (such as when vendor prices are unavailable or not deemed to be representative), fixed-income securities will be valued in good faith at the mean quoted bid and ask prices that are reasonably and timely available (or bid prices, if ask prices are not available) or at prices for securities of comparable maturity, quality and type.
Securities with both fixed-income and equity characteristics, or equity securities traded principally among fixed-income dealers, are generally valued in the manner described above for either equity or fixed-income securities, depending on which method is deemed most appropriate by the fund’s investment adviser. Short-term securities purchased within 60 days to maturity are valued at amortized cost, which approximates fair value. The value of short-term securities originally purchased with maturities greater than 60 days is determined based on an amortized value to par when they reach 60 days. Forward currency contracts are valued at the mean of representative quoted bid and ask prices, generally based on prices supplied by one or more vendors.
Securities and other assets for which representative market quotations are not readily available or are considered unreliable by the fund’s investment adviser are fair valued as determined in good faith under fair value guidelines adopted by authority of the fund’s board of trustees as further described below. The investment adviser follows fair valuation guidelines, consistent with U.S. Securities and Exchange Commission (“SEC”) rules and guidance, to consider relevant principles and factors when making fair value determinations. The investment adviser considers relevant indications of value that are reasonably and timely available to it in determining the fair value to be assigned to a particular security, such as the type and cost of the security; contractual or legal restrictions on resale of the security; relevant financial or business developments of the issuer; actively traded similar or related securities; conversion or exchange rights on the security; related corporate actions; significant events occurring after the close of trading in the security; and changes in overall market conditions. In addition, the closing prices of equity securities that trade in markets outside U.S. time zones may be adjusted to reflect significant events that occur after the close of local trading but before the net asset value of the fund is determined. Fair valuations and valuations of investments that are not actively trading involve judgment and may differ materially from valuations that would have been used had greater market activity occurred.
Processes and structure — The fund’s board of trustees has delegated authority to the fund’s investment adviser to make fair value determinations, subject to board oversight. The investment adviser has established a Joint Fair Valuation Committee (the “Fair Valuation Committee”) to administer, implement and oversee the fair value process, and to make fair value decisions. The Fair Valuation Committee regularly reviews its own fair value decisions, as well as decisions made under its standing instructions to the investment adviser’s valuation teams. The Fair Valuation Committee reviews changes in fair value measurements from period to period, and may, as deemed appropriate, update the fair valuation guidelines to better reflect the results of back testing and address new or evolving issues. The Fair Valuation Committee reports any changes to the fair value guidelines to the board of trustees with supplemental information to support the changes. The fund’s board of trustees and audit committee regularly review reports that describe fair value determinations and methods.
The fund’s investment adviser has also established a Fixed-Income Pricing Review Group to administer and oversee the fixed-income valuation process, including the use of fixed-income pricing vendors. This group regularly reviews pricing vendor information and market data. Pricing decisions, processes and controls over security valuation are also subject to additional internal reviews, including an annual control self-evaluation program facilitated by the investment adviser’s compliance group.
Classifications — The fund’s investment adviser classifies the fund’s assets and liabilities into three levels based on the inputs used to value the assets or liabilities. Level 1 values are based on quoted prices in active markets for identical securities. Level 2 values are based on significant observable market inputs, such as quoted prices for similar securities and quoted prices in inactive markets. Certain securities trading outside the U.S. may transfer between Level 1 and Level 2 due to valuation adjustments resulting from significant market movements following the close of local trading. Level 3 values are based on significant unobservable inputs that reflect the investment adviser’s determination of assumptions that market participants might reasonably use in valuing the securities. The valuation levels are not necessarily an indication of the risk or liquidity associated
| | |
| 18 | Capital Emerging Markets Total Opportunities Fund |
with the underlying investment. For example, U.S. government securities are reflected as Level 2 because the inputs used to determine fair value may not always be quoted prices in an active market. The following table presents the fund’s valuation levels as of October 31, 2012 (dollars in thousands):
| | | | | | | | | | | | | | |
| | | Investment securities | |
| | |
|
|
| | | Level 1 | | Level 21 | | Level 3 | | Total | |
|
|
|
|
|
|
|
|
|
|
| Assets: | | | | | | | | | | | | | |
| Bonds and notes | | | | | | | | | | | | | |
| Latin America | | $ | — | | $ | 152,946 | | $ | — | | $ | 152,946 | |
| Eastern Europe and Middle East | | | — | | | 57,612 | | | — | | | 57,612 | |
| Asia-Pacific | | | — | | | 30,762 | | | — | | | 30,762 | |
| Other markets | | | — | | | 23,602 | | | — | | | 23,602 | |
| Miscellaneous | | | — | | | 5,188 | | | — | | | 5,188 | |
| Equity securities | | | | | | | | | | | | | |
| Asia-Pacific | | | 119,908 | | | — | | | — | | | 119,908 | |
| Other markets | | | 78,437 | | | 1,751 | | | — | | | 80,188 | |
| Miscellaneous | | | 19,880 | | | — | | | — | | | 19,880 | |
| Short-term securities | | | — | | | 12,204 | | | — | | | 12,204 | |
| | |
|
| |
|
| |
|
| |
|
| |
| Total | | $ | 218,225 | | $ | 284,065 | | $ | — | | $ | 502,290 | |
| | |
|
| |
|
| |
|
| |
|
| |
|
|
|
|
|
|
|
|
|
|
| | | Other investments2 | |
| | |
|
|
| | | Level 1 | | Level 2 | | Level 3 | | Total | |
|
|
|
|
|
|
|
|
|
|
| Assets: | | | | | | | | | | | | | |
| Unrealized appreciation on open forward currency contracts | | $ | — | | $ | 136 | | $ | — | | $ | 136 | |
| | | | | | | | | | | | | | |
| Liabilities: | | | | | | | | | | | | | |
| Unrealized depreciation on open forward currency contracts | | | — | | | (114 | ) | | — | | | (114 | ) |
| | |
|
| |
|
| |
|
| |
|
| |
| Total | | $ | — | | $ | 22 | | $ | — | | $ | 22 | |
| | |
|
| |
|
| |
|
| |
|
| |
| | |
| 1 | Level 2 includes investment securities with an aggregate value of $1,751,000 that were fair valued under guidelines adopted by authority of the fund’s board of trustees. |
| 2 | Forward currency contracts are not included in the investment portfolio. |
4. Principal risks
This section describes the principal risks associated with the fund’s principal investment strategies. You may lose money by investing in the fund. The likelihood of loss may be greater if you invest for a shorter period of time.
Market conditions — The prices of, and the income generated by, the securities held by the fund may decline due to market conditions and other factors, including those directly involving the issuers of securities held by the fund.
Investing in growth-oriented stocks — Growth-oriented stocks may involve larger price swings and greater potential for loss than other types of investments. These risks may be even greater in the case of smaller capitalization stocks.
Investing in income-oriented stocks — Income provided by the fund may be reduced by changes in the dividend policies of, and the capital resources available at, the companies in which the fund invests.
Investing outside the United States — Securities of issuers domiciled outside the United States, or with significant operations outside the United States, may lose value because of adverse political, social, economic or market developments in the countries or regions in which the issuer operates. These securities may also lose value due to changes in foreign currency exchange rates against the U.S. dollar and/or currencies of other countries. Securities markets in certain countries may be more volatile and/or less liquid than those in the United States. Investments outside the United States may also be subject to different settlement and accounting practices and different regulatory, legal and reporting standards, and may be more difficult to value, than those in the United States. The risks of investing outside the United States may be heightened in connection with investments in emerging markets.
Investing in emerging markets — Investing in emerging markets may involve risks in addition to and greater than those generally associated with investing in developed countries. For instance, developing countries may have less developed legal and accounting systems than those in developed countries. The governments of these countries may be less stable and more likely to impose capital controls, nationalize a company or industry, place restrictions on foreign ownership and on withdrawing
| | |
| Capital Emerging Markets Total Opportunities Fund | 19 |
sale proceeds of securities from the country, and/or impose punitive taxes that could adversely affect the prices of securities. In addition, the economies of these countries may be dependent on relatively few industries that are more susceptible to local and global changes. Securities markets in these countries can also be relatively small and have substantially lower trading volumes. As a result, securities issued in these countries may be more volatile and less liquid, and may be more difficult to value, than securities issued in countries with more developed economies and/or markets. Additionally, there may be increased settlement risks for transactions in local securities.
Investing in bonds — Rising interest rates will generally cause the prices of bonds and other debt securities to fall. Longer maturity debt securities may be subject to greater price fluctuations than shorter maturity debt securities. In addition, falling interest rates may cause an issuer to redeem, call or refinance a security before its stated maturity, which may result in the fund having to reinvest the proceeds in lower yielding securities.
Bonds and other debt securities are subject to credit risk, which is the possibility that the credit strength of an issuer will weaken and/or an issuer of a debt security will fail to make timely payments of principal or interest and the security will go into default. Credit risk is gauged, in part, by the credit ratings of the securities in which the fund invests. However, ratings are only the opinions of the rating agencies issuing them and are not guarantees as to credit quality or an evaluation of market risk.
Investing in lower rated bonds — Lower rated bonds and other lower rated debt securities generally have higher rates of interest and involve greater risk of default or price declines due to changes in the issuer’s creditworthiness than those of higher quality debt securities. The market prices of these securities may fluctuate more than the prices of higher quality debt securities and may decline significantly in periods of general economic difficulty. These risks may be increased with respect to lower quality, higher yielding debt securities (rated Ba1 or below or BB+ or below by Nationally Recognized Statistical Rating Organizations designated by the fund’s investment adviser or unrated but determined to be of equivalent quality by the fund’s investment adviser). Such securities are sometimes referred to as “junk bonds.” Junk bonds are considered speculative.
Thinly traded securities — There may be little trading in the secondary market for particular bonds or other debt securities, which may make them more difficult to value, acquire or sell.
Management — The investment adviser to the fund actively manages the fund’s investments. Consequently, the fund is subject to the risk that the methods and analyses employed by the investment adviser in this process may not produce the desired results. This could cause the fund to lose value or its investment results to lag relevant benchmarks or other funds with similar objectives.
Your investment in the fund is not a bank deposit and is not insured or guaranteed by the Federal Deposit Insurance Corporation or any other governmental agency, entity or person. You should consider how the fund fits into your overall investment program.
5. Taxation and distributions
Federal income taxation — The fund complies with the requirements under Subchapter M of the Internal Revenue Code applicable to regulated investment companies and intends to distribute substantially all of its net taxable income and net capital gains each year. The fund is not subject to income taxes to the extent such distributions are made. Therefore, no federal income tax provision is required.
As of and during the period ended October 31, 2012, the fund did not have a liability for any unrecognized tax benefits. The fund recognizes interest and penalties, if any, related to unrecognized tax benefits as income tax expense in the statement of operations. During the period, the fund did not incur any interest or penalties.
The fund is not subject to examination by U.S. federal tax authorities, by state tax authorities and by tax authorities outside the U.S. for tax years before 2012, the year the fund commenced operations.
Non-U.S. taxation — Dividend and interest income are recorded net of non-U.S. taxes paid. Gains realized by the fund on the sale of securities in certain countries are subject to non-U.S. taxes. When the fund is taxed on either realized and/or unrealized capital gains, the fund will accrue for non-U.S. taxes as applicable. As of October 31, 2012, the fund accrued $4,000 of liabilities for non-U.S. taxes on realized and unrealized gains.
Distributions — Distributions paid to shareholders are based on net investment income and net realized gains determined on a tax basis, which may differ from net investment income and net realized gains for financial reporting purposes. These differences are due primarily to different treatment for items such as currency gains and losses; capital losses related to sales of certain securities within 30 days of purchase; paydowns on fixed-income securities; cost of investments sold; net capital losses; unrealized appreciation of certain investments in securities outside the U.S.; short-term capital gains and losses; and income on certain investments.
| | |
| 20 | Capital Emerging Markets Total Opportunities Fund |
The fiscal year in which amounts are distributed may differ from the year in which the net investment income and net realized gains are recorded by the fund for financial reporting purposes. For the period from January 27, 2012 (commencement of operations) through October 31, 2012, there were no distributions paid to shareholders. The fund may designate a portion of the amount paid to redeeming shareholders as distribution for tax purposes.
During the period ended October 31, 2012, the fund reclassed $1,838,000 from undistributed net investment income to accumulated net realized loss, $90,000 from undistributed net investment income to capital paid in on shares of capital stock and $1,584,000 from accumulated net realized loss to capital paid in on shares of capital stock to align financial reporting with tax reporting.
As of October 31, 2012, the tax basis components of distributable earnings, unrealized appreciation (depreciation) and cost of investment securities were as follows:
| | | | | |
| | | (dollars in thousands) | |
|
|
|
|
|
| Undistributed ordinary income | | $ | 12,284 | |
| Capital loss carryforward* | | | (3,445 | ) |
|
|
|
|
|
| Gross unrealized appreciation on investment securities | | | 40,005 | |
| Gross unrealized depreciation on investment securities | | | (21,497 | ) |
|
|
|
|
|
| Net unrealized appreciation on investment securities | | | 18,508 | |
|
|
|
|
|
| Cost of investment securities | | | 483,782 | |
| | |
| * | The capital loss carryforward will be used to offset any capital gains realized by the fund in future years. The fund will not make distributions from capital gains while a capital loss carryforward remains. |
6. Fees and transactions with related parties
CGTC serves as investment adviser to the fund and other funds. CGTC is wholly owned by Capital Group International, Inc., which is wholly owned by The Capital Group Companies, Inc. Expense limitations have been imposed through December 31, 2013, to limit the fund’s total annual fund operating expenses to 1.10% (as a percentage of average daily net assets).
Investment advisory services fee — The Investment Advisory and Service Agreement with CGTC provides for monthly fees accrued daily. The fee is 1.00% of the average daily net assets of the fund.
Distribution services — American Funds Distributors,® Inc. (“AFD”) is the principal underwriter of the fund’s shares. AFD does not receive any compensation related to the sale of shares of the fund.
Affiliated officers and trustees — Officers and certain trustees of the fund are or may be considered to be affiliated with CGTC and AFD. No affiliated officers and trustees received any compensation directly from the fund.
7. Restricted securities
The fund has invested in certain securities for which resale may be limited (for example, in the United States, to qualified institutional buyers) or which are otherwise restricted. These securities are identified in the investment portfolio. As of October 31, 2012, the total value of restricted securities was $28,882,000, which represents 5.58% of the net assets of the fund.
8. Investment transactions and other disclosures
The fund made purchases and sales of investment securities, excluding short term securities, of $304,307,000 and $175,198,000, respectively, during the period from January 27, 2012 (commencement of operations) through October 31, 2012.
9. Fund merger
On January 27, 2012, the fund acquired all of the assets and assumed all of the liabilities of the Predecessor Fund pursuant to a plan of reorganization approved by the trustee of the Predecessor Fund and the board of trustees of the fund on October 26, 2011, and October 20, 2011. The fund began with a $100,000 seed investment. The acquisition was accomplished by a tax-free exchange as follows:
On the close of business on January 27, 2012, 35,113,792 shares of the Predecessor Fund, valued at $386,996,070, were outstanding. After the reorganization, the fund had 35,122,866 shares valued at $387,096,070.
The investment portfolio of the Predecessor Fund, with a value of $377,210,268 and identified cost of $370,087,014 were the principal assets acquired by the fund. For financial reporting purposes, assets received and shares issued by the fund were recorded at fair value; however, the cost basis of the investments received from the Predecessor Fund was carried forward to align ongoing reporting of the fund’s realized and unrealized gains and losses with amounts distributable to shareholders for tax purposes. Immediately prior to the merger, the net assets of the Predecessor Fund were $386,996,070.
| | |
| Capital Emerging Markets Total Opportunities Fund | 21 |
Because the combined investment portfolios have been managed as a single integrated portfolio since the merger was completed, it is not practicable to separate the amounts of revenue and earnings of the Predecessor Fund that have been reflected in the statement of operations since January 27, 2012, for the fund.
| | | | | | | | | | | |
| | | Before reorganization | | | | After reorganization | |
|
|
|
|
|
|
|
|
| | | The Predecessor Fund | | The fund | | The fund | |
|
|
|
|
|
|
|
|
| |
| Net assets | | $ | 386,996,070 | | $ | 100,000 | | $ | 387,096,070 | |
| Shares outstanding | | | 35,113,792 | | | — | | | 35,122,866 | |
| Net asset value per share | | $ | 11.02 | | $ | — | | $ | 11.02 | |
| Net unrealized appreciation/(depreciation) | | | 6,187,269 | | | — | | | 6,187,269 | |
10. Forward currency contracts
The fund has entered into forward currency contracts, which represent agreements to exchange currencies on specific future dates at predetermined rates. The fund’s investment adviser uses forward currency contracts to manage the fund’s exposure to changes in exchange rates. Upon entering into these contracts, risks may arise from the potential inability of counterparties to meet the terms of their contracts and from possible movements in exchange rates.
On a daily basis, the Fund values forward currency contracts based on the applicable exchange rates and records unrealized appreciation or depreciation for open forward currency contracts in the fund’s statement of assets and liabilities. Realized gains or losses at the time the forward currency contract is closed or offset by another contract with the same broker for the same settlement date and currency. Closed forward currency contracts that have not reached their settlement date are included in the respective receivables or payables for closed forward currency contracts in the fund’s statement of assets and liabilities. Net realized gains or losses from closed forward currency contracts and net unrealized appreciation or depreciation from open forward currency contracts are recorded in the fund’s statement of operations.
As of October 31, 2012, the fund had open forward currency contracts to sell currencies, as shown on the following table. The open forward currency contracts shown are generally indicative of the volume of activity for the year (as a percentage of the fund’s total net assets).
| | | | | | | | | | | | | | | |
| | | | | Contract amount
(000) | | U.S. valuation
(000) | |
| | | | |
| |
|
|
| | | Counterparty | | Non-U.S. | | U.S. | | Amount | | Unrealized
(depreciation)/
appreciation | |
|
|
|
|
|
|
|
|
|
|
|
|
| Sales: | | | | | | | | | | | | | | |
| Australian dollar to U.S. dollar expiring 11/5/2012 | | Bank of America | | AUD192 | | $ | 197 | | $ | 199 | | $ | (2 | ) |
| Brazilian real to U.S. dollar expiring 11/19/2012 | | JPMorgan Chase | | BRL39,859 | | | 19,519 | | | 19,580 | | | (61 | ) |
| British pound to U.S. dollar expiring 11/9/2012 | | JPMorgan Chase | | GBP575 | | | 932 | | | 928 | | | 4 | |
| British pound to U.S. dollar expiring 11/20/2012 | | Bank of New York Mellon | | GBP5,567 | | | 8,983 | | | 8,983 | | | — | * |
| Czech koruna to U.S. dollar expiring 11/15/2012 | | Bank of America | | CZK6,818 | | | 355 | | | 353 | | | 2 | |
| Euro to U.S. dollar expiring 11/20/2012 | | Bank of New York Mellon | | EUR2,122 | | | 2,780 | | | 2,751 | | | 29 | |
| Euro to U.S. dollar expiring 11/20–11/28/2012 | | JPMorgan Chase | | EUR4,102 | | | 5,346 | | | 5,318 | | | 28 | |
| Korean won to U.S. dollar expiring 11/30/2012 | | Bank of America | | KRW5,048,438 | | | 4,594 | | | 4,622 | | | (28 | ) |
| South African Rand to U.S. dollar expiring 11/9/2012 | | Credit Suisse First Boston | | ZAR34,358 | | | 4,030 | | | 3,959 | | | 71 | |
| South African Rand to U.S. dollar expiring 11/30/2012 | | UBS AG | | ZAR21,518 | | | 2,473 | | | 2,471 | | | 2 | |
| Turkish Lira to U.S. dollar expiring 11/19/2012 | | Credit Suisse First Boston | | TRY5,521 | | | 3,050 | | | 3,073 | | | (23 | ) |
| | | | | | | | | | | | |
|
| |
| |
| Forward currency contracts — net | | | | | | | | | | | | $ | 22 | |
| | | | | | | | | | | | |
|
| |
*Amount less than one thousand.
22 Capital Emerging Markets Total Opportunities Fund
| | | | | | | | | | | | | | |
| | | For the period
January 27, 2012
through
October 31, 20121 | | For the period
January 1, 2012
through
January 26, 20122 | | For the
year ended
December 31, 20112 | | For the period
March 1, 20103
through
December 31, 20102 | |
| | |
| |
| |
| |
| |
| Net asset value, beginning of period | | $ | 11.02 | | $ | 10.45 | | $ | 11.12 | | $ | 10.00 | |
| From investment operations4: | | | | | | | | | | | | | |
| Net investment income | | | .35 | | | .03 | | | .52 | | | .45 | |
| Net realized and unrealized gain (loss) | | | .21 | | | .54 | | | (1.19 | ) | | .67 | |
| | |
|
| |
|
| |
|
| |
|
| |
| Total from investment operations | | | .56 | | | .57 | | | (.67 | ) | | 1.12 | |
| | |
|
| |
|
| |
|
| |
|
| |
| | | | | | | | | | | | | | |
| Net asset value, end of period | | $ | 11.58 | | $ | 11.02 | | $ | 10.45 | | $ | 11.12 | |
| | |
|
| |
|
| |
|
| |
|
| |
| Total return | | | 5.08 | % | | 5.45 | % | | (6.03 | )% | | 11.20 | % |
| | | | | | | | | | | | | | |
| Net assets, end of period (in millions) | | $ | 518 | | $ | 387 | | $ | 381 | | $ | 282 | |
| |
| Ratios/Supplemental data: | | | | | | | | | | | | | |
| Ratio of expenses to average net assets | | | 1.10 | %5 | | .05 | %5 | | .04 | % | | .08 | %5 |
| Ratio of net investment income to average net assets | | | 4.11 | %5 | | 3.95 | %5 | | 4.78 | % | | 5.07 | %5 |
| Portfolio turnover rate | | | 42.49 | %6 | | 7.00 | %6 | | 59.52 | %7 | | 69.40 | %6, 7 |
| | |
| 1 | The fund commenced operations as a Registered Investment Company on January 27, 2012. |
| 2 | Capital Guardian Emerging Markets Total Opportunities Common Trust Fund (the Predecessor Fund) was reorganized into the Capital Emerging Markets Total Opportunities Fund at the close of business effective January 26, 2012. |
| 3 | The Predecessor Fund commenced operations on March 1, 2010. |
| 4 | The per–share/unit data is based on average shares/units outstanding. |
| 5 | Annualized. |
| 6 | Based on operations for the period shown (unless otherwise noted) and, accordingly, may not be representative of a full year. |
| 7 | Unaudited. |
Capital Emerging Markets Total Opportunities Fund 23
| |
| Report of Independent Registered Public Accounting Firm |
|
To the Shareholders and Board of Trustees of Capital Emerging Markets Total Opportunities Fund:
We have audited the accompanying statement of assets and liabilities of Capital Emerging Markets Total Opportunities Fund (the “Fund”), including the schedule of investments, as of October 31, 2012, and the related statement of operations for the period January 27, 2012 (commencement of operations) to October 31, 2012, and the statements of changes in net assets and financial highlights for the period January 1, 2012 through January 26, 2012 and for the period January 27, 2012 (commencement of operations) to October 31, 2012. These financial statements and financial highlights are the responsibility of the Fund’s management. Our responsibility is to express an opinion on these financial statements and financial highlights based on our audits. The statement of changes in net assets and the financial highlights for the year ended December 31, 2011 and the financial highlights for the period March 1, 2010 through December 31, 2010 were audited by other auditors whose reports, dated March 5, 2012 and March 7, 2011, respectively, expressed an unqualified opinion on those statements.
We conducted our audits in accordance with the standards of the Public Company Accounting Oversight Board (United States). Those standards require that we plan and perform the audit to obtain reasonable assurance about whether the financial statements and financial highlights are free of material misstatement. The Fund is not required to have, nor were we engaged to perform, an audit of its internal control over financial reporting. Our audit included consideration of internal control over financial reporting as a basis for designing audit procedures that are appropriate in the circumstances, but not for the purpose of expressing an opinion on the effectiveness of the Fund’s internal control over financial reporting. Accordingly, we express no such opinion. An audit also includes examining, on a test basis, evidence supporting the amounts and disclosures in the financial statements, assessing the accounting principles used and significant estimates made by management, as well as evaluating the overall financial statement presentation. Our procedures included confirmation of securities owned as of October 31, 2012, by correspondence with the custodian and brokers; where replies were not received from brokers, we performed other auditing procedures. We believe that our audit provides a reasonable basis for our opinion.
In our opinion, such financial statements and financial highlights referred to above present fairly, in all material respects, the financial position of Capital Emerging Markets Total Opportunities Fund as of October 31, 2012, the results of its operations for the year then ended, and the changes in its net assets and financial highlights for the period January 1, 2012 through January 26, 2012 and for the period January 27, 2012 (commencement of operations) through October 31 2012, in conformity with accounting principles generally accepted in the United States of America.
DELOITTE & TOUCHE LLP
Costa Mesa, California
December 28, 2012
| | |
| 24 | Capital Emerging Markets Total Opportunities Fund |
As a shareholder of the fund, you incur ongoing costs, including investment advisory services fees and other expenses. This example is intended to help you understand your ongoing costs (in dollars) of investing in the fund so you can compare these costs with the ongoing costs of investing in other mutual funds. The example is based on an investment of $1,000 invested at the beginning of the period and held for the entire period.
Actual expenses:
The first line of the table below provides information about actual account values and actual expenses. You may use the information in this line, together with the amount you invested, to estimate the expenses that you paid over the period. Simply divide your account value by $1,000 (for example, an $8,600 account value divided by $1,000 = 8.6), then multiply the result by the number in the first line under the heading entitled “Expenses paid during period” to estimate the expenses you paid on your account during this period.
Hypothetical example for comparison purposes:
The second line of the table below provides information about hypothetical account values and hypothetical expenses based on the fund’s actual expense ratio and an assumed rate of return of 5% per year before expenses, which is not the fund’s actual return. The hypothetical account values and expenses may not be used to estimate the actual ending account balance or expenses you paid for the period. You may use this information to compare the ongoing costs of investing in the fund and other funds. To do so, compare this 5% hypothetical example with the 5% hypothetical examples that appear in the shareholder reports of the other funds.
| | | | | | | | | | | | | | |
| | | Beginning
account value
4/30/2012 | | Ending
account value
10/31/2012 | | Expenses
paid during
period* | | Annualized
expense
ratio | |
|
|
|
|
|
|
|
|
|
|
|
|
|
|
| Actual return | | $ | 1,000.00 | | $ | 1,024.78 | | $ | 5.60 | | | 1.10 | % |
| Hypothetical 5% return before expenses | | | 1,000.00 | | | 1,019.61 | | | 5.58 | | | 1.10 | |
*The “expenses paid during period” are equal to the “annualized expense ratio”, multiplied by the average account value over the period, multiplied by the number of days in the period, and divided by 366 (to reflect the current period).
We are required to advise you of the federal tax status of certain distributions received by shareholders during the fiscal year. The fund hereby designates the following amounts for the period January 27, 2012 (commencement of operations) through October 31, 2012:
| | | | | |
| Foreign taxes | | $ | 0.01 per share | |
|
|
|
|
|
| Foreign source income | | $ | 0.40 per share | |
|
|
|
|
|
| Qualified dividend income | | | 100 | % |
|
|
|
|
|
Individual shareholders should refer to their Form 1099 or other tax information, which will be mailed in January 2013, to determine the calendar year amounts to be included on their 2012 tax returns. Shareholders should consult their tax advisers.
| | |
| Capital Emerging Markets Total Opportunities Fund | 25 |
| | | | | | | | | |
| Board of trustees and other officers |
|
| “Independent” trustees1 |
|
|
|
|
|
|
|
|
|
| Name and age | | Year first elected
a trustee
of the fund2 | | Principal occupation(s) during past five years | | Number of portfolios3
overseen by trustee | | Other directorships4
held by trustee |
|
|
|
|
|
|
|
|
|
Richard G. Capen, Jr., 78
(Lead independent trustee) | | 2011 | | Corporate director and author | | 1 | | Capital Private Client Services Funds |
| | | | | | | | | |
| H. Frederick Christie, 79 | | 2011 | | Private investor | | 1 | | Capital Private Client Services Funds |
| | | | | | | | | |
| Martin Fenton, 77 | | 2011 | | Chairman, Senior Resource Group LLC (development and management of senior living communities) | | 1 | | Capital Private Client Services Funds |
| | | | | | | | | |
| Richard G. Newman, 78 | | 2011 | | Chairman Emeritus of the Board and Consultant, AECOM Technology Corporation (global engineering, consulting and professional technical services) | | 1 | | Capital Private Client Services Funds |
| | | | | | | | | |
|
|
|
|
|
|
|
|
|
| “Interested” trustee5 |
|
|
|
|
|
|
|
|
|
| Name, age and position with fund | | Year first elected a trustee or officer of the fund2 | | Principal occupation(s) during past five years and positions held with affiliated entities or the principal underwriter of the fund | | Number of portfolios3
overseen by trustee | | Other directorships4
held by trustee |
|
|
|
|
|
|
|
|
|
Paul F. Roye, 59
Chairman of the Board | | 2011 | | Senior Vice President — Fund Business Management Group, Capital Research and Management Company; Director, American Funds Service Company7 | | 1 | | Capital Private Client Services Funds |
The fund’s statement of additional information includes further details about fund trustees and is available without charge upon request by calling Capital Guardian Trust Company at 800/266-9532. The address for all trustees and officers of the fund is 6455 Irvine Center Drive, Irvine, CA 92618, Attention: Secretary.
| | |
| 26 | Capital Emerging Markets Total Opportunities Fund |
| | | | | |
| Other officers |
|
| Name, age and position with fund | | Year first elected
an officer
of the fund2 | | Principal occupation(s) during past five years and positions held
with affiliated entities or the principal underwriter of the fund |
|
|
|
|
|
John B. Emerson, 58
President | | 2011 | | Senior Vice President, Capital Guardian Trust Company;
President — Private Client Services Division, Capital Guardian Trust Company;
Chairman of the Board, Capital Guardian Trust Company, a Nevada Corporation (CGTN)7 |
| | | | | |
Shelby Notkin, 71
Senior Vice President | | 2011 | | Senior Vice President, Capital Guardian Trust Company;
Chairman of the Board — Private Client Services Division, Capital Guardian Trust Company; Director, Capital Guardian Trust Company, a Nevada Corporation (CGTN)7 |
| | | | | |
John R. Queen, 47
Senior Vice President | | 2011 | | Vice President, Capital Guardian Trust Company;
Senior President — Private Client Services Division, Capital Guardian Trust Company;
Vice President — Fixed Income, Capital Research and Management Company7 |
| | | | | |
Timothy W. McHale, 34
Vice President | | 2011 | | Associate Counsel — Fund Business Management Group, Capital Research and Management Company;7 Secretary, American Funds Distributors, Inc.7 |
| | | | | |
Courtney R. Taylor, 37
Secretary | | 2011 | | Assistant Vice President — Fund Business Management Group, Capital Research and Management Company7 |
| | | | | |
Kevin M. Saks, 40
Treasurer | | 2011 | | Vice President, Capital Guardian Trust Company;
Senior Vice President — Private Client Services Division, Capital Guardian Trust Company; Director, Capital Guardian Trust Company, a Nevada Corporation (CGTN)7 |
| | | | | |
Susan K. Countess, 46
Assistant Secretary | | 2012 | | Associate — Fund Business Management Group, Capital Research and Management Company7 |
| | | | | |
Susan R. Sunga, 57
Assistant Treasurer | | 2011 | | Vice President, Capital Guardian Trust Company;
Senior Manager — Private Client Services Division, Capital Guardian Trust Company;
Tax Officer, Capital Guardian Trust Company, a Nevada Corporation (CGTN)7 |
| | |
| 1 | The term “independent” trustee refers to a trustee who is not an “interested person” of the fund within the meaning of the Investment Company Act of 1940. |
| 2 | Trustees and officers of the fund serve until their resignation, removal or retirement. |
| 3 | Capital Emerging Markets Total Opportunities Fund. |
| 4 | This includes all directorships (other than those in Capital Emerging Markets Total Opportunities Fund) that are held by each trustee as a trustee or director of a public company or a registered investment company. Unless otherwise noted, all directorships are current. |
| 5 | “Interested persons” of the fund within the meaning of the Investment Company Act of 1940, on the basis of their affiliation with the fund’s investment adviser, Capital Guardian Trust Company, or affiliated entities (including the fund’s principal underwriter). |
| 6 | All of the officers listed are officers and/or directors/trustees of one or more of the other funds for which Capital Guardian Trust Company serves as investment adviser. |
| 7 | Company affiliated with Capital Guardian Trust Company. |
| | |
| Capital Emerging Markets Total Opportunities Fund | 27 |
| |
| Offices of the fund and of the |
| investment adviser |
| Capital Guardian Trust Company |
| 6455 Irvine Center Drive |
| Irvine, CA 92618 |
| |
| Transfer agent for |
| shareholder accounts |
| J.P. Morgan Investor Services Company |
| One Beacon Street |
| Boston, MA 02108 |
| |
| Custodian of assets |
| JPMorgan Chase Bank |
| 270 Park Avenue |
| New York, NY 10017-2070 |
| |
| Counsel |
| Bingham McCutchen LLP |
| 355 South Grand Avenue, Suite 4400 |
| Los Angeles, CA 90071-3106 |
| |
| Independent registered public accounting firm |
| Deloitte & Touche LLP |
| 695 Town Center Drive |
| Suite 1200 |
| Costa Mesa, CA 92626-7188 |
| |
| Principal underwriter |
| American Funds Distributors, Inc. |
| 333 South Hope Street |
| Los Angeles, CA 90071-1406 |
Investors should carefully consider investment objectives, risks, charges and expenses. This and other important information is contained in the fund prospectus, which can be obtained from Capital Guardian Trust Company by calling 800/266-9532 and should be read carefully before investing.
Capital Emerging Markets Total Opportunities Fund files a complete list of its portfolio holdings with the U.S. Securities and Exchange Commission (SEC) for the first and third quarters of each fiscal year on Form N-Q. This filing is available free of charge on the SEC website (www.sec.gov). You may also review or, for a fee, copy this filing at the SEC’s Public Reference Room in Washington, D.C. Additional information regarding the operation of the Public Reference Room may be obtained by calling the SEC’s Office of Investor Education and Advocacy at 800/SEC-0330. Additionally, the list of portfolio holdings is available by calling Capital Guardian Trust Company at 800/266-9532.
The proxy voting procedures and policies of Capital Emerging Markets Total Opportunities Fund — which describe how we vote proxies relating to portfolio securities — is available upon request by calling Capital Guardian Trust Company at 800/266-9532. The fund files its proxy voting record with the SEC for the 12 months ended June 30 by August 31. The report also is available on the SEC website or by calling Capital Guardian Trust Company.
This report is for the information of shareholders of Capital Emerging Markets Total Opportunities Fund, but it also may be used as sales literature when preceded or accompanied by the current prospectus, which gives details about charges, expenses, investment objectives and operating policies of the fund. If used as sales material after December 31, 2012, this report must be accompanied by a statistical update for the most recently completed calendar quarter.
| | | | | | | | | |
|
|
|
|
|
|
| The Capital Group Companies | | | | | |
| Capital International | | Capital Guardian | | Capital Research and Management | | Capital Bank and Trust | | American Funds |

ITEM 2 – Code of Ethics
The Registrant has adopted a Code of Ethics that applies to its Principal Executive Officer and Principal Financial Officer. The Registrant undertakes to provide to any person without charge, upon request, a copy of the Code of Ethics. Such request can be made to American Funds Service Company at 800/421-0180 or to the Secretary of the Registrant, 6455 Irvine Center Drive, Irvine, California 92618.
ITEM 3 – Audit Committee Financial Expert
The Registrant’s board has determined that Martin Fenton, a member of the Registrant’s audit committee, is an “audit committee financial expert” and "independent," as such terms are defined in this Item. This designation will not increase the designee’s duties, obligations or liability as compared to his or her duties, obligations and liability as a member of the audit committee and of the board, nor will it reduce the responsibility of the other audit committee members. There may be other individuals who, through education or experience, would qualify as "audit committee financial experts" if the board had designated them as such. Most importantly, the board believes each member of the audit committee contributes significantly to the effective oversight of the Registrant’s financial statements and condition.
ITEM 4 – Principal Accountant Fees and Services
| | Registrant: |
| | | a) Audit Fees: |
| | | | 2012 | $37,500 |
| | | | |
| | | b) Audit-Related Fees: |
| | | | 2012 | None |
| | | | The audit-related fees consist of assurance and related services relating to the examination of the Registrant’s investment adviser conducted in accordance with Statement on Auditing Standards Number 70 issued by the American Institute of Certified Public Accountants. |
| | | |
| | | c) Tax Fees: |
| | | | 2012 | $6,800 |
| | | | The tax fees consist of professional services relating to the review of the Registrant’s tax returns. |
| | | |
| | | d) All Other Fees: |
| | | | 2012 | None |
| | | | The other fees consist of the review of the N1A annual update. |
| | | | |
| | Adviser and affiliates (includes only fees for non-audit services billed to the adviser and affiliates for engagements that relate directly to the operations and financial reporting of the Registrant and were subject to the pre-approval policies described below): |
| | | a) Audit Fees: |
| | | | Not Applicable |
| | | |
| | | b) Audit-Related Fees: |
| | | | Not Applicable |
| | | |
| | | c) Tax Fees: |
| | | | Not Applicable |
| | | |
| | | d) All Other Fees: |
| | | | Not Applicable |
All audit and permissible non-audit services that the Registrant’s audit committee considers compatible with maintaining the independent registered public accounting firm’s independence are required to be pre-approved by the committee. The pre-approval requirement will extend to all non-audit services provided to the Registrant, the investment adviser, and any entity controlling, controlled by, or under common control with the investment adviser that provides ongoing services to the Registrant, if the engagement relates directly to the operations and financial reporting of the Registrant. The committee will not delegate its responsibility to pre-approve these services to the investment adviser. The committee may delegate to one or more committee members the authority to review and pre-approve audit and permissible non-audit services. Actions taken under any such delegation will be reported to the full committee at its next meeting. The pre-approval requirement is waived with respect to non-audit services if certain conditions are met. The pre-approval requirement was not waived for any of the non-audit services listed above provided to the Registrant, adviser and affiliates.
ITEM 5 – Audit Committee of Listed Registrants
Not applicable to this Registrant, insofar as the Registrant is not a listed issuer as defined in Rule 10A-3 under the Securities Exchange Act of 1934.
ITEM 6 – Schedule of Investments
Not applicable, insofar as the schedule is included as part of the report to shareholders filed under Item 1 of this Form.
ITEM 7 – Disclosure of Proxy Voting Policies and Procedures for Closed-End Management Investment Companies
Not applicable to this Registrant, insofar as the Registrant is not a closed-end management investment company.
ITEM 8 – Portfolio Managers of Closed-End Management Investment Companies
Not applicable to this Registrant, insofar as the Registrant is not a closed-end management investment company.
ITEM 9 – Purchases of Equity Securities by Closed-End Management Investment Company and Affiliated Purchasers
Not applicable to this Registrant, insofar as the Registrant is not a closed-end management investment company.
ITEM 10 – Submission of Matters to a Vote of Security Holders
There have been no material changes to the procedures by which shareholders may recommend nominees to the Registrant’s board of trustees since the Registrant last submitted a proxy statement to its shareholders. The procedures are as follows. The Registrant has a nominating committee comprised solely of persons who are not considered ‘‘interested persons’’ of the Registrant within the meaning of the Investment Company Act of 1940, as amended. The committee periodically reviews such issues as the board’s composition, responsibilities, committees, compensation and other relevant issues, and recommends any appropriate changes to the full board of trustees. While the committee normally is able to identify from its own resources an ample number of qualified candidates, it will consider shareholder suggestions of persons to be considered as nominees to fill future vacancies on the board. Such suggestions must be sent in writing to the nominating committee of the Registrant, c/o the Registrant’s Secretary, and must be accompanied by complete biographical and occupational data on the prospective nominee, along with a written consent of the prospective nominee for consideration of his or her name by the nominating committee.
ITEM 11 – Controls and Procedures
| (a) | The Registrant’s Principal Executive Officer and Principal Financial Officer have concluded, based on their evaluation of the Registrant’s disclosure controls and procedures (as such term is defined in Rule 30a-3 under the Investment Company Act of 1940), that such controls and procedures are adequate and reasonably designed to achieve the purposes described in paragraph (c) of such rule. |
| | |
| (b) | There were no changes in the Registrant’s internal controls over financial reporting (as defined in Rule 30a-3(d) under the Investment Company Act of 1940) that occurred during the Registrant’s second fiscal quarter of the period covered by this report that has materially affected, or is reasonably likely to materially affect, the Registrant’s internal control over financial reporting. |
ITEM 12 – Exhibits
| (a)(1) | The Code of Ethics that is the subject of the disclosure required by Item 2 is attached as an exhibit hereto. |
| | |
| (a)(2) | The certifications required by Rule 30a-2 of the Investment Company Act of 1940 and Sections 302 and 906 of the Sarbanes-Oxley Act of 2002 are attached as exhibits hereto. |
SIGNATURES
Pursuant to the requirements of the Securities Exchange Act of 1934 and the Investment Company Act of 1940, the Registrant has duly caused this report to be signed on its behalf by the undersigned, thereunto duly authorized.
| | CAPITAL EMERGING MARKETS TOTAL OPPORTUNITIES FUND |
| | |
| | By /s/ John B. Emerson |
| | John B. Emerson, President and Principal Executive Officer |
| | |
| | Date: December 31, 2012 |
Pursuant to the requirements of the Securities Exchange Act of 1934 and the Investment Company Act of 1940, this report has been signed below by the following persons on behalf of the Registrant and in the capacities and on the dates indicated.
| By /s/ John B. Emerson |
John B. Emerson, President and Principal Executive Officer |
| |
| Date: December 31, 2012 |
| By /s/ Kevin M. Saks |
Kevin M. Saks, Treasurer and Principal Financial Officer |
| |
| Date: December 31, 2012 |