UNITED STATES
SECURITIES AND EXCHANGE COMMISSION
Washington, D.C. 20549
FORM N-CSR
Certified Shareholder Report of
Registered Management Investment Companies
Investment Company Act File Number: 811-22605
Capital Group Emerging Markets Total Opportunities Fund
(Exact Name of Registrant as Specified in Charter)
6455 Irvine Center Drive
Irvine, California 92618
(Address of Principal Executive Offices)
Registrant's telephone number, including area code: (949) 975-5000
Date of fiscal year end: October 31
Date of reporting period: April 30, 2019
Gregory F. Niland
Capital Group Emerging Markets Total Opportunities Fund
333 South Hope Street
Los Angeles, California 90071
(Name and Address of Agent for Service)
ITEM 1 – Reports to Stockholders
 | Capital Group Emerging Markets Total Opportunities Fund® Semi-annual report for the six months ended April 30, 2019 |

Beginning January 1, 2021, as permitted by regulations adopted by the Securities and Exchange Commission, we intend to no longer mail paper copies of the fund’s shareholder reports, unless specifically requested from the fund or your financial intermediary, such as a broker-dealer or bank. Instead, the reports will be made available on the fund’s website (capitalguardian.com/ETOP); you will be notified by mail and provided with a website link to access the report each time a report is posted.
You may elect to receive paper copies of all future reports free of charge. If you invest through a financial intermediary, you may contact your financial intermediary to request that you continue to receive paper copies of your shareholder reports. If you invest directly with the fund, you may inform the fund that you wish to continue receiving paper copies of your shareholder reports by contacting us at (800) 421-4225. Your election to receive reports in paper will apply to all funds held with the fund’s transfer agent or through your financial intermediary.
Capital Group Emerging Markets Total Opportunities Fund seeks long-term growth and preservation of capital with lower volatility of returns than emerging markets equities.
Fund results shown in this report are for past periods and are not predictive of results for future periods. The results shown are before taxes on fund distributions and sale of fund shares. Current and future results may be lower or higher than those shown. Share prices and returns will vary, so investors may lose money. Investing for short periods makes losses more likely. For current information and month-end results, please call (800) 421-4225, ext. 90.
Here is the average annual total return on a $1,000 investment with all distributions reinvested for periods ended March 31, 2019 (the most recent calendar quarter-end):
| | | | Lifetime |
| | 1 year | 5 years | (since 1/27/12) |
| | | | |
| Class F-3 shares* | –3.33% | 1.07% | 1.65% |
| * | Class F-3 shares were first offered on September 1, 2017. Class F-3 share results prior to September 1, 2017, are based on the results of the original share class of the fund, which was closed as of September 1, 2017. |
The fund’s gross expense ratio is 1.13%, and the net expense ratio is 1.00% for Class F-3 shares as of the prospectus dated January 1, 2019 (as supplemented to date).
Investment results assume all distributions are reinvested and reflect applicable fees and expenses. The investment advisor is currently reimbursing a portion of other expenses. This reimbursement will be in effect through at least January 1, 2020. The advisor may elect at its discretion to extend, modify or terminate the reimbursement at that time.
This report is for the information of shareholders of Capital Group Emerging Markets Total Opportunities Fund, but it also may be used as sales literature when preceded or accompanied by the current prospectus, which gives details about charges, expenses, investment objectives and operating policies of the fund. If used as sales material after June 30, 2019, this report must be accompanied by a statistical update for the most recently completed calendar quarter.
Investing in emerging markets involves risks, such as significant currency and price fluctuations, political instability, differing securities regulations and periods of illiquidity, which are detailed in the fund prospectus. Investments in emerging markets have been more volatile than investments in developed markets, reflecting the greater uncertainties of investing in less-established economies. Individuals investing in emerging markets should have a long-term perspective and be able to tolerate potentially sharp declines in the value of their investments.
Investments are not FDIC-insured, nor are they deposits of or guaranteed by a bank or any other entity, so they may lose value.
Contents
Fellow investors:
We’re pleased to present this semi-annual report for Capital Group Emerging Markets Total Opportunities Fund (CGETOP) for the six months ended April 30, 2019. The fund invests in the full spectrum of emerging markets debt and equity securities while seeking to limit the volatility typically associated with investments in the developing world.
The fund posted gains for the six-month period, advancing 8.40%. The MSCI Emerging Markets Investable Market Index (MSCI EM IMI), which measures the results of the large-, mid- and small-capitalization segments of more than 20 emerging equity markets, gained 13.57%. The fund’s realized volatility was 8.26%, considerably lower than the 12.68% recorded by the MSCI EM IMI.
Emerging markets stocks were up solidly for the period, overcoming the volatility of late 2018. Markets were lifted by progress in the U.S.-China trade dispute and news the U.S. Federal Reserve expects to slow its pace of interest rate hikes.
Unless otherwise indicated, equity returns are based on MSCI indexes and measured in U.S. dollars with net dividends reinvested.
This report, and any product, index or fund referred to herein, is not sponsored, endorsed or promoted in any way by J.P. Morgan or any of its affiliates, who provide no warranties whatsoever, express or implied, and shall have no liability to any prospective investor in connection with this report. J.P. Morgan disclaimer: http://www.jpmorgan.com/pages/jpmorgan/ib/girg.
Results at a glance
For periods ended April 30, 2019, with distributions reinvested
| | | Cumulative | | Average annual |
| | total returns | | total returns |
| | 6 months | | 1 year | | 3 years | | 5 years | | Lifetime1 |
| | | | | | | | | | | |
| Capital Group Emerging Markets Total Opportunities Fund (Class F-3 shares)2 | | | 8.40 | % | | | –1.15 | % | | | 5.37 | % | | | 1.24 | % | | | 1.80 | % |
| MSCI Emerging Markets IMI3,4 | | | 13.57 | | | | –5.85 | | | | 10.53 | | | | 3.77 | | | | 3.29 | |
| J.P. Morgan GBI-EM Global Diversified3 | | | 7.00 | | | | –4.93 | | | | 2.34 | | | | –0.97 | | | | –0.41 | |
| J.P. Morgan EMBI Global3 | | | 7.86 | | | | 5.19 | | | | 4.58 | | | | 4.51 | | | | 5.04 | |
| Emerging markets blended market universe5 | | | 10.53 | | | | –2.80 | | | | 7.08 | | | | 2.91 | | | | 2.93 | |
Realized daily volatility
Annualized standard deviation of daily returns, for periods ended April 30, 20196
| | 1 year | | 5 years | | Lifetime1 |
| | | | | | | | | | | | | |
| Capital Group Emerging Markets Total Opportunities Fund (Class F-3 shares)2 | | | 8.06 | % | | | 8.21 | % | | | 8.11 | % |
| MSCI Emerging Markets IMI3,4 | | | 13.89 | | | | 13.61 | | | | 13.44 | |
| 1 | Since 1/27/12. |
| 2 | Class F-3 shares were first offered on September 1, 2017. Class F-3 share results prior to September 1, 2017, are based on the results of the original share class of the fund, which was closed as of September 1, 2017. |
| 3 | The market indexes are unmanaged and, therefore, have no expenses. Investors cannot invest directly in an index. |
| 4 | Source: MSCI. |
| 5 | Emerging markets blended market universe combines the MSCI EM IMI, JPM EMBI Global and JPM GBI-EM Global Diversified indexes by weighting their cumulative total returns at 50%, 25% and 25%, respectively. This assumes the blend is rebalanced monthly. Information has been obtained from sources believed to be reliable but J.P. Morgan does not warrant its completeness or accuracy. The index is used with permission. The index may not be copied, used, or distributed without J.P. Morgan’s prior written approval. Copyright 2019, J.P. Morgan Chase & Co. All rights reserved. |
| 6 | Realized daily volatility is calculated using annualized standard deviation based on a 252-day factor, and is a measure of how returns over time have varied from the mean. A lower number signifies lower volatility. |
| Capital Group Emerging Markets Total Opportunities Fund | 1 |
20 largest holdings
| | | Percent of |
| | | net assets as |
| | | of 4/30/19 |
| Mexico government bonds | | | 3.6 | % |
| Turkey government bonds | | | 2.6 | |
| Argentina government bonds | | | 1.9 | |
| Petróleos Mexicanos | | | 1.7 | |
| Brazil government bonds | | | 1.7 | |
| Indonesia government bonds | | | 1.7 | |
| Sri Lanka government bonds | | | 1.6 | |
| Greece government bonds | | | 1.5 | |
| Samsung Electronics | | | 1.4 | |
| AIA Group | | | 1.3 | |
| South Africa government bonds | | | 1.3 | |
| Romanian government bonds | | | 1.3 | |
| Galaxy Entertainment | | | 1.3 | |
| Pakistan government bonds | | | 1.2 | |
| Carlsberg A/S | | | 1.2 | |
| Ukraine government bonds | | | 1.1 | |
| Central Bank of Tunisia | | | 1.1 | |
| Dominican Republic government bonds | | | 1.1 | |
| Alibaba Group Holdings | | | 1.1 | |
| Panama government bonds | | | 1.0 | |
| | | | 30.7 | % |
Fixed income in emerging markets also rallied. The J.P. Morgan Emerging Markets Bond Index (EMBI) Global, which represents U.S. dollar-denominated debt, advanced 7.86%. Local currency sovereign bonds gained, with the J.P. Morgan Government Bond Index-Emerging Markets (GBI-EM) Global Diversified rising 7.00%.
The fund takes a multi-asset approach to emerging markets investing. By broadening the opportunity set across traditional market and asset class boundaries, the fund seeks to lower volatility and help limit the impact of turbulent markets. The ultimate goal is to achieve equity-like returns with lower volatility than an all-equity portfolio.
Market review
In Asia, Chinese stocks soared on hopes that the U.S. and China could de-escalate their ongoing trade tensions. Constructive negotiations and cheaper valuations following last year’s selloff lured investors despite China’s slowing economy. China lowered its forecast for economic growth, but announced a package of tax cuts and increased infrastructure spending in an effort to support its economy. For the six months, the MSCI China IMI gained 20.93%.
Indian equities also posted sharp gains for the period despite lagging most emerging markets in January and February. The MSCI India IMI advanced 17.50%. With its handling of a terrorist attack in the Kashmir region, Prime Minister Narendra Modi’s party regained some momentum ahead of general elections taking place in April and May. Plans by opposition parties to create a strong nationwide alliance against Modi also have not panned out.
In Latin America, Brazilian stocks rose for the period, but a multimonth rebound slowed in March. The MSCI Brazil IMI gained 3.95%. President Jair Bolsonaro, who took office on January 1, unveiled his much-awaited pension reform plan, but it remains to be seen if he can muster enough support in Brazil’s fractured legislature. Pension reform is a key building block of his pro-market agenda to revive the country’s sluggish growth.
Portfolio review
Our strategy takes a highly selective approach that is diversified across more than 30 countries, with key positions in China, Mexico and Brazil. The fund also held a 2.3% position in U.S.-domiciled companies that derive significant economic exposure from emerging markets.
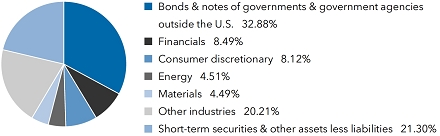
At the close of the fiscal year, the portfolio held 39.6% of its net assets in equities, 39.1% in bonds, and 21.3% in cash and cash equivalents. The fund’s diversified asset mix is not a top-down decision. It is driven by the managers’ bottom-up approach and fundamental company-by-company research in pursuit of the fund’s objective.
Amid a positive environment, both equity and bond holdings contributed to results overall. On a regional basis, investments in Hong Kong, China and India were the biggest contributors.
Among equities, all sectors except energy contributed positively to returns, and holdings in the consumer discretionary sector led returns. Naspers, the century-old South African media conglomerate, advanced on its valuable stake in Chinese online giant Tencent. Shares of Chinese gaming companies Galaxy Entertainment and Sands China both rose.
| 2 | Capital Group Emerging Markets Total Opportunities Fund |
| Asset mix(percent of net assets) | as of April 30, 2019 |
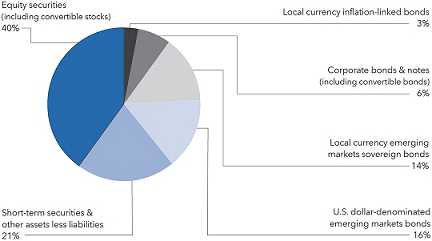
| Top 5 equity sectors | | Percent of
net assets |
| Consumer discretionary | | | 8.1 | % |
| Financials | | | 7.3 | |
| Materials | | | 4.5 | |
| Health care | | | 3.9 | |
| Industrials | | | 3.0 | |
15 largest country positions
| | | Percent of net assets |
| | | as of 4/30/19 |
| | | Equity | | Bonds, notes & other | | |
| | | securities | | debt instruments | | Total |
| China (including Hong Kong) | | | 10.0 | % | | | 2.8 | % | | | 12.8 | % |
| Mexico | | | 0.9 | | | | 5.5 | | | | 6.4 | |
| Brazil | | | 3.7 | | | | 2.5 | | | | 6.2 | |
| Russian Federation | | | 3.4 | | | | 0.6 | | | | 4.0 | |
| India | | | 3.2 | | | | 0.4 | | | | 3.6 | |
| South Africa | | | 1.9 | | | | 1.3 | | | | 3.2 | |
| Indonesia | | | 1.3 | | | | 1.7 | | | | 3.0 | |
| Turkey | | | — | | | | 2.6 | | | | 2.6 | |
| United States* | | | 2.0 | | | | 0.3 | | | | 2.3 | |
| Argentina | | | 0.1 | | | | 2.1 | | | | 2.2 | |
| Taiwan | | | 1.8 | | | | — | | | | 1.8 | |
| South Korea | | | 1.8 | | | | — | | | | 1.8 | |
| Sri Lanka | | | — | | | | 1.6 | | | | 1.6 | |
| Greece | | | — | | | | 1.5 | | | | 1.5 | |
| Islamic Republic of Pakistan | | | — | | | | 1.5 | | | | 1.5 | |
| | | | 30.1 | % | | | 24.4 | % | | | 54.5 | % |
| * | Includes investments in companies listed in developed markets that have significant operations in emerging markets. |
| Capital Group Emerging Markets Total Opportunities Fund | 3 |
Shares of MercadoLibre climbed to record highs. Latin America’s largest e-commerce platform completed a US$1.85 billion equity offering that included a strategic investment from PayPal. MercadoLibre plans to use the proceeds to strengthen its logistics network and online payments platform.
Shares of Ctrip surged after China’s largest online travel provider topped consensus estimates with a 22% increase in fourth-quarter revenue. The company also issued an upbeat forecast for 2019 after disappointing investors last year.
Holdings in the consumer staples sector also contributed to returns, in particular the investment in pork producer WH Group, which rose on expectations of a favorable outcome to U.S.-China trade negotiations.
Within financials, Hong Kong–based insurer AIA Group advanced as it expanded its access in China, which presents a significant opportunity given the rising middle class.
Among fixed income holdings, the largest contributors were local currency government bonds issued by Mexico and Egypt, and U.S. dollar-denominated government bonds issued by Sri Lanka.
Offshore rig operator Ensco was the largest detractor from returns, paring some of the gains made in 2018. Ensco reported its third-quarter 2018 earnings were down from the previous year. British American Tobacco declined due to a difficult regulatory environment, although it remained a solid dividend payer. Maritime shipping company BW LPG lost ground during the period. Shares of Brazilian mining company Vale dropped following a disastrous waste dam collapse. Among fixed income holdings, government bonds issued by Argentina (U.S. dollar-based, local currency and local currency inflation-linked) fell on the country’s economic woes.
Outlook
Emerging markets are recovering from last year’s worries about a major U.S.-China trade war as the outlines of a potential deal are taking shape. Central banks have also signaled a willingness to keep interest rates low, which could help support the global economy.
Fundamentals for a number of developing countries are reasonably strong. In some cases, improved debt structures suggest less vulnerability to higher U.S. interest rates than in the past. Also, global growth — albeit at a moderating pace — is supportive. That said, sentiment for emerging markets assets could be challenged by idiosyncratic factors, including major elections taking place in South Africa, India and Argentina this year. China’s economic slowdown and limited stimulus within the world’s second-largest economy could also affect sentiment toward the asset class.
We believe corporate fundamentals in developing countries look encouraging, with solid profit growth projected for emerging markets companies on an aggregate basis in 2019. Equity valuations also look reasonable. While volatility is likely to continue in the near future, longer term trends such as the growth of mobile commerce, an expanding consumer class in Asia and increasing smartphone usage look sustainable.
Emerging markets debt valuations remain reasonable and we are cautiously optimistic, driven in part by the expectation that many central banks in the developed world will turn to easier monetary policies due to the lack of global inflation. Local market politics are a potential risk as both foreign and domestic tensions have increased in a number of developing countries. On the whole, U.S. dollar debt looks fairly valued, and for the most part emerging markets currencies also appear fairly valued or undervalued versus the U.S. dollar.
Overall, managers are closely monitoring near-term risks that may create overlooked opportunities if the broader market takes a blanket macro view of the entire asset class, region or country. This is especially the case for managers with a deep research base who can assess whether current price-to-earnings ratios, spreads and currency levels for individual markets carry enough premium to compensate for the risks.
We continue to believe that the emerging markets universe offers a wide range of compelling long-term investment opportunities. We look forward to reporting to you again in six months.
Sincerely,

John S. Armour
President
June 17, 2019
| 4 | Capital Group Emerging Markets Total Opportunities Fund |
| Investment portfolio April 30, 2019 | unaudited |
| Industry sector diversification | Percent of net assets |
| Common stocks 39.55% | | Shares | | | Value
(000) | |
| Asia-Pacific 20.44% | | | | | | | | |
| China 6.03% | | | | | | | | |
| Alibaba Group Holding Ltd. (ADR)1 | | | 3,400 | | | $ | 631 | |
| Cansino Biologics Inc., Class H1 | | | 3,400 | | | | 17 | |
| China Merchants Bank Co., Ltd., Class H | | | 47,000 | | | | 233 | |
| China Oilfield Services Ltd., Class H | | | 136,000 | | | | 146 | |
| Ctrip.com International, Ltd. (ADR)1 | | | 4,761 | | | | 210 | |
| Hangzhou Tigermed Consulting Co., Ltd., Class A | | | 8,800 | | | | 87 | |
| Hua Medicine1 | | | 113,500 | | | | 102 | |
| Huazhu Group Ltd. (ADR) | | | 2,800 | | | | 119 | |
| Hutchison China MediTech Ltd. (ADR)1 | | | 18,612 | | | | 560 | |
| IMAX China Holding, Inc. | | | 77,070 | | | | 212 | |
| Jiangsu Hengrui Medicine Co., Ltd., Class A | | | 8,400 | | | | 82 | |
| Longfor Group Holdings Ltd. | | | 105,500 | | | | 389 | |
| Ping An Insurance (Group) Co. of China, Ltd., Class H | | | 9,000 | | | | 108 | |
| Shanghai Fosun Pharmaceutical (Group) Co., Ltd. Class H | | | 135,500 | | | | 465 | |
| Shanghai Pharmaceutical (Group) Co., Ltd., Class H | | | 54,100 | | | | 113 | |
| Tencent Holdings Ltd. | | | 2,600 | | | | 128 | |
| | | | | | | | 3,602 | |
| | | | | | | | | |
| Hong Kong 3.97% | | | | | | | | |
| AIA Group Ltd. | | | 76,100 | | | | 775 | |
| BeiGene, Ltd. (ADR)1 | | | 1,000 | | | | 124 | |
| Chow Sang Sang Holdings International Ltd. | | | 88,000 | | | | 146 | |
| CK Asset Holdings Ltd. | | | 22,000 | | | | 177 | |
| Galaxy Entertainment Group Ltd. | | | 100,000 | | | | 748 | |
| Hong Kong Exchanges and Clearing Ltd. | | | 1,500 | | | | 52 | |
| Sands China Ltd. | | | 63,006 | | | | 346 | |
| | | | | | | | 2,368 | |
| | | | | | | | | |
| India 3.17% | | | | | | | | |
| Bharti Airtel Ltd. | | | 25,571 | | | | 118 | |
| City Union Bank Ltd. | | | 24,000 | | | | 70 | |
| HDFC Bank Ltd. | | | 3,316 | | | | 110 | |
| HDFC Bank Ltd. (ADR) | | | 1,700 | | | | 195 | |
| ICICI Bank Ltd. | | | 67,182 | | | | 394 | |
| Info Edge (India) Ltd. | | | 4,549 | | | | 126 | |
| Kotak Mahindra Bank Ltd. | | | 5,000 | | | | 100 | |
| Maruti Suzuki India Ltd. | | | 1,634 | | | | 157 | |
| Piramal Enterprises Ltd., interim shares1,2 | | | 8,920 | | | | 303 | |
| Tata Steel Ltd. | | | 35,894 | | | | 287 | |
| Varun Beverages Ltd. | | | 2,500 | | | | 31 | |
| | | | | | | | 1,891 | |
| Capital Group Emerging Markets Total Opportunities Fund | 5 |
| Common stocks (continued) | | Shares | | | Value
(000) | |
| Asia-Pacific (continued) | | | | | | | | |
| Indonesia 1.27% | | | | | | | | |
| Astra International Tbk PT | | | 189,400 | | | $ | 101 | |
| Bank Central Asia Tbk PT | | | 164,500 | | | | 332 | |
| Indocement Tunggal Prakarsa Tbk PT | | | 47,000 | | | | 72 | |
| PT Surya Citra Media Tbk | | | 1,299,300 | | | | 170 | |
| Semen Indonesia (Persero) Tbk PT | | | 89,600 | | | | 85 | |
| | | | | | | | 760 | |
| | | | | | | | | |
| Japan 0.49% | | | | | | | | |
| Kansai Paint Co., Ltd.2 | | | 11,000 | | | | 209 | |
| SMC Corp.2 | | | 200 | | | | 83 | |
| | | | | | | | 292 | |
| | | | | | | | | |
| Philippines 0.51% | | | | | | | | |
| Bloomberry Resorts Corp. | | | 1,235,473 | | | | 302 | |
| | | | | | | | | |
| Singapore 1.12% | | | | | | | | |
| City Developments Ltd. | | | 58,692 | | | | 386 | |
| DBS Group Holdings Ltd. | | | 6,242 | | | | 130 | |
| Oversea-Chinese Banking Corp. Ltd. | | | 17,344 | | | | 154 | |
| | | | | | | | 670 | |
| | | | | | | | | |
| South Korea 1.78% | | | | | | | | |
| Hyundai Motor Co. | | | 1,442 | | | | 171 | |
| Hyundai Motor Co., Series 2 | | | 979 | | | | 73 | |
| Samsung Electronics Co., Ltd. | | | 20,947 | | | | 822 | |
| | | | | | | | 1,066 | |
| | | | | | | | | |
| Taiwan 1.79% | | | | | | | | |
| CTCI Corp. (Taiwan) | | | 209,000 | | | | 324 | |
| Gourmet Master Co. Ltd. | | | 11,000 | | | | 70 | |
| MediaTek Inc. | | | 20,000 | | | | 192 | |
| Taiwan Semiconductor Manufacturing Co., Ltd. | | | 58,000 | | | | 486 | |
| | | | | | | | 1,072 | |
| | | | | | | | | |
| Vietnam 0.31% | | | | | | | | |
| Vinhomes JSC1,2 | | | 46,225 | | | | 183 | |
| | | | | | | | | |
| Total Asia-Pacific | | | | | | | 12,206 | |
| | | | | | | | | |
| Other markets 6.78% | | | | | | | | |
| Australia 0.26% | | | | | | | | |
| Newcrest Mining Ltd. | | | 8,911 | | | | 157 | |
| | | | | | | | | |
| Canada 0.68% | | | | | | | | |
| Barrick Gold Corp. | | | 32,100 | | | | 408 | |
| | | | | | | | | |
| Denmark 1.17% | | | | | | | | |
| Carlsberg A/S, Class B | | | 5,413 | | | | 699 | |
| | | | | | | | | |
| France 0.13% | | | | | | | | |
| LVMH Moët Hennessy-Louis Vuitton SE | | | 198 | | | | 78 | |
| | | | | | | | | |
| Netherlands 0.15% | | | | | | | | |
| ASML Holding NV | | | 431 | | | | 90 | |
| | | | | | | | | |
| Norway 0.13% | | | | | | | | |
| BW LPG Ltd.1 | | | 16,393 | | | | 75 | |
| 6 | Capital Group Emerging Markets Total Opportunities Fund |
| | | Shares | | | Value
(000) | |
| Sweden 0.27% | | | | | | | | |
| Epiroc AB, Class A1 | | | 7,342 | | | $ | 76 | |
| Epiroc AB, Class B1 | | | 8,647 | | | | 86 | |
| | | | | | | | 162 | |
| | | | | | | | | |
| Switzerland 0.63% | | | | | | | | |
| LafargeHolcim Ltd. | | | 7,323 | | | | 376 | |
| | | | | | | | | |
| United Kingdom 1.38% | | | | | | | | |
| British American Tobacco PLC | | | 14,561 | | | | 568 | |
| PZ Cussons PLC | | | 71,235 | | | | 190 | |
| Spirax-Sarco Engineering PLC | | | 600 | | | | 65 | |
| | | | | | | | 823 | |
| | | | | | | | | |
| United States 1.98% | | | | | | | | |
| AES Corp. | | | 15,335 | | | | 263 | |
| Broadcom Inc. | | | 500 | | | | 159 | |
| Ensco Rowan PLC, Class A | | | 29,375 | | | | 410 | |
| MercadoLibre, Inc.1 | | | 445 | | | | 215 | |
| Philip Morris International Inc. | | | 800 | | | | 69 | |
| Weatherford International PLC1 | | | 118,400 | | | | 66 | |
| | | | | | | | 1,182 | |
| | | | | | | | | |
| Total Other markets | | | | | | | 4,050 | |
| | | | | | | | | |
| Eastern Europe and Middle East 5.47% | | | | | | | | |
| Romania 0.15% | | | | | | | | |
| OMV Petrom SA | | | 1,004,319 | | | | 90 | |
| | | | | | | | | |
| Russian Federation 3.35% | | | | | | | | |
| Alrosa PJSC | | | 411,705 | | | | 600 | |
| Detsky Mir PJSC | | | 264,230 | | | | 361 | |
| Global Ports Investments PLC (GDR)1 | | | 69,147 | | | | 161 | |
| Globaltrans Investment PLC (GDR) | | | 5,248 | | | | 51 | |
| Sberbank of Russia PJSC (ADR) | | | 8,180 | | | | 117 | |
| TCS Group Holding PLC (GDR)3 | | | 21,503 | | | | 428 | |
| TCS Group Holding PLC (GDR) | | | 2,074 | | | | 41 | |
| Yandex NV, Class A1 | | | 6,360 | | | | 238 | |
| | | | | | | | 1,997 | |
| | | | | | | | | |
| Slovenia 0.62% | | | | | | | | |
| Nova Ljubljanska banka dd (GDR)1 | | | 27,456 | | | | 372 | |
| | | | | | | | | |
| United Arab Emirates 1.35% | | | | | | | | |
| DPWorld PLC | | | 28,858 | | | | 577 | |
| First Abu Dhabi Bank PJSC, non-registered shares | | | 52,216 | | | | 228 | |
| | | | | | | | 805 | |
| | | | | | | | | |
| Total Eastern Europe and Middle East | | | | | | | 3,264 | |
| | | | | | | | | |
| Latin America 4.92% | | | | | | | | |
| Argentina 0.06% | | | | | | | | |
| Loma Negra Compania Industrial Argentina SA (ADR)1 | | | 3,900 | | | | 39 | |
| | | | | | | | | |
| Brazil 3.71% | | | | | | | | |
| BR Malls Participacoes SA, ordinary nominative | | | 52,000 | | | | 163 | |
| CCR SA, ordinary nominative | | | 119,974 | | | | 358 | |
| Cyrela Brazil Realty SA, ordinary nominative | | | 77,425 | | | | 351 | |
| Hypera SA, ordinary nominative | | | 55,200 | | | | 395 | |
| Lojas Americanas SA, ordinary nominative | | | 40,800 | | | | 133 | |
| Lojas Americanas SA, preferred nominative | | | 18,900 | | | | 76 | |
| Nexa Resources SA | | | 37,788 | | | | 448 | |
| OdontoPrev SA, ordinary nominative | | | 24,000 | | | | 102 | |
| Petróleo Brasileiro SA (Petrobras), preferred nominative | | | 27,300 | | | | 189 | |
| | | | | | | | 2,215 | |
| Capital Group Emerging Markets Total Opportunities Fund | 7 |
| Common stocks (continued) | | Shares | | | Value
(000) | |
| Latin America (continued) | | | | | | | | |
| Chile 0.29% | | | | | | | | |
| Enel Américas SA (ADR) | | | 19,514 | | | $ | 171 | |
| | | | | | | | | |
| Mexico 0.86% | | | | | | | | |
| América Móvil, SAB de CV, Series L (ADR) | | | 34,900 | | | | 515 | |
| | | | | | | | | |
| Total Latin America | | | | | | | 2,940 | |
| | | | | | | | | |
| Africa 1.94% | | | | | | | | |
| South Africa 1.94% | | | | | | | | |
| Discovery Ltd. | | | 50,947 | | | | 513 | |
| MultiChoice Group Ltd.1 | | | 465 | | | | 4 | |
| Naspers Ltd., Class N | | | 2,190 | | | | 559 | |
| Shoprite Holdings Ltd. | | | 6,939 | | | | 84 | |
| | | | | | | | 1,160 | |
| | | | | | | | | |
| Total common stocks (cost: $21,906,000) | | | | | | | 23,620 | |
| | | | | | | | | |
| Rights & warrants 0.02% | | | | | | | | |
| Asia-Pacific 0.02% | | | | | | | | |
| India 0.02% | | | | | | | | |
| Bharti Airtel Ltd., rights, expire 20191,2 | | | 7,251 | | | | 10 | |
| Piramal Enterprises Ltd., rights, expire 20191,2,4 | | | 387 | | | | — | |
| | | | | | | | 10 | |
| | | | | | | | | |
| Total rights & warrants (cost: $0) | | | | | | | 10 | |
| Bonds, notes & other debt instruments 39.13% | | Principal amount
(000) | | | | |
| Latin America 15.59% | | | | | | | | |
| Argentina 2.13% | | | | | | | | |
| Argentine Republic 2.25% 20205 | | ARS | 4,516 | | | | 83 | |
| Argentine Republic (Argentina Central Bank 7D Repo Reference Rate) 54.47% 20206 | | | 5,018 | | | | 115 | |
| Argentine Republic 2.50% 20215 | | | 8,566 | | | | 133 | |
| Argentine Republic 6.875% 2021 | | $ | 500 | | | | 422 | |
| Argentine Republic 3.375% 2023 | | € | 230 | | | | 188 | |
| Argentine Republic 16.00% 2023 | | ARS | 1,078 | | | | 19 | |
| Argentine Republic 3.75% 2038 (5.25% on 3/31/2029)7 | | $ | 350 | | | | 185 | |
| Buenos Aires (City of) (Badlar Private Banks ARS Index + 3.25%) 42.415% 20246 | | ARS | 7,560 | | | | 128 | |
| | | | | | | | 1,273 | |
| | | | | | | | | |
| Brazil 2.50% | | | | | | | | |
| Brazil (Federative Republic of) 6.00% 20225 | | BRL | 408 | | | | 110 | |
| Brazil (Federative Republic of) 6.00% 20245 | | | 441 | | | | 121 | |
| Brazil (Federative Republic of) 10.00% 2025 | | | 300 | | | | 81 | |
| Brazil (Federative Republic of) 10.00% 2027 | | | 350 | | | | 95 | |
| Brazil (Federative Republic of) 6.00% 20285 | | | 1,143 | | | | 325 | |
| Brazil (Federative Republic of) 6.00% 20505 | | | 947 | | | | 296 | |
| Cemig Geração e Transmissão SA 9.25% 20243 | | $ | 105 | | | | 116 | |
| Cemig Geração e Transmissão SA 9.25% 2024 | | | 200 | | | | 220 | |
| Odebrecht Drilling Norbe 6.72% 20223 | | | 43 | | | | 41 | |
| Odebrecht Drilling Norbe 7.72% 2026 (87.05% PIK)3,8 | | | 328 | | | | 84 | |
| Odebrecht Drilling Norbe 0% 20493 | | | 70 | | | | 1 | |
| | | | | | | | 1,490 | |
| | | | | | | | | |
| Colombia 0.67% | | | | | | | | |
| Colombia (Republic of), Series B, 7.00% 2032 | | COP | 310,000 | | | | 96 | |
| Ecopetrol SA 5.875% 2023 | | $ | 23 | | | | 25 | |
| Ecopetrol SA 5.375% 2026 | | | 205 | | | | 220 | |
| Emgesa SA ESP 8.75% 2021 | | COP | 125,000 | | | | 41 | |
| Emgesa SA ESP 8.75% 2021 | | | 50,000 | | | | 16 | |
| | | | | | | | 398 | |
| 8 | Capital Group Emerging Markets Total Opportunities Fund |
| | | Principal amount | | | Value | |
| | | (000) | | | (000) | |
| Dominican Republic 1.07% | | | | | | | | |
| Dominican Republic 8.90% 2023 | | DOP | 8,000 | | | $ | 158 | |
| Dominican Republic 6.875% 20263 | | $ | 100 | | | | 111 | |
| Dominican Republic 5.95% 20273 | | | 100 | | | | 106 | |
| Dominican Republic 5.95% 2027 | | | 253 | | | | 267 | |
| | | | | | | | 642 | |
| | | | | | | | | |
| Honduras 0.44% | | | | | | | | |
| Honduras (Republic of) 6.25% 2027 | | | 250 | | | | 264 | |
| | | | | | | | | |
| Mexico 5.53% | | | | | | | | |
| Petróleos Mexicanos 7.65% 2021 | | MXN | 8,740 | | | | 436 | |
| Petróleos Mexicanos 7.19% 2024 | | | 1,780 | | | | 79 | |
| Petróleos Mexicanos 7.47% 2026 | | | 12,140 | | | | 520 | |
| Red de Carreteras de Occidente 9.00% 2028 | | | 2,100 | | | | 107 | |
| United Mexican States 3.50% 2021 | | $ | 192 | | | | 194 | |
| United Mexican States 4.50% 20255 | | MXN | 1,946 | | | | 107 | |
| United Mexican States 4.00% 20465 | | | 3,766 | | | | 200 | |
| United Mexican States, Series M, 8.00% 2020 | | | 2,890 | | | | 153 | |
| United Mexican States, Series M, 8.00% 2023 | | | 6,300 | | | | 333 | |
| United Mexican States, Series M20, 10.00% 2024 | | | 15,980 | | | | 922 | |
| United Mexican States, Series M, 7.50% 2027 | | | 4,990 | | | | 254 | |
| | | | | | | | 3,305 | |
| | | | | | | | | |
| Panama 1.32% | | | | | | | | |
| ENA Norte Trust 4.95% 2028 | | $ | 158 | | | | 162 | |
| Panama (Republic of) 7.125% 2026 | | | 200 | | | | 245 | |
| Panama (Republic of) 4.50% 2047 | | | 360 | | | | 379 | |
| | | | | | | | 786 | |
| | | | | | | | | |
| Paraguay 0.55% | | | | | | | | |
| Paraguay (Republic of) 5.60% 20483 | | | 305 | | | | 327 | |
| | | | | | | | | |
| Peru 0.92% | | | | | | | | |
| Banco de Crédito del Perú 6.875% 2026 (3-month USD-LIBOR + 6.875% on 9/16/2021)7 | | | 199 | | | | 214 | |
| Banco de Crédito del Perú 6.875% 2026 (3-month USD-LIBOR + 7.708% on 9/16/2021)3,7 | | | 10 | | | | 11 | |
| Peru (Republic of) 6.15% 2032 | | PEN | 1,026 | | | | 327 | |
| | | | | | | | 552 | |
| | | | | | | | | |
| Uruguay 0.46% | | | | | | | | |
| Uruguay (Oriental Republic of) 9.875% 2022 | | UYU | 4,890 | | | | 140 | |
| Uruguay (Oriental Republic of) 4.25% 20275 | | | 4,391 | | | | 135 | |
| | | | | | | | 275 | |
| | | | | | | | | |
| Total Latin America | | | | | | | 9,312 | |
| | | | | | | | | |
| Asia-Pacific 8.47% | | | | | | | | |
| China 2.83% | | | | | | | | |
| Bank of China Ltd. 1.875% 20199 | | $ | 200 | | | | 199 | |
| China Development Bank (3-month USD-LIBOR + 0.55%) 3.158% 20206 | | | 355 | | | | 355 | |
| China Peoples Rep. (Bond Connect), Series 1827, 3.25% 2028 | | CNY | 500 | | | | 73 | |
| Export-Import Bank of China (3-month USD-LIBOR + 0.60%) 3.195% 20203,6 | | $ | 480 | | | | 480 | |
| Industrial and Commercial Bank of China Ltd. 3.231% 2019 | | | 350 | | | | 351 | |
| State Grid Overseas Investment Ltd. 2.75% 2019 | | | 230 | | | | 230 | |
| | | | | | | | 1,688 | |
| | | | | | | | | |
| India 0.39% | | | | | | | | |
| HDFC Bank Ltd. 8.10% 2025 | | INR | 10,000 | | | | 140 | |
| India (Republic of) 8.60% 2028 | | | 5,900 | | | | 90 | |
| | | | | | | | 230 | |
| Capital Group Emerging Markets Total Opportunities Fund | 9 |
| Bonds, notes & other debt instruments (continued) | | Principal amount
(000) | | | Value
(000) | |
| Asia-Pacific (continued) | | | | | | | | |
| Indonesia 1.68% | | | | | | | | |
| Indonesia (Republic of) 4.125% 20253 | | $ | 325 | | | $ | 336 | |
| Indonesia (Republic of), Series 77, 8.125% 2024 | | IDR | 3,400,000 | | | | 247 | |
| Indonesia (Republic of), Series 64, 6.125% 2028 | | | 1,000,000 | | | | 63 | |
| Indonesia (Republic of), Series 78, 8.25% 2029 | | | 2,036,000 | | | | 148 | |
| Indonesia (Republic of), Series 73, 8.75% 2031 | | | 2,854,000 | | | | 211 | |
| | | | | | | | 1,005 | |
| | | | | | | | | |
| Islamic Republic of Pakistan 1.51% | | | | | | | | |
| Pakistan (Islamic Republic of) 5.50% 20213 | | $ | 200 | | | | 202 | |
| Pakistan (Islamic Republic of) 6.875% 2027 | | | 705 | | | | 702 | |
| | | | | | | | 904 | |
| | | | | | | | | |
| Philippines 0.37% | | | | | | | | |
| Philippines (Republic of the), Series R511, 4.625% 2022 | | PHP | 5,900 | | | | 109 | |
| Philippines (Republic of the), Series 575, 5.50% 2023 | | | 5,800 | | | | 110 | |
| | | | | | | | 219 | |
| | | | | | | | | |
| Sri Lanka 1.61% | | | | | | | | |
| Sri Lanka (Democratic Socialist Republic of) 6.825% 2026 | | $ | 675 | | | | 669 | |
| Sri Lanka (Democratic Socialist Republic of) 6.75% 2028 | | | 200 | | | | 193 | |
| Sri Lanka (Democratic Socialist Republic of) 6.25% 2020 | | | 100 | | | | 101 | |
| | | | | | | | 963 | |
| | | | | | | | | |
| Thailand 0.08% | | | | | �� | | | |
| Thailand (Kingdom of) 3.30% 2038 | | THB | 1,430 | | | | 46 | |
| | | | | | | | | |
| Total Asia-Pacific | | | | | | | 5,055 | |
| | | | | | | | | |
| Eastern Europe and Middle East 8.43% | | | | | | | | |
| Armenia 0.34% | | | | | | | | |
| Armenia (Republic of) 6.00% 2020 | | $ | 200 | | | | 205 | |
| | | | | | | | | |
| Bahrain 0.19% | | | | | | | | |
| Bahrain (Kingdom of) 5.50% 2020 | | | 115 | | | | 116 | |
| | | | | | | | | |
| Greece 1.53% | | | | | | | | |
| Greece (Hellenic Republic of) 3.45% 2024 | | € | 325 | | | | 385 | |
| Greece (Hellenic Republic of) 3.375% 2025 | | | 192 | | | | 223 | |
| Greece (Hellenic Republic of) 3.875% 2029 | | | 259 | | | | 303 | |
| | | | | | | | 911 | |
| | | | | | | | | |
| Kingdom of Saudi Arabia 0.64% | | | | | | | | |
| Saudi Arabia (Kingdom of) 3.25% 20263 | | $ | 385 | | | | 379 | |
| | | | | | | | | |
| Poland 0.15% | | | | | | | | |
| Polish Government, Series 0428, 2.75% 2028 | | PLN | 347 | | | | 90 | |
| | | | | | | | | |
| Romania 1.27% | | | | | | | | |
| Romania 4.375% 2023 | | $ | 316 | | | | 329 | |
| Romania 2.00% 2026 | | € | 65 | | | | 74 | |
| Romania 3.50% 2034 | | | 70 | | | | 79 | |
| Romania 5.125% 2048 | | $ | 270 | | | | 274 | |
| | | | | | | | 756 | |
| | | | | | | | | |
| Russian Federation 0.58% | | | | | | | | |
| Russian Federation 5.00% 2020 | | | 100 | | | | 102 | |
| Russian Federation 7.50% 2021 | | RUB | 10,262 | | | | 159 | |
| Russian Federation 7.05% 2028 | | | 6,000 | | | | 88 | |
| | | | | | | | 349 | |
| 10 | Capital Group Emerging Markets Total Opportunities Fund |
| | | Principal amount
(000) | | | Value
(000) | |
| Turkey 2.60% | | | | | | | | |
| Turkey (Republic of) 7.00% 2020 | | $ | 100 | | | $ | 101 | |
| Turkey (Republic of) 9.20% 2021 | | TRY | 1,185 | | | | 152 | |
| Turkey (Republic of) 3.00% 20225 | | | 1,587 | | | | 259 | |
| Turkey (Republic of) 9.50% 2022 | | | 550 | | | | 67 | |
| Turkey (Republic of) 11.00% 2022 | | | 800 | | | | 101 | |
| Turkey (Republic of) 7.10% 2023 | | | 2,010 | | | | 208 | |
| Turkey (Republic of) 7.375% 2025 | | $ | 118 | | | | 117 | |
| Turkey (Republic of) 4.25% 2026 | | | 200 | | | | 167 | |
| Turkey (Republic of) 6.00% 2027 | | | 250 | | | | 226 | |
| Turkey (Republic of) 5.75% 2047 | | | 200 | | | | 157 | |
| | | | | | | | 1,555 | |
| | | | | | | | | |
| Ukraine 1.13% | | | | | | | | |
| Ukraine Government 7.75% 2024 | | | 264 | | | | 253 | |
| Ukraine Government 9.75% 2028 | | | 200 | | | | 205 | |
| Ukraine Government 0% 2040 | | | 340 | | | | 218 | |
| | | | | | | | 676 | |
| | | | | | | | | |
| Total Eastern Europe and Middle East | | | | | | | 5,037 | |
| | | | | | | | | |
| Africa 5.77% | | | | | | | | |
| Benin 0.57% | | | | | | | | |
| Benin (Republic of) 5.75% 2026 | | € | 305 | | | | 340 | |
| | | | | | | | | |
| Cameroon 0.54% | | | | | | | | |
| Cameroon (Republic of) 9.50% 2025 | | $ | 300 | | | | 322 | |
| | | | | | | | | |
| Egypt 0.80% | | | | | | | | |
| Egypt (Arab Republic of) 17.20% 2023 | | EGP | 700 | | | | 42 | |
| Egypt (Arab Republic of) 15.90% 2024 | | | 3,190 | | | | 186 | |
| Egypt (Arab Republic of) 4.75% 2026 | | € | 228 | | | | 251 | |
| | | | | | | | 479 | |
| | | | | | | | | |
| Federal Republic of Nigeria 0.32% | | | | | | | | |
| Nigeria (Republic of) 7.625% 2047 | | $ | 200 | | | | 192 | |
| | | | | | | | | |
| Ghana 0.60% | | | | | | | | |
| Ghana (Republic of) 24.75% 2021 | | GHS | 575 | | | | 123 | |
| Ghana (Republic of) 8.95% 20513 | | $ | 240 | | | | 238 | |
| | | | | | | | 361 | |
| | | | | | | | | |
| Republic of Kenya 0.59% | | | | | | | | |
| Kenya (Republic of) 5.875% 2019 | | | 350 | | | | 351 | |
| | | | | | | | | |
| South Africa 1.27% | | | | | | | | |
| South Africa (Republic of) 8.50% 2037 | | ZAR | 3,843 | | | | 242 | |
| South Africa (Republic of), Series R-2023, 7.75% 2023 | | | 1,312 | | | | 92 | |
| South Africa (Republic of), Series R-209, 6.25% 2036 | | | 1,457 | | | | 74 | |
| South Africa (Republic of), Series 2040, 9.00% 2040 | | | 1,650 | | | | 108 | |
| South Africa (Republic of), Series R-2048, 8.75% 2048 | | | 3,800 | | | | 240 | |
| | | | | | | | 756 | |
| | | | | | | | | |
| Tunisia 1.08% | | | | | | | | |
| Banque Centrale de Tunisie 6.75% 2023 | | € | 345 | | | | 390 | |
| Banque Centrale de Tunisie 5.625% 2024 | | | 230 | | | | 252 | |
| | | | | | | | 642 | |
| | | | | | | | | |
| Total Africa | | | | | | | 3,443 | |
| | | | | | | | | |
| Other markets 0.87% | | | | | | | | |
| Netherlands 0.35% | | | | | | | | |
| IHS Netherlands Holdco BV 9.50% 2021 | | $ | 200 | | | | 208 | |
| Capital Group Emerging Markets Total Opportunities Fund | 11 |
| Bonds, notes & other debt instruments (continued) | | Principal amount
(000) | | | Value
(000) | |
| Other markets (continued) | | | | | | | | |
| Switzerland 0.22% | | | | | | | | |
| Transocean Inc. 6.125% 20253 | | $ | 128 | | | $ | 132 | |
| | | | | | | | | |
| United States 0.30% | | | | | | | | |
| Ensco PLC 7.75% 2026 | | | 106 | | | | 92 | |
| Ensco PLC 5.75% 2044 | | | 136 | | | | 90 | |
| | | | | | | | 182 | |
| | | | | | | | | |
| Total other markets | | | | | | | 522 | |
| | | | | | | | | |
| Total bonds, notes & other debt instruments (cost: $23,961,000) | | | | | | | 23,369 | |
| | | | | | | | | |
| | | | | | | | | |
| Short-term securities 3.95% | | Shares | | | | | |
| Money market investments 1.52% | | | | | | | | |
| Capital Group Central Cash Fund | | | 9,089 | | | | 909 | |
| | | | | | | | | |
| | | Principal amount
(000) | | | | | |
| Other short-term securities 2.43% | | | | | | | | |
| Argentinian Treasury Bills (51.59%)–9.92% due 7/19/2019–7/31/2020 | | ARS | 15,799,000 | | | | 352 | |
| Egyptian Treasury Bills 14.84%–16.60% due 5/14/2019–10/8/2019 | | EGP | 15,775,000 | | | | 890 | |
| Nigerian Treasury Bills 12.27%–14.45% due 11/21/2019–1/30/2020 | | NGN | 81,000,000 | | | | 206 | |
| | | | | | | | 1,448 | |
| | | | | | | | | |
| Total short-term securities (cost: $2,410,000) | | | | | | | 2,357 | |
| Total investment securities 82.65% (cost: $48,277,000) | | | | | | | 49,356 | |
| Other assets less liabilities 17.35% | | | | | | | 10,358 | |
| | | | | | | | | |
| Net assets 100.00% | | | | | | | 59,714 | |
Forward currency contracts
| | | | | | | | | Unrealized | |
| | | | | | | appreciation | |
| Contract amount | | | | | | (depreciation) | |
| Purchases | | Sales | | | | | | at 4/30/2019 | |
| (000) | | (000) | | Counterparty | | Settlement date | | (000) | |
| USD156 | | BRL604 | | JPMorgan Chase | | 5/6/2019 | | | $ | 2 | |
| USD150 | | ZAR2,141 | | Bank of America, N.A. | | 5/6/2019 | | | | 1 | |
| BRL604 | | USD154 | | JPMorgan Chase | | 5/6/2019 | | | | — | 10 |
| USD114 | | EUR101 | | Bank of America, N.A. | | 5/6/2019 | | | | — | 10 |
| USD386 | | TRY2,320 | | JPMorgan Chase | | 5/6/2019 | | | | (1 | ) |
| USD134 | | MXN2,577 | | Bank of America, N.A. | | 5/6/2019 | | | | (2 | ) |
| TRY1,250 | | USD222 | | Citibank | | 5/6/2019 | | | | (14 | ) |
| TRY1,070 | | USD195 | | HSBC Bank | | 5/6/2019 | | | | (17 | ) |
| USD599 | | BRL2,312 | | JPMorgan Chase | | 5/9/2019 | | | | 9 | |
| USD111 | | INR7,746 | | Goldman Sachs | | 5/10/2019 | | | | — | 10 |
| USD62 | | PLN237 | | Goldman Sachs | | 5/10/2019 | | | | — | 10 |
| CZK5,000 | | EUR195 | | Morgan Stanley | | 5/13/2019 | | | | — | 10 |
| USD155 | | AUD216 | | Goldman Sachs | | 5/17/2019 | | | | 3 | |
| USD289 | | GBP220 | | Standard Chartered Bank | | 5/17/2019 | | | | 2 | |
| USD108 | | BRL422 | | Goldman Sachs | | 5/20/2019 | | | | 1 | |
| USD77 | | EUR68 | | Bank of America, N.A. | | 5/23/2019 | | | | 1 | |
| USD435 | | EUR386 | | HSBC Bank | | 5/23/2019 | | | | 1 | |
| USD57 | | ZAR794 | | JPMorgan Chase | | 5/23/2019 | | | | 1 | |
| USD412 | | KRW477,363 | | HSBC Bank | | 5/31/2019 | | | | 2 | |
| USD164 | | BRL648 | | JPMorgan Chase | | 6/3/2019 | | | | — | 10 |
| USD339 | | INR24,337 | | JPMorgan Chase | | 6/6/2019 | | | | (9 | ) |
| TRY2,932 | | USD479 | | JPMorgan Chase | | 6/7/2019 | | | | 1 | |
| USD125 | | ARS5,532 | | Goldman Sachs | | 7/23/2019 | | | | 16 | |
| ARS19,013 | | USD418 | | Goldman Sachs | | 7/23/2019 | | | | (42 | ) |
| 12 | Capital Group Emerging Markets Total Opportunities Fund |
| | | | | | | | | Unrealized | |
| | | | | | | | | appreciation | |
| Contract amount | | | | | | (depreciation) | |
| Purchases | | Sales | | | | | | at 4/30/2019 | |
| (000) | | (000) | | Counterparty | | Settlement date | | (000) | |
| USD541 | | BRL2,116 | | Citibank | | 10/2/2019 | | | $ | 8 | |
| BRL2,116 | | USD568 | | JPMorgan Chase | | 10/2/2019 | | | | (35 | ) |
| CNY328 | | USD48 | | JPMorgan Chase | | 10/11/2019 | | | | — | 10 |
| USD171 | | CNY1,205 | | Bank of America, N.A. | | 10/11/2019 | | | | (8 | ) |
| USD812 | | CNY5,720 | | Goldman Sachs | | 10/11/2019 | | | | (36 | ) |
| USD380 | | INR27,365 | | JPMorgan Chase | | 3/12/2020 | | | | 1 | |
| | | | | | | | | | $ | (115 | ) |
| 1 | Security did not produce income during the last 12 months. |
| 2 | Valued under fair value procedures adopted by authority of the board of trustees. The total value of all such securities was $788,000, which represented 1.32% of the net assets of the fund. This amount includes $475,000 related to certain securities trading outside the U.S. whose values were adjusted as a result of significant market movements following the close of local trading. |
| 3 | Acquired in a transaction exempt from registration under Rule 144A of the Securities Act of 1933. May be resold in the U.S. in transactions exempt from registration, normally to qualified institutional buyers. The total value of all such securities was $2,992,000, which represented 5.01% of the net assets of the fund. |
| 4 | Purchased on a TBA basis. |
| 5 | Index-linked bond whose principal amount moves with a government price index. |
| 6 | Coupon rate may change periodically. |
| 7 | Step bond; coupon rate may change at a later date. |
| 8 | Payment in kind; the issuer has the option of paying additional securities in lieu of cash. Most recent payment was 100% cash unless otherwise noted. |
| 9 | Principal payments may be made periodically. Therefore, the effective maturity date may be earlier than the stated maturity date. |
| 10 | Amount less than one thousand. |
Key to abbreviations and symbols
ADR = American Depositary Receipts
ARS = Argentine pesos
AUD = Australian dollars
BRL = Brazilian reais
CNY = Chinese yuan renminbi
COP = Colombian pesos
CZK = Czech korunas
DOP = Dominican pesos
EGP = Egyptian pounds
EUR/€ = Euros
GBP = British pounds
GDR = Global Depositary Receipts
GHS = Ghanaian cedi
IDR = Indonesian rupiah
INR = Indian rupees
KRW = South Korean won
LIBOR = London Interbank Offered Rate
MXN = Mexican pesos
NGN = Nigerian naira
PEN = Peruvian nuevos soles
PHP = Philippine pesos
PLN = Polish zloty
RUB = Russian rubles
TBA = To-be-announced
THB = Thai baht
TRY = Turkish lira
USD/$ = U.S. dollars
UYU = Uruguayan pesos
ZAR = South African rand
See notes to financial statements
| Capital Group Emerging Markets Total Opportunities Fund | 13 |
Financial statements
| Statement of assets and liabilities | unaudited |
| at April 30, 2019 | (dollars in thousands) |
| Assets: | | | | | | | | |
| Investment securities in unaffiliated issuers, at value (cost: $48,277) | | | | | | $ | 49,356 | |
| Cash | | | | | | | 3 | |
| Cash denominated in currencies other than U.S. dollars (cost: $1,132) | | | | | | | 1,138 | |
| Unrealized appreciation on open forward currency contracts | | | | | | | 49 | |
| Receivables for: | | | | | | | | |
| Sales of investments | | $ | 205 | | | | | |
| Sales of fund’s shares | | | 15,194 | | | | | |
| Dividends and interest | | | 496 | | | | | |
| Closed forward currency contracts | | | 9 | | | | 15,904 | |
| | | | | | | | 66,450 | |
| Liabilities: | | | | | | | | |
| Unrealized depreciation on open forward currency contracts | | | | | | | 164 | |
| Payables for: | | | | | | | | |
| Purchases of investments | | | 6,500 | | | | | |
| Repurchases of fund’s shares | | | 8 | | | | | |
| Investment advisory services | | | 31 | | | | | |
| Services provided by related parties | | | 2 | | | | | |
| Other | | | 31 | | | | 6,572 | |
| Net assets at April 30, 2019 | | | | | | $ | 59,714 | |
| | | | | | | | | |
| Net assets consist of: | | | | | | | | |
| Capital paid in on shares of beneficial interest | | | | | | $ | 81,493 | |
| Total accumulated loss | | | | | | | (21,779 | ) |
| Net assets at April 30, 2019 | | | | | | $ | 59,714 | |
(dollars and shares in thousands, except per-share amounts)
Shares of beneficial interest issued and outstanding (no stated par value) —
unlimited shares authorized (5,442 total shares outstanding)
| | | Net assets | | | Shares
outstanding | | | Net asset value
per share | |
| Class F-2 | | $ | 9 | | | | 1 | | | $ | 10.97 | |
| Class F-3 | | | 35,250 | | | | 3,214 | | | | 10.97 | |
| Class R-6 | | | 24,455 | | | | 2,227 | | | | 10.98 | |
See notes to financial statements
| 14 | Capital Group Emerging Markets Total Opportunities Fund |
| Statement of operations | unaudited |
| for the six months ended April 30, 2019 | (dollars in thousands) |
| Investment income: | | | | | | | | |
| Income: | | | | | | | | |
| Interest (net of non-U.S. taxes of $8) | | $ | 1,136 | | | | | |
| Dividends (net of non-U.S. taxes of $8) | | | 221 | | | $ | 1,357 | |
| Fees and expenses*: | | | | | | | | |
| Investment advisory services | | | 206 | | | | | |
| Transfer agent services | | | 1 | | | | | |
| Administrative services | | | 12 | | | | | |
| Reports to shareholders | | | 8 | | | | | |
| Registration statement and prospectus | | | 48 | | | | | |
| Trustees’ compensation | | | 2 | | | | | |
| Auditing and legal | | | 3 | | | | | |
| Custodian | | | 10 | | | | | |
| Other | | | 17 | | | | | |
| Total fees and expenses before reimbursements | | | 307 | | | | | |
| Less reimbursements of fees and expenses: | | | | | | | | |
| Miscellaneous fee reimbursements | | | 34 | | | | | |
| Transfer agent services fee reimbursements | | | — | † | | | | |
| Total fees and expenses after reimbursements | | | | | | | 272 | |
| Net investment income | | | | | | | 1,085 | |
| | | | | | | | | |
| Net realized loss and unrealized appreciation: | | | | | | | | |
| Net realized (loss) gain on: | | | | | | | | |
| Investments in unaffiliated issuers (net of non-U.S. taxes of $18) | | | (1,721 | ) | | | | |
| Forward currency contracts | | | (152 | ) | | | | |
| Currency transactions | | | 1 | | | | (1,872 | ) |
| Net unrealized appreciation (depreciation) on: | | | | | | | | |
| Investments in unaffiliated issuers (net of non-U.S. taxes of $26) | | | 4,457 | | | | | |
| Forward currency contracts | | | (26 | ) | | | | |
| Currency translations | | | 37 | | | | 4,468 | |
| Net realized loss and unrealized appreciation | | | | | | | 2,596 | |
| | | | | | | | | |
| Net increase in net assets resulting from operations | | | | | | $ | 3,681 | |
| * | Additional information related to class-specific fees and expenses is included in the notes to financial statements. |
| † | Amount less than one thousand. |
Statements of changes in net assets
(dollars in thousands)
| | | Six months ended
April 30, 2019* | | | Year ended
October 31, 2018 | |
| Operations: | | | | | | | | |
| Net investment income | | $ | 1,085 | | | $ | 3,758 | |
| Net realized loss | | | (1,872 | ) | | | (1,642 | ) |
| Net unrealized appreciation (depreciation) | | | 4,468 | | | | (8,355 | ) |
| Net increase (decrease) in net assets resulting from operations | | | 3,681 | | | | (6,239 | ) |
| | | | | | | | | |
| Distributions paid to shareholders | | | (3,016 | ) | | | (6,366 | ) |
| | | | | | | | | |
| Net capital share transactions | | | (6,628 | ) | | | (66,865 | ) |
| | | | | | | | | |
| Total decrease in net assets | | | (4,455 | ) | | | (79,470 | ) |
| | | | | | | | | |
| Net assets: | | | | | | | | |
| Beginning of period | | | 64,169 | | | | 143,639 | |
| End of period | | $ | 59,714 | | | $ | 64,169 | |
See notes to financial statements
| Capital Group Emerging Markets Total Opportunities Fund | 15 |
| Notes to financial statements | unaudited |
1. Organization
Capital Group Emerging Markets Total Opportunities Fund (the “fund”) is registered under the Investment Company Act of 1940 as an open-end, diversified management investment company. The fund seeks long-term growth and preservation of capital with lower volatility of returns than emerging market equities.
The fund has three share classes consisting of two retail share classes (Classes F-2 and F-3), and one retirement plan share class (Class R-6). The retirement plan share class is generally offered only through eligible employer-sponsored retirement plans. The fund’s share classes are described further in the following table:
| Share class | | Initial sales charge | | Contingent deferred sales charge upon
redemption | | Conversion feature |
| Classes F-2 and F-3 | | None | | None | | None |
| Class R-6 | | None | | None | | None |
Holders of all share classes have equal pro rata rights to the assets, dividends and liquidation proceeds of the fund. Each share class has identical voting rights, except for the exclusive right to vote on matters affecting only its class. Share classes have different fees and expenses (“class-specific fees and expenses”), primarily due to different arrangements for distribution, transfer agent and administrative services. Differences in class-specific fees and expenses will result in differences in net investment income and, therefore, the payment of different per-share dividends by each share class.
2. Significant accounting policies
The fund is an investment company that applies the accounting and reporting guidance issued in Topic 946 by the U.S. Financial Accounting Standards Board. The fund’s financial statements have been prepared to comply with U.S. generally accepted accounting principles (“U.S. GAAP”). These principles require the fund’s investment adviser to make estimates and assumptions that affect reported amounts and disclosures. Actual results could differ from those estimates. Subsequent events, if any, have been evaluated through the date of issuance in the preparation of the financial statements. The fund follows the significant accounting policies described in this section, as well as the valuation policies described in the next section on valuation.
Security transactions and related investment income— Security transactions are recorded by the fund as of the date the trades are executed with brokers. Realized gains and losses from security transactions are determined based on the specific identified cost of the securities. In the event a security is purchased with a delayed payment date, the fund will segregate liquid assets sufficient to meet its payment obligations. Dividend income is recognized on the ex-dividend date and interest income is recognized on an accrual basis. Market discounts, premiums and original issue discounts on fixed-income securities are amortized daily over the expected life of the security.
Class allocations— Income, fees and expenses (other than class-specific fees and expenses) and realized and unrealized gains and losses are allocated daily among the various share classes based on their relative net assets. Class-specific fees and expenses, such as distribution, transfer agent and administrative services, are charged directly to the respective share class.
Distributions paid to shareholders— Income dividends and capital gain distributions are recorded on the ex-dividend date.
Currency translation— Assets and liabilities, including investment securities, denominated in currencies other than U.S. dollars are translated into U.S. dollars at the exchange rates supplied by one or more pricing vendors on the valuation date. Purchases and sales of investment securities and income and expenses are translated into U.S. dollars at the exchange rates on the dates of such transactions. The effects of changes in exchange rates on investment securities are included with the net realized gain or loss and net unrealized appreciation or depreciation on investments in the fund’s statement of operations. The realized gain or loss and unrealized appreciation or depreciation resulting from all other transactions denominated in currencies other than U.S. dollars are disclosed separately.
| 16 | Capital Group Emerging Markets Total Opportunities Fund |
3. Valuation
Capital Guardian Trust Company (“CGTC”), the fund’s investment adviser, values the fund’s investments at fair value as defined by U.S. GAAP. The net asset value of each share class of the fund is generally determined as of approximately 4:00 p.m. New York time each day the New York Stock Exchange is open.
Methods and inputs— The fund’s investment adviser uses the following methods and inputs to establish the fair value of the fund’s assets and liabilities. Use of particular methods and inputs may vary over time based on availability and relevance as market and economic conditions evolve.
Equity securities are generally valued at the official closing price of, or the last reported sale price on, the exchange or market on which such securities are traded, as of the close of business on the day the securities are being valued or, lacking any sales, at the last available bid price. Prices for each security are taken from the principal exchange or market on which the security trades.
Fixed-income securities, including short-term securities, are generally valued at prices obtained from one or more pricing vendors. Vendors value such securities based on one or more of the inputs described in the following table. The table provides examples of inputs that are commonly relevant for valuing particular classes of fixed-income securities in which the fund is authorized to invest. However, these classifications are not exclusive, and any of the inputs may be used to value any other class of fixed-income security.
| Fixed-income class | | Examples of standard inputs |
| All | | Benchmark yields, transactions, bids, offers, quotations from dealers and trading systems, new issues, spreads and other relationships observed in the markets among comparable securities; and proprietary pricing models such as yield measures calculated using factors such as cash flows, financial or collateral performance and other reference data (collectively referred to as “standard inputs”) |
| Corporate bonds & notes; convertible securities | | Standard inputs and underlying equity of the issuer |
| Bonds & notes of governments & government agencies | | Standard inputs and interest rate volatilities |
When the fund’s investment adviser deems it appropriate to do so (such as when vendor prices are unavailable or deemed to be not representative), fixed-income securities will be valued in good faith at the mean quoted bid and ask prices that are reasonably and timely available (or bid prices, if ask prices are not available) or at prices for securities of comparable maturity, quality and type.
Securities with both fixed-income and equity characteristics, or equity securities traded principally among fixed-income dealers, are generally valued in the manner described for either equity or fixed-income securities, depending on which method is deemed most appropriate by the fund’s investment adviser. The Capital Group Central Cash Fund (“CCF”) is valued based upon a floating net asset value, which fluctuates with changes in the value of CCF’s portfolio securities. The underlying securities are valued based on the policies and procedures in CCF’s statement of additional information. Forward currency contracts are valued at the mean of representative quoted bid and ask prices, generally based on prices supplied by one or more pricing vendors.
Securities and other assets for which representative market quotations are not readily available or are considered unreliable by the fund’s investment adviser are fair valued as determined in good faith under fair valuation guidelines adopted by authority of the fund’s board of trustees as further described. The investment adviser follows fair valuation guidelines, consistent with U.S. Securities and Exchange Commission rules and guidance, to consider relevant principles and factors when making fair value determinations. The investment adviser considers relevant indications of value that are reasonably and timely available to it in determining the fair value to be assigned to a particular security, such as the type and cost of the security; contractual or legal restrictions on resale of the security; relevant financial or business developments of the issuer; actively traded similar or related securities; conversion or exchange rights on the security; related corporate actions; significant events occurring after the close of trading in the security; and changes in overall market conditions. In addition, the closing prices of equity securities that trade in markets outside U.S. time zones may be adjusted to reflect significant events that occur after the close of local trading but before the net asset value of each share class of the fund is determined. Fair valuations and valuations of investments that are not actively trading involve judgment and may differ materially from valuations that would have been used had greater market activity occurred.
Processes and structure— The fund’s board of trustees has delegated authority to the fund’s investment adviser to make fair value determinations, subject to board oversight. The investment adviser has established a Joint Fair Valuation Committee (the “Fair Valuation Committee”) to administer, implement and oversee the fair valuation process, and to make fair value decisions. The Fair Valuation Committee regularly reviews its own fair value decisions, as well as decisions made under its standing instructions to the investment
| Capital Group Emerging Markets Total Opportunities Fund | 17 |
adviser’s valuation teams. The Fair Valuation Committee reviews changes in fair value measurements from period to period and may, as deemed appropriate, update the fair valuation guidelines to better reflect the results of back testing and address new or evolving issues. The Fair Valuation Committee reports any changes to the fair valuation guidelines to the board of trustees. The fund’s board and audit committee also regularly review reports that describe fair value determinations and methods.
The fund’s investment adviser has also established a Fixed-Income Pricing Review Group to administer and oversee the fixed-income valuation process, including the use of fixed-income pricing vendors. This group regularly reviews pricing vendor information and market data. Pricing decisions, processes and controls over security valuation are also subject to additional internal reviews, including an annual control self-evaluation program facilitated by the investment adviser’s compliance group.
Classifications— The fund’s investment adviser classifies the fund’s assets and liabilities into three levels based on the inputs used to value the assets or liabilities. Level 1 values are based on quoted prices in active markets for identical securities. Level 2 values are based on significant observable market inputs, such as quoted prices for similar securities and quoted prices in inactive markets. Certain securities trading outside the U.S. may transfer between Level 1 and Level 2 due to valuation adjustments resulting from significant market movements following the close of local trading. Level 3 values are based on significant unobservable inputs that reflect the investment adviser’s determination of assumptions that market participants might reasonably use in valuing the securities. The valuation levels are not necessarily an indication of the risk or liquidity associated with the underlying investment. For example, U.S. government securities are reflected as Level 2 because the inputs used to determine fair value may not always be quoted prices in an active market. The following tables present the fund’s valuation levels as of April 30, 2019 (dollars in thousands):
| | | Investment securities | |
| | | Level 1 | | | Level 2 | | | Level 3 | | | Total | |
| Assets: | | | | | | | | | | | | | | | | |
| Common stocks: | | | | | | | | | | | | | | | | |
| Asia-Pacific | | $ | 11,428 | | | $ | 778 | | | $ | — | | | $ | 12,206 | |
| Other markets | | | 4,050 | | | | — | | | | — | | | | 4,050 | |
| Eastern Europe and Middle East | | | 3,264 | | | | — | | | | — | | | | 3,264 | |
| Latin America | | | 2,940 | | | | — | | | | — | | | | 2,940 | |
| Africa | | | 1,160 | | | | — | | | | — | | | | 1,160 | |
| Rights & warrants | | | — | | | | 10 | | | | — | | | | 10 | |
| Bonds, notes & other debt instruments | | | | | | | | | | | | | | | | |
| Latin America | | | — | | | | 9,312 | | | | — | | | | 9,312 | |
| Asia-Pacific | | | — | | | | 5,055 | | | | — | | | | 5,055 | |
| Eastern Europe and Middle East | | | — | | | | 5,037 | | | | — | | | | 5,037 | |
| Africa | | | — | | | | 3,443 | | | | — | | | | 3,443 | |
| Other markets | | | — | | | | 522 | | | | — | | | | 522 | |
| Short-term securities | | | 909 | | | | 1,448 | | | | — | | | | 2,357 | |
| Total | | $ | 23,751 | | | $ | 25,605 | | | $ | — | | | $ | 49,356 | |
| | | Other investments* | |
| | | Level 1 | | | Level 2 | | | Level 3 | | | Total | |
| Assets: | | | | | | | | | | | | | | | | |
| Unrealized appreciation on open forward currency contracts | | $ | — | | | $ | 49 | | | $ | — | | | $ | 49 | |
| Liabilities: | | | | | | | | | | | | | | | | |
| Unrealized depreciation on open forward currency contracts | | | — | | | | (164 | ) | | | — | | | | (164 | ) |
| Total | | $ | — | | | $ | (115 | ) | | $ | — | | | $ | (115 | ) |
| * | Forward currency contracts are not included in the investment portfolio. |
4. Risk factors
Investing in the fund may involve certain risks including, but not limited to, those described below.
Market conditions— The prices of, and the income generated by, the securities held by the fund may decline — sometimes rapidly or unpredictably — due to various factors, including events or conditions affecting the general economy or particular industries; overall market changes; local, regional or global political, social or economic instability; governmental, governmental agency or central bank responses to economic conditions; and currency exchange rate, interest rate and commodity price fluctuations.
| 18 | Capital Group Emerging Markets Total Opportunities Fund |
Issuer risks— The prices of, and the income generated by, securities held by the fund may decline in response to various factors directly related to the issuers of such securities, including reduced demand for an issuer’s goods or services, poor management performance, major litigation against the issuer, changes in government regulations affecting the issuer or its competitive environment and strategic initiatives such as mergers, acquisitions or dispositions and the market response to any such initiatives.
Investing in growth-oriented stocks— Growth-oriented common stocks and other equity-type securities (such as preferred stocks, convertible preferred stocks and convertible bonds) may involve larger price swings and greater potential for loss than other types of investments. These risks may be even greater in the case of smaller capitalization stocks.
Investing in income-oriented stocks— The value of the fund’s securities and income provided by the fund may be reduced by changes in the dividend policies of, and the capital resources available for dividend payments at, the companies in which the fund invests.
Investing outside the U.S.— Securities of issuers domiciled outside the U.S., or with significant operations or revenues outside the U.S., may lose value because of adverse political, social, economic or market developments (including social instability, regional conflicts, terrorism and war) in the countries or regions in which the issuers operate or generate revenue. These securities may also lose value due to changes in foreign currency exchange rates against the U.S. dollar and/or currencies of other countries. Issuers of these securities may be more susceptible to actions of foreign governments, such as nationalization, currency blockage or the imposition of price controls or punitive taxes, each of which could adversely impact the value of these securities. Securities markets in certain countries may be more volatile and/or less liquid than those in the U.S. Investments outside the U.S. may also be subject to different accounting practices and different regulatory, legal and reporting standards and practices, and may be more difficult to value, than those in the U.S. In addition, the value of investments outside the U.S. may be reduced by foreign taxes, including foreign withholding taxes on interest and dividends. Further, there may be increased risks of delayed settlement of securities purchased or sold by the fund. The risks of investing outside the U.S. may be heightened in connection with investments in emerging markets.
Investing in emerging markets— Investing in emerging markets may involve risks in addition to and greater than those generally associated with investing in the securities markets of developed countries. For instance, emerging market countries may have less developed legal and accounting systems than those in developed countries. The governments of these countries may be less stable and more likely to impose capital controls, nationalize a company or industry, place restrictions on foreign ownership and on withdrawing sale proceeds of securities from the country, and/or impose punitive taxes that could adversely affect the prices of securities. In addition, the economies of these countries may be dependent on relatively few industries that are more susceptible to local and global changes. Securities markets in these countries can also be relatively small and have substantially lower trading volumes. As a result, securities issued in these countries may be more volatile and less liquid, and may be more difficult to value, than securities issued in countries with more developed economies and/or markets. Less certainty with respect to security valuations may lead to additional challenges and risks in calculating the fund’s net asset value. Additionally, emerging markets are more likely to experience problems with the clearing and settling of trades and the holding of securities by banks, agents and depositories that are less established than those in developed countries.
Investing in small companies— Investing in smaller companies may pose additional risks. For example, it is often more difficult to value or dispose of small company stocks and more difficult to obtain information about smaller companies than about larger companies. Furthermore, smaller companies often have limited product lines, operating histories, markets and/or financial resources, may be dependent on one or a few key persons for management, and can be more susceptible to losses. Moreover, the prices of their stocks may be more volatile than stocks of larger, more established companies, particularly during times of market turmoil.
Investing in debt instruments— The prices of, and the income generated by, bonds and other debt securities held by the fund may be affected by changing interest rates and by changes in the effective maturities and credit ratings of these securities.
Rising interest rates will generally cause the prices of bonds and other debt securities to fall. A general rise in interest rates may cause investors to sell debt securities on a large scale, which could also adversely affect the price and liquidity of debt securities and could also result in increased redemptions from the fund. Falling interest rates may cause an issuer to redeem, call or refinance a debt security before its stated maturity, which may result in the fund failing to recoup the full amount of its initial investment and having to reinvest the proceeds in lower yielding securities. Longer maturity debt securities generally have greater sensitivity to changes in interest rates and may be subject to greater price fluctuations than shorter maturity debt securities.
Bonds and other debt securities are also subject to credit risk, which is the possibility that the credit strength of an issuer or guarantor will weaken or be perceived to be weaker, and/or an issuer of a debt security will fail to make timely payments of principal or interest and the security will go into default. A downgrade or default affecting any of the fund’s securities could cause the value of the fund’s shares to decrease. Credit risk is gauged, in part, by the credit ratings of the debt securities in which the fund invests. However, ratings are only the
| Capital Group Emerging Markets Total Opportunities Fund | 19 |
opinions of the rating agencies issuing them and are not guarantees as to credit quality or an evaluation of market risk. The fund’s investment adviser relies on its own credit analysts to research issuers and issues in seeking to assess credit and default risks.
Investing in lower rated debt instruments— Lower rated bonds and other lower rated debt securities generally have higher rates of interest and involve greater risk of default or price declines due to changes in the issuer’s creditworthiness than those of higher quality debt securities. The market prices of these securities may fluctuate more than the prices of higher quality debt securities and may decline significantly in periods of general economic difficulty. These risks may be increased with respect to investments in junk bonds.
Liquidity risk— Certain fund holdings may be or become difficult or impossible to sell, particularly during times of market turmoil. Illiquidity may result from the lack of an active market for a holding, legal or contractual restrictions on resale, or the reduced number and capacity of market participants to make a market in such holding. Market prices for less liquid or illiquid holdings may be volatile, and reduced liquidity may have an adverse impact on the market price of such holdings. Additionally, the sale of less liquid or illiquid holdings may involve substantial delays (including delays in settlement) and additional costs and the fund may be unable to sell such holdings when necessary to meet its liquidity needs or may be forced to sell at a loss.
Management— The investment adviser to the fund actively manages the fund’s investments. Consequently, the fund is subject to the risk that the methods and analyses, including models, tools and data, employed by the investment adviser in this process may be flawed or incorrect and may not produce the desired results. This could cause the fund to lose value or its investment results to lag relevant benchmarks or other funds with similar objectives.
5. Certain investment techniques
Index-linked bonds— The fund has invested in index-linked bonds, which are fixed-income securities whose principal value is periodically adjusted to a government price index. Over the life of an index-linked bond, interest is paid on the adjusted principal value. Increases or decreases in the principal value of index-linked bonds are recorded as interest income in the fund’s statement of operations.
Forward currency contracts— The fund has entered into forward currency contracts, which represent agreements to exchange currencies on specific future dates at predetermined rates. The fund’s investment adviser uses forward currency contracts to manage the fund’s exposure to changes in exchange rates. Upon entering into these contracts, risks may arise from the potential inability of counterparties to meet the terms of their contracts and from possible movements in exchange rates.
On a daily basis, the fund’s investment adviser values forward currency contracts and records unrealized appreciation or depreciation for open forward currency contracts in the fund’s statement of assets and liabilities. Realized gains or losses are recorded at the time the forward currency contract is closed or offset by another contract with the same broker for the same settlement date and currency.
Closed forward currency contracts that have not reached their settlement date are included in the respective receivables or payables for closed forward currency contracts in the fund’s statement of assets and liabilities. Net realized gains or losses from closed forward currency contracts and net unrealized appreciation or depreciation from open forward currency contracts are recorded in the fund’s statement of operations. The average month-end notional amount of open forward currency contracts while held was $8,213,000.
The following tables identify the location and fair value amounts on the fund’s statement of assets and liabilities and the effect on the fund’s statement of operations resulting from the fund’s use of forward currency contracts as of, or for the six months ended, April 30, 2019 (dollars in thousands):
| | | | | Assets | | | Liabilities | |
| Contracts | | Risk type | | Location on statement of
assets and liabilities | | Value | | | Location on statement of
assets and liabilities | | Value | |
| Forward currency | | Currency | | Unrealized appreciation on open forward currency contracts | | $ | 49 | | | Unrealized depreciation on open forward currency contracts | | $ | 164 | |
| Forward currency | | Currency | | Receivables for closed forward currency contracts | | | 9 | | | Payables for closed forward currency contracts | | | — | |
| | | | | | | $ | 58 | | | | | $ | 164 | |
| 20 | Capital Group Emerging Markets Total Opportunities Fund |
| | | | | Net realized loss | | | Net unrealized depreciation | |
| Contracts | | Risk type | | Location on statement of
operations | | Value | | | Location on statement of
operations | | Value | |
| Forward currency | | Currency | | Net realized loss on forward currency contracts | | $ | (152 | ) | | Net unrealized depreciation on forward currency contracts | | $ | (26 | ) |
Rights of offset— The fund has entered into enforceable master netting agreements with certain counterparties for forward currency contracts, where on any date amounts payable by each party to the other (in the same currency with respect to the same transaction) may be closed or offset by each party’s payment obligation. If an early termination date occurs under these agreements following an event of default or termination event, all obligations of each party to its counterparty are settled net through a single payment in a single currency (“close-out netting���). For financial reporting purposes, the fund does not offset financial assets and financial liabilities that are subject to these master netting arrangements in the statement of assets and liabilities.
The following table presents the fund’s forward currency contracts by counterparty that are subject to master netting agreements but that are not offset in the fund’s statement of assets and liabilities. The net amount column shows the impact of offsetting on the fund’s statement of assets and liabilities as of April 30, 2019, if close-out netting was exercised (dollars in thousands):
| | | Gross amounts recognized in the | | | Gross amounts not offset in the
statement of assets and liabilities and
subject to a master netting agreement | | | | |
| Counterparty | | statement of assets
and liabilities | | | Available
to offset | | | Non-cash
collateral* | | | Cash
collateral* | | | Net
amount | |
| Assets: | | | | | | | | | | | | | | | |
| Bank of America, N.A. | | $ | 2 | | | $ | (2 | ) | | $ | — | | | $ | — | | | $ | — | |
| Citibank | | | 8 | | | | (8 | ) | | | — | | | | — | | | | — | |
| Goldman Sachs | | | 20 | | | | (20 | ) | | | — | | | | — | | | | — | |
| HSBC Bank | | | 12 | | | | (12 | ) | | | — | | | | — | | | | — | |
| JPMorgan Chase | | | 14 | | | | (14 | ) | | | — | | | | — | | | | — | |
| Standard Chartered Bank | | | 2 | | | | — | | | | — | | | | — | | | | 2 | |
| Total | | $ | 58 | | | $ | (56 | ) | | $ | — | | | $ | — | | | $ | 2 | |
| Liabilities: | | | | | | | | | | | | | | | | | | | | |
| Bank of America, N.A. | | $ | 10 | | | $ | (2 | ) | | $ | — | | | $ | — | | | $ | 8 | |
| Citibank | | | 14 | | | | (8 | ) | | | — | | | | — | | | | 6 | |
| Goldman Sachs | | | 78 | | | | (20 | ) | | | — | | | | — | | | | 58 | |
| HSBC Bank | | | 17 | | | | (12 | ) | | | — | | | | — | | | | 5 | |
| JPMorgan Chase | | | 45 | | | | (14 | ) | | | — | | | | — | | | | 31 | |
| Total | | $ | 164 | | | $ | (56 | ) | | $ | — | | | $ | — | | | $ | 108 | |
| * | Collateral is shown on a settlement basis. |
6. Taxation and distributions
Federal income taxation— The fund complies with the requirements under Subchapter M of the Internal Revenue Code applicable to mutual funds and intends to distribute substantially all of its net taxable income and net capital gains each year. The fund is not subject to income taxes to the extent such distributions are made. Therefore, no federal income tax provision is required.
As of and during the period ended April 30, 2019, the fund did not have a liability for any unrecognized tax benefits. The fund recognizes interest and penalties, if any, related to unrecognized tax benefits as income tax expense in the statement of operations. During the period, the fund did not incur any significant interest or penalties.
The fund’s tax returns are not subject to examination by federal, state and, if applicable, non-U.S. tax authorities after the expiration of each jurisdiction’s statute of limitations, which is generally three years after the date of filing but can be extended in certain jurisdictions.
Non-U.S. taxation— Dividend and interest income are recorded net of non-U.S. taxes paid. The fund may file withholding tax reclaims in certain jurisdictions to recover a portion of amounts previously withheld. These reclaims are recorded when the amount is known and there are no significant uncertainties on collectability. Gains realized by the fund on the sale of securities in certain countries, if any, may be subject to non-U.S. taxes. If applicable, the fund records an estimated deferred tax liability based on unrealized gains to provide for potential non-U.S. taxes payable upon the sale of these securities.
| Capital Group Emerging Markets Total Opportunities Fund | 21 |
Distributions— Distributions paid to shareholders are based on net investment income and net realized gains determined on a tax basis, which may differ from net investment income and net realized gains for financial reporting purposes. These differences are due primarily to different treatment for items such as currency gains and losses; short-term capital gains and losses; capital losses related to sales of certain securities within 30 days of purchase; cost of investments sold; net capital losses; non-U.S. taxes on capital gains and income on certain investments. The fiscal year in which amounts are distributed may differ from the year in which the net investment income and net realized gains are recorded by the fund for financial reporting purposes.
The components of distributable earnings on a tax basis are reported as of the fund’s most recent year-end. As of October 31, 2018, the components of distributable earnings on a tax basis were as follows (dollars in thousands):
| Undistributed ordinary income | | $ | 1,503 | |
| Capital loss carryforward* | | | (22,250 | ) |
| * | The capital loss carryforward will be used to offset any capital gains realized by the fund in the current year or in subsequent years. The fund will not make distributions from capital gains while a capital loss carryforward remains. |
As of April 30, 2019, the tax basis unrealized appreciation (depreciation) and cost of investments were as follows (dollars in thousands):
| Gross unrealized appreciation on investments | | $ | 4,669 | |
| Gross unrealized depreciation on investments | | | (3,789 | ) |
| Net unrealized appreciation on investments | | | 880 | |
| Cost of investments | | | 48,361 | |
Tax-basis distributions paid to shareholders from ordinary income were as follows (dollars in thousands):
| | | Six months ended | | | Year ended | |
| Share class | | April 30, 2019 | | | October 31, 2018 | |
| Class F-2 | | $ | — | * | | $ | — | * |
| Class F-3 | | | 1,249 | | | | 3,717 | |
| Class R-6 | | | 259 | | | | 2,649 | |
| Total | | $ | 1,508 | | | $ | 6,366 | |
| * | Amount less than one thousand. |
7. Fees and transactions with related parties
CGTC is the fund’s investment adviser. American Funds Distributors,®Inc. (“AFD”), the fund’s principal underwriter, and American Funds Service Company® (“AFS”), the fund’s transfer agent are affiliated with CGTC. CGTC, AFD and AFS are considered related parties to the fund.
Investment advisory services— The fund has an investment advisory and service agreement with CGTC that provides for monthly fees accrued daily. For the six months ended April 30, 2019, the investment advisory services fee was $206,000, which was equivalent to an annualized rate of 0.850% of average daily net assets.
Miscellaneous fee reimbursement— CGTC has agreed to reimburse a portion of miscellaneous fees and expenses of the fund. This reimbursement will be in effect through at least January 1, 2020. At its discretion, the adviser may elect to extend, modify or terminate the reimbursement. Fees and expenses in the statement of operations are presented gross of the reimbursement from CGTC. The amount reimbursed by CGTC is reflected as a reimbursement of miscellaneous fees and expenses.
Class-specific fees and expenses— Expenses that are specific to individual share classes are accrued directly to the respective share class. The principal class-specific fees and expenses are further described below:
Distribution services— American Funds Distributors®, Inc. (“AFD”), an affiliate of CGTC, is the principal underwriter of the fund’s shares. AFD does not receive any compensation related to the sale of shares of the fund.
| 22 | Capital Group Emerging Markets Total Opportunities Fund |
Transfer agent services— The fund has a shareholder services agreement with AFS under which the fund compensates AFS for providing transfer agent services to each of the fund’s share classes. These services include recordkeeping, shareholder communications and transaction processing. In addition, the fund reimburses AFS for amounts paid to third parties for performing transfer agent services on behalf of fund shareholders.
Administrative services— The fund has an administrative services agreement with CGTC under which the fund compensates CGTC for providing administrative services to Class F-2, F-3 and R-6 shares. These services include, but are not limited to, coordinating, monitoring, assisting and overseeing third parties that provide services to fund shareholders. Under the agreement, Class F-2, F-3 and R-6 shares pay an annual fee of 0.05% of their respective daily net assets. The fund’s board of trustees authorized effective July 1, 2019, an administrative services fee at the annual rate of 0.03% of the daily net assets of the fund attributable to each share class of the fund Class F-2, F-3 and R-6 shares (which could increase as noted above) for its provision of administrative services.
For the six months ended April 30, 2019, class-specific expenses under the agreements were as follows (dollars in thousands):
| | | Transfer agent | | | Administrative | |
| Share class | | services | | | services | |
| Class F-2 | | $ | — | * | | $ | — | * |
| Class F-3 | | | 1 | | | | 10 | |
| Class R-6 | | | — | * | | | 2 | |
| Total class-specific expenses | | $ | 1 | | | $ | 12 | |
| * | Amount less than one thousand. |
Miscellaneous fee reimbursements— CGTC reimbursed a portion of the fund’s fees and expenses. For the six months ended April 30, 2019, the total fees reimbursed by CGTC were as follows (dollars in thousands):
| Share class | | | |
| Class F-2 | | $ | — | * |
| Class F-3 | | | 27 | |
| Class R-6 | | | 7 | |
| Total reimbursements | | $ | 34 | |
| * | Amount less than one thousand. |
Affiliated officers and trustees— Officers and certain trustees of the fund are or may be considered to be affiliated with CGTC, AFD, and AFS. No affiliated officers or trustees received any compensation directly from the fund.
Investment in CCF— The fund holds shares of CCF, an institutional prime money market fund managed by Capital Research and Management Company (“CRMC”). CCF invests in high-quality, short-term money market instruments. CCF is used as the primary investment vehicle for the fund’s short-term investments. CCF shares are only available for purchase by CRMC, its affiliates, and other funds managed by CRMC and are not available to the public. CRMC does not receive an investment advisory services fee from CCF.
Security transactions with related funds— The fund may purchase from, or sell securities to, other funds managed by CGTC (or funds managed by certain affiliates of CGTC) under procedures adopted by the fund’s board of trustees. The funds involved in such transactions are considered related by virtue of having a common investment adviser (or affiliated investment advisers), common Trustees and/or common officers. When such transactions occur, each transaction is executed at the current market price of the security and no brokerage commissions or fees are paid in accordance with Rule 17a-7 of the 1940 Act.
Interfund lending— Pursuant to an exemptive order issued by the SEC, the fund, along with other CGTC-managed funds (or funds managed by certain affiliates of CGTC), may participate in an interfund lending program. The program provides an alternate credit facility that permits the funds to lend or borrow cash for temporary purposes directly to or from one another, subject to the conditions of the exemptive order. The fund did not lend or borrow cash through the interfund lending program at any time during the six months ended April 30, 2019.
| Capital Group Emerging Markets Total Opportunities Fund | 23 |
8. Committed line of credit
The fund participates with other funds managed by CGTC (or funds managed by certain affiliates of CGTC) in a $1.5 billion credit facility (the “line of credit”) to be utilized for temporary purposes to support shareholder redemptions. The fund has agreed to pay commitment fees on its pro-rata portion of the line of credit, which are reflected in other expenses in the fund’s statement of operations. The fund did not borrow on this line of credit at any time during the six months ended April 30, 2019.
9. Capital share transactions
Capital share transactions in the fund were as follows (dollars and shares in thousands):
| | | Sales* | | | Reinvestments of
distributions | | | Repurchases* | | | Net (decrease)
increase | |
| Share class | | Amount | | | Shares | | | Amount | | | Shares | | | Amount | | | Shares | | | Amount | | | Shares | |
| | | | | | | | | | | | | | | | | | | | | | | | | |
| Six months ended April 30, 2019 | | | | | | | | | | | | | | | | | | | | | | | | |
| | | | | | | | | | | | | | | | | | | | | | | | | |
| Class F-2 | | $ | — | | | | — | | | $ | — | | | | — | | | $ | — | | | | — | | | $ | — | | | | — | |
| Class F-3 | | | 1,282 | | | | 119 | | | | 1,243 | | | | 123 | | | | (24,578 | ) | | | (2,348 | ) | | | (22,053 | ) | | | (2,106 | ) |
| Class R-6 | | | 15,250 | | | | 1,389 | | | | 259 | | | | 26 | | | | (84 | ) | | | (8 | ) | | | 15,425 | | | | 1,407 | |
| Total net increase (decrease) | | $ | 16,532 | | | | 1,508 | | | $ | 1,502 | | | | 149 | | | $ | (24,662 | ) | | | (2,356 | ) | | $ | (6,628 | ) | | | (699 | ) |
| | | | | | | | | | | | | | | | | | | | | | | | | | | | | | | | | |
| Year ended October 31, 2018 | | | | | | | | | | | | | | | | | | | | | | | | | | | | | | | | |
| | | | | | | | | | | | | | | | | | | | | | | | | | | | | | | | | |
| Class F-2 | | $ | — | | | | — | | | $ | — | | | | — | | | $ | — | | | | — | | | $ | — | | | | — | |
| Class F-3 | | | 2,153 | | | | 196 | | | | 3,608 | | | | 310 | | | | (26,752 | ) | | | (2,341 | ) | | | (20,991 | ) | | | (1,835 | ) |
| Class R-6 | | | 5,030 | | | | 429 | | | | 2,649 | | | | 227 | | | | (53,553 | ) | | | (4,771 | ) | | | (45,874 | ) | | | (4,115 | ) |
| Total net increase (decrease) | | $ | 7,183 | | | | 625 | | | $ | 6,257 | | | | 537 | | | $ | (80,305 | ) | | | (7,112 | ) | | $ | (66,865 | ) | | | (5,950 | ) |
| * | Includes exchanges between share classes of the fund. |
10. Investment transactions
The fund made purchases and sales of investment securities, excluding short-term securities and U.S. government obligations, if any, of $24,486,000 and $34,160,000, respectively, during the six months ended April 30, 2019.
| 24 | Capital Group Emerging Markets Total Opportunities Fund |
Financial highlights
| | | | | Income (loss) from
investment operations1 | | | | | | | | | | | | | | | | | | | | | | |
| Period ended | | Net asset
value,
beginning
of period | | | Net
investment
income | | | Net gains
(losses) on
securities
(both
realized and
unrealized) | | | Total from
investment
operations | | | Dividends
(from net
investment
income) | | | Net asset
value,
end
of period | | | Total
return2 | | | Net assets,
end of period
(in millions) | | | Ratio of
expenses
to average net
assets before
reimbursements | | | Ratio of
expenses
to average net
assets after
reimbursements2 | | | Ratio of
net income
to average
net assets2 | |
| Class F-2: | | | | | | | | | | | | | | | | | | | | | | | | | | | | | | | | | | | | | | | | | | | | |
| 4/30/20193,4 | | $ | 10.44 | | | $ | .23 | | | $ | .62 | | | $ | .85 | | | $ | (.32 | ) | | $ | 10.97 | | | | 8.41 | %5 | | $ | — | 6 | | | 1.53 | %7 | | | 1.22 | %7 | | | 4.40 | %7 |
| 10/31/2018 | | | 11.88 | | | | .41 | | | | (1.31 | ) | | | (.90 | ) | | | (.54 | ) | | | 10.44 | | | | (8.08 | )8 | | | — | 6 | | | 1.41 | 8 | | | 1.08 | 8 | | | 3.58 | 8 |
| 10/31/20173,9 | | | 11.80 | | | | .08 | | | | — | 10 | | | .08 | | | | — | | | | 11.88 | | | | .68 | 5,8 | | | — | 6 | | | .21 | 5,8 | | | .18 | 5,8 | | | .68 | 5,8 |
| Class F-3: | | | | | | | | | | | | | | | | | | | | | | | | | | | | | | | | | | | | | | | | | | | | |
| 4/30/20193,4 | | | 10.45 | | | | .24 | | | | .61 | | | | .85 | | | | (.33 | ) | | | 10.97 | | | | 8.40 | 5 | | | 35 | | | | 1.27 | 7 | | | 1.13 | 7 | | | 4.46 | 7 |
| 10/31/2018 | | | 11.88 | | | | .41 | | | | (1.30 | ) | �� | | (.89 | ) | | | (.54 | ) | | | 10.45 | | | | (7.98 | ) | | | 56 | | | | 1.15 | | | | .98 | | | | 3.61 | |
| 10/31/20173,9 | | | 11.80 | | | | .08 | | | | — | 10 | | | .08 | | | | — | | | | 11.88 | | | | .68 | 5 | | | 85 | | | | .19 | 5 | | | .16 | 5 | | | .70 | 5 |
| Class R-6: | | | | | | | | | | | | | | | | | | | | | | | | | | | | | | | | | | | | | | | | | | | | |
| 4/30/20193,4 | | | 10.45 | | | | .24 | | | | .61 | | | | .85 | | | | (.32 | ) | | | 10.98 | | | | 8.35 | 5 | | | 25 | | | | 1.26 | 7 | | | 1.10 | 7 | | | 4.48 | 7 |
| 10/31/2018 | | | 11.88 | | | | .39 | | | | (1.28 | ) | | | (.89 | ) | | | (.54 | ) | | | 10.45 | | | | (7.97 | ) | | | 8 | | | | 1.10 | | | | 1.05 | | | | 3.32 | |
| 10/31/20173,9 | | | 11.80 | | | | .08 | | | | — | 10 | | | .08 | | | | — | | | | 11.88 | | | | .68 | 5 | | | 59 | | | | .20 | 5 | | | .16 | 5 | | | .70 | 5 |
| | | Six months ended
April 30, | | Year ended October 31 |
| | | 20193,4,5 | | 2018 | | 2017 |
| Portfolio turnover rate for all share classes | | | 53% | | | | 56 | % | | | 61 | % |
| 1 | Based on average shares outstanding. |
| 2 | This column reflects the impact, if any, of certain reimbursements from CGTC. During the periods shown, CGTC reimbursed a portion of miscellaneous fees and expenses. In addition, during one of the years shown, CGTC paid a portion of the fund’s transfer agent fees. |
| 3 | Based on operations for a period that is less than a full year. |
| 4 | Unaudited. |
| 5 | Not annualized. |
| 6 | Amount less than $1 million. |
| 7 | Annualized. |
| 8 | All or a significant portion of assets in this class consisted of seed capital invested by CGTC and/or its affiliates. Certain fees are not charged or accrued on these seed capital assets. If such fees were paid by the fund on seed capital assets, fund expenses would have been higher and net income and total return would have been lower. |
| 9 | Class F-2, F-3 and R-6 shares began investment operations on September 1, 2017. |
| 10 | Amount less than $.01. |
See notes to financial statements
| Capital Group Emerging Markets Total Opportunities Fund | 25 |
As a fund shareholder, you incur ongoing costs, including investment advisory services fees and other expenses. This example is intended to help you understand your ongoing costs (in dollars) of investing in the fund so you can compare these costs with the ongoing costs of investing in other mutual funds. The example is based on an investment of $1,000 invested at the beginning of the period and held for the entire six-month period (November 1, 2018, through April 30, 2019).
Actual expenses:
The first line of each share class in the table on the following page provides information about actual account values and actual expenses. You may use the information in this line, together with the amount you invested, to estimate the expenses that you paid over the period. Simply divide your account value by $1,000 (for example, an $8,600 account value divided by $1,000 = 8.6), then multiply the result by the number in the first line under the heading titled “Expenses paid during period” to estimate the expenses you paid on your account during this period.
Hypothetical example for comparison purposes:
The second line of each share class in the table on the following page provides information about hypothetical account values and hypothetical expenses based on the actual expense ratio for the share class and an assumed rate of return of 5.00% per year before expenses, which is not the actual return of the share class. The hypothetical account values and expenses may not be used to estimate the actual ending account balance or expenses you paid for the period. You may use this information to compare the ongoing costs of investing in the fund and other funds. To do so, compare this 5.00% hypothetical example with the 5.00% hypothetical examples that appear in the shareholder reports of the other funds.
Notes:
Retirement plan participants may be subject to certain fees charged by the plan sponsor, and Class F-2 and F-3 shareholders may be subject to fees charged by financial intermediaries, typically ranging from 0.75% to 1.50% of assets annually depending on services offered. You can estimate the impact of these fees by adding the amount of the fees to the total estimated expenses you paid on your account during the period as calculated above. In addition, your ending account value would be lower by the amount of these fees.
Note that the expenses shown in the table on the following page are meant to highlight your ongoing costs only and do not reflect any transactional costs, such as sales charges (loads). Therefore, the second line of each share class in the table is useful in comparing ongoing costs only and will not help you determine the relative total costs of owning different funds. In addition, if these transactional costs were included, your costs would have been higher.
| 26 | Capital Group Emerging Markets Total Opportunities Fund |
| | | Beginning
account value
11/1/2018 | | | Ending
account value
4/30/2019 | | | Expenses paid
during period* | | | Annualized
expense ratio | |
| Class F-2 – actual return | | $ | 1,000.00 | | | $ | 1,084.11 | | | $ | 6.30 | | | | 1.22 | % |
| Class F-2 – assumed 5% return | | | 1,000.00 | | | | 1,018.74 | | | | 6.11 | | | | 1.22 | |
| Class F-3 – actual return | | | 1,000.00 | | | | 1,084.02 | | | | 5.84 | | | | 1.13 | |
| Class F-3 – assumed 5% return | | | 1,000.00 | | | | 1,019.19 | | | | 5.66 | | | | 1.13 | |
| Class R-6 – actual return | | | 1,000.00 | | | | 1,083.47 | | | | 5.68 | | | | 1.10 | |
| Class R-6 – assumed 5% return | | | 1,000.00 | | | | 1,019.34 | | | | 5.51 | | | | 1.10 | |
| * | The “expenses paid during period” are equal to the “annualized expense ratio,” multiplied by the average account value over the period, multiplied by the number of days in the period, and divided by 365 (to reflect the one-half year period). |
| Capital Group Emerging Markets Total Opportunities Fund | 27 |
Approval of Investment Advisory and Service Agreement
Capital Group Emerging Markets Total Opportunities Fund’s board has approved renewal of the fund’s Investment Advisory and Service Agreement (the “agreement”) with Capital Guardian Trust Company (“CGTC”) for an additional one-year term through July 31, 2020. The board took this action recognizing that the board had previously approved transferring investment advisory responsibilities from CGTC to Capital Research and Management Company (“CRMC”). The board approved the agreement following the recommendation of the fund’s Contracts Committee (the “committee”), which is composed of all of the fund’s independent board members. The board and the committee determined in the exercise of their business judgment that the fund’s advisory fee structure was fair and reasonable in relation to the services provided, and that approving the agreement was in the best interests of the fund and its shareholders.
In reaching this decision, the board and the committee took into account information furnished to them throughout the year and otherwise provided to them, as well as information prepared specifically in connection with their review of the agreement, and were advised by their independent counsel with respect to the matters considered. They considered the following factors, among others, but did not identify any single issue or particular piece of information that, in isolation, was the controlling factor, and each board and committee member did not necessarily attribute the same weight to each factor.
1. Nature, extent and quality of services
The board and the committee considered the depth and quality of CGTC’s/CRMC’s investment management process, including its global research capabilities; the experience, capability and integrity of its senior management and other personnel; the low turnover rates of its key personnel; the overall financial strength and stability of CGTC/CRMC and the Capital Group organization; the resources and systems CGTC/CRMC devotes to investment management, compliance, trading, portfolio accounting and other services; and the ongoing evolution of CGTC’s/CRMC’s organizational structure designed to maintain and strengthen these qualities. The board and the committee also considered the nature, extent and quality of administrative, compliance and shareholder services provided by CGTC/CRMC to the fund under the agreement and other agreements. The board and the committee concluded that the nature, extent and quality of the services provided by CGTC/CRMC have benefited and should continue to benefit the fund and its shareholders.
2. Investment results
The board and the committee considered the investment results of the fund in light of its objective of providing long-term growth and preservation of capital with lower volatility of returns than emerging markets equities. They compared the fund’s investment results with those of other funds (including the funds that currently form the basis of the Lipper index for the category in which the fund is included), and data such as relevant market and fund indexes, over various periods through December 31, 2018. This report, including the letter to shareholders and other related disclosures, contains certain information about the fund’s investment results. The board and the committee reviewed the fund’s investment results measured against various indexes, including the MSCI Emerging Markets IMI Index and the Lipper Emerging Markets Funds Average, as well as the J.P. Morgan GBI-EM Global Diversified and J.P. Morgan EMBI Global indexes. They reviewed the results for the one-year, three-year, five-year and lifetime periods, and placed greater emphasis on longer term periods. They noted that the investment results of the fund were mixed compared to the results of these indexes. The board and the committee concluded that the fund’s investment results have been sufficient for renewal of the agreement and that CGTC’s record in managing the fund indicated that its and CRMC’s continued management should benefit the fund and its shareholders.
3. Advisory fees and total expenses
The board and the committee compared the advisory fees and total expense levels of the fund to those of other relevant funds. They observed that the fund’s advisory fees and expenses generally compared favorably to those of other similar funds included in the Lipper Emerging Markets Funds category. It was also noted that administrative services fees for Class F-2 shares, Class F-3 shares and Class R-6 shares were reduced from 0.05% to 0.03%. The board and the committee noted that the fees paid to CGTC/ CRMC by clients with separately managed accounts are in many cases lower than those paid by the fund and concluded that the differences appropriately reflected the significant investment, operational, regulatory and market differences between advising the fund and the other clients. The board and the committee concluded that the fund’s cost structure was fair and reasonable in relation to the services provided, and that the fund’s shareholders receive reasonable value in return for the advisory fees paid to CGTC/CRMC by the fund.
| 28 | Capital Group Emerging Markets Total Opportunities Fund |
4. Ancillary benefits
The board and the committee considered a variety of other benefits that CGTC/CRMC and its affiliates receive as a result of CGTC’s/CRMC’s relationship with the fund, including fees for administrative services paid to CGTC/CRMC, and possible ancillary benefits to CGTC/CRMC and its affiliates in managing other investment vehicles and accounts. The board and the committee reviewed CGTC’s/CRMC’s portfolio trading practices, noting that through December 31, 2018, CGTC benefited from research obtained with commissions from portfolio transactions made on behalf of the fund and since that time has borne the cost of obtaining such research. The board and the committee took these ancillary benefits into account in evaluating the reasonableness of the advisory fees paid to CGTC/CRMC by the fund.
5. Adviser financial information
The board and the committee reviewed information regarding CGTC’s/CRMC’s costs of providing services to the fund, including personnel, systems and resources of investment, compliance, trading, accounting and other administrative operations. They considered CGTC’s/CRMC’s costs and related cost allocation methodology as well as its track record of investing in technology, infrastructure and staff to maintain and expand services and capabilities, respond to industry and regulatory developments, and attract and retain qualified personnel. They noted information regarding the compensation structure for CGTC’s/CRMC’s investment professionals. They reviewed information on the profitability of the investment adviser and its affiliates. The board and the committee also compared Capital Group’s profitability and compensation data to the reported results and data of several large, publicly held investment management companies. The board and the committee noted the competitiveness and cyclicality of both the mutual fund industry and the capital markets, and the importance in that environment of the Capital Group organization’s long-term profitability for maintaining CGTC’s/CRMC’s independence, company culture and management continuity. They further considered CGTC’s/CRMC’s reimbursement of fund expenses through voluntary fee caps and other fee reductions and costs voluntarily absorbed. The board and the committee concluded that the fund’s advisory fee structure reflected a reasonable sharing of benefits between CGTC/CRMC and the fund’s shareholders.
| Capital Group Emerging Markets Total Opportunities Fund | 29 |
This page was intentionally left blank.
| 30 | Capital Group Emerging Markets Total Opportunities Fund |
This page was intentionally left blank.
| Capital Group Emerging Markets Total Opportunities Fund | 31 |
This page was intentionally left blank.
| 32 | Capital Group Emerging Markets Total Opportunities Fund |
Office of the fund and of the investment adviser
Capital Guardian Trust Company
6455 Irvine Center Drive
Irvine, CA 92618-4518
Transfer agent for shareholder accounts
American Funds Service Company
(Write to the address near you.)
P.O. Box 6007
Indianapolis, IN 46206-6007
P.O. Box 2280
Norfolk, VA 23501-2280
Custodian of assets
JPMorgan Chase Bank
270 Park Avenue
New York, NY 10017-2070
Counsel
Morgan, Lewis & Bockius LLP
One Federal Street
Boston, MA 02110-1726
Independent registered public accounting firm
PricewaterhouseCoopers LLP
601 South Figueroa Street
Los Angeles, CA 90017-3874
Principal underwriter
American Funds Distributors, Inc.
333 South Hope Street
Los Angeles, CA 90071-1406
Investors should carefully consider investment objectives, risks, charges and expenses. This and other important information is contained in the fund prospectus, which can be obtained from Capital Guardian Trust Company by calling (800) 266-9532 and should be read carefully before investing. Fund shares offered through American Funds Distributors, Inc.
Capital Group Emerging Markets Total Opportunities Fund files a complete list of its portfolio holdings with the U.S. Securities and Exchange Commission (SEC) for the first and third quarters of each fiscal year on Form N-PORT-EX. This filing is available free of charge on the SEC website (www.sec.gov). Additionally, the list of portfolio holdings is available by calling your relationship manager at (800) 266-9532.
The proxy voting procedures and policies of Capital Group Emerging Markets Total Opportunities Fund — which describe how we vote proxies relating to portfolio securities — are available upon request by calling your relationship manager at (800) 266-9532. The fund files its proxy voting record with the SEC for the 12 months ended June 30 by August 31. The report also is available on the SEC website or by calling your relationship manager.
All Capital Group trademarks mentioned are owned by The Capital Group Companies, Inc., an affiliated company or fund. All other company and product names mentioned are the property of their respective companies.

ITEM 2 – Code of Ethics
Not applicable for filing of semi-annual reports to shareholders.
ITEM 3 – Audit Committee Financial Expert
Not applicable for filing of semi-annual reports to shareholders.
ITEM 4 – Principal Accountant Fees and Services
Not applicable for filing of semi-annual reports to shareholders.
ITEM 5 – Audit Committee of Listed Registrants
Not applicable to this Registrant, insofar as the Registrant is not a listed issuer as defined in Rule 10A-3 under the Securities Exchange Act of 1934.
ITEM 6 – Schedule of Investments
Not applicable, insofar as the schedule is included as part of the report to shareholders filed under Item 1 of this Form.
ITEM 7 – Disclosure of Proxy Voting Policies and Procedures for Closed-End Management Investment
Companies
Not applicable to this Registrant, insofar as the Registrant is not a closed-end management investment company.
ITEM 8 – Portfolio Managers of Closed-End Management Investment Companies
Not applicable to this Registrant, insofar as the Registrant is not a closed-end management investment company.
ITEM 9 – Purchases of Equity Securities by Closed-End Management Investment Company and Affiliated Purchasers
Not applicable to this Registrant, insofar as the Registrant is not a closed-end management investment company.
ITEM 10 – Submission of Matters to a Vote of Security Holders
There have been no material changes to the procedures by which shareholders may recommend nominees to the Registrant’s board of trustees since the Registrant last submitted a proxy statement to its shareholders. The procedures are as follows. The Registrant has a nominating committee comprised solely of persons who are not considered ‘‘interested persons’’ of the Registrant within the meaning of the Investment Company Act of 1940, as amended. The committee periodically reviews such issues as the board’s composition, responsibilities, committees, compensation and other relevant issues, and recommends any appropriate changes to the full board of trustees. While the committee normally is able to identify from its own resources an ample number of qualified candidates, it will consider shareholder suggestions of persons to be considered as nominees to fill future vacancies on the board. Such suggestions must be sent in writing to the nominating committee of the Registrant, c/o the Registrant’s Secretary, and must be accompanied by complete biographical and occupational data on the prospective nominee, along with a written consent of the prospective nominee for consideration of his or her name by the nominating committee.
ITEM 11 – Controls and Procedures
| (a) | The Registrant’s Principal Executive Officer and Principal Financial Officer have concluded, based on their evaluation of the Registrant’s disclosure controls and procedures (as such term is defined in Rule 30a-3 under the Investment Company Act of 1940), that such controls and procedures are adequate and reasonably designed to achieve the purposes described in paragraph (c) of such rule. |
| | |
| (b) | There were no changes in the Registrant’s internal controls over financial reporting (as defined in Rule 30a-3(d) under the Investment Company Act of 1940) that occurred during the Registrant’s semi-annual period covered by this report that has materially affected, or is reasonably likely to materially affect, the Registrant’s internal control over financial reporting. |
ITEM 12 – Exhibits
| (a)(1) | Not applicable for filing of semi-annual reports to shareholders. |
| | |
| (a)(2) | The certifications required by Rule 30a-2 of the Investment Company Act of 1940 and Sections 302 and 906 of the Sarbanes-Oxley Act of 2002 are attached as exhibits hereto. |
SIGNATURES
Pursuant to the requirements of the Securities Exchange Act of 1934 and the Investment Company Act of 1940, the Registrant has duly caused this report to be signed on its behalf by the undersigned, thereunto duly authorized.
| | CAPITAL GROUP EMERGING MARKETS TOTAL OPPORTUNITIES FUND |
| | |
| | By__/s/ John S. Armour____________________ |
| | John S. Armour, President and Principal Executive Officer |
| | |
| | Date: June 28, 2019 |
Pursuant to the requirements of the Securities Exchange Act of 1934 and the Investment Company Act of 1940, this report has been signed below by the following persons on behalf of the Registrant and in the capacities and on the dates indicated.
| By__/s/ John S. Armour_________________ |
John S. Armour, President and Principal Executive Officer |
| |
| Date: June 28, 2019 |
| By ___/s/ Gregory F. Niland __________ |
Gregory F. Niland, Treasurer and Principal Financial Officer |
| |
| Date: June 28, 2019 |