UNITED STATES
SECURITIES AND EXCHANGE COMMISSION
Washington, D.C. 20549
FORM N-CSR
Certified Shareholder Report of
Registered Management Investment Companies
Investment Company Act File Number: 811-22605
Capital Group Emerging Markets Total Opportunities Fund
(Exact Name of Registrant as Specified in Charter)
6455 Irvine Center Drive
Irvine, California 92618
(Address of Principal Executive Offices)
Registrant's telephone number, including area code: (213) 486-9200
Date of fiscal year end: October 31
Date of reporting period: April 30, 2016
Courtney R. Taylor
Capital Group Emerging Markets Total Opportunities Fund
333 South Hope Street
Los Angeles, California 90071
(Name and Address of Agent for Service)
ITEM 1 – Reports to Stockholders
 | Capital Group Emerging Markets
Total Opportunities FundSM Semi-annual report
for the six months ended
April 30, 2016 |
| | |
 |
Capital Group Emerging Markets Total Opportunities Fund seeks long-term growth and preservation of capital with lower volatility of returns than emerging markets equities.
Fund results shown in this report are for past periods and are not predictive of results for future periods. The results shown are before taxes on fund distributions and sale of fund shares. Current and future results may be lower or higher than those shown. Share prices and returns will vary, so investors may lose money. Investing for short periods makes losses more likely. Investments are not FDIC-insured, nor are they deposits of or guaranteed by a bank or any other entity, so they may lose value. For current information and month-end results, please call (800) 266-9532.
Here are the average annual total returns on a $1,000 investment with all distributions reinvested for the period ended March 31, 2016 (the most recent calendar quarter-end):
| | | 1 year | | Lifetime
(since 1/27/12) |
| | | | | |
| Average annual total returns | | | –7.83 | % | | | –1.23 | % |
The total annual fund net operating expense ratio is 1.10% as of the most recent fiscal year-end, and as reflected in the prospectus dated January 1, 2016.
Investment results assume all distributions are reinvested and reflect applicable fees and expenses.
This report is for the information of shareholders of Capital Group Emerging Markets Total Opportunities Fund, but it also may be used as sales literature when preceded or accompanied by the current prospectus, which gives details about charges, expenses, investment objectives and operating policies of the fund. If used as sales material after June 30, 2016, this report must be accompanied by a statistical update for the most recently completed calendar quarter.
Investors should carefully read and consider the investment objectives, guidelines, risks, fees and expenses associated with Capital Group Emerging Markets Total Opportunities Fund (CGETOP) prior to investing. This and other important information is contained in CGETOP’s prospectus, which can be obtained from your relationship manager.
Investing in emerging markets involves risks, such as significant currency and price fluctuations, political instability, differing securities regulations and periods of illiquidity, which are detailed in the fund prospectus. Investments in emerging markets have been more volatile than investments in developed markets, reflecting the greater uncertainties of investing in less established economies. Individuals investing in emerging markets should have a long-term perspective and be able to tolerate potentially sharp declines in the value of their investments.
Fellow investors:
This is the semi-annual report for Capital Group Emerging Markets Total Opportunities Fund (CGETOP) for the six-month period ended April 30, 2016. The fund invests in the full spectrum of emerging markets debt and equity securities while seeking to limit the volatility typically associated with investments in the developing world.
For the six-month period, the fund delivered higher returns and lower volatility than emerging markets equities.
For the period, the fund advanced 2.01%, while the MSCI Emerging Markets Investable Market Index (MSCI EM IMI) edged down 0.13%. The fund’s realized volatility was 10.39% compared to 18.95% realized volatility for the MSCI
EM IMI.
While emerging markets equities ended the reporting period with essentially flat results, the six months were marked by sharp volatility and huge swings in investor sentiment. In the fourth quarter of 2015, emerging markets equities posted a slight gain, steadying as China rolled out more stimulus measures to help offset its decelerating economy and the U.S. Federal Reserve provided clarity on U.S. monetary policy. Early in 2016, fears of a global slowdown led to a sharp downturn in equities. Late in the first quarter of 2016, emerging markets gained traction, benefiting from a rebound in currencies as well as rising energy and commodity prices. In addition, comments related to international economies by U.S. Federal Reserve Board Chair Janet Yellen appeared to lift markets.
In fixed-income markets, emerging markets bonds were supported by the deferral of U.S. interest rate increases as well as the search for yield in a low-interest-rate environment. Local currency sovereign bonds were up soundly, with the J.P. Morgan Government Bond
Results at a glance
For periods ended April 30, 2016, with distributions reinvested
| | | Cumulative | | Average annual |
| | | total returns | | total returns |
| | | 6 months | | 1 year | | Lifetime1 |
| | | | | | | |
| Capital Group Emerging Markets Total Opportunities Fund | | | 2.01 | % | | | –9.96 | % | | | –0.65 | % |
| MSCI Emerging Markets IMI2 | | | –0.13 | | | | –17.56 | | | | –1.52 | |
| J.P. Morgan GBI-EM Global Diversified2 | | | 8.93 | | | | –1.98 | | | | –2.31 | |
| J.P. Morgan EMBI Global2 | | | 5.56 | | | | 4.30 | | | | 5.37 | |
| Emerging markets blended market universe3 | | | 3.63 | | | | –8.44 | | | | 0.10 | |
Realized daily volatility
Annualized standard deviation of daily returns, for periods ended April 30, 20164
| | | 6 months | | 1 year | | Lifetime1 |
| | | | | | | |
| Capital Group Emerging Markets Total Opportunities Fund | | | 10.39 | % | | | 10.78 | % | | | 8.45 | % |
| MSCI Emerging Markets IMI2 | | | 18.95 | | | | 18.19 | | | | 13.98 | |
| 1 | Since 1/27/12. |
| 2 | The market indexes are unmanaged and, therefore, have no expenses. Investors cannot invest directly in an index. |
| 3 | Emerging markets blended market universe combines the MSCI EM IMI, JPM EMBI Global, and JPM GBI-EM Global Diversified indexes by weighting their cumulative total returns at 50%, 25%, and 25%, respectively. This assumes the blend is rebalanced monthly. |
| 4 | Realized daily volatility is calculated using annualized standard deviation based on a 252-day factor, and is a measure of how returns over time have varied from the mean. A lower number signifies lower volatility. |
Unless otherwise indicated, equity returns are based on MSCI indexes and measured in U.S. dollars with net dividends reinvested.
| Capital Group Emerging Markets Total Opportunities Fund | 1 |
20 largest holdings
| | | Percent of |
| | | net assets as |
| | | of 4/30/16 |
| India government bonds | | | 4.9 | % |
| Argentina government bonds | | | 4.0 | |
| Mexican government bonds | | | 3.9 | |
| Brazilian inflation-linked bonds | | | 2.4 | |
| Turkey government bonds | | | 2.4 | |
| Petroleos Mexicanos | | | 2.3 | |
| Mexican inflation-linked bonds | | | 2.2 | |
| Taiwan Semiconductor Manufacturing | | | 2.2 | |
| Colombian government bonds | | | 2.0 | |
| América Móvil | | | 2.0 | |
| Minth Group | | | 1.7 | |
| United States Treasury Note | | | 1.6 | |
| Indonesia government bonds | | | 1.5 | |
| Bharti Airtel | | | 1.5 | |
| Hungarian government bonds | | | 1.5 | |
| CEMEX | | | 1.3 | |
| YPF | | | 1.3 | |
| Wynn Macau | | | 1.2 | |
| Brazilian government bonds | | | 1.1 | |
| Unilever | | | 1.0 | |
| | | | 42.0 | % |
Index-Emerging Markets (GBI-EM) Global Diversified advancing 8.93%, as most currencies strengthened against the U.S. dollar. Emerging markets U.S. dollar–denominated debt also posted solid results, as the J.P. Morgan Emerging Markets Bond Index (EMBI) Global increased 5.56%.
Market review
Despite a fourth-quarter rally triggered by government measures to spark consumption, Chinese stocks declined during the reporting period as concerns persisted about the health of China’s economy and the efficacy of its monetary policy. The MSCI China IMI lost 9.03%, but managed to claw back from much steeper losses early in the first quarter of 2016. Government leaders took selective actions to curb capital flight and made further moves to help sustain economic growth, including cutting interest rates, lowering taxes on home and car purchases and reducing the amount of cash banks must hold as reserves. But questions remained whether these measures would be sufficient to stem the deceleration in gross domestic product growth.
Indian equities fell 4.54% amid concern about the strength of corporate profits and rising doubts about Prime Minister Narendra Modi’s ability to pass key economic legislation. An increase in nonperforming loans also weighed on financial institutions.
Brazilian stocks were a bright spot, rallying on fresh hopes that the country had reached a tipping point. The MSCI Brazil IMI soared 29.71% on a recovery in commodity prices and speculation about political change. As President Dilma Rousseff faced impeachment, investors hoped the stage was set for much-needed reforms in a country long mired in recession and a corruption scandal. The Brazilian real rose solidly against the U.S. dollar.
Mexican stocks were flat, as the MSCI Mexico IMI edged up 0.36%. Mexico’s central bank raised its benchmark interest rate by 50 basis points in mid-February to help stabilize the peso, which touched a record low against the dollar earlier in 2016.
Turkish equities posted strong gains despite geopolitical turmoil. The MSCI Turkey IMI increased 13.56%, driven by further monetary easing in Europe and broad market appetite for riskier assets in the emerging markets. Neither Mexico nor Turkey participated in the currency rally.
Portfolio review
In a volatile environment, fixed-income holdings overall were helpful to the fund. Top contributors included Brazilian local currency sovereign bonds and government inflation-linked bonds (BRL) — the fund’s fourth largest holding. Local currency sovereign bonds issued by Indonesia were additive, as Indonesia’s central bank cut interest rates. Also beneficial were local currency sovereign bonds issued by Turkey and Colombia.
Several Brazilian stocks helped lift the fund as it appeared the country may be turning a corner. Hypermarcas, a Brazilian consumer products manufacturer, rose on the sale of a non-core business. Vale, which produces and sells iron ore, pellets and manganese, was aided by strengthening commodities prices, demand from China and hope for improvement in Brazil’s political situation.
The fund was lifted by its holdings in Mexico — its single largest country position. Shares of CEMEX helped results, as the Mexican cement maker
| 2 | Capital Group Emerging Markets Total Opportunities Fund |
| Asset mix (percent of net assets) | as of April 30, 2016 |
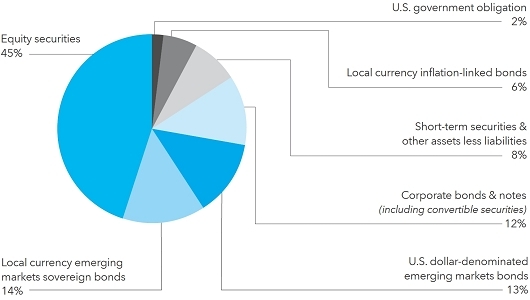
| Top 5 equity sectors | | percent of
net assets |
| Consumer discretionary | | | 7.3 | % |
| Information technology | | | 6.7 | |
| Industrials | | | 6.0 | |
| Consumer staples | | | 5.1 | |
| Financials | | | 4.8 | |
15 largest country positions
| | | Percent of net assets |
| | | as of 4/30/16 |
| | | | | | | |
| | | Equity | | Bonds, notes & | | |
| | | securities | | other debt instruments | | Total |
| Mexico | | | 2.8 | % | | | 10.5 | % | | | 13.3 | % |
| China (including Hong Kong) | | | 10.6 | | | | .3 | | | | 10.9 | |
| India | | | 5.9 | | | | 4.9 | | | | 10.8 | |
| Brazil | | | .9 | | | | 5.0 | | | | 5.9 | |
| Argentina | | | .5 | | | | 5.3 | | | | 5.8 | |
| United States of America* | | | 2.0 | | | | 3.1 | | | | 5.1 | |
| Taiwan | | | 4.5 | | | | — | | | | 4.5 | |
| Turkey | | | .5 | | | | 3.2 | | | | 3.7 | |
| Colombia | | | — | | | | 2.6 | | | | 2.6 | |
| United Kingdom* | | | 2.1 | | | | .1 | | | | 2.2 | |
| South Africa | | | 1.0 | | | | 1.0 | | | | 2.0 | |
| South Korea | | | 1.6 | | | | .1 | | | | 1.7 | |
| Indonesia | | | .1 | | | | 1.6 | | | | 1.7 | |
| United Arab Emirates | | | 1.4 | | | | .2 | | | | 1.6 | |
| Chile | | | .9 | | | | .7 | | | | 1.6 | |
| | | | 34.8 | % | | | 38.6 | % | | | 73.4 | % |
* Includes investments in companies listed in developed markets that have significant operations in emerging markets.
| Capital Group Emerging Markets Total Opportunities Fund | 3 |
posted its first annual profit since 2009 on stronger U.S. sales and made headway on cost-cutting efforts. Hard currency corporate bonds issued by Petroleos Mexicanos, Mexico’s state-owned oil company, were boosted by a comeback in oil prices.
The materials sector was the top-contributing equity sector overall for the fund, as Lonmin, a producer of platinum-group metals, contributed positively to results. Shares of gold miner Newcrest Mining were up solidly, benefiting from a persistently weak Australian dollar and a sharp increase in gold prices.
On a regional basis, Chinese equity holdings were the fund’s top detractor. However, shares of Minth Group, an auto parts manufacturer, posted solid results. Among industry sectors, industrials and energy were the top detractors. Among individual holdings, Chinese seller of electrical distribution equipment Boer Power Holdings was harmed by allegations of inflated profit numbers. Shares of waste-to-energy treatment firm China Everbright International declined. Both stock and bond holdings in U.S.-based oil producer Cobalt International Energy hurt results.
Outlook
Emerging markets continue to be sensitive to the pace of global growth, commodity prices, the U.S. dollar and U.S. interest rates. Yet they are becoming a much less homogenous grouping. Wide variations in countries’ economic circumstances, sensitivity to commodities, progress on reform and political change will result in varying returns across markets.
The portfolio takes a highly selective approach while embracing the entire emerging markets universe. The fund is invested in more than 40 countries, with the largest positions in Mexico, China and India. We have high conviction in Mexico, with its reform-oriented government, proximity to the U.S., weak currency, low inflation and solid growth. China is experiencing a structural slowdown as it continues a multidecade transition from an investment- and export-led economy to one led by consumption and services. The phasing out of excess capacity and reducing leverage is part of the challenge. However, China has many pockets of strength that provide opportunities against a backdrop that remains positive for the longer term. Brazil presents a challenge and an opportunity. It remains in recession, though the prospect of change in its political leadership may raise the likelihood of an economic turnaround.
Valuations of many emerging markets assets are attractive, particularly versus developed-market counterparts. Equities, as well as local currency debt, are coming off extended periods of weak returns. As emerging markets currencies appreciate following their recent weakness, other emerging markets assets should be poised to benefit.
Portfolio assets are almost equally split between equities and fixed income. Within fixed income, sovereign hard currency bonds and sovereign local currency bonds are the top sectors. Within equities, managers emphasize the consumer discretionary, information technology and industrials sectors. A portion of the portfolio is maintained in cash to mitigate volatility and to provide liquidity.
We remain committed to the thesis that the emerging markets universe offers a wide range of compelling long-term investment opportunities. We look forward to reporting to you again in six months.
Sincerely,

John S. Armour
President
June 17, 2016
| 4 | Capital Group Emerging Markets Total Opportunities Fund |
| Investment portfolio April 30, 2016 | unaudited |
Sector diversification
| | | Equity securities | | Bonds, notes &
other debt instruments | | Percent of net assets |
| Government | | | — | % | | | 34.9 | % | | | 34.9 | % |
| Consumer discretionary | | | 7.3 | | | | 1.3 | | | | 8.6 | |
| Energy | | | 2.6 | | | | 5.8 | | | | 8.4 | |
| Information technology | | | 6.7 | | | | .3 | | | | 7.0 | |
| Industrials | | | 6.0 | | | | .8 | | | | 6.8 | |
| Financials | | | 4.8 | | | | 1.0 | | | | 5.8 | |
| Telecommunication services | | | 2.8 | | | | 2.4 | | | | 5.2 | |
| Consumer staples | | | 5.1 | | | | .1 | | | | 5.2 | |
| Materials | | | 4.5 | | | | .4 | | | | 4.9 | |
| Health care | | | 3.3 | | | | — | | | | 3.3 | |
| Utilities | | | 1.6 | | | | .4 | | | | 2.0 | |
| | | | 44.7 | % | | | 47.4 | % | | | 92.1 | |
| | | | | | | | | | | | | |
| Short-term securities | | | | | | | | | | | 6.8 | |
| Other assets less liabilities | | | | | | | | | | | 1.1 | |
| Net assets | | | | | | | | | | | 100.0 | % |
| Bonds & notes 46.7% | | Principal amount
(000) | | | Value
(000) | |
| Latin America 25.9% | | | | | | |
| Argentina 5.3% | | | | | | |
| Arcos Dorados Holdings Inc. 10.25% 2016 | | BRL | 1,280 | | | $ | 359 | |
| Argentina (Republic of): | | | | | | | | |
| Series 07X, 7.00% 2017 | | $ | 636 | | | | 648 | |
| 8.75% 2017 | | | 105 | | | | 110 | |
| 6.875% 20211 | | | 2,200 | | | | 2,273 | |
| 8.75% 20242 | | | 855 | | | | 934 | |
| 7.50% 20261 | | | 1,600 | | | | 1,628 | |
| 8.28% 2033 | | | 1,030 | | | | 1,085 | |
| 0.00% 20353 | | | 4,580 | | | | 490 | |
| 7.625% 20461 | | | 550 | | | | 542 | |
| City of Buenos Aires Argentina 8.95% 20211,2 | | | 300 | | | | 325 | |
| YPF SA: | | | | | | | | |
| 8.50% 2025 | | | 650 | | | | 672 | |
| 8.50% 20251 | | | 1,180 | | | | 1,220 | |
| | | | | | | | 10,286 | |
| Brazil 5.0% | | | | | | | | |
| Banco Votorantim SA 6.25% 20164 | | BRL | 1,000 | | | | 400 | |
| Brazil (Federal Republic of): | | | | | | | | |
| Series B, 6.00% 2018 – 20504 | | | 6 | | | | 4,686 | |
| Series F, 10.00% 2018 – 2025 | | | 6 | | | | 1,662 | |
| Brazil (Federal Republic of) Global 4.875% 2021 | | $ | 475 | | | | 484 | |
| Brazilian Treasury Bill 12.46% 2018 | | BRL | 1 | | | | 151 | |
| Capital Group Emerging Markets Total Opportunities Fund | 5 |
| Bonds & notes (continued) | | Principal amount
(000) | | | Value
(000) | |
| Latin America (continued) | | | | | | | | |
| Brazil (continued) | | | | | | | | |
| Cosan Luxembourg, SA 9.50% 2018 | | BRL | 500 | | | $ | 122 | |
| Odebrecht Offshore Drilling Finance Ltd. 6.75% 20221,2 | | $ | 611 | | | | 86 | |
| Petrobras Global Finance Co.: | | | | | | | | |
| 2.238% 20163 | | | 150 | | | | 150 | |
| 6.25% 2024 | | | 839 | | | | 734 | |
| 6.85% 2115 | | | 1,385 | | | | 1,032 | |
| Petrobras International Finance Co. 5.375% 2021 | | | 120 | | | | 107 | |
| | | | | | | | 9,614 | |
| | | | | | | | | |
| Chile 0.7% | | | | | | | | |
| Chilean Government 3.00% 2018 – 20234 | | CLP | 21 | | | | 881 | |
| Corporación Nacional del Cobre de Chile 4.50% 2025 | | $ | 200 | | | | 209 | |
| Emgesa SA ESP 8.75% 2021 | | COP | 598,000 | | | | 203 | |
| | | | | | | | 1,293 | |
| | | | | | | | | |
| Colombia 2.6% | | | | | | | | |
| Colombia (Republic of): | | | | | | | | |
| Series B, 10.00% 2024 | | | 5,944,500 | | | | 2,355 | |
| Series B, 6.00% 2028 | | | 1,758,000 | | | | 517 | |
| Series B, 7.75% 2030 | | | 780,000 | | | | 263 | |
| Colombia (Republic of) Global: | | | | | | | | |
| 7.375% 2017 | | $ | 480 | | | | 503 | |
| 4.50% 2026 | | | 200 | | | | 205 | |
| Colombian TES 3.00% 20334 | | COP | 2,705,693 | | | | 831 | |
| Ecopetrol SA 5.375% 2026 | | $ | 400 | | | | 368 | |
| | | | | | | | 5,042 | |
| | | | | | | | | |
| Costa Rica 0.1% | | | | | | | | |
| Costa Rica (Republic of) 4.25% 2023 | | | 200 | | | | 186 | |
| | | | | | | | | |
| Dominican Republic 0.6% | | | | | | | | |
| Dominican Republic: | | | | | | | | |
| 5.50% 20251 | | | 698 | | | | 701 | |
| 7.45% 2044 | | | 210 | | | | 224 | |
| 6.85% 2045 | | | 250 | | | | 251 | |
| | | | | | | | 1,176 | |
| Mexico 10.5% | | | | | | | | |
| América Móvil, SAB de CV: | | | | | | | | |
| 2.375% 2016 | | | 2,320 | | | | 2,331 | |
| 7.125% 2024 | | MXN | 3,000 | | | | 170 | |
| BBVA Bancomer SA 6.50% 2021 | | $ | 295 | | | | 324 | |
| Comision Federal de Electricidad: | | | | | | | | |
| Series 2014-2, 7.35% 2025 | | MXN | 25 | | | | 143 | |
| 6.125% 20451 | | $ | 200 | | | | 204 | |
| Elementia SAB de CV 5.50% 20251 | | | 200 | | | | 199 | |
| Petroleos Mexicanos: | | | | | | | | |
| 3.50% 2020 | | | 1,145 | | | | 1,124 | |
| 6.375% 20211 | | | 200 | | | | 216 | |
| 4.875% 2024 | | | 120 | | | | 120 | |
| 4.50% 2026 | | | 1,212 | | | | 1,156 | |
| 6.875% 20261 | | | 1,490 | | | | 1,648 | |
| 7.47% 2026 | | MXN | 46 | | | | 233 | |
| Red de Carreteras de Occidente 9.00% 20282 | | | 10,500 | | | | 616 | |
| | | | | | | | | |
| 6 | Capital Group Emerging Markets Total Opportunities Fund |
| | | Principal amount
(000) | | | Value
(000) | |
| Latin America (continued) | | | | | | | | |
| Mexico (continued) | | | | | | | | |
| United Mexican States Government: | | | | | | | | |
| Series M, 8.00% 2020 | | MXN | 9 | | | $ | 58 | |
| 2.50% 20204 | | | 155 | | | | 908 | |
| Series M, 6.50% 2021 | | | 88 | | | | 540 | |
| Series M20, 10.00% 2024 | | | 284 | | | | 2,131 | |
| 4.50% 20254 | | | 323 | | | | 2,124 | |
| Series M, 5.75% 2026 | | | 260 | | | | 1,503 | |
| 4.00% 20404 | | | 194 | | | | 1,217 | |
| United Mexican States Government Global: | | | | | | | | |
| Series A, 4.00% 2023 | | $ | 200 | | | | 210 | |
| 4.125% 2026 | | | 2,110 | | | | 2,221 | |
| Series A, 6.05% 2040 | | | 266 | | | | 316 | |
| 5.55% 2045 | | | 250 | | | | 282 | |
| 4.60% 2046 | | | 389 | | | | 386 | |
| Urbi Desarrollos Urbanos, SA de CV: | | | | | | | | |
| 8.50% 20165 | | | 1,425 | | | | — | |
| 8.50% 20161,5 | | | 560 | | | | — | |
| 9.50% 20205 | | | 2,400 | | | | 1 | |
| 9.50% 20201,5 | | | 230 | | | | — | |
| 9.75% 20225 | | | 990 | | | | — | |
| 9.75% 20221,5 | | | 1,655 | | | | — | |
| | | | | | | | 20,381 | |
| | | | | | | | | |
| Panama 0.2% | | | | | | | | |
| ENA Norte Trust: | | | | | | | | |
| 4.95% 20232 | | | 223 | | | | 230 | |
| 4.95% 20231,2 | | | 210 | | | | 217 | |
| | | | | | | | 447 | |
| | | | | | | | | |
| Peru 0.4% | | | | | | | | |
| Banco de Credito del Peru 6.875% 2026 | | | 525 | | | | 585 | |
| Peru (Republic of) 8.375% 2016 | | | 249 | | | | 249 | |
| | | | | | | | 834 | |
| | | | | | | | | |
| Venezuela 0.5% | | | | | | | | |
| Petroleos de Venezuela, SA 5.375% 2027 | | | 2,070 | | | | 733 | |
| Venezuela (Republic of): | | | | | | | | |
| 12.75% 20222 | | | 140 | | | | 66 | |
| 8.25% 2024 | | | 70 | | | | 26 | |
| 11.75% 2026 | | | 90 | | | | 38 | |
| 9.25% 2027 | | | 310 | | | | 134 | |
| 11.95% 20312 | | | 90 | | | | 39 | |
| | | | | | | | 1,036 | |
| | | | | | | | | |
| Total Latin America | | | | | | | 50,295 | |
| | | | | | | | | |
| Asia-Pacific 7.5% | | | | | | | | |
| Hong Kong 0.3% | | | | | | | | |
| Wynn Macau, Ltd. 5.25% 20211 | | | 550 | | | | 529 | |
| | | | | | | | | |
| India 4.9% | | | | | | | | |
| India (Republic of): | | | | | | | | |
| 8.83% 2023 | | INR | 207,700 | | | | 3,331 | |
| 8.40% 2024 | | | 5,100 | | | | 80 | |
| 9.15% 2024 | | | 113,200 | | | | 1,851 | |
| 8.60% 2028 | | | 209,600 | | | | 3,357 | |
| 9.20% 2030 | | | 52,300 | | | | 877 | |
| | | | | | | | 9,496 | |
| | | | | | | | | |
| Capital Group Emerging Markets Total Opportunities Fund | 7 |
| Bonds & notes (continued) | | | Principal amount
(000) | | | | Value
(000) | |
| Asia-Pacific (continued) | | | | | | | | |
| Indonesia 1.6% | | | | | | | | |
| Indonesia (Republic of): | | | | | | | | |
| 3.75% 2022 | | $ | 300 | | | $ | 308 | |
| Series FR70, 8.375% 2024 | | IDR | 1,750,000 | | | | 139 | |
| 4.125% 20251 | | $ | 1,200 | | | | 1,226 | |
| 4.75% 20261 | | | 200 | | | | 213 | |
| Series FR56, 8.375% 2026 | | | 1,200,000 | | | | 95 | |
| Series FR68, 8.375% 2034 | | IDR | 13,730,000 | | | | 1,095 | |
| | | | | | | | 3,076 | |
| | | | | | | | | |
| Malaysia 0.6% | | | | | | | | |
| Malaysian Government, Series 0315, 3.659% 2020 | | MYR | 4,540 | | | | 1,170 | |
| | | | | | | | | |
| South Korea 0.1% | | | | | | | | |
| Export-Import Bank of Korea 1.492% 20163 | | $ | 270 | | | | 271 | |
| | | | | | | | | |
| Total Asia-Pacific | | | | | | | 14,542 | |
| | | | | | | | | |
| Eastern Europe and Middle East 5.5% | | | | | | | | |
| Greece 0.0% | | | | | | | | |
| Greek Government 4.75% 2019 | | € | 70 | | | | 72 | |
| | | | | | | | | |
| Hungary 1.5% | | | | | | | | |
| Hungarian Government: | | | | | | | | |
| 4.125% 2018 | | $ | 180 | | | | 187 | |
| 4.00% 2019 | | | 254 | | | | 264 | |
| 6.25% 2020 | | | 205 | | | | 228 | |
| 5.75% 2023 | | | 1,654 | | | | 1,875 | |
| 5.375% 2024 | | | 130 | | | | 145 | |
| Series 25B, 5.50% 2025 | | HUF | 34,000 | | | | 148 | |
| | | | | | | | 2,847 | |
| | | | | | | | | |
| Poland 0.2% | | | | | | | | |
| Poland Government Bond: | | | | | | | | |
| Series 0922, 5.75% 2022 | | PLN | 930 | | | | 290 | |
| Series 0726, 2.50% 2026 | | | 335 | | | | 84 | |
| | | | | | | | 374 | |
| | | | | | | | | |
| Slovenia 0.4% | | | | | | | | |
| Slovenia (Republic of) 4.125% 2019 | | $ | 670 | | | | 709 | |
| | | | | | | | | |
| Turkey 3.2% | | | | | | | | |
| Turkey (Republic of): | | | | | | | | |
| 4.00% 20204 | | TRY | 783 | | | | 299 | |
| 9.40% 2020 | | | 4,600 | | | | 1,673 | |
| 2.00% 20224 | | | 3,932 | | | | 1,391 | |
| 5.75% 2024 | | $ | 200 | | | | 220 | |
| 9.00% 2024 | | TRY | 4,930 | | | | 1,758 | |
| 8.00% 2025 | | | 1,000 | | | | 335 | |
| 4.25% 2026 | | $ | 610 | | | | 607 | |
| | | | | | | | 6,283 | |
| | | | | | | | | |
| United Arab Emirates 0.2% | | | | | | | | |
| Abu Dhabi National Energy Co. PJSC (TAQA) 4.125% 2017 | | | 300 | | | | 306 | |
| | | | | | | | | |
| Total Eastern Europe and Middle East | | | | | | | 10,591 | |
| | | | | | | | | |
| 8 | Capital Group Emerging Markets Total Opportunities Fund |
| | | Principal amount
(000) | | | Value
(000) | |
| Africa 3.3% | | | | | | | | |
| Ethiopia 0.5% | | | | | | | | |
| Ethiopia (Republic of) 6.625% 20241 | | $ | 1,010 | | | $ | 924 | |
| | | | | | | | | |
| Gabon 0.1% | | | | | | | | |
| Republic of Gabon 6.95% 2025 | | | 200 | | | | 176 | |
| | | | | | | | | |
| Ghana 0.3% | | | | | | | | |
| Ghana (Republic of): | | | | | | | | |
| 7.875% 2023 | | | 210 | | | | 168 | |
| 8.125% 20262 | | | 500 | | | | 398 | |
| | | | | | | | 566 | |
| Kenya 0.3% | | | | | | | | |
| Kenya (Republic of): | | | | | | | | |
| 6.875% 2024 | | | 200 | | | | 189 | |
| 6.875% 20241 | | | 525 | | | | 496 | |
| | | | | | | | 685 | |
| Nigeria 0.6% | | | | | | | | |
| Nigeria (Republic of): | | | | | | | | |
| 6.75% 2021 | | | 1,000 | | | | 978 | |
| 6.375% 2023 | | | 200 | | | | 187 | |
| | | | | | | | 1,165 | |
| | | | | | | | | |
| South Africa 1.0% | | | | | | | | |
| Myriad International Holdings BV 5.50% 20251 | | | 250 | | | | 256 | |
| South Africa (Republic of): | | | | | | | | |
| Series R-2023, 7.75% 2023 | | ZAR | 23,255 | | | | 1,547 | |
| Series R-209, 6.25% 2036 | | | 4,367 | | | | 218 | |
| | | | | | | | 2,021 | |
| Zambia 0.5% | | | | | | | | |
| Zambia (Republic of): | | | | | | | | |
| 5.375% 2022 | | $ | 450 | | | | 336 | |
| 8.97% 20272 | | | 200 | | | | 166 | |
| 8.97% 20271,2 | | | 460 | | | | 382 | |
| | | | | | | | 884 | |
| Total Africa | | | | | | | 6,421 | |
| | | | | | | | | |
| Other markets 4.5% | | | | | | | | |
| Canada 0.3% | | | | | | | | |
| First Quantum Minerals Ltd.: | | | | | | | | |
| 6.75% 2020¹ | | | 200 | | | | 168 | |
| 7.25% 20221 | | | 400 | | | | 322 | |
| | | | | | | | 490 | |
| | | | | | | | | |
| Cayman Islands 0.1% | | | | | | | | |
| Lima Metro Line Finance Ltd. 5.875% 20342 | | | 200 | | | | 206 | |
| | | | | | | | | |
| Germany 0.3% | | | | | | | | |
| Volkswagen International Finance NV, junior subordinated 2.50% 20223 | | € | 650 | | | | 663 | |
| | | | | | | | | |
| Jamaica 0.7% | | | | | | | | |
| Digicel Group Ltd.: | | | | | | | | |
| 8.25% 2020 | | $ | 800 | | | | 734 | |
| 8.25% 20201 | | | 400 | | | | 367 | |
| 6.00% 2021 | | | 200 | | | | 184 | |
| | | | | | | | 1,285 | |
| | | | | | | | | |
| Capital Group Emerging Markets Total Opportunities Fund | 9 |
| Bonds & notes (continued) | | Principal amount
(000) | | | Value
(000) | |
| Other markets (continued) | | | | | | | | |
| Sweden 0.3% | | | | | | | | |
| Millicom International Cellular SA: | | | | | | | | |
| 6.625% 2021 | | $ | 200 | | | $ | 203 | |
| 6.625% 20211 | | | 275 | | | | 280 | |
| | | | | | | | 483 | |
| | | | | | | | | |
| United Kingdom 0.1% | | | | | | | | |
| Standard Chartered Bank 8.103% 20163 | | £ | 160 | | | | 234 | |
| | | | | | | | | |
| United States of America 2.7% | | | | | | | | |
| Ensco PLC 5.20% 2025 | | $ | 985 | | | | 719 | |
| Philip Morris International Inc. 1.25% 2017 | | | 235 | | | | 236 | |
| Trilogy International Partners, LLC 13.375% 20191 | | | 462 | | | | 462 | |
| U.S. Treasury Note 1.625% 2019 | | | 3,087 | | | | 3,148 | |
| Volkswagen Group of America Finance LLC: | | | | | | | | |
| 1.25% 20171 | | | 200 | | | | 199 | |
| 1.65% 20181 | | | 300 | | | | 297 | |
| 2.40% 20201 | | | 200 | | | | 199 | |
| | | | | | | | 5,260 | |
| Total other markets | | | | | | | 8,621 | |
| Total bonds & notes (cost: $99,798,000) | | | | | | | 90,470 | |
| Common stocks 44.0% | | Shares | | | | |
| Asia-Pacific 23.3% | | | | | | | | |
| China 7.0% | | | | | | | | |
| Anhui Conch Cement Co. Ltd. (Hong Kong) | | | 90,000 | | | | 237 | |
| Beijing Enterprises Holdings Ltd. (Hong Kong) | | | 198,500 | | | | 1,026 | |
| Boer Power Holdings Ltd. (Hong Kong) | | | 567,000 | | | | 318 | |
| China Everbright International Ltd. (Hong Kong) | | | 1,242,000 | | | | 1,391 | |
| China Mengniu Dairy Co. (Hong Kong) | | | 163,306 | | | | 276 | |
| China Modern Dairy Holdings Ltd. (Hong Kong) | | | 1,848,000 | | | | 339 | |
| China Pacific Insurance (Group) Co., Ltd. (Hong Kong) | | | 67,800 | | | | 238 | |
| China Resources Land Ltd. (Hong Kong) | | | 66,888 | | | | 164 | |
| China Unicom Ltd. (Hong Kong) | | | 102,000 | | | | 119 | |
| Haitian International Holdings Ltd. (Hong Kong) | | | 691,000 | | | | 1,179 | |
| Hilong Holding Ltd. (Hong Kong) | | | 1,881,000 | | | | 216 | |
| Honghua Group Ltd. (Hong Kong)6 | | | 1,704,000 | | | | 81 | |
| Lenovo Group Ltd. (Hong Kong) | | | 867,000 | | | | 684 | |
| Minth Group Ltd. (Hong Kong) | | | 1,250,000 | | | | 3,265 | |
| Nine Dragons Paper (Holdings) Ltd. (Hong Kong) | | | 303,000 | | | | 217 | |
| Shanghai Fosun Pharmaceutical (Group) Co., Ltd. (Hong Kong) | | | 695,000 | | | | 1,870 | |
| Shanghai Fudan-Zhangjiang Bio-Pharmaceutical Co., Ltd. (Hong Kong) | | | 138,000 | | | | 112 | |
| Shanghai Pharmaceutical (Group) Co., Ltd. (Hong Kong) | | | 364,900 | | | | 771 | |
| Zhuzhou CRRC Times Electric Co., Ltd. (Hong Kong) | | | 181,500 | | | | 1,023 | |
| | | | | | | | 13,526 | |
| 10 | Capital Group Emerging Markets Total Opportunities Fund |
| | | Shares | | | Value
(000) | |
| Asia-Pacific (continued) | | | | | | | | |
| Hong Kong 3.6% | | | | | | | | |
| AIA Group Ltd. | | | 261,800 | | | $ | 1,566 | |
| Chow Sang Sang Holdings International Ltd. | | | 640,000 | | | | 1,038 | |
| HKT Trust and HKT Ltd., units | | | 355,840 | | | | 514 | |
| Melco Crown Entertainment Ltd. (ADR) | | | 12,600 | | | | 187 | |
| Sands China Ltd. | | | 518,000 | | | | 1,846 | |
| Wynn Macau, Ltd. | | | 1,238,400 | | | | 1,762 | |
| | | | | | | | 6,913 | |
| | | | | | | | | |
| India 5.9% | | | | | | | | |
| Bharti Airtel Ltd. | | | 535,946 | | | | 2,930 | |
| Blue Dart Express Ltd. | | | 5,649 | | | | 483 | |
| ICICI Bank Ltd. | | | 224,310 | | | | 793 | |
| Info Edge (India) Ltd. | | | 60,627 | | | | 685 | |
| Infosys Ltd. | | | 46,843 | | | | 851 | |
| ITC Ltd. | | | 4,807 | | | | 23 | |
| Lupin Ltd. | | | 57,349 | | | | 1,386 | |
| State Bank of India | | | 210,000 | | | | 595 | |
| Steel Authority of India Ltd. | | | 608,202 | | | | 432 | |
| Sun Pharmaceutical Industries Ltd. | | | 122,445 | | | | 1,493 | |
| Tech Mahindra Ltd. | | | 100,144 | | | | 732 | |
| Thermax Ltd. | | | 6,229 | | | | 72 | |
| Torrent Power Ltd. | | | 132,069 | | | | 466 | |
| TTK Prestige Ltd. | | | 6,343 | | | | 429 | |
| | | | | | | | 11,370 | |
| | | | | | | | | |
| Indonesia 0.1% | | | | | | | | |
| Matahari Department Store Tbk PT | | | 144,700 | | | | 208 | |
| | | | | | | | | |
| Malaysia 0.4% | | | | | | | | |
| Bumi Armada Bhd. | | | 990,200 | | | | 199 | |
| IJM Corp. Bhd. | | | 788,400 | | | | 697 | |
| | | | | | | | 896 | |
| | | | | | | | | |
| Singapore 0.2% | | | | | | | | |
| KrisEnergy Ltd.6 | | | 1,272,320 | | | | 175 | |
| Singapore Telecommunications Ltd. | | | 86,800 | | | | 248 | |
| | | | | | | | 423 | |
| | | | | | | | | |
| South Korea 1.6% | | | | | | | | |
| Hankook Tire Co., Ltd. | | | 4,749 | | | | 221 | |
| Hyundai Motor Co. | | | 12,141 | | | | 1,526 | |
| Orion Corp. | | | 313 | | | | 255 | |
| Samsung Electronics Co., Ltd. | | | 954 | | | | 1,037 | |
| | | | | | | | 3,039 | |
| | | | | | | | | |
| Taiwan 4.5% | | | | | | | | |
| AirTAC International Group | | | 169,754 | | | | 1,122 | |
| ASUSTeK Computer Inc. | | | 32,820 | | | | 288 | |
| CTCI Corp. | | | 448,000 | | | | 583 | |
| Delta Electronics, Inc. | | | 362,781 | | | | 1,681 | |
| Ginko International Co., Ltd. | | | 59,000 | | | | 638 | |
| Taiwan Cement Corp. | | | 253,000 | | | | 257 | |
| Taiwan Semiconductor Manufacturing Co., Ltd. | | | 915,000 | | | | 4,193 | |
| | | | | | | | 8,762 | |
| Capital Group Emerging Markets Total Opportunities Fund | 11 |
| Common stocks (continued) | | Shares | | | Value
(000) | |
| Asia-Pacific (continued) | | | | | | | | |
| Thailand 0.0% | | | | | | | | |
| Bangkok Bank PCL, nonvoting depository receipt | | | 18,500 | | | $ | 87 | |
| | | | | | | | | |
| Total Asia-Pacific | | | | | | | 45,224 | |
| | | | | | | | | |
| Latin America 5.1% | | | | | | | | |
| Argentina 0.5% | | | | | | | | |
| Arcos Dorados Holdings Inc., Class A6 | | | 60,800 | | | | 252 | |
| YPF SA, Class D (ADR) | | | 35,800 | | | | 722 | |
| | | | | | | | 974 | |
| | | | | | | | | |
| Brazil 0.9% | | | | | | | | |
| Hypermarcas SA, ordinary nominative | | | 116,200 | | | | 1,025 | |
| Vale SA, Class A, preferred nominative (ADR) | | | 167,700 | | | | 762 | |
| | | | | | | | 1,787 | |
| | | | | | | | | |
| Chile 0.9% | | | | | | | | |
| Enersis Americas SA (ADR) | | | 55,400 | | | | 474 | |
| Enersis Chile SA (ADR)6 | | | 55,400 | | | | 353 | |
| Inversiones La Construccion SA | | | 68,977 | | | | 813 | |
| | | | | | | | 1,640 | |
| | | | | | | | | |
| Mexico 2.8% | | | | | | | | |
| América Móvil, SAB de CV, Series L (ADR) | | | 93,100 | | | | 1,318 | |
| CEMEX, SAB de CV, ordinary participation certificates, units (ADR)6 | | | 350,955 | | | | 2,615 | |
| Fibra Uno Administracion, SA de CV | | | 70,700 | | | | 168 | |
| Grupo Comercial Chedraui, SAB de CV, Class B | | | 87,100 | | | | 247 | |
| Grupo Sanborns, SAB de CV, Series B1 | | | 380,200 | | | | 526 | |
| Impulsora del Desarrollo y el Empleo en América Latina, SA de CV, Series B16 | | | 374,800 | | | | 516 | |
| | | | | | | | 5,390 | |
| Total Latin America | | | | | | | 9,791 | |
| | | | | | | | | |
| Eastern Europe and Middle East 2.6% | | | | | | | | |
| Greece 0.2% | | | | | | | | |
| Titan Cement Co. SA | | | 13,006 | | | | 296 | |
| | | | | | | | | |
| Oman 0.1% | | | | | | | | |
| bank muscat SAOG | | | 208,435 | | | | 221 | |
| | | | | | | | | |
| Russia 0.4% | | | | | | | | |
| Alrosa PJSC | | | 304,062 | | | | 348 | |
| Globaltrans Investment PLC (GDR)6 | | | 37,548 | | | | 143 | |
| MegaFon PJSC (GDR) | | | 23,102 | | | | 266 | |
| | | | | | | | 757 | |
| | | | | | | | | |
| Turkey 0.5% | | | | | | | | |
| Akbank TAS | | | 347,470 | | | | 1,068 | |
| | | | | | | | | |
| United Arab Emirates 1.4% | | | | | | | | |
| DP World Ltd. | | | 58,323 | | | | 1,097 | |
| First Gulf Bank PJSC | | | 296,742 | | | | 1,042 | |
| Union National Bank PJSC | | | 648,738 | | | | 630 | |
| | | | | | | | 2,769 | |
| Total Eastern Europe and Middle East | | | | | | | 5,111 | |
| 12 | Capital Group Emerging Markets Total Opportunities Fund |
| | | Shares | | | Value
(000) | |
| Africa 1.0% | | | | | | | | |
| South Africa 1.0% | | | | | | | | |
| Discovery Ltd. | | | 52,433 | | | $ | 469 | |
| Naspers Ltd., Class N | | | 10,776 | | | | 1,486 | |
| | | | | | | | | |
| Total Africa | | | | | | | 1,955 | |
| | | | | | | | | |
| Other markets 7.7% | | | | | | | | |
| Australia 0.9% | | | | | | | | |
| Newcrest Mining Ltd.6 | | | 53,471 | | | | 784 | |
| Oil Search Ltd. | | | 172,946 | | | | 911 | |
| | | | | | | | 1,695 | |
| | | | | | | | | |
| Austria 0.1% | | | | | | | | |
| Vienna Insurance Group AG | | | 5,588 | | | | 126 | |
| | | | | | | | | |
| Canada 0.5% | | | | | | | | |
| First Quantum Minerals Ltd. | | | 123,600 | | | | 1,053 | |
| | | | | | | | | |
| Italy 0.3% | | | | | | | | |
| Tenaris SA (ADR) | | | 20,643 | | | | 559 | |
| | | | | | | | | |
| Netherlands 1.0% | | | | | | | | |
| Unilever NV, depository receipts | | | 46,073 | | | | 2,025 | |
| | | | | | | | | |
| Norway 0.5% | | | | | | | | |
| BW LPG Ltd. | | | 153,548 | | | | 918 | |
| | | | | | | | | |
| Switzerland 0.3% | | | | | | | | |
| Dufry AG6 | | | 4,737 | | | | 623 | |
| | | | | | | | | |
| United Kingdom 2.1% | | | | | | | | |
| Global Ports Investments PLC (GDR)6 | | | 111,647 | | | | 369 | |
| Lonmin PLC6 | | | 216,954 | | | | 600 | |
| PZ Cussons PLC | | | 216,200 | | | | 1,018 | |
| SABMiller PLC | | | 21,500 | | | | 1,316 | |
| Tullow Oil PLC6 | | | 77,700 | | | | 321 | |
| Unilever PLC | | | 12,000 | | | | 538 | |
| | | | | | | | 4,162 | |
| | | | | | | | | |
| United States of America 2.0% | | | | | | | | |
| AES Corp. | | | 161,000 | | | | 1,797 | |
| Cobalt International Energy, Inc.6 | | | 120,300 | | | | 389 | |
| Cognizant Technology Solutions Corp., Class A6 | | | 5,500 | | | | 321 | |
| Ensco PLC, Class A | | | 28,300 | | | | 338 | |
| MercadoLibre, Inc. | | | 7,500 | | | | 937 | |
| | | | | | | | 3,782 | |
| Total other markets | | | | | | | 14,943 | |
| | | | | | | | | |
| Miscellaneous 4.3% | | | | | | | | |
| Other common stocks in initial period of acquisition | | | | | | | 8,396 | |
| | | | | | | | | |
| Total common stocks (cost: $93,675,000) | | | | | | | 85,420 | |
| Capital Group Emerging Markets Total Opportunities Fund | 13 |
| Convertible bonds 0.7% | | Principal amount
(000) | | | Value
(000) | |
| Eastern Europe and Middle East 0.3% | | | | | | | | |
| Oman 0.0% | | | | | | | | |
| bank muscat (SAOG), convertible notes, 3.50% 2018 | | OMR | 101 | | | $ | 25 | |
| bank muscat (SAOG), convertible notes, 4.50% 2017 | | | 139 | | | | 37 | |
| | | | | | | | 62 | |
| | | | | | | | | |
| Russia 0.3% | | | | | | | | |
| Yandex NV, convertible notes, 1.125% 2018 | | $ | 618 | | | | 560 | |
| | | | | | | | | |
| Total Eastern Europe and Middle East | | | | | | | 622 | |
| | | | | | | | | |
| Other markets 0.4% | | | | | | | | |
| United States of America 0.4% | | | | | | | | |
| Cobalt International Energy, Inc., convertible notes, 2.625% 2019 | | | 332 | | | | 168 | |
| Cobalt International Energy, Inc., convertible notes, 3.125% 2024 | | | 1,320 | | | | 571 | |
| | | | | | | | | |
| Total other markets | | | | | | | 739 | |
| Total convertible bonds (cost: $1,736,000) | | | | | | | 1,361 | |
| | | | | | | | | |
| Warrants 0.5% | | Shares | | | | |
| Eastern Europe and Middle East 0.5% | | | | | | | | |
| Saudi Arabia 0.5% | | | | | | | | |
| Saudi Basic Industries Corp., warrants, expire 20161 | | | 32,100 | | | | 727 | |
| Savola Group Co., warrants, expire 20171 | | | 22,500 | | | | 240 | |
| | | | | | | | | |
| Total warrants (cost: $1,039,000) | | | | | | | 967 | |
| | | | | | | | | |
| Preferred securities 0.2% | | | | | | | | |
| Miscellaneous 0.2% | | | | | | | | |
| Other preferred securities in initial period of acquisition | | | | | | | 379 | |
| | | | | | | | | |
| Total preferred securities (cost: $393,000) | | | | | | | 379 | |
| | | | | | | | | |
| | | | | | | | | |
| Short-term securities 6.8% | | Principal amount
(000) | | | | |
| Certificates of deposit 0.1% | | | | | | | | |
| Banco Bradesco 1.05% due 7/20/20161 | | $ | 250 | | | | 250 | |
| | | | | | | | | |
| Commercial paper 4.0% | | | | | | | | |
| General Electric Co. 0.31% due 5/2/2016 | | | 4,100 | | | | 4,100 | |
| National Rural Utilities Cooperative Finance Corp. 0.40% due 5/4/2016 | | | 1,400 | | | | 1,400 | |
| Siemens Capital Co. LLC 0.40% due 5/11/20161 | | | 1,200 | | | | 1,200 | |
| Victory Receivables Corp. 0.41% due 5/6/20161 | | | 1,000 | | | | 1,000 | |
| | | | | | | | 7,700 | |
| | | | | | | | | |
| Discount notes 1.6% | | | | | | | | |
| Federal Home Loan Bank 0.300%–0.305% due 5/16/2016–5/20/2016 | | | 3,000 | | | | 3,000 | |
| | | | | | | | | |
| Foreign government treasury bills 1.1% | | | | | | | | |
| Letras Del Banco Central De La Republica Argentina Bill 0.00%–37.22% due 5/11/2016–5/18/2016 | | | 31,165 | | | | 2,154 | |
| | | | | | | | | |
| Total short-term securities (cost: $13,101,000) | | | | | | | 13,104 | |
| | | | | | | | | |
| Total investment securities 98.9% (cost: $209,742,000) | | | | | | | 191,701 | |
| Other assets less liabilities 1.1% | | | | | | | 2,224 | |
| | | | | | | | | |
| Net assets 100.0% | | | | | | $ | 193,925 | |
As permitted by U.S. Securities and Exchange Commission regulations, “Miscellaneous” securities include holdings in their first year of acquisition that have not previously been publicly disclosed.
| 14 | Capital Group Emerging Markets Total Opportunities Fund |
Forward currency contracts
The fund has entered into the over-the-counter (“OTC”) forward currency contracts as shown in the following table. The average month-end notional amount of open OTC forward currency contracts while held was $25,285,000.
| | | | | | | | | | | Unrealized | |
| | | | | | | | | | | appreciation | |
| | | | | | | Notional amount | | (depreciation) | |
| | | | | | | Receive | | Deliver | | at 4/30/2016 | |
| | | Settlement date | | Counterparty | | (000) | | (000) | | (000) | |
| Sales: | | | | | | | | | | | | |
| Australian dollars | | 5/18/2016 | | Credit Suisse First Boston | | $170 | | A$222 | | | $1 | |
| Brazilian reais | | 5/9/2016 | | Bank of America | | $138 | | BRL510 | | | (10 | ) |
| Brazilian reais | | 5/23–5/25/2016 | | JPMorgan Chase | | $921 | | BRL3,281 | | | (27 | ) |
| British pounds | | 5/16–5/23/2016 | | Credit Suisse First Boston | | $2,027 | | £1,410 | | | (34 | ) |
| British pounds | | 5/20/2016 | | Bank of America | | $121 | | £85 | | | (4 | ) |
| British pounds | | 5/23/2016 | | Citibank N.A. | | $176 | | £122 | | | (2 | ) |
| Chilean pesos | | 6/3/2016 | | Citibank N.A. | | $235 | | CLP158,038 | | | (3 | ) |
| Chinese yuan renminbi offshore | | 5/23/2016 | | Citibank N.A. | | $4,767 | | CNH30,931 | | | 3 | |
| Colombian pesos | | 6/3/2016 | | JPMorgan Chase | | $59 | | COP175,896 | | | (2 | ) |
| Euros | | 5/18/2016 | | JPMorgan Chase | | $301 | | €267 | | | (4 | ) |
| Hungarian forints | | 5/11/2016 | | UBS AG | | $42 | | HUF11,580 | | | — | 7 |
| Indian rupees | | 5/31/2016 | | Citibank N.A. | | $6,156 | | INR412,002 | | | (21 | ) |
| Mexican pesos | | 5/16/2016 | | Credit Suisse First Boston | | $277 | | MXN4,887 | | | (7 | ) |
| New Taiwan dollars | | 5/25/2016 | | Bank of America | | $2,953 | | TWD95,429 | | | (6 | ) |
| South African rand | | 5/31/2016 | | JPMorgan Chase | | $295 | | ZAR4,307 | | | (5 | ) |
| South Korean won | | 5/23/2016 | | Citibank N.A. | | $2,646 | | KRW2,996,072 | | | 17 | |
| South Korean won | | 6/3/2016 | | Citibank N.A. | | $47 | | KRW53,771 | | | (1 | ) |
| Turkish lira | | 5/18/2016 | | Bank of America | | $58 | | TRY167 | | | (1 | ) |
| | | | | | | | | | | | $(106 | ) |
The following footnotes apply to either the individual securities noted or one or more of the securities aggregated and listed as a single item.
| 1 | Acquired in a transaction exempt from registration under Rule 144A or Section 4(2) of the Securities Act of 1933 (not including purchases of securities that were publicly offered in the primary local market but were not registered under U.S. securities laws). May be resold in the U.S. in transactions exempt from registration, normally to qualified institutional buyers. The total value of all such securities was $19,600,000, which represented 10.11% of the net assets of the fund. |
| 2 | Principal payments may be made periodically. Therefore, the effective maturity date may be earlier than the stated maturity date. |
| 3 | Coupon rate may change periodically. |
| 4 | Index-linked bond whose principal amount moves with a government retail price index. |
| 5 | Scheduled interest and/or principal payment was not received. |
| 6 | Security did not produce income during the last 12 months. |
| 7 | Amount less than one thousand. |
Key to abbreviations and symbols:
| ADR | — | American Depositary Receipts |
| GDR | — | Global Depositary Receipts |
| A$ | — | Australian dollars |
| BRL | — | Brazilian reais |
| £ | — | British pounds |
| CLP | — | Chilean pesos |
| CNH | — | Chinese Yuan Renminbi Offshore |
| COP | — | Colombian pesos |
| € | — | Euros |
| HUF | — | Hungarian forints |
| IDR | — | Indonesian rupiah |
| INR | — | Indian rupees |
| MXN | — | Mexican pesos |
| MYR | — | Malaysian ringgits |
| OMR | — | Omani rials |
| PLN | — | Polish zloty |
| KRW | — | South Korean won |
| TRY | — | Turkish lira |
| TWD | — | New Taiwan dollars |
| ZAR | — | South African rand |
See Notes to Financial Statements
| Capital Group Emerging Markets Total Opportunities Fund | 15 |
Financial statements
| Statement of assets and liabilities | unaudited |
| at April 30, 2016 | (dollars in thousands, except per-share amounts) |
| Assets: | | | | | | | | |
| Investment securities, at value (cost: $209,742) | | | | | | $ | 191,701 | |
| Cash | | | | | | | 201 | |
| Unrealized appreciation on open forward currency contracts | | | | | | | 21 | |
| Receivables for: | | | | | | | | |
| Sales of investments | | $ | 1,848 | | | | | |
| Sales of fund’s shares | | | 51 | | | | | |
| Dividends and interest | | | 2,039 | | | | | |
| Non-U.S. taxes | | | 2 | | | | | |
| Due from custodian | | | 24 | | | | | |
| Other | | | 11 | | | | 3,975 | |
| | | | | | | | 195,898 | |
| Liabilities: | | | | | | | | |
| Cash denominated in non-U.S. currency (cost: $66) | | | | | | | 66 | |
| Unrealized depreciation on open forward currency contracts | | | | | | | 127 | |
| Payables for: | | | | | | | | |
| Purchases of investments | | | 1,421 | | | | | |
| Investment advisory services | | | 159 | | | | | |
| Repurchases of fund’s shares | | | 14 | | | | | |
| Non-U.S. taxes | | | 131 | | | | | |
| Other accrued expenses | | | 55 | | | | 1,780 | |
| | | | | | | | 1,973 | |
| Net assets at April 30, 2016: | | | | | | | | |
| Equivalent to $10.13 per share on 19,143,745 shares of $0.01 par value capital stock outstanding (unlimited authorized shares) | | | | | | $ | 193,925 | |
| | | | | | | | | |
| Net assets consist of: | | | | | | | | |
| Capital paid in on shares of stock | | | | | | $ | 233,253 | |
| Undistributed net investment income | | | | | | | 3,265 | |
| Accumulated net realized loss | | | | | | | (24,359 | ) |
| Net unrealized depreciation | | | | | | | (18,234 | ) |
| Net assets at April 30, 2016 | | | | | | $ | 193,925 | |
See Notes to Financial Statements
| 16 | Capital Group Emerging Markets Total Opportunities Fund |
Statement of operations
for the six months ended April 30, 2016 | unaudited |
| | (dollars in thousands) |
| | |
| Investment income: | | | | | | | | |
| Income: | | | | | | | | |
| Interest (net of non-U.S. withholding tax of $16) | | $ | 3,580 | | | | | |
| Dividends (net of non-U.S. withholding tax of $27) | | | 886 | | | $ | 4,466 | |
| | | | | | | | | |
| Fees and expenses: | | | | | | | | |
| Investment advisory services | | | 1,093 | | | | | |
| Custodian | | | 37 | | | | | |
| Registration statement and prospectus | | | 19 | | | | | |
| Auditing and legal | | | 39 | | | | | |
| Reports to shareholders | | | 7 | | | | | |
| Trustees’ compensation | | | 15 | | | | | |
| Other | | | 28 | | | | | |
| Total fees and expenses before reimbursement | | | 1,238 | | | | | |
| Less investment advisory services reimbursement | | | 37 | | | | | |
| Total fees and expenses after reimbursement | | | | | | | 1,201 | |
| Net investment income | | | | | | | 3,265 | |
| | | | | | | | | |
| Net realized loss and unrealized appreciation: | | | | | | | | |
| Net realized (loss) gain on: | | | | | | | | |
| Investments (net of non-U.S. taxes of $113) | | | (16,176 | ) | | | | |
| Forward currency contracts | | | 257 | | | | | |
| Currency transactions | | | 2 | | | | (15,917 | ) |
| Net unrealized appreciation (depreciation) on: | | | | | | | | |
| Investments (net of non-U.S. taxes of $131) | | | 12,500 | | | | | |
| Forward currency contracts | | | (161 | ) | | | | |
| Currency translations | | | 46 | | | | 12,385 | |
| Net realized loss and unrealized appreciation | | | | | | | (3,532 | ) |
| | | | | | | | | |
| Net decrease in net assets resulting from operations | | | | | | $ | (267 | ) |
See Notes to Financial Statements
| Capital Group Emerging Markets Total Opportunities Fund | 17 |
Statements of changes in net assets
(dollars in thousands)
| | | Six months ended
April 30, 2016* | | | Year ended
October 31, 2015 | |
| Operations: | | | | | | | | |
| Net investment income | | $ | 3,265 | | | $ | 9,618 | |
| Net realized loss | | | (15,917 | ) | | | (17,449 | ) |
| Net unrealized appreciation (depreciation) | | | 12,385 | | | | (28,572 | ) |
| Net decrease in net assets resulting from operations | | | (267 | ) | | | (36,403 | ) |
| | | | | | | | | |
| Dividends and distributions paid to shareholders: | | | | | | | | |
| Dividends from net investment income | | | — | | | | (1,556 | ) |
| Distributions from net realized gain on investments | | | — | | | | (2,461 | ) |
| Total dividends and distributions paid to shareholders | | | — | | | | (4,017 | ) |
| | | | | | | | | |
| Capital share transactions: | | | | | | | | |
| Proceeds from shares sold: 1,209,027 and 2,776,583 shares, respectively | | | 11,618 | | | | 29,660 | |
| Proceeds from shares issued in reinvestment of net investment income dividends: — and 354,594 shares, respectively | | | — | | | | 3,784 | |
| Cost of shares repurchased: 11,013,230 and 12,002,627 shares, respectively | | | (104,770 | ) | | | (126,690 | ) |
| Net decrease in net assets resulting from capital share transactions | | | (93,152 | ) | | | (93,246 | ) |
| | | | | | | | | |
| Total decrease in net assets | | | (93,419 | ) | | | (133,666 | ) |
| | | | | | | | | |
| Net assets: | | | | | | | | |
| Beginning of period | | | 287,344 | | | | 421,010 | |
| End of period (including undistributed net investment income: $3,265 and $—, respectively) | | $ | 193,925 | | | $ | 287,344 | |
* Unaudited
See Notes to Financial Statements
| 18 | Capital Group Emerging Markets Total Opportunities Fund |
Notes to financial statements
Capital Group Emerging Markets Total Opportunities Fund (the “fund”) is registered under the Investment Company Act of 1940, as an open-end, diversified management investment company. The fund seeks long-term growth and preservation of capital with lower volatility of returns than emerging market equities.
2. Significant accounting policies
The fund is an investment company that applies the accounting and reporting guidance issued in Topic 946 by the U.S. Financial Accounting Standards Board. The fund’s financial statements have been prepared to comply with U.S. generally accepted accounting principles (“U.S. GAAP”). These principles require management to make estimates and assumptions that affect reported amounts and disclosures. Actual results could differ from those estimates. Subsequent events, if any, have been evaluated through the date of issuance in the preparation of the financial statements. The fund follows the significant accounting policies described below, as well as the valuation policies described in the next section on valuation.
Security transactions and related investment income — Security transactions are recorded by the fund as of the date the trades are executed with brokers. Realized gains and losses from security transactions are determined based on the specific identified cost of the securities. In the event a security is purchased with a delayed payment date, the fund will segregate liquid assets sufficient to meet its payment obligations. Dividend income is recognized on the ex-dividend date and interest income is recognized on an accrual basis. Market discounts, premiums and original issue discounts on fixed-income securities are amortized daily over the expected life of the security.
Dividends and distributions to shareholders — Dividends and distributions to shareholders are recorded on the ex-dividend date.
Currency translation — Assets and liabilities, including investment securities, denominated in currencies other than U.S. dollars are translated into U.S. dollars at the exchange rates supplied by one or more pricing vendors on the valuation date. Purchases and sales of investment securities and income and expenses are translated into U.S. dollars at the exchange rates on the dates of such transactions. The effects of changes in exchange rates on investment securities are included with the net realized gain or loss and net unrealized appreciation or depreciation on investments on the fund’s statement of operations. The realized gain or loss and unrealized appreciation or depreciation resulting from all other transactions denominated in currencies other than U.S. dollars are disclosed separately.
3. Valuation
Capital Guardian Trust Company (“CGTC”), the fund’s investment adviser, values the fund’s investments at fair value as defined by U.S. GAAP. The net asset value of the fund is generally determined as of approximately 4:00 p.m. New York time each day the New York Stock Exchange is open.
Methods and inputs — The fund’s investment adviser uses the following methods and inputs to establish the fair value of the fund’s assets and liabilities. Use of particular methods and inputs may vary over time based on availability and relevance as market and economic conditions evolve.
Equity securities are generally valued at the official closing price of, or the last reported sale price on, the exchange or market on which such securities are traded, as of the close of business on the day the securities are being valued or, lacking any sales, at the last available bid price. Prices for each security are taken from the principal exchange or market on which the security trades.
Fixed-income securities, including short-term securities, are generally valued at prices obtained from one or more pricing vendors. Vendors value such securities based on one or more of the inputs described in the following table. The table provides examples of inputs that are commonly relevant for valuing particular classes of fixed-income securities in which the fund is authorized to invest. However, these classifications are not exclusive and any of the inputs may be used to value any other class of fixed-income security.
| Capital Group Emerging Markets Total Opportunities Fund | 19 |
| Fixed-income class | Examples of standard inputs |
| All | Benchmark yields, transactions, bids, offers, quotations from dealers and trading systems, new issues, spreads and other relationships observed in the markets among comparable securities; and proprietary pricing models such as yield measures calculated using factors such as cash flows, financial or collateral performance and other reference data (collectively referred to as “standard inputs”) |
| Corporate bonds & notes; convertible securities | Standard inputs and underlying equity of the issuer |
| Bonds & notes of governments & government agencies | Standard inputs and interest rate volatilities |
When the fund’s investment adviser deems it appropriate to do so (such as when vendor prices are unavailable or not deemed to be representative), fixed-income securities will be valued in good faith at the mean quoted bid and ask prices that are reasonably and timely available (or bid prices, if ask prices are not available) or at prices for securities of comparable maturity, quality and type.
Securities with both fixed-income and equity characteristics, or equity securities traded principally among fixed-income dealers, are generally valued in the manner described for either equity or fixed-income securities, depending on which method is deemed most appropriate by the fund’s investment adviser. Forward currency contracts are valued at the mean of representative quoted bid and ask prices, generally based on prices supplied by one or more pricing vendors.
Securities and other assets for which representative market quotations are not readily available or are considered unreliable by the fund’s investment adviser are fair valued as determined in good faith under fair valuation guidelines adopted by authority of the fund’s board of trustees as further described. The investment adviser follows fair valuation guidelines, consistent with U.S. Securities and Exchange Commission rules and guidance, to consider relevant principles and factors when making fair value determinations. The investment adviser considers relevant indications of value that are reasonably and timely available to it in determining the fair value to be assigned to a particular security, such as the type and cost of the security; contractual or legal restrictions on resale of the security; relevant financial or business developments of the issuer; actively traded similar or related securities; conversion or exchange rights on the security; related corporate actions; significant events occurring after the close of trading in the security; and changes in overall market conditions. In addition, the closing prices of equity securities that trade in markets outside U.S. time zones may be adjusted to reflect significant events that occur after the close of local trading but before the net asset value of the fund is determined. Fair valuations and valuations of investments that are not actively trading involve judgment and may differ materially from valuations that would have been used had greater market activity occurred.
Processes and structure — The fund’s board of trustees has delegated authority to the fund’s investment adviser to make fair value determinations, subject to board oversight. The investment adviser has established a Joint Fair Valuation Committee (the “Fair Valuation Committee”) to administer, implement and oversee the fair valuation process, and to make fair value decisions. The Fair Valuation Committee regularly reviews its own fair value decisions, as well as decisions made under its standing instructions to the investment adviser’s valuation teams. The Fair Valuation Committee reviews changes in fair value measurements from period to period and may, as deemed appropriate, update the fair valuation guidelines to better reflect the results of back testing and address new or evolving issues. The Fair Valuation Committee reports any changes to the fair valuation guidelines to the board of trustees with supplemental information to support the changes. The fund’s board of trustees and audit committee also regularly review reports that describe fair value determinations and methods.
The fund’s investment adviser has also established a Fixed-Income Pricing Review Group to administer and oversee the fixed-income valuation process, including the use of fixed-income pricing vendors. This group regularly reviews pricing vendor information and market data. Pricing decisions, processes and controls over security valuation are also subject to additional internal reviews, including an annual control self-evaluation program facilitated by the investment adviser’s compliance group.
Classifications — The fund’s investment adviser classifies the fund’s assets and liabilities into three levels based on the inputs used to value the assets or liabilities. Level 1 values are based on quoted prices in active markets for identical securities. Level 2 values are based on significant observable market inputs, such as quoted prices for similar securities and quoted prices in inactive markets.
| 20 | Capital Group Emerging Markets Total Opportunities Fund |
Certain securities trading outside the U.S. may transfer between Level 1 and Level 2 due to valuation adjustments resulting from significant market movements following the close of local trading. Level 3 values are based on significant unobservable inputs that reflect the investment adviser’s determination of assumptions that market participants might reasonably use in valuing the securities. The valuation levels are not necessarily an indication of the risk or liquidity associated with the underlying investment. For example, U.S. government securities are reflected as Level 2 because the inputs used to determine fair value may not always be quoted prices in an active market. The following tables present the fund’s valuation levels as of April 30, 2016 (dollars in thousands):
| | | Investment securities | |
| | | Level 1 | | | Level 2* | | | Level 3* | | | Total | |
| Assets: | | | | | | | | | | | | | | | | |
| Bonds & notes: | | | | | | | | | | | | | | | | |
| Latin America | | $ | — | | | $ | 50,294 | | | $ | 1 | | | $ | 50,295 | |
| Asia-Pacific | | | — | | | | 14,542 | | | | — | | | | 14,542 | |
| Eastern Europe and Middle East | | | — | | | | 10,591 | | | | — | | | | 10,591 | |
| Africa | | | — | | | | 6,421 | | | | — | | | | 6,421 | |
| Other markets | | | — | | | | 8,621 | | | | — | | | | 8,621 | |
| Common stocks: | | | | | | | | | | | | | | | | |
| Asia-Pacific | | | 187 | | | | 45,037 | | | | — | | | | 45,224 | |
| Latin America | | | 9,791 | | | | — | | | | — | | | | 9,791 | |
| Eastern Europe and Middle East | | | — | | | | 5,111 | | | | — | | | | 5,111 | |
| Africa | | | — | | | | 1,955 | | | | — | | | | 1,955 | |
| Other markets | | | 5,394 | | | | 9,549 | | | | — | | | | 14,943 | |
| Miscellaneous | | | 1,473 | | | | 6,923 | | | | — | | | | 8,396 | |
| Convertible bonds | | | — | | | | 1,361 | | | | — | | | | 1,361 | |
| Warrants | | | — | | | | 967 | | | | — | | | | 967 | |
| Preferred securities | | | — | | | | 379 | | | | — | | | | 379 | |
| Short-term securities | | | — | | | | 13,104 | | | | — | | | | 13,104 | |
| Total | | $ | 16,845 | | | $ | 174,855 | | | $ | 1 | | | $ | 191,701 | |
| | | | | | | | | | |
| | | | Other investments† | |
| | | | Level 1 | | | | Level 2 | | | | Level 3 | | | | Total | |
| Assets: | | | | | | | | | | | | | | | | |
| Unrealized appreciation on open forward currency contracts | | $ | — | | | $ | 21 | | | $ | — | | | $ | 21 | |
| Liabilities: | | | | | | | | | | | | | | | | |
| Unrealized depreciation on open forward currency contracts | | | — | | | | (127 | ) | | | — | | | | (127 | ) |
| Total | | $ | — | | | $ | (106 | ) | | $ | — | | | $ | (106 | ) |
| | |
| * | Level 2 and Level 3 include investment securities with an aggregate value of $69,923,000, which represented 36.06% of the net assets of the fund, that were fair valued under guidelines adopted by authority of the fund’s board of trustees. Of this amount, securities with an aggregate value of $68,324,000, which represented 35.23% of the net assets of the fund, were fair valued as a result of significant market movements following the close of local trading. |
| † | Forward currency contracts are not included in the investment portfolio. |
4. Risk factors
This section describes the principal risks associated with the fund’s principal investment strategies. You may lose money by investing in the fund. The likelihood of loss may be greater if you invest for a shorter period of time.
Market conditions — The prices of, and the income generated by, the securities held by the fund may decline — sometimes rapidly or unpredictably — due to various factors, including events or conditions affecting the general economy or particular industries; overall market changes; local, regional or global political, social or economic instability; governmental or governmental agency responses to economic conditions; and currency exchange rate, interest rate and commodity price fluctuations.
| Capital Group Emerging Markets Total Opportunities Fund | 21 |
Issuer risks — The prices of, and the income generated by, securities held by the fund may decline in response to various factors directly related to the issuers of such securities, including reduced demand for an issuer’s goods or services, poor management performance and strategic initiatives such as mergers, acquisitions or dispositions and the market response to any such initiatives.
Investing in growth-oriented stocks — Growth-oriented common stocks and other equity-type securities (such as preferred stocks, convertible preferred stocks and convertible bonds) may involve larger price swings and greater potential for loss than other types of investments. These risks may be even greater in the case of smaller capitalization stocks.
Investing in income-oriented stocks — Income provided by the fund may be reduced by changes in the dividend policies of, and the capital resources available for dividend payments at, the companies in which the fund invests.
Investing outside the U.S. — Securities of issuers domiciled outside the U.S., or with significant operations or revenues outside the U.S., may lose value because of adverse political, social, economic or market developments (including social instability, regional conflicts, terrorism and war) in the countries or regions in which the issuers operate or generate revenue. These securities may also lose value due to changes in foreign currency exchange rates against the U.S. dollar and/or currencies of other countries. Issuers of these securities may be more susceptible to actions of foreign governments, such as the imposition of price controls or punitive taxes, that could adversely impact revenues. Securities markets in certain countries may be more volatile and/or less liquid than those in the U.S. Investments outside the U.S. may also be subject to different accounting practices and different regulatory, legal and reporting standards and practices, and may be more difficult to value, than those in the U.S. In addition, the value of investments outside the U.S. may be reduced by foreign taxes, including foreign withholding taxes on interest and dividends. Further, there may be increased risks of delayed settlement of securities purchased or sold by the fund. The risks of investing outside the U.S. may be heightened in connection with investments in emerging markets.
Investing in emerging markets — Investing in emerging markets may involve risks in addition to and greater than those generally associated with investing in the securities markets of developed countries. For instance, developing countries may have less developed legal and accounting systems than those in developed countries. The governments of these countries may be less stable and more likely to impose capital controls, nationalize a company or industry, place restrictions on foreign ownership and on withdrawing sale proceeds of securities from the country, and/or impose punitive taxes that could adversely affect the prices of securities. In addition, the economies of these countries may be dependent on relatively few industries that are more susceptible to local and global changes. Securities markets in these countries can also be relatively small and have substantially lower trading volumes. As a result, securities issued in these countries may be more volatile and less liquid, and may be more difficult to value, than securities issued in countries with more developed economies and/or markets. Less certainty with respect to security valuations may lead to additional challenges and risks in calculating the fund’s net asset value. Additionally, there may be increased settlement risks for transactions in local securities
Investing in debt instruments — The prices of, and the income generated by, bonds and other debt securities held by the fund may be affected by changing interest rates and by changes in the effective maturities and credit ratings of these securities.
Rising interest rates will generally cause the prices of bonds and other debt securities to fall. Falling interest rates may cause an issuer to redeem, call or refinance a debt security before its stated maturity, which may result in the fund having to reinvest the proceeds in lower yielding securities. Longer maturity debt securities generally have greater sensitivity to changes in interest rates and may be subject to greater price fluctuations than shorter maturity debt securities.
Bonds and other debt securities are also subject to credit risk, which is the possibility that the credit strength of an issuer will weaken and/or an issuer of a debt security will fail to make timely payments of principal or interest and the security will go into default. Credit risk is gauged, in part, by the credit ratings of the debt securities in which the fund invests. However, ratings are only the opinions of the rating agencies issuing them and are not guarantees as to credit quality or an evaluation of market risk. The fund’s investment adviser relies on its own credit analysts to research issuers and issues in seeking to mitigate various credit and default risks.
Investing in lower rated debt instruments — Lower rated bonds and other lower rated debt securities generally have higher rates of interest and involve greater risk of default or price declines due to changes in the issuer’s creditworthiness than those of higher quality debt securities. The market prices of these securities may fluctuate more than the prices of higher quality debt securities and may decline significantly in periods of general economic difficulty. These risks may be increased with respect to investments in junk bonds.
| 22 | Capital Group Emerging Markets Total Opportunities Fund |
Thinly traded securities — There may be little trading in the secondary market for particular bonds or other debt securities, which may make them more difficult to value, acquire or sell.
Management — The investment adviser to the fund actively manages the fund’s investments. Consequently, the fund is subject to the risk that the methods and analyses employed by the investment adviser in this process may not produce the desired results. This could cause the fund to lose value or its investment results to lag relevant benchmarks or other funds with similar objectives.
5. Certain investment techniques
Forward currency contracts — The fund has entered into OTC forward currency contracts, which represent agreements to exchange currencies on specific future dates at predetermined rates. The fund’s investment adviser uses forward currency contracts to manage the fund’s exposure to changes in exchange rates. Upon entering into these contracts, risks may arise from the potential inability of counterparties to meet the terms of their contracts and from possible movements in exchange rates.
On a daily basis, forward currency contracts are valued and unrealized appreciation or depreciation for open forward currency contracts is recorded in the fund’s statement of assets and liabilities. Realized gains or losses are recorded at the time the forward currency contract is closed or offset by another contract with the same broker for the same settlement date and currency. Closed forward currency contracts that have not reached their settlement date are included in the respective receivables or payables for closed forward currency contracts in the fund’s statement of assets and liabilities. Net realized gains or losses from closed forward currency contracts and net unrealized appreciation or depreciation from open forward currency contracts are recorded in the fund’s statement of operations and statements of changes in net assets.
Rights of offset — The fund has entered into enforceable master netting agreements with certain counterparties for forward currency contracts, where on any date amounts payable by each party to the other (in the same currency with respect to the same transaction) may be closed or offset by each party’s payment obligation. If an early termination date occurs under these agreements following an event of default or termination event, all obligations of each party to its counterparty are settled net through a single payment in a single currency (“close-out netting”). For financial reporting purposes, the fund does not offset the financial assets and financial liabilities that are subject to these master netting arrangements in the statement of assets and liabilities.
The following table presents the fund’s forward currency contracts by counterparty that are subject to master netting agreements but that are not offset in the fund’s statement of assets and liabilities. The net amount column shows the impact of offsetting on the fund’s statement of assets and liabilities as of April 30, 2016 (dollars in thousands) if close-out netting was exercised:
| | | | | | | | | Gross amounts not offset in the | | | | |
| | | | | | | | | statement of assets and liabilities and | | | | |
| | | | | | | | | subject to a master netting agreement | | | | |
| | | | | Gross amounts | | | | | | | | | | | | | | | | |
| | | | | recognized in the | | | | | | | | | | | | | | | | |
| | | | | statement of assets | | Available | | Non-cash | | Cash | | Net |
| | | Counterparty | | and liabilities | | to offset | | collateral* | | collateral | | amount |
| Assets: | | | | | | | | | | | | | | | | | | | | | | | | | | | |
| | | Citibank N.A. | | | $ | 20 | | | | $ | (20 | ) | | | $ | — | | | | $ | — | | | | $ | — | |
| | | Credit Suisse First Boston | | | | 1 | | | | | (1 | ) | | | | — | | | | | — | | | | | — | |
| | | Total | | | $ | 21 | | | | $ | (21 | ) | | | $ | — | | | | $ | — | | | | $ | — | |
| | | | | | | | | | | | | | | | | | | | | | | | | | | | |
| Liabilities: | | | | | | | | | | | | | | | | | | | | | | | | | | | |
| | | Bank of America | | | $ | 21 | | | | $ | — | | | | $ | — | | | | $ | — | | | | $ | 21 | |
| | | Citibank N.A. | | | | 27 | | | | | (20 | ) | | | | — | | | | | — | | | | | 7 | |
| | | Credit Suisse First Boston | | | | 41 | | | | | (1 | ) | | | | — | | | | | — | | | | | 40 | |
| | | JPMorgan Chase | | | | 38 | | | | | — | | | | | — | | | | | — | | | | | 38 | |
| | | Total | | | $ | 127 | | | | $ | (21 | ) | | | $ | — | | | | $ | — | | | | $ | 106 | |
*Non-cash collateral is shown on a settlement basis.
| Capital Group Emerging Markets Total Opportunities Fund | 23 |
6. Taxation and distributions
Federal income taxation — The fund complies with the requirements under Subchapter M of the Internal Revenue Code applicable to regulated investment companies and intends to distribute substantially all of its net taxable income and net capital gains each year. The fund is not subject to income taxes to the extent such distributions are made. Therefore, no federal income tax provision is required.
As of and during the six months ended April 30, 2016, the fund did not have a liability for any unrecognized tax benefits. The fund recognizes interest and penalties, if any, related to unrecognized tax benefits as income tax expense in the statement of operations. During the period, the fund did not incur any interest or penalties.
The fund is not subject to examination by U.S. federal tax authorities, by state tax authorities and by tax authorities outside the U.S. for tax years before 2012, the year the fund commenced operations.
Non-U.S. taxation — Dividend and interest income are recorded net of non-U.S. taxes paid. The fund may file withholding tax reclaims in certain jurisdictions to recover a portion of amounts previously withheld. These reclaims are recorded when the amount is known and there are no significant uncertainties on collectability. Gains realized by the fund on the sale of securities in certain countries are subject to non-U.S. taxes. The fund records a liability based on unrealized gains to provide for potential non-U.S. taxes payable upon the sale of these securities.
Distributions — Distributions paid to shareholders are based on net investment income and net realized gains determined on a tax basis, which may differ from net investment income and net realized gains for financial reporting purposes. These differences are due primarily to different treatment for items such as currency gains and losses; capital losses related to sales of certain securities within 30 days of purchase; net capital losses; short-term capital gains and losses; and cost of investments sold.
The fiscal year in which amounts are distributed may differ from the year in which the net investment income and net realized gains are recorded by the fund for financial reporting purposes. No distributions were paid to shareholders during the six months ended April 30, 2016. For the year ended October 31, 2015, the tax characters of distributions paid to shareholders were ordinary income and long-term capital gain in the amounts of $1,551,000 and $2,466,000, respectively.
The components of distributable earnings on a tax basis are reported as of the fund’s most recent year-end. As of October 31, 2015, the components of distributable earnings on a tax basis were as follows (dollars in thousands):
| Capital loss carryforward* | | $ | (7,527 | ) |
*The capital loss carryforward will be used to offset any capital gains realized by the fund in the current year or in subsequent years. The fund will not make distributions from capital gains while a capital loss carryforward remains.
As of April 30, 2016, the tax basis unrealized appreciation (depreciation) and cost of investments securities were as follows (dollars in thousands):
| Gross unrealized appreciation on investment securities | | $ | 11,805 | |
| Gross unrealized depreciation on investment securities | | | (31,655 | ) |
| Net unrealized depreciation on investment securities | | | (19,850 | ) |
| Cost of investment securities | | | 211,551 | |
7. Fees and transactions with related parties
CGTC, the fund’s investment adviser, is wholly owned by Capital Group International, Inc., which is wholly owned by The Capital Group Companies, Inc. (“CGC”).
Investment advisory services — The fund has an investment advisory and service agreement with CGTC that provides for monthly fees accrued daily. The fee is 1.00% of the average daily net assets of the fund.
| 24 | Capital Group Emerging Markets Total Opportunities Fund |
Other reimbursement — Expense limitations have been imposed through January 1, 2017, to limit the fund’s total annual fund operating expenses to 1.10% (as a percentage of average daily net assets). CGTC has agreed to reimburse a portion of the fees and expenses of the fund. At its discretion, the adviser may elect to extend, modify or terminate the reimbursement. Fees and expenses in the statement of operations are presented gross of the reimbursement from CGTC. The amount reimbursed by CGTC is reflected as reimbursement of fees and expenses.
Distribution services — American Funds Distributors®, Inc. (“AFD”), an affiliate of CGC, is the principal underwriter of the fund’s shares. AFD does not receive any compensation related to the sale of shares of the fund.
Affiliated officers and trustees — Officers and certain trustees of the fund are or may be considered to be affiliated with CGTC and AFD. No affiliated officers or trustees received any compensation directly from the fund.
8. Investment transactions
The fund made purchases and sales of investment securities, excluding short term securities, of $50,637,000 and $107,719,000 respectively, during the six months ended April 30, 2016.
| Capital Group Emerging Markets Total Opportunities Fund | 25 |
Financial highlights
| | | Six months
ended | | Year ended October 31 | | For the
period
1/27/123
through | | For the
period
1/1/12
through | | Year ended |
| | | 4/30/161,2 | | 2015 | | 2014 | | 2013 | | 10/31/122,4 | | 1/26/122,4 | | 12/31/114 |
| Net asset value, beginning of period | | | $9.93 | | | | $11.13 | | | | $11.51 | | | | $11.58 | | | | $11.02 | | | | $10.45 | | | | $11.12 | |
| Income (loss) from investment operations5: | | | | | | | | | | | | | | | | | | | | | | | | | | | | |
| Net investment income | | | .14 | | | | .28 | | | | .29 | | | | .32 | | | | .35 | | | | .03 | | | | .52 | |
| Net realized and unrealized gain (loss) on investments | | | .06 | | | | (1.37 | ) | | | (.46 | ) | | | (.06 | ) | | | .21 | | | | .54 | | | | (1.19 | ) |
| Total from investment operations | | | .20 | | | | (1.09 | ) | | | (.17 | ) | | | .26 | | | | .56 | | | | .57 | | | | (.67 | ) |
| Less dividends and distributions: | | | | | | | | | | | | | | | | | | | | | | | | | | | | |
| Dividends from net investment income | | | — | | | | (.04 | ) | | | (.21 | ) | | | (.33 | ) | | | — | | | | — | | | | — | |
| Distributions from net realized gains | | | — | | | | (.07 | ) | | | — | | | | — | | | | — | | | | — | | | | — | |
| Total dividends and distributions | | | — | | | | (.11 | ) | | | (.21 | ) | | | (.33 | ) | | | — | | | | — | | | | — | |
| Net asset value, end of period | | | $10.13 | | | | $9.93 | | | | $11.13 | | | | $11.51 | | | | $11.58 | | | | $11.02 | | | | $10.45 | |
| Total return6 | | | 2.01 | %7 | | | (9.85 | )% | | | (1.50 | )% | | | 2.19 | % | | | 5.08 | % | | | 5.45 | % | | | (6.03 | )% |
| | | | | | | | | | | | | | | | | | | | | | | | | | | | | |
| Ratios/Supplemental data: | | | | | | | | | | | | | | | | | | | | | | | | | | | | |
| Net assets, end of period (in millions) | | | $194 | | | | $287 | | | | $421 | | | | $604 | | | | $518 | | | | $387 | | | | $381 | |
| Ratio of expenses to average net assets before reimbursements/waivers | | | 1.13 | %8 | | | 1.12 | % | | | 1.10 | % | | | 1.10 | % | | | 1.10 | %8 | | | .05 | %8 | | | .04 | % |
| Ratio of expenses to average net assets after reimbursements/waivers6 | | | 1.10 | %8 | | | 1.10 | % | | | 1.10 | % | | | 1.10 | % | | | 1.10 | %8 | | | .05 | %8 | | | .04 | % |
| Ratio of net investment income to average net assets6 | | | 2.99 | %8 | | | 2.66 | % | | | 2.52 | % | | | 2.74 | % | | | 4.11 | %8 | | | 3.95 | %8 | | | 4.78 | % |
| Portfolio turnover rate | | | 25.94 | %7 | | | 51.50 | % | | | 56.13 | % | | | 63.85 | % | | | 42.49 | % | | | 7.00 | % | | | 59.52 | %1 |
| 1 | Unaudited. |
| 2 | Based on operations for the period shown (unless otherwise noted) and, accordingly, may not be representative of a full year. |
| 3 | The fund commenced operations as a Registered Investment Company on January 27, 2012. |
| 4 | Capital Guardian Emerging Markets Total Opportunities Common Trust Fund (the Predecessor Fund) was reorganized into the Capital Group Emerging Markets Total Opportunities Fund effective January 27, 2012. In connection with the reorganization, the Predecessor Fund transferred all its assets and liabilities to the Capital Group Emerging Markets Total Opportunities Fund and changed its fiscal year-end from December 31 to October 31. |
| 5 | The per-share data is based on average shares outstanding. |
| 6 | This row reflects the impact, if any, of certain reimbursements/waivers from CGTC. For the year ended October 31, 2015, and the six months ended April 30, 2016, CGTC reimbursed other fees and expenses. |
| 7 | Not annualized. |
| 8 | Annualized. |
| 26 | Capital Group Emerging Markets Total Opportunities Fund |
As a shareholder of the fund, you incur ongoing costs, including investment advisory services fees and other expenses. This example is intended to help you understand your ongoing costs (in dollars) of investing in the fund so you can compare these costs with the ongoing costs of investing in other mutual funds. The example is based on an investment of $1,000 invested at the beginning of the period and held for the entire period.
Actual expenses:
The first line of the table below provides information about actual account values and actual expenses. You may use the information in this line, together with the amount you invested, to estimate the expenses that you paid over the period. Simply divide your account value by $1,000 (for example, an $8,600 account value divided by $1,000 = 8.6), then multiply the result by the number in the first line under the heading entitled “Expenses paid during period” to estimate the expenses you paid on your account during this period.
Hypothetical example for comparison purposes:
The second line of the table below provides information about hypothetical account values and hypothetical expenses based on the fund’s actual expense ratio and an assumed rate of return of 5% per year before expenses, which is not the fund’s actual return. The hypothetical account values and expenses may not be used to estimate the actual ending account balance or expenses you paid for the period. You may use this information to compare the ongoing costs of investing in the fund and other funds. To do so, compare this 5% hypothetical example with the 5% hypothetical examples that appear in the shareholder reports of the other funds.
| | | Beginning | | Ending | | Expenses | | Annualized |
| | | account value | | account value | | paid during | | expense |
| | | 11/1/2015 | | 4/30/2016 | | period* | | ratio |
| Actual return | | $ | 1,000.00 | | | $ | 1,020.14 | | | $ | 5.53 | | | | 1.10 | % |
| Hypothetical 5% return before expenses | | | 1,000.00 | | | | 1,019.39 | | | | 5.52 | | | | 1.10 | |
| * | The “expenses paid during period” are equal to the “annualized expense ratio,” multiplied by the average account value over the period, multiplied by the number of days in the period, and divided by 366 (to reflect the current period). |
| Capital Group Emerging Markets Total Opportunities Fund | 27 |
Approval of Investment Advisory and Service Agreement
The Capital Group Emerging Markets Total Opportunities Fund’s board has approved the fund’s Investment Advisory and Service Agreement (the “agreement”) with Capital Guardian Trust Company (“CGTC”) for an additional one-year term through April 30, 2017. The board approved the agreement following the recommendation of the fund’s Contracts Committee (the “committee”), which is composed of all of the fund’s independent board members. The board and the committee determined that the fund’s advisory fee structure was fair and reasonable in relation to the services provided and that approving the agreement was in the best interests of the fund and its shareholders.
In reaching this decision, the board and the committee took into account information furnished to them throughout the year and otherwise provided to them, as well as information prepared specifically in connection with their review of the agreement, and were advised by their independent counsel. They considered the following factors, among others, but did not identify any single issue or particular piece of information that, in isolation, was the controlling factor, and each board and committee member did not necessarily attribute the same weight to each factor.
1. Nature, extent and quality of services
The board and the committee considered the depth and quality of CGTC’s investment management process, including its global research capabilities; the experience, capability and integrity of its senior management and other personnel; the low turnover rates of its key personnel; the overall financial strength and stability of CGTC and the Capital Group organization; and the ongoing evolution of CGTC’s organizational structure designed to maintain and strengthen these qualities. The board and the committee also considered the nature, extent and quality of administrative, compliance and shareholder services provided by CGTC to the fund under the agreement and other agreements. The board and the committee concluded that the nature, extent and quality of the services provided by CGTC have benefited and should continue to benefit the fund and its shareholders.
2. Investment results
The board and the committee considered the investment results of the fund in light of its objective of providing long-term growth and preservation of capital with lower volatility of returns than emerging markets equities. They compared the fund’s investment results with the results of relevant market indexes over various periods through October 31, 2015. This report, including the letter to shareholders and related disclosures, contains certain information about the fund’s investment results. The board and the committee reviewed the fund’s investment results measured against various indexes, including the MSCI Emerging Markets IMI index, the J.P. Morgan GBI-EM Global Diversified index, the J.P. Morgan EMBI Global index, and the Lipper Emerging Markets Funds Average. They noted that for the lifetime, one-year, 10-month and three-month periods, the fund’s investment results were above all benchmarks except the J.P. Morgan EMBI Global index. They further noted that for the three-year period, the fund’s investment results were above the J.P. Morgan GBI-EM Global Diversified index but below all other benchmarks, and for the one-month period, the fund’s investment results were above the J.P. Morgan EMBI Global index but below all other benchmarks. The board and the committee concluded that the fund’s investment results have been sufficient for renewal and that CGTC’s record in managing the fund indicated that its continued management should benefit the fund and its shareholders.
3. Advisory fees and total expenses
The board and the committee compared the advisory fees and total expense levels of the fund to those of other relevant funds. They observed that the fund’s advisory fees were in line with the median of the other relevant funds in the Lipper Emerging Markets Fund category, and its total expense level was lower than the Lipper Emerging Markets Funds Averages. The board and the committee noted that the fees paid to CGTC by clients with separately managed accounts are in many cases lower than those paid by the fund and concluded that the differences appropriately reflected the significant investment, operational and regulatory differences between advising the fund and the other clients. The board and the committee concluded that the fund’s cost structure was fair and reasonable in relation to the services provided, and that the fund’s shareholders receive reasonable value in return for the advisory fees paid to CGTC by the fund.
| 28 | Capital Group Emerging Markets Total Opportunities Fund |
4. Ancillary benefits
The board and the committee considered a variety of other benefits that CGTC and its affiliates receive as a result of CGTC’s relationship with the fund, including fees for administrative services paid to Capital Group Private Client Services, a division of Capital Bank and Trust company, and possible ancillary benefits to CGTC and its affiliates in managing other investment vehicles and accounts. The board and the committee reviewed CGTC’s portfolio trading practices, noting the potential benefits CGTC receives from the research obtained with commissions from portfolio transactions made on behalf of the fund. The board and the committee took these ancillary benefits into account in evaluating the reasonableness of the advisory fees paid to CGTC by the fund.
5. Adviser financial information
The board and the committee reviewed information regarding CGTC’s costs of providing services to the fund, including personnel, systems and resources of investment, compliance, trading and other administrative operations. They considered CGTC’s costs and related cost allocation methodology as well as their willingness to invest in technology, infrastructure and staff to maintain and expand services and capabilities, respond to industry and regulatory developments, and attract and retain qualified personnel. They noted information regarding the compensation structure for CGTC’s investment professionals. The board and the committee noted the competitiveness and cyclicality of both the mutual fund industry and the capital markets, and the importance in that environment of The Capital Group organization’s long-term profitability for maintaining CGTC’s independence, company culture and management continuity. They further considered CGTC’s reimbursement of fund expenses through voluntary fee caps. The board and the committee concluded that the fund’s advisory fee structure reflected a reasonable sharing of benefits between CGTC and fund shareholders.
| Capital Group Emerging Markets Total Opportunities Fund | 29 |
Office of the fund and of the investment adviser
Capital Guardian Trust Company
6455 Irvine Center Drive
Irvine, CA 92618-4518
Transfer agent for shareholder accounts
J.P. Morgan Investor Services Company
One Beacon Street
Boston, MA 02108
Custodian of assets
JPMorgan Chase Bank
270 Park Avenue
New York, NY 10017-2070
Counsel
Morgan, Lewis & Bockius LLP
300 South Grand Avenue
Twenty-second Floor
Los Angeles, CA 90071-3132
Independent registered public accounting firm
Deloitte & Touche LLP
695 Town Center Drive
Suite 1200
Costa Mesa, CA 92626-7188
Principal underwriter
American Funds Distributors, Inc.
333 South Hope Street
Los Angeles, CA 90071-1406
Investors should carefully consider investment objectives, risks, charges and expenses. This and other important information is contained in the fund prospectus, which can be obtained from Capital Guardian Trust Company by calling (800) 266-9532 and should be read carefully before investing.
Capital Group Emerging Markets Total Opportunities Fund files a complete list of its portfolio holdings with the U.S. Securities and Exchange Commission (SEC) for the first and third quarters of each fiscal year on Form N-Q. This filing is available free of charge on the SEC website (sec.gov). You may also review or, for a fee, copy this filing at the SEC’s Public Reference Room in Washington, D.C. Additional information regarding the operation of the Public Reference Room may be obtained by calling the SEC’s Office of Investor Education and Advocacy at (800) SEC-0330. Additionally, the list of portfolio holdings is available by calling your relationship manager at (800) 266-9532.
The proxy voting procedures and policies of Capital Group Emerging Markets Total Opportunities Fund — which describe how we vote proxies relating to portfolio securities — are available upon request by calling your relationship manager at (800) 266-9532. The fund files its proxy voting record with the SEC for the 12 months ended June 30 by August 31. The report also is available on the SEC website or by calling your relationship manager.
Lit. No. MFGESRX-370-0616P Printed in USA TAG/CGIRV/10328-S56374
© 2016 Capital Group Emerging Markets Total Opportunities Fund
ITEM 2 – Code of Ethics
Not applicable for filing of semi-annual reports to shareholders.
ITEM 3 – Audit Committee Financial Expert
Not applicable for filing of semi-annual reports to shareholders.
ITEM 4 – Principal Accountant Fees and Services
Not applicable for filing of semi-annual reports to shareholders.
ITEM 5 – Audit Committee of Listed Registrants
Not applicable to this Registrant, insofar as the Registrant is not a listed issuer as defined in Rule 10A-3 under the Securities Exchange Act of 1934.
ITEM 6 – Schedule of Investments
Not applicable, insofar as the schedule is included as part of the report to shareholders filed under Item 1 of this Form.
ITEM 7 – Disclosure of Proxy Voting Policies and Procedures for Closed-End Management Investment Companies
Not applicable to this Registrant, insofar as the Registrant is not a closed-end management investment company.
ITEM 8 – Portfolio Managers of Closed-End Management Investment Companies
Not applicable to this Registrant, insofar as the Registrant is not a closed-end management investment company.
ITEM 9 – Purchases of Equity Securities by Closed-End Management Investment Company and Affiliated Purchasers
Not applicable to this Registrant, insofar as the Registrant is not a closed-end management investment company.
ITEM 10 – Submission of Matters to a Vote of Security Holders
There have been no material changes to the procedures by which shareholders may recommend nominees to the Registrant’s board of trustees since the Registrant last submitted a proxy statement to its shareholders. The procedures are as follows. The Registrant has a nominating committee comprised solely of persons who are not considered ‘‘interested persons’’ of the Registrant within the meaning of the Investment Company Act of 1940, as amended. The committee periodically reviews such issues as the board’s composition, responsibilities, committees, compensation and other relevant issues, and recommends any appropriate changes to the full board of trustees. While the committee normally is able to identify from its own resources an ample number of qualified candidates, it will consider shareholder suggestions of persons to be considered as nominees to fill future vacancies on the board. Such suggestions must be sent in writing to the nominating committee of the Registrant, c/o the Registrant’s Secretary, and must be accompanied by complete biographical and occupational data on the prospective nominee, along with a written consent of the prospective nominee for consideration of his or her name by the nominating committee.
ITEM 11 – Controls and Procedures
| (a) | The Registrant’s Principal Executive Officer and Principal Financial Officer have concluded, based on their evaluation of the Registrant’s disclosure controls and procedures (as such term is defined in Rule 30a-3 under the Investment Company Act of 1940), that such controls and procedures are adequate and reasonably designed to achieve the purposes described in paragraph (c) of such rule. |
| | |
| (b) | There were no changes in the Registrant’s internal controls over financial reporting (as defined in Rule 30a-3(d) under the Investment Company Act of 1940) that occurred during the Registrant’s second fiscal quarter of the period covered by this report that has materially affected, or is reasonably likely to materially affect, the Registrant’s internal control over financial reporting. |
ITEM 12 – Exhibits
| (a)(1) | Not applicable for filing of semi-annual reports to shareholders. |
| | |
| (a)(2) | The certifications required by Rule 30a-2 of the Investment Company Act of 1940 and Sections 302 and 906 of the Sarbanes-Oxley Act of 2002 are attached as exhibits hereto. |
SIGNATURES
Pursuant to the requirements of the Securities Exchange Act of 1934 and the Investment Company Act of 1940, the Registrant has duly caused this report to be signed on its behalf by the undersigned, thereunto duly authorized.
| | CAPITAL GROUP EMERGING MARKETS TOTAL OPPORTUNITIES FUND |
| | |
| | By /s/ John S. Armour |
| | John S. Armour, President and Principal Executive Officer |
| | |
| | Date: June 30, 2016 |
Pursuant to the requirements of the Securities Exchange Act of 1934 and the Investment Company Act of 1940, this report has been signed below by the following persons on behalf of the Registrant and in the capacities and on the dates indicated.
| By /s/ John S. Armour |
John S. Armour, President and Principal Executive Officer |
| |
| Date: June 30, 2016 |
| By /s/ Gregory F. Niland |
Gregory F. Niland, Treasurer and Principal Financial Officer |
| |
| Date: June 30, 2016 |