UNITED STATES
SECURITIES AND EXCHANGE COMMISSION
Washington, D.C. 20549
FORM N-CSR
Certified Shareholder Report of
Registered Management Investment Companies
Investment Company Act File Number: 811-22605
Capital Group Emerging Markets Total Opportunities Fund
(Exact Name of Registrant as Specified in Charter)
6455 Irvine Center Drive
Irvine, California 92618
(Address of Principal Executive Offices)
Registrant's telephone number, including area code: (213) 486-9200
Date of fiscal year end: October 31
Date of reporting period: April 30, 2015
Courtney R. Taylor
Capital Group Emerging Markets Total Opportunities Fund
6455 Irvine Center Drive
Irvine, California 92618
(Name and Address of Agent for Service)
Copies to:
Michael Glazer
Morgan, Lewis & Bockius LLP
355 South Grand Avenue, Suite 4400
Los Angeles, California 90071
(Counsel for the Registrant)
ITEM 1 – Reports to Stockholders
Capital Group Emerging Markets
Semi-annual report | |
 | |
Capital Group Emerging Markets Total Opportunities Fund seeks long-term growth and preservation of capital with lower volatility of returns than emerging markets equities.
Fund results shown in this report are for past periods and are not predictive of results for future periods. The results shown are before taxes on fund distributions and sale of fund shares. Current and future results may be lower or higher than those shown. Share prices and returns will vary, so investors may lose money. Investing for short periods makes losses more likely. Investments are not FDIC-insured, nor are they deposits of or guaranteed by a bank or any other entity, so they may lose value. For current information and month-end results, please call (800) 266-9532.
Here are the average annual total returns on a $1,000 investment with all distributions reinvested for periods ended March 31, 2015 (the most recent calendar quarter-end):
| 1 year | Lifetime (since 1/27/12) | |||||||
| Average annual total returns | -3.37 | % | 0.95 | % | ||||
The total annual fund operating expense ratio was 1.10% as of the most recent fiscal year-end, and as reflected in the prospectus dated January 1, 2015.
Investment results assume all distributions are reinvested and reflect applicable fees and expenses.
This report is for the information of shareholders of Capital Group Emerging Markets Total Opportunities Fund, but it also may be used as sales literature when preceded or accompanied by the current prospectus, which gives details about charges, expenses, investment objectives and operating policies of the fund. If used as sales material after June 30, 2015, this report must be accompanied by a statistical update for the most recently completed calendar quarter.
Investors should carefully read and consider the investment objectives, guidelines, risks, fees and expenses associated with Capital Group Emerging Markets Total Opportunities Fund (CGETOP) prior to investing. This and other important information is contained in CGETOP’s prospectus, which can be obtained from your relationship manager.
Investing in emerging markets involves risks, such as significant currency and price fluctuations, political instability, differing securities regulations and periods of illiquidity, which are detailed in the fund prospectus. Investments in emerging markets have been more volatile than investments in developed markets, reflecting the greater uncertainties of investing in less established economies. Individuals investing in emerging markets should have a long-term perspective and be able to tolerate potentially sharp declines in the value of their investments.
| Contents | |
| 1 | Letter to investors |
| 2 | 20 largest holdings |
| 3 | 15 largest country positions |
| 5 | Investment portfolio |
| 15 | Financial statements |
| 26 | Expense example |
Capital Group Emerging Markets Total Opportunities Fund (CGETOP) invests in the full spectrum of emerging markets debt and equity securities while seeking to limit the volatility typically associated with investments in the developing world. The following report covers the period from November 1, 2014, through April 30, 2015. During this time, the MSCI Emerging Markets (EM) Investable Market Index (IMI) climbed 4.46% amid more accommodative policies around the world and as investors seemed to take comfort from a likely delay in U.S. interest rate hikes. Technology, health care and financial stocks led. The energy sector declined, however, hurt by lower oil prices in 2014.
Emerging markets U.S. dollar-denominated debt posted modest gains on the heels of last year’s sharp rally, with the J.P. Morgan Emerging Markets Bond Index (EMBI) Global edging 0.70% higher. But local currency debt fell in U.S. dollar terms, weighed down by the depreciation of several emerging markets currencies. Commodity-related currencies such as the Russian ruble registered some of the steepest losses as did currencies of countries grappling with increased political challenges like Brazil and Turkey. The local currency J.P. Morgan Government Bond Index Emerging Markets (GBI-EM) Global Diversified rose 2.79% in local currency, but shed 8.24% in U.S. dollar terms. In this environment, the fund rose 2.13% for the period. The realized volatility of the portfolio was 7.90%, compared with 11.94% for the MSCI EM IMI.
Market review
Equity returns varied dramatically by country. Chinese stocks climbed 30% as the government pushed ahead with reforms and investors seemed to be soothed by expectations that looser monetary policies would help stabilize slowing economic growth.
Results at a glance
For periods ended April 30, 2015, with distributions reinvested
| Cumulative | Average annual | |||||||||||
| total returns | total returns | |||||||||||
| 6 months | 1 year | Lifetime1 | ||||||||||
| Capital Group Emerging Markets Total Opportunities Fund | 2.13 | % | 0.95 | % | 2.40 | % | ||||||
| MSCI Emerging Markets IMI2 | 4.46 | 8.07 | 4.00 | |||||||||
| JP Morgan GBI-EM Global Diversified2 | -8.24 | -9.35 | -2.41 | |||||||||
| JP Morgan EMBI Global2 | 0.70 | 4.50 | 5.70 | |||||||||
| Emerging markets blended market universe3 | 0.27 | 2.66 | 2.88 | |||||||||
Realized daily volatility
Annualized standard deviation of daily returns, for periods ended April 30, 20154
| 6 months | 1 year | Lifetime1 | ||||||||||
| Capital Group Emerging Markets Total Opportunities Fund | 7.90 | % | 6.86 | % | 7.60 | % | ||||||
| MSCI Emerging Markets IMI2 | 11.94 | 10.71 | 12.52 | |||||||||
| 1 | Since 1/27/12. |
| 2 | The market indexes are unmanaged and, therefore, have no expenses. |
| 3 | Emerging markets blended market universe combines the MSCI EM IMI, JPM EMBI Global, and JPM GBI-EM Global Diversified indexes by weighting their cumulative total returns at 50%, 25%, and 25%, respectively. This assumes the blend is rebalanced monthly. |
| 4 | Realized daily volatility is calculated using annualized standard deviation based on a 252-day factor, and is a measure of how returns over time have varied from the mean. A lower number signifies lower volatility. |
Unless otherwise indicated, equity returns are based on MSCI indexes and measured in U.S. dollars with net dividends reinvested.
| Capital Group Emerging Markets Total Opportunities Fund | 1 |
| Percent of net assets as of 4/30/15 | ||||
| Indian government bonds (INR) | 5.4 | % | ||
| Mexican inflation-linked bonds | 2.4 | |||
| Greek government bonds (EUR) | 2.1 | |||
| Taiwan Semiconductor Manufacturing | 2.0 | |||
| Indonesian government bonds (IDR) | 2.0 | |||
| Argentine government bonds (USD) | 1.8 | |||
| Mexican government bonds (MXN) | 1.8 | |||
| Minth Group | 1.6 | |||
| Turkish government bonds (TRY) | 1.6 | |||
| China Everbright International | 1.4 | |||
| United States Treasury Note | 1.3 | |||
| Pemex (USD) | 1.3 | |||
| Bharti Airtel | 1.2 | |||
| South African government bonds (ZAR) | 1.2 | |||
| HKT Trust | 1.2 | |||
| Hungarian government bonds (USD) | 1.1 | |||
| Brazilian inflation-linked bonds | 1.1 | |||
| Slovenian government bonds (USD) | 1.0 | |||
| Delta Electronics | 1.0 | |||
| AES | 1.0 | |||
| 33.5 | % | |||
The People’s Bank of China surprised many observers by cutting interest rates for the first time in more than two years in November, followed by a further reduction in February. Financial stocks and industrials rose sharply. Several other reform-oriented Asian markets paused after rallying for much of 2014. India lost steam late in the period as investor enthusiasm surrounding new reforms and economic improvements seemed to wane and investors appeared to take profits on concerns about stock valuations. The MSCI India IMI declined 5%.
Latin American markets struggled. Brazilian stocks fell 16%, weighed down by concerns about deteriorating economic and political conditions and the 18% depreciation of the real. A corruption scandal involving the country’s largest state-owned energy firm rocked the Brazilian equity market, raising concerns about the government’s involvement and the efficacy of reforms following President Dilma Rousseff’s re-election last October. Local Brazilian bonds declined 15%, hurt by the real’s slide and worries about a potential sovereign downgrade. The 12% depreciation of the Mexican peso also weighed heavily on the country’s local bond market. Elsewhere in Latin America, U.S. dollar-denominated Venezuelan bonds shed 13%, dogged by lower oil prices and fears of a possible default.
Weak oil prices also hampered Russia late last year as did worries about the impact of economic sanctions. The country’s debt and equity markets sank at the end of 2014 as the country suffered its largest political and economic crisis in decades, sparked by military tensions with Ukraine. The country’s central bank hiked interest rates sharply in late 2014 to help support the ailing ruble, but reversed course in 2015, taking the key interest rate down to 12.5% by the end of April. Russian stocks regained some momentum in early 2015, but still ended the six-month period 5% lower. The ruble dropped 17%, weighing heavily on local bond returns (local currency debt lost 14% in U.S. dollar terms during the period). U.S. dollar-denominated debt edged higher, despite concerns about credit rating downgrades from Standard & Poor’s and Moody’s. Several other countries struggled with increased political challenges. Investors were shaken by worries about a potential debt default in Greece. Turkish local bonds also lost ground amid worries about the independence of the country’s central bank and sharp currency losses. The lira fell 17% against the U.S. dollar.
Portfolio review*
The portfolio rose modestly, supported by strong equity returns, particularly among the fund’s investments in China. Several industrials companies in China rose sharply, with waste-to-energy treatment firm China Everbright International expected to benefit from environmental reforms. A few train-related stocks also climbed, bolstered
| * | Percentages of net assets for securities mentioned in the portfolio review are listed in the 20 largest holdings, except for Lenovo, which makes up 1% of net assets, and Vale, which is 0.4%. |
| 2 | Capital Group Emerging Markets Total Opportunities Fund |
| Asset mix (percent of net assets) | as of April 30, 2015 |
| Top 5 equity sectors | percent of net assets | |||
| Industrials | 7.8 | % | ||
| Information technology | 6.8 | |||
| Financials | 5.9 | |||
| Consumer discretionary | 5.9 | |||
| Materials | 5.8 | |||
| Percent of net assets | ||||||||||||
| as of 4/30/15 | ||||||||||||
| Equity | Bonds & notes | Total | ||||||||||
| China (including Hong Kong) | 14.7 | % | 0.3 | % | 15.0 | % | ||||||
| India | 4.1 | 5.4 | 9.5 | |||||||||
| Mexico | 1.7 | 6.7 | 8.4 | |||||||||
| Taiwan | 4.5 | — | 4.5 | |||||||||
| United States of America* | 2.6 | 1.8 | 4.4 | |||||||||
| Brazil | 0.9 | 2.7 | 3.6 | |||||||||
| South Korea | 3.1 | 0.1 | 3.2 | |||||||||
| Argentina | 0.5 | 2.6 | 3.1 | |||||||||
| Indonesia | — | 2.7 | 2.7 | |||||||||
| Greece | 0.4 | 2.1 | 2.5 | |||||||||
| Malaysia | 1.4 | 0.7 | 2.1 | |||||||||
| Turkey | — | 1.8 | 1.8 | |||||||||
| United Kingdom* | 1.5 | — | 1.5 | |||||||||
| Russia | 0.8 | 0.7 | 1.5 | |||||||||
| Canada | 1.0 | 0.3 | 1.3 | |||||||||
| 37.2 | % | 27.9 | % | 65.1 | % | |||||||
| * | Includes investments in companies listed in developed markets that have significant operations in emerging markets. |
| Capital Group Emerging Markets Total Opportunities Fund | 3 |
by the government’s continued commitment to infrastructure spending and following a merger between two major trainmakers in late 2014. Financial stocks in China also rallied, benefitting from looser economic policies and expectations that reduced reserve ratio requirements would help spur bank lending.
The fund’s selection of technology stocks further lifted returns as smartphone demand boosted earnings for several companies. Chinese PC maker Lenovo Group posted stronger-than-expected profits, with smartphone sales more than doubling. Among other Asian technology stocks, Apple chip supplier Taiwan Semiconductor Manufacturing (TSMC) announced record quarterly earnings and unveiled plans to significantly increase its spending on advanced chip technology.
Several commodity-related stocks weighed on returns, however, with a few oil services companies and exploration and production firms sliding further. Brazilian commodity giant Vale fell as weak demand from China helped send iron ore prices lower and the firm reported sluggish profits. Among consumer discretionary stocks, several Hong Kong–listed casinos fell further as gambling revenue in Macau declined, hampered by China’s anticorruption campaign.
Investments in local bonds also held back gains. Local debt investments in Brazil, Mexico and Turkey lost value, with currency depreciation weighing heavily on returns. Greek bonds also fell sharply amid renewed concerns that the country might default on its debt obligations.
Outlook
The global economy still seems to be finding its footing while facing a number of crosscurrents: Countries around the world are at varying phases of the business cycle and responding differently to deflation, weaker commodity prices and U.S. dollar strength. The timing of a U.S. interest rate hike remains uncertain, though an increase seems likely later in the year.
Globally, central banks seem to be leaning toward more accommodative policies, which should help support growth in several developed and developing economies. Europe has embarked on a new quantitative easing program and China’s government appears committed to providing targeted stimulus measures and interest rate cuts to help maintain modest economic growth. China and several other Asian countries also seem dedicated to carrying out longer term reforms. Overall, the portfolio remains poised for moderate economic growth, with a focus on select companies and fixed-income markets that appear to be supported by strong fundamentals combined with gradually improving macroeconomic conditions.
About half of total portfolio assets are invested in equities, with an emphasis on stocks that are likely to benefit from increased consumer demand for a wide variety of products and services in Asia. More than 17% of the portfolio’s total assets are invested in consumer and financial stocks combined. The portfolio also emphasizes industrial companies that should reap the rewards of demand in niche areas and supportive policy measures. From a country perspective, investments in China and Hong Kong continue to make up a significant portion of assets at 15% of the portfolio. Managers take a company-specific approach to investing in China across industries, from consumer goods and financial services to industrials and utilities firms that should be helped by a shift toward more environmentally friendly policies.
More broadly, the portfolio has exposure to equity and fixed-income investments in about 50 countries, offering a diverse opportunity set. Divergent policy responses and country fundamentals are likely to result in significant differences in currency movements, valuations and spreads. Managers are finding attractive opportunities in higher yielding local debt markets that should be supported by improving fundamentals such as India and Indonesia. Investments in India make up a significant portion of the portfolio. About 5% of the fund’s assets are invested in Indian local bonds — the largest single holding in the portfolio. In hard currency debt, managers tend to favor bonds offering higher yields and wider spreads compared to U.S. Treasuries.
In general, managers expect equity market volatility to stay relatively subdued as many central banks are leaning toward accommodative policies and inflation remains low. They remain flexible and ready to take advantage of new investment opportunities. We look forward to reporting to you again in another six months.
Sincerely,

John S. Armour
President
June 17, 2015
| 4 | Capital Group Emerging Markets Total Opportunities Fund |
| Investment portfolio April 30, 2015 | unaudited |
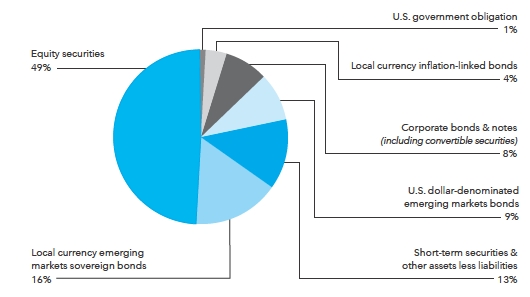
Sector diversification
| Equity securities | Bonds & notes | Percent of net assets | ||||||||||
| Government | — | % | 29.9 | % | 29.9 | % | ||||||
| Industrials | 7.8 | 0.5 | 8.3 | |||||||||
| Energy | 4.5 | 3.2 | 7.7 | |||||||||
| Information technology | 6.8 | 0.3 | 7.1 | |||||||||
| Consumer discretionary | 5.9 | 1.1 | 7.0 | |||||||||
| Financials | 5.9 | 0.6 | 6.5 | |||||||||
| Materials | 5.8 | 0.7 | 6.5 | |||||||||
| Telecommunication services | 4.7 | 1.3 | 6.0 | |||||||||
| Consumer staples | 4.0 | — | 4.0 | |||||||||
| Utilities | 2.1 | 0.2 | 2.3 | |||||||||
| Health care | 1.3 | — | 1.3 | |||||||||
| 48.8 | % | 37.8 | % | 86.6 | ||||||||
| Short-term securities | 12.9 | |||||||||||
| Other assets less liabilities (including forward currency contracts) | 0.5 | |||||||||||
| Net assets | 100.0 | % | ||||||||||
| Equity securities | Shares | Value (000) | ||||||
| Asia-Pacific 29.6% | ||||||||
| China 11.2% | ||||||||
| Anhui Conch Cement Co., Ltd. (Hong Kong) | 310,000 | $ | 1,259 | |||||
| Bank of China Ltd. (Hong Kong) | 5,152,511 | 3,539 | ||||||
| Beijing Enterprises Holdings Ltd. (Hong Kong) | 303,500 | 2,776 | ||||||
| Boer Power Holdings Ltd. (Hong Kong) | 975,000 | 1,881 | ||||||
| China Everbright International Ltd. (Hong Kong) | 2,804,000 | 5,246 | ||||||
| China Mengniu Dairy Co. (Hong Kong) | 81,653 | 415 | ||||||
| China Modern Dairy Holdings Ltd. (Hong Kong)1 | 2,506,000 | 1,023 | ||||||
| China Pacific Insurance (Group) Co., Ltd. (Hong Kong) | 170,800 | 931 | ||||||
| China Resources Land Ltd. (Hong Kong) | 156,888 | 571 | ||||||
| China Unicom Ltd. (Hong Kong)1 | 1,192,000 | 2,239 | ||||||
| First Tractor Co. Ltd. (Hong Kong) | 108,000 | 97 | ||||||
| Haitian International Holdings Ltd. (Hong Kong) | 1,137,000 | 2,833 | ||||||
| Honghua Group Ltd. (Hong Kong) | 2,820,000 | 388 | ||||||
| Huaneng Power International, Inc. (Hong Kong) | 1,364,000 | 1,934 | ||||||
| Industrial and Commercial Bank of China Ltd. (Hong Kong) | 1,237,000 | 1,075 | ||||||
| Lenovo Group Ltd. (Hong Kong) | 2,222,000 | 3,834 | ||||||
| Minth Group Ltd. (Hong Kong) | 2,444,000 | 6,130 | ||||||
| Nine Dragons Paper (Holdings) Ltd. (Hong Kong) | 1,210,000 | 987 | ||||||
| Shanghai Pharmaceutical (Group) Co., Ltd. (Hong Kong) | 688,900 | 2,149 | ||||||
| Zhuzhou CSR Times Electric Co., Ltd. (Hong Kong) | 455,500 | 3,881 | ||||||
| 43,188 | ||||||||
| Capital Group Emerging Markets Total Opportunities Fund | 5 |
| Equity securities (continued) | Shares | Value (000) | ||||||
| Asia-Pacific (continued) | ||||||||
| Hong Kong 3.5% | ||||||||
| AIA Group Ltd. | 350,200 | $ | 2,338 | |||||
| Chow Sang Sang Holdings International Ltd. | 1,150,000 | 2,648 | ||||||
| Hilong Holding Ltd. | 4,575,000 | 1,729 | ||||||
| HKT Trust and HKT Ltd., units | 3,351,840 | 4,485 | ||||||
| Melco Crown Entertainment Ltd. (ADR) | 12,600 | 257 | ||||||
| MGM China Holdings Ltd. | 459,200 | 868 | ||||||
| Wynn Macau, Ltd. | 543,200 | 1,101 | ||||||
| 13,426 | ||||||||
| India 4.1% | ||||||||
| Bharti Airtel Ltd. | 799,963 | 4,790 | ||||||
| Blue Dart Express Ltd. | 11,190 | 1,013 | ||||||
| ICICI Bank Ltd. | 262,150 | 1,363 | ||||||
| Infosys Ltd. | 101,618 | 3,110 | ||||||
| ITC Ltd. | 70,000 | 355 | ||||||
| Larsen & Toubro Ltd. | 5,430 | 139 | ||||||
| Steel Authority of India Ltd. | 1,199,209 | 1,310 | ||||||
| Sun Pharmaceutical Industries Ltd. | 33,302 | 491 | ||||||
| Tech Mahindra Ltd. | 163,732 | 1,601 | ||||||
| Thermax Ltd. | 101,754 | 1,571 | ||||||
| 15,743 | ||||||||
| Malaysia 1.4% | ||||||||
| Bumi Armada Bhd. | 4,031,100 | 1,342 | ||||||
| Genting Bhd | 679,700 | 1,669 | ||||||
| Genting Bhd, warrants, expire 20181 | 228,825 | 119 | ||||||
| IJM Corp. Bhd. | 1,138,300 | 2,343 | ||||||
| 5,473 | ||||||||
| Philippines 0.5% | ||||||||
| Ayala Land, Inc. | 2,437,500 | 2,113 | ||||||
| Singapore 0.7% | ||||||||
| KrisEnergy Ltd.1 | 896,000 | 360 | ||||||
| Mapletree Greater China Commercial Trust | 2,391,100 | 1,913 | ||||||
| Singapore Telecommunications Ltd. | 187,000 | 625 | ||||||
| 2,898 | ||||||||
| South Korea 3.1% | ||||||||
| HYUNDAI MOBIS Co., Ltd. | 6,118 | 1,343 | ||||||
| Hyundai Motor Co. | 23,160 | 3,635 | ||||||
| LG Uplus Corp. | 182,634 | 1,827 | ||||||
| Orion Corp. | 2,115 | 2,469 | ||||||
| Samsung Electronics Co., Ltd. | 1,868 | 2,450 | ||||||
| SK Telecom Co., Ltd. | 1,615 | 432 | ||||||
| 12,156 | ||||||||
| Taiwan 4.5% | ||||||||
| AirTAC International Group | 269,290 | 2,201 | ||||||
| ASUSTeK Computer Inc. | 32,820 | 348 | ||||||
| CTCI Corp. | 819,000 | 1,440 | ||||||
| 6 | Capital Group Emerging Markets Total Opportunities Fund |
| Value | ||||||||
| Shares | (000) | |||||||
| Asia-Pacific (continued) | ||||||||
| Taiwan (continued) | ||||||||
| Delta Electronics, Inc. | 657,000 | $ | 3,950 | |||||
| Taiwan Cement Corp. | 1,114,000 | 1,583 | ||||||
| Taiwan Semiconductor Manufacturing Co., Ltd. | 1,591,000 | 7,681 | ||||||
| 17,203 | ||||||||
| Thailand 0.6% | ||||||||
| Bangkok Bank PCL, nonvoting depository receipt | 320,100 | 1,793 | ||||||
| Glow Energy PCL | 143,700 | 371 | ||||||
| 2,164 | ||||||||
| Total Asia-Pacific | 114,364 | |||||||
| Latin America 3.9% | ||||||||
| Argentina 0.5% | ||||||||
| YPF Sociedad Anónima, Class D (ADR) | 65,300 | 1,994 | ||||||
| Brazil 0.9% | ||||||||
| Gerdau SA (ADR) | 56,900 | 191 | ||||||
| Hypermarcas SA, ordinary nominative1 | 182,600 | 1,205 | ||||||
| TIM Participacoes SA, ordinary nominative | 72,300 | 232 | ||||||
| Usinas Siderúrgicas de Minas Gerais SA – Usiminas, Class A, preferred nominative | 77,700 | 154 | ||||||
| Vale SA, Class A, preferred nominative (ADR) | 52,900 | 320 | ||||||
| Vale SA, ordinary nominative | 132,000 | 992 | ||||||
| Vale SA, ordinary nominative (ADR) | 43,600 | 335 | ||||||
| 3,429 | ||||||||
| Chile 0.8% | ||||||||
| Enersis SA (ADR) | 82,600 | 1,468 | ||||||
| Inversiones La Construccion SA | 121,318 | 1,553 | ||||||
| 3,021 | ||||||||
| Mexico 1.7% | ||||||||
| CEMEX, SAB de CV, ordinary participation certificates, units (ADR)1 | 392,757 | 3,778 | ||||||
| Fibra Uno Administracion, SA de CV | 150,700 | 376 | ||||||
| Grupo Comercial Chedraui, SAB de CV, Class B | 87,100 | 261 | ||||||
| Grupo Sanborns, SAB de CV, Series B1 | 551,600 | 882 | ||||||
| Impulsora del Desarrollo y el Empleo en América Latina, SA de CV, Series B11 | 673,100 | 1,483 | ||||||
| 6,780 | ||||||||
| Total Latin America | 15,224 | |||||||
| Eastern Europe and Middle East 2.6% | ||||||||
| Greece 0.4% | ||||||||
| Titan Cement Co. SA | 57,292 | 1,444 | ||||||
| Oman 0.2% | ||||||||
| bank muscat SAOG | 661,559 | 909 | ||||||
| Russia 0.8% | ||||||||
| Alrosa OJSC | 1,655,029 | 2,196 | ||||||
| Globaltrans Investment PLC (GDR)1 | 37,548 | 188 | ||||||
| MegaFon OJSC (GDR) | 42,502 | 722 | ||||||
| 3,106 | ||||||||
| Capital Group Emerging Markets Total Opportunities Fund | 7 |
| Equity securities (continued) | Shares | Value (000) | ||||||
| Eastern Europe and Middle East (continued) | ||||||||
| Saudi Arabia 0.6% | ||||||||
| Saudi Basic Industries Corp., warrants, expire 20162 | 69,300 | $ | 2,008 | |||||
| Savola Group Co., warrants, expire 20172 | 16,700 | 346 | ||||||
| 2,354 | ||||||||
| United Arab Emirates 0.6% | ||||||||
| DP World Ltd. | 98,852 | 2,281 | ||||||
| Total Eastern Europe and Middle East | 10,094 | |||||||
| Africa 0.1% | ||||||||
| South Africa 0.1% | ||||||||
| Discovery Ltd. | 28,440 | 315 | ||||||
| Other markets 7.7% | ||||||||
| Australia 0.4% | ||||||||
| Oil Search Ltd. | 256,206 | 1,632 | ||||||
| Austria 0.3% | ||||||||
| Vienna Insurance Group AG | 25,079 | 999 | ||||||
| Canada 1.0% | ||||||||
| Centerra Gold Inc. | 72,000 | 372 | ||||||
| First Quantum Minerals Ltd. | 231,100 | 3,540 | ||||||
| 3,912 | ||||||||
| Italy 0.4% | ||||||||
| Tenaris SA (ADR) | 43,643 | 1,342 | ||||||
| Netherlands 0.8% | ||||||||
| Unilever NV, depository receipts | 73,810 | 3,213 | ||||||
| Norway 0.7% | ||||||||
| BW LPG Ltd. | 300,318 | 2,658 | ||||||
| United Kingdom 1.5% | ||||||||
| Glencore PLC1 | 34,200 | 163 | ||||||
| Global Ports Investments PLC (GDR) | 111,647 | 776 | ||||||
| Imperial Tobacco Group PLC | 12,646 | 618 | ||||||
| Ophir Energy PLC1 | 44,383 | 97 | ||||||
| SABMiller PLC | 58,000 | 3,073 | ||||||
| Unilever PLC | 23,400 | 1,028 | ||||||
| 5,755 | ||||||||
| United States of America 2.6% | ||||||||
| AES Corp. | 297,500 | 3,942 | ||||||
| Arcos Dorados Holdings, Inc., Class A | 175,900 | 1,055 | ||||||
| Cobalt International Energy, Inc.1 | 248,900 | 2,663 | ||||||
| Ensco PLC, Class A | 81,700 | 2,229 | ||||||
| Xoom Corp.1 | 13,900 | 246 | ||||||
| 10,135 | ||||||||
| Total other markets | 29,646 | |||||||
| 8 | Capital Group Emerging Markets Total Opportunities Fund |
| Value | ||||||||
| (000) | ||||||||
| Miscellaneous 4.9% | ||||||||
| Other equity securities in initial period of acquisition | $ | 18,981 | ||||||
| Total equity securities (cost: $167,876,000) | 188,624 | |||||||
| Bonds & notes | Principal amount (000) | |||||||
| Latin America 15.1% | ||||||||
| Argentina 2.6% | ||||||||
| Argentina (Republic of) 7.00% 2015 – 2017 | $ | 7,328 | 7,070 | |||||
| City of Buenos Aires Argentina 8.95% 20212,3 | 500 | 536 | ||||||
| YPF Sociedad Anónima 8.50% 20252 | 2,280 | 2,318 | ||||||
| 9,924 | ||||||||
| Brazil 2.7% | ||||||||
| Banco Votorantim SA, 6.25% 20164 | BRL | 1,000 | 406 | |||||
| Brazil (Federal Republic of): | ||||||||
| Series B, 6.00% 2018 – 20504 | 1 | 4,285 | ||||||
| Series F, 10.00% 2025 | 1 | 226 | ||||||
| Brazil (Federal Republic of) Global 4.875% 2021 | $ | 850 | 913 | |||||
| Cosan Luxembourg, SA 9.50% 2018 | BRL | 500 | 141 | |||||
| Odebrecht Offshore Drilling Finance Ltd. 6.75% 20222,3 | $ | 646 | 559 | |||||
| Petrobras Global Finance Co.: | ||||||||
| 3.00% 2019 | 1,230 | 1,152 | ||||||
| 4.375% 2023 | 40 | 36 | ||||||
| 6.25% 2024 | 2,365 | 2,366 | ||||||
| Petrobras International Finance Co.: | ||||||||
| 3.875% 2016 | 190 | 191 | ||||||
| 7.875% 2019 | 345 | 376 | ||||||
| 10,651 | ||||||||
| Chile 0.4% | ||||||||
| Chilean Government: | ||||||||
| 3.00% 2018 – 20234 | CLP | 27,500 | 1,204 | |||||
| Emgesa SA ESP 8.75% 2021 | COP | 598,000 | 273 | |||||
| 1,477 | ||||||||
| Colombia 1.2% | ||||||||
| Colombia (Republic of): | ||||||||
| Series B, 5.00% 2018 | 6,330,000 | 2,655 | ||||||
| Series B, 10.00% 2024 | 1,240,000 | 636 | ||||||
| Series B, 6.00% 2028 | 250,000 | 94 | ||||||
| Colombia (Republic of) Global 7.375% 2017 | $ | 940 | 1,042 | |||||
| Financiera de Desarrollo Territorial 7.875% 2024 | COP | 318,000 | 136 | |||||
| 4,563 | ||||||||
| Dominican Republic 0.5% | ||||||||
| Dominican Republic: | ||||||||
| 5.50% 20252 | $ | 1,573 | 1,632 | |||||
| 7.45% 2044 | 175 | 198 | ||||||
| 1,830 | ||||||||
| Capital Group Emerging Markets Total Opportunities Fund | 9 |
| Bonds & notes (continued) | Principal amount (000) | Value (000) | ||||||
| Latin America (continued) | ||||||||
| Mexico 6.7% | ||||||||
| América Móvil, SAB de CV: | ||||||||
| 2.375% 2016 | $ | 300 | $ | 305 | ||||
| 7.125% 2024 | MXN | 3,000 | 195 | |||||
| BBVA Bancomer SA 6.50% 2021 | $ | 295 | 328 | |||||
| Elementia SA de CV 5.50% 20252 | 200 | 200 | ||||||
| Petróleos Mexicanos: | ||||||||
| 3.50% 20202 | 3,070 | 3,147 | ||||||
| 4.50% 20262 | 1,847 | 1,879 | ||||||
| 7.47% 2026 | MXN | 4,600 | 289 | |||||
| Red de Carreteras de Occidente 9.00% 20283 | 15,500 | 992 | ||||||
| United Mexican States Government: | ||||||||
| 4.00% 2019 – 20404 | 732 | 5,235 | ||||||
| Series M, 8.00% 2020 | 441 | 3,228 | ||||||
| Series M20, 10.00% 2024 | 447 | 3,781 | ||||||
| 4.50% 20254 | 513 | 3,844 | ||||||
| United Mexican States Government Global: | ||||||||
| 3.60% 2025 | $ | 200 | 204 | |||||
| Series A, 6.05% 2040 | 566 | 688 | ||||||
| 5.55% 2045 | 390 | 447 | ||||||
| 4.60% 2046 | 389 | 389 | ||||||
| Urbi Desarrollos Urbanos SA de CV: | ||||||||
| 8.50% 20165 | 1,425 | 171 | ||||||
| 8.50% 20162,5 | 560 | 67 | ||||||
| 9.50% 20205 | 2,400 | 288 | ||||||
| 9.50% 20202,5 | 230 | 27 | ||||||
| 9.75% 20225 | 990 | 119 | ||||||
| 9.75% 20222,5 | 1,655 | 199 | ||||||
| 26,022 | ||||||||
| Panama 0.2% | ||||||||
| ENA Norte Trust: | ||||||||
| 4.95% 20283 | 498 | 518 | ||||||
| 4.95% 20282,3 | 222 | 232 | ||||||
| 750 | ||||||||
| Peru 0.7% | ||||||||
| Banco de Credito del Peru 6.875% 2026 | 950 | 1,089 | ||||||
| Peru (Republic of): | ||||||||
| 8.375% 2016 | 374 | 403 | ||||||
| 6.95% 2031 | PEN | 2,955 | 979 | |||||
| 5.625% 2050 | $ | 140 | 169 | |||||
| 2,640 | ||||||||
| Uruguay 0.1% | ||||||||
| Uruguay (Republic of) 4.375% 20283,4 | UYU | 9,625 | 368 | |||||
| Total Latin America | 58,225 | |||||||
| Asia-Pacific 9.3% | ||||||||
| Hong Kong 0.3% | ||||||||
| Wynn Macau, Ltd. 5.25% 20212 | $ | 1,300 | 1,225 | |||||
| 10 | Capital Group Emerging Markets Total Opportunities Fund |
| Principal amount (000) | Value (000) | |||||||
| Asia-Pacific (continued) | ||||||||
| India 5.4% | ||||||||
| India (Republic of): | ||||||||
| 7.28% 2019 | INR | 310,000 | $ | 4,819 | ||||
| 8.83% 2023 | 630,000 | 10,501 | ||||||
| 9.15% 2024 | 180,000 | 3,093 | ||||||
| 8.60% 2028 | 90,000 | 1,512 | ||||||
| 9.20% 2030 | 52,300 | 928 | ||||||
| 20,853 | ||||||||
| Indonesia 2.7% | ||||||||
| Indonesia (Republic of): | ||||||||
| 5.875% 2020 | $ | 320 | 364 | |||||
| 3.75% 2022 | 500 | 512 | ||||||
| Series FR70, 8.375% 2024 | IDR | 25,000,000 | 2,018 | |||||
| 4.125% 20252 | $ | 1,900 | 1,945 | |||||
| Series FR71, 9.00% 2029 | IDR | 11,000,000 | 930 | |||||
| Series FR68, 8.375% 2034 | 55,910,000 | 4,475 | ||||||
| Series FR67, 8.75% 2044 | 2,100,000 | 175 | ||||||
| 10,419 | ||||||||
| Malaysia 0.7% | ||||||||
| Malaysian Government: | ||||||||
| Series 0310, 4.498% 2030 | MYR | 8,700 | 2,569 | |||||
| Series 0413, 3.844% 2033 | 475 | 128 | ||||||
| 2,697 | ||||||||
| Philippines 0.1% | ||||||||
| Philippines (Republic of) 4.95% 2021 | PHP | 11,000 | 263 | |||||
| South Korea 0.1% | ||||||||
| Export-Import Bank of Korea 1.121% 20166 | $ | 270 | 271 | |||||
| Total Asia-Pacific | 35,728 | |||||||
| Eastern Europe and Middle East 6.9% | ||||||||
| Greece 2.1% | ||||||||
| Greek Government: | ||||||||
| 4.75% 2019 | EUR | 690 | 570 | |||||
| 3.00%/3.65% 2023–20427 | 12,020 | 7,377 | ||||||
| 7,947 | ||||||||
| Hungary 1.2% | ||||||||
| Hungarian Government: | ||||||||
| 4.125% 2018 | $ | 180 | 189 | |||||
| 4.00% 2019 | 400 | 419 | ||||||
| 6.25% 2020 | 405 | 465 | ||||||
| 5.75% 2023 | 2,770 | 3,197 | ||||||
| 5.375% 2024 | 144 | 162 | ||||||
| Series 25B, 5.50% 2025 | HUF | 34,000 | 147 | |||||
| 4,579 | ||||||||
| Iraq 0.0% | ||||||||
| Iraq (Republic of) 5.80% 20283 | $ | 250 | 217 | |||||
| Capital Group Emerging Markets Total Opportunities Fund | 11 |
| Bonds & notes (continued) | Principal amount (000) | Value (000) | ||||||
| Eastern Europe and Middle East (continued) | ||||||||
| Oman 0.0% | ||||||||
| bank muscat SAOG 3.50% convertible 2018 | OMR | 1,008 | $ | 26 | ||||
| bank muscat SAOG 4.50% convertible 2017 | 139 | 38 | ||||||
| 64 | ||||||||
| Russia 0.7% | ||||||||
| Alrosa Finance SA 7.75% 2020 | $ | 1,360 | 1,418 | |||||
| Yandex NV, convertible bond, 1.125% 2018 | 1,337 | 1,175 | ||||||
| 2,593 | ||||||||
| Slovenia 1.0% | ||||||||
| Slovenia (Republic of): | ||||||||
| 4.125% 2019 | 1,820 | 1,932 | ||||||
| 5.50% 2022 | 1,795 | 2,078 | ||||||
| 4,010 | ||||||||
| Turkey 1.8% | ||||||||
| Turkey (Republic of): | ||||||||
| 9.00% 2016 – 2024 | TRY | 10,600 | 3,956 | |||||
| 7.10% 2023 | 6,530 | 2,158 | ||||||
| 4.25% 2026 | $ | 1,010 | 983 | |||||
| 7,097 | ||||||||
| United Arab Emirates 0.1% | ||||||||
| Abu Dhabi National Energy Co. PJSC (TAQA) 4.125% 2017 | 300 | 314 | ||||||
| Total Eastern Europe and Middle East | 26,821 | |||||||
| Africa 3.1% | ||||||||
| Cote d’lvoire 0.0% | ||||||||
| Ivory Coast Government 6.375% 20282,3 | 200 | 202 | ||||||
| Ethiopia 0.6% | ||||||||
| Ethiopia (Republic of): | ||||||||
| 6.625% 2024 | 200 | 203 | ||||||
| 6.625% 20242 | 1,910 | 1,941 | ||||||
| 2,144 | ||||||||
| Ghana 0.6% | ||||||||
| Ghana Government Bond: | ||||||||
| 16.90% 2016 | GHS | 590 | 146 | |||||
| 25.48% 2017 | 290 | 81 | ||||||
| 26.00% 2017 | 165 | 46 | ||||||
| 25.40% 2017 | 130 | 37 | ||||||
| 23.00% 2017 | 470 | 126 | ||||||
| 21.00% 2020 | 245 | 62 | ||||||
| Ghana (Republic of): | ||||||||
| 7.875% 2023 | $ | 210 | 204 | |||||
| 8.125% 20262,3 | 1,570 | 1,523 | ||||||
| 2,225 | ||||||||
| Kenya 0.4% | ||||||||
| Kenya (Republic of) 6.875% 20242 | 1,450 | 1,537 | ||||||
| South Africa 1.2% | ||||||||
| South Africa (Republic of): | ||||||||
| Series R-2023, 7.75% 2023 | ZAR | 48,280 | 4,057 | |||||
| Series R-209, 6.25% 2036 | 3,917 | 257 | ||||||
| Series R-214, 6.50% 2041 | 6,200 | 410 | ||||||
| 4,724 | ||||||||
| 12 | Capital Group Emerging Markets Total Opportunities Fund |
| Principal amount (000) | Value (000) | |||||||
| Africa (continued) | ||||||||
| Zambia 0.3% | ||||||||
| Zambia (Republic of) 5.375% 2022 | $ | 1,400 | $ | 1,305 | ||||
| Total Africa | 12,137 | |||||||
| Other markets 3.4% | ||||||||
| Canada 0.3% | ||||||||
| First Quantum Minerals Ltd.: | ||||||||
| 6.75% 20202 | 810 | 758 | ||||||
| 7.25% 20222 | 400 | 374 | ||||||
| 1,132 | ||||||||
| Jamaica 0.6% | ||||||||
| Digicel Group Ltd.: | ||||||||
| 8.25% 2020 | 600 | 622 | ||||||
| 8.25% 20202 | 825 | 855 | ||||||
| 6.00% 2021 | 1,000 | 973 | ||||||
| 2,450 | ||||||||
| Sweden 0.3% | ||||||||
| Millicom International Cellular SA: | ||||||||
| 6.625% 2021 | 550 | 588 | ||||||
| 6.625% 20212 | 500 | 534 | ||||||
| 1,122 | ||||||||
| Switzerland 0.4% | ||||||||
| Dufry AG, convertible 2.00% 2015 | CHF | 1,400 | 1,354 | |||||
| United States of America 1.8% | ||||||||
| Arcos Dorados Holdings, Inc. 10.25% 20162 | BRL | 2,600 | 790 | |||||
| Ensco PLC 5.20% 2025 | $ | 95 | 98 | |||||
| Trilogy International Partners, LLC 10.25% 20162 | 1,000 | 976 | ||||||
| U.S. Treasury Note 1.625% 2019 | 5,022 | 5,074 | ||||||
| 6,938 | ||||||||
| Total other markets | 12,996 | |||||||
| Total bonds & notes (cost: $158,061,000) | 145,907 | |||||||
| Short-term securities | ||||||||
| Commercial paper 9.2% | ||||||||
| Abbott Laboratories 0.12% due 7/21/20152 | 5,000 | 4,999 | ||||||
| AstraZeneca PLC 0.12% due 5/20/20152 | 5,000 | 5,000 | ||||||
| BNP Paribas Finance Inc. 0.06% due 5/1/2015 | 8,800 | 8,800 | ||||||
| John Deere Capital Corp. 0.11% due 6/15/20152 | 5,100 | 5,099 | ||||||
| John Deere Financial Ltd. 0.10% due 5/7/20152 | 4,400 | 4,400 | ||||||
| General Electric Co. 0.08% due 5/1/2015 | 7,000 | 7,000 | ||||||
| Discount notes 3.7% | ||||||||
| Federal Home Loan Bank 0.075% due 5/8/2015 | 8,600 | 8,600 | ||||||
| Freddie Mac 0.115% due 8/28/2015 | 5,800 | 5,799 | ||||||
| Total short-term securities (cost: $49,695,000) | 49,697 | |||||||
| Capital Group Emerging Markets Total Opportunities Fund | 13 |
| Value | ||||
| (000) | ||||
| Total investment securities (cost: $375,632,000) | $ | 384,228 | ||
| Other assets less liabilities (including forward currency contracts) | 2,089 | |||
| Net assets | $ | 386,317 | ||
As permitted by U.S. Securities and Exchange Commission regulations, “Miscellaneous” securities include holdings in their first year of acquisition that have not previously been publicly disclosed.
Forward currency contracts — The fund has entered into the over-the-counter (“OTC”) forward currency contracts as shown in the following table. The average notional amount of open OTC forward currency contracts was $67,012,000 over the prior 12-month period.
| Unrealized | ||||||||||||
| (depreciation)/ | ||||||||||||
| Notional amount | appreciation | |||||||||||
| Receive | Deliver | at 4/30/2015 | ||||||||||
| Settlement date | Counterparty | (000) | (000) | (000) | ||||||||
| Sales: | ||||||||||||
| Australian dollars | 5/13/2015 | Credit Suisse First Boston | $359 | AUD468 | $(12 | ) | ||||||
| Brazilian reais | 5/8/2015 | Citibank N.A. | 531 | BRL1,656 | (18 | ) | ||||||
| Brazilian reais | 5/26/2015 | UBS AG | 2,387 | BRL7,359 | (36 | ) | ||||||
| Brazilian reais | 6/5/2015 | Citibank N.A. | 438 | BRL1,301 | 11 | |||||||
| Brazilian reais | 6/5/2015 | JPMorgan Chase | 2,129 | BRL6,479 | 4 | |||||||
| British pounds | 5/11/2015 | Citibank N.A. | 688 | GBP463 | (23 | ) | ||||||
| British pounds | 5/11/2015 | JPMorgan Chase | 2,211 | GBP1,497 | (86 | ) | ||||||
| British pounds | 5/13/2015 | Credit Suisse First Boston | 1,723 | GBP1,176 | (82 | ) | ||||||
| Colombian pesos | 5/8/2015 | Citibank N.A. | 210 | COP529,082 | (12 | ) | ||||||
| Euros | 5/8/2015 | Bank of America | 2,958 | EUR2,681 | (53 | ) | ||||||
| Euros | 5/8/2015 | Citibank N.A. | 69 | EUR65 | (4 | ) | ||||||
| Hungarian forints | 5/13/2015 | UBS AG | 73 | HUF20,361 | (3 | ) | ||||||
| Malaysian ringgits | 5/8/2015 | JPMorgan Chase | 1,019 | MYR3,706 | (21 | ) | ||||||
| Mexican pesos | 5/11–5/22/2015 | JPMorgan Chase | 1,859 | MXN28,277 | 17 | |||||||
| Mexican pesos | 5/15/2015 | JPMorgan Chase | 8,143 | MXN125,315 | (19 | ) | ||||||
| Mexican pesos | 5/20/2015 | Credit Suisse First Boston | 1,066 | MXN16,240 | 9 | |||||||
| New Taiwan dollars | 5/8–5/15/2015 | JPMorgan Chase | 2,081 | TWD64,955 | (40 | ) | ||||||
| New Taiwan dollars | 5/14/2015 | Bank of America | 2,428 | TWD75,890 | (49 | ) | ||||||
| Singapore dollars | 5/8/2015 | Citibank N.A. | 780 | SGD1,055 | (17 | ) | ||||||
| Singapore dollars | 5/13/2015 | UBS AG | 1,488 | SGD2,034 | (49 | ) | ||||||
| South Korean won | 5/8–5/11/2015 | Citibank N.A. | 7,537 | KRW8,207,321 | (118 | ) | ||||||
| South Korean won | 5/8/2015 | UBS AG | 439 | KRW476,592 | (6 | ) | ||||||
| Forward currency contracts — net | $(607 | ) | ||||||||||
| 1 | Security did not produce income during the last 12 months. |
| 2 | Acquired in a transaction exempt from registration under Rule 144A or section 4(2) of the Securities Act of 1933 (not including purchases of securities that were publicly offered in the primary local market but were not registered under U.S. securities laws). May be resold in the U.S. in transactions exempt from registration, normally to qualified institutional buyers. The total value of all such securities was $45,308,000, which represented 11.73% of the net assets of the fund. |
| 3 | Principal payments may be made periodically. Therefore, the effective maturity date may be earlier than the stated maturity date. |
| 4 | Index-linked bond whose principal amount moves with a government retail price index. |
| 5 | Scheduled interest and/or principal payment was not received. |
| 6 | Coupon rate may change periodically. |
| 7 | Step bond; coupon rate will increase at a later date. |
Key to abbreviations:
| ADR | — | American Depositary Receipts |
| GDR | — | Global Depositary Receipts |
| BRL | — | Brazilian reais |
| CHF | — | Swiss francs |
| CLP | — | Chilean pesos |
| COP | — | Colombian pesos |
| EUR | — | Euros |
| GHS | — | Ghanaian cedi |
| HUF | — | Hungarian forints |
| IDR | — | Indonesian rupiah |
| INR | — | Indian rupees |
| MXN | — | Mexican pesos |
| MYR | — | Malaysian ringgits |
| OMR | — | Omani rials |
| PEN | — | Peruvian nuevo soles |
| PHP | — | Philippine pesos |
| TRY | — | Turkish lira |
| UYU | — | Uruguayan pesos |
| ZAR | — | South African rand |
| See Notes to Financial Statements | ||
| 14 | Capital Group Emerging Markets Total Opportunities Fund |
| Statement of assets and liabilities | unaudited |
| at April 30, 2015 | (dollars in thousands, except per-share amounts) |
| Assets: | ||||||||
| Investment securities, at value (cost: $375,632) | $ | 384,228 | ||||||
| Cash | 200 | |||||||
| Cash denominated in non-U.S. currency (cost: $44) | 44 | |||||||
| Unrealized appreciation on open forward currency contracts | 41 | |||||||
| Receivables for: | ||||||||
| Sales of investments | $ | 859 | ||||||
| Dividends and interest | 2,450 | |||||||
| Non-U.S. taxes | 2 | |||||||
| Other | 52 | 3,363 | ||||||
| 387,876 | ||||||||
| Liabilities: | ||||||||
| Unrealized depreciation on open forward currency contracts | 648 | |||||||
| Payables for: | ||||||||
| Purchases of investments | 404 | |||||||
| Investment advisory services | 317 | |||||||
| Repurchases of fund’s shares | 21 | |||||||
| Non-U.S. taxes | 78 | |||||||
| Other accrued expenses | 91 | 911 | ||||||
| 1,559 | ||||||||
| Net assets at April 30, 2015: | ||||||||
| Equivalent to $11.25 per share on 34,332,930 shares of $0.01 par value capital stock outstanding (unlimited authorized shares) | $ | 386,317 | ||||||
| Net assets consist of: | ||||||||
| Capital paid in on shares of stock | $ | 383,556 | ||||||
| Undistributed net investment income | 2,663 | |||||||
| Accumulated net realized loss | (7,802 | ) | ||||||
| Net unrealized appreciation | 7,900 | |||||||
| Net assets at April 30, 2015 | $ | 386,317 |
See Notes to Financial Statements
| Capital Group Emerging Markets Total Opportunities Fund | 15 |
| Statement of operations for the six months ended April 30, 2015 | unaudited |
| (dollars in thousands) | |
| Investment income: | ||||||||
| Income: | ||||||||
| Interest (net of non-U.S. withholding tax of $112) | $ | 4,845 | ||||||
| Dividends (net of non-U.S. withholding tax of $56) | 1,134 | $ | 5,979 | |||||
| Fees and expenses: | ||||||||
| Investment advisory services | 1,943 | |||||||
| Custodian | 65 | |||||||
| Registration statement and prospectus | 15 | |||||||
| Auditing and legal | 38 | |||||||
| Reports to shareholders | 7 | |||||||
| Trustees’ compensation | 24 | |||||||
| Other | 63 | |||||||
| Total fees and expenses before waiver | 2,155 | |||||||
| Less investment advisory services waiver | 16 | |||||||
| Total fees and expenses after waiver | 2,139 | |||||||
| Net investment income | 3,840 | |||||||
| Net realized loss and unrealized appreciation on investments, forward currency contracts and currency: | ||||||||
| Net realized (loss) gain on: | ||||||||
| Investments (net of non-U.S. taxes of $97) | (13,397 | ) | ||||||
| Forward currency contracts | 7,367 | |||||||
| Currency transactions | (338 | ) | (6,368 | ) | ||||
| Net unrealized appreciation (depreciation) on: | ||||||||
| Investments (net of non-U.S. taxes of $45) | 11,283 | |||||||
| Forward currency contracts | (1,396 | ) | ||||||
| Currency translations | 60 | 9,947 | ||||||
| Net realized loss and unrealized appreciation on investments, forward currency contracts and currency | 3,579 | |||||||
| Net increase in net assets resulting from operations | $ | 7,419 |
See Notes to Financial Statements
| 16 | Capital Group Emerging Markets Total Opportunities Fund |
Statements of changes in net assets
(dollars in thousands)
| Six months ended April 30, 2015* | Year ended October 31, 2014 | |||||||
| Operations: | ||||||||
| Net investment income | $ | 3,840 | $ | 12,624 | ||||
| Net realized (loss) gain on investments, forward currency contracts and currency transactions | (6,368 | ) | 2,888 | |||||
| Net unrealized appreciation (depreciation) on investments, forward currency contracts and currency translations | 9,947 | (25,711 | ) | |||||
| Net increase (decrease) in net assets resulting from operations | 7,419 | (10,199 | ) | |||||
| Dividends and distributions paid to shareholders: | ||||||||
| Dividends from net investment income | (1,556 | ) | (9,656 | ) | ||||
| Distributions from net realized gain on investments | (2,461 | ) | — | |||||
| Total dividends and distributions paid to shareholders | (4,017 | ) | (9,656 | ) | ||||
| Capital share transactions: | ||||||||
| Proceeds from shares sold: 1,296,323 and 8,160,725 shares, respectively | 14,076 | 92,891 | ||||||
| Proceeds from shares issued in reinvestment of net investment income dividends and net realized gain distributions: 354,594 and 781,023 shares, respectively | 3,784 | 8,669 | ||||||
| Cost of shares repurchased: 5,137,385 and 23,612,134 shares, respectively | (55,955 | ) | (264,867 | ) | ||||
| Net decrease in net assets resulting from capital share transactions | (38,095 | ) | (163,307 | ) | ||||
| Total decrease in net assets | (34,693 | ) | (183,162 | ) | ||||
| Net assets: | ||||||||
| Beginning of period | 421,010 | 604,172 | ||||||
| End of period (including undistributed net investment income: $2,663 and $379, respectively) | $ | 386,317 | $ | 421,010 | ||||
*Unaudited.
See Notes to Financial Statements
| Capital Group Emerging Markets Total Opportunities Fund | 17 |
| Notes to financial statements | unaudited |
1. Organization
Capital Group Emerging Markets Total Opportunities Fund (the “fund”) is registered under the Investment Company Act of 1940, as an open-end, diversified management investment company. The fund seeks long-term growth and preservation of capital with lower volatility of returns than emerging market equities.
2. Significant accounting policies
The fund is an investment company that applies the accounting and reporting guidance issued in Topic 946 by the U.S. Financial Accounting Standards Board. The fund’s financial statements have been prepared to comply with U.S. generally accepted accounting principles (“U.S. GAAP”).These principles require management to make estimates and assumptions that affect reported amounts and disclosures. Actual results could differ from those estimates. The fund follows the significant accounting policies described below, as well as the valuation policies described in the next section on valuation.
Security transactions and related investment income — Security transactions are recorded by the fund as of the date the trades are executed with brokers. Realized gains and losses from security transactions are determined based on the specific identified cost of the securities. In the event a security is purchased with a delayed payment date, the fund will segregate liquid assets sufficient to meet its payment obligations. Dividend income is recognized on the ex-dividend date and interest income is recognized on an accrual basis. Market discounts, premiums and original issue discounts on fixed-income securities are amortized daily over the expected life of the security.
Dividends and distributions to shareholders — Dividends and distributions to shareholders are recorded on the ex-dividend date.
Currency translation — Assets and liabilities, including investment securities, denominated in currencies other than U.S. dollars are translated into U.S. dollars at the exchange rates supplied by one or more pricing vendors on the valuation date. Purchases and sales of investment securities and income and expenses are translated into U.S. dollars at the exchange rates on the dates of such transactions. The effects of changes in exchange rates on investment securities are included with the net realized gain or loss and net unrealized appreciation or depreciation on investments on the fund’s statement of operations. The realized gain or loss and unrealized appreciation or depreciation resulting from all other transactions denominated in currencies other than U.S. dollars are disclosed separately.
3. Valuation
Capital Guardian Trust Company (“CGTC”), the fund’s investment adviser, values the fund’s investments at fair value as defined by U.S. GAAP. The net asset value of the fund is generally determined as of approximately 4:00 p.m. New York time each day the New York Stock Exchange is open.
Methods and inputs — The fund’s investment adviser uses the following methods and inputs to establish the fair value of the fund’s assets and liabilities. Use of particular methods and inputs may vary over time based on availability and relevance as market and economic conditions evolve.
Equity securities are generally valued at the official closing price of, or the last reported sale price on, the exchange or market on which such securities are traded, as of the close of business on the day the securities are being valued or, lacking any sales, at the last available bid price. Prices for each security are taken from the principal exchange or market on which the security trades.
Fixed-income securities, including short-term securities, are generally valued at prices obtained from one or more pricing vendors. Vendors value such securities based on one or more of the inputs described in the following table. The table provides examples of inputs that are commonly relevant for valuing particular classes of fixed-income securities in which the fund is authorized to invest. However, these classifications are not exclusive and any of the inputs may be used to value any other class of fixed-income security.
| 18 | Capital Group Emerging Markets Total Opportunities Fund |
| Fixed-income class | Examples of standard inputs |
| All | Benchmark yields, transactions, bids, offers, quotations from dealers and trading systems, new issues, spreads and other relationships observed in the markets among comparable securities; and proprietary pricing models such as yield measures calculated using factors such as cash flows, financial or collateral performance and other reference data (collectively referred to as “standard inputs”) |
| Corporate bonds & notes; convertible securities | Standard inputs and underlying equity of the issuer |
| Bonds & notes of governments & government agencies | Standard inputs and interest rate volatilities |
When the fund’s investment adviser deems it appropriate to do so (such as when vendor prices are unavailable or not deemed to be representative), fixed-income securities will be valued in good faith at the mean quoted bid and ask prices that are reasonably and timely available (or bid prices, if ask prices are not available) or at prices for securities of comparable maturity, quality and type.
Securities with both fixed-income and equity characteristics, or equity securities traded principally among fixed-income dealers, are generally valued in the manner described for either equity or fixed-income securities, depending on which method is deemed most appropriate by the fund’s investment adviser. Forward currency contracts are valued at the mean of representative quoted bid and ask prices, generally based on prices supplied by one or more pricing vendors.
Securities and other assets for which representative market quotations are not readily available or are considered unreliable by the fund’s investment adviser are fair valued as determined in good faith under fair valuation guidelines adopted by authority of the fund’s board of trustees as further described. The investment adviser follows fair valuation guidelines, consistent with U.S. Securities and Exchange Commission rules and guidance, to consider relevant principles and factors when making fair value determinations. The investment adviser considers relevant indications of value that are reasonably and timely available to it in determining the fair value to be assigned to a particular security, such as the type and cost of the security; contractual or legal restrictions on resale of the security; relevant financial or business developments of the issuer; actively traded similar or related securities; conversion or exchange rights on the security; related corporate actions; significant events occurring after the close of trading in the security; and changes in overall market conditions. In addition, the closing prices of equity securities that trade in markets outside U.S. time zones may be adjusted to reflect significant events that occur after the close of local trading but before the net asset value of the fund is determined. Fair valuations and valuations of investments that are not actively trading involve judgment and may differ materially from valuations that would have been used had greater market activity occurred.
Processes and structure — The fund’s board of trustees has delegated authority to the fund’s investment adviser to make fair value determinations, subject to board oversight. The investment adviser has established a Joint Fair Valuation Committee (the “Fair Valuation Committee”) to administer, implement and oversee the fair valuation process, and to make fair value decisions. The Fair Valuation Committee regularly reviews its own fair value decisions, as well as decisions made under its standing instructions to the investment adviser’s valuation teams. The Fair Valuation Committee reviews changes in fair value measurements from period to period and may, as deemed appropriate, update the fair valuation guidelines to better reflect the results of back testing and address new or evolving issues. The Fair Valuation Committee reports any changes to the fair valuation guidelines to the board of trustees with supplemental information to support the changes. The fund’s board of trustees and audit committee also regularly review reports that describe fair value determinations and methods.
The fund’s investment adviser has also established a Fixed-Income Pricing Review Group to administer and oversee the fixed-income valuation process, including the use of fixed-income pricing vendors. This group regularly reviews pricing vendor information and market data. Pricing decisions, processes and controls over security valuation are also subject to additional internal reviews, including an annual control self-evaluation program facilitated by the investment adviser’s compliance group.
Classifications — The fund’s investment adviser classifies the fund’s assets and liabilities into three levels based on the inputs used to value the assets or liabilities. Level 1 values are based on quoted prices in active markets for identical securities. Level 2 values are based on significant observable market inputs, such as quoted prices for similar securities and quoted prices in inactive
| Capital Group Emerging Markets Total Opportunities Fund | 19 |
markets. Certain securities trading outside the U.S. may transfer between Level 1 and Level 2 due to valuation adjustments resulting from significant market movements following the close of local trading. Level 3 values are based on significant unobservable inputs that reflect the investment adviser’s determination of assumptions that market participants might reasonably use in valuing the securities. The valuation levels are not necessarily an indication of the risk or liquidity associated with the underlying investment. For example, U.S. government securities are reflected as Level 2 because the inputs used to determine fair value may not always be quoted prices in an active market. The following tables present the fund’s valuation levels as of April 30, 2015 (dollars in thousands):
| Investment securities | ||||||||||||||||
| Level 1 | Level 21,2 | Level 32 | Total | |||||||||||||
| Assets: | ||||||||||||||||
| Equity securities: | ||||||||||||||||
| Asia-Pacific | $ | 257 | $ | 114,107 | $ | — | $ | 114,364 | ||||||||
| Other markets | 30,614 | 24,665 | — | 55,279 | ||||||||||||
| Miscellaneous | 3,615 | 15,366 | — | 18,981 | ||||||||||||
| Bonds & notes: | ||||||||||||||||
| Latin America | — | 58,225 | — | 58,225 | ||||||||||||
| Asia-Pacific | — | 35,728 | — | 35,728 | ||||||||||||
| Eastern Europe and Middle East | — | 26,795 | 26 | 26,821 | ||||||||||||
| Other markets | — | 25,133 | — | 25,133 | ||||||||||||
| Short-term securities | — | 49,697 | — | 49,697 | ||||||||||||
| Total | $ | 34,486 | $ | 349,716 | $ | 26 | $ | 384,228 | ||||||||
| Other investments3 | ||||||||||||||||
| Level 1 | Level 2 | Level 3 | Total | |||||||||||||
| Assets: | ||||||||||||||||
| Unrealized appreciation on open forward currency contracts | $ | — | $ | 41 | $ | — | $ | 41 | ||||||||
| Liabilities: | ||||||||||||||||
| Unrealized depreciation on open forward currency contracts | — | (648 | ) | — | (648 | ) | ||||||||||
| Total | $ | — | $ | (607 | ) | $ | — | $ | (607 | ) | ||||||
| 1 | Securities with a value of $134,597,000, which represented 34.84% of the net assets of the fund, transferred from Level 1 to Level 2 since the prior fiscal year-end, primarily due to significant market movements following the close of local trading. |
| 2 | Level 2 and Level 3 include investment securities with an aggregate value of $154,164,000, which represented 39.91% of the net assets of the fund, that were fair valued under guidelines adopted by authority of the fund’s board of trustees. Of this amount, securities with an aggregate value of $151,784,000 were fair valued as a result of significant market movements following the close of local trading. |
| 3 | Forward currency contracts are not included in the investment portfolio. |
4. Risk factors
This section describes the principal risks associated with the fund’s principal investment strategies. You may lose money by investing in the fund. The likelihood of loss may be greater if you invest for a shorter period of time.
Market conditions — The prices of, and the income generated by, the securities held by the fund may decline – sometimes rapidly or unpredictably – due to various factors, including events or conditions affecting the general economy or particular industries; overall market changes; local, regional or global political, social or economic instability; governmental or governmental agency responses to economic conditions; and currency, interest rate and commodity price fluctuations.
Issuer risks — The prices of, and the income generated by, securities held by the fund may decline in response to various factors directly related to the issuers of such securities, including reduced demand for an issuer’s goods or services, poor management performance and strategic initiatives such as mergers, acquisitions or dispositions and the market response to any such initiatives.
Investing in growth-oriented stocks — Growth-oriented common stocks and other equity-type securities (such as preferred stocks, convertible preferred stocks and convertible bonds) may involve larger price swings and greater potential for loss than other types of investments. These risks may be even greater in the case of smaller capitalization stocks.
| 20 | Capital Group Emerging Markets Total Opportunities Fund |
Investing in income-oriented stocks — Income provided by the fund may be reduced by changes in the dividend policies of, and the capital resources available for dividend payments at, the companies in which the fund invests.
Investing outside the United States — Securities of issuers domiciled outside the United States, or with significant operations outside the United States, may lose value because of adverse political, social, economic or market developments (including social instability, regional conflicts, terrorism and war) in the countries or regions in which the issuers are domiciled or operate. These securities may also lose value due to changes in foreign currency exchange rates against the U.S. dollar and/or currencies of other countries. Securities markets in certain countries may be more volatile and/or less liquid than those in the United States. Investments outside the United States may also be subject to different accounting practices and different regulatory, legal and reporting standards and practices, and may be more difficult to value, than those in the United States. In addition, the value of investments outside the United States may be reduced by foreign taxes, including foreign withholding taxes on interest and dividends. Further, there may be increased risks of delayed settlement of securities purchased or sold by the fund. The risks of investing outside the United States may be heightened in connection with investments in emerging markets.
Investing in emerging markets — Investing in emerging markets may involve risks in addition to and greater than those generally associated with investing in the securities markets of developed countries. For instance, developing countries may have less developed legal and accounting systems than those in developed countries. The governments of these countries may be less stable and more likely to impose capital controls, nationalize a company or industry, place restrictions on foreign ownership and on withdrawing sale proceeds of securities from the country, and/or impose punitive taxes that could adversely affect the prices of securities. In addition, the economies of these countries may be dependent on relatively few industries that are more susceptible to local and global changes. Securities markets in these countries can also be relatively small and have substantially lower trading volumes. As a result, securities issued in these countries may be more volatile and less liquid, and may be more difficult to value, than securities issued in countries with more developed economies and/or markets. Less certainty with respect to security valuations may lead to additional challenges and risks in calculating the fund’s net asset value. Additionally, there may be increased settlement risks for transactions in local securities.
Investing in debt instruments — The prices of, and the income generated by, bonds and other debt securities held by the fund may be affected by changing interest rates and by changes in the effective maturities and credit ratings of these securities.
Rising interest rates will generally cause the prices of bonds and other debt securities to fall. Falling interest rates may cause an issuer to redeem, call or refinance a debt security before its stated maturity, which may result in the fund having to reinvest the proceeds in lower yielding securities. Longer maturity debt securities generally have greater sensitivity to changes in interest rates and may be subject to greater price fluctuations than shorter maturity debt securities.
Bonds and other debt securities are subject to credit risk, which is the possibility that the credit strength of an issuer will weaken and/or an issuer of a debt security will fail to make timely payments of principal or interest and the security will go into default. Credit risk is gauged, in part, by the credit ratings of the debt securities in which the fund invests. However, ratings are only the opinions of the rating agencies issuing them and are not guarantees as to credit quality or an evaluation of market risk. The fund’s investment adviser relies on its own credit analysts to research issuers and issues in seeking to mitigate various credit and default risks.
Investing in lower rated debt instruments — Lower rated bonds and other lower rated debt securities generally have higher rates of interest and involve greater risk of default or price declines due to changes in the issuer’s creditworthiness than those of higher quality debt securities. The market prices of these securities may fluctuate more than the prices of higher quality debt securities and may decline significantly in periods of general economic difficulty. These risks may be increased with respect to investments in junk bonds.
Thinly traded securities — There may be little trading in the secondary market for particular bonds or other debt securities, which may make them more difficult to value, acquire or sell.
Management — The investment adviser to the fund actively manages the fund’s investments. Consequently, the fund is subject to the risk that the methods and analyses employed by the investment adviser in this process may not produce the desired results. This could cause the fund to lose value or its investment results to lag relevant benchmarks or other funds with similar objectives.
| Capital Group Emerging Markets Total Opportunities Fund | 21 |
5. Certain investment techniques
Forward currency contracts — The fund has entered into OTC forward currency contracts, which represent agreements to exchange currencies on specific future dates at predetermined rates. The fund’s investment adviser uses forward currency contracts to manage the fund’s exposure to changes in exchange rates. Upon entering into these contracts, risks may arise from the potential inability of counterparties to meet the terms of their contracts and from possible movements in exchange rates.
On a daily basis, forward currency contracts are valued and unrealized appreciation or depreciation for open forward currency contracts is recorded in the fund’s statement of assets and liabilities. Realized gains or losses are recorded at the time the forward currency contract is closed or offset by another contract with the same broker for the same settlement date and currency. Closed forward currency contracts that have not reached their settlement date are included in the respective receivables or payables for closed forward currency contracts in the fund’s statement of assets and liabilities. Net realized gains or losses from closed forward currency contracts and net unrealized appreciation or depreciation from open forward currency contracts are recorded in the fund’s statement of operations and statements of changes in net assets.
Rights of offset — The fund has entered into enforceable master netting agreements with certain counterparties for forward currency contracts, where on any date amounts payable by each party to the other (in the same currency with respect to the same transaction) may be closed or offset by each party’s payment obligation. If an early termination date occurs under these agreements following an event of default or termination event, all obligations of each party to its counterparty are settled net through a single payment in a single currency (“close-out netting”). For financial reporting purposes, the fund does not offset the financial assets and financial liabilities that are subject to these master netting arrangements in the statement of assets and liabilities.
The following table presents the fund’s forward currency contracts by counterparty that are subject to master netting agreements but that are not offset in the fund’s statement of assets and liabilities. The net amount column shows the impact of offsetting on the fund’s statement of assets and liabilities as of April 30, 2015 (dollars in thousands) if close-out netting was exercised:
| Gross amounts not offset in the | |||||||||||||||||||||||||||
| statement of assets and liabilities and | |||||||||||||||||||||||||||
| subject to a master netting agreement | |||||||||||||||||||||||||||
| Gross amounts | |||||||||||||||||||||||||||
| recognized in the | |||||||||||||||||||||||||||
| statement of assets | Available | Non-cash | Cash | Net | |||||||||||||||||||||||
| Counterparty | and liabilities | to offset | collateral* | collateral | amount | ||||||||||||||||||||||
| Assets: | |||||||||||||||||||||||||||
| Citibank N.A. | $ | 11 | $ | (11 | ) | $ | — | $ | — | $ | — | ||||||||||||||||
| Credit Suisse First Boston | 9 | (9 | ) | — | — | — | |||||||||||||||||||||
| JPMorgan Chase | 21 | (21 | ) | — | — | — | |||||||||||||||||||||
| $ | 41 | $ | (41 | ) | $ | — | $ | — | $ | — | |||||||||||||||||
| Liabilities: | |||||||||||||||||||||||||||
| Bank of America | $ | (102 | ) | $ | — | $ | — | $ | — | $ | (102 | ) | |||||||||||||||
| Citibank N.A. | (192 | ) | 11 | — | — | (181 | ) | ||||||||||||||||||||
| Credit Suisse First Boston | (94 | ) | 9 | — | — | (85 | ) | ||||||||||||||||||||
| JPMorgan Chase | (166 | ) | 21 | — | — | (145 | ) | ||||||||||||||||||||
| UBS AG | (94 | ) | — | — | — | (94 | ) | ||||||||||||||||||||
| $ | (648 | ) | $ | 41 | $ | — | $ | — | $ | (607 | ) | ||||||||||||||||
*Non-cash collateral is shown on a settlement basis.
| 22 | Capital Group Emerging Markets Total Opportunities Fund |
6. Taxation and distributions
Federal income taxation — The fund complies with the requirements under Subchapter M of the Internal Revenue Code applicable to regulated investment companies and intends to distribute substantially all of its net taxable income and net capital gains each year. The fund is not subject to income taxes to the extent such distributions are made. Therefore, no federal income tax provision is required.
As of and during the period ended April 30, 2015, the fund did not have a liability for any unrecognized tax benefits. The fund recognizes interest and penalties, if any, related to unrecognized tax benefits as income tax expense in the statement of operations. During the period, the fund did not incur any interest or penalties.
The fund is not subject to examination by U.S. federal tax authorities, by state tax authorities and by tax authorities outside the U.S. for tax years before 2012, the year the fund commenced operations.
Non-U.S. taxation — Dividend and interest income are recorded net of non-U.S. taxes paid. Gains realized by the fund on the sale of securities in certain countries are subject to non-U.S. taxes. The fund records a liability based on unrealized gains to provide for potential non-U.S. taxes payable upon the sale of these securities.
Distributions — Distributions paid to shareholders are based on net investment income and net realized gains determined on a tax basis, which may differ from net investment income and net realized gains for financial reporting purposes. These differences are due primarily to different treatment for items such as currency gains and losses; capital losses related to sales of certain securities within 30 days of purchase; net capital losses; short-term capital gains and losses; and cost of investments sold.
The fiscal year in which amounts are distributed may differ from the year in which the net investment income and net realized gains are recorded by the fund for financial reporting purposes. For the six months ended April 30, 2015, the tax character of distributions paid to shareholders were ordinary income and long-term capital gain in the amounts of $1,556,000 and $2,461,000, respectively. For the year ended October 31, 2014, the tax character of the distribution paid to shareholders was ordinary income in the amount of $9,656,000.
As of October 31, 2014, the tax basis components of distributable earnings were as follows (dollars in thousands):
| Undistributed ordinary income | $ | 379 | ||
| Undistributed long-term capital gain | 2,464 |
As of April 30, 2015, the tax basis unrealized appreciation (depreciation) and cost of investment securities were as follows (dollars in thousands):
| Gross unrealized appreciation on investment securities | $ | 39,026 | ||
| Gross unrealized depreciation on investment securities | (31,502 | ) | ||
| Net unrealized appreciation on investment securities | 7,524 | |||
| Cost of investment securities for federal income tax purposes | 376,704 | |||
| Capital Group Emerging Markets Total Opportunities Fund | 23 |
7. Fees and transactions with related parties
CGTC, the fund’s investment adviser, is wholly owned by Capital Group International, Inc., which is wholly owned by The Capital Group Companies, Inc. (“CGC”). Expense limitations have been imposed through December 31, 2015, to limit the fund’s total annual fund operating expenses to 1.10% (as a percentage of average daily net assets).
For the six months ended April 30, 2015, total investment advisory services fees waived by CGTC were $16,000. As a result, the fee of $1,943,000 shown on the statement of operations, which was equivalent to an annualized rate of 1.00%, was reduced to $1,927,000, or 0.99% of average daily net assets.
Investment advisory services — The fund has an investment advisory and service agreement with CGTC that provides for monthly fees accrued daily. The fee is 1.00% of the average daily net assets of the fund.
Distribution services — American Funds Distributors®, Inc. (“AFD”), an affiliate of CGC, is the principal underwriter of the fund’s shares. AFD does not receive any compensation related to the sale of shares of the fund.
Affiliated officers and trustees — Officers and certain trustees of the fund are or may be considered to be affiliated with CGTC and AFD. No affiliated officers or trustees received any compensation directly from the fund.
8. Investment transactions
The fund made purchases and sales of investment securities, excluding short term securities, of $101,334,000 and $123,438,000, respectively, during the six months ended April 30, 2015.
| 24 | Capital Group Emerging Markets Total Opportunities Fund |
Financial highlights
| For the | For the | For the | ||||||||||||||||||||||||||
| period | period | period | ||||||||||||||||||||||||||
| Six months | 1/27/123 | 1/1/12 | 3/1/105 | |||||||||||||||||||||||||
| ended | Year ended October 31 | through | through | Year ended | through | |||||||||||||||||||||||
| 4/30/151,2 | 2014 | 2013 | 10/31/122,4 | 1/26/122,4 | 12/31/114 | 12/31/102,4 | ||||||||||||||||||||||
| Net asset value, beginning of period | $11.13 | $11.51 | $11.58 | $11.02 | $10.45 | $11.12 | $10.00 | |||||||||||||||||||||
| Income (loss) from investment operations6: | ||||||||||||||||||||||||||||
| Net investment income | .11 | .29 | .32 | .35 | .03 | .52 | .45 | |||||||||||||||||||||
| Net realized and unrealized gain (loss) on investments | .12 | (.46 | ) | (.06 | ) | .21 | .54 | (1.19 | ) | .67 | ||||||||||||||||||
| Total from investment operations | .23 | (.17 | ) | .26 | .56 | .57 | (.67 | ) | 1.12 | |||||||||||||||||||
| Less dividends and distributions: | ||||||||||||||||||||||||||||
| Dividends from net investment income | (.04 | ) | (.21 | ) | (.33 | ) | — | — | — | — | ||||||||||||||||||
| Distributions from net realized gains | (.07 | ) | — | — | — | — | — | — | ||||||||||||||||||||
| Total dividends and distributions | (.11 | ) | (.21 | ) | (.33 | ) | — | — | — | — | ||||||||||||||||||
| Net asset value, end of period | $11.25 | $11.13 | $11.51 | $11.58 | $11.02 | $10.45 | $11.12 | |||||||||||||||||||||
| Total return7 | 2.13 | % | (1.50 | )% | 2.19 | % | 5.08 | % | 5.45 | % | (6.03 | )% | 11.20 | % | ||||||||||||||
| Ratios/Supplemental data: | ||||||||||||||||||||||||||||
| Net assets, end of period (in millions) | $386 | $421 | $604 | $518 | $387 | $381 | $282 | |||||||||||||||||||||
| Ratio of expenses to average net assets before reimbursements/waivers | 1.11 | %8 | 1.10 | % | 1.10 | % | 1.10 | %8 | .05 | %8 | .04 | % | .08 | %8 | ||||||||||||||
| Ratio of expenses to average net assets after reimbursements/waivers7 | 1.10 | %8 | 1.10 | % | 1.10 | % | 1.10 | %8 | .05 | %8 | .04 | % | .08 | %8 | ||||||||||||||
| Ratio of net investment income to average net assets7 | 1.98 | %8 | 2.52 | % | 2.74 | % | 4.11 | %8 | 3.95 | %8 | 4.78 | % | 5.07 | %8 | ||||||||||||||
| Portfolio turnover rate | 29.79 | %9 | 56.13 | % | 63.85 | % | 42.49 | % | 7.00 | % | 59.52 | %1 | 69.40 | %1 | ||||||||||||||
| 1 | Unaudited. |
| 2 | Based on operations for the period shown (unless otherwise noted) and, accordingly, may not be representative of a full year. |
| 3 | The fund commenced operations as a Registered Investment Company on January 27, 2012. |
| 4 | Capital Guardian Emerging Markets Total Opportunities Common Trust Fund (the Predecessor Fund) was reorganized into the Capital Group Emerging Markets Total Opportunities Fund effective January 27, 2012. In connection with the reorganization, the Predecessor Fund transferred all its assets and liabilities to the Capital Group Emerging Markets Total Opportunities Fund and changed its fiscal year-end from December 31 to October 31. |
| 5 | The Predecessor Fund commenced operations on March 1, 2010. |
| 6 | The per-share data is based on average shares outstanding. |
| 7 | This row reflects the impact, if any, of certain reimbursements/waivers from CGTC. For the six months ended April 30, 2015, CGTC reduced fees for investment advisory services. |
| 8 | Annualized. |
| 9 | Not annualized. |
| Capital Group Emerging Markets Total Opportunities Fund | 25 |
| Expense example | unaudited |
As a shareholder of the fund, you incur ongoing costs, including investment advisory services fees and other expenses. This example is intended to help you understand your ongoing costs (in dollars) of investing in the fund so you can compare these costs with the ongoing costs of investing in other mutual funds. The example is based on an investment of $1,000 invested at the beginning of the period and held for the entire period.
Actual expenses:
The first line of the table below provides information about actual account values and actual expenses. You may use the information in this line, together with the amount you invested, to estimate the expenses that you paid over the period. Simply divide your account value by $1,000 (for example, an $8,600 account value divided by $1,000 = 8.6), then multiply the result by the number in the first line under the heading entitled “Expenses paid during period” to estimate the expenses you paid on your account during this period.
Hypothetical example for comparison purposes:
The second line of the table below provides information about hypothetical account values and hypothetical expenses based on the fund’s actual expense ratio and an assumed rate of return of 5% per year before expenses, which is not the fund’s actual return. The hypothetical account values and expenses may not be used to estimate the actual ending account balance or expenses you paid for the period. You may use this information to compare the ongoing costs of investing in the fund and other funds. To do so, compare this 5% hypothetical example with the 5% hypothetical examples that appear in the shareholder reports of the other funds.
| Beginning | Ending | Expenses | Annualized | |||||||||||||
| account value | account value | paid during | expense | |||||||||||||
| 11/1/2014 | 4/30/2015 | period* | ratio | |||||||||||||
| Actual return | $ | 1,000.00 | $ | 1,021.30 | $ | 5.51 | 1.10 | % | ||||||||
| Hypothetical 5% return before expenses | 1,000.00 | 1,019.34 | 5.51 | 1.10 | ||||||||||||
| * | The “expenses paid during period” are equal to the “annualized expense ratio,” multiplied by the average account value over the period, multiplied by the number of days in the period, and divided by 365 (to reflect the current period). |
| 26 | Capital Group Emerging Markets Total Opportunities Fund |
Approval of Investment Advisory and Service Agreement
The Capital Group Emerging Markets Total Opportunities Fund board has approved the fund’s Investment Advisory and Service Agreement (the “agreement”) with Capital Guardian Trust Company (“CGTC”) for an additional one year term through April 30, 2016. The board approved the agreement following the recommendation of the fund’s Contracts Committee (the “committee”), which is composed of all of the fund’s independent board members. The board and the committee determined that the fund’s advisory fee structure was fair and reasonable in relation to the services provided and that approving the agreement was in the best interests of the fund and its shareholders.
In reaching this decision, the board and the committee took into account information furnished to them throughout the year and otherwise provided to them, as well as information prepared specifically in connection with their review of the agreement, and were advised by their independent counsel. They considered the following factors, among others, but did not identify any single issue or particular piece of information that, in isolation, was the controlling factor, and each board and committee member did not necessarily attribute the same weight to each factor.
1. Nature, extent and quality of services
The board and the committee considered the depth and quality of CGTC’s investment management process, including its global research capabilities; the experience, capability and integrity of its senior management and other personnel; the low turnover rates of its key personnel; the overall financial strength and stability of CGTC and the Capital Group organization; and the ongoing evolution of CGTC’s organizational structure designed to maintain and strengthen these qualities. The board and the committee also considered the nature, extent and quality of administrative, compliance and shareholder services provided by CGTC to the fund under the agreement and other agreements. The board and the committee concluded that the nature, extent and quality of the services provided by CGTC have benefited and should continue to benefit the fund and its shareholders.
2. Investment results
The board and the committee considered the investment results of the fund in light of its objective of providing long-term growth and preservation of capital with lower volatility of returns than emerging markets equities. They compared the fund’s investment results with the results of relevant market indexes over various periods through October 31, 2014. This report, including the letter to shareholders and related disclosures, contains certain information about the fund’s investment results. The board and the committee reviewed the fund’s investment results measured against various indexes, including the MSCI Emerging Markets IMI Index, the J.P. Morgan GBI-EM Global Diversified Index, the J.P. Morgan EMBI Global Index, and the Lipper Emerging Markets Funds Average. They noted that the fund’s investment results trailed the MSCI Emerging Markets IMI Index and the Lipper Emerging Markets Funds Average for the lifetime, one-year, year-to-date and three-month periods. They further noted that the fund’s investment results against the J.P. Morgan indexes were mixed over the same periods. The board and the committee concluded that the fund’s investment results have been sufficient for renewal and that CGTC’s record in managing the fund indicated that its continued management should benefit the fund and its shareholders.
3. Advisory fees and total expenses
The board and the committee compared the advisory fees and total expense levels of the fund to those of other relevant funds. They observed that the fund’s advisory fees and expenses were lower than the Lipper Emerging Markets Funds Average. The board and the committee noted that the fees paid to CGTC by clients with separately managed accounts are in many cases lower than those paid by the fund and concluded that the differences appropriately reflected the significant investment, operational and regulatory differences between advising the fund and the other clients. The board and the committee concluded that the fund’s cost structure was fair and reasonable in relation to the services provided, and that the fund’s shareholders receive reasonable value in return for the advisory fees paid to CGTC by the fund.
| Capital Group Emerging Markets Total Opportunities Fund | 27 |
4. Ancillary benefits
The board and the committee considered a variety of other benefits that CGTC and its affiliates receive as a result of CGTC’s relationship with the fund, including fees for administrative services paid to CGTC’s Capital Group Private Client Services division, and possible ancillary benefits to CGTC and its affiliates in managing other investment vehicles and accounts. The board and the committee reviewed CGTC’s portfolio trading practices, noting the potential benefits CGTC receives from the research obtained with commissions from portfolio transactions made on behalf of the fund. The board and the committee took these ancillary benefits into account in evaluating the reasonableness of the advisory fees paid to CGTC by the fund.
5. Adviser financial information
The board and the committee reviewed information regarding CGTC’s costs of providing services to the fund, including personnel, systems and resources of investment, compliance, trading and other administrative operations. They considered CGTC’s costs and willingness to invest in technology, infrastructure and staff to maintain and expand services and capabilities, respond to industry and regulatory developments, and attract and retain qualified personnel. They noted information regarding the compensation structure for CGTC’s investment professionals. The board and the committee noted the competitiveness and cyclicality of both the mutual fund industry and the capital markets, and the importance in that environment of The Capital Group organization’s long-term profitability for maintaining CGTC’s independence, company culture and management continuity. They further considered CGTC’s reimbursement of fund expenses through voluntary fee caps. The board and the committee concluded that the fund’s advisory fee structure reflected a reasonable sharing of benefits between CGTC and fund shareholders.
| 28 | Capital Group Emerging Markets Total Opportunities Fund |
Office of the fund and of the investment adviser
Capital Guardian Trust Company
6455 Irvine Center Drive
Irvine, CA 92618-4518
Transfer agent for shareholder accounts
J.P. Morgan Investor Services Company
One Beacon Street
Boston, MA 02108
Custodian of assets
JPMorgan Chase Bank
270 Park Avenue
New York, NY 10017-2070
Counsel
Morgan, Lewis & Bockius LLP
355 South Grand Avenue, Suite 4400
Los Angeles, CA 90071-3106
Independent registered public accounting firm
Deloitte & Touche LLP
695 Town Center Drive
Suite 1200
Costa Mesa, CA 92626-7188
Principal underwriter
American Funds Distributors, Inc.
333 South Hope Street
Los Angeles, CA 90071-1406
Investors should carefully consider investment objectives, risks, charges and expenses. This and other important information is contained in the fund prospectus, which can be obtained from Capital Guardian Trust Company by calling (800) 266-9532 and should be read carefully before investing.
Capital Group Emerging Markets Total Opportunities Fund files a complete list of its portfolio holdings with the U.S. Securities and Exchange Commission (SEC) for the first and third quarters of each fiscal year on Form N-Q. This filing is available free of charge on the SEC website (sec.gov). You may also review or, for a fee, copy this filing at the SEC’s Public Reference Room in Washington, D.C. Additional information regarding the operation of the Public Reference Room may be obtained by calling the SEC’s Office of Investor Education and Advocacy at (800) SEC-0330. Additionally, the list of portfolio holdings is available by calling your relationship manager at (800) 266-9532.
The proxy voting procedures and policies of Capital Group Emerging Markets Total Opportunities Fund — which describe how we vote proxies relating to portfolio securities — are available upon request by calling your relationship manager at (800) 266-9532. The fund files its proxy voting record with the SEC for the 12 months ended June 30 by August 31. The report also is available on the SEC website or by calling your relationship manager.
Lit. No. MFGESRX-370-0615P Printed in USA TAG/CGIRV/10328-S50890
© 2015 Capital Group Emerging Markets Total Opportunities Fund
ITEM 2 – Code of Ethics
Not applicable for filing of semi-annual reports to shareholders.
ITEM 3 – Audit Committee Financial Expert
Not applicable for filing of semi-annual reports to shareholders.
ITEM 4 – Principal Accountant Fees and Services
Not applicable for filing of semi-annual reports to shareholders.
ITEM 5 – Audit Committee of Listed Registrants
Not applicable to this Registrant, insofar as the Registrant is not a listed issuer as defined in Rule 10A-3 under the Securities Exchange Act of 1934.
ITEM 6 – Schedule of Investments
Not applicable, insofar as the schedule is included as part of the report to shareholders filed under Item 1 of this Form.
ITEM 7 – Disclosure of Proxy Voting Policies and Procedures for Closed-End Management Investment Companies
Not applicable to this Registrant, insofar as the Registrant is not a closed-end management investment company.
ITEM 8 – Portfolio Managers of Closed-End Management Investment Companies
Not applicable to this Registrant, insofar as the Registrant is not a closed-end management investment company.
ITEM 9 – Purchases of Equity Securities by Closed-End Management Investment Company and Affiliated Purchasers
Not applicable to this Registrant, insofar as the Registrant is not a closed-end management investment company.
ITEM 10 – Submission of Matters to a Vote of Security Holders
There have been no material changes to the procedures by which shareholders may recommend nominees to the Registrant’s board of trustees since the Registrant last submitted a proxy statement to its shareholders. The procedures are as follows. The Registrant has a nominating committee comprised solely of persons who are not considered ‘‘interested persons’’ of the Registrant within the meaning of the Investment Company Act of 1940, as amended. The committee periodically reviews such issues as the board’s composition, responsibilities, committees, compensation and other relevant issues, and recommends any appropriate changes to the full board of trustees. While the committee normally is able to identify from its own resources an ample number of qualified candidates, it will consider shareholder suggestions of persons to be considered as nominees to fill future vacancies on the board. Such suggestions must be sent in writing to the nominating committee of the Registrant, c/o the Registrant’s Secretary, and must be accompanied by complete biographical and occupational data on the prospective nominee, along with a written consent of the prospective nominee for consideration of his or her name by the nominating committee.
ITEM 11 – Controls and Procedures
| (a) | The Registrant’s Principal Executive Officer and Principal Financial Officer have concluded, based on their evaluation of the Registrant’s disclosure controls and procedures (as such term is defined in Rule 30a-3 under the Investment Company Act of 1940), that such controls and procedures are adequate and reasonably designed to achieve the purposes described in paragraph (c) of such rule. |
| (b) | There were no changes in the Registrant’s internal controls over financial reporting (as defined in Rule 30a-3(d) under the Investment Company Act of 1940) that occurred during the Registrant’s second fiscal quarter of the period covered by this report that has materially affected, or is reasonably likely to materially affect, the Registrant’s internal control over financial reporting. |
ITEM 12 – Exhibits
| (a)(1) | Not applicable for filing of semi-annual reports to shareholders. |
| (a)(2) | The certifications required by Rule 30a-2 of the Investment Company Act of 1940 and Sections 302 and 906 of the Sarbanes-Oxley Act of 2002 are attached as exhibits hereto. |
SIGNATURES
Pursuant to the requirements of the Securities Exchange Act of 1934 and the Investment Company Act of 1940, the Registrant has duly caused this report to be signed on its behalf by the undersigned, thereunto duly authorized.
| CAPITAL GROUP EMERGING MARKETS TOTAL OPPORTUNITIES FUND | |
| By /s/ John S. Armour | |
John S. Armour, President and Principal Executive Officer | |
| Date: June 30, 2015 |
Pursuant to the requirements of the Securities Exchange Act of 1934 and the Investment Company Act of 1940, this report has been signed below by the following persons on behalf of the Registrant and in the capacities and on the dates indicated.
| By /s/ John S. Armour |
John S. Armour, President and Principal Executive Officer |
| Date: June 30, 2015 |
| By /s/ Gregory F. Niland |
Gregory F. Niland, Treasurer and Principal Financial Officer |
| Date: June 30, 2015 |