UNITED STATES
SECURITIES AND EXCHANGE COMMISSION
Washington, D.C. 20549
FORM N-CSR
Certified Shareholder Report of
Registered Management Investment Companies
Investment Company Act File Number: 811-22605
Capital Emerging Markets Total Opportunities Fund
(Exact Name of Registrant as Specified in Charter)
6455 Irvine Center Drive
Irvine, California 92618
(Address of Principal Executive Offices)
Registrant's telephone number, including area code: (949) 975-5000
Date of fiscal year end: October 31
Date of reporting period: April 30, 2013
Susan K. Countess
Capital Emerging Markets Total Opportunities Fund
6455 Irvine Center Drive
Irvine, California 92618
(Name and Address of Agent for Service)
Copies to:
Michael Glazer
Bingham McCutchen LLP
355 South Grand Avenue, Suite 4400
Los Angeles, California 90071
(Counsel for the Registrant)
ITEM 1 – Reports to Stockholders

Capital Emerging Markets
Total Opportunities Fund®
Semi-annual report for the six months ended April 30, 2013
Capital Emerging Markets Total Opportunities Fund seeks long-term growth and preservation of capital with lower volatility of returns than emerging markets equities.
Fund results shown in this report are for past periods and are not predictive of results for future periods. The results shown are before taxes on fund distributions and sale of fund shares. Current and future results may be lower or higher than those shown. Share prices and returns will vary, so investors may lose money. Investing for short periods makes losses more likely. Investments are not FDIC-insured, nor are they deposits of or guaranteed by a bank or any other entity, so they may lose value. For current information and month-end results, please call (800) 266-9532.
Here are the average annual total returns on a $1,000 investment with all distributions reinvested for periods ended March 31, 2013 (the most recent calendar quarter-end):
| | | 1 year | | | Lifetime (since 1/27/2012) | |
| Average annual total returns | | | 8.11% | | | | 8.83% | |
The total annual fund operating expense ratio was 1.10% as of the prospectus dated January 1, 2013.
Investment results assume all distributions are reinvested and reflect applicable fees and expenses.
This report is for the information of shareholders of Capital Emerging Markets Total Opportunities Fund, but it also may be used as sales literature when preceded or accompanied by the current prospectus, which gives details about charges, expenses, investment objectives and operating policies of the fund. If used as sales material after June 30, 2013, this report must be accompanied by a statistical update for the most recently completed calendar quarter.
Investors should carefully read and consider the investment objectives, guidelines, risks, fees and expenses associated with Capital Emerging Markets Total Opportunities Fund (CETOP) prior to investing. This and other important information is contained in CETOP’s prospectus, which can be obtained from Capital International/Capital Guardian or your relationship manager.
Investing in emerging markets involves risks, such as significant currency and price fluctuations, political instability, differing securities regulations and periods of illiquidity, which are detailed in the fund prospectus. Investments in emerging markets have been more volatile than investments in developed markets, reflecting the greater uncertainties of investing in less established economies. Individuals investing in emerging markets should have a long-term perspective and be able to tolerate potentially sharp declines in the value of their investments.
Fellow investors:
Capital Emerging Markets Total Opportunities Fund invests in the full spectrum of emerging markets debt and equity securities while seeking to limit the volatility typically associated with investments in the developing world. This fund was started on January 27, 2012.
The following report covers the period from November 1, 2012 through April 30, 2013. During this time, global equities climbed amid ongoing monetary stimulus in the developed world and as investors became more confident in policymakers’ ability to address the European debt crisis, U.S. fiscal challenges and economic stagnation in Japan. The MSCI Emerging Markets (EM) Investable Market Index (IMI) rose 6.2%, lagging most developed-market stocks. Emerging markets equities rallied at the end of 2012, but paused in early 2013 as investors grappled with slower-than-expected growth in China and a few other key emerging markets. Energy and materials stocks declined as prices for most commodities slid. Financial stocks gained. The consumer staples and information technology sectors also advanced as shares of several market heavyweights were lifted by robust earnings. Emerging markets debt registered solid gains, with local currency bonds posting particularly strong returns: the J.P. Morgan EMBI Global index climbed 3.0%, while the local currency GBI-EM Global Diversified index rose 7.0%. Against this backdrop, the fund advanced 6.8%. The realized volatility of the portfolio was about 6.8% for the reporting period, compared with 9.3% for the MSCI EM IMI.
Market review
Global stock markets rallied during the six-month period ended April 30, fueled by stimulus measures in many developed markets and improvements in U.S. economic activity. U.S. stocks touched record highs in early 2013, with the unmanaged* Standard & Poor’s 500 Composite Index rising almost 15% for the period. The U.S. Federal Reserve unveiled a new bond-buying initiative at its December meeting to replace the expiring “Operation Twist” maturity extension program, indicating that it would inject at least $85 billion monthly into bond markets. The Fed also said it planned to maintain interest rates at near zero until unemployment falls below 6.5%. Investors breathed another sigh of relief at the start of 2013 after U.S. legislators were able to reach a last-minute deal on a package of tax hikes and spending cuts to avoid the fiscal cliff, though concerns about the sequester and across-the-board budget cuts triggered on March 1 lingered throughout the early part of the year.
European equities also climbed despite flare-ups in the euro-zone debt crisis, a deepening recession and record unemployment. Inconclusive Italian elections in February worried investors (Prime Minister Enrico Letta and his new cabinet took office in April). In March, the tiny island nation of Cyprus briefly shook financial markets, inspiring widespread protests before the government narrowly approved a €10 billion bailout package to rescue its crippled banking system. But neither event could derail a rally that began last summer with the European Central Bank’s pledge to do “whatever it takes” to preserve the euro.
Meanwhile, Japan’s stock market rose sharply as the country’s central bank announced aggressive monetary easing to help revive the economy and tackle deflation following Shinzo Abe’s election as prime minister in December. In early 2013, Prime Minister Abe appointed new central bank leaders who were widely expected to pursue accommodative monetary policies. In April, the Bank of Japan’s new governor, Haruhiko Kuroda, surprised the market by announcing plans for further quantitative easing, including a pledge to double the monetary base over two years to achieve a 2% inflation target by 2015. The yen weakened considerably over the period, with the U.S. dollar and euro rising 22% and 24%, respectively, against the Japanese currency. Most emerging markets currencies appreciated against the U.S. dollar. Japan’s bold moves to ramp up quantitative easing fueled increased capital flows to the emerging markets and currency appreciation in several Asian countries.
| * | The market indexes are unmanaged and, therefore, have no expenses. Unless otherwise indicated, equity returns are based on MSCI indexes and measured in U.S. dollars with net dividends reinvested. |
| Capital Emerging Markets Total Opportunities Fund | 1 |
Economic data in China disappointed, raising concerns about the pace of recovery. First-quarter GDP expanded 7.7%, compared with 7.9% in the previous quarter. The HSBC Purchasing Managers’ Index (PMI), which measures manufacturing activity in China, slowed to 50.4 in April, approaching the line at 50 that separates expansion from contraction. The MSCI China IMI rose 5%. Energy and materials stocks posted the sharpest losses. But Chinese banks gained, with several large institutions reporting healthy, albeit slower, profit growth even as provisions for bad loans increased. Property stocks also climbed against a backdrop of recovering home sales. By early 2013, housing prices reached their highest levels in two years, prompting concerns about renewed credit tightening in the property market.
Elsewhere in Asia, Indian equities advanced 5% despite weaker-than-expected economic growth. Consumer stocks posted strong gains. Banks also rose sharply as retail loan growth fueled profits. South Korean equities edged 3% higher amid sluggish GDP growth and fears that a weaker yen would curb exports by making the won less competitive. The won rose 21% against the Japanese yen during the period. Auto stocks slid on concerns about the won’s relative strength and the impact of labor disputes on production. But technology stocks supported equity markets in both South Korea and Taiwan, with heavyweights such as Samsung Electronics and Taiwan Semiconductor Manufacturing rising on strong earnings. Taiwanese stocks jumped 13%. Meanwhile, several Southeast Asian markets, such as Thailand and the Philippines, posted double-digit gains, buoyed by signs of improvement in their economies.
In Latin America, Brazilian stocks rose 6%, led by consumer stocks and banks. But commodity-related stocks fell on disappointing profits. Investors worried about tepid economic growth in Brazil over the period and as inflation rose above the government’s 6% target. Brazil’s central bank raised the Selic rate by 25 basis points to 7.5% in April — ending a 525-basis-point easing cycle that began in August 2011. Brazil was one of a few countries to raise interest rates as most emerging markets central banks eased monetary policy during the period.
Meanwhile, Mexican equities rallied more than 10%, supported by the rise of the peso; the currency gained 8% against the U.S. dollar on an improving outlook for the U.S.
20 largest holdings
| | | Percent of | |
| | | net assets as | |
| | | of 4/30/13 | |
| Mexico government bonds (MXN) | | | 6.2 | % |
| Brazil inflation-linked bonds | | | 5.6 | |
| Mexico inflation-linked bonds | | | 2.9 | |
| South Africa government bonds (ZAR) | | | 2.4 | |
| Turkey government bonds (TRY) | | | 1.9 | |
| Philippines government bonds (PHP) | | | 1.5 | |
| Standard Chartered | | | 1.5 | |
| Venezuela government bonds (USD) | | | 1.4 | |
| SK Hynix | | | 1.4 | |
| Hungary government bonds (HUF) | | | 1.4 | |
| Taiwan Semiconductor Manufacturing | | | 1.4 | |
| Turkey inflation-linked bonds | | | 1.4 | |
| Brazil government bonds (BRL) | | | 1.4 | |
| First Quantum Minerals | | | 1.3 | |
| Bharti Airtel | | | 1.3 | |
| Delta Electronics | | | 1.2 | |
| RZD Capital | | | 1.1 | |
| MediaTek Inc. | | | 1.1 | |
| Ensco | | | 1.1 | |
| HKT Trust | | | 1.0 | |
| Total | | | 38.5 | % |
economy and continued reform initiatives by the Mexican government. President Enrique Peña Nieto, who took office on December 1, continued to push through a series of structural reforms in a range of areas, including education, labor and telecommunications regulation. Mexican local bonds rose 19%, fueled by currency appreciation and the lifting of its sovereign credit outlook to positive by Standard & Poor’s. Mexico’s central bank surprised markets in March by slashing interest rates to a record low of 4%.
| 2 | Capital Emerging Markets Total Opportunities Fund |
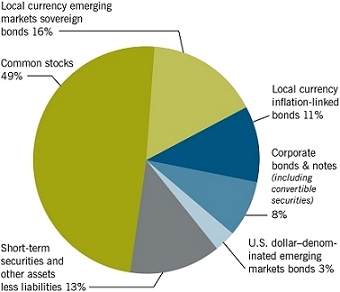
Asset mix (percent of net assets)
As of April 30, 2013
Top five equity sectors
| | | Percent of | |
| | | net assets | |
| Financials | | | 9.6 | % |
| Information technology | | | 7.6 | |
| Energy | | | 7.4 | |
| Materials | | | 5.8 | |
| Consumer discretionary | | | 4.8 | |
15 largest country positions
| | | Percent of net assets | |
| | | as of 4/30/13 | |
| | | | |
| | | Equity | | | Bonds and notes | | | Total | |
| Mexico | | | 0.9 | % | | | 10.3 | % | | | 11.2 | % |
| China (including Hong Kong) | | | 10.2 | | | | 0.7 | | | | 10.9 | |
| Brazil | | | 2.0 | | | | 7.7 | | | | 9.7 | |
| South Korea | | | 5.8 | | | | 0.7 | | | | 6.5 | |
| Taiwan | | | 5.1 | | | | — | | | | 5.1 | |
| United Kingdom* | | | 4.6 | | | | 0.1 | | | | 4.7 | |
| Russia | | | 2.9 | | | | 1.5 | | | | 4.4 | |
| Turkey | | | 0.4 | | | | 3.4 | | | | 3.8 | |
| South Africa | | | 0.2 | | | | 3.0 | | | | 3.2 | |
| India | | | 2.4 | | | | 0.2 | | | | 2.6 | |
| United States of America* | | | 1.5 | | | | 0.6 | | | | 2.1 | |
| Thailand | | | 1.5 | | | | 0.2 | | | | 1.7 | |
| Canada* | | | 1.4 | | | | 0.3 | | | | 1.7 | |
| Netherlands* | | | 1.6 | | | | — | | | | 1.6 | |
| Philippines | | | — | | | | 1.5 | | | | 1.5 | |
| Total net assets | | | 40.5 | % | | | 30.2 | % | | | 70.7 | % |
| * | Includes investments in companies listed in developed markets that have significant operations in emerging markets. |
| Capital Emerging Markets Total Opportunities Fund | 3 |
Commodity-related stocks weighed on markets in Russia and South Africa. South African equities ended the period flat amid continued worries about politics and the mining industry; gold producers weighed heavily on the market as prices for the commodity declined. The South African rand depreciated 3% against the U.S. dollar. Russian stocks also posted only marginal gains, with shares of energy firm Gazprom sliding on weaker profits and lower gas sales to Europe.
Turkish equities were a bright spot in the region, despite concerns about tensions with Syria. The MSCI Turkey IMI climbed 19% against a backdrop of low interest rates, favorable demographics and expectations for solid economic growth. Turkish local bonds rallied after Fitch Ratings lifted the country’s credit rating to investment grade for the first time since 1994.
Elsewhere in Central and Eastern Europe, Polish zloty bonds advanced 9% in U.S. dollar terms; the nation’s central bank continued to lower interest rates to help boost the economy. Hungarian local debt posted a 5% return despite concerns about unorthodox government policies. The central bank, chaired by a newly appointed governor, cut interest rates for the ninth consecutive month in April to 4.75%. The government also abandoned its quest for support from the International Monetary Fund, instead seeking dollar-based funding from the markets. In February, the government raised $3.25 billion in its first sale of dollar-denominated bonds in almost two years, paying higher-than-market yields. The offering included $2 billion of 10-year notes to yield 345 basis points above U.S. Treasuries and $1.25 billion of five-year securities at a spread of 335 basis points.
In Asia, local bond markets in the Philippines and Thailand rose amid signs of improving domestic economies and support from currency gains. The Thai baht climbed 4% against the U.S. dollar.
In U.S. dollar–denominated bonds, Venezuelan debt gained 14% amid hopes for political change as President Hugo Chávez’s health took a turn for the worse following his re-election in early October. Venezuelan bonds lost some ground late in the period on controversy surrounding the election of Nicolás Maduro following Chávez’s death in March; opposition candidate Henrique Capriles contested the results.
Portfolio review
The portfolio benefited from positive returns across the key investment areas. The fund’s significant exposure to sovereign local currency debt had a strong positive impact on results overall. More than 15% of fund assets were invested in local currency government bonds, as of April 30, compared with less than 5% in U.S. dollar–denominated debt. Managers have reduced investments in U.S. dollar investment-grade debt over the last year as these securities are valued at a spread to U.S. Treasuries and appear less attractive in their view as U.S. bond yields could rise. Managers prefer to invest in local emerging markets bonds that they believe are poised to benefit from strong domestic economies and stable interest rates.
Investments in Mexico were a major contributor to portfolio gains, particularly local sovereign bonds, which rallied on improved economic growth, a sharp rise in the peso and optimism concerning new reforms. Exposure to Mexican linkers also helped. Managers continued to favor Mexico’s local bond market based on the strength of the peso, expectations for continued reform and the overall competitiveness of the economy. Investments in Mexico comprised 11% of portfolio assets at the end of the period.
The fund’s emphasis on inflation-linked bonds lifted results on the whole, with investments in this area making up 11% of fund assets. Exposure to Uruguayan linkers contributed to returns as inflation in Uruguay remained well above target. Inflation-linked bonds in Turkey and Poland also supported results. Managers reduced investments in Polish linkers during the period after a strong run and as the country’s inflation slowed to its lowest level in six years. On the other hand, they increased investments in Chilean linkers, which are likely to provide an attractive real yield and should benefit from modest inflation in their view.
Local currency bonds in several other markets also had a positive impact on results. Turkish local bond returns rose sharply following Fitch’s upgrade in November and amid investor hopes for longer term economic improvements in Turkey. Philippine peso bonds also posted strong returns, partly on Fitch’s long-awaited upgrade of the country’s sovereign debt to investment-grade status. A combination of sustained economic growth and fiscal prudence has contributed to a brighter economic outlook for the country. Investments in Hungarian bonds further helped results as the central bank
| 4 | Capital Emerging Markets Total Opportunities Fund |
continued to slash interest rates. However, managers trimmed investments in Hungarian local bonds over the period on concerns about potentially erratic policymaking.
Equity investments in the information technology sector were another bright spot in the portfolio. Shares of Delta Electronics continued to climb, gaining more than 40% during the period. The company, which has businesses in power supplies and industrial automation, has benefited from stronger-than-expected earnings, largely attributed to cost-cutting measures and developments in its automation line. Shares of semiconductor firm SK Hynix rallied further as profits beat estimates and the company issued a more upbeat outlook on signs of improving chip prices. Shares of several PC makers also gained: ASUSTeK Computer rose, lifted by robust sales of its Android-based Nexus 7 tablet, while Lenovo benefited from strong demand from China.
The fund’s emphasis on equities in China and Hong Kong had a strong positive impact on results. Investments in China and Hong Kong made up 11% of the portfolio as of April 30. Shares of Hong Kong–based Honghua Group — one of the world’s largest oil rig manufacturers — climbed on robust profits and as the firm continued to develop its capabilities in shale gas exploration. China’s Beijing Enterprises — which has businesses in gas distribution and transmission as well as water treatment — also rose on solid demand. On the other hand, investments in South Korean automaker Hyundai Motor and auto parts manufacturer Hyundai Mobis slid on worries about weak profits, production issues and a stronger won relative to the yen.
Investments in several commodity-related stocks also detracted from results. Shares of China Shenhua Energy fell on concerns about lower coal prices and a dimmer outlook for the industry given a national policy shift in favor of cleaner energy. Gold producers, which made up about 2% of the portfolio’s assets, continued to slide on worries about falling gold prices and the potential impact of labor unrest on the industry. Shares of metals conglomerate First Quantum Minerals fell despite posting healthy earnings that were bolstered by increased production and lower costs. Managers believe that First Quantum is well positioned to become a leading global copper producer following its C$5.1 billion acquisition of Inmet Mining in March and new ownership of the $6.2 billion Cobre Panama project — one of the largest untapped copper deposits in the world. Meanwhile, Gazprom declined in the face of lower earnings.
Outlook
Monetary stimulus measures in the developed world have boosted investor sentiment in recent months and assuaged some fears about a global economic slowdown. The U.S. economy has shown signs of strength, Japan has taken bold steps to revitalize its economy, and policymakers in Europe have demonstrated a greater willingness and ability to address various challenges while pursuing more growth-oriented policies.
Although these developments have reduced uncertainty in the marketplace, economic recovery is taking longer than expected in several key markets around the world, with a number of emerging markets economies struggling to gain momentum. Demand for some commodities has been lackluster. At the same time, emerging markets stock valuations appear attractive on the whole, particularly for some small- and mid-cap companies.
Against this backdrop, managers have been willing to take more aggressive positions in both equities and bonds, while continuing to seek the preservation of capital. They have increased equity investments in an environment of historically low volatility. In their view, China’s economy has continued to stabilize on the path to somewhat slower — but more sustainable — growth over the long term. The portfolio highlights a range of companies poised to benefit from moderate economic growth in China, including firms that are equipped to meet the growing demand for clean energy in Asia. Managers are also concentrating on a few technology companies across a wide range of industries — from Internet and technology services providers to firms that appear likely to outpace their peers in competitive industries, such as the manufacture of smartphones for lower end segments of the market. Furthermore, they are attracted to Asian stocks that are likely to reap the rewards of rising consumer spending in certain areas, such as gaming and autos. Financial stocks constitute about 10% of the fund’s assets; the portfolio emphasizes several regional banks in Asia, as well as domestic franchises that are expanding into underpenetrated segments of their markets.
| Capital Emerging Markets Total Opportunities Fund | 5 |
Increasing investments in equities is one way to demonstrate a more positive view of the broader global economy. Fund managers have also added to local currency sovereign debt to take advantage of improvements in select emerging markets economies. Managers have continued to shift away from U.S. dollar investment-grade debt, whose valuations are more closely linked to U.S. Treasuries. Managers have also favored local currency bonds for their higher yield, especially those issued by sovereigns with improving economies, such as Turkey and Mexico. In addition, managers have a favorable view of prospects for several emerging markets currencies like the Mexican peso.
Inflation-linked bonds are a growing area in emerging markets debt and continue to make up a significant portion of the portfolio. Several markets provide attractive opportunities in inflation-linked bonds, including Turkey and Mexico. In addition, managers believe that Brazil continues to offer an appealing combination of high real yields and the potential for inflation accrual.
About 8% of the fund’s assets are currently invested in corporate bond securities across the credit spectrum. Some of these investments are in non-investment-grade rated bonds issued by companies that managers view as sound based on the extensive credit research of our analysts. Among the corporate bonds owned in the portfolio are securities issued by commodity-related firms and several railroad companies and telecommunications firms.
Managers also have the flexibility to invest in corporate bonds issued in local currency — another nascent area of emerging markets debt. In general, managers are exploring and investing in these newer segments of the market as appropriate by drawing on Capital’s deep credit research capabilities.
We are enthusiastic about the myriad opportunities offered across the emerging markets universe and look forward to reporting to you again in six months.
Sincerely,

Shaw B. Wagener
Portfolio manager

John B. Emerson
President
June 19, 2013
| 6 | Capital Emerging Markets Total Opportunities Fund |
Investment portfolio
April 30, 2013
| | | | Equity
securities | | | | Bonds
and notes | | | | Percent
of net
assets | |
| Sector diversification | | | | | | | | | | | | | | | | | | |
| Government | | | | — | % | | | | | 30.4 | % | | | | | 30.4 | % | |
| Financials | | | | 9.6 | | | | | | 2.6 | | | | | | 12.2 | | |
| Energy | | | | 7.4 | | | | | | 1.2 | | | | | | 8.6 | | |
| Information technology | | | | 7.6 | | | | | | 0.1 | | | | | | 7.7 | | |
| Materials | | | | 5.8 | | | | | | 0.6 | | | | | | 6.4 | | |
| Industrials | | | | 4.5 | | | | | | 1.4 | | | | | | 5.9 | | |
| Consumer discretionary | | | | 4.8 | | | | | | 0.9 | | | | | | 5.7 | | |
| Telecommunication services | | | | 4.3 | | | | | | 0.6 | | | | | | 4.9 | | |
| Consumer staples | | | | 4.4 | | | | | | 0.1 | | | | | | 4.5 | | |
| Utilities | | | | 0.8 | | | | | | 0.2 | | | | | | 1.0 | | |
| Health care | | | | 0.1 | | | | | | — | | | | | | 0.1 | | |
| | | | | 49.3 | % | | | | | 38.1 | % | | | | | 87.4 | | |
| Short-term securities | | | | | | | | | | | | | | | | 12.3 | | |
| Other assets less liabilities (including forward currency contracts) | | | | | | | | | 0.3 | | |
| Net assets | | | | | | | | | | | | | | | | 100.0 | % | |
Equity securities | | | Shares | | | | Value
(000) | | | | Percent
of net
assets | |
| Asia-Pacific — 27.6% | | | | | | | | | | | | |
| China — 8.2% | | | | | | | | | | | | |
| Anhui Conch Cement Co. Ltd. (Hong Kong) | | | 804,000 | | | $ | 2,912 | | | | 0.5 | % |
| ANTA Sports Products Ltd. (Hong Kong) | | | 1,779,000 | | | | 1,492 | | | | 0.2 | |
| Bank of China Ltd. (Hong Kong) | | | 10,963,511 | | | | 5,176 | | | | 0.8 | |
| Beijing Enterprises Holdings Ltd. (Hong Kong) | | | 481,000 | | | | 3,598 | | | | 0.6 | |
| Beijing Enterprises Water Group Ltd. (Hong Kong) | | | 2,930,000 | | | | 888 | | | | 0.1 | |
| China High Speed Transmission Equipment Group Co., Ltd. (Hong Kong)1 | | | 3,464,000 | | | | 1,678 | | | | 0.3 | |
| China Life Insurance Co. Ltd. (Hong Kong) | | | 998,000 | | | | 2,731 | | | | 0.5 | |
| China Petroleum & Chemical Corp. (Hong Kong) | | | 3,582,000 | | | | 3,958 | | | | 0.6 | |
| China Power International Development Ltd. (Hong Kong) | | | 5,251,000 | | | | 1,898 | | | | 0.3 | |
| China Shenhua Energy Co. Ltd. (Hong Kong) | | | 1,380,500 | | | | 4,893 | | | | 0.8 | |
| CSR Corp. Ltd. (Hong Kong) | | | 1,890,000 | | | | 1,248 | | | | 0.2 | |
| First Tractor Co. Ltd. (Hong Kong)1 | | | 1,594,000 | | | | 1,191 | | | | 0.2 | |
| Haitian International Holdings Ltd. (Hong Kong) | | | 1,751,000 | | | | 2,997 | | | | 0.5 | |
| Hilong Holding Ltd. (Hong Kong) | | | 5,319,000 | | | | 2,196 | | | | 0.4 | |
| Honghua Group Ltd. (Hong Kong) | | | 3,936,000 | | | | 1,933 | | | | 0.3 | |
| Industrial & Commercial Bank of China Ltd. (Hong Kong) | | | 388,000 | | | | 273 | | | | — | |
| Lenovo Group Ltd. (Hong Kong) | | | 3,610,000 | | | | 3,332 | | | | 0.5 | |
| Minth Group Ltd. (Hong Kong) | | | 1,282,000 | | | | 2,295 | | | | 0.4 | |
| Nine Dragons Paper (Holdings) Ltd. (Hong Kong) | | | 2,055,000 | | | | 1,802 | | | | 0.3 | |
| Zhongsheng Group Holdings Ltd. (Hong Kong) | | | 608,500 | | | | 851 | | | | 0.1 | |
| Zhuzhou CSR Times Electric Co., Ltd. (Hong Kong) | | | 1,234,000 | | | | 3,411 | | | | 0.6 | |
| | | | | | | | 50,753 | | | | 8.2 | |
| Capital Emerging Markets Total Opportunities Fund | 7 |
| Equity securities | | Shares | | | Value
(000) | | | Percent
of net
assets | |
| Asia-Pacific (continued) | | | | | | | | | | | | |
| Hong Kong — 2.0% | | | | | | | | | | | | |
| AIA Group Ltd. | | | 692,200 | | | $ | 3,078 | | | | 0.5 | % |
| Cheung Kong (Holdings) Ltd. | | | 21,000 | | | | 316 | | | | 0.1 | |
| HKT Trust, units | | | 6,042,000 | | | | 6,373 | | | | 1.0 | |
| SJM Holdings Ltd. | | | 1,127,000 | | | | 2,843 | | | | 0.4 | |
| | | | | | | | 12,610 | | | | 2.0 | |
| | | | | | | | | | | | | |
| India — 2.4% | | | | | | | | | | | | |
| Bharti Airtel Ltd. | | | 1,333,067 | | | | 7,893 | | | | 1.3 | |
| DLF Ltd. | | | 283,000 | | | | 1,254 | | | | 0.2 | |
| ICICI Bank Ltd. | | | 123,600 | | | | 2,677 | | | | 0.4 | |
| Jain Irrigation Systems Ltd. | | | 450,000 | | | | 529 | | | | 0.1 | |
| Kotak Mahindra Bank Ltd. | | | 43,697 | | | | 574 | | | | 0.1 | |
| United Spirits Ltd. | | | 50,000 | | | | 2,056 | | | | 0.3 | |
| | | | | | | | 14,983 | | | | 2.4 | |
| | | | | | | | | | | | | |
| Malaysia — 1.3% | | | | | | | | | | | | |
| Bumi Armada Bhd. | | | 2,242,900 | | | | 2,940 | | | | 0.4 | |
| CIMB Group Holdings Bhd. | | | 448,100 | | | | 1,141 | | | | 0.2 | |
| Genting Bhd. | | | 915,300 | | | | 3,161 | | | | 0.5 | |
| IHH Healthcare Bhd.1 | | | 255,000 | | | | 314 | | | | 0.1 | |
| IJM Corp. Bhd. | | | 369,100 | | | | 661 | | | | 0.1 | |
| | | | | | | | 8,217 | | | | 1.3 | |
| | | | | | | | | | | | | |
| Philippines — 0.0% | | | | | | | | | | | | |
| Energy Development Corp. | | | 1,956,600 | | | | 310 | | | | — | |
| | | | | | | | | | | | | |
| Singapore — 1.3% | | | | | | | | | | | | |
| DBS Group Holdings Ltd. | | | 392,643 | | | | 5,349 | | | | 0.9 | |
| Mapletree Greater China Commercial Trust1 | | | 2,511,000 | | | | 2,273 | | | | 0.4 | |
| | | | | | | | 7,622 | | | | 1.3 | |
| | | | | | | | | | | | | |
| South Korea — 5.8% | | | | | | | | | | | | |
| Amorepacific Corp. | | | 223 | | | | 182 | | | | — | |
| Daum Communications Corp. | | | 3,000 | | | | 245 | | | | — | |
| Hana Financial Group Inc. | | | 185,130 | | | | 5,922 | | | | 1.0 | |
| Hyundai Engineering & Construction Co., Ltd. | | | 4,100 | | | | 216 | | | | — | |
| Hyundai Mobis Co., Ltd. | | | 13,703 | | | | 3,112 | | | | 0.5 | |
| Hyundai Motor Co. | | | 30,300 | | | | 5,494 | | | | 0.9 | |
| Korea Electric Power Corp.1 | | | 73,660 | | | | 2,117 | | | | 0.3 | |
| KT Corp. | | | 55,150 | | | | 1,805 | | | | 0.3 | |
| OCI Co. Ltd. | | | 26,071 | | | | 3,374 | | | | 0.6 | |
| Samsung Electronics Co. Ltd. | | | 3,092 | | | | 4,272 | | | | 0.7 | |
| SK hynix Inc.1 | | | 323,320 | | | | 8,792 | | | | 1.4 | |
| SK Telecom Co., Ltd. | | | 2,000 | | | | 352 | | | | 0.1 | |
| | | | | | | | 35,883 | | | | 5.8 | |
| | | | | | | | | | | | | |
| Taiwan — 5.1% | | | | | | | | | | | | |
| ASUSTeK Computer Inc. | | | 391,820 | | | | 4,565 | | | | 0.8 | |
| CTCI Corp. | | | 1,045,000 | | | | 2,091 | | | | 0.3 | |
| Delta Electronics, Inc. | | | 1,597,000 | | | | 7,667 | | | | 1.2 | |
| Hon Hai Precision Industry Co., Ltd. | | | 555,100 | | | | 1,435 | | | | 0.2 | |
| MediaTek Inc. | | | 562,000 | | | | 6,861 | | | | 1.1 | |
| Taiwan Semiconductor Manufacturing Co. Ltd. | | | 2,292,000 | | | | 8,516 | | | | 1.4 | |
| Tripod Technology Corp. | | | 327,000 | | | | 743 | | | | 0.1 | |
| | | | | | | | 31,878 | | | | 5.1 | |
| 8 | Capital Emerging Markets Total Opportunities Fund |
| | | Shares | | | Value
(000) | | | Percent
of net
assets | |
| Asia-Pacific (continued) | | | | | | | | | | | | |
| Thailand — 1.5% | | | | | | | | | | | | |
| Advanced Info Service PCL | | | 208,700 | | | $ | 1,927 | | | | 0.3 | % |
| Bangkok Bank PCL, nonvoting depository receipt | | | 434,700 | | | | 3,355 | | | | 0.5 | |
| Shin Corp. PCL, nonvoting depository receipt | | | 1,404,400 | | | | 4,133 | | | | 0.7 | |
| | | | | | | | 9,415 | | | | 1.5 | |
| | | | | | | | | | | | | |
| Eastern Europe and Middle East — 4.3% | | | | | | | | | | | | |
| Oman — 0.4% | | | | | | | | | | | | |
| BankMuscat (SAOG) (GDR) | | | 309,541 | | | | 2,043 | | | | 0.4 | |
| BankMuscat (SAOG) (GDR)2 | | | 24,603 | | | | 162 | | | | — | |
| | | | | | | | 2,205 | | | | 0.4 | |
| | | | | | | | | | | | | |
| Poland — 0.1% | | | | | | | | | | | | |
| Bank Pekao SA | | | 8,700 | | | | 417 | | | | 0.1 | |
| Telekomunikacja Polska SA | | | 108,998 | | | | 243 | | | | — | |
| | | | | | | | 660 | | | | 0.1 | |
| | | | | | | | | | | | | |
| Russia — 2.9% | | | | | | | | | | | | |
| Etalon Group Ltd. (GDR)1 | | | 42,059 | | | | 181 | | | | — | |
| OAO Lukoil (ADR) | | | 71,400 | | | | 4,529 | | | | 0.7 | |
| OJSC Gazprom (ADR) | | | 430,532 | | | | 3,418 | | | | 0.6 | |
| OJSC Mining and Metallurgical Co. Norilsk Nickel (ADR) | | | 238,000 | | | | 3,648 | | | | 0.6 | |
| Sberbank of Russia | | | 1,259,713 | | | | 4,020 | | | | 0.6 | |
| Sberbank of Russia (GDR)2 | | | 145,436 | | | | 1,872 | | | | 0.3 | |
| Yandex NV, Class A1 | | | 20,400 | | | | 525 | | | | 0.1 | |
| | | | | | | | 18,193 | | | | 2.9 | |
| Turkey — 0.4% | | | | | | | | | | | | |
| Türk Telekomünikasyon AŞ, Class D | | | 531,000 | | | | 2,521 | | | | 0.4 | |
| | | | | | | | | | | | | |
| United Arab Emirates — 0.5% | | | | | | | | | | | | |
| DP World Ltd. | | | 195,452 | | | | 2,998 | | | | 0.5 | |
|
|
| | | | | | | | | | | | | |
| Latin America — 2.9% | | | | | | | | | | | | |
| Brazil — 2.0% | | | | | | | | | | | | |
| Banco Bradesco SA, preferred nominative (ADR) | | | 16,830 | | | | 279 | | | | — | |
| BRF – Brasil Foods SA, ordinary nominative | | | 108,500 | | | | 2,685 | | | | 0.4 | |
| BRF – Brasil Foods SA, ordinary nominative (ADR) | | | 72,100 | | | | 1,790 | | | | 0.3 | |
| Gerdau SA (ADR) | | | 416,300 | | | | 3,268 | | | | 0.5 | |
| Hypermarcas SA, ordinary nominative1 | | | 333,100 | | | | 2,665 | | | | 0.4 | |
| Mills Estruturas e Serviços de Engenharia SA, ordinary nominative | | | 21,000 | | | | 345 | | | | 0.1 | |
| Oi SA, ordinary nominative | | | 133,000 | | | | 391 | | | | 0.1 | |
| Oi SA, ordinary nominative (ADR) | | | 14,336 | | | | 41 | | | | — | |
| Oi SA, preferred nominative | | | 144,000 | | | | 356 | | | | 0.1 | |
| Oi SA, preferred nominative (ADR) | | | 206,967 | | | | 495 | | | | 0.1 | |
| | | | | | | | 12,315 | | | | 2.0 | |
| | | | | | | | | | | | | |
| Chile — 0.0% | | | | | | | | | | | | |
| Ripley Corp SA | | | 185,000 | | | | 193 | | | | — | |
| Capital Emerging Markets Total Opportunities Fund | 9 |
| Equity securities | | Shares | | | Value
(000) | | | Percent
of net
assets | |
| Latin America (continued) | | | | | | | | | | | | |
| Mexico — 0.9% | | | | | | | | | | | | |
| Arca Continental, SAB de CV | | | 41,061 | | | $ | 339 | | | | 0.1 | % |
| CEMEX, SAB de CV, ordinary participation certificates, units (ADR)1 | | | 243,354 | | | | 2,738 | | | | 0.4 | |
| Grupo Comercial Chedraui, SAB de CV, Class B | | | 105,000 | | | | 400 | | | | 0.1 | |
| Impulsora del Desarrollo y el Empleo en América Latina, SAB de CV, Series B11 | | | 814,200 | | | | 1,974 | | | | 0.3 | |
| | | | | | | | 5,451 | | | | 0.9 | |
| | | | | | | | | | | | | |
| Africa — 0.2% | | | | | | | | | | | | |
| South Africa — 0.2% | | | | | | | | | | | | |
| AngloGold Ashanti Ltd. | | | 39,092 | | | | 755 | | | | 0.1 | |
| AngloGold Ashanti Ltd. (ADR) | | | 21,400 | | | | 417 | | | | 0.1 | |
| | | | | | | | 1,172 | | | | 0.2 | |
| | | | | | | | | | | | | |
| Other markets — 10.3% | | | | | | | | | | | | |
| Australia — 0.4% | | | | | | | | | | | | |
| Oil Search Ltd. | | | 344,342 | | | | 2,656 | | | | 0.4 | |
| | | | | | | | | | | | | |
| Austria — 0.4% | | | | | | | | | | | | |
| Vienna Insurance Group | | | 50,879 | | | | 2,698 | | | | 0.4 | |
| | | | | | | | | | | | | |
| Canada — 1.4% | | | | | | | | | | | | |
| Barrick Gold Corp. | | | 36,300 | | | | 715 | | | | 0.1 | |
| First Quantum Minerals Ltd. | | | 452,600 | | | | 7,903 | | | | 1.3 | |
| | | | | | | | 8,618 | | | | 1.4 | |
| | | | | | | | | | | | | |
| Italy — 0.4% | | | | | | | | | | | | |
| Tenaris SA (ADR) | | | 53,143 | | | | 2,364 | | | | 0.4 | |
| | | | | | | | | | | | | |
| Netherlands — 1.6% | | | | | | | | | | | | |
| Fugro NV | | | 92,540 | | | | 5,371 | | | | 0.9 | |
| Unilever NV, depository receipts | | | 99,907 | | | | 4,260 | | | | 0.7 | |
| | | | | | | | 9,631 | | | | 1.6 | |
| | | | | | | | | | | | | |
| United Kingdom — 4.6% | | | | | | | | | | | | |
| Anglo American PLC | | | 68,700 | | | | 1,671 | | | | 0.3 | |
| Glencore International PLC | | | 96,700 | | | | 476 | | | | 0.1 | |
| Global Ports Investments PLC (GDR) | | | 111,647 | | | | 1,748 | | | | 0.3 | |
| Imperial Tobacco Group PLC | | | 92,815 | | | | 3,319 | | | | 0.5 | |
| Inchcape PLC | | | 754,000 | | | | 5,878 | | | | 0.9 | |
| Mondi PLC | | | 53,558 | | | | 708 | | | | 0.1 | |
| SABMiller PLC | | | 98,400 | | | | 5,309 | | | | 0.9 | |
| Standard Chartered PLC | | | 360,857 | | | | 9,096 | | | | 1.5 | |
| | | | | | | | 28,205 | | | | 4.6 | |
| | | | | | | | | | | | | |
| United States of America — 1.5% | | | | | | | | | | | | |
| Cobalt International Energy, Inc.1 | | | 111,500 | | | | 3,115 | | | | 0.5 | |
| Ensco PLC, Class A | | | 113,200 | | | | 6,530 | | | | 1.0 | |
| | | | | | | | 9,645 | | | | 1.5 | |
| | | | | | | | | | | | | |
| Miscellaneous — 4.0% | | | | | | | | | | | | |
| Equity securities in initial period of acquisition | | | | | | | 24,852 | | | | 4.0 | |
| | | | | | | | | | | | | |
| Total equity securities (cost: $283,125,000) | | | | | | | 306,048 | | | | 49.3 | |
| 10 | Capital Emerging Markets Total Opportunities Fund |
| Bonds and notes | | Principal
amount
(000) | | | Value
(000) | | | Percent
of net
assets | |
| Latin America — 21.6% | | | | | | | | | | | | |
| Argentina — 0.2% | | | | | | | | | | | | |
| Provincia de Buenos Aires 10.875% January 26, 2021 | | $ | 1,675 | | | $ | 1,206 | | | | 0.2 | % |
| | | | | | | | | | | | | |
| Brazil — 7.7% | | | | | | | | | | | | |
| Banco BMG SA 8.00% April 15, 2018 | | | 1,550 | | | | 1,488 | | | | 0.2 | |
| Banco Votorantim SA 6.735% May 16, 20163,4 | | BRL | 1,000 | | | | 580 | | | | 0.1 | |
| BFF International Ltd. 7.25% January 28, 2020 | | $ | 200 | | | | 243 | | | | — | |
| Brazil (Federal Republic of) Global: | | | | | | | | | | | | |
| 4.875% January 22, 2021 | | | 2,000 | | | | 2,392 | | | | 0.4 | |
| 10.25% January 10, 2028 | | BRL | 2,611 | | | | 1,635 | | | | 0.3 | |
| Brazil Notas do Tesouro Nacional: | | | | | | | | | | | | |
| Series F, 10.00% January 1, 2014 – January 1, 2017 | | | 2 | | | | 989 | | | | 0.2 | |
| Series B, 6.00% May 15, 2015 – May 15, 20453,4 | | | 16 | | | | 22,649 | | | | 3.7 | |
| JPMorgan Chase & Co., Brazil (Federal Republic of), Credit Linked Notes: | | | | | | | | | | | | |
| 6.00% February 27, 2014 – February 28, 20143,4 | | | 765 | | | | 11,061 | | | | 1.8 | |
| 10.00% February 28, 2014 | | | 10,461 | | | | 5,432 | | | | 0.9 | |
| Cosan Luxembourg SA 9.50% March 14, 2018 | | | 500 | | | | 261 | | | | — | |
| Itaú Unibanco Holding SA 6.20% December 21, 20212 | | $ | 600 | | | | 671 | | | | 0.1 | |
| Odebrecht Drilling Norbe VIII/IX Ltd. 6.35% June 30, 2021 | | | 261 | | | | 291 | | | | — | |
| | | | | | | | 47,692 | | | | 7.7 | |
| | | | | | | | | | | | | |
| Chile — 0.6% | | | | | | | | | | | | |
| Banco Santander Chile 2.292% February 14, 20142,4 | | | 2,450 | | | | 2,430 | | | | 0.4 | |
| Emgesa SA ESP 8.75% January 25, 2021 | | COP | 1,770,000 | | | | 1,179 | | | | 0.2 | |
| | | | | | | | 3,609 | | | | 0.6 | |
| | | | | | | | | | | | | |
| Colombia — 0.2% | | | | | | | | | | | | |
| Transportadora de Gas Internacional: | | | | | | | | | | | | |
| 5.70% March 20, 2022 | | $ | 500 | | | | 554 | | | | 0.1 | |
| 5.70% March 20, 20222 | | | 400 | | | | 443 | | | | 0.1 | |
| | | | | | | | 997 | | | | 0.2 | |
| | | | | | | | | | | | | |
| Mexico — 10.3% | | | | | | | | | | | | |
| América Móvil, SAB de CV 3.50% February 8, 2015 | | CNY | 4,000 | | | | 659 | | | | 0.1 | |
| BBVA Bancomer SA 6.50% March 10, 2021 | | $ | 250 | | | | 286 | | | | 0.1 | |
| CEMEX Finance LLC 9.50% December 14, 2016 | | | 1,290 | | | | 1,393 | | | | 0.2 | |
| CEMEX, SAB de CV 9.25% May 12, 2020 | | | 250 | | | | 276 | | | | — | |
| Petroleos Mexicanos 4.875% January 24, 2022 | | | 750 | | | | 855 | | | | 0.1 | |
| United Mexican States Government: | | | | | | | | | | | | |
| Series MI10, 9.50% December 18, 2014 | | MXN | 29 | | | | 255 | | | | — | |
| Series M10, 7.75% December 14, 2017 | | | 598 | | | | 5,687 | | | | 0.9 | |
| 2.50% December 10, 20203,4 | | | 78 | | | | 714 | | | | 0.1 | |
| Series M, 6.50% June 10, 2021 | | | 1,101 | | | | 10,389 | | | | 1.7 | |
| Series M20, 10.00% December 5, 2024 | | | 955 | | | | 11,743 | | | | 1.9 | |
| Series M30, 10.00% November 20, 2036 | | | 759 | | | | 10,231 | | | | 1.7 | |
| 4.00% November 15, 20403,4 | | | 1,468 | | | | 17,283 | | | | 2.8 | |
| United Mexican States Government Global, Series A, 6.05% January 11, 2040 | | $ | 1,550 | | | | 2,046 | | | | 0.3 | |
| Urbi Desarrollos Urbanos SAB de CV: | | | | | | | | | | | | |
| 8.50% April 19, 2016 | | | 1,425 | | | | 449 | | | | 0.1 | |
| 8.50% April 19, 20162 | | | 560 | | | | 176 | | | | — | |
| 9.50% January 21, 2020 | | | 2,400 | | | | 756 | | | | 0.1 | |
| 9.50% January 21, 20202 | | | 230 | | | | 72 | | | | — | |
| 9.75% February 3, 2022 | | | 990 | | | | 312 | | | | 0.1 | |
| 9.75% February 3, 20222 | | | 1,655 | | | | 522 | | | | 0.1 | |
| | | | | | | | 64,104 | | | | 10.3 | |
| Capital Emerging Markets Total Opportunities Fund | 11 |
| Bonds and notes | | Principal
amount
(000) | | | Value
(000) | | | Percent
of net
assets | |
| Latin America (continued) | | | | | | | | | | | | |
| Panama — 0.2% | | | | | | | | | | | | |
| ENA Norte Trust 4.95% April 25, 20282 | | $ | 979 | | | $ | 1,022 | | | | 0.2 | % |
| | | | | | | | | | | | | |
| Peru — 0.7% | | | | | | | | | | | | |
| Banco de Crédito del Perú 6.875% September 16, 2026 | | | 1,800 | | | | 2,084 | | | | 0.3 | |
| Peru (Republic of) 5.20% September 12, 2023 | | PEN | 100 | | | | 412 | | | | 0.1 | |
| Transportadora de Gas del Peru SA 4.25% April 30, 20282 | | $ | 2,115 | | | | 2,123 | | | | 0.3 | |
| | | | | | | | 4,619 | | | | 0.7 | |
| | | | | | | | | | | | | |
| Uruguay — 0.3% | | | | | | | | | | | | |
| Uruguay (Republic of): | | | | | | | | | | | | |
| 5.00% September 14, 20183,4 | | UYU | 4,947 | | | | 307 | | | | — | |
| 4.375% December 15, 20283,4 | | | 25,410 | | | | 1,715 | | | | 0.3 | |
| | | | | | | | 2,022 | | | | 0.3 | |
| | | | | | | | | | | | | |
| Venezuela — 1.4% | | | | | | | | | | | | |
| Venezuela (Republic of): | | | | | | | | | | | | |
| 9.25% September 15, 2027 | | $ | 8,560 | | | | 8,454 | | | | 1.4 | |
| 9.25% May 7, 2028 | | | 250 | | | | 240 | | | | — | |
| 9.375% January 13, 2034 | | | 225 | | | | 217 | | | | — | |
| | | | | | | | 8,911 | | | | 1.4 | |
| | | | | | | | | | | | | |
| Eastern Europe and Middle East — 8.0% | | | | | | | | | | | | |
| Belarus — 0.1% | | | | | | | | | | | | |
| Republic of Belarus 8.95% January 26, 2018 | | | 490 | | | | 534 | | | | 0.1 | |
| | | | | | | | | | | | | |
| Croatia — 0.2% | | | | | | | | | | | | |
| Croatian Government 5.50% April 4, 20232 | | | 1,175 | | | | 1,254 | | | | 0.2 | |
| | | | | | | | | | | | | |
| Hungary — 1.5% | | | | | | | | | | | | |
| Hungarian Government: | | | | | | | | | | | | |
| 4.125% February 19, 2018 | | | 180 | | | | 179 | | | | — | |
| Series 19/A, 6.50% June 24, 2019 | | HUF | 337,400 | | | | 1,600 | | | | 0.3 | |
| 6.25% January 29, 2020 | | $ | 305 | | | | 340 | | | | 0.1 | |
| Series 20/A, 7.50% November 12, 2020 | | HUF | 33,020 | | | | 166 | | | | — | |
| Series 22/A, 7.00% June 24, 2022 | | | 801,610 | | | | 3,962 | | | | 0.6 | |
| Series 23/A, 6.00% November 24, 2023 | | | 565,720 | | | | 2,636 | | | | 0.4 | |
| Series 28/A, 6.75% October 22, 2028 | | | 77,950 | | | | 391 | | | | 0.1 | |
| | | | | | | | 9,274 | | | | 1.5 | |
| | | | | | | | | | | | | |
| Iraq — 0.1% | | | | | | | | | | | | |
| Iraq (Republic of) 5.80% January 15, 2028 | | $ | 600 | | | | 552 | | | | 0.1 | |
| | | | | | | | | | | | | |
| Poland — 1.0% | | | | | | | | | | | | |
| Poland Government Bond: | | | | | | | | | | | | |
| Series 1021, 5.75% October 25, 2021 | | PLN | 10,650 | | | | 4,026 | | | | 0.7 | |
| 2.75% August 25, 20233,4 | | | 4,767 | | | | 1,703 | | | | 0.3 | |
| 4.00% October 25, 2023 | | | 900 | | | | 304 | | | | — | |
| | | | | | | | 6,033 | | | | 1.0 | |
| | | | | | | | | | | | | |
| Russia — 1.5% | | | | | | | | | | | | |
| Brunswick Rail Finance Ltd. 6.50% November 1, 20172 | | $ | 750 | | | | 794 | | | | 0.1 | |
| Gazprom OJSC 4.95% July 19, 20222 | | | 270 | | | | 285 | | | | — | |
| OJSC AK Transneft 5.67% March 5, 2014 | | | 495 | | | | 514 | | | | 0.1 | |
| 12 | Capital Emerging Markets Total Opportunities Fund |
| | | Principal
amount
(000) | | Value
(000) | | Percent
of net
assets |
| Eastern Europe and Middle East (continued) | | | | | | | | | | | | |
| Russia (continued) | | | | | | | | | | | | |
| RZD Capital Ltd. 8.30% April 2, 2019 | | RUB | 206,200 | | | $ | 6,962 | | | | 1.1 | % |
| Sberbank of Russia 5.717% June 16, 2021 | | $ | 500 | | | | 554 | | | | 0.1 | |
| VEB Finance Ltd. 6.902% July 9, 2020 | | | 470 | | | | 559 | | | | 0.1 | |
| | | | | | | | 9,668 | | | | 1.5 | |
| | | | | | | | | | | | | |
| Slovenia — 0.1% | | | | | | | | | | | | |
| Slovenia (Republic of) 5.50% October 26, 2022 | | | 605 | | | | 600 | | | | 0.1 | |
| | | | | | | | | | | | | |
| Turkey — 3.4% | | | | | | | | | | | | |
| Turkey (Republic of): | | | | | | | | | | | | |
| 9.50% January 12, 2022 | | TRY | 17,815 | | | | 12,063 | | | | 1.9 | |
| 3.00% February 23, 20223,4 | | | 12,766 | | | | 8,403 | | | | 1.4 | |
| 6.25% September 26, 2022 | | $ | 300 | | | | 371 | | | | 0.1 | |
| | | | | | | | 20,837 | | | | 3.4 | |
| | | | | | | | | | | | | |
| United Arab Emirates — 0.1% | | | | | | | | | | | | |
| Abu Dhabi National Energy Co. PJSC (TAQA) 4.125% March 13, 2017 | | | 300 | | | | 325 | | | | 0.1 | |
| | | | | | | | | | | | | |
| Asia-Pacific—3.3% | | | | | | | | | | | | |
| China — 0.7% | | | | | | | | | | | | |
| China Government International Bond 4.75% October 29, 2013 | | | 144 | | | | 147 | | | | — | |
| Longfor Properties Co. Ltd. 9.50% April 7, 2016 | | | 1,700 | | | | 1,867 | | | | 0.3 | |
| Renhe Commercial Holdings Co. Ltd.: | | | | | | | | | | | | |
| 11.75% May 18, 2015 | | | 2,210 | | | | 1,488 | | | | 0.3 | |
| 13.00% March 10, 2016 | | | 1,050 | | | | 677 | | | | 0.1 | |
| | | | | | | | 4,179 | | | | 0.7 | |
| | | | | | | | | | | | | |
| India — 0.2% | | | | | | | | | | | | |
| ICICI Bank Ltd. 4.70% February 21, 20182 | | | 1,325 | | | | 1,411 | | | | 0.2 | |
| | | | | | | | | | | | | |
| Philippines — 1.5% | | | | | | | | | | | | |
| Philippines (Republic of): | | | | | | | | | | | | |
| 4.95% January 15, 2021 | | PHP | 10,000 | | | | 273 | | | | 0.1 | |
| Series 1054, 6.375% January 19, 2022 | | | 265,686 | | | | 8,233 | | | | 1.3 | |
| 6.25% January 14, 2036 | | | 23,000 | | | | 733 | | | | 0.1 | |
| | | | | | | | 9,239 | | | | 1.5 | |
| | | | | | | | | | | | | |
| South Korea — 0.7% | | | | | | | | | | | | |
| Samsung Electronics America, Inc. 1.75% April 10, 20172 | | $ | 1,100 | | | | 1,119 | | | | 0.2 | |
| South Korean Government, Series 1609, 5.00% September 10, 2016 | | KRW | 3,497,300 | | | | 3,430 | | | | 0.5 | |
| | | | | | | | 4,549 | | | | 0.7 | |
| | | | | | | | | | | | | |
| Thailand — 0.2% | | | | | | | | | | | | |
| Thailand Government Bond 1.20% July 14, 20213,4 | | THB | 44,023 | | | | 1,540 | | | | 0.2 | |
| | | | | | | | | | | | | |
| Africa — 3.1% | | | | | | | | | | | | |
| Angola — 0.1% | | | | | | | | | | | | |
| Republic of Angola 7.00% August 16, 2019 | | $ | 500 | | | | 551 | | | | 0.1 | |
| Capital Emerging Markets Total Opportunities Fund | 13 |
| Bonds and notes | | Principal
amount
(000) | | Value
(000) | | Percent
of net
assets |
| Africa (continued) | | | | | | | | | | | | |
| South Africa — 3.0% | | | | | | | | | | | | |
| South Africa (Republic of): | | | | | | | | | | | | |
| Series 197, 5.50% December 7, 20233,4 | | ZAR | 3,033 | | | $ | 508 | | | | 0.1 | % |
| Series R214, 6.50% February 28, 2041 | | | 154,554 | | | | 15,003 | | | | 2.4 | |
| Standard Bank PLC 8.125% December 2, 2019 | | $ | 1,535 | | | | 1,819 | | | | 0.3 | |
| Steinhoff International Holdings Ltd. 9.625% convertible debenture, July 20, 2015 | | ZAR | 8,000 | | | | 1,140 | | | | 0.2 | |
| | | | | | | | 18,470 | | | | 3.0 | |
| | | | | | | | | | | | | |
| Other markets — 1.5% | | | | | | | | | | | | |
| Canada — 0.3% | | | | | | | | | | | | |
| Inmet Mining Corp.: | | | | | | | | | | | | |
| 8.75% June 1, 2020 | | $ | 220 | | | | 239 | | | | — | |
| 7.50% June 1, 20212 | | | 1,555 | | | | 1,632 | | | | 0.3 | |
| | | | | | | | 1,871 | | | | 0.3 | |
| | | | | | | | | | | | | |
| Jamaica — 0.2% | | | | | | | | | | | | |
| Digicel Group Ltd. 8.25% September 30, 20202 | | | 1,375 | | | | 1,478 | | | | 0.2 | |
| | | | | | | | | | | | | |
| Switzerland — 0.3% | | | | | | | | | | | | |
| Transocean, Inc. 6.375% December 15, 2021 | | | 1,700 | | | | 2,040 | | | | 0.3 | |
| | | | | | | | | | | | | |
| United Kingdom — 0.1% | | | | | | | | | | | | |
| SABMiller Holdings, Inc. 1.85% January 15, 20152 | | | 400 | | | | 408 | | | | 0.1 | |
| | | | | | | | | | | | | |
| United States of America — 0.6% | | | | | | | | | | | | |
| Arcos Dorados Holdings Inc. 10.25% July 13, 20162 | | BRL | 3,900 | | | | 2,071 | | | | 0.3 | |
| Trilogy International Partners, LLC 10.25% August 15, 20162 | | $ | 1,700 | | | | 1,683 | | | | 0.3 | |
| | | | | | | | 3,754 | | | | 0.6 | |
| | | | | | | | | | | | | |
| Miscellaneous — 0.6% | | | | | | | | | | | | |
| Bonds and notes in initial period of acquisition | | | | | | | 3,958 | | | | 0.6 | |
| | | | | | | | | | | | | |
| Total bonds and notes (cost: $216,766,000) | | | | | | | 236,707 | | | | 38.1 | |
| | | | | | | | | | | | | |
| Short-term securities | | | | | | | | | | | | |
| Certificate of deposit — 0.1% | | | | | | | | | | | | |
| Itaú Unibanco Holding SA 0.75% due 6/13/13 | | | 600 | | | | 600 | | | | 0.1 | |
| | | | | | | | | | | | | |
| Commercial paper — 7.7% | | | | | | | | | | | | |
| Abbott Laboratories 0.13% due 6/3/132 | | | 7,780 | | | | 7,779 | | | | 1.3 | |
| Bank of Nova Scotia 0.09% due 5/1/13 | | | 10,000 | | | | 10,000 | | | | 1.6 | |
| Coca-Cola Co. 0.14% due 7/17/132 | | | 4,500 | | | | 4,499 | | | | 0.7 | |
| KFW 0.16% due 5/8/132 | | | 4,200 | | | | 4,200 | | | | 0.7 | |
| Reckitt Benckiser Treasury Services PLC 0.13% due 5/10/132 | | | 7,000 | | | | 7,000 | | | | 1.1 | |
| Walt Disney Co. 0.10% due 5/17/132 | | | 14,100 | | | | 14,099 | | | | 2.3 | |
| | | | | | | | 47,577 | | | | 7.7 | |
| 14 | Capital Emerging Markets Total Opportunities Fund |
| Short-term securities | | Principal
amount
(000) | | Value
(000) | | Percent
of net
assets |
| Discount notes — 4.5% | | | | | | | | | | | | |
| Federal Home Loan Banks 0.11% due 5/10/13 | | $ | 5,100 | | | $ | 5,100 | | | | 0.8 | % |
| Federal Home Loan Mortgage Corp. 0.11%–0.125% due 7/8/13–11/19/13 | | | 22,800 | | | | 22,792 | | | | 3.7 | |
| | | | | | | | 27,892 | | | | 4.5 | |
| | | | | | | | | | | | | |
| Total short-term securities (cost: $76,067,000) | | | | | | | 76,069 | | | | 12.3 | |
| | | | | | | | | | | | | |
| Total investment securities (cost: $575,958,000) | | | | | | | 618,824 | | | | 99.7 | |
| Other assets less liabilities (including forward currency contracts) | | | | | | | 1,916 | | | | 0.3 | |
| | | | | | | | | | | | | |
| Net assets | | | | | | $ | 620,740 | | | | 100.0 | % |
| 1 | Security did not produce income during the last 12 months. |
| 2 | Acquired in a transaction exempt from registration under Rule 144A or section 4(2) of the Securities Act of 1933 (not including purchases of securities that were publicly offered in the primary local market but were not registered under U.S. securities laws). May be resold in the U.S. in transactions exempt from registration, normally to qualified institutional buyers. The total value of all such securities was $59,205,000, which represented 9.54% of the net assets of the fund. |
| 3 | Index-linked bond whose principal amount moves with a government retail price index. |
| 4 | Coupon rate may change periodically. |
Abbreviations
Securities:
ADR — American Depositary Receipts
GDR — Global Depositary Receipts
Currency:
BRL — Brazilian real
CNY — Chinese renminbi
COP — Colombian peso
HUF — Hungarian forint
KRW — Korean won
MXN — Mexican peso
PEN — Peruvian nuevo sol
PHP — Philippine peso
PLN — Polish zloty
RUB — Russian ruble
THB — Thai baht
TRY — Turkish lira
UYU — Uruguayan peso
ZAR — South African rand
| Capital Emerging Markets Total Opportunities Fund | 15 |
| Financial statements | | | | unaudited |
| Statement of assets and liabilities at April 30, 2013 | | (dollars in thousands, except per-share data) |
| Assets: | | | | | | | | |
| Investment securities, at value: (cost: $575,958) | | | | | | $ | 618,824 | |
| Cash | | | | | | | 118 | |
| Cash denominated in non-U.S. currency (cost: $33) | | | | | | | 33 | |
| Unrealized appreciation on open forward currency contracts | | | | | | | 40 | |
| Receivables for — | | | | | | | | |
| Sales of investments | | $ | 1,296 | | | | | |
| Sales of fund’s shares | | | 115 | | | | | |
| Dividends and interest | | | 4,943 | | | | | |
| Other | | | 49 | | | | 6,403 | |
| | | | | | | | 625,418 | |
| | | | | | | | | |
| Liabilities: | | | | | | | | |
| Unrealized depreciation on open forward currency contracts | | | | | | | 417 | |
| Payables for — | | | | | | | | |
| Purchases of investments | | | 3,655 | | | | | |
| Investment advisory services | | | 497 | | | | | |
| Repurchase of fund’s shares | | | 5 | | | | | |
| Other accrued expenses | | | 104 | | | | 4,261 | |
| | | | | | | | 4,678 | |
| | | | | | | | | |
| Net assets at April 30, 2013 — | | | | | | | | |
| Equivalent to $12.03 per share on 51,595,872 shares of $0.01 par value capital stock outstanding (unlimited authorized shares) | | | | | | $ | 620,740 | |
| | | | | | | | | |
| Net assets consist of: | | | | | | | | |
| Capital paid in on shares of stock | | | | | | $ | 572,254 | |
| Undistributed net investment income | | | | | | | 4,876 | |
| Accumulated net realized gain | | | | | | | 1,093 | |
| Net unrealized appreciation | | | | | | | 42,517 | |
| | | | | | | | | |
| Net assets at April 30, 2013 | | | | | | $ | 620,740 | |
See Notes to Financial Statements
| 16 | Capital Emerging Markets Total Opportunities Fund |
| | | | | | unaudited | |
| Statement of operations for the six months ended April 30, 2013 | | (dollars in thousands) | |
| Investment income: | | | | | | | | |
| Income: | | | | | | | | |
| Interest (net of non-U.S. withholding tax of $78) | | $ | 8,618 | | | | | |
| Dividends (net of non-U.S. withholding tax of $96) | | | 1,971 | | | $ | 10,589 | |
| Fees and expenses: | | | | | | | | |
| Investment advisory services | | | 2,816 | | | | | |
| Custodian | | | 108 | | | | | |
| Registration statement and prospectus | | | 76 | | | | | |
| Auditing and legal | | | 32 | | | | | |
| Reports to shareholders | | | 1 | | | | | |
| Trustees’ compensation | | | 20 | | | | | |
| Other | | | 30 | | | | | |
| Total fees and expenses | | | | | | | 3,083 | |
| | | | | | | | | |
| Net investment income | | | | | | | 7,506 | |
| | | | | | | | | |
| Net realized gain and unrealized appreciation on investments, forward currency contracts and currency: | | | | | | | | |
| Net realized gain (loss) on: | | | | | | | | |
| Investments | | | 4,873 | | | | | |
| Forward currency contracts | | | 195 | | | | | |
| Currency transactions | | | (97 | ) | | | 4,971 | |
| Net unrealized appreciation (depreciation) on: | | | | | | | | |
| Investments (net of non-U.S. taxes of $4) | | | 23,951 | | | | | |
| Forward currency contracts | | | (399 | ) | | | | |
| Currency translations | | | 42 | | | | 23,594 | |
| Net realized gains and unrealized appreciation on investments, forward currency contracts and currency | | | | | | | 28,565 | |
| Net increase in net assets resulting from operations | | | | | | $ | 36,071 | |
See Notes to Financial Statements
| Capital Emerging Markets Total Opportunities Fund | 17 |
Financial statements
| Statements of changes in net assets | | (dollars in thousands) | |
| | | | | | For the period | | | For the period | | | | |
| | | (unaudited) | | | January 27, 2012 | | | January 1, 2012 | | | | |
| | | 6 months ended | | | through | | | through | | | Year-ended | |
| | | April 30, 2013 | | | October 31, 20121 | | | January 26, 20122 | | | December 31, 20112 | |
| Operations: | | | | | | | | | | | | | | | | |
| Net investment income | | $ | 7,506 | | | $ | 14,212 | | | $ | 1,112 | | | $ | 15,787 | |
| Net realized gain (loss) on investments, forward currency contracts and currency transactions | | | 4,971 | | | | (4,132 | ) | | | (4,408 | ) | | | (5,404 | ) |
| Net unrealized appreciation (depreciation) on investments, forward currency contracts and currency translations | | | 23,594 | | | | 12,736 | | | | 23,664 | | | | (31,418 | ) |
| Net increase (decrease) in net assets resulting from operations | | | 36,071 | | | | 22,816 | | | | 20,368 | | | | (21,035 | ) |
| Dividends paid to shareholders: | | | | | | | | | | | | | | | | |
| Dividends from net investment income | | | (14,914 | ) | | | — | | | | — | | | | — | |
| Capital share transactions: | | | | | | | | | | | | | | | | |
| Proceeds from shares sold: 8,364,948, 11,008,378, 0 and 13,413,689 shares, respectively | | | 99,397 | | | | 123,646 | | | | — | | | | 145,154 | |
| Proceeds from shares issued in reinvestment of net investment income dividends: 1,183,067, 0, 0 and 0 shares, respectively | | | 13,854 | | | | — | | | | — | | | | — | |
| Cost of shares repurchased: 2,676,698, 1,397,615, 1,376,931 and 2,289,015 shares, respectively | | | (31,431 | ) | | | (15,695 | ) | | | (14,651 | ) | | | (24,860 | ) |
| Net increase (decrease) in net assets resulting from capital share transactions | | | 81,820 | | | | 107,951 | | | | (14,651 | ) | | | 120,294 | |
| | | | | | | | | | | | | | | | | |
| Total increase in net assets | | | 102,977 | | | | 130,767 | | | | 5,717 | | | | 99,259 | |
| Net assets: | | | | | | | | | | | | | | | | |
| Beginning of period | | | 517,763 | | | | 386,996 | | | | 381,279 | | | | 282,020 | |
| End of period (including undistributed net investment income: $4,876, $12,284, — and —, respectively) | | $ | 620,740 | | | $ | 517,763 | | | $ | 386,996 | | | $ | 381,279 | |
| 1 | The fund commenced operations as a Registered Investment Company on January 27, 2012. |
| 2 | Capital Guardian Emerging Markets Total Opportunities Common Trust Fund (the Predecessor Fund) was reorganized into the Capital Emerging Markets Total Opportunities Fund at the close of business effective January 26, 2012. In connection with the reorganization, the Predecessor Fund transferred all its assets and liabilities to the Capital Emerging Markets Total Opportunities Fund and changed its fiscal year-end from December to October. |
See Notes to Financial Statements
| 18 | Capital Emerging Markets Total Opportunities Fund |
Notes to financial statements
unaudited
1. Organization
Capital Emerging Markets Total Opportunities Fund (the “fund”) was organized on November 18, 2011 as a Delaware statutory trust. The fund is registered under the Investment Company Act of 1940, as amended, as an open-end management investment company. The fund seeks long-term growth and preservation of capital with lower volatility of returns than emerging market equities by allocating a portion of its assets to bonds and other debt securities of emerging market issuers.
Capital Guardian Emerging Markets Total Opportunities Fund for Tax-Exempt Trusts (the “Predecessor Fund”) was reorganized and merged into Capital Emerging Markets Total Opportunities Fund, pursuant to the approval of the trustee of the Predecessor Fund and the board of trustees of the fund on October 26, 2011, and October 20, 2011, respectively. The Predecessor Fund transferred all of its assets and liabilities to the fund, effective at the close of business January 27, 2012. In connection with the reorganization, the fiscal year-end and tax year-end of the Predecessor Fund was changed from December 31 to October 31.
2. Significant accounting policies
The financial statements have been prepared to comply with accounting principles generally accepted in the United States of America. These principles require management to make estimates and assumptions that affect reported amounts and disclosures. Actual results could differ from those estimates. The fund follows the significant accounting policies described below, as well as the valuation policies described in the next section on valuation.
Security transactions and related investment income — Security transactions are recorded by the fund as of the date the trades are executed with brokers. Realized gains and losses from security transactions are determined based on the specific identified cost of the securities. In the event a security is purchased with a delayed payment date, the fund will segregate liquid assets sufficient to meet its payment obligations. Dividend income is recognized on the ex-dividend date and interest income is recognized on an accrual basis. Market discounts, premiums and original issue discounts on bonds, notes and short-term securities are amortized daily over the expected life of the security.
Dividends and distributions to shareholders — Dividends and distributions paid to shareholders are recorded on the ex-dividend date.
Currency translation — Assets and liabilities, including investment securities, denominated in currencies other than U.S. dollars are translated into U.S. dollars at the exchange rates supplied by one or more pricing vendors on the valuation date. Purchases and sales of investment securities and income and expenses are translated into U.S. dollars at the exchange rates on the dates of such transactions. On the accompanying financial statements, the effects of changes in exchange rates on investment securities are included with the net realized gain or loss and net unrealized appreciation or depreciation on investments. The realized gain or loss and unrealized appreciation or depreciation resulting from all other transactions denominated in currencies other than U.S. dollars are disclosed separately.
3. Valuation
Capital Guardian Trust Company (“CGTC”), the fund’s investment adviser, values the fund’s investments at fair value as defined by accounting principles generally accepted in the United States of America. The net asset value of the fund is the value of a single share. The fund calculates its net asset value each day the New York Stock Exchange is open for trading as of approximately 4:00 p.m. New York time, the normal close of regular trading.
Methods and inputs — The fund’s investment adviser uses the following methods and inputs to establish the fair value of the fund’s assets and liabilities. Use of particular methods and inputs may vary over time based on availability and relevance as market and economic conditions evolve.
Equity securities are generally valued at the official closing price of, or the last reported sale price on, the exchange or market on which such securities are traded, as of the close of business on the day the securities are being valued or, lacking any sales, at the last available bid price. Prices for each security are taken from the principal exchange or market on which the security trades.
Fixed-income securities, including short-term securities purchased with more than 60 days left to maturity, are generally valued at prices obtained from one or more pricing vendors. Vendors value such securities based on one or more of the inputs described in the table on the following page. The table provides examples of inputs that are commonly relevant for valuing particular classes of fixed-income securities in which the fund is authorized to invest. However, these classifications are not exclusive and any of the inputs may be used to value any other class of fixed-income security.
| Capital Emerging Markets Total Opportunities Fund | 19 |
| Fixed-income class | Examples of standard inputs |
| All | Benchmark yields, transactions, bids, offers, quotations from dealers and trading systems, new issues, spreads and other relationships observed in the markets among comparable securities; and proprietary pricing models such as yield measures calculated using factors such as cash flows, financial or collateral performance and other reference data (collectively referred to as “standard inputs”) |
| Corporate bonds & notes; convertible securities | Standard inputs and underlying equity of the issuer |
| Bonds & notes of governments & government agencies | Standard inputs and interest rate volatilities |
When the fund’s investment adviser deems it appropriate to do so (such as when vendor prices are unavailable or not deemed to be representative), fixed-income securities will be valued in good faith at the mean quoted bid and ask prices that are reasonably and timely available (or bid prices, if ask prices are not available) or at prices for securities of comparable maturity, quality and type.
Securities with both fixed-income and equity characteristics, or equity securities traded principally among fixed-income dealers, are generally valued in the manner described above for either equity or fixed-income securities, depending on which method is deemed most appropriate by the fund’s investment adviser. Short-term securities purchased within 60 days to maturity are valued at amortized cost, which approximates fair value. The value of short-term securities originally purchased with maturities greater than 60 days is determined based on an amortized value to par when they reach 60 days. Forward currency contracts are valued at the mean of representative quoted bid and ask prices, generally based on prices supplied by one or more vendors.
Securities and other assets for which representative market quotations are not readily available or are considered unreliable by the fund’s investment adviser are fair valued as determined in good faith under fair value guidelines adopted by authority of the fund’s board of trustees as further described below. The investment adviser follows fair valuation guidelines, consistent with U.S. Securities and Exchange Commission (“SEC”) rules and guidance, to consider relevant principles and factors when making fair value determinations. The investment adviser considers relevant indications of value that are reasonably and timely available to it in determining the fair value to be assigned to a particular security, such as the type and cost of the security; contractual or legal restrictions on resale of the security; relevant financial or business developments of the issuer; actively traded similar or related securities; conversion or exchange rights on the security; related corporate actions; significant events occurring after the close of trading in the security; and changes in overall market conditions. In addition, the closing prices of equity securities that trade in markets outside U.S. time zones may be adjusted to reflect significant events that occur after the close of local trading but before the net asset value of the fund is determined. Fair valuations and valuations of investments that are not actively trading involve judgment and may differ materially from valuations that would have been used had greater market activity occurred.
Processes and structure — The fund’s board of trustees has delegated authority to the fund’s investment adviser to make fair value determinations, subject to board oversight. The investment adviser has established a Joint Fair Valuation Committee (the “Fair Valuation Committee”) to administer, implement and oversee the fair value process, and to make fair value decisions. The Fair Valuation Committee regularly reviews its own fair value decisions, as well as decisions made under its standing instructions to the investment adviser’s valuation teams. The Fair Valuation Committee reviews changes in fair value measurements from period to period and may, as deemed appropriate, update the fair valuation guidelines to better reflect the results of back testing and address new or evolving issues. The Fair Valuation Committee reports any changes to the fair value guidelines to the board of trustees with supplemental information to support the changes. The fund’s board of trustees and audit committee regularly review reports that describe fair value determinations and methods.
The fund’s investment adviser has also established a Fixed-Income Pricing Review Group to administer and oversee the fixed-income valuation process, including the use of fixed-income pricing vendors. This group regularly reviews pricing vendor information and market data. Pricing decisions, processes and controls over security valuation are also subject to internal reviews, including an annual control self-evaluation program facilitated by the investment adviser’s compliance group.
Classifications — The fund’s investment adviser classifies the fund’s assets and liabilities into three levels based on the inputs used to value the assets or liabilities. Level 1 values are based on quoted prices in active markets for identical securities. Level 2 values are based on significant observable market inputs, such as quoted prices for similar securities and quoted prices in inactive markets. Certain securities trading outside the U.S. may transfer between Level 1 and Level 2 due to valuation adjustments resulting from significant market movements following the close of local trading. Level 3 values are based on significant
| 20 | Capital Emerging Markets Total Opportunities Fund |
unobservable inputs that reflect the investment adviser’s determination of assumptions that market participants might reasonably use in valuing the securities. The valuation levels are not necessarily an indication of the risk or liquidity associated with the underlying investment. For example, U.S. government securities are reflected as Level 2 because the inputs used to determine fair value may not always be quoted prices in an active market. The following table presents the fund’s valuation levels as of April 30, 2013 (dollars in thousands):
| | | Investment securities | |
| | | Level 1 | | | Level 21,2 | | | Level 3 | | | Total | |
| Assets: | | | | | | | | | | | | | | | | |
| Equity securities: | | | | | | | | | | | | | | | | |
| Asia-Pacific | | $ | — | | | $ | 171,671 | | | $ | — | | | $ | 171,671 | |
| Other markets | | | 39,528 | | | | 69,997 | | | | — | | | | 109,525 | |
| Miscellaneous | | | 9,832 | | | | 15,020 | | | | — | | | | 24,852 | |
| Bonds and notes: | | | | | | | | | | | | | | | | |
| Latin America | | | — | | | | 134,182 | | | | — | | | | 134,182 | |
| Eastern Europe and Middle East | | | — | | | | 49,077 | | | | — | | | | 49,077 | |
| Other markets | | | — | | | | 49,490 | | | | — | | | | 49,490 | |
| Miscellaneous | | | — | | | | 3,958 | | | | — | | | | 3,958 | |
| Short-term securities | | | — | | | | 76,069 | | | | — | | | | 76,069 | |
| Total | | $ | 49,360 | | | $ | 569,464 | | | $ | — | | | $ | 618,824 | |
| | | Other investments3 | |
| | | Level 1 | | | Level 2 | | | Level 3 | | | Total | |
| Assets: | | | | | | | | | | | | | | | | |
| Unrealized appreciation on open forward currency contracts | | $ | — | | | $ | 40 | | | $ | — | | | $ | 40 | |
| Liabilities: | | | | | | | | | | | | | | | | |
| Unrealized depreciation on open forward currency contracts | | | — | | | | (417 | ) | | | — | | | | (417 | ) |
| Total | | $ | — | | | $ | (377 | ) | | $ | — | | | $ | (377 | ) |
| 1 | Securities with a market value of $199,870,000, which represented 32.20% of the net assets of the fund, transferred from Level 1 to Level 2 since the prior fiscal year-end, primarily due to significant market movements following the close of local trading. |
| 2 | Level 2 includes investment securities with an aggregate value of $273,181,000, which represented 44.01% of the net assets of the fund, that were fair valued under guidelines adopted by authority of the fund’s board of trustees. |
| 3 | Forward currency contracts are not included in the investment portfolio. |
4. Principal risks
This section describes the principal risks associated with the fund’s principal investment strategies. You may lose money by investing in the fund. The likelihood of loss may be greater if you invest for a shorter period of time.
Market conditions — The prices of, and the income generated by, the securities held by the fund may decline due to market conditions and other factors, including those directly involving the issuers of securities held by the fund.
Investing in growth-oriented stocks — Growth-oriented stocks may involve larger price swings and greater potential for loss than other types of investments. These risks may be even greater in the case of smaller capitalization stocks.
Investing in income-oriented stocks — Income provided by the fund may be reduced by changes in the dividend policies of, and the capital resources available at, the companies in which the fund invests.
Investing outside the United States — Securities of issuers domiciled outside the United States, or with significant operations outside the United States, may lose value because of adverse political, social, economic or market developments in the countries or regions in which the issuer operates. These securities may also lose value due to changes in foreign currency exchange rates against the U.S. dollar and/or currencies of other countries. Securities markets in certain countries may be more volatile and/or less liquid than those in the United States. Investments outside the United States may also be subject to different settlement and accounting practices and different regulatory, legal and reporting standards, and may be more difficult to value, than those in the United States. The risks of investing outside the United States may be heightened in connection with investments in emerging markets.
| Capital Emerging Markets Total Opportunities Fund | 21 |
Investing in emerging markets — Investing in emerging markets may involve risks in addition to and greater than those generally associated with investing in developed countries. For instance, developing countries may have less developed legal and accounting systems than those in developed countries. The governments of these countries may be less stable and more likely to impose capital controls, nationalize a company or industry, place restrictions on foreign ownership and on withdrawing sale proceeds of securities from the country, and/or impose punitive taxes that could adversely affect the prices of securities. In addition, the economies of these countries may be dependent on relatively few industries that are more susceptible to local and global changes. Securities markets in these countries can also be relatively small and have substantially lower trading volumes. As a result, securities issued in these countries may be more volatile and less liquid, and may be more difficult to value, than securities issued in countries with more developed economies and/or markets. Additionally, there may be increased settlement risks for transactions in local securities.
Investing in bonds — Rising interest rates will generally cause the prices of bonds and other debt securities to fall. Longer maturity debt securities may be subject to greater price fluctuations than shorter maturity debt securities. In addition, falling interest rates may cause an issuer to redeem, call or refinance a security before its stated maturity, which may result in the fund having to reinvest the proceeds in lower yielding securities.
Bonds and other debt securities are subject to credit risk, which is the possibility that the credit strength of an issuer will weaken and/or an issuer of a debt security will fail to make timely payments of principal or interest and the security will go into default. Credit risk is gauged, in part, by the credit ratings of the securities in which the fund invests. However, ratings are only the opinions of the rating agencies issuing them and are not guarantees as to credit quality or an evaluation of market risk.
Investing in lower rated bonds — Lower rated bonds and other lower rated debt securities generally have higher rates of interest and involve greater risk of default or price declines due to changes in the issuer’s creditworthiness than those of higher quality debt securities. The market prices of these securities may fluctuate more than the prices of higher quality debt securities and may decline significantly in periods of general economic difficulty. These risks may be increased with respect to lower quality, higher yielding debt securities (rated Ba1 or below or BB+ or below by Nationally Recognized Statistical Rating Organizations designated by the fund’s investment adviser or unrated but determined to be of equivalent quality by the fund’s investment adviser). Such securities are sometimes referred to as “junk bonds.” Junk bonds are considered speculative.
Thinly traded securities — There may be little trading in the secondary market for particular bonds or other debt securities, which may make them more difficult to value, acquire or sell.
Management — The investment adviser to the fund actively manages the fund’s investments. Consequently, the fund is subject to the risk that the methods and analyses employed by the investment adviser in this process may not produce the desired results. This could cause the fund to lose value or its investment results to lag relevant benchmarks or other funds with similar objectives.
Your investment in the fund is not a bank deposit and is not insured or guaranteed by the Federal Deposit Insurance Corporation or any other governmental agency, entity or person. You should consider how the fund fits into your overall investment program.
5. Taxation and distributions
Federal income taxation — The fund complies with the requirements under Subchapter M of the Internal Revenue Code applicable to regulated investment companies and intends to distribute substantially all of its net taxable income and net capital gains each year. The fund is not subject to income taxes to the extent such distributions are made. Therefore, no federal income tax provision is required.
As of and during the six months ended April 30, 2013, the fund did not have a liability for any unrecognized tax benefits. The fund recognizes interest and penalties, if any, related to unrecognized tax benefits as income tax expense in the statement of operations. During the period, the fund did not incur any interest or penalties.
The fund is not subject to examination by U.S. federal tax authorities, by state tax authorities and by tax authorities outside the U.S. for tax years before 2012, the year the fund commenced operations.
Non-U.S. taxation — Dividend and interest income are recorded net of non-U.S. taxes paid. Gains realized by the fund on the sale of securities in certain countries are subject to non-U.S. taxes. When the fund is taxed on either realized and/or unrealized capital gains, the fund will accrue for non-U.S. taxes as applicable. As of April 30, 2013, the fund did not accrue any liabilities for non-U.S. taxes on realized and unrealized gains.
Distributions — Distributions paid to shareholders are based on net investment income and net realized gains determined on a tax basis, which may differ from net investment income and net realized gains for financial reporting purposes. These differences
| 22 | Capital Emerging Markets Total Opportunities Fund |
are due primarily to different treatment for items such as currency gains and losses; capital losses related to sales of certain securities within 30 days of purchase; net capital losses; and short-term capital gains and losses.
The fiscal year in which amounts are distributed may differ from the year in which the net investment income and net realized gains are recorded by the fund for financial reporting purposes. For the six months ended April 30, 2013, the tax character of the distribution paid to shareholders was ordinary income in the amount of $14,914,000. For the period from January 27, 2012 (commencement of operations), through October 31, 2012, there were no distributions paid to shareholders. The fund may designate a portion of the amount paid to redeeming shareholders as distribution for tax purposes.
The components of distributable earnings on a tax basis are reported as of the fund’s most recent year-end. As of October 31, 2012, the components of distributable earnings on a tax basis were as follows (dollars in thousands):
| Undistributed ordinary income | | $ | 12,269 |
| Capital loss carryforward* | | | (3,445) |
| * | The capital loss carryforward will be used to offset any capital gains realized by the fund in the current year or in subsequent years. The fund will not make distributions from capital gains while a capital loss carryforward remains. |
As of April 30, 2013, the tax basis unrealized appreciation (depreciation) and cost of investments were as follows (dollars in thousands):
| Gross unrealized appreciation on investment securities | | $ | 66,405 |
| Gross unrealized depreciation on investment securities | | | (23,961) |
| Net unrealized appreciation on investment securities | | | 42,444 |
| Cost of investment securities | | | 576,380 |
6. Fees and transactions with related parties
CGTC serves as investment adviser to the fund and other funds. CGTC is wholly owned by Capital Group International, Inc., which is wholly owned by The Capital Group Companies, Inc. Expense limitations have been imposed through December 31, 2013, to limit the fund’s total annual fund operating expenses to 1.10% (as a percentage of average daily net assets).
Investment advisory services fee — The Investment Advisory and Service Agreement with CGTC provides for monthly fees accrued daily. The fee is 1.00% of the average daily net assets of the fund.
Distribution services — American Funds Distributors,® Inc. (“AFD”) is the principal underwriter of the fund’s shares. AFD does not receive any compensation related to the sale of shares of the fund.
Affiliated officers and trustees — Officers and certain trustees of the fund are or may be considered to be affiliated with CGTC and AFD. No affiliated officers or trustees received any compensation directly from the fund.
7. Investment transactions and other disclosures
The fund made purchases and sales of investment securities, excluding short term securities, of $178,450,000 and $162,101,000, respectively, during the six months ended April 30, 2013.
8. Fund merger
On January 27, 2012, the fund acquired all of the assets and assumed all of the liabilities of the Predecessor Fund pursuant to a plan of reorganization approved by the trustee of the Predecessor Fund and the board of trustees of the fund on October 26, 2011, and October 20, 2011. The fund began with a $100,000 seed investment. The acquisition was accomplished by a tax-free exchange as follows:
On the close of business on January 27, 2012, 35,113,792 shares of the Predecessor Fund, valued at $386,996,070, were outstanding. After the reorganization, the fund had 35,122,866 shares valued at $387,096,070.
The investment portfolio of the Predecessor Fund, with a value of $377,210,268 and identified cost of $370,087,014, were the principal assets acquired by the fund. For financial reporting purposes, assets received and shares issued by the fund were recorded at fair value; however, the cost basis of the investments received from the Predecessor Fund was carried forward
| Capital Emerging Markets Total Opportunities Fund | 23 |
to align ongoing reporting of the fund’s realized and unrealized gains and losses with amounts distributable to shareholders for tax purposes. Immediately prior to the merger, the net assets of the Predecessor Fund were $386,996,070.
Because the combined investment portfolios have been managed as a single integrated portfolio since the merger was completed, it is not practicable to separate the amounts of revenue and earnings of the Predecessor Fund that have been reflected in the statement of operations since January 27, 2012, for the fund.
| | | Before reorganization | | | After reorganization | |
| | | The Predecessor Fund | | | The fund | | | The fund | |
| Net assets | | $ | 386,996,070 | | | $ | 100,000 | | | $ | 387,096,070 | |
| Shares outstanding | | | 35,113,792 | | | | — | | | | 35,122,866 | |
| Net asset value per share | | $ | 11.02 | | | $ | — | | | $ | 11.02 | |
| Net unrealized appreciation | | $ | 6,187,269 | | | $ | — | | | $ | 6,187,269 | |
9. Forward currency contracts
The fund has entered into forward currency contracts, which represent agreements to exchange currencies on specific future dates at predetermined rates. The fund’s investment adviser uses forward currency contracts to manage the fund’s exposure to changes in exchange rates. Upon entering into these contracts, risks may arise from the potential inability of counterparties to meet the terms of their contracts and from possible movements in exchange rates.
On a daily basis, the fund’s investment adviser values forward currency contracts based on the applicable exchange rates and records unrealized appreciation or depreciation for open forward currency contracts in the fund’s statement of assets and liabilities. Realized gains or losses are recorded at the time the forward contract is closed or offset by another contract with the same broker for the same settlement date and currency. Closed forward currency contracts that have not reached their expiration date are included in the respective receivables or payables for closed forward currency contracts in the fund’s statement of assets and liabilities. Net realized gains or losses from closed forward currency contracts and net unrealized appreciation or depreciation from open forward currency contracts are recorded in the fund’s statement of operations.
As of April 30, 2013, the fund had open forward currency contracts to sell currencies, as shown in the following table. The open forward currency contracts shown are generally indicative of the volume of activity during the year (as a percentage of the fund’s total net assets).
| | | | | Contract amount
(000) | | | U.S. valuation
(000) | |
| | | Counterparty | | Non-U.S. | | U.S. | | | Amount | | | Unrealized
appreciation/
(depreciation) | |
| Sales: | | | | | | | | | | | | | | | | |
| Australian dollar to U.S. dollar expiring 5/7/2013 | | UBS AG | | AUD270 | | $ | 282 | | | $ | 279 | | | $ | 3 | |
| Brazilian real to U.S. dollar expiring 5/20/2013 | | Bank of America | | BRL20,550 | | | 10,281 | | | | 10,249 | | | | 32 | |
| British pound to U.S. dollar expiring 5/7–5/13/2013 | | Bank of New York Mellon | | GBP12,807 | | | 19,683 | | | | 19,893 | | | | (210 | ) |
| Euro to U.S. dollar expiring 5/7/2013 | | JPMorgan Chase | | EUR454 | | | 583 | | | | 598 | | | | (15 | ) |
| Euro to U.S. dollar expiring 5/13–5/22/2013 | | Bank of New York Mellon | | EUR8,334 | | | 10,913 | | | | 10,976 | | | | (63 | ) |
| South Korean Won to U.S. dollar expiring 5/7/2013 | | JPMorgan Chase | | KRW827,488 | | | 740 | | | | 751 | | | | (11 | ) |
| Mexican peso to U.S. dollar expiring 5/28/2013 | | UBS AG | | MXN7,600 | | | 619 | | | | 625 | | | | (6 | ) |
| Russian Ruble to U.S. dollar expiring 5/24/2013 | | JPMorgan Chase | | RUB4,934 | | | 155 | | | | 158 | | | | (3 | ) |
| South African Rand to U.S. dollar expiring 5/7/2013 | | UBS AG | | ZAR26,445 | | | 2,848 | | | | 2,945 | | | | (97 | ) |
| South African Rand to U.S. dollar expiring 5/8/2013 | | Bank of America | | ZAR1,480 | | | 165 | | | | 165 | | | | — | * |
| Thai Baht to U.S. dollar expiring 5/20/2013 | | UBS AG | | THB8,570 | | | 297 | | | | 292 | | | | 5 | |
| Turkish Lira to U.S. dollar expiring 5/22/2013 | | UBS AG | | TRY6,643 | | | 3,685 | | | | 3,697 | | | | (12 | ) |
| | | | | | | | | | | | | | | | | |
| Forward currency contracts — net | | | | | | | | | | | | | | $ | (377 | ) |
| * | Amount less than one thousand. |
| 24 | Capital Emerging Markets Total Opportunities Fund |
Financial highlights
| | | 6 months
ended
April 30, 20131 | | | For the period
January 27, 2012
through
October 31, 20122 | | | For the period
January 1, 2012
through
January 26, 20123 | | | For the year ended
December 31, 20113 | | | For the period
March 1, 20104
through
December 31, 20103 | |
| Net asset value, beginning of period | | $ | 11.58 | | | $ | 11.02 | | | $ | 10.45 | | | $ | 11.12 | | | $ | 10.00 | |
| Income (loss) from investment operations5: | | | | | | | | | | | | | | | | | | | | |
| Net investment income | | | .16 | | | | .35 | | | | .03 | | | | .52 | | | | .45 | |
| Net realized and unrealized gain (loss) on investments | | | .62 | | | | .21 | | | | .54 | | | | (1.19 | ) | | | .67 | |
| Total income (loss) from investment operations | | | .78 | | | | .56 | | | | .57 | | | | (.67 | ) | | | 1.12 | |
| Less distributions: | | | | | | | | | | | | | | | | | | | | |
| Dividends from net investment income | | | (.33 | ) | | | — | | | | — | | | | — | | | | — | |
| Net asset value, end of period | | $ | 12.03 | | | $ | 11.58 | | | $ | 11.02 | | | $ | 10.45 | | | $ | 11.12 | |
| Total return | | | 6.80 | % | | | 5.08 | % | | | 5.45 | % | | | (6.03 | )% | | | 11.20 | % |
| | | | | | | | | | | | | | | | | | | | | |
| Ratios/Supplemental data: | | | | | | | | | | | | | | | | | | | | |
| Net assets, end of period (in millions) | | $ | 621 | | | $ | 518 | | | $ | 387 | | | $ | 381 | | | $ | 282 | |
| Ratio of expenses to average net assets | | | 1.09 | %6 | | | 1.10 | %6 | | | .05 | %6 | | | .04 | % | | | .08 | %6 |
| Ratio of net investment income to average net assets | | | 2.66 | %6 | | | 4.11 | %6 | | | 3.95 | %6 | | | 4.78 | % | | | 5.07 | %6 |
| Portfolio turnover rate | | | 31.47 | %7 | | | 42.49 | %7 | | | 7.00 | %7 | | | 59.52 | %1 | | | 69.40 | %1,7 |
| 1 | Unaudited. |
| 2 | The fund commenced operations as a Registered Investment Company on January 27, 2012. |
| 3 | Capital Guardian Emerging Markets Total Opportunities Common Trust Fund (the Predecessor Fund) was reorganized into the Capital Emerging Markets Total Opportunities Fund at the close of business effective January 26, 2012. |
| 4 | The Predecessor Fund commenced operations on March 1, 2010. |
| 5 | The per-share/unit data is based on average shares/units outstanding. |
| 6 | Annualized. |
| 7 | Based on operations for the period shown (unless otherwise noted) and, accordingly, may not be representative of a full year. |
| Capital Emerging Markets Total Opportunities Fund | 25 |
As a shareholder of the fund, you incur ongoing costs, including investment advisory services fees and other expenses. This example is intended to help you understand your ongoing costs (in dollars) of investing in the fund so you can compare these costs with the ongoing costs of investing in other mutual funds. The example is based on an investment of $1,000 invested at the beginning of the period and held for the entire period.
Actual expenses:
The first line of the table below provides information about actual account values and actual expenses. You may use the information in this line, together with the amount you invested, to estimate the expenses that you paid over the period. Simply divide your account value by $1,000 (for example, an $8,600 account value divided by $1,000 = 8.6), then multiply the result by the number in the first line under the heading entitled “Expenses paid during period” to estimate the expenses you paid on your account during this period.
Hypothetical example for comparison purposes:
The second line of the table below provides information about hypothetical account values and hypothetical expenses based on the fund’s actual expense ratio and an assumed rate of return of 5% per year before expenses, which is not the fund’s actual return. The hypothetical account values and expenses may not be used to estimate the actual ending account balance or expenses you paid for the period. You may use this information to compare the ongoing costs of investing in the fund and other funds. To do so, compare this 5% hypothetical example with the 5% hypothetical examples that appear in the shareholder reports of the other funds.
| | | Beginning
account value
10/31/2012 | | | Ending
account value
4/30/2013 | | | Expenses
paid during
period* | | | Annualized
expense
ratio | |
| Actual return | | $ | 1,000.00 | | | $ | 1,068.05 | | | $ | 5.59 | | | | 1.09 | % |
| Hypothetical 5% return before expenses | | | 1,000.00 | | | | 1,019.39 | | | | 5.46 | | | | 1.09 | |
*The “expenses paid during period” are equal to the “annualized expense ratio,” multiplied by the average account value over the period, multiplied by the number of days in the period, and divided by 365 (to reflect the current period).
| 26 | Capital Emerging Markets Total Opportunities Fund |
Approval of Investment Advisory and Service Agreement
The fund’s Board of Trustees (the “Board”) has approved the fund’s Investment Advisory and Service Agreement (the “agreement”) with Capital Guardian Trust Company (“CGTC”) for an additional one year term through March 31, 2014. The Board approved the agreement following the recommendation of the fund’s Contracts Committee (the “Committee”), which is composed of all of the fund’s independent board members. The Board and the Committee determined that the fund’s advisory fee structure was fair and reasonable in relation to the services provided and that approving the agreement was in the best interests of the fund and its shareholders.
In reaching this decision, the Board and the Committee took into account information furnished to them throughout the year, as well as information prepared specifically in connection with their review of the agreement, and were advised by their independent counsel. They considered the factors discussed here, among others, but did not identify any single issue or particular piece of information that, in isolation, was the controlling factor, and each Board member did not necessarily attribute the same weight to each factor.
1. Nature, extent and quality of services
The Board and the Committee considered the depth and quality of CGTC’s investment management process, including its global research capabilities; the experience, capability and integrity of its senior management and other personnel; the low turnover rates of its key personnel; the overall financial strength and stability of its organization; and the ongoing evolution of CGTC’s organizational structure designed to maintain and strengthen these qualities. The Board and the Committee also considered the nature, extent and quality of administrative and compliance services provided by CGTC to the fund under the agreement and other agreements. The Board and the Committee concluded that the nature, extent and quality of the services provided by CGTC have benefited and should continue to benefit the fund and its shareholders.
2. Investment results
The Board and the Committee considered the investment results of the fund in light of its objective of providing long-term growth and preservation of capital with lower volatility of returns than emerging markets equities. They compared the fund’s total returns with those of other funds and market indices for the lifetime (since January 2012), three-month and one-month periods ended October 31, 2012, and September 30, 2012.
This report, including the letter to shareholders and related disclosures, contains certain information about the fund’s investment results. The Board and the Committee reviewed the fund’s investment results measured against (i) the MSCI Emerging Markets IMI Index, (ii) the J.P. Morgan GBI-EM Global Diversified index, (iii) the J.P. Morgan EMBI Global index and (iv) the Lipper Emerging Markets Funds Average. They noted that the investment results for the fund were superior to the Lipper Emerging Markets Funds Average for the lifetime periods but below that measure for shorter periods, and were mixed compared to the various indices for all periods. The Board and the Committee concluded that the fund’s results have been satisfactory and that CGTC’s record in managing the fund indicated that its continued management should benefit the fund and its shareholders.
3. Advisory fees and total expenses
The Board and the Committee compared the advisory fees and total expense levels of the fund to those of other funds. They observed that the fund’s advisory fees and expenses were below those of most similar funds included in the Lipper Emerging Markets Fund Average. The Board and the Committee noted that the fees paid to CGTC by clients with separately managed accounts are in many cases lower than those paid by the fund and concluded that the differences appropriately reflected the significant investment, operational and regulatory differences between advising the fund and the other clients. The Board and the Committee concluded that the fund’s cost structure was fair and reasonable in relation to the services provided, and that the shareholders receive reasonable value in return for the advisory fees and other amounts paid to CGTC by the fund.
| Capital Emerging Markets Total Opportunities Fund | 27 |
4. Ancillary benefits
The Board and the Committee considered a variety of other benefits that CGTC and its affiliates receive as a result of CGTC’s relationship with the fund, including fees for administrative services paid to CGTC’s Capital Group Private Client Services division and possible ancillary benefits to CGTC and its affiliates. The Board and the Committee reviewed CGTC’s portfolio trading practices, noting that while CGTC receives the benefit of research provided by broker-dealers executing portfolio transactions on behalf of the fund, it does not obtain third-party research or other services in return for allocating brokerage to such broker-dealers. The Board and the Committee took these ancillary benefits into account in evaluating the reasonableness of the advisory fees and other amounts paid to CGTC by the fund.
5. Adviser financial information
The Board and the Committee reviewed information regarding CGTC’s costs of providing services to the fund, including personnel, systems and resources of investment, compliance, trading and other administrative operations. They considered CGTC’s costs and willingness to invest in technology, infrastructure and staff to maintain and expand services and capabilities, respond to industry and regulatory developments, and attract and retain qualified personnel. They noted information regarding the compensation structure for CGTC’s investment professionals. The Board and the Committee also noted the competitiveness and cyclicality of both the mutual fund industry and the capital markets, and the importance in that environment of the Capital Group organization’s long-term profitability for maintaining CGTC’s independence, company culture and management continuity. They further considered CGTC’s reimbursement of fund expenses through voluntary fee caps. The Board and the Committee concluded that the fund’s advisory fee structure reflected a reasonable sharing of benefits between CGTC and the fund’s shareholders.
| 28 | Capital Emerging Markets Total Opportunities Fund |
Offices of the fund and of the investment adviser
Capital Guardian Trust Company
333 South Hope Street
Los Angeles, CA 90071-1406
6455 Irvine Center Drive
Irvine, CA 92618
Transfer agent for shareholder accounts
J.P. Morgan Investor Services Company
One Beacon Street
Boston, MA 02108
Custodian of assets
JPMorgan Chase Bank
270 Park Avenue
New York, NY 10017-2070
Counsel
Bingham McCutchen LLP
355 South Grand Avenue, Suite 4400
Los Angeles, CA 90071-3106
Independent registered public accounting firm
Deloitte & Touche LLP
695 Town Center Drive
Suite 1200
Costa Mesa, CA 92626-7188
Principal underwriter
American Funds Distributors, Inc.
333 South Hope Street
Los Angeles, CA 90071-1406
Investors should carefully consider investment objectives, risks, charges and expenses. This and other important information is contained in the fund prospectus, which can be obtained from Capital Guardian Trust Company by calling (800) 266-9532 and should be read carefully before investing.
Capital Emerging Markets Total Opportunities Fund files a complete list of its portfolio holdings with the U.S. Securities and Exchange Commission (SEC) for the first and third quarters of each fiscal year on Form N-Q. This filing is available free of charge on the SEC website. You may also review or, for a fee, copy this filing at the SEC’s Public Reference Room in Washington, D.C. Additional information regarding the operation of the Public Reference Room may be obtained by calling the SEC’s Office of Investor Education and Advocacy at (800) SEC-0330. Additionally, the list of portfolio holdings is available by calling Capital Guardian Trust Company.
The proxy voting procedures and principles of Capital Emerging Markets Total Opportunities Fund — which describe how we vote proxies relating to portfolio securities — is available upon request by calling Capital Guardian Trust Company at (800) 266-9532. The fund files its proxy voting record with the SEC for the 12 months ended June 30 by August 31. The report also is available on the SEC website at sec.gov or by calling Capital Guardian Trust Company.

| The Capital Group Companies | | | | | | |
| Capital International | | Capital Guardian | | Capital Research and Management | | Capital Bank and Trust | | American Funds |
ITEM 2 – Code of Ethics
Not applicable for filing of semi-annual reports to shareholders.
ITEM 3 – Audit Committee Financial Expert
Not applicable for filing of semi-annual reports to shareholders.
ITEM 4 – Principal Accountant Fees and Services
Not applicable for filing of semi-annual reports to shareholders.
ITEM 5 – Audit Committee of Listed Registrants
Not applicable to this Registrant, insofar as the Registrant is not a listed issuer as defined in Rule 10A-3 under the Securities Exchange Act of 1934.
ITEM 6 – Schedule of Investments
Not applicable, insofar as the schedule is included as part of the report to shareholders filed under Item 1 of this Form.
ITEM 7 – Disclosure of Proxy Voting Policies and Procedures for Closed-End Management Investment Companies
Not applicable to this Registrant, insofar as the Registrant is not a closed-end management investment company.
ITEM 8 – Portfolio Managers of Closed-End Management Investment Companies
Not applicable to this Registrant, insofar as the Registrant is not a closed-end management investment company.
ITEM 9 – Purchases of Equity Securities by Closed-End Management Investment Company and Affiliated Purchasers
Not applicable to this Registrant, insofar as the Registrant is not a closed-end management investment company.
ITEM 10 – Submission of Matters to a Vote of Security Holders
There have been no material changes to the procedures by which shareholders may recommend nominees to the Registrant’s board of trustees since the Registrant last submitted a proxy statement to its shareholders. The procedures are as follows. The Registrant has a nominating committee comprised solely of persons who are not considered ‘‘interested persons’’ of the Registrant within the meaning of the Investment Company Act of 1940, as amended. The committee periodically reviews such issues as the board’s composition, responsibilities, committees, compensation and other relevant issues, and recommends any appropriate changes to the full board of trustees. While the committee normally is able to identify from its own resources an ample number of qualified candidates, it will consider shareholder suggestions of persons to be considered as nominees to fill future vacancies on the board. Such suggestions must be sent in writing to the nominating committee of the Registrant, c/o the Registrant’s Secretary, and must be accompanied by complete biographical and occupational data on the prospective nominee, along with a written consent of the prospective nominee for consideration of his or her name by the nominating committee.
ITEM 11 – Controls and Procedures
| (a) | The Registrant’s Principal Executive Officer and Principal Financial Officer have concluded, based on their evaluation of the Registrant’s disclosure controls and procedures (as such term is defined in Rule 30a-3 under the Investment Company Act of 1940), that such controls and procedures are adequate and reasonably designed to achieve the purposes described in paragraph (c) of such rule. |
| | |
| (b) | There were no changes in the Registrant’s internal controls over financial reporting (as defined in Rule 30a-3(d) under the Investment Company Act of 1940) that occurred during the Registrant’s second fiscal quarter of the period covered by this report that has materially affected, or is reasonably likely to materially affect, the Registrant’s internal control over financial reporting. |
ITEM 12 – Exhibits
| (a)(1) | Not applicable for filing of semi-annual reports to shareholders. |
| | |
| (a)(2) | The certifications required by Rule 30a-2 of the Investment Company Act of 1940 and Sections 302 and 906 of the Sarbanes-Oxley Act of 2002 are attached as exhibits hereto. |
SIGNATURES
Pursuant to the requirements of the Securities Exchange Act of 1934 and the Investment Company Act of 1940, the Registrant has duly caused this report to be signed on its behalf by the undersigned, thereunto duly authorized.
| | CAPITAL EMERGING MARKETS TOTAL OPPORTUNITIES FUND |
| | |
| | By /s/ John B. Emerson |
| | John B. Emerson, President and Principal Executive Officer |
| | |
| | Date: June 28, 2013 |
Pursuant to the requirements of the Securities Exchange Act of 1934 and the Investment Company Act of 1940, this report has been signed below by the following persons on behalf of the Registrant and in the capacities and on the dates indicated.
| By /s/ John B. Emerson |
John B. Emerson, President and Principal Executive Officer |
| |
| Date: June 28, 2013 |
| By /s/ Kevin M. Saks |
Kevin M. Saks, Treasurer and Principal Financial Officer |
| |
| Date: June 28, 2013 |