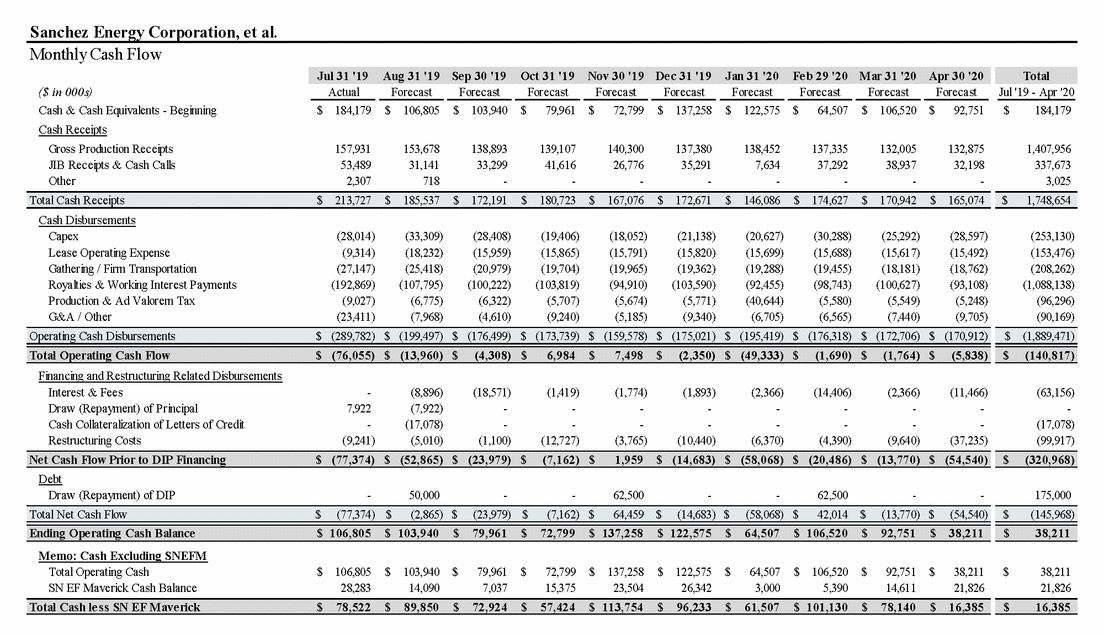
Sanchez Energy Corporation, et al. Monthly Cash Flow Jul 31 '19 Aug 31 '19 Se p 30 '19 Oct 31 '19 Nov 30 '19 De c 31 '19 Jan 31 '20 Fe b 29 '20 M ar 31 '20 Apr 30 '20 Total ($ in 000s) Cash & Cash Equivalents - Beginning Cash Receipts Actual Forecast Forecast Forecast Forecast Forecast Forecast Forecast Forecast Forecast Jul '19 - Apr '20 $ 184,179 $ 106,805 $ 103,940 $ 79,961 $ 72,799 $ 137,258 $ 122,575 $ 64,507 $ 106,520 $ 92,751 $ 184,179 Gross Production Receipts JIB Receipts & Cash Calls Other 157,931 53,489 2,307 153,678 31,141 718 138,893 33,299 - 139,107 41,616 - 140,300 26,776 - 137,380 35,291 - 138,452 7,634 - 137,335 37,292 - 132,005 38,937 - 132,875 32,198 - 1,407,956 337,673 3,025 Cash Disbursements Capex Lease Operating Expense Gathering / Firm Transportation Royalties & Working Interest Payments Production & Ad Valorem Tax G&A / Other (28,014) (9,314) (27,147) (192,869) (9,027) (23,411) (33,309) (18,232) (25,418) (107,795) (6,775) (7,968) (28,408) (15,959) (20,979) (100,222) (6,322) (4,610) (19,406) (15,865) (19,704) (103,819) (5,707) (9,240) (18,052) (15,791) (19,965) (94,910) (5,674) (5,185) (21,138) (15,820) (19,362) (103,590) (5,771) (9,340) (20,627) (15,699) (19,288) (92,455) (40,644) (6,705) (30,288) (15,688) (19,455) (98,743) (5,580) (6,565) (25,292) (15,617) (18,181) (100,627) (5,549) (7,440) (28,597) (15,492) (18,762) (93,108) (5,248) (9,705) (253,130) (153,476) (208,262) (1,088,138) (96,296) (90,169) Financing and Restructuring Related Disbursements Interest & Fees Draw (Repayment) of Principal Cash Collateralization of Letters of Credit Restructuring Costs - 7,922 - (9,241) (8,896) (7,922) (17,078) (5,010) (18,571) - - (1,100) (1,419) - - (12,727) (1,774) - - (3,765) (1,893) - - (10,440) (2,366) - - (6,370) (14,406) - - (4,390) (2,366) - - (9,640) (11,466) - - (37,235) (63,156) - (17,078) (99,917) Debt Draw (Repayment) of DIP - 50,000 - - 62,500 - - 62,500 - - 175,000 M e mo: Cas h Excluding SNEFM Total Operating Cash SN EF Maverick Cash Balance $ 106,805 28,283 $ 103,940 14,090 $ 79,961 7,037 $ 72,799 15,375 $ 137,258 23,504 $ 122,575 26,342 $ 64,507 3,000 $ 106,520 5,390 $ 92,751 14,611 $ 38,211 21,826 $ 38,211 21,826 Total Cas h le s s SN EF Mave rick $ 78,522 $ 89,850 $ 72,924 $ 57,424 $ 113,754 $ 96,233 $ 61,507 $ 101,130 $ 78,140 $ 16,385 $ 16,385 Total Net Cash Flow $ (77,374) $ (2,865) $ (23,979) $ (7,162) $ 64,459 $ (14,683) $ (58,068) $ 42,014 $ (13,770) $ (54,540) $ (145,968) Ending Ope rating Cas h B alance $ 106,805 $ 103,940 $ 79,961 $ 72,799 $ 137,258 $ 122,575 $ 64,507 $ 106,520 $ 92,751 $ 38,211 $ 38,211 Ne t Cas h Flow Prior to DIP Financing $ (77,374) $ (52,865) $ (23,979) $ (7,162) $ 1,959 $ (14,683) $ (58,068) $ (20,486) $ (13,770) $ (54,540) $ (320,968) Operating Cash Disbursements $ (289,782) $ (199,497) $ (176,499) $ (173,739) $ (159,578) $ (175,021) $ (195,419) $ (176,318) $ (172,706) $ (170,912) $ (1,889,471) Total Ope rating Cas h Flow $ (76,055) $ (13,960) $ (4,308) $ 6,984 $ 7,498 $ (2,350) $ (49,333) $ (1,690) $ (1,764) $ (5,838) $ (140,817) Total Cash Receipts $ 213,727 $ 185,537 $ 172,191 $ 180,723 $ 167,076 $ 172,671 $ 146,086 $ 174,627 $ 170,942 $ 165,074 $ 1,748,654


