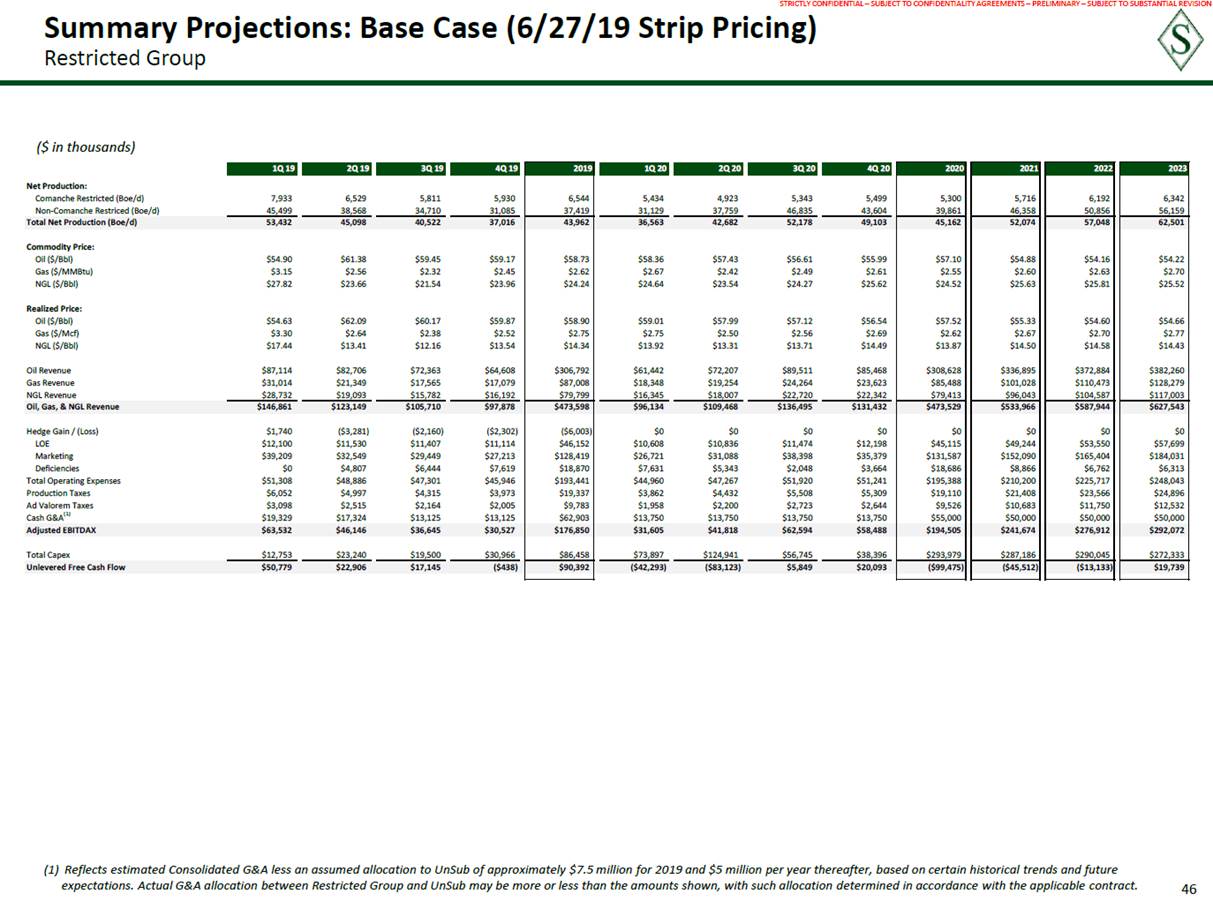
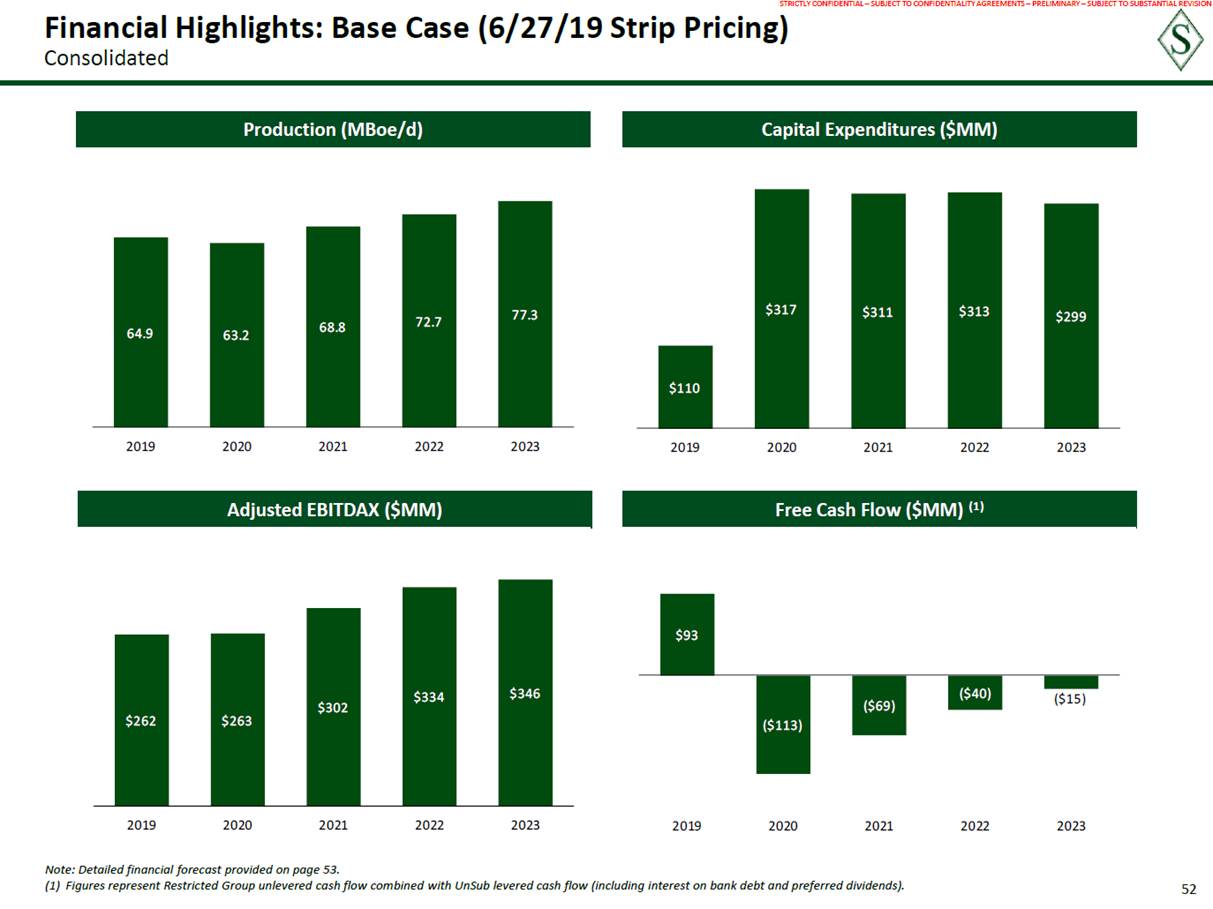
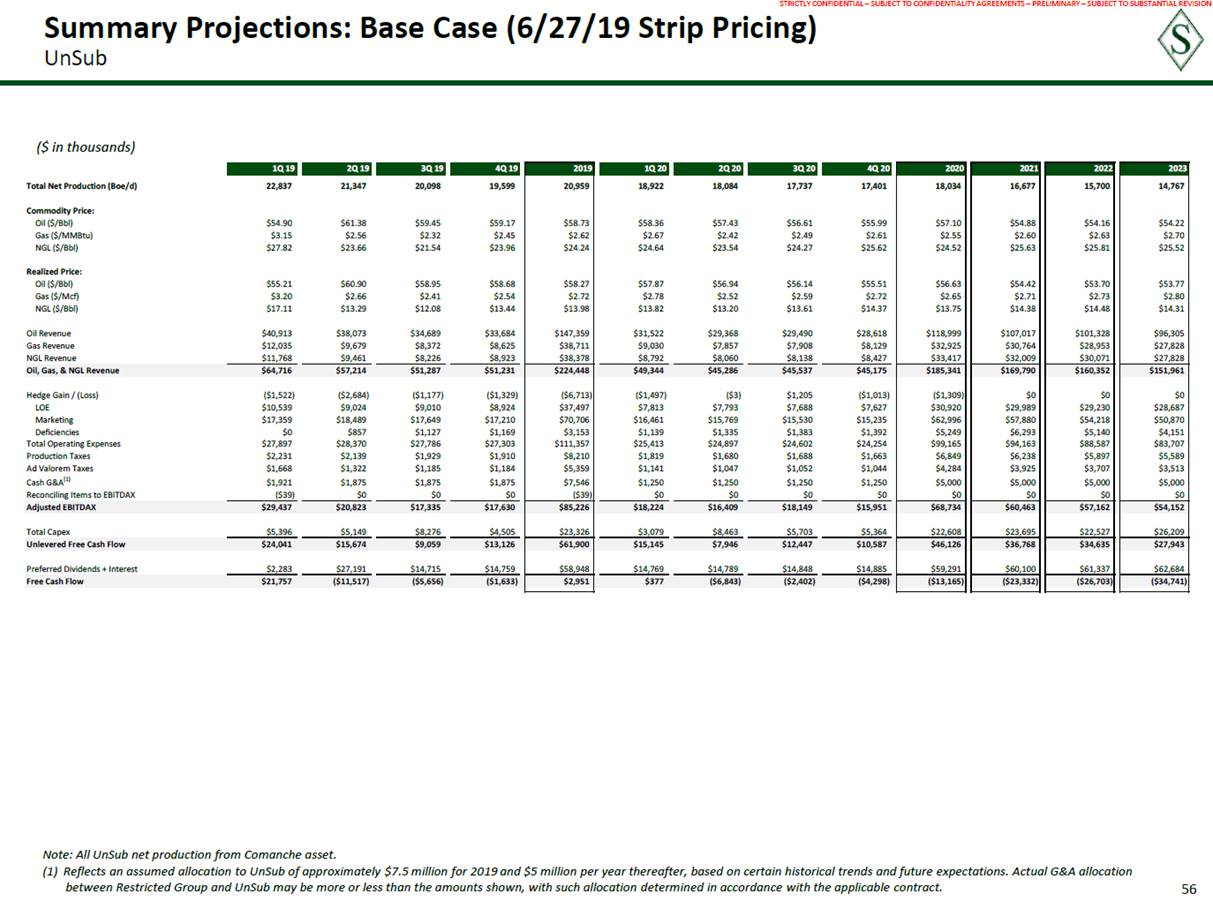
STRICTLY CONFIDENTIAL – SUBJECT TO CONFIDENTIALITY AGREEMENTS – PRELIMINARY – SUBJECT TO SUBSTANTIAL REVISION Summary Projections: Base Case (6/27/19 Strip Pricing) Consolidated ($ in thousands) (1) Reflects an assumed allocation to UnSub of approximately $7.5 million for 2019 and $5 million per year thereafter, based on certain historical trends and future expectations. Actual G&A allocation between Restricted Group and UnSub may be more or less than the amounts shown, with such allocation determined in accordance with the applicable contract. 53 1Q 19 2Q 19 3Q 19 4Q 19 2019 1Q 20 2Q 20 3Q 20 4Q 20 2020 2021 2022 2023 Net Production: Comanche (Boe/d)30,77027,87625,90925,529 Non-Comanche (Boe/d)45,49938,56834,71031,085 27,502 37,419 24,35723,00723,08022,900 31,12937,75946,83543,604 23,334 39,861 22,393 46,358 21,892 50,856 21,109 56,159 Total Net Production (Boe/d)76,26866,44460,62056,615 64,921 55,48660,76669,91666,504 63,195 68,750 72,748 77,267 Commodity Price: Oil ($/Bbl)$54.90$61.38$59.45$59.17 Gas ($/MMBtu)$3.15$2.56$2.32$2.45 NGL ($/Bbl)$27.82$23.66$21.54$23.96 Realized Price: Oil ($/Bbl)$54.81$61.71$59.77$59.45 Gas ($/Mcf)$3.27$2.65$2.39$2.53 NGL ($/Bbl)$17.34$13.37$12.14$13.50 Oil Revenue$128,028$120,780$107,051$98,292 Gas Revenue$43,049$31,029$25,938$25,704 NGL Revenue$40,500$28,554$24,008$25,114 $58.73 $2.62 $24.24 $58.70 $2.74 $14.22 $454,151 $125,719 $118,177 $58.36$57.43$56.61$55.99 $2.67$2.42$2.49$2.61 $24.64$23.54$24.27$25.62 $58.62$57.68$56.87$56.28 $2.76$2.50$2.57$2.70 $13.89$13.27$13.69$14.46 $92,963$101,575$119,001$114,086 $27,378$27,111$32,172$31,752 $25,137$26,067$30,858$30,769 $57.10 $2.55 $24.52 $57.27 $2.63 $13.83 $427,626 $118,413 $112,831 $54.88 $2.60 $25.63 $55.11 $2.68 $14.47 $443,912 $131,792 $128,052 $54.16 $2.63 $25.81 $54.40 $2.71 $14.56 $474,213 $139,426 $134,658 $54.22 $2.70 $25.52 $54.48 $2.78 $14.41 $478,566 $156,107 $144,831 Oil, Gas, & NGL Revenue$211,577$180,362$156,997$149,110 $698,046 $145,478$154,754$182,032$176,607 $658,870 $703,756 $748,297 $779,503 Hedge Gain / (Loss) $218 ($5,965) ($3,337) ($3,632) LOE$22,638$20,555$20,417$20,039 Marketing$56,567$51,038$47,098$44,422 Deficiencies$0$5,664$7,571$8,788 Total Operating Expenses$79,206$77,256$75,086$73,249 Production Taxes$8,283$7,136$6,244$5,883 Ad Valorem Taxes$4,767$3,837$3,348$3,189 Cash G&A(1)$21,250$19,199$15,000$15,000 ($12,716) $83,649 $199,125 $22,023 $304,798 $27,547 $15,141 $70,448 ($1,497)($3)$1,205($1,013) $18,420$18,629$19,162$19,825 $43,183$46,857$53,928$50,614 $8,769$6,678$3,431$5,056 $70,372$72,164$76,522$75,495 $5,680$6,112$7,196$6,971 $3,099$3,247$3,776$3,689 $15,000$15,000$15,000$15,000 ($1,309) $76,036 $194,583 $23,935 $294,553 $25,960 $13,810 $60,000 $0 $79,233 $209,971 $15,159 $304,363 $27,647 $14,609 $55,000 $0 $82,780 $219,622 $11,902 $314,304 $29,462 $15,457 $55,000 $0 $86,386 $234,900 $10,463 $331,749 $30,485 $16,045 $55,000 Adjusted EBITDAX$92,969$66,969$53,980$48,157 $262,076 $49,829$58,227$80,743$74,439 $263,238 $302,138 $334,074 $346,224 Total Capex$18,149$28,389$27,776$35,470 $109,784 $76,976$133,404$62,448$43,759 $316,587 $310,882 $312,572 $298,542 Unlevered Free Cash Flow$74,820$38,580$26,204$12,687 $152,291 ($27,147)($75,177)$18,295$30,680 ($53,349) ($8,744) $21,502 $47,682 UnSub Preferred Dividends + Interest$2,283$27,191$14,715$14,759 $58,948 $14,769$14,789$14,848$14,885 $59,291 $60,100 $61,337 $62,684 Free Cash Flow$72,536$11,389$11,489($2,072) $93,343 ($41,916)($89,966)$3,447$15,795 ($112,640) ($68,844) ($39,836) ($15,002)