UNITED STATES
SECURITIES AND EXCHANGE COMMISSION
Washington, D.C. 20549
FORM N-CSR
CERTIFIED SHAREHOLDER REPORT
OF
REGISTERED MANAGEMENT INVESTMENT COMPANIES
Investment Company Act file number: 811-22619
Name of Registrant: Vanguard Charlotte Funds
Address of Registrant:
P.O. Box 2600
Valley Forge, PA 19482
Name and address of agent for service:
Heidi Stam, Esquire
P.O. Box 876
Valley Forge, PA 19482
Registrant’s telephone number, including area code: (610) 669-1000
Date of fiscal year end: October 31
Date of reporting period: November 1, 2013 – April 30, 2014
Item 1: Reports to Shareholders

Semiannual Report | April 30, 2014
Vanguard Total International Bond Index Fund

Vanguard’s Principles for Investing Success
We want to give you the best chance of investment success. These principles, grounded in Vanguard’s research and experience, can put you on the right path.
Goals. Create clear, appropriate investment goals.
Balance. Develop a suitable asset allocation using broadly diversified funds. Cost. Minimize cost.
Discipline. Maintain perspective and long-term discipline.
A single theme unites these principles: Focus on the things you can control.
We believe there is no wiser course for any investor.
| |
| Contents | |
| Your Fund’s Total Returns. | 1 |
| Chairman’s Letter. | 2 |
| Fund Profile. | 7 |
| Performance Summary. | 9 |
| Financial Statements. | 10 |
| About Your Fund’s Expenses. | 80 |
| Trustees Approve Advisory Arrangement. | 82 |
| Glossary. | 83 |
Please note: The opinions expressed in this report are just that—informed opinions. They should not be considered promises or advice.
Also, please keep in mind that the information and opinions cover the period through the date on the front of this report. Of course, the risks of investing in your fund are spelled out in the prospectus.
See the Glossary for definitions of investment terms used in this report.
About the cover: The ship’s wheel represents leadership and guidance, essential qualities in navigating difficult seas.
This one is a replica based on an 18th-century British vessel. The HMSVanguard, another ship of that era, served as the flagship for British Admiral Horatio Nelson when he defeated a French fleet at the Battle of the Nile.
| | | | |
| Your Fund’s Total Returns | | | | |
| |
| |
| |
| |
| Six Months Ended April 30, 2014 | | | | |
| | 30-Day SEC | Income | Capital | Total |
| | Yield | Returns | Returns | Returns |
| Vanguard Total International Bond Index Fund | | | | |
| Investor Shares | 1.44% | 0.74% | 1.40% | 2.14% |
| Admiral™ Shares | 1.47 | 0.76 | 1.45 | 2.21 |
| Institutional Shares | 1.55 | 0.80 | 1.47 | 2.27 |
| ETF Shares | 1.47 | | | |
| Market Price | | | | 2.33 |
| Net Asset Value | | | | 2.20 |
| Barclays Global Aggregate ex-USD Float Adjusted RIC Capped | | | | |
| Index (USD Hedged) | | | | 2.45 |
| International Income Funds Average | | | | 2.28 |
| International Income Funds Average: Derived from data provided by Lipper, a Thomson Reuters Company. | | |
Admiral Shares carry lower expenses and are available to investors who meet certain account-balance requirements. Institutional Shares are available to certain institutional investors who meet specific administrative, service, and account-size criteria. The Vanguard ETF® Shares shown are traded on the NYSE Arca exchange and are available only through brokers. The table provides ETF returns based on both the NYSE Arca market price and the net asset value for a share. U.S. Pat. Nos. 6,879,964; 7,337,138; 7,720,749; 7,925,573; 8,090,646; and 8,417,623. The Vanguard ETF® Shares shown are traded on the Nasdaq exchange and are available only through brokers. The table provides ETF returns based on both the Nasdaq market price and the net asset value for a share. U.S. Pat. Nos. 6,879,964; 7,337,138; 7,720,749; 7,925,573; 8,090,646; and 8,417,623.
For the ETF Shares, the market price is determined by the midpoint of the bid-offer spread as of the closing time of the New York Stock Exchange (generally 4 p.m., Eastern time). The net asset value is also determined as of the NYSE closing time. For more information about how the ETF Shares' market prices have compared with their net asset value, visit vanguard.com, select your ETF, and then select the Price and Performance tab. The ETF premium/discount analysis there shows the percentages of days on which the ETF Shares' market price was above or below the NAV.
| | | | |
| Your Fund’s Performance at a Glance | | | | |
| October 31, 2013, Through April 30, 2014 | | | | |
| | | | Distributions Per Share |
| | Starting | Ending | Income | Capital |
| | Share Price | Share Price | Dividends | Gains |
| Vanguard Total International Bond Index Fund | | | | |
| Investor Shares | $9.99 | $10.13 | $0.073 | $0.000 |
| Admiral Shares | 19.98 | 20.27 | 0.150 | 0.000 |
| Institutional Shares | 29.97 | 30.41 | 0.237 | 0.000 |
| ETF Shares | 49.95 | 50.67 | 0.371 | 0.000 |
1

Chairman’s Letter
Dear Shareholder,
As global bond markets found their footing during the six months ended April 30, 2014, Vanguard Total International Bond Index Fund returned 2.14% for Investor Shares and a bit more for other share classes. In addition to earning interest income, the fund’s holdings increased in price.
The fund accomplished its investment objective of closely tracking its benchmark index: The Barclays Global Aggregate ex-USD Float Adjusted RIC Capped Index (USD Hedged), which of course incurs no expenses, returned 2.45%. This close tracking, for a fund that is shy of its one-year anniversary, is a tribute to the skill and experience of Vanguard Fixed Income Group, the fund’s advisor.
As I noted in my first shareholder report last year, Barclays constructs and manages your fund’s custom index with caps, or limits, on certain holdings. The intent is to comply with Internal Revenue Service diversification standards for regulated investment companies, or RICs, a category that includes mutual funds. In seeking to track the index, the advisor uses a sampling strategy, holding a range of securities that in total approximates the index’s key risk factors and characteristics—such as average duration and credit quality. Sampling is a common industry practice for bond index funds because it can be very difficult and potentially costly to own all the bonds in an index—currently more than 7,600 bonds in the case of your fund’s benchmark.
2
At April 30, the fund’s 30-day SEC yield for Investor Shares was 1.44%, down from 1.64% last October and lower than the 2.10% yield of the broad U.S. bond market (as measured by Vanguard Total Bond Market Index Fund).
Despite low yields, the bond market experienced a surprising rally
Overall, bonds continued to emerge from the struggles that marked much of 2013, when many markets were roiled by the prospect that the Federal Reserve would reduce its stimulative bond-buying. Such concerns hit emerging economies especially hard, because their capital markets have been bolstered by significant cash inflows under the Fed’s easy-money policy. In January, however, when the Fed actually started to trim purchases, investors seemed to take the news in stride.
Outside the United States, bond markets overall (as measured by the Barclays Global Aggregate Index ex USD, unhedged for currency exposure) returned 2.33% for the six months ended April 30. Some of the best performers were emerging economies—whose bonds make up a very small slice of the total international bond market—and a few European markets; the European Central Bank reiterated its commitment to fight deflation and continue to stimulate economic growth. However, Russia’s conflict with Ukraine, and concerns about the impact of more Western sanctions against Russia, led to negative returns for Russian bonds.
| | | |
| Market Barometer | | | |
| | | | Total Returns |
| | | Periods Ended April 30, 2014 |
| | Six | One | Five Years |
| | Months | Year | (Annualized) |
| Bonds | | | |
| Barclays U.S. Aggregate Bond Index (Broad taxable | | | |
| market) | 1.74% | -0.26% | 4.88% |
| Barclays Municipal Bond Index (Broad tax-exempt market) | 4.08 | 0.50 | 5.54 |
| Citigroup Three-Month U.S. Treasury Bill Index | 0.00 | 0.04 | 0.08 |
| |
| Stocks | | | |
| Russell 1000 Index (Large-caps) | 8.25% | 20.81% | 19.52% |
| Russell 2000 Index (Small-caps) | 3.08 | 20.50 | 19.84 |
| Russell 3000 Index (Broad U.S. market) | 7.83 | 20.78 | 19.54 |
| FTSE All-World ex US Index (International) | 2.84 | 9.77 | 13.22 |
| |
| CPI | | | |
| Consumer Price Index | 1.51% | 1.95% | 2.14% |
3
The broad U.S. taxable bond market lagged international bonds, returning 1.74%. The yield of the 10-year Treasury note ended at 2.69% in April, up from 2.54% on October 31 but down from nearly 3% on December 31. (Bond prices and yields move in opposite directions.) Municipal bonds returned 4.08%. Money market funds and savings accounts posted paltry returns as the Fed’s target for short-term interest rates remained at 0%–0.25%.
Global stocks continued to climb, despite some recent choppiness
International stocks, in aggregate, returned nearly 3% for the half year, with the developed markets of Europe faring the best. The developed markets of the Pacific region and emerging markets declined.
Investors were unsettled by the conflict in Ukraine and weak economic data from China—whose efforts to reposition its economy have significant implications for trade with countries around the globe.
U.S. stocks returned almost 8%, notwithstanding the patches of turbulence the market has encountered in 2014. Technology stocks, for example, turned in a rocky performance amid concerns about pricey valuations.
Global economic and political shifts are, of course, as inevitable as they are unpredictable. Broad diversification across stock and bond markets remains the best way of managing the risks they pose to your portfolio. As Joe Davis, our chief economist, noted recently, “Having a
| | | | | |
| Expense Ratios | | | | | |
| Your Fund Compared With Its Peer Group | | | | | |
| |
| | Investor | Admiral | Institutional | ETF | Peer Group |
| | Shares | Shares | Shares | Shares | Average |
| Total International Bond Index Fund | 0.23% | 0.20% | 0.12% | 0.20% | 1.01% |
The fund expense ratios shown are from the prospectus dated February 27, 2014, and represent estimated costs for the current fiscal year. For the six months ended April 30, 2014, the fund’s annualized expense ratios were 0.23% for Investor Shares, 0.20% for Admiral Shares, 0.12% for Institutional Shares, and 0.20% for ETF Shares. The peer-group expense ratio is derived from data provided by Lipper, a Thomson Reuters Company, and captures information through year-end 2013.
Peer group: International Income Funds.
4
broader portfolio tends to moderate those individual issues, and that’s always, I think, a valuable starting point for investors.”
Most bond markets gained, led by Southern Europe
Because of their sheer size, European bond markets tend to be the main drivers of your fund’s performance. During the half year, they represented the largest regional slice of the fund and its index—nearly 60%. But Europe’s stock markets don’t always move in lockstep, and neither do their bond markets—which underscores the benefits of diversification.
A case in point: France and Germany, the two largest European markets in the index, posted returns of about 2% to 3%. Both countries have relatively strong economies compared with some other Eurozone markets such as Italy and Spain. But Italy and Spain both posted some of the highest returns in the index, about 7%, as investors gained more confidence in those nations’ creditworthiness (which helped push down bond yields and pull up their prices).
Offering perhaps the best sign of increasing confidence is Greece, which required bailouts during the financial crisis. Most Greek bonds still don’t meet the credit standards for inclusion in the Barclays Global Aggregate Index. The government’s successful sale of more than $4 billion of bonds in April was a welcome sign that things seem to be returning to normal—for Greece and the Eurozone as a whole.
The performance of Japanese bonds—the largest country holding in the fund and its index—helps illustrate the importance of your fund’s currency-hedging strategy. As the yen weakened against the U.S. dollar during the six months, Japanese bond returns were lower for U.S. investors than for yen-based investors. For example, the unhedged Barclays Japanese Aggregate Bond Index returned about –3% when translated into dollars. However, the currency-hedged index had a positive return of about half a percentage point, similar to its return in yen. Admittedly, the reverse can happen: If a foreign currency strengthens, hedging would reduce a U.S. investor’s return. Either way, hedging allows international bonds to perform like bonds.
Global bonds can help diversify interest rate risk
As the Fed further trims its bond-buying program, we’re likely to see more headlines about the prospect of higher interest rates and lower bond prices. But the latest media speculation is never a sound basis for changing your portfolio’s long-term allocation to bonds, which serve to moderate the much higher volatility of stocks.
You can nevertheless take a step to limit your exposure to U.S. interest rate risk while maintaining your portfolio’s bond allocation, by shifting some of your holdings into international bonds that are hedged for foreign currency risk.
5
Using nearly three decades of data from periods when interest rates rose, Vanguard’s research has shown that adding international bonds can effectively diversify an investor’s portfolio of local bonds—regardless of the investor’s home country. Much of this benefit arises because the interest rate movements of various markets can cancel one another out to some extent, leading to more stable returns.
Of course, there’s no guarantee that such trends will continue, and diversification doesn’t prevent losses. But it’s unlikely that all interest rates across the globe would increase at the same time or by the same magnitude. (You can read more in Fearful of Rising Interest Rates? Consider a More Global Bond Portfolio, available at vanguard.com/research.)
This strategy of global diversification is simple and straightforward and can make sense in any rate environment. As an investor in Vanguard Total International Bond Index Fund, with its low costs, you’ve already taken a step in this direction. And unlike changes in interest rates, such a strategy is under your control.
As always, thank you for investing with Vanguard.
Sincerely,

F. William McNabb III
Chairman and Chief Executive Officer
May 19, 2014
6
Total International Bond Index Fund
Fund Profile
As of April 30, 2014
| | | | |
| Share-Class Characteristics | | | | |
| | Investor | Admiral | Institutional | |
| | Shares | Shares | Shares | ETF Shares |
| Ticker Symbol | VTIBX | VTABX | VTIFX | BNDX |
| Expense Ratio1 | 0.23% | 0.20% | 0.12% | 0.20% |
| 30-Day SEC Yield | 1.44% | 1.47% | 1.55% | 1.47% |
| | |
| Financial Attributes | | |
| |
| | | Barclays GA |
| | | ex-USD |
| | | Float Adj |
| | | RIC Capped Idx |
| | Fund | (USD Hedged) |
| Number of Bonds | 2,549 | 7,661 |
| Yield to Maturity | | |
| (before expenses) | 1.7% | 1.7% |
| Average Coupon | 3.1% | 3.2% |
| Average Duration | 6.8 years | 6.7 years |
| Average Effective | | |
| Maturity | 8.4 years | 8.4 years |
| Short-Term | | |
| Reserves | 0.9% | — |
| |
| |
| Sector Diversification (% of portfolio) |
| Asset-Backed | | 0.3% |
| Finance | | 6.5 |
| Foreign Government | | 80.6 |
| Industrial | | 5.0 |
| Utilities | | 1.4 |
| Other | | 6.2 |
| The agency and mortgage-backed securities sectors may include issues from government-sponsored enterprises; such issues are generally not backed by the full faith and credit of the U.S. government. |
|
|
| | |
| |
| Distribution by Credit Quality (% of portfolio) |
| Aaa | 24.6% |
| Aa | 45.8 |
| A | 10.3 |
| Baa | 19.3 |
| For information about these ratings, see the Glossary entry for Credit Quality. |
| |
| |
| |
| Distribution by Effective Maturity | |
| (% of portfolio) | |
| Under 1 Year | 0.2% |
| 1 - 3 Years | 23.8 |
| 3 - 5 Years | 20.7 |
| 5 - 10 Years | 31.5 |
| 10 - 20 Years | 14.0 |
| 20 - 30 Years | 7.7 |
| Over 30 Years | 2.1 |
Investment Focus
1 The expense ratios shown are from the prospectus dated February 27, 2014, and represent estimated costs for the current fiscal year. For the six months ended April 30, 2014, the annualized expense ratios were 0.23% for Investor Shares, 0.20% for Admiral Shares, 0.12% for Institutional Shares, and 0.20% for ETF Shares.
7
| |
| Total International Bond Index Fund | |
| |
| |
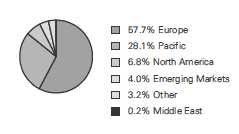
| Market Diversification (% of portfolio ) | |
| | Fund |
| Europe | |
| France | 11.6% |
| Germany | 10.8 |
| Italy | 8.3 |
| United Kingdom | 8.1 |
| Spain | 5.6 |
| Netherlands | 3.5 |
| Belgium | 2.1 |
| Sweden | 1.7 |
| Austria | 1.5 |
| Switzerland | 1.5 |
| Other | 3.0 |
| Subtotal | 57.7% |
| Pacific | |
| Japan | 22.6% |
| Australia | 2.6 |
| South Korea | 2.1 |
| Other | 0.8 |
| Subtotal | 28.1% |
| Emerging Markets | 4.0% |
| North America | |
| Canada | 5.1% |
| United States | 1.7 |
| Subtotal | 6.8% |
| Middle East | 0.2% |
| Other | 3.2% |
Allocation by Region(% of portfolio)
8
Total International Bond Index Fund
Performance Summary
All of the returns in this report represent past performance, which is not a guarantee of future results that may be achieved by the fund. (Current performance may be lower or higher than the performance data cited. For performance data current to the most recent month-end, visit our website at vanguard.com/performance.) Note, too, that both investment returns and principal value can fluctuate widely, so an investor’s shares, when sold, could be worth more or less than their original cost. The returns shown do not reflect taxes that a shareholder would pay on fund distributions or on the sale of fund shares.
| | | | |
| Fiscal-Year Total Returns (%): May 31, 2013, Through April 30, 2014 | | |
| | | | | Barclays GA |
| | | | | ex-USD |
| | | | | Float Adj |
| | | | | RIC Capped Idx |
| | | | Investor Shares | (USD Hedged) |
| Fiscal Year | Income Returns | Capital Returns | Total Returns | Total Returns |
| 2013 | 0.60% | -0.10% | 0.50% | 0.62% |
| 2014 | 0.74 | 1.40 | 2.14 | 2.45 |
| Note: For 2014, performance data reflect the six months ended April 30, 2014. | | |
Total Returns: Periods Ended March 31, 2014
This table presents returns through the latest calendar quarter—rather than through the end of the fiscal period.
Securities and Exchange Commission rules require that we provide this information.
| | | | |
| | | | | Since Inception |
| | Inception Date | Income | Capital | Total |
| Investor Shares | 5/31/2013 | 1.20% | 0.90% | 2.10% |
| Admiral Shares | 5/31/2013 | 1.25 | 0.85 | 2.10 |
| Institutional Shares | 5/31/2013 | 1.30 | 0.87 | 2.17 |
| ETF Shares | 5/31/2013 | | | |
| Market Price | | | | 2.41 |
| Net Asset Value | | | | 2.08 |
See Financial Highlights for dividend and capital gains information.
9
Total International Bond Index Fund
Financial Statements (unaudited)
Statement of Net Assets
As of April 30, 2014
The fund reports a complete list of its holdings in regulatory filings four times in each fiscal year, at the quarter-ends. For the second and fourth fiscal quarters, the lists appear in the fund’s semiannual and annual reports to shareholders. For the first and third fiscal quarters, the fund files the lists with the Securities and Exchange Commission on Form N-Q. Shareholders can look up the fund’s Forms N-Q on the SEC’s website at sec.gov. Forms N-Q may also be reviewed and copied at the SEC’s Public Reference Room (see the back cover of this report for further information).
| | | | | |
| | | | | Face | Market |
| | | Maturity | | Amount | Value |
| | Coupon | Date | Currency | (000) | ($000) |
| Australia (2.6%) | | | | | |
| Asset-Backed/Commercial Mortgage-Backed Securities (0.1%) | | | | |
| Australia & New Zealand Banking Group Ltd. | 1.125% | 5/13/20 | EUR | 2,000 | 2,742 |
| Australia & New Zealand Banking Group Ltd. | 1.375% | 9/4/18 | EUR | 2,000 | 2,825 |
| Commonwealth Bank of Australia | 2.625% | 1/12/17 | EUR | 1,000 | 1,463 |
| Commonwealth Bank of Australia | 3.000% | 5/3/22 | EUR | 3,000 | 4,559 |
| Commonwealth Bank of Australia | 3.000% | 9/4/26 | GBP | 700 | 1,109 |
| National Australia Bank Ltd. | 2.250% | 6/6/25 | EUR | 1,800 | 2,530 |
| National Australia Bank Ltd. | 3.000% | 9/4/26 | GBP | 500 | 792 |
| Westpac Banking Corp. | 1.375% | 4/17/20 | EUR | 2,000 | 2,786 |
| | | | | | 18,806 |
| Corporate Bonds (0.5%) | | | | | |
| Asciano Finance Ltd. | 5.000% | 9/19/23 | GBP | 500 | 875 |
| Australia & New Zealand Banking Group Ltd. | 3.750% | 3/10/17 | EUR | 5,000 | 7,501 |
| BHP Billiton Finance Ltd. | 2.125% | 11/29/18 | EUR | 3,800 | 5,513 |
| BHP Billiton Finance Ltd. | 2.250% | 9/25/20 | EUR | 1,000 | 1,448 |
| BHP Billiton Finance Ltd. | 3.125% | 4/29/33 | EUR | 500 | 710 |
| BHP Billiton Finance Ltd. | 3.250% | 9/25/24 | GBP | 3,000 | 4,852 |
| BHP Billiton Finance Ltd. | 6.375% | 4/4/16 | EUR | 2,000 | 3,076 |
| Commonwealth Bank of Australia | 1.625% | 2/4/19 | EUR | 2,000 | 2,829 |
| Commonwealth Bank of Australia | 3.875% | 12/14/15 | GBP | 180 | 318 |
| Commonwealth Bank of Australia | 4.250% | 11/10/16 | EUR | 4,000 | 6,032 |
| Commonwealth Bank of Australia | 4.375% | 2/25/20 | EUR | 3,500 | 5,654 |
| Macquarie Bank Ltd. | 3.000% | 8/9/17 | CHF | 3,000 | 3,640 |
| Macquarie Bank Ltd. | 6.000% | 9/21/20 | EUR | 1,500 | 2,397 |
| National Australia Bank Ltd. | 3.625% | 11/8/17 | GBP | 400 | 713 |
| National Australia Bank Ltd. | 4.000% | 7/13/20 | EUR | 5,100 | 8,075 |
| National Australia Bank Ltd. | 4.250% | 6/24/15 | CHF | 1,000 | 1,187 |
| National Australia Bank Ltd. | 4.750% | 7/15/16 | EUR | 4,000 | 6,036 |
| National Australia Bank Ltd. | 5.125% | 12/9/21 | GBP | 1,000 | 1,907 |
| National Australia Bank Ltd. | 6.000% | 2/15/17 | AUD | 7,500 | 7,420 |
| Origin Energy Finance Ltd. | 2.875% | 10/11/19 | EUR | 2,000 | 2,896 |
| 1 Origin Energy Finance Ltd. | 3.500% | 10/4/21 | EUR | 1,500 | 2,206 |
| 2 QBE Capital Funding IV Ltd. | 7.500% | 5/24/41 | GBP | 1,000 | 1,876 |
| QBE Insurance Group Ltd. | 6.125% | 9/28/15 | GBP | 130 | 232 |
| 2 Santos Finance Ltd. | 8.250% | 9/22/70 | EUR | 750 | 1,180 |
| Telstra Corp. Ltd. | 2.500% | 9/15/23 | EUR | 3,000 | 4,243 |
| Wesfarmers Ltd. | 2.750% | 8/2/22 | EUR | 3,000 | 4,330 |
| Wesfarmers Ltd. | 4.750% | 3/12/20 | AUD | 5,000 | 4,671 |
| Westfield Retail Trust 1 | 3.250% | 9/11/23 | EUR | 3,273 | 4,850 |
10
| | | | | |
| Total International Bond Index Fund | | | | | |
| |
| |
| |
| | | | | Face | Market |
| | | Maturity | | Amount | Value |
| | Coupon | Date | Currency | (000) | ($000) |
| Westfield UK & Europe Finance plc | 4.250% | 7/11/22 | GBP | 2,300 | 4,225 |
| Westpac Banking Corp. | 1.375% | 12/23/15 | GBP | 300 | 509 |
| Westpac Banking Corp. | 4.250% | 9/22/16 | EUR | 6,000 | 9,017 |
| Westpac Banking Corp. | 6.000% | 2/20/17 | AUD | 3,700 | 3,661 |
| Westpac Banking Corp. | 7.250% | 11/18/16 | AUD | 11,500 | 11,663 |
| | | | | | 125,742 |
| Sovereign Bonds (2.0%) | | | | | |
| Australia Government Bond | 5.750% | 7/15/22 | AUD | 10,000 | 10,574 |
| Commonwealth of Australia | 2.750% | 4/21/24 | AUD | 21,000 | 17,581 |
| Commonwealth of Australia | 3.250% | 4/21/29 | AUD | 13,000 | 10,639 |
| Commonwealth of Australia | 4.250% | 7/21/17 | AUD | 10,000 | 9,640 |
| Commonwealth of Australia | 4.500% | 4/15/20 | AUD | 22,000 | 21,551 |
| Commonwealth of Australia | 4.500% | 4/21/33 | AUD | 7,000 | 6,511 |
| Commonwealth of Australia | 4.750% | 10/21/15 | AUD | 25,000 | 23,915 |
| Commonwealth of Australia | 4.750% | 6/15/16 | AUD | 40,000 | 38,669 |
| Commonwealth of Australia | 4.750% | 4/21/27 | AUD | 10,000 | 9,818 |
| Commonwealth of Australia | 5.250% | 3/15/19 | AUD | 11,000 | 11,098 |
| Commonwealth of Australia | 5.500% | 1/21/18 | AUD | 16,000 | 16,098 |
| Commonwealth of Australia | 5.500% | 4/21/23 | AUD | 50,600 | 52,871 |
| Commonwealth of Australia | 5.750% | 5/15/21 | AUD | 15,000 | 15,759 |
| Commonwealth of Australia | 6.000% | 2/15/17 | AUD | 35,000 | 35,184 |
| New South Wales Treasury Corp. | 3.500% | 3/20/19 | AUD | 10,000 | 9,289 |
| New South Wales Treasury Corp. | 4.000% | 2/20/17 | AUD | 11,000 | 10,483 |
| New South Wales Treasury Corp. | 6.000% | 5/1/20 | AUD | 5,000 | 5,208 |
| New South Wales Treasury Corp. | 6.000% | 3/1/22 | AUD | 14,000 | 14,732 |
| New South Wales Treasury Corp. | 6.000% | 5/1/30 | AUD | 3,000 | 3,178 |
| Queensland Treasury Corp. | 3.500% | 9/21/17 | AUD | 15,000 | 14,052 |
| Queensland Treasury Corp. | 4.250% | 7/21/23 | AUD | 10,000 | 9,241 |
| Queensland Treasury Corp. | 5.500% | 6/21/21 | AUD | 3,000 | 3,043 |
| Queensland Treasury Corp. | 6.000% | 4/21/16 | AUD | 9,000 | 8,857 |
| Queensland Treasury Corp. | 6.000% | 2/21/18 | AUD | 10,000 | 10,166 |
| Queensland Treasury Corp. | 6.000% | 7/21/22 | AUD | 15,000 | 15,707 |
| Queensland Treasury Corp. | 6.250% | 2/21/20 | AUD | 10,000 | 10,485 |
| South Australian Government | | | | | |
| Financing Authority | 4.750% | 8/6/19 | AUD | 7,500 | 7,313 |
| Treasury Corp. of Victoria | 5.500% | 11/15/18 | AUD | 10,000 | 10,096 |
| Treasury Corp. of Victoria | 5.500% | 12/17/24 | AUD | 10,000 | 10,200 |
| Treasury Corp. of Victoria | 6.000% | 6/15/20 | AUD | 10,000 | 10,434 |
| Treasury Corp. of Victoria | 6.000% | 10/17/22 | AUD | 7,000 | 7,390 |
| Western Australian Treasury Corp. | 3.000% | 6/8/16 | AUD | 14,000 | 13,029 |
| | | | | | 452,811 |
| Total Australia (Cost $600,677) | | | | | 597,359 |
| Austria (1.5%) | | | | | |
| Asset-Backed/Commercial Mortgage-Backed Securities (0.1%) | | | | |
| BAWAG PSK Bank fuer Arbeit und Wirtschaft | | | | | |
| und Oesterreichische Postsparkasse AG | 1.875% | 9/18/19 | EUR | 500 | 718 |
| Erste Group Bank AG | 4.000% | 1/20/21 | EUR | 2,000 | 3,242 |
| HYPO NOE Gruppe Bank AG | 3.000% | 5/9/22 | EUR | 2,000 | 3,055 |
| Raiffeisen-Landesbank Steiermark AG | 2.375% | 6/14/28 | EUR | 300 | 419 |
| Raiffeisenlandesbank | | | | | |
| Niederoesterreich-Wien AG | 1.750% | 10/2/20 | EUR | 1,700 | 2,421 |
| UniCredit Bank Austria AG | 2.875% | 11/4/16 | EUR | 2,000 | 2,940 |
| UniCredit Bank Austria AG | 4.125% | 2/24/21 | EUR | 2,000 | 3,240 |
| | | | | | 16,035 |
11
Total International Bond Index Fund
| | | | | | |
| | | | | | Face | Market |
| | | | Maturity | | Amount | Value |
| | | Coupon | Date | Currency | (000) | ($000) |
| Corporate Bonds (0.1%) | | | | | |
| | Erste Group Bank AG | 3.375% | 3/28/17 | EUR | 1,500 | 2,226 |
| | OMV AG | 3.500% | 9/27/27 | EUR | 1,000 | 1,526 |
| | OMV AG | 4.250% | 10/12/21 | EUR | 1,000 | 1,612 |
| 2 | OMV AG | 6.750% | 6/29/49 | EUR | 1,000 | 1,563 |
| | Raiffeisen Bank International AG | 2.750% | 7/10/17 | EUR | 1,500 | 2,178 |
| 2 | Raiffeisen Bank International AG | 4.500% | 2/21/25 | EUR | 1,000 | 1,369 |
| | Telekom Finanzmanagement GmbH | 3.125% | 12/3/21 | EUR | 5,000 | 7,392 |
| | Telekom Finanzmanagement GmbH | 4.250% | 1/27/17 | EUR | 634 | 958 |
| | UniCredit Bank Austria AG | 2.625% | 1/30/18 | EUR | 1,000 | 1,434 |
| 2 | Vienna Insurance Group AG Wiener | | | | | |
| | Versicherung Gruppe | 5.500% | 10/9/43 | EUR | 1,000 | 1,535 |
| | | | | | | 21,793 |
| Sovereign Bonds (1.3%) | | | | | |
| 3 | Autobahnen- Und | | | | | |
| | Schnellstrassen-Finanzierungs-AG | 2.750% | 6/11/32 | EUR | 500 | 720 |
| 3 | Autobahnen- Und | | | | | |
| | Schnellstrassen-Finanzierungs-AG | 2.750% | 6/20/33 | EUR | 700 | 997 |
| 3 | Autobahnen- Und | | | | | |
| | Schnellstrassen-Finanzierungs-AG | 3.375% | 9/22/25 | EUR | 2,000 | 3,141 |
| 3 | Autobahnen- Und | | | | | |
| | Schnellstrassen-Finanzierungs-AG | 4.375% | 7/8/19 | EUR | 4,000 | 6,489 |
| | Autobahnen- Und | | | | | |
| | Schnellstrassen-Finanzierungs-AG | 4.500% | 10/16/17 | EUR | 1,000 | 1,572 |
| | Erdoel-Lagergesellschaft mbH | 2.750% | 3/20/28 | EUR | 2,000 | 2,860 |
| 3 | Hypo Alpe-Adria-Bank International AG | 2.375% | 12/13/22 | EUR | 3,000 | 4,212 |
| 3 | OeBB Infrastruktur AG | 2.250% | 7/4/23 | EUR | 1,000 | 1,443 |
| 3 | OeBB Infrastruktur AG | 3.375% | 5/18/32 | EUR | 2,000 | 3,116 |
| 3 | OeBB Infrastruktur AG | 3.500% | 10/19/20 | EUR | 6,000 | 9,479 |
| 3 | OeBB Infrastruktur AG | 3.500% | 10/19/26 | EUR | 1,000 | 1,586 |
| 3 | Oesterreichische Kontrollbank AG | 2.000% | 12/17/18 | GBP | 2,000 | 3,377 |
| 3 | Oesterreichische Kontrollbank AG | 2.125% | 7/23/19 | CHF | 3,500 | 4,313 |
| | Oesterreichische Kontrollbank AG | 3.875% | 9/15/16 | EUR | 2,000 | 3,005 |
| 1,4 | Republic of Austria | 1.150% | 10/19/18 | EUR | 9,000 | 12,735 |
| 1 | Republic of Austria | 1.750% | 10/20/23 | EUR | 10,000 | 13,927 |
| 1 | Republic of Austria | 1.950% | 6/18/19 | EUR | 12,000 | 17,564 |
| 1 | Republic of Austria | 2.400% | 5/23/34 | EUR | 4,000 | 5,536 |
| 1 | Republic of Austria | 3.150% | 6/20/44 | EUR | 5,000 | 7,799 |
| 1 | Republic of Austria | 3.200% | 2/20/17 | EUR | 20,000 | 29,956 |
| 1 | Republic of Austria | 3.400% | 11/22/22 | EUR | 10,000 | 15,931 |
| 1 | Republic of Austria | 3.500% | 7/15/15 | EUR | 10,000 | 14,420 |
| 1 | Republic of Austria | 3.500% | 9/15/21 | EUR | 12,000 | 19,195 |
| 1 | Republic of Austria | 3.800% | 1/26/62 | EUR | 3,000 | 5,500 |
| 1,4 | Republic of Austria | 3.900% | 7/15/20 | EUR | 15,000 | 24,306 |
| 1 | Republic of Austria | 4.000% | 9/15/16 | EUR | 10,000 | 15,095 |
| 1 | Republic of Austria | 4.150% | 3/15/37 | EUR | 9,800 | 17,509 |
| 1 | Republic of Austria | 4.350% | 3/15/19 | EUR | 5,000 | 8,115 |
| 1 | Republic of Austria | 4.650% | 1/15/18 | EUR | 7,000 | 11,180 |
| 1 | Republic of Austria | 4.850% | 3/15/26 | EUR | 15,000 | 27,099 |
| | Republic of Austria | 6.250% | 7/15/27 | EUR | 6,000 | 12,297 |
| | | | | | | 304,474 |
| Total Austria (Cost $322,252) | | | | | 342,302 |
12
| | | | | | |
| Total International Bond Index Fund | | | | | |
| |
| |
| |
| | | | | | Face | Market |
| | | | Maturity | | Amount | Value |
| | | Coupon | Date | Currency | (000) | ($000) |
| Belgium (2.1%) | | | | | |
| Asset-Backed/Commercial Mortgage-Backed Securities (0.0%) | | | | |
| | Belfius Bank SA | 1.375% | 6/5/20 | EUR | 1,500 | 2,100 |
| | KBC Bank NV | 1.250% | 5/28/20 | EUR | 3,000 | 4,161 |
| | | | | | | 6,261 |
| Corporate Bonds (0.2%) | | | | | |
| | Anheuser-Busch InBev NV | 2.000% | 12/16/19 | EUR | 750 | 1,078 |
| | Anheuser-Busch InBev NV | 2.875% | 9/25/24 | EUR | 4,000 | 5,829 |
| | Anheuser-Busch InBev NV | 4.000% | 4/26/18 | EUR | 1,173 | 1,816 |
| | Anheuser-Busch InBev NV | 6.500% | 6/23/17 | GBP | 2,480 | 4,775 |
| | Anheuser-Busch InBev NV | 8.625% | 1/30/17 | EUR | 3,000 | 5,043 |
| | Anheuser-Busch InBev NV | 9.750% | 7/30/24 | GBP | 800 | 2,033 |
| | BNP Paribas Fortis SA | 5.757% | 10/4/17 | EUR | 2,500 | 3,957 |
| | Elia System Operator SA | 5.625% | 4/22/16 | EUR | 900 | 1,366 |
| | KBC Internationale | | | | | |
| | Financieringsmaatschappij NV | 5.000% | 3/16/16 | EUR | 3,450 | 5,158 |
| | | | | | | 31,055 |
| Sovereign Bonds (1.9%) | | | | | |
| | Belgacom SA | 3.875% | 2/7/18 | EUR | 1,000 | 1,530 |
| 5,6,7 Dexia Credit Local SA | 1.000% | 7/11/16 | EUR | 5,000 | 7,004 |
| 5,6,7 Dexia Credit Local SA | 1.625% | 10/29/18 | EUR | 3,000 | 4,264 |
| | Eandis CVBA | 4.500% | 11/8/21 | EUR | 1,500 | 2,437 |
| | Flemish Community | 3.000% | 1/31/18 | EUR | 2,000 | 2,996 |
| | Flemish Community | 3.875% | 7/20/16 | EUR | 2,000 | 2,982 |
| | Kingdom of Belgium | 1.250% | 6/22/18 | EUR | 9,000 | 12,760 |
| | Kingdom of Belgium | 2.250% | 6/22/23 | EUR | 28,500 | 40,783 |
| 1 | Kingdom of Belgium | 2.750% | 3/28/16 | EUR | 10,000 | 14,527 |
| 4 | Kingdom of Belgium | 3.000% | 9/28/19 | EUR | 16,000 | 24,514 |
| 1 | Kingdom of Belgium | 3.000% | 6/22/34 | EUR | 5,000 | 7,112 |
| 1 | Kingdom of Belgium | 3.250% | 9/28/16 | EUR | 30,000 | 44,560 |
| 1 | Kingdom of Belgium | 3.500% | 6/28/17 | EUR | 15,000 | 22,780 |
| 1 | Kingdom of Belgium | 3.750% | 9/28/15 | EUR | 5,000 | 7,280 |
| 1 | Kingdom of Belgium | 3.750% | 9/28/20 | EUR | 13,000 | 20,838 |
| | Kingdom of Belgium | 3.750% | 6/22/45 | EUR | 5,000 | 7,930 |
| 1 | Kingdom of Belgium | 4.000% | 3/28/17 | EUR | 6,000 | 9,186 |
| 1 | Kingdom of Belgium | 4.000% | 3/28/18 | EUR | 10,000 | 15,672 |
| | Kingdom of Belgium | 4.000% | 3/28/19 | EUR | 15,000 | 23,940 |
| | Kingdom of Belgium | 4.000% | 3/28/22 | EUR | 12,000 | 19,643 |
| | Kingdom of Belgium | 4.000% | 3/28/32 | EUR | 14,000 | 22,960 |
| 1 | Kingdom of Belgium | 4.250% | 9/28/21 | EUR | 12,000 | 19,905 |
| | Kingdom of Belgium | 4.250% | 9/28/22 | EUR | 10,000 | 16,642 |
| 1 | Kingdom of Belgium | 4.250% | 3/28/41 | EUR | 14,500 | 25,012 |
| 1 | Kingdom of Belgium | 4.500% | 3/28/26 | EUR | 7,000 | 11,955 |
| 1 | Kingdom of Belgium | 5.000% | 3/28/35 | EUR | 15,000 | 27,889 |
| | Kingdom of Belgium | 5.500% | 3/28/28 | EUR | 13,000 | 24,512 |
| | | | | | | 441,613 |
| Total Belgium (Cost $446,892) | | | | | 478,929 |
| Bermuda (0.0%) | | | | | |
| Corporate Bond (0.0%) | | | | | |
| | Bacardi Ltd. | 2.750% | 7/3/23 | EUR | 2,000 | 2,830 |
| Total Bermuda (Cost $2,655) | | | | | 2,830 |
13
| | | | | |
| Total International Bond Index Fund | | | | | |
| |
| |
| |
| | | | | Face | Market |
| | | Maturity | | Amount | Value |
| | Coupon | Date | Currency | (000) | ($000) |
| Brazil (0.1%) | | | | | |
| Corporate Bonds (0.0%) | | | | | |
| Telemar Norte Leste SA | 5.125% | 12/15/17 | EUR | 500 | 752 |
| Vale SA | 3.750% | 1/10/23 | EUR | 1,500 | 2,222 |
| | | | | | 2,974 |
| Sovereign Bonds (0.1%) | | | | | |
| 1 Banco do Brasil SA | 3.750% | 7/25/18 | EUR | 3,000 | 4,304 |
| 1 Banco Nacional de Desenvolvimento | | | | | |
| Economico e Social | 3.625% | 1/21/19 | EUR | 1,000 | 1,437 |
| Federative Republic of Brazil | 2.875% | 4/1/21 | EUR | 1,900 | 2,652 |
| Petrobras Global Finance BV | 2.750% | 1/15/18 | EUR | 500 | 702 |
| Petrobras Global Finance BV | 3.250% | 4/1/19 | EUR | 5,000 | 7,103 |
| Petrobras Global Finance BV | 3.750% | 1/14/21 | EUR | 500 | 712 |
| Petrobras Global Finance BV | 4.750% | 1/14/25 | EUR | 500 | 717 |
| Petrobras International Finance Co. | 6.250% | 12/14/26 | GBP | 2,000 | 3,391 |
| | | | | | 21,018 |
| Total Brazil (Cost $23,182) | | | | | 23,992 |
| Canada (5.0%) | | | | | |
| Asset-Backed/Commercial Mortgage-Backed Securities (0.1%) | | | | |
| National Bank of Canada | 1.250% | 12/17/18 | EUR | 2,000 | 2,817 |
| Royal Bank of Canada | 1.625% | 8/4/20 | EUR | 1,500 | 2,121 |
| Royal Bank of Canada | 3.770% | 3/30/18 | CAD | 5,000 | 4,892 |
| Royal Bank of Canada | 4.625% | 1/22/18 | EUR | 3,000 | 4,755 |
| | | | | | 14,585 |
| Corporate Bonds (0.9%) | | | | | |
| 407 International Inc. | 3.870% | 11/24/17 | CAD | 2,000 | 1,937 |
| 407 International Inc. | 4.190% | 4/25/42 | CAD | 1,500 | 1,339 |
| 407 International Inc. | 4.300% | 5/26/21 | CAD | 1,500 | 1,490 |
| AltaLink LP | 3.668% | 11/6/23 | CAD | 2,000 | 1,868 |
| Bank of Montreal | 1.890% | 10/5/15 | CAD | 5,000 | 4,588 |
| Bank of Montreal | 2.240% | 12/11/17 | CAD | 7,500 | 6,886 |
| Bank of Montreal | 2.390% | 7/12/17 | CAD | 5,000 | 4,625 |
| Bank of Montreal | 6.020% | 5/2/18 | CAD | 4,000 | 4,225 |
| Bank of Nova Scotia | 2.242% | 3/22/18 | CAD | 7,500 | 6,869 |
| Bank of Nova Scotia | 2.250% | 5/8/15 | CAD | 2,000 | 1,840 |
| Bank of Nova Scotia | 2.598% | 2/27/17 | CAD | 2,000 | 1,865 |
| 2 Bank of Nova Scotia | 3.036% | 10/18/24 | CAD | 5,000 | 4,633 |
| Bank of Nova Scotia | 3.270% | 1/11/21 | CAD | 5,000 | 4,677 |
| Bank of Nova Scotia | 3.610% | 2/22/16 | CAD | 2,000 | 1,889 |
| Bell Aliant Regional Communications LP | 5.520% | 2/26/19 | CAD | 2,000 | 2,054 |
| Bell Canada | 3.350% | 6/18/19 | CAD | 5,000 | 4,693 |
| Bell Canada | 3.350% | 3/22/23 | CAD | 5,000 | 4,493 |
| Brookfield Asset Management Inc. | 4.540% | 3/31/23 | CAD | 2,000 | 1,890 |
| Brookfield Asset Management Inc. | 5.040% | 3/8/24 | CAD | 1,500 | 1,452 |
| Caisse Centrale Desjardins | 2.795% | 11/19/18 | CAD | 4,000 | 3,712 |
| Canadian Imperial Bank of Commerce | 2.220% | 3/7/18 | CAD | 3,000 | 2,759 |
| Canadian Imperial Bank of Commerce | 2.350% | 10/18/17 | CAD | 1,500 | 1,389 |
| Canadian Imperial Bank of Commerce | 2.650% | 11/8/16 | CAD | 10,000 | 9,328 |
| 2 Canadian Imperial Bank of Commerce | 3.150% | 11/2/20 | CAD | 2,000 | 1,866 |
| Canadian Pacific Railway Co. | 6.450% | 11/17/39 | CAD | 1,000 | 1,154 |
| 2 Capital Desjardins Inc. | 4.954% | 12/15/26 | CAD | 3,000 | 3,062 |
| Capital Power LP | 5.276% | 11/16/20 | CAD | 4,000 | 3,971 |
| CU Inc. | 4.543% | 10/24/41 | CAD | 1,000 | 949 |
| Enbridge Gas Distribution Inc. | 4.950% | 11/22/50 | CAD | 1,000 | 1,025 |
14
| | | | | |
| Total International Bond Index Fund | | | | | |
| |
| |
| |
| | | | | Face | Market |
| | | Maturity | | Amount | Value |
| | Coupon | Date | Currency | (000) | ($000) |
| Enbridge Inc. | 4.240% | 8/27/42 | CAD | 2,000 | 1,745 |
| Enbridge Inc. | 4.530% | 3/9/20 | CAD | 3,000 | 3,010 |
| Enbridge Pipelines Inc. | 4.550% | 8/17/43 | CAD | 1,000 | 948 |
| Fairfax Financial Holdings Ltd. | 5.840% | 10/14/22 | CAD | 2,000 | 1,989 |
| 2 Great-West Lifeco Finance Delaware LP | 5.691% | 6/21/67 | CAD | 4,000 | 4,023 |
| Greater Toronto Airports Authority | 5.300% | 2/25/41 | CAD | 2,000 | 2,125 |
| HSBC Bank Canada | 2.938% | 1/14/20 | CAD | 2,000 | 1,852 |
| HSBC Bank Canada | 3.558% | 10/4/17 | CAD | 5,000 | 4,796 |
| Loblaw Cos. Ltd. | 3.748% | 3/12/19 | CAD | 2,500 | 2,382 |
| 2 Manulife Financial Capital Trust II | 7.405% | 12/31/08 | CAD | 4,000 | 4,480 |
| 2 National Bank of Canada | 3.261% | 4/11/22 | CAD | 7,000 | 6,592 |
| NAV Canada | 1.949% | 4/19/18 | CAD | 2,000 | 1,819 |
| NAV Canada | 5.304% | 4/17/19 | CAD | 1,000 | 1,048 |
| Plenary Properties LTAP LP | 6.288% | 1/31/44 | CAD | 1,500 | 1,833 |
| Rogers Communications Inc. | 4.000% | 3/13/24 | CAD | 4,000 | 3,645 |
| Rogers Communications Inc. | 5.340% | 3/22/21 | CAD | 6,000 | 6,195 |
| Royal Bank of Canada | 2.260% | 3/12/18 | CAD | 7,500 | 6,874 |
| Royal Bank of Canada | 2.770% | 12/11/18 | CAD | 3,000 | 2,783 |
| 2 Royal Bank of Canada | 2.990% | 12/6/24 | CAD | 4,000 | 3,699 |
| 2 Royal Bank of Canada | 3.180% | 11/2/20 | CAD | 2,000 | 1,863 |
| Royal Bank of Canada | 3.360% | 1/11/16 | CAD | 7,500 | 7,045 |
| 2 Royal Bank of Canada | 4.350% | 6/15/20 | CAD | 2,000 | 1,878 |
| Shaw Communications Inc. | 6.750% | 11/9/39 | CAD | 2,500 | 2,689 |
| Sobeys Inc. | 3.520% | 8/8/18 | CAD | 2,000 | 1,884 |
| Sun Life Financial Inc. | 4.570% | 8/23/21 | CAD | 3,000 | 2,990 |
| Talisman Energy Inc. | 6.625% | 12/5/17 | GBP | 1,350 | 2,564 |
| TELUS Corp. | 3.200% | 4/5/21 | CAD | 750 | 684 |
| TELUS Corp. | 3.350% | 4/1/24 | CAD | 7,500 | 6,626 |
| Teranet Holdings LP | 4.807% | 12/16/20 | CAD | 4,000 | 3,968 |
| Thomson Reuters Corp. | 6.000% | 3/31/16 | CAD | 3,000 | 2,942 |
| Toronto-Dominion Bank | 2.171% | 4/2/18 | CAD | 7,500 | 6,859 |
| Toronto-Dominion Bank | 2.447% | 4/2/19 | CAD | 5,000 | 4,562 |
| Toronto-Dominion Bank | 2.948% | 8/2/16 | CAD | 2,000 | 1,876 |
| TransCanada PipeLines Ltd. | 4.550% | 11/15/41 | CAD | 2,000 | 1,885 |
| Wells Fargo Canada Corp. | 2.944% | 7/25/19 | CAD | 2,000 | 1,868 |
| Wells Fargo Canada Corp. | 3.700% | 3/30/16 | CAD | 3,000 | 2,843 |
| Westcoast Energy Inc. | 5.600% | 1/16/19 | CAD | 275 | 281 |
| | | | | | 209,673 |
| Sovereign Bonds (4.0%) | | | | | |
| Alberta Capital Finance Authority | 3.050% | 6/15/15 | CAD | 2,000 | 1,864 |
| Canada | 1.000% | 5/1/15 | CAD | 5,000 | 4,562 |
| Canada | 1.250% | 2/1/16 | CAD | 30,000 | 27,459 |
| Canada | 1.250% | 3/1/18 | CAD | 37,000 | 33,531 |
| Canada | 1.250% | 9/1/18 | CAD | 21,840 | 19,656 |
| Canada | 1.500% | 8/1/15 | CAD | 15,000 | 13,770 |
| Canada | 1.500% | 3/1/17 | CAD | 20,000 | 18,417 |
| Canada | 1.500% | 6/1/23 | CAD | 9,000 | 7,678 |
| Canada | 1.750% | 3/1/19 | CAD | 13,000 | 11,899 |
| Canada | 2.500% | 6/1/15 | CAD | 35,000 | 32,445 |
| Canada | 2.500% | 6/1/24 | CAD | 5,000 | 4,600 |
| Canada | 2.750% | 9/1/16 | CAD | 25,000 | 23,673 |
| Canada | 2.750% | 6/1/22 | CAD | 12,000 | 11,425 |
| Canada | 3.000% | 12/1/15 | CAD | 10,000 | 9,405 |
| Canada | 3.250% | 6/1/21 | CAD | 7,000 | 6,915 |
| Canada | 3.500% | 1/13/20 | EUR | 2,000 | 3,187 |
15
| | | | | | |
| Total International Bond Index Fund | | | | | |
| |
| |
| |
| | | | | | Face | Market |
| | | | Maturity | | Amount | Value |
| | | Coupon | Date | Currency | (000) | ($000) |
| | Canada | 3.500% | 6/1/20 | CAD | 12,250 | 12,242 |
| | Canada | 3.500% | 12/1/45 | CAD | 11,600 | 11,821 |
| | Canada | 4.000% | 6/1/41 | CAD | 14,000 | 15,281 |
| | Canada | 4.250% | 6/1/18 | CAD | 10,000 | 10,130 |
| | Canada | 5.000% | 6/1/37 | CAD | 16,000 | 19,736 |
| | Canada | 5.750% | 6/1/29 | CAD | 11,000 | 13,832 |
| | Canada | 5.750% | 6/1/33 | CAD | 23,500 | 30,649 |
| | Canada | 8.000% | 6/1/23 | CAD | 6,000 | 8,064 |
| | Canada | 8.000% | 6/1/27 | CAD | 7,000 | 10,246 |
| 1 | Canada Housing Trust No 1 | 1.700% | 12/15/17 | CAD | 7,000 | 6,411 |
| 1 | Canada Housing Trust No 1 | 1.850% | 12/15/16 | CAD | 10,000 | 9,244 |
| 1 | Canada Housing Trust No 1 | 2.050% | 6/15/17 | CAD | 10,000 | 9,286 |
| 1 | Canada Housing Trust No 1 | 2.050% | 6/15/18 | CAD | 10,000 | 9,242 |
| 1 | Canada Housing Trust No 1 | 2.350% | 12/15/18 | CAD | 10,000 | 9,319 |
| 1 | Canada Housing Trust No 1 | 2.400% | 12/15/22 | CAD | 10,000 | 8,958 |
| 1 | Canada Housing Trust No 1 | 2.450% | 12/15/15 | CAD | 20,000 | 18,630 |
| 1 | Canada Housing Trust No 1 | 2.650% | 3/15/22 | CAD | 7,500 | 6,904 |
| 1 | Canada Housing Trust No 1 | 2.750% | 6/15/16 | CAD | 20,000 | 18,831 |
| | Canada Housing Trust No 1 | 2.900% | 6/15/24 | CAD | 5,000 | 4,590 |
| 1 | Canada Housing Trust No 1 | 3.150% | 9/15/23 | CAD | 5,000 | 4,720 |
| 1 | Canada Housing Trust No 1 | 3.800% | 6/15/21 | CAD | 5,000 | 4,972 |
| 1,8 | Canada Housing Trust No 1 | 4.100% | 12/15/18 | CAD | 10,000 | 10,026 |
| 8 | Canada Post Corp. | 4.360% | 7/16/40 | CAD | 1,000 | 1,043 |
| | CDP Financial Inc. | 4.600% | 7/15/20 | CAD | 350 | 356 |
| | City of Montreal Canada | 3.500% | 9/1/23 | CAD | 2,500 | 2,306 |
| | City of Toronto | 4.700% | 6/10/41 | CAD | 2,000 | 2,007 |
| | City of Toronto | 5.200% | 6/1/40 | CAD | 1,000 | 1,074 |
| | Export Development Canada | 0.875% | 12/7/16 | GBP | 1,000 | 1,675 |
| | Export Development Canada | 1.875% | 12/17/18 | GBP | 3,000 | 5,053 |
| | Financement-Quebec | 2.450% | 12/1/19 | CAD | 9,000 | 8,232 |
| | Hydro One Inc. | 2.780% | 10/9/18 | CAD | 2,000 | 1,865 |
| | Hydro One Inc. | 3.200% | 1/13/22 | CAD | 5,000 | 4,633 |
| | Hydro One Inc. | 3.790% | 7/31/62 | CAD | 2,000 | 1,630 |
| | Hydro One Inc. | 4.400% | 6/1/20 | CAD | 3,000 | 3,008 |
| | Hydro-Quebec | 5.000% | 2/15/45 | CAD | 8,500 | 9,116 |
| | Hydro-Quebec | 5.000% | 2/15/50 | CAD | 6,500 | 7,075 |
| | Hydro-Quebec | 6.000% | 8/15/31 | CAD | 4,000 | 4,634 |
| | Hydro-Quebec | 6.000% | 2/15/40 | CAD | 1,000 | 1,202 |
| | Hydro-Quebec | 6.500% | 1/16/35 | CAD | 280 | 349 |
| | Hydro-Quebec | 6.500% | 2/15/35 | CAD | 3,000 | 3,737 |
| | Hydro-Quebec | 10.500% | 10/15/21 | CAD | 2,000 | 2,749 |
| 1,8 | Labrador-Island Link Funding Trust | 3.760% | 6/1/33 | CAD | 3,000 | 2,894 |
| 1,8 | Labrador-Island Link Funding Trust | 3.850% | 12/1/53 | CAD | 1,000 | 980 |
| | Municipal Finance Authority | | | | | |
| | of British Columbia | 3.000% | 6/1/16 | CAD | 5,000 | 4,730 |
| 1,8 | Muskrat Falls / Labrador Transmission | | | | | |
| | Assets Funding Trust | 3.830% | 6/1/37 | CAD | 1,000 | 972 |
| 1,8 | Muskrat Falls / Labrador Transmission | | | | | |
| | Assets Funding Trust | 3.860% | 12/1/48 | CAD | 1,500 | 1,474 |
| | Ontario Electricity Financial Corp. | 8.250% | 6/22/26 | CAD | 2,000 | 2,701 |
| | Ontario Electricity Financial Corp. | 10.125% | 10/15/21 | CAD | 2,500 | 3,353 |
| | Province of Alberta | 1.700% | 12/15/17 | CAD | 7,500 | 6,855 |
| | Province of Alberta | 2.900% | 9/20/29 | CAD | 2,800 | 2,381 |
| | Province of Alberta | 3.450% | 12/1/43 | CAD | 4,000 | 3,478 |
| | Province of Alberta | 3.900% | 12/1/33 | CAD | 2,000 | 1,889 |
16
| | | | | |
| Total International Bond Index Fund | | | | | |
| |
| |
| |
| | | | | Face | Market |
| | | Maturity | | Amount | Value |
| | Coupon | Date | Currency | (000) | ($000) |
| Province of British Columbia | 2.700% | 12/18/22 | CAD | 5,000 | 4,506 |
| Province of British Columbia | 3.200% | 6/18/44 | CAD | 5,000 | 4,134 |
| Province of British Columbia | 3.250% | 12/18/21 | CAD | 5,000 | 4,745 |
| Province of British Columbia | 4.100% | 12/18/19 | CAD | 5,000 | 5,025 |
| Province of British Columbia | 4.300% | 6/18/42 | CAD | 2,500 | 2,506 |
| Province of British Columbia | 4.650% | 12/18/18 | CAD | 2,000 | 2,036 |
| Province of British Columbia | 4.700% | 6/18/37 | CAD | 3,300 | 3,464 |
| Province of British Columbia | 4.900% | 6/18/48 | CAD | 3,000 | 3,357 |
| Province of Manitoba | 4.100% | 3/5/41 | CAD | 5,000 | 4,784 |
| Province of Manitoba | 4.150% | 6/3/20 | CAD | 6,000 | 6,015 |
| Province of Manitoba | 4.600% | 3/5/38 | CAD | 3,000 | 3,078 |
| Province of Manitoba | 5.200% | 12/3/15 | CAD | 3,000 | 2,908 |
| Province of New Brunswick | 2.850% | 6/2/23 | CAD | 5,000 | 4,451 |
| Province of New Brunswick | 3.550% | 6/3/43 | CAD | 1,000 | 849 |
| Province of New Brunswick | 3.650% | 6/3/24 | CAD | 3,000 | 2,822 |
| Province of New Brunswick | 4.450% | 3/26/18 | CAD | 2,000 | 2,009 |
| Province of New Brunswick | 4.800% | 6/3/41 | CAD | 2,750 | 2,855 |
| Province of Newfoundland and Labrador | 4.650% | 10/17/40 | CAD | 2,000 | 2,050 |
| Province of Newfoundland and Labrador | 6.150% | 4/17/28 | CAD | 1,000 | 1,163 |
| Province of Nova Scotia | 3.500% | 6/2/62 | CAD | 2,500 | 2,120 |
| Province of Nova Scotia | 4.100% | 6/1/21 | CAD | 6,000 | 5,966 |
| Province of Nova Scotia | 4.400% | 6/1/42 | CAD | 2,000 | 1,990 |
| Province of Ontario | 1.900% | 9/8/17 | CAD | 15,000 | 13,874 |
| Province of Ontario | 2.100% | 9/8/18 | CAD | 15,000 | 13,828 |
| Province of Ontario | 2.850% | 6/2/23 | CAD | 10,000 | 8,953 |
| Province of Ontario | 3.000% | 9/28/20 | EUR | 3,750 | 5,733 |
| Province of Ontario | 3.150% | 6/2/22 | CAD | 15,000 | 13,915 |
| Province of Ontario | 3.450% | 6/2/45 | CAD | 7,000 | 5,908 |
| Province of Ontario | 3.500% | 6/2/43 | CAD | 10,000 | 8,542 |
| Province of Ontario | 4.000% | 6/2/21 | CAD | 6,000 | 5,926 |
| Province of Ontario | 4.200% | 6/2/20 | CAD | 15,000 | 15,025 |
| Province of Ontario | 4.300% | 3/8/17 | CAD | 5,000 | 4,937 |
| Province of Ontario | 4.600% | 6/2/39 | CAD | 15,000 | 15,262 |
| Province of Ontario | 4.650% | 6/2/41 | CAD | 12,500 | 12,885 |
| Province of Ontario | 4.700% | 6/2/37 | CAD | 9,000 | 9,268 |
| Province of Ontario | 4.850% | 6/2/20 | CAD | 10,000 | 10,350 |
| Province of Ontario | 5.600% | 6/2/35 | CAD | 8,000 | 9,159 |
| Province of Ontario | 5.850% | 3/8/33 | CAD | 6,500 | 7,555 |
| Province of Ontario | 6.500% | 3/8/29 | CAD | 4,000 | 4,861 |
| Province of Ontario | 7.600% | 6/2/27 | CAD | 3,000 | 3,923 |
| Province of Saskatchewan | 3.400% | 2/3/42 | CAD | 3,500 | 3,018 |
| Province of Saskatchewan | 4.750% | 6/1/40 | CAD | 2,000 | 2,133 |
| Quebec | 3.000% | 9/1/23 | CAD | 10,000 | 9,001 |
| Quebec | 3.500% | 12/1/22 | CAD | 7,000 | 6,616 |
| Quebec | 4.250% | 12/1/21 | CAD | 15,000 | 14,981 |
| Quebec | 4.250% | 12/1/43 | CAD | 10,000 | 9,546 |
| Quebec | 4.500% | 12/1/17 | CAD | 5,000 | 5,013 |
| Quebec | 4.500% | 12/1/18 | CAD | 5,000 | 5,048 |
| Quebec | 4.500% | 12/1/20 | CAD | 8,000 | 8,125 |
| Quebec | 4.750% | 4/29/18 | EUR | 1,000 | 1,600 |
| Quebec | 5.000% | 4/29/19 | EUR | 5,500 | 9,092 |
| Quebec | 5.000% | 12/1/38 | CAD | 2,000 | 2,114 |
| Quebec | 5.000% | 12/1/41 | CAD | 10,000 | 10,667 |
| Quebec | 5.350% | 6/1/25 | CAD | 5,000 | 5,346 |
| Quebec | 5.750% | 12/1/36 | CAD | 2,000 | 2,312 |
17
| | | | | |
| Total International Bond Index Fund | | | | | |
| |
| |
| |
| | | | | Face | Market |
| | | Maturity | | Amount | Value |
| | Coupon | Date | Currency | (000) | ($000) |
| Quebec | 6.000% | 10/1/29 | CAD | 5,000 | 5,778 |
| Quebec | 6.250% | 6/1/32 | CAD | 7,000 | 8,389 |
| Regional Municipality of Peel Ontario | 5.100% | 6/29/40 | CAD | 1,000 | 1,040 |
| | | | | | 929,627 |
| Total Canada (Cost $1,218,711) | | | | | 1,153,885 |
| Chile (0.0%) | | | | | |
| Corporate Bond (0.0%) | | | | | |
| Banco Santander Chile | 1.000% | 7/31/17 | CHF | 1,000 | 1,140 |
| Total Chile (Cost $1,138) | | | | | 1,140 |
| China (0.0%) | | | | | |
| Sovereign Bond (0.0%) | | | | | |
| 1 Sinopec Group Overseas | | | | | |
| Development 2013 Ltd. | 2.625% | 10/17/20 | EUR | 500 | 706 |
| Total China (Cost $672) | | | | | 706 |
| Czech Republic (0.3%) | | | | | |
| Sovereign Bonds (0.3%) | | | | | |
| CEZ AS | 3.000% | 6/5/28 | EUR | 500 | 684 |
| CEZ AS | 4.875% | 4/16/25 | EUR | 500 | 829 |
| CEZ AS | 5.000% | 10/19/21 | EUR | 2,000 | 3,317 |
| Czech Republic | 0.500% | 7/28/16 | CZK | 50,000 | 2,538 |
| Czech Republic | 2.500% | 8/25/28 | CZK | 70,000 | 3,497 |
| Czech Republic | 3.625% | 4/14/21 | EUR | 3,000 | 4,701 |
| Czech Republic | 3.750% | 9/12/20 | CZK | 100,000 | 5,775 |
| Czech Republic | 3.850% | 9/29/21 | CZK | 80,000 | 4,693 |
| Czech Republic | 3.875% | 5/24/22 | EUR | 2,000 | 3,178 |
| Czech Republic | 4.000% | 4/11/17 | CZK | 328,000 | 18,265 |
| Czech Republic | 4.600% | 8/18/18 | CZK | 100,000 | 5,875 |
| Czech Republic | 4.850% | 11/26/57 | CZK | 50,000 | 2,979 |
| Czech Republic | 5.000% | 6/11/18 | EUR | 2,000 | 3,240 |
| Czech Republic | 5.700% | 5/25/24 | CZK | 100,000 | 6,810 |
| Total Czech Republic (Cost $65,424) | | | | | 66,381 |
| Denmark (0.8%) | | | | | |
| Asset-Backed/Commercial Mortgage-Backed Securities (0.1%) | | | | |
| Danske Bank A/S | 1.625% | 2/28/20 | EUR | 4,000 | 5,681 |
| Danske Bank A/S | 3.250% | 3/9/16 | EUR | 1,000 | 1,459 |
| Danske Bank A/S | 4.125% | 11/26/19 | EUR | 1,000 | 1,610 |
| Nordea Kredit Realkreditaktieselskab | 2.000% | 1/1/16 | DKK | 20,000 | 3,827 |
| Nordea Kredit Realkreditaktieselskab | 3.500% | 10/1/44 | DKK | 9,788 | 1,855 |
| Nykredit Realkredit A/S | 2.000% | 4/1/18 | DKK | 30,000 | 5,835 |
| Nykredit Realkredit A/S | 2.000% | 10/1/18 | DKK | 20,000 | 3,905 |
| Nykredit Realkredit A/S | 3.250% | 6/1/17 | EUR | 2,000 | 2,945 |
| Realkredit Danmark A/S | 2.000% | 4/1/16 | DKK | 5,000 | 957 |
| Realkredit Danmark A/S | 4.000% | 10/1/41 | DKK | 4,392 | 860 |
| | | | | | 28,934 |
| Corporate Bonds (0.1%) | | | | | |
| AP Moeller - Maersk A/S | 3.375% | 8/28/19 | EUR | 2,000 | 3,012 |
| AP Moeller - Maersk A/S | 4.000% | 4/4/25 | GBP | 700 | 1,168 |
| AP Moeller - Maersk A/S | 6.250% | 12/16/16 | NOK | 5,000 | 913 |
| Carlsberg Breweries A/S | 2.625% | 7/3/19 | EUR | 3,000 | 4,351 |
| Carlsberg Breweries A/S | 7.250% | 11/28/16 | GBP | 1,600 | 3,056 |
18
| | | | | |
| Total International Bond Index Fund | | | | | |
| |
| |
| |
| | | | | Face | Market |
| | | Maturity | | Amount | Value |
| | Coupon | Date | Currency | (000) | ($000) |
| Danske Bank A/S | 3.875% | 5/18/16 | EUR | 3,000 | 4,422 |
| Danske Bank A/S | 4.000% | 12/9/15 | GBP | 200 | 351 |
| 2 Danske Bank A/S | 4.878% | 5/29/49 | EUR | 3,000 | 4,370 |
| TDC A/S | 4.375% | 2/23/18 | EUR | 2,000 | 3,099 |
| | | | | | 24,742 |
| Sovereign Bonds (0.6%) | | | | | |
| DONG Energy A/S | 2.625% | 9/19/22 | EUR | 1,000 | 1,433 |
| DONG Energy A/S | 4.875% | 1/12/32 | GBP | 1,000 | 1,742 |
| DONG Energy A/S | 4.875% | 7/8/49 | EUR | 1,500 | 2,207 |
| DONG Energy A/S | 5.750% | 4/9/40 | GBP | 1,000 | 1,945 |
| 2 DONG Energy A/S | 6.250% | 6/26/13 | EUR | 1,045 | 1,622 |
| DONG Energy A/S | 6.500% | 5/7/19 | EUR | 1,000 | 1,721 |
| Kingdom of Denmark | 1.500% | 11/15/23 | DKK | 60,100 | 11,148 |
| Kingdom of Denmark | 1.750% | 10/5/15 | EUR | 5,000 | 7,088 |
| Kingdom of Denmark | 3.000% | 11/15/21 | DKK | 145,000 | 30,546 |
| Kingdom of Denmark | 4.000% | 11/15/17 | DKK | 109,800 | 23,022 |
| Kingdom of Denmark | 4.000% | 11/15/19 | DKK | 80,000 | 17,486 |
| 4 Kingdom of Denmark | 4.500% | 11/15/39 | DKK | 100,900 | 26,511 |
| Kingdom of Denmark | 7.000% | 11/10/24 | DKK | 22,600 | 6,462 |
| | | | | | 132,933 |
| Total Denmark (Cost $176,457) | | | | | 186,609 |
| Finland (0.7%) | | | | | |
| Asset-Backed/Commercial Mortgage-Backed Securities (0.1%) | | | | |
| Aktia Bank plc | 1.125% | 6/25/18 | EUR | 1,200 | 1,686 |
| Danske Bank Oyj | 3.875% | 6/21/21 | EUR | 2,000 | 3,230 |
| Nordea Bank Finland Abp | 1.375% | 1/15/20 | EUR | 6,000 | 8,448 |
| Nordea Bank Finland Abp | 2.250% | 5/3/19 | EUR | 2,000 | 2,948 |
| Nordea Bank Finland Abp | 2.375% | 7/17/17 | EUR | 5,000 | 7,327 |
| OP Mortgage Bank | 1.625% | 5/23/17 | EUR | 5,000 | 7,157 |
| OP Mortgage Bank | 3.500% | 7/11/18 | EUR | 500 | 771 |
| | | | | | 31,567 |
| Corporate Bonds (0.1%) | | | | | |
| Citycon Oyj | 3.750% | 6/24/20 | EUR | 500 | 733 |
| Pohjola Bank plc | 1.250% | 5/14/18 | EUR | 825 | 1,148 |
| Pohjola Bank plc | 3.125% | 1/12/16 | EUR | 1,500 | 2,169 |
| Sampo Oyj | 4.250% | 2/22/16 | EUR | 2,000 | 2,935 |
| Sampo Oyj | 4.250% | 2/27/17 | EUR | 500 | 752 |
| Teollisuuden Voima Oyj | 4.625% | 2/4/19 | EUR | 1,000 | 1,566 |
| | | | | | 9,303 |
| Sovereign Bonds (0.5%) | | | | | |
| Fortum Oyj | 2.250% | 9/6/22 | EUR | 1,500 | 2,081 |
| Fortum Oyj | 6.000% | 3/20/19 | EUR | 1,000 | 1,676 |
| Municipality Finance plc | 1.125% | 12/7/17 | GBP | 1,800 | 2,985 |
| Republic of Finland | 1.125% | 12/7/17 | GBP | 200 | 333 |
| 1 Republic of Finland | 1.125% | 9/15/18 | EUR | 3,000 | 4,248 |
| 1 Republic of Finland | 1.500% | 4/15/23 | EUR | 10,000 | 13,780 |
| 1 Republic of Finland | 1.625% | 9/15/22 | EUR | 4,000 | 5,610 |
| 1 Republic of Finland | 1.750% | 4/15/16 | EUR | 10,000 | 14,292 |
| 1 Republic of Finland | 2.625% | 7/4/42 | EUR | 2,000 | 2,887 |
| 1 Republic of Finland | 2.750% | 7/4/28 | EUR | 3,000 | 4,456 |
| 1 Republic of Finland | 3.375% | 4/15/20 | EUR | 10,000 | 15,777 |
| 1 Republic of Finland | 3.500% | 4/15/21 | EUR | 3,000 | 4,795 |
19
| | | | | |
| Total International Bond Index Fund | | | | | |
| |
| |
| |
| | | | | Face | Market |
| | | Maturity | | Amount | Value |
| | Coupon | Date | Currency | (000) | ($000) |
| 1 Republic of Finland | 3.875% | 9/15/17 | EUR | 10,000 | 15,465 |
| 1 Republic of Finland | 4.000% | 7/4/25 | EUR | 10,000 | 16,798 |
| 1 Republic of Finland | 4.375% | 7/4/19 | EUR | 4,000 | 6,546 |
| | | | | | 111,729 |
| Total Finland (Cost $142,953) | | | | | 152,599 |
| France (11.3%) | | | | | |
| Asset-Backed/Commercial Mortgage-Backed Securities (1.3%) | | | | |
| AXA Bank Europe SCF | 1.875% | 9/20/19 | EUR | 3,000 | 4,325 |
| AXA Bank Europe SCF | 2.250% | 4/19/17 | EUR | 2,000 | 2,904 |
| BNP Paribas Home Loan SFH | 1.375% | 6/17/20 | EUR | 7,500 | 10,523 |
| BNP Paribas Home Loan SFH | 3.125% | 3/22/22 | EUR | 2,000 | 3,090 |
| BNP Paribas Home Loan SFH | 3.375% | 1/12/17 | EUR | 2,000 | 2,987 |
| BNP Paribas Public Sector SCF SA | 2.250% | 10/22/15 | EUR | 1,000 | 1,425 |
| BPCE SFH SA | 2.125% | 9/17/20 | EUR | 3,000 | 4,364 |
| BPCE SFH SA | 3.625% | 5/12/16 | EUR | 8,000 | 11,862 |
| BPCE SFH SA | 4.000% | 3/23/22 | EUR | 3,000 | 4,897 |
| Caisse de Refinancement de l’Habitat SA | 1.375% | 10/25/19 | EUR | 1,500 | 2,116 |
| Caisse de Refinancement de l’Habitat SA | 2.400% | 1/17/25 | EUR | 1,000 | 1,438 |
| Caisse de Refinancement de l’Habitat SA | 2.500% | 3/29/21 | CHF | 1,000 | 1,252 |
| Caisse de Refinancement de l’Habitat SA | 2.600% | 4/26/16 | EUR | 3,841 | 5,564 |
| Caisse de Refinancement de l’Habitat SA | 3.300% | 9/23/22 | EUR | 6,500 | 10,140 |
| Caisse de Refinancement de l’Habitat SA | 3.500% | 4/25/17 | EUR | 2,500 | 3,770 |
| Caisse de Refinancement de l’Habitat SA | 3.600% | 9/13/21 | EUR | 2,000 | 3,177 |
| Caisse de Refinancement de l’Habitat SA | 3.600% | 3/8/24 | EUR | 5,000 | 7,977 |
| Caisse de Refinancement de l’Habitat SA | 4.000% | 4/25/18 | EUR | 4,525 | 7,076 |
| Caisse de Refinancement de l’Habitat SA | 4.000% | 6/17/22 | EUR | 4,870 | 7,951 |
| Caisse de Refinancement de l’Habitat SA | 4.100% | 10/25/15 | EUR | 8,140 | 11,921 |
| Caisse Francaise de Financement Local | 2.375% | 2/9/16 | CHF | 2,000 | 2,356 |
| Caisse Francaise de Financement Local | 2.750% | 1/25/16 | EUR | 11,000 | 15,871 |
| Caisse Francaise de Financement Local | 3.000% | 10/2/28 | EUR | 2,000 | 2,947 |
| Caisse Francaise de Financement Local | 3.125% | 9/15/15 | EUR | 1,500 | 2,158 |
| Caisse Francaise de Financement Local | 3.500% | 9/16/16 | EUR | 2,000 | 2,970 |
| Caisse Francaise de Financement Local | 3.500% | 9/24/20 | EUR | 3,051 | 4,795 |
| Caisse Francaise de Financement Local | 3.625% | 2/26/18 | EUR | 3,000 | 4,607 |
| Caisse Francaise de Financement Local | 4.250% | 1/26/22 | EUR | 3,000 | 4,948 |
| Caisse Francaise de Financement Local | 5.250% | 2/6/17 | EUR | 3,037 | 4,751 |
| Caisse Francaise de Financement Local | 5.375% | 7/8/24 | EUR | 4,000 | 7,243 |
| CIF Euromortgage SA | 3.750% | 10/23/19 | EUR | 7,000 | 11,027 |
| Compagnie De Financement Foncier SA | 5.500% | 1/26/27 | GBP | 350 | 681 |
| Compagnie De Financement Foncier SA | 2.250% | 8/21/15 | EUR | 5,000 | 7,100 |
| Compagnie De Financement Foncier SA | 2.375% | 8/24/18 | CHF | 4,000 | 4,893 |
| Compagnie De Financement Foncier SA | 2.375% | 11/21/22 | EUR | 5,000 | 7,287 |
| Compagnie De Financement Foncier SA | 4.125% | 10/25/17 | EUR | 1,500 | 2,323 |
| Compagnie De Financement Foncier SA | 4.250% | 1/19/22 | EUR | 1,000 | 1,650 |
| Compagnie De Financement Foncier SA | 4.625% | 9/23/17 | EUR | 13,000 | 20,392 |
| Compagnie De Financement Foncier SA | 4.875% | 5/25/21 | EUR | 11,544 | 19,569 |
| Compagnie De Financement Foncier SA | 5.750% | 10/4/21 | EUR | 500 | 895 |
| Credit Agricole Home Loan SFH | 1.625% | 3/11/20 | EUR | 2,200 | 3,135 |
| Credit Agricole Home Loan SFH | 1.750% | 7/27/17 | CHF | 2,000 | 2,399 |
| Credit Agricole Home Loan SFH | 3.250% | 3/23/17 | EUR | 3,000 | 4,479 |
| Credit Agricole Home Loan SFH | 3.875% | 1/12/21 | EUR | 2,500 | 4,016 |
| Credit Agricole Home Loan SFH | 4.000% | 7/16/25 | EUR | 2,000 | 3,290 |
| Credit Agricole Home Loan SFH | 4.500% | 1/29/16 | EUR | 5,800 | 8,616 |
| Credit Agricole Public Sector SCF | 1.875% | 9/20/19 | EUR | 1,500 | 2,165 |
| Credit Agricole Public Sector SCF | 1.875% | 6/7/23 | EUR | 1,200 | 1,673 |
20
Total International Bond Index Fund
| | | | | |
| | | | | Face | Market |
| | | Maturity | | Amount | Value |
| | Coupon | Date | Currency | (000) | ($000) |
| Credit Mutuel - CIC Home Loan SFH | 1.375% | 4/22/20 | EUR | 6,500 | 9,115 |
| Credit Mutuel - CIC Home Loan SFH | 2.500% | 9/11/23 | EUR | 3,000 | 4,390 |
| Credit Mutuel - CIC Home Loan SFH | 3.375% | 7/18/16 | EUR | 4,000 | 5,902 |
| Credit Mutuel Arkea Home Loans SFH | 2.375% | 7/11/23 | EUR | 2,000 | 2,900 |
| HSBC SFH France SA | 1.875% | 10/28/20 | EUR | 2,000 | 2,874 |
| HSBC SFH France SA | 2.000% | 10/16/23 | EUR | 2,500 | 3,519 |
| Societe Generale SCF SA | 4.250% | 2/3/23 | EUR | 4,000 | 6,671 |
| Societe Generale SFH | 3.250% | 6/6/16 | EUR | 5,000 | 7,343 |
| Societe Generale SFH | 4.000% | 1/18/22 | EUR | 2,000 | 3,265 |
| | | | | | 312,974 |
| Corporate Bonds (1.8%) | | | | | |
| Air Liquide SA | 2.908% | 10/12/18 | EUR | 2,800 | 4,197 |
| 2 Allianz France SA | 4.625% | 6/29/49 | EUR | 1,000 | 1,421 |
| Alstom SA | 2.250% | 10/11/17 | EUR | 2,000 | 2,862 |
| Alstom SA | 2.875% | 10/5/15 | EUR | 2,000 | 2,854 |
| Alstom SA | 4.125% | 2/1/17 | EUR | 2,000 | 2,995 |
| Arkema SA | 3.850% | 4/30/20 | EUR | 600 | 924 |
| Arkema SA | 4.000% | 10/25/17 | EUR | 1,000 | 1,518 |
| Autoroutes du Sud de la France SA | 2.875% | 1/18/23 | EUR | 3,000 | 4,358 |
| Autoroutes du Sud de la France SA | 4.125% | 4/13/20 | EUR | 2,000 | 3,153 |
| 2 AXA SA | 5.125% | 7/4/43 | EUR | 3,000 | 4,698 |
| AXA SA | 5.250% | 4/16/40 | EUR | 1,350 | 2,113 |
| 2 AXA SA | 5.777% | 7/29/49 | EUR | 2,000 | 2,963 |
| 2 AXA SA | 6.667% | 7/29/49 | GBP | 450 | 813 |
| 2 AXA SA | 6.772% | 10/29/49 | GBP | 2,000 | 3,703 |
| AXA SA | 7.125% | 12/15/20 | GBP | 500 | 1,006 |
| Banque Federative du Credit Mutuel SA | 1.625% | 1/11/18 | EUR | 1,000 | 1,411 |
| Banque Federative du Credit Mutuel SA | 2.875% | 6/21/17 | EUR | 5,000 | 7,332 |
| Banque Federative du Credit Mutuel SA | 4.000% | 10/22/20 | EUR | 4,000 | 6,126 |
| Banque Federative du Credit Mutuel SA | 4.375% | 5/31/16 | EUR | 4,000 | 5,957 |
| 7 Banque PSA Finance SA | 0.625% | 4/8/16 | EUR | 4,000 | 5,576 |
| BNP Paribas SA | 1.375% | 11/21/18 | EUR | 4,000 | 5,583 |
| BNP Paribas SA | 2.250% | 1/13/21 | EUR | 2,000 | 2,853 |
| BNP Paribas SA | 2.375% | 11/20/19 | GBP | 3,350 | 5,586 |
| BNP Paribas SA | 2.875% | 11/27/17 | EUR | 4,000 | 5,896 |
| BNP Paribas SA | 2.875% | 9/26/23 | EUR | 5,000 | 7,291 |
| BNP Paribas SA | 3.000% | 2/24/17 | EUR | 2,000 | 2,934 |
| BNP Paribas SA | 3.500% | 3/7/16 | EUR | 3,000 | 4,372 |
| 2 BNP Paribas SA | 5.019% | 4/29/49 | EUR | 2,500 | 3,714 |
| 2 BNP Paribas SA | 5.945% | 4/29/49 | GBP | 650 | 1,150 |
| Bouygues SA | 3.641% | 10/29/19 | EUR | 2,500 | 3,824 |
| Bouygues SA | 6.125% | 7/3/15 | EUR | 3,000 | 4,420 |
| BPCE SA | 1.750% | 3/14/16 | EUR | 5,000 | 7,067 |
| BPCE SA | 2.875% | 1/16/24 | EUR | 3,500 | 5,066 |
| BPCE SA | 4.625% | 7/18/23 | EUR | 1,500 | 2,294 |
| 2 BPCE SA | 4.625% | 7/29/49 | EUR | 600 | 852 |
| 2 BPCE SA | 6.117% | 10/29/49 | EUR | 1,250 | 1,912 |
| Carrefour SA | 1.750% | 5/22/19 | EUR | 5,420 | 7,626 |
| Carrefour SA | 1.875% | 12/19/17 | EUR | 1,000 | 1,426 |
| Casino Guichard Perrachon SA | 3.311% | 1/25/23 | EUR | 3,000 | 4,385 |
| Casino Guichard Perrachon SA | 4.726% | 5/26/21 | EUR | 1,900 | 3,065 |
| 2 CNP Assurances | 6.000% | 9/14/40 | EUR | 1,000 | 1,570 |
| 2 CNP Assurances | 7.375% | 9/30/41 | GBP | 1,000 | 1,927 |
| Compagnie De St. Gobain SA | 3.500% | 9/30/15 | EUR | 2,500 | 3,601 |
| Compagnie De St. Gobain SA | 3.625% | 3/28/22 | EUR | 5,000 | 7,662 |
| Compagnie De St. Gobain SA | 5.625% | 12/15/16 | GBP | 300 | 554 |
21
Total International Bond Index Fund
| | | | | |
| | | | | Face | Market |
| | | Maturity | | Amount | Value |
| | Coupon | Date | Currency | (000) | ($000) |
| Cie Financiere et Industrielle | | | | | |
| des Autoroutes SA | 5.000% | 5/24/21 | EUR | 1,500 | 2,494 |
| Credit Agricole SA | 2.375% | 11/27/20 | EUR | 5,000 | 7,190 |
| Credit Agricole SA | 3.625% | 3/8/16 | EUR | 4,900 | 7,157 |
| Credit Agricole SA | 3.875% | 2/13/19 | EUR | 4,000 | 6,196 |
| Credit Agricole SA | 5.875% | 6/11/19 | EUR | 4,000 | 6,613 |
| 2 Credit Agricole SA | 7.875% | 10/29/49 | EUR | 2,000 | 3,288 |
| Danone SA | 1.375% | 6/10/19 | EUR | 2,600 | 3,635 |
| Danone SA | 2.250% | 11/15/21 | EUR | 2,000 | 2,858 |
| Edenred | 3.625% | 10/6/17 | EUR | 1,500 | 2,239 |
| Eutelsat SA | 4.125% | 3/27/17 | EUR | 2,000 | 3,010 |
| GDF Suez | 1.500% | 7/20/17 | EUR | 2,000 | 2,831 |
| GDF Suez | 2.250% | 6/1/18 | EUR | 3,500 | 5,086 |
| GDF Suez | 2.750% | 10/18/17 | EUR | 2,000 | 2,946 |
| 2 GDF Suez | 4.750% | 7/29/49 | EUR | 1,000 | 1,500 |
| GDF Suez | 5.000% | 10/1/60 | GBP | 1,650 | 2,983 |
| GDF Suez | 5.625% | 1/18/16 | EUR | 2,000 | 3,011 |
| GDF Suez | 6.375% | 1/18/21 | EUR | 4,500 | 8,097 |
| GDF Suez | 6.875% | 1/24/19 | EUR | 250 | 435 |
| GDF Suez | 7.000% | 10/30/28 | GBP | 550 | 1,216 |
| Gecina SA | 2.875% | 5/30/23 | EUR | 2,500 | 3,526 |
| Groupe Auchan SA | 2.250% | 4/6/23 | EUR | 2,000 | 2,789 |
| Groupe Auchan SA | 2.375% | 12/12/22 | EUR | 2,000 | 2,835 |
| Klepierre | 4.000% | 4/13/17 | EUR | 2,100 | 3,153 |
| La Banque Postale Home Loan SFH | 2.375% | 1/15/24 | EUR | 1,800 | 2,603 |
| Legrand SA | 4.375% | 3/21/18 | EUR | 1,000 | 1,550 |
| 2 Natixis | 6.307% | 10/29/49 | EUR | 200 | 306 |
| Orange SA | 1.875% | 10/2/19 | EUR | 5,000 | 7,068 |
| Orange SA | 2.500% | 3/1/23 | EUR | 100 | 141 |
| Orange SA | 3.125% | 1/9/24 | EUR | 3,000 | 4,413 |
| Orange SA | 3.375% | 9/16/22 | EUR | 3,000 | 4,540 |
| 2 Orange SA | 4.250% | 2/28/49 | EUR | 1,500 | 2,129 |
| Orange SA | 4.750% | 2/21/17 | EUR | 4,000 | 6,138 |
| Orange SA | 5.375% | 11/22/50 | GBP | 1,000 | 1,792 |
| Orange SA | 5.625% | 5/22/18 | EUR | 2,000 | 3,257 |
| 2 Orange SA | 5.875% | 2/28/49 | GBP | 700 | 1,215 |
| Orange SA | 7.250% | 11/10/20 | GBP | 400 | 825 |
| Orange SA | 8.000% | 12/20/17 | GBP | 800 | 1,608 |
| Orange SA | 8.125% | 11/20/28 | GBP | 1,000 | 2,313 |
| Pernod Ricard SA | 2.000% | 6/22/20 | EUR | 2,000 | 2,801 |
| Pernod Ricard SA | 5.000% | 3/15/17 | EUR | 2,500 | 3,842 |
| RCI Banque SA | 1.750% | 7/6/16 | EUR | 1,500 | 2,110 |
| RCI Banque SA | 2.875% | 1/22/18 | EUR | 2,500 | 3,645 |
| RCI Banque SA | 3.250% | 4/25/18 | GBP | 500 | 863 |
| RCI Banque SA | 4.000% | 3/16/16 | EUR | 690 | 1,008 |
| Sanofi | 1.000% | 11/14/17 | EUR | 2,000 | 2,803 |
| Sanofi | 1.875% | 9/4/20 | EUR | 3,000 | 4,241 |
| Sanofi | 4.125% | 10/11/19 | EUR | 1,000 | 1,597 |
| Sanofi | 4.500% | 5/18/16 | EUR | 2,000 | 2,991 |
| Schneider Electric SA | 4.000% | 8/11/17 | EUR | 4,137 | 6,293 |
| 2 SCOR SE | 5.375% | 12/29/49 | CHF | 2,000 | 2,394 |
| Societe Des Autoroutes Paris-Rhin-Rhone | 4.875% | 1/21/19 | EUR | 1,000 | 1,603 |
| Societe Des Autoroutes Paris-Rhin-Rhone | 5.000% | 1/12/17 | EUR | 2,500 | 3,828 |
| Societe Des Autoroutes Paris-Rhin-Rhone | 5.125% | 1/18/18 | EUR | 1,500 | 2,371 |
| Societe Generale SA | 2.250% | 1/23/20 | EUR | 4,000 | 5,738 |
| Societe Generale SA | 3.875% | 12/17/15 | GBP | 50 | 88 |
22
Total International Bond Index Fund
| | | | | |
| | | | | Face | Market |
| | | Maturity | | Amount | Value |
| | Coupon | Date | Currency | (000) | ($000) |
| Societe Generale SA | 4.000% | 4/20/16 | EUR | 1,500 | 2,213 |
| Societe Generale SA | 4.000% | 6/7/23 | EUR | 3,700 | 5,395 |
| Societe Generale SA | 4.750% | 3/2/21 | EUR | 1,000 | 1,643 |
| Societe Generale SA | 5.000% | 12/20/18 | GBP | 2,790 | 5,209 |
| Societe Generale SA | 5.400% | 1/30/18 | GBP | 700 | 1,279 |
| 2 Suez Environnement Co. | 4.820% | 9/29/49 | EUR | 500 | 715 |
| Suez Environnement Co. | 5.500% | 7/22/24 | EUR | 2,400 | 4,223 |
| Thales SA | 1.625% | 3/20/18 | EUR | 2,500 | 3,528 |
| Total Capital International SA | 2.125% | 3/15/23 | EUR | 3,000 | 4,223 |
| Total Capital International SA | 2.500% | 3/25/26 | EUR | 2,000 | 2,799 |
| Total Capital SA | 4.250% | 12/8/17 | GBP | 550 | 1,009 |
| Total Capital SA | 4.700% | 6/6/17 | EUR | 3,000 | 4,657 |
| Transport et Infrastructures Gaz France SA | 4.339% | 7/7/21 | EUR | 2,000 | 3,171 |
| Unibail-Rodamco SE | 1.625% | 6/26/17 | EUR | 1,400 | 1,981 |
| Unibail-Rodamco SE | 2.375% | 2/25/21 | EUR | 2,000 | 2,870 |
| Unibail-Rodamco SE | 2.500% | 6/12/23 | EUR | 800 | 1,139 |
| Unibail-Rodamco SE | 4.625% | 9/23/16 | EUR | 3,000 | 4,530 |
| Veolia Environnement SA | 4.247% | 1/6/21 | EUR | 3,000 | 4,759 |
| Veolia Environnement SA | 4.625% | 3/30/27 | EUR | 500 | 801 |
| Veolia Environnement SA | 6.125% | 11/25/33 | EUR | 1,000 | 1,825 |
| Veolia Environnement SA | 6.125% | 10/29/37 | GBP | 1,000 | 1,947 |
| Vinci SA | 3.375% | 3/30/20 | EUR | 1,500 | 2,276 |
| Vinci SA | 4.125% | 2/20/17 | EUR | 2,000 | 3,015 |
| 2 Vinci SA | 6.250% | 11/29/49 | EUR | 1,000 | 1,481 |
| Vivendi SA | 4.125% | 7/18/17 | EUR | 900 | 1,373 |
| Vivendi SA | 4.250% | 12/1/16 | EUR | 2,150 | 3,250 |
| Vivendi SA | 4.750% | 7/13/21 | EUR | 2,000 | 3,267 |
| | | | | | 410,390 |
| Sovereign Bonds (8.2%) | | | | | |
| Aeroports de Paris | 2.750% | 6/5/28 | EUR | 1,000 | 1,399 |
| Aeroports de Paris | 3.125% | 6/11/24 | EUR | 2,000 | 2,992 |
| Agence Francaise de Developpement | 2.250% | 5/27/25 | EUR | 10,000 | 13,898 |
| 2 Agence Francaise de Developpement | 4.615% | 7/29/49 | EUR | 500 | 735 |
| Areva SA | 3.500% | 3/22/21 | EUR | 3,500 | 5,125 |
| Bpifrance Financement | 2.750% | 10/25/25 | EUR | 3,000 | 4,361 |
| Bpifrance Financement SA | 2.000% | 7/25/17 | EUR | 3,000 | 4,347 |
| Caisse d’Amortissement de la Dette Sociale | 1.000% | 5/25/18 | EUR | 10,000 | 14,028 |
| Caisse d’Amortissement de la Dette Sociale | 2.250% | 12/7/15 | GBP | 1,000 | 1,724 |
| Caisse d’Amortissement de la Dette Sociale | 2.375% | 1/25/24 | EUR | 3,500 | 5,028 |
| Caisse d’Amortissement de la Dette Sociale | 2.500% | 10/25/22 | EUR | 3,000 | 4,420 |
| Caisse d’Amortissement de la Dette Sociale | 3.000% | 2/25/16 | EUR | 13,000 | 18,902 |
| Caisse d’Amortissement de la Dette Sociale | 3.375% | 4/25/21 | EUR | 3,000 | 4,714 |
| Caisse d’Amortissement de la Dette Sociale | 3.625% | 4/25/16 | EUR | 7,000 | 10,337 |
| Caisse d’Amortissement de la Dette Sociale | 3.750% | 10/25/20 | EUR | 2,000 | 3,201 |
| Caisse d’Amortissement de la Dette Sociale | 4.000% | 12/15/25 | EUR | 8,000 | 13,129 |
| Caisse d’Amortissement de la Dette Sociale | 4.125% | 4/25/17 | EUR | 6,500 | 9,992 |
| Caisse d’Amortissement de la Dette Sociale | 4.125% | 4/25/23 | EUR | 5,000 | 8,244 |
| Caisse d’Amortissement de la Dette Sociale | 4.250% | 4/25/20 | EUR | 3,000 | 4,900 |
| Caisse d’Amortissement de la Dette Sociale | 4.375% | 10/25/21 | EUR | 8,000 | 13,359 |
| Caisse des Depots et Consignations | 4.375% | 4/9/18 | EUR | 3,000 | 4,739 |
| Caisse Nationale des Autoroutes | 4.500% | 3/28/18 | EUR | 3,870 | 6,136 |
| Caisse Nationale des Autoroutes | 6.000% | 10/26/15 | EUR | 943 | 1,418 |
| 2 Electricite de France SA | 4.250% | 12/29/49 | EUR | 4,000 | 5,834 |
| Electricite de France SA | 2.250% | 9/29/17 | CHF | 1,000 | 1,203 |
| Electricite de France SA | 3.875% | 1/18/22 | EUR | 3,000 | 4,716 |
| Electricite de France SA | 4.500% | 11/12/40 | EUR | 3,900 | 6,428 |
23
| | | | | |
| Total International Bond Index Fund | | | | | |
| |
| |
| |
| | | | | Face | Market |
| | | Maturity | | Amount | Value |
| | Coupon | Date | Currency | (000) | ($000) |
| Electricite de France SA | 4.625% | 9/11/24 | EUR | 2,000 | 3,320 |
| Electricite de France SA | 5.125% | 9/22/50 | GBP | 2,000 | 3,570 |
| Electricite de France SA | 5.375% | 5/29/20 | EUR | 2,000 | 3,372 |
| 2 Electricite de France SA | 5.375% | 1/29/49 | EUR | 3,400 | 5,144 |
| Electricite de France SA | 5.500% | 10/17/41 | GBP | 1,000 | 1,872 |
| 2 Electricite de France SA | 6.000% | 12/29/49 | GBP | 3,800 | 6,707 |
| Electricite de France SA | 6.250% | 1/25/21 | EUR | 5,000 | 8,901 |
| Electricite de France SA | 6.250% | 5/30/28 | GBP | 3,000 | 6,057 |
| French Republic | 0.250% | 11/25/15 | EUR | 25,000 | 34,705 |
| French Republic | 1.000% | 7/25/17 | EUR | 30,000 | 42,385 |
| French Republic | 1.000% | 5/25/18 | EUR | 39,000 | 54,934 |
| French Republic | 1.000% | 11/25/18 | EUR | 20,000 | 28,080 |
| French Republic | 1.000% | 5/25/19 | EUR | 10,000 | 13,979 |
| French Republic | 1.750% | 2/25/17 | EUR | 45,000 | 64,899 |
| French Republic | 1.750% | 5/25/23 | EUR | 36,000 | 49,935 |
| French Republic | 2.000% | 7/12/15 | EUR | 20,000 | 28,340 |
| French Republic | 2.250% | 2/25/16 | EUR | 30,000 | 43,141 |
| French Republic | 2.250% | 10/25/22 | EUR | 35,000 | 50,954 |
| French Republic | 2.250% | 5/25/24 | EUR | 20,000 | 28,482 |
| French Republic | 2.500% | 7/25/16 | EUR | 42,000 | 61,147 |
| French Republic | 2.500% | 10/25/20 | EUR | 39,000 | 58,597 |
| French Republic | 2.750% | 10/25/27 | EUR | 16,000 | 23,235 |
| French Republic | 3.000% | 10/25/15 | EUR | 40,000 | 57,782 |
| French Republic | 3.000% | 4/25/22 | EUR | 31,000 | 47,839 |
| French Republic | 3.250% | 4/25/16 | EUR | 20,000 | 29,385 |
| French Republic | 3.250% | 10/25/21 | EUR | 37,000 | 58,075 |
| French Republic | 3.250% | 5/25/45 | EUR | 12,000 | 17,651 |
| French Republic | 3.500% | 4/25/20 | EUR | 50,000 | 79,173 |
| French Republic | 3.500% | 4/25/26 | EUR | 40,000 | 63,070 |
| French Republic | 3.750% | 4/25/17 | EUR | 20,000 | 30,524 |
| French Republic | 3.750% | 10/25/19 | EUR | 40,000 | 63,845 |
| French Republic | 3.750% | 4/25/21 | EUR | 28,000 | 45,214 |
| French Republic | 4.000% | 4/25/18 | EUR | 15,000 | 23,597 |
| French Republic | 4.000% | 10/25/38 | EUR | 25,000 | 41,908 |
| French Republic | 4.000% | 4/25/55 | EUR | 14,000 | 23,936 |
| French Republic | 4.000% | 4/25/60 | EUR | 10,000 | 17,166 |
| French Republic | 4.250% | 10/25/17 | EUR | 25,000 | 39,198 |
| French Republic | 4.250% | 10/25/18 | EUR | 25,000 | 40,117 |
| French Republic | 4.250% | 4/25/19 | EUR | 25,000 | 40,500 |
| French Republic | 4.250% | 10/25/23 | EUR | 25,000 | 42,040 |
| French Republic | 4.500% | 4/25/41 | EUR | 21,500 | 39,022 |
| French Republic | 4.750% | 4/25/35 | EUR | 19,300 | 35,421 |
| French Republic | 5.000% | 10/25/16 | EUR | 20,000 | 30,964 |
| French Republic | 5.500% | 4/25/29 | EUR | 26,000 | 49,903 |
| French Republic | 5.750% | 10/25/32 | EUR | 31,500 | 63,789 |
| French Republic | 6.000% | 10/25/25 | EUR | 15,000 | 29,065 |
| La Poste SA | 2.750% | 11/26/24 | EUR | 4,200 | 6,124 |
| Regie Autonome des Transports Parisiens | 4.500% | 5/28/18 | EUR | 4,000 | 6,389 |
| Region of Ile de France | 2.250% | 6/10/23 | EUR | 900 | 1,283 |
| Reseau Ferre de France | 3.125% | 10/25/28 | EUR | 2,000 | 2,956 |
| Reseau Ferre de France | 4.250% | 10/7/26 | EUR | 1,500 | 2,499 |
| Reseau Ferre de France | 4.375% | 6/2/22 | EUR | 7,000 | 11,670 |
| Reseau Ferre de France | 4.830% | 3/25/60 | GBP | 1,000 | 1,891 |
| Reseau Ferre de France | 5.000% | 10/10/33 | EUR | 7,000 | 12,770 |
| Reseau Ferre de France | 5.500% | 12/1/21 | GBP | 3,000 | 5,950 |
| SA de Gestion de Stocks de Securitee | 1.750% | 10/22/19 | EUR | 2,500 | 3,589 |
24
| | | | | |
| Total International Bond Index Fund | | | | | |
| |
| |
| |
| | | | | Face | Market |
| | | Maturity | | Amount | Value |
| | Coupon | Date | Currency | (000) | ($000) |
| Societe Nationale des Chemins de Fer Francais | 3.625% | 6/3/20 | EUR | 1,000 | 1,576 |
| Societe Nationale des Chemins de Fer Francais | 4.125% | 2/19/25 | EUR | 700 | 1,145 |
| Societe Nationale des Chemins de Fer Francais | 4.375% | 7/10/18 | EUR | 5,000 | 7,944 |
| 7 UNEDIC | 1.250% | 5/29/20 | EUR | 5,000 | 6,986 |
| 7 UNEDIC | 2.125% | 4/26/17 | EUR | 5,000 | 7,277 |
| 7 UNEDIC | 2.375% | 5/25/24 | EUR | 3,000 | 4,281 |
| | | | | | 1,890,579 |
| Total France (Cost $2,445,754) | | | | | 2,613,943 |
| Germany (10.6%) | | | | | |
| Asset-Backed/Commercial Mortgage-Backed Securities (0.6%) | | | | |
| Aareal Bank AG | 1.000% | 6/28/18 | EUR | 500 | 702 |
| Aareal Bank AG | 1.375% | 6/19/17 | EUR | 2,000 | 2,845 |
| Bayerische Landesbank | 1.625% | 4/18/23 | EUR | 5,000 | 6,971 |
| Bayerische Landesbank | 3.250% | 6/8/15 | EUR | 1,000 | 1,433 |
| Berlin Hyp AG | 1.125% | 2/5/18 | EUR | 5,000 | 7,063 |
| Deutsche Bank AG | 1.375% | 9/7/20 | EUR | 2,000 | 2,826 |
| Deutsche Genossenschafts- | | | | | |
| Hypothekenbank AG | 3.250% | 6/15/15 | EUR | 3,000 | 4,300 |
| Deutsche Genossenschafts- | | | | | |
| Hypothekenbank AG | 4.000% | 10/31/16 | EUR | 1,950 | 2,946 |
| Deutsche Hypothekenbank AG | 1.250% | 6/20/17 | EUR | 3,000 | 4,255 |
| Deutsche Hypothekenbank AG | 1.375% | 6/10/20 | EUR | 1,500 | 2,111 |
| Deutsche Pfandbriefbank AG | 1.500% | 3/18/20 | EUR | 4,000 | 5,662 |
| Deutsche Pfandbriefbank AG | 1.625% | 7/4/17 | EUR | 4,800 | 6,877 |
| Deutsche Pfandbriefbank AG | 1.875% | 12/20/19 | GBP | 600 | 971 |
| Deutsche Pfandbriefbank AG | 2.375% | 5/29/28 | EUR | 1,000 | 1,393 |
| Deutsche Pfandbriefbank AG | 2.625% | 10/6/16 | EUR | 1,253 | 1,827 |
| Deutsche Postbank AG | 3.375% | 3/31/20 | EUR | 5,000 | 7,880 |
| Dexia Kommunalbank Deutschland AG | 4.750% | 5/23/18 | EUR | 2,000 | 3,188 |
| 9 German Postal Pensions Securitisation 2 plc | 4.375% | 1/18/22 | EUR | 3,000 | 5,002 |
| 9 German Postal Pensions Securitisation plc | 3.375% | 1/18/16 | EUR | 5,000 | 7,278 |
| Hypothekenbank Frankfurt AG | 2.875% | 1/19/16 | EUR | 8,637 | 12,488 |
| Hypothekenbank Frankfurt AG | 3.750% | 5/25/16 | EUR | 4,491 | 6,654 |
| Hypothekenbank Frankfurt International SA | 2.500% | 8/29/25 | CHF | 2,000 | 2,212 |
| Landesbank Hessen-Thueringen Girozentrale | 1.000% | 6/26/18 | EUR | 1,800 | 2,530 |
| Landesbank Hessen-Thueringen Girozentrale | 1.875% | 6/26/23 | EUR | 800 | 1,139 |
| Landesbank Hessen-Thueringen Girozentrale | 4.125% | 6/8/16 | EUR | 5,000 | 7,491 |
| LBBW | 2.250% | 6/21/16 | EUR | 5,000 | 7,228 |
| Muenchener Hypothekenbank eG | 0.750% | 9/11/17 | EUR | 3,000 | 4,197 |
| Muenchener Hypothekenbank eG | 2.000% | 6/15/15 | EUR | 4,000 | 5,655 |
| Norddeutsche Landesbank Girozentrale | 3.250% | 1/18/21 | EUR | 4,000 | 6,277 |
| UniCredit Bank AG | 2.625% | 5/31/17 | EUR | 7,000 | 10,323 |
| WL BANK AG Westfaelische | | | | | |
| Landschaft Bodenkreditbank | 1.125% | 5/29/20 | EUR | 2,500 | 3,491 |
| | | | | | 145,215 |
| Corporate Bonds (1.3%) | | | | | |
| Allianz Finance II BV | 1.375% | 3/13/18 | EUR | 2,100 | 2,968 |
| Allianz Finance II BV | 3.000% | 3/13/28 | EUR | 2,000 | 2,894 |
| 2 Allianz Finance II BV | 4.375% | 12/29/49 | EUR | 2,000 | 2,932 |
| Allianz Finance II BV | 4.500% | 3/13/43 | GBP | 500 | 875 |
| 2 Allianz Finance II BV | 5.750% | 7/8/41 | EUR | 3,000 | 4,868 |
| 2 Allianz SE | 4.750% | 10/29/49 | EUR | 500 | 742 |
| 2 Allianz SE | 5.625% | 10/17/42 | EUR | 2,000 | 3,234 |
| BASF Finance Europe NV | 5.125% | 6/9/15 | EUR | 2,000 | 2,914 |
| BASF SE | 1.875% | 2/4/21 | EUR | 5,000 | 7,112 |
25
| | | | | |
| Total International Bond Index Fund | | | | | |
| |
| |
| |
| | | | | Face | Market |
| | | Maturity | | Amount | Value |
| | Coupon | Date | Currency | (000) | ($000) |
| BASF SE | 2.000% | 12/5/22 | EUR | 3,000 | 4,226 |
| Bayer AG | 1.125% | 1/24/18 | EUR | 2,000 | 2,804 |
| 2 Bayer AG | 5.000% | 7/29/05 | EUR | 1,000 | 1,440 |
| Bertelsmann SE & Co. KGaA | 2.625% | 8/2/22 | EUR | 1,000 | 1,437 |
| BMW Finance NV | 1.500% | 6/5/18 | EUR | 1,500 | 2,117 |
| BMW Finance NV | 3.375% | 12/14/18 | GBP | 950 | 1,679 |
| BMW Finance NV | 3.625% | 1/29/18 | EUR | 1,000 | 1,520 |
| BMW UK Capital plc | 5.000% | 10/2/17 | GBP | 500 | 935 |
| BMW US Capital LLC | 1.000% | 7/18/17 | EUR | 10,000 | 13,904 |
| BMW US Capital LLC | 5.000% | 5/28/15 | EUR | 5,000 | 7,263 |
| Commerzbank AG | 3.625% | 7/10/17 | EUR | 4,500 | 6,747 |
| Continental AG | 3.000% | 7/16/18 | EUR | 1,000 | 1,483 |
| Continental AG | 3.125% | 9/9/20 | EUR | 1,000 | 1,485 |
| Daimler AG | 1.000% | 7/8/16 | EUR | 1,000 | 1,398 |
| Daimler AG | 1.375% | 12/10/15 | GBP | 200 | 339 |
| Daimler AG | 1.500% | 11/19/18 | EUR | 5,000 | 7,045 |
| Daimler AG | 1.750% | 5/21/15 | EUR | 4,000 | 5,621 |
| Daimler AG | 1.750% | 11/8/17 | GBP | 2,000 | 3,361 |
| Daimler AG | 2.000% | 5/5/17 | EUR | 1,000 | 1,434 |
| Daimler AG | 2.000% | 6/25/21 | EUR | 600 | 846 |
| Daimler AG | 2.375% | 3/8/23 | EUR | 2,000 | 2,867 |
| Deutsche Annington Finance BV | 3.125% | 7/25/19 | EUR | 2,000 | 2,945 |
| Deutsche Bank AG | 2.375% | 1/11/23 | EUR | 4,000 | 5,707 |
| Deutsche Bank AG | 5.000% | 6/24/20 | EUR | 1,500 | 2,370 |
| Deutsche Bank AG | 5.125% | 8/31/17 | EUR | 2,000 | 3,162 |
| Deutsche Boerse AG | 1.125% | 3/26/18 | EUR | 2,000 | 2,807 |
| Deutsche Pfandbriefbank AG | 2.000% | 7/19/16 | EUR | 1,500 | 2,119 |
| Deutsche Post AG | 2.750% | 10/9/23 | EUR | 2,000 | 2,905 |
| Deutsche Post AG | 2.875% | 12/11/24 | EUR | 2,000 | 2,908 |
| Deutsche Telekom International Finance BV | 2.125% | 1/18/21 | EUR | 2,000 | 2,846 |
| Deutsche Telekom International Finance BV | 2.750% | 10/24/24 | EUR | 2,000 | 2,864 |
| Deutsche Telekom International Finance BV | 4.250% | 7/13/22 | EUR | 3,000 | 4,834 |
| Deutsche Telekom International Finance BV | 4.875% | 4/22/25 | EUR | 3,000 | 5,032 |
| Deutsche Telekom International Finance BV | 6.000% | 1/20/17 | EUR | 3,000 | 4,726 |
| Deutsche Telekom International Finance BV | 6.500% | 4/8/22 | GBP | 2,400 | 4,855 |
| DVB Bank SE | 1.625% | 5/28/18 | EUR | 2,000 | 2,809 |
| E.ON International Finance BV | 5.500% | 10/2/17 | EUR | 4,000 | 6,381 |
| E.ON International Finance BV | 5.750% | 5/7/20 | EUR | 2,000 | 3,409 |
| E.ON International Finance BV | 6.000% | 10/30/19 | GBP | 1,000 | 1,953 |
| E.ON International Finance BV | 6.375% | 6/7/32 | GBP | 2,000 | 4,107 |
| Eurogrid GmbH | 3.875% | 10/22/20 | EUR | 1,000 | 1,558 |
| 2 Hannover Finance Luxembourg SA | 5.000% | 6/30/43 | EUR | 2,000 | 3,122 |
| 2 Henkel AG & Co. KGaA | 5.375% | 11/25/04 | EUR | 1,000 | 1,469 |
| HSH Nordbank AG | 1.375% | 10/2/18 | EUR | 2,000 | 2,830 |
| Linde AG | 2.000% | 4/18/23 | EUR | 2,500 | 3,475 |
| 2 Linde Finance BV | 7.375% | 7/14/66 | EUR | 1,000 | 1,561 |
| 2 Linde Finance BV | 8.125% | 7/14/66 | GBP | 400 | 761 |
| MAN SE | 1.000% | 9/21/15 | EUR | 730 | 1,018 |
| MAN SE | 2.125% | 3/13/17 | EUR | 2,000 | 2,867 |
| Merck Financial Services GmbH | 4.500% | 3/24/20 | EUR | 1,000 | 1,618 |
| Metro AG | 3.375% | 3/1/19 | EUR | 1,050 | 1,576 |
| 2 Muenchener Rueckversicherungs AG | 5.767% | 6/29/49 | EUR | 2,000 | 3,024 |
| 2 Muenchener Rueckversicherungs AG | 6.000% | 5/26/41 | EUR | 500 | 830 |
| 2 Muenchener Rueckversicherungs AG | 6.250% | 5/26/42 | EUR | 1,500 | 2,542 |
| 2 RWE AG | 4.625% | 9/29/49 | EUR | 1,000 | 1,430 |
| RWE Finance BV | 1.875% | 1/30/20 | EUR | 4,000 | 5,621 |
26
| | | | | | |
| Total International Bond Index Fund | | | | | |
| |
| |
| |
| | | | | | Face | Market |
| | | | Maturity | | Amount | Value |
| | | Coupon | Date | Currency | (000) | ($000) |
| | RWE Finance BV | 4.750% | 1/31/34 | GBP | 1,200 | 2,025 |
| | RWE Finance BV | 5.125% | 7/23/18 | EUR | 1,000 | 1,602 |
| | RWE Finance BV | 5.625% | 12/6/23 | GBP | 1,400 | 2,673 |
| | RWE Finance BV | 6.250% | 6/3/30 | GBP | 1,500 | 2,996 |
| | RWE Finance BV | 6.500% | 4/20/21 | GBP | 1,000 | 1,991 |
| | RWE Finance BV | 6.625% | 1/31/19 | EUR | 1,000 | 1,712 |
| | Siemens Financieringsmaatschappij NV | 1.500% | 3/10/20 | EUR | 4,000 | 5,613 |
| | Siemens Financieringsmaatschappij NV | 2.750% | 9/10/25 | GBP | 1,000 | 1,535 |
| | Siemens Financieringsmaatschappij NV | 3.750% | 9/10/42 | GBP | 1,000 | 1,529 |
| 2 | Siemens Financieringsmaatschappij NV | 5.250% | 9/14/66 | EUR | 1,000 | 1,497 |
| | Siemens Financieringsmaatschappij NV | 5.625% | 6/11/18 | EUR | 2,000 | 3,289 |
| 2 | Siemens Financieringsmaatschappij NV | 6.125% | 9/14/66 | GBP | 630 | 1,146 |
| 2 | Talanx Finanz Luxembourg SA | 8.367% | 6/15/42 | EUR | 200 | 363 |
| | Vier Gas Transport Gmbh | 2.000% | 6/12/20 | EUR | 1,500 | 2,114 |
| | Vier Gas Transport Gmbh | 2.875% | 6/12/25 | EUR | 1,000 | 1,431 |
| | Vier Gas Transport GmbH | 3.125% | 7/10/23 | EUR | 5,000 | 7,409 |
| | Volkswagen Financial Services NV | 1.250% | 5/23/16 | GBP | 2,800 | 4,715 |
| | Volkswagen Financial Services NV | 1.250% | 12/15/16 | GBP | 1,250 | 2,096 |
| | Volkswagen Financial Services NV | 2.000% | 10/23/15 | GBP | 450 | 769 |
| | Volkswagen International Finance NV | 1.000% | 10/26/16 | EUR | 5,000 | 6,966 |
| | Volkswagen International Finance NV | 1.250% | 8/20/15 | GBP | 300 | 508 |
| | Volkswagen International Finance NV | 2.000% | 3/26/21 | EUR | 5,000 | 7,046 |
| 2 | Volkswagen International Finance NV | 3.750% | 3/29/49 | EUR | 1,500 | 2,132 |
| 2 | Volkswagen International Finance NV | 5.125% | 9/29/49 | EUR | 4,000 | 6,117 |
| | Volkswagen Leasing GmbH | 1.500% | 9/15/15 | EUR | 5,000 | 7,014 |
| | Volkswagen Leasing GmbH | 2.625% | 1/15/24 | EUR | 4,000 | 5,687 |
| | Volkswagen Leasing GmbH | 3.375% | 6/3/16 | EUR | 2,000 | 2,922 |
| | Wuerth Finance International BV | 1.750% | 5/21/20 | EUR | 4,130 | 5,826 |
| | | | | | | 293,254 |
| Sovereign Bonds (8.7%) | | | | | |
| 10 | Bayerische Landesbodenkreditanstalt | 1.875% | 1/25/23 | EUR | 1,000 | 1,414 |
| 9 | Bund Laender Anleihe | 1.500% | 7/15/20 | EUR | 5,000 | 7,097 |
| | Deutsche Bahn Finance BV | 1.375% | 10/30/17 | GBP | 1,500 | 2,511 |
| | Deutsche Bahn Finance BV | 1.500% | 12/18/17 | CHF | 2,000 | 2,379 |
| | Deutsche Bahn Finance BV | 2.750% | 3/19/29 | EUR | 1,000 | 1,426 |
| | Deutsche Bahn Finance BV | 2.875% | 6/30/16 | EUR | 2,000 | 2,908 |
| | Deutsche Bahn Finance BV | 3.000% | 3/8/24 | EUR | 4,000 | 5,966 |
| | Deutsche Bahn Finance BV | 3.125% | 7/24/26 | GBP | 500 | 820 |
| | Deutsche Bahn Finance BV | 3.750% | 6/1/21 | EUR | 2,000 | 3,168 |
| 2 | EnBW Energie Baden-Wuerttemberg AG | 7.375% | 4/2/72 | EUR | 1,000 | 1,561 |
| | EnBW International Finance BV | 6.125% | 7/7/39 | EUR | 1,000 | 1,945 |
| | Erste Abwicklungsanstalt | 1.125% | 9/30/15 | EUR | 2,000 | 2,805 |
| | Erste Abwicklungsanstalt | 1.125% | 8/30/17 | EUR | 5,000 | 7,057 |
| | EWE AG | 4.125% | 11/4/20 | EUR | 2,000 | 3,124 |
| | Federal Republic of Germany | 0.500% | 4/7/17 | EUR | 25,000 | 34,965 |
| | Federal Republic of Germany | 0.500% | 2/23/18 | EUR | 5,000 | 6,976 |
| | Federal Republic of Germany | 1.000% | 10/12/18 | EUR | 25,000 | 35,468 |
| | Federal Republic of Germany | 1.000% | 2/22/19 | EUR | 50,000 | 70,817 |
| | Federal Republic of Germany | 1.500% | 2/15/23 | EUR | 8,000 | 11,277 |
| | Federal Republic of Germany | 1.500% | 5/15/23 | EUR | 27,000 | 37,944 |
| | Federal Republic of Germany | 1.750% | 10/9/15 | EUR | 15,000 | 21,287 |
| | Federal Republic of Germany | 1.750% | 7/4/22 | EUR | 6,000 | 8,690 |
| | Federal Republic of Germany | 1.750% | 2/15/24 | EUR | 33,500 | 47,642 |
| | Federal Republic of Germany | 2.000% | 2/26/16 | EUR | 16,000 | 22,943 |
| | Federal Republic of Germany | 2.000% | 1/4/22 | EUR | 10,000 | 14,802 |
| | Federal Republic of Germany | 2.000% | 8/15/23 | EUR | 32,500 | 47,490 |
27
| | | | | | |
| Total International Bond Index Fund | | | | | |
| |
| |
| |
| | | | | | Face | Market |
| | | | Maturity | | Amount | Value |
| | | Coupon | Date | Currency | (000) | ($000) |
| | Federal Republic of Germany | 2.250% | 9/4/20 | EUR | 31,900 | 48,156 |
| | Federal Republic of Germany | 2.250% | 9/4/21 | EUR | 14,000 | 21,111 |
| | Federal Republic of Germany | 2.500% | 1/4/21 | EUR | 38,000 | 58,231 |
| | Federal Republic of Germany | 2.500% | 7/4/44 | EUR | 29,000 | 41,670 |
| | Federal Republic of Germany | 2.750% | 4/8/16 | EUR | 127,000 | 184,979 |
| | Federal Republic of Germany | 3.000% | 7/4/20 | EUR | 17,000 | 26,742 |
| | Federal Republic of Germany | 3.250% | 1/4/20 | EUR | 18,000 | 28,538 |
| 4 | Federal Republic of Germany | 3.250% | 7/4/21 | EUR | 28,000 | 44,941 |
| | Federal Republic of Germany | 3.250% | 7/4/42 | EUR | 11,500 | 19,008 |
| | Federal Republic of Germany | 3.500% | 1/4/16 | EUR | 50,000 | 73,244 |
| | Federal Republic of Germany | 3.500% | 7/4/19 | EUR | 15,000 | 23,897 |
| | Federal Republic of Germany | 3.750% | 1/4/19 | EUR | 55,000 | 87,783 |
| | Federal Republic of Germany | 4.000% | 7/4/16 | EUR | 15,000 | 22,535 |
| | Federal Republic of Germany | 4.000% | 1/4/18 | EUR | 13,000 | 20,468 |
| | Federal Republic of Germany | 4.000% | 1/4/37 | EUR | 41,000 | 73,847 |
| | Federal Republic of Germany | 4.250% | 7/4/17 | EUR | 26,000 | 40,625 |
| | Federal Republic of Germany | 4.250% | 7/4/18 | EUR | 17,000 | 27,345 |
| | Federal Republic of Germany | 4.250% | 7/4/39 | EUR | 14,400 | 27,350 |
| | Federal Republic of Germany | 4.750% | 7/4/28 | EUR | 1,500 | 2,803 |
| 11 | Federal Republic of Germany | 4.750% | 7/4/34 | EUR | 4,500 | 8,770 |
| | Federal Republic of Germany | 4.750% | 7/4/40 | EUR | 6,000 | 12,289 |
| | Federal Republic of Germany | 5.500% | 1/4/31 | EUR | 44,000 | 89,779 |
| | Federal Republic of Germany | 5.625% | 1/4/28 | EUR | 12,000 | 24,110 |
| | FMS Wertmanagement AoeR | 0.375% | 5/22/15 | EUR | 5,000 | 6,946 |
| 9 | FMS Wertmanagement AoeR | 0.750% | 12/15/17 | GBP | 2,000 | 3,273 |
| | FMS Wertmanagement AoeR | 1.000% | 7/18/17 | EUR | 2,000 | 2,820 |
| | FMS Wertmanagement AoeR | 1.125% | 12/7/16 | GBP | 3,200 | 5,387 |
| | FMS Wertmanagement AoeR | 1.875% | 8/24/15 | EUR | 1,500 | 2,124 |
| | FMS Wertmanagement AoeR | 1.875% | 5/9/19 | EUR | 6,000 | 8,733 |
| | FMS Wertmanagement AoeR | 2.750% | 6/3/16 | EUR | 1,000 | 1,457 |
| | FMS Wertmanagement AoeR | 3.000% | 9/8/21 | EUR | 6,000 | 9,294 |
| | Free and Hanseatic City of Hamburg | 1.875% | 9/26/22 | EUR | 4,000 | 5,695 |
| | Free State of Bavaria | 1.875% | 2/7/19 | EUR | 3,000 | 4,370 |
| | Free State of Bavaria | 3.500% | 1/27/16 | EUR | 2,263 | 3,316 |
| | Gemeinsame Deutsche Bundeslaender | 1.375% | 10/11/19 | EUR | 2,459 | 3,481 |
| | Gemeinsame Deutsche Bundeslaender | 1.750% | 6/13/22 | EUR | 4,000 | 5,651 |
| | Gemeinsame Deutsche Bundeslaender | 1.750% | 1/31/23 | EUR | 3,000 | 4,205 |
| | Gemeinsame Deutsche Bundeslaender | 2.000% | 6/2/15 | EUR | 5,000 | 7,070 |
| | Gemeinsame Deutsche Bundeslaender | 2.625% | 3/18/16 | EUR | 975 | 1,410 |
| | Gemeinsame Deutsche Bundeslaender | 2.875% | 2/9/16 | EUR | 2,100 | 3,045 |
| | Gemeinsame Deutsche Bundeslaender | 3.500% | 10/7/19 | EUR | 1,500 | 2,356 |
| 9 | KFW | 0.500% | 2/26/16 | EUR | 20,000 | 27,891 |
| 9 | KFW | 0.500% | 7/25/16 | EUR | 5,000 | 6,974 |
| 9 | KFW | 0.625% | 5/29/15 | EUR | 10,000 | 13,938 |
| 9 | KFW | 0.875% | 10/13/17 | EUR | 12,000 | 16,870 |
| 9 | KFW | 0.875% | 6/25/18 | EUR | 1,500 | 2,101 |
| 9 | KFW | 1.000% | 12/7/17 | GBP | 9,500 | 15,720 |
| 9 | KFW | 1.125% | 10/16/18 | EUR | 25,000 | 35,322 |
| 9 | KFW | 1.125% | 1/15/20 | EUR | 13,000 | 18,204 |
| 9 | KFW | 1.375% | 2/21/17 | EUR | 13,000 | 18,552 |
| 9 | KFW | 2.125% | 8/15/23 | EUR | 5,000 | 7,247 |
| 9 | KFW | 2.500% | 1/17/22 | EUR | 10,000 | 15,068 |
| 9 | KFW | 2.500% | 8/25/25 | CHF | 2,000 | 2,574 |
| 9 | KFW | 3.125% | 4/8/16 | EUR | 5,000 | 7,324 |
| 9 | KFW | 3.375% | 1/18/21 | EUR | 10,350 | 16,403 |
| 9 | KFW | 3.500% | 7/4/15 | EUR | 10,000 | 14,405 |
28
Total International Bond Index Fund
| | | | | |
| | | | | Face | Market |
| | | Maturity | | Amount | Value |
| | Coupon | Date | Currency | (000) | ($000) |
| 9 KFW | 3.750% | 9/7/16 | GBP | 200 | 359 |
| 9 KFW | 3.750% | 7/18/18 | AUD | 10,000 | 9,355 |
| 9 KFW | 3.875% | 1/21/19 | EUR | 10,000 | 15,873 |
| 9 KFW | 4.375% | 2/9/16 | CAD | 5,000 | 4,794 |
| 9 KFW | 4.875% | 3/15/37 | GBP | 3,000 | 6,160 |
| KFW | 5.000% | 5/22/19 | NOK | 20,000 | 3,742 |
| 9 KFW | 5.550% | 6/7/21 | GBP | 4,000 | 8,067 |
| 9 KFW | 5.625% | 8/25/17 | GBP | 1,000 | 1,913 |
| 9 KFW | 5.750% | 6/7/32 | GBP | 1,000 | 2,208 |
| 9 KFW | 6.000% | 12/7/28 | GBP | 3,000 | 6,655 |
| 9 KFW | 6.250% | 12/4/19 | AUD | 4,000 | 4,154 |
| Land Thueringen | 1.625% | 8/17/20 | EUR | 2,462 | 3,509 |
| Landesbank Berlin AG | 5.875% | 11/25/19 | EUR | 1,500 | 2,401 |
| Landeskreditbank Baden-Wuerttemberg | | | | | |
| Foerderbank | 0.750% | 12/12/17 | EUR | 2,500 | 3,493 |
| Landeskreditbank Baden-Wuerttemberg | | | | | |
| Foerderbank | 0.875% | 12/15/17 | GBP | 1,000 | 1,642 |
| 9 Landwirtschaftliche Rentenbank | 1.000% | 12/15/17 | GBP | 1,350 | 2,231 |
| 9 Landwirtschaftliche Rentenbank | 1.875% | 5/11/20 | EUR | 1,500 | 2,181 |
| 9 Landwirtschaftliche Rentenbank | 2.250% | 5/22/19 | NOK | 10,000 | 1,642 |
| 9 Landwirtschaftliche Rentenbank | 2.875% | 8/30/21 | EUR | 3,000 | 4,631 |
| 9 Landwirtschaftliche Rentenbank | 4.250% | 1/24/23 | AUD | 7,500 | 6,866 |
| 9 Landwirtschaftliche Rentenbank | 5.500% | 3/9/20 | AUD | 15,000 | 15,048 |
| NRW Bank | 0.625% | 8/1/16 | EUR | 6,000 | 8,367 |
| NRW Bank | 0.875% | 12/15/17 | GBP | 1,000 | 1,640 |
| NRW Bank | 1.000% | 11/10/15 | EUR | 3,000 | 4,206 |
| NRW Bank | 1.250% | 10/22/18 | EUR | 5,000 | 7,064 |
| NRW Bank | 1.875% | 9/22/17 | EUR | 5,000 | 7,231 |
| NRW Bank | 3.875% | 1/27/20 | EUR | 4,000 | 6,382 |
| State of Baden-Wurttemberg | 2.000% | 11/13/23 | EUR | 2,000 | 2,853 |
| State of Baden-Wurttemberg | 3.250% | 1/18/16 | EUR | 2,000 | 2,918 |
| State of Berlin | 1.500% | 8/28/20 | EUR | 2,000 | 2,824 |
| State of Berlin | 1.875% | 6/12/23 | EUR | 800 | 1,127 |
| State of Berlin | 3.125% | 9/14/15 | EUR | 4,000 | 5,764 |
| State of Berlin | 3.125% | 8/17/21 | EUR | 2,300 | 3,571 |
| State of Berlin | 3.500% | 6/22/17 | EUR | 5,718 | 8,651 |
| State of Berlin | 4.125% | 5/24/16 | EUR | 3,000 | 4,482 |
| State of Brandenburg | 3.500% | 6/15/21 | EUR | 5,000 | 7,938 |
| State of Hesse | 1.750% | 6/19/20 | EUR | 2,930 | 4,216 |
| State of Hesse | 1.750% | 1/20/23 | EUR | 3,000 | 4,222 |
| State of Hesse | 2.000% | 6/16/15 | EUR | 5,000 | 7,073 |
| State of Hesse | 2.750% | 5/30/16 | EUR | 4,975 | 7,246 |
| State of Lower Saxony | 1.375% | 9/26/19 | EUR | 7,000 | 9,924 |
| State of Lower Saxony | 2.125% | 10/11/23 | EUR | 1,000 | 1,438 |
| State of Lower Saxony | 3.500% | 2/22/16 | EUR | 7,000 | 10,264 |
| State of North Rhine-Westphalia | 0.875% | 12/4/17 | EUR | 17,000 | 23,767 |
| State of North Rhine-Westphalia | 1.000% | 2/15/19 | EUR | 2,000 | 2,788 |
| State of North Rhine-Westphalia | 1.500% | 1/14/21 | EUR | 4,000 | 5,618 |
| State of North Rhine-Westphalia | 1.875% | 9/15/22 | EUR | 5,000 | 7,083 |
| State of North Rhine-Westphalia | 2.000% | 10/15/25 | EUR | 3,000 | 4,152 |
| State of North Rhine-Westphalia | 2.250% | 3/1/19 | CHF | 2,000 | 2,460 |
| State of North Rhine-Westphalia | 2.375% | 5/13/33 | EUR | 700 | 957 |
| State of North Rhine-Westphalia | 2.625% | 1/21/16 | EUR | 4,000 | 5,769 |
| State of Rhineland-Palatinate | 1.250% | 1/16/20 | EUR | 2,000 | 2,808 |
| State of Rhineland-Palatinate | 2.375% | 2/23/22 | EUR | 2,500 | 3,707 |
29
| | | | | |
| Total International Bond Index Fund | | | | | |
| |
| |
| |
| | | | | Face | Market |
| | | Maturity | | Amount | Value |
| | Coupon | Date | Currency | (000) | ($000) |
| State of Rhineland-Palatinate | 2.875% | 3/3/17 | EUR | 1,500 | 2,220 |
| State of Saxony-Anhalt | 1.625% | 4/25/23 | EUR | 4,000 | 5,550 |
| Wirtschafts- und Infrastrukturbank Hessen | 1.750% | 12/6/22 | EUR | 2,500 | 3,507 |
| | | | | | 2,008,640 |
| Total Germany (Cost $2,314,437) | | | | | 2,447,109 |
| Hong Kong (0.1%) | | | | | |
| Corporate Bonds (0.1%) | | | | | |
| 2 Hutchison Whampoa Europe Finance 13 Ltd. | 3.750% | 5/29/49 | EUR | 1,200 | 1,659 |
| Hutchison Whampoa Finance 06 Ltd. | 4.625% | 9/21/16 | EUR | 2,000 | 3,012 |
| Hutchison Whampoa Finance 09 Ltd. | 4.750% | 11/14/16 | EUR | 5,000 | 7,584 |
| | | | | | 12,255 |
| Sovereign Bond (0.0%) | | | | | |
| Hong Kong Special Administrative Region | 0.340% | 5/9/16 | HKD | 35,000 | 4,495 |
| | | | | | 4,495 |
| Total Hong Kong (Cost $15,946) | | | | | 16,750 |
| Ireland (0.8%) | | | | | |
| Asset-Backed/Commercial Mortgage-Backed Securities (0.1%) | | | | |
| AIB Mortgage Bank | 2.625% | 7/29/16 | EUR | 3,000 | 4,300 |
| Bank of Ireland Mortgage Bank | 2.750% | 3/22/18 | EUR | 4,000 | 5,868 |
| Bank of Ireland Mortgage Bank | 3.250% | 6/22/15 | EUR | 1,300 | 1,850 |
| Depfa ACS Bank | 3.875% | 11/14/16 | EUR | 6,000 | 8,785 |
| | | | | | 20,803 |
| Corporate Bonds (0.1%) | | | | | |
| CRH Finance Ltd. | 3.125% | 4/3/23 | EUR | 3,150 | 4,624 |
| CRH Finland Services Oyj | 2.750% | 10/15/20 | EUR | 4,000 | 5,849 |
| Dali Capital plc | 4.799% | 12/21/37 | GBP | 150 | 251 |
| Freshwater Finance plc | 4.607% | 10/17/36 | GBP | 125 | 208 |
| | | | | | 10,932 |
| Sovereign Bonds (0.6%) | | | | | |
| DAA Finance plc | 6.587% | 7/9/18 | EUR | 500 | 823 |
| ESB Finance Ltd. | 3.494% | 1/12/24 | EUR | 1,000 | 1,492 |
| ESB Finance Ltd. | 4.375% | 11/21/19 | EUR | 2,000 | 3,159 |
| Ireland | 3.400% | 3/18/24 | EUR | 5,000 | 7,293 |
| Ireland | 3.900% | 3/20/23 | EUR | 7,000 | 10,761 |
| Ireland | 4.400% | 6/18/19 | EUR | 10,000 | 15,974 |
| Ireland | 4.500% | 10/18/18 | EUR | 10,000 | 15,915 |
| Ireland | 4.500% | 4/18/20 | EUR | 12,000 | 19,266 |
| Ireland | 4.600% | 4/18/16 | EUR | 10,000 | 14,994 |
| Ireland | 5.000% | 10/18/20 | EUR | 5,000 | 8,264 |
| Ireland | 5.400% | 3/13/25 | EUR | 10,000 | 16,941 |
| Ireland | 5.500% | 10/18/17 | EUR | 10,000 | 16,119 |
| Ireland | 5.900% | 10/18/19 | EUR | 5,000 | 8,557 |
| | | | | | 139,558 |
| Total Ireland (Cost $154,436) | | | | | 171,293 |
| Israel (0.2%) | | | | | |
| Sovereign Bonds (0.2%) | | | | | |
| State of Israel | 2.500% | 5/31/16 | ILS | 8,000 | 2,386 |
| State of Israel | 2.875% | 1/29/24 | EUR | 1,000 | 1,442 |
| State of Israel | 4.250% | 3/31/23 | ILS | 15,000 | 4,684 |
| State of Israel | 4.625% | 3/18/20 | EUR | 1,000 | 1,615 |
| State of Israel | 5.000% | 1/31/20 | ILS | 19,000 | 6,279 |
30
| | | | | |
| Total International Bond Index Fund | | | | | |
| |
| |
| |
| | | | | Face | Market |
| | | Maturity | | Amount | Value |
| | Coupon | Date | Currency | (000) | ($000) |
| State of Israel | 5.500% | 2/28/17 | ILS | 33,000 | 10,661 |
| State of Israel | 5.500% | 1/31/22 | ILS | 20,000 | 6,814 |
| State of Israel | 5.500% | 1/31/42 | ILS | 6,000 | 1,969 |
| State of Israel | 6.000% | 2/28/19 | ILS | 28,000 | 9,582 |
| State of Israel | 6.250% | 10/30/26 | ILS | 13,000 | 4,723 |
| Total Israel (Cost $47,561) | | | | | 50,155 |
| Italy (8.1%) | | | | | |
| Asset-Backed/Commercial Mortgage-Backed Securities (0.2%) | | | | |
| Banca Popolare di Milano Scarl | 3.250% | 11/16/15 | EUR | 2,000 | 2,851 |
| Banco Popolare SC | 3.625% | 3/31/17 | EUR | 3,000 | 4,392 |
| Intesa Sanpaolo SPA | 3.625% | 12/5/22 | EUR | 4,200 | 6,463 |
| Intesa Sanpaolo SPA | 3.750% | 9/25/19 | EUR | 4,000 | 6,205 |
| Intesa Sanpaolo SPA | 4.375% | 8/16/16 | EUR | 3,000 | 4,497 |
| UniCredit SPA | 1.875% | 1/31/19 | EUR | 3,600 | 5,112 |
| UniCredit SPA | 2.625% | 10/31/15 | EUR | 5,000 | 7,131 |
| UniCredit SPA | 2.625% | 10/31/20 | EUR | 3,000 | 4,375 |
| UniCredit SPA | 4.250% | 7/29/16 | EUR | 3,000 | 4,475 |
| UniCredit SPA | 5.250% | 4/30/23 | EUR | 2,000 | 3,431 |
| Unione di Banche Italiane SCPA | 3.125% | 10/14/20 | EUR | 2,000 | 2,975 |
| Unione di Banche Italiane SCPA | 5.250% | 1/28/21 | EUR | 2,500 | 4,173 |
| | | | | | 56,080 |
| Corporate Bonds (0.7%) | | | | | |
| Assicurazioni Generali SPA | 5.125% | 9/16/24 | EUR | 1,500 | 2,458 |
| 2 Assicurazioni Generali SPA | 10.125% | 7/10/42 | EUR | 2,200 | 4,266 |
| Atlantia SPA | 3.375% | 9/18/17 | EUR | 2,500 | 3,711 |
| Atlantia SPA | 4.375% | 3/16/20 | EUR | 2,000 | 3,173 |
| Atlantia SPA | 4.500% | 2/8/19 | EUR | 1,000 | 1,574 |
| Atlantia SPA | 5.625% | 5/6/16 | EUR | 1,000 | 1,515 |
| Atlantia SPA | 6.250% | 6/9/22 | GBP | 320 | 627 |
| Enel Finance International NV | 3.625% | 4/17/18 | EUR | 104 | 156 |
| Enel Finance International NV | 4.875% | 3/11/20 | EUR | 6,040 | 9,745 |
| Enel Finance International NV | 4.875% | 4/17/23 | EUR | 5,000 | 8,200 |
| Enel Finance International NV | 5.000% | 7/12/21 | EUR | 2,000 | 3,278 |
| Enel Finance International NV | 5.750% | 9/14/40 | GBP | 2,800 | 4,961 |
| Eni SPA | 3.250% | 7/10/23 | EUR | 2,360 | 3,538 |
| Eni SPA | 3.625% | 1/29/29 | EUR | 3,000 | 4,457 |
| Eni SPA | 3.750% | 6/27/19 | EUR | 4,000 | 6,179 |
| Eni SPA | 3.750% | 9/12/25 | EUR | 2,000 | 3,084 |
| Eni SPA | 4.750% | 11/14/17 | EUR | 1,000 | 1,561 |
| 2 Generali Finance BV | 5.317% | 6/29/49 | EUR | 2,000 | 2,881 |
| 2 Generali Finance BV | 6.214% | 6/29/49 | GBP | 250 | 437 |
| Intesa Sanpaolo SPA | 3.500% | 1/17/22 | EUR | 5,000 | 7,340 |
| Intesa Sanpaolo SPA | 4.000% | 11/9/17 | EUR | 6,000 | 9,028 |
| Intesa Sanpaolo SPA | 4.000% | 11/8/18 | EUR | 500 | 760 |
| Intesa Sanpaolo SPA | 4.125% | 9/19/16 | EUR | 4,000 | 5,919 |
| Intesa Sanpaolo SPA | 4.125% | 4/14/20 | EUR | 2,100 | 3,255 |
| Intesa Sanpaolo SPA | 4.875% | 7/10/15 | EUR | 3,000 | 4,350 |
| Intesa Sanpaolo SPA | 5.150% | 7/16/20 | EUR | 2,000 | 3,058 |
| Luxottica Group SPA | 2.625% | 2/10/24 | EUR | 3,000 | 4,310 |
| Luxottica Group SPA | 3.625% | 3/19/19 | EUR | 2,000 | 3,073 |
| Luxottica Group SPA | 4.000% | 11/10/15 | EUR | 2,000 | 2,908 |
| Romulus Finance Srl | 5.441% | 2/20/23 | GBP | 250 | 461 |
| Snam SPA | 2.000% | 11/13/15 | EUR | 3,000 | 4,233 |
| Snam SPA | 3.250% | 1/22/24 | EUR | 1,000 | 1,485 |
| Snam SPA | 3.375% | 1/29/21 | EUR | 500 | 755 |
31
| | | | | |
| Total International Bond Index Fund | | | | | |
| |
| |
| |
| | | | | Face | Market |
| | | Maturity | | Amount | Value |
| | Coupon | Date | Currency | (000) | ($000) |
| Snam SPA | 3.875% | 3/19/18 | EUR | 2,796 | 4,253 |
| Snam SPA | 5.000% | 1/18/19 | EUR | 1,400 | 2,252 |
| Snam SPA | 5.250% | 9/19/22 | EUR | 700 | 1,194 |
| Societa Iniziative Autostradali e Servizi SPA | 4.500% | 10/26/20 | EUR | 1,000 | 1,587 |
| Terna Rete Elettrica Nazionale SPA | 4.750% | 3/15/21 | EUR | 3,000 | 4,920 |
| UniCredit SPA | 2.250% | 12/16/16 | EUR | 3,000 | 4,256 |
| UniCredit SPA | 3.625% | 1/24/19 | EUR | 2,000 | 2,990 |
| UniCredit SPA | 6.950% | 10/31/22 | EUR | 4,000 | 6,503 |
| Unione di Banche Italiane SCpA | 3.125% | 2/5/24 | EUR | 3,000 | 4,382 |
| | | | | | 149,073 |
| Sovereign Bonds (7.2%) | | | | | |
| A2A SPA | 3.625% | 1/13/22 | EUR | 1,000 | 1,478 |
| A2A SPA | 4.500% | 11/28/19 | EUR | 1,000 | 1,561 |
| ACEA SPA | 3.750% | 9/12/18 | EUR | 2,000 | 3,017 |
| ACEA SPA | 4.500% | 3/16/20 | EUR | 500 | 782 |
| Cassa Depositi e Prestiti SPA | 4.250% | 9/14/16 | EUR | 500 | 743 |
| City of Rome Italy | 5.345% | 1/27/48 | EUR | 1,300 | 1,779 |
| Edison SPA | 3.875% | 11/10/17 | EUR | 500 | 757 |
| Ferrovie dello Stato SPA | 4.000% | 7/22/20 | EUR | 2,000 | 3,066 |
| Hera SPA | 5.200% | 1/29/28 | EUR | 2,000 | 3,326 |
| Italy Buoni Poliennali Del Tesoro | 1.500% | 12/15/16 | EUR | 27,000 | 37,919 |
| Italy Buoni Poliennali Del Tesoro | 2.750% | 11/15/16 | EUR | 29,000 | 42,000 |
| Italy Buoni Poliennali Del Tesoro | 3.500% | 12/1/18 | EUR | 15,000 | 22,508 |
| Italy Buoni Poliennali Del Tesoro | 3.750% | 5/1/21 | EUR | 20,000 | 30,147 |
| Italy Buoni Poliennali Del Tesoro | 3.750% | 9/1/24 | EUR | 2,000 | 2,925 |
| Italy Buoni Poliennali Del Tesoro | 4.500% | 3/1/24 | EUR | 33,000 | 51,439 |
| 1 Italy Buoni Poliennali Del Tesoro | 4.750% | 9/1/44 | EUR | 12,900 | 19,929 |
| Poste Italiane SPA | 3.250% | 6/18/18 | EUR | 650 | 954 |
| Republic of Italy | 2.250% | 5/15/16 | EUR | 27,000 | 38,529 |
| Republic of Italy | 2.500% | 1/30/18 | CHF | 1,000 | 1,179 |
| Republic of Italy | 2.750% | 12/1/15 | EUR | 15,000 | 21,453 |
| Republic of Italy | 3.000% | 6/15/15 | EUR | 15,000 | 21,336 |
| Republic of Italy | 3.000% | 11/1/15 | EUR | 15,000 | 21,507 |
| Republic of Italy | 3.500% | 11/1/17 | EUR | 15,000 | 22,338 |
| Republic of Italy | 3.500% | 6/1/18 | EUR | 41,500 | 62,051 |
| Republic of Italy | 3.750% | 8/1/15 | EUR | 22,000 | 31,662 |
| Republic of Italy | 3.750% | 8/1/16 | EUR | 20,000 | 29,505 |
| Republic of Italy | 3.750% | 3/1/21 | EUR | 20,000 | 30,229 |
| Republic of Italy | 3.750% | 8/1/21 | EUR | 40,000 | 60,289 |
| Republic of Italy | 4.000% | 2/1/17 | EUR | 20,000 | 29,953 |
| Republic of Italy | 4.000% | 9/1/20 | EUR | 20,000 | 30,764 |
| Republic of Italy | 4.000% | 2/1/37 | EUR | 16,000 | 23,090 |
| Republic of Italy | 4.250% | 2/1/19 | EUR | 10,000 | 15,501 |
| Republic of Italy | 4.250% | 9/1/19 | EUR | 25,000 | 38,886 |
| Republic of Italy | 4.250% | 3/1/20 | EUR | 19,000 | 29,564 |
| Republic of Italy | 4.500% | 7/15/15 | EUR | 22,000 | 31,889 |
| Republic of Italy | 4.500% | 2/1/18 | EUR | 10,000 | 15,434 |
| Republic of Italy | 4.500% | 8/1/18 | EUR | 25,000 | 38,882 |
| Republic of Italy | 4.500% | 3/1/19 | EUR | 35,000 | 54,888 |
| Republic of Italy | 4.500% | 2/1/20 | EUR | 15,000 | 23,614 |
| Republic of Italy | 4.500% | 5/1/23 | EUR | 35,000 | 54,636 |
| Republic of Italy | 4.500% | 3/1/26 | EUR | 20,000 | 30,989 |
| Republic of Italy | 4.750% | 9/15/16 | EUR | 10,000 | 15,106 |
| Republic of Italy | 4.750% | 5/1/17 | EUR | 35,000 | 53,619 |
| Republic of Italy | 4.750% | 6/1/17 | EUR | 35,000 | 53,713 |
| Republic of Italy | 4.750% | 9/1/21 | EUR | 23,500 | 37,538 |
32
| | | | | |
| Total International Bond Index Fund | | | | | |
| |
| |
| |
| | | | | Face | Market |
| | | Maturity | | Amount | Value |
| | Coupon | Date | Currency | (000) | ($000) |
| 1 Republic of Italy | 4.750% | 8/1/23 | EUR | 25,000 | 39,795 |
| 1 Republic of Italy | 4.750% | 9/1/28 | EUR | 47,000 | 73,729 |
| Republic of Italy | 5.000% | 3/1/22 | EUR | 16,500 | 26,734 |
| 1 Republic of Italy | 5.000% | 3/1/25 | EUR | 15,000 | 24,174 |
| Republic of Italy | 5.000% | 8/1/34 | EUR | 25,000 | 40,438 |
| Republic of Italy | 5.000% | 8/1/39 | EUR | 20,500 | 33,097 |
| Republic of Italy | 5.000% | 9/1/40 | EUR | 22,000 | 35,316 |
| Republic of Italy | 5.250% | 8/1/17 | EUR | 15,000 | 23,449 |
| Republic of Italy | 5.250% | 11/1/29 | EUR | 20,000 | 33,014 |
| Republic of Italy | 5.500% | 9/1/22 | EUR | 22,000 | 36,693 |
| Republic of Italy | 5.500% | 11/1/22 | EUR | 22,000 | 36,660 |
| Republic of Italy | 5.750% | 2/1/33 | EUR | 13,800 | 24,195 |
| Republic of Italy | 6.000% | 5/1/31 | EUR | 30,000 | 53,450 |
| Republic of Italy | 6.500% | 11/1/27 | EUR | 15,000 | 27,519 |
| Republic of Italy | 7.250% | 11/1/26 | EUR | 10,000 | 19,328 |
| | | | | | 1,670,065 |
| Total Italy (Cost $1,696,174) | | | | | 1,875,218 |
| Japan (22.2%) | | | | | |
| Corporate Bonds (0.8%) | | | | | |
| Bank of Tokyo-Mitsubishi UFJ Ltd. | 0.460% | 1/24/17 | JPY | 100,000 | 985 |
| Bank of Tokyo-Mitsubishi UFJ Ltd. | 0.555% | 1/20/16 | JPY | 500,000 | 4,921 |
| Bank of Tokyo-Mitsubishi UFJ Ltd. | 0.710% | 4/18/16 | JPY | 300,000 | 2,964 |
| Bank of Tokyo-Mitsubishi UFJ Ltd. | 1.390% | 5/31/22 | JPY | 100,000 | 1,029 |
| Bank of Tokyo-Mitsubishi UFJ Ltd. | 1.560% | 1/20/21 | JPY | 400,000 | 4,165 |
| Kansai Electric Power Co. Inc. | 0.527% | 12/20/16 | JPY | 1,400,000 | 13,726 |
| Kirin Holdings Co. Ltd. | 1.239% | 9/24/21 | JPY | 300,000 | 3,080 |
| Mizuho Bank Ltd. | 0.270% | 1/24/18 | JPY | 600,000 | 5,863 |
| Mizuho Bank Ltd. | 0.540% | 7/20/16 | JPY | 1,000,000 | 9,844 |
| Mizuho Bank Ltd. | 2.250% | 11/4/16 | JPY | 1,000,000 | 10,235 |
| 2 MUFG Capital Finance 5 Ltd. | 6.299% | 1/29/49 | GBP | 330 | 605 |
| Nippon Telegraph & Telephone Corp. | 1.020% | 9/17/21 | JPY | 500,000 | 5,066 |
| Nippon Telegraph & Telephone Corp. | 1.310% | 12/18/20 | JPY | 500,000 | 5,171 |
| Nippon Telegraph & Telephone Corp. | 1.820% | 3/20/18 | JPY | 100,000 | 1,037 |
| Nomura Europe Finance NV | 1.875% | 5/29/18 | EUR | 3,200 | 4,464 |
| Nomura Europe Finance NV | 5.500% | 3/23/17 | GBP | 300 | 547 |
| Nomura Holdings Inc. | 1.808% | 6/24/20 | JPY | 600,000 | 6,260 |
| Norinchukin Bank | 0.300% | 4/27/18 | JPY | 500,000 | 4,893 |
| Norinchukin Bank | 0.350% | 6/27/17 | JPY | 700,000 | 6,868 |
| Norinchukin Bank | 0.400% | 5/26/17 | JPY | 1,400,000 | 13,755 |
| Norinchukin Bank | 0.500% | 9/25/15 | JPY | 200,000 | 1,964 |
| Norinchukin Bank | 0.500% | 11/27/15 | JPY | 200,000 | 1,965 |
| Norinchukin Bank | 0.550% | 1/27/16 | JPY | 180,000 | 1,771 |
| Norinchukin Bank | 0.700% | 4/27/15 | JPY | 100,000 | 984 |
| Panasonic Corp. | 1.081% | 3/20/18 | JPY | 1,400,000 | 14,075 |
| Shinkin Central Bank | 0.300% | 7/27/17 | JPY | 200,000 | 1,962 |
| Shinkin Central Bank | 0.300% | 9/27/17 | JPY | 200,000 | 1,961 |
| Shinkin Central Bank | 0.350% | 5/26/17 | JPY | 100,000 | 982 |
| Shinkin Central Bank | 0.350% | 6/27/17 | JPY | 200,000 | 1,965 |
| Shinkin Central Bank | 0.350% | 9/27/18 | JPY | 500,000 | 4,909 |
| Shinkin Central Bank | 0.400% | 4/27/17 | JPY | 700,000 | 6,886 |
| Shinkin Central Bank | 0.450% | 11/27/15 | JPY | 200,000 | 1,965 |
| Shinkin Central Bank | 0.450% | 9/27/16 | JPY | 200,000 | 1,968 |
| Shinkin Central Bank | 0.700% | 3/25/16 | JPY | 200,000 | 1,975 |
| Sumitomo Mitsui Banking Corp. | 0.280% | 10/20/17 | JPY | 300,000 | 2,939 |
| Sumitomo Mitsui Banking Corp. | 1.430% | 9/28/20 | JPY | 600,000 | 6,199 |
33
Total International Bond Index Fund
| | | | | | |
| | | | | | Face | Market |
| | | | Maturity | | Amount | Value |
| | | Coupon | Date | Currency | (000) | ($000) |
| | Sumitomo Mitsui Banking Corp. | 2.250% | 12/16/20 | EUR | 3,000 | 4,251 |
| | Toyota Motor Credit Corp. | 1.250% | 8/1/17 | EUR | 7,500 | 10,572 |
| | Toyota Motor Credit Corp. | 4.000% | 12/7/17 | GBP | 400 | 727 |
| | | | | | | 175,498 |
| Sovereign Bonds (21.4%) | | | | | |
| | Central Nippon Expressway Co. Ltd. | 0.501% | 3/20/18 | JPY | 400,000 | 3,944 |
| 12 | Deposit Insurance Corp. of Japan | 0.100% | 7/11/16 | JPY | 800,000 | 7,816 |
| | Deposit Insurance Corp. of Japan | 0.200% | 10/20/17 | JPY | 1,000,000 | 9,798 |
| | Development Bank of Japan Inc. | 0.460% | 3/17/17 | JPY | 500,000 | 4,927 |
| 12 | Development Bank of Japan Inc. | 0.819% | 9/20/22 | JPY | 286,000 | 2,858 |
| 12 | Development Bank of Japan Inc. | 1.750% | 3/17/17 | JPY | 500,000 | 5,113 |
| | Japan | 0.100% | 5/15/15 | JPY | 4,500,000 | 44,027 |
| | Japan | 0.100% | 3/20/18 | JPY | 6,900,000 | 67,372 |
| | Japan | 0.200% | 6/15/15 | JPY | 12,300,000 | 120,470 |
| | Japan | 0.200% | 6/20/17 | JPY | 15,000,000 | 147,092 |
| | Japan | 0.200% | 9/20/17 | JPY | 11,000,000 | 107,859 |
| | Japan | 0.200% | 9/20/18 | JPY | 6,000,000 | 58,772 |
| | Japan | 0.200% | 12/20/18 | JPY | 2,902,250 | 28,405 |
| | Japan | 0.300% | 9/20/15 | JPY | 4,600,000 | 45,129 |
| | Japan | 0.300% | 6/20/16 | JPY | 9,850,000 | 96,770 |
| | Japan | 0.300% | 6/20/18 | JPY | 2,500,000 | 24,597 |
| | Japan | 0.400% | 6/20/15 | JPY | 5,500,000 | 53,991 |
| | Japan | 0.400% | 6/20/16 | JPY | 9,000,000 | 88,606 |
| | Japan | 0.400% | 9/20/16 | JPY | 9,900,000 | 97,522 |
| | Japan | 0.400% | 3/20/18 | JPY | 3,410,000 | 33,682 |
| | Japan | 0.400% | 6/20/18 | JPY | 1,000,000 | 9,881 |
| | Japan | 0.500% | 12/20/15 | JPY | 11,200,000 | 110,282 |
| | Japan | 0.500% | 3/20/16 | JPY | 1,200,000 | 11,828 |
| | Japan | 0.600% | 3/20/16 | JPY | 900,000 | 8,888 |
| | Japan | 0.600% | 3/20/23 | JPY | 4,800,000 | 47,143 |
| | Japan | 0.600% | 12/20/23 | JPY | 5,000,000 | 48,887 |
| | Japan | 0.600% | 3/20/24 | JPY | 1,500,000 | 14,639 |
| | Japan | 0.700% | 12/20/22 | JPY | 4,000,000 | 39,684 |
| | Japan | 0.800% | 9/20/20 | JPY | 5,200,000 | 52,493 |
| | Japan | 0.800% | 6/20/22 | JPY | 4,000,000 | 40,105 |
| | Japan | 0.800% | 9/20/22 | JPY | 6,500,000 | 65,113 |
| | Japan | 0.800% | 12/20/22 | JPY | 5,500,000 | 55,040 |
| | Japan | 0.800% | 6/20/23 | JPY | 600,000 | 5,989 |
| | Japan | 0.800% | 6/20/23 | JPY | 3,693,500 | 36,856 |
| | Japan | 0.800% | 9/20/23 | JPY | 1,100,000 | 10,967 |
| | Japan | 0.900% | 3/20/22 | JPY | 1,200,000 | 12,138 |
| | Japan | 0.900% | 6/20/22 | JPY | 2,500,000 | 25,263 |
| | Japan | 1.000% | 3/20/22 | JPY | 8,000,000 | 81,526 |
| | Japan | 1.000% | 3/20/23 | JPY | 530,000 | 5,386 |
| | Japan | 1.100% | 6/20/20 | JPY | 5,100,000 | 52,388 |
| | Japan | 1.100% | 9/20/21 | JPY | 150,000 | 1,540 |
| | Japan | 1.100% | 3/20/33 | JPY | 450,000 | 4,174 |
| | Japan | 1.200% | 12/20/20 | JPY | 5,637,350 | 58,306 |
| | Japan | 1.200% | 6/20/21 | JPY | 5,150,000 | 53,249 |
| | Japan | 1.300% | 12/20/18 | JPY | 5,800,000 | 59,626 |
| | Japan | 1.300% | 3/20/19 | JPY | 6,000,000 | 61,839 |
| | Japan | 1.300% | 12/20/19 | JPY | 6,400,000 | 66,360 |
| | Japan | 1.300% | 3/20/20 | JPY | 4,400,000 | 45,682 |
| | Japan | 1.300% | 6/20/20 | JPY | 1,000,000 | 10,390 |
| | Japan | 1.300% | 3/20/21 | JPY | 5,800,000 | 60,378 |
| | Japan | 1.400% | 9/20/15 | JPY | 1,300,000 | 12,945 |
34
| | | | | |
| Total International Bond Index Fund | | | | | |
| |
| |
| |
| | | | | Face | Market |
| | | Maturity | | Amount | Value |
| | Coupon | Date | Currency | (000) | ($000) |
| Japan | 1.400% | 12/20/18 | JPY | 5,000,000 | 51,626 |
| Japan | 1.400% | 9/20/19 | JPY | 4,100,000 | 42,647 |
| Japan | 1.500% | 9/20/18 | JPY | 14,250,000 | 147,521 |
| Japan | 1.500% | 3/20/33 | JPY | 600,000 | 5,955 |
| Japan | 1.600% | 3/20/16 | JPY | 7,000,000 | 70,406 |
| Japan | 1.600% | 6/20/30 | JPY | 500,000 | 5,211 |
| Japan | 1.600% | 3/20/33 | JPY | 3,000,000 | 30,259 |
| Japan | 1.600% | 12/20/33 | JPY | 2,100,000 | 20,992 |
| Japan | 1.700% | 12/20/16 | JPY | 5,000,000 | 50,959 |
| Japan | 1.700% | 3/20/17 | JPY | 4,000,000 | 40,912 |
| Japan | 1.700% | 3/20/18 | JPY | 6,600,000 | 68,429 |
| Japan | 1.700% | 12/20/22 | JPY | 3,500,000 | 37,637 |
| Japan | 1.700% | 9/20/32 | JPY | 3,600,000 | 37,122 |
| Japan | 1.700% | 12/20/32 | JPY | 2,845,000 | 29,249 |
| Japan | 1.700% | 6/20/33 | JPY | 800,000 | 8,177 |
| Japan | 1.700% | 6/20/33 | JPY | 2,150,000 | 21,962 |
| Japan | 1.700% | 9/20/33 | JPY | 2,800,000 | 28,512 |
| Japan | 1.700% | 12/20/43 | JPY | 2,900,000 | 28,335 |
| Japan | 1.800% | 6/20/23 | JPY | 2,500,000 | 27,108 |
| Japan | 1.800% | 9/20/30 | JPY | 300,000 | 3,206 |
| Japan | 1.800% | 9/20/31 | JPY | 3,400,000 | 36,004 |
| Japan | 1.800% | 12/20/31 | JPY | 2,600,000 | 27,466 |
| Japan | 1.800% | 3/20/43 | JPY | 2,000,000 | 20,046 |
| Japan | 1.800% | 9/20/43 | JPY | 100,000 | 1,000 |
| Japan | 1.900% | 9/20/23 | JPY | 3,000,000 | 32,838 |
| Japan | 1.900% | 12/20/23 | JPY | 1,800,000 | 19,737 |
| Japan | 1.900% | 6/20/25 | JPY | 1,150,000 | 12,674 |
| Japan | 1.900% | 12/20/28 | JPY | 5,160,000 | 56,523 |
| Japan | 1.900% | 3/20/29 | JPY | 1,150,000 | 12,584 |
| Japan | 1.900% | 9/20/30 | JPY | 2,600,000 | 28,155 |
| Japan | 1.900% | 6/20/31 | JPY | 2,900,000 | 31,233 |
| Japan | 1.900% | 9/20/42 | JPY | 2,200,000 | 22,549 |
| Japan | 1.900% | 6/20/43 | JPY | 1,263,200 | 12,935 |
| Japan | 1.900% | 3/20/53 | JPY | 1,400,000 | 14,084 |
| Japan | 2.000% | 3/20/16 | JPY | 900,000 | 9,119 |
| Japan | 2.000% | 12/20/25 | JPY | 3,260,000 | 36,305 |
| Japan | 2.000% | 3/20/27 | JPY | 650,000 | 7,237 |
| Japan | 2.000% | 3/20/31 | JPY | 2,650,000 | 28,995 |
| Japan | 2.000% | 12/20/33 | JPY | 500,000 | 5,331 |
| Japan | 2.000% | 9/20/40 | JPY | 2,500,000 | 26,207 |
| Japan | 2.000% | 3/20/42 | JPY | 3,740,850 | 39,152 |
| Japan | 2.000% | 3/20/52 | JPY | 1,100,000 | 11,385 |
| Japan | 2.100% | 9/20/24 | JPY | 1,150,000 | 12,871 |
| Japan | 2.100% | 6/20/25 | JPY | 3,000,000 | 33,702 |
| Japan | 2.100% | 3/20/26 | JPY | 780,000 | 8,772 |
| Japan | 2.100% | 12/20/26 | JPY | 5,600,000 | 63,008 |
| Japan | 2.100% | 12/20/27 | JPY | 2,000,000 | 22,492 |
| Japan | 2.100% | 9/20/28 | JPY | 6,550,000 | 73,550 |
| Japan | 2.100% | 12/20/28 | JPY | 600,000 | 6,732 |
| Japan | 2.100% | 3/20/29 | JPY | 3,000,000 | 33,636 |
| Japan | 2.100% | 6/20/29 | JPY | 2,900,000 | 32,465 |
| Japan | 2.100% | 9/20/29 | JPY | 3,600,000 | 40,293 |
| Japan | 2.100% | 12/20/29 | JPY | 3,000,000 | 33,524 |
| Japan | 2.200% | 3/20/26 | JPY | 800,000 | 9,085 |
| Japan | 2.200% | 3/20/28 | JPY | 2,850,000 | 32,391 |
| Japan | 2.200% | 9/20/28 | JPY | 1,200,000 | 13,633 |
35
| | | | | | |
| Total International Bond Index Fund | | | | | |
| |
| |
| |
| | | | | | Face | Market |
| | | | Maturity | | Amount | Value |
| | | Coupon | Date | Currency | (000) | ($000) |
| | Japan | 2.200% | 3/20/49 | JPY | 1,560,000 | 17,034 |
| | Japan | 2.200% | 3/20/50 | JPY | 800,000 | 8,731 |
| | Japan | 2.200% | 3/20/51 | JPY | 2,050,000 | 22,350 |
| | Japan | 2.300% | 5/20/30 | JPY | 170,000 | 1,944 |
| | Japan | 2.300% | 3/20/35 | JPY | 2,500,000 | 27,713 |
| | Japan | 2.300% | 6/20/35 | JPY | 580,000 | 6,423 |
| | Japan | 2.300% | 12/20/35 | JPY | 1,010,000 | 11,173 |
| | Japan | 2.300% | 12/20/36 | JPY | 750,000 | 8,278 |
| | Japan | 2.300% | 3/20/39 | JPY | 4,130,000 | 45,709 |
| | Japan | 2.300% | 3/20/40 | JPY | 2,000,000 | 22,197 |
| | Japan | 2.400% | 3/20/28 | JPY | 2,800,000 | 32,531 |
| | Japan | 2.400% | 6/20/28 | JPY | 750,000 | 8,715 |
| | Japan | 2.400% | 3/20/34 | JPY | 3,700,000 | 41,833 |
| | Japan | 2.400% | 12/20/34 | JPY | 2,300,000 | 25,916 |
| | Japan | 2.400% | 3/20/37 | JPY | 2,100,000 | 23,572 |
| | Japan | 2.400% | 9/20/38 | JPY | 2,500,000 | 28,132 |
| | Japan | 2.400% | 3/20/48 | JPY | 800,000 | 9,134 |
| | Japan | 2.500% | 6/20/34 | JPY | 2,000,000 | 22,933 |
| | Japan | 2.500% | 9/20/34 | JPY | 400,000 | 4,576 |
| | Japan | 2.500% | 9/20/35 | JPY | 1,000,000 | 11,416 |
| | Japan | 2.500% | 3/20/36 | JPY | 700,000 | 7,988 |
| | Japan | 2.500% | 6/20/36 | JPY | 1,200,000 | 13,691 |
| | Japan | 2.500% | 9/20/36 | JPY | 600,000 | 6,838 |
| | Japan | 2.500% | 3/20/38 | JPY | 2,800,000 | 32,019 |
| | Japan | 2.600% | 3/20/19 | JPY | 700,000 | 7,648 |
| 12 | Japan Bank for International Cooperation | 2.625% | 12/15/20 | GBP | 2,000 | 3,378 |
| 12 | Japan Expressway Holding & | | | | | |
| | Debt Repayment Agency | 0.300% | 11/30/15 | JPY | 500,000 | 4,898 |
| | Japan Expressway Holding & | | | | | |
| | Debt Repayment Agency | 0.360% | 12/18/15 | JPY | 1,000,000 | 9,817 |
| | Japan Expressway Holding & | | | | | |
| | Debt Repayment Agency | 0.500% | 9/17/38 | JPY | 200,000 | 1,376 |
| | Japan Expressway Holding & | | | | | |
| | Debt Repayment Agency | 0.500% | 3/18/39 | JPY | 200,000 | 1,367 |
| 12 | Japan Expressway Holding & | | | | | |
| | Debt Repayment Agency | 0.668% | 3/17/23 | JPY | 800,000 | 7,869 |
| | Japan Expressway Holding & | | | | | |
| | Debt Repayment Agency | 0.765% | 9/20/22 | JPY | 200,000 | 1,989 |
| | Japan Expressway Holding & | | | | | |
| | Debt Repayment Agency | 0.796% | 9/20/22 | JPY | 300,000 | 2,991 |
| 12 | Japan Expressway Holding & | | | | | |
| | Debt Repayment Agency | 0.815% | 2/28/23 | JPY | 500,000 | 4,982 |
| 12 | Japan Expressway Holding & | | | | | |
| | Debt Repayment Agency | 0.834% | 1/31/23 | JPY | 800,000 | 7,986 |
| 12 | Japan Expressway Holding & | | | | | |
| | Debt Repayment Agency | 0.839% | 7/29/22 | JPY | 500,000 | 5,005 |
| 12 | Japan Expressway Holding & | | | | | |
| | Debt Repayment Agency | 0.895% | 6/30/22 | JPY | 500,000 | 5,029 |
| 12 | Japan Expressway Holding & | | | | | |
| | Debt Repayment Agency | 0.900% | 10/30/20 | JPY | 1,200,000 | 12,145 |
| 12 | Japan Expressway Holding & | | | | | |
| | Debt Repayment Agency | 1.200% | 12/27/19 | JPY | 100,000 | 1,028 |
| 12 | Japan Expressway Holding & | | | | | |
| | Debt Repayment Agency | 1.300% | 1/30/19 | JPY | 100,000 | 1,027 |
| 12 | Japan Expressway Holding & | | | | | |
| | Debt Repayment Agency | 1.300% | 5/29/20 | JPY | 100,000 | 1,036 |
36
Total International Bond Index Fund
| | | | | | |
| | | | | | Face | Market |
| | | | Maturity | | Amount | Value |
| | | Coupon | Date | Currency | (000) | ($000) |
| 12 | Japan Expressway Holding & | | | | | |
| | Debt Repayment Agency | 1.400% | 7/31/19 | JPY | 301,000 | 3,118 |
| 12 | Japan Expressway Holding & | | | | | |
| | Debt Repayment Agency | 1.500% | 1/29/16 | JPY | 200,000 | 2,003 |
| 12 | Japan Expressway Holding & | | | | | |
| | Debt Repayment Agency | 1.500% | 12/27/17 | JPY | 273,000 | 2,799 |
| 12 | Japan Expressway Holding & | | | | | |
| | Debt Repayment Agency | 1.500% | 6/28/19 | JPY | 301,000 | 3,132 |
| 12 | Japan Expressway Holding & | | | | | |
| | Debt Repayment Agency | 1.600% | 2/28/18 | JPY | 100,000 | 1,031 |
| 12 | Japan Expressway Holding & | | | | | |
| | Debt Repayment Agency | 1.600% | 10/31/18 | JPY | 501,000 | 5,203 |
| 12 | Japan Expressway Holding & | | | | | |
| | Debt Repayment Agency | 1.700% | 7/31/18 | JPY | 900,000 | 9,358 |
| 12 | Japan Expressway Holding & | | | | | |
| | Debt Repayment Agency | 1.800% | 6/29/18 | JPY | 400,000 | 4,171 |
| 12 | Japan Expressway Holding & | | | | | |
| | Debt Repayment Agency | 1.900% | 8/31/17 | JPY | 500,000 | 5,173 |
| 12 | Japan Expressway Holding & | | | | | |
| | Debt Repayment Agency | 2.000% | 8/31/16 | JPY | 229,000 | 2,337 |
| 12 | Japan Expressway Holding & | | | | | |
| | Debt Repayment Agency | 2.100% | 12/28/29 | JPY | 500,000 | 5,538 |
| | Japan Expressway Holding & | | | | | |
| | Debt Repayment Agency | 2.120% | 6/20/16 | JPY | 100,000 | 1,019 |
| 12 | Japan Expressway Holding & | | | | | |
| | Debt Repayment Agency | 2.300% | 2/29/40 | JPY | 200,000 | 2,180 |
| | Japan Expressway Holding & | | | | | |
| | Debt Repayment Agency | 2.340% | 10/20/27 | JPY | 700,000 | 7,926 |
| | Japan Expressway Holding & | | | | | |
| | Debt Repayment Agency | 2.700% | 3/20/48 | JPY | 200,000 | 2,159 |
| | Japan Expressway Holding & | | | | | |
| | Debt Repayment Agency | 2.870% | 12/20/46 | JPY | 80,000 | 895 |
| | Japan Expressway Holding & | | | | | |
| | Debt Repayment Agency | 2.960% | 3/19/46 | JPY | 250,000 | 2,838 |
| 12 | Japan Expressway Holding and | | | | | |
| | Debt Repayment Agency | 1.500% | 5/31/19 | JPY | 75,000 | 780 |
| 12 | Japan Finance Corp. | 0.194% | 3/18/20 | JPY | 500,000 | 4,846 |
| 12 | Japan Finance Organization for Municipalities | 0.250% | 10/29/18 | JPY | 300,000 | 2,938 |
| 12 | Japan Finance Organization for Municipalities | 0.576% | 9/24/21 | JPY | 600,000 | 5,920 |
| | Japan Finance Organization for Municipalities | 0.576% | 4/28/23 | JPY | 800,000 | 7,754 |
| 12 | Japan Finance Organization for Municipalities | 0.668% | 3/17/23 | JPY | 370,000 | 3,638 |
| | Japan Finance Organization for Municipalities | 0.678% | 3/28/23 | JPY | 500,000 | 4,893 |
| 12 | Japan Finance Organization for Municipalities | 0.900% | 11/17/20 | JPY | 100,000 | 1,012 |
| 12 | Japan Finance Organization for Municipalities | 0.900% | 3/14/22 | JPY | 600,000 | 6,045 |
| 12 | Japan Finance Organization for Municipalities | 1.300% | 5/25/15 | JPY | 1,000,000 | 9,903 |
| 12 | Japan Finance Organization for Municipalities | 1.400% | 4/15/19 | JPY | 800,000 | 8,270 |
| | Japan Finance Organization for Municipalities | 1.570% | 9/24/15 | JPY | 180,000 | 1,795 |
| 12 | Japan Finance Organization for Municipalities | 1.600% | 10/16/18 | JPY | 200,000 | 2,076 |
| | Japan Finance Organization for Municipalities | 1.770% | 9/25/18 | JPY | 400,000 | 4,170 |
| 12 | Japan Finance Organization for Municipalities | 1.900% | 6/22/18 | JPY | 500,000 | 5,222 |
| | Japan Finance Organization for Municipalities | 1.970% | 6/20/18 | JPY | 500,000 | 5,236 |
| 12 | Japan Finance Organization for Municipalities | 2.000% | 5/9/16 | JPY | 1,500,000 | 15,209 |
| | Japan Government Five Year Bond | 0.400% | 12/20/16 | JPY | 3,500,000 | 34,501 |
| | Japan Government Ten Year Bond | 1.000% | 12/20/21 | JPY | 3,000,000 | 30,585 |
| | Japan Government Ten Year Bond | 1.300% | 3/20/18 | JPY | 3,000,000 | 30,649 |
| | Japan Government Thirty Year Bond | 1.700% | 3/20/44 | JPY | 200,000 | 1,951 |
37
| | | | | |
| Total International Bond Index Fund | | | | | |
| |
| |
| |
| | | | | Face | Market |
| | | Maturity | | Amount | Value |
| | Coupon | Date | Currency | (000) | ($000) |
| Japan Government Twenty Year Bond | 1.500% | 3/20/34 | JPY | 1,500,000 | 14,680 |
| Japan Government Two Year Bond | 0.100% | 3/15/16 | JPY | 5,000,000 | 48,918 |
| Japan Highway Public Corp. | 1.540% | 12/20/22 | JPY | 500,000 | 5,284 |
| Major Joint Local Government Bond | 0.680% | 3/24/23 | JPY | 700,000 | 6,881 |
| Major Joint Local Government Bond | 0.720% | 12/22/22 | JPY | 400,000 | 3,952 |
| Major Joint Local Government Bond | 0.760% | 1/25/24 | JPY | 1,500,000 | 14,730 |
| Major Joint Local Government Bond | 0.890% | 6/24/22 | JPY | 800,000 | 8,034 |
| Major Joint Local Government Bond | 0.900% | 10/23/20 | JPY | 300,000 | 3,034 |
| Major Joint Local Government Bond | 1.030% | 9/24/21 | JPY | 400,000 | 4,071 |
| Major Joint Local Government Bond | 1.030% | 11/25/21 | JPY | 200,000 | 2,034 |
| Major Joint Local Government Bond | 1.050% | 8/25/21 | JPY | 500,000 | 5,097 |
| Major Joint Local Government Bond | 1.070% | 12/24/21 | JPY | 400,000 | 4,080 |
| Major Joint Local Government Bond | 1.170% | 7/24/20 | JPY | 1,100,000 | 11,307 |
| Major Joint Local Government Bond | 1.280% | 2/25/21 | JPY | 200,000 | 2,071 |
| Major Joint Local Government Bond | 1.290% | 6/25/20 | JPY | 130,000 | 1,346 |
| Major Joint Local Government Bond | 1.300% | 6/25/15 | JPY | 200,000 | 1,982 |
| Major Joint Local Government Bond | 1.300% | 9/25/15 | JPY | 100,000 | 994 |
| Major Joint Local Government Bond | 1.320% | 12/25/19 | JPY | 100,000 | 1,034 |
| Major Joint Local Government Bond | 1.340% | 10/25/19 | JPY | 300,000 | 3,103 |
| Major Joint Local Government Bond | 1.380% | 3/25/20 | JPY | 100,000 | 1,039 |
| Major Joint Local Government Bond | 1.400% | 8/25/15 | JPY | 200,000 | 1,988 |
| Major Joint Local Government Bond | 1.400% | 7/25/19 | JPY | 300,000 | 3,107 |
| Major Joint Local Government Bond | 1.440% | 4/24/20 | JPY | 200,000 | 2,086 |
| Major Joint Local Government Bond | 1.500% | 10/23/15 | JPY | 700,000 | 6,984 |
| Major Joint Local Government Bond | 1.500% | 10/25/18 | JPY | 100,000 | 1,034 |
| Major Joint Local Government Bond | 1.540% | 8/23/19 | JPY | 100,000 | 1,043 |
| Major Joint Local Government Bond | 1.550% | 9/25/18 | JPY | 100,000 | 1,035 |
| Major Joint Local Government Bond | 1.570% | 2/23/18 | JPY | 500,000 | 5,149 |
| Major Joint Local Government Bond | 1.570% | 5/24/19 | JPY | 453,900 | 4,732 |
| Major Joint Local Government Bond | 1.600% | 11/25/15 | JPY | 315,800 | 3,159 |
| Major Joint Local Government Bond | 1.600% | 12/25/15 | JPY | 112,800 | 1,130 |
| Major Joint Local Government Bond | 1.600% | 2/25/16 | JPY | 150,000 | 1,506 |
| Major Joint Local Government Bond | 1.640% | 6/25/19 | JPY | 100,000 | 1,047 |
| Major Joint Local Government Bond | 1.800% | 1/25/17 | JPY | 509,000 | 5,201 |
| Major Joint Local Government Bond | 1.900% | 6/23/17 | JPY | 200,000 | 2,064 |
| 12 Nuclear Damage Liability Facilitation Fund | 0.151% | 11/17/17 | JPY | 1,000,000 | 9,777 |
| Shoko Chukin Bank | 0.150% | 2/26/16 | JPY | 500,000 | 4,887 |
| Shoko Chukin Bank | 0.200% | 10/27/15 | JPY | 500,000 | 4,892 |
| Shoko Chukin Bank | 0.250% | 4/27/16 | JPY | 100,000 | 979 |
| Shoko Chukin Bank | 0.250% | 7/27/16 | JPY | 1,500,000 | 14,689 |
| Shoko Chukin Bank | 0.350% | 6/27/17 | JPY | 300,000 | 2,947 |
| Shoko Chukin Bank | 0.400% | 4/27/17 | JPY | 500,000 | 4,918 |
| Shoko Chukin Bank | 0.550% | 6/27/16 | JPY | 100,000 | 986 |
| Tokyo Metropolitan Government | 0.360% | 6/19/15 | JPY | 100,000 | 981 |
| Tokyo Metropolitan Government | 0.760% | 12/20/22 | JPY | 185,000 | 1,835 |
| Tokyo Metropolitan Government | 0.770% | 9/20/22 | JPY | 300,000 | 2,982 |
| Tokyo Metropolitan Government | 0.860% | 3/20/23 | JPY | 800,000 | 7,990 |
| Tokyo Metropolitan Government | 0.990% | 9/17/21 | JPY | 200,000 | 2,030 |
| Tokyo Metropolitan Government | 1.020% | 9/17/21 | JPY | 500,000 | 5,086 |
| Tokyo Metropolitan Government | 1.380% | 9/20/19 | JPY | 400,000 | 4,145 |
| Tokyo Metropolitan Government | 1.400% | 3/19/20 | JPY | 400,000 | 4,163 |
| Tokyo Metropolitan Government | 1.580% | 6/20/19 | JPY | 200,000 | 2,088 |
| Tokyo Metropolitan Government | 1.730% | 3/18/16 | JPY | 200,000 | 2,014 |
| Tokyo Metropolitan Government | 1.830% | 9/20/16 | JPY | 101,000 | 1,027 |
| Tokyo Metropolitan Government | 1.840% | 12/20/16 | JPY | 100,000 | 1,021 |
38
| | | | | |
| Total International Bond Index Fund | | | | | |
| |
| |
| |
| | | | | Face | Market |
| | | Maturity | | Amount | Value |
| | Coupon | Date | Currency | (000) | ($000) |
| Tokyo Metropolitan Government | 1.970% | 3/18/16 | JPY | 1,503,000 | 15,202 |
| Tokyo Metropolitan Government | 1.980% | 6/20/31 | JPY | 100,000 | 1,076 |
| Tokyo Metropolitan Government | 2.000% | 6/20/16 | JPY | 150,000 | 1,525 |
| | | | | | 4,932,539 |
| Total Japan (Cost $5,088,860) | | | | | 5,108,037 |
| Latvia (0.0%) | | | | | |
| Sovereign Bonds (0.0%) | | | | | |
| 1 Republic of Latvia | 2.625% | 1/21/21 | EUR | 1,000 | 1,410 |
| Republic of Latvia | 5.500% | 3/5/18 | EUR | 500 | 801 |
| Total Latvia (Cost $2,141) | | | | | 2,211 |
| Lithuania (0.0%) | | | | | |
| Sovereign Bond (0.0%) | | | | | |
| Republic of Lithuania | 4.850% | 2/7/18 | EUR | 3,000 | 4,660 |
| Total Lithuania (Cost $4,344) | | | | | 4,660 |
| Luxembourg (0.0%) | | | | | |
| Sovereign Bond (0.0%) | | | | | |
| Grand Duchy of Luxembourg | 2.250% | 3/19/28 | EUR | 3,000 | 4,182 |
| Total Luxembourg (Cost $3,957) | | | | | 4,182 |
| Malaysia (0.4%) | | | | | |
| Sovereign Bonds (0.4%) | | | | | |
| 13 Federation of Malaysia | 3.260% | 3/1/18 | MYR | 30,000 | 9,077 |
| Federation of Malaysia | 3.418% | 8/15/22 | MYR | 15,000 | 4,400 |
| Federation of Malaysia | 3.480% | 3/15/23 | MYR | 20,000 | 5,858 |
| Federation of Malaysia | 4.127% | 4/15/32 | MYR | 25,000 | 7,219 |
| Federation of Malaysia | 4.181% | 7/15/24 | MYR | 22,000 | 6,793 |
| Federation of Malaysia | 4.262% | 9/15/16 | MYR | 80,000 | 24,999 |
| Federation of Malaysia | 4.378% | 11/29/19 | MYR | 70,000 | 22,097 |
| Federation of Malaysia | 4.392% | 4/15/26 | MYR | 10,000 | 3,104 |
| Total Malaysia (Cost $90,777) | | | | | 83,547 |
| Mexico (0.8%) | | | | | |
| Corporate Bonds (0.1%) | | | | | |
| America Movil SAB de CV | 1.125% | 9/12/18 | CHF | 1,000 | 1,154 |
| America Movil SAB de CV | 3.000% | 7/12/21 | EUR | 2,500 | 3,679 |
| America Movil SAB de CV | 3.750% | 6/28/17 | EUR | 3,500 | 5,255 |
| America Movil SAB de CV | 5.000% | 10/27/26 | GBP | 1,500 | 2,723 |
| 2 America Movil SAB de CV | 5.125% | 9/6/73 | EUR | 2,000 | 2,949 |
| | | | | | 15,760 |
| Sovereign Bonds (0.7%) | | | | | |
| Pemex Project Funding Master Trust | 5.500% | 2/24/25 | EUR | 2,000 | 3,309 |
| Pemex Project Funding Master Trust | 6.375% | 8/5/16 | EUR | 1,000 | 1,544 |
| 1 Petroleos Mexicanos | 3.125% | 11/27/20 | EUR | 1,000 | 1,437 |
| Petroleos Mexicanos | 5.500% | 1/9/17 | EUR | 1,500 | 2,311 |
| Petroleos Mexicanos | 8.250% | 6/2/22 | GBP | 2,250 | 4,779 |
| United Mexican States | 1.160% | 8/8/16 | JPY | 300,000 | 2,952 |
| United Mexican States | 2.375% | 4/9/21 | EUR | 2,667 | 3,713 |
| United Mexican States | 2.750% | 4/22/23 | EUR | 3,000 | 4,189 |
| United Mexican States | 3.625% | 4/9/29 | EUR | 1,000 | 1,400 |
| United Mexican States | 4.750% | 6/14/18 | MXN | 140,000 | 10,592 |
| United Mexican States | 5.000% | 6/15/17 | MXN | 181,000 | 14,078 |
| United Mexican States | 5.625% | 3/19/14 | GBP | 4,000 | 6,653 |
39
| | | | | |
| Total International Bond Index Fund | | | | | |
| |
| |
| |
| | | | | Face | Market |
| | | Maturity | | Amount | Value |
| | Coupon | Date | Currency | (000) | ($000) |
| United Mexican States | 6.000% | 6/18/15 | MXN | 240,000 | 18,794 |
| United Mexican States | 6.250% | 6/16/16 | MXN | 80,000 | 6,385 |
| United Mexican States | 6.500% | 6/10/21 | MXN | 90,000 | 7,166 |
| United Mexican States | 6.500% | 6/9/22 | MXN | 80,000 | 6,303 |
| United Mexican States | 7.250% | 12/15/16 | MXN | 100,000 | 8,197 |
| United Mexican States | 7.500% | 6/3/27 | MXN | 50,000 | 4,126 |
| United Mexican States | 7.750% | 5/29/31 | MXN | 120,000 | 9,840 |
| United Mexican States | 7.750% | 11/13/42 | MXN | 48,000 | 3,843 |
| United Mexican States | 8.000% | 6/11/20 | MXN | 110,000 | 9,455 |
| United Mexican States | 8.000% | 12/7/23 | MXN | 147,600 | 12,732 |
| United Mexican States | 8.500% | 5/31/29 | MXN | 90,000 | 7,963 |
| United Mexican States | 8.500% | 11/18/38 | MXN | 105,000 | 9,106 |
| United Mexican States | 10.000% | 12/5/24 | MXN | 111,000 | 10,919 |
| United Mexican States | 10.000% | 11/20/36 | MXN | 55,000 | 5,444 |
| | | | | | 177,230 |
| Total Mexico (Cost $205,772) | | | | | 192,990 |
| Morocco (0.0%) | | | | | |
| Sovereign Bond (0.0%) | | | | | |
| Kingdom of Morocco | 5.375% | 6/27/17 | EUR | 2,000 | 3,074 |
| Total Morocco (Cost $2,958) | | | | | 3,074 |
| Netherlands (3.4%) | | | | | |
| Asset-Backed/Commercial Mortgage-Backed Securities (0.3%) | | | | |
| ABN AMRO Bank NV | 1.875% | 7/31/19 | EUR | 4,500 | 6,514 |
| ABN AMRO Bank NV | 2.500% | 9/5/23 | EUR | 2,000 | 2,937 |
| ABN AMRO Bank NV | 3.500% | 1/12/18 | EUR | 2,000 | 3,056 |
| ABN AMRO Bank NV | 3.500% | 1/18/22 | EUR | 3,000 | 4,740 |
| ABN AMRO Bank NV | 4.250% | 4/6/21 | EUR | 5,000 | 8,210 |
| ING Bank NV | 1.875% | 5/22/23 | EUR | 10,400 | 14,569 |
| ING Bank NV | 3.250% | 3/3/16 | EUR | 3,000 | 4,376 |
| ING Bank NV | 3.375% | 1/11/18 | EUR | 5,000 | 7,695 |
| SNS Bank NV | 2.125% | 8/30/17 | EUR | 5,350 | 7,743 |
| | | | | | 59,840 |
| Corporate Bonds (0.8%) | | | | | |
| ABN AMRO Bank NV | 2.500% | 11/29/23 | EUR | 3,000 | 4,247 |
| ABN AMRO Bank NV | 4.125% | 3/28/22 | EUR | 1,500 | 2,402 |
| ABN AMRO Bank NV | 4.250% | 4/11/16 | EUR | 4,000 | 5,927 |
| ABN AMRO Bank NV | 6.375% | 4/27/21 | EUR | 500 | 832 |
| ABN AMRO Bank NV | 7.125% | 7/6/22 | EUR | 1,500 | 2,616 |
| 2 Achmea BV | 6.000% | 4/4/43 | EUR | 2,000 | 3,177 |
| Achmea Hypotheekbank NV | 2.000% | 1/23/18 | EUR | 2,000 | 2,829 |
| Aegon NV | 3.000% | 7/18/17 | EUR | 300 | 441 |
| Aegon NV | 6.625% | 12/16/39 | GBP | 1,000 | 2,209 |
| Ahold Finance USA LLC | 6.500% | 3/14/17 | GBP | 400 | 758 |
| Akzo Nobel NV | 4.000% | 12/17/18 | EUR | 2,500 | 3,877 |
| Akzo Nobel NV | 8.000% | 4/6/16 | GBP | 200 | 378 |
| ASML Holding NV | 3.375% | 9/19/23 | EUR | 1,000 | 1,471 |
| Cooperatieve Centrale | | | | | |
| Raiffeisen-Boerenleenbank BA | 0.487% | 5/24/16 | JPY | 500,000 | 4,904 |
| Cooperatieve Centrale | | | | | |
| Raiffeisen-Boerenleenbank BA | 1.750% | 1/22/19 | EUR | 5,000 | 7,094 |
| Cooperatieve Centrale | | | | | |
| Raiffeisen-Boerenleenbank BA | 2.000% | 2/6/19 | CHF | 1,000 | 1,211 |
| Cooperatieve Centrale | | | | | |
| Raiffeisen-Boerenleenbank BA | 2.000% | 9/16/21 | CHF | 2,000 | 2,424 |
40
| | | | | |
| Total International Bond Index Fund | | | | | |
| |
| |
| |
| | | | | Face | Market |
| | | Maturity | | Amount | Value |
| | Coupon | Date | Currency | (000) | ($000) |
| Cooperatieve Centrale | | | | | |
| Raiffeisen-Boerenleenbank BA | 2.125% | 10/11/17 | CHF | 2,000 | 2,403 |
| Cooperatieve Centrale | | | | | |
| Raiffeisen-Boerenleenbank BA | 2.375% | 5/22/23 | EUR | 5,000 | 7,035 |
| Cooperatieve Centrale | | | | | |
| Raiffeisen-Boerenleenbank BA | 3.125% | 9/15/26 | CHF | 1,000 | 1,314 |
| Cooperatieve Centrale | | | | | |
| Raiffeisen-Boerenleenbank BA | 3.250% | 11/1/17 | GBP | 500 | 879 |
| Cooperatieve Centrale | | | | | |
| Raiffeisen-Boerenleenbank BA | 3.625% | 7/2/19 | CHF | 2,500 | 3,264 |
| Cooperatieve Centrale | | | | | |
| Raiffeisen-Boerenleenbank BA | 4.000% | 9/10/15 | GBP | 1,550 | 2,720 |
| Cooperatieve Centrale | | | | | |
| Raiffeisen-Boerenleenbank BA | 4.000% | 9/19/22 | GBP | 1,187 | 2,096 |
| Cooperatieve Centrale | | | | | |
| Raiffeisen-Boerenleenbank BA | 4.125% | 1/12/21 | EUR | 5,000 | 7,966 |
| Cooperatieve Centrale | | | | | |
| Raiffeisen-Boerenleenbank BA | 4.125% | 9/14/22 | EUR | 3,000 | 4,573 |
| Cooperatieve Centrale | | | | | |
| Raiffeisen-Boerenleenbank BA | 4.125% | 7/14/25 | EUR | 5,000 | 8,030 |
| Cooperatieve Centrale | | | | | |
| Raiffeisen-Boerenleenbank BA | 4.250% | 1/16/17 | EUR | 10,000 | 15,123 |
| Cooperatieve Centrale | | | | | |
| Raiffeisen-Boerenleenbank BA | 5.250% | 9/14/27 | GBP | 1,250 | 2,230 |
| Cooperatieve Centrale | | | | | |
| Raiffeisen-Boerenleenbank BA | 5.250% | 5/23/41 | GBP | 800 | 1,505 |
| Cooperatieve Centrale | | | | | |
| Raiffeisen-Boerenleenbank BA | 7.250% | 4/20/18 | AUD | 5,250 | 5,436 |
| Corio NV | 3.250% | 2/26/21 | EUR | 2,000 | 2,923 |
| Delta Lloyd NV | 4.250% | 11/17/17 | EUR | 500 | 753 |
| F Van Lanschot Bankiers NV | 3.125% | 6/5/18 | EUR | 1,000 | 1,422 |
| Heineken NV | 2.000% | 4/6/21 | EUR | 1,000 | 1,402 |
| Heineken NV | 2.875% | 8/4/25 | EUR | 2,000 | 2,836 |
| ING Bank NV | 1.875% | 2/27/18 | EUR | 9,000 | 12,889 |
| 2 ING Bank NV | 3.500% | 11/21/23 | EUR | 1,000 | 1,426 |
| ING Bank NV | 3.875% | 5/24/16 | EUR | 1,500 | 2,214 |
| ING Bank NV | 3.875% | 12/23/16 | GBP | 90 | 160 |
| ING Bank NV | 4.500% | 2/21/22 | EUR | 2,500 | 4,105 |
| ING Bank NV | 4.875% | 1/18/21 | EUR | 1,000 | 1,663 |
| 2 ING Bank NV | 6.875% | 5/29/23 | GBP | 2,200 | 4,151 |
| ING Groep NV | 4.750% | 5/31/17 | EUR | 2,000 | 3,080 |
| Koninklijke KPN NV | 3.250% | 2/1/21 | EUR | 5,630 | 8,228 |
| Koninklijke KPN NV | 3.750% | 9/21/20 | EUR | 1,200 | 1,814 |
| Koninklijke KPN NV | 4.750% | 1/17/17 | EUR | 1,000 | 1,521 |
| Koninklijke KPN NV | 5.750% | 3/18/16 | GBP | 550 | 995 |
| Koninklijke KPN NV | 5.750% | 9/17/29 | GBP | 1,000 | 1,830 |
| Koninklijke KPN NV | 6.000% | 5/29/19 | GBP | 400 | 761 |
| Koninklijke KPN NV | 6.500% | 1/15/16 | EUR | 1,700 | 2,579 |
| LeasePlan Corp. NV | 2.500% | 9/19/16 | EUR | 500 | 717 |
| LeasePlan Corp. NV | 3.875% | 9/16/15 | EUR | 2,000 | 2,891 |
| PostNL NV | 7.500% | 8/14/18 | GBP | 2,580 | 5,091 |
| Robert Bosch Investment Nederland BV | 1.625% | 5/24/21 | EUR | 800 | 1,110 |
| Robert Bosch Investment Nederland BV | 2.625% | 5/24/28 | EUR | 1,000 | 1,403 |
| Shell International Finance BV | 4.375% | 5/14/18 | EUR | 1,000 | 1,579 |
| Shell International Finance BV | 4.625% | 5/22/17 | EUR | 5,000 | 7,770 |
41
| | | | | | |
| Total International Bond Index Fund | | | | | |
| |
| |
| |
| | | | | | Face | Market |
| | | | Maturity | | Amount | Value |
| | | Coupon | Date | Currency | (000) | ($000) |
| | Unilever NV | 1.750% | 8/5/20 | EUR | 2,000 | 2,828 |
| | Unilever plc | 4.750% | 6/16/17 | GBP | 650 | 1,200 |
| | Wolters Kluwer NV | 2.875% | 3/21/23 | EUR | 2,000 | 2,870 |
| | | | | | | 195,582 |
| Sovereign Bonds (2.3%) | | | | | |
| | Alliander NV | 2.875% | 6/14/24 | EUR | 500 | 734 |
| | Alliander NV | 5.500% | 4/20/16 | EUR | 1,000 | 1,518 |
| | Bank Nederlandse Gemeenten | 0.750% | 5/21/18 | EUR | 14,600 | 20,222 |
| | Bank Nederlandse Gemeenten | 1.875% | 12/7/18 | GBP | 2,800 | 4,669 |
| | Bank Nederlandse Gemeenten | 1.875% | 6/6/19 | EUR | 3,000 | 4,332 |
| | Bank Nederlandse Gemeenten | 1.875% | 1/14/21 | EUR | 2,000 | 2,852 |
| | Bank Nederlandse Gemeenten | 2.125% | 7/14/15 | EUR | 6,000 | 8,504 |
| | Bank Nederlandse Gemeenten | 2.250% | 8/24/16 | EUR | 5,000 | 7,226 |
| | Bank Nederlandse Gemeenten | 2.250% | 10/14/20 | CHF | 4,000 | 5,015 |
| | Bank Nederlandse Gemeenten | 3.875% | 5/26/23 | EUR | 3,000 | 4,870 |
| | Bank Nederlandse Gemeenten | 5.200% | 12/7/28 | GBP | 700 | 1,366 |
| | Deutsche Bahn Finance BV | 1.500% | 8/26/24 | CHF | 1,000 | 1,150 |
| | Enexis Holding NV | 1.875% | 11/13/20 | EUR | 1,500 | 2,112 |
| | Kingdom of Netherlands | 0.500% | 4/15/17 | EUR | 20,000 | 27,874 |
| 1 | Kingdom of Netherlands | 1.250% | 1/15/19 | EUR | 20,000 | 28,424 |
| 1 | Kingdom of Netherlands | 1.750% | 7/15/23 | EUR | 22,000 | 30,812 |
| | Kingdom of Netherlands | 2.000% | 7/15/24 | EUR | 5,000 | 7,066 |
| 1 | Kingdom of Netherlands | 2.250% | 7/15/22 | EUR | 25,000 | 36,826 |
| 1 | Kingdom of Netherlands | 2.500% | 1/15/17 | EUR | 35,000 | 51,424 |
| 1 | Kingdom of Netherlands | 2.500% | 1/15/33 | EUR | 11,400 | 16,209 |
| | Kingdom of Netherlands | 2.750% | 1/15/47 | EUR | 5,000 | 7,379 |
| 1 | Kingdom of Netherlands | 3.250% | 7/15/15 | EUR | 10,000 | 14,384 |
| 1,4 | Kingdom of Netherlands | 3.250% | 7/15/21 | EUR | 13,900 | 21,922 |
| 1 | Kingdom of Netherlands | 3.500% | 7/15/20 | EUR | 15,000 | 23,894 |
| 1 | Kingdom of Netherlands | 3.750% | 1/15/23 | EUR | 10,000 | 16,386 |
| 1 | Kingdom of Netherlands | 3.750% | 1/15/42 | EUR | 14,000 | 24,667 |
| 1 | Kingdom of Netherlands | 4.000% | 7/15/16 | EUR | 25,000 | 37,536 |
| 1 | Kingdom of Netherlands | 4.000% | 7/15/18 | EUR | 15,000 | 23,754 |
| 1 | Kingdom of Netherlands | 4.000% | 7/15/19 | EUR | 5,000 | 8,060 |
| 1 | Kingdom of Netherlands | 4.000% | 1/15/37 | EUR | 13,500 | 24,020 |
| 1 | Kingdom of Netherlands | 5.500% | 1/15/28 | EUR | 10,000 | 19,522 |
| | Nederlandse Gasunie NV | 2.625% | 7/13/22 | EUR | 1,500 | 2,184 |
| | Nederlandse Gasunie NV | 3.625% | 10/13/21 | EUR | 1,500 | 2,332 |
| | Nederlandse Gasunie NV | 4.250% | 6/20/16 | EUR | 2,000 | 2,981 |
| | Nederlandse Waterschapsbank NV | 1.125% | 1/28/19 | EUR | 2,000 | 2,797 |
| | Nederlandse Waterschapsbank NV | 1.625% | 8/23/19 | EUR | 4,000 | 5,690 |
| | Nederlandse Waterschapsbank NV | 1.750% | 7/22/16 | CHF | 2,000 | 2,348 |
| | Nederlandse Waterschapsbank NV | 2.125% | 9/7/16 | GBP | 500 | 861 |
| | Nederlandse Waterschapsbank NV | 2.375% | 6/4/15 | EUR | 4,000 | 5,674 |
| | Nederlandse Waterschapsbank NV | 3.375% | 4/3/17 | NOK | 20,000 | 3,466 |
| | Nederlandse Waterschapsbank NV | 3.500% | 1/14/21 | EUR | 5,000 | 7,851 |
| | TenneT Holding BV | 3.875% | 2/21/18 | EUR | 540 | 827 |
| | TenneT Holding BV | 4.500% | 2/9/22 | EUR | 1,500 | 2,435 |
| | | | | | | 524,175 |
| Total Netherlands (Cost $732,687) | | | | | 779,597 |
42
| | | | | |
| Total International Bond Index Fund | | | | | |
| |
| |
| |
| | | | | Face | Market |
| | | Maturity | | Amount | Value |
| | Coupon | Date | Currency | (000) | ($000) |
| New Zealand (0.4%) | | | | | |
| Asset-Backed/Commercial Mortgage-Backed Securities (0.1%) | | | | |
| ANZ New Zealand Int’l Ltd. | 3.000% | 10/20/16 | EUR | 5,000 | 7,345 |
| Westpac Securities NZ Ltd. | 3.500% | 6/16/16 | EUR | 5,000 | 7,368 |
| | | | | | 14,713 |
| Corporate Bonds (0.0%) | | | | | |
| ANZ New Zealand Int’l Ltd. | 1.500% | 12/17/15 | GBP | 450 | 766 |
| BNZ International Funding Ltd. | 1.250% | 5/23/18 | EUR | 2,800 | 3,898 |
| | | | | | 4,664 |
| Sovereign Bonds (0.3%) | | | | | |
| New Zealand | 3.000% | 4/15/20 | NZD | 7,500 | 6,044 |
| New Zealand | 5.000% | 3/15/19 | NZD | 15,000 | 13,431 |
| New Zealand | 5.500% | 4/15/23 | NZD | 7,500 | 6,986 |
| New Zealand | 6.000% | 4/15/15 | NZD | 13,000 | 11,472 |
| New Zealand | 6.000% | 12/15/17 | NZD | 12,500 | 11,498 |
| New Zealand | 6.000% | 5/15/21 | NZD | 12,500 | 11,889 |
| | | | | | 61,320 |
| Total New Zealand (Cost $79,165) | | | | | 80,697 |
| Norway (0.7%) | | | | | |
| Asset-Backed/Commercial Mortgage-Backed Securities (0.2%) | | | | |
| DNB Boligkreditt AS | 1.000% | 1/22/18 | EUR | 6,000 | 8,413 |
| DNB Boligkreditt AS | 1.125% | 11/12/18 | EUR | 5,000 | 7,011 |
| DNB Boligkreditt AS | 2.375% | 4/11/17 | EUR | 6,000 | 8,762 |
| DNB Boligkreditt AS | 2.750% | 3/21/22 | EUR | 7,500 | 11,310 |
| Eika Boligkreditt AS | 2.125% | 1/30/23 | EUR | 2,000 | 2,840 |
| Nordea Eiendomskreditt AS | 4.050% | 6/21/17 | NOK | 5,000 | 885 |
| SpareBank 1 Boligkreditt AS | 1.500% | 6/12/20 | EUR | 6,000 | 8,437 |
| SpareBank 1 Boligkreditt AS | 2.375% | 11/22/16 | EUR | 5,000 | 7,262 |
| | | | | | 54,920 |
| Corporate Bonds (0.1%) | | | | | |
| 2 DNB Bank ASA | 3.000% | 9/26/23 | EUR | 3,000 | 4,363 |
| DNB Bank ASA | 4.375% | 2/24/21 | EUR | 3,000 | 4,872 |
| 2 DNB Bank ASA | 4.750% | 3/8/22 | EUR | 4,000 | 6,041 |
| 2 DNB Bank ASA | 7.250% | 6/23/20 | GBP | 75 | 134 |
| SpareBank 1 SR Bank ASA | 2.125% | 2/3/20 | EUR | 1,500 | 2,124 |
| Sparebanken Vest Boligkreditt AS | 1.250% | 1/16/19 | EUR | 5,000 | 7,032 |
| | | | | | 24,566 |
| Sovereign Bonds (0.4%) | | | | | |
| Kingdom of Norway | 2.000% | 5/24/23 | NOK | 85,000 | 13,539 |
| Kingdom of Norway | 3.000% | 3/14/24 | NOK | 29,900 | 5,127 |
| Kingdom of Norway | 3.750% | 5/25/21 | NOK | 39,100 | 7,140 |
| Kingdom of Norway | 4.250% | 5/19/17 | NOK | 80,000 | 14,463 |
| Kingdom of Norway | 4.500% | 5/22/19 | NOK | 20,300 | 3,807 |
| Kingdom of Norway | 5.000% | 5/15/15 | NOK | 79,300 | 13,825 |
| Kommunalbanken AS | 1.125% | 12/15/16 | GBP | 3,000 | 5,044 |
| Kommunalbanken AS | 1.125% | 12/15/17 | GBP | 500 | 829 |
| Statkraft AS | 5.000% | 11/10/16 | NOK | 2,500 | 447 |
| Statkraft AS | 6.625% | 4/2/19 | EUR | 2,950 | 5,089 |
| Statoil ASA | 5.625% | 3/11/21 | EUR | 4,700 | 8,190 |
43
| | | | | |
| Total International Bond Index Fund | | | | | |
| |
| |
| |
| | | | | Face | Market |
| | | Maturity | | Amount | Value |
| | Coupon | Date | Currency | (000) | ($000) |
| Statoil ASA | 6.875% | 3/11/31 | GBP | 750 | 1,709 |
| Telenor ASA | 1.750% | 1/15/18 | EUR | 2,000 | 2,850 |
| Telenor ASA | 2.500% | 5/22/25 | EUR | 2,400 | 3,336 |
| | | | | | 85,395 |
| Total Norway (Cost $160,397) | | | | | 164,881 |
| Poland (0.6%) | | | | | |
| Sovereign Bonds (0.6%) | | | | | |
| Republic of Poland | 1.625% | 1/15/19 | EUR | 8,000 | 11,343 |
| Republic of Poland | 2.250% | 5/15/18 | CHF | 3,000 | 3,617 |
| Republic of Poland | 2.500% | 7/25/18 | PLN | 35,000 | 11,143 |
| Republic of Poland | 3.375% | 7/9/24 | EUR | 5,000 | 7,463 |
| Republic of Poland | 3.625% | 2/1/16 | EUR | 5,000 | 7,310 |
| Republic of Poland | 3.750% | 4/25/18 | PLN | 15,000 | 5,021 |
| Republic of Poland | 4.000% | 10/25/23 | PLN | 27,500 | 9,030 |
| Republic of Poland | 4.200% | 4/15/20 | EUR | 8,000 | 12,892 |
| Republic of Poland | 4.750% | 4/25/17 | PLN | 32,100 | 11,083 |
| Republic of Poland | 5.000% | 4/25/16 | PLN | 54,100 | 18,577 |
| Republic of Poland | 5.250% | 10/25/17 | PLN | 15,000 | 5,273 |
| Republic of Poland | 5.250% | 10/25/20 | PLN | 15,000 | 5,378 |
| Republic of Poland | 5.250% | 1/20/25 | EUR | 2,000 | 3,451 |
| Republic of Poland | 5.500% | 4/25/15 | PLN | 39,300 | 13,323 |
| Republic of Poland | 5.500% | 10/25/19 | PLN | 18,000 | 6,499 |
| Republic of Poland | 5.750% | 10/25/21 | PLN | 100 | 37 |
| Republic of Poland | 5.750% | 9/23/22 | PLN | 25,000 | 9,262 |
| Republic of Poland | 5.750% | 4/25/29 | PLN | 8,000 | 2,997 |
| Total Poland (Cost $136,980) | | | | | 143,699 |
| Portugal (0.0%) | | | | | |
| Asset-Backed/Commercial Mortgage-Backed Security (0.0%) | | | | |
| Caixa Geral de Depositos SA | 3.750% | 1/18/18 | EUR | 3,500 | 5,216 |
| | | | | | 5,216 |
| Sovereign Bond (0.0%) | | | | | |
| Caixa Geral de Depositos SA | 3.000% | 1/15/19 | EUR | 1,000 | 1,454 |
| | | | | | 1,454 |
| Total Portugal (Cost $6,083) | | | | | 6,670 |
| Romania (0.1%) | | | | | |
| Sovereign Bonds (0.1%) | | | | | |
| Republic of Romania | 4.625% | 9/18/20 | EUR | 2,000 | 3,044 |
| Republic of Romania | 4.875% | 11/7/19 | EUR | 2,000 | 3,075 |
| Republic of Romania | 5.250% | 6/17/16 | EUR | 3,000 | 4,465 |
| Total Romania (Cost $9,777) | | | | | 10,584 |
| Russia (0.3%) | | | | | |
| Sovereign Bonds (0.3%) | | | | | |
| Gazprom OAO Via Gaz Capital SA | 3.389% | 3/20/20 | EUR | 3,000 | 3,969 |
| Gazprom OAO Via Gaz Capital SA | 3.755% | 3/15/17 | EUR | 3,000 | 4,135 |
| Gazprom OAO Via Gaz Capital SA | 4.364% | 3/21/25 | EUR | 300 | 406 |
| Gazprom OAO Via Gaz Capital SA | 5.338% | 9/25/20 | GBP | 1,000 | 1,655 |
| Russian Federation | 3.625% | 9/16/20 | EUR | 1,000 | 1,383 |
| Russian Federation | 6.800% | 12/11/19 | RUB | 285,715 | 7,223 |
| Russian Federation | 7.000% | 8/16/23 | RUB | 300,000 | 7,232 |
| Russian Federation | 7.050% | 1/19/28 | RUB | 100,000 | 2,307 |
| Russian Federation | 7.350% | 1/20/16 | RUB | 400,000 | 11,052 |
44
| | | | | |
| Total International Bond Index Fund | | | | | |
| |
| |
| |
| | | | | Face | Market |
| | | Maturity | | Amount | Value |
| | Coupon | Date | Currency | (000) | ($000) |
| Russian Federation | 7.400% | 4/19/17 | RUB | 295,000 | 7,983 |
| Russian Federation | 7.500% | 3/15/18 | RUB | 500,000 | 13,375 |
| Russian Federation | 7.600% | 7/20/22 | RUB | 300,000 | 7,631 |
| Russian Railways via RZD Capital plc | 2.177% | 2/26/18 | CHF | 3,000 | 3,258 |
| Russian Railways via RZD Capital plc | 3.374% | 5/20/21 | EUR | 2,000 | 2,564 |
| Vnesheconombank Via VEB Finance plc | 3.035% | 2/21/18 | EUR | 2,000 | 2,635 |
| Total Russia (Cost $79,315) | | | | | 76,808 |
| Singapore (0.3%) | | | | | |
| Sovereign Bonds (0.3%) | | | | | |
| Republic of Singapore | 0.500% | 4/1/18 | SGD | 35,000 | 27,443 |
| Republic of Singapore | 2.250% | 6/1/21 | SGD | 10,000 | 8,037 |
| Republic of Singapore | 2.750% | 4/1/42 | SGD | 8,500 | 6,361 |
| Republic of Singapore | 3.125% | 9/1/22 | SGD | 9,000 | 7,623 |
| Republic of Singapore | 3.375% | 9/1/33 | SGD | 1,500 | 1,254 |
| Republic of Singapore | 3.500% | 3/1/27 | SGD | 13,000 | 11,177 |
| Total Singapore (Cost $63,364) | | | | | 61,895 |
| Slovakia (0.1%) | | | | | |
| Sovereign Bonds (0.1%) | | | | | |
| Republic of Slovakia | 1.375% | 10/16/19 | CHF | 2,000 | 2,320 |
| Republic of Slovakia | 3.625% | 1/16/29 | EUR | 1,000 | 1,501 |
| Republic of Slovakia | 4.000% | 4/27/20 | EUR | 7,750 | 12,394 |
| Republic of Slovakia | 4.350% | 10/14/25 | EUR | 5,000 | 8,157 |
| Republic of Slovakia | 4.625% | 1/19/17 | EUR | 3,000 | 4,614 |
| Total Slovakia (Cost $26,937) | | | | | 28,986 |
| Slovenia (0.1%) | | | | | |
| Sovereign Bonds (0.1%) | | | | | |
| Republic of Slovenia | 4.125% | 1/26/20 | EUR | 2,000 | 2,990 |
| Republic of Slovenia | 4.375% | 2/6/19 | EUR | 2,000 | 3,025 |
| Republic of Slovenia | 4.625% | 9/9/24 | EUR | 4,000 | 6,017 |
| Total Slovenia (Cost $10,013) | | | | | 12,032 |
| South Africa (0.4%) | | | | | |
| Sovereign Bonds (0.4%) | | | | | |
| Eskom Holdings SOC Ltd. | 10.000% | 1/25/23 | ZAR | 15,000 | 1,551 |
| Republic of South Africa | 6.250% | 3/31/36 | ZAR | 130,000 | 9,082 |
| Republic of South Africa | 6.500% | 2/28/41 | ZAR | 50,000 | 3,512 |
| Republic of South Africa | 6.750% | 3/31/21 | ZAR | 190,000 | 16,745 |
| Republic of South Africa | 7.000% | 2/28/31 | ZAR | 60,000 | 4,747 |
| Republic of South Africa | 7.250% | 1/15/20 | ZAR | 100,000 | 9,190 |
| Republic of South Africa | 8.000% | 12/21/18 | ZAR | 50,000 | 4,790 |
| Republic of South Africa | 8.000% | 1/31/30 | ZAR | 120,000 | 10,480 |
| Republic of South Africa | 8.250% | 9/15/17 | ZAR | 50,000 | 4,849 |
| Republic of South Africa | 8.500% | 1/31/37 | ZAR | 25,000 | 2,238 |
| Republic of South Africa | 8.750% | 2/28/48 | ZAR | 50,000 | 4,580 |
| Republic of South Africa | 10.500% | 12/21/26 | ZAR | 100,000 | 10,998 |
| Republic of South Africa | 13.500% | 9/15/15 | ZAR | 150,000 | 15,476 |
| Total South Africa (Cost $115,982) | | | | | 98,238 |
| South Korea (2.1%) | | | | | |
| Sovereign Bonds (2.1%) | | | | | |
| Bank of Korea | 2.470% | 4/2/15 | KRW | 20,000,000 | 19,320 |
| Export-Import Bank of Korea | 2.000% | 4/30/20 | EUR | 1,800 | 2,502 |
| Korea Development Bank | 1.500% | 5/30/18 | EUR | 600 | 837 |
45
| | | | | |
| Total International Bond Index Fund | | | | | |
| |
| |
| |
| | | | | Face | Market |
| | | Maturity | | Amount | Value |
| | Coupon | Date | Currency | (000) | ($000) |
| Korea Railroad Corp. | 1.000% | 11/16/18 | CHF | 4,000 | 4,634 |
| Republic of Korea | 2.500% | 4/30/18 | KRW | 20,000,000 | 18,660 |
| Republic of Korea | 2.750% | 12/10/15 | KRW | 55,000,000 | 53,222 |
| Republic of Korea | 2.750% | 3/10/18 | KRW | 67,000,000 | 64,128 |
| Republic of Korea | 3.000% | 12/10/16 | KRW | 15,000,000 | 14,580 |
| Republic of Korea | 3.000% | 3/10/23 | KRW | 34,000,000 | 31,714 |
| Republic of Korea | 3.000% | 12/10/42 | KRW | 14,500,000 | 12,060 |
| Republic of Korea | 3.500% | 9/10/16 | KRW | 43,000,000 | 42,223 |
| Republic of Korea | 3.500% | 3/10/17 | KRW | 20,000,000 | 19,668 |
| Republic of Korea | 3.750% | 12/10/33 | KRW | 5,000,000 | 4,925 |
| Republic of Korea | 4.000% | 3/10/16 | KRW | 44,000,000 | 43,500 |
| Republic of Korea | 4.000% | 12/10/31 | KRW | 25,000,000 | 25,102 |
| Republic of Korea | 4.250% | 6/10/21 | KRW | 15,000,000 | 15,309 |
| Republic of Korea | 4.750% | 12/10/30 | KRW | 9,000,000 | 9,840 |
| Republic of Korea | 5.000% | 6/10/20 | KRW | 46,500,000 | 49,245 |
| Republic of Korea | 5.250% | 3/10/27 | KRW | 4,500,000 | 5,078 |
| Republic of Korea | 5.500% | 3/10/28 | KRW | 20,000,000 | 23,219 |
| Republic of Korea | 5.750% | 3/10/26 | KRW | 14,000,000 | 16,343 |
| Total South Korea (Cost $455,692) | | | | | 476,109 |
| Spain (5.5%) | | | | | |
| Asset-Backed/Commercial Mortgage-Backed Securities (0.9%) | | | | |
| AyT Cedulas Cajas Fondo de Titulizacion | 4.500% | 12/2/19 | EUR | 5,000 | 7,692 |
| AyT Cedulas Cajas Global | 3.750% | 12/14/22 | EUR | 800 | 1,164 |
| AyT Cedulas Cajas Global | 4.000% | 3/24/21 | EUR | 1,000 | 1,499 |
| AyT Cedulas Cajas Global | 4.250% | 10/25/23 | EUR | 1,000 | 1,500 |
| AyT Cedulas Cajas Global | 4.750% | 5/25/27 | EUR | 2,000 | 3,024 |
| AyT Cedulas Cajas IX Fondo de Titulizacion | 4.000% | 3/31/20 | EUR | 5,000 | 7,484 |
| AyT Cedulas Cajas X Fondo de Titulizacion | 3.750% | 6/30/25 | EUR | 1,300 | 1,797 |
| Banco Bilbao Vizcaya Argentaria SA | 3.500% | 10/7/20 | EUR | 1,000 | 1,541 |
| Banco Bilbao Vizcaya Argentaria SA | 3.500% | 1/24/21 | EUR | 1,000 | 1,539 |
| Banco Bilbao Vizcaya Argentaria SA | 3.625% | 1/18/17 | EUR | 3,000 | 4,458 |
| Banco Bilbao Vizcaya Argentaria SA | 3.875% | 1/30/23 | EUR | 5,000 | 7,898 |
| Banco Bilbao Vizcaya Argentaria SA | 4.000% | 2/25/25 | EUR | 2,100 | 3,345 |
| Banco Bilbao Vizcaya Argentaria SA | 4.750% | 2/10/16 | EUR | 6,300 | 9,344 |
| Banco de Sabadell SA | 3.375% | 1/23/18 | EUR | 4,000 | 5,946 |
| Banco Espanol de Credito SA | 3.500% | 1/18/16 | EUR | 1,100 | 1,593 |
| Banco Espanol de Credito SA | 3.625% | 9/7/15 | EUR | 3,000 | 4,318 |
| Banco Espanol de Credito SA | 3.750% | 6/17/16 | EUR | 6,700 | 9,840 |
| Banco Espanol de Credito SA | 4.750% | 1/24/17 | EUR | 6,300 | 9,615 |
| Banco Popular Espanol SA | 3.750% | 1/22/19 | EUR | 5,000 | 7,544 |
| Banco Popular Espanol SA | 4.125% | 3/30/17 | EUR | 4,500 | 6,737 |
| Banco Santander SA | 2.875% | 1/30/18 | EUR | 5,500 | 8,097 |
| Banco Santander SA | 3.125% | 9/28/15 | EUR | 1,500 | 2,148 |
| Banco Santander SA | 4.125% | 1/9/17 | EUR | 1,000 | 1,501 |
| Banco Santander SA | 4.625% | 1/20/16 | EUR | 1,400 | 2,065 |
| Bankia SA | 3.500% | 12/14/15 | EUR | 600 | 866 |
| Bankia SA | 3.625% | 10/5/16 | EUR | 4,350 | 6,379 |
| Bankia SA | 4.000% | 2/3/25 | EUR | 1,600 | 2,408 |
| Bankia SA | 4.125% | 3/24/36 | EUR | 1,700 | 2,464 |
| Bankia SA | 4.250% | 7/5/16 | EUR | 950 | 1,405 |
| Bankia SA | 4.250% | 5/25/18 | EUR | 1,450 | 2,225 |
| Bankia SA | 4.500% | 4/26/22 | EUR | 2,050 | 3,225 |
| Bankia SA | 5.750% | 6/29/16 | EUR | 1,000 | 1,523 |
| Bankinter SA | 2.750% | 7/26/16 | EUR | 3,300 | 4,762 |
| CaixaBank | 3.500% | 3/31/16 | EUR | 4,500 | 6,554 |
46
| | | | | | |
| Total International Bond Index Fund | | | | | |
| |
| |
| |
| | | | | | Face | Market |
| | | | Maturity | | Amount | Value |
| | | Coupon | Date | Currency | (000) | ($000) |
| | CaixaBank | 3.875% | 2/17/25 | EUR | 2,000 | 3,120 |
| | CaixaBank | 4.625% | 6/4/19 | EUR | 5,400 | 8,615 |
| | CaixaBank | 5.125% | 4/27/16 | EUR | 10,000 | 15,029 |
| | Caja Rural de Navarra | 2.875% | 6/11/18 | EUR | 1,700 | 2,485 |
| | Cajas Rurales Unidas | 3.375% | 5/16/16 | EUR | 2,000 | 2,876 |
| | Cedulas TDA | 4.125% | 4/10/21 | EUR | 1,500 | 2,269 |
| | Cedulas TDA 6 Fondo de Titulizacion de Activos | 3.875% | 5/23/25 | EUR | 7,000 | 9,952 |
| | Cedulas TDA 6 Fondo de Titulizacion de Activos | 4.250% | 4/10/31 | EUR | 3,000 | 4,208 |
| | IM Cedulas 10 | 4.500% | 2/21/22 | EUR | 1,300 | 1,985 |
| | IM Cedulas 6-M1 - Fondo de Titulizacion | 3.500% | 12/2/15 | EUR | 3,500 | 5,018 |
| | Kutxabank SA | 3.000% | 2/1/17 | EUR | 2,500 | 3,654 |
| | Santander Consumer Finance SA | 3.875% | 3/23/16 | EUR | 1,400 | 2,047 |
| | | | | | | 204,758 |
| Corporate Bonds (0.5%) | | | | | |
| | Abertis Infraestructuras SA | 3.750% | 6/20/23 | EUR | 1,000 | 1,516 |
| | Abertis Infraestructuras SA | 4.750% | 10/25/19 | EUR | 3,500 | 5,612 |
| | Bankinter SA | 4.125% | 3/22/17 | EUR | 1,500 | 2,263 |
| | BBVA Senior Finance SAU | 3.250% | 3/21/16 | EUR | 5,000 | 7,222 |
| | BBVA Senior Finance SAU | 3.750% | 1/17/18 | EUR | 3,500 | 5,251 |
| | CaixaBank SA | 2.500% | 4/18/17 | EUR | 3,000 | 4,299 |
| | Ferrovial Emisiones SA | 3.375% | 6/7/21 | EUR | 700 | 1,036 |
| | Gas Natural Capital Markets SA | 5.375% | 5/24/19 | EUR | 2,600 | 4,278 |
| | Gas Natural Capital Markets SA | 5.625% | 2/9/17 | EUR | 3,000 | 4,681 |
| | Gas Natural Fenosa Finance BV | 2.875% | 3/11/24 | EUR | 1,000 | 1,422 |
| | Gas Natural Fenosa Finance BV | 3.875% | 4/11/22 | EUR | 2,000 | 3,112 |
| | Iberdrola Finanzas SAU | 4.750% | 1/25/16 | EUR | 2,500 | 3,702 |
| | Iberdrola International BV | 3.500% | 2/1/21 | EUR | 3,000 | 4,567 |
| | Iberdrola International BV | 4.250% | 10/11/18 | EUR | 1,000 | 1,558 |
| | Iberdrola International BV | 4.500% | 9/21/17 | EUR | 600 | 925 |
| 2 | Iberdrola International BV | 5.750% | 2/27/49 | EUR | 1,000 | 1,495 |
| | Red Electrica Financiaciones SA Unipersonal | 2.375% | 5/31/19 | EUR | 800 | 1,161 |
| | Red Electrica Financiaciones SA Unipersonal | 3.500% | 10/7/16 | EUR | 2,500 | 3,681 |
| | Red Electrica Financiaciones SA Unipersonal | 4.875% | 4/29/20 | EUR | 2,000 | 3,275 |
| | Repsol International Finance BV | 2.625% | 5/28/20 | EUR | 3,500 | 5,053 |
| | Repsol International Finance BV | 4.250% | 2/12/16 | EUR | 3,500 | 5,138 |
| | Santander Consumer Finance SA | 1.450% | 1/29/16 | EUR | 7,000 | 9,772 |
| | Santander International Debt SAU | 4.000% | 3/27/17 | EUR | 1,000 | 1,493 |
| | Santander International Debt SAU | 4.000% | 1/24/20 | EUR | 3,500 | 5,456 |
| | Santander International Debt SAU | 4.625% | 3/21/16 | EUR | 4,000 | 5,913 |
| | Telefonica Emisiones SAU | 2.736% | 5/29/19 | EUR | 6,000 | 8,801 |
| | Telefonica Emisiones SAU | 3.987% | 1/23/23 | EUR | 4,300 | 6,636 |
| | Telefonica Emisiones SAU | 4.375% | 2/2/16 | EUR | 7,000 | 10,294 |
| | Telefonica Emisiones SAU | 4.693% | 11/11/19 | EUR | 2,000 | 3,202 |
| | Telefonica Emisiones SAU | 5.289% | 12/9/22 | GBP | 1,000 | 1,834 |
| | | | | | | 124,648 |
| Sovereign Bonds (4.1%) | | | | | |
| | Autonomous Community of Madrid Spain | 4.300% | 9/15/26 | EUR | 4,800 | 7,015 |
| | Autonomous Community of Madrid Spain | 4.622% | 6/23/15 | EUR | 2,250 | 3,254 |
| | Autonomous Community of Madrid Spain | 4.688% | 3/12/20 | EUR | 2,000 | 3,132 |
| 14 | FADE - Fondo de Amortizacion | | | | | |
| | del Deficit Electrico | 2.875% | 9/17/16 | EUR | 5,000 | 7,240 |
| 14 | FADE - Fondo de Amortizacion | | | | | |
| | del Deficit Electrico | 3.375% | 3/17/19 | EUR | 7,000 | 10,426 |
| 14 | FADE - Fondo de Amortizacion | | | | | |
| | del Deficit Electrico | 3.875% | 3/17/18 | EUR | 2,000 | 3,022 |
47
| | | | | | |
| Total International Bond Index Fund | | | | | |
| |
| |
| |
| | | | | | Face | Market |
| | | | Maturity | | Amount | Value |
| | | Coupon | Date | Currency | (000) | ($000) |
| 14 | FADE - Fondo de Amortizacion | | | | | |
| | del Deficit Electrico | 4.000% | 12/17/15 | EUR | 3,000 | 4,373 |
| 14 | FADE - Fondo de Amortizacion | | | | | |
| | del Deficit Electrico | 5.900% | 3/17/21 | EUR | 2,000 | 3,384 |
| 14 | Instituto de Credito Oficial | 2.375% | 10/31/15 | EUR | 10,000 | 14,188 |
| 14 | Instituto de Credito Oficial | 4.125% | 9/28/17 | EUR | 3,000 | 4,547 |
| | Instituto de Credito Oficial | 4.500% | 3/17/16 | EUR | 3,000 | 4,438 |
| 14 | Instituto de Credito Oficial | 4.750% | 4/30/20 | EUR | 9,000 | 14,352 |
| 14 | Instituto de Credito Oficial | 5.000% | 7/5/16 | EUR | 2,000 | 3,013 |
| 14 | Instituto de Credito Oficial | 5.125% | 1/25/16 | EUR | 11,000 | 16,365 |
| | Kingdom of Spain | 2.100% | 4/30/17 | EUR | 3,000 | 4,287 |
| | Kingdom of Spain | 2.750% | 4/30/19 | EUR | 30,000 | 43,753 |
| | Kingdom of Spain | 3.150% | 1/31/16 | EUR | 10,000 | 14,462 |
| | Kingdom of Spain | 3.250% | 4/30/16 | EUR | 20,000 | 29,108 |
| | Kingdom of Spain | 3.300% | 7/30/16 | EUR | 16,000 | 23,402 |
| | Kingdom of Spain | 3.750% | 10/31/15 | EUR | 26,000 | 37,713 |
| | Kingdom of Spain | 3.750% | 10/31/18 | EUR | 23,000 | 34,929 |
| 1 | Kingdom of Spain | 3.800% | 4/30/24 | EUR | 11,000 | 16,289 |
| | Kingdom of Spain | 3.800% | 1/31/17 | EUR | 25,000 | 37,318 |
| | Kingdom of Spain | 4.000% | 7/30/15 | EUR | 25,000 | 36,109 |
| | Kingdom of Spain | 4.000% | 4/30/20 | EUR | 18,000 | 27,840 |
| | Kingdom of Spain | 4.100% | 7/30/18 | EUR | 8,000 | 12,302 |
| | Kingdom of Spain | 4.200% | 1/31/37 | EUR | 15,000 | 21,748 |
| | Kingdom of Spain | 4.250% | 10/31/16 | EUR | 20,000 | 30,017 |
| | Kingdom of Spain | 4.300% | 10/31/19 | EUR | 10,000 | 15,662 |
| 1 | Kingdom of Spain | 4.400% | 10/31/23 | EUR | 23,000 | 35,718 |
| | Kingdom of Spain | 4.500% | 1/31/18 | EUR | 26,000 | 40,217 |
| | Kingdom of Spain | 4.600% | 7/30/19 | EUR | 30,000 | 47,565 |
| | Kingdom of Spain | 4.650% | 7/30/25 | EUR | 10,000 | 15,776 |
| | Kingdom of Spain | 4.700% | 7/30/41 | EUR | 12,000 | 18,515 |
| | Kingdom of Spain | 4.800% | 1/31/24 | EUR | 20,000 | 32,007 |
| | Kingdom of Spain | 4.850% | 10/31/20 | EUR | 14,000 | 22,591 |
| | Kingdom of Spain | 4.900% | 7/30/40 | EUR | 7,000 | 11,148 |
| 1 | Kingdom of Spain | 5.150% | 10/31/28 | EUR | 14,000 | 22,852 |
| 1 | Kingdom of Spain | 5.150% | 10/31/44 | EUR | 9,000 | 14,712 |
| 1 | Kingdom of Spain | 5.400% | 1/31/23 | EUR | 30,000 | 49,909 |
| | Kingdom of Spain | 5.500% | 7/30/17 | EUR | 15,000 | 23,667 |
| | Kingdom of Spain | 5.500% | 4/30/21 | EUR | 21,000 | 35,118 |
| | Kingdom of Spain | 5.750% | 7/30/32 | EUR | 20,000 | 35,240 |
| | Kingdom of Spain | 5.850% | 1/31/22 | EUR | 10,000 | 17,068 |
| | Kingdom of Spain | 5.900% | 7/30/26 | EUR | 10,000 | 17,423 |
| | Kingdom of Spain | 6.000% | 1/31/29 | EUR | 10,000 | 17,680 |
| | | | | | | 940,894 |
| Total Spain (Cost $1,143,153) | | | | | 1,270,300 |
| Supranational (3.1%) | | | | | |
| Sovereign Bonds (3.1%) | | | | | |
| | African Development Bank | 0.500% | 6/22/15 | CAD | 1,550 | 1,397 |
| | Asian Development Bank | 0.000% | 2/7/16 | CHF | 2,000 | 2,268 |
| | Asian Development Bank | 1.000% | 12/15/16 | GBP | 1,500 | 2,519 |
| | Asian Development Bank | 3.500% | 7/25/18 | AUD | 8,850 | 8,210 |
| | Council Of Europe Development Bank | 1.125% | 10/22/18 | EUR | 5,000 | 7,049 |
| | Council Of Europe Development Bank | 1.750% | 12/19/16 | GBP | 1,000 | 1,711 |
| | Council Of Europe Development Bank | 3.000% | 7/13/20 | EUR | 1,000 | 1,536 |
| | EUROFIMA | 3.000% | 5/15/26 | CHF | 4,500 | 6,015 |
48
Total International Bond Index Fund
| | | | | | |
| | | | | | Face | Market |
| | | | Maturity | | Amount | Value |
| | | Coupon | Date | Currency | (000) | ($000) |
| | EUROFIMA | 4.550% | 3/30/27 | CAD | 655 | 617 |
| | European Bank for Reconstruction | | | | | |
| | & Development | 5.625% | 12/7/28 | GBP | 1,000 | 2,099 |
| 15 | European Financial Stability Facility | 0.500% | 3/7/16 | EUR | 3,000 | 4,184 |
| 15 | European Financial Stability Facility | 0.750% | 6/5/17 | EUR | 2,500 | 3,494 |
| 15 | European Financial Stability Facility | 0.875% | 4/16/18 | EUR | 20,000 | 27,884 |
| 15 | European Financial Stability Facility | 1.125% | 6/1/15 | EUR | 13,000 | 18,213 |
| 15 | European Financial Stability Facility | 1.125% | 11/30/17 | EUR | 5,000 | 7,054 |
| 15 | European Financial Stability Facility | 1.250% | 2/5/18 | EUR | 5,000 | 7,079 |
| 15 | European Financial Stability Facility | 1.500% | 1/22/20 | EUR | 7,600 | 10,742 |
| 15 | European Financial Stability Facility | 1.625% | 9/15/17 | EUR | 2,500 | 3,588 |
| 15 | European Financial Stability Facility | 1.625% | 7/17/20 | EUR | 16,000 | 22,688 |
| 15 | European Financial Stability Facility | 1.875% | 5/23/23 | EUR | 15,000 | 20,993 |
| 15 | European Financial Stability Facility | 2.250% | 9/5/22 | EUR | 3,000 | 4,357 |
| 15 | European Financial Stability Facility | 2.625% | 5/2/19 | EUR | 10,000 | 14,976 |
| 15 | European Financial Stability Facility | 2.750% | 7/18/16 | EUR | 5,000 | 7,313 |
| 15 | European Financial Stability Facility | 3.000% | 9/4/34 | EUR | 5,000 | 7,408 |
| 15 | European Financial Stability Facility | 3.375% | 7/5/21 | EUR | 1,675 | 2,635 |
| 15 | European Financial Stability Facility | 3.375% | 4/3/37 | EUR | 3,000 | 4,743 |
| 15 | European Financial Stability Facility | 3.875% | 3/30/32 | EUR | 5,000 | 8,293 |
| | European Investment Bank | 1.000% | 7/13/18 | EUR | 13,700 | 19,271 |
| | European Investment Bank | 1.250% | 8/2/19 | CHF | 3,000 | 3,552 |
| | European Investment Bank | 1.375% | 1/15/18 | GBP | 8,100 | 13,487 |
| | European Investment Bank | 1.375% | 9/15/20 | EUR | 4,000 | 5,602 |
| | European Investment Bank | 1.375% | 9/15/21 | EUR | 2,000 | 2,765 |
| | European Investment Bank | 1.400% | 6/20/17 | JPY | 1,100,000 | 11,193 |
| | European Investment Bank | 1.500% | 2/1/19 | GBP | 5,000 | 8,224 |
| | European Investment Bank | 1.500% | 4/15/21 | EUR | 10,000 | 14,024 |
| | European Investment Bank | 1.750% | 4/21/17 | CHF | 2,000 | 2,380 |
| | European Investment Bank | 2.000% | 4/14/23 | EUR | 5,000 | 7,094 |
| 1 | European Investment Bank | 2.125% | 2/4/19 | CAD | 2,000 | 1,820 |
| | European Investment Bank | 2.125% | 1/15/24 | EUR | 7,000 | 9,968 |
| | European Investment Bank | 2.250% | 10/14/22 | EUR | 7,000 | 10,183 |
| | European Investment Bank | 2.375% | 7/10/20 | CHF | 2,500 | 3,154 |
| | European Investment Bank | 2.500% | 7/22/15 | CHF | 2,000 | 2,356 |
| | European Investment Bank | 2.500% | 10/31/22 | GBP | 5,500 | 9,010 |
| | European Investment Bank | 2.625% | 3/15/18 | EUR | 5,000 | 7,477 |
| | European Investment Bank | 2.750% | 3/15/40 | EUR | 4,250 | 6,078 |
| | European Investment Bank | 3.000% | 12/7/15 | GBP | 1,000 | 1,745 |
| | European Investment Bank | 3.000% | 10/14/33 | EUR | 5,000 | 7,395 |
| | European Investment Bank | 3.125% | 10/15/15 | EUR | 8,000 | 11,562 |
| | European Investment Bank | 3.125% | 6/30/36 | CHF | 1,000 | 1,418 |
| | European Investment Bank | 3.500% | 4/15/16 | EUR | 15,000 | 22,117 |
| | European Investment Bank | 3.500% | 4/15/27 | EUR | 5,000 | 7,923 |
| | European Investment Bank | 3.750% | 12/7/27 | GBP | 3,800 | 6,614 |
| | European Investment Bank | 3.875% | 6/8/37 | GBP | 3,300 | 5,677 |
| | European Investment Bank | 4.000% | 7/12/16 | SEK | 25,000 | 4,079 |
| | European Investment Bank | 4.000% | 4/15/30 | EUR | 7,000 | 11,659 |
| | European Investment Bank | 4.000% | 10/15/37 | EUR | 5,000 | 8,625 |
| | European Investment Bank | 4.250% | 5/19/17 | NOK | 20,000 | 3,565 |
| | European Investment Bank | 4.375% | 7/8/15 | GBP | 5,400 | 9,508 |
| | European Investment Bank | 4.500% | 10/15/25 | EUR | 15,000 | 25,960 |
| | European Investment Bank | 4.625% | 4/15/20 | EUR | 20,000 | 33,292 |
| | European Investment Bank | 4.625% | 10/12/54 | GBP | 200 | 400 |
| | European Investment Bank | 4.750% | 10/15/17 | EUR | 20,000 | 31,770 |
| | European Investment Bank | 5.000% | 12/1/20 | SEK | 25,000 | 4,465 |
49
| | | | | |
| Total International Bond Index Fund | | | | | |
| |
| |
| |
| | | | | Face | Market |
| | | Maturity | | Amount | Value |
| | Coupon | Date | Currency | (000) | ($000) |
| European Investment Bank | 5.000% | 4/15/39 | GBP | 2,000 | 4,040 |
| European Investment Bank | 6.000% | 8/6/20 | AUD | 12,000 | 12,303 |
| European Investment Bank | 6.000% | 12/7/28 | GBP | 1,000 | 2,152 |
| European Investment Bank | 6.500% | 8/7/19 | AUD | 8,000 | 8,346 |
| European Stability Mechanism | 1.250% | 10/15/18 | EUR | 15,000 | 21,254 |
| European Stability Mechanism | 2.125% | 11/20/23 | EUR | 3,000 | 4,303 |
| European Union | 2.375% | 10/4/18 | EUR | 5,000 | 7,453 |
| European Union | 2.500% | 12/4/15 | EUR | 18,000 | 25,874 |
| European Union | 2.750% | 9/21/21 | EUR | 5,000 | 7,602 |
| European Union | 2.875% | 4/4/28 | EUR | 5,000 | 7,465 |
| European Union | 3.000% | 9/4/26 | EUR | 7,000 | 10,676 |
| European Union | 3.375% | 4/4/32 | EUR | 3,000 | 4,741 |
| European Union | 3.375% | 4/4/38 | EUR | 2,000 | 3,185 |
| European Union | 3.500% | 6/4/21 | EUR | 5,000 | 7,951 |
| European Union | 3.625% | 4/6/16 | EUR | 2,000 | 2,954 |
| European Union | 3.750% | 4/4/42 | EUR | 3,000 | 5,111 |
| Inter-American Development Bank | 0.625% | 12/15/15 | GBP | 5,000 | 8,423 |
| International Bank for Reconstruction | | | | | |
| & Development | 1.250% | 10/2/17 | GBP | 5,000 | 8,375 |
| International Bank for Reconstruction | | | | | |
| & Development | 3.875% | 5/20/19 | EUR | 6,000 | 9,577 |
| International Bank for Reconstruction | | | | | |
| & Development | 5.400% | 6/7/21 | GBP | 200 | 403 |
| International Bank for Reconstruction | | | | | |
| & Development | 5.750% | 10/21/19 | AUD | 7,000 | 7,128 |
| International Bank for Reconstruction | | | | | |
| & Development | 5.750% | 6/7/32 | GBP | 1,000 | 2,224 |
| International Finance Corp. | 0.625% | 12/15/15 | GBP | 3,000 | 5,056 |
| Nordic Investment Bank | 2.125% | 8/9/17 | NOK | 10,000 | 1,688 |
| Total Supranational (Cost $685,866) | | | | | 722,761 |
| Sweden (1.7%) | | | | | |
| Asset-Backed/Commercial Mortgage-Backed Securities (0.7%) | | | | |
| Lansforsakringar Hypotek AB | 4.000% | 3/15/16 | SEK | 40,000 | 6,490 |
| Nordea Hypotek AB | 2.000% | 6/20/18 | SEK | 40,000 | 6,221 |
| Nordea Hypotek AB | 3.000% | 6/21/17 | SEK | 51,000 | 8,228 |
| Nordea Hypotek AB | 3.250% | 6/17/15 | SEK | 73,000 | 11,527 |
| Skandinaviska Enskilda Banken AB | 1.500% | 2/25/20 | EUR | 5,000 | 7,094 |
| Skandinaviska Enskilda Banken AB | 2.500% | 6/17/15 | EUR | 2,000 | 2,841 |
| Skandinaviska Enskilda Banken AB | 3.000% | 6/21/17 | SEK | 50,000 | 7,956 |
| Skandinaviska Enskilda Banken AB | 3.000% | 6/20/18 | SEK | 125,000 | 20,246 |
| Skandinaviska Enskilda Banken AB | 4.250% | 6/15/16 | SEK | 50,000 | 8,233 |
| Stadshypotek AB | 1.000% | 6/19/18 | EUR | 5,000 | 7,000 |
| Stadshypotek AB | 3.000% | 3/21/18 | SEK | 65,000 | 10,557 |
| Stadshypotek AB | 3.000% | 12/19/18 | SEK | 50,000 | 8,041 |
| Stadshypotek AB | 6.000% | 9/21/16 | SEK | 50,000 | 8,592 |
| Sveriges Sakerstallda Obligationer AB | 3.250% | 3/30/17 | EUR | 1,200 | 1,793 |
| Sveriges Sakerstallda Obligationer AB | 3.375% | 4/20/16 | EUR | 3,000 | 4,399 |
| Sveriges Sakerstallda Obligationer AB | 4.000% | 9/21/16 | SEK | 40,000 | 6,569 |
| Swedbank Hypotek AB | 1.125% | 5/7/20 | EUR | 5,000 | 6,935 |
| Swedbank Hypotek AB | 2.500% | 6/15/15 | EUR | 2,000 | 2,840 |
| Swedbank Hypotek AB | 3.750% | 6/15/16 | SEK | 75,000 | 12,188 |
| Swedbank Hypotek AB | 3.750% | 3/15/17 | SEK | 75,000 | 12,352 |
| Swedbank Hypotek AB | 3.750% | 12/20/17 | SEK | 40,000 | 6,643 |
| | | | | | 166,745 |
50
| | | | | |
| Total International Bond Index Fund | | | | | |
| |
| |
| |
| | | | | Face | Market |
| | | Maturity | | Amount | Value |
| | Coupon | Date | Currency | (000) | ($000) |
| Corporate Bonds (0.4%) | | | | | |
| Atlas Copco AB | 2.500% | 2/28/23 | EUR | 1,500 | 2,159 |
| Investor AB | 4.000% | 3/14/16 | EUR | 1,000 | 1,472 |
| Investor AB | 4.500% | 5/12/23 | EUR | 2,000 | 3,294 |
| Nordea Bank AB | 0.875% | 9/25/18 | CHF | 1,000 | 1,153 |
| Nordea Bank AB | 3.625% | 2/11/16 | EUR | 5,000 | 7,320 |
| Nordea Bank AB | 3.750% | 2/24/17 | EUR | 2,000 | 3,002 |
| Nordea Bank AB | 3.875% | 12/15/15 | GBP | 600 | 1,057 |
| Nordea Bank AB | 4.000% | 6/29/20 | EUR | 8,743 | 13,821 |
| Nordea Bank AB | 4.500% | 3/26/20 | EUR | 2,000 | 3,152 |
| 2 Nordea Bank AB | 4.625% | 2/15/22 | EUR | 500 | 752 |
| Skandinaviska Enskilda Banken AB | 1.875% | 11/14/19 | EUR | 2,620 | 3,716 |
| 2 Skandinaviska Enskilda Banken AB | 4.000% | 9/12/22 | EUR | 3,500 | 5,216 |
| 2 Skandinaviska Enskilda Banken AB | 7.092% | 12/29/49 | EUR | 500 | 797 |
| Svenska Cellulosa AB | 2.500% | 6/9/23 | EUR | 700 | 995 |
| Svenska Handelsbanken AB | 1.500% | 7/6/15 | EUR | 2,000 | 2,809 |
| Svenska Handelsbanken AB | 2.250% | 6/14/18 | EUR | 2,500 | 3,625 |
| Svenska Handelsbanken AB | 2.250% | 8/27/20 | EUR | 5,000 | 7,211 |
| Svenska Handelsbanken AB | 3.750% | 2/24/17 | EUR | 2,500 | 3,751 |
| Svenska Handelsbanken AB | 4.000% | 1/18/19 | GBP | 1,000 | 1,799 |
| Svenska Handelsbanken AB | 4.375% | 10/20/21 | EUR | 180 | 294 |
| Swedbank AB | 1.750% | 6/18/15 | EUR | 3,500 | 4,923 |
| Swedbank AB | 2.375% | 4/4/16 | EUR | 2,000 | 2,868 |
| Swedish Match AB | 3.875% | 11/24/17 | EUR | 500 | 752 |
| Telefonaktiebolaget LM Ericsson | 5.375% | 6/27/17 | EUR | 1,000 | 1,569 |
| TeliaSonera AB | 3.875% | 10/1/25 | EUR | 2,000 | 3,116 |
| TeliaSonera AB | 4.750% | 11/16/21 | EUR | 3,000 | 4,981 |
| Volvo Treasury AB | 5.000% | 5/31/17 | EUR | 600 | 927 |
| | | | | | 86,531 |
| Sovereign Bonds (0.6%) | | | | | |
| Kingdom of Sweden | 0.875% | 1/31/18 | EUR | 3,000 | 4,219 |
| Kingdom of Sweden | 1.500% | 11/13/23 | SEK | 128,900 | 19,013 |
| Kingdom of Sweden | 2.250% | 6/1/32 | SEK | 20,000 | 2,961 |
| Kingdom of Sweden | 3.000% | 7/12/16 | SEK | 50,000 | 8,080 |
| Kingdom of Sweden | 3.500% | 6/1/22 | SEK | 15,000 | 2,603 |
| Kingdom of Sweden | 3.500% | 3/30/39 | SEK | 35,000 | 6,179 |
| Kingdom of Sweden | 3.750% | 8/12/17 | SEK | 70,000 | 11,753 |
| Kingdom of Sweden | 4.250% | 3/12/19 | SEK | 147,000 | 25,801 |
| Kingdom of Sweden | 4.500% | 8/12/15 | SEK | 21,400 | 3,455 |
| Kingdom of Sweden | 5.000% | 12/1/20 | SEK | 64,000 | 11,951 |
| Kommuninvest I Sverige AB | 2.750% | 8/12/15 | SEK | 20,000 | 3,138 |
| Kommuninvest I Sverige AB | 4.000% | 8/12/17 | SEK | 35,000 | 5,789 |
| SBAB Bank AB | 1.375% | 5/2/18 | EUR | 3,600 | 5,039 |
| Svensk Exportkredit AB | 1.125% | 12/15/16 | GBP | 500 | 840 |
| Svensk Exportkredit AB | 1.125% | 11/20/18 | EUR | 5,000 | 7,002 |
| 2 Vattenfall AB | 5.250% | 6/29/49 | EUR | 1,000 | 1,438 |
| Vattenfall AB | 6.125% | 12/16/19 | GBP | 1,000 | 1,980 |
| Vattenfall AB | 6.250% | 3/17/21 | EUR | 2,000 | 3,543 |
| Vattenfall AB | 6.750% | 1/31/19 | EUR | 1,000 | 1,724 |
| Vattenfall AB | 6.875% | 4/15/39 | GBP | 500 | 1,130 |
| | | | | | 127,638 |
| Total Sweden (Cost $369,046) | | | | | 380,914 |
51
| | | | | |
| Total International Bond Index Fund | | | | | |
| |
| |
| |
| | | | | Face | Market |
| | | Maturity | | Amount | Value |
| | Coupon | Date | Currency | (000) | ($000) |
| Switzerland (1.4%) | | | | | |
| Asset-Backed/Commercial Mortgage-Backed Securities (0.4%) | | | | |
| Credit Suisse AG | 1.750% | 1/15/21 | EUR | 2,000 | 2,847 |
| Credit Suisse AG | 2.625% | 12/1/15 | EUR | 5,000 | 7,177 |
| Credit Suisse AG | 2.875% | 10/18/18 | EUR | 500 | 755 |
| Pfandbriefbank der schweizerischen | | | | | |
| Hypothekarinstitute AG | 0.875% | 8/13/19 | CHF | 5,000 | 5,815 |
| Pfandbriefbank der schweizerischen | | | | | |
| Hypothekarinstitute AG | 1.000% | 8/13/21 | CHF | 14,000 | 16,111 |
| Pfandbriefbank der schweizerischen | | | | | |
| Hypothekarinstitute AG | 1.500% | 8/2/33 | CHF | 1,000 | 1,084 |
| Pfandbriefbank der schweizerischen | | | | | |
| Hypothekarinstitute AG | 1.625% | 3/15/22 | CHF | 2,000 | 2,377 |
| Pfandbriefbank der schweizerischen | | | | | |
| Hypothekarinstitute AG | 1.625% | 7/3/30 | CHF | 2,000 | 2,242 |
| Pfandbriefbank der schweizerischen | | | | | |
| Hypothekarinstitute AG | 1.875% | 9/28/15 | CHF | 1,000 | 1,165 |
| Pfandbriefbank der schweizerischen | | | | | |
| Hypothekarinstitute AG | 2.375% | 1/27/21 | CHF | 5,000 | 6,301 |
| Pfandbriefbank der schweizerischen | | | | | |
| Hypothekarinstitute AG | 2.500% | 3/30/26 | CHF | 1,000 | 1,273 |
| Pfandbriefbank der schweizerischen | | | | | |
| Hypothekarinstitute AG | 2.500% | 2/16/27 | CHF | 2,000 | 2,522 |
| Pfandbriefbank der schweizerischen | | | | | |
| Hypothekarinstitute AG | 2.750% | 12/15/26 | CHF | 3,000 | 3,910 |
| Pfandbriefbank der schweizerischen | | | | | |
| Hypothekarinstitute AG | 2.875% | 2/14/22 | CHF | 3,000 | 3,907 |
| Pfandbriefbank der schweizerischen | | | | | |
| Hypothekarinstitute AG | 3.000% | 6/27/17 | CHF | 1,000 | 1,237 |
| Pfandbriefzentrale der schweizerischen | | | | | |
| Kantonalbanken AG | 0.875% | 12/3/18 | CHF | 800 | 931 |
| Pfandbriefzentrale der schweizerischen | | | | | |
| Kantonalbanken AG | 0.875% | 4/16/21 | CHF | 2,000 | 2,291 |
| Pfandbriefzentrale der schweizerischen | | | | | |
| Kantonalbanken AG | 1.000% | 9/9/22 | CHF | 8,500 | 9,666 |
| Pfandbriefzentrale der schweizerischen | | | | | |
| Kantonalbanken AG | 1.250% | 2/3/22 | CHF | 4,000 | 4,667 |
| Pfandbriefzentrale der schweizerischen | | | | | |
| Kantonalbanken AG | 1.375% | 11/5/27 | CHF | 3,000 | 3,330 |
| Pfandbriefzentrale der schweizerischen | | | | | |
| Kantonalbanken AG | 1.750% | 4/12/17 | CHF | 1,000 | 1,188 |
| Pfandbriefzentrale der schweizerischen | | | | | |
| Kantonalbanken AG | 2.500% | 6/30/15 | CHF | 1,380 | 1,611 |
| Pfandbriefzentrale der schweizerischen | | | | | |
| Kantonalbanken AG | 3.500% | 6/21/18 | CHF | 500 | 643 |
| UBS AG | 2.250% | 1/10/17 | EUR | 6,000 | 8,705 |
| | | | | | 91,755 |
| Corporate Bonds (0.4%) | | | | | |
| ABB Finance BV | 2.625% | 3/26/19 | EUR | 1,000 | 1,474 |
| 2 Aquarius and Investments plc | | | | | |
| for Zurich Insurance Co. Ltd. | 4.250% | 10/2/43 | EUR | 1,310 | 1,942 |
| 2 Cloverie plc for Swiss Reinsurance Co. Ltd. | 6.625% | 9/1/42 | EUR | 1,000 | 1,743 |
| Coca-Cola HBC Finance BV | 2.375% | 6/18/20 | EUR | 500 | 711 |
| Credit Suisse AG | 2.875% | 9/24/15 | EUR | 7,500 | 10,730 |
| Credit Suisse AG | 4.750% | 8/5/19 | EUR | 1,000 | 1,624 |
| Flughafen Zuerich AG | 1.500% | 4/17/23 | CHF | 3,000 | 3,447 |
52
| | | | | |
| Total International Bond Index Fund | | | | | |
| |
| |
| |
| | | | | Face | Market |
| | | Maturity | | Amount | Value |
| | Coupon | Date | Currency | (000) | ($000) |
| Glencore Finance Europe SA | 2.625% | 12/3/18 | CHF | 1,000 | 1,199 |
| Glencore Finance Europe SA | 4.625% | 4/3/18 | EUR | 2,500 | 3,846 |
| Glencore Finance Europe SA | 6.500% | 2/27/19 | GBP | 300 | 577 |
| Holcim GB Finance Ltd. | 8.750% | 4/24/17 | GBP | 550 | 1,099 |
| Holcim Ltd. | 3.000% | 11/22/22 | CHF | 3,000 | 3,748 |
| Holcim Overseas Finance Ltd. | 3.375% | 6/10/21 | CHF | 2,000 | 2,568 |
| LGT Bank AG | 1.500% | 5/10/21 | CHF | 1,000 | 1,178 |
| Nestle Finance International Ltd. | 0.750% | 10/17/16 | EUR | 2,000 | 2,798 |
| Nestle Finance International Ltd. | 1.750% | 9/12/22 | EUR | 1,100 | 1,531 |
| Nestle Finance International Ltd. | 2.250% | 11/30/23 | GBP | 600 | 947 |
| Pfandbriefzentrale der Schweizerischen | | | | | |
| Kantonalbanken AG | 1.000% | 2/17/21 | CHF | 2,000 | 2,322 |
| Roche Finance Europe BV | 2.000% | 6/25/18 | EUR | 1,000 | 1,453 |
| Roche Finance Europe BV | 5.375% | 8/29/23 | GBP | 1,000 | 1,989 |
| Roche Kapitalmarkt AG | 4.500% | 3/23/17 | CHF | 5,000 | 6,398 |
| Swiss Reinsurance Co. Ltd. | 2.125% | 9/22/17 | CHF | 2,000 | 2,398 |
| 2 Swiss Reinsurance Co. via ELM BV | 5.252% | 5/29/49 | EUR | 250 | 365 |
| 2 Swiss Reinsurance Co. via ELM BV | 6.302% | 3/29/49 | GBP | 500 | 924 |
| UBS AG | 3.125% | 1/18/16 | EUR | 5,000 | 7,236 |
| UBS AG | 3.500% | 7/15/15 | EUR | 470 | 675 |
| 2 UBS AG | 5.250% | 6/21/21 | GBP | 450 | 806 |
| UBS AG | 6.375% | 7/20/16 | GBP | 750 | 1,398 |
| UBS AG | 6.625% | 4/11/18 | GBP | 1,250 | 2,455 |
| 2 UBS AG | 7.152% | 12/29/49 | EUR | 1,000 | 1,579 |
| Willow No.2 Ireland plc | | | | | |
| for Zurich Insurance Co. Ltd. | 3.375% | 6/27/22 | EUR | 1,000 | 1,513 |
| Xstrata Canada Financial Corp. | 6.250% | 5/27/15 | EUR | 4,000 | 5,852 |
| Xstrata Canada Financial Corp. | 7.375% | 5/27/20 | GBP | 850 | 1,714 |
| Xstrata Finance Canada Ltd. | 5.250% | 6/13/17 | EUR | 2,250 | 3,483 |
| Xstrata Finance Dubai Ltd. | 2.625% | 11/19/18 | EUR | 2,500 | 3,588 |
| 2 Zurich Insurance Co. Ltd. | 4.625% | 5/29/49 | CHF | 3,000 | 3,633 |
| | | | | | 90,943 |
| Sovereign Bonds (0.6%) | | | | | |
| Canton of Zurich | 0.500% | 12/3/20 | CHF | 2,595 | 2,945 |
| Canton of Zurich | 2.375% | 2/3/16 | CHF | 1,000 | 1,181 |
| Swiss Confederation | 1.250% | 6/11/24 | CHF | 3,000 | 3,541 |
| Swiss Confederation | 1.250% | 6/27/37 | CHF | 5,000 | 5,502 |
| Swiss Confederation | 1.500% | 7/24/25 | CHF | 4,500 | 5,419 |
| Swiss Confederation | 1.500% | 4/30/42 | CHF | 9,200 | 10,626 |
| Swiss Confederation | 2.000% | 10/12/16 | CHF | 2,100 | 2,505 |
| 4 Swiss Confederation | 2.000% | 4/28/21 | CHF | 8,200 | 10,338 |
| Swiss Confederation | 2.000% | 5/25/22 | CHF | 1,000 | 1,262 |
| Swiss Confederation | 2.250% | 6/22/31 | CHF | 3,500 | 4,552 |
| Swiss Confederation | 2.500% | 3/12/16 | CHF | 21,000 | 25,006 |
| Swiss Confederation | 3.000% | 1/8/18 | CHF | 15,100 | 19,021 |
| Swiss Confederation | 3.000% | 5/12/19 | CHF | 1,000 | 1,299 |
| Swiss Confederation | 3.250% | 6/27/27 | CHF | 8,000 | 11,485 |
| Swiss Confederation | 3.500% | 4/8/33 | CHF | 1,600 | 2,463 |
| Swiss Confederation | 3.750% | 6/10/15 | CHF | 10,831 | 12,823 |
| Swiss Confederation | 4.250% | 6/5/17 | CHF | 17,000 | 21,842 |
| Swisscom AG | 1.750% | 7/10/24 | CHF | 2,000 | 2,376 |
| Swisscom AG | 2.625% | 8/31/22 | CHF | 1,000 | 1,263 |
| Zuercher Kantonalbank | 2.125% | 2/5/18 | CHF | 3,500 | 4,260 |
| | | | | | 149,709 |
| Total Switzerland (Cost $311,103) | | | | | 332,407 |
53
| | | | | |
| Total International Bond Index Fund | | | | | |
| |
| |
| |
| | | | | Face | Market |
| | | Maturity | | Amount | Value |
| | Coupon | Date | Currency | (000) | ($000) |
| Thailand (0.5%) | | | | | |
| Sovereign Bonds (0.5%) | | | | | |
| Kingdom of Thailand | 3.250% | 6/16/17 | THB | 500,000 | 15,816 |
| Kingdom of Thailand | 3.580% | 12/17/27 | THB | 277,000 | 8,313 |
| Kingdom of Thailand | 3.625% | 5/22/15 | THB | 800,000 | 25,128 |
| Kingdom of Thailand | 3.625% | 6/16/23 | THB | 400,000 | 12,454 |
| Kingdom of Thailand | 3.650% | 12/17/21 | THB | 200,000 | 6,290 |
| Kingdom of Thailand | 3.775% | 6/25/32 | THB | 100,000 | 2,956 |
| Kingdom of Thailand | 3.800% | 6/14/41 | THB | 150,000 | 4,291 |
| Kingdom of Thailand | 3.875% | 6/13/19 | THB | 850,000 | 27,310 |
| Kingdom of Thailand | 4.875% | 6/22/29 | THB | 100,000 | 3,412 |
| Total Thailand (Cost $110,852) | | | | | 105,970 |
| Turkey (0.3%) | | | | | |
| Sovereign Bonds (0.3%) | | | | | |
| Republic of Turkey | 4.125% | 4/11/23 | EUR | 1,400 | 1,980 |
| Republic of Turkey | 4.350% | 11/12/21 | EUR | 2,100 | 3,056 |
| Republic of Turkey | 5.000% | 3/1/16 | EUR | 1,000 | 1,470 |
| Republic of Turkey | 5.125% | 5/18/20 | EUR | 3,000 | 4,566 |
| Republic of Turkey | 7.100% | 3/8/23 | TRY | 20,000 | 8,301 |
| Republic of Turkey | 8.500% | 9/14/22 | TRY | 20,000 | 8,949 |
| Republic of Turkey | 8.800% | 11/14/18 | TRY | 25,000 | 11,712 |
| Republic of Turkey | 9.000% | 1/27/16 | TRY | 50,000 | 23,684 |
| Republic of Turkey | 10.500% | 1/15/20 | TRY | 20,000 | 10,059 |
| Total Turkey (Cost $70,370) | | | | | 73,777 |
| United Arab Emirates (0.0%) | | | | | |
| Sovereign Bonds (0.0%) | | | | | |
| IPIC GMTN Ltd. | 5.875% | 3/14/21 | EUR | 3,000 | 5,075 |
| IPIC GMTN Ltd. | 6.875% | 3/14/26 | GBP | 640 | 1,344 |
| Total United Arab Emirates (Cost $5,886) | | | | | 6,419 |
| United Kingdom (7.9%) | | | | | |
Asset-Backed/Commercial Mortgage-Backed Securities (0.8%)
| | | | | |
| 2 Abbey National Treasury Services plc | 3.375% | 6/8/16 | EUR | 1,900 | 2,719 |
| Abbey National Treasury Services plc | 3.625% | 9/8/16 | EUR | 11,100 | 16,508 |
| Abbey National Treasury Services plc | 4.375% | 1/24/18 | EUR | 1,000 | 1,569 |
| 2 Abbey National Treasury Services plc | 5.250% | 2/16/30 | GBP | 758 | 1,480 |
| 2 Abbey National Treasury Services plc | 5.750% | 3/2/27 | GBP | 3,855 | 7,863 |
| Annington Finance No 4 plc | 0.000% | 12/7/22 | GBP | 3,740 | 4,696 |
| Annington Finance No 4 plc | 0.000% | 1/10/23 | GBP | 1,000 | 1,218 |
| Annington Repackaging No 1 Ltd. | 5.324% | 1/10/23 | GBP | 400 | 744 |
| Arqiva Financing plc | 4.882% | 12/31/32 | GBP | 1,200 | 2,068 |
| Artesian Finance II plc | 6.000% | 9/30/33 | GBP | 1,000 | 1,986 |
| Aspire Defence Finance plc | 4.674% | 3/31/40 | GBP | 1,000 | 1,721 |
| Aspire Defence Finance plc | 4.674% | 3/31/40 | GBP | 800 | 1,378 |
| Bank of Scotland plc | 4.500% | 7/13/21 | EUR | 1,160 | 1,943 |
| Bank of Scotland plc | 4.750% | 6/8/22 | EUR | 1,840 | 3,159 |
| Bank of Scotland plc | 4.875% | 6/4/19 | EUR | 1,000 | 1,652 |
| Bank of Scotland plc | 4.875% | 12/20/24 | GBP | 1,000 | 1,897 |
| 2 Barclays Bank plc | 2.250% | 2/22/18 | EUR | 5,000 | 7,258 |
| Barclays Bank plc | 3.625% | 4/13/16 | EUR | 5,000 | 7,363 |
| Barclays Bank plc | 4.000% | 1/12/21 | EUR | 500 | 814 |
| Barclays Bank plc | 4.250% | 1/12/22 | GBP | 1,000 | 1,826 |
| Bradford & Bingley plc | 4.250% | 5/4/16 | EUR | 2,000 | 2,976 |
54
Total International Bond Index Fund
| | | | | |
| | | | | Face | Market |
| | | Maturity | | Amount | Value |
| | Coupon | Date | Currency | (000) | ($000) |
| 2 Broadgate Financing plc | 4.999% | 10/5/33 | GBP | 1,000 | 1,866 |
| 2 Canary Wharf Finance II plc | 6.455% | 10/22/33 | GBP | 895 | 1,847 |
| Clydesdale Bank plc | 4.625% | 6/8/26 | GBP | 1,000 | 1,818 |
| Coventry Building Society | 4.625% | 4/19/18 | GBP | 300 | 554 |
| CTRL Section 1 Finance plc | 5.234% | 5/2/35 | GBP | 1,000 | 1,941 |
| Delamare Finance plc | 5.546% | 2/19/29 | GBP | 900 | 1,657 |
| Derby Healthcare plc | 5.564% | 6/30/41 | GBP | 349 | 661 |
| Dwr Cymru Financing Ltd. | 6.907% | 3/31/21 | GBP | 567 | 1,171 |
| 2 Fosse Master Issuer plc | 4.635% | 10/18/54 | GBP | 1,550 | 2,801 |
| Great Rolling Stock Co. plc | 6.875% | 7/27/35 | GBP | 960 | 1,977 |
| Greene King Finance plc | 5.318% | 9/15/31 | GBP | 1,157 | 2,187 |
| Highbury Finance BV | 7.017% | 3/20/23 | GBP | 746 | 1,495 |
| Integrated Accommodation Services plc | 6.480% | 3/31/29 | GBP | 158 | 325 |
| Juturna European Loan Conduit No 16 plc | 5.064% | 8/10/33 | GBP | 945 | 1,776 |
| Leeds Building Society | 4.250% | 12/17/18 | GBP | 1,000 | 1,839 |
| Lloyds Bank plc | 3.500% | 1/11/17 | EUR | 7,500 | 11,228 |
| Lloyds Bank plc | 4.000% | 6/25/18 | EUR | 500 | 784 |
| Lloyds Bank plc | 4.125% | 4/6/16 | EUR | 7,500 | 11,137 |
| Lloyds Bank plc | 4.875% | 3/30/27 | GBP | 3,081 | 5,780 |
| Lloyds Bank plc | 5.125% | 3/7/25 | GBP | 500 | 961 |
| 2 Longstone Finance plc | 4.791% | 4/19/36 | GBP | 1,007 | 1,876 |
| Mitchells & Butlers Finance plc | 5.574% | 12/15/30 | GBP | 518 | 990 |
| Nationwide Building Society | 3.125% | 10/13/16 | EUR | 5,500 | 8,118 |
| Nationwide Building Society | 4.375% | 2/28/22 | EUR | 2,000 | 3,360 |
| Nationwide Building Society | 4.625% | 2/8/21 | EUR | 1,000 | 1,684 |
| Nationwide Building Society | 5.625% | 1/28/26 | GBP | 1,500 | 3,053 |
| Nats En Route plc | 5.250% | 3/31/26 | GBP | 220 | 418 |
| 2 Northern Rock Asset Management plc | 4.125% | 3/27/18 | EUR | 3,000 | 4,565 |
| Octagon Healthcare Funding plc | 5.333% | 12/31/35 | GBP | 903 | 1,673 |
| RMPA Services plc | 5.337% | 9/30/38 | GBP | 308 | 575 |
| Royal Bank of Scotland plc | 3.875% | 10/19/20 | EUR | 4,000 | 6,410 |
| Royal Bank of Scotland plc | 4.125% | 1/15/18 | EUR | 1,500 | 2,335 |
| Royal Bank of Scotland plc | 5.125% | 1/13/24 | GBP | 500 | 961 |
| RSL Finance No 1 plc | 6.625% | 3/31/38 | GBP | 672 | 1,432 |
| Sceptre Funding No. 1 plc | 5.253% | 2/9/27 | GBP | 123 | 237 |
| South East Water Finance Ltd. | 5.658% | 9/30/19 | GBP | 400 | 748 |
| 2 Telereal Securitisation plc | 5.389% | 12/10/33 | GBP | 1,583 | 3,028 |
| Telereal Securitisation plc | 5.553% | 12/10/31 | GBP | 285 | 554 |
| Tesco Property Finance 2 plc | 6.052% | 10/13/39 | GBP | 471 | 892 |
| Tesco Property Finance 3 plc | 5.744% | 4/13/40 | GBP | 3,756 | 6,787 |
| Yorkshire Building Society | 4.750% | 4/12/18 | GBP | 1,300 | 2,395 |
| | | | | | 178,734 |
| Corporate Bonds (2.3%) | | | | | |
| Abbey National Treasury Services plc | 1.625% | 11/26/20 | EUR | 3,000 | 4,228 |
| Abbey National Treasury Services plc | 1.750% | 1/15/18 | EUR | 2,000 | 2,828 |
| Abbey National Treasury Services plc | 2.000% | 1/14/19 | EUR | 2,000 | 2,847 |
| Affinity Sutton Capital Markets plc | 5.981% | 9/17/38 | GBP | 300 | 639 |
| 2 Amlin plc | 6.500% | 12/19/26 | GBP | 350 | 621 |
| Anglian Water Services Financing plc | 5.250% | 10/30/15 | GBP | 1,100 | 1,967 |
| Anglian Water Services Financing plc | 6.250% | 6/27/16 | EUR | 2,000 | 3,092 |
| Anglo American Capital plc | 1.750% | 11/20/17 | EUR | 5,000 | 6,991 |
| Anglo American Capital plc | 2.500% | 4/29/21 | EUR | 2,400 | 3,338 |
| 2 Aviva plc | 6.875% | 5/22/38 | EUR | 2,030 | 3,288 |
| 2 Aviva plc | 6.875% | 5/20/58 | GBP | 2,327 | 4,551 |
| Aviva plc | 9.500% | 6/20/16 | GBP | 150 | 293 |
55
Total International Bond Index Fund
| | | | | |
| | | | | Face | Market |
| | | Maturity | | Amount | Value |
| | Coupon | Date | Currency | (000) | ($000) |
| AWG Parent Co. Ltd. | 6.625% | 1/15/29 | GBP | 615 | 1,299 |
| Bank of Scotland plc | 9.375% | 5/15/21 | GBP | 1,620 | 3,530 |
| Barclays Bank plc | 2.500% | 3/29/16 | CHF | 1,500 | 1,774 |
| Barclays Bank plc | 4.000% | 1/20/17 | EUR | 5,000 | 7,519 |
| Barclays Bank plc | 4.125% | 3/15/16 | EUR | 1,000 | 1,476 |
| Barclays Bank plc | 5.750% | 9/14/26 | GBP | 1,300 | 2,401 |
| Barclays Bank plc | 6.000% | 1/14/21 | EUR | 2,500 | 4,115 |
| 2 Barclays Bank plc | 6.750% | 1/16/23 | GBP | 550 | 1,025 |
| Barclays Bank plc | 10.000% | 5/21/21 | GBP | 2,533 | 5,655 |
| BAT International Finance plc | 2.750% | 3/25/25 | EUR | 2,500 | 3,534 |
| BAT International Finance plc | 4.000% | 9/4/26 | GBP | 1,500 | 2,538 |
| BAT International Finance plc | 5.375% | 6/29/17 | EUR | 3,000 | 4,725 |
| BG Energy Capital plc | 3.625% | 7/16/19 | EUR | 1,000 | 1,537 |
| BG Energy Capital plc | 5.125% | 12/7/17 | GBP | 200 | 374 |
| BG Energy Capital plc | 5.125% | 12/1/25 | GBP | 3,000 | 5,580 |
| 2 BG Energy Capital plc | 6.500% | 11/30/72 | GBP | 300 | 552 |
| 2 BG Energy Capital plc | 6.500% | 11/30/72 | EUR | 500 | 778 |
| BP Capital Markets plc | 1.000% | 8/28/20 | CHF | 2,000 | 2,295 |
| BP Capital Markets plc | 2.177% | 2/16/16 | EUR | 7,500 | 10,690 |
| BP Capital Markets plc | 2.994% | 2/18/19 | EUR | 650 | 972 |
| BP Capital Markets plc | 3.497% | 11/9/20 | CAD | 750 | 704 |
| BP Capital Markets plc | 4.154% | 6/1/20 | EUR | 1,600 | 2,549 |
| British American Tobacco Holdings | | | | | |
| The Netherlands BV | 5.500% | 9/15/16 | GBP | 600 | 1,105 |
| British Telecommunications plc | 5.750% | 12/7/28 | GBP | 1,390 | 2,683 |
| British Telecommunications plc | 6.375% | 6/23/37 | GBP | 1,500 | 3,151 |
| British Telecommunications plc | 6.500% | 7/7/15 | EUR | 3,500 | 5,186 |
| British Telecommunications plc | 6.625% | 6/23/17 | GBP | 200 | 383 |
| British Telecommunications plc | 8.500% | 12/7/16 | GBP | 380 | 748 |
| BSKYB Finance UK plc | 5.750% | 10/20/17 | GBP | 200 | 377 |
| BUPA Finance plc | 7.500% | 7/4/16 | GBP | 730 | 1,378 |
| Centrica plc | 4.250% | 9/12/44 | GBP | 750 | 1,165 |
| Centrica plc | 4.375% | 3/13/29 | GBP | 3,000 | 5,049 |
| Centrica plc | 5.500% | 10/24/16 | GBP | 650 | 1,195 |
| Centrica plc | 7.000% | 9/19/18 | GBP | 1,000 | 2,000 |
| Centrica plc | 7.000% | 9/19/33 | GBP | 1,000 | 2,203 |
| Circle Anglia Social Housing plc | 7.250% | 11/12/38 | GBP | 650 | 1,590 |
| Close Brothers Group plc | 6.500% | 2/10/17 | GBP | 472 | 868 |
| Community Finance Co. 1 plc | 5.017% | 7/31/34 | GBP | 400 | 765 |
| Compass Group plc | 3.125% | 2/13/19 | EUR | 1,000 | 1,496 |
| Coventry Building Society | 2.250% | 12/4/17 | EUR | 5,000 | 7,175 |
| Coventry Building Society | 2.500% | 11/18/20 | EUR | 1,500 | 2,135 |
| 2 CPUK Finance Ltd. | 7.239% | 2/28/42 | GBP | 1,000 | 2,077 |
| Dwr Cymru Financing Ltd. | 6.015% | 3/31/28 | GBP | 500 | 1,005 |
| Eastern Power Networks plc | 4.750% | 9/30/21 | GBP | 1,000 | 1,828 |
| Eastern Power Networks plc | 8.500% | 3/31/25 | GBP | 1,000 | 2,321 |
| EE Finance plc | 4.375% | 3/28/19 | GBP | 1,000 | 1,767 |
| Elsevier Finance SA Via ELM BV | 2.500% | 9/24/20 | EUR | 1,000 | 1,435 |
| ENW Capital Finance plc | 6.750% | 6/20/15 | GBP | 200 | 357 |
| Eversholt Funding plc | 5.831% | 12/2/20 | GBP | 800 | 1,534 |
| Eversholt Funding plc | 6.359% | 12/2/25 | GBP | 500 | 1,003 |
| Eversholt Funding plc | 6.697% | 2/22/35 | GBP | 1,000 | 2,056 |
| Experian Finance plc | 4.750% | 11/23/18 | GBP | 700 | 1,302 |
| Experian Finance plc | 4.750% | 2/4/20 | EUR | 4,000 | 6,432 |
56
| | | | | |
| Total International Bond Index Fund | | | | | |
| |
| |
| |
| | | | | Face | Market |
| | | Maturity | | Amount | Value |
| | Coupon | Date | Currency | (000) | ($000) |
| FCE Bank plc | 1.750% | 5/21/18 | EUR | 1,060 | 1,485 |
| FCE Bank plc | 1.875% | 5/12/16 | EUR | 1,650 | 2,326 |
| FCE Bank plc | 4.825% | 2/15/17 | GBP | 650 | 1,175 |
| FCE Bank plc | 5.125% | 11/16/15 | GBP | 100 | 178 |
| Firstgroup plc | 5.250% | 11/29/22 | GBP | 2,000 | 3,596 |
| 2 Friends Life Group plc | 6.292% | 6/29/49 | GBP | 600 | 1,025 |
| G4S International Finance plc | 2.875% | 5/2/17 | EUR | 2,000 | 2,876 |
| 2 Gatwick Funding Ltd. | 5.250% | 1/23/26 | GBP | 1,000 | 1,850 |
| GlaxoSmithKline Capital plc | 3.375% | 12/20/27 | GBP | 3,000 | 4,772 |
| GlaxoSmithKline Capital plc | 3.875% | 7/6/15 | EUR | 5,000 | 7,205 |
| GlaxoSmithKline Capital plc | 4.250% | 12/18/45 | GBP | 200 | 332 |
| GlaxoSmithKline Capital plc | 6.375% | 3/9/39 | GBP | 845 | 1,874 |
| Go-Ahead Group plc | 5.375% | 9/29/17 | GBP | 450 | 828 |
| Great Rolling Stock Co. plc | 6.250% | 7/27/20 | GBP | 1,200 | 2,333 |
| Hammerson plc | 7.250% | 4/21/28 | GBP | 1,000 | 2,171 |
| Heathrow Funding Ltd. | 3.000% | 6/8/15 | GBP | 400 | 688 |
| Heathrow Funding Ltd. | 4.125% | 10/12/16 | EUR | 2,200 | 3,282 |
| 2 Heathrow Funding Ltd. | 4.375% | 1/25/19 | EUR | 2,000 | 3,020 |
| Heathrow Funding Ltd. | 5.225% | 2/15/23 | GBP | 3,000 | 5,594 |
| Heathrow Funding Ltd. | 6.250% | 9/10/18 | GBP | 200 | 379 |
| Heathrow Funding Ltd. | 6.450% | 12/10/31 | GBP | 500 | 1,041 |
| Heathrow Funding Ltd. | 7.125% | 2/14/24 | GBP | 2,620 | 5,319 |
| Heathrow Funding Ltd. | 12.450% | 3/31/16 | GBP | 650 | 1,312 |
| 2 HSBC Bank Capital Funding Sterling 1 LP | 5.844% | 11/29/49 | GBP | 250 | 438 |
| HSBC Bank plc | 2.375% | 4/4/18 | CHF | 1,000 | 1,219 |
| HSBC Bank plc | 3.125% | 11/15/17 | EUR | 3,000 | 4,483 |
| HSBC Bank plc | 3.750% | 11/30/16 | EUR | 1,500 | 2,243 |
| HSBC Bank plc | 4.000% | 1/15/21 | EUR | 4,500 | 7,213 |
| 2 HSBC Bank plc | 5.000% | 3/20/23 | GBP | 1,680 | 3,004 |
| HSBC Bank plc | 6.250% | 1/30/41 | GBP | 66 | 131 |
| 2 HSBC Capital Funding LP | 5.130% | 3/29/49 | EUR | 1,000 | 1,470 |
| 2 HSBC Capital Funding LP | 8.208% | 6/29/49 | GBP | 250 | 452 |
| HSBC Holdings plc | 3.875% | 3/16/16 | EUR | 3,000 | 4,406 |
| HSBC Holdings plc | 6.000% | 6/10/19 | EUR | 2,000 | 3,310 |
| HSBC Holdings plc | 6.000% | 3/29/40 | GBP | 2,250 | 4,256 |
| 2 HSBC Holdings plc | 6.375% | 10/18/22 | GBP | 4,600 | 8,585 |
| HSBC Holdings plc | 6.750% | 9/11/28 | GBP | 1,750 | 3,520 |
| Hyde Housing Association Ltd. | 5.125% | 7/23/40 | GBP | 275 | 524 |
| Imperial Tobacco Finance plc | 4.500% | 7/5/18 | EUR | 2,000 | 3,120 |
| Imperial Tobacco Finance plc | 4.875% | 6/7/32 | GBP | 2,000 | 3,413 |
| Imperial Tobacco Finance plc | 5.500% | 11/22/16 | GBP | 250 | 459 |
| Imperial Tobacco Finance plc | 9.000% | 2/17/22 | GBP | 2,500 | 5,654 |
| InterContinental Hotels Group plc | 3.875% | 11/28/22 | GBP | 1,500 | 2,547 |
| InterContinental Hotels Group plc | 6.000% | 12/9/16 | GBP | 400 | 743 |
| 2 Intu SGS Finance plc | 3.875% | 3/17/28 | GBP | 1,100 | 1,840 |
| 2 Land Securities Capital Markets plc | 4.875% | 11/7/19 | GBP | 550 | 1,019 |
| 2 Land Securities Capital Markets plc | 4.875% | 9/29/25 | GBP | 300 | 559 |
| 2 Land Securities Capital Markets plc | 5.391% | 3/31/27 | GBP | 614 | 1,193 |
| 2 Land Securities Capital Markets plc | 5.396% | 7/31/32 | GBP | 400 | 781 |
| 2 Legal & General Group plc | 6.385% | 5/29/49 | GBP | 3,450 | 6,234 |
| Linde Finance BV | 6.500% | 1/29/16 | GBP | 250 | 459 |
| 2 Liverpool Victoria Friendly Society Ltd. | 6.500% | 5/22/43 | GBP | 600 | 1,014 |
| Lloyds Bank plc | 4.625% | 2/2/17 | EUR | 4,500 | 6,880 |
| 2 Lloyds Bank plc | 5.750% | 7/9/25 | GBP | 300 | 547 |
57
| | | | | |
| Total International Bond Index Fund | | | | | |
| |
| |
| |
| | | | | Face | Market |
| | | Maturity | | Amount | Value |
| | Coupon | Date | Currency | (000) | ($000) |
| Lloyds Bank plc | 6.500% | 3/24/20 | EUR | 2,000 | 3,340 |
| Lloyds Bank plc | 6.500% | 9/17/40 | GBP | 1,250 | 2,677 |
| 2 Lloyds Bank plc | 6.963% | 5/29/20 | GBP | 561 | 991 |
| 2 Lloyds Bank plc | 10.125% | 12/16/21 | CAD | 2,406 | 2,585 |
| 2 Lloyds Bank plc | 10.750% | 12/16/21 | GBP | 900 | 1,814 |
| London & Quadrant Housing Trust | 4.625% | 12/5/33 | GBP | 500 | 903 |
| London & Quadrant Housing Trust | 5.500% | 1/27/40 | GBP | 400 | 811 |
| London Power Networks plc | 5.375% | 11/11/16 | GBP | 700 | 1,286 |
| London Stock Exchange Group plc | 6.125% | 7/7/16 | GBP | 400 | 733 |
| Manchester Airport Group Funding plc | 4.750% | 3/31/34 | GBP | 2,000 | 3,428 |
| Marks & Spencer plc | 4.750% | 6/12/25 | GBP | 1,500 | 2,574 |
| Mondi Finance plc | 5.750% | 4/3/17 | EUR | 1,000 | 1,555 |
| Motability Operations Group plc | 4.375% | 2/8/27 | GBP | 2,000 | 3,495 |
| Motability Operations Group plc | 5.250% | 9/28/16 | GBP | 100 | 184 |
| Motability Operations Group plc | 6.625% | 12/10/19 | GBP | 1,000 | 2,027 |
| National Express Group plc | 6.250% | 1/13/17 | GBP | 130 | 241 |
| National Grid Electricity Transmission plc | 6.500% | 7/27/28 | GBP | 1,694 | 3,551 |
| National Grid Gas plc | 6.000% | 6/7/17 | GBP | 500 | 948 |
| National Grid Gas plc | 6.375% | 3/3/20 | GBP | 500 | 996 |
| National Grid plc | 4.375% | 3/10/20 | EUR | 1,000 | 1,596 |
| 2 Nationwide Building Society | 4.125% | 3/20/23 | EUR | 2,600 | 3,818 |
| Nationwide Building Society | 6.750% | 7/22/20 | EUR | 500 | 842 |
| Next plc | 5.875% | 10/12/16 | GBP | 650 | 1,203 |
| 2 NGG Finance plc | 4.250% | 6/18/76 | EUR | 1,500 | 2,171 |
| 2 NGG Finance plc | 5.625% | 6/18/73 | GBP | 500 | 870 |
| Northern Gas Networks Finance plc | 4.875% | 6/30/27 | GBP | 300 | 537 |
| Northern Gas Networks Finance plc | 5.875% | 7/8/19 | GBP | 750 | 1,438 |
| Northern Powergrid Holdings Co. | 7.250% | 12/15/22 | GBP | 250 | 516 |
| Northern Powergrid Yorkshire plc | 5.125% | 5/4/35 | GBP | 354 | 642 |
| Northumbrian Water Finance plc | 5.125% | 1/23/42 | GBP | 350 | 633 |
| Northumbrian Water Finance plc | 6.000% | 10/11/17 | GBP | 700 | 1,331 |
| Notting Hill Housing Trust | 3.750% | 12/20/32 | GBP | 2,200 | 3,497 |
| Peabody Capital No 2 plc | 4.625% | 12/12/53 | GBP | 150 | 265 |
| Pearson Funding One plc | 6.000% | 12/15/15 | GBP | 800 | 1,448 |
| Phoenix Natural Gas Finance plc | 5.500% | 7/10/17 | GBP | 350 | 646 |
| Porterbrook Rail Finance Ltd. | 6.500% | 10/20/20 | GBP | 1,000 | 1,975 |
| Prudential plc | 1.250% | 11/16/15 | GBP | 600 | 1,014 |
| 2 Prudential plc | 5.700% | 12/19/63 | GBP | 1,000 | 1,726 |
| Prudential plc | 6.125% | 12/19/31 | GBP | 1,000 | 1,923 |
| Reed Elsevier Investments plc | 5.625% | 10/20/16 | GBP | 100 | 184 |
| Reed Elsevier Investments plc | 7.000% | 12/11/17 | GBP | 600 | 1,179 |
| Rentokil Initial plc | 3.375% | 9/24/19 | EUR | 1,000 | 1,493 |
| Rentokil Initial plc | 5.750% | 3/31/16 | GBP | 550 | 995 |
| 2 RL Finance Bonds plc | 6.125% | 12/29/49 | GBP | 1,200 | 2,064 |
| Rolls-Royce plc | 2.125% | 6/18/21 | EUR | 500 | 709 |
| Rolls-Royce plc | 3.375% | 6/18/26 | GBP | 2,000 | 3,238 |
| Rolls-Royce plc | 7.375% | 6/14/16 | GBP | 450 | 851 |
| Royal Bank of Scotland plc | 4.750% | 5/18/16 | EUR | 6,000 | 8,966 |
| Royal Bank of Scotland plc | 4.875% | 1/20/17 | EUR | 1,000 | 1,523 |
| Royal Bank of Scotland plc | 6.000% | 5/17/17 | GBP | 250 | 467 |
| Royal Bank of Scotland plc | 6.625% | 9/17/18 | GBP | 800 | 1,566 |
| Royal Bank of Scotland plc | 6.875% | 5/17/25 | GBP | 2,376 | 4,926 |
| Royal Bank of Scotland plc | 6.934% | 4/9/18 | EUR | 3,500 | 5,567 |
| Royal Bank of Scotland plc | 9.625% | 6/22/15 | GBP | 650 | 1,183 |
58
| | | | | |
| Total International Bond Index Fund | | | | | |
| |
| |
| |
| | | | | Face | Market |
| | | Maturity | | Amount | Value |
| | Coupon | Date | Currency | (000) | ($000) |
| 2 RSA Insurance Group plc | 6.701% | 5/29/49 | GBP | 190 | 337 |
| 2 RSA Insurance Group plc | 9.375% | 5/20/39 | GBP | 3,000 | 6,168 |
| SABMiller Holdings Inc. | 1.875% | 1/20/20 | EUR | 1,000 | 1,409 |
| Safeway Ltd. | 6.000% | 1/10/17 | GBP | 425 | 775 |
| Sanctuary Capital plc | 5.000% | 4/26/47 | GBP | 190 | 364 |
| Saxon Weald Capital plc | 5.375% | 6/6/42 | GBP | 296 | 557 |
| Scotland Gas Networks plc | 4.750% | 2/21/17 | GBP | 450 | 813 |
| Scotland Gas Networks plc | 4.875% | 12/21/34 | GBP | 1,000 | 1,777 |
| Scottish Power UK plc | 8.375% | 2/20/17 | GBP | 550 | 1,081 |
| 2 Scottish Widows plc | 5.125% | 9/29/49 | GBP | 270 | 464 |
| Scottish Widows plc | 5.500% | 6/16/23 | GBP | 2,500 | 4,408 |
| Severn Trent Utilities Finance plc | 3.625% | 1/16/26 | GBP | 2,500 | 4,063 |
| Severn Trent Utilities Finance plc | 6.000% | 1/22/18 | GBP | 1,650 | 3,135 |
| 2 Society of Lloyd’s | 7.421% | 6/21/49 | GBP | 300 | 551 |
| South Eastern Power Networks plc | 5.625% | 9/30/30 | GBP | 2,350 | 4,470 |
| Southern Electric Power Distribution plc | 5.500% | 6/7/32 | GBP | 206 | 397 |
| 2 Southern Water Services Finance Ltd. | 4.500% | 3/31/38 | GBP | 1,000 | 1,686 |
| Southern Water Services Finance Ltd. | 5.000% | 3/31/21 | GBP | 1,000 | 1,831 |
| SPD Finance UK plc | 5.875% | 7/17/26 | GBP | 1,000 | 1,942 |
| SSE plc | 2.000% | 6/17/20 | EUR | 7,200 | 10,138 |
| SSE plc | 5.000% | 10/1/18 | GBP | 1,000 | 1,874 |
| 2 SSE plc | 5.025% | 10/29/49 | EUR | 1,000 | 1,436 |
| 2 SSE plc | 5.453% | 9/29/49 | GBP | 980 | 1,710 |
| SSE plc | 8.375% | 11/20/28 | GBP | 150 | 362 |
| Stagecoach Group plc | 5.750% | 12/16/16 | GBP | 100 | 184 |
| 2 Standard Chartered Bank | 5.375% | 6/29/49 | GBP | 1,000 | 1,731 |
| Standard Chartered Bank | 7.750% | 4/3/18 | GBP | 450 | 886 |
| 2 Standard Chartered Bank | 8.103% | 5/29/49 | GBP | 300 | 554 |
| Standard Chartered plc | 1.750% | 10/29/17 | EUR | 5,000 | 7,092 |
| Standard Chartered plc | 3.625% | 11/23/22 | EUR | 1,500 | 2,152 |
| Standard Chartered plc | 4.375% | 1/18/38 | GBP | 1,080 | 1,773 |
| 2 Standard Life plc | 5.500% | 12/4/42 | GBP | 1,500 | 2,684 |
| Tesco plc | 5.000% | 3/24/23 | GBP | 1,000 | 1,779 |
| Tesco plc | 5.200% | 3/5/57 | GBP | 1,000 | 1,660 |
| Tesco plc | 6.125% | 2/24/22 | GBP | 2,000 | 3,860 |
| Thames Water Utilities Cayman Finance Ltd. | 4.375% | 7/3/34 | GBP | 945 | 1,556 |
| 2 Thames Water Utilities Cayman Finance Ltd. | 5.375% | 7/21/25 | GBP | 1,030 | 1,862 |
| Thames Water Utilities Cayman Finance Ltd. | 5.500% | 2/11/41 | GBP | 1,175 | 2,224 |
| Thames Water Utilities Cayman Finance Ltd. | 7.241% | 4/9/58 | GBP | 750 | 1,461 |
| THFC Funding No 3 plc | 5.200% | 10/11/43 | GBP | 1,000 | 1,907 |
| UBM plc | 6.500% | 11/23/16 | GBP | 400 | 745 |
| 2 UNITE USAF II plc | 3.374% | 6/30/28 | GBP | 500 | 813 |
| United Utilities Water plc | 4.250% | 1/24/20 | EUR | 3,000 | 4,736 |
| United Utilities Water plc | 5.625% | 12/20/27 | GBP | 500 | 963 |
| United Utilities Water plc | 5.750% | 3/25/22 | GBP | 2,250 | 4,381 |
| United Utilities Water plc | 6.125% | 12/29/15 | GBP | 420 | 763 |
| Vodafone Group plc | 5.375% | 12/5/17 | GBP | 2,450 | 4,600 |
| Vodafone Group plc | 5.900% | 11/26/32 | GBP | 1,000 | 1,956 |
| Vodafone Group plc | 6.250% | 1/15/16 | EUR | 4,000 | 6,064 |
| Wales & West Utilities Finance plc | 5.125% | 12/2/16 | GBP | 150 | 274 |
| Wales & West Utilities Finance plc | 6.250% | 11/30/21 | GBP | 1,000 | 2,003 |
| Western Power Distribution East Midlands plc | 5.250% | 1/17/23 | GBP | 2,500 | 4,644 |
| Western Power Distribution South Wales plc | 5.750% | 3/23/40 | GBP | 450 | 876 |
| Western Power Distribution South West plc | 5.750% | 3/23/40 | GBP | 200 | 390 |
| WM Morrison Supermarkets plc | 2.250% | 6/19/20 | EUR | 300 | 412 |
59
Total International Bond Index Fund
| | | | | | |
| | | | | | Face | Market |
| | | | Maturity | | Amount | Value |
| | | Coupon | Date | Currency | (000) | ($000) |
| | WPP Finance SA | 6.375% | 11/6/20 | GBP | 3,000 | 5,998 |
| | WPP plc | 6.000% | 4/4/17 | GBP | 50 | 93 |
| | WPP plc | 6.625% | 5/12/16 | EUR | 1,000 | 1,545 |
| | Yorkshire Water Services Bradford Finance Ltd. | 3.625% | 8/1/29 | GBP | 500 | 779 |
| 2 | Yorkshire Water Services Bradford Finance Ltd. | 6.000% | 4/24/25 | GBP | 180 | 330 |
| | | | | | | 525,070 |
| Sovereign Bonds (4.8%) | | | | | |
| | Barclays Bank plc | 1.500% | 4/4/17 | GBP | 1,000 | 1,693 |
| 16 | LCR Finance plc | 4.500% | 12/7/28 | GBP | 2,000 | 3,759 |
| 16 | LCR Finance plc | 4.500% | 12/7/38 | GBP | 1,100 | 2,106 |
| 16 | LCR Finance plc | 5.100% | 3/7/51 | GBP | 200 | 439 |
| 16 | Network Rail Infrastructure Finance plc | 1.000% | 12/7/17 | GBP | 3,200 | 5,303 |
| 16 | Network Rail Infrastructure Finance plc | 1.125% | 12/15/16 | GBP | 2,000 | 3,375 |
| 16 | Network Rail Infrastructure Finance plc | 4.375% | 12/9/30 | GBP | 2,500 | 4,704 |
| 16 | Network Rail Infrastructure Finance plc | 4.625% | 7/21/20 | GBP | 200 | 383 |
| 16 | Network Rail Infrastructure Finance plc | 4.750% | 11/29/35 | GBP | 200 | 393 |
| | Transport for London | 2.250% | 8/9/22 | GBP | 900 | 1,431 |
| | Transport for London | 3.625% | 5/15/45 | GBP | 1,600 | 2,515 |
| | Transport for London | 3.875% | 7/23/42 | GBP | 400 | 655 |
| | United Kingdom | 1.000% | 9/7/17 | GBP | 37,000 | 61,754 |
| | United Kingdom | 1.250% | 7/22/18 | GBP | 30,000 | 49,805 |
| | United Kingdom | 1.750% | 1/22/17 | GBP | 10,000 | 17,186 |
| | United Kingdom | 1.750% | 7/22/19 | GBP | 20,000 | 33,460 |
| | United Kingdom | 1.750% | 9/7/22 | GBP | 14,800 | 23,560 |
| | United Kingdom | 2.000% | 1/22/16 | GBP | 49,500 | 85,451 |
| | United Kingdom | 2.250% | 9/7/23 | GBP | 16,000 | 26,113 |
| | United Kingdom | 2.750% | 9/7/24 | GBP | 4,500 | 7,564 |
| | United Kingdom | 3.250% | 1/22/44 | GBP | 32,900 | 53,503 |
| | United Kingdom | 3.500% | 7/22/68 | GBP | 9,000 | 15,579 |
| | United Kingdom | 3.750% | 9/7/20 | GBP | 27,500 | 50,913 |
| | United Kingdom | 3.750% | 9/7/21 | GBP | 24,100 | 44,684 |
| | United Kingdom | 3.750% | 7/22/52 | GBP | 16,800 | 30,385 |
| | United Kingdom | 4.000% | 9/7/16 | GBP | 3,000 | 5,433 |
| | United Kingdom | 4.000% | 3/7/22 | GBP | 2,800 | 5,278 |
| | United Kingdom | 4.000% | 1/22/60 | GBP | 15,700 | 30,347 |
| | United Kingdom | 4.250% | 12/7/27 | GBP | 20,900 | 40,105 |
| | United Kingdom | 4.250% | 6/7/32 | GBP | 22,500 | 43,154 |
| | United Kingdom | 4.250% | 3/7/36 | GBP | 23,000 | 44,171 |
| | United Kingdom | 4.250% | 9/7/39 | GBP | 28,000 | 54,053 |
| | United Kingdom | 4.250% | 12/7/40 | GBP | 15,600 | 30,178 |
| | United Kingdom | 4.250% | 12/7/46 | GBP | 6,200 | 12,179 |
| | United Kingdom | 4.250% | 12/7/49 | GBP | 11,700 | 23,217 |
| | United Kingdom | 4.250% | 12/7/55 | GBP | 15,400 | 31,014 |
| | United Kingdom | 4.500% | 3/7/19 | GBP | 5,800 | 11,024 |
| | United Kingdom | 4.500% | 9/7/34 | GBP | 21,100 | 41,823 |
| | United Kingdom | 4.500% | 12/7/42 | GBP | 19,600 | 39,685 |
| | United Kingdom | 4.750% | 9/7/15 | GBP | 18,000 | 32,125 |
| | United Kingdom | 4.750% | 3/7/20 | GBP | 29,000 | 56,321 |
| | United Kingdom | 4.750% | 12/7/30 | GBP | 17,300 | 35,085 |
| | United Kingdom | 4.750% | 12/7/38 | GBP | 9,000 | 18,685 |
| | United Kingdom | 5.000% | 3/7/18 | GBP | 10,000 | 19,097 |
| | United Kingdom | 5.000% | 3/7/25 | GBP | 11,000 | 22,414 |
| | Urenco Finance NV | 4.000% | 5/5/17 | EUR | 700 | 1,046 |
| | | | | | | 1,123,147 |
| Total United Kingdom (Cost $1,715,858) | | | | | 1,826,951 |
60
| | | | | |
| Total International Bond Index Fund | | | | | |
| |
| |
| |
| | | | | Face | Market |
| | | Maturity | | Amount | Value |
| | Coupon | Date | Currency | (000) | ($000) |
| United States (1.6%) | | | | | |
| Asset-Backed/Commercial Mortgage-Backed Security (0.0%) | | | | |
| BA Covered Bond Issuer | 4.250% | 4/5/17 | EUR | 2,000 | 3,045 |
| | | | | | 3,045 |
| Corporate Bonds (1.6%) | | | | | |
| American Express Canada Credit Corp. | 2.310% | 3/29/18 | CAD | 4,000 | 3,663 |
| 2 American International Group Inc. | 4.875% | 3/15/67 | EUR | 1,000 | 1,423 |
| 2 American International Group Inc. | 5.750% | 3/15/67 | GBP | 450 | 779 |
| American International Group Inc. | 6.765% | 11/15/17 | GBP | 1,020 | 1,970 |
| 2 American International Group Inc. | 8.625% | 5/22/68 | GBP | 2,000 | 3,977 |
| Amgen Inc. | 2.125% | 9/13/19 | EUR | 2,000 | 2,860 |
| Amgen Inc. | 4.000% | 9/13/29 | GBP | 1,000 | 1,624 |
| Amgen Inc. | 5.500% | 12/7/26 | GBP | 200 | 384 |
| AT&T Inc. | 2.500% | 3/15/23 | EUR | 2,000 | 2,833 |
| AT&T Inc. | 3.550% | 12/17/32 | EUR | 2,500 | 3,583 |
| AT&T Inc. | 4.250% | 6/1/43 | GBP | 1,000 | 1,519 |
| AT&T Inc. | 4.875% | 6/1/44 | GBP | 2,000 | 3,356 |
| AT&T Inc. | 5.875% | 4/28/17 | GBP | 1,000 | 1,871 |
| Bank of America Corp. | 2.500% | 7/27/20 | EUR | 500 | 722 |
| Bank of America Corp. | 4.625% | 2/7/17 | EUR | 500 | 752 |
| Bank of America Corp. | 4.625% | 8/7/17 | EUR | 1,450 | 2,234 |
| Bank of America Corp. | 4.750% | 4/3/17 | EUR | 5,000 | 7,661 |
| Bank of America Corp. | 5.250% | 11/9/16 | GBP | 250 | 453 |
| Bank of America Corp. | 7.000% | 6/15/16 | EUR | 2,500 | 3,905 |
| Bank of America Corp. | 7.000% | 7/31/28 | GBP | 2,350 | 5,143 |
| Bank of America Corp. | 7.750% | 4/30/18 | GBP | 350 | 705 |
| Brookfield Infrastructure Finance Pty Ltd. | 3.455% | 10/10/17 | CAD | 5,000 | 4,702 |
| Cargill Inc. | 1.875% | 9/4/19 | EUR | 600 | 852 |
| Citigroup Inc. | 1.750% | 1/29/18 | EUR | 1,000 | 1,415 |
| Citigroup Inc. | 2.400% | 10/31/25 | JPY | 500,000 | 5,165 |
| Citigroup Inc. | 3.000% | 3/21/19 | CHF | 1,000 | 1,244 |
| Citigroup Inc. | 4.500% | 3/3/31 | GBP | 1,000 | 1,629 |
| Citigroup Inc. | 5.000% | 8/2/19 | EUR | 5,000 | 8,120 |
| Citigroup Inc. | 5.125% | 12/12/18 | GBP | 6,000 | 10,932 |
| 2 Citigroup Inc. | 5.160% | 5/24/27 | CAD | 1,000 | 932 |
| Citigroup Inc. | 5.500% | 11/18/15 | GBP | 750 | 1,348 |
| Citigroup Inc. | 7.375% | 9/4/19 | EUR | 1,000 | 1,788 |
| Citigroup Inc. | 7.375% | 9/1/39 | GBP | 400 | 979 |
| Citigroup Inc. | 7.625% | 4/3/18 | GBP | 300 | 604 |
| Coca-Cola Enterprises Inc. | 2.000% | 12/5/19 | EUR | 1,000 | 1,415 |
| Digital Stout Holding LLC | 4.250% | 1/17/25 | GBP | 2,000 | 3,222 |
| DIRECTV Holdings LLC / DIRECTV | | | | | |
| Financing Co. Inc. | 2.750% | 5/19/23 | EUR | 1,600 | 2,199 |
| Discovery Communications LLC | 2.375% | 3/7/22 | EUR | 1,000 | 1,394 |
| Ford Credit Canada Ltd. | 4.875% | 2/8/17 | CAD | 4,000 | 3,911 |
| GE Capital Canada Funding Co. | 2.420% | 5/31/18 | CAD | 2,000 | 1,850 |
| GE Capital Canada Funding Co. | 4.600% | 1/26/22 | CAD | 6,500 | 6,578 |
| GE Capital European Funding | 1.625% | 3/15/18 | EUR | 8,000 | 11,323 |
| GE Capital European Funding | 5.250% | 5/18/15 | EUR | 6,000 | 8,726 |
| GE Capital European Funding | 5.375% | 1/23/20 | EUR | 2,300 | 3,841 |
| GE Capital European Funding | 6.025% | 3/1/38 | EUR | 1,500 | 2,927 |
| GE Capital UK Funding | 2.250% | 9/8/15 | GBP | 450 | 771 |
| GE Capital UK Funding | 4.125% | 9/28/17 | GBP | 4,500 | 8,106 |
61
| | | | | |
| Total International Bond Index Fund | | | | | |
| |
| |
| |
| | | | | Face | Market |
| | | Maturity | | Amount | Value |
| | Coupon | Date | Currency | (000) | ($000) |
| GE Capital UK Funding | 4.125% | 9/13/23 | GBP | 3,000 | 5,300 |
| GE Capital UK Funding | 4.375% | 7/31/19 | GBP | 1,000 | 1,818 |
| GE Capital UK Funding | 4.625% | 1/18/16 | GBP | 580 | 1,032 |
| GE Capital UK Funding | 6.250% | 5/5/38 | GBP | 1,414 | 3,038 |
| General Electric Capital Corp. | 2.500% | 2/8/18 | CHF | 3,000 | 3,658 |
| General Electric Capital Corp. | 3.125% | 12/6/19 | CHF | 1,000 | 1,280 |
| General Electric Capital Corp. | 4.125% | 9/19/35 | EUR | 1,700 | 2,543 |
| General Electric Capital Corp. | 4.875% | 9/18/37 | GBP | 800 | 1,404 |
| 2 General Electric Capital Corp. | 5.500% | 9/15/66 | GBP | 1,400 | 2,486 |
| 2 General Electric Capital Corp. | 5.500% | 9/15/67 | EUR | 2,000 | 2,974 |
| General Electric Capital Corp. | 6.250% | 12/15/17 | GBP | 300 | 579 |
| 2 General Electric Capital Corp. | 6.500% | 9/15/67 | GBP | 100 | 185 |
| General Mills Inc. | 2.100% | 11/16/20 | EUR | 1,000 | 1,417 |
| Goldman Sachs Group Inc. | 3.250% | 2/1/23 | EUR | 4,000 | 5,877 |
| Goldman Sachs Group Inc. | 4.375% | 3/16/17 | EUR | 5,950 | 8,994 |
| Goldman Sachs Group Inc. | 4.500% | 5/9/16 | EUR | 1,500 | 2,232 |
| Goldman Sachs Group Inc. | 4.500% | 5/23/16 | EUR | 1,000 | 1,489 |
| Goldman Sachs Group Inc. | 5.250% | 12/15/15 | GBP | 800 | 1,430 |
| Goldman Sachs Group Inc. | 5.500% | 10/12/21 | GBP | 2,800 | 5,144 |
| Goldman Sachs Group Inc. | 6.125% | 5/14/17 | GBP | 800 | 1,481 |
| Goldman Sachs Group Inc. | 7.250% | 4/10/28 | GBP | 300 | 659 |
| Health Care REIT Inc. | 4.800% | 11/20/28 | GBP | 500 | 857 |
| HSBC Finance Corp. | 4.500% | 6/14/16 | EUR | 2,000 | 2,978 |
| International Business Machines Corp. | 1.375% | 11/19/19 | EUR | 3,000 | 4,180 |
| International Business Machines Corp. | 2.750% | 12/21/20 | GBP | 1,000 | 1,683 |
| International Business Machines Corp. | 2.875% | 11/7/25 | EUR | 4,000 | 5,780 |
| John Deere Bank SA | 3.250% | 6/22/16 | EUR | 300 | 438 |
| JPMorgan Chase & Co. | 1.875% | 11/21/19 | EUR | 5,622 | 7,954 |
| JPMorgan Chase & Co. | 2.750% | 2/1/23 | EUR | 2,000 | 2,902 |
| JPMorgan Chase & Co. | 2.875% | 5/24/28 | EUR | 2,500 | 3,511 |
| JPMorgan Chase & Co. | 3.750% | 6/15/16 | EUR | 4,500 | 6,633 |
| JPMorgan Chase & Co. | 3.875% | 9/23/20 | EUR | 1,000 | 1,569 |
| JPMorgan Chase & Co. | 4.250% | 1/25/17 | GBP | 250 | 450 |
| JPMorgan Chase Bank NA | 5.375% | 9/28/16 | GBP | 1,100 | 2,005 |
| McDonald’s Corp. | 2.000% | 6/1/23 | EUR | 1,500 | 2,067 |
| Merrill Lynch & Co. Inc. | 4.625% | 9/14/18 | EUR | 1,500 | 2,311 |
| Merrill Lynch & Co. Inc. | 5.500% | 11/22/21 | GBP | 800 | 1,479 |
| MetLife Inc. | 5.375% | 12/9/24 | GBP | 350 | 672 |
| Metropolitan Life Global Funding I | 2.375% | 1/11/23 | EUR | 500 | 704 |
| Metropolitan Life Global Funding I | 2.875% | 1/11/23 | GBP | 2,000 | 3,247 |
| Microsoft Corp. | 2.125% | 12/6/21 | EUR | 2,000 | 2,847 |
| Microsoft Corp. | 3.125% | 12/6/28 | EUR | 1,200 | 1,762 |
| Mondelez International Inc. | 1.125% | 1/26/17 | EUR | 1,200 | 1,672 |
| Mondelez International Inc. | 2.375% | 1/26/21 | EUR | 1,200 | 1,712 |
| Morgan Stanley | 2.250% | 3/12/18 | EUR | 5,000 | 7,162 |
| Morgan Stanley | 2.375% | 3/31/21 | EUR | 1,200 | 1,689 |
| Morgan Stanley | 3.750% | 9/21/17 | EUR | 2,000 | 3,000 |
| Morgan Stanley | 4.500% | 2/23/16 | EUR | 4,000 | 5,900 |
| Morgan Stanley | 5.125% | 11/30/15 | GBP | 1,100 | 1,962 |
| Morgan Stanley | 5.500% | 10/2/17 | EUR | 1,000 | 1,581 |
| Morgan Stanley | 5.750% | 2/14/17 | GBP | 250 | 462 |
| NASDAQ OMX Group Inc. | 3.875% | 6/7/21 | EUR | 1,000 | 1,486 |
| National Grid North America Inc. | 1.750% | 2/20/18 | EUR | 1,400 | 1,978 |
| Oracle Corp. | 3.125% | 7/10/25 | EUR | 1,000 | 1,483 |
62
| | | | | |
| Total International Bond Index Fund | | | | | |
| |
| |
| |
| | | | | Face | Market |
| | | Maturity | | Amount | Value |
| | Coupon | Date | Currency | (000) | ($000) |
| PepsiCo Inc. | 1.750% | 4/28/21 | EUR | 500 | 697 |
| Pfizer Inc. | 4.550% | 5/15/17 | EUR | 1,820 | 2,802 |
| Pfizer Inc. | 4.750% | 6/3/16 | EUR | 4,500 | 6,767 |
| Pfizer Inc. | 6.500% | 6/3/38 | GBP | 2,000 | 4,439 |
| Philip Morris International Inc. | 1.000% | 12/6/16 | CHF | 2,000 | 2,314 |
| Philip Morris International Inc. | 1.750% | 3/19/20 | EUR | 2,500 | 3,502 |
| Philip Morris International Inc. | 2.875% | 3/3/26 | EUR | 1,500 | 2,118 |
| Philip Morris International Inc. | 3.125% | 6/3/33 | EUR | 1,000 | 1,392 |
| Praxair Inc. | 1.500% | 3/11/20 | EUR | 500 | 693 |
| Procter & Gamble Co. | 2.000% | 11/5/21 | EUR | 2,800 | 3,967 |
| Procter & Gamble Co. | 2.000% | 8/16/22 | EUR | 3,080 | 4,331 |
| Procter & Gamble Co. | 4.125% | 12/7/20 | EUR | 2,150 | 3,455 |
| Prologis LP | 3.375% | 2/20/24 | EUR | 1,500 | 2,188 |
| Roche Holdings Inc. | 6.500% | 3/4/21 | EUR | 3,595 | 6,550 |
| Time Warner Cable Inc. | 5.250% | 7/15/42 | GBP | 800 | 1,426 |
| Time Warner Cable Inc. | 5.750% | 6/2/31 | GBP | 700 | 1,322 |
| United Parcel Service Inc. | 5.125% | 2/12/50 | GBP | 500 | 1,018 |
| Verizon Communications Inc. | 3.250% | 2/17/26 | EUR | 1,500 | 2,193 |
| Verizon Communications Inc. | 4.750% | 2/17/34 | GBP | 1,000 | 1,721 |
| Wal-Mart Stores Inc. | 0.940% | 7/28/15 | JPY | 100,000 | 986 |
| Wal-Mart Stores Inc. | 1.900% | 4/8/22 | EUR | 1,100 | 1,532 |
| Wal-Mart Stores Inc. | 2.550% | 4/8/26 | EUR | 1,100 | 1,539 |
| Wal-Mart Stores Inc. | 4.875% | 9/21/29 | EUR | 500 | 873 |
| Wal-Mart Stores Inc. | 4.875% | 1/19/39 | GBP | 1,400 | 2,622 |
| Wal-Mart Stores Inc. | 5.625% | 3/27/34 | GBP | 3,000 | 6,137 |
| Wells Fargo & Co. | 2.250% | 5/2/23 | EUR | 2,000 | 2,795 |
| Wells Fargo & Co. | 3.500% | 9/12/29 | GBP | 1,330 | 2,116 |
| Wells Fargo & Co. | 4.375% | 8/1/16 | EUR | 5,000 | 7,500 |
| Wells Fargo Bank NA | 5.250% | 8/1/23 | GBP | 1,650 | 3,046 |
| | | | | | 370,567 |
| U.S. Government and Agency Obligations (0.0%) | | | | | |
| 17 Tennessee Valley Authority | 5.625% | 6/7/32 | GBP | 1,400 | 2,883 |
| | | | | | 2,883 |
| Total United States (Cost $358,101) | | | | | 376,495 |
| Temporary Cash Investments (0.9%) | | | | | |
| Time Deposits (0.7%) | | | | | |
| Australian Dollar Time Deposits | 2.002% | 5/1/14 | AUD | 12,153 | 11,291 |
| British Pound Sterling Time Deposits | 0.067% | 5/1/14 | GBP | 14,129 | 23,856 |
| Canadian Dollar Time Deposits | 0.438% | 5/1/14 | CAD | 9,876 | 9,011 |
| Danish Krone Time Deposits | 0.000% | 5/1/14 | DKK | 17,692 | 3,288 |
| Euro Time Deposits | 0.054% | 5/2/14 | EUR | 65,105 | 90,324 |
| Hong Kong Dollar Time Deposits | 0.005% | 5/2/14 | HKD | 35,429 | 4,570 |
| Japanese Yen Time Deposits | 0.005% | 5/1/14 | JPY | 2,273,402 | 22,237 |
| New Zealand Dollar Time Deposits | 2.500% | 5/1/14 | NZD | 2,186 | 1,885 |
| Norwegian Krone Time Deposits | 0.900% | 5/2/14 | NOK | 3 | 1 |
| Singapore Dollar Time Deposits | 0.005% | 5/2/14 | SGD | 27 | 21 |
| South African Rand Time Deposits | 4.781% | 5/2/14 | ZAR | 4,150 | 394 |
| Swedish Krona Time Deposits | 0.178% | 5/2/14 | SEK | 897 | 138 |
| Switzerland Dollar Time Deposits | 0.001% | 5/2/14 | CHF | 3,626 | 4,120 |
| United States Dollar Time Deposits | 0.030% | 5/1/14 | USD | 157 | 157 |
| | | | | | 171,293 |
63
| | | |
| Total International Bond Index Fund | | | |
| |
| |
| | | | Market |
| | | | Value |
| | Coupon | Shares | ($000) |
| Money Market Fund (0.2%) | | | |
| 18 Vanguard Market Liquidity Fund | 0.124% | 37,102,782 | 37,103 |
| Total Temporary Cash Investments (Cost $208,396) | | | 208,396 |
| Total Investments (99.0%) (Cost $21,929,153) | | | 22,824,487 |
| Other Assets and Liabilities (1.0%) | | | |
| Other Assets | | | 975,609 |
| Liabilities | | | (747,833) |
| | | | 227,776 |
| Net Assets (100%) | | | 23,052,263 |
| |
| |
| At April 30, 2014, net assets consisted of: | | | |
| | | | Amount |
| | | | ($000) |
| Paid-in Capital | | | 23,000,946 |
| Undistributed Net Investment Income | | | 6,109 |
| Accumulated Net Realized Losses | | | (748,335) |
| Unrealized Appreciation (Depreciation) | | | |
| Investment Securities | | | 895,334 |
| Futures Contracts | | | 60 |
| Forward Currency Contracts | | | (105,264) |
| Foreign Currencies | | | 3,413 |
| Net Assets | | | 23,052,263 |
| |
| Investor Shares—Net Assets | | | |
| Applicable to 1,321,100,144 outstanding $.001 par value shares of | | | |
| beneficial interest (unlimited authorization) | | | 13,389,169 |
| Net Asset Value Per Share—Investor Shares | | | $10.13 |
| |
| Admiral Shares—Net Assets | | | |
| Applicable to 161,143,445 outstanding $.001 par value shares of | | | |
| beneficial interest (unlimited authorization) | | | 3,265,985 |
| Net Asset Value Per Share—Admiral Shares | | | $20.27 |
| |
| Institutional Shares—Net Assets | | | |
| Applicable to 173,158,291 outstanding $.001 par value shares of | | | |
| beneficial interest (unlimited authorization) | | | 5,265,895 |
| Net Asset Value Per Share—Institutional Shares | | | $30.41 |
64
| |
| Total International Bond Index Fund | |
| |
| |
| |
| | Amount |
| | ($000) |
| ETF Shares—Net Assets | |
| Applicable to 22,323,583 outstanding $.001 par value shares of | |
| beneficial interest (unlimited authorization) | 1,131,214 |
| Net Asset Value Per Share—ETF Shares | $50.67 |
See Note A in Notes to Financial Statements.
1 Security exempt from registration under Rule 144A of the Securities Act of 1933. Such securities may be sold in transactions exempt from registration, normally to qualified institutional buyers. At April 30, 2014, the aggregate value of these securities was $1,388,367,000, representing 6.0% of net assets.
2 The average or expected maturity is shorter than the final maturity shown because of the possibility of interim principal payments and prepayments or the possibility of the issue being called.
3 Guaranteed by the Republic of Austria.
4 Securities with a value of $117,904,000 have been segregated as collateral for open forward currency contracts.
5 Guaranteed by the Government of Luxembourg.
6 Guaranteed by the Kingdom of Belgium.
7 Guaranteed by the Republic of France.
8 Guaranteed by the Government of Canada.
9 Guaranteed by the Federal Republic of Germany.
10 Guaranteed by the Free State of Bavaria.
11 Securities with a value of $974,000 have been segregated as initial margin for open futures contracts.
12 Guaranteed by the Government of Japan.
13 Guaranteed by the Federation of Malaysia.
14 Guaranteed by the Kingdom of Spain.
15 Guaranteed by multiple countries.
16 Guaranteed by the Government of the United Kingdom.
17 The issuer operates under a congressional charter; its securities are generally neither guaranteed by the U.S. Treasury nor backed by the full faith and credit of the U.S. government.
18 Affiliated money market fund available only to Vanguard funds and certain trusts and accounts managed by Vanguard. Rate shown is the 7-day yield.
REIT—Real Estate Investment Trust.
AUD—Australian dollar.
CAD—Canadian dollar.
CHF—Swiss franc.
CZK—Czech koruna.
DKK—Danish krone.
EUR—Euro.
GBP—British pound.
HKD—Hong Kong dollar.
ILS—Israeli shekel.
JPY—Japanese yen.
KRW—South Korean won.
MXN—Mexican peso.
MYR—Malaysian ringgit.
NOK—Norwegian krone.
NZD—New Zealand dollar.
PLN—Polish new zloty.
RUB—Russian ruble.
SEK—Swedish krona.
SGD—Singapore dollar.
THB—Thai baht.
TRY—Turkish new lira.
USD—U.S. dollar.
ZAR—South African rand.
See accompanying Notes, which are an integral part of the Financial Statements.
65
| |
| Total International Bond Index Fund | |
| |
| |
| Statement of Operations | |
| |
| | Six Months Ended |
| | April 30, 2014 |
| | ($000) |
| Investment Income | |
| Income | |
| Interest1,2 | 177,047 |
| Total Income | 177,047 |
| Expenses | |
| The Vanguard Group—Note B | |
| Investment Advisory Services | 232 |
| Management and Administrative—Investor Shares | 12,939 |
| Management and Administrative—Admiral Shares | 2,138 |
| Management and Administrative—Institutional Shares | 1,864 |
| Management and Administrative—ETF Shares | 703 |
| Marketing and Distribution—Investor Shares | 895 |
| Marketing and Distribution—Admiral Shares | 142 |
| Marketing and Distribution—Institutional Shares | 427 |
| Marketing and Distribution—ETF Shares | 93 |
| Custodian Fees | 957 |
| Shareholders’ Reports—Investor Shares | 23 |
| Shareholders’ Reports—Admiral Shares | 30 |
| Shareholders’ Reports—Institutional Shares | 1 |
| Shareholders’ Reports—ETF Shares | 12 |
| Trustees’ Fees and Expenses | 7 |
| Total Expenses | 20,463 |
| Net Investment Income | 156,584 |
| Realized Net Gain (Loss) | |
| Investment Securities Sold | 22,411 |
| Futures Contracts | 769 |
| Foreign Currencies and Forward Currency Contracts | (91,426) |
| Realized Net Gain (Loss) | (68,246) |
| Change in Unrealized Appreciation (Depreciation) | |
| Investment Securities | 465,942 |
| Futures Contracts | 71 |
| Foreign Currencies and Forward Currency Contracts | (86,675) |
| Change in Unrealized Appreciation (Depreciation) | 379,338 |
| Net Increase (Decrease) in Net Assets Resulting from Operations | 467,676 |
| 1 Interest income from an affiliated company of the fund was $44,000. | |
| 2 Interest income is net of foreign withholding taxes of $955,000. | |
| |
| |
| |
| See accompanying Notes, which are an integral part of the Financial Statements. | |
66
| | |
| Total International Bond Index Fund | | |
| |
| |
| Statement of Changes in Net Assets | | |
| |
| | Six Months Ended | April 30, 20131 |
| | April 30, | to October 31, |
| | 2014 | 2013 |
| | ($000) | ($000) |
| Increase (Decrease) in Net Assets | | |
| Operations | | |
| Net Investment Income | 156,584 | 108,993 |
| Realized Net Gain (Loss) | (68,246) | (680,089) |
| Change in Unrealized Appreciation (Depreciation) | 379,338 | 414,205 |
| Net Increase (Decrease) in Net Assets Resulting from Operations | 467,676 | (156,891) |
| Distributions | | |
| Net Investment Income | | |
| Investor Shares | (93,547) | (69,814) |
| Admiral Shares | (19,459) | (6,369) |
| Institutional Shares | (34,066) | (18,529) |
| ETF Shares | (6,127) | (2,463) |
| Transition Shares | — | (9,094) |
| Realized Capital Gain | | |
| Investor Shares | — | — |
| Admiral Shares | — | — |
| Institutional Shares | — | — |
| ETF Shares | — | — |
| Transition Shares | — | — |
| Total Distributions | (153,199) | (106,269) |
| Capital Share Transactions | | |
| Investor Shares | 746,979 | 12,467,965 |
| Admiral Shares | 1,587,495 | 1,621,818 |
| Institutional Shares | 1,835,513 | 3,355,980 |
| ETF Shares | 451,722 | 656,499 |
| Transition Shares | — | 276,875 |
| Net Increase (Decrease) from Capital Share Transactions | 4,621,709 | 18,379,137 |
| Total Increase (Decrease) | 4,936,186 | 18,115,977 |
| Net Assets | | |
| Beginning of Period | 18,116,077 | 100 |
| End of Period2 | 23,052,263 | 18,116,077 |
1 Commencement of Transition Period. See Notes to Financial Statements.
2 Net Assets—End of Period includes undistributed (overdistributed) net investment income of $6,109,000 and $2,724,000.
See accompanying Notes, which are an integral part of the Financial Statements.
67
| | |
| Total International Bond Index Fund | | |
| |
| |
| Financial Highlights | | |
| |
| |
| Investor Shares | | |
| | Six Months | May 31, |
| | Ended | 20131 to |
| | April 30, | Oct. 31, |
| For a Share Outstanding Throughout Each Period | 2014 | 2013 |
| Net Asset Value, Beginning of Period | $9.99 | $10.00 |
| Investment Operations | | |
| Net Investment Income | . 074 | . 060 |
| Net Realized and Unrealized Gain (Loss) on Investments | .139 | (.011) |
| Total from Investment Operations | . 213 | . 049 |
| Distributions | | |
| Dividends from Net Investment Income | (.073) | (.059) |
| Distributions from Realized Capital Gains | — | — |
| Total Distributions | (. 073) | (. 059) |
| Net Asset Value, End of Period | $10.13 | $9.99 |
| |
| Total Return 2 | 2.14% | 0.50% |
| |
| Ratios/Supplemental Data | | |
| Net Assets, End of Period (Millions) | $13,389 | $12,454 |
| Ratio of Total Expenses to Average Net Assets | 0.23% | 0.23%3 |
| Ratio of Net Investment Income to Average Net Assets | 1.52% | 1.44%3 |
| Portfolio Turnover Rate | 126% | 31%4,5 |
The expense ratio, net income ratio, and turnover rate for the current period have been annualized.
1 Inception.
2 Total returns do not include account service fees that may have applied in the periods shown. Fund prospectuses provide information about any applicable account service fees.
3 Annualized.
4 Excludes the value of portfolio securities received or delivered as a result of in-kind purchases or redemptions of the fund’s capital shares, including ETF Creation Units.
5 Excludes trading activity during the Transition Period; see Notes to Financial Statements. Portfolio turnover including trading activity during the Transition Period was 128%.
See accompanying Notes, which are an integral part of the Financial Statements.
68
| | |
| Total International Bond Index Fund | | |
| |
| |
| Financial Highlights | | |
| |
| |
| Admiral Shares | | |
| | Six Months | May 31, |
| | Ended | 20131 to |
| | April 30, | Oct. 31, |
| For a Share Outstanding Throughout Each Period | 2014 | 2013 |
| Net Asset Value, Beginning of Period | $19.98 | $20.00 |
| Investment Operations | | |
| Net Investment Income | .152 | .125 |
| Net Realized and Unrealized Gain (Loss) on Investments | .288 | (.023) |
| Total from Investment Operations | . 440 | .102 |
| Distributions | | |
| Dividends from Net Investment Income | (.150) | (.122) |
| Distributions from Realized Capital Gains | — | — |
| Total Distributions | (.150) | (.122) |
| Net Asset Value, End of Period | $20.27 | $19.98 |
| |
| Total Return 2 | 2.21% | 0.52% |
| |
| Ratios/Supplemental Data | | |
| Net Assets, End of Period (Millions) | $3,266 | $1,636 |
| Ratio of Total Expenses to Average Net Assets | 0.20% | 0.20%3 |
| Ratio of Net Investment Income to Average Net Assets | 1.55% | 1.49%3 |
| Portfolio Turnover Rate | 126% | 31%4,5 |
The expense ratio, net income ratio, and turnover rate for the current period have been annualized.
1 Inception.
2 Total returns do not include account service fees that may have applied in the periods shown. Fund prospectuses provide information about any applicable account service fees.
3 Annualized.
4 Excludes the value of portfolio securities received or delivered as a result of in-kind purchases or redemptions of the fund’s capital shares, including ETF Creation Units.
5 Excludes trading activity during the Transition Period; see Notes to Financial Statements. Portfolio turnover including trading activity during the Transition Period was 128%.
See accompanying Notes, which are an integral part of the Financial Statements.
69
| | |
| Total International Bond Index Fund | | |
| |
| |
| Financial Highlights | | |
| |
| |
| Institutional Shares | | |
| | Six Months | May 31, |
| | Ended | 20131 to |
| | April 30, | Oct. 31, |
| For a Share Outstanding Throughout Each Period | 2014 | 2013 |
| Net Asset Value, Beginning of Period | $29.97 | $30.00 |
| Investment Operations | | |
| Net Investment Income | . 240 | .193 |
| Net Realized and Unrealized Gain (Loss) on Investments | .437 | (.034) |
| Total from Investment Operations | .677 | .159 |
| Distributions | | |
| Dividends from Net Investment Income | (.237) | (.189) |
| Distributions from Realized Capital Gains | — | — |
| Total Distributions | (.237) | (.189) |
| Net Asset Value, End of Period | $30.41 | $29.97 |
| |
| Total Return | 2.27% | 0.54% |
| |
| Ratios/Supplemental Data | | |
| Net Assets, End of Period (Millions) | $5,266 | $3,361 |
| Ratio of Total Expenses to Average Net Assets | 0.12% | 0.12%2 |
| Ratio of Net Investment Income to Average Net Assets | 1.63% | 1.55%2 |
| Portfolio Turnover Rate | 126% | 31%3,4 |
The expense ratio, net income ratio, and turnover rate for the current period have been annualized.
1 Inception.
2 Annualized.
3 Excludes the value of portfolio securities received or delivered as a result of in-kind purchases or redemptions of the fund’s capital shares, including ETF Creation Units.
4 Excludes trading activity during the Transition Period; see Notes to Financial Statements. Portfolio turnover including trading activity during the Transition Period was 128%.
See accompanying Notes, which are an integral part of the Financial Statements.
70
| | |
| Total International Bond Index Fund | | |
| |
| |
| Financial Highlights | | |
| |
| |
| ETF Shares | | |
| | Six Months | May 31, |
| | Ended | 20131 to |
| | April 30, | Oct. 31, |
| For a Share Outstanding Throughout Each Period | 2014 | 2013 |
| Net Asset Value, Beginning of Period | $49.95 | $49.94 |
| Investment Operations | | |
| Net Investment Income | . 380 | . 306 |
| Net Realized and Unrealized Gain (Loss) on Investments | .711 | (.054) |
| Total from Investment Operations | 1.091 | .252 |
| Distributions | | |
| Dividends from Net Investment Income | (.371) | (.242) |
| Distributions from Realized Capital Gains | — | — |
| Total Distributions | (. 371) | (. 242) |
| Net Asset Value, End of Period | $50.67 | $49.95 |
| |
| Total Return | 2.20% | 0.51% |
| |
| Ratios/Supplemental Data | | |
| Net Assets, End of Period (Millions) | $1,131 | $665 |
| Ratio of Total Expenses to Average Net Assets | 0.20% | 0.20%2 |
| Ratio of Net Investment Income to Average Net Assets | 1.55% | 1.48%2 |
| Portfolio Turnover Rate | 126% | 31%3,4 |
The expense ratio, net income ratio, and turnover rate for the current period have been annualized.
1 Inception.
2 Annualized.
3 Excludes the value of portfolio securities received or delivered as a result of in-kind purchases or redemptions of the fund’s capital shares, including ETF Creation Units.
4 Excludes trading activity during the Transition Period; see Notes to Financial Statements. Portfolio turnover including trading activity during the Transition Period was 128%.
See accompanying Notes, which are an integral part of the Financial Statements.
71
Total International Bond Index Fund
Notes to Financial Statements
Vanguard Total International Bond Index Fund is registered under the Investment Company Act of 1940 as an open-end investment company, or mutual fund. The fund invests in securities of foreign issuers, which may subject it to investment risks not normally associated with investing in securities of U.S. corporations. To minimize the currency risk associated with investments in bonds denominated in currencies other than the U.S. dollar, the fund attempts to hedge its currency exposures. The fund offers four classes of shares: Investor Shares, Admiral Shares, Institutional Shares, and ETF Shares. Investor Shares are available to any investor who meets the fund’s minimum purchase requirements. Admiral Shares and Institutional Shares are designed for investors who meet certain administrative, service, and account-size criteria. ETF Shares are listed for trading on Nasdaq; they can be purchased and sold through a broker.
The fund was organized on September 28, 2011, and its operations up to April 30, 2013, were limited to the sale and issuance of 3,333 Transition Shares of beneficial interest at an aggregate cost of $100,000 to a subsidiary of the The Vanguard Group. On May 1, 2013, the fund issued Transition Shares to other Vanguard funds and collective trusts in exchange for U.S. bonds transferred in-kind. The other Vanguard funds and trusts held and traded Transition Shares between May 1, 2013, and May 30, 2013, (the “Transition Period”). During the Transition Period, the fund sold the U.S. bonds it received in-kind and used the proceeds to purchase international bonds consistent with its stated investment objective. The fund offered only Transition Shares during the Transition Period, ensuring that the transaction costs related to the bond sales and purchases were borne solely by the shareholders who caused the fund to incur those costs. All Transition Shares were converted to Investor Shares, Admiral Shares, or Institutional Shares on May 31, 2013.
The fund no longer offers Transition Shares.
A. The following significant accounting policies conform to generally accepted accounting principles for U.S. investment companies. The fund consistently follows such policies in preparing its financial statements.
1. Security Valuation: Securities are valued as of the close of trading on the New York Stock Exchange (generally 4 p.m., Eastern time) on the valuation date. Bonds, and temporary cash investments acquired over 60 days to maturity, are valued using the latest bid prices or using valuations based on a matrix system (which considers such factors as security prices, yields, maturities, and ratings), both as furnished by independent pricing services. Structured debt securities, including mortgages and asset-backed securities, are valued using the latest bid prices or using valuations based on a matrix system that considers such factors as issuer, tranche, nominal or option-adjusted spreads, weighted average coupon, weighted average maturity, credit enhancements, and collateral. Investments in Vanguard Market Liquidity Fund are valued at that fund’s net asset value. Other temporary cash investments are valued at amortized cost, which approximates market value. Securities for which market quotations are not readily available, or whose values have been affected by events occurring before the fund’s pricing time but after the close of the securities’ primary markets, are valued at their fair values calculated according to procedures adopted by the board of trustees. These procedures include obtaining quotations from an independent pricing service, monitoring news to identify significant market- or security-specific events, and evaluating changes in the values of foreign market proxies (for example, ADRs, futures contracts, or exchange-traded funds), between the time the foreign markets close and the fund’s pricing time. When fair-value pricing is employed, the prices of securities used by a fund to calculate its net asset value may differ from quoted or published prices for the same securities.
72
Total International Bond Index Fund
2. Foreign Currency: Securities and other assets and liabilities denominated in foreign currencies are translated into U.S. dollars using exchange rates obtained from an independent third party as of the fund’s pricing time on the valuation date. Realized gains (losses) and unrealized appreciation (depreciation) on investment securities include the effects of changes in exchange rates since the securities were purchased, combined with the effects of changes in security prices. Fluctuations in the value of other assets and liabilities resulting from changes in exchange rates are recorded as unrealized foreign currency gains (losses) until the assets or liabilities are settled in cash, at which time they are recorded as realized foreign currency gains (losses).
3. Futures Contracts: The fund uses futures contracts to invest in fixed income asset classes with greater efficiency and lower cost than is possible through direct investment, to add value when these instruments are attractively priced, or to adjust sensitivity to changes in interest rates. The primary risks associated with the use of futures contracts are imperfect correlation between changes in market values of bonds held by the fund and the prices of futures contracts, and the possibility of an illiquid market. Counterparty risk involving futures is mitigated because a regulated clearinghouse is the counterparty instead of the clearing broker. To further mitigate counterparty risk, the fund trades futures contracts on an exchange, monitors the financial strength of its clearing brokers and clearinghouse, and has entered into clearing agreements with its clearing brokers. The clearinghouse imposes initial margin requirements to secure the fund’s performance and requires daily settlement of variation margin representing changes in the market value of each contract.
Futures contracts are valued at their quoted daily settlement prices. The aggregate notional amounts of the contracts are not recorded in the Statement of Net Assets. Fluctuations in the value of the contracts are recorded in the Statement of Net Assets as an asset (liability) and in the Statement of Operations as unrealized appreciation (depreciation) until the contracts are closed, when they are recorded as realized futures gains (losses).
During the six months ended April 30, 2014, the fund’s average investments in long and short futures contracts each represented less than 1% of net assets, based on quarterly average aggregate settlement values.
4. Forward Currency Contracts: The fund enters into forward currency contracts to protect the value of securities and related receivables and payables against changes in future foreign exchange rates. The fund’s risks in using these contracts include movement in the values of the foreign currencies relative to the U.S. dollar and the ability of the counterparties to fulfill their obligations under the contracts. The fund mitigates its counterparty risk by entering into forward currency contracts only with a diverse group of prequalified counterparties, monitoring their financial strength, entering into master netting arrangements with its counterparties, and requiring its counterparties to transfer collateral as security for their performance. The master netting arrangements provide that, in the event of a counterparty’s default (including bankruptcy), the fund may terminate the forward currency contracts, determine the net amount owed by either party in accordance with its master netting arrangements, and sell or retain any collateral held up to the net amount owed to the fund under the master netting arrangements. The forward currency contracts contain provisions whereby a counterparty may terminate open contracts if the fund’s net assets decline below a certain level, triggering a payment by the fund if the fund is in a net liability position at the time of the termination.
73
Total International Bond Index Fund
The payment amount would be reduced by any collateral the fund has pledged. Any assets pledged as collateral for open contracts are noted in the Statement of Net Assets. The value of collateral received or pledged is compared daily to the value of the forward currency contracts exposure with each counterparty, and any difference, if in excess of a specified minimum transfer amount, is adjusted and settled within two business days.
Forward currency contracts are valued at their quoted daily prices obtained from an independent third party, adjusted for currency risk based on the expiration date of each contract. The aggregate notional amounts of the contracts are not recorded in the Statement of Net Assets. Fluctuations in the value of the contracts are recorded in the Statement of Net Assets as an asset (liability) and in the Statement of Operations as unrealized appreciation (depreciation) until the contracts are closed, when they are recorded as realized forward currency contract gains (losses).
During the six months ended April 30, 2014, the fund’s average investment in forward currency contracts represented 100% of net assets, based on quarterly average notional amounts.
5. Federal Income Taxes: The fund intends to qualify as a regulated investment company and distribute all of its taxable income. Management has analyzed the fund’s tax positions taken for its open federal income tax period ended October 31, 2013, and for the period ended April 30, 2014, and has concluded that no provision for federal income tax is required in the fund’s financial statements.
6. Distributions: Distributions to shareholders are recorded on the ex-dividend date.
7. Credit Facility: The fund and certain other funds managed by The Vanguard Group participate in a $2.89 billion committed credit facility provided by a syndicate of lenders pursuant to a credit agreement that may be renewed annually; each fund is individually liable for its borrowings, if any, under the credit facility. Borrowings may be utilized for temporary and emergency purposes, and are subject to the fund’s regulatory and contractual borrowing restrictions. The participating funds are charged administrative fees and an annual commitment fee of 0.06% of the undrawn amount of the facility; these fees are allocated to the funds based on a method approved by the fund’s board of trustees and included in Management and Administrative expenses on the fund’s Statement of Operations. Any borrowings under this facility bear interest at a rate equal to the higher of the federal funds rate or LIBOR reference rate plus an agreed-upon spread.
The fund had no borrowings outstanding at April 30, 2014, or at any time during the period then ended.
8. Other: Interest income includes income distributions received from Vanguard Market Liquidity Fund and is accrued daily. Premiums and discounts on debt securities purchased are amortized and accreted, respectively, to interest income over the lives of the respective securities. Security transactions are accounted for on the date securities are bought or sold. Costs used to determine realized gains (losses) on the sale of investment securities are those of the specific securities sold.
Each class of shares has equal rights as to assets and earnings, except that each class separately bears certain class-specific expenses related to maintenance of shareholder accounts (included in Management and Administrative expenses) and shareholder reporting. Marketing and distribution expenses are allocated to each class of shares based on a method approved by the board of trustees. Income, other non-class-specific expenses, and gains and losses on investments are allocated to each class of shares based on its relative net assets.
74
Total International Bond Index Fund
B. The Vanguard Group furnishes at cost investment advisory, corporate management, administrative, marketing, and distribution services. The costs of such services are allocated to the fund based on methods approved by the board of trustees. The fund has committed to provide up to 0.40% of its net assets in capital contributions to Vanguard. At April 30, 2014, the fund had contributed capital of $2,375,000 to Vanguard (included in Other Assets), representing 0.01% of the fund’s net assets and 0.95% of Vanguard’s capitalization. The fund’s trustees and officers are also directors and officers of Vanguard.
C. Various inputs may be used to determine the value of the fund’s investments. These inputs are summarized in three broad levels for financial statement purposes. The inputs or methodologies used to value securities are not necessarily an indication of the risk associated with investing in those securities.
Level 1—Quoted prices in active markets for identical securities.
Level 2—Other significant observable inputs (including quoted prices for similar securities, interest rates, prepayment speeds, credit risk, etc.).
Level 3—Significant unobservable inputs (including the fund’s own assumptions used to determine the fair value of investments).
The following table summarizes the market value of the fund’s investments as of April 30, 2014, based on the inputs used to value them:
| | | |
| | Level 1 | Level 2 | Level 3 |
| Investments | ($000) | ($000) | ($000) |
| U.S. Government and Agency Obligations | — | 2,883 | — |
| Asset-Backed/Commercial Mortgage-Backed Securities | — | 1,430,986 | — |
| Corporate Bonds | — | 2,918,985 | — |
| Sovereign Bonds | — | 18,263,237 | — |
| Temporary Cash Investments | 37,103 | 171,293 | — |
| Futures Contracts—Liabilities1 | (28) | — | — |
| Forward Currency Contracts—Assets | — | 12,737 | — |
| Forward Currency Contracts—Liabilities | — | (118,001) | — |
| Total | 37,075 | 22,682,120 | — |
| 1 Represents variation margin on the last day of the reporting period. | | | |
D. At April 30, 2014, the fair values of derivatives were reflected in the Statement of Net Assets as follows:
| | | |
| | Interest Rate | Currency | |
| | Contracts | Contracts | Total |
| Statement of Net Assets Caption | ($000) | ($000) | ($000) |
| Other Assets | — | 12,737 | 12,737 |
| Liabilities | (28) | (118,001) | (118,029) |
75
Total International Bond Index Fund
Realized net gain (loss) and the change in unrealized appreciation (depreciation) on derivatives for the six months ended April 30, 2014, were:
| | | |
| Interest Rate | Currency | |
| | Contracts | Contracts | Total |
| Realized Net Gain (Loss) on Derivatives | ($000) | ($000) | ($000) |
| Futures Contracts | 769 | — | 769 |
| Forward Currency Contracts | — | (73,557) | (73,557) |
| Realized Net Gain (Loss) on Derivatives | 769 | (73,557) | (72,788) |
| |
| Change in Unrealized Appreciation (Depreciation) on Derivatives | | | |
| Futures Contracts | 71 | — | 71 |
| Forward Currency Contracts | — | (129,926) | (129,926) |
| Change in Unrealized Appreciation (Depreciation) on Derivatives | 71 | (129,926) | (129,855) |
At April 30, 2014, the aggregate settlement value of open futures contracts and the related unrealized appreciation (depreciation) were:
| | | | |
| | | | | ($000) |
| | | | Aggregate | |
| | | Number of | Settlement | Unrealized |
| | | Long (Short) | Value | Appreciation |
| Futures Contracts | Expiration | Contracts | Long (Short) | (Depreciation) |
| Long Gilt | June 2014 | 110 | 20,491 | 60 |
Unrealized appreciation (depreciation) on open futures contracts is required to be treated as realized gain (loss) for tax purposes.
At April 30, 2014, the fund had open forward currency contracts to receive and deliver currencies as follows. Unrealized appreciation (depreciation) on open forward currency contracts is treated as realized gain (loss) for tax purposes.
| | | | | | |
| | | | | | | Unrealized |
| | Contract | | | | | Appreciation |
| | Settlement | | | Contract Amount (000) | (Depreciation) |
| Counterparty | Date | | Receive | | Deliver | ($000) |
| Citigroup Global Markets | 5/2/14 | JPY | 519,150,000 | USD | 5,082,232 | (4,226) |
| Bank of America | 6/3/14 | USD | 11,883,224 | EUR | 8,571,000 | (7,896) |
| BNP Paribas | 5/2/14 | USD | 5,833,791 | EUR | 4,232,865 | (38,744) |
| Citigroup Global Markets | 6/3/14 | USD | 5,130,691 | JPY | 524,000,000 | 5,244 |
| Bank of America | 5/2/14 | EUR | 4,280,365 | USD | 5,934,949 | 3,487 |
| Credit Suisse Securities | 5/6/14 | THB | 3,449,602 | USD | 106,601 | — |
| Bank of America | 5/2/14 | USD | 2,548,596 | JPY | 262,435,000 | (18,382) |
| BNP Paribas | 5/2/14 | USD | 2,472,540 | JPY | 254,585,000 | (17,654) |
| BNP Paribas | 6/3/14 | USD | 2,079,781 | GBP | 1,232,000 | (351) |
| HSBC Holdings | 6/3/14 | JPY | 2,000,000 | USD | 19,589 | (26) |
| BNP Paribas | 5/5/14 | MXN | 1,954,760 | USD | 149,344 | 71 |
| Morgan Stanley | 5/5/14 | SEK | 1,756,840 | USD | 269,582 | 610 |
76
Total International Bond Index Fund
| | | | | | |
| | | | | | | Unrealized |
| | Contract | | | | | Appreciation |
| | Settlement | | | Contract Amount (000) | (Depreciation) |
| Counterparty | Date | | Receive | | Deliver | ($000) |
| BNP Paribas | 6/2/14 | USD | 1,159,128 | CAD | 1,273,000 | (2,315) |
| JP Morgan | 5/6/14 | ZAR | 1,062,010 | USD | 100,845 | 102 |
| Citigroup Global Markets | 5/5/14 | CZK | 1,018,380 | USD | 51,407 | 53 |
| HSBC Holdings | 5/2/14 | USD | 1,008,497 | GBP | 605,020 | (13,031) |
| Morgan Stanley | 5/2/14 | DKK | 756,000 | USD | 140,441 | 80 |
| Citigroup Global Markets | 5/2/14 | AUD | 631,960 | USD | 585,543 | 1,552 |
| BNP Paribas | 5/2/14 | GBP | 605,020 | USD | 1,021,607 | (80) |
| BNP Paribas | 5/2/14 | USD | 578,979 | AUD | 625,960 | (2,542) |
| Citigroup Global Markets | 6/3/14 | USD | 573,203 | AUD | 620,000 | (2,780) |
| BNP Paribas | 6/3/14 | USD | 477,849 | KRW | 494,000,000 | (231) |
| Morgan Stanley | 5/5/14 | NOK | 453,050 | USD | 76,065 | 151 |
| Credit Suisse Securities | 6/3/14 | USD | 360,125 | CHF | 317,000 | (62) |
| BNP Paribas | 5/5/14 | USD | 354,672 | CHF | 313,220 | (1,220) |
| BNP Paribas | 5/5/14 | PLN | 330,000 | USD | 108,999 | (4) |
| Credit Suisse Securities | 5/5/14 | CHF | 315,220 | USD | 358,021 | 142 |
| HSBC Holdings | 5/5/14 | USD | 281,460 | SEK | 1,826,840 | 503 |
| Morgan Stanley | 6/3/14 | USD | 270,842 | SEK | 1,766,000 | (758) |
| JP Morgan | 5/5/14 | ILS | 186,450 | USD | 53,867 | 13 |
| BNP Paribas | 6/3/14 | USD | 156,479 | MXN | 2,053,000 | (445) |
| HSBC Holdings | 5/5/14 | USD | 149,427 | MXN | 1,954,760 | 12 |
| Morgan Stanley | 6/3/14 | USD | 146,776 | DKK | 790,000 | (64) |
| HSBC Holdings | 5/2/14 | USD | 139,592 | DKK | 756,000 | (929) |
| BNP Paribas | 6/3/14 | USD | 109,522 | PLN | 332,200 | (200) |
| HSBC Holdings | 5/5/14 | USD | 108,989 | PLN | 330,000 | (6) |
| Credit Suisse Securities | 6/3/14 | USD | 107,650 | THB | 3,490,000 | (200) |
| HSBC Holdings | 5/6/14 | USD | 100,459 | ZAR | 1,062,010 | (487) |
| HSBC Holdings | 5/6/14 | USD | 99,904 | THB | 3,245,380 | (386) |
| JP Morgan | 6/3/14 | USD | 99,248 | ZAR | 1,050,000 | (557) |
| BNP Paribas | 6/3/14 | USD | 84,650 | MYR | 277,000 | (176) |
| Morgan Stanley | 5/5/14 | SGD | 82,610 | USD | 65,806 | 87 |
| Morgan Stanley | 6/3/14 | USD | 76,186 | NOK | 454,300 | (240) |
| HSBC Holdings | 5/5/14 | USD | 75,575 | NOK | 453,050 | (641) |
| JP Morgan | 6/3/14 | USD | 75,025 | TRY | 160,200 | (844) |
| BNP Paribas | 5/2/14 | NZD | 73,700 | USD | 63,316 | 236 |
| Morgan Stanley | 5/5/14 | HKD | 70,310 | USD | 9,069 | — |
| JP Morgan | 5/5/14 | SEK | 70,000 | USD | 10,800 | (34) |
| Morgan Stanley | 6/3/14 | USD | 66,515 | SGD | 83,500 | (88) |
| JP Morgan | 5/2/14 | USD | 65,734 | EUR | 47,500 | (166) |
77
Total International Bond Index Fund
| | | | | | |
| | | | | | | Unrealized |
| | Contract | | | | | Appreciation |
| | Settlement | | | Contract Amount (000) | (Depreciation) |
| Counterparty | Date | | Receive | | Deliver | ($000) |
| JP Morgan | 6/2/14 | USD | 63,926 | RUB | 2,300,000 | (635) |
| HSBC Holdings | 5/2/14 | USD | 63,790 | NZD | 73,700 | 238 |
| BNP Paribas | 6/3/14 | USD | 63,578 | NZD | 74,200 | (405) |
| JP Morgan | 5/5/14 | USD | 62,511 | SGD | 78,610 | (191) |
| JP Morgan | 6/2/14 | USD | 54,152 | ILS | 187,500 | (31) |
| Bank of America | 5/5/14 | USD | 53,402 | ILS | 186,450 | (478) |
| Citigroup Global Markets | 6/3/14 | USD | 51,749 | CZK | 1,025,000 | (46) |
| JP Morgan | 5/5/14 | USD | 51,191 | CZK | 1,018,380 | (270) |
| JP Morgan | 6/3/14 | EUR | 28,000 | USD | 38,832 | 14 |
| JP Morgan | 5/2/14 | USD | 12,780 | JPY | 1,300,000 | 64 |
| BNP Paribas | 5/2/14 | CAD | 10,000 | USD | 9,113 | 11 |
| Morgan Stanley | 6/4/14 | USD | 9,081 | HKD | 70,400 | 1 |
| HSBC Holdings | 5/2/14 | USD | 9,076 | CAD | 10,000 | (48) |
| JP Morgan | 5/5/14 | USD | 9,065 | HKD | 70,310 | (4) |
| HSBC Holdings | 5/2/14 | USD | 8,070 | JPY | 830,000 | (49) |
| Bank of America | 6/3/14 | USD | 7,800 | JPY | 800,000 | (25) |
| Bank of America | 5/6/14 | USD | 6,300 | THB | 204,222 | (11) |
| JP Morgan | 5/2/14 | USD | 5,640 | AUD | 6,000 | 66 |
| BNP Paribas | 5/5/14 | USD | 3,176 | SGD | 4,000 | (14) |
| HSBC Holdings | 5/5/14 | USD | 2,243 | CHF | 2,000 | (29) |
| | | | | | | (105,264) |
| Refer to the Statement of Net Assets for currency abbreviations. | | | | | |
E. Distributions are determined on a tax basis and may differ from net investment income and realized capital gains for financial reporting purposes. Differences may be permanent or temporary. Permanent differences are reclassified among capital accounts in the financial statements to reflect their tax character. Temporary differences arise when certain items of income, expense, gain, or loss are recognized in different periods for financial statement and tax purposes. These differences will reverse at some time in the future. Differences in classification may also result from the treatment of short-term gains as ordinary income for tax purposes.
The fund’s tax-basis capital gains and losses are determined only at the end of each fiscal year. For tax purposes, at October 31, 2013, the fund had available capital losses totaling $175,789,000 that may be carried forward indefinitely to offset future net capital gains. The fund will use these capital losses to offset net taxable capital gains, if any, realized during the year ending October 31, 2014; should the fund realize net capital losses for the year, the losses will be added to the loss carryforward balance above.
At April 30, 2014, the cost of investment securities for tax purposes was $21,929,153,000. Net unrealized appreciation of investment securities for tax purposes was $895,334,000, consisting of unrealized gains of $1,077,491,000 on securities that had risen in value since their purchase and $182,157,000 in unrealized losses on securities that had fallen in value since their purchase.
78
Total International Bond Index Fund
F. During the six months ended April 30, 2014, the fund purchased $15,660,240,000 of investment securities and sold $11,651,233,000 of investment securities, other than U.S. government securities and temporary cash investments. Purchases and sales of U.S. government securities were $11,978,000 and $11,958,000, respectively.
G. Capital share transactions for each class of shares were:
| | | | |
| | Six Months Ended | | Period Ended |
| | | April 30, 2014 | October 31, 2013 |
| | Amount | Shares | Amount | Shares |
| | ($000) | (000) | ($000) | (000) |
| Investor Shares1 | | | | |
| Issued | 1,062,509 | 105,800 | 12,613,415 | 1,261,422 |
| Issued in Lieu of Cash Distributions | 93,532 | 9,315 | 69,809 | 7,049 |
| Redeemed | (409,062) | (40,741) | (215,259) | (21,745) |
| Net Increase (Decrease)—Investor Shares | 746,979 | 74,374 | 12,467,965 | 1,246,726 |
| Admiral Shares1 | | | | |
| Issued | 1,679,356 | 83,825 | 1,662,591 | 83,968 |
| Issued in Lieu of Cash Distributions | 18,580 | 924 | 6,134 | 309 |
| Redeemed | (110,441) | (5,511) | (46,907) | (2,371) |
| Net Increase (Decrease)—Admiral Shares | 1,587,495 | 79,238 | 1,621,818 | 81,906 |
| Institutional Shares1 | | | | |
| Issued | 1,816,739 | 60,412 | 3,342,098 | 111,654 |
| Issued in Lieu of Cash Distributions | 34,040 | 1,129 | 18,502 | 622 |
| Redeemed | (15,266) | (507) | (4,620) | (152) |
| Net Increase (Decrease)—Institutional Shares | 1,835,513 | 61,034 | 3,355,980 | 112,124 |
| ETF Shares1 | | | | |
| Issued | 451,722 | 9,018 | 656,499 | 13,306 |
| Issued in Lieu of Cash Distributions | — | — | — | — |
| Redeemed | — | — | — | — |
| Net Increase (Decrease)—ETF Shares | 451,722 | 9,018 | 656,499 | 13,306 |
| Transition Shares 2 | | | | |
| Issued | — | — | 14,364,752 | 478,993 |
| Issued in Lieu of Cash Distributions | — | — | 9,094 | 309 |
| Redeemed | — | — | (14,096,971) | (479,305) |
| Net Increase (Decrease)—Transition Shares | — | — | 276,875 | (3) |
1 Inception date was May 31, 2013.
2 Commencement of the Transition Period was April 30, 2013. Effective May 31, 2013, all Transition Shares were converted to Investor Shares, Admiral Shares, or Institutional Shares. The fund no longer offers Transition Shares.
H. Management has determined that no material events or transactions occurred subsequent to April 30, 2014, that would require recognition or disclosure in these financial statements.
79
About Your Fund’s Expenses
As a shareholder of the fund, you incur ongoing costs, which include costs for portfolio management, administrative services, and shareholder reports (like this one), among others. Operating expenses, which are deducted from a fund’s gross income, directly reduce the investment return of the fund.
A fund’s expenses are expressed as a percentage of its average net assets. This figure is known as the expense ratio. The following examples are intended to help you understand the ongoing costs (in dollars) of investing in your fund and to compare these costs with those of other mutual funds. The examples are based on an investment of $1,000 made at the beginning of the period shown and held for the entire period.
The accompanying table illustrates your fund’s costs in two ways:
• Based on actual fund return. This section helps you to estimate the actual expenses that you paid over the period. The ”Ending Account Value“ shown is derived from the fund‘s actual return, and the third column shows the dollar amount that would have been paid by an investor who started with $1,000 in the fund. You may use the information here, together with the amount you invested, to estimate the expenses that you paid over the period.
To do so, simply divide your account value by $1,000 (for example, an $8,600 account value divided by $1,000 = 8.6), then multiply the result by the number given for your fund under the heading ”Expenses Paid During Period.“
• Based on hypothetical 5% yearly return. This section is intended to help you compare your fund‘s costs with those of other mutual funds. It assumes that the fund had a yearly return of 5% before expenses, but that the expense ratio is unchanged. In this case—because the return used is not the fund’s actual return—the results do not apply to your investment. The example is useful in making comparisons because the Securities and Exchange Commission requires all mutual funds to calculate expenses based on a 5% return. You can assess your fund’s costs by comparing this hypothetical example with the hypothetical examples that appear in shareholder reports of other funds.
Note that the expenses shown in the table are meant to highlight and help you compare ongoing costs only and do not reflect transaction costs incurred by the fund for buying and selling securities. Further, the expenses do not include any purchase, redemption, or account service fees described in the fund prospectus. If such fees were applied to your account, your costs would be higher. Your fund does not carry a “sales load.”
The calculations assume no shares were bought or sold during the period. Your actual costs may have been higher or lower, depending on the amount of your investment and the timing of any purchases or redemptions.
You can find more information about the fund’s expenses, including annual expense ratios, in the Financial Statements section of this report. For additional information on operating expenses and other shareholder costs, please refer to your fund’s current prospectus.
80
| | | |
| Six Months Ended April 30, 2014 | | | |
| | Beginning | Ending | Expenses |
| | Account Value | Account Value | Paid During |
| Total International Bond Index Fund | 10/31/2013 | 4/30/2014 | Period |
| Based on Actual Fund Return | | | |
| Investor Shares | $1,000.00 | $1,021.41 | $1.15 |
| Admiral Shares | 1,000.00 | 1,022.12 | 1.00 |
| Institutional Shares | 1,000.00 | 1,022.69 | 0.60 |
| ETF Shares | 1,000.00 | 1,021.96 | 1.00 |
| Based on Hypothetical 5% Yearly Return | | | |
| Investor Shares | $1,000.00 | $1,023.65 | $1.15 |
| Admiral Shares | 1,000.00 | 1,023.80 | 1.00 |
| Institutional Shares | 1,000.00 | 1,024.20 | 0.60 |
| ETF Shares | 1,000.00 | 1,023.80 | 1.00 |
The calculations are based on expenses incurred in the most recent six-month period. The fund’s annualized six-month expense ratios for that period are 0.23% for Investor Shares, 0.20% for Admiral Shares, 0.12% for Institutional Shares, and 0.20% for ETF Shares. The dollar amounts shown as “Expenses Paid” are equal to the annualized expense ratio multiplied by the average account value over the period, multiplied by the number of days in the most recent six-month period, then divided by the number of days in the most recent 12-month period.
81
Trustees Approve Advisory Arrangement
The board of trustees of Vanguard Total International Bond Index Fund has renewed the fund’s investment advisory arrangement with The Vanguard Group, Inc. (Vanguard). Vanguard—through its Fixed Income Group—serves as the investment advisor for the fund. The board determined that continuing the fund’s internalized management structure was in the best interests of the fund and its shareholders.
The board based its decision upon an evaluation of the advisor’s investment staff, portfolio management process, and performance. The trustees considered the factors discussed below, among others. However, no single factor determined whether the board approved the arrangement. Rather, it was the totality of the circumstances that drove the board’s decision.
Nature, extent, and quality of services
The board considered the quality of the investment management services provided since the fund’s inception in 2013, and took into account the organizational depth and stability of the advisor. The board noted that Vanguard has been managing investments for more than three decades. The Fixed Income Group adheres to a sound, disciplined investment management process; the team has considerable experience, stability, and depth.
The board concluded that Vanguard’s experience, stability, depth, and performance, among other factors, warranted continuation of the advisory arrangement.
Investment performance
The board considered the performance of the fund since its inception, including any periods of outperformance or underperformance relative to a target index and peer group. The board concluded that the performance was such that the advisory arrangement should continue. Information about the fund’s performance since inception can be found in the Performance Summary section of this report.
Cost
The board concluded that the fund’s expense ratio was well below the average expense ratio charged by funds in its peer group and that the fund’s advisory fee rate was also well below its peer-group average. Information about the fund’s expense ratio appears in the Financial Statements section.
The board did not conduct a profitability analysis of Vanguard, because of Vanguard’s unique “at-cost” structure. Unlike most other mutual fund management companies, Vanguard is owned by the funds it oversees, and produces “profits” only in the form of reduced expenses for fund shareholders.
The benefit of economies of scale
The board concluded that the fund’s at-cost arrangement with Vanguard ensures that the fund will realize economies of scale as it grows, with the cost to shareholders declining as fund assets increase.
The board will consider whether to renew the advisory arrangement again after a one-year period.
82
Glossary
30-Day SEC Yield. A fund’s 30-day SEC yield is derived using a formula specified by the U.S. Securities and Exchange Commission. Under the formula, data related to the fund’s security holdings in the previous 30 days are used to calculate the fund’s hypothetical net income for that period, which is then annualized and divided by the fund’s estimated average net assets over the calculation period. For the purposes of this calculation, a security’s income is based on its current market yield to maturity (for bonds), its actual income (for asset-backed securities), or its projected dividend yield (for stocks). Because the SEC yield represents hypothetical annualized income, it will differ—at times significantly—from the fund’s actual experience. As a result, the fund’s income distributions may be higher or lower than implied by the SEC yield.
Average Coupon. The average interest rate paid on the fixed income securities held by a fund. It is expressed as a percentage of face value.
Average Duration. An estimate of how much the value of the bonds held by a fund will fluctuate in response to a change in interest rates. To see how the value could change, multiply the average duration by the change in rates. If interest rates rise by 1 percentage point, the value of the bonds in a fund with an average duration of five years would decline by about 5%. If rates decrease by a percentage point, the value would rise by 5%.
Average Effective Maturity. The average length of time until fixed income securities held by a fund reach maturity and are repaid, taking into consideration the possibility that the issuer may call the bond before its maturity date. The figure reflects the proportion of fund assets represented by each security; it also reflects any futures contracts held. In general, the longer the average effective maturity, the more a fund’s share price will fluctuate in response to changes in market interest rates.
Credit Quality. Credit-quality ratings are measured on a scale that generally ranges from AAA (highest) to D (lowest). “Not Rated” is used to classify securities for which a rating is not available. U.S. Treasury, U.S. Agency, and U.S. Agency mortgage-backed securities appear under “U.S. Government.” Credit-quality ratings are obtained from Barclays using ratings generally derived from Moody’s, Fitch, and S&P. When ratings from all three agencies are used, the median rating is shown. When ratings from two of the agencies are used, the lower rating is shown.
Expense Ratio. A fund’s total annual operating expenses expressed as a percentage of the fund’s average net assets. The expense ratio includes management and administrative expenses, but does not include the transaction costs of buying and selling portfolio securities.
Inception Date. The date on which the assets of a fund (or one of its share classes) are first invested in accordance with the fund’s investment objective. For funds with a subscription period, the inception date is the day after that period ends. Investment performance is measured from the inception date.
Short-Term Reserves. The percentage of a fund invested in highly liquid, short-term securities that can be readily converted to cash.
Yield to Maturity. The rate of return an investor would receive if the fixed income securities held by a fund were held to their maturity dates.
83
The People Who Govern Your Fund
The trustees of your mutual fund are there to see that the fund is operated and managed in your best interests since, as a shareholder, you are a part owner of the fund. Your fund’s trustees also serve on the board of directors of The Vanguard Group, Inc., which is owned by the Vanguard funds and provides services to them on an at-cost basis.
A majority of Vanguard’s board members are independent, meaning that they have no affiliation with Vanguard or the funds they oversee, apart from the sizable personal investments they have made as private individuals. The independent board members have distinguished backgrounds in business, academia, and public service. Each of the trustees and executive officers oversees 178 Vanguard funds.
The following table provides information for each trustee and executive officer of the fund. More information about the trustees is in the Statement of Additional Information, which can be obtained, without charge, by contacting Vanguard at 800-662-7447, or online at vanguard.com.
| |
| InterestedTrustee1 | and Delphi Automotive LLP (automotive components); |
| | Senior Advisor at New Mountain Capital. |
| F. William McNabb III | |
| Born 1957. Trustee Since July 2009. Chairman of the | Amy Gutmann |
| Board. Principal Occupation(s) During the Past Five | Born 1949. Trustee Since June 2006. Principal |
| Years: Chairman of the Board of The Vanguard Group, | Occupation(s) During the Past Five Years: President of |
| Inc., and of each of the investment companies served | the University of Pennsylvania; Christopher H. Browne |
| by The Vanguard Group, since January 2010; Director | Distinguished Professor of Political Science, School of |
| of The Vanguard Group since 2008; Chief Executive | Arts and Sciences, and Professor of Communication, |
| Officer and President of The Vanguard Group, and of | Annenberg School for Communication, with secondary |
| each of the investment companies served by The | faculty appointments in the Department of Philosophy, |
| Vanguard Group, since 2008; Director of Vanguard | School of Arts and Sciences, and at the Graduate |
| Marketing Corporation; Managing Director of The | School of Education, University of Pennsylvania; |
| Vanguard Group (1995–2008). | Trustee of the National Constitution Center; Chair |
| | of the Presidential Commission for the Study of |
| IndependentTrustees | Bioethical Issues. |
| |
| Emerson U. Fullwood | JoAnn Heffernan Heisen |
| Born 1948. Trustee Since January 2008. Principal | Born 1950. Trustee Since July 1998. Principal |
| Occupation(s) During the Past Five Years: Executive | Occupation(s) During the Past Five Years: Corporate |
| Chief Staff and Marketing Officer for North America | Vice President and Chief Global Diversity Officer |
| and Corporate Vice President (retired 2008) of Xerox | (retired 2008) and Member of the Executive |
| Corporation (document management products and | Committee (1997–2008) of Johnson & Johnson |
| services); Executive in Residence and 2009–2010 | (pharmaceuticals/medical devices/consumer |
| Distinguished Minett Professor at the Rochester | products); Director of Skytop Lodge Corporation |
| Institute of Technology; Director of SPX Corporation | (hotels), the University Medical Center at Princeton, |
| (multi-industry manufacturing), the United Way of | the Robert Wood Johnson Foundation, and the Center |
| Rochester, Amerigroup Corporation (managed health | for Talent Innovation; Member of the Advisory Board |
| care), the University of Rochester Medical Center, | of the Maxwell School of Citizenship and Public Affairs |
| Monroe Community College Foundation, and North | at Syracuse University. |
| Carolina A&T University. | F. Joseph Loughrey |
| Rajiv L. Gupta | Born 1949. Trustee Since October 2009. Principal |
| Born 1945. Trustee Since December 2001.2 | Occupation(s) During the Past Five Years: President |
| Principal Occupation(s) During the Past Five Years: | and Chief Operating Officer (retired 2009) of Cummins |
| Chairman and Chief Executive Officer (retired 2009) | Inc. (industrial machinery); Chairman of the Board |
| and President (2006–2008) of Rohm and Haas Co. | of Hillenbrand, Inc. (specialized consumer services), |
| (chemicals); Director of Tyco International, Ltd. | and of Oxfam America; Director of SKF AB (industrial |
| (diversified manufacturing and services), Hewlett- | machinery), Hyster-Yale Materials Handling, Inc. |
| Packard Co. (electronic computer manufacturing), | (forklift trucks), the Lumina Foundation for Education, |
| | |
| and the V Foundation for Cancer Research; Member | Executive Officers | |
| of the Advisory Council for the College of Arts and | | |
| Letters and of the Advisory Board to the Kellogg | Glenn Booraem | |
| Institute for International Studies, both at the | Born 1967. Controller Since July 2010. Principal |
| University of Notre Dame. | Occupation(s) During the Past Five Years: Principal |
| | of The Vanguard Group, Inc.; Controller of each of |
| Mark Loughridge | the investment companies served by The Vanguard |
| Born 1953. Trustee Since March 2012. Principal | Group; Assistant Controller of each of the investment |
| Occupation(s) During the Past Five Years: Senior Vice | companies served by The Vanguard Group (2001–2010). |
| President and Chief Financial Officer (retired 2013) | | |
| at IBM (information technology services); Fiduciary | Thomas J. Higgins | |
| Member of IBM’s Retirement Plan Committee (2004– | Born 1957. Chief Financial Officer Since September |
| 2013); Member of the Council on Chicago Booth. | 2008. Principal Occupation(s) During the Past Five |
| | Years: Principal of The Vanguard Group, Inc.; Chief |
| Scott C. Malpass | Financial Officer of each of the investment companies |
| Born 1962. Trustee Since March 2012. Principal | served by The Vanguard Group; Treasurer of each of |
| Occupation(s) During the Past Five Years: Chief | the investment companies served by The Vanguard |
| Investment Officer and Vice President at the University | Group (1998–2008). | |
| of Notre Dame; Assistant Professor of Finance at the | | |
| Mendoza College of Business at Notre Dame; Member | Kathryn J. Hyatt | |
| of the Notre Dame 403(b) Investment Committee; | Born 1955. Treasurer Since November 2008. Principal |
| Board Member of TIFF Advisory Services, Inc. | Occupation(s) During the Past Five Years: Principal of |
| (investment advisor); Member of the Investment | The Vanguard Group, Inc.; Treasurer of each of the |
| Advisory Committees of the Financial Industry | investment companies served by The Vanguard |
| Regulatory Authority (FINRA) and of Major League | Group; Assistant Treasurer of each of the investment |
| Baseball. | companies served by The Vanguard Group (1988–2008). |
| |
| André F. Perold | Heidi Stam | |
| Born 1952. Trustee Since December 2004. Principal | Born 1956. Secretary Since July 2005. Principal |
| Occupation(s) During the Past Five Years: George | Occupation(s) During the Past Five Years: Managing |
| Gund Professor of Finance and Banking, Emeritus | Director of The Vanguard Group, Inc.; General Counsel |
| at the Harvard Business School (retired 2011); | of The Vanguard Group; Secretary of The Vanguard |
| Chief Investment Officer and Managing Partner of | Group and of each of the investment companies |
| HighVista Strategies LLC (private investment firm); | served by The Vanguard Group; Director and Senior |
| Director of Rand Merchant Bank; Overseer of the | Vice President of Vanguard Marketing Corporation. |
| Museum of Fine Arts Boston. | | |
| |
| Alfred M. Rankin, Jr. | Vanguard Senior ManagementTeam |
| Born 1941. Trustee Since January 1993. Principal | Mortimer J. Buckley | Chris D. McIsaac |
| Occupation(s) During the Past Five Years: Chairman, | Kathleen C. Gubanich | Michael S. Miller |
| President, and Chief Executive Officer of NACCO | Paul A. Heller | James M. Norris |
| Industries, Inc. (housewares/lignite), and of Hyster- | Martha G. King | Glenn W. Reed |
| Yale Materials Handling, Inc. (forklift trucks); Chairman | John T. Marcante | |
| of the Board of University Hospitals of Cleveland. | | |
| |
| Peter F. Volanakis | Chairman Emeritus and Senior Advisor |
| Born 1955. Trustee Since July 2009. Principal | John J. Brennan | |
| Occupation(s) During the Past Five Years: President | Chairman, 1996–2009 | |
| and Chief Operating Officer (retired 2010) of Corning | Chief Executive Officer and President, 1996–2008 |
| Incorporated (communications equipment); Trustee of | | |
| Colby-Sawyer College; Member of the Advisory Board | | |
| of the Norris Cotton Cancer Center and of the Advisory | Founder | |
| Board of the Parthenon Group (strategy consulting). | John C. Bogle | |
| | Chairman and Chief Executive Officer, 1974–1996 |
1 Mr. McNabb is considered an “interested person,” as defined in the Investment Company Act of 1940, because he is an officer of the Vanguard funds.
2 December 2002 for Vanguard Equity Income Fund, the Vanguard Municipal Bond Funds, and the Vanguard State Tax-Exempt Funds.
|  |
| P.O. Box 2600 |
| Valley Forge, PA 19482-2600 |
Connect with Vanguard® > vanguard.com
| |
| Fund Information > 800-662-7447 | |
| Direct Investor Account Services > 800-662-2739 | |
| Institutional Investor Services > 800-523-1036 | |
| Text Telephone for People | |
| With Hearing Impairment > 800-749-7273 | |
| �� |
| This material may be used in conjunction | |
| with the offering of shares of any Vanguard | |
| fund only if preceded or accompanied by | |
| the fund’s current prospectus. | |
| |
| All comparative mutual fund data are from Lipper, a | |
| Thomson Reuters Company, or Morningstar, Inc., unless | |
| otherwise noted. | |
| |
| You can obtain a free copy of Vanguard’s proxy voting | |
| guidelines by visiting vanguard.com/proxyreporting or by | |
| calling Vanguard at 800-662-2739. The guidelines are | |
| also available from the SEC’s website, sec.gov. In | |
| addition, you may obtain a free report on how your fund | |
| voted the proxies for securities it owned during the 12 | |
| months ended June 30. To get the report, visit either | |
| vanguard.com/proxyreporting or sec.gov. | |
| |
| You can review and copy information about your fund at | |
| the SEC’s Public Reference Room in Washington, D.C. To | |
| find out more about this public service, call the SEC at | |
| 202-551-8090. Information about your fund is also | |
| available on the SEC’s website, and you can receive | |
| copies of this information, for a fee, by sending a | |
| request in either of two ways: via e-mail addressed to | |
| publicinfo@sec.gov or via regular mail addressed to the | |
| Public Reference Section, Securities and Exchange | |
| Commission, Washington, DC 20549-1520. | |
| |
| | © 2014 The Vanguard Group, Inc. |
| | All rights reserved. |
| | Vanguard Marketing Corporation, Distributor. |
| |
| | Q12312 062014 |
Item 2: Code of Ethics.
Not Applicable.
Item 3:
Not Applicable.
Item 4: Principal Accountant Fees and Services.
Not. Applicable.
Item 5: Audit Committee of Listed Registrants.
Not Applicable.
Item 6: Investments.
Not Applicable.
Item 7: Disclosure of Proxy Voting Policies and Procedures for Closed-End Management Investment Companies.
Not Applicable.
Item 8: Portfolio Managers of Closed-End Management Investment Companies.
Not Applicable.
Item 9: Purchase of Equity Securities by Closed-End Management Investment Company and Affiliated Purchasers.
Not Applicable.
Item 10: Submission of Matters to a Vote of Security Holders.
Not Applicable.
Item 11: Controls and Procedures.
(a) Disclosure Controls and Procedures. The Principal Executive and Financial Officers concluded that the Registrant’s Disclosure Controls and Procedures are effective based on their evaluation of the Disclosure Controls and Procedures as of a date within 90 days of the filing date of this report.
(b) Internal Control Over Financial Reporting. There were no significant changes in Registrant’s Internal Control Over Financial Reporting or in other factors that could significantly affect this control subsequent to the date of the evaluation, including any corrective actions with regard to significant deficiencies and material weaknesses.
Item 12: Exhibits.
(a) Certifications.
Pursuant to the requirements of the Securities Exchange Act of 1934 and the Investment Company Act of 1940, the registrant has duly caused this report to be signed on its behalf by the undersigned, thereunto duly authorized.
| |
| | VANGUARD CHARLOTTE FUNDS |
| |
| By: | /s/ F. WILLIAM MCNABB III* |
| | F. WILLIAM MCNABB III |
| | CHIEF EXECUTIVE OFFICER |
| |
| Date: June 19, 2014 |
Pursuant to the requirements of the Securities Exchange Act of 1934 and the Investment Company Act of 1940, this report has been signed below by the following persons on behalf of the registrant and in the capacities and on the dates indicated.
| |
| | VANGUARD CHARLOTTE FUNDS |
| |
| By: | /s/ F. WILLIAM MCNABB III* |
| | F. WILLIAM MCNABB III |
| | CHIEF EXECUTIVE OFFICER |
| |
| Date: June 19, 2014 |
| |
| | VANGUARD CHARLOTTE FUNDS |
| |
| By: | /s/ THOMAS J. HIGGINS* |
| | THOMAS J. HIGGINS |
| | CHIEF FINANCIAL OFFICER |
| |
| Date: June 19, 2014 |
* By: /s/ Heidi Stam
Heidi Stam, pursuant to a Power of Attorney filed on April 22, 2014 see file Number 2-17620, Incorporated by Reference.