UNITED STATES
SECURITIES AND EXCHANGE COMMISSION Washington, D.C. 20549
FORM N-CSR
CERTIFIED SHAREHOLDER REPORT OF
REGISTERED MANAGEMENT INVESTMENT COMPANIES
| | |
| Investment Company Act file number: | 811-22619 |
Name of Registrant: | Vanguard Charlotte Funds |
Address of Registrant: | P.O. Box 2600 |
| | Valley Forge, PA 19482 |
Name and address of agent for service: | Anne E. Robinson, Esquire |
| | P.O. Box 876 |
| | Valley Forge, PA 19482 |
Registrant’s telephone number, including area code: (610) 669-1000 |
Date of fiscal year end: October 31 |
Date of reporting period: November 1, 2015 – October 31, 2016 |
Item 1: Reports to Shareholders |
Annual Report | October 31, 2016
Vanguard Tax-Exempt Bond Index Fund
A new format, unwavering commitment
As you begin reading this report, you’ll notice that we’ve made some improvements to the opening sections—based on feedback from you, our clients.
Page 1 starts with a new ”Your Fund’s Performance at a Glance,” a concise, handy summary of how your fund performed during the period.
In the renamed ”Chairman’s Perspective,” Bill McNabb will focus on enduring principles and investment insights.
We’ve modified some tables, and eliminated some redundancy, but we haven’t removed any information.
At Vanguard, we’re always looking for better ways to communicate and to help you make sound investment decisions. Thank you for entrusting your assets to us.
| |
| Contents | |
| Your Fund’s Performance at a Glance. | 1 |
| Chairman’s Perspective. | 3 |
| Fund Profile. | 7 |
| Performance Summary. | 8 |
| Financial Statements. | 10 |
| About Your Fund’s Expenses. | 81 |
| Glossary. | 83 |
Please note: The opinions expressed in this report are just that—informed opinions. They should not be considered promises or advice.
Also, please keep in mind that the information and opinions cover the period through the date on the front of this report. Of course, the
risks of investing in your fund are spelled out in the prospectus.
See the Glossary for definitions of investment terms used in this report.
About the cover: No matter what language you speak, Vanguard has one consistent message and set of principles. Our primary
focus is on you, our clients. We conduct our business with integrity as a faithful steward of your assets. This message is shown
translated into seven languages, reflecting our expanding global presence.
Your Fund’s Performance at a Glance
• For the 12 months ended October 31, 2016, Vanguard Tax-Exempt Bond Index Fund returned 4.28% for Investor Shares, 4.29% for ETF Shares, and 4.36% for Admiral Shares. Its benchmark index returned 4.32%, and the average return of peer funds was 4.34%.
• Municipal bond issuance picked up in the second half of the fiscal year. At the same time, demand was solid, helped by concerns about global growth and Britain’s vote to leave the European Union.
• Toward the end of the period, the fund posted negative monthly returns. Demand cooled while supply accelerated as the prospect of a Federal Reserve rate hike seemed increasingly likely.
• By maturity, lower-quality investment-grade bonds generally returned more than their higher-quality counterparts. And with the muni bond yield curve flattening, longer-dated bonds outstripped shorter-dated ones, although returns were positive across the maturity spectrum.
| | | | | |
| Total Returns: Fiscal Year Ended October 31, 2016 | | | | |
| | | Taxable- | | | |
| | 30-Day SEC | Equivalent | Income | Capital | Total |
| | Yield | Yield | Returns | Returns | Returns |
| Vanguard Tax-Exempt Bond Index Fund | | | | | |
| Investor Shares | 1.61% | 2.84% | 1.49% | 2.79% | 4.28% |
| ETF Shares | 1.70 | 3.00 | | | |
| Market Price | | | | | 4.19 |
| Net Asset Value | | | | | 4.29 |
| Admiral™ Shares | 1.70 | 3.00 | 1.62 | 2.74 | 4.36 |
| S&P National AMT-Free Municipal Bond Index | | | | | 4.32 |
| General Municipal Funds Average | | | | | 4.34 |
The calculation of taxable-equivalent yield assumes a typical itemized tax return and is based on the maximum federal tax rate of 43.4%.
State and local taxes were not considered. Please see the prospectus for a detailed explanation of the calculation.
General Municipal Funds Average: Derived from data provided by Lipper, a Thomson Reuters Company.
Admiral Shares carry lower expenses and are available to investors who meet certain account-balance requirements. The Vanguard ETF®
Shares shown are traded on the NYSE Arca exchange and are available only through brokers. The table provides ETF returns based on both
the NYSE Arca market price and the net asset value for a share. U.S. Pat. Nos. 6,879,964; 7,337,138; 7,720,749; 7,925,573; 8,090,646; and
8,417,623.
For the ETF Shares, the market price is determined by the midpoint of the bid-offer spread as of the closing time of the New York Stock
Exchange (generally 4 p.m., Eastern time). The net asset value is also determined as of the NYSE closing time. For more information about
how the ETF Shares' market prices have compared with their net asset value, visit vanguard.com, select your ETF, and then select the Price
and Performance tab. The ETF premium/discount analysis there shows the percentages of days on which the ETF Shares' market price was
above or below the NAV.
1
| | | | |
| Expense Ratios | | | | |
| Your Fund Compared With Its Peer Group | | | | |
| | Investor | ETF | Admiral | Peer Group |
| | Shares | Shares | Shares | Average |
| Tax-Exempt Bond Index Fund | 0.20% | 0.12% | 0.12% | 0.94% |
The fund expense ratios shown are from the prospectus dated February 26, 2016, and represent estimated costs for the current fiscal year.
For the fiscal year ended October 31, 2016, the fund’s expense ratios were 0.19% for Investor Shares, 0.09% for ETF Shares, and 0.09% for
Admiral Shares. The peer-group expense ratio is derived from data provided by Lipper, a Thomson Reuters Company, and captures information
through year-end 2015.
Peer group: General Municipal Funds Average.
2
Chairman’s Perspective

Bill McNabb
Chairman and Chief Executive Officer
Dear Shareholder,
Over the three years ended August 31, 2016, investors poured more than $1 trillion into index funds. Indexing now accounts for nearly a third of all mutual fund assets—more than double what it did a decade ago and eight times its share two decades ago.1
By contrast, active management’s commercial struggles have reflected its disappointing investment performance. Over the decade ended December 31, 2015, 82% of actively managed stock funds and 81% of active bond funds have either underperformed their benchmarks or shut down.
This subpar performance has fueled the explosion of asset growth in indexing among individual, retirement, and nonprofit investors. So what might the trend mean for the future of actively managed funds?
Our research and experience indicate that active management can survive—and even succeed—but only if it’s offered at much lower expense.
High costs, which limit a manager’s ability to deliver benchmark-beating returns to clients, are the biggest reason why active has lagged. Industrywide as of December 31, 2015, the average expense ratio for all active stock funds is 1.14%, compared with 0.76% for stock index
1 Sources: Wall Street Journal; Morningstar, Inc.; and Investment Company Institute, 2016.
3
funds. And the expense advantage is even wider for bonds; the average expense ratio for an active bond fund is 0.93%, compared with 0.43% for bond index funds.
But even these big differences understate the real gap. These days, it’s not hard to find an index fund that charges maybe 0.05% or 0.10%. So even if you have identified active managers who are skilled at selecting stocks and bonds, to match the return of a comparable (much cheaper) index fund would require significant outperformance. Think about it. Any fund that charges 1.00% in expenses—not even the high end of the range—will find it extraordinarily difficult to overcome the index fund’s head start.
Active management also has taken a hit from a regulatory environment that has been favorable to low-cost strategies. The U.S. Department of Labor several years ago mandated greater disclosure of retirement plan fees. And its new fiduciary rule, which is set to take effect in April, requires financial advisors to demonstrate that their recommendations are aligned with their clients’ best interest. Both changes encourage the use of lower-cost investments, including index funds.
The future of active management
In light of all this, people have been asking me whether active management is “dead.” My response is both yes and no. High-cost active management is dead, and rightly so. It has never been a winning proposition
| | | |
| Market Barometer | | | |
| | Average Annual Total Returns |
| | Periods Ended October 31, 2016 |
| | One | Three | Five |
| | Year | Years | Years |
| Stocks | | | |
| Russell 1000 Index (Large-caps) | 4.26% | 8.48% | 13.51% |
| Russell 2000 Index (Small-caps) | 4.11 | 4.12 | 11.51 |
| Russell 3000 Index (Broad U.S. market) | 4.24 | 8.13 | 13.35 |
| FTSE All-World ex US Index (International) | 0.64 | -0.94 | 4.09 |
| |
| Bonds | | | |
| Bloomberg Barclays U.S. Aggregate Bond Index | | | |
| (Broad taxable market) | 4.37% | 3.48% | 2.90% |
| Bloomberg Barclays Municipal Bond Index | | | |
| (Broad tax-exempt market) | 4.06 | 4.89 | 4.34 |
| Citigroup Three-Month U.S. Treasury Bill Index | 0.22 | 0.07 | 0.07 |
| |
| CPI | | | |
| Consumer Price Index | 1.64% | 1.15% | 1.32% |
4
for investors. Low-cost active funds, though, can potentially play an important role for investors who seek to outperform the market.
Paying less for your funds is the only sure-fire way to improve your odds of achieving success in active management. But even if you have found an active manager with low costs, the odds of outperforming the market are still long. You have to be able to identify talented stock and bond portfolio managers with long time horizons and clear investment strategies. Look for managers with consistent track records and the discipline to stick closely to their investment strategy.
Know what you own and why
Despite the well-deserved reputation of indexing and the challenges for active managers, there’s still a place for traditional active strategies that are low-cost, diversified, and highly disciplined, and are run by talented managers who focus on the long term.
Vanguard has always applied these principles to our active strategies, and investors have benefited as a majority of our active funds outperformed their benchmarks and bested their peers’ average annual return over the ten years ended September 30, 2016.
|
| Worried about the election’s impact on your portfolio? |
|
| The 2016 presidential election season was |
| one of the most intense and unpredictable |
| in U.S. history. In its aftermath, investors |
| may be left with lingering questions about |
| what the outcome will mean for their |
| portfolios. The answer, based on Vanguard |
| research into decades of historical data, is |
| that presidential elections typically have no |
| long-term effect on market performance. |
| |
| These findings hold true regardless of the |
| market’s initial reaction. Whether there’s |
| a swoon or bounce immediately after an |
| election, investors shouldn’t extrapolate |
| that performance to the long term. |
| |
| As you can see in the accompanying chart, |
| data going back to 1853 show that stock |
| market returns are virtually identical no matter |
| which party controls the White House. |
| Although headlines out of Washington at any |
| given time may still cause concern, investors |
| shouldn’t overreact to short-term events. |
| Instead, it’s best to maintain a balanced and |
| diversified portfolio and stay focused on your |
| long-term goals. |
| |
| Average annual stock market returns based |
| on party control of the White House |
| (1853–2015) |
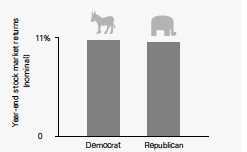
| Sources: Global Financial Data, 1853–1926; Morningstar, Inc., |
| and Ibbotson Associates thereafter through 2015. |
5
But it’s crucial for investors to be patient. Even active managers with the best track records frequently underperform their benchmarks when their investment styles are out of favor. Such periods, though temporary, can persist. So it’s important when entrusting your assets to an active strategy to be in it for the long haul.
Make sure you know what you’re buying and what the risks are. Active strategies are becoming more complex, so it’s important to clearly understand what the investments in your portfolio are designed to accomplish and why you want to hold them. Otherwise, you run the risk of selecting strategies that don’t fit your needs or objectives.
Keeping these considerations in mind can potentially boost your chances of success in identifying active strategies that may be able to help you reach your goals.
As always, thank you for investing with Vanguard.
Sincerely,

F. William McNabb III
Chairman and Chief Executive Officer
November 9, 2016
6
Tax-Exempt Bond Index Fund
Fund Profile
As of October 31, 2016
| | | |
| Share-Class Characteristics | | |
| |
| |
| | Investor | ETF | Admiral |
| | Shares | Shares | Shares |
| Ticker Symbol | VTEBX | VTEB | VTEAX |
| Expense Ratio1 | 0.20% | 0.12% | 0.12% |
| 30-Day SEC Yield | 1.61% | 1.70% | 1.70% |
| | |
| Financial Attributes | | |
| |
| | | S&P |
| | | National |
| | | AMT-Free |
| | Fund | Muni Bond Idx |
| Number of Bonds | 2,118 | 11,032 |
| Yield to Maturity | | |
| (before expenses) | 1.8% | 1.7% |
| Average Coupon | 4.7% | 4.6% |
| Average Duration | 5.6 years | 5.5 years |
| Average Stated | | |
| Maturity | 13.2 years | 13.0 years |
| Short-Term Reserves | 1.6% | — |
| |
| Largest Area Concentrations | |
| |
| New York | 20.8% |
| California | 14.9 |
| Texas | 10.1 |
| New Jersey | 5.7 |
| Pennsylvania | 4.9 |
| Massachusetts | 4.5 |
| Illinois | 4.3 |
| Florida | 3.6 |
| Maryland | 2.5 |
| Georgia | 2.3 |
| Top Ten | 73.6% |
| Percentage of net assets, excluding any futures contracts. |
| |
| Distribution by Stated Maturity | |
| (% of portfolio) | |
| Under 1 Year | 4.9% |
| 1 - 3 Years | 13.5 |
| 3 - 5 Years | 8.9 |
| 5 - 10 Years | 16.6 |
| 10 - 20 Years | 28.3 |
| 20 - 30 Years | 24.0 |
| Over 30 Years | 3.8 |
| |
| Distribution by Credit Quality (% of portfolio) |
| AAA | 23.8% |
| AA | 57.1 |
| A | 15.3 |
| BBB | 2.9 |
| Not Rated | 0.9 |
Credit-quality ratings are from Moody's and S&P. The higher rating
for each issue is shown. "Not Rated" is used to classify securities
for which a rating is not available. For more information about
these ratings, see the Glossary entry for Credit Quality.
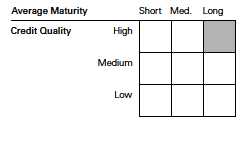
Investment Focus
1 The expense ratios shown are from the prospectus dated February 26, 2016, and represent estimated costs for the current fiscal year. For the fiscal
year ended October 31, 2016, the expense ratios were 0.19% for Investor Shares, 0.09% for ETF Shares, and 0.09% for Admiral Shares.
7
Tax-Exempt Bond Index Fund
Performance Summary
All of the returns in this report represent past performance, which is not a guarantee of future results that may be achieved by the fund. (Current performance may be lower or higher than the performance data cited. For performance data current to the most recent month-end, visit our website at vanguard.com/performance.) Note, too, that both investment returns and principal value can fluctuate widely, so an investor’s shares, when sold, could be worth more or less than their original cost. The returns shown do not reflect taxes that a shareholder would pay on fund distributions or on the sale of fund shares.
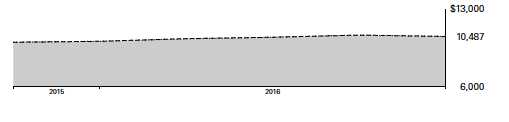
Cumulative Performance: August 21, 2015, Through October 31, 2016
Initial Investment of $10,000
| | | | |
| | | Average Annual Total Returns | |
| | | Periods Ended October 31, 2016 | |
| |
| | | | Since | Final Value |
| | | One | Inception | of a $10,000 |
| | | Year | (8/21/2015) | Investment |
| | Tax-Exempt Bond Index FundInvestor | | | |
| | Shares | 4.02% | 4.06% | $10,487 |
| | S&P National AMT-Free Municipal Bond | | | |
| • • • • • • • • | | | | |
| | Index | 4.32 | 4.32 | 10,519 |
| |
| – – – – | General Municipal Funds Average | 4.34 | 4.37 | 10,525 |
General Municipal Funds Average: Derived from data provided by Lipper, a Thomson Reuters Company.
"Since Inception" performance is calculated from the Investor Shares’ inception date for both the fund and its comparative standards.
| | | |
| | | Since | Final Value |
| | One | Inception | of a $10,000 |
| | Year | (8/21/2015) | Investment |
| Tax-Exempt Bond Index Fund | | | |
| ETF Shares Net Asset Value | 4.29% | 4.32% | $10,518 |
| Tax-Exempt Bond Index Fund | | | |
| ETF Shares Market Price | 4.19 | 4.36 | 10,523 |
| S&P National AMT-Free Municipal Bond | | | |
| Index | 4.32 | 4.32 | 10,519 |
| "Since Inception" performance is calculated from the ETF Shares’ inception date for both the fund and its comparative standards. |
Vanguard fund returns are adjusted to reflect the 0.25% fee on purchases of fund shares. The fee does not apply to the ETF Shares. The
Fiscal-Year Total Returns table is not adjusted for fees.
See Financial Highlights for dividend and capital gains information.
8
Tax-Exempt Bond Index Fund
| | | |
| | Average Annual Total Returns | |
| | Periods Ended October 31, 2016 | |
| |
| | | Since | Final Value |
| | One | Inception | of a $10,000 |
| | Year | (8/25/2015) | Investment |
| Tax-Exempt Bond Index Fund Admiral Shares | 4.10% | 4.26% | $10,507 |
| S&P National AMT-Free Municipal Bond | | | |
| Index | 4.32 | 4.45 | 10,528 |
| "Since Inception" performance is calculated from the Admiral Shares’ inception date for both the fund and its comparative standards. |
| | |
| Cumulative Returns of ETF Shares: August 21, 2015, Through October 31, 2016 | |
| | | Since |
| | One | Inception |
| | Year | (8/21/2015) |
| Tax-Exempt Bond Index Fund ETF Shares Market | | |
| Price | 4.19% | 5.23% |
| Tax-Exempt Bond Index Fund ETF Shares Net | | |
| Asset Value | 4.29 | 5.18 |
| S&P National AMT-Free Municipal Bond Index | 4.32 | 5.19 |
| "Since Inception" performance is calculated from the ETF Shares’ inception date for both the fund and its comparative standards. |
| | | | |
| Fiscal-Year Total Returns (%): August 21, 2015, Through October 31, 2016 | |
| | | | | S&P |
| | | | | National |
| | | | | AMT-Free |
| | | | Investor Shares | Muni Bond Idx |
| Fiscal Year | Income Returns | Capital Returns | Total Returns | Total Returns |
| 2015 | 0.32% | 0.50% | 0.82% | 0.83% |
| 2016 | 1.49 | 2.79 | 4.28 | 4.32 |
Average Annual Total Returns: Periods Ended September 30, 2016
This table presents returns through the latest calendar quarter—rather than through the end of the fiscal period.
Securities and Exchange Commission rules require that we provide this information.
| | | | | |
| | | | Since Inception |
| | Inception Date | One Year | Income | Capital | Total |
| Investor Shares | 8/21/2015 | 5.72% | 1.55% | 3.95% | 5.50% |
| Fee-Adjusted Returns | | 5.45 | | | 5.27 |
| ETF Shares | 8/21/2015 | | | | |
| Market Price | | 5.58 | | | 5.47 |
| Net Asset Value | | 5.71 | | | 5.54 |
| Admiral Shares | 8/25/2015 | 5.74 | 1.69 | 4.04 | 5.73 |
| Fee-Adjusted Returns | | 5.48 | | | 5.49 |
Vanguard fund returns are adjusted to reflect the 0.25% fee on purchases of fund shares. The fee does not apply to the ETF Shares. The
Fiscal-Year Total Returns table is not adjusted for fees.
9
Tax-Exempt Bond Index Fund
Financial Statements
Statement of Net Assets
As of October 31, 2016
The fund reports a complete list of its holdings in regulatory filings four times in each fiscal year, at the quarter-ends. For the second and fourth fiscal quarters, the lists appear in the fund’s semiannual and annual reports to shareholders. For the first and third fiscal quarters, the fund files the lists with the Securities and Exchange Commission on Form N-Q. Shareholders can look up the fund’s Forms N-Q on the SEC’s website at sec.gov. Forms N-Q may also be reviewed and copied at the SEC’s Public Reference Room (see the back cover of this report for further information).
| | | | |
| | | | Face | Market |
| | | Maturity | Amount | Value• |
| | Coupon | Date | ($000) | ($000) |
| Tax-Exempt Municipal Bonds (98.1%) | | | | |
| Alabama (0.9%) | | | | |
| Alabama Federal Aid Highway Finance | | | | |
| Authority GAN | 5.000% | 9/1/18 | 100 | 107 |
| Alabama Federal Aid Highway Finance | | | | |
| Authority GAN | 5.000% | 9/1/27 | 260 | 317 |
| Alabama Federal Aid Highway Finance | | | | |
| Authority Special | 5.000% | 9/1/19 | 200 | 221 |
| Alabama Federal Aid Highway Finance | | | | |
| Authority Special Obligation Revenue | 5.000% | 9/1/28 | 250 | 304 |
| Alabama Incentives Financing Authority Special | | | | |
| Obligation Revenue | 5.000% | 9/1/37 | 380 | 431 |
| Alabama Public School & College Authority | 5.000% | 1/1/24 | 225 | 275 |
| Alabama Public School & College Authority | 5.000% | 1/1/26 | 290 | 359 |
| Alabama Public School & College Authority | 5.000% | 1/1/27 | 325 | 398 |
| Alabama Public School & College Authority | | | | |
| Capital Improvement Revenue | 5.000% | 12/1/17 (Prere.) | 150 | 157 |
| Alabama Public School & College Authority | | | | |
| Capital Improvement Revenue | 5.000% | 5/1/18 | 55 | 58 |
| Alabama Public School & College Authority | | | | |
| Capital Improvement Revenue | 5.000% | 1/1/23 | 160 | 192 |
| Auburn University Alabama General Fee Revenue | 5.000% | 6/1/28 | 300 | 372 |
| Baldwin County AL Board of Education Revenue | 4.500% | 7/1/37 (2) | 505 | 516 |
| Birmingham AL Airport Authority Revenue | 5.250% | 7/1/30 (4) | 150 | 169 |
| Birmingham AL Airport Authority Revenue | 5.500% | 7/1/40 (4) | 140 | 158 |
| Birmingham AL Water Works & Sewer Board | | | | |
| Water Revenue | 4.500% | 1/1/43 (2) | 100 | 101 |
| Birmingham AL Water Works Board Water | | | | |
| Revenue | 5.000% | 1/1/21 (Prere.) | 575 | 665 |
| Birmingham AL Water Works Board Water | | | | |
| Revenue | 5.000% | 1/1/43 | 650 | 758 |
| | | | | 5,558 |
| Alaska (0.3%) | | | | |
| Alaska Municipal Bond Bank Authority Revenue | 5.000% | 2/1/27 | 515 | 607 |
| Alaska Municipal Bond Bank Authority Revenue | 5.000% | 3/1/27 | 245 | 296 |
| Anchorage AK Electric Utility Revenue | 5.000% | 12/1/41 | 270 | 312 |
| Anchorage AK GO | 5.000% | 9/1/19 | 700 | 776 |
| Anchorage AK Water Revenue | 5.000% | 5/1/37 (14) | 100 | 102 |
| | | | | 2,093 |
10
| | | | |
| Tax-Exempt Bond Index Fund | | | | |
| |
| |
| |
| | | | Face | Market |
| | | Maturity | Amount | Value• |
| | Coupon | Date | ($000) | ($000) |
| Arizona (1.4%) | | | | |
| Arizona Board Regents Arizona State University | | | | |
| System Revenue | 5.000% | 7/1/37 | 380 | 441 |
| Arizona COP | 5.000% | 10/1/18 (4) | 50 | 54 |
| Arizona COP | 5.000% | 10/1/29 (4) | 110 | 121 |
| Arizona School Facilities Board COP | 5.250% | 9/1/18 (Prere.) | 200 | 216 |
| Arizona School Facilities Board COP | 5.750% | 9/1/18 (Prere.) | 420 | 457 |
| Arizona School Facilities Board COP | 5.000% | 9/1/23 | 500 | 606 |
| Arizona Transportation Board Excise Tax Revenue | 5.250% | 7/1/19 (Prere.) | 135 | 150 |
| Arizona Transportation Board Excise Tax Revenue | 5.000% | 7/1/23 | 60 | 73 |
| Arizona Transportation Board Excise Tax Revenue | | | | |
| (Maricopa County Regional Area) | 5.000% | 7/1/18 | 80 | 85 |
| Arizona Transportation Board Excise Tax Revenue | | | | |
| (Maricopa County Regional Area) | 5.000% | 7/1/19 (Prere.) | 300 | 331 |
| Arizona Transportation Board Highway Revenue | 5.000% | 7/1/24 | 145 | 182 |
| Arizona Transportation Board Highway Revenue | 5.000% | 7/1/25 | 520 | 622 |
| Arizona Transportation Board Highway Revenue | 5.000% | 7/1/26 | 50 | 60 |
| Arizona Transportation Board Highway Revenue | 5.000% | 7/1/31 | 55 | 66 |
| Arizona Transportation Board Highway Revenue | 5.000% | 7/1/32 | 60 | 72 |
| Arizona Water Infrastructure Finance Authority | | | | |
| Revenue | 5.000% | 10/1/20 (Prere.) | 150 | 172 |
| Arizona Water Infrastructure Finance Authority | | | | |
| Revenue | 5.000% | 10/1/23 | 125 | 154 |
| Phoenix AZ Civic Improvement Corp. Transit | | | | |
| Excise Tax Revenue (Light Rail Project) | 5.000% | 7/1/20 | 200 | 228 |
| Phoenix AZ Civic Improvement Corp. Water | | | | |
| System Revenue | 5.000% | 7/1/20 | 700 | 799 |
| Phoenix AZ Civic Improvement Corp. Water | | | | |
| System Revenue | 5.000% | 7/1/21 | 275 | 322 |
| Phoenix AZ GO | 4.000% | 7/1/24 | 65 | 76 |
| Phoenix AZ GO | 5.000% | 7/1/26 | 500 | 638 |
| Pima County AZ Industrial Development Authority | | | | |
| Lease Revenue (Clark County Detention | | | | |
| Facilities Project) | 5.000% | 9/1/39 | 270 | 282 |
| Pima County AZ Sewer Revenue | 5.000% | 7/1/24 | 200 | 249 |
| Pinal County AZ Electric District Revenue | 5.250% | 7/1/21 (Prere.) | 70 | 83 |
| Salt River Project Arizona Agricultural | | | | |
| Improvement & Power District Revenue | 5.000% | 12/1/19 | 100 | 112 |
| Salt River Project Arizona Agricultural | | | | |
| Improvement & Power District Revenue | 5.000% | 1/1/27 | 100 | 105 |
| Salt River Project Arizona Agricultural | | | | |
| Improvement & Power District Revenue | 5.000% | 12/1/27 | 300 | 352 |
| Salt River Project Arizona Agricultural | | | | |
| Improvement & Power District Revenue | 5.000% | 1/1/28 | 50 | 54 |
| Salt River Project Arizona Agricultural | | | | |
| Improvement & Power District Revenue | 5.000% | 12/1/28 | 125 | 147 |
| Salt River Project Arizona Agricultural | | | | |
| Improvement & Power District Revenue | 5.000% | 12/1/31 | 120 | 141 |
| Salt River Project Arizona Agricultural | | | | |
| Improvement & Power District Revenue | 5.000% | 1/1/32 | 55 | 60 |
| Salt River Project Arizona Agricultural | | | | |
| Improvement & Power District Revenue | 5.000% | 1/1/33 | 75 | 81 |
| Salt River Project Arizona Agricultural | | | | |
| Improvement & Power District Revenue | 5.000% | 1/1/38 | 195 | 204 |
11
| | | | |
| Tax-Exempt Bond Index Fund | | | | |
| |
| |
| |
| | | | Face | Market |
| | | Maturity | Amount | Value• |
| | Coupon | Date | ($000) | ($000) |
| Salt River Project Arizona Agricultural | | | | |
| Improvement & Power District Revenue | 5.000% | 1/1/39 | 525 | 566 |
| Salt River Project Arizona Agricultural | | | | |
| Improvement & Power District Revenue | 5.000% | 12/1/45 | 125 | 147 |
| | | | | 8,508 |
| Arkansas (0.1%) | | | | |
| Arkansas GO | 5.000% | 6/15/21 | 225 | 263 |
| Fort Smith AR Water & Sewer Revenue | 5.000% | 10/1/32 (4) | 100 | 107 |
| | | | | 370 |
| California (14.9%) | | | | |
| Alameda CA Corridor Transportation Authority | | | | |
| Revenue | 5.450% | 10/1/17 (Prere.) | 200 | 209 |
| Alameda CA Corridor Transportation Authority | | | | |
| Revenue | 0.000% | 10/1/19 (ETM) | 235 | 227 |
| Alameda CA Corridor Transportation Authority | | | | |
| Revenue | 0.000% | 10/1/19 (2) | 15 | 14 |
| Alameda CA Corridor Transportation Authority | | | | |
| Revenue | 0.000% | 10/1/20 (ETM) | 140 | 133 |
| Alameda CA Corridor Transportation Authority | | | | |
| Revenue | 0.000% | 10/1/20 (2) | 5 | 5 |
| Alameda CA Corridor Transportation Authority | | | | |
| Revenue | 5.000% | 10/1/34 | 250 | 293 |
| Alameda CA Corridor Transportation Authority | | | | |
| Revenue | 0.000% | 10/1/35 (14) | 315 | 160 |
| Alvord CA Unified School District GO | 0.000% | 8/1/41 (4) | 150 | 57 |
| Anaheim CA Housing & Public Improvements | | | | |
| Authority Revenue (Electric Utility Distribution | | | | |
| System) | 5.000% | 10/1/34 | 500 | 574 |
| Anaheim CA Public Financing Authority Lease | | | | |
| Revenue | 0.000% | 9/1/36 (4) | 140 | 69 |
| Anaheim CA Redevelopment Agency Tax | | | | |
| Allocation Revenue (Merged Redevelopment | | | | |
| Project Area) | 5.000% | 2/1/31 (4) | 100 | 104 |
| Baldwin Park CA Unified School District GO | 0.000% | 8/1/42 (15) | 100 | 23 |
| Bay Area Toll Authority California Toll Bridge | | | | |
| Revenue (San Francisco Bay Area) | 5.000% | 4/1/18 (Prere.) | 150 | 159 |
| Bay Area Toll Authority California Toll Bridge | | | | |
| Revenue (San Francisco Bay Area) | 5.250% | 4/1/19 (Prere.) | 125 | 138 |
| Bay Area Toll Authority California Toll Bridge | | | | |
| Revenue (San Francisco Bay Area) | 5.000% | 4/1/28 | 355 | 425 |
| Bay Area Toll Authority California Toll Bridge | | | | |
| Revenue (San Francisco Bay Area) | 5.000% | 4/1/43 | 145 | 169 |
| Bay Area Toll Authority California Toll Bridge | | | | |
| Revenue (San Francisco Bay Area) | 5.000% | 10/1/54 | 760 | 879 |
| Bay Area Toll Authority California Toll Bridge | | | | |
| Revenue (San Francisco Bay Area) PUT | 1.500% | 4/2/18 | 935 | 940 |
| Bay Area Toll Authority California Toll Bridge | | | | |
| Revenue (San Francisco Bay Area) PUT | 2.000% | 4/1/21 | 250 | 256 |
| California Department of Water Resources | | | | |
| Power Supply Revenue | 5.000% | 5/1/17 (4) | 270 | 276 |
| California Department of Water Resources | | | | |
| Power Supply Revenue | 5.000% | 5/1/17 | 125 | 128 |
| California Department of Water Resources | | | | |
| Power Supply Revenue | 4.000% | 5/1/18 | 150 | 157 |
12
| | | | |
| Tax-Exempt Bond Index Fund | | | | |
| |
| |
| |
| | | | Face | Market |
| | | Maturity | Amount | Value• |
| | Coupon | Date | ($000) | ($000) |
| California Department of Water Resources | | | | |
| Power Supply Revenue | 5.000% | 5/1/18 (Prere.) | 250 | 266 |
| California Department of Water Resources | | | | |
| Power Supply Revenue | 5.000% | 5/1/18 (Prere.) | 250 | 266 |
| California Department of Water Resources | | | | |
| Power Supply Revenue | 5.000% | 5/1/19 | 305 | 336 |
| California Department of Water Resources | | | | |
| Power Supply Revenue | 5.000% | 5/1/20 | 225 | 256 |
| California Department of Water Resources | | | | |
| Power Supply Revenue | 5.000% | 5/1/21 | 500 | 585 |
| California Department of Water Resources Water | | | | |
| System Revenue (Central Valley Project) | 5.000% | 12/1/19 (Prere.) | 100 | 112 |
| California Department of Water Resources Water | | | | |
| System Revenue (Central Valley Project) | 5.000% | 12/1/26 | 100 | 125 |
| California Department of Water Resources Water | | | | |
| System Revenue (Central Valley Project) | 5.000% | 12/1/29 | 150 | 186 |
| California Economic Recovery GO | 5.000% | 7/1/19 (Prere.) | 100 | 111 |
| California Educational Facilities Authority Revenue | | | | |
| (Stanford University) | 5.000% | 3/15/39 | 400 | 541 |
| California Educational Facilities Authority Revenue | | | | |
| (Stanford University) | 5.000% | 6/1/43 | 150 | 207 |
| California Educational Facilities Authority Revenue | | | | |
| (Stanford University) | 5.000% | 5/1/45 | 300 | 418 |
| California Educational Facilities Authority Revenue | | | | |
| (University of Southern California) | 5.000% | 10/1/18 (Prere.) | 325 | 351 |
| California Educational Facilities Authority Revenue | | | | |
| (University of Southern California) | 5.250% | 10/1/18 (Prere.) | 580 | 629 |
| California GO | 5.000% | 2/1/17 | 370 | 374 |
| California GO | 5.000% | 2/1/17 | 125 | 126 |
| California GO | 5.000% | 6/1/17 (Prere.) | 335 | 343 |
| California GO | 5.000% | 6/1/17 (Prere.) | 340 | 348 |
| California GO | 5.000% | 9/1/17 | 1,200 | 1,243 |
| California GO | 3.500% | 10/1/17 | 140 | 144 |
| California GO | 5.000% | 11/1/17 | 400 | 417 |
| California GO | 5.000% | 11/1/17 (Prere.) | 595 | 620 |
| California GO | 5.000% | 12/1/17 (Prere.) | 230 | 241 |
| California GO | 5.000% | 12/1/17 (Prere.) | 200 | 209 |
| California GO | 6.000% | 2/1/18 (2) | 100 | 107 |
| California GO | 5.500% | 4/1/18 | 165 | 176 |
| California GO | 5.000% | 8/1/18 | 1,200 | 1,287 |
| California GO | 5.000% | 2/1/19 | 300 | 327 |
| California GO | 5.500% | 4/1/19 | 100 | 111 |
| California GO | 6.000% | 4/1/19 | 165 | 185 |
| California GO | 5.000% | 8/1/19 | 100 | 111 |
| California GO | 5.000% | 9/1/19 | 100 | 100 |
| California GO | 5.000% | 2/1/20 | 225 | 254 |
| California GO | 5.000% | 10/1/20 | 210 | 241 |
| California GO | 5.000% | 10/1/20 | 500 | 575 |
| California GO | 5.250% | 10/1/20 | 500 | 562 |
| California GO | 5.000% | 2/1/21 | 505 | 585 |
| California GO | 5.500% | 4/1/21 | 400 | 444 |
| California GO | 5.000% | 9/1/21 | 260 | 306 |
| California GO | 5.000% | 10/1/21 | 125 | 147 |
| California GO | 5.000% | 11/1/21 | 670 | 792 |
| California GO | 5.000% | 12/1/21 | 265 | 314 |
13
| | | | |
| Tax-Exempt Bond Index Fund | | | | |
| |
| |
| |
| | | | Face | Market |
| | | Maturity | Amount | Value• |
| | Coupon | Date | ($000) | ($000) |
| California GO | 5.000% | 2/1/22 | 100 | 119 |
| California GO | 5.000% | 2/1/22 | 175 | 208 |
| California GO | 5.000% | 9/1/22 | 350 | 421 |
| California GO | 5.000% | 10/1/22 | 110 | 133 |
| California GO | 5.250% | 10/1/22 | 150 | 183 |
| California GO | 5.000% | 2/1/23 | 250 | 298 |
| California GO | 5.000% | 8/1/23 | 170 | 172 |
| California GO | 5.000% | 9/1/23 | 100 | 121 |
| California GO | 5.250% | 9/1/23 | 100 | 120 |
| California GO | 5.000% | 11/1/23 | 1,025 | 1,260 |
| California GO | 5.000% | 12/1/23 | 250 | 308 |
| California GO | 5.000% | 12/1/23 | 75 | 92 |
| California GO | 5.000% | 3/1/24 | 500 | 616 |
| California GO | 5.000% | 8/1/24 | 600 | 745 |
| California GO | 5.500% | 2/1/25 | 500 | 643 |
| California GO | 5.625% | 4/1/25 | 310 | 344 |
| California GO | 5.000% | 10/1/25 | 500 | 615 |
| California GO | 5.000% | 10/1/25 | 70 | 86 |
| California GO | 5.000% | 3/1/26 | 200 | 248 |
| California GO | 5.000% | 3/1/26 | 565 | 699 |
| California GO | 5.000% | 4/1/26 | 100 | 106 |
| California GO | 5.000% | 8/1/26 | 500 | 623 |
| California GO | 5.000% | 9/1/26 | 145 | 156 |
| California GO | 5.000% | 10/1/26 | 100 | 123 |
| California GO | 5.000% | 11/1/26 | 100 | 104 |
| California GO | 5.000% | 3/1/27 | 390 | 478 |
| California GO | 4.500% | 8/1/27 | 155 | 156 |
| California GO | 5.000% | 9/1/27 | 315 | 382 |
| California GO | 5.000% | 10/1/27 | 100 | 120 |
| California GO | 5.000% | 10/1/27 | 170 | 209 |
| California GO | 5.000% | 11/1/27 | 500 | 609 |
| California GO | 5.750% | 4/1/28 | 295 | 328 |
| California GO | 4.500% | 8/1/28 (12) | 100 | 101 |
| California GO | 5.000% | 9/1/28 | 100 | 121 |
| California GO | 5.000% | 10/1/28 | 200 | 245 |
| California GO | 5.000% | 8/1/29 | 200 | 243 |
| California GO | 3.000% | 9/1/29 | 105 | 109 |
| California GO | 5.000% | 10/1/29 | 250 | 305 |
| California GO | 5.000% | 10/1/29 | 750 | 793 |
| California GO | 5.000% | 10/1/29 | 90 | 100 |
| California GO | 5.250% | 10/1/29 | 105 | 117 |
| California GO | 5.000% | 12/1/29 | 75 | 91 |
| California GO | 5.000% | 3/1/30 | 160 | 192 |
| California GO | 5.250% | 3/1/30 | 300 | 338 |
| California GO | 4.500% | 8/1/30 | 420 | 424 |
| California GO | 5.000% | 8/1/30 | 50 | 60 |
| California GO | 5.000% | 8/1/30 | 300 | 362 |
| California GO | 5.000% | 10/1/30 | 340 | 414 |
| California GO | 5.000% | 2/1/31 | 50 | 59 |
| California GO | 5.750% | 4/1/31 | 335 | 372 |
| California GO | 5.000% | 8/1/31 | 150 | 181 |
| California GO | 3.250% | 9/1/31 | 115 | 119 |
| California GO | 5.000% | 9/1/31 | 200 | 233 |
| California GO | 5.000% | 10/1/31 | 215 | 260 |
| California GO | 5.000% | 11/1/31 | 145 | 174 |
14
| | | | |
| Tax-Exempt Bond Index Fund | | | | |
| |
| |
| |
| | | | Face | Market |
| | | Maturity | Amount | Value• |
| | Coupon | Date | ($000) | ($000) |
| California GO | 5.000% | 5/1/32 | 50 | 60 |
| California GO | 5.000% | 8/1/32 | 250 | 296 |
| California GO | 5.250% | 8/1/32 (4) | 505 | 670 |
| California GO | 3.000% | 9/1/32 | 330 | 332 |
| California GO | 5.000% | 2/1/33 | 510 | 598 |
| California GO | 6.500% | 4/1/33 | 655 | 740 |
| California GO | 4.250% | 8/1/33 (14) | 740 | 746 |
| California GO | 5.000% | 8/1/33 | 300 | 360 |
| California GO | 5.000% | 8/1/33 | 275 | 325 |
| California GO | 3.000% | 9/1/33 | 310 | 309 |
| California GO | 3.375% | 9/1/33 | 210 | 216 |
| California GO | 4.000% | 9/1/33 | 250 | 275 |
| California GO | 4.000% | 8/1/34 | 275 | 297 |
| California GO | 4.000% | 9/1/34 | 250 | 274 |
| California GO | 5.000% | 9/1/34 | 750 | 901 |
| California GO | 5.500% | 11/1/34 | 145 | 163 |
| California GO | 4.500% | 12/1/34 | 130 | 130 |
| California GO | 6.000% | 4/1/35 | 270 | 301 |
| California GO | 5.000% | 8/1/35 | 330 | 393 |
| California GO | 4.000% | 9/1/35 | 250 | 272 |
| California GO | 3.750% | 12/1/35 | 500 | 524 |
| California GO | 5.250% | 3/1/36 | 100 | 105 |
| California GO | 5.125% | 8/1/36 | 100 | 107 |
| California GO | 4.000% | 9/1/36 | 250 | 272 |
| California GO | 4.500% | 12/1/36 (12) | 90 | 90 |
| California GO | 4.000% | 9/1/37 | 250 | 272 |
| California GO | 5.000% | 11/1/37 | 110 | 114 |
| California GO | 5.000% | 12/1/37 | 90 | 94 |
| California GO | 5.250% | 3/1/38 | 260 | 274 |
| California GO | 5.000% | 4/1/38 | 55 | 58 |
| California GO | 6.000% | 4/1/38 | 605 | 675 |
| California GO | 5.000% | 10/1/39 | 120 | 142 |
| California GO | 6.000% | 11/1/39 | 250 | 285 |
| California GO | 5.500% | 3/1/40 | 145 | 165 |
| California GO | 5.250% | 11/1/40 | 100 | 115 |
| California GO | 5.000% | 9/1/41 | 640 | 737 |
| California GO | 5.000% | 10/1/41 | 100 | 115 |
| California GO | 5.000% | 4/1/42 | 200 | 231 |
| California GO | 5.000% | 9/1/42 | 100 | 116 |
| California GO | 5.000% | 2/1/43 | 110 | 127 |
| California GO | 5.000% | 4/1/43 | 200 | 232 |
| California GO | 4.875% | 11/1/43 | 165 | 192 |
| California GO | 5.000% | 11/1/43 | 605 | 710 |
| California GO | 4.500% | 12/1/43 | 405 | 460 |
| California GO | 4.000% | 11/1/44 | 200 | 214 |
| California GO | 5.000% | 8/1/45 | 500 | 595 |
| California GO PUT | 3.000% | 12/1/19 | 125 | 131 |
| California Public Works Board Lease Revenue | | | | |
| (Department of Corrections) | 5.000% | 9/1/20 | 100 | 114 |
| California Public Works Board Lease Revenue | | | | |
| (Department of Corrections) | 4.000% | 6/1/28 | 60 | 67 |
| California Public Works Board Lease Revenue | | | | |
| (Department of Corrections) | 5.000% | 9/1/39 | 300 | 350 |
| California Public Works Board Lease Revenue | | | | |
| (Department of General Services) | 5.000% | 5/1/18 | 150 | 159 |
15
| | | | |
| Tax-Exempt Bond Index Fund | | | | |
| |
| |
| |
| | | | Face | Market |
| | | Maturity | Amount | Value• |
| | Coupon | Date | ($000) | ($000) |
| California Public Works Board Lease Revenue | | | | |
| (Judicial Council Projects) | 5.000% | 12/1/24 | 150 | 176 |
| California Public Works Board Lease Revenue | | | | |
| (Judicial Council Projects) | 5.250% | 12/1/25 | 250 | 296 |
| California Public Works Board Lease Revenue | | | | |
| (Regents of The University of California) | 5.000% | 12/1/21 (Prere.) | 205 | 244 |
| California Public Works Board Lease Revenue | | | | |
| (Various Capital Projects) | 5.000% | 4/1/21 | 125 | 145 |
| California Public Works Board Lease Revenue | | | | |
| (Various Capital Projects) | 5.250% | 11/1/28 | 300 | 367 |
| California Public Works Board Lease Revenue | | | | |
| (Various Capital Projects) | 5.000% | 11/1/29 | 100 | 120 |
| California Public Works Board Lease Revenue | | | | |
| (Various Capital Projects) | 5.750% | 10/1/30 | 200 | 225 |
| California Public Works Board Lease Revenue | | | | |
| (Various Capital Projects) | 5.000% | 4/1/37 | 205 | 235 |
| California St For Previous Issues See 13062T | | | | |
| Forfuture Issues See 13063B Rfdg | 5.500% | 8/1/30 | 100 | 108 |
| California State University Systemwide Revenue | 5.250% | 5/1/19 (Prere.) | 255 | 282 |
| California State University Systemwide Revenue | 5.250% | 5/1/19 (Prere.) | 90 | 100 |
| California State University Systemwide Revenue | 5.000% | 11/1/29 | 255 | 312 |
| California State University Systemwide Revenue | 5.000% | 11/1/31 | 150 | 182 |
| California State University Systemwide Revenue | 5.000% | 11/1/31 | 510 | 627 |
| California State University Systemwide Revenue | 5.000% | 11/1/32 | 50 | 61 |
| California State University Systemwide Revenue | 4.000% | 11/1/34 | 125 | 138 |
| California State University Systemwide Revenue | 4.000% | 11/1/35 | 235 | 259 |
| California State University Systemwide Revenue | 4.000% | 11/1/37 | 375 | 410 |
| California State University Systemwide Revenue | 5.000% | 11/1/37 | 250 | 291 |
| California State University Systemwide Revenue | 5.000% | 11/1/37 | 350 | 414 |
| California State University Systemwide Revenue | 4.000% | 11/1/38 | 125 | 137 |
| California State University Systemwide Revenue | 5.000% | 11/1/41 | 490 | 586 |
| California State University Systemwide Revenue | 4.000% | 11/1/43 | 200 | 217 |
| California State University Systemwide Revenue | 5.000% | 11/1/47 | 105 | 125 |
| Chino Basin Regional Financing Authority California | | | | |
| Revenue (Inland Empire Utilities Agency) | 5.000% | 11/1/33 (2) | 100 | 104 |
| Chino Basin Regional Financing Authority California | | | | |
| Revenue (Inland Empire Utilities Agency) | 5.000% | 11/1/38 (2) | 200 | 208 |
| Clovis CA Unified School District GO | 4.000% | 8/1/40 | 150 | 162 |
| Coast CA Community College District GO | 5.000% | 8/1/38 | 680 | 802 |
| Corona-Norco CA Unified School District GO | 0.000% | 8/1/39 (4) | 400 | 171 |
| Cypress CA Elementary School District GO | 0.000% | 8/1/40 | 250 | 109 |
| East Bay CA Municipal Utility District Water | | | | |
| System Revenue | 5.000% | 6/1/19 | 150 | 166 |
| East Bay CA Municipal Utility District Water | | | | |
| System Revenue | 5.000% | 6/1/32 | 145 | 176 |
| East Bay CA Municipal Utility District Water | | | | |
| System Revenue | 5.000% | 6/1/35 | 250 | 300 |
| Eastern California Municipal Water District Water | | | | |
| & Sewer COP | 5.000% | 7/1/18 (Prere.) | 200 | 214 |
| Gilroy CA School Facilities Finance Authority | | | | |
| Revenue | 4.000% | 8/1/42 | 320 | 348 |
| Imperial CA Irrigation District Electric Revenue | 5.000% | 11/1/18 (Prere.) | 105 | 114 |
| Los Angeles CA Community College District GO | 5.000% | 8/1/28 | 570 | 703 |
| Los Angeles CA Community College District GO | 5.000% | 8/1/29 | 250 | 307 |
| Los Angeles CA Community College District GO | 5.000% | 8/1/30 | 130 | 159 |
16
| | | | |
| Tax-Exempt Bond Index Fund | | | | |
| |
| |
| |
| | | | Face | Market |
| | | Maturity | Amount | Value• |
| | Coupon | Date | ($000) | ($000) |
| Los Angeles CA Community College District GO | 5.000% | 8/1/31 | 305 | 371 |
| Los Angeles CA Community College District GO | 4.000% | 8/1/39 | 325 | 354 |
| Los Angeles CA Department of Airports | | | | |
| International Airport Revenue | 5.000% | 5/15/29 | 100 | 109 |
| Los Angeles CA Department of Airports | | | | |
| International Airport Revenue | 5.250% | 5/15/29 | 250 | 276 |
| Los Angeles CA Department of Airports | | | | |
| International Airport Revenue | 5.000% | 5/15/35 | 690 | 780 |
| Los Angeles CA Department of Airports | | | | |
| International Airport Revenue | 5.000% | 5/15/35 | 160 | 189 |
| Los Angeles CA Department of Water & Power | | | | |
| Revenue | 5.000% | 7/1/18 | 140 | 150 |
| Los Angeles CA Department of Water & Power | | | | |
| Revenue | 5.000% | 7/1/20 | 290 | 332 |
| Los Angeles CA Department of Water & Power | | | | |
| Revenue | 5.000% | 7/1/24 | 125 | 152 |
| Los Angeles CA Department of Water & Power | | | | |
| Revenue | 5.000% | 7/1/29 | 245 | 296 |
| Los Angeles CA Department of Water & Power | | | | |
| Revenue | 5.000% | 7/1/29 | 140 | 167 |
| Los Angeles CA Department of Water & Power | | | | |
| Revenue | 5.000% | 7/1/32 | 130 | 155 |
| Los Angeles CA Department of Water & Power | | | | |
| Revenue | 5.000% | 7/1/35 | 300 | 359 |
| Los Angeles CA Department of Water & Power | | | | |
| Revenue | 5.000% | 7/1/39 (2) | 200 | 205 |
| Los Angeles CA Department of Water & Power | | | | |
| Revenue | 5.000% | 7/1/43 | 180 | 210 |
| Los Angeles CA Department of Water & Power | | | | |
| Revenue | 5.000% | 7/1/43 | 240 | 281 |
| Los Angeles CA Department of Water & Power | | | | |
| Revenue | 5.000% | 7/1/44 (2) | 500 | 513 |
| Los Angeles CA Department of Water & Power | | | | |
| Revenue | 5.000% | 7/1/44 | 150 | 176 |
| Los Angeles CA Department of Water & Power | | | | |
| Revenue | 5.000% | 7/1/46 | 750 | 890 |
| Los Angeles CA GO | 4.500% | 9/1/28 | 200 | 213 |
| Los Angeles CA Municipal Improvement Corp. | | | | |
| Lease Revenue | 4.000% | 11/1/33 | 480 | 526 |
| Los Angeles CA Unified School District GO | 4.500% | 7/1/17 (Prere.) | 100 | 103 |
| Los Angeles CA Unified School District GO | 5.000% | 7/1/17 (Prere.) | 100 | 103 |
| Los Angeles CA Unified School District GO | 5.000% | 7/1/17 (Prere.) | 100 | 103 |
| Los Angeles CA Unified School District GO | 5.500% | 7/1/17 (3) | 100 | 103 |
| Los Angeles CA Unified School District GO | 5.000% | 7/1/19 | 70 | 78 |
| Los Angeles CA Unified School District GO | 4.500% | 7/1/22 (4) | 530 | 543 |
| Los Angeles CA Unified School District GO | 5.000% | 7/1/22 | 200 | 241 |
| Los Angeles CA Unified School District GO | 5.000% | 7/1/24 | 500 | 627 |
| Los Angeles CA Unified School District GO | 5.000% | 7/1/27 | 120 | 148 |
| Los Angeles CA Unified School District GO | 4.250% | 1/1/28 (3) | 100 | 102 |
| Los Angeles CA Unified School District GO | 4.500% | 1/1/28 (14) | 455 | 466 |
| Los Angeles CA Unified School District GO | 5.000% | 7/1/28 | 230 | 282 |
| Los Angeles CA Unified School District GO | 5.000% | 7/1/29 | 295 | 363 |
| Los Angeles CA Unified School District GO | 5.200% | 7/1/29 | 200 | 222 |
| Los Angeles CA Unified School District GO | 5.000% | 7/1/32 | 300 | 348 |
| Los Angeles CA Unified School District GO | 5.000% | 1/1/34 | 140 | 155 |
17
| | | | |
| Tax-Exempt Bond Index Fund | | | | |
| |
| |
| |
| | | | Face | Market |
| | | Maturity | Amount | Value• |
| | Coupon | Date | ($000) | ($000) |
| Los Angeles CA Unified School District GO | 4.000% | 7/1/40 | 735 | 804 |
| Los Angeles CA Wastewater System Revenue | 5.000% | 6/1/35 | 500 | 590 |
| Los Angeles CA Wastewater System Revenue | 5.000% | 6/1/45 | 250 | 295 |
| Los Angeles County CA Public Works Financing | | | | |
| Authority Lease Revenue | 5.000% | 8/15/18 (Prere.) | 100 | 107 |
| Los Angeles County CA Public Works Financing | | | | |
| Authority Lease Revenue | 4.000% | 12/1/40 | 580 | 623 |
| Los Angeles County CA Sanitation Districts | | | | |
| Financing Authority Revenue | 5.000% | 10/1/20 | 55 | 63 |
| Metropolitan Water District of Southern California | | | | |
| Revenue | 5.000% | 7/1/35 | 100 | 111 |
| Metropolitan Water District of Southern California | | | | |
| Revenue | 5.000% | 7/1/37 | 100 | 103 |
| Mount San Antonio CA Community College | | | | |
| District GO | 0.000% | 8/1/43 | 150 | 124 |
| New Haven CA Unified School District GO | 0.000% | 8/1/34 (12) | 120 | 67 |
| Orange County CA Sanitation District Wastewater | | | | |
| Revenue | 3.000% | 2/1/31 | 150 | 154 |
| Orange County CA Water District Revenue | 5.000% | 8/15/39 | 125 | 138 |
| Pittsburg CA Unified School District Financing | | | | |
| Authority Revenue | 5.500% | 9/1/21 (Prere.) | 350 | 422 |
| Poway CA Unified School District GO | 0.000% | 8/1/33 | 300 | 171 |
| Riverside County CA Transportation Commission | | | | |
| Sales Tax Revenue | 5.250% | 6/1/39 | 515 | 614 |
| Sacramento CA Municipal Utility District Revenue | 5.000% | 8/15/18 (Prere.) | 40 | 43 |
| Sacramento CA Municipal Utility District Revenue | 5.000% | 8/15/20 | 195 | 224 |
| Sacramento CA Municipal Utility District Revenue | 5.000% | 8/15/27 (4) | 60 | 64 |
| Sacramento CA Municipal Utility District Revenue | 5.000% | 8/15/37 | 75 | 89 |
| Sacramento CA Water Revenue | 5.000% | 9/1/38 | 425 | 499 |
| Sacramento County CA Airport Revenue | 6.000% | 7/1/41 | 170 | 183 |
| San Diego CA Community College District GO | 5.000% | 8/1/30 | 95 | 114 |
| San Diego CA Public Facilities Financing Authority | | | | |
| Lease Revenue | 5.000% | 9/1/28 | 125 | 141 |
| San Diego CA Public Facilities Financing Authority | | | | |
| Sewer Revenue | 5.000% | 5/15/17 | 115 | 118 |
| San Diego CA Public Facilities Financing Authority | | | | |
| Sewer Revenue | 5.000% | 5/15/19 (Prere.) | 80 | 88 |
| San Diego CA Public Facilities Financing Authority | | | | |
| Sewer Revenue | 5.250% | 5/15/19 (Prere.) | 250 | 277 |
| San Diego CA Public Facilities Financing Authority | | | | |
| Sewer Revenue | 5.250% | 5/15/20 (Prere.) | 100 | 115 |
| San Diego CA Unified School District GO | 0.000% | 7/1/35 | 400 | 211 |
| San Diego CA Unified School District GO | 5.000% | 7/1/35 | 100 | 118 |
| San Diego CA Unified School District GO | 0.000% | 7/1/36 | 100 | 50 |
| San Diego CA Unified School District GO | 0.000% | 7/1/37 | 200 | 97 |
| San Diego CA Unified School District GO | 0.000% | 7/1/38 | 170 | 79 |
| San Diego CA Unified School District GO | 5.000% | 7/1/40 | 200 | 237 |
| San Diego CA Unified School District GO | 0.000% | 7/1/42 | 150 | 99 |
| San Diego CA Unified School District GO | 4.000% | 7/1/45 | 225 | 242 |
| San Diego CA Unified School District GO | 0.000% | 7/1/47 | 250 | 82 |
| San Diego CA Unified School District GO | 0.000% | 7/1/47 | 100 | 68 |
| San Diego County CA Regional Transportation | | | | |
| Commission Sales Tax Revenue | 5.000% | 4/1/42 | 350 | 407 |
| San Diego County CA Regional Transportation | | | | |
| Commission Sales Tax Revenue | 4.750% | 4/1/48 | 465 | 527 |
18
| | | | |
| Tax-Exempt Bond Index Fund | | | | |
| |
| |
| |
| | | | Face | Market |
| | | Maturity | Amount | Value• |
| | Coupon | Date | ($000) | ($000) |
| San Diego County CA Water Authority Revenue | 5.000% | 5/1/18 (Prere.) | 30 | 32 |
| San Diego County CA Water Authority Revenue | 5.000% | 5/1/18 (Prere.) | 140 | 149 |
| San Francisco CA City & County (War Memorial | | | | |
| Veterans Building Seismic Upgrade & | | | | |
| Improvements) COP | 4.000% | 4/1/45 | 150 | 160 |
| San Francisco CA City & County COP | 5.000% | 9/1/18 | 700 | 752 |
| San Francisco CA City & County GO | 5.000% | 6/15/26 | 100 | 122 |
| San Francisco CA City & County GO | 5.000% | 10/1/28 | 100 | 114 |
| San Francisco CA City & County International | | | | |
| Airport Revenue | 4.900% | 5/1/29 | 100 | 111 |
| San Francisco CA City & County International | | | | |
| Airport Revenue | 6.000% | 5/1/39 | 125 | 140 |
| San Francisco CA City & County International | | | | |
| Airport Revenue | 5.000% | 5/1/43 | 130 | 149 |
| San Francisco CA City & County Public Utilities | | | | |
| Commission Water Revenue | 5.000% | 11/1/32 | 540 | 649 |
| San Joaquin Hills CA Transportation Corridor | | | | |
| Agency Toll Road Revenue | 5.000% | 1/15/50 | 100 | 113 |
| San Jose CA Finance Authority Revenue | | | | |
| (Civic Center Project) | 5.000% | 6/1/39 | 100 | 115 |
| San Jose CA Unified School District Santa Clara | | | | |
| County GO | 5.000% | 8/1/18 (Prere.) | 100 | 107 |
| San Marcos CA Unified School District GO | 0.000% | 8/1/51 | 100 | 25 |
| San Mateo CA Union High School District GO | 5.000% | 9/1/21 (Prere.) | 10 | 12 |
| San Mateo CA Union High School District GO | 0.000% | 9/1/41 | 100 | 84 |
| San Mateo CA Union High School District GO | 5.000% | 9/1/42 | 90 | 104 |
| Santa Clara County CA GO | 5.000% | 8/1/34 | 250 | 278 |
| Santa Clara Valley CA Water District Revenue | 5.000% | 6/1/46 | 325 | 386 |
| Southern California Public Power Authority | | | | |
| Revenue (Windy Point/Windy Flats Project) | 5.000% | 7/1/25 | 120 | 137 |
| Southern California Water Replenishment District | | | | |
| Financing Authority Revenue | 5.000% | 8/1/41 | 680 | 810 |
| State of California | 5.000% | 9/1/22 | 185 | 223 |
| Turlock CA Irrigation District Revenue | 5.000% | 1/1/20 (Prere.) | 210 | 236 |
| University of California Regents Medical Center | | | | |
| Pooled Revenue | 4.000% | 5/15/37 | 300 | 327 |
| University of California Revenue | 5.000% | 5/15/22 | 100 | 120 |
| University of California Revenue | 5.000% | 5/15/23 | 500 | 615 |
| University of California Revenue | 5.000% | 5/15/27 | 75 | 94 |
| University of California Revenue | 5.000% | 5/15/29 | 195 | 241 |
| University of California Revenue | 5.000% | 5/15/31 | 55 | 67 |
| University of California Revenue | 5.000% | 5/15/32 | 1,050 | 1,272 |
| University of California Revenue | 5.000% | 5/15/33 | 700 | 828 |
| University of California Revenue | 4.000% | 5/15/36 | 350 | 383 |
| University of California Revenue | 5.000% | 5/15/37 | 100 | 117 |
| University of California Revenue | 5.000% | 5/15/42 | 640 | 745 |
| University of California Revenue | 5.000% | 5/15/46 | 500 | 595 |
| University of California Revenue PUT | 5.000% | 5/15/23 | 100 | 123 |
| Ventura County CA Public Financing Authority | | | | |
| Lease Revenue | 5.000% | 11/1/38 | 170 | 198 |
| Ventura County CA Public Financing Authority | | | | |
| Lease Revenue | 4.000% | 11/1/43 | 115 | 122 |
| Ventura County CA Public Financing Authority | | | | |
| Lease Revenue | 5.000% | 11/1/43 | 30 | 35 |
19
| | | | |
| Tax-Exempt Bond Index Fund | | | | |
| |
| |
| |
| | | | Face | Market |
| | | Maturity | Amount | Value• |
| | Coupon | Date | ($000) | ($000) |
| William S. Hart Union High School District | | | | |
| California GO | 4.000% | 8/1/38 | 100 | 107 |
| Yosemite CA Community College District GO | 5.000% | 8/1/18 (Prere.) | 100 | 107 |
| Yosemite CA Community College District GO | 5.000% | 8/1/32 | 100 | 121 |
| Yosemite CA Community College District GO | 0.000% | 8/1/42 | 75 | 54 |
| | | | | 92,839 |
| Colorado (0.5%) | | | | |
| Board of Governors of the Colorado State | | | | |
| University System Enterprise Revenue | 5.000% | 3/1/47 | 125 | 144 |
| Boulder Larimer & Weld Counties CO St. Vrain | | | | |
| Valley School District GO | 5.000% | 12/15/18 (Prere.) | 100 | 109 |
| Colorado Higher Education Capital Construction | | | | |
| Lease Purchase Financing Program COP | 5.250% | 11/1/18 (Prere.) | 155 | 168 |
| Colorado Higher Education Capital Construction | | | | |
| Lease Purchase Financing Program COP | 5.500% | 11/1/18 (Prere.) | 400 | 436 |
| Colorado Public Highway Authority Capital | | | | |
| Appreciation Revenue | 0.000% | 9/1/35 | 235 | 120 |
| Colorado Springs CO Utility System Revenue | 5.000% | 11/15/43 | 50 | 59 |
| Denver CO City & County Airport Revenue | 5.000% | 11/15/33 | 200 | 235 |
| Denver CO City & County Airport Revenue | 4.000% | 11/15/43 | 170 | 180 |
| Denver CO City & County Dedicated Tax Revenue | 4.000% | 8/1/46 | 150 | 160 |
| E-470 Public Highway Authority Colorado Revenue | 0.000% | 9/1/29 (14) | 200 | 134 |
| E-470 Public Highway Authority Colorado Revenue | 0.000% | 9/1/30 (14) | 230 | 148 |
| E-470 Public Highway Authority Colorado Revenue | 0.000% | 9/1/32 (14) | 155 | 92 |
| E-470 Public Highway Authority Colorado Revenue | 0.000% | 9/1/37 (14) | 350 | 138 |
| Regional Transportation District of Colorado COP | 5.000% | 6/1/39 | 245 | 278 |
| Regional Transportation District of Colorado Sales | | | | |
| Tax Revenue (FasTracks Project) | 5.000% | 11/1/16 (Prere.) | 50 | 50 |
| Regional Transportation District of Colorado Sales | | | | |
| Tax Revenue (FasTracks Project) | 5.000% | 11/1/29 | 350 | 418 |
| Regional Transportation District of Colorado Sales | | | | |
| Tax Revenue (FasTracks Project) | 4.500% | 11/1/34 (4) | 80 | 83 |
| University of Colorado Enterprise System Revenue | 5.000% | 6/1/37 | 125 | 146 |
| University of Colorado Enterprise System Revenue | 5.000% | 6/1/43 | 250 | 291 |
| | | | | 3,389 |
| Connecticut (1.4%) | | | | |
| Connecticut GO | 5.000% | 11/1/16 (Prere.) | 345 | 345 |
| Connecticut GO | 5.000% | 6/15/17 | 500 | 513 |
| Connecticut GO | 5.000% | 10/15/20 | 150 | 170 |
| Connecticut GO | 5.000% | 12/15/20 | 280 | 282 |
| Connecticut GO | 5.000% | 12/1/21 | 400 | 446 |
| Connecticut GO | 5.000% | 10/15/22 | 180 | 213 |
| Connecticut GO | 5.000% | 12/1/22 | 100 | 104 |
| Connecticut GO | 5.000% | 3/15/24 | 275 | 330 |
| Connecticut GO | 5.000% | 10/15/25 | 100 | 119 |
| Connecticut GO | 5.000% | 11/1/26 | 310 | 334 |
| Connecticut GO | 5.000% | 8/15/27 | 500 | 608 |
| Connecticut GO | 5.000% | 11/15/27 | 500 | 606 |
| Connecticut GO | 5.000% | 11/15/28 | 300 | 360 |
| Connecticut Health & Educational Facilities | | | | |
| Authority Revenue (Yale University) | 4.700% | 7/1/29 | 100 | 103 |
| Connecticut Health & Educational Facilities | | | | |
| Authority Revenue (Yale University) | 4.850% | 7/1/37 | 290 | 297 |
20
| | | | |
| Tax-Exempt Bond Index Fund | | | | |
| |
| |
| |
| | | | Face | Market |
| | | Maturity | Amount | Value• |
| | Coupon | Date | ($000) | ($000) |
| Connecticut Health & Educational Facilities | | | | |
| Authority Revenue (Yale University) | 5.000% | 7/1/40 | 445 | 473 |
| Connecticut Health & Educational Facilities | | | | |
| Authority Revenue (Yale University) | 5.050% | 7/1/42 | 200 | 205 |
| Connecticut Health & Educational Facilities | | | | |
| Authority Revenue (Yale University) PUT | 1.375% | 7/11/18 | 100 | 101 |
| Connecticut Special Tax Revenue | | | | |
| (Transportation Infrastructure) | 5.000% | 2/1/19 | 175 | 190 |
| Connecticut Special Tax Revenue | | | | |
| (Transportation Infrastructure) | 5.000% | 8/1/23 | 315 | 381 |
| Connecticut Special Tax Revenue | | | | |
| (Transportation Infrastructure) | 5.000% | 9/1/26 | 150 | 184 |
| Connecticut Special Tax Revenue | | | | |
| (Transportation Infrastructure) | 5.000% | 9/1/26 | 950 | 1,196 |
| Connecticut Special Tax Revenue | | | | |
| (Transportation Infrastructure) | 5.000% | 8/1/27 | 100 | 122 |
| Connecticut Special Tax Revenue | | | | |
| (Transportation Infrastructure) | 5.000% | 8/1/30 | 300 | 360 |
| Connecticut Special Tax Revenue | | | | |
| (Transportation Infrastructure) | 5.000% | 10/1/30 | 225 | 270 |
| Connecticut Special Tax Revenue | | | | |
| (Transportation Infrastructure) | 5.000% | 10/1/33 | 100 | 119 |
| | | | | 8,431 |
| Delaware (0.2%) | | | | |
| Delaware GO | 5.000% | 7/1/23 | 400 | 493 |
| Delaware Transportation Authority Transportation | | | | |
| System Revenue | 5.000% | 6/1/55 | 450 | 510 |
| | | | | 1,003 |
| District of Columbia (1.0%) | | | | |
| District of Columbia GO | 5.000% | 6/1/24 | 75 | 91 |
| District of Columbia GO | 4.750% | 6/1/33 (14) | 520 | 531 |
| District of Columbia GO | 5.000% | 6/1/33 (4) | 430 | 449 |
| District of Columbia GO | 5.000% | 6/1/33 | 155 | 184 |
| District of Columbia GO | 5.000% | 6/1/33 (13) | 105 | 111 |
| District of Columbia GO | 5.000% | 6/1/34 | 500 | 593 |
| District of Columbia GO | 4.750% | 6/1/36 (14) | 240 | 245 |
| District of Columbia GO | 4.500% | 6/1/37 (14) | 100 | 102 |
| District of Columbia GO | 5.000% | 6/1/37 | 180 | 213 |
| District of Columbia GO | 4.000% | 6/1/41 | 170 | 185 |
| District of Columbia GO | 5.000% | 6/1/41 | 200 | 238 |
| District of Columbia Income Tax Revenue | 5.000% | 12/1/23 | 150 | 181 |
| District of Columbia Income Tax Revenue | 5.250% | 12/1/26 | 420 | 472 |
| District of Columbia Income Tax Revenue | 5.000% | 12/1/28 | 230 | 260 |
| District of Columbia Water & Sewer Authority | | | | |
| Public Utility Revenue | 5.250% | 10/1/40 | 100 | 121 |
| District of Columbia Water & Sewer Authority | | | | |
| Public Utility Revenue | 5.000% | 10/1/44 | 285 | 333 |
| District of Columbia Water & Sewer Authority | | | | |
| Public Utility Revenue | 5.000% | 10/1/45 | 930 | 1,088 |
| Metropolitan Washington DC/VA Airports | | | | |
| Authority Airport System Revenue | 5.000% | 10/1/35 | 125 | 141 |
| Metropolitan Washington DC/VA Airports | | | | |
| Authority Airport System Revenue | 5.000% | 10/1/39 | 145 | 163 |
| Metropolitan Washington DC/VA Airports | | | | |
| Authority Dulles Toll Road Revenue | 5.000% | 10/1/39 | 20 | 22 |
21
| | | | |
| Tax-Exempt Bond Index Fund | | | | |
| |
| |
| |
| | | | Face | Market |
| | | Maturity | Amount | Value• |
| | Coupon | Date | ($000) | ($000) |
| Metropolitan Washington DC/VA Airports | | | | |
| Authority Dulles Toll Road Revenue (Dulles | | | | |
| Metrorail & Capital Improvement Projects) | 0.000% | 10/1/37 | 130 | 55 |
| Metropolitan Washington DC/VA Airports | | | | |
| Authority Dulles Toll Road Revenue (Dulles | | | | |
| Metrorail & Capital Improvement Projects) | 0.000% | 10/1/39 | 90 | 35 |
| Metropolitan Washington DC/VA Airports | | | | |
| Authority Dulles Toll Road Revenue (Dulles | | | | |
| Metrorail & Capital Improvement Projects) | 0.000% | 10/1/40 (12) | 1,000 | 388 |
| Metropolitan Washington DC/VA Airports | | | | |
| Authority Dulles Toll Road Revenue (Dulles | | | | |
| Metrorail & Capital Improvement Projects) | 5.250% | 10/1/44 | 20 | 22 |
| Metropolitan Washington DC/VA Airports | | | | |
| Authority Dulles Toll Road Revenue (Dulles | | | | |
| Metrorail & Capital Improvement Projects) | 5.000% | 10/1/53 | 270 | 300 |
| | | | | 6,523 |
| Florida (3.6%) | | | | |
| Broward County FL Airport System Revenue | 5.000% | 10/1/42 | 420 | 482 |
| Broward County FL School Board COP | 5.250% | 7/1/18 (Prere.) | 60 | 64 |
| Broward County FL School Board COP | 5.000% | 7/1/24 | 125 | 153 |
| Broward County FL Water & Sewer Utility | | | | |
| Revenue | 5.250% | 10/1/18 (Prere.) | 500 | 541 |
| Cape Coral FL Water & Sewer System Revenue | 5.000% | 10/1/41 (4) | 280 | 322 |
| Duval County FL School Board COP | 5.000% | 7/1/17 (Prere.) | 300 | 309 |
| Florida Board of Education Lottery Revenue | 5.000% | 7/1/24 | 220 | 273 |
| Florida Board of Education Public Education | | | | |
| Capital Outlay GO | 5.000% | 6/1/17 | 100 | 103 |
| Florida Board of Education Public Education | | | | |
| Capital Outlay GO | 5.000% | 6/1/18 | 205 | 218 |
| Florida Board of Education Public Education | | | | |
| Capital Outlay GO | 5.000% | 6/1/21 | 110 | 125 |
| Florida Board of Education Public Education | | | | |
| Capital Outlay GO | 5.000% | 6/1/25 | 250 | 291 |
| Florida Board of Education Public Education | | | | |
| Capital Outlay GO | 5.000% | 6/1/25 | 225 | 269 |
| Florida Board of Education Public Education | | | | |
| Capital Outlay GO | 5.000% | 6/1/33 | 715 | 804 |
| Florida Board of Education Public Education | | | | |
| Capital Outlay GO | 4.750% | 6/1/37 (14) | 145 | 149 |
| Florida Municipal Power Agency Revenue | 5.250% | 10/1/18 (Prere.) | 105 | 114 |
| Florida Municipal Power Agency Revenue | 5.250% | 10/1/18 (Prere.) | 125 | 135 |
| Florida Municipal Power Agency Revenue | 5.250% | 10/1/19 | 135 | 150 |
| Florida Municipal Power Agency Revenue | 5.000% | 10/1/22 | 290 | 345 |
| Florida Water Pollution Control Financing | | | | |
| Corp. Revenue | 5.000% | 1/15/20 | 200 | 217 |
| Fort Lauderdale FL Water & Sewer Revenue | 4.750% | 9/1/17 (Prere.) | 100 | 103 |
| Greater Orlando Aviation Authority Florida | | | | |
| Airport Facilities Revenue | 5.000% | 10/1/39 | 400 | 451 |
| Hillsborough County FL School Board | | | | |
| (Master Lease Program) COP | 5.000% | 7/1/26 | 55 | 68 |
| Hillsborough County FL School Board | | | | |
| (Master Lease Program) COP | 5.000% | 7/1/29 | 200 | 231 |
| Jacksonville FL Electric Authority Electric | | | | |
| System Revenue | 5.000% | 10/1/39 | 40 | 46 |
22
| | | | |
| Tax-Exempt Bond Index Fund | | | | |
| |
| |
| |
| | | | Face | Market |
| | | Maturity | Amount | Value• |
| | Coupon | Date | ($000) | ($000) |
| Miami-Dade County FL Aviation Revenue | | | | |
| (Miami International Airport) | 4.500% | 10/1/17 (Prere.) | 105 | 108 |
| Miami-Dade County FL Aviation Revenue | | | | |
| (Miami International Airport) | 5.250% | 10/1/17 (Prere.) | 325 | 338 |
| Miami-Dade County FL Aviation Revenue | | | | |
| (Miami International Airport) | 5.000% | 10/1/18 (Prere.) | 375 | 404 |
| Miami-Dade County FL Aviation Revenue | | | | |
| (Miami International Airport) | 5.000% | 10/1/30 | 250 | 301 |
| Miami-Dade County FL Aviation Revenue | | | | |
| (Miami International Airport) | 5.375% | 10/1/35 | 100 | 113 |
| Miami-Dade County FL Aviation Revenue | | | | |
| (Miami International Airport) | 5.500% | 10/1/36 | 305 | 342 |
| Miami-Dade County FL Aviation Revenue | | | | |
| (Miami International Airport) | 5.000% | 10/1/41 | 250 | 292 |
| Miami-Dade County FL Aviation Revenue | | | | |
| (Miami International Airport) | 5.500% | 10/1/41 | 100 | 112 |
| Miami-Dade County FL Building Better | | | | |
| Communities GO | 5.625% | 7/1/18 (Prere.) | 165 | 178 |
| Miami-Dade County FL Building Better | | | | |
| Communities GO | 5.625% | 7/1/18 (Prere.) | 110 | 119 |
| Miami-Dade County FL Building Better | | | | |
| Communities GO | 5.000% | 7/1/38 | 500 | 592 |
| Miami-Dade County FL Educational Facilities | | | | |
| Authority Revenue (University of Miami) | 4.000% | 4/1/45 | 100 | 107 |
| Miami-Dade County FL Educational Facilities | | | | |
| Authority Revenue (University of Miami) | 5.000% | 4/1/45 | 180 | 207 |
| Miami-Dade County FL Expressway Authority | | | | |
| Toll System Revenue | 5.000% | 7/1/24 | 200 | 245 |
| Miami-Dade County FL Expressway Authority | | | | |
| Toll System Revenue | 5.000% | 7/1/40 | 370 | 414 |
| Miami-Dade County FL Industrial Development | | | | |
| Authority Revenue (Biscayne Properties LLC) | 5.000% | 6/1/48 | 255 | 268 |
| Miami-Dade County FL Professional Sports | | | | |
| Franchise Facilities Tax Revenue | 0.000% | 10/1/48 (12) | 200 | 55 |
| Miami-Dade County FL Professional Sports | | | | |
| Franchise Facilities Tax Revenue | 0.000% | 4/1/49 (12) | 475 | 127 |
| Miami-Dade County FL School Board COP | 5.000% | 5/1/17 (Prere.) | 100 | 102 |
| Miami-Dade County FL School Board COP | 5.250% | 5/1/18 (Prere.) | 150 | 160 |
| Miami-Dade County FL School Board COP | 5.250% | 5/1/18 (Prere.) | 100 | 107 |
| Miami-Dade County FL School Board COP | 5.250% | 5/1/18 (Prere.) | 120 | 128 |
| Miami-Dade County FL School Board COP | 5.250% | 5/1/18 (Prere.) | 100 | 107 |
| Miami-Dade County FL School Board COP | 5.250% | 5/1/18 (Prere.) | 250 | 266 |
| Miami-Dade County FL School Board COP | 5.375% | 2/1/19 (Prere.) | 195 | 214 |
| Miami-Dade County FL School Board COP | 5.625% | 5/1/31 | 65 | 75 |
| Miami-Dade County FL School Board COP | 3.250% | 2/1/33 | 695 | 697 |
| Miami-Dade County FL School District GO | 5.000% | 3/15/46 | 750 | 866 |
| Miami-Dade County FL Special Obligation | | | | |
| Revenue | 5.000% | 10/1/17 (Prere.) | 175 | 182 |
| Miami-Dade County FL Special Obligation | | | | |
| Revenue | 5.000% | 10/1/35 | 560 | 636 |
| Miami-Dade County FL Special Obligation | | | | |
| Revenue | 5.000% | 10/1/35 | 300 | 353 |
| Miami-Dade County FL Transit Sales Surtax | | | | |
| Revenue | 4.000% | 7/1/42 | 190 | 200 |
23
| | | | |
| Tax-Exempt Bond Index Fund | | | | |
| |
| |
| |
| | | | Face | Market |
| | | Maturity | Amount | Value• |
| | Coupon | Date | ($000) | ($000) |
| Miami-Dade County FL Transit Sales Surtax | | | | |
| Revenue | 5.000% | 7/1/42 | 195 | 224 |
| Miami-Dade County FL Water & Sewer Revenue | 5.125% | 10/1/18 (Prere.) | 440 | 475 |
| Miami-Dade County FL Water & Sewer Revenue | 5.250% | 10/1/18 (4) | 300 | 325 |
| Miami-Dade County FL Water & Sewer Revenue | 6.000% | 10/1/18 (Prere.) | 110 | 121 |
| Miami-Dade County FL Water & Sewer Revenue | 5.000% | 10/1/23 | 100 | 122 |
| Miami-Dade County FL Water & Sewer Revenue | 5.000% | 10/1/24 | 250 | 311 |
| Miami-Dade County FL Water & Sewer Revenue | 5.000% | 10/1/34 | 65 | 73 |
| Miami-Dade County FL Water & Sewer Revenue | 5.000% | 10/1/39 (12) | 100 | 112 |
| Miami-Dade County FL Water & Sewer Revenue | 5.000% | 10/1/42 | 600 | 688 |
| Orange County FL School Board COP | 5.000% | 8/1/17 (Prere.) | 135 | 139 |
| Orange County FL School Board COP | 5.500% | 8/1/19 (Prere.) | 310 | 348 |
| Orlando & Orange County FL Expressway | | | | |
| Authority Revenue | 5.000% | 7/1/20 (Prere.) | 240 | 273 |
| Orlando FL Contract Tourist Development | | | | |
| Tax Payments Revenue | 5.250% | 11/1/31 | 200 | 240 |
| Orlando FL Contract Tourist Development | | | | |
| Tax Payments Revenue | 5.000% | 11/1/44 | 400 | 459 |
| Orlando FL Utility Commission Utility System | | | | |
| Revenue | 5.000% | 10/1/18 | 400 | 431 |
| Orlando FL Utility Commission Utility System | | | | |
| Revenue | 5.000% | 4/1/19 (Prere.) | 1,000 | 1,095 |
| Orlando FL Utility Commission Utility System | | | | |
| Revenue | 5.000% | 10/1/23 | 125 | 153 |
| Orlando FL Utility Commission Utility System | | | | |
| Revenue | 5.000% | 10/1/25 | 125 | 157 |
| Osceola County FL Expressway System Revenue | | | | |
| (Poinciana Parkway Project) | 0.000% | 10/1/22 | 50 | 39 |
| Osceola County FL Expressway System Revenue | | | | |
| (Poinciana Parkway Project) | 0.000% | 10/1/32 | 45 | 35 |
| Osceola County FL Expressway System Revenue | | | | |
| (Poinciana Parkway Project) | 0.000% | 10/1/39 | 590 | 447 |
| Osceola County FL Expressway System Revenue | | | | |
| (Poinciana Parkway Project) | 5.375% | 10/1/47 | 140 | 155 |
| Palm Beach County FL Public Improvement | | | | |
| Revenue | 5.000% | 5/1/18 (Prere.) | 210 | 223 |
| Palm Beach County FL Public Improvement | | | | |
| Revenue | 5.000% | 5/1/18 (Prere.) | 105 | 111 |
| Palm Beach County FL Solid Waste Authority | | | | |
| Revenue | 5.500% | 10/1/18 (Prere.) | 65 | 71 |
| Palm Beach County FL Solid Waste Authority | | | | |
| Revenue | 5.000% | 10/1/21 (Prere.) | 5 | 6 |
| Palm Beach County FL Solid Waste Authority | | | | |
| Revenue | 5.000% | 10/1/31 | 95 | 110 |
| Port St. Lucie FL Utility Revenue | 5.000% | 9/1/18 (Prere.) | 100 | 108 |
| Port St. Lucie FL Utility Revenue | 5.000% | 9/1/35 (12) | 10 | 11 |
| South Florida Water Management District COP | 5.000% | 10/1/33 | 275 | 328 |
| Tallahassee FL Utility System Revenue | 5.000% | 10/1/32 | 105 | 109 |
| Tallahassee FL Utility System Revenue | 5.000% | 10/1/37 | 150 | 155 |
| Tampa Bay FL Water Utility System Revenue | 5.000% | 10/1/18 (Prere.) | 85 | 92 |
| Tampa Bay FL Water Utility System Revenue | 5.000% | 10/1/18 (ETM) | 120 | 129 |
| Tampa Bay FL Water Utility System Revenue | 5.000% | 10/1/19 (ETM) | 130 | 145 |
| | | | | 22,398 |
24
| | | | |
| Tax-Exempt Bond Index Fund | | | | |
| |
| |
| |
| | | | Face | Market |
| | | Maturity | Amount | Value• |
| | Coupon | Date | ($000) | ($000) |
| Georgia (2.3%) | | | | |
| Atlanta GA Metropolitan Rapid Transit Authority | | | | |
| Revenue | 5.000% | 7/1/39 | 215 | 236 |
| Atlanta GA Water & Wastewater Revenue | 6.000% | 11/1/19 (Prere.) | 245 | 281 |
| Atlanta GA Water & Wastewater Revenue | 6.000% | 11/1/19 (Prere.) | 50 | 57 |
| Atlanta GA Water & Wastewater Revenue | 6.250% | 11/1/19 (Prere.) | 1,120 | 1,292 |
| Atlanta GA Water & Wastewater Revenue | 6.250% | 11/1/19 (Prere.) | 135 | 156 |
| Atlanta GA Water & Wastewater Revenue | 5.250% | 11/1/27 (4) | 150 | 197 |
| Atlanta GA Water & Wastewater Revenue | 5.000% | 11/1/33 | 550 | 652 |
| Atlanta GA Water & Wastewater Revenue | 5.000% | 11/1/40 | 100 | 117 |
| Atlanta GA Water & Wastewater Revenue | 5.000% | 11/1/43 | 475 | 554 |
| DeKalb County GA Water & Sewer Revenue | 5.250% | 10/1/41 | 215 | 251 |
| Georgia GO | 5.000% | 7/1/17 | 250 | 257 |
| Georgia GO | 5.000% | 7/1/17 | 1,000 | 1,029 |
| Georgia GO | 4.000% | 9/1/17 | 215 | 221 |
| Georgia GO | 5.000% | 7/1/18 (Prere.) | 150 | 160 |
| Georgia GO | 5.000% | 1/1/19 (Prere.) | 350 | 380 |
| Georgia GO | 5.000% | 7/1/19 | 665 | 736 |
| Georgia GO | 5.000% | 7/1/19 | 100 | 111 |
| Georgia GO | 5.000% | 10/1/21 | 250 | 296 |
| Georgia GO | 5.000% | 2/1/22 | 100 | 119 |
| Georgia GO | 4.500% | 11/1/22 | 135 | 156 |
| Georgia GO | 5.000% | 7/1/24 | 130 | 139 |
| Georgia GO | 5.000% | 7/1/27 | 100 | 120 |
| Georgia Road & Tollway Authority GAN | 5.000% | 6/1/17 | 200 | 205 |
| Georgia Road & Tollway Authority Revenue | 5.000% | 3/1/21 | 1,000 | 1,165 |
| Gwinnett County GA School District GO | 4.500% | 10/1/17 | 200 | 207 |
| Gwinnett County GA School District GO | 5.000% | 8/1/22 | 1,000 | 1,209 |
| Metropolitan Atlanta GA Rapid Transportation | | | | |
| Authority Georgia Sales Tax Revenue | 4.500% | 7/1/17 (Prere.) | 185 | 190 |
| Metropolitan Atlanta GA Rapid Transportation | | | | |
| Authority Georgia Sales Tax Revenue | 5.000% | 7/1/20 (14) | 570 | 649 |
| Metropolitan Atlanta GA Rapid Transportation | | | | |
| Authority Georgia Sales Tax Revenue | 5.250% | 7/1/36 | 180 | 198 |
| Municipal Electric Authority Georgia Revenue | 5.000% | 1/1/20 | 400 | 448 |
| Municipal Electric Authority Georgia Revenue | 5.000% | 7/1/60 | 100 | 115 |
| Municipal Electric Authority Georgia Revenue | | | | |
| (Project One) | 5.250% | 1/1/17 | 200 | 202 |
| Private Colleges & University Authority of Georgia | | | | |
| Revenue (Emory University) | 5.000% | 9/1/18 (Prere.) | 555 | 596 |
| Private Colleges & University Authority of Georgia | | | | |
| Revenue (Emory University) | 5.000% | 10/1/38 | 500 | 599 |
| Private Colleges & University Authority of Georgia | | | | |
| Revenue (Savannah College of Art & Design) | 5.000% | 4/1/44 | 500 | 561 |
| Sandy Springs GA Public Facilities Authority | | | | |
| (City Center Project) | 5.000% | 5/1/41 | 500 | 598 |
| | | | | 14,459 |
| Hawaii (0.7%) | | | | |
| Hawaii GO | 5.000% | 5/1/18 (Prere.) | 95 | 101 |
| Hawaii GO | 5.000% | 5/1/18 (Prere.) | 5 | 5 |
| Hawaii GO | 5.000% | 12/1/18 | 500 | 542 |
| Hawaii GO | 5.000% | 12/1/21 (Prere.) | 90 | 107 |
| Hawaii GO | 5.000% | 12/1/21 (Prere.) | 135 | 161 |
| Hawaii GO | 5.000% | 12/1/21 (Prere.) | 125 | 149 |
| Hawaii GO | 5.000% | 12/1/21 (Prere.) | 65 | 77 |
25
| | | | |
| Tax-Exempt Bond Index Fund | | | | |
| |
| |
| |
| | | | Face | Market |
| | | Maturity | Amount | Value• |
| | Coupon | Date | ($000) | ($000) |
| Hawaii GO | 5.000% | 8/1/23 | 115 | 141 |
| Hawaii GO | 5.000% | 8/1/23 (Prere.) | 40 | 49 |
| Hawaii GO | 5.000% | 8/1/25 | 245 | 304 |
| Hawaii GO | 5.000% | 12/1/26 | 260 | 304 |
| Hawaii GO | 5.000% | 10/1/27 | 500 | 621 |
| Hawaii GO | 5.000% | 12/1/27 | 195 | 228 |
| Hawaii GO | 5.000% | 8/1/28 | 50 | 61 |
| Hawaii GO | 5.000% | 12/1/28 | 100 | 117 |
| Hawaii GO | 5.000% | 8/1/29 | 50 | 61 |
| Hawaii GO | 5.000% | 8/1/30 | 125 | 149 |
| Hawaii GO | 5.000% | 8/1/30 | 300 | 362 |
| Hawaii GO | 3.000% | 4/1/36 | 470 | 470 |
| Honolulu HI City & County Wastewater System | | | | |
| Revenue | 5.000% | 7/1/37 | 175 | 205 |
| | | | | 4,214 |
| Idaho (0.0%) | | | | |
| Idaho Housing & Finance Association RAN | 5.250% | 7/15/18 (Prere.) | 65 | 70 |
| Idaho Housing & Finance Association RAN | 5.000% | 7/15/26 | 75 | 92 |
| | | | | 162 |
| Illinois (4.3%) | | | | |
| Chicago IL GO | 5.000% | 1/1/23 | 35 | 37 |
| Chicago IL GO | 5.000% | 12/1/23 (2) | 100 | 100 |
| Chicago IL GO | 4.300% | 1/1/24 (2) | 100 | 100 |
| Chicago IL GO | 5.000% | 1/1/27 (4) | 200 | 213 |
| Chicago IL GO | 4.750% | 1/1/28 (14) | 75 | 75 |
| Chicago IL GO | 4.750% | 1/1/32 (4) | 170 | 171 |
| Chicago IL GO | 5.500% | 1/1/33 | 100 | 106 |
| Chicago IL GO | 5.500% | 1/1/34 | 150 | 159 |
| Chicago IL GO | 4.750% | 1/1/36 (4) | 395 | 396 |
| Chicago IL Metropolitan Water Reclamation | | | | |
| District GO | 5.000% | 12/1/16 (Prere.) | 145 | 146 |
| Chicago IL Metropolitan Water Reclamation | | | | |
| District GO | 5.000% | 12/1/18 | 100 | 108 |
| Chicago IL Metropolitan Water Reclamation | | | | |
| District GO | 5.000% | 12/1/24 | 275 | 337 |
| Chicago IL Metropolitan Water Reclamation | | | | |
| District GO | 5.000% | 12/1/26 | 60 | 75 |
| Chicago IL Midway Airport Revenue | 5.000% | 1/1/25 | 75 | 88 |
| Chicago IL Midway Airport Revenue | 5.000% | 1/1/27 | 60 | 70 |
| Chicago IL O’Hare International Airport Revenue | 5.000% | 1/1/17 | 480 | 483 |
| Chicago IL O’Hare International Airport Revenue | 5.000% | 1/1/24 | 185 | 225 |
| Chicago IL O’Hare International Airport Revenue | 5.000% | 1/1/26 | 100 | 121 |
| Chicago IL O’Hare International Airport Revenue | 5.000% | 1/1/28 | 85 | 102 |
| Chicago IL O’Hare International Airport Revenue | 5.000% | 1/1/30 | 200 | 236 |
| Chicago IL O’Hare International Airport Revenue | 5.000% | 1/1/32 | 140 | 156 |
| Chicago IL O’Hare International Airport Revenue | 5.000% | 1/1/35 | 50 | 54 |
| Chicago IL O’Hare International Airport Revenue | 4.500% | 1/1/38 (4) | 610 | 630 |
| Chicago IL O’Hare International Airport Revenue | 5.000% | 1/1/39 | 525 | 597 |
| Chicago IL O’Hare International Airport Revenue | 5.750% | 1/1/39 | 435 | 502 |
| Chicago IL O’Hare International Airport Revenue | 6.500% | 1/1/41 | 25 | 30 |
| Chicago IL O’Hare International Airport Revenue | 5.000% | 1/1/44 | 125 | 142 |
| Chicago IL Transit Authority Sales Tax Receipts | | | | |
| Revenue | 5.250% | 12/1/49 | 250 | 284 |
| Chicago IL Wastewater Transmission Revenue | 5.000% | 1/1/20 | 500 | 547 |
| Chicago IL Wastewater Transmission Revenue | 0.000% | 1/1/28 (14) | 275 | 189 |
26
| | | | |
| Tax-Exempt Bond Index Fund | | | | |
| |
| |
| |
| | | | Face | Market |
| | | Maturity | Amount | Value• |
| | Coupon | Date | ($000) | ($000) |
| Chicago IL Wastewater Transmission Revenue | 5.000% | 1/1/39 | 150 | 166 |
| Chicago IL Water Revenue | 5.000% | 11/1/29 | 50 | 56 |
| Chicago IL Water Revenue | 5.000% | 11/1/32 (2) | 250 | 251 |
| Chicago IL Water Revenue | 5.250% | 11/1/38 | 350 | 367 |
| Chicago IL Waterworks Revenue | 5.000% | 11/1/30 | 250 | 291 |
| Chicago IL Waterworks Revenue | 5.000% | 11/1/36 (2) | 175 | 176 |
| Cook County IL GO | 5.000% | 11/15/17 (14) | 300 | 312 |
| Cook County IL GO | 5.000% | 11/15/18 | 25 | 27 |
| Cook County IL GO | 5.000% | 11/15/21 | 25 | 27 |
| Cook County IL GO | 5.250% | 11/15/22 | 100 | 113 |
| Cook County IL GO | 5.000% | 11/15/23 | 250 | 293 |
| Cook County IL GO | 5.250% | 11/15/24 | 200 | 227 |
| Cook County IL GO | 5.250% | 11/15/25 | 100 | 113 |
| Cook County IL GO | 5.000% | 11/15/28 | 85 | 92 |
| Cook County IL Sales Tax Revenue | 5.000% | 11/15/37 | 250 | 280 |
| Illinois Finance Authority Revenue | | | | |
| (DePaul University) | 6.125% | 4/1/21 (Prere.) | 205 | 249 |
| Illinois Finance Authority Revenue | | | | |
| (Illinois Wesleyan University) | 5.000% | 9/1/46 | 140 | 156 |
| Illinois Finance Authority Revenue | | | | |
| (University of Chicago) | 4.000% | 10/1/32 | 90 | 96 |
| Illinois Finance Authority Revenue | | | | |
| (University of Chicago) | 4.000% | 10/1/33 | 50 | 53 |
| Illinois Finance Authority Revenue | | | | |
| (University of Chicago) | 4.000% | 10/1/49 | 90 | 93 |
| Illinois Finance Authority Revenue | | | | |
| (University of Chicago) | 5.000% | 10/1/51 | 75 | 83 |
| Illinois GO | 5.000% | 7/1/20 | 125 | 134 |
| Illinois GO | 4.000% | 9/1/20 | 135 | 140 |
| Illinois GO | 5.000% | 7/1/21 | 125 | 136 |
| Illinois GO | 5.000% | 8/1/21 | 535 | 583 |
| Illinois GO | 5.000% | 5/1/22 | 55 | 60 |
| Illinois GO | 5.000% | 8/1/22 (4) | 200 | 222 |
| Illinois GO | 4.000% | 9/1/22 | 200 | 208 |
| Illinois GO | 5.000% | 7/1/23 | 50 | 55 |
| Illinois GO | 5.000% | 8/1/23 | 480 | 529 |
| Illinois GO | 5.000% | 1/1/24 | 50 | 52 |
| Illinois GO | 5.000% | 3/1/25 | 390 | 417 |
| Illinois GO | 5.500% | 7/1/25 | 210 | 236 |
| Illinois GO | 4.000% | 8/1/25 | 170 | 173 |
| Illinois GO | 5.000% | 8/1/25 | 60 | 64 |
| Illinois GO | 5.500% | 7/1/26 | 160 | 179 |
| Illinois GO | 5.000% | 2/1/27 | 50 | 54 |
| Illinois GO | 5.000% | 2/1/27 | 500 | 552 |
| Illinois GO | 5.000% | 3/1/28 | 150 | 151 |
| Illinois GO | 5.000% | 9/1/28 (4) | 50 | 50 |
| Illinois GO | 5.000% | 11/1/28 (2) | 100 | 100 |
| Illinois GO | 5.000% | 5/1/29 | 75 | 80 |
| Illinois GO | 5.250% | 7/1/29 | 130 | 142 |
| Illinois GO | 4.000% | 2/1/31 (4) | 250 | 250 |
| Illinois GO | 5.000% | 3/1/34 | 1,370 | 1,375 |
| Illinois GO | 5.000% | 5/1/35 | 150 | 156 |
| Illinois GO | 5.000% | 5/1/36 | 50 | 52 |
| Illinois Municipal Electric Agency Power Supply | | | | |
| System Revenue | 5.000% | 2/1/22 | 100 | 117 |
27
| | | | |
| Tax-Exempt Bond Index Fund | | | | |
| |
| |
| |
| | | | Face | Market |
| | | Maturity | Amount | Value• |
| | Coupon | Date | ($000) | ($000) |
| Illinois Municipal Electric Agency Power Supply | | | | |
| System Revenue | 5.000% | 2/1/23 | 175 | 208 |
| Illinois Municipal Electric Agency Power Supply | | | | |
| System Revenue | 4.000% | 2/1/33 | 250 | 267 |
| Illinois Regional Transportation Authority Revenue | 6.500% | 7/1/26 (14) | 65 | 87 |
| Illinois Sales Tax Revenue | 4.750% | 6/15/19 (Prere.) | 75 | 82 |
| Illinois Sales Tax Revenue | 5.250% | 6/15/19 (Prere.) | 160 | 178 |
| Illinois Sales Tax Revenue | 5.000% | 6/15/20 | 100 | 113 |
| Illinois Sales Tax Revenue | 5.000% | 6/15/20 | 220 | 249 |
| Illinois Sales Tax Revenue | 5.000% | 6/15/23 | 400 | 480 |
| Illinois Sales Tax Revenue | 5.000% | 6/15/24 | 315 | 376 |
| Illinois Sports Facility Authority Revenue | 0.000% | 6/15/26 (2) | 90 | 63 |
| Illinois Sports Facility Authority Revenue | 5.000% | 6/15/27 (4) | 330 | 378 |
| Illinois Toll Highway Authority Revenue | 5.500% | 1/1/18 (Prere.) | 50 | 53 |
| Illinois Toll Highway Authority Revenue | 4.000% | 12/1/31 | 185 | 201 |
| Illinois Toll Highway Authority Revenue | 5.000% | 12/1/32 | 90 | 107 |
| Illinois Toll Highway Authority Revenue | 5.000% | 1/1/36 | 750 | 864 |
| Illinois Toll Highway Authority Revenue | 5.000% | 1/1/37 | 375 | 432 |
| Illinois Toll Highway Authority Revenue | 5.000% | 1/1/38 | 375 | 428 |
| Illinois Toll Highway Authority Revenue | 5.000% | 1/1/40 | 150 | 173 |
| Illinois Toll Highway Authority Revenue | 5.000% | 1/1/40 | 200 | 230 |
| Illinois Unemployment Insurance Fund Building | | | | |
| Receipts Revenue | 5.000% | 12/15/16 | 500 | 503 |
| Metropolitan Pier & Exposition Authority Illinois | | | | |
| Dedicated Sales Tax Revenue | 0.000% | 12/15/23 (14) | 105 | 82 |
| Metropolitan Pier & Exposition Authority Illinois | | | | |
| Dedicated Sales Tax Revenue | 0.000% | 6/15/27 (4) | 180 | 118 |
| Metropolitan Pier & Exposition Authority Illinois | | | | |
| Dedicated Sales Tax Revenue | 0.000% | 12/15/29 (14) | 70 | 40 |
| Metropolitan Pier & Exposition Authority Illinois | | | | |
| Dedicated Sales Tax Revenue | 0.000% | 12/15/34 (14) | 255 | 115 |
| Metropolitan Pier & Exposition Authority Illinois | | | | |
| Dedicated Sales Tax Revenue | 0.000% | 6/15/44 (4) | 520 | 151 |
| Metropolitan Pier & Exposition Authority Illinois | | | | |
| Dedicated Sales Tax Revenue | 0.000% | 6/15/46 (4) | 615 | 162 |
| Metropolitan Pier & Exposition Authority Illinois | | | | |
| Dedicated Sales Tax Revenue | 5.250% | 6/15/50 | 50 | 53 |
| Metropolitan Pier & Exposition Authority Illinois | | | | |
| Dedicated Sales Tax Revenue | 5.500% | 6/15/50 | 235 | 250 |
| Metropolitan Pier & Exposition Authority Illinois | | | | |
| Dedicated Sales Tax Revenue (McCormick | | | | |
| Place Expansion Project) | 0.000% | 6/15/20 (14) | 215 | 193 |
| Metropolitan Pier & Exposition Authority Illinois | | | | |
| Dedicated Sales Tax Revenue (McCormick | | | | |
| Place Expansion Project) | 5.000% | 12/15/20 | 70 | 78 |
| Metropolitan Pier & Exposition Authority Illinois | | | | |
| Dedicated Sales Tax Revenue (McCormick | | | | |
| Place Expansion Project) | 5.000% | 12/15/22 | 100 | 115 |
| Metropolitan Pier & Exposition Authority Illinois | | | | |
| Dedicated Sales Tax Revenue (McCormick | | | | |
| Place Expansion Project) | 5.000% | 12/15/26 | 65 | 72 |
| Metropolitan Pier & Exposition Authority Illinois | | | | |
| Dedicated Sales Tax Revenue (McCormick | | | | |
| Place Expansion Project) | 0.000% | 6/15/31 (14) | 365 | 193 |
28
| | | | |
| Tax-Exempt Bond Index Fund | | | | |
| |
| |
| |
| | | | Face | Market |
| | | Maturity | Amount | Value• |
| | Coupon | Date | ($000) | ($000) |
| Metropolitan Pier & Exposition Authority Illinois | | | | |
| Dedicated Sales Tax Revenue (McCormick | | | | |
| Place Expansion Project) | 0.000% | 6/15/32 (14) | 130 | 66 |
| Metropolitan Pier & Exposition Authority Illinois | | | | |
| Dedicated Sales Tax Revenue (McCormick | | | | |
| Place Expansion Project) | 0.000% | 6/15/37 (14) | 200 | 79 |
| Metropolitan Pier & Exposition Authority Illinois | | | | |
| Dedicated Sales Tax Revenue (McCormick | | | | |
| Place Expansion Project) | 0.000% | 12/15/41 | 200 | 59 |
| Metropolitan Pier & Exposition Authority Illinois | | | | |
| Dedicated Sales Tax Revenue (McCormick | | | | |
| Place Expansion Project) | 4.250% | 6/15/42 | 315 | 319 |
| Metropolitan Pier & Exposition Authority Illinois | | | | |
| Dedicated Sales Tax Revenue (McCormick | | | | |
| Place Expansion Project) | 0.000% | 6/15/43 (4) | 320 | 97 |
| Metropolitan Pier & Exposition Authority Illinois | | | | |
| Dedicated Sales Tax Revenue (McCormick | | | | |
| Place Expansion Project) | 0.000% | 6/15/45 (4) | 340 | 94 |
| Metropolitan Pier & Exposition Authority Illinois | | | | |
| Dedicated Sales Tax Revenue (McCormick | | | | |
| Place Expansion Project) | 5.000% | 6/15/50 | 340 | 355 |
| Metropolitan Pier & Exposition Authority Illinois | | | | |
| Dedicated Sales Tax Revenue (McCormick | | | | |
| Place Expansion Project) | 5.200% | 6/15/50 | 350 | 369 |
| Metropolitan Pier & Exposition Authority Illinois | | | | |
| Dedicated Sales Tax Revenue (McCormick | | | | |
| Place Expansion Project) | 0.000% | 12/15/50 | 570 | 103 |
| Metropolitan Pier & Exposition Authority Illinois | | | | |
| Dedicated Sales Tax Revenue (McCormick | | | | |
| Place Expansion Project) | 0.000% | 12/15/51 (4) | 570 | 114 |
| Metropolitan Pier & Exposition Authority Illinois | | | | |
| Dedicated Sales Tax Revenue (McCormick | | | | |
| Place Expansion Project) | 0.000% | 12/15/51 | 185 | 32 |
| Northern Illinois Municipal Power Agency | | | | |
| Project Revenue | 4.000% | 12/1/32 | 175 | 188 |
| Northern Illinois Municipal Power Agency | | | | |
| Project Revenue | 4.000% | 12/1/35 | 185 | 196 |
| Northern Illinois Municipal Power Agency | | | | |
| Project Revenue (Prairie State Project) | 5.000% | 1/1/18 (Prere.) | 225 | 236 |
| Northern Illinois Municipal Power Agency | | | | |
| Project Revenue (Prairie State Project) | 5.000% | 1/1/18 (Prere.) | 130 | 136 |
| Springfield IL Electric Revenue | 5.000% | 3/1/18 (Prere.) | 365 | 385 |
| Will County IL Community High School District | | | | |
| No. 210 (Lincoln-Way) GO | 0.000% | 1/1/31 | 190 | 92 |
| Will County IL Community High School District | | | | |
| No. 210 (Lincoln-Way) GO | 0.000% | 1/1/32 | 90 | 41 |
| Will County IL Community High School District | | | | |
| No. 210 (Lincoln-Way) GO | 0.000% | 1/1/33 | 300 | 128 |
| | | | | 26,450 |
| Indiana (0.4%) | | | | |
| Indiana Finance Authority Highway Revenue | 5.000% | 12/1/25 | 220 | 278 |
| Indiana Finance Authority Highway Revenue | 5.000% | 6/1/27 | 300 | 381 |
| Indiana Finance Authority Revenue | 5.000% | 2/1/25 | 50 | 63 |
| Indiana Finance Authority Revenue | | | | |
| (State Revolving Fund) | 5.000% | 2/1/21 (Prere.) | 235 | 273 |
29
| | | | |
| Tax-Exempt Bond Index Fund | | | | |
| |
| |
| |
| | | | Face | Market |
| | | Maturity | Amount | Value• |
| | Coupon | Date | ($000) | ($000) |
| Indiana Finance Authority Wastewater Utility | | | | |
| Revenue (CWA Authority Project) | 5.000% | 10/1/41 | 145 | 166 |
| Indiana Municipal Power Agency Revenue | 6.000% | 1/1/19 (Prere.) | 100 | 111 |
| Indiana Municipal Power Agency Revenue | 5.000% | 1/1/42 | 500 | 579 |
| Indianapolis IN Local Public Improvement Bond | | | | |
| Bank Revenue (Bank-Waterworks Project) | 5.500% | 1/1/29 | 150 | 164 |
| Indianapolis IN Local Public Improvement Bond | | | | |
| Bank Revenue (Bank-Waterworks Project) | 5.750% | 1/1/38 | 100 | 110 |
| Indianapolis IN Local Public Improvement Bond | | | | |
| Bank Revenue (Waterworks Project) | 5.250% | 1/1/29 (12) | 60 | 65 |
| | | | | 2,190 |
| Iowa (0.2%) | | | | |
| Iowa Finance Authority Revenue | 5.000% | 8/1/20 | 285 | 326 |
| Iowa Special Obligation Revenue | 5.000% | 6/1/28 | 250 | 310 |
| Iowa Special Obligation Revenue (Ijobs Program) | 5.000% | 6/1/19 (Prere.) | 555 | 611 |
| | | | | 1,247 |
| Kansas (0.3%) | | | | |
| Kansas Department of Transportation Highway | | | | |
| Revenue | 5.500% | 3/1/19 (4) | 205 | 227 |
| Kansas Department of Transportation Highway | | | | |
| Revenue | 5.000% | 9/1/20 | 30 | 34 |
| Kansas Department of Transportation Highway | | | | |
| Revenue | 5.000% | 9/1/30 | 750 | 924 |
| Kansas Department of Transportation Highway | | | | |
| Revenue | 5.000% | 9/1/34 | 195 | 236 |
| Seward County KS Unified School District | | | | |
| No. 480 GO | 5.000% | 9/1/39 | 500 | 568 |
| Wyandotte County/Kansas City KS Unified | | | | |
| Government Utility System Revenue | 5.000% | 9/1/40 | 75 | 86 |
| | | | | 2,075 |
| Kentucky (0.5%) | | | | |
| Kentucky Municipal Power Agency Power | | | | |
| System Revenue | 4.000% | 9/1/39 (14) | 110 | 116 |
| Kentucky Municipal Power Agency Power | | | | |
| System Revenue | 5.000% | 9/1/42 (14) | 150 | 170 |
| Kentucky Property & Building Commission | | | | |
| Revenue | 5.250% | 2/1/18 | 110 | 116 |
| Kentucky Property & Building Commission | | | | |
| Revenue | 5.000% | 8/1/18 | 345 | 368 |
| Kentucky Property & Building Commission | | | | |
| Revenue | 5.375% | 11/1/18 (Prere.) | 160 | 174 |
| Kentucky Property & Building Commission | | | | |
| Revenue | 5.500% | 11/1/18 (Prere.) | 320 | 348 |
| Kentucky Property & Building Commission | | | | |
| Revenue | 5.250% | 2/1/19 (Prere.) | 230 | 252 |
| Kentucky Property & Building Commission | | | | |
| Revenue | 5.000% | 11/1/20 | 120 | 129 |
| Kentucky Property & Building Commission | | | | |
| Revenue | 5.000% | 8/1/23 | 105 | 125 |
| Kentucky Property & Building Commission | | | | |
| Revenue | 5.250% | 2/1/24 (12) | 15 | 16 |
| Kentucky Property & Building Commission | | | | |
| Revenue | 5.000% | 11/1/26 | 500 | 613 |
30
| | | | |
| Tax-Exempt Bond Index Fund | | | | |
| |
| |
| |
| | | | Face | Market |
| | | Maturity | Amount | Value• |
| | Coupon | Date | ($000) | ($000) |
| Kentucky Property & Building Commission | | | | |
| Revenue | 5.500% | 11/1/28 | 30 | 33 |
| Kentucky Public Transportation Infrastructure | | | | |
| Authority Toll Revenue (Downtown Crossing | | | | |
| Project) BAN | 6.000% | 7/1/53 | 200 | 235 |
| Louisville & Jefferson County KY Metropolitan | | | | |
| Sewer & Drain System | 3.000% | 5/15/46 | 500 | 467 |
| Louisville & Jefferson County KY Metropolitan | | | | |
| Sewer & Drain System Revenue | 5.000% | 5/15/34 | 100 | 116 |
| Louisville & Jefferson County KY Metropolitan | | | | |
| Sewer & Drain System Revenue | 4.250% | 5/15/38 (12) | 65 | 68 |
| | | | | 3,346 |
| Louisiana (0.8%) | | | | |
| East Baton Rouge Parish LA Sewer Commission | | | | |
| Revenue | 5.250% | 2/1/19 (Prere.) | 55 | 60 |
| Lafayette LA Communications System Revenue | 5.250% | 11/1/17 (Prere.) | 275 | 287 |
| Louisiana Citizens Property Insurance Corp. | | | | |
| Assessment Revenue | 5.000% | 6/1/23 | 500 | 600 |
| Louisiana Gasoline & Fuel Tax Revenue | 5.000% | 5/1/23 | 145 | 172 |
| Louisiana Gasoline & Fuel Tax Revenue | 5.000% | 5/1/36 | 150 | 175 |
| Louisiana Gasoline & Fuel Tax Revenue | 5.000% | 5/1/41 | 110 | 128 |
| Louisiana Gasoline & Fuel Tax Revenue | 5.000% | 5/1/45 | 290 | 322 |
| Louisiana GO | 5.000% | 8/1/25 | 100 | 122 |
| Louisiana GO | 5.000% | 9/1/34 | 1,000 | 1,181 |
| Louisiana Local Government Environmental | | | | |
| Facilities & Community Development Authority | | | | |
| Revenue (East Baton Rouge Sewerage | | | | |
| Commission Projects) | 5.000% | 2/1/43 | 100 | 112 |
| Louisiana Local Government Environmental | | | | |
| Facilities & Community Development Authority | | | | |
| Revenue (East Baton Rouge Sewerage | | | | |
| Commission Projects) | 4.000% | 2/1/48 | 130 | 135 |
| Louisiana Local Government Environmental | | | | |
| Facilities & Community Development Authority | | | | |
| Revenue (LCTCS Facilities Corp. Project) | 5.000% | 10/1/37 | 495 | 573 |
| Louisiana Local Government Environmental | | | | |
| Facilities & Community Development Authority | | | | |
| Revenue (LCTCS Facilities Corp. Project) | 5.000% | 10/1/39 | 100 | 116 |
| Louisiana Public Facilities Authority Lease Revenue | 5.000% | 7/1/51 | 150 | 169 |
| Louisiana Public Facilities Authority Lease Revenue | 5.000% | 7/1/56 | 150 | 166 |
| Louisiana Public Facilities Authority Revenue | | | | |
| (Loyola University) | 5.000% | 10/1/41 | 215 | 235 |
| New Orleans LA Sewage Service Revenue | 5.000% | 6/1/44 | 160 | 183 |
| | | | | 4,736 |
| Maryland (2.5%) | | | | |
| Baltimore County MD GO | 3.000% | 2/1/34 | 295 | 299 |
| Baltimore MD Project Revenue | 4.500% | 7/1/32 (2) | 300 | 307 |
| Baltimore MD Project Revenue | 5.000% | 7/1/38 | 60 | 69 |
| Baltimore MD Project Revenue | 5.000% | 7/1/41 | 660 | 756 |
| Baltimore MD Project Revenue | 5.000% | 7/1/43 | 105 | 121 |
| Howard County MD GO | 3.000% | 2/15/30 | 100 | 103 |
| Maryland Department of Transportation Revenue | 5.000% | 9/1/18 (Prere.) | 205 | 220 |
| Maryland Department of Transportation Revenue | 5.000% | 2/15/23 | 500 | 610 |
| Maryland Department of Transportation Revenue | 3.000% | 12/15/30 | 755 | 776 |
| Maryland GO | 5.000% | 3/1/18 | 100 | 105 |
31
| | | | |
| Tax-Exempt Bond Index Fund | | | | |
| |
| |
| |
| | | | Face | Market |
| | | Maturity | Amount | Value• |
| | Coupon | Date | ($000) | ($000) |
| Maryland GO | 5.000% | 7/15/18 (Prere.) | 115 | 123 |
| Maryland GO | 5.000% | 3/1/19 | 110 | 120 |
| Maryland GO | 5.000% | 3/1/19 (Prere.) | 60 | 66 |
| Maryland GO | 5.000% | 3/15/19 | 125 | 137 |
| Maryland GO | 5.000% | 3/15/19 (Prere.) | 240 | 263 |
| Maryland GO | 5.000% | 8/1/19 (Prere.) | 200 | 222 |
| Maryland GO | 5.000% | 8/1/20 | 500 | 573 |
| Maryland GO | 5.000% | 8/1/21 | 125 | 143 |
| Maryland GO | 5.000% | 8/1/21 | 1,200 | 1,414 |
| Maryland GO | 5.000% | 3/1/22 (Prere.) | 250 | 299 |
| Maryland GO | 5.000% | 3/1/22 | 250 | 290 |
| Maryland GO | 5.000% | 8/1/23 | 250 | 309 |
| Maryland GO | 5.000% | 3/1/24 | 430 | 526 |
| Maryland GO | 5.000% | 6/1/24 | 940 | 1,178 |
| Maryland GO | 4.000% | 8/1/24 | 700 | 825 |
| Maryland GO | 5.000% | 8/1/24 | 200 | 251 |
| Maryland GO | 5.000% | 8/1/24 | 115 | 142 |
| Maryland GO | 5.000% | 3/1/26 | 75 | 91 |
| Maryland GO | 5.000% | 6/1/26 | 1,000 | 1,241 |
| Maryland GO | 3.000% | 3/1/27 | 350 | 366 |
| Maryland GO | 4.000% | 8/1/27 | 140 | 160 |
| Maryland GO | 3.000% | 3/1/28 | 295 | 307 |
| Maryland GO | 3.000% | 3/1/30 | 200 | 208 |
| Maryland GO | 3.000% | 6/1/31 | 500 | 511 |
| Maryland Transportation Authority Facilities | | | | |
| Projects Revenue | 5.000% | 7/1/38 (4) | 100 | 106 |
| Maryland Transportation Authority Facilities | | | | |
| Projects Revenue | 4.500% | 7/1/41 (4) | 670 | 685 |
| Montgomery County MD GO | 5.000% | 7/1/21 | 200 | 235 |
| Montgomery County MD GO | 5.000% | 11/1/23 | 750 | 930 |
| Montgomery County MD GO | 5.000% | 11/1/25 | 500 | 627 |
| Montgomery County MD GO | 5.000% | 11/1/26 | 50 | 62 |
| | | | | 15,776 |
| Massachusetts (4.5%) | | | | |
| Massachusetts Bay Transportation Authority | | | | |
| Assessment Revenue | 4.050% | 7/1/41 | 50 | 53 |
| Massachusetts Bay Transportation Authority | | | | |
| Assessment Revenue | 5.000% | 7/1/41 | 150 | 175 |
| Massachusetts Bay Transportation Authority | | | | |
| Sales Tax Revenue | 5.500% | 7/1/17 | 115 | 119 |
| Massachusetts Bay Transportation Authority | | | | |
| Sales Tax Revenue | 5.250% | 7/1/18 (Prere.) | 130 | 139 |
| Massachusetts Bay Transportation Authority | | | | |
| Sales Tax Revenue | 5.500% | 7/1/18 | 425 | 457 |
| Massachusetts Bay Transportation Authority | | | | |
| Sales Tax Revenue | 5.000% | 7/1/31 | 90 | 117 |
| Massachusetts Bay Transportation Authority | | | | |
| Sales Tax Revenue | 5.000% | 7/1/45 | 535 | 626 |
| Massachusetts Department of Transportation | | | | |
| Metropolitan Highway System Revenue | 5.000% | 1/1/32 | 560 | 622 |
| Massachusetts Department of Transportation | | | | |
| Metropolitan Highway System Revenue | 5.000% | 1/1/35 | 40 | 45 |
| Massachusetts Department of Transportation | | | | |
| Metropolitan Highway System Revenue | 5.000% | 1/1/37 | 25 | 28 |
32
| | | | |
| Tax-Exempt Bond Index Fund | | | | |
| |
| |
| |
| | | | Face | Market |
| | | Maturity | Amount | Value• |
| | Coupon | Date | ($000) | ($000) |
| Massachusetts Development Finance Agency | | | | |
| Revenue (Boston University) | 5.000% | 7/1/42 | 145 | 149 |
| Massachusetts Development Finance Agency | | | | |
| Revenue (Brandeis University) | 5.000% | 10/1/35 | 165 | 183 |
| Massachusetts Development Finance Agency | | | | |
| Revenue (Harvard University) | 5.000% | 10/15/20 (Prere.) | 1,015 | 1,167 |
| Massachusetts Development Finance Agency | | | | |
| Revenue (Williams College) | 5.000% | 7/1/43 | 380 | 450 |
| Massachusetts Federal Highway GAN | | | | |
| (Accelerated Bridge Program) | 5.000% | 6/15/24 | 60 | 75 |
| Massachusetts Federal Highway GAN | | | | |
| (Accelerated Bridge Program) | 5.000% | 6/15/26 | 320 | 395 |
| Massachusetts GO | 5.000% | 8/1/17 (Prere.) | 500 | 516 |
| Massachusetts GO | 5.000% | 8/1/17 (Prere.) | 360 | 372 |
| Massachusetts GO | 5.000% | 8/1/18 (Prere.) | 125 | 134 |
| Massachusetts GO | 5.500% | 8/1/18 | 145 | 157 |
| Massachusetts GO | 5.000% | 3/1/19 (Prere.) | 100 | 109 |
| Massachusetts GO | 5.000% | 7/1/19 (Prere.) | 50 | 55 |
| Massachusetts GO | 5.000% | 4/1/21 (Prere.) | 100 | 117 |
| Massachusetts GO | 5.000% | 8/1/21 (Prere.) | 100 | 118 |
| Massachusetts GO | 5.250% | 8/1/21 | 75 | 89 |
| Massachusetts GO | 5.250% | 9/1/21 (4) | 500 | 594 |
| Massachusetts GO | 5.250% | 8/1/22 | 250 | 304 |
| Massachusetts GO | 5.000% | 3/1/23 | 1,000 | 1,215 |
| Massachusetts GO | 5.250% | 8/1/23 | 75 | 93 |
| Massachusetts GO | 5.000% | 10/1/23 | 150 | 177 |
| Massachusetts GO | 5.000% | 7/1/24 | 335 | 416 |
| Massachusetts GO | 5.250% | 9/1/25 (4) | 150 | 192 |
| Massachusetts GO | 5.000% | 7/1/26 | 500 | 637 |
| Massachusetts GO | 5.000% | 7/1/27 | 775 | 922 |
| Massachusetts GO | 4.000% | 10/1/27 | 225 | 247 |
| Massachusetts GO | 4.000% | 11/1/29 | 100 | 110 |
| Massachusetts GO | 5.000% | 7/1/30 | 505 | 612 |
| Massachusetts GO | 5.000% | 7/1/33 | 100 | 120 |
| Massachusetts GO | 5.000% | 8/1/35 | 100 | 116 |
| Massachusetts GO | 3.375% | 10/1/35 | 200 | 203 |
| Massachusetts GO | 4.000% | 9/1/37 | 200 | 216 |
| Massachusetts GO | 3.250% | 9/1/38 | 200 | 200 |
| Massachusetts GO | 3.600% | 10/1/38 | 160 | 163 |
| Massachusetts GO | 4.000% | 5/1/39 | 255 | 272 |
| Massachusetts GO | 3.625% | 10/1/39 | 100 | 102 |
| Massachusetts GO | 4.000% | 5/1/40 | 100 | 106 |
| Massachusetts GO | 3.625% | 10/1/41 | 800 | 811 |
| Massachusetts GO | 4.000% | 4/1/42 | 955 | 1,005 |
| Massachusetts GO | 4.500% | 12/1/43 | 1,200 | 1,332 |
| Massachusetts GO | 5.000% | 7/1/45 | 400 | 470 |
| Massachusetts GO | 5.000% | 3/1/46 | 585 | 679 |
| Massachusetts GO | 4.000% | 4/1/46 | 770 | 819 |
| Massachusetts Health & Educational Facilities | | | | |
| Authority Revenue (Harvard University) | 5.000% | 10/1/17 (Prere.) | 685 | 712 |
| Massachusetts Health & Educational Facilities | | | | |
| Authority Revenue (Harvard University) | 5.000% | 12/15/19 (Prere.) | 335 | 376 |
| Massachusetts Health & Educational Facilities | | | | |
| Authority Revenue (MIT) | 5.250% | 7/1/33 | 100 | 137 |
| Massachusetts Port Authority Revenue | 5.000% | 7/1/45 | 160 | 187 |
33
| | | | |
| Tax-Exempt Bond Index Fund | | | | |
| |
| |
| |
| | | | Face | Market |
| | | Maturity | Amount | Value• |
| | Coupon | Date | ($000) | ($000) |
| Massachusetts School Building Authority | | | | |
| Dedicated Sales Tax Revenue | 4.500% | 8/15/17 (Prere.) | 240 | 247 |
| Massachusetts School Building Authority | | | | |
| Dedicated Sales Tax Revenue | 4.500% | 8/15/17 (Prere.) | 90 | 93 |
| Massachusetts School Building Authority | | | | |
| Dedicated Sales Tax Revenue | 4.750% | 8/15/17 (Prere.) | 725 | 748 |
| Massachusetts School Building Authority | | | | |
| Dedicated Sales Tax Revenue | 5.000% | 8/15/19 | 75 | 83 |
| Massachusetts School Building Authority | | | | |
| Dedicated Sales Tax Revenue | 5.000% | 10/15/19 | 595 | 664 |
| Massachusetts School Building Authority | | | | |
| Dedicated Sales Tax Revenue | 5.000% | 8/15/29 | 750 | 898 |
| Massachusetts School Building Authority | | | | |
| Dedicated Sales Tax Revenue | 5.000% | 10/15/32 | 275 | 320 |
| Massachusetts School Building Authority | | | | |
| Dedicated Sales Tax Revenue | 5.250% | 10/15/35 | 55 | 65 |
| Massachusetts School Building Authority | | | | |
| Dedicated Sales Tax Revenue | 5.000% | 10/15/41 | 360 | 419 |
| Massachusetts School Building Authority | | | | |
| Dedicated Sales Tax Revenue | 4.000% | 11/15/46 | 300 | 321 |
| Massachusetts Special Obligation Dedicated | | | | |
| Tax Revenue | 5.500% | 1/1/30 (14) | 125 | 165 |
| Massachusetts State Health & Educational | | | | |
| Facilities Authority Revenue Prerefunded-Berklee | | | | |
| CLG Music | 5.000% | 10/1/17 (Prere.) | 170 | 177 |
| Massachusetts State Health & Educational | | | | |
| Facilities Authority Revenue Unrefunded-Berklee | | | | |
| CLG Music | 5.000% | 10/1/37 | 10 | 10 |
| Massachusetts Transportation Fund Revenue | | | | |
| (Accelerated Bridge Program) | 4.375% | 6/1/43 | 85 | 93 |
| Massachusetts Transportation Fund Revenue | | | | |
| (Accelerated Bridge Program) | 5.000% | 6/1/44 | 750 | 884 |
| Massachusetts Transportation Fund Revenue | | | | |
| (Rail Enhancement Program) | 4.000% | 6/1/45 | 150 | 163 |
| Massachusetts Water Pollution Abatement | | | | |
| Trust Revenue | 5.250% | 8/1/18 | 120 | 129 |
| Massachusetts Water Pollution Abatement | | | | |
| Trust Revenue | 5.250% | 8/1/19 | 100 | 112 |
| Massachusetts Water Pollution Abatement | | | | |
| Trust Revenue | 5.000% | 8/1/22 | 400 | 484 |
| Massachusetts Water Resources Authority | | | | |
| Revenue | 4.500% | 2/1/17 (Prere.) | 100 | 101 |
| Massachusetts Water Resources Authority | | | | |
| Revenue | 5.000% | 8/1/19 (Prere.) | 210 | 233 |
| Massachusetts Water Resources Authority | | | | |
| Revenue | 5.000% | 8/1/19 (Prere.) | 170 | 188 |
| Massachusetts Water Resources Authority | | | | |
| Revenue | 5.250% | 8/1/31 (4) | 80 | 106 |
| Massachusetts Water Resources Authority | | | | |
| Revenue | 5.000% | 8/1/37 | 125 | 145 |
| Massachusetts Water Resources Authority | | | | |
| Revenue | 4.000% | 8/1/40 | 500 | 544 |
| Massachusetts Water Resources Authority | | | | |
| Revenue | 5.000% | 8/1/40 | 250 | 298 |
34
| | | | |
| Tax-Exempt Bond Index Fund | | | | |
| |
| |
| |
| | | | Face | Market |
| | | Maturity | Amount | Value• |
| | Coupon | Date | ($000) | ($000) |
| University of Massachusetts Building Authority | | | | |
| Revenue | 5.000% | 11/1/44 | 85 | 99 |
| University of Massachusetts Building Authority | | | | |
| Revenue | 4.000% | 11/1/45 | 150 | 159 |
| | | | | 27,960 |
| Michigan (1.8%) | | | | |
| Detroit MI City School District GO | 5.250% | 5/1/27 (4) | 110 | 135 |
| Detroit MI City School District GO | 5.250% | 5/1/32 (4) | 125 | 152 |
| Detroit MI GO | 5.250% | 3/1/17 (Prere.) | 100 | 104 |
| Detroit MI Sewage Disposal System Revenue | 5.250% | 7/1/29 (13) | 100 | 106 |
| Detroit MI Sewage Disposal System Revenue | 5.000% | 7/1/36 (14) | 110 | 110 |
| Detroit MI Water Supply System Revenue | 5.750% | 7/1/23 (13) | 250 | 269 |
| Holland MI Electric Utility System Revenue | 5.000% | 7/1/27 | 250 | 288 |
| Karegnondi Water Authority Michigan Water Supply | | | | |
| System Revenue (Karegnondi Water Pipeline) | 5.250% | 11/1/28 | 500 | 584 |
| Kent County MI Airport Revenue (Gerald R. Ford | | | | |
| International Airport) | 5.000% | 1/1/17 (Prere.) | 100 | 101 |
| Lansing MI Board of Water & Light Utility System | | | | |
| Revenue | 5.000% | 7/1/37 | 50 | 57 |
| Lansing MI Board of Water & Light Utility System | | | | |
| Revenue | 5.500% | 7/1/41 | 250 | 293 |
| Michigan Building Authority Revenue | 5.000% | 4/15/19 | 215 | 235 |
| Michigan Building Authority Revenue | 5.000% | 4/15/22 | 100 | 118 |
| Michigan Building Authority Revenue | 5.000% | 4/15/23 | 115 | 139 |
| Michigan Building Authority Revenue | 5.000% | 10/15/32 | 250 | 299 |
| Michigan Building Authority Revenue | 5.000% | 10/15/33 | 125 | 149 |
| Michigan Building Authority Revenue | 5.000% | 4/15/38 | 130 | 151 |
| Michigan Building Authority Revenue | 5.000% | 4/15/41 | 500 | 585 |
| Michigan Building Authority Revenue | 5.000% | 10/15/50 | 110 | 126 |
| Michigan Finance Authority Revenue | 5.000% | 4/1/19 | 250 | 271 |
| Michigan Finance Authority Revenue | 5.000% | 4/1/21 | 250 | 284 |
| Michigan Finance Authority Revenue | 5.000% | 7/1/44 | 500 | 552 |
| Michigan Finance Authority Revenue | | | | |
| (Detroit School District) | 5.000% | 5/1/18 | 600 | 633 |
| Michigan Finance Authority Revenue | | | | |
| (Detroit Water & Sewer) | 5.000% | 7/1/25 (4) | 250 | 300 |
| Michigan Finance Authority Revenue | | | | |
| (Detroit Water & Sewer) | 5.000% | 7/1/25 (4) | 400 | 481 |
| Michigan Finance Authority Revenue | | | | |
| (Detroit Water & Sewer) | 5.000% | 7/1/26 (4) | 280 | 334 |
| Michigan Finance Authority Revenue | | | | |
| (Detroit Water & Sewer) | 5.000% | 7/1/32 (4) | 115 | 132 |
| Michigan Finance Authority Revenue | | | | |
| (Detroit Water & Sewer) | 5.000% | 7/1/34 | 485 | 549 |
| Michigan Finance Authority Revenue | | | | |
| (Unemployment Obligation Assessment) | 5.000% | 1/1/18 | 200 | 210 |
| Michigan Finance Authority Revenue | | | | |
| (Unemployment Obligation Assessment) | 5.000% | 7/1/19 | 200 | 221 |
| Michigan Finance Authority Revenue | | | | |
| (Unemployment Obligation Assessment) | 5.000% | 7/1/20 | 110 | 122 |
| Michigan GAN | 5.000% | 3/15/22 | 300 | 354 |
| Michigan GAN | 5.000% | 3/15/27 | 250 | 312 |
| Michigan GO | 5.250% | 9/15/17 (Prere.) | 245 | 254 |
| Michigan GO | 5.000% | 11/1/18 (Prere.) | 50 | 54 |
| Michigan GO | 5.000% | 5/1/19 | 65 | 69 |
35
| | | | |
| Tax-Exempt Bond Index Fund | | | | |
| |
| |
| |
| | | | Face | Market |
| | | Maturity | Amount | Value• |
| | Coupon | Date | ($000) | ($000) |
| Michigan Grant Anticipation Revenue | 5.250% | 9/15/17 (Prere.) | 400 | 416 |
| Michigan Trunk Line Revenue | 5.500% | 11/1/18 | 65 | 71 |
| Michigan Trunk Line Revenue | 5.000% | 11/1/19 | 50 | 56 |
| University of Michigan Revenue | 5.000% | 4/1/40 | 500 | 599 |
| Wayne County MI Airport Authority Revenue | | | | |
| (Detroit Metropolitan Wayne County Airport) | 5.000% | 12/1/42 (4) | 230 | 260 |
| Wayne State University Michigan Revenue | 5.000% | 11/15/18 (Prere.) | 155 | 168 |
| Wayne State University Michigan Revenue | 5.000% | 11/15/24 (4) | 200 | 216 |
| Western Michigan University Revenue | 5.000% | 5/15/18 (Prere.) | 50 | 53 |
| | | | | 10,972 |
| Minnesota (0.8%) | | | | |
| Hennepin County MN Sales Tax Revenue | 4.750% | 12/15/33 | 250 | 261 |
| Minnesota General Fund Revenue | 5.000% | 3/1/29 | 760 | 888 |
| Minnesota GO | 5.000% | 8/1/17 | 125 | 129 |
| Minnesota GO | 5.000% | 8/1/17 (Prere.) | 545 | 562 |
| Minnesota GO | 5.000% | 8/1/17 (Prere.) | 145 | 150 |
| Minnesota GO | 5.000% | 8/1/19 | 200 | 222 |
| Minnesota GO | 5.000% | 11/1/19 | 75 | 84 |
| Minnesota GO | 5.000% | 8/1/20 | 500 | 573 |
| Minnesota GO | 5.000% | 8/1/21 | 485 | 553 |
| Minnesota GO | 5.000% | 8/1/22 | 160 | 182 |
| Minnesota GO | 5.000% | 8/1/23 | 200 | 228 |
| Minnesota GO | 5.000% | 8/1/23 | 540 | 666 |
| Minnesota GO | 5.000% | 8/1/25 | 500 | 636 |
| Minnesota Municipal Power Agency Revenue | 5.000% | 1/1/40 | 60 | 69 |
| | | | | 5,203 |
| Mississippi (0.3%) | | | | |
| Mississippi Development Bank Special Obligation | | | | |
| Revenue | 5.250% | 8/1/20 (Prere.) | 500 | 576 |
| Mississippi GO | 5.000% | 10/1/20 | 75 | 86 |
| Mississippi GO | 5.000% | 11/1/21 | 150 | 178 |
| Mississippi GO | 5.000% | 10/1/36 | 855 | 993 |
| | | | | 1,833 |
| Missouri (0.3%) | | | | |
| Bi-State Development Agency of the | | | | |
| Missouri-Illinois Metropolitan District | | | | |
| Mass Transit Sales Tax Revenue | 5.000% | 10/1/28 | 100 | 107 |
| Jackson County MO Special Obligation | | | | |
| Revenue (Truman Sports Complex Project) | 5.000% | 12/1/31 | 150 | 177 |
| Kansas City MO Special Obligation Revenue | | | | |
| (Downtown Arena Project) | 5.125% | 4/1/18 (Prere.) | 300 | 318 |
| Kansas City MO Special Obligation Revenue | | | | |
| (Downtown Arena Project) | 5.000% | 4/1/40 | 500 | 573 |
| Metropolitan St. Louis MO Sewer District | | | | |
| Wastewater System Revenue | 5.000% | 5/1/27 | 50 | 61 |
| Missouri Joint Municipal Electric Utility | | | | |
| Commission Power Project Revenue | 5.000% | 1/1/17 (Prere.) | 140 | 141 |
| Missouri Joint Municipal Electric Utility Commission | | | | |
| Power Project Revenue (Iatan 2 Project) | 6.000% | 1/1/19 (Prere.) | 115 | 127 |
| Springfield MO Public Utility Revenue | 4.000% | 8/1/31 | 130 | 143 |
| St. Louis MO Airport Revenue (Lambert-St. Louis | | | | |
| International Airport) | 5.500% | 7/1/30 (14) | 50 | 64 |
| St. Louis MO Sewer & Wastewater Revenue | 5.000% | 5/1/42 | 250 | 292 |
| | | | | 2,003 |
36
| | | | |
| Tax-Exempt Bond Index Fund | | | | |
| |
| |
| |
| | | | Face | Market |
| | | Maturity | Amount | Value• |
| | Coupon | Date | ($000) | ($000) |
| Nebraska (0.3%) | | | | |
| Nebraska GO (Lincoln-West Haymarket Joint | | | | |
| Public Agency) | 5.000% | 12/15/42 | 50 | 58 |
| Nebraska Public Power District Revenue | 5.000% | 1/1/40 | 880 | 1,014 |
| Omaha NE Public Power District Electric Revenue | 5.000% | 2/1/21 | 150 | 174 |
| Omaha NE Public Power District Electric Revenue | 5.000% | 2/1/28 | 250 | 311 |
| Omaha NE Public Power District Electric Revenue | 4.000% | 2/1/38 | 175 | 189 |
| Omaha NE Public Power District Electric Revenue | 4.000% | 2/1/42 | 150 | 158 |
| Omaha NE Public Power District Electric Revenue | 5.250% | 2/1/42 | 135 | 160 |
| | | | | 2,064 |
| Nevada (1.9%) | | | | |
| Clark County NV GO | 5.000% | 11/1/16 (Prere.) | 90 | 90 |
| Clark County NV GO | 5.000% | 11/1/24 (2) | 135 | 135 |
| Clark County NV GO | 5.000% | 11/1/27 | 600 | 754 |
| Clark County NV GO | 5.000% | 6/1/33 | 55 | 58 |
| Clark County NV GO | 5.000% | 6/1/38 | 295 | 312 |
| Clark County NV Highway Improvement Motor | | | | |
| Vehicle Fuel Tax Revenue | 5.000% | 7/1/19 (Prere.) | 500 | 552 |
| Clark County NV Passenger Facility Charge Revenue | | | | |
| (Las Vegas McCarran International Airport) | 5.000% | 7/1/17 (Prere.) | 200 | 206 |
| Clark County NV Passenger Facility Charge Revenue | | | | |
| (Las Vegas McCarran International Airport) | 5.000% | 7/1/17 (Prere.) | 100 | 103 |
| Clark County NV Passenger Facility Charge Revenue | | | | |
| (Las Vegas McCarran International Airport) | 5.000% | 7/1/30 | 100 | 110 |
| Clark County NV Passenger Facility Charge Revenue | | | | |
| (Las Vegas McCarran International Airport) | 5.250% | 7/1/39 (4) | 115 | 127 |
| Clark County NV Passenger Facility Charge Revenue | | | | |
| (Las Vegas McCarran International Airport) | 5.250% | 7/1/42 | 110 | 122 |
| Clark County NV School District GO | 4.500% | 6/15/17 (14) | 55 | 56 |
| Clark County NV School District GO | 5.500% | 6/15/17 | 100 | 103 |
| Clark County NV School District GO | 5.000% | 12/15/17 (Prere.) | 245 | 257 |
| Clark County NV School District GO | 5.000% | 6/15/18 | 720 | 767 |
| Clark County NV School District GO | 5.000% | 6/15/18 (Prere.) | 1,125 | 1,200 |
| Clark County NV School District GO | 5.000% | 6/15/18 (Prere.) | 400 | 427 |
| Clark County NV School District GO | 5.000% | 6/15/18 (Prere.) | 155 | 165 |
| Clark County NV School District GO | 5.000% | 6/15/18 (Prere.) | 320 | 341 |
| Clark County NV School District GO | 5.000% | 6/15/20 | 250 | 266 |
| Clark County NV School District GO | 5.000% | 6/15/21 (14) | 125 | 132 |
| Clark County NV School District GO | 5.000% | 6/15/22 (14) | 75 | 79 |
| Clark County NV School District GO | 5.000% | 6/15/22 | 50 | 53 |
| Clark County NV School District GO | 5.000% | 6/15/23 (14) | 325 | 343 |
| Clark County NV School District GO | 3.500% | 6/15/24 (14) | 125 | 127 |
| Las Vegas NV Convention & Visitors Authority | | | | |
| Revenue | 5.000% | 7/1/28 | 155 | 190 |
| Las Vegas NV Convention & Visitors Authority | | | | |
| Revenue | 5.000% | 7/1/29 | 160 | 194 |
| Las Vegas NV GO | 6.000% | 4/1/19 (Prere.) | 100 | 112 |
| Las Vegas Valley Water District Nevada GO | 5.000% | 2/1/30 | 220 | 231 |
| Las Vegas Valley Water District Nevada GO | 5.000% | 2/1/35 | 150 | 157 |
| Las Vegas Valley Water District Nevada GO | 5.000% | 2/1/36 | 105 | 110 |
| Las Vegas Valley Water District Nevada GO | 5.000% | 6/1/38 | 60 | 68 |
| Las Vegas Valley Water District Nevada GO | 5.000% | 6/1/39 | 865 | 1,021 |
| Las Vegas Valley Water District Nevada GO | 4.000% | 6/1/42 | 200 | 213 |
| Las Vegas Valley Water District Nevada GO | 5.000% | 6/1/42 | 285 | 328 |
| Nevada Capital Improvement & Cultural Affairs GO | 5.000% | 12/1/17 (Prere.) | 125 | 131 |
37
| | | | |
| Tax-Exempt Bond Index Fund | | | | |
| |
| |
| |
| | | | Face | Market |
| | | Maturity | Amount | Value• |
| | Coupon | Date | ($000) | ($000) |
| Nevada Capital Improvement & Cultural Affairs GO | 5.000% | 3/1/22 | 50 | 59 |
| Nevada GO | 5.000% | 12/1/17 (Prere.) | 100 | 105 |
| Nevada GO | 5.000% | 4/1/24 | 110 | 135 |
| Nevada GO | 5.000% | 11/1/24 | 115 | 143 |
| Nevada GO | 5.000% | 11/1/26 | 250 | 309 |
| Nevada Unemployment Compensation Revenue | 5.000% | 12/1/17 | 100 | 105 |
| Truckee Meadows NV Water Authority Water | | | | |
| Revenue | 4.500% | 7/1/30 (4) | 200 | 205 |
| Washoe County NV Highway Fuel Tax Revenue | 5.000% | 2/1/29 | 885 | 957 |
| | | | | 11,658 |
| New Hampshire (0.1%) | | | | |
| New Hampshire Health & Education Facilities | | | | |
| Authority Revenue (Dartmouth College) | 5.250% | 6/1/19 (Prere.) | 365 | 405 |
| |
| New Jersey (5.7%) | | | | |
| Garden State Preservation Trust New Jersey | | | | |
| Revenue (Open Space & Farmland Preservation) | 5.125% | 11/1/16 (4) | 150 | 150 |
| Garden State Preservation Trust New Jersey | | | | |
| Revenue (Open Space & Farmland Preservation) | 5.125% | 11/1/17 (4) | 90 | 94 |
| Garden State Preservation Trust New Jersey | | | | |
| Revenue (Open Space & Farmland Preservation) | 5.000% | 11/1/20 | 145 | 164 |
| New Jersey COP | 5.250% | 6/15/30 | 250 | 269 |
| New Jersey Economic Development Authority | | | | |
| Lease Revenue (Rutgers State University) | 5.000% | 6/15/46 | 495 | 571 |
| New Jersey Economic Development Authority | | | | |
| Revenue | 5.000% | 6/15/23 | 155 | 173 |
| New Jersey Economic Development Authority | | | | |
| Revenue | 4.000% | 6/15/24 | 100 | 106 |
| New Jersey Economic Development Authority | | | | |
| Revenue (Cigarette Tax) | 5.000% | 6/15/17 | 100 | 102 |
| New Jersey Economic Development Authority | | | | |
| Revenue (Cigarette Tax) | 5.000% | 6/15/24 | 130 | 145 |
| New Jersey Economic Development Authority | | | | |
| Revenue (Cigarette Tax) | 4.250% | 6/15/27 | 320 | 333 |
| New Jersey Economic Development Authority | | | | |
| Revenue (School Facilities Construction) | 5.000% | 3/1/17 (ETM) | 15 | 15 |
| New Jersey Economic Development Authority | | | | |
| Revenue (School Facilities Construction) | 5.000% | 9/1/17 (Prere.) | 120 | 124 |
| New Jersey Economic Development Authority | | | | |
| Revenue (School Facilities Construction) | 5.000% | 9/1/17 (ETM) | 590 | 611 |
| New Jersey Economic Development Authority | | | | |
| Revenue (School Facilities Construction) | 5.000% | 3/1/19 (ETM) | 1,000 | 1,091 |
| New Jersey Economic Development Authority | | | | |
| Revenue (School Facilities Construction) | 5.000% | 6/15/19 | 400 | 430 |
| New Jersey Economic Development Authority | | | | |
| Revenue (School Facilities Construction) | 5.000% | 3/1/20 | 220 | 239 |
| New Jersey Economic Development Authority | | | | |
| Revenue (School Facilities Construction) | 5.000% | 3/1/21 | 250 | 274 |
| New Jersey Economic Development Authority | | | | |
| Revenue (School Facilities Construction) | 5.250% | 12/15/21 (14) | 100 | 115 |
| New Jersey Economic Development Authority | | | | |
| Revenue (School Facilities Construction) | 5.000% | 3/1/22 | 350 | 388 |
| New Jersey Economic Development Authority | | | | |
| Revenue (School Facilities Construction) | 5.000% | 3/1/23 | 575 | 641 |
38
| | | | |
| Tax-Exempt Bond Index Fund | | | | |
| |
| |
| |
| | | | Face | Market |
| | | Maturity | Amount | Value• |
| | Coupon | Date | ($000) | ($000) |
| New Jersey Economic Development Authority | | | | |
| Revenue (School Facilities Construction) | 5.000% | 3/1/24 | 750 | 836 |
| New Jersey Economic Development Authority | | | | |
| Revenue (School Facilities Construction) | 5.000% | 3/1/25 | 1,515 | 1,687 |
| New Jersey Economic Development Authority | | | | |
| Revenue (School Facilities Construction) | 5.250% | 9/1/25 | 250 | 277 |
| New Jersey Economic Development Authority | | | | |
| Revenue (School Facilities Construction) | 5.000% | 3/1/26 | 155 | 172 |
| New Jersey Economic Development Authority | | | | |
| Revenue (School Facilities Construction) | 4.375% | 6/15/27 | 110 | 118 |
| New Jersey Economic Development Authority | | | | |
| Revenue (School Facilities Construction) | 5.000% | 6/15/27 | 165 | 186 |
| New Jersey Economic Development Authority | | | | |
| Revenue (School Facilities Construction) | 5.000% | 3/1/28 | 455 | 503 |
| New Jersey Economic Development Authority | | | | |
| Revenue (School Facilities Construction) | 5.000% | 3/1/29 | 180 | 198 |
| New Jersey Economic Development Authority | | | | |
| Revenue (School Facilities Construction) | 5.000% | 3/1/38 | 150 | 161 |
| New Jersey Economic Development Authority | | | | |
| Revenue (School Facilities Construction) | 5.000% | 6/15/40 | 100 | 108 |
| New Jersey Economic Development Authority | | | | |
| Revenue(Provident Group-Rowan Properties | | | | |
| LLC - Rowan University Housing Project) | 5.000% | 1/1/48 | 100 | 111 |
| New Jersey Economic Development Authority | | | | |
| Sublease Revenue (New Jersey Transit Corp. | | | | |
| Light Rail Transit System Project) | 5.000% | 5/1/19 | 215 | 231 |
| New Jersey Educational Facilities Authority | | | | |
| Revenue (College of New Jersey) | 5.000% | 7/1/18 (Prere.) | 140 | 150 |
| New Jersey Educational Facilities Authority | | | | |
| Revenue (Kean University) | 5.000% | 7/1/17 (Prere.) | 100 | 103 |
| New Jersey Educational Facilities Authority | | | | |
| Revenue (Princeton University) | 5.000% | 7/1/33 | 160 | 165 |
| New Jersey Educational Facilities Authority | | | | |
| Revenue (Princeton University) | 4.500% | 7/1/35 | 1,000 | 1,056 |
| New Jersey Educational Facilities Authority | | | | |
| Revenue (Princeton University) | 4.500% | 7/1/37 | 300 | 307 |
| New Jersey Educational Facilities Authority | | | | |
| Revenue (Princeton University) | 4.000% | 7/1/45 | 140 | 155 |
| New Jersey Equipment Lease Purchase COP | 5.000% | 6/15/21 | 100 | 106 |
| New Jersey GO | 5.000% | 6/1/20 | 300 | 335 |
| New Jersey GO | 5.000% | 6/1/22 | 500 | 583 |
| New Jersey GO | 5.000% | 6/1/28 | 125 | 149 |
| New Jersey Health Care Facilities Financing | | | | |
| Authority Revenue (Hospital Asset | | | | |
| Transformation Program) | 5.250% | 10/1/18 (Prere.) | 15 | 16 |
| New Jersey Health Care Facilities Financing | | | | |
| Authority Revenue (Hospital Asset | | | | |
| Transformation Program) | 5.250% | 10/1/38 | 40 | 42 |
| New Jersey Higher Education Assistance | | | | |
| Authority Student Loan Revenue | 5.625% | 6/1/30 | 100 | 110 |
| New Jersey Transportation Trust Fund Authority | | | | |
| Federal Highway Reimbursement Revenue | 5.000% | 6/15/19 | 150 | 162 |
| New Jersey Transportation Trust Fund Authority | | | | |
| Federal Highway Reimbursement Revenue | 5.000% | 6/15/20 | 200 | 219 |
39
| | | | |
| Tax-Exempt Bond Index Fund | | | | |
| |
| |
| |
| | | | Face | Market |
| | | Maturity | Amount | Value• |
| | Coupon | Date | ($000) | ($000) |
| New Jersey Transportation Trust Fund Authority | | | | |
| Federal Highway Reimbursement Revenue | 5.000% | 6/15/21 | 150 | 157 |
| New Jersey Transportation Trust Fund Authority | | | | |
| Federal Highway Reimbursement Revenue | 5.000% | 6/15/22 | 150 | 157 |
| New Jersey Transportation Trust Fund Authority | | | | |
| Federal Highway Reimbursement Revenue | 5.000% | 6/15/23 | 150 | 157 |
| New Jersey Transportation Trust Fund Authority | | | | |
| Federal Highway Reimbursement Revenue | 5.000% | 6/15/23 | 100 | 113 |
| New Jersey Transportation Trust Fund Authority | | | | |
| Federal Highway Reimbursement Revenue | 5.000% | 6/15/24 | 160 | 167 |
| New Jersey Transportation Trust Fund Authority | | | | |
| Federal Highway Reimbursement Revenue | 5.000% | 6/15/25 | 200 | 227 |
| New Jersey Transportation Trust Fund Authority | | | | |
| Federal Highway Reimbursement Revenue | 5.000% | 6/15/27 | 300 | 339 |
| New Jersey Transportation Trust Fund Authority | | | | |
| Federal Highway Reimbursement Revenue | 5.000% | 6/15/28 | 300 | 336 |
| New Jersey Transportation Trust Fund Authority | | | | |
| Federal Highway Reimbursement Revenue | 5.000% | 6/15/29 | 200 | 208 |
| New Jersey Transportation Trust Fund Authority | | | | |
| Federal Highway Reimbursement Revenue | 5.000% | 6/15/30 | 150 | 166 |
| New Jersey Transportation Trust Fund Authority | | | | |
| Federal Highway Reimbursement Revenue | 5.000% | 6/15/30 | 225 | 234 |
| New Jersey Transportation Trust Fund Authority | | | | |
| Federal Highway Reimbursement Revenue | 5.000% | 6/15/31 | 250 | 260 |
| New Jersey Transportation Trust Fund Authority | | | | |
| Transportation Program Revenue | 5.000% | 6/15/25 | 580 | 641 |
| New Jersey Transportation Trust Fund Authority | | | | |
| Transportation Program Revenue | 5.000% | 12/15/25 (2) | 245 | 254 |
| New Jersey Transportation Trust Fund Authority | | | | |
| Transportation Program Revenue | 5.000% | 6/15/28 | 100 | 110 |
| New Jersey Transportation Trust Fund Authority | | | | |
| Transportation Program Revenue | 5.750% | 12/15/31 | 200 | 216 |
| New Jersey Transportation Trust Fund Authority | | | | |
| Transportation Program Revenue | 5.000% | 6/15/32 | 250 | 271 |
| New Jersey Transportation Trust Fund Authority | | | | |
| Transportation Program Revenue | 0.000% | 12/15/36 | 170 | 67 |
| New Jersey Transportation Trust Fund Authority | | | | |
| Transportation Program Revenue | 4.750% | 6/15/38 | 150 | 160 |
| New Jersey Transportation Trust Fund Authority | | | | |
| Transportation Program Revenue | 5.000% | 6/15/38 | 460 | 495 |
| New Jersey Transportation Trust Fund Authority | | | | |
| Transportation Program Revenue | 5.000% | 6/15/44 | 400 | 431 |
| New Jersey Transportation Trust Fund Authority | | | | |
| Transportation Program Revenue | 5.000% | 6/15/46 | 50 | 54 |
| New Jersey Transportation Trust Fund Authority | | | | |
| Transportation System Revenue | 5.000% | 12/15/16 | 400 | 402 |
| New Jersey Transportation Trust Fund Authority | | | | |
| Transportation System Revenue | 5.000% | 12/15/16 | 160 | 161 |
| New Jersey Transportation Trust Fund Authority | | | | |
| Transportation System Revenue | 5.500% | 12/15/16 (14) | 440 | 443 |
| New Jersey Transportation Trust Fund Authority | | | | |
| Transportation System Revenue | 5.500% | 12/15/16 (4) | 110 | 111 |
| New Jersey Transportation Trust Fund Authority | | | | |
| Transportation System Revenue | 5.000% | 12/15/19 | 200 | 218 |
40
| | | | |
| Tax-Exempt Bond Index Fund | | | | |
| |
| |
| |
| | | | Face | Market |
| | | Maturity | Amount | Value• |
| | Coupon | Date | ($000) | ($000) |
| New Jersey Transportation Trust Fund Authority | | | | |
| Transportation System Revenue | 5.250% | 12/15/19 | 500 | 549 |
| New Jersey Transportation Trust Fund Authority | | | | |
| Transportation System Revenue | 5.250% | 12/15/19 | 325 | 357 |
| New Jersey Transportation Trust Fund Authority | | | | |
| Transportation System Revenue | 5.500% | 12/15/21 | 635 | 722 |
| New Jersey Transportation Trust Fund Authority | | | | |
| Transportation System Revenue | 5.000% | 6/15/22 | 125 | 139 |
| New Jersey Transportation Trust Fund Authority | | | | |
| Transportation System Revenue | 5.250% | 6/15/22 | 65 | 72 |
| New Jersey Transportation Trust Fund Authority | | | | |
| Transportation System Revenue | 5.500% | 12/15/22 | 170 | 195 |
| New Jersey Transportation Trust Fund Authority | | | | |
| Transportation System Revenue | 5.000% | 12/15/23 | 430 | 485 |
| New Jersey Transportation Trust Fund Authority | | | | |
| Transportation System Revenue | 5.250% | 12/15/23 (2) | 255 | 292 |
| New Jersey Transportation Trust Fund Authority | | | | |
| Transportation System Revenue | 5.000% | 6/15/24 | 140 | 159 |
| New Jersey Transportation Trust Fund Authority | | | | |
| Transportation System Revenue | 5.000% | 12/15/24 | 250 | 285 |
| New Jersey Transportation Trust Fund Authority | | | | |
| Transportation System Revenue | 0.000% | 12/15/26 (2) | 150 | 105 |
| New Jersey Transportation Trust Fund Authority | | | | |
| Transportation System Revenue | 5.000% | 12/15/26 (2) | 100 | 104 |
| New Jersey Transportation Trust Fund Authority | | | | |
| Transportation System Revenue | 5.000% | 12/15/27 (2) | 130 | 135 |
| New Jersey Transportation Trust Fund Authority | | | | |
| Transportation System Revenue | 0.000% | 12/15/28 (2) | 745 | 472 |
| New Jersey Transportation Trust Fund Authority | | | | |
| Transportation System Revenue | 0.000% | 12/15/28 | 220 | 135 |
| New Jersey Transportation Trust Fund Authority | | | | |
| Transportation System Revenue | 0.000% | 12/15/29 | 100 | 58 |
| New Jersey Transportation Trust Fund Authority | | | | |
| Transportation System Revenue | 0.000% | 12/15/30 | 280 | 156 |
| New Jersey Transportation Trust Fund Authority | | | | |
| Transportation System Revenue | 0.000% | 12/15/31 | 495 | 253 |
| New Jersey Transportation Trust Fund Authority | | | | |
| Transportation System Revenue | 5.000% | 6/15/32 | 700 | 769 |
| New Jersey Transportation Trust Fund Authority | | | | |
| Transportation System Revenue | 5.250% | 6/15/32 | 500 | 559 |
| New Jersey Transportation Trust Fund Authority | | | | |
| Transportation System Revenue | 0.000% | 12/15/32 (4) | 865 | 456 |
| New Jersey Transportation Trust Fund Authority | | | | |
| Transportation System Revenue | 0.000% | 12/15/32 | 60 | 29 |
| New Jersey Transportation Trust Fund Authority | | | | |
| Transportation System Revenue | 5.000% | 12/15/32 (2) | 100 | 103 |
| New Jersey Transportation Trust Fund Authority | | | | |
| Transportation System Revenue | 0.000% | 12/15/34 | 305 | 133 |
| New Jersey Transportation Trust Fund Authority | | | | |
| Transportation System Revenue | 5.250% | 6/15/36 | 250 | 274 |
| New Jersey Transportation Trust Fund Authority | | | | |
| Transportation System Revenue | 0.000% | 12/15/37 | 415 | 157 |
| New Jersey Transportation Trust Fund Authority | | | | |
| Transportation System Revenue | 0.000% | 12/15/38 | 720 | 258 |
41
| | | | |
| Tax-Exempt Bond Index Fund | | | | |
| |
| |
| |
| | | | Face | Market |
| | | Maturity | Amount | Value• |
| | Coupon | Date | ($000) | ($000) |
| New Jersey Transportation Trust Fund Authority | | | | |
| Transportation System Revenue | 0.000% | 12/15/38 | 150 | 54 |
| New Jersey Transportation Trust Fund Authority | | | | |
| Transportation System Revenue | 5.875% | 12/15/38 | 200 | 217 |
| New Jersey Transportation Trust Fund Authority | | | | |
| Transportation System Revenue | 6.000% | 12/15/38 | 250 | 272 |
| New Jersey Transportation Trust Fund Authority | | | | |
| Transportation System Revenue | 0.000% | 12/15/39 | 155 | 53 |
| New Jersey Transportation Trust Fund Authority | | | | |
| Transportation System Revenue | 0.000% | 12/15/40 | 380 | 123 |
| New Jersey Transportation Trust Fund Authority | | | | |
| Transportation System Revenue | 5.000% | 6/15/42 | 370 | 393 |
| New Jersey Transportation Trust Fund Authority | | | | |
| Transportation System Revenue | 5.000% | 6/15/42 | 315 | 339 |
| New Jersey Turnpike Authority Revenue | 5.000% | 1/1/19 | 80 | 87 |
| New Jersey Turnpike Authority Revenue | 5.000% | 1/1/20 | 150 | 168 |
| New Jersey Turnpike Authority Revenue | 5.000% | 1/1/25 | 200 | 238 |
| New Jersey Turnpike Authority Revenue | 5.250% | 1/1/26 (4) | 240 | 305 |
| New Jersey Turnpike Authority Revenue | 5.000% | 1/1/27 | 170 | 201 |
| New Jersey Turnpike Authority Revenue | 5.250% | 1/1/27 (4) | 50 | 64 |
| New Jersey Turnpike Authority Revenue | 5.000% | 1/1/29 | 100 | 118 |
| New Jersey Turnpike Authority Revenue | 5.000% | 1/1/30 | 100 | 120 |
| New Jersey Turnpike Authority Revenue | 5.000% | 1/1/32 | 100 | 119 |
| New Jersey Turnpike Authority Revenue | 5.000% | 1/1/33 | 400 | 469 |
| New Jersey Turnpike Authority Revenue | 5.000% | 1/1/33 | 170 | 201 |
| New Jersey Turnpike Authority Revenue | 5.000% | 1/1/34 | 255 | 301 |
| New Jersey Turnpike Authority Revenue | 5.000% | 1/1/38 | 790 | 903 |
| New Jersey Turnpike Authority Revenue | 4.000% | 1/1/43 | 100 | 105 |
| New Jersey Turnpike Authority Revenue | 5.000% | 1/1/43 | 435 | 496 |
| New Jersey Turnpike Authority Revenue | 5.000% | 1/1/45 | 850 | 981 |
| Newark NJ Housing Authority Port Authority-Port | | | | |
| Newark Marine Terminal Revenue (City of Newark | | | | |
| Redevelopment Projects) | 4.375% | 1/1/37 (14) | 105 | 105 |
| Rutgers State University New Jersey Revenue | 5.000% | 5/1/19 (Prere.) | 315 | 346 |
| South Jersey Transportation Authority New Jersey | | | | |
| Transportation System Revenue | 5.000% | 11/1/20 | 130 | 145 |
| | | | | 35,170 |
| New Mexico (0.1%) | | | | |
| New Mexico Finance Authority Transportation | | | | |
| Revenue | 5.000% | 6/15/17 | 350 | 360 |
| New Mexico Finance Authority Transportation | | | | |
| Revenue | 5.000% | 6/15/18 | 125 | 133 |
| | | | | 493 |
| New York (20.8%) | | | | |
| Brooklyn NY Local Development Corp. PILOT | | | | |
| Revenue (Barclays Center Project) | 6.375% | 1/15/20 (Prere.) | 625 | 729 |
| Brooklyn NY Local Development Corp. PILOT | | | | |
| Revenue (Barclays Center Project) | 6.500% | 1/15/20 (Prere.) | 255 | 298 |
| Brooklyn NY Local Development Corp. PILOT | | | | |
| Revenue (Barclays Center Project) | 0.000% | 7/15/46 | 175 | 47 |
| Brooklyn NY Local Development Corp. PILOT | | | | |
| Revenue (Barclays Center Project) | 0.000% | 7/15/47 | 240 | 62 |
| Brooklyn NY Local Development Corp. PILOT | | | | |
| Revenue (Brooklyn Events Center) | 5.000% | 7/15/42 | 200 | 229 |
42
| | | | |
| Tax-Exempt Bond Index Fund | | | | |
| |
| |
| |
| | | | Face | Market |
| | | Maturity | Amount | Value• |
| | Coupon | Date | ($000) | ($000) |
| Hudson Yards Infrastructure Corp. New York | | | | |
| Revenue | 4.500% | 2/15/47 (14) | 905 | 915 |
| Hudson Yards Infrastructure Corp. New York | | | | |
| Revenue | 5.000% | 2/15/47 | 1,425 | 1,442 |
| Hudson Yards Infrastructure Corp. New York | | | | |
| Revenue | 5.000% | 2/15/47 (3) | 1,015 | 1,027 |
| Long Island NY Power Authority Electric System | | | | |
| Revenue | 5.000% | 12/1/16 (Prere.) | 190 | 191 |
| Long Island NY Power Authority Electric System | | | | |
| Revenue | 5.000% | 12/1/16 (Prere.) | 10 | 10 |
| Long Island NY Power Authority Electric System | | | | |
| Revenue | 5.500% | 4/1/19 (Prere.) | 400 | 443 |
| Long Island NY Power Authority Electric System | | | | |
| Revenue | 5.750% | 4/1/19 (Prere.) | 135 | 150 |
| Long Island NY Power Authority Electric System | | | | |
| Revenue | 5.750% | 4/1/19 (Prere.) | 150 | 167 |
| Long Island NY Power Authority Electric System | | | | |
| Revenue | 6.250% | 4/1/19 (Prere.) | 335 | 377 |
| Long Island NY Power Authority Electric System | | | | |
| Revenue | 5.500% | 5/1/19 (Prere.) | 300 | 333 |
| Long Island NY Power Authority Electric System | | | | |
| Revenue | 6.000% | 5/1/19 (Prere.) | 550 | 618 |
| Long Island NY Power Authority Electric System | | | | |
| Revenue | 0.000% | 6/1/22 (4) | 100 | 91 |
| Long Island NY Power Authority Electric System | | | | |
| Revenue | 0.000% | 6/1/26 (4) | 110 | 89 |
| Long Island NY Power Authority Electric System | | | | |
| Revenue | 5.000% | 9/1/26 | 100 | 117 |
| Long Island NY Power Authority Electric System | | | | |
| Revenue | 0.000% | 6/1/28 (4) | 270 | 203 |
| Long Island NY Power Authority Electric System | | | | |
| Revenue | 5.000% | 9/1/37 | 500 | 574 |
| Long Island NY Power Authority Electric System | | | | |
| Revenue | 5.000% | 9/1/41 | 495 | 576 |
| Long Island NY Power Authority Electric System | | | | |
| Revenue | 5.000% | 9/1/42 | 105 | 120 |
| Long Island NY Power Authority Electric System | | | | |
| Revenue | 5.000% | 9/1/45 | 200 | 230 |
| Nassau County NY GO | 5.000% | 4/1/39 | 250 | 287 |
| Nassau County NY GO | 5.000% | 4/1/43 | 300 | 343 |
| New York City NY GO | 5.000% | 8/1/17 | 285 | 294 |
| New York City NY GO | 5.000% | 8/1/17 | 100 | 103 |
| New York City NY GO | 5.000% | 8/1/17 | 550 | 568 |
| New York City NY GO | 5.000% | 8/1/18 | 405 | 433 |
| New York City NY GO | 5.000% | 8/1/18 | 500 | 535 |
| New York City NY GO | 5.000% | 8/1/18 | 240 | 257 |
| New York City NY GO | 5.000% | 8/1/18 | 500 | 535 |
| New York City NY GO | 5.000% | 5/15/19 (Prere.) | 15 | 17 |
| New York City NY GO | 5.000% | 8/1/19 | 120 | 133 |
| New York City NY GO | 5.000% | 8/1/19 | 195 | 216 |
| New York City NY GO | 5.000% | 8/1/19 | 175 | 194 |
| New York City NY GO | 4.000% | 9/1/19 | 255 | 270 |
| New York City NY GO | 5.000% | 8/1/20 | 310 | 353 |
| New York City NY GO | 5.000% | 8/1/20 | 500 | 569 |
| New York City NY GO | 5.000% | 8/1/20 | 1,300 | 1,480 |
43
| | | | |
| Tax-Exempt Bond Index Fund | | | | |
| |
| |
| |
| | | | Face | Market |
| | | Maturity | Amount | Value• |
| | Coupon | Date | ($000) | ($000) |
| New York City NY GO | 5.000% | 8/1/20 | 210 | 232 |
| New York City NY GO | 5.000% | 4/1/21 | 705 | 817 |
| New York City NY GO | 5.000% | 8/1/21 | 125 | 138 |
| New York City NY GO | 5.000% | 8/1/21 | 300 | 351 |
| New York City NY GO | 5.000% | 8/1/22 | 120 | 144 |
| New York City NY GO | 5.000% | 8/1/22 | 300 | 359 |
| New York City NY GO | 5.000% | 8/1/22 | 60 | 72 |
| New York City NY GO | 5.000% | 8/1/22 | 60 | 72 |
| New York City NY GO | 5.000% | 4/1/23 | 700 | 832 |
| New York City NY GO | 5.000% | 8/1/23 | 125 | 138 |
| New York City NY GO | 5.000% | 8/1/23 | 250 | 293 |
| New York City NY GO | 5.000% | 4/1/24 | 150 | 159 |
| New York City NY GO | 5.000% | 8/1/24 | 435 | 540 |
| New York City NY GO | 5.000% | 8/1/24 | 550 | 683 |
| New York City NY GO | 5.000% | 8/1/24 | 575 | 714 |
| New York City NY GO | 5.000% | 2/1/25 | 120 | 126 |
| New York City NY GO | 5.000% | 8/1/25 | 200 | 241 |
| New York City NY GO | 5.000% | 8/1/25 | 170 | 208 |
| New York City NY GO | 5.000% | 8/1/25 | 140 | 174 |
| New York City NY GO | 5.000% | 8/1/25 | 350 | 440 |
| New York City NY GO | 5.000% | 4/1/26 | 100 | 106 |
| New York City NY GO | 5.000% | 8/1/26 | 500 | 596 |
| New York City NY GO | 5.500% | 11/15/26 | 100 | 109 |
| New York City NY GO | 5.125% | 12/1/26 | 100 | 105 |
| New York City NY GO | 5.000% | 8/1/27 | 200 | 248 |
| New York City NY GO | 5.000% | 8/1/28 | 300 | 365 |
| New York City NY GO | 5.000% | 8/1/28 | 55 | 68 |
| New York City NY GO | 5.000% | 10/1/28 | 225 | 268 |
| New York City NY GO | 5.000% | 8/1/29 | 315 | 379 |
| New York City NY GO | 5.000% | 8/1/29 | 240 | 288 |
| New York City NY GO | 5.000% | 3/1/30 | 100 | 118 |
| New York City NY GO | 5.000% | 10/1/30 | 200 | 233 |
| New York City NY GO | 5.000% | 5/15/31 | 230 | 251 |
| New York City NY GO | 5.000% | 8/1/32 | 110 | 130 |
| New York City NY GO | 5.000% | 10/1/32 | 185 | 216 |
| New York City NY GO | 5.000% | 8/1/35 | 50 | 58 |
| New York City NY IDA (Yankee Stadium) | 5.000% | 3/1/31 (3) | 20 | 20 |
| New York City NY Industrial Development | | | | |
| Agency PILOT Revenue (Yankee Stadium Project) | 5.000% | 3/1/36 (14) | 100 | 100 |
| New York City NY Industrial Development | | | | |
| Agency PILOT Revenue (Yankee Stadium Project) | 4.500% | 3/1/39 (3) | 50 | 50 |
| New York City NY Industrial Development | | | | |
| Agency PILOT Revenue (Yankee Stadium Project) | 4.750% | 3/1/46 (14) | 100 | 100 |
| New York City NY Industrial Development Agency | | | | |
| PILOT Revenue (Yankee Stadium Project) | 5.000% | 3/1/46 (3) | 565 | 568 |
| New York City NY Municipal Water Finance | | | | |
| Authority Water & Sewer System Revenue | 4.500% | 6/15/17 (Prere.) | 55 | 56 |
| New York City NY Municipal Water Finance | | | | |
| Authority Water & Sewer System Revenue | 4.750% | 6/15/17 (Prere.) | 85 | 87 |
| New York City NY Municipal Water Finance | | | | |
| Authority Water & Sewer System Revenue | 5.000% | 6/15/18 (Prere.) | 15 | 16 |
| New York City NY Municipal Water Finance | | | | |
| Authority Water & Sewer System Revenue | 5.000% | 6/15/26 | 240 | 281 |
| New York City NY Municipal Water Finance | | | | |
| Authority Water & Sewer System Revenue | 5.000% | 6/15/29 | 170 | 191 |
44
| | | | |
| Tax-Exempt Bond Index Fund | | | | |
| |
| |
| |
| | | | Face | Market |
| | | Maturity | Amount | Value• |
| | Coupon | Date | ($000) | ($000) |
| New York City NY Municipal Water Finance | | | | |
| Authority Water & Sewer System Revenue | 5.250% | 6/15/30 | 120 | 143 |
| New York City NY Municipal Water Finance | | | | |
| Authority Water & Sewer System Revenue | 4.750% | 6/15/33 (14) | 50 | 51 |
| New York City NY Municipal Water Finance | | | | |
| Authority Water & Sewer System Revenue | 4.000% | 6/15/34 | 150 | 165 |
| New York City NY Municipal Water Finance | | | | |
| Authority Water & Sewer System Revenue | 5.000% | 6/15/34 | 460 | 546 |
| New York City NY Municipal Water Finance | | | | |
| Authority Water & Sewer System Revenue | 4.750% | 6/15/35 | 15 | 15 |
| New York City NY Municipal Water Finance | | | | |
| Authority Water & Sewer System Revenue | 5.000% | 6/15/35 | 625 | 688 |
| New York City NY Municipal Water Finance | | | | |
| Authority Water & Sewer System Revenue | 4.750% | 6/15/36 (4) | 150 | 154 |
| New York City NY Municipal Water Finance | | | | |
| Authority Water & Sewer System Revenue | 5.000% | 6/15/36 | 485 | 575 |
| New York City NY Municipal Water Finance | | | | |
| Authority Water & Sewer System Revenue | 5.000% | 6/15/37 | 170 | 181 |
| New York City NY Municipal Water Finance | | | | |
| Authority Water & Sewer System Revenue | 4.500% | 6/15/38 | 500 | 526 |
| New York City NY Municipal Water Finance | | | | |
| Authority Water & Sewer System Revenue | 5.000% | 6/15/38 | 790 | 810 |
| New York City NY Municipal Water Finance | | | | |
| Authority Water & Sewer System Revenue | 5.000% | 6/15/38 | 350 | 411 |
| New York City NY Municipal Water Finance | | | | |
| Authority Water & Sewer System Revenue | 4.500% | 6/15/39 (14) | 205 | 209 |
| New York City NY Municipal Water Finance | | | | |
| Authority Water & Sewer System Revenue | 5.000% | 6/15/39 | 100 | 118 |
| New York City NY Municipal Water Finance | | | | |
| Authority Water & Sewer System Revenue | 5.000% | 6/15/39 | 300 | 354 |
| New York City NY Municipal Water Finance | | | | |
| Authority Water & Sewer System Revenue | 5.000% | 6/15/39 | 700 | 769 |
| New York City NY Municipal Water Finance | | | | |
| Authority Water & Sewer System Revenue | 5.000% | 6/15/39 | 195 | 231 |
| New York City NY Municipal Water Finance | | | | |
| Authority Water & Sewer System Revenue | 5.000% | 6/15/40 | 1,220 | 1,340 |
| New York City NY Municipal Water Finance | | | | |
| Authority Water & Sewer System Revenue | 5.250% | 6/15/40 | 260 | 287 |
| New York City NY Municipal Water Finance | | | | |
| Authority Water & Sewer System Revenue | 5.500% | 6/15/40 | 120 | 133 |
| New York City NY Municipal Water Finance | | | | |
| Authority Water & Sewer System Revenue | 5.750% | 6/15/40 | 180 | 194 |
| New York City NY Municipal Water Finance | | | | |
| Authority Water & Sewer System Revenue | 5.000% | 6/15/43 | 115 | 132 |
| New York City NY Municipal Water Finance | | | | |
| Authority Water & Sewer System Revenue | 5.375% | 6/15/43 | 740 | 858 |
| New York City NY Municipal Water Finance | | | | |
| Authority Water & Sewer System Revenue | 5.500% | 6/15/43 | 65 | 76 |
| New York City NY Municipal Water Finance | | | | |
| Authority Water & Sewer System Revenue | 5.000% | 6/15/44 | 555 | 637 |
| New York City NY Municipal Water Finance | | | | |
| Authority Water & Sewer System Revenue | 5.250% | 6/15/44 | 400 | 472 |
| New York City NY Municipal Water Finance | | | | |
| Authority Water & Sewer System Revenue | 4.000% | 6/15/45 | 100 | 107 |
45
| | | | |
| Tax-Exempt Bond Index Fund | | | | |
| |
| |
| |
| | | | Face | Market |
| | | Maturity | Amount | Value• |
| | Coupon | Date | ($000) | ($000) |
| New York City NY Municipal Water Finance | | | | |
| Authority Water & Sewer System Revenue | 5.000% | 6/15/45 | 655 | 759 |
| New York City NY Municipal Water Finance | | | | |
| Authority Water & Sewer System Revenue | 5.000% | 6/15/46 | 775 | 899 |
| New York City NY Municipal Water Finance | | | | |
| Authority Water & Sewer System Revenue | 5.000% | 6/15/47 | 300 | 347 |
| New York City NY Municipal Water Finance | | | | |
| Authority Water & Sewer System Revenue | 5.000% | 6/15/47 | 250 | 290 |
| New York City NY Municipal Water Finance | | | | |
| Authority Water & Sewer System Revenue | 5.000% | 6/15/47 | 1,190 | 1,386 |
| New York City NY Municipal Water Finance | | | | |
| Authority Water & Sewer System Revenue | 5.000% | 6/15/47 | 355 | 413 |
| New York City NY Sales Tax Asset Receivable | | | | |
| Corp. Revenue | 5.000% | 10/15/21 | 750 | 889 |
| New York City NY Sales Tax Asset Receivable | | | | |
| Corp. Revenue | 5.000% | 10/15/22 | 200 | 243 |
| New York City NY Sales Tax Asset Receivable | | | | |
| Corp. Revenue | 5.000% | 10/15/28 | 295 | 368 |
| New York City NY Sales Tax Asset Receivable | | | | |
| Corp. Revenue | 5.000% | 10/15/30 | 165 | 204 |
| New York City NY Sales Tax Asset Receivable | | | | |
| Corp. Revenue | 5.000% | 10/15/31 | 215 | 264 |
| New York City NY Transitional Finance Authority | | | | |
| Building Aid Revenue | 5.000% | 7/15/25 | 160 | 187 |
| New York City NY Transitional Finance Authority | | | | |
| Building Aid Revenue | 3.250% | 7/15/27 | 100 | 106 |
| New York City NY Transitional Finance Authority | | | | |
| Building Aid Revenue | 5.250% | 1/15/30 | 60 | 65 |
| New York City NY Transitional Finance Authority | | | | |
| Building Aid Revenue | 4.500% | 1/15/31 (14) | 350 | 352 |
| New York City NY Transitional Finance Authority | | | | |
| Building Aid Revenue | 5.000% | 7/15/31 | 80 | 97 |
| New York City NY Transitional Finance Authority | | | | |
| Building Aid Revenue | 5.500% | 1/15/33 | 315 | 346 |
| New York City NY Transitional Finance Authority | | | | |
| Building Aid Revenue | 6.000% | 7/15/33 | 280 | 304 |
| New York City NY Transitional Finance Authority | | | | |
| Building Aid Revenue | 4.250% | 1/15/34 | 245 | 246 |
| New York City NY Transitional Finance Authority | | | | |
| Building Aid Revenue | 5.000% | 1/15/34 | 700 | 733 |
| New York City NY Transitional Finance Authority | | | | |
| Building Aid Revenue | 5.375% | 1/15/34 | 140 | 153 |
| New York City NY Transitional Finance Authority | | | | |
| Building Aid Revenue | 5.000% | 7/15/35 | 750 | 888 |
| New York City NY Transitional Finance Authority | | | | |
| Building Aid Revenue | 5.000% | 7/15/36 | 100 | 115 |
| New York City NY Transitional Finance Authority | | | | |
| Building Aid Revenue | 5.000% | 7/15/36 (12) | 100 | 101 |
| New York City NY Transitional Finance Authority | | | | |
| Building Aid Revenue | 5.500% | 1/15/39 | 245 | 269 |
| New York City NY Transitional Finance Authority | | | | |
| Building Aid Revenue | 5.000% | 7/15/43 | 300 | 349 |
| New York City NY Transitional Finance Authority | | | | |
| Future Tax Revenue | 5.000% | 11/1/17 | 350 | 365 |
46
| | | | |
| Tax-Exempt Bond Index Fund | | | | |
| |
| |
| |
| | | | Face | Market |
| | | Maturity | Amount | Value• |
| | Coupon | Date | ($000) | ($000) |
| New York City NY Transitional Finance Authority | | | | |
| Future Tax Revenue | 5.000% | 11/1/20 | 200 | 224 |
| New York City NY Transitional Finance Authority | | | | |
| Future Tax Revenue | 5.000% | 11/1/21 | 125 | 148 |
| New York City NY Transitional Finance Authority | | | | |
| Future Tax Revenue | 5.000% | 11/1/21 | 100 | 118 |
| New York City NY Transitional Finance Authority | | | | |
| Future Tax Revenue | 5.250% | 2/1/22 | 450 | 526 |
| New York City NY Transitional Finance Authority | | | | |
| Future Tax Revenue | 5.000% | 11/1/22 | 215 | 254 |
| New York City NY Transitional Finance Authority | | | | |
| Future Tax Revenue | 5.000% | 11/1/24 | 595 | 701 |
| New York City NY Transitional Finance Authority | | | | |
| Future Tax Revenue | 5.000% | 11/1/25 | 150 | 190 |
| New York City NY Transitional Finance Authority | | | | |
| Future Tax Revenue | 5.000% | 11/1/25 | 150 | 189 |
| New York City NY Transitional Finance Authority | | | | |
| Future Tax Revenue | 5.000% | 11/1/26 | 200 | 250 |
| New York City NY Transitional Finance Authority | | | | |
| Future Tax Revenue | 5.000% | 11/1/26 | 125 | 151 |
| New York City NY Transitional Finance Authority | | | | |
| Future Tax Revenue | 5.000% | 11/1/27 | 100 | 124 |
| New York City NY Transitional Finance Authority | | | | |
| Future Tax Revenue | 5.000% | 5/1/30 | 210 | 250 |
| New York City NY Transitional Finance Authority | | | | |
| Future Tax Revenue | 5.000% | 5/1/31 | 50 | 59 |
| New York City NY Transitional Finance Authority | | | | |
| Future Tax Revenue | 5.000% | 8/1/31 | 200 | 242 |
| New York City NY Transitional Finance Authority | | | | |
| Future Tax Revenue | 5.000% | 11/1/31 | 185 | 226 |
| New York City NY Transitional Finance Authority | | | | |
| Future Tax Revenue | 5.000% | 11/1/31 | 100 | 119 |
| New York City NY Transitional Finance Authority | | | | |
| Future Tax Revenue | 5.000% | 5/1/32 | 750 | 906 |
| New York City NY Transitional Finance Authority | | | | |
| Future Tax Revenue | 5.000% | 8/1/32 | 150 | 182 |
| New York City NY Transitional Finance Authority | | | | |
| Future Tax Revenue | 5.000% | 11/1/32 | 100 | 119 |
| New York City NY Transitional Finance Authority | | | | |
| Future Tax Revenue | 5.000% | 8/1/33 | 475 | 576 |
| New York City NY Transitional Finance Authority | | | | |
| Future Tax Revenue | 5.000% | 11/1/33 | 400 | 455 |
| New York City NY Transitional Finance Authority | | | | |
| Future Tax Revenue | 5.000% | 5/1/34 | 320 | 377 |
| New York City NY Transitional Finance Authority | | | | |
| Future Tax Revenue | 5.000% | 8/1/34 | 100 | 119 |
| New York City NY Transitional Finance Authority | | | | |
| Future Tax Revenue | 3.000% | 2/1/35 | 300 | 300 |
| New York City NY Transitional Finance Authority | | | | |
| Future Tax Revenue | 5.000% | 2/1/35 | 305 | 349 |
| New York City NY Transitional Finance Authority | | | | |
| Future Tax Revenue | 5.000% | 5/1/35 | 500 | 598 |
| New York City NY Transitional Finance Authority | | | | |
| Future Tax Revenue | 5.000% | 11/1/35 | 450 | 536 |
47
| | | | |
| Tax-Exempt Bond Index Fund | | | | |
| |
| |
| |
| | | | Face | Market |
| | | Maturity | Amount | Value• |
| | Coupon | Date | ($000) | ($000) |
| New York City NY Transitional Finance Authority | | | | |
| Future Tax Revenue | 5.000% | 5/1/37 | 625 | 740 |
| New York City NY Transitional Finance Authority | | | | |
| Future Tax Revenue | 5.000% | 2/1/38 | 200 | 236 |
| New York City NY Transitional Finance Authority | | | | |
| Future Tax Revenue | 5.000% | 5/1/38 | 85 | 100 |
| New York City NY Transitional Finance Authority | | | | |
| Future Tax Revenue | 5.000% | 11/1/38 | 60 | 70 |
| New York City NY Transitional Finance Authority | | | | |
| Future Tax Revenue | 5.000% | 11/1/38 | 165 | 195 |
| New York City NY Transitional Finance Authority | | | | |
| Future Tax Revenue | 5.000% | 8/1/39 | 500 | 599 |
| New York City NY Transitional Finance Authority | | | | |
| Future Tax Revenue | 5.000% | 11/1/39 | 480 | 546 |
| New York City NY Transitional Finance Authority | | | | |
| Future Tax Revenue | 5.000% | 2/1/40 | 750 | 881 |
| New York City NY Transitional Finance Authority | | | | |
| Future Tax Revenue | 5.000% | 2/1/41 | 440 | 511 |
| New York City NY Transitional Finance Authority | | | | |
| Future Tax Revenue | 5.000% | 5/1/42 | 600 | 696 |
| New York City NY Transitional Finance Authority | | | | |
| Future Tax Revenue | 5.000% | 8/1/42 | 500 | 588 |
| New York Convention Center Development Corp. | | | | |
| Revenue | 5.000% | 11/15/40 | 100 | 117 |
| New York Metropolitan Transportation Authority | | | | |
| Revenue | 4.500% | 11/15/17 (Prere.) | 120 | 125 |
| New York Metropolitan Transportation Authority | | | | |
| Revenue | 4.500% | 11/15/17 (Prere.) | 80 | 83 |
| New York Metropolitan Transportation Authority | | | | |
| Revenue | 5.000% | 11/15/17 | 100 | 104 |
| New York Metropolitan Transportation Authority | | | | |
| Revenue | 5.000% | 11/15/18 | 145 | 157 |
| New York Metropolitan Transportation Authority | | | | |
| Revenue | 5.000% | 11/15/18 | 70 | 76 |
| New York Metropolitan Transportation Authority | | | | |
| Revenue | 5.000% | 11/15/19 | 300 | 334 |
| New York Metropolitan Transportation Authority | | | | |
| Revenue | 5.000% | 11/15/19 | 150 | 167 |
| New York Metropolitan Transportation Authority | | | | |
| Revenue | 5.000% | 11/15/19 | 50 | 56 |
| New York Metropolitan Transportation Authority | | | | |
| Revenue | 5.000% | 11/15/19 | 250 | 250 |
| New York Metropolitan Transportation Authority | | | | |
| Revenue | 5.000% | 11/15/20 | 115 | 132 |
| New York Metropolitan Transportation Authority | | | | |
| Revenue | 5.000% | 11/15/21 | 120 | 141 |
| New York Metropolitan Transportation Authority | | | | |
| Revenue | 5.000% | 11/15/24 | 275 | 331 |
| New York Metropolitan Transportation Authority | | | | |
| Revenue | 5.000% | 11/15/25 | 275 | 330 |
| New York Metropolitan Transportation Authority | | | | |
| Revenue | 5.000% | 11/15/25 | 100 | 121 |
| New York Metropolitan Transportation Authority | | | | |
| Revenue | 5.000% | 11/15/27 | 500 | 555 |
48
| | | | |
| Tax-Exempt Bond Index Fund | | | | |
| |
| |
| |
| | | | Face | Market |
| | | Maturity | Amount | Value• |
| | Coupon | Date | ($000) | ($000) |
| New York Metropolitan Transportation Authority | | | | |
| Revenue | 5.000% | 11/15/27 | 250 | 308 |
| New York Metropolitan Transportation Authority | | | | |
| Revenue | 5.000% | 11/15/28 | 475 | 566 |
| New York Metropolitan Transportation Authority | | | | |
| Revenue | 5.000% | 11/15/28 | 100 | 108 |
| New York Metropolitan Transportation Authority | | | | |
| Revenue | 5.000% | 11/15/29 | 150 | 179 |
| New York Metropolitan Transportation Authority | | | | |
| Revenue | 5.000% | 11/15/31 | 315 | 316 |
| New York Metropolitan Transportation Authority | | | | |
| Revenue | 5.000% | 11/15/36 (4) | 220 | 256 |
| New York Metropolitan Transportation Authority | | | | |
| Revenue | 5.000% | 11/15/36 | 240 | 279 |
| New York Metropolitan Transportation Authority | | | | |
| Revenue | 5.000% | 11/15/37 | 350 | 406 |
| New York Metropolitan Transportation Authority | | | | |
| Revenue | 5.000% | 11/15/38 | 150 | 175 |
| New York Metropolitan Transportation Authority | | | | |
| Revenue | 5.000% | 11/15/38 | 50 | 58 |
| New York Metropolitan Transportation Authority | | | | |
| Revenue | 5.250% | 11/15/38 | 175 | 206 |
| New York Metropolitan Transportation Authority | | | | |
| Revenue | 4.250% | 11/15/39 | 100 | 107 |
| New York Metropolitan Transportation Authority | | | | |
| Revenue | 5.000% | 11/15/42 | 50 | 58 |
| New York Metropolitan Transportation Authority | | | | |
| Revenue | 5.000% | 11/15/42 | 550 | 636 |
| New York Metropolitan Transportation Authority | | | | |
| Revenue | 5.000% | 11/15/43 | 100 | 115 |
| New York Metropolitan Transportation Authority | | | | |
| Revenue | 5.000% | 11/15/43 | 345 | 400 |
| New York Metropolitan Transportation Authority | | | | |
| Revenue | 5.000% | 11/15/44 | 660 | 765 |
| New York Metropolitan Transportation Authority | | | | |
| Revenue | 5.000% | 11/15/45 | 250 | 290 |
| New York Metropolitan Transportation Authority | | | | |
| Revenue | 5.250% | 11/15/55 | 55 | 65 |
| New York Metropolitan Transportation Authority | | | | |
| Revenue | 5.000% | 11/15/56 | 800 | 932 |
| New York Metropolitan Transportation Authority | | | | |
| Revenue (Dedicated Petroleum Tax) | 5.000% | 11/15/34 | 1,210 | 1,349 |
| New York Metropolitan Transportation Authority | | | | |
| Revenue (Dedicated Tax Fund) | 0.000% | 11/15/30 | 500 | 335 |
| New York Metropolitan Transportation Authority | | | | |
| Revenue (Dedicated Tax Fund) | 5.250% | 11/15/30 | 55 | 69 |
| New York Metropolitan Transportation Authority | | | | |
| Revenue (Dedicated Tax Fund) | 5.000% | 11/15/36 | 300 | 359 |
| New York Metropolitan Transportation Authority | | | | |
| Revenue (Hudson Yards Development) | 5.000% | 11/15/46 | 400 | 436 |
| New York Metropolitan Transportation Authority | | | | |
| Revenue (Hudson Yards Development) | 5.000% | 11/15/51 | 400 | 446 |
| New York Metropolitan Transportation Authority | | | | |
| Revenue (Hudson Yards Development) | 5.000% | 11/15/56 | 200 | 226 |
49
| | | | |
| Tax-Exempt Bond Index Fund | | | | |
| |
| |
| |
| | | | Face | Market |
| | | Maturity | Amount | Value• |
| | Coupon | Date | ($000) | ($000) |
| New York Metropolitan Transportation Authority | | | | |
| Revenue (Transit Revenue) | 5.000% | 11/15/25 | 100 | 124 |
| New York Metropolitan Transportation Authority | | | | |
| Revenue (Transit Revenue) | 6.500% | 11/15/28 | 205 | 228 |
| New York Metropolitan Transportation Authority | | | | |
| Revenue (Transit Revenue) | 5.000% | 11/15/41 | 410 | 474 |
| New York State Dormitory Authority Lease | | | | |
| Revenue (State University Dormitory Facilities) | 5.000% | 7/1/35 | 250 | 289 |
| New York State Dormitory Authority Lease | | | | |
| Revenue (State University Dormitory Facilities) | 5.000% | 7/1/45 | 250 | 294 |
| New York State Dormitory Authority Revenue | 5.250% | 5/15/19 (2) | 50 | 55 |
| New York State Dormitory Authority Revenue | | | | |
| (Columbia University) | 5.000% | 7/1/38 | 410 | 437 |
| New York State Dormitory Authority Revenue | | | | |
| (Columbia University) | 5.000% | 10/1/41 | 400 | 462 |
| New York State Dormitory Authority Revenue | | | | |
| (Columbia University) | 5.000% | 10/1/46 | 265 | 319 |
| New York State Dormitory Authority Revenue | | | | |
| (Cornell University) | 5.000% | 7/1/39 | 170 | 187 |
| New York State Dormitory Authority Revenue | | | | |
| (Mount Sinai School of Medicine of New York | | | | |
| University) | 5.125% | 7/1/19 (Prere.) | 250 | 277 |
| New York State Dormitory Authority Revenue | | | | |
| (New York University) | 5.000% | 7/1/36 | 170 | 205 |
| New York State Dormitory Authority Revenue | | | | |
| (New York University) | 5.000% | 7/1/48 | 190 | 220 |
| New York State Dormitory Authority Revenue | | | | |
| (Personal Income Tax) | 5.000% | 12/15/16 (Prere.) | 100 | 101 |
| New York State Dormitory Authority Revenue | | | | |
| (Personal Income Tax) | 5.000% | 3/15/17 | 100 | 102 |
| New York State Dormitory Authority Revenue | | | | |
| (Personal Income Tax) | 5.000% | 3/15/17 (Prere.) | 200 | 203 |
| New York State Dormitory Authority Revenue | | | | |
| (Personal Income Tax) | 5.000% | 2/15/18 | 260 | 274 |
| New York State Dormitory Authority Revenue | | | | |
| (Personal Income Tax) | 5.000% | 2/15/18 | 50 | 53 |
| New York State Dormitory Authority Revenue | | | | |
| (Personal Income Tax) | 5.000% | 3/15/18 | 100 | 106 |
| New York State Dormitory Authority Revenue | | | | |
| (Personal Income Tax) | 5.000% | 3/15/20 | 500 | 563 |
| New York State Dormitory Authority Revenue | | | | |
| (Personal Income Tax) | 5.000% | 3/15/20 | 60 | 68 |
| New York State Dormitory Authority Revenue | | | | |
| (Personal Income Tax) | 5.000% | 12/15/20 | 180 | 207 |
| New York State Dormitory Authority Revenue | | | | |
| (Personal Income Tax) | 5.000% | 3/15/21 | 145 | 168 |
| New York State Dormitory Authority Revenue | | | | |
| (Personal Income Tax) | 5.000% | 3/15/21 | 125 | 145 |
| New York State Dormitory Authority Revenue | | | | |
| (Personal Income Tax) | 5.000% | 3/15/21 | 400 | 463 |
| New York State Dormitory Authority Revenue | | | | |
| (Personal Income Tax) | 5.000% | 8/15/21 | 265 | 310 |
| New York State Dormitory Authority Revenue | | | | |
| (Personal Income Tax) | 5.000% | 3/15/22 | 350 | 415 |
50
| | | | |
| Tax-Exempt Bond Index Fund | | | | |
| |
| |
| |
| | | | Face | Market |
| | | Maturity | Amount | Value• |
| | Coupon | Date | ($000) | ($000) |
| New York State Dormitory Authority Revenue | | | | |
| (Personal Income Tax) | 5.000% | 2/15/23 | 100 | 121 |
| New York State Dormitory Authority Revenue | | | | |
| (Personal Income Tax) | 5.000% | 3/15/24 | 250 | 297 |
| New York State Dormitory Authority Revenue | | | | |
| (Personal Income Tax) | 5.000% | 3/15/25 | 140 | 174 |
| New York State Dormitory Authority Revenue | | | | |
| (Personal Income Tax) | 5.000% | 3/15/25 | 250 | 311 |
| New York State Dormitory Authority Revenue | | | | |
| (Personal Income Tax) | 5.000% | 2/15/26 | 180 | 222 |
| New York State Dormitory Authority Revenue | | | | |
| (Personal Income Tax) | 5.000% | 3/15/27 | 75 | 93 |
| New York State Dormitory Authority Revenue | | | | |
| (Personal Income Tax) | 5.000% | 2/15/29 | 80 | 97 |
| New York State Dormitory Authority Revenue | | | | |
| (Personal Income Tax) | 5.000% | 3/15/29 | 350 | 412 |
| New York State Dormitory Authority Revenue | | | | |
| (Personal Income Tax) | 5.000% | 3/15/29 | 65 | 79 |
| New York State Dormitory Authority Revenue | | | | |
| (Personal Income Tax) | 5.000% | 12/15/29 | 100 | 120 |
| New York State Dormitory Authority Revenue | | | | |
| (Personal Income Tax) | 5.000% | 3/15/30 | 400 | 468 |
| New York State Dormitory Authority Revenue | | | | |
| (Personal Income Tax) | 5.000% | 3/15/30 | 520 | 626 |
| New York State Dormitory Authority Revenue | | | | |
| (Personal Income Tax) | 5.000% | 2/15/32 | 150 | 179 |
| New York State Dormitory Authority Revenue | | | | |
| (Personal Income Tax) | 5.000% | 3/15/34 | 235 | 282 |
| New York State Dormitory Authority Revenue | | | | |
| (Personal Income Tax) | 5.000% | 3/15/34 | 155 | 179 |
| New York State Dormitory Authority Revenue | | | | |
| (Personal Income Tax) | 5.000% | 3/15/35 | 750 | 889 |
| New York State Dormitory Authority Revenue | | | | |
| (Personal Income Tax) | 5.000% | 3/15/36 | 500 | 589 |
| New York State Dormitory Authority Revenue | | | | |
| (Personal Income Tax) | 5.000% | 2/15/37 | 290 | 340 |
| New York State Dormitory Authority Revenue | | | | |
| (Personal Income Tax) | 5.000% | 2/15/38 | 105 | 123 |
| New York State Dormitory Authority Revenue | | | | |
| (Personal Income Tax) | 5.000% | 3/15/38 | 55 | 65 |
| New York State Dormitory Authority Revenue | | | | |
| (Personal Income Tax) | 5.000% | 2/15/39 | 1,190 | 1,388 |
| New York State Dormitory Authority Revenue | | | | |
| (Personal Income Tax) | 5.000% | 3/15/41 | 585 | 663 |
| New York State Dormitory Authority Revenue | | | | |
| (School Districts Financing Program) | 5.000% | 3/15/17 | 500 | 508 |
| New York State Dormitory Authority Revenue | | | | |
| (Service Contract) | 5.000% | 7/1/20 | 600 | 662 |
| New York State Dormitory Authority Revenue | | | | |
| (State University Educational Facilities) | 4.000% | 5/15/17 | 100 | 102 |
| New York State Dormitory Authority Revenue | | | | |
| (State University Educational Facilities) | 4.000% | 5/15/19 | 225 | 242 |
| New York State Dormitory Authority Revenue | | | | |
| (State University Educational Facilities) | 5.000% | 5/15/20 | 75 | 85 |
51
| | | | |
| Tax-Exempt Bond Index Fund | | | | |
| |
| |
| |
| | | | Face | Market |
| | | Maturity | Amount | Value• |
| | Coupon | Date | ($000) | ($000) |
| New York State Dormitory Authority Revenue | | | | |
| (State University Educational Facilities) | 5.000% | 5/15/23 | 50 | 60 |
| New York State Dormitory Authority Revenue | | | | |
| (State University Educational Facilities) | 5.000% | 5/15/29 | 500 | 589 |
| New York State Dormitory Authority Sales Tax | | | | |
| Revenue | 5.000% | 3/15/17 | 460 | 467 |
| New York State Dormitory Authority Sales Tax | | | | |
| Revenue | 5.000% | 3/15/18 | 1,250 | 1,320 |
| New York State Dormitory Authority Sales Tax | | | | |
| Revenue | 5.000% | 3/15/23 | 500 | 609 |
| New York State Dormitory Authority Sales Tax | | | | |
| Revenue | 5.000% | 3/15/25 | 105 | 132 |
| New York State Dormitory Authority Sales Tax | | | | |
| Revenue | 5.000% | 3/15/26 | 250 | 311 |
| New York State Dormitory Authority Sales Tax | | | | |
| Revenue | 5.000% | 3/15/26 | 250 | 315 |
| New York State Dormitory Authority Sales Tax | | | | |
| Revenue | 5.000% | 3/15/27 | 120 | 148 |
| New York State Dormitory Authority Sales Tax | | | | |
| Revenue | 5.000% | 3/15/28 | 1,000 | 1,204 |
| New York State Dormitory Authority Sales Tax | | | | |
| Revenue | 5.000% | 3/15/30 | 100 | 123 |
| New York State Dormitory Authority Sales Tax | | | | |
| Revenue | 5.000% | 3/15/33 | 500 | 611 |
| New York State Environmental Fac. Corp. Rev. | | | | |
| (Clean Water & Drinking Revolving Funds) | 5.000% | 6/15/37 | 85 | 91 |
| New York State Environmental Facilities Corp. | | | | |
| Revenue (State Clean Water & Drinking Water | | | | |
| Revolving Funds) | 5.000% | 6/15/18 | 100 | 107 |
| New York State Environmental Facilities Corp. | | | | |
| Revenue (State Clean Water & Drinking Water | | | | |
| Revolving Funds) | 5.000% | 6/15/21 | 250 | 267 |
| New York State Environmental Facilities Corp. | | | | |
| Revenue (State Clean Water & Drinking Water | | | | |
| Revolving Funds) | 4.750% | 6/15/32 | 100 | 102 |
| New York State Environmental Facilities Corp. | | | | |
| Revenue (State Clean Water & Drinking Water | | | | |
| Revolving Funds) | 4.500% | 6/15/36 | 100 | 102 |
| New York State Environmental Facilities Corp. | | | | |
| Revenue (State Clean Water & Drinking Water | | | | |
| Revolving Funds) | 5.000% | 6/15/41 | 250 | 301 |
| New York State Environmental Facilities Corp. | | | | |
| Revenue (State Clean Water & Drinking Water | | | | |
| Revolving Funds) | 4.000% | 6/15/46 | 100 | 108 |
| New York State GO | 3.500% | 3/1/43 | 350 | 365 |
| New York State Local Government Assistance | | | | |
| Corp. Revenue | 5.000% | 4/1/20 | 100 | 106 |
| New York State Thruway Authority Revenue | 5.000% | 5/1/19 (4) | 985 | 1,081 |
| New York State Thruway Authority Revenue | 5.000% | 5/1/19 | 1,290 | 1,416 |
| New York State Thruway Authority Revenue | 5.000% | 1/1/20 (14) | 130 | 136 |
| New York State Thruway Authority Revenue | 5.000% | 1/1/26 | 350 | 411 |
| New York State Thruway Authority Revenue | 5.000% | 1/1/31 | 330 | 381 |
| New York State Thruway Authority Revenue | 5.000% | 1/1/31 | 125 | 148 |
| New York State Thruway Authority Revenue | 4.000% | 1/1/56 | 100 | 104 |
| New York State Thruway Authority Revenue | 5.250% | 1/1/56 | 100 | 118 |
52
| | | | |
| Tax-Exempt Bond Index Fund | | | | |
| |
| |
| |
| | | | Face | Market |
| | | Maturity | Amount | Value• |
| | Coupon | Date | ($000) | ($000) |
| New York State Thruway Authority Revenue | | | | |
| (Highway & Bridge Trust Fund) | 5.000% | 4/1/20 | 175 | 198 |
| New York State Thruway Authority Revenue | | | | |
| (Highway & Bridge Trust Fund) | 5.000% | 4/1/31 | 500 | 574 |
| New York State Thruway Authority Revenue | | | | |
| (Personal Income Tax) | 5.500% | 3/15/19 (2) | 285 | 315 |
| New York State Thruway Authority Revenue | | | | |
| (Personal Income Tax) | 5.000% | 3/15/20 | 250 | 282 |
| New York State Thruway Authority Revenue | | | | |
| (Personal Income Tax) | 5.000% | 3/15/23 | 200 | 232 |
| New York State Thruway Authority Revenue | | | | |
| (Personal Income Tax) | 5.000% | 3/15/29 | 340 | 389 |
| New York State Thruway Authority Revenue | | | | |
| (Personal Income Tax) | 5.000% | 3/15/30 | 60 | 70 |
| New York State Thruway Authority Revenue | | | | |
| (Second Generation Highway & Bridge | | | | |
| Trust Fund) | 5.000% | 4/1/18 (Prere.) | 105 | 111 |
| New York State Urban Development Corp. | | | | |
| Revenue | 5.000% | 1/1/18 | 150 | 157 |
| New York State Urban Development Corp. | | | | |
| Revenue | 5.500% | 1/1/19 | 100 | 110 |
| New York State Urban Development Corp. | | | | |
| Revenue | 5.000% | 3/15/20 | 240 | 270 |
| New York State Urban Development Corp. | | | | |
| Revenue | 5.250% | 1/1/22 | 200 | 214 |
| New York State Urban Development Corp. | | | | |
| Revenue (Personal Income Tax) | 5.000% | 3/15/17 | 400 | 407 |
| New York State Urban Development Corp. | | | | |
| Revenue (Personal Income Tax) | 4.500% | 3/15/18 (Prere.) | 50 | 53 |
| New York State Urban Development Corp. | | | | |
| Revenue (Personal Income Tax) | 4.500% | 3/15/18 (Prere.) | 55 | 58 |
| New York State Urban Development Corp. | | | | |
| Revenue (Personal Income Tax) | 5.000% | 12/15/18 | 145 | 157 |
| New York State Urban Development Corp. | | | | |
| Revenue (Personal Income Tax) | 5.000% | 12/15/19 | 170 | 191 |
| New York State Urban Development Corp. | | | | |
| Revenue (Personal Income Tax) | 5.000% | 3/15/22 | 300 | 355 |
| New York State Urban Development Corp. | | | | |
| Revenue (Personal Income Tax) | 5.000% | 3/15/23 | 300 | 363 |
| New York State Urban Development Corp. | | | | |
| Revenue (Personal Income Tax) | 5.000% | 3/15/24 | 260 | 320 |
| New York State Urban Development Corp. | | | | |
| Revenue (Personal Income Tax) | 5.000% | 3/15/25 | 270 | 329 |
| New York State Urban Development Corp. | | | | |
| Revenue (Personal Income Tax) | 5.000% | 3/15/26 | 300 | 378 |
| New York State Urban Development Corp. | | | | |
| Revenue (Personal Income Tax) | 5.000% | 3/15/27 | 1,000 | 1,248 |
| New York State Urban Development Corp. | | | | |
| Revenue (Personal Income Tax) | 5.000% | 3/15/28 | 160 | 199 |
| New York State Urban Development Corp. | | | | |
| Revenue (Personal Income Tax) | 5.000% | 3/15/29 | 200 | 239 |
| New York State Urban Development Corp. | | | | |
| Revenue (Personal Income Tax) | 5.000% | 3/15/30 | 400 | 481 |
| New York State Urban Development Corp. | | | | |
| Revenue (Personal Income Tax) | 5.000% | 3/15/30 | 65 | 77 |
53
| | | | |
| Tax-Exempt Bond Index Fund | | | | |
| |
| |
| |
| | | | Face | Market |
| | | Maturity | Amount | Value• |
| | Coupon | Date | ($000) | ($000) |
| New York State Urban Development Corp. | | | | |
| Revenue (Personal Income Tax) | 5.000% | 3/15/30 | 55 | 66 |
| New York State Urban Development Corp. | | | | |
| Revenue (Personal Income Tax) | 5.000% | 3/15/30 | 500 | 608 |
| New York State Urban Development Corp. | | | | |
| Revenue (Personal Income Tax) | 5.000% | 3/15/31 | 115 | 133 |
| New York State Urban Development Corp. | | | | |
| Revenue (Personal Income Tax) | 5.000% | 3/15/32 | 185 | 220 |
| New York State Urban Development Corp. | | | | |
| Revenue (Personal Income Tax) | 5.000% | 3/15/33 | 250 | 296 |
| New York State Urban Development Corp. | | | | |
| Revenue (Personal Income Tax) | 5.000% | 3/15/33 | 300 | 361 |
| New York State Urban Development Corp. | | | | |
| Revenue (Personal Income Tax) | 5.000% | 3/15/35 | 250 | 296 |
| New York State Urban Development Corp. | | | | |
| Revenue (Personal Income Tax) | 5.250% | 3/15/38 | 250 | 272 |
| New York State Urban Development Corp. | | | | |
| Revenue (Service Contract) | 5.000% | 1/1/18 (4) | 100 | 105 |
| New York State Urban Development Corp. | | | | |
| Revenue (Service Contract) | 5.250% | 1/1/20 | 310 | 338 |
| New York State Urban Development Corp. | | | | |
| Revenue (Service Contract) | 5.000% | 1/1/21 | 460 | 517 |
| Port Authority of New York & New Jersey Revenue | 5.000% | 12/1/20 | 75 | 87 |
| Port Authority of New York & New Jersey Revenue | 5.000% | 12/1/21 | 60 | 71 |
| Port Authority of New York & New Jersey Revenue | 5.000% | 5/1/26 | 100 | 125 |
| Port Authority of New York & New Jersey Revenue | 5.000% | 12/1/30 | 70 | 85 |
| Port Authority of New York & New Jersey Revenue | 4.750% | 7/15/31 | 100 | 106 |
| Port Authority of New York & New Jersey Revenue | 5.000% | 11/15/31 | 250 | 261 |
| Port Authority of New York & New Jersey Revenue | 5.000% | 10/15/32 | 250 | 303 |
| Port Authority of New York & New Jersey Revenue | 5.000% | 10/15/32 | 500 | 555 |
| Port Authority of New York & New Jersey Revenue | 5.000% | 6/1/33 | 255 | 304 |
| Port Authority of New York & New Jersey Revenue | 4.750% | 7/15/33 | 620 | 659 |
| Port Authority of New York & New Jersey Revenue | 5.000% | 9/1/34 | 50 | 60 |
| Port Authority of New York & New Jersey Revenue | 4.500% | 11/15/34 (2) | 85 | 88 |
| Port Authority of New York & New Jersey Revenue | 5.000% | 9/1/36 | 60 | 71 |
| Port Authority of New York & New Jersey Revenue | 4.750% | 11/1/36 | 140 | 152 |
| Port Authority of New York & New Jersey Revenue | 5.000% | 8/15/37 (4) | 125 | 129 |
| Port Authority of New York & New Jersey Revenue | 4.500% | 10/15/37 | 385 | 420 |
| Port Authority of New York & New Jersey Revenue | 5.000% | 11/15/37 | 400 | 418 |
| Port Authority of New York & New Jersey Revenue | 5.000% | 12/1/38 | 565 | 668 |
| Port Authority of New York & New Jersey Revenue | 4.500% | 9/15/39 | 300 | 327 |
| Port Authority of New York & New Jersey Revenue | 5.000% | 10/15/41 | 550 | 650 |
| Port Authority of New York & New Jersey Revenue | 5.000% | 5/1/45 | 300 | 351 |
| Port Authority of New York & New Jersey Revenue | 4.000% | 10/15/45 | 360 | 391 |
| Port Authority of New York & New Jersey Revenue | 5.250% | 10/15/55 | 250 | 299 |
| Port Authority of New York & New Jersey Revenue | 6.125% | 6/1/94 | 200 | 254 |
| Suffolk County NY Water Authority Water System | | | | |
| Revenue | 3.000% | 6/1/32 | 200 | 203 |
| Triborough Bridge & Tunnel Authority New York | | | | |
| Revenue | 5.000% | 11/15/18 | 110 | 119 |
| Triborough Bridge & Tunnel Authority New York | | | | |
| Revenue | 5.500% | 11/15/20 (14) | 185 | 217 |
| Triborough Bridge & Tunnel Authority New York | | | | |
| Revenue | 5.000% | 11/15/21 | 80 | 95 |
54
| | | | |
| Tax-Exempt Bond Index Fund | | | | |
| |
| |
| |
| | | | Face | Market |
| | | Maturity | Amount | Value• |
| | Coupon | Date | ($000) | ($000) |
| Triborough Bridge & Tunnel Authority New York | | | | |
| Revenue | 5.000% | 11/15/21 | 590 | 699 |
| Triborough Bridge & Tunnel Authority New York | | | | |
| Revenue | 5.000% | 11/15/22 | 495 | 600 |
| Triborough Bridge & Tunnel Authority New York | | | | |
| Revenue | 5.000% | 11/15/23 | 80 | 99 |
| Triborough Bridge & Tunnel Authority New York | | | | |
| Revenue | 5.000% | 11/15/24 | 75 | 94 |
| Triborough Bridge & Tunnel Authority New York | | | | |
| Revenue | 5.000% | 1/1/25 | 125 | 147 |
| Triborough Bridge & Tunnel Authority New York | | | | |
| Revenue | 5.000% | 11/15/25 | 105 | 127 |
| Triborough Bridge & Tunnel Authority New York | | | | |
| Revenue | 5.000% | 1/1/28 | 175 | 205 |
| Triborough Bridge & Tunnel Authority New York | | | | |
| Revenue | 0.000% | 11/15/29 | 200 | 136 |
| Triborough Bridge & Tunnel Authority New York | | | | |
| Revenue | 0.000% | 11/15/30 | 160 | 105 |
| Triborough Bridge & Tunnel Authority New York | | | | |
| Revenue | 4.750% | 11/15/30 | 540 | 570 |
| Triborough Bridge & Tunnel Authority New York | | | | |
| Revenue | 0.000% | 11/15/31 | 140 | 89 |
| Triborough Bridge & Tunnel Authority New York | | | | |
| Revenue | 5.000% | 11/15/33 | 50 | 53 |
| Triborough Bridge & Tunnel Authority New York | | | | |
| Revenue | 3.000% | 11/15/34 | 240 | 244 |
| Triborough Bridge & Tunnel Authority New York | | | | |
| Revenue | 5.000% | 11/15/37 | 50 | 53 |
| Triborough Bridge & Tunnel Authority New York | | | | |
| Revenue | 5.000% | 11/15/38 | 805 | 866 |
| Triborough Bridge & Tunnel Authority New York | | | | |
| Revenue | 5.000% | 11/15/46 | 70 | 83 |
| Utility Debt Securitization Authority New York | | | | |
| Revenue | 5.000% | 12/15/23 | 600 | 712 |
| Utility Debt Securitization Authority New York | | | | |
| Revenue | 5.000% | 12/15/24 | 500 | 606 |
| Utility Debt Securitization Authority New York | | | | |
| Revenue | 5.000% | 12/15/26 | 750 | 931 |
| Utility Debt Securitization Authority New York | | | | |
| Revenue | 5.000% | 12/15/30 | 245 | 297 |
| Utility Debt Securitization Authority New York | | | | |
| Revenue | 3.000% | 12/15/32 | 100 | 103 |
| Utility Debt Securitization Authority New York | | | | |
| Revenue | 5.000% | 12/15/32 | 50 | 61 |
| Utility Debt Securitization Authority New York | | | | |
| Revenue | 5.000% | 12/15/34 | 155 | 185 |
| Utility Debt Securitization Authority New York | | | | |
| Revenue | 5.000% | 12/15/35 | 250 | 301 |
| Utility Debt Securitization Authority New York | | | | |
| Revenue | 4.000% | 12/15/37 | 200 | 221 |
| Utility Debt Securitization Authority New York | | | | |
| Revenue | 5.000% | 12/15/37 | 805 | 967 |
| Utility Debt Securitization Authority New York | | | | |
| Revenue | 5.000% | 12/15/41 | 400 | 474 |
| | | | | 129,042 |
55
| | | | |
| Tax-Exempt Bond Index Fund | | | | |
| |
| |
| |
| | | | Face | Market |
| | | Maturity | Amount | Value• |
| | Coupon | Date | ($000) | ($000) |
| North Carolina (1.6%) | | | | |
| Cape Fear NC Public Utility Authority Water & | | | | |
| Sewer System Revenue | 5.000% | 8/1/18 (Prere.) | 115 | 123 |
| Cape Fear NC Public Utility Authority Water & | | | | |
| Sewer System Revenue | 5.000% | 8/1/29 | 250 | 312 |
| Charlotte NC COP | 3.000% | 6/1/22 | 200 | 202 |
| Charlotte NC Water & Sewer System Revenue | 5.000% | 7/1/21 | 300 | 352 |
| Charlotte NC Water & Sewer System Revenue | 4.750% | 7/1/33 | 255 | 271 |
| North Carolina Capital Facilities Finance Agency | | | | |
| Revenue (Duke University Project) | 5.000% | 4/1/19 (Prere.) | 520 | 570 |
| North Carolina Capital Facilities Finance Agency | | | | |
| Revenue (Duke University Project) | 5.000% | 10/1/41 | 250 | 297 |
| North Carolina Capital Facilities Finance Agency | | | | |
| Revenue (Duke University Project) | 4.250% | 7/1/42 | 255 | 255 |
| North Carolina Capital Facilities Finance Agency | | | | |
| Revenue (Duke University Project) | 5.000% | 10/1/55 | 500 | 586 |
| North Carolina Capital Improvement Revenue | 4.500% | 5/1/28 | 475 | 526 |
| North Carolina Eastern Municipal Power Agency | | | | |
| Power Systems Revenue | 5.000% | 1/1/19 (Prere.) | 545 | 591 |
| North Carolina Eastern Municipal Power Agency | | | | |
| Power Systems Revenue | 6.000% | 1/1/22 (ETM) | 370 | 457 |
| North Carolina GAN | 5.250% | 3/1/20 | 215 | 236 |
| North Carolina GAN PUT | 4.000% | 3/1/18 | 125 | 128 |
| North Carolina GO | 5.000% | 5/1/19 | 120 | 132 |
| North Carolina GO | 5.000% | 5/1/20 | 200 | 227 |
| North Carolina GO | 5.000% | 5/1/20 (Prere.) | 90 | 102 |
| North Carolina GO | 5.000% | 5/1/22 | 500 | 601 |
| North Carolina GO | 5.000% | 5/1/22 | 30 | 34 |
| North Carolina Municipal Power Agency No. 1 | | | | |
| Revenue (Catawba Electric) | 4.000% | 1/1/18 | 70 | 73 |
| North Carolina Municipal Power Agency No. 1 | | | | |
| Revenue (Catawba Electric) | 5.000% | 1/1/19 (Prere.) | 230 | 250 |
| North Carolina Municipal Power Agency No. 1 | | | | |
| Revenue (Catawba Electric) | 5.000% | 1/1/30 | 55 | 59 |
| North Carolina Revenue | 5.000% | 11/1/19 | 250 | 279 |
| North Carolina Revenue | 5.000% | 5/1/22 | 475 | 567 |
| North Carolina Revenue | 5.000% | 6/1/25 | 75 | 94 |
| Raleigh NC Combined Enterprise System Revenue | 5.000% | 3/1/40 | 265 | 303 |
| University of North Carolina University System | | | | |
| Revenue | 5.000% | 12/1/17 (Prere.) | 2,120 | 2,218 |
| Wake County NC GO | 5.000% | 3/1/22 | 200 | 239 |
| | | | | 10,084 |
| Ohio (1.7%) | | | | |
| American Municipal Power Ohio Inc. Revenue | 4.375% | 2/15/44 | 105 | 111 |
| American Municipal Power Ohio Inc. Revenue | | | | |
| (Fremont Energy Center Project) | 5.000% | 2/15/42 | 325 | 368 |
| American Municipal Power Ohio Inc. Revenue | | | | |
| (Prairie State Energy Campus Project) | 5.250% | 2/15/18 (Prere.) | 50 | 53 |
| American Municipal Power Ohio Inc. Revenue | | | | |
| (Prairie State Energy Campus Project) | 5.000% | 2/15/26 | 50 | 60 |
| American Municipal Power Ohio Inc. Revenue | | | | |
| (Prairie State Energy Campus Project) PUT | 5.000% | 8/15/19 | 150 | 163 |
| American Municipal Power Ohio Inc. Revenue | | | | |
| (Prairie State Energy Campus Project) PUT | 5.000% | 8/15/20 | 210 | 234 |
| Cleveland Heights OH City School District GO | 4.500% | 12/1/47 | 165 | 180 |
56
| | | | |
| Tax-Exempt Bond Index Fund | | | | |
| |
| |
| |
| | | | Face | Market |
| | | Maturity | Amount | Value• |
| | Coupon | Date | ($000) | ($000) |
| Cleveland OH Airport System Revenue | 5.000% | 1/1/29 | 200 | 227 |
| Cleveland State University Ohio General Receipts | | | | |
| Revenue | 5.000% | 6/1/37 | 95 | 109 |
| Columbus OH GO | 5.000% | 7/1/25 | 100 | 127 |
| Columbus OH GO | 5.000% | 7/1/26 | 405 | 520 |
| Columbus OH Sewer Revenue | 5.000% | 6/1/27 | 50 | 62 |
| Columbus OH Sewer Revenue | 5.000% | 6/1/28 | 500 | 618 |
| Franklin County OH GO | 5.000% | 12/1/17 (Prere.) | 100 | 105 |
| Hamilton County OH Sales Tax Revenue | 4.000% | 12/1/31 | 300 | 331 |
| Hamilton County OH Sewer System Revenue | 5.000% | 12/1/38 | 110 | 129 |
| Northeast Ohio Regional Sewer District | | | | |
| Wastewater Revenue | 5.000% | 11/15/39 | 250 | 294 |
| Northeast Ohio Regional Sewer District | | | | |
| Wastewater Revenue | 5.000% | 11/15/44 | 335 | 392 |
| Northeast Ohio Regional Sewer District | | | | |
| Wastewater Revenue | 4.000% | 11/15/49 | 255 | 270 |
| Ohio GO | 5.000% | 9/15/21 | 200 | 236 |
| Ohio GO | 5.000% | 9/15/24 | 535 | 668 |
| Ohio GO | 5.000% | 9/15/25 | 250 | 316 |
| Ohio State University General Receipts Revenue | 5.000% | 12/1/39 | 60 | 70 |
| Ohio State University General Receipts Revenue | 4.000% | 6/1/43 | 145 | 155 |
| Ohio Turnpike Commission Turnpike Revenue | 0.000% | 2/15/36 | 100 | 49 |
| Ohio Turnpike Commission Turnpike Revenue | 0.000% | 2/15/38 | 930 | 423 |
| Ohio Turnpike Commission Turnpike Revenue | 5.250% | 2/15/39 | 105 | 122 |
| Ohio Turnpike Commission Turnpike Revenue | 0.000% | 2/15/42 | 215 | 83 |
| Ohio Turnpike Commission Turnpike Revenue | 0.000% | 2/15/43 | 465 | 173 |
| Ohio Water Development Authority Water | | | | |
| Pollution Control Loan Fund Revenue | 5.000% | 12/1/19 (Prere.) | 1,060 | 1,188 |
| Sandusky OH BAN | 2.000% | 10/5/17 | 450 | 454 |
| Springboro OH BAN | 1.500% | 1/26/17 | 500 | 501 |
| Springboro OH BAN | 1.500% | 3/30/17 | 1,000 | 1,002 |
| Willoughby-Eastlake City OH School District GO | 5.000% | 12/1/46 | 295 | 342 |
| Willoughby-Eastlake City OH School District GO | 4.000% | 12/1/50 | 520 | 543 |
| | | | | 10,678 |
| Oklahoma (0.1%) | | | | |
| Oklahoma Municipal Power Authority Power | | | | |
| Supply System Revenue | 5.000% | 1/1/47 | 200 | 230 |
| Oklahoma Turnpike Authority Revenue | 5.000% | 1/1/17 | 100 | 101 |
| | | | | 331 |
| Oregon (0.5%) | | | | |
| North Clackamas County OR School District | | | | |
| No. 12 GO | 4.500% | 6/15/17 (Prere.) | 50 | 51 |
| Oregon Department of Administrative Services | | | | |
| Lottery Revenue | 5.000% | 4/1/19 (Prere.) | 700 | 766 |
| Oregon Department of Transportation Highway | | | | |
| User Tax Revenue | 5.000% | 11/15/30 | 500 | 611 |
| Oregon Department of Transportation Highway | | | | |
| User Tax Revenue | 5.000% | 11/15/31 | 400 | 486 |
| Oregon GO | 4.500% | 8/1/32 | 65 | 67 |
| Oregon GO (Veterans Welfare) | 4.700% | 6/1/41 | 175 | 194 |
| Port of Portland OR International Airport Revenue | 5.500% | 7/1/18 (Prere.) | 50 | 54 |
| Portland OR Sewer System Revenue | 5.000% | 3/1/35 | 120 | 134 |
| Tri-County Metropolitan Transportation District of | | | | |
| Oregon Capital Grant Receipt Revenue | 5.000% | 11/1/18 | 500 | 510 |
| | | | | 2,873 |
57
| | | | |
| Tax-Exempt Bond Index Fund | | | | |
| |
| |
| |
| | | | Face | Market |
| | | Maturity | Amount | Value• |
| | Coupon | Date | ($000) | ($000) |
| Pennsylvania (4.9%) | | | | |
| Allegheny County PA Airport Authority Revenue | | | | |
| (Pittsburgh International Airport) | 5.000% | 1/1/17 (4) | 145 | 146 |
| Allegheny County PA Airport Authority Revenue | | | | |
| (Pittsburgh International Airport) | 5.000% | 1/1/18 (4) | 80 | 84 |
| Allegheny County PA GO | 5.000% | 11/1/19 (Prere.) | 545 | 609 |
| Allegheny County PA GO | 5.000% | 11/1/28 | 500 | 615 |
| Allegheny County PA GO | 5.000% | 12/1/37 | 150 | 176 |
| Allentown PA Neighborhood Improvement Zone | | | | |
| Development Authority Tax Revenue | 5.000% | 5/1/25 | 335 | 375 |
| Allentown PA Neighborhood Improvement Zone | | | | |
| Development Authority Tax Revenue | 5.000% | 5/1/30 | 150 | 164 |
| Chester County PA GO | 5.000% | 7/15/19 (Prere.) | 75 | 83 |
| Chester County PA GO | 5.000% | 7/15/28 | 25 | 28 |
| Commonwealth Financing Authority Pennsylvania | | | | |
| Revenue | 5.000% | 6/1/36 | 100 | 112 |
| Delaware River Port Authority Pennsylvania & | | | | |
| New Jersey Revenue | 4.500% | 7/1/17 (Prere.) | 125 | 128 |
| Delaware River Port Authority Pennsylvania & | | | | |
| New Jersey Revenue | 4.500% | 1/1/32 | 200 | 224 |
| Delaware River Port Authority Pennsylvania & | | | | |
| New Jersey Revenue | 5.000% | 1/1/35 | 100 | 111 |
| Delaware River Port Authority Pennsylvania & | | | | |
| New Jersey Revenue | 5.000% | 1/1/40 | 125 | 138 |
| Delaware Valley PA Regional Finance Authority | | | | |
| Revenue | 5.600% | 7/1/17 (2) | 50 | 52 |
| Delaware Valley PA Regional Finance Authority | | | | |
| Revenue | 5.750% | 7/1/17 | 250 | 258 |
| Delaware Valley PA Regional Finance Authority | | | | |
| Revenue | 5.500% | 8/1/28 (2) | 60 | 75 |
| Delaware Valley PA Regional Finance Authority | | | | |
| Revenue | 5.750% | 7/1/32 | 705 | 905 |
| Lehigh County PA Authority Water & Sewer | | | | |
| Revenue | 5.000% | 12/1/43 | 115 | 130 |
| Pennsylvania Economic Development Financing | | | | |
| Authority Unemployment Compensation Revenue | 5.000% | 7/1/17 | 600 | 617 |
| Pennsylvania Economic Development Financing | | | | |
| Authority Unemployment Compensation Revenue | 5.000% | 1/1/19 | 390 | 424 |
| Pennsylvania Economic Development Financing | | | | |
| Authority Unemployment Compensation Revenue | 5.000% | 1/1/20 | 360 | 398 |
| Pennsylvania GO | 5.000% | 3/1/17 | 100 | 101 |
| Pennsylvania GO | 5.000% | 5/1/17 | 100 | 102 |
| Pennsylvania GO | 4.500% | 11/1/17 (Prere.) | 1,250 | 1,296 |
| Pennsylvania GO | 5.000% | 6/1/18 | 500 | 531 |
| Pennsylvania GO | 5.000% | 7/1/18 | 100 | 107 |
| Pennsylvania GO | 5.000% | 7/1/18 | 125 | 133 |
| Pennsylvania GO | 5.000% | 2/15/19 | 75 | 81 |
| Pennsylvania GO | 5.000% | 7/1/19 | 70 | 77 |
| Pennsylvania GO | 5.000% | 7/1/20 | 275 | 310 |
| Pennsylvania GO | 5.000% | 7/1/22 | 100 | 118 |
| Pennsylvania GO | 5.000% | 4/15/24 | 200 | 218 |
| Pennsylvania GO | 5.000% | 11/15/24 | 190 | 221 |
| Pennsylvania GO | 5.000% | 6/1/25 | 500 | 585 |
| Pennsylvania GO | 5.000% | 4/1/26 | 635 | 749 |
| Pennsylvania GO | 5.000% | 6/15/26 | 100 | 120 |
58
| | | | |
| Tax-Exempt Bond Index Fund | | | | |
| |
| |
| |
| | | | Face | Market |
| | | Maturity | Amount | Value• |
| | Coupon | Date | ($000) | ($000) |
| Pennsylvania GO | 5.000% | 9/15/26 | 1,150 | 1,427 |
| Pennsylvania GO | 5.000% | 3/15/27 | 750 | 903 |
| Pennsylvania GO | 4.000% | 10/15/28 | 100 | 110 |
| Pennsylvania GO | 5.000% | 9/15/29 | 750 | 903 |
| Pennsylvania GO | 5.000% | 3/15/31 | 200 | 234 |
| Pennsylvania GO | 4.000% | 6/15/32 | 395 | 422 |
| Pennsylvania GO | 5.000% | 10/15/32 | 430 | 496 |
| Pennsylvania GO | 4.000% | 3/15/34 | 200 | 212 |
| Pennsylvania GO | 4.000% | 9/15/34 | 500 | 539 |
| Pennsylvania GO | 3.000% | 9/15/35 | 500 | 477 |
| Pennsylvania Higher Educational Facilities | | | | |
| Authority Revenue (Drexel University) | 5.000% | 11/1/17 (Prere.) | 125 | 130 |
| Pennsylvania Higher Educational Facilities | | | | |
| Authority Revenue (Temple University) | 5.000% | 4/1/42 | 100 | 113 |
| Pennsylvania Public School Building Authority | | | | |
| Lease Revenue (School District of Philadelphia) | 5.000% | 6/1/29 (4) | 100 | 117 |
| Pennsylvania Public School Building Authority | | | | |
| Lease Revenue (School District of Philadelphia) | 4.500% | 6/1/32 (4) | 700 | 702 |
| Pennsylvania Public School Building Authority | | | | |
| Lease Revenue (School District of Philadelphia) | 5.000% | 6/1/33 (4) | 135 | 135 |
| Pennsylvania Public School Building Authority | | | | |
| Revenue (Harrisburg School District) | 4.750% | 5/15/19 (Prere.) | 370 | 405 |
| Pennsylvania State University Revenue | 5.000% | 9/1/41 | 200 | 237 |
| Pennsylvania Turnpike Commission Motor | | | | |
| License Fund Revenue | 5.250% | 12/1/43 | 50 | 58 |
| Pennsylvania Turnpike Commission Oil Franchise | | | | |
| Tax Revenue | 5.000% | 12/1/18 (Prere.) | 150 | 163 |
| Pennsylvania Turnpike Commission Revenue | 5.250% | 6/1/18 (Prere.) | 30 | 32 |
| Pennsylvania Turnpike Commission Revenue | 6.250% | 6/1/18 (Prere.) | 110 | 119 |
| Pennsylvania Turnpike Commission Revenue | 5.000% | 6/1/19 (Prere.) | 20 | 22 |
| Pennsylvania Turnpike Commission Revenue | 5.000% | 6/1/19 (Prere.) | 130 | 143 |
| Pennsylvania Turnpike Commission Revenue | 5.000% | 6/1/19 (Prere.) | 55 | 61 |
| Pennsylvania Turnpike Commission Revenue | 5.250% | 6/1/19 (Prere.) | 10 | 11 |
| Pennsylvania Turnpike Commission Revenue | 5.250% | 6/1/19 (Prere.) | 120 | 133 |
| Pennsylvania Turnpike Commission Revenue | 5.750% | 6/1/19 (Prere.) | 100 | 112 |
| Pennsylvania Turnpike Commission Revenue | 5.000% | 12/1/19 (Prere.) | 5 | 6 |
| Pennsylvania Turnpike Commission Revenue | 5.000% | 12/1/19 (Prere.) | 65 | 73 |
| Pennsylvania Turnpike Commission Revenue | 5.350% | 12/1/20 (Prere.) | 310 | 363 |
| Pennsylvania Turnpike Commission Revenue | 5.350% | 12/1/20 (Prere.) | 20 | 23 |
| Pennsylvania Turnpike Commission Revenue | 5.750% | 12/1/20 (Prere.) | 110 | 130 |
| Pennsylvania Turnpike Commission Revenue | 6.000% | 12/1/20 (Prere.) | 90 | 108 |
| Pennsylvania Turnpike Commission Revenue | 6.500% | 12/1/20 (Prere.) | 60 | 73 |
| Pennsylvania Turnpike Commission Revenue | 5.000% | 12/1/21 | 60 | 67 |
| Pennsylvania Turnpike Commission Revenue | 5.000% | 6/1/26 | 300 | 365 |
| Pennsylvania Turnpike Commission Revenue | 5.750% | 12/1/28 | 120 | 138 |
| Pennsylvania Turnpike Commission Revenue | 0.000% | 12/1/30 | 200 | 248 |
| Pennsylvania Turnpike Commission Revenue | 5.350% | 12/1/30 | 35 | 40 |
| Pennsylvania Turnpike Commission Revenue | 6.250% | 6/1/33 (4) | 200 | 259 |
| Pennsylvania Turnpike Commission Revenue | 6.000% | 12/1/34 | 630 | 737 |
| Pennsylvania Turnpike Commission Revenue | 5.450% | 12/1/35 | 165 | 188 |
| Pennsylvania Turnpike Commission Revenue | 5.000% | 12/1/37 | 595 | 654 |
| Pennsylvania Turnpike Commission Revenue | 0.000% | 12/1/38 | 510 | 630 |
| Pennsylvania Turnpike Commission Revenue | 4.500% | 12/1/38 | 100 | 104 |
| Pennsylvania Turnpike Commission Revenue | 5.000% | 12/1/38 | 695 | 764 |
| Pennsylvania Turnpike Commission Revenue | 5.000% | 6/1/39 (12) | 150 | 163 |
59
| | | | |
| Tax-Exempt Bond Index Fund | | | | |
| |
| |
| |
| | | | Face | Market |
| | | Maturity | Amount | Value• |
| | Coupon | Date | ($000) | ($000) |
| Pennsylvania Turnpike Commission Revenue | 5.250% | 6/1/39 | 360 | 393 |
| Pennsylvania Turnpike Commission Revenue | 5.000% | 12/1/39 | 85 | 98 |
| Pennsylvania Turnpike Commission Revenue | 5.125% | 12/1/40 | 155 | 170 |
| Pennsylvania Turnpike Commission Revenue | 5.300% | 12/1/41 | 140 | 154 |
| Pennsylvania Turnpike Commission Revenue | 5.000% | 12/1/44 | 715 | 821 |
| Pennsylvania Turnpike Commission Revenue | 5.000% | 12/1/44 | 250 | 287 |
| Pennsylvania Turnpike Commission Revenue | 5.250% | 12/1/44 (15) | 240 | 282 |
| Pennsylvania Turnpike Commission Revenue | 5.000% | 12/1/45 | 150 | 168 |
| Philadelphia PA Airport Revenue | 5.000% | 6/15/40 | 50 | 56 |
| Philadelphia PA Gas Works Revenue | 5.000% | 10/1/17 (Prere.) | 285 | 296 |
| Philadelphia PA Gas Works Revenue | 5.250% | 8/1/20 (Prere.) | 145 | 167 |
| Philadelphia PA Gas Works Revenue | 4.000% | 10/1/35 | 250 | 268 |
| Philadelphia PA Gas Works Revenue | 5.250% | 8/1/40 | 230 | 258 |
| Philadelphia PA GO | 5.000% | 7/15/38 | 495 | 561 |
| Philadelphia PA Water & Waste Water Revenue | 5.000% | 8/1/17 (4) | 115 | 119 |
| Philadelphia PA Water & Waste Water Revenue | 4.250% | 11/1/31 (2) | 70 | 72 |
| Philadelphia PA Water & Waste Water Revenue | 5.000% | 7/1/40 | 230 | 265 |
| Philadelphia PA Water & Waste Water Revenue | 5.000% | 1/1/41 | 135 | 152 |
| Philadelphia PA Water & Waste Water Revenue | 5.125% | 1/1/43 | 50 | 56 |
| Philadelphia PA Water & Waste Water Revenue | 5.000% | 7/1/43 | 740 | 849 |
| University of Pittsburgh of the Commonwealth | | | | |
| System of Higher Education Pennsylvania | | | | |
| Revenue (University Capital Project) | 5.000% | 9/15/28 | 470 | 513 |
| Westmoreland County PA Municipal Authority | | | | |
| Revenue | 5.000% | 8/15/42 (15) | 250 | 286 |
| | | | | 30,441 |
| Rhode Island (0.0%) | | | | |
| Rhode Island Turnpike & Bridge Authority Revenue | 5.000% | 10/1/40 | 100 | 116 |
| |
| South Carolina (1.4%) | | | | |
| Charleston SC Educational Excellence Financing | | | | |
| Corp. Revenue (Charleston County School District, | | | | |
| South Carolina Project) | 5.000% | 12/1/24 | 125 | 154 |
| Charleston SC Educational Excellence Financing | | | | |
| Corp. Revenue (Charleston County School District, | | | | |
| South Carolina Project) | 5.000% | 12/1/27 | 350 | 423 |
| Charleston SC Educational Excellence Financing | | | | |
| Corp. Revenue (Charleston County School District, | | | | |
| South Carolina Project) | 5.000% | 12/1/30 | 780 | 930 |
| Charleston SC Waterworks & Sewer Capital | | | | |
| Improvement Revenue | 5.000% | 1/1/21 (Prere.) | 110 | 127 |
| Columbia SC Waterworks & Sewer System | | | | |
| Revenue | 5.000% | 2/1/40 | 50 | 56 |
| Greenville County SC School District GO | 5.000% | 12/1/27 | 110 | 110 |
| Greenville County SC School District Installment | | | | |
| Revenue | 5.000% | 12/1/25 (12) | 150 | 151 |
| Piedmont SC Municipal Power Agency Revenue | 5.000% | 1/1/22 | 275 | 313 |
| South Carolina Public Service Authority Revenue | 3.000% | 12/1/46 | 600 | 575 |
| South Carolina Public Service Authority Revenue | 5.250% | 1/1/19 (Prere.) | 100 | 109 |
| South Carolina Public Service Authority Revenue | 5.250% | 1/1/19 (Prere.) | 480 | 524 |
| South Carolina Public Service Authority Revenue | 5.500% | 1/1/19 (Prere.) | 90 | 99 |
| South Carolina Public Service Authority Revenue | 5.000% | 1/1/20 (Prere.) | 315 | 353 |
| South Carolina Public Service Authority Revenue | 5.000% | 12/1/21 | 75 | 88 |
| South Carolina Public Service Authority Revenue | 4.000% | 1/1/32 | 105 | 109 |
| South Carolina Public Service Authority Revenue | 5.000% | 12/1/33 | 350 | 417 |
60
| | | | |
| Tax-Exempt Bond Index Fund | | | | |
| |
| |
| |
| | | | Face | Market |
| | | Maturity | Amount | Value• |
| | Coupon | Date | ($000) | ($000) |
| South Carolina Public Service Authority Revenue | 5.000% | 12/1/36 | 100 | 113 |
| South Carolina Public Service Authority Revenue | 5.000% | 12/1/36 | 290 | 340 |
| South Carolina Public Service Authority Revenue | 5.125% | 12/1/43 | 50 | 58 |
| South Carolina Public Service Authority Revenue | 5.000% | 12/1/46 | 1,415 | 1,619 |
| South Carolina Public Service Authority Revenue | 5.000% | 12/1/48 | 520 | 596 |
| South Carolina Public Service Authority Revenue | 5.000% | 12/1/49 | 130 | 147 |
| South Carolina Public Service Authority Revenue | 5.000% | 12/1/50 | 385 | 433 |
| South Carolina Public Service Authority Revenue | 5.500% | 12/1/54 | 150 | 177 |
| South Carolina Public Service Authority Revenue | 5.000% | 12/1/55 | 250 | 281 |
| South Carolina Public Service Authority Revenue | 5.250% | 12/1/55 | 250 | 295 |
| South Carolina Transportation Infrastructure | | | | |
| Revenue | 5.000% | 10/1/20 | 230 | 263 |
| South Carolina Transportation Infrastructure | | | | |
| Revenue | 3.375% | 10/1/32 | 155 | 159 |
| | | | | 9,019 |
| Tennessee (0.4%) | | | | |
| Memphis-Shelby County TN Sports Authority | | | | |
| Revenue (Memphis Arena) | 5.375% | 11/1/29 | 110 | 123 |
| Metropolitan Government of Nashville & Davidson | | | | |
| County TN Electric Revenue | 5.000% | 5/15/27 | 450 | 539 |
| Metropolitan Government of Nashville & Davidson | | | | |
| County TN GO | 5.000% | 1/1/18 (Prere.) | 485 | 509 |
| Metropolitan Government of Nashville & Davidson | | | | |
| County TN GO | 5.000% | 1/1/18 (Prere.) | 100 | 105 |
| Metropolitan Government of Nashville & Davidson | | | | |
| County TN GO | 5.000% | 7/1/18 | 100 | 107 |
| Metropolitan Government of Nashville & Davidson | | | | |
| County TN GO | 5.000% | 1/1/28 | 250 | 313 |
| Tennessee GO | 5.000% | 8/1/18 | 490 | 525 |
| Tennessee GO | 5.000% | 8/1/21 | 205 | 242 |
| | | | | 2,463 |
| Texas (10.1%) | | | | |
| Alamo TX Community College District GO | 4.500% | 8/15/33 (14) | 100 | 103 |
| Alamo TX Regional Mobility Authority Revenue | 5.000% | 6/15/46 | 310 | 359 |
| Austin TX Water & Wastewater System Revenue | 5.000% | 11/15/41 | 200 | 231 |
| Central Texas Regional Mobility Authority Revenue | 6.000% | 1/1/21 (Prere.) | 100 | 119 |
| Central Texas Regional Mobility Authority Revenue | 6.250% | 1/1/21 (Prere.) | 275 | 331 |
| Central Texas Regional Mobility Authority Revenue | 5.000% | 1/1/40 | 300 | 340 |
| Central Texas Regional Mobility Authority Revenue | 5.000% | 1/1/45 | 100 | 112 |
| Cypress-Fairbanks TX Independent School | | | | |
| District GO | 5.000% | 2/15/27 | 185 | 224 |
| Cypress-Fairbanks TX Independent School | | | | |
| District GO | 4.500% | 2/15/28 | 250 | 253 |
| Cypress-Fairbanks TX Independent School | | | | |
| District GO | 5.000% | 2/15/44 | 1,000 | 1,160 |
| Dallas TX Area Rapid Transit Sales Tax Revenue | 5.000% | 12/1/16 (Prere.) | 145 | 145 |
| Dallas TX Area Rapid Transit Sales Tax Revenue | 4.750% | 12/1/18 (Prere.) | 55 | 59 |
| Dallas TX Area Rapid Transit Sales Tax Revenue | 5.000% | 12/1/18 (Prere.) | 190 | 206 |
| Dallas TX Area Rapid Transit Sales Tax Revenue | 5.250% | 12/1/18 (Prere.) | 125 | 136 |
| Dallas TX Area Rapid Transit Sales Tax Revenue | 5.250% | 12/1/18 (Prere.) | 325 | 354 |
| Dallas TX Area Rapid Transit Sales Tax Revenue | 5.250% | 12/1/18 (Prere.) | 90 | 98 |
| Dallas TX Area Rapid Transit Sales Tax Revenue | 5.250% | 12/1/18 (Prere.) | 60 | 65 |
| Dallas TX Area Rapid Transit Sales Tax Revenue | 5.250% | 12/1/29 (2) | 170 | 222 |
| Dallas TX Area Rapid Transit Sales Tax Revenue | 5.250% | 12/1/30 (2) | 100 | 131 |
| Dallas TX Area Rapid Transit Sales Tax Revenue | 5.000% | 12/1/32 (2) | 5 | 5 |
61
| | | | |
| Tax-Exempt Bond Index Fund | | | | |
| |
| |
| |
| | | | Face | Market |
| | | Maturity | Amount | Value• |
| | Coupon | Date | ($000) | ($000) |
| Dallas TX Area Rapid Transit Sales Tax Revenue | 5.000% | 12/1/46 | 350 | 410 |
| Dallas TX GO | 5.000% | 2/15/18 | 100 | 105 |
| Dallas TX GO | 5.000% | 2/15/23 | 75 | 91 |
| Dallas TX GO | 5.000% | 2/15/24 | 100 | 118 |
| Dallas TX GO | 5.000% | 2/15/25 | 300 | 366 |
| Dallas TX GO | 5.000% | 2/15/26 | 375 | 455 |
| Dallas TX Independent School District GO | 5.500% | 2/15/18 (Prere.) | 155 | 164 |
| Dallas TX Independent School District GO | 6.375% | 2/15/18 (Prere.) | 1,000 | 1,071 |
| Dallas TX Independent School District GO | 5.000% | 8/15/24 | 250 | 312 |
| Dallas TX Independent School District GO | 5.000% | 8/15/28 | 130 | 158 |
| Dallas TX Waterworks & Sewer System Revenue | 5.000% | 10/1/37 | 500 | 595 |
| Dallas TX Waterworks & Sewer System Revenue | 5.000% | 10/1/41 | 50 | 59 |
| Dallas-Fort Worth TX International Airport Revenue | 5.250% | 11/1/33 | 100 | 119 |
| Dallas-Fort Worth TX International Airport Revenue | 5.000% | 11/1/35 | 80 | 90 |
| Dallas-Fort Worth TX International Airport Revenue | 5.000% | 11/1/35 | 50 | 57 |
| Dallas-Fort Worth TX International Airport Revenue | 5.000% | 11/1/43 | 150 | 173 |
| Dallas-Fort Worth TX International Airport Revenue | 5.000% | 11/1/44 | 165 | 190 |
| Dallas-Fort Worth TX International Airport Revenue | 4.000% | 11/1/45 | 140 | 148 |
| Dallas-Fort Worth TX International Airport Revenue | 5.000% | 11/1/45 | 385 | 431 |
| Dallas-Fort Worth TX International Airport Revenue | 5.000% | 11/1/45 | 100 | 114 |
| Fort Bend TX Grand Parkway Toll Road Authority | | | | |
| Revenue | 5.000% | 3/1/32 | 50 | 59 |
| Fort Bend TX Grand Parkway Toll Road Authority | | | | |
| Revenue | 5.000% | 3/1/37 | 300 | 350 |
| Fort Bend TX Grand Parkway Toll Road Authority | | | | |
| Revenue | 4.000% | 3/1/46 | 300 | 315 |
| Fort Bend TX Independent School District GO | 5.000% | 8/15/19 | 175 | 194 |
| Fort Bend TX Independent School District GO | 4.750% | 8/15/34 | 50 | 53 |
| Fort Worth TX Independent School District GO | 5.000% | 2/15/34 | 300 | 333 |
| Fort Worth TX Water & Sewer Revenue | 5.000% | 2/15/23 | 700 | 847 |
| Grand Parkway Transportation Corp. Texas | | | | |
| System Toll Revenue | 5.250% | 10/1/51 | 325 | 383 |
| Grand Parkway Transportation Corp. Texas | | | | |
| System Toll Revenue | 5.000% | 4/1/53 | 450 | 521 |
| Harris County TX Flood Control District Revenue | 5.000% | 10/1/34 | 865 | 979 |
| Harris County TX Flood Control District Revenue | 5.000% | 10/1/39 | 100 | 113 |
| Harris County TX GO | 5.750% | 10/1/18 (Prere.) | 350 | 382 |
| Harris County TX GO | 5.000% | 8/15/22 | 50 | 60 |
| Harris County TX GO | 5.000% | 10/1/23 | 205 | 235 |
| Harris County TX GO | 5.000% | 8/15/28 | 250 | 310 |
| Harris County TX GO | 5.000% | 10/1/28 | 500 | 618 |
| Harris County TX Metropolitan Transit Authority | | | | |
| Sales & Use Tax Revenue | 5.000% | 11/1/36 | 350 | 405 |
| Harris County TX Sports Authority Revenue | 5.000% | 11/15/30 | 190 | 223 |
| Harris County TX Sports Authority Revenue | 0.000% | 11/15/34 (4) | 175 | 86 |
| Harris County TX Sports Authority Revenue | 0.000% | 11/15/43 (4) | 200 | 64 |
| Harris County TX Toll Road Revenue | 5.000% | 8/15/18 (Prere.) | 575 | 617 |
| Harris County TX Toll Road Revenue | 5.000% | 8/15/19 (Prere.) | 150 | 166 |
| Harris County TX Toll Road Revenue | 5.000% | 8/15/29 | 265 | 312 |
| Houston TX Airport System Revenue | 5.000% | 7/1/27 (14) | 730 | 749 |
| Houston TX Community College GO | 5.000% | 2/15/34 | 130 | 152 |
| Houston TX Community College System GO | 5.000% | 2/15/33 | 415 | 486 |
| Houston TX Community College System GO | 5.000% | 2/15/36 | 400 | 446 |
| Houston TX GO | 5.000% | 3/1/18 | 300 | 316 |
| Houston TX GO | 5.000% | 3/1/18 (Prere.) | 100 | 105 |
62
| | | | |
| Tax-Exempt Bond Index Fund | | | | |
| |
| |
| |
| | | | Face | Market |
| | | Maturity | Amount | Value• |
| | Coupon | Date | ($000) | ($000) |
| Houston TX GO | 5.250% | 3/1/18 (Prere.) | 310 | 328 |
| Houston TX GO | 5.000% | 3/1/19 (Prere.) | 90 | 98 |
| Houston TX GO | 5.000% | 3/1/24 | 10 | 11 |
| Houston TX GO | 5.000% | 3/1/24 | 500 | 586 |
| Houston TX GO | 5.000% | 3/1/27 | 250 | 308 |
| Houston TX GO | 5.000% | 3/1/28 | 500 | 611 |
| Houston TX Higher Education Finance Corp. | | | | |
| Revenue (Rice University Project) | 4.750% | 11/15/17 (Prere.) | 150 | 156 |
| Houston TX Independent School District GO | 5.000% | 2/15/17 (Prere.) | 200 | 202 |
| Houston TX Independent School District GO PUT | 4.000% | 6/1/17 | 500 | 509 |
| Houston TX Utility System Revenue | 5.250% | 11/15/17 (4) | 160 | 167 |
| Houston TX Utility System Revenue | 5.375% | 5/15/19 (Prere.) | 110 | 122 |
| Houston TX Utility System Revenue | 5.000% | 5/15/22 | 130 | 155 |
| Houston TX Utility System Revenue | 5.000% | 5/15/24 | 250 | 309 |
| Houston TX Utility System Revenue | 5.000% | 11/15/24 | 80 | 100 |
| Houston TX Utility System Revenue | 5.250% | 11/15/28 | 215 | 249 |
| Houston TX Utility System Revenue | 5.250% | 11/15/29 | 160 | 185 |
| Houston TX Utility System Revenue | 5.000% | 11/15/34 | 200 | 236 |
| Houston TX Utility System Revenue | 5.000% | 11/15/36 | 125 | 145 |
| Houston TX Utility System Revenue | 5.000% | 11/15/44 | 75 | 87 |
| Irving TX Combination Tax & Hotel Occupancy | | | | |
| Revenue GO | 5.000% | 8/15/39 | 375 | 407 |
| Judson TX Independent School District GO | 4.500% | 2/1/17 (Prere.) | 135 | 136 |
| Judson TX Independent School District GO | 4.500% | 2/1/35 | 65 | 66 |
| Keller TX Independent School District GO | 5.250% | 2/15/19 (Prere.) | 180 | 197 |
| Keller TX Independent School District GO | 5.500% | 2/15/19 (Prere.) | 735 | 809 |
| Klein TX Independent School District GO | 5.000% | 8/1/18 (Prere.) | 75 | 80 |
| Lake Travis TX Independent School District GO | 5.000% | 2/15/42 | 510 | 581 |
| Lamar TX Consolidated Independent School | | | | |
| District GO | 5.000% | 2/15/17 (Prere.) | 100 | 101 |
| Leander TX Independent School District GO | 5.000% | 8/15/26 | 400 | 485 |
| Leander TX Independent School District GO | 5.000% | 8/15/40 | 380 | 447 |
| Lewisville TX Independent School District GO | 5.000% | 2/15/19 (Prere.) | 100 | 109 |
| Lewisville TX Independent School District GO | 5.000% | 2/15/19 (Prere.) | 325 | 354 |
| Lewisville TX Independent School District GO | 5.000% | 2/15/19 (Prere.) | 125 | 136 |
| Lewisville TX Independent School District GO | 5.000% | 8/15/20 | 400 | 457 |
| Lewisville TX Independent School District GO | 4.000% | 8/15/26 | 400 | 464 |
| Lone Star College System Texas GO | 5.000% | 8/15/18 (Prere.) | 150 | 161 |
| Lone Star College System Texas GO | 5.000% | 8/15/18 (Prere.) | 35 | 38 |
| Lone Star College System Texas GO | 5.000% | 8/15/38 | 35 | 37 |
| Lower Colorado River Authority Texas Revenue | 6.250% | 5/15/18 (Prere.) | 250 | 271 |
| Lower Colorado River Authority Texas Revenue | 5.000% | 5/15/21 | 125 | 142 |
| Lower Colorado River Authority Texas Revenue | 5.250% | 5/15/29 | 150 | 164 |
| Lower Colorado River Authority Texas Revenue | 5.500% | 5/15/33 | 195 | 214 |
| Lower Colorado River Authority Texas Revenue | 5.000% | 5/15/39 | 200 | 228 |
| Lower Colorado River Authority Texas Revenue | 5.625% | 5/15/39 | 125 | 137 |
| Lower Colorado River Authority Texas Revenue | 5.000% | 5/15/40 | 540 | 600 |
| Lower Colorado River Authority Texas | | | | |
| Transmission Contract Revenue | | | | |
| (LCRA Transmission Services Corp.) | 5.000% | 5/15/35 (13) | 300 | 318 |
| Lower Colorado River Authority Texas | | | | |
| Transmission Contract Revenue | | | | |
| (LCRA Transmission Services Corp.) | 4.000% | 5/15/39 | 220 | 231 |
| Lower Colorado River Authority Texas | | | | |
| Transmission Contract Revenue | | | | |
| (LCRA Transmission Services Corp.) | 5.000% | 5/15/40 (4) | 100 | 111 |
63
| | | | |
| Tax-Exempt Bond Index Fund | | | | |
| |
| |
| |
| | | | Face | Market |
| | | Maturity | Amount | Value• |
| | Coupon | Date | ($000) | ($000) |
| Lower Colorado River Authority Texas | | | | |
| Transmission Contract Revenue | | | | |
| (LCRA Transmission Services Corp.) | 5.000% | 5/15/41 | 275 | 305 |
| North East TX Regional Mobility Authority Revenue | 5.000% | 1/1/22 | 600 | 690 |
| North East TX Regional Mobility Authority Revenue | 5.000% | 1/1/46 | 130 | 147 |
| North Harris County TX Regional Water Authority | | | | |
| Revenue | 5.250% | 12/15/18 (Prere.) | 485 | 530 |
| North Harris County TX Regional Water Authority | | | | |
| Revenue | 5.375% | 12/15/18 (Prere.) | 375 | 410 |
| North Texas Tollway Authority System Revenue | 5.125% | 1/1/18 (Prere.) | 275 | 289 |
| North Texas Tollway Authority System Revenue | 5.500% | 1/1/18 | 170 | 179 |
| North Texas Tollway Authority System Revenue | 5.625% | 1/1/18 (Prere.) | 50 | 53 |
| North Texas Tollway Authority System Revenue | 5.750% | 1/1/19 (Prere.) | 950 | 1,047 |
| North Texas Tollway Authority System Revenue | 6.000% | 1/1/19 (Prere.) | 100 | 111 |
| North Texas Tollway Authority System Revenue | 5.000% | 1/1/21 | 105 | 120 |
| North Texas Tollway Authority System Revenue | 6.000% | 1/1/23 | 50 | 55 |
| North Texas Tollway Authority System Revenue | 5.000% | 1/1/27 | 180 | 216 |
| North Texas Tollway Authority System Revenue | 5.125% | 1/1/28 (14) | 10 | 10 |
| North Texas Tollway Authority System Revenue | 5.000% | 1/1/30 | 200 | 235 |
| North Texas Tollway Authority System Revenue | 5.000% | 1/1/30 | 230 | 276 |
| North Texas Tollway Authority System Revenue | 5.000% | 9/1/31 | 185 | 214 |
| North Texas Tollway Authority System Revenue | 0.000% | 1/1/32 (12) | 155 | 91 |
| North Texas Tollway Authority System Revenue | 5.000% | 9/1/32 | 270 | 312 |
| North Texas Tollway Authority System Revenue | 5.625% | 1/1/33 | 5 | 5 |
| North Texas Tollway Authority System Revenue | 5.625% | 1/1/33 | 10 | 10 |
| North Texas Tollway Authority System Revenue | 0.000% | 1/1/35 (12) | 200 | 103 |
| North Texas Tollway Authority System Revenue | 5.500% | 9/1/36 | 70 | 83 |
| North Texas Tollway Authority System Revenue | 0.000% | 1/1/38 (12) | 600 | 272 |
| North Texas Tollway Authority System Revenue | 5.000% | 1/1/38 | 500 | 575 |
| North Texas Tollway Authority System Revenue | 4.000% | 1/1/39 | 535 | 570 |
| North Texas Tollway Authority System Revenue | 5.000% | 1/1/40 | 895 | 1,024 |
| North Texas Tollway Authority System Revenue | 5.500% | 9/1/41 | 270 | 318 |
| North Texas Tollway Authority System Revenue | 6.000% | 1/1/43 | 160 | 188 |
| North Texas Tollway Authority System Revenue | 5.250% | 1/1/44 | 25 | 27 |
| North Texas Tollway Authority System Revenue | | | | |
| PUT | 1.950% | 1/1/19 | 500 | 505 |
| Plano TX Independent School District GO | 5.250% | 2/15/18 (Prere.) | 170 | 180 |
| Port of Houston Authority of Harris County Texas | | | | |
| Tax Revenue | 5.000% | 10/1/35 | 100 | 114 |
| Red River TX Education Finance Corp. Revenue | | | | |
| (Texas Christian University Project) | 5.000% | 3/15/43 | 85 | 98 |
| Round Rock TX Independent School District GO | 5.000% | 8/1/33 | 200 | 214 |
| San Antonio TX Electric & Gas Systems Revenue | 5.000% | 2/1/18 | 60 | 63 |
| San Antonio TX Electric & Gas Systems Revenue | 5.000% | 2/1/19 | 200 | 218 |
| San Antonio TX Electric & Gas Systems Revenue | 5.000% | 2/1/19 | 110 | 120 |
| San Antonio TX Electric & Gas Systems Revenue | 5.000% | 2/1/20 | 1,350 | 1,518 |
| San Antonio TX Electric & Gas Systems Revenue | 5.000% | 2/1/22 | 70 | 83 |
| San Antonio TX Electric & Gas Systems Revenue | 5.000% | 2/1/23 | 140 | 169 |
| San Antonio TX Electric & Gas Systems Revenue | 5.250% | 2/1/24 | 110 | 138 |
| San Antonio TX Electric & Gas Systems Revenue | 5.000% | 2/1/32 | 150 | 181 |
| San Antonio TX GO | 5.000% | 2/1/20 | 200 | 225 |
| San Antonio TX Independent School District GO | 5.000% | 2/15/24 | 100 | 124 |
| San Antonio TX Public Facilities Corp. Lease | | | | |
| Revenue | 4.000% | 9/15/33 | 140 | 150 |
64
| | | | |
| Tax-Exempt Bond Index Fund | | | | |
| |
| |
| |
| | | | Face | Market |
| | | Maturity | Amount | Value• |
| | Coupon | Date | ($000) | ($000) |
| San Antonio TX Public Facilities Corp. Lease | | | | |
| Revenue | 4.000% | 9/15/34 | 70 | 75 |
| San Antonio TX Public Facilities Corp. Lease | | | | |
| Revenue | 4.000% | 9/15/42 | 615 | 647 |
| San Antonio TX Water Revenue | 4.500% | 5/15/32 (14) | 330 | 336 |
| San Antonio TX Water Revenue | 4.500% | 5/15/37 (14) | 280 | 285 |
| San Jacinto TX Community College District GO | 5.000% | 2/15/19 (Prere.) | 895 | 976 |
| Spring Branch TX Independent School District GO | 5.250% | 2/1/17 (Prere.) | 200 | 202 |
| Tarrant Regional Water District Texas Water | | | | |
| Revenue | 5.000% | 3/1/37 | 115 | 134 |
| Texas GO | 5.000% | 4/1/18 (Prere.) | 190 | 201 |
| Texas GO | 5.000% | 4/1/20 | 100 | 113 |
| Texas GO | 5.000% | 10/1/20 | 500 | 575 |
| Texas GO | 5.000% | 10/1/22 | 545 | 658 |
| Texas GO | 5.000% | 10/1/27 | 145 | 178 |
| Texas GO | 5.000% | 10/1/27 | 55 | 69 |
| Texas GO | 5.000% | 10/1/28 | 100 | 121 |
| Texas GO | 5.000% | 4/1/30 | 100 | 106 |
| Texas GO | 5.000% | 4/1/44 | 200 | 233 |
| Texas GO | 5.000% | 10/1/44 | 820 | 962 |
| Texas Municipal Power Agency Revenue | 5.000% | 9/1/40 | 170 | 191 |
| Texas Transportation Commission GO | 5.000% | 10/1/18 | 200 | 216 |
| Texas Transportation Commission GO | 5.000% | 10/1/21 | 300 | 354 |
| Texas Transportation Commission GO | 5.000% | 4/1/23 | 100 | 122 |
| Texas Transportation Commission GO | 5.000% | 4/1/24 | 365 | 453 |
| Texas Transportation Commission GO | 5.000% | 10/1/25 | 720 | 897 |
| Texas Transportation Commission GO | 5.000% | 4/1/26 | 100 | 118 |
| Texas Transportation Commission GO | 5.000% | 4/1/31 | 300 | 357 |
| Texas Transportation Commission Mobility | | | | |
| Fund GO | 5.000% | 4/1/17 (Prere.) | 105 | 107 |
| Texas Transportation Commission Mobility | | | | |
| Fund GO | 5.000% | 10/1/28 | 55 | 68 |
| Texas Transportation Commission Mobility | | | | |
| Fund GO | 5.000% | 10/1/29 | 50 | 62 |
| Texas Transportation Commission Mobility | | | | |
| Fund GO | 4.500% | 4/1/35 (14) | 200 | 203 |
| Texas Transportation Commission Mobility | | | | |
| Fund GO | 4.750% | 4/1/37 | 530 | 556 |
| Texas Transportation Commission Revenue | 5.000% | 4/1/17 (Prere.) | 300 | 305 |
| Texas Transportation Commission Revenue | 4.000% | 10/1/18 | 190 | 201 |
| Texas Transportation Commission Revenue | 5.000% | 4/1/19 | 140 | 153 |
| Texas Transportation Commission Revenue | 5.000% | 4/1/20 | 540 | 611 |
| Texas Transportation Commission Revenue | 5.000% | 10/1/20 | 500 | 574 |
| Texas Transportation Commission Revenue | 5.000% | 4/1/21 | 380 | 442 |
| Texas Transportation Commission Revenue | 5.000% | 10/1/22 | 150 | 181 |
| Texas Transportation Commission Revenue | 5.000% | 4/1/24 | 70 | 87 |
| Texas Transportation Commission Revenue | 5.000% | 10/1/24 | 90 | 112 |
| Texas Transportation Commission Revenue | 5.000% | 10/1/25 | 235 | 297 |
| Texas Transportation Commission Revenue | 5.000% | 10/1/26 | 100 | 128 |
| Texas Transportation Commission Revenue | 5.000% | 4/1/34 | 100 | 118 |
| Texas Transportation Commission Revenue | 5.000% | 8/15/41 | 100 | 113 |
| Texas Transportation Commission Turnpike | | | | |
| System Revenue | 5.000% | 8/15/34 | 800 | 918 |
| Texas Transportation Commission Turnpike | | | | |
| System Revenue | 5.000% | 8/15/37 | 260 | 299 |
65
| | | | |
| Tax-Exempt Bond Index Fund | | | | |
| |
| |
| |
| | | | Face | Market |
| | | Maturity | Amount | Value• |
| | Coupon | Date | ($000) | ($000) |
| Texas Transportation Commission Turnpike | | | | |
| System Revenue | 5.000% | 8/15/42 | 400 | 453 |
| Texas Turnpike Authority Central Texas Turnpike | | | | |
| System Revenue | 0.000% | 8/15/22 (2) | 95 | 85 |
| Texas Water Development Board Revenue | 5.000% | 7/15/26 | 100 | 103 |
| Texas Water Development Board Revenue | 5.000% | 10/15/30 | 100 | 123 |
| Texas Water Development Board Revenue | 5.000% | 10/15/31 | 525 | 640 |
| Texas Water Development Board Revenue | 5.000% | 10/15/45 | 400 | 476 |
| Texas Water Financial Assistance GO | 4.000% | 8/1/41 | 100 | 108 |
| University of Texas Permanent University Fund | | | | |
| Revenue | 5.250% | 7/1/30 | 55 | 72 |
| University of Texas Permanent University Fund | | | | |
| Revenue | 4.000% | 7/1/34 | 300 | 330 |
| University of Texas Permanent University Fund | | | | |
| Revenue | 5.000% | 7/1/41 | 300 | 357 |
| University of Texas System Revenue Financing | | | | |
| System Revenue | 5.000% | 8/15/20 | 50 | 57 |
| University of Texas System Revenue Financing | | | | |
| System Revenue | 5.375% | 8/15/23 | 110 | 138 |
| University of Texas System Revenue Financing | | | | |
| System Revenue | 5.000% | 8/15/25 | 100 | 127 |
| University of Texas System Revenue Financing | | | | |
| System Revenue | 5.000% | 8/15/26 | 400 | 513 |
| University of Texas System Revenue Financing | | | | |
| System Revenue | 4.250% | 8/15/36 | 100 | 101 |
| University of Texas System Revenue Financing | | | | |
| System Revenue | 5.000% | 8/15/43 | 450 | 530 |
| | | | | 62,695 |
| Utah (0.6%) | | | | |
| Intermountain Power Agency Utah Power Supply | | | | |
| Revenue | 5.000% | 7/1/21 | 210 | 224 |
| Intermountain Power Agency Utah Power Supply | | | | |
| Revenue | 5.000% | 7/1/22 | 480 | 512 |
| University of Utah Revenue | 5.000% | 8/1/32 | 135 | 159 |
| Utah GO | 5.000% | 7/1/18 (Prere.) | 200 | 214 |
| Utah GO | 5.000% | 7/1/21 (Prere.) | 250 | 294 |
| Utah GO | 5.000% | 7/1/25 | 395 | 498 |
| Utah Transit Authority Sales Tax Revenue | 4.750% | 6/15/18 (Prere.) | 240 | 255 |
| Utah Transit Authority Sales Tax Revenue | 5.000% | 6/15/18 (Prere.) | 75 | 80 |
| Utah Transit Authority Sales Tax Revenue | 5.000% | 6/15/18 (Prere.) | 195 | 208 |
| Utah Transit Authority Sales Tax Revenue | 5.000% | 6/15/27 | 340 | 424 |
| Utah Transit Authority Sales Tax Revenue | 5.000% | 6/15/28 | 60 | 74 |
| Utah Transit Authority Sales Tax Revenue | 5.000% | 6/15/30 | 80 | 98 |
| Utah Transit Authority Sales Tax Revenue | 4.000% | 12/15/30 | 500 | 553 |
| Utah Transit Authority Sales Tax Revenue | 5.000% | 6/15/38 | 200 | 238 |
| | | | | 3,831 |
| Virginia (1.0%) | | | | |
| Arlington County VA GO | 5.000% | 8/1/22 | 240 | 290 |
| Fairfax County VA Public Improvement GO | 5.000% | 4/1/21 | 350 | 409 |
| Fairfax County VA Public Improvement GO | 5.000% | 4/1/23 | 110 | 135 |
| Fairfax VA GO | 4.000% | 1/15/31 | 120 | 131 |
| Hampton Roads VA Sanitation & Wastewater | | | | |
| District Revenue | 5.000% | 4/1/18 (Prere.) | 85 | 90 |
| Richmond VA Public Utility Revenue | 4.500% | 1/15/33 (4) | 50 | 50 |
| Richmond VA Public Utility Revenue | 5.000% | 1/15/40 | 120 | 130 |
66
| | | | |
| Tax-Exempt Bond Index Fund | | | | |
| |
| |
| |
| | | | Face | Market |
| | | Maturity | Amount | Value• |
| | Coupon | Date | ($000) | ($000) |
| University of Virginia Revenue | 5.000% | 6/1/40 | 475 | 505 |
| Virginia College Building Authority Educational | | | | |
| Facilities Revenue (21st Century College & | | | | |
| Equipment Programs) | 5.000% | 2/1/31 | 1,000 | 1,200 |
| Virginia Commonwealth Transportation Board | | | | |
| Revenue | 5.000% | 5/15/23 | 315 | 385 |
| Virginia Commonwealth Transportation Board | | | | |
| Revenue | 4.500% | 5/15/36 | 50 | 56 |
| Virginia GO | 5.000% | 6/1/19 | 200 | 221 |
| Virginia GO | 5.000% | 6/1/26 | 250 | 316 |
| Virginia GO | 5.000% | 6/1/27 | 85 | 107 |
| Virginia Public Building Authority Public Facilities | | | | |
| Revenue | 5.000% | 8/1/18 | 150 | 161 |
| Virginia Public Building Authority Public Facilities | | | | |
| Revenue | 5.000% | 8/1/25 | 250 | 314 |
| Virginia Public School Authority Revenue | 5.000% | 8/1/19 | 130 | 144 |
| Virginia Public School Authority Revenue | 5.000% | 8/1/22 | 50 | 60 |
| Virginia Public School Authority Revenue | 5.000% | 8/1/22 | 240 | 288 |
| Virginia Public School Authority Revenue | 5.000% | 8/1/23 | 205 | 247 |
| Virginia Public School Authority Revenue | 5.000% | 8/1/25 | 550 | 693 |
| | | | | 5,932 |
| Washington (2.1%) | | | | |
| Central Puget Sound WA Regional Transit | | | | |
| Authority Sales & Use Tax Revenue | 5.000% | 11/1/31 | 200 | 243 |
| Central Puget Sound WA Regional Transit | | | | |
| Authority Sales & Use Tax Revenue | 5.000% | 11/1/32 | 100 | 121 |
| Central Puget Sound WA Regional Transit | | | | |
| Authority Sales & Use Tax Revenue | 5.000% | 11/1/35 | 350 | 416 |
| Central Puget Sound WA Regional Transit | | | | |
| Authority Sales & Use Tax Revenue | 5.000% | 11/1/45 | 950 | 1,114 |
| Energy Northwest Washington Electric Revenue | | | | |
| (Columbia Generating Station) | 5.000% | 7/1/18 | 650 | 694 |
| Energy Northwest Washington Electric Revenue | | | | |
| (Columbia Generating Station) | 5.000% | 7/1/19 | 260 | 287 |
| Energy Northwest Washington Electric Revenue | | | | |
| (Columbia Generating Station) | 5.000% | 7/1/21 | 75 | 88 |
| Energy Northwest Washington Electric Revenue | | | | |
| (Columbia Generating Station) | 5.000% | 7/1/30 | 200 | 241 |
| Energy Northwest Washington Electric Revenue | | | | |
| (Project No. 1) | 5.000% | 7/1/25 | 50 | 62 |
| Energy Northwest Washington Electric Revenue | | | | |
| (Project No. 1) | 5.000% | 7/1/28 | 50 | 57 |
| Energy Northwest Washington Electric Revenue | | | | |
| (Project No. 3) | 5.000% | 7/1/18 | 300 | 320 |
| Energy Northwest Washington Electric Revenue | | | | |
| (Project No. 3) | 5.000% | 7/1/27 | 250 | 314 |
| King County WA Sewer Revenue Unrefunded-REF | 5.000% | 1/1/45 | 30 | 33 |
| King County WA Sewer Revenue | 5.000% | 1/1/19 (Prere.) | 550 | 598 |
| King County WA Sewer Revenue | 5.000% | 7/1/20 (Prere.) | 95 | 108 |
| King County WA Sewer Revenue | 5.125% | 1/1/21 (Prere.) | 35 | 41 |
| King County WA Sewer Revenue | 5.125% | 1/1/37 | 30 | 34 |
| Northwest Energy Washington Electric Revenue | | | | |
| (Columbia Generating Station) | 5.250% | 7/1/18 | 125 | 134 |
| Port of Seattle WA Revenue | 5.000% | 2/1/30 | 250 | 301 |
| Port of Seattle WA Revenue | 5.000% | 8/1/31 | 100 | 117 |
67
| | | | |
| Tax-Exempt Bond Index Fund | | | | |
| |
| |
| |
| | | | Face | Market |
| | | Maturity | Amount | Value• |
| | Coupon | Date | ($000) | ($000) |
| Port of Tacoma WA GO | 5.000% | 6/1/18 (Prere.) | 115 | 122 |
| Seattle WA Municipal Light & Power Revenue | 5.000% | 2/1/20 (Prere.) | 15 | 17 |
| Seattle WA Municipal Light & Power Revenue | 5.000% | 2/1/23 | 60 | 67 |
| University of Washington Revenue | 3.125% | 7/1/42 | 465 | 460 |
| Washington (Motor Vehicle Fuel Tax) GO | 4.500% | 1/1/17 (Prere.) | 100 | 101 |
| Washington (Motor Vehicle Fuel Tax) GO | 4.000% | 7/1/18 | 60 | 63 |
| Washington (Motor Vehicle Fuel Tax) GO | 5.000% | 7/1/23 | 235 | 287 |
| Washington (Motor Vehicle Fuel Tax) GO | 4.000% | 7/1/25 | 100 | 110 |
| Washington (Motor Vehicle Fuel Tax) GO | 5.000% | 7/1/29 | 200 | 242 |
| Washington (Motor Vehicle Fuel Tax) GO | 5.000% | 8/1/33 | 500 | 590 |
| Washington (Motor Vehicle Fuel Tax) GO | 5.000% | 6/1/41 | 200 | 230 |
| Washington Federal Highway Grant Anticipation | | | | |
| Revenue (520 Corridor Program) | 5.000% | 9/1/21 | 100 | 117 |
| Washington Federal Highway Grant Anticipation | | | | |
| Revenue (520 Corridor Program) | 5.000% | 9/1/22 | 90 | 107 |
| Washington Federal Highway Grant Anticipation | | | | |
| Revenue (520 Corridor Program) | 5.000% | 9/1/24 | 70 | 83 |
| Washington GO | 5.000% | 7/1/17 | 200 | 206 |
| Washington GO | 5.000% | 1/1/18 | 530 | 556 |
| Washington GO | 5.000% | 1/1/18 (Prere.) | 195 | 204 |
| Washington GO | 5.000% | 1/1/18 (Prere.) | 100 | 105 |
| Washington GO | 5.000% | 1/1/18 (Prere.) | 65 | 68 |
| Washington GO | 5.000% | 7/1/18 (Prere.) | 170 | 182 |
| Washington GO | 5.000% | 7/1/18 | 150 | 160 |
| Washington GO | 5.000% | 7/1/18 | 210 | 224 |
| Washington GO | 5.000% | 7/1/18 (Prere.) | 60 | 64 |
| Washington GO | 5.000% | 7/1/18 (Prere.) | 100 | 107 |
| Washington GO | 5.000% | 7/1/18 (Prere.) | 80 | 85 |
| Washington GO | 5.000% | 1/1/19 (Prere.) | 85 | 92 |
| Washington GO | 5.000% | 2/1/19 (Prere.) | 60 | 65 |
| Washington GO | 5.000% | 1/1/20 | 175 | 196 |
| Washington GO | 5.000% | 1/1/21 | 150 | 173 |
| Washington GO | 4.000% | 7/1/26 | 350 | 384 |
| Washington GO | 5.000% | 7/1/26 | 150 | 188 |
| Washington GO | 3.000% | 7/1/29 | 275 | 277 |
| Washington GO | 5.000% | 8/1/30 | 75 | 90 |
| Washington GO | 5.000% | 7/1/32 | 100 | 119 |
| Washington GO | 5.000% | 7/1/32 | 100 | 120 |
| Washington GO | 5.000% | 7/1/33 | 275 | 325 |
| Washington GO | 5.000% | 7/1/33 | 500 | 598 |
| Washington GO | 5.000% | 8/1/34 | 250 | 282 |
| Washington GO | 5.000% | 8/1/39 | 500 | 593 |
| | | | | 13,382 |
| West Virginia (0.0%) | | | | |
| West Virginia Economic Development Authority | | | | |
| Lottery Revenue | 5.000% | 6/15/40 | 50 | 56 |
| |
| Wisconsin (0.8%) | | | | |
| Wisconsin Annual Appropriation Revenue | 5.750% | 5/1/29 | 100 | 111 |
| Wisconsin GO | 5.000% | 5/1/19 (2) | 175 | 192 |
| Wisconsin GO | 5.000% | 11/1/20 | 60 | 69 |
| Wisconsin GO | 5.000% | 11/1/20 | 500 | 576 |
| Wisconsin GO | 5.000% | 11/1/22 | 250 | 294 |
| Wisconsin GO | 5.000% | 11/1/23 | 205 | 253 |
| Wisconsin GO | 5.000% | 5/1/25 | 90 | 107 |
68
| | | | |
| Tax-Exempt Bond Index Fund | | | | |
| |
| |
| |
| | | | Face | Market |
| | | Maturity | Amount | Value• |
| | Coupon | Date | ($000) | ($000) |
| Wisconsin GO | 5.000% | 11/1/29 | 500 | 617 |
| Wisconsin GO | 5.000% | 5/1/35 | 520 | 609 |
| Wisconsin GO | 6.000% | 5/1/36 | 450 | 502 |
| Wisconsin GO | 5.000% | 5/1/37 | 750 | 882 |
| Wisconsin Health & Educational Facilities Authority | | | | |
| Revenue (Medical College Wisconsin) | 4.000% | 12/1/46 | 300 | 316 |
| Wisconsin Public Finance Authority Lease | | | | |
| Development Revenue (Central District | | | | |
| Development Project) | 5.000% | 3/1/41 | 245 | 283 |
| Wisconsin Public Power System Power Supply | | | | |
| System Revenue | 5.000% | 7/1/37 | 290 | 334 |
| Wisconsin Transportation Revenue | 5.000% | 7/1/19 (14) | 90 | 100 |
| | | | | 5,245 |
| Wyoming (0.0%) | | | | |
| Campbell County WY Solid Waste Facilities | | | | |
| Revenue(Basin Electric Power Cooperative - | | | | |
| Dry Fork Station Facilities) | 5.750% | 7/15/39 | 225 | 249 |
| Total Tax-Exempt Municipal Bonds (Cost $608,888) | | | | 609,965 |
| |
| | | | Shares | |
| Temporary Cash Investment (1.6%) | | | | |
| Money Market Fund (1.6%) | | | | |
| 1 Vanguard Municipal Cash Management Fund | | | | |
| (Cost $9,699) | 0.614% | | 96,989 | 9,699 |
| Total Investments (99.7%) (Cost $618,587) | | | | 619,664 |
| |
| | | | | Amount |
| | | | | ($000) |
| Other Assets and Liabilities (0.3%) | | | | |
| Other Assets | | | | |
| Investment in Vanguard | | | | 45 |
| Receivables for Accrued Income | | | | 7,469 |
| Receivables for Capital Shares Issued | | | | 1,053 |
| Total Other Assets | | | | 8,567 |
| Liabilities | | | | |
| Payables for Investment Securities Purchased | | | | (6,247) |
| Payables for Capital Shares Redeemed | | | | (16) |
| Payables for Distributions | | | | (13) |
| Payables to Vanguard | | | | (49) |
| Other Liabilities | | | | (92) |
| Total Liabilities | | | | (6,417) |
| Net Assets (100%) | | | | 621,814 |
69
Tax-Exempt Bond Index Fund
| |
| At October 31, 2016, net assets consisted of: | |
| | Amount |
| | ($000) |
| Paid-in Capital | 619,992 |
| Undistributed Net Investment Income | 781 |
| Accumulated Net Realized Losses | (36) |
| Unrealized Appreciation (Depreciation) | 1,077 |
| Net Assets | 621,814 |
| |
| Investor Shares—Net Assets | |
| Applicable to 224,620 outstanding $.001 par value shares of | |
| beneficial interest (unlimited authorization) | 2,319 |
| Net Asset Value Per Share—Investor Shares | $10.33 |
| |
| ETF Shares—Net Assets | |
| Applicable to 10,650,709 outstanding $.001 par value shares of | |
| beneficial interest (unlimited authorization) | 550,354 |
| Net Asset Value Per Share—ETF Shares | $51.67 |
| |
| Admiral Shares—Net Assets | |
| Applicable to 3,348,831 outstanding $.001 par value shares of | |
| beneficial interest (unlimited authorization) | 69,141 |
| Net Asset Value Per Share—Admiral Shares | $20.65 |
• See Note A in Notes to Financial Statements.
1 Affiliated money market fund available only to Vanguard funds and certain trusts and accounts managed by Vanguard. Rate shown is
the 7-day yield.
A Key to abbreviations and other references follows the Statement of Net Assets.
See accompanying Notes, which are an integral part of the Financial Statements.
70
Tax-Exempt Bond Index Fund
Key to Abbreviations
ARS—Auction Rate Security.
BAN—Bond Anticipation Note.
COP—Certificate of Participation.
CP—Commercial Paper.
FR—Floating Rate.
GAN—Grant Anticipation Note.
GO—General Obligation Bond.
PILOT—Payments in Lieu of Taxes.
PUT—Put Option Obligation.
RAN—Revenue Anticipation Note.
TAN—Tax Anticipation Note.
TOB—Tender Option Bond.
TRAN—Tax Revenue Anticipation Note.
VRDO—Variable Rate Demand Obligation.
VRDP—Variable Rate Demand Preferred.
(ETM)—Escrowed to Maturity.
(Prere.)—Prerefunded.
Scheduled principal and interest payments are guaranteed by:
(1) MBIA (Municipal Bond Investors Assurance).
(2) AMBAC (Ambac Assurance Corporation).
(3) FGIC (Financial Guaranty Insurance Company).
(4) AGM (Assured Guaranty Municipal Corporation).
(5) BIGI (Bond Investors Guaranty Insurance).
(6) Connie Lee Inc.
(7) FHA (Federal Housing Authority).
(8) CapMAC (Capital Markets Assurance Corporation).
(9) American Capital Access Financial Guaranty Corporation.
(10) XL Capital Assurance Inc.
(11) CIFG (CDC IXIS Financial Guaranty).
(12) AGC (Assured Guaranty Corporation).
(13) BHAC (Berkshire Hathaway Assurance Corporation).
(14) NPFG (National Public Finance Guarantee Corporation).
(15) BAM (Build America Mutual Assurance Company).
(16) MAC (Municipal Assurance Corporation).
(17) RAA (Radian Asset Assurance Inc.).
(18) SBLF (Michigan School Bond Loan Fund).
The insurance does not guarantee the market value of the municipal bonds.
LOC—Scheduled principal and interest payments are guaranteed by bank letter of credit.
71
Tax-Exempt Bond Index Fund
Statement of Operations
| |
| | Year Ended |
| | October 31, 2016 |
| | ($000) |
| Investment Income | |
| Income | |
| Interest1 | 6,074 |
| Total Income | 6,074 |
| Expenses | |
| The Vanguard Group—Note B | |
| Investment Advisory Services | 37 |
| Management and Administrative—Investor Shares | 5 |
| Management and Administrative—ETF Shares | 169 |
| Management and Administrative—Admiral Shares | 21 |
| Marketing and Distribution—Investor Shares | — |
| Marketing and Distribution—ETF Shares | 24 |
| Marketing and Distribution—Admiral Shares | 4 |
| Custodian Fees | 1 |
| Auditing Fees | 37 |
| Shareholders’ Reports—Investor Shares | — |
| Shareholders’ Reports—ETF Shares | 4 |
| Shareholders’ Reports—Admiral Shares | 1 |
| Total Expenses | 303 |
| Net Investment Income | 5,771 |
| Realized Net Gain (Loss) on Investment Securities Sold1 | (32) |
| Change in Unrealized Appreciation (Depreciation) of Investment Securities | 744 |
| Net Increase (Decrease) in Net Assets Resulting from Operations | 6,483 |
| 1 Interest income and realized net gain (loss) from an affiliated company of the fund were $34,000 and $0, respectively. |
See accompanying Notes, which are an integral part of the Financial Statements.
72
Tax-Exempt Bond Index Fund
Statement of Changes in Net Assets
| | |
| | | August 21, |
| | Year Ended | 20151 to |
| | October 31, | October 31, |
| | 2016 | 2015 |
| | ($000) | ($000) |
| Increase (Decrease) in Net Assets | | |
| Operations | | |
| Net Investment Income | 5,771 | 223 |
| Realized Net Gain (Loss) | (32) | (4) |
| Change in Unrealized Appreciation (Depreciation) | 744 | 333 |
| Net Increase (Decrease) in Net Assets Resulting from Operations | 6,483 | 552 |
| Distributions | | |
| Net Investment Income | | |
| Investor Shares | (24) | (7) |
| ETF Shares | (4,401) | (107) |
| Admiral Shares | (657) | (17) |
| Realized Capital Gain | | |
| Investor Shares | — | — |
| ETF Shares | — | — |
| Admiral Shares | — | — |
| Total Distributions | (5,082) | (131) |
| Capital Share Transactions | | |
| Investor Shares | (3,074) | 5,377 |
| ETF Shares | 488,632 | 60,013 |
| Admiral Shares | 61,896 | 7,148 |
| Net Increase (Decrease) from Capital Share Transactions | 547,454 | 72,538 |
| Total Increase (Decrease) | 548,855 | 72,959 |
| Net Assets | | |
| Beginning of Period | 72,959 | — |
| End of Period2 | 621,814 | 72,959 |
| 1 Inception. |
| 2 Net Assets—End of Period includes undistributed (overdistributed) net investment income of $781,000 and $92,000. |
See accompanying Notes, which are an integral part of the Financial Statements.
73
Tax-Exempt Bond Index Fund
Financial Highlights
| | |
| Investor Shares | | |
| | Year | Aug. 21, |
| | Ended | 20151 to |
| | October 31, | Oct. 31, |
| For a Share Outstanding Throughout Each Period | 2016 | 2015 |
| Net Asset Value, Beginning of Period | $10.05 | $10.00 |
| Investment Operations | | |
| Net Investment Income | .149 | . 034 |
| Net Realized and Unrealized Gain (Loss) on Investments2 | .280 | .048 |
| Total from Investment Operations | .429 | .082 |
| Distributions | | |
| Dividends from Net Investment Income | (.149) | (.032) |
| Distributions from Realized Capital Gains | — | — |
| Total Distributions | (.149) | (.032) |
| Net Asset Value, End of Period | $10.33 | $10.05 |
| |
| Total Return3 | 4.28% | 0.82% |
| |
| Ratios/Supplemental Data | | |
| Net Assets, End of Period (Millions) | $2 | $5 |
| Ratio of Total Expenses to Average Net Assets | 0.19% | 0.20%4 |
| Ratio of Net Investment Income to Average Net Assets | 1.61% | 1.88%4 |
| Portfolio Turnover Rate 5 | 8% | 1% |
1 Inception.
2 Includes increases from purchase fees of $0.00 and $0.06.
3 Total returns do not include transaction or account service fees that may have applied in the periods shown. Fund prospectuses provide
information about any applicable transaction and account service fees.
4 Annualized.
5 Excludes the value of portfolio securities received or delivered as a result of in-kind purchases or redemptions of the fund’s capital shares,
including ETF Creation Units.
See accompanying Notes, which are an integral part of the Financial Statements.
74
Tax-Exempt Bond Index Fund
Financial Highlights
| | |
| ETF Shares | | |
| | Year | Aug. 21, |
| | Ended | 20151 to |
| | October 31, | Oct. 31, |
| For a Share Outstanding Throughout Each Period | 2016 | 2015 |
| Net Asset Value, Beginning of Period | $50.33 | $50.00 |
| Investment Operations | | |
| Net Investment Income | . 810 | .170 |
| Net Realized and Unrealized Gain (Loss) on Investments2 | 1.343 | .255 |
| Total from Investment Operations | 2.153 | .425 |
| Distributions | | |
| Dividends from Net Investment Income | (.813) | (.095) |
| Distributions from Realized Capital Gains | — | — |
| Total Distributions | (.813) | (.095) |
| Net Asset Value, End of Period | $51.67 | $50.33 |
| |
| Total Return | 4.29% | 0.85% |
| |
| Ratios/Supplemental Data | | |
| Net Assets, End of Period (Millions) | $550 | $60 |
| Ratio of Total Expenses to Average Net Assets | 0.09% | 0.12%3 |
| Ratio of Net Investment Income to Average Net Assets | 1.71% | 1.96%3 |
| Portfolio Turnover Rate | 8% | 1% |
| 1 Inception. |
| 2 Includes increases from purchase fees of $0.02 and $0.00. |
| 3 Annualized. |
See accompanying Notes, which are an integral part of the Financial Statements.
75
Tax-Exempt Bond Index Fund
Financial Highlights
| | |
| Admiral Shares | | |
| | Year | Aug. 25, |
| | Ended | 20151 to |
| | October 31, | Oct. 31, |
| For a Share Outstanding Throughout Each Period | 2016 | 2015 |
| Net Asset Value, Beginning of Period | $20.10 | $19.98 |
| Investment Operations | | |
| Net Investment Income | . 324 | . 066 |
| Net Realized and Unrealized Gain (Loss) on Investments | .550 | .120 |
| Total from Investment Operations | .874 | .186 |
| Distributions | | |
| Dividends from Net Investment Income | (.324) | (.066) |
| Distributions from Realized Capital Gains | — | — |
| Total Distributions | (.324) | (.066) |
| Net Asset Value, End of Period | $20.65 | $20.10 |
| |
| Total Return2 | 4.36% | 0.93% |
| |
| Ratios/Supplemental Data | | |
| Net Assets, End of Period (Millions) | $69 | $7 |
| Ratio of Total Expenses to Average Net Assets | 0.09% | 0.12%3 |
| Ratio of Net Investment Income to Average Net Assets | 1.71% | 1.96%3 |
| Portfolio Turnover Rate 4 | 8% | 1% |
1 Inception.
2 Total returns do not include transaction or account service fees that may have applied in the periods shown. Fund prospectuses provide
information about any applicable transaction and account service fees.
3 Annualized.
4 Excludes the value of portfolio securities received or delivered as a result of in-kind purchases or redemptions of the fund’s capital shares,
including ETF Creation Units.
See accompanying Notes, which are an integral part of the Financial Statements.
76
Tax-Exempt Bond Index Fund
Notes to Financial Statements
Vanguard Tax-Exempt Bond Index Fund is registered under the Investment Company Act of 1940 as an open-end investment company, or mutual fund. The fund invests in debt instruments of many municipal issuers; the issuers’ abilities to meet their obligations may be affected by economic and political developments in a specific state or region. The fund offers three classes of shares: Investor Shares, ETF Shares, and Admiral Shares. Investor Shares are available to any investor who meets the fund’s minimum purchase requirements. ETF Shares are listed for trading on NYSE Arca; they can be purchased and sold through a broker. Admiral Shares are designed for investors who meet certain administrative, service, and account-size criteria.
A. The following significant accounting policies conform to generally accepted accounting principles for U.S. investment companies. The fund consistently follows such policies in preparing its financial statements.
1. Security Valuation: Securities are valued as of the close of trading on the New York Stock Exchange (generally 4 p.m., Eastern time) on the valuation date. Bonds and temporary cash investments acquired over 60 days to maturity are valued using the latest bid prices or using valuations based on a matrix system (which considers such factors as security prices, yields, maturities, and ratings), both as furnished by independent pricing services. Investments in Vanguard Municipal Cash Management Fund are valued at that fund’s net asset value. Other temporary cash investments are valued at amortized cost, which approximates market value. Securities for which market quotations are not readily available, or whose values have been affected by events occurring before the fund’s pricing time but after the close of the securities’ primary markets, are valued by methods deemed by the board of trustees to represent fair value.
2. Federal Income Taxes: The fund intends to continue to qualify as a regulated investment company and distribute all of its income. Management has analyzed the fund’s tax positions taken for all open federal income tax years (October 31, 2015–2016), and has concluded that no provision for federal income tax is required in the fund’s financial statements.
3. Distributions: Distributions to shareholders are recorded on the ex-dividend date.
4. Credit Facility: The fund and certain other funds managed by The Vanguard Group (“Vanguard”) participate in a $3.1 billion committed credit facility provided by a syndicate of lenders pursuant to a credit agreement that may be renewed annually; each fund is individually liable for its borrowings, if any, under the credit facility. Borrowings may be utilized for temporary and emergency purposes, and are subject to the fund’s regulatory and contractual borrowing restrictions. The participating funds are charged administrative fees and an annual commitment fee of 0.10% of the undrawn amount of the facility; these fees are allocated to the funds based on a method approved by the fund’s board of trustees and included in Management and Administrative expenses on the fund’s Statement of Operations. Any borrowings under this facility bear interest at a rate based upon the higher of the one-month London Interbank Offered Rate, federal funds effective rate, or overnight bank funding rate plus an agreed-upon spread.
The fund had no borrowings outstanding at October 31, 2016, or at any time during the period then ended.
5. Other: Interest income includes income distributions received from Vanguard Municipal Cash Management Fund and is accrued daily. Premiums and discounts on debt securities purchased are amortized and accreted, respectively, to interest income over the lives of the respective securities. Security transactions are accounted for on the date securities are bought or sold. Costs used to determine realized gains (losses) on the sale of investment securities are those of the specific securities sold. Fees assessed on capital share transactions are credited to paid-in capital.
77
Tax-Exempt Bond Index Fund
Each class of shares has equal rights as to assets and earnings, except that each class separately bears certain class-specific expenses related to maintenance of shareholder accounts (included in Management and Administrative expenses) and shareholder reporting. Marketing and distribution expenses are allocated to each class of shares based on a method approved by the board of trustees. Income, other non-class-specific expenses, and gains and losses on investments are allocated to each class of shares based on its relative net assets.
B. In accordance with the terms of a Funds’ Service Agreement (the “FSA”) between Vanguard and the fund, Vanguard furnishes to the fund investment advisory, corporate management, administrative, marketing, and distribution services at Vanguard’s cost of operations (as defined by the FSA). These costs of operations are allocated to the fund based on methods and guidelines approved by the board of trustees. Vanguard does not require reimbursement in the current period for certain costs of operations (such as deferred compensation/benefits and risk/insurance costs); the fund’s liability for these costs of operations is included in Payables to Vanguard on the Statement of Net Assets.
Upon the request of Vanguard, the fund may invest up to 0.40% of its net assets as capital in Vanguard. At October 31, 2016, the fund had contributed to Vanguard capital in the amount of $45,000, representing 0.01% of the fund’s net assets and 0.02% of Vanguard’s capitalization. The fund’s trustees and officers are also directors and employees, respectively, of Vanguard.
C. Various inputs may be used to determine the value of the fund’s investments. These inputs are summarized in three broad levels for financial statement purposes. The inputs or methodologies used to value securities are not necessarily an indication of the risk associated with investing in those securities.
Level 1—Quoted prices in active markets for identical securities.
Level 2—Other significant observable inputs (including quoted prices for similar securities, interest rates, prepayment speeds, credit risk, etc.).
Level 3—Significant unobservable inputs (including the fund’s own assumptions used to determine the fair value of investments).
The following table summarizes the market value of the fund’s investments as of October 31, 2016, based on the inputs used to value them:
| | | |
| | Level 1 | Level 2 | Level 3 |
| Investments | ($000) | ($000) | ($000) |
| Tax-Exempt Municipal Bonds | — | 609,965 | — |
| Temporary Cash Investments | 9,699 | — | — |
| Total | 9,699 | 609,965 | — |
D. Distributions are determined on a tax basis and may differ from net investment income and realized capital gains for financial reporting purposes. Differences may be permanent or temporary. Permanent differences are reclassified among capital accounts in the financial statements to reflect their tax character. Temporary differences arise when certain items of income, expense, gain, or loss are recognized in different periods for financial statement and tax purposes. These differences will reverse at some time in the future. Differences in classification may also result from the treatment of short-term gains as ordinary income for tax purposes.
For tax purposes, at October 31, 2016, the fund had $809,000 of ordinary income available for distribution. The fund had available capital losses totaling $36,000 that may be carried forward indefinitely to offset future net capital gains.
78
Tax-Exempt Bond Index Fund
At October 31, 2016, the cost of investment securities for tax purposes was $618,587,000. Net unrealized appreciation of investment securities for tax purposes was $1,077,000, consisting of unrealized gains of $4,577,000 on securities that had risen in value since their purchase and $3,500,000 in unrealized losses on securities that had fallen in value since their purchase.
E. During the year ended October 31, 2016, the fund purchased $549,370,000 of investment securities and sold $23,969,000 of investment securities, other than temporary cash investments. Purchases include $352,036,000 in connection with in-kind purchases of the fund’s capital shares.
F. Capital share transactions for each class of shares were:
| | | | |
| | Year Ended | August 21, 20151 to |
| | October 31, 2016 | October 31, 2015 |
| | Amount | Shares | Amount | Shares |
| | ($000) | (000) | ($000) | (000) |
| Investor Shares | | | | |
| Issued 2 | 3,124 | 303 | 5,438 | 542 |
| Issued in Lieu of Cash Distributions | 19 | 2 | 7 | 1 |
| Redeemed | (6,217) | (616) | (68) | (7) |
| Net Increase (Decrease)—Investor Shares | (3,074) | (311) | 5,377 | 536 |
| ETF Shares | | | | |
| Issued 2 | 488,632 | 9,451 | 60,013 | 1,200 |
| Issued in Lieu of Cash Distributions | — | — | — | — |
| Redeemed | — | — | — | — |
| Net Increase (Decrease)—ETF Shares | 488,632 | 9,451 | 60,013 | 1,200 |
| Admiral Shares | | | | |
| Issued 2 | 75,733 | 3,667 | 7,277 | 363 |
| Issued in Lieu of Cash Distributions | 579 | 28 | 14 | 1 |
| Redeemed | (14,416) | (703) | (143) | (7) |
| Net Increase (Decrease)—Admiral Shares | 61,896 | 2,992 | 7,148 | 357 |
| 1 Inception. |
| 2 Includes purchase fees for fiscal 2016 and 2015 of $182,000 and $32,000, respectively (fund totals). |
At October 31, 2016, one shareholder was the record or beneficial owner of 26% of the fund’s net assets. If the shareholder were to redeem its investment in the fund, the redemption might result in an increase in the fund’s expense ratio.
G. Management has determined that no material events or transactions occurred subsequent to October 31, 2016, that would require recognition or disclosure in these financial statements.
79
Report of Independent Registered
Public Accounting Firm
To the Board of Trustees of Vanguard Municipal Bond Funds and the Shareholders of Vanguard Tax-Exempt Bond Index Fund: In our opinion, the accompanying statement of net assets and the related statements of operations and of changes in net assets and the financial highlights present fairly, in all material respects, the financial position of Vanguard Tax-Exempt Bond Index Fund (constituting a separate portfolio of Vanguard Municipal Bond Funds, hereafter referred to as the “Fund”) at October 31, 2016, and the results of its operations for the year then ended, and the changes in its net assets and financial highlights for the periods indicated, in conformity with accounting principles generally accepted in the United States of America. These financial statements and financial highlights (hereafter referred to as “financial statements”) are the responsibility of the Fund’s management. Our responsibility is to express an opinion on these financial statements based on our audits. We conducted our audits of these financial statements in accordance with the standards of the Public Company Accounting Oversight Board (United States). Those standards require that we plan and perform the audit to obtain reasonable assurance about whether the financial statements are free of material misstatement. An audit includes examining, on a test basis, evidence supporting the amounts and disclosures in the financial statements, assessing the accounting principles used and significant estimates made by management, and evaluating the overall financial statement presentation. We believe that our audits, which included confirmation of securities at October 31, 2016 by correspondence with the custodian and brokers and by agreement to the underlying ownership records of the transfer agent, provide a reasonable basis for our opinion.
/s/PricewaterhouseCoopers LLP
Philadelphia, Pennsylvania
December 15, 2016

Special 2016 tax information (unaudited) for Vanguard Tax-Exempt Bond Index Fund
This information for the fiscal year ended October 31, 2016, is included pursuant to provisions of
the Internal Revenue Code.
The fund designates 100% of its income dividends as exempt-interest dividends.
80
About Your Fund’s Expenses
As a shareholder of the fund, you incur ongoing costs, which include costs for portfolio management, administrative services, and shareholder reports (like this one), among others. Operating expenses, which are deducted from a fund’s gross income, directly reduce the investment return of the fund.
A fund’s expenses are expressed as a percentage of its average net assets. This figure is known as the expense ratio. The following examples are intended to help you understand the ongoing costs (in dollars) of investing in your fund and to compare these costs with those of other mutual funds. The examples are based on an investment of $1,000 made at the beginning of the period shown and held for the entire period.
The accompanying table illustrates your fund’s costs in two ways:
• Based on actual fund return. This section helps you to estimate the actual expenses that you paid over the period. The ”Ending Account Value“ shown is derived from the fund‘s actual return, and the third column shows the dollar amount that would have been paid by an investor who started with $1,000 in the fund. You may use the information here, together with the amount you invested, to estimate the expenses that you paid over the period.
To do so, simply divide your account value by $1,000 (for example, an $8,600 account value divided by $1,000 = 8.6), then multiply the result by the number given for your fund under the heading ”Expenses Paid During Period.“
• Based on hypothetical 5% yearly return. This section is intended to help you compare your fund‘s costs with those of other mutual funds. It assumes that the fund had a yearly return of 5% before expenses, but that the expense ratio is unchanged. In this case—because the return used is not the fund’s actual return—the results do not apply to your investment. The example is useful in making comparisons because the Securities and Exchange Commission requires all mutual funds to calculate expenses based on a 5% return. You can assess your fund’s costs by comparing this hypothetical example with the hypothetical examples that appear in shareholder reports of other funds.
Note that the expenses shown in the table are meant to highlight and help you compare ongoing costs only and do not reflect transaction costs incurred by the fund for buying and selling securities. Further, the expenses do not include any purchase, redemption, or account service fees described in the fund prospectus. If such fees were applied to your account, your costs would be higher. Your fund does not carry a “sales load.”
The calculations assume no shares were bought or sold during the period. Your actual costs may have been higher or lower, depending on the amount of your investment and the timing of any purchases or redemptions.
You can find more information about the fund’s expenses, including annual expense ratios, in the Financial Statements section of this report. For additional information on operating expenses and other shareholder costs, please refer to your fund’s current prospectus.
81
| | | |
| Six Months Ended October 31, 2016 | | | |
| | Beginning | Ending | Expenses |
| | Account Value | Account Value | Paid During |
| Tax-Exempt Bond Index Fund | 4/30/2016 | 10/31/2016 | Period |
| Based on Actual Fund Return | | | |
| Investor Shares | $1,000.00 | $1,006.23 | $0.91 |
| ETF Shares | 1,000.00 | 1,006.50 | 0.35 |
| Admiral Shares | 1,000.00 | 1,006.71 | 0.35 |
| Based on Hypothetical 5% Yearly Return | | | |
| Investor Shares | $1,000.00 | $1,024.23 | $0.92 |
| ETF Shares | 1,000.00 | 1,024.78 | 0.36 |
| Admiral Shares | 1,000.00 | 1,024.78 | 0.36 |
The calculations are based on expenses incurred in the most recent six-month period. The fund’s annualized six-month expense ratios for that
period are 0.18% for Investor Shares, 0.07% for ETF Shares, and 0.07% for Admiral Shares. The dollar amounts shown as “Expenses Paid”
are equal to the annualized expense ratio multiplied by the average account value over the period, multiplied by the number of days in the
most recent six-month period, then divided by the number of days in the most recent 12-month period (184/366).
82
Glossary
30-Day SEC Yield. A fund’s 30-day SEC yield is derived using a formula specified by the U.S. Securities and Exchange Commission. Under the formula, data related to the fund’s security holdings in the previous 30 days are used to calculate the fund’s hypothetical net income for that period, which is then annualized and divided by the fund’s estimated average net assets over the calculation period. For the purposes of this calculation, a security’s income is based on its current market yield to maturity (for bonds), its actual income (for asset-backed securities), or its projected dividend yield (for stocks). Because the SEC yield represents hypothetical annualized income, it will differ—at times significantly—from the fund’s actual experience. As a result, the fund’s income distributions may be higher or lower than implied by the SEC yield.
Average Coupon. The average interest rate paid on the fixed income securities held by a fund. It is expressed as a percentage of face value.
Average Duration. An estimate of how much the value of the bonds held by a fund will fluctuate in response to a change in interest rates. To see how the value could change, multiply the average duration by the change in rates. If interest rates rise by 1 percentage point, the value of the bonds in a fund with an average duration of five years would decline by about 5%. If rates decrease by a percentage point, the value would rise by 5%.
Average Stated Maturity. The average length of time until fixed income securities held by a fund reach maturity and are repaid using the maturity date of the security. The figure reflects the proportion of fund assets represented by each security; it also reflects any futures contracts held. In general, the longer the average stated maturity, the more a fund’s share price will fluctuate in response to changes in market interest rates.
Credit Quality. Credit-quality ratings are measured on a scale that generally ranges from AAA (highest) to D (lowest). Credit-quality ratings are obtained from Moody’s and S&P, and the higher rating for each issue is used. ”Not Rated” is used to classify securities for which a rating is not available.
Expense Ratio. A fund’s total annual operating expenses expressed as a percentage of the fund’s average net assets. The expense ratio includes management and administrative expenses, but does not include the transaction costs of buying and selling portfolio securities.
Inception Date. The date on which the assets of a fund (or one of its share classes) are first invested in accordance with the fund’s investment objective. For funds with a subscription period, the inception date is the day after that period ends. Investment performance is measured from the inception date.
Short-Term Reserves. The percentage of a fund invested in highly liquid, short-term securities that can be readily converted to cash.
Yield to Maturity. The rate of return an investor would receive if the fixed income securities held by a fund were held to their maturity dates.
83
The People Who Govern Your Fund
The trustees of your mutual fund are there to see that the fund is operated and managed in your best interests since, as a shareholder, you are a part owner of the fund. Your fund’s trustees also serve on the board of directors of The Vanguard Group, Inc., which is owned by the Vanguard funds and provides services to them on an at-cost basis.
A majority of Vanguard’s board members are independent, meaning that they have no affiliation with Vanguard or the funds they oversee, apart from the sizable personal investments they have made as private individuals. The independent board members have distinguished backgrounds in business, academia, and public service. Each of the trustees and executive officers oversees 198 Vanguard funds.
The following table provides information for each trustee and executive officer of the fund. The mailing address of the trustees and officers is P.O. Box 876, Valley Forge, PA 19482. More information about the trustees is in the Statement of Additional Information, which can be obtained, without charge, by contacting Vanguard at 800-662-7447, or online at vanguard.com.
InterestedTrustee1
F. William McNabb III
Born 1957. Trustee Since July 2009. Chairman of
the Board. Principal Occupation(s) During the Past
Five Years and Other Experience: Chairman of the
Board of The Vanguard Group, Inc., and of each of
the investment companies served by The Vanguard
Group, since January 2010; Director of The Vanguard
Group since 2008; Chief Executive Officer and
President of The Vanguard Group, and of each of
the investment companies served by The Vanguard
Group, since 2008; Director of Vanguard Marketing
Corporation; Managing Director of The Vanguard
Group (1995–2008).
IndependentTrustees
Emerson U. Fullwood
Born 1948. Trustee Since January 2008. Principal
Occupation(s) During the Past Five Years and Other
Experience: Executive Chief Staff and Marketing
Officer for North America and Corporate Vice President
(retired 2008) of Xerox Corporation (document manage-
ment products and services); Executive in Residence
and 2009–2010 Distinguished Minett Professor at
the Rochester Institute of Technology; Lead Director
of SPX FLOW, Inc. (multi-industry manufacturing);
Director of the United Way of Rochester, the University
of Rochester Medical Center, Monroe Community
College Foundation, North Carolina A&T University,
and Roberts Wesleyan College.
Rajiv L. Gupta
Born 1945. Trustee Since December 2001.2 Principal
Occupation(s) During the Past Five Years and Other
Experience: Chairman and Chief Executive Officer
(retired 2009) and President (2006–2008) of
Rohm and Haas Co. (chemicals); Director of Tyco
International plc (diversified manufacturing and
services), HP Inc. (printer and personal computer
manufacturing), and Delphi Automotive plc
(automotive components); Senior Advisor at
New Mountain Capital.
Amy Gutmann
Born 1949. Trustee Since June 2006. Principal
Occupation(s) During the Past Five Years and
Other Experience: President of the University of
Pennsylvania; Christopher H. Browne Distinguished
Professor of Political Science, School of Arts and
Sciences, and Professor of Communication, Annenberg
School for Communication, with secondary faculty
appointments in the Department of Philosophy, School
of Arts and Sciences, and at the Graduate School of
Education, University of Pennsylvania; Trustee of the
National Constitution Center; Chair of the Presidential
Commission for the Study of Bioethical Issues.
JoAnn Heffernan Heisen
Born 1950. Trustee Since July 1998. Principal
Occupation(s) During the Past Five Years and
Other Experience: Corporate Vice President and
Chief Global Diversity Officer (retired 2008) and
Member of the Executive Committee (1997–2008)
of Johnson & Johnson (pharmaceuticals/medical
devices/consumer products); Director of Skytop
Lodge Corporation (hotels) and the Robert Wood
Johnson Foundation; Member of the Advisory
Board of the Institute for Women’s Leadership
at Rutgers University.
F. Joseph Loughrey
Born 1949. Trustee Since October 2009. Principal
Occupation(s) During the Past Five Years and Other
Experience: President and Chief Operating Officer
(retired 2009) of Cummins Inc. (industrial machinery);
Chairman of the Board of Hillenbrand, Inc. (specialized
consumer services), and of Oxfam America; Director
of SKF AB (industrial machinery), Hyster-Yale Materials
Handling, Inc. (forklift trucks), the Lumina Foundation
for Education, and the V Foundation for Cancer
Research; Member of the Advisory Council for the
College of Arts and Letters and of the Advisory Board
to the Kellogg Institute for International Studies, both
at the University of Notre Dame.
Mark Loughridge
Born 1953. Trustee Since March 2012. Principal
Occupation(s) During the Past Five Years and Other
Experience: Senior Vice President and Chief Financial
Officer (retired 2013) at IBM (information technology
services); Fiduciary Member of IBM’s Retirement Plan
Committee (2004–2013); Director of the Dow Chemical
Company; Member of the Council on Chicago Booth.
Scott C. Malpass
Born 1962. Trustee Since March 2012. Principal
Occupation(s) During the Past Five Years and Other
Experience: Chief Investment Officer and Vice
President at the University of Notre Dame; Assistant
Professor of Finance at the Mendoza College of
Business at Notre Dame; Member of the Notre Dame
403(b) Investment Committee, the Board of Advisors
for Spruceview Capital Partners, and the Investment
Advisory Committee of Major League Baseball; Board
Member of TIFF Advisory Services, Inc., and Catholic
Investment Services, Inc. (investment advisors).
André F. Perold
Born 1952. Trustee Since December 2004. Principal
Occupation(s) During the Past Five Years and Other
Experience: George Gund Professor of Finance and
Banking, Emeritus at the Harvard Business School
(retired 2011); Chief Investment Officer and Managing
Partner of HighVista Strategies LLC (private investment
firm); Director of Rand Merchant Bank; Overseer of
the Museum of Fine Arts Boston.
Peter F. Volanakis
Born 1955. Trustee Since July 2009. Principal
Occupation(s) During the Past Five Years and
Other Experience: President and Chief Operating
Officer (retired 2010) of Corning Incorporated
(communications equipment); Chairman of the
Board of Trustees of Colby-Sawyer College;
Member of the Advisory Board of the Norris
Cotton Cancer Center.
Executive Officers
Glenn Booraem
Born 1967. Treasurer Since May 2015. Principal
Occupation(s) During the Past Five Years and
Other Experience: Principal of The Vanguard Group,
Inc.; Treasurer of each of the investment companies
served by The Vanguard Group; Controller of each of
the investment companies served by The Vanguard
Group (2010–2015); Assistant Controller of each of
the investment companies served by The Vanguard
Group (2001–2010).
Thomas J. Higgins
Born 1957. Chief Financial Officer Since September
2008. Principal Occupation(s) During the Past Five
Years and Other Experience: Principal of The Vanguard
Group, Inc.; Chief Financial Officer of each of the
investment companies served by The Vanguard Group;
Treasurer of each of the investment companies served
by The Vanguard Group (1998–2008).
Peter Mahoney
Born 1974. Controller Since May 2015. Principal
Occupation(s) During the Past Five Years and Other
Experience: Head of Global Fund Accounting at The
Vanguard Group, Inc.; Controller of each of the invest-
ment companies served by The Vanguard Group;
Head of International Fund Services at The Vanguard
Group (2008–2014).
Anne E. Robinson
Born 1970. Secretary Since September 2016. Principal
Occupation(s) During the Past Five Years and Other
Experience: Managing Director of The Vanguard Group,
Inc.; General Counsel of The Vanguard Group; Secretary
of The Vanguard Group and of each of the investment
companies served by The Vanguard Group; Director
and Senior Vice President of Vanguard Marketing
Corporation; Managing Director and General Counsel
of Global Cards and Consumer Services at Citigroup
(2014–2016); Counsel at American Express (2003–2014).
| |
| Vanguard Senior Management Team |
| Mortimer J. Buckley | James M. Norris |
| Kathleen C. Gubanich | Thomas M. Rampulla |
| Martha G. King | Glenn W. Reed |
| John T. Marcante | Karin A. Risi |
| Chris D. McIsaac | Michael Rollings |
| |
| Chairman Emeritus and Senior Advisor |
| John J. Brennan | |
| Chairman, 1996–2009 | |
| Chief Executive Officer and President, 1996–2008 |
| |
| Founder | |
| John C. Bogle | |
| Chairman and Chief Executive Officer, 1974–1996 |
1 Mr. McNabb is considered an “interested person,” as defined in the Investment Company Act of 1940, because he is an officer of the Vanguard funds.
2 December 2002 for Vanguard Equity Income Fund, the Vanguard Municipal Bond Funds, and the Vanguard State Tax-Exempt Funds.
|  |
| | P.O. Box 2600 |
| | Valley Forge, PA 19482-2600 |
| |
| |
| |
| Connect with Vanguard® > vanguard.com |
| |
| |
| |
| Fund Information > 800-662-7447 | The index is a product of S&P Dow Jones Indices LLC |
| Direct Investor Account Services > 800-662-2739 | (“SPDJI”), and has been licensed for use by Vanguard. |
| | Standard & Poor’s® and S&P® are registered |
| Institutional Investor Services > 800-523-1036 | trademarks of Standard & Poor’s Financial Services LLC |
| Text Telephone for People | (“S&P”); Dow Jones® is a registered trademark of Dow |
| Who Are Deaf or Hard of Hearing > 800-749-7273 | Jones Trademark Holdings LLC (“Dow Jones”); S&P® |
| | and S&P 500® are trademarks of S&P; and these |
| This material may be used in conjunction | trademarks have been licensed for use by SPDJI and |
| with the offering of shares of any Vanguard | sublicensed for certain purposes by Vanguard. |
| fund only if preceded or accompanied by | Vanguard product(s) are not sponsored, endorsed, sold |
| | or promoted by SPDJI, Dow Jones, S&P, or their |
| the fund’s current prospectus. | respective affiliates and none of such parties make any |
| All comparative mutual fund data are from Lipper, a | representation regarding the advisability of investing in |
| Thomson Reuters Company, or Morningstar, Inc., unless | such product(s) nor do they have any liability for any |
| otherwise noted. | errors, omissions, or interruptions of the index. |
| |
| You can obtain a free copy of Vanguard’s proxy voting | |
| guidelines by visiting vanguard.com/proxyreporting or by | |
| calling Vanguard at 800-662-2739. The guidelines are | |
| also available from the SEC’s website, sec.gov. In | |
| addition, you may obtain a free report on how your fund | |
| voted the proxies for securities it owned during the 12 | |
| months ended June 30. To get the report, visit either | |
| vanguard.com/proxyreporting or sec.gov. | |
| |
| You can review and copy information about your fund at | |
| the SEC’s Public Reference Room in Washington, D.C. To | |
| find out more about this public service, call the SEC at | |
| 202-551-8090. Information about your fund is also | |
| available on the SEC’s website, and you can receive | |
| copies of this information, for a fee, by sending a | |
| request in either of two ways: via email addressed to | |
| publicinfo@sec.gov or via regular mail addressed to the | |
| Public Reference Section, Securities and Exchange | |
| Commission, Washington, DC 20549-1520. | |
| |
| | © 2016 The Vanguard Group, Inc. |
| | All rights reserved. |
| | Vanguard Marketing Corporation, Distributor. |
| |
| | Q14910 122016 |
Item 2: Code of Ethics. The Registrant has adopted a code of ethics that applies to the Registrant’s principal executive officer, principal financial officer, principal accounting officer or controller or persons performing similar functions. The Code of Ethics was amended during the reporting period covered by this report to make certain technical, non-material changes.
Item 3: Audit Committee Financial Expert. All members of the Audit Committee have been determined by the Registrant’s Board of Trustees to be Audit Committee Financial Experts and to be independent: Rajiv L. Gupta, JoAnn Heffernan Heisen, F. Joseph Loughrey, Mark Loughridge, and Peter F. Volanakis.
Item 4: Principal Accountant Fees and Services.
(a) Audit Fees.
Audit Fees of the Registrant
Fiscal Year Ended October 31, 2016: $48,000
Fiscal Year Ended October 31, 2015: $49,000
Aggregate Audit Fees of Registered Investment Companies in the Vanguard Group.
Fiscal Year Ended October 31, 2016: $9,629,849
Fiscal Year Ended October 31, 2015: $7,000,200
Includes fees billed in connection with audits of the Registrant, other registered investment companies in the Vanguard complex, The Vanguard Group, Inc. and Vanguard Marketing Corporation.
(b) Audit-Related Fees.
Fiscal Year Ended October 31, 2016: $2,717,627
Fiscal Year Ended October 31, 2015: $2,899,096
Includes fees billed in connection with assurance and related services provided to the Registrant, other registered investment companies in the Vanguard complex, The Vanguard Group, Inc., and Vanguard Marketing Corporation.
(c) Tax Fees.
Fiscal Year Ended October 31, 2016: $254,050
Fiscal Year Ended October 31, 2015: $353,389
Includes fees billed in connection with tax compliance, planning, and advice services provided to the Registrant, other registered investment companies in the Vanguard complex, The Vanguard Group, Inc., and Vanguard Marketing Corporation.
(d) All Other Fees.
Fiscal Year Ended October 31, 2016: $214,225
Fiscal Year Ended October 31, 2015: $202,313
Includes fees billed for services related to tax reported information provided to the Registrant, other registered investment companies in the Vanguard complex, The Vanguard Group, Inc., and Vanguard Marketing Corporation.
(e) (1) Pre-Approval Policies. The policy of the Registrant’s Audit Committee is to consider and, if appropriate, approve before the principal accountant is engaged for such services, all specific audit and non-audit services provided to: the Registrant, other registered investment companies in the Vanguard complex, The Vanguard Group, Inc., and entities controlled by The Vanguard Group, Inc. that provide ongoing services to the Registrant. In making a determination, the Audit Committee considers whether the services are consistent with maintaining the principal accountant’s independence.
In the event of a contingency situation in which the principal accountant is needed to provide services in between scheduled Audit Committee meetings, the Chairman of the Audit Committee would be called on to consider and, if appropriate, pre-approve audit or permitted non-audit services in an amount sufficient to complete services through the next Audit Committee meeting, and to determine if such services would be consistent with maintaining the accountant’s independence. At the next scheduled Audit Committee meeting, services and fees would be presented to the Audit Committee for formal consideration, and, if appropriate, approval by the entire Audit Committee. The Audit Committee would again consider whether such services and fees are consistent with maintaining the principal accountant’s independence.
The Registrant’s Audit Committee is informed at least annually of all audit and non-audit services provided by the principal accountant to the Vanguard complex, whether such services are provided to: the Registrant, other registered investment companies in the Vanguard complex, The Vanguard Group, Inc., or other entities controlled by The Vanguard Group, Inc. that provide ongoing services to the Registrant.
(2) No percentage of the principal accountant’s fees or services were approved pursuant to the waiver provision of paragraph (c)(7)(i)(C) of Rule 2-01 of Regulation S-X.
(f) For the most recent fiscal year, over 50% of the hours worked under the principal accountant’s engagement were not performed by persons other than full-time, permanent employees of the principal accountant.
(g) Aggregate Non-Audit Fees.
Fiscal Year Ended October 31, 2016: $468,275
Fiscal Year Ended October 31, 2015: $555,702
Includes fees billed for non-audit services provided to the Registrant, other registered investment companies in the Vanguard complex, The Vanguard Group, Inc., and Vanguard Marketing Corporation.
(h) For the most recent fiscal year, the Audit Committee has determined that the provision of all non-audit services was consistent with maintaining the principal accountant’s independence.
Item 5: Audit Committee of Listed Registrants.
The Registrant is a listed issuer as defined in rule 10A-3 under the Securities Exchange Act of 1934 (“Exchange Act”). The Registrant has a separately-designated standing audit committee established in accordance with Section 3(a)(58)(A) of the Exchange Act. The Registrant’s audit committee members are: Rajiv L. Gupta, JoAnn Heffernan Heisen, F. Joseph Loughrey, Mark Loughridge, and Peter F. Volanakis.
Item 6: Investments. Not Applicable.
Item 7: Disclosure of Proxy Voting Policies and Procedures for Closed-End Management Investment Companies.
Not Applicable.
Item 8: Portfolio Managers of Closed-End Management Investment Companies.
Not Applicable.
Item 9: Purchase of Equity Securities by Closed-End Management Investment Company and Affiliated Purchasers.
Not Applicable.
Item 10: Submission of Matters to a Vote of Security Holders. Not Applicable.
Item 11: Controls and Procedures.
(a) Disclosure Controls and Procedures. The Principal Executive and Financial Officers concluded that the Registrant’s Disclosure Controls and Procedures are effective based on their evaluation of the Disclosure Controls and Procedures as of a date within 90 days of the filing date of this report.
(b) Internal Control Over Financial Reporting. There were no significant changes in Registrant’s Internal Control Over Financial Reporting or in other factors that could significantly affect this control subsequent to the date of the evaluation, including any corrective actions with regard to significant deficiencies and material weaknesses.
Item 12: Exhibits.
(a) Code of Ethics. (b) Certifications.
Pursuant to the requirements of the Securities Exchange Act of 1934 and the Investment Company Act of 1940, the registrant has duly caused this report to be signed on its behalf by the undersigned, thereunto duly authorized.
| |
| | VANGUARD CHARLOTTE FUNDS |
| |
| |
| BY: | /s/ F. WILLIAM MCNABB III* |
| | F. WILLIAM MCNABB III |
| | CHIEF EXECUTIVE OFFICER |
| |
| Date: December 19, 2016 |
Pursuant to the requirements of the Securities Exchange Act of 1934 and the Investment Company Act of 1940, this report has been signed below by the following persons on behalf of the registrant and in the capacities and on the dates indicated.
| |
| | VANGUARD CHARLOTTE FUNDS |
| |
| BY: | /s/ F. WILLIAM MCNABB III* |
| | F. WILLIAM MCNABB III |
| | CHIEF EXECUTIVE OFFICER |
Date: December 19, 2016 |
| VANGUARD CHARLOTTE FUNDS |
| |
| BY: | /s/ THOMAS J. HIGGINS* |
| THOMAS J. HIGGINS |
| | CHIEF FINANCIAL OFFICER |
Date: December 19, 2016 |
* By: /s/ Anne E. Robinson
Anne E. Robinson, pursuant to a Power of Attorney filed on October 4, 2016 see file Number 33-32548, Incorporated by Reference.