UNITED STATES
SECURITIES AND EXCHANGE COMMISSION
Washington, D.C. 20549
FORM N-CSR
CERTIFIED SHAREHOLDER REPORT
OF
REGISTERED MANAGEMENT INVESTMENT COMPANIES
| |
| Investment Company Act file number: | 811-22619 |
Name of Registrant: | Vanguard Charlotte Funds |
Address of Registrant: | P.O. Box 2600 |
| | Valley Forge, PA 19482 |
Name and address of agent for service: | Anne E. Robinson, Esquire |
| | P.O. Box 876 |
| | Valley Forge, PA 19482 |
Registrant’s telephone number, including area code: | (610) 669-1000 |
Date of fiscal year end: October 31 | |
Date of reporting period: November 1, 2017 – October 31, 2018 |
Item 1: Reports to Shareholders | |

|
| Annual Report | October 31, 2018 |
| |
| Vanguard Total International Bond |
| Index Fund |

Vanguard’s Principles for Investing Success
We want to give you the best chance of investment success. These principles, grounded in Vanguard’s research and experience, can put you on the right path.
Goals. Create clear, appropriate investment goals.
Balance. Develop a suitable asset allocation using broadly diversified funds. Cost. Minimize cost.
Discipline. Maintain perspective and long-term discipline.
A single theme unites these principles: Focus on the things you can control.
We believe there is no wiser course for any investor.
| |
| Contents | |
| Your Fund’s Performance at a Glance. | 1 |
| CEO’s Perspective. | 3 |
| Fund Profile. | 5 |
| Performance Summary. | 7 |
| Financial Statements. | 10 |
| About Your Fund’s Expenses. | 145 |
| Glossary. | 147 |
Please note: The opinions expressed in this report are just that—informed opinions. They should not be considered promises
or advice. Also, please keep in mind that the information and opinions cover the period through the date on the front of this
report. Of course, the risks of investing in your fund are spelled out in the prospectus.
See the Glossary for definitions of investment terms used in this report.
Your Fund’s Performance at a Glance
• For the 12 months ended October 31, 2018, Vanguard Total International Bond Index Fund returned 1.68% for Investor Shares. Its benchmark returned 1.91% and the average return of its peer group was –2.22%.
• The period was marked by rising rates and an upswing in volatility. Among the largest constituents in the index, South Korea, Spain, and Australia outperformed while Canada and Italy underperformed.
• During the period, the fund entered into forward currency contracts to protect the value of the securities, and the related receivables and payables, against changes in future foreign exchange rates. The fund’s use of these contracts had a positive impact on performance and helped the fund achieve its objectives of minimizing currency-related fluctuations and closely tracking its benchmark.
• Please note that shortly after the close of the period, Vanguard lowered the investment minimum for your fund’s Admiral Shares from $10,000 to $3,000.
| | | | |
| Total Returns: Fiscal Year Ended October 31, 2018 | | | |
| | 30-Day SEC | Income | Capital | Total |
| | Yield | Returns | Returns | Returns |
| Vanguard Total International Bond Index Fund | | | | |
| Investor Shares | 1.09% | 2.23% | -0.55% | 1.68% |
| ETF Shares | 1.13 | | | |
| Market Price | | | | 1.61 |
| Net Asset Value | | | | 1.74 |
| Admiral™ Shares | 1.13 | 2.25 | -0.55 | 1.70 |
| Institutional Shares | 1.15 | 2.29 | -0.55 | 1.74 |
| Bloomberg Barclays Global Aggregate ex-USD Float | | | | |
| Adjusted RIC Capped Index (USD Hedged) | | | | 1.91 |
| International Income Funds Average | | | | -2.22 |
| International Income Funds Average: Derived from data provided by Lipper, a Thomson Reuters Company. | | |
Admiral Shares carry lower expenses and are available to investors who meet certain account-balance requirements. Institutional Shares
are available to certain institutional investors who meet specific administrative, service, and account-size criteria. The Vanguard ETF®
Shares shown are traded on the Nasdaq exchange and are available only through brokers. The table provides ETF returns based on both
the Nasdaq market price and the net asset value for a share. U.S. Pat. Nos. 6,879,964; 7,337,138; 7,720,749; 7,925,573; 8,090,646; and
8,417,623.
For the ETF Shares, the market price is determined by the midpoint of the bid-offer spread as of the closing time of the New York Stock
Exchange (generally 4 p.m., Eastern time). The net asset value is also determined as of the NYSE closing time. For more information about
how the ETF Shares' market prices have compared with their net asset value, visit vanguard.com, select your ETF, and then select the
Price and Performance tab. The ETF premium/discount analysis there shows the percentages of days on which the ETF Shares' market
price was above or below the NAV.
1
| |
| Total Returns: Inception Through October 31, 2018 | |
| | Average |
| | Annual Return |
| Total International Bond Index Fund Investor Shares (Returns since inception: 5/31/2013) | 3.28% |
| Bloomberg Barclays Global Aggregate ex-USD Float Adjusted RIC Capped Index (USD Hedged) | 3.58 |
| International Income Funds Average | 0.56 |
| International Income Funds Average: Derived from data provided by Lipper, a Thomson Reuters Company. | |
The figures shown represent past performance, which is not a guarantee of future results. (Current
performance may be lower or higher than the performance data cited. For performance data current to the
most recent month-end, visit our website at vanguard.com/performance.) Note, too, that both investment
returns and principal value can fluctuate widely, so an investor’s shares, when sold, could be worth more
or less than their original cost.
| | | | | |
| Expense Ratios | | | | | |
| Your Fund Compared With Its Peer Group | | | | | |
| | Investor | ETF | Admiral | Institutional | Peer Group |
| | Shares | Shares | Shares | Shares | Average |
| Total International Bond Index Fund | 0.13% | 0.11% | 0.11% | 0.07% | 0.98% |
The fund expense ratios shown are from the prospectus dated February 23, 2018, and represent estimated costs for the current fiscal year.
For the fiscal year ended October 31, 2018, the fund’s expense ratios were 0.13% for Investor Shares, 0.09% for ETF Shares, 0.11% for
Admiral Shares, and 0.07% for Institutional Shares. The peer-group expense ratio is derived from data provided by Lipper, a Thomson
Reuters Company, and captures information through year-end 2017.
Peer group: International Income Funds.
2
CEO’s Perspective

Tim Buckley
President and Chief Executive Officer
Dear Shareholder,
Over the years, I’ve found that prudent investors exhibit a common trait: discipline. No matter how the markets move or what new investing fad hits the headlines, those who stay focused on their goals and tune out the noise are set up for long-term success.
The prime gateway to investing is saving, and you don’t usually become a saver without a healthy dose of discipline. Savers make the decision to sock away part of their income, which means spending less and delaying gratification, no matter how difficult that may be.
Of course, disciplined investing extends beyond diligent saving. The financial markets, in the short term especially, are unpredictable; I have yet to meet the investor who can time them perfectly. It takes discipline to resist the urge to go all-in when markets are frothy or to retreat when things look bleak.
Staying put with your investments is one strategy for handling volatility. Another, rebalancing, requires even more discipline because it means steering your money away from strong performers and toward poorer performers.
Patience—a form of discipline—is also the friend of long-term investors. Higher returns are the potential reward for weathering the market’s turbulence and uncertainty.
3
We have been enjoying one of the longest bull markets in history, but it won’t continue forever. Prepare yourself now for how you will react when volatility comes back. Don’t panic. Don’t chase returns or look for answers outside the asset classes you trust. And be sure to rebalance periodically, even when there’s turmoil.
Whether you’re a master of self-control, get a boost from technology, or work with a professional advisor, know that discipline is necessary to get the most out of your investment portfolio. And know that Vanguard is with you for the entire ride.
Thank you for your continued loyalty.
Sincerely,

Mortimer J. Buckley
President and Chief Executive Officer
November 16, 2018
| | | |
| Market Barometer | | | |
| | Average Annual Total Returns |
| | Periods Ended October 31, 2018 |
| | One Year | Three Years | Five Years |
| Stocks | | | |
| Russell 1000 Index (Large-caps) | 6.98% | 11.31% | 11.05% |
| Russell 2000 Index (Small-caps) | 1.85 | 10.68 | 8.01 |
| Russell 3000 Index (Broad U.S. market) | 6.60 | 11.27 | 10.81 |
| FTSE All-World ex US Index (International) | -7.99 | 4.57 | 2.01 |
| |
| Bonds | | | |
| Bloomberg Barclays U.S. Aggregate Bond Index | | | |
| (Broad taxable market) | -2.05% | 1.04% | 1.83% |
| Bloomberg Barclays Municipal Bond Index | | | |
| (Broad tax-exempt market) | -0.51 | 1.90 | 3.25 |
| FTSE Three-Month U. S. Treasury Bill Index | 1.67 | 0.86 | 0.52 |
| |
| CPI | | | |
| Consumer Price Index | 2.52% | 2.07% | 1.60% |
4
Total International Bond Index Fund
Fund Profile
As of October 31, 2018
| | | | |
| Share-Class Characteristics | | | | |
| | Investor | | Admiral | Institutional |
| | Shares | ETF Shares | Shares | Shares |
| Ticker Symbol | VTIBX | BNDX | VTABX | VTIFX |
| Expense Ratio1 | 0.13% | 0.11% | 0.11% | 0.07% |
| 30-Day SEC Yield | 1.09% | 1.13% | 1.13% | 1.15% |
| | |
| Financial Attributes | | |
| |
| | | Bloomberg |
| | | Barclays GA |
| | | ex-USD |
| | | Float Adj |
| | | RIC Capped |
| | | Idx |
| | | (USD |
| | Fund | Hedged) |
| |
| Number of Bonds | 5,261 | 9,939 |
| |
| Yield to Maturity | | |
| (before expenses) | 1.1% | 1.2% |
| |
| Average Coupon | 2.0% | 2.4% |
| |
| Average Duration | 7.7 years | 7.8 years |
| |
| Average Effective | | |
| Maturity | 9.2 years | 9.3 years |
| |
| Short-Term Reserves | 0.1% | — |
| |
| Sector Diversification (% of portfolio) | |
| Asset-Backed | 0.1% |
| Finance | 5.7 |
| Foreign | 80.5 |
| Industrial | 6.6 |
| Utilities | 1.3 |
| Other | 5.8 |
| The agency and mortgage-backed securities sectors may include |
| issues from government-sponsored enterprises; such issues are |
| generally not backed by the full faith and credit of the U.S. | |
| government. | |
| |
| Volatility Measures | |
| | Bloomberg |
| | Barclays GA |
| | ex-USD |
| | Float Adj |
| | RIC Capped Idx |
| | (USD Hedged) |
| R-Squared | 0.99 |
| Beta | 0.99 |
| These measures show the degree and timing of the fund’s |
| fluctuations compared with the index over 36 months. |
| |
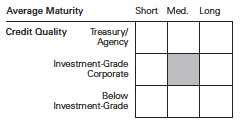
| Distribution by Credit Quality (% of portfolio) |
| Aaa | 22.4% |
| Aa | 27.7 |
| A | 33.7 |
| Baa | 16.2 |
Credit-quality ratings are obtained from Barclays and are from
Moody's, Fitch, and S&P. When ratings from all three agencies are
used, the median rating is shown. When ratings from two of the
agencies are used, the lower rating for each issue is shown. "Not
Rated" is used to classify securities for which a rating is not
available. For more information about these ratings, see the
Glossary entry for Credit Quality.
| |
| Distribution by Effective Maturity | |
| (% of portfolio) | |
| Under 1 Year | 1.4% |
| 1 - 3 Years | 21.5 |
| 3 - 5 Years | 19.3 |
| 5 - 10 Years | 30.1 |
| 10 - 20 Years | 16.0 |
| 20 - 30 Years | 9.2 |
| Over 30 Years | 2.5 |
1 The expense ratios shown are from the prospectus dated February 23, 2018, and represent estimated costs for the current fiscal year.
For the fiscal year ended October 31, 2018, the expense ratios were 0.13% for Investor Shares, 0.09% for ETF Shares, 0.11% for Admiral
Shares, and 0.07% for Institutional Shares.
5
Total International Bond Index Fund
Investment Focus
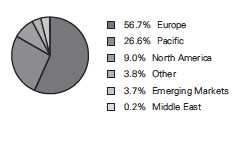
Allocation by Region (% of portfolio)
| |
| Market Diversification (% of portfolio) | |
| Europe | |
| France | 12.1% |
| Germany | 10.8 |
| Italy | 7.5 |
| United Kingdom | 7.5 |
| Spain | 5.5 |
| Netherlands | 2.9 |
| Belgium | 2.4 |
| Switzerland | 1.5 |
| Austria | 1.4 |
| Sweden | 1.4 |
| Other | 3.7 |
| Subtotal | 56.7% |
| Pacific | |
| Japan | 20.2% |
| Australia | 2.8 |
| South Korea | 2.8 |
| Other | 0.8 |
| Subtotal | 26.6% |
| Emerging Markets | 3.7% |
| North America | |
| Canada | 6.0% |
| United States | 3.0 |
| Subtotal | 9.0% |
| Middle East | 0.2% |
| Other | 3.8% |
6
Total International Bond Index Fund
Performance Summary
All of the returns in this report represent past performance, which is not a guarantee of future results that may be achieved by the fund. (Current performance may be lower or higher than the performance data cited. For performance data current to the most recent month-end, visit our website at vanguard.com/performance.) Note, too, that both investment returns and principal value can fluctuate widely, so an investor’s shares, when sold, could be worth more or less than their original cost. The returns shown do not reflect taxes that a shareholder would pay on fund distributions or on the sale of fund shares.
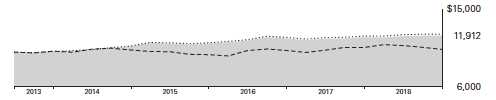
Cumulative Performance: May 31, 2013, Through October 31, 2018
Initial Investment of $10,000
| | | | |
| | Average Annual Total Returns | |
| | Periods Ended October 31, 2018 | |
| |
| | | | Since | Final Value |
| | One | Five | Inception | of a $10,000 |
| | Year | Years | (5/31/2013) | Investment |
| Total International Bond Index Fund | | | | |
| Investor Shares | 1.68% | 3.46% | 3.28% | $11,912 |
| Bloomberg Barclays Global Aggregate | | | | |
| • • • • • • • • | | | | |
| ex-USD Float Adjusted RIC Capped | | | | |
| Index (USD Hedged) | 1.91 | 3.76 | 3.58 | 12,098 |
| |
| – – – – International Income Funds Average | -2.22 | 0.39 | 0.56 | 10,307 |
| International Income Funds Average: Derived from data provided by Lipper, a Thomson Reuters Company. | |
| "Since Inception" performance is calculated from the Investor Shares’ inception date for both the fund and its comparative standards. |
| | | | |
| | | | Since | Final Value |
| | One | Five | Inception | of a $10,000 |
| | Year | Years | (5/31/2013) | Investment |
| Total International Bond Index Fund | | | | |
| ETF Shares Net Asset Value | 1.74% | 3.49% | 3.31% | $11,932 |
| Total International Bond Index Fund | | | | |
| ETF Shares Market Price | 1.61 | 3.47 | 3.33 | 11,946 |
| Bloomberg Barclays Global Aggregate | | | | |
| ex-USD Float Adjusted RIC Capped Index | | | | |
| (USD Hedged) | 1.91 | 3.76 | 3.58 | 12,098 |
| "Since Inception" performance is calculated from the ETF Shares’ inception date for both the fund and its comparative standard. |
See Financial Highlights for dividend and capital gains information.
7
Total International Bond Index Fund
| | | | |
| | Average Annual Total Returns | |
| | Periods Ended October 31, 2018 | |
| |
| | | | Since | Final Value |
| | One | Five | Inception | of a $10,000 |
| | Year | Years | (5/31/2013) | Investment |
| Total International Bond Index Fund Admiral | | | | |
| Shares | 1.70% | 3.48% | 3.31% | $11,983 |
| Bloomberg Barclays Global Aggregate | | | | |
| ex-USD Float Adjusted RIC Capped Index | | | | |
| (USD Hedged) | 1.91 | 3.76 | 3.58 | 12,151 |
| "Since Inception" performance is calculated from the Admiral Shares’ inception date for both the fund and its comparative standard. |
| | | | |
| | | | Since | Final Value |
| | One | Five | Inception | of a $5,000,000 |
| | Year | Years | (5/31/2013) | Investment |
| Total International Bond Index Fund | | | | |
| Institutional Shares | 1.74% | 3.55% | 3.37% | $5,983,402 |
| Bloomberg Barclays Global Aggregate | | | | |
| ex-USD Float Adjusted RIC Capped Index | | | | |
| (USD Hedged) | 1.91 | 3.76 | 3.58 | 6,049,015 |
| "Since Inception" performance is calculated from the Institutional Shares’ inception date for both the fund and its comparative standard. |
| | | |
| Cumulative Returns of ETF Shares: May 31, 2013, Through October 31, 2018 | | |
| |
| | | | Since |
| | One | Five | Inception |
| | Year | Years | (5/31/2013) |
| Total International Bond Index Fund | | | |
| ETF Shares Market Price | 1.61% | 18.61% | 19.46% |
| Total International Bond Index Fund | | | |
| ETF Shares Net Asset Value | 1.74 | 18.71 | 19.32 |
| Bloomberg Barclays Global Aggregate ex-USD Float | | | |
| Adjusted RIC Capped Index (USD Hedged) | 1.91 | 20.24 | 20.98 |
| "Since Inception" performance is calculated from the ETF Shares’ inception date for both the fund and its comparative standard. |
8
Total International Bond Index Fund
| | | | |
| Fiscal-Year Total Returns (%): May 31, 2013, Through October 31, 2018 | |
| | | | | Bloomberg |
| | | | | Barclays GA |
| | | | | ex-USD |
| | | | | Float Adj |
| | | | | RIC Capped Idx |
| | | | Investor Shares | (USD Hedged) |
| Fiscal Year | Income Returns | Capital Returns | Total Returns | Total Returns |
| 2013 | 0.60% | -0.10% | 0.50% | 0.62% |
| 2014 | 1.52 | 4.60 | 6.12 | 6.46 |
| 2015 | 1.51 | 1.53 | 3.04 | 3.38 |
| 2016 | 1.52 | 3.86 | 5.38 | 5.70 |
| 2017 | 1.70 | -0.54 | 1.16 | 1.43 |
| 2018 | 2.23 | -0.55 | 1.68 | 1.91 |
Average Annual Total Returns: Periods Ended September 30, 2018
This table presents returns through the latest calendar quarter—rather than through the end of the fiscal period.
Securities and Exchange Commission rules require that we provide this information.
| | | | | | |
| | | | | | Since Inception |
| | Inception Date | One Year | Five Years | Income | Capital | Total |
| Investor Shares | 5/31/2013 | 2.14% | 3.62% | 1.69% | 1.59% | 3.28% |
| ETF Shares | 5/31/2013 | | | | | |
| Market Price | | 2.20 | 3.65 | | | 3.37 |
| Net Asset Value | | 2.24 | 3.65 | | | 3.32 |
| Admiral Shares | 5/31/2013 | 2.22 | 3.65 | 1.73 | 1.59 | 3.32 |
| Institutional Shares | 5/31/2013 | 2.30 | 3.71 | 1.77 | 1.61 | 3.38 |
9
Total International Bond Index Fund
Financial Statements
Statement of Net Assets
As of October 31, 2018
The fund reports a complete list of its holdings in regulatory filings four times in each fiscal year, at the quarter-ends. For the second and fourth fiscal quarters, the lists appear in the fund’s semiannual and annual reports to shareholders. For the first and third fiscal quarters, the fund files the lists with the Securities and Exchange Commission on Form N-Q. Shareholders can look up the fund’s Forms N-Q on the SEC’s website at sec.gov.
| | | | | |
| | | | | Face | Market |
| | | Maturity | | Amount | Value • |
| | Coupon | Date | Currency | (000) | ($000) |
| Australia (2.8%) | | | | | |
| Asset-Backed/Commercial Mortgage-Backed Securities (0.2%) | | | |
| Australia & New Zealand Banking Group Ltd. | 0.450% | 11/22/23 | EUR | 16,000 | 18,131 |
| Australia & New Zealand Banking Group Ltd. | 1.125% | 5/13/20 | EUR | 7,000 | 8,085 |
| Australia & New Zealand Banking Group Ltd. | 2.500% | 1/16/24 | EUR | 5,000 | 6,257 |
| Australia & New Zealand Banking Group Ltd. | 5.000% | 8/16/23 | AUD | 2,000 | 1,545 |
| Commonwealth Bank of Australia | 0.500% | 7/27/26 | EUR | 31,600 | 34,844 |
| Commonwealth Bank of Australia | 0.750% | 11/4/21 | EUR | 9,000 | 10,399 |
| Commonwealth Bank of Australia | 3.000% | 5/3/22 | EUR | 15,100 | 18,784 |
| Commonwealth Bank of Australia | 3.000% | 9/4/26 | GBP | 1,700 | 2,360 |
| National Australia Bank Ltd. | 0.875% | 11/16/22 | EUR | 5,000 | 5,804 |
| National Australia Bank Ltd. | 0.875% | 2/19/27 | EUR | 10,000 | 11,284 |
| National Australia Bank Ltd. | 1.375% | 5/28/21 | EUR | 700 | 821 |
| National Australia Bank Ltd. | 1.875% | 1/13/23 | EUR | 5,000 | 6,035 |
| National Australia Bank Ltd. | 2.250% | 6/6/25 | EUR | 1,800 | 2,244 |
| National Australia Bank Ltd. | 3.000% | 9/4/26 | GBP | 500 | 695 |
| National Australia Bank Ltd. | 5.000% | 3/11/24 | AUD | 4,000 | 3,100 |
| Westpac Banking Corp. | 0.625% | 1/14/22 | EUR | 10,000 | 11,504 |
| Westpac Banking Corp. | 1.375% | 4/17/20 | EUR | 2,000 | 2,317 |
| Westpac Banking Corp. | 1.500% | 3/24/21 | EUR | 7,200 | 8,452 |
| Westpac Banking Corp. | 2.750% | 8/31/22 | AUD | 10,000 | 7,061 |
| Westpac Banking Corp. | 5.250% | 11/21/23 | AUD | 2,000 | 1,568 |
| | | | | | 161,290 |
| Corporate Bonds (0.4%) | | | | | |
| AGL Energy Ltd. | 5.000% | 11/5/21 | AUD | 1,500 | 1,110 |
| APT Pipelines Ltd. | 1.375% | 3/22/22 | EUR | 300 | 348 |
| APT Pipelines Ltd. | 2.000% | 3/22/27 | EUR | 8,400 | 9,539 |
| APT Pipelines Ltd. | 3.500% | 3/22/30 | GBP | 12,200 | 16,080 |
| APT Pipelines Ltd. | 4.250% | 11/26/24 | GBP | 1,000 | 1,395 |
| Asciano Finance Ltd. | 5.000% | 9/19/23 | GBP | 500 | 708 |
| Asciano Finance Ltd. | 5.250% | 5/19/25 | AUD | 5,000 | 3,708 |
| Aurizon Network Pty Ltd. | 2.000% | 9/18/24 | EUR | 3,000 | 3,515 |
| Ausgrid Finance Pty Ltd. | 1.250% | 7/30/25 | EUR | 3,000 | 3,342 |
| AusNet Services Holdings Pty Ltd. | 1.500% | 2/26/27 | EUR | 2,700 | 3,101 |
| AusNet Services Holdings Pty Ltd. | 3.000% | 2/13/24 | EUR | 4,000 | 5,051 |
| Australia & New Zealand Banking Group Ltd. | 0.625% | 2/21/23 | EUR | 10,000 | 11,334 |
| Australia Pacific Airports Melbourne Pty Ltd. | 1.750% | 10/15/24 | EUR | 14,000 | 16,553 |
| Australia Pacific Airports Melbourne Pty Ltd. | 3.125% | 9/26/23 | EUR | 5,000 | 6,344 |
| Bank of Queensland Ltd. | 0.500% | 7/10/22 | EUR | 500 | 570 |
| |
| 10 |
| | | | | |
| Total International Bond Index Fund | | | | | |
| |
| |
| |
| | | | | Face | Market |
| | | Maturity | | Amount | Value • |
| | Coupon | Date | Currency | (000) | ($000) |
| BHP Billiton Finance Ltd. | 1.500% | 4/29/30 | EUR | 5,000 | 5,601 |
| BHP Billiton Finance Ltd. | 3.000% | 3/30/20 | AUD | 5,140 | 3,667 |
| BHP Billiton Finance Ltd. | 3.125% | 4/29/33 | EUR | 3,000 | 3,943 |
| BHP Billiton Finance Ltd. | 3.250% | 9/24/27 | EUR | 16,500 | 21,738 |
| BHP Billiton Finance Ltd. | 4.300% | 9/25/42 | GBP | 9,175 | 14,339 |
| 1 BHP Billiton Finance Ltd. | 5.625% | 10/22/79 | EUR | 100 | 132 |
| 1 BHP Billiton Finance Ltd. | 6.500% | 10/22/77 | GBP | 2,200 | 3,129 |
| Commonwealth Bank of Australia | 0.375% | 2/10/21 | EUR | 1,500 | 1,716 |
| Commonwealth Bank of Australia | 0.375% | 4/11/24 | EUR | 12,100 | 13,590 |
| Commonwealth Bank of Australia | 0.407% | 5/2/19 | JPY | 500,000 | 4,438 |
| Commonwealth Bank of Australia | 1.625% | 2/10/31 | EUR | 100 | 118 |
| 1 Commonwealth Bank of Australia | 1.936% | 10/3/29 | EUR | 6,000 | 6,659 |
| 1 Commonwealth Bank of Australia | 2.000% | 4/22/27 | EUR | 10,100 | 11,640 |
| Commonwealth Bank of Australia | 3.250% | 1/17/22 | AUD | 500 | 358 |
| Commonwealth Bank of Australia | 3.750% | 10/18/19 | AUD | 10,000 | 7,170 |
| Commonwealth Bank of Australia | 4.375% | 2/25/20 | EUR | 3,500 | 4,204 |
| Commonwealth Bank of Australia | 5.150% | 4/9/20 | CAD | 6,989 | 5,468 |
| Goodman Australia Finance Pty Ltd. | 1.375% | 9/27/25 | EUR | 4,000 | 4,356 |
| Macquarie Bank Ltd. | 1.125% | 1/20/22 | EUR | 600 | 695 |
| Macquarie Bank Ltd. | 3.250% | 3/3/20 | AUD | 1,000 | 714 |
| Macquarie Bank Ltd. | 3.500% | 12/18/20 | GBP | 1,000 | 1,329 |
| Macquarie Bank Ltd. | 6.000% | 9/21/20 | EUR | 1,500 | 1,872 |
| 1 Macquarie Group Ltd. | 1.250% | 3/5/25 | EUR | 20,000 | 21,874 |
| National Australia Bank Ltd. | 0.300% | 10/31/25 | CHF | 9,900 | 9,647 |
| National Australia Bank Ltd. | 0.350% | 9/7/22 | EUR | 10,100 | 11,387 |
| National Australia Bank Ltd. | 0.625% | 8/30/23 | EUR | 100 | 113 |
| National Australia Bank Ltd. | 0.875% | 1/20/22 | EUR | 18,000 | 20,721 |
| National Australia Bank Ltd. | 1.000% | 4/17/20 | CHF | 1,000 | 1,014 |
| National Australia Bank Ltd. | 1.125% | 11/10/21 | GBP | 1,600 | 2,030 |
| National Australia Bank Ltd. | 1.375% | 6/27/22 | GBP | 500 | 632 |
| National Australia Bank Ltd. | 1.875% | 2/20/20 | GBP | 11,100 | 14,278 |
| National Australia Bank Ltd. | 2.000% | 11/12/20 | EUR | 6,000 | 7,075 |
| 1 National Australia Bank Ltd. | 2.000% | 11/12/24 | EUR | 2,000 | 2,299 |
| National Australia Bank Ltd. | 4.000% | 7/13/20 | EUR | 5,850 | 7,088 |
| National Australia Bank Ltd. | 4.625% | 2/10/20 | EUR | 1,000 | 1,198 |
| National Australia Bank Ltd. | 5.125% | 12/9/21 | GBP | 5,500 | 7,760 |
| Origin Energy Finance Ltd. | 2.500% | 10/23/20 | EUR | 310 | 367 |
| Perth Airport Pty Ltd. | 5.500% | 3/25/21 | AUD | 6,500 | 4,866 |
| Qantas Airways Ltd. | 7.500% | 6/11/21 | AUD | 8,500 | 6,659 |
| Qantas Airways Ltd. | 7.750% | 5/19/22 | AUD | 1,230 | 995 |
| QPH Finance Co. Pty Ltd. | 5.750% | 7/29/20 | AUD | 780 | 580 |
| Rio Tinto Finance plc | 2.000% | 5/11/20 | EUR | 5,000 | 5,840 |
| Rio Tinto Finance plc | 2.875% | 12/11/24 | EUR | 300 | 380 |
| Rio Tinto Finance plc | 4.000% | 12/11/29 | GBP | 5,200 | 7,631 |
| Scentre Group Trust 1 | 1.500% | 7/16/20 | EUR | 5,000 | 5,787 |
| Scentre Group Trust 1 | 2.250% | 7/16/24 | EUR | 3,898 | 4,725 |
| Scentre Group Trust 1 | 4.500% | 9/8/21 | AUD | 1,600 | 1,174 |
| Scentre Group Trust 1 / Scentre Group | | | | | |
| Trust 2 | 1.750% | 4/11/28 | EUR | 6,000 | 6,870 |
| Scentre Group Trust 1 / Scentre Group | | | | | |
| Trust 2 | 2.375% | 4/8/22 | GBP | 4,100 | 5,352 |
| Scentre Group Trust 2 | 3.250% | 9/11/23 | EUR | 6,273 | 7,963 |
| Telstra Corp. Ltd. | 1.125% | 4/14/26 | EUR | 11,000 | 12,339 |
| Telstra Corp. Ltd. | 2.500% | 9/15/23 | EUR | 10,000 | 12,354 |
| Telstra Corp. Ltd. | 3.500% | 9/21/22 | EUR | 500 | 634 |
| |
| 11 |
| | | | | |
| Total International Bond Index Fund | | | | | |
| |
| |
| |
| | | | | Face | Market |
| | | Maturity | | Amount | Value • |
| | Coupon | Date | Currency | (000) | ($000) |
| Telstra Corp. Ltd. | 3.750% | 5/16/22 | EUR | 100 | 127 |
| Telstra Corp. Ltd. | 4.000% | 9/16/22 | AUD | 1,000 | 730 |
| Telstra Corp. Ltd. | 4.500% | 11/13/18 | AUD | 6,000 | 4,251 |
| Transurban Finance Co. Pty Ltd. | 1.875% | 9/16/24 | EUR | 3,000 | 3,535 |
| United Energy Distribution Pty Ltd. | 3.850% | 10/23/24 | AUD | 1,350 | 968 |
| Vicinity Centres | 3.375% | 4/7/26 | GBP | 1,259 | 1,677 |
| Wesfarmers Ltd. | 1.250% | 10/7/21 | EUR | 500 | 585 |
| Wesfarmers Ltd. | 2.750% | 8/2/22 | EUR | 3,000 | 3,695 |
| Wesfarmers Ltd. | 3.660% | 11/18/20 | AUD | 1,400 | 1,009 |
| Wesfarmers Ltd. | 4.750% | 3/12/20 | AUD | 10,000 | 7,288 |
| Westpac Banking Corp. | 0.250% | 1/17/22 | EUR | 1,000 | 1,129 |
| Westpac Banking Corp. | 0.625% | 11/22/24 | EUR | 5,000 | 5,576 |
| Westpac Banking Corp. | 0.875% | 2/16/21 | EUR | 15,000 | 17,314 |
| Westpac Banking Corp. | 0.875% | 4/17/27 | EUR | 200 | 222 |
| Westpac Banking Corp. | 1.125% | 9/5/27 | EUR | 1,100 | 1,235 |
| Westpac Banking Corp. | 1.450% | 7/17/28 | EUR | 800 | 912 |
| Westpac Banking Corp. | 2.625% | 12/14/22 | GBP | 2,300 | 3,038 |
| Westpac Banking Corp. | 3.250% | 1/22/20 | AUD | 10,000 | 7,148 |
| Westpac Banking Corp. | 4.125% | 6/4/26 | AUD | 1,000 | 732 |
| | | | | | 452,377 |
| Sovereign Bonds (2.2%) | | | | | |
| Australian Capital Territory | 4.000% | 5/22/24 | AUD | 5,000 | 3,791 |
| Commonwealth Bank of Australia | 1.125% | 12/22/21 | GBP | 1,800 | 2,283 |
| Commonwealth of Australia | 1.750% | 11/21/20 | AUD | 75,000 | 52,859 |
| Commonwealth of Australia | 2.000% | 12/21/21 | AUD | 145,000 | 102,520 |
| Commonwealth of Australia | 2.250% | 5/21/28 | AUD | 57,000 | 39,107 |
| Commonwealth of Australia | 2.500% | 5/21/30 | AUD | 40,000 | 27,797 |
| Commonwealth of Australia | 2.750% | 4/21/24 | AUD | 148,800 | 107,747 |
| Commonwealth of Australia | 2.750% | 11/21/27 | AUD | 116,000 | 83,118 |
| Commonwealth of Australia | 2.750% | 11/21/28 | AUD | 168,500 | 120,500 |
| Commonwealth of Australia | 2.750% | 11/21/29 | AUD | 97,000 | 69,268 |
| Commonwealth of Australia | 2.750% | 6/21/35 | AUD | 58,365 | 40,471 |
| Commonwealth of Australia | 3.000% | 3/21/47 | AUD | 35,000 | 24,209 |
| Commonwealth of Australia | 3.250% | 4/21/25 | AUD | 232,790 | 173,041 |
| Commonwealth of Australia | 3.250% | 4/21/29 | AUD | 110,000 | 82,265 |
| Commonwealth of Australia | 3.250% | 6/21/39 | AUD | 80,000 | 58,638 |
| Commonwealth of Australia | 3.750% | 4/21/37 | AUD | 41,000 | 32,266 |
| Commonwealth of Australia | 4.250% | 4/21/26 | AUD | 220,500 | 174,794 |
| Commonwealth of Australia | 4.500% | 4/15/20 | AUD | 119,350 | 87,562 |
| Commonwealth of Australia | 4.500% | 4/21/33 | AUD | 42,000 | 35,751 |
| Commonwealth of Australia | 4.750% | 4/21/27 | AUD | 159,351 | 131,613 |
| Commonwealth of Australia | 5.500% | 4/21/23 | AUD | 100,600 | 81,264 |
| Commonwealth of Australia | 5.750% | 5/15/21 | AUD | 62,540 | 48,372 |
| Commonwealth of Australia | 5.750% | 7/15/22 | AUD | 102,322 | 81,876 |
| New South Wales Treasury Corp. | 3.000% | 5/20/27 | AUD | 34,000 | 24,191 |
| New South Wales Treasury Corp. | 3.000% | 3/20/28 | AUD | 40,000 | 28,342 |
| New South Wales Treasury Corp. | 3.000% | 2/20/30 | AUD | 15,960 | 11,112 |
| New South Wales Treasury Corp. | 3.500% | 3/20/19 | AUD | 20,000 | 14,247 |
| New South Wales Treasury Corp. | 4.000% | 4/8/21 | AUD | 10,000 | 7,390 |
| New South Wales Treasury Corp. | 4.000% | 4/20/23 | AUD | 28,000 | 21,160 |
| New South Wales Treasury Corp. | 4.000% | 5/20/26 | AUD | 5,000 | 3,834 |
| New South Wales Treasury Corp. | 5.000% | 8/20/24 | AUD | 17,000 | 13,608 |
| New South Wales Treasury Corp. | 6.000% | 5/1/20 | AUD | 5,000 | 3,746 |
| New South Wales Treasury Corp. | 6.000% | 3/1/22 | AUD | 34,000 | 26,955 |
12
| | | | | |
| Total International Bond Index Fund | | | | | |
| |
| |
| |
| | | | | Face | Market |
| | | Maturity | | Amount | Value • |
| | Coupon | Date | Currency | (000) | ($000) |
| New South Wales Treasury Corp. | 6.000% | 5/1/30 | AUD | 3,000 | 2,705 |
| Northern Territory Treasury Corp. | 2.750% | 10/21/24 | AUD | 500 | 351 |
| Northern Territory Treasury Corp. | 4.250% | 9/20/21 | AUD | 2,200 | 1,640 |
| 2 Queensland Treasury Corp. | 2.750% | 8/20/27 | AUD | 18,000 | 12,482 |
| 2 Queensland Treasury Corp. | 3.250% | 7/21/26 | AUD | 18,500 | 13,421 |
| 2 Queensland Treasury Corp. | 3.250% | 7/21/28 | AUD | 42,200 | 30,274 |
| 2 Queensland Treasury Corp. | 3.500% | 8/21/30 | AUD | 10,000 | 7,228 |
| 2 Queensland Treasury Corp. | 4.250% | 7/21/23 | AUD | 43,000 | 32,800 |
| 2 Queensland Treasury Corp. | 4.750% | 7/21/25 | AUD | 42,000 | 33,365 |
| Queensland Treasury Corp. | 5.500% | 6/21/21 | AUD | 42,000 | 32,216 |
| Queensland Treasury Corp. | 5.750% | 7/22/24 | AUD | 36,000 | 29,698 |
| Queensland Treasury Corp. | 6.000% | 7/21/22 | AUD | 59,600 | 47,652 |
| Queensland Treasury Corp. | 6.250% | 2/21/20 | AUD | 45,000 | 33,554 |
| Queensland Treasury Corp. | 6.500% | 3/14/33 | AUD | 3,650 | 3,521 |
| SGSP Australia Assets Pty Ltd. | 2.000% | 6/30/22 | EUR | 3,700 | 4,420 |
| SGSP Australia Assets Pty Ltd. | 5.125% | 2/11/21 | GBP | 1,000 | 1,377 |
| SGSP Australia Assets Pty Ltd. | 5.500% | 3/12/21 | AUD | 4,000 | 3,001 |
| South Australian Government Financing | | | | | |
| Authority | 1.500% | 9/22/22 | AUD | 22,800 | 15,583 |
| South Australian Government Financing | | | | | |
| Authority | 2.250% | 8/15/24 | AUD | 15,000 | 10,356 |
| South Australian Government Financing | | | | | |
| Authority | 2.750% | 4/16/25 | AUD | 11,000 | 7,763 |
| South Australian Government Financing | | | | | |
| Authority | 3.000% | 7/20/26 | AUD | 6,500 | 4,618 |
| South Australian Government Financing | | | | | |
| Authority | 3.000% | 9/20/27 | AUD | 1,250 | 881 |
| South Australian Government Financing | | | | | |
| Authority | 4.250% | 11/20/23 | AUD | 5,000 | 3,819 |
| South Australian Government Financing | | | | | |
| Authority | 4.750% | 8/6/19 | AUD | 7,500 | 5,420 |
| South Australian Government Financing | | | | | |
| Authority | 5.000% | 5/20/21 | AUD | 10,000 | 7,570 |
| Tasmanian Public Finance Corp. | 3.250% | 2/19/26 | AUD | 9,000 | 6,491 |
| Treasury Corp. of Victoria | 2.250% | 10/29/21 | AUD | 10,000 | 7,080 |
| Treasury Corp. of Victoria | 3.000% | 10/20/28 | AUD | 25,620 | 18,142 |
| Treasury Corp. of Victoria | 4.250% | 12/20/32 | AUD | 20,500 | 16,215 |
| Treasury Corp. of Victoria | 5.500% | 11/15/18 | AUD | 25,000 | 17,722 |
| Treasury Corp. of Victoria | 5.500% | 12/17/24 | AUD | 10,000 | 8,246 |
| Treasury Corp. of Victoria | 5.500% | 11/17/26 | AUD | 35,800 | 30,308 |
| Treasury Corp. of Victoria | 6.000% | 6/15/20 | AUD | 10,000 | 7,520 |
| Treasury Corp. of Victoria | 6.000% | 10/17/22 | AUD | 22,000 | 17,733 |
| Western Australian Treasury Corp. | 2.500% | 7/22/20 | AUD | 59,000 | 42,033 |
| Western Australian Treasury Corp. | 2.500% | 7/23/24 | AUD | 37,000 | 25,906 |
| Western Australian Treasury Corp. | 2.750% | 10/20/22 | AUD | 45,000 | 32,230 |
| Western Australian Treasury Corp. | 3.000% | 10/21/26 | AUD | 10,000 | 7,088 |
| Western Australian Treasury Corp. | 3.000% | 10/21/27 | AUD | 10,000 | 7,040 |
| Western Australian Treasury Corp. | 3.250% | 7/20/28 | AUD | 8,000 | 5,722 |
| Western Australian Treasury Corp. | 5.000% | 7/23/25 | AUD | 12,000 | 9,639 |
| Western Australian Treasury Corp. | 7.000% | 10/15/19 | AUD | 15,000 | 11,112 |
| Westpac Banking Corp. | 0.750% | 7/22/21 | EUR | 10,000 | 11,540 |
| Westpac Banking Corp. | 1.000% | 6/30/22 | GBP | 1,500 | 1,889 |
| | | | | | 2,445,068 |
| Total Australia (Cost $3,272,890) | | | | | 3,058,735 |
| |
| 13 |
| | | | | |
| Total International Bond Index Fund | | | | | |
| |
| |
| |
| | | | | Face | Market |
| | | Maturity | | Amount | Value • |
| | Coupon | Date | Currency | (000) | ($000) |
| Austria (1.4%) | | | | | |
| Asset-Backed/Commercial Mortgage-Backed Securities (0.0%) | | | |
| Erste Group Bank AG | 0.750% | 2/5/25 | EUR | 2,500 | 2,876 |
| Erste Group Bank AG | 3.500% | 2/8/22 | EUR | 600 | 756 |
| Erste Group Bank AG | 4.000% | 1/20/21 | EUR | 2,000 | 2,473 |
| Hypo Tirol Bank AG | 0.500% | 2/11/21 | EUR | 1,000 | 1,145 |
| Hypoe NOE Landesbank fuer | | | | | |
| Niederoesterreich und Wien AG | 3.000% | 5/9/22 | EUR | 2,000 | 2,489 |
| Raiffeisen-Landesbank Steiermark AG | 0.625% | 1/20/23 | EUR | 3,700 | 4,258 |
| Raiffeisen-Landesbank Steiermark AG | 2.375% | 6/14/28 | EUR | 300 | 383 |
| Raiffeisenlandesbank | | | | | |
| Niederoesterreich-Wien AG | 0.625% | 3/3/25 | EUR | 300 | 342 |
| Raiffeisenlandesbank | | | | | |
| Niederoesterreich-Wien AG | 1.750% | 10/2/20 | EUR | 1,700 | 1,996 |
| UniCredit Bank Austria AG | 0.750% | 2/25/25 | EUR | 500 | 573 |
| UniCredit Bank Austria AG | 1.375% | 5/26/21 | EUR | 5,000 | 5,869 |
| UniCredit Bank Austria AG | 2.375% | 1/22/24 | EUR | 5,100 | 6,370 |
| UniCredit Bank Austria AG | 4.125% | 2/24/21 | EUR | 2,000 | 2,485 |
| | | | | | 32,015 |
| Corporate Bonds (0.1%) | | | | | |
| Erste Group Bank AG | 0.625% | 1/19/23 | EUR | 4,200 | 4,842 |
| Erste Group Bank AG | 0.625% | 4/17/26 | EUR | 15,000 | 16,906 |
| Erste Group Bank AG | 0.750% | 1/17/28 | EUR | 16,100 | 18,021 |
| JAB Holdings BV | 1.750% | 5/25/23 | EUR | 1,100 | 1,296 |
| JAB Holdings BV | 1.750% | 6/25/26 | EUR | 100 | 113 |
| JAB Holdings BV | 2.500% | 6/25/29 | EUR | 10,300 | 11,835 |
| OMV AG | 1.000% | 12/14/26 | EUR | 1,250 | 1,401 |
| OMV AG | 3.500% | 9/27/27 | EUR | 2,400 | 3,220 |
| OMV AG | 4.250% | 10/12/21 | EUR | 1,100 | 1,399 |
| 1 OMV AG | 5.250% | 12/29/49 | EUR | 1,550 | 1,937 |
| 1 OMV AG | 6.250% | 12/29/49 | EUR | 3,250 | 4,295 |
| Telekom Finanzmanagement GmbH | 3.125% | 12/3/21 | EUR | 5,000 | 6,158 |
| Telekom Finanzmanagement GmbH | 4.000% | 4/4/22 | EUR | 500 | 636 |
| 1 UNIQA Insurance Group AG | 6.000% | 7/27/46 | EUR | 3,100 | 3,973 |
| 1 Vienna Insurance Group AG Wiener | | | | | |
| Versicherung Gruppe | 5.500% | 10/9/43 | EUR | 1,200 | 1,553 |
| | | | | | 77,585 |
| Sovereign Bonds (1.3%) | | | | | |
| 3 Autobahnen- Und Schnellstrassen- | | | | | |
| Finanzierungs AG | 0.250% | 10/18/24 | EUR | 7,000 | 7,894 |
| 3 Autobahnen- Und Schnellstrassen- | | | | | |
| Finanzierungs AG | 1.750% | 10/21/20 | EUR | 200 | 236 |
| 3 Autobahnen- Und Schnellstrassen- | | | | | |
| Finanzierungs-AG | 1.375% | 4/9/21 | EUR | 17,000 | 20,037 |
| 3 Autobahnen- Und Schnellstrassen- | | | | | |
| Finanzierungs-AG | 2.750% | 6/11/32 | EUR | 500 | 671 |
| 3 Autobahnen- Und Schnellstrassen- | | | | | |
| Finanzierungs-AG | 2.750% | 6/20/33 | EUR | 1,200 | 1,615 |
| 3 Autobahnen- Und Schnellstrassen- | | | | | |
| Finanzierungs-AG | 3.375% | 9/22/25 | EUR | 2,000 | 2,713 |
| 3 Hypo Alpe-Adria-Bank International AG | 2.375% | 12/13/22 | EUR | 3,000 | 3,660 |
| Hypoe NOE Landesbank fuer | | | | | |
| Niederoesterreich und Wien AG | 0.500% | 9/11/20 | EUR | 31,500 | 36,091 |
14
| | | | | |
| Total International Bond Index Fund | | | | | |
| |
| |
| |
| | | | | Face | Market |
| | | Maturity | | Amount | Value • |
| | Coupon | Date | Currency | (000) | ($000) |
| 3 KA Finanz AG | 0.375% | 8/11/20 | EUR | 10,900 | 12,473 |
| KA Finanz AG | 1.625% | 2/19/21 | EUR | 2,000 | 2,350 |
| 3 Kaerntner Ausgleichszahlungs-Fonds | 0.000% | 1/14/32 | EUR | 40,000 | 38,235 |
| 3 OeBB Infrastruktur AG | 1.000% | 11/18/24 | EUR | 7,000 | 8,240 |
| 3 OeBB Infrastruktur AG | 2.250% | 7/4/23 | EUR | 10,000 | 12,455 |
| 3 OeBB Infrastruktur AG | 2.250% | 5/28/29 | EUR | 3,000 | 3,827 |
| 3 OeBB Infrastruktur AG | 3.375% | 5/18/32 | EUR | 7,000 | 10,002 |
| 3 OeBB Infrastruktur AG | 3.500% | 10/19/20 | EUR | 6,000 | 7,310 |
| 3 OeBB Infrastruktur AG | 3.500% | 10/19/26 | EUR | 1,800 | 2,490 |
| 3 OeBB Infrastruktur AG | 3.625% | 7/13/21 | EUR | 1,000 | 1,251 |
| 3 OeBB Infrastruktur AG | 3.000% | 10/24/33 | EUR | 150 | 208 |
| 3 OeBB Infrastruktur AG | 3.875% | 6/30/25 | EUR | 10,000 | 13,887 |
| 3 Oesterreichische Kontrollbank AG | 0.750% | 3/7/22 | GBP | 1,500 | 1,886 |
| 3 Oesterreichische Kontrollbank AG | 2.625% | 11/22/24 | CHF | 30,610 | 35,360 |
| 3 Oesterreichische Kontrollbank AG | 2.875% | 2/25/30 | CHF | 4,500 | 5,651 |
| 2 Republic of Austria | 0.000% | 9/20/22 | EUR | 101,250 | 115,705 |
| 2 Republic of Austria | 0.000% | 7/15/23 | EUR | 75,000 | 85,243 |
| 2 Republic of Austria | 0.500% | 4/20/27 | EUR | 41,000 | 46,431 |
| 2 Republic of Austria | 0.750% | 10/20/26 | EUR | 122,200 | 141,982 |
| 2 Republic of Austria | 0.750% | 2/20/28 | EUR | 75,000 | 86,125 |
| 2 Republic of Austria | 1.200% | 10/20/25 | EUR | 31,000 | 37,389 |
| 2 Republic of Austria | 1.500% | 2/20/47 | EUR | 21,800 | 25,220 |
| 2 Republic of Austria | 1.500% | 11/2/86 | EUR | 24,898 | 25,949 |
| 2 Republic of Austria | 1.650% | 10/21/24 | EUR | 41,900 | 51,865 |
| 2 Republic of Austria | 1.750% | 10/20/23 | EUR | 930 | 1,149 |
| 2 Republic of Austria | 2.100% | 9/20/17 | EUR | 24,067 | 30,671 |
| 2 Republic of Austria | 2.400% | 5/23/34 | EUR | 37,605 | 50,746 |
| 2 Republic of Austria | 3.150% | 6/20/44 | EUR | 40,245 | 63,901 |
| 2 Republic of Austria | 3.400% | 11/22/22 | EUR | 30,300 | 39,398 |
| 2 Republic of Austria | 3.500% | 9/15/21 | EUR | 40,435 | 51,001 |
| 2 Republic of Austria | 3.650% | 4/20/22 | EUR | 53,160 | 68,563 |
| 2 Republic of Austria | 3.800% | 1/26/62 | EUR | 1,100 | 2,145 |
| 2 Republic of Austria | 3.900% | 7/15/20 | EUR | 70,800 | 86,319 |
| 2 Republic of Austria | 4.150% | 3/15/37 | EUR | 55,565 | 94,439 |
| 2 Republic of Austria | 4.850% | 3/15/26 | EUR | 45,250 | 68,317 |
| Republic of Austria | 6.250% | 7/15/27 | EUR | 14,935 | 25,241 |
| | | | | | 1,426,341 |
| Total Austria (Cost $1,541,146) | | | | | 1,535,941 |
| Belgium (2.4%) | | | | | |
| Asset-Backed/Commercial Mortgage-Backed Securities (0.1%) | | | |
| Belfius Bank SA | 1.750% | 6/24/24 | EUR | 600 | 730 |
| Belfius Bank SA/NV | 0.625% | 10/14/21 | EUR | 29,700 | 34,247 |
| Belfius Bank SA/NV | 0.750% | 2/10/25 | EUR | 200 | 229 |
| Belfius Bank SA/NV | 1.375% | 6/5/20 | EUR | 11,500 | 13,352 |
| Belfius Bank SA/NV | 2.125% | 1/30/23 | EUR | 3,400 | 4,159 |
| KBC Bank NV | 0.450% | 1/22/22 | EUR | 5,000 | 5,740 |
| KBC Bank NV | 1.250% | 5/28/20 | EUR | 3,000 | 3,476 |
| | | | | | 61,933 |
| Corporate Bonds (0.3%) | | | | | |
| Anheuser-Busch InBev SA/NV | 0.625% | 3/17/20 | EUR | 15,000 | 17,152 |
| Anheuser-Busch InBev SA/NV | 0.875% | 3/17/22 | EUR | 12,900 | 14,841 |
| Anheuser-Busch InBev SA/NV | 1.150% | 1/22/27 | EUR | 12,400 | 13,612 |
| Anheuser-Busch InBev SA/NV | 1.500% | 3/17/25 | EUR | 6,320 | 7,333 |
| |
| 15 |
| | | | | |
| Total International Bond Index Fund | | | | | |
| |
| |
| |
| | | | | Face | Market |
| | | Maturity | | Amount | Value • |
| | Coupon | Date | Currency | (000) | ($000) |
| Anheuser-Busch InBev SA/NV | 1.875% | 1/20/20 | EUR | 3,000 | 3,479 |
| Anheuser-Busch InBev SA/NV | 2.000% | 12/16/19 | EUR | 750 | 869 |
| Anheuser-Busch InBev SA/NV | 2.000% | 3/17/28 | EUR | 16,500 | 19,143 |
| Anheuser-Busch InBev SA/NV | 2.000% | 1/23/35 | EUR | 10,000 | 10,546 |
| Anheuser-Busch InBev SA/NV | 2.700% | 3/31/26 | EUR | 200 | 249 |
| Anheuser-Busch InBev SA/NV | 2.750% | 3/17/36 | EUR | 16,150 | 18,486 |
| Anheuser-Busch InBev SA/NV | 2.850% | 5/25/37 | GBP | 6,900 | 8,104 |
| Anheuser-Busch InBev SA/NV | 2.875% | 9/25/24 | EUR | 4,500 | 5,677 |
| Anheuser-Busch InBev SA/NV | 3.250% | 1/24/33 | EUR | 5,000 | 6,295 |
| Anheuser-Busch InBev SA/NV | 4.000% | 6/2/21 | EUR | 5,100 | 6,350 |
| Anheuser-Busch InBev SA/NV | 4.000% | 9/24/25 | GBP | 11,200 | 15,709 |
| Anheuser-Busch InBev SA/NV | 9.750% | 7/30/24 | GBP | 1,900 | 3,380 |
| 1 Argenta Spaarbank NV | 3.875% | 5/24/26 | EUR | 24,300 | 29,193 |
| Belfius Bank SA/NV | 1.000% | 10/26/24 | EUR | 10,000 | 10,987 |
| Belfius Bank SA/NV | 0.750% | 9/12/22 | EUR | 4,900 | 5,515 |
| Belfius Bank SA/NV | 3.125% | 5/11/26 | EUR | 1,800 | 2,100 |
| BNP Paribas Fortis SA | 0.875% | 3/22/28 | EUR | 10,000 | 9,929 |
| Brussels Airport Co. SA/NV | 1.000% | 5/3/24 | EUR | 16,300 | 18,658 |
| Elia System Operator SA/NV | 1.375% | 5/27/24 | EUR | 100 | 116 |
| Elia System Operator SA/NV | 1.500% | 9/5/28 | EUR | 100 | 112 |
| Elia System Operator SA/NV | 3.000% | 4/7/29 | EUR | 400 | 512 |
| Elia System Operator SA/NV | 3.250% | 4/4/28 | EUR | 300 | 391 |
| Euroclear Bank SA/NV | 0.500% | 7/10/23 | EUR | 12,500 | 14,112 |
| FBG Finance Pty Ltd. | 3.750% | 9/6/24 | AUD | 6,500 | 4,641 |
| FBG Finance Pty Ltd. | 4.100% | 9/6/27 | AUD | 1,120 | 797 |
| KBC Bank NV | 0.375% | 9/1/22 | EUR | 32,000 | 36,579 |
| KBC Bank NV | 0.750% | 10/24/27 | EUR | 2,300 | 2,571 |
| KBC Group NV | 0.750% | 10/18/23 | EUR | 13,200 | 14,783 |
| KBC Group NV | 1.000% | 4/26/21 | EUR | 200 | 231 |
| Solvay SA | 1.625% | 12/2/22 | EUR | 8,300 | 9,823 |
| Solvay SA | 2.750% | 12/2/27 | EUR | 700 | 851 |
| | | | | | 313,126 |
| Sovereign Bonds (2.0%) | | | | | |
| 4 Dexia Credit Local SA | 0.200% | 3/16/21 | EUR | 5,000 | 5,708 |
| 4 Dexia Credit Local SA | 0.250% | 3/19/20 | EUR | 10,000 | 11,408 |
| Dexia Credit Local SA | 0.500% | 1/17/25 | EUR | 10,000 | 11,299 |
| 4 Dexia Credit Local SA | 0.625% | 1/21/22 | EUR | 16,500 | 19,052 |
| 4 Dexia Credit Local SA | 0.625% | 2/3/24 | EUR | 63,000 | 72,233 |
| 4 Dexia Credit Local SA | 0.750% | 1/25/23 | EUR | 28,000 | 32,445 |
| 4 Dexia Credit Local SA | 0.875% | 9/7/21 | GBP | 5,600 | 7,062 |
| 4 Dexia Credit Local SA | 1.000% | 10/18/27 | EUR | 200 | 228 |
| 4 Dexia Credit Local SA | 1.125% | 6/15/22 | GBP | 2,300 | 2,906 |
| 4 Dexia Credit Local SA | 1.250% | 11/26/24 | EUR | 17,200 | 20,317 |
| 4 Dexia Credit Local SA | 2.000% | 6/17/20 | GBP | 6,600 | 8,538 |
| 4 Dexia Credit Local SA | 2.125% | 2/12/25 | GBP | 3,000 | 3,907 |
| Eandis System Operator SCRL | 1.750% | 12/4/26 | EUR | 6,000 | 7,170 |
| Eandis System Operator SCRL | 2.875% | 10/9/23 | EUR | 3,000 | 3,758 |
| Eandis System Operator SCRL | 4.500% | 11/8/21 | EUR | 1,500 | 1,912 |
| Flemish Community | 0.375% | 10/13/26 | EUR | 5,000 | 5,509 |
| 2 Kingdom of Belgium | 0.200% | 10/22/23 | EUR | 31,500 | 35,969 |
| 2 Kingdom of Belgium | 0.500% | 10/22/24 | EUR | 2,000 | 2,304 |
| 2 Kingdom of Belgium | 0.800% | 6/22/25 | EUR | 62,510 | 73,005 |
| 2 Kingdom of Belgium | 0.800% | 6/22/27 | EUR | 178,800 | 205,114 |
| 2 Kingdom of Belgium | 0.800% | 6/22/28 | EUR | 30,000 | 34,046 |
| |
| |
| 16 |
| | | | | |
| Total International Bond Index Fund | | | | | |
| |
| |
| |
| | | | | Face | Market |
| | | Maturity | | Amount | Value • |
| | Coupon | Date | Currency | (000) | ($000) |
| 2 Kingdom of Belgium | 1.000% | 6/22/26 | EUR | 147,864 | 173,654 |
| 2 Kingdom of Belgium | 1.000% | 6/22/31 | EUR | 107,200 | 120,661 |
| Kingdom of Belgium | 1.250% | 4/22/33 | EUR | 30,000 | 34,272 |
| 2 Kingdom of Belgium | 1.450% | 6/22/37 | EUR | 5,220 | 5,925 |
| 2 Kingdom of Belgium | 1.600% | 6/22/47 | EUR | 51,225 | 56,441 |
| 2 Kingdom of Belgium | 1.900% | 6/22/38 | EUR | 93,642 | 114,076 |
| 2 Kingdom of Belgium | 2.150% | 6/22/66 | EUR | 48,500 | 57,172 |
| Kingdom of Belgium | 2.250% | 6/22/23 | EUR | 69,990 | 87,852 |
| 2 Kingdom of Belgium | 2.250% | 6/22/57 | EUR | 10,600 | 13,012 |
| 2 Kingdom of Belgium | 2.600% | 6/22/24 | EUR | 80,380 | 103,590 |
| 2 Kingdom of Belgium | 3.000% | 6/22/34 | EUR | 101,770 | 143,748 |
| 2 Kingdom of Belgium | 3.750% | 9/28/20 | EUR | 152,752 | 187,214 |
| Kingdom of Belgium | 3.750% | 6/22/45 | EUR | 21,445 | 35,278 |
| Kingdom of Belgium | 4.000% | 3/28/22 | EUR | 29,315 | 38,090 |
| Kingdom of Belgium | 4.000% | 3/28/32 | EUR | 40,320 | 62,367 |
| 2 Kingdom of Belgium | 4.250% | 9/28/21 | EUR | 137,475 | 176,809 |
| 2 Kingdom of Belgium | 4.250% | 9/28/22 | EUR | 82,650 | 109,980 |
| 2 Kingdom of Belgium | 4.250% | 3/28/41 | EUR | 76,430 | 131,210 |
| 2 Kingdom of Belgium | 4.500% | 3/28/26 | EUR | 7,400 | 10,872 |
| 2 Kingdom of Belgium | 5.000% | 3/28/35 | EUR | 4,430 | 7,784 |
| Kingdom of Belgium | 5.500% | 3/28/28 | EUR | 1,005 | 1,637 |
| Proximus SADP | 2.375% | 4/4/24 | EUR | 3,100 | 3,814 |
| | | | | | 2,239,348 |
| Total Belgium (Cost $2,631,148) | | | | | 2,614,407 |
| Bermuda (0.0%) | | | | | |
| Corporate Bond (0.0%) | | | | | |
| Bacardi Ltd. | 2.750% | 7/3/23 | EUR | 2,000 | 2,405 |
| Total Bermuda (Cost $2,671) | | | | | 2,405 |
| Brazil (0.0%) | | | | | |
| Corporate Bond (0.0%) | | | | | |
| Vale SA | 3.750% | 1/10/23 | EUR | 5,000 | 6,223 |
| Total Brazil (Cost $5,637) | | | | | 6,223 |
| Bulgaria (0.0%) | | | | | |
| Sovereign Bonds (0.0%) | | | | | |
| Republic of Bulgaria | 1.875% | 3/21/23 | EUR | 6,000 | 7,257 |
| Republic of Bulgaria | 2.000% | 3/26/22 | EUR | 3,000 | 3,609 |
| Republic of Bulgaria | 2.625% | 3/26/27 | EUR | 3,000 | 3,736 |
| Republic of Bulgaria | 2.950% | 9/3/24 | EUR | 800 | 1,025 |
| Republic of Bulgaria | 3.000% | 3/21/28 | EUR | 25,000 | 31,771 |
| Republic of Bulgaria | 3.125% | 3/26/35 | EUR | 3,000 | 3,599 |
| Total Bulgaria (Cost $45,483) | | | | | 50,997 |
| Canada (5.8%) | | | | | |
| Asset-Backed/Commercial Mortgage-Backed Securities (0.2%) | | | |
| Bank of Montreal | 0.100% | 10/20/23 | EUR | 10,000 | 11,155 |
| Bank of Montreal | 0.125% | 4/19/21 | EUR | 200 | 227 |
| Bank of Montreal | 0.250% | 1/22/20 | EUR | 10,000 | 11,393 |
| Bank of Montreal | 0.375% | 8/5/20 | EUR | 15,000 | 17,146 |
| Bank of Nova Scotia | 0.125% | 1/13/22 | EUR | 1,100 | 1,246 |
| Bank of Nova Scotia | 0.500% | 7/23/20 | EUR | 23,000 | 26,338 |
| Bank of Nova Scotia | 0.750% | 9/14/21 | GBP | 1,500 | 1,886 |
17
| | | | | |
| Total International Bond Index Fund | | | | | |
| |
| |
| |
| | | | | Face | Market |
| | | Maturity | | Amount | Value • |
| | Coupon | Date | Currency | (000) | ($000) |
| Bank of Nova Scotia | 0.750% | 9/17/21 | EUR | 10,900 | 12,588 |
| Canadian Imperial Bank of Commerce | 0.000% | 7/25/22 | EUR | 15,000 | 16,867 |
| National Bank of Canada | 0.000% | 9/29/23 | EUR | 4,600 | 5,110 |
| National Bank of Canada | 0.500% | 1/26/22 | EUR | 14,000 | 16,052 |
| National Bank of Canada | 1.500% | 3/25/21 | EUR | 5,000 | 5,871 |
| Royal Bank of Canada | 0.125% | 3/11/21 | EUR | 4,000 | 4,548 |
| Royal Bank of Canada | 0.875% | 6/17/22 | EUR | 12,000 | 13,927 |
| Royal Bank of Canada | 1.625% | 8/4/20 | EUR | 21,500 | 25,118 |
| Toronto-Dominion Bank | 0.250% | 4/27/22 | EUR | 5,000 | 5,679 |
| Toronto-Dominion Bank | 0.375% | 1/12/21 | EUR | 10,000 | 11,435 |
| Toronto-Dominion Bank | 0.375% | 4/27/23 | EUR | 21,000 | 23,826 |
| Toronto-Dominion Bank | 0.750% | 10/29/21 | EUR | 6,000 | 6,934 |
| | | | | | 217,346 |
| Corporate Bonds (1.2%) | | | | | |
| 407 International Inc. | 3.600% | 5/21/47 | CAD | 6,900 | 4,925 |
| 407 International Inc. | 3.830% | 5/11/46 | CAD | 10,000 | 7,435 |
| 407 International Inc. | 4.190% | 4/25/42 | CAD | 5,500 | 4,321 |
| 407 International Inc. | 4.300% | 5/26/21 | CAD | 1,500 | 1,173 |
| 407 International Inc. | 4.450% | 11/15/41 | CAD | 5,000 | 4,079 |
| 407 International Inc. | 5.750% | 2/14/36 | CAD | 1,995 | 1,844 |
| Aeroports de Montreal | 5.170% | 9/17/35 | CAD | 325 | 292 |
| Aeroports de Montreal | 5.670% | 10/16/37 | CAD | 2,000 | 1,919 |
| Alberta Powerline LP | 4.065% | 12/1/53 | CAD | 5,000 | 3,827 |
| Alectra Inc. | 2.488% | 5/17/27 | CAD | 11,000 | 7,779 |
| 2 Algonquin Power Co. | 4.090% | 2/17/27 | CAD | 800 | 594 |
| Alimentation Couche-Tard Inc. | 3.056% | 7/26/24 | CAD | 10,000 | 7,274 |
| Alimentation Couche-Tard Inc. | 3.600% | 6/2/25 | CAD | 7,900 | 5,859 |
| Allied Properties REIT | 3.636% | 4/21/25 | CAD | 10,000 | 7,266 |
| AltaGas Ltd. | 4.500% | 8/15/44 | CAD | 1,757 | 1,181 |
| AltaLink LP | 3.399% | 6/6/24 | CAD | 10,000 | 7,651 |
| AltaLink LP | 3.668% | 11/6/23 | CAD | 12,000 | 9,318 |
| AltaLink LP | 3.717% | 12/3/46 | CAD | 4,000 | 2,938 |
| AltaLink LP | 3.990% | 6/30/42 | CAD | 2,925 | 2,249 |
| AltaLink LP | 4.922% | 9/17/43 | CAD | 3,000 | 2,642 |
| Bank of Montreal | 0.050% | 12/30/22 | CHF | 7,000 | 6,895 |
| Bank of Montreal | 0.200% | 1/26/23 | EUR | 6,600 | 7,449 |
| Bank of Montreal | 1.610% | 10/28/21 | CAD | 10,000 | 7,284 |
| Bank of Montreal | 1.625% | 6/21/22 | GBP | 1,000 | 1,277 |
| Bank of Montreal | 2.100% | 10/6/20 | CAD | 5,100 | 3,815 |
| Bank of Montreal | 2.120% | 3/16/22 | CAD | 15,300 | 11,252 |
| 1 Bank of Montreal | 2.570% | 6/1/27 | CAD | 5,000 | 3,659 |
| Bank of Montreal | 2.700% | 9/11/24 | CAD | 10,000 | 7,355 |
| Bank of Montreal | 2.700% | 12/9/26 | CAD | 10,000 | 7,226 |
| Bank of Montreal | 2.890% | 6/20/23 | CAD | 12,000 | 8,980 |
| Bank of Montreal | 3.190% | 3/1/28 | CAD | 10,000 | 7,445 |
| 1 Bank of Montreal | 3.320% | 6/1/26 | CAD | 10,500 | 7,953 |
| 1 Bank of Montreal | 3.340% | 12/8/25 | CAD | 10,750 | 8,168 |
| Bank of Montreal | 3.400% | 4/23/21 | CAD | 3,000 | 2,301 |
| Bank of Montreal | 4.609% | 9/10/25 | CAD | 5,000 | 4,088 |
| Bank of Nova Scotia | 1.250% | 6/8/22 | GBP | 500 | 629 |
| Bank of Nova Scotia | 1.900% | 12/2/21 | CAD | 10,000 | 7,329 |
| Bank of Nova Scotia | 2.090% | 9/9/20 | CAD | 8,400 | 6,284 |
| Bank of Nova Scotia | 2.130% | 6/15/20 | CAD | 20,000 | 15,021 |
| Bank of Nova Scotia | 2.360% | 11/8/22 | CAD | 5,000 | 3,677 |
18
| | | | | |
| Total International Bond Index Fund | | | | | |
| |
| |
| |
| | | | | Face | Market |
| | | Maturity | | Amount | Value • |
| | Coupon | Date | Currency | (000) | ($000) |
| 1 Bank of Nova Scotia | 2.580% | 3/30/27 | CAD | 4,550 | 3,339 |
| Bank of Nova Scotia | 2.620% | 12/2/26 | CAD | 15,000 | 10,773 |
| Bank of Nova Scotia | 2.980% | 4/17/23 | CAD | 10,000 | 7,511 |
| Bank of Nova Scotia | 3.100% | 2/2/28 | CAD | 25,000 | 18,473 |
| Bank of Nova Scotia | 3.270% | 1/11/21 | CAD | 5,000 | 3,825 |
| 1 Bank of Nova Scotia | 3.367% | 12/8/25 | CAD | 7,000 | 5,321 |
| Bell Canada Inc. | 3.000% | 10/3/22 | CAD | 5,200 | 3,879 |
| Bell Canada Inc. | 3.250% | 6/17/20 | CAD | 9,350 | 7,127 |
| Bell Canada Inc. | 3.350% | 3/22/23 | CAD | 5,000 | 3,763 |
| Bell Canada Inc. | 3.350% | 3/12/25 | CAD | 2,200 | 1,626 |
| Bell Canada Inc. | 3.550% | 3/2/26 | CAD | 3,000 | 2,224 |
| Bell Canada Inc. | 4.350% | 12/18/45 | CAD | 9,150 | 6,488 |
| Bell Canada Inc. | 4.450% | 2/27/47 | CAD | 8,098 | 5,828 |
| Bell Canada Inc. | 4.750% | 9/29/44 | CAD | 3,500 | 2,643 |
| Bell Canada Inc. | 7.850% | 4/2/31 | CAD | 5,000 | 5,007 |
| 1 BMO Capital Trust II | 10.221% | 12/31/07 | CAD | 700 | 538 |
| BP LP | 3.244% | 1/9/20 | CAD | 995 | 758 |
| British Columbia Ferry Services Inc. | 4.702% | 10/23/43 | CAD | 7,000 | 6,085 |
| Brookfield Asset Management Inc. | 3.800% | 3/16/27 | CAD | 4,235 | 3,089 |
| Brookfield Asset Management Inc. | 4.540% | 3/31/23 | CAD | 11,875 | 9,319 |
| Brookfield Asset Management Inc. | 4.820% | 1/28/26 | CAD | 21,000 | 16,491 |
| Brookfield Asset Management Inc. | 5.040% | 3/8/24 | CAD | 1,500 | 1,196 |
| Brookfield Infrastructure Finance ULC | 3.315% | 2/22/24 | CAD | 5,000 | 3,681 |
| Brookfield Infrastructure Finance ULC | 3.538% | 10/30/20 | CAD | 850 | 650 |
| Brookfield Renewable Partners ULC | 3.752% | 6/2/25 | CAD | 5,301 | 3,961 |
| Bruce Power LP | 3.969% | 6/23/26 | CAD | 5,000 | 3,787 |
| Bruce Power LP | 4.132% | 6/21/33 | CAD | 2,200 | 1,617 |
| Caisse Centrale Desjardins | 1.748% | 3/2/20 | CAD | 10,150 | 7,606 |
| Cameco Corp. | 4.190% | 6/24/24 | CAD | 3,500 | 2,630 |
| Canadian Imperial Bank of Commerce | 0.250% | 1/24/23 | EUR | 14,000 | 15,833 |
| Canadian Imperial Bank of Commerce | 1.640% | 7/12/21 | CAD | 250 | 183 |
| Canadian Imperial Bank of Commerce | 1.850% | 7/14/20 | CAD | 250 | 187 |
| Canadian Imperial Bank of Commerce | 1.900% | 4/26/21 | CAD | 14,000 | 10,356 |
| Canadian Imperial Bank of Commerce | 2.040% | 3/21/22 | CAD | 10,000 | 7,335 |
| Canadian Imperial Bank of Commerce | 2.300% | 7/11/22 | CAD | 15,000 | 11,049 |
| Canadian Imperial Bank of Commerce | 2.970% | 7/11/23 | CAD | 10,000 | 7,502 |
| Canadian Imperial Bank of Commerce | 3.300% | 5/26/25 | CAD | 15,000 | 11,355 |
| 1 Canadian Imperial Bank of Commerce | 3.420% | 1/26/26 | CAD | 20,000 | 15,189 |
| 1 Canadian Imperial Bank of Commerce | 3.450% | 4/4/28 | CAD | 8,000 | 5,961 |
| Canadian National Railway Co. | 2.800% | 9/22/25 | CAD | 5,000 | 3,680 |
| Canadian National Railway Co. | 3.600% | 8/1/47 | CAD | 10,000 | 7,140 |
| Canadian Natural Resources Ltd. | 2.890% | 8/14/20 | CAD | 10,400 | 7,867 |
| Canadian Natural Resources Ltd. | 3.310% | 2/11/22 | CAD | 20,000 | 15,102 |
| Canadian Natural Resources Ltd. | 3.550% | 6/3/24 | CAD | 10,000 | 7,504 |
| Canadian Pacific Railway Co. | 6.450% | 11/17/39 | CAD | 1,750 | 1,750 |
| Canadian Tire Corp. Ltd. | 2.646% | 7/6/20 | CAD | 16,000 | 12,078 |
| Canadian Tire Corp. Ltd. | 3.167% | 7/6/23 | CAD | 8,100 | 6,045 |
| 1 Capital Desjardins Inc. | 4.954% | 12/15/26 | CAD | 3,000 | 2,390 |
| Capital Desjardins Inc. | 5.187% | 5/5/20 | CAD | 5,355 | 4,195 |
| Capital Power Corp. | 5.276% | 11/16/20 | CAD | 4,650 | 3,656 |
| Chartwell Retirement Residences | 4.211% | 4/28/25 | CAD | 1,000 | 755 |
| Choice Properties REIT | 3.546% | 1/10/25 | CAD | 8,000 | 5,881 |
| Choice Properties REIT | 3.556% | 9/9/24 | CAD | 2,032 | 1,501 |
| CI Financial Corp. | 2.645% | 12/7/20 | CAD | 5,200 | 3,896 |
| |
| |
| 19 |
| | | | | |
| Total International Bond Index Fund | | | | | |
| |
| |
| |
| | | | | Face | Market |
| | | Maturity | | Amount | Value • |
| | Coupon | Date | Currency | (000) | ($000) |
| CI Financial Corp. | 2.775% | 11/25/21 | CAD | 10,000 | 7,438 |
| 1 CIBC Capital Trust | 10.250% | 6/30/08 | CAD | 225 | 202 |
| Cogeco Communications Inc. | 4.175% | 5/26/23 | CAD | 250 | 193 |
| Concordia University | 6.550% | 9/2/42 | CAD | 3,000 | 3,261 |
| CT REIT | 3.469% | 6/16/27 | CAD | 1,332 | 950 |
| CU Inc. | 3.805% | 9/10/42 | CAD | 450 | 332 |
| CU Inc. | 3.964% | 7/27/45 | CAD | 3,000 | 2,269 |
| CU Inc. | 4.085% | 9/2/44 | CAD | 5,400 | 4,164 |
| CU Inc. | 4.211% | 10/29/55 | CAD | 15,000 | 11,661 |
| CU Inc. | 4.543% | 10/24/41 | CAD | 1,000 | 823 |
| CU Inc. | 4.722% | 9/9/43 | CAD | 3,000 | 2,537 |
| Emera Inc. | 2.900% | 6/16/23 | CAD | 33,000 | 24,277 |
| Enbridge Gas Distribution Inc. | 2.500% | 8/5/26 | CAD | 2,000 | 1,415 |
| Enbridge Gas Distribution Inc. | 3.150% | 8/22/24 | CAD | 6,480 | 4,858 |
| Enbridge Gas Distribution Inc. | 3.310% | 9/11/25 | CAD | 240 | 181 |
| Enbridge Gas Distribution Inc. | 4.000% | 8/22/44 | CAD | 2,000 | 1,517 |
| Enbridge Gas Distribution Inc. | 4.040% | 11/23/20 | CAD | 350 | 272 |
| Enbridge Gas Distribution Inc. | 4.950% | 11/22/50 | CAD | 1,000 | 873 |
| Enbridge Inc. | 3.190% | 12/5/22 | CAD | 15,070 | 11,288 |
| Enbridge Inc. | 3.200% | 6/8/27 | CAD | 10,000 | 7,115 |
| Enbridge Inc. | 4.240% | 8/27/42 | CAD | 2,460 | 1,700 |
| Enbridge Inc. | 4.530% | 3/9/20 | CAD | 9,700 | 7,510 |
| Enbridge Inc. | 4.570% | 3/11/44 | CAD | 1,400 | 1,014 |
| Enbridge Income Fund | 3.950% | 11/19/24 | CAD | 3,000 | 2,285 |
| Enbridge Pipelines Inc. | 3.450% | 9/29/25 | CAD | 5,240 | 3,926 |
| Enbridge Pipelines Inc. | 4.130% | 8/9/46 | CAD | 5,000 | 3,538 |
| Enbridge Pipelines Inc. | 4.550% | 8/17/43 | CAD | 1,000 | 758 |
| Enbridge Pipelines Inc. | 4.550% | 9/29/45 | CAD | 5,600 | 4,237 |
| EPCOR Utilities Inc. | 3.554% | 11/27/47 | CAD | 7,000 | 4,943 |
| EPCOR Utilities Inc. | 4.550% | 2/28/42 | CAD | 2,995 | 2,475 |
| Fairfax Financial Holdings Ltd. | 4.250% | 12/6/27 | CAD | 2,465 | 1,812 |
| Fairfax Financial Holdings Ltd. | 4.500% | 3/22/23 | CAD | 2,500 | 1,952 |
| Fairfax Financial Holdings Ltd. | 4.700% | 12/16/26 | CAD | 5,000 | 3,834 |
| Fairfax Financial Holdings Ltd. | 4.950% | 3/3/25 | CAD | 575 | 453 |
| Fairfax Financial Holdings Ltd. | 5.840% | 10/14/22 | CAD | 2,800 | 2,290 |
| Federation des Caisses Desjardins du | | | | | |
| Quebec | 2.091% | 1/17/22 | CAD | 2,590 | 1,906 |
| Federation des Caisses Desjardins du | | | | | |
| Quebec | 3.056% | 9/11/23 | CAD | 5,000 | 3,759 |
| First Capital Realty Inc. | 4.323% | 7/31/25 | CAD | 10,000 | 7,618 |
| First Capital Realty Inc. | 4.790% | 8/30/24 | CAD | 5,000 | 3,925 |
| Fortis Inc. | 2.850% | 12/12/23 | CAD | 2,500 | 1,834 |
| FortisBC Energy Inc. | 6.050% | 2/15/38 | CAD | 10,000 | 9,762 |
| FortisBC Energy Inc. | 6.500% | 5/1/34 | CAD | 10,000 | 9,894 |
| Great-West Lifeco Inc. | 1.750% | 12/7/26 | EUR | 500 | 575 |
| Great-West Lifeco Inc. | 5.998% | 11/16/39 | CAD | 11,000 | 10,594 |
| Great-West Lifeco Inc. | 6.670% | 3/21/33 | CAD | 2,000 | 1,956 |
| Greater Toronto Airports Authority | 1.510% | 2/16/21 | CAD | 4,955 | 3,653 |
| 2 Greater Toronto Airports Authority | 4.530% | 12/2/41 | CAD | 5,000 | 4,312 |
| Greater Toronto Airports Authority | 5.300% | 2/25/41 | CAD | 3,100 | 2,945 |
| H&R REIT | 3.416% | 1/23/23 | CAD | 4,705 | 3,497 |
| Hospital for Sick Children | 3.416% | 12/7/57 | CAD | 2,792 | 1,961 |
| Hospital Infrastructure Partners NOH | | | | | |
| Partnership | 5.439% | 1/31/45 | CAD | 5,531 | 4,720 |
| |
| |
| 20 |
| | | | | |
| Total International Bond Index Fund | | | | | |
| |
| |
| |
| | | | | Face | Market |
| | | Maturity | | Amount | Value • |
| | Coupon | Date | Currency | (000) | ($000) |
| HSBC Bank Canada | 1.816% | 7/7/20 | CAD | 10,000 | 7,454 |
| HSBC Bank Canada | 2.170% | 6/29/22 | CAD | 10,500 | 7,666 |
| HSBC Bank Canada | 2.449% | 1/29/21 | CAD | 150 | 112 |
| HSBC Bank Canada | 2.542% | 1/31/23 | CAD | 10,000 | 7,345 |
| HSBC Bank Canada | 2.908% | 9/29/21 | CAD | 3,000 | 2,261 |
| HSBC Bank Canada | 2.938% | 1/14/20 | CAD | 1,950 | 1,488 |
| HSBC Bank Canada | 3.245% | 9/15/23 | CAD | 10,000 | 7,531 |
| Husky Energy Inc. | 3.600% | 3/10/27 | CAD | 3,000 | 2,188 |
| Hydro One Inc. | 1.840% | 2/24/21 | CAD | 400 | 296 |
| Hydro One Inc. | 2.570% | 6/25/21 | CAD | 2,045 | 1,534 |
| Hydro One Inc. | 2.770% | 2/24/26 | CAD | 9,800 | 7,087 |
| Hydro One Inc. | 2.970% | 6/26/25 | CAD | 245 | 181 |
| Hydro One Inc. | 3.200% | 1/13/22 | CAD | 350 | 266 |
| Hydro One Inc. | 3.630% | 6/25/49 | CAD | 10,420 | 7,294 |
| Hydro One Inc. | 3.720% | 11/18/47 | CAD | 1,441 | 1,028 |
| Hydro One Inc. | 3.790% | 7/31/62 | CAD | 2,000 | 1,399 |
| Hydro One Inc. | 4.390% | 9/26/41 | CAD | 5,115 | 4,065 |
| Hydro One Inc. | 4.400% | 6/1/20 | CAD | 3,000 | 2,332 |
| Hydro One Inc. | 4.590% | 10/9/43 | CAD | 5,500 | 4,509 |
| Hydro One Inc. | 4.890% | 3/13/37 | CAD | 5,000 | 4,218 |
| Hydro One Inc. | 5.360% | 5/20/36 | CAD | 1,000 | 888 |
| Hydro One Inc. | 5.490% | 7/16/40 | CAD | 3,525 | 3,219 |
| Hydro One Inc. | 6.930% | 6/1/32 | CAD | 1,000 | 995 |
| Hydro One Inc. | 7.350% | 6/3/30 | CAD | 2,000 | 1,999 |
| 1 Industrial Alliance Insurance & Financial | | | | | |
| Services Inc. | 3.300% | 9/15/28 | CAD | 5,000 | 3,758 |
| Intact Financial Corp. | 3.770% | 3/2/26 | CAD | 2,376 | 1,812 |
| Intact Financial Corp. | 5.160% | 6/16/42 | CAD | 2,530 | 2,158 |
| Inter Pipeline Ltd. | 2.608% | 9/13/23 | CAD | 10,000 | 7,224 |
| Inter Pipeline Ltd. | 2.734% | 4/18/24 | CAD | 5,000 | 3,593 |
| Inter Pipeline Ltd. | 3.173% | 3/24/25 | CAD | 4,950 | 3,596 |
| Inter Pipeline Ltd. | 3.776% | 5/30/22 | CAD | 2,300 | 1,759 |
| Inter Pipeline Ltd. | 4.637% | 5/30/44 | CAD | 3,000 | 2,182 |
| John Deere Canada Funding Inc. | 2.050% | 9/17/20 | CAD | 700 | 523 |
| John Deere Canada Funding Inc. | 2.700% | 1/17/23 | CAD | 1,611 | 1,195 |
| Keyera Corp. | 3.934% | 6/21/28 | CAD | 10,000 | 7,390 |
| Kraft Canada Inc. | 2.700% | 7/6/20 | CAD | 1,865 | 1,406 |
| Laurentian Bank of Canada | 2.500% | 1/23/20 | CAD | 300 | 227 |
| Laurentian Bank of Canada | 3.450% | 6/27/23 | CAD | 5,000 | 3,729 |
| Loblaw Cos. Ltd. | 4.860% | 9/12/23 | CAD | 7,000 | 5,576 |
| Loblaw Cos. Ltd. | 5.900% | 1/18/36 | CAD | 1,300 | 1,141 |
| 1 Manufacturers Life Insurance Co. | 2.100% | 6/1/25 | CAD | 9,000 | 6,737 |
| 1 Manufacturers Life Insurance Co. | 2.640% | 1/15/25 | CAD | 200 | 152 |
| 1 Manufacturers Life Insurance Co. | 3.181% | 11/22/27 | CAD | 5,000 | 3,767 |
| 1 Manulife Finance Delaware LP | 5.059% | 12/15/41 | CAD | 900 | 730 |
| 1 Manulife Financial Capital Trust II | 7.405% | 12/31/08 | CAD | 4,000 | 3,183 |
| Metro Inc. | 3.390% | 12/6/27 | CAD | 15,000 | 10,799 |
| Metro Inc. | 4.270% | 12/4/47 | CAD | 2,000 | 1,411 |
| Metro Inc. | 5.970% | 10/15/35 | CAD | 5,048 | 4,441 |
| National Bank of Canada | 1.742% | 3/3/20 | CAD | 500 | 375 |
| National Bank of Canada | 1.809% | 7/26/21 | CAD | 5,000 | 3,676 |
| 1 National Bank of Canada | 3.183% | 2/1/28 | CAD | 10,000 | 7,352 |
| Nissan Canada Financial Services Inc. | 2.606% | 3/5/21 | CAD | 10,000 | 7,476 |
| |
| |
| |
| 21 |
| | | | | |
| Total International Bond Index Fund | | | | | |
| |
| |
| |
| | | | | Face | Market |
| | | Maturity | | Amount | Value • |
| | Coupon | Date | Currency | (000) | ($000) |
| North West Redwater Partnership / NWR | | | | | |
| Financing Co. Ltd. | 2.800% | 6/1/27 | CAD | 10,000 | 7,101 |
| North West Redwater Partnership / NWR | | | | | |
| Financing Co. Ltd. | 3.700% | 2/23/43 | CAD | 4,000 | 2,833 |
| North West Redwater Partnership / NWR | | | | | |
| Financing Co. Ltd. | 4.050% | 7/22/44 | CAD | 3,350 | 2,503 |
| North West Redwater Partnership / NWR | | | | | |
| Financing Co. Ltd. | 4.250% | 6/1/29 | CAD | 250 | 196 |
| North West Redwater Partnership / NWR | | | | | |
| Financing Co. Ltd. | 4.750% | 6/1/37 | CAD | 5,000 | 4,110 |
| Nova Scotia Power Inc. | 5.610% | 6/15/40 | CAD | 4,300 | 3,963 |
| OMERS Realty Corp. | 2.858% | 2/23/24 | CAD | 5,000 | 3,709 |
| OMERS Realty Corp. | 3.328% | 11/12/24 | CAD | 1,374 | 1,039 |
| OMERS Realty Corp. | 3.331% | 6/5/25 | CAD | 3,000 | 2,261 |
| OMERS Realty Corp. | 3.628% | 6/5/30 | CAD | 4,380 | 3,305 |
| Ottawa MacDonald-Cartier International | | | | | |
| Airport Authority | 3.933% | 6/9/45 | CAD | 775 | 593 |
| Pembina Pipeline Corp. | 3.710% | 8/11/26 | CAD | 4,850 | 3,603 |
| Pembina Pipeline Corp. | 4.240% | 6/15/27 | CAD | 3,000 | 2,298 |
| Pembina Pipeline Corp. | 4.750% | 4/30/43 | CAD | 3,000 | 2,212 |
| Pembina Pipeline Corp. | 4.810% | 3/25/44 | CAD | 9,000 | 6,697 |
| Plenary Properties LTAP LP | 6.288% | 1/31/44 | CAD | 4,397 | 4,164 |
| RioCan REIT | 3.746% | 5/30/22 | CAD | 8,842 | 6,737 |
| Rogers Communications Inc. | 4.000% | 3/13/24 | CAD | 4,000 | 3,090 |
| Rogers Communications Inc. | 4.700% | 9/29/20 | CAD | 400 | 313 |
| Rogers Communications Inc. | 5.340% | 3/22/21 | CAD | 6,000 | 4,775 |
| Rogers Communications Inc. | 6.110% | 8/25/40 | CAD | 5,000 | 4,466 |
| Rogers Communications Inc. | 6.680% | 11/4/39 | CAD | 3,044 | 2,889 |
| Royal Bank of Canada | 0.250% | 6/28/23 | EUR | 2,100 | 2,366 |
| Royal Bank of Canada | 0.500% | 12/16/20 | EUR | 5,000 | 5,733 |
| Royal Bank of Canada | 1.125% | 12/22/21 | GBP | 3,300 | 4,191 |
| Royal Bank of Canada | 1.583% | 9/13/21 | CAD | 4,700 | 3,427 |
| Royal Bank of Canada | 1.650% | 7/15/21 | CAD | 37,000 | 27,111 |
| Royal Bank of Canada | 1.968% | 3/2/22 | CAD | 25,100 | 18,365 |
| Royal Bank of Canada | 2.000% | 3/21/22 | CAD | 4,500 | 3,295 |
| Royal Bank of Canada | 2.333% | 12/5/23 | CAD | 8,500 | 6,177 |
| Royal Bank of Canada | 2.350% | 12/9/19 | CAD | 6,750 | 5,118 |
| Royal Bank of Canada | 2.360% | 12/5/22 | CAD | 12,000 | 8,823 |
| Royal Bank of Canada | 2.949% | 5/1/23 | CAD | 10,000 | 7,509 |
| 1 Royal Bank of Canada | 2.990% | 12/6/24 | CAD | 14,225 | 10,837 |
| 1 Royal Bank of Canada | 3.040% | 7/17/24 | CAD | 400 | 304 |
| 1 Royal Bank of Canada | 3.310% | 1/20/26 | CAD | 10,900 | 8,280 |
| 1 Royal Bank of Canada | 3.450% | 9/29/26 | CAD | 10,000 | 7,594 |
| Royal Office Finance LP | 5.209% | 11/12/32 | CAD | 6,872 | 5,962 |
| Saputo Inc. | 2.654% | 11/26/19 | CAD | 250 | 190 |
| Saputo Inc. | 3.603% | 8/14/25 | CAD | 10,000 | 7,460 |
| 1 Scotiabank Capital Trust | 5.650% | 12/31/56 | CAD | 200 | 179 |
| Shaw Communications Inc. | 4.350% | 1/31/24 | CAD | 10,000 | 7,767 |
| Shaw Communications Inc. | 5.500% | 12/7/20 | CAD | 8,443 | 6,700 |
| Shaw Communications Inc. | 6.750% | 11/9/39 | CAD | 6,200 | 5,606 |
| SmartCentres REIT | 3.834% | 12/21/27 | CAD | 5,000 | 3,588 |
| 1 Sun Life Financial Inc. | 2.600% | 9/25/25 | CAD | 350 | 263 |
| 1 Sun Life Financial Inc. | 3.050% | 9/19/28 | CAD | 10,000 | 7,422 |
| Sun Life Financial Inc. | 4.570% | 8/23/21 | CAD | 3,000 | 2,363 |
22
| | | | | |
| Total International Bond Index Fund | | | | | |
| |
| |
| |
| | | | | Face | Market |
| | | Maturity | | Amount | Value • |
| | Coupon | Date | Currency | (000) | ($000) |
| 1 Sun Life Financial Inc. | 5.400% | 5/29/42 | CAD | 850 | 740 |
| Suncor Energy Inc. | 3.000% | 9/14/26 | CAD | 3,000 | 2,165 |
| Suncor Energy Inc. | 4.340% | 9/13/46 | CAD | 5,154 | 3,906 |
| TCHC Issuer Trust | 5.395% | 2/22/40 | CAD | 2,078 | 1,956 |
| TELUS Corp. | 2.350% | 3/28/22 | CAD | 9,800 | 7,195 |
| TELUS Corp. | 3.200% | 4/5/21 | CAD | 750 | 569 |
| TELUS Corp. | 3.350% | 4/1/24 | CAD | 10,700 | 7,987 |
| TELUS Corp. | 3.750% | 1/17/25 | CAD | 2,460 | 1,864 |
| TELUS Corp. | 3.750% | 3/10/26 | CAD | 900 | 676 |
| TELUS Corp. | 4.400% | 4/1/43 | CAD | 3,000 | 2,120 |
| TELUS Corp. | 4.400% | 1/29/46 | CAD | 250 | 176 |
| TELUS Corp. | 4.750% | 1/17/45 | CAD | 1,430 | 1,064 |
| TELUS Corp. | 4.850% | 4/5/44 | CAD | 9,250 | 6,985 |
| TELUS Corp. | 5.050% | 7/23/20 | CAD | 300 | 236 |
| Teranet Holdings LP | 4.807% | 12/16/20 | CAD | 8,875 | 6,908 |
| Teranet Holdings LP | 5.754% | 12/17/40 | CAD | 1,200 | 915 |
| Thomson Reuters Corp. | 3.309% | 11/12/21 | CAD | 2,500 | 1,905 |
| Toromont Industries Ltd. | 3.842% | 10/27/27 | CAD | 7,000 | 5,252 |
| Toronto-Dominion Bank | 0.500% | 4/3/24 | EUR | 8,000 | 9,070 |
| Toronto-Dominion Bank | 1.000% | 12/13/21 | GBP | 1,000 | 1,265 |
| Toronto-Dominion Bank | 1.680% | 6/8/21 | CAD | 10,000 | 7,375 |
| Toronto-Dominion Bank | 1.693% | 4/2/20 | CAD | 15,000 | 11,229 |
| Toronto-Dominion Bank | 1.994% | 3/23/22 | CAD | 10,000 | 7,330 |
| Toronto-Dominion Bank | 2.045% | 3/8/21 | CAD | 5,000 | 3,719 |
| Toronto-Dominion Bank | 2.621% | 12/22/21 | CAD | 22,450 | 16,833 |
| 1 Toronto-Dominion Bank | 2.982% | 9/30/25 | CAD | 7,400 | 5,593 |
| Toronto-Dominion Bank | 3.005% | 5/30/23 | CAD | 15,000 | 11,297 |
| 1 Toronto-Dominion Bank | 3.224% | 7/25/29 | CAD | 6,000 | 4,381 |
| Toronto-Dominion Bank | 3.226% | 7/24/24 | CAD | 5,450 | 4,129 |
| 1 Toronto-Dominion Bank | 3.589% | 9/14/28 | CAD | 8,000 | 5,989 |
| 1 Toronto-Dominion Bank | 4.859% | 3/4/31 | CAD | 5,150 | 4,105 |
| TransAlta Corp. | 5.000% | 11/25/20 | CAD | 2,650 | 2,070 |
| TransCanada PipeLines Ltd. | 3.390% | 3/15/28 | CAD | 20,000 | 14,600 |
| TransCanada PipeLines Ltd. | 3.650% | 11/15/21 | CAD | 5,000 | 3,854 |
| TransCanada PipeLines Ltd. | 3.690% | 7/19/23 | CAD | 5,240 | 4,023 |
| TransCanada PipeLines Ltd. | 4.180% | 7/3/48 | CAD | 15,000 | 10,661 |
| TransCanada PipeLines Ltd. | 4.330% | 9/16/47 | CAD | 5,000 | 3,652 |
| TransCanada PipeLines Ltd. | 4.350% | 6/6/46 | CAD | 4,000 | 2,934 |
| TransCanada PipeLines Ltd. | 4.550% | 11/15/41 | CAD | 2,000 | 1,515 |
| TransCanada PipeLines Ltd. | 6.280% | 5/26/28 | CAD | 4,514 | 3,979 |
| Union Gas Ltd. | 3.790% | 7/10/23 | CAD | 30,000 | 23,250 |
| Union Gas Ltd. | 4.200% | 6/2/44 | CAD | 2,400 | 1,877 |
| Union Gas Ltd. | 4.880% | 6/21/41 | CAD | 3,450 | 2,951 |
| University of Toronto | 5.841% | 12/15/43 | CAD | 130 | 132 |
| Veresen Inc. | 3.430% | 11/10/21 | CAD | 3,000 | 2,281 |
| Wells Fargo Canada Corp. | 3.040% | 1/29/21 | CAD | 10,000 | 7,596 |
| | | | | | 1,376,061 |
| Sovereign Bonds (4.4%) | | | | | |
| Canada | 0.500% | 3/1/22 | CAD | 50,330 | 35,939 |
| Canada | 0.750% | 9/1/20 | CAD | 235,955 | 174,197 |
| Canada | 0.750% | 3/1/21 | CAD | 139,695 | 102,292 |
| Canada | 1.000% | 9/1/22 | CAD | 207,652 | 149,622 |
| Canada | 1.250% | 11/1/19 | CAD | 133,950 | 100,865 |
| Canada | 1.250% | 2/1/20 | CAD | 65,892 | 49,477 |
| |
| |
| 23 |
| | | | | | |
| Total International Bond Index Fund | | | | | |
| |
| |
| |
| | | | | | Face | Market |
| | | | Maturity | | Amount | Value • |
| | | Coupon | Date | Currency | (000) | ($000) |
| | Canada | 1.500% | 3/1/20 | CAD | 59,625 | 44,860 |
| | Canada | 1.500% | 6/1/26 | CAD | 60,485 | 42,871 |
| | Canada | 1.750% | 5/1/20 | CAD | 118,155 | 89,071 |
| | Canada | 1.750% | 8/1/20 | CAD | 31,101 | 23,401 |
| | Canada | 1.750% | 3/1/23 | CAD | 120,376 | 88,923 |
| | Canada | 2.000% | 11/1/20 | CAD | 26,491 | 19,994 |
| | Canada | 2.000% | 9/1/23 | CAD | 33,535 | 24,980 |
| | Canada | 2.000% | 6/1/28 | CAD | 24,402 | 17,773 |
| | Canada | 2.000% | 12/1/51 | CAD | 13,600 | 9,117 |
| | Canada | 2.250% | 6/1/25 | CAD | 36,460 | 27,331 |
| | Canada | 2.250% | 6/1/29 | CAD | 32,000 | 23,746 |
| | Canada | 2.500% | 6/1/24 | CAD | 59,510 | 45,319 |
| | Canada | 2.750% | 6/1/22 | CAD | 1,755 | 1,349 |
| | Canada | 2.750% | 12/1/48 | CAD | 40,302 | 32,047 |
| | Canada | 2.750% | 12/1/64 | CAD | 93,529 | 76,007 |
| | Canada | 3.250% | 6/1/21 | CAD | 25,015 | 19,425 |
| | Canada | 3.500% | 1/13/20 | EUR | 2,000 | 2,374 |
| | Canada | 3.500% | 12/1/45 | CAD | 102,394 | 92,382 |
| | Canada | 4.000% | 6/1/41 | CAD | 108,350 | 102,801 |
| | Canada | 5.000% | 6/1/37 | CAD | 90,706 | 93,934 |
| | Canada | 5.750% | 6/1/29 | CAD | 31,844 | 31,436 |
| | Canada | 5.750% | 6/1/33 | CAD | 70,753 | 74,795 |
| | Canada | 8.000% | 6/1/23 | CAD | 1,100 | 1,036 |
| | Canada | 8.000% | 6/1/27 | CAD | 7,000 | 7,577 |
| | Canada | 9.000% | 6/1/25 | CAD | 20,000 | 21,183 |
| | Canada | 10.500% | 3/15/21 | CAD | 15,000 | 13,538 |
| 2 | Canada Housing Trust No 1 | 1.150% | 12/15/21 | CAD | 75,854 | 55,028 |
| 2 | Canada Housing Trust No 1 | 1.200% | 6/15/20 | CAD | 24,050 | 17,952 |
| 2 | Canada Housing Trust No 1 | 1.250% | 12/15/20 | CAD | 50,000 | 37,268 |
| 2,5 | Canada Housing Trust No 1 | 1.250% | 6/15/21 | CAD | 30,000 | 22,094 |
| 2 | Canada Housing Trust No 1 | 1.450% | 6/15/20 | CAD | 25,000 | 18,736 |
| 2 | Canada Housing Trust No 1 | 1.500% | 12/15/21 | CAD | 600 | 440 |
| 2 | Canada Housing Trust No 1 | 1.750% | 6/15/22 | CAD | 35,000 | 25,787 |
| 2 | Canada Housing Trust No 1 | 1.900% | 9/15/26 | CAD | 31,950 | 22,654 |
| 2 | Canada Housing Trust No 1 | 1.950% | 12/15/25 | CAD | 20,000 | 14,338 |
| 2 | Canada Housing Trust No 1 | 2.000% | 12/15/19 | CAD | 53,800 | 40,759 |
| 2 | Canada Housing Trust No 1 | 2.250% | 12/15/25 | CAD | 5,225 | 3,822 |
| 2 | Canada Housing Trust No 1 | 2.350% | 6/15/23 | CAD | 48,275 | 36,095 |
| 2 | Canada Housing Trust No 1 | 2.350% | 9/15/23 | CAD | 13,940 | 10,411 |
| 2 | Canada Housing Trust No 1 | 2.350% | 3/15/28 | CAD | 425 | 309 |
| 2 | Canada Housing Trust No 1 | 2.400% | 12/15/22 | CAD | 30,000 | 22,555 |
| 2 | Canada Housing Trust No 1 | 2.550% | 12/15/23 | CAD | 56,195 | 42,278 |
| 2 | Canada Housing Trust No 1 | 2.550% | 3/15/25 | CAD | 13,000 | 9,728 |
| 2 | Canada Housing Trust No 1 | 2.650% | 3/15/22 | CAD | 21,500 | 16,314 |
| 2 | Canada Housing Trust No 1 | 2.650% | 3/15/28 | CAD | 85,365 | 63,635 |
| 2 | Canada Housing Trust No 1 | 2.650% | 12/15/28 | CAD | 10,900 | 8,103 |
| 2 | Canada Housing Trust No 1 | 2.900% | 6/15/24 | CAD | 14,000 | 10,694 |
| 2 | Canada Housing Trust No 1 | 3.150% | 9/15/23 | CAD | 21,270 | 16,470 |
| 2 | Canada Housing Trust No 1 | 3.350% | 12/15/20 | CAD | 26,000 | 20,140 |
| 2,5 | Canada Housing Trust No 1 | 3.750% | 3/15/20 | CAD | 10,000 | 7,771 |
| 2 | Canada Housing Trust No 1 | 3.800% | 6/15/21 | CAD | 56,000 | 43,975 |
| | Canada Post Corp. | 4.360% | 7/16/40 | CAD | 3,650 | 3,274 |
| | CDP Financial Inc. | 4.600% | 7/15/20 | CAD | 350 | 275 |
| | City of Montreal | 3.000% | 9/1/25 | CAD | 7,000 | 5,249 |
24
| | | | | | |
| Total International Bond Index Fund | | | | | |
| |
| |
| |
| | | | | | Face | Market |
| | | | Maturity | | Amount | Value • |
| | | Coupon | Date | Currency | (000) | ($000) |
| | City of Montreal | 3.150% | 9/1/28 | CAD | 3,050 | 2,276 |
| | City of Montreal | 3.150% | 12/1/36 | CAD | 2,000 | 1,431 |
| | City of Montreal | 3.500% | 9/1/23 | CAD | 7,450 | 5,788 |
| | City of Montreal | 3.500% | 9/1/24 | CAD | 10,000 | 7,748 |
| | City of Montreal | 3.500% | 12/1/38 | CAD | 6,000 | 4,495 |
| | City of Montreal | 4.100% | 12/1/34 | CAD | 3,195 | 2,588 |
| | City of Montreal | 3.000% | 9/1/27 | CAD | 5,000 | 3,739 |
| | City of Ottawa Ontario | 3.100% | 7/27/48 | CAD | 4,190 | 2,906 |
| | City of Toronto | 2.400% | 6/7/27 | CAD | 1,590 | 1,130 |
| | City of Toronto | 2.950% | 4/28/35 | CAD | 6,250 | 4,386 |
| | City of Toronto | 3.200% | 8/1/48 | CAD | 1,820 | 1,293 |
| | City of Toronto | 3.800% | 12/13/42 | CAD | 19,000 | 14,939 |
| | City of Toronto | 3.900% | 9/29/23 | CAD | 4,742 | 3,753 |
| | City of Toronto | 4.150% | 3/10/44 | CAD | 4,950 | 4,086 |
| | City of Toronto | 4.500% | 12/2/19 | CAD | 5,000 | 3,897 |
| | City of Toronto | 4.700% | 6/10/41 | CAD | 2,000 | 1,783 |
| | City of Toronto | 5.200% | 6/1/40 | CAD | 1,220 | 1,152 |
| | City of Winnipeg | 4.100% | 6/1/45 | CAD | 1,000 | 829 |
| | CNA Financial Corp. | 4.000% | 12/1/19 | CAD | 9,000 | 6,984 |
| | CPPIB Capital Inc. | 0.375% | 6/20/24 | EUR | 35,000 | 39,547 |
| | CPPIB Capital Inc. | 1.400% | 6/4/20 | CAD | 10,700 | 7,993 |
| | CPPIB Capital Inc. | 1.500% | 3/4/33 | EUR | 15,000 | 17,427 |
| 5 | Export Development Canada | 1.000% | 12/15/20 | GBP | 4,000 | 5,106 |
| | Export Development Canada | 1.375% | 12/16/19 | GBP | 3,500 | 4,493 |
| | Export Development Canada | 1.375% | 12/8/23 | GBP | 10,000 | 12,777 |
| | Export Development Canada | 1.800% | 9/1/22 | CAD | 195 | 143 |
| | Export Development Canada | 2.400% | 6/7/21 | AUD | 20,564 | 14,578 |
| | Fair Hydro Trust | 3.357% | 5/15/33 | CAD | 7,125 | 5,323 |
| | Financement-Quebec | 2.450% | 12/1/19 | CAD | 9,240 | 7,033 |
| | Financement-Quebec | 5.250% | 6/1/34 | CAD | 3,000 | 2,798 |
| | Hydro-Quebec | 4.000% | 2/15/55 | CAD | 16,247 | 14,120 |
| | Hydro-Quebec | 5.000% | 2/15/45 | CAD | 18,950 | 18,540 |
| | Hydro-Quebec | 5.000% | 2/15/50 | CAD | 34,400 | 34,551 |
| | Hydro-Quebec | 6.000% | 8/15/31 | CAD | 9,290 | 9,010 |
| | Hydro-Quebec | 6.000% | 2/15/40 | CAD | 15,915 | 16,924 |
| | Hydro-Quebec | 6.500% | 1/16/35 | CAD | 4,155 | 4,351 |
| | Hydro-Quebec | 6.500% | 2/15/35 | CAD | 16,000 | 16,950 |
| | Hydro-Quebec | 9.625% | 7/15/22 | CAD | 12,000 | 11,293 |
| | Hydro-Quebec | 10.500% | 10/15/21 | CAD | 4,000 | 3,705 |
| | Hydro-Quebec | 11.000% | 8/15/20 | CAD | 1,450 | 1,265 |
| 2,5 | Labrador-Island Link Funding Trust | 3.760% | 6/1/33 | CAD | 3,000 | 2,437 |
| 2,5 | Labrador-Island Link Funding Trust | 3.850% | 12/1/53 | CAD | 4,123 | 3,540 |
| 2,5 | Labrador-Island Link Funding Trust | 3.860% | 12/1/45 | CAD | 3,790 | 3,201 |
| | Lower Mattagami Energy LP | 3.416% | 6/20/24 | CAD | 2,000 | 1,532 |
| | Lower Mattagami Energy LP | 5.139% | 5/18/41 | CAD | 5,000 | 4,482 |
| 5 | Maritime Link Financing Trust | 3.500% | 12/1/52 | CAD | 7,372 | 5,668 |
| | Municipal Finance Authority of British | | | | | |
| | Columbia | 1.650% | 4/19/21 | CAD | 4,500 | 3,338 |
| | Municipal Finance Authority of British | | | | | |
| | Columbia | 2.500% | 4/19/26 | CAD | 1,850 | 1,344 |
| | Municipal Finance Authority of British | | | | | |
| | Columbia | 2.600% | 4/23/23 | CAD | 1,848 | 1,386 |
| | Municipal Finance Authority of British | | | | | |
| | Columbia | 2.950% | 10/14/24 | CAD | 6,000 | 4,661 |
25
| | | | | | |
| Total International Bond Index Fund | | | | | |
| |
| |
| |
| | | | | | Face | Market |
| | | | Maturity | | Amount | Value • |
| | | Coupon | Date | Currency | (000) | ($000) |
| | Municipal Finance Authority of British | | | | | |
| | Columbia | 3.050% | 10/23/28 | CAD | 7,620 | 5,712 |
| | Municipal Finance Authority of British | | | | | |
| | Columbia | 4.150% | 6/1/21 | CAD | 4,050 | 3,197 |
| | Municipal Finance Authority of British | | | | | |
| | Columbia | 4.450% | 6/1/20 | CAD | 400 | 313 |
| 2,5 | Muskrat Falls / Labrador Transmission | | | | | |
| | Assets Funding Trust | 3.630% | 6/1/29 | CAD | 5,300 | 4,235 |
| 2,5 | Muskrat Falls / Labrador Transmission | | | | | |
| | Assets Funding Trust | 3.830% | 6/1/37 | CAD | 1,000 | 826 |
| 2,5 | Muskrat Falls / Labrador Transmission | | | | | |
| | Assets Funding Trust | 3.860% | 12/1/48 | CAD | 3,500 | 2,991 |
| | Newfoundland & Labrador Hydro | 3.600% | 12/1/45 | CAD | 1,500 | 1,140 |
| | Newfoundland & Labrador Hydro | 6.650% | 8/27/31 | CAD | 2,000 | 2,002 |
| | Ontario Electricity Financial Corp. | 8.250% | 6/22/26 | CAD | 7,000 | 7,168 |
| | Ontario Electricity Financial Corp. | 8.900% | 8/18/22 | CAD | 10,250 | 9,488 |
| | Ontario Electricity Financial Corp. | 10.125% | 10/15/21 | CAD | 2,500 | 2,290 |
| | Ontario Infrastructure & Lands Corp. | 4.700% | 6/1/37 | CAD | 1,439 | 1,259 |
| | Ontario Power Generation Inc. | 3.838% | 6/22/48 | CAD | 10,000 | 7,177 |
| | OPB Finance Trust | 2.950% | 2/2/26 | CAD | 29,000 | 21,542 |
| | OPB Finance Trust | 2.980% | 1/25/27 | CAD | 5,000 | 3,697 |
| | Province of Alberta | 0.625% | 4/18/25 | EUR | 10,600 | 12,032 |
| | Province of Alberta | 1.000% | 11/15/21 | GBP | 6,300 | 7,971 |
| | Province of Alberta | 1.250% | 6/1/20 | CAD | 15,900 | 11,860 |
| | Province of Alberta | 1.350% | 9/1/21 | CAD | 12,000 | 8,802 |
| | Province of Alberta | 1.600% | 9/1/22 | CAD | 9,000 | 6,543 |
| | Province of Alberta | 2.200% | 6/1/26 | CAD | 20,000 | 14,313 |
| | Province of Alberta | 2.350% | 6/1/25 | CAD | 9,300 | 6,788 |
| | Province of Alberta | 2.550% | 6/1/27 | CAD | 22,285 | 16,207 |
| | Province of Alberta | 2.900% | 12/1/28 | CAD | 6,625 | 4,913 |
| | Province of Alberta | 2.900% | 9/20/29 | CAD | 6,000 | 4,425 |
| | Province of Alberta | 3.050% | 12/1/48 | CAD | 37,911 | 27,102 |
| | Province of Alberta | 3.100% | 6/1/50 | CAD | 4,405 | 3,233 |
| | Province of Alberta | 3.300% | 12/1/46 | CAD | 19,165 | 14,367 |
| | Province of Alberta | 3.400% | 12/1/23 | CAD | 3,000 | 2,336 |
| | Province of Alberta | 3.900% | 12/1/33 | CAD | 7,075 | 5,748 |
| | Province of Alberta | 3.450% | 12/1/43 | CAD | 19,075 | 14,680 |
| | Province of Alberta | 4.500% | 12/1/40 | CAD | 5,000 | 4,460 |
| | Province of British Columbia | 2.300% | 6/18/26 | CAD | 15,000 | 10,885 |
| | Province of British Columbia | 2.550% | 6/18/27 | CAD | 3,900 | 2,851 |
| | Province of British Columbia | 2.700% | 12/18/22 | CAD | 4,902 | 3,715 |
| | Province of British Columbia | 2.800% | 6/18/48 | CAD | 31,521 | 21,904 |
| | Province of British Columbia | 2.850% | 6/18/25 | CAD | 5,185 | 3,920 |
| | Province of British Columbia | 2.950% | 12/18/28 | CAD | 24,932 | 18,722 |
| | Province of British Columbia | 2.950% | 6/18/50 | CAD | 3,965 | 2,848 |
| | Province of British Columbia | 3.200% | 6/18/44 | CAD | 12,800 | 9,609 |
| | Province of British Columbia | 3.250% | 12/18/21 | CAD | 2,270 | 1,758 |
| | Province of British Columbia | 3.300% | 12/18/23 | CAD | 11,000 | 8,532 |
| | Province of British Columbia | 4.100% | 12/18/19 | CAD | 25,000 | 19,438 |
| | Province of British Columbia | 4.300% | 6/18/42 | CAD | 21,725 | 19,302 |
| | Province of British Columbia | 4.700% | 6/18/37 | CAD | 3,200 | 2,916 |
| | Province of British Columbia | 4.800% | 6/15/21 | CAD | 94 | 75 |
| | Province of British Columbia | 4.900% | 6/18/48 | CAD | 3,000 | 2,980 |
| | Province of British Columbia | 4.950% | 6/18/40 | CAD | 8,000 | 7,659 |
26
| | | | | |
| Total International Bond Index Fund | | | | | |
| |
| |
| |
| | | | | Face | Market |
| | | Maturity | | Amount | Value • |
| | Coupon | Date | Currency | (000) | ($000) |
| Province of British Columbia | 5.700% | 6/18/29 | CAD | 13,575 | 12,710 |
| Province of British Columbia | 6.350% | 6/18/31 | CAD | 15,000 | 15,140 |
| Province of Manitoba | 0.750% | 12/15/21 | GBP | 6,300 | 6,543 |
| Province of Manitoba | 1.550% | 9/5/21 | CAD | 5,000 | 3,687 |
| Province of Manitoba | 1.600% | 9/5/20 | CAD | 3,000 | 2,243 |
| Province of Manitoba | 2.450% | 6/2/25 | CAD | 7,000 | 5,140 |
| Province of Manitoba | 2.550% | 6/2/26 | CAD | 19,000 | 13,921 |
| Province of Manitoba | 2.600% | 6/2/27 | CAD | 18,000 | 13,102 |
| Province of Manitoba | 2.850% | 9/5/46 | CAD | 8,000 | 5,420 |
| Province of Manitoba | 3.000% | 6/2/28 | CAD | 10,000 | 7,485 |
| Province of Manitoba | 3.150% | 9/5/52 | CAD | 2,750 | 1,968 |
| Province of Manitoba | 3.250% | 9/5/29 | CAD | 2,270 | 1,719 |
| Province of Manitoba | 3.300% | 6/2/24 | CAD | 3,000 | 2,322 |
| Province of Manitoba | 3.350% | 3/5/43 | CAD | 2,000 | 1,492 |
| Province of Manitoba | 3.400% | 9/5/48 | CAD | 24,049 | 18,129 |
| Province of Manitoba | 3.450% | 3/5/63 | CAD | 3,597 | 2,737 |
| Province of Manitoba | 4.050% | 9/5/45 | CAD | 5,000 | 4,187 |
| Province of Manitoba | 4.100% | 3/5/41 | CAD | 5,000 | 4,179 |
| Province of Manitoba | 4.150% | 6/3/20 | CAD | 6,000 | 4,678 |
| Province of Manitoba | 4.400% | 9/5/25 | CAD | 3,500 | 2,875 |
| Province of Manitoba | 4.400% | 3/5/42 | CAD | 6,500 | 5,685 |
| Province of Manitoba | 4.600% | 3/5/38 | CAD | 3,000 | 2,647 |
| Province of Manitoba | 4.650% | 3/5/40 | CAD | 4,000 | 3,589 |
| Province of Manitoba | 4.700% | 3/5/50 | CAD | 235 | 221 |
| Province of Manitoba | 4.750% | 2/11/20 | CAD | 5,250 | 4,107 |
| Province of Manitoba | 5.700% | 3/5/37 | CAD | 3,000 | 3,002 |
| Province of New Brunswick | 1.550% | 5/4/22 | CAD | 98 | 71 |
| Province of New Brunswick | 2.350% | 8/14/27 | CAD | 1,700 | 1,206 |
| Province of New Brunswick | 2.600% | 8/14/26 | CAD | 10,000 | 7,315 |
| Province of New Brunswick | 2.850% | 6/2/23 | CAD | 10,000 | 7,587 |
| Province of New Brunswick | 3.100% | 8/14/48 | CAD | 16,500 | 11,574 |
| Province of New Brunswick | 3.550% | 6/3/43 | CAD | 3,000 | 2,274 |
| Province of New Brunswick | 3.650% | 6/3/24 | CAD | 11,000 | 8,639 |
| Province of New Brunswick | 3.800% | 8/14/45 | CAD | 7,965 | 6,317 |
| Province of New Brunswick | 4.500% | 6/2/20 | CAD | 2,000 | 1,567 |
| Province of New Brunswick | 4.550% | 3/26/37 | CAD | 7,000 | 6,050 |
| Province of New Brunswick | 4.800% | 9/26/39 | CAD | 2,420 | 2,180 |
| Province of New Brunswick | 4.800% | 6/3/41 | CAD | 2,990 | 2,711 |
| Province of Newfoundland and Labrador | 2.300% | 6/2/25 | CAD | 5,000 | 3,611 |
| Province of Newfoundland and Labrador | 2.850% | 6/2/28 | CAD | 15,000 | 11,019 |
| Province of Newfoundland and Labrador | 3.000% | 6/2/26 | CAD | 10,000 | 7,509 |
| Province of Newfoundland and Labrador | 3.300% | 10/17/46 | CAD | 15,205 | 10,963 |
| Province of Newfoundland and Labrador | 3.700% | 10/17/48 | CAD | 1,214 | 945 |
| Province of Newfoundland and Labrador | 4.650% | 10/17/40 | CAD | 2,270 | 2,007 |
| Province of Newfoundland and Labrador | 6.150% | 4/17/28 | CAD | 1,000 | 938 |
| Province of Nova Scotia | 2.100% | 6/1/27 | CAD | 16,000 | 11,234 |
| Province of Nova Scotia | 3.450% | 6/1/45 | CAD | 3,000 | 2,314 |
| Province of Nova Scotia | 3.500% | 6/2/62 | CAD | 7,220 | 5,614 |
| Province of Nova Scotia | 4.100% | 6/1/21 | CAD | 8,000 | 6,300 |
| Province of Nova Scotia | 4.150% | 11/25/19 | CAD | 250 | 193 |
| Province of Nova Scotia | 4.400% | 6/1/42 | CAD | 6,000 | 5,316 |
| Province of Nova Scotia | 4.500% | 6/1/37 | CAD | 3,000 | 2,631 |
| Province of Nova Scotia | 4.700% | 6/1/41 | CAD | 2,000 | 1,828 |
| Province of Nova Scotia | 5.800% | 6/1/33 | CAD | 2,000 | 1,948 |
27
| | | | | |
| Total International Bond Index Fund | | | | | |
| |
| |
| |
| | | | | Face | Market |
| | | Maturity | | Amount | Value • |
| | Coupon | Date | Currency | (000) | ($000) |
| Province of Ontario | 0.375% | 6/14/24 | EUR | 24,200 | 27,296 |
| Province of Ontario | 0.875% | 1/21/25 | EUR | 5,000 | 5,788 |
| Province of Ontario | 1.350% | 3/8/22 | CAD | 42,500 | 30,915 |
| Province of Ontario | 1.875% | 5/21/24 | EUR | 5,000 | 6,115 |
| Province of Ontario | 2.375% | 5/7/20 | CHF | 1,100 | 1,143 |
| Province of Ontario | 2.400% | 6/2/26 | CAD | 28,280 | 20,529 |
| Province of Ontario | 2.600% | 9/8/23 | CAD | 19,200 | 14,409 |
| Province of Ontario | 2.600% | 6/2/25 | CAD | 77,465 | 57,431 |
| Province of Ontario | 2.600% | 6/2/27 | CAD | 74,500 | 54,352 |
| Province of Ontario | 2.800% | 6/2/48 | CAD | 62,696 | 42,691 |
| Province of Ontario | 2.850% | 6/2/23 | CAD | 50,090 | 38,037 |
| Province of Ontario | 2.900% | 6/2/28 | CAD | 60,432 | 44,923 |
| Province of Ontario | 2.900% | 12/2/46 | CAD | 65,467 | 45,498 |
| Province of Ontario | 2.900% | 6/2/49 | CAD | 47,266 | 32,877 |
| Province of Ontario | 3.000% | 9/28/20 | EUR | 7,750 | 9,328 |
| Province of Ontario | 3.150% | 6/2/22 | CAD | 78,000 | 60,022 |
| Province of Ontario | 3.450% | 6/2/45 | CAD | 73,735 | 56,830 |
| Province of Ontario | 3.500% | 6/2/24 | CAD | 46,250 | 36,151 |
| Province of Ontario | 3.500% | 6/2/43 | CAD | 54,000 | 41,890 |
| Province of Ontario | 4.000% | 12/3/19 | EUR | 35,000 | 41,536 |
| Province of Ontario | 4.000% | 6/2/21 | CAD | 40,720 | 32,002 |
| Province of Ontario | 4.200% | 6/2/20 | CAD | 35,839 | 27,965 |
| Province of Ontario | 4.600% | 6/2/39 | CAD | 44,500 | 39,996 |
| Province of Ontario | 4.650% | 6/2/41 | CAD | 72,175 | 65,929 |
| Province of Ontario | 4.700% | 6/2/37 | CAD | 37,700 | 33,941 |
| Province of Ontario | 4.850% | 6/2/20 | CAD | 10,000 | 7,877 |
| Province of Ontario | 5.600% | 6/2/35 | CAD | 30,000 | 29,285 |
| Province of Ontario | 5.850% | 3/8/33 | CAD | 22,850 | 22,439 |
| Province of Ontario | 6.200% | 6/2/31 | CAD | 13,000 | 12,876 |
| Province of Ontario | 6.250% | 9/29/20 | AUD | 9,535 | 7,240 |
| Province of Ontario | 6.500% | 3/8/29 | CAD | 16,560 | 16,155 |
| Province of Ontario | 7.600% | 6/2/27 | CAD | 15,000 | 15,210 |
| Province of Prince Edward Island | 3.600% | 1/17/53 | CAD | 2,994 | 2,262 |
| Province of Quebec | 0.875% | 5/24/22 | GBP | 1,500 | 1,886 |
| Province of Quebec | 0.875% | 1/15/25 | EUR | 17,600 | 20,380 |
| Province of Quebec | 0.875% | 5/4/27 | EUR | 31,900 | 36,215 |
| Province of Quebec | 1.650% | 3/3/22 | CAD | 15,000 | 11,040 |
| Province of Quebec | 2.250% | 7/17/23 | EUR | 13,500 | 16,712 |
| Province of Quebec | 2.375% | 1/22/24 | EUR | 1,000 | 1,249 |
| Province of Quebec | 2.450% | 3/1/23 | CAD | 2,000 | 1,500 |
| Province of Quebec | 2.500% | 9/1/26 | CAD | 37,500 | 27,431 |
| Province of Quebec | 2.600% | 7/6/25 | CAD | 835 | 620 |
| Province of Quebec | 2.750% | 9/1/25 | CAD | 28,480 | 21,335 |
| Province of Quebec | 2.750% | 9/1/27 | CAD | 42,178 | 31,233 |
| Province of Quebec | 2.750% | 9/1/28 | CAD | 27,430 | 20,183 |
| Province of Quebec | 3.000% | 9/1/23 | CAD | 20,240 | 15,492 |
| Province of Quebec | 3.500% | 12/1/22 | CAD | 34,220 | 26,698 |
| Province of Quebec | 3.500% | 12/1/45 | CAD | 56,425 | 44,168 |
| Province of Quebec | 3.500% | 12/1/48 | CAD | 69,000 | 54,186 |
| Province of Quebec | 3.750% | 9/1/24 | CAD | 19,650 | 15,581 |
| Province of Quebec | 4.250% | 12/1/21 | CAD | 35,000 | 27,892 |
| Province of Quebec | 4.250% | 12/1/43 | CAD | 34,125 | 29,963 |
| Province of Quebec | 4.500% | 12/1/19 | CAD | 13,000 | 10,128 |
| Province of Quebec | 4.500% | 12/1/20 | CAD | 22,597 | 17,874 |
28
| | | | | |
| Total International Bond Index Fund | | | | | |
| |
| |
| |
| | | | | Face | Market |
| | | Maturity | | Amount | Value • |
| | Coupon | Date | Currency | (000) | ($000) |
| Province of Quebec | 5.000% | 12/1/38 | CAD | 21,900 | 20,709 |
| Province of Quebec | 5.000% | 12/1/41 | CAD | 42,690 | 41,130 |
| Province of Quebec | 5.350% | 6/1/25 | CAD | 5,000 | 4,317 |
| Province of Quebec | 5.750% | 12/1/36 | CAD | 17,240 | 17,412 |
| Province of Quebec | 6.000% | 10/1/29 | CAD | 15,000 | 14,343 |
| Province of Quebec | 6.250% | 6/1/32 | CAD | 15,370 | 15,496 |
| Province of Quebec | 8.500% | 4/1/26 | CAD | 10,000 | 10,301 |
| Province of Quebec | 9.375% | 1/16/23 | CAD | 3,000 | 2,862 |
| Province of Saskatchewan | 2.550% | 6/2/26 | CAD | 4,875 | 3,576 |
| Province of Saskatchewan | 2.650% | 6/2/27 | CAD | 10,000 | 7,333 |
| Province of Saskatchewan | 2.750% | 12/2/46 | CAD | 11,950 | 8,057 |
| Province of Saskatchewan | 2.950% | 6/2/58 | CAD | 900 | 626 |
| Province of Saskatchewan | 3.100% | 6/2/50 | CAD | 4,295 | 3,106 |
| Province of Saskatchewan | 3.200% | 6/3/24 | CAD | 9,500 | 7,316 |
| Province of Saskatchewan | 3.300% | 6/2/48 | CAD | 10,920 | 8,205 |
| Province of Saskatchewan | 3.400% | 2/3/42 | CAD | 3,500 | 2,670 |
| Province of Saskatchewan | 3.750% | 3/5/54 | CAD | 2,795 | 2,308 |
| Province of Saskatchewan | 3.900% | 6/2/45 | CAD | 6,000 | 4,977 |
| Province of Saskatchewan | 4.750% | 6/1/40 | CAD | 2,400 | 2,206 |
| Province of Saskatchewan | 5.000% | 3/5/37 | CAD | 240 | 223 |
| Province of Saskatchewan | 5.750% | 3/5/29 | CAD | 6,000 | 5,558 |
| PSP Capital Inc. | 1.730% | 6/21/22 | CAD | 2,000 | 1,465 |
| PSP Capital Inc. | 2.090% | 11/22/23 | CAD | 4,000 | 2,925 |
| PSP Capital Inc. | 3.290% | 4/4/24 | CAD | 19,825 | 15,328 |
| Regional Municipality of Peel Ontario | 5.100% | 6/29/40 | CAD | 1,600 | 1,496 |
| Regional Municipality of York | 2.350% | 6/9/27 | CAD | 5,000 | 3,534 |
| Regional Municipality of York | 2.500% | 6/2/26 | CAD | 3,000 | 2,176 |
| Regional Municipality of York | 2.600% | 12/15/25 | CAD | 5,000 | 3,669 |
| Regional Municipality of York | 4.050% | 5/1/34 | CAD | 2,400 | 1,957 |
| Toronto Hydro Corp. | 2.520% | 8/25/26 | CAD | 10,000 | 7,181 |
| Vancouver Airport Authority | 7.425% | 12/7/26 | CAD | 15,000 | 14,687 |
| | | | | | 4,877,108 |
| Total Canada (Cost $6,848,230) | | | | | 6,470,515 |
| Chile (0.0%) | | | | | |
| Sovereign Bonds (0.0%) | | | | | |
| Corp. Nacional del Cobre de Chile | 2.250% | 7/9/24 | EUR | 3,000 | 3,603 |
| 1 Republic of Chile | 1.440% | 2/1/29 | EUR | 15,000 | 16,695 |
| Republic of Chile | 1.750% | 1/20/26 | EUR | 100 | 117 |
| Republic of Chile | 1.875% | 5/27/30 | EUR | 22,900 | 26,347 |
| Total Chile (Cost $50,682) | | | | | 46,762 |
| China (0.1%) | | | | | |
| Sovereign Bonds (0.1%) | | | | | |
| China Development Bank | 0.375% | 11/16/21 | EUR | 21,900 | 24,695 |
| China Development Bank | 0.875% | 1/24/24 | EUR | 1,600 | 1,793 |
| China Development Bank Corp. | 0.125% | 11/3/19 | EUR | 600 | 678 |
| China Development Bank Corp. | 0.500% | 6/1/21 | EUR | 22,800 | 25,877 |
| Export-Import Bank of China | 0.250% | 12/2/19 | EUR | 30,000 | 33,965 |
| Export-Import Bank of China | 0.250% | 3/14/20 | EUR | 100 | 113 |
| Export-Import Bank of China | 0.750% | 6/8/22 | EUR | 2,840 | 3,237 |
| Export-Import Bank of China | 0.750% | 5/28/23 | EUR | 18,000 | 20,297 |
| Sinopec Group Overseas Development | | | | | |
| 2013 Ltd. | 2.625% | 10/17/20 | EUR | 2,350 | 2,788 |
29
| | | | | |
| Total International Bond Index Fund | | | | | |
| |
| |
| |
| | | | | Face | Market |
| | | Maturity | | Amount | Value • |
| | Coupon | Date | Currency | (000) | ($000) |
| Sinopec Group Overseas Development | | | | | |
| 2015 Ltd. | 1.000% | 4/28/22 | EUR | 11,000 | 12,626 |
| State Grid Europe Development 2014 plc | 2.450% | 1/26/27 | EUR | 2,240 | 2,699 |
| State Grid Overseas Investment 2016 Ltd. | 1.375% | 5/2/25 | EUR | 5,000 | 5,598 |
| Total China (Cost $135,623) | | | | | 134,366 |
| Colombia (0.0%) | | | | | |
| Sovereign Bond (0.0%) | | | | | |
| 1 Republic of Colombia | 3.875% | 3/22/26 | EUR | 5,000 | 6,369 |
| Total Colombia (Cost $6,538) | | | | | 6,369 |
| Czech Republic (0.2%) | | | | | |
| Sovereign Bonds (0.2%) | | | | | |
| CEZ AS | 3.000% | 6/5/28 | EUR | 500 | 622 |
| CEZ AS | 4.500% | 6/29/20 | EUR | 550 | 669 |
| CEZ AS | 4.875% | 4/16/25 | EUR | 12,500 | 17,226 |
| CEZ AS | 5.000% | 10/19/21 | EUR | 2,000 | 2,575 |
| Czech Republic | 0.450% | 10/25/23 | CZK | 390,910 | 15,952 |
| Czech Republic | 0.950% | 5/15/30 | CZK | 660,000 | 24,963 |
| Czech Republic | 2.000% | 10/13/33 | CZK | 100,000 | 4,144 |
| Czech Republic | 2.400% | 9/17/25 | CZK | 250,000 | 11,161 |
| Czech Republic | 2.500% | 8/25/28 | CZK | 370,000 | 16,672 |
| Czech Republic | 2.750% | 7/23/29 | CZK | 600,000 | 27,485 |
| Czech Republic | 3.625% | 4/14/21 | EUR | 3,000 | 3,699 |
| Czech Republic | 3.750% | 9/12/20 | CZK | 489,910 | 22,236 |
| Czech Republic | 3.850% | 9/29/21 | CZK | 350,000 | 16,227 |
| Czech Republic | 3.875% | 5/24/22 | EUR | 2,620 | 3,355 |
| Czech Republic | 4.125% | 3/18/20 | EUR | 7,000 | 8,400 |
| Czech Republic | 4.200% | 12/4/36 | CZK | 150,000 | 7,970 |
| Czech Republic | 4.700% | 9/12/22 | CZK | 130,000 | 6,301 |
| Czech Republic | 4.850% | 11/26/57 | CZK | 80,000 | 4,803 |
| Czech Republic | 5.700% | 5/25/24 | CZK | 220,000 | 11,633 |
| Total Czech Republic (Cost $214,859) | | | | | 206,093 |
| Denmark (0.8%) | | | | | |
| Asset-Backed/Commercial Mortgage-Backed Securities (0.2%) | | | |
| BRFkredit A/S | 0.250% | 4/1/21 | EUR | 10,800 | 12,309 |
| BRFkredit A/S | 0.250% | 7/1/23 | EUR | 8,000 | 9,025 |
| BRFkredit A/S | 0.500% | 10/1/26 | EUR | 13,500 | 14,903 |
| Danske Bank A/S | 0.125% | 3/9/21 | EUR | 2,300 | 2,616 |
| Danske Bank A/S | 0.250% | 6/4/20 | EUR | 3,800 | 4,333 |
| Danske Bank A/S | 1.250% | 6/11/21 | EUR | 10,000 | 11,700 |
| Danske Bank A/S | 1.625% | 2/28/20 | EUR | 5,000 | 5,801 |
| Danske Bank A/S | 3.750% | 6/23/22 | EUR | 500 | 640 |
| Danske Bank A/S | 4.125% | 11/26/19 | EUR | 1,000 | 1,186 |
| DLR Kredit A/S | 1.000% | 10/1/22 | DKK | 200,000 | 31,390 |
| Nordea Kredit Realkreditaktieselskab | 1.000% | 10/1/21 | DKK | 200,000 | 31,594 |
| Nordea Kredit Realkreditaktieselskab | 3.500% | 10/1/44 | DKK | 1,387 | 232 |
| Nykredit Realkredit A/S | 1.000% | 7/1/21 | DKK | 285,000 | 44,782 |
| Nykredit Realkredit A/S | 1.000% | 1/1/22 | DKK | 348,000 | 54,915 |
| Nykredit Realkredit A/S | 2.000% | 10/1/47 | DKK | 173,303 | 26,429 |
| | | | | | 251,855 |
30
| | | | | |
| Total International Bond Index Fund | | | | | |
| |
| |
| |
| | | | | Face | Market |
| | | Maturity | | Amount | Value • |
| | Coupon | Date | Currency | (000) | ($000) |
| Corporate Bonds (0.2%) | | | | | |
| AP Moller - Maersk A/S | 4.000% | 4/4/25 | GBP | 5,500 | 7,245 |
| AP Moller - Maersk A/S | 1.750% | 3/18/21 | EUR | 10,700 | 12,502 |
| AP Moller - Maersk A/S | 1.750% | 3/16/26 | EUR | 300 | 328 |
| Carlsberg Breweries A/S | 0.500% | 9/6/23 | EUR | 500 | 560 |
| Carlsberg Breweries A/S | 2.500% | 5/28/24 | EUR | 17,000 | 20,840 |
| Carlsberg Breweries A/S | 2.625% | 11/15/22 | EUR | 120 | 148 |
| Danske Bank A/S | 0.125% | 2/14/22 | EUR | 21,670 | 24,552 |
| Danske Bank A/S | 0.250% | 11/28/22 | EUR | 1,700 | 1,873 |
| Danske Bank A/S | 0.500% | 5/6/21 | EUR | 6,100 | 6,886 |
| Danske Bank A/S | 0.750% | 5/4/20 | EUR | 200 | 228 |
| Danske Bank A/S | 0.750% | 6/2/23 | EUR | 6,100 | 6,807 |
| Danske Bank A/S | 0.875% | 5/22/23 | EUR | 16,000 | 17,536 |
| 1 Danske Bank A/S | 2.750% | 5/19/26 | EUR | 9,800 | 11,421 |
| ISS Global A/S | 1.125% | 1/9/20 | EUR | 7,188 | 8,228 |
| ISS Global A/S | 1.125% | 1/7/21 | EUR | 14,752 | 16,993 |
| ISS Global A/S | 1.500% | 8/31/27 | EUR | 20,000 | 21,909 |
| ISS Global A/S | 2.125% | 12/2/24 | EUR | 500 | 597 |
| 1 Jyske Bank A/S | 2.250% | 4/5/29 | EUR | 15,100 | 17,091 |
| Nordea Kredit Realkreditaktieselskab | 1.000% | 10/1/22 | DKK | 137,000 | 21,817 |
| Nykredit Realkredit A/S | 0.750% | 7/14/21 | EUR | 300 | 343 |
| 1 Nykredit Realkredit A/S | 2.750% | 11/17/27 | EUR | 7,600 | 9,001 |
| | | | | | 206,905 |
| Sovereign Bonds (0.4%) | | | | | |
| Kingdom of Denmark | 0.500% | 11/15/27 | DKK | 461,000 | 71,063 |
| Kingdom of Denmark | 1.500% | 11/15/23 | DKK | 242,545 | 39,874 |
| Kingdom of Denmark | 1.750% | 11/15/25 | DKK | 177,300 | 30,063 |
| Kingdom of Denmark | 3.000% | 11/15/21 | DKK | 179,410 | 30,127 |
| Kingdom of Denmark | 4.000% | 11/15/19 | DKK | 85,000 | 13,530 |
| Kingdom of Denmark | 4.500% | 11/15/39 | DKK | 547,830 | 142,884 |
| Kingdom of Denmark | 7.000% | 11/10/24 | DKK | 74,285 | 16,088 |
| Kommunekredit | 0.250% | 10/9/20 | EUR | 3,000 | 3,434 |
| Kommunekredit | 0.250% | 3/29/23 | EUR | 700 | 797 |
| Kommunekredit | 0.250% | 5/15/23 | EUR | 600 | 683 |
| Kommunekredit | 0.250% | 2/16/24 | EUR | 2,000 | 2,261 |
| Kommunekredit | 0.750% | 5/18/27 | EUR | 25,178 | 28,557 |
| Orsted A/S | 1.500% | 11/26/29 | EUR | 20,089 | 22,641 |
| Orsted A/S | 4.875% | 1/12/32 | GBP | 2,500 | 3,851 |
| Orsted A/S | 5.750% | 4/9/40 | GBP | 4,000 | 7,086 |
| 1 Orsted A/S | 6.250% | 6/26/13 | EUR | 1,045 | 1,356 |
| | | | | | 414,295 |
| Total Denmark (Cost $866,263) | | | | | 873,055 |
| Finland (0.7%) | | | | | |
| Asset-Backed/Commercial Mortgage-Backed Securities (0.1%) | | | |
| Danske Bank Oyj | 0.250% | 11/26/20 | EUR | 10,000 | 11,413 |
| Danske Bank Oyj | 3.875% | 6/21/21 | EUR | 2,000 | 2,498 |
| Nordea Mortgage Bank plc | 0.250% | 11/21/23 | EUR | 5,000 | 5,645 |
| Nordea Mortgage Bank plc | 0.625% | 3/17/27 | EUR | 13,000 | 14,541 |
| Nordea Mortgage Bank plc | 1.000% | 11/5/24 | EUR | 5,900 | 6,902 |
| Nordea Mortgage Bank plc | 1.375% | 1/15/20 | EUR | 11,400 | 13,168 |
| Nordea Mortgage Bank plc | 4.000% | 2/10/21 | EUR | 11,000 | 13,631 |
| OP Mortgage Bank | 0.250% | 3/13/24 | EUR | 30,000 | 33,802 |
| |
| |
| 31 |
| | | | | |
| Total International Bond Index Fund | | | | | |
| |
| |
| |
| | | | | Face | Market |
| | | Maturity | | Amount | Value • |
| | Coupon | Date | Currency | (000) | ($000) |
| OP Mortgage Bank | 0.625% | 9/4/22 | EUR | 22,700 | 26,230 |
| OP Mortgage Bank | 1.500% | 3/17/21 | EUR | 10,000 | 11,763 |
| | | | | | 139,593 |
| Corporate Bonds (0.1%) | | | | | |
| Citycon Oyj | 3.750% | 6/24/20 | EUR | 500 | 601 |
| Nordea Mortgage Bank plc | 0.025% | 1/24/22 | EUR | 10,000 | 11,332 |
| Nordea Mortgage Bank plc | 0.625% | 10/19/22 | EUR | 300 | 346 |
| OP Corporate Bank plc | 0.750% | 3/3/22 | EUR | 1,000 | 1,150 |
| OP Corporate Bank plc | 0.875% | 6/21/21 | EUR | 8,000 | 9,238 |
| OP Corporate Bank plc | 2.000% | 3/3/21 | EUR | 3,000 | 3,555 |
| OP Corporate Bank plc | 2.500% | 5/20/22 | GBP | 1,800 | 2,370 |
| OP Mortgage Bank | 0.250% | 5/11/23 | EUR | 6,745 | 7,653 |
| Sampo Oyj | 1.000% | 9/18/23 | EUR | 500 | 572 |
| Sampo Oyj | 1.500% | 9/16/21 | EUR | 5,800 | 6,802 |
| | | | | | 43,619 |
| Sovereign Bonds (0.5%) | | | | | |
| 6 Finnvera Oyj | 0.625% | 11/19/21 | EUR | 20,000 | 23,195 |
| Fortum Oyj | 2.250% | 9/6/22 | EUR | 9,500 | 11,388 |
| Fortum Oyj | 4.000% | 5/24/21 | EUR | 5,000 | 6,195 |
| Municipality Finance plc | 0.625% | 11/26/26 | EUR | 5,000 | 5,681 |
| Municipality Finance plc | 0.750% | 12/15/20 | GBP | 1,200 | 1,523 |
| Municipality Finance plc | 1.250% | 2/23/33 | EUR | 10,000 | 11,390 |
| 2 Republic of Finland | 0.000% | 4/15/22 | EUR | 26,000 | 29,739 |
| 2 Republic of Finland | 0.000% | 9/15/23 | EUR | 33,750 | 38,333 |
| 2 Republic of Finland | 0.375% | 9/15/20 | EUR | 70,450 | 81,158 |
| 2 Republic of Finland | 0.500% | 4/15/26 | EUR | 16,640 | 19,033 |
| Republic of Finland | 0.500% | 9/15/27 | EUR | 11,000 | 12,423 |
| 2 Republic of Finland | 0.750% | 4/15/31 | EUR | 40,492 | 45,305 |
| 2 Republic of Finland | 0.875% | 9/15/25 | EUR | 10,500 | 12,382 |
| 2 Republic of Finland | 1.125% | 4/15/34 | EUR | 25,000 | 28,888 |
| 2 Republic of Finland | 1.375% | 4/15/47 | EUR | 21,000 | 24,533 |
| Republic of Finland | 1.500% | 12/19/19 | GBP | 1,950 | 2,507 |
| 2 Republic of Finland | 1.500% | 4/15/23 | EUR | 35,140 | 42,682 |
| 2 Republic of Finland | 1.625% | 12/15/20 | GBP | 4,000 | 5,176 |
| 2 Republic of Finland | 1.625% | 9/15/22 | EUR | 7,080 | 8,591 |
| 2 Republic of Finland | 2.000% | 4/15/24 | EUR | 29,000 | 36,361 |
| 2 Republic of Finland | 2.625% | 7/4/42 | EUR | 14,215 | 21,135 |
| 2 Republic of Finland | 2.750% | 7/4/28 | EUR | 11,353 | 15,452 |
| 2 Republic of Finland | 3.375% | 4/15/20 | EUR | 18,370 | 22,009 |
| 2 Republic of Finland | 3.500% | 4/15/21 | EUR | 13,000 | 16,162 |
| 2 Republic of Finland | 4.000% | 7/4/25 | EUR | 43,663 | 61,791 |
| | | | | | 583,032 |
| Total Finland (Cost $768,773) | | | | | 766,244 |
| France (11.8%) | | | | | |
| Asset-Backed/Commercial Mortgage-Backed Securities (0.9%) | | | |
| Arkea Home Loans SFH SA | 1.500% | 6/1/33 | EUR | 10,000 | 11,479 |
| Arkea Home Loans SFH SA | 4.500% | 4/13/21 | EUR | 1,000 | 1,260 |
| BNP Paribas Home Loan SFH | 0.250% | 9/2/21 | EUR | 10,500 | 12,000 |
| BNP Paribas Home Loan SFH | 0.875% | 11/14/24 | EUR | 5,000 | 5,811 |
| BNP Paribas Home Loan SFH | 1.375% | 6/17/20 | EUR | 7,500 | 8,722 |
| BNP Paribas Home Loan SFH | 3.125% | 3/22/22 | EUR | 7,000 | 8,756 |
| BNP Paribas Home Loan SFH | 3.750% | 4/20/20 | EUR | 3,000 | 3,600 |
32
| | | | | |
| Total International Bond Index Fund | | | | | |
| |
| |
| |
| | | | | Face | Market |
| | | Maturity | | Amount | Value • |
| | Coupon | Date | Currency | (000) | ($000) |
| BPCE SFH SA | 0.375% | 7/28/20 | EUR | 700 | 801 |
| BPCE SFH SA | 1.000% | 2/24/25 | EUR | 13,500 | 15,723 |
| BPCE SFH SA | 1.500% | 1/30/20 | EUR | 20,400 | 23,617 |
| BPCE SFH SA | 1.750% | 6/27/24 | EUR | 20,000 | 24,299 |
| BPCE SFH SA | 2.125% | 9/17/20 | EUR | 15,000 | 17,735 |
| BPCE SFH SA | 2.375% | 11/29/23 | EUR | 5,000 | 6,240 |
| BPCE SFH SA | 3.750% | 9/13/21 | EUR | 6,300 | 7,909 |
| BPCE SFH SA | 4.000% | 3/23/22 | EUR | 3,000 | 3,851 |
| Caisse de Refinancement de l’Habitat SA | 2.400% | 1/17/25 | EUR | 1,120 | 1,417 |
| Caisse de Refinancement de l’Habitat SA | 2.500% | 3/29/21 | CHF | 1,000 | 1,064 |
| Caisse de Refinancement de l’Habitat SA | 3.300% | 9/23/22 | EUR | 9,500 | 12,100 |
| Caisse de Refinancement de l’Habitat SA | 3.500% | 6/22/20 | EUR | 5,000 | 6,012 |
| Caisse de Refinancement de l’Habitat SA | 3.600% | 9/13/21 | EUR | 2,000 | 2,504 |
| Caisse de Refinancement de l’Habitat SA | 3.600% | 3/8/24 | EUR | 10,600 | 14,086 |
| Caisse de Refinancement de l’Habitat SA | 3.750% | 2/19/20 | EUR | 15,000 | 17,877 |
| Caisse de Refinancement de l’Habitat SA | 3.900% | 10/20/23 | EUR | 5,000 | 6,680 |
| Caisse de Refinancement de l’Habitat SA | 4.000% | 6/17/22 | EUR | 19,870 | 25,739 |
| Caisse de Refinancement de l’Habitat SA | 4.300% | 2/24/23 | EUR | 7,000 | 9,334 |
| Caisse Francaise de Financement Local | 0.200% | 4/27/23 | EUR | 15,600 | 17,637 |
| Caisse Francaise de Financement Local | 0.375% | 5/11/24 | EUR | 10,000 | 11,300 |
| Caisse Francaise de Financement Local | 0.375% | 6/23/25 | EUR | 23,100 | 25,804 |
| Caisse Francaise de Financement Local | 0.625% | 1/26/23 | EUR | 19,000 | 21,910 |
| Caisse Francaise de Financement Local | 0.750% | 9/27/27 | EUR | 10,000 | 11,201 |
| Caisse Francaise de Financement Local | 1.125% | 9/9/25 | EUR | 12,200 | 14,290 |
| Caisse Francaise de Financement Local | 1.250% | 1/22/35 | EUR | 500 | 551 |
| Caisse Francaise de Financement Local | 1.750% | 7/16/20 | EUR | 10,000 | 11,710 |
| Caisse Francaise de Financement Local | 2.375% | 1/17/24 | EUR | 12,000 | 15,020 |
| Caisse Francaise de Financement Local | 3.000% | 10/2/28 | EUR | 9,500 | 12,802 |
| Caisse Francaise de Financement Local | 3.500% | 9/24/20 | EUR | 8,951 | 10,852 |
| Caisse Francaise de Financement Local | 4.250% | 1/26/21 | EUR | 7,000 | 8,709 |
| Caisse Francaise de Financement Local | 4.250% | 1/26/22 | EUR | 3,000 | 3,862 |
| Caisse Francaise de Financement Local | 5.375% | 7/8/24 | EUR | 4,000 | 5,791 |
| Cie de Financement Foncier SA | 0.225% | 9/14/26 | EUR | 3,600 | 3,893 |
| Cie de Financement Foncier SA | 0.250% | 3/16/22 | EUR | 16,000 | 18,210 |
| Cie de Financement Foncier SA | 0.250% | 4/11/23 | EUR | 200 | 226 |
| Cie de Financement Foncier SA | 0.325% | 9/12/23 | EUR | 10,000 | 11,302 |
| Cie de Financement Foncier SA | 0.500% | 9/4/24 | EUR | 10,000 | 11,328 |
| Cie de Financement Foncier SA | 0.625% | 11/12/21 | EUR | 24,000 | 27,686 |
| Cie de Financement Foncier SA | 0.625% | 2/10/23 | EUR | 22,000 | 25,310 |
| Cie de Financement Foncier SA | 0.750% | 1/21/25 | EUR | 17,000 | 19,472 |
| Cie de Financement Foncier SA | 1.000% | 2/2/26 | EUR | 100 | 115 |
| Cie de Financement Foncier SA | 2.000% | 5/7/24 | EUR | 14,300 | 17,561 |
| Cie de Financement Foncier SA | 2.250% | 10/13/21 | CHF | 3,000 | 3,198 |
| Cie de Financement Foncier SA | 2.375% | 11/21/22 | EUR | 5,800 | 7,142 |
| Cie de Financement Foncier SA | 3.500% | 11/5/20 | EUR | 21,400 | 26,030 |
| Cie de Financement Foncier SA | 3.875% | 4/25/55 | EUR | 4,000 | 6,626 |
| Cie de Financement Foncier SA | 4.000% | 10/24/25 | EUR | 25,300 | 35,176 |
| Cie de Financement Foncier SA | 4.250% | 1/19/22 | EUR | 1,000 | 1,286 |
| Cie de Financement Foncier SA | 4.375% | 4/15/21 | EUR | 16,628 | 20,900 |
| Cie de Financement Foncier SA | 4.875% | 5/25/21 | EUR | 16,544 | 21,119 |
| Cie de Financement Foncier SA | 5.500% | 1/26/27 | GBP | 2,350 | 3,833 |
| Cie de Financement Foncier SA | 5.750% | 10/4/21 | EUR | 500 | 662 |
| Credit Agricole Home Loan SFH SA | 0.625% | 11/28/22 | EUR | 16,000 | 18,460 |
| Credit Agricole Home Loan SFH SA | 1.250% | 3/24/31 | EUR | 18,000 | 20,509 |
33
| | | | | |
| Total International Bond Index Fund | | | | | |
| |
| |
| |
| | | | | Face | Market |
| | | Maturity | | Amount | Value • |
| | Coupon | Date | Currency | (000) | ($000) |
| Credit Agricole Home Loan SFH SA | 1.625% | 3/11/20 | EUR | 8,400 | 9,761 |
| Credit Agricole Home Loan SFH SA | 3.875% | 1/12/21 | EUR | 7,500 | 9,251 |
| Credit Agricole Home Loan SFH SA | 4.000% | 1/17/22 | EUR | 5,000 | 6,391 |
| Credit Agricole Home Loan SFH SA | 4.000% | 7/16/25 | EUR | 2,000 | 2,776 |
| Credit Agricole Home Loan SFH SA | 0.125% | 8/28/20 | EUR | 200 | 228 |
| Credit Agricole Home Loan SFH SA | 0.375% | 10/21/21 | EUR | 10,000 | 11,471 |
| Credit Agricole Home Loan SFH SA | 0.375% | 9/30/24 | EUR | 100 | 113 |
| Credit Agricole Home Loan SFH SA | 0.500% | 2/19/26 | EUR | 1,500 | 1,674 |
| Credit Agricole Home Loan SFH SA | 0.625% | 9/11/23 | EUR | 3,000 | 3,449 |
| Credit Agricole Home Loan SFH SA | 0.750% | 5/5/27 | EUR | 36,000 | 40,437 |
| Credit Agricole Home Loan SFH SA | 0.875% | 8/11/28 | EUR | 10,000 | 11,214 |
| Credit Agricole Public Sector SCF SA | 1.875% | 6/7/23 | EUR | 6,200 | 7,545 |
| Credit Agricole Public Sector SCF SA | 0.250% | 10/31/26 | EUR | 1,000 | 1,085 |
| Credit Agricole Public Sector SCF SA | 0.875% | 8/2/27 | EUR | 700 | 794 |
| Credit Mutuel - CIC Home Loan SFH SA | 0.500% | 1/21/22 | EUR | 10,000 | 11,496 |
| Credit Mutuel - CIC Home Loan SFH SA | 1.375% | 4/22/20 | EUR | 6,500 | 7,538 |
| Credit Mutuel - CIC Home Loan SFH SA | 2.500% | 9/11/23 | EUR | 3,000 | 3,758 |
| Credit Mutuel - CIC Home Loan SFH SA | 4.125% | 1/16/23 | EUR | 6,100 | 8,043 |
| Credit Mutuel - CIC Home Loan SFH SA | 0.625% | 2/10/25 | EUR | 2,200 | 2,507 |
| Credit Mutuel - CIC Home Loan SFH SA | 0.625% | 2/2/26 | EUR | 5,000 | 5,638 |
| Credit Mutuel - CIC Home Loan SFH SA | 0.750% | 9/15/27 | EUR | 8,600 | 9,619 |
| Credit Mutuel - CIC Home Loan SFH SA | 0.875% | 4/7/26 | EUR | 800 | 918 |
| Credit Mutuel - CIC Home Loan SFH SA | 4.125% | 1/19/24 | EUR | 1,000 | 1,353 |
| Credit Mutuel - CIC Home Loan SFH SA | 4.375% | 3/17/21 | EUR | 1,400 | 1,754 |
| Credit Mutuel Arkea Home Loans SFH | 2.375% | 7/11/23 | EUR | 6,000 | 7,447 |
| HSBC SFH France SA | 0.375% | 3/11/22 | EUR | 5,000 | 5,734 |
| HSBC SFH France SA | 1.875% | 10/28/20 | EUR | 2,000 | 2,360 |
| HSBC SFH France SA | 2.000% | 10/16/23 | EUR | 2,500 | 3,073 |
| La Banque Postale Home Loan SFH SA | 0.175% | 4/22/22 | EUR | 5,000 | 5,691 |
| La Banque Postale Home Loan SFH SA | 2.375% | 1/15/24 | EUR | 4,800 | 6,008 |
| La Banque Postale Home Loan SFH SA | 0.875% | 2/7/28 | EUR | 1,000 | 1,128 |
| La Banque Postale Home Loan SFH SA | 1.875% | 9/11/20 | EUR | 6,200 | 7,299 |
| Societe Generale SCF SA | 4.250% | 2/3/23 | EUR | 4,600 | 6,108 |
| Societe Generale SFH SA | 1.625% | 1/5/21 | EUR | 1,000 | 1,176 |
| Societe Generale SFH SA | 1.750% | 3/5/20 | EUR | 3,000 | 3,490 |
| Societe Generale SFH SA | 2.000% | 4/29/24 | EUR | 13,400 | 16,512 |
| Societe Generale SFH SA | 4.000% | 1/18/22 | EUR | 2,000 | 2,556 |
| Societe Generale SFH SA | 0.125% | 2/27/20 | EUR | 1,000 | 1,139 |
| Societe Generale SFH SA | 0.750% | 1/19/28 | EUR | 10,000 | 11,177 |
| | | | | | 959,810 |
| Corporate Bonds (1.9%) | | | | | |
| Accor SA | 1.250% | 1/25/24 | EUR | 9,800 | 11,168 |
| Accor SA | 2.375% | 9/17/23 | EUR | 2,300 | 2,775 |
| Accor SA | 2.625% | 2/5/21 | EUR | 2,000 | 2,382 |
| Air Liquide Finance SA | 0.500% | 6/13/22 | EUR | 1,400 | 1,604 |
| Air Liquide Finance SA | 1.250% | 6/3/25 | EUR | 5,600 | 6,538 |
| Air Liquide Finance SA | 1.250% | 6/13/28 | EUR | 1,000 | 1,146 |
| Air Liquide Finance SA | 2.125% | 10/15/21 | EUR | 5,300 | 6,380 |
| Air Liquide Finance SA | 2.375% | 9/6/23 | EUR | 2,300 | 2,853 |
| Airbus Finance BV | 0.875% | 5/13/26 | EUR | 800 | 893 |
| Airbus Finance BV | 1.375% | 5/13/31 | EUR | 6,336 | 7,043 |
| Airbus Finance BV | 2.125% | 10/29/29 | EUR | 700 | 847 |
| Airbus Finance BV | 2.375% | 4/2/24 | EUR | 3,700 | 4,559 |
| Altarea SCA | 2.250% | 7/5/24 | EUR | 10,000 | 11,324 |
34
| | | | | |
| Total International Bond Index Fund | | | | | |
| |
| |
| |
| | | | | Face | Market |
| | | Maturity | | Amount | Value • |
| | Coupon | Date | Currency | (000) | ($000) |
| APRR SA | 1.125% | 1/15/21 | EUR | 12,200 | 14,120 |
| APRR SA | 1.125% | 1/9/26 | EUR | 10,400 | 11,877 |
| APRR SA | 1.250% | 1/6/27 | EUR | 10,800 | 12,378 |
| APRR SA | 1.500% | 1/15/24 | EUR | 500 | 592 |
| APRR SA | 1.500% | 1/17/33 | EUR | 100 | 110 |
| APRR SA | 1.625% | 1/13/32 | EUR | 8,700 | 9,818 |
| APRR SA | 1.875% | 1/15/25 | EUR | 2,400 | 2,882 |
| APRR SA | 2.250% | 1/16/20 | EUR | 2,000 | 2,330 |
| Arkema SA | 1.500% | 4/20/27 | EUR | 17,200 | 19,245 |
| Arkema SA | 3.850% | 4/30/20 | EUR | 9,500 | 11,386 |
| Auchan Holding SA | 1.750% | 4/23/21 | EUR | 3,100 | 3,624 |
| Auchan Holding SA | 2.250% | 4/6/23 | EUR | 6,000 | 7,097 |
| Auchan Holding SA | 2.375% | 12/12/22 | EUR | 2,000 | 2,385 |
| Autoroutes du Sud de la France SA | 1.000% | 5/13/26 | EUR | 700 | 786 |
| Autoroutes du Sud de la France SA | 1.125% | 4/20/26 | EUR | 1,400 | 1,589 |
| Autoroutes du Sud de la France SA | 1.250% | 1/18/27 | EUR | 400 | 455 |
| Autoroutes du Sud de la France SA | 2.875% | 1/18/23 | EUR | 3,400 | 4,251 |
| Autoroutes du Sud de la France SA | 2.950% | 1/17/24 | EUR | 5,200 | 6,563 |
| Autoroutes du Sud de la France SA | 4.125% | 4/13/20 | EUR | 2,250 | 2,705 |
| Autoroutes du Sud de la France SA | 5.625% | 7/4/22 | EUR | 100 | 136 |
| AXA Bank Europe SCF | 0.125% | 3/14/22 | EUR | 1,000 | 1,135 |
| AXA Bank Europe SCF | 0.375% | 3/23/23 | EUR | 1,000 | 1,138 |
| AXA SA | 1.125% | 5/15/28 | EUR | 700 | 805 |
| 1 AXA SA | 3.250% | 5/28/49 | EUR | 5,000 | 5,477 |
| 1 AXA SA | 3.375% | 7/6/47 | EUR | 10,650 | 12,228 |
| 1 AXA SA | 3.875% | 5/20/49 | EUR | 950 | 1,104 |
| 1 AXA SA | 3.941% | 11/29/49 | EUR | 9,580 | 11,264 |
| 1 AXA SA | 5.125% | 7/4/43 | EUR | 7,000 | 9,017 |
| AXA SA | 5.250% | 4/16/40 | EUR | 2,350 | 2,833 |
| 1 AXA SA | 5.453% | 12/31/49 | GBP | 150 | 198 |
| 1 AXA SA | 5.625% | 1/16/54 | GBP | 18,870 | 25,373 |
| 1 AXA SA | 6.686% | 7/29/49 | GBP | 1,800 | 2,563 |
| AXA SA | 7.125% | 12/15/20 | GBP | 6,290 | 8,912 |
| Banque Federative du Credit Mutuel SA | 0.375% | 1/13/22 | EUR | 400 | 454 |
| Banque Federative du Credit Mutuel SA | 0.750% | 7/17/25 | EUR | 200 | 222 |
| Banque Federative du Credit Mutuel SA | 0.875% | 6/8/20 | GBP | 3,500 | 4,426 |
| Banque Federative du Credit Mutuel SA | 1.250% | 1/14/25 | EUR | 1,100 | 1,268 |
| Banque Federative du Credit Mutuel SA | 1.625% | 1/19/26 | EUR | 10,500 | 12,287 |
| Banque Federative du Credit Mutuel SA | 1.875% | 11/4/26 | EUR | 1,600 | 1,753 |
| Banque Federative du Credit Mutuel SA | 2.375% | 3/24/26 | EUR | 11,200 | 12,826 |
| Banque Federative du Credit Mutuel SA | 2.500% | 5/25/28 | EUR | 5,000 | 5,597 |
| Banque Federative du Credit Mutuel SA | 2.625% | 2/24/21 | EUR | 16,000 | 19,201 |
| Banque Federative du Credit Mutuel SA | 2.625% | 3/18/24 | EUR | 10,000 | 12,426 |
| Banque Federative du Credit Mutuel SA | 2.625% | 3/31/27 | EUR | 1,100 | 1,266 |
| Banque Federative du Credit Mutuel SA | 3.000% | 11/28/23 | EUR | 8,200 | 10,372 |
| Banque Federative du Credit Mutuel SA | 3.000% | 5/21/24 | EUR | 17,324 | 20,843 |
| Banque Federative du Credit Mutuel SA | 3.000% | 9/11/25 | EUR | 3,200 | 3,851 |
| Banque Federative du Credit Mutuel SA | 3.250% | 8/23/22 | EUR | 6,300 | 7,914 |
| Banque Federative du Credit Mutuel SA | 4.000% | 10/22/20 | EUR | 4,000 | 4,872 |
| Banque Federative du Credit Mutuel SA | 4.125% | 7/20/20 | EUR | 250 | 304 |
| BNP Paribas SA | 0.500% | 6/1/22 | EUR | 5,000 | 5,696 |
| BNP Paribas SA | 1.000% | 6/27/24 | EUR | 5,000 | 5,549 |
| BNP Paribas SA | 1.125% | 8/16/22 | GBP | 4,000 | 4,975 |
| BNP Paribas SA | 1.125% | 1/15/23 | EUR | 1,100 | 1,278 |
35
| | | | | |
| Total International Bond Index Fund | | | | | |
| |
| |
| |
| | | | | Face | Market |
| | | Maturity | | Amount | Value • |
| | Coupon | Date | Currency | (000) | ($000) |
| BNP Paribas SA | 1.125% | 10/10/23 | EUR | 21,800 | 24,650 |
| BNP Paribas SA | 1.125% | 11/22/23 | EUR | 500 | 563 |
| BNP Paribas SA | 1.125% | 6/11/26 | EUR | 20,000 | 21,636 |
| BNP Paribas SA | 1.500% | 11/17/25 | EUR | 30,500 | 34,238 |
| BNP Paribas SA | 1.500% | 5/23/28 | EUR | 20,000 | 21,868 |
| BNP Paribas SA | 2.250% | 1/13/21 | EUR | 12,500 | 14,858 |
| BNP Paribas SA | 2.375% | 11/20/19 | GBP | 3,350 | 4,327 |
| BNP Paribas SA | 2.375% | 5/20/24 | EUR | 18,500 | 22,767 |
| BNP Paribas SA | 2.375% | 2/17/25 | EUR | 5,000 | 5,783 |
| 1 BNP Paribas SA | 2.625% | 10/14/27 | EUR | 3,100 | 3,670 |
| BNP Paribas SA | 2.750% | 1/27/26 | EUR | 400 | 471 |
| BNP Paribas SA | 2.875% | 10/24/22 | EUR | 5,000 | 6,202 |
| BNP Paribas SA | 2.875% | 9/26/23 | EUR | 5,550 | 6,960 |
| 1 BNP Paribas SA | 2.875% | 3/20/26 | EUR | 6,000 | 7,086 |
| BNP Paribas SA | 2.875% | 10/1/26 | EUR | 4,700 | 5,565 |
| 1 BNP Paribas SA | 4.032% | 11/29/49 | EUR | 1,200 | 1,402 |
| BNP Paribas SA | 4.125% | 1/14/22 | EUR | 200 | 255 |
| BNP Paribas SA | 4.500% | 3/21/23 | EUR | 160 | 212 |
| Bouygues SA | 1.375% | 6/7/27 | EUR | 18,700 | 20,845 |
| Bouygues SA | 3.625% | 1/16/23 | EUR | 2,500 | 3,191 |
| Bouygues SA | 4.250% | 7/22/20 | EUR | 400 | 486 |
| Bouygues SA | 4.500% | 2/9/22 | EUR | 18,500 | 23,765 |
| Bouygues SA | 5.500% | 10/6/26 | GBP | 3,600 | 5,493 |
| BPCE SA | 0.375% | 10/5/23 | EUR | 10,100 | 11,288 |
| BPCE SA | 0.750% | 1/22/20 | EUR | 1,500 | 1,718 |
| BPCE SA | 0.875% | 1/31/24 | EUR | 10,200 | 11,313 |
| BPCE SA | 1.125% | 1/18/23 | EUR | 3,800 | 4,322 |
| BPCE SA | 2.125% | 3/17/21 | EUR | 9,100 | 10,822 |
| 1 BPCE SA | 2.750% | 7/8/26 | EUR | 9,000 | 10,636 |
| 1 BPCE SA | 2.750% | 11/30/27 | EUR | 100 | 119 |
| BPCE SA | 2.875% | 1/16/24 | EUR | 8,500 | 10,694 |
| BPCE SA | 4.250% | 2/6/23 | EUR | 100 | 131 |
| BPCE SA | 4.625% | 7/18/23 | EUR | 1,500 | 1,953 |
| BPCE SA | 5.250% | 4/16/29 | GBP | 3,000 | 4,349 |
| BPCE SFH SA | 0.375% | 2/10/23 | EUR | 100 | 114 |
| BPCE SFH SA | 0.375% | 2/21/24 | EUR | 12,700 | 14,371 |
| BPCE SFH SA | 0.875% | 4/13/28 | EUR | 12,100 | 13,600 |
| BPCE SFH SA | 1.000% | 6/8/29 | EUR | 4,600 | 5,162 |
| Caisse Francaise de Financement Local | 0.500% | 4/13/22 | EUR | 5,000 | 5,748 |
| Caisse Francaise de Financement Local | 0.625% | 4/13/26 | EUR | 2,000 | 2,253 |
| Caisse Francaise de Financement Local | 0.750% | 1/11/27 | EUR | 8,000 | 9,019 |
| Caisse Francaise de Financement Local | 1.250% | 5/11/32 | EUR | 13,100 | 14,751 |
| Caisse Francaise de Financement Local | 1.500% | 1/31/31 | EUR | 10,000 | 10,368 |
| Cap Gemini SA | 1.750% | 7/1/20 | EUR | 23,300 | 27,085 |
| Cap Gemini SA | 2.500% | 7/1/23 | EUR | 6,000 | 7,309 |
| Capgemini SE | 0.500% | 11/9/21 | EUR | 100 | 114 |
| Carmila SA | 2.125% | 3/7/28 | EUR | 1,500 | 1,635 |
| Carmila SA | 2.375% | 9/16/24 | EUR | 4,100 | 4,787 |
| Carrefour SA | 0.750% | 4/26/24 | EUR | 8,100 | 8,956 |
| Carrefour SA | 1.250% | 6/3/25 | EUR | 2,000 | 2,249 |
| Carrefour SA | 4.000% | 4/9/20 | EUR | 6,000 | 7,194 |
| Cie de Financement Foncier SA | 0.750% | 5/29/26 | EUR | 2,100 | 2,376 |
| Cie de Financement Foncier SA | 0.750% | 1/11/28 | EUR | 11,000 | 12,234 |
| Cie de Saint-Gobain | 0.000% | 3/27/20 | EUR | 15,000 | 16,983 |
36
| | | | | |
| Total International Bond Index Fund | | | | | |
| |
| |
| |
| | | | | Face | Market |
| | | Maturity | | Amount | Value • |
| | Coupon | Date | Currency | (000) | ($000) |
| Cie de Saint-Gobain | 1.000% | 3/17/25 | EUR | 900 | 1,002 |
| Cie Financiere et Industrielle des | | | | | |
| Autoroutes SA | 1.125% | 10/13/27 | EUR | 1,000 | 1,115 |
| Cie Generale des Etablissements | | | | | |
| Michelin SCA | 2.500% | 9/3/38 | EUR | 5,000 | 5,654 |
| 1 CNP Assurances | 4.250% | 6/5/45 | EUR | 3,000 | 3,631 |
| 1 CNP Assurances | 4.500% | 6/10/47 | EUR | 17,500 | 21,150 |
| 1 CNP Assurances | 6.000% | 9/14/40 | EUR | 4,000 | 4,938 |
| 1 CNP Assurances | 6.875% | 9/30/41 | EUR | 500 | 654 |
| 1 CNP Assurances | 7.375% | 9/30/41 | GBP | 1,000 | 1,411 |
| Compagnie De St. Gobain SA | 3.625% | 3/28/22 | EUR | 5,000 | 6,273 |
| Compagnie Financiere et Industrielle des | | | | | |
| Autoroutes SA | 5.000% | 5/24/21 | EUR | 17,400 | 22,210 |
| 1 Credit Agricole Assurances SA | 2.625% | 1/29/48 | EUR | 10,100 | 10,323 |
| 1 Credit Agricole Assurances SA | 4.250% | 1/29/49 | EUR | 3,000 | 3,512 |
| 1 Credit Agricole Assurances SA | 4.500% | 10/31/49 | EUR | 2,100 | 2,484 |
| 1 Credit Agricole Assurances SA | 4.750% | 9/27/48 | EUR | 30,000 | 36,441 |
| Credit Agricole SA | 0.443% | 6/9/22 | JPY | 300,000 | 2,667 |
| Credit Agricole SA | 0.875% | 1/19/22 | EUR | 12,400 | 14,303 |
| Credit Agricole SA | 1.250% | 4/14/26 | EUR | 100 | 114 |
| Credit Agricole SA | 1.375% | 5/3/27 | EUR | 800 | 911 |
| Credit Agricole SA | 1.875% | 12/20/26 | EUR | 10,100 | 11,493 |
| Credit Agricole SA | 2.375% | 11/27/20 | EUR | 5,000 | 5,947 |
| Credit Agricole SA | 2.375% | 5/20/24 | EUR | 2,000 | 2,454 |
| Credit Agricole SA | 2.625% | 3/17/27 | EUR | 35,100 | 40,924 |
| Credit Agricole SA | 3.125% | 7/17/23 | EUR | 700 | 885 |
| Credit Agricole SA | 3.125% | 2/5/26 | EUR | 4,100 | 5,312 |
| Credit Agricole SA | 3.900% | 4/19/21 | EUR | 100 | 123 |
| Credit Agricole SA | 7.375% | 12/18/23 | GBP | 800 | 1,261 |
| Credit Agricole SA | 1.375% | 3/13/25 | EUR | 2,000 | 2,244 |
| Credit Mutuel - CIC Home Loan SFH SA | 1.750% | 6/19/24 | EUR | 30,000 | 36,497 |
| Credit Mutuel Arkea SA | 1.000% | 1/26/23 | EUR | 8,500 | 9,797 |
| Credit Mutuel Arkea SA | 1.250% | 5/31/24 | EUR | 21,500 | 23,783 |
| Credit Mutuel Arkea SA | 3.250% | 6/1/26 | EUR | 100 | 117 |
| Credit Mutuel Arkea SA | 3.500% | 2/9/29 | EUR | 25,000 | 29,337 |
| Danone SA | 0.167% | 11/3/20 | EUR | 26,700 | 30,386 |
| Danone SA | 0.424% | 11/3/22 | EUR | 6,300 | 7,151 |
| Danone SA | 0.709% | 11/3/24 | EUR | 600 | 677 |
| Danone SA | 1.208% | 11/3/28 | EUR | 5,000 | 5,587 |
| Danone SA | 1.250% | 5/30/24 | EUR | 200 | 233 |
| Danone SA | 2.250% | 11/15/21 | EUR | 2,000 | 2,402 |
| Danone SA | 2.600% | 6/28/23 | EUR | 5,700 | 7,079 |
| Danone SA | 3.600% | 11/23/20 | EUR | 500 | 609 |
| Edenred | 1.375% | 3/10/25 | EUR | 100 | 114 |
| Engie Alliance GIE | 5.750% | 6/24/23 | EUR | 5,988 | 8,449 |
| Engie SA | 0.875% | 3/27/24 | EUR | 2,000 | 2,292 |
| Engie SA | 1.375% | 5/19/20 | EUR | 7,000 | 8,115 |
| Engie SA | 1.375% | 6/22/28 | EUR | 1,700 | 1,926 |
| Engie SA | 1.375% | 2/28/29 | EUR | 8,700 | 9,743 |
| 1 Engie SA | 1.375% | 12/31/49 | EUR | 5,100 | 5,427 |
| Engie SA | 1.500% | 3/13/35 | EUR | 3,100 | 3,362 |
| Engie SA | 2.000% | 9/28/37 | EUR | 100 | 113 |
| Engie SA | 2.375% | 5/19/26 | EUR | 200 | 248 |
| Engie SA | 2.625% | 7/20/22 | EUR | 800 | 987 |
| |
| |
| 37 |
| | | | | |
| Total International Bond Index Fund | | | | | |
| |
| |
| |
| | | | | Face | Market |
| | | Maturity | | Amount | Value • |
| | Coupon | Date | Currency | (000) | ($000) |
| Engie SA | 3.000% | 2/1/23 | EUR | 4,000 | 5,042 |
| 1 Engie SA | 3.875% | 6/2/49 | EUR | 3,700 | 4,381 |
| 1 Engie SA | 4.750% | 7/29/49 | EUR | 6,200 | 7,604 |
| Engie SA | 5.000% | 10/1/60 | GBP | 3,550 | 6,511 |
| Engie SA | 5.950% | 3/16/11 | EUR | 6,172 | 11,735 |
| Engie SA | 7.000% | 10/30/28 | GBP | 2,850 | 5,110 |
| Eutelsat SA | 2.625% | 1/13/20 | EUR | 5,000 | 5,794 |
| Fonciere Des Regions | 1.875% | 5/20/26 | EUR | 100 | 113 |
| Gecina SA | 1.000% | 1/30/29 | EUR | 2,300 | 2,392 |
| Gecina SA | 1.375% | 6/30/27 | EUR | 100 | 111 |
| Gecina SA | 1.375% | 1/26/28 | EUR | 1,100 | 1,208 |
| Gecina SA | 1.500% | 1/20/25 | EUR | 10,600 | 12,271 |
| Gecina SA | 2.000% | 6/17/24 | EUR | 600 | 716 |
| Holding d’Infrastructures de Transport SAS | 1.625% | 11/27/27 | EUR | 5,000 | 5,271 |
| Holding d’Infrastructures de Transport SAS | 2.250% | 3/24/25 | EUR | 4,100 | 4,714 |
| Holding d’Infrastructures de Transport SAS | 4.875% | 10/27/21 | EUR | 1,700 | 2,163 |
| HSBC France SA | 0.625% | 12/3/20 | EUR | 100 | 115 |
| HSBC France SA | 1.875% | 1/16/20 | EUR | 300 | 348 |
| ICADE | 1.125% | 11/17/25 | EUR | 10,600 | 11,638 |
| ICADE | 1.875% | 9/14/22 | EUR | 100 | 118 |
| ICADE | 2.250% | 4/16/21 | EUR | 5,000 | 5,919 |
| Imerys SA | 0.875% | 3/31/22 | EUR | 600 | 690 |
| Imerys SA | 1.500% | 1/15/27 | EUR | 1,100 | 1,222 |
| Imerys SA | 2.000% | 12/10/24 | EUR | 600 | 714 |
| JCDecaux SA | 1.000% | 6/1/23 | EUR | 10,000 | 11,480 |
| Kering SA | 1.250% | 5/10/26 | EUR | 9,300 | 10,609 |
| Klepierre SA | 1.250% | 9/29/31 | EUR | 200 | 210 |
| Klepierre SA | 1.875% | 2/19/26 | EUR | 7,600 | 9,001 |
| Klepierre SA | 1.000% | 4/17/23 | EUR | 200 | 231 |
| Klepierre SA | 1.375% | 2/16/27 | EUR | 1,200 | 1,358 |
| Legrand SA | 0.750% | 7/6/24 | EUR | 200 | 226 |
| Legrand SA | 1.875% | 7/6/32 | EUR | 1,000 | 1,170 |
| Legrand SA | 3.375% | 4/19/22 | EUR | 300 | 376 |
| LVMH Moet Hennessy Louis Vuitton SE | 0.375% | 5/26/22 | EUR | 750 | 853 |
| LVMH Moet Hennessy Louis Vuitton SE | 0.750% | 5/26/24 | EUR | 10,077 | 11,464 |
| LVMH Moet Hennessy Louis Vuitton SE | 1.000% | 9/24/21 | EUR | 2,000 | 2,322 |
| LVMH Moet Hennessy Louis Vuitton SE | 1.000% | 6/14/22 | GBP | 9,000 | 11,366 |
| LVMH Moet Hennessy Louis Vuitton SE | 1.250% | 11/4/19 | EUR | 7,400 | 8,500 |
| LVMH Moet Hennessy Louis Vuitton SE | 1.750% | 11/13/20 | EUR | 100 | 117 |
| Mercialys SA | 1.787% | 3/31/23 | EUR | 5,100 | 5,771 |
| Michelin Luxembourg SCS | 1.125% | 5/28/22 | EUR | 200 | 232 |
| Michelin Luxembourg SCS | 1.750% | 5/28/27 | EUR | 100 | 118 |
| Orange SA | 0.875% | 2/3/27 | EUR | 1,500 | 1,645 |
| Orange SA | 1.000% | 5/12/25 | EUR | 10,100 | 11,452 |
| Orange SA | 1.375% | 3/20/28 | EUR | 13,000 | 14,497 |
| Orange SA | 1.375% | 1/16/30 | EUR | 7,400 | 8,077 |
| Orange SA | 1.500% | 9/9/27 | EUR | 7,000 | 8,021 |
| Orange SA | 1.875% | 9/12/30 | EUR | 10,000 | 11,237 |
| Orange SA | 2.500% | 3/1/23 | EUR | 200 | 246 |
| Orange SA | 3.125% | 1/9/24 | EUR | 8,000 | 10,169 |
| Orange SA | 3.375% | 9/16/22 | EUR | 3,500 | 4,419 |
| Orange SA | 3.875% | 4/9/20 | EUR | 100 | 120 |
| Orange SA | 3.875% | 1/14/21 | EUR | 200 | 246 |
| 1 Orange SA | 4.000% | 12/31/49 | EUR | 18,600 | 22,426 |
38
| | | | | |
| Total International Bond Index Fund | | | | | |
| |
| |
| |
| | | | | Face | Market |
| | | Maturity | | Amount | Value • |
| | Coupon | Date | Currency | (000) | ($000) |
| 1 Orange SA | 4.250% | 12/31/49 | EUR | 5,000 | 5,883 |
| Orange SA | 5.000% | 10/1/66 | EUR | 7,400 | 9,088 |
| Orange SA | 5.250% | 12/5/25 | GBP | 2,400 | 3,649 |
| 1 Orange SA | 5.250% | 12/31/49 | EUR | 12,150 | 15,230 |
| Orange SA | 5.625% | 1/23/34 | GBP | 400 | 664 |
| 1 Orange SA | 5.875% | 12/31/49 | GBP | 6,600 | 8,970 |
| Orange SA | 7.250% | 11/10/20 | GBP | 400 | 570 |
| Orange SA | 8.125% | 11/20/28 | GBP | 1,500 | 2,792 |
| Orange SA | 8.125% | 1/28/33 | EUR | 600 | 1,175 |
| Pernod Ricard SA | 1.500% | 5/18/26 | EUR | 3,000 | 3,470 |
| Pernod Ricard SA | 2.000% | 6/22/20 | EUR | 12,900 | 15,123 |
| Publicis Groupe SA | 1.125% | 12/16/21 | EUR | 10,000 | 11,584 |
| Publicis Groupe SA | 1.625% | 12/16/24 | EUR | 5,200 | 6,098 |
| RCI Banque SA | 0.500% | 9/15/23 | EUR | 11,800 | 12,814 |
| RCI Banque SA | 0.625% | 3/4/20 | EUR | 100 | 114 |
| RCI Banque SA | 0.625% | 11/10/21 | EUR | 1,967 | 2,223 |
| RCI Banque SA | 0.750% | 1/12/22 | EUR | 900 | 1,017 |
| RCI Banque SA | 0.750% | 9/26/22 | EUR | 10,000 | 11,201 |
| RCI Banque SA | 1.000% | 5/17/23 | EUR | 6,400 | 7,168 |
| RCI Banque SA | 1.375% | 11/17/20 | EUR | 4,000 | 4,633 |
| RCI Banque SA | 1.375% | 3/8/24 | EUR | 10,500 | 11,864 |
| RCI Banque SA | 1.625% | 4/11/25 | EUR | 8,000 | 8,914 |
| RCI Banque SA | 1.875% | 11/8/22 | GBP | 1,500 | 1,889 |
| Renault SA | 1.000% | 11/28/25 | EUR | 1,800 | 1,913 |
| Renault SA | 3.125% | 3/5/21 | EUR | 2,125 | 2,560 |
| Sanef SA | 0.950% | 10/19/28 | EUR | 1,300 | 1,363 |
| Sanofi | 0.000% | 1/13/20 | EUR | 1,100 | 1,249 |
| Sanofi | 0.000% | 9/13/22 | EUR | 5,000 | 5,622 |
| Sanofi | 0.500% | 3/21/23 | EUR | 12,000 | 13,715 |
| Sanofi | 0.500% | 1/13/27 | EUR | 400 | 436 |
| Sanofi | 0.875% | 9/22/21 | EUR | 700 | 812 |
| Sanofi | 1.125% | 4/5/28 | EUR | 10,400 | 11,841 |
| Sanofi | 1.375% | 3/21/30 | EUR | 15,000 | 17,066 |
| Sanofi | 1.750% | 9/10/26 | EUR | 7,000 | 8,436 |
| Sanofi | 1.875% | 9/4/20 | EUR | 6,100 | 7,131 |
| Sanofi | 1.875% | 3/21/38 | EUR | 7,000 | 7,992 |
| Sanofi | 2.500% | 11/14/23 | EUR | 5,000 | 6,234 |
| Schneider Electric SE | 0.250% | 9/9/24 | EUR | 1,000 | 1,096 |
| Schneider Electric SE | 0.875% | 3/11/25 | EUR | 2,500 | 2,818 |
| Schneider Electric SE | 2.500% | 9/6/21 | EUR | 1,000 | 1,210 |
| 1 SCOR SE | 3.000% | 6/8/46 | EUR | 100 | 114 |
| Societe Generale SA | 0.448% | 5/26/22 | JPY | 900,000 | 7,949 |
| Societe Generale SA | 0.750% | 11/25/20 | EUR | 10,000 | 11,509 |
| Societe Generale SA | 1.000% | 4/1/22 | EUR | 10,000 | 11,371 |
| Societe Generale SA | 2.250% | 1/23/20 | EUR | 9,000 | 10,502 |
| 1 Societe Generale SA | 2.500% | 9/16/26 | EUR | 2,000 | 2,339 |
| Societe Generale SA | 4.000% | 6/7/23 | EUR | 4,400 | 5,533 |
| Societe Generale SA | 4.250% | 7/13/22 | EUR | 2,500 | 3,232 |
| Societe Generale SA | 4.750% | 3/2/21 | EUR | 1,000 | 1,256 |
| Societe Generale SA | 0.500% | 1/20/23 | EUR | 1,700 | 1,951 |
| Sodexo SA | 2.500% | 6/24/26 | EUR | 600 | 748 |
| 1 Sogecap SA | 4.125% | 12/31/49 | EUR | 100 | 115 |
| Suez | 1.000% | 4/3/25 | EUR | 10,200 | 11,640 |
| Suez | 1.500% | 4/3/29 | EUR | 1,300 | 1,479 |
39
| | | | | |
| Total International Bond Index Fund | | | | | |
| |
| |
| |
| | | | | Face | Market |
| | | Maturity | | Amount | Value • |
| | Coupon | Date | Currency | (000) | ($000) |
| Suez | 1.625% | 9/21/32 | EUR | 6,300 | 7,015 |
| Suez | 1.750% | 9/10/25 | EUR | 500 | 596 |
| Suez | 2.750% | 10/9/23 | EUR | 3,000 | 3,776 |
| 1 Suez | 3.000% | 6/23/49 | EUR | 3,400 | 3,948 |
| Suez | 4.078% | 5/17/21 | EUR | 2,000 | 2,498 |
| Suez | 4.125% | 6/24/22 | EUR | 400 | 518 |
| Suez | 5.500% | 7/22/24 | EUR | 7,750 | 11,147 |
| TDF Infrastructure SAS | 2.500% | 4/7/26 | EUR | 800 | 927 |
| TDF Infrastructure SAS | 2.875% | 10/19/22 | EUR | 21,200 | 25,653 |
| Terega SA | 2.200% | 8/5/25 | EUR | 100 | 120 |
| Total Capital Canada Ltd. | 1.125% | 3/18/22 | EUR | 13,000 | 15,241 |
| Total Capital Canada Ltd. | 1.875% | 7/9/20 | EUR | 8,300 | 9,730 |
| Total Capital Canada Ltd. | 2.125% | 9/18/29 | EUR | 5,900 | 7,243 |
| Total Capital International SA | 0.250% | 7/12/23 | EUR | 8,400 | 9,482 |
| Total Capital International SA | 0.625% | 10/4/24 | EUR | 11,800 | 13,360 |
| Total Capital International SA | 0.750% | 7/12/28 | EUR | 7,600 | 8,285 |
| Total Capital International SA | 1.375% | 3/19/25 | EUR | 5,600 | 6,601 |
| Total Capital International SA | 2.125% | 11/19/21 | EUR | 3,900 | 4,707 |
| Total Capital International SA | 2.125% | 3/15/23 | EUR | 4,000 | 4,892 |
| Total Capital International SA | 2.250% | 6/9/22 | GBP | 2,782 | 3,657 |
| Total Capital International SA | 2.500% | 3/25/26 | EUR | 4,000 | 5,066 |
| Total Capital International SA | 2.875% | 11/19/25 | EUR | 4,100 | 5,312 |
| Total Capital International SA | 4.250% | 11/26/21 | AUD | 2,798 | 2,069 |
| 1 Total SA | 2.250% | 12/29/49 | EUR | 16,500 | 19,089 |
| 1 Total SA | 2.625% | 12/29/49 | EUR | 6,000 | 6,859 |
| 1 Total SA | 2.708% | 12/31/49 | EUR | 13,000 | 15,189 |
| 1 Total SA | 3.369% | 12/31/49 | EUR | 7,100 | 8,377 |
| 1 Total SA | 3.875% | 12/31/49 | EUR | 500 | 609 |
| Transport et Infrastructures Gaz France SA | 4.339% | 7/7/21 | EUR | 2,000 | 2,514 |
| Unibail-Rodamco SE | 0.875% | 2/21/25 | EUR | 1,000 | 1,129 |
| Unibail-Rodamco SE | 1.000% | 3/14/25 | EUR | 10,000 | 11,329 |
| Unibail-Rodamco SE | 1.125% | 9/15/25 | EUR | 6,200 | 7,037 |
| Unibail-Rodamco SE | 1.375% | 3/9/26 | EUR | 584 | 670 |
| Unibail-Rodamco SE | 1.375% | 4/15/30 | EUR | 13,500 | 14,726 |
| Unibail-Rodamco SE | 1.500% | 2/22/28 | EUR | 5,000 | 5,651 |
| Unibail-Rodamco SE | 1.500% | 5/29/29 | EUR | 300 | 335 |
| Unibail-Rodamco SE | 1.875% | 1/15/31 | EUR | 15,000 | 17,024 |
| Unibail-Rodamco SE | 2.000% | 4/28/36 | EUR | 1,300 | 1,432 |
| Unibail-Rodamco SE | 2.250% | 5/14/38 | EUR | 2,000 | 2,268 |
| Unibail-Rodamco SE | 2.375% | 2/25/21 | EUR | 2,000 | 2,390 |
| Unibail-Rodamco SE | 2.500% | 2/26/24 | EUR | 1,890 | 2,340 |
| Unibail-Rodamco SE | 2.500% | 6/4/26 | EUR | 500 | 617 |
| 1 Unibail-Rodamco SE | 2.875% | 12/31/49 | EUR | 5,000 | 5,469 |
| Valeo SA | 0.625% | 1/11/23 | EUR | 11,000 | 12,196 |
| Valeo SA | 1.625% | 3/18/26 | EUR | 8,000 | 8,722 |
| Veolia Environnement SA | 0.314% | 10/4/23 | EUR | 1,000 | 1,115 |
| Veolia Environnement SA | 0.927% | 1/4/29 | EUR | 5,000 | 5,358 |
| Veolia Environnement SA | 1.590% | 1/10/28 | EUR | 5,700 | 6,544 |
| Veolia Environnement SA | 4.247% | 1/6/21 | EUR | 3,000 | 3,707 |
| Veolia Environnement SA | 4.625% | 3/30/27 | EUR | 9,200 | 13,241 |
| Veolia Environnement SA | 6.125% | 11/25/33 | EUR | 2,250 | 3,978 |
| Veolia Environnement SA | 6.125% | 10/29/37 | GBP | 3,050 | 5,472 |
| Vinci SA | 3.375% | 3/30/20 | EUR | 1,600 | 1,901 |
| Vivendi SA | 1.875% | 5/26/26 | EUR | 400 | 474 |
| | | | | | 2,177,910 |
40
| | | | | |
| Total International Bond Index Fund | | | | | |
| |
| |
| |
| | | | | Face | Market |
| | | Maturity | | Amount | Value • |
| | Coupon | Date | Currency | (000) | ($000) |
| Sovereign Bonds (9.0%) | | | | | |
| Aeroports de Paris | 1.500% | 7/24/23 | EUR | 5,000 | 5,940 |
| Aeroports de Paris | 1.500% | 4/7/25 | EUR | 4,000 | 4,707 |
| Aeroports de Paris | 2.750% | 6/5/28 | EUR | 1,000 | 1,277 |
| Aeroports de Paris | 3.125% | 6/11/24 | EUR | 2,000 | 2,577 |
| Agence Francaise de Developpement | 0.125% | 3/31/21 | EUR | 10,000 | 11,403 |
| Agence Francaise de Developpement | 0.125% | 4/30/22 | EUR | 28,000 | 31,857 |
| Agence Francaise de Developpement | 0.125% | 11/15/23 | EUR | 8,000 | 9,007 |
| Agence Francaise de Developpement | 0.250% | 7/21/26 | EUR | 17,100 | 18,720 |
| Agence Francaise de Developpement | 0.375% | 4/30/24 | EUR | 10,000 | 11,355 |
| Agence Francaise de Developpement | 1.000% | 1/31/28 | EUR | 5,000 | 5,729 |
| Agence Francaise de Developpement | 1.375% | 9/17/24 | EUR | 30,500 | 36,549 |
| Agence Francaise de Developpement | 1.375% | 7/5/32 | EUR | 15,000 | 17,174 |
| Agence Francaise de Developpement | 2.125% | 2/15/21 | EUR | 35,000 | 41,723 |
| Agence Francaise de Developpement | 2.250% | 5/27/25 | EUR | 10,000 | 12,596 |
| Agence Francaise de Developpement | 3.750% | 2/15/27 | EUR | 3,600 | 5,066 |
| Bpifrance Financement SA | 0.125% | 11/25/20 | EUR | 15,000 | 17,125 |
| Bpifrance Financement SA | 0.250% | 2/14/23 | EUR | 20,000 | 22,749 |
| Bpifrance Financement SA | 0.500% | 5/25/25 | EUR | 10,000 | 11,304 |
| Bpifrance Financement SA | 0.750% | 10/25/21 | EUR | 47,600 | 55,290 |
| Bpifrance Financement SA | 0.750% | 11/25/24 | EUR | 15,000 | 17,326 |
| Bpifrance Financement SA | 2.500% | 5/25/24 | EUR | 10,000 | 12,671 |
| Bpifrance Financement SA | 2.750% | 10/25/25 | EUR | 28,000 | 36,700 |
| Caisse d’Amortissement de la Dette Sociale | 0.050% | 11/25/20 | EUR | 94,000 | 107,310 |
| Caisse d’Amortissement de la Dette Sociale | 0.125% | 11/25/22 | EUR | 39,000 | 44,504 |
| Caisse d’Amortissement de la Dette Sociale | 0.500% | 5/25/23 | EUR | 90,000 | 103,975 |
| Caisse d’Amortissement de la Dette Sociale | 1.375% | 11/25/24 | EUR | 15,000 | 18,098 |
| Caisse d’Amortissement de la Dette Sociale | 2.375% | 1/25/24 | EUR | 43,500 | 55,022 |
| Caisse d’Amortissement de la Dette Sociale | 2.500% | 10/25/22 | EUR | 3,000 | 3,747 |
| Caisse d’Amortissement de la Dette Sociale | 3.750% | 10/25/20 | EUR | 2,000 | 2,452 |
| Caisse d’Amortissement de la Dette Sociale | 4.000% | 12/15/25 | EUR | 8,000 | 11,337 |
| Caisse d’Amortissement de la Dette Sociale | 4.125% | 4/25/23 | EUR | 5,000 | 6,704 |
| Caisse d’Amortissement de la Dette Sociale | 4.250% | 4/25/20 | EUR | 3,000 | 3,633 |
| Caisse d’Amortissement de la Dette Sociale | 4.375% | 10/25/21 | EUR | 8,000 | 10,315 |
| Caisse des Depots et Consignations | 1.500% | 12/23/19 | GBP | 5,000 | 6,421 |
| Coentreprise de Transport d’Electricite SA | 2.125% | 7/29/32 | EUR | 16,400 | 18,470 |
| 4 Dexia Credit Local SA | 2.000% | 1/22/21 | EUR | 8,000 | 9,495 |
| Electricite de France SA | 1.000% | 10/13/26 | EUR | 21,300 | 23,496 |
| Electricite de France SA | 1.875% | 10/13/36 | EUR | 18,700 | 19,463 |
| Electricite de France SA | 2.250% | 4/27/21 | EUR | 7,000 | 8,364 |
| Electricite de France SA | 2.750% | 3/10/23 | EUR | 5,900 | 7,333 |
| Electricite de France SA | 3.875% | 1/18/22 | EUR | 3,100 | 3,926 |
| Electricite de France SA | 4.000% | 11/12/25 | EUR | 2,150 | 2,909 |
| Electricite de France SA | 4.125% | 3/25/27 | EUR | 4,100 | 5,616 |
| 1 Electricite de France SA | 4.125% | 1/29/49 | EUR | 6,000 | 7,144 |
| 1 Electricite de France SA | 4.250% | 12/29/49 | EUR | 4,000 | 4,706 |
| Electricite de France SA | 4.500% | 11/12/40 | EUR | 3,900 | 5,704 |
| Electricite de France SA | 4.625% | 9/11/24 | EUR | 5,000 | 6,865 |
| Electricite de France SA | 4.625% | 4/26/30 | EUR | 200 | 289 |
| 1 Electricite de France SA | 5.000% | 1/22/49 | EUR | 3,000 | 3,476 |
| Electricite de France SA | 5.125% | 9/22/50 | GBP | 2,100 | 3,292 |
| Electricite de France SA | 5.375% | 5/29/20 | EUR | 13,600 | 16,732 |
| 1 Electricite de France SA | 5.375% | 1/29/49 | EUR | 3,400 | 4,092 |
| Electricite de France SA | 5.500% | 3/27/37 | GBP | 2,800 | 4,430 |
| |
| |
| 41 |
| | | | | |
| Total International Bond Index Fund | | | | | |
| |
| |
| |
| | | | | Face | Market |
| | | Maturity | | Amount | Value • |
| | Coupon | Date | Currency | (000) | ($000) |
| Electricite de France SA | 5.500% | 10/17/41 | GBP | 8,700 | 14,081 |
| Electricite de France SA | 5.625% | 2/21/33 | EUR | 4,650 | 7,411 |
| Electricite de France SA | 5.875% | 7/18/31 | GBP | 15,800 | 25,954 |
| 1 Electricite de France SA | 5.875% | 7/22/49 | GBP | 2,500 | 3,099 |
| 1 Electricite de France SA | 6.000% | 12/29/49 | GBP | 3,800 | 4,853 |
| Electricite de France SA | 6.000% | 1/23/14 | GBP | 6,900 | 11,319 |
| Electricite de France SA | 6.250% | 1/25/21 | EUR | 7,200 | 9,293 |
| French Republic | 0.000% | 2/25/20 | EUR | 9,700 | 11,071 |
| French Republic | 0.000% | 5/25/20 | EUR | 284,370 | 324,883 |
| French Republic | 0.000% | 5/25/21 | EUR | 486,250 | 556,717 |
| French Republic | 0.000% | 5/25/22 | EUR | 161,500 | 184,550 |
| French Republic | 0.000% | 3/25/23 | EUR | 156,550 | 178,064 |
| French Republic | 0.000% | 3/25/24 | EUR | 300,000 | 337,980 |
| French Republic | 0.250% | 11/25/20 | EUR | 366,000 | 420,839 |
| French Republic | 0.250% | 11/25/26 | EUR | 150,000 | 166,822 |
| French Republic | 0.500% | 11/25/19 | EUR | 113,000 | 129,497 |
| French Republic | 0.500% | 5/25/25 | EUR | 142,940 | 164,428 |
| French Republic | 0.500% | 5/25/26 | EUR | 195,000 | 222,456 |
| French Republic | 0.750% | 5/25/28 | EUR | 263,000 | 299,606 |
| French Republic | 0.750% | 11/25/28 | EUR | 150,000 | 169,828 |
| French Republic | 1.000% | 11/25/25 | EUR | 35,000 | 41,500 |
| French Republic | 1.000% | 5/25/27 | EUR | 551,100 | 647,360 |
| French Republic | 1.250% | 5/25/34 | EUR | 173,850 | 199,679 |
| 2 French Republic | 1.250% | 5/25/36 | EUR | 108,200 | 122,362 |
| French Republic | 1.500% | 5/25/31 | EUR | 241,333 | 290,591 |
| French Republic | 1.750% | 5/25/23 | EUR | 267,450 | 328,494 |
| French Republic | 1.750% | 11/25/24 | EUR | 153,840 | 190,853 |
| 2 French Republic | 1.750% | 6/25/39 | EUR | 110,050 | 133,153 |
| 2 French Republic | 1.750% | 5/25/66 | EUR | 91,902 | 101,596 |
| 2 French Republic | 2.000% | 5/25/48 | EUR | 105,010 | 129,309 |
| French Republic | 2.250% | 10/25/22 | EUR | 211,840 | 263,361 |
| French Republic | 2.250% | 5/25/24 | EUR | 92,000 | 116,716 |
| French Republic | 2.500% | 10/25/20 | EUR | 229,170 | 275,135 |
| French Republic | 2.500% | 5/25/30 | EUR | 71,650 | 95,731 |
| French Republic | 2.750% | 10/25/27 | EUR | 81,950 | 110,471 |
| French Republic | 3.000% | 4/25/22 | EUR | 110,420 | 139,402 |
| French Republic | 3.250% | 10/25/21 | EUR | 90,450 | 113,532 |
| French Republic | 3.250% | 5/25/45 | EUR | 155,485 | 242,509 |
| French Republic | 3.500% | 4/25/20 | EUR | 101,050 | 121,367 |
| French Republic | 3.500% | 4/25/26 | EUR | 112,000 | 156,491 |
| French Republic | 3.750% | 4/25/21 | EUR | 72,005 | 90,058 |
| French Republic | 4.000% | 10/25/38 | EUR | 157,820 | 264,397 |
| French Republic | 4.000% | 4/25/55 | EUR | 48,690 | 89,315 |
| French Republic | 4.000% | 4/25/60 | EUR | 37,250 | 70,000 |
| French Republic | 4.250% | 10/25/23 | EUR | 110,770 | 152,350 |
| French Republic | 4.500% | 4/25/41 | EUR | 160,015 | 290,441 |
| French Republic | 4.750% | 4/25/35 | EUR | 61,979 | 108,550 |
| French Republic | 5.500% | 4/25/29 | EUR | 66,700 | 111,870 |
| French Republic | 5.750% | 10/25/32 | EUR | 77,310 | 142,035 |
| French Republic | 6.000% | 10/25/25 | EUR | 55,000 | 86,895 |
| French Republic | 8.250% | 4/25/22 | EUR | 14,000 | 20,594 |
| French Republic | 8.500% | 4/25/23 | EUR | 400 | 629 |
| La Banque Postale SA | 1.000% | 10/16/24 | EUR | 5,000 | 5,533 |
| 1 La Banque Postale SA | 2.750% | 4/23/26 | EUR | 2,000 | 2,355 |
42
| | | | | |
| Total International Bond Index Fund | | | | | |
| |
| |
| |
| | | | | Face | Market |
| | | Maturity | | Amount | Value • |
| | Coupon | Date | Currency | (000) | ($000) |
| 1 La Banque Postale SA | 2.750% | 11/19/27 | EUR | 4,000 | 4,751 |
| La Banque Postale SA | 3.000% | 6/9/28 | EUR | 2,000 | 2,407 |
| La Poste SA | 1.125% | 6/4/25 | EUR | 10,000 | 11,586 |
| La Poste SA | 2.750% | 11/26/24 | EUR | 4,200 | 5,348 |
| Regie Autonome des Transports Parisiens | 2.625% | 11/6/19 | CHF | 3,000 | 3,071 |
| Region of Ile de France | 0.625% | 4/23/27 | EUR | 5,000 | 5,608 |
| Region of Ile de France | 1.375% | 3/14/29 | EUR | 100 | 119 |
| Region of Ile de France | 1.375% | 6/20/33 | EUR | 6,000 | 6,941 |
| Region of Ile de France | 2.250% | 6/10/23 | EUR | 900 | 1,123 |
| Region of Ile de France | 3.625% | 3/27/24 | EUR | 13,300 | 17,806 |
| RTE Reseau de Transport d’Electricite SA | 2.000% | 4/18/36 | EUR | 500 | 571 |
| RTE Reseau de Transport d’Electricite SA | 2.750% | 6/20/29 | EUR | 2,400 | 3,068 |
| RTE Reseau de Transport d’Electricite SA | 4.125% | 2/3/21 | EUR | 1,400 | 1,733 |
| RTE Reseau de Transport d’Electricite SA | 1.875% | 10/23/37 | EUR | 5,000 | 5,553 |
| SA de Gestion de Stocks de Securite | 0.625% | 5/25/23 | EUR | 12,000 | 13,886 |
| SNCF Mobilites | 5.375% | 3/18/27 | GBP | 1,000 | 1,610 |
| SNCF Mobilities EPIC | 4.125% | 2/19/25 | EUR | 700 | 972 |
| SNCF Mobilities EPIC | 4.875% | 6/12/23 | EUR | 4,000 | 5,507 |
| SNCF Reseau | 1.125% | 5/25/30 | EUR | 28,100 | 31,898 |
| SNCF Reseau | 1.500% | 5/29/37 | EUR | 18,000 | 20,209 |
| 7 SNCF Reseau | 2.625% | 12/29/25 | EUR | 3,000 | 3,884 |
| SNCF Reseau | 3.125% | 10/25/28 | EUR | 7,000 | 9,599 |
| SNCF Reseau | 4.250% | 10/7/26 | EUR | 1,500 | 2,174 |
| SNCF Reseau | 4.375% | 6/2/22 | EUR | 15,000 | 19,676 |
| SNCF Reseau | 4.830% | 3/25/60 | GBP | 1,400 | 2,874 |
| SNCF Reseau | 5.000% | 10/10/33 | EUR | 10,500 | 17,820 |
| SNCF Reseau | 5.000% | 3/11/52 | GBP | 3,725 | 7,401 |
| SNCF Reseau | 5.250% | 12/7/28 | GBP | 17,000 | 28,058 |
| SNCF Reseau | 5.250% | 1/31/35 | GBP | 1,400 | 2,484 |
| SNCF Reseau | 5.500% | 12/1/21 | GBP | 5,000 | 7,196 |
| SNCF Reseau | 6.000% | 10/12/20 | EUR | 9,000 | 11,443 |
| SNCF Reseau EPIC | 0.100% | 5/27/21 | EUR | 31,000 | 35,352 |
| SNCF Reseau EPIC | 1.000% | 11/9/31 | EUR | 15,000 | 16,561 |
| SNCF Reseau EPIC | 2.250% | 12/20/47 | EUR | 2,500 | 3,071 |
| Societe Nationale des Chemins de Fer | | | | | |
| Francais | 3.625% | 6/3/20 | EUR | 3,711 | 4,467 |
| 7 UNEDIC ASSEO | 0.000% | 11/25/20 | EUR | 9,000 | 10,252 |
| UNEDIC ASSEO | 0.125% | 5/25/22 | EUR | 10,000 | 11,402 |
| UNEDIC ASSEO | 0.125% | 11/25/24 | EUR | 45,000 | 50,168 |
| UNEDIC ASSEO | 0.250% | 11/24/23 | EUR | 30,000 | 34,181 |
| 7 UNEDIC ASSEO | 0.300% | 11/4/21 | EUR | 5,000 | 5,742 |
| 7 UNEDIC ASSEO | 0.625% | 2/17/25 | EUR | 25,000 | 28,840 |
| 7 UNEDIC ASSEO | 0.625% | 3/3/26 | EUR | 10,000 | 11,442 |
| 7 UNEDIC ASSEO | 0.875% | 10/25/22 | EUR | 22,200 | 26,030 |
| 7 UNEDIC ASSEO | 1.250% | 5/29/20 | EUR | 5,000 | 5,806 |
| 7 UNEDIC ASSEO | 1.250% | 10/21/27 | EUR | 1,500 | 1,783 |
| 7 UNEDIC ASSEO | 1.500% | 4/16/21 | EUR | 36,000 | 42,509 |
| 7 UNEDIC ASSEO | 2.250% | 4/5/23 | EUR | 7,000 | 8,692 |
| UNEDIC ASSEO | 2.375% | 5/25/24 | EUR | 3,000 | 3,794 |
| | | | | | 9,972,018 |
| Total France (Cost $13,127,532) | | | | | 13,109,738 |
43
| | | | | |
| Total International Bond Index Fund | | | | | |
| |
| |
| |
| | | | | Face | Market |
| | | Maturity | | Amount | Value • |
| | Coupon | Date | Currency | (000) | ($000) |
| Germany (10.5%) | | | | | |
| Asset-Backed/Commercial Mortgage-Backed Securities (0.5%) | | | |
| Bayerische Landesbank | 0.350% | 12/1/22 | EUR | 5,000 | 5,726 |
| Bayerische Landesbank | 0.500% | 3/19/25 | EUR | 10,000 | 11,373 |
| Bayerische Landesbank | 1.000% | 7/9/21 | EUR | 250 | 292 |
| Bayerische Landesbank | 1.625% | 4/18/23 | EUR | 5,000 | 6,035 |
| Bayerische Landesbank | 2.000% | 7/11/22 | EUR | 700 | 851 |
| Berlin Hyp AG | 0.125% | 10/22/20 | EUR | 5,000 | 5,703 |
| Berlin Hyp AG | 0.125% | 10/23/23 | EUR | 25,500 | 28,682 |
| Berlin Hyp AG | 0.125% | 1/5/24 | EUR | 10,000 | 11,231 |
| Berlin Hyp AG | 0.375% | 5/3/24 | EUR | 1,100 | 1,249 |
| Berlin Hyp AG | 1.250% | 4/23/21 | EUR | 6,000 | 7,035 |
| Commerzbank AG | 0.250% | 1/26/22 | EUR | 4,000 | 4,572 |
| Commerzbank AG | 0.500% | 6/9/26 | EUR | 15,000 | 16,806 |
| Commerzbank AG | 0.625% | 5/28/25 | EUR | 9,000 | 10,264 |
| Commerzbank AG | 0.625% | 8/24/27 | EUR | 1,100 | 1,230 |
| Commerzbank AG | 0.875% | 9/8/25 | EUR | 10,100 | 11,704 |
| Commerzbank AG | 4.125% | 4/7/21 | EUR | 4,500 | 5,630 |
| Deutsche Bank AG | 0.250% | 3/8/24 | EUR | 9,300 | 10,463 |
| Deutsche Bank AG | 0.250% | 8/31/28 | EUR | 5,000 | 5,279 |
| Deutsche Bank AG | 1.375% | 9/7/20 | EUR | 2,000 | 2,331 |
| Deutsche Genossenschafts- | | | | | |
| Hypothekenbank AG | 0.125% | 9/30/22 | EUR | 13,000 | 14,756 |
| Deutsche Genossenschafts- | | | | | |
| Hypothekenbank AG | 0.375% | 3/31/26 | EUR | 5,900 | 6,572 |
| Deutsche Genossenschafts- | | | | | |
| Hypothekenbank AG | 0.500% | 9/30/26 | EUR | 10,000 | 11,188 |
| Deutsche Hypothekenbank AG | 0.125% | 4/20/22 | EUR | 5,000 | 5,686 |
| Deutsche Hypothekenbank AG | 0.250% | 11/18/21 | EUR | 4,900 | 5,602 |
| Deutsche Hypothekenbank AG | 0.500% | 6/29/26 | EUR | 100 | 112 |
| Deutsche Hypothekenbank AG | 1.375% | 6/10/20 | EUR | 1,500 | 1,744 |
| Deutsche Kreditbank AG | 0.500% | 3/19/27 | EUR | 1,600 | 1,777 |
| Deutsche Kreditbank AG | 1.625% | 6/18/24 | EUR | 1,000 | 1,212 |
| Deutsche Pfandbriefbank AG | 0.050% | 8/9/21 | EUR | 1,000 | 1,137 |
| Deutsche Pfandbriefbank AG | 0.125% | 11/27/20 | EUR | 10,000 | 11,403 |
| Deutsche Pfandbriefbank AG | 0.200% | 3/1/22 | EUR | 5,450 | 6,214 |
| Deutsche Pfandbriefbank AG | 0.250% | 7/30/20 | EUR | 5,500 | 6,281 |
| Deutsche Pfandbriefbank AG | 0.250% | 3/15/23 | EUR | 20,000 | 22,730 |
| Deutsche Pfandbriefbank AG | 1.500% | 3/18/20 | EUR | 4,100 | 4,757 |
| Deutsche Pfandbriefbank AG | 1.875% | 12/20/19 | GBP | 5,900 | 7,593 |
| Deutsche Pfandbriefbank AG | 1.875% | 1/21/22 | EUR | 10,000 | 12,016 |
| Deutsche Pfandbriefbank AG | 2.375% | 5/29/28 | EUR | 6,100 | 7,807 |
| Deutsche Postbank AG | 3.375% | 3/31/20 | EUR | 5,000 | 5,956 |
| Dexia Kommunalbank Deutschland AG | 0.050% | 9/8/21 | EUR | 18,300 | 20,744 |
| Dexia Kommunalbank Deutschland AG | 0.375% | 3/3/22 | EUR | 8,300 | 9,476 |
| DZ HYP AG | 0.625% | 6/5/24 | EUR | 100 | 115 |
| 8 German Postal Pensions Securitisation | | | | | |
| 2 plc | 4.375% | 1/18/22 | EUR | 3,000 | 3,865 |
| HSH Nordbank AG | 0.100% | 7/20/20 | EUR | 900 | 1,023 |
| HSH Nordbank AG | 0.375% | 4/27/23 | EUR | 10,808 | 12,210 |
| HSH Nordbank AG | 0.750% | 6/22/22 | EUR | 400 | 461 |
| Landesbank Baden-Wuerttemberg | 0.125% | 2/21/22 | EUR | 5,000 | 5,694 |
| Landesbank Baden-Wuerttemberg | 0.250% | 1/10/25 | EUR | 10,000 | 11,197 |
44
| | | | | |
| Total International Bond Index Fund | | | | | |
| |
| |
| |
| | | | | Face | Market |
| | | Maturity | | Amount | Value • |
| | Coupon | Date | Currency | (000) | ($000) |
| Landesbank Hessen-Thueringen | | | | | |
| Girozentrale | 0.100% | 3/4/20 | EUR | 5,000 | 5,694 |
| Landesbank Hessen-Thueringen | | | | | |
| Girozentrale | 0.125% | 11/21/22 | EUR | 22,500 | 25,518 |
| Landesbank Hessen-Thueringen | | | | | |
| Girozentrale | 0.250% | 3/20/23 | EUR | 15,000 | 17,062 |
| Landesbank Hessen-Thueringen | | | | | |
| Girozentrale | 0.375% | 2/8/24 | EUR | 10,000 | 11,365 |
| Landesbank Hessen-Thueringen | | | | | |
| Girozentrale | 1.125% | 5/27/21 | EUR | 10,000 | 11,701 |
| Landesbank Hessen-Thueringen | | | | | |
| Girozentrale | 1.875% | 6/26/23 | EUR | 800 | 977 |
| Muenchener Hypothekenbank eG | 1.375% | 4/16/21 | EUR | 15,000 | 17,642 |
| Muenchener Hypothekenbank eG | 1.750% | 6/3/22 | EUR | 1,000 | 1,203 |
| Muenchener Hypothekenbank eG | 2.500% | 7/4/28 | EUR | 7,750 | 10,085 |
| Norddeutsche Landesbank Girozentrale | 0.250% | 10/28/26 | EUR | 15,000 | 16,418 |
| Norddeutsche Landesbank Girozentrale | 3.250% | 1/18/21 | EUR | 4,000 | 4,874 |
| UniCredit Bank AG | 0.125% | 4/9/21 | EUR | 5,000 | 5,704 |
| UniCredit Bank AG | 1.875% | 9/12/22 | EUR | 500 | 606 |
| UniCredit Bank AG | 1.875% | 4/9/24 | EUR | 5,100 | 6,261 |
| WL BANK AG Westfaelische Landschaft | | | | | |
| Bodenkreditbank | 0.375% | 6/6/25 | EUR | 2,000 | 2,250 |
| WL BANK AG Westfaelische Landschaft | | | | | |
| Bodenkreditbank | 0.500% | 4/1/27 | EUR | 5,000 | 5,565 |
| WL BANK AG Westfaelische Landschaft | | | | | |
| Bodenkreditbank | 0.625% | 8/30/27 | EUR | 15,000 | 16,793 |
| WL BANK AG Westfaelische Landschaft | | | | | |
| Bodenkreditbank | 0.750% | 2/2/26 | EUR | 10,000 | 11,478 |
| WL BANK AG Westfaelische Landschaft | | | | | |
| Bodenkreditbank | 0.875% | 1/18/30 | EUR | 12,200 | 13,549 |
| WL BANK AG Westfaelische Landschaft | | | | | |
| Bodenkreditbank | 1.125% | 5/29/20 | EUR | 2,500 | 2,894 |
| WL BANK AG Westfaelische Landschaft | | | | | |
| Bodenkreditbank | 2.500% | 3/29/22 | EUR | 10,400 | 12,789 |
| | | | | | 546,212 |
| Corporate Bonds (1.4%) | | | | | |
| ADO Properties SA | 1.500% | 7/26/24 | EUR | 3,400 | 3,630 |
| Allianz Finance II BV | 1.375% | 4/21/31 | EUR | 12,500 | 13,998 |
| Allianz Finance II BV | 3.000% | 3/13/28 | EUR | 2,800 | 3,710 |
| Allianz Finance II BV | 3.500% | 2/14/22 | EUR | 8,500 | 10,663 |
| Allianz Finance II BV | 4.500% | 3/13/43 | GBP | 3,100 | 5,105 |
| 1 Allianz Finance II BV | 5.750% | 7/8/41 | EUR | 34,800 | 44,248 |
| 1 Allianz SE | 2.241% | 7/7/45 | EUR | 6,500 | 7,319 |
| 1 Allianz SE | 3.099% | 7/6/47 | EUR | 2,500 | 2,895 |
| 1 Allianz SE | 3.375% | 9/29/49 | EUR | 3,400 | 4,029 |
| 1 Allianz SE | 4.750% | 10/29/49 | EUR | 7,500 | 9,454 |
| 1 Allianz SE | 5.625% | 10/17/42 | EUR | 2,000 | 2,626 |
| alstria office REIT-AG | 1.500% | 11/15/27 | EUR | 10,000 | 10,577 |
| alstria office REIT-AG | 2.125% | 4/12/23 | EUR | 200 | 235 |
| Aroundtown SA | 1.000% | 1/7/25 | EUR | 500 | 530 |
| Aroundtown SA | 1.625% | 1/31/28 | EUR | 1,300 | 1,326 |
| Aroundtown SA | 1.875% | 1/19/26 | EUR | 16,500 | 18,047 |
| Aroundtown SA | 2.000% | 11/2/26 | EUR | 6,300 | 6,864 |
| ATF Netherlands BV | 1.500% | 7/15/24 | EUR | 26,800 | 29,661 |
45
| | | | | |
| Total International Bond Index Fund | | | | | |
| |
| |
| |
| | | | | Face | Market |
| | | Maturity | | Amount | Value • |
| | Coupon | Date | Currency | (000) | ($000) |
| BASF SE | 0.875% | 10/6/23 | GBP | 500 | 618 |
| BASF SE | 0.875% | 10/6/31 | EUR | 600 | 623 |
| BASF SE | 1.500% | 5/22/30 | EUR | 8,000 | 9,074 |
| BASF SE | 1.625% | 11/15/37 | EUR | 5,100 | 5,527 |
| BASF SE | 1.750% | 3/11/25 | GBP | 800 | 1,016 |
| BASF SE | 1.875% | 2/4/21 | EUR | 5,000 | 5,920 |
| BASF SE | 2.000% | 12/5/22 | EUR | 10,000 | 12,196 |
| Bayer AG | 1.875% | 1/25/21 | EUR | 3,000 | 3,520 |
| 1 Bayer AG | 3.000% | 7/1/75 | EUR | 2,000 | 2,293 |
| 1 Bayer AG | 3.750% | 7/1/74 | EUR | 5,754 | 6,576 |
| Bayer Capital Corp. BV | 0.625% | 12/15/22 | EUR | 15,000 | 17,066 |
| Bayer Capital Corp. BV | 1.250% | 11/13/23 | EUR | 500 | 586 |
| Bayer Capital Corp. BV | 2.125% | 12/15/29 | EUR | 10,000 | 11,336 |
| Berlin Hyp AG | 1.125% | 10/25/27 | EUR | 100 | 112 |
| Berlin Hyp AG | 1.250% | 1/22/25 | EUR | 400 | 464 |
| Bertelsmann SE & Co. KGaA | 1.750% | 10/14/24 | EUR | 800 | 950 |
| Bertelsmann SE & Co. KGaA | 2.625% | 8/2/22 | EUR | 1,400 | 1,718 |
| 1 Bertelsmann SE & Co. KGaA | 3.000% | 4/23/75 | EUR | 100 | 113 |
| 1 Bertelsmann SE & Co. KGaA | 3.500% | 4/23/75 | EUR | 3,000 | 3,302 |
| BMW Canada Inc. | 2.570% | 8/6/21 | CAD | 12,590 | 9,404 |
| BMW Finance NV | 0.125% | 1/12/21 | EUR | 15,600 | 17,675 |
| BMW Finance NV | 0.375% | 7/10/23 | EUR | 10,000 | 11,134 |
| BMW Finance NV | 0.500% | 1/21/20 | EUR | 200 | 228 |
| BMW Finance NV | 0.750% | 7/12/24 | EUR | 10,600 | 11,858 |
| BMW Finance NV | 0.875% | 11/17/20 | EUR | 1,000 | 1,151 |
| BMW Finance NV | 0.875% | 8/16/22 | GBP | 2,400 | 2,943 |
| BMW Finance NV | 0.875% | 4/3/25 | EUR | 9,100 | 10,163 |
| BMW Finance NV | 1.000% | 2/15/22 | EUR | 800 | 927 |
| BMW Finance NV | 1.125% | 5/22/26 | EUR | 2,700 | 3,010 |
| BMW Finance NV | 1.125% | 1/10/28 | EUR | 9,564 | 10,428 |
| BMW Finance NV | 1.250% | 9/5/22 | EUR | 1,000 | 1,167 |
| BMW Finance NV | 1.875% | 6/29/20 | GBP | 200 | 257 |
| BMW Finance NV | 2.000% | 9/4/20 | EUR | 4,000 | 4,701 |
| BMW Finance NV | 2.375% | 1/24/23 | EUR | 400 | 486 |
| BMW International Investment BV | 1.000% | 11/17/21 | GBP | 2,500 | 3,116 |
| BMW International Investment BV | 1.750% | 4/19/22 | GBP | 900 | 1,143 |
| BMW US Capital LLC | 0.625% | 4/20/22 | EUR | 16,410 | 18,733 |
| BMW US Capital LLC | 1.000% | 4/20/27 | EUR | 300 | 329 |
| BMW US Capital LLC | 1.125% | 9/18/21 | EUR | 100 | 116 |
| BMW US Capital LLC | 2.000% | 11/20/19 | GBP | 1,000 | 1,284 |
| Brenntag Finance BV | 1.125% | 9/27/25 | EUR | 2,900 | 3,229 |
| Commerzbank AG | 0.125% | 12/15/26 | EUR | 1,800 | 1,945 |
| Commerzbank AG | 0.500% | 9/13/23 | EUR | 1,000 | 1,091 |
| Commerzbank AG | 1.500% | 9/21/22 | EUR | 5,000 | 5,812 |
| Commerzbank AG | 4.000% | 9/16/20 | EUR | 3,000 | 3,640 |
| Commerzbank AG | 4.000% | 3/23/26 | EUR | 10,290 | 12,354 |
| Continental AG | 3.125% | 9/9/20 | EUR | 4,600 | 5,501 |
| Covestro AG | 1.750% | 9/25/24 | EUR | 10,000 | 11,852 |
| Daimler AG | 0.250% | 5/11/20 | EUR | 8,200 | 9,318 |
| Daimler AG | 0.625% | 3/5/20 | EUR | 10,000 | 11,427 |
| Daimler AG | 0.875% | 1/12/21 | EUR | 17,900 | 20,584 |
| Daimler AG | 1.000% | 12/20/19 | GBP | 2,400 | 3,046 |
| Daimler AG | 1.000% | 11/15/27 | EUR | 300 | 320 |
| Daimler AG | 1.375% | 5/11/28 | EUR | 7,100 | 7,764 |
46
| | | | | |
| Total International Bond Index Fund | | | | | |
| |
| |
| |
| | | | | Face | Market |
| | | Maturity | | Amount | Value • |
| | Coupon | Date | Currency | (000) | ($000) |
| Daimler AG | 1.400% | 1/12/24 | EUR | 8,570 | 9,890 |
| Daimler AG | 1.500% | 1/13/22 | GBP | 2,500 | 3,141 |
| Daimler AG | 2.000% | 4/7/20 | EUR | 400 | 466 |
| Daimler AG | 2.000% | 6/25/21 | EUR | 600 | 711 |
| Daimler AG | 2.125% | 7/3/37 | EUR | 11,400 | 12,596 |
| Daimler AG | 2.250% | 1/24/22 | EUR | 1,750 | 2,095 |
| Daimler AG | 2.375% | 9/12/22 | EUR | 7,000 | 8,456 |
| Daimler AG | 2.375% | 3/8/23 | EUR | 2,500 | 3,034 |
| Daimler AG | 2.750% | 12/4/20 | GBP | 4,500 | 5,863 |
| Daimler Canada Finance Inc. | 1.910% | 7/8/21 | CAD | 5,000 | 3,657 |
| Daimler International Finance BV | 0.200% | 9/13/21 | EUR | 100 | 113 |
| Daimler International Finance BV | 0.250% | 8/9/21 | EUR | 15,000 | 16,914 |
| Daimler International Finance BV | 0.250% | 5/11/22 | EUR | 800 | 895 |
| Daimler International Finance BV | 1.000% | 11/11/25 | EUR | 1,000 | 1,106 |
| Daimler International Finance BV | 1.500% | 8/18/21 | GBP | 200 | 253 |
| Daimler International Finance BV | 2.125% | 6/7/22 | GBP | 100 | 128 |
| Deutsche Apotheker-und Aerztebank eG | 0.750% | 10/5/27 | EUR | 700 | 792 |
| Deutsche Bank AG | 0.000% | 10/15/26 | EUR | 4,906 | 4,362 |
| Deutsche Bank AG | 0.625% | 12/19/23 | CHF | 11,500 | 10,887 |
| Deutsche Bank AG | 1.250% | 9/8/21 | EUR | 11,200 | 12,672 |
| Deutsche Bank AG | 1.500% | 1/20/22 | EUR | 400 | 453 |
| Deutsche Bank AG | 1.875% | 2/28/20 | GBP | 6,900 | 8,762 |
| Deutsche Bank AG | 2.375% | 1/11/23 | EUR | 14,800 | 17,208 |
| Deutsche Boerse AG | 1.125% | 3/26/28 | EUR | 10,000 | 11,402 |
| Deutsche Boerse AG | 1.625% | 10/8/25 | EUR | 4,098 | 5,004 |
| Deutsche Boerse AG | 2.375% | 10/5/22 | EUR | 500 | 616 |
| Deutsche Hypothekenbank AG | 0.125% | 11/23/23 | EUR | 100 | 112 |
| Deutsche Hypothekenbank AG | 0.250% | 2/22/23 | EUR | 15,000 | 17,055 |
| Deutsche Hypothekenbank AG | 0.250% | 5/17/24 | EUR | 3,500 | 3,941 |
| Deutsche Kreditbank AG | 0.625% | 6/8/21 | EUR | 15,100 | 17,259 |
| Deutsche Pfandbriefbank AG | 1.125% | 4/27/20 | EUR | 5,580 | 6,393 |
| Deutsche Post AG | 2.750% | 10/9/23 | EUR | 2,000 | 2,521 |
| Deutsche Post AG | 2.875% | 12/11/24 | EUR | 2,000 | 2,556 |
| Deutsche Telekom International Finance BV | 0.250% | 4/19/21 | EUR | 5,800 | 6,596 |
| Deutsche Telekom International Finance BV | 0.375% | 10/30/21 | EUR | 17,500 | 19,932 |
| Deutsche Telekom International Finance BV | 0.625% | 12/1/22 | EUR | 10,000 | 11,385 |
| Deutsche Telekom International Finance BV | 0.625% | 4/3/23 | EUR | 12,000 | 13,623 |
| Deutsche Telekom International Finance BV | 1.250% | 10/6/23 | GBP | 615 | 762 |
| Deutsche Telekom International Finance BV | 1.375% | 12/1/25 | EUR | 12,300 | 14,096 |
| Deutsche Telekom International Finance BV | 1.500% | 4/3/28 | EUR | 10,600 | 11,899 |
| Deutsche Telekom International Finance BV | 2.125% | 1/18/21 | EUR | 14,500 | 17,169 |
| Deutsche Telekom International Finance BV | 2.750% | 10/24/24 | EUR | 2,196 | 2,763 |
| Deutsche Telekom International Finance BV | 3.250% | 1/17/28 | EUR | 100 | 130 |
| Deutsche Telekom International Finance BV | 4.250% | 7/13/22 | EUR | 3,000 | 3,887 |
| Deutsche Telekom International Finance BV | 4.875% | 4/22/25 | EUR | 8,500 | 12,019 |
| Deutsche Telekom International Finance BV | 6.500% | 4/8/22 | GBP | 10,400 | 15,382 |
| Deutsche Telekom International Finance BV | 7.500% | 1/24/33 | EUR | 400 | 752 |
| Deutsche Telekom International Finance BV | 8.875% | 11/27/28 | GBP | 900 | 1,742 |
| DVB Bank SE | 0.875% | 4/9/21 | EUR | 400 | 455 |
| DVB Bank SE | 1.000% | 4/25/22 | EUR | 2,000 | 2,261 |
| DVB Bank SE | 1.250% | 4/22/20 | EUR | 9,900 | 11,357 |
| DVB Bank SE | 1.250% | 9/15/21 | EUR | 16,600 | 19,015 |
| DVB Bank SE | 1.250% | 6/16/23 | EUR | 22,200 | 25,099 |
| DZ HYP AG | 0.750% | 6/30/27 | EUR | 100 | 113 |
47
| | | | | |
| Total International Bond Index Fund | | | | | |
| |
| |
| |
| | | | | Face | Market |
| | | Maturity | | Amount | Value • |
| | Coupon | Date | Currency | (000) | ($000) |
| E.ON International Finance BV | 5.750% | 5/7/20 | EUR | 10,000 | 12,322 |
| E.ON International Finance BV | 5.875% | 10/30/37 | GBP | 8,950 | 15,152 |
| E.ON International Finance BV | 6.375% | 6/7/32 | GBP | 10,600 | 18,177 |
| E.ON International Finance BV | 6.750% | 1/27/39 | GBP | 1,000 | 1,865 |
| E.ON SE | 0.375% | 8/23/21 | EUR | 7,000 | 7,978 |
| E.ON SE | 1.625% | 5/22/29 | EUR | 100 | 113 |
| Eurogrid GmbH | 1.500% | 4/18/28 | EUR | 1,100 | 1,243 |
| Eurogrid GmbH | 1.625% | 11/3/23 | EUR | 1,900 | 2,249 |
| Eurogrid GmbH | 1.875% | 6/10/25 | EUR | 4,100 | 4,872 |
| Eurogrid GmbH | 3.875% | 10/22/20 | EUR | 1,100 | 1,340 |
| Evonik Finance BV | 0.000% | 3/8/21 | EUR | 300 | 339 |
| Evonik Finance BV | 0.750% | 9/7/28 | EUR | 5,100 | 5,304 |
| Evonik Industries AG | 1.875% | 4/8/20 | EUR | 1,100 | 1,281 |
| Fresenius Finance Ireland plc | 1.500% | 1/30/24 | EUR | 3,000 | 3,468 |
| Fresenius Medical Care AG & Co. KGaA | 1.500% | 7/11/25 | EUR | 200 | 227 |
| Fresenius SE & Co. KGaA | 0.875% | 1/31/22 | EUR | 3,000 | 3,439 |
| Fresenius SE & Co. KGaA | 2.125% | 2/1/27 | EUR | 6,800 | 7,916 |
| Fresenius SE & Co. KGaA | 3.000% | 1/30/32 | EUR | 906 | 1,082 |
| Fresenius SE & Co. KGaA | 4.000% | 2/1/24 | EUR | 8,800 | 11,424 |
| Grand City Properties SA | 1.375% | 8/3/26 | EUR | 10,100 | 10,844 |
| Grand City Properties SA | 1.500% | 4/17/25 | EUR | 13,200 | 14,692 |
| 1 Grand City Properties SA | 3.750% | 12/31/49 | EUR | 1,000 | 1,161 |
| 1 Hannover Finance Luxembourg SA | 5.000% | 6/30/43 | EUR | 2,300 | 2,995 |
| 1 Hannover Finance Luxembourg SA | 5.750% | 9/14/40 | EUR | 2,000 | 2,469 |
| 1 Hannover Rueck SE | 3.375% | 12/31/49 | EUR | 100 | 118 |
| HeidelbergCement AG | 2.250% | 3/30/23 | EUR | 8,000 | 9,461 |
| HeidelbergCement AG | 2.250% | 6/3/24 | EUR | 10,700 | 12,623 |
| HeidelbergCement Finance Luxembourg SA | 0.500% | 1/18/21 | EUR | 8,000 | 9,063 |
| HeidelbergCement Finance Luxembourg SA | 1.500% | 6/14/27 | EUR | 400 | 427 |
| HeidelbergCement Finance Luxembourg SA | 1.625% | 4/7/26 | EUR | 2,700 | 2,994 |
| HeidelbergCement Finance Luxembourg SA | 1.750% | 4/24/28 | EUR | 10,000 | 10,654 |
| HeidelbergCement Finance Luxembourg SA | 7.500% | 4/3/20 | EUR | 2,000 | 2,500 |
| HELLA Finance International BV | 1.000% | 5/17/24 | EUR | 700 | 795 |
| Henkel AG & Co. KGaA | 0.875% | 9/13/22 | GBP | 13,779 | 17,282 |
| innogy Finance BV | 1.000% | 4/13/25 | EUR | 10,000 | 11,265 |
| innogy Finance BV | 1.500% | 7/31/29 | EUR | 32,680 | 35,604 |
| innogy Finance BV | 1.875% | 1/30/20 | EUR | 11,900 | 13,812 |
| innogy Finance BV | 4.750% | 1/31/34 | GBP | 5,400 | 8,032 |
| innogy Finance BV | 5.500% | 7/6/22 | GBP | 1,100 | 1,590 |
| innogy Finance BV | 5.625% | 12/6/23 | GBP | 1,400 | 2,090 |
| innogy Finance BV | 6.250% | 6/3/30 | GBP | 15,600 | 25,999 |
| innogy Finance BV | 6.500% | 4/20/21 | GBP | 11,050 | 15,768 |
| innogy Finance BV | 6.500% | 8/10/21 | EUR | 300 | 400 |
| LANXESS AG | 0.250% | 10/7/21 | EUR | 615 | 699 |
| LANXESS AG | 1.000% | 10/7/26 | EUR | 8,215 | 8,882 |
| LANXESS AG | 2.625% | 11/21/22 | EUR | 300 | 370 |
| LEG Immobilien AG | 1.250% | 1/23/24 | EUR | 800 | 899 |
| Linde AG | 1.750% | 9/17/20 | EUR | 5,000 | 5,865 |
| Linde AG | 2.000% | 4/18/23 | EUR | 2,500 | 3,052 |
| Linde Finance BV | 0.250% | 1/18/22 | EUR | 7,600 | 8,661 |
| Linde Finance BV | 1.875% | 5/22/24 | EUR | 100 | 123 |
| Linde Finance BV | 3.875% | 6/1/21 | EUR | 400 | 499 |
| Merck Financial Services GmbH | 4.500% | 3/24/20 | EUR | 1,000 | 1,205 |
| 1 Merck KGaA | 2.625% | 12/12/74 | EUR | 2,000 | 2,327 |
48
| | | | | |
| Total International Bond Index Fund | | | | | |
| |
| |
| |
| | | | | Face | Market |
| | | Maturity | | Amount | Value • |
| | Coupon | Date | Currency | (000) | ($000) |
| Muenchener Hypothekenbank eG | 0.500% | 4/22/26 | EUR | 500 | 562 |
| Muenchener Hypothekenbank eG | 0.625% | 10/23/26 | EUR | 1,200 | 1,356 |
| Muenchener Hypothekenbank eG | 0.625% | 5/7/27 | EUR | 12,000 | 13,474 |
| 1 Muenchener Rueckversicherungs | | | | | |
| Gesellschaft In Muenchen AG | 6.000% | 5/26/41 | EUR | 500 | 641 |
| 1 Muenchener Rueckversicherungs | | | | | |
| Gesellschaft In Muenchen AG | 6.250% | 5/26/42 | EUR | 11,800 | 15,756 |
| 1 Muenchener Rueckversicherungs- | | | | | |
| Gesellschaft AG in Muenchen | 6.625% | 5/26/42 | GBP | 3,500 | 5,062 |
| O2 Telefonica Deutschland Finanzierungs | | | | | |
| GmbH | 2.375% | 2/10/21 | EUR | 700 | 830 |
| Robert Bosch GmbH | 1.750% | 7/8/24 | EUR | 200 | 243 |
| Santander Consumer Bank AG | 0.750% | 10/17/22 | EUR | 14,000 | 15,695 |
| SAP SE | 1.125% | 2/20/23 | EUR | 1,000 | 1,176 |
| SAP SE | 1.750% | 2/22/27 | EUR | 5,000 | 6,063 |
| Siemens Financieringsmaatschappij NV | 1.375% | 9/6/30 | EUR | 14,800 | 16,581 |
| Siemens Financieringsmaatschappij NV | 1.500% | 3/10/20 | EUR | 4,250 | 4,928 |
| Siemens Financieringsmaatschappij NV | 1.750% | 3/12/21 | EUR | 6,000 | 7,090 |
| Siemens Financieringsmaatschappij NV | 2.750% | 9/10/25 | GBP | 1,000 | 1,352 |
| Siemens Financieringsmaatschappij NV | 2.875% | 3/10/28 | EUR | 500 | 658 |
| Siemens Financieringsmaatschappij NV | 3.750% | 9/10/42 | GBP | 3,100 | 4,632 |
| Talanx AG | 2.500% | 7/23/26 | EUR | 2,000 | 2,509 |
| 1 Talanx Finanz Luxembourg SA | 8.367% | 6/15/42 | EUR | 200 | 277 |
| TLG Immobilien AG | 1.375% | 11/27/24 | EUR | 300 | 332 |
| Vier Gas Transport GmbH | 2.000% | 6/12/20 | EUR | 1,500 | 1,755 |
| Vier Gas Transport GmbH | 2.875% | 6/12/25 | EUR | 11,500 | 14,705 |
| Vier Gas Transport GmbH | 3.125% | 7/10/23 | EUR | 8,100 | 10,289 |
| Volkswagen Bank GmbH | 0.625% | 9/8/21 | EUR | 15,000 | 16,925 |
| Volkswagen Bank GmbH | 0.750% | 6/15/23 | EUR | 11,400 | 12,574 |
| Volkswagen Bank GmbH | 1.250% | 6/10/24 | EUR | 15,100 | 16,659 |
| Volkswagen Bank GmbH | 1.250% | 12/15/25 | EUR | 1,300 | 1,391 |
| Volkswagen Financial Services AG | 0.750% | 10/14/21 | EUR | 800 | 904 |
| Volkswagen Financial Services NV | 1.500% | 4/12/21 | GBP | 3,000 | 3,785 |
| Volkswagen Financial Services NV | 1.625% | 6/9/22 | GBP | 1,000 | 1,254 |
| Volkswagen Financial Services NV | 1.750% | 4/17/20 | GBP | 4,984 | 6,362 |
| Volkswagen Financial Services NV | 2.750% | 10/2/20 | GBP | 1,170 | 1,519 |
| Volkswagen International Finance NV | 0.500% | 3/30/21 | EUR | 4,000 | 4,530 |
| Volkswagen International Finance NV | 0.875% | 1/16/23 | EUR | 10,950 | 12,270 |
| Volkswagen International Finance NV | 1.125% | 10/2/23 | EUR | 12,000 | 13,435 |
| Volkswagen International Finance NV | 1.875% | 3/30/27 | EUR | 12,700 | 13,884 |
| Volkswagen International Finance NV | 2.000% | 1/14/20 | EUR | 1,000 | 1,159 |
| Volkswagen International Finance NV | 2.000% | 3/26/21 | EUR | 3,300 | 3,871 |
| 1 Volkswagen International Finance NV | 2.700% | 12/14/65 | EUR | 11,500 | 12,758 |
| Volkswagen International Finance NV | 3.300% | 3/22/33 | EUR | 200 | 233 |
| 1 Volkswagen International Finance NV | 3.375% | 12/31/49 | EUR | 8,000 | 8,811 |
| 1 Volkswagen International Finance NV | 3.500% | 12/29/49 | EUR | 10,000 | 10,316 |
| 1 Volkswagen International Finance NV | 3.875% | 6/14/66 | EUR | 10,000 | 10,714 |
| 1 Volkswagen International Finance NV | 4.625% | 3/29/49 | EUR | 2,000 | 2,294 |
| 1 Volkswagen International Finance NV | 5.125% | 12/31/49 | EUR | 4,100 | 5,016 |
| Volkswagen Leasing GmbH | 0.250% | 10/5/20 | EUR | 8,500 | 9,617 |
| Volkswagen Leasing GmbH | 0.250% | 2/16/21 | EUR | 10,300 | 11,617 |
| Volkswagen Leasing GmbH | 0.750% | 8/11/20 | EUR | 12,100 | 13,838 |
| Volkswagen Leasing GmbH | 1.125% | 4/4/24 | EUR | 10,500 | 11,550 |
| Volkswagen Leasing GmbH | 1.375% | 1/20/25 | EUR | 11,400 | 12,558 |
| |
| |
| 49 |
| | | | | |
| Total International Bond Index Fund | | | | | |
| |
| |
| |
| | | | | Face | Market |
| | | Maturity | | Amount | Value • |
| | Coupon | Date | Currency | (000) | ($000) |
| Volkswagen Leasing GmbH | 1.625% | 8/15/25 | EUR | 2,070 | 2,292 |
| Volkswagen Leasing GmbH | 2.125% | 4/4/22 | EUR | 9,000 | 10,587 |
| Volkswagen Leasing GmbH | 2.375% | 9/6/22 | EUR | 10,000 | 11,876 |
| Volkswagen Leasing GmbH | 2.625% | 1/15/24 | EUR | 2,000 | 2,381 |
| Vonovia Finance BV | 0.750% | 1/15/24 | EUR | 13,000 | 14,387 |
| Vonovia Finance BV | 0.875% | 3/30/20 | EUR | 50 | 57 |
| Vonovia Finance BV | 0.875% | 7/3/23 | EUR | 600 | 676 |
| Vonovia Finance BV | 1.500% | 3/31/25 | EUR | 10,000 | 11,307 |
| Vonovia Finance BV | 1.500% | 1/14/28 | EUR | 300 | 322 |
| Vonovia Finance BV | 1.750% | 1/25/27 | EUR | 200 | 223 |
| Vonovia Finance BV | 2.250% | 12/15/23 | EUR | 12,700 | 15,137 |
| Vonovia Finance BV | 2.750% | 3/22/38 | EUR | 200 | 223 |
| Vonovia Finance BV | 3.625% | 10/8/21 | EUR | 3,100 | 3,849 |
| 1 Vonovia Finance BV | 4.000% | 12/29/49 | EUR | 2,300 | 2,738 |
| 1 Vonovia Finance BV | 4.625% | 4/8/74 | EUR | 3,000 | 3,441 |
| WL BANK AG Westfaelische Landschaft | | | | | |
| Bodenkreditbank | 0.100% | 8/31/26 | EUR | 1,000 | 1,087 |
| Wuerth Finance International BV | 1.750% | 5/21/20 | EUR | 4,130 | 4,815 |
| | | | | | 1,624,032 |
| Sovereign Bonds (8.6%) | | | | | |
| Bayerische Landesbank | 1.250% | 12/20/21 | GBP | 2,700 | 3,433 |
| Bayerische Landesbodenkreditanstalt | 1.750% | 4/24/24 | EUR | 3,000 | 3,666 |
| Bayerische Landesbodenkreditanstalt | 1.875% | 1/25/23 | EUR | 6,290 | 7,661 |
| 8 Bund Laender Anleihe | 1.500% | 7/15/20 | EUR | 5,000 | 5,852 |
| Bundesschatzanweisungen | 0.000% | 6/12/20 | EUR | 533,000 | 610,227 |
| Deutsche Bahn Finance BV | 1.500% | 8/26/24 | CHF | 1,000 | 1,075 |
| Deutsche Bahn Finance BV | 3.125% | 7/24/26 | GBP | 500 | 697 |
| Deutsche Bahn Finance GmbH | 0.000% | 7/19/21 | EUR | 30,000 | 34,084 |
| Deutsche Bahn Finance GmbH | 0.875% | 7/11/31 | EUR | 2,700 | 2,872 |
| Deutsche Bahn Finance GmbH | 1.000% | 12/17/27 | EUR | 10,000 | 11,413 |
| Deutsche Bahn Finance GmbH | 1.250% | 10/23/25 | EUR | 2,500 | 2,964 |
| Deutsche Bahn Finance GmbH | 1.625% | 8/16/33 | EUR | 8,000 | 9,179 |
| Deutsche Bahn Finance GmbH | 2.500% | 9/12/23 | EUR | 18,500 | 23,212 |
| Deutsche Bahn Finance GmbH | 2.750% | 6/20/22 | GBP | 1,600 | 2,142 |
| Deutsche Bahn Finance GmbH | 2.750% | 3/19/29 | EUR | 3,500 | 4,606 |
| Deutsche Bahn Finance GmbH | 3.000% | 3/8/24 | EUR | 4,000 | 5,157 |
| Deutsche Bahn Finance GmbH | 3.750% | 6/1/21 | EUR | 2,000 | 2,496 |
| Deutsche Bahn Finance GmbH | 3.750% | 7/9/25 | EUR | 5,919 | 8,092 |
| 1 EnBW Energie Baden-Wuerttemberg AG | 3.375% | 4/5/77 | EUR | 1,800 | 2,119 |
| 1 EnBW Energie Baden-Wuerttemberg AG | 3.625% | 4/2/76 | EUR | 3,500 | 4,123 |
| Enbw International Finance BV | 2.500% | 6/4/26 | EUR | 2,000 | 2,516 |
| Enbw International Finance BV | 6.125% | 7/7/39 | EUR | 2,285 | 4,205 |
| EWE AG | 4.125% | 11/4/20 | EUR | 2,000 | 2,455 |
| EWE AG | 5.250% | 7/16/21 | EUR | 8,950 | 11,523 |
| Federal Republic of Germany | 0.000% | 4/17/20 | EUR | 150,000 | 171,646 |
| Federal Republic of Germany | 0.000% | 4/9/21 | EUR | 252,800 | 290,332 |
| Federal Republic of Germany | 0.000% | 10/8/21 | EUR | 150,000 | 172,423 |
| Federal Republic of Germany | 0.000% | 4/8/22 | EUR | 175,000 | 201,201 |
| Federal Republic of Germany | 0.000% | 10/7/22 | EUR | 207,500 | 238,370 |
| Federal Republic of Germany | 0.000% | 4/14/23 | EUR | 95,000 | 108,924 |
| Federal Republic of Germany | 0.000% | 10/13/23 | EUR | 338,000 | 386,642 |
| Federal Republic of Germany | 0.000% | 8/15/26 | EUR | 9,000 | 10,068 |
| Federal Republic of Germany | 0.250% | 10/16/20 | EUR | 140,000 | 161,293 |
| Federal Republic of Germany | 0.250% | 2/15/27 | EUR | 58,400 | 66,386 |
50
| | | | | |
| Total International Bond Index Fund | | | | | |
| |
| |
| |
| | | | | Face | Market |
| | | Maturity | | Amount | Value • |
| | Coupon | Date | Currency | (000) | ($000) |
| Federal Republic of Germany | 0.250% | 8/15/28 | EUR | 454,000 | 507,649 |
| Federal Republic of Germany | 0.500% | 2/15/25 | EUR | 12,000 | 14,034 |
| Federal Republic of Germany | 0.500% | 2/15/26 | EUR | 95,000 | 110,775 |
| Federal Republic of Germany | 0.500% | 8/15/27 | EUR | 256,073 | 295,974 |
| Federal Republic of Germany | 0.500% | 2/15/28 | EUR | 134,300 | 154,550 |
| Federal Republic of Germany | 1.000% | 8/15/24 | EUR | 100,000 | 120,385 |
| Federal Republic of Germany | 1.250% | 8/15/48 | EUR | 100,500 | 120,495 |
| Federal Republic of Germany | 1.500% | 9/4/22 | EUR | 10,000 | 12,150 |
| Federal Republic of Germany | 1.500% | 2/15/23 | EUR | 65,530 | 80,019 |
| Federal Republic of Germany | 1.500% | 5/15/23 | EUR | 163,500 | 200,158 |
| Federal Republic of Germany | 1.500% | 5/15/24 | EUR | 255,000 | 314,873 |
| Federal Republic of Germany | 1.750% | 7/4/22 | EUR | 180,771 | 221,082 |
| Federal Republic of Germany | 1.750% | 2/15/24 | EUR | 14,500 | 18,087 |
| Federal Republic of Germany | 2.000% | 1/4/22 | EUR | 480 | 587 |
| Federal Republic of Germany | 2.000% | 8/15/23 | EUR | 81,500 | 102,253 |
| Federal Republic of Germany | 2.250% | 9/4/20 | EUR | 11,900 | 14,202 |
| Federal Republic of Germany | 2.250% | 9/4/21 | EUR | 67,400 | 82,397 |
| Federal Republic of Germany | 2.500% | 1/4/21 | EUR | 65,000 | 78,648 |
| Federal Republic of Germany | 2.500% | 7/4/44 | EUR | 171,000 | 261,414 |
| Federal Republic of Germany | 2.500% | 8/15/46 | EUR | 86,550 | 133,909 |
| Federal Republic of Germany | 3.000% | 7/4/20 | EUR | 79,000 | 95,001 |
| Federal Republic of Germany | 3.250% | 1/4/20 | EUR | 53,000 | 62,893 |
| Federal Republic of Germany | 3.250% | 7/4/21 | EUR | 21,400 | 26,716 |
| Federal Republic of Germany | 3.250% | 7/4/42 | EUR | 74,994 | 127,532 |
| Federal Republic of Germany | 4.000% | 1/4/37 | EUR | 141,268 | 247,577 |
| Federal Republic of Germany | 4.250% | 7/4/39 | EUR | 48,400 | 90,418 |
| Federal Republic of Germany | 4.750% | 7/4/28 | EUR | 63,500 | 102,197 |
| 9 Federal Republic of Germany | 4.750% | 7/4/34 | EUR | 48,800 | 88,735 |
| Federal Republic of Germany | 4.750% | 7/4/40 | EUR | 45,785 | 92,092 |
| Federal Republic of Germany | 5.500% | 1/4/31 | EUR | 71,900 | 129,613 |
| Federal Republic of Germany | 5.625% | 1/4/28 | EUR | 7,365 | 12,385 |
| Federal Republic of Germany | 6.250% | 1/4/24 | EUR | 25,000 | 37,773 |
| Federal Republic of Germany | 6.500% | 7/4/27 | EUR | 54,400 | 94,925 |
| FMS Wertmanagement AoeR | 0.000% | 5/22/20 | EUR | 25,000 | 28,480 |
| FMS Wertmanagement AoeR | 0.000% | 11/13/20 | EUR | 25,000 | 28,522 |
| FMS Wertmanagement AoeR | 1.000% | 9/7/22 | GBP | 5,000 | 6,331 |
| FMS Wertmanagement AoeR | 0.000% | 2/17/20 | EUR | 20,000 | 22,819 |
| FMS Wertmanagement AoeR | 0.000% | 10/20/20 | EUR | 7,500 | 8,552 |
| FMS Wertmanagement AoeR | 0.050% | 7/6/21 | EUR | 10,000 | 11,411 |
| FMS Wertmanagement AoeR | 0.125% | 4/16/20 | EUR | 4,000 | 4,565 |
| 8 FMS Wertmanagement AoeR | 0.875% | 5/14/21 | GBP | 21,300 | 27,095 |
| FMS Wertmanagement AoeR | 3.000% | 9/8/21 | EUR | 6,000 | 7,422 |
| FMS Wertmanagement AoeR | 3.375% | 6/17/21 | EUR | 11,000 | 13,648 |
| Free and Hanseatic City of Hamburg | 0.250% | 1/20/25 | EUR | 23,000 | 25,905 |
| Free and Hanseatic City of Hamburg | 1.000% | 6/18/21 | EUR | 9,500 | 11,114 |
| Free and Hanseatic City of Hamburg | 1.875% | 9/26/22 | EUR | 9,000 | 10,959 |
| Gemeinsame Deutsche Bundeslaender | 0.125% | 4/14/23 | EUR | 10,000 | 11,362 |
| Gemeinsame Deutsche Bundeslaender | 0.250% | 3/18/24 | EUR | 25,000 | 28,378 |
| Gemeinsame Deutsche Bundeslaender | 0.375% | 6/23/20 | EUR | 5,000 | 5,737 |
| Gemeinsame Deutsche Bundeslaender | 0.500% | 2/5/25 | EUR | 15,000 | 17,139 |
| Gemeinsame Deutsche Bundeslaender | 1.125% | 9/30/24 | EUR | 1,000 | 1,188 |
| Gemeinsame Deutsche Bundeslaender | 1.500% | 1/29/21 | EUR | 5,000 | 5,897 |
| Gemeinsame Deutsche Bundeslaender | 1.750% | 6/13/22 | EUR | 14,000 | 16,925 |
| Gemeinsame Deutsche Bundeslaender | 1.750% | 1/31/23 | EUR | 8,000 | 9,730 |
51
| | | | | |
| Total International Bond Index Fund | | | | | |
| |
| |
| |
| | | | | Face | Market |
| | | Maturity | | Amount | Value • |
| | Coupon | Date | Currency | (000) | ($000) |
| Gemeinsame Deutsche Bundeslaender | 2.250% | 10/23/23 | EUR | 175 | 219 |
| 8 KFW | 0.000% | 2/5/20 | EUR | 25,000 | 28,478 |
| 8 KFW | 0.000% | 6/30/21 | EUR | 51,300 | 58,558 |
| 8 KFW | 0.000% | 4/28/22 | EUR | 52,900 | 60,231 |
| 8 KFW | 0.000% | 9/15/23 | EUR | 32,000 | 36,074 |
| 8 KFW | 0.050% | 5/30/24 | EUR | 3,000 | 3,373 |
| 8 KFW | 0.125% | 6/1/20 | EUR | 50,000 | 57,145 |
| 8 KFW | 0.125% | 10/27/20 | EUR | 20,000 | 22,892 |
| 8 KFW | 0.125% | 11/7/23 | EUR | 10,823 | 12,260 |
| 8 KFW | 0.125% | 10/4/24 | EUR | 40,000 | 44,941 |
| 8 KFW | 0.375% | 12/15/20 | GBP | 10,000 | 12,605 |
| 8 KFW | 0.375% | 3/15/23 | EUR | 25,000 | 28,776 |
| 8 KFW | 0.375% | 4/23/25 | EUR | 25,000 | 28,383 |
| 8 KFW | 0.375% | 3/9/26 | EUR | 5,000 | 5,627 |
| 8 KFW | 0.375% | 4/23/30 | EUR | 15,000 | 16,003 |
| KFW | 0.500% | 9/15/27 | EUR | 65,000 | 72,591 |
| 8 KFW | 0.625% | 1/15/25 | EUR | 43,675 | 50,405 |
| 8 KFW | 0.625% | 2/22/27 | EUR | 38,000 | 43,137 |
| KFW | 0.625% | 1/7/28 | EUR | 50,000 | 56,253 |
| 8 KFW | 0.875% | 3/15/22 | GBP | 20,000 | 25,312 |
| 8 KFW | 1.000% | 11/4/20 | NOK | 20,000 | 2,357 |
| 8 KFW | 1.125% | 12/23/19 | GBP | 500 | 640 |
| 8 KFW | 1.125% | 1/15/20 | EUR | 27,000 | 31,176 |
| 8 KFW | 1.250% | 7/4/36 | EUR | 23,000 | 26,138 |
| 8 KFW | 1.375% | 1/28/20 | CAD | 15,270 | 11,463 |
| 8 KFW | 1.375% | 7/31/35 | EUR | 10,000 | 11,611 |
| 8 KFW | 1.500% | 6/11/24 | EUR | 2,460 | 2,987 |
| 8 KFW | 1.625% | 1/15/21 | EUR | 43,000 | 50,842 |
| 8 KFW | 2.500% | 1/17/22 | EUR | 12,000 | 14,771 |
| 8 KFW | 2.500% | 8/25/25 | CHF | 21,500 | 25,059 |
| 8 KFW | 2.750% | 4/16/20 | AUD | 5,000 | 3,566 |
| 8 KFW | 2.900% | 6/6/22 | AUD | 17,500 | 12,538 |
| 8 KFW | 3.375% | 1/18/21 | EUR | 25,350 | 31,096 |
| 8 KFW | 3.500% | 7/4/21 | EUR | 25,000 | 31,189 |
| 8 KFW | 4.700% | 6/2/37 | CAD | 2,350 | 2,087 |
| 8 KFW | 4.875% | 3/15/37 | GBP | 4,000 | 7,394 |
| 8 KFW | 5.000% | 3/19/24 | AUD | 10,000 | 7,894 |
| 8 KFW | 5.500% | 2/9/22 | AUD | 24,000 | 18,612 |
| 8 KFW | 5.500% | 6/18/25 | GBP | 20,000 | 32,054 |
| 8 KFW | 5.550% | 6/7/21 | GBP | 19,000 | 27,054 |
| 8 KFW | 5.750% | 6/7/32 | GBP | 6,000 | 11,268 |
| 8 KFW | 6.000% | 8/20/20 | AUD | 10,000 | 7,545 |
| 8 KFW | 6.000% | 12/7/28 | GBP | 10,000 | 17,911 |
| 8 KFW | 6.250% | 12/4/19 | AUD | 3,000 | 2,216 |
| 8 KFW | 6.250% | 5/19/21 | AUD | 9,000 | 6,983 |
| 8 KFW | 1.375% | 2/1/21 | GBP | 10,000 | 12,876 |
| KFW | 2.800% | 3/7/23 | AUD | 25,000 | 17,843 |
| 8 KFW | 3.200% | 9/11/26 | AUD | 10,000 | 7,194 |
| Land Berlin | 0.250% | 4/22/25 | EUR | 10,000 | 11,227 |
| Land Berlin | 0.500% | 2/10/25 | EUR | 21,000 | 24,000 |
| Land Thueringen | 0.200% | 10/26/26 | EUR | 15,000 | 16,473 |
| Land Thueringen | 0.500% | 5/12/25 | EUR | 4,500 | 5,153 |
| Land Thueringen | 1.625% | 8/17/20 | EUR | 2,462 | 2,889 |
| Landesbank Baden-Wuerttemberg | 0.200% | 1/10/24 | EUR | 2,000 | 2,261 |
52
| | | | | | |
| Total International Bond Index Fund | | | | | |
| |
| |
| |
| | | | | | Face | Market |
| | | | Maturity | | Amount | Value • |
| | | Coupon | Date | Currency | (000) | ($000) |
| | Landesbank Baden-Wuerttemberg | 0.250% | 7/21/20 | EUR | 400 | 457 |
| | Landesbank Baden-Wuerttemberg | 0.375% | 2/27/25 | EUR | 10,000 | 11,284 |
| | Landesbank Berlin AG | 5.875% | 11/25/19 | EUR | 1,500 | 1,796 |
| | Landesbank Hessen-Thueringen | | | | | |
| | Girozentrale | 0.000% | 1/12/22 | EUR | 7,600 | 8,621 |
| | Landeskreditbank Baden-Wuerttemberg | | | | | |
| | Foerderbank | 0.250% | 11/25/19 | EUR | 4,500 | 5,133 |
| | Landeskreditbank Baden-Wuerttemberg | | | | | |
| | Foerderbank | 0.375% | 4/13/26 | EUR | 15,000 | 16,825 |
| | Landeskreditbank Baden-Wuerttemberg | | | | | |
| | Foerderbank | 1.125% | 5/17/21 | GBP | 5,700 | 7,284 |
| | Landeskreditbank Baden-Wuerttemberg | | | | | |
| | Foerderbank | 2.250% | 2/17/21 | AUD | 20,000 | 14,095 |
| | Landeskreditbank Baden-Wuerttemberg | | | | | |
| | Foerderbank | 4.250% | 8/7/25 | AUD | 10,000 | 7,613 |
| 8 | Landwirtschaftliche Rentenbank | 0.250% | 11/24/22 | EUR | 10,000 | 11,447 |
| 8 | Landwirtschaftliche Rentenbank | 0.250% | 7/15/24 | EUR | 12,900 | 14,609 |
| 8 | Landwirtschaftliche Rentenbank | 0.375% | 1/22/24 | EUR | 40,100 | 45,881 |
| 8 | Landwirtschaftliche Rentenbank | 0.375% | 3/16/26 | EUR | 10,000 | 11,216 |
| 8 | Landwirtschaftliche Rentenbank | 0.625% | 5/18/27 | EUR | 15,300 | 17,289 |
| 8 | Landwirtschaftliche Rentenbank | 0.625% | 2/20/30 | EUR | 20,000 | 21,927 |
| 8 | Landwirtschaftliche Rentenbank | 1.125% | 12/15/23 | GBP | 14,600 | 18,453 |
| 8 | Landwirtschaftliche Rentenbank | 1.250% | 5/20/22 | EUR | 5,000 | 5,936 |
| 8 | Landwirtschaftliche Rentenbank | 1.375% | 12/15/20 | GBP | 3,100 | 3,991 |
| 8 | Landwirtschaftliche Rentenbank | 1.500% | 12/23/19 | GBP | 5,000 | 6,430 |
| 2,8 | Landwirtschaftliche Rentenbank | 1.875% | 11/21/19 | CAD | 2,655 | 2,005 |
| 8 | Landwirtschaftliche Rentenbank | 1.875% | 11/21/19 | CAD | 3,000 | 2,266 |
| 8 | Landwirtschaftliche Rentenbank | 1.875% | 5/11/20 | EUR | 1,500 | 1,759 |
| 8 | Landwirtschaftliche Rentenbank | 2.500% | 4/13/21 | AUD | 5,000 | 3,550 |
| 8 | Landwirtschaftliche Rentenbank | 2.600% | 3/23/27 | AUD | 3,200 | 2,193 |
| 8 | Landwirtschaftliche Rentenbank | 2.700% | 1/20/20 | AUD | 7,000 | 4,985 |
| 8 | Landwirtschaftliche Rentenbank | 2.700% | 9/5/22 | AUD | 10,000 | 7,117 |
| 8 | Landwirtschaftliche Rentenbank | 2.875% | 8/30/21 | EUR | 13,000 | 16,024 |
| 8 | Landwirtschaftliche Rentenbank | 4.000% | 1/30/20 | NZD | 8,513 | 5,679 |
| 8 | Landwirtschaftliche Rentenbank | 4.250% | 1/24/23 | AUD | 7,500 | 5,663 |
| 8 | Landwirtschaftliche Rentenbank | 4.250% | 1/9/25 | AUD | 10,000 | 7,657 |
| 8 | Landwirtschaftliche Rentenbank | 4.750% | 3/12/19 | NZD | 5,000 | 3,294 |
| 8 | Landwirtschaftliche Rentenbank | 5.500% | 3/9/20 | AUD | 8,000 | 5,909 |
| 8 | Landwirtschaftliche Rentenbank | 5.500% | 3/29/22 | AUD | 5,000 | 3,889 |
| | Norddeutsche Landesbank Girozentrale | 0.375% | 10/9/24 | EUR | 1,100 | 1,243 |
| | NRW Bank | 0.000% | 2/1/22 | EUR | 30,000 | 34,109 |
| | NRW Bank | 0.100% | 1/10/23 | EUR | 25,000 | 28,365 |
| | NRW Bank | 0.125% | 3/10/23 | EUR | 5,000 | 5,675 |
| | NRW Bank | 0.250% | 3/10/25 | EUR | 15,000 | 16,810 |
| | NRW Bank | 0.500% | 5/11/26 | EUR | 12,000 | 13,544 |
| | NRW Bank | 0.500% | 9/13/27 | EUR | 15,000 | 16,679 |
| | NRW Bank | 0.625% | 2/11/26 | EUR | 15,000 | 17,133 |
| | NRW Bank | 0.625% | 2/23/27 | EUR | 15,000 | 16,956 |
| | NRW Bank | 1.000% | 6/15/22 | GBP | 1,000 | 1,265 |
| | NRW Bank | 3.875% | 1/27/20 | EUR | 4,000 | 4,770 |
| | State of Baden-Wurttemberg | 0.625% | 2/9/27 | EUR | 10,000 | 11,352 |
| | State of Baden-Wurttemberg | 1.000% | 7/18/22 | EUR | 5,000 | 5,895 |
| | State of Baden-Wurttemberg | 2.000% | 11/13/23 | EUR | 8,000 | 9,914 |
| | State of Berlin | 0.625% | 3/20/26 | EUR | 25,000 | 28,573 |
53
| | | | | |
| Total International Bond Index Fund | | | | | |
| |
| |
| |
| | | | | Face | Market |
| | | Maturity | | Amount | Value • |
| | Coupon | Date | Currency | (000) | ($000) |
| State of Berlin | 0.625% | 8/25/36 | EUR | 1,500 | 1,502 |
| State of Berlin | 0.750% | 11/11/22 | EUR | 10,000 | 11,684 |
| State of Berlin | 1.000% | 5/19/32 | EUR | 15,000 | 16,612 |
| State of Berlin | 1.500% | 8/28/20 | EUR | 2,000 | 2,344 |
| State of Berlin | 1.500% | 1/21/21 | EUR | 3,300 | 3,891 |
| State of Berlin | 1.875% | 6/12/23 | EUR | 1,800 | 2,207 |
| State of Berlin | 3.125% | 8/17/21 | EUR | 30,300 | 37,554 |
| State of Brandenburg | 3.500% | 6/15/21 | EUR | 15,000 | 18,671 |
| State of Bremen | 0.500% | 7/30/21 | EUR | 15,000 | 17,331 |
| State of Bremen | 0.500% | 3/3/25 | EUR | 13,000 | 14,838 |
| State of Bremen | 1.375% | 4/28/21 | EUR | 1,000 | 1,179 |
| 8 State of Hesse | 0.000% | 9/15/21 | EUR | 4,900 | 5,587 |
| State of Hesse | 0.250% | 6/10/25 | EUR | 25,000 | 28,045 |
| State of Hesse | 0.375% | 7/4/22 | EUR | 10,000 | 11,523 |
| State of Hesse | 0.375% | 3/10/23 | EUR | 38,000 | 43,679 |
| State of Hesse | 0.500% | 2/17/25 | EUR | 10,500 | 12,016 |
| State of Hesse | 0.750% | 8/4/36 | EUR | 12,000 | 12,274 |
| State of Hesse | 1.375% | 2/5/20 | EUR | 8,000 | 9,274 |
| State of Hesse | 1.375% | 6/10/24 | EUR | 4,000 | 4,819 |
| State of Hesse | 1.750% | 6/19/20 | EUR | 3,730 | 4,376 |
| State of Hesse | 1.750% | 1/20/23 | EUR | 3,000 | 3,651 |
| State of Hesse | 3.000% | 8/23/21 | EUR | 12,000 | 14,833 |
| State of Hesse | 3.500% | 3/10/20 | EUR | 5,000 | 5,966 |
| State of Lower Saxony | 0.000% | 3/1/21 | EUR | 18,200 | 20,763 |
| State of Lower Saxony | 0.000% | 1/10/22 | EUR | 10,000 | 11,385 |
| State of Lower Saxony | 0.000% | 8/2/24 | EUR | 47,000 | 52,406 |
| State of Lower Saxony | 0.050% | 11/10/22 | EUR | 10,000 | 11,351 |
| State of Lower Saxony | 0.125% | 3/7/23 | EUR | 20,000 | 22,716 |
| State of Lower Saxony | 0.375% | 1/19/23 | EUR | 15,000 | 17,240 |
| State of Lower Saxony | 0.400% | 7/10/20 | EUR | 5,000 | 5,742 |
| State of Lower Saxony | 0.500% | 6/8/26 | EUR | 2,500 | 2,826 |
| State of Lower Saxony | 0.625% | 1/20/25 | EUR | 10,000 | 11,527 |
| State of Lower Saxony | 0.625% | 7/6/27 | EUR | 20,000 | 22,562 |
| State of Lower Saxony | 1.000% | 8/18/22 | EUR | 11,000 | 12,962 |
| State of Lower Saxony | 2.125% | 10/11/23 | EUR | 1,000 | 1,244 |
| State of Lower Saxony | 2.125% | 1/16/24 | EUR | 310 | 386 |
| State of Lower Saxony | 2.750% | 9/13/21 | EUR | 20,000 | 24,577 |
| State of North Rhine-Westphalia | 0.200% | 4/17/23 | EUR | 20,000 | 22,783 |
| State of North Rhine-Westphalia | 0.200% | 2/16/24 | EUR | 35,800 | 40,525 |
| State of North Rhine-Westphalia | 0.375% | 10/19/21 | EUR | 10,000 | 11,530 |
| State of North Rhine-Westphalia | 0.375% | 2/16/23 | EUR | 4,300 | 4,941 |
| State of North Rhine-Westphalia | 0.500% | 3/11/25 | EUR | 3,000 | 3,430 |
| State of North Rhine-Westphalia | 0.500% | 4/16/26 | EUR | 10,000 | 11,297 |
| State of North Rhine-Westphalia | 0.500% | 2/16/27 | EUR | 20,400 | 22,864 |
| State of North Rhine-Westphalia | 0.625% | 7/21/31 | EUR | 15,000 | 15,959 |
| State of North Rhine-Westphalia | 0.750% | 1/16/26 | EUR | 15,000 | 17,290 |
| State of North Rhine-Westphalia | 0.875% | 12/16/19 | EUR | 5,000 | 5,750 |
| State of North Rhine-Westphalia | 1.250% | 3/13/20 | EUR | 5,000 | 5,796 |
| State of North Rhine-Westphalia | 1.250% | 5/12/36 | EUR | 4,000 | 4,423 |
| State of North Rhine-Westphalia | 1.375% | 5/16/22 | EUR | 5,050 | 6,015 |
| State of North Rhine-Westphalia | 1.500% | 12/15/20 | EUR | 48,000 | 56,502 |
| State of North Rhine-Westphalia | 1.500% | 1/14/21 | EUR | 4,000 | 4,717 |
| State of North Rhine-Westphalia | 1.625% | 10/24/30 | EUR | 10,000 | 12,003 |
| State of North Rhine-Westphalia | 1.875% | 9/15/22 | EUR | 11,150 | 13,573 |
54
| | | | | |
| Total International Bond Index Fund | | | | | |
| |
| |
| |
| | | | | Face | Market |
| | | Maturity | | Amount | Value • |
| | Coupon | Date | Currency | (000) | ($000) |
| State of North Rhine-Westphalia | 1.875% | 3/15/24 | EUR | 1,950 | 2,405 |
| State of North Rhine-Westphalia | 2.000% | 10/15/25 | EUR | 3,000 | 3,757 |
| State of North Rhine-Westphalia | 2.375% | 5/13/33 | EUR | 21,400 | 27,912 |
| State of North Rhine-Westphalia Germany | 0.950% | 3/13/28 | EUR | 25,000 | 28,788 |
| State of North Rhine-Westphalia Germany | 1.000% | 1/16/25 | EUR | 220 | 259 |
| State of North Rhine-Westphalia Germany | 1.450% | 2/16/43 | EUR | 5,000 | 5,535 |
| State of North Rhine-Westphalia Germany | 1.650% | 2/22/38 | EUR | 10,000 | 11,707 |
| State of North Rhine-Westphalia Germany | 1.750% | 10/26/57 | EUR | 16,000 | 18,314 |
| State of North Rhine-Westphalia Germany | 1.750% | 7/11/68 | EUR | 5,000 | 5,516 |
| State of Rhineland-Palatinate | 0.000% | 3/23/20 | EUR | 317 | 361 |
| State of Rhineland-Palatinate | 0.100% | 8/18/26 | EUR | 10,000 | 10,930 |
| State of Rhineland-Palatinate | 0.500% | 9/3/21 | EUR | 5,000 | 5,782 |
| State of Rhineland-Palatinate | 0.500% | 1/21/25 | EUR | 6,000 | 6,858 |
| State of Rhineland-Palatinate | 0.700% | 1/26/28 | EUR | 10,000 | 11,348 |
| State of Rhineland-Palatinate | 1.250% | 1/16/20 | EUR | 10,745 | 12,425 |
| State of Rhineland-Palatinate | 2.375% | 2/23/22 | EUR | 2,500 | 3,069 |
| State of Saxony-Anhalt | 1.625% | 4/25/23 | EUR | 4,000 | 4,848 |
| State of Saxony-Anhalt | 1.875% | 4/10/24 | EUR | 9,000 | 11,104 |
| Wirtschafts- und Infrastrukturbank Hessen | 1.750% | 12/6/22 | EUR | 2,500 | 3,021 |
| | | | | | 9,536,801 |
| Total Germany (Cost $11,833,996) | | | | | 11,707,045 |
| Hong Kong (0.1%) | | | | | |
| Corporate Bonds (0.1%) | | | | | |
| Cheung Kong Infrastructure Finance BVI Ltd. | 1.000% | 12/12/24 | EUR | 100 | 109 |
| CK Hutchison Europe Finance 18 Ltd. | 1.250% | 4/13/25 | EUR | 10,300 | 11,522 |
| CK Hutchison Europe Finance 18 Ltd. | 2.000% | 4/13/30 | EUR | 700 | 765 |
| CK Hutchison Finance 16 II Ltd. | 0.875% | 10/3/24 | EUR | 11,400 | 12,639 |
| CK Hutchison Finance 16 Ltd. | 1.250% | 4/6/23 | EUR | 17,000 | 19,533 |
| CK Hutchison Finance 16 Ltd. | 2.000% | 4/6/28 | EUR | 100 | 113 |
| Hutchison Whampoa Finance 14 Ltd. | 1.375% | 10/31/21 | EUR | 100 | 116 |
| | | | | | 44,797 |
| Sovereign Bonds (0.0%) | | | | | |
| Hong Kong Special Administrative Region | 0.910% | 11/5/20 | HKD | 100,000 | 12,440 |
| Hong Kong Special Administrative Region | 1.470% | 2/20/19 | HKD | 35,000 | 4,461 |
| Hong Kong Special Administrative Region | 2.220% | 8/7/24 | HKD | 30,000 | 3,800 |
| | | | | | 20,701 |
| Total Hong Kong (Cost $65,541) | | | | | 65,498 |
| Hungary (0.1%) | | | | | |
| Sovereign Bonds (0.1%) | | | | | |
| Republic of Hungary | 0.500% | 4/21/21 | HUF | 3,766,700 | 12,781 |
| Republic of Hungary | 1.750% | 10/26/22 | HUF | 400,000 | 1,375 |
| Republic of Hungary | 1.750% | 10/10/27 | EUR | 2,500 | 2,854 |
| Republic of Hungary | 2.500% | 10/27/21 | HUF | 900,000 | 3,215 |
| Republic of Hungary | 3.000% | 10/27/27 | HUF | 16,700,100 | 55,280 |
| Republic of Hungary | 5.500% | 6/24/25 | HUF | 6,037,430 | 24,015 |
| Republic of Hungary | 6.000% | 11/24/23 | HUF | 2,910,000 | 11,856 |
| Republic of Hungary | 7.000% | 6/24/22 | HUF | 534,000 | 2,181 |
| Total Hungary (Cost $117,954) | | | | | 113,557 |
55
| | | | | |
| Total International Bond Index Fund | | | | | |
| |
| |
| |
| | | | | Face | Market |
| | | Maturity | | Amount | Value • |
| | Coupon | Date | Currency | (000) | ($000) |
| India (0.0%) | | | | | |
| Corporate Bonds (0.0%) | | | | | |
| Bharti Airtel International Netherlands BV | 3.000% | 3/31/20 | CHF | 3,000 | 3,048 |
| Bharti Airtel International Netherlands BV | 3.375% | 5/20/21 | EUR | 875 | 1,029 |
| Total India (Cost $4,381) | | | | | 4,077 |
| Indonesia (0.5%) | | | | | |
| Sovereign Bonds (0.5%) | | | | | |
| Republic of Indonesia | 5.625% | 5/15/23 | IDR | 913,604,000 | 53,938 |
| Republic of Indonesia | 1.750% | 4/24/25 | EUR | 13,400 | 14,659 |
| Republic of Indonesia | 2.625% | 6/14/23 | EUR | 200 | 235 |
| Republic of Indonesia | 2.875% | 7/8/21 | EUR | 11,020 | 13,125 |
| Republic of Indonesia | 3.750% | 6/14/28 | EUR | 18,200 | 22,229 |
| Republic of Indonesia | 6.125% | 5/15/28 | IDR | 1,930,000,000 | 107,270 |
| Republic of Indonesia | 6.625% | 5/15/33 | IDR | 2,049,414,000 | 110,788 |
| Republic of Indonesia | 7.000% | 5/15/27 | IDR | 1,491,251,000 | 88,529 |
| Republic of Indonesia | 7.500% | 5/15/38 | IDR | 419,972,000 | 23,793 |
| Republic of Indonesia | 8.250% | 5/15/36 | IDR | 347,800,000 | 21,541 |
| Republic of Indonesia | 8.375% | 3/15/24 | IDR | 1,390,785,000 | 90,839 |
| Total Indonesia (Cost $639,852) | | | | | 546,946 |
| Ireland (0.6%) | | | | | |
| Asset-Backed/Commercial Mortgage-Backed Security (0.0%) | | | |
| AIB Mortgage Bank | 0.625% | 2/3/22 | EUR | 3,000 | 3,462 |
| |
| Corporate Bonds (0.1%) | | | | | |
| AIB Mortgage Bank | 2.250% | 3/26/21 | EUR | 15,000 | 17,941 |
| Bank of Ireland Group plc | 1.375% | 8/29/23 | EUR | 15,000 | 16,874 |
| CRH Finance DAC | 1.375% | 10/18/28 | EUR | 1,300 | 1,388 |
| CRH Finance Ltd. | 3.125% | 4/3/23 | EUR | 10,850 | 13,590 |
| CRH Finance Switzerland AG | 1.375% | 9/30/22 | CHF | 5,300 | 5,418 |
| CRH Finland Services Oyj | 2.750% | 10/15/20 | EUR | 5,488 | 6,497 |
| Dali Capital plc | 4.799% | 12/21/37 | GBP | 150 | 237 |
| Freshwater Finance plc | 4.607% | 10/17/36 | GBP | 1,125 | 1,775 |
| Kerry Group Financial Services | 2.375% | 9/10/25 | EUR | 10,500 | 12,743 |
| Ryanair DAC | 1.125% | 8/15/23 | EUR | 3,000 | 3,379 |
| | | | | | 79,842 |
| Sovereign Bonds (0.5%) | | | | | |
| ESB Finance Ltd. | 2.125% | 6/8/27 | EUR | 6,200 | 7,416 |
| ESB Finance Ltd. | 3.494% | 1/12/24 | EUR | 1,000 | 1,288 |
| ESB Finance Ltd. | 6.500% | 3/5/20 | GBP | 3,000 | 4,084 |
| Ireland | 0.000% | 10/18/22 | EUR | 500 | 567 |
| Ireland | 0.800% | 3/15/22 | EUR | 57,280 | 66,921 |
| Ireland | 1.000% | 5/15/26 | EUR | 91,950 | 106,762 |
| Ireland | 1.300% | 5/15/33 | EUR | 400 | 445 |
| Ireland | 1.700% | 5/15/37 | EUR | 25,190 | 29,029 |
| Ireland | 2.000% | 2/18/45 | EUR | 52,390 | 62,272 |
| Ireland | 2.400% | 5/15/30 | EUR | 29,090 | 37,296 |
| Ireland | 3.400% | 3/18/24 | EUR | 55,200 | 73,077 |
| Ireland | 3.900% | 3/20/23 | EUR | 22,965 | 30,445 |
| Ireland | 4.500% | 4/18/20 | EUR | 62,200 | 75,571 |
| Ireland | 5.000% | 10/18/20 | EUR | 24,000 | 30,120 |
| Ireland | 5.400% | 3/13/25 | EUR | 10,735 | 15,918 |
56
| | | | | |
| Total International Bond Index Fund | | | | | |
| |
| |
| |
| | | | | Face | Market |
| | | Maturity | | Amount | Value • |
| | Coupon | Date | Currency | (000) | ($000) |
| Republic of Ireland | 0.900% | 5/15/28 | EUR | 50,600 | 57,032 |
| Republic of Ireland | 1.350% | 3/18/31 | EUR | 30,000 | 34,170 |
| | | | | | 632,413 |
| Total Ireland (Cost $708,658) | | | | | 715,717 |
| Israel (0.2%) | | | | | |
| Sovereign Bonds (0.2%) | | | | | |
| State of Israel | 0.500% | 1/31/21 | ILS | 22,600 | 6,056 |
| State of Israel | 1.000% | 4/30/21 | ILS | 65,000 | 17,588 |
| State of Israel | 1.250% | 11/30/22 | ILS | 50,000 | 13,454 |
| State of Israel | 1.500% | 1/18/27 | EUR | 16,000 | 18,347 |
| State of Israel | 1.750% | 8/31/25 | ILS | 129,500 | 34,496 |
| State of Israel | 2.000% | 3/31/27 | ILS | 162,000 | 43,159 |
| State of Israel | 2.250% | 9/28/28 | ILS | 13,000 | 3,448 |
| State of Israel | 2.875% | 1/29/24 | EUR | 3,400 | 4,242 |
| State of Israel | 3.750% | 3/31/24 | ILS | 37,000 | 11,075 |
| State of Israel | 3.750% | 3/31/47 | ILS | 51,000 | 14,602 |
| State of Israel | 4.250% | 3/31/23 | ILS | 73,000 | 22,107 |
| State of Israel | 4.625% | 3/18/20 | EUR | 1,000 | 1,203 |
| State of Israel | 5.000% | 1/31/20 | ILS | 69,000 | 19,622 |
| State of Israel | 5.500% | 1/31/22 | ILS | 20,000 | 6,158 |
| State of Israel | 5.500% | 1/31/42 | ILS | 66,000 | 24,605 |
| State of Israel | 6.250% | 10/30/26 | ILS | 56,360 | 19,855 |
| Total Israel (Cost $260,342) | | | | | 260,017 |
| Italy (7.3%) | | | | | |
| Asset-Backed/Commercial Mortgage-Backed Securities (0.2%) | | | |
| Aeroporti Di Roma SPA | 5.441% | 2/20/23 | GBP | 250 | 355 |
| Banca Monte dei Paschi di Siena SPA | 2.875% | 7/16/24 | EUR | 5,640 | 6,806 |
| 1 Banca Monte dei Paschi di Siena SPA | 2.875% | 4/16/59 | EUR | 4,000 | 4,754 |
| Banca Popolare dell’Emilia Romagna SC | 0.875% | 1/22/22 | EUR | 5,000 | 5,677 |
| Banca Popolare di Milano Scarl | 0.625% | 6/8/23 | EUR | 10,000 | 11,014 |
| Banco BPM SpA | 0.750% | 3/31/22 | EUR | 10,000 | 11,267 |
| Banco BPM SpA | 1.000% | 1/23/25 | EUR | 15,000 | 16,467 |
| Banco di Desio e della Brianza SPA | 0.875% | 9/12/24 | EUR | 16,000 | 17,887 |
| Credit Agricole Cariparma SpA | 0.250% | 9/30/24 | EUR | 10,800 | 11,655 |
| Credit Agricole Cariparma SpA | 0.875% | 6/16/23 | EUR | 10,000 | 11,330 |
| Intesa Sanpaolo SPA | 0.625% | 1/20/22 | EUR | 5,000 | 5,693 |
| Intesa Sanpaolo SPA | 3.250% | 2/10/26 | EUR | 9,000 | 11,574 |
| Intesa Sanpaolo SPA | 3.375% | 1/24/25 | EUR | 10,500 | 13,583 |
| Intesa Sanpaolo SPA | 3.625% | 12/5/22 | EUR | 4,200 | 5,339 |
| Mediobanca SpA | 3.625% | 10/17/23 | EUR | 5,000 | 6,415 |
| UniCredit SPA | 2.625% | 10/31/20 | EUR | 5,000 | 5,934 |
| UniCredit SPA | 2.750% | 1/31/20 | EUR | 1,310 | 1,532 |
| UniCredit SPA | 5.000% | 10/31/21 | EUR | 3,000 | 3,857 |
| UniCredit SPA | 5.250% | 4/30/23 | EUR | 9,000 | 12,220 |
| Unione di Banche Italiane SpA | 3.125% | 10/14/20 | EUR | 8,500 | 10,170 |
| Unione di Banche Italiane SpA | 5.250% | 1/28/21 | EUR | 2,500 | 3,139 |
| Unione di Banche Italiane SpA | 0.375% | 9/14/26 | EUR | 10,000 | 10,386 |
| Unione di Banche Italiane SpA | 1.000% | 1/27/23 | EUR | 10,500 | 11,945 |
| Unione di Banche Italiane SpA | 1.125% | 10/4/27 | EUR | 6,700 | 7,281 |
| Unione di Banche Italiane SpA | 1.250% | 2/7/25 | EUR | 2,500 | 2,837 |
| Unione di Banche Italiane SpA | 3.125% | 2/5/24 | EUR | 4,000 | 5,024 |
| Unione di Banche Italiane SpA | 4.000% | 12/16/19 | EUR | 200 | 236 |
| | | | | | 214,377 |
57
| | | | | |
| Total International Bond Index Fund | | | | | |
| |
| |
| |
| | | | | Face | Market |
| | | Maturity | | Amount | Value • |
| | Coupon | Date | Currency | (000) | ($000) |
| Corporate Bonds (0.5%) | | | | | |
| 2i Rete Gas SPA | 1.608% | 10/31/27 | EUR | 1,500 | 1,536 |
| 2i Rete Gas SPA | 3.000% | 7/16/24 | EUR | 5,500 | 6,569 |
| Aeroporti di Roma SPA | 1.625% | 6/8/27 | EUR | 11,000 | 11,713 |
| Aeroporti di Roma SPA | 3.250% | 2/20/21 | EUR | 3,800 | 4,521 |
| Assicurazioni Generali SPA | 2.875% | 1/14/20 | EUR | 3,245 | 3,789 |
| Assicurazioni Generali SPA | 4.125% | 5/4/26 | EUR | 2,000 | 2,325 |
| Assicurazioni Generali SPA | 5.125% | 9/16/24 | EUR | 7,280 | 9,823 |
| 1 Assicurazioni Generali SPA | 7.750% | 12/12/42 | EUR | 16,000 | 20,957 |
| 1 Assicurazioni Generali SPA | 10.125% | 7/10/42 | EUR | 2,200 | 3,096 |
| Atlantia SPA | 1.625% | 2/3/25 | EUR | 5,600 | 5,753 |
| Atlantia SPA | 2.875% | 2/26/21 | EUR | 3,500 | 4,023 |
| Atlantia SPA | 5.875% | 6/9/24 | EUR | 300 | 381 |
| Atlantia SPA | 6.250% | 6/9/22 | GBP | 3,820 | 5,180 |
| Autostrade per l’Italia SpA | 1.125% | 11/4/21 | EUR | 8,000 | 8,721 |
| Autostrade per l’Italia SpA | 1.750% | 2/1/27 | EUR | 550 | 539 |
| Autostrade per l’Italia SpA | 1.875% | 11/4/25 | EUR | 13,935 | 14,093 |
| Autostrade per l’Italia SpA | 1.875% | 9/26/29 | EUR | 1,800 | 1,708 |
| Autostrade per l’Italia SpA | 4.375% | 9/16/25 | EUR | 100 | 119 |
| Banca Monte dei Paschi di Siena SPA | 1.250% | 1/20/22 | EUR | 5,000 | 5,693 |
| Banca Monte dei Paschi di Siena SPA | 2.125% | 11/26/25 | EUR | 9,000 | 10,360 |
| Banca Popolare di Milano Scarl | 1.500% | 12/2/25 | EUR | 7,200 | 8,074 |
| Credit Agricole Cariparma SPA | 0.625% | 1/13/26 | EUR | 600 | 640 |
| Enel Finance International NV | 1.000% | 9/16/24 | EUR | 3,100 | 3,414 |
| Enel Finance International NV | 1.125% | 9/16/26 | EUR | 3,800 | 4,013 |
| Enel Finance International NV | 1.375% | 6/1/26 | EUR | 39,745 | 43,215 |
| Enel Finance International NV | 1.966% | 1/27/25 | EUR | 4,350 | 4,997 |
| Enel Finance International NV | 4.875% | 3/11/20 | EUR | 14,740 | 17,796 |
| Enel Finance International NV | 4.875% | 4/17/23 | EUR | 5,000 | 6,663 |
| Enel Finance International NV | 5.000% | 7/12/21 | EUR | 2,000 | 2,552 |
| Enel Finance International NV | 5.250% | 9/29/23 | EUR | 736 | 993 |
| Enel Finance International NV | 5.625% | 8/14/24 | GBP | 3,300 | 4,834 |
| Enel Finance International NV | 5.750% | 9/14/40 | GBP | 9,700 | 15,244 |
| 1 Enel SPA | 2.500% | 11/24/78 | EUR | 10,500 | 11,114 |
| Enel SPA | 5.750% | 6/22/37 | GBP | 1,000 | 1,546 |
| 1 Enel SPA | 6.625% | 9/15/76 | GBP | 2,900 | 3,960 |
| Eni SPA | 0.625% | 9/19/24 | EUR | 10,000 | 10,956 |
| Eni SPA | 0.750% | 5/17/22 | EUR | 500 | 572 |
| Eni SPA | 1.125% | 9/19/28 | EUR | 5,500 | 5,779 |
| Eni SPA | 1.500% | 1/17/27 | EUR | 5,000 | 5,594 |
| Eni SPA | 1.625% | 5/17/28 | EUR | 3,000 | 3,329 |
| Eni SPA | 2.625% | 11/22/21 | EUR | 3,000 | 3,643 |
| Eni SPA | 3.250% | 7/10/23 | EUR | 7,360 | 9,297 |
| Eni SPA | 3.625% | 1/29/29 | EUR | 6,200 | 8,113 |
| Eni SPA | 3.750% | 9/12/25 | EUR | 6,600 | 8,607 |
| Eni SPA | 4.250% | 2/3/20 | EUR | 2,570 | 3,067 |
| EXOR NV | 2.500% | 10/8/24 | EUR | 10,000 | 11,796 |
| FCA Bank SpA | 1.625% | 9/29/21 | GBP | 3,000 | 3,739 |
| FCA Capital Ireland plc | 1.000% | 11/15/21 | EUR | 23,600 | 26,458 |
| FCA Capital Ireland plc | 1.250% | 9/23/20 | EUR | 1,600 | 1,829 |
| Intesa Sanpaolo SPA | 0.875% | 6/27/22 | EUR | 6,600 | 7,146 |
| Intesa Sanpaolo SPA | 1.125% | 1/14/20 | EUR | 5,000 | 5,666 |
| Intesa Sanpaolo SPA | 1.125% | 3/4/22 | EUR | 100 | 110 |
| Intesa Sanpaolo SPA | 1.375% | 1/18/24 | EUR | 10,000 | 10,654 |
| |
| |
| 58 |
| | | | | |
| Total International Bond Index Fund | | | | | |
| |
| |
| |
| | | | | Face | Market |
| | | Maturity | | Amount | Value • |
| | Coupon | Date | Currency | (000) | ($000) |
| Intesa Sanpaolo SPA | 1.750% | 3/20/28 | EUR | 12,000 | 11,843 |
| Intesa Sanpaolo SPA | 2.000% | 6/18/21 | EUR | 12,228 | 13,911 |
| Intesa Sanpaolo SPA | 2.750% | 3/20/20 | EUR | 100 | 116 |
| Intesa Sanpaolo SPA | 3.500% | 1/17/22 | EUR | 8,100 | 9,569 |
| Intesa Sanpaolo SPA | 4.000% | 10/30/23 | EUR | 6,100 | 7,385 |
| Intesa Sanpaolo SPA | 4.125% | 4/14/20 | EUR | 2,350 | 2,772 |
| Iren SPA | 0.875% | 11/4/24 | EUR | 2,100 | 2,201 |
| Italgas SPA | 0.500% | 1/19/22 | EUR | 18,000 | 20,024 |
| Italgas SPA | 1.625% | 1/19/27 | EUR | 5,000 | 5,360 |
| Luxottica Group SPA | 2.625% | 2/10/24 | EUR | 8,800 | 10,977 |
| Mediobanca Banca di Credito Finanziario | | | | | |
| SPA | 1.375% | 11/10/25 | EUR | 10,800 | 12,132 |
| Mediobanca SPA | 0.750% | 2/17/20 | EUR | 10,000 | 11,260 |
| Mediobanca SPA | 1.250% | 11/24/29 | EUR | 2,100 | 2,216 |
| Mediobanca SPA | 1.625% | 1/19/21 | EUR | 5,000 | 5,665 |
| Snam SPA | 0.000% | 10/25/20 | EUR | 4,800 | 5,400 |
| Snam SPA | 0.875% | 10/25/26 | EUR | 19,655 | 20,078 |
| Snam SPA | 1.250% | 1/25/25 | EUR | 500 | 546 |
| Snam SPA | 1.500% | 4/21/23 | EUR | 100 | 115 |
| Societa Iniziative Autostradali e Servizi SPA | 1.625% | 2/8/28 | EUR | 9,911 | 10,102 |
| Societa Iniziative Autostradali e Servizi SPA | 4.500% | 10/26/20 | EUR | 1,000 | 1,216 |
| Terna Rete Elettrica Nazionale SPA | 0.875% | 2/2/22 | EUR | 7,066 | 7,995 |
| Terna Rete Elettrica Nazionale SPA | 1.375% | 7/26/27 | EUR | 9,740 | 10,241 |
| Terna Rete Elettrica Nazionale SPA | 4.750% | 3/15/21 | EUR | 6,000 | 7,478 |
| UniCredit SPA | 0.375% | 10/31/26 | EUR | 12,750 | 13,295 |
| UniCredit SPA | 2.000% | 3/4/23 | EUR | 15,000 | 16,774 |
| UniCredit SPA | 3.250% | 1/14/21 | EUR | 1,500 | 1,760 |
| Unione di Banche Italiane SPA | 0.750% | 10/17/22 | EUR | 100 | 101 |
| | | | | | 586,841 |
| Sovereign Bonds (6.6%) | | | | | |
| ACEA SPA | 2.625% | 7/15/24 | EUR | 3,200 | 3,762 |
| Cassa Depositi e Prestiti SPA | 1.500% | 4/9/25 | EUR | 7,700 | 7,810 |
| Cassa Depositi e Prestiti SPA | 1.875% | 2/7/26 | EUR | 5,000 | 5,112 |
| Cassa Depositi e Prestiti SPA | 2.750% | 5/31/21 | EUR | 2,000 | 2,307 |
| Ferrovie dello Stato SPA | 4.000% | 7/22/20 | EUR | 2,000 | 2,388 |
| Hera SPA | 5.200% | 1/29/28 | EUR | 6,000 | 8,281 |
| Republic of Italy | 0.050% | 4/15/21 | EUR | 100,000 | 108,997 |
| Republic of Italy | 0.200% | 10/15/20 | EUR | 100,000 | 110,863 |
| Republic of Italy | 0.350% | 6/15/20 | EUR | 4,500 | 5,039 |
| Republic of Italy | 0.350% | 11/1/21 | EUR | 121,277 | 131,449 |
| Republic of Italy | 0.450% | 6/1/21 | EUR | 201,100 | 221,101 |
| Republic of Italy | 0.650% | 11/1/20 | EUR | 105,000 | 117,383 |
| Republic of Italy | 0.650% | 10/15/23 | EUR | 201,750 | 208,558 |
| Republic of Italy | 0.700% | 5/1/20 | EUR | 62,500 | 70,447 |
| Republic of Italy | 0.900% | 8/1/22 | EUR | 106,400 | 114,503 |
| Republic of Italy | 0.950% | 3/1/23 | EUR | 240,000 | 254,942 |
| Republic of Italy | 0.950% | 3/15/23 | EUR | 55,400 | 58,964 |
| Republic of Italy | 1.050% | 12/1/19 | EUR | 143,000 | 162,606 |
| Republic of Italy | 1.200% | 4/1/22 | EUR | 169,500 | 185,902 |
| Republic of Italy | 1.250% | 12/1/26 | EUR | 53,900 | 53,339 |
| Republic of Italy | 1.350% | 4/15/22 | EUR | 89,000 | 98,096 |
| Republic of Italy | 1.450% | 11/15/24 | EUR | 90,500 | 94,326 |
| Republic of Italy | 1.500% | 6/1/25 | EUR | 112,500 | 116,504 |
| Republic of Italy | 1.600% | 6/1/26 | EUR | 96,200 | 98,614 |
59
| | | | | |
| Total International Bond Index Fund | | | | | |
| |
| |
| |
| | | | | Face | Market |
| | | Maturity | | Amount | Value • |
| | Coupon | Date | Currency | (000) | ($000) |
| 2 Republic of Italy | 1.650% | 3/1/32 | EUR | 700 | 644 |
| Republic of Italy | 1.850% | 5/15/24 | EUR | 63,000 | 67,835 |
| Republic of Italy | 2.000% | 12/1/25 | EUR | 87,220 | 92,421 |
| Republic of Italy | 2.000% | 2/1/28 | EUR | 326,900 | 334,057 |
| Republic of Italy | 2.050% | 8/1/27 | EUR | 203,900 | 210,277 |
| Republic of Italy | 2.150% | 12/15/21 | EUR | 111,200 | 126,748 |
| Republic of Italy | 2.200% | 6/1/27 | EUR | 193,250 | 202,355 |
| 2 Republic of Italy | 2.250% | 9/1/36 | EUR | 64,181 | 60,076 |
| 2 Republic of Italy | 2.450% | 9/1/33 | EUR | 220,700 | 217,721 |
| Republic of Italy | 2.500% | 12/1/24 | EUR | 132,800 | 147,529 |
| Republic of Italy | 2.800% | 12/1/28 | EUR | 112,000 | 120,322 |
| 2 Republic of Italy | 2.800% | 3/1/67 | EUR | 41,420 | 37,680 |
| 2 Republic of Italy | 2.950% | 9/1/38 | EUR | 115,190 | 115,291 |
| 2 Republic of Italy | 3.250% | 9/1/46 | EUR | 58,450 | 59,901 |
| 2 Republic of Italy | 3.450% | 3/1/48 | EUR | 146,724 | 152,549 |
| 2 Republic of Italy | 3.500% | 3/1/30 | EUR | 85,050 | 96,430 |
| Republic of Italy | 3.750% | 3/1/21 | EUR | 80,300 | 95,420 |
| Republic of Italy | 3.750% | 5/1/21 | EUR | 126,450 | 150,101 |
| Republic of Italy | 3.750% | 8/1/21 | EUR | 201,225 | 238,948 |
| Republic of Italy | 3.750% | 9/1/24 | EUR | 58,900 | 69,742 |
| Republic of Italy | 4.000% | 9/1/20 | EUR | 108,180 | 128,351 |
| Republic of Italy | 4.000% | 2/1/37 | EUR | 120,310 | 141,738 |
| Republic of Italy | 4.250% | 3/1/20 | EUR | 49,000 | 57,852 |
| Republic of Italy | 4.500% | 2/1/20 | EUR | 155,950 | 184,326 |
| Republic of Italy | 4.500% | 5/1/23 | EUR | 89,680 | 110,047 |
| Republic of Italy | 4.500% | 3/1/24 | EUR | 93,780 | 114,933 |
| Republic of Italy | 4.500% | 3/1/26 | EUR | 215,575 | 266,971 |
| Republic of Italy | 4.750% | 9/1/21 | EUR | 27,500 | 33,525 |
| 2 Republic of Italy | 4.750% | 8/1/23 | EUR | 45,580 | 56,642 |
| 2 Republic of Italy | 4.750% | 9/1/28 | EUR | 54,320 | 68,811 |
| 2 Republic of Italy | 4.750% | 9/1/44 | EUR | 97,980 | 124,313 |
| Republic of Italy | 5.000% | 3/1/22 | EUR | 37,895 | 46,765 |
| 2 Republic of Italy | 5.000% | 3/1/25 | EUR | 116,280 | 147,146 |
| Republic of Italy | 5.000% | 8/1/34 | EUR | 82,730 | 108,096 |
| Republic of Italy | 5.000% | 8/1/39 | EUR | 44,430 | 57,900 |
| Republic of Italy | 5.000% | 9/1/40 | EUR | 121,460 | 157,746 |
| Republic of Italy | 5.250% | 11/1/29 | EUR | 53,510 | 70,407 |
| Republic of Italy | 5.500% | 9/1/22 | EUR | 62,500 | 78,815 |
| Republic of Italy | 5.500% | 11/1/22 | EUR | 70,000 | 88,392 |
| Republic of Italy | 5.750% | 2/1/33 | EUR | 97,200 | 135,077 |
| Republic of Italy | 6.000% | 8/4/28 | GBP | 10,900 | 15,838 |
| Republic of Italy | 6.000% | 5/1/31 | EUR | 96,345 | 135,437 |
| Republic of Italy | 6.500% | 11/1/27 | EUR | 795 | 1,120 |
| Republic of Italy | 7.250% | 11/1/26 | EUR | 60,300 | 87,743 |
| Republic of Italy | 9.000% | 11/1/23 | EUR | 31,000 | 45,441 |
| | | | | | 7,300,772 |
| Total Italy (Cost $8,690,202) | | | | | 8,101,990 |
| Japan (19.8%) | | | | | |
| Corporate Bonds (0.4%) | | | | | |
| American Honda Finance Corp. | 0.750% | 1/17/24 | EUR | 7,200 | 8,102 |
| American Honda Finance Corp. | 1.300% | 3/21/22 | GBP | 15,000 | 18,951 |
| American Honda Finance Corp. | 1.375% | 11/10/22 | EUR | 5,100 | 5,985 |
| Asahi Group Holdings Ltd. | 0.321% | 9/19/21 | EUR | 300 | 340 |
60
| | | | | |
| Total International Bond Index Fund | | | | | |
| |
| |
| |
| | | | | Face | Market |
| | | Maturity | | Amount | Value • |
| | Coupon | Date | Currency | (000) | ($000) |
| Bank of Tokyo-Mitsubishi UFJ Ltd. | 1.390% | 5/31/22 | JPY | 100,000 | 926 |
| Bank of Tokyo-Mitsubishi UFJ Ltd. | 1.560% | 1/20/21 | JPY | 400,000 | 3,658 |
| East Japan Railway Co. | 4.500% | 1/25/36 | GBP | 400 | 644 |
| East Japan Railway Co. | 4.875% | 6/14/34 | GBP | 5,500 | 9,117 |
| Honda Canada Finance Inc. | 1.823% | 12/7/21 | CAD | 16,173 | 11,772 |
| Honda Canada Finance Inc. | 2.268% | 7/15/22 | CAD | 5,000 | 3,658 |
| Kansai Electric Power Co. Inc. | 0.470% | 5/25/27 | JPY | 78,000 | 694 |
| Kansai Electric Power Co. Inc. | 0.490% | 7/23/27 | JPY | 45,000 | 400 |
| Kirin Holdings Co. Ltd. | 1.239% | 9/24/21 | JPY | 300,000 | 2,743 |
| Kyushu Electric Power Co. Inc. | 1.064% | 2/23/24 | JPY | 200,000 | 1,848 |
| Mitsubishi UFJ Financial Group Inc. | 0.680% | 1/26/23 | EUR | 10,000 | 11,315 |
| Mitsubishi UFJ Financial Group Inc. | 0.872% | 9/7/24 | EUR | 10,000 | 11,180 |
| Mizuho Bank Ltd. | 0.285% | 1/25/19 | JPY | 1,000,000 | 8,865 |
| Mizuho Bank Ltd. | 0.300% | 4/26/19 | JPY | 1,000,000 | 8,872 |
| Mizuho Financial Group Inc. | 0.100% | 7/22/21 | JPY | 300,000 | 2,635 |
| Mizuho Financial Group Inc. | 0.956% | 10/16/24 | EUR | 4,950 | 5,580 |
| MUFG Bank Ltd. | 0.875% | 3/11/22 | EUR | 5,000 | 5,735 |
| Nippon Telegraph & Telephone Corp. | 1.020% | 9/17/21 | JPY | 500,000 | 4,549 |
| Nippon Telegraph & Telephone Corp. | 1.310% | 12/18/20 | JPY | 500,000 | 4,549 |
| Nissan Motor Co. Ltd. | 0.150% | 3/19/21 | JPY | 1,500,000 | 13,293 |
| Nomura Europe Finance NV | 1.500% | 5/12/21 | EUR | 5,600 | 6,559 |
| Nomura Holdings Inc. | 1.808% | 6/24/20 | JPY | 600,000 | 5,464 |
| Norinchukin Bank | 0.230% | 1/27/21 | JPY | 1,000,000 | 8,891 |
| Norinchukin Bank | 0.250% | 9/27/19 | JPY | 1,200,000 | 10,653 |
| Norinchukin Bank | 0.270% | 7/27/20 | JPY | 1,400,000 | 12,452 |
| Norinchukin Bank | 0.280% | 6/26/20 | JPY | 1,000,000 | 8,894 |
| Panasonic Corp. | 0.387% | 3/19/20 | JPY | 1,400,000 | 12,464 |
| Resona Bank Ltd. | 1.780% | 3/15/22 | JPY | 500,000 | 4,655 |
| Shinkin Central Bank | 0.030% | 10/27/21 | JPY | 2,600,000 | 22,995 |
| Shinkin Central Bank | 0.070% | 3/26/21 | JPY | 200,000 | 1,772 |
| Shinkin Central Bank | 0.200% | 8/27/19 | JPY | 450,000 | 3,993 |
| Shinkin Central Bank | 0.200% | 9/27/19 | JPY | 300,000 | 2,662 |
| Shinkin Central Bank | 0.225% | 11/27/19 | JPY | 1,200,000 | 10,653 |
| Shinkin Central Bank | 0.225% | 12/27/19 | JPY | 200,000 | 1,776 |
| Shinkin Central Bank | 0.225% | 3/27/20 | JPY | 200,000 | 1,777 |
| Shinkin Central Bank | 0.250% | 6/27/19 | JPY | 2,000,000 | 17,746 |
| Shinkin Central Bank | 0.250% | 2/27/20 | JPY | 200,000 | 1,777 |
| Shinkin Central Bank | 0.250% | 6/26/20 | JPY | 2,000,000 | 17,777 |
| Sumitomo Mitsui Banking Corp. | 1.000% | 1/19/22 | EUR | 100 | 115 |
| Sumitomo Mitsui Banking Corp. | 1.430% | 9/28/20 | JPY | 600,000 | 5,448 |
| Sumitomo Mitsui Banking Corp. | 2.250% | 12/16/20 | EUR | 18,500 | 21,946 |
| Sumitomo Mitsui Banking Corp. | 2.750% | 7/24/23 | EUR | 500 | 620 |
| Sumitomo Mitsui Financial Group Inc. | 0.606% | 1/18/22 | EUR | 200 | 228 |
| Sumitomo Mitsui Financial Group Inc. | 0.819% | 7/23/23 | EUR | 1,600 | 1,813 |
| Sumitomo Mitsui Financial Group Inc. | 0.849% | 9/12/24 | JPY | 1,500,000 | 13,589 |
| Sumitomo Mitsui Financial Group Inc. | 0.934% | 10/11/24 | EUR | 200 | 225 |
| Sumitomo Mitsui Financial Group Inc. | 1.546% | 6/15/26 | EUR | 8,200 | 9,422 |
| Sumitomo Mitsui Financial Group Inc. | 3.662% | 3/29/22 | AUD | 4,400 | 3,139 |
| Sumitomo Mitsui Trust Bank Ltd. | 1.620% | 3/22/22 | JPY | 500,000 | 4,642 |
| Toyota Credit Canada Inc. | 2.020% | 2/28/22 | CAD | 10,000 | 7,303 |
| Toyota Finance Australia Ltd. | 4.250% | 5/15/19 | AUD | 1,000 | 715 |
| Toyota Finance Corp. | 0.244% | 6/20/19 | JPY | 400,000 | 3,548 |
| Toyota Motor Corp. | 2.010% | 12/20/18 | JPY | 200,000 | 1,777 |
| Toyota Motor Credit Corp. | 1.000% | 9/10/21 | EUR | 13,000 | 15,082 |
61
| | | | | | |
| Total International Bond Index Fund | | | | | |
| |
| |
| |
| | | | | | Face | Market |
| | | | Maturity | | Amount | Value • |
| | | Coupon | Date | Currency | (000) | ($000) |
| | Toyota Motor Credit Corp. | 1.000% | 9/27/22 | GBP | 2,300 | 2,863 |
| | Toyota Motor Credit Corp. | 1.125% | 9/7/21 | GBP | 4,000 | 5,060 |
| | Toyota Motor Credit Corp. | 2.375% | 2/1/23 | EUR | 1,000 | 1,225 |
| | | | | | | 397,131 |
| Sovereign Bonds (19.4%) | | | | | |
| | Central Nippon Expressway Co. Ltd. | 0.030% | 7/14/21 | JPY | 900,000 | 7,971 |
| | Central Nippon Expressway Co. Ltd. | 0.030% | 9/17/21 | JPY | 1,000,000 | 8,855 |
| | Central Nippon Expressway Co. Ltd. | 0.070% | 3/18/22 | JPY | 1,600,000 | 14,184 |
| | Central Nippon Expressway Co. Ltd. | 0.262% | 6/2/20 | JPY | 2,800,000 | 24,900 |
| | Central Nippon Expressway Co. Ltd. | 0.294% | 3/20/19 | JPY | 1,000,000 | 8,869 |
| 10 | Deposit Insurance Corp. of Japan | 0.100% | 1/17/20 | JPY | 800,000 | 7,099 |
| | Deposit Insurance Corp. of Japan | 0.100% | 10/19/21 | JPY | 1,700,000 | 15,108 |
| | Deposit Insurance Corp. of Japan | 0.100% | 10/19/21 | JPY | 100,000 | 889 |
| 10 | Deposit Insurance Corp. of Japan | 0.100% | 10/14/22 | JPY | 2,900,000 | 25,822 |
| 10 | Development Bank of Japan Inc. | 0.020% | 3/16/26 | JPY | 45,500 | 402 |
| | Development Bank of Japan Inc. | 0.161% | 12/18/20 | JPY | 100,000 | 889 |
| 10 | Development Bank of Japan Inc. | 0.240% | 1/21/19 | JPY | 300,000 | 2,660 |
| 10 | Development Bank of Japan Inc. | 0.450% | 3/13/25 | JPY | 400,000 | 3,637 |
| 10 | Development Bank of Japan Inc. | 0.466% | 12/12/24 | JPY | 600,000 | 5,457 |
| 10 | Development Bank of Japan Inc. | 0.645% | 3/18/24 | JPY | 501,000 | 4,591 |
| 10 | Development Bank of Japan Inc. | 0.819% | 9/20/22 | JPY | 286,000 | 2,616 |
| 10 | Development Bank of Japan Inc. | 1.400% | 2/17/20 | JPY | 200,000 | 1,805 |
| 10 | Development Bank of Japan Inc. | 1.700% | 9/20/22 | JPY | 760,000 | 7,186 |
| | East Nippon Expressway Co. Ltd. | 0.005% | 6/20/19 | JPY | 1,800,000 | 15,950 |
| | East Nippon Expressway Co. Ltd. | 0.005% | 12/20/19 | JPY | 200,000 | 1,772 |
| | East Nippon Expressway Co. Ltd. | 0.010% | 6/20/19 | JPY | 400,000 | 3,544 |
| | East Nippon Expressway Co. Ltd. | 0.030% | 6/18/21 | JPY | 500,000 | 4,428 |
| | East Nippon Expressway Co. Ltd. | 0.060% | 6/18/21 | JPY | 280,000 | 2,482 |
| | East Nippon Expressway Co. Ltd. | 0.090% | 6/20/22 | JPY | 600,000 | 5,322 |
| | East Nippon Expressway Co. Ltd. | 0.090% | 12/20/22 | JPY | 500,000 | 4,433 |
| | East Nippon Expressway Co. Ltd. | 0.180% | 3/19/20 | JPY | 650,000 | 5,771 |
| | East Nippon Expressway Co. Ltd. | 0.262% | 6/19/20 | JPY | 1,850,000 | 16,455 |
| | Japan | 0.100% | 12/20/19 | JPY | 12,150,000 | 107,964 |
| | Japan | 0.100% | 1/15/20 | JPY | 6,000,000 | 53,327 |
| | Japan | 0.100% | 2/15/20 | JPY | 50,000,000 | 444,486 |
| | Japan | 0.100% | 3/15/20 | JPY | 1,400,000 | 12,447 |
| | Japan | 0.100% | 3/20/20 | JPY | 39,500,000 | 351,196 |
| | Japan | 0.100% | 4/15/20 | JPY | 375,000 | 3,335 |
| | Japan | 0.100% | 6/20/20 | JPY | 27,000,000 | 240,189 |
| | Japan | 0.100% | 9/20/20 | JPY | 35,050,000 | 311,967 |
| | Japan | 0.100% | 11/1/20 | JPY | 22,299,350 | 198,482 |
| | Japan | 0.100% | 12/20/20 | JPY | 7,500,000 | 66,799 |
| | Japan | 0.100% | 3/20/21 | JPY | 5,600,000 | 49,895 |
| | Japan | 0.100% | 6/20/21 | JPY | 54,570,000 | 486,447 |
| | Japan | 0.100% | 9/20/21 | JPY | 59,450,000 | 530,140 |
| | Japan | 0.100% | 12/20/21 | JPY | 5,150,000 | 45,951 |
| | Japan | 0.100% | 3/20/22 | JPY | 31,475,000 | 280,958 |
| | Japan | 0.100% | 6/20/22 | JPY | 65,910,000 | 588,531 |
| | Japan | 0.100% | 9/20/22 | JPY | 42,300,000 | 377,845 |
| | Japan | 0.100% | 12/20/22 | JPY | 32,600,000 | 291,289 |
| | Japan | 0.100% | 3/20/23 | JPY | 34,500,000 | 308,358 |
| | Japan | 0.100% | 6/20/23 | JPY | 19,300,000 | 172,534 |
| | Japan | 0.100% | 9/20/23 | JPY | 35,000,000 | 312,902 |
| | Japan | 0.100% | 3/20/26 | JPY | 13,600,000 | 121,360 |
| |
| |
| 62 |
| | | | | |
| Total International Bond Index Fund | | | | | |
| |
| |
| |
| | | | | Face | Market |
| | | Maturity | | Amount | Value • |
| | Coupon | Date | Currency | (000) | ($000) |
| Japan | 0.100% | 6/20/26 | JPY | 26,170,000 | 233,365 |
| Japan | 0.100% | 9/20/26 | JPY | 37,300,000 | 332,297 |
| Japan | 0.100% | 12/20/26 | JPY | 22,220,000 | 197,825 |
| Japan | 0.100% | 3/20/27 | JPY | 25,185,000 | 224,055 |
| Japan | 0.100% | 6/20/27 | JPY | 15,250,000 | 135,529 |
| Japan | 0.100% | 9/20/27 | JPY | 29,850,000 | 265,030 |
| Japan | 0.100% | 12/20/27 | JPY | 26,600,000 | 235,985 |
| Japan | 0.100% | 12/20/27 | JPY | 525,000 | 4,658 |
| Japan | 0.100% | 3/20/28 | JPY | 39,020,000 | 345,762 |
| Japan | 0.100% | 6/20/28 | JPY | 29,500,000 | 260,946 |
| Japan | 0.200% | 6/20/36 | JPY | 13,000,000 | 108,453 |
| Japan | 0.300% | 12/20/24 | JPY | 10,500,000 | 94,966 |
| Japan | 0.300% | 12/20/25 | JPY | 9,900,000 | 89,629 |
| Japan | 0.300% | 6/20/46 | JPY | 5,800,000 | 44,551 |
| Japan | 0.400% | 3/20/25 | JPY | 9,865,000 | 89,830 |
| Japan | 0.400% | 6/20/25 | JPY | 8,000,000 | 72,877 |
| Japan | 0.400% | 9/20/25 | JPY | 3,195,000 | 29,125 |
| Japan | 0.400% | 3/20/36 | JPY | 20,420,000 | 177,035 |
| Japan | 0.400% | 3/20/56 | JPY | 11,335,000 | 82,094 |
| Japan | 0.500% | 9/20/24 | JPY | 12,700,000 | 116,182 |
| Japan | 0.500% | 12/20/24 | JPY | 7,730,000 | 70,755 |
| Japan | 0.500% | 9/20/36 | JPY | 14,730,000 | 129,122 |
| Japan | 0.500% | 3/20/38 | JPY | 30,375,000 | 262,359 |
| Japan | 0.500% | 6/20/38 | JPY | 15,400,000 | 132,784 |
| Japan | 0.500% | 9/20/46 | JPY | 11,730,000 | 94,976 |
| Japan | 0.600% | 3/20/23 | JPY | 12,020,000 | 109,751 |
| Japan | 0.600% | 9/20/23 | JPY | 1,000,000 | 9,155 |
| Japan | 0.600% | 12/20/23 | JPY | 15,660,000 | 143,560 |
| Japan | 0.600% | 3/20/24 | JPY | 18,890,000 | 173,353 |
| Japan | 0.600% | 6/20/24 | JPY | 710,000 | 6,522 |
| Japan | 0.600% | 12/20/36 | JPY | 16,900,000 | 150,282 |
| Japan | 0.600% | 6/20/37 | JPY | 12,020,000 | 106,515 |
| Japan | 0.600% | 9/20/37 | JPY | 11,875,000 | 104,891 |
| Japan | 0.600% | 12/20/37 | JPY | 14,405,550 | 127,068 |
| Japan | 0.600% | 12/20/46 | JPY | 12,550,000 | 104,175 |
| Japan | 0.700% | 12/20/22 | JPY | 4,025,000 | 36,841 |
| Japan | 0.700% | 3/20/37 | JPY | 21,555,000 | 194,668 |
| Japan | 0.700% | 9/20/38 | JPY | 8,000,000 | 71,553 |
| Japan | 0.700% | 6/20/48 | JPY | 10,700,000 | 90,331 |
| Japan | 0.800% | 9/20/20 | JPY | 3,800,000 | 34,268 |
| Japan | 0.800% | 6/20/22 | JPY | 12,120,000 | 110,943 |
| Japan | 0.800% | 9/20/22 | JPY | 4,170,000 | 38,252 |
| Japan | 0.800% | 12/20/22 | JPY | 12,605,000 | 115,840 |
| Japan | 0.800% | 6/20/23 | JPY | 13,713,500 | 126,504 |
| Japan | 0.800% | 6/20/23 | JPY | 600,000 | 5,535 |
| Japan | 0.800% | 9/20/23 | JPY | 1,256,000 | 11,608 |
| Japan | 0.800% | 3/20/46 | JPY | 5,620,000 | 49,305 |
| Japan | 0.800% | 3/20/47 | JPY | 1,895,000 | 16,566 |
| Japan | 0.800% | 6/20/47 | JPY | 6,440,000 | 56,227 |
| Japan | 0.800% | 9/20/47 | JPY | 12,090,000 | 105,420 |
| Japan | 0.800% | 12/20/47 | JPY | 14,505,000 | 126,330 |
| Japan | 0.800% | 3/20/48 | JPY | 16,215,000 | 140,968 |
| Japan | 0.800% | 3/20/58 | JPY | 3,600,000 | 29,727 |
| Japan | 0.900% | 3/20/22 | JPY | 4,740,000 | 43,442 |
63
| | | | | |
| Total International Bond Index Fund | | | | | |
| |
| |
| |
| | | | | Face | Market |
| | | Maturity | | Amount | Value • |
| | Coupon | Date | Currency | (000) | ($000) |
| Japan | 0.900% | 6/20/22 | JPY | 7,557,000 | 69,425 |
| Japan | 0.900% | 9/20/48 | JPY | 7,000,000 | 62,367 |
| Japan | 0.900% | 3/20/57 | JPY | 13,595,000 | 116,725 |
| Japan | 1.000% | 9/20/20 | JPY | 5,295,000 | 47,924 |
| Japan | 1.000% | 9/20/21 | JPY | 138,000 | 1,262 |
| Japan | 1.000% | 12/20/21 | JPY | 11,100,000 | 101,801 |
| Japan | 1.000% | 3/20/22 | JPY | 8,120,000 | 74,664 |
| Japan | 1.000% | 3/20/23 | JPY | 530,000 | 4,921 |
| Japan | 1.000% | 12/20/35 | JPY | 6,300,000 | 60,192 |
| Japan | 1.100% | 6/20/20 | JPY | 5,325,000 | 48,138 |
| Japan | 1.100% | 9/20/21 | JPY | 6,400,000 | 58,702 |
| Japan | 1.100% | 12/20/21 | JPY | 4,200,000 | 38,632 |
| Japan | 1.100% | 3/20/33 | JPY | 490,000 | 4,785 |
| Japan | 1.200% | 12/20/20 | JPY | 7,337,350 | 66,856 |
| Japan | 1.200% | 6/20/21 | JPY | 6,000,000 | 55,019 |
| Japan | 1.200% | 12/20/34 | JPY | 10,210,000 | 100,746 |
| Japan | 1.200% | 3/20/35 | JPY | 22,905,000 | 225,828 |
| Japan | 1.200% | 9/20/35 | JPY | 11,600,000 | 114,250 |
| Japan | 1.300% | 3/20/20 | JPY | 4,421,000 | 39,952 |
| Japan | 1.300% | 6/20/20 | JPY | 4,500,000 | 40,810 |
| Japan | 1.300% | 3/20/21 | JPY | 9,634,000 | 88,270 |
| Japan | 1.300% | 6/20/35 | JPY | 10,780,000 | 107,741 |
| Japan | 1.400% | 3/20/20 | JPY | 240,000 | 2,172 |
| Japan | 1.400% | 12/20/22 | JPY | 6,500,000 | 61,166 |
| Japan | 1.400% | 9/20/34 | JPY | 19,330,000 | 196,079 |
| Japan | 1.400% | 9/20/45 | JPY | 1,860,000 | 18,733 |
| Japan | 1.400% | 12/20/45 | JPY | 7,210,000 | 72,604 |
| Japan | 1.400% | 3/20/55 | JPY | 7,685,000 | 76,969 |
| Japan | 1.500% | 6/20/32 | JPY | 6,300,000 | 64,511 |
| Japan | 1.500% | 3/20/33 | JPY | 12,463,100 | 127,924 |
| Japan | 1.500% | 3/20/34 | JPY | 15,633,000 | 160,582 |
| Japan | 1.500% | 6/20/34 | JPY | 8,680,000 | 89,220 |
| Japan | 1.500% | 12/20/44 | JPY | 18,930,000 | 194,546 |
| Japan | 1.500% | 3/20/45 | JPY | 10,765,000 | 110,605 |
| Japan | 1.600% | 6/20/30 | JPY | 570,000 | 5,848 |
| Japan | 1.600% | 3/20/32 | JPY | 8,950,000 | 92,567 |
| Japan | 1.600% | 6/20/32 | JPY | 3,108,000 | 32,184 |
| Japan | 1.600% | 3/20/33 | JPY | 10,564,000 | 109,698 |
| Japan | 1.600% | 12/20/33 | JPY | 8,900,000 | 92,541 |
| Japan | 1.600% | 6/20/45 | JPY | 2,800,000 | 29,383 |
| Japan | 1.700% | 12/20/22 | JPY | 3,500,000 | 33,321 |
| Japan | 1.700% | 9/20/31 | JPY | 25,000,000 | 261,152 |
| Japan | 1.700% | 12/20/31 | JPY | 6,700,000 | 69,999 |
| Japan | 1.700% | 3/20/32 | JPY | 3,200,000 | 33,483 |
| Japan | 1.700% | 9/20/32 | JPY | 14,789,000 | 155,074 |
| Japan | 1.700% | 12/20/32 | JPY | 11,230,000 | 117,912 |
| Japan | 1.700% | 6/20/33 | JPY | 8,090,000 | 85,092 |
| Japan | 1.700% | 6/20/33 | JPY | 1,550,000 | 16,302 |
| Japan | 1.700% | 9/20/33 | JPY | 7,101,000 | 74,723 |
| Japan | 1.700% | 12/20/43 | JPY | 4,700,000 | 50,161 |
| Japan | 1.700% | 3/20/44 | JPY | 7,710,000 | 82,314 |
| Japan | 1.700% | 6/20/44 | JPY | 5,285,000 | 56,444 |
| Japan | 1.700% | 9/20/44 | JPY | 6,073,000 | 64,878 |
| Japan | 1.700% | 3/20/54 | JPY | 7,175,000 | 77,659 |
64
| | | | | |
| Total International Bond Index Fund | | | | | |
| |
| |
| |
| | | | | Face | Market |
| | | Maturity | | Amount | Value • |
| | Coupon | Date | Currency | (000) | ($000) |
| Japan | 1.800% | 6/20/23 | JPY | 2,500,000 | 24,095 |
| Japan | 1.800% | 6/20/30 | JPY | 40,000 | 419 |
| Japan | 1.800% | 9/20/30 | JPY | 1,400,000 | 14,685 |
| Japan | 1.800% | 6/20/31 | JPY | 4,500,000 | 47,410 |
| Japan | 1.800% | 9/20/31 | JPY | 7,575,000 | 79,964 |
| Japan | 1.800% | 12/20/31 | JPY | 25,062,000 | 264,632 |
| Japan | 1.800% | 3/20/32 | JPY | 1,130,000 | 11,952 |
| Japan | 1.800% | 12/20/32 | JPY | 6,000,000 | 63,714 |
| Japan | 1.800% | 3/20/43 | JPY | 7,391,000 | 80,225 |
| Japan | 1.800% | 9/20/43 | JPY | 1,135,000 | 12,337 |
| Japan | 1.900% | 9/20/22 | JPY | 67,000 | 640 |
| Japan | 1.900% | 9/20/23 | JPY | 3,055,000 | 29,693 |
| Japan | 1.900% | 12/20/23 | JPY | 1,800,000 | 17,572 |
| Japan | 1.900% | 3/20/24 | JPY | 500,000 | 4,900 |
| Japan | 1.900% | 6/20/25 | JPY | 1,150,000 | 11,487 |
| Japan | 1.900% | 12/20/28 | JPY | 7,240,000 | 75,477 |
| Japan | 1.900% | 3/20/29 | JPY | 4,150,000 | 43,367 |
| Japan | 1.900% | 9/20/30 | JPY | 4,370,000 | 46,287 |
| Japan | 1.900% | 3/20/31 | JPY | 6,000,000 | 63,737 |
| Japan | 1.900% | 6/20/31 | JPY | 5,950,000 | 63,383 |
| Japan | 1.900% | 9/20/42 | JPY | 18,862,000 | 208,137 |
| Japan | 1.900% | 6/20/43 | JPY | 6,573,200 | 72,668 |
| Japan | 1.900% | 3/20/53 | JPY | 3,147,000 | 35,675 |
| Japan | 2.000% | 6/21/21 | JPY | 4,000,000 | 37,429 |
| Japan | 2.000% | 3/20/25 | JPY | 75,000 | 751 |
| Japan | 2.000% | 12/20/25 | JPY | 3,340,000 | 33,822 |
| Japan | 2.000% | 3/20/27 | JPY | 1,000,000 | 10,304 |
| Japan | 2.000% | 6/20/30 | JPY | 5,000,000 | 53,341 |
| Japan | 2.000% | 12/20/30 | JPY | 3,000,000 | 32,158 |
| Japan | 2.000% | 3/20/31 | JPY | 12,180,000 | 130,776 |
| Japan | 2.000% | 12/20/33 | JPY | 500,000 | 5,460 |
| Japan | 2.000% | 9/20/40 | JPY | 17,972,000 | 200,199 |
| Japan | 2.000% | 9/20/41 | JPY | 12,897,000 | 144,296 |
| Japan | 2.000% | 3/20/42 | JPY | 15,226,850 | 170,641 |
| Japan | 2.000% | 3/20/52 | JPY | 4,860,000 | 56,214 |
| Japan | 2.100% | 12/20/21 | JPY | 105,000 | 995 |
| Japan | 2.100% | 9/20/24 | JPY | 1,305,000 | 13,022 |
| Japan | 2.100% | 6/20/25 | JPY | 3,000,000 | 30,328 |
| Japan | 2.100% | 9/20/25 | JPY | 200,000 | 2,030 |
| Japan | 2.100% | 3/20/26 | JPY | 860,000 | 8,795 |
| Japan | 2.100% | 12/20/26 | JPY | 5,000,000 | 51,728 |
| Japan | 2.100% | 3/20/27 | JPY | 350,000 | 3,632 |
| Japan | 2.100% | 12/20/27 | JPY | 2,241,000 | 23,494 |
| Japan | 2.100% | 9/20/28 | JPY | 6,126,000 | 64,773 |
| Japan | 2.100% | 12/20/28 | JPY | 600,000 | 6,361 |
| Japan | 2.100% | 3/20/29 | JPY | 4,513,000 | 47,981 |
| Japan | 2.100% | 6/20/29 | JPY | 5,530,000 | 58,960 |
| Japan | 2.100% | 9/20/29 | JPY | 8,580,000 | 91,732 |
| Japan | 2.100% | 12/20/29 | JPY | 7,500,000 | 80,363 |
| Japan | 2.100% | 3/20/30 | JPY | 80,000 | 859 |
| Japan | 2.100% | 12/20/30 | JPY | 8,170,000 | 88,375 |
| Japan | 2.200% | 3/20/26 | JPY | 800,000 | 8,237 |
| Japan | 2.200% | 9/20/26 | JPY | 60,000 | 622 |
| Japan | 2.200% | 9/20/27 | JPY | 15,000 | 158 |
65
| | | | | | |
| Total International Bond Index Fund | | | | | |
| |
| |
| |
| | | | | | Face | Market |
| | | | Maturity | | Amount | Value • |
| | | Coupon | Date | Currency | (000) | ($000) |
| | Japan | 2.200% | 3/20/28 | JPY | 3,950,000 | 41,853 |
| | Japan | 2.200% | 9/20/28 | JPY | 1,200,000 | 12,793 |
| | Japan | 2.200% | 12/20/29 | JPY | 6,590,000 | 71,249 |
| | Japan | 2.200% | 3/20/30 | JPY | 6,300,000 | 68,307 |
| | Japan | 2.200% | 3/20/31 | JPY | 500,000 | 5,478 |
| | Japan | 2.200% | 9/20/39 | JPY | 8,928,000 | 102,309 |
| | Japan | 2.200% | 3/20/41 | JPY | 13,268,000 | 153,117 |
| | Japan | 2.200% | 3/20/49 | JPY | 1,625,000 | 19,413 |
| | Japan | 2.200% | 3/20/50 | JPY | 2,240,000 | 26,892 |
| | Japan | 2.200% | 3/20/51 | JPY | 3,000,000 | 36,162 |
| | Japan | 2.200% | 3/20/51 | JPY | 58,000 | 699 |
| | Japan | 2.300% | 9/20/26 | JPY | 35,000 | 366 |
| | Japan | 2.300% | 6/20/27 | JPY | 20,000 | 211 |
| | Japan | 2.300% | 5/20/30 | JPY | 170,000 | 1,863 |
| | Japan | 2.300% | 3/20/35 | JPY | 2,500,000 | 28,515 |
| | Japan | 2.300% | 6/20/35 | JPY | 3,580,000 | 40,829 |
| | Japan | 2.300% | 12/20/35 | JPY | 2,510,000 | 28,716 |
| | Japan | 2.300% | 12/20/36 | JPY | 808,000 | 9,283 |
| | Japan | 2.300% | 3/20/39 | JPY | 4,508,000 | 52,282 |
| | Japan | 2.300% | 3/20/40 | JPY | 4,580,000 | 53,333 |
| | Japan | 2.400% | 3/20/28 | JPY | 5,850,000 | 62,948 |
| | Japan | 2.400% | 6/20/28 | JPY | 1,030,000 | 11,119 |
| | Japan | 2.400% | 3/20/34 | JPY | 3,700,000 | 42,405 |
| | Japan | 2.400% | 12/20/34 | JPY | 2,300,000 | 26,494 |
| | Japan | 2.400% | 3/20/37 | JPY | 3,614,000 | 42,134 |
| | Japan | 2.400% | 9/20/38 | JPY | 2,532,000 | 29,734 |
| | Japan | 2.400% | 3/20/48 | JPY | 800,000 | 9,891 |
| | Japan | 2.500% | 6/20/34 | JPY | 2,013,000 | 23,378 |
| | Japan | 2.500% | 9/20/34 | JPY | 400,000 | 4,656 |
| | Japan | 2.500% | 9/20/35 | JPY | 1,000,000 | 11,722 |
| | Japan | 2.500% | 3/20/36 | JPY | 2,208,000 | 25,923 |
| | Japan | 2.500% | 6/20/36 | JPY | 1,450,000 | 17,064 |
| | Japan | 2.500% | 9/20/36 | JPY | 600,000 | 7,065 |
| | Japan | 2.500% | 9/20/37 | JPY | 17,000 | 201 |
| | Japan | 2.500% | 3/20/38 | JPY | 2,917,000 | 34,630 |
| 10 | Japan Bank for International Cooperation | 2.625% | 12/15/20 | GBP | 3,500 | 4,600 |
| 10 | Japan Expressway Holding & Debt | | | | | |
| | Repayment Agency | 0.090% | 9/30/27 | JPY | 2,440,000 | 21,461 |
| 10 | Japan Expressway Holding & Debt | | | | | |
| | Repayment Agency | 0.140% | 4/30/27 | JPY | 2,300,000 | 20,406 |
| 10 | Japan Expressway Holding & Debt | | | | | |
| | Repayment Agency | 0.149% | 7/31/36 | JPY | 2,000,000 | 16,412 |
| 10 | Japan Expressway Holding & Debt | | | | | |
| | Repayment Agency | 0.155% | 8/31/27 | JPY | 2,100,000 | 18,663 |
| | Japan Expressway Holding & Debt | | | | | |
| | Repayment Agency | 0.160% | 11/30/27 | JPY | 600,000 | 5,320 |
| 10 | Japan Expressway Holding & Debt | | | | | |
| | Repayment Agency | 0.170% | 10/29/27 | JPY | 2,200,000 | 19,536 |
| | Japan Expressway Holding & Debt | | | | | |
| | Repayment Agency | 0.185% | 1/31/28 | JPY | 1,500,000 | 13,310 |
| 10 | Japan Expressway Holding & Debt | | | | | |
| | Repayment Agency | 0.306% | 4/30/36 | JPY | 1,200,000 | 10,145 |
| 10 | Japan Expressway Holding & Debt | | | | | |
| | Repayment Agency | 0.320% | 1/31/25 | JPY | 400,000 | 3,607 |
66
| | | | | | |
| Total International Bond Index Fund | | | | | |
| |
| |
| |
| | | | | | Face | Market |
| | | | Maturity | | Amount | Value • |
| | | Coupon | Date | Currency | (000) | ($000) |
| 10 | Japan Expressway Holding & Debt | | | | | |
| | Repayment Agency | 0.320% | 1/30/26 | JPY | 751,000 | 6,771 |
| 10 | Japan Expressway Holding & Debt | | | | | |
| | Repayment Agency | 0.379% | 12/26/25 | JPY | 1,000,000 | 9,057 |
| 10 | Japan Expressway Holding & Debt | | | | | |
| | Repayment Agency | 0.397% | 10/31/36 | JPY | 200,000 | 1,711 |
| 10 | Japan Expressway Holding & Debt | | | | | |
| | Repayment Agency | 0.414% | 2/28/25 | JPY | 409,000 | 3,710 |
| 10 | Japan Expressway Holding & Debt | | | | | |
| | Repayment Agency | 0.450% | 3/31/25 | JPY | 1,000,000 | 9,093 |
| 10 | Japan Expressway Holding & Debt | | | | | |
| | Repayment Agency | 0.466% | 12/27/24 | JPY | 2,000,000 | 18,192 |
| 10 | Japan Expressway Holding & Debt | | | | | |
| | Repayment Agency | 0.495% | 11/29/24 | JPY | 1,520,000 | 13,846 |
| | Japan Expressway Holding & Debt | | | | | |
| | Repayment Agency | 0.500% | 9/17/38 | JPY | 200,000 | 1,667 |
| | Japan Expressway Holding & Debt | | | | | |
| | Repayment Agency | 0.500% | 3/18/39 | JPY | 200,000 | 1,660 |
| 10 | Japan Expressway Holding & Debt | | | | | |
| | Repayment Agency | 0.509% | 5/30/25 | JPY | 580,000 | 5,295 |
| 10 | Japan Expressway Holding & Debt | | | | | |
| | Repayment Agency | 0.538% | 5/31/38 | JPY | 400,000 | 3,454 |
| 10 | Japan Expressway Holding & Debt | | | | | |
| | Repayment Agency | 0.539% | 10/31/24 | JPY | 1,000,000 | 9,135 |
| 10 | Japan Expressway Holding & Debt | | | | | |
| | Repayment Agency | 0.541% | 4/28/23 | JPY | 800,000 | 7,262 |
| 10 | Japan Expressway Holding & Debt | | | | | |
| | Repayment Agency | 0.591% | 1/29/38 | JPY | 2,000,000 | 17,488 |
| 10 | Japan Expressway Holding & Debt | | | | | |
| | Repayment Agency | 0.601% | 7/31/24 | JPY | 2,000,000 | 18,359 |
| 10 | Japan Expressway Holding & Debt | | | | | |
| | Repayment Agency | 0.645% | 3/29/24 | JPY | 1,000,000 | 9,166 |
| 10 | Japan Expressway Holding & Debt | | | | | |
| | Repayment Agency | 0.660% | 2/29/24 | JPY | 2,000,000 | 18,335 |
| 10 | Japan Expressway Holding & Debt | | | | | |
| | Repayment Agency | 0.660% | 5/31/24 | JPY | 1,000,000 | 9,206 |
| 10 | Japan Expressway Holding & Debt | | | | | |
| | Repayment Agency | 0.668% | 3/17/23 | JPY | 800,000 | 7,298 |
| 10 | Japan Expressway Holding & Debt | | | | | |
| | Repayment Agency | 0.669% | 11/30/23 | JPY | 1,000,000 | 9,159 |
| 10 | Japan Expressway Holding & Debt | | | | | |
| | Repayment Agency | 0.669% | 4/30/24 | JPY | 1,000,000 | 9,210 |
| 10 | Japan Expressway Holding & Debt | | | | | |
| | Repayment Agency | 0.693% | 12/28/23 | JPY | 500,000 | 4,587 |
| | Japan Expressway Holding & Debt | | | | | |
| | Repayment Agency | 0.765% | 9/20/22 | JPY | 200,000 | 1,821 |
| 10 | Japan Expressway Holding & Debt | | | | | |
| | Repayment Agency | 0.791% | 10/31/22 | JPY | 86,700 | 793 |
| | Japan Expressway Holding & Debt | | | | | |
| | Repayment Agency | 0.796% | 9/20/22 | JPY | 300,000 | 2,735 |
| 10 | Japan Expressway Holding & Debt | | | | | |
| | Repayment Agency | 0.801% | 8/31/22 | JPY | 800,000 | 7,308 |
| 10 | Japan Expressway Holding & Debt | | | | | |
| | Repayment Agency | 0.805% | 11/30/22 | JPY | 1,568,700 | 14,361 |
| |
| |
| 67 |
| | | | | | |
| Total International Bond Index Fund | | | | | |
| |
| |
| |
| | | | | | Face | Market |
| | | | Maturity | | Amount | Value • |
| | | Coupon | Date | Currency | (000) | ($000) |
| 10 | Japan Expressway Holding & Debt | | | | | |
| | Repayment Agency | 0.815% | 2/28/23 | JPY | 557,700 | 5,111 |
| 10 | Japan Expressway Holding & Debt | | | | | |
| | Repayment Agency | 0.819% | 9/30/22 | JPY | 1,500,000 | 13,722 |
| 10 | Japan Expressway Holding & Debt | | | | | |
| | Repayment Agency | 0.834% | 1/31/23 | JPY | 900,000 | 8,259 |
| 10 | Japan Expressway Holding & Debt | | | | | |
| | Repayment Agency | 0.839% | 7/29/22 | JPY | 500,000 | 4,567 |
| 10 | Japan Expressway Holding & Debt | | | | | |
| | Repayment Agency | 0.882% | 6/30/23 | JPY | 800,000 | 7,373 |
| 10 | Japan Expressway Holding & Debt | | | | | |
| | Repayment Agency | 0.895% | 6/30/22 | JPY | 1,200,000 | 10,986 |
| 10 | Japan Expressway Holding & Debt | | | | | |
| | Repayment Agency | 0.900% | 10/30/20 | JPY | 1,390,200 | 12,546 |
| 10 | Japan Expressway Holding & Debt | | | | | |
| | Repayment Agency | 0.900% | 11/30/20 | JPY | 100,000 | 903 |
| 10 | Japan Expressway Holding & Debt | | | | | |
| | Repayment Agency | 0.911% | 7/31/23 | JPY | 1,300,000 | 12,016 |
| 10 | Japan Expressway Holding & Debt | | | | | |
| | Repayment Agency | 0.934% | 1/31/36 | JPY | 3,600,000 | 33,744 |
| 10 | Japan Expressway Holding & Debt | | | | | |
| | Repayment Agency | 0.970% | 1/31/35 | JPY | 2,400,000 | 22,710 |
| 10 | Japan Expressway Holding & Debt | | | | | |
| | Repayment Agency | 1.000% | 8/31/20 | JPY | 100,000 | 903 |
| 10 | Japan Expressway Holding & Debt | | | | | |
| | Repayment Agency | 1.000% | 9/30/20 | JPY | 150,000 | 1,355 |
| 10 | Japan Expressway Holding & Debt | | | | | |
| | Repayment Agency | 1.200% | 12/27/19 | JPY | 100,000 | 899 |
| 10 | Japan Expressway Holding & Debt | | | | | |
| | Repayment Agency | 1.200% | 12/28/20 | JPY | 300,000 | 2,728 |
| 10 | Japan Expressway Holding & Debt | | | | | |
| | Repayment Agency | 1.240% | 7/31/35 | JPY | 600,000 | 5,895 |
| 10 | Japan Expressway Holding & Debt | | | | | |
| | Repayment Agency | 1.300% | 5/29/20 | JPY | 125,000 | 1,131 |
| 10 | Japan Expressway Holding & Debt | | | | | |
| | Repayment Agency | 1.338% | 10/31/34 | JPY | 100,000 | 997 |
| 10 | Japan Expressway Holding & Debt | | | | | |
| | Repayment Agency | 1.400% | 7/31/19 | JPY | 301,000 | 2,695 |
| 10 | Japan Expressway Holding & Debt | | | | | |
| | Repayment Agency | 1.427% | 7/31/34 | JPY | 700,000 | 7,068 |
| 10 | Japan Expressway Holding & Debt | | | | | |
| | Repayment Agency | 1.500% | 5/31/19 | JPY | 75,000 | 670 |
| 10 | Japan Expressway Holding & Debt | | | | | |
| | Repayment Agency | 1.500% | 6/28/19 | JPY | 702,000 | 6,283 |
| 10 | Japan Expressway Holding & Debt | | | | | |
| | Repayment Agency | 2.100% | 12/28/29 | JPY | 500,000 | 5,317 |
| 10 | Japan Expressway Holding & Debt | | | | | |
| | Repayment Agency | 2.300% | 2/29/40 | JPY | 200,000 | 2,298 |
| | Japan Expressway Holding & Debt | | | | | |
| | Repayment Agency | 2.340% | 10/20/27 | JPY | 700,000 | 7,350 |
| | Japan Expressway Holding & Debt | | | | | |
| | Repayment Agency | 2.370% | 9/20/28 | JPY | 50,000 | 533 |
| | Japan Expressway Holding & Debt | | | | | |
| | Repayment Agency | 2.420% | 6/20/28 | JPY | 880,000 | 9,393 |
| |
| |
| 68 |
| | | | | | |
| Total International Bond Index Fund | | | | | |
| |
| |
| |
| | | | | | Face | Market |
| | | | Maturity | | Amount | Value • |
| | | Coupon | Date | Currency | (000) | ($000) |
| | Japan Expressway Holding & Debt | | | | | |
| | Repayment Agency | 2.450% | 3/19/26 | JPY | 180,000 | 1,862 |
| | Japan Expressway Holding & Debt | | | | | |
| | Repayment Agency | 2.700% | 3/20/48 | JPY | 200,000 | 2,516 |
| | Japan Expressway Holding & Debt | | | | | |
| | Repayment Agency | 2.870% | 12/20/46 | JPY | 80,000 | 1,024 |
| | Japan Expressway Holding & Debt | | | | | |
| | Repayment Agency | 2.960% | 3/19/46 | JPY | 250,000 | 3,244 |
| 10 | Japan Expressway Holding & Debt | | | | | |
| | Repayment Agency | 0.130% | 6/30/27 | JPY | 300,000 | 2,653 |
| 10 | Japan Finance Corp. | 0.160% | 9/16/20 | JPY | 800,000 | 7,113 |
| 10 | Japan Finance Corp. | 0.194% | 3/18/20 | JPY | 500,000 | 4,442 |
| 10 | Japan Finance Organization for | | | | | |
| | Municipalities | 0.001% | 6/30/20 | JPY | 1,490,000 | 13,095 |
| 10 | Japan Finance Organization for | | | | | |
| | Municipalities | 0.020% | 3/13/26 | JPY | 100,000 | 883 |
| 10 | Japan Finance Organization for | | | | | |
| | Municipalities | 0.110% | 5/21/27 | JPY | 1,500,000 | 13,265 |
| 10 | Japan Finance Organization for | | | | | |
| | Municipalities | 0.140% | 4/16/27 | JPY | 1,250,000 | 11,126 |
| 10 | Japan Finance Organization for | | | | | |
| | Municipalities | 0.145% | 2/16/26 | JPY | 90,000 | 801 |
| 10 | Japan Finance Organization for | | | | | |
| | Municipalities | 0.160% | 7/16/27 | JPY | 1,000,000 | 8,895 |
| | Japan Finance Organization for | | | | | |
| | Municipalities | 0.160% | 11/15/27 | JPY | 2,000,000 | 17,732 |
| | Japan Finance Organization for | | | | | |
| | Municipalities | 0.185% | 1/21/28 | JPY | 2,000,000 | 17,790 |
| 10 | Japan Finance Organization for | | | | | |
| | Municipalities | 0.202% | 4/24/20 | JPY | 2,000,000 | 17,780 |
| 10 | Japan Finance Organization for | | | | | |
| | Municipalities | 0.311% | 7/28/23 | JPY | 1,830,000 | 16,453 |
| 10 | Japan Finance Organization for | | | | | |
| | Municipalities | 0.320% | 1/19/26 | JPY | 1,000,000 | 9,018 |
| 10 | Japan Finance Organization for | | | | | |
| | Municipalities | 0.391% | 4/25/25 | JPY | 225,000 | 2,035 |
| 10 | Japan Finance Organization for | | | | | |
| | Municipalities | 0.484% | 6/13/25 | JPY | 100,000 | 914 |
| 10 | Japan Finance Organization for | | | | | |
| | Municipalities | 0.576% | 9/24/21 | JPY | 600,000 | 5,407 |
| | Japan Finance Organization for | | | | | |
| | Municipalities | 0.576% | 4/28/23 | JPY | 800,000 | 7,252 |
| 10 | Japan Finance Organization for | | | | | |
| | Municipalities | 0.644% | 6/14/24 | JPY | 2,000,000 | 18,342 |
| 10 | Japan Finance Organization for | | | | | |
| | Municipalities | 0.660% | 2/16/24 | JPY | 1,000,000 | 9,154 |
| 10 | Japan Finance Organization for | | | | | |
| | Municipalities | 0.660% | 5/21/24 | JPY | 3,058,000 | 28,063 |
| 10 | Japan Finance Organization for | | | | | |
| | Municipalities | 0.668% | 3/17/23 | JPY | 370,000 | 3,375 |
| 10 | Japan Finance Organization for | | | | | |
| | Municipalities | 0.669% | 11/17/23 | JPY | 1,579,000 | 14,460 |
| 10 | Japan Finance Organization for | | | | | |
| | Municipalities | 0.669% | 4/12/24 | JPY | 1,550,000 | 14,224 |
| |
| |
| 69 |
| | | | | | |
| Total International Bond Index Fund | | | | | |
| |
| |
| |
| | | | | | Face | Market |
| | | | Maturity | | Amount | Value • |
| | | Coupon | Date | Currency | (000) | ($000) |
| | Japan Finance Organization for | | | | | |
| | Municipalities | 0.678% | 3/28/23 | JPY | 500,000 | 4,551 |
| | Japan Finance Organization for | | | | | |
| | Municipalities | 0.801% | 10/28/22 | JPY | 850,000 | 7,756 |
| 10 | Japan Finance Organization for | | | | | |
| | Municipalities | 0.801% | 9/15/23 | JPY | 50,000 | 460 |
| 10 | Japan Finance Organization for | | | | | |
| | Municipalities | 0.815% | 2/17/23 | JPY | 1,500,000 | 13,724 |
| | Japan Finance Organization for | | | | | |
| | Municipalities | 0.875% | 9/22/21 | EUR | 5,000 | 5,793 |
| 10 | Japan Finance Organization for | | | | | |
| | Municipalities | 0.882% | 6/16/23 | JPY | 1,000,000 | 9,224 |
| 10 | Japan Finance Organization for | | | | | |
| | Municipalities | 0.900% | 11/17/20 | JPY | 100,000 | 903 |
| 10 | Japan Finance Organization for | | | | | |
| | Municipalities | 0.900% | 3/14/22 | JPY | 600,000 | 5,481 |
| | Japan Finance Organization for | | | | | |
| | Municipalities | 0.922% | 7/28/23 | JPY | 300,000 | 2,766 |
| 10 | Japan Finance Organization for | | | | | |
| | Municipalities | 0.977% | 4/22/22 | JPY | 2,200,000 | 20,167 |
| 10 | Japan Finance Organization for | | | | | |
| | Municipalities | 1.000% | 9/14/21 | JPY | 220,600 | 2,012 |
| 10 | Japan Finance Organization for | | | | | |
| | Municipalities | 1.400% | 12/14/18 | JPY | 310,000 | 2,751 |
| 10 | Japan Finance Organization for | | | | | |
| | Municipalities | 1.400% | 4/15/19 | JPY | 800,000 | 7,135 |
| | Japan Finance Organization for | | | | | |
| | Municipalities | 2.220% | 1/28/30 | JPY | 2,130,000 | 22,721 |
| | Japan Finance Organization for | | | | | |
| | Municipalities | 2.290% | 4/27/29 | JPY | 80,000 | 852 |
| | Japan Highway Public Corp. | 1.540% | 12/20/22 | JPY | 500,000 | 4,702 |
| 10 | Japan Highway Public Corp. | 1.600% | 7/15/20 | JPY | 500,000 | 4,553 |
| | Japan Highway Public Corp. | 2.700% | 6/20/22 | JPY | 390,000 | 3,788 |
| | Major Joint Local Government Bond | 0.145% | 12/25/26 | JPY | 200,000 | 1,770 |
| | Major Joint Local Government Bond | 0.180% | 1/25/27 | JPY | 3,090,000 | 27,407 |
| | Major Joint Local Government Bond | 0.180% | 4/25/28 | JPY | 1,200,000 | 10,583 |
| | Major Joint Local Government Bond | 0.200% | 5/25/28 | JPY | 890,000 | 7,860 |
| | Major Joint Local Government Bond | 0.210% | 3/25/27 | JPY | 1,900,000 | 16,886 |
| | Major Joint Local Government Bond | 0.215% | 10/25/27 | JPY | 792,400 | 7,027 |
| | Major Joint Local Government Bond | 0.240% | 2/25/28 | JPY | 399,000 | 3,541 |
| | Major Joint Local Government Bond | 0.245% | 2/25/27 | JPY | 1,700,000 | 15,162 |
| | Major Joint Local Government Bond | 0.406% | 4/25/25 | JPY | 3,650,000 | 32,996 |
| | Major Joint Local Government Bond | 0.448% | 2/25/25 | JPY | 2,300,000 | 20,844 |
| | Major Joint Local Government Bond | 0.456% | 12/25/24 | JPY | 2,400,000 | 21,756 |
| | Major Joint Local Government Bond | 0.470% | 3/25/25 | JPY | 4,750,000 | 43,111 |
| | Major Joint Local Government Bond | 0.496% | 11/25/25 | JPY | 1,000,000 | 9,101 |
| | Major Joint Local Government Bond | 0.500% | 8/25/25 | JPY | 1,600,000 | 14,560 |
| | Major Joint Local Government Bond | 0.510% | 9/25/25 | JPY | 2,170,600 | 19,769 |
| | Major Joint Local Government Bond | 0.548% | 6/25/25 | JPY | 2,600,000 | 23,726 |
| | Major Joint Local Government Bond | 0.553% | 5/23/25 | JPY | 5,100,000 | 46,544 |
| | Major Joint Local Government Bond | 0.553% | 7/25/25 | JPY | 1,243,700 | 11,355 |
| | Major Joint Local Government Bond | 0.554% | 9/25/24 | JPY | 1,500,000 | 13,668 |
| | Major Joint Local Government Bond | 0.566% | 8/23/24 | JPY | 500,000 | 4,558 |
| | Major Joint Local Government Bond | 0.611% | 7/25/24 | JPY | 700,000 | 6,395 |
| |
| |
| 70 |
| | | | | |
| Total International Bond Index Fund | | | | | |
| |
| |
| |
| | | | | Face | Market |
| | | Maturity | | Amount | Value • |
| | Coupon | Date | Currency | (000) | ($000) |
| Major Joint Local Government Bond | 0.659% | 6/25/24 | JPY | 800,000 | 7,328 |
| Major Joint Local Government Bond | 0.660% | 11/24/23 | JPY | 1,440,000 | 13,156 |
| Major Joint Local Government Bond | 0.674% | 5/24/24 | JPY | 400,000 | 3,665 |
| Major Joint Local Government Bond | 0.680% | 3/24/23 | JPY | 700,000 | 6,378 |
| Major Joint Local Government Bond | 0.680% | 10/25/23 | JPY | 200,000 | 1,828 |
| Major Joint Local Government Bond | 0.689% | 4/25/24 | JPY | 250,000 | 2,292 |
| Major Joint Local Government Bond | 0.710% | 12/25/23 | JPY | 3,700,000 | 33,907 |
| Major Joint Local Government Bond | 0.720% | 12/22/22 | JPY | 400,000 | 3,645 |
| Major Joint Local Government Bond | 0.760% | 1/25/24 | JPY | 1,500,000 | 13,784 |
| Major Joint Local Government Bond | 0.800% | 11/25/22 | JPY | 250,000 | 2,285 |
| Major Joint Local Government Bond | 0.820% | 9/22/22 | JPY | 90,000 | 822 |
| Major Joint Local Government Bond | 0.820% | 8/25/23 | JPY | 90,000 | 827 |
| Major Joint Local Government Bond | 0.890% | 6/24/22 | JPY | 800,000 | 7,312 |
| Major Joint Local Government Bond | 0.900% | 10/23/20 | JPY | 300,000 | 2,705 |
| Major Joint Local Government Bond | 0.910% | 7/25/23 | JPY | 500,000 | 4,613 |
| Major Joint Local Government Bond | 1.030% | 9/24/21 | JPY | 400,000 | 3,649 |
| Major Joint Local Government Bond | 1.030% | 11/25/21 | JPY | 200,000 | 1,827 |
| Major Joint Local Government Bond | 1.050% | 8/25/21 | JPY | 500,000 | 4,560 |
| Major Joint Local Government Bond | 1.070% | 12/24/21 | JPY | 400,000 | 3,662 |
| Major Joint Local Government Bond | 1.170% | 7/24/20 | JPY | 1,100,000 | 9,941 |
| Major Joint Local Government Bond | 1.180% | 5/25/21 | JPY | 500,000 | 4,563 |
| Major Joint Local Government Bond | 1.280% | 2/25/21 | JPY | 200,000 | 1,824 |
| Major Joint Local Government Bond | 1.290% | 6/25/20 | JPY | 130,000 | 1,176 |
| Major Joint Local Government Bond | 1.320% | 12/25/19 | JPY | 100,000 | 899 |
| Major Joint Local Government Bond | 1.340% | 10/25/19 | JPY | 300,000 | 2,693 |
| Major Joint Local Government Bond | 1.380% | 3/25/20 | JPY | 100,000 | 903 |
| Major Joint Local Government Bond | 1.400% | 7/25/19 | JPY | 300,000 | 2,685 |
| Major Joint Local Government Bond | 1.440% | 4/24/20 | JPY | 200,000 | 1,809 |
| Major Joint Local Government Bond | 1.540% | 8/23/19 | JPY | 100,000 | 897 |
| Major Joint Local Government Bond | 1.570% | 5/24/19 | JPY | 453,900 | 4,056 |
| Major Joint Local Government Bond | 1.640% | 6/25/19 | JPY | 100,000 | 895 |
| Metropolitan Expressway Co. Ltd. | 0.030% | 6/18/21 | JPY | 500,000 | 4,431 |
| Metropolitan Expressway Co. Ltd. | 0.030% | 9/17/21 | JPY | 300,000 | 2,656 |
| Metropolitan Expressway Co. Ltd. | 0.090% | 9/20/22 | JPY | 600,000 | 5,320 |
| Osaka Prefecture | 1.453% | 9/26/34 | JPY | 270,000 | 2,701 |
| Shoko Chukin Bank Ltd. | 0.020% | 12/27/19 | JPY | 1,900,000 | 16,826 |
| Shoko Chukin Bank Ltd. | 0.020% | 3/27/20 | JPY | 200,000 | 1,771 |
| Shoko Chukin Bank Ltd. | 0.070% | 8/27/20 | JPY | 1,000,000 | 8,856 |
| Shoko Chukin Bank Ltd. | 0.220% | 11/27/20 | JPY | 1,100,000 | 9,770 |
| Shoko Chukin Bank Ltd. | 0.230% | 10/27/20 | JPY | 1,300,000 | 11,548 |
| Tokyo Metropolitan Government | 0.075% | 9/18/26 | JPY | 177,400 | 1,563 |
| Tokyo Metropolitan Government | 0.210% | 3/19/27 | JPY | 2,000,000 | 17,777 |
| Tokyo Metropolitan Government | 0.386% | 3/19/25 | JPY | 1,000,000 | 9,023 |
| Tokyo Metropolitan Government | 0.426% | 12/20/24 | JPY | 140,000 | 1,266 |
| Tokyo Metropolitan Government | 0.435% | 3/19/25 | JPY | 2,478,000 | 22,428 |
| Tokyo Metropolitan Government | 0.444% | 12/19/25 | JPY | 600,000 | 5,439 |
| Tokyo Metropolitan Government | 0.456% | 9/19/25 | JPY | 500,000 | 4,535 |
| Tokyo Metropolitan Government | 0.475% | 9/19/25 | JPY | 1,100,000 | 9,990 |
| Tokyo Metropolitan Government | 0.499% | 6/20/25 | JPY | 750,000 | 6,819 |
| Tokyo Metropolitan Government | 0.505% | 9/20/24 | JPY | 700,000 | 6,357 |
| Tokyo Metropolitan Government | 0.533% | 6/20/25 | JPY | 500,000 | 4,556 |
| Tokyo Metropolitan Government | 0.635% | 3/19/24 | JPY | 700,000 | 6,395 |
| Tokyo Metropolitan Government | 0.690% | 3/19/24 | JPY | 190,000 | 1,741 |
| Tokyo Metropolitan Government | 0.700% | 9/20/23 | JPY | 450,000 | 4,116 |
71
| | | | | |
| Total International Bond Index Fund | | | | | |
| |
| |
| |
| | | | | Face | Market |
| | | Maturity | | Amount | Value • |
| | Coupon | Date | Currency | (000) | ($000) |
| Tokyo Metropolitan Government | 0.720% | 12/20/23 | JPY | 30,000 | 275 |
| Tokyo Metropolitan Government | 0.730% | 12/20/23 | JPY | 2,000,000 | 18,343 |
| Tokyo Metropolitan Government | 0.760% | 12/20/22 | JPY | 185,000 | 1,688 |
| Tokyo Metropolitan Government | 0.770% | 9/20/22 | JPY | 300,000 | 2,734 |
| Tokyo Metropolitan Government | 0.860% | 3/20/23 | JPY | 800,000 | 7,344 |
| Tokyo Metropolitan Government | 0.990% | 9/17/21 | JPY | 200,000 | 1,821 |
| Tokyo Metropolitan Government | 0.990% | 12/20/21 | JPY | 103,500 | 945 |
| Tokyo Metropolitan Government | 1.020% | 9/17/21 | JPY | 500,000 | 4,557 |
| Tokyo Metropolitan Government | 1.293% | 6/20/35 | JPY | 100,000 | 983 |
| Tokyo Metropolitan Government | 1.380% | 9/20/19 | JPY | 450,000 | 4,036 |
| Tokyo Metropolitan Government | 1.400% | 3/19/20 | JPY | 400,000 | 3,612 |
| Tokyo Metropolitan Government | 1.580% | 6/20/19 | JPY | 200,000 | 1,790 |
| Tokyo Metropolitan Government | 1.980% | 6/20/31 | JPY | 100,000 | 1,053 |
| West Nippon Expressway Co. Ltd. | 0.090% | 9/20/22 | JPY | 500,000 | 4,431 |
| West Nippon Expressway Co. Ltd. | 0.170% | 5/22/26 | JPY | 220,000 | 1,939 |
| | | | | | 21,551,959 |
| Total Japan (Cost $21,870,217) | | | | | 21,949,090 |
| Jersey, C.I. (0.0%) | | | | | |
| Sovereign Bond (0.0%) | | | | | |
| Bailiwick of Jersey | 3.750% | 6/9/54 | GBP | 1,510 | 2,389 |
| Total Jersey, C.I. (Cost $2,585) | | | | | 2,389 |
| Latvia (0.0%) | | | | | |
| Sovereign Bonds (0.0%) | | | | | |
| Republic of Latvia | 2.625% | 1/21/21 | EUR | 1,000 | 1,198 |
| 2 Republic of Latvia | 2.625% | 1/21/21 | EUR | 1,000 | 1,199 |
| Republic of Latvia | 2.875% | 4/30/24 | EUR | 1,000 | 1,286 |
| Total Latvia (Cost $3,744) | | | | | 3,683 |
| Lithuania (0.0%) | | | | | |
| Sovereign Bond (0.0%) | | | | | |
| Republic of Lithuania | 2.125% | 10/29/26 | EUR | 13,800 | 17,176 |
| Total Lithuania (Cost $16,926) | | | | | 17,176 |
| Luxembourg (0.1%) | | | | | |
| Asset-Backed/Commercial Mortgage-Backed Security (0.0%) | | | |
| Nord/LB Covered Finance Bank SA | 0.250% | 3/10/20 | EUR | 10,000 | 11,384 |
| |
| Corporate Bonds (0.1%) | | | | | |
| ArcelorMittal | 0.950% | 1/17/23 | EUR | 2,800 | 3,082 |
| ArcelorMittal | 3.125% | 1/14/22 | EUR | 11,000 | 13,123 |
| CPI Property Group SA | 2.125% | 10/4/24 | EUR | 5,000 | 5,577 |
| Dream Global Funding I Sarl | 1.375% | 12/21/21 | EUR | 8,000 | 9,053 |
| | | | | | 30,835 |
| Sovereign Bonds (0.0%) | | | | | |
| Grand Duchy of Luxembourg | 2.250% | 3/21/22 | EUR | 4,000 | 4,921 |
| Grand Duchy of Luxembourg | 2.250% | 3/19/28 | EUR | 3,000 | 3,903 |
| Grand Duchy of Luxembourg | 3.375% | 5/18/20 | EUR | 4,000 | 4,803 |
| | | | | | 13,627 |
| Total Luxembourg (Cost $56,258) | | | | | 55,846 |
72
| | | | | |
| Total International Bond Index Fund | | | | | |
| |
| |
| |
| | | | | Face | Market |
| | | Maturity | | Amount | Value • |
| | Coupon | Date | Currency | (000) | ($000) |
| Malaysia (0.5%) | | | | | |
| Sovereign Bonds (0.5%) | | | | | |
| Federation of Malaysia | 3.418% | 8/15/22 | MYR | 15,000 | 3,534 |
| Federation of Malaysia | 3.480% | 3/15/23 | MYR | 110,500 | 25,964 |
| Federation of Malaysia | 3.492% | 3/31/20 | MYR | 31,000 | 7,409 |
| Federation of Malaysia | 3.733% | 6/15/28 | MYR | 141,400 | 32,765 |
| Federation of Malaysia | 3.795% | 9/30/22 | MYR | 160,000 | 38,184 |
| Federation of Malaysia | 3.800% | 8/17/23 | MYR | 50,000 | 11,883 |
| Federation of Malaysia | 3.844% | 4/15/33 | MYR | 293,550 | 64,469 |
| Federation of Malaysia | 3.892% | 3/15/27 | MYR | 500 | 117 |
| Federation of Malaysia | 3.900% | 11/30/26 | MYR | 131,500 | 30,846 |
| Federation of Malaysia | 3.955% | 9/15/25 | MYR | 427,000 | 101,255 |
| Federation of Malaysia | 4.048% | 9/30/21 | MYR | 30,500 | 7,361 |
| Federation of Malaysia | 4.059% | 9/30/24 | MYR | 54,000 | 12,938 |
| Federation of Malaysia | 4.127% | 4/15/32 | MYR | 25,000 | 5,722 |
| Federation of Malaysia | 4.160% | 7/15/21 | MYR | 190,000 | 45,967 |
| Federation of Malaysia | 4.181% | 7/15/24 | MYR | 142,000 | 34,205 |
| Federation of Malaysia | 4.232% | 6/30/31 | MYR | 20,700 | 4,805 |
| Federation of Malaysia | 4.254% | 5/31/35 | MYR | 107,000 | 24,046 |
| Federation of Malaysia | 4.378% | 11/29/19 | MYR | 110,000 | 26,532 |
| Federation of Malaysia | 4.392% | 4/15/26 | MYR | 70,000 | 16,958 |
| Federation of Malaysia | 4.498% | 4/15/30 | MYR | 140,500 | 33,537 |
| Federation of Malaysia | 4.736% | 3/15/46 | MYR | 35,000 | 8,034 |
| Federation of Malaysia | 4.762% | 4/7/37 | MYR | 46,600 | 11,015 |
| Federation of Malaysia | 4.893% | 6/8/38 | MYR | 70,000 | 16,779 |
| Total Malaysia (Cost $603,386) | | | | | 564,325 |
| Mexico (0.8%) | | | | | |
| Corporate Bonds (0.1%) | | | | | |
| America Movil SAB de CV | 1.500% | 3/10/24 | EUR | 600 | 695 |
| America Movil SAB de CV | 2.125% | 3/10/28 | EUR | 5,100 | 5,971 |
| America Movil SAB de CV | 3.000% | 7/12/21 | EUR | 2,500 | 3,040 |
| America Movil SAB de CV | 4.375% | 8/7/41 | GBP | 7,300 | 10,723 |
| America Movil SAB de CV | 4.750% | 6/28/22 | EUR | 5,005 | 6,547 |
| America Movil SAB de CV | 5.000% | 10/27/26 | GBP | 2,300 | 3,455 |
| America Movil SAB de CV | 5.750% | 6/28/30 | GBP | 200 | 324 |
| 1 America Movil SAB de CV | 6.375% | 9/6/73 | GBP | 8,200 | 11,069 |
| 1 America Movil SAB de CV | 6.375% | 9/6/73 | EUR | 5,000 | 6,556 |
| | | | | | 48,380 |
| Sovereign Bonds (0.7%) | | | | | |
| Petroleos Mexicanos | 1.875% | 4/21/22 | EUR | 700 | 776 |
| Petroleos Mexicanos | 2.500% | 8/21/21 | EUR | 200 | 228 |
| Petroleos Mexicanos | 2.750% | 4/21/27 | EUR | 21,000 | 20,833 |
| Petroleos Mexicanos | 3.125% | 11/27/20 | EUR | 1,000 | 1,173 |
| Petroleos Mexicanos | 3.750% | 2/21/24 | EUR | 500 | 572 |
| Petroleos Mexicanos | 3.750% | 4/16/26 | EUR | 700 | 767 |
| Petroleos Mexicanos | 4.750% | 2/26/29 | EUR | 9,800 | 10,236 |
| Petroleos Mexicanos | 5.500% | 2/24/25 | EUR | 12,000 | 15,035 |
| Petroleos Mexicanos | 8.250% | 6/2/22 | GBP | 2,750 | 4,124 |
| United Mexican States | 1.375% | 1/15/25 | EUR | 29,540 | 32,768 |
| United Mexican States | 1.625% | 3/6/24 | EUR | 3,000 | 3,414 |
| United Mexican States | 1.750% | 4/17/28 | EUR | 15,900 | 17,064 |
| United Mexican States | 2.375% | 4/9/21 | EUR | 4,667 | 5,546 |
| United Mexican States | 2.750% | 4/22/23 | EUR | 7,000 | 8,489 |
73
| | | | | |
| Total International Bond Index Fund | | | | | |
| |
| |
| |
| | | | | Face | Market |
| | | Maturity | | Amount | Value • |
| | Coupon | Date | Currency | (000) | ($000) |
| United Mexican States | 3.000% | 3/6/45 | EUR | 7,400 | 7,865 |
| United Mexican States | 3.375% | 2/23/31 | EUR | 8,000 | 9,943 |
| United Mexican States | 3.625% | 4/9/29 | EUR | 4,000 | 5,052 |
| United Mexican States | 4.000% | 3/15/15 | EUR | 2,700 | 2,672 |
| United Mexican States | 5.000% | 12/11/19 | MXN | 765,000 | 36,245 |
| United Mexican States | 5.625% | 3/19/14 | GBP | 4,000 | 5,082 |
| United Mexican States | 5.750% | 3/5/26 | MXN | 850,000 | 34,939 |
| United Mexican States | 6.500% | 6/10/21 | MXN | 2,387,500 | 111,638 |
| United Mexican States | 6.500% | 6/9/22 | MXN | 3,140,000 | 144,087 |
| United Mexican States | 7.500% | 6/3/27 | MXN | 1,525,000 | 68,912 |
| United Mexican States | 7.750% | 5/29/31 | MXN | 445,000 | 19,863 |
| United Mexican States | 7.750% | 11/23/34 | MXN | 510,000 | 22,403 |
| United Mexican States | 7.750% | 11/13/42 | MXN | 1,138,000 | 49,747 |
| United Mexican States | 8.000% | 6/11/20 | MXN | 504,500 | 24,596 |
| United Mexican States | 8.000% | 12/7/23 | MXN | 472,600 | 22,536 |
| United Mexican States | 8.000% | 11/7/47 | MXN | 325,000 | 14,223 |
| United Mexican States | 8.500% | 5/31/29 | MXN | 480,000 | 22,903 |
| United Mexican States | 8.500% | 11/18/38 | MXN | 425,000 | 19,842 |
| United Mexican States | 10.000% | 12/5/24 | MXN | 1,133,500 | 58,849 |
| United Mexican States | 10.000% | 11/20/36 | MXN | 350,000 | 18,667 |
| | | | | | 821,089 |
| Total Mexico (Cost $1,075,158) | | | | | 869,469 |
| Morocco (0.0%) | | | | | |
| Sovereign Bonds (0.0%) | | | | | |
| Kingdom of Morocco | 3.500% | 6/19/24 | EUR | 2,000 | 2,470 |
| Kingdom of Morocco | 4.500% | 10/5/20 | EUR | 2,000 | 2,434 |
| Total Morocco (Cost $5,016) | | | | | 4,904 |
| Netherlands (2.9%) | | | | | |
| Asset-Backed/Commercial Mortgage-Backed Securities (0.2%) | | | |
| ABN AMRO Bank NV | 1.000% | 4/13/31 | EUR | 8,000 | 8,849 |
| ABN AMRO Bank NV | 1.125% | 1/12/32 | EUR | 3,100 | 3,448 |
| ABN AMRO Bank NV | 1.500% | 9/30/30 | EUR | 24,700 | 29,087 |
| ABN AMRO Bank NV | 2.375% | 1/23/24 | EUR | 21,400 | 26,825 |
| ABN AMRO Bank NV | 2.500% | 9/5/23 | EUR | 7,000 | 8,794 |
| ABN AMRO Bank NV | 3.500% | 1/18/22 | EUR | 13,000 | 16,386 |
| ABN AMRO Bank NV | 3.500% | 9/21/22 | EUR | 1,100 | 1,410 |
| ABN AMRO Bank NV | 4.250% | 4/6/21 | EUR | 5,000 | 6,268 |
| Aegon Bank NV | 0.250% | 5/25/23 | EUR | 18,500 | 20,894 |
| Aegon Bank NV | 0.750% | 6/27/27 | EUR | 2,500 | 2,789 |
| ING Bank NV | 1.875% | 5/22/23 | EUR | 17,400 | 21,200 |
| ING Bank NV | 2.000% | 8/28/20 | EUR | 10,000 | 11,792 |
| ING Bank NV | 3.375% | 1/10/22 | EUR | 1,100 | 1,380 |
| ING Bank NV | 3.625% | 8/31/21 | EUR | 8,500 | 10,639 |
| NIBC Bank NV | 0.250% | 4/22/22 | EUR | 30,235 | 34,401 |
| 1 NIBC Bank NV | 0.625% | 6/1/58 | EUR | 11,600 | 12,986 |
| | | | | | 217,148 |
| Corporate Bonds (0.8%) | | | | | |
| ABN AMRO Bank NV | 0.625% | 5/31/22 | EUR | 600 | 689 |
| ABN AMRO Bank NV | 0.875% | 1/14/26 | EUR | 1,000 | 1,155 |
| ABN AMRO Bank NV | 1.000% | 6/30/20 | GBP | 1,400 | 1,777 |
| ABN AMRO Bank NV | 1.375% | 6/7/22 | GBP | 3,200 | 4,036 |
| ABN AMRO Bank NV | 1.375% | 1/12/37 | EUR | 21,900 | 24,388 |
74
| | | | | |
| Total International Bond Index Fund | | | | | |
| |
| |
| |
| | | | | Face | Market |
| | | Maturity | | Amount | Value • |
| | Coupon | Date | Currency | (000) | ($000) |
| ABN AMRO Bank NV | 2.500% | 11/29/23 | EUR | 4,100 | 5,074 |
| 1 ABN AMRO Bank NV | 2.875% | 6/30/25 | EUR | 10,000 | 11,747 |
| ABN AMRO Bank NV | 4.125% | 3/28/22 | EUR | 5,800 | 7,430 |
| ABN AMRO Bank NV | 6.375% | 4/27/21 | EUR | 4,600 | 5,975 |
| ABN AMRO Bank NV | 7.125% | 7/6/22 | EUR | 6,500 | 8,966 |
| Achmea BV | 2.500% | 11/19/20 | EUR | 2,500 | 2,967 |
| 1 Achmea BV | 6.000% | 4/4/43 | EUR | 2,100 | 2,592 |
| Aegon Bank NV | 0.375% | 11/21/24 | EUR | 10,000 | 11,207 |
| Aegon NV | 1.000% | 12/8/23 | EUR | 1,100 | 1,266 |
| 1 Aegon NV | 4.000% | 4/25/44 | EUR | 2,500 | 2,934 |
| Aegon NV | 6.625% | 12/16/39 | GBP | 1,000 | 1,907 |
| Akzo Nobel NV | 1.125% | 4/8/26 | EUR | 7,000 | 7,769 |
| ASML Holding NV | 1.625% | 5/28/27 | EUR | 1,400 | 1,619 |
| ASML Holding NV | 3.375% | 9/19/23 | EUR | 1,000 | 1,283 |
| 1 ASR Nederland NV | 5.125% | 9/29/45 | EUR | 100 | 122 |
| Citycon Treasury BV | 2.375% | 1/15/27 | EUR | 10,000 | 10,902 |
| Cooperatieve Rabobank UA | 0.125% | 10/11/21 | EUR | 400 | 454 |
| Cooperatieve Rabobank UA | 0.500% | 12/6/22 | EUR | 14,215 | 16,225 |
| Cooperatieve Rabobank UA | 0.750% | 8/29/23 | EUR | 15,000 | 16,920 |
| Cooperatieve Rabobank UA | 0.875% | 2/8/28 | EUR | 1,100 | 1,245 |
| Cooperatieve Rabobank UA | 1.125% | 4/8/21 | CHF | 12,100 | 12,416 |
| Cooperatieve Rabobank UA | 1.250% | 3/23/26 | EUR | 10,000 | 11,554 |
| Cooperatieve Rabobank UA | 1.250% | 5/31/32 | EUR | 7,500 | 8,451 |
| Cooperatieve Rabobank UA | 1.375% | 2/3/27 | EUR | 400 | 466 |
| Cooperatieve Rabobank UA | 2.000% | 9/16/21 | CHF | 8,900 | 9,392 |
| Cooperatieve Rabobank UA | 2.250% | 3/23/22 | GBP | 500 | 651 |
| Cooperatieve Rabobank UA | 2.375% | 5/22/23 | EUR | 5,750 | 7,064 |
| 1 Cooperatieve Rabobank UA | 2.500% | 5/26/26 | EUR | 12,100 | 14,269 |
| Cooperatieve Rabobank UA | 3.125% | 9/15/26 | CHF | 4,000 | 4,767 |
| Cooperatieve Rabobank UA | 3.750% | 11/9/20 | EUR | 19,150 | 23,204 |
| Cooperatieve Rabobank UA | 3.875% | 7/25/23 | EUR | 5,700 | 7,266 |
| Cooperatieve Rabobank UA | 4.000% | 1/11/22 | EUR | 15,800 | 20,049 |
| Cooperatieve Rabobank UA | 4.000% | 9/19/22 | GBP | 3,187 | 4,432 |
| Cooperatieve Rabobank UA | 4.125% | 1/14/20 | EUR | 10,050 | 11,975 |
| Cooperatieve Rabobank UA | 4.125% | 1/12/21 | EUR | 6,400 | 7,905 |
| Cooperatieve Rabobank UA | 4.125% | 9/14/22 | EUR | 8,000 | 10,171 |
| Cooperatieve Rabobank UA | 4.125% | 7/14/25 | EUR | 20,000 | 27,405 |
| Cooperatieve Rabobank UA | 4.375% | 6/7/21 | EUR | 100 | 126 |
| Cooperatieve Rabobank UA | 4.550% | 8/30/29 | GBP | 6,108 | 9,348 |
| Cooperatieve Rabobank UA | 4.625% | 1/13/21 | GBP | 1,000 | 1,365 |
| Cooperatieve Rabobank UA | 4.625% | 5/23/29 | GBP | 9,500 | 13,174 |
| Cooperatieve Rabobank UA | 4.750% | 6/6/22 | EUR | 5,600 | 7,360 |
| Cooperatieve Rabobank UA | 5.250% | 9/14/27 | GBP | 12,612 | 18,346 |
| Cooperatieve Rabobank UA | 5.250% | 5/23/41 | GBP | 800 | 1,397 |
| Delhaize Le Lion / De Leeuw BV | 3.125% | 2/27/20 | EUR | 300 | 354 |
| 1 Delta Lloyd Levensverzekering NV | 9.000% | 8/29/42 | EUR | 13,000 | 18,559 |
| Heineken NV | 1.375% | 1/29/27 | EUR | 10,100 | 11,467 |
| Heineken NV | 1.500% | 12/7/24 | EUR | 5,100 | 5,965 |
| Heineken NV | 1.500% | 10/3/29 | EUR | 500 | 553 |
| Heineken NV | 2.000% | 4/6/21 | EUR | 1,000 | 1,186 |
| Heineken NV | 2.125% | 8/4/20 | EUR | 18,350 | 21,580 |
| Heineken NV | 2.875% | 8/4/25 | EUR | 5,900 | 7,461 |
| ING Bank NV | 0.700% | 4/16/20 | EUR | 600 | 688 |
| ING Bank NV | 0.750% | 11/24/20 | EUR | 2,600 | 2,992 |
75
| | | | | |
| Total International Bond Index Fund | | | | | |
| |
| |
| |
| | | | | Face | Market |
| | | Maturity | | Amount | Value • |
| | Coupon | Date | Currency | (000) | ($000) |
| ING Bank NV | 0.750% | 2/22/21 | EUR | 10,700 | 12,321 |
| ING Bank NV | 0.875% | 4/11/28 | EUR | 15,600 | 17,639 |
| ING Bank NV | 1.250% | 12/13/19 | EUR | 15,896 | 18,289 |
| 1 ING Bank NV | 3.625% | 2/25/26 | EUR | 15,200 | 18,325 |
| ING Bank NV | 4.500% | 2/21/22 | EUR | 10,600 | 13,680 |
| ING Bank NV | 4.875% | 1/18/21 | EUR | 1,000 | 1,254 |
| ING Bank NV | 5.375% | 4/15/21 | GBP | 3,000 | 4,193 |
| ING Groep NV | 0.750% | 3/9/22 | EUR | 30,300 | 34,393 |
| ING Groep NV | 1.125% | 2/14/25 | EUR | 1,900 | 2,102 |
| ING Groep NV | 1.375% | 1/11/28 | EUR | 300 | 325 |
| 1 ING Groep NV | 1.625% | 9/26/29 | EUR | 500 | 547 |
| ING Groep NV | 2.000% | 9/20/28 | EUR | 15,000 | 16,924 |
| 1 ING Groep NV | 3.000% | 4/11/28 | EUR | 200 | 238 |
| JAB Holdings BV | 1.250% | 5/22/24 | EUR | 10,100 | 11,516 |
| JAB Holdings BV | 1.625% | 4/30/25 | EUR | 4,100 | 4,690 |
| JAB Holdings BV | 2.000% | 5/18/28 | EUR | 7,800 | 8,724 |
| JAB Holdings BV | 2.125% | 9/16/22 | EUR | 3,000 | 3,605 |
| Koninklijke DSM NV | 0.750% | 9/28/26 | EUR | 100 | 110 |
| Koninklijke DSM NV | 1.000% | 4/9/25 | EUR | 3,200 | 3,657 |
| Koninklijke DSM NV | 2.375% | 4/3/24 | EUR | 1,700 | 2,095 |
| Koninklijke KPN NV | 0.625% | 4/9/25 | EUR | 10,000 | 10,853 |
| Koninklijke KPN NV | 3.250% | 2/1/21 | EUR | 5,630 | 6,827 |
| Koninklijke KPN NV | 3.750% | 9/21/20 | EUR | 1,200 | 1,457 |
| Koninklijke KPN NV | 4.250% | 3/1/22 | EUR | 100 | 127 |
| Koninklijke KPN NV | 5.000% | 11/18/26 | GBP | 3,660 | 5,348 |
| Koninklijke KPN NV | 5.750% | 9/17/29 | GBP | 3,115 | 4,864 |
| Koninklijke Philips NV | 1.375% | 5/2/28 | EUR | 7,000 | 7,777 |
| LeasePlan Corp. NV | 0.750% | 10/3/22 | EUR | 1,575 | 1,766 |
| Nationale-Nederlanden Bank NV | 0.500% | 10/10/24 | EUR | 800 | 902 |
| Nationale-Nederlanden Bank NV | 0.625% | 9/11/25 | EUR | 7,700 | 8,669 |
| NIBC Bank NV | 1.000% | 9/11/28 | EUR | 5,000 | 4,947 |
| NIBC Bank NV | 1.500% | 1/31/22 | EUR | 18,484 | 21,340 |
| NN Group NV | 0.875% | 1/13/23 | EUR | 500 | 572 |
| NN Group NV | 1.000% | 3/18/22 | EUR | 10,000 | 11,531 |
| NN Group NV | 1.625% | 6/1/27 | EUR | 330 | 372 |
| 1 NN Group NV | 4.500% | 7/15/49 | EUR | 5,500 | 6,400 |
| 1 NN Group NV | 4.625% | 4/8/44 | EUR | 2,600 | 3,157 |
| PostNL NV | 1.000% | 11/21/24 | EUR | 1,100 | 1,226 |
| Rabobank Capital Funding Trust IV | 5.556% | 10/29/49 | GBP | 1,700 | 2,243 |
| Robert Bosch Investment Nederland BV | 1.625% | 5/24/21 | EUR | 800 | 941 |
| Robert Bosch Investment Nederland BV | 2.625% | 5/24/28 | EUR | 1,000 | 1,293 |
| Shell International Finance BV | 0.375% | 2/15/25 | EUR | 23,600 | 26,221 |
| Shell International Finance BV | 0.750% | 5/12/24 | EUR | 15,000 | 17,185 |
| Shell International Finance BV | 0.750% | 8/15/28 | EUR | 5,000 | 5,399 |
| Shell International Finance BV | 1.000% | 4/6/22 | EUR | 200 | 233 |
| Shell International Finance BV | 1.250% | 3/15/22 | EUR | 400 | 471 |
| Shell International Finance BV | 1.250% | 5/12/28 | EUR | 600 | 685 |
| Shell International Finance BV | 1.625% | 3/24/21 | EUR | 10,000 | 11,778 |
| Shell International Finance BV | 2.000% | 12/20/19 | GBP | 2,500 | 3,223 |
| Unilever NV | 0.000% | 4/29/20 | EUR | 100 | 114 |
| Unilever NV | 0.375% | 2/14/23 | EUR | 1,100 | 1,246 |
| Unilever NV | 1.125% | 2/12/27 | EUR | 10,000 | 11,315 |
| Unilever NV | 1.375% | 7/31/29 | EUR | 5,100 | 5,723 |
76
| | | | | |
| Total International Bond Index Fund | | | | | |
| |
| |
| |
| | | | | Face | Market |
| | | Maturity | | Amount | Value • |
| | Coupon | Date | Currency | (000) | ($000) |
| Unilever plc | 1.125% | 2/3/22 | GBP | 1,200 | 1,524 |
| Wolters Kluwer NV | 2.875% | 3/21/23 | EUR | 2,000 | 2,494 |
| WPC Eurobond BV | 2.250% | 4/9/26 | EUR | 6,000 | 6,749 |
| | | | | | 825,606 |
| Sovereign Bonds (1.9%) | | | | | |
| Alliander NV | 2.875% | 6/14/24 | EUR | 500 | 638 |
| BNG Bank NV | 0.050% | 7/13/24 | EUR | 25,000 | 27,964 |
| BNG Bank NV | 0.200% | 11/9/24 | EUR | 20,000 | 22,461 |
| BNG Bank NV | 0.250% | 6/7/24 | EUR | 6,000 | 6,789 |
| BNG Bank NV | 0.375% | 1/14/22 | EUR | 5,000 | 5,750 |
| BNG Bank NV | 0.500% | 8/26/22 | EUR | 37,000 | 42,726 |
| BNG Bank NV | 0.500% | 4/16/25 | EUR | 10,000 | 11,364 |
| BNG Bank NV | 0.625% | 6/19/27 | EUR | 20,000 | 22,471 |
| BNG Bank NV | 1.000% | 1/12/26 | EUR | 5,000 | 5,839 |
| BNG Bank NV | 1.125% | 5/24/21 | GBP | 1,900 | 2,429 |
| BNG Bank NV | 1.125% | 9/4/24 | EUR | 1,400 | 1,661 |
| BNG Bank NV | 1.375% | 10/21/30 | EUR | 6,000 | 7,034 |
| BNG Bank NV | 1.500% | 3/29/38 | EUR | 3,000 | 3,428 |
| BNG Bank NV | 1.625% | 8/26/25 | GBP | 500 | 642 |
| BNG Bank NV | 1.875% | 1/14/21 | EUR | 12,000 | 14,245 |
| BNG Bank NV | 2.250% | 10/14/20 | CHF | 7,000 | 7,348 |
| BNG Bank NV | 2.250% | 8/30/22 | EUR | 5,000 | 6,153 |
| BNG Bank NV | 3.250% | 7/15/25 | AUD | 10,000 | 7,198 |
| BNG Bank NV | 3.300% | 7/17/28 | AUD | 15,000 | 10,653 |
| BNG Bank NV | 3.750% | 1/14/20 | EUR | 5,000 | 5,950 |
| BNG Bank NV | 3.875% | 5/26/23 | EUR | 28,000 | 37,168 |
| BNG Bank NV | 4.750% | 3/6/23 | AUD | 15,000 | 11,540 |
| BNG Bank NV | 5.200% | 12/7/28 | GBP | 3,200 | 5,328 |
| BNG Bank NV | 5.250% | 5/20/24 | AUD | 5,000 | 3,984 |
| 1 Eneco Holding NV | 3.250% | 12/29/49 | EUR | 3,600 | 4,260 |
| Enexis Holding NV | 1.875% | 11/13/20 | EUR | 1,500 | 1,766 |
| 2 Kingdom of Netherlands | 0.000% | 1/15/22 | EUR | 85,550 | 98,120 |
| 2 Kingdom of Netherlands | 0.000% | 1/15/24 | EUR | 61,500 | 69,828 |
| 2 Kingdom of Netherlands | 0.250% | 1/15/20 | EUR | 55,000 | 63,036 |
| 2 Kingdom of Netherlands | 0.250% | 7/15/25 | EUR | 111,220 | 126,753 |
| 2 Kingdom of Netherlands | 0.500% | 7/15/26 | EUR | 74,650 | 85,964 |
| 2 Kingdom of Netherlands | 0.750% | 7/15/28 | EUR | 75,000 | 86,845 |
| 2 Kingdom of Netherlands | 1.750% | 7/15/23 | EUR | 147,650 | 182,307 |
| 2 Kingdom of Netherlands | 2.000% | 7/15/24 | EUR | 72,500 | 91,416 |
| 2 Kingdom of Netherlands | 2.250% | 7/15/22 | EUR | 57,850 | 71,835 |
| 2 Kingdom of Netherlands | 2.500% | 1/15/33 | EUR | 90,500 | 126,519 |
| 2 Kingdom of Netherlands | 2.750% | 1/15/47 | EUR | 69,707 | 111,358 |
| 2 Kingdom of Netherlands | 3.250% | 7/15/21 | EUR | 64,470 | 80,499 |
| 2 Kingdom of Netherlands | 3.500% | 7/15/20 | EUR | 31,103 | 37,743 |
| Kingdom of Netherlands | 3.750% | 1/15/23 | EUR | 10,280 | 13,622 |
| 2 Kingdom of Netherlands | 3.750% | 1/15/42 | EUR | 63,870 | 114,467 |
| 2 Kingdom of Netherlands | 4.000% | 1/15/37 | EUR | 76,410 | 132,444 |
| Kingdom of Netherlands | 5.500% | 1/15/28 | EUR | 45,780 | 75,717 |
| 2 Kingdom of Netherlands | 0.750% | 7/15/27 | EUR | 71,550 | 83,400 |
| Nederlandse Financierings Maatschappij | | | | | |
| voor Ontwikkelingslanden NV | 0.125% | 11/4/20 | EUR | 518 | 593 |
| Nederlandse Financierings Maatschappij | | | | | |
| voor Ontwikkelingslanden NV | 0.125% | 4/20/22 | EUR | 6,347 | 7,261 |
77
| | | | | |
| Total International Bond Index Fund | | | | | |
| |
| |
| |
| | | | | Face | Market |
| | | Maturity | | Amount | Value • |
| | Coupon | Date | Currency | (000) | ($000) |
| Nederlandse Gasunie NV | 1.000% | 5/11/26 | EUR | 6,714 | 7,632 |
| Nederlandse Gasunie NV | 2.625% | 7/13/22 | EUR | 1,500 | 1,846 |
| Nederlandse Gasunie NV | 3.625% | 10/13/21 | EUR | 3,500 | 4,385 |
| Nederlandse Waterschapsbank NV | 0.500% | 10/27/22 | EUR | 11,600 | 13,395 |
| Nederlandse Waterschapsbank NV | 0.750% | 10/4/41 | EUR | 42,300 | 40,480 |
| Nederlandse Waterschapsbank NV | 0.875% | 12/20/21 | GBP | 2,000 | 2,529 |
| Nederlandse Waterschapsbank NV | 1.250% | 5/27/36 | EUR | 18,200 | 20,094 |
| Nederlandse Waterschapsbank NV | 1.750% | 7/9/20 | EUR | 2,000 | 2,346 |
| Nederlandse Waterschapsbank NV | 2.375% | 1/27/23 | CHF | 3,000 | 3,323 |
| Nederlandse Waterschapsbank NV | 3.000% | 9/11/31 | EUR | 6,000 | 8,279 |
| Nederlandse Waterschapsbank NV | 3.150% | 9/2/26 | AUD | 7,580 | 5,382 |
| Nederlandse Waterschapsbank NV | 3.250% | 3/9/27 | EUR | 10,000 | 13,675 |
| Nederlandse Waterschapsbank NV | 3.450% | 7/17/28 | AUD | 1,500 | 1,083 |
| Nederlandse Waterschapsbank NV | 3.500% | 1/14/21 | EUR | 5,000 | 6,138 |
| Nederlandse Waterschapsbank NV | 3.875% | 2/17/20 | EUR | 1,500 | 1,794 |
| Nederlandse Waterschapsbank NV | 5.375% | 6/7/32 | GBP | 10,000 | 17,790 |
| Stedin Holding NV | 0.875% | 10/24/25 | EUR | 2,200 | 2,463 |
| TenneT Holding BV | 1.000% | 6/13/26 | EUR | 200 | 225 |
| TenneT Holding BV | 1.250% | 10/24/33 | EUR | 100 | 107 |
| TenneT Holding BV | 1.375% | 6/26/29 | EUR | 30,523 | 34,495 |
| TenneT Holding BV | 2.125% | 11/1/20 | EUR | 3,900 | 4,608 |
| TenneT Holding BV | 4.500% | 2/9/22 | EUR | 1,500 | 1,940 |
| | | | | | 2,130,525 |
| Total Netherlands (Cost $3,190,368) | | | | | 3,173,279 |
| New Zealand (0.2%) | | | | | |
| Asset-Backed/Commercial Mortgage-Backed Securities (0.0%) | | | |
| ANZ New Zealand International Ltd. | 0.625% | 1/27/22 | EUR | 5,000 | 5,747 |
| ASB Finance Ltd. | 0.625% | 10/18/24 | EUR | 3,625 | 4,104 |
| | | | | | 9,851 |
| Corporate Bonds (0.0%) | | | | | |
| ANZ New Zealand International Ltd. | 0.625% | 6/1/21 | EUR | 1,200 | 1,374 |
| ASB Finance Ltd. | 0.500% | 6/17/20 | EUR | 7,912 | 9,042 |
| ASB Finance Ltd. | 0.500% | 6/10/22 | EUR | 20,886 | 23,657 |
| Bank of New Zealand | 4.426% | 6/18/20 | NZD | 2,000 | 1,345 |
| BNZ International Funding Ltd. | 0.125% | 6/17/21 | EUR | 1,000 | 1,135 |
| BNZ International Funding Ltd. | 0.500% | 5/13/23 | EUR | 5,100 | 5,715 |
| Chorus Ltd. | 6.750% | 4/6/20 | GBP | 1,100 | 1,496 |
| Fonterra Co-operative Group Ltd. | 0.750% | 11/8/24 | EUR | 1,520 | 1,683 |
| Fonterra Co-operative Group Ltd. | 4.500% | 6/30/21 | AUD | 1,500 | 1,108 |
| | | | | | 46,555 |
| Sovereign Bonds (0.2%) | | | | | |
| Auckland Council | 0.625% | 11/13/24 | EUR | 10,000 | 11,374 |
| New Zealand | 2.750% | 4/15/25 | NZD | 60,000 | 40,468 |
| New Zealand | 2.750% | 4/15/37 | NZD | 10,000 | 6,430 |
| New Zealand | 3.000% | 4/15/20 | NZD | 42,300 | 28,098 |
| New Zealand | 3.000% | 4/20/29 | NZD | 30,000 | 20,384 |
| New Zealand | 3.500% | 4/14/33 | NZD | 25,000 | 17,850 |
| New Zealand | 4.500% | 4/15/27 | NZD | 11,000 | 8,339 |
| New Zealand | 5.000% | 3/15/19 | NZD | 10,000 | 6,603 |
| New Zealand | 5.500% | 4/15/23 | NZD | 25,000 | 18,773 |
| New Zealand | 6.000% | 5/15/21 | NZD | 27,500 | 19,816 |
78
| | | | | |
| Total International Bond Index Fund | | | | | |
| |
| |
| |
| | | | | Face | Market |
| | | Maturity | | Amount | Value • |
| | Coupon | Date | Currency | (000) | ($000) |
| New Zealand Local Government Funding | | | | | |
| Agency Ltd. | 4.500% | 4/15/27 | NZD | 2,000 | 1,425 |
| New Zealand Local Government Funding | | | | | |
| Agency Ltd. | 5.500% | 4/15/23 | NZD | 5,000 | 3,669 |
| New Zealand Local Government Funding | | | | | |
| Agency Ltd. | 6.000% | 5/15/21 | NZD | 4,000 | 2,854 |
| | | | | | 186,083 |
| Total New Zealand (Cost $252,620) | | | | | 242,489 |
| Norway (0.7%) | | | | | |
| Asset-Backed/Commercial Mortgage-Backed Securities (0.2%) | | | |
| DNB Boligkreditt AS | 0.250% | 4/18/23 | EUR | 1,000 | 1,131 |
| DNB Boligkreditt AS | 0.250% | 9/7/26 | EUR | 20,100 | 21,833 |
| DNB Boligkreditt AS | 0.375% | 10/20/20 | EUR | 14,000 | 16,025 |
| DNB Boligkreditt AS | 0.375% | 1/14/21 | EUR | 7,000 | 8,013 |
| DNB Boligkreditt AS | 0.375% | 11/20/24 | EUR | 20,000 | 22,408 |
| DNB Boligkreditt AS | 1.875% | 11/21/22 | EUR | 13,000 | 15,705 |
| DNB Boligkreditt AS | 2.750% | 3/21/22 | EUR | 17,500 | 21,584 |
| DNB Boligkreditt AS | 3.875% | 6/16/21 | EUR | 17,900 | 22,341 |
| DNB Boligkreditt AS | 5.000% | 5/25/21 | NOK | 20,500 | 2,628 |
| Eika Boligkreditt AS | 0.375% | 4/20/23 | EUR | 100 | 114 |
| Eika Boligkreditt AS | 0.375% | 2/26/25 | EUR | 1,600 | 1,787 |
| Eika Boligkreditt AS | 2.125% | 1/30/23 | EUR | 7,000 | 8,544 |
| SpareBank 1 Boligkreditt AS | 0.050% | 1/25/22 | EUR | 10,000 | 11,308 |
| SpareBank 1 Boligkreditt AS | 0.750% | 9/5/22 | EUR | 10,000 | 11,567 |
| SpareBank 1 Boligkreditt AS | 1.500% | 1/20/20 | EUR | 34,400 | 39,786 |
| SpareBank 1 Boligkreditt AS | 1.500% | 6/12/20 | EUR | 11,000 | 12,798 |
| SpareBank 1 Boligkreditt AS | 3.375% | 9/7/21 | EUR | 10,000 | 12,406 |
| Sparebanken Vest Boligkreditt AS | 0.750% | 2/27/25 | EUR | 10,000 | 11,430 |
| SR-Boligkreditt AS | 0.125% | 9/8/21 | EUR | 2,500 | 2,838 |
| SR-Boligkreditt AS | 0.500% | 9/28/20 | EUR | 2,500 | 2,865 |
| SR-Boligkreditt AS | 0.750% | 1/18/23 | EUR | 10,000 | 11,553 |
| | | | | | 258,664 |
| Corporate Bonds (0.1%) | | | | | |
| 1 DNB Bank ASA | 1.125% | 3/20/28 | EUR | 9,300 | 10,412 |
| DNB Bank ASA | 4.250% | 1/27/20 | GBP | 7,500 | 9,914 |
| DNB Bank ASA | 4.250% | 1/18/22 | EUR | 300 | 383 |
| DNB Bank ASA | 4.375% | 2/24/21 | EUR | 3,000 | 3,736 |
| Santander Consumer Bank AS | 0.375% | 2/17/20 | EUR | 2,000 | 2,275 |
| Santander Consumer Bank AS | 0.750% | 3/1/23 | EUR | 10,000 | 11,274 |
| SpareBank 1 Boligkreditt AS | 0.250% | 8/30/26 | EUR | 2,000 | 2,173 |
| SpareBank 1 Boligkreditt AS | 0.375% | 3/9/23 | EUR | 11,750 | 13,352 |
| Sparebank 1 Oestlandet | 0.875% | 3/13/23 | EUR | 100 | 113 |
| SpareBank 1 SMN | 0.500% | 3/9/22 | EUR | 3,100 | 3,515 |
| SpareBank 1 SMN | 0.750% | 6/8/21 | EUR | 19,494 | 22,378 |
| SpareBank 1 SMN | 0.750% | 7/3/23 | EUR | 2,700 | 3,048 |
| SpareBank 1 SR Bank ASA | 2.125% | 2/3/20 | EUR | 1,500 | 1,747 |
| SpareBank 1 SR-Bank ASA | 0.375% | 2/10/22 | EUR | 8,470 | 9,579 |
| SpareBank 1 SR-Bank ASA | 2.125% | 4/14/21 | EUR | 10,100 | 11,977 |
| SR-Boligkreditt AS | 0.375% | 10/3/24 | EUR | 1,600 | 1,795 |
| 1 Storebrand Livsforsikring AS | 6.875% | 4/4/43 | EUR | 100 | 133 |
| | | | | | 107,804 |
| |
| |
| |
| 79 |
| | | | | |
| Total International Bond Index Fund | | | | | |
| |
| |
| |
| | | | | Face | Market |
| | | Maturity | | Amount | Value • |
| | Coupon | Date | Currency | (000) | ($000) |
| Sovereign Bonds (0.4%) | | | | | |
| Avinor AS | 1.000% | 4/29/25 | EUR | 100 | 114 |
| Equinor ASA | 1.250% | 2/17/27 | EUR | 8,000 | 9,211 |
| Equinor ASA | 6.125% | 11/27/28 | GBP | 200 | 342 |
| 2 Kingdom of Norway | 1.500% | 2/19/26 | NOK | 130,000 | 15,107 |
| 2 Kingdom of Norway | 1.750% | 3/13/25 | NOK | 175,000 | 20,791 |
| 2 Kingdom of Norway | 1.750% | 2/17/27 | NOK | 153,000 | 17,988 |
| 2 Kingdom of Norway | 2.000% | 5/24/23 | NOK | 392,915 | 47,538 |
| 2 Kingdom of Norway | 2.000% | 4/26/28 | NOK | 200,000 | 23,865 |
| 2 Kingdom of Norway | 3.000% | 3/14/24 | NOK | 417,600 | 52,983 |
| 2 Kingdom of Norway | 3.750% | 5/25/21 | NOK | 231,275 | 29,136 |
| Kommunalbanken AS | 0.875% | 5/24/27 | EUR | 34,700 | 39,574 |
| Kommunalbanken AS | 3.000% | 12/9/26 | AUD | 6,000 | 4,204 |
| Kommunalbanken AS | 4.500% | 7/18/22 | AUD | 3,500 | 2,648 |
| Kommunalbanken AS | 4.500% | 4/17/23 | AUD | 5,248 | 4,000 |
| Kommunalbanken AS | 5.000% | 3/28/19 | NZD | 10,000 | 6,602 |
| Kommunalbanken AS | 5.250% | 7/15/24 | AUD | 4,800 | 3,828 |
| Kommunalbanken AS | 6.500% | 4/12/21 | AUD | 5,000 | 3,884 |
| Statkraft AS | 2.500% | 11/28/22 | EUR | 2,500 | 3,069 |
| Statoil ASA | 0.875% | 2/17/23 | EUR | 21,800 | 25,224 |
| Statoil ASA | 1.625% | 2/17/35 | EUR | 5,000 | 5,631 |
| Statoil ASA | 1.625% | 11/9/36 | EUR | 2,000 | 2,214 |
| Statoil ASA | 2.000% | 9/10/20 | EUR | 3,000 | 3,529 |
| Statoil ASA | 2.875% | 9/10/25 | EUR | 11,400 | 14,707 |
| Statoil ASA | 5.625% | 3/11/21 | EUR | 22,700 | 29,145 |
| Statoil ASA | 6.875% | 3/11/31 | GBP | 3,750 | 7,046 |
| Telenor ASA | 2.500% | 5/22/25 | EUR | 2,400 | 2,980 |
| Telenor ASA | 2.750% | 6/27/22 | EUR | 5,000 | 6,155 |
| Telenor ASA | 4.125% | 3/26/20 | EUR | 500 | 600 |
| | | | | | 382,115 |
| Total Norway (Cost $769,796) | | | | | 748,583 |
| Peru (0.0%) | | | | | |
| Sovereign Bonds (0.0%) | | | | | |
| Republic of Peru | 2.750% | 1/30/26 | EUR | 14,000 | 17,200 |
| Republic of Peru | 3.750% | 3/1/30 | EUR | 8,000 | 10,706 |
| Total Peru (Cost $29,301) | | | | | 27,906 |
| Poland (0.5%) | | | | | |
| Corporate Bonds (0.0%) | | | | | |
| ORLEN Capital AB | 2.500% | 6/30/21 | EUR | 100 | 119 |
| ORLEN Capital AB | 2.500% | 6/7/23 | EUR | 5,700 | 6,846 |
| | | | | | 6,965 |
| Sovereign Bonds (0.5%) | | | | | |
| Republic of Poland | 0.875% | 5/10/27 | EUR | 13,900 | 15,345 |
| Republic of Poland | 1.000% | 10/25/28 | EUR | 900 | 997 |
| Republic of Poland | 1.125% | 8/7/26 | EUR | 500 | 571 |
| Republic of Poland | 1.375% | 10/22/27 | EUR | 50 | 57 |
| Republic of Poland | 1.500% | 4/25/20 | PLN | 120,000 | 31,282 |
| Republic of Poland | 1.500% | 9/9/25 | EUR | 5,000 | 5,877 |
| Republic of Poland | 1.500% | 1/19/26 | EUR | 40,800 | 47,765 |
| Republic of Poland | 1.750% | 7/25/21 | PLN | 42,500 | 11,066 |
| Republic of Poland | 2.000% | 4/25/21 | PLN | 4,500 | 1,180 |
| Republic of Poland | 2.000% | 10/25/46 | EUR | 300 | 335 |
80
| | | | | |
| Total International Bond Index Fund | | | | | |
| |
| |
| |
| | | | | Face | Market |
| | | Maturity | | Amount | Value • |
| | Coupon | Date | Currency | (000) | ($000) |
| Republic of Poland | 2.250% | 4/25/22 | PLN | 253,000 | 66,238 |
| Republic of Poland | 2.500% | 1/25/23 | PLN | 144,000 | 37,718 |
| Republic of Poland | 2.500% | 7/25/26 | PLN | 257,000 | 64,531 |
| Republic of Poland | 2.500% | 7/25/27 | PLN | 175,000 | 43,427 |
| Republic of Poland | 2.750% | 4/25/28 | PLN | 53,890 | 13,511 |
| Republic of Poland | 3.250% | 7/25/25 | PLN | 131,000 | 34,945 |
| Republic of Poland | 3.375% | 7/9/24 | EUR | 5,000 | 6,502 |
| Republic of Poland | 3.750% | 1/19/23 | EUR | 4,600 | 5,973 |
| Republic of Poland | 4.000% | 3/23/21 | EUR | 2,000 | 2,482 |
| Republic of Poland | 4.000% | 10/25/23 | PLN | 209,375 | 58,425 |
| Republic of Poland | 4.200% | 4/15/20 | EUR | 10,000 | 12,025 |
| Republic of Poland | 4.500% | 1/18/22 | EUR | 6,500 | 8,416 |
| Republic of Poland | 5.250% | 10/25/20 | PLN | 51,400 | 14,350 |
| Republic of Poland | 5.250% | 1/20/25 | EUR | 7,400 | 10,664 |
| Republic of Poland | 5.750% | 10/25/21 | PLN | 126,100 | 36,549 |
| Republic of Poland | 5.750% | 9/23/22 | PLN | 42,500 | 12,523 |
| Republic of Poland | 5.750% | 4/25/29 | PLN | 25,850 | 8,259 |
| | | | | | 551,013 |
| Total Poland (Cost $559,210) | | | | | 557,978 |
| Portugal (0.8%) | | | | | |
| Asset-Backed/Commercial Mortgage-Backed Security (0.0%) | | | |
| Banco Santander Totta SA | 1.250% | 9/26/27 | EUR | 8,700 | 9,949 |
| |
| Corporate Bonds (0.1%) | | | | | |
| Banco Santander Totta SA | 0.875% | 4/25/24 | EUR | 100 | 115 |
| Brisa Concessao Rodoviaria SA | 2.000% | 3/22/23 | EUR | 200 | 238 |
| Brisa Concessao Rodoviaria SA | 2.375% | 5/10/27 | EUR | 13,100 | 15,355 |
| EDP Finance BV | 1.125% | 2/12/24 | EUR | 26,400 | 29,431 |
| EDP Finance BV | 1.875% | 9/29/23 | EUR | 8,900 | 10,412 |
| EDP Finance BV | 2.000% | 4/22/25 | EUR | 10,000 | 11,486 |
| EDP Finance BV | 2.375% | 3/23/23 | EUR | 800 | 959 |
| EDP Finance BV | 2.625% | 1/18/22 | EUR | 10,955 | 13,199 |
| EDP Finance BV | 4.125% | 6/29/20 | EUR | 5,400 | 6,518 |
| EDP Finance BV | 4.875% | 9/14/20 | EUR | 2,670 | 3,291 |
| EDP Finance BV | 8.625% | 1/4/24 | GBP | 11,355 | 18,700 |
| Galp Gas Natural Distribuicao SA | 1.375% | 9/19/23 | EUR | 2,600 | 2,981 |
| Ren Finance BV | 1.750% | 1/18/28 | EUR | 1,900 | 2,115 |
| | | | | | 114,800 |
| Sovereign Bonds (0.7%) | | | | | |
| Caixa Geral de Depositos SA | 1.000% | 1/27/22 | EUR | 4,900 | 5,662 |
| 2 Portugal Obrigacoes do Tesouro OT | 2.125% | 10/17/28 | EUR | 72,801 | 84,308 |
| 2 Portugal Obrigacoes do Tesouro OT | 2.200% | 10/17/22 | EUR | 65,000 | 78,975 |
| 2 Portugal Obrigacoes do Tesouro OT | 2.875% | 10/15/25 | EUR | 150,000 | 187,323 |
| 2 Portugal Obrigacoes do Tesouro OT | 3.850% | 4/15/21 | EUR | 81,000 | 100,422 |
| 2 Portugal Obrigacoes do Tesouro OT | 4.100% | 4/15/37 | EUR | 16,700 | 22,897 |
| Portugal Obrigacoes do Tesouro OT | 4.125% | 4/14/27 | EUR | 54,400 | 73,261 |
| 2 Portuguese Republic | 4.100% | 2/15/45 | EUR | 44,000 | 60,149 |
| 2 Portuguese Republic | 4.800% | 6/15/20 | EUR | 30,000 | 36,696 |
| 2 Portuguese Republic | 4.950% | 10/25/23 | EUR | 43,100 | 58,983 |
| | | | | | 708,676 |
| Total Portugal (Cost $861,563) | | | | | 833,425 |
81
| | | | | |
| Total International Bond Index Fund | | | | | |
| |
| |
| |
| | | | | Face | Market |
| | | Maturity | | Amount | Value • |
| | Coupon | Date | Currency | (000) | ($000) |
| Romania (0.1%) | | | | | |
| Sovereign Bonds (0.1%) | | | | | |
| Republic of Romania | 2.500% | 2/8/30 | EUR | 2,000 | 2,120 |
| Republic of Romania | 2.750% | 10/29/25 | EUR | 11,385 | 13,880 |
| Republic of Romania | 2.875% | 5/26/28 | EUR | 33,525 | 38,163 |
| Republic of Romania | 3.625% | 4/24/24 | EUR | 5,200 | 6,691 |
| Republic of Romania | 4.625% | 9/18/20 | EUR | 3,000 | 3,690 |
| Republic of Romania | 4.875% | 11/7/19 | EUR | 7,000 | 8,314 |
| Romania | 2.375% | 4/19/27 | EUR | 14,860 | 16,788 |
| Total Romania (Cost $91,519) | | | | | 89,646 |
| Russia (0.3%) | | | | | |
| Sovereign Bonds (0.3%) | | | | | |
| Gazprom OAO Via Gaz Capital SA | 2.750% | 11/30/21 | CHF | 2,100 | 2,164 |
| Gazprom OAO Via Gaz Capital SA | 3.125% | 11/17/23 | EUR | 500 | 585 |
| Gazprom OAO Via Gaz Capital SA | 3.389% | 3/20/20 | EUR | 2,400 | 2,812 |
| Gazprom OAO Via Gaz Capital SA | 4.250% | 4/6/24 | GBP | 3,643 | 4,659 |
| Russian Federation | 6.400% | 5/27/20 | RUB | 1,150,000 | 17,121 |
| Russian Federation | 6.800% | 12/11/19 | RUB | 3,135,715 | 47,221 |
| Russian Federation | 7.000% | 1/25/23 | RUB | 1,525,000 | 22,238 |
| Russian Federation | 7.000% | 8/16/23 | RUB | 2,100,000 | 30,443 |
| Russian Federation | 7.050% | 1/19/28 | RUB | 2,650,000 | 36,733 |
| Russian Federation | 7.600% | 4/14/21 | RUB | 1,600,000 | 24,106 |
| Russian Federation | 7.600% | 7/20/22 | RUB | 2,600,000 | 38,897 |
| Russian Federation | 8.150% | 2/3/27 | RUB | 4,000,000 | 59,814 |
| Russian Railways Via RZD Capital plc | 7.487% | 3/25/31 | GBP | 2,000 | 2,996 |
| Total Russia (Cost $336,257) | | | | | 289,789 |
| Singapore (0.4%) | | | | | |
| Corporate Bonds (0.0%) | | | | | |
| DBS Bank Ltd. | 0.375% | 1/23/24 | EUR | 31,000 | 34,862 |
| Oversea-Chinese Banking Corp. Ltd. | 0.375% | 3/1/23 | EUR | 2,060 | 2,335 |
| Oversea-Chinese Banking Corp. Ltd. | 0.625% | 4/18/25 | EUR | 1,000 | 1,126 |
| United Overseas Bank Ltd. | 0.125% | 3/2/22 | EUR | 2,300 | 2,601 |
| United Overseas Bank Ltd. | 0.500% | 1/16/25 | EUR | 12,500 | 14,020 |
| | | | | | 54,944 |
| Sovereign Bonds (0.4%) | | | | | |
| Housing & Development Board | 1.470% | 7/19/21 | SGD | 30,000 | 21,162 |
| Housing & Development Board | 2.035% | 9/16/26 | SGD | 9,750 | 6,685 |
| Housing & Development Board | 2.288% | 9/19/19 | SGD | 20,000 | 14,448 |
| Housing & Development Board | 3.100% | 7/24/24 | SGD | 9,250 | 6,850 |
| Housing & Development Board | 3.140% | 3/18/21 | SGD | 10,000 | 7,348 |
| Republic of Singapore | 1.625% | 10/1/19 | SGD | 10,000 | 7,194 |
| Republic of Singapore | 1.750% | 4/1/22 | SGD | 20,000 | 14,240 |
| Republic of Singapore | 1.750% | 2/1/23 | SGD | 37,600 | 26,605 |
| Republic of Singapore | 2.000% | 7/1/20 | SGD | 20,000 | 14,424 |
| Republic of Singapore | 2.125% | 6/1/26 | SGD | 21,240 | 14,982 |
| Republic of Singapore | 2.250% | 6/1/21 | SGD | 45,370 | 32,859 |
| Republic of Singapore | 2.250% | 8/1/36 | SGD | 25,500 | 16,950 |
| Republic of Singapore | 2.375% | 6/1/25 | SGD | 40,000 | 28,791 |
| Republic of Singapore | 2.625% | 5/1/28 | SGD | 35,000 | 25,507 |
| Republic of Singapore | 2.750% | 7/1/23 | SGD | 10,150 | 7,473 |
| Republic of Singapore | 2.750% | 4/1/42 | SGD | 21,485 | 15,015 |
| Republic of Singapore | 2.750% | 3/1/46 | SGD | 21,250 | 14,758 |
82
| | | | | |
| Total International Bond Index Fund | | | | | |
| |
| |
| |
| | | | | Face | Market |
| | | Maturity | | Amount | Value • |
| | Coupon | Date | Currency | (000) | ($000) |
| Republic of Singapore | 2.875% | 7/1/29 | SGD | 13,435 | 9,944 |
| Republic of Singapore | 2.875% | 9/1/30 | SGD | 19,600 | 14,458 |
| Republic of Singapore | 3.000% | 9/1/24 | SGD | 16,500 | 12,309 |
| Republic of Singapore | 3.125% | 9/1/22 | SGD | 69,000 | 51,442 |
| Republic of Singapore | 3.375% | 9/1/33 | SGD | 32,000 | 24,693 |
| Republic of Singapore | 3.500% | 3/1/27 | SGD | 45,400 | 35,262 |
| Temasek Financial I Ltd. | 0.500% | 3/1/22 | EUR | 9,000 | 10,320 |
| Temasek Financial I Ltd. | 5.125% | 7/26/40 | GBP | 2,000 | 3,675 |
| | | | | | 437,394 |
| Total Singapore (Cost $512,263) | | | | | 492,338 |
| Slovakia (0.2%) | | | | | |
| Sovereign Bonds (0.2%) | | | | | |
| Slovak Republic | 0.000% | 11/13/23 | EUR | 62,800 | 69,847 |
| Slovak Republic | 0.625% | 5/22/26 | EUR | 13,000 | 14,695 |
| Slovak Republic | 1.375% | 1/21/27 | EUR | 11,200 | 13,311 |
| Slovak Republic | 1.625% | 1/21/31 | EUR | 14,500 | 16,972 |
| Slovak Republic | 3.000% | 2/28/23 | EUR | 5,000 | 6,364 |
| Slovak Republic | 3.375% | 11/15/24 | EUR | 20,000 | 26,587 |
| Slovak Republic | 3.625% | 1/16/29 | EUR | 3,000 | 4,232 |
| Slovak Republic | 4.000% | 4/27/20 | EUR | 15,750 | 19,031 |
| Slovak Republic | 4.000% | 3/26/21 | EUR | 1,000 | 1,254 |
| Slovak Republic | 4.350% | 10/14/25 | EUR | 6,500 | 9,551 |
| Total Slovakia (Cost $179,071) | | | | | 181,844 |
| Slovenia (0.1%) | | | | | |
| Sovereign Bonds (0.1%) | | | | | |
| Republic of Slovenia | 1.000% | 3/6/28 | EUR | 25,000 | 27,935 |
| Republic of Slovenia | 1.250% | 3/22/27 | EUR | 9,000 | 10,371 |
| Republic of Slovenia | 1.500% | 3/25/35 | EUR | 12,000 | 13,256 |
| Republic of Slovenia | 1.750% | 11/3/40 | EUR | 10,000 | 11,280 |
| Republic of Slovenia | 2.250% | 3/25/22 | EUR | 11,072 | 13,492 |
| Republic of Slovenia | 3.125% | 8/7/45 | EUR | 10,000 | 14,029 |
| Republic of Slovenia | 4.125% | 1/26/20 | EUR | 2,000 | 2,391 |
| Republic of Slovenia | 4.625% | 9/9/24 | EUR | 4,000 | 5,599 |
| Republic of Slovenia | 5.125% | 3/30/26 | EUR | 8,000 | 11,905 |
| Total Slovenia (Cost $106,664) | | | | | 110,258 |
| South Africa (0.0%) | | | | | |
| Corporate Bonds (0.0%) | | | | | |
| Anglo American Capital plc | 1.625% | 9/18/25 | EUR | 250 | 272 |
| Anglo American Capital plc | 3.500% | 3/28/22 | EUR | 6,709 | 8,170 |
| Total South Africa (Cost $8,971) | | | | | 8,442 |
| South Korea (2.7%) | | | | | |
| Asset-Backed/Commercial Mortgage-Backed Security (0.0%) | | | |
| 2 Korea Housing Finance Corp. | 0.750% | 10/30/23 | EUR | 4,800 | 5,434 |
| |
| Corporate Bond (0.0%) | | | | | |
| Hyundai Capital Services Inc. | 3.500% | 6/3/21 | AUD | 395 | 282 |
| |
| Sovereign Bonds (2.7%) | | | | | |
| Bank of Korea | 2.060% | 12/2/19 | KRW | 50,000,000 | 43,905 |
| 2 Export-Import Bank of Korea | 1.927% | 2/24/20 | CAD | 800 | 601 |
83
| | | | | |
| Total International Bond Index Fund | | | | | |
| |
| |
| |
| | | | | Face | Market |
| | | Maturity | | Amount | Value • |
| | Coupon | Date | Currency | (000) | ($000) |
| Export-Import Bank of Korea | 2.000% | 4/30/20 | EUR | 1,800 | 2,100 |
| 2 Export-Import Bank of Korea | 2.711% | 12/5/19 | CAD | 3,420 | 2,593 |
| Republic of Korea | 1.250% | 12/10/19 | KRW | 71,726,070 | 62,543 |
| Republic of Korea | 1.250% | 7/31/21 | KRW | 20,000,000 | 17,186 |
| Republic of Korea | 1.250% | 8/31/21 | KRW | 17,000,000 | 14,595 |
| Republic of Korea | 1.250% | 11/30/21 | KRW | 10,000,000 | 8,567 |
| Republic of Korea | 1.375% | 9/10/21 | KRW | 173,000,000 | 149,294 |
| Republic of Korea | 1.500% | 4/30/21 | KRW | 20,000,000 | 17,330 |
| Republic of Korea | 1.500% | 11/30/21 | KRW | 40,000,000 | 34,524 |
| Republic of Korea | 1.500% | 12/31/21 | KRW | 40,000,000 | 34,489 |
| Republic of Korea | 1.500% | 12/10/26 | KRW | 130,000,000 | 108,094 |
| Republic of Korea | 1.500% | 9/10/36 | KRW | 140,000,000 | 110,620 |
| Republic of Korea | 1.750% | 5/31/20 | KRW | 20,000,000 | 17,510 |
| Republic of Korea | 1.750% | 6/10/20 | KRW | 120,000,000 | 105,081 |
| Republic of Korea | 1.750% | 6/30/20 | KRW | 10,000,000 | 8,754 |
| Republic of Korea | 1.750% | 7/31/20 | KRW | 38,000,000 | 33,256 |
| Republic of Korea | 1.750% | 8/31/20 | KRW | 30,000,000 | 26,215 |
| Republic of Korea | 1.750% | 10/31/20 | KRW | 10,000,000 | 8,741 |
| Republic of Korea | 1.750% | 11/30/20 | KRW | 20,000,000 | 17,478 |
| Republic of Korea | 1.750% | 12/10/20 | KRW | 40,000,000 | 34,974 |
| Republic of Korea | 1.750% | 12/31/20 | KRW | 10,000,000 | 8,735 |
| Republic of Korea | 1.750% | 1/31/21 | KRW | 10,000,000 | 8,733 |
| Republic of Korea | 1.875% | 3/10/22 | KRW | 200,000,000 | 174,784 |
| Republic of Korea | 1.875% | 6/10/26 | KRW | 182,000,000 | 156,189 |
| Republic of Korea | 2.000% | 11/30/19 | KRW | 10,000,000 | 8,791 |
| Republic of Korea | 2.000% | 2/29/20 | KRW | 30,000,000 | 26,363 |
| Republic of Korea | 2.000% | 3/10/20 | KRW | 60,000,000 | 52,767 |
| Republic of Korea | 2.000% | 3/31/20 | KRW | 10,000,000 | 8,792 |
| Republic of Korea | 2.000% | 9/10/20 | KRW | 45,000,000 | 39,567 |
| Republic of Korea | 2.000% | 9/10/22 | KRW | 40,000,000 | 35,051 |
| Republic of Korea | 2.000% | 3/10/46 | KRW | 65,000,000 | 55,325 |
| Republic of Korea | 2.125% | 6/10/24 | EUR | 4,300 | 5,264 |
| Republic of Korea | 2.125% | 6/10/27 | KRW | 105,000,000 | 91,425 |
| Republic of Korea | 2.125% | 3/10/47 | KRW | 104,000,000 | 90,898 |
| Republic of Korea | 2.250% | 6/10/21 | KRW | 50,000,000 | 44,195 |
| Republic of Korea | 2.250% | 6/10/25 | KRW | 79,000,000 | 69,744 |
| Republic of Korea | 2.250% | 12/10/25 | KRW | 30,000,000 | 26,459 |
| Republic of Korea | 2.250% | 9/10/37 | KRW | 108,000,000 | 95,707 |
| Republic of Korea | 2.375% | 3/10/23 | KRW | 110,000,000 | 97,795 |
| Republic of Korea | 2.375% | 12/10/27 | KRW | 95,000,000 | 84,346 |
| Republic of Korea | 2.375% | 9/10/38 | KRW | 38,500,000 | 34,842 |
| Republic of Korea | 2.625% | 6/10/28 | KRW | 155,000,000 | 140,571 |
| Republic of Korea | 2.625% | 9/10/35 | KRW | 49,000,000 | 45,584 |
| Republic of Korea | 2.625% | 3/10/48 | KRW | 55,695,000 | 53,984 |
| Republic of Korea | 2.750% | 12/10/44 | KRW | 38,000,000 | 37,346 |
| Republic of Korea | 3.000% | 3/10/23 | KRW | 84,000,000 | 76,603 |
| Republic of Korea | 3.000% | 9/10/24 | KRW | 95,000,000 | 87,391 |
| Republic of Korea | 3.000% | 12/10/42 | KRW | 41,000,000 | 41,678 |
| Republic of Korea | 3.375% | 9/10/23 | KRW | 40,000,000 | 37,203 |
| Republic of Korea | 3.750% | 12/10/33 | KRW | 96,500,000 | 101,399 |
| Republic of Korea | 4.000% | 12/10/31 | KRW | 41,000,000 | 43,247 |
| Republic of Korea | 4.250% | 6/10/21 | KRW | 45,000,000 | 41,718 |
| Republic of Korea | 4.750% | 12/10/30 | KRW | 28,000,000 | 31,138 |
| Republic of Korea | 5.000% | 6/10/20 | KRW | 146,500,000 | 134,910 |
84
| | | | | |
| Total International Bond Index Fund | | | | | |
| |
| |
| |
| | | | | Face | Market |
| | | Maturity | | Amount | Value • |
| | Coupon | Date | Currency | (000) | ($000) |
| Republic of Korea | 5.250% | 3/10/27 | KRW | 15,500,000 | 16,728 |
| Republic of Korea | 5.500% | 3/10/28 | KRW | 20,000,000 | 22,355 |
| Republic of Korea | 5.500% | 12/10/29 | KRW | 16,000,000 | 18,544 |
| Republic of Korea | 5.750% | 3/10/26 | KRW | 14,000,000 | 15,248 |
| | | | | | 3,019,869 |
| Total South Korea (Cost $3,030,775) | | | | | 3,025,585 |
| Spain (5.4%) | | | | | |
| Asset-Backed/Commercial Mortgage-Backed Securities (0.5%) | | | |
| AyT Cedulas Cajas Global | 3.750% | 12/14/22 | EUR | 800 | 1,032 |
| AyT Cedulas Cajas Global | 4.000% | 3/24/21 | EUR | 7,000 | 8,683 |
| AyT Cedulas Cajas Global | 4.250% | 10/25/23 | EUR | 1,100 | 1,472 |
| AyT Cedulas Cajas Global | 4.500% | 12/2/19 | EUR | 5,000 | 5,944 |
| AyT Cedulas Cajas Global | 4.750% | 5/25/27 | EUR | 10,700 | 15,664 |
| AyT Cedulas Cajas IX Fondo de | | | | | |
| Titulizacion de Activos | 4.000% | 3/31/20 | EUR | 7,000 | 8,389 |
| AyT Cedulas Cajas VIII Fondo de | | | | | |
| Titulizacion de Activos | 4.250% | 11/18/19 | EUR | 11,000 | 13,025 |
| AyT Cedulas Cajas X Fondo de | | | | | |
| Titulizacion de Activos | 3.750% | 6/30/25 | EUR | 10,000 | 13,530 |
| Banco Bilbao Vizcaya Argentaria SA | 2.250% | 6/12/24 | EUR | 3,000 | 3,726 |
| Banco Bilbao Vizcaya Argentaria SA | 3.500% | 10/7/20 | EUR | 1,000 | 1,212 |
| Banco Bilbao Vizcaya Argentaria SA | 3.500% | 1/24/21 | EUR | 5,000 | 6,111 |
| Banco Bilbao Vizcaya Argentaria SA | 3.875% | 1/30/23 | EUR | 6,000 | 7,824 |
| Banco Bilbao Vizcaya Argentaria SA | 4.000% | 2/25/25 | EUR | 2,100 | 2,878 |
| Banco de Sabadell SA | 0.625% | 6/10/24 | EUR | 30,500 | 34,606 |
| Banco de Sabadell SA | 0.875% | 11/12/21 | EUR | 10,000 | 11,569 |
| Banco Popular Espanol SA | 1.000% | 4/7/25 | EUR | 43,000 | 49,244 |
| Banco Santander SA | 0.750% | 9/9/22 | EUR | 20,700 | 23,938 |
| Banco Santander SA | 1.125% | 11/27/24 | EUR | 14,500 | 16,996 |
| Banco Santander SA | 2.000% | 11/27/34 | EUR | 6,600 | 7,985 |
| Banco Santander SA | 3.875% | 2/6/26 | EUR | 400 | 553 |
| Banco Santander SA | 4.000% | 4/7/20 | EUR | 2,000 | 2,401 |
| Banco Santander SA | 4.625% | 5/4/27 | EUR | 1,600 | 2,364 |
| Bankia SA | 0.875% | 1/21/21 | EUR | 5,800 | 6,693 |
| Bankia SA | 1.000% | 9/25/25 | EUR | 1,200 | 1,367 |
| Bankia SA | 1.125% | 8/5/22 | EUR | 23,000 | 26,851 |
| Bankia SA | 4.000% | 2/3/25 | EUR | 12,300 | 16,617 |
| Bankia SA | 4.125% | 3/24/36 | EUR | 4,700 | 6,970 |
| Bankia SA | 4.500% | 4/26/22 | EUR | 4,050 | 5,262 |
| Bankinter SA | 0.875% | 8/3/22 | EUR | 10,000 | 11,589 |
| Bankinter SA | 1.000% | 2/5/25 | EUR | 8,200 | 9,431 |
| CaixaBank SA | 0.625% | 3/27/25 | EUR | 18,000 | 20,180 |
| CaixaBank SA | 2.625% | 3/21/24 | EUR | 5,600 | 7,049 |
| CaixaBank SA | 3.625% | 1/18/21 | EUR | 5,000 | 6,118 |
| CaixaBank SA | 3.875% | 2/17/25 | EUR | 12,000 | 16,224 |
| CaixaBank SA | 4.500% | 1/26/22 | EUR | 15,000 | 19,359 |
| Caja Rural de Castilla-La Mancha SCC | 0.875% | 10/1/21 | EUR | 4,000 | 4,628 |
| Caja Rural de Castilla-La Mancha SCC | 0.875% | 5/27/24 | EUR | 5,000 | 5,703 |
| Caja Rural de Navarra SCC | 0.500% | 3/16/22 | EUR | 14,700 | 16,743 |
| Cajamar Caja Rural SCC | 0.875% | 6/18/23 | EUR | 15,000 | 17,107 |
| Cajamar Caja Rural SCC | 1.250% | 1/26/22 | EUR | 3,100 | 3,604 |
| Cedulas TDA 5 Fondo de Titulizacion de | | | | | |
| Activos | 4.125% | 11/29/19 | EUR | 10,400 | 12,321 |
| |
| |
| 85 |
| | | | | |
| Total International Bond Index Fund | | | | | |
| |
| |
| |
| | | | | Face | Market |
| | | Maturity | | Amount | Value • |
| | Coupon | Date | Currency | (000) | ($000) |
| Cedulas TDA 6 Fondo de Titulizacion de | | | | | |
| Activos | 4.250% | 4/10/31 | EUR | 10,800 | 15,965 |
| IM Cedulas 10 | 4.500% | 2/21/22 | EUR | 11,300 | 14,601 |
| IM Cedulas 7 Fondo de Titulazion de | | | | | |
| Activos | 4.000% | 3/31/21 | EUR | 10,000 | 12,399 |
| Kutxabank SA | 1.750% | 5/27/21 | EUR | 5,000 | 5,907 |
| Programa Cedulas TDA Fondo de | | | | | |
| Titulizacion de Activos | 4.125% | 4/10/21 | EUR | 6,500 | 8,090 |
| Programa Cedulas TDA Fondo de | | | | | |
| Titulizacion de Activos | 4.250% | 3/28/27 | EUR | 8,500 | 12,059 |
| | | | | | 521,983 |
| Corporate Bonds (0.5%) | | | | | |
| Abertis Infraestructuras SA | 1.000% | 2/27/27 | EUR | 1,300 | 1,333 |
| Abertis Infraestructuras SA | 1.375% | 5/20/26 | EUR | 700 | 746 |
| Abertis Infraestructuras SA | 2.500% | 2/27/25 | EUR | 200 | 235 |
| Abertis Infraestructuras SA | 3.750% | 6/20/23 | EUR | 3,100 | 3,918 |
| Abertis Infraestructuras SA | 4.375% | 3/30/20 | EUR | 700 | 842 |
| Banco Bilbao Vizcaya Argentaria SA | 0.625% | 1/17/22 | EUR | 1,000 | 1,138 |
| Banco Bilbao Vizcaya Argentaria SA | 0.625% | 3/18/23 | EUR | 20,000 | 22,928 |
| Banco Bilbao Vizcaya Argentaria SA | 0.750% | 1/20/22 | EUR | 12,100 | 13,996 |
| Banco Bilbao Vizcaya Argentaria SA | 1.000% | 1/20/21 | EUR | 1,000 | 1,154 |
| 1 Banco Bilbao Vizcaya Argentaria SA | 3.500% | 4/11/24 | EUR | 8,000 | 9,159 |
| Banco Bilbao Vizcaya Argentaria SA | 3.500% | 2/10/27 | EUR | 14,100 | 16,534 |
| Banco de Sabadell SA | 0.875% | 3/5/23 | EUR | 700 | 764 |
| Banco de Sabadell SA | 1.625% | 3/7/24 | EUR | 6,000 | 6,621 |
| Banco Santander SA | 1.125% | 1/17/25 | EUR | 20,000 | 21,946 |
| Banco Santander SA | 1.375% | 3/3/21 | EUR | 100 | 116 |
| Banco Santander SA | 1.375% | 2/9/22 | EUR | 10,500 | 12,049 |
| Banco Santander SA | 1.375% | 12/14/22 | EUR | 1,400 | 1,629 |
| Banco Santander SA | 1.500% | 1/25/26 | EUR | 400 | 478 |
| Banco Santander SA | 2.125% | 2/8/28 | EUR | 5,900 | 6,121 |
| Banco Santander SA | 2.500% | 3/18/25 | EUR | 14,100 | 15,936 |
| Banco Santander SA | 3.250% | 4/4/26 | EUR | 500 | 582 |
| Bankia SA | 1.000% | 3/14/23 | EUR | 17,700 | 20,556 |
| CaixaBank SA | 0.750% | 4/18/23 | EUR | 1,700 | 1,878 |
| CaixaBank SA | 1.000% | 2/8/23 | EUR | 1,500 | 1,746 |
| CaixaBank SA | 1.125% | 1/12/23 | EUR | 10,000 | 11,076 |
| CaixaBank SA | 1.250% | 1/11/27 | EUR | 600 | 692 |
| 1 CaixaBank SA | 2.250% | 4/17/30 | EUR | 22,000 | 23,200 |
| 1 CaixaBank SA | 2.750% | 7/14/28 | EUR | 4,000 | 4,543 |
| Canal de Isabel II Gestion SA | 1.680% | 2/26/25 | EUR | 3,500 | 3,989 |
| Criteria Caixa SAU | 1.625% | 4/21/22 | EUR | 3,000 | 3,426 |
| Enagas Financiaciones SAU | 1.000% | 3/25/23 | EUR | 100 | 116 |
| Enagas Financiaciones SAU | 1.250% | 2/6/25 | EUR | 5,200 | 6,032 |
| Enagas Financiaciones SAU | 1.375% | 5/5/28 | EUR | 200 | 226 |
| Enagas Financiaciones SAU | 2.500% | 4/11/22 | EUR | 2,000 | 2,447 |
| Ferrovial Emisiones SA | 2.500% | 7/15/24 | EUR | 5,000 | 6,057 |
| Ferrovial Emisiones SA | 3.375% | 6/7/21 | EUR | 700 | 854 |
| Gas Natural Capital Markets SA | 1.125% | 4/11/24 | EUR | 4,300 | 4,917 |
| Gas Natural Fenosa Finance BV | 0.875% | 5/15/25 | EUR | 15,300 | 16,810 |
| Gas Natural Fenosa Finance BV | 1.250% | 4/19/26 | EUR | 8,900 | 9,878 |
| Gas Natural Fenosa Finance BV | 1.375% | 1/19/27 | EUR | 200 | 222 |
| Gas Natural Fenosa Finance BV | 2.875% | 3/11/24 | EUR | 4,000 | 4,997 |
| Iberdrola Finanzas SA | 1.000% | 3/7/24 | EUR | 5,900 | 6,770 |
86
| | | | | |
| Total International Bond Index Fund | | | | | |
| |
| |
| |
| | | | | Face | Market |
| | | Maturity | | Amount | Value • |
| | Coupon | Date | Currency | (000) | ($000) |
| Iberdrola Finanzas SA | 1.000% | 3/7/25 | EUR | 300 | 340 |
| Iberdrola Finanzas SA | 1.621% | 11/29/29 | EUR | 700 | 781 |
| Iberdrola Finanzas SA | 4.125% | 3/23/20 | EUR | 1,200 | 1,439 |
| Iberdrola Finanzas SA | 6.000% | 7/1/22 | GBP | 6,500 | 9,519 |
| Iberdrola Finanzas SA | 7.375% | 1/29/24 | GBP | 5,000 | 8,000 |
| Iberdrola International BV | 0.375% | 9/15/25 | EUR | 16,700 | 17,986 |
| Iberdrola International BV | 1.125% | 1/27/23 | EUR | 200 | 232 |
| Iberdrola International BV | 1.125% | 4/21/26 | EUR | 6,800 | 7,630 |
| Iberdrola International BV | 1.750% | 9/17/23 | EUR | 10,000 | 11,941 |
| Iberdrola International BV | 1.875% | 10/8/24 | EUR | 400 | 480 |
| 1 Iberdrola International BV | 1.875% | 12/31/49 | EUR | 400 | 432 |
| Iberdrola International BV | 2.500% | 10/24/22 | EUR | 2,600 | 3,189 |
| 1 Iberdrola International BV | 2.625% | 12/31/49 | EUR | 200 | 222 |
| Iberdrola International BV | 3.000% | 1/31/22 | EUR | 3,200 | 3,943 |
| Iberdrola International BV | 3.500% | 2/1/21 | EUR | 14,100 | 17,186 |
| Inmobiliaria Colonial Socimi SA | 1.450% | 10/28/24 | EUR | 1,500 | 1,651 |
| Inmobiliaria Colonial Socimi SA | 1.625% | 11/28/25 | EUR | 1,100 | 1,201 |
| Inmobiliaria Colonial Socimi SA | 2.728% | 6/5/23 | EUR | 7,300 | 8,771 |
| Mapfre SA | 1.625% | 5/19/26 | EUR | 1,500 | 1,681 |
| Merlin Properties Socimi SA | 1.750% | 5/26/25 | EUR | 9,670 | 10,721 |
| Merlin Properties Socimi SA | 2.225% | 4/25/23 | EUR | 300 | 353 |
| Merlin Properties Socimi SA | 2.375% | 5/23/22 | EUR | 8,600 | 10,193 |
| NorteGas Energia Distribucion SAU | 2.065% | 9/28/27 | EUR | 10,500 | 11,612 |
| Prosegur Cash SA | 1.375% | 2/4/26 | EUR | 800 | 856 |
| Red Electrica Financiaciones SAU | 2.125% | 7/1/23 | EUR | 6,800 | 8,281 |
| Red Electrica Financiaciones SAU | 4.875% | 4/29/20 | EUR | 2,100 | 2,553 |
| Red Electrica Financiaciones SAU | 1.000% | 4/21/26 | EUR | 600 | 675 |
| Red Electrica Financiaciones SAU | 1.125% | 4/24/25 | EUR | 300 | 346 |
| Red Electrica Financiaciones SAU | 3.875% | 1/25/22 | EUR | 2,000 | 2,535 |
| Repsol International Finance BV | 0.500% | 5/23/22 | EUR | 7,500 | 8,563 |
| Repsol International Finance BV | 2.125% | 12/16/20 | EUR | 4,200 | 4,963 |
| Repsol International Finance BV | 2.250% | 12/10/26 | EUR | 10,000 | 12,167 |
| Repsol International Finance BV | 2.625% | 5/28/20 | EUR | 7,800 | 9,197 |
| Santander Consumer Finance SA | 0.500% | 10/4/21 | EUR | 20,100 | 22,813 |
| Santander Consumer Finance SA | 0.900% | 2/18/20 | EUR | 15,200 | 17,418 |
| Santander Consumer Finance SA | 1.000% | 5/26/21 | EUR | 100 | 115 |
| Santander Consumer Finance SA | 1.500% | 11/12/20 | EUR | 500 | 581 |
| Santander International Debt SAU | 4.000% | 1/24/20 | EUR | 5,600 | 6,660 |
| Telefonica Emisiones SAU | 0.318% | 10/17/20 | EUR | 8,200 | 9,324 |
| Telefonica Emisiones SAU | 1.447% | 1/22/27 | EUR | 6,000 | 6,556 |
| Telefonica Emisiones SAU | 1.460% | 4/13/26 | EUR | 6,000 | 6,673 |
| Telefonica Emisiones SAU | 1.528% | 1/17/25 | EUR | 9,300 | 10,630 |
| Telefonica Emisiones SAU | 1.930% | 10/17/31 | EUR | 7,300 | 7,698 |
| Telefonica Emisiones SAU | 2.318% | 10/17/28 | EUR | 800 | 913 |
| Telefonica Emisiones SAU | 2.932% | 10/17/29 | EUR | 8,600 | 10,274 |
| Telefonica Emisiones SAU | 3.961% | 3/26/21 | EUR | 6,000 | 7,415 |
| Telefonica Emisiones SAU | 3.987% | 1/23/23 | EUR | 20,000 | 25,706 |
| Telefonica Emisiones SAU | 4.693% | 11/11/19 | EUR | 7,400 | 8,786 |
| Telefonica Emisiones SAU | 5.289% | 12/9/22 | GBP | 1,000 | 1,439 |
| Telefonica Emisiones SAU | 5.375% | 2/2/26 | GBP | 2,600 | 3,839 |
| Telefonica Emisiones SAU | 5.445% | 10/8/29 | GBP | 5,750 | 8,754 |
| Telefonica Emisiones SAU | 5.597% | 3/12/20 | GBP | 2,000 | 2,691 |
| Telefonica Europe BV | 5.875% | 2/14/33 | EUR | 832 | 1,302 |
| | | | | | 607,883 |
| |
| |
| 87 |
| | | | | | |
| Total International Bond Index Fund | | | | | |
| |
| |
| |
| | | | | | Face | Market |
| | | | Maturity | | Amount | Value • |
| | | Coupon | Date | Currency | (000) | ($000) |
| Sovereign Bonds (4.4%) | | | | | |
| | ADIF Alta Velocidad | 1.875% | 1/28/25 | EUR | 15,100 | 17,799 |
| | ADIF Alta Velocidad | 3.500% | 5/27/24 | EUR | 12,000 | 15,374 |
| | Autonomous Community of Madrid Spain | 0.727% | 5/19/21 | EUR | 23,300 | 26,800 |
| | Autonomous Community of Madrid Spain | 0.997% | 9/30/24 | EUR | 1,720 | 1,946 |
| | Autonomous Community of Madrid Spain | 1.773% | 4/30/28 | EUR | 8,000 | 9,110 |
| | Autonomous Community of Madrid Spain | 1.826% | 4/30/25 | EUR | 5,000 | 5,900 |
| | Autonomous Community of Madrid Spain | 2.146% | 4/30/27 | EUR | 7,000 | 8,288 |
| | Autonomous Community of Madrid Spain | 2.875% | 7/17/23 | EUR | 8,950 | 11,147 |
| | Autonomous Community of Madrid Spain | 4.125% | 5/21/24 | EUR | 21,500 | 28,518 |
| | Autonomous Community of Madrid Spain | 4.300% | 9/15/26 | EUR | 5,800 | 7,958 |
| | Autonomous Community of Madrid Spain | 4.688% | 3/12/20 | EUR | 2,000 | 2,410 |
| 11 | FADE - Fondo de Amortizacion del Deficit | | | | | |
| | Electrico | 0.500% | 3/17/23 | EUR | 30,000 | 33,855 |
| 11 | FADE - Fondo de Amortizacion del Deficit | | | | | |
| | Electrico | 5.900% | 3/17/21 | EUR | 2,000 | 2,575 |
| 11 | Instituto de Credito Oficial | 0.050% | 7/30/20 | EUR | 25,000 | 28,418 |
| 11 | Instituto de Credito Oficial | 4.750% | 4/30/20 | EUR | 9,000 | 10,937 |
| 11 | Instituto de Credito Oficial | 6.000% | 3/8/21 | EUR | 5,000 | 6,451 |
| | Kingdom of Spain | 0.050% | 1/31/21 | EUR | 152,100 | 172,816 |
| | Kingdom of Spain | 0.400% | 4/30/22 | EUR | 35,000 | 39,938 |
| | Kingdom of Spain | 0.450% | 10/31/22 | EUR | 100,300 | 114,210 |
| | Kingdom of Spain | 0.750% | 7/30/21 | EUR | 62,700 | 72,509 |
| | Kingdom of Spain | 1.150% | 7/30/20 | EUR | 132,500 | 153,648 |
| 2 | Kingdom of Spain | 1.300% | 10/31/26 | EUR | 1,450 | 1,651 |
| | Kingdom of Spain | 1.400% | 1/31/20 | EUR | 104,720 | 121,193 |
| 2 | Kingdom of Spain | 1.400% | 4/30/28 | EUR | 172,100 | 193,274 |
| 2 | Kingdom of Spain | 1.400% | 7/30/28 | EUR | 65,000 | 72,623 |
| 2 | Kingdom of Spain | 1.450% | 10/31/27 | EUR | 39,400 | 44,705 |
| 2 | Kingdom of Spain | 1.500% | 4/30/27 | EUR | 165,267 | 189,371 |
| 2 | Kingdom of Spain | 1.600% | 4/30/25 | EUR | 142,255 | 167,908 |
| 2 | Kingdom of Spain | 1.950% | 4/30/26 | EUR | 227,860 | 272,323 |
| 2 | Kingdom of Spain | 1.950% | 7/30/30 | EUR | 132,200 | 152,498 |
| 2 | Kingdom of Spain | 2.150% | 10/31/25 | EUR | 71,100 | 86,396 |
| 2 | Kingdom of Spain | 2.350% | 7/30/33 | EUR | 137,515 | 161,657 |
| 2 | Kingdom of Spain | 2.700% | 10/31/48 | EUR | 20,330 | 23,176 |
| 2 | Kingdom of Spain | 2.750% | 10/31/24 | EUR | 207,800 | 261,706 |
| 2 | Kingdom of Spain | 2.900% | 10/31/46 | EUR | 26,350 | 31,602 |
| 2 | Kingdom of Spain | 3.450% | 7/30/66 | EUR | 73,000 | 92,962 |
| 2 | Kingdom of Spain | 3.800% | 4/30/24 | EUR | 82,820 | 109,134 |
| 2 | Kingdom of Spain | 4.000% | 4/30/20 | EUR | 313,500 | 377,800 |
| 2 | Kingdom of Spain | 4.200% | 1/31/37 | EUR | 169,580 | 250,378 |
| 2 | Kingdom of Spain | 4.400% | 10/31/23 | EUR | 80,495 | 108,093 |
| 2 | Kingdom of Spain | 4.650% | 7/30/25 | EUR | 18,760 | 26,311 |
| 2 | Kingdom of Spain | 4.700% | 7/30/41 | EUR | 182,400 | 289,536 |
| 2 | Kingdom of Spain | 4.800% | 1/31/24 | EUR | 51,335 | 70,449 |
| 2 | Kingdom of Spain | 4.850% | 10/31/20 | EUR | 24,400 | 30,378 |
| 2 | Kingdom of Spain | 4.900% | 7/30/40 | EUR | 37,980 | 61,610 |
| 2 | Kingdom of Spain | 5.150% | 10/31/28 | EUR | 78,090 | 117,696 |
| 2 | Kingdom of Spain | 5.150% | 10/31/44 | EUR | 72,195 | 122,496 |
| 2 | Kingdom of Spain | 5.400% | 1/31/23 | EUR | 144,580 | 198,239 |
| 2 | Kingdom of Spain | 5.500% | 4/30/21 | EUR | 27,810 | 35,848 |
| | Kingdom of Spain | 5.750% | 7/30/32 | EUR | 35,450 | 58,938 |
| 2 | Kingdom of Spain | 5.850% | 1/31/22 | EUR | 132,300 | 177,648 |
| |
| |
| 88 |
| | | | | |
| Total International Bond Index Fund | | | | | |
| |
| |
| |
| | | | | Face | Market |
| | | Maturity | | Amount | Value • |
| | Coupon | Date | Currency | (000) | ($000) |
| 2 Kingdom of Spain | 5.900% | 7/30/26 | EUR | 90,420 | 137,731 |
| Kingdom of Spain | 6.000% | 1/31/29 | EUR | 27,165 | 43,637 |
| | | | | | 4,859,574 |
| Total Spain (Cost $5,951,904) | | | | | 5,989,440 |
| Supranational (3.2%) | | | | | |
| Sovereign Bonds (3.2%) | | | | | |
| African Development Bank | 0.125% | 10/7/26 | EUR | 4,000 | 4,342 |
| African Development Bank | 0.250% | 11/21/24 | EUR | 22,600 | 25,420 |
| African Development Bank | 0.875% | 12/20/21 | GBP | 1,500 | 1,901 |
| African Development Bank | 4.000% | 1/10/25 | AUD | 12,830 | 9,646 |
| African Development Bank | 5.250% | 3/23/22 | AUD | 10,900 | 8,408 |
| Asian Development Bank | 1.375% | 6/11/20 | CAD | 23,495 | 17,571 |
| Asian Development Bank | 2.600% | 1/16/20 | AUD | 20,000 | 14,224 |
| Asian Development Bank | 2.750% | 1/19/22 | AUD | 3,400 | 2,431 |
| Asian Development Bank | 3.000% | 1/17/23 | NZD | 10,000 | 6,623 |
| Asian Development Bank | 3.500% | 5/22/19 | AUD | 15,000 | 10,700 |
| Asian Development Bank | 3.500% | 5/30/24 | NZD | 20,000 | 13,543 |
| Asian Development Bank | 3.750% | 3/12/25 | AUD | 9,100 | 6,786 |
| Asian Development Bank | 5.000% | 3/9/22 | AUD | 13,000 | 9,956 |
| Asian Development Bank | 6.250% | 3/5/20 | AUD | 5,000 | 3,727 |
| Corp. Andina de Fomento | 1.125% | 2/13/25 | EUR | 15,000 | 17,166 |
| Corp. Andina de Fomento | 0.500% | 2/26/26 | CHF | 3,000 | 2,931 |
| Council of Europe Development Bank | 0.375% | 6/8/26 | EUR | 17,000 | 19,028 |
| Council of Europe Development Bank | 1.250% | 12/23/19 | GBP | 3,000 | 3,846 |
| Council of Europe Development Bank | 2.875% | 8/31/21 | EUR | 23,000 | 28,337 |
| Council of Europe Development Bank | 3.000% | 7/13/20 | EUR | 6,500 | 7,788 |
| Eurofima | 3.000% | 5/22/24 | CHF | 5,000 | 5,792 |
| Eurofima | 3.000% | 5/15/26 | CHF | 6,500 | 7,792 |
| Eurofima | 3.375% | 12/29/20 | CHF | 4,000 | 4,301 |
| Eurofima | 4.000% | 10/27/21 | EUR | 5,000 | 6,342 |
| Eurofima | 4.550% | 3/30/27 | CAD | 655 | 541 |
| Eurofima | 6.250% | 12/28/18 | AUD | 5,980 | 4,260 |
| European Bank for Reconstruction & | | | | | |
| Development | 1.250% | 12/15/22 | GBP | 10,000 | 12,769 |
| European Bank for Reconstruction & | | | | | |
| Development | 5.625% | 12/7/28 | GBP | 1,000 | 1,736 |
| European Financial Stability Facility | 0.000% | 3/29/21 | EUR | 35,000 | 39,885 |
| European Financial Stability Facility | 0.000% | 11/17/22 | EUR | 25,000 | 28,347 |
| European Financial Stability Facility | 0.100% | 1/19/21 | EUR | 20,000 | 22,846 |
| European Financial Stability Facility | 0.125% | 11/4/19 | EUR | 60,000 | 68,344 |
| 4 European Financial Stability Facility | 0.200% | 4/28/25 | EUR | 3,000 | 3,343 |
| European Financial Stability Facility | 0.400% | 2/17/25 | EUR | 30,000 | 33,951 |
| 4 European Financial Stability Facility | 0.400% | 5/31/26 | EUR | 39,500 | 44,143 |
| 4 European Financial Stability Facility | 0.500% | 1/20/23 | EUR | 37,000 | 42,752 |
| European Financial Stability Facility | 0.750% | 5/3/27 | EUR | 31,100 | 35,302 |
| European Financial Stability Facility | 0.875% | 7/26/27 | EUR | 25,000 | 28,624 |
| European Financial Stability Facility | 0.950% | 2/14/28 | EUR | 20,000 | 22,920 |
| European Financial Stability Facility | 1.200% | 2/17/45 | EUR | 36,500 | 37,907 |
| European Financial Stability Facility | 1.250% | 5/24/33 | EUR | 15,000 | 17,013 |
| 4 European Financial Stability Facility | 1.375% | 6/7/21 | EUR | 200 | 236 |
| European Financial Stability Facility | 1.375% | 5/31/47 | EUR | 8,600 | 9,198 |
| European Financial Stability Facility | 1.450% | 9/5/40 | EUR | 5,000 | 5,591 |
| 4 European Financial Stability Facility | 1.500% | 1/22/20 | EUR | 31,800 | 36,868 |
89
| | | | | |
| Total International Bond Index Fund | | | | | |
| |
| |
| |
| | | | | Face | Market |
| | | Maturity | | Amount | Value • |
| | Coupon | Date | Currency | (000) | ($000) |
| 4 European Financial Stability Facility | 1.625% | 7/17/20 | EUR | 16,000 | 18,734 |
| European Financial Stability Facility | 1.700% | 2/13/43 | EUR | 26,600 | 30,945 |
| 4 European Financial Stability Facility | 1.750% | 10/29/20 | EUR | 23,000 | 27,134 |
| 4 European Financial Stability Facility | 1.750% | 6/27/24 | EUR | 27,000 | 33,099 |
| European Financial Stability Facility | 1.750% | 7/17/53 | EUR | 10,000 | 11,270 |
| European Financial Stability Facility | 1.800% | 7/10/48 | EUR | 45,000 | 52,688 |
| 4 European Financial Stability Facility | 1.875% | 5/23/23 | EUR | 36,000 | 44,088 |
| European Financial Stability Facility | 2.000% | 2/28/56 | EUR | 31,780 | 38,211 |
| 4 European Financial Stability Facility | 2.125% | 2/19/24 | EUR | 16,500 | 20,546 |
| 4 European Financial Stability Facility | 2.250% | 9/5/22 | EUR | 33,250 | 41,047 |
| 4 European Financial Stability Facility | 2.350% | 7/29/44 | EUR | 13,600 | 18,051 |
| 4 European Financial Stability Facility | 2.750% | 12/3/29 | EUR | 11,600 | 15,616 |
| 4 European Financial Stability Facility | 3.000% | 9/4/34 | EUR | 5,200 | 7,316 |
| 4 European Financial Stability Facility | 3.375% | 7/5/21 | EUR | 1,675 | 2,081 |
| 4 European Financial Stability Facility | 3.375% | 4/3/37 | EUR | 30,800 | 45,978 |
| 4 European Financial Stability Facility | 3.875% | 3/30/32 | EUR | 20,000 | 30,379 |
| European Investment Bank | 0.000% | 10/16/23 | EUR | 30,000 | 33,767 |
| European Investment Bank | 0.000% | 3/15/24 | EUR | 75,000 | 83,907 |
| European Investment Bank | 0.000% | 3/13/26 | EUR | 10,000 | 10,904 |
| European Investment Bank | 0.050% | 12/15/23 | EUR | 25,000 | 28,186 |
| European Investment Bank | 0.125% | 6/15/20 | EUR | 10,000 | 11,432 |
| European Investment Bank | 0.125% | 4/15/25 | EUR | 30,000 | 33,385 |
| European Investment Bank | 0.200% | 7/15/24 | EUR | 20,000 | 22,527 |
| European Investment Bank | 0.250% | 10/15/20 | EUR | 51,000 | 58,486 |
| European Investment Bank | 0.375% | 3/15/22 | EUR | 25,000 | 28,818 |
| European Investment Bank | 0.375% | 7/16/25 | EUR | 20,000 | 22,577 |
| European Investment Bank | 0.500% | 11/15/23 | EUR | 20,000 | 23,081 |
| European Investment Bank | 0.500% | 1/15/27 | EUR | 33,700 | 37,750 |
| European Investment Bank | 0.500% | 11/13/37 | EUR | 15,000 | 14,616 |
| European Investment Bank | 0.875% | 3/15/21 | GBP | 20,000 | 25,476 |
| European Investment Bank | 0.875% | 12/15/23 | GBP | 10,000 | 12,471 |
| European Investment Bank | 0.875% | 9/13/24 | EUR | 33,000 | 38,651 |
| European Investment Bank | 0.875% | 1/14/28 | EUR | 10,000 | 11,450 |
| European Investment Bank | 1.000% | 9/21/26 | GBP | 200 | 244 |
| European Investment Bank | 1.000% | 3/14/31 | EUR | 73,000 | 82,261 |
| European Investment Bank | 1.000% | 4/14/32 | EUR | 31,000 | 34,604 |
| European Investment Bank | 1.125% | 2/18/20 | CAD | 1,650 | 1,237 |
| European Investment Bank | 1.125% | 9/7/21 | GBP | 5,000 | 6,396 |
| 2 European Investment Bank | 1.125% | 9/16/21 | CAD | 13,340 | 9,714 |
| European Investment Bank | 1.125% | 4/13/33 | EUR | 30,000 | 33,798 |
| European Investment Bank | 1.125% | 9/15/36 | EUR | 24,000 | 26,335 |
| European Investment Bank | 1.250% | 8/2/19 | CHF | 3,000 | 3,025 |
| 2 European Investment Bank | 1.250% | 11/5/20 | CAD | 3,500 | 2,590 |
| European Investment Bank | 1.250% | 11/5/20 | CAD | 650 | 481 |
| European Investment Bank | 1.250% | 11/13/26 | EUR | 6,000 | 7,179 |
| European Investment Bank | 1.375% | 11/15/19 | EUR | 33,000 | 38,091 |
| European Investment Bank | 1.375% | 9/15/20 | EUR | 4,000 | 4,682 |
| European Investment Bank | 1.375% | 9/15/21 | EUR | 35,000 | 41,485 |
| European Investment Bank | 1.500% | 7/15/20 | EUR | 30,000 | 35,097 |
| European Investment Bank | 1.500% | 4/15/21 | EUR | 43,000 | 50,884 |
| European Investment Bank | 1.500% | 8/2/24 | CHF | 11,400 | 12,396 |
| European Investment Bank | 1.500% | 11/15/47 | EUR | 5,000 | 5,607 |
| European Investment Bank | 1.625% | 3/15/23 | EUR | 56,150 | 67,978 |
| European Investment Bank | 1.625% | 2/4/25 | CHF | 2,500 | 2,751 |
| |
| |
| 90 |
| | | | | |
| Total International Bond Index Fund | | | | | |
| |
| |
| |
| | | | | Face | Market |
| | | Maturity | | Amount | Value • |
| | Coupon | Date | Currency | (000) | ($000) |
| European Investment Bank | 1.750% | 9/15/45 | EUR | 20,000 | 23,766 |
| European Investment Bank | 2.125% | 1/15/24 | EUR | 17,000 | 21,201 |
| European Investment Bank | 2.250% | 3/7/20 | GBP | 12,000 | 15,612 |
| European Investment Bank | 2.250% | 5/25/21 | PLN | 10,000 | 2,630 |
| 2 European Investment Bank | 2.250% | 7/30/21 | CAD | 26,015 | 19,556 |
| European Investment Bank | 2.250% | 10/14/22 | EUR | 7,000 | 8,657 |
| European Investment Bank | 2.375% | 7/10/20 | CHF | 2,500 | 2,612 |
| 2 European Investment Bank | 2.375% | 1/18/23 | CAD | 2,800 | 2,093 |
| European Investment Bank | 2.375% | 7/6/23 | CAD | 300 | 224 |
| European Investment Bank | 2.500% | 10/31/22 | GBP | 5,500 | 7,371 |
| European Investment Bank | 2.625% | 3/16/20 | EUR | 50,000 | 59,044 |
| European Investment Bank | 2.625% | 3/15/35 | EUR | 7,100 | 9,683 |
| European Investment Bank | 2.750% | 9/15/21 | EUR | 5,000 | 6,154 |
| European Investment Bank | 2.750% | 9/15/25 | EUR | 35,000 | 45,862 |
| European Investment Bank | 2.750% | 8/25/26 | PLN | 10,000 | 2,520 |
| European Investment Bank | 2.750% | 9/13/30 | EUR | 10,000 | 13,556 |
| European Investment Bank | 2.750% | 3/15/40 | EUR | 18,550 | 26,197 |
| European Investment Bank | 3.000% | 9/28/22 | EUR | 4,000 | 5,074 |
| European Investment Bank | 3.000% | 10/14/33 | EUR | 10,000 | 14,122 |
| European Investment Bank | 3.100% | 8/17/26 | AUD | 20,513 | 14,609 |
| European Investment Bank | 3.125% | 6/30/36 | CHF | 1,000 | 1,390 |
| European Investment Bank | 3.500% | 4/15/27 | EUR | 5,000 | 7,013 |
| European Investment Bank | 3.625% | 3/14/42 | EUR | 5,600 | 9,084 |
| European Investment Bank | 3.750% | 12/7/27 | GBP | 3,800 | 5,701 |
| European Investment Bank | 3.875% | 6/8/37 | GBP | 4,800 | 7,864 |
| European Investment Bank | 4.000% | 4/15/30 | EUR | 7,125 | 10,754 |
| European Investment Bank | 4.500% | 10/15/25 | EUR | 15,000 | 21,792 |
| European Investment Bank | 4.500% | 6/7/29 | GBP | 12,000 | 19,332 |
| European Investment Bank | 4.500% | 3/7/44 | GBP | 8,500 | 15,892 |
| European Investment Bank | 4.625% | 4/15/20 | EUR | 20,500 | 24,937 |
| European Investment Bank | 4.625% | 10/12/54 | GBP | 7,700 | 16,147 |
| European Investment Bank | 5.000% | 12/1/20 | SEK | 25,000 | 3,013 |
| European Investment Bank | 5.000% | 8/22/22 | AUD | 6,800 | 5,243 |
| European Investment Bank | 5.000% | 4/15/39 | GBP | 2,000 | 3,806 |
| European Investment Bank | 6.000% | 8/6/20 | AUD | 17,500 | 13,186 |
| European Investment Bank | 6.000% | 12/7/28 | GBP | 14,000 | 24,858 |
| European Investment Bank | 6.250% | 6/8/21 | AUD | 12,000 | 9,323 |
| European Stability Mechanism | 0.000% | 10/18/22 | EUR | 15,000 | 16,995 |
| European Stability Mechanism | 0.100% | 11/3/20 | EUR | 10,000 | 11,435 |
| European Stability Mechanism | 0.125% | 4/22/24 | EUR | 41,500 | 46,721 |
| European Stability Mechanism | 0.500% | 3/2/26 | EUR | 21,700 | 24,556 |
| European Stability Mechanism | 0.750% | 3/15/27 | EUR | 25,000 | 28,509 |
| European Stability Mechanism | 1.000% | 9/23/25 | EUR | 20,000 | 23,473 |
| European Stability Mechanism | 1.125% | 5/3/32 | EUR | 25,000 | 28,326 |
| European Stability Mechanism | 1.200% | 5/23/33 | EUR | 20,000 | 22,671 |
| European Stability Mechanism | 1.375% | 3/4/21 | EUR | 37,800 | 44,508 |
| European Stability Mechanism | 1.625% | 11/17/36 | EUR | 15,000 | 17,744 |
| European Stability Mechanism | 1.750% | 10/20/45 | EUR | 10,000 | 11,974 |
| European Stability Mechanism | 1.800% | 11/2/46 | EUR | 15,000 | 17,959 |
| European Stability Mechanism | 1.850% | 12/1/55 | EUR | 10,000 | 11,796 |
| European Stability Mechanism | 2.125% | 11/20/23 | EUR | 3,220 | 4,017 |
| European Union | 0.250% | 7/4/20 | EUR | 20,000 | 22,919 |
| European Union | 0.500% | 4/4/25 | EUR | 50,000 | 57,262 |
| European Union | 0.625% | 11/4/23 | EUR | 25,000 | 29,001 |
91
| | | | | |
| Total International Bond Index Fund | | | | | |
| |
| |
| |
| | | | | Face | Market |
| | | Maturity | | Amount | Value • |
| | Coupon | Date | Currency | (000) | ($000) |
| European Union | 0.750% | 4/4/31 | EUR | 20,000 | 22,014 |
| European Union | 1.125% | 4/4/36 | EUR | 20,000 | 22,111 |
| European Union | 1.250% | 4/4/33 | EUR | 25,000 | 28,788 |
| European Union | 1.375% | 10/4/29 | EUR | 16,000 | 19,080 |
| European Union | 2.500% | 11/4/27 | EUR | 19,000 | 24,902 |
| European Union | 2.750% | 9/21/21 | EUR | 5,000 | 6,155 |
| European Union | 2.750% | 4/4/22 | EUR | 20,600 | 25,651 |
| European Union | 2.875% | 4/4/28 | EUR | 5,000 | 6,784 |
| European Union | 3.000% | 9/4/26 | EUR | 7,125 | 9,627 |
| European Union | 3.375% | 4/4/38 | EUR | 6,000 | 9,206 |
| European Union | 3.500% | 6/4/21 | EUR | 21,000 | 26,121 |
| Inter-American Development Bank | 0.625% | 12/15/21 | GBP | 2,000 | 2,517 |
| Inter-American Development Bank | 1.875% | 3/20/20 | CAD | 6,750 | 5,100 |
| Inter-American Development Bank | 3.250% | 2/7/20 | AUD | 9,000 | 6,454 |
| Inter-American Development Bank | 3.750% | 7/25/22 | AUD | 22,300 | 16,476 |
| Inter-American Development Bank | 6.000% | 2/26/21 | AUD | 13,000 | 9,965 |
| International Bank for Reconstruction & | | | | | |
| Development | 0.375% | 6/15/21 | GBP | 500 | 628 |
| International Bank for Reconstruction & | | | | | |
| Development | 0.500% | 4/16/30 | EUR | 5,400 | 5,809 |
| International Bank for Reconstruction & | | | | | |
| Development | 0.625% | 1/12/33 | EUR | 19,000 | 20,038 |
| International Bank for Reconstruction & | | | | | |
| Development | 0.750% | 12/7/21 | GBP | 3,600 | 4,551 |
| International Bank for Reconstruction & | | | | | |
| Development | 1.200% | 8/8/34 | EUR | 9,646 | 10,912 |
| International Bank for Reconstruction & | | | | | |
| Development | 1.375% | 12/15/20 | GBP | 32,400 | 41,723 |
| International Bank for Reconstruction & | | | | | |
| Development | 2.250% | 1/17/23 | CAD | 5,400 | 4,028 |
| International Bank for Reconstruction & | | | | | |
| Development | 2.500% | 3/12/20 | AUD | 20,000 | 14,216 |
| International Bank for Reconstruction & | | | | | |
| Development | 2.500% | 8/3/23 | CAD | 1,060 | 797 |
| International Bank for Reconstruction & | | | | | |
| Development | 2.600% | 9/20/22 | AUD | 10,000 | 7,090 |
| International Bank for Reconstruction & | | | | | |
| Development | 2.800% | 1/13/21 | AUD | 4,000 | 2,862 |
| International Bank for Reconstruction & | | | | | |
| Development | 2.800% | 1/12/22 | AUD | 22,000 | 15,852 |
| International Bank for Reconstruction & | | | | | |
| Development | 3.000% | 2/2/23 | NZD | 10,000 | 6,625 |
| International Bank for Reconstruction & | | | | | |
| Development | 3.000% | 10/19/26 | AUD | 10,000 | 7,100 |
| International Bank for Reconstruction & | | | | | |
| Development | 3.375% | 1/25/22 | NZD | 12,000 | 8,057 |
| International Bank for Reconstruction & | | | | | |
| Development | 3.750% | 2/10/20 | NZD | 5,000 | 3,328 |
| International Bank for Reconstruction & | | | | | |
| Development | 4.250% | 6/24/25 | AUD | 10,800 | 8,303 |
| International Bank for Reconstruction & | | | | | |
| Development | 4.625% | 10/6/21 | NZD | 5,804 | 4,027 |
| International Bank for Reconstruction & | | | | | |
| Development | 4.875% | 12/7/28 | GBP | 400 | 663 |
92
| | | | | |
| Total International Bond Index Fund | | | | | |
| |
| |
| |
| | | | | Face | Market |
| | | Maturity | | Amount | Value • |
| | Coupon | Date | Currency | (000) | ($000) |
| International Bank for Reconstruction & | | | | | |
| Development | 5.400% | 6/7/21 | GBP | 200 | 284 |
| International Bank for Reconstruction & | | | | | |
| Development | 5.750% | 10/1/20 | AUD | 15,000 | 11,312 |
| International Bank for Reconstruction & | | | | | |
| Development | 5.750% | 6/7/32 | GBP | 6,000 | 11,245 |
| International Finance Corp. | 1.250% | 12/15/23 | GBP | 13,800 | 17,574 |
| International Finance Corp. | 1.375% | 3/7/25 | GBP | 9,821 | 12,451 |
| International Finance Corp. | 2.375% | 7/19/23 | CAD | 1,920 | 1,430 |
| International Finance Corp. | 2.700% | 2/5/21 | AUD | 15,000 | 10,711 |
| International Finance Corp. | 2.800% | 8/15/22 | AUD | 18,000 | 12,876 |
| International Finance Corp. | 3.625% | 5/20/20 | NZD | 8,500 | 5,672 |
| International Finance Corp. | 4.250% | 8/21/23 | AUD | 10,000 | 7,595 |
| Nordic Investment Bank | 0.125% | 6/10/24 | EUR | 10,000 | 11,289 |
| Nordic Investment Bank | 0.500% | 11/3/25 | EUR | 19,600 | 22,404 |
| Nordic Investment Bank | 0.625% | 11/2/21 | GBP | 1,700 | 2,141 |
| Nordic Investment Bank | 4.125% | 3/19/20 | NZD | 16,495 | 11,051 |
| Nordic Investment Bank | 5.000% | 4/19/22 | AUD | 9,000 | 6,905 |
| Total Supranational (Cost $3,677,348) | | | | | 3,608,923 |
| Sweden (1.3%) | | | | | |
| Asset-Backed/Commercial Mortgage-Backed Securities (0.5%) | | | |
| Landshypotek Bank AB | 0.625% | 6/17/20 | SEK | 63,000 | 6,958 |
| Lansforsakringar Hypotek AB | 0.250% | 4/22/22 | EUR | 1,500 | 1,704 |
| Lansforsakringar Hypotek AB | 0.375% | 3/14/24 | EUR | 1,400 | 1,579 |
| Lansforsakringar Hypotek AB | 1.125% | 5/7/20 | EUR | 5,000 | 5,775 |
| Lansforsakringar Hypotek AB | 1.500% | 3/18/21 | EUR | 200 | 235 |
| Lansforsakringar Hypotek AB | 3.250% | 9/16/20 | SEK | 100,000 | 11,725 |
| Nordea Hypotek AB | 1.000% | 4/8/22 | SEK | 538,000 | 60,227 |
| Nordea Hypotek AB | 1.250% | 9/20/23 | SEK | 500,000 | 55,960 |
| Nordea Hypotek AB | 3.250% | 6/17/20 | SEK | 50,000 | 5,806 |
| Skandinaviska Enskilda Banken AB | 0.250% | 6/20/24 | EUR | 25,000 | 28,004 |
| Skandinaviska Enskilda Banken AB | 0.750% | 11/15/27 | EUR | 1,100 | 1,231 |
| Skandinaviska Enskilda Banken AB | 1.500% | 2/25/20 | EUR | 11,000 | 12,751 |
| Skandinaviska Enskilda Banken AB | 1.625% | 11/4/20 | EUR | 5,000 | 5,866 |
| Skandinaviska Enskilda Banken AB | 4.125% | 4/7/21 | EUR | 5,000 | 6,242 |
| Stadshypotek AB | 0.125% | 10/5/26 | EUR | 500 | 538 |
| Stadshypotek AB | 0.375% | 2/22/23 | EUR | 8,700 | 9,907 |
| Stadshypotek AB | 0.375% | 2/21/24 | EUR | 6,900 | 7,799 |
| Stadshypotek AB | 0.625% | 11/10/21 | EUR | 22,700 | 26,188 |
| Stadshypotek AB | 0.750% | 11/1/27 | EUR | 10,000 | 11,194 |
| Stadshypotek AB | 1.500% | 12/15/21 | SEK | 280,000 | 31,657 |
| Stadshypotek AB | 1.500% | 6/1/23 | SEK | 380,000 | 43,162 |
| Stadshypotek AB | 1.625% | 10/30/20 | EUR | 10,000 | 11,733 |
| Stadshypotek AB | 4.250% | 6/17/20 | SEK | 150,000 | 17,513 |
| Sveriges Sakerstallda Obligationer AB | 0.500% | 1/29/25 | EUR | 1,000 | 1,128 |
| Sveriges Sakerstallda Obligationer AB | 0.625% | 10/7/21 | EUR | 31,300 | 36,100 |
| Sveriges Sakerstallda Obligationer AB | 0.875% | 3/29/27 | EUR | 800 | 909 |
| Sveriges Sakerstallda Obligationer AB | 1.000% | 3/17/21 | SEK | 400,000 | 44,695 |
| Sveriges Sakerstallda Obligationer AB | 2.000% | 6/17/20 | SEK | 50,000 | 5,660 |
| Swedbank Hypotek AB | 0.375% | 9/29/20 | EUR | 19,300 | 22,088 |
| Swedbank Hypotek AB | 0.375% | 3/11/22 | EUR | 5,000 | 5,721 |
| Swedbank Hypotek AB | 1.000% | 6/15/22 | SEK | 332,000 | 37,089 |
| Swedbank Hypotek AB | 1.000% | 12/20/23 | SEK | 400,000 | 44,361 |
93
| | | | | |
| Total International Bond Index Fund | | | | | |
| |
| |
| |
| | | | | Face | Market |
| | | Maturity | | Amount | Value • |
| | Coupon | Date | Currency | (000) | ($000) |
| Swedbank Hypotek AB | 1.125% | 5/7/20 | EUR | 5,000 | 5,779 |
| Swedbank Hypotek AB | 1.125% | 5/21/21 | EUR | 2,000 | 2,334 |
| Swedbank Hypotek AB | 5.700% | 5/12/20 | SEK | 200,000 | 23,814 |
| | | | | | 593,432 |
| Corporate Bonds (0.4%) | | | | | |
| Akelius Residential Property AB | 1.125% | 3/14/24 | EUR | 2,900 | 3,166 |
| Akelius Residential Property AB | 1.750% | 2/7/25 | EUR | 1,500 | 1,667 |
| Alfa Laval Treasury International AB | 1.375% | 9/12/22 | EUR | 400 | 468 |
| Atlas Copco AB | 0.625% | 8/30/26 | EUR | 430 | 468 |
| Atlas Copco AB | 2.500% | 2/28/23 | EUR | 4,500 | 5,550 |
| Danske Hypotek AB | 1.000% | 12/21/22 | SEK | 200,000 | 22,144 |
| Essity AB | 1.125% | 3/27/24 | EUR | 1,000 | 1,145 |
| Essity AB | 1.625% | 3/30/27 | EUR | 1,600 | 1,819 |
| Fastighets AB Balder | 1.125% | 3/14/22 | EUR | 10,000 | 11,382 |
| Investor AB | 4.500% | 5/12/23 | EUR | 2,000 | 2,669 |
| Lansforsakringar Hypotek AB | 0.250% | 4/12/23 | EUR | 500 | 565 |
| Lansforsakringar Hypotek AB | 1.250% | 9/20/23 | SEK | 550,000 | 60,818 |
| Lansforsakringar Hypotek AB | 1.500% | 9/18/24 | SEK | 160,000 | 17,866 |
| Molnlycke Holding AB | 1.875% | 2/28/25 | EUR | 5,000 | 5,713 |
| Nordea Bank AB | 1.125% | 2/12/25 | EUR | 10,000 | 11,610 |
| 1 Nordea Bank AB | 1.875% | 11/10/25 | EUR | 5,000 | 5,788 |
| Nordea Bank AB | 2.125% | 11/13/19 | GBP | 3,700 | 4,769 |
| Nordea Bank AB | 2.375% | 6/2/22 | GBP | 7,000 | 9,157 |
| Nordea Bank AB | 3.250% | 7/5/22 | EUR | 5,400 | 6,760 |
| Nordea Bank AB | 4.000% | 6/29/20 | EUR | 13,743 | 16,635 |
| Nordea Bank AB | 4.000% | 3/29/21 | EUR | 6,110 | 7,510 |
| Nordea Bank AB | 4.500% | 3/26/20 | EUR | 2,000 | 2,402 |
| Securitas AB | 2.625% | 2/22/21 | EUR | 3,000 | 3,586 |
| Skandinaviska Enskilda Banken AB | 0.150% | 2/11/21 | EUR | 1,000 | 1,139 |
| Skandinaviska Enskilda Banken AB | 1.000% | 12/20/23 | SEK | 200,000 | 21,954 |
| 1 Skandinaviska Enskilda Banken AB | 1.375% | 10/31/28 | EUR | 31,575 | 35,177 |
| Skandinaviska Enskilda Banken AB | 1.500% | 12/15/21 | SEK | 365,000 | 41,516 |
| Skandinaviska Enskilda Banken AB | 1.875% | 11/14/19 | EUR | 2,620 | 3,030 |
| Skandinaviska Enskilda Banken AB | 2.000% | 2/19/21 | EUR | 5,000 | 5,914 |
| 1 Skandinaviska Enskilda Banken AB | 2.500% | 5/28/26 | EUR | 14,700 | 17,322 |
| SKF AB | 1.625% | 12/2/22 | EUR | 700 | 824 |
| Svenska Cellulosa AB SCA | 2.500% | 6/9/23 | EUR | 700 | 861 |
| Svenska Handelsbanken AB | 0.250% | 2/28/22 | EUR | 500 | 566 |
| Svenska Handelsbanken AB | 1.125% | 12/14/22 | EUR | 14,000 | 16,304 |
| Svenska Handelsbanken AB | 2.250% | 8/27/20 | EUR | 5,000 | 5,908 |
| Svenska Handelsbanken AB | 3.000% | 11/20/20 | GBP | 4,100 | 5,405 |
| Svenska Handelsbanken AB | 4.375% | 10/20/21 | EUR | 1,380 | 1,760 |
| Sveriges Sakerstallda Obligationer AB | 0.250% | 1/20/21 | EUR | 8,000 | 9,134 |
| Swedbank AB | 0.300% | 9/6/22 | EUR | 17,100 | 19,306 |
| Swedbank AB | 0.400% | 8/29/23 | EUR | 100 | 112 |
| Swedbank AB | 1.250% | 12/29/21 | GBP | 1,000 | 1,258 |
| Swedbank Hypotek AB | 1.000% | 12/16/20 | SEK | 550,000 | 61,571 |
| 1 Telia Co. AB | 3.000% | 4/4/78 | EUR | 100 | 113 |
| Telia Co. AB | 3.500% | 9/5/33 | EUR | 3,000 | 3,954 |
| Telia Co. AB | 3.875% | 10/1/25 | EUR | 2,000 | 2,655 |
| Telia Co. AB | 4.000% | 3/22/22 | EUR | 350 | 445 |
| Telia Co. AB | 4.750% | 11/16/21 | EUR | 3,000 | 3,856 |
| Volvo Treasury AB | 2.375% | 11/26/19 | EUR | 300 | 348 |
| | | | | | 464,089 |
94
| | | | | |
| Total International Bond Index Fund | | | | | |
| |
| |
| |
| | | | | Face | Market |
| | | Maturity | | Amount | Value • |
| | Coupon | Date | Currency | (000) | ($000) |
| Sovereign Bonds (0.4%) | | | | | |
| Kingdom of Sweden | 0.050% | 2/12/20 | EUR | 21,200 | 24,174 |
| Kingdom of Sweden | 0.125% | 4/24/23 | EUR | 30,000 | 34,143 |
| Kingdom of Sweden | 0.750% | 5/12/28 | SEK | 7,000 | 775 |
| 2 Kingdom of Sweden | 0.750% | 11/12/29 | SEK | 289,000 | 31,347 |
| Kingdom of Sweden | 1.000% | 11/12/26 | SEK | 345,700 | 39,425 |
| 2 Kingdom of Sweden | 1.500% | 11/13/23 | SEK | 424,200 | 49,644 |
| Kingdom of Sweden | 2.250% | 6/1/32 | SEK | 175,000 | 22,133 |
| Kingdom of Sweden | 2.500% | 5/12/25 | SEK | 129,300 | 16,163 |
| Kingdom of Sweden | 3.500% | 6/1/22 | SEK | 290,750 | 35,918 |
| Kingdom of Sweden | 3.500% | 3/30/39 | SEK | 131,450 | 20,037 |
| Kingdom of Sweden | 5.000% | 12/1/20 | SEK | 216,000 | 26,285 |
| Kommuninvest I Sverige AB | 1.000% | 9/15/21 | SEK | 300,000 | 33,470 |
| Kommuninvest I Sverige AB | 1.000% | 11/13/23 | SEK | 170,000 | 18,801 |
| Kommuninvest I Sverige AB | 2.500% | 12/1/20 | SEK | 25,000 | 2,875 |
| SBAB Bank AB | 0.250% | 9/7/22 | EUR | 5,000 | 5,620 |
| SBAB Bank AB | 2.375% | 9/4/20 | EUR | 4,000 | 4,730 |
| Stockholms Lans Landsting | 0.750% | 2/26/25 | EUR | 5,000 | 5,742 |
| Svensk Exportkredit AB | 0.625% | 12/7/20 | GBP | 1,000 | 1,266 |
| 1 Vattenfall AB | 3.000% | 3/19/77 | EUR | 5,000 | 5,443 |
| Vattenfall AB | 6.125% | 12/16/19 | GBP | 3,000 | 4,034 |
| Vattenfall AB | 6.250% | 3/17/21 | EUR | 8,000 | 10,385 |
| Vattenfall AB | 6.875% | 4/15/39 | GBP | 5,000 | 9,926 |
| | | | | | 402,336 |
| Total Sweden (Cost $1,531,982) | | | | | 1,459,857 |
| Switzerland (1.5%) | | | | | |
| Asset-Backed/Commercial Mortgage-Backed Securities (0.6%) | | | |
| Credit Suisse AG | 1.750% | 1/15/21 | EUR | 47,600 | 56,089 |
| Pfandbriefbank schweizerischer | | | | | |
| Hypothekarinstitute AG | 0.000% | 7/6/20 | CHF | 20,000 | 20,028 |
| Pfandbriefbank schweizerischer | | | | | |
| Hypothekarinstitute AG | 0.000% | 7/5/22 | CHF | 17,500 | 17,518 |
| Pfandbriefbank schweizerischer | | | | | |
| Hypothekarinstitute AG | 0.125% | 9/6/28 | CHF | 13,000 | 12,423 |
| Pfandbriefbank schweizerischer | | | | | |
| Hypothekarinstitute AG | 0.250% | 1/18/27 | CHF | 10,000 | 9,841 |
| Pfandbriefbank schweizerischer | | | | | |
| Hypothekarinstitute AG | 0.375% | 10/15/25 | CHF | 5,000 | 5,021 |
| Pfandbriefbank schweizerischer | | | | | |
| Hypothekarinstitute AG | 0.375% | 1/26/26 | CHF | 8,000 | 8,009 |
| Pfandbriefbank schweizerischer | | | | | |
| Hypothekarinstitute AG | 0.375% | 7/8/39 | CHF | 8,300 | 7,287 |
| Pfandbriefbank schweizerischer | | | | | |
| Hypothekarinstitute AG | 0.500% | 6/15/29 | CHF | 15,000 | 14,783 |
| Pfandbriefbank schweizerischer | | | | | |
| Hypothekarinstitute AG | 0.500% | 10/5/35 | CHF | 5,000 | 4,630 |
| Pfandbriefbank schweizerischer | | | | | |
| Hypothekarinstitute AG | 0.625% | 5/16/31 | CHF | 3,500 | 3,435 |
| Pfandbriefbank schweizerischer | | | | | |
| Hypothekarinstitute AG | 0.625% | 4/25/33 | CHF | 5,000 | 4,847 |
| Pfandbriefbank schweizerischer | | | | | |
| Hypothekarinstitute AG | 0.875% | 5/7/35 | CHF | 2,000 | 1,981 |
95
| | | | | |
| Total International Bond Index Fund | | | | | |
| |
| |
| |
| | | | | Face | Market |
| | | Maturity | | Amount | Value • |
| | Coupon | Date | Currency | (000) | ($000) |
| Pfandbriefbank schweizerischer | | | | | |
| Hypothekarinstitute AG | 1.000% | 8/13/21 | CHF | 29,000 | 29,932 |
| Pfandbriefbank schweizerischer | | | | | |
| Hypothekarinstitute AG | 1.000% | 5/21/24 | CHF | 10,600 | 11,096 |
| Pfandbriefbank schweizerischer | | | | | |
| Hypothekarinstitute AG | 1.000% | 5/12/32 | CHF | 7,500 | 7,684 |
| Pfandbriefbank schweizerischer | | | | | |
| Hypothekarinstitute AG | 1.250% | 9/29/23 | CHF | 6,980 | 7,380 |
| Pfandbriefbank schweizerischer | | | | | |
| Hypothekarinstitute AG | 1.375% | 8/15/22 | CHF | 7,500 | 7,894 |
| Pfandbriefbank schweizerischer | | | | | |
| Hypothekarinstitute AG | 1.375% | 2/14/24 | CHF | 8,000 | 8,518 |
| Pfandbriefbank schweizerischer | | | | | |
| Hypothekarinstitute AG | 1.375% | 9/20/29 | CHF | 2,000 | 2,151 |
| Pfandbriefbank schweizerischer | | | | | |
| Hypothekarinstitute AG | 1.500% | 8/2/33 | CHF | 17,500 | 19,062 |
| Pfandbriefbank schweizerischer | | | | | |
| Hypothekarinstitute AG | 1.625% | 3/15/22 | CHF | 2,000 | 2,113 |
| Pfandbriefbank schweizerischer | | | | | |
| Hypothekarinstitute AG | 1.625% | 7/3/30 | CHF | 2,000 | 2,203 |
| Pfandbriefbank schweizerischer | | | | | |
| Hypothekarinstitute AG | 1.875% | 9/15/31 | CHF | 10,500 | 11,914 |
| Pfandbriefbank schweizerischer | | | | | |
| Hypothekarinstitute AG | 2.125% | 6/28/23 | CHF | 61,000 | 66,852 |
| Pfandbriefbank schweizerischer | | | | | |
| Hypothekarinstitute AG | 2.250% | 2/25/20 | CHF | 3,000 | 3,089 |
| Pfandbriefbank schweizerischer | | | | | |
| Hypothekarinstitute AG | 2.250% | 8/13/32 | CHF | 10,200 | 12,116 |
| Pfandbriefbank schweizerischer | | | | | |
| Hypothekarinstitute AG | 2.375% | 1/27/21 | CHF | 9,000 | 9,506 |
| Pfandbriefbank schweizerischer | | | | | |
| Hypothekarinstitute AG | 2.375% | 1/25/24 | CHF | 3,500 | 3,917 |
| Pfandbriefbank schweizerischer | | | | | |
| Hypothekarinstitute AG | 2.500% | 3/30/26 | CHF | 11,900 | 13,765 |
| Pfandbriefbank schweizerischer | | | | | |
| Hypothekarinstitute AG | 2.500% | 2/16/27 | CHF | 2,000 | 2,332 |
| Pfandbriefbank schweizerischer | | | | | |
| Hypothekarinstitute AG | 2.750% | 12/15/26 | CHF | 3,000 | 3,552 |
| Pfandbriefbank schweizerischer | | | | | |
| Hypothekarinstitute AG | 2.875% | 2/14/22 | CHF | 3,000 | 3,288 |
| Pfandbriefzentrale der schweizerischen | | | | | |
| Kantonalbanken AG | 0.000% | 7/25/23 | CHF | 17,000 | 16,931 |
| Pfandbriefzentrale der schweizerischen | | | | | |
| Kantonalbanken AG | 0.000% | 6/14/24 | CHF | 32,500 | 32,220 |
| Pfandbriefzentrale der schweizerischen | | | | | |
| Kantonalbanken AG | 0.050% | 11/6/26 | CHF | 10,000 | 9,701 |
| Pfandbriefzentrale der schweizerischen | | | | | |
| Kantonalbanken AG | 0.125% | 3/12/24 | CHF | 15,000 | 14,975 |
| Pfandbriefzentrale der schweizerischen | | | | | |
| Kantonalbanken AG | 0.125% | 12/2/24 | CHF | 15,000 | 14,799 |
| Pfandbriefzentrale der schweizerischen | | | | | |
| Kantonalbanken AG | 0.125% | 9/2/31 | CHF | 7,000 | 6,419 |
| Pfandbriefzentrale der schweizerischen | | | | | |
| Kantonalbanken AG | 0.250% | 2/11/28 | CHF | 985 | 958 |
96
| | | | | |
| Total International Bond Index Fund | | | | | |
| |
| |
| |
| | | | | Face | Market |
| | | Maturity | | Amount | Value • |
| | Coupon | Date | Currency | (000) | ($000) |
| Pfandbriefzentrale der schweizerischen | | | | | |
| Kantonalbanken AG | 0.300% | 6/6/31 | CHF | 7,500 | 7,067 |
| Pfandbriefzentrale der schweizerischen | | | | | |
| Kantonalbanken AG | 0.375% | 8/30/23 | CHF | 7,500 | 7,599 |
| Pfandbriefzentrale der schweizerischen | | | | | |
| Kantonalbanken AG | 0.500% | 7/28/25 | CHF | 5,000 | 5,065 |
| Pfandbriefzentrale der schweizerischen | | | | | |
| Kantonalbanken AG | 0.500% | 4/30/30 | CHF | 5,000 | 4,900 |
| Pfandbriefzentrale der schweizerischen | | | | | |
| Kantonalbanken AG | 0.500% | 9/20/30 | CHF | 17,500 | 17,010 |
| Pfandbriefzentrale der schweizerischen | | | | | |
| Kantonalbanken AG | 0.650% | 2/15/33 | CHF | 10,000 | 9,740 |
| Pfandbriefzentrale der schweizerischen | | | | | |
| Kantonalbanken AG | 0.750% | 4/15/24 | CHF | 1,000 | 1,031 |
| Pfandbriefzentrale der schweizerischen | | | | | |
| Kantonalbanken AG | 0.750% | 9/23/24 | CHF | 2,200 | 2,272 |
| Pfandbriefzentrale der schweizerischen | | | | | |
| Kantonalbanken AG | 0.875% | 4/16/21 | CHF | 2,000 | 2,048 |
| Pfandbriefzentrale der schweizerischen | | | | | |
| Kantonalbanken AG | 0.875% | 6/20/22 | CHF | 18,000 | 18,587 |
| Pfandbriefzentrale der schweizerischen | | | | | |
| Kantonalbanken AG | 1.000% | 2/17/21 | CHF | 7,000 | 7,180 |
| Pfandbriefzentrale der schweizerischen | | | | | |
| Kantonalbanken AG | 1.000% | 9/9/22 | CHF | 8,500 | 8,839 |
| Pfandbriefzentrale der schweizerischen | | | | | |
| Kantonalbanken AG | 1.000% | 9/22/28 | CHF | 5,000 | 5,194 |
| Pfandbriefzentrale der schweizerischen | | | | | |
| Kantonalbanken AG | 1.125% | 4/28/23 | CHF | 6,675 | 6,993 |
| Pfandbriefzentrale der schweizerischen | | | | | |
| Kantonalbanken AG | 1.250% | 2/3/22 | CHF | 4,000 | 4,174 |
| Pfandbriefzentrale der schweizerischen | | | | | |
| Kantonalbanken AG | 1.375% | 3/19/27 | CHF | 8,000 | 8,593 |
| Pfandbriefzentrale der schweizerischen | | | | | |
| Kantonalbanken AG | 1.375% | 11/5/27 | CHF | 3,000 | 3,225 |
| Pfandbriefzentrale der schweizerischen | | | | | |
| Kantonalbanken AG | 1.500% | 9/3/20 | CHF | 4,000 | 4,111 |
| Pfandbriefzentrale der schweizerischen | | | | | |
| Kantonalbanken AG | 1.500% | 5/21/29 | CHF | 1,000 | 1,089 |
| Pfandbriefzentrale der schweizerischen | | | | | |
| Kantonalbanken AG | 1.625% | 6/17/26 | CHF | 7,000 | 7,646 |
| Pfandbriefzentrale der schweizerischen | | | | | |
| Kantonalbanken AG | 2.000% | 10/30/25 | CHF | 3,000 | 3,346 |
| Pfandbriefzentrale der schweizerischen | | | | | |
| Kantonalbanken AG | 2.250% | 6/16/23 | CHF | 10,500 | 11,562 |
| UBS AG | 1.375% | 4/16/21 | EUR | 5,000 | 5,865 |
| | | | | | 643,395 |
| Corporate Bonds (0.4%) | | | | | |
| ABB Ltd. | 2.250% | 10/11/21 | CHF | 2,000 | 2,115 |
| Adecco International Financial Services BV | 1.000% | 12/2/24 | EUR | 1,000 | 1,137 |
| 1 Aquarius and Investments plc for Zurich | | | | | |
| Insurance Co. Ltd. | 4.250% | 10/2/43 | EUR | 6,810 | 8,504 |
| Argentum Netherlands BV for Givaudan SA | 2.000% | 9/17/30 | EUR | 200 | 230 |
| 1 Argentum Netherlands BV for Swiss Life AG | 4.375% | 12/29/49 | EUR | 500 | 597 |
| 1 Cloverie plc for Swiss Reinsurance Co. Ltd. | 6.625% | 9/1/42 | EUR | 3,000 | 4,088 |
| |
| |
| 97 |
| | | | | |
| Total International Bond Index Fund | | | | | |
| |
| |
| |
| | | | | Face | Market |
| | | Maturity | | Amount | Value • |
| | Coupon | Date | Currency | (000) | ($000) |
| Cloverie plc for Zurich Insurance Co. Ltd. | 1.750% | 9/16/24 | EUR | 5,400 | 6,422 |
| Coca-Cola HBC Finance BV | 1.875% | 11/11/24 | EUR | 200 | 239 |
| Coca-Cola HBC Finance BV | 2.375% | 6/18/20 | EUR | 500 | 585 |
| Credit Suisse AG | 1.000% | 6/7/23 | EUR | 10,000 | 11,537 |
| Credit Suisse AG | 1.375% | 11/29/19 | EUR | 10,000 | 11,514 |
| Credit Suisse AG | 1.375% | 1/31/22 | EUR | 15,748 | 18,439 |
| Credit Suisse AG | 3.500% | 4/29/20 | AUD | 9,000 | 6,454 |
| Credit Suisse AG | 1.125% | 9/15/20 | EUR | 5,800 | 6,714 |
| Credit Suisse AG | 1.500% | 4/10/26 | EUR | 800 | 940 |
| 1 Credit Suisse Group AG | 2.125% | 9/12/25 | GBP | 1,000 | 1,221 |
| Credit Suisse Group Funding Guernsey Ltd. | 1.250% | 4/14/22 | EUR | 5,600 | 6,435 |
| Credit Suisse Group Funding Guernsey Ltd. | 3.000% | 5/27/22 | GBP | 1,500 | 1,973 |
| 1 Demeter Investments BV for Zurich | | | | | |
| Insurance Co. Ltd. | 3.500% | 10/1/46 | EUR | 10,000 | 11,876 |
| 1 ELM BV for Swiss Life Insurance & | | | | | |
| Pension Group | 4.500% | 12/29/49 | EUR | 500 | 593 |
| 1 ELM BV for Swiss Reinsurance Co. Ltd. | 2.600% | 12/29/49 | EUR | 9,250 | 10,503 |
| Flughafen Zuerich AG | 1.500% | 4/17/23 | CHF | 3,000 | 3,180 |
| Glencore Canada Financial Corp. | 7.375% | 5/27/20 | GBP | 8,850 | 12,252 |
| Glencore Finance Europe Ltd. | 1.250% | 3/17/21 | EUR | 5,000 | 5,725 |
| Glencore Finance Europe Ltd. | 1.625% | 1/18/22 | EUR | 500 | 572 |
| Glencore Finance Europe Ltd. | 1.750% | 3/17/25 | EUR | 11,500 | 12,532 |
| Glencore Finance Europe Ltd. | 6.000% | 4/3/22 | GBP | 8,000 | 11,383 |
| Holcim Finance Luxembourg SA | 1.375% | 5/26/23 | EUR | 10,500 | 12,024 |
| Holcim Finance Luxembourg SA | 3.000% | 1/22/24 | EUR | 1,100 | 1,341 |
| Holcim Overseas Finance Ltd. | 3.375% | 6/10/21 | CHF | 2,000 | 2,151 |
| Holcim US Finance Sarl & Cie SCS | 2.625% | 9/7/20 | EUR | 130 | 154 |
| LafargeHolcim Ltd. | 3.000% | 11/22/22 | CHF | 3,000 | 3,264 |
| LafargeHolcim Sterling Finance | | | | | |
| Netherlands BV | 3.000% | 5/12/32 | GBP | 100 | 116 |
| LGT Bank AG | 1.500% | 5/10/21 | CHF | 1,000 | 1,034 |
| Nestle Finance International Ltd. | 0.375% | 1/18/24 | EUR | 12,000 | 13,513 |
| Nestle Finance International Ltd. | 1.750% | 9/12/22 | EUR | 6,100 | 7,339 |
| Nestle Finance International Ltd. | 1.750% | 11/2/37 | EUR | 9,100 | 10,364 |
| Nestle Finance International Ltd. | 2.250% | 11/30/23 | GBP | 900 | 1,191 |
| Nestle Holdings Inc. | 1.750% | 12/9/20 | GBP | 12,000 | 15,503 |
| Novartis AG | 0.625% | 11/13/29 | CHF | 2,750 | 2,682 |
| Novartis Finance SA | 0.125% | 9/20/23 | EUR | 100 | 112 |
| Novartis Finance SA | 0.500% | 8/14/23 | EUR | 5,000 | 5,717 |
| Novartis Finance SA | 0.625% | 9/20/28 | EUR | 100 | 107 |
| Novartis Finance SA | 1.375% | 8/14/30 | EUR | 9,000 | 10,095 |
| Novartis Finance SA | 1.625% | 11/9/26 | EUR | 5,000 | 5,961 |
| Pfandbriefbank schweizerischer | | | | | |
| Hypothekarinstitute AG | 0.500% | 5/5/28 | CHF | 8,000 | 7,963 |
| Richemont International Holding SA | 1.000% | 3/26/26 | EUR | 15,000 | 16,826 |
| Richemont International Holding SA | 2.000% | 3/26/38 | EUR | 15,000 | 16,389 |
| Roche Finance Europe BV | 0.500% | 2/27/23 | EUR | 9,000 | 10,349 |
| Roche Finance Europe BV | 0.875% | 2/25/25 | EUR | 500 | 578 |
| Roche Holdings Inc. | 6.500% | 3/4/21 | EUR | 16,195 | 21,172 |
| UBS AG | 1.125% | 6/30/20 | EUR | 5,000 | 5,779 |
| UBS AG | 1.250% | 12/10/20 | GBP | 4,000 | 5,083 |
| UBS AG | 1.250% | 9/3/21 | EUR | 6,700 | 7,824 |
| UBS Group Funding Jersey Ltd. | 1.250% | 9/1/26 | EUR | 38,300 | 42,251 |
| UBS Group Funding Jersey Ltd. | 1.500% | 11/30/24 | EUR | 12,700 | 14,566 |
98
| | | | | |
| Total International Bond Index Fund | | | | | |
| |
| |
| |
| | | | | Face | Market |
| | | Maturity | | Amount | Value • |
| | Coupon | Date | Currency | (000) | ($000) |
| UBS Group Funding Jersey Ltd. | 1.750% | 11/16/22 | EUR | 5,000 | 5,881 |
| UBS Group Funding Jersey Ltd. | 2.125% | 3/4/24 | EUR | 800 | 950 |
| 1 UBS Group Funding Switzerland AG | 1.250% | 4/17/25 | EUR | 11,000 | 12,348 |
| Willow No.2 Ireland plc for Zurich Insurance | | | | | |
| Co. Ltd. | 3.375% | 6/27/22 | EUR | 1,000 | 1,253 |
| | | | | | 419,640 |
| Sovereign Bonds (0.5%) | | | | | |
| Basellandschaftliche Kantonalbank | 0.000% | 3/23/23 | CHF | 6,000 | 5,982 |
| Basellandschaftliche Kantonalbank | 1.750% | 11/9/20 | CHF | 9,500 | 9,849 |
| Basler Kantonalbank | 0.000% | 4/11/22 | CHF | 5,000 | 5,005 |
| Basler Kantonalbank | 0.300% | 6/22/27 | CHF | 4,500 | 4,414 |
| Basler Kantonalbank | 2.500% | 3/24/21 | CHF | 9,300 | 9,885 |
| Canton of Basel-City | 3.250% | 1/31/20 | CHF | 3,000 | 3,122 |
| Canton of Geneva Switzerland | 0.400% | 4/28/36 | CHF | 5,000 | 4,607 |
| Canton of Geneva Switzerland | 1.500% | 3/5/32 | CHF | 1,600 | 1,752 |
| Canton of Geneva Switzerland | 1.625% | 7/30/29 | CHF | 3,550 | 3,933 |
| Canton of Geneva Switzerland | 2.125% | 6/15/20 | CHF | 5,000 | 5,180 |
| Canton of Geneva Switzerland | 2.250% | 2/22/21 | CHF | 4,600 | 4,858 |
| Canton of Vaud | 2.000% | 10/24/33 | CHF | 8,905 | 10,604 |
| Canton of Zurich | 0.000% | 6/27/25 | CHF | 10,000 | 9,911 |
| Canton of Zurich | 0.500% | 12/3/20 | CHF | 4,595 | 4,663 |
| Canton of Zurich | 1.250% | 7/29/22 | CHF | 7,300 | 7,691 |
| Canton of Zurich | 1.250% | 12/3/32 | CHF | 3,000 | 3,227 |
| Canton of Zurich | 2.000% | 7/29/38 | CHF | 5,000 | 6,073 |
| Lunar Funding V for Swisscom AG | 1.875% | 9/8/21 | EUR | 2,000 | 2,373 |
| Luzerner Kantonalbank AG | 0.200% | 4/11/25 | CHF | 2,940 | 2,923 |
| Luzerner Kantonalbank AG | 1.125% | 6/30/23 | CHF | 8,000 | 8,376 |
| Swiss Confederation | 0.000% | 6/22/29 | CHF | 26,000 | 25,613 |
| Swiss Confederation | 0.500% | 5/27/30 | CHF | 12,000 | 12,399 |
| Swiss Confederation | 0.500% | 6/27/32 | CHF | 1,700 | 1,743 |
| Swiss Confederation | 0.500% | 5/30/58 | CHF | 8,000 | 7,788 |
| Swiss Confederation | 1.250% | 6/11/24 | CHF | 21,200 | 22,920 |
| Swiss Confederation | 1.250% | 5/28/26 | CHF | 30,800 | 33,846 |
| Swiss Confederation | 1.250% | 6/27/37 | CHF | 25,200 | 28,603 |
| Swiss Confederation | 1.500% | 7/24/25 | CHF | 17,450 | 19,349 |
| Swiss Confederation | 1.500% | 4/30/42 | CHF | 48,600 | 58,562 |
| Swiss Confederation | 2.000% | 4/28/21 | CHF | 3,850 | 4,082 |
| Swiss Confederation | 2.000% | 5/25/22 | CHF | 49,400 | 53,530 |
| Swiss Confederation | 2.000% | 6/25/64 | CHF | 6,800 | 10,506 |
| Swiss Confederation | 2.250% | 7/6/20 | CHF | 9,500 | 9,913 |
| Swiss Confederation | 2.250% | 6/22/31 | CHF | 17,500 | 21,785 |
| Swiss Confederation | 2.500% | 3/8/36 | CHF | 6,150 | 8,189 |
| Swiss Confederation | 3.250% | 6/27/27 | CHF | 9,000 | 11,523 |
| Swiss Confederation | 3.500% | 4/8/33 | CHF | 10,600 | 15,219 |
| Swiss Confederation | 4.000% | 2/11/23 | CHF | 2,405 | 2,848 |
| Swiss Confederation | 4.000% | 4/8/28 | CHF | 400 | 547 |
| Swiss Confederation | 4.000% | 1/6/49 | CHF | 4,500 | 8,726 |
| Swisscom AG | 1.750% | 7/10/24 | CHF | 2,000 | 2,158 |
| Swisscom AG | 2.625% | 8/31/22 | CHF | 11,000 | 12,022 |
| Syngenta Finance NV | 1.875% | 11/2/21 | EUR | 5,800 | 6,771 |
| Zuercher Kantonalbank | 0.030% | 2/11/22 | CHF | 5,000 | 5,012 |
| Zuercher Kantonalbank | 0.125% | 5/13/26 | CHF | 1,640 | 1,608 |
| Zuercher Kantonalbank | 0.250% | 3/31/21 | CHF | 20,000 | 20,179 |
| Zuercher Kantonalbank | 0.250% | 1/27/26 | CHF | 5,000 | 4,957 |
99
| | | | | |
| Total International Bond Index Fund | | | | | |
| |
| |
| |
| | | | | Face | Market |
| | | Maturity | | Amount | Value • |
| | Coupon | Date | Currency | (000) | ($000) |
| Zuercher Kantonalbank | 1.250% | 1/31/22 | CHF | 17,000 | 17,721 |
| Zuercher Kantonalbank | 2.125% | 6/29/22 | CHF | 16,400 | 17,687 |
| | | | | | 560,234 |
| Total Switzerland (Cost $1,668,563) | | | | | 1,623,269 |
| Thailand (0.6%) | | | | | |
| Sovereign Bonds (0.6%) | | | | | |
| Kingdom of Thailand | 1.875% | 6/17/22 | THB | 1,700,000 | 50,593 |
| Kingdom of Thailand | 2.125% | 12/17/26 | THB | 400,000 | 11,545 |
| Kingdom of Thailand | 2.550% | 6/26/20 | THB | 2,500,000 | 76,127 |
| Kingdom of Thailand | 2.875% | 12/17/28 | THB | 823,550 | 24,877 |
| Kingdom of Thailand | 2.875% | 6/17/46 | THB | 1,129,525 | 30,665 |
| Kingdom of Thailand | 3.400% | 6/17/36 | THB | 3,221,200 | 99,134 |
| Kingdom of Thailand | 3.450% | 3/8/19 | THB | 200,000 | 6,072 |
| Kingdom of Thailand | 3.580% | 12/17/27 | THB | 1,077,000 | 34,492 |
| Kingdom of Thailand | 3.600% | 6/17/67 | THB | 592,500 | 16,884 |
| Kingdom of Thailand | 3.625% | 6/16/23 | THB | 600,000 | 19,072 |
| Kingdom of Thailand | 3.650% | 12/17/21 | THB | 2,200,000 | 69,365 |
| Kingdom of Thailand | 3.650% | 6/20/31 | THB | 1,330,000 | 42,102 |
| Kingdom of Thailand | 3.775% | 6/25/32 | THB | 1,584,000 | 50,796 |
| Kingdom of Thailand | 3.800% | 6/14/41 | THB | 150,000 | 4,787 |
| Kingdom of Thailand | 3.850% | 12/12/25 | THB | 1,250,000 | 40,665 |
| Kingdom of Thailand | 3.875% | 6/13/19 | THB | 700,000 | 21,384 |
| Kingdom of Thailand | 4.000% | 6/17/66 | THB | 85,000 | 2,712 |
| Kingdom of Thailand | 4.260% | 12/12/37 | THB | 277,000 | 9,356 |
| Kingdom of Thailand | 4.675% | 6/29/44 | THB | 751,000 | 27,453 |
| Kingdom of Thailand | 4.875% | 6/22/29 | THB | 1,740,000 | 61,496 |
| Kingdom of Thailand | 5.500% | 3/13/23 | THB | 130,000 | 4,430 |
| Kingdom of Thailand | 5.670% | 3/13/28 | THB | 120,000 | 4,467 |
| Total Thailand (Cost $713,279) | | | | | 708,474 |
| United Arab Emirates (0.0%) | | | | | |
| Sovereign Bonds (0.0%) | | | | | |
| Emirates Telecommunications Group Co. | | | | | |
| PJSC | 1.750% | 6/18/21 | EUR | 4,500 | 5,283 |
| Emirates Telecommunications Group Co. | | | | | |
| PJSC | 2.750% | 6/18/26 | EUR | 3,000 | 3,698 |
| IPIC GMTN Ltd. | 3.625% | 5/30/23 | EUR | 3,000 | 3,835 |
| IPIC GMTN Ltd. | 5.875% | 3/14/21 | EUR | 7,500 | 9,622 |
| IPIC GMTN Ltd. | 6.875% | 3/14/26 | GBP | 640 | 1,063 |
| Total United Arab Emirates (Cost $24,245) | | | | | 23,501 |
| United Kingdom (7.3%) | | | | | |
| Asset-Backed/Commercial Mortgage-Backed Securities (0.4%) | | | |
| AA Bond Co. Ltd. | 2.875% | 1/31/22 | GBP | 4,000 | 4,914 |
| AA Bond Co. Ltd. | 4.249% | 7/31/20 | GBP | 4,100 | 5,377 |
| AA Bond Co. Ltd. | 6.269% | 7/31/25 | GBP | 2,000 | 2,731 |
| Arqiva Financing plc | 4.040% | 6/30/20 | GBP | 1,800 | 2,369 |
| Arqiva Financing plc | 4.882% | 12/31/32 | GBP | 2,900 | 4,100 |
| Artesian Finance II plc | 6.000% | 9/30/33 | GBP | 1,990 | 3,539 |
| Aspire Defence Finance plc | 4.674% | 3/31/40 | GBP | 2,383 | 3,674 |
| Aspire Defence Finance plc | 4.674% | 3/31/40 | GBP | 1,833 | 2,823 |
| Bank of Scotland plc | 3.875% | 2/7/20 | EUR | 19,300 | 22,979 |
| Bank of Scotland plc | 4.500% | 7/13/21 | EUR | 6,160 | 7,803 |
100
| | | | | | |
| Total International Bond Index Fund | | | | | |
| |
| |
| |
| | | | | | Face | Market |
| | | | Maturity | | Amount | Value • |
| | | Coupon | Date | Currency | (000) | ($000) |
| | Bank of Scotland plc | 4.750% | 6/8/22 | EUR | 1,840 | 2,418 |
| | Bank of Scotland plc | 4.875% | 12/20/24 | GBP | 1,400 | 2,109 |
| | Barclays Bank plc | 4.000% | 1/12/21 | EUR | 15,500 | 19,105 |
| | Barclays Bank plc | 4.250% | 1/12/22 | GBP | 3,600 | 5,013 |
| 1 | Broadgate Financing plc | 4.999% | 10/5/33 | GBP | 4,000 | 6,117 |
| 1 | Broadgate Financing plc | 5.098% | 4/5/35 | GBP | 8,375 | 12,287 |
| 1 | Canary Wharf Finance II plc | 6.455% | 10/22/33 | GBP | 250 | 401 |
| | Clydesdale Bank plc | 4.625% | 6/8/26 | GBP | 13,000 | 19,817 |
| | Co-Operative Bank plc | 4.750% | 11/11/21 | GBP | 8,900 | 12,165 |
| | Coventry Building Society | 0.500% | 1/12/24 | EUR | 900 | 1,017 |
| 12 | CTRL Section 1 Finance plc | 5.234% | 5/2/35 | GBP | 1,087 | 1,746 |
| | Derby Healthcare plc | 5.564% | 6/30/41 | GBP | 1,168 | 1,925 |
| | Dignity Finance plc | 3.546% | 12/31/34 | GBP | 3,514 | 4,752 |
| | Green King Finance plc | 4.064% | 3/15/35 | GBP | 1,806 | 2,440 |
| | Greene King Finance plc | 5.318% | 9/15/31 | GBP | 1,045 | 1,533 |
| | High Speed Rail Finance (1) plc | 4.375% | 11/1/38 | GBP | 6,700 | 10,216 |
| | Highbury Finance BV | 7.017% | 3/20/23 | GBP | 635 | 938 |
| | Integrated Accommodation Services plc | 6.480% | 3/31/29 | GBP | 606 | 956 |
| 1 | Intu SGS Finance plc | 4.625% | 3/17/33 | GBP | 2,000 | 2,775 |
| | Juturna European Loan Conduit No 16 plc | 5.064% | 8/10/33 | GBP | 4,083 | 6,285 |
| | Leeds Building Society | 4.875% | 11/16/20 | GBP | 2,000 | 2,746 |
| | Lloyds Bank plc | 0.500% | 7/22/20 | EUR | 1,000 | 1,144 |
| | Lloyds Bank plc | 1.375% | 4/16/21 | EUR | 35,800 | 41,874 |
| | Lloyds Bank plc | 1.750% | 3/31/22 | GBP | 3,300 | 4,271 |
| | Lloyds Bank plc | 4.000% | 9/29/20 | EUR | 1,000 | 1,220 |
| | Lloyds Bank plc | 4.875% | 1/13/23 | EUR | 8,200 | 11,039 |
| | Lloyds Bank plc | 4.875% | 3/30/27 | GBP | 3,081 | 4,814 |
| | Lloyds Bank plc | 5.125% | 3/7/25 | GBP | 15,200 | 23,272 |
| | Lloyds Bank plc | 6.000% | 2/8/29 | GBP | 15,350 | 26,490 |
| 1 | Longstone Finance plc | 4.791% | 4/19/36 | GBP | 784 | 1,150 |
| 1 | Marston’s Issuer plc | 5.158% | 10/15/27 | GBP | 1,150 | 1,410 |
| | Nationwide Building Society | 0.625% | 3/25/27 | EUR | 11,790 | 12,982 |
| | Nationwide Building Society | 1.375% | 6/29/32 | EUR | 16,000 | 18,018 |
| | Nationwide Building Society | 2.250% | 6/25/29 | EUR | 5,000 | 6,262 |
| | Nationwide Building Society | 4.375% | 2/28/22 | EUR | 17,000 | 21,921 |
| | Nationwide Building Society | 4.625% | 2/8/21 | EUR | 3,100 | 3,879 |
| | Nationwide Building Society | 5.625% | 1/28/26 | GBP | 1,500 | 2,421 |
| | Nats En Route plc | 5.250% | 3/31/26 | GBP | 2,776 | 4,059 |
| 1 | Octagon Healthcare Funding plc | 5.333% | 6/30/36 | GBP | 843 | 1,318 |
| | Royal Bank of Scotland plc | 3.875% | 10/19/20 | EUR | 22,000 | 26,847 |
| | Royal Bank of Scotland plc | 5.125% | 1/13/24 | GBP | 500 | 750 |
| | Santander UK plc | 0.250% | 8/9/21 | EUR | 10,000 | 11,369 |
| | Santander UK plc | 0.250% | 4/21/22 | EUR | 20,000 | 22,654 |
| | Santander UK plc | 1.250% | 9/18/24 | EUR | 6,700 | 7,871 |
| | Santander UK plc | 1.625% | 11/26/20 | EUR | 18,000 | 21,084 |
| | Santander UK plc | 5.125% | 4/14/21 | GBP | 5,900 | 8,226 |
| | Santander UK plc | 5.250% | 2/16/29 | GBP | 758 | 1,243 |
| 1 | Santander UK plc | 5.750% | 3/2/27 | GBP | 5,855 | 9,453 |
| | Telereal Secured Finance plc | 4.010% | 12/10/31 | GBP | 4,572 | 6,211 |
| 1 | Telereal Securitisation plc | 5.389% | 12/10/33 | GBP | 2,312 | 3,500 |
| | Yorkshire Building Society | 1.250% | 6/11/21 | EUR | 7,000 | 8,168 |
| | | | | | | 491,990 |
| |
| |
| |
| |
| 101 |
| | | | | |
| Total International Bond Index Fund | | | | | |
| |
| |
| |
| | | | | Face | Market |
| | | Maturity | | Amount | Value • |
| | Coupon | Date | Currency | (000) | ($000) |
| Corporate Bonds (2.2%) | | | | | |
| 3i Group plc | 5.750% | 12/3/32 | GBP | 5,000 | 7,931 |
| A2Dominion Housing Group Ltd. | 3.500% | 11/15/28 | GBP | 6,200 | 8,028 |
| ABP Finance plc | 6.250% | 12/14/26 | GBP | 4,300 | 6,680 |
| Admiral Group plc | 5.500% | 7/25/24 | GBP | 2,400 | 3,328 |
| Affinity Sutton Capital Markets plc | 4.250% | 10/8/42 | GBP | 2,500 | 3,779 |
| Affinity Sutton Capital Markets plc | 5.981% | 9/17/38 | GBP | 300 | 548 |
| Affinity Water Finance 2004 plc | 5.875% | 7/13/26 | GBP | 2,150 | 3,453 |
| Affinity Water Programme Finance Ltd. | 4.500% | 3/31/36 | GBP | 4,500 | 7,111 |
| Anglian Water Services Financing plc | 2.625% | 6/15/27 | GBP | 3,400 | 4,110 |
| Anglian Water Services Financing plc | 6.625% | 1/15/29 | GBP | 615 | 1,065 |
| Anglian Water Services Financing plc | 6.875% | 8/21/23 | GBP | 4,300 | 6,785 |
| Annington Funding plc | 1.650% | 7/12/24 | EUR | 3,800 | 4,228 |
| Annington Funding plc | 2.646% | 7/12/25 | GBP | 1,000 | 1,257 |
| Annington Funding plc | 3.184% | 7/12/29 | GBP | 3,000 | 3,775 |
| Annington Funding plc | 3.685% | 7/12/34 | GBP | 7,900 | 10,090 |
| Annington Funding plc | 3.935% | 7/12/47 | GBP | 800 | 1,016 |
| AstraZeneca plc | 0.250% | 5/12/21 | EUR | 1,000 | 1,135 |
| AstraZeneca plc | 1.250% | 5/12/28 | EUR | 100 | 111 |
| AstraZeneca plc | 5.750% | 11/13/31 | GBP | 5,000 | 8,367 |
| 1 Aviva plc | 3.375% | 12/4/45 | EUR | 3,000 | 3,382 |
| 1 Aviva plc | 3.875% | 7/3/44 | EUR | 300 | 351 |
| 1 Aviva plc | 4.375% | 9/12/49 | GBP | 300 | 362 |
| 1 Aviva plc | 5.125% | 6/4/50 | GBP | 3,000 | 3,781 |
| 1 Aviva plc | 5.902% | 11/29/49 | GBP | 2,300 | 2,984 |
| 1 Aviva plc | 6.125% | 11/14/36 | GBP | 3,350 | 4,677 |
| 1 Aviva plc | 6.125% | 7/5/43 | EUR | 1,000 | 1,302 |
| 1 Aviva plc | 6.125% | 9/29/49 | GBP | 1,200 | 1,633 |
| 1 Aviva plc | 6.625% | 6/3/41 | GBP | 2,500 | 3,480 |
| 1 Aviva plc | 6.875% | 11/29/49 | GBP | 3,500 | 4,593 |
| 1 Aviva plc | 6.875% | 5/20/58 | GBP | 2,327 | 3,457 |
| Babcock International Group plc | 1.750% | 10/6/22 | EUR | 7,800 | 9,104 |
| Babcock International Group plc | 1.875% | 10/5/26 | GBP | 4,000 | 4,722 |
| BAE Systems plc | 4.125% | 6/8/22 | GBP | 6,000 | 8,258 |
| Bank of Scotland plc | 9.375% | 5/15/21 | GBP | 3,620 | 5,410 |
| Barclays Bank plc | 2.125% | 2/24/21 | EUR | 5,000 | 5,916 |
| Barclays Bank plc | 4.250% | 3/2/22 | EUR | 10,000 | 12,848 |
| Barclays Bank plc | 6.000% | 1/14/21 | EUR | 3,000 | 3,750 |
| Barclays Bank plc | 6.625% | 3/30/22 | EUR | 7,159 | 9,373 |
| Barclays Bank plc | 10.000% | 5/21/21 | GBP | 8,533 | 12,837 |
| Barclays plc | 1.500% | 4/1/22 | EUR | 1,000 | 1,150 |
| Barclays plc | 1.875% | 3/23/21 | EUR | 200 | 234 |
| Barclays plc | 3.250% | 2/12/27 | GBP | 655 | 814 |
| Barclays plc | 3.250% | 1/17/33 | GBP | 8,500 | 9,726 |
| BAT Capital Corp. | 2.125% | 8/15/25 | GBP | 1,300 | 1,603 |
| BAT International Finance plc | 0.875% | 10/13/23 | EUR | 8,615 | 9,648 |
| BAT International Finance plc | 1.000% | 5/23/22 | EUR | 700 | 801 |
| BAT International Finance plc | 1.750% | 7/5/21 | GBP | 2,700 | 3,451 |
| BAT International Finance plc | 2.250% | 1/16/30 | EUR | 10,600 | 11,535 |
| BAT International Finance plc | 2.250% | 9/9/52 | GBP | 3,000 | 2,742 |
| BAT International Finance plc | 2.375% | 1/19/23 | EUR | 100 | 120 |
| BAT International Finance plc | 2.750% | 3/25/25 | EUR | 7,850 | 9,536 |
| BAT International Finance plc | 3.125% | 3/6/29 | EUR | 8,100 | 9,780 |
| BAT International Finance plc | 4.000% | 9/4/26 | GBP | 1,500 | 2,072 |
102
| | | | | |
| Total International Bond Index Fund | | | | | |
| |
| |
| |
| | | | | Face | Market |
| | | Maturity | | Amount | Value • |
| | Coupon | Date | Currency | (000) | ($000) |
| BAT International Finance plc | 4.875% | 2/24/21 | EUR | 5,250 | 6,582 |
| BAT International Finance plc | 5.750% | 7/5/40 | GBP | 400 | 668 |
| BAT International Finance plc | 6.000% | 11/24/34 | GBP | 1,000 | 1,663 |
| BAT International Finance plc | 6.375% | 12/12/19 | GBP | 6,311 | 8,493 |
| Bazalgette Finance plc | 2.375% | 11/29/27 | GBP | 1,200 | 1,506 |
| BG Energy Capital plc | 1.250% | 11/21/22 | EUR | 6,400 | 7,517 |
| BG Energy Capital plc | 2.250% | 11/21/29 | EUR | 11,411 | 13,898 |
| BG Energy Capital plc | 5.000% | 11/4/36 | GBP | 300 | 513 |
| BG Energy Capital plc | 5.125% | 12/1/25 | GBP | 5,000 | 7,720 |
| BP Capital Markets plc | 0.830% | 9/19/24 | EUR | 8,000 | 9,044 |
| BP Capital Markets plc | 1.000% | 8/28/20 | CHF | 2,000 | 2,033 |
| BP Capital Markets plc | 1.077% | 6/26/25 | EUR | 4,300 | 4,887 |
| BP Capital Markets plc | 1.177% | 8/12/23 | GBP | 3,100 | 3,878 |
| BP Capital Markets plc | 1.373% | 3/3/22 | EUR | 2,700 | 3,173 |
| BP Capital Markets plc | 1.526% | 9/26/22 | EUR | 11,100 | 13,144 |
| BP Capital Markets plc | 1.573% | 2/16/27 | EUR | 5,000 | 5,788 |
| BP Capital Markets plc | 1.637% | 6/26/29 | EUR | 2,729 | 3,122 |
| BP Capital Markets plc | 1.953% | 3/3/25 | EUR | 7,200 | 8,627 |
| BP Capital Markets plc | 2.030% | 2/14/25 | GBP | 300 | 384 |
| BP Capital Markets plc | 2.177% | 9/28/21 | EUR | 5,700 | 6,846 |
| BP Capital Markets plc | 2.213% | 9/25/26 | EUR | 13,000 | 15,801 |
| BP Capital Markets plc | 2.972% | 2/27/26 | EUR | 4,100 | 5,232 |
| BP Capital Markets plc | 3.497% | 11/9/20 | CAD | 12,000 | 9,209 |
| BPHA Finance plc | 4.816% | 4/11/44 | GBP | 1,000 | 1,600 |
| Brambles Finance Ltd. | 2.375% | 6/12/24 | EUR | 400 | 485 |
| British Land Co. plc | 2.375% | 9/14/29 | GBP | 1,400 | 1,706 |
| British Telecommunications plc | 0.625% | 3/10/21 | EUR | 11,000 | 12,560 |
| British Telecommunications plc | 1.000% | 11/21/24 | EUR | 100 | 110 |
| British Telecommunications plc | 1.125% | 3/10/23 | EUR | 1,600 | 1,825 |
| British Telecommunications plc | 1.500% | 6/23/27 | EUR | 700 | 759 |
| British Telecommunications plc | 1.750% | 3/10/26 | EUR | 19,420 | 21,987 |
| British Telecommunications plc | 5.750% | 12/7/28 | GBP | 3,990 | 6,288 |
| British Telecommunications plc | 6.375% | 6/23/37 | GBP | 1,500 | 2,566 |
| BUPA Finance plc | 2.000% | 4/5/24 | GBP | 11,000 | 13,949 |
| BUPA Finance plc | 3.375% | 6/17/21 | GBP | 7,400 | 9,884 |
| Cadent Finance plc | 0.625% | 9/22/24 | EUR | 17,320 | 19,192 |
| Cadent Finance plc | 1.125% | 9/22/21 | GBP | 3,700 | 4,674 |
| Cadent Finance plc | 2.125% | 9/22/28 | GBP | 10,508 | 12,604 |
| Cadent Finance plc | 2.625% | 9/22/38 | GBP | 100 | 115 |
| Cadent Finance plc | 2.750% | 9/22/46 | GBP | 950 | 1,067 |
| Cadent Finance plc | 3.125% | 3/21/40 | GBP | 200 | 246 |
| 1 Centrica plc | 3.000% | 4/10/76 | EUR | 100 | 116 |
| Centrica plc | 4.250% | 9/12/44 | GBP | 5,450 | 7,727 |
| Centrica plc | 4.375% | 3/13/29 | GBP | 4,800 | 6,899 |
| Centrica plc | 6.375% | 3/10/22 | GBP | 1,050 | 1,550 |
| Centrica plc | 7.000% | 9/19/33 | GBP | 1,400 | 2,558 |
| Chancellor Masters and Scholars of the | | | | | |
| University of Oxford | 2.544% | 12/8/17 | GBP | 7,000 | 7,978 |
| 1 Channel Link Enterprises Finance plc | 3.043% | 6/30/50 | GBP | 3,200 | 4,032 |
| Circle Anglia Social Housing plc | 7.250% | 11/12/38 | GBP | 2,650 | 5,429 |
| Close Brothers Finance plc | 3.875% | 6/27/21 | GBP | 3,000 | 4,021 |
| CNH Industrial Finance Europe SA | 1.750% | 9/12/25 | EUR | 8,400 | 9,367 |
| CNH Industrial Finance Europe SA | 1.875% | 1/19/26 | EUR | 500 | 556 |
| CNH Industrial Finance Europe SA | 2.875% | 5/17/23 | EUR | 7,000 | 8,436 |
103
| | | | | | |
| Total International Bond Index Fund | | | | | |
| |
| |
| |
| | | | | | Face | Market |
| | | | Maturity | | Amount | Value • |
| | | Coupon | Date | Currency | (000) | ($000) |
| | Coca-Cola European Partners plc | 0.750% | 2/24/22 | EUR | 6,000 | 6,896 |
| | Coca-Cola European Partners plc | 1.125% | 5/26/24 | EUR | 5,300 | 6,101 |
| | Coca-Cola European Partners plc | 1.750% | 5/26/28 | EUR | 5,100 | 5,880 |
| | Coca-Cola European Partners plc | 2.000% | 12/5/19 | EUR | 1,000 | 1,152 |
| | Coca-Cola European Partners plc | 2.375% | 5/7/25 | EUR | 3,000 | 3,671 |
| | Community Finance Co. 1 plc | 5.017% | 7/31/34 | GBP | 700 | 1,159 |
| | Compass Group International BV | 0.625% | 7/3/24 | EUR | 1,700 | 1,905 |
| | Compass Group plc | 2.000% | 7/3/29 | GBP | 500 | 617 |
| | Coventry Building Society | 1.000% | 5/5/20 | GBP | 2,000 | 2,538 |
| | Coventry Building Society | 2.500% | 11/18/20 | EUR | 6,546 | 7,768 |
| | Coventry Building Society | 5.875% | 9/28/22 | GBP | 15,868 | 23,229 |
| | CPUK Finance Ltd. | 2.666% | 2/28/20 | GBP | 1,000 | 1,292 |
| 1 | CPUK Finance Ltd. | 7.239% | 2/28/42 | GBP | 2,700 | 4,214 |
| | Crh Finance UK plc | 4.125% | 12/2/29 | GBP | 4,200 | 5,926 |
| 1 | CYBG plc | 3.125% | 6/22/25 | GBP | 5,000 | 6,148 |
| 1 | CYBG plc | 5.000% | 2/9/26 | GBP | 800 | 1,043 |
| | Delphi Automotive plc | 1.500% | 3/10/25 | EUR | 5,822 | 6,283 |
| | Delphi Automotive plc | 1.600% | 9/15/28 | EUR | 4,030 | 4,077 |
| | Diageo Finance plc | 0.000% | 11/17/20 | EUR | 700 | 793 |
| | Diageo Finance plc | 0.500% | 6/19/24 | EUR | 854 | 949 |
| | Diageo Finance plc | 1.750% | 9/23/24 | EUR | 200 | 238 |
| | DS Smith plc | 2.250% | 9/16/22 | EUR | 100 | 118 |
| | Dwr Cymru Financing Ltd. | 2.500% | 3/31/36 | GBP | 600 | 742 |
| 13 | Dwr Cymru Financing Ltd. | 6.015% | 3/31/28 | GBP | 500 | 836 |
| | Dwr Cymru Financing Ltd. | 6.907% | 3/31/21 | GBP | 567 | 819 |
| | East Finance plc | 5.486% | 6/15/42 | GBP | 297 | 511 |
| | Eastern Power Networks plc | 4.750% | 9/30/21 | GBP | 2,400 | 3,342 |
| | Eastern Power Networks plc | 5.750% | 3/8/24 | GBP | 3,000 | 4,502 |
| | Eastern Power Networks plc | 6.250% | 11/12/36 | GBP | 200 | 362 |
| | easyJet plc | 1.750% | 2/9/23 | EUR | 800 | 930 |
| | Electricity North West Ltd. | 8.875% | 3/25/26 | GBP | 2,000 | 3,645 |
| | ELM BV for RELX Finance | 2.500% | 9/24/20 | EUR | 1,000 | 1,186 |
| | EMH Treasury plc | 4.500% | 1/29/44 | GBP | 394 | 599 |
| | ENW Finance plc | 6.125% | 7/21/21 | GBP | 1,000 | 1,430 |
| | Eversholt Funding plc | 3.529% | 8/7/42 | GBP | 1,400 | 1,702 |
| | Eversholt Funding plc | 5.831% | 12/2/20 | GBP | 800 | 1,108 |
| | Eversholt Funding plc | 6.359% | 12/2/25 | GBP | 500 | 775 |
| | Eversholt Funding plc | 6.697% | 2/22/35 | GBP | 1,800 | 2,902 |
| | Experian Finance plc | 1.375% | 6/25/26 | EUR | 100 | 113 |
| | Experian Finance plc | 3.500% | 10/15/21 | GBP | 6,815 | 9,155 |
| | Experian Finance plc | 4.750% | 2/4/20 | EUR | 4,000 | 4,804 |
| | FCE Bank plc | 0.869% | 9/13/21 | EUR | 1,000 | 1,114 |
| | FCE Bank plc | 1.114% | 5/13/20 | EUR | 16,199 | 18,489 |
| | FCE Bank plc | 1.134% | 2/10/22 | EUR | 1,430 | 1,595 |
| | FCE Bank plc | 1.528% | 11/9/20 | EUR | 3,200 | 3,680 |
| | FCE Bank plc | 1.615% | 5/11/23 | EUR | 400 | 445 |
| | FCE Bank plc | 1.875% | 6/24/21 | EUR | 5,000 | 5,740 |
| | FCE Bank plc | 2.759% | 11/13/19 | GBP | 5,100 | 6,560 |
| | FCE Bank plc | 3.250% | 11/19/20 | GBP | 2,000 | 2,588 |
| | Fidelity International Ltd. | 2.500% | 11/4/26 | EUR | 1,157 | 1,303 |
| | Fidelity International Ltd. | 7.125% | 2/13/24 | GBP | 2,000 | 3,086 |
| | Firstgroup plc | 5.250% | 11/29/22 | GBP | 15,714 | 21,695 |
| | Firstgroup plc | 6.875% | 9/18/24 | GBP | 2,660 | 3,988 |
| | Firstgroup plc | 8.750% | 4/8/21 | GBP | 5,000 | 7,283 |
104
| | | | | |
| Total International Bond Index Fund | | | | | |
| |
| |
| |
| | | | | Face | Market |
| | | Maturity | | Amount | Value • |
| | Coupon | Date | Currency | (000) | ($000) |
| Friends Life Holdings plc | 8.250% | 4/21/22 | GBP | 3,000 | 4,549 |
| G4S International Finance plc | 1.500% | 1/9/23 | EUR | 1,700 | 1,948 |
| G4S International Finance plc | 1.500% | 6/2/24 | EUR | 11,900 | 13,424 |
| G4S International Finance plc | 1.875% | 5/24/25 | EUR | 22,300 | 25,174 |
| 1 Gatwick Funding Ltd. | 2.625% | 10/7/48 | GBP | 1,200 | 1,310 |
| Gatwick Funding Ltd. | 3.125% | 9/28/39 | GBP | 4,100 | 5,031 |
| Gatwick Funding Ltd. | 3.250% | 2/26/48 | GBP | 300 | 369 |
| 1 Gatwick Funding Ltd. | 5.250% | 1/23/26 | GBP | 1,000 | 1,463 |
| 1 Gatwick Funding Ltd. | 5.750% | 1/23/39 | GBP | 500 | 841 |
| 1 Gatwick Funding Ltd. | 6.125% | 3/2/28 | GBP | 5,950 | 9,347 |
| Genfinance II plc | 6.064% | 12/21/39 | GBP | 4,400 | 7,816 |
| GKN Holdings Ltd. | 3.375% | 5/12/32 | GBP | 800 | 953 |
| GlaxoSmithKline Capital plc | 0.625% | 12/2/19 | EUR | 5,327 | 6,087 |
| GlaxoSmithKline Capital plc | 1.000% | 9/12/26 | EUR | 100 | 112 |
| GlaxoSmithKline Capital plc | 1.250% | 5/21/26 | EUR | 15,000 | 17,128 |
| GlaxoSmithKline Capital plc | 1.375% | 12/2/24 | EUR | 350 | 410 |
| GlaxoSmithKline Capital plc | 1.750% | 5/21/30 | EUR | 10,400 | 12,064 |
| GlaxoSmithKline Capital plc | 3.375% | 12/20/27 | GBP | 3,400 | 4,758 |
| GlaxoSmithKline Capital plc | 4.000% | 6/16/25 | EUR | 1,000 | 1,354 |
| GlaxoSmithKline Capital plc | 4.250% | 12/18/45 | GBP | 600 | 941 |
| GlaxoSmithKline Capital plc | 5.250% | 12/19/33 | GBP | 7,339 | 12,356 |
| GlaxoSmithKline Capital plc | 5.250% | 4/10/42 | GBP | 355 | 627 |
| GlaxoSmithKline Capital plc | 6.375% | 3/9/39 | GBP | 1,145 | 2,226 |
| Global Switch Holdings Ltd. | 1.500% | 1/31/24 | EUR | 1,200 | 1,347 |
| Global Switch Holdings Ltd. | 2.250% | 5/31/27 | EUR | 500 | 557 |
| Global Switch Holdings Ltd. | 4.375% | 12/13/22 | GBP | 1,000 | 1,392 |
| Great Places Housing Group Ltd. | 4.750% | 10/22/42 | GBP | 500 | 786 |
| Great Rolling Stock Co. Ltd. | 6.250% | 7/27/20 | GBP | 5,200 | 7,155 |
| Great Rolling Stock Co. Ltd. | 6.875% | 7/27/35 | GBP | 778 | 1,245 |
| Guinness Partnership Ltd. | 4.000% | 10/24/44 | GBP | 978 | 1,419 |
| Gwynt Y Mor Ofto plc | 2.778% | 2/17/34 | GBP | 2,466 | 3,202 |
| Hammerson plc | 2.000% | 7/1/22 | EUR | 7,200 | 8,469 |
| Hammerson plc | 3.500% | 10/27/25 | GBP | 300 | 390 |
| Hammerson plc | 6.000% | 2/23/26 | GBP | 4,000 | 5,984 |
| Hammerson plc | 7.250% | 4/21/28 | GBP | 10,700 | 17,745 |
| 1 HBOS plc | 4.500% | 3/18/30 | EUR | 3,000 | 3,737 |
| 1 Heathrow Funding Ltd. | 1.500% | 2/11/32 | EUR | 10,000 | 10,963 |
| 1 Heathrow Funding Ltd. | 1.875% | 5/23/24 | EUR | 300 | 356 |
| Heathrow Funding Ltd. | 1.875% | 7/12/32 | EUR | 1,200 | 1,340 |
| Heathrow Funding Ltd. | 2.750% | 8/9/49 | GBP | 850 | 950 |
| Heathrow Funding Ltd. | 3.400% | 3/8/28 | CAD | 7,000 | 5,081 |
| Heathrow Funding Ltd. | 4.625% | 10/31/46 | GBP | 500 | 774 |
| Heathrow Funding Ltd. | 5.225% | 2/15/23 | GBP | 2,200 | 3,198 |
| Heathrow Funding Ltd. | 5.875% | 5/13/41 | GBP | 12,400 | 21,996 |
| Heathrow Funding Ltd. | 6.000% | 3/20/20 | GBP | 10,000 | 13,546 |
| Heathrow Funding Ltd. | 6.450% | 12/10/31 | GBP | 3,050 | 5,340 |
| Heathrow Funding Ltd. | 7.125% | 2/14/24 | GBP | 3,320 | 5,156 |
| Hiscox Ltd. | 2.000% | 12/14/22 | GBP | 700 | 887 |
| 1 Hiscox Ltd. | 6.125% | 11/24/45 | GBP | 1,000 | 1,335 |
| 1 HSBC Bank Capital Funding Sterling 1 LP | 5.844% | 11/29/49 | GBP | 250 | 384 |
| 1 HSBC Bank Capital Funding Sterling 2 LP | 5.862% | 4/29/49 | GBP | 1,000 | 1,331 |
| HSBC Bank plc | 4.000% | 1/15/21 | EUR | 9,500 | 11,701 |
| HSBC Bank plc | 4.750% | 3/24/46 | GBP | 100 | 145 |
| 1 HSBC Bank plc | 5.375% | 11/4/30 | GBP | 1,000 | 1,454 |
105
| | | | | |
| Total International Bond Index Fund | | | | | |
| |
| |
| |
| | | | | Face | Market |
| | | Maturity | | Amount | Value • |
| | Coupon | Date | Currency | (000) | ($000) |
| HSBC Bank plc | 5.375% | 8/22/33 | GBP | 2,000 | 3,045 |
| HSBC Bank plc | 6.250% | 1/30/41 | GBP | 66 | 113 |
| HSBC Bank plc | 6.500% | 7/7/23 | GBP | 5,000 | 7,528 |
| HSBC Holdings plc | 0.875% | 9/6/24 | EUR | 20,600 | 22,930 |
| HSBC Holdings plc | 1.500% | 3/15/22 | EUR | 21,200 | 24,789 |
| 1 HSBC Holdings plc | 2.175% | 6/27/23 | GBP | 14,100 | 17,912 |
| 1 HSBC Holdings plc | 2.256% | 11/13/26 | GBP | 6,000 | 7,339 |
| HSBC Holdings plc | 2.625% | 8/16/28 | GBP | 20,125 | 24,784 |
| HSBC Holdings plc | 3.000% | 6/30/25 | EUR | 26,200 | 32,022 |
| HSBC Holdings plc | 3.196% | 12/5/23 | CAD | 10,000 | 7,434 |
| HSBC Holdings plc | 6.000% | 3/29/40 | GBP | 14,250 | 22,286 |
| HSBC Holdings plc | 6.750% | 9/11/28 | GBP | 2,750 | 4,381 |
| HSBC Holdings plc | 7.000% | 4/7/38 | GBP | 1,000 | 1,720 |
| Hyde Housing Association Ltd. | 5.125% | 7/23/40 | GBP | 275 | 448 |
| Imperial Brands Finance plc | 3.375% | 2/26/26 | EUR | 500 | 623 |
| Imperial Brands Finance plc | 4.875% | 6/7/32 | GBP | 7,050 | 10,168 |
| Imperial Brands Finance plc | 5.000% | 12/2/19 | EUR | 3,000 | 3,582 |
| Imperial Brands Finance plc | 9.000% | 2/17/22 | GBP | 12,400 | 19,296 |
| InterContinental Hotels Group plc | 3.875% | 11/28/22 | GBP | 3,500 | 4,782 |
| Intu Metrocentre Finance plc | 4.125% | 12/6/23 | GBP | 2,000 | 2,700 |
| 1 Intu SGS Finance plc | 3.875% | 3/17/28 | GBP | 1,500 | 1,989 |
| Investec Bank plc | 9.625% | 2/17/22 | GBP | 1,000 | 1,509 |
| Investec plc | 4.500% | 5/5/22 | GBP | 4,000 | 5,405 |
| ITV plc | 2.125% | 9/21/22 | EUR | 100 | 118 |
| Kennedy Wilson Europe Real Estate plc | 3.950% | 6/30/22 | GBP | 2,000 | 2,626 |
| Land Securities Capital Markets plc | 1.974% | 2/8/24 | GBP | 1,000 | 1,277 |
| Land Securities Capital Markets plc | 2.375% | 3/29/27 | GBP | 800 | 1,027 |
| Land Securities Capital Markets plc | 2.750% | 9/22/57 | GBP | 1,300 | 1,559 |
| Leeds Building Society | 0.125% | 4/21/20 | EUR | 900 | 1,022 |
| Leeds Building Society | 0.500% | 7/3/24 | EUR | 500 | 563 |
| Leeds Building Society | 1.375% | 5/5/22 | EUR | 22,195 | 25,489 |
| Leeds Building Society | 2.625% | 4/1/21 | EUR | 22,000 | 26,120 |
| 1 Leeds Building Society | 3.750% | 4/25/29 | GBP | 500 | 598 |
| Legal & General Finance plc | 5.875% | 12/11/31 | GBP | 3,000 | 5,113 |
| 1 Legal & General Group plc | 5.375% | 10/27/45 | GBP | 5,400 | 7,289 |
| 1 Legal & General Group plc | 5.500% | 6/27/64 | GBP | 2,400 | 3,076 |
| 1 Legal & General Group plc | 10.000% | 7/23/41 | GBP | 3,200 | 4,871 |
| Lendlease Europe Finance plc | 6.125% | 10/12/21 | GBP | 21,000 | 29,801 |
| Libra Longhurst Group Treasury plc | 5.125% | 8/2/38 | GBP | 1,797 | 2,889 |
| 1 Liverpool Victoria Friendly Society Ltd. | 6.500% | 5/22/43 | GBP | 600 | 824 |
| Lloyds Bank plc | 0.625% | 4/20/20 | EUR | 5,000 | 5,723 |
| Lloyds Bank plc | 0.625% | 9/14/22 | EUR | 8,780 | 10,064 |
| 1 Lloyds Bank plc | 5.750% | 7/9/25 | GBP | 3,650 | 4,897 |
| Lloyds Bank plc | 6.500% | 3/24/20 | EUR | 2,000 | 2,457 |
| Lloyds Bank plc | 6.500% | 9/17/40 | GBP | 2,050 | 3,845 |
| Lloyds Bank plc | 7.500% | 4/15/24 | GBP | 1,170 | 1,887 |
| Lloyds Bank plc | 7.625% | 4/22/25 | GBP | 8,190 | 13,137 |
| Lloyds Banking Group plc | 0.482% | 12/14/23 | JPY | 1,400,000 | 12,249 |
| Lloyds Banking Group plc | 0.750% | 11/9/21 | EUR | 800 | 915 |
| Lloyds Banking Group plc | 1.000% | 11/9/23 | EUR | 200 | 222 |
| Lloyds Banking Group plc | 2.250% | 10/16/24 | GBP | 1,400 | 1,733 |
| Lloyds Banking Group plc | 4.000% | 3/7/25 | AUD | 9,400 | 6,635 |
| Lloyds Banking Group plc | 4.250% | 11/22/27 | AUD | 3,460 | 2,427 |
| London & Quadrant Housing Trust Ltd. | 2.625% | 5/5/26 | GBP | 4,000 | 5,185 |
106
| | | | | |
| Total International Bond Index Fund | | | | | |
| |
| |
| |
| | | | | Face | Market |
| | | Maturity | | Amount | Value • |
| | Coupon | Date | Currency | (000) | ($000) |
| London & Quadrant Housing Trust Ltd. | 4.625% | 12/5/33 | GBP | 500 | 767 |
| London & Quadrant Housing Trust Ltd. | 5.500% | 1/27/40 | GBP | 400 | 688 |
| London & Quadrant Housing Trust Ltd. | 2.750% | 7/20/57 | GBP | 2,000 | 2,224 |
| London & Quadrant Housing Trust Ltd. | 3.125% | 2/28/53 | GBP | 600 | 740 |
| London Power Networks plc | 5.125% | 3/31/23 | GBP | 3,000 | 4,372 |
| Manchester Airport Group Funding plc | 4.750% | 3/31/34 | GBP | 2,000 | 3,077 |
| Marks & Spencer plc | 3.000% | 12/8/23 | GBP | 1,400 | 1,810 |
| Marks & Spencer plc | 4.750% | 6/12/25 | GBP | 4,610 | 6,383 |
| Marks & Spencer plc | 6.125% | 12/2/19 | GBP | 2,000 | 2,676 |
| Martlet Homes Ltd. | 3.000% | 5/9/52 | GBP | 800 | 946 |
| Mitchells & Butlers Finance plc | 5.574% | 12/15/30 | GBP | 392 | 568 |
| 1 Mitchells & Butlers Finance plc | 6.013% | 12/15/30 | GBP | 2,677 | 3,899 |
| Mondi Finance plc | 1.500% | 4/15/24 | EUR | 11,550 | 13,256 |
| Motability Operations Group plc | 0.875% | 3/14/25 | EUR | 7,816 | 8,783 |
| Motability Operations Group plc | 1.625% | 6/9/23 | EUR | 500 | 594 |
| Motability Operations Group plc | 2.375% | 3/14/32 | GBP | 800 | 995 |
| Motability Operations Group plc | 3.625% | 3/10/36 | GBP | 400 | 570 |
| Motability Operations Group plc | 4.375% | 2/8/27 | GBP | 7,600 | 11,215 |
| Motability Operations Group plc | 5.375% | 6/28/22 | GBP | 1,000 | 1,456 |
| Motability Operations Group plc | 5.625% | 11/29/30 | GBP | 2,000 | 3,376 |
| Motability Operations Group plc | 6.625% | 12/10/19 | GBP | 4,449 | 6,013 |
| National Express Group plc | 2.500% | 11/11/23 | GBP | 5,000 | 6,349 |
| National Grid plc | 4.375% | 3/10/20 | EUR | 1,000 | 1,201 |
| Nationwide Building Society | 0.750% | 10/26/22 | EUR | 6,000 | 6,913 |
| 1 Nationwide Building Society | 2.000% | 7/25/29 | EUR | 10,750 | 11,768 |
| Nationwide Building Society | 2.250% | 4/29/22 | GBP | 1,500 | 1,949 |
| Nationwide Building Society | 3.000% | 5/6/26 | GBP | 17,980 | 23,674 |
| Nationwide Building Society | 6.750% | 7/22/20 | EUR | 5,500 | 6,901 |
| Next plc | 3.625% | 5/18/28 | GBP | 7,000 | 8,987 |
| Next plc | 5.375% | 10/26/21 | GBP | 4,000 | 5,606 |
| 1 NGG Finance plc | 4.250% | 6/18/76 | EUR | 1,600 | 1,900 |
| Northern Gas Networks Finance plc | 4.875% | 6/30/27 | GBP | 300 | 454 |
| Northern Gas Networks Finance plc | 4.875% | 11/15/35 | GBP | 3,800 | 6,034 |
| Northern Powergrid Holdings Co. | 7.250% | 12/15/22 | GBP | 1,060 | 1,654 |
| Northern Powergrid Yorkshire plc | 5.125% | 5/4/35 | GBP | 1,533 | 2,523 |
| Northern Powergrid Yorkshire plc | 9.250% | 1/17/20 | GBP | 4,530 | 6,325 |
| Northumbrian Water Finance plc | 1.625% | 10/11/26 | GBP | 4,900 | 5,831 |
| Northumbrian Water Finance plc | 2.375% | 10/5/27 | GBP | 400 | 497 |
| Northumbrian Water Finance plc | 5.125% | 1/23/42 | GBP | 750 | 1,234 |
| Notting Hill Housing Trust | 3.250% | 10/12/48 | GBP | 250 | 305 |
| Notting Hill Housing Trust | 3.750% | 12/20/32 | GBP | 5,399 | 7,397 |
| Notting Hill Housing Trust | 4.375% | 2/20/54 | GBP | 5,000 | 7,573 |
| Notting Hill Housing Trust | 5.250% | 7/7/42 | GBP | 1,500 | 2,470 |
| Orbit Capital plc | 3.500% | 3/24/45 | GBP | 1,967 | 2,556 |
| Peabody Capital No 2 plc | 4.625% | 12/12/53 | GBP | 150 | 241 |
| Peabody Capital plc | 5.250% | 3/17/43 | GBP | 7,650 | 12,839 |
| Pearson Funding Five plc | 1.375% | 5/6/25 | EUR | 100 | 113 |
| Penarian Housing Finance plc | 3.212% | 6/7/52 | GBP | 200 | 244 |
| Pension Insurance Corp. plc | 8.000% | 11/23/26 | GBP | 6,500 | 9,586 |
| Phoenix Group Holdings | 4.125% | 7/20/22 | GBP | 5,025 | 6,472 |
| Phoenix Group Holdings | 6.625% | 12/18/25 | GBP | 5,000 | 6,691 |
| Places For People Treasury plc | 2.875% | 8/17/26 | GBP | 10,300 | 12,890 |
| Porterbrook Rail Finance Ltd. | 6.500% | 10/20/20 | GBP | 1,500 | 2,088 |
| Porterbrook Rail Finance Ltd. | 7.125% | 10/20/26 | GBP | 3,000 | 4,913 |
107
| | | | | | |
| Total International Bond Index Fund | | | | | |
| |
| |
| |
| | | | | | Face | Market |
| | | | Maturity | | Amount | Value • |
| | | Coupon | Date | Currency | (000) | ($000) |
| | Principality Building Society | 2.375% | 11/23/23 | GBP | 1,000 | 1,253 |
| 1 | Prudential plc | 5.700% | 12/19/63 | GBP | 4,000 | 5,780 |
| | Prudential plc | 5.875% | 5/11/29 | GBP | 1,111 | 1,849 |
| | Prudential plc | 6.125% | 12/19/31 | GBP | 9,000 | 14,630 |
| 1 | Prudential plc | 11.375% | 5/29/39 | GBP | 200 | 270 |
| | RAC Bond Co. plc | 4.870% | 5/6/26 | GBP | 3,000 | 3,839 |
| | RELX Capital Inc. | 1.300% | 5/12/25 | EUR | 2,000 | 2,260 |
| 1 | RL Finance Bonds No. 2 plc | 6.125% | 11/30/43 | GBP | 1,100 | 1,535 |
| | RL Finance Bonds No. 3 plc | 6.125% | 11/13/28 | GBP | 7,500 | 10,193 |
| | Rolls-Royce plc | 0.875% | 5/9/24 | EUR | 10,900 | 12,015 |
| | Rolls-Royce plc | 1.625% | 5/9/28 | EUR | 200 | 219 |
| | Rolls-Royce plc | 2.125% | 6/18/21 | EUR | 1,500 | 1,783 |
| | Rolls-Royce plc | 3.375% | 6/18/26 | GBP | 2,300 | 3,131 |
| 1 | Royal Bank of Scotland Group plc | 1.750% | 3/2/26 | EUR | 15,000 | 16,470 |
| 1 | Royal Bank of Scotland Group plc | 2.000% | 3/8/23 | EUR | 1,000 | 1,156 |
| | Royal Bank of Scotland Group plc | 2.500% | 3/22/23 | EUR | 15,700 | 18,516 |
| | Royal Bank of Scotland plc | 5.500% | 3/23/20 | EUR | 2,000 | 2,434 |
| 1 | RSA Insurance Group plc | 5.125% | 10/10/45 | GBP | 2,000 | 2,680 |
| | RSL Finance No 1 plc | 6.625% | 3/31/38 | GBP | 1,020 | 1,778 |
| | Sanctuary Capital plc | 5.000% | 4/26/47 | GBP | 4,112 | 6,982 |
| | Santander UK Group Holdings plc | 1.125% | 9/8/23 | EUR | 21,105 | 23,518 |
| | Santander UK Group Holdings plc | 3.625% | 1/14/26 | GBP | 375 | 492 |
| | Santander UK plc | 0.500% | 1/10/25 | EUR | 8,100 | 9,072 |
| | Santander UK plc | 1.125% | 1/14/22 | EUR | 11,000 | 12,701 |
| | Santander UK plc | 1.125% | 3/10/25 | EUR | 11,100 | 12,539 |
| | Santander UK plc | 1.875% | 2/17/20 | GBP | 7,600 | 9,747 |
| | Santander UK plc | 2.625% | 7/16/20 | EUR | 5,350 | 6,327 |
| | Santander UK plc | 3.875% | 10/15/29 | GBP | 5,200 | 7,237 |
| | Saxon Weald Capital plc | 5.375% | 6/6/42 | GBP | 296 | 487 |
| | Scotland Gas Networks plc | 3.250% | 3/8/27 | GBP | 5,200 | 6,919 |
| | Scotland Gas Networks plc | 4.875% | 12/21/34 | GBP | 1,000 | 1,555 |
| | Scottish Widows Ltd. | 5.500% | 6/16/23 | GBP | 2,500 | 3,493 |
| | Scottish Widows Ltd. | 7.000% | 6/16/43 | GBP | 2,900 | 4,326 |
| | Segro plc | 2.875% | 10/11/37 | GBP | 300 | 360 |
| | Segro plc | 5.625% | 12/7/20 | GBP | 1,300 | 1,794 |
| | Severn Trent Utilities Finance plc | 1.125% | 9/7/21 | GBP | 1,700 | 2,148 |
| | Severn Trent Utilities Finance plc | 2.750% | 12/5/31 | GBP | 1,300 | 1,623 |
| | Severn Trent Utilities Finance plc | 3.625% | 1/16/26 | GBP | 2,500 | 3,408 |
| | Severn Trent Utilities Finance plc | 4.875% | 1/24/42 | GBP | 2,240 | 3,580 |
| | Skipton Building Society | 1.750% | 6/30/22 | GBP | 1,630 | 2,040 |
| | Sky plc | 1.500% | 9/15/21 | EUR | 7,037 | 8,245 |
| | Sky plc | 1.875% | 11/24/23 | EUR | 5,500 | 6,552 |
| | Sky plc | 2.250% | 11/17/25 | EUR | 500 | 603 |
| | Sky plc | 2.500% | 9/15/26 | EUR | 21,500 | 26,133 |
| | Sky plc | 2.875% | 11/24/20 | GBP | 8,950 | 11,753 |
| | Sky plc | 4.000% | 11/26/29 | GBP | 4,800 | 6,846 |
| | Smiths Group plc | 2.000% | 2/23/27 | EUR | 10,800 | 12,122 |
| | Society of Lloyd’s | 4.750% | 10/30/24 | GBP | 1,500 | 2,029 |
| | South Eastern Power Networks plc | 5.625% | 9/30/30 | GBP | 2,550 | 4,136 |
| | South Eastern Power Networks plc | 6.375% | 11/12/31 | GBP | 2,850 | 4,978 |
| | Southern Electric Power Distribution plc | 4.625% | 2/20/37 | GBP | 400 | 605 |
| | Southern Electric Power Distribution plc | 5.500% | 6/7/32 | GBP | 206 | 334 |
| 14 | Southern Gas Networks plc | 4.875% | 12/21/20 | GBP | 5,000 | 6,839 |
| | Southern Gas Networks plc | 6.375% | 5/15/40 | GBP | 420 | 788 |
108
| | | | | | |
| Total International Bond Index Fund | | | | | |
| |
| |
| |
| | | | | | Face | Market |
| | | | Maturity | | Amount | Value • |
| | | Coupon | Date | Currency | (000) | ($000) |
| 1 | Southern Water Services Finance Ltd. | 4.500% | 3/31/38 | GBP | 1,570 | 2,138 |
| 15 | Southern Water Services Finance Ltd. | 4.500% | 3/31/52 | GBP | 200 | 332 |
| | Southern Water Services Finance Ltd. | 5.000% | 3/31/21 | GBP | 7,850 | 10,845 |
| | Southern Water Services Finance Ltd. | 5.125% | 9/30/56 | GBP | 100 | 188 |
| | Southern Water Services Finance Ltd. | 6.192% | 3/31/29 | GBP | 3,000 | 5,077 |
| | Sovereign Housing Capital plc | 4.768% | 6/1/43 | GBP | 289 | 469 |
| | SPD Finance UK plc | 5.875% | 7/17/26 | GBP | 1,300 | 2,051 |
| | SSE plc | 0.875% | 9/6/25 | EUR | 600 | 663 |
| | SSE plc | 2.000% | 6/17/20 | EUR | 7,200 | 8,407 |
| | SSE plc | 2.375% | 2/10/22 | EUR | 100 | 120 |
| 1 | SSE plc | 3.875% | 12/29/49 | GBP | 5,500 | 7,056 |
| | SSE plc | 5.875% | 9/22/22 | GBP | 400 | 591 |
| | SSE plc | 6.250% | 8/27/38 | GBP | 2,600 | 4,669 |
| | SSE plc | 8.375% | 11/20/28 | GBP | 1,150 | 2,168 |
| | Stagecoach Group plc | 4.000% | 9/29/25 | GBP | 300 | 397 |
| 1 | Standard Chartered Bank | 5.375% | 6/29/49 | GBP | 1,000 | 1,305 |
| 1 | Standard Chartered plc | 0.750% | 10/3/23 | EUR | 5,000 | 5,554 |
| | Standard Chartered plc | 1.625% | 6/13/21 | EUR | 15,076 | 17,654 |
| 1 | Standard Chartered plc | 1.625% | 10/3/27 | EUR | 700 | 773 |
| | Standard Chartered plc | 3.125% | 11/19/24 | EUR | 500 | 597 |
| | Standard Chartered plc | 3.625% | 11/23/22 | EUR | 1,900 | 2,321 |
| 1 | Standard Chartered plc | 4.000% | 10/21/25 | EUR | 4,000 | 4,778 |
| 1 | Standard Life Aberdeen plc | 5.500% | 12/4/42 | GBP | 4,000 | 5,655 |
| | Sunderlan SHG Finance plc | 6.380% | 3/31/42 | GBP | 267 | 462 |
| | Swan Housing Capital plc | 3.625% | 3/5/48 | GBP | 2,364 | 3,076 |
| | Thames Water Utilities Cayman Finance Ltd. | 2.625% | 1/24/32 | GBP | 7,000 | 8,419 |
| | Thames Water Utilities Cayman Finance Ltd. | 3.500% | 2/25/28 | GBP | 1,300 | 1,745 |
| | Thames Water Utilities Cayman Finance Ltd. | 4.000% | 6/19/25 | GBP | 8,000 | 11,143 |
| | Thames Water Utilities Cayman Finance Ltd. | 4.375% | 7/3/34 | GBP | 1,795 | 2,592 |
| | Thames Water Utilities Cayman Finance Ltd. | 4.625% | 6/4/46 | GBP | 1,645 | 2,532 |
| | Thames Water Utilities Cayman Finance Ltd. | 5.500% | 2/11/41 | GBP | 3,675 | 6,188 |
| 1 | Thames Water Utilities Cayman Finance Ltd. | 5.750% | 9/13/30 | GBP | 500 | 707 |
| | Thames Water Utilities Cayman Finance Ltd. | 7.738% | 4/9/58 | GBP | 100 | 231 |
| | THFC Funding No. 3 plc | 5.200% | 10/11/43 | GBP | 4,900 | 8,151 |
| | Together Housing Finance plc | 4.500% | 12/17/42 | GBP | 430 | 653 |
| | TP ICAP plc | 5.250% | 1/26/24 | GBP | 1,020 | 1,247 |
| 1 | TSB Banking Group plc | 5.750% | 5/6/26 | GBP | 2,700 | 3,563 |
| | Unilever NV | 0.500% | 2/3/22 | EUR | 200 | 229 |
| | Unilever NV | 1.000% | 6/3/23 | EUR | 100 | 116 |
| | Unilever NV | 1.750% | 8/5/20 | EUR | 2,300 | 2,691 |
| 1 | UNITE USAF II plc | 3.374% | 6/30/28 | GBP | 1,000 | 1,357 |
| | UNITE USAF II plc | 3.921% | 6/30/25 | GBP | 3,896 | 5,463 |
| | United Utilities Water Finance plc | 2.000% | 2/14/25 | GBP | 2,900 | 3,675 |
| | United Utilities Water Ltd. | 4.250% | 1/24/20 | EUR | 3,000 | 3,581 |
| | United Utilities Water Ltd. | 5.625% | 12/20/27 | GBP | 6,810 | 10,918 |
| | United Utilities Water Ltd. | 5.750% | 3/25/22 | GBP | 3,750 | 5,465 |
| | University of Cambridge | 3.750% | 10/17/52 | GBP | 900 | 1,482 |
| | University of Liverpool | 3.375% | 6/25/55 | GBP | 300 | 441 |
| | University of Southampton | 2.250% | 4/11/57 | GBP | 100 | 113 |
| 1 | Virgin Money Holdings UK plc | 3.375% | 4/24/26 | GBP | 8,166 | 10,344 |
| | Vodafone Group plc | 0.500% | 1/30/24 | EUR | 100 | 110 |
| | Vodafone Group plc | 0.875% | 11/17/20 | EUR | 10,900 | 12,553 |
| | Vodafone Group plc | 1.125% | 11/20/25 | EUR | 1,000 | 1,106 |
| | Vodafone Group plc | 1.250% | 8/25/21 | EUR | 9,000 | 10,479 |
109
| | | | | |
| Total International Bond Index Fund | | | | | |
| |
| |
| |
| | | | | Face | Market |
| | | Maturity | | Amount | Value • |
| | Coupon | Date | Currency | (000) | ($000) |
| Vodafone Group plc | 1.500% | 7/24/27 | EUR | 2,200 | 2,441 |
| Vodafone Group plc | 1.600% | 7/29/31 | EUR | 6,300 | 6,577 |
| Vodafone Group plc | 1.750% | 8/25/23 | EUR | 13,700 | 16,196 |
| Vodafone Group plc | 1.875% | 9/11/25 | EUR | 10,400 | 12,136 |
| Vodafone Group plc | 1.875% | 11/20/29 | EUR | 10,000 | 11,070 |
| Vodafone Group plc | 2.200% | 8/25/26 | EUR | 300 | 353 |
| Vodafone Group plc | 2.875% | 11/20/37 | EUR | 200 | 221 |
| Vodafone Group plc | 3.000% | 8/12/56 | GBP | 5,700 | 5,927 |
| Vodafone Group plc | 3.375% | 8/8/49 | GBP | 400 | 456 |
| Vodafone Group plc | 4.200% | 12/13/27 | AUD | 8,000 | 5,593 |
| Vodafone Group plc | 4.650% | 1/20/22 | EUR | 100 | 129 |
| Vodafone Group plc | 5.625% | 12/4/25 | GBP | 3,400 | 5,221 |
| Vodafone Group plc | 5.900% | 11/26/32 | GBP | 1,000 | 1,670 |
| Wales & West Utilities Finance plc | 3.000% | 8/3/38 | GBP | 100 | 126 |
| Wales & West Utilities Finance plc | 5.750% | 3/29/30 | GBP | 5,000 | 8,264 |
| Wellcome Trust Finance plc | 4.000% | 5/9/59 | GBP | 2,200 | 3,863 |
| Wellcome Trust Finance plc | 4.750% | 5/28/21 | GBP | 500 | 695 |
| Wellcome Trust Ltd. | 2.517% | 2/7/18 | GBP | 4,300 | 4,842 |
| Wessex Water Services Finance plc | 4.000% | 9/24/21 | GBP | 1,000 | 1,366 |
| Wessex Water Services Finance plc | 5.375% | 3/10/28 | GBP | 800 | 1,259 |
| Western Power Distribution East Midlands | | | | | |
| plc | 5.250% | 1/17/23 | GBP | 2,500 | 3,619 |
| Western Power Distribution South Wales | | | | | |
| plc | 5.750% | 3/23/40 | GBP | 850 | 1,473 |
| Western Power Distribution South West | | | | | |
| plc | 5.750% | 3/23/40 | GBP | 1,750 | 3,034 |
| Western Power Distribution West Midlands | | | | | |
| plc | 3.875% | 10/17/24 | GBP | 3,000 | 4,151 |
| Western Power Distribution West Midlands | | | | | |
| plc | 5.750% | 4/16/32 | GBP | 5,600 | 9,201 |
| Wheatley Group Capital plc | 4.375% | 11/28/44 | GBP | 3,100 | 4,535 |
| WHG Treasury plc | 4.250% | 10/6/45 | GBP | 4,000 | 5,925 |
| WM Morrison Supermarkets plc | 2.250% | 6/19/20 | EUR | 600 | 704 |
| WM Morrison Supermarkets plc | 3.500% | 7/27/26 | GBP | 1,350 | 1,821 |
| WM Morrison Supermarkets plc | 4.625% | 12/8/23 | GBP | 800 | 1,142 |
| WM Morrison Supermarkets plc | 4.750% | 7/4/29 | GBP | 5,150 | 7,556 |
| Wods Transmission plc | 3.446% | 8/24/34 | GBP | 594 | 812 |
| WPP Finance 2013 | 2.875% | 9/14/46 | GBP | 500 | 498 |
| WPP Finance 2013 | 3.000% | 11/20/23 | EUR | 9,000 | 11,083 |
| WPP Finance 2016 | 1.375% | 3/20/25 | EUR | 15,000 | 16,605 |
| WPP Finance SA | 2.250% | 9/22/26 | EUR | 300 | 344 |
| WPP Finance SA | 6.375% | 11/6/20 | GBP | 3,200 | 4,465 |
| Yorkshire Building Society | 0.875% | 3/20/23 | EUR | 200 | 224 |
| Yorkshire Building Society | 1.250% | 3/17/22 | EUR | 21,403 | 24,568 |
| Yorkshire Building Society | 3.500% | 4/21/26 | GBP | 100 | 132 |
| Yorkshire Power Finance Ltd. | 7.250% | 8/4/28 | GBP | 200 | 356 |
| Yorkshire Water Services Bradford Finance | | | | | |
| Ltd. | 3.625% | 8/1/29 | GBP | 6,400 | 8,926 |
| 1 Yorkshire Water Services Bradford Finance | | | | | |
| Ltd. | 3.750% | 3/22/46 | GBP | 1,000 | 1,322 |
| Yorkshire Water Services Bradford Finance | | | | | |
| Ltd. | 6.375% | 8/19/39 | GBP | 400 | 764 |
| Yorkshire Water Services Bradford Finance | | | | | |
| Ltd. | 5.500% | 5/28/37 | GBP | 300 | 515 |
| | | | | | 2,420,853 |
110
| | | | | | |
| Total International Bond Index Fund | | | | | |
| |
| |
| |
| | | | | | Face | Market |
| | | | Maturity | | Amount | Value • |
| | | Coupon | Date | Currency | (000) | ($000) |
| Sovereign Bonds (4.7%) | | | | | |
| 1,12 Affordable Housing Finance plc | 2.893% | 8/11/45 | GBP | 2,673 | 3,829 |
| 12 | LCR Finance plc | 4.500% | 12/7/28 | GBP | 15,500 | 24,890 |
| 12 | LCR Finance plc | 4.500% | 12/7/38 | GBP | 1,600 | 2,868 |
| 12 | LCR Finance plc | 5.100% | 3/7/51 | GBP | 1,200 | 2,609 |
| 12 | Merseylink Issuer plc | 3.842% | 3/31/43 | GBP | 300 | 484 |
| 12 | Network Rail Infrastructure Finance plc | 2.750% | 10/6/21 | CHF | 2,500 | 2,712 |
| 12 | Network Rail Infrastructure Finance plc | 4.375% | 12/9/30 | GBP | 8,900 | 14,522 |
| 12 | Network Rail Infrastructure Finance plc | 4.625% | 7/21/20 | GBP | 200 | 272 |
| 12 | Network Rail Infrastructure Finance plc | 4.750% | 1/22/24 | GBP | 5,000 | 7,484 |
| 12 | Network Rail Infrastructure Finance plc | 4.750% | 11/29/35 | GBP | 4,200 | 7,504 |
| | Transport for London | 2.125% | 4/24/25 | GBP | 5,000 | 6,501 |
| | Transport for London | 2.250% | 8/9/22 | GBP | 900 | 1,183 |
| | Transport for London | 3.625% | 5/15/45 | GBP | 4,900 | 7,294 |
| | Transport for London | 3.875% | 7/23/42 | GBP | 2,400 | 3,700 |
| | Transport for London | 4.000% | 4/7/64 | GBP | 1,200 | 2,046 |
| | United Kingdom | 0.500% | 7/22/22 | GBP | 152,485 | 192,137 |
| | United Kingdom | 0.750% | 7/22/23 | GBP | 260,150 | 328,402 |
| | United Kingdom | 1.250% | 7/22/27 | GBP | 221,500 | 281,147 |
| | United Kingdom | 1.500% | 1/22/21 | GBP | 118,000 | 153,274 |
| | United Kingdom | 1.500% | 7/22/26 | GBP | 24,400 | 31,799 |
| | United Kingdom | 1.500% | 7/22/47 | GBP | 219,800 | 258,544 |
| | United Kingdom | 1.625% | 10/22/28 | GBP | 42,000 | 54,625 |
| | United Kingdom | 1.625% | 10/22/71 | GBP | 95,659 | 115,713 |
| | United Kingdom | 1.750% | 9/7/37 | GBP | 193,300 | 244,741 |
| | United Kingdom | 1.750% | 7/22/57 | GBP | 92,450 | 116,947 |
| | United Kingdom | 2.000% | 7/22/20 | GBP | 163,300 | 213,207 |
| | United Kingdom | 2.500% | 7/22/65 | GBP | 69,000 | 108,533 |
| | United Kingdom | 2.750% | 9/7/24 | GBP | 86,580 | 121,030 |
| | United Kingdom | 3.250% | 1/22/44 | GBP | 203,900 | 331,727 |
| | United Kingdom | 3.500% | 1/22/45 | GBP | 93,920 | 159,958 |
| | United Kingdom | 3.500% | 7/22/68 | GBP | 22,764 | 45,510 |
| | United Kingdom | 3.750% | 9/7/20 | GBP | 28,500 | 38,424 |
| | United Kingdom | 3.750% | 9/7/21 | GBP | 68,100 | 94,249 |
| | United Kingdom | 3.750% | 7/22/52 | GBP | 106,100 | 201,330 |
| | United Kingdom | 4.000% | 1/22/60 | GBP | 62,000 | 130,332 |
| | United Kingdom | 4.250% | 12/7/27 | GBP | 77,000 | 123,250 |
| | United Kingdom | 4.250% | 6/7/32 | GBP | 41,541 | 70,116 |
| | United Kingdom | 4.250% | 3/7/36 | GBP | 137,000 | 240,482 |
| | United Kingdom | 4.250% | 9/7/39 | GBP | 95,796 | 173,819 |
| | United Kingdom | 4.250% | 12/7/40 | GBP | 54,445 | 100,030 |
| | United Kingdom | 4.250% | 12/7/46 | GBP | 65,600 | 127,142 |
| | United Kingdom | 4.250% | 12/7/49 | GBP | 72,600 | 145,321 |
| | United Kingdom | 4.250% | 12/7/55 | GBP | 89,100 | 188,941 |
| | United Kingdom | 4.500% | 9/7/34 | GBP | 104,225 | 184,801 |
| | United Kingdom | 4.500% | 12/7/42 | GBP | 34,100 | 65,956 |
| | United Kingdom | 4.750% | 12/7/30 | GBP | 72,410 | 125,421 |
| | United Kingdom | 4.750% | 12/7/38 | GBP | 6,708 | 12,840 |
| | United Kingdom | 5.000% | 3/7/25 | GBP | 141,707 | 224,052 |
| | United Kingdom of Great Britain and | | | | | |
| | Northern Ireland | 4.250% | 6/7/32 | GBP | 61,000 | 102,960 |
| | United Kingdom of Great Britain and | | | | | |
| | Northern Ireland | 8.000% | 6/7/21 | GBP | 26,000 | 39,400 |
| |
| |
| |
| 111 |
| | | | | |
| Total International Bond Index Fund | | | | | |
| |
| |
| |
| | | | | Face | Market |
| | | Maturity | | Amount | Value • |
| | Coupon | Date | Currency | (000) | ($000) |
| Urenco Finance NV | 2.375% | 12/2/24 | EUR | 4,000 | 4,889 |
| Urenco Finance NV | 2.500% | 2/15/21 | EUR | 3,000 | 3,572 |
| | | | | | 5,242,519 |
| Total United Kingdom (Cost $8,566,117) | | | | | 8,155,362 |
| United States (2.9%) | | | | | |
| Corporate Bonds (2.9%) | | | | | |
| 3M Co. | 0.375% | 2/15/22 | EUR | 17,000 | 19,392 |
| 3M Co. | 0.950% | 5/15/23 | EUR | 2,000 | 2,328 |
| 3M Co. | 1.500% | 11/9/26 | EUR | 300 | 353 |
| 3M Co. | 1.750% | 5/15/30 | EUR | 1,617 | 1,915 |
| 3M Co. | 1.875% | 11/15/21 | EUR | 400 | 477 |
| AbbVie Inc. | 0.375% | 11/18/19 | EUR | 3,800 | 4,322 |
| AbbVie Inc. | 1.375% | 5/17/24 | EUR | 12,000 | 13,719 |
| AbbVie Inc. | 2.125% | 11/17/28 | EUR | 6,800 | 7,704 |
| Air Products & Chemicals Inc. | 1.000% | 2/12/25 | EUR | 3,337 | 3,832 |
| Albemarle Corp. | 1.875% | 12/8/21 | EUR | 100 | 118 |
| Allergan Funding SCS | 0.500% | 6/1/21 | EUR | 4,800 | 5,444 |
| Allergan Funding SCS | 1.250% | 6/1/24 | EUR | 10,000 | 11,032 |
| Allergan Funding SCS | 2.125% | 6/1/29 | EUR | 8,400 | 9,063 |
| American Express Credit Corp. | 0.625% | 11/22/21 | EUR | 26,702 | 30,592 |
| American International Group Inc. | 1.500% | 6/8/23 | EUR | 500 | 578 |
| American International Group Inc. | 1.875% | 6/21/27 | EUR | 10,300 | 11,556 |
| American International Group Inc. | 5.000% | 4/26/23 | GBP | 3,400 | 4,841 |
| American Tower Corp. | 1.375% | 4/4/25 | EUR | 8,500 | 9,478 |
| American Tower Corp. | 1.950% | 5/22/26 | EUR | 9,700 | 11,037 |
| Amgen Inc. | 1.250% | 2/25/22 | EUR | 18,360 | 21,373 |
| Amgen Inc. | 2.000% | 2/25/26 | EUR | 2,600 | 3,091 |
| Amgen Inc. | 4.000% | 9/13/29 | GBP | 4,500 | 6,379 |
| Amgen Inc. | 5.500% | 12/7/26 | GBP | 4,400 | 6,809 |
| Anheuser-Busch InBev Finance Inc. | 2.600% | 5/15/24 | CAD | 6,000 | 4,283 |
| Anheuser-Busch InBev Finance Inc. | 3.375% | 1/25/23 | CAD | 10,000 | 7,518 |
| Anheuser-Busch InBev Finance Inc. | 4.320% | 5/15/47 | CAD | 3,000 | 2,110 |
| Aon plc | 2.875% | 5/14/26 | EUR | 3,400 | 4,145 |
| Apple Inc. | 0.350% | 6/10/20 | JPY | 1,350,000 | 12,019 |
| Apple Inc. | 0.750% | 2/25/30 | CHF | 5,500 | 5,436 |
| Apple Inc. | 0.875% | 5/24/25 | EUR | 12,000 | 13,694 |
| Apple Inc. | 1.000% | 11/10/22 | EUR | 13,450 | 15,788 |
| Apple Inc. | 1.375% | 1/17/24 | EUR | 10,100 | 11,963 |
| Apple Inc. | 1.375% | 5/24/29 | EUR | 7,800 | 8,956 |
| Apple Inc. | 1.625% | 11/10/26 | EUR | 4,139 | 4,912 |
| Apple Inc. | 2.000% | 9/17/27 | EUR | 7,080 | 8,620 |
| Apple Inc. | 2.513% | 8/19/24 | CAD | 24,220 | 17,630 |
| Apple Inc. | 3.050% | 7/31/29 | GBP | 14,700 | 20,361 |
| Apple Inc. | 3.600% | 6/10/26 | AUD | 1,190 | 859 |
| Apple Inc. | 3.700% | 8/28/22 | AUD | 4,250 | 3,108 |
| Archer-Daniels-Midland Co. | 1.000% | 9/12/25 | EUR | 15,600 | 17,580 |
| Archer-Daniels-Midland Co. | 1.750% | 6/23/23 | EUR | 10,000 | 11,937 |
| 2 AT&T Inc. | 1.050% | 9/5/23 | EUR | 2,100 | 2,372 |
| AT&T Inc. | 1.300% | 9/5/23 | EUR | 600 | 688 |
| AT&T Inc. | 1.375% | 12/4/24 | CHF | 500 | 515 |
| AT&T Inc. | 1.450% | 6/1/22 | EUR | 14,714 | 17,134 |
| 2 AT&T Inc. | 1.800% | 9/5/26 | EUR | 3,800 | 4,262 |
| AT&T Inc. | 1.875% | 12/4/20 | EUR | 400 | 468 |
112
| | | | | |
| Total International Bond Index Fund | | | | | |
| |
| |
| |
| | | | | Face | Market |
| | | Maturity | | Amount | Value • |
| | Coupon | Date | Currency | (000) | ($000) |
| 2 AT&T Inc. | 2.350% | 9/5/29 | EUR | 15,300 | 17,036 |
| AT&T Inc. | 2.400% | 3/15/24 | EUR | 9,000 | 10,767 |
| AT&T Inc. | 2.450% | 3/15/35 | EUR | 100 | 102 |
| AT&T Inc. | 2.500% | 3/15/23 | EUR | 2,000 | 2,414 |
| AT&T Inc. | 2.600% | 12/17/29 | EUR | 3,775 | 4,323 |
| AT&T Inc. | 2.650% | 12/17/21 | EUR | 100 | 121 |
| AT&T Inc. | 2.750% | 5/19/23 | EUR | 9,848 | 12,031 |
| AT&T Inc. | 2.900% | 12/4/26 | GBP | 15,000 | 18,978 |
| AT&T Inc. | 3.150% | 9/4/36 | EUR | 6,400 | 7,027 |
| AT&T Inc. | 3.375% | 3/15/34 | EUR | 2,800 | 3,254 |
| AT&T Inc. | 3.500% | 12/17/25 | EUR | 2,300 | 2,925 |
| AT&T Inc. | 3.550% | 12/17/32 | EUR | 10,962 | 13,268 |
| AT&T Inc. | 3.825% | 11/25/20 | CAD | 11,750 | 9,027 |
| AT&T Inc. | 4.000% | 11/25/25 | CAD | 14,225 | 10,632 |
| AT&T Inc. | 4.250% | 6/1/43 | GBP | 4,767 | 6,223 |
| AT&T Inc. | 4.375% | 9/14/29 | GBP | 5,488 | 7,610 |
| AT&T Inc. | 4.850% | 5/25/47 | CAD | 3,930 | 2,761 |
| AT&T Inc. | 4.875% | 6/1/44 | GBP | 2,350 | 3,344 |
| AT&T Inc. | 5.100% | 11/25/48 | CAD | 3,000 | 2,184 |
| AT&T Inc. | 5.200% | 11/18/33 | GBP | 5,000 | 7,487 |
| AT&T Inc. | 7.000% | 4/30/40 | GBP | 5,150 | 9,305 |
| 1 Bank of America Corp. | 0.736% | 2/7/22 | EUR | 100 | 114 |
| Bank of America Corp. | 0.750% | 7/26/23 | EUR | 15,000 | 16,863 |
| Bank of America Corp. | 1.375% | 9/10/21 | EUR | 10,000 | 11,714 |
| Bank of America Corp. | 1.375% | 3/26/25 | EUR | 3,000 | 3,419 |
| 1 Bank of America Corp. | 1.379% | 2/7/25 | EUR | 100 | 114 |
| Bank of America Corp. | 1.625% | 9/14/22 | EUR | 5,000 | 5,881 |
| 1 Bank of America Corp. | 1.776% | 5/4/27 | EUR | 2,100 | 2,402 |
| Bank of America Corp. | 2.300% | 7/25/25 | GBP | 1,000 | 1,261 |
| Bank of America Corp. | 2.375% | 6/19/24 | EUR | 5,000 | 6,059 |
| Bank of America Corp. | 2.500% | 7/27/20 | EUR | 10,700 | 12,649 |
| 1 Bank of America Corp. | 2.604% | 3/15/23 | CAD | 4,850 | 3,581 |
| 1 Bank of America Corp. | 3.301% | 4/24/24 | CAD | 2,225 | 1,666 |
| 1 Bank of America Corp. | 3.407% | 9/20/25 | CAD | 2,040 | 1,517 |
| Bank of America Corp. | 4.250% | 3/5/20 | AUD | 10,540 | 7,620 |
| Bank of America Corp. | 4.250% | 12/10/26 | GBP | 2,900 | 4,119 |
| Bank of America Corp. | 5.500% | 12/4/19 | GBP | 3,950 | 5,273 |
| Bank of America Corp. | 5.500% | 11/22/21 | GBP | 1,800 | 2,526 |
| Bank of America Corp. | 6.125% | 9/15/21 | GBP | 7,400 | 10,603 |
| Bank of America Corp. | 7.000% | 7/31/28 | GBP | 5,800 | 10,001 |
| Baxter International Inc. | 1.300% | 5/30/25 | EUR | 7,055 | 8,043 |
| Becton Dickinson & Co. | 1.000% | 12/15/22 | EUR | 7,830 | 8,914 |
| Becton Dickinson & Co. | 1.900% | 12/15/26 | EUR | 11,818 | 13,320 |
| Berkshire Hathaway Inc. | 0.500% | 3/13/20 | EUR | 8,100 | 9,249 |
| Berkshire Hathaway Inc. | 0.750% | 3/16/23 | EUR | 1,000 | 1,142 |
| Berkshire Hathaway Inc. | 1.125% | 3/16/27 | EUR | 7,832 | 8,757 |
| Berkshire Hathaway Inc. | 1.300% | 3/15/24 | EUR | 4,400 | 5,126 |
| Berkshire Hathaway Inc. | 1.625% | 3/16/35 | EUR | 9,000 | 9,926 |
| Berkshire Hathaway Inc. | 2.150% | 3/15/28 | EUR | 10,300 | 12,464 |
| BlackRock Inc. | 1.250% | 5/6/25 | EUR | 6,550 | 7,514 |
| Blackstone Holdings Finance Co. LLC | 1.000% | 10/5/26 | EUR | 889 | 954 |
| Blackstone Holdings Finance Co. LLC | 2.000% | 5/19/25 | EUR | 100 | 117 |
| BorgWarner Inc. | 1.800% | 11/7/22 | EUR | 100 | 117 |
| Bristol-Myers Squibb Co. | 1.000% | 5/15/25 | EUR | 1,625 | 1,863 |
| |
| |
| 113 |
| | | | | |
| Total International Bond Index Fund | | | | | |
| |
| |
| |
| | | | | Face | Market |
| | | Maturity | | Amount | Value • |
| | Coupon | Date | Currency | (000) | ($000) |
| Bristol-Myers Squibb Co. | 1.750% | 5/15/35 | EUR | 4,000 | 4,480 |
| Brown-Forman Corp. | 1.200% | 7/7/26 | EUR | 2,260 | 2,576 |
| Brown-Forman Corp. | 2.600% | 7/7/28 | GBP | 9,320 | 11,974 |
| Bunge Finance Europe BV | 1.850% | 6/16/23 | EUR | 16,570 | 19,134 |
| Cargill Inc. | 2.500% | 2/15/23 | EUR | 10,400 | 12,774 |
| Carnival Corp. | 1.125% | 11/6/19 | EUR | 5,000 | 5,729 |
| Carnival Corp. | 1.625% | 2/22/21 | EUR | 9,000 | 10,526 |
| Carnival Corp. | 1.875% | 11/7/22 | EUR | 5,550 | 6,600 |
| Caterpillar International Finance DAC | 0.750% | 10/13/20 | EUR | 200 | 230 |
| Celanese US Holdings LLC | 2.125% | 3/1/27 | EUR | 6,900 | 7,744 |
| Chubb INA Holdings Inc. | 1.550% | 3/15/28 | EUR | 20,389 | 22,936 |
| Chubb INA Holdings Inc. | 2.500% | 3/15/38 | EUR | 18,774 | 21,144 |
| Citigroup Inc. | 0.750% | 10/26/23 | EUR | 500 | 559 |
| Citigroup Inc. | 1.375% | 10/27/21 | EUR | 10,000 | 11,697 |
| Citigroup Inc. | 1.500% | 10/26/28 | EUR | 1,000 | 1,093 |
| Citigroup Inc. | 1.625% | 3/21/28 | EUR | 10,000 | 11,099 |
| Citigroup Inc. | 1.750% | 1/28/25 | EUR | 600 | 698 |
| Citigroup Inc. | 2.125% | 9/10/26 | EUR | 5,400 | 6,383 |
| Citigroup Inc. | 2.375% | 5/22/24 | EUR | 5,000 | 6,045 |
| Citigroup Inc. | 2.400% | 10/31/25 | JPY | 500,000 | 4,927 |
| Citigroup Inc. | 3.390% | 11/18/21 | CAD | 4,970 | 3,792 |
| Citigroup Inc. | 4.500% | 3/3/31 | GBP | 1,000 | 1,403 |
| Citigroup Inc. | 6.800% | 6/25/38 | GBP | 400 | 761 |
| Citigroup Inc. | 7.375% | 9/1/39 | GBP | 600 | 1,207 |
| Coca-Cola Co. | 0.000% | 3/9/21 | EUR | 3,750 | 4,249 |
| Coca-Cola Co. | 0.500% | 3/8/24 | EUR | 5,800 | 6,533 |
| Coca-Cola Co. | 0.750% | 3/9/23 | EUR | 5,500 | 6,323 |
| Coca-Cola Co. | 1.100% | 9/2/36 | EUR | 1,600 | 1,625 |
| Coca-Cola Co. | 1.125% | 9/22/22 | EUR | 1,000 | 1,170 |
| Coca-Cola Co. | 1.125% | 3/9/27 | EUR | 3,100 | 3,519 |
| Coca-Cola Co. | 1.625% | 3/9/35 | EUR | 5,650 | 6,255 |
| Coca-Cola Co. | 1.875% | 9/22/26 | EUR | 2,959 | 3,569 |
| Coca-Cola Co. | 2.600% | 6/9/20 | AUD | 1,000 | 709 |
| Coca-Cola Co. | 3.250% | 6/11/24 | AUD | 400 | 286 |
| Comcast Corp. | 5.500% | 11/23/29 | GBP | 4,000 | 6,462 |
| Corning Inc. | 0.992% | 8/10/27 | JPY | 1,700,000 | 15,126 |
| DH Europe Finance SA | 1.700% | 1/4/22 | EUR | 26,000 | 30,750 |
| Digital Euro Finco LLC | 2.625% | 4/15/24 | EUR | 100 | 119 |
| Digital Stout Holding LLC | 3.300% | 7/19/29 | GBP | 3,000 | 3,802 |
| Digital Stout Holding LLC | 4.250% | 1/17/25 | GBP | 2,000 | 2,751 |
| Digital Stout Holding LLC | 4.750% | 10/13/23 | GBP | 1,000 | 1,405 |
| Discovery Communications LLC | 1.900% | 3/19/27 | EUR | 18,742 | 20,761 |
| Discovery Communications LLC | 2.375% | 3/7/22 | EUR | 1,000 | 1,198 |
| Discovery Communications LLC | 2.500% | 9/20/24 | GBP | 4,400 | 5,515 |
| Dover Corp. | 1.250% | 11/9/26 | EUR | 19,700 | 21,862 |
| Dover Corp. | 2.125% | 12/1/20 | EUR | 1,300 | 1,534 |
| DXC Technology Co. | 1.750% | 1/15/26 | EUR | 9,900 | 11,020 |
| Eastman Chemical Co. | 1.500% | 5/26/23 | EUR | 10,000 | 11,789 |
| Eastman Chemical Co. | 1.875% | 11/23/26 | EUR | 5,700 | 6,671 |
| Ecolab Inc. | 1.000% | 1/15/24 | EUR | 7,620 | 8,742 |
| Eli Lilly & Co. | 1.000% | 6/2/22 | EUR | 13,800 | 16,076 |
| Eli Lilly & Co. | 2.125% | 6/3/30 | EUR | 8,100 | 9,799 |
| Expedia Group Inc. | 2.500% | 6/3/22 | EUR | 1,450 | 1,720 |
| FedEx Corp. | 0.500% | 4/9/20 | EUR | 8,900 | 10,157 |
114
| | | | | |
| Total International Bond Index Fund | | | | | |
| |
| |
| |
| | | | | Face | Market |
| | | Maturity | | Amount | Value • |
| | Coupon | Date | Currency | (000) | ($000) |
| FedEx Corp. | 1.000% | 1/11/23 | EUR | 700 | 807 |
| FedEx Corp. | 1.625% | 1/11/27 | EUR | 3,000 | 3,393 |
| Fidelity National Information Services Inc. | 0.400% | 1/15/21 | EUR | 6,662 | 7,569 |
| Fidelity National Information Services Inc. | 1.100% | 7/15/24 | EUR | 10,909 | 12,270 |
| Fidelity National Information Services Inc. | 1.700% | 6/30/22 | GBP | 2,990 | 3,782 |
| Flowserve Corp. | 1.250% | 3/17/22 | EUR | 3,700 | 4,185 |
| Fluor Corp. | 1.750% | 3/21/23 | EUR | 7,450 | 8,713 |
| Ford Credit Canada Co. | 2.710% | 2/23/22 | CAD | 8,000 | 5,773 |
| Ford Credit Canada Co. | 3.742% | 5/8/23 | CAD | 10,000 | 7,287 |
| Ford Credit Canada Ltd. | 2.580% | 5/10/21 | CAD | 5,000 | 3,664 |
| Ford Credit Canada Ltd. | 2.923% | 9/16/20 | CAD | 1,450 | 1,084 |
| Ford Credit Canada Ltd. | 3.279% | 7/2/21 | CAD | 2,800 | 2,081 |
| Ford Motor Credit Co. LLC | 1.355% | 2/7/25 | EUR | 8,900 | 9,419 |
| Ford Motor Credit Co. LLC | 3.588% | 6/2/20 | AUD | 330 | 235 |
| GE Capital Canada Funding Co. | 4.600% | 1/26/22 | CAD | 5,411 | 4,242 |
| GE Capital Canada Funding Co. | 5.730% | 10/22/37 | CAD | 1,500 | 1,259 |
| GE Capital European Funding Unlimited Co. | 2.625% | 3/15/23 | EUR | 15,000 | 17,967 |
| GE Capital European Funding Unlimited Co. | 4.350% | 11/3/21 | EUR | 100 | 126 |
| GE Capital European Funding Unlimited Co. | 4.625% | 2/22/27 | EUR | 4,400 | 5,913 |
| GE Capital European Funding Unlimited Co. | 5.375% | 1/23/20 | EUR | 11,300 | 13,616 |
| GE Capital European Funding Unlimited Co. | 6.025% | 3/1/38 | EUR | 1,500 | 2,276 |
| GE Capital UK Funding Unlimited Co. | 4.125% | 9/13/23 | GBP | 3,249 | 4,480 |
| GE Capital UK Funding Unlimited Co. | 5.875% | 11/4/20 | GBP | 3,830 | 5,269 |
| GE Capital UK Funding Unlimited Co. | 5.875% | 1/18/33 | GBP | 2,500 | 3,969 |
| GE Capital UK Funding Unlimited Co. | 6.250% | 5/5/38 | GBP | 2,414 | 4,093 |
| General Electric Co. | 0.375% | 5/17/22 | EUR | 6,400 | 7,106 |
| General Electric Co. | 0.875% | 5/17/25 | EUR | 12,650 | 13,535 |
| General Electric Co. | 1.500% | 5/17/29 | EUR | 18,700 | 19,228 |
| General Electric Co. | 1.875% | 5/28/27 | EUR | 13,400 | 14,778 |
| General Electric Co. | 2.125% | 5/17/37 | EUR | 13,200 | 12,708 |
| General Electric Co. | 3.125% | 12/6/19 | CHF | 1,000 | 1,030 |
| General Electric Co. | 4.125% | 9/19/35 | EUR | 5,200 | 6,534 |
| General Electric Co. | 4.875% | 9/18/37 | GBP | 7,236 | 9,847 |
| General Electric Co. | 5.500% | 6/7/21 | GBP | 3,000 | 4,173 |
| General Electric Co. | 6.250% | 9/29/20 | GBP | 1,657 | 2,290 |
| General Mills Inc. | 1.000% | 4/27/23 | EUR | 7,000 | 8,059 |
| General Mills Inc. | 1.500% | 4/27/27 | EUR | 2,000 | 2,262 |
| General Mills Inc. | 2.100% | 11/16/20 | EUR | 1,000 | 1,174 |
| General Motors Financial Co. Inc. | 0.955% | 9/7/23 | EUR | 300 | 330 |
| General Motors Financial Co. Inc. | 1.694% | 3/26/25 | EUR | 9,856 | 10,983 |
| General Motors Financial of Canada Ltd. | 2.600% | 6/1/22 | CAD | 7,000 | 5,079 |
| Goldman Sachs Group Inc. | 0.550% | 9/9/21 | CHF | 2,150 | 2,160 |
| Goldman Sachs Group Inc. | 1.250% | 5/1/25 | EUR | 11,040 | 12,315 |
| Goldman Sachs Group Inc. | 1.375% | 7/26/22 | EUR | 10,800 | 12,550 |
| Goldman Sachs Group Inc. | 1.375% | 5/15/24 | EUR | 2,800 | 3,187 |
| Goldman Sachs Group Inc. | 1.625% | 7/27/26 | EUR | 30,713 | 34,413 |
| Goldman Sachs Group Inc. | 2.000% | 7/27/23 | EUR | 20,266 | 23,911 |
| Goldman Sachs Group Inc. | 2.000% | 3/22/28 | EUR | 1,100 | 1,243 |
| Goldman Sachs Group Inc. | 2.000% | 11/1/28 | EUR | 10,100 | 11,276 |
| Goldman Sachs Group Inc. | 2.125% | 9/30/24 | EUR | 9,139 | 10,816 |
| 1 Goldman Sachs Group Inc. | 2.433% | 4/26/23 | CAD | 10,200 | 7,453 |
| Goldman Sachs Group Inc. | 2.500% | 10/18/21 | EUR | 50 | 60 |
| Goldman Sachs Group Inc. | 2.875% | 6/3/26 | EUR | 5,000 | 6,107 |
| Goldman Sachs Group Inc. | 3.125% | 7/25/29 | GBP | 6,000 | 7,575 |
115
| | | | | |
| Total International Bond Index Fund | | | | | |
| |
| |
| |
| | | | | Face | Market |
| | | Maturity | | Amount | Value • |
| | Coupon | Date | Currency | (000) | ($000) |
| Goldman Sachs Group Inc. | 3.250% | 2/1/23 | EUR | 23,800 | 29,563 |
| 1 Goldman Sachs Group Inc. | 3.307% | 10/31/25 | CAD | 800 | 587 |
| Goldman Sachs Group Inc. | 4.250% | 1/29/26 | GBP | 3,100 | 4,316 |
| Goldman Sachs Group Inc. | 4.750% | 10/12/21 | EUR | 1,100 | 1,394 |
| Goldman Sachs Group Inc. | 5.000% | 8/21/19 | AUD | 16,500 | 11,901 |
| Goldman Sachs Group Inc. | 5.500% | 10/12/21 | GBP | 6,500 | 9,095 |
| Goldman Sachs Group Inc. | 6.875% | 1/18/38 | GBP | 6,100 | 10,668 |
| Goldman Sachs Group Inc. | 7.250% | 4/10/28 | GBP | 700 | 1,197 |
| Harman Finance International SCA | 2.000% | 5/27/22 | EUR | 8,500 | 10,057 |
| Honeywell International Inc. | 0.650% | 2/21/20 | EUR | 5,920 | 6,773 |
| Honeywell International Inc. | 1.300% | 2/22/23 | EUR | 3,300 | 3,869 |
| Honeywell International Inc. | 2.250% | 2/22/28 | EUR | 5,490 | 6,774 |
| Illinois Tool Works Inc. | 1.250% | 5/22/23 | EUR | 3,100 | 3,630 |
| Illinois Tool Works Inc. | 1.750% | 5/20/22 | EUR | 7,900 | 9,397 |
| Illinois Tool Works Inc. | 2.125% | 5/22/30 | EUR | 11,700 | 14,151 |
| Intel Corp. | 4.000% | 12/1/22 | AUD | 5,000 | 3,675 |
| International Business Machines Corp. | 0.500% | 9/7/21 | EUR | 10,000 | 11,420 |
| International Business Machines Corp. | 0.950% | 5/23/25 | EUR | 18,200 | 20,509 |
| International Business Machines Corp. | 1.375% | 11/19/19 | EUR | 3,000 | 3,449 |
| International Business Machines Corp. | 1.500% | 5/23/29 | EUR | 7,200 | 8,082 |
| International Business Machines Corp. | 1.875% | 11/6/20 | EUR | 400 | 470 |
| International Business Machines Corp. | 2.625% | 8/5/22 | GBP | 500 | 662 |
| International Business Machines Corp. | 2.750% | 12/21/20 | GBP | 4,000 | 5,252 |
| International Business Machines Corp. | 2.875% | 11/7/25 | EUR | 4,100 | 5,202 |
| International Flavors & Fragrances Inc. | 0.500% | 9/25/21 | EUR | 1,800 | 2,050 |
| International Flavors & Fragrances Inc. | 1.750% | 3/14/24 | EUR | 7,130 | 8,349 |
| International Flavors & Fragrances Inc. | 1.800% | 9/25/26 | EUR | 5,800 | 6,611 |
| John Deere Canada Funding Inc. | 1.850% | 3/24/21 | CAD | 5,000 | 3,693 |
| John Deere Cash Management SA | 0.500% | 9/15/23 | EUR | 1,100 | 1,248 |
| Johnson & Johnson | 0.250% | 1/20/22 | EUR | 2,600 | 2,962 |
| Johnson & Johnson | 0.650% | 5/20/24 | EUR | 10,200 | 11,675 |
| Johnson & Johnson | 1.150% | 11/20/28 | EUR | 1,200 | 1,365 |
| Johnson & Johnson | 1.650% | 5/20/35 | EUR | 150 | 173 |
| Johnson Controls International plc | 0.000% | 12/4/20 | EUR | 3,300 | 3,728 |
| Johnson Controls International plc | 1.375% | 2/25/25 | EUR | 4,065 | 4,622 |
| JPMorgan Chase & Co. | 0.500% | 12/4/23 | CHF | 37,600 | 37,494 |
| JPMorgan Chase & Co. | 1.375% | 9/16/21 | EUR | 5,350 | 6,264 |
| JPMorgan Chase & Co. | 1.500% | 1/27/25 | EUR | 10,000 | 11,567 |
| JPMorgan Chase & Co. | 1.500% | 10/29/26 | EUR | 6,208 | 7,090 |
| 1 JPMorgan Chase & Co. | 1.638% | 5/18/28 | EUR | 1,000 | 1,130 |
| JPMorgan Chase & Co. | 1.875% | 11/21/19 | EUR | 5,622 | 6,506 |
| JPMorgan Chase & Co. | 1.875% | 2/10/20 | GBP | 8,700 | 11,192 |
| JPMorgan Chase & Co. | 2.750% | 2/1/23 | EUR | 3,000 | 3,693 |
| JPMorgan Chase & Co. | 2.875% | 5/24/28 | EUR | 2,500 | 3,189 |
| JPMorgan Chase & Co. | 3.000% | 2/19/26 | EUR | 5,600 | 7,102 |
| JPMorgan Chase & Co. | 3.190% | 3/5/21 | CAD | 270 | 206 |
| JPMorgan Chase & Co. | 3.500% | 12/18/26 | GBP | 5,000 | 6,885 |
| JPMorgan Chase & Co. | 3.875% | 9/23/20 | EUR | 1,000 | 1,216 |
| Kellogg Co. | 1.250% | 3/10/25 | EUR | 5,100 | 5,762 |
| Kinder Morgan Inc. | 1.500% | 3/16/22 | EUR | 7,000 | 8,137 |
| Kinder Morgan Inc. | 2.250% | 3/16/27 | EUR | 7,267 | 8,400 |
| Kraft Heinz Foods Co. | 1.500% | 5/24/24 | EUR | 1,000 | 1,150 |
| Kraft Heinz Foods Co. | 2.000% | 6/30/23 | EUR | 5,000 | 5,940 |
| Liberty Mutual Group Inc. | 2.750% | 5/4/26 | EUR | 14,000 | 16,805 |
116
| | | | | |
| Total International Bond Index Fund | | | | | |
| |
| |
| |
| | | | | Face | Market |
| | | Maturity | | Amount | Value • |
| | Coupon | Date | Currency | (000) | ($000) |
| LYB International Finance II BV | 1.875% | 3/2/22 | EUR | 15,500 | 18,193 |
| ManpowerGroup Inc. | 1.750% | 6/22/26 | EUR | 100 | 114 |
| ManpowerGroup Inc. | 1.875% | 9/11/22 | EUR | 100 | 119 |
| MasterCard Inc. | 1.100% | 12/1/22 | EUR | 12,850 | 14,955 |
| MasterCard Inc. | 2.100% | 12/1/27 | EUR | 8,140 | 9,976 |
| McDonald’s Corp. | 0.625% | 1/29/24 | EUR | 12,600 | 14,069 |
| McDonald’s Corp. | 1.000% | 11/15/23 | EUR | 7,000 | 8,001 |
| McDonald’s Corp. | 1.125% | 5/26/22 | EUR | 200 | 232 |
| McDonald’s Corp. | 1.500% | 11/28/29 | EUR | 1,300 | 1,425 |
| McDonald’s Corp. | 1.750% | 5/3/28 | EUR | 16,100 | 18,427 |
| McDonald’s Corp. | 1.875% | 5/26/27 | EUR | 100 | 117 |
| McDonald’s Corp. | 2.000% | 6/1/23 | EUR | 1,500 | 1,799 |
| McDonald’s Corp. | 2.375% | 11/27/24 | EUR | 100 | 122 |
| McDonald’s Corp. | 2.625% | 6/11/29 | EUR | 100 | 123 |
| McDonald’s Corp. | 3.125% | 3/4/25 | CAD | 10,000 | 7,356 |
| McDonald’s Corp. | 4.125% | 6/11/54 | GBP | 1,000 | 1,469 |
| McKesson Corp. | 0.625% | 8/17/21 | EUR | 4,250 | 4,856 |
| McKesson Corp. | 1.500% | 11/17/25 | EUR | 12,600 | 14,153 |
| McKesson Corp. | 3.125% | 2/17/29 | GBP | 9,000 | 11,336 |
| Merck & Co. Inc. | 0.500% | 11/2/24 | EUR | 9,920 | 11,104 |
| Merck & Co. Inc. | 1.125% | 10/15/21 | EUR | 7,600 | 8,865 |
| Merck & Co. Inc. | 1.375% | 11/2/36 | EUR | 2,300 | 2,451 |
| Merck & Co. Inc. | 1.875% | 10/15/26 | EUR | 3,300 | 3,983 |
| Merck & Co. Inc. | 2.500% | 10/15/34 | EUR | 5,260 | 6,640 |
| MetLife Inc. | 5.250% | 6/29/20 | GBP | 3,200 | 4,331 |
| MetLife Inc. | 5.375% | 12/9/24 | GBP | 2,350 | 3,560 |
| Metropolitan Life Global Funding I | 0.875% | 1/20/22 | EUR | 10,000 | 11,521 |
| Metropolitan Life Global Funding I | 1.000% | 9/19/22 | CHF | 3,000 | 3,096 |
| Metropolitan Life Global Funding I | 1.125% | 12/15/21 | GBP | 233 | 294 |
| Metropolitan Life Global Funding I | 2.375% | 1/11/23 | EUR | 600 | 733 |
| Metropolitan Life Global Funding I | 2.625% | 12/5/22 | GBP | 2,150 | 2,847 |
| Metropolitan Life Global Funding I | 2.875% | 1/11/23 | GBP | 2,000 | 2,670 |
| Metropolitan Life Global Funding I | 4.000% | 7/13/27 | AUD | 1,000 | 707 |
| Metropolitan Life Global Funding I | 4.500% | 4/16/19 | AUD | 3,900 | 2,785 |
| Microsoft Corp. | 2.125% | 12/6/21 | EUR | 2,100 | 2,524 |
| Microsoft Corp. | 2.625% | 5/2/33 | EUR | 4,000 | 5,277 |
| Microsoft Corp. | 3.125% | 12/6/28 | EUR | 11,200 | 15,183 |
| Mohawk Industries Inc. | 2.000% | 1/14/22 | EUR | 8,100 | 9,497 |
| Molson Coors Brewing Co. | 1.250% | 7/15/24 | EUR | 15,300 | 17,137 |
| Molson Coors International LP | 2.750% | 9/18/20 | CAD | 150 | 113 |
| Molson Coors International LP | 2.840% | 7/15/23 | CAD | 5,000 | 3,622 |
| Molson Coors International LP | 3.440% | 7/15/26 | CAD | 2,850 | 2,023 |
| Mondelez International Inc. | 1.000% | 3/7/22 | EUR | 2,150 | 2,487 |
| Mondelez International Inc. | 1.625% | 1/20/23 | EUR | 5,800 | 6,854 |
| Mondelez International Inc. | 1.625% | 3/8/27 | EUR | 11,865 | 13,537 |
| Mondelez International Inc. | 2.375% | 3/6/35 | EUR | 1,162 | 1,317 |
| Moody’s Corp. | 1.750% | 3/9/27 | EUR | 3,010 | 3,513 |
| Morgan Stanley | 1.000% | 12/2/22 | EUR | 16,090 | 18,447 |
| 1 Morgan Stanley | 1.342% | 10/23/26 | EUR | 500 | 553 |
| Morgan Stanley | 1.375% | 10/27/26 | EUR | 17,311 | 19,058 |
| Morgan Stanley | 1.750% | 3/11/24 | EUR | 11,150 | 12,930 |
| Morgan Stanley | 1.750% | 1/30/25 | EUR | 12,300 | 14,125 |
| Morgan Stanley | 1.875% | 3/30/23 | EUR | 3,000 | 3,532 |
| Morgan Stanley | 1.875% | 4/27/27 | EUR | 15,954 | 18,173 |
117
| | | | | |
| Total International Bond Index Fund | | | | | |
| |
| |
| |
| | | | | Face | Market |
| | | Maturity | | Amount | Value • |
| | Coupon | Date | Currency | (000) | ($000) |
| Morgan Stanley | 2.375% | 3/31/21 | EUR | 11,200 | 13,339 |
| Morgan Stanley | 2.625% | 3/9/27 | GBP | 23,000 | 28,986 |
| Morgan Stanley | 3.000% | 2/7/24 | CAD | 10,000 | 7,352 |
| Morgan Stanley | 3.125% | 8/5/21 | CAD | 9,500 | 7,188 |
| Mylan NV | 1.250% | 11/23/20 | EUR | 12,000 | 13,802 |
| Mylan NV | 3.125% | 11/22/28 | EUR | 1,180 | 1,343 |
| Nasdaq Inc. | 3.875% | 6/7/21 | EUR | 1,000 | 1,236 |
| National Grid North America Inc. | 0.750% | 2/11/22 | EUR | 10,800 | 12,381 |
| National Grid North America Inc. | 1.000% | 7/12/24 | EUR | 500 | 566 |
| New York Life Global Funding | 0.375% | 2/2/22 | CHF | 3,000 | 3,018 |
| Oracle Corp. | 2.250% | 1/10/21 | EUR | 575 | 684 |
| Oracle Corp. | 3.125% | 7/10/25 | EUR | 1,000 | 1,306 |
| Parker-Hannifin Corp. | 1.125% | 3/1/25 | EUR | 4,500 | 5,084 |
| PartnerRe Ireland Finance DAC | 1.250% | 9/15/26 | EUR | 167 | 181 |
| PepsiCo Inc. | 0.875% | 7/18/28 | EUR | 3,600 | 3,901 |
| PepsiCo Inc. | 1.750% | 4/28/21 | EUR | 3,000 | 3,534 |
| PepsiCo Inc. | 2.150% | 5/6/24 | CAD | 3,200 | 2,289 |
| PepsiCo Inc. | 2.500% | 11/1/22 | GBP | 500 | 667 |
| PerkinElmer Inc. | 1.875% | 7/19/26 | EUR | 4,600 | 5,260 |
| Pfizer Inc. | 0.000% | 3/6/20 | EUR | 2,550 | 2,899 |
| Pfizer Inc. | 0.250% | 3/6/22 | EUR | 12,200 | 13,871 |
| Pfizer Inc. | 1.000% | 3/6/27 | EUR | 3,400 | 3,822 |
| Pfizer Inc. | 2.735% | 6/15/43 | GBP | 6,841 | 8,590 |
| Philip Morris International Inc. | 0.625% | 11/8/24 | EUR | 1,000 | 1,105 |
| Philip Morris International Inc. | 1.750% | 3/19/20 | EUR | 2,500 | 2,903 |
| Philip Morris International Inc. | 1.875% | 11/6/37 | EUR | 4,700 | 4,895 |
| Philip Morris International Inc. | 2.000% | 5/9/36 | EUR | 8,000 | 8,656 |
| Philip Morris International Inc. | 2.875% | 3/3/26 | EUR | 1,500 | 1,879 |
| Philip Morris International Inc. | 2.875% | 5/14/29 | EUR | 2,500 | 3,123 |
| Philip Morris International Inc. | 3.125% | 6/3/33 | EUR | 1,000 | 1,274 |
| PPG Industries Inc. | 0.875% | 3/13/22 | EUR | 2,500 | 2,875 |
| PPG Industries Inc. | 0.875% | 11/3/25 | EUR | 2,600 | 2,864 |
| PPG Industries Inc. | 1.400% | 3/13/27 | EUR | 300 | 337 |
| Praxair Inc. | 1.500% | 3/11/20 | EUR | 1,500 | 1,737 |
| Praxair Inc. | 1.625% | 12/1/25 | EUR | 2,750 | 3,250 |
| Priceline Group Inc. | 0.800% | 3/10/22 | EUR | 9,398 | 10,778 |
| Priceline Group Inc. | 1.800% | 3/3/27 | EUR | 10,138 | 11,601 |
| Priceline Group Inc. | 2.375% | 9/23/24 | EUR | 4,000 | 4,829 |
| Procter & Gamble Co. | 0.500% | 10/25/24 | EUR | 3,000 | 3,355 |
| Procter & Gamble Co. | 0.625% | 10/30/24 | EUR | 4,000 | 4,514 |
| Procter & Gamble Co. | 1.125% | 11/2/23 | EUR | 11,620 | 13,521 |
| Procter & Gamble Co. | 1.200% | 10/30/28 | EUR | 4,500 | 5,062 |
| Procter & Gamble Co. | 1.250% | 10/25/29 | EUR | 7,000 | 7,878 |
| Procter & Gamble Co. | 1.375% | 5/3/25 | GBP | 9,800 | 12,231 |
| Procter & Gamble Co. | 1.800% | 5/3/29 | GBP | 12,625 | 15,679 |
| Procter & Gamble Co. | 1.875% | 10/30/38 | EUR | 2,300 | 2,611 |
| Procter & Gamble Co. | 2.000% | 11/5/21 | EUR | 4,000 | 4,791 |
| Procter & Gamble Co. | 2.000% | 8/16/22 | EUR | 1,730 | 2,087 |
| Procter & Gamble Co. | 4.125% | 12/7/20 | EUR | 2,150 | 2,652 |
| Prologis Euro Finance LLC | 1.875% | 1/5/29 | EUR | 9,400 | 10,562 |
| Prologis International Funding II SA | 1.750% | 3/15/28 | EUR | 500 | 555 |
| Prologis LP | 1.375% | 10/7/20 | EUR | 3,683 | 4,265 |
| Prologis LP | 1.375% | 5/13/21 | EUR | 8,400 | 9,791 |
| Prologis LP | 2.250% | 6/30/29 | GBP | 4,318 | 5,198 |
118
| | | | | |
| Total International Bond Index Fund | | | | | |
| |
| |
| |
| | | | | Face | Market |
| | | Maturity | | Amount | Value • |
| | Coupon | Date | Currency | (000) | ($000) |
| Prologis LP | 3.000% | 6/2/26 | EUR | 1,600 | 2,021 |
| Prologis LP | 3.375% | 2/20/24 | EUR | 1,500 | 1,906 |
| Southern Power Co. | 1.000% | 6/20/22 | EUR | 25,600 | 29,332 |
| Southern Power Co. | 1.850% | 6/20/26 | EUR | 9,700 | 11,182 |
| Thermo Fisher Scientific Inc. | 0.750% | 9/12/24 | EUR | 4,680 | 5,188 |
| Thermo Fisher Scientific Inc. | 1.375% | 9/12/28 | EUR | 3,749 | 4,039 |
| Thermo Fisher Scientific Inc. | 1.400% | 1/23/26 | EUR | 6,552 | 7,385 |
| Thermo Fisher Scientific Inc. | 1.450% | 3/16/27 | EUR | 5,700 | 6,357 |
| Thermo Fisher Scientific Inc. | 1.500% | 12/1/20 | EUR | 800 | 931 |
| Thermo Fisher Scientific Inc. | 2.000% | 4/15/25 | EUR | 1,000 | 1,181 |
| Thermo Fisher Scientific Inc. | 2.150% | 7/21/22 | EUR | 800 | 960 |
| Thermo Fisher Scientific Inc. | 2.875% | 7/24/37 | EUR | 6,622 | 7,474 |
| Time Warner Cable Inc. | 5.750% | 6/2/31 | GBP | 2,200 | 3,209 |
| Time Warner Cable LLC | 5.250% | 7/15/42 | GBP | 800 | 1,114 |
| Time Warner Inc. | 1.950% | 9/15/23 | EUR | 800 | 943 |
| Toyota Motor Credit Corp. | 0.625% | 11/21/24 | EUR | 10,000 | 11,158 |
| Toyota Motor Credit Corp. | 1.000% | 3/9/21 | EUR | 5,000 | 5,790 |
| Trinity Acquisition plc | 2.125% | 5/26/22 | EUR | 5,626 | 6,615 |
| Tyco Electronics Group SA | 1.100% | 3/1/23 | EUR | 3,727 | 4,322 |
| United Parcel Service Inc. | 0.375% | 11/15/23 | EUR | 7,400 | 8,306 |
| United Parcel Service Inc. | 1.500% | 11/15/32 | EUR | 3,300 | 3,707 |
| United Parcel Service Inc. | 1.625% | 11/15/25 | EUR | 11,900 | 14,031 |
| United Parcel Service Inc. | 2.125% | 5/21/24 | CAD | 7,000 | 4,981 |
| United Parcel Service Inc. | 5.125% | 2/12/50 | GBP | 1,350 | 2,498 |
| United Technologies Corp. | 1.125% | 12/15/21 | EUR | 4,840 | 5,608 |
| United Technologies Corp. | 1.250% | 5/22/23 | EUR | 3,200 | 3,704 |
| United Technologies Corp. | 1.875% | 2/22/26 | EUR | 1,760 | 2,067 |
| US Bancorp | 0.850% | 6/7/24 | EUR | 14,843 | 16,740 |
| Verizon Communications Inc. | 0.500% | 6/2/22 | EUR | 400 | 453 |
| Verizon Communications Inc. | 0.875% | 4/2/25 | EUR | 4,900 | 5,447 |
| Verizon Communications Inc. | 1.375% | 10/27/26 | EUR | 17,000 | 18,982 |
| Verizon Communications Inc. | 1.375% | 11/2/28 | EUR | 4,800 | 5,187 |
| Verizon Communications Inc. | 1.875% | 10/26/29 | EUR | 13,500 | 15,051 |
| Verizon Communications Inc. | 2.375% | 2/17/22 | EUR | 2,000 | 2,412 |
| Verizon Communications Inc. | 2.625% | 12/1/31 | EUR | 15,179 | 17,708 |
| Verizon Communications Inc. | 2.875% | 1/15/38 | EUR | 4,400 | 4,882 |
| Verizon Communications Inc. | 3.125% | 11/2/35 | GBP | 6,700 | 8,185 |
| Verizon Communications Inc. | 3.250% | 2/17/26 | EUR | 2,600 | 3,316 |
| Verizon Communications Inc. | 3.375% | 10/27/36 | GBP | 19,100 | 23,873 |
| Verizon Communications Inc. | 4.073% | 6/18/24 | GBP | 1,000 | 1,416 |
| Verizon Communications Inc. | 4.500% | 8/17/27 | AUD | 5,000 | 3,591 |
| VF Corp. | 0.625% | 9/20/23 | EUR | 5,400 | 6,107 |
| Wal-Mart Stores Inc. | 1.900% | 4/8/22 | EUR | 8,500 | 10,177 |
| Wal-Mart Stores Inc. | 2.550% | 4/8/26 | EUR | 6,900 | 8,692 |
| Wal-Mart Stores Inc. | 4.875% | 9/21/29 | EUR | 5,750 | 8,837 |
| Wal-Mart Stores Inc. | 5.250% | 9/28/35 | GBP | 1,000 | 1,765 |
| Wal-Mart Stores Inc. | 5.625% | 3/27/34 | GBP | 9,000 | 16,094 |
| Walgreens Boots Alliance Inc. | 2.875% | 11/20/20 | GBP | 3,643 | 4,772 |
| Walgreens Boots Alliance Inc. | 3.600% | 11/20/25 | GBP | 7,325 | 9,749 |
| Walt Disney Co. | 2.758% | 10/7/24 | CAD | 15,325 | 11,239 |
| Wells Fargo & Co. | 0.500% | 11/2/23 | CHF | 4,300 | 4,284 |
| Wells Fargo & Co. | 1.000% | 2/2/27 | EUR | 14,828 | 15,933 |
| Wells Fargo & Co. | 1.125% | 10/29/21 | EUR | 5,000 | 5,806 |
| Wells Fargo & Co. | 1.375% | 6/30/22 | GBP | 1,700 | 2,122 |
119
| | | | | |
| Total International Bond Index Fund | | | | | |
| |
| |
| |
| | | | | Face | Market |
| | | Maturity | | Amount | Value • |
| | Coupon | Date | Currency | (000) | ($000) |
| Wells Fargo & Co. | 1.375% | 10/26/26 | EUR | 6,000 | 6,677 |
| Wells Fargo & Co. | 1.625% | 6/2/25 | EUR | 5,000 | 5,763 |
| Wells Fargo & Co. | 2.000% | 7/28/25 | GBP | 31,400 | 38,628 |
| Wells Fargo & Co. | 2.000% | 4/27/26 | EUR | 15,000 | 17,533 |
| Wells Fargo & Co. | 2.125% | 4/22/22 | GBP | 3,500 | 4,490 |
| Wells Fargo & Co. | 2.222% | 3/15/21 | CAD | 2,700 | 2,006 |
| Wells Fargo & Co. | 2.250% | 9/3/20 | EUR | 9,000 | 10,608 |
| Wells Fargo & Co. | 2.250% | 5/2/23 | EUR | 16,300 | 19,639 |
| Wells Fargo & Co. | 2.625% | 8/16/22 | EUR | 20,600 | 25,133 |
| Wells Fargo & Co. | 2.975% | 5/19/26 | CAD | 10,100 | 7,188 |
| Wells Fargo & Co. | 3.000% | 7/27/21 | AUD | 11,200 | 7,943 |
| Wells Fargo & Co. | 3.250% | 4/27/22 | AUD | 3,200 | 2,275 |
| Wells Fargo & Co. | 3.500% | 9/12/29 | GBP | 3,330 | 4,516 |
| Wells Fargo & Co. | 3.874% | 5/21/25 | CAD | 350 | 262 |
| Wells Fargo Bank NA | 5.250% | 8/1/23 | GBP | 1,650 | 2,364 |
| Welltower Inc. | 4.500% | 12/1/34 | GBP | 2,800 | 3,933 |
| Welltower Inc. | 4.800% | 11/20/28 | GBP | 4,500 | 6,481 |
| Whirlpool Corp. | 0.625% | 3/12/20 | EUR | 2,400 | 2,738 |
| Whirlpool Finance Luxembourg Sarl | 1.100% | 11/9/27 | EUR | 3,600 | 3,772 |
| Whirlpool Finance Luxembourg Sarl | 1.250% | 11/2/26 | EUR | 10,700 | 11,595 |
| WPC Eurobond BV | 2.125% | 4/15/27 | EUR | 16,334 | 18,023 |
| WPC Eurobond BV | 2.250% | 7/19/24 | EUR | 13,100 | 15,154 |
| WPC Eurobond BV | 2.250% | 4/9/26 | EUR | 7,900 | 8,887 |
| 1 XLIT Ltd. | 3.250% | 6/29/47 | EUR | 11,400 | 12,693 |
| Xylem Inc. | 2.250% | 3/11/23 | EUR | 3,800 | 4,557 |
| Zimmer Biomet Holdings Inc. | 1.414% | 12/13/22 | EUR | 5,200 | 6,001 |
| Zimmer Biomet Holdings Inc. | 2.425% | 12/13/26 | EUR | 5,000 | 5,837 |
| | | | | | 3,202,470 |
| U. S. Government and Agency Obligations (0.0%) | | | | |
| 16 Tennessee Valley Authority | 5.625% | 6/7/32 | GBP | 1,400 | 2,457 |
| Total United States (Cost $3,258,864) | | | | | 3,204,927 |
| |
| | | | | Shares | |
| | | | | ($000) | |
| Temporary Cash Investments (0.1%) | | | | | |
| Money Market Fund (0.1%) | | | | | |
| 17 Vanguard Market Liquidity Fund | | | | | |
| (Cost $127,238) | 2.308% | | USD | 1,272,521 | 127,252 |
| Total Investments (97.7%) (Cost $110,919,609) | | | | | 108,546,146 |
| Other Assets and Liabilities (2.3%) | | | | | |
| Other Assets | | | | | 6,424,075 |
| Liabilities | | | | | (3,832,158) |
| | | | | | 2,591,917 |
| Net Assets (100%) | | | | | 111,138,063 |
120
| |
| Total International Bond Index Fund | |
| |
| |
| |
| |
| | Amount |
| | ($000) |
| Statement of Assets and Liabilities | |
| Assets | |
| Investments in Securities, at Value | |
| Unaffiliated Issuers | 108,418,894 |
| Affiliated Issuers | 127,252 |
| Total Investments in Securities | 108,546,146 |
| Investment in Vanguard | 5,654 |
| Receivables for Investment Securities Sold | 1,146,180 |
| Receivables for Accrued Income | 772,819 |
| Receivables for Capital Shares Issued | 30,260 |
| Unrealized Appreciation—Forward Currency Contracts | 2,365,229 |
| Other Assets | 2,103,933 |
| Total Assets | 114,970,221 |
| Liabilities | |
| Payables for Investment Securities Purchased | 2,343,823 |
| Payables for Capital Shares Redeemed | 1,227,553 |
| Payables for Distributions | 1,551 |
| Payables to Vanguard | 18,612 |
| Variation Margin Payable—Futures Contracts | 92 |
| Unrealized Depreciation—Forward Currency Contracts | 188,416 |
| Other Liabilities | 52,111 |
| Total Liabilities | 3,832,158 |
| Net Assets | 111,138,063 |
| |
| |
| At October 31, 2018, net assets consisted of: | |
| | Amount |
| | ($000) |
| Paid-in Capital | 108,416,632 |
| Total Distributable Earnings (Loss) | 2,721,431 |
| Net Assets | 111,138,063 |
| |
| |
| Investor Shares—Net Assets | |
| Applicable to 2,504,382,660 outstanding $.001 par value shares of | |
| beneficial interest (unlimited authorization) | 27,299,486 |
| Net Asset Value Per Share—Investor Shares | $10.90 |
| |
| |
| ETF Shares—Net Assets | |
| Applicable to 221,988,565 outstanding $.001 par value shares of | |
| beneficial interest (unlimited authorization) | 12,091,679 |
| Net Asset Value Per Share—ETF Shares | $54.47 |
| |
| |
| Admiral Shares—Net Assets | |
| Applicable to 1,998,222,860 outstanding $.001 par value shares of | |
| beneficial interest (unlimited authorization) | 43,550,465 |
| Net Asset Value Per Share—Admiral Shares | $21.79 |
121
Total International Bond Index Fund
| |
| | Amount |
| | ($000) |
| Institutional Shares—Net Assets | |
| Applicable to 862,180,044 outstanding $.001 par value shares of | |
| beneficial interest (unlimited authorization) | 28,196,433 |
| Net Asset Value Per Share—Institutional Shares | $32.70 |
• See Note A in Notes to Financial Statements.
1 The average or expected maturity is shorter than the final maturity shown because of the possibility of interim principal payments
and prepayments or the possibility of the issue being called.
2 Security exempt from registration under Rule 144A of the Securities Act of 1933. Such securities may be sold in transactions
exempt from registration, normally to qualified institutional buyers. At October 31, 2018, the aggregate value of these securities
was $12,201,900,000, representing 11.0% of net assets.
3 Guaranteed by the Republic of Austria.
4 Guaranteed by multiple countries.
5 Guaranteed by the Government of Canada.
6 Guaranteed by the Republic of Finland.
7 Guaranteed by the Republic of France.
8 Guaranteed by the Federal Republic of Germany.
9 Securities with a value of $963,000 have been segregated as initial margin for open futures contracts.
10 Guaranteed by the Government of Japan.
11 Guaranteed by the Kingdom of Spain.
12 Guaranteed by the Government of the United Kingdom.
13 Scheduled principal and interest payments are guaranteed by Municipal Bond Insurance Association.
14 Scheduled principal and interest payments are guaranteed by AMBAC (Ambac Assurance Corporation).
15 Scheduled principal and interest payments are guaranteed by National Public Finance Guarantee Corp.
16 The issuer operates under a congressional charter; its securities are generally neither guaranteed by the U.S. Treasury nor backed
by the full faith and credit of the U.S. government.
17 Affiliated money market fund available only to Vanguard funds and certain trusts and accounts managed by Vanguard. Rate shown
is the 7-day yield.
REIT—Real Estate Investment Trust.
AUD—Australian dollar.
CAD—Canadian dollar.
CHF—Swiss franc.
CZK—Czech koruna.
DKK—Danish krone.
EUR—Euro.
GBP—British pound.
HKD—Hong Kong dollar.
HUF—Hungarian forint.
IDR—Indonesian rupiah.
ILS—Israeli shekel.
JPY—Japanese yen.
KRW—Korean won.
MXN—Mexican peso.
MYR—Malaysian ringgit.
NOK—Norwegian krone.
NZD—New Zealand dollar.
PLN—Polish new zloty.
RUB—Russian ruble.
SEK—Swedish krona.
SGD—Singapore dollar.
THB—Thai baht.
USD—U.S. dollar.
122
Total International Bond Index Fund
| | | | | | |
| Derivative Financial Instruments Outstanding as of Period End | | | | |
| Futures Contracts | | | | | | |
| | | | | | | (000) |
| | | | | | Value and |
| | | Number of | | | Unrealized |
| | | Long (Short) | | Notional | Appreciation |
| | Expiration | Contracts | | Amount | (Depreciation) |
| Long Futures Contracts | | | | | | |
| AUD 3-Year Treasury Bond | December 2018 | 870 | AUD | 68,654 | USD | (41) |
| JGB 10-Year | December 2018 | 47 | JPY | 62,743 | USD | (4) |
| AUD 10-Year Treasury Bond | December 2018 | 91 | AUD | 8,340 | USD | (34) |
| | | | | | USD | (79) |
| | | | | | |
| Forward Currency Contracts | | | | | | |
| | | | | | | Unrealized |
| | Contract | | | | | Appreciation |
| | Settlement | Contract Amount (000) | (Depreciation) |
| Counterparty | Date | | Receive | | Deliver | ($000) |
| Morgan Stanley Capital Services LLC | 11/2/18 | EUR | 10,000,000 | USD | 11,330,500 | (3,932) |
| Barclays Capital | 11/2/18 | GBP | 6,855,793 | USD | 8,759,989 | 3,087 |
| UBS AG | 11/2/18 | EUR | 6,151,514 | USD | 6,969,973 | (2,419) |
| BNP Paribas | 11/2/18 | EUR | 6,000,000 | USD | 6,798,300 | (2,360) |
| Toronto-Dominion Bank | 11/2/18 | EUR | 6,000,000 | USD | 6,798,300 | (2,359) |
| Bank of America, N.A. | 11/2/18 | EUR | 5,000,000 | USD | 5,665,250 | (1,966) |
| Toronto-Dominion Bank | 11/2/18 | CAD | 7,398,642 | USD | 5,634,898 | (14,751) |
| Morgan Stanley Capital Services LLC | 11/2/18 | JPY | 623,066,126 | USD | 5,520,944 | 979 |
| Citibank, N.A. | 11/2/18 | EUR | 4,712,572 | USD | 5,339,580 | (1,853) |
| Deutsche Bank AG | 11/2/18 | EUR | 4,000,000 | USD | 4,532,200 | (1,572) |
| Barclays Capital | 11/2/18 | EUR | 3,848,485 | USD | 4,360,527 | (1,513) |
| Deutsche Bank AG | 11/2/18 | JPY | 448,000,000 | USD | 3,969,696 | 704 |
| Barclays Capital | 11/2/18 | JPY | 448,000,000 | USD | 3,969,696 | 704 |
| HSBC Bank USA, N.A. | 11/2/18 | EUR | 3,000,000 | USD | 3,399,150 | (1,180) |
| BNP Paribas | 11/2/18 | KRW | 3,432,399,651 | USD | 3,005,604 | 6,462 |
| HSBC Bank USA, N.A. | 11/2/18 | JPY | 336,000,000 | USD | 2,977,272 | 528 |
| Goldman Sachs Bank AG | 11/2/18 | EUR | 2,000,000 | USD | 2,266,100 | (786) |
| BNP Paribas | 11/2/18 | JPY | 228,512,223 | USD | 2,024,664 | 526 |
| Toronto-Dominion Bank | 11/2/18 | JPY | 224,000,000 | USD | 1,984,848 | 352 |
| Barclays Capital | 11/2/18 | CHF | 1,455,471 | USD | 1,446,935 | (1,796) |
| JPMorgan Chase Bank, N.A. | 11/2/18 | EUR | 1,099,032 | USD | 1,248,354 | (3,528) |
| UBS AG | 11/2/18 | JPY | 121,379,463 | USD | 1,075,218 | 508 |
123
| | | | | | |
| Total International Bond Index Fund | | | | | |
| |
| |
| Forward Currency Contracts (continued) | | | | | |
| | | | | | | Unrealized |
| | Contract | | | | | Appreciation |
| | Settlement | Contract Amount (000) | (Depreciation) |
| Counterparty | Date | | Receive | | Deliver | ($000) |
| Citibank, N.A. | 11/2/18 | JPY | 112,000,000 | USD | 992,424 | 176 |
| Goldman Sachs Bank AG | 11/2/18 | SEK | 8,441,323 | USD | 923,589 | (1,156) |
| JPMorgan Chase Bank, N.A. | 11/2/18 | AUD | 1,168,000 | USD | 827,820 | (701) |
| BNP Paribas | 11/2/18 | AUD | 1,099,896 | USD | 779,956 | (1,065) |
| UBS AG | 11/2/18 | CAD | 1,000,000 | USD | 761,470 | (1,851) |
| UBS AG | 11/2/18 | AUD | 1,010,000 | USD | 715,838 | (606) |
| BNP Paribas | 11/2/18 | THB | 23,760,728 | USD | 714,823 | 1,941 |
| Goldman Sachs Bank AG | 11/5/18 | MXN | 13,836,531 | USD | 683,252 | (2,660) |
| Toronto-Dominion Bank | 11/2/18 | DKK | 4,243,700 | USD | 644,479 | (215) |
| Deutsche Bank AG | 11/2/18 | MYR | 2,687,143 | USD | 642,243 | (77) |
| Deutsche Bank AG | 11/5/18 | PLN | 1,941,210 | USD | 506,771 | (820) |
| Citibank, N.A. | 11/2/18 | AUD | 695,000 | USD | 492,581 | (417) |
| BNP Paribas | 11/2/18 | SGD | 613,800 | USD | 443,241 | (112) |
| Barclays Capital | 11/2/18 | AUD | 429,200 | USD | 304,196 | (257) |
| Deutsche Bank AG | 11/13/18 | IDR | 4,491,884,056 | USD | 294,793 | 189 |
| Toronto-Dominion Bank | 11/2/18 | ILS | 903,500 | USD | 242,733 | 153 |
| Morgan Stanley Capital Services LLC | 11/2/18 | NOK | 1,950,297 | USD | 232,041 | (684) |
| Deutsche Bank AG | 11/2/18 | CZK | 4,440,000 | USD | 193,900 | (28) |
| BNP Paribas | 11/1/18 | RUB | 10,912,500 | USD | 166,324 | (666) |
| Morgan Stanley Capital Services LLC | 11/1/18 | RUB | 10,000,000 | USD | 152,045 | (239) |
| Deutsche Bank AG | 11/6/18 | HUF | 41,360,000 | USD | 144,187 | 155 |
| Barclays Capital | 11/13/18 | IDR | 1,413,701,539 | USD | 92,891 | (55) |
| JPMorgan Chase Bank, N.A. | 11/2/18 | GBP | 59,590 | USD | 77,835 | (1,668) |
| UBS AG | 11/2/18 | GBP | 53,750 | USD | 70,189 | (1,485) |
| Barclays Capital | 11/2/18 | NZD | 97,500 | USD | 63,668 | (44) |
| Citibank, N.A. | 11/2/18 | NZD | 97,500 | USD | 63,668 | (44) |
| BNP Paribas | 11/2/18 | NZD | 97,500 | USD | 63,668 | (43) |
| UBS AG | 11/2/18 | NZD | 97,500 | USD | 63,668 | (43) |
| BNP Paribas | 11/2/18 | KRW | 55,462,500 | USD | 49,796 | (1,125) |
| JPMorgan Chase Bank, N.A. | 11/2/18 | HKD | 351,500 | USD | 44,838 | (15) |
| Toronto-Dominion Bank | 12/4/18 | CAD | 51,244 | USD | 39,043 | (92) |
| JPMorgan Chase Bank, N.A. | 11/1/18 | RUB | 2,237,500 | USD | 33,601 | 365 |
| JPMorgan Chase Bank, N.A. | 12/4/18 | MXN | 436,808 | USD | 21,460 | (78) |
| JPMorgan Chase Bank, N.A. | 12/3/18 | RUB | 1,200,000 | USD | 18,191 | (52) |
| BNP Paribas | 11/2/18 | CHF | 8,739 | USD | 8,971 | (294) |
| BNP Paribas | 12/13/18 | IDR | 130,234,277 | USD | 8,508 | 10 |
124
| | | | | | |
| Total International Bond Index Fund | | | | | |
| |
| |
| Forward Currency Contracts (continued) | | | | | |
| | | | | | | Unrealized |
| | Contract | | | | | Appreciation |
| | Settlement | Contract Amount (000) | (Depreciation) |
| Counterparty | Date | | Receive | | Deliver | ($000) |
| BNP Paribas | 11/2/18 | SEK | 51,425 | USD | 5,798 | (178) |
| BNP Paribas | 11/2/18 | USD | 12,008,414 | EUR | 10,314,016 | 326,172 |
| Morgan Stanley Capital Services LLC | 11/2/18 | USD | 9,969,184 | EUR | 8,563,604 | 269,559 |
| Morgan Stanley Capital Services LLC | 12/4/18 | USD | 9,087,216 | EUR | 8,000,000 | 205 |
| Barclays Capital | 11/2/18 | USD | 8,977,417 | GBP | 6,874,979 | 189,817 |
| Barclays Capital | 12/4/18 | USD | 8,772,055 | GBP | 6,855,793 | (5,041) |
| Toronto-Dominion Bank | 11/2/18 | USD | 8,150,257 | EUR | 7,000,000 | 221,660 |
| Citibank, N.A. | 11/2/18 | USD | 8,150,193 | EUR | 7,000,000 | 221,595 |
| UBS AG | 12/4/18 | USD | 6,987,301 | EUR | 6,151,514 | (58) |
| Bank of America, N.A. | 11/2/18 | USD | 6,985,974 | EUR | 6,000,000 | 190,034 |
| Toronto-Dominion Bank | 12/4/18 | USD | 6,824,589 | EUR | 6,008,348 | (152) |
| Goldman Sachs Bank AG | 11/2/18 | USD | 5,821,626 | EUR | 5,000,000 | 158,342 |
| Bank of America, N.A. | 12/4/18 | USD | 5,679,462 | EUR | 5,000,000 | 80 |
| BNP Paribas | 12/4/18 | USD | 5,679,395 | EUR | 5,000,000 | 13 |
| Toronto-Dominion Bank | 12/4/18 | USD | 5,585,244 | CAD | 7,330,981 | 12,910 |
| Morgan Stanley Capital Services LLC | 12/4/18 | USD | 5,533,520 | JPY | 623,066,126 | (3,045) |
| Toronto-Dominion Bank | 11/2/18 | USD | 4,953,500 | CAD | 6,398,642 | 92,973 |
| BNP Paribas | 11/2/18 | USD | 4,941,242 | JPY | 560,000,000 | (21,757) |
| UBS AG | 11/2/18 | USD | 4,657,288 | EUR | 4,000,000 | 126,660 |
| Deutsche Bank AG | 12/4/18 | USD | 4,543,452 | EUR | 4,000,000 | (52) |
| Barclays Capital | 12/4/18 | USD | 4,371,236 | EUR | 3,848,485 | (168) |
| Barclays Capital | 12/4/18 | USD | 3,978,786 | JPY | 448,000,000 | (2,142) |
| Deutsche Bank AG | 12/4/18 | USD | 3,978,740 | JPY | 448,000,000 | (2,188) |
| Toronto-Dominion Bank | 11/2/18 | USD | 3,473,490 | JPY | 393,657,812 | (15,302) |
| HSBC Bank USA, N.A. | 12/4/18 | USD | 3,407,647 | EUR | 3,000,000 | 18 |
| Citibank, N.A. | 12/4/18 | USD | 3,407,634 | EUR | 3,000,000 | 5 |
| Barclays Capital | 11/2/18 | USD | 3,135,042 | JPY | 355,300,000 | (13,803) |
| BNP Paribas | 11/2/18 | USD | 3,130,198 | KRW | 3,487,862,151 | 69,462 |
| Barclays Capital | 11/2/18 | USD | 3,066,814 | EUR | 2,633,984 | 83,414 |
| BNP Paribas | 12/4/18 | USD | 3,049,316 | KRW | 3,479,929,783 | (7,340) |
| HSBC Bank USA, N.A. | 12/4/18 | USD | 2,984,077 | JPY | 336,000,000 | (1,619) |
| Morgan Stanley Capital Services LLC | 11/2/18 | USD | 2,964,777 | JPY | 336,000,000 | (13,022) |
| Deutsche Bank AG | 11/2/18 | USD | 2,964,766 | JPY | 336,000,000 | (13,034) |
| Goldman Sachs Bank AG | 12/4/18 | USD | 2,271,687 | EUR | 2,000,000 | (65) |
| Morgan Stanley Capital Services LLC | 12/4/18 | USD | 2,271,685 | EUR | 2,000,000 | (67) |
| BNP Paribas | 12/4/18 | USD | 2,052,298 | JPY | 231,082,043 | (1,097) |
125
| | | | | | |
| Total International Bond Index Fund | | | | | |
| |
| |
| Forward Currency Contracts (continued) | | | | | |
| | | | | | | Unrealized |
| | Contract | | | | | Appreciation |
| | Settlement | Contract Amount (000) | (Depreciation) |
| Counterparty | Date | | Receive | | Deliver | ($000) |
| Toronto-Dominion Bank | 12/4/18 | USD | 1,989,371 | JPY | 224,000,000 | (1,093) |
| Citibank, N.A. | 11/2/18 | USD | 1,976,510 | JPY | 224,000,000 | (8,689) |
| Goldman Sachs Bank AG | 11/2/18 | USD | 1,976,506 | JPY | 224,000,000 | (8,694) |
| Citibank, N.A. | 12/4/18 | USD | 1,945,211 | EUR | 1,712,572 | (59) |
| BNP Paribas | 12/4/18 | USD | 1,703,760 | EUR | 1,500,000 | (54) |
| Deutsche Bank AG | 11/2/18 | USD | 1,513,694 | EUR | 1,300,000 | 41,240 |
| Barclays Capital | 12/4/18 | USD | 1,450,962 | CHF | 1,455,471 | 1,142 |
| Barclays Capital | 11/2/18 | USD | 1,449,774 | CHF | 1,412,211 | 47,589 |
| JPMorgan Chase Bank, N.A. | 12/4/18 | USD | 1,135,840 | EUR | 1,000,000 | (36) |
| UBS AG | 12/4/18 | USD | 994,705 | JPY | 112,000,000 | (527) |
| Citibank, N.A. | 12/4/18 | USD | 994,678 | JPY | 112,000,000 | (554) |
| Bank of America, N.A. | 11/2/18 | USD | 988,260 | JPY | 112,000,000 | (4,340) |
| Toronto-Dominion Bank | 11/2/18 | USD | 957,382 | SEK | 8,492,748 | 29,330 |
| Goldman Sachs Bank AG | 12/4/18 | USD | 925,952 | SEK | 8,441,323 | 771 |
| JPMorgan Chase Bank, N.A. | 12/4/18 | USD | 828,096 | AUD | 1,168,000 | 669 |
| JPMorgan Chase Bank, N.A. | 11/2/18 | USD | 809,071 | AUD | 1,118,000 | 17,359 |
| BNP Paribas | 12/4/18 | USD | 785,073 | AUD | 1,107,334 | 624 |
| Morgan Stanley Capital Services LLC | 11/2/18 | USD | 774,156 | CAD | 1,000,000 | 14,537 |
| UBS AG | 11/2/18 | USD | 774,151 | CAD | 1,000,000 | 14,533 |
| UBS AG | 12/4/18 | USD | 761,873 | CAD | 1,000,000 | 1,765 |
| UBS AG | 11/2/18 | USD | 754,783 | AUD | 1,043,000 | 16,182 |
| Goldman Sachs Bank AG | 11/5/18 | USD | 736,015 | MXN | 13,836,531 | 55,423 |
| UBS AG | 12/4/18 | USD | 716,072 | AUD | 1,010,000 | 575 |
| BNP Paribas | 12/4/18 | USD | 714,651 | THB | 23,760,728 | (2,760) |
| Goldman Sachs Bank AG | 12/4/18 | USD | 679,948 | MXN | 13,836,531 | 2,660 |
| BNP Paribas | 11/2/18 | USD | 669,465 | AUD | 925,096 | 14,358 |
| Citibank, N.A. | 11/2/18 | USD | 662,698 | DKK | 4,243,700 | 18,434 |
| Deutsche Bank AG | 11/2/18 | USD | 648,012 | MYR | 2,687,143 | 5,846 |
| Toronto-Dominion Bank | 12/4/18 | USD | 646,164 | DKK | 4,243,700 | (55) |
| Deutsche Bank AG | 12/4/18 | USD | 641,752 | MYR | 2,687,143 | 58 |
| Deutsche Bank AG | 11/2/18 | USD | 602,153 | THB | 19,475,140 | 14,668 |
| Deutsche Bank AG | 11/5/18 | USD | 527,009 | PLN | 1,941,210 | 21,058 |
| Deutsche Bank AG | 12/4/18 | USD | 507,068 | PLN | 1,941,210 | 769 |
| Citibank, N.A. | 12/4/18 | USD | 492,742 | AUD | 695,000 | 395 |
| Citibank, N.A. | 11/2/18 | USD | 492,096 | AUD | 680,000 | 10,554 |
| UBS AG | 11/2/18 | USD | 449,539 | SGD | 613,800 | 6,410 |
126
| | | | | | |
| Total International Bond Index Fund | | | | | |
| |
| |
| Forward Currency Contracts (continued) | | | | | |
| | | | | | | Unrealized |
| | Contract | | | | | Appreciation |
| | Settlement | Contract Amount (000) | (Depreciation) |
| Counterparty | Date | | Receive | | Deliver | ($000) |
| BNP Paribas | 12/4/18 | USD | 443,520 | SGD | 613,800 | 74 |
| Barclays Capital | 11/2/18 | USD | 387,882 | AUD | 536,000 | 8,313 |
| UBS AG | 11/1/18 | USD | 350,473 | RUB | 23,150,000 | (958) |
| Barclays Capital | 12/4/18 | USD | 304,293 | AUD | 429,200 | 243 |
| Deutsche Bank AG | 12/13/18 | USD | 293,024 | IDR | 4,491,884,056 | (746) |
| UBS AG | 12/4/18 | USD | 287,883 | GBP | 225,000 | (172) |
| JPMorgan Chase Bank, N.A. | 11/13/18 | USD | 259,402 | IDR | 3,980,002,055 | (1,965) |
| JPMorgan Chase Bank, N.A. | 11/2/18 | USD | 249,105 | ILS | 903,500 | 6,219 |
| Toronto-Dominion Bank | 12/4/18 | USD | 243,331 | ILS | 903,500 | (227) |
| UBS AG | 11/2/18 | USD | 239,798 | NOK | 1,950,297 | 8,440 |
| Morgan Stanley Capital Services LLC | 12/4/18 | USD | 232,343 | NOK | 1,950,297 | 640 |
| BNP Paribas | 11/2/18 | USD | 200,241 | CZK | 4,440,000 | 6,368 |
| Deutsche Bank AG | 12/4/18 | USD | 194,061 | CZK | 4,440,000 | (137) |
| JPMorgan Chase Bank, N.A. | 11/13/18 | USD | 191,295 | IDR | 2,882,500,000 | 2,001 |
| BNP Paribas | 11/2/18 | USD | 175,494 | NZD | 264,665 | 2,786 |
| BNP Paribas | 12/3/18 | USD | 165,668 | RUB | 10,912,500 | 717 |
| Morgan Stanley Capital Services LLC | 12/3/18 | USD | 151,453 | RUB | 10,000,000 | 295 |
| Barclays Capital | 11/6/18 | USD | 148,876 | HUF | 41,360,000 | 4,534 |
| Deutsche Bank AG | 12/4/18 | USD | 144,446 | HUF | 41,360,000 | (193) |
| JPMorgan Chase Bank, N.A. | 11/2/18 | USD | 131,904 | THB | 4,285,588 | 2,626 |
| Morgan Stanley Capital Services LLC | 12/4/18 | USD | 99,497 | GBP | 77,860 | (182) |
| Barclays Capital | 12/13/18 | USD | 92,372 | IDR | 1,413,701,539 | (83) |
| Barclays Capital | 12/4/18 | USD | 63,690 | NZD | 97,500 | 44 |
| BNP Paribas | 12/4/18 | USD | 63,689 | NZD | 97,500 | 43 |
| Citibank, N.A. | 12/4/18 | USD | 63,688 | NZD | 97,500 | 42 |
| UBS AG | 12/4/18 | USD | 63,686 | NZD | 97,500 | 41 |
| UBS AG | 11/2/18 | USD | 52,389 | CHF | 52,000 | 759 |
| JPMorgan Chase Bank, N.A. | 11/2/18 | USD | 52,206 | GBP | 40,000 | 1,078 |
| BNP Paribas | 11/2/18 | USD | 51,996 | GBP | 40,000 | 868 |
| Barclays Capital | 11/13/18 | USD | 49,730 | IDR | 750,000,000 | 477 |
| Morgan Stanley Capital Services LLC | 11/2/18 | USD | 49,432 | AUD | 70,000 | (139) |
| BNP Paribas | 11/2/18 | USD | 44,941 | HKD | 351,500 | 118 |
| JPMorgan Chase Bank, N.A. | 12/4/18 | USD | 44,889 | HKD | 351,500 | 13 |
| Barclays Capital | 11/2/18 | USD | 43,324 | NZD | 65,335 | 689 |
| UBS AG | 11/2/18 | USD | 39,784 | NZD | 60,000 | 630 |
| Morgan Stanley Capital Services LLC | 12/4/18 | USD | 39,232 | MXN | 800,000 | 73 |
127
Total International Bond Index Fund
| | | | | | |
| Forward Currency Contracts (continued) | | | | | |
| | | | | | | Unrealized |
| | Contract | | | | | Appreciation |
| | Settlement | Contract Amount (000) | (Depreciation) |
| Counterparty | Date | | Receive | | Deliver | ($000) |
| BNP Paribas | 12/13/18 | USD | 24,495 | IDR | 374,697,758 | (10) |
| Morgan Stanley Capital Services LLC | 11/2/18 | USD | 21,256 | AUD | 30,000 | 12 |
| Toronto-Dominion Bank | 11/2/18 | USD | 18,465 | GBP | 14,153 | 374 |
| Toronto-Dominion Bank | 12/4/18 | USD | 15,196 | CAD | 20,000 | (6) |
| Citibank, N.A. | 12/4/18 | USD | 6,674 | CHF | 6,694 | 5 |
| | | | | | | 2,176,813 |
At October 31, 2018, counterparties had deposited in segregated accounts securities with a value of $1,480,143,000 and cash of $690,700,000 in connection with open forward currency contracts.
See accompanying Notes, which are an integral part of the Financial Statements.
128
Total International Bond Index Fund
| |
| Statement of Operations | |
| |
| |
| | Year Ended |
| | October 31, 2018 |
| | ($000) |
| Investment Income | |
| Income | |
| Interest1,2 | 1,223,622 |
| Total Income | 1,223,622 |
| Expenses | |
| The Vanguard Group—Note B | |
| Investment Advisory Services | 3,240 |
| Management and Administrative—Investor Shares | 28,142 |
| Management and Administrative—ETF Shares | 7,355 |
| Management and Administrative—Admiral Shares | 35,976 |
| Management and Administrative—Institutional Shares | 15,155 |
| Marketing and Distribution—Investor Shares | 3,810 |
| Marketing and Distribution—ETF Shares | 633 |
| Marketing and Distribution—Admiral Shares | 3,163 |
| Marketing and Distribution—Institutional Shares | 663 |
| Custodian Fees | 8,379 |
| Auditing Fees | 142 |
| Shareholders’ Reports and Proxy—Investor Shares | 258 |
| Shareholders’ Reports and Proxy—ETF Shares | 731 |
| Shareholders’ Reports and Proxy—Admiral Shares | 786 |
| Shareholders’ Reports and Proxy—Institutional Shares | 10 |
| Trustees’ Fees and Expenses | 70 |
| Total Expenses | 108,513 |
| Net Investment Income | 1,115,109 |
| Realized Net Gain (Loss) | |
| Investment Securities Sold1 | 144,972 |
| Futures Contracts | 1,974 |
| Forward Currency Contracts | 4,187,551 |
| Foreign Currencies | (45,322) |
| Realized Net Gain (Loss) | 4,289,175 |
| Change in Unrealized Appreciation (Depreciation) | |
| Investment Securities1 | (4,377,512) |
| Futures Contracts | (604) |
| Forward Currency Contracts | 785,839 |
| Foreign Currencies | (35,783) |
| Change in Unrealized Appreciation (Depreciation) | (3,628,060) |
| Net Increase (Decrease) in Net Assets Resulting from Operations | 1,776,224 |
1 Interest income, realized net gain (loss), and change in unrealized appreciation (depreciation) from affiliated companies of the fund
were $3,562,000, $314,000, and $20,000, respectively.
2 Interest income is net of foreign withholding taxes of $9,408,000.
See accompanying Notes, which are an integral part of the Financial Statements.
129
Total International Bond Index Fund
Statement of Changes in Net Assets
| | |
| | Year Ended October 31, |
| | 2018 | 2017 |
| | ($000) | ($000) |
| Increase (Decrease) in Net Assets | | |
| Operations | | |
| Net Investment Income | 1,115,109 | 852,368 |
| Realized Net Gain (Loss) | 4,289,175 | (1,667,215) |
| Change in Unrealized Appreciation (Depreciation) | (3,628,060) | 2,047,005 |
| Net Increase (Decrease) in Net Assets Resulting from Operations | 1,776,224 | 1,232,158 |
| Distributions | | |
| Net Investment Income | | |
| Investor Shares | (585,484) | (385,377) |
| ETF Shares | (220,281) | (115,732) |
| Admiral Shares | (863,631) | (465,740) |
| Institutional Shares | (585,371) | (340,754) |
| Realized Capital Gain | | |
| Investor Shares | — | — |
| ETF Shares | — | — |
| Admiral Shares | — | — |
| Institutional Shares | — | — |
| Total Distributions | (2,254,767) | (1,307,603) |
| Capital Share Transactions | | |
| Investor Shares | 1,826,036 | 4,163,515 |
| ETF Shares | 3,624,970 | 2,820,521 |
| Admiral Shares | 7,668,085 | 15,480,488 |
| Institutional Shares | 3,953,708 | 7,596,500 |
| Net Increase (Decrease) from Capital Share Transactions | 17,072,799 | 30,061,024 |
| Total Increase (Decrease) | 16,594,256 | 29,985,579 |
| Net Assets | | |
| Beginning of Period | 94,543,807 | 64,558,228 |
| End of Period | 111,138,063 | 94,543,807 |
See accompanying Notes, which are an integral part of the Financial Statements.
130
Total International Bond Index Fund
Financial Highlights
| | | | | |
| Investor Shares | | | | | |
| |
| For a Share Outstanding | Year Ended October 31, |
| Throughout Each Period | 2018 | 2017 | 2016 | 2015 | 2014 |
| Net Asset Value, Beginning of Period | $10.96 | $11.02 | $10.61 | $10.45 | $9.99 |
| Investment Operations | | | | | |
| Net Investment Income | .1131 | .1141 | .135 | .141 | .152 |
| Net Realized and Unrealized Gain (Loss) | | | | | |
| on Investments | .068 | .011 | . 432 | .176 | . 455 |
| Total from Investment Operations | .181 | .125 | .567 | .317 | .607 |
| Distributions | | | | | |
| Dividends from Net Investment Income | (. 241) | (.185) | (.157) | (.157) | (.147) |
| Distributions from Realized Capital Gains | — | — | — | — | — |
| Total Distributions | (. 241) | (.185) | (.157) | (.157) | (.147) |
| Net Asset Value, End of Period | $10.90 | $10.96 | $11.02 | $10.61 | $10.45 |
| |
| Total Return2 | 1.68% | 1.16% | 5.38% | 3.04% | 6.12% |
| |
| Ratios/Supplemental Data | | | | | |
| Net Assets, End of Period (Millions) | $27,299 | $25,603 | $21,521 | $20,434 | $14,573 |
| Ratio of Total Expenses to Average Net Assets | 0.13% | 0.13% | 0.15% | 0.17% | 0.23% |
| Ratio of Net Investment Income to | | | | | |
| Average Net Assets | 1.03% | 1.05% | 1.18% | 1.32% | 1.52% |
| Portfolio Turnover Rate 3 | 22% | 19% | 20% | 13% | 16% |
1 Calculated based on average shares outstanding.
2 Total returns do not include account service fees that may have applied in the periods shown. Fund prospectuses provide information
about any applicable account service fees.
3 Excludes the value of portfolio securities received or delivered as a result of in-kind purchases or redemptions of the fund’s capital
shares, including ETF Creation Units.
See accompanying Notes, which are an integral part of the Financial Statements.
131
Total International Bond Index Fund
Financial Highlights
| | | | | |
| ETF Shares | | | | | |
| |
| For a Share Outstanding | Year Ended October 31, |
| Throughout Each Period | 2018 | 2017 | 2016 | 2015 | 2014 |
| Net Asset Value, Beginning of Period | $54.75 | $55.09 | $53.04 | $52.23 | $49.95 |
| Investment Operations | | | | | |
| Net Investment Income | . 5841 | .5781 | .697 | .714 | .783 |
| Net Realized and Unrealized Gain (Loss) | | | | | |
| on Investments | .356 | .038 | 2.175 | .882 | 2.249 |
| Total from Investment Operations | .940 | .616 | 2.872 | 1.596 | 3.032 |
| Distributions | | | | | |
| Dividends from Net Investment Income | (1.220) | (. 956) | (. 822) | (.786) | (.752) |
| Distributions from Realized Capital Gains | — | — | — | — | — |
| Total Distributions | (1.220) | (. 956) | (. 822) | (.786) | (.752) |
| Net Asset Value, End of Period | $54.47 | $54.75 | $55.09 | $53.04 | $52.23 |
| |
| Total Return | 1.74% | 1.15% | 5.46% | 3.07% | 6.13% |
| |
| Ratios/Supplemental Data | | | | | |
| Net Assets, End of Period (Millions) | $12,092 | $8,504 | $5,692 | $3,968 | $2,300 |
| Ratio of Total Expenses to Average Net Assets | 0.09% | 0.11% | 0.12% | 0.15% | 0.19% |
| Ratio of Net Investment Income to | | | | | |
| Average Net Assets | 1.07% | 1.07% | 1.21% | 1.34% | 1.56% |
| Portfolio Turnover Rate2 | 22% | 19% | 20% | 13% | 16% |
| 1 Calculated based on average shares outstanding. | | | | | |
| 2 Excludes the value of portfolio securities received or delivered as a result of in-kind purchases or redemptions of the fund’s capital |
| shares, including ETF Creation Units. | | | | | |
See accompanying Notes, which are an integral part of the Financial Statements.
132
Total International Bond Index Fund
Financial Highlights
| | | | | |
| Admiral Shares | | | | | |
| |
| For a Share Outstanding | Year Ended October 31, |
| Throughout Each Period | 2018 | 2017 | 2016 | 2015 | 2014 |
| Net Asset Value, Beginning of Period | $21.91 | $22.04 | $21.21 | $20.89 | $19.98 |
| Investment Operations | | | | | |
| Net Investment Income | . 2301 | .2311 | .277 | .289 | .312 |
| Net Realized and Unrealized Gain (Loss) | | | | | |
| on Investments | .137 | .017 | .874 | .349 | .903 |
| Total from Investment Operations | .367 | .248 | 1.151 | .638 | 1.215 |
| Distributions | | | | | |
| Dividends from Net Investment Income | (. 487) | (. 378) | (. 321) | (. 318) | (. 305) |
| Distributions from Realized Capital Gains | — | — | — | — | — |
| Total Distributions | (. 487) | (. 378) | (. 321) | (. 318) | (. 305) |
| Net Asset Value, End of Period | $21.79 | $21.91 | $22.04 | $21.21 | $20.89 |
| |
| Total Return2 | 1.70% | 1.16% | 5.46% | 3.06% | 6.13% |
| |
| Ratios/Supplemental Data | | | | | |
| Net Assets, End of Period (Millions) | $43,550 | $36,072 | $20,572 | $12,595 | $4,725 |
| Ratio of Total Expenses to Average Net Assets | 0.11% | 0.11% | 0.12% | 0.14% | 0.19% |
| Ratio of Net Investment Income to | | | | | |
| Average Net Assets | 1.05% | 1.07% | 1.21% | 1.35% | 1.56% |
| Portfolio Turnover Rate 3 | 22% | 19% | 20% | 13% | 16% |
1 Calculated based on average shares outstanding.
2 Total returns do not include account service fees that may have applied in the periods shown. Fund prospectuses provide information
about any applicable account service fees.
3 Excludes the value of portfolio securities received or delivered as a result of in-kind purchases or redemptions of the fund’s capital
shares, including ETF Creation Units.
See accompanying Notes, which are an integral part of the Financial Statements.
133
Total International Bond Index Fund
Financial Highlights
| | | | | |
| Institutional Shares | | | | | |
| |
| For a Share Outstanding | Year Ended October 31, |
| Throughout Each Period | 2018 | 2017 | 2016 | 2015 | 2014 |
| Net Asset Value, Beginning of Period | $32.88 | $33.07 | $31.83 | $31.34 | $29.97 |
| Investment Operations | | | | | |
| Net Investment Income | . 3581 | .3601 | .431 | .449 | .490 |
| Net Realized and Unrealized Gain (Loss) | | | | | |
| on Investments | .206 | .033 | 1.306 | .536 | 1.358 |
| Total from Investment Operations | .564 | .393 | 1.737 | .985 | 1.848 |
| Distributions | | | | | |
| Dividends from Net Investment Income | (.744) | (. 583) | (. 497) | (. 495) | (. 478) |
| Distributions from Realized Capital Gains | — | — | — | — | — |
| Total Distributions | (.744) | (. 583) | (. 497) | (. 495) | (. 478) |
| Net Asset Value, End of Period | $32.70 | $32.88 | $33.07 | $31.83 | $31.34 |
| |
| Total Return | 1.74% | 1.22% | 5.49% | 3.15% | 6.22% |
| |
| Ratios/Supplemental Data | | | | | |
| Net Assets, End of Period (Millions) | $28,196 | $24,365 | $16,773 | $13,032 | $6,747 |
| Ratio of Total Expenses to Average Net Assets | 0.07% | 0.07% | 0.07% | 0.09% | 0.12% |
| Ratio of Net Investment Income to | | | | | |
| Average Net Assets | 1.09% | 1.11% | 1.26% | 1.40% | 1.63% |
| Portfolio Turnover Rate2 | 22% | 19% | 20% | 13% | 16% |
1 Calculated based on average shares outstanding.
2 Excludes the value of portfolio securities received or delivered as a result of in-kind purchases or redemptions of the fund’s capital
shares, including ETF Creation Units.
See accompanying Notes, which are an integral part of the Financial Statements.
134
Total International Bond Index Fund
Notes to Financial Statements
Vanguard Total International Bond Index Fund is registered under the Investment Company Act of 1940 as an open-end investment company, or mutual fund. Certain of the fund’s investments are in corporate debt instruments; the issuers’ abilities to meet their obligations may be affected by economic developments in their respective industries. The fund invests in securities of foreign issuers, which may subject it to investment risks not normally associated with investing in securities of U.S. corporations. To minimize the currency risk associated with investment in bonds denominated in currencies other than the U.S. dollar, the fund attempts to hedge its currency exposures. The fund offers five classes of shares: Investor Shares, ETF Shares, Admiral Shares, Institutional Shares, and Institutional Select Shares. Investor Shares are available to any investor who meets the fund’s minimum purchase requirements. ETF Shares are listed for trading on Nasdaq; they can be purchased and sold through a broker. Admiral Shares, Institutional Shares, and Institutional Select Shares are designed for investors who meet certain administrative, service, and account-size criteria. The fund has not issued any Institutional Select Shares through October 31, 2018.
A. The following significant accounting policies conform to generally accepted accounting principles for U.S. investment companies. The fund consistently follows such policies in preparing its financial statements.
1. Security Valuation: Securities are valued as of the close of trading on the New York Stock Exchange (generally 4 p.m., Eastern time) on the valuation date. Bonds and temporary cash investments are valued using the latest bid prices or using valuations based on a matrix system (which considers such factors as security prices, yields, maturities, and ratings), both as furnished by independent pricing services. Structured debt securities, including mortgages and asset-backed securities, are valued using the latest bid prices or using valuations based on a matrix system that considers such factors as issuer, tranche, nominal or option-adjusted spreads, weighted average coupon, weighted average maturity, credit enhancements, and collateral. Investments in Vanguard Market Liquidity Fund are valued at that fund’s net asset value. Securities for which market quotations are not readily available, or whose values have been affected by events occurring before the fund’s pricing time but after the close of the securities’ primary markets, are valued at their fair values calculated according to procedures adopted by the board of trustees. These procedures include obtaining quotations from an independent pricing service, monitoring news to identify significant market- or security-specific events, and evaluating changes in the values of foreign market proxies (for example, ADRs, futures contracts, or exchange-traded funds), between the time the foreign markets close and the fund’s pricing time. When fair-value pricing is employed, the prices of securities used by a fund to calculate its net asset value may differ from quoted or published prices for the same securities.
2. Foreign Currency: Securities and other assets and liabilities denominated in foreign currencies are translated into U.S. dollars using exchange rates obtained from an independent third party as of the fund’s pricing time on the valuation date. Realized gains (losses) and unrealized appreciation (depreciation) on investment securities include the effects of changes in exchange rates since the securities were purchased, combined with the effects of changes in security prices. Fluctuations in the value of other assets and liabilities resulting from changes in exchange rates are recorded as unrealized foreign currency gains (losses) until the assets or liabilities are settled in cash, at which time they are recorded as realized foreign currency gains (losses).
3. Futures Contracts: The fund uses futures contracts to invest in fixed income asset classes with greater efficiency and lower cost than is possible through direct investment, to add value when these instruments are attractively priced, or to adjust sensitivity to changes in interest rates. The
135
Total International Bond Index Fund
primary risks associated with the use of futures contracts are imperfect correlation between changes in market values of bonds held by the fund and the prices of futures contracts, and the possibility of an illiquid market. Counterparty risk involving futures is mitigated because a regulated clearinghouse is the counterparty instead of the clearing broker. To further mitigate counterparty risk, the fund trades futures contracts on an exchange, monitors the financial strength of its clearing brokers and clearinghouse, and has entered into clearing agreements with its clearing brokers. The clearinghouse imposes initial margin requirements to secure the fund’s performance and requires daily settlement of variation margin representing changes in the market value of each contract. Any assets pledged as initial margin for open contracts are noted in the Statement of Net Assets.
Futures contracts are valued at their quoted daily settlement prices. The notional amounts of the contracts are not recorded in the Statement of Net Assets. Fluctuations in the value of the contracts are recorded in the Statement of Assets and Liabilities as an asset (liability) and in the Statement of Operations as unrealized appreciation (depreciation) until the contracts are closed, when they are recorded as realized futures gains (losses).
During the year ended October 31, 2018, the fund’s average investments in long and short futures contracts each represented less than 1% of net assets, based on the average of the notional amounts at each quarter-end during the period.
4. Forward Currency Contracts: The fund enters into forward currency contracts to protect the value of securities and related receivables and payables against changes in future foreign exchange rates. The fund’s risks in using these contracts include movement in the values of the foreign currencies relative to the U.S. dollar and the ability of the counterparties to fulfill their obligations under the contracts. The fund mitigates its counterparty risk by entering into forward currency contracts only with a diverse group of prequalified counterparties, monitoring their financial strength, entering into master netting arrangements with its counterparties, and requiring its counterparties to transfer collateral as security for their performance. In the absence of a default, the collateral pledged or received by the fund cannot be repledged, resold, or rehypothecated. The master netting arrangements provide that, in the event of a counterparty’s default (including bankruptcy), the fund may terminate the forward currency contracts, determine the net amount owed by either party in accordance with its master netting arrangements, and sell or retain any collateral held up to the net amount owed to the fund under the master netting arrangements. The forward currency contracts contain provisions whereby a counterparty may terminate open contracts if the fund’s net assets decline below a certain level, triggering a payment by the fund if the fund is in a net liability position at the time of the termination. The payment amount would be reduced by any collateral the fund has pledged. Any assets pledged as collateral for open contracts are noted in the Statement of Net Assets. The value of collateral received or pledged is compared daily to the value of the forward currency contracts exposure with each counterparty, and any difference, if in excess of a specified minimum transfer amount, is adjusted and settled within two business days.
Forward currency contracts are valued at their quoted daily prices obtained from an independent third party, adjusted for currency risk based on the expiration date of each contract. The notional amounts of the contracts are not recorded in the Statement of Net Assets. Fluctuations in the value of the contracts are recorded in the Statement of Assets and Liabilities as an asset (liability) and in the Statement of Operations as unrealized appreciation (depreciation) until the contracts are closed, when they are recorded as realized forward currency contract gains (losses).
136
Total International Bond Index Fund
During the year ended October 31, 2018, the fund’s average investment in forward currency contracts represented 101% of net assets, based on the average of notional amounts at each quarter-end during the period.
The following table summarizes the fund’s derivative assets and liabilities by counterparty for derivatives subject to agreements that provide for offsetting assets and liabilities. Exchange-traded derivatives are listed separately.
| | | | | | |
| | | | | | |
| | | | | | |
| Assets | Liabilities | | Amounts Not Offset in | |
| | Reflected in | Reflected in | | the Statement of Assets | Net |
| Statement of | Statement of | Net Amount | and Liabilities | Exposure3 |
| | Assets and | Assets and | Receivable | Collateral | Collateral | (Not Less |
| | Liabilities1 | Liabilities1 | (Payable) | Pledged 2 | Received 2 | Than $0) |
| | ($000) | ($000) | ($000) | ($000) | ($000) | ($000) |
| Forwards subject to offsetting | | | | | |
| arrangements, by counterparty | | | | | |
| Bank of America N.A. | 190,114 | (6,306) | 183,808 | — | 250,124 | — |
| Barclays Capital | 340,053 | (24,902) | 315,151 | — | 346,900 | — |
| BNP Paribas | 430,542 | (38,861) | 391,681 | — | 362,594 | 29,087 |
| Citibank, N.A. | 251,206 | (11,616) | 239,590 | — | 212,390 | 27,200 |
| Deutsche Bank AG | 84,687 | (18,847) | 65,840 | — | 65,840 | — |
| Goldman Sachs Bank AG | 217,196 | (13,361) | 203,835 | — | 187,080 | 16,755 |
| HSBC Bank USA N.A. | 546 | (2,799) | (2,253) | — | — | — |
| JPMorgan Chase Bank | | | | | | |
| N. A. | 30,330 | (8,043) | 22,287 | — | 21,348 | 939 |
| Morgan Stanley Capital | | | | | | |
| Services LLC | 286,300 | (21,310) | 264,990 | — | 252,930 | 12,060 |
| Toronto Dominion | | | | | | |
| Securities | 357,752 | (34,252) | 323,500 | — | 313,468 | 10,032 |
| UBS AG | 176,503 | (8,119) | 168,384 | — | 158,169 | 10,215 |
| Exchange-Traded | | | | | | |
| Futures Contracts | — | (92) | (92) | 963 | — | — |
| Total | 2,365,229 | (188,508) | 2,176,721 | 963 | 2,170,843 | 106,288 |
1 Absent an event of default or early termination, derivative assets and liabilities are presented gross and not offset in the
Statement of Assets and Liabilities.
2 Securities or other assets pledged as collateral are noted in the Statement of Net Assets. Securities received as collateral are
held in a segregated account and not included in the fund’s security holdings in the Statement of Net Assets.
3 Net exposure represents the net amount receivable from the counterparty in the event of default. Counterparties may not
exchange collateral if amount is below a specified minimum transfer amount.
5. Federal Income Taxes: The fund intends to continue to qualify as a regulated investment company and distribute all of its taxable income. Management has analyzed the fund’s tax positions taken for all open federal income tax years (October 31, 2015–2018), and has concluded that no provision for federal income tax is required in the fund’s financial statements.
137
Total International Bond Index Fund
6. Distributions: Distributions to shareholders are recorded on the ex-dividend date. Distributions are determined on a tax basis and may differ from net investment income and realized capital gains for financial reporting purposes.
7. Credit Facility: The fund and certain other funds managed by The Vanguard Group (“Vanguard”) participate in a $3.1 billion committed credit facility provided by a syndicate of lenders pursuant to a credit agreement that may be renewed annually; each fund is individually liable for its borrowings, if any, under the credit facility. Borrowings may be utilized for temporary and emergency purposes, and are subject to the fund’s regulatory and contractual borrowing restrictions. The participating funds are charged administrative fees and an annual commitment fee of 0.10% of the undrawn amount of the facility; these fees are allocated to the funds based on a method approved by the fund’s board of trustees and included in Management and Administrative expenses on the fund’s Statement of Operations. Any borrowings under this facility bear interest at a rate based upon the higher of the one-month London Interbank Offered Rate, federal funds effective rate, or overnight bank funding rate plus an agreed-upon spread.
The fund had no borrowings outstanding at October 31, 2018, or at any time during the period then ended.
8. Other: Interest income includes income distributions received from Vanguard Market Liquidity Fund and is accrued daily. Premiums and discounts on debt securities purchased are amortized and accreted, respectively, to interest income over the lives of the respective securities. Security transactions are accounted for on the date securities are bought or sold. Costs used to determine realized gains (losses) on the sale of investment securities are those of the specific securities sold.
Each class of shares has equal rights as to assets and earnings, except that each class separately bears certain class-specific expenses related to maintenance of shareholder accounts (included in Management and Administrative expenses), shareholder reporting, and the proxy. Marketing and distribution expenses are allocated to each class of shares based on a method approved by the board of trustees. Income, other non-class-specific expenses, and gains and losses on investments are allocated to each class of shares based on its relative net assets.
B. In accordance with the terms of a Funds’ Service Agreement (the “FSA”) between Vanguard and the fund, Vanguard furnishes to the fund investment advisory, corporate management, administrative, marketing, and distribution services at Vanguard’s cost of operations (as defined by the FSA). These costs of operations are allocated to the fund based on methods and guidelines approved by the board of trustees. Vanguard does not require reimbursement in the current period for certain costs of operations (such as deferred compensation/benefits and risk/insurance costs); the fund’s liability for these costs of operations is included in Payables to Vanguard on the Statement of Assets and Liabilities. All other costs of operations payable to Vanguard are generally settled twice a month.
Upon the request of Vanguard, the fund may invest up to 0.40% of its net assets as capital in Vanguard. At October 31, 2018, the fund had contributed to Vanguard capital in the amount of $5,654,000, representing 0.01% of the fund’s net assets and 2.26% of Vanguard’s capitalization. The fund’s trustees and officers are also directors and employees, respectively, of Vanguard.
138
Total International Bond Index Fund
C. Various inputs may be used to determine the value of the fund’s investments. These inputs are summarized in three broad levels for financial statement purposes. The inputs or methodologies used to value securities are not necessarily an indication of the risk associated with investing in those securities.
Level 1—Quoted prices in active markets for identical securities.
Level 2—Other significant observable inputs (including quoted prices for similar securities, interest rates, prepayment speeds, credit risk, etc.).
Level 3—Significant unobservable inputs (including the fund’s own assumptions used to determine
the fair value of investments). Any investments valued with significant unobservable inputs are
noted on the Statement of Net Assets.
The following table summarizes the market value of the fund’s investments as of October 31, 2018, based on the inputs used to value them:
| | | |
| | Level 1 | Level 2 | Level 3 |
| Investments | ($000) | ($000) | ($000) |
| U.S. Government and Agency Obligations | — | 2,457 | — |
| Asset-Backed/Commercial Mortgage-Backed Securities | — | 5,351,123 | — |
| Corporate Bonds | — | 15,752,479 | — |
| Sovereign Bonds | — | 87,312,835 | — |
| Temporary Cash Investments | 127,252 | — | — |
| Futures Contracts—Liabilities1 | (92) | — | — |
| Forward Currency Contracts—Assets | — | 2,365,229 | — |
| Forward Currency Contracts—Liabilities | — | (188,416) | — |
| Total | 127,160 | 110,595,707 | — |
| 1 Represents variation margin on the last day of the reporting period. | | | |
D. At October 31, 2018, the fair values of derivatives were reflected in the Statement of Assets and Liabilities as follows:
| | | |
| | Interest Rate | Currency | |
| | Contracts | Contracts | Total |
| Statement of Assets and Liabilities Caption | ($000) | ($000) | ($000) |
| Unrealized Appreciation—Forward Currency Contracts | — | 2,365,229 | 2,365,229 |
| |
| Variation Margin Payable—Futures Contracts | (92) | — | (92) |
| Unrealized Depreciation—Forward Currency Contracts | — | (188,416) | (188,416) |
| Total Liabilities | (92) | (188,416) | (188,508) |
139
Total International Bond Index Fund
Realized net gain (loss) and the change in unrealized appreciation (depreciation) on derivatives for the year ended October 31, 2018, were:
| | | |
| Interest Rate | Currency | |
| | Contracts | Contracts | Total |
| Realized Net Gain (Loss) on Derivatives | ($000) | ($000) | ($000) |
| Futures Contracts | 1,974 | — | 1,974 |
| Forward Currency Contracts | — | 4,187,551 | 4,187,551 |
| Realized Net Gain (Loss) on Derivatives | 1,974 | 4,187,551 | 4,189,525 |
| |
| Change in Unrealized Appreciation (Depreciation) on Derivatives | | | |
| Futures Contracts | (604) | — | (604) |
| Forward Currency Contracts | — | 785,839 | 785,839 |
| Change in Unrealized Appreciation (Depreciation) on Derivatives | (604) | 785,839 | 785,235 |
E. Permanent differences between book-basis and tax-basis components of net assets are reclassified among capital accounts in the financial statements to reflect their tax character. These reclassifications have no effect on net assets or net asset value per share. As of period end, permanent differences primarily attributable to the accounting for foreign currency transactions were reclassified between the individual components of total distributable earnings (loss).
| |
| | Amount |
| | ($000) |
| Paid-in Capital | — |
| Total Distibutable Earnings (Loss) | — |
Temporary differences between book-basis and tax-basis components of total distributable earnings (loss) arise when certain items of income, gain, or loss are recognized in different periods for financial statement and tax purposes; these differences will reverse at some time in the future. The differences are primarily related to the tax deferral of losses on wash sales; the realization of unrealized gains or losses on certain futures contracts, payables for distributions, and the tax recognition of gain or loss from foreign currency hedges. As of period end, the tax-basis components of total distributable earnings (loss) are detailed in the table as follows:
| |
| | Amount |
| | ($000) |
| Undistributed Ordinary Income | 5,251,219 |
| Undistributed Long-Term Gains | — |
| Capital Loss Carryforwards (Non-expiring) | (109,017) |
| Net Unrealized Gains (Losses) | (2,408,060) |
140
Total International Bond Index Fund
As of October 31, 2018, gross unrealized appreciation and depreciation for investments and derivatives based on cost for U.S. federal income tax purposes were as follows:
| |
| | Amount |
| | ($000) |
| Tax Cost | 110,919,609 |
| Gross Unrealized Appreciation | 1,508,396 |
| Gross Unrealized Depreciation | (3,881,938) |
| Net Unrealized Appreciation (Depreciation) | (2,373,542) |
F. During the year ended October 31, 2018, the fund purchased $39,392,861,000 of investment securities and sold $22,032,010,000 of investment securities, other than U.S. government securities and temporary cash investments.
G. Capital share transactions for each class of shares were:
| | | | |
| | Year Ended October 31, |
| | 2018 | 2017 |
| | Amount | Shares | Amount | Shares |
| | ($000) | (000) | ($000) | (000) |
| Investor Shares | | | | |
| Issued | 2,626,095 | 241,252 | 4,269,591 | 393,356 |
| Issued in Lieu of Cash Distributions | 585,031 | 53,841 | 385,037 | 35,511 |
| Redeemed | (1,385,090) | (127,114) | (491,113) | (45,151) |
| Net Increase (Decrease)—Investor Shares | 1,826,036 | 167,979 | 4,163,515 | 383,716 |
| ETF Shares | | | | |
| Issued | 4,285,695 | 78,832 | 2,825,994 | 52,080 |
| Issued in Lieu of Cash Distributions | — | — | — | — |
| Redeemed | (660,725) | (12,150) | (5,473) | (100) |
| Net Increase (Decrease)—ETF Shares | 3,624,970 | 66,682 | 2,820,521 | 51,980 |
| Admiral Shares | | | | |
| Issued | 10,394,835 | 477,028 | 17,394,004 | 801,059 |
| Issued in Lieu of Cash Distributions | 801,365 | 36,875 | 439,207 | 20,249 |
| Redeemed | (3,528,115) | (162,068) | (2,352,723) | (108,350) |
| Net Increase (Decrease)—Admiral Shares | 7,668,085 | 351,835 | 15,480,488 | 712,958 |
| Institutional Shares | | | | |
| Issued | 5,700,602 | 174,448 | 9,474,335 | 291,743 |
| Issued in Lieu of Cash Distributions | 582,570 | 17,865 | 339,162 | 10,421 |
| Redeemed | (2,329,464) | (71,248) | (2,216,997) | (68,185) |
| Net Increase (Decrease)—Institutional Shares | 3,953,708 | 121,065 | 7,596,500 | 233,979 |
141
Total International Bond Index Fund
At October 31, 2018, several Vanguard funds and trusts managed by Vanguard or its affiliates were each a record or beneficial owner of the fund, and had a combined ownership of 46% of the fund’s net assets.
H. Management has determined that no events or transactions occurred subsequent to October 31, 2018, that would require recognition or disclosure in these financial statements.
142
Report of Independent Registered
Public Accounting Firm
To the Board of Trustees of Vanguard Charlotte Funds and Shareholders of Vanguard Total International Bond Index Fund
Opinion on the Financial Statements
We have audited the accompanying statement of net assets and statement of assets and liabilities of Vanguard Total International Bond Index Fund (one of the funds constituting Vanguard Charlotte Funds, referred to hereafter as the “Fund”) as of October 31, 2018, the related statement of operations for the year ended October 31, 2018, the statement of changes in net assets for each of the two years in the period ended October 31, 2018, including the related notes, and the financial highlights for each of the five years in the period ended October 31, 2018 (collectively referred to as the “financial statements”). In our opinion, the financial statements present fairly, in all material respects, the financial position of the Fund as of October 31, 2018, the results of its operations for the year then ended, the changes in its net assets for each of the two years in the period ended October 31, 2018 and the financial highlights for each of the five years in the period ended October 31, 2018 in conformity with accounting principles generally accepted in the United States of America.
Basis for Opinion
These financial statements are the responsibility of the Fund’s management. Our responsibility is to express an opinion on the Fund’s financial statements based on our audits. We are a public accounting firm registered with the Public Company Accounting Oversight Board (United States) (“PCAOB”) and are required to be independent with respect to the Fund in accordance with the U.S. federal securities laws and the applicable rules and regulations of the Securities and Exchange Commission and the PCAOB.
We conducted our audits of these financial statements in accordance with the standards of the PCAOB. Those standards require that we plan and perform the audit to obtain reasonable assurance about whether the financial statements are free of material misstatement, whether due to error or fraud.
Our audits included performing procedures to assess the risks of material misstatement of the financial statements, whether due to error or fraud, and performing procedures that respond to those risks. Such procedures included examining, on a test basis, evidence regarding the amounts and disclosures in the financial statements. Our audits also included evaluating the accounting principles used and significant estimates made by management, as well as evaluating the overall presentation of the financial statements. Our procedures included confirmation of securities owned as of October 31, 2018 by correspondence with the custodians and brokers and by agreement to the underlying ownership records of the transfer agent; when replies were not received from brokers, we performed other auditing procedures. We believe that our audits provide a reasonable basis for our opinion.
/s/PricewaterhouseCoopers LLP
Philadelphia, Pennsylvania
December 18, 2018
We have served as the auditor of one or more investment companies in The Vanguard Group of
Funds since 1975.
143

Special 2018 tax information (unaudited) for Vanguard Total International Bond Index Fund
This information for the fiscal year ended October 31, 2018, is included pursuant to provisions of
the Internal Revenue Code.
The fund designates to shareholders foreign source income of $1,169,345,000 and foreign taxes
paid of $8,433,000. Shareholders will receive more detailed information with their Form 1099-DIV
in January 2019 to determine the calendar-year amounts to be included on their 2018 tax returns.
144
About Your Fund’s Expenses
As a shareholder of the fund, you incur ongoing costs, which include costs for portfolio management, administrative services, and shareholder reports (like this one), among others. Operating expenses, which are deducted from a fund’s gross income, directly reduce the investment return of the fund.
A fund’s expenses are expressed as a percentage of its average net assets. This figure is known as the expense ratio. The following examples are intended to help you understand the ongoing costs (in dollars) of investing in your fund and to compare these costs with those of other mutual funds. The examples are based on an investment of $1,000 made at the beginning of the period shown and held for the entire period.
The accompanying table illustrates your fund’s costs in two ways:
• Based on actual fund return. This section helps you to estimate the actual expenses that you paid over the period. The ”Ending Account Value“ shown is derived from the fund‘s actual return, and the third column shows the dollar amount that would have been paid by an investor who started with $1,000 in the fund. You may use the information here, together with the amount you invested, to estimate the expenses that you paid over the period.
To do so, simply divide your account value by $1,000 (for example, an $8,600 account value divided by $1,000 = 8.6), then multiply the result by the number given for your fund under the heading ”Expenses Paid During Period.“
• Based on hypothetical 5% yearly return. This section is intended to help you compare your fund‘s costs with those of other mutual funds. It assumes that the fund had a yearly return of 5% before expenses, but that the expense ratio is unchanged. In this case—because the return used is not the fund’s actual return—the results do not apply to your investment. The example is useful in making comparisons because the Securities and Exchange Commission requires all mutual funds to calculate expenses based on a 5% return. You can assess your fund’s costs by comparing this hypothetical example with the hypothetical examples that appear in shareholder reports of other funds.
Note that the expenses shown in the table are meant to highlight and help you compare ongoing costs only and do not reflect transaction costs incurred by the fund for buying and selling securities. Further, the expenses do not include any purchase, redemption, or account service fees described in the fund prospectus. If such fees were applied to your account, your costs would be higher. Your fund does not carry a “sales load.”
The calculations assume no shares were bought or sold during the period. Your actual costs may have been higher or lower, depending on the amount of your investment and the timing of any purchases or redemptions.
You can find more information about the fund’s expenses, including annual expense ratios, in the Financial Statements section of this report. For additional information on operating expenses and other shareholder costs, please refer to your fund’s current prospectus.
145
| | | |
| Six Months Ended October 31, 2018 | | | |
| | Beginning | Ending | Expenses |
| | Account Value | Account Value | Paid During |
| Total International Bond Index Fund | 4/30/2018 | 10/31/2018 | Period |
| Based on Actual Fund Return | | | |
| Investor Shares | $1,000.00 | $1,005.27 | $0.66 |
| ETF Shares | 1,000.00 | 1,005.69 | 0.40 |
| Admiral Shares | 1,000.00 | 1,005.37 | 0.56 |
| Institutional Shares | 1,000.00 | 1,005.57 | 0.35 |
| Based on Hypothetical 5% Yearly Return | | | |
| Investor Shares | $1,000.00 | $1,024.55 | $0.66 |
| ETF Shares | 1,000.00 | 1,024.80 | 0.41 |
| Admiral Shares | 1,000.00 | 1,024.65 | 0.56 |
| Institutional Shares | 1,000.00 | 1,024.85 | 0.36 |
The calculations are based on expenses incurred in the most recent six-month period. The fund’s annualized six-month expense ratios for
that period are 0.13% for Investor Shares, 0.08% for ETF Shares, 0.11% for Admiral Shares, and 0.07% for Institutional Shares. The dollar
amounts shown as “Expenses Paid” are equal to the annualized expense ratio multiplied by the average account value over the period,
multiplied by the number of days in the most recent six-month period, then divided by the number of days in the most recent 12-month
period (184/365).
146
Glossary
30-Day SEC Yield. A fund’s 30-day SEC yield is derived using a formula specified by the U.S. Securities and Exchange Commission. Under the formula, data related to the fund’s security holdings in the previous 30 days are used to calculate the fund’s hypothetical net income for that period, which is then annualized and divided by the fund’s estimated average net assets over the calculation period. For the purposes of this calculation, a security’s income is based on its current market yield to maturity (for bonds), its actual income (for asset-backed securities), or its projected dividend yield (for stocks). Because the SEC yield represents hypothetical annualized income, it will differ—at times significantly—from the fund’s actual experience. As a result, the fund’s income distributions may be higher or lower than implied by the SEC yield.
Average Coupon. The average interest rate paid on the fixed income securities held by a fund. It is expressed as a percentage of face value.
Average Duration. An estimate of how much the value of the bonds held by a fund will fluctuate in response to a change in interest rates. To see how the value could change, multiply the average duration by the change in rates. If interest rates rise by 1 percentage point, the value of the bonds in a fund with an average duration of five years would decline by about 5%. If rates decrease by a percentage point, the value would rise by 5%.
Average Effective Maturity. The average length of time until fixed income securities held by a fund reach maturity and are repaid, taking into consideration the possibility that the issuer may call the bond before its maturity date. The figure reflects the proportion of fund assets represented by each security; it also reflects any futures contracts held. In general, the longer the average effective maturity, the more a fund’s share price will fluctuate in response to changes in market interest rates.
Beta. A measure of the magnitude of a fund’s past share-price fluctuations in relation to the ups and downs of a given market index. The index is assigned a beta of 1.00. Compared with a given index, a fund with a beta of 1.20 typically would have seen its share price rise or fall by 12% when the index rose or fell by 10%. For this report, beta is based on returns over the past 36 months for both the fund and the index. Note that a fund’s beta should be reviewed in conjunction with its R-squared (see definition). The lower the R-squared, the less correlation there is between the fund and the index, and the less reliable beta is as an indicator of volatility.
Credit Quality. Credit-quality ratings are measured on a scale that generally ranges from AAA (highest) to D (lowest). U.S. Treasury, U.S. Agency, and U.S. Agency mortgage-backed securities appear under “U.S. Government.” Credit-quality ratings are obtained from Barclays and are from Moody’s, Fitch, and S&P. When ratings from all three agencies are used, the median rating is shown. When ratings from two of the agencies are used, the lower rating for each issue is shown. “Not Rated” is used to classify securities for which a rating is not available.
Expense Ratio. A fund’s total annual operating expenses expressed as a percentage of the fund’s average net assets. The expense ratio includes management and administrative expenses, but does not include the transaction costs of buying and selling portfolio securities.
Inception Date. The date on which the assets of a fund (or one of its share classes) are first invested in accordance with the fund’s investment objective. For funds with a subscription period, the inception date is the day after that period ends. Investment performance is measured from the inception date.
147
R-Squared. A measure of how much of a fund’s past returns can be explained by the returns from the market in general, as measured by a given index. If a fund’s total returns were precisely synchronized with an index’s returns, its R-squared would be 1.00. If the fund’s returns bore no relationship to the index’s returns, its R-squared would be 0. For this report, R-squared is based on returns over the past 36 months for both the fund and the index.
Short-Term Reserves. The percentage of a fund invested in highly liquid, short-term securities that can be readily converted to cash.
Yield to Maturity. The rate of return an investor would receive if the fixed income securities held by a fund were held to their maturity dates.
148
BLOOMBERG is a trademark and service mark of Bloomberg Finance L.P. BARCLAYS is a trademark and service mark
of Barclays Bank Plc, used under license. Bloomberg Finance L.P. and its affiliates, including Bloomberg Index Services
Limited (BISL) (collectively, Bloomberg), or Bloomberg’s licensors, own all proprietary rights in the Bloomberg Barclays
Global Aggregate ex-USD Float Adjusted RIC Capped Index (USD Hedged) (Index or Bloomberg Barclays Index).
Neither Barclays Bank Plc, Barclays Capital Inc., or any affiliate (collectively Barclays) or Bloomberg is the issuer or
producer of the Total International Bond Index Fund and neither Bloomberg nor Barclays has any responsibilities,
obligations or duties to investors in the Total International Bond Index Fund. The Index is licensed for use by The Vanguard
Group, Inc. (Vanguard) as the sponsor of the Total International Bond Index Fund. Bloomberg and Barclays’ only relationship
with Vanguard in respect of the Index is the licensing of the Index, which is determined, composed and calculated by BISL,
or any successor thereto, without regard to the Issuer or the Total International Bond Index Fund or the owners of the Total
International Bond Index Fund.
Additionally, Vanguard may for itself execute transaction(s) with Barclays in or relating to the Index in connection with
the Total International Bond Index Fund. Investors acquire the Total International Bond Index Fund from Vanguard and
investors neither acquire any interest in the Index nor enter into any relationship of any kind whatsoever with Bloomberg
or Barclays upon making an investment in the Total International Bond Index Fund. The Total International Bond Index
Fund is not sponsored, endorsed, sold or promoted by Bloomberg or Barclays. Neither Bloomberg nor Barclays makes any
representation or warranty, express or implied regarding the advisability of investing in the Total International Bond Index
Fund or the advisability of investing in securities generally or the ability of the Index to track corresponding or relative
market performance. Neither Bloomberg nor Barclays has passed on the legality or suitability of the Total International
Bond Index Fund with respect to any person or entity. Neither Bloomberg nor Barclays is responsible for and has not
participated in the determination of the timing of, prices at, or quantities of the Total International Bond Index Fund to
be issued. Neither Bloomberg nor Barclays has any obligation to take the needs of the Issuer or the owners of the Total
International Bond Index Fund or any other third party into consideration in determining, composing or calculating the
Index. Neither Bloomberg nor Barclays has any obligation or liability in connection with administration, marketing or
trading of the Total International Bond Index Fund.
149
The licensing agreement between Bloomberg and Barclays is solely for the benefit of Bloomberg and Barclays and not
for the benefit of the owners of the Total International Bond Index Fund, investors or other third parties. In addition, the
licensing agreement between Vanguard and Bloomberg is solely for the benefit of Vanguard and Bloomberg and not for
the benefit of the owners of the Total International Bond Index Fund, investors or other third parties.
NEITHER BLOOMBERG NOR BARCLAYS SHALL HAVE ANY LIABILITY TO THE ISSUER, INVESTORS OR TO OTHER THIRD
PARTIES FOR THE QUALITY, ACCURACY AND/OR COMPLETENESS OF THE BLOOMBERG BARCLAYS INDEX OR ANY
DATA INCLUDED THEREIN OR FOR INTERRUPTIONS IN THE DELIVERY OF THE BLOOMBERG BARCLAYS INDEX. NEITHER
BLOOMBERG NOR BARCLAYS MAKES ANY WARRANTY, EXPRESS OR IMPLIED, AS TO RESULTS TO BE OBTAINED BY
THE ISSUER, THE INVESTORS OR ANY OTHER PERSON OR ENTITY FROM THE USE OF THE BLOOMBERG BARCLAYS
INDEX OR ANY DATA INCLUDED THEREIN. NEITHER BLOOMBERG NOR BARCLAYS MAKES ANY EXPRESS OR IMPLIED
WARRANTIES, AND EACH HEREBY EXPRESSLY DISCLAIMS ALL WARRANTIES OF MERCHANTABILITY OR FITNESS FOR
A PARTICULAR PURPOSE OR USE WITH RESPECT TO THE BLOOMBERG BARCLAYS INDEX OR ANY DATA INCLUDED
THEREIN. BLOOMBERG RESERVES THE RIGHT TO CHANGE THE METHODS OF CALCULATION OR PUBLICATION, OR TO
CEASE THE CALCULATION OR PUBLICATION OF THE BLOOMBERG BARCLAYS INDEX, AND NEITHER BLOOMBERG
NOR BARCLAYS SHALL BE LIABLE FOR ANY MISCALCULATION OF OR ANY INCORRECT, DELAYED OR INTERRUPTED
PUBLICATION WITH RESPECT TO THE BLOOMBERG BARCLAYS INDEX. NEITHER BLOOMBERG NOR BARCLAYS SHALL
BE LIABLE FOR ANY DAMAGES, INCLUDING, WITHOUT LIMITATION, ANY SPECIAL, INDIRECT OR CONSEQUENTIAL
DAMAGES, OR ANY LOST PROFITS AND EVEN IF ADVISED OF THE POSSIBILITY OF SUCH, RESULTING FROM THE USE
OF THE BLOOMBERG BARCLAYS INDEX OR ANY DATA INCLUDED THEREIN OR WITH RESPECT TO THE TOTAL
INTERNATIONAL BOND INDEX FUND.
None of the information supplied by Bloomberg or Barclays and used in this publication may be reproduced in any manner
without the prior written permission of both Bloomberg and Barclays Capital, the investment banking division of Barclays
Bank Plc. Barclays Bank Plc is registered in England No. 1026167. Registered office 1 Churchill Place London E14 5HP.
© 2018 Bloomberg. Used with Permission.
Source: Bloomberg Index Services Limited. Copyright 2018, Bloomberg. All rights reserved.
150
This page intentionally left blank.
This page intentionally left blank.
This page intentionally left blank.
This page intentionally left blank.
The People Who Govern Your Fund
The trustees of your mutual fund are there to see that the fund is operated and managed in your best interests since, as a shareholder, you are a part owner of the fund. Your fund’s trustees also serve on the board of directors of The Vanguard Group, Inc., which is owned by the Vanguard funds and provides services to them on an at-cost basis.
A majority of Vanguard’s board members are independent, meaning that they have no affiliation with Vanguard or the funds they oversee, apart from the sizable personal investments they have made as private individuals. The independent board members have distinguished backgrounds in business, academia, and public service. Each of the trustees and executive officers oversees 211 Vanguard funds.
Information for each trustee and executive officer of the fund appears below. The mailing address of the trustees and officers is P.O. Box 876, Valley Forge, PA 19482. More information about the trustees is in the Statement of Additional Information, which can be obtained, without charge, by contacting Vanguard at 800-662-7447, or online at vanguard.com.
Interested Trustees1
F. William McNabb III
Born in 1957. Trustee since July 2009. Principal occupation(s) during the past five years and other experience: chairman of the board (January 2010–present) of Vanguard and of each of the investment companies served by Vanguard, trustee (2009–present) of each of the investment companies served by Vanguard, and director (2008–present) of Vanguard. Chief executive officer and president (2008–2017) of Vanguard and each of the investment companies served by Vanguard, managing director (1995–2008) of Vanguard, and director (1997–2018) of Vanguard Marketing Corporation. Director (2018–present) of UnitedHealth Group.
Mortimer J. Buckley
Born in 1969. Trustee since January 2018. Principal occupation(s) during the past five years and other experience: chief executive officer (January 2018–present) of Vanguard; chief executive officer, president, and trustee (January 2018–present) of each of the investment companies served by Vanguard; president and director (2017–present) of Vanguard; and president (February 2018–present) of Vanguard Marketing Corporation. Chief investment officer (2013–2017), managing director (2002–2017), head of the Retail Investor Group (2006–2012), and chief information officer (2001–2006) of Vanguard. Chairman of the board (2011–2017) of the Children’s Hospital of Philadelphia.
Independent Trustees
Emerson U. Fullwood
Born in 1948. Trustee since January 2008. Principal occupation(s) during the past five years and other experience: executive chief staff and marketing officer for North America and corporate vice president (retired 2008) of Xerox Corporation (document management products and services). Former president of the Worldwide Channels Group, Latin America, and Worldwide Customer Service and executive chief staff officer of Developing Markets of Xerox. Executive in residence and 2009–2010 Distinguished Minett Professor at the Rochester Institute of Technology. Lead director of SPX FLOW, Inc. (multi-industry manufacturing). Director of the University of Rochester Medical Center, the Monroe Community College Foundation, the United Way of Rochester, North Carolina A&T University, and Roberts Wesleyan College. Trustee of the University of Rochester.
Amy Gutmann
Born in 1949. Trustee since June 2006. Principal occupation(s) during the past five years and other experience: president (2004–present) of the University of Pennsylvania. Christopher H. Browne Distinguished Professor of Political Science, School of Arts and Sciences, and professor of communication, Annenberg School for Communication, with secondary faculty appointments in the Department of Philosophy, School of Arts and Sciences, and at the Graduate School of Education, University of Pennsylvania. Trustee of the National Constitution Center.
1 Mr. McNabb and Mr. Buckley are considered “interested persons,” as defined in the Investment Company Act of 1940, because
they are officers of the Vanguard funds.
JoAnn Heffernan Heisen
Born in 1950. Trustee since July 1998. Principal occupation(s) during the past five years and other experience: corporate vice president of Johnson & Johnson (pharmaceuticals/medical devices/consumer products) and member of its executive committee (1997–2008). Chief global diversity officer (retired 2008), vice president and chief information officer (1997–2006), controller (1995–1997), treasurer (1991–1995), and assistant treasurer (1989–1991) of Johnson & Johnson. Director of Skytop Lodge Corporation (hotels) and the Robert Wood Johnson Foundation. Member of the advisory board of the Institute for Women’s Leadership at Rutgers University.
F. Joseph Loughrey
Born in 1949. Trustee since October 2009. Principal occupation(s) during the past five years and other experience: president and chief operating officer (retired 2009) and vice chairman of the board (2008–2009) of Cummins Inc. (industrial machinery). Chairman of the board of Hillenbrand, Inc. (specialized consumer services), Oxfam America, and the Lumina Foundation for Education. Director of the V Foundation for Cancer Research. Member of the advisory council for the College of Arts and Letters and chair of the advisory board to the Kellogg Institute for International Studies, both at the University of Notre Dame.
Mark Loughridge
Born in 1953. Trustee since March 2012. Principal occupation(s) during the past five years and other experience: senior vice president and chief financial officer (retired 2013) of IBM (information technology services). Fiduciary member of IBM’s Retirement Plan Committee (2004–2013), senior vice president and general manager (2002–2004) of IBM Global Financing, vice president and controller (1998–2002) of IBM, and a variety of other prior management roles at IBM. Member of the Council on Chicago Booth.
Scott C. Malpass
Born in 1962. Trustee since March 2012. Principal occupation(s) during the past five years and other experience: chief investment officer (1989–present) and vice president (1996–present) of the University of Notre Dame. Assistant professor of finance at the Mendoza College of Business, University of Notre Dame, and member of the Notre Dame 403(b) Investment Committee. Chairman of the board of TIFF Advisory Services, Inc. Member of the board of Catholic Investment Services, Inc. (investment advisors), the board of advisors for Spruceview Capital Partners, and the board of superintendence of the Institute for the Works of Religion.
Deanna Mulligan
Born in 1963. Trustee since January 2018. Principal occupation(s) during the past five years and other experience: president (2010–present) and chief executive officer (2011–present) of The Guardian Life Insurance Company of America. Chief operating officer (2010–2011) and executive vice president (2008–2010) of Individual Life and Disability of The Guardian Life Insurance Company of America. Member of the board of The Guardian Life Insurance Company of America, the American Council of Life Insurers, the Partnership for New York City (business leadership), and the Committee Encouraging Corporate Philanthropy. Trustee of the Economic Club of New York and the Bruce Museum (arts and science). Member of the Advisory Council for the Stanford Graduate School of Business.
André F. Perold
Born in 1952. Trustee since December 2004. Principal occupation(s) during the past five years and other experience: George Gund Professor of Finance and Banking, Emeritus at the Harvard Business School (retired 2011). Chief investment officer and co-managing partner of HighVista Strategies LLC (private investment firm). Overseer of the Museum of Fine Arts Boston.
Sarah Bloom Raskin
Born in 1961. Trustee since January 2018. Principal occupation(s) during the past five years and other experience: deputy secretary (2014–2017) of the United States Department of the Treasury. Governor (2010–2014) of the Federal Reserve Board. Commissioner (2007–2010) of financial regulation for the State of Maryland. Member of the board of directors (2012–2014) of Neighborhood Reinvestment Corporation. Director of i(x) Investments, LLC.
Peter F. Volanakis
Born in 1955. Trustee since July 2009. Principal occupation(s) during the past five years and other experience: president and chief operating officer (retired 2010) of Corning Incorporated (communications equipment) and director of Corning Incorporated (2000–2010) and Dow Corning (2001–2010). Director (2012) of SPX Corporation (multi-industry manufacturing). Overseer of the Amos Tuck School of Business Administration, Dartmouth College (2001–2013). Chairman of the board of trustees of Colby-Sawyer College. Member of the Board of Hypertherm Inc. (industrial cutting systems, software, and consumables).
Executive Officers
Glenn Booraem
Born in 1967. Principal occupation(s) during the past five years and other experience: principal of Vanguard. Investment stewardship officer (2017–present), treasurer (2015–2017), controller (2010–2015), and assistant controller (2001–2010) of each of the investment companies served by Vanguard.
Christine M. Buchanan
Born in 1970. Principal occupation(s) during the past five years and other experience: principal of Vanguard and global head of Fund Administration at Vanguard. Treasurer (2017–present) of each of the investment companies served by Vanguard. Partner (2005–2017) at KPMG LLP (audit, tax, and advisory services).
Brian Dvorak
Born in 1973. Principal occupation(s) during the past five years and other experience: principal of Vanguard. Chief compliance officer (2017–present) of Vanguard and each of the investment companies served by Vanguard. Assistant vice president (2017–present) of Vanguard Marketing Corporation. Vice president and director of Enterprise Risk Management (2011–2013) at Oppenheimer Funds, Inc.
Thomas J. Higgins
Born in 1957. Principal occupation(s) during the past five years and other experience: principal of Vanguard. Chief financial officer (2008–present) and treasurer (1998–2008) of each of the investment companies served by Vanguard.
Peter Mahoney
Born in 1974. Principal occupation(s) during the past five years and other experience: principal of Vanguard. Controller (2015–present) of each of the investment companies served by Vanguard. Head of International Fund Services (2008–2014) at Vanguard.
Anne E. Robinson
Born in 1970. Principal occupation(s) during the past five years and other experience: general counsel (2016–present) of Vanguard. Secretary (2016–present) of Vanguard and of each of the investment companies served by Vanguard. Managing director (2016–present) of Vanguard. Director and senior vice president (2016–2018) of Vanguard Marketing Corporation. Managing director and general counsel of Global Cards and Consumer Services (2014–2016) at Citigroup. Counsel (2003–2014) at American Express.
Michael Rollings
Born in 1963. Principal occupation(s) during the past five years and other experience: finance director (2017–present) and treasurer (2017) of each of the investment companies served by Vanguard. Managing director (2016–present) of Vanguard. Chief financial officer (2016–present) of Vanguard. Director (2016–present) of Vanguard Marketing Corporation. Executive vice president and chief financial officer (2006–2016) of MassMutual Financial Group.
| |
| Vanguard Senior Management Team |
| |
| Joseph Brennan | Chris D. McIsaac |
| Mortimer J. Buckley | James M. Norris |
| Gregory Davis | Thomas M. Rampulla |
| John James | Karin A. Risi |
| Martha G. King | Anne E. Robinson |
| John T. Marcante | Michael Rollings |
| |
| |
| Chairman Emeritus and Senior Advisor |
| |
| John J. Brennan | |
| Chairman, 1996–2009 | |
| Chief Executive Officer and President, 1996–2008 |
| |
| |
| Founder | |
| |
| John C. Bogle | |
| Chairman and Chief Executive Officer, 1974–1996 |
|  |
| P.O. Box 2600 |
| Valley Forge, PA 19482-2600 |
| |
| |
| |
| Connect with Vanguard® > vanguard.com |
| |
| |
| |
| Fund Information > 800-662-7447 |
| Direct Investor Account Services > 800-662-2739 |
| Institutional Investor Services > 800-523-1036 |
| Text Telephone for People |
| Who Are Deaf or Hard of Hearing > 800-749-7273 |
| |
| This material may be used in conjunction |
| with the offering of shares of any Vanguard |
| fund only if preceded or accompanied by |
| the fund’s current prospectus. |
| |
| All comparative mutual fund data are from Lipper, a |
| Thomson Reuters Company, or Morningstar, Inc., unless |
| otherwise noted. |
| |
| You can obtain a free copy of Vanguard’s proxy voting |
| guidelines by visiting vanguard.com/proxyreporting or by |
| calling Vanguard at 800-662-2739. The guidelines are |
| also available from the SEC’s website, sec.gov. In |
| addition, you may obtain a free report on how your fund |
| voted the proxies for securities it owned during the 12 |
| months ended June 30. To get the report, visit either |
| vanguard.com/proxyreporting or sec.gov. |
| |
| You can review information about your fund on the |
| SEC’s website, and you can receive copies of this |
| information, for a fee, by sending a request via email |
| addressed to publicinfo@sec.gov. |
| |
| |
| |
| |
| © 2018 The Vanguard Group, Inc. |
| All rights reserved. |
| Vanguard Marketing Corporation, Distributor. |
| |
| Q12310 122018 |
Item 2: Code of Ethics. The Registrant has adopted a code of ethics that applies to the Registrant’s
principal executive officer, principal financial officer, principal accounting officer or controller or
persons performing similar functions. The Code of Ethics was amended during the reporting period
covered by this report to make certain technical, non-material changes.
Item 3: Audit Committee Financial Expert. All members of the Audit Committee have been
determined by the Registrant’s Board of Trustees to be Audit Committee Financial Experts and to be
independent: JoAnn Heffernan Heisen, F. Joseph Loughrey, Mark Loughridge, Sarah Bloom Raskin,
and Peter F. Volanakis.
Item 4: Principal Accountant Fees and Services.
(a) Audit Fees.
Audit Fees of the Registrant.
Fiscal Year Ended October 31, 2018: $142,000
Fiscal Year Ended October 31, 2017: $143,000
Aggregate Audit Fees of Registered Investment Companies in the Vanguard Group.
Fiscal Year Ended October 31, 2018: $9,734,277
Fiscal Year Ended October 31, 2017: $8,424,459
Includes fees billed in connection with audits of the Registrant, other registered investment companies in the Vanguard complex, The Vanguard Group, Inc. and Vanguard Marketing Corporation.
(b) Audit-Related Fees.
Fiscal Year Ended October 31, 2018: $5,581,336
Fiscal Year Ended October 31, 2017: $3,194,093
Includes fees billed in connection with assurance and related services provided to the Registrant, other registered investment companies in the Vanguard complex, The Vanguard Group, Inc., and Vanguard Marketing Corporation.
(c) Tax Fees.
Fiscal Year Ended October 31, 2018: $347,985
Fiscal Year Ended October 31, 2017: $274,313
Includes fees billed in connection with tax compliance, planning, and advice services provided to the Registrant, other registered investment companies in the Vanguard complex, The Vanguard Group, Inc., and Vanguard Marketing Corporation.
(d) All Other Fees.
Fiscal Year Ended October 31, 2018: $0
Fiscal Year Ended October 31, 2017: $0
Includes fees billed for services related to tax reported information provided to the Registrant, other registered investment companies in the Vanguard complex, The Vanguard Group, Inc., and Vanguard Marketing Corporation.
(e) (1) Pre-Approval Policies. The policy of the Registrant’s Audit Committee is to consider and, if appropriate, approve before the principal accountant is engaged for such services, all specific audit and non-audit services provided to: the Registrant, other registered investment companies in the Vanguard complex, The Vanguard Group, Inc., and entities controlled by The Vanguard Group, Inc. that provide ongoing services to the Registrant. In making a determination, the Audit Committee considers whether the services are consistent with maintaining the principal accountant’s independence.
In the event of a contingency situation in which the principal accountant is needed to provide services in between scheduled Audit Committee meetings, the Chairman of the Audit Committee would be called on to consider and, if appropriate, pre-approve audit or permitted non-audit services in an amount sufficient to complete services through the next Audit Committee meeting, and to determine if such services would be consistent with maintaining the accountant’s independence. At the next scheduled Audit Committee meeting, services and fees would be presented to the Audit Committee for formal consideration, and, if appropriate, approval by the entire Audit Committee. The Audit Committee would again consider whether such services and fees are consistent with maintaining the principal accountant’s independence.
The Registrant’s Audit Committee is informed at least annually of all audit and non-audit services provided by the principal accountant to the Vanguard complex, whether such services are provided to: the Registrant, other registered investment companies in the Vanguard complex, The Vanguard Group, Inc., or other entities controlled by The Vanguard Group, Inc. that provide ongoing services to the Registrant.
(2) No percentage of the principal accountant’s fees or services were approved pursuant to the waiver provision of paragraph (c)(7)(i)(C) of Rule 2-01 of Regulation S-X.
(f) For the most recent fiscal year, over 50% of the hours worked under the principal accountant’s engagement were not performed by persons other than full-time, permanent employees of the principal accountant.
(g) Aggregate Non-Audit Fees.
Fiscal Year Ended October 31, 2018: $347,985
Fiscal Year Ended October 31, 2017: $274,313
Includes fees billed for non-audit services provided to the Registrant, other registered investment companies in the Vanguard complex, The Vanguard Group, Inc., and Vanguard Marketing Corporation.
(h) For the most recent fiscal year, the Audit Committee has determined that the provision of all non-audit services was consistent with maintaining the principal accountant’s independence.
Item 5: Audit Committee of Listed Registrants.
The Registrant is a listed issuer as defined in rule 10A-3 under the Securities Exchange Act of 1934 (“Exchange Act”). The Registrant has a separately-designated standing audit committee established in accordance with Section 3(a)(58)(A) of the Exchange Act. The Registrant’s audit committee members are: JoAnn Heffernan Heisen, F. Joseph Loughrey, Mark Loughridge, Sarah Bloom Raskin, and Peter F. Volanakis.
Item 6: Investments.
Not Applicable.
Item 7: Disclosure of Proxy Voting Policies and Procedures for Closed-End Management Investment
Companies.
Not Applicable.
Item 8: Portfolio Managers of Closed-End Management Investment Companies.
Not Applicable.
Item 9: Purchase of Equity Securities by Closed-End Management Investment Company and
Affiliated Purchasers.
Not Applicable.
Item 10: Submission of Matters to a Vote of Security Holders.
Not Applicable.
Item 11: Controls and Procedures.
(a) Disclosure Controls and Procedures. The Principal Executive and Financial Officers concluded that the Registrant’s Disclosure Controls and Procedures are effective based on their evaluation of the Disclosure Controls and Procedures as of a date within 90 days of the filing date of this report.
(b) Internal Control Over Financial Reporting. There were no significant changes in Registrant’s Internal Control Over Financial Reporting or in other factors that could significantly affect this control subsequent to the date of the evaluation, including any corrective actions with regard to significant deficiencies and material weaknesses.
Item 12: Disclosure of Securities Lending Activities for Closed-End Management
Investment Companies.
Not Applicable.
Item 13: Exhibits.
(a) Code of Ethics.
(b) Certifications.
Pursuant to the requirements of the Securities Exchange Act of 1934 and the Investment Company Act of 1940, the registrant has duly caused this report to be signed on its behalf by the undersigned, thereunto duly authorized.
| |
| | VANGUARD CHARLOTTE FUNDS |
| |
| |
| BY: | /s/ MORTIMER J. BUCKLEY* |
| | MORTIMER J. BUCKLEY |
| | CHIEF EXECUTIVE OFFICER |
| |
Date: December 18, 2018 |
Pursuant to the requirements of the Securities Exchange Act of 1934 and the Investment Company Act of 1940, this report has been signed below by the following persons on behalf of the registrant and in the capacities and on the dates indicated.
| |
| | VANGUARD CHARLOTTE FUNDS |
| |
| BY: | /s/ MORTIMER J. BUCKLEY * |
| | MORTIMER J. BUCKLEY |
| | CHIEF EXECUTIVE OFFICER |
Date: December 18, 2018 |
| VANGUARD CHARLOTTE FUNDS |
| |
| BY: | /s/ THOMAS J. HIGGINS* |
| THOMAS J. HIGGINS |
| | CHIEF FINANCIAL OFFICER |
Date: December 18, 2018 |
* By: /s/ Anne E. Robinson
Anne E. Robinson, pursuant to a Power of Attorney filed on January 18, 2018 see file Number
33-32216, Incorporated by Reference.