UNITED STATES
SECURITIES AND EXCHANGE COMMISSION
Washington, D.C. 20549
FORM N-CSR
CERTIFIED SHAREHOLDER REPORT
OF
REGISTERED MANAGEMENT INVESTMENT COMPANIES
Investment Company Act file number: 811-22619
Name of Registrant: | Vanguard Charlotte Funds |
Address of Registrant: | P.O. Box 2600 |
| Valley Forge, PA 19482 |
Name and address of agent for service: | Anne E. Robinson, Esquire |
| P.O. Box 876 |
| Valley Forge, PA 19482 |
Registrant’s telephone number, including area code: (610) 669-1000
Date of fiscal year end: October 31
Date of reporting period: November 1, 2018—October 31, 2019
Item 1: Reports to Shareholders

Annual Report | October 31, 2019 Vanguard Total International Bond Index Fund |
See the inside front cover for important information about access to your fund’s annual and semiannual shareholder reports. |
Important information about access to shareholder reports
Beginning on January 1, 2021, as permitted by regulations adopted by the Securities and Exchange Commission, paper copies of your fund’s annual and semiannual shareholder reports will no longer be sent to you by mail, unless you specifically request them. Instead, you will be notified by mail each time a report is posted on the website and will be provided with a link to access the report.
If you have already elected to receive shareholder reports electronically, you will not be affected by this change and do not need to take any action. You may elect to receive shareholder reports and other communications from the fund electronically by contacting your financial intermediary (such as a broker-dealer or bank) or, if you invest directly with the fund, by calling Vanguard at one of the phone numbers on the back cover of this report or by logging on to vanguard.com.
You may elect to receive paper copies of all future shareholder reports free of charge. If you invest through a financial intermediary, you can contact the intermediary to request that you continue to receive paper copies. If you invest directly with the fund, you can call Vanguard at one of the phone numbers on the back cover of this report or log on to vanguard.com. Your election to receive paper copies will apply to all the funds you hold through an intermediary or directly with Vanguard.
Contents | |
| |
A Note From Our Chairman | 1 |
Your Fund’s Performance at a Glance | 2 |
About Your Fund’s Expenses | 3 |
Performance Summary | 5 |
Financial Statements | 8 |
Please note: The opinions expressed in this report are just that—informed opinions. They should not be considered promises or advice. Also, please keep in mind that the information and opinions cover the period through the date on the front of this report. Of course, the risks of investing in your fund are spelled out in the prospectus.
A Note From Our Chairman

Tim Buckley
Chairman and Chief Executive Officer
Dear Shareholder,
Recent volatility in financial markets— affecting stocks, bonds, and commodities— has been a good reminder of the wise old adage, “Never keep all your eggs in one basket.” Maintaining balance and diversification in your investment portfolio can help to both limit risk and set you up for long-term success.
It’s understandable why some investors might become complacent after a long market run-up like the one that lifted stock prices, especially U.S. stock prices, in the years following the global financial crisis. But failing to rebalance regularly can leave a portfolio with a much different mix of assets than intended and, often, more risk than intended.
Balance across and diversification within asset classes are powerful tools for managing risk and achieving your investment goals. A portfolio’s allocation will determine a large portion of its long-term return and also the majority of its volatility risk. A well-diversified portfolio is less vulnerable to significant swings in the performance of any one segment of the asset classes in which it invests.
Balance and diversification will never eliminate the risk of loss, nor will they guarantee positive returns in a declining market. But they should reduce the chance that you’ll suffer disproportionate losses in one particular high-flying asset class or sector when it comes back to earth. And exposure to all key market components should give you at least some participation in the sectors that are performing best at any given time.
Vanguard is committed to helping you achieve balance and diversification in your portfolios to help meet your investment goals. We thank you for your continued loyalty.
Sincerely,

Mortimer J. Buckley
Chairman and Chief Executive Officer
November 18, 2019
1
Your Fund’s Performance at a Glance
· Global markets rallied during the 12 months ended October 31, 2019. Investors were initially worried about slowing global growth, heightened trade tensions, and tightening monetary policies—but they relaxed and again reached for yield as central banks turned more accommodative and growth concerns eased. Global bond yields ended the period lower, pushing bond prices higher.
· Investor Shares of Vanguard Total International Bond Index Fund returned 10.39%. These results were in line with the 10.53% return of the fund’s benchmark index, a theoretical construct that, unlike your fund, incurs no operating or transaction costs.
· All 64 countries in the index recorded gains in U.S. dollar terms. Among the largest contributors were Italy and the United Kingdom.
· By credit quality, returns were highest for Baa-rated issues, the lowest rung on the investment-grade ladder. These bonds returned almost 16% and accounted for a bit less than one-fifth of the index.
· Longer-dated issues had higher returns than their shorter-dated counterparts. Bonds with maturities of 30 or more years returned nearly 30%.
· The fund regularly uses derivatives to hedge portfolio risks. The fund’s holdings of forward currency contracts boosted performance.
Market Barometer
| | Average Annual Total Returns | |
| | Periods Ended October 31, 2019 | |
| | One Year | | Three Years | | Five Years | |
Stocks | | | | | | | |
Russell 1000 Index (Large-caps) | | 14.15% | | 14.73% | | 10.55% | |
Russell 2000 Index (Small-caps) | | 4.90 | | 10.96 | | 7.37 | |
Russell 3000 Index (Broad U.S. market) | | 13.49 | | 14.47 | | 10.31 | |
FTSE All-World ex US Index (International) | | 11.52 | | 8.21 | | 4.16 | |
| | | | | | | |
Bonds | | | | | | | |
Bloomberg Barclays U.S. Aggregate Bond Index (Broad taxable market) | | 11.51% | | 3.29% | | 3.24% | |
Bloomberg Barclays Municipal Bond Index (Broad tax-exempt market) | | 9.42 | | 3.62 | | 3.55 | |
FTSE Three-Month U.S. Treasury Bill Index | | 2.35 | | 1.57 | | 0.98 | |
| | | | | | | |
CPI | | | | | | | |
Consumer Price Index | | 1.76% | | 2.11% | | 1.62% | |
2
About Your Fund’s Expenses
As a shareholder of the fund, you incur ongoing costs, which include costs for portfolio management, administrative services, and shareholder reports (like this one), among others. Operating expenses, which are deducted from a fund’s gross income, directly reduce the investment return of the fund.
A fund’s expenses are expressed as a percentage of its average net assets. This figure is known as the expense ratio. The following examples are intended to help you understand the ongoing costs (in dollars) of investing in your fund and to compare these costs with those of other mutual funds. The examples are based on an investment of $1,000 made at the beginning of the period shown and held for the entire period.
The accompanying table illustrates your fund’s costs in two ways:
· Based on actual fund return. This section helps you to estimate the actual expenses that you paid over the period. The “Ending Account Value” shown is derived from the fund’s actual return, and the third column shows the dollar amount that would have been paid by an investor who started with $1,000 in the fund. You may use the information here, together with the amount you invested, to estimate the expenses that you paid over the period.
To do so, simply divide your account value by $1,000 (for example, an $8,600 account value divided by $1,000 = 8.6), then multiply the result by the number given for your fund under the heading “Expenses Paid During Period.”
· Based on hypothetical 5% yearly return. This section is intended to help you compare your fund’s costs with those of other mutual funds. It assumes that the fund had a yearly return of 5% before expenses, but that the expense ratio is unchanged. In this case—because the return used is not the fund’s actual return—the results do not apply to your investment. The example is useful in making comparisons because the Securities and Exchange Commission requires all mutual funds to calculate expenses based on a 5% return. You can assess your fund’s costs by comparing this hypothetical example with the hypothetical examples that appear in shareholder reports of other funds.
Note that the expenses shown in the table are meant to highlight and help you compare ongoing costs only and do not reflect transaction costs incurred by the fund for buying and selling securities. Further, the expenses do not include any purchase, redemption, or account service fees described in the fund prospectus. If such fees were applied to your account, your costs would be higher. Your fund does not carry a “sales load.”
The calculations assume no shares were bought or sold during the period. Your actual costs may have been higher or lower, depending on the amount of your investment and the timing of any purchases or redemptions.
You can find more information about the fund’s expenses, including annual expense ratios, in the Financial Statements section of this report. For additional information on operating expenses and other shareholder costs, please refer to your fund’s current prospectus.
3
Six Months Ended October 31, 2019
| Beginning | Ending | Expenses |
| Account Value | Account Value | Paid During |
Total International Bond Index Fund | 4/30/2019 | 10/31/2019 | Period |
Based on Actual Fund Return | | | |
Investor Shares | $1,000.00 | $1,053.02 | $0.67 |
ETF Shares | 1,000.00 | 1,053.04 | 0.36 |
Admiral™ Shares | 1,000.00 | 1,053.13 | 0.57 |
Institutional Shares | 1,000.00 | 1,053.03 | 0.36 |
Based on Hypothetical 5% Yearly Return | | | |
Investor Shares | $1,000.00 | $1,024.55 | $0.66 |
ETF Shares | 1,000.00 | 1,024.85 | 0.36 |
Admiral Shares | 1,000.00 | 1,024.65 | 0.56 |
Institutional Shares | 1,000.00 | 1,024.85 | 0.36 |
The calculations are based on expenses incurred in the most recent six-month period. The fund’s annualized six-month expense ratios for that period are 0.13% for Investor Shares, 0.07% for ETF Shares, 0.11% for Admiral Shares, and 0.07% for Institutional Shares. The dollar amounts shown as “Expenses Paid” are equal to the annualized expense ratio multiplied by the average account value over the period, multiplied by the number of days in the most recent six-month period, then divided by the number of days in the most recent 12-month period (184/365).
4
Total International Bond Index Fund
Performance Summary
All of the returns in this report represent past performance, which is not a guarantee of future results that may be achieved by the fund. (Current performance may be lower or higher than the performance data cited. For performance data current to the most recent month-end, visit our website at vanguard.com/performance.) Note, too, that both investment returns and principal value can fluctuate widely, so an investor’s shares, when sold, could be worth more or less than their original cost. The returns shown do not reflect taxes that a shareholder would pay on fund distributions or on the sale of fund shares.
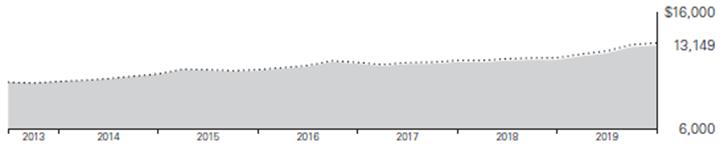
Cumulative Performance: May 31, 2013, Through October 31, 2019
Initial Investment of $10,000
| | | | Average Annual Total Returns | | |
| | | | Periods Ended October 31, 2019 | | |
| | | | | | | | Since | | Final Value |
| | | | One | | Five | | Inception | | of a $10,000 |
| | | | Year | | Years | | (5/31/2013) | | Investment |

| | Total International Bond Index Fund Investor Shares | | 10.39% | | 4.28% | | 4.36% | | $13,149 |

| | Bloomberg Barclays Global Aggregate ex-USD Float Adjusted RIC Capped Index (USD Hedged) | | 10.53 | | 4.54 | | 4.63 | | 13,372 |
“Since Inception” performance is calculated from the Investor Shares’ inception date for both the fund and its comparative standard.
| | | | | | | | Since | | Final Value |
| | | | One | | Five | | Inception | | of a $10,000 |
| | | | Year | | Years | | (5/31/2013) | | Investment |
Total International Bond Index Fund ETF Shares Net Asset Value | | 10.40% | | 4.31% | | 4.39% | | $13,173 |
Total International Bond Index Fund ETF Shares Market Price | | 10.50 | | 4.29 | | 4.42 | | 13,200 |
Bloomberg Barclays Global Aggregate ex-USD Float Adjusted RIC Capped Index (USD Hedged) | | 10.53 | | 4.54 | | 4.63 | | 13,372 |
“Since Inception” performance is calculated from the ETF Shares’ inception date for both the fund and its comparative standard.
See Financial Highlights for dividend and capital gains information.
5
Total International Bond Index Fund
| | | | Average Annual Total Returns | | |
| | | | Periods Ended October 31, 2019 | | |
| | | | | | | | Since | | Final Value |
| | | | One | | Five | | Inception | | of a $10,000 |
| | | | Year | | Years | | (5/31/2013) | | Investment |
Total International Bond Index Fund Admiral Shares | | 10.41% | | 4.30% | | 4.38% | | $13,170 |
Bloomberg Barclays Global Aggregate ex-USD Float Adjusted RIC Capped Index (USD Hedged) | | 10.53 | | 4.54 | | 4.63 | | 13,372 |
“Since Inception” performance is calculated from the Admiral Shares’ inception date for both the fund and its comparative standard.
| | | | | | | | Since | | Final Value |
| | | | One | | Five | | Inception | | of a $5,000,000 |
| | | | Year | | Years | | (5/31/2013) | | Investment |
Total International Bond Index Fund Institutional Shares | | 10.42% | | 4.35% | | 4.44% | | $6,606,850 |
Bloomberg Barclays Global Aggregate ex-USD Float Adjusted RIC Capped Index (USD Hedged) | | 10.53 | | 4.54 | | 4.63 | | 6,685,871 |
“Since Inception” performance is calculated from the Institutional Shares’ inception date for both the fund and its comparative standard.
Cumulative Returns of ETF Shares: May 31, 2013, Through October 31, 2019
| | | | | | Since |
| | One | | Five | | Inception |
| | Year | | Years | | (5/31/2013) |
Total International Bond Index Fund ETF Shares Market Price | | 10.50% | | 23.40% | | 32.00% |
Total International Bond Index Fund ETF Shares Net Asset Value | | 10.40 | | 23.49 | | 31.73 |
Bloomberg Barclays Global Aggregate ex-USD Float Adjusted RIC Capped Index (USD Hedged) | | 10.53 | | 24.84 | | 33.72 |
“Since Inception” performance is calculated from the ETF Shares’ inception date for both the fund and its comparative standard.
For the ETF Shares, the market price is determined by the midpoint of the bid-offer spread as of the closing time of the New York Stock Exchange (generally 4 p.m., Eastern time). The net asset value is also determined as of the NYSE closing time. For more information about how the ETF Shares’ market prices have compared with their net asset value, visit vanguard.com, select your ETF, and then select the Price and Performance tab. The ETF premium/discount analysis there shows the percentages of days on which the ETF Shares’ market price was above or below the NAV.
6
Total International Bond Index Fund
Sector Diversification
As of October 31, 2019
Finance | 7.7% |
Foreign | 80.1 |
Industrial | 6.6 |
Utilities | 1.2 |
Other | 4.4 |
The table reflects the fund’s market exposure. Any holdings in short-term reserves are excluded. The agency and mortgage-backed securities sectors may include issues from government-sponsored enterprises; such issues are generally not backed by the full faith and credit of the U.S. government.
7
Total International Bond Index Fund
Financial Statements
Statement of Net Assets
As of October 31, 2019
The fund files its complete schedule of portfolio holdings with the Securities and Exchange Commission (SEC) for the first and third quarters of each fiscal year as an exhibit to its reports on Form N-PORT. The fund’s Form N-PORT reports are available on the SEC’s website at www.sec.gov.
| | | | | | | Face | | Market | |
| | | | | Maturity | | Amount | | Value· | |
| | | Coupon | | Date | Currency | (000 | ) | ($000 | ) |
Australia (2.6%) | | | | | | | | | |
Asset-Backed/Commercial Mortgage-Backed Securities (0.1%) | | | | |
| Australia & New Zealand Banking Group Ltd. | | 0.450% | | 11/22/23 | EUR | 16,000 | | 18,322 | |
| Australia & New Zealand Banking Group Ltd. | | 2.500% | | 1/16/24 | EUR | 5,000 | | 6,206 | |
| Australia & New Zealand Banking Group Ltd. | | 5.000% | | 8/16/23 | AUD | 5,500 | | 4,285 | |
| Commonwealth Bank of Australia | | 0.500% | | 7/27/26 | EUR | 31,600 | | 36,507 | |
| Commonwealth Bank of Australia | | 0.750% | | 11/4/21 | EUR | 9,000 | | 10,257 | |
| Commonwealth Bank of Australia | | 0.875% | | 2/19/29 | EUR | 10,000 | | 11,921 | |
| Commonwealth Bank of Australia | | 1.125% | | 12/22/21 | GBP | 1,800 | | 2,337 | |
| Commonwealth Bank of Australia | | 2.750% | | 11/17/21 | AUD | 3,100 | | 2,202 | |
| Commonwealth Bank of Australia | | 3.000% | | 5/3/22 | EUR | 15,100 | | 18,233 | |
| Commonwealth Bank of Australia | | 3.000% | | 9/4/26 | GBP | 1,700 | | 2,474 | |
| National Australia Bank Ltd. | | 0.875% | | 11/16/22 | EUR | 5,000 | | 5,769 | |
| National Australia Bank Ltd. | | 0.875% | | 2/19/27 | EUR | 10,000 | | 11,845 | |
| National Australia Bank Ltd. | | 1.375% | | 5/28/21 | EUR | 700 | | 802 | |
| National Australia Bank Ltd. | | 1.875% | | 1/13/23 | EUR | 5,000 | | 5,955 | |
| National Australia Bank Ltd. | | 2.250% | | 6/6/25 | EUR | 1,800 | | 2,273 | |
| National Australia Bank Ltd. | | 3.000% | | 9/4/26 | GBP | 500 | | 730 | |
| National Australia Bank Ltd. | | 5.000% | | 3/11/24 | AUD | 6,750 | | 5,326 | |
| Suncorp-Metway Ltd. | | 3.000% | | 9/13/23 | AUD | 2,400 | | 1,747 | |
| Suncorp-Metway Ltd. | | 3.250% | | 8/24/26 | AUD | 1,000 | | 748 | |
| Westpac Banking Corp. | | 0.625% | | 1/14/22 | EUR | 10,000 | | 11,379 | |
| Westpac Banking Corp. | | 0.750% | | 7/22/21 | EUR | 10,000 | | 11,357 | |
| Westpac Banking Corp. | | 1.000% | | 6/30/22 | GBP | 1,500 | | 1,938 | |
| Westpac Banking Corp. | | 1.375% | | 5/17/32 | EUR | 10,000 | | 12,623 | |
| Westpac Banking Corp. | | 1.500% | | 3/24/21 | EUR | 7,200 | | 8,236 | |
| Westpac Banking Corp. | | 2.750% | | 8/31/22 | AUD | 13,200 | | 9,466 | |
| Westpac Banking Corp. | | 5.250% | | 11/21/23 | AUD | 3,500 | | 2,774 | |
| | | | | | | | | 205,712 | |
Corporate Bonds (0.5%) | | | | | | | | | |
| AGL Energy Ltd. | | 5.000% | | 11/5/21 | AUD | 4,380 | | 3,167 | |
| AMP Capital Wholesale Office Fund | | 4.750% | | 10/7/21 | AUD | 1,000 | | 716 | |
| APT Pipelines Ltd. | | 1.375% | | 3/22/22 | EUR | 300 | | 345 | |
| APT Pipelines Ltd. | | 2.000% | | 3/22/27 | EUR | 8,400 | | 10,154 | |
| APT Pipelines Ltd. | | 3.500% | | 3/22/30 | GBP | 12,300 | | 17,737 | |
| APT Pipelines Ltd. | | 4.250% | | 11/26/24 | GBP | 1,000 | | 1,461 | |
| Asciano Finance Ltd. | | 5.000% | | 9/19/23 | GBP | 500 | | 723 | |
| Aurizon Network Pty Ltd. | | 2.000% | | 9/18/24 | EUR | 3,000 | | 3,637 | |
| Aurizon Network Pty Ltd. | | 4.000% | | 6/21/24 | AUD | 1,520 | | 1,119 | |
| Ausgrid Finance Pty Ltd. | | 1.250% | | 7/30/25 | EUR | 3,300 | | 3,826 | |
| Ausgrid Finance Pty Ltd. | | 3.750% | | 10/30/24 | AUD | 6,000 | | 4,469 | |
| AusNet Services Holdings Pty Ltd. | | 1.500% | | 2/26/27 | EUR | 2,700 | | 3,232 | |
8
Total International Bond Index Fund
| | | | | | | Face | | Market | |
| | | | | Maturity | | Amount | | Value· | |
| | | Coupon | | Date | Currency | (000 | ) | ($000 | ) |
| AusNet Services Holdings Pty Ltd. | | 3.000% | | 2/13/24 | EUR | 4,000 | | 5,021 | |
| AusNet Services Holdings Pty Ltd. | | 4.200% | | 8/21/28 | AUD | 2,800 | | 2,234 | |
| AusNet Services Holdings Pty Ltd. | | 4.400% | | 8/16/27 | AUD | 1,040 | | 834 | |
| AusNet Services Holdings Pty Ltd. | | 5.750% | | 6/28/22 | AUD | 1,490 | | 1,140 | |
| Australia & New Zealand Banking Group Ltd. | | 0.625% | | 2/21/23 | EUR | 10,000 | | 11,401 | |
| Australia & New Zealand Banking Group Ltd. | | 2.950% | | 7/16/21 | AUD | 700 | | 496 | |
| Australia & New Zealand Banking Group Ltd. | | 3.100% | | 2/8/24 | AUD | 13,816 | | 10,111 | |
| Australia & New Zealand Banking Group Ltd. | | 3.300% | | 3/7/22 | AUD | 800 | | 576 | |
| Australia & New Zealand Banking Group Ltd. | | 3.350% | | 5/9/23 | AUD | 400 | | 293 | |
| Australia Pacific Airports Melbourne Pty Ltd. | | 1.750% | | 10/15/24 | EUR | 14,000 | | 16,742 | |
| Australia Pacific Airports Melbourne Pty Ltd. | | 3.125% | | 9/26/23 | EUR | 5,000 | | 6,238 | |
| Australian Gas Networks Vic 3 Pty Ltd. | | 4.500% | | 12/17/21 | AUD | 270 | | 197 | |
| Bank of Queensland Ltd. | | 0.500% | | 7/10/22 | EUR | 500 | | 567 | |
| BHP Billiton Finance Ltd. | | 0.750% | | 10/28/22 | EUR | 200 | | 228 | |
| BHP Billiton Finance Ltd. | | 1.500% | | 4/29/30 | EUR | 5,100 | | 6,142 | |
| BHP Billiton Finance Ltd. | | 3.125% | | 4/29/33 | EUR | 3,000 | | 4,294 | |
| BHP Billiton Finance Ltd. | | 3.250% | | 9/24/27 | EUR | 16,500 | | 22,462 | |
| BHP Billiton Finance Ltd. | | 4.300% | | 9/25/42 | GBP | 9,175 | | 16,615 | |
1 | BHP Billiton Finance Ltd. | | 5.625% | | 10/22/79 | EUR | 300 | | 407 | |
1 | BHP Billiton Finance Ltd. | | 6.500% | | 10/22/77 | GBP | 2,200 | | 3,213 | |
| Brisbane Airport Corp. Pty Ltd. | | 3.900% | | 4/24/25 | AUD | 3,810 | | 2,864 | |
| Caltex Australia Ltd. | | 4.000% | | 4/17/25 | AUD | 14,200 | | 10,600 | |
| Commonwealth Bank of Australia | | 0.375% | | 2/10/21 | EUR | 1,500 | | 1,688 | |
| Commonwealth Bank of Australia | | 0.375% | | 4/11/24 | EUR | 12,100 | | 13,819 | |
| Commonwealth Bank of Australia | | 1.125% | | 1/18/28 | EUR | 3,000 | | 3,592 | |
| Commonwealth Bank of Australia | | 1.625% | | 2/10/31 | EUR | 100 | | 129 | |
1 | Commonwealth Bank of Australia | | 1.936% | | 10/3/29 | EUR | 19,000 | | 22,124 | |
1 | Commonwealth Bank of Australia | | 2.000% | | 4/22/27 | EUR | 7,100 | | 8,220 | |
| Commonwealth Bank of Australia | | 2.750% | | 8/16/21 | AUD | 750 | | 530 | |
| Commonwealth Bank of Australia | | 2.900% | | 7/12/21 | AUD | 46,170 | | 32,670 | |
| Commonwealth Bank of Australia | | 3.000% | | 1/11/24 | AUD | 17,500 | | 12,750 | |
| Commonwealth Bank of Australia | | 3.200% | | 8/16/23 | AUD | 600 | | 439 | |
| Commonwealth Bank of Australia | | 3.250% | | 1/17/22 | AUD | 1,050 | | 754 | |
| Commonwealth Bank of Australia | | 3.250% | | 3/31/22 | AUD | 2,600 | | 1,872 | |
| Commonwealth Bank of Australia | | 3.250% | | 4/25/23 | AUD | 1,000 | | 730 | |
| ConnectEast Finance Pty Ltd. | | 4.250% | | 2/25/22 | AUD | 930 | | 674 | |
| DBNGP Finance Co. Pty Ltd. | | 4.225% | | 5/28/25 | AUD | 2,890 | | 2,198 | |
| ETSA Utilities Finance Pty Ltd. | | 3.500% | | 8/29/24 | AUD | 930 | | 687 | |
| Goodman Australia Finance Pty Ltd. | | 1.375% | | 9/27/25 | EUR | 4,000 | | 4,625 | |
| Incitec Pivot Ltd. | | 4.300% | | 3/18/26 | AUD | 2,040 | | 1,525 | |
| Lonsdale Finance Pty Ltd. | | 3.900% | | 10/15/25 | AUD | 5,030 | | 3,783 | |
| Macquarie Bank Ltd. | | 0.375% | | 3/3/21 | EUR | 6,000 | | 6,752 | |
| Macquarie Bank Ltd. | | 1.125% | | 1/20/22 | EUR | 3,600 | | 4,121 | |
| Macquarie Bank Ltd. | | 3.500% | | 12/18/20 | GBP | 1,000 | | 1,329 | |
1 | Macquarie Group Ltd. | | 1.250% | | 3/5/25 | EUR | 20,000 | | 23,099 | |
| Macquarie Group Ltd. | | 3.250% | | 12/15/21 | AUD | 500 | | 354 | |
| National Australia Bank Ltd. | | 0.250% | | 1/19/23 | CHF | 2,600 | | 2,682 | |
| National Australia Bank Ltd. | | 0.250% | | 5/20/24 | EUR | 10,000 | | 11,259 | |
| National Australia Bank Ltd. | | 0.300% | | 10/31/25 | CHF | 9,900 | | 10,290 | |
| National Australia Bank Ltd. | | 0.350% | | 9/7/22 | EUR | 10,100 | | 11,413 | |
| National Australia Bank Ltd. | | 0.625% | | 8/30/23 | EUR | 100 | | 114 | |
| National Australia Bank Ltd. | | 0.625% | | 9/18/24 | EUR | 2,500 | | 2,862 | |
| National Australia Bank Ltd. | | 0.875% | | 1/20/22 | EUR | 18,100 | | 20,636 | |
| National Australia Bank Ltd. | | 1.125% | | 11/10/21 | GBP | 1,600 | | 2,077 | |
9
Total International Bond Index Fund
| | | | | | | Face | | Market | |
| | | | | Maturity | | Amount | | Value· | |
| | | Coupon | | Date | Currency | (000 | ) | ($000 | ) |
| National Australia Bank Ltd. | | 1.375% | | 6/27/22 | GBP | 500 | | 652 | |
| National Australia Bank Ltd. | | 2.000% | | 11/12/20 | EUR | 6,000 | | 6,847 | |
| National Australia Bank Ltd. | | 2.750% | | 4/16/21 | AUD | 40,700 | | 28,642 | |
| National Australia Bank Ltd. | | 2.900% | | 2/26/24 | AUD | 16,300 | | 11,841 | |
| National Australia Bank Ltd. | | 3.000% | | 2/10/23 | AUD | 2,100 | | 1,518 | |
| National Australia Bank Ltd. | | 3.250% | | 3/24/22 | AUD | 1,800 | | 1,295 | |
| National Australia Bank Ltd. | | 5.125% | | 12/9/21 | GBP | 5,500 | | 7,717 | |
| Origin Energy Finance Ltd. | | 1.000% | | 9/17/29 | EUR | 5,000 | | 5,516 | |
| Pacific National Finance Pty Ltd. | | 5.250% | | 5/19/25 | AUD | 5,690 | | 4,447 | |
| Perth Airport Pty Ltd. | | 5.500% | | 3/25/21 | AUD | 7,500 | | 5,446 | |
| Qantas Airways Ltd. | | 7.500% | | 6/11/21 | AUD | 10,600 | | 7,970 | |
| Qantas Airways Ltd. | | 7.750% | | 5/19/22 | AUD | 1,730 | | 1,365 | |
| Rio Tinto Finance plc | | 2.875% | | 12/11/24 | EUR | 300 | | 380 | |
| Rio Tinto Finance plc | | 4.000% | | 12/11/29 | GBP | 5,200 | | 8,299 | |
| Scentre Group Trust 1 | | 2.250% | | 7/16/24 | EUR | 3,898 | | 4,745 | |
| Scentre Group Trust 1 | | 3.875% | | 7/16/26 | GBP | 7,000 | | 10,136 | |
| Scentre Group Trust 1 | | 4.500% | | 9/8/21 | AUD | 2,500 | | 1,803 | |
| Scentre Group Trust 1 / Scentre Group Trust 2 | | 1.375% | | 3/22/23 | EUR | 5,000 | | 5,789 | |
| Scentre Group Trust 1 / Scentre Group Trust 2 | | 1.450% | | 3/28/29 | EUR | 5,000 | | 5,920 | |
| Scentre Group Trust 1 / Scentre Group Trust 2 | | 1.750% | | 4/11/28 | EUR | 9,000 | | 10,928 | |
| Scentre Group Trust 1 / Scentre Group Trust 2 | | 2.375% | | 4/8/22 | GBP | 4,100 | | 5,447 | |
| Scentre Group Trust 2 | | 3.250% | | 9/11/23 | EUR | 6,273 | | 7,818 | |
| Telstra Corp. Ltd. | | 1.125% | | 4/14/26 | EUR | 11,500 | | 13,570 | |
| Telstra Corp. Ltd. | | 2.500% | | 9/15/23 | EUR | 10,000 | | 12,222 | |
| Telstra Corp. Ltd. | | 3.500% | | 9/21/22 | EUR | 500 | | 615 | |
| Telstra Corp. Ltd. | | 3.750% | | 5/16/22 | EUR | 100 | | 122 | |
| Telstra Corp. Ltd. | | 4.000% | | 9/16/22 | AUD | 2,020 | | 1,486 | |
| Telstra Corp. Ltd. | | 4.000% | | 4/19/27 | AUD | 2,000 | | 1,551 | |
| Toyota Finance Australia Ltd. | | 3.300% | | 11/22/23 | AUD | 550 | | 403 | |
| Transurban Finance Co. Pty Ltd. | | 1.750% | | 3/29/28 | EUR | 5,000 | | 6,033 | |
| Transurban Finance Co. Pty Ltd. | | 1.875% | | 9/16/24 | EUR | 3,000 | | 3,584 | |
| United Energy Distribution Pty Ltd. | | 3.500% | | 9/12/23 | AUD | 560 | | 408 | |
| United Energy Distribution Pty Ltd. | | 3.850% | | 10/23/24 | AUD | 3,050 | | 2,288 | |
| University of Technology Sydney | | 3.750% | | 7/20/27 | AUD | 300 | | 235 | |
| Vicinity Centres | | 3.375% | | 4/7/26 | GBP | 1,259 | | 1,740 | |
| Volkswagen Financial Services Australia Pty Ltd. | | 3.250% | | 4/13/21 | AUD | 900 | | 632 | |
| Wesfarmers Ltd. | | 1.250% | | 10/7/21 | EUR | 500 | | 572 | |
| Wesfarmers Ltd. | | 2.750% | | 8/2/22 | EUR | 3,000 | | 3,606 | |
| Wesfarmers Ltd. | | 3.660% | | 11/18/20 | AUD | 2,300 | | 1,622 | |
| Westpac Banking Corp. | | 0.250% | | 1/17/22 | EUR | 1,000 | | 1,124 | |
| Westpac Banking Corp. | | 0.375% | | 3/5/23 | EUR | 8,000 | | 9,025 | |
| Westpac Banking Corp. | | 0.500% | | 12/4/23 | EUR | 1,000 | | 1,148 | |
| Westpac Banking Corp. | | 0.500% | | 5/17/24 | EUR | 2,500 | | 2,872 | |
| Westpac Banking Corp. | | 0.625% | | 11/22/24 | EUR | 5,000 | | 5,717 | |
| Westpac Banking Corp. | | 0.875% | | 2/16/21 | EUR | 6,000 | | 6,782 | |
| Westpac Banking Corp. | | 0.875% | | 4/17/27 | EUR | 200 | | 234 | |
| Westpac Banking Corp. | | 1.125% | | 9/5/27 | EUR | 11,100 | | 13,248 | |
| Westpac Banking Corp. | | 1.450% | | 7/17/28 | EUR | 800 | | 983 | |
| Westpac Banking Corp. | | 2.625% | | 12/14/22 | GBP | 2,300 | | 3,118 | |
10
Total International Bond Index Fund
| | | | | | | Face | | Market | |
| | | | | Maturity | | Amount | | Value· | |
| | | Coupon | | Date | Currency | (000 | ) | ($000 | ) |
| Westpac Banking Corp. | | 3.000% | | 4/24/24 | AUD | 800 | | 584 | |
| Westpac Banking Corp. | | 3.100% | | 6/3/21 | AUD | 500 | | 354 | |
| Westpac Banking Corp. | | 3.125% | | 10/27/22 | AUD | 1,800 | | 1,302 | |
| Westpac Banking Corp. | | 3.250% | | 11/16/23 | AUD | 600 | | 441 | |
| Westpac Banking Corp. | | 4.125% | | 6/4/26 | AUD | 1,700 | | 1,331 | |
| WSO Finance Pty Ltd. | | 4.500% | | 3/31/27 | AUD | 3,450 | | 2,719 | |
| | | | | | | | | 629,250 | |
| | | | | | | | | | |
Sovereign Bonds (2.0%) | | | | | | | | | |
| Australian Capital Territory | | 4.000% | | 5/22/24 | AUD | 5,000 | | 3,882 | |
| Commonwealth of Australia | | 1.500% | | 6/21/31 | AUD | 35,000 | | 24,981 | |
| Commonwealth of Australia | | 1.750% | | 11/21/20 | AUD | 39,773 | | 27,668 | |
| Commonwealth of Australia | | 2.000% | | 12/21/21 | AUD | 145,000 | | 102,435 | |
| Commonwealth of Australia | | 2.250% | | 11/21/22 | AUD | 50,000 | | 35,959 | |
| Commonwealth of Australia | | 2.250% | | 5/21/28 | AUD | 57,000 | | 42,988 | |
| Commonwealth of Australia | | 2.500% | | 5/21/30 | AUD | 109,800 | | 85,910 | |
| Commonwealth of Australia | | 2.750% | | 4/21/24 | AUD | 104,800 | | 78,294 | |
| Commonwealth of Australia | | 2.750% | | 11/21/27 | AUD | 116,000 | | 90,273 | |
| Commonwealth of Australia | | 2.750% | | 11/21/28 | AUD | 289,715 | | 227,873 | |
| Commonwealth of Australia | | 2.750% | | 11/21/29 | AUD | 122,000 | | 97,033 | |
| Commonwealth of Australia | | 2.750% | | 6/21/35 | AUD | 93,365 | | 77,066 | |
| Commonwealth of Australia | | 2.750% | | 5/21/41 | AUD | 28,348 | | 23,613 | |
| Commonwealth of Australia | | 3.000% | | 3/21/47 | AUD | 71,000 | | 62,654 | |
| Commonwealth of Australia | | 3.250% | | 4/21/25 | AUD | 182,790 | | 141,679 | |
| Commonwealth of Australia | | 3.250% | | 4/21/29 | AUD | 240,000 | | 197,056 | |
| Commonwealth of Australia | | 3.250% | | 6/21/39 | AUD | 69,700 | | 62,113 | |
| Commonwealth of Australia | | 3.750% | | 4/21/37 | AUD | 41,000 | | 38,342 | |
| Commonwealth of Australia | | 4.250% | | 4/21/26 | AUD | 152,914 | | 127,055 | |
| Commonwealth of Australia | | 4.500% | | 4/21/33 | AUD | 42,000 | | 40,675 | |
| Commonwealth of Australia | | 4.750% | | 4/21/27 | AUD | 159,351 | | 139,232 | |
| Commonwealth of Australia | | 5.500% | | 4/21/23 | AUD | 100,600 | | 80,412 | |
| Commonwealth of Australia | | 5.750% | | 5/15/21 | AUD | 62,540 | | 46,318 | |
| Commonwealth of Australia | | 5.750% | | 7/15/22 | AUD | 102,322 | | 79,828 | |
| National Housing Finance and Investment Corp. | | 2.380% | | 3/28/29 | AUD | 2,110 | | 1,574 | |
| New South Wales Treasury Corp. | | 3.000% | | 5/20/27 | AUD | 55,975 | | 43,084 | |
| New South Wales Treasury Corp. | | 3.000% | | 3/20/28 | AUD | 49,000 | | 37,898 | |
| New South Wales Treasury Corp. | | 3.000% | | 11/15/28 | AUD | 20,000 | | 15,520 | |
| New South Wales Treasury Corp. | | 3.000% | | 4/20/29 | AUD | 23,331 | | 18,131 | |
| New South Wales Treasury Corp. | | 3.000% | | 2/20/30 | AUD | 30,960 | | 24,183 | |
| New South Wales Treasury Corp. | | 4.000% | | 4/8/21 | AUD | 11,000 | | 7,910 | |
| New South Wales Treasury Corp. | | 4.000% | | 4/20/23 | AUD | 31,000 | | 23,528 | |
| New South Wales Treasury Corp. | | 4.000% | | 5/20/26 | AUD | 5,000 | | 4,039 | |
| New South Wales Treasury Corp. | | 5.000% | | 8/20/24 | AUD | 21,200 | | 17,254 | |
| New South Wales Treasury Corp. | | 6.000% | | 3/1/22 | AUD | 35,050 | | 26,950 | |
| New South Wales Treasury Corp. | | 6.000% | | 5/1/30 | AUD | 3,000 | | 2,957 | |
| Northern Territory Treasury Corp. | | 2.500% | | 11/21/22 | AUD | 500 | | 358 | |
| Northern Territory Treasury Corp. | | 2.750% | | 10/21/24 | AUD | 500 | | 367 | |
| Northern Territory Treasury Corp. | | 2.750% | | 4/21/27 | AUD | 10,400 | | 7,729 | |
| Northern Territory Treasury Corp. | | 4.250% | | 9/20/21 | AUD | 2,200 | | 1,605 | |
| Optus Finance Pty Ltd. | | 3.250% | | 8/23/22 | AUD | 300 | | 216 | |
| Optus Finance Pty Ltd. | | 3.250% | | 9/6/23 | AUD | 550 | | 400 | |
2 | Queensland Treasury Corp. | | 2.750% | | 8/20/27 | AUD | 18,000 | | 13,602 | |
2 | Queensland Treasury Corp. | | 3.000% | | 3/22/24 | AUD | 10,000 | | 7,444 | |
2 | Queensland Treasury Corp. | | 3.250% | | 7/21/26 | AUD | 42,500 | | 32,913 | |
11
Total International Bond Index Fund
| | | | | | | Face | | Market | |
| | | | | Maturity | | Amount | | Value· | |
| | | Coupon | | Date | Currency | (000 | ) | ($000 | ) |
2 | Queensland Treasury Corp. | | 3.250% | | 7/21/28 | AUD | 42,200 | | 33,189 | |
2 | Queensland Treasury Corp. | | 3.250% | | 8/21/29 | AUD | 15,000 | | 11,877 | |
2 | Queensland Treasury Corp. | | 3.500% | | 8/21/30 | AUD | 17,000 | | 13,826 | |
2 | Queensland Treasury Corp. | | 4.200% | | 2/20/47 | AUD | 7,360 | | 7,043 | |
2 | Queensland Treasury Corp. | | 4.250% | | 7/21/23 | AUD | 43,000 | | 33,056 | |
2 | Queensland Treasury Corp. | | 4.750% | | 7/21/25 | AUD | 42,000 | | 34,548 | |
| Queensland Treasury Corp. | | 5.500% | | 6/21/21 | AUD | 47,500 | | 35,122 | |
| Queensland Treasury Corp. | | 5.750% | | 7/22/24 | AUD | 38,200 | | 31,897 | |
| Queensland Treasury Corp. | | 6.000% | | 7/21/22 | AUD | 59,600 | | 46,546 | |
| Queensland Treasury Corp. | | 6.500% | | 3/14/33 | AUD | 3,650 | | 3,919 | |
| SGSP Australia Assets Pty Ltd. | | 2.000% | | 6/30/22 | EUR | 3,700 | | 4,334 | |
| SGSP Australia Assets Pty Ltd. | | 3.750% | | 6/28/23 | AUD | 900 | | 667 | |
| SGSP Australia Assets Pty Ltd. | | 5.125% | | 2/11/21 | GBP | 1,000 | | 1,354 | |
| SGSP Australia Assets Pty Ltd. | | 5.500% | | 3/12/21 | AUD | 4,400 | | 3,197 | |
| South Australian Government Financing Authority | | 1.500% | | 9/22/22 | AUD | 22,800 | | 15,935 | |
| South Australian Government Financing Authority | | 2.250% | | 8/15/24 | AUD | 15,000 | | 10,867 | |
| South Australian Government Financing Authority | | 2.750% | | 4/16/25 | AUD | 11,000 | | 8,183 | |
| South Australian Government Financing Authority | | 2.750% | | 5/24/30 | AUD | 18,000 | | 13,682 | |
| South Australian Government Financing Authority | | 3.000% | | 7/20/26 | AUD | 6,500 | | 4,957 | |
| South Australian Government Financing Authority | | 3.000% | | 9/20/27 | AUD | 1,250 | | 962 | |
| South Australian Government Financing Authority | | 3.000% | | 5/24/28 | AUD | 5,890 | | 4,539 | |
| South Australian Government Financing Authority | | 4.250% | | 11/20/23 | AUD | 5,000 | | 3,880 | |
| South Australian Government Financing Authority | | 5.000% | | 5/20/21 | AUD | 10,000 | | 7,318 | |
| Tasmanian Public Finance Corp. | | 3.250% | | 2/19/26 | AUD | 9,000 | | 6,890 | |
| Treasury Corp. of Victoria | | 2.250% | | 10/29/21 | AUD | 10,000 | | 7,066 | |
| Treasury Corp. of Victoria | | 2.500% | | 10/22/29 | AUD | 17,000 | | 12,721 | |
| Treasury Corp. of Victoria | | 3.000% | | 10/20/28 | AUD | 25,620 | | 19,932 | |
| Treasury Corp. of Victoria | | 4.250% | | 12/20/32 | AUD | 20,500 | | 18,282 | |
| Treasury Corp. of Victoria | | 5.500% | | 12/17/24 | AUD | 14,000 | | 11,744 | |
| Treasury Corp. of Victoria | | 5.500% | | 11/17/26 | AUD | 45,800 | | 40,585 | |
| Treasury Corp. of Victoria | | 6.000% | | 10/17/22 | AUD | 32,000 | | 25,266 | |
| Western Australian Treasury Corp. | | 2.500% | | 7/23/24 | AUD | 43,000 | | 31,468 | |
| Western Australian Treasury Corp. | | 2.750% | | 10/20/22 | AUD | 45,000 | | 32,559 | |
| Western Australian Treasury Corp. | | 2.750% | | 7/24/29 | AUD | 5,000 | | 3,800 | |
| Western Australian Treasury Corp. | | 3.000% | | 10/21/26 | AUD | 35,000 | | 26,757 | |
| Western Australian Treasury Corp. | | 3.000% | | 10/21/27 | AUD | 10,000 | | 7,691 | |
| Western Australian Treasury Corp. | | 3.250% | | 7/20/28 | AUD | 23,000 | | 18,087 | |
| Western Australian Treasury Corp. | | 5.000% | | 7/23/25 | AUD | 12,000 | | 9,996 | |
| Western Australian Treasury Corp. | | 6.000% | | 10/16/23 | AUD | 10,000 | | 8,202 | |
| | | | | | | | | 2,832,945 | |
Total Australia (Cost $3,657,300) | | | | | | | | 3,667,907 | |
12
Total International Bond Index Fund
| | | | | | | Face | | Market | |
| | | | | Maturity | | Amount | | Value· | |
| | | Coupon | | Date | Currency | (000 | ) | ($000 | ) |
Austria (1.4%) | | | | | | | | | |
Asset-Backed/Commercial Mortgage-Backed Securities (0.1%) | | | | |
| Erste Group Bank AG | | 0.750% | | 2/5/25 | EUR | 2,500 | | 2,932 | |
| Erste Group Bank AG | | 3.500% | | 2/8/22 | EUR | 1,500 | | 1,818 | |
| Erste Group Bank AG | | 4.000% | | 1/20/21 | EUR | 2,000 | | 2,349 | |
| Hypo Tirol Bank AG | | 0.500% | | 2/11/21 | EUR | 1,000 | | 1,125 | |
| Hypoe NOE Landesbank fuer Niederoesterreich und Wien AG | | 3.000% | | 5/9/22 | EUR | 2,000 | | 2,414 | |
| KA Finanz AG | | 1.625% | | 2/19/21 | EUR | 2,000 | | 2,286 | |
| Raiffeisen-Landesbank Steiermark AG | | 0.625% | | 1/20/23 | EUR | 3,700 | | 4,245 | |
| Raiffeisen-Landesbank Steiermark AG | | 2.375% | | 6/14/28 | EUR | 300 | | 403 | |
| Raiffeisenlandesbank Niederoesterreich-Wien AG | | 0.625% | | 3/3/25 | EUR | 300 | | 350 | |
| Raiffeisenlandesbank Niederoesterreich-Wien AG | | 0.875% | | 1/24/28 | EUR | 3,000 | | 3,596 | |
| Raiffeisenlandesbank Niederoesterreich-Wien AG | | 2.125% | | 9/12/22 | EUR | 3,920 | | 4,681 | |
| UniCredit Bank Austria AG | | 0.250% | | 6/4/27 | EUR | 10,000 | | 11,411 | |
| UniCredit Bank Austria AG | | 0.750% | | 2/25/25 | EUR | 500 | | 585 | |
| UniCredit Bank Austria AG | | 1.375% | | 5/26/21 | EUR | 5,000 | | 5,724 | |
| UniCredit Bank Austria AG | | 2.375% | | 1/22/24 | EUR | 5,100 | | 6,317 | |
| UniCredit Bank Austria AG | | 4.125% | | 2/24/21 | EUR | 2,000 | | 2,360 | |
| | | | | | | | | 52,596 | |
Corporate Bonds (0.1%) | | | | | | | | | |
| BAWAG PSK Bank fuer Arbeit und Wirtschaft und Oesterreichische Postsparkasse AG | | 0.375% | | 9/3/27 | EUR | 7,000 | | 7,502 | |
| Borealis AG | | 1.750% | | 12/10/25 | EUR | 300 | | 358 | |
| Erste Group Bank AG | | 0.625% | | 1/19/23 | EUR | 4,200 | | 4,826 | |
| Erste Group Bank AG | | 0.625% | | 4/17/26 | EUR | 15,000 | | 17,563 | |
| Erste Group Bank AG | | 0.750% | | 1/17/28 | EUR | 16,100 | | 19,133 | |
| Erste Group Bank AG | | 0.875% | | 5/15/34 | EUR | 10,000 | | 12,082 | |
| Erste Group Bank AG | | 7.125% | | 10/10/22 | EUR | 1,700 | | 2,273 | |
| JAB Holdings BV | | 1.250% | | 5/22/24 | EUR | 10,100 | | 11,791 | |
| JAB Holdings BV | | 1.750% | | 6/25/26 | EUR | 14,000 | | 16,719 | |
| JAB Holdings BV | | 2.125% | | 9/16/22 | EUR | 3,000 | | 3,543 | |
| JAB Holdings BV | | 2.500% | | 6/25/29 | EUR | 11,300 | | 14,213 | |
| OMV AG | | 0.750% | | 12/4/23 | EUR | 2,500 | | 2,868 | |
| OMV AG | | 1.000% | | 12/14/26 | EUR | 3,450 | | 4,060 | |
| OMV AG | | 1.875% | | 12/4/28 | EUR | 2,200 | | 2,769 | |
| OMV AG | | 2.625% | | 9/27/22 | EUR | 200 | | 240 | |
| OMV AG | | 3.500% | | 9/27/27 | EUR | 2,900 | | 4,044 | |
| OMV AG | | 4.250% | | 10/12/21 | EUR | 1,100 | | 1,331 | |
1 | OMV AG | | 5.250% | | 12/29/49 | EUR | 1,600 | | 1,963 | |
1 | OMV AG | | 6.250% | | 12/29/49 | EUR | 3,300 | | 4,684 | |
| Raiffeisen-Landesbank Steiermark AG | | 1.375% | | 5/11/33 | EUR | 5,000 | | 6,398 | |
| Raiffeisenlandesbank Niederoesterreich-Wien AG | | 0.875% | | 1/30/29 | EUR | 12,100 | | 14,542 | |
| Telekom Finanzmanagement GmbH | | 3.125% | | 12/3/21 | EUR | 5,000 | | 5,939 | |
| Telekom Finanzmanagement GmbH | | 4.000% | | 4/4/22 | EUR | 500 | | 612 | |
1 | UNIQA Insurance Group AG | | 6.000% | | 7/27/46 | EUR | 3,200 | | 4,452 | |
1 | UNIQA Insurance Group AG | | 6.875% | | 7/31/43 | EUR | 1,200 | | 1,602 | |
1 | Vienna Insurance Group AG Wiener Versicherung Gruppe | | 5.500% | | 10/9/43 | EUR | 1,200 | | 1,581 | |
| | | | | | | | | 167,088 | |
13
Total International Bond Index Fund
| | | | | | | Face | | Market | |
| | | | | Maturity | | Amount | | Value· | |
| | | Coupon | | Date | Currency | (000 | ) | ($000 | ) |
Sovereign Bonds (1.2%) | | | | | | | | | |
3 | Autobahnen- Und
Schnellstrassen-Finanzierungs AG | | 0.100% | | 7/9/29 | EUR | 9,000 | | 10,176 | |
3 | Autobahnen- Und
Schnellstrassen-Finanzierungs AG | | 0.250% | | 10/18/24 | EUR | 27,000 | | 31,074 | |
3 | Autobahnen- Und
Schnellstrassen-Finanzierungs-AG | | 1.375% | | 4/9/21 | EUR | 17,000 | | 19,482 | |
3 | Autobahnen- Und
Schnellstrassen-Finanzierungs-AG | | 2.750% | | 6/11/32 | EUR | 500 | | 732 | |
3 | Autobahnen- Und
Schnellstrassen-Finanzierungs-AG | | 2.750% | | 6/20/33 | EUR | 1,200 | | 1,781 | |
3 | Autobahnen- Und
Schnellstrassen-Finanzierungs-AG | | 3.375% | | 9/22/25 | EUR | 2,000 | | 2,718 | |
3 | Hypo Alpe-Adria-Bank International AG | | 2.375% | | 12/13/22 | EUR | 3,000 | | 3,595 | |
3 | Kaerntner Ausgleichszahlungs-Fonds | | 0.000% | | 1/14/32 | EUR | 40,000 | | 43,163 | |
3 | OeBB Infrastruktur AG | | 1.000% | | 11/18/24 | EUR | 7,000 | | 8,340 | |
3 | OeBB Infrastruktur AG | | 2.250% | | 7/4/23 | EUR | 10,000 | | 12,257 | |
3 | OeBB Infrastruktur AG | | 2.250% | | 5/28/29 | EUR | 3,000 | | 4,062 | |
3 | OeBB Infrastruktur AG | | 3.375% | | 5/18/32 | EUR | 7,000 | | 10,829 | |
3 | OeBB Infrastruktur AG | | 3.500% | | 10/19/26 | EUR | 1,800 | | 2,528 | |
3 | OeBB Infrastruktur AG | | 3.625% | | 7/13/21 | EUR | 1,000 | | 1,193 | |
3 | OeBB-Infrastruktur AG | | 3.000% | | 10/24/33 | EUR | 150 | | 229 | |
3 | OeBB-Infrastruktur AG | | 3.875% | | 6/30/25 | EUR | 10,000 | | 13,817 | |
3 | Oesterreichische Kontrollbank AG | | 0.750% | | 3/7/22 | GBP | 1,500 | | 1,942 | |
3 | Oesterreichische Kontrollbank AG | | 2.625% | | 11/22/24 | CHF | 30,610 | | 35,999 | |
3 | Oesterreichische Kontrollbank AG | | 2.875% | | 2/25/30 | CHF | 4,500 | | 6,025 | |
3 | Oesterreichische Kontrollbank AG | | 3.200% | | 8/25/25 | AUD | 1,500 | | 1,118 | |
2 | Republic of Austria | | 0.000% | | 9/20/22 | EUR | 101,250 | | 114,907 | |
2 | Republic of Austria | | 0.000% | | 7/15/23 | EUR | 75,000 | | 85,357 | |
2 | Republic of Austria | | 0.000% | | 7/15/24 | EUR | 20,000 | | 22,820 | |
2 | Republic of Austria | | 0.500% | | 4/20/27 | EUR | 41,000 | | 48,481 | |
2 | Republic of Austria | | 0.500% | | 2/20/29 | EUR | 102,876 | | 121,900 | |
2 | Republic of Austria | | 0.750% | | 10/20/26 | EUR | 122,200 | | 146,848 | |
2 | Republic of Austria | | 0.750% | | 2/20/28 | EUR | 75,000 | | 90,615 | |
2 | Republic of Austria | | 1.200% | | 10/20/25 | EUR | 31,000 | | 37,963 | |
2 | Republic of Austria | | 1.500% | | 2/20/47 | EUR | 31,800 | | 45,244 | |
2 | Republic of Austria | | 1.500% | | 11/2/86 | EUR | 26,898 | | 41,008 | |
2 | Republic of Austria | | 1.650% | | 10/21/24 | EUR | 66,900 | | 82,565 | |
2 | Republic of Austria | | 1.750% | | 10/20/23 | EUR | 50,930 | | 62,036 | |
2 | Republic of Austria | | 2.100% | | 9/20/17 | EUR | 24,067 | | 46,493 | |
2 | Republic of Austria | | 2.400% | | 5/23/34 | EUR | 47,605 | | 70,687 | |
2 | Republic of Austria | | 3.150% | | 6/20/44 | EUR | 40,245 | | 74,751 | |
2 | Republic of Austria | | 3.400% | | 11/22/22 | EUR | 30,300 | | 37,946 | |
2 | Republic of Austria | | 3.500% | | 9/15/21 | EUR | 40,435 | | 48,570 | |
2 | Republic of Austria | | 3.650% | | 4/20/22 | EUR | 53,160 | | 65,546 | |
2 | Republic of Austria | | 3.800% | | 1/26/62 | EUR | 11,100 | | 27,214 | |
2 | Republic of Austria | | 4.150% | | 3/15/37 | EUR | 90,565 | | 169,864 | |
2 | Republic of Austria | | 4.850% | | 3/15/26 | EUR | 45,250 | | 67,522 | |
| Republic of Austria | | 6.250% | | 7/15/27 | EUR | 2,080 | | 3,505 | |
| | | | | | | | | 1,722,902 | |
Total Austria (Cost $1,847,302) | | | | | | | | 1,942,586 | |
14
Total International Bond Index Fund
| | | | | | | Face | | Market | |
| | | | | Maturity | | Amount | | Value· | |
| | | Coupon | | Date | Currency | (000 | ) | ($000 | ) |
Belgium (2.3%) | | | | | | | | | |
Asset-Backed/Commercial Mortgage-Backed Securities (0.1%) | | | | | |
| Belfius Bank SA/NV | | 0.125% | | 9/14/26 | EUR | 10,000 | | 11,343 | |
| Belfius Bank SA/NV | | 0.625% | | 10/14/21 | EUR | 29,700 | | 33,767 | |
| Belfius Bank SA/NV | | 0.750% | | 2/10/25 | EUR | 200 | | 235 | |
| Belfius Bank SA/NV | | 1.750% | | 6/24/24 | EUR | 600 | | 732 | |
| Belfius Bank SA/NV | | 2.125% | | 1/30/23 | EUR | 3,400 | | 4,095 | |
| KBC Bank NV | | 0.450% | | 1/22/22 | EUR | 5,000 | | 5,678 | |
| | | | | | | | | 55,850 | |
Corporate Bonds (0.3%) | | | | | | | | | |
| Anheuser-Busch InBev Finance Inc. | | 2.600% | | 5/15/24 | CAD | 6,000 | | 4,571 | |
| Anheuser-Busch InBev Finance Inc. | | 3.375% | | 1/25/23 | CAD | 10,000 | | 7,820 | |
| Anheuser-Busch InBev Finance Inc. | | 4.320% | | 5/15/47 | CAD | 3,000 | | 2,405 | |
| Anheuser-Busch InBev SA/NV | | 0.875% | | 3/17/22 | EUR | 21,200 | | 24,151 | |
| Anheuser-Busch InBev SA/NV | | 1.150% | | 1/22/27 | EUR | 10,000 | | 11,835 | |
| Anheuser-Busch InBev SA/NV | | 1.500% | | 3/17/25 | EUR | 6,320 | | 7,574 | |
| Anheuser-Busch InBev SA/NV | | 1.500% | | 4/18/30 | EUR | 900 | | 1,094 | |
| Anheuser-Busch InBev SA/NV | | 1.650% | | 3/28/31 | EUR | 20,700 | | 25,465 | |
| Anheuser-Busch InBev SA/NV | | 2.000% | | 3/17/28 | EUR | 13,900 | | 17,518 | |
| Anheuser-Busch InBev SA/NV | | 2.000% | | 1/23/35 | EUR | 12,000 | | 15,301 | |
| Anheuser-Busch InBev SA/NV | | 2.700% | | 3/31/26 | EUR | 200 | | 259 | |
| Anheuser-Busch InBev SA/NV | | 2.750% | | 3/17/36 | EUR | 21,250 | | 29,589 | |
| Anheuser-Busch InBev SA/NV | | 2.850% | | 5/25/37 | GBP | 10,000 | | 13,765 | |
| Anheuser-Busch InBev SA/NV | | 2.875% | | 9/25/24 | EUR | 4,500 | | 5,721 | |
| Anheuser-Busch InBev SA/NV | | 3.250% | | 1/24/33 | EUR | 5,100 | | 7,449 | |
| Anheuser-Busch InBev SA/NV | | 4.000% | | 6/2/21 | EUR | 5,100 | | 6,063 | |
| Anheuser-Busch InBev SA/NV | | 4.000% | | 9/24/25 | GBP | 11,200 | | 16,637 | |
| Anheuser-Busch InBev SA/NV | | 9.750% | | 7/30/24 | GBP | 1,900 | | 3,402 | |
| Argenta Spaarbank NV | | 1.000% | | 2/6/24 | EUR | 8,000 | | 9,224 | |
1 | Argenta Spaarbank NV | | 3.875% | | 5/24/26 | EUR | 24,500 | | 28,571 | |
| Belfius Bank SA/NV | | 0.000% | | 8/28/26 | EUR | 5,000 | | 5,466 | |
| Belfius Bank SA/NV | | 0.750% | | 9/12/22 | EUR | 4,900 | | 5,576 | |
| Belfius Bank SA/NV | | 1.000% | | 10/26/24 | EUR | 10,000 | | 11,552 | |
| Belfius Bank SA/NV | | 3.125% | | 5/11/26 | EUR | 1,800 | | 2,291 | |
| BNP Paribas Fortis SA | | 0.625% | | 10/4/25 | EUR | 500 | | 584 | |
| BNP Paribas Fortis SA | | 0.875% | | 3/22/28 | EUR | 10,000 | | 11,964 | |
| Brussels Airport Co. NV/SA | | 1.000% | | 5/3/24 | EUR | 16,300 | | 18,827 | |
| Elia System Operator SA/NV | | 1.375% | | 5/27/24 | EUR | 100 | | 118 | |
| Elia System Operator SA/NV | | 1.500% | | 9/5/28 | EUR | 2,500 | | 3,034 | |
1 | Elia System Operator SA/NV | | 2.750% | | 12/31/49 | EUR | 500 | | 586 | |
| Elia System Operator SA/NV | | 3.000% | | 4/7/29 | EUR | 400 | | 548 | |
| Elia System Operator SA/NV | | 3.250% | | 4/4/28 | EUR | 300 | | 413 | |
| Ethias SA | | 5.000% | | 1/14/26 | EUR | 8,800 | | 11,581 | |
| Euroclear Bank SA/NV | | 0.500% | | 7/10/23 | EUR | 12,500 | | 14,184 | |
| Euroclear Investments SA | | 1.125% | | 12/7/26 | EUR | 6,000 | | 7,094 | |
| FBG Finance Pty Ltd. | | 3.250% | | 9/6/22 | AUD | 12,550 | | 9,023 | |
| FBG Finance Pty Ltd. | | 3.750% | | 9/6/24 | AUD | 10,000 | | 7,508 | |
| FBG Finance Pty Ltd. | | 4.100% | | 9/6/27 | AUD | 2,420 | | 1,879 | |
| KBC Bank NV | | 0.375% | | 9/1/22 | EUR | 32,000 | | 36,426 | |
| KBC Bank NV | | 0.750% | | 10/24/27 | EUR | 7,300 | | 8,663 | |
| KBC Group NV | | 0.625% | | 4/10/25 | EUR | 5,000 | | 5,681 | |
| KBC Group NV | | 0.750% | | 10/18/23 | EUR | 4,200 | | 4,793 | |
| KBC Group NV | | 1.000% | | 4/26/21 | EUR | 200 | | 227 | |
| KBC Group NV | | 1.125% | | 1/25/24 | EUR | 11,500 | | 13,342 | |
15
Total International Bond Index Fund
| | | | | | | Face | | Market | |
| | | | | Maturity | | Amount | | Value· | |
| | | Coupon | | Date | Currency | (000 | ) | ($000 | ) |
| Solvay SA | | 1.625% | | 12/2/22 | EUR | 8,300 | | 9,666 | |
| Solvay SA | | 2.750% | | 12/2/27 | EUR | 700 | | 917 | |
| | | | | | | | | 430,357 | |
Sovereign Bonds (1.9%) | | | | | | | | | |
4 | Dexia Credit Local SA | | 0.200% | | 3/16/21 | EUR | 5,000 | | 5,621 | |
| Dexia Credit Local SA | | 0.500% | | 1/17/25 | EUR | 5,000 | | 5,774 | |
4 | Dexia Credit Local SA | | 0.625% | | 1/21/22 | EUR | 16,500 | | 18,791 | |
4 | Dexia Credit Local SA | | 0.625% | | 2/3/24 | EUR | 63,000 | | 72,855 | |
4 | Dexia Credit Local SA | | 0.750% | | 1/25/23 | EUR | 28,000 | | 32,307 | |
4 | Dexia Credit Local SA | | 0.875% | | 9/7/21 | GBP | 5,600 | | 7,248 | |
4 | Dexia Credit Local SA | | 1.000% | | 10/18/27 | EUR | 200 | | 241 | |
4 | Dexia Credit Local SA | | 1.250% | | 11/26/24 | EUR | 17,200 | | 20,576 | |
4 | Dexia Credit Local SA | | 2.125% | | 2/12/25 | GBP | 3,000 | | 4,097 | |
| Flemish Community | | 0.375% | | 10/13/26 | EUR | 5,000 | | 5,757 | |
| Flemish Community | | 1.000% | | 10/13/36 | EUR | 10,400 | | 12,608 | |
| Flemish Community | | 1.500% | | 7/12/38 | EUR | 3,000 | | 3,912 | |
| Flemish Community | | 1.500% | | 4/11/44 | EUR | 3,300 | | 4,294 | |
| Flemish Community | | 1.875% | | 6/2/42 | EUR | 3,500 | | 4,858 | |
| FLUVIUS System Operator CVBA | | 1.750% | | 12/4/26 | EUR | 6,000 | | 7,347 | |
| FLUVIUS System Operator CVBA | | 2.875% | | 10/9/23 | EUR | 3,000 | | 3,693 | |
| FLUVIUS System Operator CVBA | | 4.500% | | 11/8/21 | EUR | 1,500 | | 1,822 | |
2 | Kingdom of Belgium | | 0.200% | | 10/22/23 | EUR | 31,500 | | 36,159 | |
2 | Kingdom of Belgium | | 0.500% | | 10/22/24 | EUR | 52,000 | | 60,723 | |
2 | Kingdom of Belgium | | 0.800% | | 6/22/25 | EUR | 137,510 | | 163,786 | |
2 | Kingdom of Belgium | | 0.800% | | 6/22/27 | EUR | 128,800 | | 155,303 | |
2 | Kingdom of Belgium | | 0.800% | | 6/22/28 | EUR | 6,741 | | 8,162 | |
2 | Kingdom of Belgium | | 0.900% | | 6/22/29 | EUR | 127,231 | | 155,766 | |
2 | Kingdom of Belgium | | 1.000% | | 6/22/26 | EUR | 197,864 | | 240,319 | |
2 | Kingdom of Belgium | | 1.000% | | 6/22/31 | EUR | 107,200 | | 133,166 | |
| Kingdom of Belgium | | 1.250% | | 4/22/33 | EUR | 30,000 | | 38,588 | |
2 | Kingdom of Belgium | | 1.450% | | 6/22/37 | EUR | 17,220 | | 22,818 | |
2 | Kingdom of Belgium | | 1.600% | | 6/22/47 | EUR | 51,225 | | 71,179 | |
2 | Kingdom of Belgium | | 1.700% | | 6/22/50 | EUR | 47,723 | | 67,503 | |
2 | Kingdom of Belgium | | 1.900% | | 6/22/38 | EUR | 111,642 | | 158,486 | |
2 | Kingdom of Belgium | | 2.150% | | 6/22/66 | EUR | 48,500 | | 79,018 | |
| Kingdom of Belgium | | 2.250% | | 6/22/23 | EUR | 69,990 | | 86,172 | |
2 | Kingdom of Belgium | | 2.250% | | 6/22/57 | EUR | 10,600 | | 17,152 | |
2 | Kingdom of Belgium | | 2.600% | | 6/22/24 | EUR | 80,380 | | 102,605 | |
2 | Kingdom of Belgium | | 3.000% | | 6/22/34 | EUR | 101,770 | | 160,261 | |
2 | Kingdom of Belgium | | 3.750% | | 9/28/20 | EUR | 72,220 | | 83,725 | |
| Kingdom of Belgium | | 3.750% | | 6/22/45 | EUR | 56,445 | | 110,885 | |
| Kingdom of Belgium | | 4.000% | | 3/28/22 | EUR | 29,315 | | 36,365 | |
| Kingdom of Belgium | | 4.000% | | 3/28/32 | EUR | 40,320 | | 67,103 | |
2 | Kingdom of Belgium | | 4.250% | | 9/28/21 | EUR | 137,475 | | 167,699 | |
2 | Kingdom of Belgium | | 4.250% | | 9/28/22 | EUR | 82,650 | | 105,316 | |
2 | Kingdom of Belgium | | 4.250% | | 3/28/41 | EUR | 76,430 | | 150,545 | |
2 | Kingdom of Belgium | | 4.500% | | 3/28/26 | EUR | 7,400 | | 10,843 | |
2 | Kingdom of Belgium | | 5.000% | | 3/28/35 | EUR | 4,430 | | 8,520 | |
| Kingdom of Belgium | | 5.500% | | 3/28/28 | EUR | 1,005 | | 1,667 | |
| Proximus SADP | | 2.375% | | 4/4/24 | EUR | 3,100 | | 3,813 | |
| | | | | | | | | 2,715,448 | |
Total Belgium (Cost $3,026,235) | | | | | | | | 3,201,655 | |
16
Total International Bond Index Fund
| | | | | | | Face | | Market | |
| | | | | Maturity | | Amount | | Value· | |
| | | Coupon | | Date | Currency | (000 | ) | ($000 | ) |
Brazil (0.0%) | | | | | |
Corporate Bond (0.0%) | | | | | |
| Vale SA | | 3.750% | | 1/10/23 | EUR | 5,000 | | 6,047 | |
Total Brazil (Cost $5,551) | | | | | | | | 6,047 | |
Bulgaria (0.0%) | | | | | | | | | |
Sovereign Bonds (0.0%) | | | | | | | | | |
| Republic of Bulgaria | | 1.875% | | 3/21/23 | EUR | 6,000 | | 7,136 | |
| Republic of Bulgaria | | 2.000% | | 3/26/22 | EUR | 3,000 | | 3,521 | |
| Republic of Bulgaria | | 2.625% | | 3/26/27 | EUR | 3,000 | | 3,988 | |
| Republic of Bulgaria | | 2.950% | | 9/3/24 | EUR | 800 | | 1,022 | |
| Republic of Bulgaria | | 3.000% | | 3/21/28 | EUR | 25,000 | | 34,675 | |
| Republic of Bulgaria | | 3.125% | | 3/26/35 | EUR | 5,000 | | 7,340 | |
Total Bulgaria (Cost $48,073) | | | | | | | | 57,682 | |
Canada (5.9%) | | | | | | | | | |
Asset-Backed/Commercial Mortgage-Backed Securities (0.1%) | | | | |
| Bank of Montreal | | 0.100% | | 10/20/23 | EUR | 10,000 | | 11,305 | |
| Bank of Montreal | | 0.125% | | 4/19/21 | EUR | 200 | | 225 | |
| Bank of Nova Scotia | | 0.125% | | 1/13/22 | EUR | 1,100 | | 1,239 | |
| Bank of Nova Scotia | | 0.250% | | 1/11/24 | EUR | 10,000 | | 11,383 | |
| Bank of Nova Scotia | | 0.750% | | 9/14/21 | GBP | 1,500 | | 1,933 | |
| Bank of Nova Scotia | | 0.750% | | 9/17/21 | EUR | 10,900 | | 12,408 | |
| Canadian Imperial Bank of Commerce | | 0.000% | | 7/25/22 | EUR | 15,000 | | 16,865 | |
| National Bank of Canada | | 0.000% | | 9/29/23 | EUR | 4,600 | | 5,182 | |
| National Bank of Canada | | 0.375% | | 1/15/24 | EUR | 5,000 | | 5,720 | |
| National Bank of Canada | | 0.500% | | 1/26/22 | EUR | 18,900 | | 21,468 | |
| National Bank of Canada | | 1.500% | | 3/25/21 | EUR | 5,000 | | 5,720 | |
| Royal Bank of Canada | | 0.125% | | 3/11/21 | EUR | 4,000 | | 4,490 | |
| Royal Bank of Canada | | 0.875% | | 6/17/22 | EUR | 7,000 | | 8,053 | |
| Toronto-Dominion Bank | | 0.250% | | 4/27/22 | EUR | 5,000 | | 5,657 | |
| Toronto-Dominion Bank | | 0.375% | | 1/12/21 | EUR | 10,000 | | 11,248 | |
| Toronto-Dominion Bank | | 0.375% | | 4/27/23 | EUR | 21,000 | | 23,942 | |
| Toronto-Dominion Bank | | 0.625% | | 6/6/25 | EUR | 14,000 | | 16,305 | |
| Toronto-Dominion Bank | | 0.750% | | 10/29/21 | EUR | 6,000 | | 6,838 | |
| | | | | | | | | 169,981 | |
Corporate Bonds (1.4%) | | | | | | | | | |
| 407 International Inc. | | 2.430% | | 5/4/27 | CAD | 2,000 | | 1,538 | |
| 407 International Inc. | | 3.600% | | 5/21/47 | CAD | 6,875 | | 5,757 | |
| 407 International Inc. | | 3.830% | | 5/11/46 | CAD | 10,000 | | 8,666 | |
| 407 International Inc. | | 4.190% | | 4/25/42 | CAD | 5,500 | | 4,948 | |
| 407 International Inc. | | 4.300% | | 5/26/21 | CAD | 1,490 | | 1,165 | |
| 407 International Inc. | | 4.450% | | 11/15/41 | CAD | 5,000 | | 4,644 | |
| 407 International Inc. | | 5.750% | | 2/14/36 | CAD | 1,995 | | 2,028 | |
| 55 Ontario School Board Trust | | 5.900% | | 6/2/33 | CAD | 4,335 | | 4,548 | |
| Aeroports de Montreal | | 5.170% | | 9/17/35 | CAD | 3,625 | | 3,601 | |
| Aeroports de Montreal | | 5.670% | | 10/16/37 | CAD | 2,000 | | 2,128 | |
| AIMCo Realty Investors LP | | 2.266% | | 6/26/24 | CAD | 5,000 | | 3,806 | |
| AIMCo Realty Investors LP | | 2.712% | | 6/1/29 | CAD | 2,000 | | 1,546 | |
| AIMCo Realty Investors LP | | 3.367% | | 6/1/27 | CAD | 1,885 | | 1,527 | |
| Alberta Powerline LP | | 4.065% | | 12/1/53 | CAD | 5,000 | | 4,344 | |
| Alberta Powerline LP | | 4.065% | | 3/1/54 | CAD | 488 | | 424 | |
| Alectra Inc. | | 2.488% | | 5/17/27 | CAD | 11,000 | | 8,479 | |
| Alectra Inc. | | 3.458% | | 4/12/49 | CAD | 2,000 | | 1,647 | |
17
Total International Bond Index Fund
| | | | | | | Face | | Market | |
| | | | | Maturity | | Amount | | Value· | |
| | | Coupon | | Date | Currency | (000 | ) | ($000 | ) |
2 | Algonquin Power Co. | | 4.090% | | 2/17/27 | CAD | 800 | | 646 | |
| Algonquin Power Co. | | 4.600% | | 1/29/29 | CAD | 2,266 | | 1,885 | |
| Alimentation Couche-Tard Inc. | | 1.875% | | 5/6/26 | EUR | 100 | | 121 | |
| Alimentation Couche-Tard Inc. | | 3.056% | | 7/26/24 | CAD | 9,990 | | 7,710 | |
| Alimentation Couche-Tard Inc. | | 3.600% | | 6/2/25 | CAD | 3,900 | | 3,075 | |
| Alliance Pipeline LP | | 6.765% | | 12/31/25 | CAD | 35 | | 30 | |
| Allied Properties REIT | | 3.636% | | 4/21/25 | CAD | 10,000 | | 7,872 | |
| AltaGas Canada Inc. | | 4.260% | | 12/5/28 | CAD | 1,497 | | 1,260 | |
| AltaGas Ltd. | | 3.840% | | 1/15/25 | CAD | 11,165 | | 8,831 | |
| AltaGas Ltd. | | 4.500% | | 8/15/44 | CAD | 1,757 | | 1,361 | |
| AltaGas Ltd. | | 4.990% | | 10/4/47 | CAD | 770 | | 643 | |
| AltaLink LP | | 3.399% | | 6/6/24 | CAD | 10,000 | | 8,001 | |
| AltaLink LP | | 3.668% | | 11/6/23 | CAD | 200 | | 161 | |
| AltaLink LP | | 3.717% | | 12/3/46 | CAD | 4,000 | | 3,462 | |
| AltaLink LP | | 3.990% | | 6/30/42 | CAD | 2,925 | | 2,599 | |
| AltaLink LP | | 4.872% | | 11/15/40 | CAD | 5,000 | | 4,930 | |
| AltaLink LP | | 4.922% | | 9/17/43 | CAD | 3,000 | | 3,041 | |
1 | Atco Ltd. | | 5.500% | | 11/1/78 | CAD | 1,021 | | 843 | |
| Bank of Montreal | | 0.050% | | 12/30/22 | CHF | 7,000 | | 7,181 | |
| Bank of Montreal | | 0.200% | | 1/26/23 | EUR | 7,600 | | 8,605 | |
| Bank of Montreal | | 1.610% | | 10/28/21 | CAD | 10,000 | | 7,528 | |
| Bank of Montreal | | 1.625% | | 6/21/22 | GBP | 1,100 | | 1,450 | |
| Bank of Montreal | | 2.120% | | 3/16/22 | CAD | 15,300 | | 11,625 | |
| Bank of Montreal | | 2.270% | | 7/11/22 | CAD | 22,000 | | 16,775 | |
| Bank of Montreal | | 2.280% | | 7/29/24 | CAD | 11,900 | | 8,984 | |
1 | Bank of Montreal | | 2.570% | | 6/1/27 | CAD | 5,000 | | 3,811 | |
| Bank of Montreal | | 2.700% | | 9/11/24 | CAD | 14,036 | | 10,913 | |
| Bank of Montreal | | 2.700% | | 12/9/26 | CAD | 10,000 | | 7,816 | |
| Bank of Montreal | | 2.850% | | 3/6/24 | CAD | 7,000 | | 5,418 | |
| Bank of Montreal | | 2.890% | | 6/20/23 | CAD | 12,000 | | 9,348 | |
| Bank of Montreal | | 3.190% | | 3/1/28 | CAD | 10,000 | | 8,104 | |
| Bank of Montreal | | 3.200% | | 9/7/23 | AUD | 800 | | 583 | |
| Bank of Montreal | | 3.250% | | 10/6/22 | AUD | 1,900 | | 1,373 | |
1 | Bank of Montreal | | 3.320% | | 6/1/26 | CAD | 10,500 | | 8,101 | |
1 | Bank of Montreal | | 3.340% | | 12/8/25 | CAD | 10,750 | | 8,259 | |
| Bank of Montreal | | 3.400% | | 4/23/21 | CAD | 3,000 | | 2,324 | |
| Bank of Montreal | | 4.609% | | 9/10/25 | CAD | 5,000 | | 4,293 | |
| Bank of Nova Scotia | | 1.250% | | 6/8/22 | GBP | 500 | | 652 | |
| Bank of Nova Scotia | | 1.900% | | 12/2/21 | CAD | 10,000 | | 7,567 | |
| Bank of Nova Scotia | | 2.360% | | 11/8/22 | CAD | 35,000 | | 26,758 | |
1 | Bank of Nova Scotia | | 2.580% | | 3/30/27 | CAD | 4,550 | | 3,469 | |
| Bank of Nova Scotia | | 2.620% | | 12/2/26 | CAD | 15,000 | | 11,667 | |
| Bank of Nova Scotia | | 2.873% | | 6/4/21 | CAD | 3,150 | | 2,423 | |
| Bank of Nova Scotia | | 2.980% | | 4/17/23 | CAD | 9,965 | | 7,775 | |
| Bank of Nova Scotia | | 3.100% | | 2/2/28 | CAD | 25,000 | | 20,146 | |
| Bank of Nova Scotia | | 3.270% | | 1/11/21 | CAD | 5,000 | | 3,851 | |
1 | Bank of Nova Scotia | | 3.367% | | 12/8/25 | CAD | 7,000 | | 5,379 | |
1 | Bank of Nova Scotia | | 3.890% | | 1/18/29 | CAD | 4,855 | | 3,848 | |
| Bankers Hall LP | | 4.377% | | 11/20/23 | CAD | 91 | | 71 | |
| bcIMC Realty Corp. | | 2.840% | | 6/3/25 | CAD | 7,001 | | 5,476 | |
| Bell Canada Inc. | | 2.900% | | 8/12/26 | CAD | 3,000 | | 2,295 | |
| Bell Canada Inc. | | 3.000% | | 10/3/22 | CAD | 5,200 | | 4,027 | |
| Bell Canada Inc. | | 3.150% | | 9/29/21 | CAD | 20,000 | | 15,448 | |
| Bell Canada Inc. | | 3.350% | | 3/22/23 | CAD | 15,000 | | 11,722 | |
18
Total International Bond Index Fund
| | | | | | | Face | | Market | |
| | | | | Maturity | | Amount | | Value· | |
| | | Coupon | | Date | Currency | (000 | ) | ($000 | ) |
| Bell Canada Inc. | | 3.350% | | 3/12/25 | CAD | 2,200 | | 1,728 | |
| Bell Canada Inc. | | 3.550% | | 3/2/26 | CAD | 3,000 | | 2,379 | |
| Bell Canada Inc. | | 3.800% | | 8/21/28 | CAD | 3,000 | | 2,421 | |
| Bell Canada Inc. | | 4.350% | | 12/18/45 | CAD | 9,150 | | 7,484 | |
| Bell Canada Inc. | | 4.450% | | 2/27/47 | CAD | 8,098 | | 6,742 | |
| Bell Canada Inc. | | 4.750% | | 9/29/44 | CAD | 3,500 | | 3,024 | |
| Bell Canada Inc. | | 7.850% | | 4/2/31 | CAD | 5,000 | | 5,356 | |
| Bow Centre Street LP | | 3.797% | | 6/13/23 | CAD | 1,564 | | 1,196 | |
| Bridging North America GP | | 4.341% | | 8/31/53 | CAD | 2,178 | | 1,890 | |
| British Columbia Ferry Services Inc. | | 4.702% | | 10/23/43 | CAD | 12,495 | | 12,380 | |
| Brookfield Asset Management Inc. | | 3.800% | | 3/16/27 | CAD | 4,235 | | 3,366 | |
| Brookfield Asset Management Inc. | | 4.540% | | 3/31/23 | CAD | 11,875 | | 9,608 | |
| Brookfield Asset Management Inc. | | 4.820% | | 1/28/26 | CAD | 21,000 | | 17,563 | |
| Brookfield Asset Management Inc. | | 5.040% | | 3/8/24 | CAD | 1,500 | | 1,242 | |
| Brookfield Infrastructure Finance ULC | | 3.315% | | 2/22/24 | CAD | 5,000 | | 3,871 | |
| Brookfield Infrastructure Finance ULC | | 4.193% | | 9/11/28 | CAD | 4,248 | | 3,403 | |
| Brookfield Renewable Partners ULC | | 3.380% | | 1/15/30 | CAD | 5,500 | | 4,185 | |
| Brookfield Renewable Partners ULC | | 3.752% | | 6/2/25 | CAD | 5,301 | | 4,219 | |
| Brookfield Renewable Partners ULC | | 4.290% | | 11/5/49 | CAD | 1,200 | | 918 | |
| Bruce Power LP | | 2.844% | | 6/23/21 | CAD | 3,300 | | 2,528 | |
| Bruce Power LP | | 3.000% | | 6/21/24 | CAD | 2,000 | | 1,547 | |
| Bruce Power LP | | 3.969% | | 6/23/26 | CAD | 5,000 | | 4,038 | |
| Bruce Power LP | | 4.132% | | 6/21/33 | CAD | 2,200 | | 1,780 | |
| Bruce Power LP | | 4.746% | | 6/21/49 | CAD | 3,200 | | 2,701 | |
| Cameco Corp. | | 4.190% | | 6/24/24 | CAD | 3,500 | | 2,751 | |
| Canadian Imperial Bank of Commerce | | 0.250% | | 1/24/23 | EUR | 14,500 | | 16,441 | |
| Canadian Imperial Bank of Commerce | | 0.375% | | 5/3/24 | EUR | 19,000 | | 21,245 | |
| Canadian Imperial Bank of Commerce | | 0.750% | | 3/22/23 | EUR | 10,000 | | 11,448 | |
| Canadian Imperial Bank of Commerce | | 1.640% | | 7/12/21 | CAD | 225 | | 170 | |
| Canadian Imperial Bank of Commerce | | 1.900% | | 4/26/21 | CAD | 14,000 | | 10,612 | |
| Canadian Imperial Bank of Commerce | | 2.040% | | 3/21/22 | CAD | 10,000 | | 7,583 | |
| Canadian Imperial Bank of Commerce | | 2.300% | | 7/11/22 | CAD | 15,000 | | 11,441 | |
| Canadian Imperial Bank of Commerce | | 2.350% | | 8/28/24 | CAD | 8,500 | | 6,504 | |
| Canadian Imperial Bank of Commerce | | 2.970% | | 7/11/23 | CAD | 9,940 | | 7,763 | |
| Canadian Imperial Bank of Commerce | | 3.290% | | 1/15/24 | CAD | 6,500 | | 5,114 | |
| Canadian Imperial Bank of Commerce | | 3.300% | | 5/26/25 | CAD | 15,000 | | 12,036 | |
1 | Canadian Imperial Bank of Commerce | | 3.420% | | 1/26/26 | CAD | 20,000 | | 15,392 | |
1 | Canadian Imperial Bank of Commerce | | 3.450% | | 4/4/28 | CAD | 8,000 | | 6,230 | |
| Canadian National Railway Co. | | 2.800% | | 9/22/25 | CAD | 4,995 | | 3,924 | |
| Canadian National Railway Co. | | 3.200% | | 7/31/28 | CAD | 2,750 | | 2,215 | |
| Canadian National Railway Co. | | 3.600% | | 8/1/47 | CAD | 9,990 | | 8,343 | |
| Canadian National Railway Co. | | 3.600% | | 2/8/49 | CAD | 180 | | 151 | |
| Canadian Natural Resources Ltd. | | 3.310% | | 2/11/22 | CAD | 20,000 | | 15,479 | |
| Canadian Natural Resources Ltd. | | 3.550% | | 6/3/24 | CAD | 10,000 | | 7,851 | |
| Canadian Natural Resources Ltd. | | 4.850% | | 5/30/47 | CAD | 735 | | 646 | |
| Canadian Pacific Railway Co. | | 3.150% | | 3/13/29 | CAD | 3,134 | | 2,463 | |
| Canadian Pacific Railway Co. | | 6.450% | | 11/17/39 | CAD | 1,750 | | 1,935 | |
| Canadian Tire Corp. Ltd. | | 3.167% | | 7/6/23 | CAD | 8,090 | | 6,294 | |
| Canadian Tire Corp. Ltd. | | 5.610% | | 9/4/35 | CAD | 2,000 | | 1,862 | |
| Canadian Western Bank | | 2.597% | | 9/6/24 | CAD | 4,000 | | 3,018 | |
| Canadian Western Bank | | 2.788% | | 9/13/21 | CAD | 4,700 | | 3,598 | |
| Canadian Western Bank | | 2.924% | | 12/15/22 | CAD | 4,700 | | 3,613 | |
| Capital City Link General Partnership | | 4.386% | | 3/31/46 | CAD | 833 | | 725 | |
1 | Capital Desjardins Inc. | | 4.954% | | 12/15/26 | CAD | 3,000 | | 2,402 | |
19
Total International Bond Index Fund
| | | | | | | Face | | Market | |
| | | | | Maturity | | Amount | | Value· | |
| | | Coupon | | Date | Currency | (000 | ) | ($000 | ) |
| Capital Power Corp. | | 4.986% | | 1/23/26 | CAD | 3,000 | | 2,440 | |
| Capital Power Corp. | | 5.276% | | 11/16/20 | CAD | 4,650 | | 3,634 | |
| CCL Industries Inc. | | 3.864% | | 4/13/28 | CAD | 1,620 | | 1,303 | |
| Chartwell Retirement Residences | | 4.211% | | 4/28/25 | CAD | 1,000 | | 801 | |
| Choice Properties REIT | | 3.532% | | 6/11/29 | CAD | 7,100 | | 5,501 | |
| Choice Properties REIT | | 3.546% | | 1/10/25 | CAD | 8,000 | | 6,280 | |
| Choice Properties REIT | | 3.556% | | 9/9/24 | CAD | 2,032 | | 1,596 | |
| CI Financial Corp. | | 2.645% | | 12/7/20 | CAD | 5,200 | | 3,958 | |
| CI Financial Corp. | | 2.775% | | 11/25/21 | CAD | 10,000 | | 7,626 | |
1 | CIBC Capital Trust | | 10.250% | | 6/30/08 | CAD | 280 | | 255 | |
| Clover LP | | 4.216% | | 6/30/34 | CAD | 1,899 | | 1,525 | |
| Cogeco Communications Inc. | | 4.175% | | 5/26/23 | CAD | 250 | | 198 | |
| Concordia University | | 6.550% | | 9/2/42 | CAD | 3,000 | | 3,616 | |
| Crosslinx Transit Solutions GP | | 4.651% | | 9/30/46 | CAD | 3,133 | | 2,621 | |
| CSS FSCC Partnership | | 6.915% | | 7/31/42 | CAD | 28 | | 29 | |
| CT REIT | | 3.469% | | 6/16/27 | CAD | 1,332 | | 1,040 | |
| CU Inc. | | 2.963% | | 9/7/49 | CAD | 4,500 | | 3,350 | |
| CU Inc. | | 3.805% | | 9/10/42 | CAD | 450 | | 383 | |
| CU Inc. | | 3.950% | | 11/23/48 | CAD | 970 | | 860 | |
| CU Inc. | | 3.964% | | 7/27/45 | CAD | 3,000 | | 2,636 | |
| CU Inc. | | 4.085% | | 9/2/44 | CAD | 5,400 | | 4,814 | |
| CU Inc. | | 4.211% | | 10/29/55 | CAD | 15,000 | | 14,060 | |
| CU Inc. | | 4.543% | | 10/24/41 | CAD | 2,000 | | 1,875 | |
| CU Inc. | | 4.593% | | 10/24/61 | CAD | 125 | | 127 | |
| CU Inc. | | 4.722% | | 9/9/43 | CAD | 3,000 | | 2,905 | |
| CU Inc. | | 4.801% | | 11/22/21 | CAD | 5,500 | | 4,404 | |
| Dollarama Inc. | | 3.550% | | 11/6/23 | CAD | 4,470 | | 3,504 | |
| Edmonton Regional Airports Authority | | 7.214% | | 11/1/30 | CAD | 963 | | 917 | |
| Emera Inc. | | 2.900% | | 6/16/23 | CAD | 28,000 | | 21,579 | |
1 | Empire Life Insurance Co. | | 3.383% | | 12/16/26 | CAD | 1,000 | | 772 | |
1 | Empire Life Insurance Co. | | 3.664% | | 3/15/28 | CAD | 1,000 | | 783 | |
| Enbridge Gas Distribution Inc. | | 2.500% | | 8/5/26 | CAD | 2,000 | | 1,537 | |
| Enbridge Gas Distribution Inc. | | 3.150% | | 8/22/24 | CAD | 6,480 | | 5,134 | |
| Enbridge Gas Distribution Inc. | | 3.310% | | 9/11/25 | CAD | 3,240 | | 2,603 | |
| Enbridge Gas Distribution Inc. | | 4.000% | | 8/22/44 | CAD | 2,000 | | 1,759 | |
| Enbridge Gas Distribution Inc. | | 4.040% | | 11/23/20 | CAD | 350 | | 271 | |
| Enbridge Gas Distribution Inc. | | 4.950% | | 11/22/50 | CAD | 1,000 | | 1,041 | |
| Enbridge Gas Inc. | | 3.010% | | 8/9/49 | CAD | 3,000 | | 2,253 | |
| Enbridge Gas Inc. | | 3.510% | | 11/29/47 | CAD | 4,696 | | 3,856 | |
| Enbridge Inc. | | 3.160% | | 3/11/21 | CAD | 1,839 | | 1,412 | |
| Enbridge Inc. | | 3.190% | | 12/5/22 | CAD | 15,070 | | 11,700 | |
| Enbridge Inc. | | 3.200% | | 6/8/27 | CAD | 2,400 | | 1,862 | |
| Enbridge Inc. | | 3.950% | | 11/19/24 | CAD | 3,000 | | 2,411 | |
| Enbridge Inc. | | 4.240% | | 8/27/42 | CAD | 3,360 | | 2,632 | |
| Enbridge Inc. | | 4.570% | | 3/11/44 | CAD | 4,600 | | 3,783 | |
| Enbridge Inc. | | 4.870% | | 11/21/44 | CAD | 4,200 | | 3,596 | |
| Enbridge Pipelines Inc. | | 3.450% | | 9/29/25 | CAD | 5,240 | | 4,182 | |
| Enbridge Pipelines Inc. | | 3.790% | | 8/17/23 | CAD | 4,800 | | 3,829 | |
| Enbridge Pipelines Inc. | | 4.130% | | 8/9/46 | CAD | 5,000 | | 4,069 | |
| Enbridge Pipelines Inc. | | 4.330% | | 2/22/49 | CAD | 1,500 | | 1,264 | |
| Enbridge Pipelines Inc. | | 4.550% | | 8/17/43 | CAD | 1,000 | | 859 | |
| Enbridge Pipelines Inc. | | 4.550% | | 9/29/45 | CAD | 5,600 | | 4,843 | |
| EPCOR Utilities Inc. | | 3.554% | | 11/27/47 | CAD | 7,000 | | 5,784 | |
| EPCOR Utilities Inc. | | 4.550% | | 2/28/42 | CAD | 2,985 | | 2,804 | |
20
Total International Bond Index Fund
| | | | | | | Face | | Market | |
| | | | | Maturity | | Amount | | Value· | |
| | | Coupon | | Date | Currency | (000 | ) | ($000 | ) |
| Fairfax Financial Holdings Ltd. | | 4.230% | | 6/14/29 | CAD | 750 | | 581 | |
| Fairfax Financial Holdings Ltd. | | 4.250% | | 12/6/27 | CAD | 2,465 | | 1,932 | |
| Fairfax Financial Holdings Ltd. | | 4.500% | | 3/22/23 | CAD | 2,500 | | 2,011 | |
| Fairfax Financial Holdings Ltd. | | 4.700% | | 12/16/26 | CAD | 5,000 | | 4,051 | |
| Fairfax Financial Holdings Ltd. | | 4.950% | | 3/3/25 | CAD | 4,060 | | 3,352 | |
| Fairfax Financial Holdings Ltd. | | 5.840% | | 10/14/22 | CAD | 2,800 | | 2,321 | |
| Federated Co-Operatives Ltd. | | 3.917% | | 6/17/25 | CAD | 594 | | 469 | |
| Federation des Caisses Desjardins du Quebec | | 2.091% | | 1/17/22 | CAD | 2,590 | | 1,967 | |
| Federation des Caisses Desjardins du Quebec | | 3.056% | | 9/11/23 | CAD | 5,000 | | 3,920 | |
| First Capital Realty Inc. | | 4.323% | | 7/31/25 | CAD | 10,000 | | 8,033 | |
| First Capital Realty Inc. | | 4.790% | | 8/30/24 | CAD | 4,985 | | 4,079 | |
| Fortis Inc. | | 2.850% | | 12/12/23 | CAD | 2,500 | | 1,936 | |
| FortisAlberta Inc. | | 3.672% | | 9/9/47 | CAD | 4,188 | | 3,529 | |
| FortisBC Energy Inc. | | 6.050% | | 2/15/38 | CAD | 10,000 | | 10,860 | |
| FortisBC Energy Inc. | | 6.500% | | 5/1/34 | CAD | 10,000 | | 10,837 | |
| FortisBC Inc. | | 4.000% | | 10/28/44 | CAD | 2,100 | | 1,837 | |
| Genworth MI Canada Inc. | | 4.242% | | 4/1/24 | CAD | 1,024 | | 820 | |
| Gibson Energy Inc. | | 3.600% | | 9/17/29 | CAD | 2,800 | | 2,142 | |
| Great-West Lifeco Inc. | | 1.750% | | 12/7/26 | EUR | 500 | | 610 | |
| Great-West Lifeco Inc. | | 5.998% | | 11/16/39 | CAD | 11,000 | | 11,849 | |
| Great-West Lifeco Inc. | | 6.670% | | 3/21/33 | CAD | 1,990 | | 2,125 | |
| Greater Toronto Airports Authority | | 2.730% | | 4/3/29 | CAD | 4,300 | | 3,375 | |
| Greater Toronto Airports Authority | | 2.750% | | 10/17/39 | CAD | 7,300 | | 5,523 | |
2 | Greater Toronto Airports Authority | | 4.530% | | 12/2/41 | CAD | 5,000 | | 4,867 | |
| Greater Toronto Airports Authority | | 5.300% | | 2/25/41 | CAD | 3,100 | | 3,287 | |
| H&R REIT | | 3.369% | | 1/30/24 | CAD | 1,513 | | 1,169 | |
| H&R REIT | | 3.416% | | 1/23/23 | CAD | 5,307 | | 4,108 | |
| Halifax International Airport Authority | | 5.503% | | 7/19/41 | CAD | 204 | | 217 | |
| Honda Canada Finance Inc. | | 1.823% | | 12/7/21 | CAD | 16,173 | | 12,184 | |
| Honda Canada Finance Inc. | | 3.444% | | 5/23/25 | CAD | 4,300 | | 3,416 | |
| Hospital for Sick Children | | 3.416% | | 12/7/57 | CAD | 2,727 | | 2,331 | |
| Hospital Infrastructure Partners NOH Partnership | | 5.439% | | 1/31/45 | CAD | 5,433 | | 5,108 | |
| HSBC Bank Canada | | 2.170% | | 6/29/22 | CAD | 10,500 | | 7,948 | |
| HSBC Bank Canada | | 2.449% | | 1/29/21 | CAD | 130 | | 99 | |
| HSBC Bank Canada | | 2.542% | | 1/31/23 | CAD | 9,980 | | 7,625 | |
| HSBC Bank Canada | | 2.908% | | 9/29/21 | CAD | 3,000 | | 2,308 | |
| HSBC Bank Canada | | 3.245% | | 9/15/23 | CAD | 10,000 | | 7,832 | |
| Husky Energy Inc. | | 3.550% | | 3/12/25 | CAD | 800 | | 625 | |
| Husky Energy Inc. | | 3.600% | | 3/10/27 | CAD | 6,127 | | 4,780 | |
| Hydro One Inc. | | 1.840% | | 2/24/21 | CAD | 6,360 | | 4,815 | |
| Hydro One Inc. | | 2.570% | | 6/25/21 | CAD | 2,045 | | 1,566 | |
| Hydro One Inc. | | 2.770% | | 2/24/26 | CAD | 9,800 | | 7,664 | |
| Hydro One Inc. | | 2.970% | | 6/26/25 | CAD | 245 | | 193 | |
| Hydro One Inc. | | 3.020% | | 4/5/29 | CAD | 3,800 | | 3,006 | |
| Hydro One Inc. | | 3.200% | | 1/13/22 | CAD | 330 | | 256 | |
| Hydro One Inc. | | 3.630% | | 6/25/49 | CAD | 10,385 | | 8,593 | |
| Hydro One Inc. | | 3.720% | | 11/18/47 | CAD | 1,441 | | 1,207 | |
| Hydro One Inc. | | 3.790% | | 7/31/62 | CAD | 2,000 | | 1,714 | |
| Hydro One Inc. | | 3.910% | | 2/23/46 | CAD | 3,200 | | 2,751 | |
| Hydro One Inc. | | 4.390% | | 9/26/41 | CAD | 5,115 | | 4,638 | |
| Hydro One Inc. | | 4.590% | | 10/9/43 | CAD | 5,500 | | 5,162 | |
21
Total International Bond Index Fund
| | | | | | | Face | | Market | |
| | | | | Maturity | | Amount | | Value· | |
| | | Coupon | | Date | Currency | (000 | ) | ($000 | ) |
| Hydro One Inc. | | 4.890% | | 3/13/37 | CAD | 5,000 | | 4,721 | |
| Hydro One Inc. | | 5.360% | | 5/20/36 | CAD | 1,000 | | 988 | |
| Hydro One Inc. | | 5.490% | | 7/16/40 | CAD | 3,525 | | 3,623 | |
| Hydro One Inc. | | 6.930% | | 6/1/32 | CAD | 1,000 | | 1,073 | |
| Hydro One Inc. | | 7.350% | | 6/3/30 | CAD | 2,000 | | 2,159 | |
| IGM Financial Inc. | | 4.115% | | 12/9/47 | CAD | 6,085 | | 4,915 | |
| IGM Financial Inc. | | 4.206% | | 3/21/50 | CAD | 1,400 | | 1,152 | |
| IGM Financial Inc. | | 4.560% | | 1/25/47 | CAD | 900 | | 777 | |
1 | Industrial Alliance Insurance & Financial Services Inc. | | 3.300% | | 9/15/28 | CAD | 5,000 | | 3,912 | |
| InPower BC General Partnership | | 4.471% | | 3/31/33 | CAD | 4,689 | | 3,885 | |
| Intact Financial Corp. | | 2.850% | | 6/7/27 | CAD | 375 | | 288 | |
| Intact Financial Corp. | | 3.770% | | 3/2/26 | CAD | 2,376 | | 1,924 | |
| Intact Financial Corp. | | 5.160% | | 6/16/42 | CAD | 2,980 | | 2,901 | |
| Integrated Team Solutions SJHC Partnership | | 5.946% | | 11/30/42 | CAD | 108 | | 109 | |
| Inter Pipeline Ltd. | | 2.608% | | 9/13/23 | CAD | 5,000 | | 3,797 | |
| Inter Pipeline Ltd. | | 2.734% | | 4/18/24 | CAD | 5,000 | | 3,797 | |
| Inter Pipeline Ltd. | | 3.173% | | 3/24/25 | CAD | 4,950 | | 3,817 | |
| Inter Pipeline Ltd. | | 3.776% | | 5/30/22 | CAD | 2,300 | | 1,803 | |
| Inter Pipeline Ltd. | | 4.637% | | 5/30/44 | CAD | 2,535 | | 2,095 | |
| Ivanhoe Cambridge II Inc. | | 2.909% | | 6/27/23 | CAD | 2,546 | | 1,984 | |
| John Deere Canada Funding Inc. | | 2.700% | | 1/17/23 | CAD | 1,611 | | 1,239 | |
| Keyera Corp. | | 3.934% | | 6/21/28 | CAD | 10,000 | | 7,993 | |
| Kingston Solar LP | | 3.571% | | 7/31/35 | CAD | 25 | | 20 | |
| Laurentian Bank of Canada | | 3.450% | | 6/27/23 | CAD | 5,000 | | 3,901 | |
| Loblaw Cos. Ltd. | | 4.488% | | 12/11/28 | CAD | 8,500 | | 7,200 | |
| Loblaw Cos. Ltd. | | 4.860% | | 9/12/23 | CAD | 7,000 | | 5,746 | |
| Loblaw Cos. Ltd. | | 5.900% | | 1/18/36 | CAD | 1,300 | | 1,256 | |
1 | Manufacturers Life Insurance Co. | | 3.181% | | 11/22/27 | CAD | 5,000 | | 3,894 | |
| Manulife Bank of Canada | | 2.844% | | 1/12/23 | CAD | 6,175 | | 4,778 | |
1 | Manulife Finance Delaware LP | | 5.059% | | 12/15/41 | CAD | 3,700 | | 3,384 | |
1 | Manulife Financial Corp. | | 3.049% | | 8/20/29 | CAD | 5,000 | | 3,882 | |
| McGill University | | 3.975% | | 1/29/56 | CAD | 151 | | 143 | |
| McGill University | | 6.150% | | 9/22/42 | CAD | 60 | | 70 | |
| Metro Inc. | | 3.390% | | 12/6/27 | CAD | 15,000 | | 11,806 | |
| Metro Inc. | | 4.270% | | 12/4/47 | CAD | 2,000 | | 1,650 | |
| Metro Inc. | | 5.970% | | 10/15/35 | CAD | 5,048 | | 4,893 | |
| Morguard Corp. | | 4.715% | | 1/25/24 | CAD | 2,781 | | 2,182 | |
| Mountain View Partners GP | | 3.974% | | 3/31/51 | CAD | 115 | | 96 | |
| National Bank of Canada | | 0.250% | | 7/24/23 | EUR | 2,000 | | 2,273 | |
| National Bank of Canada | | 0.750% | | 3/13/25 | EUR | 9,000 | | 10,538 | |
| National Bank of Canada | | 1.809% | | 7/26/21 | CAD | 5,000 | | 3,782 | |
| National Bank of Canada | | 1.957% | | 6/30/22 | CAD | 12,500 | | 9,453 | |
1 | National Bank of Canada | | 3.183% | | 2/1/28 | CAD | 9,945 | | 7,643 | |
| Nissan Canada Financial Services Inc. | | 2.606% | | 3/5/21 | CAD | 9,990 | | 7,602 | |
| North West Redwater Partnership / NWR Financing Co. Ltd. | | 2.800% | | 6/1/27 | CAD | 10,000 | | 7,671 | |
| North West Redwater Partnership / NWR Financing Co. Ltd. | | 3.200% | | 7/22/24 | CAD | 4,000 | | 3,149 | |
| North West Redwater Partnership / NWR Financing Co. Ltd. | | 3.700% | | 2/23/43 | CAD | 4,000 | | 3,184 | |
| North West Redwater Partnership / NWR Financing Co. Ltd. | | 4.050% | | 7/22/44 | CAD | 3,350 | | 2,818 | |
22
Total International Bond Index Fund
| | | | | | | Face | | Market | |
| | | | | Maturity | | Amount | | Value· | |
| | | Coupon | | Date | Currency | (000 | ) | ($000 | ) |
| North West Redwater Partnership / NWR Financing Co. Ltd. | | 4.150% | | 6/1/33 | CAD | 5,500 | | 4,644 | |
| North West Redwater Partnership / NWR Financing Co. Ltd. | | 4.250% | | 6/1/29 | CAD | 250 | | 211 | |
| North West Redwater Partnership / NWR Financing Co. Ltd. | | 4.350% | | 1/10/39 | CAD | 1,500 | | 1,295 | |
| North West Redwater Partnership / NWR Financing Co. Ltd. | | 4.750% | | 6/1/37 | CAD | 5,000 | | 4,514 | |
2 | Northern Courier Pipeline LP | | 3.365% | | 6/30/42 | CAD | 3,650 | | 2,833 | |
| Northwestern Hydro Acquisition Co. II LP | | 3.877% | | 12/31/36 | CAD | 2,770 | | 2,239 | |
| Northwestern Hydro Acquisition Co. II LP | | 3.940% | | 12/31/38 | CAD | 2,729 | | 2,247 | |
| Nouvelle Autoroute 30 Financement Inc. | | 4.114% | | 3/31/42 | CAD | 5,724 | | 4,833 | |
| Nova Scotia Power Inc. | | 3.571% | | 4/5/49 | CAD | 1,800 | | 1,465 | |
| Nova Scotia Power Inc. | | 4.500% | | 7/20/43 | CAD | 3,308 | | 3,042 | |
| Nova Scotia Power Inc. | | 5.610% | | 6/15/40 | CAD | 4,300 | | 4,442 | |
| OMERS Realty Corp. | | 2.858% | | 2/23/24 | CAD | 4,985 | | 3,889 | |
| OMERS Realty Corp. | | 3.328% | | 11/12/24 | CAD | 1,374 | | 1,099 | |
| OMERS Realty Corp. | | 3.331% | | 6/5/25 | CAD | 3,000 | | 2,401 | |
| OMERS Realty Corp. | | 3.358% | | 6/5/23 | CAD | 4,000 | | 3,167 | |
| OMERS Realty Corp. | | 3.628% | | 6/5/30 | CAD | 4,380 | | 3,662 | |
| Original Wempi Inc. | | 4.056% | | 2/13/24 | CAD | 2,292 | | 1,802 | |
| Original Wempi Inc. | | 4.309% | | 2/13/24 | CAD | 1,719 | | 1,365 | |
| Ottawa MacDonald-Cartier International Airport Authority | | 3.933% | | 6/9/45 | CAD | 775 | | 648 | |
| Pembina Pipeline Corp. | | 2.990% | | 1/22/24 | CAD | 8,000 | | 6,158 | |
| Pembina Pipeline Corp. | | 3.310% | | 2/1/30 | CAD | 7,400 | | 5,604 | |
| Pembina Pipeline Corp. | | 3.620% | | 4/3/29 | CAD | 3,000 | | 2,344 | |
| Pembina Pipeline Corp. | | 3.710% | | 8/11/26 | CAD | 4,850 | | 3,851 | |
| Pembina Pipeline Corp. | | 4.240% | | 6/15/27 | CAD | 3,000 | | 2,457 | |
| Pembina Pipeline Corp. | | 4.540% | | 4/3/49 | CAD | 1,100 | | 881 | |
| Pembina Pipeline Corp. | | 4.740% | | 1/21/47 | CAD | 700 | | 577 | |
| Pembina Pipeline Corp. | | 4.750% | | 4/30/43 | CAD | 3,000 | | 2,463 | |
| Pembina Pipeline Corp. | | 4.810% | | 3/25/44 | CAD | 9,000 | | 7,458 | |
| Penske Truck Leasing Canada Inc. | | 2.850% | | 12/7/22 | CAD | 1,550 | | 1,188 | |
| Plenary Properties LTAP LP | | 6.288% | | 1/31/44 | CAD | 6,271 | | 6,551 | |
| Power Financial Corp. | | 6.900% | | 3/11/33 | CAD | 1,254 | | 1,307 | |
| Reliance LP | | 3.750% | | 3/15/26 | CAD | 3,775 | | 2,952 | |
| RioCan REIT | | 2.576% | | 2/12/25 | CAD | 4,300 | | 3,233 | |
| RioCan REIT | | 3.746% | | 5/30/22 | CAD | 8,842 | | 6,942 | |
| Rogers Communications Inc. | | 3.250% | | 5/1/29 | CAD | 8,040 | | 6,239 | |
| Rogers Communications Inc. | | 4.000% | | 6/6/22 | CAD | 3,000 | | 2,376 | |
| Rogers Communications Inc. | | 4.000% | | 3/13/24 | CAD | 8,300 | | 6,686 | |
| Rogers Communications Inc. | | 5.340% | | 3/22/21 | CAD | 6,000 | | 4,752 | |
| Rogers Communications Inc. | | 6.110% | | 8/25/40 | CAD | 5,000 | | 4,999 | |
| Rogers Communications Inc. | | 6.680% | | 11/4/39 | CAD | 3,044 | | 3,219 | |
| Royal Bank of Canada | | 0.050% | | 6/19/26 | EUR | 10,000 | | 11,259 | |
| Royal Bank of Canada | | 0.125% | | 7/23/24 | EUR | 3,000 | | 3,333 | |
| Royal Bank of Canada | | 0.250% | | 6/28/23 | EUR | 16,100 | | 18,297 | |
| Royal Bank of Canada | | 0.250% | | 1/29/24 | EUR | 11,000 | | 12,521 | |
| Royal Bank of Canada | | 0.500% | | 12/16/20 | EUR | 5,000 | | 5,629 | |
| Royal Bank of Canada | | 1.125% | | 12/22/21 | GBP | 9,300 | | 12,064 | |
| Royal Bank of Canada | | 1.583% | | 9/13/21 | CAD | 4,700 | | 3,539 | |
| Royal Bank of Canada | | 1.650% | | 7/15/21 | CAD | 37,000 | | 27,918 | |
| Royal Bank of Canada | | 1.968% | | 3/2/22 | CAD | 25,100 | | 19,006 | |
23
Total International Bond Index Fund
| | | | | | | Face | | Market | |
| | | | | Maturity | | Amount | | Value· | |
| | | Coupon | | Date | Currency | (000 | ) | ($000 | ) |
| Royal Bank of Canada | | 2.000% | | 3/21/22 | CAD | 4,455 | | 3,375 | |
| Royal Bank of Canada | | 2.333% | | 12/5/23 | CAD | 8,370 | | 6,402 | |
| Royal Bank of Canada | | 2.352% | | 7/2/24 | CAD | 13,800 | | 10,462 | |
| Royal Bank of Canada | | 2.360% | | 12/5/22 | CAD | 15,000 | | 11,468 | |
1 | Royal Bank of Canada | | 2.740% | | 7/25/29 | CAD | 10,000 | | 7,571 | |
| Royal Bank of Canada | | 2.949% | | 5/1/23 | CAD | 10,000 | | 7,797 | |
1 | Royal Bank of Canada | | 3.310% | | 1/20/26 | CAD | 10,900 | | 8,378 | |
1 | Royal Bank of Canada | | 3.450% | | 9/29/26 | CAD | 10,000 | | 7,757 | |
| Royal Office Finance LP | | 5.209% | | 11/12/32 | CAD | 6,715 | | 6,301 | |
| Saputo Inc. | | 3.603% | | 8/14/25 | CAD | 10,000 | | 7,890 | |
1 | Scotiabank Capital Trust | | 5.650% | | 12/31/56 | CAD | 3,946 | | 3,793 | |
| SEC LP and Arci Ltd. | | 5.188% | | 8/29/33 | CAD | 2,748 | | 2,273 | |
| Shaw Communications Inc. | | 4.350% | | 1/31/24 | CAD | 10,000 | | 8,078 | |
| Shaw Communications Inc. | | 4.400% | | 11/2/28 | CAD | 2,500 | | 2,074 | |
| Shaw Communications Inc. | | 5.500% | | 12/7/20 | CAD | 3,443 | | 2,704 | |
| Shaw Communications Inc. | | 6.750% | | 11/9/39 | CAD | 7,668 | | 7,738 | |
| SmartCentres REIT | | 3.834% | | 12/21/27 | CAD | 5,000 | | 3,953 | |
| SSL Finance Inc. | | 4.099% | | 10/31/45 | CAD | 3,067 | | 2,587 | |
1 | Sun Life Financial Inc. | | 3.050% | | 9/19/28 | CAD | 10,000 | | 7,765 | |
| Sun Life Financial Inc. | | 4.570% | | 8/23/21 | CAD | 3,000 | | 2,375 | |
1 | Sun Life Financial Inc. | | 5.400% | | 5/29/42 | CAD | 3,350 | | 3,269 | |
| Suncor Energy Inc. | | 3.000% | | 9/14/26 | CAD | 11,700 | | 9,107 | |
| Suncor Energy Inc. | | 4.340% | | 9/13/46 | CAD | 1,454 | | 1,260 | |
| TCHC Issuer Trust | | 5.395% | | 2/22/40 | CAD | 2,078 | | 2,189 | |
| TELUS Corp. | | 2.350% | | 3/28/22 | CAD | 4,800 | | 3,652 | |
| TELUS Corp. | | 3.200% | | 4/5/21 | CAD | 750 | | 577 | |
| TELUS Corp. | | 3.300% | | 5/2/29 | CAD | 8,000 | | 6,197 | |
| TELUS Corp. | | 3.350% | | 4/1/24 | CAD | 10,700 | | 8,394 | |
| TELUS Corp. | | 3.625% | | 3/1/28 | CAD | 9,600 | | 7,651 | |
| TELUS Corp. | | 3.750% | | 1/17/25 | CAD | 4,460 | | 3,561 | |
| TELUS Corp. | | 3.750% | | 3/10/26 | CAD | 6,894 | | 5,525 | |
| TELUS Corp. | | 4.400% | | 4/1/43 | CAD | 3,000 | | 2,414 | |
| TELUS Corp. | | 4.400% | | 1/29/46 | CAD | 250 | | 202 | |
| TELUS Corp. | | 4.700% | | 3/6/48 | CAD | 2,700 | | 2,291 | |
| TELUS Corp. | | 4.750% | | 1/17/45 | CAD | 1,430 | | 1,213 | |
| TELUS Corp. | | 4.850% | | 4/5/44 | CAD | 9,250 | | 7,937 | |
| Teranet Holdings LP | | 4.807% | | 12/16/20 | CAD | 8,875 | | 6,909 | |
| Teranet Holdings LP | | 5.754% | | 12/17/40 | CAD | 3,395 | | 2,833 | |
| Teranet Holdings LP | | 6.100% | | 6/17/41 | CAD | 400 | | 348 | |
| Thomson Reuters Corp. | | 3.309% | | 11/12/21 | CAD | 2,500 | | 1,935 | |
| THP Partnership | | 4.394% | | 10/31/46 | CAD | 116 | | 101 | |
| TMX Group Ltd. | | 4.461% | | 10/3/23 | CAD | 5,705 | | 4,647 | |
| Toromont Industries Ltd. | | 3.842% | | 10/27/27 | CAD | 6,995 | | 5,667 | |
| Toronto-Dominion Bank | | 0.100% | | 7/19/27 | EUR | 15,000 | | 16,897 | |
| Toronto-Dominion Bank | | 0.375% | | 4/25/24 | EUR | 5,000 | | 5,631 | |
| Toronto-Dominion Bank | | 0.500% | | 4/3/24 | EUR | 8,000 | | 9,207 | |
| Toronto-Dominion Bank | | 1.000% | | 12/13/21 | GBP | 1,000 | | 1,294 | |
| Toronto-Dominion Bank | | 1.680% | | 6/8/21 | CAD | 10,000 | | 7,563 | |
| Toronto-Dominion Bank | | 1.909% | | 7/18/23 | CAD | 3,000 | | 2,261 | |
| Toronto-Dominion Bank | | 1.994% | | 3/23/22 | CAD | 17,500 | | 13,260 | |
| Toronto-Dominion Bank | | 2.045% | | 3/8/21 | CAD | 10,000 | | 7,598 | |
| Toronto-Dominion Bank | | 2.496% | | 12/2/24 | CAD | 15,512 | | 11,833 | |
| Toronto-Dominion Bank | | 2.621% | | 12/22/21 | CAD | 7,250 | | 5,565 | |
| Toronto-Dominion Bank | | 2.850% | | 3/8/24 | CAD | 5,500 | | 4,262 | |
24
Total International Bond Index Fund
| | | | | | | Face | | Market | |
| | | | | Maturity | | Amount | | Value· | |
| | | Coupon | | Date | Currency | (000 | ) | ($000 | ) |
| Toronto-Dominion Bank | | 3.005% | | 5/30/23 | CAD | 15,000 | | 11,733 | |
1 | Toronto-Dominion Bank | | 3.060% | | 1/26/32 | CAD | 9,800 | | 7,465 | |
1 | Toronto-Dominion Bank | | 3.224% | | 7/25/29 | CAD | 10,525 | | 8,151 | |
| Toronto-Dominion Bank | | 3.226% | | 7/24/24 | CAD | 15,450 | | 12,297 | |
1 | Toronto-Dominion Bank | | 3.589% | | 9/14/28 | CAD | 8,000 | | 6,292 | |
1 | Toronto-Dominion Bank | | 4.859% | | 3/4/31 | CAD | 6,155 | | 5,198 | |
| Toyota Credit Canada Inc. | | 2.020% | | 2/28/22 | CAD | 10,000 | | 7,568 | |
| Toyota Credit Canada Inc. | | 3.040% | | 7/12/23 | CAD | 4,494 | | 3,505 | |
| TransCanada PipeLines Ltd. | | 3.300% | | 7/17/25 | CAD | 3,500 | | 2,765 | |
| TransCanada PipeLines Ltd. | | 3.390% | | 3/15/28 | CAD | 3,000 | | 2,368 | |
| TransCanada PipeLines Ltd. | | 3.650% | | 11/15/21 | CAD | 5,000 | | 3,901 | |
| TransCanada PipeLines Ltd. | | 3.690% | | 7/19/23 | CAD | 5,240 | | 4,160 | |
| TransCanada PipeLines Ltd. | | 4.180% | | 7/3/48 | CAD | 6,000 | | 4,775 | |
| TransCanada PipeLines Ltd. | | 4.330% | | 9/16/47 | CAD | 5,000 | | 4,070 | |
| TransCanada PipeLines Ltd. | | 4.340% | | 10/15/49 | CAD | 7,025 | | 5,734 | |
| TransCanada PipeLines Ltd. | | 4.350% | | 6/6/46 | CAD | 4,000 | | 3,259 | |
| TransCanada PipeLines Ltd. | | 4.550% | | 11/15/41 | CAD | 7,000 | | 5,824 | |
| TransCanada PipeLines Ltd. | | 6.280% | | 5/26/28 | CAD | 4,514 | | 4,252 | |
| TransEd Partners GP | | 3.951% | | 9/30/50 | CAD | 1,858 | | 1,433 | |
| Trillium Health Partners Volunteers | | 3.702% | | 12/20/58 | CAD | 950 | | 855 | |
| Union Gas Ltd. | | 3.790% | | 7/10/23 | CAD | 29,995 | | 24,047 | |
| Union Gas Ltd. | | 4.200% | | 6/2/44 | CAD | 2,400 | | 2,172 | |
| Union Gas Ltd. | | 4.880% | | 6/21/41 | CAD | 3,450 | | 3,354 | |
| University of Toronto | | 4.251% | | 12/7/51 | CAD | 2,500 | | 2,461 | |
| University of Toronto | | 5.841% | | 12/15/43 | CAD | 130 | | 150 | |
| University of Western Ontario | | 4.798% | | 5/24/47 | CAD | 184 | | 192 | |
| Vancouver Airport Authority | | 7.425% | | 12/7/26 | CAD | 15,000 | | 15,267 | |
| Veresen Inc. | | 3.430% | | 11/10/21 | CAD | 3,000 | | 2,326 | |
| Waste Management of Canada Corp. | | 2.600% | | 9/23/26 | CAD | 2,800 | | 2,135 | |
| Westcoast Energy Inc. | | 3.430% | | 9/12/24 | CAD | 6,700 | | 5,309 | |
| Westcoast Energy Inc. | | 4.791% | | 10/28/41 | CAD | 2,214 | | 1,986 | |
| York University | | 6.480% | | 3/7/42 | CAD | 1,725 | | 2,072 | |
| | | | | | | | | 1,942,288 | |
Sovereign Bonds (4.4%) | | | | | | | | | |
| Cadillac Fairview Finance Trust | | 4.310% | | 1/25/21 | CAD | 3,650 | | 2,852 | |
| Canada | | 0.500% | | 3/1/22 | CAD | 152,606 | | 113,175 | |
| Canada | | 0.750% | | 3/1/21 | CAD | 95,793 | | 71,924 | |
| Canada | | 0.750% | | 9/1/21 | CAD | 88,250 | | 66,050 | |
| Canada | | 1.000% | | 9/1/22 | CAD | 323,022 | | 241,978 | |
| Canada | | 1.250% | | 11/1/21 | CAD | 7,412 | | 5,597 | |
| Canada | | 1.500% | | 8/1/21 | CAD | 74,047 | | 56,173 | |
| Canada | | 1.500% | | 6/1/23 | CAD | 13,400 | | 10,195 | |
| Canada | | 1.500% | | 9/1/24 | CAD | 257,220 | | 196,033 | |
| Canada | | 1.750% | | 5/1/21 | CAD | 133,921 | | 101,927 | |
| Canada | | 1.750% | | 3/1/23 | CAD | 39,704 | | 30,414 | |
| Canada | | 2.000% | | 11/1/20 | CAD | 60,447 | | 46,044 | |
| Canada | | 2.000% | | 9/1/23 | CAD | 45,786 | | 35,475 | |
| Canada | | 2.000% | | 6/1/28 | CAD | 193,638 | | 153,987 | |
| Canada | | 2.000% | | 12/1/51 | CAD | 20,350 | | 17,082 | |
| Canada | | 2.250% | | 2/1/21 | CAD | 65,792 | | 50,352 | |
| Canada | | 2.250% | | 3/1/24 | CAD | 66,457 | | 52,165 | |
| Canada | | 2.250% | | 6/1/29 | CAD | 172,375 | | 140,641 | |
| Canada | | 2.500% | | 6/1/24 | CAD | 12,130 | | 9,647 | |
| Canada | | 2.750% | | 6/1/22 | CAD | 21,900 | | 17,150 | |
25
Total International Bond Index Fund
| | | | | | | Face | | Market | |
| | | | | Maturity | | Amount | | Value· | |
| | | Coupon | | Date | Currency | (000 | ) | ($000 | ) |
| Canada | | 2.750% | | 12/1/48 | CAD | 65,590 | | 63,255 | |
| Canada | | 2.750% | | 12/1/64 | CAD | 42,994 | | 45,029 | |
| Canada | | 3.500% | | 12/1/45 | CAD | 80,673 | | 85,967 | |
| Canada | | 4.000% | | 6/1/41 | CAD | 100,947 | | 110,020 | |
| Canada | | 5.000% | | 6/1/37 | CAD | 71,895 | | 83,162 | |
| Canada | | 5.750% | | 6/1/29 | CAD | 45,134 | | 47,398 | |
| Canada | | 5.750% | | 6/1/33 | CAD | 76,015 | | 87,777 | |
| Canada | | 8.000% | | 6/1/23 | CAD | 1,100 | | 1,024 | |
| Canada | | 8.000% | | 6/1/27 | CAD | 7,000 | | 7,812 | |
| Canada | | 9.000% | | 6/1/25 | CAD | 12,000 | | 12,789 | |
| Canada | | 10.500% | | 3/15/21 | CAD | 15,000 | | 12,743 | |
2 | Canada Housing Trust No. 1 | | 1.150% | | 12/15/21 | CAD | 75,854 | | 57,057 | |
2 | Canada Housing Trust No. 1 | | 1.250% | | 12/15/20 | CAD | 49,950 | | 37,737 | |
2,5 | Canada Housing Trust No. 1 | | 1.250% | | 6/15/21 | CAD | 57,000 | | 42,957 | |
2 | Canada Housing Trust No. 1 | | 1.500% | | 12/15/21 | CAD | 600 | | 454 | |
2 | Canada Housing Trust No. 1 | | 1.750% | | 6/15/22 | CAD | 35,000 | | 26,588 | |
2 | Canada Housing Trust No. 1 | | 1.800% | | 12/15/24 | CAD | 16,840 | | 12,832 | |
2 | Canada Housing Trust No. 1 | | 1.900% | | 9/15/26 | CAD | 31,875 | | 24,324 | |
2 | Canada Housing Trust No. 1 | | 1.950% | | 12/15/25 | CAD | 20,000 | | 15,325 | |
2 | Canada Housing Trust No. 1 | | 2.100% | | 9/15/29 | CAD | 40,000 | | 31,107 | |
2 | Canada Housing Trust No. 1 | | 2.250% | | 12/15/25 | CAD | 5,225 | | 4,078 | |
2 | Canada Housing Trust No. 1 | | 2.350% | | 6/15/23 | CAD | 60,265 | | 46,695 | |
2 | Canada Housing Trust No. 1 | | 2.350% | | 9/15/23 | CAD | 13,940 | | 10,816 | |
2 | Canada Housing Trust No. 1 | | 2.350% | | 6/15/27 | CAD | 18,500 | | 14,557 | |
2 | Canada Housing Trust No. 1 | | 2.350% | | 3/15/28 | CAD | 425 | | 336 | |
2 | Canada Housing Trust No. 1 | | 2.400% | | 12/15/22 | CAD | 78,140 | | 60,498 | |
2 | Canada Housing Trust No. 1 | | 2.550% | | 12/15/23 | CAD | 55,795 | | 43,722 | |
2 | Canada Housing Trust No. 1 | | 2.550% | | 3/15/25 | CAD | 29,000 | | 22,895 | |
2 | Canada Housing Trust No. 1 | | 2.650% | | 3/15/22 | CAD | 71,500 | | 55,451 | |
2 | Canada Housing Trust No. 1 | | 2.650% | | 3/15/28 | CAD | 77,305 | | 62,500 | |
2 | Canada Housing Trust No. 1 | | 2.650% | | 12/15/28 | CAD | 10,900 | | 8,851 | |
2 | Canada Housing Trust No. 1 | | 2.900% | | 6/15/24 | CAD | 81,650 | | 65,097 | |
2 | Canada Housing Trust No. 1 | | 3.150% | | 9/15/23 | CAD | 21,270 | | 16,979 | |
2 | Canada Housing Trust No. 1 | | 3.350% | | 12/15/20 | CAD | 26,000 | | 20,090 | |
2 | Canada Housing Trust No. 1 | | 3.800% | | 6/15/21 | CAD | 56,000 | | 43,939 | |
| Canada Post Corp. | | 4.360% | | 7/16/40 | CAD | 3,650 | | 3,724 | |
| City of Montreal | | 3.000% | | 9/1/25 | CAD | 7,000 | | 5,580 | |
| City of Montreal | | 3.000% | | 9/1/27 | CAD | 5,000 | | 4,006 | |
| City of Montreal | | 3.150% | | 9/1/28 | CAD | 3,050 | | 2,475 | |
| City of Montreal | | 3.150% | | 12/1/36 | CAD | 5,985 | | 4,849 | |
| City of Montreal | | 3.500% | | 9/1/23 | CAD | 7,450 | | 5,986 | |
| City of Montreal | | 3.500% | | 9/1/24 | CAD | 10,000 | | 8,120 | |
| City of Montreal | | 3.500% | | 12/1/38 | CAD | 6,000 | | 5,103 | |
| City of Montreal | | 4.100% | | 12/1/34 | CAD | 3,195 | | 2,885 | |
| City of Montreal Canada | | 6.000% | | 6/1/43 | CAD | 1,100 | | 1,316 | |
| City of Ottawa Ontario | | 3.100% | | 7/27/48 | CAD | 4,276 | | 3,548 | |
| City of Ottawa Ontario | | 3.250% | | 11/10/47 | CAD | 1,780 | | 1,515 | |
| City of Ottawa Ontario | | 4.600% | | 7/14/42 | CAD | 1,900 | | 1,916 | |
| City of Toronto | | 2.400% | | 6/7/27 | CAD | 1,590 | | 1,224 | |
| City of Toronto | | 2.950% | | 4/28/35 | CAD | 6,250 | | 4,946 | |
| City of Toronto | | 3.200% | | 8/1/48 | CAD | 1,820 | | 1,532 | |
| City of Toronto | | 3.800% | | 12/13/42 | CAD | 19,000 | | 17,152 | |
| City of Toronto | | 3.900% | | 9/29/23 | CAD | 4,732 | | 3,855 | |
| City of Toronto | | 4.150% | | 3/10/44 | CAD | 4,930 | | 4,706 | |
26
Total International Bond Index Fund
| | | | | | | Face | | Market | |
| �� | | | | Maturity | | Amount | | Value· | |
| | | Coupon | | Date | Currency | (000 | ) | ($000 | ) |
| City of Toronto | | 4.700% | | 6/10/41 | CAD | 2,000 | | 2,026 | |
| City of Toronto | | 5.200% | | 6/1/40 | CAD | 1,220 | | 1,295 | |
| City of Winnipeg Canada | | 4.100% | | 6/1/45 | CAD | 1,000 | | 948 | |
| City of Winnipeg Canada | | 4.300% | | 11/15/51 | CAD | 4,158 | | 4,214 | |
| Cordelio Amalco GP I | | 4.087% | | 6/30/34 | CAD | 4,324 | | 3,486 | |
| CPPIB Capital Inc. | | 0.375% | | 6/20/24 | EUR | 35,000 | | 40,139 | |
| CPPIB Capital Inc. | | 0.750% | | 7/15/49 | EUR | 4,600 | | 5,269 | |
| CPPIB Capital Inc. | | 1.500% | | 3/4/33 | EUR | 15,000 | | 19,388 | |
| CPPIB Capital Inc. | | 3.000% | | 6/15/28 | CAD | 7,970 | | 6,496 | |
| ENMAX Corp. | | 3.836% | | 6/5/28 | CAD | 2,000 | | 1,562 | |
| Export Development Canada | | 1.000% | | 12/15/20 | GBP | 2,410 | | 3,130 | |
| Export Development Canada | | 1.375% | | 12/8/23 | GBP | 10,000 | | 13,263 | |
| Export Development Canada | | 1.650% | | 7/31/24 | CAD | 4,170 | | 3,140 | |
| Export Development Canada | | 1.800% | | 9/1/22 | CAD | 195 | | 148 | |
| Export Development Canada | | 2.400% | | 6/7/21 | AUD | 23,864 | | 16,772 | |
| Export Development Canada | | 2.700% | | 10/24/22 | AUD | 5,800 | | 4,173 | |
| Export Development Canada | | 2.800% | | 5/31/23 | AUD | 2,000 | | 1,454 | |
| Fair Hydro Trust | | 3.357% | | 5/15/33 | CAD | 7,125 | | 5,933 | |
| Financement-Quebec | | 5.250% | | 6/1/34 | CAD | 3,000 | | 3,072 | |
| First Nations Finance Authority | | 3.050% | | 6/1/28 | CAD | 1,035 | | 834 | |
| Hydro Ottawa Holding Inc. | | 3.991% | | 5/14/43 | CAD | 2,100 | | 1,804 | |
| Hydro-Quebec | | 4.000% | | 2/15/55 | CAD | 31,472 | | 33,110 | |
| Hydro-Quebec | | 5.000% | | 2/15/45 | CAD | 28,170 | | 31,734 | |
| Hydro-Quebec | | 5.000% | | 2/15/50 | CAD | 38,100 | | 44,889 | |
| Hydro-Quebec | | 6.000% | | 8/15/31 | CAD | 9,290 | | 9,778 | |
| Hydro-Quebec | | 6.000% | | 2/15/40 | CAD | 18,815 | | 22,482 | |
| Hydro-Quebec | | 6.500% | | 1/16/35 | CAD | 4,155 | | 4,765 | |
| Hydro-Quebec | | 6.500% | | 2/15/35 | CAD | 22,500 | | 26,123 | |
| Hydro-Quebec | | 9.625% | | 7/15/22 | CAD | 12,000 | | 11,000 | |
| Hydro-Quebec | | 10.500% | | 10/15/21 | CAD | 4,000 | | 3,542 | |
2,5 | Labrador-Island Link Funding Trust | | 3.760% | | 6/1/33 | CAD | 4,817 | | 4,381 | |
2,5 | Labrador-Island Link Funding Trust | | 3.850% | | 12/1/53 | CAD | 4,423 | | 4,648 | |
2,5 | Labrador-Island Link Funding Trust | | 3.860% | | 12/1/45 | CAD | 3,790 | | 3,794 | |
| Lower Mattagami Energy LP | | 3.416% | | 6/20/24 | CAD | 2,000 | | 1,604 | |
| Lower Mattagami Energy LP | | 4.944% | | 9/21/43 | CAD | 255 | | 257 | |
| Lower Mattagami Energy LP | | 5.139% | | 5/18/41 | CAD | 5,000 | | 5,077 | |
5 | Maritime Link Financing Trust | | 3.500% | | 12/1/52 | CAD | 7,362 | | 6,478 | |
| Municipal Finance Authority of British Columbia | | 1.650% | | 4/19/21 | CAD | 4,500 | | 3,413 | |
| Municipal Finance Authority of British Columbia | | 2.150% | | 6/3/24 | CAD | 5,390 | | 4,138 | |
| Municipal Finance Authority of British Columbia | | 2.500% | | 4/19/26 | CAD | 1,850 | | 1,443 | |
| Municipal Finance Authority of British Columbia | | 2.550% | | 10/9/29 | CAD | 1,195 | | 938 | |
| Municipal Finance Authority of British Columbia | | 2.600% | | 4/23/23 | CAD | 1,848 | | 1,440 | |
| Municipal Finance Authority of British Columbia | | 2.800% | | 12/3/23 | CAD | 6,125 | | 4,822 | |
| Municipal Finance Authority of British Columbia | | 2.950% | | 10/14/24 | CAD | 5,985 | | 4,764 | |
| Municipal Finance Authority of British Columbia | | 3.050% | | 10/23/28 | CAD | 7,620 | | 6,204 | |
27
Total International Bond Index Fund
| | | | | | | Face | | Market | |
| | | | | Maturity | | Amount | | Value· | |
| | | Coupon | | Date | Currency | (000 | ) | ($000 | ) |
| Municipal Finance Authority of British Columbia | | 4.150% | | 6/1/21 | CAD | 4,030 | | 3,171 | |
2,5 | Muskrat Falls / Labrador Transmission Assets Funding Trust | | 3.630% | | 6/1/29 | CAD | 5,300 | | 4,597 | |
2,5 | Muskrat Falls / Labrador Transmission Assets Funding Trust | | 3.830% | | 6/1/37 | CAD | 2,295 | | 2,156 | |
2,5 | Muskrat Falls / Labrador Transmission Assets Funding Trust | | 3.860% | | 12/1/48 | CAD | 7,271 | | 7,427 | |
| New Brunswick F-M Project Co. Inc. | | 6.470% | | 11/30/27 | CAD | 970 | | 857 | |
| Newfoundland & Labrador Hydro | | 3.600% | | 12/1/45 | CAD | 3,000 | | 2,611 | |
| Newfoundland & Labrador Hydro | | 6.650% | | 8/27/31 | CAD | 2,000 | | 2,152 | |
2 | OMERS Finance Trust | | 2.600% | | 5/14/29 | CAD | 3,000 | | 2,347 | |
| Ontario Electricity Financial Corp. | | 8.250% | | 6/22/26 | CAD | 14,033 | | 14,694 | |
| Ontario Electricity Financial Corp. | | 8.900% | | 8/18/22 | CAD | 10,250 | | 9,265 | |
| Ontario Electricity Financial Corp. | | 10.125% | | 10/15/21 | CAD | 2,500 | | 2,199 | |
| Ontario Infrastructure & Lands Corp. | | 4.700% | | 6/1/37 | CAD | 1,445 | | 1,404 | |
| Ontario Power Generation Inc. | | 3.838% | | 6/22/48 | CAD | 10,000 | | 8,015 | |
| Ontario School Boards Financing Corp. | | 5.483% | | 11/26/29 | CAD | 195 | | 170 | |
| OPB Finance Trust | | 2.950% | | 2/2/26 | CAD | 29,000 | | 23,055 | |
| OPB Finance Trust | | 2.980% | | 1/25/27 | CAD | 4,985 | | 3,969 | |
| Province of Alberta | | 0.625% | | 4/18/25 | EUR | 10,600 | | 12,309 | |
| Province of Alberta | | 1.000% | | 11/15/21 | GBP | 6,300 | | 8,154 | |
| Province of Alberta | | 1.350% | | 9/1/21 | CAD | 22,745 | | 17,159 | |
| Province of Alberta | | 1.600% | | 9/1/22 | CAD | 9,000 | | 6,812 | |
| Province of Alberta | | 2.050% | | 6/1/30 | CAD | 2,000 | | 1,488 | |
| Province of Alberta | | 2.200% | | 6/1/26 | CAD | 20,000 | | 15,327 | |
| Province of Alberta | | 2.350% | | 6/1/25 | CAD | 9,300 | | 7,205 | |
| Province of Alberta | | 2.550% | | 12/15/22 | CAD | 3,200 | | 2,485 | |
| Province of Alberta | | 2.550% | | 6/1/27 | CAD | 22,285 | | 17,433 | |
| Province of Alberta | | 2.650% | | 9/1/23 | CAD | 11,000 | | 8,607 | |
| Province of Alberta | | 2.900% | | 12/1/28 | CAD | 24,665 | | 19,822 | |
| Province of Alberta | | 2.900% | | 9/20/29 | CAD | 12,500 | | 10,061 | |
| Province of Alberta | | 3.050% | | 12/1/48 | CAD | 38,566 | | 32,314 | |
| Province of Alberta | | 3.100% | | 12/14/26 | AUD | 2,100 | | 1,589 | |
| Province of Alberta | | 3.100% | | 6/1/50 | CAD | 11,205 | | 9,566 | |
| Province of Alberta | | 3.300% | | 12/1/46 | CAD | 30,665 | | 26,620 | |
| Province of Alberta | | 3.400% | | 12/1/23 | CAD | 3,000 | | 2,417 | |
| Province of Alberta | | 3.450% | | 12/1/43 | CAD | 19,075 | | 16,779 | |
| Province of Alberta | | 3.500% | | 6/1/31 | CAD | 4,600 | | 3,914 | |
| Province of Alberta | | 3.600% | | 4/11/28 | AUD | 435 | | 342 | |
| Province of Alberta | | 3.900% | | 12/1/33 | CAD | 7,075 | | 6,273 | |
| Province of Alberta | | 4.500% | | 12/1/40 | CAD | 5,000 | | 4,986 | |
| Province of British Columbia | | 2.200% | | 6/18/30 | CAD | 1,495 | | 1,130 | |
| Province of British Columbia | | 2.300% | | 6/18/26 | CAD | 15,000 | | 11,656 | |
| Province of British Columbia | | 2.550% | | 6/18/27 | CAD | 7,360 | | 5,814 | |
| Province of British Columbia | | 2.700% | | 12/18/22 | CAD | 8,402 | | 6,565 | |
| Province of British Columbia | | 2.800% | | 6/18/48 | CAD | 31,496 | | 26,467 | |
| Province of British Columbia | | 2.850% | | 6/18/25 | CAD | 5,185 | | 4,143 | |
| Province of British Columbia | | 2.950% | | 12/18/28 | CAD | 24,932 | | 20,420 | |
| Province of British Columbia | | 2.950% | | 6/18/50 | CAD | 16,715 | | 14,440 | |
| Province of British Columbia | | 3.200% | | 6/18/44 | CAD | 24,500 | | 21,494 | |
| Province of British Columbia | | 3.250% | | 12/18/21 | CAD | 3,870 | | 3,032 | |
| Province of British Columbia | | 3.300% | | 12/18/23 | CAD | 15,275 | | 12,301 | |
| Province of British Columbia | | 3.700% | | 12/18/20 | CAD | 22,000 | | 17,069 | |
28
Total International Bond Index Fund
| | | | | | | Face | | Market | |
| | | | | Maturity | | Amount | | Value· | |
| | | Coupon | | Date | Currency | (000 | ) | ($000 | ) |
| Province of British Columbia | | 4.250% | | 11/27/24 | AUD | 2,300 | | 1,800 | |
| Province of British Columbia | | 4.300% | | 6/18/42 | CAD | 21,705 | | 22,061 | |
| Province of British Columbia | | 4.700% | | 6/18/37 | CAD | 3,160 | | 3,208 | |
| Province of British Columbia | | 4.800% | | 6/15/21 | CAD | 94 | | 75 | |
| Province of British Columbia | | 4.900% | | 6/18/48 | CAD | 3,000 | | 3,486 | |
| Province of British Columbia | | 4.950% | | 6/18/40 | CAD | 12,500 | | 13,548 | |
| Province of British Columbia | | 5.700% | | 6/18/29 | CAD | 13,575 | | 13,535 | |
| Province of British Columbia | | 6.350% | | 6/18/31 | CAD | 15,000 | | 16,209 | |
| Province of Manitoba | | 0.750% | | 12/15/21 | GBP | 6,300 | | 8,126 | |
| Province of Manitoba | | 1.550% | | 9/5/21 | CAD | 5,000 | | 3,793 | |
| Province of Manitoba | | 2.450% | | 6/2/25 | CAD | 6,935 | | 5,407 | |
| Province of Manitoba | | 2.550% | | 6/2/23 | CAD | 9,405 | | 7,329 | |
| Province of Manitoba | | 2.550% | | 6/2/26 | CAD | 19,000 | | 14,885 | |
| Province of Manitoba | | 2.600% | | 6/2/27 | CAD | 15,200 | | 11,929 | |
| Province of Manitoba | | 2.750% | | 6/2/29 | CAD | 3,580 | | 2,849 | |
| Province of Manitoba | | 2.850% | | 9/5/46 | CAD | 10,320 | | 8,251 | |
| Province of Manitoba | | 3.000% | | 6/2/28 | CAD | 10,000 | | 8,089 | |
| Province of Manitoba | | 3.150% | | 9/5/52 | CAD | 2,750 | | 2,351 | |
| Province of Manitoba | | 3.200% | | 3/5/50 | CAD | 4,540 | | 3,930 | |
| Province of Manitoba | | 3.250% | | 9/5/29 | CAD | 2,270 | | 1,877 | |
| Province of Manitoba | | 3.300% | | 6/2/24 | CAD | 3,000 | | 2,423 | |
| Province of Manitoba | | 3.350% | | 3/5/43 | CAD | 2,000 | | 1,726 | |
| Province of Manitoba | | 3.400% | | 9/5/48 | CAD | 17,049 | | 15,345 | |
| Province of Manitoba | | 3.450% | | 3/5/63 | CAD | 3,597 | | 3,378 | |
| Province of Manitoba | | 4.050% | | 9/5/45 | CAD | 6,995 | | 6,849 | |
| Province of Manitoba | | 4.100% | | 3/5/41 | CAD | 5,000 | | 4,759 | |
| Province of Manitoba | | 4.250% | | 3/3/25 | AUD | 1,000 | | 783 | |
| Province of Manitoba | | 4.400% | | 9/5/25 | CAD | 6,800 | | 5,844 | |
| Province of Manitoba | | 4.400% | | 3/5/42 | CAD | 6,500 | | 6,464 | |
| Province of Manitoba | | 4.600% | | 3/5/38 | CAD | 5,675 | | 5,588 | |
| Province of Manitoba | | 4.650% | | 3/5/40 | CAD | 4,000 | | 4,057 | |
| Province of Manitoba | | 4.700% | | 3/5/50 | CAD | 235 | | 260 | |
| Province of Manitoba | | 5.700% | | 3/5/37 | CAD | 3,000 | | 3,285 | |
| Province of Manitoba | | 6.300% | | 3/5/31 | CAD | 955 | | 1,011 | |
| Province of New Brunswick | | 1.550% | | 5/4/22 | CAD | 98 | | 74 | |
| Province of New Brunswick | | 2.350% | | 8/14/27 | CAD | 1,700 | | 1,309 | |
| Province of New Brunswick | | 2.600% | | 8/14/26 | CAD | 10,000 | | 7,842 | |
| Province of New Brunswick | | 2.850% | | 6/2/23 | CAD | 10,000 | | 7,862 | |
| Province of New Brunswick | | 3.050% | | 8/14/50 | CAD | 2,500 | | 2,072 | |
| Province of New Brunswick | | 3.100% | | 8/14/28 | CAD | 3,765 | | 3,062 | |
| Province of New Brunswick | | 3.100% | | 8/14/48 | CAD | 16,480 | | 13,702 | |
| Province of New Brunswick | | 3.550% | | 6/3/43 | CAD | 5,800 | | 5,087 | |
| Province of New Brunswick | | 3.650% | | 6/3/24 | CAD | 11,000 | | 8,993 | |
| Province of New Brunswick | | 3.800% | | 8/14/45 | CAD | 7,965 | | 7,330 | |
| Province of New Brunswick | | 4.550% | | 3/26/37 | CAD | 7,000 | | 6,798 | |
| Province of New Brunswick | | 4.800% | | 9/26/39 | CAD | 2,420 | | 2,444 | |
| Province of New Brunswick | | 4.800% | | 6/3/41 | CAD | 2,990 | | 3,066 | |
| Province of New Brunswick | | 5.500% | | 1/27/34 | CAD | 4,000 | | 4,109 | |
| Province of Newfoundland and Labrador | | 2.300% | | 6/2/25 | CAD | 5,000 | | 3,846 | |
| Province of Newfoundland and Labrador | | 2.850% | | 6/2/28 | CAD | 15,000 | | 11,864 | |
| Province of Newfoundland and Labrador | | 3.000% | | 6/2/26 | CAD | 10,000 | | 7,981 | |
| Province of Newfoundland and Labrador | | 3.300% | | 10/17/46 | CAD | 15,205 | | 12,712 | |
| Province of Newfoundland and Labrador | | 3.700% | | 10/17/48 | CAD | 10,904 | | 9,803 | |
| Province of Newfoundland and Labrador | | 4.650% | | 10/17/40 | CAD | 2,270 | | 2,242 | |
29
Total International Bond Index Fund
| | | | | | | Face | | Market | |
| | | | | Maturity | | Amount | | Value· | |
| | | Coupon | | Date | Currency | (000 | ) | ($000 | ) |
| Province of Newfoundland and Labrador | | 5.700% | | 10/17/35 | CAD | 1,000 | | 1,049 | |
| Province of Newfoundland and Labrador | | 6.150% | | 4/17/28 | CAD | 1,000 | | 983 | |
| Province of Nova Scotia | | 2.100% | | 6/1/27 | CAD | 16,000 | | 12,159 | |
| Province of Nova Scotia | | 3.150% | | 12/1/51 | CAD | 5,500 | | 4,817 | |
| Province of Nova Scotia | | 3.450% | | 6/1/45 | CAD | 3,000 | | 2,691 | |
| Province of Nova Scotia | | 3.500% | | 6/2/62 | CAD | 8,420 | | 8,062 | |
| Province of Nova Scotia | | 4.100% | | 6/1/21 | CAD | 7,980 | | 6,285 | |
| Province of Nova Scotia | | 4.400% | | 6/1/42 | CAD | 6,000 | | 6,027 | |
| Province of Nova Scotia | | 4.500% | | 6/1/37 | CAD | 5,000 | | 4,884 | |
| Province of Nova Scotia | | 4.700% | | 6/1/41 | CAD | 4,000 | | 4,143 | |
| Province of Nova Scotia | | 5.800% | | 6/1/33 | CAD | 2,000 | | 2,116 | |
| Province of Ontario | | 0.375% | | 6/14/24 | EUR | 24,200 | | 27,724 | |
| Province of Ontario | | 0.875% | | 1/21/25 | EUR | 5,000 | | 5,892 | |
| Province of Ontario | | 1.350% | | 3/8/22 | CAD | 32,500 | | 24,450 | |
| Province of Ontario | | 1.875% | | 5/21/24 | EUR | 5,000 | | 6,110 | |
| Province of Ontario | | 1.950% | | 1/27/23 | CAD | 8,400 | | 6,416 | |
| Province of Ontario | | 2.300% | | 9/8/24 | CAD | 20,600 | | 15,993 | |
| Province of Ontario | | 2.400% | | 6/2/26 | CAD | 44,280 | | 34,485 | |
| Province of Ontario | | 2.600% | | 9/8/23 | CAD | 24,200 | | 18,922 | |
| Province of Ontario | | 2.600% | | 6/2/25 | CAD | 77,465 | | 60,960 | |
| Province of Ontario | | 2.600% | | 6/2/27 | CAD | 74,500 | | 58,768 | |
| Province of Ontario | | 2.650% | | 2/5/25 | CAD | 13,000 | | 10,252 | |
| Province of Ontario | | 2.650% | | 12/2/50 | CAD | 44,830 | | 35,914 | |
| Province of Ontario | | 2.700% | | 6/2/29 | CAD | 42,500 | | 33,889 | |
| Province of Ontario | | 2.800% | | 6/2/48 | CAD | 70,336 | | 57,614 | |
| Province of Ontario | | 2.850% | | 6/2/23 | CAD | 77,150 | | 60,740 | |
| Province of Ontario | | 2.900% | | 6/2/28 | CAD | 66,932 | | 54,022 | |
| Province of Ontario | | 2.900% | | 12/2/46 | CAD | 88,047 | | 72,899 | |
| Province of Ontario | | 2.900% | | 6/2/49 | CAD | 74,551 | | 62,470 | |
| Province of Ontario | | 3.100% | | 8/26/25 | AUD | 2,000 | | 1,497 | |
| Province of Ontario | | 3.150% | | 6/2/22 | CAD | 88,000 | | 69,204 | |
| Province of Ontario | | 3.450% | | 6/2/45 | CAD | 83,735 | | 75,758 | |
| Province of Ontario | | 3.500% | | 6/2/24 | CAD | 52,610 | | 42,834 | |
| Province of Ontario | | 3.500% | | 1/27/27 | AUD | 1,000 | | 773 | |
| Province of Ontario | | 3.500% | | 6/2/43 | CAD | 63,350 | | 57,287 | |
| Province of Ontario | | 4.000% | | 6/2/21 | CAD | 60,720 | | 47,755 | |
| Province of Ontario | | 4.250% | | 8/22/24 | AUD | 1,000 | | 781 | |
| Province of Ontario | | 4.600% | | 6/2/39 | CAD | 51,600 | | 52,213 | |
| Province of Ontario | | 4.650% | | 6/2/41 | CAD | 72,175 | | 74,963 | |
| Province of Ontario | | 4.700% | | 6/2/37 | CAD | 51,200 | | 51,626 | |
| Province of Ontario | | 5.600% | | 6/2/35 | CAD | 39,000 | | 42,067 | |
| Province of Ontario | | 5.850% | | 3/8/33 | CAD | 22,850 | | 24,579 | |
| Province of Ontario | | 6.200% | | 6/2/31 | CAD | 13,000 | | 13,851 | |
| Province of Ontario | | 6.500% | | 3/8/29 | CAD | 16,560 | | 17,191 | |
| Province of Ontario | | 7.500% | | 2/7/24 | CAD | 2,570 | | 2,400 | |
| Province of Ontario | | 7.600% | | 6/2/27 | CAD | 15,000 | | 15,815 | |
| Province of Prince Edward Island | | 3.600% | | 1/17/53 | CAD | 2,994 | | 2,715 | |
| Province of Quebec | | 0.875% | | 5/24/22 | GBP | 1,500 | | 1,940 | |
| Province of Quebec | | 0.875% | | 1/15/25 | EUR | 18,300 | | 21,564 | |
| Province of Quebec | | 0.875% | | 5/4/27 | EUR | 34,900 | | 41,582 | |
| Province of Quebec | | 0.875% | | 7/5/28 | EUR | 3,900 | | 4,663 | |
| Province of Quebec | | 1.650% | | 3/3/22 | CAD | 15,000 | | 11,382 | |
| Province of Quebec | | 2.250% | | 7/17/23 | EUR | 13,500 | | 16,509 | |
| Province of Quebec | | 2.250% | | 2/22/24 | CAD | 5,200 | | 4,020 | |
30
Total International Bond Index Fund
| | | | | | | Face | | Market | |
| | | | | Maturity | | Amount | | Value· | |
| | | Coupon | | Date | Currency | (000 | ) | ($000 | ) |
| Province of Quebec | | 2.300% | | 9/1/29 | CAD | 27,460 | | 21,257 | |
| Province of Quebec | | 2.375% | | 1/22/24 | EUR | 1,000 | | 1,241 | |
| Province of Quebec | | 2.450% | | 3/1/23 | CAD | 2,000 | | 1,553 | |
| Province of Quebec | | 2.500% | | 9/1/26 | CAD | 37,500 | | 29,426 | |
| Province of Quebec | | 2.600% | | 7/6/25 | CAD | 835 | | 659 | |
| Province of Quebec | | 2.750% | | 9/1/25 | CAD | 28,480 | | 22,635 | |
| Province of Quebec | | 2.750% | | 9/1/27 | CAD | 42,178 | | 33,690 | |
| Province of Quebec | | 2.750% | | 9/1/28 | CAD | 45,640 | | 36,581 | |
| Province of Quebec | | 3.000% | | 9/1/23 | CAD | 34,960 | | 27,732 | |
| Province of Quebec | | 3.100% | | 12/1/51 | CAD | 22,060 | | 19,529 | |
| Province of Quebec | | 3.500% | | 12/1/22 | CAD | 36,220 | | 28,907 | |
| Province of Quebec | | 3.500% | | 12/1/45 | CAD | 56,425 | | 51,907 | |
| Province of Quebec | | 3.500% | | 12/1/48 | CAD | 63,900 | | 59,809 | |
| Province of Quebec | | 3.700% | | 5/20/26 | AUD | 700 | | 542 | |
| Province of Quebec | | 3.750% | | 9/1/24 | CAD | 38,650 | | 31,920 | |
| Province of Quebec | | 4.200% | | 3/10/25 | AUD | 1,507 | | 1,177 | |
| Province of Quebec | | 4.250% | | 12/1/21 | CAD | 46,000 | | 36,686 | |
| Province of Quebec | | 4.250% | | 12/1/43 | CAD | 42,625 | | 43,205 | |
| Province of Quebec | | 4.500% | | 12/1/20 | CAD | 22,597 | | 17,650 | |
| Province of Quebec | | 5.000% | | 12/1/38 | CAD | 21,900 | | 23,212 | |
| Province of Quebec | | 5.000% | | 12/1/41 | CAD | 51,390 | | 56,224 | |
| Province of Quebec | | 5.350% | | 6/1/25 | CAD | 5,000 | | 4,478 | |
| Province of Quebec | | 5.750% | | 12/1/36 | CAD | 17,240 | | 19,277 | |
| Province of Quebec | | 6.000% | | 10/1/29 | CAD | 15,000 | | 15,275 | |
| Province of Quebec | | 6.250% | | 6/1/32 | CAD | 21,570 | | 23,515 | |
| Province of Quebec | | 8.500% | | 4/1/26 | CAD | 10,000 | | 10,539 | |
| Province of Quebec | | 9.375% | | 1/16/23 | CAD | 3,000 | | 2,808 | |
| Province of Saskatchewan | | 2.550% | | 6/2/26 | CAD | 4,875 | | 3,822 | |
| Province of Saskatchewan | | 2.650% | | 6/2/27 | CAD | 10,000 | | 7,890 | |
| Province of Saskatchewan | | 2.750% | | 12/2/46 | CAD | 11,950 | | 9,447 | |
| Province of Saskatchewan | | 2.950% | | 6/2/58 | CAD | 2,800 | | 2,364 | |
| Province of Saskatchewan | | 3.050% | | 12/2/28 | CAD | 3,500 | | 2,861 | |
| Province of Saskatchewan | | 3.100% | | 6/2/50 | CAD | 8,995 | | 7,702 | |
| Province of Saskatchewan | | 3.200% | | 6/3/24 | CAD | 9,500 | | 7,637 | |
| Province of Saskatchewan | | 3.300% | | 6/2/48 | CAD | 16,920 | | 14,932 | |
| Province of Saskatchewan | | 3.400% | | 2/3/42 | CAD | 3,500 | | 3,054 | |
| Province of Saskatchewan | | 3.750% | | 3/5/54 | CAD | 3,795 | | 3,708 | |
| Province of Saskatchewan | | 3.900% | | 6/2/45 | CAD | 8,200 | | 7,820 | |
| Province of Saskatchewan | | 4.750% | | 6/1/40 | CAD | 7,400 | | 7,607 | |
| Province of Saskatchewan | | 5.000% | | 3/5/37 | CAD | 240 | | 246 | |
| Province of Saskatchewan | | 5.750% | | 3/5/29 | CAD | 6,000 | | 5,908 | |
| PSP Capital Inc. | | 1.730% | | 6/21/22 | CAD | 2,000 | | 1,518 | |
| PSP Capital Inc. | | 2.090% | | 11/22/23 | CAD | 4,000 | | 3,072 | |
| PSP Capital Inc. | | 3.000% | | 11/5/25 | CAD | 6,170 | | 4,970 | |
| PSP Capital Inc. | | 3.290% | | 4/4/24 | CAD | 19,825 | | 15,995 | |
| Regional Municipality of Peel Ontario | | 5.100% | | 6/29/40 | CAD | 1,600 | | 1,679 | |
| Regional Municipality of York | | 2.350% | | 6/9/27 | CAD | 4,990 | | 3,847 | |
| Regional Municipality of York | | 2.500% | | 6/2/26 | CAD | 3,000 | | 2,337 | |
| Regional Municipality of York | | 2.600% | | 12/15/25 | CAD | 5,000 | | 3,918 | |
| Regional Municipality of York | | 4.000% | | 5/31/32 | CAD | 1,500 | | 1,334 | |
| Regional Municipality of York | | 4.050% | | 5/1/34 | CAD | 2,400 | | 2,155 | |
| South Coast British Columbia Transportation Authority | | 3.150% | | 11/16/48 | CAD | 4,394 | | 3,692 | |
31
Total International Bond Index Fund
| | | | | | | Face | | Market | |
| | | | | Maturity | | Amount | | Value· | |
| | | Coupon | | Date | Currency | (000 | ) | ($000 | ) |
| Toronto Hydro Corp. | | 2.520% | | 8/25/26 | CAD | 5,500 | | 4,271 | |
| Toronto Hydro Corp. | | 3.485% | | 2/28/48 | CAD | 4,500 | | 3,761 | |
| | | | | | | | | 6,120,206 | |
Total Canada (Cost $8,062,660) | | | | | | | | 8,232,475 | |
Chile (0.0%) | | | | | | | | | |
Sovereign Bonds (0.0%) | | | | | | | | | |
| Corp. Nacional del Cobre de Chile | | 2.250% | | 7/9/24 | EUR | 3,000 | | 3,645 | |
1 | Republic of Chile | | 0.830% | | 7/2/31 | EUR | 5,430 | | 6,197 | |
1 | Republic of Chile | | 1.440% | | 2/1/29 | EUR | 15,000 | | 18,111 | |
| Republic of Chile | | 1.750% | | 1/20/26 | EUR | 100 | | 121 | |
| Republic of Chile | | 1.875% | | 5/27/30 | EUR | 19,900 | | 25,154 | |
Total Chile (Cost $53,147) | | | | | | | | 53,228 | |
China (0.8%) | | | | | | | | | |
Sovereign Bonds (0.8%) | | | | | | | | | |
| Agricultural Development Bank of China | | 3.750% | | 1/25/29 | CNH | 275,200 | | 38,646 | |
| Agricultural Development Bank of China | | 4.000% | | 11/12/25 | CNH | 339,900 | | 48,706 | |
| Bank of China Ltd. | | 3.300% | | 11/20/20 | HKD | 19,000 | | 2,448 | |
| China Development Bank | | 0.375% | | 11/16/21 | EUR | 21,900 | | 24,601 | |
| China Development Bank | | 0.500% | | 6/1/21 | EUR | 22,800 | | 25,623 | |
| China Development Bank | | 0.625% | | 12/12/22 | EUR | 3,400 | | 3,852 | |
| China Development Bank | | 0.875% | | 1/24/24 | EUR | 1,600 | | 1,834 | |
| China Development Bank | | 3.030% | | 1/18/22 | CNH | 899,800 | | 127,684 | |
| China Development Bank | | 3.300% | | 2/1/24 | CNH | 399,900 | | 56,409 | |
| China Development Bank | | 3.500% | | 8/13/26 | CNH | 205,300 | | 28,596 | |
| China Development Bank | | 3.680% | | 2/26/26 | CNH | 1,063,800 | | 150,252 | |
| China Development Bank | | 4.010% | | 1/9/37 | CNH | 99,900 | | 14,074 | |
| China Government Bond | | 3.000% | | 10/18/20 | CNH | 859,700 | | 122,578 | |
| China Government Bond | | 3.220% | | 12/6/25 | CNH | 328,600 | | 46,597 | |
| China Government Bond | | 3.250% | | 6/6/26 | CNH | 742,800 | | 105,720 | |
| China Government Bond | | 3.860% | | 7/22/49 | CNH | 265,200 | | 37,419 | |
| Export-Import Bank of China | | 0.750% | | 6/8/22 | EUR | 2,840 | | 3,226 | |
| Export-Import Bank of China | | 0.750% | | 5/28/23 | EUR | 33,200 | | 37,855 | |
| Export-Import Bank of China | | 3.280% | | 2/11/24 | CNH | 364,800 | | 51,379 | |
| Industrial & Commercial Bank of China Ltd. | | 0.250% | | 4/25/22 | EUR | 4,611 | | 5,155 | |
| People’s Republic of China | | 3.290% | | 10/18/23 | CNH | 529,800 | | 76,043 | |
| People’s Republic of China | | 3.970% | | 7/23/48 | CNH | 250,000 | | 36,081 | |
| Sinopec Group Overseas Development 2015 Ltd. | | 1.000% | | 4/28/22 | EUR | 22,750 | | 25,851 | |
| State Grid Europe Development 2014 plc | | 2.450% | | 1/26/27 | EUR | 2,240 | | 2,742 | |
| State Grid Overseas Investment 2016 Ltd. | | 1.375% | | 5/2/25 | EUR | 7,000 | | 8,163 | |
| Syngenta Finance NV | | 1.875% | | 11/2/21 | EUR | 5,800 | | 6,641 | |
Total China (Cost $1,126,641) | | | | | | | | 1,088,175 | |
Colombia (0.0%) | | | | | | | | | |
Sovereign Bond (0.0%) | | | | | | | | | |
1 | Republic of Colombia | | 3.875% | | 3/22/26 | EUR | 5,000 | | 6,622 | |
Total Colombia (Cost $6,438) | | | | | | | | 6,622 | |
Croatia (0.0%) | | | | | | | | | |
Sovereign Bonds (0.0%) | | | | | | | | | |
| Republic of Croatia | | 1.125% | | 6/19/29 | EUR | 7,000 | | 8,186 | |
| Republic of Croatia | | 2.700% | | 6/15/28 | EUR | 5,800 | | 7,662 | |
32
Total International Bond Index Fund
| | | | | | | Face | | Market | |
| | | | | Maturity | | Amount | | Value· | |
| | | Coupon | | Date | Currency | (000 | ) | ($000 | ) |
| Republic of Croatia | | 2.750% | | 1/27/30 | EUR | 5,000 | | 6,734 | |
| Republic of Croatia | | 3.000% | | 3/11/25 | EUR | 2,000 | | 2,553 | |
| Republic of Croatia | | 3.000% | | 3/20/27 | EUR | 2,000 | | 2,644 | |
Total Croatia (Cost $27,322) | | | | | | | | 27,779 | |
Cyprus (0.0%) | | | | | | | | | |
Sovereign Bond (0.0%) | | | | | | | | | |
| Republic of Cyprus | | 2.750% | | 2/26/34 | EUR | 5,000 | | 6,960 | |
Total Cyprus (Cost $6,094) | | | | | | | | 6,960 | |
Czech Republic (0.2%) | | | | | | | | | |
Corporate Bonds (0.0%) | | | | | | | | | |
| CPI Property Group SA | | 1.450% | | 4/14/22 | EUR | 5,100 | | 5,820 | |
| CPI Property Group SA | | 2.125% | | 10/4/24 | EUR | 9,400 | | 10,975 | |
| | | | | | | | | 16,795 | |
Sovereign Bonds (0.2%) | | | | | | | | | |
| CEZ AS | | 3.000% | | 6/5/28 | EUR | 2,500 | | 3,237 | |
| CEZ AS | | 4.875% | | 4/16/25 | EUR | 12,500 | | 17,216 | |
| CEZ AS | | 5.000% | | 10/19/21 | EUR | 2,000 | | 2,443 | |
| Czech Republic | | 0.450% | | 10/25/23 | CZK | 469,910 | | 19,909 | |
| Czech Republic | | 0.950% | | 5/15/30 | CZK | 910,000 | | 37,880 | |
| Czech Republic | | 1.000% | | 6/26/26 | CZK | 167,800 | | 7,196 | |
| Czech Republic | | 2.000% | | 10/13/33 | CZK | 120,000 | | 5,594 | |
| Czech Republic | | 2.400% | | 9/17/25 | CZK | 250,000 | | 11,613 | |
| Czech Republic | | 2.500% | | 8/25/28 | CZK | 370,000 | | 17,622 | |
| Czech Republic | | 2.750% | | 7/23/29 | CZK | 688,340 | | 33,704 | |
| Czech Republic | | 3.625% | | 4/14/21 | EUR | 13,155 | | 15,511 | |
| Czech Republic | | 3.750% | | 9/12/20 | CZK | 489,910 | | 21,832 | |
| Czech Republic | | 3.850% | | 9/29/21 | CZK | 350,000 | | 16,025 | |
| Czech Republic | | 3.875% | | 5/24/22 | EUR | 9,950 | | 12,311 | |
| Czech Republic | | 4.200% | | 12/4/36 | CZK | 418,350 | | 25,766 | |
| Czech Republic | | 4.700% | | 9/12/22 | CZK | 130,000 | | 6,230 | |
| Czech Republic | | 4.850% | | 11/26/57 | CZK | 80,000 | | 5,924 | |
| Czech Republic | | 5.700% | | 5/25/24 | CZK | 220,000 | | 11,590 | |
| | | | | | | | | 271,603 | |
Total Czech Republic (Cost $282,460) | | | | | | | | 288,398 | |
Denmark (0.7%) | | | | | | | | | |
Asset-Backed/Commercial Mortgage-Backed Securities (0.1%) | | | | | | |
| Danske Bank A/S | | 0.125% | | 3/9/21 | EUR | 2,300 | | 2,582 | |
| Danske Bank A/S | | 1.250% | | 6/11/21 | EUR | 10,000 | | 11,437 | |
| Danske Bank A/S | | 3.750% | | 6/23/22 | EUR | 500 | | 618 | |
| DLR Kredit A/S | | 1.000% | | 10/1/22 | DKK | 200,000 | | 31,104 | |
| Jyske Realkredit A/S | | 0.250% | | 4/1/21 | EUR | 10,800 | | 12,145 | |
| Jyske Realkredit A/S | | 0.250% | | 7/1/23 | EUR | 8,000 | | 9,087 | |
| Jyske Realkredit A/S | | 0.500% | | 10/1/26 | EUR | 22,180 | | 25,686 | |
| Nordea Kredit Realkreditaktieselskab | | 1.000% | | 10/1/21 | DKK | 200,000 | | 30,799 | |
| Nordea Kredit Realkreditaktieselskab | | 3.500% | | 10/1/44 | DKK | 756 | | 123 | |
| Nykredit Realkredit A/S | | 1.000% | | 7/1/21 | DKK | 285,000 | | 43,574 | |
| Nykredit Realkredit A/S | | 1.000% | | 1/1/22 | DKK | 348,000 | | 53,570 | |
| Nykredit Realkredit A/S | | 2.000% | | 10/1/47 | DKK | 117,992 | | 17,888 | |
| | | | | | | | | 238,613 | |
33
Total International Bond Index Fund
| | | | | | | Face | | Market | |
| | | | | Maturity | | Amount | | Value· | |
| | | Coupon | | Date | Currency | (000 | ) | ($000 | ) |
Corporate Bonds (0.2%) | | | | | | | | | |
| AP Moller - Maersk A/S | | 1.750% | | 3/18/21 | EUR | 3,700 | | 4,225 | |
| AP Moller - Maersk A/S | | 1.750% | | 3/16/26 | EUR | 4,600 | | 5,308 | |
| Carlsberg Breweries A/S | | 0.500% | | 9/6/23 | EUR | 500 | | 568 | |
| Carlsberg Breweries A/S | | 2.500% | | 5/28/24 | EUR | 17,000 | | 20,938 | |
| Carlsberg Breweries A/S | | 2.625% | | 11/15/22 | EUR | 120 | | 145 | |
1 | Danica Pension Livsforsikrings AB | | 4.375% | | 9/29/45 | EUR | 3,400 | | 4,303 | |
| Danske Bank A/S | | 0.125% | | 2/14/22 | EUR | 21,670 | | 24,412 | |
| Danske Bank A/S | | 0.250% | | 11/28/22 | EUR | 16,700 | | 18,736 | |
| Danske Bank A/S | | 0.500% | | 5/6/21 | EUR | 8,600 | | 9,680 | |
| Danske Bank A/S | | 0.750% | | 6/2/23 | EUR | 16,100 | | 18,374 | |
| Danske Bank A/S | | 0.875% | | 5/22/23 | EUR | 23,600 | | 26,752 | |
| Danske Bank A/S | | 1.375% | | 5/24/22 | EUR | 10,000 | | 11,474 | |
| Danske Bank A/S | | 1.625% | | 3/15/24 | EUR | 3,000 | | 3,506 | |
1 | Danske Bank A/S | | 2.500% | | 6/21/29 | EUR | 3,300 | | 3,877 | |
1 | Danske Bank A/S | | 2.750% | | 5/19/26 | EUR | 4,800 | | 5,512 | |
| ISS Global A/S | | 0.875% | | 6/18/26 | EUR | 200 | | 226 | |
| ISS Global A/S | | 1.125% | | 1/7/21 | EUR | 14,752 | | 16,628 | |
| ISS Global A/S | | 1.500% | | 8/31/27 | EUR | 20,100 | | 23,691 | |
| ISS Global A/S | | 2.125% | | 12/2/24 | EUR | 500 | | 605 | |
1 | Jyske Bank A/S | | 2.250% | | 4/5/29 | EUR | 15,100 | | 17,690 | |
| Jyske Realkredit A/S | | 0.375% | | 4/1/25 | EUR | 7,000 | | 8,026 | |
| Nordea Kredit Realkreditaktieselskab | | 1.000% | | 10/1/22 | DKK | 137,000 | | 21,417 | |
| Nykredit Realkredit A/S | | 0.750% | | 7/14/21 | EUR | 300 | | 339 | |
1 | Nykredit Realkredit A/S | | 2.750% | | 11/17/27 | EUR | 7,600 | | 9,006 | |
| Sydbank A/S | | 1.250% | | 2/4/22 | EUR | 10,000 | | 11,397 | |
| Sydbank A/S | | 1.375% | | 9/18/23 | EUR | 10,000 | | 11,586 | |
| | | | | | | | | 278,421 | |
Sovereign Bonds (0.4%) | | | | | | | | | |
| Kingdom of Denmark | | 0.500% | | 11/15/27 | DKK | 461,000 | | 74,591 | |
2 | Kingdom of Denmark | | 0.500% | | 11/15/29 | DKK | 250,000 | | 40,684 | |
| Kingdom of Denmark | | 1.500% | | 11/15/23 | DKK | 242,545 | | 39,444 | |
| Kingdom of Denmark | | 1.750% | | 11/15/25 | DKK | 177,300 | | 30,290 | |
| Kingdom of Denmark | | 3.000% | | 11/15/21 | DKK | 179,410 | | 28,837 | |
| Kingdom of Denmark | | 4.500% | | 11/15/39 | DKK | 672,830 | | 196,608 | |
| Kingdom of Denmark | | 7.000% | | 11/10/24 | DKK | 74,285 | | 15,423 | |
| Kommunekredit | | 0.250% | | 3/29/23 | EUR | 700 | | 798 | |
| Kommunekredit | | 0.250% | | 5/15/23 | EUR | 600 | | 684 | |
| Kommunekredit | | 0.250% | | 2/16/24 | EUR | 2,000 | | 2,287 | |
| Kommunekredit | | 0.625% | | 5/11/26 | EUR | 4,400 | | 5,167 | |
| Kommunekredit | | 0.750% | | 5/18/27 | EUR | 25,578 | | 30,376 | |
| Kommunekredit | | 2.900% | | 11/27/26 | AUD | 1,678 | | 1,247 | |
| Orsted A/S | | 1.500% | | 11/26/29 | EUR | 20,589 | | 25,245 | |
| Orsted A/S | | 2.500% | | 5/16/33 | GBP | 100 | | 139 | |
| Orsted A/S | | 4.875% | | 1/12/32 | GBP | 17,162 | | 29,611 | |
| Orsted A/S | | 5.750% | | 4/9/40 | GBP | 4,000 | | 8,188 | |
1 | Orsted A/S | | 6.250% | | 6/26/13 | EUR | 1,045 | | 1,373 | |
| | | | | | | | | 530,992 | |
Total Denmark (Cost $1,007,071) | | | | | | | | 1,048,026 | |
Finland (0.7%) | | | | | | | | | |
Asset-Backed/Commercial Mortgage-Backed Securities (0.1%) | | | | | | | |
| Aktia Bank Oyj | | 0.250% | | 3/31/22 | EUR | 10,300 | | 11,660 | |
| Danske Bank Oyj | | 0.250% | | 11/26/20 | EUR | 10,000 | | 11,225 | |
34
Total International Bond Index Fund
| | | | | | | Face | | Market | |
| | | | | Maturity | | Amount | | Value· | |
| | | Coupon | | Date | Currency | (000 | ) | ($000 | ) |
| Danske Bank Oyj | | 3.875% | | 6/21/21 | EUR | 2,000 | | 2,384 | |
| Nordea Mortgage Bank plc | | 0.250% | | 11/21/23 | EUR | 5,000 | | 5,701 | |
| Nordea Mortgage Bank plc | | 0.625% | | 3/17/27 | EUR | 13,000 | | 15,287 | |
| Nordea Mortgage Bank plc | | 4.000% | | 2/10/21 | EUR | 12,000 | | 14,130 | |
| OP Mortgage Bank | | 0.250% | | 3/13/24 | EUR | 30,000 | | 34,256 | |
| OP Mortgage Bank | | 0.625% | | 9/4/22 | EUR | 22,700 | | 26,060 | |
| OP Mortgage Bank | | 1.000% | | 11/28/24 | EUR | 7,000 | | 8,313 | |
| OP Mortgage Bank | | 1.500% | | 3/17/21 | EUR | 10,000 | | 11,442 | |
| | | | | | | | | 140,458 | |
Corporate Bonds (0.1%) | | | | | | | | | |
| Aktia Bank Oyj | | 0.375% | | 3/5/26 | EUR | 10,000 | | 11,519 | |
| Citycon Oyj | | 3.750% | | 6/24/20 | EUR | 500 | | 570 | |
| Citycon Treasury BV | | 2.375% | | 1/15/27 | EUR | 10,000 | | 11,252 | |
| Nordea Bank AB | | 1.125% | | 2/12/25 | EUR | 4,500 | | 5,290 | |
1 | Nordea Bank AB | | 1.875% | | 11/10/25 | EUR | 5,000 | | 5,670 | |
| Nordea Bank AB | | 2.375% | | 6/2/22 | GBP | 7,000 | | 9,341 | |
| Nordea Bank AB | | 3.250% | | 7/5/22 | EUR | 5,400 | | 6,559 | |
| Nordea Bank AB | | 4.000% | | 3/29/21 | EUR | 6,110 | | 7,184 | |
| Nordea Mortgage Bank plc | | 0.025% | | 1/24/22 | EUR | 10,000 | | 11,250 | |
| Nordea Mortgage Bank plc | | 0.250% | | 2/28/23 | EUR | 10,800 | | 12,277 | |
| Nordea Mortgage Bank plc | | 0.250% | | 3/18/26 | EUR | 5,000 | | 5,725 | |
| Nordea Mortgage Bank plc | | 0.625% | | 10/19/22 | EUR | 300 | | 344 | |
| OP Corporate Bank plc | | 0.375% | | 8/29/23 | EUR | 6,000 | | 6,796 | |
| OP Corporate Bank plc | | 0.375% | | 2/26/24 | EUR | 6,800 | | 7,708 | |
| OP Corporate Bank plc | | 0.375% | | 6/19/24 | EUR | 5,000 | | 5,605 | |
| OP Corporate Bank plc | | 0.750% | | 3/3/22 | EUR | 1,000 | | 1,139 | |
| OP Corporate Bank plc | | 0.875% | | 6/21/21 | EUR | 8,000 | | 9,076 | |
| OP Corporate Bank plc | | 1.000% | | 5/22/25 | EUR | 10,000 | | 11,703 | |
| OP Corporate Bank plc | | 2.000% | | 3/3/21 | EUR | 3,000 | | 3,446 | |
| OP Corporate Bank plc | | 2.500% | | 5/20/22 | GBP | 1,800 | | 2,410 | |
| OP Mortgage Bank | | 0.050% | | 2/22/23 | EUR | 5,000 | | 5,651 | |
| OP Mortgage Bank | | 0.250% | | 5/11/23 | EUR | 6,745 | | 7,682 | |
| OP Mortgage Bank | | 0.625% | | 2/15/29 | EUR | 10,000 | | 11,791 | |
| Sampo Oyj | | 1.000% | | 9/18/23 | EUR | 500 | | 578 | |
| Sampo Oyj | | 1.500% | | 9/16/21 | EUR | 5,800 | | 6,659 | |
| Stora Enso Oyj | | 2.500% | | 6/7/27 | EUR | 4,500 | | 5,466 | |
| Stora Enso Oyj | | 2.500% | | 3/21/28 | EUR | 100 | | 122 | |
| | | | | | | | | 172,813 | |
Sovereign Bonds (0.5%) | | | | | | | | | |
| Finnvera Oyj | | 0.375% | | 4/9/29 | EUR | 10,000 | | 11,636 | |
6 | Finnvera Oyj | | 0.500% | | 4/13/26 | EUR | 6,500 | | 7,611 | |
6 | Finnvera Oyj | | 0.625% | | 11/19/21 | EUR | 20,000 | | 22,810 | |
| Fortum Oyj | | 2.125% | | 2/27/29 | EUR | 10,580 | | 12,915 | |
| Fortum Oyj | | 2.250% | | 9/6/22 | EUR | 9,500 | | 11,233 | |
| Fortum Oyj | | 4.000% | | 5/24/21 | EUR | 5,000 | | 5,925 | |
| Municipality Finance plc | | 0.625% | | 11/26/26 | EUR | 5,000 | | 5,917 | |
| Municipality Finance plc | | 0.750% | | 12/15/20 | GBP | 1,200 | | 1,553 | |
| Municipality Finance plc | | 1.250% | | 2/23/33 | EUR | 10,000 | | 12,763 | |
| Municipality Finance plc | | 5.000% | | 3/20/24 | AUD | 1,000 | | 795 | |
2 | Republic of Finland | | 0.000% | | 4/15/22 | EUR | 26,000 | | 29,436 | |
2 | Republic of Finland | | 0.000% | | 9/15/23 | EUR | 33,750 | | 38,433 | |
2 | Republic of Finland | | 0.500% | | 4/15/26 | EUR | 36,640 | | 43,191 | |
2 | Republic of Finland | | 0.500% | | 9/15/27 | EUR | 11,000 | | 13,033 | |
2 | Republic of Finland | | 0.500% | | 9/15/29 | EUR | 69,531 | | 82,600 | |
35
Total International Bond Index Fund
| | | | | | | Face | | Market | |
| | | | | Maturity | | Amount | | Value· | |
| | | Coupon | | Date | Currency | (000 | ) | ($000 | ) |
2 | Republic of Finland | | 0.750% | | 4/15/31 | EUR | 64,492 | | 78,588 | |
2 | Republic of Finland | | 0.875% | | 9/15/25 | EUR | 10,500 | | 12,603 | |
2 | Republic of Finland | | 1.125% | | 4/15/34 | EUR | 32,000 | | 41,028 | |
2 | Republic of Finland | | 1.375% | | 4/15/47 | EUR | 21,000 | | 29,694 | |
2 | Republic of Finland | | 1.500% | | 4/15/23 | EUR | 35,140 | | 42,052 | |
2 | Republic of Finland | | 1.625% | | 12/15/20 | GBP | 4,000 | | 5,228 | |
2 | Republic of Finland | | 1.625% | | 9/15/22 | EUR | 7,080 | | 8,406 | |
2 | Republic of Finland | | 2.000% | | 4/15/24 | EUR | 29,000 | | 36,026 | |
2 | Republic of Finland | | 2.625% | | 7/4/42 | EUR | 14,215 | | 24,201 | |
2 | Republic of Finland | | 2.750% | | 7/4/28 | EUR | 11,353 | | 15,995 | |
2 | Republic of Finland | | 3.500% | | 4/15/21 | EUR | 13,000 | | 15,369 | |
2 | Republic of Finland | | 4.000% | | 7/4/25 | EUR | 43,663 | | 61,232 | |
| | | | | | | | | 670,273 | |
Total Finland (Cost $958,443) | | | | | | | | 983,544 | |
France (11.9%) | | | | | | | | | |
Asset-Backed/Commercial Mortgage-Backed Securities (0.7%) | | | | | | | |
| Arkea Home Loans SFH SA | | 1.500% | | 6/1/33 | EUR | 10,000 | | 12,974 | |
| Arkea Home Loans SFH SA | | 2.375% | | 7/11/23 | EUR | 6,000 | | 7,352 | |
| Arkea Home Loans SFH SA | | 4.500% | | 4/13/21 | EUR | 1,000 | | 1,193 | |
| BNP Paribas Home Loan SFH | | 0.250% | | 9/2/21 | EUR | 10,500 | | 11,847 | |
| BNP Paribas Home Loan SFH | | 0.875% | | 11/14/24 | EUR | 5,000 | | 5,898 | |
| BNP Paribas Home Loan SFH | | 3.125% | | 3/22/22 | EUR | 7,000 | | 8,460 | |
| BPCE SFH SA | | 0.398% | | 4/24/25 | EUR | 20,000 | | 23,022 | |
| BPCE SFH SA | | 1.000% | | 2/24/25 | EUR | 13,500 | | 16,043 | |
| BPCE SFH SA | | 1.750% | | 6/27/24 | EUR | 20,000 | | 24,427 | |
| BPCE SFH SA | | 2.375% | | 11/29/23 | EUR | 5,000 | | 6,191 | |
| BPCE SFH SA | | 3.750% | | 9/13/21 | EUR | 6,300 | | 7,569 | |
| BPCE SFH SA | | 4.000% | | 3/23/22 | EUR | 20,000 | | 24,642 | |
| Caisse de Refinancement de l’Habitat SA | | 2.400% | | 1/17/25 | EUR | 1,120 | | 1,421 | |
| Caisse de Refinancement de l’Habitat SA | | 2.500% | | 3/29/21 | CHF | 1,000 | | 1,058 | |
| Caisse de Refinancement de l’Habitat SA | | 3.300% | | 9/23/22 | EUR | 9,500 | | 11,726 | |
| Caisse de Refinancement de l’Habitat SA | | 3.600% | | 9/13/21 | EUR | 2,000 | | 2,396 | |
| Caisse de Refinancement de l’Habitat SA | | 3.600% | | 3/8/24 | EUR | 11,600 | | 15,134 | |
| Caisse de Refinancement de l’Habitat SA | | 3.900% | | 10/20/23 | EUR | 5,000 | | 6,516 | |
| Caisse de Refinancement de l’Habitat SA | | 4.000% | | 6/17/22 | EUR | 19,870 | | 24,705 | |
| Caisse de Refinancement de l’Habitat SA | | 4.300% | | 2/24/23 | EUR | 7,000 | | 9,016 | |
| Caisse Francaise de Financement Local | | 0.200% | | 4/27/23 | EUR | 15,600 | | 17,723 | |
| Caisse Francaise de Financement Local | | 0.375% | | 5/11/24 | EUR | 20,000 | | 22,975 | |
| Caisse Francaise de Financement Local | | 0.375% | | 6/23/25 | EUR | 23,100 | | 26,622 | |
| Caisse Francaise de Financement Local | | 0.625% | | 1/26/23 | EUR | 19,000 | | 21,854 | |
| Caisse Francaise de Financement Local | | 0.750% | | 9/27/27 | EUR | 10,000 | | 11,855 | |
| Caisse Francaise de Financement Local | | 1.000% | | 4/25/28 | EUR | 200 | | 242 | |
| Caisse Francaise de Financement Local | | 1.125% | | 9/9/25 | EUR | 3,400 | | 4,085 | |
| Caisse Francaise de Financement Local | | 1.250% | | 1/22/35 | EUR | 500 | | 633 | |
| Caisse Francaise de Financement Local | | 1.500% | | 6/28/38 | EUR | 5,000 | | 6,647 | |
| Caisse Francaise de Financement Local | | 2.375% | | 1/17/24 | EUR | 12,000 | | 14,903 | |
| Caisse Francaise de Financement Local | | 3.000% | | 10/2/28 | EUR | 9,500 | | 13,439 | |
| Caisse Francaise de Financement Local | | 4.250% | | 1/26/21 | EUR | 7,000 | | 8,252 | |
| Caisse Francaise de Financement Local | | 4.250% | | 1/26/22 | EUR | 3,000 | | 3,694 | |
| Caisse Francaise de Financement Local | | 5.375% | | 7/8/24 | EUR | 4,000 | | 5,644 | |
| Cie de Financement Foncier SA | | 0.200% | | 9/16/22 | EUR | 10,000 | | 11,327 | |
| Cie de Financement Foncier SA | | 0.225% | | 9/14/26 | EUR | 5,600 | | 6,397 | |
| Cie de Financement Foncier SA | | 0.250% | | 3/16/22 | EUR | 16,000 | | 18,101 | |
36
Total International Bond Index Fund
| | | | | | | Face | | Market | |
| | | | | Maturity | | Amount | | Value· | |
| | | Coupon | | Date | Currency | (000 | ) | ($000 | ) |
| Cie de Financement Foncier SA | | 0.250% | | 4/11/23 | EUR | 200 | | 227 | |
| Cie de Financement Foncier SA | | 0.325% | | 9/12/23 | EUR | 23,000 | | 26,278 | |
| Cie de Financement Foncier SA | | 0.500% | | 9/4/24 | EUR | 10,000 | | 11,566 | |
| Cie de Financement Foncier SA | | 0.625% | | 11/12/21 | EUR | 32,000 | | 36,407 | |
| Cie de Financement Foncier SA | | 0.625% | | 2/10/23 | EUR | 22,000 | | 25,293 | |
| Cie de Financement Foncier SA | | 0.750% | | 1/21/25 | EUR | 7,000 | | 8,206 | |
| Cie de Financement Foncier SA | | 1.000% | | 2/2/26 | EUR | 100 | | 120 | |
| Cie de Financement Foncier SA | | 2.000% | | 5/7/24 | EUR | 14,300 | | 17,582 | |
| Cie de Financement Foncier SA | | 2.250% | | 10/13/21 | CHF | 3,000 | | 3,207 | |
| Cie de Financement Foncier SA | | 2.375% | | 11/21/22 | EUR | 5,800 | | 7,006 | |
| Cie de Financement Foncier SA | | 3.500% | | 11/5/20 | EUR | 16,400 | | 18,999 | |
| Cie de Financement Foncier SA | | 3.875% | | 4/25/55 | EUR | 4,000 | | 8,857 | |
| Cie de Financement Foncier SA | | 4.000% | | 10/24/25 | EUR | 25,300 | | 35,320 | |
| Cie de Financement Foncier SA | | 4.250% | | 1/19/22 | EUR | 1,000 | | 1,230 | |
| Cie de Financement Foncier SA | | 4.375% | | 4/15/21 | EUR | 16,628 | | 19,827 | |
| Cie de Financement Foncier SA | | 4.875% | | 5/25/21 | EUR | 16,544 | | 19,967 | |
| Cie de Financement Foncier SA | | 5.500% | | 1/26/27 | GBP | 2,350 | | 3,955 | |
| Cie de Financement Foncier SA | | 5.750% | | 10/4/21 | EUR | 500 | | 623 | |
| Credit Agricole Home Loan SFH SA | | 0.050% | | 8/29/22 | EUR | 1,000 | | 1,128 | |
| Credit Agricole Home Loan SFH SA | | 0.375% | | 10/21/21 | EUR | 10,000 | | 11,323 | |
| Credit Agricole Home Loan SFH SA | | 0.375% | | 9/30/24 | EUR | 5,100 | | 5,872 | |
| Credit Agricole Home Loan SFH SA | | 0.500% | | 2/19/26 | EUR | 1,500 | | 1,745 | |
| Credit Agricole Home Loan SFH SA | | 0.625% | | 11/28/22 | EUR | 16,000 | | 18,385 | |
| Credit Agricole Home Loan SFH SA | | 0.625% | | 9/11/23 | EUR | 3,000 | | 3,469 | |
| Credit Agricole Home Loan SFH SA | | 0.750% | | 5/5/27 | EUR | 36,000 | | 42,665 | |
| Credit Agricole Home Loan SFH SA | | 0.875% | | 8/11/28 | EUR | 15,000 | | 18,013 | |
| Credit Agricole Home Loan SFH SA | | 0.875% | | 5/6/34 | EUR | 15,000 | | 18,058 | |
| Credit Agricole Home Loan SFH SA | | 1.000% | | 1/16/29 | EUR | 5,000 | | 6,075 | |
| Credit Agricole Home Loan SFH SA | | 1.250% | | 3/24/31 | EUR | 18,000 | | 22,573 | |
| Credit Agricole Home Loan SFH SA | | 1.375% | | 2/3/32 | EUR | 4,500 | | 5,737 | |
| Credit Agricole Home Loan SFH SA | | 1.500% | | 9/28/38 | EUR | 5,000 | | 6,648 | |
| Credit Agricole Home Loan SFH SA | | 3.875% | | 1/12/21 | EUR | 7,500 | | 8,787 | |
| Credit Agricole Home Loan SFH SA | | 4.000% | | 1/17/22 | EUR | 5,000 | | 6,117 | |
| Credit Agricole Home Loan SFH SA | | 4.000% | | 7/16/25 | EUR | 2,000 | | 2,770 | |
| Credit Agricole Public Sector SCF SA | | 0.250% | | 10/31/26 | EUR | 1,000 | | 1,142 | |
| Credit Agricole Public Sector SCF SA | | 0.875% | | 8/2/27 | EUR | 700 | | 836 | |
| Credit Agricole Public Sector SCF SA | | 1.875% | | 6/7/23 | EUR | 6,200 | | 7,466 | |
| Credit Mutuel - CIC Home Loan SFH SA | | 0.250% | | 4/30/24 | EUR | 5,000 | | 5,713 | |
| Credit Mutuel - CIC Home Loan SFH SA | | 0.500% | | 1/21/22 | EUR | 10,000 | | 11,366 | |
| Credit Mutuel - CIC Home Loan SFH SA | | 0.625% | | 2/10/25 | EUR | 2,200 | | 2,566 | |
| Credit Mutuel - CIC Home Loan SFH SA | | 0.625% | | 2/2/26 | EUR | 5,000 | | 5,856 | |
| Credit Mutuel - CIC Home Loan SFH SA | | 0.750% | | 9/15/27 | EUR | 8,600 | | 10,189 | |
| Credit Mutuel - CIC Home Loan SFH SA | | 0.875% | | 4/7/26 | EUR | 800 | | 952 | |
| Credit Mutuel - CIC Home Loan SFH SA | | 1.000% | | 1/30/29 | EUR | 5,000 | | 6,072 | |
| Credit Mutuel - CIC Home Loan SFH SA | | 2.500% | | 9/11/23 | EUR | 3,000 | | 3,711 | |
| Credit Mutuel - CIC Home Loan SFH SA | | 4.125% | | 1/16/23 | EUR | 6,100 | | 7,782 | |
| Credit Mutuel - CIC Home Loan SFH SA | | 4.125% | | 1/19/24 | EUR | 6,000 | | 7,948 | |
| Credit Mutuel - CIC Home Loan SFH SA | | 4.375% | | 3/17/21 | EUR | 1,400 | | 1,663 | |
| HSBC SFH France SA | | 0.375% | | 3/11/22 | EUR | 5,000 | | 5,677 | |
| HSBC SFH France SA | | 2.000% | | 10/16/23 | EUR | 2,500 | | 3,046 | |
| La Banque Postale Home Loan SFH SA | | 0.175% | | 4/22/22 | EUR | 5,000 | | 5,652 | |
| La Banque Postale Home Loan SFH SA | | 0.625% | | 6/23/27 | EUR | 2,500 | | 2,936 | |
| La Banque Postale Home Loan SFH SA | | 0.875% | | 2/7/28 | EUR | 1,000 | | 1,199 | |
| La Banque Postale Home Loan SFH SA | | 1.000% | | 10/4/28 | EUR | 5,000 | | 6,063 | |
37
Total International Bond Index Fund
| | | | | | | Face | | Market | |
| | | | | Maturity | | Amount | | Value· | |
| | | Coupon | | Date | Currency | (000 | ) | ($000 | ) |
| La Banque Postale Home Loan SFH SA | | 2.375% | | 1/15/24 | EUR | 4,800 | | 5,958 | |
| Societe Generale SCF SA | | 4.250% | | 2/3/23 | EUR | 4,600 | | 5,897 | |
| Societe Generale SFH SA | | 0.750% | | 1/19/28 | EUR | 10,000 | | 11,894 | |
| Societe Generale SFH SA | | 1.625% | | 1/5/21 | EUR | 10,900 | | 12,444 | |
| Societe Generale SFH SA | | 2.000% | | 4/29/24 | EUR | 13,400 | | 16,478 | |
| Societe Generale SFH SA | | 4.000% | | 1/18/22 | EUR | 2,000 | | 2,447 | |
| | | | | | | | | 992,971 | |
Corporate Bonds (2.2%) | | | | | | | | | |
| Accor SA | | 1.250% | | 1/25/24 | EUR | 9,800 | | 11,323 | |
| Accor SA | | 2.375% | | 9/17/23 | EUR | 2,300 | | 2,771 | |
| Air Liquide Finance SA | | 0.500% | | 6/13/22 | EUR | 1,400 | | 1,587 | |
| Air Liquide Finance SA | | 1.000% | | 3/8/27 | EUR | 100 | | 119 | |
| Air Liquide Finance SA | | 1.250% | | 6/3/25 | EUR | 5,600 | | 6,688 | |
| Air Liquide Finance SA | | 1.250% | | 6/13/28 | EUR | 1,000 | | 1,220 | |
| Air Liquide Finance SA | | 2.125% | | 10/15/21 | EUR | 5,300 | | 6,175 | |
| Air Liquide SA | | 2.375% | | 9/6/23 | EUR | 2,300 | | 2,811 | |
| Airbus Finance BV | | 0.875% | | 5/13/26 | EUR | 5,800 | | 6,770 | |
| Airbus Finance BV | | 1.375% | | 5/13/31 | EUR | 6,536 | | 7,962 | |
| Airbus Finance BV | | 2.125% | | 10/29/29 | EUR | 700 | | 919 | |
| Airbus Finance BV | | 2.375% | | 4/2/24 | EUR | 9,300 | | 11,379 | |
| Altarea SCA | | 2.250% | | 7/5/24 | EUR | 10,000 | | 11,755 | |
| APRR SA | | 1.125% | | 1/15/21 | EUR | 13,400 | | 15,127 | |
| APRR SA | | 1.125% | | 1/9/26 | EUR | 10,700 | | 12,666 | |
| APRR SA | | 1.250% | | 1/6/27 | EUR | 10,800 | | 12,961 | |
| APRR SA | | 1.250% | | 1/18/28 | EUR | 1,200 | | 1,442 | |
| APRR SA | | 1.500% | | 1/15/24 | EUR | 600 | | 710 | |
| APRR SA | | 1.500% | | 1/25/30 | EUR | 600 | | 741 | |
| APRR SA | | 1.500% | | 1/17/33 | EUR | 300 | | 370 | |
| APRR SA | | 1.625% | | 1/13/32 | EUR | 9,400 | | 11,696 | |
| APRR SA | | 1.875% | | 1/15/25 | EUR | 2,400 | | 2,921 | |
| APRR SA | | 1.875% | | 1/6/31 | EUR | 200 | | 255 | |
| Arkea Home Loans SFH SA | | 0.375% | | 3/4/24 | EUR | 1,000 | | 1,146 | |
| Arkea Home Loans SFH SA | | 0.750% | | 10/5/27 | EUR | 100 | | 119 | |
| Arkema SA | | 1.500% | | 1/20/25 | EUR | 400 | | 477 | |
| Arkema SA | | 1.500% | | 4/20/27 | EUR | 17,600 | | 21,233 | |
| Atos SE | | 1.750% | | 5/7/25 | EUR | 8,600 | | 10,316 | |
| Auchan Holding SADIR | | 0.625% | | 2/7/22 | EUR | 100 | | 112 | |
| Auchan Holding SADIR | | 1.750% | | 4/23/21 | EUR | 3,100 | | 3,540 | |
| Auchan Holding SADIR | | 2.375% | | 12/12/22 | EUR | 2,000 | | 2,338 | |
| Auchan Holding SADIR | | 2.375% | | 4/25/25 | EUR | 1,300 | | 1,491 | |
| Auchan Holding SADIR | | 2.625% | | 1/30/24 | EUR | 6,900 | | 8,155 | |
| Autoroutes du Sud de la France SA | | 1.000% | | 5/13/26 | EUR | 10,700 | | 12,609 | |
| Autoroutes du Sud de la France SA | | 1.125% | | 4/20/26 | EUR | 1,400 | | 1,661 | |
| Autoroutes du Sud de la France SA | | 1.250% | | 1/18/27 | EUR | 400 | | 482 | |
| Autoroutes du Sud de la France SA | | 1.375% | | 2/21/31 | EUR | 8,000 | | 9,739 | |
| Autoroutes du Sud de la France SA | | 2.875% | | 1/18/23 | EUR | 3,400 | | 4,151 | |
| Autoroutes du Sud de la France SA | | 2.950% | | 1/17/24 | EUR | 5,200 | | 6,487 | |
| Autoroutes du Sud de la France SA | | 5.625% | | 7/4/22 | EUR | 100 | | 128 | |
| AXA Bank Europe SCF | | 0.125% | | 3/14/22 | EUR | 1,000 | | 1,127 | |
| AXA Bank Europe SCF | | 0.375% | | 3/23/23 | EUR | 1,000 | | 1,141 | |
| AXA Bank Europe SCF | | 1.375% | | 4/18/33 | EUR | 15,600 | | 19,886 | |
| AXA SA | | 1.125% | | 5/15/28 | EUR | 700 | | 853 | |
1 | AXA SA | | 3.250% | | 5/28/49 | EUR | 18,300 | | 23,164 | |
1 | AXA SA | | 3.375% | | 7/6/47 | EUR | 28,850 | | 36,653 | |
38
Total International Bond Index Fund
| | | | | | | Face | | Market | |
| | | | | Maturity | | Amount | | Value· | |
| | | Coupon | | Date | Currency | (000 | ) | ($000 | ) |
1 | AXA SA | | 3.875% | | 5/20/49 | EUR | 4,050 | | 5,100 | |
1 | AXA SA | | 3.941% | | 11/29/49 | EUR | 1,930 | | 2,411 | |
1 | AXA SA | | 5.125% | | 7/4/43 | EUR | 2,240 | | 2,908 | |
1 | AXA SA | | 5.453% | | 12/31/49 | GBP | 150 | | 218 | |
1 | AXA SA | | 5.625% | | 1/16/54 | GBP | 10,570 | | 16,726 | |
1 | AXA SA | | 6.686% | | 7/29/49 | GBP | 1,800 | | 2,787 | |
| AXA SA | | 7.125% | | 12/15/20 | GBP | 6,290 | | 8,655 | |
| Banque Federative du Credit Mutuel SA | | 0.375% | | 1/13/22 | EUR | 2,000 | | 2,253 | |
| Banque Federative du Credit Mutuel SA | | 0.384% | | 10/11/24 | JPY | 200,000 | | 1,865 | |
| Banque Federative du Credit Mutuel SA | | 0.443% | | 10/12/23 | JPY | 400,000 | | 3,735 | |
| Banque Federative du Credit Mutuel SA | | 0.500% | | 11/16/22 | EUR | 17,000 | | 19,266 | |
| Banque Federative du Credit Mutuel SA | | 0.750% | | 6/15/23 | EUR | 63,100 | | 72,215 | |
| Banque Federative du Credit Mutuel SA | | 0.750% | | 7/17/25 | EUR | 5,200 | | 5,986 | |
| Banque Federative du Credit Mutuel SA | | 0.750% | | 6/8/26 | EUR | 16,800 | | 19,323 | |
| Banque Federative du Credit Mutuel SA | | 1.250% | | 1/14/25 | EUR | 44,800 | | 52,788 | |
| Banque Federative du Credit Mutuel SA | | 1.625% | | 1/19/26 | EUR | 10,500 | | 12,720 | |
| Banque Federative du Credit Mutuel SA | | 1.625% | | 11/15/27 | EUR | 4,800 | | 5,656 | |
| Banque Federative du Credit Mutuel SA | | 1.750% | | 12/19/24 | GBP | 5,000 | | 6,583 | |
| Banque Federative du Credit Mutuel SA | | 1.875% | | 11/4/26 | EUR | 5,600 | | 6,693 | |
| Banque Federative du Credit Mutuel SA | | 2.250% | | 12/18/23 | GBP | 6,500 | | 8,724 | |
| Banque Federative du Credit Mutuel SA | | 2.375% | | 3/24/26 | EUR | 21,200 | | 25,990 | |
| Banque Federative du Credit Mutuel SA | | 2.500% | | 5/25/28 | EUR | 5,000 | | 6,269 | |
| Banque Federative du Credit Mutuel SA | | 2.625% | | 2/24/21 | EUR | 16,000 | | 18,500 | |
| Banque Federative du Credit Mutuel SA | | 2.625% | | 3/18/24 | EUR | 10,000 | | 12,398 | |
| Banque Federative du Credit Mutuel SA | | 2.625% | | 3/31/27 | EUR | 1,100 | | 1,389 | |
| Banque Federative du Credit Mutuel SA | | 3.000% | | 11/28/23 | EUR | 8,200 | | 10,263 | |
| Banque Federative du Credit Mutuel SA | | 3.000% | | 5/21/24 | EUR | 19,324 | | 23,952 | |
| Banque Federative du Credit Mutuel SA | | 3.000% | | 9/11/25 | EUR | 5,000 | | 6,333 | |
| Banque Federative du Credit Mutuel SA | | 3.250% | | 8/23/22 | EUR | 6,300 | | 7,700 | |
1 | BNP Paribas Cardif SA | | 4.032% | | 11/29/49 | EUR | 1,200 | | 1,493 | |
| BNP Paribas SA | | 0.500% | | 6/1/22 | EUR | 5,000 | | 5,671 | |
| BNP Paribas SA | | 1.000% | | 6/27/24 | EUR | 5,000 | | 5,761 | |
| BNP Paribas SA | | 1.125% | | 8/16/22 | GBP | 4,000 | | 5,188 | |
| BNP Paribas SA | | 1.125% | | 1/15/23 | EUR | 1,100 | | 1,273 | |
| BNP Paribas SA | | 1.125% | | 10/10/23 | EUR | 11,800 | | 13,631 | |
| BNP Paribas SA | | 1.125% | | 11/22/23 | EUR | 500 | | 578 | |
| BNP Paribas SA | | 1.125% | | 6/11/26 | EUR | 37,000 | | 43,085 | |
| BNP Paribas SA | | 1.250% | | 3/19/25 | EUR | 10,000 | | 11,687 | |
| BNP Paribas SA | | 1.500% | | 11/17/25 | EUR | 20,500 | | 24,330 | |
| BNP Paribas SA | | 2.125% | | 1/23/27 | EUR | 15,000 | | 18,374 | |
| BNP Paribas SA | | 2.250% | | 1/13/21 | EUR | 12,500 | | 14,349 | |
| BNP Paribas SA | | 2.375% | | 5/20/24 | EUR | 8,500 | | 10,472 | |
| BNP Paribas SA | | 2.375% | | 2/17/25 | EUR | 5,000 | | 6,058 | |
1 | BNP Paribas SA | | 2.625% | | 10/14/27 | EUR | 4,100 | | 4,863 | |
| BNP Paribas SA | | 2.875% | | 10/24/22 | EUR | 5,000 | | 6,071 | |
| BNP Paribas SA | | 2.875% | | 9/26/23 | EUR | 5,550 | | 6,882 | |
1 | BNP Paribas SA | | 2.875% | | 3/20/26 | EUR | 6,000 | | 6,934 | |
| BNP Paribas SA | | 2.875% | | 10/1/26 | EUR | 4,800 | | 6,095 | |
| BNP Paribas SA | | 3.375% | | 1/23/26 | GBP | 1,700 | | 2,393 | |
| BNP Paribas SA | | 4.125% | | 1/14/22 | EUR | 200 | | 244 | |
| BNP Paribas SA | | 4.500% | | 3/21/23 | EUR | 160 | | 206 | |
| Bouygues SA | | 1.375% | | 6/7/27 | EUR | 3,700 | | 4,505 | |
| Bouygues SA | | 3.625% | | 1/16/23 | EUR | 2,500 | | 3,129 | |
| Bouygues SA | | 4.500% | | 2/9/22 | EUR | 18,500 | | 22,840 | |
39
Total International Bond Index Fund
| | | | | | | Face | | Market | |
| | | | | Maturity | | Amount | | Value· | |
| | | Coupon | | Date | Currency | (000 | ) | ($000 | ) |
| Bouygues SA | | 5.500% | | 10/6/26 | GBP | 6,100 | | 9,937 | |
| BPCE SA | | 0.375% | | 10/5/23 | EUR | 14,100 | | 15,934 | |
| BPCE SA | | 0.625% | | 9/26/24 | EUR | 6,900 | | 7,807 | |
| BPCE SA | | 0.640% | | 1/27/22 | JPY | 1,700,000 | | 15,821 | |
| BPCE SA | | 0.875% | | 1/31/24 | EUR | 14,200 | | 16,246 | |
| BPCE SA | | 1.000% | | 7/15/24 | EUR | 8,500 | | 9,883 | |
| BPCE SA | | 1.000% | | 4/1/25 | EUR | 15,000 | | 17,279 | |
| BPCE SA | | 1.000% | | 10/5/28 | EUR | 10,000 | | 11,794 | |
| BPCE SA | | 1.125% | | 1/18/23 | EUR | 3,800 | | 4,375 | |
| BPCE SA | | 2.125% | | 3/17/21 | EUR | 9,100 | | 10,472 | |
1 | BPCE SA | | 2.750% | | 7/8/26 | EUR | 4,000 | | 4,644 | |
1 | BPCE SA | | 2.750% | | 11/30/27 | EUR | 5,100 | | 6,098 | |
| BPCE SA | | 2.875% | | 1/16/24 | EUR | 13,500 | | 16,840 | |
| BPCE SA | | 4.250% | | 2/6/23 | EUR | 100 | | 127 | |
| BPCE SA | | 4.500% | | 4/26/28 | AUD | 1,300 | | 999 | |
| BPCE SA | | 5.250% | | 4/16/29 | GBP | 3,000 | | 4,801 | |
| BPCE SFH SA | | 0.375% | | 2/10/23 | EUR | 5,100 | | 5,823 | |
| BPCE SFH SA | | 0.375% | | 2/21/24 | EUR | 12,700 | | 14,563 | |
| BPCE SFH SA | | 0.625% | | 9/22/27 | EUR | 5,000 | | 5,876 | |
| BPCE SFH SA | | 0.875% | | 4/13/28 | EUR | 12,100 | | 14,509 | |
| BPCE SFH SA | | 1.000% | | 6/8/29 | EUR | 4,600 | | 5,591 | |
| Caisse Francaise de Financement Local | | 0.500% | | 4/13/22 | EUR | 5,000 | | 5,699 | |
| Caisse Francaise de Financement Local | | 0.500% | | 1/19/26 | EUR | 1,500 | | 1,742 | |
| Caisse Francaise de Financement Local | | 0.625% | | 4/13/26 | EUR | 6,000 | | 7,018 | |
| Caisse Francaise de Financement Local | | 0.750% | | 1/11/27 | EUR | 8,000 | | 9,475 | |
| Caisse Francaise de Financement Local | | 1.250% | | 5/11/32 | EUR | 19,000 | | 23,921 | |
| Caisse Francaise de Financement Local | | 1.450% | | 1/16/34 | EUR | 5,000 | | 6,485 | |
| Caisse Francaise de Financement Local | | 1.500% | | 1/13/31 | EUR | 10,000 | | 12,844 | |
| Caisse Nationale de Reassurance Mutuelle Agricole Groupama | | 3.375% | | 9/24/28 | EUR | 5,600 | | 6,849 | |
| Caisse Nationale de Reassurance Mutuelle Agricole Groupama | | 6.000% | | 1/23/27 | EUR | 5,100 | | 7,248 | |
| Capgemini SE | | 0.500% | | 11/9/21 | EUR | 200 | | 225 | |
| Capgemini SE | | 1.000% | | 10/18/24 | EUR | 300 | | 347 | |
| Capgemini SE | | 1.750% | | 4/18/28 | EUR | 9,300 | | 11,486 | |
| Capgemini SE | | 2.500% | | 7/1/23 | EUR | 6,000 | | 7,236 | |
| Carmila SA | | 2.125% | | 3/7/28 | EUR | 1,500 | | 1,765 | |
| Carmila SA | | 2.375% | | 9/16/24 | EUR | 4,100 | | 4,937 | |
| Carrefour SA | | 0.750% | | 4/26/24 | EUR | 9,100 | | 10,364 | |
| Carrefour SA | | 0.875% | | 6/12/23 | EUR | 200 | | 227 | |
| Carrefour SA | | 1.250% | | 6/3/25 | EUR | 17,103 | | 19,973 | |
| Carrefour SA | | 1.750% | | 5/4/26 | EUR | 1,000 | | 1,197 | |
| Cie de Financement Foncier SA | | 0.375% | | 12/11/24 | EUR | 1,500 | | 1,726 | |
| Cie de Financement Foncier SA | | 0.375% | | 4/9/27 | EUR | 5,000 | | 5,769 | |
| Cie de Financement Foncier SA | | 0.750% | | 5/29/26 | EUR | 2,100 | | 2,481 | |
| Cie de Financement Foncier SA | | 0.750% | | 1/11/28 | EUR | 11,000 | | 13,071 | |
| Cie de Saint-Gobain | | 1.000% | | 3/17/25 | EUR | 900 | | 1,046 | |
| Cie de Saint-Gobain | | 1.875% | | 9/21/28 | EUR | 100 | | 125 | |
| Cie de Saint-Gobain | | 1.875% | | 3/15/31 | EUR | 11,500 | | 14,260 | |
| Cie Financiere et Industrielle des Autoroutes SA | | 0.375% | | 2/7/25 | EUR | 7,700 | | 8,748 | |
| Cie Financiere et Industrielle des Autoroutes SA | | 1.125% | | 10/13/27 | EUR | 1,000 | | 1,199 | |
40
Total International Bond Index Fund
| | | | | | | Face | | Market | |
| | | | | Maturity | | Amount | | Value· | |
| | | Coupon | | Date | Currency | (000 | ) | ($000 | ) |
| Cie Generale des Etablissements Michelin SCA | | 2.500% | | 9/3/38 | EUR | 5,100 | | 7,324 | |
1 | CNP Assurances | | 4.500% | | 6/10/47 | EUR | 4,600 | | 6,148 | |
| Compagnie De St. Gobain SA | | 3.625% | | 3/28/22 | EUR | 4,900 | | 5,949 | |
| Compagnie Financiere et Industrielle des Autoroutes SA | | 5.000% | | 5/24/21 | EUR | 17,400 | | 20,942 | |
| Covivio | | 1.875% | | 5/20/26 | EUR | 300 | | 363 | |
1 | Credit Agricole Assurances SA | | 4.250% | | 12/31/49 | EUR | 3,000 | | 3,682 | |
1 | Credit Agricole Assurances SA | | 4.750% | | 9/27/48 | EUR | 6,600 | | 8,853 | |
| Credit Agricole Public Sector SCF SA | | 0.500% | | 10/10/25 | EUR | 21,600 | | 25,080 | |
| Credit Agricole Public Sector SCF SA | | 0.625% | | 3/29/29 | EUR | 14,000 | | 16,419 | |
| Credit Agricole SA | | 0.443% | | 6/9/22 | JPY | 500,000 | | 4,680 | |
| Credit Agricole SA | | 0.750% | | 12/1/22 | EUR | 5,000 | | 5,725 | |
| Credit Agricole SA | | 0.875% | | 1/19/22 | EUR | 12,400 | | 14,141 | |
| Credit Agricole SA | | 1.000% | | 9/16/24 | EUR | 2,000 | | 2,329 | |
| Credit Agricole SA | | 1.000% | | 7/3/29 | EUR | 27,000 | | 31,664 | |
| Credit Agricole SA | | 1.375% | | 5/3/27 | EUR | 1,200 | | 1,448 | |
| Credit Agricole SA | | 1.750% | | 3/5/29 | EUR | 8,000 | | 9,800 | |
| Credit Agricole SA | | 1.875% | | 12/20/26 | EUR | 10,100 | | 12,367 | |
| Credit Agricole SA | | 2.000% | | 3/25/29 | EUR | 4,600 | | 5,524 | |
| Credit Agricole SA | | 2.375% | | 11/27/20 | EUR | 2,000 | | 2,294 | |
| Credit Agricole SA | | 2.375% | | 5/20/24 | EUR | 9,000 | | 11,090 | |
| Credit Agricole SA | | 2.625% | | 3/17/27 | EUR | 20,100 | | 25,276 | |
| Credit Agricole SA | | 3.125% | | 7/17/23 | EUR | 700 | | 874 | |
| Credit Agricole SA | | 3.125% | | 2/5/26 | EUR | 4,100 | | 5,409 | |
| Credit Agricole SA | | 3.900% | | 4/19/21 | EUR | 100 | | 118 | |
| Credit Agricole SA | | 7.375% | | 12/18/23 | GBP | 800 | | 1,271 | |
| Credit Mutuel - CIC Home Loan SFH SA | | 1.750% | | 6/19/24 | EUR | 30,000 | | 36,632 | |
| Credit Mutuel Arkea SA | | 1.000% | | 1/26/23 | EUR | 8,500 | | 9,785 | |
| Credit Mutuel Arkea SA | | 1.125% | | 5/23/29 | EUR | 2,300 | | 2,692 | |
| Credit Mutuel Arkea SA | | 1.250% | | 5/31/24 | EUR | 21,500 | | 24,927 | |
1 | Credit Mutuel Arkea SA | | 1.875% | | 10/25/29 | EUR | 100 | | 114 | |
| Credit Mutuel Arkea SA | | 3.375% | | 3/11/31 | EUR | 3,000 | | 3,890 | |
| Credit Mutuel Arkea SA | | 3.500% | | 2/9/29 | EUR | 19,700 | | 25,682 | |
| Danone SA | | 0.167% | | 11/3/20 | EUR | 27,400 | | 30,653 | |
| Danone SA | | 0.424% | | 11/3/22 | EUR | 6,300 | | 7,123 | |
| Danone SA | | 0.709% | | 11/3/24 | EUR | 600 | | 691 | |
| Danone SA | | 1.208% | | 11/3/28 | EUR | 5,000 | | 6,080 | |
| Danone SA | | 1.250% | | 5/30/24 | EUR | 200 | | 236 | |
| Danone SA | | 2.250% | | 11/15/21 | EUR | 2,000 | | 2,327 | |
| Danone SA | | 2.600% | | 6/28/23 | EUR | 5,700 | | 6,977 | |
| Danone SA | | 3.600% | | 11/23/20 | EUR | 500 | | 580 | |
| Dassault Systemes SE | | 0.125% | | 9/16/26 | EUR | 5,000 | | 5,565 | |
| Dassault Systemes SE | | 0.375% | | 9/16/29 | EUR | 10,000 | | 11,122 | |
| Edenred | | 1.375% | | 3/10/25 | EUR | 100 | | 118 | |
| Engie Alliance GIE | | 5.750% | | 6/24/23 | EUR | 5,988 | | 8,082 | |
| Engie SA | | 0.500% | | 3/13/22 | EUR | 15,200 | | 17,177 | |
| Engie SA | | 0.875% | | 3/27/24 | EUR | 2,100 | | 2,433 | |
| Engie SA | | 0.875% | | 9/19/25 | EUR | 13,500 | | 15,757 | |
| Engie SA | | 1.375% | | 6/22/28 | EUR | 1,700 | | 2,073 | |
| Engie SA | | 1.375% | | 2/28/29 | EUR | 8,700 | | 10,610 | |
| Engie SA | | 1.375% | | 6/21/39 | EUR | 8,000 | | 9,515 | |
1 | Engie SA | | 1.375% | | 12/31/49 | EUR | 5,100 | | 5,740 | |
| Engie SA | | 2.000% | | 9/28/37 | EUR | 100 | | 132 | |
41
Total International Bond Index Fund
| | | | | | | Face | | Market | |
| | | | | Maturity | | Amount | | Value· | |
| | | Coupon | | Date | Currency | (000 | ) | ($000 | ) |
| Engie SA | | 2.375% | | 5/19/26 | EUR | 200 | | 257 | |
| Engie SA | | 2.625% | | 7/20/22 | EUR | 800 | | 959 | |
| Engie SA | | 3.000% | | 2/1/23 | EUR | 4,000 | | 4,905 | |
1 | Engie SA | | 3.875% | | 6/2/49 | EUR | 3,700 | | 4,630 | |
| Engie SA | | 5.000% | | 10/1/60 | GBP | 3,550 | | 8,005 | |
| Engie SA | | 5.950% | | 3/16/11 | EUR | 6,172 | | 13,132 | |
| Engie SA | | 6.375% | | 1/18/21 | EUR | 30 | | 36 | |
| Engie SA | | 7.000% | | 10/30/28 | GBP | 3,450 | | 6,556 | |
| Eutelsat SA | | 2.000% | | 10/2/25 | EUR | 9,500 | | 11,147 | |
| Eutelsat SA | | 2.250% | | 7/13/27 | EUR | 3,000 | | 3,524 | |
| Gecina SA | | 1.000% | | 1/30/29 | EUR | 2,300 | | 2,699 | |
| Gecina SA | | 1.375% | | 6/30/27 | EUR | 100 | | 121 | |
| Gecina SA | | 1.375% | | 1/26/28 | EUR | 1,100 | | 1,331 | |
| Gecina SA | | 1.500% | | 1/20/25 | EUR | 9,200 | | 10,997 | |
| GELF Bond Issuer I SA | | 1.125% | | 7/18/29 | EUR | 200 | | 224 | |
| Holding d’Infrastructures de Transport SAS | | 1.625% | | 11/27/27 | EUR | 2,400 | | 2,803 | |
| Holding d’Infrastructures de Transport SAS | | 2.250% | | 3/24/25 | EUR | 4,300 | | 5,168 | |
| Holding d’Infrastructures de Transport SAS | | 4.875% | | 10/27/21 | EUR | 1,700 | | 2,078 | |
| HSBC France SA | | 0.100% | | 9/3/27 | EUR | 10,000 | | 10,970 | |
| HSBC France SA | | 0.200% | | 9/4/21 | EUR | 19,000 | | 21,309 | |
| HSBC France SA | | 0.250% | | 5/17/24 | EUR | 3,000 | | 3,375 | |
| HSBC France SA | | 0.625% | | 12/3/20 | EUR | 100 | | 113 | |
| ICADE | | 1.125% | | 11/17/25 | EUR | 10,700 | | 12,497 | |
| ICADE | | 1.875% | | 9/14/22 | EUR | 100 | | 117 | |
| Imerys SA | | 0.875% | | 3/31/22 | EUR | 600 | | 678 | |
| Imerys SA | | 1.500% | | 1/15/27 | EUR | 1,100 | | 1,268 | |
| Imerys SA | | 2.000% | | 12/10/24 | EUR | 600 | | 715 | |
| Indigo Group SAS | | 1.625% | | 4/19/28 | EUR | 500 | | 599 | |
| JCDecaux SA | | 1.000% | | 6/1/23 | EUR | 10,000 | | 11,474 | |
| Kering SA | | 1.250% | | 5/10/26 | EUR | 9,300 | | 11,175 | |
| Klepierre SA | | 0.625% | | 7/1/30 | EUR | 6,000 | | 6,652 | |
| Klepierre SA | | 1.000% | | 4/17/23 | EUR | 2,100 | | 2,416 | |
| Klepierre SA | | 1.250% | | 9/29/31 | EUR | 200 | | 236 | |
| Klepierre SA | | 1.375% | | 2/16/27 | EUR | 1,200 | | 1,434 | |
| Klepierre SA | | 1.875% | | 2/19/26 | EUR | 7,600 | | 9,271 | |
1 | La Mondiale SAM | | 5.050% | | 12/31/49 | EUR | 2,800 | | 3,595 | |
| Legrand SA | | 0.750% | | 7/6/24 | EUR | 200 | | 231 | |
| Legrand SA | | 1.000% | | 3/6/26 | EUR | 100 | | 117 | |
| Legrand SA | | 1.875% | | 12/16/27 | EUR | 100 | | 123 | |
| Legrand SA | | 1.875% | | 7/6/32 | EUR | 1,300 | | 1,665 | |
| Legrand SA | | 3.375% | | 4/19/22 | EUR | 300 | | 363 | |
| LVMH Moet Hennessy Louis Vuitton SE | | 0.375% | | 5/26/22 | EUR | 750 | | 846 | |
| LVMH Moet Hennessy Louis Vuitton SE | | 0.750% | | 5/26/24 | EUR | 10,077 | | 11,631 | |
| LVMH Moet Hennessy Louis Vuitton SE | | 1.000% | | 9/24/21 | EUR | 2,000 | | 2,276 | |
| LVMH Moet Hennessy Louis Vuitton SE | | 1.000% | | 6/14/22 | GBP | 9,000 | | 11,698 | |
| LVMH Moet Hennessy Louis Vuitton SE | | 1.750% | | 11/13/20 | EUR | 100 | | 114 | |
| Mercialys SA | | 1.787% | | 3/31/23 | EUR | 5,100 | | 5,782 | |
| Michelin Luxembourg SCS | | 1.125% | | 5/28/22 | EUR | 200 | | 230 | |
| Michelin Luxembourg SCS | | 1.750% | | 5/28/27 | EUR | 100 | | 124 | |
| MMS USA Financing Inc. | | 0.625% | | 6/13/25 | EUR | 12,200 | | 13,514 | |
| MMS USA Financing Inc. | | 1.250% | | 6/13/28 | EUR | 200 | | 226 | |
| Orange SA | | 0.500% | | 1/15/22 | EUR | 500 | | 565 | |
| Orange SA | | 0.750% | | 9/11/23 | EUR | 1,800 | | 2,062 | |
| Orange SA | | 0.875% | | 2/3/27 | EUR | 1,500 | | 1,748 | |
42
Total International Bond Index Fund
| | | | | | | Face | | Market | |
| | | | | Maturity | | Amount | | Value· | |
| | | Coupon | | Date | Currency | (000 | ) | ($000 | ) |
| Orange SA | | 1.000% | | 5/12/25 | EUR | 10,100 | | 11,792 | |
| Orange SA | | 1.000% | | 9/12/25 | EUR | 10,200 | | 11,928 | |
| Orange SA | | 1.125% | | 7/15/24 | EUR | 19,100 | | 22,317 | |
| Orange SA | | 1.375% | | 3/20/28 | EUR | 21,000 | | 25,344 | |
| Orange SA | | 1.375% | | 1/16/30 | EUR | 2,400 | | 2,905 | |
| Orange SA | | 1.875% | | 9/12/30 | EUR | 37,100 | | 47,228 | |
| Orange SA | | 2.000% | | 1/15/29 | EUR | 200 | | 254 | |
| Orange SA | | 2.500% | | 3/1/23 | EUR | 200 | | 242 | |
| Orange SA | | 3.125% | | 1/9/24 | EUR | 300 | | 378 | |
| Orange SA | | 3.250% | | 1/15/32 | GBP | 10,000 | | 14,571 | |
| Orange SA | | 3.375% | | 9/16/22 | EUR | 1,800 | | 2,216 | |
| Orange SA | | 3.875% | | 1/14/21 | EUR | 200 | | 234 | |
1 | Orange SA | | 4.000% | | 12/31/49 | EUR | 18,600 | | 22,200 | |
| Orange SA | | 5.000% | | 10/1/66 | EUR | 7,500 | | 10,119 | |
| Orange SA | | 5.250% | | 12/5/25 | GBP | 3,900 | | 6,192 | |
1 | Orange SA | | 5.250% | | 12/ 31/49 | EUR | 12,050 | | 15,698 | |
| Orange SA | | 5.625% | | 1/23/34 | GBP | 400 | | 736 | |
1 | Orange SA | | 5.750% | | 12/31/49 | GBP | 7,000 | | 10,025 | |
1 | Orange SA | | 5.875% | | 12/31/49 | GBP | 8,600 | | 12,059 | |
| Orange SA | | 7.250% | | 11/10/20 | GBP | 400 | | 551 | |
| Orange SA | | 8.125% | | 11/20/28 | GBP | 6,500 | | 12,834 | |
| Orange SA | | 8.125% | | 1/28/33 | EUR | 600 | | 1,270 | |
| Pernod Ricard SA | | 1.500% | | 5/18/26 | EUR | 3,000 | | 3,604 | |
| Peugeot SA | | 2.000% | | 3/20/25 | EUR | 3,700 | | 4,415 | |
| PSA Tresorerie GIE | | 6.000% | | 9/19/33 | EUR | 3,950 | | 6,421 | |
| Publicis Groupe SA | | 0.500% | | 11/3/23 | EUR | 400 | | 450 | |
| Publicis Groupe SA | | 1.125% | | 12/16/21 | EUR | 10,000 | | 11,385 | |
| Publicis Groupe SA | | 1.625% | | 12/16/24 | EUR | 5,200 | | 6,151 | |
| RCI Banque SA | | 0.250% | | 7/12/21 | EUR | 900 | | 1,006 | |
| RCI Banque SA | | 0.625% | | 11/10/21 | EUR | 1,967 | | 2,210 | |
| RCI Banque SA | | 0.750% | | 1/12/22 | EUR | 900 | | 1,012 | |
| RCI Banque SA | | 0.750% | | 9/26/22 | EUR | 10,300 | | 11,582 | |
| RCI Banque SA | | 1.000% | | 5/17/23 | EUR | 6,400 | | 7,221 | |
| RCI Banque SA | | 1.375% | | 11/17/20 | EUR | 4,000 | | 4,525 | |
| RCI Banque SA | | 1.375% | | 3/8/24 | EUR | 11,000 | | 12,564 | |
| RCI Banque SA | | 1.625% | | 4/11/25 | EUR | 9,400 | | 10,792 | |
| RCI Banque SA | | 1.625% | | 5/26/26 | EUR | 1,300 | | 1,470 | |
| RCI Banque SA | | 1.750% | | 4/10/26 | EUR | 2,275 | | 2,596 | |
| RCI Banque SA | | 1.875% | | 11/8/22 | GBP | 1,800 | | 2,350 | |
| Renault SA | | 1.000% | | 3/8/23 | EUR | 600 | | 679 | |
| Renault SA | | 1.000% | | 4/18/24 | EUR | 5,700 | | 6,360 | |
| Renault SA | | 1.250% | | 6/24/25 | EUR | 12,000 | | 13,323 | |
| Renault SA | | 2.000% | | 9/28/26 | EUR | 200 | | 231 | |
| Renault SA | | 3.125% | | 3/5/21 | EUR | 2,125 | | 2,467 | |
| Sanef SA | | 0.950% | | 10/19/28 | EUR | 3,600 | | 4,022 | |
| Sanofi | | 0.000% | | 9/13/22 | EUR | 6,000 | | 6,731 | |
| Sanofi | | 0.500% | | 3/21/23 | EUR | 14,500 | | 16,515 | |
| Sanofi | | 0.500% | | 1/13/27 | EUR | 500 | | 576 | |
| Sanofi | | 0.875% | | 9/22/21 | EUR | 700 | | 796 | |
| Sanofi | | 1.125% | | 4/5/28 | EUR | 10,400 | | 12,546 | |
| Sanofi | | 1.375% | | 3/21/30 | EUR | 18,800 | | 23,339 | |
| Sanofi | | 1.750% | | 9/10/26 | EUR | 7,000 | | 8,688 | |
| Sanofi | | 1.875% | | 3/21/38 | EUR | 7,200 | | 9,806 | |
| Sanofi | | 2.500% | | 11/14/23 | EUR | 5,000 | | 6,135 | |
43
Total International Bond Index Fund
| | | | | | | Face | | Market | |
| | | | | Maturity | | Amount | | Value· | |
| | | Coupon | | Date | Currency | (000 | ) | ($000 | ) |
| Schneider Electric SE | | 0.250% | | 9/9/24 | EUR | 1,000 | | 1,128 | |
| Schneider Electric SE | | 0.875% | | 3/11/25 | EUR | 3,200 | | 3,730 | |
| Schneider Electric SE | | 1.500% | | 9/8/23 | EUR | 400 | | 472 | |
| Schneider Electric SE | | 1.500% | | 1/15/28 | EUR | 11,000 | | 13,495 | |
| Schneider Electric SE | | 2.500% | | 9/6/21 | EUR | 1,100 | | 1,287 | |
1 | SCOR SE | | 3.000% | | 6/8/46 | EUR | 1,000 | | 1,252 | |
1 | SCOR SE | | 3.625% | | 5/27/48 | EUR | 6,500 | | 8,655 | |
| Societe Generale SA | | 0.250% | | 1/18/22 | EUR | 24,600 | | 27,635 | |
| Societe Generale SA | | 0.448% | | 5/26/22 | JPY | 900,000 | | 8,335 | |
| Societe Generale SA | | 0.750% | | 11/25/20 | EUR | 10,000 | | 11,269 | |
| Societe Generale SA | | 0.750% | | 5/26/23 | EUR | 5,000 | | 5,721 | |
| Societe Generale SA | | 0.875% | | 7/1/26 | EUR | 8,000 | | 9,076 | |
| Societe Generale SA | | 1.000% | | 4/1/22 | EUR | 10,000 | | 11,410 | |
| Societe Generale SA | | 1.125% | | 1/23/25 | EUR | 14,300 | | 16,453 | |
| Societe Generale SA | | 1.250% | | 2/15/24 | EUR | 31,000 | | 35,869 | |
| Societe Generale SA | | 1.750% | | 3/22/29 | EUR | 8,000 | | 9,687 | |
| Societe Generale SA | | 2.125% | | 9/27/28 | EUR | 11,000 | | 13,725 | |
| Societe Generale SA | | 2.625% | | 2/27/25 | EUR | 100 | | 122 | |
| Societe Generale SA | | 4.000% | | 6/7/23 | EUR | 4,400 | | 5,518 | |
| Societe Generale SA | | 4.250% | | 7/13/22 | EUR | 2,500 | | 3,112 | |
| Societe Generale SA | | 4.750% | | 3/2/21 | EUR | 1,000 | | 1,188 | |
| Societe Generale SFH SA | | 0.250% | | 9/11/23 | EUR | 1,100 | | 1,253 | |
| Societe Generale SFH SA | | 0.500% | | 1/20/23 | EUR | 1,700 | | 1,947 | |
| Societe Generale SFH SA | | 0.500% | | 1/30/25 | EUR | 9,000 | | 10,428 | |
| Societe Generale SFH SA | | 0.500% | | 1/28/26 | EUR | 11,200 | | 13,010 | |
| Sodexo SA | | 2.500% | | 6/24/26 | EUR | 600 | | 768 | |
1 | Sogecap SA | | 4.125% | | 12/31/49 | EUR | 100 | | 123 | |
| Suez | | 1.000% | | 4/3/25 | EUR | 10,200 | | 11,953 | |
| Suez | | 1.500% | | 4/3/29 | EUR | 9,700 | | 11,952 | |
| Suez | | 1.625% | | 9/17/30 | EUR | 600 | | 753 | |
| Suez | | 1.750% | | 9/10/25 | EUR | 500 | | 611 | |
| Suez | | 2.750% | | 10/9/23 | EUR | 3,000 | | 3,722 | |
| Suez | | 4.078% | | 5/17/21 | EUR | 2,100 | | 2,497 | |
| Suez | | 4.125% | | 6/24/22 | EUR | 400 | | 498 | |
| Suez | | 5.500% | | 7/22/24 | EUR | 7,750 | | 10,951 | |
| TDF Infrastructure SAS | | 2.500% | | 4/7/26 | EUR | 800 | | 948 | |
| TDF Infrastructure SAS | | 2.875% | | 10/19/22 | EUR | 21,200 | | 25,063 | |
| Terega SA | | 2.200% | | 8/5/25 | EUR | 100 | | 122 | |
| Total Capital Canada Ltd. | | 1.125% | | 3/18/22 | EUR | 13,000 | | 14,953 | |
| Total Capital Canada Ltd. | | 2.125% | | 9/18/29 | EUR | 10,400 | | 13,697 | |
| Total Capital International SA | | 0.250% | | 7/12/23 | EUR | 8,900 | | 10,058 | |
| Total Capital International SA | | 0.625% | | 10/4/24 | EUR | 11,800 | | 13,623 | |
| Total Capital International SA | | 0.696% | | 5/31/28 | EUR | 22,400 | | 26,085 | |
| Total Capital International SA | | 1.375% | | 3/19/25 | EUR | 13,600 | | 16,307 | |
| Total Capital International SA | | 1.491% | | 9/4/30 | EUR | 1,000 | | 1,244 | |
| Total Capital International SA | | 1.535% | | 5/31/39 | EUR | 2,000 | | 2,495 | |
| Total Capital International SA | | 1.750% | | 7/7/25 | GBP | 9,263 | | 12,329 | |
| Total Capital International SA | | 2.125% | | 11/19/21 | EUR | 3,900 | | 4,557 | |
| Total Capital International SA | | 2.125% | | 3/15/23 | EUR | 4,000 | | 4,803 | |
| Total Capital International SA | | 2.250% | | 6/9/22 | GBP | 2,782 | | 3,724 | |
| Total Capital International SA | | 2.500% | | 3/25/26 | EUR | 4,400 | | 5,681 | |
| Total Capital International SA | | 2.875% | | 11/19/25 | EUR | 7,900 | | 10,336 | |
| Total Capital International SA | | 4.250% | | 11/26/21 | AUD | 3,898 | | 2,844 | |
1 | Total SA | | 1.750% | | 12/31/49 | EUR | 100 | | 115 | |
44
Total International Bond Index Fund
| | | | | | | Face | | Market | |
| | | | | Maturity | | Amount | | Value· | |
| | | Coupon | | Date | Currency | (000 | ) | ($000 | ) |
1 | Total SA | | 2.625% | | 12/29/49 | EUR | 18,750 | | 22,604 | |
1 | Total SA | | 2.708% | | 12/31/49 | EUR | 13,600 | | 16,201 | |
1 | Total SA | | 3.369% | | 12/31/49 | EUR | 7,200 | | 9,171 | |
1 | Total SA | | 3.875% | | 12/31/49 | EUR | 8,500 | | 10,275 | |
| Transport et Infrastructures Gaz France SA | | 4.339% | | 7/7/21 | EUR | 2,000 | | 2,390 | |
| UMG Groupe VYV | | 1.625% | | 7/2/29 | EUR | 3,000 | | 3,484 | |
| Unibail-Rodamco SE | | 1.000% | | 3/14/25 | EUR | 10,000 | | 11,663 | |
| Unibail-Rodamco SE | | 1.000% | | 2/27/27 | EUR | 10,500 | | 12,189 | |
| Unibail-Rodamco SE | | 1.125% | | 9/15/25 | EUR | 11,400 | | 13,310 | |
| Unibail-Rodamco SE | | 1.375% | | 3/9/26 | EUR | 584 | | 696 | |
| Unibail-Rodamco SE | | 1.375% | | 4/15/30 | EUR | 7,500 | | 8,949 | |
| Unibail-Rodamco SE | | 1.500% | | 5/29/29 | EUR | 300 | | 362 | |
| Unibail-Rodamco SE | | 1.875% | | 1/15/31 | EUR | 15,000 | | 18,677 | |
| Unibail-Rodamco SE | | 2.000% | | 4/28/36 | EUR | 1,300 | | 1,654 | |
1 | Unibail-Rodamco SE | | 2.125% | | 12/31/49 | EUR | 5,000 | | 5,712 | |
| Unibail-Rodamco SE | | 2.250% | | 5/14/38 | EUR | 1,000 | | 1,314 | |
| Unibail-Rodamco SE | | 2.375% | | 2/25/21 | EUR | 2,000 | | 2,305 | |
| Unibail-Rodamco SE | | 2.500% | | 2/26/24 | EUR | 1,890 | | 2,334 | |
| Unibail-Rodamco SE | | 2.500% | | 6/4/26 | EUR | 500 | | 636 | |
1 | Unibail-Rodamco SE | | 2.875% | | 12/31/49 | EUR | 5,000 | | 5,915 | |
| Unibail-Rodamco-Westfield SE | | 1.750% | | 7/1/49 | EUR | 7,300 | | 8,338 | |
| Valeo SA | | 0.625% | | 1/11/23 | EUR | 11,000 | | 12,416 | |
| Valeo SA | | 1.500% | | 6/18/25 | EUR | 8,000 | | 9,385 | |
| Veolia Environnement SA | | 0.672% | | 3/30/22 | EUR | 400 | | 453 | |
| Veolia Environnement SA | | 0.892% | | 1/14/24 | EUR | 12,800 | | 14,765 | |
| Veolia Environnement SA | | 0.927% | | 1/4/29 | EUR | 5,000 | | 5,844 | |
| Veolia Environnement SA | | 1.590% | | 1/10/28 | EUR | 6,100 | | 7,499 | |
| Veolia Environnement SA | | 4.247% | | 1/6/21 | EUR | 3,100 | | 3,635 | |
| Veolia Environnement SA | | 4.625% | | 3/30/27 | EUR | 9,200 | | 13,624 | |
| Veolia Environnement SA | | 5.125% | | 5/24/22 | EUR | 100 | | 126 | |
| Veolia Environnement SA | | 6.125% | | 11/25/33 | EUR | 2,380 | | 4,572 | |
| Veolia Environnement SA | | 6.125% | | 10/29/37 | GBP | 3,050 | | 6,229 | |
| Vinci SA | | 1.000% | | 9/26/25 | EUR | 5,000 | | 5,870 | |
| Vinci SA | | 1.625% | | 1/18/29 | EUR | 2,500 | | 3,114 | |
| Vinci SA | | 1.750% | | 9/26/30 | EUR | 6,800 | | 8,594 | |
| Vinci SA | | 2.250% | | 3/15/27 | GBP | 1,000 | �� | 1,371 | |
| Vinci SA | | 2.750% | | 9/15/34 | GBP | 1,000 | | 1,445 | |
| Vivendi SA | | 0.750% | | 5/26/21 | EUR | 5,000 | | 5,644 | |
| Vivendi SA | | 1.125% | | 12/11/28 | EUR | 10,000 | | 11,502 | |
| Vivendi SA | | 1.875% | | 5/26/26 | EUR | 400 | | 486 | |
| | | | | | | | | 3,121,443 | |
Sovereign Bonds (9.0%) | | | | | | | | | |
| Aeroports de Paris | | 1.125% | | 6/18/34 | EUR | 3,000 | | 3,565 | |
| Aeroports de Paris | | 1.500% | | 7/24/23 | EUR | 5,000 | | 5,883 | |
| Aeroports de Paris | | 1.500% | | 4/7/25 | EUR | 4,000 | | 4,804 | |
| Aeroports de Paris | | 2.125% | | 10/11/38 | EUR | 7,400 | | 10,002 | |
| Aeroports de Paris | | 2.750% | | 6/5/28 | EUR | 1,000 | | 1,358 | |
| Aeroports de Paris | | 3.125% | | 6/11/24 | EUR | 2,000 | | 2,556 | |
| Agence Francaise de Developpement EPIC | | 0.125% | | 3/31/21 | EUR | 10,000 | | 11,227 | |
| Agence Francaise de Developpement EPIC | | 0.125% | | 4/30/22 | EUR | 28,000 | | 31,605 | |
| Agence Francaise de Developpement EPIC | | 0.125% | | 11/15/23 | EUR | 8,000 | | 9,078 | |
| Agence Francaise de Developpement EPIC | | 0.250% | | 7/21/26 | EUR | 12,100 | | 13,795 | |
| Agence Francaise de Developpement EPIC | | 0.250% | | 6/29/29 | EUR | 17,800 | | 20,139 | |
| Agence Francaise de Developpement EPIC | | 0.375% | | 4/30/24 | EUR | 34,000 | | 38,958 | |
45
Total International Bond Index Fund
| | | | | | | Face | | Market | |
| | | | | Maturity | | Amount | | Value· | |
| | | Coupon | | Date | Currency | (000 | ) | ($000 | ) |
| Agence Francaise de Developpement EPIC | | 0.500% | | 10/31/25 | EUR | 10,000 | | 11,586 | |
| Agence Francaise de Developpement EPIC | | 1.000% | | 1/31/28 | EUR | 5,000 | | 6,034 | |
| Agence Francaise de Developpement EPIC | | 1.375% | | 9/17/24 | EUR | 20,500 | | 24,636 | |
| Agence Francaise de Developpement EPIC | | 1.375% | | 7/5/32 | EUR | 15,000 | | 18,975 | |
| Agence Francaise de Developpement EPIC | | 2.125% | | 2/15/21 | EUR | 35,000 | | 40,287 | |
| Agence Francaise de Developpement EPIC | | 2.250% | | 5/27/25 | EUR | 10,000 | | 12,668 | |
| Agence Francaise de Developpement EPIC | | 3.750% | | 2/15/27 | EUR | 3,600 | | 5,133 | |
| Agence France Locale | | 0.500% | | 6/20/24 | EUR | 9,500 | | 10,946 | |
| Bpifrance Financement SA | | 0.100% | | 2/19/21 | EUR | 4,900 | | 5,500 | |
| Bpifrance Financement SA | | 0.125% | | 11/25/20 | EUR | 15,000 | | 16,812 | |
| Bpifrance Financement SA | | 0.250% | | 2/14/23 | EUR | 20,000 | | 22,743 | |
| Bpifrance Financement SA | | 0.500% | | 5/25/25 | EUR | 10,000 | | 11,568 | |
| Bpifrance Financement SA | | 0.750% | | 10/25/21 | EUR | 47,600 | | 54,211 | |
| Bpifrance Financement SA | | 0.750% | | 11/25/24 | EUR | 15,000 | | 17,539 | |
| Bpifrance Financement SA | | 2.500% | | 5/25/24 | EUR | 10,000 | | 12,565 | |
| Bpifrance Financement SA | | 2.750% | | 10/25/25 | EUR | 28,000 | | 36,655 | |
| Caisse d’Amortissement de la Dette Sociale | | 0.050% | | 11/25/20 | EUR | 94,000 | | 105,373 | |
| Caisse d’Amortissement de la Dette Sociale | | 0.125% | | 11/25/22 | EUR | 61,200 | | 69,480 | |
| Caisse d’Amortissement de la Dette Sociale | | 0.500% | | 5/25/23 | EUR | 90,000 | | 103,725 | |
| Caisse d’Amortissement de la Dette Sociale | | 1.375% | | 11/25/24 | EUR | 15,000 | | 18,199 | |
| Caisse d’Amortissement de la Dette Sociale | | 2.375% | | 1/25/24 | EUR | 43,500 | | 54,459 | |
| Caisse d’Amortissement de la Dette Sociale | | 2.500% | | 10/25/22 | EUR | 3,000 | | 3,644 | |
| Caisse d’Amortissement de la Dette Sociale | | 3.750% | | 10/25/20 | EUR | 2,000 | | 2,322 | |
| Caisse d’Amortissement de la Dette Sociale | | 4.000% | | 12/15/25 | EUR | 8,000 | | 11,286 | |
| Caisse d’Amortissement de la Dette Sociale | | 4.125% | | 4/25/23 | EUR | 5,000 | | 6,473 | |
| Caisse d’Amortissement de la Dette Sociale | | 4.375% | | 10/25/21 | EUR | 8,000 | | 9,783 | |
| Coentreprise de Transport d’Electricite SA | | 2.125% | | 7/29/32 | EUR | 16,400 | | 21,190 | |
4 | Dexia Credit Local SA | | 0.625% | | 1/17/26 | EUR | 3,000 | | 3,499 | |
4 | Dexia Credit Local SA | | 1.125% | | 6/15/22 | GBP | 2,300 | | 2,997 | |
4 | Dexia Credit Local SA | | 2.000% | | 1/22/21 | EUR | 8,000 | | 9,180 | |
| Electricite de France SA | | 1.000% | | 10/13/26 | EUR | 21,300 | | 25,023 | |
| Electricite de France SA | | 1.875% | | 10/13/36 | EUR | 14,700 | | 18,476 | |
| Electricite de France SA | | 2.250% | | 4/27/21 | EUR | 7,000 | | 8,085 | |
| Electricite de France SA | | 2.750% | | 3/10/23 | EUR | 20,300 | | 24,722 | |
| Electricite de France SA | | 3.875% | | 1/18/22 | EUR | 3,100 | | 3,753 | |
| Electricite de France SA | | 4.000% | | 11/12/25 | EUR | 2,150 | | 2,956 | |
| Electricite de France SA | | 4.125% | | 3/25/27 | EUR | 4,100 | | 5,829 | |
1 | Electricite de France SA | | 4.125% | | 1/29/49 | EUR | 6,000 | | 7,125 | |
| Electricite de France SA | | 4.500% | | 11/12/40 | EUR | 3,900 | | 6,756 | |
| Electricite de France SA | | 4.625% | | 9/11/24 | EUR | 5,000 | | 6,813 | |
| Electricite de France SA | | 4.625% | | 4/26/30 | EUR | 200 | | 312 | |
1 | Electricite de France SA | | 5.000% | | 1/22/49 | EUR | 3,000 | | 3,792 | |
1 | Electricite de France SA | | 5.375% | | 1/29/49 | EUR | 3,400 | | 4,348 | |
| Electricite de France SA | | 5.500% | | 3/27/37 | GBP | 2,800 | | 5,139 | |
| Electricite de France SA | | 5.500% | | 10/17/41 | GBP | 9,200 | | 17,410 | |
| Electricite de France SA | | 5.625% | | 2/21/33 | EUR | 12,805 | | 22,456 | |
| Electricite de France SA | | 5.875% | | 7/18/31 | GBP | 3,500 | | 6,315 | |
1 | Electricite de France SA | | 5.875% | | 7/22/49 | GBP | 2,500 | | 3,499 | |
1 | Electricite de France SA | | 6.000% | | 12/29/49 | GBP | 3,800 | | 5,360 | |
| Electricite de France SA | | 6.000% | | 1/23/14 | GBP | 9,900 | | 20,674 | |
| Electricite de France SA | | 6.125% | | 6/2/34 | GBP | 27,000 | | 50,994 | |
| Electricite de France SA | | 6.250% | | 1/25/21 | EUR | 7,200 | | 8,665 | |
| French Republic | | 0.000% | | 5/25/21 | EUR | 486,250 | | 547,609 | |
| French Republic | | 0.000% | | 2/25/22 | EUR | 100,000 | | 113,123 | |
| French Republic | | 0.000% | | 5/25/22 | EUR | 161,500 | | 183,047 | |
46
Total International Bond Index Fund
| | | | | | | Face | | Market | |
| | | | | Maturity | | Amount | | Value· | |
| | | Coupon | | Date | Currency | (000 | ) | ($000 | ) |
| French Republic | | 0.000% | | 3/25/24 | EUR | 500,000 | | 570,701 | |
| French Republic | | 0.000% | | 3/25/25 | EUR | 180,000 | | 205,486 | |
| French Republic | | 0.250% | | 11/25/20 | EUR | 166,000 | | 186,843 | |
| French Republic | | 0.250% | | 11/25/26 | EUR | 200,000 | | 232,379 | |
| French Republic | | 0.500% | | 5/25/25 | EUR | 142,940 | | 167,876 | |
| French Republic | | 0.500% | | 5/25/26 | EUR | 402,000 | | 474,238 | |
| French Republic | | 0.500% | | 5/25/29 | EUR | 300,000 | | 355,374 | |
| French Republic | | 0.750% | | 5/25/28 | EUR | 338,000 | | 409,049 | |
| French Republic | | 0.750% | | 11/25/28 | EUR | 511,207 | | 619,023 | |
| French Republic | | 1.000% | | 11/25/25 | EUR | 235,000 | | 284,632 | |
| French Republic | | 1.000% | | 5/25/27 | EUR | 385,707 | | 472,950 | |
| French Republic | | 1.250% | | 5/25/34 | EUR | 298,850 | | 385,738 | |
2 | French Republic | | 1.250% | | 5/25/36 | EUR | 158,200 | | 204,450 | |
| French Republic | | 1.500% | | 5/25/31 | EUR | 241,333 | | 316,563 | |
2 | French Republic | | 1.500% | | 5/25/50 | EUR | 220,031 | | 298,937 | |
| French Republic | | 1.750% | | 5/25/23 | EUR | 718,408 | | 869,037 | |
| French Republic | | 1.750% | | 11/25/24 | EUR | 153,840 | | 191,130 | |
2 | French Republic | | 1.750% | | 6/25/39 | EUR | 135,050 | | 189,650 | |
2 | French Republic | | 1.750% | | 5/25/66 | EUR | 91,902 | | 137,976 | |
2 | French Republic | | 2.000% | | 5/25/48 | EUR | 45,710 | | 69,010 | |
| French Republic | | 2.250% | | 10/25/22 | EUR | 211,840 | | 256,696 | |
| French Republic | | 2.250% | | 5/25/24 | EUR | 92,000 | | 115,745 | |
| French Republic | | 2.500% | | 10/25/20 | EUR | 229,170 | | 263,361 | |
| French Republic | | 2.500% | | 5/25/30 | EUR | 71,650 | | 101,883 | |
| French Republic | | 3.000% | | 4/25/22 | EUR | 110,420 | | 134,329 | |
| French Republic | | 3.250% | | 10/25/21 | EUR | 90,450 | | 108,660 | |
| French Republic | | 3.250% | | 5/25/45 | EUR | 180,485 | | 330,813 | |
| French Republic | | 3.500% | | 4/25/26 | EUR | 112,000 | | 156,880 | |
| French Republic | | 3.750% | | 4/25/21 | EUR | 72,005 | | 85,516 | |
| French Republic | | 4.000% | | 10/25/38 | EUR | 157,820 | | 295,488 | |
| French Republic | | 4.000% | | 4/25/55 | EUR | 63,690 | | 142,677 | |
| French Republic | | 4.000% | | 4/25/60 | EUR | 37,250 | | 87,749 | |
| French Republic | | 4.250% | | 10/25/23 | EUR | 110,770 | | 147,602 | |
| French Republic | | 4.500% | | 4/25/41 | EUR | 160,015 | | 328,766 | |
| French Republic | | 4.750% | | 4/25/35 | EUR | 61,979 | | 117,533 | |
| French Republic | | 5.500% | | 4/25/29 | EUR | 66,700 | | 114,877 | |
| French Republic | | 5.750% | | 10/25/32 | EUR | 109,810 | | 213,459 | |
| French Republic | | 6.000% | | 10/25/25 | EUR | 55,000 | | 85,149 | |
| French Republic | | 8.250% | | 4/25/22 | EUR | 14,000 | | 19,082 | |
| French Republic | | 8.500% | | 4/25/23 | EUR | 400 | | 589 | |
| La Banque Postale SA | | 1.000% | | 10/16/24 | EUR | 5,000 | | 5,765 | |
| La Banque Postale SA | | 1.375% | | 4/24/29 | EUR | 10,000 | | 11,872 | |
| La Banque Postale SA | | 2.000% | | 7/13/28 | EUR | 9,500 | | 11,895 | |
1 | La Banque Postale SA | | 2.750% | | 4/23/26 | EUR | 2,000 | | 2,310 | |
1 | La Banque Postale SA | | 2.750% | | 11/19/27 | EUR | 4,000 | | 4,759 | |
| La Banque Postale SA | | 3.000% | | 6/9/28 | EUR | 2,000 | | 2,633 | |
| La Poste SA | | 1.000% | | 9/17/34 | EUR | 5,000 | | 5,677 | |
| La Poste SA | | 1.125% | | 6/4/25 | EUR | 10,000 | | 11,774 | |
| La Poste SA | | 1.450% | | 11/30/28 | EUR | 2,100 | | 2,558 | |
| La Poste SA | | 2.750% | | 11/26/24 | EUR | 4,200 | | 5,316 | |
| Regie Autonome des Transports Parisiens | | 0.875% | | 5/25/27 | EUR | 3,000 | | 3,579 | |
| Region of Ile de France | | 0.500% | | 6/14/25 | EUR | 15,000 | | 17,456 | |
| Region of Ile de France | | 0.625% | | 4/23/27 | EUR | 5,000 | | 5,859 | |
| Region of Ile de France | | 1.375% | | 3/14/29 | EUR | 100 | | 125 | |
| Region of Ile de France | | 1.375% | | 6/20/33 | EUR | 6,000 | | 7,670 | |
47
Total International Bond Index Fund
| | | | | | | Face | | Market | |
| | | | | Maturity | | Amount | | Value· | |
| | | Coupon | | Date | Currency | (000 | ) | ($000 | ) |
| Region of Ile de France | | 2.250% | | 6/10/23 | EUR | 900 | | 1,100 | |
| Region of Ile de France | | 3.625% | | 3/27/24 | EUR | 13,300 | | 17,420 | |
| RTE Reseau de Transport d’Electricite SADIR | | 1.875% | | 10/23/37 | EUR | 5,000 | | 6,629 | |
| RTE Reseau de Transport d’Electricite SADIR | | 2.000% | | 4/18/36 | EUR | 500 | | 672 | |
| RTE Reseau de Transport d’Electricite SADIR | | 2.125% | | 9/27/38 | EUR | 25,000 | | 34,453 | |
| RTE Reseau de Transport d’Electricite SADIR | | 2.750% | | 6/20/29 | EUR | 2,400 | | 3,292 | |
| RTE Reseau de Transport d’Electricite SADIR | | 4.125% | | 2/3/21 | EUR | 1,400 | | 1,646 | |
| SA de Gestion de Stocks de Securite | | 0.625% | | 5/25/23 | EUR | 12,000 | | 13,872 | |
| SNCF Mobilites | | 1.500% | | 2/2/29 | EUR | 14,000 | | 17,554 | |
| SNCF Mobilities | | 4.125% | | 2/19/25 | EUR | 700 | | 958 | |
| SNCF Mobilities | | 4.875% | | 6/12/23 | EUR | 5,700 | | 7,565 | |
| SNCF Mobilites | | 5.375% | | 3/18/27 | GBP | 8,069 | | 13,512 | |
| SNCF Reseau EPIC | | 0.100% | | 5/27/21 | EUR | 31,000 | | 34,827 | |
| SNCF Reseau EPIC | | 0.750% | | 5/25/36 | EUR | 15,100 | | 17,255 | |
| SNCF Reseau EPIC | | 1.000% | | 11/9/31 | EUR | 10,000 | | 12,098 | |
| SNCF Reseau EPIC | | 1.125% | | 5/25/30 | EUR | 28,100 | | 34,471 | |
| SNCF Reseau EPIC | | 1.500% | | 5/29/37 | EUR | 18,000 | | 23,174 | |
| SNCF Reseau EPIC | | 2.000% | | 2/5/48 | EUR | 5,000 | | 6,942 | |
| SNCF Reseau EPIC | | 2.250% | | 12/20/47 | EUR | 12,500 | | 18,302 | |
7 | SNCF Reseau EPIC | | 2.625% | | 12/29/25 | EUR | 4,800 | | 6,258 | |
| SNCF Reseau EPIC | | 3.125% | | 10/25/28 | EUR | 7,000 | | 9,944 | |
| SNCF Reseau EPIC | | 4.250% | | 10/7/26 | EUR | 1,500 | | 2,178 | |
| SNCF Reseau EPIC | | 4.375% | | 6/2/22 | EUR | 15,000 | | 18,784 | |
| SNCF Reseau EPIC | | 4.830% | | 3/25/60 | GBP | 1,400 | | 3,317 | |
| SNCF Reseau EPIC | | 5.000% | | 10/10/33 | EUR | 15,400 | | 27,786 | |
| SNCF Reseau EPIC | | 5.000% | | 3/11/52 | GBP | 3,725 | | 8,442 | |
| SNCF Reseau EPIC | | 5.250% | | 12/7/28 | GBP | 17,000 | | 29,657 | |
| SNCF Reseau EPIC | | 5.250% | | 1/31/35 | GBP | 1,400 | | 2,707 | |
| SNCF Reseau EPIC | | 5.500% | | 12/1/21 | GBP | 7,000 | | 9,912 | |
| SNCF Reseau EPIC | | 6.000% | | 10/12/20 | EUR | 9,000 | | 10,633 | |
| Societe Du Grand Paris EPIC | | 1.125% | | 10/22/28 | EUR | 1,200 | | 1,472 | |
| Societe Du Grand Paris EPIC | | 1.125% | | 5/25/34 | EUR | 24,000 | | 29,555 | |
| Societe Du Grand Paris EPIC | | 1.700% | | 5/25/50 | EUR | 5,000 | | 6,752 | |
7 | UNEDIC ASSEO | | 0.000% | | 11/25/20 | EUR | 9,000 | | 10,086 | |
| UNEDIC ASSEO | | 0.125% | | 5/25/22 | EUR | 10,000 | | 11,294 | |
| UNEDIC ASSEO | | 0.125% | | 11/25/24 | EUR | 55,000 | | 62,362 | |
| UNEDIC ASSEO | | 0.250% | | 11/24/23 | EUR | 20,000 | | 22,931 | |
7 | UNEDIC ASSEO | | 0.300% | | 11/4/21 | EUR | 5,000 | | 5,656 | |
7 | UNEDIC ASSEO | | 0.500% | | 3/20/29 | EUR | 25,000 | | 29,243 | |
7 | UNEDIC ASSEO | | 0.625% | | 2/17/25 | EUR | 25,000 | | 29,216 | |
7 | UNEDIC ASSEO | | 0.625% | | 3/3/26 | EUR | 10,000 | | 11,759 | |
7 | UNEDIC ASSEO | | 0.875% | | 10/25/22 | EUR | 22,200 | | 25,709 | |
7 | UNEDIC ASSEO | | 1.250% | | 10/21/27 | EUR | 1,500 | | 1,858 | |
7 | UNEDIC ASSEO | | 1.250% | | 5/25/33 | EUR | 2,000 | | 2,535 | |
7 | UNEDIC ASSEO | | 1.500% | | 4/16/21 | EUR | 36,000 | | 41,277 | |
7 | UNEDIC ASSEO | | 1.500% | | 4/20/32 | EUR | 1,200 | | 1,561 | |
7 | UNEDIC ASSEO | | 2.250% | | 4/5/23 | EUR | 7,000 | | 8,519 | |
| UNEDIC ASSEO | | 2.375% | | 5/25/24 | EUR | 3,000 | | 3,762 | |
| | | | | | | | | 12,532,770 | |
Total France (Cost $16,002,520) | | | | | | | | 16,647,184 | |
48
Total International Bond Index Fund
| | | | | | | Face | | Market | |
| | | | | Maturity | | Amount | | Value· | |
| | | Coupon | | Date | Currency | (000 | ) | ($000 | ) |
Germany (9.6%) | | | | | |
Asset-Backed/Commercial Mortgage-Backed Securities (0.5%) | | | | | |
| Aareal Bank AG | | 0.125% | | 2/1/24 | EUR | 5,000 | | 5,677 | |
| Bayerische Landesbank | | 0.350% | | 12/1/22 | EUR | 5,000 | | 5,697 | |
| Bayerische Landesbank | | 0.500% | | 3/19/25 | EUR | 10,000 | | 11,619 | |
| Bayerische Landesbank | | 1.000% | | 7/9/21 | EUR | 250 | | 285 | |
| Bayerische Landesbank | | 1.250% | | 12/20/21 | GBP | 2,700 | | 3,509 | |
| Bayerische Landesbank | | 1.625% | | 4/18/23 | EUR | 5,000 | | 5,958 | |
| Bayerische Landesbank | | 2.000% | | 7/11/22 | EUR | 700 | | 831 | |
| Berlin Hyp AG | | 0.000% | | 11/29/21 | EUR | 1,000 | | 1,124 | |
| Berlin Hyp AG | | 0.125% | | 10/23/23 | EUR | 25,500 | | 28,930 | |
| Berlin Hyp AG | | 0.375% | | 5/3/24 | EUR | 7,810 | | 8,976 | |
| Berlin Hyp AG | | 1.250% | | 4/23/21 | EUR | 6,000 | | 6,851 | |
| Commerzbank AG | | 0.250% | | 1/26/22 | EUR | 4,000 | | 4,524 | |
| Commerzbank AG | | 0.500% | | 6/9/26 | EUR | 15,000 | | 17,487 | |
| Commerzbank AG | | 0.625% | | 3/13/25 | EUR | 9,200 | | 10,750 | |
| Commerzbank AG | | 0.625% | | 5/28/25 | EUR | 9,000 | | 10,520 | |
| Commerzbank AG | | 0.625% | | 8/24/27 | EUR | 1,100 | | 1,296 | |
| Commerzbank AG | | 0.875% | | 9/8/25 | EUR | 10,100 | | 11,998 | |
| Commerzbank AG | | 4.125% | | 4/7/21 | EUR | 4,500 | | 5,342 | |
| Deutsche Bank AG | | 0.250% | | 3/8/24 | EUR | 9,300 | | 10,609 | |
| Deutsche Bank AG | | 0.250% | | 8/31/28 | EUR | 5,000 | | 5,688 | |
| Deutsche Hypothekenbank AG | | 0.125% | | 4/20/22 | EUR | 5,000 | | 5,642 | |
| Deutsche Hypothekenbank AG | | 0.125% | | 11/23/23 | EUR | 100 | | 113 | |
| Deutsche Hypothekenbank AG | | 0.250% | | 11/18/21 | EUR | 24,900 | | 28,123 | |
| Deutsche Hypothekenbank AG | | 0.500% | | 6/29/26 | EUR | 100 | | 116 | |
| Deutsche Kreditbank AG | | 0.500% | | 3/19/27 | EUR | 1,600 | | 1,867 | |
| Deutsche Kreditbank AG | | 1.625% | | 6/18/24 | EUR | 1,500 | | 1,822 | |
| Deutsche Pfandbriefbank AG | | 0.050% | | 8/9/21 | EUR | 1,000 | | 1,123 | |
| Deutsche Pfandbriefbank AG | | 0.125% | | 11/27/20 | EUR | 10,000 | | 11,209 | |
| Deutsche Pfandbriefbank AG | | 0.200% | | 3/1/22 | EUR | 5,450 | | 6,154 | |
| Deutsche Pfandbriefbank AG | | 0.250% | | 3/15/23 | EUR | 20,000 | | 22,728 | |
| Deutsche Pfandbriefbank AG | | 1.250% | | 4/20/35 | EUR | 10,000 | | 12,706 | |
| Deutsche Pfandbriefbank AG | | 1.875% | | 1/21/22 | EUR | 10,000 | | 11,705 | |
| Deutsche Pfandbriefbank AG | | 2.375% | | 5/29/28 | EUR | 6,100 | | 8,206 | |
| Dexia Kommunalbank Deutschland AG | | 0.050% | | 9/8/21 | EUR | 18,300 | | 20,557 | |
| Dexia Kommunalbank Deutschland AG | | 0.375% | | 3/3/22 | EUR | 8,300 | | 9,405 | |
| DZ HYP AG | | 0.125% | | 9/30/22 | EUR | 13,000 | | 14,705 | |
| DZ HYP AG | | 0.375% | | 3/31/26 | EUR | 6,200 | | 7,178 | |
| DZ HYP AG | | 0.500% | | 9/30/26 | EUR | 10,000 | | 11,669 | |
| DZ HYP AG | | 0.625% | | 6/5/24 | EUR | 100 | | 116 | |
| DZ HYP AG | | 0.875% | | 4/17/34 | EUR | 10,000 | | 12,135 | |
8 | German Postal Pensions Securitisation 2 plc | | 4.375% | | 1/18/22 | EUR | 3,000 | | 3,694 | |
| Hamburg Commercial Bank AG | | 0.375% | | 4/27/23 | EUR | 10,808 | | 12,303 | |
| Hamburg Commercial Bank AG | | 0.750% | | 6/22/22 | EUR | 400 | | 458 | |
| ING-DiBa AG | | 0.125% | | 5/23/27 | EUR | 5,000 | | 5,689 | |
| ING-DiBa AG | | 0.250% | | 10/9/23 | EUR | 5,000 | | 5,703 | |
| ING-DiBa AG | | 0.250% | | 11/16/26 | EUR | 5,000 | | 5,744 | |
| ING-DiBa AG | | 1.000% | | 5/23/39 | EUR | 19,100 | | 23,638 | |
| Landesbank Baden-Wuerttemberg | | 0.125% | | 2/21/22 | EUR | 5,000 | | 5,642 | |
| Landesbank Baden-Wuerttemberg | | 0.200% | | 1/10/24 | EUR | 2,000 | | 2,279 | |
| Landesbank Baden-Wuerttemberg | | 0.250% | | 1/10/25 | EUR | 10,000 | | 11,454 | |
| Landesbank Baden-Wuerttemberg | | 0.375% | | 2/27/25 | EUR | 10,000 | | 11,532 | |
49
Total International Bond Index Fund
| | | | | | | Face | | Market | |
| | | | | Maturity | | Amount | | Value· | |
| | | Coupon | | Date | Currency | (000 | ) | ($000 | ) |
| Landesbank Hessen-Thueringen Girozentrale | | 0.000% | | 1/12/22 | EUR | 27,600 | | 31,037 | |
| Landesbank Hessen-Thueringen Girozentrale | | 0.125% | | 11/21/22 | EUR | 22,500 | | 25,463 | |
| Landesbank Hessen-Thueringen Girozentrale | | 0.250% | | 3/20/23 | EUR | 15,000 | | 17,061 | |
| Landesbank Hessen-Thueringen Girozentrale | | 0.375% | | 2/8/24 | EUR | 10,000 | | 11,479 | |
| Landesbank Hessen-Thueringen Girozentrale | | 0.500% | | 9/25/25 | EUR | 500 | | 582 | |
| Landesbank Hessen-Thueringen Girozentrale | | 1.125% | | 5/27/21 | EUR | 10,000 | | 11,417 | |
| Landesbank Hessen-Thueringen Girozentrale | | 1.875% | | 6/26/23 | EUR | 800 | | 964 | |
| Muenchener Hypothekenbank eG | | 1.375% | | 4/16/21 | EUR | 15,000 | | 17,158 | |
| Muenchener Hypothekenbank eG | | 1.750% | | 6/3/22 | EUR | 1,000 | | 1,177 | |
| Muenchener Hypothekenbank eG | | 2.500% | | 7/4/28 | EUR | 12,750 | | 17,409 | |
| Norddeutsche Landesbank Girozentrale | | 0.250% | | 10/28/26 | EUR | 10,000 | | 11,463 | |
| Norddeutsche Landesbank Girozentrale | | 0.375% | | 10/9/24 | EUR | 1,100 | | 1,265 | |
| Norddeutsche Landesbank Girozentrale | | 3.250% | | 1/18/21 | EUR | 4,000 | | 4,655 | |
| UniCredit Bank AG | | 0.125% | | 4/9/21 | EUR | 5,000 | | 5,616 | |
| UniCredit Bank AG | | 0.500% | | 5/4/26 | EUR | 500 | | 582 | |
| UniCredit Bank AG | | 0.625% | | 2/12/25 | EUR | 100 | | 116 | |
| UniCredit Bank AG | | 0.875% | | 1/11/29 | EUR | 10,000 | | 12,045 | |
| UniCredit Bank AG | | 1.875% | | 9/12/22 | EUR | 500 | | 593 | |
| UniCredit Bank AG | | 1.875% | | 4/9/24 | EUR | 5,100 | | 6,237 | |
| WL BANK AG Westfaelische Landschaft Bodenkreditbank | | 0.375% | | 6/6/25 | EUR | 2,000 | | 2,308 | |
| WL BANK AG Westfaelische Landschaft Bodenkreditbank | | 0.500% | | 4/1/27 | EUR | 5,000 | | 5,848 | |
| WL BANK AG Westfaelische Landschaft Bodenkreditbank | | 0.625% | | 8/30/27 | EUR | 10,000 | | 11,809 | |
| WL BANK AG Westfaelische Landschaft Bodenkreditbank | | 0.750% | | 2/2/26 | EUR | 10,000 | | 11,832 | |
| WL BANK AG Westfaelische Landschaft Bodenkreditbank | | 0.875% | | 1/18/30 | EUR | 12,200 | | 14,776 | |
| WL BANK AG Westfaelische Landschaft Bodenkreditbank | | 2.500% | | 3/29/22 | EUR | 10,400 | | 12,402 | |
| | | | | | | | | 668,380 | |
Corporate Bonds (1.6%) | | | | | | | | | |
| Aareal Bank AG | | 0.375% | | 7/15/25 | EUR | 2,200 | | 2,539 | |
| ADO Properties SA | | 1.500% | | 7/26/24 | EUR | 3,400 | | 3,782 | |
| Allianz Finance II BV | | 0.875% | | 1/15/26 | EUR | 2,000 | | 2,340 | |
| Allianz Finance II BV | | 1.375% | | 4/21/31 | EUR | 12,500 | | 15,438 | |
| Allianz Finance II BV | | 3.000% | | 3/13/28 | EUR | 2,800 | | 3,872 | |
| Allianz Finance II BV | | 3.500% | | 2/14/22 | EUR | 7,500 | | 9,065 | |
1 | Allianz SE | | 2.241% | | 7/7/45 | EUR | 9,500 | | 11,370 | |
1 | Allianz SE | | 3.375% | | 9/29/49 | EUR | 11,600 | | 14,295 | |
1 | Allianz SE | | 4.750% | | 10/29/49 | EUR | 5,500 | | 7,041 | |
1 | Allianz SE | | 5.625% | | 10/17/42 | EUR | 1,500 | | 1,932 | |
| alstria office REIT-AG | | 1.500% | | 11/15/27 | EUR | 10,000 | | 11,537 | |
| alstria office REIT-AG | | 2.125% | | 4/12/23 | EUR | 200 | | 236 | |
| Aroundtown SA | | 1.000% | | 1/7/25 | EUR | 500 | | 568 | |
| Aroundtown SA | | 1.500% | | 7/15/24 | EUR | 15,800 | | 18,404 | |
| | | | | | | | | | | | | | | | | | |
50
Total International Bond Index Fund
| | | | | | | Face | | Market | |
| | | | | Maturity | | Amount | | Value· | |
| | | Coupon | | Date | Currency | (000 | ) | ($000 | ) |
| Aroundtown SA | | 1.625% | | 1/31/28 | EUR | 1,300 | | 1,498 | |
| Aroundtown SA | | 1.875% | | 1/19/26 | EUR | 20,100 | | 23,882 | |
| Aroundtown SA | | 2.000% | | 11/2/26 | EUR | 6,800 | | 8,087 | |
1 | Aroundtown SA | | 2.125% | | 12/31/49 | EUR | 4,000 | | 4,360 | |
| Aroundtown SA | | 3.000% | | 10/16/29 | GBP | 400 | | 520 | |
| Aroundtown SA | | 3.250% | | 7/18/27 | GBP | 14,500 | | 19,366 | |
| Aroundtown SA | | 4.625% | | 9/18/25 | CAD | 1,285 | | 1,028 | |
| BASF Finance Europe NV | | 0.000% | | 11/10/20 | EUR | 100 | | 112 | |
| BASF SE | | 0.875% | | 10/6/23 | GBP | 500 | | 647 | |
| BASF SE | | 0.875% | | 11/15/27 | EUR | 100 | | 117 | |
| BASF SE | | 0.875% | | 10/6/31 | EUR | 600 | | 695 | |
| BASF SE | | 1.375% | | 6/21/22 | GBP | 100 | | 131 | |
| BASF SE | | 1.450% | | 12/13/32 | EUR | 16,500 | | 20,231 | |
| BASF SE | | 1.500% | | 5/22/30 | EUR | 8,000 | | 9,911 | |
| BASF SE | | 1.750% | | 3/11/25 | GBP | 800 | | 1,073 | |
| BASF SE | | 1.875% | | 2/4/21 | EUR | 5,000 | | 5,722 | |
| BASF SE | | 2.000% | | 12/5/22 | EUR | 10,000 | | 11,866 | |
| Bayer AG | | 1.875% | | 1/25/21 | EUR | 3,000 | | 3,411 | |
1 | Bayer AG | | 3.000% | | 7/1/75 | EUR | 2,000 | | 2,257 | |
1 | Bayer AG | | 3.750% | | 7/1/74 | EUR | 6,054 | | 7,240 | |
| Bayer Capital Corp. BV | | 0.625% | | 12/15/22 | EUR | 15,000 | | 16,990 | |
| Bayer Capital Corp. BV | | 1.500% | | 6/26/26 | EUR | 500 | | 589 | |
| Bayer Capital Corp. BV | | 2.125% | | 12/15/29 | EUR | 10,200 | | 12,479 | |
| Bayerische Landesbank | | 0.625% | | 7/19/27 | EUR | 2,000 | | 2,359 | |
| Berlin Hyp AG | | 0.125% | | 1/5/24 | EUR | 5,000 | | 5,678 | |
| Berlin Hyp AG | | 0.625% | | 10/22/25 | EUR | 500 | | 586 | |
| Berlin Hyp AG | | 1.125% | | 10/25/27 | EUR | 100 | | 119 | |
| Berlin Hyp AG | | 1.250% | | 1/22/25 | EUR | 400 | | 472 | |
| Bertelsmann SE & Co. KGaA | | 1.250% | | 9/29/25 | EUR | 9,800 | | 11,563 | |
| Bertelsmann SE & Co. KGaA | | 1.750% | | 10/14/24 | EUR | 5,900 | | 7,104 | |
| Bertelsmann SE & Co. KGaA | | 2.625% | | 8/2/22 | EUR | 1,500 | | 1,796 | |
1 | Bertelsmann SE & Co. KGaA | | 3.000% | | 4/23/75 | EUR | 100 | | 118 | |
1 | Bertelsmann SE & Co. KGaA | | 3.500% | | 4/23/75 | EUR | 3,000 | | 3,697 | |
| BMW Canada Inc. | | 2.570% | | 8/6/21 | CAD | 12,590 | | 9,622 | |
| BMW Finance NV | | 0.125% | | 1/12/21 | EUR | 15,600 | | 17,455 | |
| BMW Finance NV | | 0.125% | | 11/29/21 | EUR | 4,100 | | 4,589 | |
| BMW Finance NV | | 0.250% | | 1/14/22 | EUR | 2,920 | | 3,279 | |
| BMW Finance NV | | 0.375% | | 7/10/23 | EUR | 10,500 | | 11,833 | |
| BMW Finance NV | | 0.625% | | 10/6/23 | EUR | 11,200 | | 12,727 | |
| BMW Finance NV | | 0.750% | | 4/15/24 | EUR | 900 | | 1,029 | |
| BMW Finance NV | | 0.875% | | 11/17/20 | EUR | 1,000 | | 1,127 | |
| BMW Finance NV | | 0.875% | | 8/16/22 | GBP | 2,400 | | 3,079 | |
| BMW Finance NV | | 0.875% | | 4/3/25 | EUR | 9,200 | | 10,642 | |
| BMW Finance NV | | 1.000% | | 2/15/22 | EUR | 2,200 | | 2,515 | |
| BMW Finance NV | | 1.000% | | 11/14/24 | EUR | 11,780 | | 13,632 | |
| BMW Finance NV | | 1.000% | | 8/29/25 | EUR | 7,980 | | 9,290 | |
| BMW Finance NV | | 1.250% | | 9/5/22 | EUR | 1,200 | | 1,385 | |
| BMW Finance NV | | 1.500% | | 2/6/29 | EUR | 19,764 | | 23,846 | |
| BMW Finance NV | | 2.375% | | 1/24/23 | EUR | 400 | | 480 | |
| BMW International Investment BV | | 1.000% | | 11/17/21 | GBP | 2,600 | | 3,361 | |
| BMW International Investment BV | | 1.750% | | 4/19/22 | GBP | 2,500 | | 3,281 | |
| BMW International Investment BV | | 1.875% | | 9/11/23 | GBP | 300 | | 397 | |
| BMW US Capital LLC | | 0.625% | | 4/20/22 | EUR | 17,910 | | 20,296 | |
| BMW US Capital LLC | | 1.125% | | 9/18/21 | EUR | 400 | | 456 | |
| | | | | | | | | | | | | | | | | | |
51
Total International Bond Index Fund
| | | | | | | Face | | Market | |
| | | | | Maturity | | Amount | | Value· | |
| | | Coupon | | Date | Currency | (000 | ) | ($000 | ) |
| Brenntag Finance BV | | 1.125% | | 9/27/25 | EUR | 3,600 | | 4,118 | |
| Commerzbank AG | | 0.050% | | 7/11/24 | EUR | 5,000 | | 5,664 | |
| Commerzbank AG | | 0.125% | | 1/9/24 | EUR | 10,000 | | 11,353 | |
| Commerzbank AG | | 0.125% | | 12/15/26 | EUR | 11,800 | | 13,420 | |
| Commerzbank AG | | 0.500% | | 9/13/23 | EUR | 1,000 | | 1,119 | |
| Commerzbank AG | | 1.000% | | 3/4/26 | EUR | 5,000 | | 5,767 | |
| Commerzbank AG | | 1.250% | | 1/9/34 | EUR | 7,000 | | 8,874 | |
| Commerzbank AG | | 1.500% | | 9/21/22 | EUR | 5,000 | | 5,785 | |
| Commerzbank AG | | 1.500% | | 8/28/28 | EUR | 45 | | 54 | |
| Commerzbank AG | | 4.000% | | 3/23/26 | EUR | 11,130 | | 14,151 | |
| Commerzbank AG | | 4.000% | | 3/30/27 | EUR | 6,000 | | 7,711 | |
| Covestro AG | | 1.750% | | 9/25/24 | EUR | 10,000 | | 11,975 | |
| Daimler AG | | 0.000% | | 2/8/24 | EUR | 800 | | 882 | |
| Daimler AG | | 0.750% | | 2/8/30 | EUR | 9,000 | | 9,863 | |
| Daimler AG | | 0.875% | | 1/12/21 | EUR | 18,000 | | 20,293 | |
| Daimler AG | | 1.125% | | 8/8/34 | EUR | 10,000 | | 10,940 | |
| Daimler AG | | 1.500% | | 1/13/22 | GBP | 2,500 | | 3,256 | |
| Daimler AG | | 2.000% | | 6/25/21 | EUR | 600 | | 692 | |
| Daimler AG | | 2.000% | | 2/27/31 | EUR | 6,800 | | 8,409 | |
| Daimler AG | | 2.250% | | 1/24/22 | EUR | 1,750 | | 2,051 | |
| Daimler AG | | 2.375% | | 9/12/22 | EUR | 7,000 | | 8,321 | |
| Daimler AG | | 2.750% | | 12/4/20 | GBP | 4,500 | | 5,924 | |
| Daimler Canada Finance Inc. | | 1.910% | | 7/8/21 | CAD | 5,000 | | 3,770 | |
| Daimler Canada Finance Inc. | | 3.050% | | 5/16/22 | CAD | 8,990 | | 6,920 | |
| Daimler International Finance BV | | 0.200% | | 9/13/21 | EUR | 100 | | 112 | |
| Daimler International Finance BV | | 0.250% | | 8/9/21 | EUR | 15,000 | | 16,802 | |
| Daimler International Finance BV | | 0.250% | | 5/11/22 | EUR | 800 | | 896 | |
| Daimler International Finance BV | | 0.625% | | 2/27/23 | EUR | 10,876 | | 12,324 | |
| Daimler International Finance BV | | 0.875% | | 4/9/24 | EUR | 2,950 | | 3,379 | |
| Daimler International Finance BV | | 1.000% | | 11/11/25 | EUR | 21,000 | | 24,240 | |
| Daimler International Finance BV | | 1.375% | | 6/26/26 | EUR | 27,400 | | 32,244 | |
| Daimler International Finance BV | | 1.500% | | 8/18/21 | GBP | 1,500 | | 1,949 | |
| Daimler International Finance BV | | 2.000% | | 9/4/23 | GBP | 500 | | 661 | |
| Daimler International Finance BV | | 2.125% | | 6/7/22 | GBP | 100 | | 132 | |
| Deutsche Apotheker-und Aerztebank eG | | 0.750% | | 10/5/27 | EUR | 700 | | 834 | |
| Deutsche Bank AG | | 0.000% | | 10/15/26 | EUR | 4,906 | | 4,685 | |
| Deutsche Bank AG | | 0.625% | | 12/19/23 | CHF | 11,500 | | 11,527 | |
| Deutsche Bank AG | | 1.125% | | 8/30/23 | EUR | 3,000 | | 3,439 | |
| Deutsche Bank AG | | 1.250% | | 9/8/21 | EUR | 11,200 | | 12,586 | |
| Deutsche Bank AG | | 1.500% | | 1/20/22 | EUR | 3,400 | | 3,832 | |
| Deutsche Bank AG | | 1.875% | | 2/14/22 | EUR | 3,300 | | 3,750 | |
| Deutsche Bank AG | | 2.375% | | 1/11/23 | EUR | 11,800 | | 13,702 | |
| Deutsche Bank AG | | 2.625% | | 2/12/26 | EUR | 13,000 | | 15,522 | |
| Deutsche Bank AG | | 3.875% | | 2/12/24 | GBP | 3,100 | | 4,184 | |
| Deutsche Boerse AG | | 1.125% | | 3/26/28 | EUR | 10,000 | | 12,074 | |
| Deutsche Boerse AG | | 1.625% | | 10/8/25 | EUR | 4,098 | | 5,055 | |
| Deutsche Boerse AG | | 2.375% | | 10/5/22 | EUR | 500 | | 598 | |
| Deutsche Hypothekenbank AG | | 0.250% | | 2/22/23 | EUR | 15,000 | | 17,050 | |
| Deutsche Hypothekenbank AG | | 0.250% | | 5/17/24 | EUR | 3,500 | | 3,997 | |
| Deutsche Kreditbank AG | | 0.625% | | 6/8/21 | EUR | 15,100 | | 16,992 | |
| Deutsche Post AG | | 1.625% | | 12/5/28 | EUR | 8,000 | | 9,893 | |
| Deutsche Post AG | | 2.750% | | 10/9/23 | EUR | 2,000 | | 2,478 | |
| Deutsche Post AG | | 2.875% | | 12/11/24 | EUR | 2,000 | | 2,553 | |
| Deutsche Telekom AG | | 0.500% | | 7/5/27 | EUR | 13,000 | | 14,642 | |
| | | | | | | | | | | | | | | | | | |
52
Total International Bond Index Fund
| | | | | | | Face | | Market | |
| | | | | Maturity | | Amount | | Value· | |
| | | Coupon | | Date | Currency | (000 | ) | ($000 | ) |
| Deutsche Telekom AG | | 1.375% | | 7/5/34 | EUR | 3,000 | | 3,463 | |
| Deutsche Telekom AG | | 1.750% | | 3/25/31 | EUR | 100 | | 123 | |
| Deutsche Telekom AG | | 2.250% | | 3/29/39 | EUR | 4,250 | | 5,389 | |
| Deutsche Telekom International Finance BV | | 0.250% | | 4/19/21 | EUR | 6,300 | | 7,063 | |
| Deutsche Telekom International Finance BV | | 0.375% | | 10/30/21 | EUR | 15,500 | | 17,446 | |
| Deutsche Telekom International Finance BV | | 0.625% | | 12/1/22 | EUR | 20,100 | | 22,861 | |
| Deutsche Telekom International Finance BV | | 0.625% | | 4/3/23 | EUR | 12,000 | | 13,656 | |
| Deutsche Telekom International Finance BV | | 1.125% | | 5/22/26 | EUR | 100 | | 118 | |
| Deutsche Telekom International Finance BV | | 1.375% | | 12/1/25 | EUR | 25,065 | | 29,928 | |
| Deutsche Telekom International Finance BV | | 1.375% | | 1/30/27 | EUR | 200 | | 240 | |
| Deutsche Telekom International Finance BV | | 1.500% | | 4/3/28 | EUR | 5,235 | | 6,322 | |
| Deutsche Telekom International Finance BV | | 2.000% | | 12/1/29 | EUR | 8,700 | | 10,992 | |
| Deutsche Telekom International Finance BV | | 2.500% | | 10/10/25 | GBP | 15,000 | | 20,488 | |
| Deutsche Telekom International Finance BV | | 2.750% | | 10/24/24 | EUR | 4,396 | | 5,553 | |
| Deutsche Telekom International Finance BV | | 3.250% | | 1/17/28 | EUR | 100 | | 137 | |
| Deutsche Telekom International Finance BV | | 4.250% | | 7/13/22 | EUR | 3,000 | | 3,738 | |
| Deutsche Telekom International Finance BV | | 4.875% | | 4/22/25 | EUR | 9,250 | | 13,033 | |
| Deutsche Telekom International Finance BV | | 6.500% | | 4/8/22 | GBP | 10,400 | | 15,170 | |
| Deutsche Telekom International Finance BV | | 7.500% | | 1/24/33 | EUR | 900 | | 1,803 | |
| Deutsche Telekom International Finance BV | | 8.875% | | 11/27/28 | GBP | 900 | | 1,838 | |
| DVB Bank SE | | 0.875% | | 4/9/21 | EUR | 400 | | 451 | |
| DVB Bank SE | | 1.000% | | 4/25/22 | EUR | 6,500 | | 7,397 | |
| DVB Bank SE | | 1.250% | | 9/15/21 | EUR | 13,600 | | 15,491 | |
| DVB Bank SE | | 1.250% | | 6/16/23 | EUR | 19,300 | | 22,268 | |
| DZ HYP AG | | 0.500% | | 11/13/25 | EUR | 16,000 | | 18,639 | |
| DZ HYP AG | | 0.750% | | 6/30/27 | EUR | 1,200 | | 1,428 | |
| E.ON International Finance BV | | 5.875% | | 10/30/37 | GBP | 8,950 | | 17,151 | |
| E.ON International Finance BV | | 6.375% | | 6/7/32 | GBP | 10,800 | | 20,275 | |
| E.ON International Finance BV | | 6.750% | | 1/27/39 | GBP | 1,000 | | 2,118 | |
| E.ON SE | | 0.350% | | 2/28/30 | EUR | 10,000 | | 10,892 | |
| E.ON SE | | 0.375% | | 8/23/21 | EUR | 7,000 | | 7,863 | |
| E.ON SE | | 0.875% | | 5/22/24 | EUR | 500 | | 577 | |
| E.ON SE | | 1.625% | | 5/22/29 | EUR | 100 | | 123 | |
| Eurogrid GmbH | | 1.500% | | 4/18/28 | EUR | 1,100 | | 1,326 | |
| Eurogrid GmbH | | 1.625% | | 11/3/23 | EUR | 1,900 | | 2,243 | |
| Eurogrid GmbH | | 1.875% | | 6/10/25 | EUR | 4,100 | | 4,977 | |
| Evonik Finance BV | | 0.000% | | 3/8/21 | EUR | 300 | | 335 | |
| Evonik Finance BV | | 0.750% | | 9/7/28 | EUR | 5,100 | | 5,882 | |
| Fresenius Finance Ireland plc | | 1.500% | | 1/30/24 | EUR | 10,438 | | 12,207 | |
| Fresenius Medical Care AG & Co. KGaA | | 1.500% | | 7/11/25 | EUR | 400 | | 473 | |
| Fresenius SE & Co. KGaA | | 0.875% | | 1/31/22 | EUR | 3,000 | | 3,401 | |
| Fresenius SE & Co. KGaA | | 1.875% | | 2/15/25 | EUR | 12,500 | | 15,048 | |
| Fresenius SE & Co. KGaA | | 2.875% | | 2/15/29 | EUR | 12,000 | | 15,726 | |
| Fresenius SE & Co. KGaA | | 3.000% | | 1/30/32 | EUR | 1,572 | | 2,067 | |
| Fresenius SE & Co. KGaA | | 4.000% | | 2/1/24 | EUR | 9,000 | | 11,598 | |
| Grand City Properties SA | | 1.375% | | 8/3/26 | EUR | 10,100 | | 11,643 | |
| Grand City Properties SA | | 1.500% | | 4/17/25 | EUR | 13,200 | | 15,425 | |
| Grand City Properties SA | | 1.500% | | 2/22/27 | EUR | 2,100 | | 2,440 | |
1 | Grand City Properties SA | | 2.500% | | 12/31/49 | EUR | 1,000 | | 1,137 | |
| Hamburg Commercial Bank AG | | 0.375% | | 7/12/23 | EUR | 16,100 | | 18,345 | |
1 | Hannover Finance Luxembourg SA | | 5.000% | | 6/30/43 | EUR | 6,100 | | 7,899 | |
1 | Hannover Rueck SE | | 3.375% | | 12/31/49 | EUR | 100 | | 125 | |
| HeidelbergCement AG | | 2.250% | | 3/30/23 | EUR | 8,000 | | 9,468 | |
| HeidelbergCement AG | | 2.250% | | 6/3/24 | EUR | 10,700 | | 12,899 | |
| | | | | | | | | | | | | | | | | | |
53
Total International Bond Index Fund
| | | | | | | Face | | Market | |
| | | | | Maturity | | Amount | | Value· | |
| | | Coupon | | Date | Currency | (000 | ) | ($000 | ) |
| HeidelbergCement Finance Luxembourg SA | | 0.500% | | 1/18/21 | EUR | 8,000 | | 8,972 | |
| HeidelbergCement Finance Luxembourg SA | | 1.125% | | 12/1/27 | EUR | 10,000 | | 11,369 | |
| HeidelbergCement Finance Luxembourg SA | | 1.500% | | 6/14/27 | EUR | 400 | | 469 | |
| HeidelbergCement Finance Luxembourg SA | | 1.625% | | 4/7/26 | EUR | 2,700 | | 3,190 | |
| HeidelbergCement Finance Luxembourg SA | | 1.750% | | 4/24/28 | EUR | 11,200 | | 13,318 | |
| Hella GmbH & Co. KGaA | | 1.000% | | 5/17/24 | EUR | 800 | | 913 | |
| Henkel AG & Co. KGaA | | 0.875% | | 9/13/22 | GBP | 13,779 | | 17,808 | |
| innogy Finance BV | | 1.000% | | 4/13/25 | EUR | 10,000 | | 11,642 | |
| innogy Finance BV | | 1.500% | | 7/31/29 | EUR | 33,980 | | 41,201 | |
| innogy Finance BV | | 4.750% | | 1/31/34 | GBP | 5,400 | | 8,988 | |
| innogy Finance BV | | 5.500% | | 7/6/22 | GBP | 1,100 | | 1,587 | |
| innogy Finance BV | | 5.625% | | 12/6/23 | GBP | 1,400 | | 2,126 | |
| innogy Finance BV | | 6.125% | | 7/6/39 | GBP | 3,000 | | 5,990 | |
| innogy Finance BV | | 6.250% | | 6/3/30 | GBP | 15,900 | | 28,499 | |
| innogy Finance BV | | 6.500% | | 4/20/21 | GBP | 11,100 | | 15,436 | |
| innogy Finance BV | | 6.500% | | 8/10/21 | EUR | 300 | | 374 | |
| LANXESS AG | | 0.250% | | 10/7/21 | EUR | 615 | | 690 | |
| LANXESS AG | | 1.125% | | 5/16/25 | EUR | 9,500 | | 11,083 | |
| LANXESS AG | | 2.625% | | 11/21/22 | EUR | 300 | | 361 | |
| LEG Immobilien AG | | 1.250% | | 1/23/24 | EUR | 800 | | 922 | |
| Linde Finance BV | | 1.000% | | 4/20/28 | EUR | 500 | | 597 | |
| Linde Finance BV | | 3.875% | | 6/1/21 | EUR | 400 | | 475 | |
| Linde Finance BV | | 5.875% | | 4/24/23 | GBP | 2,177 | | 3,306 | |
| Merck Financial Services GmbH | | 0.875% | | 7/5/31 | EUR | 600 | | 687 | |
1 | Merck KGaA | | 2.625% | | 12/12/74 | EUR | 2,000 | | 2,307 | |
1 | Merck KGaA | | 3.375% | | 12/12/74 | EUR | 300 | | 374 | |
| Muenchener Hypothekenbank eG | | 0.500% | | 4/22/26 | EUR | 500 | | 583 | |
| Muenchener Hypothekenbank eG | | 0.625% | | 10/23/26 | EUR | 1,200 | | 1,413 | |
| Muenchener Hypothekenbank eG | | 0.625% | | 5/7/27 | EUR | 13,000 | | 15,319 | |
| Muenchener Hypothekenbank eG | | 0.625% | | 11/10/27 | EUR | 15,000 | | 17,729 | |
| Muenchener Hypothekenbank eG | | 1.000% | | 4/18/39 | EUR | 5,000 | | 6,220 | |
1 | Muenchener Rueckversicherungs-Gesellschaft AG in Muenchen | | 3.250% | | 5/26/49 | EUR | 9,300 | | 12,209 | |
1 | Muenchener Rueckversicherungs-Gesellschaft AG In Muenchen | | 6.000% | | 5/26/41 | EUR | 500 | | 609 | |
1 | Muenchener Rueckversicherungs-Gesellschaft AG In Muenchen | | 6.250% | | 5/26/42 | EUR | 11,800 | | 15,199 | |
1 | Muenchener Rueckversicherungs-Gesellschaft AG in Muenchen | | 6.625% | | 5/26/42 | GBP | 3,700 | | 5,397 | |
| O2 Telefonica Deutschland Finanzierungs GmbH | | 1.750% | | 7/5/25 | EUR | 2,000 | | 2,352 | |
| O2 Telefonica Deutschland Finanzierungs GmbH | | 2.375% | | 2/10/21 | EUR | 700 | | 804 | |
| Robert Bosch GmbH | | 1.750% | | 7/8/24 | EUR | 200 | | 242 | |
| Santander Consumer Bank AG | | 0.750% | | 10/17/22 | EUR | 18,700 | | 21,226 | |
| SAP SE | | 0.750% | | 12/10/24 | EUR | 1,500 | | 1,740 | |
| SAP SE | | 1.125% | | 2/20/23 | EUR | 2,650 | | 3,073 | |
| SAP SE | | 1.250% | | 3/10/28 | EUR | 5,800 | | 7,063 | |
| SAP SE | | 1.625% | | 3/10/31 | EUR | 25,200 | | 31,915 | |
| Siemens Financieringsmaatschappij NV | | 0.000% | | 9/5/24 | EUR | 13,950 | | 15,617 | |
| Siemens Financieringsmaatschappij NV | | 0.125% | | 9/5/29 | EUR | 10,000 | | 11,015 | |
| Siemens Financieringsmaatschappij NV | | 1.250% | | 2/28/31 | EUR | 15,849 | | 19,358 | |
| Siemens Financieringsmaatschappij NV | | 1.375% | | 9/6/30 | EUR | 300 | | 371 | |
| Siemens Financieringsmaatschappij NV | | 1.750% | | 3/12/21 | EUR | 6,400 | | 7,332 | |
| | | | | | | | | | | | | | | | | | |
54
Total International Bond Index Fund
| | | | | | | Face | | Market | |
| | | | | Maturity | | Amount | | Value· | |
| | | Coupon | | Date | Currency | (000 | ) | ($000 | ) |
| Siemens Financieringsmaatschappij NV | | 1.750% | | 2/28/39 | EUR | 1,198 | | 1,551 | |
| Siemens Financieringsmaatschappij NV | | 2.750% | | 9/10/25 | GBP | 1,000 | | 1,422 | |
| Siemens Financieringsmaatschappij NV | | 2.875% | | 3/10/28 | EUR | 500 | | 687 | |
| Siemens Financieringsmaatschappij NV | | 3.750% | | 9/10/42 | GBP | 3,100 | | 5,407 | |
1 | Talanx AG | | 2.250% | | 12/5/47 | EUR | 10,200 | | 11,938 | |
| Talanx AG | | 2.500% | | 7/23/26 | EUR | 2,000 | | 2,579 | |
1 | Talanx Finanz Luxembourg SA | | 8.367% | | 6/15/42 | EUR | 4,000 | | 5,411 | |
| TLG Immobilien AG | | 1.375% | | 11/27/24 | EUR | 800 | | 927 | |
| TLG Immobilien AG | | 1.500% | | 5/28/26 | EUR | 5,700 | | 6,553 | |
| UniCredit Bank AG | | 0.125% | | 10/26/23 | EUR | 2,000 | | 2,270 | |
| UniCredit Bank AG | | 0.625% | | 11/20/25 | EUR | 500 | | 585 | |
| UniCredit Bank AG | | 0.850% | | 5/22/34 | EUR | 5,100 | | 6,153 | |
| Vier Gas Transport GmbH | | 2.875% | | 6/12/25 | EUR | 11,500 | | 14,851 | |
| Vier Gas Transport GmbH | | 3.125% | | 7/10/23 | EUR | 8,100 | | 10,103 | |
| Volkswagen Bank GmbH | | 0.625% | | 9/8/21 | EUR | 15,400 | | 17,354 | |
| Volkswagen Bank GmbH | | 0.750% | | 6/15/23 | EUR | 11,400 | | 12,908 | |
| Volkswagen Bank GmbH | | 1.250% | | 8/1/22 | EUR | 800 | | 918 | |
| Volkswagen Bank GmbH | | 1.250% | | 6/10/24 | EUR | 53,300 | | 61,364 | |
| Volkswagen Bank GmbH | | 1.250% | | 12/15/25 | EUR | 1,300 | | 1,494 | |
| Volkswagen Bank GmbH | | 2.500% | | 7/31/26 | EUR | 5,300 | | 6,531 | |
| Volkswagen Financial Services AG | | 0.375% | | 4/12/21 | EUR | 800 | | 897 | |
| Volkswagen Financial Services AG | | 0.875% | | 4/12/23 | EUR | 1,100 | | 1,249 | |
| Volkswagen Financial Services AG | | 2.250% | | 10/16/26 | EUR | 2,000 | | 2,429 | |
| Volkswagen Financial Services Australia Pty Ltd. | | 3.300% | | 2/28/22 | AUD | 3,490 | | 2,478 | |
| Volkswagen Financial Services NV | | 1.500% | | 4/12/21 | GBP | 3,000 | | 3,883 | |
| Volkswagen Financial Services NV | | 1.625% | | 6/9/22 | GBP | 3,600 | | 4,665 | |
| Volkswagen Financial Services NV | | 1.750% | | 9/12/22 | GBP | 1,000 | | 1,302 | |
| Volkswagen Financial Services NV | | 1.875% | | 9/7/21 | GBP | 400 | | 521 | |
| Volkswagen Financial Services NV | | 2.250% | | 4/12/25 | GBP | 600 | | 793 | |
| Volkswagen International Finance NV | | 0.500% | | 3/30/21 | EUR | 5,000 | | 5,613 | |
| Volkswagen International Finance NV | | 1.875% | | 3/30/27 | EUR | 13,400 | | 15,970 | |
| Volkswagen International Finance NV | | 2.000% | | 3/26/21 | EUR | 3,300 | | 3,785 | |
| Volkswagen International Finance NV | | 2.625% | | 11/16/27 | EUR | 300 | | 378 | |
1 | Volkswagen International Finance NV | | 2.700% | | 12/14/65 | EUR | 21,500 | | 24,689 | |
| Volkswagen International Finance NV | | 3.250% | | 11/18/30 | EUR | 1,800 | | 2,389 | |
| Volkswagen International Finance NV | | 3.300% | | 3/22/33 | EUR | 800 | | 1,068 | |
| Volkswagen International Finance NV | | 3.375% | | 11/16/26 | GBP | 7,100 | | 9,845 | |
1 | Volkswagen International Finance NV | | 3.375% | | 12/31/49 | EUR | 18,000 | | 20,993 | |
1 | Volkswagen International Finance NV | | 3.500% | | 12/29/49 | EUR | 10,200 | | 11,634 | |
1 | Volkswagen International Finance NV | | 3.875% | | 6/14/66 | EUR | 10,400 | | 12,328 | |
| Volkswagen International Finance NV | | 4.125% | | 11/16/38 | EUR | 16,200 | | 23,593 | |
1 | Volkswagen International Finance NV | | 4.625% | | 3/29/49 | EUR | 2,000 | | 2,486 | |
1 | Volkswagen International Finance NV | | 4.625% | | 12/31/49 | EUR | 1,400 | | 1,720 | |
1 | Volkswagen International Finance NV | | 5.125% | | 12/31/49 | EUR | 4,100 | | 5,123 | |
| Volkswagen Leasing GmbH | | 0.250% | | 2/16/21 | EUR | 10,300 | | 11,524 | |
| Volkswagen Leasing GmbH | | 1.000% | | 2/16/23 | EUR | 11,450 | | 13,046 | |
| Volkswagen Leasing GmbH | | 1.125% | | 4/4/24 | EUR | 10,500 | | 12,048 | |
| Volkswagen Leasing GmbH | | 1.375% | | 1/20/25 | EUR | 11,600 | | 13,395 | |
| Volkswagen Leasing GmbH | | 1.625% | | 8/15/25 | EUR | 2,180 | | 2,555 | |
| Volkswagen Leasing GmbH | | 2.125% | | 4/4/22 | EUR | 9,600 | | 11,228 | |
| Volkswagen Leasing GmbH | | 2.375% | | 9/6/22 | EUR | 10,000 | | 11,839 | |
| Volkswagen Leasing GmbH | | 2.625% | | 1/15/24 | EUR | 2,300 | | 2,797 | |
| Vonovia Finance BV | | 0.750% | | 1/25/22 | EUR | 100 | | 113 | |
| | | | | | | | | | | | | | | | | | |
55
Total International Bond Index Fund
| | | | | | | Face | | Market | |
| | | | | Maturity | | Amount | | Value· | |
| | | Coupon | | Date | Currency | (000 | ) | ($000 | ) |
| Vonovia Finance BV | | 0.750% | | 1/15/24 | EUR | 20,000 | | 22,745 | |
| Vonovia Finance BV | | 0.875% | | 7/3/23 | EUR | 700 | | 798 | |
| Vonovia Finance BV | | 1.125% | | 9/8/25 | EUR | 2,500 | | 2,893 | |
| Vonovia Finance BV | | 1.125% | | 9/14/34 | EUR | 5,000 | | 5,400 | |
| Vonovia Finance BV | | 1.500% | | 3/31/25 | EUR | 5,100 | | 6,050 | |
| Vonovia Finance BV | | 1.500% | | 3/22/26 | EUR | 10,100 | | 11,939 | |
| Vonovia Finance BV | | 1.500% | | 6/10/26 | EUR | 5,000 | | 5,902 | |
| Vonovia Finance BV | | 1.500% | | 1/14/28 | EUR | 1,100 | | 1,305 | |
| Vonovia Finance BV | | 1.750% | | 1/25/27 | EUR | 200 | | 241 | |
| Vonovia Finance BV | | 1.800% | | 6/29/25 | EUR | 23,200 | | 27,737 | |
| Vonovia Finance BV | | 2.250% | | 12/15/23 | EUR | 12,700 | | 15,298 | |
| Vonovia Finance BV | | 2.750% | | 3/22/38 | EUR | 200 | | 267 | |
| Vonovia Finance BV | | 3.625% | | 10/8/21 | EUR | 3,100 | | 3,699 | |
1 | Vonovia Finance BV | | 4.000% | | 12/29/49 | EUR | 2,300 | | 2,744 | |
| VW Credit Canada Inc. | | 3.250% | | 3/29/23 | CAD | 8,500 | | 6,584 | |
| WL BANK AG Westfaelische Landschaft Bodenkreditbank | | 0.100% | | 8/31/26 | EUR | 1,000 | | 1,137 | |
| Wuerth Finance International BV | | 1.000% | | 5/19/22 | EUR | 400 | | 457 | |
| | | | | | | | | 2,238,634 | |
Sovereign Bonds (7.5%) | | | | | | | | | |
| Bayerische Landesbodenkreditanstalt | | 1.750% | | 4/24/24 | EUR | 3,000 | | 3,666 | |
| Bayerische Landesbodenkreditanstalt | | 1.875% | | 1/25/23 | EUR | 6,290 | | 7,531 | |
| Deutsche Bahn Finance BV | | 1.500% | | 8/26/24 | CHF | 1,000 | | 1,108 | |
| Deutsche Bahn Finance BV | | 3.125% | | 7/24/26 | GBP | 500 | | 729 | |
| Deutsche Bahn Finance GmbH | | 0.000% | | 7/19/21 | EUR | 30,000 | | 33,587 | |
| Deutsche Bahn Finance GmbH | | 0.875% | | 7/11/31 | EUR | 2,700 | | 3,178 | |
| Deutsche Bahn Finance GmbH | | 1.125% | | 12/18/28 | EUR | 10,000 | | 12,154 | |
| Deutsche Bahn Finance GmbH | | 1.250% | | 10/23/25 | EUR | 2,500 | | 3,000 | |
| Deutsche Bahn Finance GmbH | | 1.375% | | 7/7/25 | GBP | 7,000 | | 9,197 | |
| Deutsche Bahn Finance GmbH | | 1.375% | | 3/28/31 | EUR | 3,000 | | 3,701 | |
| Deutsche Bahn Finance GmbH | | 1.500% | | 12/8/32 | EUR | 7,000 | | 8,793 | |
| Deutsche Bahn Finance GmbH | | 1.625% | | 11/6/30 | EUR | 100 | | 127 | |
| Deutsche Bahn Finance GmbH | | 1.625% | | 8/16/33 | EUR | 13,000 | | 16,525 | |
| Deutsche Bahn Finance GmbH | | 1.875% | | 2/13/26 | GBP | 9,128 | | 12,334 | |
| Deutsche Bahn Finance GmbH | | 2.500% | | 9/12/23 | EUR | 18,500 | | 22,700 | |
| Deutsche Bahn Finance GmbH | | 2.750% | | 6/20/22 | GBP | 1,600 | | 2,169 | |
| Deutsche Bahn Finance GmbH | | 2.750% | | 3/19/29 | EUR | 3,500 | | 4,825 | |
| Deutsche Bahn Finance GmbH | | 3.000% | | 3/8/24 | EUR | 4,000 | | 5,042 | |
| Deutsche Bahn Finance GmbH | | 3.500% | | 9/27/24 | AUD | 2,950 | | 2,204 | |
| Deutsche Bahn Finance GmbH | | 3.750% | | 6/1/21 | EUR | 2,000 | | 2,373 | |
| Deutsche Bahn Finance GmbH | | 3.750% | | 7/9/25 | EUR | 5,919 | | 7,972 | |
1 | EnBW Energie Baden-Wuerttemberg AG | | 1.125% | | 11/5/79 | EUR | 3,000 | | 3,328 | |
1 | EnBW Energie Baden-Wuerttemberg AG | | 1.625% | | 8/5/79 | EUR | 3,100 | | 3,441 | |
1 | EnBW Energie Baden-Wuerttemberg AG | | 3.375% | | 4/5/77 | EUR | 3,800 | | 4,481 | |
1 | EnBW Energie Baden-Wuerttemberg AG | | 3.625% | | 4/2/76 | EUR | 14,500 | | 16,861 | |
| Enbw International Finance BV | | 2.500% | | 6/4/26 | EUR | 2,000 | | 2,569 | |
| Enbw International Finance BV | | 6.125% | | 7/7/39 | EUR | 2,285 | | 4,797 | |
| ENTEGA Netz AG | | 6.125% | | 4/23/41 | EUR | 400 | | 744 | |
| EWE AG | | 4.125% | | 11/4/20 | EUR | 2,000 | | 2,327 | |
| EWE AG | | 5.250% | | 7/16/21 | EUR | 8,950 | | 10,872 | |
9 | Federal Republic of Germany | | 0.000% | | 4/9/21 | EUR | 202,800 | | 228,319 | |
9 | Federal Republic of Germany | | 0.000% | | 10/8/21 | EUR | 235,000 | | 265,541 | |
9 | Federal Republic of Germany | | 0.000% | | 4/8/22 | EUR | 230,000 | | 260,778 | |
9 | Federal Republic of Germany | | 0.000% | | 10/7/22 | EUR | 97,500 | | 110,961 | |
| | | | | | | | | | | | | | | | | | |
56
Total International Bond Index Fund
| | | | | | | Face | | Market | |
| | | | | Maturity | | Amount | | Value· | |
| | | Coupon | | Date | Currency | (000 | ) | ($000 | ) |
| Federal Republic of Germany | | 0.000% | | 4/14/23 | EUR | 75,000 | | 85,657 | |
| Federal Republic of Germany | | 0.000% | | 10/13/23 | EUR | 91,568 | | 104,876 | |
9 | Federal Republic of Germany | | 0.000% | | 4/5/24 | EUR | 103,000 | | 118,181 | |
| Federal Republic of Germany | | 0.000% | | 10/18/24 | EUR | 675,000 | | 776,384 | |
| Federal Republic of Germany | | 0.000% | | 8/15/26 | EUR | 44,000 | | 51,015 | |
| Federal Republic of Germany | | 0.000% | | 8/15/29 | EUR | 473,750 | | 549,420 | |
9 | Federal Republic of Germany | | 0.250% | | 10/16/20 | EUR | 221,545 | | 249,154 | |
| Federal Republic of Germany | | 0.250% | | 2/15/27 | EUR | 48,400 | | 57,213 | |
| Federal Republic of Germany | | 0.250% | | 8/15/28 | EUR | 139,801 | | 165,993 | |
9 | Federal Republic of Germany | | 0.250% | | 2/15/29 | EUR | 140,936 | | 167,408 | |
| Federal Republic of Germany | | 0.500% | | 2/15/25 | EUR | 12,000 | | 14,193 | |
9 | Federal Republic of Germany | | 0.500% | | 2/15/26 | EUR | 267,000 | | 318,594 | |
| Federal Republic of Germany | | 0.500% | | 8/15/27 | EUR | 27,073 | | 32,682 | |
| Federal Republic of Germany | | 0.500% | | 2/15/28 | EUR | 19,300 | | 23,360 | |
9 | Federal Republic of Germany | | 1.000% | | 8/15/24 | EUR | 100,000 | | 120,428 | |
9 | Federal Republic of Germany | | 1.250% | | 8/15/48 | EUR | 244,501 | | 363,730 | |
| Federal Republic of Germany | | 1.500% | | 9/4/22 | EUR | 10,000 | | 11,856 | |
| Federal Republic of Germany | | 1.500% | | 2/15/23 | EUR | 65,530 | | 78,404 | |
| Federal Republic of Germany | | 1.500% | | 5/15/23 | EUR | 78,500 | | 94,376 | |
9 | Federal Republic of Germany | | 1.500% | | 5/15/24 | EUR | 209,404 | | 256,631 | |
9 | Federal Republic of Germany | | 1.750% | | 7/4/22 | EUR | 220,771 | | 262,470 | |
| Federal Republic of Germany | | 1.750% | | 2/15/24 | EUR | 14,500 | | 17,859 | |
| Federal Republic of Germany | | 2.000% | | 1/4/22 | EUR | 480 | | 567 | |
9 | Federal Republic of Germany | | 2.000% | | 8/15/23 | EUR | 81,500 | | 100,216 | |
| Federal Republic of Germany | | 2.250% | | 9/4/21 | EUR | 67,400 | | 79,224 | |
9 | Federal Republic of Germany | | 2.500% | | 7/4/44 | EUR | 171,000 | | 308,128 | |
| Federal Republic of Germany | | 2.500% | | 8/15/46 | EUR | 86,550 | | 159,637 | |
| Federal Republic of Germany | | 3.250% | | 7/4/21 | EUR | 21,400 | | 25,432 | |
| Federal Republic of Germany | | 3.250% | | 7/4/42 | EUR | 74,994 | | 146,677 | |
9 | Federal Republic of Germany | | 4.000% | | 1/4/37 | EUR | 141,268 | | 272,459 | |
| Federal Republic of Germany | | 4.250% | | 7/4/39 | EUR | 59,400 | | 123,867 | |
| Federal Republic of Germany | | 4.750% | | 7/4/28 | EUR | 53,500 | | 87,374 | |
10 | Federal Republic of Germany | | 4.750% | | 7/4/34 | EUR | 47,800 | | 93,389 | |
| Federal Republic of Germany | | 4.750% | | 7/4/40 | EUR | 45,785 | | 102,934 | |
| Federal Republic of Germany | | 5.500% | | 1/4/31 | EUR | 81,400 | | 151,928 | |
| Federal Republic of Germany | | 5.625% | | 1/4/28 | EUR | 7,365 | | 12,431 | |
| Federal Republic of Germany | | 6.250% | | 1/4/24 | EUR | 25,000 | | 36,043 | |
| Federal Republic of Germany | | 6.500% | | 7/4/27 | EUR | 54,400 | | 94,102 | |
| FMS Wertmanagement | | 0.000% | | 10/20/20 | EUR | 7,500 | | 8,400 | |
| FMS Wertmanagement | | 0.000% | | 11/13/20 | EUR | 25,000 | | 28,011 | |
| FMS Wertmanagement | | 0.050% | | 7/6/21 | EUR | 10,000 | | 11,253 | |
| FMS Wertmanagement | | 0.375% | | 4/29/30 | EUR | 7,000 | | 8,166 | |
8 | FMS Wertmanagement | | 0.875% | | 5/14/21 | GBP | 21,300 | | 27,601 | |
| FMS Wertmanagement | | 1.000% | | 9/7/22 | GBP | 5,000 | | 6,524 | |
| FMS Wertmanagement | | 3.000% | | 9/8/21 | EUR | 6,000 | | 7,122 | |
| FMS Wertmanagement | | 3.375% | | 6/17/21 | EUR | 11,000 | | 13,040 | |
| Free and Hanseatic City of Hamburg | | 0.250% | | 1/20/25 | EUR | 23,000 | | 26,405 | |
| Free and Hanseatic City of Hamburg | | 1.000% | | 6/18/21 | EUR | 9,500 | | 10,841 | |
| Free and Hanseatic City of Hamburg | | 1.450% | | 11/5/38 | EUR | 15,000 | | 19,935 | |
| Free and Hanseatic City of Hamburg | | 1.875% | | 9/26/22 | EUR | 9,000 | | 10,709 | |
| Gemeinsame Deutsche Bundeslaender | | 0.125% | | 4/14/23 | EUR | 10,000 | | 11,352 | |
| Gemeinsame Deutsche Bundeslaender | | 0.250% | | 3/18/24 | EUR | 25,000 | | 28,622 | |
| Gemeinsame Deutsche Bundeslaender | | 0.375% | | 4/17/25 | EUR | 20,000 | | 23,141 | |
| Gemeinsame Deutsche Bundeslaender | | 0.500% | | 2/5/25 | EUR | 15,000 | | 17,446 | |
| | | | | | | | | | | | | | | | | | |
57
Total International Bond Index Fund
| | | | | | | Face | | Market | |
| | | | | Maturity | | Amount | | Value· | |
| | | Coupon | | Date | Currency | (000 | ) | ($000 | ) |
| Gemeinsame Deutsche Bundeslaender | | 0.625% | | 2/13/29 | EUR | 4,000 | | 4,753 | |
| Gemeinsame Deutsche Bundeslaender | | 1.125% | | 9/30/24 | EUR | 5,500 | | 6,577 | |
| Gemeinsame Deutsche Bundeslaender | | 1.500% | | 1/29/21 | EUR | 5,000 | | 5,710 | |
| Gemeinsame Deutsche Bundeslaender | | 1.750% | | 6/13/22 | EUR | 14,000 | | 16,497 | |
| Gemeinsame Deutsche Bundeslaender | | 1.750% | | 1/31/23 | EUR | 8,000 | | 9,551 | |
| Gemeinsame Deutsche Bundeslaender | | 2.250% | | 10/23/23 | EUR | 175 | | 216 | |
8 | KFW | | 0.000% | | 5/25/21 | EUR | 10,000 | | 11,238 | |
8 | KFW | | 0.000% | | 6/30/21 | EUR | 51,300 | | 57,695 | |
8 | KFW | | 0.000% | | 4/28/22 | EUR | 42,900 | | 48,448 | |
8 | KFW | | 0.000% | | 6/30/22 | EUR | 20,000 | | 22,602 | |
8 | KFW | | 0.000% | | 12/15/22 | EUR | 25,000 | | 28,306 | |
8 | KFW | | 0.000% | | 9/15/23 | EUR | 32,000 | | 36,311 | |
8 | KFW | | 0.000% | | 4/2/24 | EUR | 25,000 | | 28,385 | |
8 | KFW | | 0.050% | | 5/30/24 | EUR | 3,000 | | 3,427 | |
8 | KFW | | 0.125% | | 10/27/20 | EUR | 20,000 | | 22,442 | |
8 | KFW | | 0.125% | | 11/7/23 | EUR | 10,823 | | 12,344 | |
8 | KFW | | 0.125% | | 1/15/24 | EUR | 20,000 | | 22,824 | |
8 | KFW | | 0.125% | | 10/4/24 | EUR | 56,011 | | 64,083 | |
8 | KFW | | 0.250% | | 9/15/25 | EUR | 25,000 | | 28,849 | |
8 | KFW | | 0.375% | | 12/15/20 | GBP | 10,000 | | 12,895 | |
8 | KFW | | 0.375% | | 3/15/23 | EUR | 25,000 | | 28,671 | |
8 | KFW | | 0.375% | | 4/23/25 | EUR | 25,000 | | 29,036 | |
8 | KFW | | 0.375% | | 3/9/26 | EUR | 5,000 | | 5,822 | |
8 | KFW | | 0.375% | | 4/23/30 | EUR | 15,000 | | 17,498 | |
8 | KFW | | 0.500% | | 9/15/27 | EUR | 65,000 | | 76,728 | |
8 | KFW | | 0.625% | | 7/4/22 | EUR | 20,000 | | 22,978 | |
8 | KFW | | 0.625% | | 1/15/25 | EUR | 78,675 | | 92,437 | |
8 | KFW | | 0.625% | | 2/22/27 | EUR | 38,000 | | 44,964 | |
8 | KFW | | 0.625% | | 1/7/28 | EUR | 50,000 | | 59,599 | |
8 | KFW | | 0.750% | | 6/28/28 | EUR | 20,000 | | 24,133 | |
8 | KFW | | 0.750% | | 1/15/29 | EUR | 20,000 | | 24,147 | |
8 | KFW | | 0.875% | | 3/15/22 | GBP | 20,000 | | 25,988 | |
8 | KFW | | 0.875% | | 7/4/39 | EUR | 5,000 | | 6,217 | |
8 | KFW | | 1.000% | | 11/4/20 | NOK | 20,000 | | 2,169 | |
8 | KFW | | 1.125% | | 5/9/33 | EUR | 40,000 | | 50,823 | |
8 | KFW | | 1.125% | | 6/15/37 | EUR | 10,000 | | 12,881 | |
8 | KFW | | 1.250% | | 12/29/23 | GBP | 20,000 | | 26,404 | |
8 | KFW | | 1.250% | | 7/4/36 | EUR | 23,000 | | 30,014 | |
8 | KFW | | 1.375% | | 2/1/21 | GBP | 10,000 | | 13,040 | |
8 | KFW | | 1.375% | | 12/9/24 | GBP | 10,000 | | 13,317 | |
8 | KFW | | 1.375% | | 7/31/35 | EUR | 14,000 | | 18,507 | |
8 | KFW | | 1.500% | | 6/11/24 | EUR | 22,460 | | 27,272 | |
8 | KFW | | 1.625% | | 1/15/21 | EUR | 43,000 | | 49,192 | |
8 | KFW | | 2.000% | | 2/7/22 | CAD | 13,035 | | 9,939 | |
8 | KFW | | 2.125% | | 8/15/23 | EUR | 20,000 | | 24,495 | |
8 | KFW | | 2.500% | | 1/17/22 | EUR | 12,000 | | 14,282 | |
8 | KFW | | 2.500% | | 8/25/25 | CHF | 21,500 | | 25,693 | |
8 | KFW | | 2.800% | | 2/17/21 | AUD | 7,500 | | 5,278 | |
8 | KFW | | 2.800% | | 3/7/23 | AUD | 25,600 | | 18,551 | |
8 | KFW | | 2.900% | | 6/6/22 | AUD | 25,275 | | 18,181 | |
8 | KFW | | 3.200% | | 9/11/26 | AUD | 18,460 | | 14,188 | |
8 | KFW | | 3.200% | | 3/15/28 | AUD | 1,450 | | 1,127 | |
8 | KFW | | 3.375% | | 1/18/21 | EUR | 25,350 | | 29,599 | |
8 | KFW | | 3.500% | | 7/4/21 | EUR | 25,000 | | 29,755 | |
| | | | | | | | | | | | | | | | | | |
58
Total International Bond Index Fund
| | | | | | | Face | | Market | |
| | | | | Maturity | | Amount | | Value· | |
| | | Coupon | | Date | Currency | (000 | ) | ($000 | ) |
8 | KFW | | 4.000% | | 2/27/25 | AUD | 3,400 | | 2,661 | |
8 | KFW | | 4.700% | | 6/2/37 | CAD | 2,350 | | 2,338 | |
8 | KFW | | 4.875% | | 3/15/37 | GBP | 4,400 | | 8,954 | |
8 | KFW | | 5.000% | | 3/19/24 | AUD | 10,000 | | 7,982 | |
8 | KFW | | 5.500% | | 2/9/22 | AUD | 29,200 | | 22,048 | |
8 | KFW | | 5.500% | | 6/18/25 | GBP | 20,000 | | 32,543 | |
8 | KFW | | 5.550% | | 6/7/21 | GBP | 19,000 | | 26,456 | |
8 | KFW | | 5.750% | | 6/7/32 | GBP | 10,500 | | 21,123 | |
8 | KFW | | 6.000% | | 12/7/28 | GBP | 10,000 | | 18,728 | |
8 | KFW | | 6.250% | | 5/19/21 | AUD | 11,000 | | 8,168 | |
| Land Berlin | | 0.000% | | 9/15/22 | EUR | 9,000 | | 10,163 | |
| Land Berlin | | 0.250% | | 4/22/25 | EUR | 10,000 | | 11,478 | |
| Land Berlin | | 0.500% | | 2/10/25 | EUR | 21,000 | | 24,456 | |
| Land Berlin | | 0.750% | | 4/3/34 | EUR | 10,490 | | 12,528 | |
| Land Berlin | | 1.375% | | 6/5/37 | EUR | 5,000 | | 6,539 | |
| Land Berlin | | 1.375% | | 8/27/38 | EUR | 5,000 | | 6,569 | |
| Land Thueringen | | 0.200% | | 10/26/26 | EUR | 15,000 | | 17,203 | |
| Land Thueringen | | 0.500% | | 5/12/25 | EUR | 4,500 | | 5,247 | |
| Landesbank Baden-Wuerttemberg | | 0.200% | | 12/13/21 | EUR | 7,000 | | 7,849 | |
| Landesbank Baden-Wuerttemberg | | 0.375% | | 5/24/24 | EUR | 1,500 | | 1,683 | |
| Landesbank Baden-Wuerttemberg | | 0.500% | | 6/7/22 | EUR | 3,000 | | 3,388 | |
| Landesbank Baden-Wuerttemberg | | 2.200% | | 5/9/29 | EUR | 16,900 | | 20,215 | |
| Landesbank Baden-Wuerttemberg | | 2.875% | | 9/28/26 | EUR | 15,100 | | 18,909 | |
| Landeskreditbank Baden-Wuerttemberg Foerderbank | | 0.375% | | 4/13/26 | EUR | 15,000 | | 17,432 | |
| Landeskreditbank Baden-Wuerttemberg Foerderbank | | 1.125% | | 5/17/21 | GBP | 5,700 | | 7,409 | |
| Landeskreditbank Baden-Wuerttemberg Foerderbank | | 2.250% | | 2/17/21 | AUD | 20,500 | | 14,306 | |
| Landeskreditbank Baden-Wuerttemberg Foerderbank | | 4.250% | | 8/7/25 | AUD | 11,800 | | 9,375 | |
8 | Landwirtschaftliche Rentenbank | | 0.050% | | 6/12/23 | EUR | 24,700 | | 28,044 | |
8 | Landwirtschaftliche Rentenbank | | 0.250% | | 11/24/22 | EUR | 10,000 | | 11,395 | |
8 | Landwirtschaftliche Rentenbank | | 0.250% | | 7/15/24 | EUR | 12,900 | | 14,825 | |
8 | Landwirtschaftliche Rentenbank | | 0.375% | | 1/22/24 | EUR | 40,100 | | 46,246 | |
8 | Landwirtschaftliche Rentenbank | | 0.375% | | 3/16/26 | EUR | 26,500 | | 30,850 | |
8 | Landwirtschaftliche Rentenbank | | 0.375% | | 2/14/28 | EUR | 10,000 | | 11,673 | |
8 | Landwirtschaftliche Rentenbank | | 0.500% | | 3/6/25 | EUR | 8,000 | | 9,336 | |
8 | Landwirtschaftliche Rentenbank | | 0.625% | | 5/18/27 | EUR | 15,300 | | 18,181 | |
8 | Landwirtschaftliche Rentenbank | | 0.625% | | 2/20/30 | EUR | 20,000 | | 23,907 | |
8 | Landwirtschaftliche Rentenbank | | 1.125% | | 5/12/21 | GBP | 1,049 | | 1,364 | |
8 | Landwirtschaftliche Rentenbank | | 1.125% | | 12/15/23 | GBP | 14,600 | | 19,183 | |
8 | Landwirtschaftliche Rentenbank | | 1.250% | | 5/20/22 | EUR | 5,000 | | 5,823 | |
8 | Landwirtschaftliche Rentenbank | | 1.375% | | 12/15/20 | GBP | 3,100 | | 4,042 | |
8 | Landwirtschaftliche Rentenbank | | 2.500% | | 4/13/21 | AUD | 5,000 | | 3,514 | |
8 | Landwirtschaftliche Rentenbank | | 2.600% | | 3/23/27 | AUD | 4,400 | | 3,258 | |
8 | Landwirtschaftliche Rentenbank | | 2.700% | | 9/5/22 | AUD | 13,000 | | 9,339 | |
8 | Landwirtschaftliche Rentenbank | | 2.875% | | 8/30/21 | EUR | 13,000 | | 15,393 | |
8 | Landwirtschaftliche Rentenbank | | 3.250% | | 4/12/28 | AUD | 1,650 | | 1,287 | |
8 | Landwirtschaftliche Rentenbank | | 4.250% | | 1/24/23 | AUD | 53,600 | | 40,474 | |
8 | Landwirtschaftliche Rentenbank | | 4.250% | | 1/9/25 | AUD | 13,500 | | 10,649 | |
8 | Landwirtschaftliche Rentenbank | | 4.750% | | 4/8/24 | AUD | 4,000 | | 3,166 | |
8 | Landwirtschaftliche Rentenbank | | 5.500% | | 3/29/22 | AUD | 8,500 | | 6,456 | |
| NRW Bank | | 0.000% | | 8/2/21 | EUR | 20,000 | | 22,462 | |
| | | | | | | | | | | | | | | | | | |
59
Total International Bond Index Fund
| | | | | | | Face | | Market | |
| | | | | Maturity | | Amount | | Value· | |
| | | Coupon | | Date | Currency | (000 | ) | ($000 | ) |
| NRW Bank | | 0.000% | | 2/1/22 | EUR | 30,000 | | 33,802 | |
| NRW Bank | | 0.100% | | 1/10/23 | EUR | 25,000 | | 28,339 | |
| NRW Bank | | 0.125% | | 3/10/23 | EUR | 5,000 | | 5,678 | |
| NRW Bank | | 0.250% | | 1/20/22 | EUR | 45,000 | | 50,920 | |
| NRW Bank | | 0.250% | | 3/10/25 | EUR | 15,000 | | 17,217 | |
| NRW Bank | | 0.250% | | 9/28/26 | EUR | 5,950 | | 6,843 | |
| NRW Bank | | 0.375% | | 5/16/29 | EUR | 7,250 | | 8,405 | |
| NRW Bank | | 0.500% | | 5/11/26 | EUR | 12,000 | | 14,025 | |
| NRW Bank | | 0.500% | | 9/13/27 | EUR | 15,000 | | 17,594 | |
| NRW Bank | | 0.625% | | 2/11/26 | EUR | 15,000 | | 17,643 | |
| NRW Bank | | 0.625% | | 2/23/27 | EUR | 15,000 | | 17,738 | |
| NRW Bank | | 0.625% | | 1/4/28 | EUR | 7,000 | | 8,293 | |
| NRW Bank | | 1.000% | | 6/15/22 | GBP | 1,000 | | 1,300 | |
| NRW Bank | | 1.250% | | 5/13/49 | EUR | 10,000 | | 13,232 | |
| State of Baden-Wurttemberg | | 0.625% | | 2/9/27 | EUR | 10,000 | | 11,831 | |
| State of Baden-Wurttemberg | | 1.000% | | 7/18/22 | EUR | 5,000 | | 5,792 | |
| State of Baden-Wurttemberg | | 2.000% | | 11/13/23 | EUR | 8,000 | | 9,788 | |
| State of Berlin | | 0.625% | | 3/20/26 | EUR | 25,000 | | 29,465 | |
| State of Berlin | | 0.625% | | 8/25/36 | EUR | 2,500 | | 2,917 | |
| State of Berlin | | 0.750% | | 11/11/22 | EUR | 10,000 | | 11,547 | |
| State of Berlin | | 1.000% | | 5/19/32 | EUR | 15,000 | | 18,456 | |
| State of Berlin | | 1.500% | | 1/21/21 | EUR | 3,300 | | 3,767 | |
| State of Berlin | | 1.875% | | 6/12/23 | EUR | 1,800 | | 2,173 | |
| State of Berlin | | 3.125% | | 8/17/21 | EUR | 30,300 | | 35,953 | |
| State of Brandenburg | | 0.750% | | 8/8/36 | EUR | 10,000 | | 11,946 | |
| State of Brandenburg | | 1.450% | | 11/26/38 | EUR | 10,000 | | 13,223 | |
| State of Brandenburg | | 3.500% | | 6/15/21 | EUR | 15,000 | | 17,797 | |
| State of Bremen | | 0.500% | | 7/30/21 | EUR | 15,000 | | 16,995 | |
| State of Bremen | | 0.500% | | 3/3/25 | EUR | 13,000 | | 15,117 | |
| State of Bremen | | 1.000% | | 5/27/39 | EUR | 12,500 | | 15,323 | |
| State of Bremen | | 1.375% | | 4/28/21 | EUR | 1,000 | | 1,145 | |
| State of Bremen | | 1.500% | | 11/12/38 | EUR | 4,930 | | 6,542 | |
8 | State of Hesse | | 0.000% | | 9/15/21 | EUR | 4,900 | | 5,514 | |
| State of Hesse | | 0.250% | | 6/10/25 | EUR | 25,000 | | 28,739 | |
| State of Hesse | | 0.375% | | 7/4/22 | EUR | 10,000 | | 11,388 | |
| State of Hesse | | 0.375% | | 3/10/23 | EUR | 38,000 | | 43,471 | |
| State of Hesse | | 0.375% | | 7/6/26 | EUR | 20,000 | | 23,214 | |
| State of Hesse | | 0.500% | | 2/17/25 | EUR | 10,500 | | 12,214 | |
| State of Hesse | | 0.750% | | 8/4/36 | EUR | 12,000 | | 14,268 | |
| State of Hesse | | 1.300% | | 10/10/33 | EUR | 5,000 | | 6,400 | |
| State of Hesse | | 1.375% | | 6/10/24 | EUR | 4,000 | | 4,818 | |
| State of Hesse | | 1.750% | | 1/20/23 | EUR | 3,000 | | 3,579 | |
| State of Hesse | | 3.000% | | 8/23/21 | EUR | 12,000 | | 14,214 | |
| State of Lower Saxony | | 0.000% | | 3/1/21 | EUR | 18,200 | | 20,409 | |
| State of Lower Saxony | | 0.000% | | 1/10/22 | EUR | 10,000 | | 11,252 | |
| State of Lower Saxony | | 0.000% | | 8/2/24 | EUR | 47,000 | | 53,269 | |
| State of Lower Saxony | | 0.050% | | 11/10/22 | EUR | 10,000 | | 11,308 | |
| State of Lower Saxony | | 0.125% | | 3/7/23 | EUR | 20,000 | | 22,694 | |
| State of Lower Saxony | | 0.125% | | 4/8/27 | EUR | 2,000 | | 2,283 | |
| State of Lower Saxony | | 0.375% | | 1/19/23 | EUR | 15,000 | | 17,144 | |
| State of Lower Saxony | | 0.375% | | 5/14/29 | EUR | 6,000 | | 6,971 | |
| State of Lower Saxony | | 0.500% | | 6/8/26 | EUR | 2,500 | | 2,924 | |
| State of Lower Saxony | | 0.625% | | 1/20/25 | EUR | 10,000 | | 11,704 | |
| State of Lower Saxony | | 0.625% | | 7/6/27 | EUR | 20,000 | | 23,689 | |
| | | | | | | | | | | | | | | | | | |
60
Total International Bond Index Fund
| | | | | | | Face | | Market | |
| | | | | Maturity | | Amount | | Value· | |
| | | Coupon | | Date | Currency | (000 | ) | ($000 | ) |
| State of Lower Saxony | | 1.000% | | 8/18/22 | EUR | 11,000 | | 12,752 | |
| State of Lower Saxony | | 2.125% | | 10/11/23 | EUR | 1,000 | | 1,226 | |
| State of Lower Saxony | | 2.125% | | 1/16/24 | EUR | 310 | | 382 | |
| State of Lower Saxony | | 2.750% | | 9/13/21 | EUR | 21,500 | | 25,399 | |
| State of North Rhine-Westphalia Germany | | 0.200% | | 4/17/23 | EUR | 22,000 | | 25,028 | |
| State of North Rhine-Westphalia Germany | | 0.200% | | 2/16/24 | EUR | 29,866 | | 34,103 | |
| State of North Rhine-Westphalia Germany | | 0.250% | | 3/13/26 | EUR | 17,320 | | 19,939 | |
| State of North Rhine-Westphalia Germany | | 0.375% | | 10/19/21 | EUR | 10,000 | | 11,331 | |
| State of North Rhine-Westphalia Germany | | 0.375% | | 2/16/23 | EUR | 4,300 | | 4,916 | |
| State of North Rhine-Westphalia Germany | | 0.500% | | 3/11/25 | EUR | 3,000 | | 3,490 | |
| State of North Rhine-Westphalia Germany | | 0.500% | | 4/16/26 | EUR | 10,000 | | 11,693 | |
| State of North Rhine-Westphalia Germany | | 0.500% | | 2/16/27 | EUR | 20,400 | | 23,920 | |
| State of North Rhine-Westphalia Germany | | 0.625% | | 7/21/31 | EUR | 15,000 | | 17,688 | |
| State of North Rhine-Westphalia Germany | | 0.750% | | 1/16/26 | EUR | 15,000 | | 17,773 | |
| State of North Rhine-Westphalia Germany | | 0.750% | | 8/16/41 | EUR | 2,000 | | 2,336 | |
| State of North Rhine-Westphalia Germany | | 0.800% | | 7/30/49 | EUR | 10,575 | | 12,452 | |
| State of North Rhine-Westphalia Germany | | 0.950% | | 3/13/28 | EUR | 28,000 | | 34,063 | |
| State of North Rhine-Westphalia Germany | | 1.000% | | 1/16/25 | EUR | 220 | | 262 | |
| State of North Rhine-Westphalia Germany | | 1.100% | | 3/13/34 | EUR | 27,000 | | 33,717 | |
| State of North Rhine-Westphalia Germany | | 1.250% | | 5/12/36 | EUR | 14,000 | | 17,845 | |
| State of North Rhine-Westphalia Germany | | 1.375% | | 5/16/22 | EUR | 5,050 | | 5,887 | |
| State of North Rhine-Westphalia Germany | | 1.450% | | 2/16/43 | EUR | 5,000 | | 6,689 | |
| State of North Rhine-Westphalia Germany | | 1.500% | | 12/15/20 | EUR | 48,000 | | 54,694 | |
| State of North Rhine-Westphalia Germany | | 1.500% | | 1/14/21 | EUR | 4,000 | | 4,566 | |
| State of North Rhine-Westphalia Germany | | 1.500% | | 6/12/40 | EUR | 10,000 | | 13,365 | |
| State of North Rhine-Westphalia Germany | | 1.550% | | 6/16/48 | EUR | 10,000 | | 13,979 | |
| State of North Rhine-Westphalia Germany | | 1.625% | | 10/24/30 | EUR | 10,000 | | 13,026 | |
| State of North Rhine-Westphalia Germany | | 1.650% | | 2/22/38 | EUR | 10,000 | | 13,571 | |
| State of North Rhine-Westphalia Germany | | 1.650% | | 5/16/47 | EUR | 10,000 | | 14,178 | |
| State of North Rhine-Westphalia Germany | | 1.750% | | 10/26/57 | EUR | 16,000 | | 23,931 | |
| State of North Rhine-Westphalia Germany | | 1.750% | | 7/11/68 | EUR | 5,000 | | 7,581 | |
| State of North Rhine-Westphalia Germany | | 1.875% | | 9/15/22 | EUR | 11,150 | | 13,257 | |
| State of North Rhine-Westphalia Germany | | 1.875% | | 3/15/24 | EUR | 1,950 | | 2,388 | |
| State of North Rhine-Westphalia Germany | | 1.950% | | 9/26/78 | EUR | 18,700 | | 29,801 | |
| State of North Rhine-Westphalia Germany | | 2.000% | | 10/15/25 | EUR | 3,000 | | 3,804 | |
| State of North Rhine-Westphalia Germany | | 2.150% | | 3/21/19 | EUR | 10,030 | | 16,893 | |
| State of North Rhine-Westphalia Germany | | 2.375% | | 5/13/33 | EUR | 36,400 | | 52,180 | |
| State of Rhineland-Palatinate | | 0.100% | | 8/18/26 | EUR | 10,000 | | 11,403 | |
| State of Rhineland-Palatinate | | 0.500% | | 9/3/21 | EUR | 5,000 | | 5,674 | |
| State of Rhineland-Palatinate | | 0.500% | | 1/21/25 | EUR | 6,000 | | 6,978 | |
| State of Rhineland-Palatinate | | 0.700% | | 1/26/28 | EUR | 10,000 | | 11,935 | |
| State of Rhineland-Palatinate | | 2.375% | | 2/23/22 | EUR | 2,500 | | 2,969 | |
| State of Saxony-Anhalt | | 0.500% | | 6/25/27 | EUR | 2,500 | | 2,935 | |
| State of Saxony-Anhalt | | 1.625% | | 4/25/23 | EUR | 4,000 | | 4,779 | |
| State of Saxony-Anhalt | | 1.875% | | 4/10/24 | EUR | 9,000 | | 11,032 | |
| Wirtschafts- und Infrastrukturbank Hessen | | 1.750% | | 12/6/22 | EUR | 2,500 | | 2,972 | |
| | | | | | | | | 10,556,543 | |
Total Germany (Cost $13,125,321) | | | | | | | | 13,463,557 | |
Hong Kong (0.1%) | | | | | | | | | |
Corporate Bonds (0.1%) | | | | | | | | | |
| Cheung Kong Infrastructure Finance BVI Ltd. | | 1.000% | | 12/12/24 | EUR | 600 | | 682 | |
| CK Hutchison Europe Finance 18 Ltd. | | 1.250% | | 4/13/25 | EUR | 10,300 | | 11,919 | |
| CK Hutchison Europe Finance 18 Ltd. | | 2.000% | | 4/13/30 | EUR | 1,400 | | 1,721 | |
| | | | | | | | | | | | | | | | | | |
61
Total International Bond Index Fund
| | | | | | | Face | | Market | |
| | | | | Maturity | | Amount | | Value· | |
| | | Coupon | | Date | Currency | (000 | ) | ($000 | ) |
| CK Hutchison Finance 16 II Ltd. | | 0.875% | | 10/3/24 | EUR | 11,400 | | 12,982 | |
| CK Hutchison Finance 16 Ltd. | | 1.250% | | 4/6/23 | EUR | 17,000 | | 19,579 | |
| CK Hutchison Finance 16 Ltd. | | 2.000% | | 4/6/28 | EUR | 100 | | 122 | |
| Hong Kong & Shanghai Banking Corp. Ltd. | | 2.750% | | 8/16/21 | AUD | 400 | | 282 | |
| Hutchison Whampoa Finance 14 Ltd. | | 1.375% | | 10/31/21 | EUR | 100 | | 114 | |
| | | | | | | | | 47,401 | |
Sovereign Bonds (0.0%) | | | | | | | | | |
| Hong Kong Special Administrative Region | | 0.910% | | 11/5/20 | HKD | 100,000 | | 12,655 | |
| Hong Kong Special Administrative Region | | 1.970% | | 1/17/29 | HKD | 120,000 | | 15,913 | |
| Hong Kong Special Administrative Region | | 2.220% | | 8/7/24 | HKD | 30,000 | | 3,973 | |
| | | | | | | | | 32,541 | |
Total Hong Kong (Cost $78,366) | | | | | | | | 79,942 | |
Hungary (0.1%) | | | | | | | | | |
Sovereign Bonds (0.1%) | | | | | | | | | |
| Republic of Hungary | | 0.500% | | 4/21/21 | HUF | 4,032,670 | | 13,786 | |
| Republic of Hungary | | 1.250% | | 10/22/25 | EUR | 10,000 | | 11,924 | |
| Republic of Hungary | | 1.750% | | 10/26/22 | HUF | 400,000 | | 1,408 | |
| Republic of Hungary | | 1.750% | | 10/10/27 | EUR | 4,400 | | 5,516 | |
| Republic of Hungary | | 2.500% | | 10/27/21 | HUF | 900,000 | | 3,206 | |
| Republic of Hungary | | 2.500% | | 10/24/24 | HUF | 1,467,000 | | 5,356 | |
| Republic of Hungary | | 2.750% | | 12/22/26 | HUF | 6,950,000 | | 25,729 | |
| Republic of Hungary | | 3.000% | | 10/27/27 | HUF | 19,922,490 | | 75,095 | |
| Republic of Hungary | | 3.000% | | 8/21/30 | HUF | 1,900,000 | | 7,124 | |
| Republic of Hungary | | 3.250% | | 10/22/31 | HUF | 950,000 | | 3,624 | |
| Republic of Hungary | | 5.500% | | 6/24/25 | HUF | 6,037,430 | | 25,442 | |
| Republic of Hungary | | 6.000% | | 11/24/23 | HUF | 2,910,000 | | 11,987 | |
| Republic of Hungary | | 6.750% | | 10/22/28 | HUF | 800,000 | | 3,863 | |
| Republic of Hungary | | 7.000% | | 6/24/22 | HUF | 534,000 | | 2,136 | |
Total Hungary (Cost $187,251) | | | | | | | | 196,196 | |
Indonesia (0.7%) | | | | | | | | | |
Sovereign Bonds (0.7%) | | | | | | | | | |
| Indonesia Treasury Bond | | 6.500% | | 6/15/25 | IDR | 590,000,000 | | 41,985 | |
| Indonesia Treasury Bond | | 6.625% | | 5/15/33 | IDR | 2,049,414,000 | | 136,292 | |
| Indonesia Treasury Bond | | 7.000% | | 9/15/30 | IDR | 520,000,000 | | 36,618 | |
| Indonesia Treasury Bond | | 7.500% | | 5/15/38 | IDR | 719,972,000 | | 50,884 | |
| Republic of Indonesia | | 1.400% | | 10/30/31 | EUR | 8,430 | | 9,358 | |
| Republic of Indonesia | | 1.450% | | 9/18/26 | EUR | 4,420 | | 5,099 | |
| Republic of Indonesia | | 1.750% | | 4/24/25 | EUR | 13,400 | | 15,657 | |
| Republic of Indonesia | | 2.625% | | 6/14/23 | EUR | 200 | | 239 | |
| Republic of Indonesia | | 2.875% | | 7/8/21 | EUR | 11,020 | | 12,804 | |
| Republic of Indonesia | | 3.750% | | 6/14/28 | EUR | 18,700 | | 25,296 | |
| Republic of Indonesia | | 5.625% | | 5/15/23 | IDR | 913,604,000 | | 63,622 | |
| Republic of Indonesia | | 6.125% | | 5/15/28 | IDR | 1,930,000,000 | | 130,770 | |
| Republic of Indonesia | | 7.000% | | 5/15/27 | IDR | 1,591,251,000 | | 114,099 | |
| Republic of Indonesia | | 7.500% | | 8/15/32 | IDR | 200,000,000 | | 14,350 | |
| Republic of Indonesia | | 7.500% | | 6/15/35 | IDR | 327,200,000 | | 23,375 | |
| Republic of Indonesia | | 8.125% | | 5/15/24 | IDR | 550,000,000 | | 41,703 | |
| Republic of Indonesia | | 8.250% | | 7/15/21 | IDR | 150,000,000 | | 11,075 | |
| Republic of Indonesia | | 8.250% | | 5/15/29 | IDR | 1,134,350,000 | | 87,665 | |
| Republic of Indonesia | | 8.250% | | 5/15/36 | IDR | 467,800,000 | | 35,116 | |
| Republic of Indonesia | | 8.375% | | 3/15/24 | IDR | 1,440,785,000 | | 109,897 | |
| Republic of Indonesia | | 8.375% | | 9/15/26 | IDR | 200,000,000 | | 15,559 | |
| | | | | | | | | | | | | | | | | | |
62
Total International Bond Index Fund
| | | | | | | Face | | Market | |
| | | | | Maturity | | Amount | | Value· | |
| | | Coupon | | Date | Currency | (000 | ) | ($000 | ) |
| Republic of Indonesia | | 8.375% | | 3/15/34 | IDR | 50,000,000 | | 3,833 | |
| Republic of Indonesia | | 9.750% | | 5/15/37 | IDR | 130,303,000 | | 11,062 | |
Total Indonesia (Cost $970,172) | | | | | | | | 996,358 | |
Ireland (0.7%) | | | | | | | | | |
Asset-Backed/Commercial Mortgage-Backed Security (0.0%) | | | | | |
| AIB Mortgage Bank | | 0.625% | | 2/3/22 | EUR | 3,000 | | 3,420 | |
| | | | | | | | | | |
Corporate Bonds (0.1%) | | | | | | | | | |
| AIB Group plc | | 2.250% | | 7/3/25 | EUR | 5,000 | | 6,025 | |
| AIB Mortgage Bank | | 2.250% | | 3/26/21 | EUR | 15,000 | | 17,335 | |
| Bank of Ireland Group plc | | 1.375% | | 8/29/23 | EUR | 15,200 | | 17,502 | |
| CRH Finance DAC | | 1.375% | | 10/18/28 | EUR | 1,300 | | 1,553 | |
| CRH Finance DAC | | 3.125% | | 4/3/23 | EUR | 10,850 | | 13,359 | |
| CRH Finance Switzerland AG | | 1.375% | | 9/30/22 | CHF | 5,300 | | 5,576 | |
| Dali Capital plc | | 4.799% | | 12/21/37 | GBP | 550 | | 976 | |
| Freshwater Finance plc | | 4.607% | | 10/17/36 | GBP | 1,125 | | 1,955 | |
| Kerry Group Financial Services | | 2.375% | | 9/10/25 | EUR | 10,500 | | 13,082 | |
| Roadster Finance DAC | | 2.375% | | 12/8/27 | EUR | 400 | | 465 | |
| Ryanair DAC | | 1.125% | | 8/15/23 | EUR | 3,000 | | 3,444 | |
| | | | | | | | | 81,272 | |
Sovereign Bonds (0.6%) | | | | | | | | | |
| ESB Finance DAC | | 2.125% | | 11/5/33 | EUR | 11,100 | | 14,641 | |
| ESB Finance Ltd. | | 2.125% | | 6/8/27 | EUR | 11,324 | | 14,391 | |
| ESB Finance Ltd. | | 3.494% | | 1/12/24 | EUR | 1,000 | | 1,277 | |
| GAS Networks Ireland | | 1.375% | | 12/5/26 | EUR | 2,500 | | 2,996 | |
| Ireland | | 0.000% | | 10/18/22 | EUR | 30,500 | | 34,521 | |
| Ireland | | 0.800% | | 3/15/22 | EUR | 57,280 | | 65,901 | |
| Ireland | | 1.000% | | 5/15/26 | EUR | 91,950 | | 110,797 | |
| Ireland | | 1.700% | | 5/15/37 | EUR | 25,190 | | 33,707 | |
| Ireland | | 2.000% | | 2/18/45 | EUR | 52,390 | | 76,225 | |
| Ireland | | 2.400% | | 5/15/30 | EUR | 29,090 | | 40,403 | |
| Ireland | | 3.400% | | 3/18/24 | EUR | 103,200 | | 134,405 | |
| Ireland | | 3.900% | | 3/20/23 | EUR | 22,965 | | 29,434 | |
| Ireland | | 5.000% | | 10/18/20 | EUR | 48,006 | | 56,387 | |
| Ireland | | 5.400% | | 3/13/25 | EUR | 10,735 | | 15,657 | |
| Republic of Ireland | | 0.900% | | 5/15/28 | EUR | 50,600 | | 61,213 | |
| Republic of Ireland | | 1.100% | | 5/15/29 | EUR | 25,000 | | 30,802 | |
| Republic of Ireland | | 1.300% | | 5/15/33 | EUR | 20,400 | | 25,773 | |
| Republic of Ireland | | 1.350% | | 3/18/31 | EUR | 40,000 | | 50,603 | |
| Republic of Ireland | | 1.500% | | 5/15/50 | EUR | 22,526 | | 29,488 | |
| | | | | | | | | 828,621 | |
Total Ireland (Cost $865,749) | | | | | | | | 913,313 | |
Israel (0.3%) | | | | | | | | | |
Sovereign Bonds (0.3%) | | | | | | | | | |
| State of Israel | | 0.500% | | 1/31/21 | ILS | 22,600 | | 6,441 | |
| State of Israel | | 1.000% | | 4/30/21 | ILS | 65,000 | | 18,673 | |
| State of Israel | | 1.250% | | 11/30/22 | ILS | 95,170 | | 27,797 | |
| State of Israel | | 1.500% | | 11/30/23 | ILS | 54,800 | | 16,255 | |
| State of Israel | | 1.500% | | 1/18/27 | EUR | 25,457 | | 31,057 | |
| State of Israel | | 1.500% | | 1/16/29 | EUR | 5,000 | | 6,155 | |
| State of Israel | | 1.750% | | 8/31/25 | ILS | 229,500 | | 69,540 | |
| State of Israel | | 2.000% | | 3/31/27 | ILS | 162,000 | | 50,185 | |
| | | | | | | | | | | | | | | | | | |
63
Total International Bond Index Fund
| | | | | | | Face | | Market | |
| | | | | Maturity | | Amount | | Value· | |
| | | Coupon | | Date | Currency | (000 | ) | ($000 | ) |
| State of Israel | | 2.250% | | 9/28/28 | ILS | 228,700 | | 72,527 | |
| State of Israel | | 2.500% | | 1/16/49 | EUR | 2,500 | | 3,713 | |
| State of Israel | | 2.875% | | 1/29/24 | EUR | 5,900 | | 7,399 | |
| State of Israel | | 3.750% | | 3/31/24 | ILS | 37,000 | | 12,030 | |
| State of Israel | | 3.750% | | 3/31/47 | ILS | 51,000 | | 19,628 | |
| State of Israel | | 4.250% | | 3/31/23 | ILS | 73,000 | | 23,472 | |
| State of Israel | | 5.500% | | 1/31/22 | ILS | 20,000 | | 6,349 | |
| State of Israel | | 5.500% | | 1/31/42 | ILS | 66,000 | | 31,610 | |
| State of Israel | | 6.250% | | 10/30/26 | ILS | 56,360 | | 22,077 | |
Total Israel (Cost $383,576) | | | | | | | | 424,908 | |
Italy (7.9%) | | | | | | | | | |
Asset-Backed/Commercial Mortgage-Backed Securities (0.2%) | | | | | |
| Banca Monte dei Paschi di Siena SPA | | 2.875% | | 7/16/24 | EUR | 5,640 | | 6,923 | |
1 | Banca Monte dei Paschi di Siena SPA | | 2.875% | | 4/16/59 | EUR | 4,000 | | 4,646 | |
| Banca Popolare dell’Emilia Romagna SC | | 0.875% | | 1/22/22 | EUR | 5,000 | | 5,689 | |
| Banca Popolare di Milano Scarl | | 0.625% | | 6/8/23 | EUR | 10,000 | | 11,298 | |
| Banco BPM SPA | | 0.750% | | 3/31/22 | EUR | 10,000 | | 11,302 | |
| Banco BPM SPA | | 1.000% | | 1/23/25 | EUR | 15,000 | | 17,082 | |
| Banco di Desio e della Brianza SPA | | 0.875% | | 9/12/24 | EUR | 16,000 | | 18,644 | |
| Credit Agricole Cariparma SPA | | 0.250% | | 9/30/24 | EUR | 10,800 | | 12,205 | |
| Credit Agricole Cariparma SPA | | 0.875% | | 6/16/23 | EUR | 10,000 | | 11,551 | |
| Credit Agricole Italia SPA | | 0.875% | | 1/31/22 | EUR | 10,000 | | 11,417 | |
| Credit Agricole Italia SPA | | 1.750% | | 1/15/38 | EUR | 5,000 | | 6,608 | |
| Intesa Sanpaolo SPA | | 0.500% | | 3/5/24 | EUR | 9,500 | | 10,904 | |
| Intesa Sanpaolo SPA | | 0.625% | | 1/20/22 | EUR | 5,000 | | 5,687 | |
| Intesa Sanpaolo SPA | | 3.250% | | 2/10/26 | EUR | 9,000 | | 12,106 | |
| Intesa Sanpaolo SPA | | 3.375% | | 1/24/25 | EUR | 10,500 | | 13,860 | |
| Intesa Sanpaolo SPA | | 3.625% | | 12/5/22 | EUR | 4,200 | | 5,244 | |
| Mediobanca SPA | | 3.625% | | 10/17/23 | EUR | 5,000 | | 6,409 | |
| UniCredit SPA | | 5.000% | | 10/31/21 | EUR | 3,000 | | 3,695 | |
| UniCredit SPA | | 5.250% | | 4/30/23 | EUR | 9,000 | | 11,955 | |
| Unione di Banche Italiane SPA | | 0.375% | | 9/14/26 | EUR | 10,000 | | 11,361 | |
| Unione di Banche Italiane SPA | | 1.000% | | 1/27/23 | EUR | 18,500 | | 21,413 | |
| Unione di Banche Italiane SPA | | 1.125% | | 10/4/27 | EUR | 6,700 | | 8,052 | |
| Unione di Banche Italiane SPA | | 1.250% | | 2/7/25 | EUR | 2,500 | | 2,980 | |
| Unione di Banche Italiane SPA | | 3.125% | | 2/5/24 | EUR | 4,000 | | 5,083 | |
| Unione di Banche Italiane SPA | | 5.250% | | 1/28/21 | EUR | 2,500 | | 2,973 | |
| | | | | | | | | 239,087 | |
Corporate Bonds (0.5%) | | | | | | | | | |
| 2i Rete Gas SPA | | 1.608% | | 10/31/27 | EUR | 1,500 | | 1,787 | |
| 2i Rete Gas SPA | | 3.000% | | 7/16/24 | EUR | 13,000 | | 16,366 | |
| Aeroporti di Roma SPA | | 1.625% | | 6/8/27 | EUR | 11,000 | | 12,614 | |
| Aeroporti di Roma SPA | | 3.250% | | 2/20/21 | EUR | 3,800 | | 4,401 | |
| Aeroporti di Roma SPA | | 5.441% | | 2/20/23 | GBP | 250 | | 359 | |
| Assicurazioni Generali SPA | | 4.125% | | 5/4/26 | EUR | 2,600 | | 3,386 | |
| Assicurazioni Generali SPA | | 5.125% | | 9/16/24 | EUR | 7,280 | | 10,058 | |
1 | Assicurazioni Generali SPA | | 5.500% | | 10/27/47 | EUR | 7,737 | | 10,372 | |
1 | Assicurazioni Generali SPA | | 7.750% | | 12/12/42 | EUR | 6,000 | | 8,111 | |
| Atlantia SPA | | 1.625% | | 2/3/25 | EUR | 9,160 | | 9,919 | |
| Atlantia SPA | | 1.875% | | 7/13/27 | EUR | 400 | | 426 | |
| Atlantia SPA | | 2.875% | | 2/26/21 | EUR | 3,500 | | 3,999 | |
| Atlantia SPA | | 5.875% | | 6/9/24 | EUR | 4,600 | | 6,002 | |
| Atlantia SPA | | 6.250% | | 6/9/22 | GBP | 3,820 | | 5,334 | |
| | | | | | | | | | | | | | | | | | |
64
Total International Bond Index Fund
| | | | | | | Face | | Market | |
| | | | | Maturity | | Amount | | Value· | |
| | | Coupon | | Date | Currency | (000 | ) | ($000 | ) |
| Autostrade per l’Italia SPA | | 1.125% | | 11/4/21 | EUR | 5,000 | | 5,579 | |
| Autostrade per l’Italia SPA | | 1.750% | | 2/1/27 | EUR | 550 | | 586 | |
| Autostrade per l’Italia SPA | | 1.875% | | 11/4/25 | EUR | 17,340 | | 18,815 | |
| Autostrade per l’Italia SPA | | 4.375% | | 9/16/25 | EUR | 1,100 | | 1,365 | |
| Banca Monte dei Paschi di Siena SPA | | 1.250% | | 1/20/22 | EUR | 5,000 | | 5,723 | |
| Banca Monte dei Paschi di Siena SPA | | 2.125% | | 11/26/25 | EUR | 9,000 | | 10,865 | |
| BPER Banca | | 1.125% | | 4/22/26 | EUR | 10,000 | | 11,814 | |
| Buzzi Unicem SPA | | 2.125% | | 4/28/23 | EUR | 1,300 | | 1,527 | |
| Covivio | | 2.375% | | 2/20/28 | EUR | 200 | | 251 | |
| Credit Agricole Cariparma SPA | | 0.625% | | 1/13/26 | EUR | 5,600 | | 6,442 | |
| Credit Agricole Italia SPA | | 1.000% | | 3/25/27 | EUR | 5,000 | | 5,906 | |
| Credito Emiliano SPA | | 1.125% | | 1/17/24 | EUR | 10,000 | | 11,654 | |
| Enel Finance International NV | | 1.000% | | 9/16/24 | EUR | 3,100 | | 3,594 | |
| Enel Finance International NV | | 1.125% | | 9/16/26 | EUR | 4,800 | | 5,640 | |
| Enel Finance International NV | | 1.375% | | 6/1/26 | EUR | 42,145 | | 50,387 | |
| Enel Finance International NV | | 1.966% | | 1/27/25 | EUR | 8,716 | | 10,593 | |
| Enel Finance International NV | | 4.875% | | 4/17/23 | EUR | 2,400 | | 3,126 | |
| Enel Finance International NV | | 5.000% | | 7/12/21 | EUR | 2,000 | | 2,421 | |
| Enel Finance International NV | | 5.250% | | 9/29/23 | EUR | 736 | | 985 | |
| Enel Finance International NV | | 5.625% | | 8/14/24 | GBP | 3,700 | | 5,690 | |
| Enel Finance International NV | | 5.750% | | 9/14/40 | GBP | 9,700 | | 18,437 | |
1 | Enel SPA | | 2.500% | | 11/24/78 | EUR | 11,100 | | 12,818 | |
1 | Enel SPA | | 3.375% | | 11/24/81 | EUR | 300 | | 359 | |
| Enel SPA | | 5.750% | | 6/22/37 | GBP | 1,000 | | 1,841 | |
1 | Enel SPA | | 6.625% | | 9/15/76 | GBP | 20,627 | | 29,076 | |
| Eni SPA | | 0.625% | | 9/19/24 | EUR | 10,000 | | 11,401 | |
| Eni SPA | | 0.750% | | 5/17/22 | EUR | 500 | | 569 | |
| Eni SPA | | 1.125% | | 9/19/28 | EUR | 5,500 | | 6,473 | |
| Eni SPA | | 1.500% | | 2/2/26 | EUR | 800 | | 960 | |
| Eni SPA | | 1.500% | | 1/17/27 | EUR | 5,000 | | 6,040 | |
| Eni SPA | | 1.625% | | 5/17/28 | EUR | 3,000 | | 3,667 | |
| Eni SPA | | 2.625% | | 11/22/21 | EUR | 3,000 | | 3,530 | |
| Eni SPA | | 3.250% | | 7/10/23 | EUR | 10,960 | | 13,671 | |
| Eni SPA | | 3.750% | | 9/12/25 | EUR | 6,600 | | 8,859 | |
| FCA Bank SPA | | 1.000% | | 11/15/21 | EUR | 23,900 | | 27,123 | |
| FCA Bank SPA | | 1.000% | | 2/21/22 | EUR | 100 | | 114 | |
| FCA Bank SPA | | 1.250% | | 1/21/21 | EUR | 300 | | 340 | |
| FCA Bank SPA | | 1.250% | | 6/21/22 | EUR | 110 | | 126 | |
| FCA Bank SPA | | 1.625% | | 9/29/21 | GBP | 3,000 | | 3,882 | |
| Intesa Sanpaolo SPA | | 0.875% | | 6/27/22 | EUR | 12,600 | | 14,329 | |
| Intesa Sanpaolo SPA | | 1.125% | | 3/4/22 | EUR | 1,700 | | 1,940 | |
| Intesa Sanpaolo SPA | | 1.125% | | 7/14/25 | EUR | 10,000 | | 11,937 | |
| Intesa Sanpaolo SPA | | 1.375% | | 1/18/24 | EUR | 15,000 | | 17,343 | |
| Intesa Sanpaolo SPA | | 1.750% | | 3/20/28 | EUR | 16,078 | | 18,943 | |
| Intesa Sanpaolo SPA | | 1.750% | | 7/4/29 | EUR | 19,000 | | 22,191 | |
| Intesa Sanpaolo SPA | | 2.000% | | 6/18/21 | EUR | 12,228 | | 14,071 | |
| Intesa Sanpaolo SPA | | 2.125% | | 8/30/23 | EUR | 8,000 | | 9,497 | |
| Intesa Sanpaolo SPA | | 3.500% | | 1/17/22 | EUR | 8,100 | | 9,700 | |
| Intesa Sanpaolo SPA | | 4.000% | | 10/30/23 | EUR | 6,100 | | 7,753 | |
| Iren SPA | | 1.950% | | 9/19/25 | EUR | 6,000 | | 7,286 | |
| Italgas SPA | | 0.500% | | 1/19/22 | EUR | 18,000 | | 20,286 | |
| Italgas SPA | | 1.625% | | 1/19/27 | EUR | 5,000 | | 6,059 | |
| Luxottica Group SPA | | 2.625% | | 2/10/24 | EUR | 9,200 | | 11,393 | |
| | | | | | | | | | | | | | | | | | |
65
Total International Bond Index Fund
| | | | | | | Face | | Market | |
| | | | | Maturity | | Amount | | Value· | |
| | | Coupon | | Date | Currency | (000 | ) | ($000 | ) |
| Mediobanca Banca di Credito Finanziario SPA | | 1.375% | | 11/10/25 | EUR | 10,800 | | 12,996 | |
| Mediobanca SPA | | 1.250% | | 11/24/29 | EUR | 2,600 | | 3,163 | |
| Mediobanca SPA | | 1.625% | | 1/19/21 | EUR | 5,000 | | 5,684 | |
| Snam SPA | | 0.875% | | 10/25/26 | EUR | 19,655 | | 22,742 | |
| Snam SPA | | 1.000% | | 9/18/23 | EUR | 100 | | 115 | |
| Snam SPA | | 1.250% | | 1/25/25 | EUR | 500 | | 588 | |
| Societa Iniziative Autostradali e Servizi SPA | | 1.625% | | 2/8/28 | EUR | 9,911 | | 11,315 | |
| Terna Rete Elettrica Nazionale SPA | | 0.875% | | 2/2/22 | EUR | 7,066 | | 8,036 | |
| Terna Rete Elettrica Nazionale SPA | | 1.000% | | 10/11/28 | EUR | 13,300 | | 15,479 | |
| Terna Rete Elettrica Nazionale SPA | | 1.375% | | 7/26/27 | EUR | 9,740 | | 11,634 | |
| Terna Rete Elettrica Nazionale SPA | | 4.750% | | 3/15/21 | EUR | 6,000 | | 7,136 | |
| UniCredit SPA | | 0.375% | | 10/31/26 | EUR | 12,750 | | 14,600 | |
1 | UniCredit SPA | | 1.250% | | 6/25/25 | EUR | 23,300 | | 26,708 | |
| UniCredit SPA | | 2.000% | | 3/4/23 | EUR | 10,000 | | 11,782 | |
| UniCredit SPA | | 3.250% | | 1/14/21 | EUR | 1,500 | | 1,739 | |
1 | UniCredit SPA | | 4.375% | | 1/3/27 | EUR | 4,000 | | 4,773 | |
1 | UniCredit SPA | | 4.875% | | 2/20/29 | EUR | 2,000 | | 2,508 | |
| UniCredit SPA | | 6.950% | | 10/31/22 | EUR | 7,000 | | 9,218 | |
| Unione di Banche Italiane SPA | | 0.500% | | 7/15/24 | EUR | 5,500 | | 6,305 | |
| Unione di Banche Italiane SPA | | 0.750% | | 10/17/22 | EUR | 100 | | 112 | |
| Unione di Banche Italiane SPA | | 1.000% | | 9/25/25 | EUR | 10,000 | | 11,846 | |
| Unione di Banche Italiane SPA | | 1.250% | | 1/15/30 | EUR | 500 | | 608 | |
| Unione di Banche Italiane SPA | | 1.500% | | 4/10/24 | EUR | 5,000 | | 5,733 | |
| | | | | | | | | 772,931 | |
Sovereign Bonds (7.2%) | | | | | | | | | |
| A2A SPA | | 1.250% | | 3/16/24 | EUR | 4,000 | | 4,640 | |
| ACEA SPA | | 1.000% | | 10/24/26 | EUR | 7,121 | | 8,217 | |
| ACEA SPA | | 1.500% | | 6/8/27 | EUR | 4,847 | | 5,768 | |
| ACEA SPA | | 1.750% | | 5/23/28 | EUR | 10,170 | | 12,280 | |
| ACEA SPA | | 2.625% | | 7/15/24 | EUR | 3,200 | | 3,941 | |
| Cassa Depositi e Prestiti SPA | | 1.500% | | 6/21/24 | EUR | 5,000 | | 5,814 | |
| Cassa Depositi e Prestiti SPA | | 1.500% | | 4/9/25 | EUR | 7,700 | | 8,958 | |
| Cassa Depositi e Prestiti SPA | | 1.875% | | 2/7/26 | EUR | 5,000 | | 5,952 | |
| Cassa Depositi e Prestiti SPA | | 2.125% | | 9/27/23 | EUR | 5,000 | | 5,953 | |
| Cassa Depositi e Prestiti SPA | | 2.750% | | 5/31/21 | EUR | 8,000 | | 9,318 | |
| Hera SPA | | 0.875% | | 10/14/26 | EUR | 5,000 | | 5,774 | |
| Hera SPA | | 0.875% | | 7/5/27 | EUR | 10,000 | | 11,500 | |
| Hera SPA | | 5.200% | | 1/29/28 | EUR | 6,000 | | 9,170 | |
2 | Italy Buoni Poliennali Del Tesoro | | 3.100% | | 3/1/40 | EUR | 60,000 | | 82,402 | |
| Republic of Italy | | 0.000% | | 11/27/20 | EUR | 102,000 | | 113,994 | |
| Republic of Italy | | 0.000% | | 6/29/21 | EUR | 50,000 | | 55,866 | |
| Republic of Italy | | 0.050% | | 4/15/21 | EUR | 100,000 | | 111,966 | |
| Republic of Italy | | 0.200% | | 10/15/20 | EUR | 75,000 | | 84,010 | |
| Republic of Italy | | 0.450% | | 6/1/21 | EUR | 201,100 | | 226,492 | |
| Republic of Italy | | 0.950% | | 3/1/23 | EUR | 240,000 | | 275,329 | |
| Republic of Italy | | 1.000% | | 7/15/22 | EUR | 106,198 | | 121,719 | |
| Republic of Italy | | 1.350% | | 4/15/22 | EUR | 255,559 | | 294,796 | |
| Republic of Italy | | 1.500% | | 6/1/25 | EUR | 62,500 | | 73,767 | |
| Republic of Italy | | 1.750% | | 7/1/24 | EUR | 486,133 | | 578,386 | |
| Republic of Italy | | 2.000% | | 2/1/28 | EUR | 68,386 | | 84,040 | |
| Republic of Italy | | 2.050% | | 8/1/27 | EUR | 474,273 | | 582,564 | |
| Republic of Italy | | 2.100% | | 7/15/26 | EUR | 543,043 | | 665,106 | |
| Republic of Italy | | 2.150% | | 12/15/21 | EUR | 111,200 | | 129,944 | |
| | | | | | | | | | | | | | | | | | |
66
Total International Bond Index Fund
| | | | | | | Face | | Market | |
| | | | | Maturity | | Amount | | Value· | |
| | | Coupon | | Date | Currency | (000 | ) | ($000 | ) |
| Republic of Italy | | 2.200% | | 6/1/27 | EUR | 57,700 | | 71,523 | |
| Republic of Italy | | 2.300% | | 10/15/21 | EUR | 159,835 | | 186,643 | |
| Republic of Italy | | 2.450% | | 10/1/23 | EUR | 541,311 | | 656,827 | |
| Republic of Italy | | 2.500% | | 11/15/25 | EUR | 86,733 | | 108,111 | |
2 | Republic of Italy | | 2.800% | | 3/1/67 | EUR | 20,637 | | 26,686 | |
2 | Republic of Italy | | 2.950% | | 9/1/38 | EUR | 120,190 | | 162,522 | |
| Republic of Italy | | 3.000% | | 8/1/29 | EUR | 380,078 | | 506,554 | |
2 | Republic of Italy | | 3.350% | | 3/1/35 | EUR | 444,514 | | 624,494 | |
2 | Republic of Italy | | 3.500% | | 3/1/30 | EUR | 147,000 | | 204,175 | |
| Republic of Italy | | 3.750% | | 3/1/21 | EUR | 80,300 | | 94,290 | |
2 | Republic of Italy | | 3.750% | | 5/1/21 | EUR | 126,450 | | 149,375 | |
2 | Republic of Italy | | 3.750% | | 8/1/21 | EUR | 301,225 | | 358,818 | |
| Republic of Italy | | 3.750% | | 9/1/24 | EUR | 58,900 | | 76,384 | |
2 | Republic of Italy | | 3.850% | | 9/1/49 | EUR | 338,017 | | 532,264 | |
2 | Republic of Italy | | 4.000% | | 2/1/37 | EUR | 120,310 | | 183,113 | |
| Republic of Italy | | 4.500% | | 5/1/23 | EUR | 164,680 | | 211,704 | |
| Republic of Italy | | 4.500% | | 3/1/24 | EUR | 93,780 | | 123,657 | |
2 | Republic of Italy | | 4.500% | | 3/1/26 | EUR | 215,575 | | 299,730 | |
| Republic of Italy | | 4.750% | | 9/1/21 | EUR | 27,500 | | 33,397 | |
2 | Republic of Italy | | 4.750% | | 8/1/23 | EUR | 45,580 | | 59,517 | |
2 | Republic of Italy | | 4.750% | | 9/1/44 | EUR | 107,980 | | 188,511 | |
| Republic of Italy | | 5.000% | | 3/1/22 | EUR | 37,895 | | 47,290 | |
2 | Republic of Italy | | 5.000% | | 3/1/25 | EUR | 235,471 | | 326,066 | |
2 | Republic of Italy | | 5.000% | | 8/1/34 | EUR | 92,730 | | 152,846 | |
2 | Republic of Italy | | 5.000% | | 8/1/39 | EUR | 44,430 | | 76,978 | |
2 | Republic of Italy | | 5.000% | | 9/1/40 | EUR | 164,460 | | 285,257 | |
| Republic of Italy | | 5.250% | | 11/1/29 | EUR | 53,510 | | 84,110 | |
| Republic of Italy | | 5.500% | | 9/1/22 | EUR | 62,500 | | 80,618 | |
| Republic of Italy | | 5.500% | | 11/1/22 | EUR | 70,000 | | 90,853 | |
| Republic of Italy | | 5.750% | | 2/1/33 | EUR | 97,200 | | 167,044 | |
| Republic of Italy | | 6.000% | | 8/4/28 | GBP | 11,900 | | 19,830 | |
| Republic of Italy | | 6.000% | | 5/1/31 | EUR | 96,345 | | 164,372 | |
| Republic of Italy | | 6.500% | | 11/1/27 | EUR | 795 | | 1,282 | |
| Republic of Italy | | 7.250% | | 11/1/26 | EUR | 60,300 | | 97,639 | |
| Republic of Italy | | 9.000% | | 11/1/23 | EUR | 31,000 | | 46,680 | |
| | | | | | | | | 10,076,826 | |
Total Italy (Cost $10,324,712) | | | | | | | | 11,088,844 | |
Japan (19.6%) | | | | | | | | | |
Corporate Bonds (0.3%) | | | | | | | | | |
| American Honda Finance Corp. | | 0.350% | | 8/26/22 | EUR | 2,820 | | 3,174 | |
| American Honda Finance Corp. | | 0.750% | | 1/17/24 | EUR | 7,200 | | 8,248 | |
| American Honda Finance Corp. | | 1.375% | | 11/10/22 | EUR | 5,100 | | 5,918 | |
| Asahi Group Holdings Ltd. | | 0.321% | | 9/19/21 | EUR | 700 | | 785 | |
| Daiichi Sankyo Co. Ltd. | | 0.810% | | 7/25/36 | JPY | 400,000 | | 3,801 | |
| Denso Corp. | | 0.315% | | 3/17/28 | JPY | 800,000 | | 7,455 | |
| East Japan Railway Co. | | 4.500% | | 1/25/36 | GBP | 1,300 | | 2,353 | |
| East Japan Railway Co. | | 4.875% | | 6/14/34 | GBP | 5,500 | | 10,165 | |
| Fast Retailing Co. Ltd. | | 0.405% | | 6/6/28 | JPY | 1,400,000 | | 13,143 | |
| Fast Retailing Co. Ltd. | | 0.749% | | 12/18/25 | JPY | 100,000 | | 957 | |
| Honda Canada Finance Inc. | | 2.268% | | 7/15/22 | CAD | 5,000 | | 3,797 | |
| JT International Financial Services BV | | 2.750% | | 9/28/33 | GBP | 5,100 | | 6,953 | |
| Kansai Electric Power Co. Inc. | | 0.280% | | 4/25/24 | JPY | 92,000 | | 855 | |
| Kansai Electric Power Co. Inc. | | 0.460% | | 12/20/27 | JPY | 700,000 | | 6,521 | |
| | | | | | | | | | | | | | | | | | |
67
Total International Bond Index Fund
| | | | | | | Face | | Market | |
| | | | | Maturity | | Amount | | Value· | |
| | | Coupon | | Date | Currency | (000 | ) | ($000 | ) |
| Kansai Electric Power Co. Inc. | | 0.470% | | 5/25/27 | JPY | 175,000 | | 1,633 | |
| Kansai Electric Power Co. Inc. | | 0.490% | | 7/23/27 | JPY | 244,000 | | 2,280 | |
| Kirin Holdings Co. Ltd. | | 1.239% | | 9/24/21 | JPY | 300,000 | | 2,840 | |
| Kyushu Electric Power Co. Inc. | | 0.430% | | 5/25/29 | JPY | 180,000 | | 1,678 | |
| Kyushu Electric Power Co. Inc. | | 1.064% | | 2/23/24 | JPY | 200,000 | | 1,927 | |
1 | Mitsubishi UFJ Financial Group Inc. | | 0.360% | | 10/31/28 | JPY | 400,000 | | 3,645 | |
| Mitsubishi UFJ Financial Group Inc. | | 0.366% | | 7/29/26 | JPY | 111,000 | | 1,025 | |
| Mitsubishi UFJ Financial Group Inc. | | 0.535% | | 4/28/26 | JPY | 100,000 | | 934 | |
| Mitsubishi UFJ Financial Group Inc. | | 0.535% | | 5/31/28 | JPY | 300,000 | | 2,797 | |
| Mitsubishi UFJ Financial Group Inc. | | 0.652% | | 7/26/27 | JPY | 200,000 | | 1,885 | |
| Mitsubishi UFJ Financial Group Inc. | | 0.680% | | 1/26/23 | EUR | 10,000 | | 11,328 | |
| Mitsubishi UFJ Financial Group Inc. | | 0.848% | | 7/19/29 | EUR | 6,000 | | 6,890 | |
| Mitsubishi UFJ Financial Group Inc. | | 0.872% | | 9/7/24 | EUR | 15,000 | | 17,180 | |
| Mitsubishi UFJ Financial Group Inc. | | 0.940% | | 6/26/24 | JPY | 200,000 | | 1,902 | |
| Mizuho Financial Group Inc. | | 0.100% | | 7/22/21 | JPY | 300,000 | | 2,759 | |
| Mizuho Financial Group Inc. | | 0.402% | | 9/6/29 | EUR | 5,000 | | 5,497 | |
1 | Mizuho Financial Group Inc. | | 0.500% | | 1/26/27 | JPY | 200,000 | | 1,853 | |
| Mizuho Financial Group Inc. | | 0.523% | | 6/10/24 | EUR | 2,300 | | 2,590 | |
| Mizuho Financial Group Inc. | | 0.650% | | 1/26/27 | JPY | 261,000 | | 2,452 | |
| Mizuho Financial Group Inc. | | 0.956% | | 10/16/24 | EUR | 4,950 | | 5,683 | |
| Mizuho Financial Group Inc. | | 1.020% | | 10/11/23 | EUR | 9,200 | | 10,563 | |
| MUFG Bank Ltd. | | 0.875% | | 3/11/22 | EUR | 5,000 | | 5,692 | |
| MUFG Bank Ltd. | | 1.390% | | 5/31/22 | JPY | 100,000 | | 956 | |
| MUFG Bank Ltd. | | 1.560% | | 1/20/21 | JPY | 1,400,000 | | 13,189 | |
| MUFG Bank Ltd. | | 1.950% | | 11/12/25 | JPY | 500,000 | | 5,108 | |
| Nippon Telegraph & Telephone Corp. | | 1.020% | | 9/17/21 | JPY | 500,000 | | 4,713 | |
| Nippon Telegraph & Telephone Corp. | | 1.310% | | 12/18/20 | JPY | 500,000 | | 4,694 | |
| Nissan Motor Co. Ltd. | | 0.150% | | 3/19/21 | JPY | 1,500,000 | | 13,874 | |
| Nomura Europe Finance NV | | 1.500% | | 5/12/21 | EUR | 5,600 | | 6,386 | |
| Norinchukin Bank | | 0.230% | | 1/27/21 | JPY | 1,000,000 | | 9,278 | |
| Panasonic Corp. | | 0.300% | | 9/20/23 | JPY | 400,000 | | 3,735 | |
| Panasonic Corp. | | 0.470% | | 9/18/26 | JPY | 1,800,000 | | 16,859 | |
| Panasonic Corp. | | 0.934% | | 3/19/25 | JPY | 1,200,000 | | 11,583 | |
| Resona Bank Ltd. | | 1.780% | | 3/15/22 | JPY | 500,000 | | 4,802 | |
| Shinkin Central Bank | | 0.030% | | 10/27/21 | JPY | 2,600,000 | | 24,065 | |
| Shinkin Central Bank | | 0.070% | | 3/26/21 | JPY | 200,000 | | 1,852 | |
| Shinkin Central Bank | | 0.110% | | 6/27/23 | JPY | 300,000 | | 2,784 | |
| Shinkin Central Bank | | 0.110% | | 10/27/23 | JPY | 200,000 | | 1,857 | |
| Sony Corp. | | 0.230% | | 9/17/21 | JPY | 1,200,000 | | 11,139 | |
| Sumitomo Mitsui Banking Corp. | | 1.000% | | 1/19/22 | EUR | 5,100 | | 5,812 | |
| Sumitomo Mitsui Banking Corp. | | 1.610% | | 12/17/20 | JPY | 300,000 | | 2,824 | |
| Sumitomo Mitsui Banking Corp. | | 2.250% | | 12/16/20 | EUR | 18,500 | | 21,188 | |
| Sumitomo Mitsui Banking Corp. | | 2.750% | | 7/24/23 | EUR | 500 | | 613 | |
| Sumitomo Mitsui Financial Group Inc. | | 0.585% | | 3/16/28 | JPY | 285,000 | | 2,659 | |
| Sumitomo Mitsui Financial Group Inc. | | 0.606% | | 1/18/22 | EUR | 200 | | 226 | |
| Sumitomo Mitsui Financial Group Inc. | | 0.819% | | 7/23/23 | EUR | 1,600 | | 1,825 | |
| Sumitomo Mitsui Financial Group Inc. | | 0.849% | | 9/12/24 | JPY | 1,500,000 | | 14,172 | |
| Sumitomo Mitsui Financial Group Inc. | | 0.934% | | 10/11/24 | EUR | 200 | | 230 | |
| Sumitomo Mitsui Financial Group Inc. | | 1.546% | | 6/15/26 | EUR | 11,200 | | 13,473 | |
| Sumitomo Mitsui Financial Group Inc. | | 3.662% | | 3/29/22 | AUD | 4,400 | | 3,158 | |
| Sumitomo Mitsui Trust Bank Ltd. | | 1.620% | | 3/22/22 | JPY | 500,000 | | 4,790 | |
2 | Takeda Pharmaceutical Co. Ltd. | | 0.375% | | 11/21/20 | EUR | 9,200 | | 10,317 | |
2 | Takeda Pharmaceutical Co. Ltd. | | 1.125% | | 11/21/22 | EUR | 7,300 | | 8,402 | |
2 | Takeda Pharmaceutical Co. Ltd. | | 2.250% | | 11/21/26 | EUR | 8,300 | | 10,398 | |
| | | | | | | | | | | | | | | | | | |
68
Total International Bond Index Fund
| | | | | | | Face | | Market | |
| | | | | Maturity | | Amount | | Value· | |
| | | Coupon | | Date | Currency | (000 | ) | ($000 | ) |
| Takeda Pharmaceutical Co. Ltd. | | 2.250% | | 11/21/26 | EUR | 300 | | 376 | |
2 | Takeda Pharmaceutical Co. Ltd. | | 3.000% | | 11/21/30 | EUR | 9,000 | | 12,053 | |
| Toyota Finance Australia Ltd. | | 0.500% | | 4/6/23 | EUR | 1,100 | | 1,248 | |
| Toyota Finance Australia Ltd. | | 1.625% | | 7/11/22 | GBP | 2,200 | | 2,891 | |
| Toyota Finance Australia Ltd. | | 3.100% | | 5/19/22 | AUD | 6,928 | | 4,964 | |
| Toyota Motor Credit Corp. | | 0.750% | | 7/21/22 | EUR | 1,600 | | 1,825 | |
| Toyota Motor Credit Corp. | | 1.000% | | 9/10/21 | EUR | 13,300 | | 15,137 | |
| Toyota Motor Credit Corp. | | 1.125% | | 9/7/21 | GBP | 4,000 | | 5,195 | |
| Toyota Motor Credit Corp. | | 2.750% | | 7/26/21 | AUD | 1,450 | | 1,023 | |
| Toyota Motor Finance Netherlands BV | | 0.250% | | 1/10/22 | EUR | 200 | | 225 | |
| Toyota Motor Finance Netherlands BV | | 0.625% | | 9/26/23 | EUR | 12,700 | | 14,529 | |
| | | | | | | | | 465,585 | |
Sovereign Bonds (19.3%) | | | | | | | | | |
| Central Nippon Expressway Co. Ltd. | | 0.030% | | 7/14/21 | JPY | 900,000 | | 8,333 | |
| Central Nippon Expressway Co. Ltd. | | 0.030% | | 9/17/21 | JPY | 1,000,000 | | 9,258 | |
| Central Nippon Expressway Co. Ltd. | | 0.070% | | 3/18/22 | JPY | 1,600,000 | | 14,827 | |
| Deposit Insurance Corp. of Japan | | 0.100% | | 10/19/21 | JPY | 1,800,000 | | 16,711 | |
11 | Deposit Insurance Corp. of Japan | | 0.100% | | 10/14/22 | JPY | 2,900,000 | | 26,962 | |
11 | Development Bank of Japan Inc. | | 0.020% | | 3/16/26 | JPY | 45,500 | | 423 | |
| Development Bank of Japan Inc. | | 0.161% | | 12/18/20 | JPY | 100,000 | | 927 | |
11 | Development Bank of Japan Inc. | | 0.450% | | 3/13/25 | JPY | 400,000 | | 3,807 | |
11 | Development Bank of Japan Inc. | | 0.466% | | 12/12/24 | JPY | 600,000 | | 5,706 | |
11 | Development Bank of Japan Inc. | | 0.645% | | 3/18/24 | JPY | 501,000 | | 4,782 | |
11 | Development Bank of Japan Inc. | | 0.819% | | 9/20/22 | JPY | 286,000 | | 2,715 | |
11 | Development Bank of Japan Inc. | | 1.700% | | 9/20/22 | JPY | 760,000 | | 7,430 | |
| East Nippon Expressway Co. Ltd. | | 0.030% | | 6/18/21 | JPY | 500,000 | | 4,629 | |
| East Nippon Expressway Co. Ltd. | | 0.060% | | 6/18/21 | JPY | 280,000 | | 2,593 | |
| East Nippon Expressway Co. Ltd. | | 0.090% | | 6/20/22 | JPY | 600,000 | | 5,566 | |
| East Nippon Expressway Co. Ltd. | | 0.090% | | 12/20/22 | JPY | 500,000 | | 4,638 | |
| Japan | | 0.100% | | 12/1/20 | JPY | 17,600,000 | | 163,528 | |
| Japan | | 0.100% | | 12/20/20 | JPY | 7,500,000 | | 69,713 | |
| Japan | | 0.100% | | 1/1/21 | JPY | 39,650,000 | | 368,507 | |
| Japan | | 0.100% | | 2/1/21 | JPY | 33,300,000 | | 309,572 | |
| Japan | | 0.100% | | 3/20/21 | JPY | 5,600,000 | | 52,098 | |
| Japan | | 0.100% | | 5/1/21 | JPY | 7,000,000 | | 65,129 | |
| Japan | | 0.100% | | 6/1/21 | JPY | 7,800,000 | | 72,589 | |
| Japan | | 0.100% | | 6/20/21 | JPY | 53,270,000 | | 495,847 | |
| Japan | | 0.100% | | 7/1/21 | JPY | 12,000,000 | | 111,710 | |
| Japan | | 0.100% | | 9/1/21 | JPY | 5,400,000 | | 50,297 | |
| Japan | | 0.100% | | 9/20/21 | JPY | 45,950,000 | | 428,055 | |
| Japan | | 0.100% | | 10/1/21 | JPY | 40,000,000 | | 372,801 | |
| Japan | | 0.100% | | 12/20/21 | JPY | 5,150,000 | | 48,019 | |
| Japan | | 0.100% | | 3/20/22 | JPY | 31,475,000 | | 293,751 | |
| Japan | | 0.100% | | 6/20/22 | JPY | 65,910,000 | | 615,704 | |
| Japan | | 0.100% | | 9/20/22 | JPY | 40,000,000 | | 374,026 | |
| Japan | | 0.100% | | 12/20/22 | JPY | 32,600,000 | | 305,117 | |
| Japan | | 0.100% | | 3/20/23 | JPY | 34,500,000 | | 323,193 | |
| Japan | | 0.100% | | 6/20/23 | JPY | 34,300,000 | | 321,611 | |
| Japan | | 0.100% | | 9/20/23 | JPY | 58,450,000 | | 548,504 | |
| Japan | | 0.100% | | 12/20/23 | JPY | 22,613,750 | | 212,408 | |
| Japan | | 0.100% | | 3/20/24 | JPY | 41,270,000 | | 388,033 | |
| Japan | | 0.100% | | 6/20/24 | JPY | 29,850,000 | | 280,956 | |
| Japan | | 0.100% | | 3/20/26 | JPY | 5,100,000 | | 48,394 | |
| Japan | | 0.100% | | 6/20/26 | JPY | 5,208,300 | | 49,404 | |
| | | | | | | | | | | | | | | | | | |
69
Total International Bond Index Fund
| | | | | | | Face | | Market | |
| | | | | Maturity | | Amount | | Value· | |
| | | Coupon | | Date | Currency | (000 | ) | ($000 | ) |
| Japan | | 0.100% | | 9/20/26 | JPY | 6,950,000 | | 65,986 | |
| Japan | | 0.100% | | 12/20/26 | JPY | 20,280,000 | | 192,701 | |
| Japan | | 0.100% | | 3/20/27 | JPY | 17,835,000 | | 169,587 | |
| Japan | | 0.100% | | 6/20/27 | JPY | 15,250,000 | | 145,106 | |
| Japan | | 0.100% | | 9/20/27 | JPY | 18,910,000 | | 180,054 | |
| Japan | | 0.100% | | 12/20/27 | JPY | 27,125,000 | | 258,325 | |
| Japan | | 0.100% | | 3/20/28 | JPY | 39,020,000 | | 371,462 | |
| Japan | | 0.100% | | 6/20/28 | JPY | 29,500,000 | | 280,694 | |
| Japan | | 0.100% | | 9/20/28 | JPY | 26,600,250 | | 252,976 | |
| Japan | | 0.100% | | 9/20/28 | JPY | 1,620,000 | | 15,407 | |
| Japan | | 0.100% | | 12/20/28 | JPY | 46,672,600 | | 443,515 | |
| Japan | | 0.100% | | 3/20/29 | JPY | 40,170,000 | | 381,326 | |
| Japan | | 0.100% | | 6/20/29 | JPY | 50,040,000 | | 474,401 | |
| Japan | | 0.200% | | 6/20/36 | JPY | 13,000,000 | | 121,443 | |
| Japan | | 0.300% | | 12/20/24 | JPY | 10,500,000 | | 100,138 | |
| Japan | | 0.300% | | 12/20/25 | JPY | 32,700,000 | | 313,735 | |
| Japan | | 0.300% | | 6/20/39 | JPY | 19,280,000 | | 180,466 | |
| Japan | | 0.300% | | 6/20/46 | JPY | 5,800,000 | | 52,912 | |
| Japan | | 0.400% | | 3/20/25 | JPY | 9,865,000 | | 94,720 | |
| Japan | | 0.400% | | 6/20/25 | JPY | 8,000,000 | | 76,945 | |
| Japan | | 0.400% | | 9/20/25 | JPY | 3,195,000 | | 30,784 | |
| Japan | | 0.400% | | 3/20/36 | JPY | 20,420,000 | | 197,752 | |
| Japan | | 0.400% | | 3/20/39 | JPY | 28,004,100 | | 267,501 | |
| Japan | | 0.400% | | 6/20/49 | JPY | 18,883,600 | | 174,571 | |
| Japan | | 0.400% | | 9/20/49 | JPY | 2,750,000 | | 25,362 | |
| Japan | | 0.400% | | 3/20/56 | JPY | 11,335,000 | | 103,858 | |
| Japan | | 0.500% | | 9/20/24 | JPY | 12,700,000 | | 122,054 | |
| Japan | | 0.500% | | 12/20/24 | JPY | 7,730,000 | | 74,459 | |
| Japan | | 0.500% | | 9/20/36 | JPY | 14,730,000 | | 144,250 | |
| Japan | | 0.500% | | 3/20/38 | JPY | 33,875,000 | | 330,569 | |
| Japan | | 0.500% | | 6/20/38 | JPY | 16,180,000 | | 157,773 | |
| Japan | | 0.500% | | 12/20/38 | JPY | 20,081,600 | | 195,505 | |
| Japan | | 0.500% | | 9/20/46 | JPY | 11,730,000 | | 112,448 | |
| Japan | | 0.500% | | 3/20/49 | JPY | 14,000,000 | | 133,226 | |
| Japan | | 0.500% | | 3/20/59 | JPY | 8,110,000 | | 76,610 | |
| Japan | | 0.600% | | 3/20/23 | JPY | 12,020,000 | | 114,540 | |
| Japan | | 0.600% | | 9/20/23 | JPY | 1,000,000 | | 9,572 | |
| Japan | | 0.600% | | 12/20/23 | JPY | 15,660,000 | | 150,229 | |
| Japan | | 0.600% | | 3/20/24 | JPY | 18,890,000 | | 181,630 | |
| Japan | | 0.600% | | 6/20/24 | JPY | 710,000 | | 6,843 | |
| Japan | | 0.600% | | 12/20/36 | JPY | 16,900,000 | | 168,049 | |
| Japan | | 0.600% | | 6/20/37 | JPY | 12,020,000 | | 119,460 | |
| Japan | | 0.600% | | 9/20/37 | JPY | 13,475,000 | | 133,865 | |
| Japan | | 0.600% | | 12/20/37 | JPY | 18,405,550 | | 182,766 | |
| Japan | | 0.600% | | 12/20/46 | JPY | 12,550,000 | | 123,227 | |
| Japan | | 0.700% | | 12/20/22 | JPY | 4,025,000 | | 38,394 | |
| Japan | | 0.700% | | 3/20/37 | JPY | 43,755,000 | | 441,905 | |
| Japan | | 0.700% | | 9/20/38 | JPY | 18,020,000 | | 181,744 | |
| Japan | | 0.700% | | 6/20/48 | JPY | 13,250,000 | | 133,029 | |
| Japan | | 0.700% | | 12/20/48 | JPY | 13,998,500 | | 140,441 | |
| Japan | | 0.800% | | 6/20/22 | JPY | 12,120,000 | | 115,341 | |
| Japan | | 0.800% | | 9/20/22 | JPY | 4,170,000 | | 39,786 | |
| Japan | | 0.800% | | 12/20/22 | JPY | 12,605,000 | | 120,605 | |
| Japan | | 0.800% | | 6/20/23 | JPY | 13,713,500 | | 131,904 | |
| | | | | | | | | | | | | | | | | | |
70
Total International Bond Index Fund
| | | | | | | Face | | Market | |
| | | | | Maturity | | Amount | | Value· | |
| | | Coupon | | Date | Currency | (000 | ) | ($000 | ) |
| Japan | | 0.800% | | 6/20/23 | JPY | 600,000 | | 5,772 | |
| Japan | | 0.800% | | 9/20/23 | JPY | 1,256,000 | | 12,113 | |
| Japan | | 0.800% | | 3/20/46 | JPY | 5,620,000 | | 58,318 | |
| Japan | | 0.800% | | 3/20/47 | JPY | 2,411,000 | | 24,824 | |
| Japan | | 0.800% | | 6/20/47 | JPY | 6,440,000 | | 66,302 | |
| Japan | | 0.800% | | 9/20/47 | JPY | 12,090,000 | | 124,459 | |
| Japan | | 0.800% | | 12/20/47 | JPY | 14,505,000 | | 149,303 | |
| Japan | | 0.800% | | 3/20/48 | JPY | 21,215,000 | | 218,346 | |
| Japan | | 0.800% | | 3/20/58 | JPY | 11,426,950 | | 119,303 | |
| Japan | | 0.900% | | 3/20/22 | JPY | 4,740,000 | | 45,092 | |
| Japan | | 0.900% | | 6/20/22 | JPY | 7,557,000 | | 72,090 | |
| Japan | | 0.900% | | 9/20/48 | JPY | 14,094,450 | | 148,574 | |
| Japan | | 0.900% | | 3/20/57 | JPY | 12,841,300 | | 137,964 | |
| Japan | | 1.000% | | 9/20/21 | JPY | 138,000 | | 1,308 | |
| Japan | | 1.000% | | 12/20/21 | JPY | 11,100,000 | | 105,503 | |
| Japan | | 1.000% | | 3/20/22 | JPY | 8,120,000 | | 77,425 | |
| Japan | | 1.000% | | 3/20/23 | JPY | 530,000 | | 5,118 | |
| Japan | | 1.000% | | 12/20/35 | JPY | 6,300,000 | | 66,635 | |
| Japan | | 1.100% | | 9/20/21 | JPY | 6,400,000 | | 60,755 | |
| Japan | | 1.100% | | 12/20/21 | JPY | 4,200,000 | | 40,003 | |
| Japan | | 1.200% | | 12/20/20 | JPY | 7,337,350 | | 69,037 | |
| Japan | | 1.200% | | 6/20/21 | JPY | 6,000,000 | | 56,857 | |
| Japan | | 1.200% | | 12/20/34 | JPY | 9,910,000 | | 107,231 | |
| Japan | | 1.200% | | 3/20/35 | JPY | 11,040,000 | | 119,613 | |
| Japan | | 1.200% | | 9/20/35 | JPY | 11,600,000 | | 125,981 | |
| Japan | | 1.300% | | 3/20/21 | JPY | 9,634,000 | | 91,097 | |
| Japan | | 1.300% | | 6/20/35 | JPY | 30,410,000 | | 334,236 | |
| Japan | | 1.400% | | 12/20/22 | JPY | 6,500,000 | | 63,328 | |
| Japan | | 1.400% | | 9/20/34 | JPY | 19,330,000 | | 214,228 | |
| Japan | | 1.400% | | 9/20/45 | JPY | 2,860,000 | | 33,620 | |
| Japan | | 1.400% | | 12/20/45 | JPY | 7,210,000 | | 84,845 | |
| Japan | | 1.400% | | 3/20/55 | JPY | 7,685,000 | | 94,674 | |
| Japan | | 1.500% | | 6/20/32 | JPY | 6,300,000 | | 69,598 | |
| Japan | | 1.500% | | 3/20/33 | JPY | 12,463,100 | | 138,428 | |
| Japan | | 1.500% | | 3/20/34 | JPY | 18,875,250 | | 211,131 | |
| Japan | | 1.500% | | 6/20/34 | JPY | 8,680,000 | | 97,238 | |
| Japan | | 1.500% | | 12/20/44 | JPY | 18,930,000 | | 226,013 | |
| Japan | | 1.500% | | 3/20/45 | JPY | 10,765,000 | | 128,697 | |
| Japan | | 1.600% | | 6/20/30 | JPY | 570,000 | | 6,243 | |
| Japan | | 1.600% | | 3/20/32 | JPY | 8,950,000 | | 99,706 | |
| Japan | | 1.600% | | 6/20/32 | JPY | 3,108,000 | | 34,699 | |
| Japan | | 1.600% | | 3/20/33 | JPY | 10,564,000 | | 118,671 | |
| Japan | | 1.600% | | 12/20/33 | JPY | 10,900,000 | | 123,138 | |
| Japan | | 1.600% | | 6/20/45 | JPY | 4,200,000 | | 51,231 | |
| Japan | | 1.700% | | 12/20/22 | JPY | 3,500,000 | | 34,401 | |
| Japan | | 1.700% | | 9/20/31 | JPY | 25,000,000 | | 279,737 | |
| Japan | | 1.700% | | 12/20/31 | JPY | 6,700,000 | | 75,222 | |
| Japan | | 1.700% | | 3/20/32 | JPY | 3,200,000 | | 36,015 | |
| Japan | | 1.700% | | 9/20/32 | JPY | 14,789,000 | | 167,219 | |
| Japan | | 1.700% | | 12/20/32 | JPY | 11,230,000 | | 127,276 | |
| Japan | | 1.700% | | 6/20/33 | JPY | 8,090,000 | | 92,050 | |
| Japan | | 1.700% | | 6/20/33 | JPY | 1,550,000 | | 17,641 | |
| Japan | | 1.700% | | 9/20/33 | JPY | 7,101,000 | | 80,992 | |
| Japan | | 1.700% | | 12/20/43 | JPY | 5,231,700 | | 64,342 | |
| | | | | | | | | | | | | | | | | | |
71
Total International Bond Index Fund
| | | | | | | Face | | Market | |
| | | | | Maturity | | Amount | | Value· | |
| | | Coupon | | Date | Currency | (000 | ) | ($000 | ) |
| Japan | | 1.700% | | 3/20/44 | JPY | 9,536,700 | | 117,494 | |
| Japan | | 1.700% | | 6/20/44 | JPY | 6,316,400 | | 77,951 | |
| Japan | | 1.700% | | 9/20/44 | JPY | 6,073,000 | | 75,075 | |
| Japan | | 1.700% | | 3/20/54 | JPY | 7,175,000 | | 94,327 | |
| Japan | | 1.800% | | 6/20/23 | JPY | 2,500,000 | | 24,885 | |
| Japan | | 1.800% | | 6/20/30 | JPY | 40,000 | | 446 | |
| Japan | | 1.800% | | 9/20/30 | JPY | 1,400,000 | | 15,647 | |
| Japan | | 1.800% | | 6/20/31 | JPY | 4,500,000 | | 50,756 | |
| Japan | | 1.800% | | 9/20/31 | JPY | 7,575,000 | | 85,596 | |
| Japan | | 1.800% | | 12/20/31 | JPY | 25,062,000 | | 284,189 | |
| Japan | | 1.800% | | 3/20/32 | JPY | 1,130,000 | | 12,848 | |
| Japan | | 1.800% | | 12/20/32 | JPY | 6,000,000 | | 68,722 | |
| Japan | | 1.800% | | 3/20/43 | JPY | 8,235,000 | | 102,561 | |
| Japan | | 1.800% | | 9/20/43 | JPY | 3,486,750 | | 43,552 | |
| Japan | | 1.900% | | 9/20/22 | JPY | 67,000 | | 659 | |
| Japan | | 1.900% | | 9/20/23 | JPY | 3,055,000 | | 30,675 | |
| Japan | | 1.900% | | 12/20/23 | JPY | 1,800,000 | | 18,162 | |
| Japan | | 1.900% | | 3/20/24 | JPY | 500,000 | | 5,071 | |
| Japan | | 1.900% | | 6/20/25 | JPY | 1,150,000 | | 11,966 | |
| Japan | | 1.900% | | 12/20/28 | JPY | 7,240,000 | | 80,033 | |
| Japan | | 1.900% | | 3/20/29 | JPY | 4,150,000 | | 46,007 | |
| Japan | | 1.900% | | 9/20/30 | JPY | 4,370,000 | | 49,274 | |
| Japan | | 1.900% | | 3/20/31 | JPY | 6,000,000 | | 68,124 | |
| Japan | | 1.900% | | 6/20/31 | JPY | 5,950,000 | | 67,704 | |
| Japan | | 1.900% | | 9/20/42 | JPY | 18,862,000 | | 237,648 | |
| Japan | | 1.900% | | 6/20/43 | JPY | 7,405,650 | | 93,880 | |
| Japan | | 1.900% | | 3/20/53 | JPY | 3,147,000 | | 42,858 | |
| Japan | | 2.000% | | 6/21/21 | JPY | 4,000,000 | | 38,386 | |
| Japan | | 2.000% | | 3/20/25 | JPY | 75,000 | | 780 | |
| Japan | | 2.000% | | 12/20/25 | JPY | 3,340,000 | | 35,292 | |
| Japan | | 2.000% | | 3/20/27 | JPY | 1,000,000 | | 10,836 | |
| Japan | | 2.000% | | 6/20/30 | JPY | 5,000,000 | | 56,745 | |
| Japan | | 2.000% | | 12/20/30 | JPY | 3,000,000 | | 34,239 | |
| Japan | | 2.000% | | 3/20/31 | JPY | 12,180,000 | | 139,483 | |
| Japan | | 2.000% | | 12/20/33 | JPY | 500,000 | | 5,909 | |
| Japan | | 2.000% | | 9/20/40 | JPY | 17,972,000 | | 225,926 | |
| Japan | | 2.000% | | 9/20/41 | JPY | 12,897,000 | | 163,700 | |
| Japan | | 2.000% | | 3/20/42 | JPY | 15,226,850 | | 194,237 | |
| Japan | | 2.000% | | 3/20/52 | JPY | 4,860,000 | | 67,012 | |
| Japan | | 2.100% | | 12/20/21 | JPY | 105,000 | | 1,021 | |
| Japan | | 2.100% | | 9/20/24 | JPY | 1,305,000 | | 13,494 | |
| Japan | | 2.100% | | 6/20/25 | JPY | 3,000,000 | | 31,520 | |
| Japan | | 2.100% | | 9/20/25 | JPY | 200,000 | | 2,114 | |
| Japan | | 2.100% | | 3/20/26 | JPY | 860,000 | | 9,185 | |
| Japan | | 2.100% | | 12/20/26 | JPY | 5,000,000 | | 54,216 | |
| Japan | | 2.100% | | 3/20/27 | JPY | 350,000 | | 3,817 | |
| Japan | | 2.100% | | 12/20/27 | JPY | 2,241,000 | | 24,785 | |
| Japan | | 2.100% | | 9/20/28 | JPY | 6,126,000 | | 68,528 | |
| Japan | | 2.100% | | 12/20/28 | JPY | 600,000 | | 6,735 | |
| Japan | | 2.100% | | 3/20/29 | JPY | 4,513,000 | | 50,832 | |
| Japan | | 2.100% | | 6/20/29 | JPY | 5,530,000 | | 62,478 | |
| Japan | | 2.100% | | 9/20/29 | JPY | 8,580,000 | | 97,210 | |
| Japan | | 2.100% | | 12/20/29 | JPY | 7,500,000 | | 85,247 | |
| Japan | | 2.100% | | 3/20/30 | JPY | 80,000 | | 913 | |
| | | | | | | | | | | | | | | | | | |
72
Total International Bond Index Fund
| | | | | | | Face | | Market | |
| | | | | Maturity | | Amount | | Value· | |
| | | Coupon | | Date | Currency | (000 | ) | ($000 | ) |
| Japan | | 2.100% | | 12/20/30 | JPY | 8,170,000 | | 94,203 | |
| Japan | | 2.200% | | 3/20/26 | JPY | 800,000 | | 8,589 | |
| Japan | | 2.200% | | 9/20/26 | JPY | 60,000 | | 651 | |
| Japan | | 2.200% | | 9/20/27 | JPY | 15,000 | | 166 | |
| Japan | | 2.200% | | 3/20/28 | JPY | 3,950,000 | | 44,168 | |
| Japan | | 2.200% | | 9/20/28 | JPY | 1,200,000 | | 13,523 | |
| Japan | | 2.200% | | 12/20/29 | JPY | 6,590,000 | | 75,526 | |
| Japan | | 2.200% | | 3/20/30 | JPY | 6,300,000 | | 72,479 | |
| Japan | | 2.200% | | 3/20/31 | JPY | 500,000 | | 5,832 | |
| Japan | | 2.200% | | 9/20/39 | JPY | 8,928,000 | | 114,374 | |
| Japan | | 2.200% | | 3/20/41 | JPY | 13,268,000 | | 172,707 | |
| Japan | | 2.200% | | 3/20/49 | JPY | 1,625,000 | | 22,733 | |
| Japan | | 2.200% | | 3/20/50 | JPY | 2,240,000 | | 31,592 | |
| Japan | | 2.200% | | 3/20/51 | JPY | 3,058,000 | | 43,456 | |
| Japan | | 2.300% | | 9/20/26 | JPY | 35,000 | | 382 | |
| Japan | | 2.300% | | 6/20/27 | JPY | 20,000 | | 222 | |
| Japan | | 2.300% | | 5/20/30 | JPY | 170,000 | | 1,977 | |
| Japan | | 2.300% | | 3/20/35 | JPY | 2,500,000 | | 30,943 | |
| Japan | | 2.300% | | 6/20/35 | JPY | 3,580,000 | | 44,486 | |
| Japan | | 2.300% | | 12/20/35 | JPY | 2,510,000 | | 31,346 | |
| Japan | | 2.300% | | 12/20/36 | JPY | 808,000 | | 10,214 | |
| Japan | | 2.300% | | 3/20/39 | JPY | 4,508,000 | | 58,231 | |
| Japan | | 2.300% | | 3/20/40 | JPY | 4,580,000 | | 59,823 | |
| Japan | | 2.400% | | 3/20/28 | JPY | 5,850,000 | | 66,330 | |
| Japan | | 2.400% | | 6/20/28 | JPY | 1,030,000 | | 11,729 | |
| Japan | | 2.400% | | 3/20/34 | JPY | 3,700,000 | | 45,801 | |
| Japan | | 2.400% | | 12/20/34 | JPY | 2,300,000 | | 28,727 | |
| Japan | | 2.400% | | 3/20/37 | JPY | 3,614,000 | | 46,383 | |
| Japan | | 2.400% | | 9/20/38 | JPY | 2,532,000 | | 33,025 | |
| Japan | | 2.400% | | 3/20/48 | JPY | 800,000 | | 11,496 | |
| Japan | | 2.500% | | 6/20/34 | JPY | 2,013,000 | | 25,263 | |
| Japan | | 2.500% | | 9/20/34 | JPY | 400,000 | | 5,036 | |
| Japan | | 2.500% | | 9/20/35 | JPY | 1,000,000 | | 12,744 | |
| Japan | | 2.500% | | 3/20/36 | JPY | 2,208,000 | | 28,342 | |
| Japan | | 2.500% | | 6/20/36 | JPY | 1,450,000 | | 18,670 | |
| Japan | | 2.500% | | 9/20/36 | JPY | 600,000 | | 7,750 | |
| Japan | | 2.500% | | 9/20/37 | JPY | 17,000 | | 222 | |
| Japan | | 2.500% | | 3/20/38 | JPY | 2,917,000 | | 38,335 | |
11 | Japan Bank for International Cooperation | | 2.625% | | 12/15/20 | GBP | 3,500 | | 4,617 | |
11 | Japan Expressway Holding & Debt Repayment Agency | | 0.090% | | 9/30/27 | JPY | 2,969,000 | | 27,768 | |
11 | Japan Expressway Holding & Debt Repayment Agency | | 0.130% | | 6/30/27 | JPY | 300,000 | | 2,815 | |
11 | Japan Expressway Holding & Debt Repayment Agency | | 0.140% | | 4/30/27 | JPY | 2,300,000 | | 21,598 | |
11 | Japan Expressway Holding & Debt Repayment Agency | | 0.149% | | 7/31/36 | JPY | 2,000,000 | | 18,321 | |
11 | Japan Expressway Holding & Debt Repayment Agency | | 0.155% | | 8/31/27 | JPY | 2,100,000 | | 19,746 | |
| Japan Expressway Holding & Debt Repayment Agency | | 0.160% | | 11/30/27 | JPY | 600,000 | | 5,643 | |
11 | Japan Expressway Holding & Debt Repayment Agency | | 0.170% | | 10/29/27 | JPY | 2,200,000 | | 20,705 | |
| | | | | | | | | | | | | | | | | | |
73
Total International Bond Index Fund
| | | | | | | Face | | Market | |
| | | | | Maturity | | Amount | | Value· | |
| | | Coupon | | Date | Currency | (000 | ) | ($000 | ) |
| Japan Expressway Holding & Debt Repayment Agency | | 0.185% | | 1/31/28 | JPY | 1,500,000 | | 14,121 | |
11 | Japan Expressway Holding & Debt Repayment Agency | | 0.306% | | 4/30/36 | JPY | 1,200,000 | | 11,302 | |
11 | Japan Expressway Holding & Debt Repayment Agency | | 0.320% | | 1/31/25 | JPY | 400,000 | | 3,778 | |
11 | Japan Expressway Holding & Debt Repayment Agency | | 0.320% | | 1/30/26 | JPY | 751,000 | | 7,117 | |
11 | Japan Expressway Holding & Debt Repayment Agency | | 0.379% | | 12/26/25 | JPY | 1,000,000 | | 9,509 | |
11 | Japan Expressway Holding & Debt Repayment Agency | | 0.397% | | 10/31/36 | JPY | 200,000 | | 1,906 | |
11 | Japan Expressway Holding & Debt Repayment Agency | | 0.414% | | 2/28/25 | JPY | 409,000 | | 3,883 | |
11 | Japan Expressway Holding & Debt Repayment Agency | | 0.450% | | 3/31/25 | JPY | 1,000,000 | | 9,515 | |
11 | Japan Expressway Holding & Debt Repayment Agency | | 0.466% | | 12/27/24 | JPY | 2,000,000 | | 19,024 | |
11 | Japan Expressway Holding & Debt Repayment Agency | | 0.495% | | 11/29/24 | JPY | 1,520,000 | | 14,471 | |
| Japan Expressway Holding & Debt Repayment Agency | | 0.500% | | 9/17/38 | JPY | 200,000 | | 1,907 | |
| Japan Expressway Holding & Debt Repayment Agency | | 0.500% | | 3/18/39 | JPY | 200,000 | | 1,905 | |
11 | Japan Expressway Holding & Debt Repayment Agency | | 0.509% | | 5/30/25 | JPY | 580,000 | | 5,540 | |
11 | Japan Expressway Holding & Debt Repayment Agency | | 0.538% | | 5/31/38 | JPY | 400,000 | | 3,895 | |
11 | Japan Expressway Holding & Debt Repayment Agency | | 0.539% | | 10/31/24 | JPY | 1,000,000 | | 9,537 | |
11 | Japan Expressway Holding & Debt Repayment Agency | | 0.541% | | 4/28/23 | JPY | 800,000 | | 7,562 | |
| Japan Expressway Holding & Debt Repayment Agency | | 0.542% | | 5/31/49 | JPY | 900,000 | | 8,542 | |
11 | Japan Expressway Holding & Debt Repayment Agency | | 0.591% | | 1/29/38 | JPY | 2,000,000 | | 19,677 | |
11 | Japan Expressway Holding & Debt Repayment Agency | | 0.601% | | 7/31/24 | JPY | 2,000,000 | | 19,103 | |
11 | Japan Expressway Holding & Debt Repayment Agency | | 0.645% | | 3/29/24 | JPY | 1,000,000 | | 9,546 | |
11 | Japan Expressway Holding & Debt Repayment Agency | | 0.660% | | 2/29/24 | JPY | 2,000,000 | | 19,097 | |
11 | Japan Expressway Holding & Debt Repayment Agency | | 0.660% | | 5/31/24 | JPY | 1,000,000 | | 9,567 | |
11 | Japan Expressway Holding & Debt Repayment Agency | | 0.668% | | 3/17/23 | JPY | 800,000 | | 7,589 | |
11 | Japan Expressway Holding & Debt Repayment Agency | | 0.669% | | 11/30/23 | JPY | 1,000,000 | | 9,534 | |
11 | Japan Expressway Holding & Debt Repayment Agency | | 0.669% | | 4/30/24 | JPY | 1,000,000 | | 9,563 | |
11 | Japan Expressway Holding & Debt Repayment Agency | | 0.693% | | 12/28/23 | JPY | 500,000 | | 4,774 | |
| Japan Expressway Holding & Debt Repayment Agency | | 0.765% | | 9/20/22 | JPY | 200,000 | | 1,892 | |
74
Total International Bond Index Fund
| | | | | | | Face | | Market | |
| | | | | Maturity | | Amount | | Value· | |
| | | Coupon | | Date | Currency | (000 | ) | ($000 | ) |
11 | Japan Expressway Holding & Debt Repayment Agency | | 0.791% | | 10/31/22 | JPY | 86,700 | | 823 | |
| Japan Expressway Holding & Debt Repayment Agency | | 0.796% | | 9/20/22 | JPY | 300,000 | | 2,840 | |
11 | Japan Expressway Holding & Debt Repayment Agency | | 0.801% | | 8/31/22 | JPY | 800,000 | | 7,586 | |
11 | Japan Expressway Holding & Debt Repayment Agency | | 0.805% | | 11/30/22 | JPY | 1,568,700 | | 14,911 | |
11 | Japan Expressway Holding & Debt Repayment Agency | | 0.815% | | 2/28/23 | JPY | 557,700 | | 5,300 | |
11 | Japan Expressway Holding & Debt Repayment Agency | | 0.819% | | 9/30/22 | JPY | 1,500,000 | | 14,242 | |
11 | Japan Expressway Holding & Debt Repayment Agency | | 0.834% | | 1/31/23 | JPY | 900,000 | | 8,575 | |
11 | Japan Expressway Holding & Debt Repayment Agency | | 0.839% | | 7/29/22 | JPY | 500,000 | | 4,763 | |
11 | Japan Expressway Holding & Debt Repayment Agency | | 0.882% | | 6/30/23 | JPY | 817,000 | | 7,801 | |
11 | Japan Expressway Holding & Debt Repayment Agency | | 0.895% | | 6/30/22 | JPY | 1,200,000 | | 11,390 | |
11 | Japan Expressway Holding & Debt Repayment Agency | | 0.900% | | 11/30/20 | JPY | 100,000 | | 935 | |
11 | Japan Expressway Holding & Debt Repayment Agency | | 0.911% | | 7/31/23 | JPY | 1,300,000 | | 12,475 | |
11 | Japan Expressway Holding & Debt Repayment Agency | | 0.934% | | 1/31/36 | JPY | 3,600,000 | | 37,373 | |
11 | Japan Expressway Holding & Debt Repayment Agency | | 0.970% | | 1/31/35 | JPY | 3,000,000 | | 31,263 | |
11 | Japan Expressway Holding & Debt Repayment Agency | | 1.200% | | 12/28/20 | JPY | 300,000 | | 2,818 | |
11 | Japan Expressway Holding & Debt Repayment Agency | | 1.240% | | 7/31/35 | JPY | 600,000 | | 6,491 | |
11 | Japan Expressway Holding & Debt Repayment Agency | | 1.338% | | 10/31/34 | JPY | 100,000 | | 1,092 | |
11 | Japan Expressway Holding & Debt Repayment Agency | | 1.427% | | 7/31/34 | JPY | 700,000 | | 7,708 | |
| Japan Expressway Holding & Debt Repayment Agency | | 1.861% | | 3/19/55 | JPY | 2,400,000 | | 30,743 | |
11 | Japan Expressway Holding & Debt Repayment Agency | | 2.100% | | 12/28/29 | JPY | 500,000 | | 5,607 | |
11 | Japan Expressway Holding & Debt Repayment Agency | | 2.300% | | 2/29/40 | JPY | 200,000 | | 2,593 | |
| Japan Expressway Holding & Debt Repayment Agency | | 2.340% | | 10/20/27 | JPY | 700,000 | | 7,663 | |
| Japan Expressway Holding & Debt Repayment Agency | | 2.370% | | 9/20/28 | JPY | 50,000 | | 558 | |
| Japan Expressway Holding & Debt Repayment Agency | | 2.420% | | 6/20/28 | JPY | 880,000 | | 9,810 | |
| Japan Expressway Holding & Debt Repayment Agency | | 2.450% | | 3/19/26 | JPY | 180,000 | | 1,923 | |
| Japan Expressway Holding & Debt Repayment Agency | | 2.700% | | 3/20/48 | JPY | 1,550,000 | | 22,675 | |
| Japan Expressway Holding & Debt Repayment Agency | | 2.870% | | 12/20/46 | JPY | 80,000 | | 1,187 | |
75
Total International Bond Index Fund
| | | | | | | Face | | Market | |
| | | | | Maturity | | Amount | | Value· | |
| | | Coupon | | Date | Currency | (000 | ) | ($000 | ) |
| Japan Expressway Holding & Debt Repayment Agency | | 2.960% | | 3/19/46 | JPY | 250,000 | | 3,722 | |
11 | Japan Expressway Holding and Debt Repayment Agency | | 0.110% | | 5/31/27 | JPY | 11,000 | | 103 | |
11 | Japan Expressway Holding and Debt Repayment Agency | | 0.440% | | 8/29/25 | JPY | 64,000 | | 610 | |
11 | Japan Expressway Holding and Debt Repayment Agency | | 0.557% | | 7/31/25 | JPY | 14,000 | | 134 | |
11 | Japan Finance Organization for Municipalities | | 0.020% | | 3/13/26 | JPY | 100,000 | | 930 | |
11 | Japan Finance Organization for Municipalities | | 0.110% | | 5/21/27 | JPY | 1,500,000 | | 14,050 | |
11 | Japan Finance Organization for Municipalities | | 0.140% | | 4/16/27 | JPY | 1,250,000 | | 11,734 | |
11 | Japan Finance Organization for Municipalities | | 0.145% | | 2/16/26 | JPY | 90,000 | | 844 | |
11 | Japan Finance Organization for Municipalities | | 0.160% | | 7/16/27 | JPY | 1,000,000 | | 9,403 | |
| Japan Finance Organization for Municipalities | | 0.160% | | 11/15/27 | JPY | 2,000,000 | | 18,803 | |
| Japan Finance Organization for Municipalities | | 0.185% | | 1/21/28 | JPY | 2,000,000 | | 18,751 | |
11 | Japan Finance Organization for Municipalities | | 0.311% | | 7/28/23 | JPY | 1,830,000 | | 17,180 | |
11 | Japan Finance Organization for Municipalities | | 0.320% | | 1/19/26 | JPY | 1,000,000 | | 9,479 | |
11 | Japan Finance Organization for Municipalities | | 0.391% | | 4/25/25 | JPY | 225,000 | | 2,140 | |
11 | Japan Finance Organization for Municipalities | | 0.484% | | 6/13/25 | JPY | 100,000 | | 955 | |
11 | Japan Finance Organization for Municipalities | | 0.576% | | 9/24/21 | JPY | 600,000 | | 5,621 | |
| Japan Finance Organization for Municipalities | | 0.576% | | 4/28/23 | JPY | 800,000 | | 7,552 | |
11 | Japan Finance Organization for Municipalities | | 0.644% | | 6/14/24 | JPY | 2,000,000 | | 19,125 | |
11 | Japan Finance Organization for Municipalities | | 0.660% | | 2/16/24 | JPY | 1,000,000 | | 9,511 | |
11 | Japan Finance Organization for Municipalities | | 0.660% | | 5/21/24 | JPY | 3,058,000 | | 29,250 | |
11 | Japan Finance Organization for Municipalities | | 0.668% | | 3/17/23 | JPY | 370,000 | | 3,510 | |
11 | Japan Finance Organization for Municipalities | | 0.669% | | 11/17/23 | JPY | 1,579,000 | | 15,053 | |
11 | Japan Finance Organization for Municipalities | | 0.669% | | 4/12/24 | JPY | 1,550,000 | | 14,819 | |
| Japan Finance Organization for Municipalities | | 0.678% | | 3/28/23 | JPY | 500,000 | | 4,734 | |
| Japan Finance Organization for Municipalities | | 0.801% | | 10/28/22 | JPY | 850,000 | | 8,055 | |
11 | Japan Finance Organization for Municipalities | | 0.801% | | 9/15/23 | JPY | 50,000 | | 478 | |
11 | Japan Finance Organization for Municipalities | | 0.815% | | 2/17/23 | JPY | 1,500,000 | | 14,253 | |
76
Total International Bond Index Fund
| | | | | | | Face | | Market | |
| | | | | Maturity | | Amount | | Value· | |
| | | Coupon | | Date | Currency | (000 | ) | ($000 | ) |
11 | Japan Finance Organization for Municipalities | | 0.819% | | 9/16/22 | JPY | 1,000,000 | | 9,491 | |
| Japan Finance Organization for Municipalities | | 0.875% | | 9/22/21 | EUR | 5,000 | | 5,696 | |
11 | Japan Finance Organization for Municipalities | | 0.882% | | 6/16/23 | JPY | 1,000,000 | | 9,576 | |
11 | Japan Finance Organization for Municipalities | | 0.900% | | 11/17/20 | JPY | 100,000 | | 935 | |
11 | Japan Finance Organization for Municipalities | | 0.900% | | 3/14/22 | JPY | 600,000 | | 5,680 | |
| Japan Finance Organization for Municipalities | | 0.922% | | 7/28/23 | JPY | 300,000 | | 2,872 | |
11 | Japan Finance Organization for Municipalities | | 0.977% | | 4/22/22 | JPY | 2,200,000 | | 20,888 | |
11 | Japan Finance Organization for Municipalities | | 1.000% | | 9/14/21 | JPY | 220,600 | | 2,082 | |
| Japan Finance Organization for Municipalities | | 2.220% | | 1/28/30 | JPY | 2,130,000 | | 24,051 | |
| Japan Finance Organization for Municipalities | | 2.290% | | 4/27/29 | JPY | 80,000 | | 899 | |
| Japan Highway Public Corp. | | 1.540% | | 12/20/22 | JPY | 500,000 | | 4,850 | |
| Japan Highway Public Corp. | | 2.700% | | 6/20/22 | JPY | 390,000 | | 3,865 | |
| Major Joint Local Government Bond | | 0.140% | | 2/22/29 | JPY | 1,600,000 | | 14,930 | |
| Major Joint Local Government Bond | | 0.145% | | 12/25/26 | JPY | 3,300,000 | | 30,779 | |
| Major Joint Local Government Bond | | 0.160% | | 1/25/29 | JPY | 1,610,000 | | 15,050 | |
| Major Joint Local Government Bond | | 0.180% | | 1/25/27 | JPY | 3,090,000 | | 28,894 | |
| Major Joint Local Government Bond | | 0.180% | | 4/25/28 | JPY | 5,700,000 | | 53,360 | |
| Major Joint Local Government Bond | | 0.200% | | 5/25/28 | JPY | 890,000 | | 8,346 | |
| Major Joint Local Government Bond | | 0.210% | | 3/25/27 | JPY | 1,900,000 | | 17,809 | |
| Major Joint Local Government Bond | | 0.215% | | 10/25/27 | JPY | 792,400 | | 7,436 | |
| Major Joint Local Government Bond | | 0.240% | | 2/25/28 | JPY | 399,000 | | 3,753 | |
| Major Joint Local Government Bond | | 0.245% | | 2/25/27 | JPY | 1,700,000 | | 15,973 | |
| Major Joint Local Government Bond | | 0.406% | | 4/25/25 | JPY | 3,650,000 | | 34,521 | |
| Major Joint Local Government Bond | | 0.448% | | 2/25/25 | JPY | 2,300,000 | | 21,785 | |
| Major Joint Local Government Bond | | 0.456% | | 12/25/24 | JPY | 2,400,000 | | 22,724 | |
| Major Joint Local Government Bond | | 0.469% | | 12/25/25 | JPY | 5,100,000 | | 48,525 | |
| Major Joint Local Government Bond | | 0.470% | | 3/25/25 | JPY | 4,750,000 | | 45,056 | |
| Major Joint Local Government Bond | | 0.496% | | 11/25/25 | JPY | 1,000,000 | | 9,527 | |
| Major Joint Local Government Bond | | 0.500% | | 8/25/25 | JPY | 1,600,000 | | 15,231 | |
| Major Joint Local Government Bond | | 0.510% | | 9/25/25 | JPY | 2,170,600 | | 20,682 | |
| Major Joint Local Government Bond | | 0.548% | | 6/25/25 | JPY | 2,600,000 | | 24,795 | |
| Major Joint Local Government Bond | | 0.553% | | 5/23/25 | JPY | 5,100,000 | | 48,627 | |
| Major Joint Local Government Bond | | 0.553% | | 7/25/25 | JPY | 1,243,700 | | 11,868 | |
| Major Joint Local Government Bond | | 0.554% | | 9/25/24 | JPY | 1,500,000 | | 14,255 | |
| Major Joint Local Government Bond | | 0.566% | | 8/23/24 | JPY | 500,000 | | 4,751 | |
| Major Joint Local Government Bond | | 0.611% | | 7/25/24 | JPY | 700,000 | | 6,662 | |
| Major Joint Local Government Bond | | 0.659% | | 6/25/24 | JPY | 800,000 | | 7,627 | |
| Major Joint Local Government Bond | | 0.660% | | 11/24/23 | JPY | 1,440,000 | | 13,679 | |
| Major Joint Local Government Bond | | 0.674% | | 5/24/24 | JPY | 400,000 | | 3,814 | |
| Major Joint Local Government Bond | | 0.680% | | 3/24/23 | JPY | 700,000 | | 6,626 | |
| Major Joint Local Government Bond | | 0.680% | | 10/25/23 | JPY | 200,000 | | 1,900 | |
| Major Joint Local Government Bond | | 0.689% | | 4/25/24 | JPY | 250,000 | | 2,384 | |
| Major Joint Local Government Bond | | 0.710% | | 12/25/23 | JPY | 3,700,000 | | 35,235 | |
| Major Joint Local Government Bond | | 0.720% | | 12/22/22 | JPY | 400,000 | | 3,785 | |
77
Total International Bond Index Fund
| | | | | | | Face | | Market | |
| | | | | Maturity | | Amount | | Value· | |
| | | Coupon | | Date | Currency | (000 | ) | ($000 | ) |
| Major Joint Local Government Bond | | 0.760% | | 1/25/24 | JPY | 1,500,000 | | 14,323 | |
| Major Joint Local Government Bond | | 0.800% | | 11/25/22 | JPY | 250,000 | | 2,370 | |
| Major Joint Local Government Bond | | 0.820% | | 9/22/22 | JPY | 90,000 | | 853 | |
| Major Joint Local Government Bond | | 0.820% | | 8/25/23 | JPY | 90,000 | | 859 | |
| Major Joint Local Government Bond | | 0.890% | | 6/24/22 | JPY | 800,000 | | 7,577 | |
| Major Joint Local Government Bond | | 0.910% | | 7/25/23 | JPY | 500,000 | | 4,783 | |
| Major Joint Local Government Bond | | 1.000% | | 10/25/21 | JPY | 6,100,000 | | 57,577 | |
| Major Joint Local Government Bond | | 1.010% | | 2/25/22 | JPY | 75,000 | | 710 | |
| Major Joint Local Government Bond | | 1.030% | | 9/24/21 | JPY | 7,890,000 | | 74,445 | |
| Major Joint Local Government Bond | | 1.030% | | 11/25/21 | JPY | 200,000 | | 1,890 | |
| Major Joint Local Government Bond | | 1.050% | | 8/25/21 | JPY | 500,000 | | 4,716 | |
| Major Joint Local Government Bond | | 1.070% | | 12/24/21 | JPY | 400,000 | | 3,787 | |
| Major Joint Local Government Bond | | 1.180% | | 5/25/21 | JPY | 500,000 | | 4,712 | |
| Major Joint Local Government Bond | | 1.280% | | 2/25/21 | JPY | 200,000 | | 1,882 | |
| Metropolitan Expressway Co. Ltd. | | 0.030% | | 6/18/21 | JPY | 500,000 | | 4,629 | |
| Metropolitan Expressway Co. Ltd. | | 0.030% | | 9/17/21 | JPY | 300,000 | | 2,777 | |
| Metropolitan Expressway Co. Ltd. | | 0.090% | | 9/20/22 | JPY | 600,000 | | 5,566 | |
| Osaka Prefecture | | 1.453% | | 9/26/34 | JPY | 270,000 | | 2,952 | |
| Shoko Chukin Bank Ltd. | | 0.220% | | 11/27/20 | JPY | 1,100,000 | | 10,202 | |
| Tokyo Metropolitan Government | | 0.075% | | 9/18/26 | JPY | 177,400 | | 1,647 | |
| Tokyo Metropolitan Government | | 0.210% | | 3/19/27 | JPY | 2,000,000 | | 18,762 | |
| Tokyo Metropolitan Government | | 0.386% | | 3/19/25 | JPY | 1,000,000 | | 9,450 | |
| Tokyo Metropolitan Government | | 0.426% | | 12/20/24 | JPY | 140,000 | | 1,325 | |
| Tokyo Metropolitan Government | | 0.435% | | 3/19/25 | JPY | 2,478,000 | | 23,476 | |
| Tokyo Metropolitan Government | | 0.444% | | 12/19/25 | JPY | 600,000 | | 5,703 | |
| Tokyo Metropolitan Government | | 0.456% | | 9/19/25 | JPY | 500,000 | | 4,752 | |
| Tokyo Metropolitan Government | | 0.475% | | 9/19/25 | JPY | 1,100,000 | | 10,465 | |
| Tokyo Metropolitan Government | | 0.499% | | 6/20/25 | JPY | 750,000 | | 7,137 | |
| Tokyo Metropolitan Government | | 0.505% | | 9/20/24 | JPY | 700,000 | | 6,640 | |
| Tokyo Metropolitan Government | | 0.533% | | 6/20/25 | JPY | 500,000 | | 4,767 | |
| Tokyo Metropolitan Government | | 0.635% | | 3/19/24 | JPY | 700,000 | | 6,659 | |
| Tokyo Metropolitan Government | | 0.690% | | 3/19/24 | JPY | 190,000 | | 1,812 | |
| Tokyo Metropolitan Government | | 0.700% | | 9/20/23 | JPY | 450,000 | | 4,278 | |
| Tokyo Metropolitan Government | | 0.720% | | 12/20/23 | JPY | 30,000 | | 286 | |
| Tokyo Metropolitan Government | | 0.730% | | 12/20/23 | JPY | 2,000,000 | | 19,067 | |
| Tokyo Metropolitan Government | | 0.760% | | 12/20/22 | JPY | 185,000 | | 1,753 | |
| Tokyo Metropolitan Government | | 0.770% | | 9/20/22 | JPY | 300,000 | | 2,838 | |
| Tokyo Metropolitan Government | | 0.860% | | 3/20/23 | JPY | 800,000 | | 7,619 | |
| Tokyo Metropolitan Government | | 0.990% | | 9/17/21 | JPY | 200,000 | | 1,886 | |
| Tokyo Metropolitan Government | | 0.990% | | 12/20/21 | JPY | 103,500 | | 978 | |
| Tokyo Metropolitan Government | | 1.020% | | 9/17/21 | JPY | 500,000 | | 4,716 | |
| Tokyo Metropolitan Government | | 1.293% | | 6/20/35 | JPY | 100,000 | | 1,080 | |
| Tokyo Metropolitan Government | | 1.980% | | 6/20/31 | JPY | 100,000 | | 1,123 | |
| West Nippon Expressway Co. Ltd. | | 0.090% | | 9/20/22 | JPY | 500,000 | | 4,638 | |
| West Nippon Expressway Co. Ltd. | | 0.170% | | 5/22/26 | JPY | 220,000 | | 2,052 | |
| | | | | | | | | 27,081,898 | |
Total Japan (Cost $25,676,154) | | | | | | | | 27,547,483 | |
Jersey, C.I. (0.0%) | | | | | | | | | |
Sovereign Bond (0.0%) | | | | | | | | | |
| Bailiwick of Jersey | | 3.750% | | 6/9/54 | GBP | 1,510 | | 2,849 | |
Total Jersey, C.I. (Cost $2,583) | | | | | | | | 2,849 | |
78
Total International Bond Index Fund
| | | | | | | Face | | Market | |
| | | | | Maturity | | Amount | | Value· | |
| | | Coupon | | Date | Currency | (000 | ) | ($000 | ) |
Kazakhstan (0.0%) | | | | | | | | | |
Sovereign Bonds (0.0%) | | | | | | | | | |
2 | Republic of Kazakhstan | | 0.600% | | 9/30/26 | EUR | 6,300 | | 6,985 | |
2 | Republic of Kazakhstan | | 1.500% | | 9/30/34 | EUR | 4,800 | | 5,325 | |
| Republic of Kazakhstan | | 1.550% | | 11/9/23 | EUR | 2,000 | | 2,338 | |
2 | Republic of Kazakhstan | | 1.550% | | 11/9/23 | EUR | 3,150 | | 3,682 | |
| Republic of Kazakhstan | | 2.375% | | 11/9/28 | EUR | 10,000 | | 12,540 | |
Total Kazakhstan (Cost $29,666) | | | | | | | | 30,870 | |
Latvia (0.0%) | | | | | | | | | |
Sovereign Bonds (0.0%) | | | | | | | | | |
| Republic of Latvia | | 2.625% | | 1/21/21 | EUR | 1,000 | | 1,152 | |
2 | Republic of Latvia | | 2.625% | | 1/21/21 | EUR | 1,000 | | 1,152 | |
| Republic of Latvia | | 2.875% | | 4/30/24 | EUR | 1,000 | | 1,271 | |
Total Latvia (Cost $3,697) | | | | | | | | 3,575 | |
Lithuania (0.0%) | | | | | | | | | |
Sovereign Bond (0.0%) | | | | | | | | | |
| Republic of Lithuania | | 2.125% | | 10/29/26 | EUR | 13,800 | | 17,671 | |
Total Lithuania (Cost $16,795) | | | | | | | | 17,671 | |
Luxembourg (0.1%) | | | | | | | | | |
Corporate Bonds (0.1%) | | | | | | | | | |
| ArcelorMittal | | 0.950% | | 1/17/23 | EUR | 3,600 | | 4,039 | |
| ArcelorMittal | | 2.250% | | 1/17/24 | EUR | 13,400 | | 15,638 | |
| ArcelorMittal | | 3.125% | | 1/14/22 | EUR | 11,000 | | 13,039 | |
| Blackstone Property Partners Europe Holdings Sarl | | 1.400% | | 7/6/22 | EUR | 3,100 | | 3,538 | |
| Blackstone Property Partners Europe Holdings Sarl | | 2.000% | | 2/15/24 | EUR | 9,300 | | 10,900 | |
| Blackstone Property Partners Europe Holdings Sarl | | 2.200% | | 7/24/25 | EUR | 16,550 | | 19,617 | |
| Dream Global Funding I Sarl | | 1.375% | | 12/21/21 | EUR | 8,000 | | 9,081 | |
| Logicor Financing Sarl | | 1.500% | | 11/14/22 | EUR | 7,000 | | 8,061 | |
| Logicor Financing Sarl | | 2.250% | | 5/13/25 | EUR | 3,000 | | 3,598 | |
| Logicor Financing Sarl | | 3.250% | | 11/13/28 | EUR | 13,800 | | 17,426 | |
| NORD/LB Luxembourg SA Covered Bond Bank | | 0.375% | | 6/15/23 | EUR | 10,000 | | 11,352 | |
| Prologis International Funding II SA | | 0.875% | | 7/9/29 | EUR | 6,000 | | 6,718 | |
| SELP Finance Sarl | | 1.250% | | 10/25/23 | EUR | 4,100 | | 4,719 | |
| | | | | | | | | 127,726 | |
Sovereign Bonds (0.0%) | | | | | | | | | |
| Grand Duchy of Luxembourg | | 2.250% | | 3/21/22 | EUR | 4,000 | | 4,774 | |
| Grand Duchy of Luxembourg | | 2.250% | | 3/19/28 | EUR | 3,000 | | 4,054 | |
| Grand Duchy of Luxembourg | | 3.375% | | 5/18/20 | EUR | 4,000 | | 4,554 | |
| | | | | | | | | 13,382 | |
Total Luxembourg (Cost $140,462) | | | | | | | | 141,108 | |
Malaysia (0.6%) | | | | | | | | | |
Sovereign Bonds (0.6%) | | | | | | | | | |
| Federation of Malaysia | | 3.418% | | 8/15/22 | MYR | 15,000 | | 3,611 | |
| Federation of Malaysia | | 3.478% | | 6/14/24 | MYR | 120,000 | | 28,876 | |
| Federation of Malaysia | | 3.480% | | 3/15/23 | MYR | 110,500 | | 26,634 | |
79
Total International Bond Index Fund
| | | | | | | Face | | Market | |
| | | | | Maturity | | Amount | | Value· | |
| | | Coupon | | Date | Currency | (000 | ) | ($000 | ) |
| Federation of Malaysia | | 3.492% | | 3/31/20 | MYR | 31,000 | | 7,430 | |
| Federation of Malaysia | | 3.733% | | 6/15/28 | MYR | 256,400 | | 62,410 | |
| Federation of Malaysia | | 3.795% | | 9/30/22 | MYR | 160,000 | | 38,913 | |
| Federation of Malaysia | | 3.800% | | 8/17/23 | MYR | 165,000 | | 40,167 | |
| Federation of Malaysia | | 3.828% | | 7/5/34 | MYR | 69,600 | | 16,716 | |
| Federation of Malaysia | | 3.844% | | 4/15/33 | MYR | 293,550 | | 71,223 | |
| Federation of Malaysia | | 3.882% | | 3/14/25 | MYR | 85,000 | | 20,807 | |
| Federation of Malaysia | | 3.885% | | 8/15/29 | MYR | 130,000 | | 32,194 | |
| Federation of Malaysia | | 3.892% | | 3/15/27 | MYR | 500 | | 123 | |
| Federation of Malaysia | | 3.899% | | 11/16/27 | MYR | 97,000 | | 23,845 | |
| Federation of Malaysia | | 3.900% | | 11/30/26 | MYR | 131,500 | | 32,325 | |
| Federation of Malaysia | | 3.906% | | 7/15/26 | MYR | 90,000 | | 22,154 | |
| Federation of Malaysia | | 3.955% | | 9/15/25 | MYR | 427,000 | | 105,260 | |
| Federation of Malaysia | | 4.048% | | 9/30/21 | MYR | 30,500 | | 7,421 | |
| Federation of Malaysia | | 4.059% | | 9/30/24 | MYR | 54,000 | | 13,309 | |
| Federation of Malaysia | | 4.127% | | 4/15/32 | MYR | 25,000 | | 6,246 | |
| Federation of Malaysia | | 4.160% | | 7/15/21 | MYR | 300,000 | | 73,001 | |
| Federation of Malaysia | | 4.181% | | 7/15/24 | MYR | 142,000 | | 35,179 | |
| Federation of Malaysia | | 4.232% | | 6/30/31 | MYR | 20,700 | | 5,221 | |
| Federation of Malaysia | | 4.254% | | 5/31/35 | MYR | 107,000 | | 27,042 | |
| Federation of Malaysia | | 4.392% | | 4/15/26 | MYR | 70,000 | | 17,700 | |
| Federation of Malaysia | | 4.498% | | 4/15/30 | MYR | 140,500 | | 36,160 | |
| Federation of Malaysia | | 4.642% | | 11/7/33 | MYR | 53,700 | | 14,021 | |
| Federation of Malaysia | | 4.736% | | 3/15/46 | MYR | 35,000 | | 9,287 | |
| Federation of Malaysia | | 4.762% | | 4/7/37 | MYR | 46,600 | | 12,370 | |
| Federation of Malaysia | | 4.893% | | 6/8/38 | MYR | 197,500 | | 53,387 | |
| Federation of Malaysia | | 4.921% | | 7/6/48 | MYR | 84,000 | | 22,634 | |
| Federation of Malaysia | | 4.935% | | 9/30/43 | MYR | 9,298 | | 2,547 | |
Total Malaysia (Cost $869,631) | | | | | | | | 868,213 | |
Mexico (0.8%) | | | | | | | | | |
Corporate Bonds (0.0%) | | | | | | | | | |
| America Movil SAB de CV | | 0.750% | | 6/26/27 | EUR | 4,300 | | 4,875 | |
| America Movil SAB de CV | | 1.500% | | 3/10/24 | EUR | 600 | | 705 | |
| America Movil SAB de CV | | 2.125% | | 3/10/28 | EUR | 5,100 | | 6,388 | |
| America Movil SAB de CV | | 3.000% | | 7/12/21 | EUR | 2,700 | | 3,164 | |
| America Movil SAB de CV | | 4.375% | | 8/7/41 | GBP | 7,300 | | 12,435 | |
| America Movil SAB de CV | | 4.750% | | 6/28/22 | EUR | 5,005 | | 6,275 | |
| America Movil SAB de CV | | 5.000% | | 10/27/26 | GBP | 2,300 | | 3,634 | |
| America Movil SAB de CV | | 5.750% | | 6/28/30 | GBP | 3,900 | | 6,893 | |
1 | America Movil SAB de CV | | 6.375% | | 9/6/73 | EUR | 8,400 | | 11,256 | |
| Fomento Economico Mexicano SAB de CV | | 1.750% | | 3/20/23 | EUR | 1,692 | | 1,984 | |
| | | | | | | | | 57,609 | |
Sovereign Bonds (0.8%) | | | | | | | | | |
| Petroleos Mexicanos | | 1.875% | | 4/21/22 | EUR | 700 | | 790 | |
| Petroleos Mexicanos | | 2.500% | | 8/21/21 | EUR | 200 | | 229 | |
| Petroleos Mexicanos | | 2.750% | | 4/21/27 | EUR | 21,000 | | 21,742 | |
| Petroleos Mexicanos | | 3.125% | | 11/27/20 | EUR | 1,000 | | 1,146 | |
| Petroleos Mexicanos | | 3.625% | | 11/24/25 | EUR | 300 | | 337 | |
| Petroleos Mexicanos | | 3.750% | | 2/21/24 | EUR | 1,000 | | 1,174 | |
| Petroleos Mexicanos | | 3.750% | | 4/16/26 | EUR | 825 | | 926 | |
| Petroleos Mexicanos | | 4.750% | | 2/26/29 | EUR | 9,800 | | 11,322 | |
| Petroleos Mexicanos | | 4.875% | | 2/21/28 | EUR | 100 | | 117 | |
| Petroleos Mexicanos | | 5.500% | | 2/24/25 | EUR | 12,000 | | 15,061 | |
80
Total International Bond Index Fund
| | | | | | | Face | | Market | |
| | | | | Maturity | | Amount | | Value· | |
| | | Coupon | | Date | Currency | (000 | ) | ($000 | ) |
| Petroleos Mexicanos | | 8.250% | | 6/2/22 | GBP | 2,750 | | 3,999 | |
| United Mexican States | | 1.375% | | 1/15/25 | EUR | 19,540 | | 22,725 | |
| United Mexican States | | 1.625% | | 3/6/24 | EUR | 3,000 | | 3,525 | |
| United Mexican States | | 1.625% | | 4/8/26 | EUR | 4,105 | | 4,779 | |
| United Mexican States | | 1.750% | | 4/17/28 | EUR | 16,500 | | 19,385 | |
| United Mexican States | | 2.375% | | 4/9/21 | EUR | 4,667 | | 5,377 | |
| United Mexican States | | 2.750% | | 4/22/23 | EUR | 7,000 | | 8,460 | |
| United Mexican States | | 2.875% | | 4/8/39 | EUR | 4,725 | | 5,941 | |
| United Mexican States | | 3.000% | | 3/6/45 | EUR | 7,500 | | 9,432 | |
| United Mexican States | | 3.375% | | 2/23/31 | EUR | 18,000 | | 24,147 | |
| United Mexican States | | 3.625% | | 4/9/29 | EUR | 9,200 | | 12,491 | |
| United Mexican States | | 4.000% | | 3/15/15 | EUR | 3,400 | | 4,243 | |
| United Mexican States | | 5.625% | | 3/19/14 | GBP | 6,006 | | 8,635 | |
| United Mexican States | | 5.750% | | 3/5/26 | MXN | 850,000 | | 42,041 | |
| United Mexican States | | 6.500% | | 6/10/21 | MXN | 2,387,500 | | 123,836 | |
| United Mexican States | | 6.500% | | 6/9/22 | MXN | 2,460,000 | | 127,698 | |
| United Mexican States | | 7.500% | | 6/3/27 | MXN | 1,525,000 | | 82,751 | |
| United Mexican States | | 7.750% | | 5/29/31 | MXN | 1,015,000 | | 56,429 | |
| United Mexican States | | 7.750% | | 11/23/34 | MXN | 510,000 | | 28,373 | |
| United Mexican States | | 7.750% | | 11/13/42 | MXN | 1,138,000 | | 63,001 | |
| United Mexican States | | 8.000% | | 12/7/23 | MXN | 1,212,600 | | 66,150 | |
| United Mexican States | | 8.000% | | 9/5/24 | MXN | 970,000 | | 53,253 | |
| United Mexican States | | 8.000% | | 11/7/47 | MXN | 535,000 | | 30,629 | |
| United Mexican States | | 8.500% | | 5/31/29 | MXN | 1,060,000 | | 61,567 | |
| United Mexican States | | 8.500% | | 11/18/38 | MXN | 945,000 | | 56,352 | |
| United Mexican States | | 10.000% | | 12/5/24 | MXN | 1,233,500 | | 73,437 | |
| United Mexican States | | 10.000% | | 11/20/36 | MXN | 350,000 | | 23,559 | |
| | | | | | | | | 1,075,059 | |
Total Mexico (Cost $1,179,956) | | | | | | | | 1,132,668 | |
Morocco (0.0%) | | | | | | | | | |
Sovereign Bond (0.0%) | | | | | | | | | |
| Kingdom of Morocco | | 3.500% | | 6/19/24 | EUR | 2,000 | | 2,534 | |
Total Morocco (Cost $2,666) | | | | | | | | 2,534 | |
Netherlands (2.8%) | | | | | | | | | |
Asset-Backed/Commercial Mortgage-Backed Securities (0.2%) | | | | | | | |
| ABN AMRO Bank NV | | 1.000% | | 4/13/31 | EUR | 8,000 | | 9,826 | |
| ABN AMRO Bank NV | | 1.125% | | 1/12/32 | EUR | 3,100 | | 3,862 | |
| ABN AMRO Bank NV | | 1.500% | | 9/30/30 | EUR | 24,700 | | 31,823 | |
| ABN AMRO Bank NV | | 2.375% | | 1/23/24 | EUR | 16,400 | | 20,403 | |
| ABN AMRO Bank NV | | 2.500% | | 9/5/23 | EUR | 7,000 | | 8,664 | |
| ABN AMRO Bank NV | | 3.500% | | 1/18/22 | EUR | 15,000 | | 18,170 | |
| ABN AMRO Bank NV | | 3.500% | | 9/21/22 | EUR | 1,100 | | 1,365 | |
| ABN AMRO Bank NV | | 4.250% | | 4/6/21 | EUR | 5,000 | | 5,945 | |
| Aegon Bank NV | | 0.250% | | 5/25/23 | EUR | 18,500 | | 21,007 | |
| Aegon Bank NV | | 0.750% | | 6/27/27 | EUR | 2,500 | | 2,939 | |
| Cooperatieve Rabobank UA | | 1.500% | | 4/26/38 | EUR | 4,000 | | 5,344 | |
| ING Bank NV | | 1.875% | | 5/22/23 | EUR | 17,400 | | 20,947 | |
| ING Bank NV | | 3.375% | | 1/10/22 | EUR | 11,100 | | 13,403 | |
| ING Bank NV | | 3.625% | | 8/31/21 | EUR | 8,500 | | 10,176 | |
| NIBC Bank NV | | 0.250% | | 4/22/22 | EUR | 31,235 | | 35,302 | |
1 | NIBC Bank NV | | 0.625% | | 6/1/58 | EUR | 11,600 | | 13,517 | |
| | | | | | | | | 222,693 | |
81
Total International Bond Index Fund
| | | | | | | Face | | Market | |
| | | | | Maturity | | Amount | | Value· | |
| | | Coupon | | Date | Currency | (000 | ) | ($000 | ) |
Corporate Bonds (0.8%) | | | | | | | | | |
| ABN AMRO Bank NV | | 0.500% | | 7/17/23 | EUR | 3,000 | | 3,401 | |
| ABN AMRO Bank NV | | 0.625% | | 5/31/22 | EUR | 600 | | 681 | |
| ABN AMRO Bank NV | | 0.875% | | 1/15/24 | EUR | 6,000 | | 6,905 | |
| ABN AMRO Bank NV | | 0.875% | | 1/14/26 | EUR | 1,000 | | 1,193 | |
| ABN AMRO Bank NV | | 1.125% | | 4/23/39 | EUR | 5,000 | | 6,318 | |
| ABN AMRO Bank NV | | 1.375% | | 6/7/22 | GBP | 3,200 | | 4,168 | |
| ABN AMRO Bank NV | | 1.375% | | 1/10/34 | EUR | 9,300 | | 11,984 | |
| ABN AMRO Bank NV | | 1.375% | | 1/12/37 | EUR | 21,900 | | 28,609 | |
| ABN AMRO Bank NV | | 1.450% | | 4/12/38 | EUR | 3,500 | | 4,650 | |
| ABN AMRO Bank NV | | 2.500% | | 11/29/23 | EUR | 4,100 | | 5,023 | |
| ABN AMRO Bank NV | | 4.125% | | 3/28/22 | EUR | 5,800 | | 7,116 | |
| ABN AMRO Bank NV | | 6.375% | | 4/27/21 | EUR | 4,600 | | 5,597 | |
| ABN AMRO Bank NV | | 7.125% | | 7/6/22 | EUR | 6,500 | | 8,555 | |
| Achmea BV | | 2.500% | | 11/19/20 | EUR | 2,500 | | 2,866 | |
1 | Achmea BV | | 6.000% | | 4/4/43 | EUR | 2,100 | | 2,702 | |
| Aegon Bank NV | | 0.375% | | 11/21/24 | EUR | 10,000 | | 11,455 | |
| Aegon NV | | 1.000% | | 12/8/23 | EUR | 1,100 | | 1,275 | |
1 | Aegon NV | | 4.000% | | 4/25/44 | EUR | 2,000 | | 2,467 | |
| Aegon NV | | 6.625% | | 12/16/39 | GBP | 1,000 | | 2,143 | |
| Akzo Nobel NV | | 1.125% | | 4/8/26 | EUR | 4,100 | | 4,844 | |
| Akzo Nobel NV | | 1.750% | | 11/7/24 | EUR | 3,600 | | 4,351 | |
| Argentum Netherlands BV for Givaudan SA | | 2.000% | | 9/17/30 | EUR | 900 | | 1,148 | |
1 | Argentum Netherlands BV for Swiss Life AG | | 4.375% | | 12/29/49 | EUR | 4,000 | | 5,099 | |
| ASML Holding NV | | 1.375% | | 7/7/26 | EUR | 10,800 | | 12,937 | |
| ASML Holding NV | | 1.625% | | 5/28/27 | EUR | 1,400 | | 1,720 | |
| ASML Holding NV | | 3.375% | | 9/19/23 | EUR | 1,000 | | 1,262 | |
1 | ASR Nederland NV | | 3.375% | | 5/2/49 | EUR | 6,149 | | 7,496 | |
| Cooperatieve Rabobank UA | | 0.000% | | 6/21/27 | EUR | 10,000 | | 11,249 | |
| Cooperatieve Rabobank UA | | 0.125% | | 10/11/21 | EUR | 400 | | 449 | |
| Cooperatieve Rabobank UA | | 0.500% | | 12/6/22 | EUR | 12,215 | | 13,891 | |
| Cooperatieve Rabobank UA | | 0.625% | | 2/27/24 | EUR | 10,000 | | 11,408 | |
| Cooperatieve Rabobank UA | | 0.750% | | 8/29/23 | EUR | 17,300 | | 19,797 | |
| Cooperatieve Rabobank UA | | 0.750% | | 6/21/39 | EUR | 5,000 | | 5,908 | |
| Cooperatieve Rabobank UA | | 0.875% | | 2/8/28 | EUR | 1,100 | | 1,322 | |
| Cooperatieve Rabobank UA | | 0.875% | | 2/1/29 | EUR | 10,000 | | 12,063 | |
| Cooperatieve Rabobank UA | | 1.125% | | 4/8/21 | CHF | 18,100 | | 18,783 | |
| Cooperatieve Rabobank UA | | 1.250% | | 3/23/26 | EUR | 5,800 | | 6,950 | |
| Cooperatieve Rabobank UA | | 1.250% | | 5/31/32 | EUR | 7,500 | | 9,472 | |
| Cooperatieve Rabobank UA | | 1.375% | | 2/3/27 | EUR | 4,400 | | 5,344 | |
| Cooperatieve Rabobank UA | | 2.000% | | 9/16/21 | CHF | 8,900 | | 9,447 | |
| Cooperatieve Rabobank UA | | 2.250% | | 3/23/22 | GBP | 500 | | 667 | |
| Cooperatieve Rabobank UA | | 2.375% | | 5/22/23 | EUR | 5,750 | | 6,961 | |
1 | Cooperatieve Rabobank UA | | 2.500% | | 5/26/26 | EUR | 12,100 | | 13,965 | |
| Cooperatieve Rabobank UA | | 3.125% | | 9/15/26 | CHF | 4,000 | | 4,987 | |
| Cooperatieve Rabobank UA | | 3.750% | | 11/9/20 | EUR | 14,150 | | 16,372 | |
| Cooperatieve Rabobank UA | | 3.875% | | 7/25/23 | EUR | 3,350 | | 4,235 | |
| Cooperatieve Rabobank UA | | 4.000% | | 1/11/22 | EUR | 25,800 | | 31,388 | |
| Cooperatieve Rabobank UA | | 4.000% | | 9/19/22 | GBP | 3,187 | | 4,473 | |
| Cooperatieve Rabobank UA | | 4.125% | | 1/12/21 | EUR | 6,400 | | 7,504 | |
| Cooperatieve Rabobank UA | | 4.125% | | 9/14/22 | EUR | 8,000 | | 9,936 | |
| Cooperatieve Rabobank UA | | 4.125% | | 7/14/25 | EUR | 20,000 | | 27,499 | |
| Cooperatieve Rabobank UA | | 4.250% | | 5/12/26 | AUD | 800 | | 621 | |
| Cooperatieve Rabobank UA | | 4.375% | | 6/7/21 | EUR | 100 | | 120 | |
82
Total International Bond Index Fund
| | | | | | | Face | | Market | |
| | | | | Maturity | | Amount | | Value· | |
| | | Coupon | | Date | Currency | (000 | ) | ($000 | ) |
| Cooperatieve Rabobank UA | | 4.550% | | 8/30/29 | GBP | 6,108 | | 10,220 | |
| Cooperatieve Rabobank UA | | 4.625% | | 1/13/21 | GBP | 1,000 | | 1,349 | |
| Cooperatieve Rabobank UA | | 4.625% | | 5/23/29 | GBP | 9,500 | | 14,659 | |
| Cooperatieve Rabobank UA | | 4.750% | | 6/6/22 | EUR | 5,600 | | 7,039 | |
| Cooperatieve Rabobank UA | | 5.250% | | 9/14/27 | GBP | 12,612 | | 19,807 | |
| Cooperatieve Rabobank UA | | 5.250% | | 5/23/41 | GBP | 800 | | 1,672 | |
1 | Delta Lloyd Levensverzekering NV | | 9.000% | | 8/29/42 | EUR | 18,634 | | 25,820 | |
1 | ELM BV for Helvetia Schweizerische Versicherungsgesellschaft AG | | 3.375% | | 9/29/47 | EUR | 6,000 | | 7,464 | |
1 | ELM BV for Swiss Reinsurance Co. Ltd. | | 2.600% | | 12/29/49 | EUR | 19,150 | | 23,028 | |
| EXOR NV | | 1.750% | | 1/18/28 | EUR | 5,300 | | 6,221 | |
| EXOR NV | | 2.500% | | 10/8/24 | EUR | 10,000 | | 12,239 | |
| Heineken NV | | 1.375% | | 1/29/27 | EUR | 10,100 | | 12,153 | |
| Heineken NV | | 1.500% | | 12/7/24 | EUR | 5,100 | | 6,086 | |
| Heineken NV | | 1.500% | | 10/3/29 | EUR | 500 | | 614 | |
| Heineken NV | | 2.000% | | 4/6/21 | EUR | 1,000 | | 1,150 | |
| Heineken NV | | 2.875% | | 8/4/25 | EUR | 5,900 | | 7,633 | |
| ING Bank NV | | 0.375% | | 11/26/21 | EUR | 8,000 | | 9,019 | |
| ING Bank NV | | 0.750% | | 11/24/20 | EUR | 2,600 | | 2,929 | |
| ING Bank NV | | 0.750% | | 2/22/21 | EUR | 11,400 | | 12,872 | |
| ING Bank NV | | 0.750% | | 2/18/29 | EUR | 10,000 | | 11,918 | |
| ING Bank NV | | 0.875% | | 4/11/28 | EUR | 15,600 | | 18,751 | |
1 | ING Bank NV | | 3.625% | | 2/25/26 | EUR | 9,200 | | 10,721 | |
| ING Bank NV | | 4.500% | | 2/21/22 | EUR | 13,200 | | 16,290 | |
| ING Bank NV | | 4.875% | | 1/18/21 | EUR | 1,300 | | 1,539 | |
| ING Bank NV | | 5.375% | | 4/15/21 | GBP | 3,000 | | 4,123 | |
| ING Groep NV | | 0.750% | | 3/9/22 | EUR | 36,300 | | 41,171 | |
| ING Groep NV | | 1.000% | | 9/20/23 | EUR | 6,100 | | 7,025 | |
| ING Groep NV | | 1.125% | | 2/14/25 | EUR | 14,400 | | 16,748 | |
| ING Groep NV | | 1.375% | | 1/11/28 | EUR | 300 | | 360 | |
1 | ING Groep NV | | 1.625% | | 9/26/29 | EUR | 26,700 | | 30,854 | |
| ING Groep NV | | 2.000% | | 9/20/28 | EUR | 16,700 | | 20,946 | |
| ING Groep NV | | 2.125% | | 1/10/26 | EUR | 15,000 | | 18,531 | |
1 | ING Groep NV | | 2.500% | | 2/15/29 | EUR | 10,000 | | 11,985 | |
| ING Groep NV | | 3.000% | | 2/18/26 | GBP | 11,000 | | 15,238 | |
| JAB Holdings BV | | 1.750% | | 5/25/23 | EUR | 4,500 | | 5,311 | |
| Koninklijke Ahold Delhaize NV | | 1.125% | | 3/19/26 | EUR | 100 | | 117 | |
| Koninklijke DSM NV | | 0.750% | | 9/28/26 | EUR | 100 | | 115 | |
| Koninklijke DSM NV | | 1.000% | | 4/9/25 | EUR | 3,200 | | 3,731 | |
| Koninklijke DSM NV | | 2.375% | | 4/3/24 | EUR | 1,700 | | 2,078 | |
| Koninklijke KPN NV | | 0.625% | | 4/9/25 | EUR | 10,000 | | 11,322 | |
| Koninklijke KPN NV | | 3.250% | | 2/1/21 | EUR | 5,630 | | 6,541 | |
| Koninklijke KPN NV | | 4.250% | | 3/1/22 | EUR | 100 | | 123 | |
| Koninklijke KPN NV | | 5.000% | | 11/18/26 | GBP | 3,660 | | 5,512 | |
| Koninklijke KPN NV | | 5.750% | | 9/17/29 | GBP | 3,115 | | 4,889 | |
| Koninklijke Philips NV | | 0.500% | | 5/22/26 | EUR | 100 | | 114 | |
| Koninklijke Philips NV | | 1.375% | | 5/2/28 | EUR | 7,700 | | 9,309 | |
| LeasePlan Corp. NV | | 0.750% | | 10/3/22 | EUR | 1,575 | | 1,782 | |
| Nationale-Nederlanden Bank NV | | 0.500% | | 10/10/24 | EUR | 800 | | 920 | |
| Nationale-Nederlanden Bank NV | | 0.625% | | 9/11/25 | EUR | 7,700 | | 8,926 | |
| NIBC Bank NV | | 0.500% | | 3/19/27 | EUR | 15,300 | | 17,639 | |
| NIBC Bank NV | | 0.875% | | 7/8/25 | EUR | 10,000 | | 11,261 | |
| NIBC Bank NV | | 1.000% | | 9/11/28 | EUR | 5,000 | | 5,989 | |
| NIBC Bank NV | | 1.125% | | 4/19/23 | EUR | 17,300 | | 19,841 | |
83
Total International Bond Index Fund
| | | | | | | Face | | Market | |
| | | | | Maturity | | Amount | | Value· | |
| | | Coupon | | Date | Currency | (000 | ) | ($000 | ) |
| NIBC Bank NV | | 1.500% | | 1/31/22 | EUR | 17,954 | | 20,638 | |
| NN Group NV | | 0.875% | | 1/13/23 | EUR | 500 | | 572 | |
| NN Group NV | | 1.000% | | 3/18/22 | EUR | 10,000 | | 11,432 | |
| NN Group NV | | 1.625% | | 6/1/27 | EUR | 330 | | 401 | |
1 | NN Group NV | | 4.375% | | 12/31/49 | EUR | 2,000 | | 2,454 | |
1 | NN Group NV | | 4.500% | | 7/15/49 | EUR | 5,500 | | 6,865 | |
1 | NN Group NV | | 4.625% | | 4/8/44 | EUR | 9,100 | | 11,478 | |
1 | NN Group NV | | 4.625% | | 1/13/48 | EUR | 7,400 | | 9,645 | |
| PostNL NV | | 1.000% | | 11/21/24 | EUR | 1,900 | | 2,183 | |
| Robert Bosch Investment Nederland BV | | 1.625% | | 5/24/21 | EUR | 800 | | 917 | |
| Robert Bosch Investment Nederland BV | | 2.625% | | 5/24/28 | EUR | 1,000 | | 1,335 | |
| Shell International Finance BV | | 0.375% | | 2/15/25 | EUR | 23,600 | | 26,935 | |
| Shell International Finance BV | | 0.750% | | 8/15/28 | EUR | 5,000 | | 5,819 | |
| Shell International Finance BV | | 1.000% | | 4/6/22 | EUR | 200 | | 230 | |
| Shell International Finance BV | | 1.250% | | 3/15/22 | EUR | 400 | | 462 | |
| Shell International Finance BV | | 1.250% | | 5/12/28 | EUR | 600 | | 728 | |
| Shell International Finance BV | | 1.625% | | 3/24/21 | EUR | 10,000 | | 11,443 | |
| Shell International Finance BV | | 1.625% | | 1/20/27 | EUR | 24,431 | | 30,261 | |
| Unilever NV | | 0.375% | | 2/14/23 | EUR | 1,100 | | 1,250 | |
| Unilever NV | | 1.125% | | 2/12/ 27 | EUR | 10,100 | | 12,139 | |
| Unilever NV | | 1.375% | | 7/31/29 | EUR | 5,300 | | 6,555 | |
| Unilever NV | | 1.375% | | 9/4/30 | EUR | 1,300 | | 1,604 | |
| Unilever plc | | 1.500% | | 7/22/26 | GBP | 200 | | 263 | |
| Vesteda Finance BV | | 1.500% | | 5/24/27 | EUR | 4,000 | | 4,718 | |
| Wolters Kluwer NV | | 2.875% | | 3/21/23 | EUR | 5,000 | | 6,118 | |
| | | | | | | | | 1,110,915 | |
Sovereign Bonds (1.8%) | | | | | | | | | |
| Alliander NV | | 2.875% | | 6/14/24 | EUR | 500 | | 632 | |
| BNG Bank NV | | 0.050% | | 7/13/24 | EUR | 25,000 | | 28,405 | |
| BNG Bank NV | | 0.125% | | 4/11/26 | EUR | 5,000 | | 5,705 | |
| BNG Bank NV | | 0.200% | | 11/9/24 | EUR | 20,000 | | 22,889 | |
| BNG Bank NV | | 0.250% | | 6/7/24 | EUR | 6,000 | | 6,881 | |
| BNG Bank NV | | 0.250% | | 5/7/25 | EUR | 17,000 | | 19,502 | |
| BNG Bank NV | | 0.375% | | 1/14/22 | EUR | 5,000 | | 5,677 | |
| BNG Bank NV | | 0.500% | | 8/26/22 | EUR | 37,000 | | 42,378 | |
| BNG Bank NV | | 0.500% | | 4/16/25 | EUR | 10,500 | | 12,201 | |
| BNG Bank NV | | 0.625% | | 6/19/27 | EUR | 22,800 | | 26,912 | |
| BNG Bank NV | | 0.750% | | 1/24/29 | EUR | 5,000 | | 5,988 | |
| BNG Bank NV | | 0.875% | | 10/17/35 | EUR | 5,000 | | 6,056 | |
| BNG Bank NV | | 1.000% | | 1/12/26 | EUR | 5,000 | | 6,001 | |
| BNG Bank NV | | 1.125% | | 5/24/21 | GBP | 1,900 | | 2,470 | |
| BNG Bank NV | | 1.125% | | 9/4/24 | EUR | 1,400 | | 1,672 | |
| BNG Bank NV | | 1.375% | | 10/21/30 | EUR | 6,000 | | 7,622 | |
| BNG Bank NV | | 1.500% | | 3/29/38 | EUR | 3,000 | | 3,991 | |
| BNG Bank NV | | 1.500% | | 7/15/39 | EUR | 4,000 | | 5,327 | |
| BNG Bank NV | | 1.625% | | 8/26/25 | GBP | 500 | | 673 | |
| BNG Bank NV | | 1.875% | | 1/14/21 | EUR | 12,000 | | 13,759 | |
| BNG Bank NV | | 2.250% | | 8/30/22 | EUR | 5,000 | | 6,001 | |
| BNG Bank NV | | 3.250% | | 7/15/25 | AUD | 15,000 | | 11,352 | |
| BNG Bank NV | | 3.250% | | 8/24/26 | AUD | 500 | | 382 | |
| BNG Bank NV | | 3.300% | | 7/17/28 | AUD | 16,500 | | 12,840 | |
| BNG Bank NV | | 3.500% | | 7/19/27 | AUD | 1,700 | | 1,331 | |
| BNG Bank NV | | 3.875% | | 5/26/23 | EUR | 28,000 | | 36,033 | |
| BNG Bank NV | | 4.750% | | 3/6/23 | AUD | 18,000 | | 13,811 | |
84
Total International Bond Index Fund
| | | | | | | Face | | Market | |
| | | | | Maturity | | Amount | | Value· | |
| | | Coupon | | Date | Currency | (000 | ) | ($000 | ) |
| BNG Bank NV | | 5.200% | | 12/7/28 | GBP | 3,200 | | 5,636 | |
| BNG Bank NV | | 5.250% | | 5/20/24 | AUD | 7,000 | | 5,643 | |
1 | Eneco Holding NV | | 3.250% | | 12/29/49 | EUR | 3,600 | | 4,237 | |
| Enexis Holding NV | | 1.875% | | 11/13/20 | EUR | 1,500 | | 1,709 | |
2 | Kingdom of Netherlands | | 0.000% | | 1/15/22 | EUR | 115,550 | | 130,715 | |
2 | Kingdom of Netherlands | | 0.000% | | 1/15/24 | EUR | 151,500 | | 173,183 | |
2 | Kingdom of Netherlands | | 0.250% | | 7/15/25 | EUR | 111,220 | | 129,474 | |
2 | Kingdom of Netherlands | | 0.250% | | 7/15/29 | EUR | 58,500 | | 68,569 | |
2 | Kingdom of Netherlands | | 0.500% | | 7/15/26 | EUR | 74,650 | | 88,663 | |
2 | Kingdom of Netherlands | | 0.500% | | 1/15/40 | EUR | 108,751 | | 131,261 | |
2 | Kingdom of Netherlands | | 0.750% | | 7/15/27 | EUR | 71,550 | | 86,833 | |
2 | Kingdom of Netherlands | | 0.750% | | 7/15/28 | EUR | 100,582 | | 122,941 | |
2 | Kingdom of Netherlands | | 1.750% | | 7/15/23 | EUR | 147,650 | | 179,434 | |
2 | Kingdom of Netherlands | | 2.000% | | 7/15/24 | EUR | 72,500 | | 90,760 | |
2 | Kingdom of Netherlands | | 2.250% | | 7/15/22 | EUR | 57,850 | | 69,676 | |
2 | Kingdom of Netherlands | | 2.500% | | 1/15/33 | EUR | 65,500 | | 98,647 | |
2 | Kingdom of Netherlands | | 2.750% | | 1/15/47 | EUR | 69,707 | | 132,223 | |
2 | Kingdom of Netherlands | | 3.250% | | 7/15/21 | EUR | 64,470 | | 76,691 | |
| Kingdom of Netherlands | | 3.750% | | 1/15/23 | EUR | 10,280 | | 13,109 | |
2 | Kingdom of Netherlands | | 3.750% | | 1/15/42 | EUR | 88,870 | | 179,928 | |
2 | Kingdom of Netherlands | | 4.000% | | 1/15/37 | EUR | 76,410 | | 144,308 | |
| Kingdom of Netherlands | | 5.500% | | 1/15/28 | EUR | 45,780 | | 76,035 | |
| Nederlandse Financierings Maatschappij voor Ontwikkelingslanden NV | | 0.125% | | 11/4/20 | EUR | 518 | | 581 | |
| Nederlandse Financierings Maatschappij voor Ontwikkelingslanden NV | | 0.125% | | 4/20/22 | EUR | 6,347 | | 7,189 | |
| Nederlandse Gasunie NV | | 1.000% | | 5/11/26 | EUR | 6,714 | | 7,943 | |
| Nederlandse Gasunie NV | | 2.625% | | 7/13/22 | EUR | 1,500 | | 1,797 | |
| Nederlandse Gasunie NV | | 3.625% | | 10/13/21 | EUR | 3,500 | | 4,189 | |
| Nederlandse Waterschapsbank NV | | 0.125% | | 1/17/24 | EUR | 5,000 | | 5,700 | |
| Nederlandse Waterschapsbank NV | | 0.500% | | 10/27/22 | EUR | 11,600 | | 13,299 | |
| Nederlandse Waterschapsbank NV | | 0.500% | | 4/29/30 | EUR | 5,500 | | 6,410 | |
| Nederlandse Waterschapsbank NV | | 0.750% | | 10/4/41 | EUR | 42,300 | | 49,630 | |
| Nederlandse Waterschapsbank NV | | 0.875% | | 12/20/21 | GBP | 2,000 | | 2,590 | |
| Nederlandse Waterschapsbank NV | | 1.000% | | 3/1/28 | EUR | 6,000 | | 7,313 | |
| Nederlandse Waterschapsbank NV | | 1.250% | | 5/27/36 | EUR | 18,200 | | 23,168 | |
| Nederlandse Waterschapsbank NV | | 1.500% | | 6/15/39 | EUR | 5,000 | | 6,650 | |
| Nederlandse Waterschapsbank NV | | 2.375% | | 1/27/23 | CHF | 3,000 | | 3,332 | |
| Nederlandse Waterschapsbank NV | | 3.000% | | 3/28/22 | EUR | 2,000 | | 2,415 | |
| Nederlandse Waterschapsbank NV | | 3.000% | | 9/11/31 | EUR | 6,000 | | 8,920 | |
| Nederlandse Waterschapsbank NV | | 3.150% | | 9/2/26 | AUD | 8,980 | | 6,793 | |
| Nederlandse Waterschapsbank NV | | 3.250% | | 3/9/27 | EUR | 10,000 | | 13,980 | |
| Nederlandse Waterschapsbank NV | | 3.400% | | 7/22/25 | AUD | 3,500 | | 2,664 | |
| Nederlandse Waterschapsbank NV | | 3.450% | | 7/17/28 | AUD | 3,700 | | 2,900 | |
| Nederlandse Waterschapsbank NV | | 3.500% | | 1/14/21 | EUR | 5,000 | | 5,842 | |
| Nederlandse Waterschapsbank NV | | 5.200% | | 3/31/25 | CAD | 1,400 | | 1,232 | |
| Nederlandse Waterschapsbank NV | | 5.250% | | 4/18/24 | AUD | 3,460 | | 2,784 | |
| Nederlandse Waterschapsbank NV | | 5.375% | | 6/7/32 | GBP | 10,000 | | 19,204 | |
| Stedin Holding NV | | 0.875% | | 10/24/25 | EUR | 14,200 | | 16,450 | |
| TenneT Holding BV | | 1.000% | | 6/13/26 | EUR | 200 | | 235 | |
| TenneT Holding BV | | 1.250% | | 10/24/33 | EUR | 100 | | 120 | |
| TenneT Holding BV | | 1.375% | | 6/26/29 | EUR | 30,523 | | 37,260 | |
| TenneT Holding BV | | 1.500% | | 6/3/39 | EUR | 11,130 | | 13,607 | |
85
Total International Bond Index Fund
| | | | | | | Face | | Market | |
| | | | | Maturity | | Amount | | Value· | |
| | | Coupon | | Date | Currency | (000 | ) | ($000 | ) |
| TenneT Holding BV | | 2.125% | | 11/1/20 | EUR | 3,900 | | 4,446 | |
| TenneT Holding BV | | 4.500% | | 2/9/22 | EUR | 1,500 | | 1,849 | |
| | | | | | | | | 2,596,658 | |
Total Netherlands (Cost $3,794,488) | | | | | | | | 3,930,266 | |
New Zealand (0.2%) | | | | | | | | | |
Asset-Backed/Commercial Mortgage-Backed Securities (0.0%) | | | | | | | |
| ANZ New Zealand International Ltd. | | 0.625% | | 1/27/22 | EUR | 5,000 | | 5,690 | |
| ASB Finance Ltd. | | 0.625% | | 10/18/24 | EUR | 3,625 | | 4,189 | |
| ASB Finance Ltd. | | 0.750% | | 10/9/25 | EUR | 5,000 | | 5,830 | |
| BNZ International Funding Ltd. | | 0.625% | | 7/3/25 | EUR | 15,000 | | 17,374 | |
| | | | | | | | | 33,083 | |
Corporate Bonds (0.0%) | | | | | | | | | |
| ANZ New Zealand International Ltd. | | 0.625% | | 6/1/21 | EUR | 1,200 | | 1,354 | |
| ASB Finance Ltd. | | 0.500% | | 6/10/22 | EUR | 20,886 | | 23,652 | |
| BNZ International Funding Ltd. | | 0.125% | | 6/17/21 | EUR | 1,000 | | 1,123 | |
| BNZ International Funding Ltd. | | 0.500% | | 5/13/23 | EUR | 5,100 | | 5,783 | |
| Fonterra Co-operative Group Ltd. | | 0.750% | | 11/8/24 | EUR | 1,520 | | 1,731 | |
| Fonterra Co-operative Group Ltd. | | 4.000% | | 11/2/27 | AUD | 300 | | 233 | |
| Fonterra Co-operative Group Ltd. | | 4.500% | | 6/30/21 | AUD | 2,200 | | 1,592 | |
| Fonterra Co-operative Group Ltd. | | 9.375% | | 12/4/23 | GBP | 1,200 | | 2,052 | |
| | | | | | | | | 37,520 | |
Sovereign Bonds (0.2%) | | | | | | | | | |
| Auckland Council | | 0.625% | | 11/13/24 | EUR | 10,000 | | 11,579 | |
| Auckland Council | | 3.500% | | 3/9/26 | AUD | 500 | | 382 | |
| Housing New Zealand Ltd. | | 2.247% | | 10/5/26 | NZD | 1,550 | | 1,038 | |
| New Zealand | | 1.500% | | 5/15/31 | NZD | 20,000 | | 12,908 | |
| New Zealand | | 2.750% | | 4/15/25 | NZD | 60,000 | | 42,021 | |
| New Zealand | | 2.750% | | 4/15/37 | NZD | 37,635 | | 28,094 | |
| New Zealand | | 3.000% | | 4/15/20 | NZD | 42,300 | | 27,382 | |
| New Zealand | | 3.000% | | 4/20/29 | NZD | 70,000 | | 51,697 | |
| New Zealand | | 3.500% | | 4/14/33 | NZD | 25,000 | | 19,928 | |
| New Zealand | | 4.500% | | 4/15/27 | NZD | 46,000 | | 36,506 | |
| New Zealand | | 5.500% | | 4/15/23 | NZD | 25,000 | | 18,531 | |
| New Zealand | | 6.000% | | 5/15/21 | NZD | 27,500 | | 19,001 | |
| New Zealand Local Government Funding Agency Ltd. | | 4.500% | | 4/15/27 | NZD | 2,000 | | 1,532 | |
| New Zealand Local Government Funding Agency Ltd. | | 5.500% | | 4/15/23 | NZD | 5,000 | | 3,657 | |
| New Zealand Local Government Funding Agency Ltd. | | 6.000% | | 5/15/21 | NZD | 4,000 | | 2,751 | |
| Transpower New Zealand Ltd. | | 5.750% | | 8/28/23 | AUD | 320 | | 256 | |
| | | | | | | | | 277,263 | |
Total New Zealand (Cost $349,403) | | | | | | | | 347,866 | |
Norway (0.6%) | | | | | | | | | |
Asset-Backed/Commercial Mortgage-Backed Securities (0.2%) | | | | | | |
| DNB Boligkreditt AS | | 0.250% | | 4/18/23 | EUR | 2,000 | | 2,272 | |
| DNB Boligkreditt AS | | 0.250% | | 9/7/26 | EUR | 20,100 | | 22,965 | |
| DNB Boligkreditt AS | | 0.375% | | 1/14/21 | EUR | 7,000 | | 7,877 | |
| DNB Boligkreditt AS | | 0.375% | | 11/20/24 | EUR | 20,000 | | 22,985 | |
| DNB Boligkreditt AS | | 0.625% | | 6/19/25 | EUR | 100 | | 117 | |
| DNB Boligkreditt AS | | 1.875% | | 11/21/22 | EUR | 13,000 | | 15,474 | |
86
Total International Bond Index Fund
| | | | | | | Face | | Market | |
| | | | | Maturity | | Amount | | Value· | |
| | | Coupon | | Date | Currency | (000 | ) | ($000 | ) |
| DNB Boligkreditt AS | | 2.750% | | 3/21/22 | EUR | 17,500 | | 20,960 | |
| DNB Boligkreditt AS | | 3.875% | | 6/16/21 | EUR | 19,400 | | 23,120 | |
| DNB Boligkreditt AS | | 5.000% | | 5/25/21 | NOK | 20,500 | | 2,331 | |
| Eika Boligkreditt AS | | 0.375% | | 4/20/23 | EUR | 100 | | 114 | |
| Eika Boligkreditt AS | | 0.375% | | 2/26/25 | EUR | 1,600 | | 1,837 | |
| Eika Boligkreditt AS | | 1.500% | | 3/12/21 | EUR | 10,000 | | 11,436 | |
| Eika Boligkreditt AS | | 2.125% | | 1/30/23 | EUR | 12,000 | | 14,447 | |
| SpareBank 1 Boligkreditt AS | | 0.050% | | 1/25/22 | EUR | 15,000 | | 16,874 | |
| SpareBank 1 Boligkreditt AS | | 0.750% | | 9/5/22 | EUR | 10,000 | | 11,492 | |
| SpareBank 1 Boligkreditt AS | | 3.375% | | 9/7/21 | EUR | 10,000 | | 11,918 | |
| Sparebanken Vest Boligkreditt AS | | 0.500% | | 2/12/26 | EUR | 19,900 | | 23,067 | |
| Sparebanken Vest Boligkreditt AS | | 0.750% | | 2/27/25 | EUR | 10,000 | | 11,704 | |
| SR-Boligkreditt AS | | 0.125% | | 9/8/21 | EUR | 2,500 | | 2,812 | |
| SR-Boligkreditt AS | | 0.750% | | 1/18/23 | EUR | 10,000 | | 11,526 | |
| | | | | | | | | 235,328 | |
Corporate Bonds (0.1%) | | | | | | | | | |
| DNB Bank ASA | | 0.600% | | 9/25/23 | EUR | 6,000 | | 6,857 | |
1 | DNB Bank ASA | | 1.125% | | 3/20/28 | EUR | 9,300 | | 10,613 | |
| DNB Bank ASA | | 4.250% | | 1/18/22 | EUR | 300 | | 367 | |
| DNB Bank ASA | | 4.375% | | 2/24/21 | EUR | 3,000 | | 3,548 | |
| Norsk Hydro ASA | | 1.125% | | 4/11/25 | EUR | 1,200 | | 1,367 | |
| Norsk Hydro ASA | | 2.000% | | 4/11/29 | EUR | 200 | | 234 | |
| Santander Consumer Bank AS | | 0.750% | | 3/1/23 | EUR | 27,800 | | 31,657 | |
| Santander Consumer Bank AS | | 0.875% | | 1/21/22 | EUR | 500 | | 568 | |
| SpareBank 1 Boligkreditt AS | | 0.125% | | 5/14/26 | EUR | 10,000 | | 11,342 | |
| SpareBank 1 Boligkreditt AS | | 0.250% | | 8/30/26 | EUR | 2,000 | | 2,286 | |
| SpareBank 1 Boligkreditt AS | | 0.375% | | 3/9/23 | EUR | 11,750 | | 13,400 | |
| SpareBank 1 Boligkreditt AS | | 1.000% | | 1/30/29 | EUR | 10,000 | | 12,123 | |
| Sparebank 1 Oestlandet | | 0.875% | | 3/13/23 | EUR | 100 | | 115 | |
| SpareBank 1 SMN | | 0.500% | | 3/9/22 | EUR | 3,100 | | 3,506 | |
| SpareBank 1 SMN | | 0.750% | | 6/8/21 | EUR | 19,494 | | 22,049 | |
| SpareBank 1 SMN | | 0.750% | | 7/3/23 | EUR | 2,700 | | 3,088 | |
| SpareBank 1 SR-Bank ASA | | 0.375% | | 2/10/22 | EUR | 8,470 | | 9,532 | |
| SpareBank 1 SR-Bank ASA | | 2.125% | | 4/14/21 | EUR | 10,100 | | 11,641 | |
| SR-Boligkreditt AS | | 0.375% | | 10/3/24 | EUR | 1,600 | | 1,836 | |
1 | Storebrand Livsforsikring AS | | 6.875% | | 4/4/43 | EUR | 100 | | 130 | |
| | | | | | | | | 146,259 | |
Sovereign Bonds (0.3%) | | | | | | | | | |
| Avinor AS | | 1.000% | | 4/29/25 | EUR | 100 | | 117 | |
| Equinor ASA | | 1.250% | | 2/17/27 | EUR | 18,600 | | 22,267 | |
| Equinor ASA | | 1.625% | | 2/17/35 | EUR | 5,100 | | 6,494 | |
| Equinor ASA | | 1.625% | | 11/9/36 | EUR | 2,000 | | 2,571 | |
| Equinor ASA | | 2.875% | | 9/10/25 | EUR | 11,400 | | 14,794 | |
| Equinor ASA | | 5.625% | | 3/11/21 | EUR | 22,700 | | 27,295 | |
| Equinor ASA | | 6.125% | | 11/27/28 | GBP | 200 | | 362 | |
| Equinor ASA | | 6.875% | | 3/11/31 | GBP | 7,150 | | 14,413 | |
2 | Kingdom of Norway | | 1.500% | | 2/19/26 | NOK | 130,000 | | 14,323 | |
2 | Kingdom of Norway | | 1.750% | | 3/13/25 | NOK | 175,000 | | 19,513 | |
2 | Kingdom of Norway | | 1.750% | | 2/17/27 | NOK | 153,000 | | 17,152 | |
2 | Kingdom of Norway | | 1.750% | | 9/6/29 | NOK | 356,904 | | 40,214 | |
2 | Kingdom of Norway | | 2.000% | | 5/24/23 | NOK | 392,915 | | 43,841 | |
2 | Kingdom of Norway | | 2.000% | | 4/26/28 | NOK | 200,000 | | 22,916 | |
2 | Kingdom of Norway | | 3.000% | | 3/14/24 | NOK | 567,600 | | 66,351 | |
2 | Kingdom of Norway | | 3.750% | | 5/25/21 | NOK | 231,275 | | 26,109 | |
87
Total International Bond Index Fund
| | | | | | | Face | | Market | |
| | | | | Maturity | | Amount | | Value· | |
| | | Coupon | | Date | Currency | (000 | ) | ($000 | ) |
| Kommunalbanken AS | | 0.875% | | 5/24/27 | EUR | 29,700 | | 35,532 | |
| Kommunalbanken AS | | 1.500% | | 12/15/23 | GBP | 15,000 | | 19,940 | |
| Kommunalbanken AS | | 2.700% | | 9/5/23 | AUD | 800 | | 579 | |
| Kommunalbanken AS | | 3.000% | | 12/9/26 | AUD | 8,900 | | 6,747 | |
| Kommunalbanken AS | | 3.400% | | 7/24/28 | AUD | 1,500 | | 1,176 | |
| Kommunalbanken AS | | 4.250% | | 7/16/25 | AUD | 3,400 | | 2,705 | |
| Kommunalbanken AS | | 4.500% | | 7/18/22 | AUD | 3,700 | | 2,771 | |
| Kommunalbanken AS | | 4.500% | | 4/17/23 | AUD | 7,948 | | 6,076 | |
| Kommunalbanken AS | | 5.250% | | 7/15/24 | AUD | 6,270 | | 5,084 | |
| Kommunalbanken AS | | 6.500% | | 4/12/21 | AUD | 6,400 | | 4,744 | |
| Statkraft AS | | 1.125% | | 3/20/25 | EUR | 15,000 | | 17,532 | |
| Statkraft AS | | 1.500% | | 3/26/30 | EUR | 2,710 | | 3,302 | |
| Statkraft AS | | 2.500% | | 11/28/22 | EUR | 2,500 | | 3,004 | |
| Statnett SF | | 0.875% | | 3/8/25 | EUR | 5,000 | | 5,787 | |
| Telenor ASA | | 0.750% | | 5/31/26 | EUR | 16,200 | | 18,675 | |
| Telenor ASA | | 1.125% | | 5/31/29 | EUR | 16,150 | | 19,121 | |
| Telenor ASA | | 2.500% | | 5/22/25 | EUR | 2,400 | | 3,026 | |
| Telenor ASA | | 2.750% | | 6/27/22 | EUR | 5,000 | | 5,998 | |
| | | | | | | | | 500,531 | |
Total Norway (Cost $914,741) | | | | | | | | 882,118 | |
Peru (0.0%) | | | | | | | | | |
Sovereign Bonds (0.0%) | | | | | | | | | |
| Republic of Peru | | 2.750% | | 1/30/26 | EUR | 14,000 | | 17,951 | |
| Republic of Peru | | 3.750% | | 3/1/30 | EUR | 8,000 | | 11,623 | |
Total Peru (Cost $29,014) | | | | | | | | 29,574 | |
Philippines (0.0%) | | | | | | | | | |
Sovereign Bond (0.0%) | | | | | | | | | |
| Republic of the Philippines | | 0.875% | | 5/17/27 | EUR | 7,860 | | 9,004 | |
Total Philippines (Cost $8,866) | | | | | | | | 9,004 | |
Poland (0.6%) | | | | | | | | | |
Corporate Bonds (0.0%) | | | | | | | | | |
| ORLEN Capital AB | | 2.500% | | 6/30/21 | EUR | 100 | | 116 | |
| ORLEN Capital AB | | 2.500% | | 6/7/23 | EUR | 5,700 | | 6,823 | |
| | | | | | | | | 6,939 | |
Sovereign Bonds (0.6%) | | | | | | | | | |
12 | Bank Gospodarstwa Krajowego | | 1.375% | | 6/1/25 | EUR | 5,185 | | 6,198 | |
12 | Bank Gospodarstwa Krajowego | | 1.625% | | 4/30/28 | EUR | 5,130 | | 6,370 | |
12 | Bank Gospodarstwa Krajowego | | 1.750% | | 5/6/26 | EUR | 4,000 | | 4,919 | |
12 | Bank Gospodarstwa Krajowego | | 2.000% | | 6/1/30 | EUR | 900 | | 1,174 | |
| Republic of Poland | | 0.875% | | 5/10/27 | EUR | 13,900 | | 16,536 | |
| Republic of Poland | | 1.000% | | 10/25/28 | EUR | 2,900 | | 3,510 | |
| Republic of Poland | | 1.125% | | 8/7/26 | EUR | 3,500 | | 4,206 | |
| Republic of Poland | | 1.375% | | 10/22/27 | EUR | 4,050 | | 4,999 | |
| Republic of Poland | | 1.500% | | 9/9/25 | EUR | 5,000 | | 6,087 | |
| Republic of Poland | | 1.500% | | 1/19/26 | EUR | 40,800 | | 49,937 | |
| Republic of Poland | | 1.750% | | 7/25/21 | PLN | 139,500 | | 36,717 | |
| Republic of Poland | | 2.000% | | 4/25/21 | PLN | 104,500 | | 27,609 | |
| Republic of Poland | | 2.000% | | 10/25/46 | EUR | 300 | | 414 | |
| Republic of Poland | | 2.250% | | 4/25/22 | PLN | 353,000 | | 94,005 | |
| Republic of Poland | | 2.375% | | 1/18/36 | EUR | 13,313 | | 18,527 | |
| Republic of Poland | | 2.500% | | 1/25/23 | PLN | 144,000 | | 38,778 | |
| Republic of Poland | | 2.500% | | 4/25/24 | PLN | 109,940 | | 29,771 | |
88
Total International Bond Index Fund
| | | | | | | Face | | Market | |
| | | | | Maturity | | Amount | | Value· | |
| | | Coupon | | Date | Currency | (000 | ) | ($000 | ) |
| Republic of Poland | | 2.500% | | 7/25/26 | PLN | 257,000 | | 69,858 | |
| Republic of Poland | | 2.500% | | 7/25/27 | PLN | 155,000 | | 42,219 | |
| Republic of Poland | | 2.750% | | 4/25/28 | PLN | 263,290 | | 73,095 | |
| Republic of Poland | | 2.750% | | 10/25/29 | PLN | 78,020 | | 21,837 | |
| Republic of Poland | | 3.000% | | 1/15/24 | EUR | 400 | | 506 | |
| Republic of Poland | | 3.250% | | 7/25/25 | PLN | 131,000 | | 36,962 | |
| Republic of Poland | | 3.375% | | 7/9/24 | EUR | 6,000 | | 7,792 | |
| Republic of Poland | | 3.750% | | 1/19/23 | EUR | 4,600 | | 5,784 | |
| Republic of Poland | | 4.000% | | 3/23/21 | EUR | 2,000 | | 2,361 | |
| Republic of Poland | | 4.000% | | 10/25/23 | PLN | 209,375 | | 59,703 | |
| Republic of Poland | | 4.000% | | 4/25/47 | PLN | 31,954 | | 10,789 | |
| Republic of Poland | | 4.500% | | 1/18/22 | EUR | 6,500 | | 8,004 | |
| Republic of Poland | | 5.250% | | 10/25/20 | PLN | 51,400 | | 14,023 | |
| Republic of Poland | | 5.250% | | 1/20/25 | EUR | 7,400 | | 10,573 | |
| Republic of Poland | | 5.750% | | 10/25/21 | PLN | 126,100 | | 35,750 | |
| Republic of Poland | | 5.750% | | 9/23/22 | PLN | 42,500 | | 12,433 | |
| Republic of Poland | | 5.750% | | 4/25/29 | PLN | 25,850 | | 9,091 | |
| | | | | | | | | 770,537 | |
Total Poland (Cost $750,020) | | | | | | | | 777,476 | |
Portugal (0.8%) | | | | | | | | | |
Asset-Backed/Commercial Mortgage-Backed Securities (0.0%) | | | | | |
| Banco Santander Totta SA | | 1.250% | | 9/26/27 | EUR | 9,200 | | 11,153 | |
| Caixa Geral de Depositos SA | | 1.000% | | 1/27/22 | EUR | 4,900 | | 5,608 | |
| | | | | | | | | 16,761 | |
Corporate Bonds (0.1%) | | | | | | | | | |
| Banco Comercial Portugues SA | | 0.750% | | 5/31/22 | EUR | 700 | | 797 | |
| Banco Santander Totta SA | | 0.875% | | 4/25/24 | EUR | 100 | | 117 | |
| Brisa Concessao Rodoviaria SA | | 2.000% | | 3/22/23 | EUR | 200 | | 237 | |
| Brisa Concessao Rodoviaria SA | | 2.375% | | 5/10/27 | EUR | 13,300 | | 16,591 | |
| EDP Finance BV | | 1.125% | | 2/12/24 | EUR | 26,400 | | 30,592 | |
| EDP Finance BV | | 1.875% | | 9/29/23 | EUR | 8,900 | | 10,572 | |
| EDP Finance BV | | 1.875% | | 10/13/25 | EUR | 1,200 | | 1,458 | |
| EDP Finance BV | | 2.000% | | 4/22/25 | EUR | 11,700 | | 14,222 | |
| EDP Finance BV | | 2.375% | | 3/23/23 | EUR | 800 | | 961 | |
| EDP Finance BV | | 2.625% | | 1/18/22 | EUR | 10,955 | | 12,920 | |
| EDP Finance BV | | 8.625% | | 1/4/24 | GBP | 9,005 | | 14,974 | |
| Galp Gas Natural Distribuicao SA | | 1.375% | | 9/19/23 | EUR | 2,600 | | 3,020 | |
| Ren Finance BV | | 1.750% | | 1/18/28 | EUR | 2,650 | | 3,190 | |
| | | | | | | | | 109,651 | |
Sovereign Bonds (0.7%) | | | | | | | | | |
2 | Portugal Obrigacoes do Tesouro OT | | 3.850% | | 4/15/21 | EUR | 111,000 | | 131,732 | |
2 | Portugal Obrigacoes do Tesouro OT | | 4.100% | | 4/15/37 | EUR | 16,700 | | 28,959 | |
| Portugal Obrigacoes do Tesouro OT | | 4.125% | | 4/14/27 | EUR | 33,009 | | 48,056 | |
2 | Portuguese Republic | | 1.950% | | 6/15/29 | EUR | 154,129 | | 201,382 | |
2 | Portuguese Republic | | 2.200% | | 10/17/22 | EUR | 65,000 | | 78,131 | |
2 | Portuguese Republic | | 2.250% | | 4/18/34 | EUR | 50,000 | | 69,195 | |
2 | Portuguese Republic | | 2.875% | | 10/15/25 | EUR | 123,086 | | 161,618 | |
2 | Portuguese Republic | | 3.875% | | 2/15/30 | EUR | 30,000 | | 45,906 | |
2 | Portuguese Republic | | 4.100% | | 2/15/45 | EUR | 44,000 | | 82,158 | |
2 | Portuguese Republic | | 4.950% | | 10/25/23 | EUR | 43,100 | | 58,092 | |
2 | Portuguese Republic | | 5.650% | | 2/15/24 | EUR | 80,000 | | 111,743 | |
| | | | | | | | | 1,016,972 | |
Total Portugal (Cost $1,083,796) | | | | | | | | 1,143,384 | |
89
Total International Bond Index Fund
| | | | | | | Face | | Market | |
| | | | | Maturity | | Amount | | Value· | |
| | | Coupon | | Date | Currency | (000 | ) | ($000 | ) |
Romania (0.1%) | | | | | | | | | |
Sovereign Bonds (0.1%) | | | | | | | | | |
2 | Republic of Romania | | 2.000% | | 12/8/26 | EUR | 3,650 | | 4,407 | |
| Republic of Romania | | 2.124% | | 7/16/31 | EUR | 50 | | 58 | |
2 | Republic of Romania | | 2.124% | | 7/16/31 | EUR | 4,310 | | 4,970 | |
| Republic of Romania | | 2.375% | | 4/19/27 | EUR | 22,500 | | 27,815 | |
| Republic of Romania | | 2.500% | | 2/8/30 | EUR | 7,000 | | 8,566 | |
| Republic of Romania | | 2.750% | | 10/29/25 | EUR | 11,385 | | 14,384 | |
| Republic of Romania | | 2.875% | | 5/26/28 | EUR | 33,525 | | 42,518 | |
| Republic of Romania | | 3.625% | | 4/24/24 | EUR | 5,200 | | 6,703 | |
| Republic of Romania | | 3.875% | | 10/29/35 | EUR | 8,000 | | 10,639 | |
| Republic of Romania | | 4.125% | | 3/11/39 | EUR | 3,000 | | 4,049 | |
| Republic of Romania | | 4.625% | | 4/3/49 | EUR | 2,000 | | 2,895 | |
2 | Republic of Romania | | 4.625% | | 4/3/49 | EUR | 8,485 | | 12,332 | |
Total Romania (Cost $128,559) | | | | | | | | 139,336 | |
Russia (0.3%) | | | | | | | | | |
Sovereign Bonds (0.3%) | | | | | | | | | |
| Gazprom OAO Via Gaz Capital SA | | 2.750% | | 11/30/21 | CHF | 2,100 | | 2,244 | |
| Gazprom OAO Via Gaz Capital SA | | 2.949% | | 1/24/24 | EUR | 500 | | 605 | |
| Gazprom OAO Via Gaz Capital SA | | 3.125% | | 11/17/23 | EUR | 500 | | 610 | |
| Gazprom OAO Via Gaz Capital SA | | 4.250% | | 4/6/24 | GBP | 3,643 | | 5,110 | |
| Russian Federation | | 2.875% | | 12/4/25 | EUR | 100 | | 126 | |
2 | Russian Federation | | 2.875% | | 12/4/25 | EUR | 12,300 | | 15,456 | |
| Russian Federation | | 6.500% | | 2/28/24 | RUB | 1,000,000 | | 15,844 | |
| Russian Federation | | 6.900% | | 5/23/29 | RUB | 2,899,000 | | 46,912 | |
| Russian Federation | | 7.000% | | 12/15/21 | RUB | 450,000 | | 7,166 | |
| Russian Federation | | 7.000% | | 1/25/23 | RUB | 1,525,000 | | 24,498 | |
| Russian Federation | | 7.000% | | 8/16/23 | RUB | 3,070,000 | | 49,414 | |
| Russian Federation | | 7.050% | | 1/19/28 | RUB | 2,650,000 | | 43,272 | |
| Russian Federation | | 7.100% | | 10/16/24 | RUB | 300,000 | | 4,871 | |
| Russian Federation | | 7.250% | | 5/10/34 | RUB | 2,300,000 | | 38,069 | |
| Russian Federation | | 7.400% | | 12/7/22 | RUB | 745,000 | | 12,083 | |
| Russian Federation | | 7.400% | | 7/17/24 | RUB | 1,249,000 | | 20,502 | |
| Russian Federation | | 7.600% | | 4/14/21 | RUB | 1,600,000 | | 25,529 | |
| Russian Federation | | 7.600% | | 7/20/22 | RUB | 2,600,000 | | 42,194 | |
| Russian Federation | | 7.700% | | 3/23/33 | RUB | 840,000 | | 14,437 | |
| Russian Federation | | 7.950% | | 10/7/26 | RUB | 2,350,000 | | 40,098 | |
| Russian Federation | | 8.150% | | 2/3/27 | RUB | 4,454,500 | | 76,917 | |
| Russian Railways Via RZD Capital plc | | 7.487% | | 3/25/31 | GBP | 2,000 | | 3,444 | |
Total Russia (Cost $475,395) | | | | | | | | 489,401 | |
Saudi Arabia (0.0%) | | | | | | | | | |
Sovereign Bonds (0.0%) | | | | | | | | | |
2 | Kingdom of Saudi Arabia | | 0.750% | | 7/9/27 | EUR | 10,000 | | 11,391 | |
| Kingdom of Saudi Arabia | | 2.000% | | 7/9/39 | EUR | 7,000 | | 8,246 | |
Total Saudi Arabia (Cost $19,922) | | | | | | | | 19,637 | |
Singapore (0.5%) | | | | | | | | | |
Corporate Bonds (0.1%) | | | | | | | | | |
| DBS Bank Ltd. | | 0.375% | | 1/23/24 | EUR | 31,000 | | 35,359 | |
1 | DBS Group Holdings Ltd. | | 1.500% | | 4/11/28 | EUR | 5,000 | | 5,663 | |
1 | DBS Group Holdings Ltd. | | 3.980% | | 12/31/49 | SGD | 1,750 | | 1,328 | |
| Oversea-Chinese Banking Corp. Ltd. | | 0.375% | | 3/1/23 | EUR | 2,060 | | 2,342 | |
90
Total International Bond Index Fund
| | | | | | | Face | | Market | |
| | | | | Maturity | | Amount | | Value· | |
| | | Coupon | | Date | Currency | (000 | ) | ($000 | ) |
| Oversea-Chinese Banking Corp. Ltd. | | 0.625% | | 4/18/25 | EUR | 10,000 | | 11,584 | |
1 | Oversea-Chinese Banking Corp. Ltd. | | 4.000% | | 12/31/49 | SGD | 2,750 | | 2,081 | |
| United Overseas Bank Ltd. | | 0.125% | | 3/2/22 | EUR | 2,300 | | 2,588 | |
| United Overseas Bank Ltd. | | 0.500% | | 1/16/25 | EUR | 12,500 | | 14,368 | |
| | | | | | | | | 75,313 | |
Sovereign Bonds (0.4%) | | | | | | | | | |
| Housing & Development Board | | 1.470% | | 7/19/21 | SGD | 30,000 | | 21,948 | |
| Housing & Development Board | | 2.035% | | 9/16/26 | SGD | 9,750 | | 7,203 | |
| Housing & Development Board | | 2.598% | | 10/30/29 | SGD | 6,000 | | 4,590 | |
| Housing & Development Board | | 2.675% | | 1/22/29 | SGD | 5,000 | | 3,858 | |
| Housing & Development Board | | 3.080% | | 5/31/30 | SGD | 5,000 | | 3,992 | |
| Housing & Development Board | | 3.100% | | 7/24/24 | SGD | 9,250 | | 7,185 | |
| Housing & Development Board | | 3.140% | | 3/18/21 | SGD | 10,000 | | 7,488 | |
| Republic of Singapore | | 1.750% | | 4/1/22 | SGD | 20,000 | | 14,745 | |
| Republic of Singapore | | 1.750% | | 2/1/23 | SGD | 100,000 | | 73,770 | |
| Republic of Singapore | | 2.000% | | 7/1/20 | SGD | 20,000 | | 14,734 | |
| Republic of Singapore | | 2.125% | | 6/1/26 | SGD | 21,240 | | 16,008 | |
| Republic of Singapore | | 2.250% | | 6/1/21 | SGD | 45,370 | | 33,675 | |
| Republic of Singapore | | 2.250% | | 8/1/36 | SGD | 25,500 | | 19,641 | |
| Republic of Singapore | | 2.375% | | 6/1/25 | SGD | 40,000 | | 30,507 | |
| Republic of Singapore | | 2.375% | | 7/1/39 | SGD | 21,100 | | 16,540 | |
| Republic of Singapore | | 2.625% | | 5/1/28 | SGD | 75,000 | | 58,938 | |
| Republic of Singapore | | 2.750% | | 7/1/23 | SGD | 10,150 | | 7,756 | |
| Republic of Singapore | | 2.750% | | 4/1/42 | SGD | 21,485 | | 17,901 | |
| Republic of Singapore | | 2.750% | | 3/1/46 | SGD | 47,250 | | 39,387 | |
| Republic of Singapore | | 2.875% | | 7/1/29 | SGD | 13,435 | | 10,850 | |
| Republic of Singapore | | 2.875% | | 9/1/30 | SGD | 19,600 | | 15,945 | |
| Republic of Singapore | | 3.000% | | 9/1/24 | SGD | 16,500 | | 12,902 | |
| Republic of Singapore | | 3.125% | | 9/1/22 | SGD | 69,000 | | 52,829 | |
| Republic of Singapore | | 3.375% | | 9/1/33 | SGD | 32,000 | | 27,898 | |
| Republic of Singapore | | 3.500% | | 3/1/27 | SGD | 45,400 | | 37,497 | |
| Temasek Financial I Ltd. | | 0.500% | | 3/1/22 | EUR | 9,000 | | 10,203 | |
| Temasek Financial I Ltd. | | 5.125% | | 7/26/40 | GBP | 2,000 | | 4,166 | |
| | | | | | | | | 572,156 | |
Total Singapore (Cost $632,069) | | | | | | | | 647,469 | |
Slovakia (0.2%) | | | | | | | | | |
Sovereign Bonds (0.2%) | | | | | | | | | |
| Slovak Republic | | 0.000% | | 11/13/23 | EUR | 62,800 | | 70,912 | |
| Slovak Republic | | 0.625% | | 5/22/26 | EUR | 13,000 | | 15,297 | |
| Slovak Republic | | 0.750% | | 4/9/30 | EUR | 4,825 | | 5,778 | |
| Slovak Republic | | 1.000% | | 6/12/28 | EUR | 24,730 | | 30,073 | |
| Slovak Republic | | 1.375% | | 1/21/27 | EUR | 21,200 | | 26,179 | |
| Slovak Republic | | 1.625% | | 1/21/31 | EUR | 14,500 | | 18,837 | |
| Slovak Republic | | 1.875% | | 3/9/37 | EUR | 5,000 | | 6,811 | |
| Slovak Republic | | 2.000% | | 10/17/47 | EUR | 6,125 | | 9,055 | |
| Slovak Republic | | 2.250% | | 6/12/68 | EUR | 2,500 | | 4,164 | |
| Slovak Republic | | 3.000% | | 2/28/23 | EUR | 5,000 | | 6,190 | |
| Slovak Republic | | 3.375% | | 11/15/24 | EUR | 20,000 | | 26,429 | |
| Slovak Republic | | 3.625% | | 1/16/29 | EUR | 3,000 | | 4,504 | |
| Slovak Republic | | 4.000% | | 3/26/21 | EUR | 1,000 | | 1,183 | |
Total Slovakia (Cost $213,082) | | | | | | | | 225,412 | |
91
Total International Bond Index Fund
| | | | | | | Face | | Market | |
| | | | | Maturity | | Amount | | Value· | |
| | | Coupon | | Date | Currency | (000 | ) | ($000 | ) |
Slovenia (0.1%) | | | | | | | | | |
Sovereign Bonds (0.1%) | | | | | | | | | |
| Republic of Slovenia | | 1.000% | | 3/6/28 | EUR | 35,000 | | 42,317 | |
| Republic of Slovenia | | 1.188% | | 3/14/29 | EUR | 10,000 | | 12,313 | |
| Republic of Slovenia | | 1.250% | | 3/22/27 | EUR | 14,000 | | 17,180 | |
| Republic of Slovenia | | 1.500% | | 3/25/35 | EUR | 12,000 | | 15,399 | |
| Republic of Slovenia | | 1.750% | | 11/3/40 | EUR | 10,000 | | 13,572 | |
| Republic of Slovenia | | 2.125% | | 7/28/25 | EUR | 5,000 | | 6,343 | |
| Republic of Slovenia | | 2.250% | | 3/25/22 | EUR | 11,072 | | 13,149 | |
| Republic of Slovenia | | 3.125% | | 8/7/45 | EUR | 10,000 | | 16,783 | |
| Republic of Slovenia | | 4.625% | | 9/9/24 | EUR | 4,000 | | 5,533 | |
| Republic of Slovenia | | 5.125% | | 3/30/26 | EUR | 8,000 | | 11,985 | |
Total Slovenia (Cost $138,964) | | | | | | | | 154,574 | |
South Africa (0.0%) | | | | | | | | | |
Corporate Bonds (0.0%) | | | | | | | | | |
| Anglo American Capital plc | | 1.625% | | 9/18/25 | EUR | 250 | | 290 | |
| Anglo American Capital plc | | 1.625% | | 3/11/26 | EUR | 200 | | 231 | |
| Anglo American Capital plc | | 3.500% | | 3/28/22 | EUR | 11,849 | | 14,228 | |
Total South Africa (Cost $15,201) | | | | | | | | 14,749 | |
South Korea (2.7%) | | | | | | | | | |
Asset-Backed/Commercial Mortgage-Backed Security (0.0%) | | | | | |
2 | Korea Housing Finance Corp. | | 0.750% | | 10/30/23 | EUR | 4,800 | | 5,525 | |
| | | | | | | | | | |
Corporate Bonds (0.0%) | | | | | | | | | |
| Hyundai Capital Services Inc. | | 3.500% | | 6/3/21 | AUD | 995 | | 703 | |
2 | LG Chem Ltd. | | 0.500% | | 4/15/23 | EUR | 1,100 | | 1,239 | |
| | | | | | | | | 1,942 | |
Sovereign Bonds (2.7%) | | | | | | | | | |
| Bank of Korea | | 2.060% | | 12/2/19 | KRW | 50,000,000 | | 42,997 | |
| Export-Import Bank of Korea | | 0.375% | | 3/26/24 | EUR | 10,000 | | 11,334 | |
| Export-Import Bank of Korea | | 0.625% | | 7/11/23 | EUR | 1,000 | | 1,144 | |
| Export-Import Bank of Korea | | 4.000% | | 6/7/27 | AUD | 850 | | 658 | |
| Korea Development Bank | | 0.625% | | 7/17/23 | EUR | 13,475 | | 15,428 | |
| Korea Monetary Stabilization Bond | | 1.740% | | 4/2/21 | KRW | 76,000,000 | | 65,503 | |
| Korea Monetary Stabilization Bond | | 1.810% | | 2/2/21 | KRW | 67,000,000 | | 57,791 | |
| Republic of Korea | | 1.250% | | 7/31/21 | KRW | 20,000,000 | | 17,123 | |
| Republic of Korea | | 1.250% | | 8/31/21 | KRW | 17,000,000 | | 14,575 | |
| Republic of Korea | | 1.250% | | 11/30/21 | KRW | 10,000,000 | | 8,567 | |
| Republic of Korea | | 1.375% | | 9/10/21 | KRW | 173,000,000 | | 148,659 | |
| Republic of Korea | | 1.500% | | 4/30/21 | KRW | 20,000,000 | | 17,209 | |
| Republic of Korea | | 1.500% | | 11/30/21 | KRW | 40,000,000 | | 34,451 | |
| Republic of Korea | | 1.500% | | 12/31/21 | KRW | 40,000,000 | | 34,452 | |
| Republic of Korea | | 1.500% | | 12/10/26 | KRW | 130,000,000 | | 110,505 | |
| Republic of Korea | | 1.500% | | 9/10/36 | KRW | 140,000,000 | | 116,085 | |
| Republic of Korea | | 1.750% | | 5/31/20 | KRW | 20,000,000 | | 17,228 | |
| Republic of Korea | | 1.750% | | 6/30/20 | KRW | 10,000,000 | | 8,617 | |
| Republic of Korea | | 1.750% | | 7/31/20 | KRW | 38,000,000 | | 32,753 | |
| Republic of Korea | | 1.750% | | 8/31/20 | KRW | 30,000,000 | | 25,865 | |
| Republic of Korea | | 1.750% | | 10/31/20 | KRW | 10,000,000 | | 8,627 | |
| Republic of Korea | | 1.750% | | 11/30/20 | KRW | 20,000,000 | | 17,260 | |
| Republic of Korea | | 1.750% | | 12/10/20 | KRW | 40,000,000 | | 34,546 | |
| Republic of Korea | | 1.750% | | 12/31/20 | KRW | 10,000,000 | | 8,630 | |
92
Total International Bond Index Fund
| | | | | | | Face | | Market | |
| | | | | Maturity | | Amount | | Value· | |
| | | Coupon | | Date | Currency | (000 | ) | ($000 | ) |
| Republic of Korea | | 1.750% | | 1/31/21 | KRW | 10,000,000 | | 8,632 | |
| Republic of Korea | | 1.875% | | 3/10/22 | KRW | 200,000,000 | | 173,740 | |
| Republic of Korea | | 1.875% | | 3/10/24 | KRW | 90,000,000 | | 78,532 | |
| Republic of Korea | | 1.875% | | 6/10/26 | KRW | 132,000,000 | | 115,089 | |
| Republic of Korea | | 1.875% | | 6/10/29 | KRW | 138,000,000 | | 119,727 | |
| Republic of Korea | | 2.000% | | 2/29/20 | KRW | 30,000,000 | | 25,844 | |
| Republic of Korea | | 2.000% | | 3/31/20 | KRW | 10,000,000 | | 8,619 | |
| Republic of Korea | | 2.000% | | 12/10/21 | KRW | 205,000,000 | | 178,368 | |
| Republic of Korea | | 2.000% | | 9/10/22 | KRW | 40,000,000 | | 34,932 | |
| Republic of Korea | | 2.000% | | 3/10/46 | KRW | 65,000,000 | | 59,753 | |
| Republic of Korea | | 2.000% | | 3/10/49 | KRW | 130,360,000 | | 119,287 | |
| Republic of Korea | | 2.000% | | 9/10/68 | KRW | 25,682,000 | | 24,071 | |
| Republic of Korea | | 2.125% | | 6/10/24 | EUR | 12,217 | | 14,885 | |
| Republic of Korea | | 2.125% | | 6/10/27 | KRW | 125,000,000 | | 110,613 | |
| Republic of Korea | | 2.125% | | 3/10/47 | KRW | 104,000,000 | | 97,203 | |
| Republic of Korea | | 2.250% | | 6/10/21 | KRW | 110,000,000 | | 95,878 | |
| Republic of Korea | | 2.250% | | 9/10/23 | KRW | 115,000,000 | | 101,656 | |
| Republic of Korea | | 2.250% | | 6/10/25 | KRW | 79,000,000 | | 70,370 | |
| Republic of Korea | | 2.250% | | 12/10/25 | KRW | 30,000,000 | | 26,732 | |
| Republic of Korea | | 2.250% | | 9/10/37 | KRW | 108,000,000 | | 100,077 | |
| Republic of Korea | | 2.375% | | 3/10/23 | KRW | 110,000,000 | | 97,392 | |
| Republic of Korea | | 2.375% | | 12/10/27 | KRW | 95,000,000 | | 85,672 | |
| Republic of Korea | | 2.375% | | 12/10/28 | KRW | 100,000,000 | | 90,571 | |
| Republic of Korea | | 2.375% | | 9/10/38 | KRW | 126,600,000 | | 119,507 | |
| Republic of Korea | | 2.625% | | 6/10/28 | KRW | 175,000,000 | | 161,149 | |
| Republic of Korea | | 2.625% | | 9/10/35 | KRW | 49,000,000 | | 47,521 | |
| Republic of Korea | | 2.625% | | 3/10/48 | KRW | 108,695,000 | | 112,334 | |
| Republic of Korea | | 2.750% | | 12/10/44 | KRW | 47,990,000 | | 50,333 | |
| Republic of Korea | | 3.000% | | 3/10/23 | KRW | 84,000,000 | | 75,875 | |
| Republic of Korea | | 3.000% | | 9/10/24 | KRW | 95,000,000 | | 87,384 | |
| Republic of Korea | | 3.000% | | 12/10/42 | KRW | 41,000,000 | | 44,167 | |
| Republic of Korea | | 3.375% | | 9/10/23 | KRW | 40,000,000 | | 36,845 | |
| Republic of Korea | | 3.750% | | 12/10/33 | KRW | 96,500,000 | | 104,156 | |
| Republic of Korea | | 4.000% | | 12/10/31 | KRW | 41,000,000 | | 44,051 | |
| Republic of Korea | | 4.250% | | 6/10/21 | KRW | 45,000,000 | | 40,443 | |
| Republic of Korea | | 4.750% | | 12/10/30 | KRW | 28,000,000 | | 31,452 | |
| Republic of Korea | | 5.250% | | 3/10/27 | KRW | 15,500,000 | | 16,593 | |
| Republic of Korea | | 5.500% | | 3/10/28 | KRW | 20,000,000 | | 22,228 | |
| Republic of Korea | | 5.500% | | 12/10/29 | KRW | 16,000,000 | | 18,579 | |
| Republic of Korea | | 5.750% | | 3/10/26 | KRW | 14,000,000 | | 15,003 | |
| | | | | | | | | 3,715,270 | |
Total South Korea (Cost $3,684,734) | | | | | | | | 3,722,737 | |
Spain (5.5%) | | | | | | | | | |
Asset-Backed/Commercial Mortgage-Backed Securities (0.4%) | | | | | |
| AyT Cedulas Cajas Global | | 3.750% | | 12/14/22 | EUR | 800 | | 1,001 | |
| AyT Cedulas Cajas Global | | 4.000% | | 3/24/21 | EUR | 7,000 | | 8,258 | |
| AyT Cedulas Cajas Global | | 4.250% | | 10/25/23 | EUR | 1,100 | | 1,441 | |
| AyT Cedulas Cajas Global | | 4.750% | | 5/25/27 | EUR | 10,700 | | 16,063 | |
| AyT Cedulas Cajas X Fondo de Titulizacion de Activos | | 3.750% | | 6/30/25 | EUR | 10,000 | | 13,589 | |
| Banco Bilbao Vizcaya Argentaria SA | | 2.250% | | 6/12/24 | EUR | 3,000 | | 3,729 | |
| Banco Bilbao Vizcaya Argentaria SA | | 3.500% | | 1/24/21 | EUR | 5,000 | | 5,837 | |
| Banco Bilbao Vizcaya Argentaria SA | | 3.875% | | 1/30/23 | EUR | 6,000 | | 7,602 | |
93
Total International Bond Index Fund
| | | | | | | Face | | Market | |
| | | | | Maturity | | Amount | | Value· | |
| | | Coupon | | Date | Currency | (000 | ) | ($000 | ) |
| Banco Bilbao Vizcaya Argentaria SA | | 4.000% | | 2/25/25 | EUR | 7,100 | | 9,698 | |
| Banco de Sabadell SA | | 0.625% | | 6/10/24 | EUR | 30,500 | | 35,311 | |
| Banco de Sabadell SA | | 0.875% | | 11/12/21 | EUR | 10,000 | | 11,427 | |
| Banco Santander SA | | 0.750% | | 9/9/22 | EUR | 20,700 | | 23,804 | |
| Banco Santander SA | | 1.000% | | 4/7/25 | EUR | 43,000 | | 51,054 | |
| Banco Santander SA | | 1.125% | | 11/27/24 | EUR | 14,500 | | 17,280 | |
| Banco Santander SA | | 1.125% | | 10/25/28 | EUR | 7,600 | | 9,318 | |
| Banco Santander SA | | 2.000% | | 11/27/34 | EUR | 6,600 | | 9,146 | |
| Banco Santander SA | | 3.875% | | 2/6/26 | EUR | 400 | | 559 | |
| Banco Santander SA | | 4.625% | | 5/4/27 | EUR | 1,600 | | 2,419 | |
| Bankia SA | | 0.875% | | 1/21/21 | EUR | 5,800 | | 6,559 | |
| Bankia SA | | 1.000% | | 9/25/25 | EUR | 11,200 | | 13,208 | |
| Bankia SA | | 1.125% | | 8/5/22 | EUR | 23,000 | | 26,624 | |
| Bankia SA | | 4.000% | | 2/3/25 | EUR | 12,300 | | 16,637 | |
| Bankia SA | | 4.125% | | 3/24/36 | EUR | 4,700 | | 8,099 | |
| Bankia SA | | 4.500% | | 4/26/22 | EUR | 4,050 | | 5,051 | |
| Bankinter SA | | 0.875% | | 8/3/22 | EUR | 10,300 | | 11,847 | |
| Bankinter SA | | 1.000% | | 2/5/25 | EUR | 8,200 | | 9,680 | |
| CaixaBank SA | | 0.625% | | 3/27/25 | EUR | 18,000 | | 20,846 | |
| CaixaBank SA | | 2.625% | | 3/21/24 | EUR | 5,600 | | 7,022 | |
| CaixaBank SA | | 3.625% | | 1/18/21 | EUR | 5,000 | | 5,842 | |
| CaixaBank SA | | 3.875% | | 2/17/25 | EUR | 12,000 | | 16,236 | |
| CaixaBank SA | | 4.500% | | 1/26/22 | EUR | 15,000 | | 18,545 | |
| Caja Rural de Navarra SCC | | 0.500% | | 3/16/22 | EUR | 14,700 | | 16,671 | |
| Caja Rural de Navarra SCC | | 0.875% | | 5/8/25 | EUR | 6,400 | | 7,477 | |
| Cajamar Caja Rural SCC | | 0.875% | | 6/18/23 | EUR | 15,000 | | 17,279 | |
| Cajamar Caja Rural SCC | | 1.250% | | 1/26/22 | EUR | 3,100 | | 3,568 | |
| Cedulas TDA 6 Fondo de Titulizacion de Activos | | 3.875% | | 5/23/25 | EUR | 5,000 | | 6,830 | |
| Eurocaja Rural SCC | | 0.875% | | 10/1/21 | EUR | 4,000 | | 4,562 | |
| Eurocaja Rural SCC | | 0.875% | | 5/27/24 | EUR | 5,000 | | 5,803 | |
| IM Cedulas 10 | | 4.500% | | 2/21/22 | EUR | 11,300 | | 13,977 | |
| IM Cedulas 7 Fondo de Titulazion de Activos | | 4.000% | | 3/31/21 | EUR | 10,000 | | 11,823 | |
| Kutxabank SA | | 1.750% | | 5/27/21 | EUR | 5,000 | | 5,757 | |
| Programa Cedulas TDA Fondo de Titulizacion de Activos | | 4.125% | | 4/10/21 | EUR | 6,500 | | 7,706 | |
| Programa Cedulas TDA Fondo de Titulizacion de Activos | | 4.250% | | 3/28/27 | EUR | 8,500 | | 12,417 | |
| Programa Cedulas TDA Fondo de Titulizacion de Activos | | 4.250% | | 4/10/31 | EUR | 19,800 | | 32,075 | |
| | | | | | | | | 539,677 | |
Corporate Bonds (0.6%) | | | | | | | | | |
| Abertis Infraestructuras SA | | 0.625% | | 7/15/25 | EUR | 5,000 | | 5,501 | |
| Abertis Infraestructuras SA | | 1.000% | | 2/27/27 | EUR | 1,300 | | 1,451 | |
| Abertis Infraestructuras SA | | 1.375% | | 5/20/26 | EUR | 700 | | 804 | |
| Abertis Infraestructuras SA | | 1.500% | | 6/27/24 | EUR | 1,900 | | 2,198 | |
| Abertis Infraestructuras SA | | 2.375% | | 9/27/27 | EUR | 10,000 | | 12,067 | |
| Abertis Infraestructuras SA | | 2.500% | | 2/27/25 | EUR | 200 | | 244 | |
| Abertis Infraestructuras SA | | 3.000% | | 3/27/31 | EUR | 10,000 | | 12,423 | |
| Abertis Infraestructuras SA | | 3.375% | | 11/27/26 | GBP | 3,000 | | 4,116 | |
| Abertis Infraestructuras SA | | 3.750% | | 6/20/23 | EUR | 3,100 | | 3,887 | |
| ACS Servicios Comunicaciones y Energia SL | | 1.875% | | 4/20/26 | EUR | 3,900 | | 4,632 | |
| Banco Bilbao Vizcaya Argentaria SA | | 0.625% | | 1/17/22 | EUR | 1,000 | | 1,133 | |
94
Total International Bond Index Fund
| | | | | | | Face | | Market | |
| | | | | Maturity | | Amount | | Value· | |
| | | Coupon | | Date | Currency | (000 | ) | ($000 | ) |
| Banco Bilbao Vizcaya Argentaria SA | | 0.625% | | 3/18/23 | EUR | 21,000 | | 24,130 | |
| Banco Bilbao Vizcaya Argentaria SA | | 0.750% | | 1/20/22 | EUR | 12,100 | | 13,823 | |
| Banco Bilbao Vizcaya Argentaria SA | | 1.000% | | 1/20/21 | EUR | 1,000 | | 1,131 | |
| Banco Bilbao Vizcaya Argentaria SA | | 1.125% | | 2/28/24 | EUR | 3,000 | | 3,460 | |
| Banco Bilbao Vizcaya Argentaria SA | | 3.500% | | 2/10/27 | EUR | 17,100 | | 22,259 | |
| Banco de Sabadell SA | | 0.125% | | 10/20/23 | EUR | 9,800 | | 11,087 | |
| Banco de Sabadell SA | | 0.875% | | 3/5/23 | EUR | 5,000 | | 5,659 | |
| Banco de Sabadell SA | | 1.625% | | 3/7/24 | EUR | 18,700 | | 21,801 | |
| Banco Santander SA | | 0.250% | | 7/10/29 | EUR | 10,000 | | 11,304 | |
| Banco Santander SA | | 0.875% | | 5/9/31 | EUR | 10,200 | | 12,251 | |
| Banco Santander SA | | 1.125% | | 1/17/25 | EUR | 9,000 | | 10,443 | |
| Banco Santander SA | | 1.375% | | 3/3/21 | EUR | 100 | | 114 | |
| Banco Santander SA | | 1.375% | | 2/9/22 | EUR | 10,500 | | 12,071 | |
| Banco Santander SA | | 1.375% | | 12/14/22 | EUR | 6,900 | | 8,021 | |
| Banco Santander SA | | 1.375% | | 7/31/24 | GBP | 4,000 | | 5,149 | |
| Banco Santander SA | | 1.500% | | 1/25/26 | EUR | 26,000 | | 32,003 | |
| Banco Santander SA | | 2.125% | | 2/8/28 | EUR | 2,600 | | 3,109 | |
| Banco Santander SA | | 2.500% | | 3/18/25 | EUR | 19,400 | | 23,529 | |
| Banco Santander SA | | 2.750% | | 9/12/23 | GBP | 2,400 | | 3,243 | |
| Banco Santander SA | | 3.250% | | 4/4/26 | EUR | 500 | | 638 | |
| Bankia SA | | 0.750% | | 7/9/26 | EUR | 3,800 | | 4,285 | |
| Bankia SA | | 1.000% | | 3/14/23 | EUR | 18,200 | | 21,122 | |
| Bankinter SA | | 1.250% | | 2/7/28 | EUR | 500 | | 611 | |
| CaixaBank SA | | 0.750% | | 4/18/23 | EUR | 1,700 | | 1,933 | |
| CaixaBank SA | | 1.000% | | 2/8/23 | EUR | 6,300 | | 7,314 | |
| CaixaBank SA | | 1.000% | | 1/17/28 | EUR | 5,500 | | 6,609 | |
| CaixaBank SA | | 1.125% | | 1/12/23 | EUR | 2,000 | | 2,283 | |
| CaixaBank SA | | 1.125% | | 5/17/24 | EUR | 8,000 | | 9,270 | |
| CaixaBank SA | | 1.250% | | 1/11/27 | EUR | 600 | | 730 | |
| CaixaBank SA | | 1.375% | | 6/19/26 | EUR | 10,000 | | 11,542 | |
| CaixaBank SA | | 1.750% | | 10/24/23 | EUR | 10,000 | | 11,712 | |
1 | CaixaBank SA | | 2.250% | | 4/17/30 | EUR | 25,000 | | 28,802 | |
| CaixaBank SA | | 2.375% | | 2/1/24 | EUR | 6,700 | | 8,056 | |
1 | CaixaBank SA | | 2.750% | | 7/14/28 | EUR | 4,000 | | 4,713 | |
| Canal de Isabel II Gestion SA | | 1.680% | | 2/26/25 | EUR | 3,500 | | 4,147 | |
| Criteria Caixa SAU | | 1.500% | | 5/10/23 | EUR | 2,700 | | 3,132 | |
| Criteria Caixa SAU | | 1.625% | | 4/21/22 | EUR | 3,000 | | 3,475 | |
| Enagas Financiaciones SAU | | 1.000% | | 3/25/23 | EUR | 100 | | 115 | |
| Enagas Financiaciones SAU | | 1.250% | | 2/6/25 | EUR | 5,200 | | 6,119 | |
| Enagas Financiaciones SAU | | 1.375% | | 5/5/28 | EUR | 200 | | 239 | |
| Enagas Financiaciones SAU | | 2.500% | | 4/11/22 | EUR | 2,000 | | 2,366 | |
| Ferrovial Emisiones SA | | 2.500% | | 7/15/24 | EUR | 5,000 | | 6,146 | |
| Ferrovial Emisiones SA | | 3.375% | | 6/7/21 | EUR | 700 | | 823 | |
| Iberdrola Finanzas SAU | | 1.000% | | 3/7/24 | EUR | 5,900 | | 6,844 | |
| Iberdrola Finanzas SAU | | 1.000% | | 3/7/25 | EUR | 300 | | 350 | |
| Iberdrola Finanzas SAU | | 1.621% | | 11/29/29 | EUR | 700 | | 874 | |
| Iberdrola Finanzas SAU | | 6.000% | | 7/1/22 | GBP | 6,500 | | 9,465 | |
| Iberdrola Finanzas SAU | | 7.375% | | 1/29/24 | GBP | 4,600 | | 7,444 | |
| Iberdrola International BV | | 0.375% | | 9/15/25 | EUR | 16,700 | | 18,881 | |
| Iberdrola International BV | | 1.125% | | 1/27/23 | EUR | 200 | | 231 | |
| Iberdrola International BV | | 1.125% | | 4/21/26 | EUR | 6,800 | | 8,049 | |
| Iberdrola International BV | | 1.750% | | 9/17/23 | EUR | 10,000 | | 11,899 | |
| Iberdrola International BV | | 1.875% | | 10/8/24 | EUR | 400 | | 486 | |
1 | Iberdrola International BV | | 1.875% | | 12/31/49 | EUR | 800 | | 912 | |
95
Total International Bond Index Fund
| | | | | | | Face | | Market | |
| | | | | Maturity | | Amount | | Value· | |
| | | Coupon | | Date | Currency | (000 | ) | ($000 | ) |
| Iberdrola International BV | | 2.500% | | 10/24/22 | EUR | 2,600 | | 3,117 | |
1 | Iberdrola International BV | | 2.625% | | 12/31/49 | EUR | 1,100 | | 1,303 | |
| Iberdrola International BV | | 3.000% | | 1/31/22 | EUR | 3,200 | | 3,815 | |
1 | Iberdrola International BV | | 3.250% | | 12/31/49 | EUR | 14,600 | | 17,797 | |
| Iberdrola International BV | | 3.500% | | 2/1/21 | EUR | 14,100 | | 16,436 | |
| Inmobiliaria Colonial Socimi SA | | 1.450% | | 10/28/24 | EUR | 4,500 | | 5,265 | |
| Inmobiliaria Colonial Socimi SA | | 1.625% | | 11/28/25 | EUR | 1,100 | | 1,301 | |
| Inmobiliaria Colonial Socimi SA | | 2.728% | | 6/5/23 | EUR | 7,300 | | 8,893 | |
| Mapfre SA | | 1.625% | | 5/19/26 | EUR | 1,500 | | 1,812 | |
1 | Mapfre SA | | 4.125% | | 9/7/48 | EUR | 7,100 | | 9,124 | |
1 | Mapfre SA | | 4.375% | | 3/31/47 | EUR | 4,500 | | 5,800 | |
| Merlin Properties Socimi SA | | 1.750% | | 5/26/25 | EUR | 9,670 | | 11,449 | |
| Merlin Properties Socimi SA | | 2.225% | | 4/25/23 | EUR | 400 | | 475 | |
| Merlin Properties Socimi SA | | 2.375% | | 5/23/22 | EUR | 8,700 | | 10,216 | |
| Naturgy Capital Markets SA | | 1.125% | | 4/11/24 | EUR | 4,300 | | 5,001 | |
| Naturgy Finance BV | | 0.875% | | 5/15/25 | EUR | 15,300 | | 17,691 | |
| Naturgy Finance BV | | 1.250% | | 4/19/26 | EUR | 8,900 | | 10,508 | |
| Naturgy Finance BV | | 1.375% | | 1/19/27 | EUR | 200 | | 238 | |
| Naturgy Finance BV | | 2.875% | | 3/11/24 | EUR | 4,000 | | 4,996 | |
| NorteGas Energia Distribucion SAU | | 0.918% | | 9/28/22 | EUR | 400 | | 455 | |
| NorteGas Energia Distribucion SAU | | 2.065% | | 9/28/27 | EUR | 10,500 | | 12,552 | |
| Prosegur Cash SA | | 1.375% | | 2/4/26 | EUR | 1,200 | | 1,360 | |
| Red Electrica Financiaciones SAU | | 1.000% | | 4/21/26 | EUR | 600 | | 703 | |
| Red Electrica Financiaciones SAU | | 1.125% | | 4/24/25 | EUR | 300 | | 354 | |
| Red Electrica Financiaciones SAU | | 1.250% | | 3/13/27 | EUR | 600 | | 716 | |
| Red Electrica Financiaciones SAU | | 2.125% | | 7/1/23 | EUR | 6,800 | | 8,171 | |
| Red Electrica Financiaciones SAU | | 3.875% | | 1/25/22 | EUR | 2,000 | | 2,426 | |
| Repsol International Finance BV | | 0.250% | | 8/2/27 | EUR | 1,200 | | 1,325 | |
| Repsol International Finance BV | | 0.500% | | 5/23/22 | EUR | 7,500 | | 8,477 | |
| Repsol International Finance BV | | 2.125% | | 12/16/20 | EUR | 4,200 | | 4,802 | |
| Repsol International Finance BV | | 2.250% | | 12/10/26 | EUR | 10,100 | | 12,838 | |
| Santander Consumer Finance SA | | 0.500% | | 10/4/21 | EUR | 20,100 | | 22,671 | |
| Santander Consumer Finance SA | | 0.875% | | 1/24/22 | EUR | 30,700 | | 34,912 | |
| Santander Consumer Finance SA | | 0.875% | | 5/30/23 | EUR | 3,300 | | 3,773 | |
| Santander Consumer Finance SA | | 1.000% | | 5/26/21 | EUR | 100 | | 114 | |
| Santander Consumer Finance SA | | 1.000% | | 2/27/24 | EUR | 6,000 | | 6,904 | |
| Santander Consumer Finance SA | | 1.125% | | 10/9/23 | EUR | 15,000 | | 17,334 | |
| Santander Consumer Finance SA | | 1.500% | | 11/12/20 | EUR | 7,400 | | 8,395 | |
| Telefonica Emisiones SAU | | 1.069% | | 2/5/24 | EUR | 17,000 | | 19,701 | |
| Telefonica Emisiones SAU | | 1.447% | | 1/22/27 | EUR | 9,100 | | 10,822 | |
| Telefonica Emisiones SAU | | 1.460% | | 4/13/26 | EUR | 4,000 | | 4,769 | |
| Telefonica Emisiones SAU | | 1.477% | | 9/14/21 | EUR | 12,000 | | 13,771 | |
| Telefonica Emisiones SAU | | 1.788% | | 3/12/29 | EUR | 8,600 | | 10,504 | |
| Telefonica Emisiones SAU | | 1.957% | | 7/1/39 | EUR | 8,000 | | 9,517 | |
| Telefonica Emisiones SAU | | 2.318% | | 10/17/28 | EUR | 800 | | 1,027 | |
| Telefonica Emisiones SAU | | 2.932% | | 10/17/29 | EUR | 11,300 | | 15,285 | |
| Telefonica Emisiones SAU | | 3.961% | | 3/26/21 | EUR | 12,100 | | 14,271 | |
| Telefonica Emisiones SAU | | 3.987% | | 1/23/23 | EUR | 20,000 | | 25,139 | |
| Telefonica Emisiones SAU | | 5.289% | | 12/9/22 | GBP | 1,000 | | 1,453 | |
| Telefonica Emisiones SAU | | 5.375% | | 2/2/26 | GBP | 2,600 | | 4,065 | |
| Telefonica Emisiones SAU | | 5.445% | | 10/8/29 | GBP | 3,750 | | 6,266 | |
| Telefonica Europe BV | | 5.875% | | 2/14/33 | EUR | 832 | | 1,452 | |
| | | | | | | | | 906,221 | |
96
Total International Bond Index Fund
| | | | | | | Face | | Market | |
| | | | | Maturity | | Amount | | Value· | |
| | | Coupon | | Date | Currency | (000 | ) | ($000 | ) |
Sovereign Bonds (4.5%) | | | | | | | | | |
| Adif - Alta Velocidad | | 1.875% | | 1/28/25 | EUR | 15,100 | | 18,403 | |
| Adif - Alta Velocidad | | 3.500% | | 5/27/24 | EUR | 12,000 | | 15,483 | |
| Autonomous Community of Madrid Spain | | 0.727% | | 5/19/21 | EUR | 23,300 | | 26,372 | |
| Autonomous Community of Madrid Spain | | 0.997% | | 9/30/24 | EUR | 1,720 | | 2,018 | |
| Autonomous Community of Madrid Spain | | 1.571% | | 4/30/29 | EUR | 10,000 | | 12,405 | |
| Autonomous Community of Madrid Spain | | 1.773% | | 4/30/28 | EUR | 13,625 | | 17,104 | |
| Autonomous Community of Madrid Spain | | 1.826% | | 4/30/25 | EUR | 14,000 | | 17,128 | |
| Autonomous Community of Madrid Spain | | 2.080% | | 3/12/30 | EUR | 5,000 | | 6,481 | |
| Autonomous Community of Madrid Spain | | 2.146% | | 4/30/27 | EUR | 17,000 | | 21,708 | |
| Autonomous Community of Madrid Spain | | 2.875% | | 7/17/23 | EUR | 8,950 | | 11,084 | |
| Autonomous Community of Madrid Spain | | 4.125% | | 5/21/24 | EUR | 21,500 | | 28,510 | |
| Autonomous Community of Madrid Spain | | 4.300% | | 9/15/26 | EUR | 10,800 | | 15,440 | |
13 | FADE - Fondo de Amortizacion del Deficit Electrico | | 0.500% | | 3/17/23 | EUR | 30,000 | | 34,199 | |
13 | FADE - Fondo de Amortizacion del Deficit Electrico | | 5.900% | | 3/17/21 | EUR | 2,000 | | 2,418 | |
13 | Fondo De Titulizacion Del Deficit Del Sistema Electrico FTA | | 0.850% | | 12/17/23 | EUR | 5,000 | | 5,800 | |
13 | Instituto de Credito Oficial | | 6.000% | | 3/8/21 | EUR | 5,000 | | 6,050 | |
| Kingdom of Spain | | 0.050% | | 1/31/21 | EUR | 227,100 | | 254,839 | |
| Kingdom of Spain | | 0.050% | | 10/31/21 | EUR | 157,839 | | 177,703 | |
| Kingdom of Spain | | 0.350% | | 7/30/23 | EUR | 238,590 | | 272,391 | |
| Kingdom of Spain | | 0.400% | | 4/30/22 | EUR | 285,000 | | 324,207 | |
2 | Kingdom of Spain | | 0.600% | | 10/31/29 | EUR | 24,000 | | 27,758 | |
2 | Kingdom of Spain | | 1.400% | | 4/30/28 | EUR | 122,100 | | 151,023 | |
2 | Kingdom of Spain | | 1.400% | | 7/30/28 | EUR | 161,563 | | 199,917 | |
2 | Kingdom of Spain | | 1.450% | | 10/31/27 | EUR | 39,400 | | 48,732 | |
2 | Kingdom of Spain | | 1.450% | | 4/30/29 | EUR | 292,799 | | 364,747 | |
2 | Kingdom of Spain | | 1.500% | | 4/30/27 | EUR | 296,489 | | 366,719 | |
2 | Kingdom of Spain | | 1.600% | | 4/30/25 | EUR | 142,255 | | 173,848 | |
2 | Kingdom of Spain | | 1.850% | | 7/30/35 | EUR | 60,000 | | 78,949 | |
2 | Kingdom of Spain | | 1.950% | | 4/30/26 | EUR | 223,371 | | 281,315 | |
2 | Kingdom of Spain | | 1.950% | | 7/30/30 | EUR | 132,200 | | 173,264 | |
2 | Kingdom of Spain | | 2.150% | | 10/31/25 | EUR | 71,100 | | 89,940 | |
2 | Kingdom of Spain | | 2.350% | | 7/30/33 | EUR | 115,926 | | 160,923 | |
2 | Kingdom of Spain | | 2.700% | | 10/31/48 | EUR | 88,330 | | 137,044 | |
2 | Kingdom of Spain | | 2.750% | | 10/31/24 | EUR | 217,800 | | 278,813 | |
2 | Kingdom of Spain | | 2.900% | | 10/31/46 | EUR | 38,350 | | 61,073 | |
2 | Kingdom of Spain | | 3.450% | | 7/30/66 | EUR | 73,000 | | 136,517 | |
2 | Kingdom of Spain | | 3.800% | | 4/30/24 | EUR | 82,820 | | 109,108 | |
2 | Kingdom of Spain | | 4.200% | | 1/31/37 | EUR | 144,580 | | 254,193 | |
2 | Kingdom of Spain | | 4.400% | | 10/31/23 | EUR | 80,495 | | 106,555 | |
2 | Kingdom of Spain | | 4.650% | | 7/30/25 | EUR | 18,760 | | 26,642 | |
2 | Kingdom of Spain | | 4.700% | | 7/30/41 | EUR | 182,400 | | 356,858 | |
2 | Kingdom of Spain | | 4.800% | | 1/31/24 | EUR | 51,335 | | 69,541 | |
2 | Kingdom of Spain | | 4.900% | | 7/30/40 | EUR | 37,980 | | 75,162 | |
2 | Kingdom of Spain | | 5.150% | | 10/31/28 | EUR | 208,090 | | 335,440 | |
2 | Kingdom of Spain | | 5.150% | | 10/31/44 | EUR | 81,195 | | 173,993 | |
2 | Kingdom of Spain | | 5.400% | | 1/31/23 | EUR | 144,580 | | 191,424 | |
2 | Kingdom of Spain | | 5.500% | | 4/30/21 | EUR | 27,810 | | 33,768 | |
| Kingdom of Spain | | 5.750% | | 7/30/32 | EUR | 35,450 | | 65,954 | |
2 | Kingdom of Spain | | 5.850% | | 1/31/22 | EUR | 132,300 | | 168,456 | |
97
Total International Bond Index Fund
| | | | | | | Face | | Market | |
| | | | | Maturity | | Amount | | Value· | |
| | | Coupon | | Date | Currency | (000 | ) | ($000 | ) |
2 | Kingdom of Spain | | 5.900% | | 7/30/26 | EUR | 157,401 | | 245,615 | |
| Kingdom of Spain | | 6.000% | | 1/31/29 | EUR | 27,165 | | 46,503 | |
| | | | | | | | | 6,259,537 | |
Total Spain (Cost $7,168,041) | | | | | | | | 7,705,435 | |
Supranational (3.2%) | | | | | | | | | |
Sovereign Bonds (3.2%) | | | | | | | | | |
| African Development Bank | | 0.125% | | 10/7/26 | EUR | 4,000 | | 4,568 | |
| African Development Bank | | 0.250% | | 11/21/24 | EUR | 22,600 | | 26,017 | |
| African Development Bank | | 0.500% | | 3/21/29 | EUR | 4,000 | | 4,680 | |
| African Development Bank | | 0.875% | | 12/20/21 | GBP | 1,500 | | 1,946 | |
| African Development Bank | | 3.300% | | 7/27/27 | AUD | 1,000 | | 766 | |
| African Development Bank | | 3.350% | | 8/8/28 | AUD | 500 | | 388 | |
| African Development Bank | | 4.000% | | 1/10/25 | AUD | 14,330 | | 11,106 | |
| African Development Bank | | 4.500% | | 6/2/26 | AUD | 3,000 | | 2,431 | |
| African Development Bank | | 4.750% | | 3/6/24 | AUD | 2,000 | | 1,569 | |
| African Development Bank | | 5.250% | | 3/23/22 | AUD | 14,000 | | 10,539 | |
| Asian Development Bank | | 0.000% | | 10/24/29 | EUR | 5,200 | | 5,831 | |
| Asian Development Bank | | 0.200% | | 5/25/23 | EUR | 1,000 | | 1,141 | |
| Asian Development Bank | | 0.625% | | 9/15/26 | GBP | 7,400 | | 9,434 | |
| Asian Development Bank | | 2.450% | | 1/17/24 | AUD | 1,800 | | 1,300 | |
| Asian Development Bank | | 2.650% | | 1/11/23 | AUD | 1,500 | | 1,079 | |
| Asian Development Bank | | 2.750% | | 1/19/22 | AUD | 5,900 | | 4,197 | |
| Asian Development Bank | | 3.000% | | 1/17/23 | NZD | 10,000 | | 6,747 | |
| Asian Development Bank | | 3.000% | | 10/14/26 | AUD | 1,825 | | 1,387 | |
| Asian Development Bank | | 3.300% | | 8/8/28 | AUD | 2,600 | | 2,040 | |
| Asian Development Bank | | 3.400% | | 9/10/27 | AUD | 2,700 | | 2,117 | |
| Asian Development Bank | | 3.500% | | 5/30/24 | NZD | 20,000 | | 13,993 | |
| Asian Development Bank | | 3.750% | | 3/12/25 | AUD | 11,230 | | 8,703 | |
| Asian Development Bank | | 4.500% | | 9/5/23 | AUD | 1,250 | | 965 | |
| Asian Development Bank | | 4.650% | | 2/16/27 | CAD | 2,792 | | 2,493 | |
| Asian Development Bank | | 5.000% | | 3/9/22 | AUD | 15,500 | | 11,618 | |
| Corp. Andina de Fomento | | 0.500% | | 1/25/22 | EUR | 4,780 | | 5,378 | |
| Corp. Andina de Fomento | | 0.500% | | 2/26/26 | CHF | 3,000 | | 3,065 | |
| Corp. Andina de Fomento | | 0.750% | | 6/13/23 | EUR | 5,000 | | 5,678 | |
| Corp. Andina de Fomento | | 1.125% | | 2/13/25 | EUR | 15,000 | | 17,375 | |
| Corp. Andina de Fomento | | 4.500% | | 9/14/27 | AUD | 1,600 | | 1,259 | |
| Council Of Europe Development Bank | | 0.125% | | 5/25/23 | EUR | 10,000 | | 11,381 | |
| Council Of Europe Development Bank | | 0.375% | | 6/8/26 | EUR | 17,000 | | 19,767 | |
| Council Of Europe Development Bank | | 2.875% | | 8/31/21 | EUR | 23,000 | | 27,242 | |
| Eurofima | | 2.600% | | 1/13/27 | AUD | 24,820 | | 18,104 | |
| Eurofima | | 3.000% | | 5/22/24 | CHF | 5,000 | | 5,867 | |
| Eurofima | | 3.000% | | 5/15/26 | CHF | 6,500 | | 8,032 | |
| Eurofima | | 3.375% | | 12/29/20 | CHF | 4,000 | | 4,243 | |
| Eurofima | | 3.900% | | 12/19/25 | AUD | 1,000 | | 781 | |
| Eurofima | | 4.000% | | 10/27/21 | EUR | 5,000 | | 6,064 | |
| Eurofima | | 4.550% | | 3/30/27 | CAD | 655 | | 564 | |
| European Bank for Reconstruction & Development | | 0.000% | | 10/17/24 | EUR | 10,000 | | 11,346 | |
| European Bank for Reconstruction & Development | | 1.250% | | 12/15/22 | GBP | 10,000 | | 13,139 | |
| European Bank for Reconstruction & Development | | 5.625% | | 12/7/28 | GBP | 1,000 | | 1,831 | |
| European Financial Stability Facility | | 0.000% | | 3/29/21 | EUR | 48,700 | | 54,670 | |
98
Total International Bond Index Fund
| | | | | | | Face | | Market | |
| | | | | Maturity | | Amount | | Value· | |
| | | Coupon | | Date | Currency | (000 | ) | ($000 | ) |
| European Financial Stability Facility | | 0.000% | | 11/17/22 | EUR | 65,000 | | 73,430 | |
| European Financial Stability Facility | | 0.000% | | 4/19/24 | EUR | 40,000 | | 45,330 | |
| European Financial Stability Facility | | 0.100% | | 1/19/21 | EUR | 20,000 | | 22,459 | |
| European Financial Stability Facility | | 0.125% | | 10/17/23 | EUR | 15,300 | | 17,415 | |
| European Financial Stability Facility | | 0.200% | | 1/17/24 | EUR | 1,900 | | 2,171 | |
4 | European Financial Stability Facility | | 0.200% | | 4/28/25 | EUR | 3,000 | | 3,441 | |
| European Financial Stability Facility | | 0.400% | | 2/17/25 | EUR | 30,000 | | 34,749 | |
4 | European Financial Stability Facility | | 0.400% | | 5/31/26 | EUR | 55,000 | | 64,035 | |
4 | European Financial Stability Facility | | 0.500% | | 1/20/23 | EUR | 37,000 | | 42,497 | |
| European Financial Stability Facility | | 0.500% | | 7/11/25 | EUR | 5,000 | | 5,834 | |
| European Financial Stability Facility | | 0.750% | | 5/3/27 | EUR | 31,100 | | 37,174 | |
| European Financial Stability Facility | | 0.875% | | 7/26/27 | EUR | 25,000 | | 30,195 | |
| European Financial Stability Facility | | 0.875% | | 4/10/35 | EUR | 15,000 | | 18,359 | |
| European Financial Stability Facility | | 0.950% | | 2/14/28 | EUR | 20,000 | | 24,388 | |
| European Financial Stability Facility | | 1.200% | | 2/17/45 | EUR | 36,500 | | 48,103 | |
| European Financial Stability Facility | | 1.250% | | 5/24/33 | EUR | 15,000 | | 19,217 | |
4 | European Financial Stability Facility | | 1.375% | | 6/7/21 | EUR | 32,000 | | 36,752 | |
| European Financial Stability Facility | | 1.375% | | 5/31/47 | EUR | 18,365 | | 25,237 | |
| European Financial Stability Facility | | 1.450% | | 9/5/40 | EUR | 5,000 | | 6,773 | |
| European Financial Stability Facility | | 1.700% | | 2/13/43 | EUR | 36,600 | | 52,515 | |
4 | European Financial Stability Facility | | 1.750% | | 6/27/24 | EUR | 17,000 | | 20,828 | |
| European Financial Stability Facility | | 1.750% | | 7/17/53 | EUR | 14,500 | | 21,599 | |
| European Financial Stability Facility | | 1.800% | | 7/10/48 | EUR | 45,450 | | 68,064 | |
4 | European Financial Stability Facility | | 1.875% | | 5/23/23 | EUR | 36,000 | | 43,434 | |
| European Financial Stability Facility | | 2.000% | | 2/28/56 | EUR | 30,780 | | 49,376 | |
4 | European Financial Stability Facility | | 2.125% | | 2/19/24 | EUR | 19,500 | | 24,110 | |
4 | European Financial Stability Facility | | 2.250% | | 9/5/22 | EUR | 48,250 | | 58,009 | |
4 | European Financial Stability Facility | | 2.350% | | 7/29/44 | EUR | 13,600 | | 21,952 | |
4 | European Financial Stability Facility | | 2.750% | | 12/3/29 | EUR | 5,500 | | 7,884 | |
4 | European Financial Stability Facility | | 3.000% | | 9/4/34 | EUR | 5,200 | | 8,188 | |
4 | European Financial Stability Facility | | 3.375% | | 7/5/21 | EUR | 6,675 | | 7,932 | |
4 | European Financial Stability Facility | | 3.375% | | 4/3/37 | EUR | 30,800 | | 52,251 | |
4 | European Financial Stability Facility | | 3.875% | | 3/30/32 | EUR | 20,000 | | 32,861 | |
| European Investment Bank | | 0.000% | | 10/16/23 | EUR | 30,000 | | 34,035 | |
| European Investment Bank | | 0.000% | | 3/15/24 | EUR | 135,000 | | 153,194 | |
| European Investment Bank | | 0.000% | | 3/13/26 | EUR | 10,000 | | 11,378 | |
| European Investment Bank | | 0.000% | | 12/7/28 | GBP | 2,600 | | 3,067 | |
| European Investment Bank | | 0.050% | | 12/15/23 | EUR | 25,000 | | 28,445 | |
| European Investment Bank | | 0.050% | | 5/24/24 | EUR | 20,000 | | 22,764 | |
| European Investment Bank | | 0.100% | | 10/15/26 | EUR | 19,900 | | 22,780 | |
| European Investment Bank | | 0.125% | | 4/15/25 | EUR | 30,000 | | 34,348 | |
| European Investment Bank | | 0.125% | | 6/20/29 | EUR | 30,000 | | 34,285 | |
| European Investment Bank | | 0.200% | | 7/15/24 | EUR | 40,000 | | 45,845 | |
| European Investment Bank | | 0.375% | | 3/15/22 | EUR | 25,000 | | 28,462 | |
| European Investment Bank | | 0.375% | | 7/16/25 | EUR | 20,000 | | 23,235 | |
| European Investment Bank | | 0.375% | | 4/14/26 | EUR | 10,000 | | 11,644 | |
| European Investment Bank | | 0.500% | | 11/15/23 | EUR | 20,000 | | 23,215 | |
| European Investment Bank | | 0.500% | | 1/15/27 | EUR | 53,700 | | 63,309 | |
| European Investment Bank | | 0.500% | | 11/13/37 | EUR | 15,000 | | 17,495 | |
| European Investment Bank | | 0.625% | | 1/22/29 | EUR | 30,000 | | 35,877 | |
| European Investment Bank | | 0.750% | | 11/15/24 | GBP | 1,000 | | 1,293 | |
| European Investment Bank | | 0.875% | | 3/15/21 | GBP | 20,000 | | 25,941 | |
| European Investment Bank | | 0.875% | | 12/15/23 | GBP | 31,050 | | 40,334 | |
| European Investment Bank | | 0.875% | | 9/13/24 | EUR | 33,000 | | 39,072 | |
99
Total International Bond Index Fund
| | | | | | | Face | | Market | |
| | | | | Maturity | | Amount | | Value· | |
| | | Coupon | | Date | Currency | (000 | ) | ($000 | ) |
| European Investment Bank | | 0.875% | | 1/14/28 | EUR | 23,000 | | 27,966 | |
| European Investment Bank | | 1.000% | | 9/21/26 | GBP | 3,200 | | 4,191 | |
| European Investment Bank | | 1.000% | | 3/14/31 | EUR | 68,000 | | 84,551 | |
| European Investment Bank | | 1.000% | | 4/14/32 | EUR | 32,000 | | 39,915 | |
| European Investment Bank | | 1.125% | | 9/7/21 | GBP | 5,000 | | 6,518 | |
2 | European Investment Bank | | 1.125% | | 9/16/21 | CAD | 13,340 | | 10,019 | |
| European Investment Bank | | 1.125% | | 11/15/32 | EUR | 20,000 | | 25,365 | |
| European Investment Bank | | 1.125% | | 4/13/33 | EUR | 30,000 | | 38,081 | |
| European Investment Bank | | 1.125% | | 9/15/36 | EUR | 33,000 | | 42,300 | |
2 | European Investment Bank | | 1.250% | | 11/5/20 | CAD | 3,500 | | 2,643 | |
| European Investment Bank | | 1.250% | | 11/5/20 | CAD | 650 | | 491 | |
| European Investment Bank | | 1.250% | | 11/13/26 | EUR | 6,000 | | 7,458 | |
| European Investment Bank | | 1.375% | | 9/15/21 | EUR | 35,000 | | 40,394 | |
| European Investment Bank | | 1.375% | | 5/12/28 | SEK | 75,000 | | 8,369 | |
| European Investment Bank | | 1.500% | | 4/15/21 | EUR | 43,000 | | 49,351 | |
| European Investment Bank | | 1.500% | | 8/2/24 | CHF | 11,400 | | 12,722 | |
| European Investment Bank | | 1.500% | | 11/15/47 | EUR | 5,000 | | 7,136 | |
| European Investment Bank | | 1.500% | | 10/16/48 | EUR | 12,975 | | 18,534 | |
| European Investment Bank | | 1.625% | | 3/15/23 | EUR | 56,150 | | 67,014 | |
| European Investment Bank | | 1.625% | | 2/4/25 | CHF | 2,500 | | 2,828 | |
| European Investment Bank | | 1.750% | | 9/15/45 | EUR | 20,000 | | 29,531 | |
| European Investment Bank | | 2.125% | | 1/15/24 | EUR | 17,000 | | 20,978 | |
| European Investment Bank | | 2.250% | | 5/25/21 | PLN | 10,000 | | 2,646 | |
2 | European Investment Bank | | 2.250% | | 7/30/21 | CAD | 26,015 | | 19,929 | |
| European Investment Bank | | 2.250% | | 10/14/22 | EUR | 27,000 | | 32,561 | |
2 | European Investment Bank | | 2.375% | | 1/18/23 | CAD | 2,800 | | 2,166 | |
| European Investment Bank | | 2.375% | | 7/6/23 | CAD | 300 | | 233 | |
| European Investment Bank | | 2.500% | | 10/31/22 | GBP | 5,500 | | 7,491 | |
| European Investment Bank | | 2.625% | | 3/15/35 | EUR | 7,100 | | 10,855 | |
| European Investment Bank | | 2.700% | | 1/12/23 | AUD | 3,100 | | 2,237 | |
| European Investment Bank | | 2.750% | | 9/15/21 | EUR | 5,000 | | 5,917 | |
| European Investment Bank | | 2.750% | | 9/15/25 | EUR | 40,000 | | 52,745 | |
| European Investment Bank | | 2.750% | | 8/25/26 | PLN | 10,000 | | 2,737 | |
| European Investment Bank | | 2.750% | | 9/13/30 | EUR | 30,000 | | 43,600 | |
| European Investment Bank | | 2.750% | | 3/15/40 | EUR | 18,550 | | 30,471 | |
| European Investment Bank | | 3.000% | | 9/28/22 | EUR | 4,000 | | 4,918 | |
| European Investment Bank | | 3.000% | | 10/14/33 | EUR | 10,000 | | 15,610 | |
| European Investment Bank | | 3.100% | | 8/17/26 | AUD | 23,513 | | 17,931 | |
| European Investment Bank | | 3.125% | | 6/30/36 | CHF | 1,000 | | 1,544 | |
| European Investment Bank | | 3.300% | | 2/3/28 | AUD | 3,250 | | 2,543 | |
| European Investment Bank | | 3.500% | | 4/15/27 | EUR | 5,000 | | 7,184 | |
| European Investment Bank | | 3.625% | | 3/14/42 | EUR | 5,600 | | 10,635 | |
| European Investment Bank | | 3.750% | | 12/7/27 | GBP | 3,800 | | 6,023 | |
| European Investment Bank | | 3.875% | | 6/8/37 | GBP | 4,800 | | 8,740 | |
| European Investment Bank | | 4.000% | | 4/15/30 | EUR | 7,125 | | 11,359 | |
| European Investment Bank | | 4.500% | | 10/15/25 | EUR | 15,000 | | 21,676 | |
| European Investment Bank | | 4.500% | | 6/7/29 | GBP | 12,000 | | 20,556 | |
| European Investment Bank | | 4.500% | | 3/7/44 | GBP | 8,500 | | 18,256 | |
| European Investment Bank | | 4.625% | | 10/12/54 | GBP | 7,700 | | 19,046 | |
| European Investment Bank | | 4.750% | | 8/7/24 | AUD | 3,250 | | 2,597 | |
| European Investment Bank | | 5.000% | | 12/1/20 | SEK | 25,000 | | 2,723 | |
| European Investment Bank | | 5.000% | | 8/22/22 | AUD | 10,300 | | 7,847 | |
| European Investment Bank | | 5.000% | | 4/15/39 | GBP | 7,000 | | 14,906 | |
| European Investment Bank | | 5.500% | | 4/15/25 | GBP | 10,000 | | 16,151 | |
100
Total International Bond Index Fund
| | | | | | | Face | | Market | |
| | | | | Maturity | | Amount | | Value· | |
| | | Coupon | | Date | Currency | (000 | ) | ($000 | ) |
| European Investment Bank | | 6.000% | | 12/7/28 | GBP | 16,000 | | 29,698 | |
| European Investment Bank | | 6.250% | | 6/8/21 | AUD | 15,500 | | 11,541 | |
| European Stability Mechanism | | 0.000% | | 1/17/22 | EUR | 1,700 | | 1,915 | |
| European Stability Mechanism | | 0.000% | | 10/18/22 | EUR | 55,000 | | 62,140 | |
| European Stability Mechanism | | 0.100% | | 11/3/20 | EUR | 10,000 | | 11,216 | |
| European Stability Mechanism | | 0.100% | | 7/31/23 | EUR | 41,000 | | 46,590 | |
| European Stability Mechanism | | 0.125% | | 4/22/24 | EUR | 64,000 | | 72,871 | |
| European Stability Mechanism | | 0.500% | | 3/2/26 | EUR | 21,700 | | 25,414 | |
| European Stability Mechanism | | 0.500% | | 3/5/29 | EUR | 42,000 | | 49,634 | |
| European Stability Mechanism | | 0.750% | | 3/15/27 | EUR | 25,000 | | 29,943 | |
| European Stability Mechanism | | 0.750% | | 9/5/28 | EUR | 20,000 | | 24,112 | |
| European Stability Mechanism | | 1.000% | | 9/23/25 | EUR | 40,000 | | 48,067 | |
| European Stability Mechanism | | 1.125% | | 5/3/32 | EUR | 15,000 | | 18,985 | |
| European Stability Mechanism | | 1.200% | | 5/23/33 | EUR | 30,000 | | 38,455 | |
| European Stability Mechanism | | 1.375% | | 3/4/21 | EUR | 37,800 | | 43,197 | |
| European Stability Mechanism | | 1.625% | | 11/17/36 | EUR | 39,950 | | 54,814 | |
| European Stability Mechanism | | 1.750% | | 10/20/45 | EUR | 10,000 | | 14,824 | |
| European Stability Mechanism | | 1.800% | | 11/2/46 | EUR | 15,000 | | 22,535 | |
| European Stability Mechanism | | 1.850% | | 12/1/55 | EUR | 15,000 | | 23,423 | |
| European Stability Mechanism | | 2.125% | | 11/20/23 | EUR | 3,220 | | 3,964 | |
| European Union | | 0.500% | | 4/4/25 | EUR | 50,000 | | 58,377 | |
| European Union | | 0.625% | | 11/4/23 | EUR | 27,000 | | 31,420 | |
| European Union | | 0.750% | | 4/4/31 | EUR | 20,000 | | 24,236 | |
| European Union | | 1.125% | | 4/4/36 | EUR | 20,000 | | 25,502 | |
| European Union | | 1.250% | | 4/4/33 | EUR | 25,000 | | 32,158 | |
| European Union | | 1.375% | | 10/4/29 | EUR | 16,000 | | 20,436 | |
| European Union | | 2.500% | | 11/4/27 | EUR | 19,000 | | 25,840 | |
| European Union | | 2.750% | | 9/21/21 | EUR | 5,000 | | 5,920 | |
| European Union | | 2.750% | | 4/4/22 | EUR | 30,600 | | 36,811 | |
| European Union | | 2.875% | | 4/4/28 | EUR | 5,000 | | 7,033 | |
| European Union | | 3.000% | | 9/4/26 | EUR | 7,125 | | 9,749 | |
| European Union | | 3.375% | | 4/4/38 | EUR | 16,000 | | 27,666 | |
| European Union | | 3.500% | | 6/4/21 | EUR | 22,800 | | 27,047 | |
| European Union | | 3.750% | | 4/4/42 | EUR | 10,000 | | 19,183 | |
| Inter-American Development Bank | | 0.625% | | 12/15/21 | GBP | 2,000 | | 2,582 | |
| Inter-American Development Bank | | 1.250% | | 12/15/25 | GBP | 6,000 | | 7,994 | |
| Inter-American Development Bank | | 1.375% | | 12/15/24 | GBP | 5,000 | | 6,670 | |
| Inter-American Development Bank | | 1.700% | | 10/10/24 | CAD | 12,380 | | 9,317 | |
| Inter-American Development Bank | | 2.750% | | 10/30/25 | AUD | 4,400 | | 3,268 | |
| Inter-American Development Bank | | 3.750% | | 7/25/22 | AUD | 23,800 | | 17,533 | |
| Inter-American Development Bank | | 4.250% | | 6/11/26 | AUD | 1,300 | | 1,056 | |
| Inter-American Development Bank | | 4.400% | | 1/26/26 | CAD | 50 | | 43 | |
| Inter-American Development Bank | | 4.750% | | 8/27/24 | AUD | 4,050 | | 3,241 | |
| Inter-American Development Bank | | 6.000% | | 2/26/21 | AUD | 20,000 | | 14,651 | |
| International Bank for Reconstruction & Development | | 0.250% | | 1/10/50 | EUR | 5,000 | | 5,149 | |
| International Bank for Reconstruction & Development | | 0.375% | | 6/15/21 | GBP | 500 | | 643 | |
| International Bank for Reconstruction & Development | | 0.500% | | 4/16/30 | EUR | 5,400 | | 6,373 | |
| International Bank for Reconstruction & Development | | 0.625% | | 11/22/27 | EUR | 11,000 | | 13,091 | |
| International Bank for Reconstruction & Development | | 0.625% | | 1/12/33 | EUR | 19,000 | | 22,642 | |
101
Total International Bond Index Fund
| | | | | | | Face | | Market | |
| | | | | Maturity | | Amount | | Value· | |
| | | Coupon | | Date | Currency | (000 | ) | ($000 | ) |
| International Bank for Reconstruction & Development | | 0.750% | | 12/7/21 | GBP | 3,600 | | 4,661 | |
| International Bank for Reconstruction & Development | | 0.875% | | 12/13/24 | GBP | 6,000 | | 7,806 | |
| International Bank for Reconstruction & Development | | 1.200% | | 8/8/34 | EUR | 9,646 | | 12,366 | |
| International Bank for Reconstruction & Development | | 1.375% | | 12/15/20 | GBP | 32,400 | | 42,238 | |
| International Bank for Reconstruction & Development | | 1.800% | | 7/26/24 | CAD | 11,580 | | 8,790 | |
| International Bank for Reconstruction & Development | | 1.950% | | 9/20/29 | CAD | 1,805 | | 1,372 | |
| International Bank for Reconstruction & Development | | 2.200% | | 1/18/22 | CAD | 13,410 | | 10,284 | |
| International Bank for Reconstruction & Development | | 2.200% | | 2/27/24 | AUD | 5,600 | | 4,011 | |
| International Bank for Reconstruction & Development | | 2.250% | | 1/17/23 | CAD | 5,400 | | 4,164 | |
| International Bank for Reconstruction & Development | | 2.500% | | 8/3/23 | CAD | 1,060 | | 826 | |
| International Bank for Reconstruction & Development | | 2.600% | | 9/20/22 | AUD | 12,000 | | 8,605 | |
| International Bank for Reconstruction & Development | | 2.800% | | 1/13/21 | AUD | 11,000 | | 7,733 | |
| International Bank for Reconstruction & Development | | 2.800% | | 1/12/22 | AUD | 22,400 | | 15,987 | |
| International Bank for Reconstruction & Development | | 2.900% | | 11/26/25 | AUD | 10,400 | | 7,804 | |
| International Bank for Reconstruction & Development | | 3.000% | | 2/2/23 | NZD | 10,000 | | 6,754 | |
| International Bank for Reconstruction & Development | | 3.000% | | 10/19/26 | AUD | 12,300 | | 9,346 | |
| International Bank for Reconstruction & Development | | 3.300% | | 8/14/28 | AUD | 1,800 | | 1,417 | |
| International Bank for Reconstruction & Development | | 3.375% | | 1/25/22 | NZD | 12,000 | | 8,050 | |
| International Bank for Reconstruction & Development | | 4.250% | | 6/24/25 | AUD | 12,600 | | 10,053 | |
| International Bank for Reconstruction & Development | | 4.625% | | 10/6/21 | NZD | 5,804 | | 3,959 | |
| International Bank for Reconstruction & Development | | 4.875% | | 12/7/28 | GBP | 400 | | 699 | |
| International Bank for Reconstruction & Development | | 5.000% | | 3/7/22 | AUD | 4,000 | | 3,001 | |
| International Bank for Reconstruction & Development | | 5.400% | | 6/7/21 | GBP | 200 | | 277 | |
| International Bank for Reconstruction & Development | | 5.750% | | 6/7/32 | GBP | 6,000 | | 12,141 | |
| International Finance Corp. | | 1.250% | | 12/15/23 | GBP | 13,800 | | 18,237 | |
| International Finance Corp. | | 1.375% | | 9/13/24 | CAD | 3,365 | | 2,508 | |
| International Finance Corp. | | 1.375% | | 3/7/25 | GBP | 9,821 | | 13,111 | |
| International Finance Corp. | | 2.375% | | 7/19/23 | CAD | 1,920 | | 1,490 | |
| International Finance Corp. | | 2.700% | | 2/5/21 | AUD | 18,300 | | 12,861 | |
| International Finance Corp. | | 2.800% | | 8/15/22 | AUD | 22,300 | | 16,052 | |
102
Total International Bond Index Fund
| | | | | | | Face | | Market | |
| | | | | Maturity | | Amount | | Value· | |
| | | Coupon | | Date | Currency | (000 | ) | ($000 | ) |
| International Finance Corp. | | 3.150% | | 6/26/29 | AUD | 2,300 | | 1,804 | |
| International Finance Corp. | | 3.200% | | 7/22/26 | AUD | 3,800 | | 2,912 | |
| International Finance Corp. | | 3.200% | | 10/18/27 | AUD | 1,200 | | 930 | |
| International Finance Corp. | | 4.000% | | 4/3/25 | AUD | 1,500 | | 1,177 | |
| International Finance Corp. | | 4.250% | | 8/21/23 | AUD | 12,000 | | 9,191 | |
| Nordic Investment Bank | | 0.125% | | 6/10/24 | EUR | 10,000 | | 11,466 | |
| Nordic Investment Bank | | 0.500% | | 11/3/25 | EUR | 19,600 | | 22,970 | |
| Nordic Investment Bank | | 0.625% | | 11/2/21 | GBP | 1,700 | | 2,194 | |
| Nordic Investment Bank | | 1.125% | | 3/16/22 | GBP | 15,000 | | 19,599 | |
| Nordic Investment Bank | | 4.750% | | 2/28/24 | AUD | 5,240 | | 4,131 | |
| Nordic Investment Bank | | 5.000% | | 4/19/22 | AUD | 11,500 | | 8,650 | |
Total Supranational (Cost $4,329,426) | | | | | | | | 4,490,205 | |
Sweden (1.3%) | | | | | | | | | |
Asset-Backed/Commercial Mortgage-Backed Securities (0.6%) | | | | | |
| Danske Hypotek AB | | 1.000% | | 12/15/21 | SEK | 500,000 | | 52,707 | |
| Lansforsakringar Hypotek AB | | 0.250% | | 4/22/22 | EUR | 1,500 | | 1,697 | |
| Lansforsakringar Hypotek AB | | 0.375% | | 3/14/24 | EUR | 1,400 | | 1,603 | |
| Lansforsakringar Hypotek AB | | 1.500% | | 3/18/21 | EUR | 200 | | 229 | |
| Nordea Hypotek AB | | 1.000% | | 4/8/22 | SEK | 538,000 | | 56,841 | |
| Nordea Hypotek AB | | 1.250% | | 5/19/21 | SEK | 500,000 | | 52,662 | |
| Nordea Hypotek AB | | 1.250% | | 9/20/23 | SEK | 500,000 | | 53,740 | |
| Skandinaviska Enskilda Banken AB | | 0.250% | | 6/20/24 | EUR | 25,000 | | 28,543 | |
| Skandinaviska Enskilda Banken AB | | 0.750% | | 6/16/22 | EUR | 5,000 | | 5,738 | |
| Skandinaviska Enskilda Banken AB | | 0.750% | | 11/15/27 | EUR | 1,100 | | 1,306 | |
| Skandinaviska Enskilda Banken AB | | 1.000% | | 12/18/24 | SEK | 48,000 | | 5,110 | |
| Skandinaviska Enskilda Banken AB | | 1.500% | | 12/15/21 | SEK | 665,000 | | 70,583 | |
| Skandinaviska Enskilda Banken AB | | 1.625% | | 11/4/20 | EUR | 5,000 | | 5,688 | |
| Skandinaviska Enskilda Banken AB | | 4.125% | | 4/7/21 | EUR | 5,000 | | 5,935 | |
| Stadshypotek AB | | 0.050% | | 6/20/22 | EUR | 4,800 | | 5,408 | |
| Stadshypotek AB | | 0.125% | | 10/5/26 | EUR | 500 | | 567 | |
| Stadshypotek AB | | 0.375% | | 2/22/23 | EUR | 8,700 | | 9,925 | |
| Stadshypotek AB | | 0.375% | | 2/21/24 | EUR | 6,900 | | 7,909 | |
| Stadshypotek AB | | 0.375% | | 3/13/26 | EUR | 5,000 | | 5,756 | |
| Stadshypotek AB | | 0.500% | | 7/11/25 | EUR | 3,000 | | 3,477 | |
| Stadshypotek AB | | 0.625% | | 11/10/21 | EUR | 22,700 | | 25,825 | |
| Stadshypotek AB | | 0.750% | | 11/1/27 | EUR | 7,000 | | 8,312 | |
| Stadshypotek AB | | 1.500% | | 12/15/21 | SEK | 280,000 | | 29,825 | |
| Stadshypotek AB | | 1.500% | | 6/1/23 | SEK | 580,000 | | 62,785 | |
| Stadshypotek AB | | 1.500% | | 3/1/24 | SEK | 350,000 | | 38,139 | |
| Stadshypotek AB | | 1.500% | | 12/3/24 | SEK | 222,000 | | 24,309 | |
| Sveriges Sakerstallda Obligationer AB | | 0.250% | | 4/19/23 | EUR | 5,000 | | 5,681 | |
| Sveriges Sakerstallda Obligationer AB | | 0.500% | | 1/29/25 | EUR | 11,000 | | 12,723 | |
| Sveriges Sakerstallda Obligationer AB | | 0.625% | | 10/7/21 | EUR | 31,300 | | 35,579 | |
| Sveriges Sakerstallda Obligationer AB | | 0.625% | | 10/30/25 | EUR | 5,000 | | 5,840 | |
| Sveriges Sakerstallda Obligationer AB | | 0.875% | | 3/29/27 | EUR | 800 | | 956 | |
| Sveriges Sakerstallda Obligationer AB | | 1.000% | | 3/17/21 | SEK | 400,000 | | 41,945 | |
| Swedbank Hypotek AB | | 0.375% | | 3/11/22 | EUR | 5,000 | | 5,673 | |
| Swedbank Hypotek AB | | 0.400% | | 5/8/24 | EUR | 5,000 | | 5,743 | |
| Swedbank Hypotek AB | | 1.000% | | 6/15/22 | SEK | 332,000 | | 35,094 | |
| Swedbank Hypotek AB | | 1.000% | | 12/20/23 | SEK | 400,000 | | 42,640 | |
| Swedbank Hypotek AB | | 1.000% | | 9/18/24 | SEK | 95,000 | | 10,141 | |
| Swedbank Hypotek AB | | 1.125% | | 5/21/21 | EUR | 2,000 | | 2,282 | |
| | | | | | | | | 768,916 | |
103
Total International Bond Index Fund
| | | | | | | Face | | Market | |
| | | | | Maturity | | Amount | | Value· | |
| | | Coupon | | Date | Currency | (000 | ) | ($000 | ) |
Corporate Bonds (0.3%) | | | | | | | | | |
| Akelius Residential Property AB | | 1.125% | | 3/14/24 | EUR | 2,900 | | 3,314 | |
| Akelius Residential Property AB | | 1.750% | | 2/7/25 | EUR | 1,500 | | 1,755 | |
| Alfa Laval Treasury International AB | | 1.375% | | 9/12/22 | EUR | 400 | | 462 | |
| Atlas Copco AB | | 0.625% | | 8/30/26 | EUR | 430 | | 492 | |
| Atlas Copco AB | | 2.500% | | 2/28/23 | EUR | 4,500 | | 5,452 | |
| Danske Hypotek AB | | 1.000% | | 12/21/22 | SEK | 200,000 | | 21,229 | |
| Essity AB | | 1.125% | | 3/27/24 | EUR | 1,700 | | 1,969 | |
| Essity AB | | 1.625% | | 3/30/27 | EUR | 1,600 | | 1,937 | |
| Fastighets AB Balder | | 1.125% | | 3/14/22 | EUR | 10,000 | | 11,369 | |
| Fastighets AB Balder | | 1.875% | | 1/23/26 | EUR | 3,000 | | 3,477 | |
| Heimstaden Bostad AB | | 1.750% | | 12/7/21 | EUR | 4,000 | | 4,589 | |
| Investor AB | | 4.500% | | 5/12/23 | EUR | 2,000 | | 2,586 | |
| Lansforsakringar Bank AB | | 0.875% | | 9/25/23 | EUR | 100 | | 115 | |
| Lansforsakringar Hypotek AB | | 0.250% | | 4/12/23 | EUR | 500 | | 568 | |
| Lansforsakringar Hypotek AB | | 1.250% | | 9/20/23 | SEK | 550,000 | | 59,184 | |
| Lansforsakringar Hypotek AB | | 1.500% | | 9/18/24 | SEK | 160,000 | | 17,476 | |
| Molnlycke Holding AB | | 1.875% | | 2/28/25 | EUR | 5,000 | | 5,953 | |
| Samhallsbyggnadsbolaget i Norden AB | | 1.750% | | 1/14/25 | EUR | 6,000 | | 6,909 | |
| Securitas AB | | 2.625% | | 2/22/21 | EUR | 3,000 | | 3,464 | |
| Skandinaviska Enskilda Banken AB | | 0.150% | | 2/11/21 | EUR | 1,000 | | 1,123 | |
| Skandinaviska Enskilda Banken AB | | 0.375% | | 2/9/26 | EUR | 20,000 | | 23,042 | |
| Skandinaviska Enskilda Banken AB | | 0.750% | | 8/24/21 | EUR | 9,000 | | 10,204 | |
| Skandinaviska Enskilda Banken AB | | 1.000% | | 12/20/23 | SEK | 200,000 | | 21,326 | |
1 | Skandinaviska Enskilda Banken AB | | 1.375% | | 10/31/28 | EUR | 31,575 | | 36,230 | |
| Skandinaviska Enskilda Banken AB | | 2.000% | | 2/19/21 | EUR | 5,000 | | 5,736 | |
1 | Skandinaviska Enskilda Banken AB | | 2.500% | | 5/28/26 | EUR | 14,700 | | 16,960 | |
| SKF AB | | 1.625% | | 12/2/22 | EUR | 700 | | 817 | |
| Svenska Handelsbanken AB | | 0.250% | | 2/28/22 | EUR | 500 | | 562 | |
| Svenska Handelsbanken AB | | 1.125% | | 12/14/22 | EUR | 14,000 | | 16,188 | |
1 | Svenska Handelsbanken AB | | 1.250% | | 3/2/28 | EUR | 5,000 | | 5,729 | |
| Svenska Handelsbanken AB | | 1.625% | | 6/18/22 | GBP | 9,000 | | 11,820 | |
| Svenska Handelsbanken AB | | 3.000% | | 11/20/20 | GBP | 4,100 | | 5,420 | |
| Svenska Handelsbanken AB | | 4.375% | | 10/20/21 | EUR | 1,380 | | 1,677 | |
| Sveriges Sakerstallda Obligationer AB | | 0.250% | | 1/20/21 | EUR | 8,000 | | 8,989 | |
| Swedbank AB | | 0.300% | | 9/6/22 | EUR | 17,100 | | 19,216 | |
| Swedbank AB | | 0.400% | | 8/29/23 | EUR | 5,100 | | 5,754 | |
| Swedbank AB | | 1.000% | | 6/1/22 | EUR | 4,700 | | 5,382 | |
1 | Swedbank AB | | 1.000% | | 11/22/27 | EUR | 5,900 | | 6,630 | |
| Swedbank AB | | 1.250% | | 12/29/21 | GBP | 1,000 | | 1,294 | |
| Swedbank AB | | 1.625% | | 12/28/22 | GBP | 5,700 | | 7,445 | |
| Swedbank Hypotek AB | | 0.500% | | 2/5/26 | EUR | 10,000 | | 11,602 | |
| Swedbank Hypotek AB | | 1.000% | | 12/16/20 | SEK | 550,000 | | 57,459 | |
| Tele2 AB | | 1.125% | | 5/15/24 | EUR | 200 | | 231 | |
| Tele2 AB | | 2.125% | | 5/15/28 | EUR | 6,200 | | 7,605 | |
| Telia Co. AB | | 1.625% | | 2/23/35 | EUR | 200 | | 238 | |
| Telia Co. AB | | 2.125% | | 2/20/34 | EUR | 15,100 | | 18,988 | |
| Telia Co. AB | | 3.000% | | 9/7/27 | EUR | 100 | | 133 | |
1 | Telia Co. AB | | 3.000% | | 4/4/78 | EUR | 100 | | 118 | |
| Telia Co. AB | | 3.500% | | 9/5/33 | EUR | 3,000 | | 4,345 | |
| Telia Co. AB | | 3.625% | | 2/14/24 | EUR | 100 | | 129 | |
| Telia Co. AB | | 3.875% | | 10/1/25 | EUR | 2,000 | | 2,699 | |
| Telia Co. AB | | 4.000% | | 3/22/22 | EUR | 350 | | 428 | |
| Telia Co. AB | | 4.750% | | 11/16/21 | EUR | 3,000 | | 3,676 | |
| | | | | | | | | 471,495 | |
104
Total International Bond Index Fund
| | | | | | | Face | | Market | |
| | | | | Maturity | | Amount | | Value· | |
| | | Coupon | | Date | Currency | (000 | ) | ($000 | ) |
Sovereign Bonds (0.4%) | | | | | | | | | |
| Kingdom of Sweden | | 0.125% | | 4/24/23 | EUR | 30,000 | | 34,150 | |
| Kingdom of Sweden | | 0.750% | | 5/12/28 | SEK | 7,000 | | 786 | |
2 | Kingdom of Sweden | | 0.750% | | 11/12/29 | SEK | 389,000 | | 43,844 | |
| Kingdom of Sweden | | 1.000% | | 11/12/26 | SEK | 345,700 | | 39,056 | |
2 | Kingdom of Sweden | | 1.500% | | 11/13/23 | SEK | 924,200 | | 103,059 | |
| Kingdom of Sweden | | 2.250% | | 6/1/32 | SEK | 175,000 | | 23,297 | |
| Kingdom of Sweden | | 2.500% | | 5/12/25 | SEK | 129,300 | | 15,521 | |
| Kingdom of Sweden | | 3.500% | | 6/1/22 | SEK | 290,750 | | 33,172 | |
| Kingdom of Sweden | | 3.500% | | 3/30/39 | SEK | 231,450 | | 38,943 | |
| Kingdom of Sweden | | 5.000% | | 12/1/20 | SEK | 216,000 | | 23,670 | |
| Kommuninvest I Sverige AB | | 1.000% | | 9/15/21 | SEK | 300,000 | | 31,621 | |
| Kommuninvest I Sverige AB | | 1.000% | | 11/13/23 | SEK | 570,000 | | 61,165 | |
| Kommuninvest I Sverige AB | | 1.000% | | 5/12/25 | SEK | 194,050 | | 20,866 | |
| Kommuninvest I Sverige AB | | 1.000% | | 11/12/26 | SEK | 600,000 | | 64,434 | |
| Kommuninvest I Sverige AB | | 2.500% | | 12/1/20 | SEK | 25,000 | | 2,665 | |
| SBAB Bank AB | | 0.250% | | 9/7/22 | EUR | 5,000 | | 5,623 | |
| Stockholms Lans Landsting | | 0.750% | | 2/26/25 | EUR | 5,000 | | 5,866 | |
| Svensk Exportkredit AB | | 0.625% | | 12/7/20 | GBP | 1,000 | | 1,291 | |
| Vattenfall AB | | 6.250% | | 3/17/21 | EUR | 8,000 | | 9,701 | |
| Vattenfall AB | | 6.875% | | 4/15/39 | GBP | 5,000 | | 11,209 | |
| | | | | | | | | 569,939 | |
Total Sweden (Cost $1,906,293) | | | | | | | | 1,810,350 | |
Switzerland (1.4%) | | | | | | | | | |
Asset-Backed/Commercial Mortgage-Backed Securities (0.5%) | | | | | |
| Credit Suisse AG | | 1.750% | | 1/15/21 | EUR | 47,600 | | 54,410 | |
| Pfandbriefbank schweizerischer Hypothekarinstitute AG | | 0.000% | | 7/5/22 | CHF | 17,500 | | 17,970 | |
| Pfandbriefbank schweizerischer Hypothekarinstitute AG | | 0.125% | | 3/25/24 | CHF | 5,000 | | 5,183 | |
| Pfandbriefbank schweizerischer Hypothekarinstitute AG | | 0.125% | | 9/6/28 | CHF | 13,000 | | 13,472 | |
| Pfandbriefbank schweizerischer Hypothekarinstitute AG | | 0.125% | | 7/15/31 | CHF | 9,250 | | 9,473 | |
| Pfandbriefbank schweizerischer Hypothekarinstitute AG | | 0.250% | | 1/18/27 | CHF | 10,000 | | 10,486 | |
| Pfandbriefbank schweizerischer Hypothekarinstitute AG | | 0.375% | | 10/15/25 | CHF | 5,000 | | 5,279 | |
| Pfandbriefbank schweizerischer Hypothekarinstitute AG | | 0.375% | | 1/26/26 | CHF | 8,000 | | 8,443 | |
| Pfandbriefbank schweizerischer Hypothekarinstitute AG | | 0.375% | | 5/12/27 | CHF | 25,000 | | 26,516 | |
| Pfandbriefbank schweizerischer Hypothekarinstitute AG | | 0.375% | | 7/10/28 | CHF | 5,000 | | 5,292 | |
| Pfandbriefbank schweizerischer Hypothekarinstitute AG | | 0.375% | | 7/8/39 | CHF | 8,300 | | 8,649 | |
| Pfandbriefbank schweizerischer Hypothekarinstitute AG | | 0.500% | | 1/22/29 | CHF | 9,900 | | 10,627 | |
| Pfandbriefbank schweizerischer Hypothekarinstitute AG | | 0.500% | | 6/15/29 | CHF | 15,000 | | 16,088 | |
| Pfandbriefbank schweizerischer Hypothekarinstitute AG | | 0.500% | | 10/5/35 | CHF | 5,000 | | 5,343 | |
105
Total International Bond Index Fund
| | | | | | | Face | | Market | |
| | | | | Maturity | | Amount | | Value· | |
| | | Coupon | | Date | Currency | (000 | ) | ($000 | ) |
| Pfandbriefbank schweizerischer Hypothekarinstitute AG | | 0.625% | | 5/16/31 | CHF | 3,500 | | 3,801 | |
| Pfandbriefbank schweizerischer Hypothekarinstitute AG | | 0.625% | | 4/25/33 | CHF | 5,000 | | 5,437 | |
| Pfandbriefbank schweizerischer Hypothekarinstitute AG | | 0.625% | | 1/23/37 | CHF | 4,000 | | 4,379 | |
| Pfandbriefbank schweizerischer Hypothekarinstitute AG | | 0.875% | | 5/7/35 | CHF | 2,000 | | 2,252 | |
| Pfandbriefbank schweizerischer Hypothekarinstitute AG | | 0.875% | | 6/19/43 | CHF | 5,500 | | 6,383 | |
| Pfandbriefbank schweizerischer Hypothekarinstitute AG | | 1.000% | | 8/13/21 | CHF | 29,000 | | 30,218 | |
| Pfandbriefbank schweizerischer Hypothekarinstitute AG | | 1.000% | | 5/21/24 | CHF | 10,600 | | 11,439 | |
| Pfandbriefbank schweizerischer Hypothekarinstitute AG | | 1.000% | | 5/12/32 | CHF | 7,500 | | 8,521 | |
| Pfandbriefbank schweizerischer Hypothekarinstitute AG | | 1.250% | | 9/29/23 | CHF | 6,980 | | 7,542 | |
| Pfandbriefbank schweizerischer Hypothekarinstitute AG | | 1.375% | | 8/15/22 | CHF | 7,500 | | 8,000 | |
| Pfandbriefbank schweizerischer Hypothekarinstitute AG | | 1.375% | | 2/14/24 | CHF | 8,000 | | 8,728 | |
| Pfandbriefbank schweizerischer Hypothekarinstitute AG | | 1.375% | | 9/20/29 | CHF | 2,000 | | 2,326 | |
| Pfandbriefbank schweizerischer Hypothekarinstitute AG | | 1.500% | | 8/2/33 | CHF | 17,500 | | 21,172 | |
| Pfandbriefbank schweizerischer Hypothekarinstitute AG | | 1.500% | | 12/5/40 | CHF | 5,000 | | 6,406 | |
| Pfandbriefbank schweizerischer Hypothekarinstitute AG | | 1.625% | | 3/15/22 | CHF | 2,000 | | 2,131 | |
| Pfandbriefbank schweizerischer Hypothekarinstitute AG | | 1.625% | | 7/3/30 | CHF | 2,000 | | 2,395 | |
| Pfandbriefbank schweizerischer Hypothekarinstitute AG | | 1.875% | | 9/15/31 | CHF | 10,500 | | 12,998 | |
| Pfandbriefbank schweizerischer Hypothekarinstitute AG | | 2.125% | | 6/28/23 | CHF | 61,000 | | 67,648 | |
| Pfandbriefbank schweizerischer Hypothekarinstitute AG | | 2.250% | | 8/13/32 | CHF | 10,200 | | 13,254 | |
| Pfandbriefbank schweizerischer Hypothekarinstitute AG | | 2.375% | | 1/25/24 | CHF | 3,500 | | 3,967 | |
| Pfandbriefbank schweizerischer Hypothekarinstitute AG | | 2.500% | | 3/30/26 | CHF | 11,900 | | 14,238 | |
| Pfandbriefbank schweizerischer Hypothekarinstitute AG | | 2.500% | | 2/16/27 | CHF | 2,000 | | 2,436 | |
| Pfandbriefbank schweizerischer Hypothekarinstitute AG | | 2.750% | | 12/15/26 | CHF | 3,000 | | 3,694 | |
| Pfandbriefbank schweizerischer Hypothekarinstitute AG | | 2.875% | | 2/14/22 | CHF | 3,000 | | 3,279 | |
| Pfandbriefzentrale der schweizerischen Kantonalbanken AG | | 0.000% | | 7/25/23 | CHF | 17,000 | | 17,524 | |
| Pfandbriefzentrale der schweizerischen Kantonalbanken AG | | 0.000% | | 6/14/24 | CHF | 32,500 | | 33,533 | |
| Pfandbriefzentrale der schweizerischen Kantonalbanken AG | | 0.050% | | 11/6/26 | CHF | 10,000 | | 10,347 | |
106
Total International Bond Index Fund
| | | | | | | Face | | Market | |
| | | | | Maturity | | Amount | | Value· | |
| | | Coupon | | Date | Currency | (000 | ) | ($000 | ) |
| Pfandbriefzentrale der schweizerischen Kantonalbanken AG | | 0.125% | | 3/12/24 | CHF | 15,000 | | 15,541 | |
| Pfandbriefzentrale der schweizerischen Kantonalbanken AG | | 0.125% | | 12/2/24 | CHF | 15,000 | | 15,580 | |
| Pfandbriefzentrale der schweizerischen Kantonalbanken AG | | 0.125% | | 9/2/31 | CHF | 7,000 | | 7,179 | |
| Pfandbriefzentrale der schweizerischen Kantonalbanken AG | | 0.250% | | 12/1/25 | CHF | 14,350 | | 15,034 | |
| Pfandbriefzentrale der schweizerischen Kantonalbanken AG | | 0.250% | | 2/11/28 | CHF | 985 | | 1,033 | |
| Pfandbriefzentrale der schweizerischen Kantonalbanken AG | | 0.300% | | 6/6/31 | CHF | 7,500 | | 7,846 | |
| Pfandbriefzentrale der schweizerischen Kantonalbanken AG | | 0.375% | | 8/30/23 | CHF | 7,500 | | 7,839 | |
| Pfandbriefzentrale der schweizerischen Kantonalbanken AG | | 0.500% | | 7/28/25 | CHF | 5,000 | | 5,308 | |
| Pfandbriefzentrale der schweizerischen Kantonalbanken AG | | 0.500% | | 4/30/30 | CHF | 5,000 | | 5,362 | |
| Pfandbriefzentrale der schweizerischen Kantonalbanken AG | | 0.500% | | 9/20/30 | CHF | 17,500 | | 18,733 | |
| Pfandbriefzentrale der schweizerischen Kantonalbanken AG | | 0.600% | | 12/11/35 | CHF | 3,000 | | 3,253 | |
| Pfandbriefzentrale der schweizerischen Kantonalbanken AG | | 0.650% | | 2/15/33 | CHF | 10,000 | | 10,915 | |
| Pfandbriefzentrale der schweizerischen Kantonalbanken AG | | 0.750% | | 4/15/24 | CHF | 1,000 | | 1,065 | |
| Pfandbriefzentrale der schweizerischen Kantonalbanken AG | | 0.750% | | 9/23/24 | CHF | 2,200 | | 2,352 | |
| Pfandbriefzentrale der schweizerischen Kantonalbanken AG | | 0.875% | | 4/16/21 | CHF | 2,000 | | 2,071 | |
| Pfandbriefzentrale der schweizerischen Kantonalbanken AG | | 0.875% | | 6/20/22 | CHF | 18,000 | | 18,900 | |
| Pfandbriefzentrale der schweizerischen Kantonalbanken AG | | 1.000% | | 2/17/21 | CHF | 7,000 | | 7,238 | |
| Pfandbriefzentrale der schweizerischen Kantonalbanken AG | | 1.000% | | 9/9/22 | CHF | 8,500 | | 8,987 | |
| Pfandbriefzentrale der schweizerischen Kantonalbanken AG | | 1.000% | | 9/22/28 | CHF | 5,000 | | 5,588 | |
| Pfandbriefzentrale der schweizerischen Kantonalbanken AG | | 1.125% | | 4/28/23 | CHF | 6,675 | | 7,137 | |
| Pfandbriefzentrale der schweizerischen Kantonalbanken AG | | 1.250% | | 2/3/22 | CHF | 4,000 | | 4,219 | |
| Pfandbriefzentrale der schweizerischen Kantonalbanken AG | | 1.375% | | 3/19/27 | CHF | 8,000 | | 9,065 | |
| Pfandbriefzentrale der schweizerischen Kantonalbanken AG | | 1.375% | | 11/5/27 | CHF | 3,000 | | 3,430 | |
| Pfandbriefzentrale der schweizerischen Kantonalbanken AG | | 1.500% | | 5/21/29 | CHF | 1,000 | | 1,170 | |
| Pfandbriefzentrale der schweizerischen Kantonalbanken AG | | 1.625% | | 6/17/26 | CHF | 7,000 | | 7,998 | |
| Pfandbriefzentrale der schweizerischen Kantonalbanken AG | | 2.000% | | 10/30/25 | CHF | 3,000 | | 3,469 | |
107
Total International Bond Index Fund
| | | | | | | Face | | Market | |
| | | | | Maturity | | Amount | | Value· | |
| | | Coupon | | Date | Currency | (000 | ) | ($000 | ) |
| Pfandbriefzentrale der schweizerischen Kantonalbanken AG | | 2.250% | | 6/16/23 | CHF | 10,500 | | 11,688 | |
| UBS AG | | 1.375% | | 4/16/21 | EUR | 5,000 | | 5,713 | |
| | | | | | | | | 724,992 | |
Corporate Bonds (0.4%) | | | | | | | | | |
| ABB Ltd. | | 2.250% | | 10/11/21 | CHF | 2,000 | | 2,132 | |
| Adecco International Financial Services BV | | 1.000% | | 12/2/24 | EUR | 1,000 | | 1,168 | |
1 | Aquarius and Investments plc for Zurich Insurance Co. Ltd. | | 4.250% | | 10/2/43 | EUR | 10,910 | | 13,869 | |
1 | Argentum Netherlands BV for Zurich Insurance Co. Ltd. | | 2.750% | | 2/19/49 | EUR | 3,000 | | 3,717 | |
| Barry Callebaut Services NV | | 2.375% | | 5/24/24 | EUR | 3,600 | | 4,363 | |
| Cloverie plc for Zurich Insurance Co. Ltd. | | 1.750% | | 9/16/24 | EUR | 5,400 | | 6,502 | |
| Coca-Cola HBC Finance BV | | 1.875% | | 11/11/24 | EUR | 200 | | 242 | |
| Credit Suisse AG | | 1.000% | | 6/7/23 | EUR | 10,000 | | 11,539 | |
| Credit Suisse AG | | 1.375% | | 1/31/22 | EUR | 15,748 | | 18,144 | |
| Credit Suisse AG | | 1.500% | | 4/10/26 | EUR | 800 | | 965 | |
| Credit Suisse Group AG | | 0.650% | | 9/10/29 | EUR | 5,000 | | 5,516 | |
1 | Credit Suisse Group AG | | 1.000% | | 6/24/27 | EUR | 15,000 | | 17,185 | |
1 | Credit Suisse Group AG | | 2.125% | | 9/12/25 | GBP | 4,400 | | 5,778 | |
| Credit Suisse Group Funding Guernsey Ltd. | | 1.000% | | 4/14/23 | CHF | 10,000 | | 10,459 | |
| Credit Suisse Group Funding Guernsey Ltd. | | 1.250% | | 4/14/22 | EUR | 25,600 | | 29,411 | |
| Credit Suisse Group Funding Guernsey Ltd. | | 3.000% | | 5/27/22 | GBP | 1,500 | | 2,025 | |
1 | Demeter Investments BV for Zurich Insurance Co. Ltd. | | 3.500% | | 10/1/46 | EUR | 27,950 | | 35,903 | |
1 | ELM BV for Swiss Life Insurance & Pension Group | | 4.500% | | 12/29/49 | EUR | 2,650 | | 3,484 | |
| Flughafen Zuerich AG | | 1.500% | | 4/17/23 | CHF | 3,000 | | 3,230 | |
| Glencore Finance Europe Ltd. | | 1.250% | | 3/17/21 | EUR | 16,098 | | 18,175 | |
| Glencore Finance Europe Ltd. | | 1.500% | | 10/15/26 | EUR | 300 | | 340 | |
| Glencore Finance Europe Ltd. | | 1.625% | | 1/18/22 | EUR | 600 | | 687 | |
| Glencore Finance Europe Ltd. | | 1.750% | | 3/17/25 | EUR | 12,300 | | 14,230 | |
| Glencore Finance Europe Ltd. | | 1.875% | | 9/13/23 | EUR | 300 | | 351 | |
| Glencore Finance Europe Ltd. | | 2.750% | | 4/1/21 | EUR | 300 | | 344 | |
| Glencore Finance Europe Ltd. | | 3.750% | | 4/1/26 | EUR | 200 | | 257 | |
| Glencore Finance Europe Ltd. | | 6.000% | | 4/3/22 | GBP | 8,000 | | 11,436 | |
| Holcim Finance Australia Pty Ltd. | | 3.500% | | 6/16/22 | AUD | 1,350 | | 969 | |
| Holcim Finance Luxembourg SA | | 1.375% | | 5/26/23 | EUR | 10,500 | | 12,200 | |
| Holcim Finance Luxembourg SA | | 2.250% | | 5/26/28 | EUR | 4,500 | | 5,604 | |
| Holcim Finance Luxembourg SA | | 3.000% | | 1/22/24 | EUR | 5,600 | | 6,996 | |
| Holcim Overseas Finance Ltd. | | 3.375% | | 6/10/21 | CHF | 2,000 | | 2,138 | |
| LafargeHolcim Ltd. | | 3.000% | | 11/22/22 | CHF | 3,000 | | 3,326 | |
| LafargeHolcim Sterling Finance Netherlands BV | | 3.000% | | 5/12/32 | GBP | 800 | | 1,093 | |
| LGT Bank AG | | 1.500% | | 5/10/21 | CHF | 1,000 | | 1,043 | |
| Nestle Finance International Ltd. | | 0.375% | | 1/18/24 | EUR | 12,000 | | 13,664 | |
| Nestle Finance International Ltd. | | 1.250% | | 11/2/29 | EUR | 3,000 | | 3,698 | |
| Nestle Finance International Ltd. | | 1.750% | | 9/12/22 | EUR | 6,100 | | 7,186 | |
| Nestle Finance International Ltd. | | 1.750% | | 11/2/37 | EUR | 6,100 | | 8,171 | |
| Nestle Finance International Ltd. | | 2.250% | | 11/30/23 | GBP | 900 | | 1,235 | |
| Nestle Holdings Inc. | | 1.750% | | 12/9/20 | GBP | 12,000 | | 15,690 | |
| Novartis AG | | 0.625% | | 11/13/29 | CHF | 2,750 | | 2,952 | |
| Novartis Finance SA | | 0.125% | | 9/20/23 | EUR | 100 | | 113 | |
| Novartis Finance SA | | 0.500% | | 8/14/23 | EUR | 5,000 | | 5,702 | |
108
Total International Bond Index Fund
| | | | | | | Face | | Market | |
| | | | | Maturity | | Amount | | Value· | |
| | | Coupon | | Date | Currency | (000 | ) | ($000 | ) |
| Novartis Finance SA | | 0.625% | | 9/20/28 | EUR | 100 | | 115 | |
| Novartis Finance SA | | 1.375% | | 8/14/30 | EUR | 8,100 | | 9,893 | |
| Novartis Finance SA | | 1.625% | | 11/9/26 | EUR | 5,000 | | 6,183 | |
| Pfandbriefbank schweizerischer Hypothekarinstitute AG | | 0.500% | | 5/5/28 | CHF | 8,000 | | 8,571 | |
| Pfandbriefzentrale der schweizerischen Kantonalbanken AG | | 0.550% | | 1/29/31 | CHF | 9,500 | | 10,261 | |
| Pfandbriefzentrale der schweizerischen Kantonalbanken AG | | 0.700% | | 3/4/39 | CHF | 5,000 | | 5,554 | |
| Richemont International Holding SA | | 1.000% | | 3/26/26 | EUR | 15,400 | | 18,047 | |
| Richemont International Holding SA | | 2.000% | | 3/26/38 | EUR | 15,400 | | 20,606 | |
| Roche Finance Europe BV | | 0.500% | | 2/27/23 | EUR | 9,000 | | 10,244 | |
| Roche Finance Europe BV | | 0.875% | | 2/25/25 | EUR | 600 | | 699 | |
| Roche Holdings Inc. | | 6.500% | | 3/4/21 | EUR | 16,195 | | 19,709 | |
1 | Swiss Re Finance Luxembourg SA | | 2.534% | | 4/30/50 | EUR | 4,000 | | 4,950 | |
| UBS AG | | 0.125% | | 11/5/21 | EUR | 8,000 | | 8,968 | |
| UBS AG | | 1.250% | | 12/10/20 | GBP | 4,000 | | 5,192 | |
| UBS AG | | 1.250% | | 9/3/21 | EUR | 1,700 | | 1,945 | |
| UBS Group Funding Jersey Ltd. | | 1.250% | | 9/1/26 | EUR | 26,500 | | 31,348 | |
| UBS Group Funding Jersey Ltd. | | 1.500% | | 11/30/24 | EUR | 12,700 | | 14,914 | |
| UBS Group Funding Jersey Ltd. | | 1.750% | | 11/16/22 | EUR | 5,000 | | 5,860 | |
| UBS Group Funding Jersey Ltd. | | 2.125% | | 3/4/24 | EUR | 800 | | 967 | |
1 | UBS Group Funding Switzerland AG | | 1.250% | | 4/17/25 | EUR | 21,000 | | 24,410 | |
| Willow No.2 Ireland plc for Zurich Insurance Co. Ltd. | | 3.375% | | 6/27/22 | EUR | 1,000 | | 1,216 | |
| Zurich Finance Australia Ltd. | | 3.477% | | 5/31/23 | AUD | 700 | | 511 | |
| Zurich Finance Ireland Designated Activity Co. | | 1.625% | | 6/17/39 | EUR | 10,000 | | 12,253 | |
| | | | | | | | | 535,648 | |
Sovereign Bonds (0.5%) | | | | | | | | | |
| Basellandschaftliche Kantonalbank | | 0.000% | | 3/23/23 | CHF | 6,000 | | 6,168 | |
| Basellandschaftliche Kantonalbank | | 1.750% | | 11/9/20 | CHF | 9,500 | | 9,855 | |
| Basler Kantonalbank | | 0.000% | | 4/11/22 | CHF | 5,000 | | 5,129 | |
| Basler Kantonalbank | | 0.300% | | 6/22/27 | CHF | 4,500 | | 4,728 | |
| Basler Kantonalbank | | 0.375% | | 8/10/23 | CHF | 5,300 | | 5,526 | |
| Basler Kantonalbank | | 2.500% | | 3/24/21 | CHF | 9,300 | | 9,813 | |
| Canton of Basel-Landschaft | | 1.375% | | 9/29/34 | CHF | 11,600 | | 14,278 | |
| Canton of Geneva Switzerland | | 0.400% | | 4/28/36 | CHF | 5,000 | �� | 5,257 | |
| Canton of Geneva Switzerland | | 0.600% | | 7/4/46 | CHF | 2,990 | | 3,331 | |
| Canton of Geneva Switzerland | | 1.500% | | 3/5/32 | CHF | 1,600 | | 1,917 | |
| Canton of Geneva Switzerland | | 1.625% | | 7/30/29 | CHF | 3,550 | | 4,214 | |
| Canton of Geneva Switzerland | | 2.250% | | 2/22/21 | CHF | 4,600 | | 4,832 | |
| Canton of Vaud | | 2.000% | | 10/24/33 | CHF | 8,905 | | 11,677 | |
| Canton of Zurich | | 0.000% | | 6/27/25 | CHF | 10,000 | | 10,418 | |
| Canton of Zurich | | 0.500% | | 12/3/20 | CHF | 4,595 | | 4,720 | |
| Canton of Zurich | | 1.250% | | 7/29/22 | CHF | 7,300 | | 7,779 | |
| Canton of Zurich | | 1.250% | | 12/3/32 | CHF | 3,000 | | 3,586 | |
| Canton of Zurich | | 2.000% | | 7/29/38 | CHF | 10,000 | | 13,878 | |
| Lunar Funding V for Swisscom AG | | 1.875% | | 9/8/21 | EUR | 2,000 | | 2,308 | |
| Luzerner Kantonalbank AG | | 1.125% | | 6/30/23 | CHF | 8,000 | | 8,565 | |
| Swiss Confederation | | 0.000% | | 6/22/29 | CHF | 26,000 | | 27,806 | |
| Swiss Confederation | | 0.500% | | 5/27/30 | CHF | 12,000 | | 13,519 | |
| Swiss Confederation | | 0.500% | | 6/27/32 | CHF | 14,200 | | 16,083 | |
| Swiss Confederation | | 0.500% | | 6/28/45 | CHF | 10,000 | | 12,054 | |
109
Total International Bond Index Fund
| | | | | | | Face | | Market | |
| | | | | Maturity | | Amount | | Value· | |
| | | Coupon | | Date | Currency | (000 | ) | ($000 | ) |
| Swiss Confederation | | 0.500% | | 5/24/55 | CHF | 6,000 | | 7,389 | |
| Swiss Confederation | | 0.500% | | 5/30/58 | CHF | 13,000 | | 16,480 | |
| Swiss Confederation | | 1.250% | | 6/11/24 | CHF | 21,200 | | 23,498 | |
| Swiss Confederation | | 1.250% | | 5/28/26 | CHF | 30,800 | | 35,274 | |
| Swiss Confederation | | 1.250% | | 6/27/37 | CHF | 35,250 | | 45,682 | |
| Swiss Confederation | | 1.500% | | 7/24/25 | CHF | 17,450 | | 19,949 | |
| Swiss Confederation | | 1.500% | | 4/30/42 | CHF | 56,100 | | 79,409 | |
| Swiss Confederation | | 2.000% | | 4/28/21 | CHF | 3,850 | | 4,065 | |
| Swiss Confederation | | 2.000% | | 5/25/22 | CHF | 49,400 | | 53,669 | |
| Swiss Confederation | | 2.000% | | 6/25/64 | CHF | 6,800 | | 13,384 | |
| Swiss Confederation | | 2.250% | | 7/6/20 | CHF | 2,500 | | 2,588 | |
| Swiss Confederation | | 2.250% | | 6/22/31 | CHF | 17,500 | | 23,520 | |
| Swiss Confederation | | 2.500% | | 3/8/36 | CHF | 6,150 | | 9,146 | |
| Swiss Confederation | | 3.250% | | 6/27/27 | CHF | 9,000 | | 11,895 | |
| Swiss Confederation | | 3.500% | | 4/8/33 | CHF | 10,600 | | 16,469 | |
| Swiss Confederation | | 4.000% | | 2/11/23 | CHF | 2,405 | | 2,824 | |
| Swiss Confederation | | 4.000% | | 4/8/28 | CHF | 400 | | 567 | |
| Swiss Confederation | | 4.000% | | 1/6/49 | CHF | 4,500 | | 10,268 | |
| Swisscom AG | | 1.750% | | 7/10/24 | CHF | 2,000 | | 2,227 | |
| Swisscom AG | | 2.625% | | 8/31/22 | CHF | 11,000 | | 12,101 | |
| Zuercher Kantonalbank | | 0.030% | | 2/11/22 | CHF | 5,000 | | 5,130 | |
| Zuercher Kantonalbank | | 0.125% | | 5/13/26 | CHF | 1,640 | | 1,703 | |
| Zuercher Kantonalbank | | 0.250% | | 3/31/21 | CHF | 20,000 | | 20,515 | |
| Zuercher Kantonalbank | | 0.250% | | 1/27/26 | CHF | 5,000 | | 5,233 | |
| Zuercher Kantonalbank | | 1.250% | | 1/31/22 | CHF | 17,000 | | 17,935 | |
| Zuercher Kantonalbank | | 2.125% | | 6/29/22 | CHF | 16,400 | | 17,772 | |
| | | | | | | | | 666,133 | |
Total Switzerland (Cost $1,873,015) | | | | | | | | 1,926,773 | |
Thailand (0.8%) | | | | | | | | | |
Sovereign Bonds (0.8%) | | | | | | | | | |
| Bank of Thailand Bond | | 1.620% | | 3/12/21 | THB | 700,000 | | 23,239 | |
| Bank of Thailand Bond | | 1.810% | | 3/25/22 | THB | 1,700,000 | | 56,814 | |
| Bank of Thailand Bond | | 1.840% | | 5/27/21 | THB | 700,000 | | 23,330 | |
| Bank of Thailand Bond | | 2.090% | | 9/24/21 | THB | 600,000 | | 20,121 | |
| Kingdom of Thailand | | 1.450% | | 12/17/24 | THB | 425,000 | | 14,085 | |
| Kingdom of Thailand | | 1.875% | | 6/17/22 | THB | 1,700,000 | | 56,974 | |
| Kingdom of Thailand | | 2.000% | | 12/17/22 | THB | 100,000 | | 3,371 | |
| Kingdom of Thailand | | 2.125% | | 12/17/26 | THB | 1,100,000 | | 37,916 | |
| Kingdom of Thailand | | 2.400% | | 12/17/23 | THB | 2,602,000 | | 89,535 | |
| Kingdom of Thailand | | 2.550% | | 6/26/20 | THB | 998,000 | | 33,289 | |
| Kingdom of Thailand | | 2.875% | | 12/17/28 | THB | 311,050 | | 11,459 | |
| Kingdom of Thailand | | 2.875% | | 6/17/46 | THB | 1,129,525 | | 45,811 | |
| Kingdom of Thailand | | 3.300% | | 6/17/38 | THB | 455,000 | | 18,906 | |
| Kingdom of Thailand | | 3.400% | | 6/17/36 | THB | 3,221,200 | | 133,914 | |
| Kingdom of Thailand | | 3.580% | | 12/17/27 | THB | 1,077,000 | | 41,212 | |
| Kingdom of Thailand | | 3.600% | | 6/17/67 | THB | 2,092,500 | | 98,648 | |
| Kingdom of Thailand | | 3.625% | | 6/16/23 | THB | 600,000 | | 21,409 | |
| Kingdom of Thailand | | 3.650% | | 12/17/21 | THB | 2,200,000 | | 76,309 | |
| Kingdom of Thailand | | 3.650% | | 6/20/31 | THB | 1,330,000 | | 53,642 | |
| Kingdom of Thailand | | 3.775% | | 6/25/32 | THB | 1,584,000 | | 65,549 | |
| Kingdom of Thailand | | 3.800% | | 6/14/41 | THB | 150,000 | | 6,798 | |
| Kingdom of Thailand | | 3.850% | | 12/12/25 | THB | 1,250,000 | | 47,170 | |
| Kingdom of Thailand | | 4.000% | | 6/17/66 | THB | 325,000 | | 16,562 | |
110
Total International Bond Index Fund
| | | | | | | Face | | Market | |
| | | | | Maturity | | Amount | | Value· | |
| | | Coupon | | Date | Currency | (000 | ) | ($000 | ) |
| Kingdom of Thailand | | 4.260% | | 12/12/37 | THB | 277,000 | | 12,320 | |
| Kingdom of Thailand | | 4.675% | | 6/29/44 | THB | 751,000 | | 38,957 | |
| Kingdom of Thailand | | 4.875% | | 6/22/29 | THB | 1,740,000 | | 74,673 | |
| Kingdom of Thailand | | 5.500% | | 3/13/23 | THB | 130,000 | | 4,880 | |
| Kingdom of Thailand | | 5.670% | | 3/13/28 | THB | 120,000 | | 5,253 | |
Total Thailand (Cost $943,745) | | | | | | | | 1,132,146 | |
United Arab Emirates (0.0%) | | | | | | | | | |
Sovereign Bonds (0.0%) | | | | | | | | | |
| DP World plc | | 2.375% | | 9/25/26 | EUR | 400 | | 481 | |
| DP World plc | | 4.250% | | 9/25/30 | GBP | 2,000 | | 2,860 | |
| Emirates NBD PJSC | | 1.750% | | 3/23/22 | EUR | 3,000 | | 3,475 | |
| Emirates NBD PJSC | | 4.750% | | 2/18/22 | AUD | 1,400 | | 1,021 | |
| Emirates NBD PJSC | | 4.750% | | 2/9/28 | AUD | 1,400 | | 1,094 | |
| Emirates Telecommunications Group Co. PJSC | | 1.750% | | 6/18/21 | EUR | 6,500 | | 7,454 | |
| Emirates Telecommunications Group Co. PJSC | | 2.750% | | 6/18/26 | EUR | 3,000 | | 3,856 | |
| IPIC GMTN Ltd. | | 3.625% | | 5/30/23 | EUR | 3,000 | | 3,751 | |
| IPIC GMTN Ltd. | | 5.875% | | 3/14/21 | EUR | 7,500 | | 9,053 | |
| IPIC GMTN Ltd. | | 6.875% | | 3/14/26 | GBP | 640 | | 1,096 | |
Total United Arab Emirates (Cost $34,822) | | | | | | | | 34,141 | |
United Kingdom (7.3%) | | | | | | | | | |
Asset-Backed/Commercial Mortgage-Backed Securities (0.3%) | | | | | | | |
| AA Bond Co. Ltd. | | 2.875% | | 1/31/22 | GBP | 6,250 | | 7,807 | |
| AA Bond Co. Ltd. | | 6.269% | | 7/31/25 | GBP | 2,000 | | 2,681 | |
| Arqiva Financing plc | | 4.882% | | 12/31/32 | GBP | 4,950 | | 7,357 | |
| Artesian Finance II plc | | 6.000% | | 9/30/33 | GBP | 1,990 | | 3,875 | |
| Aspire Defence Finance plc | | 4.674% | | 3/31/40 | GBP | 3,485 | | 5,983 | |
| Aspire Defence Finance plc | | 4.674% | | 3/31/40 | GBP | 3,753 | | 6,466 | |
| Bank of Scotland plc | | 4.500% | | 7/13/21 | EUR | 6,160 | | 7,426 | |
| Bank of Scotland plc | | 4.750% | | 6/8/22 | EUR | 1,840 | | 2,318 | |
| Bank of Scotland plc | | 4.875% | | 12/20/24 | GBP | 1,400 | | 2,143 | |
| Barclays Bank plc | | 4.000% | | 1/12/21 | EUR | 15,500 | | 18,177 | |
| Barclays Bank plc | | 4.250% | | 1/12/22 | GBP | 3,600 | | 4,995 | |
1 | Broadgate Financing plc | | 4.999% | | 10/5/33 | GBP | 6,500 | | 10,356 | |
1 | Broadgate Financing plc | | 5.098% | | 4/5/35 | GBP | 4,059 | | 6,305 | |
1 | Canary Wharf Finance II plc | | 6.455% | | 10/22/33 | GBP | 234 | | 384 | |
1 | Channel Link Enterprises Finance plc | | 3.043% | | 6/30/50 | GBP | 5,200 | | 7,053 | |
| Clydesdale Bank plc | | 4.625% | | 6/8/26 | GBP | 13,000 | | 20,604 | |
| Co-Operative Bank plc | | 4.750% | | 11/11/21 | GBP | 8,900 | | 12,156 | |
| Coventry Building Society | | 0.500% | | 1/12/24 | EUR | 900 | | 1,028 | |
| CTRL Section 1 Finance plc | | 5.234% | | 5/2/35 | GBP | 941 | | 1,644 | |
| Derby Healthcare plc | | 5.564% | | 6/30/41 | GBP | 1,156 | | 2,077 | |
| Greene King Finance plc | | 4.064% | | 3/15/35 | GBP | 1,716 | | 2,448 | |
| Greene King Finance plc | | 5.318% | | 9/15/31 | GBP | 1,010 | | 1,545 | |
| High Speed Rail Finance 1 plc | | 4.375% | | 11/1/38 | GBP | 6,700 | | 11,392 | |
| Highbury Finance BV | | 7.017% | | 3/20/23 | GBP | 600 | | 882 | |
| Integrated Accommodation Services plc | | 6.480% | | 3/31/29 | GBP | 559 | | 902 | |
| Intu SGS Finance plc | | 4.250% | | 9/17/30 | GBP | 700 | | 777 | |
| Juturna European Loan Conduit No. 16 plc | | 5.064% | | 8/10/33 | GBP | 6,430 | | 10,589 | |
| Leeds Building Society | | 4.875% | | 11/16/20 | GBP | 2,000 | | 2,694 | |
| Lloyds Bank plc | | 1.375% | | 4/16/21 | EUR | 30,800 | | 35,172 | |
111
Total International Bond Index Fund
| | | | | | | Face | | Market | |
| | | | | Maturity | | Amount | | Value· | |
| | | Coupon | | Date | Currency | (000 | ) | ($000 | ) |
| Lloyds Bank plc | | 1.750% | | 3/31/22 | GBP | 3,300 | | 4,350 | |
| Lloyds Bank plc | | 4.875% | | 1/13/23 | EUR | 8,200 | | 10,634 | |
| Lloyds Bank plc | | 4.875% | | 3/30/27 | GBP | 3,081 | | 5,004 | |
| Lloyds Bank plc | | 5.125% | | 3/7/25 | GBP | 15,200 | | 23,742 | |
| Lloyds Bank plc | | 6.000% | | 2/8/29 | GBP | 10,350 | | 18,783 | |
1 | Longstone Finance plc | | 4.791% | | 4/19/36 | GBP | 742 | | 1,123 | |
| Meadowhall Finance plc | | 4.986% | | 1/12/32 | GBP | 2,762 | | 4,438 | |
1 | Mitchells & Butlers Finance plc | | 6.013% | | 12/15/30 | GBP | 593 | | 879 | |
| National Westminster Bank plc | | 5.125% | | 1/13/24 | GBP | 500 | | 757 | |
| Nationwide Building Society | | 0.625% | | 3/25/27 | EUR | 11,790 | | 13,731 | |
| Nationwide Building Society | | 1.375% | | 6/29/32 | EUR | 16,000 | | 20,022 | |
| Nationwide Building Society | | 2.250% | | 6/25/29 | EUR | 5,000 | | 6,684 | |
| Nationwide Building Society | | 4.375% | | 2/28/22 | EUR | 17,000 | | 20,999 | |
| Nationwide Building Society | | 4.625% | | 2/8/21 | EUR | 3,100 | | 3,673 | |
| Nationwide Building Society | | 5.625% | | 1/28/26 | GBP | 1,500 | | 2,485 | |
| Nats En Route plc | | 5.250% | | 3/31/26 | GBP | 2,435 | | 3,623 | |
1 | Octagon Healthcare Funding plc | | 5.333% | | 6/30/36 | GBP | 835 | | 1,390 | |
| RAC Bond Co. plc | | 4.565% | | 5/6/23 | GBP | 400 | | 520 | |
| RAC Bond Co. plc | | 4.870% | | 5/6/26 | GBP | 3,000 | | 3,830 | |
| Santander UK plc | | 0.250% | | 8/9/21 | EUR | 10,000 | | 11,257 | |
| Santander UK plc | | 0.250% | | 4/21/22 | EUR | 20,000 | | 22,577 | |
| Santander UK plc | | 1.250% | | 9/18/24 | EUR | 6,700 | | 7,974 | |
| Santander UK plc | | 1.625% | | 11/26/20 | EUR | 18,000 | | 20,484 | |
| Santander UK plc | | 5.125% | | 4/14/21 | GBP | 5,900 | | 8,083 | |
| Santander UK plc | | 5.250% | | 2/16/29 | GBP | 758 | | 1,313 | |
1 | Santander UK plc | | 5.750% | | 3/2/26 | GBP | 5,855 | | 9,782 | |
| Telereal Secured Finance plc | | 4.010% | | 12/10/31 | GBP | 5,150 | | 7,356 | |
1 | Telereal Securitisation plc | | 5.389% | | 12/10/33 | GBP | 2,145 | | 3,383 | |
| Telereal Securitisation plc | | 6.165% | | 12/10/31 | GBP | 907 | | 1,492 | |
| Tesco Property Finance 1 plc | | 7.623% | | 7/13/39 | GBP | 2,614 | | 4,937 | |
| Tesco Property Finance 2 plc | | 6.052% | | 10/13/39 | GBP | 3,381 | | 5,720 | |
| Yorkshire Building Society | | 1.250% | | 6/11/21 | EUR | 7,000 | | 7,997 | |
| | | | | | | | | 456,258 | |
Corporate Bonds (2.1%) | | | | | | | | | |
| 3i Group plc | | 5.750% | | 12/3/32 | GBP | 5,000 | | 8,508 | |
| A2Dominion Housing Group Ltd. | | 3.500% | | 11/15/28 | GBP | 6,200 | | 8,682 | |
| ABP Finance plc | | 6.250% | | 12/14/26 | GBP | 4,300 | | 6,891 | |
| Admiral Group plc | | 5.500% | | 7/25/24 | GBP | 2,400 | | 3,470 | |
| Affinity Sutton Capital Markets plc | | 4.250% | | 10/8/42 | GBP | 1,500 | | 2,602 | |
| Affinity Water Finance 2004 plc | | 5.875% | | 7/13/26 | GBP | 2,150 | | 3,583 | |
| Affinity Water Programme Finance Ltd. | | 4.500% | | 3/31/36 | GBP | 4,500 | | 7,890 | |
| Anglian Water Services Financing plc | | 2.625% | | 6/15/27 | GBP | 3,600 | | 4,664 | |
| Anglian Water Services Financing plc | | 4.500% | | 10/5/27 | GBP | 2,492 | | 3,910 | |
| Anglian Water Services Financing plc | | 6.625% | | 1/15/29 | GBP | 615 | | 1,122 | |
| Anglian Water Services Financing plc | | 6.875% | | 8/21/23 | GBP | 4,300 | | 6,763 | |
| Annington Funding plc | | 1.650% | | 7/12/24 | EUR | 3,800 | | 4,386 | |
| Annington Funding plc | | 2.646% | | 7/12/25 | GBP | 1,000 | | 1,340 | |
| Annington Funding plc | | 3.685% | | 7/12/34 | GBP | 6,900 | | 9,901 | |
| Annington Funding plc | | 3.935% | | 7/12/47 | GBP | 5,800 | | 8,687 | |
| Aptiv plc | | 1.500% | | 3/10/25 | EUR | 12,022 | | 14,144 | |
| AstraZeneca plc | | 0.250% | | 5/12/21 | EUR | 1,000 | | 1,121 | |
| AstraZeneca plc | | 1.250% | | 5/12/28 | EUR | 100 | | 119 | |
| AstraZeneca plc | | 5.750% | | 11/13/31 | GBP | 5,000 | | 9,359 | |
| Aviva plc | | 0.625% | | 10/27/23 | EUR | 1,000 | | 1,140 | |
112
Total International Bond Index Fund
| | | | | | | Face | | Market | |
| | | | | Maturity | | Amount | | Value· | |
| | | Coupon | | Date | Currency | (000 | ) | ($000 | ) |
| Aviva plc | | 1.875% | | 11/13/27 | EUR | 4,000 | | 4,916 | |
1 | Aviva plc | | 3.375% | | 12/4/45 | EUR | 6,000 | | 7,311 | |
1 | Aviva plc | | 3.875% | | 7/3/44 | EUR | 2,459 | | 3,020 | |
1 | Aviva plc | | 4.375% | | 9/12/49 | GBP | 4,991 | | 6,965 | |
1 | Aviva plc | | 5.125% | | 6/4/50 | GBP | 2,000 | | 2,974 | |
1 | Aviva plc | | 6.125% | | 7/5/43 | EUR | 2,400 | | 3,136 | |
1 | Aviva plc | | 6.125% | | 9/29/49 | GBP | 4,700 | | 6,583 | |
1 | Aviva plc | | 6.625% | | 6/3/41 | GBP | 2,500 | | 3,482 | |
1 | Aviva plc | | 6.875% | | 5/20/58 | GBP | 8,692 | | 15,964 | |
| Babcock International Group plc | | 1.750% | | 10/6/22 | EUR | 7,800 | | 8,963 | |
| Babcock International Group plc | | 1.875% | | 10/5/26 | GBP | 4,000 | | 5,006 | |
| BAE Systems plc | | 4.125% | | 6/8/22 | GBP | 6,500 | | 9,024 | |
| Barclays Bank plc | | 2.125% | | 2/24/21 | EUR | 5,000 | | 5,741 | |
| Barclays Bank plc | | 4.250% | | 3/2/22 | EUR | 10,000 | | 12,334 | |
| Barclays Bank plc | | 6.000% | | 1/14/21 | EUR | 3,000 | | 3,571 | |
| Barclays Bank plc | | 6.625% | | 3/30/22 | EUR | 7,159 | | 9,171 | |
| Barclays Bank plc | | 10.000% | | 5/21/21 | GBP | 10,533 | | 15,333 | |
| Barclays plc | | 1.500% | | 4/1/22 | EUR | 1,600 | | 1,848 | |
| Barclays plc | | 1.500% | | 9/3/23 | EUR | 100 | | 117 | |
| Barclays plc | | 1.875% | | 3/23/21 | EUR | 200 | | 229 | |
| Barclays plc | | 3.000% | | 5/8/26 | GBP | 9,000 | | 12,205 | |
| Barclays plc | | 3.250% | | 2/12/27 | GBP | 655 | | 904 | |
| Barclays plc | | 3.250% | | 1/17/33 | GBP | 8,500 | | 11,637 | |
| BAT Capital Corp. | | 2.125% | | 8/15/25 | GBP | 1,300 | | 1,678 | |
| BAT International Finance plc | | 0.875% | | 10/13/23 | EUR | 8,615 | | 9,739 | |
| BAT International Finance plc | | 1.000% | | 5/23/22 | EUR | 700 | | 796 | |
| BAT International Finance plc | | 1.250% | | 3/13/27 | EUR | 7,850 | | 8,735 | |
| BAT International Finance plc | | 1.750% | | 7/5/21 | GBP | 2,700 | | 3,516 | |
| BAT International Finance plc | | 2.250% | | 1/16/30 | EUR | 19,000 | | 21,811 | |
| BAT International Finance plc | | 2.250% | | 9/9/52 | GBP | 3,000 | | 2,844 | |
| BAT International Finance plc | | 2.375% | | 1/19/23 | EUR | 100 | | 119 | |
| BAT International Finance plc | | 2.750% | | 3/25/25 | EUR | 6,000 | | 7,373 | |
| BAT International Finance plc | | 4.000% | | 9/4/26 | GBP | 1,500 | | 2,148 | |
| BAT International Finance plc | | 4.875% | | 2/24/21 | EUR | 5,250 | | 6,228 | |
| BAT International Finance plc | | 5.750% | | 7/5/40 | GBP | 400 | | 677 | |
| BAT International Finance plc | | 6.000% | | 11/24/34 | GBP | 8,050 | | 13,658 | |
| Bazalgette Finance plc | | 2.375% | | 11/29/27 | GBP | 1,200 | | 1,660 | |
| BG Energy Capital plc | | 1.250% | | 11/21/22 | EUR | 6,400 | | 7,395 | |
| BG Energy Capital plc | | 2.250% | | 11/21/29 | EUR | 12,311 | | 16,015 | |
| BG Energy Capital plc | | 5.000% | | 11/4/36 | GBP | 300 | | 565 | |
| BG Energy Capital plc | | 5.125% | | 12/1/25 | GBP | 13,008 | | 20,616 | |
| BP Capital Markets plc | | 0.830% | | 9/19/24 | EUR | 8,000 | | 9,206 | |
| BP Capital Markets plc | | 0.900% | | 7/3/24 | EUR | 2,000 | | 2,312 | |
| BP Capital Markets plc | | 1.077% | | 6/26/25 | EUR | 5,300 | | 6,184 | |
| BP Capital Markets plc | | 1.177% | | 8/12/23 | GBP | 3,100 | | 4,046 | |
| BP Capital Markets plc | | 1.231% | | 5/8/31 | EUR | 5,000 | | 5,901 | |
| BP Capital Markets plc | | 1.373% | | 3/3/22 | EUR | 2,700 | | 3,113 | |
| BP Capital Markets plc | | 1.526% | | 9/26/22 | EUR | 11,100 | | 12,943 | |
| BP Capital Markets plc | | 1.573% | | 2/16/27 | EUR | 26,582 | | 32,277 | |
| BP Capital Markets plc | | 1.953% | | 3/3/25 | EUR | 7,200 | | 8,773 | |
| BP Capital Markets plc | | 2.030% | | 2/14/25 | GBP | 1,300 | | 1,750 | |
| BP Capital Markets plc | | 2.177% | | 9/28/21 | EUR | 5,800 | | 6,756 | |
| BP Capital Markets plc | | 2.213% | | 9/25/26 | EUR | 13,000 | | 16,405 | |
| BP Capital Markets plc | | 2.274% | | 7/3/26 | GBP | 12,737 | | 17,442 | |
113
Total International Bond Index Fund
| | | | | | | Face | | Market | |
| | | | | Maturity | | Amount | | Value· | |
| | | Coupon | | Date | Currency | (000 | ) | ($000 | ) |
| BP Capital Markets plc | | 2.972% | | 2/27/26 | EUR | 5,200 | | 6,779 | |
| BP Capital Markets plc | | 3.470% | | 5/15/25 | CAD | 2,500 | | 1,992 | |
| BP Capital Markets plc | | 3.497% | | 11/9/20 | CAD | 2,460 | | 1,893 | |
| BPHA Finance plc | | 4.816% | | 4/11/44 | GBP | 1,000 | | 1,857 | |
| Brambles Finance Ltd. | | 2.375% | | 6/12/24 | EUR | 400 | | 490 | |
| British Land Co. plc | | 2.375% | | 9/14/29 | GBP | 1,400 | | 1,850 | |
| British Telecommunications plc | | 0.625% | | 3/10/21 | EUR | 6,000 | | 6,754 | |
| British Telecommunications plc | | 0.875% | | 9/26/23 | EUR | 4,000 | | 4,575 | |
| British Telecommunications plc | | 1.000% | | 11/21/24 | EUR | 8,800 | | 10,077 | |
| British Telecommunications plc | | 1.125% | | 3/10/23 | EUR | 6,600 | | 7,601 | |
| British Telecommunications plc | | 1.500% | | 6/23/27 | EUR | 10,200 | | 11,928 | |
| British Telecommunications plc | | 1.750% | | 3/10/26 | EUR | 9,920 | | 11,797 | |
| British Telecommunications plc | | 2.125% | | 9/26/28 | EUR | 100 | | 122 | |
| British Telecommunications plc | | 3.125% | | 11/21/31 | GBP | 200 | | 280 | |
| British Telecommunications plc | | 5.750% | | 12/7/28 | GBP | 4,030 | | 6,744 | |
| British Telecommunications plc | | 6.375% | | 6/23/37 | GBP | 3,500 | | 6,815 | |
| BUPA Finance plc | | 2.000% | | 4/5/24 | GBP | 11,000 | | 14,618 | |
| BUPA Finance plc | | 3.375% | | 6/17/21 | GBP | 7,400 | | 9,895 | |
| BUPA Finance plc | | 5.000% | | 12/8/26 | GBP | 2,000 | | 2,939 | |
| Cadent Finance plc | | 0.625% | | 9/22/24 | EUR | 17,320 | | 19,563 | |
| Cadent Finance plc | | 1.125% | | 9/22/21 | GBP | 4,700 | | 6,101 | |
| Cadent Finance plc | | 2.125% | | 9/22/28 | GBP | 20,208 | | 26,710 | |
| Cadent Finance plc | | 2.625% | | 9/22/38 | GBP | 100 | | 134 | |
| Cadent Finance plc | | 2.750% | | 9/22/46 | GBP | 950 | | 1,275 | |
| Cadent Finance plc | | 3.125% | | 3/21/40 | GBP | 200 | | 285 | |
| Centrica plc | | 4.250% | | 9/12/44 | GBP | 5,450 | | 8,544 | |
| Centrica plc | | 4.375% | | 3/13/29 | GBP | 4,800 | | 7,354 | |
| Centrica plc | | 6.375% | | 3/10/22 | GBP | 1,850 | | 2,686 | |
| Centrica plc | | 7.000% | | 9/19/33 | GBP | 2,100 | | 4,096 | |
| Circle Anglia Social Housing plc | | 7.250% | | 11/12/38 | GBP | 2,650 | | 6,086 | |
| Clarion Funding plc | | 2.625% | | 1/18/29 | GBP | 1,554 | | 2,160 | |
| Close Brothers Finance plc | | 3.875% | | 6/27/21 | GBP | 3,000 | | 4,050 | |
| CNH Industrial Finance Europe SA | | 1.375% | | 5/23/22 | EUR | 200 | | 230 | |
| CNH Industrial Finance Europe SA | | 1.750% | | 9/12/25 | EUR | 9,000 | | 10,618 | |
| CNH Industrial Finance Europe SA | | 1.875% | | 1/19/26 | EUR | 1,900 | | 2,237 | |
| CNH Industrial Finance Europe SA | | 2.875% | | 5/17/23 | EUR | 7,000 | | 8,507 | |
| Coca-Cola European Partners plc | | 0.750% | | 2/24/22 | EUR | 6,000 | | 6,813 | |
| Coca-Cola European Partners plc | | 1.125% | | 5/26/24 | EUR | 5,800 | | 6,774 | |
| Coca-Cola European Partners plc | | 1.750% | | 5/26/28 | EUR | 5,200 | | 6,416 | |
| Coca-Cola European Partners plc | | 2.375% | | 5/7/25 | EUR | 3,000 | | 3,725 | |
| Community Finance Co. 1 plc | | 5.017% | | 7/31/34 | GBP | 700 | | 1,257 | |
| Compass Group International BV | | 0.625% | | 7/3/24 | EUR | 1,700 | | 1,943 | |
| Compass Group plc | | 2.000% | | 9/5/25 | GBP | 400 | | 544 | |
| Compass Group plc | | 2.000% | | 7/3/29 | GBP | 1,600 | | 2,196 | |
| Connect Plus M25 Issuer plc | | 2.607% | | 3/31/39 | GBP | 2,717 | | 3,911 | |
| Coventry Building Society | | 2.500% | | 11/18/20 | EUR | 6,546 | | 7,496 | |
| Coventry Building Society | | 5.875% | | 9/28/22 | GBP | 15,868 | | 23,173 | |
| CPUK Finance Ltd. | | 3.588% | | 8/28/25 | GBP | 3,000 | | 4,188 | |
| CPUK Finance Ltd. | | 3.690% | | 8/28/28 | GBP | 100 | | 141 | |
1 | CPUK Finance Ltd. | | 7.239% | | 2/28/42 | GBP | 2,700 | | 4,227 | |
| Crh Finance UK plc | | 4.125% | | 12/2/29 | GBP | 5,700 | | 8,768 | |
1 | CYBG plc | | 3.125% | | 6/22/25 | GBP | 4,800 | | 6,116 | |
1 | CYBG plc | | 5.000% | | 2/9/26 | GBP | 800 | | 1,043 | |
| Diageo Finance plc | | 0.000% | | 11/17/20 | EUR | 700 | | 783 | |
114
Total International Bond Index Fund
| | | | | | | Face | | Market | |
| | | | | Maturity | | Amount | | Value· | |
| | | Coupon | | Date | Currency | (000 | ) | ($000 | ) |
| Diageo Finance plc | | 0.500% | | 6/19/24 | EUR | 854 | | 974 | |
| Diageo Finance plc | | 1.750% | | 9/23/24 | EUR | 200 | | 241 | |
| DS Smith plc | | 1.375% | | 7/26/24 | EUR | 400 | | 460 | |
| DS Smith plc | | 2.250% | | 9/16/22 | EUR | 100 | | 117 | |
| Dwr Cymru Financing Ltd. | | 2.500% | | 3/31/36 | GBP | 600 | | 857 | |
14 | Dwr Cymru Financing Ltd. | | 6.015% | | 3/31/28 | GBP | 500 | | 885 | |
| Dwr Cymru Financing Ltd. | | 6.907% | | 3/31/21 | GBP | 567 | | 793 | |
| East Finance plc | | 5.486% | | 6/15/42 | GBP | 2,897 | | 5,517 | |
| Eastern Power Networks plc | | 4.750% | | 9/30/21 | GBP | 2,400 | | 3,322 | |
| Eastern Power Networks plc | | 5.750% | | 3/8/24 | GBP | 3,000 | | 4,593 | |
| Eastern Power Networks plc | | 6.250% | | 11/12/36 | GBP | 200 | | 405 | |
| easyJet plc | | 1.750% | | 2/9/23 | EUR | 800 | | 929 | |
| Electricity North West Ltd. | | 8.875% | | 3/25/26 | GBP | 2,000 | | 3,717 | |
| EMH Treasury plc | | 4.500% | | 1/29/44 | GBP | 394 | | 700 | |
| ENW Finance plc | | 6.125% | | 7/21/21 | GBP | 1,000 | | 1,401 | |
| Eversholt Funding plc | | 3.529% | | 8/7/42 | GBP | 1,400 | | 1,917 | |
| Eversholt Funding plc | | 5.831% | | 12/2/20 | GBP | 800 | | 1,085 | |
| Eversholt Funding plc | | 6.359% | | 12/2/25 | GBP | 500 | | 800 | |
| Eversholt Funding plc | | 6.697% | | 2/22/35 | GBP | 1,800 | | 3,056 | |
| Experian Finance plc | | 1.375% | | 6/25/26 | EUR | 400 | | 473 | |
| Experian Finance plc | | 3.500% | | 10/15/21 | GBP | 6,815 | | 9,180 | |
| FCE Bank plc | | 0.869% | | 9/13/21 | EUR | 3,800 | | 4,230 | |
| FCE Bank plc | | 1.134% | | 2/10/22 | EUR | 1,430 | | 1,597 | |
| FCE Bank plc | | 1.615% | | 5/11/23 | EUR | 400 | | 446 | |
| FCE Bank plc | | 1.875% | | 6/24/21 | EUR | 5,000 | | 5,682 | |
| FCE Bank plc | | 2.727% | | 6/3/22 | GBP | 700 | | 920 | |
| Fidelity International Ltd. | | 2.500% | | 11/4/26 | EUR | 1,457 | | 1,758 | |
| Fidelity International Ltd. | | 7.125% | | 2/13/24 | GBP | 1,300 | | 2,059 | |
| Firstgroup plc | | 5.250% | | 11/29/22 | GBP | 15,714 | | 22,148 | |
| Firstgroup plc | | 6.875% | | 9/18/24 | GBP | 2,660 | | 4,086 | |
| Firstgroup plc | | 8.750% | | 4/8/21 | GBP | 5,000 | | 7,074 | |
| Friends Life Holdings plc | | 8.250% | | 4/21/22 | GBP | 3,000 | | 4,517 | |
| Futures Treasury plc | | 3.375% | | 2/8/44 | GBP | 700 | | 1,069 | |
| G4S International Finance plc | | 1.500% | | 1/9/23 | EUR | 2,100 | | 2,394 | |
| G4S International Finance plc | | 1.500% | | 6/2/24 | EUR | 12,300 | | 14,010 | |
| G4S International Finance plc | | 1.875% | | 5/24/25 | EUR | 23,400 | | 27,009 | |
1 | Gatwick Funding Ltd. | | 2.625% | | 10/7/48 | GBP | 1,200 | | 1,535 | |
| Gatwick Funding Ltd. | | 3.125% | | 9/28/39 | GBP | 4,300 | | 6,037 | |
| Gatwick Funding Ltd. | | 3.250% | | 2/26/48 | GBP | 400 | | 574 | |
1 | Gatwick Funding Ltd. | | 5.250% | | 1/23/26 | GBP | 1,000 | | 1,495 | |
1 | Gatwick Funding Ltd. | | 5.750% | | 1/23/39 | GBP | 500 | | 934 | |
1 | Gatwick Funding Ltd. | | 6.125% | | 3/2/28 | GBP | 9,950 | | 16,239 | |
| Genfinance II plc | | 6.064% | | 12/21/39 | GBP | 5,900 | | 11,637 | |
| GlaxoSmithKline Capital plc | | 1.000% | | 9/12/26 | EUR | 500 | | 589 | |
| GlaxoSmithKline Capital plc | | 1.250% | | 5/21/26 | EUR | 15,000 | | 17,868 | |
| GlaxoSmithKline Capital plc | | 1.375% | | 12/2/24 | EUR | 350 | | 417 | |
| GlaxoSmithKline Capital plc | | 1.750% | | 5/21/30 | EUR | 10,400 | | 13,017 | |
| GlaxoSmithKline Capital plc | | 3.375% | | 12/20/27 | GBP | 3,900 | | 5,835 | |
| GlaxoSmithKline Capital plc | | 4.000% | | 6/16/25 | EUR | 1,000 | | 1,360 | |
| GlaxoSmithKline Capital plc | | 4.250% | | 12/18/45 | GBP | 600 | | 1,096 | |
| GlaxoSmithKline Capital plc | | 5.250% | | 12/19/33 | GBP | 7,339 | | 13,641 | |
| GlaxoSmithKline Capital plc | | 5.250% | | 4/10/42 | GBP | 355 | | 713 | |
| GlaxoSmithKline Capital plc | | 6.375% | | 3/9/39 | GBP | 1,145 | | 2,486 | |
| Global Switch Holdings Ltd. | | 1.500% | | 1/31/24 | EUR | 1,800 | | 2,080 | |
115
Total International Bond Index Fund
| | | | | | | Face | | Market | |
| | | | | Maturity | | Amount | | Value· | |
| | | Coupon | | Date | Currency | (000 | ) | ($000 | ) |
| Global Switch Holdings Ltd. | | 2.250% | | 5/31/27 | EUR | 500 | | 601 | |
| Global Switch Holdings Ltd. | | 4.375% | | 12/13/22 | GBP | 1,000 | | 1,406 | |
| Great Places Housing Group Ltd. | | 4.750% | | 10/22/42 | GBP | 3,000 | | 5,415 | |
| Great Rolling Stock Co. Ltd. | | 6.875% | | 7/27/35 | GBP | 733 | | 1,222 | |
| Greater Gabbard OFTO plc | | 4.137% | | 11/29/32 | GBP | 1,329 | | 2,032 | |
| Guinness Partnership Ltd. | | 4.000% | | 10/24/44 | GBP | 978 | | 1,652 | |
| Gwynt Y Mor Ofto plc | | 2.778% | | 2/17/34 | GBP | 2,365 | | 3,316 | |
| Hammerson plc | | 2.000% | | 7/1/22 | EUR | 7,200 | | 8,299 | |
| Hammerson plc | | 3.500% | | 10/27/25 | GBP | 300 | | 394 | |
| Hammerson plc | | 6.000% | | 2/23/26 | GBP | 4,000 | | 5,939 | |
| Hammerson plc | | 7.250% | | 4/21/28 | GBP | 5,700 | | 9,324 | |
| Haven Funding plc | | 8.125% | | 9/30/37 | GBP | 1,129 | | 2,346 | |
1 | HBOS plc | | 4.500% | | 3/18/30 | EUR | 3,500 | | 4,558 | |
| HBOS Sterling Finance Jersey LP | | 7.881% | | 12/31/49 | GBP | 1,000 | | 1,998 | |
1 | Heathrow Funding Ltd. | | 1.500% | | 2/11/32 | EUR | 7,100 | | 8,452 | |
1 | Heathrow Funding Ltd. | | 1.875% | | 5/23/24 | EUR | 400 | | 468 | |
| Heathrow Funding Ltd. | | 1.875% | | 7/12/32 | EUR | 1,200 | | 1,468 | |
| Heathrow Funding Ltd. | | 1.875% | | 3/14/34 | EUR | 5,500 | | 6,680 | |
| Heathrow Funding Ltd. | | 2.750% | | 8/9/49 | GBP | 950 | | 1,305 | |
| Heathrow Funding Ltd. | | 3.400% | | 3/8/28 | CAD | 7,000 | | 5,532 | |
| Heathrow Funding Ltd. | | 4.625% | | 10/31/46 | GBP | 500 | | 917 | |
| Heathrow Funding Ltd. | | 5.225% | | 2/15/23 | GBP | 2,200 | | 3,224 | |
| Heathrow Funding Ltd. | | 5.875% | | 5/13/41 | GBP | 12,700 | | 25,902 | |
| Heathrow Funding Ltd. | | 6.450% | | 12/10/31 | GBP | 3,050 | | 5,726 | |
| Heathrow Funding Ltd. | | 7.125% | | 2/14/24 | GBP | 10,320 | | 16,287 | |
| Hiscox Ltd. | | 2.000% | | 12/14/22 | GBP | 700 | | 917 | |
1 | HSBC Bank Capital Funding Sterling 1 LP | | 5.844% | | 11/29/49 | GBP | 250 | | 434 | |
| HSBC Bank plc | | 4.000% | | 1/15/21 | EUR | 9,500 | | 11,123 | |
| HSBC Bank plc | | 4.750% | | 3/24/46 | GBP | 100 | | 168 | |
1 | HSBC Bank plc | | 5.375% | | 11/4/30 | GBP | 1,000 | | 1,524 | |
| HSBC Bank plc | | 5.375% | | 8/22/33 | GBP | 2,000 | | 3,382 | |
| HSBC Bank plc | | 6.250% | | 1/30/41 | GBP | 66 | | 128 | |
| HSBC Bank plc | | 6.500% | | 7/7/23 | GBP | 5,000 | | 7,574 | |
| HSBC Holdings plc | | 0.450% | | 9/24/21 | JPY | 500,000 | | 4,661 | |
| HSBC Holdings plc | | 0.875% | | 9/6/24 | EUR | 17,600 | | 20,304 | |
| HSBC Holdings plc | | 1.500% | | 3/15/22 | EUR | 21,200 | | 24,497 | |
1 | HSBC Holdings plc | | 1.500% | | 12/4/24 | EUR | 5,300 | | 6,240 | |
1 | HSBC Holdings plc | | 2.175% | | 6/27/23 | GBP | 4,100 | | 5,395 | |
1 | HSBC Holdings plc | | 2.256% | | 11/13/26 | GBP | 6,000 | | 7,931 | |
| HSBC Holdings plc | | 2.625% | | 8/16/28 | GBP | 3,125 | | 4,315 | |
| HSBC Holdings plc | | 3.000% | | 6/30/25 | EUR | 26,500 | | 33,435 | |
1 | HSBC Holdings plc | | 3.000% | | 7/22/28 | GBP | 20,500 | | 28,435 | |
1 | HSBC Holdings plc | | 3.000% | | 5/29/30 | GBP | 3,800 | | 5,241 | |
| HSBC Holdings plc | | 3.196% | | 12/5/23 | CAD | 9,790 | | 7,594 | |
| HSBC Holdings plc | | 6.000% | | 3/29/40 | GBP | 13,250 | | 23,900 | |
| HSBC Holdings plc | | 6.750% | | 9/11/28 | GBP | 2,750 | | 4,744 | |
| HSBC Holdings plc | | 7.000% | | 4/7/38 | GBP | 6,500 | | 12,641 | |
| Hyde Housing Association Ltd. | | 5.125% | | 7/23/40 | GBP | 275 | | 513 | |
| Imperial Brands Finance plc | | 0.500% | | 7/27/21 | EUR | 500 | | 561 | |
| Imperial Brands Finance plc | | 1.375% | | 1/27/25 | EUR | 1,000 | | 1,142 | |
| Imperial Brands Finance plc | | 2.125% | | 2/12/27 | EUR | 15,500 | | 17,989 | |
| Imperial Brands Finance plc | | 2.250% | | 2/26/21 | EUR | 600 | | 685 | |
| Imperial Brands Finance plc | | 3.375% | | 2/26/26 | EUR | 600 | | 752 | |
| Imperial Brands Finance plc | | 9.000% | | 2/17/22 | GBP | 12,400 | | 18,734 | |
116
Total International Bond Index Fund
| | | | | | | Face | | Market | |
| | | | | Maturity | | Amount | | Value· | |
| | | Coupon | | Date | Currency | (000 | ) | ($000 | ) |
| Incommunities Treasury plc | | 3.250% | | 3/21/49 | GBP | 1,300 | | 2,018 | |
| Informa plc | | 1.500% | | 7/5/23 | EUR | 1,300 | | 1,507 | |
| InterContinental Hotels Group plc | | 3.875% | | 11/28/22 | GBP | 3,500 | | 4,872 | |
| International Consolidated Airlines Group SA | | 1.500% | | 7/4/27 | EUR | 11,300 | | 12,491 | |
| Intu Metrocentre Finance plc | | 4.125% | | 12/6/23 | GBP | 2,600 | | 3,119 | |
1 | Intu SGS Finance plc | | 3.875% | | 3/17/28 | GBP | 2,700 | | 3,204 | |
1 | Intu SGS Finance plc | | 4.625% | | 3/17/33 | GBP | 2,000 | | 2,231 | |
1 | Investec Bank plc | | 4.250% | | 7/24/28 | GBP | 1,000 | | 1,320 | |
| Investec Bank plc | | 9.625% | | 2/17/22 | GBP | 1,000 | | 1,499 | |
| Investec plc | | 4.500% | | 5/5/22 | GBP | 4,000 | | 5,505 | |
| Just Group plc | | 3.500% | | 2/7/25 | GBP | 2,000 | | 2,430 | |
| Karbon Homes Ltd. | | 3.375% | | 11/15/47 | GBP | 5,900 | | 9,430 | |
| Kennedy Wilson Europe Real Estate Ltd. | | 3.950% | | 6/30/22 | GBP | 3,000 | | 4,010 | |
| Land Securities Capital Markets plc | | 1.974% | | 2/8/24 | GBP | 1,000 | | 1,325 | |
| Land Securities Capital Markets plc | | 2.375% | | 3/29/27 | GBP | 800 | | 1,092 | |
| Land Securities Capital Markets plc | | 2.625% | | 9/22/37 | GBP | 9,200 | | 12,619 | |
| Land Securities Capital Markets plc | | 2.750% | | 9/22/57 | GBP | 1,300 | | 1,878 | |
| Leeds Building Society | | 0.500% | | 7/3/24 | EUR | 500 | | 572 | |
| Leeds Building Society | | 1.375% | | 5/5/22 | EUR | 22,195 | | 25,576 | |
| Leeds Building Society | | 2.625% | | 4/1/21 | EUR | 14,000 | | 16,203 | |
1 | Leeds Building Society | | 3.750% | | 4/25/29 | GBP | 500 | | 662 | |
| Legal & General Finance plc | | 5.875% | | 12/11/31 | GBP | 4,000 | | 7,420 | |
1 | Legal & General Group plc | | 5.125% | | 11/14/48 | GBP | 1,000 | | 1,454 | |
1 | Legal & General Group plc | | 5.375% | | 10/27/45 | GBP | 3,400 | | 4,962 | |
1 | Legal & General Group plc | | 5.500% | | 6/27/64 | GBP | 2,800 | | 4,298 | |
1 | Legal & General Group plc | | 10.000% | | 7/23/41 | GBP | 2,700 | | 3,986 | |
| Lendlease Europe Finance plc | | 6.125% | | 10/12/21 | GBP | 21,000 | | 29,318 | |
| Libra Longhurst Group Treasury plc | | 5.125% | | 8/2/38 | GBP | 1,797 | | 3,234 | |
1 | Liverpool Victoria Friendly Society Ltd. | | 6.500% | | 5/22/43 | GBP | 600 | | 868 | |
| Lloyds Bank plc | | 0.125% | | 6/18/26 | EUR | 10,000 | | 11,214 | |
| Lloyds Bank plc | | 0.250% | | 3/25/24 | EUR | 8,000 | | 9,058 | |
| Lloyds Bank plc | | 0.625% | | 9/14/22 | EUR | 8,780 | | 10,027 | |
| Lloyds Bank plc | | 0.625% | | 3/26/25 | EUR | 500 | | 578 | |
| Lloyds Bank plc | | 6.500% | | 9/17/40 | GBP | 2,050 | | 4,506 | |
| Lloyds Bank plc | | 7.500% | | 4/15/24 | GBP | 10,170 | | 16,627 | |
| Lloyds Bank plc | | 7.625% | | 4/22/25 | GBP | 8,190 | | 13,551 | |
| Lloyds Banking Group plc | | 0.482% | | 12/14/23 | JPY | 1,800,000 | | 16,514 | |
1 | Lloyds Banking Group plc | | 0.625% | | 1/15/24 | EUR | 2,800 | | 3,150 | |
| Lloyds Banking Group plc | | 0.650% | | 5/30/23 | JPY | 200,000 | | 1,850 | |
| Lloyds Banking Group plc | | 0.750% | | 11/9/21 | EUR | 800 | | 907 | |
| Lloyds Banking Group plc | | 0.824% | | 5/30/25 | JPY | 1,600,000 | | 14,853 | |
| Lloyds Banking Group plc | | 3.500% | | 2/3/25 | CAD | 2,600 | | 1,994 | |
| Lloyds Banking Group plc | | 3.650% | | 3/20/23 | AUD | 1,800 | | 1,291 | |
| Lloyds Banking Group plc | | 4.000% | | 3/7/25 | AUD | 11,900 | | 8,738 | |
| Lloyds Banking Group plc | | 4.250% | | 11/22/27 | AUD | 4,960 | | 3,730 | |
| London & Quadrant Housing Trust Ltd. | | 2.625% | | 5/5/26 | GBP | 2,000 | | 2,733 | |
| London & Quadrant Housing Trust Ltd. | | 2.625% | | 2/28/28 | GBP | 2,500 | | 3,410 | |
| London & Quadrant Housing Trust Ltd. | | 2.750% | | 7/20/57 | GBP | 2,000 | | 2,597 | |
| London & Quadrant Housing Trust Ltd. | | 3.750% | | 10/27/49 | GBP | 3,800 | | 6,018 | |
| London & Quadrant Housing Trust Ltd. | | 4.625% | | 12/5/33 | GBP | 500 | | 835 | |
| London & Quadrant Housing Trust Ltd. | | 5.500% | | 1/27/40 | GBP | 2,400 | | 4,513 | |
| London Power Networks plc | | 5.125% | | 3/31/23 | GBP | 3,000 | | 4,401 | |
| London Stock Exchange Group plc | | 1.750% | | 12/6/27 | EUR | 9,300 | | 11,200 | |
| Manchester Airport Group Funding plc | | 4.125% | | 4/2/24 | GBP | 2,000 | | 2,901 | |
117
Total International Bond Index Fund
| | | | | | | Face | | Market | |
| | | | | Maturity | | Amount | | Value· | |
| | | Coupon | | Date | Currency | (000 | ) | ($000 | ) |
| Manchester Airport Group Funding plc | | 4.750% | | 3/31/34 | GBP | 2,000 | | 3,410 | |
| Marks & Spencer plc | | 3.000% | | 12/8/23 | GBP | 1,400 | | 1,872 | |
| Marks & Spencer plc | | 3.250% | | 7/10/27 | GBP | 100 | | 128 | |
| Marks & Spencer plc | | 4.750% | | 6/12/25 | GBP | 4,610 | | 6,542 | |
| Martlet Homes Ltd. | | 3.000% | | 5/9/52 | GBP | 3,300 | | 4,736 | |
| Metropolitan Funding plc | | 4.125% | | 4/5/48 | GBP | 2,000 | | 3,208 | |
| Mitchells & Butlers Finance plc | | 5.574% | | 12/15/30 | GBP | 361 | | 535 | |
| Mondi Finance plc | | 1.500% | | 4/15/24 | EUR | 11,550 | | 13,491 | |
| Motability Operations Group plc | | 0.875% | | 3/14/25 | EUR | 7,816 | | 9,028 | |
| Motability Operations Group plc | | 1.625% | | 6/9/23 | EUR | 500 | | 590 | |
| Motability Operations Group plc | | 2.375% | | 3/14/32 | GBP | 800 | | 1,105 | |
| Motability Operations Group plc | | 2.375% | | 7/3/39 | GBP | 100 | | 135 | |
| Motability Operations Group plc | | 3.625% | | 3/10/36 | GBP | 500 | | 795 | |
| Motability Operations Group plc | | 4.375% | | 2/8/27 | GBP | 7,600 | | 11,906 | |
| Motability Operations Group plc | | 5.375% | | 6/28/22 | GBP | 1,000 | | 1,447 | |
| Motability Operations Group plc | | 5.625% | | 11/29/30 | GBP | 2,000 | | 3,643 | |
| Myriad Capital plc | | 4.750% | | 12/20/43 | GBP | 500 | | 928 | |
| National Express Group plc | | 2.500% | | 11/11/23 | GBP | 5,000 | | 6,664 | |
| Nationwide Building Society | | 0.750% | | 10/26/22 | EUR | 6,000 | | 6,884 | |
| Nationwide Building Society | | 1.250% | | 3/3/25 | EUR | 500 | | 591 | |
1 | Nationwide Building Society | | 2.000% | | 7/25/29 | EUR | 21,235 | | 24,574 | |
| Nationwide Building Society | | 2.250% | | 4/29/22 | GBP | 1,500 | | 2,003 | |
| Nationwide Building Society | | 3.000% | | 5/6/26 | GBP | 17,980 | | 25,533 | |
| Next plc | | 3.625% | | 5/18/28 | GBP | 7,000 | | 9,615 | |
| Next plc | | 5.375% | | 10/26/21 | GBP | 4,000 | | 5,584 | |
| Northern Gas Networks Finance plc | | 4.875% | | 6/30/27 | GBP | 300 | | 482 | |
| Northern Gas Networks Finance plc | | 4.875% | | 11/15/35 | GBP | 3,800 | | 6,787 | |
| Northern Powergrid Holdings Co. | | 7.250% | | 12/15/22 | GBP | 1,060 | | 1,623 | |
| Northern Powergrid Yorkshire plc | | 5.125% | | 5/4/35 | GBP | 1,533 | | 2,809 | |
| Northumbrian Water Finance plc | | 1.625% | | 10/11/26 | GBP | 6,900 | | 8,935 | |
| Northumbrian Water Finance plc | | 2.375% | | 10/5/27 | GBP | 400 | | 544 | |
| Northumbrian Water Finance plc | | 5.125% | | 1/23/42 | GBP | 750 | | 1,447 | |
| Northumbrian Water Finance plc | | 5.625% | | 4/29/33 | GBP | 2,495 | | 4,618 | |
| Notting Hill Housing Trust | | 3.250% | | 10/12/48 | GBP | 250 | | 351 | |
| Notting Hill Housing Trust | | 3.750% | | 12/20/32 | GBP | 5,399 | | 8,083 | |
| Notting Hill Housing Trust | | 4.375% | | 2/20/54 | GBP | 5,000 | | 8,756 | |
| Notting Hill Housing Trust | | 5.250% | | 7/7/42 | GBP | 1,500 | | 2,753 | |
| Orbit Capital plc | | 3.500% | | 3/24/45 | GBP | 3,967 | | 6,026 | |
| Peabody Capital No. 2 plc | | 4.625% | | 12/12/53 | GBP | 150 | | 283 | |
| Peabody Capital plc | | 5.250% | | 3/17/43 | GBP | 5,650 | | 10,804 | |
| Pearson Funding Five plc | | 1.375% | | 5/6/25 | EUR | 600 | | 695 | |
| Penarian Housing Finance plc | | 3.212% | | 6/7/52 | GBP | 200 | | 285 | |
| Pension Insurance Corp. plc | | 5.625% | | 9/20/30 | GBP | 1,000 | | 1,416 | |
| Pension Insurance Corp. plc | | 6.500% | | 7/3/24 | GBP | 300 | | 440 | |
| Pension Insurance Corp. plc | | 8.000% | | 11/23/26 | GBP | 5,600 | | 9,002 | |
| Phoenix Group Holdings | | 4.125% | | 7/20/22 | GBP | 2,025 | | 2,735 | |
| Phoenix Group Holdings | | 4.375% | | 1/24/29 | EUR | 4,700 | | 5,650 | |
| Phoenix Group Holdings | | 6.625% | | 12/18/25 | GBP | 3,700 | | 5,500 | |
| Places For People Treasury plc | | 2.875% | | 8/17/26 | GBP | 10,300 | | 13,792 | |
| Porterbrook Rail Finance Ltd. | | 7.125% | | 10/20/26 | GBP | 3,000 | | 5,072 | |
| Principality Building Society | | 2.375% | | 11/23/23 | GBP | 1,000 | | 1,319 | |
1 | Prudential plc | | 5.560% | | 7/20/55 | GBP | 5,100 | | 7,371 | |
1 | Prudential plc | | 5.625% | | 10/20/51 | GBP | 5,700 | | 8,395 | |
| Prudential plc | | 5.875% | | 5/11/29 | GBP | 1,111 | | 1,969 | |
118
Total International Bond Index Fund
| | | | | | | Face | | Market | |
| | | | | Maturity | | Amount | | Value· | |
| | | Coupon | | Date | Currency | (000 | ) | ($000 | ) |
| Prudential plc | | 6.125% | | 12/19/31 | GBP | 9,000 | | 15,742 | |
1 | Prudential plc | | 6.340% | | 12/19/63 | GBP | 4,300 | | 6,717 | |
| Quadgas Finance plc | | 3.375% | | 9/17/29 | GBP | 2,400 | | 3,214 | |
| RELX Capital Inc. | | 1.300% | | 5/12/25 | EUR | 2,000 | | 2,353 | |
| Rentokil Initial plc | | 0.950% | | 11/22/24 | EUR | 5,100 | | 5,845 | |
| Rentokil Initial plc | | 3.250% | | 10/7/21 | EUR | 150 | | 176 | |
| RL Finance Bonds No. 3 plc | | 6.125% | | 11/13/28 | GBP | 6,700 | | 10,224 | |
| Rolls-Royce plc | | 0.875% | | 5/9/24 | EUR | 17,900 | | 20,342 | |
| Rolls-Royce plc | | 1.625% | | 5/9/28 | EUR | 1,200 | | 1,423 | |
| Rolls-Royce plc | | 2.125% | | 6/18/21 | EUR | 1,500 | | 1,729 | |
| Rolls-Royce plc | | 3.375% | | 6/18/26 | GBP | 2,500 | | 3,558 | |
1 | Royal Bank of Scotland Group plc | | 1.750% | | 3/2/26 | EUR | 25,000 | | 29,295 | |
1 | Royal Bank of Scotland Group plc | | 2.000% | | 3/8/23 | EUR | 1,000 | | 1,159 | |
| Royal Bank of Scotland Group plc | | 2.500% | | 3/22/23 | EUR | 15,700 | | 18,777 | |
1 | Royal Bank of Scotland Group plc | | 2.875% | | 9/19/26 | GBP | 2,200 | | 2,952 | |
1 | Royal Bank of Scotland Group plc | | 3.125% | | 3/28/27 | GBP | 6,000 | | 8,168 | |
1 | RSA Insurance Group plc | | 5.125% | | 10/10/45 | GBP | 2,000 | | 2,902 | |
| RSL Finance No. 1 plc | | 6.625% | | 3/31/38 | GBP | 995 | | 1,910 | |
| Sanctuary Capital plc | | 5.000% | | 4/26/47 | GBP | 4,112 | | 8,181 | |
| Santander UK Group Holdings plc | | 1.125% | | 9/8/23 | EUR | 11,105 | | 12,774 | |
1 | Santander UK Group Holdings plc | | 2.920% | | 5/8/26 | GBP | 11,000 | | 14,808 | |
| Santander UK Group Holdings plc | | 3.625% | | 1/14/26 | GBP | 375 | | 529 | |
| Santander UK plc | | 0.500% | | 1/10/25 | EUR | 8,100 | | 9,314 | |
| Santander UK plc | | 1.125% | | 1/14/22 | EUR | 11,000 | | 12,571 | |
| Santander UK plc | | 1.125% | | 3/10/25 | EUR | 11,100 | | 12,926 | |
| Santander UK plc | | 3.875% | | 10/15/29 | GBP | 6,200 | | 9,596 | |
| Saxon Weald Capital plc | | 5.375% | | 6/6/42 | GBP | 596 | | 1,080 | |
| Scotland Gas Networks plc | | 3.250% | | 3/8/27 | GBP | 5,200 | | 7,446 | |
| Scotland Gas Networks plc | | 4.875% | | 12/21/34 | GBP | 1,000 | | 1,759 | |
| Scottish Widows Ltd. | | 5.500% | | 6/16/23 | GBP | 2,500 | | 3,606 | |
| Scottish Widows Ltd. | | 7.000% | | 6/16/43 | GBP | 1,300 | | 2,287 | |
| Segro plc | | 2.875% | | 10/11/37 | GBP | 300 | | 416 | |
| Severn Trent Utilities Finance plc | | 1.125% | | 9/7/21 | GBP | 1,700 | | 2,201 | |
| Severn Trent Utilities Finance plc | | 2.750% | | 12/5/31 | GBP | 1,300 | | 1,844 | |
| Severn Trent Utilities Finance plc | | 3.625% | | 1/16/26 | GBP | 2,500 | | 3,612 | |
| Severn Trent Utilities Finance plc | | 4.875% | | 1/24/42 | GBP | 2,540 | | 4,734 | |
| Skipton Building Society | | 1.750% | | 6/30/22 | GBP | 1,630 | | 2,116 | |
| Sky Ltd. | | 1.500% | | 9/15/21 | EUR | 7,037 | | 8,080 | |
| Sky Ltd. | | 1.875% | | 11/24/23 | EUR | 5,500 | | 6,583 | |
| Sky Ltd. | | 2.250% | | 11/17/25 | EUR | 500 | | 625 | |
| Sky Ltd. | | 2.500% | | 9/15/26 | EUR | 26,700 | | 34,120 | |
| Sky Ltd. | | 2.875% | | 11/24/20 | GBP | 8,950 | | 11,809 | |
| Sky Ltd. | | 4.000% | | 11/26/29 | GBP | 4,800 | | 7,511 | |
| Smiths Group plc | | 2.000% | | 2/23/27 | EUR | 10,800 | | 12,849 | |
| Society of Lloyd’s | | 4.750% | | 10/30/24 | GBP | 2,500 | | 3,602 | |
1 | Society of Lloyd’s | | 4.875% | | 2/7/47 | GBP | 5,000 | | 7,158 | |
| South Eastern Power Networks plc | | 5.625% | | 9/30/30 | GBP | 2,550 | | 4,495 | |
| South Eastern Power Networks plc | | 6.375% | | 11/12/31 | GBP | 2,850 | | 5,447 | |
| Southern Electric Power Distribution plc | | 4.625% | | 2/20/37 | GBP | 3,400 | | 5,742 | |
| Southern Electric Power Distribution plc | | 5.500% | | 6/7/32 | GBP | 206 | | 364 | |
15 | Southern Gas Networks plc | | 4.875% | | 12/21/20 | GBP | 5,000 | | 6,740 | |
| Southern Gas Networks plc | | 6.375% | | 5/15/40 | GBP | 420 | | 903 | |
| Southern Housing Group Ltd. | | 3.500% | | 10/19/47 | GBP | 1,500 | | 2,314 | |
16 | Southern Water Services Finance Ltd. | | 4.500% | | 3/31/52 | GBP | 200 | | 395 | |
119
Total International Bond Index Fund
| | | | | | | Face | | Market | |
| | | | | Maturity | | Amount | | Value· | |
| | | Coupon | | Date | Currency | (000 | ) | ($000 | ) |
16 | Southern Water Services Finance Ltd. | | 5.000% | | 3/31/21 | GBP | 7,850 | | 10,678 | |
16 | Southern Water Services Finance Ltd. | | 5.125% | | 9/30/56 | GBP | 100 | | 225 | |
16 | Southern Water Services Finance Ltd. | | 6.192% | | 3/31/29 | GBP | 3,000 | | 5,369 | |
| Sovereign Housing Capital plc | | 4.768% | | 6/1/43 | GBP | 289 | | 545 | |
| SPD Finance UK plc | | 5.875% | | 7/17/26 | GBP | 1,300 | | 2,121 | |
| SSE plc | | 0.875% | | 9/6/25 | EUR | 1,600 | | 1,828 | |
| SSE plc | | 2.375% | | 2/10/22 | EUR | 100 | | 118 | |
1 | SSE plc | | 3.625% | | 9/16/77 | GBP | 100 | | 131 | |
1 | SSE plc | | 3.875% | | 12/29/49 | GBP | 5,500 | | 7,156 | |
| SSE plc | | 4.250% | | 9/14/21 | GBP | 1,500 | | 2,054 | |
| SSE plc | | 5.875% | | 9/22/22 | GBP | 400 | | 586 | |
| SSE plc | | 6.250% | | 8/27/38 | GBP | 2,600 | | 5,093 | |
| SSE plc | | 8.375% | | 11/20/28 | GBP | 5,030 | | 9,820 | |
| Stagecoach Group plc | | 4.000% | | 9/29/25 | GBP | 300 | | 416 | |
1 | Standard Chartered plc | | 0.750% | | 10/3/23 | EUR | 8,000 | | 9,054 | |
| Standard Chartered plc | | 1.625% | | 6/13/21 | EUR | 15,076 | | 17,285 | |
1 | Standard Chartered plc | | 1.625% | | 10/3/27 | EUR | 700 | | 837 | |
| Standard Chartered plc | | 3.125% | | 11/19/24 | EUR | 500 | | 626 | |
| Student Finance plc | | 2.666% | | 9/30/24 | GBP | 1,500 | | 1,949 | |
| Sunderlan SHG Finance plc | | 6.380% | | 3/31/42 | GBP | 267 | | 500 | |
| Swan Housing Capital plc | | 3.625% | | 3/5/48 | GBP | 4,264 | | 6,385 | |
| TC Dudgeon Ofto plc | | 3.158% | | 11/12/38 | GBP | 1,270 | | 1,838 | |
| Tesco plc | | 5.125% | | 4/10/47 | EUR | 3,800 | | 6,070 | |
| Thames Water Utilities Cayman Finance Ltd. | | 2.625% | | 1/24/32 | GBP | 7,000 | | 9,323 | |
| Thames Water Utilities Cayman Finance Ltd. | | 2.875% | | 12/12/24 | CAD | 1,175 | | 871 | |
| Thames Water Utilities Cayman Finance Ltd. | | 3.500% | | 2/25/28 | GBP | 1,300 | | 1,860 | |
| Thames Water Utilities Cayman Finance Ltd. | | 4.000% | | 6/19/25 | GBP | 8,000 | | 11,600 | |
| Thames Water Utilities Cayman Finance Ltd. | | 4.375% | | 7/3/34 | GBP | 1,795 | | 2,858 | |
| Thames Water Utilities Cayman Finance Ltd. | | 4.625% | | 6/4/46 | GBP | 1,645 | | 2,845 | |
| Thames Water Utilities Cayman Finance Ltd. | | 5.500% | | 2/11/41 | GBP | 6,176 | | 11,583 | |
1 | Thames Water Utilities Cayman Finance Ltd. | | 5.750% | | 9/13/30 | GBP | 500 | | 706 | |
| Thames Water Utilities Cayman Finance Ltd. | | 7.738% | | 4/9/58 | GBP | 100 | | 267 | |
| Thames Water Utilities Finance plc | | 1.875% | | 1/24/24 | GBP | 1,500 | | 1,970 | |
| Thames Water Utilities Finance plc | | 5.125% | | 9/28/37 | GBP | 1,407 | | 2,455 | |
| Thames Water Utilities Finance plc | | 6.750% | | 11/16/28 | GBP | 3,590 | | 6,401 | |
| THFC Funding No. 3 plc | | 5.200% | | 10/11/43 | GBP | 4,900 | | 9,420 | |
| Together Housing Finance plc | | 4.500% | | 12/17/42 | GBP | 430 | | 760 | |
| TP ICAP plc | | 5.250% | | 1/26/24 | GBP | 320 | | 447 | |
| TP ICAP plc | | 5.250% | | 5/29/26 | GBP | 1,000 | | 1,378 | |
1 | TSB Banking Group plc | | 5.750% | | 5/6/26 | GBP | 1,700 | | 2,233 | |
| Unilever NV | | 0.500% | | 2/3/22 | EUR | 200 | | 227 | |
| Unilever NV | | 0.500% | | 1/6/25 | EUR | 100 | | 115 | |
| Unilever NV | | 1.000% | | 6/3/23 | EUR | 100 | | 116 | |
| Unilever plc | | 1.125% | | 2/3/22 | GBP | 1,200 | | 1,565 | |
| Unilever plc | | 1.500% | | 6/11/39 | EUR | 5,200 | | 6,404 | |
1 | UNITE USAF II plc | | 3.374% | | 6/30/28 | GBP | 1,600 | | 2,213 | |
| UNITE USAF II plc | | 3.921% | | 6/30/25 | GBP | 3,896 | | 5,632 | |
| United Utilities Water Finance plc | | 2.000% | | 2/14/25 | GBP | 3,000 | | 4,007 | |
| United Utilities Water Finance plc | | 2.625% | | 2/12/31 | GBP | 900 | | 1,285 | |
| United Utilities Water Ltd. | | 5.625% | | 12/20/27 | GBP | 6,810 | | 11,667 | |
| United Utilities Water Ltd. | | 5.750% | | 3/25/22 | GBP | 3,750 | | 5,402 | |
| University of Cambridge | | 2.350% | | 6/27/78 | GBP | 1,850 | | 2,930 | |
| University of Cambridge | | 3.750% | | 10/17/52 | GBP | 900 | | 1,825 | |
| University of Liverpool | | 3.375% | | 6/25/55 | GBP | 300 | | 545 | |
120
Total International Bond Index Fund
| | | | | | | Face | | Market | |
| | | | | Maturity | | Amount | | Value· | |
| | | Coupon | | Date | Currency | (000 | ) | ($000 | ) |
| University of Oxford | | 2.544% | | 12/8/17 | GBP | 7,000 | | 11,001 | |
| University of Southampton | | 2.250% | | 4/11/57 | GBP | 100 | | 133 | |
1 | Virgin Money Holdings UK plc | | 3.375% | | 4/24/26 | GBP | 12,166 | | 15,576 | |
| Vodafone Group plc | | 0.500% | | 1/30/24 | EUR | 100 | | 113 | |
| Vodafone Group plc | | 0.875% | | 11/17/20 | EUR | 10,900 | | 12,287 | |
| Vodafone Group plc | | 0.900% | | 11/24/26 | EUR | 4,750 | | 5,463 | |
| Vodafone Group plc | | 1.125% | | 11/20/25 | EUR | 9,000 | | 10,525 | |
| Vodafone Group plc | | 1.250% | | 8/25/21 | EUR | 9,100 | | 10,395 | |
| Vodafone Group plc | | 1.500% | | 7/24/27 | EUR | 2,200 | | 2,637 | |
| Vodafone Group plc | | 1.600% | | 7/29/31 | EUR | 11,300 | | 13,294 | |
| Vodafone Group plc | | 1.625% | | 11/24/30 | EUR | 10,000 | | 11,866 | |
| Vodafone Group plc | | 1.750% | | 8/25/23 | EUR | 9,100 | | 10,796 | |
| Vodafone Group plc | | 1.875% | | 9/11/25 | EUR | 20,000 | | 24,297 | |
| Vodafone Group plc | | 1.875% | | 11/20/29 | EUR | 7,900 | | 9,680 | |
| Vodafone Group plc | | 2.200% | | 8/25/26 | EUR | 300 | | 374 | |
| Vodafone Group plc | | 2.500% | | 5/24/39 | EUR | 4,500 | | 5,565 | |
| Vodafone Group plc | | 2.875% | | 11/20/37 | EUR | 200 | | 264 | |
| Vodafone Group plc | | 3.000% | | 8/12/56 | GBP | 5,800 | | 7,337 | |
| Vodafone Group plc | | 3.250% | | 12/13/22 | AUD | 1,000 | | 720 | |
| Vodafone Group plc | | 3.375% | | 8/8/49 | GBP | 2,900 | | 3,936 | |
| Vodafone Group plc | | 4.200% | | 12/13/27 | AUD | 9,350 | | 7,123 | |
| Vodafone Group plc | | 4.650% | | 1/20/22 | EUR | 100 | | 123 | |
| Vodafone Group plc | | 5.625% | | 12/4/25 | GBP | 1,200 | | 1,926 | |
| Vodafone Group plc | | 5.900% | | 11/26/32 | GBP | 3,000 | | 5,534 | |
| Wales & West Utilities Finance plc | | 3.000% | | 8/3/38 | GBP | 1,500 | | 2,220 | |
| Wales & West Utilities Finance plc | | 5.750% | | 3/29/30 | GBP | 5,000 | | 8,959 | |
| Wellcome Trust Finance plc | | 4.000% | | 5/9/59 | GBP | 2,200 | | 4,931 | |
| Wellcome Trust Finance plc | | 4.750% | | 5/28/21 | GBP | 500 | | 685 | |
| Wellcome Trust Ltd. | | 2.517% | | 2/7/18 | GBP | 4,300 | | 6,744 | |
| Wessex Water Services Finance plc | | 4.000% | | 9/24/21 | GBP | 1,000 | | 1,365 | |
| Wessex Water Services Finance plc | | 5.375% | | 3/10/28 | GBP | 800 | | 1,334 | |
| Western Power Distribution East Midlands plc | | 5.250% | | 1/17/23 | GBP | 2,500 | | 3,645 | |
| Western Power Distribution South Wales plc | | 5.750% | | 3/23/40 | GBP | 850 | | 1,685 | |
| Western Power Distribution South West plc | | 5.750% | | 3/23/40 | GBP | 1,750 | | 3,467 | |
| Western Power Distribution South West plc | | 5.875% | | 3/25/27 | GBP | 1,000 | | 1,661 | |
| Western Power Distribution West Midlands plc | | 3.875% | | 10/17/24 | GBP | 3,700 | | 5,313 | |
| Western Power Distribution West Midlands plc | | 5.750% | | 4/16/32 | GBP | 5,600 | | 10,111 | |
| Wheatley Group Capital plc | | 4.375% | | 11/28/44 | GBP | 4,500 | | 7,561 | |
| WHG Treasury plc | | 4.250% | | 10/6/45 | GBP | 4,000 | | 6,836 | |
| Wm Morrison Supermarkets plc | | 3.500% | | 7/27/26 | GBP | 1,350 | | 1,936 | |
| Wm Morrison Supermarkets plc | | 4.625% | | 12/8/23 | GBP | 800 | | 1,171 | |
| Wm Morrison Supermarkets plc | | 4.750% | | 7/4/29 | GBP | 5,550 | | 8,732 | |
| WM Treasury 2 plc | | 3.250% | | 10/20/48 | GBP | 1,500 | | 2,274 | |
| Wods Transmission plc | | 3.446% | | 8/24/34 | GBP | 573 | | 838 | |
| WPP Finance 2013 | | 2.875% | | 9/14/46 | GBP | 500 | | 598 | |
| WPP Finance 2016 | | 1.375% | | 3/20/25 | EUR | 17,200 | | 20,020 | |
| WPP Finance Deutschland GmbH | | 1.625% | | 3/23/30 | EUR | 100 | | 119 | |
| WPP Finance SA | | 2.250% | | 9/22/26 | EUR | 300 | | 371 | |
| Yorkshire Building Society | | 0.875% | | 3/20/23 | EUR | 200 | | 227 | |
| Yorkshire Building Society | | 1.250% | | 3/17/22 | EUR | 9,403 | | 10,772 | |
121
Total International Bond Index Fund
| | | | | | | Face | | Market | |
| | | | | Maturity | | Amount | | Value· | |
| | | Coupon | | Date | Currency | (000 | ) | ($000 | ) |
| Yorkshire Building Society | | 3.500% | | 4/21/26 | GBP | 1,100 | | 1,552 | |
| Yorkshire Power Finance Ltd. | | 7.250% | | 8/4/28 | GBP | 200 | | 376 | |
| Yorkshire Water Finance plc | | 2.750% | | 4/18/41 | GBP | 100 | | 142 | |
| Yorkshire Water Services Finance Ltd. | | 3.625% | | 8/1/29 | GBP | 6,400 | | 9,613 | |
1 | Yorkshire Water Services Finance Ltd. | | 3.750% | | 3/22/46 | GBP | 1,000 | | 1,345 | |
| Yorkshire Water Services Finance Ltd. | | 5.500% | | 5/28/37 | GBP | 300 | | 591 | |
| Yorkshire Water Services Finance Ltd. | | 6.375% | | 8/19/39 | GBP | 5,377 | | 11,789 | |
| | | | | | | | | 2,915,702 | |
Sovereign Bonds (4.9%) | | | | | | | | | |
1 | Affordable Housing Finance plc | | 2.893% | | 8/11/45 | GBP | 2,673 | | 4,457 | |
| Affordable Housing Finance plc | | 3.800% | | 5/20/42 | GBP | 5,000 | | 9,380 | |
| LCR Finance plc | | 4.500% | | 12/7/28 | GBP | 7,500 | | 12,748 | |
| LCR Finance plc | | 4.500% | | 12/7/38 | GBP | 1,600 | | 3,198 | |
| LCR Finance plc | | 5.100% | | 3/7/51 | GBP | 6,700 | | 16,708 | |
| Merseylink Issuer plc | | 3.842% | | 3/31/43 | GBP | 300 | | 543 | |
| Network Rail Infrastructure Finance plc | | 2.750% | | 10/6/21 | CHF | 2,500 | | 2,699 | |
| Network Rail Infrastructure Finance plc | | 4.375% | | 12/9/30 | GBP | 8,900 | | 15,688 | |
| Network Rail Infrastructure Finance plc | | 4.750% | | 1/22/24 | GBP | 5,000 | | 7,555 | |
| Network Rail Infrastructure Finance plc | | 4.750% | | 11/29/35 | GBP | 4,200 | | 8,273 | |
| NIE Finance plc | | 2.500% | | 10/27/25 | GBP | 800 | | 1,087 | |
| PRS Finance plc | | 1.750% | | 11/24/26 | GBP | 7,650 | | 10,410 | |
| Transport for London | | 2.125% | | 4/24/25 | GBP | 5,000 | | 6,838 | |
| Transport for London | | 2.250% | | 8/9/22 | GBP | 900 | | 1,210 | |
| Transport for London | | 3.625% | | 5/15/45 | GBP | 4,900 | | 8,370 | |
| Transport for London | | 3.875% | | 7/23/42 | GBP | 800 | | 1,394 | |
| Transport for London | | 4.000% | | 4/7/64 | GBP | 4,550 | | 9,514 | |
| United Kingdom | | 0.500% | | 7/22/22 | GBP | 286,391 | | 371,765 | |
| United Kingdom | | 0.625% | | 6/7/25 | GBP | 29,281 | | 38,312 | |
| United Kingdom | | 0.750% | | 7/22/23 | GBP | 224,150 | | 293,822 | |
| United Kingdom | | 0.875% | | 10/22/29 | GBP | 70,000 | | 92,899 | |
| United Kingdom | | 1.250% | | 7/22/27 | GBP | 179,500 | | 246,620 | |
| United Kingdom | | 1.500% | | 1/22/21 | GBP | 143,000 | | 187,209 | |
| United Kingdom | | 1.500% | | 7/22/47 | GBP | 181,800 | | 256,572 | |
| United Kingdom | | 1.625% | | 10/22/28 | GBP | 105,800 | | 150,160 | |
| United Kingdom | | 1.625% | | 10/22/54 | GBP | 118,542 | | 176,878 | |
| United Kingdom | | 1.625% | | 10/22/71 | GBP | 105,659 | | 171,242 | |
| United Kingdom | | 1.750% | | 9/7/22 | GBP | 112,220 | | 150,801 | |
| United Kingdom | | 1.750% | | 9/7/37 | GBP | 259,300 | | 375,836 | |
| United Kingdom | | 1.750% | | 7/22/57 | GBP | 36,791 | | 58,121 | |
| United Kingdom | | 2.250% | | 9/7/23 | GBP | 20,000 | | 27,719 | |
| United Kingdom | | 3.250% | | 1/22/44 | GBP | 220,300 | | 414,441 | |
| United Kingdom | | 3.500% | | 1/22/45 | GBP | 99,920 | | 197,173 | |
| United Kingdom | | 3.500% | | 7/22/68 | GBP | 48,464 | | 122,129 | |
| United Kingdom | | 3.750% | | 9/7/20 | GBP | 22,027 | | 29,283 | |
| United Kingdom | | 3.750% | | 9/7/21 | GBP | 53,100 | | 72,896 | |
| United Kingdom | | 3.750% | | 7/22/52 | GBP | 93,100 | | 209,118 | |
| United Kingdom | | 4.000% | | 1/22/60 | GBP | 125,600 | | 320,374 | |
| United Kingdom | | 4.250% | | 12/7/27 | GBP | 88,000 | | 148,571 | |
| United Kingdom | | 4.250% | | 6/7/32 | GBP | 89,541 | | 164,821 | |
| United Kingdom | | 4.250% | | 3/7/36 | GBP | 127,000 | | 247,234 | |
| United Kingdom | | 4.250% | | 9/7/39 | GBP | 90,796 | | 185,717 | |
| United Kingdom | | 4.250% | | 12/7/40 | GBP | 66,445 | | 137,985 | |
| United Kingdom | | 4.250% | | 12/7/46 | GBP | 65,600 | | 147,207 | |
| United Kingdom | | 4.250% | | 12/7/49 | GBP | 72,600 | | 169,406 | |
122
Total International Bond Index Fund
| | | | | | | Face | | Market | |
| | | | | Maturity | | Amount | | Value· | |
| | | Coupon | | Date | Currency | (000 | ) | ($000 | ) |
| United Kingdom | | 4.250% | | 12/7/55 | GBP | 89,100 | | 225,100 | |
| United Kingdom | | 4.500% | | 9/7/34 | GBP | 104,225 | | 203,623 | |
| United Kingdom | | 4.500% | | 12/7/42 | GBP | 95,100 | | 209,163 | |
| United Kingdom | | 4.750% | | 12/7/30 | GBP | 14,410 | | 26,917 | |
| United Kingdom | | 4.750% | | 12/7/38 | GBP | 16,708 | | 35,801 | |
| United Kingdom | | 5.000% | | 3/7/25 | GBP | 141,707 | | 228,188 | |
| United Kingdom | | 8.000% | | 6/7/21 | GBP | 26,000 | | 37,684 | |
| United Kingdom Gilt | | 1.000% | | 4/22/24 | GBP | 250,532 | | 332,754 | |
| United Kingdom Gilt | | 1.750% | | 1/22/49 | GBP | 33,000 | | 49,391 | |
| United Kingdom Gilt | | 2.500% | | 7/22/65 | GBP | 92,200 | | 183,719 | |
| Urenco Finance NV | | 2.375% | | 12/2/24 | EUR | 4,000 | | 4,926 | |
| Urenco Finance NV | | 2.500% | | 2/15/21 | EUR | 3,000 | | 3,453 | |
| | | | | | | | | 6,825,102 | |
Total United Kingdom (Cost $9,657,046) | | | | | | | | 10,197,062 | |
United States (3.1%) | | | | | | | | | |
Corporate Bonds (3.1%) | | | | | | | | | |
| 3M Co. | | 0.375% | | 2/15/22 | EUR | 17,000 | | 19,172 | |
| 3M Co. | | 0.950% | | 5/15/23 | EUR | 2,000 | | 2,315 | |
| 3M Co. | | 1.500% | | 11/9/26 | EUR | 300 | | 366 | |
| 3M Co. | | 1.750% | | 5/15/30 | EUR | 1,617 | | 2,050 | |
| 3M Co. | | 1.875% | | 11/15/21 | EUR | 400 | | 465 | |
| Abbott Ireland Financing DAC | | 0.875% | | 9/27/23 | EUR | 100 | | 115 | |
| Abbott Ireland Financing DAC | | 1.500% | | 9/27/26 | EUR | 17,500 | | 20,977 | |
| AbbVie Inc. | | 0.750% | | 11/18/27 | EUR | 5,000 | | 5,559 | |
| AbbVie Inc. | | 1.375% | | 5/17/24 | EUR | 12,000 | | 14,017 | |
| AbbVie Inc. | | 2.125% | | 11/17/28 | EUR | 19,900 | | 24,784 | |
| Air Products & Chemicals Inc. | | 1.000% | | 2/12/25 | EUR | 3,337 | | 3,899 | |
| Albemarle Corp. | | 1.875% | | 12/8/21 | EUR | 100 | | 116 | |
| Allergan Funding SCS | | 0.500% | | 6/1/21 | EUR | 4,800 | | 5,394 | |
| Allergan Funding SCS | | 1.250% | | 6/1/24 | EUR | 10,000 | | 11,614 | |
| Allergan Funding SCS | | 1.500% | | 11/15/23 | EUR | 1,200 | | 1,410 | |
| Allergan Funding SCS | | 2.125% | | 6/1/29 | EUR | 8,400 | | 10,337 | |
| Allergan Funding SCS | | 2.625% | | 11/15/28 | EUR | 2,000 | | 2,563 | |
| Altria Group Inc. | | 1.000% | | 2/15/23 | EUR | 2,400 | | 2,710 | |
| Altria Group Inc. | | 1.700% | | 6/15/25 | EUR | 3,100 | | 3,554 | |
| Altria Group Inc. | | 2.200% | | 6/15/27 | EUR | 12,550 | | 14,723 | |
| Altria Group Inc. | | 3.125% | | 6/15/31 | EUR | 19,100 | | 23,480 | |
| American Express Credit Corp. | | 0.625% | | 11/22/21 | EUR | 26,702 | | 30,213 | |
| American Honda Finance Corp. | | 1.300% | | 3/21/22 | GBP | 15,000 | | 19,506 | |
| American International Group Inc. | | 1.500% | | 6/8/23 | EUR | 500 | | 581 | |
| American International Group Inc. | | 1.875% | | 6/21/27 | EUR | 5,300 | | 6,390 | |
| American International Group Inc. | | 5.000% | | 4/26/23 | GBP | 3,400 | | 4,932 | |
| American Tower Corp. | | 1.375% | | 4/4/25 | EUR | 8,500 | | 9,947 | |
| American Tower Corp. | | 1.950% | | 5/22/26 | EUR | 14,400 | | 17,367 | |
| Amgen Inc. | | 1.250% | | 2/25/22 | EUR | 18,360 | | 21,019 | |
| Amgen Inc. | | 2.000% | | 2/25/26 | EUR | 2,600 | | 3,203 | |
| Amgen Inc. | | 4.000% | | 9/13/29 | GBP | 4,500 | | 6,872 | |
| Amgen Inc. | | 5.500% | | 12/7/26 | GBP | 4,400 | | 7,144 | |
| Aon plc | | 2.875% | | 5/14/26 | EUR | 3,400 | | 4,307 | |
| Apple Inc. | | 0.750% | | 2/25/30 | CHF | 5,500 | | 5,973 | |
| Apple Inc. | | 0.875% | | 5/24/25 | EUR | 12,000 | | 14,067 | |
| Apple Inc. | | 1.000% | | 11/10/22 | EUR | 14,050 | | 16,238 | |
| Apple Inc. | | 1.375% | | 1/17/24 | EUR | 10,100 | | 11,978 | |
123
Total International Bond Index Fund
| | | | | | | Face | | Market | |
| | | | | Maturity | | Amount | | Value· | |
| | | Coupon | | Date | Currency | (000 | ) | ($000 | ) |
| Apple Inc. | | 1.375% | | 5/24/29 | EUR | 8,900 | | 11,044 | |
| Apple Inc. | | 1.625% | | 11/10/26 | EUR | 4,139 | | 5,146 | |
| Apple Inc. | | 2.000% | | 9/17/27 | EUR | 7,080 | | 9,097 | |
| Apple Inc. | | 2.513% | | 8/19/24 | CAD | 24,220 | | 18,684 | |
| Apple Inc. | | 3.050% | | 7/31/29 | GBP | 9,500 | | 14,239 | |
| Apple Inc. | | 3.350% | | 1/10/24 | AUD | 750 | | 554 | |
| Apple Inc. | | 3.600% | | 6/10/26 | AUD | 1,890 | | 1,443 | |
| Apple Inc. | | 3.600% | | 7/31/42 | GBP | 7,000 | | 11,921 | |
| Apple Inc. | | 3.700% | | 8/28/22 | AUD | 7,250 | | 5,312 | |
| Archer-Daniels-Midland Co. | | 1.000% | | 9/12/25 | EUR | 15,600 | | 18,207 | |
| Archer-Daniels-Midland Co. | | 1.750% | | 6/23/23 | EUR | 10,000 | | 11,885 | |
| AT&T Inc. | | 0.800% | | 3/4/30 | EUR | 4,000 | | 4,424 | |
| AT&T Inc. | | 1.050% | | 9/5/23 | EUR | 2,100 | | 2,417 | |
| AT&T Inc. | | 1.300% | | 9/5/23 | EUR | 15,314 | | 17,789 | |
| AT&T Inc. | | 1.375% | | 12/4/24 | CHF | 500 | | 538 | |
| AT&T Inc. | | 1.800% | | 9/5/26 | EUR | 3,800 | | 4,600 | |
| AT&T Inc. | | 1.800% | | 9/14/39 | EUR | 8,000 | | 8,714 | |
| AT&T Inc. | | 1.875% | | 12/4/20 | EUR | 400 | | 454 | |
| AT&T Inc. | | 1.950% | | 9/15/23 | EUR | 800 | | 950 | |
| AT&T Inc. | | 2.350% | | 9/5/29 | EUR | 15,300 | | 19,562 | |
| AT&T Inc. | | 2.400% | | 3/15/24 | EUR | 9,000 | | 10,932 | |
| AT&T Inc. | | 2.450% | | 3/15/35 | EUR | 5,100 | | 6,307 | |
| AT&T Inc. | | 2.500% | | 3/15/23 | EUR | 2,100 | | 2,515 | |
| AT&T Inc. | | 2.650% | | 12/17/21 | EUR | 200 | | 234 | |
| AT&T Inc. | | 2.750% | | 5/19/23 | EUR | 9,848 | | 11,978 | |
| AT&T Inc. | | 2.900% | | 12/4/26 | GBP | 3,200 | | 4,415 | |
| AT&T Inc. | | 3.150% | | 9/4/36 | EUR | 6,400 | | 8,568 | |
| AT&T Inc. | | 3.375% | | 3/15/34 | EUR | 2,800 | | 3,845 | |
| AT&T Inc. | | 3.450% | | 9/19/23 | AUD | 900 | | 654 | |
| AT&T Inc. | | 3.500% | | 12/17/25 | EUR | 4,800 | | 6,351 | |
| AT&T Inc. | | 3.550% | | 12/17/32 | EUR | 9,962 | | 14,098 | |
| AT&T Inc. | | 3.825% | | 11/25/20 | CAD | 11,750 | | 9,063 | |
| AT&T Inc. | | 4.000% | | 11/25/25 | CAD | 14,225 | | 11,409 | |
| AT&T Inc. | | 4.100% | | 1/19/26 | AUD | 650 | | 493 | |
| AT&T Inc. | | 4.250% | | 6/1/43 | GBP | 5,267 | | 8,114 | |
| AT&T Inc. | | 4.375% | | 9/14/29 | GBP | 5,488 | | 8,360 | |
| AT&T Inc. | | 4.600% | | 9/19/28 | AUD | 6,370 | | 5,031 | |
| AT&T Inc. | | 4.850% | | 5/25/47 | CAD | 3,930 | | 3,150 | |
| AT&T Inc. | | 4.875% | | 6/1/44 | GBP | 450 | | 750 | |
| AT&T Inc. | | 5.100% | | 11/25/48 | CAD | 3,500 | | 2,912 | |
| AT&T Inc. | | 5.200% | | 11/18/33 | GBP | 10,000 | | 16,677 | |
| AT&T Inc. | | 7.000% | | 4/30/40 | GBP | 7,150 | | 14,691 | |
1 | Bank of America Corp. | | 0.736% | | 2/7/22 | EUR | 100 | | 113 | |
| Bank of America Corp. | | 0.750% | | 7/26/23 | EUR | 19,700 | | 22,518 | |
1 | Bank of America Corp. | | 0.808% | | 5/9/26 | EUR | 10,000 | | 11,412 | |
| Bank of America Corp. | | 1.375% | | 9/10/21 | EUR | 10,000 | | 11,467 | |
| Bank of America Corp. | | 1.375% | | 3/26/25 | EUR | 3,000 | | 3,562 | |
1 | Bank of America Corp. | | 1.379% | | 2/7/25 | EUR | 5,600 | | 6,559 | |
| Bank of America Corp. | | 1.625% | | 9/14/22 | EUR | 5,000 | | 5,835 | |
1 | Bank of America Corp. | | 1.776% | | 5/4/27 | EUR | 12,100 | | 14,597 | |
| Bank of America Corp. | | 2.300% | | 7/25/25 | GBP | 4,000 | | 5,393 | |
| Bank of America Corp. | | 2.375% | | 6/19/24 | EUR | 7,000 | | 8,612 | |
1 | Bank of America Corp. | | 2.604% | | 3/15/23 | CAD | 4,850 | | 3,700 | |
1 | Bank of America Corp. | | 2.932% | | 4/25/25 | CAD | 4,698 | | 3,590 | |
124
Total International Bond Index Fund
| | | | | | | Face | | Market | |
| | | | | Maturity | | Amount | | Value· | |
| | | Coupon | | Date | Currency | (000 | ) | ($000 | ) |
1 | Bank of America Corp. | | 3.301% | | 4/24/24 | CAD | 9,525 | | 7,427 | |
1 | Bank of America Corp. | | 3.407% | | 9/20/25 | CAD | 2,040 | | 1,604 | |
| Bank of America Corp. | | 4.250% | | 12/10/26 | GBP | 2,900 | | 4,431 | |
| Bank of America Corp. | | 5.500% | | 11/22/21 | GBP | 1,800 | | 2,522 | |
| Bank of America Corp. | | 6.125% | | 9/15/21 | GBP | 7,400 | | 10,458 | |
| Baxter International Inc. | | 1.300% | | 5/30/25 | EUR | 7,055 | | 8,219 | |
| Baxter International Inc. | | 1.300% | | 5/15/29 | EUR | 7,300 | | 8,426 | |
| Becton Dickinson & Co. | | 1.000% | | 12/15/22 | EUR | 7,830 | | 8,933 | |
| Becton Dickinson & Co. | | 1.900% | | 12/15/26 | EUR | 11,818 | | 14,145 | |
| Becton Dickinson Euro Finance Sarl | | 0.174% | | 6/4/21 | EUR | 9,000 | | 10,064 | |
| Becton Dickinson Euro Finance Sarl | | 0.632% | | 6/4/23 | EUR | 10,000 | | 11,259 | |
| Becton Dickinson Euro Finance Sarl | | 1.208% | | 6/4/26 | EUR | 8,000 | | 9,162 | |
| Berkshire Hathaway Finance Corp. | | 2.375% | | 6/19/39 | GBP | 7,000 | | 9,621 | |
| Berkshire Hathaway Finance Corp. | | 2.625% | | 6/19/59 | GBP | 3,600 | | 5,267 | |
| Berkshire Hathaway Inc. | | 0.170% | | 9/13/24 | JPY | 1,500,000 | | 13,877 | |
| Berkshire Hathaway Inc. | | 0.440% | | 9/13/29 | JPY | 2,500,000 | | 23,145 | |
| Berkshire Hathaway Inc. | | 0.440% | | 9/13/29 | JPY | 3,000,000 | | 27,774 | |
| Berkshire Hathaway Inc. | | 0.750% | | 3/16/23 | EUR | 1,000 | | 1,140 | |
| Berkshire Hathaway Inc. | | 1.108% | | 9/13/49 | JPY | 800,000 | | 7,314 | |
| Berkshire Hathaway Inc. | | 1.125% | | 3/16/27 | EUR | 8,802 | | 10,412 | |
| Berkshire Hathaway Inc. | | 1.300% | | 3/15/24 | EUR | 4,400 | | 5,158 | |
| Berkshire Hathaway Inc. | | 1.625% | | 3/16/35 | EUR | 6,000 | | 7,566 | |
| Berkshire Hathaway Inc. | | 2.150% | | 3/15/28 | EUR | 16,300 | | 20,818 | |
| BlackRock Inc. | | 1.250% | | 5/6/25 | EUR | 6,550 | | 7,783 | |
| Blackstone Holdings Finance Co. LLC | | 1.000% | | 10/5/26 | EUR | 889 | | 1,028 | |
| Blackstone Holdings Finance Co. LLC | | 2.000% | | 5/19/25 | EUR | 100 | | 122 | |
| Booking Holdings Inc. | | 0.800% | | 3/10/22 | EUR | 9,398 | | 10,689 | |
| Booking Holdings Inc. | | 1.800% | | 3/3/27 | EUR | 10,138 | | 12,521 | |
| Booking Holdings Inc. | | 2.375% | | 9/23/24 | EUR | 4,000 | | 4,940 | |
| BorgWarner Inc. | | 1.800% | | 11/7/22 | EUR | 100 | | 117 | |
| Bristol-Myers Squibb Co. | | 1.000% | | 5/15/25 | EUR | 1,625 | | 1,899 | |
| Bristol-Myers Squibb Co. | | 1.750% | | 5/15/35 | EUR | 4,000 | | 5,130 | |
| Brookfield Property Finance ULC | | 4.346% | | 7/3/23 | CAD | 2,000 | | 1,575 | |
| Brown-Forman Corp. | | 1.200% | | 7/7/26 | EUR | 2,560 | | 3,004 | |
| Brown-Forman Corp. | | 2.600% | | 7/7/28 | GBP | 9,320 | | 13,153 | |
| Bunge Finance Europe BV | | 1.850% | | 6/16/23 | EUR | 16,570 | | 19,161 | |
| Carnival Corp. | | 1.625% | | 2/22/21 | EUR | 9,000 | | 10,262 | |
| Carnival Corp. | | 1.875% | | 11/7/22 | EUR | 5,550 | | 6,518 | |
| Carnival plc | | 1.000% | | 10/28/29 | EUR | 3,000 | | 3,345 | |
| Celanese US Holdings LLC | | 2.125% | | 3/1/27 | EUR | 7,900 | | 9,301 | |
| Chubb INA Holdings Inc. | | 0.875% | | 6/15/27 | EUR | 2,400 | | 2,760 | |
| Chubb INA Holdings Inc. | | 1.400% | | 6/15/31 | EUR | 4,800 | | 5,675 | |
| Chubb INA Holdings Inc. | | 1.550% | | 3/15/28 | EUR | 3,962 | | 4,775 | |
| Chubb INA Holdings Inc. | | 2.500% | | 3/15/38 | EUR | 12,574 | | 16,944 | |
| Citigroup Inc. | | 0.750% | | 10/26/23 | EUR | 500 | | 572 | |
| Citigroup Inc. | | 1.250% | | 4/10/29 | EUR | 3,000 | | 3,519 | |
| Citigroup Inc. | | 1.375% | | 10/27/21 | EUR | 10,000 | | 11,482 | |
1 | Citigroup Inc. | | 1.500% | | 7/24/26 | EUR | 20,000 | | 23,629 | |
| Citigroup Inc. | | 1.500% | | 10/26/28 | EUR | 1,000 | | 1,205 | |
| Citigroup Inc. | | 1.625% | | 3/21/28 | EUR | 3,000 | | 3,638 | |
| Citigroup Inc. | | 1.750% | | 1/28/25 | EUR | 600 | | 721 | |
| Citigroup Inc. | | 1.750% | | 10/23/26 | GBP | 5,100 | | 6,621 | |
| Citigroup Inc. | | 2.125% | | 9/10/26 | EUR | 5,400 | | 6,717 | |
| Citigroup Inc. | | 2.375% | | 5/22/24 | EUR | 2,000 | | 2,457 | |
125
Total International Bond Index Fund
| | | | | | | Face | | Market | |
| | | | | Maturity | | Amount | | Value· | |
| | | Coupon | | Date | Currency | (000 | ) | ($000 | ) |
| Citigroup Inc. | | 2.400% | | 10/31/25 | JPY | 660,000 | | 6,729 | |
| Citigroup Inc. | | 2.750% | | 1/24/24 | GBP | 11,500 | | 15,612 | |
| Citigroup Inc. | | 3.390% | | 11/18/21 | CAD | 4,970 | | 3,860 | |
| Citigroup Inc. | | 4.090% | | 6/9/25 | CAD | 3,100 | | 2,478 | |
| Citigroup Inc. | | 4.500% | | 3/3/31 | GBP | 1,000 | | 1,572 | |
| Citigroup Inc. | | 6.800% | | 6/25/38 | GBP | 400 | | 868 | |
| Citigroup Inc. | | 7.375% | | 9/1/39 | GBP | 600 | | 1,381 | |
| Coca-Cola Co. | | 0.000% | | 3/9/21 | EUR | 3,750 | | 4,195 | |
| Coca-Cola Co. | | 0.500% | | 3/8/24 | EUR | 5,800 | | 6,633 | |
| Coca-Cola Co. | | 0.750% | | 3/9/23 | EUR | 5,500 | | 6,304 | |
| Coca-Cola Co. | | 0.750% | | 9/22/26 | EUR | 10,000 | | 11,686 | |
| Coca-Cola Co. | | 1.125% | | 9/22/22 | EUR | 1,000 | | 1,158 | |
| Coca-Cola Co. | | 1.125% | | 3/9/27 | EUR | 3,100 | | 3,699 | |
| Coca-Cola Co. | | 1.250% | | 3/8/31 | EUR | 15,100 | | 18,451 | |
| Coca-Cola Co. | | 1.625% | | 3/9/35 | EUR | 5,650 | | 7,220 | |
| Coca-Cola Co. | | 1.875% | | 9/22/26 | EUR | 2,959 | | 3,706 | |
| Coca-Cola Co. | | 3.250% | | 6/11/24 | AUD | 1,670 | | 1,240 | |
| Colgate-Palmolive Co. | | 0.500% | | 3/6/26 | EUR | 1,900 | | 2,179 | |
| Colgate-Palmolive Co. | | 1.375% | | 3/6/34 | EUR | 2,600 | | 3,195 | |
| Comcast Corp. | | 5.500% | | 11/23/29 | GBP | 4,000 | | 6,963 | |
| Corning Inc. | | 0.992% | | 8/10/27 | JPY | 1,700,000 | | 16,004 | |
| DH Europe Finance II Sarl | | 0.200% | | 3/18/26 | EUR | 7,300 | | 8,060 | |
| DH Europe Finance II Sarl | | 0.450% | | 3/18/28 | EUR | 3,300 | | 3,646 | |
| DH Europe Finance II Sarl | | 0.750% | | 9/18/31 | EUR | 7,500 | | 8,196 | |
| DH Europe Finance II Sarl | | 1.350% | | 9/18/39 | EUR | 6,000 | | 6,500 | |
| DH Europe Finance II Sarl | | 1.350% | | 9/18/39 | EUR | 4,800 | | 5,200 | |
| DH Europe Finance SA | | 1.700% | | 1/4/22 | EUR | 26,000 | | 30,130 | |
| Digital Euro Finco LLC | | 2.500% | | 1/16/26 | EUR | 19,300 | | 23,495 | |
| Digital Euro Finco LLC | | 2.625% | | 4/15/24 | EUR | 5,100 | | 6,192 | |
| Digital Stout Holding LLC | | 3.300% | | 7/19/29 | GBP | 3,000 | | 4,179 | |
| Digital Stout Holding LLC | | 3.750% | | 10/17/30 | GBP | 4,000 | | 5,787 | |
| Digital Stout Holding LLC | | 4.250% | | 1/17/25 | GBP | 2,000 | | 2,906 | |
| Digital Stout Holding LLC | | 4.750% | | 10/13/23 | GBP | 1,000 | | 1,447 | |
| Discovery Communications LLC | | 1.900% | | 3/19/27 | EUR | 13,742 | | 16,207 | |
| Discovery Communications LLC | | 2.375% | | 3/7/22 | EUR | 1,000 | | 1,173 | |
| Discovery Communications LLC | | 2.500% | | 9/20/24 | GBP | 4,400 | | 5,856 | |
| Dover Corp. | | 1.250% | | 11/9/26 | EUR | 19,700 | | 22,904 | |
| Dover Corp. | | 2.125% | | 12/1/20 | EUR | 1,300 | | 1,482 | |
| DXC Technology Co. | | 1.750% | | 1/15/26 | EUR | 10,700 | | 12,081 | |
| DXC Technology Co. | | 2.750% | | 1/15/25 | GBP | 10,000 | | 13,059 | |
| Eastman Chemical Co. | | 1.500% | | 5/26/23 | EUR | 10,000 | | 11,678 | |
| Eastman Chemical Co. | | 1.875% | | 11/23/26 | EUR | 5,700 | | 6,896 | |
| Ecolab Inc. | | 1.000% | | 1/15/24 | EUR | 7,620 | | 8,789 | |
| Eli Lilly & Co. | | 1.000% | | 6/2/22 | EUR | 13,800 | | 15,829 | |
| Eli Lilly & Co. | | 1.700% | | 11/1/49 | EUR | 6,200 | | 6,928 | |
| Eli Lilly & Co. | | 2.125% | | 6/3/30 | EUR | 8,100 | | 10,460 | |
| Emerson Electric Co. | | 0.375% | | 5/22/24 | EUR | 2,050 | | 2,309 | |
| Emerson Electric Co. | | 1.250% | | 10/15/25 | EUR | 2,000 | | 2,352 | |
| Emerson Electric Co. | | 2.000% | | 10/15/29 | EUR | 2,000 | | 2,495 | |
| Equinix Inc. | | 2.875% | | 2/1/26 | EUR | 12,350 | | 14,318 | |
| Euronet Worldwide Inc. | | 1.375% | | 5/22/26 | EUR | 6,300 | | 7,007 | |
| Expedia Group Inc. | | 2.500% | | 6/3/22 | EUR | 1,450 | | 1,702 | |
| FedEx Corp. | | 1.000% | | 1/11/23 | EUR | 700 | | 800 | |
| FedEx Corp. | | 1.300% | | 8/5/31 | EUR | 2,300 | | 2,564 | |
126
Total International Bond Index Fund
| | | | | | | Face | | Market | |
| | | | | Maturity | | Amount | | Value· | |
| | | Coupon | | Date | Currency | (000 | ) | ($000 | ) |
| FedEx Corp. | | 1.625% | | 1/11/27 | EUR | 7,000 | | 8,275 | |
| Fidelity National Information Services Inc. | | 0.125% | | 5/21/21 | EUR | 1,040 | | 1,163 | |
| Fidelity National Information Services Inc. | | 0.400% | | 1/15/21 | EUR | 6,662 | | 7,468 | |
| Fidelity National Information Services Inc. | | 0.750% | | 5/21/23 | EUR | 5,215 | | 5,932 | |
| Fidelity National Information Services Inc. | | 1.500% | | 5/21/27 | EUR | 12,025 | | 14,239 | |
| Fidelity National Information Services Inc. | | 2.000% | | 5/21/30 | EUR | 3,320 | | 4,085 | |
| Fidelity National Information Services Inc. | | 2.602% | | 5/21/25 | GBP | 2,867 | | 3,901 | |
| Fidelity National Information Services Inc. | | 2.950% | | 5/21/39 | EUR | 6,420 | | 8,605 | |
| Fidelity National Information Services Inc. | | 3.360% | | 5/21/31 | GBP | 2,261 | | 3,245 | |
| Fiserv Inc. | | 0.375% | | 7/1/23 | EUR | 1,000 | | 1,123 | |
| Fiserv Inc. | | 1.125% | | 7/1/27 | EUR | 900 | | 1,039 | |
| Fiserv Inc. | | 1.625% | | 7/1/30 | EUR | 1,900 | | 2,252 | |
| Fiserv Inc. | | 2.250% | | 7/1/25 | GBP | 2,100 | | 2,806 | |
| Fiserv Inc. | | 3.000% | | 7/1/31 | GBP | 5,200 | | 7,222 | |
| Flowserve Corp. | | 1.250% | | 3/17/22 | EUR | 3,700 | | 4,169 | |
| Fluor Corp. | | 1.750% | | 3/21/23 | EUR | 7,450 | | 7,890 | |
| Ford Credit Canada Co. | | 2.710% | | 2/23/22 | CAD | 7,980 | | 5,983 | |
| Ford Credit Canada Co. | | 3.742% | | 5/8/23 | CAD | 9,935 | | 7,474 | |
| Ford Credit Canada Ltd. | | 2.580% | | 5/10/21 | CAD | 5,000 | | 3,772 | |
| Ford Credit Canada Ltd. | | 3.279% | | 7/2/21 | CAD | 2,800 | | 2,133 | |
| Ford Motor Credit Co. LLC | | 1.514% | | 2/17/23 | EUR | 4,400 | | 4,893 | |
| Ford Motor Credit Co. LLC | | 2.386% | | 2/17/26 | EUR | 39,108 | | 43,912 | |
| Ford Motor Credit Co. LLC | | 4.535% | | 3/6/25 | GBP | 6,536 | | 8,912 | |
| GE Capital Australia Funding Pty Ltd. | | 5.500% | | 8/8/22 | AUD | 500 | | 373 | |
| GE Capital Canada Funding Co. | | 4.600% | | 1/26/22 | CAD | 5,411 | | 4,252 | |
| GE Capital Canada Funding Co. | | 5.730% | | 10/22/37 | CAD | 1,500 | | 1,246 | |
| GE Capital European Funding Unlimited Co. | | 2.625% | | 3/15/23 | EUR | 17,050 | | 20,288 | |
| GE Capital European Funding Unlimited Co. | | 4.350% | | 11/3/21 | EUR | 100 | | 120 | |
| GE Capital European Funding Unlimited Co. | | 4.625% | | 2/22/27 | EUR | 2,900 | | 4,024 | |
| GE Capital European Funding Unlimited Co. | | 6.025% | | 3/1/38 | EUR | 3,500 | | 5,914 | |
| GE Capital UK Funding Unlimited Co. | | 4.125% | | 9/13/23 | GBP | 6,561 | | 9,149 | |
| GE Capital UK Funding Unlimited Co. | | 5.875% | | 11/4/20 | GBP | 3,830 | | 5,168 | |
| GE Capital UK Funding Unlimited Co. | | 5.875% | | 1/18/33 | GBP | 4,538 | | 7,442 | |
| GE Capital UK Funding Unlimited Co. | | 6.250% | | 5/5/38 | GBP | 2,414 | | 4,224 | |
| GE Capital UK Funding Unlimited Co. | | 8.000% | | 1/14/39 | GBP | 1,000 | | 1,993 | |
| General Electric Co. | | 0.375% | | 5/17/22 | EUR | 7,200 | | 8,014 | |
| General Electric Co. | | 0.875% | | 5/17/25 | EUR | 13,050 | | 14,541 | |
| General Electric Co. | | 1.250% | | 5/26/23 | EUR | 4,000 | | 4,553 | |
| General Electric Co. | | 1.500% | | 5/17/29 | EUR | 6,100 | | 6,906 | |
| General Electric Co. | | 2.125% | | 5/17/37 | EUR | 5,400 | | 6,111 | |
| General Electric Co. | | 4.125% | | 9/19/35 | EUR | 5,300 | | 7,411 | |
| General Electric Co. | | 4.875% | | 9/18/37 | GBP | 7,236 | | 10,140 | |
| General Electric Co. | | 5.500% | | 6/7/21 | GBP | 3,100 | | 4,238 | |
| General Mills Inc. | | 1.000% | | 4/27/23 | EUR | 7,000 | | 8,055 | |
| General Mills Inc. | | 1.500% | | 4/27/27 | EUR | 2,000 | | 2,346 | |
| General Mills Inc. | | 2.100% | | 11/16/20 | EUR | 1,000 | | 1,135 | |
| General Motors Financial Co. Inc. | | 2.200% | | 4/1/24 | EUR | 23,546 | | 27,481 | |
| General Motors Financial Co. Inc. | | 2.250% | | 9/6/24 | GBP | 900 | | 1,165 | |
| General Motors Financial Co. Inc. | | 3.850% | | 2/21/23 | AUD | 3,450 | | 2,483 | |
| General Motors Financial of Canada Ltd. | | 2.600% | | 6/1/22 | CAD | 7,000 | | 5,283 | |
| Goldman Sachs Group Inc. | | 0.550% | | 9/9/21 | CHF | 6,150 | | 6,316 | |
| Goldman Sachs Group Inc. | | 1.000% | | 5/24/21 | JPY | 445,000 | | 4,156 | |
| Goldman Sachs Group Inc. | | 1.250% | | 5/1/25 | EUR | 32,540 | | 37,694 | |
| Goldman Sachs Group Inc. | | 1.375% | | 7/26/22 | EUR | 10,900 | | 12,627 | |
127
Total International Bond Index Fund
| | | | | | | Face | | Market | |
| | | | | Maturity | | Amount | | Value· | |
| | | Coupon | | Date | Currency | (000 | ) | ($000 | ) |
| Goldman Sachs Group Inc. | | 1.375% | | 5/15/24 | EUR | 23,800 | | 27,609 | |
| Goldman Sachs Group Inc. | | 1.625% | | 7/27/26 | EUR | 19,713 | | 23,520 | |
| Goldman Sachs Group Inc. | | 2.000% | | 7/27/23 | EUR | 17,266 | | 20,564 | |
| Goldman Sachs Group Inc. | | 2.000% | | 3/22/28 | EUR | 7,100 | | 8,712 | |
| Goldman Sachs Group Inc. | | 2.000% | | 11/1/28 | EUR | 10,200 | | 12,559 | |
| Goldman Sachs Group Inc. | | 2.125% | | 9/30/24 | EUR | 9,139 | | 11,102 | |
1 | Goldman Sachs Group Inc. | | 2.433% | | 4/26/23 | CAD | 10,200 | | 7,737 | |
| Goldman Sachs Group Inc. | | 2.875% | | 6/3/26 | EUR | 5,000 | | 6,428 | |
| Goldman Sachs Group Inc. | | 3.125% | | 7/25/29 | GBP | 7,000 | | 9,810 | |
| Goldman Sachs Group Inc. | | 3.250% | | 2/1/23 | EUR | 23,800 | | 29,234 | |
1 | Goldman Sachs Group Inc. | | 3.307% | | 10/31/25 | CAD | 790 | | 615 | |
| Goldman Sachs Group Inc. | | 4.250% | | 1/29/26 | GBP | 18,000 | | 26,457 | |
| Goldman Sachs Group Inc. | | 4.700% | | 9/8/21 | AUD | 1,300 | | 946 | |
| Goldman Sachs Group Inc. | | 4.750% | | 10/12/21 | EUR | 1,100 | | 1,334 | |
| Goldman Sachs Group Inc. | | 5.500% | | 10/12/21 | GBP | 1,500 | | 2,096 | |
| Goldman Sachs Group Inc. | | 6.875% | | 1/18/38 | GBP | 6,100 | | 11,973 | |
| Goldman Sachs Group Inc. | | 7.125% | | 8/7/25 | GBP | 3,734 | | 6,226 | |
| Goldman Sachs Group Inc. | | 7.250% | | 4/10/28 | GBP | 700 | | 1,266 | |
| Harman Finance International SCA | | 2.000% | | 5/27/22 | EUR | 8,500 | | 9,854 | |
| Honeywell International Inc. | | 1.300% | | 2/22/23 | EUR | 8,300 | | 9,646 | |
| Honeywell International Inc. | | 2.250% | | 2/22/28 | EUR | 5,690 | | 7,378 | |
| Illinois Tool Works Inc. | | 0.250% | | 12/5/24 | EUR | 4,400 | | 4,942 | |
| Illinois Tool Works Inc. | | 0.625% | | 12/5/27 | EUR | 5,500 | | 6,267 | |
| Illinois Tool Works Inc. | | 1.000% | | 6/5/31 | EUR | 6,200 | | 7,213 | |
| Illinois Tool Works Inc. | | 1.250% | | 5/22/23 | EUR | 3,100 | | 3,608 | |
| Illinois Tool Works Inc. | | 1.750% | | 5/20/22 | EUR | 7,900 | | 9,198 | |
| Illinois Tool Works Inc. | | 2.125% | | 5/22/30 | EUR | 11,700 | | 15,177 | |
| Intel Corp. | | 4.000% | | 12/1/22 | AUD | 7,070 | | 5,229 | |
| International Business Machines Corp. | | 0.375% | | 1/31/23 | EUR | 9,700 | | 10,964 | |
| International Business Machines Corp. | | 0.500% | | 9/7/21 | EUR | 4,000 | | 4,515 | |
| International Business Machines Corp. | | 0.875% | | 1/31/25 | EUR | 3,000 | | 3,485 | |
| International Business Machines Corp. | | 0.950% | | 5/23/25 | EUR | 18,400 | | 21,465 | |
| International Business Machines Corp. | | 1.250% | | 1/29/27 | EUR | 8,600 | | 10,282 | |
| International Business Machines Corp. | | 1.750% | | 1/31/31 | EUR | 9,400 | | 11,786 | |
| International Business Machines Corp. | | 1.875% | | 11/6/20 | EUR | 500 | | 569 | |
| International Business Machines Corp. | | 2.625% | | 8/5/22 | GBP | 500 | | 676 | |
| International Business Machines Corp. | | 2.750% | | 12/21/20 | GBP | 4,000 | | 5,279 | |
| International Business Machines Corp. | | 2.875% | | 11/7/25 | EUR | 4,100 | | 5,332 | |
| International Flavors & Fragrances Inc. | | 0.500% | | 9/25/21 | EUR | 1,800 | | 2,023 | |
| International Flavors & Fragrances Inc. | | 1.750% | | 3/14/24 | EUR | 7,130 | | 8,397 | |
| International Flavors & Fragrances Inc. | | 1.800% | | 9/25/26 | EUR | 6,000 | | 7,092 | |
| John Deere Canada Funding Inc. | | 1.850% | | 3/24/21 | CAD | 5,000 | | 3,782 | |
| John Deere Canada Funding Inc. | | 2.630% | | 9/21/22 | CAD | 9,800 | | 7,526 | |
| John Deere Cash Management SA | | 0.500% | | 9/15/23 | EUR | 2,200 | | 2,504 | |
| John Deere Cash Management SA | | 1.650% | | 6/13/39 | EUR | 800 | | 974 | |
| Johnson & Johnson | | 0.250% | | 1/20/22 | EUR | 2,700 | | 3,045 | |
| Johnson & Johnson | | 0.650% | | 5/20/24 | EUR | 10,200 | | 11,736 | |
| Johnson & Johnson | | 1.150% | | 11/20/28 | EUR | 1,200 | | 1,440 | |
| Johnson & Johnson | | 1.650% | | 5/20/35 | EUR | 150 | | 192 | |
| Johnson Controls International plc | | 0.000% | | 12/4/20 | EUR | 3,300 | | 3,682 | |
| Johnson Controls International plc | | 1.000% | | 9/15/23 | EUR | 3,001 | | 3,438 | |
| Johnson Controls International plc | | 1.375% | | 2/25/25 | EUR | 15,965 | | 18,496 | |
| JPMorgan Chase & Co. | | 0.500% | | 12/4/23 | CHF | 42,600 | | 44,471 | |
| JPMorgan Chase & Co. | | 0.625% | | 1/25/24 | EUR | 2,600 | | 2,965 | |
128
Total International Bond Index Fund
| | | | | | | Face | | Market | |
| | | | | Maturity | | Amount | | Value· | |
| | | Coupon | | Date | Currency | (000 | ) | ($000 | ) |
1 | JPMorgan Chase & Co. | | 1.090% | | 3/11/27 | EUR | 47,300 | | 54,844 | |
| JPMorgan Chase & Co. | | 1.375% | | 9/16/21 | EUR | 5,350 | | 6,144 | |
| JPMorgan Chase & Co. | | 1.500% | | 1/27/25 | EUR | 8,000 | | 9,537 | |
| JPMorgan Chase & Co. | | 1.500% | | 10/29/26 | EUR | 5,308 | | 6,426 | |
1 | JPMorgan Chase & Co. | | 1.638% | | 5/18/28 | EUR | 7,000 | | 8,436 | |
| JPMorgan Chase & Co. | | 2.750% | | 2/1/23 | EUR | 3,000 | | 3,643 | |
| JPMorgan Chase & Co. | | 3.000% | | 2/19/26 | EUR | 5,600 | | 7,325 | |
| JPMorgan Chase & Co. | | 3.190% | | 3/5/21 | CAD | 270 | | 208 | |
| JPMorgan Chase & Co. | | 3.500% | | 12/18/26 | GBP | 5,000 | | 7,408 | |
| Kellogg Co. | | 1.250% | | 3/10/25 | EUR | 5,100 | | 5,982 | |
| Kinder Morgan Inc. | | 1.500% | | 3/16/22 | EUR | 7,400 | | 8,541 | |
| Kinder Morgan Inc. | | 2.250% | | 3/16/27 | EUR | 7,267 | | 8,932 | |
2 | KKR Group Finance Co. V LLC | | 1.625% | | 5/22/29 | EUR | 3,000 | | 3,516 | |
| Kraft Heinz Foods Co. | | 1.500% | | 5/24/24 | EUR | 11,600 | | 13,403 | |
| Kraft Heinz Foods Co. | | 2.000% | | 6/30/23 | EUR | 5,000 | | 5,864 | |
| Liberty Mutual Group Inc. | | 2.750% | | 5/4/26 | EUR | 14,000 | | 17,521 | |
| LYB International Finance II BV | | 0.875% | | 9/17/26 | EUR | 9,000 | | 10,004 | |
| LYB International Finance II BV | | 1.625% | | 9/17/31 | EUR | 7,300 | | 8,339 | |
| LYB International Finance II BV | | 1.875% | | 3/2/22 | EUR | 15,500 | | 17,924 | |
| ManpowerGroup Inc. | | 1.750% | | 6/22/26 | EUR | 350 | | 418 | |
| ManpowerGroup Inc. | | 1.875% | | 9/11/22 | EUR | 100 | | 117 | |
| Mastercard Inc. | | 1.100% | | 12/1/22 | EUR | 12,850 | | 14,811 | |
| Mastercard Inc. | | 2.100% | | 12/1/27 | EUR | 8,140 | | 10,461 | |
| McDonald’s Corp. | | 0.625% | | 1/29/24 | EUR | 12,600 | | 14,393 | |
| McDonald’s Corp. | | 0.900% | | 6/15/26 | EUR | 100 | | 116 | |
| McDonald’s Corp. | | 1.000% | | 11/15/23 | EUR | 7,000 | | 8,117 | |
| McDonald’s Corp. | | 1.125% | | 5/26/22 | EUR | 200 | | 230 | |
| McDonald’s Corp. | | 1.500% | | 11/28/29 | EUR | 1,700 | | 2,071 | |
| McDonald’s Corp. | | 1.750% | | 5/3/28 | EUR | 16,300 | | 20,350 | |
| McDonald’s Corp. | | 1.875% | | 5/26/27 | EUR | 100 | | 125 | |
| McDonald’s Corp. | | 2.000% | | 6/1/23 | EUR | 1,500 | | 1,798 | |
| McDonald’s Corp. | | 2.375% | | 11/27/24 | EUR | 100 | | 124 | |
| McDonald’s Corp. | | 2.625% | | 6/11/29 | EUR | 100 | | 132 | |
| McDonald’s Corp. | | 3.000% | | 3/8/24 | AUD | 21,700 | | 15,709 | |
| McDonald’s Corp. | | 3.125% | | 3/4/25 | CAD | 10,000 | | 7,837 | |
| McDonald’s Corp. | | 4.125% | | 6/11/54 | GBP | 1,400 | | 2,469 | |
| McKesson Corp. | | 0.625% | | 8/17/21 | EUR | 4,250 | | 4,788 | |
| McKesson Corp. | | 1.500% | | 11/17/25 | EUR | 12,600 | | 14,604 | |
| McKesson Corp. | | 1.625% | | 10/30/26 | EUR | 200 | | 235 | |
| McKesson Corp. | | 3.125% | | 2/17/29 | GBP | 9,000 | | 12,191 | |
| Medtronic Global Holdings SCA | | 0.000% | | 3/7/21 | EUR | 7,500 | | 8,382 | |
| Medtronic Global Holdings SCA | | 0.250% | | 7/2/25 | EUR | 2,900 | | 3,254 | |
| Medtronic Global Holdings SCA | | 0.375% | | 3/7/23 | EUR | 3,700 | | 4,180 | |
| Medtronic Global Holdings SCA | | 1.000% | | 7/2/31 | EUR | 2,800 | | 3,228 | |
| Medtronic Global Holdings SCA | | 1.125% | | 3/7/27 | EUR | 3,100 | | 3,661 | |
| Medtronic Global Holdings SCA | | 1.500% | | 7/2/39 | EUR | 5,000 | | 5,772 | |
| Medtronic Global Holdings SCA | | 1.625% | | 3/7/31 | EUR | 18,100 | | 22,342 | |
| Medtronic Global Holdings SCA | | 1.750% | | 7/2/49 | EUR | 8,100 | | 9,097 | |
| Medtronic Global Holdings SCA | | 2.250% | | 3/7/39 | EUR | 3,100 | | 4,050 | |
| Merck & Co. Inc. | | 0.500% | | 11/2/24 | EUR | 9,920 | | 11,364 | |
| Merck & Co. Inc. | | 1.125% | | 10/15/21 | EUR | 7,600 | | 8,672 | |
| Merck & Co. Inc. | | 1.375% | | 11/2/36 | EUR | 2,400 | | 2,950 | |
| Merck & Co. Inc. | | 1.875% | | 10/15/26 | EUR | 3,300 | | 4,122 | |
| Merck & Co. Inc. | | 2.500% | | 10/15/34 | EUR | 5,260 | | 7,448 | |
129
Total International Bond Index Fund
| | | | | | | Face | | Market | |
| | | | | Maturity | | Amount | | Value· | |
| | | Coupon | | Date | Currency | (000 | ) | ($000 | ) |
| MetLife Inc. | | 0.769% | | 5/23/29 | JPY | 1,400,000 | | 13,214 | |
| MetLife Inc. | | 5.375% | | 12/9/24 | GBP | 2,350 | | 3,650 | |
| Metropolitan Life Global Funding I | | 0.375% | | 4/9/24 | EUR | 7,000 | | 7,890 | |
| Metropolitan Life Global Funding I | | 0.875% | | 1/20/22 | EUR | 10,000 | | 11,378 | |
| Metropolitan Life Global Funding I | | 1.000% | | 9/19/22 | CHF | 3,000 | | 3,168 | |
| Metropolitan Life Global Funding I | | 1.125% | | 12/15/21 | GBP | 233 | | 302 | |
| Metropolitan Life Global Funding I | | 1.625% | | 6/9/22 | GBP | 3,000 | | 3,923 | |
| Metropolitan Life Global Funding I | | 2.375% | | 1/11/23 | EUR | 600 | | 719 | |
| Metropolitan Life Global Funding I | | 2.625% | | 12/5/22 | GBP | 2,150 | | 2,902 | |
| Metropolitan Life Global Funding I | | 4.000% | | 7/13/27 | AUD | 2,700 | | 2,063 | |
| Microsoft Corp. | | 2.125% | | 12/6/21 | EUR | 2,100 | | 2,448 | |
| Microsoft Corp. | | 2.625% | | 5/2/33 | EUR | 4,000 | | 5,794 | |
| Microsoft Corp. | | 3.125% | | 12/6/28 | EUR | 11,200 | | 15,828 | |
| Mohawk Industries Inc. | | 2.000% | | 1/14/22 | EUR | 8,100 | | 9,370 | |
| Molson Coors Brewing Co. | | 1.250% | | 7/15/24 | EUR | 15,300 | | 17,663 | |
| Molson Coors International LP | | 2.840% | | 7/15/23 | CAD | 5,000 | | 3,809 | |
| Molson Coors International LP | | 3.440% | | 7/15/26 | CAD | 2,850 | | 2,182 | |
| Mondelez International Inc. | | 1.000% | | 3/7/22 | EUR | 2,150 | | 2,454 | |
| Mondelez International Inc. | | 1.625% | | 1/20/23 | EUR | 5,800 | | 6,790 | |
| Mondelez International Inc. | | 1.625% | | 3/8/27 | EUR | 11,865 | | 14,247 | |
| Mondelez International Inc. | | 2.375% | | 3/6/35 | EUR | 1,162 | | 1,528 | |
| Mondelez International Inc. | | 3.250% | | 3/7/25 | CAD | 3,216 | | 2,509 | |
| Moody’s Corp. | | 1.750% | | 3/9/27 | EUR | 3,010 | | 3,638 | |
1 | Morgan Stanley | | 0.637% | | 7/26/24 | EUR | 16,700 | | 18,928 | |
| Morgan Stanley | | 1.000% | | 12/2/22 | EUR | 29,290 | | 33,595 | |
1 | Morgan Stanley | | 1.342% | | 10/23/26 | EUR | 13,500 | | 15,828 | |
| Morgan Stanley | | 1.375% | | 10/27/26 | EUR | 17,311 | | 20,462 | |
| Morgan Stanley | | 1.750% | | 3/11/24 | EUR | 11,150 | | 13,274 | |
| Morgan Stanley | | 1.750% | | 1/30/25 | EUR | 12,300 | | 14,727 | |
| Morgan Stanley | | 1.875% | | 3/30/23 | EUR | 3,000 | | 3,546 | |
| Morgan Stanley | | 1.875% | | 4/27/27 | EUR | 15,954 | | 19,582 | |
| Morgan Stanley | | 2.375% | | 3/31/21 | EUR | 7,200 | | 8,313 | |
| Morgan Stanley | | 2.625% | | 3/9/27 | GBP | 9,638 | | 13,286 | |
| Morgan Stanley | | 3.000% | | 2/7/24 | CAD | 9,990 | | 7,719 | |
| Morgan Stanley | | 3.125% | | 8/5/21 | CAD | 9,500 | | 7,323 | |
| Mylan NV | | 1.250% | | 11/23/20 | EUR | 12,000 | | 13,525 | |
| Mylan NV | | 3.125% | | 11/22/28 | EUR | 1,180 | | 1,491 | |
| Nasdaq Inc. | | 1.750% | | 3/28/29 | EUR | 2,300 | | 2,766 | |
| Nasdaq Inc. | | 3.875% | | 6/7/21 | EUR | 1,000 | | 1,184 | |
| National Grid North America Inc. | | 0.750% | | 2/11/22 | EUR | 10,800 | | 12,245 | |
| National Grid North America Inc. | | 0.750% | | 8/8/23 | EUR | 500 | | 570 | |
| National Grid North America Inc. | | 1.000% | | 7/12/24 | EUR | 500 | | 576 | |
| New York Life Global Funding | | 0.375% | | 2/2/22 | CHF | 3,000 | | 3,102 | |
| Omnicom Finance Holdings plc | | 0.800% | | 7/8/27 | EUR | 3,800 | | 4,278 | |
| Omnicom Finance Holdings plc | | 1.400% | | 7/8/31 | EUR | 4,500 | | 5,204 | |
| Oracle Corp. | | 2.250% | | 1/10/21 | EUR | 575 | | 660 | |
| Oracle Corp. | | 3.125% | | 7/10/25 | EUR | 1,000 | | 1,306 | |
| Parker-Hannifin Corp. | | 1.125% | | 3/1/25 | EUR | 4,500 | | 5,176 | |
| Parker-Hannifin Corp. | | 1.125% | | 3/1/25 | EUR | 10,000 | | 11,521 | |
| PartnerRe Ireland Finance DAC | | 1.250% | | 9/15/26 | EUR | 6,859 | | 7,933 | |
| PepsiCo Inc. | | 0.750% | | 3/18/27 | EUR | 2,000 | | 2,329 | |
| PepsiCo Inc. | | 0.875% | | 7/18/28 | EUR | 3,600 | | 4,228 | |
| PepsiCo Inc. | | 0.875% | | 10/16/39 | EUR | 4,900 | | 5,390 | |
| PepsiCo Inc. | | 1.125% | | 3/18/31 | EUR | 1,900 | | 2,280 | |
130
Total International Bond Index Fund
| | | | | | | Face | | Market | |
| | | | | Maturity | | Amount | | Value· | |
| | | Coupon | | Date | Currency | (000 | ) | ($000 | ) |
| PepsiCo Inc. | | 1.750% | | 4/28/21 | EUR | 3,100 | | 3,542 | |
| PepsiCo Inc. | | 2.150% | | 5/6/24 | CAD | 3,200 | | 2,431 | |
| PepsiCo Inc. | | 2.500% | | 11/1/22 | GBP | 500 | | 678 | |
| PerkinElmer Inc. | | 1.875% | | 7/19/26 | EUR | 4,600 | | 5,324 | |
| Pfizer Inc. | | 0.250% | | 3/6/22 | EUR | 12,700 | | 14,301 | |
| Pfizer Inc. | | 1.000% | | 3/6/27 | EUR | 3,400 | | 4,001 | |
| Pfizer Inc. | | 2.735% | | 6/15/43 | GBP | 6,841 | | 9,930 | |
| Philip Morris International Inc. | | 0.625% | | 11/8/24 | EUR | 1,000 | | 1,129 | |
| Philip Morris International Inc. | | 0.800% | | 8/1/31 | EUR | 9,300 | | 9,878 | |
| Philip Morris International Inc. | | 1.450% | | 8/1/39 | EUR | 6,200 | | 6,532 | |
| Philip Morris International Inc. | | 1.875% | | 11/6/37 | EUR | 5,400 | | 6,301 | |
| Philip Morris International Inc. | | 2.000% | | 5/9/36 | EUR | 8,000 | | 9,673 | |
| Philip Morris International Inc. | | 2.875% | | 3/3/26 | EUR | 1,500 | | 1,917 | |
| Philip Morris International Inc. | | 2.875% | | 5/14/29 | EUR | 2,500 | | 3,279 | |
| Philip Morris International Inc. | | 3.125% | | 6/3/33 | EUR | 1,000 | | 1,362 | |
| PPG Industries Inc. | | 0.875% | | 3/13/22 | EUR | 2,500 | | 2,843 | |
| PPG Industries Inc. | | 0.875% | | 11/3/25 | EUR | 2,600 | | 2,989 | |
| PPG Industries Inc. | | 1.400% | | 3/13/27 | EUR | 300 | | 352 | |
| Praxair Inc. | | 1.200% | | 2/12/24 | EUR | 4,000 | | 4,691 | |
| Praxair Inc. | | 1.625% | | 12/1/25 | EUR | 20,550 | | 24,968 | |
| Procter & Gamble Co. | | 0.500% | | 10/25/24 | EUR | 3,000 | | 3,435 | |
| Procter & Gamble Co. | | 0.625% | | 10/30/24 | EUR | 4,100 | | 4,718 | |
| Procter & Gamble Co. | | 1.125% | | 11/2/23 | EUR | 11,620 | | 13,602 | |
| Procter & Gamble Co. | | 1.200% | | 10/30/28 | EUR | 4,700 | | 5,707 | |
| Procter & Gamble Co. | | 1.250% | | 10/25/29 | EUR | 7,000 | | 8,522 | |
| Procter & Gamble Co. | | 1.375% | | 5/3/25 | GBP | 9,800 | | 12,915 | |
| Procter & Gamble Co. | | 1.800% | | 5/3/29 | GBP | 12,625 | | 17,224 | |
| Procter & Gamble Co. | | 1.875% | | 10/30/38 | EUR | 2,400 | | 3,265 | |
| Procter & Gamble Co. | | 2.000% | | 11/5/21 | EUR | 4,000 | | 4,664 | |
| Procter & Gamble Co. | | 2.000% | | 8/16/22 | EUR | 1,730 | | 2,050 | |
| Procter & Gamble Co. | | 4.125% | | 12/7/20 | EUR | 2,250 | | 2,629 | |
| Prologis Euro Finance LLC | | 0.250% | | 9/10/27 | EUR | 10,000 | | 10,953 | |
| Prologis Euro Finance LLC | | 0.625% | | 9/10/31 | EUR | 6,050 | | 6,598 | |
| Prologis Euro Finance LLC | | 1.500% | | 9/10/49 | EUR | 2,600 | | 2,692 | |
| Prologis Euro Finance LLC | | 1.875% | | 1/5/29 | EUR | 4,060 | | 5,057 | |
| Prologis International Funding II SA | | 1.750% | | 3/15/28 | EUR | 500 | | 603 | |
| Prologis LP | | 1.375% | | 5/13/21 | EUR | 8,400 | | 9,538 | |
| Prologis LP | | 2.250% | | 6/30/29 | GBP | 4,318 | | 5,893 | |
| Prologis LP | | 3.000% | | 6/2/26 | EUR | 1,600 | | 2,085 | |
| Prologis LP | | 3.375% | | 2/20/24 | EUR | 1,500 | | 1,895 | |
| Schlumberger Finance France SAS | | 1.000% | | 2/18/26 | EUR | 3,400 | | 3,995 | |
| Southern Power Co. | | 1.000% | | 6/20/22 | EUR | 25,600 | | 29,240 | |
| Southern Power Co. | | 1.850% | | 6/20/26 | EUR | 10,200 | | 12,491 | |
| Stryker Corp. | | 1.125% | | 11/30/23 | EUR | 2,300 | | 2,675 | |
| Stryker Corp. | | 2.125% | | 11/30/27 | EUR | 1,900 | | 2,415 | |
| Stryker Corp. | | 2.625% | | 11/30/30 | EUR | 2,100 | | 2,810 | |
| Sysco Canada Inc. | | 3.650% | | 4/25/25 | CAD | 2,560 | | 2,031 | |
| Thermo Fisher Scientific Inc. | | 0.125% | | 3/1/25 | EUR | 6,400 | | 7,093 | |
| Thermo Fisher Scientific Inc. | | 0.500% | | 3/1/28 | EUR | 3,100 | | 3,438 | |
| Thermo Fisher Scientific Inc. | | 0.750% | | 9/12/24 | EUR | 4,680 | | 5,360 | |
| Thermo Fisher Scientific Inc. | | 1.375% | | 9/12/28 | EUR | 1,000 | | 1,194 | |
| Thermo Fisher Scientific Inc. | | 1.400% | | 1/23/26 | EUR | 16,052 | | 19,009 | |
| Thermo Fisher Scientific Inc. | | 1.500% | | 10/1/39 | EUR | 9,000 | | 9,729 | |
| Thermo Fisher Scientific Inc. | | 1.875% | | 10/1/49 | EUR | 5,900 | | 6,258 | |
131
Total International Bond Index Fund
| | | | | | | Face | | Market | |
| | | | | Maturity | | Amount | | Value· | |
| | | Coupon | | Date | Currency | (000 | ) | ($000 | ) |
| Thermo Fisher Scientific Inc. | | 2.000% | | 4/15/25 | EUR | 1,000 | | 1,218 | |
| Thermo Fisher Scientific Inc. | | 2.150% | | 7/21/22 | EUR | 800 | | 940 | |
| Thermo Fisher Scientific Inc. | | 2.875% | | 7/24/37 | EUR | 6,622 | | 9,107 | |
| Time Warner Cable Inc. | | 5.750% | | 6/2/31 | GBP | 200 | | 317 | |
| Time Warner Cable LLC | | 5.250% | | 7/15/42 | GBP | 5,800 | | 8,897 | |
| Toyota Motor Credit Corp. | | 0.625% | | 11/21/24 | EUR | 200 | | 229 | |
| Toyota Motor Credit Corp. | | 1.000% | | 3/9/21 | EUR | 5,000 | | 5,661 | |
| Toyota Motor Credit Corp. | | 1.000% | | 9/27/22 | GBP | 6,900 | | 8,924 | |
| Trillium Windpower LP | | 5.803% | | 2/15/33 | CAD | 1,227 | | 1,084 | |
| Trinity Acquisition plc | | 2.125% | | 5/26/22 | EUR | 5,626 | | 6,560 | |
| Tyco Electronics Group SA | | 1.100% | | 3/1/23 | EUR | 3,727 | | 4,274 | |
| United Parcel Service Inc. | | 0.375% | | 11/15/23 | EUR | 7,400 | | 8,358 | |
| United Parcel Service Inc. | | 1.500% | | 11/15/32 | EUR | 3,300 | | 4,061 | |
| United Parcel Service Inc. | | 1.625% | | 11/15/25 | EUR | 11,900 | | 14,384 | |
| United Parcel Service Inc. | | 2.125% | | 5/21/24 | CAD | 7,000 | | 5,282 | |
| United Parcel Service Inc. | | 5.125% | | 2/12/50 | GBP | 1,350 | | 2,865 | |
| United Technologies Corp. | | 1.125% | | 12/15/21 | EUR | 4,840 | | 5,511 | |
| United Technologies Corp. | | 1.150% | | 5/18/24 | EUR | 6,000 | | 6,964 | |
| United Technologies Corp. | | 1.250% | | 5/22/23 | EUR | 3,200 | | 3,708 | |
| United Technologies Corp. | | 1.875% | | 2/22/26 | EUR | 1,760 | | 2,150 | |
| US Bancorp | | 0.850% | | 6/7/24 | EUR | 14,843 | | 17,099 | |
| Ventas Canada Finance Ltd. | | 2.550% | | 3/15/23 | CAD | 2,400 | | 1,824 | |
| Ventas Canada Finance Ltd. | | 4.125% | | 9/30/24 | CAD | 1,200 | | 966 | |
| Verizon Communications Inc. | | 0.500% | | 6/2/22 | EUR | 400 | | 452 | |
| Verizon Communications Inc. | | 0.875% | | 4/2/25 | EUR | 4,900 | | 5,666 | |
| Verizon Communications Inc. | | 0.875% | | 4/8/27 | EUR | 3,500 | | 4,036 | |
| Verizon Communications Inc. | | 0.875% | | 3/19/32 | EUR | 10,100 | | 11,282 | |
| Verizon Communications Inc. | | 1.250% | | 4/8/30 | EUR | 8,000 | | 9,424 | |
| Verizon Communications Inc. | | 1.375% | | 10/27/26 | EUR | 7,000 | | 8,365 | |
| Verizon Communications Inc. | | 1.375% | | 11/2/28 | EUR | 4,800 | | 5,751 | |
| Verizon Communications Inc. | | 1.500% | | 9/19/39 | EUR | 8,500 | | 9,403 | |
| Verizon Communications Inc. | | 1.875% | | 10/26/29 | EUR | 13,500 | | 16,841 | |
| Verizon Communications Inc. | | 1.875% | | 9/19/30 | GBP | 1,600 | | 2,063 | |
| Verizon Communications Inc. | | 2.375% | | 2/17/22 | EUR | 2,000 | | 2,356 | |
| Verizon Communications Inc. | | 2.500% | | 4/8/31 | GBP | 811 | | 1,114 | |
| Verizon Communications Inc. | | 2.625% | | 12/1/31 | EUR | 179 | | 242 | |
| Verizon Communications Inc. | | 2.875% | | 1/15/38 | EUR | 15,400 | | 21,134 | |
| Verizon Communications Inc. | | 3.125% | | 11/2/35 | GBP | 6,700 | | 9,813 | |
| Verizon Communications Inc. | | 3.250% | | 2/17/26 | EUR | 2,600 | | 3,444 | |
| Verizon Communications Inc. | | 3.375% | | 10/27/36 | GBP | 14,350 | | 21,518 | |
| Verizon Communications Inc. | | 3.500% | | 2/17/23 | AUD | 6,380 | | 4,642 | |
| Verizon Communications Inc. | | 4.050% | | 2/17/25 | AUD | 1,550 | | 1,178 | |
| Verizon Communications Inc. | | 4.073% | | 6/18/24 | GBP | 2,000 | | 2,941 | |
| Verizon Communications Inc. | | 4.500% | | 8/17/27 | AUD | 6,300 | | 5,006 | |
| VF Corp. | | 0.625% | | 9/20/23 | EUR | 5,400 | | 6,131 | |
| Wal-Mart Stores Inc. | | 1.900% | | 4/8/22 | EUR | 8,500 | | 9,929 | |
| Wal-Mart Stores Inc. | | 2.550% | | 4/8/26 | EUR | 6,900 | | 8,879 | |
| Wal-Mart Stores Inc. | | 4.875% | | 9/21/29 | EUR | 5,750 | | 9,229 | |
| Wal-Mart Stores Inc. | | 5.250% | | 9/28/35 | GBP | 1,000 | | 1,964 | |
| Wal-Mart Stores Inc. | | 5.625% | | 3/27/34 | GBP | 14,835 | | 29,180 | |
| Walgreens Boots Alliance Inc. | | 2.875% | | 11/20/20 | GBP | 3,643 | | 4,790 | |
| Walgreens Boots Alliance Inc. | | 3.600% | | 11/20/25 | GBP | 1,325 | | 1,853 | |
| Walt Disney Co. | | 2.758% | | 10/7/24 | CAD | 15,325 | | 11,964 | |
| Wells Fargo & Co. | | 0.500% | | 11/2/23 | CHF | 10,500 | | 10,904 | |
132
Total International Bond Index Fund
| | | | | | | Face | | Market | |
| | | | | Maturity | | Amount | | Value· | |
| | | Coupon | | Date | Currency | (000 | ) | ($000 | ) |
| Wells Fargo & Co. | | 0.500% | | 4/26/24 | EUR | 10,300 | | 11,642 | |
| Wells Fargo & Co. | | 1.000% | | 2/2/27 | EUR | 14,828 | | 17,143 | |
| Wells Fargo & Co. | | 1.125% | | 10/29/21 | EUR | 5,000 | | 5,714 | |
| Wells Fargo & Co. | | 1.375% | | 6/30/22 | GBP | 1,700 | | 2,207 | |
| Wells Fargo & Co. | | 1.375% | | 10/26/26 | EUR | 6,000 | | 7,104 | |
| Wells Fargo & Co. | | 1.500% | | 9/12/22 | EUR | 3,300 | | 3,837 | |
| Wells Fargo & Co. | | 1.500% | | 5/24/27 | EUR | 5,000 | | 5,981 | |
| Wells Fargo & Co. | | 1.625% | | 6/2/25 | EUR | 5,000 | | 5,983 | |
| Wells Fargo & Co. | | 2.000% | | 7/28/25 | GBP | 26,400 | | 34,826 | |
| Wells Fargo & Co. | | 2.000% | | 4/27/26 | EUR | 15,000 | | 18,409 | |
| Wells Fargo & Co. | | 2.125% | | 4/22/22 | GBP | 3,500 | | 4,628 | |
| Wells Fargo & Co. | | 2.222% | | 3/15/21 | CAD | 2,710 | | 2,059 | |
| Wells Fargo & Co. | | 2.250% | | 5/2/23 | EUR | 16,300 | | 19,564 | |
| Wells Fargo & Co. | | 2.509% | | 10/27/23 | CAD | 11,010 | | 8,377 | |
| Wells Fargo & Co. | | 2.625% | | 8/16/22 | EUR | 20,600 | | 24,648 | |
| Wells Fargo & Co. | | 2.975% | | 5/19/26 | CAD | 10,100 | | 7,772 | |
| Wells Fargo & Co. | | 3.000% | | 7/27/21 | AUD | 11,200 | | 7,910 | |
| Wells Fargo & Co. | | 3.184% | | 2/8/24 | CAD | 5,000 | | 3,898 | |
| Wells Fargo & Co. | | 3.250% | | 4/27/22 | AUD | 3,200 | | 2,293 | |
| Wells Fargo & Co. | | 3.500% | | 9/12/29 | GBP | 4,330 | | 6,394 | |
| Wells Fargo & Co. | | 3.874% | | 5/21/25 | CAD | 350 | | 278 | |
| Wells Fargo Bank NA | | 5.250% | | 8/1/23 | GBP | 7,350 | | 10,785 | |
| Wells Fargo Canada Corp. | | 3.040% | | 1/29/21 | CAD | 9,990 | | 7,667 | |
| Welltower Inc. | | 4.500% | | 12/1/34 | GBP | 4,800 | | 7,609 | |
| Welltower Inc. | | 4.800% | | 11/20/28 | GBP | 4,500 | | 7,008 | |
| Whirlpool Finance Luxembourg Sarl | | 1.100% | | 11/9/27 | EUR | 3,600 | | 4,167 | |
| Whirlpool Finance Luxembourg Sarl | | 1.250% | | 11/2/26 | EUR | 10,700 | | 12,593 | |
| WPC Eurobond BV | | 2.125% | | 4/15/27 | EUR | 21,434 | | 25,346 | |
| WPC Eurobond BV | | 2.250% | | 7/19/24 | EUR | 6,300 | | 7,585 | |
| WPC Eurobond BV | | 2.250% | | 4/9/26 | EUR | 14,100 | | 16,897 | |
1 | XLIT Ltd. | | 3.250% | | 6/29/47 | EUR | 13,300 | | 16,484 | |
| Xylem Inc. | | 2.250% | | 3/11/23 | EUR | 3,800 | | 4,489 | |
| Zimmer Biomet Holdings Inc. | | 1.414% | | 12/13/22 | EUR | 5,900 | | 6,824 | |
| Zimmer Biomet Holdings Inc. | | 2.425% | | 12/13/26 | EUR | 5,000 | | 6,149 | |
| | | | | | | | | 4,347,646 | |
U.S. Government and Agency Obligations (0.0%) | | | | | | | | | |
| Tennessee Valley Authority | | 5.625% | | 6/7/32 | GBP | 1,400 | | 2,672 | |
Total United States (Cost $4,232,192) | | | | | | | | 4,350,318 | |
| | | | | | | | | |
| | | | | | | Shares | | | |
Temporary Cash Investments (0.6%) | | | | | | | | | |
Money Market Fund (0.6%) | | | | | | | | | |
17 | Vanguard Market Liquidity Fund
(Cost $789,560) | | 1.984% | | | USD | 7,895,031 | | 789,582 | |
Total Investments (99.1%) (Cost $133,146,408) | | | | | | | | 139,137,372 | |
133
Total International Bond Index Fund
| Amount |
| ($000) |
Other Assets and Liabilities (0.9%) | |
Other Assets | |
Investment in Vanguard | 6,585 |
Receivables for Investment Securities Sold | 760,029 |
Receivables for Accrued Income | 900,167 |
Receivables for Capital Shares Issued | 1,025,776 |
Variation Margin Receivable—Futures Contracts | 1,577 |
Unrealized Appreciation—Forward Currency Contracts | 151,002 |
Other Assets | 1,592,545 |
Total Other Assets | 4,437,681 |
Liabilities | |
Payables for Investment Securities Purchased | (450,247) |
Payables for Capital Shares Redeemed | (39,741) |
Payables for Distributions | (2,063) |
Payables to Vanguard | (15,162) |
Variation Margin Payable—Futures Contracts | (602) |
Unrealized Depreciation—Forward Currency Contracts | (2,617,876) |
Total Liabilities | (3,125,691) |
Net Assets (100%) | 140,449,362 |
| |
| |
At October 31, 2019, net assets consisted of: | |
| Amount |
| ($000) |
Paid-in Capital | 129,057,115 |
Total Distributable Earnings (Loss) | 11,392,247 |
Net Assets | 140,449,362 |
| |
Investor Shares—Net Assets | |
Applicable to 2,573,697,821 outstanding $.001 par value shares of beneficial interest (unlimited authorization) | 30,053,248 |
Net Asset Value Per Share—Investor Shares | $11.68 |
| |
ETF Shares—Net Assets | |
Applicable to 409,827,897 outstanding $.001 par value shares of beneficial interest (unlimited authorization) | 23,910,832 |
Net Asset Value Per Share—ETF Shares | $58.34 |
| |
Admiral Shares—Net Assets | |
Applicable to 2,222,532,631 outstanding $.001 par value shares of beneficial interest (unlimited authorization) | 51,888,792 |
Net Asset Value Per Share—Admiral Shares | $23.35 |
134
Total International Bond Index Fund
| Amount |
| ($000) |
Institutional Shares—Net Assets | |
Applicable to 987,520,663 outstanding $.001 par value shares of beneficial interest (unlimited authorization) | 34,596,490 |
Net Asset Value Per Share—Institutional Shares | $35.03 |
· See Note A in Notes to Financial Statements.
1 The average or expected maturity is shorter than the final maturity shown because of the possibility of interim principal payments and prepayments or the possibility of the issue being called.
2 Security exempt from registration under Rule 144A of the Securities Act of 1933. Such securities may be sold in transactions exempt from registration, normally to qualified institutional buyers. At October 31, 2019, the aggregate value of these securities was $18,146,834,000, representing 12.9% of net assets.
3 Guaranteed by the Republic of Austria.
4 Guaranteed by multiple countries.
5 Guaranteed by the Government of Canada.
6 Guaranteed by the Republic of Finland.
7 Guaranteed by the Republic of France.
8 Guaranteed by the Federal Republic of Germany.
9 Securities with a value of $1,856,555,000 have been segregated as collateral for open forward currency contracts.
10 Securities with a value of $4,204,000 have been segregated as initial margin for open futures contracts.
11 Guaranteed by the Government of Japan.
12 Guaranteed by the Republic of Poland.
13 Guaranteed by the Kingdom of Spain.
14 Scheduled principal and interest payments are guaranteed by Municipal Bond Insurance Association.
15 Scheduled principal and interest payments are guaranteed by AMBAC (Ambac Assuarance Corporation).
16 Scheduled principal and interest payments are guaranteed by National Public Finance Guarantee Corp.
17 Affiliated money market fund available only to Vanguard funds and certain trusts and accounts managed by Vanguard. Rate shown is the 7-day yield.
REIT—Real Estate Investment Trust.
AUD—Australian dollar.
CAD—Canadian dollar.
CHF—Swiss franc.
CNH—Chinese yuan (offshore).
CZK—Czech koruna.
DKK—Danish krone.
EUR—euro.
GBP—British pound.
HKD—Hong Kong dollar.
HUF—Hungarian forint.
IDR—Indonesian rupiah.
ILS—Israeli shekel.
JPY—Japanese yen.
KRW—Korean won.
MXN—Mexican peso.
MYR—Malaysian ringgit.
NOK—Norwegian krone.
NZD—New Zealand dollar.
PLN—Polish zloty.
RUB—Russian ruble.
SEK—Swedish krona.
SGD—Singapore dollar.
THB—Thai baht.
USD—U.S. dollar.
135
Total International Bond Index Fund
Derivative Financial Instruments Outstanding as of Period End | | | | | | | |
| | | | | | | | | |
Futures Contracts | | | | | | | | | |
| | | | | | | | ($000 | ) |
| | | | | | | | Value and | |
| | | | Number of | | | | Unrealized | |
| | | | Long (Short | ) | Notional | | Appreciation | |
| | Expiration | | Contracts | | Amount | | (Depreciation | ) |
Long Futures Contracts | | | | | | | | | |
10-Year U.S. Treasury Note | | December 2019 | | 620 | | 80,784 | | (799 | ) |
Ultra Long U.S. Treasury Bond | | December 2019 | | 241 | | 45,730 | | (763 | ) |
5-Year U.S. Treasury Note | | December 2019 | | 248 | | 29,562 | | (172 | ) |
30-Year U.S. Treasury Bond | | December 2019 | | 69 | | 11,135 | | (11 | ) |
AUD 3-Year Treasury Bond | | December 2019 | | 103 | | 8,191 | | 6 | |
| | | | | | | | (1,739 | ) |
| | | | | | | | | |
Short Futures Contracts | | | | | | | | | |
10-Year Japanese Government Bond | | December 2019 | | (216 | ) | (307,929 | ) | 1,760 | |
| | | | | | | | 21 | |
Forward Currency Contracts | | | | | | | | | | | |
| | Contract | | | | | | Unrealized | | Unrealized | |
| | Settlement | | Contract Amount (000) | | Appreciation | | (Depreciation | ) |
Counterparty | | Date | | Receive | | Deliver | | ($000 | ) | ($000 | ) |
Citigroup Global Markets Inc. | | 11/4/19 | | EUR | 9,000,000 | | USD | 10,040,850 | | — | | (452 | ) |
Toronto-Dominion Bank | | 11/4/19 | | EUR | 8,770,000 | | USD | 9,784,261 | | — | | (451 | ) |
Bank of America, N.A. | | 11/4/19 | | EUR | 8,000,000 | | USD | 8,925,200 | | — | | (402 | ) |
J.P. Morgan Securities LLC | | 11/4/19 | | GBP | 6,739,017 | | USD | 8,720,288 | | 10,208 | | — | |
State Street Bank & Trust Co. | | 11/4/19 | | EUR | 7,000,000 | | USD | 7,809,550 | | — | | (353 | ) |
Deutsche Bank AG | | 11/4/19 | | EUR | 6,927,617 | | USD | 7,728,796 | | — | | (348 | ) |
Barclays Bank plc | | 11/4/19 | | EUR | 5,952,000 | | USD | 6,640,349 | | — | | (300 | ) |
Citigroup Global Markets Inc. | | 11/5/19 | | JPY | 683,024,738 | | USD | 6,318,161 | | 8,538 | | — | |
Morgan Stanley Capital Services LLC | | 11/5/19 | | JPY | 648,000,000 | | USD | 5,994,173 | | 8,100 | | — | |
Royal Bank of Canada | | 11/4/19 | | CAD | 7,329,986 | | USD | 5,576,888 | | — | | (11,604 | ) |
Morgan Stanley Capital Services LLC | | 11/4/19 | | EUR | 4,000,000 | | USD | 4,462,600 | | — | | (201 | ) |
UBS AG | | 11/4/19 | | EUR | 4,000,000 | | USD | 4,462,600 | | — | | (201 | ) |
Royal Bank of Canada | | 11/4/19 | | EUR | 4,000,000 | | USD | 4,462,600 | | — | | (202 | ) |
Morgan Stanley Capital Services LLC | | 11/4/19 | | KRW | 4,391,598,645 | | USD | 3,761,057 | | 13,882 | | — | |
BNP Paribas | | 11/4/19 | | EUR | 3,000,000 | | USD | 3,346,950 | | — | | (151 | ) |
BNP Paribas | | 11/5/19 | | JPY | 332,000,000 | | USD | 3,071,088 | | 4,150 | | — | |
HSBC Bank USA, N.A. | | 11/5/19 | | JPY | 324,000,000 | | USD | 2,997,086 | | 4,050 | | — | |
136
Total International Bond Index Fund
Forward Currency Contracts (continued) | | | | | | | |
| | Contract | | | | | | Unrealized | | Unrealized | |
| | Settlement | | Contract Amount (000) | | Appreciation | | (Depreciation | ) |
Counterparty | | Date | | Receive | | Deliver | | ($000 | ) | ($000 | ) |
Toronto-Dominion Bank | | 11/4/19 | | GBP | 2,250,000 | | USD | 2,911,500 | | 3,408 | | — | |
Deutsche Bank AG | | 11/5/19 | | JPY | 258,000,000 | | USD | 2,386,569 | | 3,225 | | — | |
J.P. Morgan Securities LLC | | 11/4/19 | | EUR | 2,064,649 | | USD | 2,303,426 | | — | | (104 | ) |
HSBC Bank USA, N.A. | | 11/4/19 | | EUR | 2,000,000 | | USD | 2,231,300 | | — | | (101 | ) |
Royal Bank of Canada | | 11/5/19 | | JPY | 216,000,000 | | USD | 1,998,058 | | 2,700 | | — | |
State Street Bank & Trust Co. | | 11/5/19 | | JPY | 216,000,000 | | USD | 1,998,057 | | 2,700 | | — | |
Toronto-Dominion Bank | | 11/4/19 | | CAD | 2,400,000 | | USD | 1,826,009 | | — | | (3,811 | ) |
J.P. Morgan Securities LLC | | 11/4/19 | | CHF | 1,719,329 | | USD | 1,742,180 | | 1,187 | | — | |
Morgan Stanley Capital Services LLC | | 11/4/19 | | SEK | 12,591,545 | | USD | 1,303,216 | | 1,116 | | — | |
Goldman Sachs Bank USA | | 11/4/19 | | EUR | 1,000,000 | | USD | 1,115,650 | | — | | (51 | ) |
Toronto-Dominion Bank | | 11/5/19 | | JPY | 108,000,000 | | USD | 999,029 | | 1,350 | | — | |
Bank of America, N.A. | | 11/5/19 | | JPY | 108,000,000 | | USD | 999,029 | | 1,350 | | — | |
UBS AG | | 11/5/19 | | JPY | 108,000,000 | | USD | 999,029 | | 1,350 | | — | |
Standard Chartered Bank | | 11/4/19 | | IDR | 12,928,441,248 | | USD | 920,829 | | — | | (169 | ) |
Royal Bank of Canada | | 11/4/19 | | MXN | 17,474,547 | | USD | 911,462 | | — | | (3,626 | ) |
BNP Paribas | | 11/4/19 | | MYR | 3,696,575 | | USD | 883,607 | | 980 | | — | |
State Street Bank & Trust Co. | | 11/4/19 | | AUD | 1,255,000 | | USD | 864,632 | | 597 | | — | |
BNP Paribas | | 11/4/19 | | THB | 25,578,816 | | USD | 847,542 | | — | | (393 | ) |
J.P. Morgan Securities LLC | | 11/4/19 | | CAD | 1,000,000 | | USD | 760,832 | | — | | (1,583 | ) |
UBS AG | | 11/4/19 | | AUD | 1,048,000 | | USD | 722,020 | | 499 | | — | |
Toronto-Dominion Bank | | 11/4/19 | | DKK | 4,568,700 | | USD | 682,541 | | — | | (328 | ) |
Toronto-Dominion Bank | | 11/4/19 | | EUR | 577,351 | | USD | 643,401 | | 691 | | — | |
Bank of America, N.A. | | 11/5/19 | | PLN | 2,455,503 | | USD | 642,718 | | — | | (7 | ) |
Deutsche Bank AG | | 11/4/19 | | CNH | 4,506,190 | | USD | 639,811 | | — | | (509 | ) |
Citigroup Global Markets Inc. | | 11/4/19 | | SGD | 814,641 | | USD | 598,428 | | 398 | | — | |
Morgan Stanley Capital Services LLC | | 11/1/19 | | RUB | 29,582,500 | | USD | 463,095 | | — | | (1,751 | ) |
J.P. Morgan Securities LLC | | 11/4/19 | | AUD | 668,000 | | USD | 459,662 | | 875 | | — | |
Barclays Bank plc | | 11/4/19 | | AUD | 652,000 | | USD | 449,195 | | 310 | | — | |
Deutsche Bank AG | | 11/4/19 | | AUD | 620,538 | | USD | 427,520 | | 295 | | — | |
Bank of America, N.A. | | 11/4/19 | | ILS | 1,347,569 | | USD | 381,856 | | 568 | | — | |
BNP Paribas | | 11/4/19 | | AUD | 535,000 | | USD | 368,588 | | 255 | | — | |
Royal Bank of Canada | | 11/4/19 | | EUR | 313,411 | | USD | 342,635 | | 7,006 | | — | |
J.P. Morgan Securities LLC | | 11/4/19 | | THB | 9,067,500 | | USD | 300,000 | | 308 | | — | |
BNP Paribas | | 11/4/19 | | CZK | 6,510,000 | | USD | 284,404 | | 89 | | — | |
Bank of America, N.A. | | 11/4/19 | | AUD | 409,000 | | USD | 281,781 | | 195 | | — | |
137
Total International Bond Index Fund
Forward Currency Contracts (continued) | | | | | | | |
| | Contract | | | | | | Unrealized | | Unrealized | |
| | Settlement | | Contract Amount (000) | | Appreciation | | (Depreciation | ) |
Counterparty | | Date | | Receive | | Deliver | | ($000 | ) | ($000 | ) |
Morgan Stanley Capital Services LLC | | 11/4/19 | | NOK | 2,460,356 | | USD | 267,238 | | 308 | | — | |
J.P. Morgan Securities LLC | | 12/3/19 | | GBP | 190,000 | | USD | 246,078 | | 301 | | — | |
BNP Paribas | | 11/5/19 | | JPY | 24,845,458 | | USD | 230,505 | | — | | (368 | ) |
Toronto-Dominion Bank | | 12/3/19 | | EUR | 200,000 | | USD | 223,465 | | 88 | | — | |
Citigroup Global Markets Inc. | | 11/4/19 | | AUD | 293,000 | | USD | 201,862 | | 139 | | — | |
BNP Paribas | | 11/4/19 | | CNH | 1,413,200 | | USD | 199,985 | | 508 | | — | |
Royal Bank of Canada | | 11/4/19 | | CNH | 1,411,660 | | USD | 199,238 | | 1,037 | | — | |
BNP Paribas | | 11/5/19 | | HUF | 57,378,251 | | USD | 194,665 | | 144 | | — | |
State Street Bank & Trust Co. | | 11/4/19 | | NZD | 268,879 | | USD | 172,432 | | — | | (27 | ) |
BNP Paribas | | 11/4/19 | | NZD | 260,000 | | USD | 166,738 | | — | | (26 | ) |
BNP Paribas | | 12/3/19 | | JPY | 16,091,893 | | USD | 149,079 | | 230 | | — | |
Toronto-Dominion Bank | | 12/3/19 | | EUR | 100,000 | | USD | 111,798 | | — | | (23 | ) |
Royal Bank of Canada | | 11/4/19 | | AUD | 154,000 | | USD | 106,098 | | 73 | | — | |
J.P. Morgan Securities LLC | | 11/5/19 | | JPY | 7,540,000 | | USD | 69,766 | | 76 | | — | |
Royal Bank of Canada | | 11/4/19 | | CAD | 80,000 | | USD | 60,466 | | 274 | | — | |
Morgan Stanley Capital Services LLC | | 11/4/19 | | EUR | 50,000 | | USD | 54,616 | | 1,164 | | — | |
State Street Bank & Trust Co. | | 11/4/19 | | HKD | 351,500 | | USD | 44,847 | | 9 | | — | |
J.P. Morgan Securities LLC | | 12/3/19 | | JPY | 4,418,107 | | USD | 40,934 | | 60 | | — | |
J.P. Morgan Securities LLC | | 12/3/19 | | CHF | 40,000 | | USD | 40,625 | | 24 | | — | |
Citigroup Global Markets Inc. | | 12/3/19 | | CAD | 50,000 | | USD | 38,051 | | — | | (86 | ) |
J.P. Morgan Securities LLC | | 11/5/19 | | JPY | 2,399,801 | | USD | 22,254 | | — | | (25 | ) |
Citigroup Global Markets Inc. | | 11/5/19 | | JPY | 2,065,597 | | USD | 19,155 | | — | | (22 | ) |
J.P. Morgan Securities LLC | | 11/4/19 | | EUR | 16,589 | | USD | 18,131 | | 376 | | — | |
J.P. Morgan Securities LLC | | 12/3/19 | | DKK | 110,000 | | USD | 16,464 | | — | | (2 | ) |
J.P. Morgan Securities LLC | | 12/3/19 | | AUD | 20,000 | | USD | 13,790 | | 9 | | — | |
Standard Chartered Bank | | 11/4/19 | | IDR | 181,349,524 | | USD | 12,799 | | 115 | | — | |
J.P. Morgan Securities LLC | | 12/3/19 | | SEK | 110,000 | | USD | 11,436 | | — | | (22 | ) |
Royal Bank of Canada | | 11/5/19 | | JPY | 1,009,144 | | USD | 9,358 | | — | | (11 | ) |
Royal Bank of Canada | | 11/4/19 | | SEK | 70,000 | | USD | 7,135 | | 116 | | — | |
Citigroup Global Markets Inc. | | 11/4/19 | | USD | 12,021,726 | | EUR | 11,000,000 | | — | | (249,872 | ) |
HSBC Bank USA, N.A. | | 11/4/19 | | USD | 10,928,718 | | EUR | 10,000,000 | | — | | (227,278 | ) |
Citigroup Global Markets Inc. | | 12/3/19 | | USD | 10,059,662 | | EUR | 9,000,000 | | — | | (188 | ) |
138
Total International Bond Index Fund
Forward Currency Contracts (continued) | | | | | | | |
| | Contract | | | | | | Unrealized | | Unrealized | |
| | Settlement | | Contract Amount (000) | | Appreciation | | (Depreciation | ) |
Counterparty | | Date | | Receive | | Deliver | | ($000 | ) | ($000 | ) |
Toronto-Dominion Bank | | 12/3/19 | | USD | 9,690,788 | | EUR | 8,670,000 | | — | | (201 | ) |
State Street Bank & Trust Co. | | 11/4/19 | | USD | 9,289,249 | | EUR | 8,500,000 | | — | | (193,347 | ) |
Bank of America, N.A. | | 12/3/19 | | USD | 8,942,030 | | EUR | 8,000,000 | | — | | (62 | ) |
BNP Paribas | | 11/4/19 | | USD | 8,852,212 | | EUR | 8,100,000 | | — | | (184,145 | ) |
J.P. Morgan Securities LLC | | 12/3/19 | | USD | 8,728,143 | | GBP | 6,739,017 | | — | | (10,562 | ) |
Toronto-Dominion Bank | | 11/4/19 | | USD | 7,838,462 | | EUR | 7,171,617 | | — | | (162,191 | ) |
State Street Bank & Trust Co. | | 12/3/19 | | USD | 7,824,325 | | EUR | 7,000,000 | | — | | (5 | ) |
Deutsche Bank AG | | 12/3/19 | | USD | 7,743,252 | | EUR | 6,927,617 | | — | | (169 | ) |
UBS AG | | 11/4/19 | | USD | 7,650,006 | | EUR | 7,000,000 | | — | | (159,193 | ) |
Morgan Stanley Capital Services LLC | | 11/4/19 | | USD | 7,291,300 | | GBP | 5,909,017 | | — | | (363,919 | ) |
Citigroup Global Markets Inc. | | 12/3/19 | | USD | 6,328,316 | | JPY | 683,024,738 | | — | | (9,150 | ) |
Morgan Stanley Capital Services LLC | | 12/3/19 | | USD | 6,003,947 | | JPY | 648,000,000 | | — | | (8,539 | ) |
Toronto-Dominion Bank | | 11/5/19 | | USD | 5,953,524 | | JPY | 642,000,000 | | 6,828 | | — | |
Royal Bank of Canada | | 12/3/19 | | USD | 5,577,266 | | CAD | 7,329,986 | | 11,534 | | — | |
Royal Bank of Canada | | 12/3/19 | | USD | 4,471,068 | | EUR | 4,000,000 | | 23 | | — | |
UBS AG | | 12/3/19 | | USD | 4,470,996 | | EUR | 4,000,000 | | — | | (48 | ) |
Morgan Stanley Capital Services LLC | | 12/3/19 | | USD | 4,470,981 | | EUR | 4,000,000 | | — | | (63 | ) |
Barclays Bank plc | | 12/3/19 | | USD | 4,417,293 | | EUR | 3,952,000 | | — | | (100 | ) |
Goldman Sachs Bank USA | | 11/4/19 | | USD | 4,371,664 | | EUR | 4,000,000 | | — | | (90,735 | ) |
Bank of America, N.A. | | 11/4/19 | | USD | 4,371,603 | | EUR | 4,000,000 | | — | | (90,795 | ) |
Royal Bank of Canada | | 11/4/19 | | USD | 4,042,854 | | CAD | 5,350,000 | | — | | (19,130 | ) |
Morgan Stanley Capital Services LLC | | 11/5/19 | | USD | 3,969,087 | | JPY | 428,000,000 | | 4,623 | | — | |
Morgan Stanley Capital Services LLC | | 12/3/19 | | USD | 3,763,207 | | KRW | 4,391,598,645 | | — | | (14,090 | ) |
BNP Paribas | | 11/4/19 | | USD | 3,612,620 | | KRW | 4,335,036,645 | | — | | (113,698 | ) |
Toronto-Dominion Bank | | 11/4/19 | | USD | 3,553,692 | | GBP | 2,880,000 | | — | | (177,390 | ) |
Bank of America, N.A. | | 11/5/19 | | USD | 3,374,560 | | JPY | 363,884,738 | | 3,981 | | — | |
BNP Paribas | | 12/3/19 | | USD | 3,353,212 | | EUR | 3,000,000 | | — | | (72 | ) |
Barclays Bank plc | | 11/4/19 | | USD | 3,278,683 | | EUR | 3,000,000 | | — | | (68,116 | ) |
BNP Paribas | | 12/3/19 | | USD | 3,076,123 | | JPY | 332,000,000 | | — | | (4,349 | ) |
HSBC Bank USA, N.A. | | 12/3/19 | | USD | 3,001,978 | | JPY | 324,000,000 | | — | | (4,265 | ) |
UBS AG | | 11/5/19 | | USD | 2,976,780 | | JPY | 321,000,000 | | 3,432 | | — | |
Citigroup Global Markets Inc. | | 11/5/19 | | USD | 2,976,700 | | JPY | 321,000,000 | | 3,352 | | — | |
Toronto-Dominion Bank | | 12/3/19 | | USD | 2,914,088 | | GBP | 2,250,000 | | — | | (3,561 | ) |
HSBC Bank USA, N.A. | | 11/4/19 | | USD | 2,523,929 | | CAD | 3,339,986 | | — | | (11,952 | ) |
139
Total International Bond Index Fund
Forward Currency Contracts (continued) | | | | | | | |
| | Contract | | | | | | Unrealized | | Unrealized | |
| | Settlement | | Contract Amount (000) | | Appreciation | | (Depreciation | ) |
Counterparty | | Date | | Receive | | Deliver | | ($000 | ) | ($000 | ) |
Deutsche Bank AG | | 12/3/19 | | USD | 2,390,449 | | JPY | 258,000,000 | | — | | (3,411 | ) |
J.P. Morgan Securities LLC | | 12/3/19 | | USD | 2,293,623 | | EUR | 2,052,000 | | — | | (23 | ) |
HSBC Bank USA, N.A. | | 12/3/19 | | USD | 2,235,550 | | EUR | 2,000,000 | | 28 | | — | |
Barclays Bank plc | | 12/3/19 | | USD | 2,235,526 | | EUR | 2,000,000 | | 4 | | — | |
Morgan Stanley Capital Services LLC | | 11/4/19 | | USD | 2,230,070 | | EUR | 2,040,000 | | — | | (45,754 | ) |
Deutsche Bank AG | | 11/4/19 | | USD | 2,185,847 | | EUR | 2,000,000 | | — | | (45,352 | ) |
State Street Bank & Trust Co. | | 12/3/19 | | USD | 2,001,357 | | JPY | 216,000,000 | | — | | (2,805 | ) |
Royal Bank of Canada | | 12/3/19 | | USD | 2,001,270 | | JPY | 216,000,000 | | — | | (2,892 | ) |
HSBC Bank USA, N.A. | | 11/5/19 | | USD | 1,984,582 | | JPY | 214,000,000 | | 2,350 | | — | |
State Street Bank & Trust Co. | | 11/5/19 | | USD | 1,984,471 | | JPY | 214,000,000 | | 2,239 | | — | |
Toronto-Dominion Bank | | 12/3/19 | | USD | 1,826,106 | | CAD | 2,400,000 | | 3,762 | | — | |
J.P. Morgan Securities LLC | | 12/3/19 | | USD | 1,715,664 | | CHF | 1,689,329 | | — | | (1,061 | ) |
J.P. Morgan Securities LLC | | 11/4/19 | | USD | 1,688,937 | | CHF | 1,679,329 | | — | | (13,871 | ) |
Morgan Stanley Capital Services LLC | | 12/3/19 | | USD | 1,305,239 | | SEK | 12,591,545 | | — | | (1,216 | ) |
Bank of America, N.A. | | 11/4/19 | | USD | 1,253,907 | | SEK | 12,271,545 | | — | | (17,278 | ) |
Goldman Sachs Bank USA | | 12/3/19 | | USD | 1,117,742 | | EUR | 1,000,000 | | — | | (19 | ) |
BNP Paribas | | 11/4/19 | | USD | 1,117,534 | | THB | 34,223,316 | | — | | (15,914 | ) |
Royal Bank of Canada | | 11/4/19 | | USD | 1,092,824 | | EUR | 1,000,000 | | — | | (22,776 | ) |
UBS AG | | 12/3/19 | | USD | 1,000,676 | | JPY | 108,000,000 | | — | | (1,405 | ) |
Toronto-Dominion Bank | | 12/3/19 | | USD | 1,000,640 | | JPY | 108,000,000 | | — | | (1,441 | ) |
Bank of America, N.A. | | 12/3/19 | | USD | 1,000,635 | | JPY | 108,000,000 | | — | | (1,446 | ) |
BNP Paribas | | 11/5/19 | | USD | 992,330 | | JPY | 107,000,000 | | 1,214 | | — | |
Royal Bank of Canada | | 11/5/19 | | USD | 992,282 | | JPY | 107,000,000 | | 1,166 | | — | |
Deutsche Bank AG | | 11/5/19 | | USD | 992,236 | | JPY | 107,000,000 | | 1,121 | | — | |
Goldman Sachs Bank USA | | 11/5/19 | | USD | 992,234 | | JPY | 107,000,000 | | 1,118 | | — | |
Barclays Bank plc | | 11/5/19 | | USD | 992,221 | | JPY | 107,000,000 | | 1,105 | | — | |
Standard Chartered Bank | | 11/4/19 | | USD | 920,725 | | IDR | 13,109,790,772 | | — | | (12,848 | ) |
Standard Chartered Bank | | 12/3/19 | | USD | 917,738 | | IDR | 12,928,441,248 | | — | | (247 | ) |
Royal Bank of Canada | | 12/3/19 | | USD | 907,283 | | MXN | 17,474,547 | | 3,578 | | — | |
BNP Paribas | | 12/3/19 | | USD | 882,366 | | MYR | 3,693,805 | | — | | (1,001 | ) |
BNP Paribas | | 11/4/19 | | USD | 880,834 | | MYR | 3,696,575 | | — | | (3,752 | ) |
State Street Bank & Trust Co. | | 12/3/19 | | USD | 865,299 | | AUD | 1,255,000 | | — | | (614 | ) |
J.P. Morgan Securities LLC | | 11/4/19 | | USD | 852,480 | | MXN | 16,924,547 | | — | | (26,782 | ) |
BNP Paribas | | 12/3/19 | | USD | 847,570 | | THB | 25,578,816 | | 198 | | — | |
Deutsche Bank AG | | 11/4/19 | | USD | 827,459 | | CNH | 5,906,850 | | — | | (10,557 | ) |
State Street Bank & Trust Co. | | 11/4/19 | | USD | 810,254 | | AUD | 1,200,000 | | — | | (17,057 | ) |
140
Total International Bond Index Fund
Forward Currency Contracts (continued) | | | | | | | |
| | Contract | | | | | | Unrealized | | Unrealized | |
| | Settlement | | Contract Amount (000) | | Appreciation | | (Depreciation | ) |
Counterparty | | Date | | Receive | | Deliver | | ($000 | ) | ($000 | ) |
J.P. Morgan Securities LLC | | 12/3/19 | | USD | 760,882 | | CAD | 1,000,000 | | 1,571 | | — | |
Barclays Bank plc | | 11/4/19 | | USD | 755,673 | | CAD | 1,000,000 | | — | | (3,576 | ) |
Toronto-Dominion Bank | | 11/4/19 | | USD | 755,664 | | CAD | 1,000,000 | | — | | (3,585 | ) |
UBS AG | | 12/3/19 | | USD | 722,575 | | AUD | 1,048,000 | | — | | (514 | ) |
UBS AG | | 11/4/19 | | USD | 688,714 | | AUD | 1,020,000 | | — | | (14,500 | ) |
Toronto-Dominion Bank | | 12/3/19 | | USD | 683,958 | | DKK | 4,568,700 | | 265 | | — | |
Morgan Stanley Capital Services LLC | | 11/4/19 | | USD | 668,855 | | DKK | 4,568,700 | | — | | (13,359 | ) |
Bank of America, N.A. | | 12/3/19 | | USD | 642,823 | | PLN | 2,455,503 | | — | | (2 | ) |
Deutsche Bank AG | | 12/3/19 | | USD | 639,309 | | CNH | 4,506,190 | | 540 | | — | |
Citigroup Global Markets Inc. | | 11/4/19 | | USD | 600,952 | | AUD | 890,000 | | — | | (12,637 | ) |
Citigroup Global Markets Inc. | | 12/3/19 | | USD | 598,593 | | SGD | 814,641 | | — | | (410 | ) |
Bank of America, N.A. | | 11/5/19 | | USD | 597,778 | | PLN | 2,395,503 | | — | | (29,229 | ) |
HSBC Bank USA, N.A. | | 11/4/19 | | USD | 589,291 | | SGD | 814,641 | | — | | (9,536 | ) |
Morgan Stanley Capital Services LLC | | 12/2/19 | | USD | 461,225 | | RUB | 29,582,500 | | 1,898 | | — | |
Barclays Bank plc | | 12/3/19 | | USD | 449,549 | | AUD | 652,000 | | — | | (312 | ) |
Morgan Stanley Capital Services LLC | | 11/1/19 | | USD | 446,942 | | RUB | 28,882,500 | | — | | (3,486 | ) |
J.P. Morgan Securities LLC | | 12/3/19 | | USD | 439,889 | | AUD | 638,000 | | — | | (312 | ) |
Barclays Bank plc | | 11/4/19 | | USD | 438,893 | | AUD | 650,000 | | — | | (9,234 | ) |
Deutsche Bank AG | | 12/3/19 | | USD | 427,862 | | AUD | 620,538 | | — | | (291 | ) |
Toronto-Dominion Bank | | 11/4/19 | | USD | 416,975 | | AUD | 617,538 | | — | | (8,771 | ) |
Deutsche Bank AG | | 11/4/19 | | USD | 388,354 | | ILS | 1,347,569 | | 5,930 | | — | |
Bank of America, N.A. | | 12/3/19 | | USD | 382,392 | | ILS | 1,347,569 | | — | | (587 | ) |
BNP Paribas | | 12/3/19 | | USD | 368,879 | | AUD | 535,000 | | — | | (255 | ) |
J.P. Morgan Securities LLC | | 11/4/19 | | USD | 337,606 | | AUD | 500,000 | | — | | (7,107 | ) |
J.P. Morgan Securities LLC | | 12/3/19 | | USD | 300,030 | | THB | 9,067,500 | | — | | (357 | ) |
BNP Paribas | | 12/3/19 | | USD | 284,431 | | CZK | 6,510,000 | | — | | (120 | ) |
Bank of America, N.A. | | 12/3/19 | | USD | 282,004 | | AUD | 409,000 | | — | | (194 | ) |
Bank of America, N.A. | | 11/4/19 | | USD | 274,994 | | CZK | 6,510,000 | | — | | (9,499 | ) |
Royal Bank of Canada | | 11/4/19 | | USD | 270,944 | | NOK | 2,460,356 | | 3,397 | | — | |
Bank of America, N.A. | | 11/4/19 | | USD | 270,092 | | AUD | 400,000 | | — | | (5,678 | ) |
Morgan Stanley Capital Services LLC | | 12/3/19 | | USD | 267,278 | | NOK | 2,460,356 | | — | | (311 | ) |
Toronto-Dominion Bank | | 12/3/19 | | USD | 223,569 | | EUR | 200,000 | | 16 | | — | |
Citigroup Global Markets Inc. | | 12/3/19 | | USD | 202,022 | | AUD | 293,000 | | — | | (139 | ) |
J.P. Morgan Securities LLC | | 11/4/19 | | USD | 199,902 | | CNH | 1,424,200 | | — | | (2,152 | ) |
BNP Paribas | | 12/3/19 | | USD | 199,843 | | CNH | 1,413,200 | | — | | (483 | ) |
141
Total International Bond Index Fund
Forward Currency Contracts (continued) | | | | | | | |
| | Contract | | | | | | Unrealized | | Unrealized | |
| | Settlement | | Contract Amount (000) | | Appreciation | | (Depreciation | ) |
Counterparty | | Date | | Receive | | Deliver | | ($000 | ) | ($000 | ) |
Royal Bank of Canada | | 12/3/19 | | USD | 199,109 | | CNH | 1,411,660 | | — | | (1,000 | ) |
BNP Paribas | | 12/3/19 | | USD | 194,928 | | HUF | 57,378,251 | | — | | (157 | ) |
BNP Paribas | | 11/5/19 | | USD | 187,089 | | HUF | 57,378,251 | | — | | (7,720 | ) |
Barclays Bank plc | | 11/4/19 | | USD | 181,975 | | NZD | 290,000 | | — | | (3,973 | ) |
State Street Bank & Trust Co. | | 12/3/19 | | USD | 172,528 | | NZD | 268,879 | | 29 | | — | |
BNP Paribas | | 12/3/19 | | USD | 166,824 | | NZD | 260,000 | | 22 | | — | |
BNP Paribas | | 11/4/19 | | USD | 148,069 | | GBP | 120,000 | | — | | (7,393 | ) |
BNP Paribas | | 11/4/19 | | USD | 122,888 | | AUD | 182,000 | | — | | (2,587 | ) |
BNP Paribas | | 11/4/19 | | USD | 112,254 | | NZD | 178,879 | | — | | (2,444 | ) |
Royal Bank of Canada | | 12/3/19 | | USD | 106,181 | | AUD | 154,000 | | — | | (74 | ) |
Royal Bank of Canada | | 11/4/19 | | USD | 104,658 | | AUD | 155,000 | | — | | (2,203 | ) |
Bank of Montreal | | 11/4/19 | | USD | 90,697 | | CAD | 120,000 | | — | | (412 | ) |
J.P. Morgan Securities LLC | | 11/4/19 | | USD | 86,494 | | GBP | 70,000 | | — | | (4,193 | ) |
State Street Bank & Trust Co. | | 11/4/19 | | USD | 44,865 | | HKD | 351,500 | | 9 | | — | |
State Street Bank & Trust Co. | | 12/3/19 | | USD | 44,842 | | HKD | 351,500 | | — | | (7 | ) |
Toronto-Dominion Bank | | 11/4/19 | | USD | 40,527 | | SEK | 390,000 | | 128 | | — | |
Morgan Stanley Capital Services LLC | | 11/4/19 | | USD | 40,227 | | CHF | 40,000 | | — | | (332 | ) |
J.P. Morgan Securities LLC | | 11/4/19 | | USD | 27,580 | | KRW | 33,000,000 | | — | | (787 | ) |
Morgan Stanley Capital Services LLC | | 11/4/19 | | USD | 19,689 | | KRW | 23,562,000 | | — | | (565 | ) |
Bank of Montreal | | 11/4/19 | | USD | 18,925 | | NZD | 30,000 | | — | | (311 | ) |
Morgan Stanley Capital Services LLC | | 11/4/19 | | USD | 18,825 | | NZD | 30,000 | | — | | (411 | ) |
J.P. Morgan Securities LLC | | 12/2/19 | | USD | 15,386 | | RUB | 990,000 | | 14 | | — | |
BNP Paribas | | 11/5/19 | | USD | 15,221 | | PLN | 60,000 | | — | | (483 | ) |
HSBC Bank USA, N.A. | | 11/4/19 | | USD | 15,120 | | MXN | 290,000 | | 54 | | — | |
Standard Chartered Bank | | 11/4/19 | | USD | 13,810 | | THB | 423,000 | | — | | (200 | ) |
Bank of Montreal | | 11/4/19 | | USD | 13,520 | | AUD | 20,000 | | — | | (268 | ) |
Royal Bank of Canada | | 11/4/19 | | USD | 13,095 | | MXN | 260,000 | | — | | (412 | ) |
Royal Bank of Canada | | 11/4/19 | | USD | 12,239 | | GBP | 10,000 | | — | | (717 | ) |
J.P. Morgan Securities LLC | | 12/3/19 | | USD | 10,902 | | MXN | 210,000 | | 42 | | — | |
J.P. Morgan Securities LLC | | 11/1/19 | | USD | 10,743 | | RUB | 700,000 | | — | | (174 | ) |
| | | | | | | | | | 151,002 | | (2,617,876 | ) |
See accompanying Notes, which are an integral part of the Financial Statements.
142
Total International Bond Index Fund
Statement of Operations
| | Year Ended | |
| | October 31, 2019 | |
| | ($000 | ) |
Investment Income | | | |
Income | | | |
Interest1,2 | | 1,497,268 | |
Total Income | | 1,497,268 | |
Expenses | | | |
The Vanguard Group—Note B | | | |
Investment Advisory Services | | 4,424 | |
Management and Administrative—Investor Shares | | 31,986 | |
Management and Administrative—ETF Shares | | 9,954 | |
Management and Administrative—Admiral Shares | | 46,234 | |
Management and Administrative—Institutional Shares | | 18,564 | |
Marketing and Distribution—Investor Shares | | 2,572 | |
Marketing and Distribution—ETF Shares | | 971 | |
Marketing and Distribution—Admiral Shares | | 2,690 | |
Marketing and Distribution—Institutional Shares | | 1,064 | |
Custodian Fees | | 4,554 | |
Auditing Fees | | 155 | |
Shareholders’ Reports—Investor Shares | | 214 | |
Shareholders’ Reports—ETF Shares | | 1,132 | |
Shareholders’ Reports—Admiral Shares | | 664 | |
Shareholders’ Reports—Institutional Shares | | 9 | |
Trustees’ Fees and Expenses | | 57 | |
Total Expenses | | 125,244 | |
Net Investment Income | | 1,372,024 | |
Realized Net Gain (Loss) | | | |
Investment Securities Sold2 | | (379,616 | ) |
Futures Contracts | | (446 | ) |
Forward Currency Contracts | | 7,478,123 | |
Foreign Currencies | | (72,183 | ) |
Realized Net Gain (Loss) | | 7,025,878 | |
Change in Unrealized Appreciation (Depreciation) | | | |
Investment Securities2 | | 8,364,427 | |
Futures Contracts | | 100 | |
Forward Currency Contracts | | (4,643,687 | ) |
Foreign Currencies | | 56,648 | |
Change in Unrealized Appreciation (Depreciation) | | 3,777,488 | |
Net Increase (Decrease) in Net Assets Resulting from Operations | | 12,175,390 | |
1 Interest Income is net of foreign withholding taxes of $6,945,000.
2 Interest income, realized net gain (loss), and change in unrealized appreciation (depreciation) from an affiliated company of the fund were $9,104,000, $82,000, and $7,000, respectively. Purchases and sales are for temporary cash investment purposes.
See accompanying Notes, which are an integral part of the Financial Statements.
143
Total International Bond Index Fund
Statement of Changes in Net Assets
| | Year Ended October 31, | |
| | 2019 | | 2018 | |
| | ($000 | ) | ($000 | ) |
Increase (Decrease) in Net Assets | | | | | |
Operations | | | | | |
Net Investment Income | | 1,372,024 | | 1,115,109 | |
Realized Net Gain (Loss) | | 7,025,878 | | 4,289,175 | |
Change in Unrealized Appreciation (Depreciation) | | 3,777,488 | | (3,628,060 | ) |
Net Increase (Decrease) in Net Assets Resulting from Operations | | 12,175,390 | | 1,776,224 | |
Distributions | | | | | |
Net Investment Income | | | | | |
Investor Shares | | (821,618 | ) | (585,484 | ) |
ETF Shares | | (430,228 | ) | (220,281 | ) |
Admiral Shares | | (1,363,556 | ) | (863,631 | ) |
Institutional Shares | | (889,172 | ) | (585,371 | ) |
Realized Capital Gain | | | | | |
Investor Shares | | — | | — | |
ETF Shares | | — | | — | |
Admiral Shares | | — | | — | |
Institutional Shares | | — | | — | |
Total Distributions | | (3,504,574 | ) | (2,254,767 | ) |
Capital Share Transactions | | | | | |
Investor Shares | | 799,480 | | 1,826,036 | |
ETF Shares | | 10,659,238 | | 3,624,970 | |
Admiral Shares | | 4,958,823 | | 7,668,085 | |
Institutional Shares | | 4,222,942 | | 3,953,708 | |
Net Increase (Decrease) from Capital Share Transactions | | 20,640,483 | | 17,072,799 | |
Total Increase (Decrease) | | 29,311,299 | | 16,594,256 | |
Net Assets | | | | | |
Beginning of Period | | 111,138,063 | | 94,543,807 | |
End of Period | | 140,449,362 | | 111,138,063 | |
See accompanying Notes, which are an integral part of the Financial Statements.
144
Total International Bond Index Fund
Financial Highlights
Investor Shares
For a Share Outstanding | | Year Ended October 31, | |
Throughout Each Period | | 2019 | | 2018 | | 2017 | | 2016 | | 2015 | |
Net Asset Value, Beginning of Period | | $10.90 | | $10.96 | | $11.02 | | $10.61 | | $10.45 | |
Investment Operations | | | | | | | | | | | |
Net Investment Income | | .121 | 1 | .113 | 1 | .114 | 1 | .135 | | .141 | |
Net Realized and Unrealized Gain (Loss) on Investments | | .988 | | .068 | | .011 | | .432 | | .176 | |
Total from Investment Operations | | 1.109 | | .181 | | .125 | | .567 | | .317 | |
Distributions | | | | | | | | | | | |
Dividends from Net Investment Income | | (.329 | ) | (.241 | ) | (.185 | ) | (.157 | ) | (.157 | ) |
Distributions from Realized Capital Gains | | — | | — | | — | | — | | — | |
Total Distributions | | (.329 | ) | (.241 | ) | (.185 | ) | (.157 | ) | (.157 | ) |
Net Asset Value, End of Period | | $11.68 | | $10.90 | | $10.96 | | $11.02 | | $10.61 | |
| | | | | | | | | | | |
Total Return2 | | 10.39% | | 1.68% | | 1.16% | | 5.38% | | 3.04% | |
| | | | | | | | | | | |
Ratios/Supplemental Data | | | | | | | | | | | |
Net Assets, End of Period (Millions) | | $30,053 | | $27,299 | | $25,603 | | $21,521 | | $20,434 | |
Ratio of Total Expenses to Average Net Assets | | 0.13% | | 0.13% | | 0.13% | | 0.15% | | 0.17% | |
Ratio of Net Investment Income to Average Net Assets | | 1.07% | | 1.03% | | 1.05% | | 1.18% | | 1.32% | |
Portfolio Turnover Rate | | 26% | | 22% | | 19% | | 20% | | 13% | |
1 Calculated based on average shares outstanding.
2 Total returns do not include account service fees that may have applied in the periods shown. Fund prospectuses provide information about any applicable account service fees.
See accompanying Notes, which are an integral part of the Financial Statements.
145
Total International Bond Index Fund
Financial Highlights
ETF Shares
For a Share Outstanding | | Year Ended October 31, | |
Throughout Each Period | | 2019 | | 2018 | | 2017 | | 2016 | | 2015 | |
Net Asset Value, Beginning of Period | | $54.47 | | $54.75 | | $55.09 | | $53.04 | | $52.23 | |
Investment Operations | | | | | | | | | | | |
Net Investment Income | | .630 | 1 | .584 | 1 | .578 | 1 | .697 | | .714 | |
Net Realized and Unrealized Gain (Loss) on Investments | | 4.913 | | .356 | | .038 | | 2.175 | | .882 | |
Total from Investment Operations | | 5.543 | | .940 | | .616 | | 2.872 | | 1.596 | |
Distributions | | | | | | | | | | | |
Dividends from Net Investment Income | | (1.673 | ) | (1.220 | ) | (.956 | ) | (.822 | ) | (.786 | ) |
Distributions from Realized Capital Gains | | — | | — | | — | | — | | — | |
Total Distributions | | (1.673 | ) | (1.220 | ) | (.956 | ) | (.822 | ) | (.786 | ) |
Net Asset Value, End of Period | | $58.34 | | $54.47 | | $54.75 | | $55.09 | | $53.04 | |
| | | | | | | | | | | |
Total Return | | 10.40% | | 1.74% | | 1.15% | | 5.46% | | 3.07% | |
| | | | | | | | | | | |
Ratios/Supplemental Data | | | | | | | | | | | |
Net Assets, End of Period (Millions) | | $23,911 | | $12,092 | | $8,504 | | $5,692 | | $3,968 | |
Ratio of Total Expenses to Average Net Assets | | 0.08% | | 0.09% | | 0.11% | | 0.12% | | 0.15% | |
Ratio of Net Investment Income to Average Net Assets | | 1.12% | | 1.07% | | 1.07% | | 1.21% | | 1.34% | |
Portfolio Turnover Rate | | 26% | | 22% | | 19% | | 20% | | 13% | |
1 Calculated based on average shares outstanding.
See accompanying Notes, which are an integral part of the Financial Statements.
146
Total International Bond Index Fund
Financial Highlights
Admiral Shares
For a Share Outstanding | | Year Ended October 31, | |
Throughout Each Period | | 2019 | | 2018 | | 2017 | | 2016 | | 2015 | |
Net Asset Value, Beginning of Period | | $21.79 | | $21.91 | | $22.04 | | $21.21 | | $20.89 | |
Investment Operations | | | | | | | | | | | |
Net Investment Income | | .246 | 1 | .230 | 1 | .231 | 1 | .277 | | .289 | |
Net Realized and Unrealized Gain (Loss) on Investments | | 1.976 | | .137 | | .017 | | .874 | | .349 | |
Total from Investment Operations | | 2.222 | | .367 | | .248 | | 1.151 | | .638 | |
Distributions | | | | | | | | | | | |
Dividends from Net Investment Income | | (.662 | ) | (.487 | ) | (.378 | ) | (.321 | ) | (.318 | ) |
Distributions from Realized Capital Gains | | — | | — | | — | | — | | — | |
Total Distributions | | (.662 | ) | (.487 | ) | (.378 | ) | (.321 | ) | (.318 | ) |
Net Asset Value, End of Period | | $23.35 | | $21.79 | | $21.91 | | $22.04 | | $21.21 | |
| | | | | | | | | | | |
Total Return2 | | 10.41% | | 1.70% | | 1.16% | | 5.46% | | 3.06% | |
| | | | | | | | | | | |
Ratios/Supplemental Data | | | | | | | | | | | |
Net Assets, End of Period (Millions) | | $51,889 | | $43,550 | | $36,072 | | $20,572 | | $12,595 | |
Ratio of Total Expenses to Average Net Assets | | 0.11% | | 0.11% | | 0.11% | | 0.12% | | 0.14% | |
Ratio of Net Investment Income to Average Net Assets | | 1.09% | | 1.05% | | 1.07% | | 1.21% | | 1.35% | |
Portfolio Turnover Rate | | 26% | | 22% | | 19% | | 20% | | 13% | |
1 Calculated based on average shares outstanding.
2 Total returns do not include account service fees that may have applied in the periods shown. Fund prospectuses provide information about any applicable account service fees.
See accompanying Notes, which are an integral part of the Financial Statements.
147
Total International Bond Index Fund
Financial Highlights
Institutional Shares
For a Share Outstanding | | Year Ended October 31, | |
Throughout Each Period | | 2019 | | 2018 | | 2017 | | 2016 | | 2015 | |
Net Asset Value, Beginning of Period | | $32.70 | | $32.88 | | $33.07 | | $31.83 | | $31.34 | |
Investment Operations | | | | | | | | | | | |
Net Investment Income | | .382 | 1 | .358 | 1 | .360 | 1 | .431 | | .449 | |
Net Realized and Unrealized Gain (Loss) on Investments | | 2.954 | | .206 | | .033 | | 1.306 | | .536 | |
Total from Investment Operations | | 3.336 | | .564 | | .393 | | 1.737 | | .985 | |
Distributions | | | | | | | | | | | |
Dividends from Net Investment Income | | (1.006 | ) | (.744 | ) | (.583 | ) | (.497 | ) | (.495 | ) |
Distributions from Realized Capital Gains | | — | | — | | — | | — | | — | |
Total Distributions | | (1.006 | ) | (.744 | ) | (.583 | ) | (.497 | ) | (.495 | ) |
Net Asset Value, End of Period | | $35.03 | | $32.70 | | $32.88 | | $33.07 | | $31.83 | |
| | | | | | | | | | | |
Total Return | | 10.42% | | 1.74% | | 1.22% | | 5.49% | | 3.15% | |
| | | | | | | | | | | |
Ratios/Supplemental Data | | | | | | | | | | | |
Net Assets, End of Period (Millions) | | $34,596 | | $28,196 | | $24,365 | | $16,773 | | $13,032 | |
Ratio of Total Expenses to Average Net Assets | | 0.07% | | 0.07% | | 0.07% | | 0.07% | | 0.09% | |
Ratio of Net Investment Income to Average Net Assets | | 1.13% | | 1.09% | | 1.11% | | 1.26% | | 1.40% | |
Portfolio Turnover Rate | | 26% | | 22% | | 19% | | 20% | | 13% | |
1 Calculated based on average shares outstanding.
See accompanying Notes, which are an integral part of the Financial Statements.
148
Total International Bond Index Fund
Notes to Financial Statements
Vanguard Total International Bond Index Fund is registered under the Investment Company Act of 1940 as an open-end investment company, or mutual fund. Certain of the fund’s investments are in corporate debt instruments; the issuers’ abilities to meet their obligations may be affected by economic developments in their respective industries. The fund invests in securities of foreign issuers, which may subject it to investment risks not normally associated with investing in securities of U.S. corporations. To minimize the currency risk associated with investment in securities denominated in currencies other than the U.S. dollar, the fund attempts to hedge its currency exposures. The fund offers five classes of shares: Investor Shares, ETF Shares, Admiral Shares, Institutional Shares, and Institutional Select Shares. Each of the share classes has different eligibility and minimum purchase requirements, and is designed for different types of investors. ETF Shares are listed for trading on Nasdaq; they can be purchased and sold through a broker. The fund has not issued Institutional Select Shares through October 31, 2019.
A. The following significant accounting policies conform to generally accepted accounting principles for U.S. investment companies. The fund consistently follows such policies in preparing its financial statements.
1. Security Valuation: Securities are valued as of the close of trading on the New York Stock Exchange (generally 4 p.m., Eastern time) on the valuation date. Bonds and temporary cash investments are valued using the latest bid prices or using valuations based on a matrix system (which considers such factors as security prices, yields, maturities, and ratings), both as furnished by independent pricing services. Structured debt securities, including mortgages and asset-backed securities, are valued using the latest bid prices or using valuations based on a matrix system that considers such factors as issuer, tranche, nominal or option-adjusted spreads, weighted average coupon, weighted average maturity, credit enhancements, and collateral. Investments in Vanguard Market Liquidity Fund are valued at that fund’s net asset value. Securities for which market quotations are not readily available, or whose values have been affected by events occurring before the fund’s pricing time but after the close of the securities’ primary markets, are valued at their fair values calculated according to procedures adopted by the board of trustees. These procedures include obtaining quotations from an independent pricing service, monitoring news to identify significant market- or security-specific events, and evaluating changes in the values of foreign market proxies (for example, ADRs, futures contracts, or exchange-traded funds), between the time the foreign markets close and the fund’s pricing time. When fair-value pricing is employed, the prices of securities used by a fund to calculate its net asset value may differ from quoted or published prices for the same securities.
2. Foreign Currency: Securities and other assets and liabilities denominated in foreign currencies are translated into U.S. dollars using exchange rates obtained from an independent third party as of the fund’s pricing time on the valuation date. Realized gains (losses) and unrealized appreciation (depreciation) on investment securities include the effects of changes in exchange rates since the securities were purchased, combined with the effects of changes in security prices. Fluctuations in the value of other assets and liabilities resulting from changes in exchange rates are recorded as unrealized foreign currency gains (losses) until the assets or liabilities are settled in cash, at which time they are recorded as realized foreign currency gains (losses).
3. Futures Contracts: The fund uses futures contracts to invest in fixed income asset classes with greater efficiency and lower cost than is possible through direct investment, to add value when these instruments are attractively priced, or to adjust sensitivity to changes in interest rates. The primary risks associated with the use of futures contracts are imperfect correlation between
149
Total International Bond Index Fund
changes in market values of bonds held by the fund and the prices of futures contracts, and the possibility of an illiquid market. Counterparty risk involving futures is mitigated because a regulated clearinghouse is the counterparty instead of the clearing broker. To further mitigate counterparty risk, the fund trades futures contracts on an exchange, monitors the financial strength of its clearing brokers and clearinghouse, and has entered into clearing agreements with its clearing brokers. The clearinghouse imposes initial margin requirements to secure the fund’s performance and requires daily settlement of variation margin representing changes in the market value of each contract. Any assets pledged as initial margin for open contracts are noted in the Statement of Net Assets.
Futures contracts are valued at their quoted daily settlement prices. The notional amounts of the contracts are not recorded in the Statement of Net Assets. Fluctuations in the value of the contracts are recorded in the Statement of Net Assets as an asset (liability) and in the Statement of Operations as unrealized appreciation (depreciation) until the contracts are closed, when they are recorded as realized futures gains (losses).
During the year ended October 31, 2019, the fund’s average investments in long and short futures contracts each represented less than 1% of net assets, based on the average of the notional amounts at each quarter-end during the period.
4. Forward Currency Contracts: The fund enters into forward currency contracts to protect the value of securities and related receivables and payables against changes in future foreign exchange rates. The fund’s risks in using these contracts include movement in the values of the foreign currencies relative to the U.S. dollar and the ability of the counterparties to fulfill their obligations under the contracts. The fund mitigates its counterparty risk by entering into forward currency contracts only with a diverse group of prequalified counterparties, monitoring their financial strength, entering into master netting arrangements with its counterparties, and requiring its counterparties to transfer collateral as security for their performance. In the absence of a default, the collateral pledged or received by the fund cannot be repledged, resold, or rehypothecated. The master netting arrangements provide that, in the event of a counterparty’s default (including bankruptcy), the fund may terminate the forward currency contracts, determine the net amount owed by either party in accordance with its master netting arrangements, and sell or retain any collateral held up to the net amount owed to the fund under the master netting arrangements. The forward currency contracts contain provisions whereby a counterparty may terminate open contracts if the fund’s net assets decline below a certain level, triggering a payment by the fund if the fund is in a net liability position at the time of the termination. The payment amount would be reduced by any collateral the fund has pledged. Any assets pledged as collateral for open contracts are noted in the Statement of Net Assets. The value of collateral received or pledged is compared daily to the value of the forward currency contracts exposure with each counterparty, and any difference, if in excess of a specified minimum transfer amount, is adjusted and settled within two business days.
Forward currency contracts are valued at their quoted daily prices obtained from an independent third party, adjusted for currency risk based on the expiration date of each contract. The notional amounts of the contracts are not recorded in the Statement of Net Assets. Fluctuations in the value of the contracts are recorded in the Statement of Net Assets as an asset (liability) and in the Statement of Operations as unrealized appreciation (depreciation) until the contracts are closed, when they are recorded as realized forward currency contract gains (losses).
150
Total International Bond Index Fund
During the year ended October 31, 2019, the fund’s average investment in forward currency contracts represented 100% of net assets, based on the average of net amounts of notional exposure at each quarter-end during the period.
The following table summarizes the fund’s derivative assets and liabilities by counterparty for derivatives subject to arrangements that provide for offsetting assets and liabilities. Exchange-traded derivatives are listed separately.
| | Assets | | Liabilities | | | | Amounts Not Offset in the | | Net | |
| | Reflected in | | Reflected in | | Net Amount | | Statement of Net Assets | | Exposure3 | |
| | Statement of | | Statement of | | Receivable | | Collateral | | Collateral | | (Not Less | |
| | Net Assets1 | | Net Assets1 | | (Payable | ) | Pledged2 | | Received2 | | Than $0 | ) |
| | ($000 | ) | ($000 | ) | ($000 | ) | ($000 | ) | ($000 | ) | ($000 | ) |
Derivatives Subject to Offsetting Arrangements, by Counterparty | | | | | | | | | | | | | |
Bank of America, N.A. | | 6,094 | | (155,179 | ) | (149,085 | ) | 91,913 | | — | | — | |
Bank of Montreal | | — | | (991 | ) | (991 | ) | 1,232 | | — | | — | |
Barclays Bank plc | | 1,419 | | (85,611 | ) | (84,192 | ) | 59,109 | | — | | — | |
BNP Paribas | | 7,790 | | (345,511 | ) | (337,721 | ) | 268,737 | | — | | — | |
Citigroup Global Markets Inc. | | 12,427 | | (272,956 | ) | (260,529 | ) | 215,778 | | — | | — | |
Deutsche Bank AG | | 11,111 | | (60,637 | ) | (49,526 | ) | 30,727 | | — | | — | |
Goldman Sachs Bank USA | | 1,118 | | (90,805 | ) | (89,687 | ) | 65,970 | | — | | — | |
HSBC Bank USA, N.A. | | 6,482 | | (253,132 | ) | (246,650 | ) | 189,361 | | — | | — | |
J.P. Morgan Securities LLC | | 15,051 | | (69,117 | ) | (54,066 | ) | 46,963 | | — | | — | |
Morgan Stanley Capital Services LLC | | 31,091 | | (453,997 | ) | (422,906 | ) | 321,249 | | — | | — | |
Royal Bank of Canada | | 30,904 | | (64,647 | ) | (33,743 | ) | 22,637 | | — | | — | |
Standard Chartered Bank | | 115 | | (13,464 | ) | (13,349 | ) | 12,766 | | — | | — | |
State Street Bank & Trust Co. | | 5,583 | | (214,215 | ) | (208,632 | ) | 151,751 | | — | | — | |
Toronto-Dominion Bank | | 16,536 | | (361,753 | ) | (345,217 | ) | 236,104 | | — | | — | |
UBS AG | | 5,281 | | (175,861 | ) | (170,580 | ) | 142,258 | | — | | — | |
Exchange-Traded Futures Contracts | | 1,577 | | (602 | ) | 975 | | 4,204 | | — | | — | |
Total | | 152,579 | | (2,618,478 | ) | (2,465,899 | ) | 1,860,759 | | — | | — | |
1 Absent an event of default or early termination, derivative assets and liabilities are presented gross and not offset in the Statement of Net Assets.
2 Securities or other assets pledged as collateral are noted in the Statement of Net Assets. Securities or other assets received as collateral are held in a segregated account and not included in the fund’s security holdings in the Statement of Net Assets.
3 Net exposure represents the net amount receivable from the counterparty in the event of default. Counterparties are not required to exchange collateral if amount is below a specified minimum transfer amount.
151
Total International Bond Index Fund
5. Federal Income Taxes: The fund intends to continue to qualify as a regulated investment company and distribute all of its taxable income. Management has analyzed the fund’s tax positions taken for all open federal income tax years (October 31, 2016–2019), and has concluded that no provision for federal income tax is required in the fund’s financial statements.
6. Distributions: Distributions to shareholders are recorded on the ex-dividend date. Distributions are determined on a tax basis and may differ from net investment income and realized capital gains for financial reporting purposes.
7. Credit Facility: The fund and certain other funds managed by The Vanguard Group (“Vanguard”) participate in a $4.3 billion committed credit facility provided by a syndicate of lenders pursuant to a credit agreement that may be renewed annually; each fund is individually liable for its borrowings, if any, under the credit facility. Borrowings may be utilized for temporary and emergency purposes, and are subject to the fund’s regulatory and contractual borrowing restrictions. The participating funds are charged administrative fees and an annual commitment fee of 0.10% of the undrawn amount of the facility; these fees are allocated to the funds based on a method approved by the fund’s board of trustees and included in Management and Administrative expenses on the fund’s Statement of Operations. Any borrowings under this facility bear interest at a rate based upon the higher of the one-month London Interbank Offered Rate, federal funds effective rate, or overnight bank funding rate plus an agreed-upon spread.
The fund had no borrowings outstanding at October 31, 2019, or at any time during the period then ended.
8. Other: Interest income includes income distributions received from Vanguard Market Liquidity Fund and is accrued daily. Premiums and discounts on debt securities purchased are amortized and accreted, respectively, to interest income over the lives of the respective securities. Security transactions are accounted for on the date securities are bought or sold. Costs used to determine realized gains (losses) on the sale of investment securities are those of the specific securities sold.
Each class of shares has equal rights as to assets and earnings, except that each class separately bears certain class-specific expenses related to maintenance of shareholder accounts (included in Management and Administrative expenses) and shareholder reporting. Marketing and distribution expenses are allocated to each class of shares based on a method approved by the board of trustees. Income, other non-class-specific expenses, and gains and losses on investments are allocated to each class of shares based on its relative net assets.
B. In accordance with the terms of a Funds’ Service Agreement (the “FSA”) between Vanguard and the fund, Vanguard furnishes to the fund investment advisory, corporate management, administrative, marketing, and distribution services at Vanguard’s cost of operations (as defined by the FSA). These costs of operations are allocated to the fund based on methods and guidelines approved by the board of trustees. Vanguard does not require reimbursement in the current period for certain costs of operations (such as deferred compensation/benefits and risk/insurance costs); the fund’s liability for these costs of operations is included in Payables to Vanguard on the Statement of Net Assets. All other costs of operations payable to Vanguard are generally settled twice a month.
152
Total International Bond Index Fund
Upon the request of Vanguard, the fund may invest up to 0.40% of its net assets as capital in Vanguard. At October 31, 2019, the fund had contributed to Vanguard capital in the amount of $6,585,000, representing less than 0.01% of the fund’s net assets and 2.63% of Vanguard’s capital received pursuant to the FSA. The fund’s trustees and officers are also directors and employees, respectively, of Vanguard.
C. Various inputs may be used to determine the value of the fund’s investments. These inputs are summarized in three broad levels for financial statement purposes. The inputs or methodologies used to value securities are not necessarily an indication of the risk associated with investing in those securities.
Level 1—Quoted prices in active markets for identical securities.
Level 2—Other significant observable inputs (including quoted prices for similar securities, interest rates, prepayment speeds, credit risk, etc.).
Level 3—Significant unobservable inputs (including the fund’s own assumptions used to determine the fair value of investments). Any investments valued with significant unobservable inputs are noted on the Statement of Net Assets.
The following table summarizes the market value of the fund’s investments and derivatives as of October 31, 2019, based on the inputs used to value them:
| | Level 1 | | Level 2 | | Level 3 | |
Investments | | ($000 | ) | ($000 | ) | ($000 | ) |
Asset-Backed/Commercial Mortgage-Backed Securities | | — | | 5,770,301 | | — | |
Corporate Bonds | | — | | 21,235,660 | | — | |
Sovereign Bonds | | — | | 111,339,157 | | — | |
U.S. Government and Agency Obligations | | — | | 2,672 | | — | |
Temporary Cash Investments | | 789,582 | | — | | — | |
Futures Contracts—Assets1 | | 1,577 | | — | | — | |
Futures Contracts—Liabilities1 | | (602 | ) | — | | — | |
Forward Currency Contracts—Assets | | — | | 151,002 | | — | |
Forward Currency Contracts—Liabilities | | — | | (2,617,876 | ) | — | |
Total | | 790,557 | | 135,880,916 | | — | |
1 Represents variation margin on the last day of the reporting period.
153
Total International Bond Index Fund
D. At October 31, 2019, the fair values of derivatives were reflected in the Statement of Net Assets as follows:
| | Interest Rate | | Currency | | | |
| | Contracts | | Contracts | | Total | |
Statement of Net Assets Caption | | ($000 | ) | ($000 | ) | ($000 | ) |
Variation Margin Receivable—Futures Contracts | | 1,577 | | — | | 1,577 | |
Unrealized Appreciation—Forward Currency Contracts | | — | | 151,002 | | 151,002 | |
Total Assets | | 1,577 | | 151,002 | | 152,579 | |
| | | | | | | |
Variation Margin Payable—Futures Contracts | | (602 | ) | — | | (602 | ) |
Unrealized Depreciation—Forward Currency Contracts | | — | | (2,617,876 | ) | (2,617,876 | ) |
Total Liabilities | | (602 | ) | (2,617,876 | ) | (2,618,478 | ) |
Realized net gain (loss) and the change in unrealized appreciation (depreciation) on derivatives for the year ended October 31, 2019, were:
| | Interest Rate | | Currency | | | |
| | Contracts | | Contracts | | Total | |
Realized Net Gain (Loss) on Derivatives | | ($000 | ) | ($000 | ) | ($000 | ) |
Futures Contracts | | (446 | ) | — | | (446 | ) |
Forward Currency Contracts | | — | | 7,478,123 | | 7,478,123 | |
Realized Net Gain (Loss) on Derivatives | | (446 | ) | 7,478,123 | | 7,477,677 | |
| | | | | | | |
Change in Unrealized Appreciation (Depreciation) on Derivatives | | | | | | | |
Futures Contracts | | 100 | | — | | 100 | |
Forward Currency Contracts | | — | | (4,643,687 | ) | (4,643,687 | ) |
Change in Unrealized Appreciation (Depreciation) on Derivatives | | 100 | | (4,643,687 | ) | (4,643,587 | ) |
E. Permanent differences between book-basis and tax-basis components of net assets are reclassified among capital accounts in the financial statements to reflect their tax character. These reclassifications have no effect on net assets or net asset value per share. As of period end, permanent differences primarily attributable to the accounting for foreign currency transactions were reclassified between the individual components of total distributable earnings (loss).
| | Amount | |
| | ($000 | ) |
Paid-in Capital | | — | |
Total Distributable Earnings (Loss) | | — | |
154
Total International Bond Index Fund
Temporary differences between book-basis and tax-basis components of total distributable earnings (loss) arise when certain items of income, gain, or loss are recognized in different periods for financial statement and tax purposes; these differences will reverse at some time in the future. The differences are primarily related to the tax deferral of losses on wash sales, the realization of unrealized gains or losses on certain futures contracts; payables for distributions, and the tax recognition of gain or loss from foreign currency hedges. As of period end, the tax-basis components of total distributable earnings (loss) are detailed in the table as follows:
| | Amount | |
| | ($000 | ) |
Undistributed Ordinary Income | | 3,229,865 | |
Undistributed Long-Term Gains | | — | |
Capital Loss Carryforwards (Non-expiring)* | | (35,901 | ) |
Net Unrealized Gains (Losses) | | 8,208,060 | |
* The fund used capital loss carryforwards of $73,116,000 to offset taxable capital gains realized during the year ended October 31, 2019.
As of October 31, 2019, gross unrealized appreciation and depreciation for investments and derivatives based on cost for U.S. federal income tax purposes were as follows:
| | Amount | |
| | ($000 | ) |
Tax Cost | | 130,929,312 | |
Gross Unrealized Appreciation | | 9,921,615 | |
Gross Unrealized Depreciation | | (1,713,555 | ) |
Net Unrealized Appreciation (Depreciation) | | 8,208,060 | |
F. During the year ended October 31, 2019, the fund purchased $50,120,657,000 of investment securities and sold $31,420,661,000 of investment securities, other than U.S. government securities and temporary cash investments.
155
Total International Bond Index Fund
G. Capital share transactions for each class of shares were:
| | | | Year Ended October 31, | |
| | 2019 | | 2018 | |
| | Amount | | Shares | | Amount | | Shares | |
| | ($000 | ) | (000 | ) | ($000 | ) | (000 | ) |
Investor Shares | | | | | | | | | |
Issued | | 2,052,911 | | 182,791 | | 2,626,095 | | 241,252 | |
Issued in Lieu of Cash Distributions | | 821,063 | | 74,721 | | 585,031 | | 53,841 | |
Redeemed1 | | (2,074,494 | ) | (188,197 | ) | (1,385,090 | ) | (127,114 | ) |
Net Increase (Decrease)—Investor Shares | | 799,480 | | 69,315 | | 1,826,036 | | 167,979 | |
ETF Shares | | | | | | | | | |
Issued | | 10,770,965 | | 189,839 | | 4,285,695 | | 78,832 | |
Issued in Lieu of Cash Distributions | | — | | — | | — | | — | |
Redeemed | | (111,727 | ) | (2,000 | ) | (660,725 | ) | (12,150 | ) |
Net Increase (Decrease)—ETF Shares | | 10,659,238 | | 187,839 | | 3,624,970 | | 66,682 | |
Admiral Shares | | | | | | | | | |
Issued1 | | 9,772,772 | | 436,239 | | 10,394,835 | | 477,028 | |
Issued in Lieu of Cash Distributions | | 1,307,627 | | 59,467 | | 801,365 | | 36,875 | |
Redeemed | | (6,121,576 | ) | (271,396 | ) | (3,528,115 | ) | (162,068 | ) |
Net Increase (Decrease)—Admiral Shares | | 4,958,823 | | 224,310 | | 7,668,085 | | 351,835 | |
Institutional Shares | | | | | | | | | |
Issued | | 5,578,722 | | 165,967 | | 5,700,602 | | 174,448 | |
Issued in Lieu of Cash Distributions | | 882,691 | | 26,735 | | 582,570 | | 17,865 | |
Redeemed | | (2,238,471 | ) | (67,361 | ) | (2,329,464 | ) | (71,248 | ) |
Net Increase (Decrease)—Institutional Shares | | 4,222,942 | | 125,341 | | 3,953,708 | | 121,065 | |
1 In November 2018, the fund announced changes to the availability and minimum investment criteria of the Investor and Admiral share classes. As a result, all of the outstanding Investor Shares automatically converted to Admiral Shares beginning in April 2019, with the exception of those held by Vanguard funds and certain other institutional investors. Investor Shares—Redeemed and Admiral Shares—Issued include 37,787,000 and 18,902,000 shares, respectively, in the amount of $425,025,000 from the conversion during the year ended October 31, 2019.
At October 31, 2019, several Vanguard funds and trusts managed by Vanguard or its affiliates were each a record or beneficial owner of the fund, and had a combined ownership of 45% of the fund’s net assets. If any of these shareholders were to redeem their investment in the fund, the redemption might result in an increase in the fund’s expense ratio, cause the fund to incur higher transaction costs, or lead to the realization of taxable capital gains.
H. Management has determined that no events or transactions occurred subsequent to October 31, 2019, that would require recognition or disclosure in these financial statements.
156
Report of Independent Registered Public Accounting Firm
To the Board of Trustees of Vanguard Charlotte Funds and Shareholders of Vanguard Total International Bond Index Fund
Opinion on the Financial Statements
We have audited the accompanying statement of net assets of Vanguard Total International Bond Index Fund (one of the funds constituting Vanguard Charlotte Funds, referred to hereafter as the “Fund”) as of October 31, 2019, the related statement of operations for the year ended October 31, 2019, the statement of changes in net assets for each of the two years in the period ended October 31, 2019, including the related notes, and the financial highlights for each of the five years in the period ended October 31, 2019 (collectively referred to as the “financial statements”). In our opinion, the financial statements present fairly, in all material respects, the financial position of the Fund as of October 31, 2019, the results of its operations for the year then ended, the changes in its net assets for each of the two years in the period ended October 31, 2019 and the financial highlights for each of the five years in the period ended October 31, 2019 in conformity with accounting principles generally accepted in the United States of America.
Basis for Opinion
These financial statements are the responsibility of the Fund’s management. Our responsibility is to express an opinion on the Fund’s financial statements based on our audits. We are a public accounting firm registered with the Public Company Accounting Oversight Board (United States) (“PCAOB”) and are required to be independent with respect to the Fund in accordance with the U.S. federal securities laws and the applicable rules and regulations of the Securities and Exchange Commission and the PCAOB.
We conducted our audits of these financial statements in accordance with the standards of the PCAOB. Those standards require that we plan and perform the audit to obtain reasonable assurance about whether the financial statements are free of material misstatement, whether due to error or fraud.
Our audits included performing procedures to assess the risks of material misstatement of the financial statements, whether due to error or fraud, and performing procedures that respond to those risks. Such procedures included examining, on a test basis, evidence regarding the amounts and disclosures in the financial statements. Our audits also included evaluating the accounting principles used and significant estimates made by management, as well as evaluating the overall presentation of the financial statements. Our procedures included confirmation of securities owned as of October 31, 2019 by correspondence with the custodian, transfer agent and brokers; when replies were not received from brokers, we performed other auditing procedures. We believe that our audits provide a reasonable basis for our opinion.
/s/PricewaterhouseCoopers LLP
Philadelphia, Pennsylvania
December 18, 2019
We have served as the auditor of one or more investment companies in The Vanguard Group of Funds since 1975.
157
Special 2019 tax information (unaudited) for Vanguard Total International Bond Index Fund
This information for the fiscal year ended October 31, 2019, is included pursuant to provisions of the Internal Revenue Code.
The fund designates to shareholders foreign source income of $1,426,162,000 and foreign taxes paid of $6,021,000. Shareholders will receive more detailed information with their Form 1099-DIV in January 2020 to determine the calendar-year amounts to be included on their 2019 tax returns.
158
BLOOMBERG is a trademark and service mark of Bloomberg Finance L.P. BARCLAYS is a trademark and service mark of Barclays Bank Plc, used under license. Bloomberg Finance L.P. and its affiliates, including Bloomberg Index Services Limited (BISL) (collectively, Bloomberg), or Bloomberg’s licensors, own all proprietary rights in the Bloomberg Barclays Global Aggregate ex-USD Float Adjusted RIC Capped Index (USD Hedged) (Index or Bloomberg Barclays Index).
Neither Barclays Bank Plc, Barclays Capital Inc., or any affiliate (collectively Barclays) or Bloomberg is the issuer or producer of the Total International Bond Index Fund and neither Bloomberg nor Barclays has any responsibilities, obligations or duties to investors in the Total International Bond Index Fund. The Index is licensed for use by The Vanguard Group, Inc. (Vanguard) as the sponsor of the Total International Bond Index Fund. Bloomberg and Barclays’ only relationship with Vanguard in respect of the Index is the licensing of the Index, which is determined, composed and calculated by BISL, or any successor thereto, without regard to the Issuer or the Total International Bond Index Fund or the owners of the Total International Bond Index Fund.
Additionally, Vanguard may for itself execute transaction(s) with Barclays in or relating to the Index in connection with the Total International Bond Index Fund. Investors acquire the Total International Bond Index Fund from Vanguard and investors neither acquire any interest in the Index nor enter into any relationship of any kind whatsoever with Bloomberg or Barclays upon making an investment in the Total International Bond Index Fund. The Total International Bond Index Fund is not sponsored, endorsed, sold or promoted by Bloomberg or Barclays. Neither Bloomberg nor Barclays makes any representation or warranty, express or implied regarding the advisability of investing in the Total International Bond Index Fund or the advisability of investing in securities generally or the ability of the Index to track corresponding or relative market performance. Neither Bloomberg nor Barclays has passed on the legality or suitability of the Total International Bond Index Fund with respect to any person or entity. Neither Bloomberg nor Barclays is responsible for and has not participated in the determination of the timing of, prices at, or quantities of the Total International Bond Index Fund to be issued. Neither Bloomberg nor Barclays has any obligation to take the needs of the Issuer or the owners of the Total International Bond Index Fund or any other third party into consideration in determining, composing or calculating the Index. Neither Bloomberg nor Barclays has any obligation or liability in connection with administration, marketing or trading of the Total International Bond Index Fund.
159
The licensing agreement between Bloomberg and Barclays is solely for the benefit of Bloomberg and Barclays and not for the benefit of the owners of the Total International Bond Index Fund, investors or other third parties. In addition, the licensing agreement between Vanguard and Bloomberg is solely for the benefit of Vanguard and Bloomberg and not for the benefit of the owners of the Total International Bond Index Fund, investors or other third parties.
NEITHER BLOOMBERG NOR BARCLAYS SHALL HAVE ANY LIABILITY TO THE ISSUER, INVESTORS OR TO OTHER THIRD PARTIES FOR THE QUALITY, ACCURACY AND/OR COMPLETENESS OF THE BLOOMBERG BARCLAYS INDEX OR ANY DATA INCLUDED THEREIN OR FOR INTERRUPTIONS IN THE DELIVERY OF THE BLOOMBERG BARCLAYS INDEX. NEITHER BLOOMBERG NOR BARCLAYS MAKES ANY WARRANTY, EXPRESS OR IMPLIED, AS TO RESULTS TO BE OBTAINED BY THE ISSUER, THE INVESTORS OR ANY OTHER PERSON OR ENTITY FROM THE USE OF THE BLOOMBERG BARCLAYS INDEX OR ANY DATA INCLUDED THEREIN. NEITHER BLOOMBERG NOR BARCLAYS MAKES ANY EXPRESS OR IMPLIED WARRANTIES, AND EACH HEREBY EXPRESSLY DISCLAIMS ALL WARRANTIES OF MERCHANTABILITY OR FITNESS FOR A PARTICULAR PURPOSE OR USE WITH RESPECT TO THE BLOOMBERG BARCLAYS INDEX OR ANY DATA INCLUDED THEREIN. BLOOMBERG RESERVES THE RIGHT TO CHANGE THE METHODS OF CALCULATION OR PUBLICATION, OR TO CEASE THE CALCULATION OR PUBLICATION OF THE BLOOMBERG BARCLAYS INDEX, AND NEITHER BLOOMBERG NOR BARCLAYS SHALL BE LIABLE FOR ANY MISCALCULATION OF OR ANY INCORRECT, DELAYED OR INTERRUPTED PUBLICATION WITH RESPECT TO THE BLOOMBERG BARCLAYS INDEX. NEITHER BLOOMBERG NOR BARCLAYS SHALL BE LIABLE FOR ANY DAMAGES, INCLUDING, WITHOUT LIMITATION, ANY SPECIAL, INDIRECT OR CONSEQUENTIAL DAMAGES, OR ANY LOST PROFITS AND EVEN IF ADVISED OF THE POSSIBILITY OF SUCH, RESULTING FROM THE USE OF THE BLOOMBERG BARCLAYS INDEX OR ANY DATA INCLUDED THEREIN OR WITH RESPECT TO THE TOTAL INTERNATIONAL BOND INDEX FUND.
None of the information supplied by Bloomberg or Barclays and used in this publication may be reproduced in any manner without the prior written permission of both Bloomberg and Barclays Capital, the investment banking division of Barclays Bank Plc. Barclays Bank Plc is registered in England No. 1026167. Registered office 1 Churchill Place London E14 5HP.
© 2019 Bloomberg. Used with Permission.
Source: Bloomberg Index Services Limited. Copyright 2019, Bloomberg. All rights reserved.
160
This page intentionally left blank.
This page intentionally left blank.
The People Who Govern Your Fund
The trustees of your mutual fund are there to see that the fund is operated and managed in your best interests since, as a shareholder, you are a part owner of the fund. Your fund’s trustees also serve on the board of directors of The Vanguard Group, Inc., which is owned by the Vanguard funds and provides services to them.
A majority of Vanguard’s board members are independent, meaning that they have no affiliation with Vanguard or the funds they oversee, apart from the sizable personal investments they have made as private individuals. The independent board members have distinguished backgrounds in business, academia, and public service. Each of the trustees and executive officers oversees 213 Vanguard funds.
Information for each trustee and executive officer of the fund appears below. That information, as well as the Vanguard fund count, is as of the date on the cover of this fund report. The mailing address of the trustees and officers is P.O. Box 876, Valley Forge, PA 19482. More information about the trustees is in the Statement of Additional Information, which can be obtained, without charge, by contacting Vanguard at 800-662-7447, or online at vanguard.com.
Interested Trustee1
Mortimer J. Buckley
Born in 1969. Trustee since January 2018. Principal occupation(s) during the past five years and other experience: chairman of the board (January 2019–present) of Vanguard and of each of the investment companies served by Vanguard; chief executive officer (January 2018–present) of Vanguard; chief executive officer, president, and trustee (January 2018–present) of each of the investment companies served by Vanguard; president and director (2017–present) of Vanguard; and president (February 2018–present) of Vanguard Marketing Corporation. Chief investment officer (2013–2017), managing director (2002–2017), head of the Retail Investor Group (2006–2012), and chief information officer (2001–2006) of Vanguard. Chairman of the board (2011–2017) and trustee (2009–2017) of the Children’s Hospital of Philadelphia; trustee (2018–present) of The Shipley School.
Independent Trustees
Emerson U. Fullwood
Born in 1948. Trustee since January 2008. Principal occupation(s) during the past five years and other experience: executive chief staff and marketing officer for North America and corporate vice president (retired 2008) of Xerox Corporation (document management products and services). Former president of the Worldwide Channels Group, Latin America, and Worldwide Customer Service and executive chief staff officer of Developing Markets of Xerox. Executive in residence and 2009–2010 Distinguished Minett Professor at the Rochester Institute of Technology. Director of SPX FLOW, Inc. (multi-industry manufacturing). Director of the University of Rochester Medical Center, the Monroe Community College Foundation, the United Way of Rochester, North Carolina A&T University, and Roberts Wesleyan College. Trustee of the University of Rochester.
Amy Gutmann
Born in 1949. Trustee since June 2006. Principal occupation(s) during the past five years and other experience: president (2004–present) of the University of Pennsylvania. Christopher H. Browne Distinguished Professor of Political Science, School of Arts and Sciences, and professor of communication, Annenberg School for Communication, with secondary faculty appointments in the Department of Philosophy, School of Arts and Sciences, and at the Graduate School of Education, University of Pennsylvania. Trustee of the National Constitution Center.
F. Joseph Loughrey
Born in 1949. Trustee since October 2009. Principal occupation(s) during the past five years and other experience: president and chief operating officer (retired 2009) and vice chairman of the board (2008–2009) of Cummins Inc. (industrial machinery). Chairman of the board of Hillenbrand, Inc. (specialized consumer services), and the Lumina Foundation.
1 Mr. Buckley is considered an “interested person,” as defined in the Investment Company Act of 1940, because he is an officer of the Vanguard funds.
Director of the V Foundation and Oxfam America. Member of the advisory council for the College of Arts and Letters and chair of the advisory board to the Kellogg Institute for International Studies, both at the University of Notre Dame.
Mark Loughridge
Born in 1953. Trustee since March 2012. Principal occupation(s) during the past five years and other experience: senior vice president and chief financial officer (retired 2013) of IBM (information technology services). Fiduciary member of IBM’s Retirement Plan Committee (2004–2013), senior vice president and general manager (2002–2004) of IBM Global Financing, vice president and controller (1998–2002) of IBM, and a variety of other prior management roles at IBM. Member of the Council on Chicago Booth.
Scott C. Malpass
Born in 1962. Trustee since March 2012. Principal occupation(s) during the past five years and other experience: chief investment officer (1989–present) and vice president (1996–present) of the University of Notre Dame. Assistant professor of finance at the Mendoza College of Business, University of Notre Dame, and member of the Notre Dame 403(b) Investment Committee. Chairman of the board of TIFF Advisory Services, Inc. Member of the board of Catholic Investment Services, Inc. (investment advisors) and the board of superintendence of the Institute for the Works of Religion.
Deanna Mulligan
Born in 1963. Trustee since January 2018. Principal occupation(s) during the past five years and other experience: president (2010–present) and chief executive officer (2011–present) of The Guardian Life Insurance Company of America. Chief operating officer (2010–2011) and executive vice president (2008–2010) of Individual Life and Disability of The Guardian Life Insurance Company of America. Member of the board of The Guardian Life Insurance Company of America, the American Council of Life Insurers, the Partnership for New York City (business leadership), and the Committee Encouraging Corporate Philanthropy. Trustee of the Economic Club of New York and the Bruce Museum (arts and science). Member of the Advisory Council for the Stanford Graduate School of Business.
André F. Perold
Born in 1952. Trustee since December 2004. Principal occupation(s) during the past five years and other experience: George Gund Professor of Finance and Banking, Emeritus at the Harvard Business School (retired 2011). Chief investment officer and co-managing partner of HighVista Strategies (private investment firm). Board of advisors and investment committee member of the Museum of Fine Arts Boston. Board member (2018–present) of RIT Capital Partners (investment firm); investment committee member of Partners Health Care System.
Sarah Bloom Raskin
Born in 1961. Trustee since January 2018. Principal occupation(s) during the past five years and other experience: deputy secretary (2014–2017) of the United States Department of the Treasury. Governor (2010–2014) of the Federal Reserve Board. Commissioner (2007–2010) of financial regulation for the State of Maryland. Member of the board of directors (2012–2014) of Neighborhood Reinvestment Corporation. Director (2017–present) of i(x) Investments; director (2017–present) of Reserve Trust. Rubinstein Fellow (2017–present) of Duke University; trustee (2017–present) of Amherst College.
Peter F. Volanakis
Born in 1955. Trustee since July 2009. Principal occupation(s) during the past five years and other experience: president and chief operating officer (retired 2010) of Corning Incorporated (communications equipment) and director of Corning Incorporated (2000–2010) and Dow Corning (2001–2010). Director (2012) of SPX Corporation (multi-industry manufacturing). Overseer of the Amos Tuck School of Business Administration, Dartmouth College (2001–2013). Chairman of the board of trustees of Colby-Sawyer College. Member of the board of Hypertherm Inc. (industrial cutting systems, software, and consumables).
Executive Officers
John Bendl
Born in 1970. Principal occupation(s) during the past five years and other experience: principal of Vanguard. Chief financial officer (October 2019–present) of each of the investment companies served by Vanguard. Chief accounting officer, treasurer, and controller of Vanguard (2017–present). Partner (2003–2016) at KPMG (audit, tax, and advisory services).
Glenn Booraem
Born in 1967. Principal occupation(s) during the past five years and other experience: principal of Vanguard. Investment stewardship officer (2017–present), treasurer (2015–2017), controller (2010–2015), and assistant controller (2001–2010) of each of the investment companies served by Vanguard.
Christine M. Buchanan
Born in 1970. Principal occupation(s) during the past five years and other experience: principal of Vanguard. Treasurer (2017–present) of each of the investment companies served by Vanguard. Partner (2005–2017) at KPMG (audit, tax, and advisory services).
David Cermak
Born in 1960. Principal occupation(s) during the past five years and other experience: principal of Vanguard. Finance director (October 2019–present) of each of the investment companies served by Vanguard. Managing director and head (2017–present) of Vanguard Investments Singapore. Managing director and head (2017–2019) of Vanguard Investments Hong Kong. Representative director and head (2014–2017) of Vanguard Investments Japan.
Thomas J. Higgins
Born in 1957. Principal occupation(s) during the past five years and other experience: principal of Vanguard. Finance director (October 2019–present), chief financial officer (2008–2019), and treasurer (1998–2008) of each of the investment companies served by Vanguard.
Peter Mahoney
Born in 1974. Principal occupation(s) during the past five years and other experience: principal of Vanguard. Controller (2015–present) of each of the investment companies served by Vanguard. Head of International Fund Services (2008–2014) at Vanguard.
Anne E. Robinson
Born in 1970. Principal occupation(s) during the past five years and other experience: general counsel (2016–present) of Vanguard. Secretary (2016–present) of Vanguard and of each of the investment companies served by Vanguard. Managing director (2016–present) of Vanguard. Managing director and general counsel of Global Cards and Consumer Services (2014–2016) at Citigroup. Counsel (2003–2014) at American Express.
Michael Rollings
Born in 1963. Principal occupation(s) during the past five years and other experience: finance director (2017–present) and treasurer (2017) of each of the investment companies served by Vanguard. Managing director (2016–present) of Vanguard. Chief financial officer (2016–present) of Vanguard. Director (2016–present) of Vanguard Marketing Corporation. Executive vice president and chief financial officer (2006–2016) of MassMutual Financial Group.
John E. Schadl
Born in 1972. Principal occupation(s) during the past five years and other experience: principal of Vanguard. Chief compliance officer (2019–present) of Vanguard and of each of the investment companies served by Vanguard. Assistant vice president (May 2019–present) of Vanguard Marketing Corporation.
Vanguard Senior Management Team
Joseph Brennan | Chris D. McIsaac |
| |
Mortimer J. Buckley | James M. Norris |
| |
Gregory Davis | Thomas M. Rampulla |
| |
John James | Karin A. Risi |
| |
Martha G. King | Anne E. Robinson |
| |
John T. Marcante | Michael Rollings |
| 
|
| |
| |
| P.O. Box 2600 |
| Valley Forge, PA 19482-2600 |
Connect with Vanguard® > vanguard.com
Fund Information > 800-662-7447
Direct Investor Account Services > 800-662-2739
Institutional Investor Services > 800-523-1036
Text Telephone for People
Who Are Deaf or Hard of Hearing > 800-749-7273
This material may be used in conjunction with the offering of shares of any Vanguard fund only if preceded or accompanied by the fund’s current prospectus.
All comparative mutual fund data are from Morningstar, Inc., unless otherwise noted.
You can obtain a free copy of Vanguard’s proxy voting guidelines by visiting vanguard.com/proxyreporting or by calling Vanguard at 800-662-2739. The guidelines are also available from the SEC’s website, www.sec.gov. In addition, you may obtain a free report on how your fund voted the proxies for securities it owned during the 12 months ended June 30. To get the report, visit either vanguard.com/proxyreporting or www.sec.gov.
You can review information about your fund on the SEC’s website, and you can receive copies of this information, for a fee, by sending a request via email addressed to publicinfo@sec.gov.
| © 2019 The Vanguard Group, Inc. All rights reserved. U.S. Patent Nos. 6,879,964; 7,337,138; 7,720,749; 7,925,573; 8,090,646; 8,417,623; and 8,626,636. Vanguard Marketing Corporation, Distributor. Q12310 122019 |

Annual Report | October 31, 2019 Vanguard Global Credit Bond Fund |
See the inside front cover for important information about access to your fund’s annual and semiannual shareholder reports. |
Important information about access to shareholder reports
Beginning on January 1, 2021, as permitted by regulations adopted by the Securities and Exchange Commission, paper copies of your fund’s annual and semiannual shareholder reports will no longer be sent to you by mail, unless you specifically request them. Instead, you will be notified by mail each time a report is posted on the website and will be provided with a link to access the report.
If you have already elected to receive shareholder reports electronically, you will not be affected by this change and do not need to take any action. You may elect to receive shareholder reports and other communications from the fund electronically by contacting your financial intermediary (such as a broker-dealer or bank) or, if you invest directly with the fund, by calling Vanguard at one of the phone numbers on the back cover of this report or by logging on to vanguard.com.
You may elect to receive paper copies of all future shareholder reports free of charge. If you invest through a financial intermediary, you can contact the intermediary to request that you continue to receive paper copies. If you invest directly with the fund, you can call Vanguard at one of the phone numbers on the back cover of this report or log on to vanguard.com. Your election to receive paper copies will apply to all the funds you hold through an intermediary or directly with Vanguard.
Contents | |
| |
A Note From Our Chairman | 1 |
Your Fund’s Performance at a Glance | 2 |
Advisor’s Report | 3 |
About Your Fund’s Expenses | 6 |
Performance Summary | 8 |
Financial Statements | 10 |
Please note: The opinions expressed in this report are just that—informed opinions. They should not be considered promises or advice. Also, please keep in mind that the information and opinions cover the period through the date on the front of this report. Of course, the risks of investing in your fund are spelled out in the prospectus.
A Note From Our Chairman

Tim Buckley
Chairman and Chief Executive Officer
Dear Shareholder,
Recent volatility in financial markets—affecting stocks, bonds, and commodities—has been a good reminder of the wise old adage, “Never keep all your eggs in one basket.” Maintaining balance and diversification in your investment portfolio can help to both limit risk and set you up for long-term success.
It’s understandable why some investors might become complacent after a long market run-up like the one that lifted stock prices, especially U.S. stock prices, in the years following the global financial crisis. But failing to rebalance regularly can leave a portfolio with a much different mix of assets than intended and, often, more risk than intended.
Balance across and diversification within asset classes are powerful tools for managing risk and achieving your investment goals. A portfolio’s allocation will determine a large portion of its long-term return and also the majority of its volatility risk. A well-diversified portfolio is less vulnerable to significant swings in the performance of any one segment of the asset classes in which it invests.
Balance and diversification will never eliminate the risk of loss, nor will they guarantee positive returns in a declining market. But they should reduce the chance that you’ll suffer disproportionate losses in one particular high-flying asset class or sector when it comes back to earth. And exposure to all key market components should give you at least some participation in the sectors that are performing best at any given time.
Vanguard is committed to helping you achieve balance and diversification in your portfolios to help meet your investment goals. We thank you for your continued loyalty.
Sincerely,

Mortimer J. Buckley
Chairman and Chief Executive Officer
November 18, 2019
1
Your Fund’s Performance at a Glance
· From its inception on November 15, 2018, through October 31, 2019, Vanguard Global Credit Bond Fund returned 13.46% for Investor Shares and 13.60% for Admiral Shares. Those results outpaced the fund’s benchmark index, which returned 12.84%.
· There was a marked shift in global monetary policy during the period. In the face of slowing global growth, many central banks turned more accommodative. Some cut interest rates and others considered doing so. The European Central Bank revived its asset-purchase program. Global bond yields ended the period lower and corporate bond spreads narrowed, which pushed bond prices significantly higher.
· Security selection drove the fund’s outperformance, and duration and yield-curve positioning helped. In emerging markets, the fund’s holdings in Mexico, Lithuania, Chile, and Indonesia added value. Among European corporate bonds, holdings in banks, consumer noncyclicals, health care, and electric utilities were bright spots for the fund. So were U.S. banks and utilities.
· Detractors from relative performance included an allocation to Argentina, an out-of-benchmark allocation to Treasury Inflation-Protected Securities, and exposure to the U.S. auto sector.
· The fund regularly uses derivatives to hedge portfolio risks. The fund’s holdings of forward currency contracts and bond futures contracts boosted performance over this period.
Market Barometer
| Average Annual Total Returns | |
| Periods Ended October 31, 2019 | |
| One Year | Three Years | Five Years | |
Stocks | | | | |
Russell 1000 Index (Large-caps) | 14.15% | 14.73% | 10.55% | |
Russell 2000 Index (Small-caps) | 4.90 | 10.96 | 7.37 | |
Russell 3000 Index (Broad U.S. market) | 13.49 | 14.47 | 10.31 | |
FTSE All-World ex US Index (International) | 11.52 | 8.21 | 4.16 | |
| | | | |
Bonds | | | | |
Bloomberg Barclays U.S. Aggregate Bond Index (Broad taxable market) | 11.51% | 3.29% | 3.24% | |
Bloomberg Barclays Municipal Bond Index (Broad tax-exempt market) | 9.42 | 3.62 | 3.55 | |
FTSE Three-Month U.S. Treasury Bill Index | 2.35 | 1.57 | 0.98 | |
| | | | |
CPI | | | | |
Consumer Price Index | 1.76% | 2.11% | 1.62% | |
2
Advisor’s Report
Vanguard Global Credit Bond Fund seeks to provide a moderate and sustainable level of current income by investing primarily in investment-grade corporate and noncorporate bonds in developed and emerging markets. The majority of its non-U.S. exposure is hedged to the U.S. dollar to mitigate currency risk.
The fund, which is an actively managed option in our lineup of global credit funds, has a broad mandate that lets our deep bench of investment professionals across the world focus on finding the best risk/reward opportunities in credit regardless of where it’s issued.
From its inception on November 15, 2018, through October 31, 2019, the fund returned 13.46% for Investor Shares and 13.60% for Admiral Shares. The fund’s benchmark returned 12.84% for the period.
With bond prices rising, the 30-day SEC yield declined to 2.11% for Investor Shares and to 2.21% for Admiral Shares. The 30-day SEC yield is a proxy for a fund’s potential annualized rate of income.
Investment environment
The financial markets were driven largely by shifts in the outlook for global growth and monetary policy during the period.
Toward the end of 2018, bond investors grew skittish at the prospect of less-accommodative monetary policy by some major central banks, especially as the global economy seemed to lose steam.
In December, the U.S. Federal Reserve raised its target range for the federal funds rate, its fourth hike in 2018, and the European Central Bank (ECB) announced it would bring its asset-purchase program to an end.
Other investor concerns as 2018 drew to a close included flare-ups in trade disputes, signs that China’s economy was slowing, and heightened geopolitical tensions in the Middle East. Greater risk aversion led to a sell-off in stocks and lower-quality bonds and a boost in demand for safer assets, including government bonds.
Further signs of a global slowdown and tepid inflation in the new year, however, led to a pivot in monetary policy toward a more accommodative bias across much of the world.
In March, the Fed announced that it would end its balance-sheet tapering. It reduced short-term interest rates in August, September, and October. Those cuts, the first in more than a decade, were justified by policymakers as “insurance” meant to cushion the effects of trade policies and prolong an economic expansion already in its 11th year. In September, the ECB pushed its deposit rate further into negative territory and announced a new round of asset purchases; at the same time, it cut its projections for euro zone growth and inflation for 2019 and 2020. Other central banks on the same page included those of New Zealand, India, Thailand, South Korea, Brazil, and Mexico.
3
In response, global bond yields ended the period lower across the maturity spectrum. The 2-year U.S. Treasury note, for example, fell 134 basis points to 1.52% and the bellwether 10-year U.S. Treasury note fell 145 basis points to 1.69%. (A basis point is one-hundredth of a percentage point.)
Management of the fund
We added value through a number of strategies during the period. While we don’t usually take significant directional bets on the market, we did going into 2019. The market had cheapened to the point where we took on more exposure to higher-beta issuers that we anticipated would benefit most in a market rebound. This tactical move worked out well for the fund.
For much of the period, however, we were more focused on finding relative value opportunities in and across markets. Emerging markets proved the biggest contributor to relative performance. Mexico, Lithuania, Chile, and Indonesia were bright spots for us.
European debt in the fund also performed well. We took advantage of some volatility there as well as tailwinds from technical factors related to the ECB’s corporate bond-buying as part of its quantitative-easing efforts. When spreads widened in Spain in response to political woes in Italy, we added long-dated Spanish government debt, which benefited the most when spreads subsequently narrowed.
We generated superior returns from U.S. corporate bonds, which constitute the largest segment in the index by market value. Selection proved strong in debt issued by banks, utilities, communications companies, and basic materials producers.
Duration and yield-curve positioning were modestly positive.
The fund held some out-of-benchmark allocations that, overall, helped performance. A small allocation to high-yield bonds added value. We had exposure to asset-backed securities and commercial mortgage-backed securities, which provided incremental return while dampening some of the return volatility in the broader market. The fund also had exposure to Treasury Inflation-Protected Securities to provide a cushion in the event that inflation expectations rose, but those securities detracted from performance for this period.
A small allocation to Argentina was another detractor. Argentina’s credit repriced sharply after a strong primary election showing by a less market-friendly presidential candidate ahead of the October general election, which the candidate won. Our position in U.S. auto sector debt also dampened performance.
The outlook
Global growth is set to keep softening, owing in part to further downdrafts from trade tensions and policy uncertainty. The
4
U.S. economy’s growth may slow to a pace of around 1% in 2020 after adjusting for inflation, below its normal trend growth of around 2%, with a not-negligible risk of a recession.
Other major economies are likely to see a deceleration as well. China, the world’s second-largest economy, is set to grow at around 5.8% in 2020—but that figure could be markedly lower without further stimulus. In the euro area, growth may stay below trend, at about 1%, given recent indications that manufacturing weakness is spilling over into supply chains and the services sector. This backdrop, along with modest wage gains and structural factors like technology advancements and globalization, is unlikely to fuel a surge in consumer prices.
The prospect of slowing growth and tame inflation is likely to elicit more monetary easing by major central banks. The Fed has cut rates by 75 basis points so far this year, and we believe it may make further reductions depending on how trade tariffs and the shape of the yield curve evolve. Other central banks stand ready to provide further monetary support, and fiscal stimulus is also under consideration, notably in Germany and China.
We are likely to see more bouts of volatility in the financial markets as the global economy slows and monetary and fiscal policy evolve, so our tactically defensive stance should allow us to take advantage of price dislocations as they arise.
The weakest debt issuers will be the most sensitive to a further deceleration in global growth, making rigorous credit analysis and dynamic management key to performance in 2020 in this asset class.
Whatever the markets may bring, our experienced team of portfolio managers, traders, and credit analysts will continue to seek out opportunities to add to the fund’s performance.
Portfolio Managers:
Samuel C. Martinez, CFA
Daniel Shaykevich, Principal
Vanguard Fixed Income Group
November 26, 2019
5
About Your Fund’s Expenses
As a shareholder of the fund, you incur ongoing costs, which include costs for portfolio management, administrative services, and shareholder reports (like this one), among others. Operating expenses, which are deducted from a fund’s gross income, directly reduce the investment return of the fund.
A fund’s expenses are expressed as a percentage of its average net assets. This figure is known as the expense ratio. The following examples are intended to help you understand the ongoing costs (in dollars) of investing in your fund and to compare these costs with those of other mutual funds. The examples are based on an investment of $1,000 made at the beginning of the period shown and held for the entire period.
The accompanying table illustrates your fund’s costs in two ways:
· Based on actual fund return. This section helps you to estimate the actual expenses that you paid over the period. The “Ending Account Value” shown is derived from the fund’s actual return, and the third column shows the dollar amount that would have been paid by an investor who started with $1,000 in the fund. You may use the information here, together with the amount you invested, to estimate the expenses that you paid over the period.
To do so, simply divide your account value by $1,000 (for example, an $8,600 account value divided by $1,000 = 8.6), then multiply the result by the number given for your fund under the heading “Expenses Paid During Period.”
· Based on hypothetical 5% yearly return. This section is intended to help you compare your fund’s costs with those of other mutual funds. It assumes that the fund had a yearly return of 5% before expenses, but that the expense ratio is unchanged. In this case—because the return used is not the fund’s actual return—the results do not apply to your investment. The example is useful in making comparisons because the Securities and Exchange Commission requires all mutual funds to calculate expenses based on a 5% return. You can assess your fund’s costs by comparing this hypothetical example with the hypothetical examples that appear in shareholder reports of other funds.
Note that the expenses shown in the table are meant to highlight and help you compare ongoing costs only and do not reflect transaction costs incurred by the fund for buying and selling securities. Further, the expenses do not include any purchase, redemption, or account service fees described in the fund prospectus. If such fees were applied to your account, your costs would be higher. Your fund does not carry a “sales load.”
The calculations assume no shares were bought or sold during the period. Your actual costs may have been higher or lower, depending on the amount of your investment and the timing of any purchases or redemptions.
You can find more information about the fund’s expenses, including annual expense ratios, in the Financial Statements section of this report. For additional information on operating expenses and other shareholder costs, please refer to your fund’s current prospectus.
6
Six Months Ended October 31, 2019
| | Beginning | | Ending | | Expenses |
| | Account Value | | Account Value | | Paid During |
Global Credit Bond Fund | | 4/30/2019 | | 10/31/2019 | | Period |
Based on Actual Fund Return | | | | | | |
Investor Shares | | $1,000.00 | | $1,064.08 | | $1.77 |
AdmiralTM Shares | | 1,000.00 | | 1,065.07 | | 1.25 |
Based on Hypothetical 5% Yearly Return | | | | | | |
Investor Shares | | $1,000.00 | | $1,023.49 | | $1.73 |
Admiral Shares | | 1,000.00 | | 1,024.00 | | 1.22 |
The calculations are based on expenses incurred in the most recent six-month period. The fund’s annualized six-month expense ratios for that period are 0.34% for Investor Shares and 0.24% for Admiral Shares. The dollar amounts shown as “Expenses Paid” are equal to the annualized expense ratio multiplied by the average account value over the period, multiplied by the number of days in the most recent six-month period, then divided by the number of days in the most recent 12-month period (184/365).
7
Global Credit Bond Fund
Performance Summary
All of the returns in this report represent past performance, which is not a guarantee of future results that may be achieved by the fund. (Current performance may be lower or higher than the performance data cited. For performance data current to the most recent month-end, visit our website at vanguard.com/performance.) Note, too, that both investment returns and principal value can fluctuate widely, so an investor’s shares, when sold, could be worth more or less than their original cost. The returns shown do not reflect taxes that a shareholder would pay on fund distributions or on the sale of fund shares.
Cumulative Performance: November 15, 2018, Through October 31, 2019
Initial Investment of $10,000
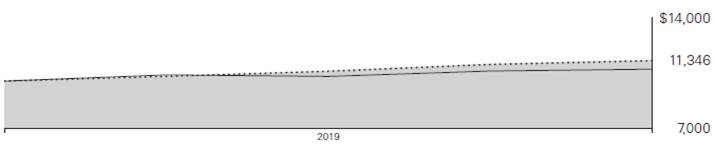
| | Total Returns | |
| | Period Ended October 31, 2019 | |
| | Since | Final Value |
| | Inception | of a $10,000 |
| | (11/15/2018) | Investment |

| Global Credit Bond Fund Investor Shares | 13.46% | $11,346 |

| Bloomberg Barclays Global Aggregate Credit Index (USD Hedged) | 12.84 | 11,284 |

| Bloomberg Barclays Global Aggregate Bond Index ex USD | 7.56 | 10,756 |
“Since Inception” performance is calculated from the Investor Shares’ inception date for both the fund and its comparative standard(s).
| | Since | Final Value |
| | Inception | of a $50,000 |
| | (11/15/2018) | Investment |
Global Credit Bond Fund Admiral Shares | 13.60% | $56,802 |
Bloomberg Barclays Global Aggregate Credit Index (USD Hedged) | 12.84 | 56,418 |
Bloomberg Barclays Global Aggregate Bond Index ex USD | 7.56 | 53,779 |
“Since Inception” performance is calculated from the Admiral Shares’ inception date for both the fund and its comparative standard(s).
See Financial Highlights for dividend and capital gains information.
8
Global Credit Bond Fund
Sector Diversification
As of October 31, 2019
Asset-Backed/Commercial Mortgage-Backed | 3.1% |
Finance | 26.7 |
Foreign | 17.5 |
Industrial | 42.7 |
Treasury | 1.7 |
Utilities | 8.0 |
Other | 0.3 |
The table reflects the fund’s market exposure. Any holdings in short-term reserves are excluded. The agency and mortgage-backed securities sectors may include issues from government-sponsored enterprises; such issues are generally not backed by the full faith and credit of the U.S. government.
9
Global Credit Bond Fund
Financial Statements
Statement of Net Assets
As of October 31, 2019
The fund files its complete schedule of portfolio holdings with the Securities and Exchange Commission (SEC) for the first and third quarters of each fiscal year as an exhibit to its reports on Form N-PORT. The fund’s Form N-PORT reports are available on the SEC’s website at www.sec.gov.
| | | | | Face | | Market | |
| | | | Maturity | Amount | | Value· | |
| | | Coupon | Date | ($000 | ) | ($000 | ) |
Argentina (0.0%) | | | | | | | |
Sovereign Bonds (0.0%) | | | | | | | |
| Argentine Republic | | 6.875% | 4/22/21 | 150 | | 67 | |
| Argentine Republic | | 6.875% | 1/26/27 | 20 | | 8 | |
Total Argentina (Cost $91) | | | | | | 75 | |
Australia (2.6%) | | | | | | | |
Corporate Bonds (2.6%) | | | | | | | |
1 | Aurizon Network Pty Ltd. | | 4.000% | 6/21/24 | 740 | | 545 | |
1,2 | Australia & New Zealand Banking Group Ltd. | | 4.750% | 5/13/27 | 1,000 | | 726 | |
3 | Commonwealth Bank of Australia | | 3.610% | 9/12/34 | 550 | | 556 | |
3 | Commonwealth Bank of Australia | | 3.743% | 9/12/39 | 500 | | 503 | |
1 | DBNGP Finance Co. Pty Ltd. | | 4.225% | 5/28/25 | 360 | | 274 | |
1,4 | Macquarie Group Ltd., 3M Australian Bank Bill Rate + 1.150% | | 2.185% | 12/15/22 | 600 | | 415 | |
1 | Macquarie Group Ltd. | | 3.250% | 12/15/22 | 400 | | 283 | |
1 | Qantas Airways Ltd. | | 4.400% | 10/10/23 | 510 | | 382 | |
1,4 | Victoria Power Networks Finance Pty Ltd., 3M Australian Bank Bill Rate + 0.280% | | 1.128% | 1/15/22 | 950 | | 644 | |
| Westpac Banking Corp. | | 3.300% | 2/26/24 | 870 | | 910 | |
| Westpac Banking Corp. | | 4.110% | 7/24/34 | 150 | | 158 | |
Total Australia (Cost $5,326) | | | | | | 5,396 | |
Belgium (0.6%) | | | | | | | |
Corporate Bonds (0.6%) | | | | | | | |
| Anheuser-Busch Cos. LLC / Anheuser-Busch InBev Worldwide Inc. | | 4.700% | 2/1/36 | 180 | | 207 | |
| Anheuser-Busch Cos. LLC / Anheuser-Busch InBev Worldwide Inc. | | 4.900% | 2/1/46 | 375 | | 447 | |
| Anheuser-Busch InBev Worldwide Inc. | | 4.375% | 4/15/38 | 280 | | 312 | |
| Anheuser-Busch InBev Worldwide Inc. | | 5.550% | 1/23/49 | 200 | | 259 | |
Total Belgium (Cost $1,065) | | | | | | 1,225 | |
Bermuda (0.6%) | | | | | | | |
Sovereign Bond (0.6%) | | | | | | | |
2 | Bermuda | | 4.750% | 2/15/29 | 1,150 | | 1,303 | |
Total Bermuda (Cost $1,153) | | | | | | 1,303 | |
10
Global Credit Bond Fund
| | | | | Face | | Market | |
| | | | Maturity | Amount | | Value· | |
| | | Coupon | Date | ($000 | ) | ($000 | ) |
Brazil (0.9%) | | | | | | | |
Corporate Bonds (0.7%) | | | | | | | |
3 | Braskem Netherlands Finance BV | | 5.875% | 1/31/50 | 700 | | 695 | |
| Vale Overseas Ltd. | | 6.250% | 8/10/26 | 504 | | 585 | |
5 | Vale SA | | 3.750% | 1/10/23 | 100 | | 121 | |
| | | | | | | 1,401 | |
Sovereign Bond (0.2%) | | | | | | | |
2 | Federative Republic of Brazil | | 4.500% | 5/30/29 | 530 | | 557 | |
Total Brazil (Cost $1,886) | | | | | | 1,958 | |
Canada (4.0%) | | | | | | | |
Corporate Bonds (2.4%) | | | | | | | |
3 | 1011778 BC ULC / New Red Finance Inc. | | 5.000% | 10/15/25 | 20 | | 21 | |
3 | 1011778 BC ULC / New Red Finance Inc. | | 3.875% | 1/15/28 | 40 | | 40 | |
3 | Alimentation Couche-Tard Inc. | | 3.550% | 7/26/27 | 300 | | 311 | |
3 | Alimentation Couche-Tard Inc. | | 4.500% | 7/26/47 | 150 | | 161 | |
3 | MEG Energy Corp. | | 6.500% | 1/15/25 | 10 | | 10 | |
| Nutrien Ltd. | | 3.375% | 3/15/25 | 100 | | 104 | |
| Nutrien Ltd. | | 4.125% | 3/15/35 | 70 | | 75 | |
| Nutrien Ltd. | | 4.900% | 6/1/43 | 40 | | 45 | |
| Royal Bank of Canada | | 2.550% | 7/16/24 | 1,250 | | 1,271 | |
6 | Toronto-Dominion Bank | | 2.850% | 3/8/24 | 2,225 | | 1,724 | |
| TransCanada PipeLines Ltd. | | 3.750% | 10/16/23 | 590 | | 624 | |
| TransCanada PipeLines Ltd. | | 4.625% | 3/1/34 | 205 | | 233 | |
| TransCanada PipeLines Ltd. | | 4.875% | 5/15/48 | 235 | | 271 | |
| | | | | | | 4,890 | |
Sovereign Bonds (1.6%) | | | | | | | |
6 | Canada | | 1.000% | 9/1/22 | 1,400 | | 1,049 | |
6 | Canada | | 5.750% | 6/1/33 | 250 | | 289 | |
6 | Canada | | 4.000% | 6/1/41 | 500 | | 545 | |
6 | Canada | | 2.750% | 12/1/48 | 300 | | 289 | |
3 | Ontario Teachers’ Cadillac Fairview Properties Trust | | 3.875% | 3/20/27 | 800 | | 865 | |
3 | Ontario Teachers’ Cadillac Fairview Properties Trust | | 4.125% | 2/1/29 | 350 | | 389 | |
| | | | | | | 3,426 | |
Total Canada (Cost $8,118) | | | | | | 8,316 | |
Chile (1.1%) | | | | | | | |
Sovereign Bonds (1.1%) | | | | | | | |
| Empresa Nacional del Petroleo | | 4.750% | 12/6/21 | 600 | | 625 | |
| Empresa Nacional del Petroleo | | 4.375% | 10/30/24 | 1,600 | | 1,684 | |
Total Chile (Cost $2,313) | | | | | | 2,309 | |
China (0.3%) | | | | | | | |
Corporate Bond (0.0%) | | | | | | | |
3 | Eagle Intermediate Global Holding BV / Ruyi US Finance LLC | | 7.500% | 5/1/25 | 50 | | 43 | |
| | | | | | | | |
Sovereign Bond (0.3%) | | | | | | | |
| Sinopec Group Overseas Development 2017 Ltd. | | 3.250% | 9/13/27 | 500 | | 515 | |
Total China (Cost $552) | | | | | | 558 | |
11
Global Credit Bond Fund
| | | | | Face | | Market | |
| | | | Maturity | Amount | | Value· | |
| | | Coupon | Date | ($000 | ) | ($000 | ) |
Colombia (0.3%) | | | | | | | |
Sovereign Bond (0.3%) | | | | | | | |
2 | Republic of Colombia | | 4.500% | 1/28/26 | 539 | | 588 | |
Total Colombia (Cost $567) | | | | | | 588 | |
Cote d’Ivoire (0.3%) | | | | | | | |
Sovereign Bond (0.3%) | | | | | | | |
5 | Republic of Cote d’Ivoire | | 5.875% | 10/17/31 | 580 | | 655 | |
Total Cote d’Ivoire (Cost $632) | | | | | | 655 | |
Croatia (0.1%) | | | | | | | |
Sovereign Bond (0.1%) | | | | | | | |
5 | Republic of Croatia | | 1.125% | 6/19/29 | 140 | | 164 | |
Total Croatia (Cost $160) | | | | | | 164 | |
El Salvador (0.2%) | | | | | | | |
Sovereign Bond (0.2%) | | | | | | | |
2,3 | Republic of El Salvador | | 7.125% | 1/20/50 | 375 | | 379 | |
Total El Salvador (Cost $375) | | | | | | 379 | |
France (2.9%) | | | | | | | |
Corporate Bonds (2.9%) | | | | | | | |
5 | Auchan Holding SA | | 2.375% | 4/25/25 | 1,100 | | 1,262 | |
5 | Engie SA | | 1.000% | 3/13/26 | 2,300 | | 2,711 | |
5 | Total Capital International SA | | 1.375% | 10/4/29 | 1,700 | | 2,094 | |
Total France (Cost $6,091) | | | | | | 6,067 | |
Germany (1.8%) | | | | | | | |
Corporate Bonds (1.4%) | | | | | | | |
7 | Aroundtown SA | | 3.250% | 7/18/27 | 800 | | 1,068 | |
5 | Aroundtown SA | | 1.625% | 1/31/28 | 400 | | 461 | |
5 | Aroundtown SA | | 1.450% | 7/9/28 | 400 | | 454 | |
1 | Volkswagen Financial Services Australia Pty Ltd. | | 3.100% | 4/17/23 | 500 | | 354 | |
3 | Volkswagen Group of America Finance LLC | | 2.700% | 9/26/22 | 650 | | 656 | |
| | | | | | | 2,993 | |
Sovereign Bond (0.4%) | | | | | | | |
5 | Federal Republic of Germany | | 4.750% | 7/4/40 | 325 | | 731 | |
Total Germany (Cost $3,678) | | | | | | 3,724 | |
Honduras (0.1%) | | | | | | | |
Sovereign Bond (0.1%) | | | | | | | |
| Republic of Honduras | | 6.250% | 1/19/27 | 150 | | 161 | |
Total Honduras (Cost $161) | | | | | | 161 | |
Hong Kong (0.2%) | | | | | | | |
Corporate Bond (0.2%) | | | | | | | |
3 | AIA Group Ltd. | | 3.600% | 4/9/29 | 467 | | 498 | |
Total Hong Kong (Cost $465) | | | | | | 498 | |
12
Global Credit Bond Fund
| | | | | Face | | Market | |
| | | | Maturity | Amount | | Value· | |
| | | Coupon | Date | ($000 | ) | ($000 | ) |
India (0.9%) | | | | | | | |
Sovereign Bonds (0.9%) | | | | | | | |
| Export-Import Bank of India | | 3.875% | 3/12/24 | 800 | | 838 | |
| NTPC Ltd. | | 3.750% | 4/3/24 | 1,075 | | 1,109 | |
Total India (Cost $1,937) | | | | | | 1,947 | |
Indonesia (1.0%) | | | | | | | |
Sovereign Bonds (1.0%) | | | | | | | |
3,5 | Perusahaan Listrik Negara PT | | 1.875% | 11/5/31 | 370 | | 410 | |
| Perusahaan Penerbit SBSN Indonesia III | | 4.350% | 9/10/24 | 450 | | 484 | |
| Republic of Indonesia | | 5.375% | 10/17/23 | 600 | | 663 | |
| Republic of Indonesia | | 5.875% | 1/15/24 | 450 | | 507 | |
Total Indonesia (Cost $1,976) | | | | | | 2,064 | |
Ireland (0.2%) | | | | | | | |
Asset-Backed/Commercial Mortgage-Backed Security (0.2%) | | | | | | | |
2,3 | Trafigura Securitisation Finance plc 2018-1A | | 3.730% | 3/15/22 | 425 | | 428 | |
Total Ireland (Cost $425) | | | | | | 428 | |
Israel (0.8%) | | | | | | | |
Sovereign Bond (0.8%) | | | | | | | |
5 | State of Israel | | 2.875% | 1/29/24 | 1,382 | | 1,733 | |
Total Israel (Cost $1,711) | | | | | | 1,733 | |
Italy (1.4%) | | | | | | | |
Corporate Bonds (0.7%) | | | | | | | |
3 | Intesa Sanpaolo SPA | | 3.250% | 9/23/24 | 500 | | 503 | |
3 | Intesa Sanpaolo SPA | | 4.000% | 9/23/29 | 1,000 | | 1,014 | |
| | | | | | | 1,517 | |
Sovereign Bond (0.7%) | | | | | | | |
3,5 | Republic of Italy | | 3.850% | 9/1/49 | 850 | | 1,338 | |
Total Italy (Cost $2,825) | | | | | | 2,855 | |
Japan (2.0%) | | | | | | | |
Corporate Bonds (1.5%) | | | | | | | |
| Sumitomo Mitsui Financial Group Inc. | | 3.748% | 7/19/23 | 1,940 | | 2,032 | |
3 | Takeda Pharmaceutical Co. Ltd. | | 4.400% | 11/26/23 | 250 | | 270 | |
3 | Takeda Pharmaceutical Co. Ltd. | | 5.000% | 11/26/28 | 700 | | 822 | |
| | | | | | | 3,124 | |
Sovereign Bonds (0.5%) | | | | | | | |
8 | Japan | | 0.100% | 6/20/24 | 65,000 | | 612 | |
8 | Japan | | 0.100% | 12/20/26 | 30,000 | | 285 | |
8 | Japan | | 0.100% | 6/20/29 | 10,000 | | 95 | |
8 | Japan | | 1.700% | 9/20/33 | 6,000 | | 68 | |
| | | | | | | 1,060 | |
Total Japan (Cost $4,081) | | | | | | 4,184 | |
Lithuania (0.2%) | | | | | | | |
Sovereign Bond (0.2%) | | | | | | | |
| Republic of Lithuania | | 6.625% | 2/1/22 | 400 | | 441 | |
Total Lithuania (Cost $426) | | | | | | 441 | |
13
Global Credit Bond Fund
| | | | | Face | | Market | |
| | | | Maturity | Amount | | Value· | |
| | | Coupon | Date | ($000 | ) | ($000 | ) |
Mexico (1.6%) | | | | | | | |
Corporate Bond (0.5%) | | | | | | | |
| Grupo Bimbo SAB de CV | | 4.500% | 1/25/22 | 1,000 | | 1,042 | |
| | | | | | | | |
Sovereign Bonds (1.1%) | | | | | | | |
| Petroleos Mexicanos | | 6.875% | 8/4/26 | 600 | | 658 | |
| Petroleos Mexicanos | | 6.750% | 9/21/47 | 950 | | 946 | |
3 | Petroleos Mexicanos | | 7.690% | 1/23/50 | 700 | | 763 | |
| | | | | | | 2,367 | |
Total Mexico (Cost $3,301) | | | | | | 3,409 | |
Netherlands (2.9%) | | | | | | | |
Corporate Bonds (2.9%) | | | | | | | |
3 | LeasePlan Corp. NV | | 2.875% | 10/24/24 | 1,025 | | 1,029 | |
7 | NIBC Bank NV | | 3.125% | 11/15/23 | 1,600 | | 2,143 | |
2,5 | NN Group NV | | 4.375% | 12/31/49 | 700 | | 859 | |
3 | NXP BV / NXP Funding LLC | | 4.125% | 6/1/21 | 400 | | 410 | |
3 | NXP BV / NXP Funding LLC | | 4.875% | 3/1/24 | 1,360 | | 1,474 | |
3 | OCI NV | | 5.250% | 11/1/24 | 20 | | 21 | |
3 | Trivium Packaging Finance BV | | 5.500% | 8/15/26 | 5 | | 5 | |
3 | Trivium Packaging Finance BV | | 8.500% | 8/15/27 | 5 | | 5 | |
Total Netherlands (Cost $5,766) | | | | | | 5,946 | |
New Zealand (0.0%) | | | | | | | |
Corporate Bond (0.0%) | | | | | | | |
3,4 | Reynolds Group Issuer Inc. / Reynolds Group | | | | | | | |
| Issuer LLC / Reynolds Group Issuer Lu, 3M | | | | | | | |
| USD LIBOR + 3.500% | | 5.501% | 7/15/21 | 50 | | 50 | |
Total New Zealand (Cost $50) | | | | | | 50 | |
Paraguay (0.5%) | | | | | | | |
Sovereign Bonds (0.5%) | | | | | | | |
| Republic of Paraguay | | 5.000% | 4/15/26 | 850 | | 939 | |
Total Paraguay (Cost $927) | | | | | | 939 | |
Peru (0.2%) | | | | | | | |
Sovereign Bond (0.2%) | | | | | | | |
| Corp. Financiera de Desarrollo SA | | 4.750% | 7/15/25 | 300 | | 329 | |
Total Peru (Cost $297) | | | | | | 329 | |
Romania (0.3%) | | | | | | | |
Sovereign Bonds (0.3%) | | | | | | | |
| Republic of Romania | | 4.375% | 8/22/23 | 200 | | 214 | |
3,5 | Republic of Romania | | 4.625% | 4/3/49 | 325 | | 472 | |
Total Romania (Cost $646) | | | | | | 686 | |
Russia (0.9%) | | | | | | | |
Sovereign Bonds (0.9%) | | | | | | | |
| Gazprom OAO Via Gaz Capital SA | | 6.510% | 3/7/22 | 400 | | 435 | |
| Russian Federation | | 4.750% | 5/27/26 | 600 | | 660 | |
| Russian Federation | | 5.100% | 3/28/35 | 600 | | 693 | |
Total Russia (Cost $1,667) | | | | | | 1,788 | |
14
Global Credit Bond Fund
| | | | | Face | | Market | |
| | | | Maturity | Amount | | Value· | |
| | | Coupon | Date | ($000 | ) | ($000 | ) |
Saudi Arabia (0.5%) | | | | | | | |
Sovereign Bonds (0.5%) | | | | | | | |
| Kingdom of Saudi Arabia | | 3.625% | 3/4/28 | 313 | | 329 | |
3 | KSA Sukuk Ltd. | | 2.969% | 10/29/29 | 600 | | 599 | |
Total Saudi Arabia (Cost $930) | | | | | | 928 | |
South Africa (1.4%) | | | | | | | |
Sovereign Bonds (1.4%) | | | | | | | |
| Republic of South Africa | | 5.875% | 9/16/25 | 300 | | 327 | |
9 | Republic of South Africa | | 10.500% | 12/21/26 | 21,500 | | 1,572 | |
| Republic of South Africa | | 4.850% | 9/27/27 | 300 | | 304 | |
| Republic of South Africa | | 4.850% | 9/30/29 | 620 | | 614 | |
Total South Africa (Cost $2,968) | | | | | | 2,817 | |
Spain (0.2%) | | | | | | | |
Corporate Bond (0.2%) | | | | | | | |
| Telefonica Emisiones SAU | | 4.895% | 3/6/48 | 375 | | 420 | |
Total Spain (Cost $408) | | | | | | 420 | |
Supranational (1.7%) | | | | | | | |
Sovereign Bonds (1.7%) | | | | | | | |
3 | Banque Ouest Africaine de Developpement | | 4.700% | 10/22/31 | 500 | | 509 | |
5,10 | European Financial Stability Facility | | 1.750% | 10/29/20 | 1,000 | | 1,140 | |
5,10 | European Financial Stability Facility | | 0.100% | 1/19/21 | 500 | | 561 | |
5,10 | European Financial Stability Facility | | 0.000% | 11/17/22 | 1,200 | | 1,356 | |
Total Supranational (Cost $3,594) | | | | | | 3,566 | |
Sweden (1.6%) | | | | | | | |
Corporate Bonds (1.6%) | | | | | | | |
5 | Samhallsbyggnadsbolaget i Norden AB | | 1.750% | 1/14/25 | 2,000 | | 2,303 | |
5 | Samhallsbyggnadsbolaget i Norden AB | | 1.125% | 9/4/26 | 300 | | 332 | |
| Svenska Handelsbanken AB | | 3.900% | 11/20/23 | 630 | | 673 | |
Total Sweden (Cost $3,261) | | | | | | 3,308 | |
Switzerland (2.5%) | | | | | | | |
Corporate Bonds (2.5%) | | | | | | | |
5 | Richemont International Holding SA | | 1.000% | 3/26/26 | 3,400 | | 3,985 | |
3 | UBS Group Funding Jersey Ltd. | | 2.650% | 2/1/22 | 400 | | 404 | |
3 | UBS Group Funding Switzerland AG | | 4.125% | 9/24/25 | 700 | | 760 | |
Total Switzerland (Cost $5,036) | | | | | | 5,149 | |
United Arab Emirates (0.7%) | | | | | | | |
Sovereign Bonds (0.7%) | | | | | | | |
3 | Emirate of Abu Dhabi | | 2.125% | 9/30/24 | 750 | | 746 | |
3 | Emirate of Abu Dhabi | | 3.125% | 9/30/49 | 800 | | 767 | |
Total United Arab Emirates (Cost $1,527) | | | | | | 1,513 | |
United Kingdom (8.8%) | | | | | | | |
Asset-Backed/Commercial Mortgage-Backed Securities (0.3%) | | | | | | | |
2,3,4 | DELAM 2018-1, 1M USD LIBOR + 0.700% | | 2.546% | 11/19/25 | 400 | | 400 | |
7 | Intu SGS Finance plc | | 4.250% | 9/17/30 | 240 | | 266 | |
| | | | | | | 666 | |
Corporate Bonds (7.7%) | | | | | | | |
| AstraZeneca plc | | 4.000% | 1/17/29 | 225 | | 252 | |
2 | Barclays plc | | 3.932% | 5/7/25 | 700 | | 730 | |
15
Global Credit Bond Fund
| | | | | Face | | Market | |
| | | | Maturity | Amount | | Value· | |
| | | Coupon | Date | ($000 | ) | ($000 | ) |
7 | BG Energy Capital plc | | 5.125% | 12/1/25 | 2,300 | | 3,645 | |
| BP Capital Markets plc | | 3.279% | 9/19/27 | 85 | | 90 | |
7 | BUPA Finance plc | | 5.000% | 12/8/26 | 800 | | 1,176 | |
7 | Centrica plc | | 4.375% | 3/13/29 | 470 | | 720 | |
3 | Connect Finco SARL / Connect US Finco LLC | | 6.750% | 10/1/26 | 15 | | 16 | |
7 | Hammerson plc | | 3.500% | 10/27/25 | 500 | | 656 | |
7 | Hammerson plc | | 7.250% | 4/21/28 | 200 | | 327 | |
2 | HSBC Holdings plc | | 3.803% | 3/11/25 | 1,100 | | 1,152 | |
2,11 | HSBC Holdings plc | | 2.633% | 11/7/25 | 540 | | 540 | |
5 | International Consolidated Airlines Group SA | | 1.500% | 7/4/27 | 700 | | 774 | |
7 | Motability Operations Group plc | | 4.375% | 2/8/27 | 750 | | 1,175 | |
7 | Motability Operations Group plc | | 3.625% | 3/10/36 | 760 | | 1,208 | |
| Reynolds American Inc. | | 4.450% | 6/12/25 | 665 | | 714 | |
2 | Royal Bank of Scotland Group plc | | 4.269% | 3/22/25 | 470 | | 498 | |
7 | Santander UK plc | | 3.875% | 10/15/29 | 500 | | 774 | |
2,7 | Society of Lloyd’s | | 4.875% | 2/7/47 | 700 | | 1,002 | |
| Unilever Capital Corp. | | 2.600% | 5/5/24 | 235 | | 241 | |
| Vodafone Group plc | | 4.125% | 5/30/25 | 400 | | 433 | |
| | | | | | | 16,123 | |
Sovereign Bonds (0.8%) | | | | | | | |
7 | United Kingdom of Great Britain and Northern Ireland | | 1.750% | 9/7/37 | 485 | | 703 | |
7 | United Kingdom of Great Britain and Northern Ireland | | 3.250% | 1/22/44 | 150 | | 282 | |
7 | United Kingdom of Great Britain and Northern Ireland | | 1.500% | 7/22/47 | 250 | | 353 | |
7 | United Kingdom of Great Britain and Northern Ireland | | 3.500% | 7/22/68 | 90 | | 227 | |
| | | | | | | 1,565 | |
Total United Kingdom (Cost $17,800) | | | | | | 18,354 | |
United States (52.7%) | | | | | | | |
Asset-Backed/Commercial Mortgage-Backed Securities (2.6%) | | | | | | |
2 | AmeriCredit Automobile Receivables Trust 2019-1 | | 3.620% | 3/18/25 | 200 | | 207 | |
2 | BANK 2018 - BN15 | | 4.407% | 11/15/61 | 215 | | 248 | |
2 | BANK 2019 - BN17 | | 3.714% | 4/15/52 | 10 | | 11 | |
2 | CD 2017-CD6 Commercial Mortgage Trust | | 3.456% | 11/13/50 | 250 | | 268 | |
2 | Citigroup Commercial Mortgage Trust 2018-C6 | | 4.343% | 11/10/51 | 320 | | 359 | |
2 | COMM 2013-CCRE13 Mortgage Trust | | 4.890% | 11/10/46 | 135 | | 144 | |
2 | COMM 2014-CCRE14 Mortgage Trust | | 4.236% | 2/10/47 | 75 | | 81 | |
2 | COMM 2015-CCRE27 Mortgage Trust | | 4.471% | 10/10/48 | 135 | | 144 | |
2 | CSAIL 2016-C7 Commercial Mortgage Trust | | 3.502% | 11/15/49 | 10 | | 11 | |
2 | CSAIL 2019-C15 Commercial Mortgage Trust | | 4.053% | 3/15/52 | 10 | | 11 | |
2 | Drive Auto Receivables Trust 2018-5 | | 4.300% | 4/15/26 | 300 | | 311 | |
2,3 | EDvestinU Private Education Loan Trust (EDVES) 2019-A | | 3.580% | 11/25/38 | 93 | | 96 | |
2,3,4,12 | Fannie Mae Connecticut Avenue Securities 2019-R03, 1M USD LIBOR + 0.750% | | 2.573% | 9/25/31 | 230 | | 230 | |
2,3 | Ford Credit Auto Owner Trust 2017-2 | | 2.360% | 3/15/29 | 150 | | 151 | |
2,3,12 | Freddie Mac Structured Agency Credit Risk Debt Notes 2018-SPI1 | | 3.740% | 2/25/48 | 127 | | 127 | |
16
Global Credit Bond Fund
| | | | | Face | | Market | |
| | | | Maturity | Amount | | Value· | |
| | | Coupon | Date | ($000 | ) | ($000 | ) |
2,3,12 | Freddie Mac Structured Agency Credit Risk Debt Notes 2018-SPI4 | | 4.458% | 11/25/48 | 90 | | 90 | |
2,3 | GMF Floorplan Owner Revolving Trust 2018-2 | | 3.130% | 3/15/23 | 300 | | 305 | |
2,3 | Hardee’s Funding HNGRY 2018-1 | | 4.959% | 6/20/48 | 198 | | 202 | |
2,3 | Houston Galleria Mall Trust 2015-HGLR | | 3.087% | 3/5/37 | 203 | | 211 | |
2 | JPMBB Commercial Mortgage Securities Trust 2014-C19 | | 3.997% | 4/15/47 | 75 | | 81 | |
2 | JPMBB Commercial Mortgage Securities Trust 2014-C24 | | 3.639% | 11/15/47 | 14 | | 15 | |
2 | Morgan Stanley Capital I Trust 2016-UB11 | | 2.782% | 8/15/49 | 125 | | 128 | |
2,3 | Navient Student Loan Trust 2018-BA | | 3.610% | 12/15/59 | 700 | | 725 | |
2,3 | Progress Residential 2017-SFR1 Trust | | 2.768% | 8/17/34 | 279 | | 280 | |
2,3 | Stack Infrastructure Issuer LLC 2019-1A | | 4.540% | 2/25/44 | 25 | | 26 | |
2,3 | Tesla Auto Lease Trust 2018-B | | 4.120% | 10/20/21 | 100 | | 102 | |
2,3 | Tesla Auto Lease Trust 2018-B | | 4.360% | 10/20/21 | 100 | | 102 | |
2,3 | Textainer Marine Containers Limited 2019-A | | 3.960% | 4/20/44 | 163 | | 166 | |
2 | UBS Commercial Mortgage Trust 2019-C16 | | 3.460% | 4/15/52 | 30 | | 32 | |
2 | Wells Fargo Commercial Mortgage Trust 2015-C26 | | 3.166% | 2/15/48 | 100 | | 105 | |
2 | Wells Fargo Commercial Mortgage Trust 2015-C30 | | 3.664% | 9/15/58 | 260 | | 280 | |
2 | Wells Fargo Commercial Mortgage Trust 2018-C48 | | 4.245% | 1/15/52 | 20 | | 22 | |
2 | Wells Fargo Commercial Mortgage Trust 2019-C49 | | 4.023% | 3/15/52 | 10 | | 11 | |
2 | Wells Fargo Commercial Mortgage Trust 2019-C50 | | 3.635% | 5/15/52 | 50 | | 54 | |
| | | | | | | 5,336 | |
Corporate Bonds (48.1%) | | | | | | | |
| AbbVie Inc. | | 3.600% | 5/14/25 | 1,150 | | 1,205 | |
| AbbVie Inc. | | 4.875% | 11/14/48 | 285 | | 314 | |
| AEP Transmission Co. LLC | | 4.250% | 9/15/48 | 200 | | 232 | |
| Aflac Inc. | | 3.250% | 3/17/25 | 410 | | 431 | |
| Alexandria Real Estate Equities Inc. | | 4.000% | 2/1/50 | 325 | | 354 | |
| Allina Health System | | 3.887% | 4/15/49 | 175 | | 196 | |
3 | Allison Transmission Inc. | | 4.750% | 10/1/27 | 30 | | 31 | |
| Altria Group Inc. | | 4.400% | 2/14/26 | 494 | | 533 | |
| Altria Group Inc. | | 4.800% | 2/14/29 | 440 | | 483 | |
| Altria Group Inc. | | 5.375% | 1/31/44 | 55 | | 62 | |
| Altria Group Inc. | | 5.950% | 2/14/49 | 25 | | 29 | |
3 | American Builders & Contractors Supply Co. Inc. | | 4.000% | 1/15/28 | 25 | | 25 | |
| Anheuser-Busch InBev Worldwide Inc. | | 3.750% | 7/15/42 | 100 | | 103 | |
| Appalachian Power Co. | | 4.500% | 3/1/49 | 100 | | 119 | |
| Apple Inc. | | 3.350% | 2/9/27 | 500 | | 536 | |
| Apple Inc. | | 3.850% | 8/4/46 | 771 | | 865 | |
| Aramark Services Inc. | | 4.750% | 6/1/26 | 60 | | 62 | |
| Arizona Public Service Co. | | 2.600% | 8/15/29 | 120 | | 121 | |
| AT&T Inc. | | 3.400% | 5/15/25 | 691 | | 724 | |
| AT&T Inc. | | 4.300% | 12/15/42 | 90 | | 94 | |
| AT&T Inc. | | 4.750% | 5/15/46 | 135 | | 149 | |
| AT&T Inc. | | 5.150% | 11/15/46 | 140 | | 163 | |
| AT&T Inc. | | 4.500% | 3/9/48 | 55 | | 59 | |
17
Global Credit Bond Fund
| | | | | Face | | Market | |
| | | | Maturity | Amount | | Value· | |
| | | Coupon | Date | ($000 | ) | ($000 | ) |
| AT&T Inc. | | 4.550% | 3/9/49 | 150 | | 161 | |
| Ball Corp. | | 4.875% | 3/15/26 | 10 | | 11 | |
2 | Bank of America Corp. | | 3.366% | 1/23/26 | 962 | | 1,007 | |
2 | Bank of America Corp. | | 3.824% | 1/20/28 | 509 | | 549 | |
2 | Bank of America Corp. | | 3.974% | 2/7/30 | 660 | | 723 | |
3 | Bausch Health Americas Inc. | | 9.250% | 4/1/26 | 5 | | 6 | |
3 | Bausch Health Cos. Inc. | | 5.750% | 8/15/27 | 10 | | 11 | |
3 | Bausch Health Cos. Inc. | | 7.000% | 1/15/28 | 40 | | 43 | |
| BB&T Corp. | | 2.500% | 8/1/24 | 700 | | 709 | |
5 | Berkshire Hathaway Inc. | | 1.125% | 3/16/27 | 1,300 | | 1,538 | |
3 | Berry Global Inc. | | 4.500% | 2/15/26 | 20 | | 20 | |
3 | Berry Global Inc. | | 4.875% | 7/15/26 | 20 | | 21 | |
| BlackRock Inc. | | 3.200% | 3/15/27 | 400 | | 425 | |
| BlackRock Inc. | | 3.250% | 4/30/29 | 758 | | 814 | |
| Boeing Co. | | 3.500% | 3/1/39 | 425 | | 434 | |
| BP Capital Markets America Inc. | | 3.796% | 9/21/25 | 335 | | 363 | |
| BP Capital Markets America Inc. | | 3.410% | 2/11/26 | 200 | | 212 | |
| BP Capital Markets America Inc. | | 3.017% | 1/16/27 | 220 | | 228 | |
| BP Capital Markets America Inc. | | 3.588% | 4/14/27 | 250 | | 269 | |
3 | Bristol-Myers Squibb Co. | | 3.200% | 6/15/26 | 590 | | 624 | |
3 | Bristol-Myers Squibb Co. | | 3.400% | 7/26/29 | 300 | | 323 | |
| Broadcom Corp. / Broadcom Cayman Finance Ltd. | | 3.625% | 1/15/24 | 300 | | 309 | |
3 | Broadcom Inc. | | 4.250% | 4/15/26 | 150 | | 157 | |
| Buckeye Partners LP | | 3.950% | 12/1/26 | 10 | | 9 | |
| Burlington Northern Santa Fe LLC | | 3.550% | 2/15/50 | 580 | | 618 | |
| Camden Property Trust | | 3.350% | 11/1/49 | 355 | | 359 | |
| CBS Corp. | | 2.900% | 1/15/27 | 550 | | 550 | |
3 | CCO Holdings LLC / CCO Holdings Capital Corp. | | 4.750% | 3/1/30 | 40 | | 41 | |
3 | CDK Global Inc. | | 5.250% | 5/15/29 | 20 | | 21 | |
| CDW LLC / CDW Finance Corp. | | 4.250% | 4/1/28 | 20 | | 21 | |
| Celgene Corp. | | 4.550% | 2/20/48 | 169 | | 206 | |
| CenterPoint Energy Houston Electric LLC | | 3.000% | 2/1/27 | 1,000 | | 1,029 | |
3 | CFX Escrow Corp. | | 6.375% | 2/15/26 | 15 | | 16 | |
| Charles Schwab Corp. | | 3.850% | 5/21/25 | 810 | | 876 | |
| Charter Communications Operating LLC / Charter Communications Operating Capital | | 4.500% | 2/1/24 | 850 | | 914 | |
| Charter Communications Operating LLC / Charter Communications Operating Capital | | 5.125% | 7/1/49 | 400 | | 425 | |
| Cheniere Corpus Christi Holdings LLC | | 5.875% | 3/31/25 | 300 | | 333 | |
| Cheniere Corpus Christi Holdings LLC | | 5.125% | 6/30/27 | 120 | | 130 | |
3 | Churchill Downs Inc. | | 5.500% | 4/1/27 | 40 | | 42 | |
3 | Churchill Downs Inc. | | 4.750% | 1/15/28 | 20 | | 21 | |
| Cigna Corp. | | 4.800% | 8/15/38 | 255 | | 291 | |
| Cimarex Energy Co. | | 3.900% | 5/15/27 | 25 | | 25 | |
| Cimarex Energy Co. | | 4.375% | 3/15/29 | 45 | | 47 | |
| Citigroup Inc. | | 3.200% | 10/21/26 | 321 | | 333 | |
2 | Citigroup Inc. | | 3.668% | 7/24/28 | 514 | | 546 | |
3 | Clean Harbors Inc. | | 4.875% | 7/15/27 | 15 | | 16 | |
3 | Clean Harbors Inc. | | 5.125% | 7/15/29 | 15 | | 16 | |
| Comcast Corp. | | 4.400% | 8/15/35 | 325 | | 376 | |
| Comcast Corp. | | 3.250% | 11/1/39 | 275 | | 281 | |
| Comcast Corp. | | 4.700% | 10/15/48 | 899 | | 1,105 | |
18
Global Credit Bond Fund
| | | | | Face | | Market | |
| | | | Maturity | Amount | | Value· | |
| | | Coupon | Date | ($000 | ) | ($000 | ) |
| CommonSpirit Health | | 2.760% | 10/1/24 | 100 | | 101 | |
| Commonwealth Edison Co. | | 3.800% | 10/1/42 | 165 | | 181 | |
| Commonwealth Edison Co. | | 3.750% | 8/15/47 | 130 | | 143 | |
3 | CommScope Finance LLC | | 5.500% | 3/1/24 | 6 | | 6 | |
3 | CommScope Finance LLC | | 8.250% | 3/1/27 | 10 | | 9 | |
| Concho Resources Inc. | | 4.850% | 8/15/48 | 150 | | 168 | |
| Connecticut Light & Power Co. | | 3.200% | 3/15/27 | 800 | | 846 | |
| ConocoPhillips Co. | | 4.300% | 11/15/44 | 100 | | 116 | |
| Constellation Brands Inc. | | 3.150% | 8/1/29 | 125 | | 127 | |
| Crown Castle International Corp. | | 3.700% | 6/15/26 | 1,799 | | 1,906 | |
3 | CSC Holdings LLC | | 5.375% | 2/1/28 | 40 | | 42 | |
3 | CSC Holdings LLC | | 5.750% | 1/15/30 | 25 | | 26 | |
| CSX Corp. | | 4.750% | 11/15/48 | 240 | | 291 | |
| CVS Health Corp. | | 2.750% | 12/1/22 | 750 | | 766 | |
| CVS Health Corp. | | 3.700% | 3/9/23 | 365 | | 380 | |
| CVS Health Corp. | | 3.000% | 8/15/26 | 600 | | 609 | |
| CVS Health Corp. | | 4.300% | 3/25/28 | 128 | | 139 | |
| CVS Health Corp. | | 3.250% | 8/15/29 | 40 | | 40 | |
| CVS Health Corp. | | 4.780% | 3/25/38 | 90 | | 99 | |
| CVS Health Corp. | | 5.050% | 3/25/48 | 179 | | 205 | |
| DaVita Inc. | | 5.125% | 7/15/24 | 25 | | 25 | |
| Delta Air Lines Inc. | | 2.900% | 10/28/24 | 300 | | 299 | |
| Devon Energy Corp. | | 5.850% | 12/15/25 | 250 | | 297 | |
| Devon Energy Corp. | | 5.000% | 6/15/45 | 240 | | 274 | |
3 | Diamond Sports Group LLC / Diamond Sports Finance Co. | | 6.625% | 8/15/27 | 30 | | 31 | |
| Diamondback Energy Inc. | | 4.750% | 11/1/24 | 71 | | 73 | |
| Discovery Communications LLC | | 5.300% | 5/15/49 | 325 | | 363 | |
| Dominion Energy Inc. | | 4.050% | 9/15/42 | 200 | | 213 | |
3 | Dow Chemical Co. | | 3.625% | 5/15/26 | 160 | | 168 | |
| Dow Chemical Co. | | 4.375% | 11/15/42 | 110 | | 115 | |
| DTE Energy Co. | | 2.600% | 6/15/22 | 880 | | 888 | |
| DTE Energy Co. | | 3.800% | 3/15/27 | 95 | | 101 | |
| DTE Energy Co. | | 3.400% | 6/15/29 | 215 | | 223 | |
| Duke Energy Carolinas LLC | | 2.450% | 8/15/29 | 160 | | 161 | |
| Duke Energy Carolinas LLC | | 4.250% | 12/15/41 | 130 | | 150 | |
| Duke Energy Corp. | | 3.400% | 6/15/29 | 700 | | 732 | |
| Duke Energy Florida LLC | | 3.400% | 10/1/46 | 65 | | 67 | |
| Duke Energy Progress LLC | | 4.100% | 5/15/42 | 130 | | 148 | |
| DuPont de Nemours Inc. | | 5.319% | 11/15/38 | 180 | | 215 | |
| Eastman Chemical Co. | | 4.500% | 12/1/28 | 80 | | 89 | |
| Eastman Chemical Co. | | 4.650% | 10/15/44 | 30 | | 32 | |
5 | Eli Lilly & Co. | | 0.625% | 11/1/31 | 790 | | 882 | |
| Encompass Health Corp. | | 4.500% | 2/1/28 | 13 | | 13 | |
| Encompass Health Corp. | | 4.750% | 2/1/30 | 10 | | 10 | |
| Energy Transfer Operating LP | | 5.500% | 6/1/27 | 147 | | 165 | |
| Energy Transfer Operating LP | | 6.250% | 4/15/49 | 270 | | 323 | |
| Energy Transfer Partners LP | | 4.950% | 6/15/28 | 200 | | 218 | |
| Energy Transfer Partners LP | | 5.800% | 6/15/38 | 125 | | 142 | |
| Enstar Group Ltd. | | 4.950% | 6/1/29 | 375 | | 397 | |
| Entergy Louisiana LLC | | 3.250% | 4/1/28 | 300 | | 316 | |
| Entergy Louisiana LLC | | 4.200% | 9/1/48 | 170 | | 197 | |
| Entergy Texas Inc. | | 3.550% | 9/30/49 | 135 | | 140 | |
| Enterprise Products Operating LLC | | 4.050% | 2/15/22 | 985 | | 1,028 | |
19
Global Credit Bond Fund
| | | | | Face | | Market | |
| | | | Maturity | Amount | | Value· | |
| | | Coupon | Date | ($000 | ) | ($000 | ) |
| Enterprise Products Operating LLC | | 3.125% | 7/31/29 | 205 | | 210 | |
| Enterprise Products Operating LLC | | 5.950% | 2/1/41 | 160 | | 205 | |
| Enterprise Products Operating LLC | | 4.250% | 2/15/48 | 75 | | 80 | |
| Enterprise Products Operating LLC | | 4.800% | 2/1/49 | 75 | | 86 | |
| EQT Corp. | | 3.900% | 10/1/27 | 40 | | 35 | |
| Equinix Inc. | | 5.375% | 5/15/27 | 15 | | 16 | |
| ERP Operating LP | | 2.500% | 2/15/30 | 730 | | 723 | |
| Evergy Inc. | | 2.900% | 9/15/29 | 400 | | 402 | |
| Exelon Corp. | | 4.450% | 4/15/46 | 175 | | 198 | |
| FedEx Corp. | | 3.100% | 8/5/29 | 390 | | 389 | |
3 | FirstEnergy Transmission LLC | | 4.350% | 1/15/25 | 1,000 | | 1,074 | |
| Fiserv Inc. | | 2.750% | 7/1/24 | 350 | | 357 | |
| Fiserv Inc. | | 3.200% | 7/1/26 | 400 | | 418 | |
| Fiserv Inc. | | 3.500% | 7/1/29 | 190 | | 200 | |
| Florida Power & Light Co. | | 3.700% | 12/1/47 | 320 | | 351 | |
| FMC Corp. | | 3.200% | 10/1/26 | 125 | | 128 | |
| FMC Corp. | | 4.500% | 10/1/49 | 45 | | 48 | |
3 | Fox Corp. | | 5.576% | 1/25/49 | 200 | | 253 | |
| General Mills Inc. | | 4.700% | 4/17/48 | 75 | | 88 | |
| General Motors Co. | | 5.200% | 4/1/45 | 100 | | 98 | |
| General Motors Financial Co. Inc. | | 3.150% | 6/30/22 | 400 | | 406 | |
| General Motors Financial Co. Inc. | | 3.500% | 11/7/24 | 700 | | 712 | |
| General Motors Financial Co. Inc. | | 4.350% | 1/17/27 | 108 | | 111 | |
| Gilead Sciences Inc. | | 3.650% | 3/1/26 | 1,000 | | 1,076 | |
| Goldman Sachs Group Inc. | | 3.750% | 5/22/25 | 1,139 | | 1,208 | |
2 | Goldman Sachs Group Inc. | | 4.411% | 4/23/39 | 86 | | 97 | |
1,4 | Goldman Sachs Group Inc., 3M Australian Bank Bill Rate + 1.550% | | 2.560% | 5/2/24 | 300 | | 209 | |
| Goodyear Tire & Rubber Co. | | 4.875% | 3/15/27 | 10 | | 10 | |
| Hartford Financial Services Group Inc. | | 2.800% | 8/19/29 | 1,115 | | 1,122 | |
| HCA Inc. | | 5.375% | 2/1/25 | 5 | | 5 | |
| HCA Inc. | | 5.250% | 6/15/26 | 175 | | 196 | |
| HCA Inc. | | 5.375% | 9/1/26 | 45 | | 49 | |
| HCA Inc. | | 5.250% | 6/15/49 | 150 | | 166 | |
| Healthpeak Properties Inc. | | 3.250% | 7/15/26 | 195 | | 203 | |
| Healthpeak Properties Inc. | | 3.500% | 7/15/29 | 630 | | 665 | |
3 | Hill-Rom Holdings Inc. | | 4.375% | 9/15/27 | 15 | | 15 | |
| Hilton Domestic Operating Co. Inc. | | 5.125% | 5/1/26 | 20 | | 21 | |
| Home Depot Inc. | | 3.900% | 12/6/28 | 96 | | 109 | |
| Home Depot Inc. | | 2.950% | 6/15/29 | 50 | | 53 | |
| Home Depot Inc. | | 3.900% | 6/15/47 | 200 | | 230 | |
13 | Illinois Tool Works Inc. | | 2.650% | 11/15/26 | 1,150 | | 1,192 | |
| Intel Corp. | | 3.700% | 7/29/25 | 400 | | 434 | |
| Intel Corp. | | 3.734% | 12/8/47 | 328 | | 366 | |
14 | International Business Machines Corp. | | 3.300% | 5/15/26 | 820 | | 867 | |
| JB Hunt Transport Services Inc. | | 3.875% | 3/1/26 | 285 | | 305 | |
| Johnson Controls International plc | | 5.125% | 9/14/45 | 28 | | 33 | |
| JPMorgan Chase & Co. | | 2.295% | 8/15/21 | 290 | | 290 | |
2 | JPMorgan Chase & Co. | | 3.540% | 5/1/28 | 1,368 | | 1,454 | |
2 | JPMorgan Chase & Co. | | 3.509% | 1/23/29 | 30 | | 32 | |
2 | JPMorgan Chase & Co. | | 2.739% | 10/15/30 | 625 | | 623 | |
| Kaiser Foundation Hospitals | | 3.150% | 5/1/27 | 647 | | 685 | |
| Kinder Morgan Energy Partners LP | | 5.000% | 10/1/21 | 500 | | 522 | |
| Kinder Morgan Energy Partners LP | | 5.800% | 3/15/35 | 260 | | 302 | |
| Kinder Morgan Inc. | | 5.550% | 6/1/45 | 25 | | 29 | |
20
Global Credit Bond Fund
| | | | | Face | | Market | |
| | | | Maturity | Amount | | Value· | |
| | | Coupon | Date | ($000 | ) | ($000 | ) |
3 | Kraft Heinz Foods Co. | | 3.750% | 4/1/30 | 37 | | 38 | |
| Kroger Co. | | 2.650% | 10/15/26 | 265 | | 264 | |
| Kroger Co. | | 3.700% | 8/1/27 | 125 | | 133 | |
| Lam Research Corp. | | 3.750% | 3/15/26 | 200 | | 216 | |
| Lennar Corp. | | 4.500% | 11/15/19 | 40 | | 40 | |
| Lennar Corp. | | 5.250% | 6/1/26 | 40 | | 44 | |
3 | Level 3 Financing Inc. | | 4.625% | 9/15/27 | 60 | | 61 | |
| Lincoln National Corp. | | 4.350% | 3/1/48 | 200 | | 220 | |
3 | Live Nation Entertainment Inc. | | 5.625% | 3/15/26 | 10 | | 11 | |
3 | Live Nation Entertainment Inc. | | 4.750% | 10/15/27 | 45 | | 47 | |
| Lockheed Martin Corp. | | 3.800% | 3/1/45 | 565 | | 623 | |
| Lowe’s Cos. Inc. | | 3.100% | 5/3/27 | 355 | | 369 | |
| Lowe’s Cos. Inc. | | 4.050% | 5/3/47 | 100 | | 107 | |
| Marathon Oil Corp. | | 4.400% | 7/15/27 | 40 | | 43 | |
| Marathon Oil Corp. | | 5.200% | 6/1/45 | 20 | | 22 | |
| Marathon Petroleum Corp. | | 3.800% | 4/1/28 | 100 | | 105 | |
| Marathon Petroleum Corp. | | 4.750% | 9/15/44 | 40 | | 44 | |
| Mastercard Inc. | | 3.650% | 6/1/49 | 345 | | 388 | |
| McDonald’s Corp. | | 2.625% | 9/1/29 | 625 | | 625 | |
| McDonald’s Corp. | | 3.625% | 9/1/49 | 100 | | 101 | |
5 | McKesson Corp. | | 1.625% | 10/30/26 | 1,000 | | 1,173 | |
5 | Medtronic Global Holdings SCA | | 1.500% | 7/2/39 | 580 | | 670 | |
| Merck & Co. Inc. | | 3.400% | 3/7/29 | 310 | | 337 | |
| MGM Growth Properties Operating Partnership LP / MGP Finance Co-Issuer Inc. | | 4.500% | 9/1/26 | 45 | | 48 | |
| MGM Resorts International | | 4.625% | 9/1/26 | 35 | | 37 | |
3 | Mid-Atlantic Interstate Transmission LLC | | 4.100% | 5/15/28 | 644 | | 706 | |
2 | Morgan Stanley | | 2.720% | 7/22/25 | 500 | | 506 | |
2 | Morgan Stanley | | 3.591% | 7/22/28 | 275 | | 291 | |
| MPLX LP | | 4.000% | 3/15/28 | 140 | | 146 | |
| MPLX LP | | 4.500% | 4/15/38 | 145 | | 147 | |
| MPLX LP | | 4.700% | 4/15/48 | 70 | | 71 | |
3 | Mueller Water Products Inc. | | 5.500% | 6/15/26 | 25 | | 26 | |
5 | Mylan NV | | 3.125% | 11/22/28 | 750 | | 948 | |
3 | National CineMedia LLC | | 5.875% | 4/15/28 | 20 | | 21 | |
| National Rural Utilities Cooperative Finance Corp. | | 4.300% | 3/15/49 | 250 | | 297 | |
3 | Nestle Holdings Inc. | | 4.000% | 9/24/48 | 600 | | 700 | |
| Netflix Inc. | | 4.375% | 11/15/26 | 15 | | 15 | |
| Newmont Goldcorp Corp. | | 2.800% | 10/1/29 | 380 | | 375 | |
3 | Nexstar Escrow Inc. | | 5.625% | 7/15/27 | 10 | | 11 | |
| NextEra Energy Capital Holdings Inc. | | 3.550% | 5/1/27 | 500 | | 530 | |
| Noble Energy Inc. | | 3.850% | 1/15/28 | 100 | | 104 | |
| Noble Energy Inc. | | 4.200% | 10/15/49 | 40 | | 39 | |
| Norfolk Southern Corp. | | 4.100% | 5/15/49 | 75 | | 85 | |
| Northrop Grumman Corp. | | 4.030% | 10/15/47 | 85 | | 95 | |
| NRG Energy Inc. | | 7.250% | 5/15/26 | 10 | | 11 | |
| Occidental Petroleum Corp. | | 2.700% | 8/15/22 | 2,185 | | 2,207 | |
| Occidental Petroleum Corp. | | 2.900% | 8/15/24 | 235 | | 237 | |
| Occidental Petroleum Corp. | | 5.550% | 3/15/26 | 180 | | 204 | |
| Occidental Petroleum Corp. | | 6.450% | 9/15/36 | 25 | | 31 | |
| Occidental Petroleum Corp. | | 4.500% | 7/15/44 | 60 | | 61 | |
| Omega Healthcare Investors Inc. | | 5.250% | 1/15/26 | 946 | | 1,050 | |
| Omnicom Group Inc. / Omnicom Capital Inc. | | 3.600% | 4/15/26 | 320 | | 338 | |
| Oncor Electric Delivery Co. LLC | | 2.950% | 4/1/25 | 445 | | 458 | |
21
Global Credit Bond Fund
| | | | | Face | | Market | |
| | | | Maturity | Amount | | Value· | |
| | | Coupon | Date | ($000 | ) | ($000 | ) |
| Oncor Electric Delivery Co. LLC | | 3.800% | 9/30/47 | 170 | | 190 | |
| ONEOK Inc. | | 4.450% | 9/1/49 | 135 | | 134 | |
| PacifiCorp | | 4.150% | 2/15/50 | 200 | | 229 | |
3 | Panther BF Aggregator 2 LP / Panther Finance Co. Inc. | | 8.500% | 5/15/27 | 25 | | 25 | |
3 | Parsley Energy LLC / Parsley Finance Corp. | | 6.250% | 6/1/24 | 10 | | 10 | |
3 | Parsley Energy LLC / Parsley Finance Corp. | | 5.625% | 10/15/27 | 25 | | 26 | |
| PayPal Holdings Inc. | | 2.400% | 10/1/24 | 400 | | 401 | |
| PECO Energy Co. | | 4.150% | 10/1/44 | 130 | | 150 | |
3 | Performance Food Group Inc. | | 5.500% | 6/1/24 | 35 | | 36 | |
3 | Performance Food Group Inc. | | 5.500% | 10/15/27 | 30 | | 32 | |
| Pfizer Inc. | | 3.600% | 9/15/28 | 285 | | 314 | |
| Phillips 66 Partners LP | | 3.150% | 12/15/29 | 45 | | 44 | |
| Plains All American Pipeline LP / PAA Finance Corp. | | 4.500% | 12/15/26 | 160 | | 169 | |
| PNC Financial Services Group Inc. | | 3.150% | 5/19/27 | 78 | | 82 | |
3 | Post Holdings Inc. | | 5.750% | 3/1/27 | 10 | | 11 | |
5 | Praxair Inc. | | 1.200% | 2/12/24 | 4,000 | | 4,691 | |
| Precision Castparts Corp. | | 2.500% | 1/15/23 | 550 | | 560 | |
| Precision Castparts Corp. | | 3.250% | 6/15/25 | 180 | | 191 | |
| Principal Financial Group Inc. | | 3.700% | 5/15/29 | 105 | | 114 | |
| Public Service Co. of Colorado | | 3.200% | 3/1/50 | 135 | | 137 | |
| Public Service Electric & Gas Co. | | 3.200% | 8/1/49 | 100 | | 103 | |
| PulteGroup Inc. | | 5.500% | 3/1/26 | 25 | | 28 | |
3 | Qorvo Inc. | | 4.375% | 10/15/29 | 50 | | 50 | |
| QUALCOMM Inc. | | 3.450% | 5/20/25 | 600 | | 634 | |
3 | Resideo Funding Inc. | | 6.125% | 11/1/26 | 45 | | 45 | |
| Rockwell Collins Inc. | | 3.500% | 3/15/27 | 525 | | 564 | |
| Sabine Pass Liquefaction LLC | | 5.875% | 6/30/26 | 220 | | 252 | |
| Sabra Health Care LP | | 3.900% | 10/15/29 | 737 | | 735 | |
| Sherwin-Williams Co. | | 2.950% | 8/15/29 | 135 | | 136 | |
| Simon Property Group LP | | 3.250% | 9/13/49 | 410 | | 403 | |
3 | Sirius XM Radio Inc. | | 4.625% | 7/15/24 | 10 | | 10 | |
3 | Sirius XM Radio Inc. | | 5.000% | 8/1/27 | 10 | | 10 | |
| SM Energy Co. | | 6.125% | 11/15/22 | 16 | | 15 | |
| Southern California Edison Co. | | 4.000% | 4/1/47 | 70 | | 73 | |
| Southern California Edison Co. | | 4.875% | 3/1/49 | 20 | | 24 | |
| Sprint Corp. | | 7.125% | 6/15/24 | 10 | | 11 | |
| Sprint Corp. | | 7.625% | 2/15/25 | 10 | | 11 | |
3 | SS&C Technologies Inc. | | 5.500% | 9/30/27 | 15 | | 16 | |
| T-Mobile USA Inc. | | 4.750% | 2/1/28 | 30 | | 32 | |
3 | Targa Resources Partners LP / Targa Resources Partners Finance Corp. | | 6.500% | 7/15/27 | 40 | | 43 | |
3 | Tenet Healthcare Corp. | | 4.625% | 9/1/24 | 5 | | 5 | |
3 | Tenet Healthcare Corp. | | 4.875% | 1/1/26 | 30 | | 31 | |
3 | Tenet Healthcare Corp. | | 6.250% | 2/1/27 | 12 | | 13 | |
3 | Tenet Healthcare Corp. | | 5.125% | 11/1/27 | 5 | | 5 | |
| Thermo Fisher Scientific Inc. | | 2.950% | 9/19/26 | 300 | | 312 | |
3 | TransDigm Inc. | | 6.250% | 3/15/26 | 35 | | 37 | |
| TransDigm Inc. | | 7.500% | 3/15/27 | 10 | | 11 | |
3 | TransDigm Inc. | | 5.500% | 11/15/27 | 45 | | 45 | |
| Tyson Foods Inc. | | 5.100% | 9/28/48 | 315 | | 386 | |
| UDR Inc. | | 3.100% | 11/1/34 | 475 | | 477 | |
| Union Electric Co. | | 4.000% | 4/1/48 | 65 | | 74 | |
| Union Electric Co. | | 3.250% | 10/1/49 | 135 | | 138 | |
22
Global Credit Bond Fund
| | | | | Face | | Market | |
| | | | Maturity | Amount | | Value· | |
| | | Coupon | Date | ($000 | ) | ($000 | ) |
| United Rentals North America Inc. | | 4.625% | 10/15/25 | 55 | | 56 | |
| United Rentals North America Inc. | | 3.875% | 11/15/27 | 25 | | 25 | |
| United Technologies Corp. | | 2.800% | 5/4/24 | 650 | | 670 | |
| United Technologies Corp. | | 4.625% | 11/16/48 | 325 | | 403 | |
| UnitedHealth Group Inc. | | 3.500% | 8/15/39 | 1,068 | | 1,108 | |
| Valero Energy Corp. | | 4.350% | 6/1/28 | 70 | | 76 | |
| Valero Energy Corp. | | 4.900% | 3/15/45 | 30 | | 34 | |
| Verisk Analytics Inc. | | 4.000% | 6/15/25 | 550 | | 595 | |
| Verisk Analytics Inc. | | 4.125% | 3/15/29 | 135 | | 149 | |
| Verizon Communications Inc. | | 4.125% | 3/16/27 | 330 | | 367 | |
| Verizon Communications Inc. | | 4.400% | 11/1/34 | 175 | | 202 | |
| Verizon Communications Inc. | | 4.522% | 9/15/48 | 555 | | 651 | |
| Verizon Communications Inc. | | 5.012% | 4/15/49 | 250 | | 320 | |
| Virginia Electric & Power Co. | | 3.150% | 1/15/26 | 75 | | 78 | |
| Virginia Electric & Power Co. | | 2.950% | 11/15/26 | 940 | | 979 | |
3 | Vistra Operations Co. LLC | | 5.000% | 7/31/27 | 10 | | 10 | |
| Walt Disney Co. | | 3.000% | 2/13/26 | 280 | | 296 | |
3 | Walt Disney Co. | | 6.650% | 11/15/37 | 160 | | 239 | |
2 | Wells Fargo & Co. | | 2.879% | 10/30/30 | 700 | | 707 | |
7 | Wells Fargo Bank NA | | 5.250% | 8/1/23 | 4,100 | | 6,016 | |
| Western Digital Corp. | | 4.750% | 2/15/26 | 30 | | 31 | |
| Western Midstream Operating LP | | 4.500% | 3/1/28 | 30 | | 29 | |
| Williams Cos. Inc. | | 3.750% | 6/15/27 | 145 | | 151 | |
| WRKCo Inc. | | 4.650% | 3/15/26 | 430 | | 475 | |
| WRKCo Inc. | | 3.900% | 6/1/28 | 270 | | 289 | |
| | | | | | | 100,052 | |
Taxable Municipal Bond (0.3%) | | | | | | | |
15 | New Jersey Economic Development Authority | | | | | | | |
| Revenue (State Pension Funding) | | 7.425% | 2/15/29 | 550 | | 701 | |
| | | | | | | | |
U.S. Government and Agency Obligations (1.7%) | | | | | | | |
14 | United States Treasury Inflation Indexed Bonds | | 0.250% | 7/15/29 | 2,100 | | 2,126 | |
14,16 | United States Treasury Note/Bond | | 4.375% | 2/15/38 | 745 | | 1,024 | |
| United States Treasury Note/Bond | | 3.125% | 5/15/48 | 300 | | 360 | |
| | | | | | | 3,510 | |
Total United States (Cost $105,861) | | | | | | 109,599 | |
| | | | | | | | |
| | | | | Shares | | | |
Temporary Cash Investments (1.8%) | | | | | | | |
17 | Vanguard Market Liquidity Fund (Cost $3,831) | | 1.984% | | 38,307 | | 3,831 | |
| | | | | | | | | |
| | | | | | Notional | | | |
| | Expiration | | | Exercise | Amount | | | |
| | Date | | Contracts | Price | (000 | ) | | |
Options Purchased (0.0%) | | | | | | | | |
Exchange-Traded Options (0.0%) | | | | | | | | |
| Put Options | | | | | | | | |
| 10-Year U.S. Treasury Note Futures Contracts | 11/22/19 | | 42 | $129.00 | 5,418 | | 5 | |
23
Global Credit Bond Fund
| | | | | | Notional | | | |
| | | | | | Amount on | | | |
| | | | | | Underlying | | Market | |
| | | | Expiration | Exercise | Swap | | Value· | |
| | Counterparty | | Date | Rate | ($000 | ) | ($000 | ) |
Over-the-Counter Swaptions (0.0%) | | | | | | | | |
Call Swaptions | | | | | | | | |
| 10-Year Interest Rate Swap, Pays 3M USD LIBOR Quarterly, Receives 1.423% Semiannually | BARC | | 1/8/20 | 1.423% | 417 | | 2 | |
| 10-Year Interest Rate Swap, Pays 3M USD LIBOR Quarterly, Receives 1.130% Semiannually | BNPSW | | 9/21/20 | 1.130% | 615 | | 5 | |
| 10-Year Interest Rate Swap, Pays 3M USD LIBOR Quarterly, Receives 1.420% Semiannually | GSCM | | 1/8/20 | 1.420% | 417 | | 2 | |
| 10-Year Interest Rate Swap, Pays 3M USD LIBOR Quarterly, Receives 1.205% Semiannually | JPMC | | 1/7/20 | 1.205% | 1,728 | | 3 | |
| 10-Year Interest Rate Swap, Pays 3M USD LIBOR Quarterly, Receives 1.721% Semiannually | MSCS | | 1/22/20 | 1.721% | 417 | | 8 | |
| | | | | | | | 20 | |
Put Swaptions | | | | | | | | |
| 10-Year Interest Rate Swap, Receives 3M USD LIBOR Quarterly, Pays 1.423% Semiannually | BARC | | 1/8/20 | 1.423% | 417 | | 9 | |
| 10-Year Interest Rate Swap, Receives 3M USD LIBOR Quarterly, Pays 1.420% Semiannually | GSCM | | 1/8/20 | 1.420% | 417 | | 9 | |
| 10-Year Interest Rate Swap, Receives 3M USD LIBOR Quarterly, Pays 1.721% Semiannually | MSCS | | 1/22/20 | 1.721% | 417 | | 3 | |
| 5-Year iTraxx Europe-S31-V1, Credit Protection Sold, Receives 1.000% Quarterly | GSI | | 11/20/19 | 0.575% | 10,35018 | | 1 | |
| 5-Year CDX-NA-IG-S32-V1, Credit Protection Sold, Receives 1.000% Quarterly | GSI | | 11/20/19 | 0.625% | 635 | | — | |
| 5-Year CDX-NA-IG-S33-V1, Credit Protection Sold, Receives 1.000% Quarterly | GSI | | 12/18/19 | 0.625% | 827 | | 1 | |
| | | | | | | | 23 | |
Total Options Purchased (Cost $79) | | | | | | | 48 | |
Total Investments (100.8%) (Cost $203,963) | | | | | | | 209,708 | |
24
Global Credit Bond Fund
| | Amount | |
| | ($000 | ) |
Other Assets and Liabilities (-0.8%) | | | |
Other Assets | | 7,373 | |
Liabilities | | (9,093 | ) |
| | (1,720 | ) |
Net Assets (100%) | | 207,988 | |
| | Amount | |
| | ($000 | ) |
Statement of Assets and Liabilities | | | |
Assets | | | |
Investments in Securities, at Value | | | |
Unaffiliated Issuers | | 205,829 | |
Affiliated Issuers | | 3,831 | |
Options Purchased | | 48 | |
Total Investments in Securities | | 209,708 | |
Investment in Vanguard | | 10 | |
Receivables for Investment Securities Sold | | 4,291 | |
Receivables for Accrued Income | | 1,887 | |
Receivables for Capital Shares Issued | | 530 | |
Variation Margin Receivable—Futures Contracts | | 145 | |
Variation Margin Receivable—CC Swap Contracts | | 7 | |
Unrealized Appreciation—Forward Currency Contracts | | 279 | |
Unrealized Appreciation—OTC Swap Contracts | | 32 | |
Other Assets | | 192 | |
Total Assets | | 217,081 | |
Liabilities | | | |
Payables for Investment Securities Purchased | | 6,772 | |
Payables for Capital Shares Redeemed | | 110 | |
Payables to Vanguard | | 30 | |
Options Written, at Value19 | | 50 | |
Variation Margin Payable—Futures Contracts | | 254 | |
Variation Margin Payable—CC Swap Contracts | | 30 | |
Unrealized Depreciation—Forward Currency Contracts | | 1,773 | |
Unrealized Depreciation—OTC Swap Contracts | | 74 | |
Total Liabilities | | 9,093 | |
Net Assets | | 207,988 | |
25
Global Credit Bond Fund
At October 31, 2019, net assets consisted of:
| | Amount | |
| | ($000 | ) |
Paid-in Capital | | 193,721 | |
Total Distributable Earnings (Loss) | | 14,267 | |
Net Assets | | 207,988 | |
| | | |
Investor Shares—Net Assets | | | |
Applicable to 2,792,932 outstanding $.001 par value shares of beneficial interest (unlimited authorization) | | 30,986 | |
Net Asset Value Per Share—Investor Shares | | $11.09 | |
| | | |
Admiral Shares—Net Assets | | | |
Applicable to 7,975,680 outstanding $.001 par value shares of beneficial interest (unlimited authorization) | | 177,002 | |
Net Asset Value Per Share—Admiral Shares | | $22.19 | |
· See Note A in Notes to Financial Statements.
1 Face amount denominated in Australian dollars.
2 The average or expected maturity is shorter than the final maturity shown because of the possibility of interim principal payments and prepayments or the possibility of the issue being called.
3 Security exempt from registration under Rule 144A of the Securities Act of 1933. Such securities may be sold in transactions exempt from registration, normally to qualified institutional buyers. At October 31, 2019, the aggregate value of these securities was $26,533,000, representing 12.8% of net assets.
4 Adjustable-rate security; rate shown is effective rate at period end. Certain adjustable-rate securities are not based on a published reference rate and spread but are determined by the issuer or agent based on current market conditions.
5 Face amount denominated in euro.
6 Face amount denominated in Canadian dollars.
7 Face amount denominated in British pounds.
8 Face amount denominated in Japanese yen.
9 Face amount denominated in South African rand.
10 Guaranteed by multiple countries.
11 Security purchased on a when-issued or delayed-delivery basis for which the fund has not taken delivery as of October 31, 2019.
12 The issuer was placed under federal conservatorship in September 2008; since that time, its daily operations have been managed by the Federal Housing Finance Agency and it receives capital from the U.S. Treasury, as needed to maintain a positive net worth, in exchange for senior preferred stock.
13 Securities with a value of $1,101,000 have been segregated as initial margin for open futures contracts.
14 Securities with a value of $1,443,000 have been segregated as collateral for open forward currency contracts and over-the-counter swap contracts.
15 Scheduled principal and interest payments are guaranteed by National Public Finance Guarantee Corp.
16 Securities with a value of $138,000 have been segregated as initial margin for open centrally cleared swap contracts.
17 Affiliated money market fund available only to Vanguard funds and certain trusts and accounts managed by Vanguard. Rate shown is the 7-day yield.
18 Notional amount denominated in euro.
19 Includes premiums received of $93,000.
BARC—Barclays Bank plc.
BNPSW—BNP Paribas.
CC—Centrally Cleared.
GSCM—Goldman Sachs Bank USA.
GSI—Goldman Sachs International.
JPMC—JPMorgan Chase Bank, N.A.
LIBOR—London Interbank Offered Rate.
MSCS—Morgan Stanley Capital Services LLC.
OTC—Over-the-Counter.
26
Global Credit Bond Fund
Derivative Financial Instruments Outstanding as of Period End | | | | | |
| | | | | | | | | |
Options Written | | | | | | | | |
| | | | | | | | | |
| | | | | | Notional | | Market | |
| | Expiration | | | Exercise | Amount | | Value | |
| | Date | | Contracts | Price | ($000 | ) | ($000 | ) |
Exchange-Traded Options | | | | | | | | |
Put Options | | | | | | | | |
2-Year U.S. Treasury Note Futures Contracts | 11/22/19 | | 52 | $107.75 | 11,206 | | (11 | ) |
| | | | | | Notional | | | |
| | | | | | Amount on | | | |
| | | | | | Underlying | | Market | |
| | | | Expiration | Exercise | Swap | | Value | |
| | Counterparty | | Date | Rate | ($000 | ) | ($000 | ) |
Over-the-Counter Swaptions | | | | | | | | |
Call Swaptions | | | | | | | | |
10-Year Interest Rate Swap,Receives 3M USD LIBOR Quarterly, Pays 1.360% Semiannually | JPMC | | 11/7/19 | 1.360% | 961 | | — | |
5-Year iTraxx Europe-S31-V1, Credit Protection Sold, Receives 1.000% Quarterly | GSI | | 11/20/19 | 0.500% | 10,3501 | | (30 | ) |
5-Year CDX-NA-IG-S32-V1, Credit Protection Sold, Receives 1.000% Quarterly | GSI | | 11/20/19 | 0.550% | 635 | | (2 | ) |
5-Year CDX-NA-IG-S33-V1, Credit Protection Sold, Receives 1.000% Quarterly | GSI | | 12/18/19 | 0.575% | 827 | | (1 | ) |
| | | | | | | (33 | ) |
| | | | | | | | |
Put Swaptions | | | | | | | | |
5-Year iTraxx Europe-S31-V1, Credit Protection Purchased, Pays 1.000% Quarterly | GSI | | 11/20/19 | 0.500% | 10,3501 | | (4 | ) |
5-Year CDX-NA-IG-S32-V1, Credit Protection Purchased, Pays 1.000% Quarterly | GSI | | 11/20/19 | 0.550% | 635 | | — | |
5-Year CDX-NA-IG-S33-V1, Credit Protection Purchased, Pays 1.000% Quarterly | GSI | | 12/18/19 | 0.575% | 827 | | (2 | ) |
| | | | | | | (6 | ) |
| | | | | | | (39 | ) |
Total Options Written (Premiums Received $93) | | | | | | | (50 | ) |
1 Notional amount denominated in euro.
GSI—Goldman Sachs International.
JPMC—JPMorgan Chase Bank, N.A.
27
Global Credit Bond Fund
Futures Contracts | | | | | | | | | |
| | | | | | | | ($000 | ) |
| | | | | | | | Value and | |
| | | | Number of | | | | Unrealized | |
| | | | Long (Short | ) | Notional | | Appreciation | |
| | Expiration | | Contracts | | Amount | | (Depreciation | ) |
Long Futures Contracts | | | | | | | | | |
2-Year U.S. Treasury Note | | December 2019 | | 74 | | 15,955 | | 5 | |
30-Year U.S. Treasury Bond | | December 2019 | | 33 | | 5,325 | | 18 | |
Euro-Bobl | | December 2019 | | 35 | | 5,255 | | 2 | |
Euro-Schatz | | December 2019 | | 36 | | 4,500 | | (5 | ) |
Euro-Bund | | December 2019 | | 17 | | 3,257 | | 5 | |
Euro-Buxl | | December 2019 | | 9 | | 2,108 | | (6 | ) |
10-Year Canadian Government Bond | | December 2019 | | 9 | | 971 | | (22 | ) |
AUD 10-Year Treasury Bond | | December 2019 | | 3 | | 302 | | — | |
| | | | | | | | (3 | ) |
| | | | | | | | | |
Short Futures Contracts | | | | | | | | | |
10-Year U.S. Treasury Note | | December 2019 | | (92 | ) | (11,987 | ) | 141 | |
Ultra 10-Year U.S. Treasury Note | | December 2019 | | (76 | ) | (10,800 | ) | 115 | |
5-Year U.S. Treasury Note | | December 2019 | | (63 | ) | (7,510 | ) | 40 | |
Euro-BTP | | December 2019 | | (21 | ) | (3,384 | ) | 6 | |
Long Gilt | | December 2019 | | (15 | ) | (2,581 | ) | (7 | ) |
AUD 3-Year Treasury Bond | | December 2019 | | (13 | ) | (1,034 | ) | (1 | ) |
Ultra Long U.S. Treasury Bond | | December 2019 | | (2 | ) | (380 | ) | — | |
| | | | | | | | 294 | |
| | | | | | | | 291 | |
Forward Currency Contracts | | | | | | |
| Contract | | | | | Unrealized | Unrealized |
| Settlement | | | Contract Amount (000) | Appreciation | (Depreciation) |
Counterparty | Date | | Receive | | Deliver | ($000) | ($000) |
Barclays Bank plc | 11/4/19 | EUR | 8,465 | USD | 9,411 | 32 | — |
BNP Paribas | 7/22/22 | JPY | 249,482 | USD | 2,485 | — | (148) |
HSBC Bank USA, N.A. | 11/4/19 | EUR | 1,558 | USD | 1,737 | 1 | — |
Goldman Sachs Bank USA | 11/4/19 | MXN | 32,342 | USD | 1,691 | — | (11) |
Morgan Stanley Capital Services LLC | 11/4/19 | EUR | 1,339 | USD | 1,481 | 13 | — |
BNP Paribas | 11/4/19 | EUR | 1,171 | USD | 1,303 | 4 | — |
Morgan Stanley Capital Services LLC | 11/4/19 | GBP | 928 | USD | 1,203 | — | — |
BNP Paribas | 11/4/19 | GBP | 813 | USD | 1,046 | 7 | — |
Morgan Stanley Capital Services LLC | 11/12/19 | PEN | 2,108 | USD | 625 | 5 | — |
Morgan Stanley Capital Services LLC | 12/3/19 | EUR | 260 | USD | 290 | — | — |
| | | | | | | | |
28
Global Credit Bond Fund
Forward Currency Contracts (continued) | | | | | | |
| Contract | | | | | Unrealized | Unrealized |
| Settlement | | | Contract Amount (000) | Appreciation | (Depreciation) |
Counterparty | Date | | Receive | | Deliver | ($000) | ($000) |
J.P. Morgan Securities LLC | 12/18/19 | JPY | 21,620 | USD | 201 | — | — |
Goldman Sachs Bank USA | 11/4/19 | AUD | 254 | USD | 175 | 1 | — |
Goldman Sachs Bank USA | 12/18/19 | NZD | 179 | USD | 114 | 1 | — |
Goldman Sachs Bank USA | 11/4/19 | GBP | 75 | USD | 95 | 2 | — |
Goldman Sachs Bank USA | 12/18/19 | JPY | 10,040 | USD | 94 | — | — |
J.P. Morgan Securities LLC | 12/18/19 | AUD | 108 | USD | 75 | — | — |
J.P. Morgan Securities LLC | 12/18/19 | NOK | 449 | USD | 50 | — | (1) |
BNP Paribas | 12/18/19 | JPY | 5,300 | USD | 50 | — | (1) |
BNP Paribas | 12/18/19 | CAD | 66 | USD | 50 | — | — |
Barclays Bank plc | 11/4/19 | GBP | 33 | USD | 43 | — | — |
Morgan Stanley Capital Services LLC | 11/4/19 | AUD | 19 | USD | 13 | — | — |
Morgan Stanley Capital Services LLC | 11/4/19 | CAD | 15 | USD | 11 | — | — |
Goldman Sachs Bank USA | 12/18/19 | NZD | 100 | AUD | 93 | — | (1) |
Morgan Stanley Capital Services LLC | 12/18/19 | NOK | 576 | CAD | 81 | 1 | — |
J.P. Morgan Securities LLC | 12/18/19 | GBP | 17 | CAD | 27 | 1 | — |
Morgan Stanley Capital Services LLC | 12/18/19 | GBP | 17 | CAD | 27 | 1 | — |
Goldman Sachs Bank USA | 12/18/19 | CAD | 55 | GBP | 33 | — | (1) |
J.P. Morgan Securities LLC | 12/18/19 | CAD | 41 | NOK | 285 | — | — |
J.P. Morgan Securities LLC | 12/18/19 | CAD | 41 | NOK | 285 | — | — |
Morgan Stanley Capital Services LLC | 11/4/19 | USD | 43,713 | EUR | 39,958 | — | (864) |
Morgan Stanley Capital Services LLC | 11/4/19 | USD | 11,128 | GBP | 8,983 | — | (509) |
BNP Paribas | 11/4/19 | USD | 6,476 | GBP | 5,036 | — | (48) |
J.P. Morgan Securities LLC | 11/4/19 | USD | 4,952 | GBP | 3,822 | 1 | — |
Morgan Stanley Capital Services LLC | 11/4/19 | USD | 3,999 | AUD | 5,905 | — | (72) |
BNP Paribas | 7/22/22 | USD | 2,485 | JPY | 249,482 | 148 | — |
BNP Paribas | 11/4/19 | USD | 2,313 | EUR | 2,090 | — | (18) |
Morgan Stanley Capital Services LLC | 11/4/19 | USD | 2,189 | CAD | 2,897 | — | (10) |
BNP Paribas | 11/29/19 | USD | 1,749 | CAD | 2,320 | — | (12) |
BNP Paribas | 11/4/19 | USD | 1,673 | ZAR | 24,441 | 56 | — |
Morgan Stanley Capital Services LLC | 11/4/19 | USD | 1,486 | MXN | 29,510 | — | (47) |
Morgan Stanley Capital Services LLC | 11/5/19 | USD | 1,079 | JPY | 116,378 | 1 | — |
HSBC Bank USA, N.A. | 11/4/19 | USD | 1,015 | GBP | 781 | 3 | — |
| | | | | | | | |
29
Global Credit Bond Fund
Forward Currency Contracts (continued) | | | | | | |
| Contract | | | | | Unrealized | Unrealized |
| Settlement | | | Contract Amount (000) | Appreciation | (Depreciation) |
Counterparty | Date | | Receive | | Deliver | ($000) | ($000) |
Morgan Stanley Capital Services LLC | 11/12/19 | USD | 650 | PEN | 2,200 | — | (7) |
BNP Paribas | 11/4/19 | USD | 382 | EUR | 342 | — | — |
J.P. Morgan Securities LLC | 11/4/19 | USD | 295 | GBP | 240 | — | (16) |
Goldman Sachs Bank USA | 11/4/19 | USD | 194 | EUR | 176 | — | (2) |
Morgan Stanley Capital Services LLC | 12/18/19 | USD | 144 | JPY | 15,415 | 1 | — |
Morgan Stanley Capital Services LLC | 12/18/19 | USD | 126 | NZD | 196 | — | — |
Goldman Sachs Bank USA | 12/18/19 | USD | 125 | AUD | 182 | — | (1) |
J.P. Morgan Securities LLC | 12/18/19 | USD | 114 | NZD | 179 | — | (1) |
J.P. Morgan Securities LLC | 12/18/19 | USD | 113 | CAD | 149 | — | (1) |
Morgan Stanley Capital Services LLC | 12/18/19 | USD | 104 | EUR | 93 | — | — |
HSBC Bank USA, N.A. | 11/4/19 | USD | 64 | GBP | 51 | — | (2) |
BNP Paribas | 12/18/19 | USD | 49 | NOK | 449 | — | — |
Morgan Stanley Capital Services LLC | 11/29/19 | USD | 35 | CAD | 47 | — | — |
Barclays Bank plc | 12/18/19 | USD | 21 | GBP | 16 | — | — |
J.P. Morgan Securities LLC | 11/4/19 | USD | 12 | CAD | 16 | — | — |
BNP Paribas | 11/4/19 | USD | 10 | CAD | 14 | — | — |
Morgan Stanley Capital Services LLC | 11/4/19 | USD | 3 | NZD | 5 | — | — |
Goldman Sachs Bank USA | 11/4/19 | USD | 3 | CAD | 4 | — | — |
| | | | | | 279 | (1,773) |
| | | | | | | | |
AUD—Australian dollar.
CAD—Canadian dollar.
EUR—euro.
GBP—British pound.
JPY—Japanese yen.
MXN—Mexican peso.
NOK—Norwegian krone.
NZD—New Zealand dollar.
PEN—Peruvian sol.
USD—U.S. dollar.
ZAR—South African rand.
30
Global Credit Bond Fund
Centrally Cleared Credit Default Swaps | | | | | |
| | | | Periodic | | |
| | | | Premium | | Unrealized |
| | | | Received | | Appreciation |
| Termination | Notional Amount | (Paid)1 | Value | (Depreciation) |
Reference Entity | Date | (000) | (%) | ($000) | ($000) |
Credit Protection Sold | | | | | | |
CDX-NA-IG-S33-V1 | 12/20/24 | USD | 860 | 1.000 | 19 | 1 |
CDX-NA-IG-S33-V1 | 12/20/29 | USD | 435 | 1.000 | (2) | 2 |
| | | | | | 3 |
| | | | | | |
Credit Protection Purchased | | | | | | |
CDX-NA-IG-S33-V1 | 12/20/22 | USD | 1,242 | (1.000) | (27) | (2) |
iTraxx Europe-S32-V1 | 12/20/24 | EUR | 340 | (1.000) | (10) | — |
| | | | | | (2) |
| | | | | | 1 |
1 Periodic premium received/paid quarterly.
EUR—euro.
USD—U.S. dollar.
Over-the-Counter Credit Default Swaps | | | | | | |
| | | | | | Remaining | | |
| | | | Periodic | | Up-Front | | |
| | | | Premium | | Premium | | |
| | | Notional | Received | | Received | Unrealized | Unrealized |
Reference | Termination | | Amount | (Paid)1 | Value | (Paid) | Appreciation | (Depreciation) |
Entity | Date | Counterparty | ($000) | (%) | ($000) | ($000) | ($000) | ($000) |
Credit Protection Sold/Moody’s Rating | | | | | | |
Republic of Turkey/Ba2 | 12/20/24 | HSBCC | 950 | 1.000 | (103) | 132 | 29 | — |
31
Global Credit Bond Fund
Over-the-Counter Credit Default Swaps (continued) | | | | | |
| | | | | | Remaining | | |
| | | | Periodic | | Up-Front | | |
| | | | Premium | | Premium | | |
| | | Notional | Received | | Received | Unrealized | Unrealized |
Reference | Termination | | Amount | (Paid)1 | Value | (Paid) | Appreciation | (Depreciation) |
Entity | Date | Counterparty | ($000) | (%) | ($000) | ($000) | ($000) | ($000) |
Credit Protection Purchased | | | | | | | |
Deutsche Bank AG | 12/20/24 | GSI | 1,0502 | (1.000) | 29 | (29) | — | — |
Federative Republic of Brazil | 12/20/24 | MSCS | 900 | (1.000) | 9 | (16) | — | (7) |
Republic of Colombia | 12/20/24 | JPMC | 4,000 | (1.000) | (40) | 16 | — | (24) |
Republic of Colombia | 12/20/24 | MSCS | 350 | (1.000) | (3) | 1 | — | (2) |
Republic of Indonesia | 6/20/24 | BARC | 500 | (1.000) | (8) | 3 | — | (5) |
Republic of South Africa | 12/20/24 | MSCS | 850 | (1.000) | 35 | (33) | 2 | — |
Republic of Turkey | 12/20/22 | HSBCC | 1,350 | (1.000) | 69 | (105) | — | (36) |
United Mexican States | 12/20/24 | GSI | 950 | (1.000) | (4) | 5 | 1 | — |
| | | | | 87 | (158) | 3 | (74) |
| | | | | (16) | (26) | 32 | (74) |
The notional amount represents the maximum potential amount the fund could be required to pay as a seller of credit protection if the reference entity was subject to a credit event.
1 Periodic premium received/paid quarterly.
2 Notional amount denominated in euro.
BARC—Barclays Bank plc.
GSI—Goldman Sachs International.
HSBCC—HSBC Bank USA, N.A.
JPMC—JPMorgan Chase Bank, N.A.
MSCS—Morgan Stanley Capital Services LLC.
32
Global Credit Bond Fund
Centrally Cleared Interest Rate Swaps | | | | | | |
| | | Fixed | Floating | | |
| | | Interest | Interest | | |
| | | Rate | Rate | | Unrealized |
| Future | Notional | Received | Received | | Appreciation |
| Effective | Amount | (Paid)3 | (Paid) | Value | (Depreciation) |
Termination Date | Date | ($000) | (%) | (%) | ($000) | ($000) |
12/19/22 | 12/18/191 | 3,6002 | (1.250) | 0.0004 | (70) | (6) |
12/18/24 | 12/18/191 | 2,6002 | (0.500) | 0.0004 | 41 | (9) |
12/18/26 | 12/18/191 | 2,9002 | (1.500) | 0.0004 | (188) | (17) |
10/11/29 | N/A | 92 | 1.485 | (1.984)5 | (1) | (1) |
10/15/29 | N/A | 177 | 1.555 | (2.001)5 | (1) | 1 |
| | | | | (219) | (32) |
1 Forward interest rate swap. In a forward interest rate swap, the fund and the counterparty agree to make periodic net payments beginning on a specified future effective date.
2 Notional amount denominated in British pounds.
3 Fixed interest payment received/paid semiannually.
4 Based on 6M GBP LIBOR as of the most recent payment date. Floating interest payment received/paid semiannually.
5 Based on 3M USD LIBOR as of the most recent payment date. Floating interest payment received/paid quarterly.
See accompanying Notes, which are an integral part of the Financial Statements.
33
Global Credit Bond Fund
Statement of Operations
| | November 15, 20181 to | |
| | October 31, 2019 | |
| | ($000 | ) |
Investment Income | | | |
Income | | | |
Interest2 | | 4,641 | |
Total Income | | 4,641 | |
Expenses | | | |
The Vanguard Group—Note B | | | |
Investment Advisory Services | | 21 | |
Management and Administrative—Investor Shares | | 68 | |
Management and Administrative—Admiral Shares | | 245 | |
Marketing and Distribution—Investor Shares | | 3 | |
Marketing and Distribution—Admiral Shares | | 7 | |
Custodian Fees | | 34 | |
Auditing Fees | | 17 | |
Shareholders’ Reports—Investor Shares | | 1 | |
Shareholders’ Reports—Admiral Shares | | 1 | |
Total Expenses | | 397 | |
Expenses Paid Indirectly | | (3 | ) |
Net Expenses | | 394 | |
Net Investment Income | | 4,247 | |
Realized Net Gain (Loss) | | | |
Investment Securities Sold2 | | 8,740 | |
Futures Contracts | | (1,131 | ) |
Options Purchased | | (10 | ) |
Options Written | | 34 | |
Swap Contracts | | (251 | ) |
Forward Currency Contracts | | 3,892 | |
Foreign Currencies | | (808 | ) |
Realized Net Gain (Loss) | | 10,466 | |
Change in Unrealized Appreciation (Depreciation) | | | |
Investment Securities2 | | 5,776 | |
Futures Contracts | | 291 | |
Options Purchased | | (31 | ) |
Options Written | | 43 | |
Swap Contracts | | (73 | ) |
Forward Currency Contracts | | (1,494 | ) |
Foreign Currencies | | (2 | ) |
Change in Unrealized Appreciation (Depreciation) | | 4,510 | |
Net Increase (Decrease) in Net Assets Resulting from Operations | | 19,223 | |
1 Inception.
2 Interest income, realized net gain (loss), and change in unrealized appreciation (depreciation) from an affiliated company of the fund were $154,000, ($1,000), and $1,000, respectively. Purchases and sales are for temporary cash investment purposes.
See accompanying Notes, which are an integral part of the Financial Statements.
34
Global Credit Bond Fund
Statement of Changes in Net Assets
| | November 15, 20181 to | |
| | October 31, 2019 | |
| | ($000 | ) |
Increase (Decrease) in Net Assets | | | |
Operations | | | |
Net Investment Income | | 4,247 | |
Realized Net Gain (Loss) | | 10,466 | |
Change in Unrealized Appreciation (Depreciation) | | 4,510 | |
Net Increase (Decrease) in Net Assets Resulting from Operations | | 19,223 | |
Distributions | | | |
Net Investment Income | | | |
Investor Shares | | (573 | ) |
Admiral Shares | | (3,184 | ) |
Realized Capital Gain | | | |
Investor Shares | | — | |
Admiral Shares | | — | |
Total Distributions | | (3,757 | ) |
Capital Share Transactions | | | |
Investor Shares | | 28,602 | |
Admiral Shares | | 163,920 | |
Net Increase (Decrease) from Capital Share Transactions | | 192,522 | |
Total Increase (Decrease) | | 207,988 | |
Net Assets | | | |
Beginning of Period | | — | |
End of Period | | 207,988 | |
1 Inception. | | | |
See accompanying Notes, which are an integral part of the Financial Statements.
35
Global Credit Bond Fund
Financial Highlights
Investor Shares
| | November 15, 20181 to | |
For a Share Outstanding Throughout the Period | | October 31, 2019 | |
Net Asset Value, Beginning of Period | | $10.00 | |
Investment Operations | | | |
Net Investment Income2 | | .287 | |
Net Realized and Unrealized Gain (Loss) on Investments | | 1.045 | |
Total from Investment Operations | | 1.332 | |
Distributions | | | |
Dividends from Net Investment Income | | (.242 | ) |
Distributions from Realized Capital Gains | | — | |
Total Distributions | | (.242 | ) |
Net Asset Value, End of Period | | $11.09 | |
| | | |
Total Return3 | | 13.46% | |
| | | |
Ratios/Supplemental Data | | | |
Net Assets, End of Period (Millions) | | $31 | |
Ratio of Total Expenses to Average Net Assets | | 0.35%4 | |
Ratio of Net Investment Income to Average Net Assets | | 2.78%4 | |
Portfolio Turnover Rate | | 284% | |
1 Inception.
2 Calculated based on average shares outstanding.
3 Total returns do not include account service fees that may have applied in the period shown. Fund prospectuses provide information about any applicable account service fees.
4 Annualized.
See accompanying Notes, which are an integral part of the Financial Statements.
36
Global Credit Bond Fund
Financial Highlights
Admiral Shares
| | November 15, 20181 to | |
For a Share Outstanding Throughout the Period | | October 31, 2019 | |
Net Asset Value, Beginning of Period | | $20.00 | |
Investment Operations | | | |
Net Investment Income2 | | .591 | |
Net Realized and Unrealized Gain (Loss) on Investments | | 2.101 | |
Total from Investment Operations | | 2.692 | |
Distributions | | | |
Dividends from Net Investment Income | | (.502 | ) |
Distributions from Realized Capital Gains | | — | |
Total Distributions | | (.502 | ) |
Net Asset Value, End of Period | | $22.19 | |
| | | |
Total Return3 | | 13.60% | |
| | | |
Ratios/Supplemental Data | | | |
Net Assets, End of Period (Millions) | | $177 | |
Ratio of Total Expenses to Average Net Assets | | 0.25%4 | |
Ratio of Net Investment Income to Average Net Assets | | 2.88%4 | |
Portfolio Turnover Rate | | 284% | |
1 Inception.
2 Calculated based on average shares outstanding.
3 Total returns do not include account service fees that may have applied in the period shown. Fund prospectuses provide information about any applicable account service fees.
4 Annualized.
See accompanying Notes, which are an integral part of the Financial Statements.
37
Global Credit Bond Fund
Notes to Financial Statements
Vanguard Global Credit Bond Fund is registered under the Investment Company Act of 1940 as an open-end investment company, or mutual fund. Certain of the fund’s investments are in corporate debt instruments; the issuers’ abilities to meet their obligations may be affected by economic developments in their respective industries. The fund invests in securities of foreign issuers, which may subject it to investment risks not normally associated with investing in securities of U.S. corporations. To minimize the currency risk associated with investment in securities denominated in currencies other than the U.S. dollar, the fund attempts to hedge its currency exposures. The fund offers two classes of shares: Investor Shares and Admiral Shares. Each of the share classes has different eligibility and minimum purchase requirements, and is designed for different types of investors.
A. The following significant accounting policies conform to generally accepted accounting principles for U.S. investment companies. The fund consistently follows such policies in preparing its financial statements.
1. Security Valuation: Securities are valued as of the close of trading on the New York Stock Exchange (generally 4 p.m., Eastern time) on the valuation date. Bonds and temporary cash investments are valued using the latest bid prices or using valuations based on a matrix system (which considers such factors as security prices, yields, maturities, and ratings), both as furnished by independent pricing services. Structured debt securities, including mortgages and asset-backed securities, are valued using the latest bid prices or using valuations based on a matrix system that considers such factors as issuer, tranche, nominal or option-adjusted spreads, weighted average coupon, weighted average maturity, credit enhancements, and collateral. Investments in Vanguard Market Liquidity Fund are valued at that fund’s net asset value. Securities for which market quotations are not readily available, or whose values have been affected by events occurring before the fund’s pricing time but after the close of the securities’ primary markets, are valued at their fair values calculated according to procedures adopted by the board of trustees. These procedures include obtaining quotations from an independent pricing service, monitoring news to identify significant market-or security-specific events, and evaluating changes in the values of foreign market proxies (for example, ADRs, futures contracts, or exchange-traded funds), between the time the foreign markets close and the fund’s pricing time. When fair-value pricing is employed, the prices of securities used by a fund to calculate its net asset value may differ from quoted or published prices for the same securities.
2. Foreign Currency: Securities and other assets and liabilities denominated in foreign currencies are translated into U.S. dollars using exchange rates obtained from an independent third party as of the fund’s pricing time on the valuation date. Realized gains (losses) and unrealized appreciation (depreciation) on investment securities include the effects of changes in exchange rates since the securities were purchased, combined with the effects of changes in security prices. Fluctuations in the value of other assets and liabilities resulting from changes in exchange rates are recorded as unrealized foreign currency gains (losses) until the assets or liabilities are settled in cash, at which time they are recorded as realized foreign currency gains (losses).
3. Futures Contracts: The fund uses futures contracts to invest in fixed income asset classes with greater efficiency and lower cost than is possible through direct investment, to add value when these instruments are attractively priced, or to adjust sensitivity to changes in interest rates. The primary risks associated with the use of futures contracts are imperfect correlation between changes in market values of bonds held by the fund and the prices of futures contracts, and the possibility of an illiquid market. Counterparty risk involving futures is mitigated because a regulated clearinghouse
38
Global Credit Bond Fund
is the counterparty instead of the clearing broker. To further mitigate counterparty risk, the fund trades futures contracts on an exchange, monitors the financial strength of its clearing brokers and clearinghouse, and has entered into clearing agreements with its clearing brokers. The clearinghouse imposes initial margin requirements to secure the fund’s performance and requires daily settlement of variation margin representing changes in the market value of each contract. Any assets pledged as initial margin for open contracts are noted in the Statement of Net Assets.
Futures contracts are valued at their quoted daily settlement prices. The notional amounts of the contracts are not recorded in the Statement of Net Assets. Fluctuations in the value of the contracts are recorded in the Statement of Assets and Liabilities as an asset (liability) and in the Statement of Operations as unrealized appreciation (depreciation) until the contracts are closed, when they are recorded as realized futures gains (losses).
During the period ended October 31, 2019, the fund’s average investments in long and short futures contracts represented 21% and 20% of net assets, respectively, based on the average of the notional amounts at each quarter-end during the period.
4. Forward Currency Contracts: The fund enters into forward currency contracts to protect the value of securities and related receivables and payables against changes in future foreign exchange rates. The fund’s risks in using these contracts include movement in the values of the foreign currencies relative to the U.S. dollar and the ability of the counterparties to fulfill their obligations under the contracts. The fund mitigates its counterparty risk by entering into forward currency contracts only with a diverse group of prequalified counterparties, monitoring their financial strength, entering into master netting arrangements with its counterparties, and requiring its counterparties to transfer collateral as security for their performance. In the absence of a default, the collateral pledged or received by the fund cannot be repledged, resold, or rehypothecated. The master netting arrangements provide that, in the event of a counterparty’s default (including bankruptcy), the fund may terminate the forward currency contracts, determine the net amount owed by either party in accordance with its master netting arrangements, and sell or retain any collateral held up to the net amount owed to the fund under the master netting arrangements. The forward currency contracts contain provisions whereby a counterparty may terminate open contracts if the fund’s net assets decline below a certain level, triggering a payment by the fund if the fund is in a net liability position at the time of the termination. The payment amount would be reduced by any collateral the fund has pledged. Any assets pledged as collateral for open contracts are noted in the Statement of Net Assets. The value of collateral received or pledged is compared daily to the value of the forward currency contracts exposure with each counterparty, and any difference, if in excess of a specified minimum transfer amount, is adjusted and settled within two business days.
Forward currency contracts are valued at their quoted daily prices obtained from an independent third party, adjusted for currency risk based on the expiration date of each contract. The notional amounts of the contracts are not recorded in the Statement of Net Assets. Fluctuations in the value of the contracts are recorded in the Statement of Assets and Liabilities as an asset (liability) and in the Statement of Operations as unrealized appreciation (depreciation) until the contracts are closed, when they are recorded as realized forward currency contract gains (losses).
During the period ended October 31, 2019, the fund’s average investment in forward currency contracts represented 72% of net assets, based on the average of notional amounts at each quarter-end during the period.
39
Global Credit Bond Fund
5. Swap Contracts: The fund invests in credit default swaps to adjust the overall credit risk of the fund or to actively overweight or underweight credit risk to a specific issuer or group of issuers. The fund may sell credit protection through credit default swaps to simulate investments in long positions that are either unavailable or considered to be less attractively priced in the bond market. The fund may purchase credit protection through credit default swaps to reduce credit exposure to a given issuer or issuers. Under the terms of the swaps, an up-front payment may be exchanged between the seller and buyer. In addition, the seller of the credit protection receives a periodic payment of premium from the buyer that is a fixed percentage applied to a notional amount. If, for example, the reference entity is subject to a credit event (such as bankruptcy, failure to pay, or obligation acceleration) during the term of the swap, the seller agrees to either physically settle or cash settle the swap contract. If the swap is physically settled, the seller agrees to pay the buyer an amount equal to the notional amount and take delivery of a debt instrument of the reference issuer with a par amount equal to such notional amount. If the swap is cash settled, the seller agrees to pay the buyer the difference between the notional amount and the final price for the relevant debt instrument, as determined either in a market auction or pursuant to a pre-agreed-upon valuation procedure.
The fund enters into interest rate swap transactions to adjust the fund’s sensitivity to changes in interest rates and maintain the ability to generate income at prevailing market rates. Under the terms of the swaps, one party pays the other an amount that is a fixed percentage rate applied to a notional amount. In return, the counterparty agrees to pay a floating rate, which is reset periodically based on short-term interest rates, applied to the same notional amount.
The notional amounts of swap contracts are not recorded in the Statement of Net Assets. Swaps are valued daily based on market quotations received from independent pricing services or recognized dealers and the change in value is recorded in the Statement of Assets and Liabilities as an asset (liability) and in the Statement of Operations as unrealized appreciation (depreciation) until the seller of credit protection is required to take delivery (or, in a cash settled swap, pay the settlement amount determined) upon occurrence of a credit event, periodic payments are made, or the swap terminates, at which time realized gain (loss) is recorded. The net premium to be received or paid by the fund under swap contracts is accrued daily and recorded as realized gain (loss) over the life of the contract.
The primary risk associated with selling credit protection is that, upon the occurrence of a defined credit event, the market value of the debt instrument received by the fund (or, in a cash settled swap, the debt instruments used to determine the settlement payment by the fund) will be significantly less than the amount paid by the fund and, in a physically settled swap, the fund may receive an illiquid debt instrument. A risk associated with all types of swaps is the possibility that a counterparty may default on its obligation to pay net amounts due to the fund. The fund’s maximum amount subject to counterparty risk is the unrealized appreciation on the swap contract. The fund mitigates its counterparty risk by entering into swaps only with a diverse group of prequalified counterparties, monitoring their financial strength, entering into master netting arrangements with its counterparties, and requiring its counterparties to transfer collateral as security for their performance. In the absence of a default, the collateral pledged or received by the fund cannot be repledged, resold, or rehypothecated. In the event of a counterparty’s default (including bankruptcy), the fund may terminate any swap contracts with that counterparty, determine the net amount owed by either party in accordance with its master netting arrangements, and sell or retain any collateral held up to the net amount owed to the fund under the master netting arrangements. The swap contracts contain provisions whereby a counterparty may terminate open contracts if the fund’s net assets decline below a certain level, triggering a payment by the fund if the fund is in a net liability position
40
Global Credit Bond Fund
at the time of the termination. The payment amount would be reduced by any collateral the fund has pledged. Any securities pledged as collateral for open contracts are noted in the Statement of Net Assets. The value of collateral received or pledged is compared daily to the value of the swap contracts exposure with each counterparty, and any difference, if in excess of a specified minimum transfer amount, is adjusted and settled within two business days.
The fund enters into centrally cleared interest rate and credit default swaps to achieve the same objectives specified with respect to the equivalent over-the-counter swaps but with less counterparty risk because a regulated clearinghouse is the counterparty instead of the clearing broker or executing broker. The clearinghouse imposes initial margin requirements to secure the fund’s performance, and requires daily settlement of variation margin representing changes in the market value of each contract. To further mitigate counterparty risk, the fund trades with a diverse group of prequalified executing brokers; monitors the financial strength of its clearing brokers, executing brokers, and clearinghouse; and has entered into agreements with its clearing brokers and executing brokers.
During the period ended October 31, 2019, the fund’s average amounts of investments in credit protection sold and credit protection purchased represented 1% and 5% of net assets, respectively, based on the average of notional amounts at each quarter-end during the period. The average amount of investments in interest rate swaps represented 1% of net assets, based on the average of notional amounts at each quarter-end during the period.
6. Options: The fund invests in options contracts on futures and swaps to adjust its exposure to the underlying investments. The primary risk associated with purchasing options is that the value of the underlying investments may move in such a way that the option is out-of-the-money (the exercise price of the option exceeds the value of the underlying investment), the position is worthless at expiration, and the fund loses the premium paid. The primary risk associated with selling options is that the value of the underlying investments may move in such a way that the option is in-the-money (the exercise price of the option exceeds the value of the underlying investment), the counterparty exercises the option, and the fund loses an amount equal to the market value of the option written less the premium received.
The fund invests in options on futures, which are exchange-traded. Counterparty risk involving exchange-traded options on futures is mitigated because a regulated clearinghouse is the counterparty instead of the clearing broker. To further mitigate counterparty risk, the fund trades options on futures on an exchange, monitors the financial strength of its clearing brokers and clearinghouses, and has entered into clearing agreements with its clearing brokers.
The fund invests in options on swaps (swaptions), which are transacted over-the-counter (OTC) and not on an exchange. A receiver swaption gives the owner the right to receive the total return of a specified asset, reference rate, or index. A payer swaption gives the owner the right to pay the total return of a specified asset, reference rate, or index. Swaptions also include options that allow an existing swap to be terminated or extended by one of the counterparties. Unlike exchange-traded options, which are standardized with respect to the underlying instrument, expiration date, contract size, and strike price, the terms of OTC options generally are established through negotiation with the other party to the option contract. Although this type of arrangement allows the purchaser or writer greater flexibility to tailor an option to its needs, OTC options generally involve greater credit risk than exchange-traded options. Credit risk involves the possibility that a counterparty may default on its obligation to pay net amounts due to the fund. The fund mitigates its counterparty risk by entering into swaptions with a diverse group of prequalified counterparties and monitoring their financial strength.
41
Global Credit Bond Fund
Options on futures contracts are valued at their quoted daily settlement prices. Swaptions are valued daily based on market quotations received from independent pricing services or recognized dealers. The premium paid for a purchased option is recorded in the Statement of Assets and Liabilities as an asset that is subsequently adjusted daily to the current market value of the option purchased. The premium received for a written option is recorded in the Statement of Assets and Liabilities as an asset with an equal liability that is subsequently adjusted daily to the current market value of the option written. Fluctuations in the value of the options are recorded in the Statement of Operations as unrealized appreciation (depreciation) until expired, closed, or exercised, at which time realized gains (losses) are recognized.
During the period ended October 31, 2019, the fund’s average value of investments in options purchased and options written each represented less than 1% of net assets, based on the average market values at each quarter-end during the period.
The following table summarizes the fund’s derivative assets and liabilities by counterparty for derivatives subject to arrangements that provide for offsetting assets and liabilities. Exchange-traded and centrally cleared derivatives are listed separately.
| | Assets | | Liabilities | | | | Amounts Not Offset in | | | |
| | Reflected in | | Reflected in | | | | the Statement of Assets | | Net | |
| | Statement of | | Statement of | | Net Amount | | and Liabilities | | Exposure3 | |
| | Assets and | | Assets and | | Receivable | | Collateral | | Collateral | | (Not Less | |
| | Liabilities1 | | Liabilities1 | | (Payable | ) | Pledged2 | | Received2 | | Than $0 | ) |
| | ($000 | ) | ($000 | ) | ($000 | ) | ($000 | ) | ($000 | ) | ($000 | ) |
Derivatives Subject to Offsetting Arrangements, by Counterparty | | | | | | | | | | | | | |
Barclays Capital | | 43 | | (5 | ) | 38 | | — | | — | | 38 | |
BNP Paribas | | 220 | | (227 | ) | (7 | ) | 65 | | — | | — | |
Goldman Sachs | | 18 | | (55 | ) | (37 | ) | — | | — | | — | |
HSBC Bank USA, N.A. | | 33 | | (38 | ) | (5 | ) | — | | — | | — | |
JPMorgan | | 5 | | (43 | ) | (38 | ) | 26 | | — | | — | |
Morgan Stanley Capital Services LLC | | 35 | | (1,518 | ) | (1,483 | ) | 1,352 | | — | | — | |
Centrally Cleared Swap Contracts | | 7 | | (30 | ) | (23 | ) | 138 | | — | | — | |
Exchange-Traded Futures Contracts | | 145 | | (254 | ) | (109 | ) | 1,101 | | — | | — | |
Total | | 506 | | (2,170 | ) | (1,664 | ) | 2,682 | | — | | 38 | |
1 Absent an event of default or early termination, derivative assets and liabilities are presented gross and not offset in the Statement of Assets and Liabilities.
2 Securities or other assets pledged as collateral are noted in the Statement of Net Assets. Securities or other assets received as collateral are held in a segregated account and not included in the fund’s security holdings in the Statement of Net Assets.
3 Net exposure represents the net amount receivable from the counterparty in the event of default. Counterparties are not required to exchange collateral if amount is below a specified minimum transfer amount.
42
Global Credit Bond Fund
7. Federal Income Taxes: The fund intends to qualify as a regulated investment company and distribute all of its taxable income. Management has analyzed the fund’s tax positions taken for the period ended October 31, 2019, and has concluded that no provision for federal income tax is required in the fund’s financial statements.
8. Distributions: Distributions to shareholders are recorded on the ex-dividend date. Distributions are determined on a tax basis and may differ from net investment income and realized capital gains for financial reporting purposes.
9. Credit Facility: The fund and certain other funds managed by The Vanguard Group (“Vanguard”) participate in a $4.3 billion committed credit facility provided by a syndicate of lenders pursuant to a credit agreement that may be renewed annually; each fund is individually liable for its borrowings, if any, under the credit facility. Borrowings may be utilized for temporary and emergency purposes, and are subject to the fund’s regulatory and contractual borrowing restrictions. The participating funds are charged administrative fees and an annual commitment fee of 0.10% of the undrawn amount of the facility; these fees are allocated to the funds based on a method approved by the fund’s board of trustees and included in Management and Administrative expenses on the fund’s Statement of Operations. Any borrowings under this facility bear interest at a rate based upon the higher of the one-month London Interbank Offered Rate, federal funds effective rate, or overnight bank funding rate plus an agreed-upon spread.
The fund had no borrowings outstanding at October 31, 2019, or at any time during the period then ended.
10. Other: Interest income includes income distributions received from Vanguard Market Liquidity Fund and is accrued daily. Premiums and discounts on debt securities purchased are amortized and accreted, respectively, to interest income over the lives of the respective securities. Security transactions are accounted for on the date securities are bought or sold. Costs used to determine realized gains (losses) on the sale of investment securities are those of the specific securities sold.
Each class of shares has equal rights as to assets and earnings, except that each class separately bears certain class-specific expenses related to maintenance of shareholder accounts (included in Management and Administrative expenses) and shareholder reporting. Marketing and distribution expenses are allocated to each class of shares based on a method approved by the board of trustees. Income, other non-class-specific expenses, and gains and losses on investments are allocated to each class of shares based on its relative net assets.
B. In accordance with the terms of a Funds’ Service Agreement (the “FSA”) between Vanguard and the fund, Vanguard furnishes to the fund investment advisory, corporate management, administrative, marketing, and distribution services at Vanguard’s cost of operations (as defined by the FSA). These costs of operations are allocated to the fund based on methods and guidelines approved by the board of trustees and are generally settled twice a month.
Upon the request of Vanguard, the fund may invest up to 0.40% of its net assets as capital in Vanguard. At October 31, 2019, the fund had contributed to Vanguard capital in the amount of $10,000, representing less than 0.01% of the fund’s net assets and 0.00% of Vanguard’s capital received pursuant to the FSA. The fund’s trustees and officers are also directors and employees, respectively, of Vanguard.
43
Global Credit Bond Fund
C. The fund’s custodian bank has agreed to reduce its fees when the fund maintains cash on deposit in the non-interest-bearing custody account. For the period ended October 31, 2019, custodian fee offset arrangements reduced the fund’s expenses by $3,000 (an annual rate of 0.00% of average net assets).
D. Various inputs may be used to determine the value of the fund’s investments. These inputs are summarized in three broad levels for financial statement purposes. The inputs or methodologies used to value securities are not necessarily an indication of the risk associated with investing in those securities.
Level 1—Quoted prices in active markets for identical securities.
Level 2—Other significant observable inputs (including quoted prices for similar securities, interest rates, prepayment speeds, credit risk, etc.).
Level 3—Significant unobservable inputs (including the fund’s own assumptions used to determine the fair value of investments). Any investments valued with significant unobservable inputs are noted on the Statement of Net Assets.
The following table summarizes the market value of the fund’s investments and derivatives as of October 31, 2019, based on the inputs used to value them:
| Level 1 | | Level 2 | | Level 3 | |
Investments | ($000 | ) | ($000 | ) | ($000 | ) |
Sovereign Bonds | — | | 35,944 | | — | |
Corporate Bonds | — | | 159,244 | | — | |
Asset-Backed/Commercial Mortgage-Backed Securities | — | | 6,430 | | — | |
Taxable Municipal Bonds | — | | 701 | | — | |
U.S. Government and Agency Obligations | — | | 3,510 | | — | |
Temporary Cash Investments | 3,831 | | — | | — | |
Options Purchased | 5 | | 43 | | — | |
Options Written | (11 | ) | (39 | ) | — | |
Futures Contracts—Assets1 | 145 | | — | | — | |
Futures Contracts—Liabilities1 | (254 | ) | — | | — | |
Forward Currency Contracts—Assets | — | | 279 | | — | |
Forward Currency Contracts—Liabilities | — | | (1,773 | ) | — | |
Swap Contracts—Assets | 71 | | 32 | | — | |
Swap Contracts—Liabilities | (30 | )1 | (74 | ) | — | |
Total | 3,693 | | 204,297 | | — | |
1 Represents variation margin on the last day of the reporting period.
44
Global Credit Bond Fund
E. At October 31, 2019, the fair values of derivatives were reflected in the Statement of Assets and Liabilities as follows:
| | Interest Rate | | Currency | | Credit | | | |
| | Contracts | | Contracts | | Contracts | | Total | |
Statement of Assets and Liabilities Caption | | ($000 | ) | ($000 | ) | ($000 | ) | ($000 | ) |
Options Purchased | | 46 | | — | | 2 | | 48 | |
Variation Margin Receivable—Futures Contracts | | 145 | | — | | — | | 145 | |
Variation Margin Receivable—CC Swap Contracts | | 7 | | — | | — | | 7 | |
Unrealized Appreciation—Forward Currency Contracts | | — | | 279 | | — | | 279 | |
Unrealized Appreciation—OTC Swap Contracts | | — | | — | | 32 | | 32 | |
Total Assets | | 198 | | 279 | | 34 | | 511 | |
| | | | | | | | | |
Options Written | | (11 | ) | — | | (39 | ) | (50 | ) |
Variation Margin Payable—Futures Contracts | | (254 | ) | — | | — | | (254 | ) |
Variation Margin Payable—CC Swap Contracts | | (29 | ) | — | | (1 | ) | (30 | ) |
Unrealized Depreciation—Forward Currency Contracts | | — | | (1,773 | ) | — | | (1,773 | ) |
Unrealized Depreciation—OTC Swap Contracts | | — | | — | | (74 | ) | (74 | ) |
Total Liabilities | | (294 | ) | (1,773 | ) | (114 | ) | (2,181 | ) |
Realized net gain (loss) and the change in unrealized appreciation (depreciation) on derivatives for the period ended October 31, 2019, were:
| | Interest Rate | | Currency | | Credit | | | |
| | Contracts | | Contracts | | Contracts | | Total | |
Realized Net Gain (Loss) on Derivatives | | ($000 | ) | ($000 | ) | ($000 | ) | ($000 | ) |
Futures Contracts | | (1,131 | ) | — | | — | | (1,131 | ) |
Options Purchased | | (28 | ) | 20 | | (2 | ) | (10 | ) |
Options Written | | 28 | | — | | 6 | | 34 | |
Swap Contracts | | 4 | | — | | (255 | ) | (251 | ) |
Forward Currency Contracts | | — | | 3,892 | | — | | 3,892 | |
Realized Net Gain (Loss) on Derivatives | | (1,127 | ) | 3,912 | | (251 | ) | 2,534 | |
| | | | | | | | | |
Change in Unrealized Appreciation (Depreciation) on Derivatives | | | | | | |
Futures Contracts | | 291 | | — | | — | | 291 | |
Options Purchased | | (12 | ) | — | | (19 | ) | (31 | ) |
Options Written | | 16 | | — | | 27 | | 43 | |
Swap Contracts | | (32 | ) | — | | (41 | ) | (73 | ) |
Forward Currency Contracts | | — | | (1,494 | ) | — | | (1,494 | ) |
Change in Unrealized Appreciation (Depreciation) on Derivatives | | 263 | | (1,494 | ) | (33 | ) | (1,264 | ) |
45
Global Credit Bond Fund
F. Permanent differences between book-basis and tax-basis components of net assets are reclassified among capital accounts in the financial statements to reflect their tax character. These reclassifications have no effect on net assets or net asset value per share. As of period end, permanent differences primarily attributable to the accounting for foreign currency transactions, distributions in connection with fund share redemptions, and swap agreements were reclassified between the following accounts:
| Amount | |
| ($000 | ) |
Paid-in Capital | 1,199 | |
Total Distributable Earnings (Loss) | (1,199 | ) |
Temporary differences between book-basis and tax-basis components of total distributable earnings (loss) arise when certain items of income, gain, or loss are recognized in different periods for financial statement and tax purposes; these differences will reverse at some time in the future. The differences are primarily related to the tax deferral of losses on wash sales and straddles, the realization of unrealized gains or losses on certain futures contracts, forward currency contracts, and options, and the tax recognition of gain or loss from foreign currency hedges. As of period end, the tax-basis components of total distributable earnings (loss) are detailed in the table as follows:
| Amount | |
| ($000 | ) |
Undistributed Ordinary Income | 9,145 | |
Undistributed Long-Term Gains | — | |
Capital Loss Carryforwards (Non-expiring) | — | |
Net Unrealized Gains (Losses) | 5,123 | |
As of October 31, 2019, gross unrealized appreciation and depreciation for investments and derivatives based on cost for U.S. federal income tax purposes were as follows:
| Amount | |
| ($000 | ) |
Tax Cost | 204,534 | |
Gross Unrealized Appreciation | 6,063 | |
Gross Unrealized Depreciation | (933 | ) |
Net Unrealized Appreciation (Depreciation) | 5,130 | |
G. During the period ended October 31, 2019, the fund purchased $539,373,000 of investment securities and sold $358,045,000 of investment securities, other than U.S. government securities and temporary cash investments. Purchases and sales of U.S. government securities were $30,555,000 and $27,333,000, respectively.
46
Global Credit Bond Fund
H. Capital share transactions for each class of shares were:
| November 15, 20181 to | |
| October 31, 2019 | |
| Amount | | Shares | |
| ($000 | ) | (000 | ) |
Investor Shares | | | | |
Issued | 60,830 | | 5,921 | |
Issued in Lieu of Cash Distributions | 478 | | 45 | |
Redeemed | (32,706 | ) | (3,173 | ) |
Net Increase (Decrease)—Investor Shares | 28,602 | | 2,793 | |
Admiral Shares | | | | |
Issued | 201,821 | | 9,744 | |
Issued in Lieu of Cash Distributions | 2,559 | | 120 | |
Redeemed | (40,460 | ) | (1,888 | ) |
Net Increase (Decrease)—Admiral Shares | 163,920 | | 7,976 | |
1 Inception.
I. Management has determined that no events or transactions occurred subsequent to October 31, 2019, that would require recognition or disclosure in these financial statements.
47
Report of Independent Registered Public Accounting Firm
To the Board of Trustees of Vanguard Charlotte Funds and Shareholders of Vanguard Global Credit Bond Fund
Opinion on the Financial Statements
We have audited the accompanying statement of net assets and statement of assets and liabilities of Vanguard Global Credit Bond Fund (one of the funds constituting Vanguard Charlotte Funds, referred to hereafter as the “Fund”) as of October 31, 2019, and the related statements of operations and changes in net assets, including the related notes, and the financial highlights for the period November 15, 2018 (inception) through October 31, 2019 (collectively referred to as the “financial statements”). In our opinion, the financial statements present fairly, in all material respects, the financial position of the Fund as of October 31, 2019, and the results of its operations, changes in its net assets, and the financial highlights for the period November 15, 2018 (inception) through October 31, 2019 in conformity with accounting principles generally accepted in the United States of America.
Basis for Opinion
These financial statements are the responsibility of the Fund’s management. Our responsibility is to express an opinion on the Fund’s financial statements based on our audit. We are a public accounting firm registered with the Public Company Accounting Oversight Board (United States) (“PCAOB”) and are required to be independent with respect to the Fund in accordance with the U.S. federal securities laws and the applicable rules and regulations of the Securities and Exchange Commission and the PCAOB.
We conducted our audit of these financial statements in accordance with the standards of the PCAOB. Those standards require that we plan and perform the audit to obtain reasonable assurance about whether the financial statements are free of material misstatement, whether due to error or fraud.
Our audit included performing procedures to assess the risks of material misstatement of the financial statements, whether due to error or fraud, and performing procedures that respond to those risks. Such procedures included examining, on a test basis, evidence regarding the amounts and disclosures in the financial statements. Our audit also included evaluating the accounting principles used and significant estimates made by management, as well as evaluating the overall presentation of the financial statements. Our procedures included confirmation of securities owned as of October 31, 2019 by correspondence with the custodian, transfer agent and brokers; when replies were not received from brokers, we performed other auditing procedures. We believe that our audit provides a reasonable basis for our opinion.
/s/PricewaterhouseCoopers LLP
Philadelphia, Pennsylvania
December 18, 2019
We have served as the auditor of one or more investment companies in The Vanguard Group of Funds since 1975.
48
BLOOMBERG is a trademark and service mark of Bloomberg Finance L.P. BARCLAYS is a trademark and service mark of Barclays Bank Plc, used under license. Bloomberg Finance L.P. and its affiliates, including Bloomberg Index Services Limited (BISL) (collectively, Bloomberg), or Bloomberg’s licensors, own all proprietary rights in the Bloomberg Barclays Global Aggregate Credit Index (USD Hedged) (Index or Bloomberg Barclays Index).
Neither Barclays Bank Plc, Barclays Capital Inc., or any affiliate (collectively Barclays) or Bloomberg is the issuer or producer of Vanguard Global Credit Bond Fund and neither Bloomberg nor Barclays has any responsibilities, obligations or duties to investors in Vanguard Global Credit Bond Fund. The Index is licensed for use by The Vanguard Group, Inc. (Vanguard) as the sponsor of Vanguard Global Credit Bond Fund. Bloomberg and Barclays’ only relationship with Vanguard in respect of the Index is the licensing of the Index, which is determined, composed and calculated by BISL, or any successor thereto, without regard to the Issuer or Vanguard Global Credit Bond Fund or the owners of Vanguard Global Credit Bond Fund.
Additionally, Vanguard may for itself execute transaction(s) with Barclays in or relating to the Index in connection with Vanguard Global Credit Bond Fund. Investors acquire Vanguard Global Credit Bond Fund from Vanguard and investors neither acquire any interest in the Index nor enter into any relationship of any kind whatsoever with Bloomberg or Barclays upon making an investment in Vanguard Global Credit Bond Fund. Vanguard Global Credit Bond Fund is not sponsored, endorsed, sold or promoted by Bloomberg or Barclays. Neither Bloomberg nor Barclays makes any representation or warranty, express or implied regarding the advisability of investing in Vanguard Global Credit Bond Fund or the advisability of investing in securities generally or the ability of the Index to track corresponding or relative market performance. Neither Bloomberg nor Barclays has passed on the legality or suitability of Vanguard Global Credit Bond Fund with respect to any person or entity. Neither Bloomberg nor Barclays is responsible for and has not participated in the determination of the timing of, prices at, or quantities of Vanguard Global Credit Bond Fund to be issued. Neither Bloomberg nor Barclays has any obligation to take the needs of the Issuer or the owners of Vanguard Global Credit Bond Fund or any other third party into consideration in determining, composing or calculating the Index. Neither Bloomberg nor Barclays has any obligation or liability in connection with administration, marketing or trading of Vanguard Global Credit Bond Fund.
The licensing agreement between Bloomberg and Barclays is solely for the benefit of Bloomberg and Barclays and not for the benefit of the owners of Vanguard Global Credit Bond Fund, investors or other third parties. In addition, the licensing agreement between Vanguard and Bloomberg is solely for the benefit of Vanguard and Bloomberg and not for the benefit of the owners of Vanguard Global Credit Bond Fund, investors or other third parties.
NEITHER BLOOMBERG NOR BARCLAYS SHALL HAVE ANY LIABILITY TO THE ISSUER, INVESTORS OR TO OTHER THIRD PARTIES FOR THE QUALITY, ACCURACY AND/OR COMPLETENESS OF THE BLOOMBERG BARCLAYS INDEX OR ANY DATA INCLUDED THEREIN OR FOR INTERRUPTIONS IN THE DELIVERY OF THE BLOOMBERG BARCLAYS INDEX. NEITHER BLOOMBERG NOR BARCLAYS MAKES ANY WARRANTY, EXPRESS OR IMPLIED, AS TO RESULTS TO BE OBTAINED BY THE ISSUER, THE INVESTORS OR ANY OTHER PERSON OR ENTITY FROM THE USE OF THE BLOOMBERG BARCLAYS INDEX OR ANY DATA INCLUDED THEREIN. NEITHER BLOOMBERG NOR BARCLAYS MAKES ANY EXPRESS OR IMPLIED WARRANTIES, AND EACH HEREBY EXPRESSLY DISCLAIMS ALL WARRANTIES OF MERCHANTABILITY OR FITNESS FOR A PARTICULAR PURPOSE OR USE WITH RESPECT TO THE BLOOMBERG BARCLAYS INDEX OR ANY DATA INCLUDED THEREIN. BLOOMBERG RESERVES THE RIGHT TO CHANGE THE METHODS OF CALCULATION OR PUBLICATION, OR TO CEASE THE CALCULATION OR PUBLICATION OF THE BLOOMBERG BARCLAYS INDEX, AND NEITHER BLOOMBERG NOR BARCLAYS SHALL BE LIABLE FOR ANY MISCALCULATION OF OR ANY INCORRECT, DELAYED OR INTERRUPTED PUBLICATION WITH RESPECT TO ANY OF THE BLOOMBERG BARCLAYS INDICES. NEITHER BLOOMBERG NOR BARCLAYS SHALL BE LIABLE FOR ANY DAMAGES, INCLUDING, WITHOUT LIMITATION, ANY SPECIAL, INDIRECT OR CONSEQUENTIAL DAMAGES, OR ANY LOST PROFITS AND EVEN IF ADVISED OF THE POSSIBILITY OF SUCH, RESULTING FROM THE USE OF THE BLOOMBERG BARCLAYS INEX OR ANY DATA INCLUDED THEREIN OR WITH RESPECT TO VANGUARD GLOBAL CREDIT BOND FUND.
None of the information supplied by Bloomberg or Barclays and used in this publication may be reproduced in any manner without the prior written permission of both Bloomberg and Barclays Capital, the investment banking division of Barclays Bank Plc. Barclays Bank Plc is registered in England No. 1026167. Registered office 1 Churchill Place London E14 5HP.
© 2019 Bloomberg. Used with Permission.
Source: Bloomberg Index Services Limited. Copyright 2019, Bloomberg. All rights reserved.
49
This page intentionally left blank.
The People Who Govern Your Fund
The trustees of your mutual fund are there to see that the fund is operated and managed in your best interests since, as a shareholder, you are a part owner of the fund. Your fund’s trustees also serve on the board of directors of The Vanguard Group, Inc., which is owned by the Vanguard funds and provides services to them.
A majority of Vanguard’s board members are independent, meaning that they have no affiliation with Vanguard or the funds they oversee, apart from the sizable personal investments they have made as private individuals. The independent board members have distinguished backgrounds in business, academia, and public service. Each of the trustees and executive officers oversees 213 Vanguard funds.
Information for each trustee and executive officer of the fund appears below. That information, as well as the Vanguard fund count, is as of the date on the cover of this fund report. The mailing address of the trustees and officers is P.O. Box 876, Valley Forge, PA 19482. More information about the trustees is in the Statement of Additional Information, which can be obtained, without charge, by contacting Vanguard at 800-662-7447, or online at vanguard.com.
Interested Trustee1
Mortimer J. Buckley
Born in 1969. Trustee since January 2018. Principal occupation(s) during the past five years and other experience: chairman of the board (January 2019–present) of Vanguard and of each of the investment companies served by Vanguard; chief executive officer (January 2018–present) of Vanguard; chief executive officer, president, and trustee (January 2018–present) of each of the investment companies served by Vanguard; president and director (2017–present) of Vanguard; and president (February 2018–present) of Vanguard Marketing Corporation. Chief investment officer (2013–2017), managing director (2002–2017), head of the Retail Investor Group (2006–2012), and chief information officer (2001–2006) of Vanguard. Chairman of the board (2011–2017) and trustee (2009–2017) of the Children’s Hospital of Philadelphia; trustee (2018–present) of The Shipley School.
Independent Trustees
Emerson U. Fullwood
Born in 1948. Trustee since January 2008. Principal occupation(s) during the past five years and other experience: executive chief staff and marketing officer for North America and corporate vice president (retired 2008) of Xerox Corporation (document management products and services). Former president of the Worldwide Channels Group, Latin America, and Worldwide Customer Service and executive chief staff officer of Developing Markets of Xerox. Executive in residence and 2009–2010 Distinguished Minett Professor at the Rochester Institute of Technology. Director of SPX FLOW, Inc. (multi-industry manufacturing). Director of the University of Rochester Medical Center, the Monroe Community College Foundation, the United Way of Rochester, North Carolina A&T University, and Roberts Wesleyan College. Trustee of the University of Rochester.
Amy Gutmann
Born in 1949. Trustee since June 2006. Principal occupation(s) during the past five years and other experience: president (2004–present) of the University of Pennsylvania. Christopher H. Browne Distinguished Professor of Political Science, School of Arts and Sciences, and professor of communication, Annenberg School for Communication, with secondary faculty appointments in the Department of Philosophy, School of Arts and Sciences, and at the Graduate School of Education, University of Pennsylvania. Trustee of the National Constitution Center.
F. Joseph Loughrey
Born in 1949. Trustee since October 2009. Principal occupation(s) during the past five years and other experience: president and chief operating officer (retired 2009) and vice chairman of the board (2008–2009) of Cummins Inc. (industrial machinery). Chairman of the board of Hillenbrand, Inc. (specialized consumer services), and the Lumina Foundation.
1 Mr. Buckley is considered an “interested person,” as defined in the Investment Company Act of 1940, because he is an officer of the Vanguard funds.
Director of the V Foundation and Oxfam America. Member of the advisory council for the College of Arts and Letters and chair of the advisory board to the Kellogg Institute for International Studies, both at the University of Notre Dame.
Mark Loughridge
Born in 1953. Trustee since March 2012. Principal occupation(s) during the past five years and other experience: senior vice president and chief financial officer (retired 2013) of IBM (information technology services). Fiduciary member of IBM’s Retirement Plan Committee (2004–2013), senior vice president and general manager (2002–2004) of IBM Global Financing, vice president and controller (1998–2002) of IBM, and a variety of other prior management roles at IBM. Member of the Council on Chicago Booth.
Scott C. Malpass
Born in 1962. Trustee since March 2012. Principal occupation(s) during the past five years and other experience: chief investment officer (1989–present) and vice president (1996–present) of the University of Notre Dame. Assistant professor of finance at the Mendoza College of Business, University of Notre Dame, and member of the Notre Dame 403(b) Investment Committee. Chairman of the board of TIFF Advisory Services, Inc. Member of the board of Catholic Investment Services, Inc. (investment advisors) and the board of superintendence of the Institute for the Works of Religion.
Deanna Mulligan
Born in 1963. Trustee since January 2018. Principal occupation(s) during the past five years and other experience: president (2010–present) and chief executive officer (2011–present) of The Guardian Life Insurance Company of America. Chief operating officer (2010–2011) and executive vice president (2008–2010) of Individual Life and Disability of The Guardian Life Insurance Company of America. Member of the board of The Guardian Life Insurance Company of America, the American Council of Life Insurers, the Partnership for New York City (business leadership), and the Committee Encouraging Corporate Philanthropy. Trustee of the Economic Club of New York and the Bruce Museum (arts and science). Member of the Advisory Council for the Stanford Graduate School of Business.
André F. Perold
Born in 1952. Trustee since December 2004. Principal occupation(s) during the past five years and other experience: George Gund Professor of Finance and Banking, Emeritus at the Harvard Business School (retired 2011). Chief investment officer and co-managing partner of HighVista Strategies (private investment firm). Board of advisors and investment committee member of the Museum of Fine Arts Boston. Board member (2018–present) of RIT Capital Partners (investment firm); investment committee member of Partners Health Care System.
Sarah Bloom Raskin
Born in 1961. Trustee since January 2018. Principal occupation(s) during the past five years and other experience: deputy secretary (2014–2017) of the United States Department of the Treasury. Governor (2010–2014) of the Federal Reserve Board. Commissioner (2007–2010) of financial regulation for the State of Maryland. Member of the board of directors (2012–2014) of Neighborhood Reinvestment Corporation. Director (2017–present) of i(x) Investments; director (2017–present) of Reserve Trust. Rubinstein Fellow (2017–present) of Duke University; trustee (2017–present) of Amherst College.
Peter F. Volanakis
Born in 1955. Trustee since July 2009. Principal occupation(s) during the past five years and other experience: president and chief operating officer (retired 2010) of Corning Incorporated (communications equipment) and director of Corning Incorporated (2000–2010) and Dow Corning (2001–2010). Director (2012) of SPX Corporation (multi-industry manufacturing). Overseer of the Amos Tuck School of Business Administration, Dartmouth College (2001–2013). Chairman of the board of trustees of Colby-Sawyer College. Member of the board of Hypertherm Inc. (industrial cutting systems, software, and consumables).
Executive Officers
John Bendl
Born in 1970. Principal occupation(s) during the past five years and other experience: principal of Vanguard. Chief financial officer (October 2019–present) of each of the investment companies served by Vanguard. Chief accounting officer, treasurer, and controller of Vanguard (2017–present). Partner (2003–2016) at KPMG (audit, tax, and advisory services).
Glenn Booraem
Born in 1967. Principal occupation(s) during the past five years and other experience: principal of Vanguard. Investment stewardship officer (2017–present), treasurer (2015–2017), controller (2010–2015), and assistant controller (2001–2010) of each of the investment companies served by Vanguard.
Christine M. Buchanan
Born in 1970. Principal occupation(s) during the past five years and other experience: principal of Vanguard. Treasurer (2017–present) of each of the investment companies served by Vanguard. Partner (2005–2017) at KPMG (audit, tax, and advisory services).
David Cermak
Born in 1960. Principal occupation(s) during the past five years and other experience: principal of Vanguard. Finance director (October 2019–present) of each of the investment companies served by Vanguard. Managing director and head (2017–present) of Vanguard Investments Singapore. Managing director and head (2017–2019) of Vanguard Investments Hong Kong. Representative director and head (2014–2017) of Vanguard Investments Japan.
Thomas J. Higgins
Born in 1957. Principal occupation(s) during the past five years and other experience: principal of Vanguard. Finance director (October 2019–present), chief financial officer (2008–2019), and treasurer (1998–2008) of each of the investment companies served by Vanguard.
Peter Mahoney
Born in 1974. Principal occupation(s) during the past five years and other experience: principal of Vanguard. Controller (2015–present) of each of the investment companies served by Vanguard. Head of International Fund Services (2008–2014) at Vanguard.
Anne E. Robinson
Born in 1970. Principal occupation(s) during the past five years and other experience: general counsel (2016–present) of Vanguard. Secretary (2016–present) of Vanguard and of each of the investment companies served by Vanguard. Managing director (2016–present) of Vanguard. Managing director and general counsel of Global Cards and Consumer Services (2014–2016) at Citigroup. Counsel (2003–2014) at American Express.
Michael Rollings
Born in 1963. Principal occupation(s) during the past five years and other experience: finance director (2017–present) and treasurer (2017) of each of the investment companies served by Vanguard. Managing director (2016–present) of Vanguard. Chief financial officer (2016–present) of Vanguard. Director (2016–present) of Vanguard Marketing Corporation. Executive vice president and chief financial officer (2006–2016) of MassMutual Financial Group.
John E. Schadl
Born in 1972. Principal occupation(s) during the past five years and other experience: principal of Vanguard. Chief compliance officer (2019–present) of Vanguard and of each of the investment companies served by Vanguard. Assistant vice president (May 2019–present) of Vanguard Marketing Corporation.
Vanguard Senior Management Team
Joseph Brennan | Chris D. McIsaac |
Mortimer J. Buckley | James M. Norris |
Gregory Davis | Thomas M. Rampulla |
John James | Karin A. Risi |
Martha G. King | Anne E. Robinson |
John T. Marcante | Michael Rollings |
| 
|
| |
| P.O. Box 2600 |
| Valley Forge, PA 19482-2600 |
Connect with Vanguard® > vanguard.com
Fund Information > 800-662-7447
Direct Investor Account Services > 800-662-2739
Institutional Investor Services > 800-523-1036
Text Telephone for People
Who Are Deaf or Hard of Hearing > 800-749-7273
This material may be used in conjunction with the offering of shares of any Vanguard fund only if preceded or accompanied by the fund’s current prospectus.
All comparative mutual fund data are from Morningstar, Inc., unless otherwise noted.
You can obtain a free copy of Vanguard’s proxy voting guidelines by visiting vanguard.com/proxyreporting or by calling Vanguard at 800-662-2739. The guidelines are also available from the SEC’s website, www.sec.gov. In addition, you may obtain a free report on how your fund voted the proxies for securities it owned during the 12 months ended June 30. To get the report, visit either vanguard.com/proxyreporting or www.sec.gov.
You can review information about your fund on the SEC’s website, and you can receive copies of this information, for a fee, by sending a request via email addressed to publicinfo@sec.gov.
CFA® is a registered trademark owned by CFA Institute.
| © 2019 The Vanguard Group, Inc. All rights reserved. Vanguard Marketing Corporation, Distributor. Q20250 122019 |
Item 2: Code of Ethics. The Registrant has adopted a code of ethics that applies to the Registrant’s principal executive officer, principal financial officer, principal accounting officer or controller or persons performing similar functions. The Code of Ethics was amended during the reporting period covered by this report to make certain technical, non-material changes.
Item 3: Audit Committee Financial Expert. All members of the Audit Committee have been determined by the Registrant’s Board of Trustees to be Audit Committee Financial Experts and to be independent: F. Joseph Loughrey, Mark Loughridge, Sarah Bloom Raskin, and Peter F. Volanakis.
Item 4: Principal Accountant Fees and Services.
(a) Audit Fees.
Audit Fees of the Registrant.
Fiscal Year Ended October 31, 2019: $172,000
Fiscal Year Ended October 31, 2018: $142,000
Aggregate Audit Fees of Registered Investment Companies in the Vanguard Group.
Fiscal Year Ended October 31, 2019: $9,568,215
Fiscal Year Ended October 31, 2018: $9,734,277
Includes fees billed in connection with audits of the Registrant, other registered investment companies in the Vanguard complex, The Vanguard Group, Inc., and Vanguard Marketing Corporation.
(b) Audit-Related Fees.
Fiscal Year Ended October 31, 2019: $3,012,031
Fiscal Year Ended October 31, 2018: $5,581,336
Includes fees billed in connection with assurance and related services provided to the Registrant, other registered investment companies in the Vanguard complex, The Vanguard Group, Inc., and Vanguard Marketing Corporation.
(c) Tax Fees.
Fiscal Year Ended October 31, 2019: $357,238
Fiscal Year Ended October 31, 2018: $347,985
Includes fees billed in connection with tax compliance, planning, and advice services provided to the Registrant, other registered investment companies in the Vanguard complex, The Vanguard Group, Inc., and Vanguard Marketing Corporation.
(d) All Other Fees.
Fiscal Year Ended October 31, 2019: $0
Fiscal Year Ended October 31, 2018: $0
Includes fees billed for services related to tax reported information provided to the Registrant, other registered investment companies in the Vanguard complex, The Vanguard Group, Inc., and Vanguard Marketing Corporation.
(e) (1) Pre-Approval Policies. The policy of the Registrant’s Audit Committee is to consider, and, if appropriate, approve before the principal accountant is engaged for such services, all specific audit and non-audit services provided to: the Registrant, other registered investment companies in the Vanguard complex, The Vanguard Group, Inc., and entities controlled by The Vanguard Group, Inc. that provide ongoing services to the Registrant. In making a determination, the Audit Committee considers whether the services are consistent with maintaining the principal accountant’s independence.
In the event of a contingency situation in which the principal accountant is needed to provide services in between scheduled Audit Committee meetings, the Chairman of the Audit Committee would be called on to consider and, if appropriate, pre-approve audit or permitted non-audit services in an amount sufficient to complete services through the next Audit Committee meeting, and to determine if such services would be consistent with maintaining the accountant’s independence. At the next scheduled Audit Committee meeting, services and fees would be presented to the Audit Committee for formal consideration, and, if appropriate, approval by the entire Audit Committee. The Audit Committee would again consider whether such services and fees are consistent with maintaining the principal accountant’s independence.
The Registrant’s Audit Committee is informed at least annually of all audit and non-audit services provided by the principal accountant to the Vanguard complex, whether such services are provided to: the Registrant, other registered investment companies in the Vanguard complex, The Vanguard Group, Inc., or other entities controlled by The Vanguard Group, Inc. that provide ongoing services to the Registrant.
(2) No percentage of the principal accountant’s fees or services were approved pursuant to the waiver provision of paragraph (c)(7)(i)(C) of Rule 2-01 of Regulation S-X.
(f) For the most recent fiscal year, over 50% of the hours worked under the principal accountant’s engagement were not performed by persons other than full-time, permanent employees of the principal accountant.
(g) Aggregate Non-Audit Fees.
Fiscal Year Ended October 31, 2019: $357,238
Fiscal Year Ended October 31, 2018: $347,985
Includes fees billed for non-audit services provided to the Registrant, other registered investment companies in the Vanguard complex, The Vanguard Group, Inc., and Vanguard Marketing Corporation.
(h) For the most recent fiscal year, the Audit Committee has determined that the provision of all non-audit services was consistent with maintaining the principal accountant’s independence.
Item 5: Audit Committee of Listed Registrants.
The Registrant is a listed issuer as defined in rule 10A-3 under the Securities Exchange Act of 1934 (“Exchange Act”). The Registrant has a separately-designated standing audit committee established in accordance with Section 3(a)(58)(A) of the Exchange Act. The Registrant’s audit committee members are: F. Joseph Loughrey, Mark Loughridge, Sarah Bloom Raskin, and Peter F. Volanakis.
Item 6: Investments.
Not applicable.
Item 7: Disclosure of Proxy Voting Policies and Procedures for Closed-End Management Investment Companies.
Not applicable.
Item 8: Portfolio Managers of Closed-End Management Investment Companies.
Not applicable.
Item 9: Purchase of Equity Securities by Closed-End Management Investment Company and Affiliated Purchasers.
Not applicable.
Item 10: Submission of Matters to a Vote of Security Holders.
Not applicable.
Item 11: Controls and Procedures.
(a) Disclosure Controls and Procedures. The Principal Executive and Financial Officers concluded that the Registrant’s Disclosure Controls and Procedures are effective based on their evaluation of the Disclosure Controls and Procedures as of a date within 90 days of the filing date of this report.
(b) Internal Control Over Financial Reporting. There were no significant changes in Registrant’s Internal Control Over Financial Reporting or in other factors that could significantly affect this control subsequent to the date of the evaluation, including any corrective actions with regard to significant deficiencies and material weaknesses.
Item 12: Disclosure of Securities Lending Activities for Closed-End Management
Investment Companies.
Not applicable.
Item 13: Exhibits.
(a) Code of Ethics.
(b) Certifications.
Pursuant to the requirements of the Securities Exchange Act of 1934 and the Investment Company Act of 1940, the registrant has duly caused this report to be signed on its behalf by the undersigned, thereunto duly authorized.
| VANGUARD CHARLOTTE FUNDS |
| |
BY: | /s/ MORTIMER J. BUCKLEY* | |
| | |
| MORTIMER J. BUCKLEY | |
| CHIEF EXECUTIVE OFFICER | |
Date: December 18, 2019
Pursuant to the requirements of the Securities Exchange Act of 1934 and the Investment Company Act of 1940, this report has been signed below by the following persons on behalf of the registrant and in the capacities and on the dates indicated.
| VANGUARD CHARLOTTE FUNDS |
| |
BY: | /s/ MORTIMER J. BUCKLEY* | |
| | |
| MORTIMER J. BUCKLEY | |
| CHIEF EXECUTIVE OFFICER | |
|
Date: December 18, 2019 |
|
| VANGUARD CHARLOTTE FUNDS |
| |
BY: | /s/ JOHN BENDL* | |
| | |
| JOHN BENDL | |
| CHIEF FINANCIAL OFFICER | |
|
Date: December 18, 2019 |
* By: /s/ Anne E. Robinson
Anne E. Robinson, pursuant to a Power of Attorney filed on January 18, 2018 (see file Number 33-32216) and a Power of Attorney filed on October 30, 2019 (see file Number 811-02554), Incorporated by Reference.