UNITED STATES
SECURITIES AND EXCHANGE COMMISSION
Washington, D.C. 20549
FORM N-CSR
CERTIFIED SHAREHOLDER REPORT
OF
REGISTERED MANAGEMENT INVESTMENT COMPANIES
Investment Company Act file number: 811-22619
| Name of Registrant: | Vanguard Charlotte Funds |
| Address of Registrant: | P.O. Box 2600 |
| | Valley Forge, PA 19482 |
| Name and address of agent for service: | Anne E. Robinson, Esquire |
| | P.O. Box 876 |
| | Valley Forge, PA 19482 |
Registrant’s telephone number, including area code: (610) 669-1000
Date of fiscal year end: October 31
Date of reporting period: November 1, 2021—October 31, 2022
Item 1: Reports to Shareholders
Annual Report | October 31, 2022
Vanguard Total International Bond Index Fund
Contents
Your Fund’s Performance at a Glance
| 1 |
About Your Fund’s Expenses
| 2 |
Performance Summary
| 4 |
Financial Statements
| 7 |
Please note: The opinions expressed in this report are just that—informed opinions. They should not be considered promises or advice. Also, please keep in mind that the information and opinions cover the period through the date on the front of this report. Of course, the risks of investing in your fund are spelled out in the prospectus.
Your Fund’s Performance at a Glance
| • | The 12 months ended October 31, 2022, were a volatile, challenging period for financial markets. In this environment, Vanguard Total International Bond Index Fund returns ranged from –12.20% for Admiral Shares to –12.16% for ETF and Investor Shares, roughly in line with the –12.08% return of its expense-free benchmark index. (Returns for ETF Shares are based on net asset value.) |
| • | The economic backdrop deteriorated as inflation soared to multidecade highs, fueled in part by higher energy and food prices in the wake of Russia’s invasion of Ukraine. Then price increases broadened to other categories of goods and services, adding to concerns that inflation would remain stubbornly high. That prompted aggressive tightening by many central banks to bring inflation back in check, which weighed on bond prices and increased fears of recession. |
| • | Bond yields moved higher across much of the developed world during the fiscal year amid concerns about inflation and central bank tightening. In general, bonds in eastern Europe produced the worst results. Bonds in Great Britain and the European Union also lagged. Japanese issues, the largest in the benchmark by weight, held up somewhat better. |
| • | The fund regularly uses derivatives to hedge portfolio risks. Its holdings of forward currency contracts helped performance for the period. |
| • | At the end of the 12-month period, the fund’s 30-day SEC yield—a proxy for its income-generating potential over 12 months—ranged from 2.88% for Investor Shares to 2.94% for ETF and Institutional Shares. |
Market Barometer
Average Annual Total Returns
Periods Ended October 31, 2022 |
| | One Year | Three Years | Five Years |
| Stocks | | | |
| Russell 1000 Index (Large-caps) | -16.38% | 9.99% | 10.19% |
| Russell 2000 Index (Small-caps) | -18.54 | 7.05 | 5.56 |
| Russell 3000 Index (Broad U.S. market) | -16.52 | 9.79 | 9.87 |
| FTSE All-World ex US Index (International) | -24.20 | -1.16 | -0.18 |
| Bonds | | | |
Bloomberg U.S. Aggregate Float Adjusted Index
(Broad taxable market) | -15.69% | -3.73% | -0.50% |
Bloomberg Municipal Bond Index
(Broad tax-exempt market) | -11.98 | -2.18 | 0.37 |
| FTSE Three-Month U.S. Treasury Bill Index | 0.88 | 0.59 | 1.15 |
| CPI | | | |
| Consumer Price Index | 7.75% | 5.01% | 3.85% |
About Your Fund’s Expenses
As a shareholder of the fund, you incur ongoing costs, which include costs for portfolio management, administrative services, and shareholder reports (like this one), among others. Operating expenses, which are deducted from a fund’s gross income, directly reduce the investment return of the fund.
A fund’s expenses are expressed as a percentage of its average net assets. This figure is known as the expense ratio. The following examples are intended to help you understand the ongoing costs (in dollars) of investing in your fund and to compare these costs with those of other mutual funds. The examples are based on an investment of $1,000 made at the beginning of the period shown and held for the entire period.
The accompanying table illustrates your fund’s costs in two ways:
| • | Based on actual fund return. This section helps you to estimate the actual expenses that you paid over the period. The ”Ending Account Value“ shown is derived from the fund‘s actual return, and the third column shows the dollar amount that would have been paid by an investor who started with $1,000 in the fund. You may use the information here, together with the amount you invested, to estimate the expenses that you paid over the period. |
To do so, simply divide your account value by $1,000 (for example, an $8,600 account value divided by $1,000 = 8.6), then multiply the result by the number given for your fund under the heading ”Expenses Paid During Period.“
| • | Based on hypothetical 5% yearly return. This section is intended to help you compare your fund‘s costs with those of other mutual funds. It assumes that the fund had a yearly return of 5% before expenses, but that the expense ratio is unchanged. In this case—because the return used is not the fund’s actual return—the results do not apply to your investment. The example is useful in making comparisons because the Securities and Exchange Commission requires all mutual funds to calculate expenses based on a 5% return. You can assess your fund’s costs by comparing this hypothetical example with the hypothetical examples that appear in shareholder reports of other funds. |
Note that the expenses shown in the table are meant to highlight and help you compare ongoing costs only and do not reflect transaction costs incurred by the fund for buying and selling securities. Further, the expenses do not include any purchase, redemption, or account service fees described in the fund prospectus. If such fees were applied to your account, your costs would be higher. Your fund does not carry a “sales load.”
The calculations assume no shares were bought or sold during the period. Your actual costs may have been higher or lower, depending on the amount of your investment and the timing of any purchases or redemptions.
You can find more information about the fund’s expenses, including annual expense ratios, in the Financial Statements section of this report. For additional information on operating expenses and other shareholder costs, please refer to your fund’s current prospectus.
| Six Months Ended October 31, 2022 | | | |
| | Beginning
Account Value
4/30/2022 | Ending
Account Value
10/31/2022 | Expenses
Paid During
Period |
| Based on Actual Fund Return | | | |
| Total International Bond Index Fund | | | |
| Investor Shares | $1,000.00 | $945.30 | $0.64 |
| ETF Shares | 1,000.00 | 945.40 | 0.34 |
| Admiral™ Shares | 1,000.00 | 945.40 | 0.54 |
| Institutional Shares | 1,000.00 | 945.60 | 0.34 |
| Six Months Ended October 31, 2022 | | | |
| | Beginning
Account Value
4/30/2022 | Ending
Account Value
10/31/2022 | Expenses
Paid During
Period |
| Based on Hypothetical 5% Yearly Return | | | |
| Total International Bond Index Fund | | | |
| Investor Shares | $1,000.00 | $1,024.55 | $0.66 |
| ETF Shares | 1,000.00 | 1,024.85 | 0.36 |
| Admiral Shares | 1,000.00 | 1,024.65 | 0.56 |
| Institutional Shares | 1,000.00 | 1,024.85 | 0.36 |
The calculations are based on expenses incurred in the most recent six-month period. The fund’s annualized six-month expense ratios for that period are 0.13% for Investor Shares, 0.07% for ETF Shares, 0.11% for Admiral Shares, and 0.07% for Institutional Shares. The dollar amounts shown as “Expenses Paid” are equal to the annualized expense ratio multiplied by the average account value over the period, multiplied by the number of days in the most recent six-month period, then divided by the number of days in the most recent 12-month period (184/365).
Total International Bond Index Fund
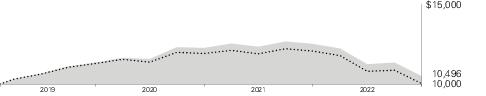
All of the returns in this report represent past performance, which is not a guarantee of future results that may be achieved by the fund. (Current performance may be lower or higher than the performance data cited. For performance data current to the most recent month-end, visit our website at vanguard.com/performance.) Note, too, that both investment returns and principal value can fluctuate widely, so an investor’s shares, when sold, could be worth more or less than their original cost. The returns shown do not reflect taxes that a shareholder would pay on fund distributions or on the sale of fund shares.
Cumulative Performance: May 31, 2013, Through October 31, 2022
Initial Investment of $10,000
| | | | Average Annual Total Returns
Periods Ended October 31, 2022 |
| | | One
Year | Five
Years | Since
Inception
(5/31/2013) | Final Value
of a $10,000
Investment |
 | Total International Bond Index Fund Investor Shares | -12.16% | -0.08% | 1.65% | $11,671 |
 | Bloomberg Global Aggregate ex-USD Float Adjusted RIC Capped Index Hedged | -12.08 | 0.09 | 1.89 | 11,925 |
“Since Inception” performance is calculated from the Investor Shares’ inception date for both the fund and its comparative standard(s).
| | | | |
| | | One
Year | Five
Years | Since
Inception
(5/31/2013) | Final Value
of a $10,000
Investment |
| Total International Bond Index Fund ETF Shares Net Asset Value | -12.16% | -0.03% | 1.69% | $11,712 |
Total International Bond Index Fund ETF Shares
Market Price | -12.16 | -0.04 | 1.71 | 11,731 |
Bloomberg Global Aggregate ex-USD Float
Adjusted RIC Capped Index Hedged | -12.08 | 0.09 | 1.89 | 11,925 |
“Since Inception” performance is calculated from the ETF Shares’ inception date for both the fund and its comparative standard(s).
| | | | |
| | | One
Year | Five
Years | Since
Inception
(5/31/2013) | Final Value
of a $10,000
Investment |
| Total International Bond Index Fund Admiral Shares | -12.20% | -0.06% | 1.68% | $11,694 |
Bloomberg Global Aggregate ex-USD Float
Adjusted RIC Capped Index Hedged | -12.08 | 0.09 | 1.89 | 11,925 |
“Since Inception” performance is calculated from the Admiral Shares’ inception date for both the fund and its comparative standard(s).
| | | | |
| | | One
Year | Five
Years | Since
Inception
(5/31/2013) | Final Value
of a $5,000,000
Investment |
| Total International Bond Index Fund Institutional Shares | -12.17% | -0.02% | 1.73% | $5,874,153 |
Bloomberg Global Aggregate ex-USD Float
Adjusted RIC Capped Index Hedged | -12.08 | 0.09 | 1.89 | 5,962,444 |
“Since Inception” performance is calculated from the Institutional Shares’ inception date for both the fund and its comparative standard(s).
See Financial Highlights for dividend and capital gains information.
Total International Bond Index Fund
Cumulative Returns of ETF Shares: May 31, 2013, Through October 31, 2022
| | One
Year | Five
Years | Since
Inception
(5/31/2013) |
Total International Bond Index Fund ETF Shares
Market Price | -12.16% | -0.22% | 17.31% |
Total International Bond Index Fund ETF Shares
Net Asset Value | -12.16 | -0.13 | 17.12 |
Bloomberg Global Aggregate ex-USD Float
Adjusted RIC Capped Index Hedged | -12.08 | 0.45 | 19.25 |
“Since Inception” performance is calculated from the ETF Shares’ inception date for both the fund and its comparative standard(s).
For the ETF Shares, the market price is determined by the midpoint of the bid-offer spread as of the closing time of the New York Stock Exchange (generally 4 p.m., Eastern time). The net asset value is also determined as of the NYSE closing time. For more information about how the ETF Shares’ market prices have compared with their net asset value, visit vanguard.com, select your ETF, click on Price, and then scroll down to the Premium/Discount chart. The ETF premium/discount chart there shows the percentage and days on which the ETF Shares’ market price was above or below the NAV.
Total International Bond Index Fund
| Japan | 16.6% |
| France | 11.9 |
| Germany | 11.0 |
| Italy | 7.3 |
| Canada | 6.8 |
| United Kingdom | 6.5 |
| Spain | 5.3 |
| Supranational | 4.1 |
| Australia | 3.7 |
| United States | 3.0 |
| Netherlands | 2.8 |
| South Korea | 2.7 |
| Belgium | 2.1 |
| Switzerland | 1.5 |
| Austria | 1.3 |
| Sweden | 1.3 |
| Indonesia | 1.2 |
| China | 1.1 |
| Other | 9.8 |
The table reflects the fund’s investments, except for short-term investments and derivatives.
The fund may invest in derivatives (such as futures and swap contracts) for various reasons, including, but not limited to, attempting to remain fully invested and tracking its target index as closely as possible.
Total International Bond Index Fund
The fund files its complete schedule of portfolio holdings with the Securities and Exchange Commission (SEC) for the first and third quarters of each fiscal year as an exhibit to its reports on Form N-PORT. The fund’s Form N-PORT reports are available on the SEC’s website at www.sec.gov.
| | | Coupon | Maturity
Date | Currency | Face
Amount
(000) | Market
Value•
($000) |
| U.S. Government and Agency Obligations (0.0%) | | | |
| | Tennessee Valley Authority (Cost $1,267) | 5.625% | 6/7/32 | GBP | 716 | 894 |
| Asset-Backed/Commercial Mortgage-Backed Securities (0.0%) | | | |
| United Kingdom (0.0%) | | | |
| 1 | Canary Wharf Finance II plc (Cost $907) | 5.952% | 10/22/37 | GBP | 570 | 664 |
| Corporate Bonds (19.6%) | | | |
| Australia (0.5%) | | | |
| | Amcor UK Finance plc | 1.125% | 6/23/27 | EUR | 2,543 | 2,148 |
| | Ampol Ltd. | 4.000% | 4/17/25 | AUD | 7,180 | 4,470 |
| | APA Infrastructure Ltd. | 2.000% | 7/15/30 | EUR | 5,000 | 4,024 |
| | APA Infrastructure Ltd. | 3.125% | 7/18/31 | GBP | 1,000 | 890 |
| | APT Pipelines Ltd. | 4.250% | 11/26/24 | GBP | 448 | 496 |
| | APT Pipelines Ltd. | 2.000% | 3/22/27 | EUR | 4,309 | 3,818 |
| | APT Pipelines Ltd. | 0.750% | 3/15/29 | EUR | 5,600 | 4,326 |
| | APT Pipelines Ltd. | 1.250% | 3/15/33 | EUR | 3,108 | 2,138 |
| | APT Pipelines Ltd. | 2.500% | 3/15/36 | GBP | 5,176 | 3,685 |
| | Aurizon Network Pty Ltd. | 4.000% | 6/21/24 | AUD | 950 | 598 |
| | Aurizon Network Pty Ltd. | 2.000% | 9/18/24 | EUR | 1,545 | 1,464 |
| | Aurizon Network Pty Ltd. | 3.125% | 6/1/26 | EUR | 18,919 | 17,834 |
| | Ausgrid Finance Pty Ltd. | 3.750% | 10/30/24 | AUD | 7,280 | 4,551 |
| | Ausgrid Finance Pty Ltd. | 1.250% | 7/30/25 | EUR | 1,710 | 1,579 |
| | Ausgrid Finance Pty Ltd. | 1.814% | 2/5/27 | AUD | 1,010 | 551 |
| | AusNet Services Holdings Pty Ltd. | 3.000% | 2/13/24 | EUR | 2,094 | 2,052 |
| | AusNet Services Holdings Pty Ltd. | 1.500% | 2/26/27 | EUR | 2,269 | 2,020 |
| | AusNet Services Holdings Pty Ltd. | 4.400% | 8/16/27 | AUD | 650 | 393 |
| | AusNet Services Holdings Pty Ltd. | 4.200% | 8/21/28 | AUD | 1,410 | 814 |
| | AusNet Services Holdings Pty Ltd. | 2.600% | 7/31/29 | AUD | 3,160 | 1,600 |
| | AusNet Services Holdings Pty Ltd. | 1.625% | 3/11/81 | EUR | 1,500 | 1,158 |
| | Australia & New Zealand Banking Group Ltd. | 5.000% | 8/16/23 | AUD | 2,750 | 1,770 |
| | Australia & New Zealand Banking Group Ltd. | 0.450% | 11/22/23 | EUR | 8,179 | 7,902 |
| | Australia & New Zealand Banking Group Ltd. | 2.500% | 1/16/24 | EUR | 2,543 | 2,505 |
| | Australia & New Zealand Banking Group Ltd. | 3.100% | 2/8/24 | AUD | 7,050 | 4,432 |
| | Australia & New Zealand Banking Group Ltd. | 0.669% | 5/5/31 | EUR | 5,600 | 4,634 |
| | Australia Pacific Airports Melbourne Pty Ltd. | 3.125% | 9/26/23 | EUR | 2,543 | 2,504 |
| | Australia Pacific Airports Melbourne Pty Ltd. | 1.750% | 10/15/24 | EUR | 7,182 | 6,778 |
| | BHP Billiton Finance Ltd. | 3.250% | 9/24/27 | EUR | 4,653 | ��� 4,497 |
| | BHP Billiton Finance Ltd. | 1.500% | 4/29/30 | EUR | 7,299 | 5,957 |
| | BHP Billiton Finance Ltd. | 3.125% | 4/29/33 | EUR | 1,545 | 1,367 |
| | BHP Billiton Finance Ltd. | 4.300% | 9/25/42 | GBP | 2,859 | 2,764 |
| | Brambles Finance Ltd. | 2.375% | 6/12/24 | EUR | 200 | 193 |
| | Brisbane Airport Corp. Pty Ltd. | 3.900% | 4/24/25 | AUD | 1,930 | 1,196 |
| | CIMIC Finance Ltd. | 1.500% | 5/28/29 | EUR | 2,800 | 2,006 |
| | Coles Group Treasury Pty Ltd. | 2.650% | 11/6/29 | AUD | 2,610 | 1,352 |
| | Coles Group Treasury Pty Ltd. | 2.100% | 8/27/30 | AUD | 1,860 | 888 |
| | Commonwealth Bank of Australia | 3.000% | 1/11/24 | AUD | 8,800 | 5,533 |
| | Commonwealth Bank of Australia | 0.375% | 4/11/24 | EUR | 6,140 | 5,859 |
| | Commonwealth Bank of Australia | 0.500% | 7/27/26 | EUR | 3,269 | 2,938 |
| | Commonwealth Bank of Australia | 3.000% | 9/4/26 | GBP | 3,376 | 3,623 |
| | Commonwealth Bank of Australia | 0.875% | 2/19/29 | EUR | 5,087 | 4,360 |
| | Commonwealth Bank of Australia | 1.936% | 10/3/29 | EUR | 10,432 | 9,674 |
| | Commonwealth Bank of Australia | 1.625% | 2/10/31 | EUR | 100 | 87 |
| | CPIF Finance Pty Ltd. | 2.485% | 10/28/30 | AUD | 2,700 | 1,295 |
| | DBNGP Finance Co. Pty Ltd. | 4.225% | 5/28/25 | AUD | 1,460 | 910 |
| | DEXUS Finance Pty Ltd. | 3.000% | 2/3/32 | AUD | 3,720 | 1,798 |
| | ETSA Utilities Finance Pty Ltd. | 3.500% | 8/29/24 | AUD | 580 | 362 |
| | GAIF Bond Issuer Pty Ltd. | 2.584% | 11/18/27 | AUD | 1,800 | 1,005 |
| | GAIF Bond Issuer Pty Ltd. | 1.900% | 12/14/28 | AUD | 2,490 | 1,269 |
| | Glencore Capital Finance DAC | 1.125% | 3/10/28 | EUR | 8,070 | 6,484 |
Total International Bond Index Fund
| | | Coupon | Maturity
Date | Currency | Face
Amount
(000) | Market
Value•
($000) |
| | Glencore Capital Finance DAC | 1.250% | 3/1/33 | EUR | 4,429 | 2,876 |
| | Glencore Finance Europe Ltd. | 1.875% | 9/13/23 | EUR | 100 | 97 |
| | Glencore Finance Europe Ltd. | 3.125% | 3/26/26 | GBP | 3,524 | 3,607 |
| | Glencore Finance Europe Ltd. | 3.750% | 4/1/26 | EUR | 100 | 96 |
| | Glencore Finance Europe Ltd. | 1.500% | 10/15/26 | EUR | 200 | 175 |
| | Goodman Australia Finance Pty Ltd. | 1.375% | 9/27/25 | EUR | 2,094 | 1,891 |
| | GTA Finance Co Pty Ltd. | 2.200% | 8/26/27 | AUD | 2,810 | 1,513 |
| | Lendlease Finance Ltd. | 3.400% | 10/27/27 | AUD | 930 | 522 |
| | Lendlease Finance Ltd. | 3.700% | 3/31/31 | AUD | 2,980 | 1,495 |
| | Lonsdale Finance Pty Ltd. | 3.900% | 10/15/25 | AUD | 2,550 | 1,573 |
| | Lonsdale Finance Pty Ltd. | 2.100% | 10/15/27 | AUD | 1,490 | 803 |
| | Macquarie Group Ltd. | 1.250% | 3/5/25 | EUR | 8,179 | 7,787 |
| | Macquarie Group Ltd. | 0.350% | 3/3/28 | EUR | 11,316 | 8,875 |
| | Macquarie Group Ltd. | 4.080% | 5/31/29 | GBP | 3,700 | 3,675 |
| | Macquarie Group Ltd. | 2.723% | 8/21/29 | CAD | 1,495 | 916 |
| | Macquarie Group Ltd. | 0.950% | 5/21/31 | EUR | 2,214 | 1,573 |
| | National Australia Bank Ltd. | 2.900% | 2/26/24 | AUD | 8,144 | 5,104 |
| | National Australia Bank Ltd. | 5.000% | 3/11/24 | AUD | 3,250 | 2,091 |
| | National Australia Bank Ltd. | 0.250% | 5/20/24 | EUR | 5,087 | 4,797 |
| | National Australia Bank Ltd. | 0.300% | 10/31/25 | CHF | 5,045 | 4,779 |
| | National Australia Bank Ltd. | 3.000% | 9/4/26 | GBP | 400 | 431 |
| | National Australia Bank Ltd. | 0.875% | 2/19/27 | EUR | 6,087 | 5,475 |
| | National Australia Bank Ltd. | 2.900% | 2/25/27 | AUD | 9,086 | 5,318 |
| | National Australia Bank Ltd. | 0.010% | 1/6/29 | EUR | 20,000 | 16,236 |
| | National Australia Bank Ltd. | 3.515% | 6/12/30 | CAD | 4,098 | 2,806 |
| | National Australia Bank Ltd. | 1.699% | 9/15/31 | GBP | 2,214 | 2,056 |
| | NBN Co. Ltd. | 2.150% | 6/2/28 | AUD | 4,650 | 2,504 |
| | NBN Co. Ltd. | 2.200% | 12/16/30 | AUD | 3,730 | 1,802 |
| | NSW Electricity Networks Finance Pty Ltd. | 2.732% | 4/23/29 | AUD | 2,240 | 1,159 |
| | Origin Energy Finance Ltd. | 1.000% | 9/17/29 | EUR | 2,599 | 1,910 |
| | Pacific National Finance Pty Ltd. | 5.000% | 9/19/23 | GBP | 300 | 337 |
| | Qantas Airways Ltd. | 3.150% | 9/27/28 | AUD | 4,430 | 2,367 |
| | Qantas Airways Ltd. | 2.950% | 11/27/29 | AUD | 740 | 366 |
| | Qantas Airways Ltd. | 5.250% | 9/9/30 | AUD | 2,530 | 1,437 |
| | Scentre Group Trust 1 | 2.250% | 7/16/24 | EUR | 2,039 | 1,946 |
| | Scentre Group Trust 1 | 3.875% | 7/16/26 | GBP | 2,591 | 2,750 |
| | Scentre Group Trust 1 / Scentre Group Trust 2 | 1.750% | 4/11/28 | EUR | 4,539 | 3,774 |
| | Scentre Group Trust 1 / Scentre Group Trust 2 | 1.450% | 3/28/29 | EUR | 1,958 | 1,517 |
| | Stockland Trust | 1.625% | 4/27/26 | EUR | 4,785 | 4,176 |
| | Suncorp-Metway Ltd. | 3.000% | 9/13/23 | AUD | 1,000 | 626 |
| | Suncorp-Metway Ltd. | 3.250% | 8/24/26 | AUD | 400 | 241 |
| | Telstra Corp. Ltd. | 1.125% | 4/14/26 | EUR | 5,910 | 5,439 |
| | Telstra Corp. Ltd. | 4.000% | 4/19/27 | AUD | 890 | 544 |
| | Telstra Corp. Ltd. | 1.375% | 3/26/29 | EUR | 1,263 | 1,095 |
| | Telstra Corp. Ltd. | 1.000% | 4/23/30 | EUR | 2,543 | 2,094 |
| | Toyota Finance Australia Ltd. | 3.300% | 11/22/23 | AUD | 331 | 209 |
| | Toyota Finance Australia Ltd. | 2.280% | 10/21/27 | EUR | 7,631 | 7,091 |
| | Transurban Finance Co. Pty Ltd. | 1.875% | 9/16/24 | EUR | 1,545 | 1,471 |
| | Transurban Finance Co. Pty Ltd. | 4.555% | 11/14/28 | CAD | 1,213 | 851 |
| | Transurban Finance Co. Pty Ltd. | 3.000% | 4/8/30 | EUR | 4,539 | 3,981 |
| | Transurban Queensland Finance Pty Ltd. | 3.250% | 8/5/31 | AUD | 2,160 | 1,078 |
| | United Energy Distribution Pty Ltd. | 3.850% | 10/23/24 | AUD | 1,540 | 966 |
| | University of Technology Sydney | 3.750% | 7/20/27 | AUD | 220 | 134 |
| | Vicinity Centres Trust | 3.375% | 4/7/26 | GBP | 590 | 613 |
| | Vicinity Centres Trust | 1.125% | 11/7/29 | EUR | 3,012 | 2,179 |
| | Wesfarmers Ltd. | 0.954% | 10/21/33 | EUR | 8,836 | 6,169 |
| | WestConnex Finance Co. Pty Ltd. | 3.150% | 3/31/31 | AUD | 3,360 | 1,671 |
| | Westpac Banking Corp. | 3.250% | 11/16/23 | AUD | 300 | 190 |
| | Westpac Banking Corp. | 5.250% | 11/21/23 | AUD | 1,700 | 1,097 |
| | Westpac Banking Corp. | 0.500% | 12/4/23 | EUR | 10,632 | 10,263 |
| | Westpac Banking Corp. | 3.000% | 4/24/24 | AUD | 400 | 250 |
| | Westpac Banking Corp. | 0.500% | 5/17/24 | EUR | 1,272 | 1,213 |
| | Westpac Banking Corp. | 0.625% | 11/22/24 | EUR | 2,543 | 2,375 |
| | Westpac Banking Corp. | 4.125% | 6/4/26 | AUD | 700 | 436 |
| | Westpac Banking Corp. | 1.079% | 4/5/27 | EUR | 6,921 | 6,261 |
| | Westpac Banking Corp. | 0.875% | 4/17/27 | EUR | 100 | 87 |
| | Westpac Banking Corp. | 1.125% | 9/5/27 | EUR | 5,690 | 5,017 |
| | Westpac Banking Corp. | 1.450% | 7/17/28 | EUR | 418 | 364 |
| | Westpac Banking Corp. | 0.010% | 9/22/28 | EUR | 19,280 | 15,758 |
Total International Bond Index Fund
| | | Coupon | Maturity
Date | Currency | Face
Amount
(000) | Market
Value•
($000) |
| | Westpac Banking Corp. | 1.375% | 5/17/32 | EUR | 5,087 | 4,218 |
| | Woolworths Group Ltd. | 1.850% | 11/15/27 | AUD | 2,980 | 1,617 |
| | Woolworths Group Ltd. | 0.375% | 11/15/28 | EUR | 9,300 | 7,233 |
| | Woolworths Group Ltd. | 2.800% | 5/20/30 | AUD | 7,340 | 3,780 |
| | WSO Finance Pty Ltd. | 4.500% | 3/31/27 | AUD | 2,180 | 1,349 |
| | | | | | | 367,123 |
| Austria (0.3%) | | | |
| | BAWAG PSK Bank fuer Arbeit und Wirtschaft und Oesterreichische Postsparkasse AG | 1.125% | 7/31/28 | EUR | 23,300 | 20,723 |
| | BAWAG PSK Bank fuer Arbeit und Wirtschaft und Oesterreichische Postsparkasse AG | 0.010% | 10/2/29 | EUR | 5,700 | 4,558 |
| | BAWAG PSK Bank fuer Arbeit und Wirtschaft und Oesterreichische Postsparkasse AG | 1.750% | 3/8/30 | EUR | 15,000 | 13,497 |
| | Borealis AG | 1.750% | 12/10/25 | EUR | 225 | 212 |
| | Erste Group Bank AG | 0.750% | 2/5/25 | EUR | 1,200 | 1,131 |
| | Erste Group Bank AG | 1.500% | 4/7/26 | EUR | 5,000 | 4,572 |
| | Erste Group Bank AG | 0.625% | 4/17/26 | EUR | 7,600 | 6,939 |
| | Erste Group Bank AG | 0.750% | 1/17/28 | EUR | 8,100 | 7,129 |
| | Erste Group Bank AG | 0.250% | 9/14/29 | EUR | 2,200 | 1,652 |
| | Erste Group Bank AG | 0.875% | 5/15/34 | EUR | 7,600 | 5,791 |
| | HYPO NOE Landesbank fuer Niederoesterreich und Wien AG | 0.375% | 6/25/24 | EUR | 3,700 | 3,481 |
| | HYPO NOE Landesbank fuer Niederoesterreich und Wien AG | 0.500% | 9/4/25 | EUR | 2,500 | 2,308 |
| | HYPO NOE Landesbank fuer Niederoesterreich und Wien AG | 1.625% | 5/11/29 | EUR | 18,200 | 16,417 |
| | JAB Holdings BV | 1.250% | 5/22/24 | EUR | 5,100 | 4,817 |
| | JAB Holdings BV | 1.750% | 6/25/26 | EUR | 7,100 | 6,396 |
| | JAB Holdings BV | 2.500% | 4/17/27 | EUR | 2,500 | 2,272 |
| | JAB Holdings BV | 2.500% | 6/25/29 | EUR | 9,400 | 7,901 |
| | JAB Holdings BV | 2.250% | 12/19/39 | EUR | 7,900 | 4,665 |
| | Mondi Finance plc | 1.500% | 4/15/24 | EUR | 5,938 | 5,647 |
| 2 | OeBB-Infrastruktur AG | 1.000% | 11/18/24 | EUR | 6,148 | 5,862 |
| 2 | OeBB-Infrastruktur AG | 3.875% | 6/30/25 | EUR | 5,124 | 5,198 |
| 2 | OeBB-Infrastruktur AG | 3.500% | 10/19/26 | EUR | 922 | 933 |
| 2 | OeBB-Infrastruktur AG | 2.250% | 5/28/29 | EUR | 1,536 | 1,455 |
| 2 | OeBB-Infrastruktur AG | 3.375% | 5/18/32 | EUR | 3,587 | 3,636 |
| 2 | OeBB-Infrastruktur AG | 3.000% | 10/24/33 | EUR | 112 | 110 |
| | OMV AG | 0.750% | 12/4/23 | EUR | 1,281 | 1,232 |
| | OMV AG | 1.000% | 12/14/26 | EUR | 1,767 | 1,592 |
| | OMV AG | 3.500% | 9/27/27 | EUR | 1,400 | 1,393 |
| | OMV AG | 1.875% | 12/4/28 | EUR | 2,327 | 2,093 |
| | OMV AG | 2.375% | 4/9/32 | EUR | 7,683 | 6,634 |
| | OMV AG | 6.250% | 12/29/49 | EUR | 1,690 | 1,696 |
| | OMV AG | 2.875% | Perpetual | EUR | 5,300 | 4,118 |
| | Raiffeisen Bank International AG | 0.250% | 1/22/25 | EUR | 2,800 | 2,484 |
| | Raiffeisen Bank International AG | 4.125% | 9/8/25 | EUR | 5,500 | 5,295 |
| | Raiffeisen Bank International AG | 0.050% | 9/1/27 | EUR | 400 | 307 |
| | Raiffeisen Bank International AG | 2.875% | 6/18/32 | EUR | 2,500 | 1,876 |
| | Raiffeisenlandesbank Niederoesterreich-Wien AG | 0.625% | 3/3/25 | EUR | 200 | 188 |
| | Raiffeisenlandesbank Niederoesterreich-Wien AG | 0.625% | 8/28/26 | EUR | 2,500 | 2,260 |
| | Raiffeisenlandesbank Niederoesterreich-Wien AG | 1.250% | 4/21/27 | EUR | 37,400 | 34,198 |
| | Raiffeisenlandesbank Niederoesterreich-Wien AG | 0.875% | 1/24/28 | EUR | 1,500 | 1,325 |
| | Raiffeisenlandesbank Niederoesterreich-Wien AG | 0.875% | 1/30/29 | EUR | 6,000 | 5,174 |
| | Raiffeisen-Landesbank Steiermark AG | 2.375% | 6/14/28 | EUR | 200 | 190 |
| | Raiffeisen-Landesbank Steiermark AG | 1.375% | 5/11/33 | EUR | 2,500 | 2,054 |
| | Raiffeisenlandesbank Vorarlberg Waren-und Revisionsverband registrierte GenmbH | 0.500% | 9/17/25 | EUR | 2,500 | 2,305 |
| | UniCredit Bank Austria AG | 2.375% | 1/22/24 | EUR | 2,600 | 2,557 |
| | UniCredit Bank Austria AG | 0.750% | 2/25/25 | EUR | 300 | 282 |
| | UniCredit Bank Austria AG | 0.250% | 6/4/27 | EUR | 5,000 | 4,357 |
| | UNIQA Insurance Group AG | 6.875% | 7/31/43 | EUR | 1,900 | 1,847 |
| | UNIQA Insurance Group AG | 6.000% | 7/27/46 | EUR | 700 | 686 |
| | Vienna Insurance Group AG Wiener Versicherung Gruppe | 5.500% | 10/9/43 | EUR | 300 | 293 |
| | | | | | | 223,738 |
| Belgium (0.3%) | | | |
| | AG Insurance SA | 3.500% | 6/30/47 | EUR | 3,400 | 2,984 |
| | Ageas SA NV | 3.250% | 7/2/49 | EUR | 5,100 | 4,220 |
| | Anheuser-Busch InBev Finance Inc. | 4.320% | 5/15/47 | CAD | 4,571 | 2,667 |
| | Anheuser-Busch InBev SA NV | 9.750% | 7/30/24 | GBP | 968 | 1,191 |
| | Anheuser-Busch InBev SA NV | 2.875% | 9/25/24 | EUR | 2,306 | 2,271 |
| | Anheuser-Busch InBev SA NV | 4.000% | 9/24/25 | GBP | 5,745 | 6,361 |
| | Anheuser-Busch InBev SA NV | 2.700% | 3/31/26 | EUR | 100 | 96 |
| | Anheuser-Busch InBev SA NV | 1.150% | 1/22/27 | EUR | 8,911 | 8,049 |
| | Anheuser-Busch InBev SA NV | 1.125% | 7/1/27 | EUR | 10,638 | 9,491 |
Total International Bond Index Fund
| | | Coupon | Maturity
Date | Currency | Face
Amount
(000) | Market
Value•
($000) |
| | Anheuser-Busch InBev SA NV | 2.125% | 12/2/27 | EUR | 5,087 | 4,717 |
| | Anheuser-Busch InBev SA NV | 2.000% | 3/17/28 | EUR | 11,734 | 10,745 |
| | Anheuser-Busch InBev SA NV | 1.500% | 4/18/30 | EUR | 461 | 392 |
| | Anheuser-Busch InBev SA NV | 1.650% | 3/28/31 | EUR | 10,558 | 8,871 |
| | Anheuser-Busch InBev SA NV | 2.875% | 4/2/32 | EUR | 5,087 | 4,635 |
| | Anheuser-Busch InBev SA NV | 3.250% | 1/24/33 | EUR | 2,599 | 2,413 |
| | Anheuser-Busch InBev SA NV | 2.000% | 1/23/35 | EUR | 3,541 | 2,805 |
| | Anheuser-Busch InBev SA NV | 2.750% | 3/17/36 | EUR | 9,995 | 8,472 |
| | Anheuser-Busch InBev SA NV | 2.850% | 5/25/37 | GBP | 6,574 | 5,555 |
| | Anheuser-Busch InBev SA NV | 3.700% | 4/2/40 | EUR | 9,527 | 8,618 |
| | Anheuser-Busch InBev Worldwide Inc. | 4.100% | 9/6/27 | AUD | 1,210 | 742 |
| | Argenta Spaarbank NV | 1.000% | 2/6/24 | EUR | 11,800 | 11,266 |
| | Argenta Spaarbank NV | 1.000% | 10/13/26 | EUR | 7,100 | 6,155 |
| | Barry Callebaut Services NV | 2.375% | 5/24/24 | EUR | 1,875 | 1,816 |
| | Belfius Bank SA | 1.750% | 6/24/24 | EUR | 300 | 292 |
| | Belfius Bank SA | 1.000% | 10/26/24 | EUR | 5,000 | 4,706 |
| | Belfius Bank SA | 0.750% | 2/10/25 | EUR | 100 | 94 |
| | Belfius Bank SA | 0.375% | 9/2/25 | EUR | 5,000 | 4,467 |
| | Belfius Bank SA | 0.375% | 2/13/26 | EUR | 3,000 | 2,631 |
| | Belfius Bank SA | 3.125% | 5/11/26 | EUR | 6,000 | 5,572 |
| | Belfius Bank SA | 0.125% | 9/14/26 | EUR | 5,000 | 4,436 |
| | Belfius Bank SA | 0.125% | 2/8/28 | EUR | 6,300 | 5,149 |
| | Belgium ING SA | 1.500% | 5/19/29 | EUR | 5,800 | 5,207 |
| | BNP Paribas Fortis SA | 0.625% | 10/4/25 | EUR | 300 | 278 |
| | BNP Paribas Fortis SA | 0.875% | 3/22/28 | EUR | 5,000 | 4,424 |
| | Brussels Airport Co. NV SA | 1.000% | 5/3/24 | EUR | 4,700 | 4,409 |
| | Cofinimmo SA | 0.875% | 12/2/30 | EUR | 1,500 | 1,024 |
| | Elia Group SA NV | 1.500% | 9/5/28 | EUR | 1,200 | 1,053 |
| | Elia Group SA NV | 2.750% | 12/31/49 | EUR | 1,500 | 1,417 |
| | Elia Transmission Belgium SA | 1.375% | 5/27/24 | EUR | 100 | 96 |
| | Elia Transmission Belgium SA | 1.375% | 1/14/26 | EUR | 9,300 | 8,595 |
| | Elia Transmission Belgium SA | 3.250% | 4/4/28 | EUR | 200 | 193 |
| | Elia Transmission Belgium SA | 3.000% | 4/7/29 | EUR | 300 | 277 |
| | Elia Transmission Belgium SA | 0.875% | 4/28/30 | EUR | 7,200 | 5,708 |
| | Ethias SA | 5.000% | 1/14/26 | EUR | 4,400 | 4,146 |
| | Euroclear Bank SA | 1.250% | 9/30/24 | GBP | 124 | 132 |
| | Euroclear Bank SA | 0.125% | 7/7/25 | EUR | 4,600 | 4,178 |
| | Euroclear Investments SA | 1.125% | 12/7/26 | EUR | 3,000 | 2,709 |
| | FLUVIUS System Operator CVBA | 1.750% | 12/4/26 | EUR | 3,000 | 2,752 |
| | FLUVIUS System Operator CVBA | 0.250% | 6/14/28 | EUR | 1,400 | 1,146 |
| | FLUVIUS System Operator CVBA | 2.875% | 5/7/29 | EUR | 100 | 94 |
| | FLUVIUS System Operator CVBA | 0.250% | 12/2/30 | EUR | 6,700 | 5,034 |
| | FLUVIUS System Operator CVBA | 0.625% | 11/24/31 | EUR | 4,500 | 3,330 |
| | Groupe Bruxelles Lambert NV | 1.875% | 6/19/25 | EUR | 3,000 | 2,839 |
| | Groupe Bruxelles Lambert SA | 1.375% | 5/23/24 | EUR | 800 | 765 |
| | ING Belgium SA | 0.625% | 5/30/25 | EUR | 6,700 | 6,254 |
| | KBC Bank NV | 0.750% | 10/24/27 | EUR | 3,600 | 3,194 |
| | KBC Group NV | 1.125% | 1/25/24 | EUR | 15,100 | 14,470 |
| | KBC Group NV | 1.500% | 3/29/26 | EUR | 4,600 | 4,265 |
| | KBC Group NV | 0.750% | 1/21/28 | EUR | 21,400 | 18,085 |
| | KBC Group NV | 0.125% | 1/14/29 | EUR | 15,100 | 11,882 |
| | Proximus SADP | 2.375% | 4/4/24 | EUR | 1,500 | 1,467 |
| | Solvay SA | 2.750% | 12/2/27 | EUR | 4,100 | 3,779 |
| | VGP NV | 1.625% | 1/17/27 | EUR | 1,900 | 1,342 |
| | VGP NV | 1.500% | 4/8/29 | EUR | 3,300 | 1,934 |
| | | | | | | 268,357 |
| Canada (1.7%) | | | |
| | 407 International Inc. | 3.350% | 5/16/24 | CAD | 1,100 | 790 |
| 3 | 407 International Inc. | 1.800% | 5/22/25 | CAD | 1,377 | 939 |
| | 407 International Inc. | 2.430% | 5/4/27 | CAD | 1,096 | 736 |
| | 407 International Inc. | 3.140% | 3/6/30 | CAD | 2,791 | 1,856 |
| 3 | 407 International Inc. | 2.590% | 5/25/32 | CAD | 1,529 | 937 |
| | 407 International Inc. | 5.750% | 2/14/36 | CAD | 1,017 | 761 |
| | 407 International Inc. | 4.450% | 11/15/41 | CAD | 2,550 | 1,689 |
| | 407 International Inc. | 4.190% | 4/25/42 | CAD | 2,805 | 1,792 |
| | 407 International Inc. | 3.650% | 9/8/44 | CAD | 5,102 | 2,970 |
| | 407 International Inc. | 3.830% | 5/11/46 | CAD | 5,102 | 3,046 |
| | 407 International Inc. | 3.600% | 5/21/47 | CAD | 3,507 | 2,001 |
| | 407 International Inc. | 3.720% | 5/11/48 | CAD | 26 | ��� 15 |
Total International Bond Index Fund
| | | Coupon | Maturity
Date | Currency | Face
Amount
(000) | Market
Value•
($000) |
| | 407 International Inc. | 3.670% | 3/8/49 | CAD | 1,019 | 587 |
| | 407 International Inc. | 2.840% | 3/7/50 | CAD | 2,092 | 1,017 |
| | 55 Ontario School Board Trust | 5.900% | 6/2/33 | CAD | 2,623 | 2,166 |
| | Aeroports de Montreal | 5.170% | 9/17/35 | CAD | 1,848 | 1,348 |
| | Aeroports de Montreal | 5.670% | 10/16/37 | CAD | 946 | 728 |
| | Aeroports de Montreal | 3.030% | 4/21/50 | CAD | 3,962 | 2,026 |
| | Aeroports de Montreal | 3.441% | 4/26/51 | CAD | 2,000 | 1,106 |
| | AIMCo Realty Investors LP | 2.266% | 6/26/24 | CAD | 2,537 | 1,781 |
| | AIMCo Realty Investors LP | 3.367% | 6/1/27 | CAD | 961 | 662 |
| | AIMCo Realty Investors LP | 3.043% | 6/1/28 | CAD | 1,019 | 681 |
| | AIMCo Realty Investors LP | 2.712% | 6/1/29 | CAD | 5,714 | 3,675 |
| | Alberta Powerline LP | 4.065% | 12/1/53 | CAD | 2,445 | 1,460 |
| | Alberta Powerline LP | 4.065% | 3/1/54 | CAD | 529 | 316 |
| | Alectra Inc. | 2.488% | 5/17/27 | CAD | 5,585 | 3,756 |
| | Alectra Inc. | 1.751% | 2/11/31 | CAD | 500 | 294 |
| | Alectra Inc. | 3.958% | 7/30/42 | CAD | 800 | 508 |
| | Alectra Inc. | 3.458% | 4/12/49 | CAD | 1,118 | 640 |
| | Algonquin Power Co. | 4.090% | 2/17/27 | CAD | 1,100 | 770 |
| 3 | Algonquin Power Co. | 4.090% | 2/17/27 | CAD | 481 | 337 |
| | Algonquin Power Co. | 4.600% | 1/29/29 | CAD | 1,155 | 818 |
| | Algonquin Power Co. | 2.850% | 7/15/31 | CAD | 1,196 | 722 |
| | Alimentation Couche-Tard Inc. | 3.056% | 7/26/24 | CAD | 2,209 | 1,563 |
| | Alimentation Couche-Tard Inc. | 3.600% | 6/2/25 | CAD | 3,484 | 2,449 |
| | Alimentation Couche-Tard Inc. | 1.875% | 5/6/26 | EUR | 100 | 91 |
| | Allied Properties REIT | 3.636% | 4/21/25 | CAD | 2,550 | 1,771 |
| | Allied Properties REIT | 1.726% | 2/12/26 | CAD | 1,496 | 959 |
| | Allied Properties REIT | 3.113% | 4/8/27 | CAD | 2,550 | 1,662 |
| | Allied Properties REIT | 3.394% | 8/15/29 | CAD | 1,267 | 786 |
| | Allied Properties REIT | 3.117% | 2/21/30 | CAD | 1,465 | 879 |
| | Allied Properties REIT | 3.095% | 2/6/32 | CAD | 1,496 | 844 |
| | AltaGas Canada Inc. | 3.150% | 4/6/26 | CAD | 925 | 634 |
| | AltaGas Canada Inc. | 4.260% | 12/5/28 | CAD | 1,062 | 738 |
| | AltaGas Ltd. | 1.227% | 3/18/24 | CAD | 3,271 | 2,270 |
| | AltaGas Ltd. | 3.840% | 1/15/25 | CAD | 4,676 | 3,311 |
| | AltaGas Ltd. | 3.980% | 10/4/27 | CAD | 1,525 | 1,048 |
| | AltaGas Ltd. | 2.075% | 5/30/28 | CAD | 1,520 | 935 |
| | AltaGas Ltd. | 4.500% | 8/15/44 | CAD | 1,574 | 917 |
| | AltaGas Ltd. | 4.990% | 10/4/47 | CAD | 863 | 536 |
| | AltaLink LP | 3.668% | 11/6/23 | CAD | 148 | 107 |
| | AltaLink LP | 3.399% | 6/6/24 | CAD | 5,075 | 3,626 |
| | AltaLink LP | 4.872% | 11/15/40 | CAD | 2,604 | 1,857 |
| | AltaLink LP | 4.462% | 11/8/41 | CAD | 1,223 | 827 |
| | AltaLink LP | 3.990% | 6/30/42 | CAD | 1,491 | 943 |
| | AltaLink LP | 4.922% | 9/17/43 | CAD | 1,529 | 1,097 |
| | AltaLink LP | 4.054% | 11/21/44 | CAD | 911 | 577 |
| | AltaLink LP | 4.090% | 6/30/45 | CAD | 813 | 517 |
| | AltaLink LP | 3.717% | 12/3/46 | CAD | 1,648 | 984 |
| | AltaLink LP | 4.446% | 7/11/53 | CAD | 500 | 333 |
| | ARC Resources Ltd. | 2.354% | 3/10/26 | CAD | 1,300 | 868 |
| | ARC Resources Ltd. | 3.465% | 3/10/31 | CAD | 2,153 | 1,356 |
| | Artis REIT | 5.600% | 4/29/25 | CAD | 700 | 495 |
| | Atco Ltd. | 5.500% | 11/1/78 | CAD | 520 | 357 |
| | Bank of Montreal | 2.850% | 3/6/24 | CAD | 7,352 | 5,235 |
| | Bank of Montreal | 2.280% | 7/29/24 | CAD | 8,713 | 6,094 |
| | Bank of Montreal | 2.700% | 9/11/24 | CAD | 7,124 | 5,025 |
| | Bank of Montreal | 2.370% | 2/3/25 | CAD | 6,123 | 4,229 |
| | Bank of Montreal | 4.609% | 9/10/25 | CAD | 2,550 | 1,857 |
| | Bank of Montreal | 1.758% | 3/10/26 | CAD | 3,485 | 2,293 |
| | Bank of Montreal | 1.000% | 4/5/26 | EUR | 13,440 | 12,395 |
| | Bank of Montreal | 1.551% | 5/28/26 | CAD | 3,742 | 2,426 |
| | Bank of Montreal | 1.000% | 9/9/26 | GBP | 2,800 | 2,697 |
| | Bank of Montreal | 2.700% | 12/9/26 | CAD | 5,102 | 3,448 |
| | Bank of Montreal | 3.650% | 4/1/27 | CAD | 6,236 | 4,297 |
| | Bank of Montreal | 4.309% | 6/1/27 | CAD | 7,533 | 5,332 |
| | Bank of Montreal | 3.190% | 3/1/28 | CAD | 8,939 | 6,058 |
| | Bank of Montreal | 0.050% | 6/8/29 | EUR | 14,781 | 11,903 |
| | Bank of Montreal | 2.880% | 9/17/29 | CAD | 950 | 662 |
| | Bank of Montreal | 2.077% | 6/17/30 | CAD | 4,184 | 2,795 |
| | Bank of Montreal | 1.928% | 7/22/31 | CAD | 5,613 | 3,576 |
Total International Bond Index Fund
| | | Coupon | Maturity
Date | Currency | Face
Amount
(000) | Market
Value•
($000) |
| | Bank of Nova Scotia | 0.250% | 1/11/24 | EUR | 5,087 | 4,880 |
| | Bank of Nova Scotia | 2.290% | 6/28/24 | CAD | 7,492 | 5,271 |
| | Bank of Nova Scotia | 2.490% | 9/23/24 | CAD | 8,933 | 6,245 |
| | Bank of Nova Scotia | 1.950% | 1/10/25 | CAD | 4,464 | 3,058 |
| | Bank of Nova Scotia | 2.160% | 2/3/25 | CAD | 5,612 | 3,855 |
| | Bank of Nova Scotia | 0.010% | 3/18/25 | EUR | 6,539 | 6,021 |
| | Bank of Nova Scotia | 0.125% | 9/4/26 | EUR | 5,938 | 5,047 |
| | Bank of Nova Scotia | 1.850% | 11/2/26 | CAD | 9,206 | 5,949 |
| | Bank of Nova Scotia | 2.620% | 12/2/26 | CAD | 7,654 | 5,157 |
| | Bank of Nova Scotia | 0.010% | 1/14/27 | EUR | 5,087 | 4,421 |
| | Bank of Nova Scotia | 2.950% | 3/8/27 | CAD | 13,397 | 8,971 |
| | Bank of Nova Scotia | 1.400% | 11/1/27 | CAD | 6,029 | 3,696 |
| | Bank of Nova Scotia | 0.010% | 12/15/27 | EUR | 28,903 | 24,306 |
| | Bank of Nova Scotia | 3.100% | 2/2/28 | CAD | 7,109 | 4,804 |
| | Bank of Nova Scotia | 3.890% | 1/18/29 | CAD | 2,476 | 1,778 |
| | Bank of Nova Scotia | 2.836% | 7/3/29 | CAD | 4,816 | 3,371 |
| | Bank of Nova Scotia | 3.934% | 5/3/32 | CAD | 7,280 | 4,913 |
| | Bankers Hall LP | 4.377% | 11/20/23 | CAD | 84 | 61 |
| | BCI QuadReal Realty | 1.680% | 3/3/25 | CAD | 1,019 | 697 |
| | BCI QuadReal Realty | 1.747% | 7/24/30 | CAD | 2,274 | 1,326 |
| | bcIMC Realty Corp. | 2.840% | 6/3/25 | CAD | 3,573 | 2,484 |
| | bcIMC Realty Corp. | 3.000% | 3/31/27 | CAD | 1,701 | 1,140 |
| | Bell Telephone Co. of Canada or Bell Canada | 2.700% | 2/27/24 | CAD | 10,088 | 7,172 |
| | Bell Telephone Co. of Canada or Bell Canada | 2.750% | 1/29/25 | CAD | 5,487 | 3,832 |
| | Bell Telephone Co. of Canada or Bell Canada | 3.350% | 3/12/25 | CAD | 6,735 | 4,738 |
| | Bell Telephone Co. of Canada or Bell Canada | 3.550% | 3/2/26 | CAD | 1,529 | 1,072 |
| | Bell Telephone Co. of Canada or Bell Canada | 2.900% | 8/12/26 | CAD | 1,529 | 1,036 |
| | Bell Telephone Co. of Canada or Bell Canada | 3.800% | 8/21/28 | CAD | 1,529 | 1,043 |
| | Bell Telephone Co. of Canada or Bell Canada | 2.900% | 9/10/29 | CAD | 2,550 | 1,621 |
| | Bell Telephone Co. of Canada or Bell Canada | 2.500% | 5/14/30 | CAD | 7,484 | 4,540 |
| | Bell Telephone Co. of Canada or Bell Canada | 3.000% | 3/17/31 | CAD | 3,800 | 2,345 |
| | Bell Telephone Co. of Canada or Bell Canada | 7.850% | 4/2/31 | CAD | 2,550 | 2,129 |
| | Bell Telephone Co. of Canada or Bell Canada | 4.750% | 9/29/44 | CAD | 2,086 | 1,315 |
| | Bell Telephone Co. of Canada or Bell Canada | 4.350% | 12/18/45 | CAD | 2,434 | 1,438 |
| | Bell Telephone Co. of Canada or Bell Canada | 4.450% | 2/27/47 | CAD | 4,132 | 2,470 |
| | Bell Telephone Co. of Canada or Bell Canada | 3.500% | 9/30/50 | CAD | 6,357 | 3,161 |
| | Bell Telephone Co. of Canada or Bell Canada | 4.050% | 3/17/51 | CAD | 3,106 | 1,725 |
| | Bridging North America GP | 4.341% | 8/31/53 | CAD | 1,045 | 585 |
| | British Columbia Ferry Services Inc. | 4.702% | 10/23/43 | CAD | 2,859 | 1,988 |
| | British Columbia Ferry Services Inc. | 2.794% | 10/15/49 | CAD | 2,550 | 1,253 |
| | Brookfield Asset Management Inc. | 5.040% | 3/8/24 | CAD | 761 | 558 |
| | Brookfield Asset Management Inc. | 4.820% | 1/28/26 | CAD | 6,855 | 4,938 |
| | Brookfield Asset Management Inc. | 3.800% | 3/16/27 | CAD | 2,160 | 1,491 |
| | Brookfield Asset Management Inc. | 5.950% | 6/14/35 | CAD | 600 | 445 |
| | Brookfield Infrastructure Finance ULC | 3.315% | 2/22/24 | CAD | 2,537 | 1,811 |
| | Brookfield Infrastructure Finance ULC | 4.193% | 9/11/28 | CAD | 2,166 | 1,495 |
| | Brookfield Infrastructure Finance ULC | 3.410% | 10/9/29 | CAD | 2,499 | 1,619 |
| | Brookfield Infrastructure Finance ULC | 2.855% | 9/1/32 | CAD | 1,819 | 1,054 |
| | Brookfield Infrastructure Finance ULC | 5.439% | 4/25/34 | CAD | 1,402 | 992 |
| | Brookfield Infrastructure Finance ULC | 5.789% | 4/25/52 | CAD | 930 | 644 |
| | Brookfield Renewable Partners ULC | 3.752% | 6/2/25 | CAD | 2,704 | 1,912 |
| | Brookfield Renewable Partners ULC | 3.630% | 1/15/27 | CAD | 1,990 | 1,371 |
| | Brookfield Renewable Partners ULC | 4.250% | 1/15/29 | CAD | 500 | 349 |
| | Brookfield Renewable Partners ULC | 3.380% | 1/15/30 | CAD | 2,805 | 1,827 |
| | Brookfield Renewable Partners ULC | 4.290% | 11/5/49 | CAD | 1,990 | 1,182 |
| | Brookfield Renewable Partners ULC | 3.330% | 8/13/50 | CAD | 896 | 443 |
| | Bruce Power LP | 3.000% | 6/21/24 | CAD | 1,013 | 719 |
| | Bruce Power LP | 3.969% | 6/23/26 | CAD | 2,550 | 1,805 |
| | Bruce Power LP | 2.680% | 12/21/28 | CAD | 1,200 | 772 |
| | Bruce Power LP | 4.010% | 6/21/29 | CAD | 1,403 | 967 |
| | Bruce Power LP | 4.000% | 6/21/30 | CAD | 2,021 | 1,369 |
| | Bruce Power LP | 4.132% | 6/21/33 | CAD | 2,245 | 1,479 |
| | Bruce Power LP | 4.746% | 6/21/49 | CAD | 2,005 | 1,274 |
| | Calgary Airport Authority | 3.199% | 10/7/36 | CAD | 6,901 | 4,077 |
| | Calgary Airport Authority | 3.341% | 10/7/38 | CAD | 2,452 | 1,439 |
| | Cameco Corp. | 4.190% | 6/24/24 | CAD | 1,396 | 1,004 |
| | Cameco Corp. | 2.950% | 10/21/27 | CAD | 1,622 | 1,066 |
| | Canadian Imperial Bank of Commerce | 3.290% | 1/15/24 | CAD | 3,298 | 2,367 |
| | Canadian Imperial Bank of Commerce | 0.375% | 5/3/24 | EUR | 9,726 | 9,152 |
Total International Bond Index Fund
| | | Coupon | Maturity
Date | Currency | Face
Amount
(000) | Market
Value•
($000) |
| | Canadian Imperial Bank of Commerce | 2.350% | 8/28/24 | CAD | 4,314 | 3,012 |
| | Canadian Imperial Bank of Commerce | 2.750% | 3/7/25 | CAD | 13,299 | 9,232 |
| | Canadian Imperial Bank of Commerce | 2.000% | 4/17/25 | CAD | 5,102 | 3,468 |
| | Canadian Imperial Bank of Commerce | 3.300% | 5/26/25 | CAD | 13,217 | 9,339 |
| | Canadian Imperial Bank of Commerce | 1.100% | 1/19/26 | CAD | 3,742 | 2,413 |
| | Canadian Imperial Bank of Commerce | 1.700% | 7/15/26 | CAD | 5,301 | 3,432 |
| | Canadian Imperial Bank of Commerce | 2.250% | 1/7/27 | CAD | 6,603 | 4,303 |
| | Canadian Imperial Bank of Commerce | 4.950% | 6/29/27 | CAD | 4,900 | 3,552 |
| | Canadian Imperial Bank of Commerce | 0.010% | 4/30/29 | EUR | 27,476 | 22,128 |
| | Canadian Imperial Bank of Commerce | 2.010% | 7/21/30 | CAD | 10,650 | 7,062 |
| | Canadian Imperial Bank of Commerce | 1.960% | 4/21/31 | CAD | 6,511 | 4,186 |
| | Canadian Imperial Bank of Commerce | 4.200% | 4/7/32 | CAD | 3,348 | 2,285 |
| | Canadian National Railway Co. | 2.800% | 9/22/25 | CAD | 2,549 | 1,775 |
| | Canadian National Railway Co. | 3.200% | 7/31/28 | CAD | 1,403 | 955 |
| | Canadian National Railway Co. | 3.600% | 8/1/47 | CAD | 5,098 | 2,911 |
| | Canadian National Railway Co. | 3.600% | 7/31/48 | CAD | 800 | 454 |
| | Canadian National Railway Co. | 3.600% | 2/8/49 | CAD | 1,432 | 813 |
| | Canadian National Railway Co. | 3.050% | 2/8/50 | CAD | 1,195 | 605 |
| | Canadian Natural Resources Ltd. | 3.550% | 6/3/24 | CAD | 5,075 | 3,662 |
| | Canadian Natural Resources Ltd. | 2.500% | 1/17/28 | CAD | 2,471 | 1,623 |
| | Canadian Natural Resources Ltd. | 4.850% | 5/30/47 | CAD | 1,166 | 726 |
| | Canadian Pacific Railway Co. | 1.589% | 11/24/23 | CAD | 1,116 | 790 |
| | Canadian Pacific Railway Co. | 2.540% | 2/28/28 | CAD | 6,865 | 4,463 |
| | Canadian Pacific Railway Co. | 3.150% | 3/13/29 | CAD | 2,618 | 1,723 |
| | Canadian Pacific Railway Co. | 6.450% | 11/17/39 | CAD | 892 | 726 |
| | Canadian Pacific Railway Co. | 3.050% | 3/9/50 | CAD | 887 | 435 |
| | Canadian Tire Corp. Ltd. | 6.570% | 2/24/34 | CAD | 441 | 333 |
| | Canadian Tire Corp. Ltd. | 5.610% | 9/4/35 | CAD | 1,016 | 703 |
| | Canadian Utilities Ltd. | 4.851% | 6/3/52 | CAD | 1,380 | 940 |
| | Canadian Western Bank | 2.597% | 9/6/24 | CAD | 2,029 | 1,414 |
| | Canadian Western Bank | 2.606% | 1/30/25 | CAD | 3,367 | 2,319 |
| | Canadian Western Bank | 3.859% | 4/21/25 | CAD | 2,200 | 1,552 |
| | Canadian Western Bank | 1.926% | 4/16/26 | CAD | 1,860 | 1,212 |
| | Canadian Western Bank | 5.146% | 9/2/27 | CAD | 1,500 | 1,081 |
| | Canadian Western Bank | 1.818% | 12/16/27 | CAD | 1,496 | 919 |
| | Capital City Link General Partnership | 4.386% | 3/31/46 | CAD | 329 | 213 |
| | Capital Power Corp. | 4.284% | 9/18/24 | CAD | 1,269 | 912 |
| | Capital Power Corp. | 4.986% | 1/23/26 | CAD | 854 | 617 |
| | Capital Power Corp. | 4.424% | 2/8/30 | CAD | 1,069 | 731 |
| | Capital Power Corp. | 3.147% | 10/1/32 | CAD | 1,434 | 841 |
| | CCL Industries Inc. | 3.864% | 4/13/28 | CAD | 825 | 564 |
| | Cenovus Energy Inc. | 3.600% | 3/10/27 | CAD | 3,125 | 2,175 |
| | Cenovus Energy Inc. | 3.500% | 2/7/28 | CAD | 4,349 | 2,972 |
| | Central 1 Credit Union | 2.584% | 12/6/23 | CAD | 2,971 | 2,112 |
| | Central 1 Credit Union | 2.391% | 6/30/31 | CAD | 1,496 | 965 |
| | CGI Inc. | 2.100% | 9/18/28 | CAD | 6,361 | 3,948 |
| | Chartwell Retirement Residences | 4.211% | 4/28/25 | CAD | 509 | 356 |
| | Choice Properties REIT | 3.556% | 9/9/24 | CAD | 2,046 | 1,449 |
| | Choice Properties REIT | 3.546% | 1/10/25 | CAD | 4,082 | 2,868 |
| | Choice Properties REIT | 2.848% | 5/21/27 | CAD | 3,551 | 2,319 |
| | Choice Properties REIT | 4.178% | 3/8/28 | CAD | 2,550 | 1,742 |
| | Choice Properties REIT | 3.532% | 6/11/29 | CAD | 3,623 | 2,340 |
| | Choice Properties REIT | 2.981% | 3/4/30 | CAD | 1,496 | 917 |
| | Choice Properties REIT | 6.003% | 6/24/32 | CAD | 900 | 663 |
| | CI Financial Corp. | 3.215% | 7/22/24 | CAD | 1,488 | 1,046 |
| | CI Financial Corp. | 3.759% | 5/26/25 | CAD | 1,529 | 1,061 |
| | CI Financial Corp. | 3.904% | 9/27/27 | CAD | 839 | 554 |
| | Clover LP | 4.216% | 3/31/34 | CAD | 922 | 645 |
| | Clover LP | 4.216% | 6/30/34 | CAD | 878 | 617 |
| | Cogeco Communications Inc. | 2.991% | 9/22/31 | CAD | 1,796 | 1,073 |
| | Concordia University | 6.550% | 9/2/42 | CAD | 1,529 | 1,333 |
| | Co-operators Financial Services Ltd. | 3.327% | 5/13/30 | CAD | 835 | 514 |
| 1 | Cordelio Amalco GP I | 4.087% | 6/30/34 | CAD | 2,101 | 1,442 |
| | Crombie REIT | 3.677% | 8/26/26 | CAD | 1,529 | 1,038 |
| | Crombie REIT | 3.917% | 6/21/27 | CAD | 917 | 621 |
| | Crombie REIT | 2.686% | 3/31/28 | CAD | 892 | 558 |
| | Crombie REIT | 3.211% | 10/9/30 | CAD | 481 | 288 |
| | Crosslinx Transit Solutions GP | 4.651% | 9/30/46 | CAD | 1,552 | 992 |
| | CSS FSCC Partnership | 6.915% | 7/31/42 | CAD | 19 | 16 |
Total International Bond Index Fund
| | | Coupon | Maturity
Date | Currency | Face
Amount
(000) | Market
Value•
($000) |
| | CT REIT | 3.527% | 6/9/25 | CAD | 2,346 | 1,632 |
| | CT REIT | 3.469% | 6/16/27 | CAD | 678 | 453 |
| | CT REIT | 3.029% | 2/5/29 | CAD | 700 | 440 |
| | CT REIT | 2.371% | 1/6/31 | CAD | 1,019 | 575 |
| | CU Inc. | 4.543% | 10/24/41 | CAD | 1,019 | 686 |
| | CU Inc. | 3.805% | 9/10/42 | CAD | 3,591 | 2,175 |
| | CU Inc. | 4.722% | 9/9/43 | CAD | 3,529 | 2,423 |
| | CU Inc. | 4.085% | 9/2/44 | CAD | 4,055 | 2,534 |
| | CU Inc. | 3.964% | 7/27/45 | CAD | 1,529 | 936 |
| | CU Inc. | 3.763% | 11/19/46 | CAD | 765 | 451 |
| | CU Inc. | 3.548% | 11/22/47 | CAD | 1,267 | 716 |
| | CU Inc. | 3.950% | 11/23/48 | CAD | 493 | 300 |
| | CU Inc. | 2.963% | 9/7/49 | CAD | 2,296 | 1,160 |
| | CU Inc. | 3.174% | 9/5/51 | CAD | 823 | 424 |
| | CU Inc. | 4.558% | 11/7/53 | CAD | 300 | 199 |
| | CU Inc. | 4.211% | 10/29/55 | CAD | 7,654 | 4,741 |
| | CU Inc. | 4.593% | 10/24/61 | CAD | 330 | 216 |
| | Dollarama Inc. | 3.550% | 11/6/23 | CAD | 2,268 | 1,640 |
| | Dollarama Inc. | 1.871% | 7/8/26 | CAD | 1,496 | 979 |
| | Dollarama Inc. | 1.505% | 9/20/27 | CAD | 1,019 | 632 |
| | Dollarama Inc. | 2.443% | 7/9/29 | CAD | 2,189 | 1,357 |
| | Dream Industrial REIT | 1.662% | 12/22/25 | CAD | 1,496 | 967 |
| | Dream Industrial REIT | 2.539% | 12/7/26 | CAD | 900 | 583 |
| | Dream Industrial REIT | 2.057% | 6/17/27 | CAD | 2,095 | 1,311 |
| | Edmonton Regional Airports Authority | 7.214% | 11/1/30 | CAD | 601 | 461 |
| | Enbridge Gas Inc. | 3.150% | 8/22/24 | CAD | 3,288 | 2,343 |
| | Enbridge Gas Inc. | 3.310% | 9/11/25 | CAD | 1,652 | 1,162 |
| | Enbridge Gas Inc. | 2.810% | 6/1/26 | CAD | 1,047 | 720 |
| | Enbridge Gas Inc. | 2.500% | 8/5/26 | CAD | 1,016 | 689 |
| | Enbridge Gas Inc. | 2.900% | 4/1/30 | CAD | 2,550 | 1,652 |
| | Enbridge Gas Inc. | 2.350% | 9/15/31 | CAD | 3,000 | 1,797 |
| | Enbridge Gas Inc. | 4.150% | 8/17/32 | CAD | 2,200 | 1,515 |
| | Enbridge Gas Inc. | 4.880% | 6/21/41 | CAD | 1,759 | 1,229 |
| | Enbridge Gas Inc. | 4.200% | 6/2/44 | CAD | 2,153 | 1,364 |
| | Enbridge Gas Inc. | 4.000% | 8/22/44 | CAD | 1,916 | 1,177 |
| | Enbridge Gas Inc. | 3.800% | 6/1/46 | CAD | 1,529 | 903 |
| | Enbridge Gas Inc. | 3.590% | 11/22/47 | CAD | 917 | 519 |
| | Enbridge Gas Inc. | 3.510% | 11/29/47 | CAD | 2,391 | 1,333 |
| | Enbridge Gas Inc. | 3.010% | 8/9/49 | CAD | 1,529 | 768 |
| | Enbridge Gas Inc. | 3.650% | 4/1/50 | CAD | 2,172 | 1,235 |
| | Enbridge Gas Inc. | 4.950% | 11/22/50 | CAD | 1,377 | 973 |
| | Enbridge Gas Inc. | 3.200% | 9/15/51 | CAD | 1,871 | 966 |
| | Enbridge Gas Inc. | 4.550% | 8/17/52 | CAD | 1,200 | 793 |
| | Enbridge Inc. | 3.950% | 11/19/24 | CAD | 1,521 | 1,087 |
| | Enbridge Inc. | 2.440% | 6/2/25 | CAD | 1,496 | 1,023 |
| | Enbridge Inc. | 3.200% | 6/8/27 | CAD | 7,547 | 5,063 |
| | Enbridge Inc. | 2.990% | 10/3/29 | CAD | 3,666 | 2,309 |
| | Enbridge Inc. | 3.100% | 9/21/33 | CAD | 4,490 | 2,602 |
| | Enbridge Inc. | 4.240% | 8/27/42 | CAD | 2,322 | 1,319 |
| | Enbridge Inc. | 4.570% | 3/11/44 | CAD | 3,107 | 1,834 |
| | Enbridge Inc. | 4.870% | 11/21/44 | CAD | 2,142 | 1,316 |
| | Enbridge Inc. | 4.100% | 9/21/51 | CAD | 1,497 | 795 |
| | Enbridge Pipelines Inc. | 3.450% | 9/29/25 | CAD | 2,669 | 1,867 |
| | Enbridge Pipelines Inc. | 3.000% | 8/10/26 | CAD | 1,800 | 1,223 |
| | Enbridge Pipelines Inc. | 3.520% | 2/22/29 | CAD | 2,369 | 1,580 |
| | Enbridge Pipelines Inc. | 2.820% | 5/12/31 | CAD | 2,093 | 1,264 |
| | Enbridge Pipelines Inc. | 4.550% | 8/17/43 | CAD | 508 | 304 |
| | Enbridge Pipelines Inc. | 4.550% | 9/29/45 | CAD | 2,856 | 1,696 |
| | Enbridge Pipelines Inc. | 4.130% | 8/9/46 | CAD | 2,548 | 1,410 |
| | Enbridge Pipelines Inc. | 4.330% | 2/22/49 | CAD | 2,079 | 1,175 |
| | Enbridge Pipelines Inc. | 4.200% | 5/12/51 | CAD | 1,651 | 906 |
| | Energir Inc. | 2.100% | 4/16/27 | CAD | 737 | 484 |
| | Energir Inc. | 3.530% | 5/16/47 | CAD | 1,085 | 621 |
| | Energir LP | 3.040% | 2/9/32 | CAD | 2,516 | 1,602 |
| | ENMAX Corp. | 3.836% | 6/5/28 | CAD | 946 | 639 |
| | ENMAX Corp. | 3.876% | 10/18/29 | CAD | 2,443 | 1,616 |
| | EPCOR Utilities Inc. | 4.550% | 2/28/42 | CAD | 1,522 | 1,030 |
| | EPCOR Utilities Inc. | 3.554% | 11/27/47 | CAD | 3,571 | 2,034 |
| | EPCOR Utilities Inc. | 3.949% | 11/26/48 | CAD | 465 | 283 |
Total International Bond Index Fund
| | | Coupon | Maturity
Date | Currency | Face
Amount
(000) | Market
Value•
($000) |
| | EPCOR Utilities Inc. | 3.106% | 7/8/49 | CAD | 1,272 | 661 |
| | EPCOR Utilities Inc. | 2.899% | 5/19/50 | CAD | 961 | 477 |
| | EPCOR Utilities Inc. | 3.287% | 6/28/51 | CAD | 747 | 398 |
| | EPCOR Utilities Inc. | 4.725% | 9/2/52 | CAD | 2,000 | 1,375 |
| | Equitable Bank | 1.983% | 5/9/24 | CAD | 2,960 | 2,049 |
| | Equitable Bank | 1.939% | 3/10/25 | CAD | 1,496 | 1,001 |
| | Equitable Bank | 1.876% | 11/26/25 | CAD | 1,019 | 663 |
| | Fair Hydro Trust | 3.357% | 5/15/35 | CAD | 3,609 | 2,390 |
| | Fairfax Financial Holdings Ltd. | 4.950% | 3/3/25 | CAD | 2,071 | 1,490 |
| | Fairfax Financial Holdings Ltd. | 4.700% | 12/16/26 | CAD | 2,550 | 1,788 |
| | Fairfax Financial Holdings Ltd. | 4.250% | 12/6/27 | CAD | 2,157 | 1,465 |
| | Fairfax Financial Holdings Ltd. | 4.230% | 6/14/29 | CAD | 1,195 | 790 |
| | Fairfax Financial Holdings Ltd. | 3.950% | 3/3/31 | CAD | 3,172 | 1,969 |
| | Federated Co-Operatives Ltd. | 3.917% | 6/17/25 | CAD | 908 | 639 |
| | Federation des Caisses Desjardins du Quebec | 2.417% | 10/4/24 | CAD | 6,580 | 4,585 |
| | Federation des Caisses Desjardins du Quebec | 0.010% | 9/24/25 | EUR | 21,713 | 19,685 |
| | Federation des Caisses Desjardins du Quebec | 1.093% | 1/21/26 | CAD | 2,325 | 1,497 |
| | Federation des Caisses Desjardins du Quebec | 1.587% | 9/10/26 | CAD | 1,100 | 707 |
| | Federation des Caisses Desjardins du Quebec | 4.407% | 5/19/27 | CAD | 3,900 | 2,759 |
| | Federation des Caisses Desjardins du Quebec | 2.856% | 5/26/30 | CAD | 2,805 | 1,910 |
| | Federation des Caisses Desjardins du Quebec | 1.992% | 5/28/31 | CAD | 4,341 | 2,777 |
| | Federation des Caisses Desjardins du Quebec | 5.035% | 8/23/32 | CAD | 3,900 | 2,744 |
| | First Capital REIT | 4.790% | 8/30/24 | CAD | 2,529 | 1,806 |
| | First Capital REIT | 4.323% | 7/31/25 | CAD | 5,102 | 3,544 |
| | First Capital REIT | 3.753% | 7/12/27 | CAD | 1,553 | 1,013 |
| | First National Financial Corp. | 2.961% | 11/17/25 | CAD | 509 | 340 |
| | Fortis Inc. | 2.180% | 5/15/28 | CAD | 3,068 | 1,951 |
| | Fortis Inc. | 4.431% | 5/31/29 | CAD | 3,100 | 2,195 |
| | FortisAlberta Inc. | 6.220% | 10/31/34 | CAD | 52 | 41 |
| | FortisAlberta Inc. | 3.672% | 9/9/47 | CAD | 2,136 | 1,237 |
| | FortisAlberta Inc. | 3.734% | 9/18/48 | CAD | 100 | 58 |
| | FortisAlberta Inc. | 2.632% | 6/8/51 | CAD | 748 | 345 |
| | FortisBC Energy Inc. | 6.500% | 5/1/34 | CAD | 5,102 | 4,164 |
| | FortisBC Energy Inc. | 6.050% | 2/15/38 | CAD | 5,102 | 4,079 |
| | FortisBC Inc. | 4.000% | 10/28/44 | CAD | 1,071 | 647 |
| | Gibson Energy Inc. | 2.450% | 7/14/25 | CAD | 917 | 622 |
| | Gibson Energy Inc. | 2.850% | 7/14/27 | CAD | 1,321 | 863 |
| | Gibson Energy Inc. | 3.600% | 9/17/29 | CAD | 1,892 | 1,223 |
| | Granite REIT Holdings LP | 3.873% | 11/30/23 | CAD | 1,612 | 1,161 |
| | Granite REIT Holdings LP | 3.062% | 6/4/27 | CAD | 1,949 | 1,285 |
| | Granite REIT Holdings LP | 2.194% | 8/30/28 | CAD | 1,496 | 912 |
| | Granite REIT Holdings LP | 2.378% | 12/18/30 | CAD | 2,028 | 1,158 |
| | Greater Toronto Airports Authority | 1.540% | 5/3/28 | CAD | 3,156 | 1,980 |
| | Greater Toronto Airports Authority | 2.730% | 4/3/29 | CAD | 4,609 | 3,035 |
| | Greater Toronto Airports Authority | 3.260% | 6/1/37 | CAD | 976 | 580 |
| | Greater Toronto Airports Authority | 2.750% | 10/17/39 | CAD | 3,889 | 2,089 |
| | Greater Toronto Airports Authority | 5.300% | 2/25/41 | CAD | 1,581 | 1,183 |
| | Greater Toronto Airports Authority | 5.300% | 2/25/41 | CAD | 2,550 | 1,736 |
| | Greater Toronto Airports Authority | 3.150% | 10/5/51 | CAD | 1,100 | 581 |
| | Great-West Lifeco Inc. | 1.750% | 12/7/26 | EUR | 400 | 360 |
| | Great-West Lifeco Inc. | 2.379% | 5/14/30 | CAD | 4,864 | 2,961 |
| | Great-West Lifeco Inc. | 6.670% | 3/21/33 | CAD | 1,015 | 822 |
| | Great-West Lifeco Inc. | 5.998% | 11/16/39 | CAD | 5,612 | 4,340 |
| | H&R REIT | 3.369% | 1/30/24 | CAD | 766 | 544 |
| | H&R REIT | 4.071% | 6/16/25 | CAD | 1,100 | 768 |
| | H&R REIT | 2.906% | 6/2/26 | CAD | 2,550 | 1,684 |
| | H&R REIT | 2.633% | 2/19/27 | CAD | 148 | 95 |
| | Halifax International Airport Authority | 5.503% | 7/19/41 | CAD | 152 | 112 |
| | Honda Canada Finance Inc. | 2.500% | 6/4/24 | CAD | 1,484 | 1,045 |
| | Honda Canada Finance Inc. | 3.444% | 5/23/25 | CAD | 2,189 | 1,537 |
| | Honda Canada Finance Inc. | 1.337% | 3/17/26 | CAD | 1,885 | 1,218 |
| | Honda Canada Finance Inc. | 1.711% | 9/28/26 | CAD | 1,494 | 960 |
| | Honda Canada Finance Inc. | 1.646% | 2/25/28 | CAD | 2,328 | 1,430 |
| | Hospital for Sick Children | 5.217% | 12/16/49 | CAD | 550 | 429 |
| | Hospital for Sick Children | 3.416% | 12/7/57 | CAD | 1,346 | 760 |
| | Hospital Infrastructure Partners NOH Partnership | 5.439% | 1/31/45 | CAD | 2,897 | 2,127 |
| | HSBC Bank Canada | 3.403% | 3/24/25 | CAD | 4,092 | 2,881 |
| | HSBC Bank Canada | 1.782% | 5/20/26 | CAD | 5,791 | 3,781 |
| | HSBC Bank Canada | 0.010% | 9/14/26 | EUR | 18,700 | 16,450 |
Total International Bond Index Fund
| | | Coupon | Maturity
Date | Currency | Face
Amount
(000) | Market
Value•
($000) |
| | HSBC Bank Canada | 1.500% | 9/15/27 | EUR | 10,300 | 9,411 |
| | Hydro One Inc. | 2.540% | 4/5/24 | CAD | 1,041 | 740 |
| | Hydro One Inc. | 2.970% | 6/26/25 | CAD | 183 | 128 |
| | Hydro One Inc. | 2.770% | 2/24/26 | CAD | 5,000 | 3,458 |
| | Hydro One Inc. | 3.020% | 4/5/29 | CAD | 1,939 | 1,301 |
| | Hydro One Inc. | 7.350% | 6/3/30 | CAD | 1,019 | 856 |
| | Hydro One Inc. | 1.690% | 1/16/31 | CAD | 3,000 | 1,754 |
| | Hydro One Inc. | 2.230% | 9/17/31 | CAD | 3,246 | 1,950 |
| | Hydro One Inc. | 6.930% | 6/1/32 | CAD | 578 | 484 |
| | Hydro One Inc. | 5.360% | 5/20/36 | CAD | 509 | 379 |
| | Hydro One Inc. | 4.890% | 3/13/37 | CAD | 2,550 | 1,810 |
| | Hydro One Inc. | 5.490% | 7/16/40 | CAD | 1,798 | 1,366 |
| | Hydro One Inc. | 4.390% | 9/26/41 | CAD | 2,610 | 1,735 |
| | Hydro One Inc. | 4.590% | 10/9/43 | CAD | 2,805 | 1,895 |
| | Hydro One Inc. | 3.910% | 2/23/46 | CAD | 1,633 | 993 |
| | Hydro One Inc. | 5.000% | 10/19/46 | CAD | 1,019 | 731 |
| | Hydro One Inc. | 3.720% | 11/18/47 | CAD | 1,734 | 1,017 |
| | Hydro One Inc. | 3.630% | 6/25/49 | CAD | 4,653 | 2,702 |
| | Hydro One Inc. | 2.710% | 2/28/50 | CAD | 1,713 | 817 |
| | Hydro One Inc. | 3.640% | 4/5/50 | CAD | 498 | 290 |
| | Hydro One Inc. | 3.100% | 9/15/51 | CAD | 2,170 | 1,115 |
| | Hydro One Inc. | 4.000% | 12/22/51 | CAD | 1,023 | 631 |
| | Hydro One Inc. | 3.790% | 7/31/62 | CAD | 1,019 | 571 |
| | Hydro One Ltd. | 1.410% | 10/15/27 | CAD | 5,859 | 3,684 |
| | Hydro Ottawa Holding Inc. | 3.991% | 5/14/43 | CAD | 1,071 | 649 |
| | Hyundai Capital Canada Inc. | 2.008% | 5/12/26 | CAD | 1,996 | 1,288 |
| | Hyundai Capital Canada Inc. | 3.196% | 2/16/27 | CAD | 1,674 | 1,103 |
| | iA Financial Corp Inc. | 3.187% | 2/25/32 | CAD | 1,700 | 1,129 |
| | iA Financial Corp. Inc. | 3.072% | 9/24/31 | CAD | 1,529 | 1,020 |
| | IGM Financial Inc. | 3.440% | 1/26/27 | CAD | 1,986 | 1,355 |
| | IGM Financial Inc. | 4.560% | 1/25/47 | CAD | 459 | 291 |
| | IGM Financial Inc. | 4.115% | 12/9/47 | CAD | 3,104 | 1,828 |
| | IGM Financial Inc. | 4.174% | 7/13/48 | CAD | 500 | 297 |
| | IGM Financial Inc. | 4.206% | 3/21/50 | CAD | 713 | 427 |
| | Independent Order of Foresters | 2.885% | 10/15/35 | CAD | 483 | 286 |
| | InPower BC General Partnership | 4.471% | 3/31/33 | CAD | 2,172 | 1,533 |
| | Intact Financial Corp. | 1.207% | 5/21/24 | CAD | 1,041 | 720 |
| | Intact Financial Corp. | 3.770% | 3/2/26 | CAD | 1,211 | 849 |
| | Intact Financial Corp. | 2.850% | 6/7/27 | CAD | 1,179 | 787 |
| | Intact Financial Corp. | 2.179% | 5/18/28 | CAD | 1,800 | 1,139 |
| | Intact Financial Corp. | 1.928% | 12/16/30 | CAD | 3,776 | 2,179 |
| | Intact Financial Corp. | 6.400% | 11/23/39 | CAD | 70 | 56 |
| | Intact Financial Corp. | 5.160% | 6/16/42 | CAD | 1,520 | 1,063 |
| | Intact Financial Corp. | 2.954% | 12/16/50 | CAD | 1,254 | 596 |
| | Integrated Team Solutions SJHC Partnership | 5.946% | 11/30/42 | CAD | 68 | 52 |
| | Inter Pipeline Ltd. | 2.734% | 4/18/24 | CAD | 1,390 | 980 |
| | Inter Pipeline Ltd. | 3.173% | 3/24/25 | CAD | 844 | 587 |
| | Inter Pipeline Ltd. | 3.484% | 12/16/26 | CAD | 1,675 | 1,129 |
| | Inter Pipeline Ltd. | 4.232% | 6/1/27 | CAD | 3,286 | 2,266 |
| | Inter Pipeline Ltd. | 3.983% | 11/25/31 | CAD | 2,818 | 1,756 |
| | Inter Pipeline Ltd. | 5.849% | 5/18/32 | CAD | 2,060 | 1,470 |
| | Inter Pipeline Ltd. | 4.637% | 5/30/44 | CAD | 1,792 | 992 |
| | Inter Pipeline Ltd. | 5.091% | 11/27/51 | CAD | 847 | 487 |
| | Ivanhoe Cambridge II Inc. | 2.296% | 12/12/24 | CAD | 1,488 | 1,039 |
| | Keyera Corp. | 3.934% | 6/21/28 | CAD | 1,123 | 757 |
| | Keyera Corp. | 3.959% | 5/29/30 | CAD | 1,622 | 1,054 |
| | Keyera Corp. | 5.022% | 3/28/32 | CAD | 1,488 | 1,012 |
| | Kingston Solar LP | 3.571% | 7/31/35 | CAD | 21 | 15 |
| | Laurentian Bank of Canada | 1.950% | 3/17/25 | CAD | 3,800 | 2,563 |
| | Loblaw Cos. Ltd. | 4.488% | 12/11/28 | CAD | 3,782 | 2,699 |
| | Loblaw Cos. Ltd. | 2.284% | 5/7/30 | CAD | 2,833 | 1,709 |
| | Loblaw Cos. Ltd. | 5.008% | 9/13/32 | CAD | 600 | 429 |
| | Loblaw Cos. Ltd. | 5.900% | 1/18/36 | CAD | 1,272 | 936 |
| | Loblaw Cos. Ltd. | 5.336% | 9/13/52 | CAD | 2,000 | 1,399 |
| | Lower Mattagami Energy LP | 3.416% | 6/20/24 | CAD | 946 | 679 |
| | Lower Mattagami Energy LP | 2.433% | 5/14/31 | CAD | 1,459 | 903 |
| | Lower Mattagami Energy LP | 5.139% | 5/18/41 | CAD | 2,443 | 1,786 |
| | Lower Mattagami Energy LP | 4.944% | 9/21/43 | CAD | 420 | 300 |
| | Lower Mattagami Energy LP | 4.175% | 4/23/52 | CAD | 900 | 571 |
Total International Bond Index Fund
| | | Coupon | Maturity
Date | Currency | Face
Amount
(000) | Market
Value•
($000) |
| | Manulife Bank of Canada | 2.378% | 11/19/24 | CAD | 1,471 | 1,021 |
| | Manulife Bank of Canada | 1.504% | 6/25/25 | CAD | 1,900 | 1,269 |
| | Manulife Bank of Canada | 1.337% | 2/26/26 | CAD | 2,471 | 1,604 |
| | Manulife Bank of Canada | 1.536% | 9/14/26 | CAD | 1,496 | 959 |
| | Manulife Bank of Canada | 2.864% | 2/16/27 | CAD | 2,418 | 1,616 |
| | Manulife Finance Delaware LP | 5.059% | 12/15/41 | CAD | 1,933 | 1,289 |
| | Manulife Financial Corp. | 3.049% | 8/20/29 | CAD | 2,550 | 1,787 |
| | Manulife Financial Corp. | 2.237% | 5/12/30 | CAD | 6,853 | 4,620 |
| | Manulife Financial Corp. | 2.818% | 5/13/35 | CAD | 5,204 | 3,135 |
| | McGill University | 6.150% | 9/22/42 | CAD | 44 | 37 |
| | McGill University | 3.975% | 1/29/56 | CAD | 112 | 70 |
| | McGill University Health Centre | 5.360% | 12/31/43 | CAD | 288 | 226 |
| | Metro Inc. | 3.390% | 12/6/27 | CAD | 5,414 | 3,689 |
| | Metro Inc. | 5.970% | 10/15/35 | CAD | 2,575 | 1,926 |
| | Metro Inc. | 4.270% | 12/4/47 | CAD | 1,334 | 795 |
| | Metro Inc. | 3.413% | 2/28/50 | CAD | 1,224 | 616 |
| | Mountain View Partners GP | 3.974% | 3/31/51 | CAD | 85 | 50 |
| | National Bank of Canada | 0.375% | 1/15/24 | EUR | 2,543 | 2,442 |
| | National Bank of Canada | 2.983% | 3/4/24 | CAD | 4,255 | 3,034 |
| | National Bank of Canada | 2.545% | 7/12/24 | CAD | 4,669 | 3,282 |
| | National Bank of Canada | 2.580% | 2/3/25 | CAD | 3,418 | 2,369 |
| | National Bank of Canada | 0.750% | 3/13/25 | EUR | 4,539 | 4,261 |
| | National Bank of Canada | 1.534% | 6/15/26 | CAD | 2,971 | 1,923 |
| | National Bank of Canada | 2.237% | 11/4/26 | CAD | 3,367 | 2,206 |
| | National Bank of Canada | 5.426% | 8/16/32 | CAD | 4,200 | 3,006 |
| | NAV Canada | 0.555% | 2/9/24 | CAD | 1,057 | 737 |
| | NAV Canada | 2.063% | 5/29/30 | CAD | 2,994 | 1,845 |
| | NAV Canada | 3.534% | 2/23/46 | CAD | 509 | 300 |
| | NAV Canada | 3.293% | 3/30/48 | CAD | 3,572 | 1,980 |
| | NAV Canada | 2.924% | 9/29/51 | CAD | 577 | 291 |
| | Nissan Canada Inc. | 1.626% | 3/18/24 | CAD | 2,919 | 2,012 |
| | Nissan Canada Inc. | 2.103% | 9/22/25 | CAD | 4,379 | 2,848 |
| | North Battleford Power LP | 4.958% | 12/31/32 | CAD | 1,702 | 1,236 |
| | North West Redwater Partnership / NWR Financing Co. Ltd. | 3.200% | 7/22/24 | CAD | 946 | 674 |
| | North West Redwater Partnership / NWR Financing Co. Ltd. | 3.200% | 4/24/26 | CAD | 2,618 | 1,811 |
| | North West Redwater Partnership / NWR Financing Co. Ltd. | 2.000% | 12/1/26 | CAD | 2,095 | 1,368 |
| | North West Redwater Partnership / NWR Financing Co. Ltd. | 2.800% | 6/1/27 | CAD | 3,870 | 2,594 |
| | North West Redwater Partnership / NWR Financing Co. Ltd. | 4.250% | 6/1/29 | CAD | 2,524 | 1,776 |
| | North West Redwater Partnership / NWR Financing Co. Ltd. | 2.800% | 6/1/31 | CAD | 4,201 | 2,591 |
| | North West Redwater Partnership / NWR Financing Co. Ltd. | 4.150% | 6/1/33 | CAD | 2,805 | 1,875 |
| | North West Redwater Partnership / NWR Financing Co. Ltd. | 3.650% | 6/1/35 | CAD | 2,593 | 1,611 |
| | North West Redwater Partnership / NWR Financing Co. Ltd. | 4.750% | 6/1/37 | CAD | �� 1,529 | 1,047 |
| | North West Redwater Partnership / NWR Financing Co. Ltd. | 4.350% | 1/10/39 | CAD | 1,144 | 734 |
| | North West Redwater Partnership / NWR Financing Co. Ltd. | 3.700% | 2/23/43 | CAD | 1,950 | 1,115 |
| | North West Redwater Partnership / NWR Financing Co. Ltd. | 4.050% | 7/22/44 | CAD | 2,522 | 1,509 |
| | North West Redwater Partnership / NWR Financing Co. Ltd. | 3.750% | 6/1/51 | CAD | 2,244 | 1,250 |
| | Northern Courier Pipeline LP | 3.365% | 6/30/42 | CAD | 854 | 547 |
| 3 | Northern Courier Pipeline LP | 3.365% | 6/30/42 | CAD | 1,769 | 1,142 |
| | Northwestern Hydro Acquisition Co. II LP | 3.877% | 12/31/36 | CAD | 730 | 449 |
| | Northwestern Hydro Acquisition Co. III LP | 3.940% | 12/31/38 | CAD | 1,174 | 712 |
| | Nouvelle Autoroute 30 Financement Inc. | 4.114% | 3/31/42 | CAD | 2,832 | 1,761 |
| | Nouvelle Autoroute 30 Financement Inc. | 4.115% | 6/30/42 | CAD | 299 | 184 |
| | Nova Scotia Power Inc. | 5.610% | 6/15/40 | CAD | 2,193 | 1,611 |
| | Nova Scotia Power Inc. | 4.500% | 7/20/43 | CAD | 1,687 | 1,074 |
| | Nova Scotia Power Inc. | 3.612% | 5/1/45 | CAD | 600 | 331 |
| | Nova Scotia Power Inc. | 3.571% | 4/5/49 | CAD | 1,921 | 1,028 |
| | Nova Scotia Power Inc. | 3.307% | 4/25/50 | CAD | 946 | 478 |
| | OMERS Realty Corp. | 2.858% | 2/23/24 | CAD | 2,529 | 1,803 |
| | OMERS Realty Corp. | 3.328% | 11/12/24 | CAD | 854 | 606 |
| | OMERS Realty Corp. | 3.331% | 6/5/25 | CAD | 1,627 | 1,145 |
| | OMERS Realty Corp. | 3.244% | 10/4/27 | CAD | 2,188 | 1,430 |
| | OMERS Realty Corp. | 3.628% | 6/5/30 | CAD | 2,296 | 1,537 |
| | Ontario Power Generation Inc. | 1.170% | 4/22/26 | CAD | 1,200 | 777 |
| | Ontario Power Generation Inc. | 3.315% | 10/4/27 | CAD | 3,195 | 2,198 |
| | Ontario Power Generation Inc. | 2.977% | 9/13/29 | CAD | 4,082 | 2,674 |
| | Ontario Power Generation Inc. | 3.215% | 4/8/30 | CAD | 3,061 | 2,013 |
| | Ontario Power Generation Inc. | 3.838% | 6/22/48 | CAD | 3,061 | 1,788 |
| | Ontario Power Generation Inc. | 4.248% | 1/18/49 | CAD | 800 | 496 |
| | Ontario Power Generation Inc. | 3.651% | 9/13/50 | CAD | 923 | 512 |
Total International Bond Index Fund
| | | Coupon | Maturity
Date | Currency | Face
Amount
(000) | Market
Value•
($000) |
| | Ontario Power Generation Inc. | 2.947% | 2/21/51 | CAD | 1,457 | 704 |
| | Original Wempi Inc. | 4.056% | 2/13/24 | CAD | 1,384 | 983 |
| | Original Wempi Inc. | 4.309% | 2/13/24 | CAD | 793 | 559 |
| | Ottawa MacDonald-Cartier International Airport Authority | 3.933% | 6/9/45 | CAD | 856 | 542 |
| | Pembina Pipeline Corp. | 2.990% | 1/22/24 | CAD | 4,060 | 2,893 |
| | Pembina Pipeline Corp. | 3.710% | 8/11/26 | CAD | 2,470 | 1,709 |
| | Pembina Pipeline Corp. | 4.240% | 6/15/27 | CAD | 1,525 | 1,067 |
| | Pembina Pipeline Corp. | 4.020% | 3/27/28 | CAD | 1,046 | 716 |
| | Pembina Pipeline Corp. | 3.620% | 4/3/29 | CAD | 1,529 | 1,007 |
| | Pembina Pipeline Corp. | 3.310% | 2/1/30 | CAD | 3,776 | 2,402 |
| | Pembina Pipeline Corp. | 3.530% | 12/10/31 | CAD | 2,600 | 1,614 |
| | Pembina Pipeline Corp. | 4.750% | 4/30/43 | CAD | 1,525 | 915 |
| | Pembina Pipeline Corp. | 4.810% | 3/25/44 | CAD | 2,830 | 1,701 |
| | Pembina Pipeline Corp. | 4.740% | 1/21/47 | CAD | 1,723 | 1,013 |
| | Pembina Pipeline Corp. | 4.750% | 3/26/48 | CAD | 2,314 | 1,354 |
| | Pembina Pipeline Corp. | 4.540% | 4/3/49 | CAD | 2,856 | 1,614 |
| | Pembina Pipeline Corp. | 4.670% | 5/28/50 | CAD | 1,523 | 876 |
| | Pembina Pipeline Corp. | 4.490% | 12/10/51 | CAD | 1,994 | 1,107 |
| | Plenary Health Care Partnerships Humber LP | 4.895% | 5/31/39 | CAD | 1,138 | 819 |
| | Plenary Properties LTAP LP | 6.288% | 1/31/44 | CAD | 3,344 | 2,644 |
| | Power Corp. of Canada | 4.455% | 7/27/48 | CAD | 1,496 | 942 |
| | Power Financial Corp. | 6.900% | 3/11/33 | CAD | 639 | 514 |
| | Primaris REIT | 4.727% | 3/30/27 | CAD | 900 | 618 |
| | Reliance LP | 3.750% | 3/15/26 | CAD | 949 | 653 |
| | Reliance LP | 2.680% | 12/1/27 | CAD | 3,443 | 2,183 |
| | Reliance LP | 2.670% | 8/1/28 | CAD | 1,496 | 927 |
| | RioCan REIT | 3.287% | 2/12/24 | CAD | 1,488 | 1,056 |
| | RioCan REIT | 2.576% | 2/12/25 | CAD | 2,193 | 1,496 |
| | RioCan REIT | 1.974% | 6/15/26 | CAD | 1,529 | 978 |
| | RioCan REIT | 2.361% | 3/10/27 | CAD | 917 | 579 |
| | RioCan REIT | 2.829% | 11/8/28 | CAD | 2,424 | 1,490 |
| | RioCan REIT | 4.628% | 5/1/29 | CAD | 500 | 337 |
| | Rogers Communications Inc. | 4.000% | 3/13/24 | CAD | 4,212 | 3,034 |
| | Rogers Communications Inc. | 3.100% | 4/15/25 | CAD | 2,139 | 1,487 |
| | Rogers Communications Inc. | 3.650% | 3/31/27 | CAD | 4,783 | 3,272 |
| | Rogers Communications Inc. | 3.750% | 4/15/29 | CAD | 3,162 | 2,128 |
| | Rogers Communications Inc. | 3.250% | 5/1/29 | CAD | 4,024 | 2,595 |
| | Rogers Communications Inc. | 4.250% | 4/15/32 | CAD | 4,262 | 2,827 |
| | Rogers Communications Inc. | 6.680% | 11/4/39 | CAD | 1,553 | 1,180 |
| | Rogers Communications Inc. | 6.110% | 8/25/40 | CAD | 3,150 | 2,255 |
| | Rogers Communications Inc. | 6.560% | 3/22/41 | CAD | 1,652 | 1,240 |
| | Rogers Communications Inc. | 5.250% | 4/15/52 | CAD | 3,720 | 2,385 |
| | Royal Bank of Canada | 2.333% | 12/5/23 | CAD | 4,248 | 3,033 |
| | Royal Bank of Canada | 0.250% | 1/29/24 | EUR | 5,635 | 5,402 |
| | Royal Bank of Canada | 2.352% | 7/2/24 | CAD | 7,004 | 4,917 |
| | Royal Bank of Canada | 0.125% | 7/23/24 | EUR | 1,545 | 1,439 |
| | Royal Bank of Canada | 2.609% | 11/1/24 | CAD | 7,727 | 5,399 |
| | Royal Bank of Canada | 1.375% | 12/9/24 | GBP | 1,445 | 1,530 |
| | Royal Bank of Canada | 1.936% | 5/1/25 | CAD | 6,276 | 4,261 |
| | Royal Bank of Canada | 4.930% | 7/16/25 | CAD | 2,900 | 2,132 |
| | Royal Bank of Canada | 3.369% | 9/29/25 | CAD | 13,950 | 9,742 |
| | Royal Bank of Canada | 1.589% | 5/4/26 | CAD | 4,490 | 2,922 |
| | Royal Bank of Canada | 0.050% | 6/19/26 | EUR | 8,728 | 7,736 |
| | Royal Bank of Canada | 0.010% | 1/21/27 | EUR | 7,631 | 6,629 |
| | Royal Bank of Canada | 2.328% | 1/28/27 | CAD | 9,062 | 5,931 |
| | Royal Bank of Canada | 0.125% | 4/26/27 | EUR | 15,000 | 12,988 |
| | Royal Bank of Canada | 3.625% | 6/14/27 | GBP | 5,000 | 5,215 |
| | Royal Bank of Canada | 4.612% | 7/26/27 | CAD | 8,600 | 6,161 |
| | Royal Bank of Canada | 1.833% | 7/31/28 | CAD | 4,658 | 2,857 |
| | Royal Bank of Canada | 2.125% | 4/26/29 | EUR | 9,600 | 8,331 |
| | Royal Bank of Canada | 2.740% | 7/25/29 | CAD | 5,102 | 3,562 |
| | Royal Bank of Canada | 2.880% | 12/23/29 | CAD | 4,918 | 3,399 |
| | Royal Bank of Canada | 2.088% | 6/30/30 | CAD | 3,572 | 2,383 |
| | Royal Bank of Canada | 2.140% | 11/3/31 | CAD | 4,415 | 2,807 |
| | Royal Bank of Canada | 2.940% | 5/3/32 | CAD | 3,860 | 2,500 |
| | Royal Bank of Canada | 1.670% | 1/28/33 | CAD | 3,367 | 2,002 |
| | Sagen MI Canada Inc. | 4.242% | 4/1/24 | CAD | 518 | 372 |
| | Sagen MI Canada Inc. | 2.955% | 3/1/27 | CAD | 943 | 611 |
| | Saputo Inc. | 2.876% | 11/19/24 | CAD | 1,942 | 1,358 |
Total International Bond Index Fund
| | | Coupon | Maturity
Date | Currency | Face
Amount
(000) | Market
Value•
($000) |
| | Saputo Inc. | 3.603% | 8/14/25 | CAD | 3,627 | 2,543 |
| | Saputo Inc. | 1.415% | 6/19/26 | CAD | 1,019 | 652 |
| | Saputo Inc. | 2.242% | 6/16/27 | CAD | 1,990 | 1,282 |
| | Saputo Inc. | 2.297% | 6/22/28 | CAD | 600 | 377 |
| | Scotiabank Capital Trust | 5.650% | 12/31/56 | CAD | 2,013 | 1,502 |
| | SEC LP and Arci Ltd. | 5.188% | 8/29/33 | CAD | 2,330 | 1,635 |
| | Shaw Communications Inc. | 4.350% | 1/31/24 | CAD | 5,075 | 3,670 |
| | Shaw Communications Inc. | 4.400% | 11/2/28 | CAD | 1,066 | 739 |
| | Shaw Communications Inc. | 3.300% | 12/10/29 | CAD | 2,200 | 1,396 |
| | Shaw Communications Inc. | 2.900% | 12/9/30 | CAD | 2,637 | 1,585 |
| | Shaw Communications Inc. | 6.750% | 11/9/39 | CAD | 4,661 | 3,535 |
| | Shaw Communications Inc. | 4.250% | 12/9/49 | CAD | 1,786 | 950 |
| | SmartCentres REIT | 3.444% | 8/28/26 | CAD | 318 | 213 |
| | SmartCentres REIT | 3.834% | 12/21/27 | CAD | 2,550 | 1,694 |
| | SmartCentres REIT | 2.307% | 12/18/28 | CAD | 1,326 | 789 |
| | SmartCentres REIT | 3.526% | 12/20/29 | CAD | 3,316 | 2,071 |
| | SmartCentres REIT | 3.648% | 12/11/30 | CAD | 1,019 | 626 |
| | SSL Finance Inc. | 4.099% | 10/31/45 | CAD | 1,479 | 936 |
| | Stantec Inc. | 2.048% | 10/8/27 | CAD | 1,100 | 695 |
| | Summit Industrial Income REIT | 2.150% | 9/17/25 | CAD | 663 | 439 |
| | Summit Industrial Income REIT | 1.820% | 4/1/26 | CAD | 1,571 | 1,011 |
| | Summit Industrial Income REIT | 2.440% | 7/14/28 | CAD | 1,496 | 922 |
| | Sun Life Financial Inc. | 2.380% | 8/13/29 | CAD | 2,245 | 1,555 |
| | Sun Life Financial Inc. | 2.460% | 11/18/31 | CAD | 2,000 | 1,296 |
| | Sun Life Financial Inc. | 2.580% | 5/10/32 | CAD | 2,805 | 1,796 |
| | Sun Life Financial Inc. | 2.800% | 11/21/33 | CAD | 4,019 | 2,510 |
| | Sun Life Financial Inc. | 4.780% | 8/10/34 | CAD | 3,300 | 2,291 |
| | Sun Life Financial Inc. | 2.060% | 10/1/35 | CAD | 5,023 | 2,830 |
| | Sun Life Financial Inc. | 5.400% | 5/29/42 | CAD | 2,473 | 1,708 |
| | Suncor Energy Inc. | 4.340% | 9/13/46 | CAD | 741 | 434 |
| | Suncor Energy Inc. | 3.950% | 3/4/51 | CAD | 1,952 | 1,045 |
| | TELUS Corp. | 3.350% | 4/1/24 | CAD | 5,430 | 3,891 |
| | TELUS Corp. | 3.750% | 1/17/25 | CAD | 2,274 | 1,617 |
| | TELUS Corp. | 3.750% | 3/10/26 | CAD | 3,518 | 2,467 |
| | TELUS Corp. | 2.350% | 1/27/28 | CAD | 3,061 | 1,953 |
| | TELUS Corp. | 3.625% | 3/1/28 | CAD | 4,899 | 3,326 |
| | TELUS Corp. | 3.300% | 5/2/29 | CAD | 3,863 | 2,525 |
| | TELUS Corp. | 5.000% | 9/13/29 | CAD | 2,200 | 1,582 |
| | TELUS Corp. | 2.050% | 10/7/30 | CAD | 1,496 | 861 |
| | TELUS Corp. | 2.850% | 11/13/31 | CAD | 1,600 | 956 |
| | TELUS Corp. | 5.250% | 11/15/32 | CAD | 4,000 | 2,867 |
| | TELUS Corp. | 4.400% | 4/1/43 | CAD | 1,490 | 881 |
| | TELUS Corp. | 4.850% | 4/5/44 | CAD | 4,720 | 2,939 |
| | TELUS Corp. | 4.750% | 1/17/45 | CAD | 1,403 | 864 |
| | TELUS Corp. | 4.400% | 1/29/46 | CAD | 1,909 | 1,112 |
| | TELUS Corp. | 4.700% | 3/6/48 | CAD | 2,307 | 1,398 |
| | TELUS Corp. | 3.950% | 2/16/50 | CAD | 3,260 | 1,724 |
| | TELUS Corp. | 4.100% | 4/5/51 | CAD | 2,028 | 1,104 |
| | TELUS Corp. | 5.650% | 9/13/52 | CAD | 2,400 | 1,677 |
| | Teranet Holdings LP | 3.544% | 6/11/25 | CAD | 3,999 | 2,791 |
| | Teranet Holdings LP | 5.754% | 12/17/40 | CAD | 1,732 | 1,178 |
| | Teranet Holdings LP | 6.100% | 6/17/41 | CAD | 298 | 209 |
| | Thomson Reuters Corp. | 2.239% | 5/14/25 | CAD | 8,628 | 5,905 |
| | THP Partnership | 4.394% | 10/31/46 | CAD | 101 | 68 |
| | Toromont Industries Ltd. | 3.842% | 10/27/27 | CAD | 1,119 | 778 |
| | Toronto Hydro Corp. | 2.520% | 8/25/26 | CAD | 2,805 | 1,912 |
| | Toronto Hydro Corp. | 2.430% | 12/11/29 | CAD | 3,061 | 1,967 |
| | Toronto Hydro Corp. | 5.540% | 5/21/40 | CAD | 148 | 115 |
| | Toronto Hydro Corp. | 3.550% | 7/28/45 | CAD | 846 | 497 |
| | Toronto Hydro Corp. | 3.485% | 2/28/48 | CAD | 2,603 | 1,496 |
| | Toronto Hydro Corp. | 2.990% | 12/10/49 | CAD | 340 | 176 |
| | Toronto Hydro Corp. | 3.270% | 10/18/51 | CAD | 897 | 489 |
| | Toronto-Dominion Bank | 0.000% | 2/9/24 | EUR | 12,023 | 11,479 |
| | Toronto-Dominion Bank | 2.850% | 3/8/24 | CAD | 13,520 | 9,627 |
| | Toronto-Dominion Bank | 0.500% | 4/3/24 | EUR | 6,633 | 6,344 |
| | Toronto-Dominion Bank | 2.050% | 7/10/24 | AUD | 1,370 | 833 |
| | Toronto-Dominion Bank | 3.226% | 7/24/24 | CAD | 6,377 | 4,551 |
| | Toronto-Dominion Bank | 2.496% | 12/2/24 | CAD | 7,872 | 5,476 |
| | Toronto-Dominion Bank | 1.943% | 3/13/25 | CAD | 3,980 | 2,712 |
Total International Bond Index Fund
| | | Coupon | Maturity
Date | Currency | Face
Amount
(000) | Market
Value•
($000) |
| | Toronto-Dominion Bank | 0.625% | 6/6/25 | EUR | 7,182 | 6,681 |
| | Toronto-Dominion Bank | 2.667% | 9/9/25 | CAD | 11,731 | 8,038 |
| | Toronto-Dominion Bank | 1.128% | 12/9/25 | CAD | 5,307 | 3,446 |
| | Toronto-Dominion Bank | 4.344% | 1/27/26 | CAD | 3,800 | 2,712 |
| | Toronto-Dominion Bank | 2.260% | 1/7/27 | CAD | 5,580 | 3,646 |
| | Toronto-Dominion Bank | 0.500% | 1/18/27 | EUR | 3,700 | 3,139 |
| | Toronto-Dominion Bank | 2.875% | 4/5/27 | GBP | 2,800 | 2,837 |
| | Toronto-Dominion Bank | 4.210% | 6/1/27 | CAD | 11,904 | 8,390 |
| | Toronto-Dominion Bank | 0.100% | 7/19/27 | EUR | 10,219 | 8,775 |
| | Toronto-Dominion Bank | 1.888% | 3/8/28 | CAD | 12,143 | 7,557 |
| | Toronto-Dominion Bank | 1.896% | 9/11/28 | CAD | 3,999 | 2,453 |
| | Toronto-Dominion Bank | 3.224% | 7/25/29 | CAD | 5,370 | 3,780 |
| | Toronto-Dominion Bank | 1.952% | 4/8/30 | EUR | 22,600 | 18,933 |
| | Toronto-Dominion Bank | 3.105% | 4/22/30 | CAD | 8,456 | 5,822 |
| | Toronto-Dominion Bank | 4.859% | 3/4/31 | CAD | 3,140 | 2,239 |
| | Toronto-Dominion Bank | 3.060% | 1/26/32 | CAD | 5,500 | 3,613 |
| | Toyota Credit Canada Inc. | 1.270% | 7/22/24 | CAD | 1,408 | 968 |
| | Toyota Credit Canada Inc. | 2.310% | 10/23/24 | CAD | 5,016 | 3,488 |
| | Toyota Credit Canada Inc. | 2.110% | 2/26/25 | CAD | 2,542 | 1,742 |
| | Toyota Credit Canada Inc. | 2.730% | 8/25/25 | CAD | 2,200 | 1,513 |
| | Toyota Credit Canada Inc. | 1.660% | 7/20/26 | CAD | 1,408 | 912 |
| | TransCanada PipeLines Ltd. | 3.300% | 7/17/25 | CAD | 2,578 | 1,801 |
| | TransCanada PipeLines Ltd. | 3.800% | 4/5/27 | CAD | 7,230 | 4,996 |
| | TransCanada PipeLines Ltd. | 3.390% | 3/15/28 | CAD | 3,125 | 2,086 |
| | TransCanada PipeLines Ltd. | 6.280% | 5/26/28 | CAD | 2,303 | 1,752 |
| | TransCanada PipeLines Ltd. | 5.650% | 6/20/29 | CAD | 400 | 295 |
| | TransCanada PipeLines Ltd. | 3.000% | 9/18/29 | CAD | 3,425 | 2,179 |
| | TransCanada PipeLines Ltd. | 2.970% | 6/9/31 | CAD | 3,401 | 2,072 |
| | TransCanada PipeLines Ltd. | 5.330% | 5/12/32 | CAD | 3,995 | 2,878 |
| | TransCanada PipeLines Ltd. | 8.050% | 2/17/39 | CAD | 66 | 58 |
| | TransCanada PipeLines Ltd. | 4.550% | 11/15/41 | CAD | 3,571 | 2,149 |
| | TransCanada PipeLines Ltd. | 4.350% | 6/6/46 | CAD | 3,059 | 1,747 |
| | TransCanada PipeLines Ltd. | 4.330% | 9/16/47 | CAD | 2,996 | 1,695 |
| | TransCanada PipeLines Ltd. | 4.180% | 7/3/48 | CAD | 3,896 | 2,144 |
| | TransCanada PipeLines Ltd. | 4.340% | 10/15/49 | CAD | 3,585 | 2,013 |
| | TransCanada PipeLines Ltd. | 5.920% | 5/12/52 | CAD | 1,300 | 930 |
| | Trillium Health Partners Volunteers | 3.702% | 12/20/58 | CAD | 315 | 189 |
| | University of Ottawa | 2.635% | 2/13/60 | CAD | 1,869 | 830 |
| | University of Toronto | 5.841% | 12/15/43 | CAD | 96 | 78 |
| | University of Toronto | 4.251% | 12/7/51 | CAD | 1,275 | 839 |
| | University of Western Ontario | 4.798% | 5/24/47 | CAD | 137 | 98 |
| 3 | Vancouver Airport Authority | 7.425% | 12/7/26 | CAD | 7,654 | 6,166 |
| | Vancouver Airport Authority | 3.857% | 11/10/45 | CAD | 279 | 172 |
| | Vancouver Airport Authority | 2.874% | 10/18/49 | CAD | 1,074 | 542 |
| | Vancouver Airport Authority | 2.800% | 9/21/50 | CAD | 1,222 | 603 |
| | Westcoast Energy Inc. | 3.430% | 9/12/24 | CAD | 3,400 | 2,413 |
| | Westcoast Energy Inc. | 3.770% | 12/8/25 | CAD | 862 | 604 |
| | Westcoast Energy Inc. | 6.750% | 12/15/27 | CAD | 700 | 539 |
| | Westcoast Energy Inc. | 4.791% | 10/28/41 | CAD | 1,129 | 715 |
| | WSP Global Inc. | 2.408% | 4/19/28 | CAD | 1,821 | 1,157 |
| | York University | 6.480% | 3/7/42 | CAD | 879 | 759 |
| | | | | | | 1,379,340 |
| China (0.0%) | | | |
| | Bank of China Ltd. | 0.000% | 4/28/24 | EUR | 2,400 | 2,261 |
| | China Construction Bank Europe SA | 0.000% | 6/28/24 | EUR | 269 | 252 |
| | Industrial & Commercial Bank of China Ltd. | 0.125% | 10/28/24 | EUR | 1,761 | 1,635 |
| | Prosus NV | 1.539% | 8/3/28 | EUR | 704 | 516 |
| 3 | Prosus NV | 1.288% | 7/13/29 | EUR | 2,616 | 1,780 |
| | Prosus NV | 2.031% | 8/3/32 | EUR | 4,985 | 3,071 |
| 3 | Prosus NV | 1.985% | 7/13/33 | EUR | 2,214 | 1,309 |
| | Prosus NV | 2.778% | 1/19/34 | EUR | 3,900 | 2,493 |
| | State Grid Europe Development 2014 plc | 2.450% | 1/26/27 | EUR | 1,128 | 1,024 |
| | State Grid Overseas Investment BVI Ltd. | 1.375% | 5/2/25 | EUR | 3,541 | 3,299 |
| | State Grid Overseas Investment BVI Ltd. | 0.797% | 8/5/26 | EUR | 14,145 | 12,310 |
| | State Grid Overseas Investment BVI Ltd. | 2.125% | 5/2/30 | EUR | 3,485 | 2,877 |
| | | | | | | 32,827 |
Total International Bond Index Fund
| | | Coupon | Maturity
Date | Currency | Face
Amount
(000) | Market
Value•
($000) |
| Czech Republic (0.0%) | | | |
| | CEZ A/S | 4.875% | 4/16/25 | EUR | 6,409 | 6,481 |
| | CEZ A/S | 3.000% | 6/5/28 | EUR | 6,359 | 5,618 |
| | CPI Property Group SA | 1.625% | 4/23/27 | EUR | 3,906 | 2,588 |
| | CPI Property Group SA | 2.750% | 1/22/28 | GBP | 3,007 | 2,314 |
| | CPI Property Group SA | 1.500% | 1/27/31 | EUR | 3,419 | 1,922 |
| | EP Infrastructure A/S | 1.659% | 4/26/24 | EUR | 386 | 326 |
| | EP Infrastructure A/S | 1.698% | 7/30/26 | EUR | 414 | 308 |
| | EP Infrastructure A/S | 2.045% | 10/9/28 | EUR | 2,187 | 1,419 |
| | EP Infrastructure A/S | 1.816% | 3/2/31 | EUR | 2,060 | 1,235 |
| | | | | | | 22,211 |
| Denmark (0.4%) | | | |
| | AP Moller - Maersk A/S | 1.750% | 3/16/26 | EUR | 15,275 | 14,188 |
| | AP Moller - Maersk A/S | 0.750% | 11/25/31 | EUR | 2,214 | 1,612 |
| | Carlsberg Breweries A/S | 2.500% | 5/28/24 | EUR | 8,728 | 8,517 |
| | Carlsberg Breweries A/S | 0.875% | 7/1/29 | EUR | 7,087 | 5,795 |
| | Carlsberg Breweries A/S | 0.625% | 3/9/30 | EUR | 5,895 | 4,624 |
| | Clearstream Banking AG | 0.000% | 12/1/25 | EUR | 2,100 | 1,893 |
| | Danfoss Finance I BV | 0.125% | 4/28/26 | EUR | 4,831 | 4,207 |
| | Danfoss Finance I BV | 0.375% | 10/28/28 | EUR | 2,000 | 1,592 |
| | Danica Pension Livsforsikrings AB | 4.375% | 9/29/45 | EUR | 1,765 | 1,652 |
| | Danmarks Skibskredit A/S | 0.250% | 6/21/28 | EUR | 9,300 | 7,760 |
| | Danske Bank A/S | 0.625% | 5/26/25 | EUR | 2,214 | 2,030 |
| | Danske Bank A/S | 0.500% | 8/27/25 | EUR | 6,600 | 6,065 |
| | Danske Bank A/S | 0.750% | 11/22/27 | EUR | 7,631 | 6,749 |
| | Danske Bank A/S | 2.250% | 1/14/28 | GBP | 6,285 | 5,992 |
| | Danske Bank A/S | 0.750% | 6/9/29 | EUR | 10,224 | 7,955 |
| | Danske Bank A/S | 1.375% | 2/12/30 | EUR | 4,364 | 3,873 |
| | DSV Panalpina Finance BV | 0.875% | 9/17/36 | EUR | 3,724 | 2,326 |
| | Eurogrid GmbH | 0.741% | 4/21/33 | EUR | 4,600 | 3,309 |
| | ISS Global A/S | 2.125% | 12/2/24 | EUR | 300 | 289 |
| | ISS Global A/S | 0.875% | 6/18/26 | EUR | 100 | 87 |
| | ISS Global A/S | 1.500% | 8/31/27 | EUR | 10,329 | 8,837 |
| | Jyske Bank A/S | 2.250% | 4/5/29 | EUR | 5,690 | 5,352 |
| | Jyske Realkredit A/S | 0.375% | 4/1/25 | EUR | 3,541 | 3,295 |
| | Jyske Realkredit A/S | 0.500% | 10/1/26 | EUR | 11,370 | 10,217 |
| | Nordea Kredit Realkreditaktieselskab | 1.000% | 10/1/26 | DKK | 186,000 | 22,633 |
| | Nordea Kredit Realkreditaktieselskab | 3.500% | 10/1/44 | DKK | 167 | 22 |
| | Novo Nordisk Finance Netherlands BV | 0.000% | 6/4/24 | EUR | 7,145 | 6,758 |
| | Novo Nordisk Finance Netherlands BV | 0.125% | 6/4/28 | EUR | 3,000 | 2,504 |
| | Nykredit Realkredit A/S | 2.000% | 1/1/25 | DKK | 172,863 | 22,441 |
| | Nykredit Realkredit A/S | 0.500% | 7/10/25 | EUR | 5,053 | 4,587 |
| | Nykredit Realkredit A/S | 2.000% | 1/1/26 | DKK | 139,500 | 17,835 |
| | Nykredit Realkredit A/S | 1.000% | 7/1/26 | DKK | 119,419 | 14,615 |
| | Nykredit Realkredit A/S | 1.000% | 1/1/27 | DKK | 149,698 | 18,068 |
| | Nykredit Realkredit A/S | 0.375% | 1/17/28 | EUR | 21,996 | 17,258 |
| | Nykredit Realkredit A/S | 2.000% | 10/1/47 | DKK | 17,953 | 1,981 |
| | Orsted A/S | 1.500% | 11/26/29 | EUR | 14,971 | 12,889 |
| | Orsted A/S | 3.250% | 9/13/31 | EUR | 2,900 | 2,755 |
| | Orsted A/S | 4.875% | 1/12/32 | GBP | 5,761 | 6,352 |
| | Orsted A/S | 2.500% | 5/16/33 | GBP | 2,150 | 1,910 |
| | Orsted A/S | 5.750% | 4/9/40 | GBP | 498 | 579 |
| | Orsted A/S | 6.250% | 6/26/13 | EUR | 535 | 528 |
| | Orsted A/S | 1.750% | 12/9/19 | EUR | 2,000 | 1,628 |
| | Orsted A/S | 2.500% | 2/18/21 | GBP | 200 | 142 |
| | Vestas Wind Systems Finance BV | 2.000% | 6/15/34 | EUR | 1,900 | 1,515 |
| | | | | | | 275,216 |
| Estonia (0.0%) | | | |
| | Luminor Bank A/S | 0.539% | 9/23/26 | EUR | 11,064 | 9,547 |
| Finland (0.2%) | | | |
| | Aktia Bank OYJ | 0.375% | 3/5/26 | EUR | 5,000 | 4,551 |
| | Elenia Verkko OYJ | 0.375% | 2/6/27 | EUR | 5,087 | 4,250 |
| | Fortum OYJ | 1.625% | 2/27/26 | EUR | 600 | 539 |
| | Fortum OYJ | 2.125% | 2/27/29 | EUR | 900 | 753 |
| | Kojamo OYJ | 1.875% | 5/27/27 | EUR | 2,609 | 2,121 |
| | Kojamo OYJ | 0.875% | 5/28/29 | EUR | 3,438 | 2,313 |
| | Nordea Bank Abp | 1.125% | 2/12/25 | EUR | 100 | 95 |
Total International Bond Index Fund
| | | Coupon | Maturity
Date | Currency | Face
Amount
(000) | Market
Value•
($000) |
| | Nordea Bank Abp | 0.550% | 6/23/25 | CHF | 6,525 | 6,304 |
| | Nordea Bank Abp | 1.125% | 2/16/27 | EUR | 11,300 | 9,962 |
| | Nordea Bank Abp | 0.500% | 5/14/27 | EUR | 5,087 | 4,395 |
| | Nordea Bank Abp | 0.500% | 11/2/28 | EUR | 12,938 | 10,332 |
| | Nordea Bank Abp | 2.500% | 5/23/29 | EUR | 4,600 | 4,113 |
| | Nordea Bank Abp | 2.875% | 8/24/32 | EUR | 7,000 | 6,219 |
| | Nordea Bank Abp | 1.625% | 12/9/32 | GBP | 1,509 | 1,330 |
| | Nordea Kiinnitysluottopankki OYJ | 0.250% | 11/21/23 | EUR | 2,543 | 2,452 |
| | Nordea Kiinnitysluottopankki OYJ | 0.250% | 3/18/26 | EUR | 12,189 | 11,033 |
| | Nordea Kiinnitysluottopankki OYJ | 0.625% | 3/17/27 | EUR | 11,820 | 10,584 |
| | OP Corporate Bank plc | 0.375% | 2/26/24 | EUR | 3,431 | 3,263 |
| | OP Corporate Bank plc | 0.375% | 6/19/24 | EUR | 4,090 | 3,819 |
| | OP Corporate Bank plc | 0.125% | 7/1/24 | EUR | 7,448 | 6,961 |
| | OP Corporate Bank plc | 1.000% | 5/22/25 | EUR | 5,087 | 4,718 |
| | OP Corporate Bank plc | 0.500% | 8/12/25 | EUR | 1,682 | 1,525 |
| | OP Corporate Bank plc | 0.600% | 1/18/27 | EUR | 11,271 | 9,534 |
| | OP Corporate Bank plc | 0.100% | 11/16/27 | EUR | 3,019 | 2,474 |
| | OP Corporate Bank plc | 1.625% | 6/9/30 | EUR | 12,818 | 11,454 |
| | OP Mortgage Bank | 0.250% | 3/13/24 | EUR | 15,362 | 14,687 |
| | OP Mortgage Bank | 1.000% | 11/28/24 | EUR | 3,541 | 3,372 |
| | OP Mortgage Bank | 0.010% | 11/19/26 | EUR | 5,087 | 4,472 |
| | OP Mortgage Bank | 0.625% | 2/15/29 | EUR | 5,087 | 4,345 |
| | OP Mortgage Bank | 0.010% | 11/19/30 | EUR | 15,362 | 11,890 |
| | Sampo OYJ | 3.375% | 5/23/49 | EUR | 10,464 | 8,804 |
| | Sampo OYJ | 2.500% | 9/3/52 | EUR | 8,627 | 6,174 |
| | SATO OYJ | 1.375% | 2/24/28 | EUR | 2,600 | 1,859 |
| | Stora Enso OYJ | 2.500% | 6/7/27 | EUR | 2,269 | 2,110 |
| | Stora Enso OYJ | 2.500% | 3/21/28 | EUR | 2,294 | 2,110 |
| | | | | | | 184,917 |
| France (3.1%) | | | |
| | Aeroports de Paris | 3.125% | 6/11/24 | EUR | 2,500 | 2,476 |
| | Aeroports de Paris | 1.500% | 4/7/25 | EUR | 2,000 | 1,888 |
| | Aeroports de Paris | 2.125% | 10/2/26 | EUR | 6,100 | 5,727 |
| | Aeroports de Paris | 1.000% | 1/5/29 | EUR | 13,600 | 11,366 |
| | Aeroports de Paris | 2.750% | 4/2/30 | EUR | 5,700 | 5,142 |
| | Aeroports de Paris | 1.500% | 7/2/32 | EUR | 3,400 | 2,643 |
| | Aeroports de Paris | 1.125% | 6/18/34 | EUR | 1,500 | 1,037 |
| | Aeroports de Paris | 2.125% | 10/11/38 | EUR | 3,700 | 2,615 |
| | Air Liquide Finance SA | 1.000% | 4/2/25 | EUR | 5,000 | 4,704 |
| | Air Liquide Finance SA | 1.250% | 6/3/25 | EUR | 2,800 | 2,644 |
| | Air Liquide Finance SA | 1.000% | 3/8/27 | EUR | 100 | 91 |
| | Air Liquide Finance SA | 1.250% | 6/13/28 | EUR | 500 | 442 |
| | Air Liquide Finance SA | 1.375% | 4/2/30 | EUR | 7,300 | 6,286 |
| | Air Liquide SA | 2.375% | 9/6/23 | EUR | 1,100 | 1,084 |
| | Airbus Finance BV | 2.375% | 4/2/24 | EUR | 4,703 | 4,627 |
| | Airbus Finance BV | 2.125% | 10/29/29 | EUR | 353 | 318 |
| | Airbus Finance BV | 1.375% | 5/13/31 | EUR | 7,504 | 6,095 |
| | Airbus SE | 1.625% | 4/7/25 | EUR | 704 | 668 |
| | Airbus SE | ���1.375% | 6/9/26 | EUR | 6,706 | 6,222 |
| | Airbus SE | 1.625% | 6/9/30 | EUR | 4,200 | 3,601 |
| | Airbus SE | 2.375% | 4/7/32 | EUR | 7,014 | 6,188 |
| | Airbus SE | 2.375% | 6/9/40 | EUR | 4,513 | 3,374 |
| | ALD SA | 1.250% | 3/2/26 | EUR | 2,500 | 2,204 |
| | ALD SA | 4.000% | 7/5/27 | EUR | 4,600 | 4,358 |
| | Alstom SA | 0.250% | 10/14/26 | EUR | 6,900 | 5,965 |
| | Alstom SA | 0.000% | 1/11/29 | EUR | 3,900 | 2,970 |
| | Altarea SCA | 2.250% | 7/5/24 | EUR | 5,000 | 4,663 |
| | APRR SA | 1.500% | 1/15/24 | EUR | 300 | 290 |
| | APRR SA | 1.875% | 1/15/25 | EUR | 1,100 | 1,055 |
| | APRR SA | 1.125% | 1/9/26 | EUR | 5,400 | 5,001 |
| | APRR SA | 1.250% | 1/6/27 | EUR | 5,400 | 4,888 |
| | APRR SA | 1.250% | 1/14/27 | EUR | 7,700 | 6,963 |
| | APRR SA | 1.250% | 1/18/28 | EUR | 700 | 619 |
| | APRR SA | 1.500% | 1/25/30 | EUR | 400 | 343 |
| | APRR SA | 1.875% | 1/6/31 | EUR | 100 | 87 |
| | APRR SA | 1.625% | 1/13/32 | EUR | 4,700 | 3,876 |
| | APRR SA | 1.500% | 1/17/33 | EUR | 200 | 161 |
| | Arkea Home Loans SFH SA | 0.375% | 3/4/24 | EUR | 500 | 479 |
| | Arkea Home Loans SFH SA | 0.750% | 10/5/27 | EUR | 75 | 67 |
Total International Bond Index Fund
| | | Coupon | Maturity
Date | Currency | Face
Amount
(000) | Market
Value•
($000) |
| | Arkea Home Loans SFH SA | 1.500% | 6/1/33 | EUR | 5,000 | 4,171 |
| | Arkema SA | 1.500% | 1/20/25 | EUR | 200 | 188 |
| | Arkema SA | 1.500% | 4/20/27 | EUR | 11,900 | 10,588 |
| | Arkema SA | 1.500% | Perpetual | EUR | 1,100 | 910 |
| | Arkema SA | 2.750% | Perpetual | EUR | 1,500 | 1,362 |
| | Autoroutes du Sud de la France SA | 2.875% | 1/18/23 | EUR | 1,700 | 1,684 |
| | Autoroutes du Sud de la France SA | 2.950% | 1/17/24 | EUR | 2,600 | 2,563 |
| | Autoroutes du Sud de la France SA | 1.125% | 4/20/26 | EUR | 800 | 736 |
| | Autoroutes du Sud de la France SA | 1.000% | 5/13/26 | EUR | 5,400 | 4,928 |
| | Autoroutes du Sud de la France SA | 1.250% | 1/18/27 | EUR | 300 | 273 |
| | Autoroutes du Sud de la France SA | 1.375% | 6/27/28 | EUR | 6,000 | 5,332 |
| | Autoroutes du Sud de la France SA | 1.375% | 2/21/31 | EUR | 4,000 | 3,397 |
| | AXA Bank Europe SCF | 0.500% | 4/18/25 | EUR | 14,300 | 13,335 |
| | AXA Bank Europe SCF | 1.375% | 4/18/33 | EUR | 7,900 | 6,526 |
| | AXA Home Loan SFH SA | 0.010% | 10/16/29 | EUR | 5,000 | 3,991 |
| | AXA SA | 1.375% | 10/7/41 | EUR | 3,724 | 2,616 |
| | AXA SA | 1.875% | 7/10/42 | EUR | 6,900 | 4,878 |
| | AXA SA | 3.375% | 7/6/47 | EUR | 10,943 | 9,878 |
| | AXA SA | 3.875% | 5/20/49 | EUR | 8,424 | 7,908 |
| | AXA SA | 3.250% | 5/28/49 | EUR | 9,504 | 8,132 |
| | AXA SA | 6.686% | 7/29/49 | GBP | 2,287 | 2,538 |
| | AXA SA | 3.941% | 11/29/49 | EUR | 5,659 | 5,439 |
| | AXA SA | 5.453% | 11/29/49 | GBP | 3,074 | 3,317 |
| | AXA SA | 5.625% | 1/16/54 | GBP | 5,612 | 5,699 |
| | Banque Federative du Credit Mutuel SA | 3.000% | 11/28/23 | EUR | 4,200 | 4,136 |
| | Banque Federative du Credit Mutuel SA | 2.250% | 12/18/23 | GBP | 1,500 | 1,669 |
| | Banque Federative du Credit Mutuel SA | 2.625% | 3/18/24 | EUR | 5,000 | 4,885 |
| | Banque Federative du Credit Mutuel SA | 3.000% | 5/21/24 | EUR | 9,629 | 9,410 |
| | Banque Federative du Credit Mutuel SA | 0.250% | 10/10/24 | JPY | 800,000 | 5,357 |
| | Banque Federative du Credit Mutuel SA | 0.384% | 10/11/24 | JPY | 100,000 | 668 |
| | Banque Federative du Credit Mutuel SA | 1.750% | 12/19/24 | GBP | 4,300 | 4,594 |
| | Banque Federative du Credit Mutuel SA | 1.250% | 1/14/25 | EUR | 22,900 | 21,492 |
| | Banque Federative du Credit Mutuel SA | 0.010% | 3/7/25 | EUR | 24,600 | 22,374 |
| | Banque Federative du Credit Mutuel SA | 0.750% | 7/17/25 | EUR | 2,600 | 2,383 |
| | Banque Federative du Credit Mutuel SA | 3.000% | 9/11/25 | EUR | 2,500 | 2,404 |
| | Banque Federative du Credit Mutuel SA | 1.625% | 1/19/26 | EUR | 400 | 370 |
| | Banque Federative du Credit Mutuel SA | 2.375% | 3/24/26 | EUR | 15,400 | 14,321 |
| | Banque Federative du Credit Mutuel SA | 0.010% | 5/11/26 | EUR | 19,000 | 16,469 |
| | Banque Federative du Credit Mutuel SA | 0.750% | 6/8/26 | EUR | 8,600 | 7,644 |
| | Banque Federative du Credit Mutuel SA | 1.000% | 7/16/26 | GBP | 7,500 | 7,369 |
| | Banque Federative du Credit Mutuel SA | 1.500% | 10/7/26 | GBP | 100 | 99 |
| | Banque Federative du Credit Mutuel SA | 1.875% | 11/4/26 | EUR | 2,800 | 2,504 |
| | Banque Federative du Credit Mutuel SA | 2.625% | 3/31/27 | EUR | 600 | 548 |
| | Banque Federative du Credit Mutuel SA | 0.100% | 10/8/27 | EUR | 3,700 | 3,077 |
| | Banque Federative du Credit Mutuel SA | 1.625% | 11/15/27 | EUR | 2,300 | 1,971 |
| | Banque Federative du Credit Mutuel SA | 0.875% | 12/7/27 | GBP | 900 | 819 |
| | Banque Federative du Credit Mutuel SA | 2.500% | 5/25/28 | EUR | 2,500 | 2,192 |
| | Banque Federative du Credit Mutuel SA | 0.250% | 6/29/28 | EUR | 16,800 | 13,707 |
| | Banque Federative du Credit Mutuel SA | 0.250% | 7/19/28 | EUR | 7,600 | 5,935 |
| | Banque Federative du Credit Mutuel SA | 1.875% | 10/26/28 | GBP | 2,800 | 2,605 |
| | Banque Federative du Credit Mutuel SA | 0.625% | 11/3/28 | EUR | 21,300 | 16,809 |
| | Banque Federative du Credit Mutuel SA | 1.875% | 6/18/29 | EUR | 5,000 | 4,074 |
| | Banque Federative du Credit Mutuel SA | 0.750% | 1/17/30 | EUR | 1,000 | 760 |
| | Banque Federative du Credit Mutuel SA | 1.250% | 6/3/30 | EUR | 11,000 | 8,612 |
| | Banque Federative du Credit Mutuel SA | 0.625% | 2/21/31 | EUR | 8,800 | 6,379 |
| | BNP Paribas Cardif SA | 4.032% | 11/29/49 | EUR | 700 | 655 |
| | BNP Paribas Home Loan SFH SA | 0.875% | 11/14/24 | EUR | 2,561 | 2,435 |
| | BNP Paribas SA | 1.125% | 11/22/23 | EUR | 300 | 290 |
| | BNP Paribas SA | 2.375% | 5/20/24 | EUR | 4,355 | 4,251 |
| | BNP Paribas SA | 1.000% | 6/27/24 | EUR | 2,543 | 2,411 |
| | BNP Paribas SA | 2.375% | 2/17/25 | EUR | 2,543 | 2,427 |
| | BNP Paribas SA | 1.250% | 3/19/25 | EUR | 5,087 | 4,748 |
| | BNP Paribas SA | 0.500% | 7/15/25 | EUR | 9,400 | 8,745 |
| | BNP Paribas SA | 1.500% | 11/17/25 | EUR | 10,449 | 9,618 |
| | BNP Paribas SA | 3.375% | 1/23/26 | GBP | 1,381 | 1,464 |
| | BNP Paribas SA | 1.125% | 6/11/26 | EUR | 9,303 | 8,267 |
| | BNP Paribas SA | 2.875% | 10/1/26 | EUR | 2,434 | 2,275 |
| | BNP Paribas SA | 2.125% | 1/23/27 | EUR | 14,800 | 13,572 |
| | BNP Paribas SA | 0.250% | 4/13/27 | EUR | 12,000 | 10,260 |
Total International Bond Index Fund
| | | Coupon | Maturity
Date | Currency | Face
Amount
(000) | Market
Value•
($000) |
| | BNP Paribas SA | 0.375% | 10/14/27 | EUR | 9,300 | 7,850 |
| | BNP Paribas SA | 1.875% | 12/14/27 | GBP | 3,000 | 2,797 |
| | BNP Paribas SA | 0.500% | 2/19/28 | EUR | 13,800 | 11,440 |
| | BNP Paribas SA | 0.500% | 5/30/28 | EUR | 14,000 | 11,538 |
| | BNP Paribas SA | 2.750% | 7/25/28 | EUR | 10,000 | 9,060 |
| | BNP Paribas SA | 0.500% | 9/1/28 | EUR | 4,400 | 3,563 |
| | BNP Paribas SA | 1.125% | 4/17/29 | EUR | 5,000 | 4,087 |
| | BNP Paribas SA | 1.375% | 5/28/29 | EUR | 12,100 | 9,731 |
| | BNP Paribas SA | 2.538% | 7/13/29 | CAD | 2,109 | 1,278 |
| | BNP Paribas SA | 0.500% | 1/19/30 | EUR | 7,600 | 5,798 |
| | BNP Paribas SA | 0.875% | 7/11/30 | EUR | 4,600 | 3,538 |
| | BNP Paribas SA | 2.375% | 11/20/30 | EUR | 5,000 | 4,534 |
| | BNP Paribas SA | 1.625% | 7/2/31 | EUR | 2,800 | 2,084 |
| | BNP Paribas SA | 1.250% | 7/13/31 | GBP | 3,000 | 2,363 |
| | BNP Paribas SA | 2.000% | 9/13/36 | GBP | 1,900 | 1,372 |
| | Bouygues SA | 5.500% | 10/6/26 | GBP | 3,050 | 3,494 |
| | Bouygues SA | 1.375% | 6/7/27 | EUR | 7,500 | 6,728 |
| | Bouygues SA | 1.125% | 7/24/28 | EUR | 2,500 | 2,156 |
| | Bouygues SA | 2.250% | 6/29/29 | EUR | 5,600 | 4,966 |
| | Bouygues SA | 3.250% | 6/30/37 | EUR | 4,500 | 3,700 |
| | BPCE SA | 0.875% | 1/31/24 | EUR | 7,300 | 6,979 |
| | BPCE SA | 1.000% | 7/15/24 | EUR | 4,300 | 4,087 |
| | BPCE SA | 3.000% | 7/19/24 | EUR | 4,300 | 4,221 |
| | BPCE SA | 0.625% | 9/26/24 | EUR | 12,500 | 11,626 |
| | BPCE SA | 1.000% | 4/1/25 | EUR | 7,600 | 7,013 |
| | BPCE SA | 0.625% | 4/28/25 | EUR | 6,700 | 6,158 |
| | BPCE SA | 0.250% | 1/15/26 | EUR | 5,400 | 4,806 |
| | BPCE SA | 1.375% | 12/23/26 | GBP | 3,500 | 3,377 |
| | BPCE SA | 0.010% | 1/14/27 | EUR | 2,300 | 1,947 |
| | BPCE SA | 0.500% | 2/24/27 | EUR | 4,600 | 3,884 |
| | BPCE SA | 1.750% | 4/26/27 | EUR | 10,000 | 9,050 |
| | BPCE SA | 0.500% | 9/15/27 | EUR | 5,000 | 4,239 |
| | BPCE SA | 2.750% | 11/30/27 | EUR | 2,600 | 2,567 |
| | BPCE SA | 0.500% | 1/14/28 | EUR | 6,500 | 5,425 |
| | BPCE SA | 1.625% | 1/31/28 | EUR | 3,700 | 3,174 |
| | BPCE SA | 4.500% | 4/26/28 | AUD | 4,500 | 2,560 |
| | BPCE SA | 5.250% | 4/16/29 | GBP | 1,500 | 1,547 |
| | BPCE SA | 0.625% | 1/15/30 | EUR | 7,100 | 5,532 |
| | BPCE SA | 0.250% | 1/14/31 | EUR | 19,900 | 14,394 |
| | BPCE SA | 1.000% | 1/14/32 | EUR | 7,500 | 5,413 |
| | BPCE SFH SA | 2.375% | 11/29/23 | EUR | 2,500 | 2,464 |
| | BPCE SFH SA | 0.375% | 2/21/24 | EUR | 6,400 | 6,140 |
| | BPCE SFH SA | 1.750% | 6/27/24 | EUR | 10,200 | 9,913 |
| | BPCE SFH SA | 1.000% | 2/24/25 | EUR | 6,800 | 6,439 |
| | BPCE SFH SA | 0.398% | 4/24/25 | EUR | 10,200 | 9,491 |
| | BPCE SFH SA | 0.750% | 9/2/25 | EUR | 5,000 | 4,657 |
| | BPCE SFH SA | 0.625% | 9/22/27 | EUR | 2,500 | 2,205 |
| | BPCE SFH SA | 0.010% | 11/10/27 | EUR | 33,100 | 28,177 |
| | BPCE SFH SA | 0.875% | 4/13/28 | EUR | 6,000 | 5,293 |
| | BPCE SFH SA | 0.750% | 2/23/29 | EUR | 23,000 | 19,724 |
| | BPCE SFH SA | 1.000% | 6/8/29 | EUR | 2,200 | 1,907 |
| | BPCE SFH SA | 1.125% | 4/12/30 | EUR | 13,800 | 11,848 |
| | BPCE SFH SA | 0.125% | 12/3/30 | EUR | 20,500 | 15,986 |
| | BPCE SFH SA | 0.625% | 5/29/31 | EUR | 8,900 | 7,121 |
| 4 | Caisse Centrale du Credit Immobilier de France SA | 0.050% | 3/25/25 | EUR | 5,000 | 4,683 |
| | Caisse de Refinancement de l'Habitat SA | 3.600% | 3/8/24 | EUR | 5,944 | 5,942 |
| | Caisse de Refinancement de l'Habitat SA | 2.400% | 1/17/25 | EUR | 573 | 561 |
| | Caisse de Refinancement de l'Habitat SA | 0.010% | 2/7/28 | EUR | 5,000 | 4,220 |
| | Caisse de Refinancement de l'Habitat SA | 0.010% | 10/8/29 | EUR | 10,700 | 8,567 |
| | Caisse Nationale de Reassurance Mutuelle Agricole Groupama | 0.750% | 7/7/28 | EUR | 4,800 | 3,658 |
| | Caisse Nationale de Reassurance Mutuelle Agricole Groupama | 3.375% | 9/24/28 | EUR | 3,200 | 2,797 |
| | Capgemini SE | 1.000% | 10/18/24 | EUR | 100 | 95 |
| | Capgemini SE | 0.625% | 6/23/25 | EUR | 2,000 | 1,845 |
| | Capgemini SE | 1.750% | 4/18/28 | EUR | 7,800 | 7,047 |
| | Capgemini SE | 1.125% | 6/23/30 | EUR | 3,000 | 2,458 |
| | Capgemini SE | 2.375% | 4/15/32 | EUR | 5,700 | 4,915 |
| | Carmila SA | 2.125% | 3/7/28 | EUR | 1,900 | 1,315 |
| | Carmila SA | 1.625% | 4/1/29 | EUR | 900 | 583 |
| | Carrefour SA | 0.875% | 6/12/23 | EUR | 100 | 97 |
Total International Bond Index Fund
| | | Coupon | Maturity
Date | Currency | Face
Amount
(000) | Market
Value•
($000) |
| | Carrefour SA | 0.750% | 4/26/24 | EUR | 4,593 | 4,351 |
| | Carrefour SA | 1.250% | 6/3/25 | EUR | 8,236 | 7,644 |
| | Carrefour SA | 1.750% | 5/4/26 | EUR | 500 | 461 |
| | Carrefour SA | 2.625% | 12/15/27 | EUR | 5,000 | 4,620 |
| | Cie de Financement Foncier SA | 2.000% | 5/7/24 | EUR | 7,300 | 7,134 |
| | Cie de Financement Foncier SA | 0.500% | 9/4/24 | EUR | 5,000 | 4,739 |
| | Cie de Financement Foncier SA | 0.375% | 12/11/24 | EUR | 900 | 845 |
| | Cie de Financement Foncier SA | 0.750% | 1/21/25 | EUR | 3,400 | 3,208 |
| | Cie de Financement Foncier SA | 4.000% | 10/24/25 | EUR | 12,964 | 13,199 |
| | Cie de Financement Foncier SA | 1.000% | 2/2/26 | EUR | 50 | 46 |
| | Cie de Financement Foncier SA | 0.750% | 5/29/26 | EUR | 1,000 | 916 |
| | Cie de Financement Foncier SA | 0.225% | 9/14/26 | EUR | 2,800 | 2,494 |
| | Cie de Financement Foncier SA | 5.500% | 1/26/27 | GBP | 1,204 | 1,404 |
| | Cie de Financement Foncier SA | 0.375% | 4/9/27 | EUR | 30,000 | 26,465 |
| | Cie de Financement Foncier SA | 0.010% | 11/10/27 | EUR | 5,000 | 4,249 |
| | Cie de Financement Foncier SA | 0.750% | 1/11/28 | EUR | 5,600 | 4,934 |
| | Cie de Financement Foncier SA | 0.500% | 3/16/28 | EUR | 9,600 | 8,308 |
| | Cie de Financement Foncier SA | 0.875% | 9/11/28 | EUR | 9,400 | 8,208 |
| | Cie de Financement Foncier SA | 0.010% | 4/16/29 | EUR | 14,800 | 12,026 |
| | Cie de Financement Foncier SA | 3.875% | 4/25/55 | EUR | 2,049 | 2,370 |
| | Cie de Saint-Gobain | 1.000% | 3/17/25 | EUR | 500 | 467 |
| | Cie de Saint-Gobain | 1.375% | 6/14/27 | EUR | 3,000 | 2,677 |
| | Cie de Saint-Gobain | 2.375% | 10/4/27 | EUR | 2,200 | 2,048 |
| | Cie de Saint-Gobain | 1.875% | 9/21/28 | EUR | 10,200 | 9,055 |
| | Cie de Saint-Gobain | 1.875% | 3/15/31 | EUR | 5,800 | 4,844 |
| | Cie de Saint-Gobain | 2.625% | 8/10/32 | EUR | 2,200 | 1,889 |
| | Cie Financiere et Industrielle des Autoroutes SA | 0.375% | 2/7/25 | EUR | 3,800 | 3,539 |
| | Cie Generale des Etablissements Michelin SCA | 1.750% | 5/28/27 | EUR | 100 | 93 |
| | Cie Generale des Etablissements Michelin SCA | 0.000% | 11/2/28 | EUR | 6,300 | 5,175 |
| | Cie Generale des Etablissements Michelin SCA | 2.500% | 9/3/38 | EUR | 2,600 | 2,178 |
| | CNP Assurances | 4.500% | 6/10/47 | EUR | 3,800 | 3,641 |
| | CNP Assurances | 2.500% | 6/30/51 | EUR | 3,100 | 2,418 |
| | Coentreprise de Transport d'Electricite SA | 2.125% | 7/29/32 | EUR | 8,400 | 6,774 |
| | Covivio | 1.875% | 5/20/26 | EUR | 200 | 184 |
| | Covivio | 2.375% | 2/20/28 | EUR | 100 | 87 |
| | Covivio | 1.625% | 6/23/30 | EUR | 2,200 | 1,707 |
| | Covivio Hotels SACA | 1.875% | 9/24/25 | EUR | 1,500 | 1,376 |
| | Covivio Hotels SACA | 1.000% | 7/27/29 | EUR | 2,800 | 2,055 |
| | Credit Agricole Assurances SA | 2.000% | 7/17/30 | EUR | 2,800 | 2,130 |
| | Credit Agricole Assurances SA | 1.500% | 10/6/31 | EUR | 5,000 | 3,501 |
| | Credit Agricole Assurances SA | 4.750% | 9/27/48 | EUR | 1,200 | 1,109 |
| | Credit Agricole Assurances SA | 4.500% | 10/31/49 | EUR | 1,900 | 1,805 |
| | Credit Agricole Assurances SA | 4.250% | 12/31/49 | EUR | 5,400 | 5,171 |
| | Credit Agricole Home Loan SFH SA | 0.375% | 9/30/24 | EUR | 2,600 | 2,455 |
| | Credit Agricole Home Loan SFH SA | 0.500% | 4/3/25 | EUR | 2,500 | 2,336 |
| | Credit Agricole Home Loan SFH SA | 4.000% | 7/16/25 | EUR | 1,000 | 1,016 |
| | Credit Agricole Home Loan SFH SA | 0.500% | 2/19/26 | EUR | 900 | 822 |
| | Credit Agricole Home Loan SFH SA | 0.750% | 5/5/27 | EUR | 18,400 | 16,480 |
| | Credit Agricole Home Loan SFH SA | 0.875% | 8/31/27 | EUR | 6,100 | 5,460 |
| | Credit Agricole Home Loan SFH SA | 0.875% | 8/11/28 | EUR | 7,600 | 6,657 |
| | Credit Agricole Home Loan SFH SA | 1.000% | 1/16/29 | EUR | 7,600 | 6,639 |
| | Credit Agricole Home Loan SFH SA | 0.050% | 12/6/29 | EUR | 5,000 | 3,994 |
| | Credit Agricole Home Loan SFH SA | 1.250% | 3/24/31 | EUR | 9,100 | 7,749 |
| | Credit Agricole Home Loan SFH SA | 0.010% | 11/3/31 | EUR | 8,600 | 6,424 |
| | Credit Agricole Home Loan SFH SA | 1.375% | 2/3/32 | EUR | 2,200 | 1,861 |
| | Credit Agricole Home Loan SFH SA | 0.875% | 5/6/34 | EUR | 7,600 | 5,799 |
| | Credit Agricole Home Loan SFH SA | 1.500% | 9/28/38 | EUR | 2,500 | 1,911 |
| | Credit Agricole Public Sector SCF SA | 0.500% | 10/10/25 | EUR | 11,000 | 10,142 |
| | Credit Agricole Public Sector SCF SA | 0.250% | 10/31/26 | EUR | 12,580 | 11,187 |
| | Credit Agricole Public Sector SCF SA | 0.875% | 8/2/27 | EUR | 20,402 | 18,271 |
| | Credit Agricole Public Sector SCF SA | 0.010% | 9/13/28 | EUR | 5,000 | 4,143 |
| | Credit Agricole Public Sector SCF SA | 0.625% | 3/29/29 | EUR | 7,100 | 6,023 |
| | Credit Agricole SA | 7.375% | 12/18/23 | GBP | 500 | 584 |
| | Credit Agricole SA | 2.375% | 5/20/24 | EUR | 7,100 | 6,908 |
| | Credit Agricole SA | 1.000% | 9/16/24 | EUR | 1,000 | 952 |
| | Credit Agricole SA | 3.125% | 2/5/26 | EUR | 2,000 | 1,930 |
| | Credit Agricole SA | 1.000% | 4/22/26 | EUR | 11,700 | 10,726 |
| | Credit Agricole SA | 1.875% | 12/20/26 | EUR | 5,100 | 4,607 |
| | Credit Agricole SA | 2.625% | 3/17/27 | EUR | 10,329 | 9,453 |
Total International Bond Index Fund
| | | Coupon | Maturity
Date | Currency | Face
Amount
(000) | Market
Value•
($000) |
| | Credit Agricole SA | 1.375% | 5/3/27 | EUR | 700 | 626 |
| | Credit Agricole SA | 0.375% | 4/20/28 | EUR | 4,800 | 3,832 |
| | Credit Agricole SA | 1.750% | 3/5/29 | EUR | 6,000 | 5,070 |
| | Credit Agricole SA | 2.000% | 3/25/29 | EUR | 6,400 | 5,338 |
| | Credit Agricole SA | 1.000% | 7/3/29 | EUR | 7,300 | 6,041 |
| | Credit Agricole SA | 0.500% | 9/21/29 | EUR | 13,600 | 10,680 |
| | Credit Agricole SA | 1.625% | 6/5/30 | EUR | 14,200 | 12,765 |
| | Credit Agricole SA | 0.875% | 1/14/32 | EUR | 6,400 | 4,610 |
| | Credit Mutuel Arkea SA | 1.250% | 5/31/24 | EUR | 11,000 | 10,460 |
| | Credit Mutuel Arkea SA | 1.375% | 1/17/25 | EUR | 100 | 94 |
| | Credit Mutuel Arkea SA | 0.875% | 5/7/27 | EUR | 1,000 | 868 |
| | Credit Mutuel Arkea SA | 0.375% | 10/3/28 | EUR | 5,100 | 4,071 |
| | Credit Mutuel Arkea SA | 3.500% | 2/9/29 | EUR | 10,000 | 9,037 |
| | Credit Mutuel Arkea SA | 1.125% | 5/23/29 | EUR | 1,100 | 899 |
| | Credit Mutuel Arkea SA | 1.875% | 10/25/29 | EUR | 100 | 92 |
| | Credit Mutuel Arkea SA | 3.375% | 3/11/31 | EUR | 2,000 | 1,726 |
| | Credit Mutuel Home Loan SFH SA | 4.125% | 1/19/24 | EUR | 3,000 | 3,016 |
| | Credit Mutuel Home Loan SFH SA | 0.250% | 4/30/24 | EUR | 5,000 | 4,762 |
| | Credit Mutuel Home Loan SFH SA | 1.750% | 6/19/24 | EUR | 5,000 | 4,859 |
| | Credit Mutuel Home Loan SFH SA | 0.625% | 2/10/25 | EUR | 1,000 | 940 |
| | Credit Mutuel Home Loan SFH SA | 0.625% | 2/2/26 | EUR | 2,500 | 2,295 |
| | Credit Mutuel Home Loan SFH SA | 0.875% | 4/7/26 | EUR | 484 | 446 |
| | Credit Mutuel Home Loan SFH SA | 0.625% | 3/4/27 | EUR | 16,000 | 14,290 |
| | Credit Mutuel Home Loan SFH SA | 0.750% | 9/15/27 | EUR | 30,700 | 27,249 |
| | Credit Mutuel Home Loan SFH SA | 0.010% | 7/20/28 | EUR | 9,200 | 7,664 |
| | Credit Mutuel Home Loan SFH SA | 1.000% | 1/30/29 | EUR | 2,800 | 2,441 |
| | Danone SA | 2.600% | 6/28/23 | EUR | 2,800 | 2,764 |
| | Danone SA | 1.250% | 5/30/24 | EUR | 200 | 192 |
| | Danone SA | 0.709% | 11/3/24 | EUR | 3,700 | 3,498 |
| | Danone SA | 1.125% | 1/14/25 | EUR | 5,000 | 4,734 |
| | Danone SA | 0.571% | 3/17/27 | EUR | 5,000 | 4,418 |
| | Danone SA | 0.395% | 6/10/29 | EUR | 9,300 | 7,545 |
| | Dassault Systemes SE | 0.125% | 9/16/26 | EUR | 2,500 | 2,201 |
| | Dassault Systemes SE | 0.375% | 9/16/29 | EUR | 5,000 | 4,035 |
| 5 | Dexia Credit Local SA | 0.625% | 2/3/24 | EUR | 31,750 | 30,607 |
| 5 | Dexia Credit Local SA | 1.250% | 11/26/24 | EUR | 8,800 | 8,435 |
| 5 | Dexia Credit Local SA | 0.500% | 1/17/25 | EUR | 12,700 | 11,939 |
| 5 | Dexia Credit Local SA | 2.125% | 2/12/25 | GBP | 1,500 | 1,639 |
| 5 | Dexia Credit Local SA | 1.250% | 7/21/25 | GBP | 5,000 | 5,288 |
| 5 | Dexia Credit Local SA | 0.625% | 1/17/26 | EUR | 4,200 | 3,869 |
| 5 | Dexia Credit Local SA | 0.250% | 12/10/26 | GBP | 5,000 | 4,834 |
| 5 | Dexia Credit Local SA | 1.000% | 10/18/27 | EUR | 4,250 | 3,823 |
| 5 | Dexia Credit Local SA | 0.000% | 1/21/28 | EUR | 5,300 | 4,497 |
| | Edenred | 1.375% | 3/10/25 | EUR | 300 | 282 |
| | Electricite de France SA | 4.625% | 9/11/24 | EUR | 9,750 | 9,829 |
| | Electricite de France SA | 0.300% | 10/14/24 | CHF | 4,335 | 4,206 |
| | Electricite de France SA | 4.000% | 11/12/25 | EUR | 5,950 | 5,928 |
| | Electricite de France SA | 1.000% | 10/13/26 | EUR | 8,300 | 7,363 |
| | Electricite de France SA | 4.125% | 3/25/27 | EUR | 4,600 | 4,556 |
| | Electricite de France SA | 4.625% | 4/26/30 | EUR | 5,150 | 5,100 |
| | Electricite de France SA | 2.000% | 10/2/30 | EUR | 1,000 | 814 |
| | Electricite de France SA | 5.875% | 7/18/31 | GBP | 1,588 | 1,785 |
| | Electricite de France SA | 5.625% | 2/21/33 | EUR | 4,512 | 4,736 |
| | Electricite de France SA | 1.000% | 11/29/33 | EUR | 6,700 | 4,476 |
| | Electricite de France SA | 6.125% | 6/2/34 | GBP | 11,050 | 12,530 |
| | Electricite de France SA | 1.875% | 10/13/36 | EUR | 5,400 | 3,680 |
| | Electricite de France SA | 5.500% | 3/27/37 | GBP | 3,600 | 3,800 |
| | Electricite de France SA | 4.500% | 11/12/40 | EUR | 1,900 | 1,734 |
| | Electricite de France SA | 5.500% | 10/17/41 | GBP | 5,500 | 5,743 |
| | Electricite de France SA | 2.000% | 12/9/49 | EUR | 4,300 | 2,279 |
| | Electricite de France SA | 5.125% | 9/22/50 | GBP | 100 | 100 |
| | Electricite de France SA | 6.000% | 1/23/14 | GBP | 5,100 | 5,347 |
| | ELO SACA | 2.375% | 12/12/22 | EUR | 1,000 | 987 |
| | ELO SACA | 2.375% | 4/25/25 | EUR | 4,200 | 3,930 |
| | Engie SA | 0.875% | 3/27/24 | EUR | 1,000 | 957 |
| | Engie SA | 0.875% | 9/19/25 | EUR | 6,800 | 6,271 |
| | Engie SA | 1.000% | 3/13/26 | EUR | 1,500 | 1,364 |
| | Engie SA | 2.375% | 5/19/26 | EUR | 100 | 95 |
| | Engie SA | 0.375% | 6/11/27 | EUR | 8,200 | 6,963 |
Total International Bond Index Fund
| | | Coupon | Maturity
Date | Currency | Face
Amount
(000) | Market
Value•
($000) |
| | Engie SA | 1.750% | 3/27/28 | EUR | 3,800 | 3,398 |
| | Engie SA | 1.375% | 6/22/28 | EUR | 1,300 | 1,131 |
| | Engie SA | 7.000% | 10/30/28 | GBP | 1,950 | 2,353 |
| | Engie SA | 0.375% | 10/26/29 | EUR | 1,000 | 775 |
| | Engie SA | 2.125% | 3/30/32 | EUR | 6,100 | 5,066 |
| | Engie SA | 1.875% | 9/19/33 | EUR | 1,200 | 919 |
| | Engie SA | 1.500% | 3/13/35 | EUR | 2,000 | 1,412 |
| | Engie SA | 1.000% | 10/26/36 | EUR | 6,000 | 3,745 |
| | Engie SA | 2.000% | 9/28/37 | EUR | 3,600 | 2,515 |
| | Engie SA | 1.375% | 6/21/39 | EUR | 2,800 | 1,692 |
| | Engie SA | 1.250% | 10/24/41 | EUR | 4,500 | 2,488 |
| | Engie SA | 3.875% | 6/2/49 | EUR | 7,200 | 7,019 |
| | Engie SA | 5.000% | 10/1/60 | GBP | 2,550 | 2,642 |
| | Engie SA | 1.500% | Perpetual | EUR | 2,500 | 1,934 |
| | Engie SA | 1.625% | Perpetual | EUR | 4,600 | 4,112 |
| | Engie SA | 5.950% | 3/16/11 | EUR | 1,625 | 1,698 |
| | EssilorLuxottica SA | 2.625% | 2/10/24 | EUR | 4,648 | 4,592 |
| | EssilorLuxottica SA | 0.125% | 5/27/25 | EUR | 5,000 | 4,600 |
| | EssilorLuxottica SA | 0.500% | 6/5/28 | EUR | 10,200 | 8,673 |
| | Eutelsat SA | 2.000% | 10/2/25 | EUR | 2,500 | 2,142 |
| | Eutelsat SA | 2.250% | 7/13/27 | EUR | 500 | 408 |
| | Eutelsat SA | 1.500% | 10/13/28 | EUR | 600 | 444 |
| | Gecina SA | 1.500% | 1/20/25 | EUR | 4,600 | 4,313 |
| | Gecina SA | 1.375% | 6/30/27 | EUR | 100 | 88 |
| | Gecina SA | 1.375% | 1/26/28 | EUR | 1,700 | 1,473 |
| | Gecina SA | 1.000% | 1/30/29 | EUR | 1,100 | 892 |
| | Gecina SA | 0.875% | 1/25/33 | EUR | 3,000 | 2,104 |
| | Gecina SA | 0.875% | 6/30/36 | EUR | 3,600 | 2,217 |
| | GELF Bond Issuer I SA | 1.125% | 7/18/29 | EUR | 2,104 | 1,560 |
| | Groupe des Assurances du Credit Mutuel SADIR | 1.850% | 4/21/42 | EUR | 2,200 | 1,531 |
| | Holding d'Infrastructures de Transport SASU | 2.250% | 3/24/25 | EUR | 2,100 | 1,976 |
| | Holding d'Infrastructures de Transport SASU | 1.625% | 11/27/27 | EUR | 8,900 | 7,576 |
| | Holding d'Infrastructures de Transport SASU | 1.475% | 1/18/31 | EUR | 8,000 | 5,948 |
| | Holding d'Infrastructures des Metiers de l'Environnement | 0.125% | 9/16/25 | EUR | 6,070 | 5,249 |
| | Holding d'Infrastructures des Metiers de l'Environnement | 0.625% | 9/16/28 | EUR | 11,845 | 8,949 |
| | HSBC Continental Europe SA | 0.250% | 5/17/24 | EUR | 1,500 | 1,415 |
| | HSBC Continental Europe SA | 0.100% | 9/3/27 | EUR | 5,100 | 4,260 |
| | HSBC SFH France SA | 2.500% | 6/28/28 | EUR | 8,800 | 8,430 |
| | ICADE | 1.125% | 11/17/25 | EUR | 6,100 | 5,349 |
| | ICADE | 1.625% | 2/28/28 | EUR | 3,700 | 2,965 |
| | ICADE | 1.000% | 1/19/30 | EUR | 1,400 | 959 |
| | ICADE | 0.625% | 1/18/31 | EUR | 3,700 | 2,354 |
| | Icade Sante SAS | 0.875% | 11/4/29 | EUR | 4,600 | 3,238 |
| | Imerys SA | 2.000% | 12/10/24 | EUR | 300 | 284 |
| | Imerys SA | 1.500% | 1/15/27 | EUR | 600 | 514 |
| | Imerys SA | 1.000% | 7/15/31 | EUR | 1,500 | 917 |
| | Indigo Group SAS | 1.625% | 4/19/28 | EUR | 400 | 339 |
| | In'li SA | 1.125% | 7/2/29 | EUR | 1,000 | 761 |
| | JCDecaux SA | 2.625% | 4/24/28 | EUR | 2,500 | 2,118 |
| | JCDecaux SA | 1.625% | 2/7/30 | EUR | 800 | ��� 601 |
| | Kering SA | 1.250% | 5/10/26 | EUR | 4,600 | 4,270 |
| | Klepierre SA | 1.875% | 2/19/26 | EUR | 3,800 | 3,431 |
| | Klepierre SA | 1.375% | 2/16/27 | EUR | 700 | 595 |
| | Klepierre SA | 2.000% | 5/12/29 | EUR | 2,200 | 1,733 |
| | Klepierre SA | 0.625% | 7/1/30 | EUR | 4,800 | 3,196 |
| | Klepierre SA | 0.875% | 2/17/31 | EUR | 1,900 | 1,266 |
| | Klepierre SA | 1.250% | 9/29/31 | EUR | 100 | 67 |
| | La Banque Postale Home Loan SFH SA | 2.375% | 1/15/24 | EUR | 2,300 | 2,264 |
| | La Banque Postale Home Loan SFH SA | 0.625% | 6/23/27 | EUR | 6,350 | 5,643 |
| | La Banque Postale Home Loan SFH SA | 0.875% | 2/7/28 | EUR | 4,500 | 3,987 |
| | La Banque Postale Home Loan SFH SA | 1.000% | 10/4/28 | EUR | 2,500 | 2,202 |
| | La Banque Postale Home Loan SFH SA | 0.010% | 10/22/29 | EUR | 23,600 | 18,868 |
| | La Banque Postale SA | 1.000% | 10/16/24 | EUR | 2,500 | 2,338 |
| | La Banque Postale SA | 2.000% | 7/13/28 | EUR | 4,700 | 4,084 |
| | La Banque Postale SA | 1.375% | 4/24/29 | EUR | 5,000 | 4,076 |
| | La Banque Postale SA | 0.875% | 1/26/31 | EUR | 2,300 | 1,935 |
| | La Banque Postale SA | 0.750% | 8/2/32 | EUR | 2,400 | 1,847 |
| | La Mondiale SAM | 5.050% | 12/29/49 | EUR | 3,431 | 3,266 |
| | La Poste SA | 2.750% | 11/26/24 | EUR | 2,000 | 1,960 |
Total International Bond Index Fund
| | | Coupon | Maturity
Date | Currency | Face
Amount
(000) | Market
Value•
($000) |
| | La Poste SA | 1.125% | 6/4/25 | EUR | 5,000 | 4,703 |
| | La Poste SA | 0.625% | 10/21/26 | EUR | 4,900 | 4,354 |
| | La Poste SA | 0.375% | 9/17/27 | EUR | 10,100 | 8,615 |
| | La Poste SA | 1.450% | 11/30/28 | EUR | 1,000 | 882 |
| | La Poste SA | 0.000% | 7/18/29 | EUR | 1,200 | 932 |
| | La Poste SA | 1.375% | 4/21/32 | EUR | 14,200 | 11,442 |
| | Legrand SA | 0.750% | 7/6/24 | EUR | 100 | 96 |
| | Legrand SA | 1.000% | 3/6/26 | EUR | 100 | 91 |
| | Legrand SA | 1.875% | 12/16/27 | EUR | 100 | 90 |
| | Legrand SA | 0.750% | 5/20/30 | EUR | 1,500 | 1,198 |
| | Legrand SA | 0.375% | 10/6/31 | EUR | �� 700 | 515 |
| | Legrand SA | 1.875% | 7/6/32 | EUR | 700 | 579 |
| | LVMH Moet Hennessy Louis Vuitton SE | 0.750% | 5/26/24 | EUR | 6,666 | 6,420 |
| | LVMH Moet Hennessy Louis Vuitton SE | 0.000% | 2/11/26 | EUR | 3,700 | 3,332 |
| | LVMH Moet Hennessy Louis Vuitton SE | 1.125% | 2/11/27 | GBP | 4,400 | 4,303 |
| | LVMH Moet Hennessy Louis Vuitton SE | 0.125% | 2/11/28 | EUR | 5,000 | 4,266 |
| | LVMH Moet Hennessy Louis Vuitton SE | 0.375% | 2/11/31 | EUR | 4,600 | 3,592 |
| | Mercialys SA | 2.500% | 2/28/29 | EUR | 1,400 | 1,034 |
| | MMS USA Investments Inc. | 0.625% | 6/13/25 | EUR | 7,300 | 6,671 |
| | MMS USA Investments Inc. | 1.250% | 6/13/28 | EUR | 100 | 85 |
| | MMS USA Investments Inc. | 1.750% | 6/13/31 | EUR | 2,600 | 2,054 |
| | Nerval SAS | 2.875% | 4/14/32 | EUR | 3,800 | 2,937 |
| | Orange SA | 3.125% | 1/9/24 | EUR | 100 | 99 |
| | Orange SA | 1.125% | 7/15/24 | EUR | 4,700 | 4,492 |
| | Orange SA | 1.000% | 5/12/25 | EUR | 5,100 | 4,783 |
| | Orange SA | 1.000% | 9/12/25 | EUR | 6,900 | 6,424 |
| | Orange SA | 5.250% | 12/5/25 | GBP | 726 | 839 |
| | Orange SA | 0.000% | 9/4/26 | EUR | 2,000 | 1,747 |
| | Orange SA | 0.875% | 2/3/27 | EUR | 900 | 805 |
| | Orange SA | 1.250% | 7/7/27 | EUR | 4,000 | 3,599 |
| | Orange SA | 1.375% | 3/20/28 | EUR | 18,400 | 16,460 |
| | Orange SA | 8.125% | 11/20/28 | GBP | 3,316 | 4,334 |
| | Orange SA | 2.000% | 1/15/29 | EUR | 2,000 | 1,833 |
| | Orange SA | 1.375% | 1/16/30 | EUR | 1,100 | 946 |
| | Orange SA | 1.875% | 9/12/30 | EUR | 8,900 | 7,817 |
| | Orange SA | 3.250% | 1/15/32 | GBP | 9,500 | 9,341 |
| | Orange SA | 1.625% | 4/7/32 | EUR | 5,000 | 4,175 |
| | Orange SA | 0.500% | 9/4/32 | EUR | 9,800 | 7,151 |
| | Orange SA | 8.125% | 1/28/33 | EUR | 362 | 473 |
| | Orange SA | 0.625% | 12/16/33 | EUR | 10,700 | 7,587 |
| | Orange SA | 5.625% | 1/23/34 | GBP | 1,700 | 2,004 |
| | Orange SA | 1.375% | 9/4/49 | EUR | 900 | 580 |
| | Orange SA | 5.000% | 10/29/49 | EUR | 7,171 | 7,044 |
| | Orange SA | 5.250% | 12/29/49 | EUR | 3,019 | 2,995 |
| | Orange SA | 1.375% | Perpetual | EUR | 1,900 | 1,413 |
| | Orange SA | 1.750% | Perpetual | EUR | 1,300 | 1,015 |
| | Orange SA | 2.375% | Perpetual | EUR | 5,000 | 4,628 |
| | Pernod Ricard SA | 1.125% | 4/7/25 | EUR | 300 | 283 |
| | Pernod Ricard SA | 1.500% | 5/18/26 | EUR | 1,500 | 1,399 |
| | Pernod Ricard SA | 1.750% | 4/8/30 | EUR | 100 | 87 |
| | Pernod Ricard SA | 0.875% | 10/24/31 | EUR | 4,000 | 3,111 |
| | PSA Tresorerie GIE | 6.000% | 9/19/33 | EUR | 2,024 | 2,089 |
| | Publicis Groupe SA | 0.500% | 11/3/23 | EUR | 200 | 192 |
| | RCI Banque SA | 1.000% | 5/17/23 | EUR | 3,279 | 3,201 |
| | RCI Banque SA | 1.375% | 3/8/24 | EUR | 5,635 | 5,405 |
| | RCI Banque SA | 1.625% | 4/11/25 | EUR | 8,574 | 7,940 |
| | RCI Banque SA | 1.750% | 4/10/26 | EUR | 1,165 | 1,051 |
| | RCI Banque SA | 1.625% | 5/26/26 | EUR | 2,666 | 2,353 |
| | RCI Banque SA | 4.750% | 7/6/27 | EUR | 3,000 | 2,915 |
| | RTE Reseau de Transport d'Electricite SADIR | 1.625% | 11/27/25 | EUR | 6,500 | 6,091 |
| | RTE Reseau de Transport d'Electricite SADIR | 0.000% | 9/9/27 | EUR | 11,100 | 9,221 |
| | RTE Reseau de Transport d'Electricite SADIR | 2.750% | 6/20/29 | EUR | 500 | 463 |
| | RTE Reseau de Transport d'Electricite SADIR | 1.500% | 9/27/30 | EUR | 2,500 | 2,066 |
| | RTE Reseau de Transport d'Electricite SADIR | 2.000% | 4/18/36 | EUR | 400 | 305 |
| | RTE Reseau de Transport d'Electricite SADIR | 1.875% | 10/23/37 | EUR | 3,000 | 2,163 |
| | RTE Reseau de Transport d'Electricite SADIR | 1.125% | 7/8/40 | EUR | 7,500 | 4,635 |
| | Safran SA | 0.950% | 10/19/28 | EUR | 800 | 649 |
| | Sanofi | 2.500% | 11/14/23 | EUR | 2,500 | 2,463 |
| | Sanofi | 1.000% | 4/1/25 | EUR | 7,600 | 7,183 |
Total International Bond Index Fund
| | | Coupon | Maturity
Date | Currency | Face
Amount
(000) | Market
Value•
($000) |
| | Sanofi | 1.750% | 9/10/26 | EUR | 3,400 | 3,185 |
| | Sanofi | 0.500% | 1/13/27 | EUR | 400 | 355 |
| | Sanofi | 1.125% | 4/5/28 | EUR | 5,200 | 4,619 |
| | Sanofi | 0.875% | 3/21/29 | EUR | 5,000 | 4,303 |
| | Sanofi | 1.500% | 4/1/30 | EUR | 7,600 | 6,728 |
| | Sanofi | 1.875% | 3/21/38 | EUR | 3,500 | 2,781 |
| | SCOR SE | 3.000% | 6/8/46 | EUR | 1,800 | 1,611 |
| | SCOR SE | 3.625% | 5/27/48 | EUR | 4,900 | 4,348 |
| | SCOR SE | 1.375% | 9/17/51 | EUR | 2,200 | 1,510 |
| | Societe Fonciere Lyonnaise SA | 1.500% | 6/5/27 | EUR | 1,900 | 1,624 |
| | Societe Fonciere Lyonnaise SA | 0.500% | 4/21/28 | EUR | 1,900 | 1,467 |
| | Societe Generale SA | 1.250% | 2/15/24 | EUR | 9,400 | 8,995 |
| | Societe Generale SA | 1.125% | 1/23/25 | EUR | 5,700 | 5,308 |
| | Societe Generale SA | 2.625% | 2/27/25 | EUR | 100 | 95 |
| | Societe Generale SA | 1.125% | 4/21/26 | EUR | 5,000 | 4,568 |
| | Societe Generale SA | 0.125% | 11/17/26 | EUR | 6,000 | 5,299 |
| | Societe Generale SA | 0.750% | 1/25/27 | EUR | 8,600 | 7,236 |
| | Societe Generale SA | 0.847% | 5/26/27 | JPY | 1,000,000 | 6,423 |
| | Societe Generale SA | 0.250% | 7/8/27 | EUR | 7,500 | 6,309 |
| | Societe Generale SA | 1.250% | 12/7/27 | GBP | 3,700 | 3,295 |
| | Societe Generale SA | 2.125% | 9/27/28 | EUR | 8,600 | 7,344 |
| | Societe Generale SA | 1.750% | 3/22/29 | EUR | 4,500 | 3,708 |
| | Societe Generale SA | 0.500% | 6/12/29 | EUR | 14,100 | 10,970 |
| | Societe Generale SA | 1.250% | 6/12/30 | EUR | 4,200 | 3,194 |
| | Societe Generale SA | 1.000% | 11/24/30 | EUR | 4,000 | 3,399 |
| | Societe Generale SFH SA | 2.000% | 4/29/24 | EUR | 6,800 | 6,645 |
| | Societe Generale SFH SA | 0.500% | 1/30/25 | EUR | 4,500 | 4,222 |
| | Societe Generale SFH SA | 0.500% | 1/28/26 | EUR | 5,700 | 5,215 |
| | Societe Generale SFH SA | 0.750% | 1/19/28 | EUR | 5,000 | 4,405 |
| | Societe Generale SFH SA | 1.375% | 5/5/28 | EUR | 12,500 | 11,329 |
| | Societe Generale SFH SA | 0.125% | 2/2/29 | EUR | 21,900 | 18,060 |
| | Societe Generale SFH SA | 0.125% | 7/18/29 | EUR | 14,000 | 11,391 |
| | Societe Generale SFH SA | 0.010% | 2/11/30 | EUR | 1,900 | 1,502 |
| | Societe Generale SFH SA | 0.010% | 2/5/31 | EUR | 10,400 | 7,952 |
| | Sodexo SA | 0.500% | 1/17/24 | EUR | 1,509 | 1,441 |
| | Sodexo SA | 0.750% | 4/27/25 | EUR | 5,914 | 5,482 |
| | Sodexo SA | 2.500% | 6/24/26 | EUR | 383 | 360 |
| | Sodexo SA | 0.750% | 4/14/27 | EUR | 5,914 | 5,126 |
| | Sodexo SA | 1.750% | 6/26/28 | GBP | 4,090 | 3,837 |
| | Sodexo SA | 1.000% | 4/27/29 | EUR | 3,700 | 3,022 |
| | Sogecap SA | 4.125% | 12/29/49 | EUR | 100 | 92 |
| | Suez SA | 5.500% | 7/22/24 | EUR | 2,350 | 2,404 |
| | Suez SA | 1.000% | 4/3/25 | EUR | 5,100 | 4,783 |
| | Suez SA | 1.750% | 9/10/25 | EUR | 300 | 284 |
| | Suez SA | 1.250% | 4/2/27 | EUR | 10,200 | 9,176 |
| | Suez SA | 1.500% | 4/3/29 | EUR | 800 | 688 |
| | Suez SA | 1.625% | 9/17/30 | EUR | 400 | 334 |
| | Suez SA | 5.375% | 12/2/30 | GBP | 600 | 682 |
| | Suez SA | 2.875% | Perpetual | EUR | 6,400 | 6,012 |
| | Suez SACA | 2.375% | 5/24/30 | EUR | 1,600 | 1,343 |
| | Suez SACA | 2.875% | 5/24/34 | EUR | 1,400 | 1,128 |
| | TDF Infrastructure SAS | 2.500% | 4/7/26 | EUR | 400 | 352 |
| | TDF Infrastructure SAS | 1.750% | 12/1/29 | EUR | 2,700 | 2,030 |
| | Teleperformance | 3.750% | 6/24/29 | EUR | 2,000 | 1,894 |
| | Terega SA | 2.200% | 8/5/25 | EUR | 100 | 95 |
| | Terega SA | 0.875% | 9/17/30 | EUR | 2,500 | 1,819 |
| | TotalEnergies Capital Canada Ltd. | 2.125% | 9/18/29 | EUR | 6,700 | 6,039 |
| | TotalEnergies Capital International SA | 0.625% | 10/4/24 | EUR | 6,000 | 5,678 |
| | TotalEnergies Capital International SA | 1.375% | 3/19/25 | EUR | 6,900 | 6,551 |
| | TotalEnergies Capital International SA | 1.750% | 7/7/25 | GBP | 4,746 | 5,028 |
| | TotalEnergies Capital International SA | 2.875% | 11/19/25 | EUR | 3,900 | 3,816 |
| | TotalEnergies Capital International SA | 2.500% | 3/25/26 | EUR | 2,200 | 2,121 |
| | TotalEnergies Capital International SA | 1.491% | 4/8/27 | EUR | 5,000 | 4,584 |
| | TotalEnergies Capital International SA | 0.696% | 5/31/28 | EUR | 11,400 | 9,760 |
| | TotalEnergies Capital International SA | 1.491% | 9/4/30 | EUR | 500 | 425 |
| | TotalEnergies Capital International SA | 1.994% | 4/8/32 | EUR | 5,200 | 4,450 |
| | TotalEnergies Capital International SA | 1.618% | 5/18/40 | EUR | 5,000 | 3,356 |
| | TotalEnergies SE | 2.625% | 12/29/49 | EUR | 12,608 | 11,641 |
| | TotalEnergies SE | 3.369% | 12/29/49 | EUR | 3,650 | 3,382 |
Total International Bond Index Fund
| | | Coupon | Maturity
Date | Currency | Face
Amount
(000) | Market
Value•
($000) |
| | TotalEnergies SE | 1.625% | Perpetual | EUR | 6,316 | 5,022 |
| | TotalEnergies SE | 1.750% | Perpetual | EUR | 4,144 | 3,851 |
| | TotalEnergies SE | 2.000% | Perpetual | EUR | 3,309 | 2,484 |
| | TotalEnergies SE | 2.000% | Perpetual | EUR | 4,000 | 3,355 |
| | TotalEnergies SE | 2.125% | Perpetual | EUR | 7,219 | 5,053 |
| | UMG Groupe VYV | 1.625% | 7/2/29 | EUR | 2,000 | 1,651 |
| | Unibail-Rodamco-Westfield SE | 2.500% | 2/26/24 | EUR | 937 | 903 |
| | Unibail-Rodamco-Westfield SE | 1.000% | 3/14/25 | EUR | 5,087 | 4,599 |
| | Unibail-Rodamco-Westfield SE | 1.125% | 9/15/25 | EUR | 5,700 | 5,041 |
| | Unibail-Rodamco-Westfield SE | 1.375% | 3/9/26 | EUR | 371 | 326 |
| | Unibail-Rodamco-Westfield SE | 2.500% | 6/4/26 | EUR | 400 | 358 |
| | Unibail-Rodamco-Westfield SE | 1.000% | 2/27/27 | EUR | 1,800 | 1,494 |
| | Unibail-Rodamco-Westfield SE | 0.625% | 5/4/27 | EUR | 10,200 | 8,230 |
| | Unibail-Rodamco-Westfield SE | 0.750% | 10/25/28 | EUR | 1,900 | 1,429 |
| | Unibail-Rodamco-Westfield SE | 1.500% | 5/29/29 | EUR | 200 | 152 |
| | Unibail-Rodamco-Westfield SE | 1.375% | 4/15/30 | EUR | 3,815 | 2,765 |
| | Unibail-Rodamco-Westfield SE | 1.875% | 1/15/31 | EUR | 10,500 | 7,696 |
| | Unibail-Rodamco-Westfield SE | 1.375% | 12/4/31 | EUR | 4,100 | 2,796 |
| | Unibail-Rodamco-Westfield SE | 0.875% | 3/29/32 | EUR | 6,300 | 3,962 |
| | Unibail-Rodamco-Westfield SE | 2.000% | 6/29/32 | EUR | 1,200 | 852 |
| | Unibail-Rodamco-Westfield SE | 1.375% | 5/25/33 | EUR | 2,200 | 1,409 |
| | Unibail-Rodamco-Westfield SE | 2.000% | 4/28/36 | EUR | 1,613 | 1,018 |
| | Unibail-Rodamco-Westfield SE | 2.250% | 5/14/38 | EUR | 600 | 353 |
| | Unibail-Rodamco-Westfield SE | 1.750% | 7/1/49 | EUR | 3,600 | 1,654 |
| | Unibail-Rodamco-Westfield SE | 2.875% | Perpetual | EUR | 700 | 507 |
| | Veolia Environnement SA | 0.892% | 1/14/24 | EUR | 2,000 | 1,921 |
| | Veolia Environnement SA | 4.625% | 3/30/27 | EUR | 5,100 | 5,240 |
| | Veolia Environnement SA | 1.590% | 1/10/28 | EUR | 3,000 | 2,658 |
| | Veolia Environnement SA | 0.927% | 1/4/29 | EUR | 2,500 | 2,083 |
| | Veolia Environnement SA | 0.800% | 1/15/32 | EUR | 7,800 | 5,800 |
| | Veolia Environnement SA | 6.125% | 11/25/33 | EUR | 2,244 | 2,542 |
| | Vinci SA | 1.000% | 9/26/25 | EUR | 2,500 | 2,334 |
| | Vinci SA | 2.250% | 3/15/27 | GBP | 500 | 508 |
| | Vinci SA | 1.625% | 1/18/29 | EUR | 7,200 | 6,473 |
| | Vinci SA | 1.750% | 9/26/30 | EUR | 3,400 | 3,007 |
| | Vinci SA | 0.500% | 1/9/32 | EUR | 11,200 | 8,557 |
| | Vinci SA | 2.750% | 9/15/34 | GBP | 600 | 541 |
| | Vivendi SE | 1.125% | 12/11/28 | EUR | 2,800 | 2,342 |
| | Wendel SE | 1.000% | 6/1/31 | EUR | 2,800 | 1,947 |
| | Wendel SE | 1.375% | 1/18/34 | EUR | 1,500 | 972 |
| | Westfield America Management Ltd. | 2.625% | 3/30/29 | GBP | 1,400 | 1,179 |
| | | | | | | 2,439,191 |
| Germany (2.3%) | | | |
| | Aareal Bank AG | 0.125% | 2/1/24 | EUR | 2,561 | 2,452 |
| | Aareal Bank AG | 0.375% | 7/15/25 | EUR | 1,127 | 1,042 |
| | Aareal Bank AG | 0.010% | 9/15/28 | EUR | 7,100 | 5,892 |
| | Allianz Finance II BV | 0.875% | 1/15/26 | EUR | 1,000 | 920 |
| | Allianz Finance II BV | 3.000% | 3/13/28 | EUR | 1,400 | 1,363 |
| | Allianz Finance II BV | 0.500% | 1/14/31 | EUR | 6,300 | 4,871 |
| | Allianz SE | 2.241% | 7/7/45 | EUR | 3,400 | 3,119 |
| | Allianz SE | 2.121% | 7/8/50 | EUR | 7,000 | 5,418 |
| | Allianz SE | 4.252% | 7/5/52 | EUR | 6,900 | 6,104 |
| | Allianz SE | 3.375% | Perpetual | EUR | 9,500 | 9,053 |
| | alstria office REIT AG | 1.500% | 11/15/27 | EUR | 4,300 | 2,802 |
| | Amprion GmbH | 0.625% | 9/23/33 | EUR | 5,800 | 3,970 |
| | Aroundtown SA | 1.000% | 1/7/25 | EUR | 3,200 | 2,728 |
| | Aroundtown SA | 0.625% | 7/9/25 | EUR | 1,000 | 812 |
| | Aroundtown SA | 4.625% | 9/18/25 | CAD | 435 | 302 |
| | Aroundtown SA | 1.500% | 5/28/26 | EUR | 4,900 | 3,857 |
| | Aroundtown SA | 0.000% | 7/16/26 | EUR | 8,600 | 6,327 |
| | Aroundtown SA | 0.375% | 4/15/27 | EUR | 7,800 | 5,552 |
| | Aroundtown SA | 1.625% | 1/31/28 | EUR | 1,600 | 1,142 |
| | Aroundtown SA | 1.450% | 7/9/28 | EUR | 4,000 | 2,777 |
| | Aroundtown SA | 3.000% | 10/16/29 | GBP | 4,483 | 3,614 |
| | Aroundtown SA | 3.625% | 4/10/31 | GBP | 1,100 | 887 |
| | Aroundtown SA | 1.625% | Perpetual | EUR | 3,800 | 1,735 |
| | Aroundtown SA | 2.125% | Perpetual | EUR | 2,000 | 972 |
| | Aroundtown SA | 2.875% | Perpetual | EUR | 3,000 | 1,374 |
| | Aroundtown SA | 3.375% | Perpetual | EUR | 1,800 | 855 |
Total International Bond Index Fund
| | | Coupon | Maturity
Date | Currency | Face
Amount
(000) | Market
Value•
($000) |
| | BASF SE | 0.101% | 6/5/23 | EUR | 2,200 | 2,138 |
| | BASF SE | 0.875% | 10/6/23 | GBP | 375 | 415 |
| | BASF SE | 1.750% | 3/11/25 | GBP | 484 | 506 |
| | BASF SE | 0.875% | 11/15/27 | EUR | 75 | 65 |
| | BASF SE | 1.500% | 5/22/30 | EUR | 4,099 | 3,425 |
| | BASF SE | 0.875% | ��10/6/31 | EUR | 362 | 272 |
| | BASF SE | 1.450% | 12/13/32 | EUR | 8,400 | 6,363 |
| | BASF SE | 1.625% | 11/15/37 | EUR | 2,254 | 1,608 |
| | Bausparkasse Schwaebisch Hall | 2.000% | 5/17/34 | EUR | 20,200 | 17,729 |
| | Bayer AG | 0.050% | 1/12/25 | EUR | 6,300 | 5,759 |
| | Bayer AG | 0.750% | 1/6/27 | EUR | 6,500 | 5,623 |
| | Bayer AG | 1.125% | 1/6/30 | EUR | 9,300 | 7,314 |
| | Bayer AG | 0.625% | 7/12/31 | EUR | 4,400 | 3,146 |
| | Bayer AG | 1.375% | 7/6/32 | EUR | 5,000 | 3,722 |
| | Bayer AG | 1.000% | 1/12/36 | EUR | 4,400 | 2,755 |
| | Bayer Capital Corp. BV | 0.625% | 12/15/22 | EUR | 7,600 | 7,501 |
| | Bayer Capital Corp. BV | 1.500% | 6/26/26 | EUR | 400 | 363 |
| | Bayer Capital Corp. BV | 2.125% | 12/15/29 | EUR | 5,100 | 4,332 |
| | Bayerische Landesbank | 0.350% | 12/1/22 | EUR | 2,561 | 2,529 |
| | Bayerische Landesbank | 0.500% | 3/19/25 | EUR | 5,124 | 4,798 |
| | Bayerische Landesbank | 0.625% | 7/19/27 | EUR | 1,023 | 910 |
| | Bayerische Landesbank | 0.200% | 5/20/30 | EUR | 2,409 | 1,935 |
| | Bayerische Landesbodenkreditanstalt | 1.750% | 4/24/24 | EUR | 1,536 | 1,500 |
| | Berlin Hyp AG | 0.125% | 1/5/24 | EUR | 2,561 | 2,458 |
| | Berlin Hyp AG | 0.375% | 5/3/24 | EUR | 4,001 | 3,819 |
| | Berlin Hyp AG | 1.250% | 1/22/25 | EUR | 200 | 187 |
| | Berlin Hyp AG | 0.625% | 10/22/25 | EUR | 375 | 347 |
| | Berlin Hyp AG | 0.010% | 8/24/26 | EUR | 18,788 | 16,663 |
| | Berlin Hyp AG | 1.125% | 10/25/27 | EUR | 100 | 85 |
| | Berlin Hyp AG | 0.010% | 1/24/28 | EUR | 6,348 | 5,383 |
| | Berlin Hyp AG | 0.010% | 7/7/28 | EUR | 25,021 | 20,931 |
| | Berlin Hyp AG | 0.125% | 1/18/30 | EUR | 15,874 | 12,789 |
| | Berlin Hyp AG | 0.250% | 5/19/33 | EUR | 6,673 | 4,894 |
| | Bertelsmann SE & Co. KGaA | 1.750% | 10/14/24 | EUR | 3,000 | 2,903 |
| | Bertelsmann SE & Co. KGaA | 2.000% | 4/1/28 | EUR | 4,000 | 3,648 |
| | BMW Canada Inc. | 0.990% | 1/14/25 | CAD | 1,496 | 1,003 |
| | BMW Finance NV | 2.375% | 1/24/23 | EUR | 300 | 297 |
| | BMW Finance NV | 0.750% | 4/15/24 | EUR | 461 | 442 |
| | BMW Finance NV | 0.750% | 7/12/24 | EUR | 2,801 | 2,671 |
| | BMW Finance NV | 1.000% | 11/14/24 | EUR | 6,035 | 5,754 |
| | BMW Finance NV | 0.500% | 2/22/25 | EUR | 2,801 | 2,621 |
| | BMW Finance NV | 0.875% | 4/3/25 | EUR | 4,714 | 4,453 |
| | BMW Finance NV | 1.000% | 8/29/25 | EUR | 4,089 | 3,846 |
| | BMW Finance NV | 0.000% | 1/11/26 | EUR | 6,365 | 5,736 |
| | BMW Finance NV | 0.375% | 1/14/27 | EUR | 7,686 | 6,843 |
| | BMW Finance NV | 1.500% | 2/6/29 | EUR | 8,112 | 7,236 |
| | BMW Finance NV | 0.200% | 1/11/33 | EUR | 4,455 | 3,140 |
| | Brenntag Finance BV | 1.125% | 9/27/25 | EUR | 1,875 | 1,701 |
| | Commerzbank AG | 0.050% | 7/11/24 | EUR | 8,574 | 8,098 |
| | Commerzbank AG | 0.625% | 8/28/24 | EUR | 5,124 | 4,800 |
| | Commerzbank AG | 0.625% | 3/13/25 | EUR | 4,714 | 4,427 |
| | Commerzbank AG | 0.625% | 5/28/25 | EUR | 4,612 | 4,309 |
| | Commerzbank AG | 0.875% | 9/8/25 | EUR | 5,175 | 4,835 |
| | Commerzbank AG | 1.000% | 3/4/26 | EUR | 11,495 | 10,371 |
| | Commerzbank AG | 0.500% | 6/9/26 | EUR | 7,686 | 6,974 |
| | Commerzbank AG | 0.500% | 12/4/26 | EUR | 7,686 | 6,662 |
| | Commerzbank AG | 0.125% | 12/15/26 | EUR | 6,045 | 5,335 |
| | Commerzbank AG | 0.875% | 1/22/27 | EUR | 2,500 | 2,076 |
| | Commerzbank AG | 0.625% | 8/24/27 | EUR | 563 | 499 |
| | Commerzbank AG | 3.000% | 9/14/27 | EUR | 6,500 | 5,900 |
| | Commerzbank AG | 0.010% | 3/11/30 | EUR | 4,612 | 3,653 |
| | Commerzbank AG | 1.250% | 1/9/34 | EUR | 3,587 | 2,904 |
| | Covestro AG | 1.750% | 9/25/24 | EUR | 5,124 | 4,866 |
| | Covestro AG | 0.875% | 2/3/26 | EUR | 1,201 | 1,080 |
| | Covestro AG | 1.375% | 6/12/30 | EUR | 2,000 | 1,552 |
| | Daimler AG | 0.000% | 2/8/24 | EUR | 484 | 461 |
| | Daimler AG | 0.375% | 11/8/26 | EUR | 7,686 | 6,848 |
| | Daimler AG | 1.000% | 11/15/27 | EUR | 5,260 | 4,679 |
| | Daimler AG | 0.750% | 2/8/30 | EUR | 4,612 | 3,776 |
Total International Bond Index Fund
| | | Coupon | Maturity
Date | Currency | Face
Amount
(000) | Market
Value•
($000) |
| | Daimler AG | 0.750% | 9/10/30 | EUR | 2,561 | 2,069 |
| | Daimler AG | 2.000% | 2/27/31 | EUR | 7,219 | 6,371 |
| | Daimler AG | 1.125% | 11/6/31 | EUR | 5,124 | 4,090 |
| | Daimler AG | 1.125% | 8/8/34 | EUR | 4,612 | 3,447 |
| | Daimler AG | 2.125% | 7/3/37 | EUR | 3,182 | 2,590 |
| | Daimler Canada Finance Inc. | 2.970% | 3/13/24 | CAD | 1,820 | 1,296 |
| | Daimler Canada Finance Inc. | 1.650% | 9/22/25 | CAD | 1,375 | 912 |
| | Daimler International Finance BV | 0.875% | 4/9/24 | EUR | 1,511 | 1,453 |
| | Daimler International Finance BV | 2.625% | 4/7/25 | EUR | 15,522 | 15,224 |
| | Daimler International Finance BV | 1.000% | 11/11/25 | EUR | 10,760 | 10,041 |
| | Daimler International Finance BV | 1.375% | 6/26/26 | EUR | 8,916 | 8,323 |
| | Daimler International Finance BV | 2.000% | 8/22/26 | EUR | 8,928 | 8,484 |
| | Daimler International Finance BV | 0.625% | 5/6/27 | EUR | 7,686 | 6,788 |
| | Daimler Trucks Finance Canada Inc. | 1.850% | 12/15/23 | CAD | 1,488 | 1,047 |
| | Daimler Trucks Finance Canada Inc. | 2.140% | 12/13/24 | CAD | 3,488 | 2,382 |
| | Daimler Trucks Finance Canada Inc. | 5.180% | 9/19/25 | CAD | 2,200 | 1,594 |
| | Daimler Trucks Finance Canada Inc. | 2.460% | 12/15/26 | CAD | 1,496 | 970 |
| | DekaBank Deutsche Girozentrale | 0.300% | 11/20/26 | EUR | 2,600 | 2,281 |
| | Deutsche Apotheker-und Aerztebank eG | 0.750% | 10/5/27 | EUR | 400 | 356 |
| | Deutsche Bahn Finance GmbH | 3.000% | 3/8/24 | EUR | 5,920 | 5,857 |
| | Deutsche Bahn Finance GmbH | 1.500% | 8/26/24 | CHF | 1,625 | 1,627 |
| | Deutsche Bahn Finance GmbH | 3.500% | 9/27/24 | AUD | 2,250 | 1,407 |
| | Deutsche Bahn Finance GmbH | 1.375% | 7/7/25 | GBP | 7,271 | 7,728 |
| | Deutsche Bahn Finance GmbH | 1.250% | 10/23/25 | EUR | 1,281 | 1,213 |
| | Deutsche Bahn Finance GmbH | 1.875% | 2/13/26 | GBP | 2,221 | 2,350 |
| | Deutsche Bahn Finance GmbH | 3.125% | 7/24/26 | GBP | 375 | 409 |
| | Deutsche Bahn Finance GmbH | 0.500% | 4/9/27 | EUR | 2,880 | 2,553 |
| | Deutsche Bahn Finance GmbH | 1.125% | 12/18/28 | EUR | 381 | 337 |
| | Deutsche Bahn Finance GmbH | 2.750% | 3/19/29 | EUR | 1,794 | 1,724 |
| | Deutsche Bahn Finance GmbH | 0.375% | 6/23/29 | EUR | 1,460 | 1,196 |
| | Deutsche Bahn Finance GmbH | 1.625% | 11/6/30 | EUR | 75 | 65 |
| | Deutsche Bahn Finance GmbH | 1.375% | 3/28/31 | EUR | 1,536 | 1,281 |
| | Deutsche Bahn Finance GmbH | 0.875% | 7/11/31 | EUR | 1,383 | 1,099 |
| | Deutsche Bahn Finance GmbH | 0.200% | 5/20/33 | CHF | 4,485 | 3,645 |
| | Deutsche Bahn Finance GmbH | 1.625% | 8/16/33 | EUR | 5,021 | 4,088 |
| | Deutsche Bahn Finance GmbH | 0.750% | 7/16/35 | EUR | 7,161 | 4,955 |
| | Deutsche Bahn Finance GmbH | 0.625% | 4/15/36 | EUR | 7,705 | 5,136 |
| | Deutsche Bahn Finance GmbH | 1.375% | 4/16/40 | EUR | 5,183 | 3,491 |
| | Deutsche Bahn Finance GmbH | 0.625% | 12/8/50 | EUR | 10,981 | 5,328 |
| | Deutsche Bahn Finance GmbH | 1.125% | 5/29/51 | EUR | 3,006 | 1,656 |
| | Deutsche Bahn Finance GmbH | 0.950% | Perpetual | EUR | 3,900 | 3,469 |
| | Deutsche Bahn Finance GmbH | 1.600% | Perpetual | EUR | 2,300 | 1,709 |
| | Deutsche Bank AG | 0.625% | 12/19/23 | CHF | 5,860 | 5,692 |
| | Deutsche Bank AG | 3.875% | 2/12/24 | GBP | 100 | 111 |
| | Deutsche Bank AG | 0.250% | 3/8/24 | EUR | 4,765 | 4,559 |
| | Deutsche Bank AG | 2.625% | 12/16/24 | GBP | 5,000 | 5,242 |
| | Deutsche Bank AG | 2.625% | 2/12/26 | EUR | 4,800 | 4,363 |
| | Deutsche Bank AG | 0.000% | 10/15/26 | EUR | 2,841 | 2,238 |
| | Deutsche Bank AG | 1.625% | 1/20/27 | EUR | 4,600 | 3,835 |
| | Deutsche Bank AG | 0.750% | 2/17/27 | EUR | 6,700 | 5,623 |
| | Deutsche Bank AG | 1.750% | 1/17/28 | EUR | 6,300 | 5,060 |
| | Deutsche Bank AG | 3.250% | 5/24/28 | EUR | 3,000 | 2,651 |
| | Deutsche Bank AG | 0.250% | 8/31/28 | EUR | 2,561 | 2,161 |
| | Deutsche Bank AG | 1.750% | 11/19/30 | EUR | 12,000 | 8,896 |
| | Deutsche Bank AG | 5.625% | 5/19/31 | EUR | 5,000 | 4,750 |
| | Deutsche Bank AG | 1.375% | 2/17/32 | EUR | 10,500 | 7,191 |
| | Deutsche Bank AG | 4.000% | 6/24/32 | EUR | 4,000 | 3,451 |
| | Deutsche Bank AG | 2.625% | 6/30/37 | EUR | 20,000 | 18,465 |
| | Deutsche Boerse AG | 0.000% | 2/22/26 | EUR | 9,300 | 8,252 |
| | Deutsche Boerse AG | 1.125% | 3/26/28 | EUR | 5,124 | 4,562 |
| | Deutsche Hypothekenbank AG | 0.125% | 11/23/23 | EUR | 100 | 96 |
| | Deutsche Hypothekenbank AG | 0.250% | 5/17/24 | EUR | 7,500 | 7,133 |
| | Deutsche Hypothekenbank AG | 0.500% | 6/29/26 | EUR | 75 | 68 |
| | Deutsche Hypothekenbank AG | 0.750% | 3/5/29 | EUR | 23,345 | 20,083 |
| | Deutsche Kreditbank AG | 1.625% | 6/18/24 | EUR | 900 | 873 |
| | Deutsche Kreditbank AG | 0.500% | 3/19/27 | EUR | 700 | 623 |
| | Deutsche Pfandbriefbank AG | 0.010% | 10/16/25 | EUR | 10,200 | 9,259 |
| | Deutsche Pfandbriefbank AG | 0.010% | 8/25/26 | EUR | 25,600 | 22,667 |
| | Deutsche Pfandbriefbank AG | 0.625% | 8/30/27 | EUR | 20,900 | 18,502 |
Total International Bond Index Fund
| | | Coupon | Maturity
Date | Currency | Face
Amount
(000) | Market
Value•
($000) |
| | Deutsche Pfandbriefbank AG | 2.375% | 5/29/28 | EUR | 3,125 | 2,988 |
| | Deutsche Pfandbriefbank AG | 1.250% | 4/20/35 | EUR | 5,124 | 4,044 |
| | Deutsche Post AG | 2.875% | 12/11/24 | EUR | 1,023 | 1,012 |
| | Deutsche Post AG | 0.375% | 5/20/26 | EUR | 1,698 | 1,539 |
| | Deutsche Post AG | 1.625% | 12/5/28 | EUR | 7,465 | 6,720 |
| | Deutsche Post AG | 0.750% | 5/20/29 | EUR | 7,182 | 6,062 |
| | Deutsche Telekom AG | 0.500% | 7/5/27 | EUR | 19,064 | 16,744 |
| | Deutsche Telekom AG | 3.125% | 2/6/34 | GBP | 934 | 889 |
| | Deutsche Telekom AG | 2.250% | 3/29/39 | EUR | 2,177 | 1,676 |
| | Deutsche Telekom AG | 1.750% | 12/9/49 | EUR | 3,523 | 2,263 |
| | Deutsche Telekom International Finance BV | 2.750% | 10/24/24 | EUR | 2,252 | 2,224 |
| | Deutsche Telekom International Finance BV | 4.875% | 4/22/25 | EUR | 4,740 | 4,897 |
| | Deutsche Telekom International Finance BV | 2.500% | 10/10/25 | GBP | 5,818 | 6,277 |
| | Deutsche Telekom International Finance BV | 1.375% | 12/1/25 | EUR | 11,305 | 10,655 |
| | Deutsche Telekom International Finance BV | 1.125% | 5/22/26 | EUR | 1,578 | 1,459 |
| | Deutsche Telekom International Finance BV | 1.375% | 1/30/27 | EUR | 149 | 137 |
| | Deutsche Telekom International Finance BV | 3.250% | 1/17/28 | EUR | 75 | 75 |
| | Deutsche Telekom International Finance BV | 1.500% | 4/3/28 | EUR | 8,285 | 7,461 |
| | Deutsche Telekom International Finance BV | 8.875% | 11/27/28 | GBP | 3,961 | 5,329 |
| | Deutsche Telekom International Finance BV | 2.250% | 4/13/29 | GBP | 1,868 | 1,783 |
| | Deutsche Telekom International Finance BV | 2.000% | 12/1/29 | EUR | 4,458 | 4,038 |
| | Deutsche Telekom International Finance BV | 7.500% | 1/24/33 | EUR | 2,715 | 3,476 |
| | Deutsche Wohnen SE | 1.000% | 4/30/25 | EUR | 5,000 | 4,559 |
| | Deutsche Wohnen SE | 1.500% | 4/30/30 | EUR | 3,000 | 2,273 |
| | Deutsche Wohnen SE | 1.300% | 4/7/41 | EUR | 900 | 444 |
| | DZ HYP AG | 0.625% | 6/5/24 | EUR | 75 | 72 |
| | DZ HYP AG | 0.375% | 6/6/25 | EUR | 1,000 | 928 |
| | DZ HYP AG | 0.500% | 11/13/25 | EUR | 8,198 | 7,551 |
| | DZ HYP AG | 0.750% | 2/2/26 | EUR | 5,000 | 4,614 |
| | DZ HYP AG | 0.375% | 3/31/26 | EUR | 3,177 | 2,886 |
| | DZ HYP AG | 0.100% | 8/31/26 | EUR | 500 | 444 |
| | DZ HYP AG | 0.500% | 9/30/26 | EUR | 5,124 | 4,617 |
| | DZ HYP AG | 0.500% | 4/1/27 | EUR | 2,500 | 2,226 |
| | DZ HYP AG | 0.750% | 6/30/27 | EUR | 614 | 550 |
| | DZ HYP AG | 0.625% | 8/30/27 | EUR | 5,000 | 4,432 |
| | DZ HYP AG | 0.875% | 3/22/28 | EUR | 9,245 | 8,201 |
| | DZ HYP AG | 0.875% | 1/30/29 | EUR | 5,124 | 4,458 |
| | DZ HYP AG | 0.010% | 4/20/29 | EUR | 37,577 | 30,700 |
| | DZ HYP AG | 0.050% | 6/29/29 | EUR | 5,124 | 4,173 |
| | DZ HYP AG | 0.875% | 1/18/30 | EUR | 6,100 | 5,198 |
| | DZ HYP AG | 0.010% | 3/29/30 | EUR | 12,731 | 10,096 |
| | DZ HYP AG | 0.875% | 4/17/34 | EUR | 5,124 | 3,951 |
| | E.ON International Finance BV | 5.625% | 12/6/23 | GBP | ��� 716 | 822 |
| | E.ON International Finance BV | 1.000% | 4/13/25 | EUR | 2,561 | 2,395 |
| | E.ON International Finance BV | 1.625% | 5/30/26 | EUR | 6,558 | 6,082 |
| | E.ON International Finance BV | 1.250% | 10/19/27 | EUR | 6,537 | 5,788 |
| | E.ON International Finance BV | 1.500% | 7/31/29 | EUR | 11,962 | 10,005 |
| | E.ON International Finance BV | 6.250% | 6/3/30 | GBP | 10,966 | 12,690 |
| | E.ON International Finance BV | 6.375% | 6/7/32 | GBP | 3,227 | 3,820 |
| | E.ON International Finance BV | 4.750% | 1/31/34 | GBP | 2,600 | 2,662 |
| | E.ON International Finance BV | 5.875% | 10/30/37 | GBP | 5,850 | 6,458 |
| | E.ON International Finance BV | 6.750% | 1/27/39 | GBP | 600 | 722 |
| | E.ON International Finance BV | 6.125% | 7/6/39 | GBP | 1,500 | 1,692 |
| | E.ON SE | 0.875% | 5/22/24 | EUR | 375 | 357 |
| | E.ON SE | 0.000% | 8/28/24 | EUR | 3,006 | 2,806 |
| | E.ON SE | 0.250% | 10/24/26 | EUR | 1,149 | 1,005 |
| | E.ON SE | 0.375% | 9/29/27 | EUR | 2,561 | 2,183 |
| | E.ON SE | 0.750% | 2/20/28 | EUR | 1,299 | 1,103 |
| | E.ON SE | 1.625% | 5/22/29 | EUR | 9,016 | 7,628 |
| | E.ON SE | 0.350% | 2/28/30 | EUR | 4,783 | 3,603 |
| | E.ON SE | 1.625% | 3/29/31 | EUR | 5,418 | 4,374 |
| | E.ON SE | 0.625% | 11/7/31 | EUR | 8,864 | 6,385 |
| | EnBW Energie Baden-Wuerttemberg AG | 1.625% | 8/5/79 | EUR | 1,500 | 1,076 |
| | EnBW Energie Baden-Wuerttemberg AG | 1.125% | 11/5/79 | EUR | 1,500 | 1,289 |
| | EnBW Energie Baden-Wuerttemberg AG | 1.875% | 6/29/80 | EUR | 5,700 | 4,498 |
| | EnBW International Finance BV | 0.625% | 4/17/25 | EUR | 11,409 | 10,586 |
| | EnBW International Finance BV | 2.500% | 6/4/26 | EUR | 1,023 | 965 |
| | EnBW International Finance BV | 0.250% | 10/19/30 | EUR | 5,619 | 4,004 |
| | EnBW International Finance BV | 6.125% | 7/7/39 | EUR | 2,195 | 2,394 |
Total International Bond Index Fund
| | | Coupon | Maturity
Date | Currency | Face
Amount
(000) | Market
Value•
($000) |
| | Eurogrid GmbH | 1.625% | 11/3/23 | EUR | 3,800 | 3,696 |
| | Eurogrid GmbH | 1.875% | 6/10/25 | EUR | 10,100 | 9,605 |
| | Eurogrid GmbH | 1.500% | 4/18/28 | EUR | 3,000 | 2,639 |
| | Evonik Industries AG | 0.625% | 9/18/25 | EUR | 3,600 | 3,263 |
| | EWE AG | 0.250% | 6/8/28 | EUR | 4,000 | 3,194 |
| | EWE AG | 0.375% | 10/22/32 | EUR | 8,592 | 5,631 |
| | Fresenius Finance Ireland plc | 1.500% | 1/30/24 | EUR | 5,348 | 5,154 |
| | Fresenius Finance Ireland plc | 0.500% | 10/1/28 | EUR | 6,365 | 4,981 |
| | Fresenius Finance Ireland plc | 0.875% | 10/1/31 | EUR | 4,000 | 2,780 |
| | Fresenius Medical Care AG & Co. KGaA | 0.250% | 11/29/23 | EUR | 3,688 | 3,519 |
| | Fresenius Medical Care AG & Co. KGaA | 1.500% | 7/11/25 | EUR | 300 | 280 |
| | Fresenius Medical Care AG & Co. KGaA | 1.500% | 5/29/30 | EUR | 5,124 | 3,953 |
| | Fresenius SE & Co. KGaA | 4.000% | 2/1/24 | EUR | 4,612 | 4,577 |
| | Fresenius SE & Co. KGaA | 1.625% | 10/8/27 | EUR | 5,124 | 4,499 |
| | Fresenius SE & Co. KGaA | 0.750% | 1/15/28 | EUR | 5,892 | 4,896 |
| | Fresenius SE & Co. KGaA | 2.875% | 2/15/29 | EUR | 6,148 | 5,475 |
| | Grand City Properties SA | 1.375% | 8/3/26 | EUR | 6,000 | 4,907 |
| | Grand City Properties SA | 1.500% | 2/22/27 | EUR | 1,000 | 783 |
| | Grand City Properties SA | 0.125% | 1/11/28 | EUR | 5,600 | 3,819 |
| | Grand City Properties SA | 1.500% | Perpetual | EUR | 1,500 | 786 |
| | Grand City Properties SA | 2.500% | Perpetual | EUR | 600 | 433 |
| | Hamburg Commercial Bank AG | 0.375% | 3/9/26 | EUR | 3,700 | 3,079 |
| | Hamburg Commercial Bank AG | 0.500% | 9/22/26 | EUR | 6,700 | 5,594 |
| | Hamburg Commercial Bank AG | 0.010% | 1/19/27 | EUR | 2,300 | 2,009 |
| | Hannover Rueck SE | 3.375% | 6/29/49 | EUR | 100 | 93 |
| | HeidelbergCement AG | 2.250% | 6/3/24 | EUR | 5,482 | 5,313 |
| | HeidelbergCement AG | 1.500% | 2/7/25 | EUR | 7,173 | 6,769 |
| | HeidelbergCement Finance Luxembourg SA | 1.625% | 4/7/26 | EUR | 3,945 | 3,623 |
| | HeidelbergCement Finance Luxembourg SA | 1.500% | 6/14/27 | EUR | 300 | 266 |
| | HeidelbergCement Finance Luxembourg SA | 1.125% | 12/1/27 | EUR | 6,627 | 5,700 |
| | HeidelbergCement Finance Luxembourg SA | 1.750% | 4/24/28 | EUR | 4,242 | 3,722 |
| | Hella GmbH & Co. KGaA | 1.000% | 5/17/24 | EUR | 484 | 456 |
| | HOCHTIEF AG | 0.625% | 4/26/29 | EUR | 4,002 | 2,766 |
| | HOWOGE Wohnungs-baugesellschaft mbH | 0.625% | 11/1/28 | EUR | 4,100 | 3,265 |
| | HOWOGE Wohnungs-baugesellschaft mbH | 1.125% | 11/1/33 | EUR | 2,100 | 1,459 |
| | Infineon Technologies AG | 1.625% | 6/24/29 | EUR | 2,100 | 1,790 |
| | Infineon Technologies AG | 2.000% | 6/24/32 | EUR | 2,200 | 1,782 |
| | ING-DiBa AG | 0.250% | 11/16/26 | EUR | 2,500 | 2,225 |
| | ING-DiBa AG | 0.125% | 5/23/27 | EUR | 2,500 | 2,177 |
| | ING-DiBa AG | 1.250% | 10/9/33 | EUR | 5,200 | 4,225 |
| | ING-DiBa AG | 1.000% | 5/23/39 | EUR | 9,700 | 6,822 |
| | Landesbank Baden-Wuerttemberg | 0.200% | 1/10/24 | EUR | 1,023 | 983 |
| | Landesbank Baden-Wuerttemberg | 0.375% | 5/24/24 | EUR | 900 | 844 |
| | Landesbank Baden-Wuerttemberg | 0.250% | 1/10/25 | EUR | 5,000 | 4,675 |
| | Landesbank Baden-Wuerttemberg | 1.500% | 2/3/25 | GBP | 4,700 | 4,903 |
| | Landesbank Baden-Wuerttemberg | 0.375% | 2/27/25 | EUR | 5,124 | 4,789 |
| | Landesbank Baden-Wuerttemberg | 0.375% | 2/18/27 | EUR | 17,800 | 14,978 |
| | Landesbank Baden-Wuerttemberg | 0.010% | 7/16/27 | EUR | 22,287 | 19,239 |
| | Landesbank Baden-Wuerttemberg | 0.010% | 9/18/28 | EUR | 4,207 | 3,499 |
| | Landesbank Baden-Wuerttemberg | 0.375% | 5/7/29 | EUR | 1,500 | 1,126 |
| | Landesbank Hessen-Thueringen Girozentrale | 0.375% | 2/8/24 | EUR | 5,000 | 4,802 |
| | Landesbank Hessen-Thueringen Girozentrale | 0.125% | 11/19/24 | EUR | 1,000 | 931 |
| | Landesbank Hessen-Thueringen Girozentrale | 0.375% | 5/12/25 | EUR | 4,500 | 4,101 |
| | Landesbank Hessen-Thueringen Girozentrale | 0.500% | 9/25/25 | EUR | 300 | 278 |
| | LANXESS AG | 1.125% | 5/16/25 | EUR | 2,999 | 2,803 |
| | LANXESS AG | 1.750% | 3/22/28 | EUR | 2,200 | 1,837 |
| | LANXESS AG | 0.625% | 12/1/29 | EUR | 2,200 | 1,606 |
| | LEG Immobilien SE | 1.250% | 1/23/24 | EUR | 400 | 377 |
| | LEG Immobilien SE | 0.375% | 1/17/26 | EUR | 3,200 | 2,710 |
| | LEG Immobilien SE | 0.875% | 11/28/27 | EUR | 4,400 | 3,476 |
| | LEG Immobilien SE | 0.875% | 1/17/29 | EUR | 1,700 | 1,273 |
| | LEG Immobilien SE | 1.000% | 11/19/32 | EUR | 3,300 | 2,019 |
| | LEG Immobilien SE | 0.875% | 3/30/33 | EUR | 1,700 | 1,013 |
| | LEG Immobilien SE | 1.500% | 1/17/34 | EUR | 3,400 | 2,130 |
| | Merck Financial Services GmbH | 0.005% | 12/15/23 | EUR | 10,200 | 9,742 |
| | Merck Financial Services GmbH | 2.375% | 6/15/30 | EUR | 4,500 | 4,117 |
| | Merck Financial Services GmbH | 0.875% | 7/5/31 | EUR | 400 | 317 |
| | Merck KGaA | 3.375% | 12/12/74 | EUR | 225 | 216 |
| | Merck KGaA | 1.625% | 9/9/80 | EUR | 5,600 | 4,776 |
Total International Bond Index Fund
| | | Coupon | Maturity
Date | Currency | Face
Amount
(000) | Market
Value•
($000) |
| | Muenchener Hypothekenbank eG | 0.500% | 4/22/26 | EUR | 375 | 342 |
| | Muenchener Hypothekenbank eG | 0.625% | 10/23/26 | EUR | 614 | 555 |
| | Muenchener Hypothekenbank eG | 0.625% | 5/7/27 | EUR | 6,661 | 5,950 |
| | Muenchener Hypothekenbank eG | 0.625% | 11/10/27 | EUR | 7,686 | 6,786 |
| | Muenchener Hypothekenbank eG | 2.500% | 7/4/28 | EUR | 6,533 | 6,296 |
| | Muenchener Hypothekenbank eG | 1.000% | 4/18/39 | EUR | 4,765 | 3,393 |
| | Muenchener Hypothekenbank eG | 0.010% | 11/2/40 | EUR | 6,365 | 3,583 |
| | Muenchener Rueckversicherungs-Gesellschaft AG in Muenchen | 1.250% | 5/26/41 | EUR | 4,600 | 3,257 |
| | Muenchener Rueckversicherungs-Gesellschaft AG in Muenchen | 3.250% | 5/26/49 | EUR | 2,100 | 1,818 |
| | Norddeutsche Landesbank-Girozentrale | 0.375% | 10/9/24 | EUR | 563 | 531 |
| | Norddeutsche Landesbank-Girozentrale | 0.010% | 9/23/26 | EUR | 26,100 | 23,042 |
| | Norddeutsche Landesbank-Girozentrale | 0.250% | 10/28/26 | EUR | 5,124 | 4,559 |
| | O2 Telefonica Deutschland Finanzierungs GmbH | 1.750% | 7/5/25 | EUR | 3,300 | 3,105 |
| | Roadster Finance DAC | 2.375% | 12/8/32 | EUR | 300 | 251 |
| | Robert Bosch GmbH | 1.750% | 7/8/24 | EUR | 100 | 97 |
| | Robert Bosch Investment Nederland BV | 2.625% | 5/24/28 | EUR | 500 | 466 |
| | RWE AG | 2.125% | 5/24/26 | EUR | 2,000 | 1,866 |
| | RWE AG | 0.500% | 11/26/28 | EUR | 8,305 | 6,687 |
| | RWE AG | 2.750% | 5/24/30 | EUR | 2,500 | 2,216 |
| | RWE AG | 0.625% | 6/11/31 | EUR | 4,509 | 3,277 |
| | RWE AG | 1.000% | 11/26/33 | EUR | 3,735 | 2,558 |
| | Santander Consumer Bank AG | 0.250% | 10/15/24 | EUR | 7,700 | 7,125 |
| | SAP SE | 0.750% | 12/10/24 | EUR | 600 | 572 |
| | SAP SE | 1.250% | 3/10/28 | EUR | 2,900 | 2,612 |
| | SAP SE | 0.375% | 5/18/29 | EUR | 7,600 | 6,279 |
| | SAP SE | 1.625% | 3/10/31 | EUR | 11,600 | 10,013 |
| | Siemens Financieringsmaatschappij NV | 0.250% | 6/5/24 | EUR | 4,500 | 4,260 |
| | Siemens Financieringsmaatschappij NV | 0.000% | 9/5/24 | EUR | 7,147 | 6,718 |
| | Siemens Financieringsmaatschappij NV | 2.250% | 3/10/25 | EUR | 5,000 | 4,858 |
| | Siemens Financieringsmaatschappij NV | 2.750% | 9/10/25 | GBP | 500 | 548 |
| | Siemens Financieringsmaatschappij NV | 2.875% | 3/10/28 | EUR | 4,577 | 4,447 |
| | Siemens Financieringsmaatschappij NV | 0.250% | 2/20/29 | EUR | 10,300 | 8,425 |
| | Siemens Financieringsmaatschappij NV | 0.125% | 9/5/29 | EUR | 9,404 | 7,558 |
| | Siemens Financieringsmaatschappij NV | 1.375% | 9/6/30 | EUR | 225 | 193 |
| | Siemens Financieringsmaatschappij NV | 1.250% | 2/28/31 | EUR | 8,121 | 6,733 |
| | Siemens Financieringsmaatschappij NV | 0.500% | 2/20/32 | EUR | 7,200 | 5,425 |
| | Siemens Financieringsmaatschappij NV | 0.500% | 9/5/34 | EUR | 3,587 | 2,504 |
| | Siemens Financieringsmaatschappij NV | 1.250% | 2/25/35 | EUR | 2,400 | 1,802 |
| | Siemens Financieringsmaatschappij NV | 1.750% | 2/28/39 | EUR | 6,114 | 4,574 |
| | Siemens Financieringsmaatschappij NV | 3.750% | 9/10/42 | GBP | 1,500 | 1,495 |
| | Sirius Real Estate Ltd. | 1.125% | 6/22/26 | EUR | 900 | 678 |
| | Talanx AG | 2.250% | 12/5/47 | EUR | 5,100 | 4,277 |
| | Traton Finance Luxembourg SA | 0.125% | 3/24/25 | EUR | 6,300 | 5,659 |
| | Traton Finance Luxembourg SA | 1.250% | 3/24/33 | EUR | 4,400 | 2,998 |
| | UniCredit Bank AG | 1.875% | 4/9/24 | EUR | 2,614 | 2,552 |
| | UniCredit Bank AG | 0.625% | 2/12/25 | EUR | 75 | 71 |
| | UniCredit Bank AG | 0.625% | 11/20/25 | EUR | 9,596 | 8,856 |
| | UniCredit Bank AG | 0.500% | 5/4/26 | EUR | 375 | 341 |
| | UniCredit Bank AG | 0.500% | 2/23/27 | EUR | 23,000 | 20,496 |
| | UniCredit Bank AG | 0.010% | 9/15/28 | EUR | 33,855 | 28,127 |
| | UniCredit Bank AG | 0.875% | 1/11/29 | EUR | 6,508 | 5,656 |
| | UniCredit Bank AG | 0.010% | 6/24/30 | EUR | 3,758 | 2,956 |
| | UniCredit Bank AG | 0.250% | 1/15/32 | EUR | 9,992 | 7,657 |
| | UniCredit Bank AG | 0.850% | 5/22/34 | EUR | 7,737 | 5,926 |
| | Vantage Towers AG | 0.375% | 3/31/27 | EUR | 2,300 | 1,910 |
| | Vantage Towers AG | 0.750% | 3/31/30 | EUR | 2,600 | 1,950 |
| | Vier Gas Transport GmbH | 3.125% | 7/10/23 | EUR | 4,144 | 4,082 |
| | Vier Gas Transport GmbH | 2.875% | 6/12/25 | EUR | 5,910 | 5,643 |
| | Vier Gas Transport GmbH | 0.125% | 9/10/29 | EUR | 3,000 | 2,190 |
| | Volkswagen Bank GmbH | 0.750% | 6/15/23 | EUR | 5,841 | 5,691 |
| | Volkswagen Bank GmbH | 1.250% | 6/10/24 | EUR | 20,900 | 19,886 |
| | Volkswagen Bank GmbH | 1.250% | 12/15/25 | EUR | 666 | 610 |
| | Volkswagen Bank GmbH | 2.500% | 7/31/26 | EUR | 2,600 | 2,419 |
| | Volkswagen Financial Services AG | 0.875% | 4/12/23 | EUR | 360 | 353 |
| | Volkswagen Financial Services AG | 1.500% | 10/1/24 | EUR | 3,074 | 2,920 |
| | Volkswagen Financial Services AG | 0.000% | 2/12/25 | EUR | 8,267 | 7,490 |
| | Volkswagen Financial Services AG | 2.250% | 10/16/26 | EUR | 7,297 | 6,791 |
| | Volkswagen Financial Services AG | 0.875% | 1/31/28 | EUR | 10,717 | 8,939 |
| | Volkswagen Financial Services AG | 3.375% | 4/6/28 | EUR | 16,019 | 15,249 |
Total International Bond Index Fund
| | | Coupon | Maturity
Date | Currency | Face
Amount
(000) | Market
Value•
($000) |
| | Volkswagen Financial Services AG | 0.375% | 2/12/30 | EUR | 5,603 | 4,161 |
| | Volkswagen Financial Services NV | 2.250% | 4/12/25 | GBP | 362 | 384 |
| | Volkswagen Financial Services NV | 3.250% | 4/13/27 | GBP | 4,400 | 4,427 |
| | Volkswagen Financial Services NV | 2.125% | 1/18/28 | GBP | 9,300 | 8,624 |
| | Volkswagen Financial Services NV | 1.375% | 9/14/28 | GBP | 3,700 | 3,196 |
| | Volkswagen International Finance NV | 3.375% | 11/16/26 | GBP | 3,500 | 3,606 |
| | Volkswagen International Finance NV | 1.875% | 3/30/27 | EUR | 9,200 | 8,270 |
| | Volkswagen International Finance NV | 3.750% | 9/28/27 | EUR | 4,000 | 3,892 |
| | Volkswagen International Finance NV | 3.250% | 11/18/30 | EUR | 800 | 732 |
| | Volkswagen International Finance NV | 4.125% | 11/17/31 | GBP | 1,200 | 1,167 |
| | Volkswagen International Finance NV | 1.250% | 9/23/32 | EUR | 2,900 | 2,212 |
| | Volkswagen International Finance NV | 3.300% | 3/22/33 | EUR | 500 | 446 |
| | Volkswagen International Finance NV | 4.125% | 11/16/38 | EUR | 6,500 | 5,987 |
| | Volkswagen International Finance NV | 1.500% | 1/21/41 | EUR | 800 | 488 |
| | Volkswagen International Finance NV | 4.625% | 3/29/49 | EUR | 5,942 | 5,561 |
| | Volkswagen International Finance NV | 3.375% | Perpetual | EUR | 8,400 | 7,889 |
| | Volkswagen International Finance NV | 3.500% | Perpetual | EUR | 7,600 | 6,977 |
| | Volkswagen International Finance NV | 3.748% | Perpetual | EUR | 8,000 | 6,834 |
| | Volkswagen International Finance NV | 3.875% | Perpetual | EUR | 7,700 | 6,774 |
| | Volkswagen International Finance NV | 3.875% | Perpetual | EUR | 7,700 | 6,332 |
| | Volkswagen International Finance NV | 4.375% | Perpetual | EUR | 2,000 | 1,603 |
| | Volkswagen International Finance NV | 4.625% | Perpetual | EUR | 4,700 | 4,162 |
| | Volkswagen Leasing GmbH | 2.625% | 1/15/24 | EUR | 1,178 | 1,152 |
| | Volkswagen Leasing GmbH | 1.125% | 4/4/24 | EUR | 5,380 | 5,130 |
| | Volkswagen Leasing GmbH | 1.375% | 1/20/25 | EUR | 5,944 | 5,593 |
| | Volkswagen Leasing GmbH | 1.625% | 8/15/25 | EUR | 1,116 | 1,043 |
| | Volkswagen Leasing GmbH | 0.375% | 7/20/26 | EUR | 16,853 | 14,603 |
| | Volkswagen Leasing GmbH | 0.500% | 1/12/29 | EUR | 13,851 | 10,911 |
| | Vonovia Finance BV | 2.250% | 12/15/23 | EUR | 6,400 | 6,182 |
| | Vonovia Finance BV | 1.500% | 3/31/25 | EUR | 2,614 | 2,425 |
| | Vonovia Finance BV | 1.800% | 6/29/25 | EUR | 12,700 | 11,603 |
| | Vonovia Finance BV | 1.125% | 9/8/25 | EUR | 1,200 | 1,070 |
| | Vonovia Finance BV | 1.500% | 3/22/26 | EUR | 8,000 | 7,048 |
| | Vonovia Finance BV | 1.500% | 6/10/26 | EUR | 2,500 | 2,181 |
| | Vonovia Finance BV | 1.750% | 1/25/27 | EUR | 100 | 86 |
| | Vonovia Finance BV | 0.625% | 10/7/27 | EUR | 3,000 | 2,374 |
| | Vonovia Finance BV | 1.500% | 1/14/28 | EUR | 600 | 492 |
| | Vonovia Finance BV | 2.250% | 4/7/30 | EUR | 3,100 | 2,433 |
| | Vonovia Finance BV | 1.000% | 7/9/30 | EUR | 2,000 | 1,410 |
| | Vonovia Finance BV | 1.125% | 9/14/34 | EUR | 5,000 | 2,958 |
| | Vonovia Finance BV | 2.750% | 3/22/38 | EUR | 2,000 | 1,305 |
| | Vonovia Finance BV | 1.625% | 10/7/39 | EUR | 4,100 | 2,134 |
| | Vonovia SE | 1.375% | 1/28/26 | EUR | 2,800 | 2,480 |
| | Vonovia SE | 1.875% | 6/28/28 | EUR | 2,900 | 2,391 |
| | Vonovia SE | 0.625% | 12/14/29 | EUR | 6,900 | 4,861 |
| | Vonovia SE | 2.375% | 3/25/32 | EUR | 3,200 | 2,458 |
| | Vonovia SE | 0.750% | 9/1/32 | EUR | 6,200 | 3,905 |
| | Vonovia SE | 1.000% | 6/16/33 | EUR | 3,700 | 2,285 |
| | Vonovia SE | 1.500% | 6/14/41 | EUR | 5,800 | 2,973 |
| | VW Credit Canada Inc. | 2.850% | 9/26/24 | CAD | 860 | 594 |
| | VW Credit Canada Inc. | 2.050% | 12/10/24 | CAD | 3,330 | 2,278 |
| | VW Credit Canada Inc. | 1.500% | 9/23/25 | CAD | 3,160 | 2,072 |
| | VW Credit Canada Inc. | 2.450% | 12/10/26 | CAD | 1,415 | 923 |
| | Wintershall Dea Finance BV | 0.840% | 9/25/25 | EUR | 5,000 | 4,436 |
| | Wintershall Dea Finance BV | 1.332% | 9/25/28 | EUR | 4,500 | 3,627 |
| | Wintershall Dea Finance BV | 1.823% | 9/25/31 | EUR | 3,100 | 2,272 |
| | | | | | | 1,806,689 |
| Hong Kong (0.0%) | | | |
| | Cheung Kong Infrastructure Finance BVI Ltd. | 1.000% | 12/12/24 | EUR | 283 | 262 |
| | Hong Kong & Shanghai Banking Corp. Ltd. | 0.204% | 6/25/24 | JPY | 200,000 | 1,330 |
| | Prudential plc | 5.875% | 5/11/29 | GBP | 1,824 | 2,095 |
| | Prudential plc | 6.125% | 12/19/31 | GBP | 3,678 | 3,967 |
| | | | | | | 7,654 |
| Hungary (0.0%) | | | |
| | MOL Hungarian Oil & Gas plc | 1.500% | 10/8/27 | EUR | 2,000 | 1,590 |
| Indonesia (0.0%) | | | |
| | Perusahaan Perseroan Persero PT Perusahaan Listrik Negara | 1.875% | 11/5/31 | EUR | 900 | 621 |
Total International Bond Index Fund
| | | Coupon | Maturity
Date | Currency | Face
Amount
(000) | Market
Value•
($000) |
| Ireland (0.1%) | | | |
| | AIB Group plc | 3.625% | 7/4/26 | EUR | 5,000 | 4,770 |
| | Bank of Ireland Group plc | 1.000% | 11/25/25 | EUR | 11,271 | 10,272 |
| | CRH Finance DAC | 1.375% | 10/18/28 | EUR | 667 | 568 |
| | CRH Finland Services OYJ | 0.875% | 11/5/23 | EUR | 1,973 | 1,903 |
| | CRH Funding BV | 1.875% | 1/9/24 | EUR | 2,000 | 1,938 |
| | CRH Funding BV | 1.625% | 5/5/30 | EUR | 9,397 | 7,708 |
| | CRH SMW Finance DAC | 1.250% | 11/5/26 | EUR | 3,724 | 3,340 |
| | Dell Bank International DAC | 0.500% | 10/27/26 | EUR | 6,500 | 5,563 |
| | ESB Finance DAC | 3.494% | 1/12/24 | EUR | 448 | 443 |
| | ESB Finance DAC | 2.125% | 6/8/27 | EUR | 3,170 | 2,920 |
| | ESB Finance DAC | 1.875% | 6/14/31 | EUR | 6,263 | 5,219 |
| | ESB Finance DAC | 2.125% | 11/5/33 | EUR | 2,671 | 2,186 |
| | Experian Europe DAC | 1.560% | 5/16/31 | EUR | 1,400 | 1,141 |
| | Freshwater Finance plc | 5.182% | 4/20/35 | GBP | 1,023 | 1,106 |
| | Freshwater Finance plc | 4.607% | 10/17/36 | GBP | 1,517 | 1,429 |
| | GAS Networks Ireland | 1.375% | 12/5/26 | EUR | 1,272 | 1,153 |
| | Kerry Group Financial Services Unltd Co. | 2.375% | 9/10/25 | EUR | 5,361 | 5,166 |
| | PartnerRe Ireland Finance DAC | 1.250% | 9/15/26 | EUR | 3,463 | 3,095 |
| | Ryanair DAC | 1.125% | 3/10/23 | EUR | 100 | 98 |
| | Ryanair DAC | 2.875% | 9/15/25 | EUR | 9,828 | 9,379 |
| | Smurfit Kappa Acquisitions ULC | 2.875% | 1/15/26 | EUR | 2,214 | 2,100 |
| | Smurfit Kappa Treasury ULC | 1.500% | 9/15/27 | EUR | 6,500 | 5,642 |
| | Smurfit Kappa Treasury ULC | 1.000% | 9/22/33 | EUR | 5,429 | 3,608 |
| | | | | | | 80,747 |
| Italy (0.7%) | | | |
| | 2i Rete Gas SpA | 3.000% | 7/16/24 | EUR | 3,092 | 3,033 |
| | 2i Rete Gas SpA | 1.750% | 8/28/26 | EUR | 300 | 267 |
| | 2i Rete Gas SpA | 1.608% | 10/31/27 | EUR | 3,266 | 2,768 |
| | 2i Rete Gas SpA | 0.579% | 1/29/31 | EUR | 5,800 | 4,081 |
| | A2A SpA | 1.250% | 3/16/24 | EUR | 2,094 | 2,011 |
| | A2A SpA | 0.625% | 10/28/32 | EUR | 1,998 | 1,272 |
| | ACEA SpA | 1.000% | 10/24/26 | EUR | 3,058 | 2,660 |
| | ACEA SpA | 1.500% | 6/8/27 | EUR | 12,881 | 11,228 |
| | ACEA SpA | 0.500% | 4/6/29 | EUR | 6,896 | 5,201 |
| | ACEA SpA | 0.250% | 7/28/30 | EUR | 4,007 | 2,861 |
| | Aeroporti di Roma SpA | 1.625% | 6/8/27 | EUR | 2,040 | 1,748 |
| | Aeroporti di Roma SpA | 1.750% | 7/30/31 | EUR | 1,900 | 1,337 |
| | AMCO - Asset Management Co. SpA | 1.375% | 1/27/25 | EUR | 1,509 | 1,409 |
| | AMCO - Asset Management Co. SpA | 2.250% | 7/17/27 | EUR | 8,958 | 8,016 |
| | AMCO - Asset Management Co. SpA | 0.750% | 4/20/28 | EUR | 7,448 | 5,956 |
| | Assicurazioni Generali SpA | 5.125% | 9/16/24 | EUR | 3,744 | 3,796 |
| | Assicurazioni Generali SpA | 2.124% | 10/1/30 | EUR | 2,300 | 1,737 |
| | Assicurazioni Generali SpA | 2.429% | 7/14/31 | EUR | 2,000 | 1,496 |
| | Assicurazioni Generali SpA | 1.713% | 6/30/32 | EUR | 2,300 | 1,577 |
| | Assicurazioni Generali SpA | 5.800% | 7/6/32 | EUR | 3,000 | 2,852 |
| | Assicurazioni Generali SpA | 5.500% | 10/27/47 | EUR | 7,669 | 7,426 |
| | Assicurazioni Generali SpA | 6.269% | 6/29/49 | GBP | 6,050 | 6,517 |
| | ASTM SpA | 1.625% | 2/8/28 | EUR | 3,729 | 3,057 |
| | ASTM SpA | 1.500% | 1/25/30 | EUR | 3,700 | 2,767 |
| | ASTM SpA | 2.375% | 11/25/33 | EUR | 2,800 | 1,939 |
| | Autostrade per l'Italia SpA | 1.750% | 2/1/27 | EUR | 2,359 | 2,039 |
| | Autostrade per l'Italia SpA | 2.000% | 12/4/28 | EUR | 4,000 | 3,255 |
| | Autostrade per l'Italia SpA | 2.000% | 1/15/30 | EUR | 4,000 | 3,112 |
| | Banca Monte dei Paschi di Siena SpA | 2.875% | 7/16/24 | EUR | 2,894 | 2,842 |
| | Banca Monte dei Paschi di Siena SpA | 2.125% | 11/26/25 | EUR | 4,539 | 4,318 |
| | Banco BPM SpA | 1.000% | 1/23/25 | EUR | 7,631 | 7,200 |
| | Banco di Desio e della Brianza SpA | 0.875% | 9/12/24 | EUR | 8,179 | 7,770 |
| | Coca-Cola HBC Finance BV | 1.875% | 11/11/24 | EUR | 100 | 96 |
| | Credit Agricole Italia SpA | 0.250% | 9/30/24 | EUR | 5,400 | 5,069 |
| | Credit Agricole Italia SpA | 0.625% | 1/13/26 | EUR | 2,800 | 2,557 |
| | Credit Agricole Italia SpA | 1.000% | 3/25/27 | EUR | 7,600 | 6,833 |
| | Credit Agricole Italia SpA | 0.250% | 1/17/28 | EUR | 2,500 | 2,113 |
| | Credit Agricole Italia SpA | 1.625% | 3/21/29 | EUR | 1,000 | 892 |
| | Credit Agricole Italia SpA | 1.750% | 1/15/38 | EUR | 2,500 | 1,904 |
| | Credit Agricole Italia SpA | 1.000% | 1/17/45 | EUR | 400 | 242 |
| | Credito Emiliano SpA | 1.125% | 1/17/24 | EUR | 5,087 | 4,920 |
| | Enel Finance International NV | 0.000% | 6/17/24 | EUR | 4,331 | 4,047 |
Total International Bond Index Fund
| | | Coupon | Maturity
Date | Currency | Face
Amount
(000) | Market
Value•
($000) |
| | Enel Finance International NV | 5.625% | 8/14/24 | GBP | 5,819 | 6,635 |
| | Enel Finance International NV | 1.000% | 9/16/24 | EUR | 1,985 | 1,877 |
| | Enel Finance International NV | 1.966% | 1/27/25 | EUR | 13,514 | 12,886 |
| | Enel Finance International NV | 1.375% | 6/1/26 | EUR | 19,114 | 17,193 |
| | Enel Finance International NV | 1.125% | 9/16/26 | EUR | 1,381 | 1,225 |
| | Enel Finance International NV | 0.375% | 6/17/27 | EUR | 4,308 | 3,558 |
| | Enel Finance International NV | 1.000% | 10/20/27 | GBP | 10,901 | 9,654 |
| | Enel Finance International NV | 2.875% | 4/11/29 | GBP | 3,700 | 3,403 |
| | Enel Finance International NV | 0.375% | 5/28/29 | EUR | 7,000 | 5,211 |
| | Enel Finance International NV | 0.500% | 6/17/30 | EUR | 9,800 | 7,002 |
| | Enel Finance International NV | 0.875% | 9/28/34 | EUR | 1,900 | 1,162 |
| | Enel Finance International NV | 1.125% | 10/17/34 | EUR | 2,653 | 1,701 |
| | Enel Finance International NV | 1.250% | 1/17/35 | EUR | 3,000 | 1,915 |
| | Enel Finance International NV | 0.875% | 6/17/36 | EUR | 2,214 | 1,276 |
| | Enel Finance International NV | 5.750% | 9/14/40 | GBP | 5,410 | 5,563 |
| | Enel SpA | 5.625% | 6/21/27 | EUR | 1,536 | 1,593 |
| | Enel SpA | 5.750% | 6/22/37 | GBP | 1,545 | 1,614 |
| | Enel SpA | 3.500% | 5/24/80 | EUR | 10,614 | 9,546 |
| | Enel SpA | 3.375% | 11/24/81 | EUR | 6,180 | 5,223 |
| | Enel SpA | 1.375% | Perpetual | EUR | 7,448 | 5,504 |
| | Enel SpA | 2.250% | Perpetual | EUR | 8,977 | 7,127 |
| | Enel SpA | 2.500% | Perpetual | EUR | 5,690 | 5,345 |
| | Eni SpA | 1.750% | 1/18/24 | EUR | 5,613 | 5,439 |
| | Eni SpA | 0.625% | 9/19/24 | EUR | 5,087 | 4,781 |
| | Eni SpA | 3.750% | 9/12/25 | EUR | 3,321 | 3,283 |
| | Eni SpA | 1.500% | 2/2/26 | EUR | 2,169 | 2,011 |
| | Eni SpA | 1.500% | 1/17/27 | EUR | 2,543 | 2,305 |
| | Eni SpA | 1.625% | 5/17/28 | EUR | 2,574 | 2,255 |
| | Eni SpA | 0.375% | 6/14/28 | EUR | 5,982 | 4,872 |
| | Eni SpA | 1.125% | 9/19/28 | EUR | 2,817 | 2,374 |
| | Eni SpA | 3.625% | 1/29/29 | EUR | 4,600 | 4,373 |
| | Eni SpA | 0.625% | 1/23/30 | EUR | 8,911 | 6,820 |
| | Eni SpA | 1.000% | 10/11/34 | EUR | 3,092 | 2,104 |
| | Eni SpA | 2.000% | Perpetual | EUR | 2,500 | 1,990 |
| | Eni SpA | 2.625% | Perpetual | EUR | 4,090 | 3,584 |
| | Eni SpA | 2.750% | Perpetual | EUR | 3,724 | 2,691 |
| | Eni SpA | 3.375% | Perpetual | EUR | 5,563 | 4,309 |
| | Hera SpA | 0.875% | 10/14/26 | EUR | 2,543 | 2,223 |
| | Hera SpA | 0.875% | 7/5/27 | EUR | 5,087 | 4,369 |
| | Hera SpA | 5.200% | 1/29/28 | EUR | 3,092 | 3,097 |
| | Hera SpA | 0.250% | 12/3/30 | EUR | 2,100 | 1,434 |
| | Hera SpA | 1.000% | 4/25/34 | EUR | 1,509 | 973 |
| | Intesa Sanpaolo SpA | 1.375% | 1/18/24 | EUR | 7,631 | 7,339 |
| | Intesa Sanpaolo SpA | 3.125% | 2/5/24 | EUR | 2,094 | 2,076 |
| | Intesa Sanpaolo SpA | 0.500% | 3/5/24 | EUR | 2,500 | 2,396 |
| | Intesa Sanpaolo SpA | 1.500% | 4/10/24 | EUR | 2,543 | 2,446 |
| | Intesa Sanpaolo SpA | 1.000% | 7/4/24 | EUR | 2,982 | 2,814 |
| | Intesa Sanpaolo SpA | 0.500% | 7/15/24 | EUR | 2,817 | 2,670 |
| | Intesa Sanpaolo SpA | 3.375% | 1/24/25 | EUR | 5,300 | 5,280 |
| | Intesa Sanpaolo SpA | 1.250% | 2/7/25 | EUR | 1,272 | 1,210 |
| | Intesa Sanpaolo SpA | 1.125% | 7/14/25 | EUR | 2,500 | 2,351 |
| | Intesa Sanpaolo SpA | 1.000% | 9/25/25 | EUR | 5,087 | 4,743 |
| | Intesa Sanpaolo SpA | 3.250% | 2/10/26 | EUR | 2,000 | 1,983 |
| | Intesa Sanpaolo SpA | 0.375% | 9/14/26 | EUR | 5,087 | 4,528 |
| | Intesa Sanpaolo SpA | 1.000% | 11/19/26 | EUR | 6,633 | 5,734 |
| | Intesa Sanpaolo SpA | 1.125% | 10/4/27 | EUR | 7,017 | 6,298 |
| | Intesa Sanpaolo SpA | 1.750% | 3/20/28 | EUR | 13,409 | 11,359 |
| | Intesa Sanpaolo SpA | 1.750% | 7/4/29 | EUR | 4,539 | 3,700 |
| | Intesa Sanpaolo SpA | 1.250% | 1/15/30 | EUR | 400 | 345 |
| | Intesa Sanpaolo SpA | 2.500% | 1/15/30 | GBP | 1,545 | 1,315 |
| | Intesa Sanpaolo SpA | 1.350% | 2/24/31 | EUR | 7,000 | 4,920 |
| | Intesa Sanpaolo SpA | 2.625% | 3/11/36 | GBP | 3,724 | 2,606 |
| | Iren SpA | 0.875% | 11/4/24 | EUR | 2,323 | 2,155 |
| | Iren SpA | 1.950% | 9/19/25 | EUR | 3,092 | 2,874 |
| | Italgas SpA | 0.875% | 4/24/30 | EUR | 5,092 | 3,786 |
| | Mediobanca Banca di Credito Finanziario SpA | 1.125% | 7/15/25 | EUR | 3,541 | 3,234 |
| | Mediobanca Banca di Credito Finanziario SpA | 1.375% | 11/10/25 | EUR | 5,525 | 5,181 |
| | Mediobanca Banca di Credito Finanziario SpA | 0.875% | 1/15/26 | EUR | 8,179 | 7,244 |
| | Mediobanca Banca di Credito Finanziario SpA | 0.750% | 11/2/28 | EUR | 5,000 | 3,891 |
Total International Bond Index Fund
| | | Coupon | Maturity
Date | Currency | Face
Amount
(000) | Market
Value•
($000) |
| | Mediobanca Banca di Credito Finanziario SpA | 1.250% | 11/24/29 | EUR | 1,326 | 1,141 |
| | Snam SpA | 0.000% | 5/12/24 | EUR | 1,545 | 1,445 |
| | Snam SpA | 0.875% | 10/25/26 | EUR | 10,085 | 8,793 |
| | Snam SpA | 0.750% | 6/20/29 | EUR | 4,400 | 3,356 |
| | Snam SpA | 0.750% | 6/17/30 | EUR | 2,500 | 1,828 |
| | Snam SpA | 1.000% | 9/12/34 | EUR | 4,090 | 2,576 |
| | Terna - Rete Elettrica Nazionale | 1.375% | 7/26/27 | EUR | 4,944 | 4,364 |
| | Terna - Rete Elettrica Nazionale | 1.000% | 10/11/28 | EUR | 6,798 | 5,629 |
| | UniCredit SpA | 1.250% | 6/25/25 | EUR | 16,190 | 15,179 |
| | UniCredit SpA | 1.250% | 6/16/26 | EUR | 8,944 | 8,081 |
| | UniCredit SpA | 0.375% | 10/31/26 | EUR | 9,753 | 8,618 |
| | UniCredit SpA | 2.200% | 7/22/27 | EUR | 12,535 | 10,956 |
| | UniCredit SpA | 0.850% | 1/19/31 | EUR | 11,986 | 8,276 |
| | | | | | | 512,441 |
| Japan (0.3%) | | | |
| | Asahi Group Holdings Ltd. | 0.155% | 10/23/24 | EUR | 3,541 | 3,294 |
| | Central Nippon Expressway Co. Ltd. | 0.040% | 8/19/24 | JPY | 30,000 | 201 |
| | Central Nippon Expressway Co. Ltd. | 0.050% | 7/27/26 | JPY | 420,000 | 2,807 |
| | Daiichi Sankyo Co. Ltd. | 0.810% | 7/25/36 | JPY | 100,000 | 652 |
| | Denso Corp. | 0.315% | 3/17/28 | JPY | 300,000 | 2,007 |
| | East Japan Railway Co. | 1.162% | 9/15/28 | GBP | 6,119 | 5,536 |
| | East Japan Railway Co. | 4.875% | 6/14/34 | GBP | 2,800 | 3,104 |
| | East Japan Railway Co. | 0.773% | 9/15/34 | EUR | 1,509 | 1,051 |
| | East Japan Railway Co. | 1.104% | 9/15/39 | EUR | 5,214 | 3,257 |
| | East Nippon Expressway Co. Ltd. | 0.070% | 6/20/25 | JPY | 670,000 | 4,495 |
| | East Nippon Expressway Co. Ltd. | 0.140% | 7/31/29 | JPY | 670,000 | 4,425 |
| | East Nippon Expressway Co. Ltd. | 0.220% | 1/31/30 | JPY | 230,000 | 1,523 |
| | East Nippon Expressway Co. Ltd. | 0.140% | 7/15/31 | JPY | 90,000 | 588 |
| | Fast Retailing Co. Ltd. | 0.749% | 12/18/25 | JPY | 100,000 | 683 |
| | Fast Retailing Co. Ltd. | 0.405% | 6/6/28 | JPY | 600,000 | 4,040 |
| | JT International Financial Services BV | 1.000% | 11/26/29 | EUR | 5,745 | 4,357 |
| | JT International Financial Services BV | 2.750% | 9/28/33 | GBP | 2,599 | 2,203 |
| | JT International Financial Services BV | 2.375% | 4/7/81 | EUR | 5,087 | 4,310 |
| | Kansai Electric Power Co. Inc. | 0.280% | 4/25/24 | JPY | 46,000 | 310 |
| | Kansai Electric Power Co. Inc. | 0.470% | 5/25/27 | JPY | 89,000 | 596 |
| | Kansai Electric Power Co. Inc. | 0.490% | 7/23/27 | JPY | 125,000 | 837 |
| | Kansai Electric Power Co. Inc. | 0.460% | 12/20/27 | JPY | 359,000 | 2,394 |
| | Kansai Electric Power Co. Inc. | 0.440% | 12/20/30 | JPY | 327,000 | 2,119 |
| | Kansai Electric Power Co. Inc. | 0.370% | 9/19/31 | JPY | 187,000 | 1,198 |
| | Kyushu Electric Power Co. Inc. | 1.064% | 2/23/24 | JPY | 102,000 | 694 |
| | Kyushu Electric Power Co. Inc. | 0.170% | 8/23/24 | JPY | 34,000 | 229 |
| | Kyushu Electric Power Co. Inc. | 0.430% | 5/25/29 | JPY | 91,000 | 599 |
| | Mitsubishi UFJ Financial Group Inc. | 0.940% | 6/26/24 | JPY | 100,000 | 677 |
| | Mitsubishi UFJ Financial Group Inc. | 0.872% | 9/7/24 | EUR | 9,726 | 9,119 |
| | Mitsubishi UFJ Financial Group Inc. | 2.264% | 6/14/25 | EUR | 5,000 | 4,790 |
| | Mitsubishi UFJ Financial Group Inc. | 0.535% | 4/28/26 | JPY | 100,000 | 672 |
| | Mitsubishi UFJ Financial Group Inc. | 0.250% | 11/4/27 | JPY | 100,000 | 653 |
| | Mitsubishi UFJ Financial Group Inc. | 0.535% | 5/31/28 | JPY | 100,000 | 666 |
| | Mitsubishi UFJ Financial Group Inc. | 0.848% | 7/19/29 | EUR | 8,179 | 6,486 |
| | Mizuho Financial Group Inc. | 0.523% | 6/10/24 | EUR | 1,161 | 1,090 |
| | Mizuho Financial Group Inc. | 0.956% | 10/16/24 | EUR | 2,516 | 2,361 |
| | Mizuho Financial Group Inc. | 0.184% | 4/13/26 | EUR | 4,600 | 3,960 |
| | Mizuho Financial Group Inc. | 0.650% | 1/26/27 | JPY | 134,000 | 898 |
| | Mizuho Financial Group Inc. | 0.402% | 9/6/29 | EUR | 2,543 | 1,896 |
| | Mizuho Financial Group Inc. | 0.797% | 4/15/30 | EUR | 5,087 | 3,865 |
| | Mizuho Financial Group Inc. | 0.895% | 6/24/30 | JPY | 100,000 | 673 |
| | Mizuho Financial Group Inc. | 0.693% | 10/7/30 | EUR | 18,700 | 13,770 |
| | MUFG Bank Ltd. | 1.950% | 11/12/25 | JPY | 100,000 | 701 |
| 3 | Nissan Motor Co. Ltd. | 1.940% | 9/15/23 | EUR | 1,129 | 1,091 |
| | Nissan Motor Co. Ltd. | 2.652% | 3/17/26 | EUR | 5,087 | 4,569 |
| 3 | Nissan Motor Co. Ltd. | 2.652% | 3/17/26 | EUR | 3,321 | 2,981 |
| | Nissan Motor Co. Ltd. | 3.201% | 9/17/28 | EUR | 6,524 | 5,431 |
| 3 | Nissan Motor Co. Ltd. | 3.201% | 9/17/28 | EUR | 3,047 | 2,537 |
| | NTT Finance Corp. | 0.010% | 3/3/25 | EUR | 7,580 | 6,973 |
| | NTT Finance Corp. | 0.280% | 12/20/27 | JPY | 100,000 | 670 |
| | NTT Finance Corp. | 0.399% | 12/13/28 | EUR | 5,600 | 4,610 |
| | NTT Finance Corp. | 0.342% | 3/3/30 | EUR | 7,490 | 5,873 |
| | NTT Finance Corp. | 0.380% | 9/20/30 | JPY | 3,100,000 | 20,584 |
| | NTT Finance Corp. | 0.270% | 9/19/31 | JPY | 200,000 | 1,334 |
Total International Bond Index Fund
| | | Coupon | Maturity
Date | Currency | Face
Amount
(000) | Market
Value•
($000) |
| | Panasonic Corp. | 0.934% | 3/19/25 | JPY | 500,000 | 3,417 |
| | Panasonic Corp. | 0.470% | 9/18/26 | JPY | 800,000 | 5,400 |
| | Shoko Chukin Bank Ltd. | 0.080% | 7/27/26 | JPY | 230,000 | 1,540 |
| | Shoko Chukin Bank Ltd. | 0.090% | 9/25/26 | JPY | 750,000 | 5,022 |
| | Shoko Chukin Bank Ltd. | 0.220% | 4/27/27 | JPY | 370,000 | 2,485 |
| | Sumitomo Mitsui Banking Corp. | 0.010% | 9/10/25 | EUR | 10,567 | 9,551 |
| | Sumitomo Mitsui Banking Corp. | 0.267% | 6/18/26 | EUR | 5,087 | 4,525 |
| | Sumitomo Mitsui Banking Corp. | 0.409% | 11/7/29 | EUR | 3,541 | 2,852 |
| | Sumitomo Mitsui Financial Group Inc. | 0.849% | 9/12/24 | JPY | 700,000 | 4,726 |
| | Sumitomo Mitsui Financial Group Inc. | 0.934% | 10/11/24 | EUR | 100 | 94 |
| | Sumitomo Mitsui Financial Group Inc. | 1.546% | 6/15/26 | EUR | 5,745 | 5,187 |
| | Sumitomo Mitsui Financial Group Inc. | 0.632% | 10/23/29 | EUR | 5,635 | 4,277 |
| | Sumitomo Mitsui Trust Bank Ltd. | 0.010% | 10/15/27 | EUR | 9,232 | 7,752 |
| | Takeda Pharmaceutical Co. Ltd. | 2.250% | 11/21/26 | EUR | 4,419 | 4,170 |
| | Takeda Pharmaceutical Co. Ltd. | 1.000% | 7/9/29 | EUR | 7,127 | 5,892 |
| | Takeda Pharmaceutical Co. Ltd. | 3.000% | 11/21/30 | EUR | 20,014 | 18,568 |
| | Takeda Pharmaceutical Co. Ltd. | 2.000% | 7/9/40 | EUR | 4,364 | 3,070 |
| | Toyota Motor Finance Netherlands BV | 3.070% | 10/27/25 | EUR | 3,724 | 3,330 |
| | West Nippon Expressway Co. Ltd. | 0.170% | 5/22/26 | JPY | 560,000 | 3,704 |
| | West Nippon Expressway Co. Ltd. | 0.175% | 8/28/26 | JPY | 1,260,000 | 8,457 |
| | | | | | | 270,458 |
| Luxembourg (0.1%) | | | |
| | Acef Holding SCA | ��0.750% | 6/14/28 | EUR | 1,107 | 802 |
| | Acef Holding SCA | 1.250% | 4/26/30 | EUR | 5,914 | 3,720 |
| | ArcelorMittal SA | 1.750% | 11/19/25 | EUR | 2,014 | 1,818 |
| | AXA Logistics Europe Master SCA | 0.375% | 11/15/26 | EUR | 3,000 | 2,396 |
| | AXA Logistics Europe Master SCA | 0.875% | 11/15/29 | EUR | 800 | 541 |
| | Bevco Lux Sarl | 1.000% | 1/16/30 | EUR | 2,214 | 1,515 |
| | Blackstone Property Partners Europe Holdings Sarl | 1.000% | 10/20/26 | EUR | 3,529 | 2,800 |
| | Blackstone Property Partners Europe Holdings Sarl | 1.250% | 4/26/27 | EUR | 4,840 | 3,746 |
| | Blackstone Property Partners Europe Holdings Sarl | 2.625% | 10/20/28 | GBP | 2,800 | 2,387 |
| | Blackstone Property Partners Europe Holdings Sarl | 1.750% | 3/12/29 | EUR | 8,728 | 6,372 |
| | Blackstone Property Partners Europe Holdings Sarl | 3.625% | 10/29/29 | EUR | 2,800 | 2,273 |
| | Blackstone Property Partners Europe Holdings Sarl | 4.875% | 4/29/32 | GBP | 2,800 | 2,559 |
| | CBRE Global Investors Open-Ended Fund SCA SICAV-SIF Pan European Core Fund | 0.500% | 1/27/28 | EUR | 4,000 | 2,949 |
| | CBRE Global Investors Open-Ended Fund SCA SICAV-SIF Pan European Core Fund | 0.900% | 10/12/29 | EUR | 1,400 | 971 |
| | Eurofins Scientific SE | 3.750% | 7/17/26 | EUR | 5,600 | 5,533 |
| | Logicor Financing Sarl | 2.250% | 5/13/25 | EUR | 1,601 | 1,403 |
| | Logicor Financing Sarl | 1.625% | 7/15/27 | EUR | 5,087 | 3,910 |
| | Logicor Financing Sarl | 3.250% | 11/13/28 | EUR | 5,980 | 4,710 |
| | Logicor Financing Sarl | 0.875% | 1/14/31 | EUR | 3,914 | 2,283 |
| | NORD/LB Luxembourg SA Covered Bond Bank | 0.375% | 3/7/24 | EUR | 2,500 | 2,387 |
| | P3 Group Sarl | 0.875% | 1/26/26 | EUR | 3,700 | 2,858 |
| | P3 Group Sarl | 1.625% | 1/26/29 | EUR | 900 | 579 |
| | Prologis International Funding II SA | 1.750% | 3/15/28 | EUR | 6,125 | 5,331 |
| | Prologis International Funding II SA | 0.875% | 7/9/29 | EUR | 3,042 | 2,370 |
| | Prologis International Funding II SA | 3.125% | 6/1/31 | EUR | 3,000 | 2,590 |
| | Prologis International Funding II SA | 1.625% | 6/17/32 | EUR | 4,819 | 3,466 |
| | SELP Finance Sarl | 1.500% | 12/20/26 | EUR | 7,448 | 6,023 |
| | SES SA | 0.875% | 11/4/27 | EUR | 1,590 | 1,273 |
| | SES SA | 2.000% | 7/2/28 | EUR | 1,900 | 1,570 |
| | | | | | | 81,135 |
| Mexico (0.0%) | | | |
| | America Movil SAB de CV | 1.500% | 3/10/24 | EUR | 283 | 272 |
| | America Movil SAB de CV | 5.000% | 10/27/26 | GBP | 1,161 | 1,289 |
| | America Movil SAB de CV | 0.750% | 6/26/27 | EUR | 2,159 | 1,869 |
| | America Movil SAB de CV | 2.125% | 3/10/28 | EUR | 2,599 | 2,354 |
| | America Movil SAB de CV | 5.750% | 6/28/30 | GBP | 1,990 | 2,265 |
| | America Movil SAB de CV | 4.948% | 7/22/33 | GBP | 900 | 959 |
| | America Movil SAB de CV | 4.375% | 8/7/41 | GBP | 3,096 | 2,954 |
| | | | | | | 11,962 |
| Netherlands (1.0%) | | | |
| | ABN AMRO Bank NV | 2.500% | 11/29/23 | EUR | 2,101 | 2,068 |
| | ABN AMRO Bank NV | 0.875% | 1/15/24 | EUR | 3,092 | 2,972 |
| | ABN AMRO Bank NV | 2.375% | 1/23/24 | EUR | 8,399 | 8,275 |
| | ABN AMRO Bank NV | 1.250% | 5/28/25 | EUR | 16,700 | 15,524 |
| | ABN AMRO Bank NV | 0.875% | 1/14/26 | EUR | 500 | 464 |
| | ABN AMRO Bank NV | 0.600% | 1/15/27 | EUR | 7,600 | 6,535 |
Total International Bond Index Fund
| | | Coupon | Maturity
Date | Currency | Face
Amount
(000) | Market
Value•
($000) |
| | ABN AMRO Bank NV | 0.500% | 9/23/29 | EUR | 5,000 | 3,840 |
| | ABN AMRO Bank NV | 1.500% | 9/30/30 | EUR | 11,107 | 9,774 |
| | ABN AMRO Bank NV | 1.000% | 4/13/31 | EUR | 4,000 | 3,341 |
| | ABN AMRO Bank NV | 3.000% | 6/1/32 | EUR | 900 | 791 |
| | ABN AMRO Bank NV | 1.000% | 6/2/33 | EUR | 6,000 | 4,245 |
| | ABN AMRO Bank NV | 1.375% | 1/10/34 | EUR | 7,300 | 5,983 |
| | ABN AMRO Bank NV | 0.375% | 1/14/35 | EUR | 20,400 | 14,378 |
| | ABN AMRO Bank NV | 1.375% | 1/12/37 | EUR | 11,100 | 8,626 |
| | ABN AMRO Bank NV | 1.450% | 4/12/38 | EUR | 1,800 | 1,385 |
| | ABN AMRO Bank NV | 1.125% | 4/23/39 | EUR | 2,500 | 1,799 |
| | ABN AMRO Bank NV | 0.400% | 9/17/41 | EUR | 10,000 | 5,997 |
| | Aegon Bank NV | 0.375% | 11/21/56 | EUR | 5,000 | 4,695 |
| | Aegon Bank NV | 0.750% | 6/27/59 | EUR | 1,200 | 1,069 |
| | Aegon NV | 1.000% | 12/8/23 | EUR | 323 | 312 |
| | Aegon NV | 6.625% | 12/16/39 | GBP | 444 | 563 |
| | Aegon NV | 4.000% | 4/25/44 | EUR | 10,996 | 10,609 |
| | Akzo Nobel NV | 1.750% | 11/7/24 | EUR | 1,875 | 1,807 |
| | Akzo Nobel NV | 1.125% | 4/8/26 | EUR | 2,050 | 1,858 |
| | Akzo Nobel NV | 1.500% | 3/28/28 | EUR | 4,000 | 3,453 |
| | Akzo Nobel NV | 1.625% | 4/14/30 | EUR | 4,600 | 3,701 |
| | Alliander NV | 2.875% | 6/14/24 | EUR | 300 | 296 |
| | Alliander NV | 0.375% | 6/10/30 | EUR | 6,316 | 4,997 |
| | ASML Holding NV | 1.375% | 7/7/26 | EUR | 10,525 | 9,811 |
| | ASML Holding NV | 1.625% | 5/28/27 | EUR | 667 | 617 |
| | ASML Holding NV | 0.625% | 5/7/29 | EUR | 2,214 | 1,848 |
| | ASR Nederland NV | 5.125% | 9/29/45 | EUR | 1,545 | 1,489 |
| | ASR Nederland NV | 3.375% | 5/2/49 | EUR | 3,862 | 3,143 |
| | ASR Nederland NV | 5.000% | 9/30/49 | EUR | 3,000 | 2,889 |
| | Athora Netherlands NV | 2.250% | 7/15/31 | EUR | 3,962 | 3,177 |
| | Cooperatieve Rabobank UA | 1.250% | 1/14/25 | GBP | 2,000 | 2,092 |
| | Cooperatieve Rabobank UA | 4.125% | 7/14/25 | EUR | 5,248 | 5,333 |
| | Cooperatieve Rabobank UA | 1.250% | 3/23/26 | EUR | 2,971 | 2,767 |
| | Cooperatieve Rabobank UA | 4.250% | 5/12/26 | AUD | 300 | 188 |
| | Cooperatieve Rabobank UA | 3.125% | 9/15/26 | CHF | 3,530 | 3,675 |
| | Cooperatieve Rabobank UA | 1.375% | 2/3/27 | EUR | 2,254 | 2,055 |
| | Cooperatieve Rabobank UA | 0.000% | 6/21/27 | EUR | 22,500 | 19,441 |
| | Cooperatieve Rabobank UA | 5.250% | 9/14/27 | GBP | 7,967 | 8,525 |
| | Cooperatieve Rabobank UA | 0.375% | 12/1/27 | EUR | 19,600 | 16,576 |
| | Cooperatieve Rabobank UA | 0.875% | 2/8/28 | EUR | 16,600 | 14,744 |
| | Cooperatieve Rabobank UA | 0.875% | 5/5/28 | EUR | 9,100 | 7,733 |
| | Cooperatieve Rabobank UA | 1.875% | 7/12/28 | GBP | 7,500 | 7,116 |
| | Cooperatieve Rabobank UA | 0.875% | 2/1/29 | EUR | 5,000 | 4,346 |
| | Cooperatieve Rabobank UA | 4.625% | 5/23/29 | GBP | 4,812 | 4,824 |
| | Cooperatieve Rabobank UA | 4.550% | 8/30/29 | GBP | 3,642 | 3,972 |
| | Cooperatieve Rabobank UA | 1.250% | 5/31/32 | EUR | 3,800 | 3,172 |
| | Cooperatieve Rabobank UA | 1.500% | 4/26/38 | EUR | 3,400 | 2,637 |
| | Cooperatieve Rabobank UA | 0.750% | 6/21/39 | EUR | 6,000 | 4,027 |
| | Cooperatieve Rabobank UA | 0.010% | 11/27/40 | EUR | 1,400 | 782 |
| | Cooperatieve Rabobank UA | 5.250% | 5/23/41 | GBP | 484 | 576 |
| | CTP NV | 2.125% | 10/1/25 | EUR | 300 | 239 |
| | CTP NV | 0.875% | 1/20/26 | EUR | 1,200 | 943 |
| | CTP NV | 0.625% | 9/27/26 | EUR | 543 | 402 |
| | CTP NV | 0.750% | 2/18/27 | EUR | 5,214 | 3,536 |
| | CTP NV | 1.250% | 6/21/29 | EUR | 3,200 | 1,887 |
| | CTP NV | 1.500% | 9/27/31 | EUR | 704 | 367 |
| | de Volksbank NV | 0.500% | 1/30/26 | EUR | 3,700 | 3,383 |
| | de Volksbank NV | 0.250% | 6/22/26 | EUR | 3,000 | 2,553 |
| | de Volksbank NV | 2.375% | 5/4/27 | EUR | 9,300 | 8,512 |
| | de Volksbank NV | 0.750% | 5/18/27 | EUR | 2,500 | 2,239 |
| | de Volksbank NV | 0.375% | 3/3/28 | EUR | 3,700 | 2,926 |
| | de Volksbank NV | 0.750% | 10/24/31 | EUR | 2,543 | 2,049 |
| | Enexis Holding NV | 0.875% | 4/28/26 | EUR | 6,000 | 5,504 |
| | Euronext NV | 1.125% | 6/12/29 | EUR | 10,300 | 8,410 |
| | Euronext NV | 1.500% | 5/17/41 | EUR | 2,800 | 1,633 |
| | EXOR NV | 1.750% | 1/18/28 | EUR | 2,708 | 2,417 |
| | EXOR NV | 2.250% | 4/29/30 | EUR | 5,053 | 4,270 |
| | Heineken NV | 1.500% | 12/7/24 | EUR | 2,599 | 2,482 |
| | Heineken NV | 1.625% | 3/30/25 | EUR | 4,090 | 3,897 |
| | Heineken NV | 2.875% | 8/4/25 | EUR | 3,037 | 2,980 |
Total International Bond Index Fund
| | | Coupon | Maturity
Date | Currency | Face
Amount
(000) | Market
Value•
($000) |
| | Heineken NV | 1.375% | 1/29/27 | EUR | 5,142 | 4,689 |
| | Heineken NV | 1.500% | 10/3/29 | EUR | 400 | 347 |
| | Heineken NV | 2.250% | 3/30/30 | EUR | 7,631 | 6,887 |
| | Heineken NV | 1.750% | 5/7/40 | EUR | 4,471 | 3,038 |
| | ING Bank NV | 0.875% | 4/11/28 | EUR | 7,900 | 6,997 |
| | ING Bank NV | 0.125% | 12/8/32 | EUR | 15,700 | 11,901 |
| | ING Groep NV | 1.000% | 9/20/23 | EUR | 3,000 | 2,901 |
| | ING Groep NV | 2.125% | 1/10/26 | EUR | 8,400 | 7,833 |
| | ING Groep NV | 3.000% | 2/18/26 | GBP | 5,400 | 5,659 |
| | ING Groep NV | 1.250% | 2/16/27 | EUR | 23,000 | 20,445 |
| | ING Groep NV | 0.375% | 9/29/28 | EUR | 27,700 | 22,251 |
| | ING Groep NV | 2.500% | 2/15/29 | EUR | 5,000 | 4,754 |
| | ING Groep NV | 0.250% | 2/18/29 | EUR | 11,800 | 9,215 |
| | ING Groep NV | 1.625% | 9/26/29 | EUR | 13,500 | 12,402 |
| | ING Groep NV | 0.250% | 2/1/30 | EUR | 2,500 | 1,869 |
| | ING Groep NV | 1.000% | 11/13/30 | EUR | 5,000 | 4,292 |
| | ING Groep NV | 1.750% | 2/16/31 | EUR | 4,500 | 3,614 |
| | JDE Peet's NV | 0.625% | 2/9/28 | EUR | 5,700 | 4,592 |
| | JDE Peet's NV | 0.500% | 1/16/29 | EUR | 7,500 | 5,699 |
| | Koninklijke Ahold Delhaize NV | 1.125% | 3/19/26 | EUR | 100 | 92 |
| | Koninklijke DSM NV | 2.375% | 4/3/24 | EUR | 832 | 812 |
| | Koninklijke DSM NV | 1.000% | 4/9/25 | EUR | 1,656 | 1,545 |
| | Koninklijke DSM NV | 0.750% | 9/28/26 | EUR | 9,400 | 8,281 |
| | Koninklijke DSM NV | 0.250% | 6/23/28 | EUR | 3,000 | 2,426 |
| | Koninklijke DSM NV | 0.625% | 6/23/32 | EUR | 7,500 | 5,394 |
| | Koninklijke KPN NV | 0.625% | 4/9/25 | EUR | 5,000 | 4,625 |
| | Koninklijke KPN NV | 5.750% | 9/17/29 | GBP | 1,771 | 1,987 |
| | Koninklijke KPN NV | 0.875% | 12/14/32 | EUR | 1,900 | 1,367 |
| | Koninklijke Philips NV | 0.500% | 5/22/26 | EUR | 100 | 89 |
| | Koninklijke Philips NV | 1.375% | 5/2/28 | EUR | 3,925 | 3,363 |
| | Koninklijke Philips NV | 2.000% | 3/30/30 | EUR | 5,087 | 4,272 |
| | LeasePlan Corp. NV | 3.500% | 4/9/25 | EUR | 3,724 | 3,567 |
| | LeasePlan Corp. NV | 2.125% | 5/6/25 | EUR | 4,600 | 4,246 |
| | LeasePlan Corp. NV | 0.250% | 2/23/26 | EUR | 7,109 | 6,018 |
| | Nationale-Nederlanden Bank NV | 0.375% | 2/26/25 | EUR | 6,700 | 6,121 |
| | Nationale-Nederlanden Bank NV | 0.500% | 9/21/28 | EUR | 2,900 | 2,299 |
| | Nationale-Nederlanden Bank NV | 0.625% | 9/11/55 | EUR | 3,800 | 3,518 |
| | Nationale-Nederlanden Bank NV | 0.250% | 2/27/56 | EUR | 5,600 | 5,359 |
| | Nationale-Nederlanden Bank NV | 0.500% | 10/10/56 | EUR | 400 | 378 |
| | Nederlandse Gasunie NV | 1.000% | 5/11/26 | EUR | 6,403 | 5,851 |
| | Nederlandse Gasunie NV | 0.375% | 10/3/31 | EUR | 1,545 | 1,129 |
| | NIBC Bank NV | 3.125% | 11/15/23 | GBP | 6,000 | 6,682 |
| | NIBC Bank NV | 0.875% | 7/8/25 | EUR | 11,800 | 10,522 |
| | NIBC Bank NV | 0.625% | 6/1/26 | EUR | 5,900 | 5,367 |
| | NIBC Bank NV | 0.250% | 9/9/26 | EUR | 9,000 | 7,393 |
| | NIBC Bank NV | 0.500% | 3/19/27 | EUR | 7,700 | 6,823 |
| | NIBC Bank NV | 1.000% | 9/11/28 | EUR | 2,500 | 2,191 |
| | NIBC Bank NV | 0.010% | 10/15/29 | EUR | 5,000 | 3,987 |
| | NIBC Bank NV | 0.125% | 4/21/31 | EUR | 19,700 | 15,051 |
| | NN Group NV | 1.625% | 6/1/27 | EUR | 230 | 206 |
| | NN Group NV | 4.625% | 4/8/44 | EUR | 1,800 | 1,750 |
| | NN Group NV | 4.625% | 1/13/48 | EUR | 11,809 | 10,693 |
| | NN Group NV | 4.375% | 6/29/49 | EUR | 13,003 | 12,514 |
| | NN Group NV | 4.500% | 7/15/49 | EUR | 5,700 | 5,338 |
| | PostNL NV | 1.000% | 11/21/24 | EUR | 943 | 881 |
| | PostNL NV | 0.625% | 9/23/26 | EUR | 2,543 | 2,235 |
| | Royal Schiphol Group NV | 0.000% | 4/22/25 | EUR | 922 | 832 |
| | Royal Schiphol Group NV | 2.000% | 4/6/29 | EUR | 18,454 | 16,306 |
| | Shell International Finance BV | 1.125% | 4/7/24 | EUR | 5,361 | 5,162 |
| | Shell International Finance BV | 0.375% | 2/15/25 | EUR | 12,052 | 11,211 |
| | Shell International Finance BV | 1.625% | 1/20/27 | EUR | 12,506 | 11,550 |
| | Shell International Finance BV | 0.125% | 11/8/27 | EUR | 2,543 | 2,154 |
| | Shell International Finance BV | 1.250% | 5/12/28 | EUR | 3,678 | 3,247 |
| | Shell International Finance BV | 0.750% | 8/15/28 | EUR | 5,087 | 4,339 |
| | Shell International Finance BV | 1.000% | 12/10/30 | GBP | 1,729 | 1,459 |
| | Shell International Finance BV | 1.875% | 4/7/32 | EUR | 7,587 | 6,491 |
| | Shell International Finance BV | 0.875% | 11/8/39 | EUR | 6,032 | 3,617 |
| | Shell International Finance BV | 1.750% | 9/10/52 | GBP | 2,543 | 1,472 |
| | Stedin Holding NV | 0.875% | 10/24/25 | EUR | 19,050 | 17,411 |
Total International Bond Index Fund
| | | Coupon | Maturity
Date | Currency | Face
Amount
(000) | Market
Value•
($000) |
| | Stedin Holding NV | 0.500% | 11/14/29 | EUR | 2,543 | 2,011 |
| | Stedin Holding NV | 2.375% | 6/3/30 | EUR | 2,500 | 2,233 |
| | TenneT Holding BV | 1.000% | 6/13/26 | EUR | 100 | 91 |
| | TenneT Holding BV | 1.375% | 6/5/28 | EUR | 14,435 | 12,698 |
| | TenneT Holding BV | 1.375% | 6/26/29 | EUR | 5,374 | 4,568 |
| | TenneT Holding BV | 0.875% | 6/3/30 | EUR | 2,000 | 1,597 |
| | TenneT Holding BV | 0.500% | 6/9/31 | EUR | 6,000 | 4,464 |
| | TenneT Holding BV | 0.125% | 11/30/32 | EUR | 500 | 336 |
| | TenneT Holding BV | 1.250% | 10/24/33 | EUR | 778 | 575 |
| | TenneT Holding BV | 0.875% | 6/16/35 | EUR | 7,300 | 4,911 |
| | TenneT Holding BV | 1.875% | 6/13/36 | EUR | 1,263 | 946 |
| | TenneT Holding BV | 1.500% | 6/3/39 | EUR | 6,768 | 4,496 |
| | TenneT Holding BV | 0.500% | 11/30/40 | EUR | 6,084 | 3,224 |
| | TenneT Holding BV | 1.125% | 6/9/41 | EUR | 3,200 | 1,907 |
| | TenneT Holding BV | 2.750% | 5/17/42 | EUR | 6,400 | 5,003 |
| | Universal Music Group NV | 3.000% | 6/30/27 | EUR | 4,300 | 4,094 |
| | Vesteda Finance BV | 1.500% | 5/24/27 | EUR | 2,094 | 1,816 |
| | Vesteda Finance BV | 0.750% | 10/18/31 | EUR | 2,214 | 1,557 |
| | VIA Outlets BV | 1.750% | 11/15/28 | EUR | 2,000 | 1,450 |
| | | | | | | 774,526 |
| New Zealand (0.1%) | | | |
| | ANZ New Zealand Int'l Ltd. | 0.200% | 9/23/27 | EUR | 13,124 | 10,777 |
| | ASB Finance Ltd. | 0.625% | 10/18/24 | EUR | 1,888 | 1,783 |
| | ASB Finance Ltd. | 0.750% | 10/9/25 | EUR | 2,543 | 2,352 |
| | ASB Finance Ltd. | 0.250% | 5/21/31 | EUR | 30,301 | 23,228 |
| | Bank of New Zealand | 2.552% | 6/29/27 | EUR | 17,456 | 16,730 |
| | BNZ International Funding Ltd. | 0.625% | 7/3/25 | EUR | 7,631 | 7,076 |
| | Chorus Ltd. | 3.625% | 9/7/29 | EUR | 2,000 | 1,923 |
| | Fonterra Co-operative Group Ltd. | 9.375% | 12/4/23 | GBP | 608 | 728 |
| | Fonterra Co-operative Group Ltd. | 0.750% | 11/8/24 | EUR | 683 | 639 |
| | Fonterra Co-operative Group Ltd. | 4.000% | 11/2/27 | AUD | 100 | 60 |
| | Westpac Securities NZ Ltd. | 0.500% | 1/17/24 | EUR | 5,087 | 4,893 |
| | Westpac Securities NZ Ltd. | 0.375% | 2/5/24 | CHF | 2,950 | 2,897 |
| | Westpac Securities NZ Ltd. | 0.300% | 6/25/24 | EUR | 4,090 | 3,841 |
| | | | | | | 76,927 |
| Norway (0.4%) | | | |
| | Aker BP ASA | 1.125% | 5/12/29 | EUR | 2,800 | 2,222 |
| | Avinor A/S | 1.000% | 4/29/25 | EUR | 100 | 94 |
| | DNB Bank ASA | 2.625% | 6/10/26 | GBP | 18,700 | 20,024 |
| | DNB Bank ASA | 4.000% | 8/17/27 | GBP | 9,000 | 9,623 |
| | DNB Bank ASA | 0.375% | 1/18/28 | EUR | 2,800 | 2,409 |
| | DNB Bank ASA | 0.250% | 2/23/29 | EUR | 10,000 | 8,030 |
| | DNB Boligkreditt A/S | 0.375% | 11/20/24 | EUR | 5,087 | 4,787 |
| | DNB Boligkreditt A/S | 0.625% | 6/19/25 | EUR | 100 | 93 |
| | DNB Boligkreditt A/S | 0.625% | 1/14/26 | EUR | 7,631 | 7,014 |
| | DNB Boligkreditt A/S | 0.250% | 9/7/26 | EUR | 19,524 | 17,408 |
| | Eika Boligkreditt A/S | 0.375% | 2/26/25 | EUR | 778 | 726 |
| | Eika Boligkreditt A/S | 0.010% | 3/23/28 | EUR | 15,943 | 13,402 |
| | Equinor ASA | 2.875% | 9/10/25 | EUR | 10,384 | 10,236 |
| | Equinor ASA | 0.750% | 5/22/26 | EUR | 482 | 439 |
| | Equinor ASA | 0.750% | 11/9/26 | EUR | 7,347 | 6,635 |
| | Equinor ASA | 1.250% | 2/17/27 | EUR | 10,219 | 9,347 |
| | Equinor ASA | 6.125% | 11/27/28 | GBP | 149 | 178 |
| | Equinor ASA | 6.875% | 3/11/31 | GBP | 3,673 | 4,692 |
| | Equinor ASA | 1.375% | 5/22/32 | EUR | 10,083 | 8,252 |
| | Equinor ASA | 1.625% | 2/17/35 | EUR | 2,599 | 2,044 |
| | Equinor ASA | 1.625% | 11/9/36 | EUR | 996 | 754 |
| | Equinor ASA | 4.250% | 4/10/41 | GBP | 2,657 | 2,639 |
| | Norsk Hydro ASA | 1.125% | 4/11/25 | EUR | 558 | 513 |
| | Santander Consumer Bank A/S | 0.125% | 9/11/24 | EUR | 12,900 | 11,934 |
| | Santander Consumer Bank A/S | 0.500% | 8/11/25 | EUR | 4,600 | 4,146 |
| | SpareBank 1 Boligkreditt A/S | 0.125% | 5/14/26 | EUR | 5,087 | 4,555 |
| | SpareBank 1 Boligkreditt A/S | 0.250% | 8/30/26 | EUR | 21,272 | 18,965 |
| | SpareBank 1 Boligkreditt A/S | 1.000% | 1/30/29 | EUR | 5,087 | 4,422 |
| | SpareBank 1 Boligkreditt A/S | 0.125% | 11/5/29 | EUR | 5,087 | 4,078 |
| | SpareBank 1 Boligkreditt AS | 1.750% | 5/11/32 | EUR | 15,000 | 13,022 |
| | SpareBank 1 SMN | 0.010% | 2/18/28 | EUR | 5,053 | 4,051 |
| | SpareBank 1 SR-Bank ASA | 0.625% | 3/25/24 | EUR | 2,094 | 1,985 |
Total International Bond Index Fund
| | | Coupon | Maturity
Date | Currency | Face
Amount
(000) | Market
Value•
($000) |
| | Sparebanken Vest Boligkreditt A/S | 0.375% | 2/14/24 | EUR | 15,943 | 15,296 |
| | Sparebanken Vest Boligkreditt A/S | 0.750% | 2/27/25 | EUR | 5,087 | 4,790 |
| | Sparebanken Vest Boligkreditt A/S | 0.500% | 2/12/26 | EUR | 26,726 | 24,415 |
| | SR-Boligkreditt A/S | 0.375% | 10/3/24 | EUR | 9,836 | 9,280 |
| | SR-Boligkreditt A/S | 0.750% | 10/17/25 | EUR | 14,075 | 13,068 |
| | Statkraft A/S | 1.125% | 3/20/25 | EUR | 7,631 | 7,175 |
| | Statkraft A/S | 1.500% | 3/26/30 | EUR | 1,387 | 1,184 |
| | Statnett SF | 0.875% | 3/8/25 | EUR | 792 | 741 |
| | Statnett SF | 1.250% | 4/26/30 | EUR | 2,023 | 1,681 |
| | Storebrand Livsforsikring A/S | 1.875% | 9/30/51 | EUR | 2,804 | 1,918 |
| | Telenor ASA | 2.500% | 5/22/25 | EUR | 1,216 | 1,171 |
| | Telenor ASA | 0.750% | 5/31/26 | EUR | 8,289 | 7,452 |
| | Telenor ASA | 1.125% | 5/31/29 | EUR | 6,836 | 5,778 |
| | | | | | | 292,668 |
| Poland (0.0%) | | | |
| | ORLEN Capital AB | 2.500% | 6/7/23 | EUR | 2,927 | 2,875 |
| Portugal (0.1%) | | | |
| | Banco Santander Totta SA | 0.875% | 4/25/24 | EUR | 100 | 96 |
| | Banco Santander Totta SA | 1.250% | 9/26/27 | EUR | 4,600 | 4,164 |
| | Brisa-Concessao Rodoviaria SA | 2.000% | 3/22/23 | EUR | 100 | 98 |
| | Brisa-Concessao Rodoviaria SA | 2.375% | 5/10/27 | EUR | 6,800 | 6,485 |
| | Cia de Seguros Fidelidade SA | 4.250% | 9/4/31 | EUR | 7,000 | 5,488 |
| | EDP - Energias de Portugal SA | 1.625% | 4/15/27 | EUR | 8,400 | 7,598 |
| | EDP Finance BV | 8.625% | 1/4/24 | GBP | 4,591 | 5,481 |
| | EDP Finance BV | 1.125% | 2/12/24 | EUR | 5,855 | 5,627 |
| | EDP Finance BV | 2.000% | 4/22/25 | EUR | 8,189 | 7,788 |
| | EDP Finance BV | 1.625% | 1/26/26 | EUR | 9,251 | 8,570 |
| | EDP Finance BV | 0.375% | 9/16/26 | EUR | 5,087 | 4,447 |
| | EDP Finance BV | 1.500% | 11/22/27 | EUR | 1,477 | 1,312 |
| | Energias de Portugal SA | 2.875% | 6/1/26 | EUR | 10,300 | 9,883 |
| | Ren Finance BV | 1.750% | 1/18/28 | EUR | 1,354 | 1,208 |
| | | | | | | 68,245 |
| Romania (0.0%) | | | |
| | NE Property BV | 1.875% | 10/9/26 | EUR | 3,092 | 2,420 |
| | NE Property BV | 3.375% | 7/14/27 | EUR | 1,107 | 854 |
| | NE Property BV | 2.000% | 1/20/30 | EUR | 1,000 | 651 |
| | | | | | | 3,925 |
| Singapore (0.1%) | | | |
| | DBS Bank Ltd. | 0.375% | 1/23/24 | EUR | 5,635 | 5,408 |
| | DBS Group Holdings Ltd. | 3.980% | Perpetual | SGD | 500 | 344 |
| | Oversea-Chinese Banking Corp. Ltd. | 0.625% | 4/18/25 | EUR | 5,087 | 4,752 |
| | Temasek Financial I Ltd. | 0.500% | 11/20/31 | EUR | 11,171 | 8,450 |
| | Temasek Financial I Ltd. | 5.125% | 7/26/40 | GBP | 3,266 | 3,764 |
| | Temasek Financial I Ltd. | 1.250% | 11/20/49 | EUR | 2,556 | 1,592 |
| | United Overseas Bank Ltd. | 0.500% | 1/16/25 | EUR | 6,359 | 5,957 |
| | United Overseas Bank Ltd. | 0.100% | 5/25/29 | EUR | 14,452 | 11,722 |
| | | | | | | 41,989 |
| South Africa (0.0%) | | | |
| | Anglo American Capital plc | 1.625% | 9/18/25 | EUR | 150 | 138 |
| | Anglo American Capital plc | 1.625% | 3/11/26 | EUR | 3,885 | 3,531 |
| | | | | | | 3,669 |
| South Korea (0.0%) | | | |
| 3 | LG Chem Ltd. | 0.500% | 4/15/23 | EUR | 503 | 492 |
| Spain (0.7%) | | | |
| | Abertis Infraestructuras SA | 3.750% | 6/20/23 | EUR | 5,100 | 5,047 |
| | Abertis Infraestructuras SA | 2.500% | 2/27/25 | EUR | 100 | 95 |
| | Abertis Infraestructuras SA | 0.625% | 7/15/25 | EUR | 2,000 | 1,814 |
| | Abertis Infraestructuras SA | 1.375% | 5/20/26 | EUR | 400 | 361 |
| | Abertis Infraestructuras SA | 3.375% | 11/27/26 | GBP | 1,500 | 1,511 |
| | Abertis Infraestructuras SA | 1.000% | 2/27/27 | EUR | 700 | 599 |
| | Abertis Infraestructuras SA | 2.375% | 9/27/27 | EUR | 3,400 | 3,059 |
| | Abertis Infraestructuras SA | 1.250% | 2/7/28 | EUR | 6,200 | 5,149 |
| | Abertis Infraestructuras SA | 2.250% | 3/29/29 | EUR | 8,500 | 7,218 |
| | Abertis Infraestructuras SA | 3.000% | 3/27/31 | EUR | 1,800 | 1,539 |
| | Abertis Infraestructuras SA | 1.875% | 3/26/32 | EUR | 3,000 | 2,300 |
Total International Bond Index Fund
| | | Coupon | Maturity
Date | Currency | Face
Amount
(000) | Market
Value•
($000) |
| | Acciona Energia Financiacion Filiales SA | 1.375% | 1/26/32 | EUR | 2,800 | 2,152 |
| | ACS Servicios Comunicaciones y Energia SA | 1.875% | 4/20/26 | EUR | 1,900 | 1,708 |
| | Amadeus IT Group SA | 1.875% | 9/24/28 | EUR | 3,700 | 3,221 |
| | AYT Cedulas Cajas Global FTA | 4.750% | 5/25/27 | EUR | 16,400 | 17,154 |
| | AyT Cedulas Cajas X Fondo de Titulizacion de Activos | 3.750% | 6/30/25 | EUR | 5,000 | 5,011 |
| | Banco Bilbao Vizcaya Argentaria SA | 1.125% | 2/28/24 | EUR | 1,500 | 1,440 |
| | Banco Bilbao Vizcaya Argentaria SA | 2.250% | 6/12/24 | EUR | 1,500 | 1,468 |
| | Banco Bilbao Vizcaya Argentaria SA | 0.375% | 10/2/24 | EUR | 1,500 | 1,398 |
| | Banco Bilbao Vizcaya Argentaria SA | 4.000% | 2/25/25 | EUR | 3,500 | 3,538 |
| | Banco Bilbao Vizcaya Argentaria SA | 0.875% | 11/22/26 | EUR | 7,600 | 6,896 |
| | Banco Bilbao Vizcaya Argentaria SA | 0.500% | 1/14/27 | EUR | 5,300 | 4,478 |
| | Banco Bilbao Vizcaya Argentaria SA | 0.125% | 3/24/27 | EUR | 9,000 | 7,826 |
| | Banco Bilbao Vizcaya Argentaria SA | 2.575% | 2/22/29 | EUR | 9,700 | 9,231 |
| | Banco Bilbao Vizcaya Argentaria SA | 1.000% | 1/16/30 | EUR | 10,700 | 9,410 |
| | Banco de Sabadell SA | 1.625% | 3/7/24 | EUR | 9,500 | 9,099 |
| | Banco de Sabadell SA | 0.625% | 6/10/24 | EUR | 15,600 | 14,862 |
| | Banco de Sabadell SA | 1.125% | 3/11/27 | EUR | 8,000 | 7,065 |
| | Banco Santander SA | 1.375% | 7/31/24 | GBP | 2,000 | 2,149 |
| | Banco Santander SA | 1.125% | 11/27/24 | EUR | 7,300 | 6,952 |
| | Banco Santander SA | 0.463% | 12/5/24 | JPY | 1,000,000 | 6,664 |
| | Banco Santander SA | 1.125% | 1/17/25 | EUR | 2,000 | 1,866 |
| | Banco Santander SA | 2.500% | 3/18/25 | EUR | 4,900 | 4,654 |
| | Banco Santander SA | 1.000% | 4/7/25 | EUR | 21,900 | 20,649 |
| | Banco Santander SA | 1.375% | 1/5/26 | EUR | 3,000 | 2,708 |
| | Banco Santander SA | 1.500% | 1/25/26 | EUR | 13,300 | 12,539 |
| | Banco Santander SA | 3.875% | 2/6/26 | EUR | 300 | 304 |
| | Banco Santander SA | 3.250% | 4/4/26 | EUR | 4,700 | 4,440 |
| | Banco Santander SA | 0.300% | 10/4/26 | EUR | 5,000 | 4,336 |
| | Banco Santander SA | 0.500% | 2/4/27 | EUR | 2,500 | 2,097 |
| | Banco Santander SA | 0.500% | 3/24/27 | EUR | 9,200 | 7,964 |
| | Banco Santander SA | 4.625% | 5/4/27 | EUR | 8,100 | 8,518 |
| | Banco Santander SA | 2.375% | 9/8/27 | EUR | 15,000 | 14,325 |
| | Banco Santander SA | 2.125% | 2/8/28 | EUR | 1,200 | 1,035 |
| | Banco Santander SA | 0.200% | 2/11/28 | EUR | 3,700 | 3,017 |
| | Banco Santander SA | 0.310% | 6/9/28 | CHF | 4,335 | 3,735 |
| | Banco Santander SA | 1.125% | 10/25/28 | EUR | 2,600 | 2,286 |
| | Banco Santander SA | 1.625% | 10/22/30 | EUR | 8,000 | 5,963 |
| | Banco Santander SA | 0.875% | 5/9/31 | EUR | 5,100 | 4,111 |
| | Banco Santander SA | 0.100% | 2/27/32 | EUR | 8,000 | 5,838 |
| | Banco Santander SA | 2.000% | 11/27/34 | EUR | 5,900 | 4,999 |
| | Bankinter SA | 1.000% | 2/5/25 | EUR | 4,200 | 3,970 |
| | Bankinter SA | 1.250% | 2/7/28 | EUR | 400 | 359 |
| | CaixaBank SA | 2.375% | 2/1/24 | EUR | 3,300 | 3,208 |
| | CaixaBank SA | 2.625% | 3/21/24 | EUR | 2,800 | 2,758 |
| | CaixaBank SA | 1.125% | 5/17/24 | EUR | 4,000 | 3,815 |
| | CaixaBank SA | 4.000% | 2/3/25 | EUR | 6,200 | 6,258 |
| | CaixaBank SA | 3.875% | 2/17/25 | EUR | 8,600 | 8,653 |
| | CaixaBank SA | 0.625% | 3/27/25 | EUR | 9,100 | 8,501 |
| | CaixaBank SA | 1.000% | 9/25/25 | EUR | 5,700 | 5,312 |
| | CaixaBank SA | 1.125% | 3/27/26 | EUR | 5,000 | 4,483 |
| | CaixaBank SA | 1.375% | 6/19/26 | EUR | 2,500 | 2,196 |
| | CaixaBank SA | 0.750% | 7/9/26 | EUR | 12,500 | 10,932 |
| | CaixaBank SA | 0.750% | 7/10/26 | EUR | 8,800 | 7,952 |
| | CaixaBank SA | 1.125% | 11/12/26 | EUR | 2,500 | 2,158 |
| | CaixaBank SA | 1.250% | 1/11/27 | EUR | 400 | 366 |
| | CaixaBank SA | 1.000% | 1/17/28 | EUR | 5,200 | 4,597 |
| | CaixaBank SA | 0.750% | 5/26/28 | EUR | 9,100 | 7,434 |
| | CaixaBank SA | 2.250% | 4/17/30 | EUR | 12,100 | 10,744 |
| | CaixaBank SA | 4.125% | 3/24/36 | EUR | 2,350 | 2,440 |
| | Caja Rural de Navarra SCC | 0.875% | 5/8/25 | EUR | 3,100 | 2,905 |
| | Canal de Isabel II Gestion SA | 1.680% | 2/26/25 | EUR | 1,800 | 1,692 |
| | Cedulas TDA 6 Fondo de Titulizacion de Activos | 3.875% | 5/23/25 | EUR | 500 | 503 |
| | Criteria Caixa SA | 0.875% | 10/28/27 | EUR | 3,100 | 2,585 |
| | Enagas Financiaciones SA | 1.000% | 3/25/23 | EUR | 100 | 98 |
| | Enagas Financiaciones SA | 1.250% | 2/6/25 | EUR | 2,600 | 2,440 |
| | Enagas Financiaciones SA | 1.375% | 5/5/28 | EUR | 100 | 87 |
| | Eurocaja Rural SCC | 0.875% | 5/27/24 | EUR | 2,500 | 2,392 |
| | FCC Aqualia SA | 2.629% | 6/8/27 | EUR | 1,107 | 987 |
| | Ferrovial Emisiones SA | 2.500% | 7/15/24 | EUR | 2,500 | 2,435 |
Total International Bond Index Fund
| | | Coupon | Maturity
Date | Currency | Face
Amount
(000) | Market
Value•
($000) |
| | Iberdrola Finanzas SA | 7.375% | 1/29/24 | GBP | 2,300 | 2,699 |
| | Iberdrola Finanzas SA | 1.000% | 3/7/24 | EUR | 1,500 | 1,448 |
| | Iberdrola Finanzas SA | 1.000% | 3/7/25 | EUR | 200 | 189 |
| | Iberdrola Finanzas SA | 0.875% | 6/16/25 | EUR | 6,000 | 5,616 |
| | Iberdrola Finanzas SA | 1.621% | 11/29/29 | EUR | 1,900 | 1,688 |
| | Iberdrola International BV | 1.875% | 10/8/24 | EUR | 200 | 194 |
| | Iberdrola International BV | 0.375% | 9/15/25 | EUR | 8,400 | 7,722 |
| | Iberdrola International BV | 1.125% | 4/21/26 | EUR | 2,100 | 1,954 |
| | Iberdrola International BV | 1.874% | Perpetual | EUR | 15,200 | 12,943 |
| | Iberdrola International BV | 2.250% | Perpetual | EUR | 1,500 | 1,134 |
| | Iberdrola International BV | 3.250% | Perpetual | EUR | 2,200 | 2,060 |
| | Inmobiliaria Colonial Socimi SA | 1.450% | 10/28/24 | EUR | 2,200 | 2,068 |
| | Inmobiliaria Colonial Socimi SA | 1.625% | 11/28/25 | EUR | 4,200 | 3,808 |
| | Inmobiliaria Colonial Socimi SA | 2.000% | 4/17/26 | EUR | 2,000 | 1,819 |
| | Inmobiliaria Colonial Socimi SA | 1.350% | 10/14/28 | EUR | 1,400 | 1,123 |
| | Inmobiliaria Colonial Socimi SA | 2.500% | 11/28/29 | EUR | 2,300 | 1,900 |
| | Lar Espana Real Estate Socimi SA | 1.843% | 11/3/28 | EUR | 1,500 | 944 |
| | Mapfre SA | 1.625% | 5/19/26 | EUR | 900 | 818 |
| | Mapfre SA | 4.375% | 3/31/47 | EUR | 2,200 | 1,974 |
| | Mapfre SA | 4.125% | 9/7/48 | EUR | 3,500 | 2,999 |
| | Merlin Properties Socimi SA | 1.750% | 5/26/25 | EUR | 4,906 | 4,474 |
| | Merlin Properties Socimi SA | 1.375% | 6/1/30 | EUR | 6,600 | 4,675 |
| | Merlin Properties Socimi SA | 1.875% | 12/4/34 | EUR | 3,000 | 1,858 |
| | Naturgy Capital Markets SA | 1.125% | 4/11/24 | EUR | 2,200 | 2,092 |
| | Naturgy Finance BV | 2.875% | 3/11/24 | EUR | 2,000 | 1,953 |
| | Naturgy Finance BV | 0.875% | 5/15/25 | EUR | 1,600 | 1,465 |
| | Naturgy Finance BV | 1.250% | 4/19/26 | EUR | 4,500 | 4,047 |
| | Naturgy Finance BV | 1.375% | 1/19/27 | EUR | 100 | 88 |
| | Naturgy Finance BV | 1.500% | 1/29/28 | EUR | 1,300 | 1,131 |
| | Naturgy Finance BV | 0.750% | 11/28/29 | EUR | 3,100 | 2,416 |
| | NorteGas Energia Distribucion SAU | 2.065% | 9/28/27 | EUR | 5,361 | 4,722 |
| | Programa Cedulas TDA Fondo de Titulizacion de Activos | 4.250% | 3/28/27 | EUR | 4,300 | 4,422 |
| | Programa Cedulas TDA Fondo de Titulizacion de Activos | 4.250% | 4/10/31 | EUR | 10,100 | 10,606 |
| | Prosegur Cash SA | 1.375% | 2/4/26 | EUR | 700 | 626 |
| | Red Electrica Financiaciones SAU | 1.125% | 4/24/25 | EUR | 200 | 189 |
| | Red Electrica Financiaciones SAU | 1.000% | 4/21/26 | EUR | 400 | 368 |
| | Red Electrica Financiaciones SAU | 1.250% | 3/13/27 | EUR | 400 | 365 |
| | Redexis Gas Finance BV | 1.875% | 5/28/25 | EUR | 3,000 | 2,781 |
| | Redexis Gas Finance BV | 1.875% | 4/27/27 | EUR | 2,104 | 1,840 |
| | Repsol Europe Finance Sarl | 0.875% | 7/6/33 | EUR | 3,100 | 2,191 |
| | Repsol International Finance BV | 2.250% | 12/10/26 | EUR | 5,100 | 4,826 |
| | Repsol International Finance BV | 0.250% | 8/2/27 | EUR | 700 | 601 |
| | Santander Consumer Finance SA | 1.000% | 2/27/24 | EUR | 5,600 | 5,358 |
| | Santander Consumer Finance SA | 0.375% | 6/27/24 | EUR | 5,000 | 4,696 |
| | Santander Consumer Finance SA | 0.375% | 1/17/25 | EUR | 4,500 | 4,144 |
| | Santander Consumer Finance SA | 0.500% | 1/14/27 | EUR | 9,300 | 7,981 |
| | Telefonica Emisiones SA | 1.069% | 2/5/24 | EUR | 8,900 | 8,598 |
| | Telefonica Emisiones SA | 5.375% | 2/2/26 | GBP | 593 | 665 |
| | Telefonica Emisiones SA | 1.460% | 4/13/26 | EUR | 2,000 | 1,850 |
| | Telefonica Emisiones SA | 1.447% | 1/22/27 | EUR | 8,000 | 7,266 |
| | Telefonica Emisiones SA | 2.318% | 10/17/28 | EUR | 400 | 364 |
| | Telefonica Emisiones SA | 1.788% | 3/12/29 | EUR | 1,300 | 1,143 |
| | Telefonica Emisiones SA | 5.445% | 10/8/29 | GBP | 1,700 | 1,861 |
| | Telefonica Emisiones SA | 2.932% | 10/17/29 | EUR | 5,700 | 5,300 |
| | Telefonica Emisiones SA | 0.664% | 2/3/30 | EUR | 3,400 | 2,692 |
| | Telefonica Emisiones SA | 2.592% | 5/25/31 | EUR | 8,400 | 7,490 |
| | Telefonica Emisiones SA | 1.807% | 5/21/32 | EUR | 9,000 | 7,248 |
| | Telefonica Emisiones SA | 1.864% | 7/13/40 | EUR | 4,000 | 2,661 |
| | Telefonica Europe BV | 5.875% | 2/14/33 | EUR | 2,680 | 2,961 |
| | Unicaja Banco SA | 4.500% | 6/30/25 | EUR | 1,000 | 980 |
| | Unicaja Banco SA | 1.000% | 12/1/26 | EUR | 2,300 | 1,983 |
| | | | | | | 566,135 |
| Sweden (1.0%) | | | |
| | Akelius Residential Property AB | 1.125% | 3/14/24 | EUR | 6,030 | 5,583 |
| | Akelius Residential Property AB | 1.750% | 2/7/25 | EUR | 723 | 651 |
| | Akelius Residential Property AB | 2.375% | 8/15/25 | GBP | 1,545 | 1,577 |
| | Akelius Residential Property Financing BV | 1.125% | 1/11/29 | EUR | 2,995 | 2,144 |
| | Akelius Residential Property Financing BV | 0.750% | 2/22/30 | EUR | 5,938 | 3,946 |
| | Alfa Laval Treasury International AB | 1.375% | 2/18/29 | EUR | 900 | 750 |
Total International Bond Index Fund
| | | Coupon | Maturity
Date | Currency | Face
Amount
(000) | Market
Value•
($000) |
| | Atlas Copco AB | 0.625% | 8/30/26 | EUR | 330 | 295 |
| | Balder Finland OYJ | 1.375% | 5/24/30 | EUR | 2,429 | 1,333 |
| | Castellum Helsinki Finance Holding Abp | 2.000% | 3/24/25 | EUR | 3,000 | 2,517 |
| | Castellum Helsinki Finance Holding Abp | 0.875% | 9/17/29 | EUR | 1,670 | 973 |
| | Danske Hypotek AB | 1.000% | 12/21/22 | SEK | 101,000 | 9,135 |
| | Danske Hypotek AB | 1.000% | 12/17/25 | SEK | 232,000 | 19,466 |
| | EQT AB | 2.375% | 4/6/28 | EUR | 3,500 | 2,942 |
| | EQT AB | 2.875% | 4/6/32 | EUR | 4,600 | 3,508 |
| | Essity AB | 1.125% | 3/27/24 | EUR | 832 | 797 |
| | Essity AB | 1.625% | 3/30/27 | EUR | 778 | 708 |
| | Essity AB | 0.250% | 2/8/31 | EUR | 6,316 | 4,542 |
| | Fastighets AB Balder | 1.875% | 3/14/25 | EUR | 100 | 81 |
| | Fastighets AB Balder | 1.875% | 1/23/26 | EUR | 4,539 | 3,494 |
| | Fastighets AB Balder | 1.125% | 1/29/27 | EUR | 700 | 469 |
| | Fastighets AB Balder | 1.250% | 1/28/28 | EUR | 2,843 | 1,812 |
| | Heimstaden Bostad Treasury BV | 1.375% | 3/3/27 | EUR | 4,248 | 3,274 |
| | Heimstaden Bostad Treasury BV | 1.000% | 4/13/28 | EUR | 3,009 | 2,149 |
| | Heimstaden Bostad Treasury BV | 0.750% | 9/6/29 | EUR | 1,800 | 1,128 |
| | Heimstaden Bostad Treasury BV | 1.625% | 10/13/31 | EUR | 7,132 | 4,231 |
| | Investor AB | 0.375% | 10/29/35 | EUR | 6,500 | 4,115 |
| | Lansforsakringar Hypotek AB | 0.375% | 3/14/24 | EUR | 667 | 639 |
| | Lansforsakringar Hypotek AB | 1.500% | 9/18/24 | SEK | 81,500 | 7,137 |
| | Lansforsakringar Hypotek AB | 1.000% | 9/15/27 | SEK | 413,000 | 32,947 |
| | Molnlycke Holding AB | 1.875% | 2/28/25 | EUR | 2,543 | 2,392 |
| | Nordea Hypotek AB | 1.000% | 9/18/24 | SEK | 694,400 | 60,508 |
| | Nordea Hypotek AB | 0.500% | 9/16/26 | SEK | 74,700 | 6,052 |
| | Nordea Hypotek AB | 1.000% | 6/16/27 | SEK | 334,000 | 26,739 |
| | Sagax AB | 2.250% | 3/13/25 | EUR | 1,509 | 1,360 |
| | Sagax Euro Mtn NL BV | 0.750% | 1/26/28 | EUR | 2,214 | 1,503 |
| | Sagax Euro Mtn NL BV | 1.000% | 5/17/29 | EUR | 1,900 | 1,232 |
| | Samhallsbyggnadsbolaget i Norden AB | 1.750% | 1/14/25 | EUR | 2,500 | 1,971 |
| | Samhallsbyggnadsbolaget i Norden AB | 1.000% | 8/12/27 | EUR | 3,587 | 2,242 |
| | Sandvik AB | 2.125% | 6/7/27 | EUR | 6,050 | 5,532 |
| | SBB Treasury OYJ | 0.750% | 12/14/28 | EUR | 2,287 | 1,223 |
| | SBB Treasury OYJ | 1.125% | 11/26/29 | EUR | 4,000 | 2,154 |
| | Skandinaviska Enskilda Banken AB | 1.000% | 12/20/23 | SEK | 100,000 | 8,862 |
| | Skandinaviska Enskilda Banken AB | 1.000% | 12/18/24 | SEK | 22,000 | 1,905 |
| | Skandinaviska Enskilda Banken AB | 1.000% | 12/17/25 | SEK | 568,000 | 47,665 |
| | Skandinaviska Enskilda Banken AB | 0.375% | 2/9/26 | EUR | 10,275 | 9,355 |
| | Skandinaviska Enskilda Banken AB | 0.375% | 2/11/27 | EUR | 3,641 | 3,088 |
| | Skandinaviska Enskilda Banken AB | 0.750% | 11/15/27 | EUR | 503 | 445 |
| | Skandinaviska Enskilda Banken AB | 0.375% | 6/21/28 | EUR | 6,000 | 4,827 |
| | Skandinaviska Enskilda Banken AB | 1.375% | 10/31/28 | EUR | 16,226 | 15,452 |
| | Skandinaviska Enskilda Banken AB | 0.625% | 11/12/29 | EUR | 5,087 | 3,932 |
| | Skandinaviska Enskilda Banken AB | 1.000% | 12/19/29 | SEK | 74,000 | 5,500 |
| | SKF AB | 0.250% | 2/15/31 | EUR | 2,906 | 2,092 |
| | Stadshypotek AB | 0.375% | 2/21/24 | EUR | 3,485 | 3,342 |
| | Stadshypotek AB | 1.500% | 3/1/24 | SEK | 177,000 | 15,700 |
| | Stadshypotek AB | 1.500% | 12/3/24 | SEK | 620,000 | 54,043 |
| | Stadshypotek AB | 0.500% | 7/11/25 | EUR | 1,545 | 1,434 |
| | Stadshypotek AB | 0.375% | 3/13/26 | EUR | 16,996 | 15,445 |
| | Stadshypotek AB | 0.500% | 6/1/26 | SEK | 566,000 | 45,956 |
| | Stadshypotek AB | 0.125% | 10/5/26 | EUR | 400 | 354 |
| | Stadshypotek AB | 1.000% | 3/1/27 | SEK | 232,000 | 18,742 |
| | Stadshypotek AB | 0.750% | 11/1/27 | EUR | 3,541 | 3,139 |
| | Stadshypotek AB | 2.000% | 9/1/28 | SEK | 50,000 | 4,116 |
| | Svenska Handelsbanken AB | 0.125% | 6/18/24 | EUR | 2,543 | 2,388 |
| | Svenska Handelsbanken AB | 1.000% | 4/15/25 | EUR | 9,640 | 9,039 |
| | Svenska Handelsbanken AB | 0.050% | 9/3/26 | EUR | 5,142 | 4,394 |
| | Svenska Handelsbanken AB | 1.375% | 2/23/29 | EUR | 6,500 | 5,413 |
| | Svenska Handelsbanken AB | 1.625% | 3/5/29 | EUR | 8,237 | 7,796 |
| | Svenska Handelsbanken AB | 0.500% | 2/18/30 | EUR | 5,087 | 3,837 |
| | Svenska Handelsbanken AB | 4.625% | 8/23/32 | GBP | 2,000 | 2,074 |
| | Sveriges Sakerstallda Obligationer AB | 1.000% | 6/12/24 | SEK | 176,000 | 15,429 |
| | Sveriges Sakerstallda Obligationer AB | 0.500% | 1/29/25 | EUR | 5,635 | 5,284 |
| | Sveriges Sakerstallda Obligationer AB | 0.500% | 6/11/25 | SEK | 382,000 | 32,167 |
| | Sveriges Sakerstallda Obligationer AB | 0.625% | 10/30/25 | EUR | 2,543 | 2,350 |
| | Sveriges Sakerstallda Obligationer AB | 2.000% | 6/17/26 | SEK | 59,000 | 5,071 |
| | Sveriges Sakerstallda Obligationer AB | 0.875% | 3/29/27 | EUR | 418 | 377 |
Total International Bond Index Fund
| | | Coupon | Maturity
Date | Currency | Face
Amount
(000) | Market
Value•
($000) |
| | Sveriges Sakerstallda Obligationer AB | 0.250% | 6/9/27 | SEK | 300,000 | 23,183 |
| | Sveriges Sakerstallda Obligationer AB | 1.750% | 2/10/32 | EUR | 24,000 | 20,938 |
| | Swedbank AB | 0.750% | 5/5/25 | EUR | 3,092 | 2,858 |
| | Swedbank AB | 0.250% | 11/2/26 | EUR | 5,233 | 4,524 |
| | Swedbank AB | 0.300% | 5/20/27 | EUR | 11,538 | 9,919 |
| | Swedbank AB | 1.000% | 11/22/27 | EUR | 3,037 | 2,994 |
| | Swedbank AB | 1.375% | 12/8/27 | GBP | 1,289 | 1,228 |
| | Swedbank AB | 0.200% | 1/12/28 | EUR | 14,841 | 11,850 |
| | Swedbank Hypotek AB | 1.000% | 12/20/23 | SEK | 204,200 | 18,056 |
| | Swedbank Hypotek AB | 0.400% | 5/8/24 | EUR | 2,543 | 2,426 |
| | Swedbank Hypotek AB | 1.000% | 9/18/24 | SEK | 465,000 | 40,301 |
| | Swedbank Hypotek AB | 0.500% | 2/5/26 | EUR | 5,087 | 4,649 |
| | Swedbank Hypotek AB | 1.375% | 5/31/27 | EUR | 18,800 | 17,299 |
| | Tele2 AB | 1.125% | 5/15/24 | EUR | 4,254 | 4,058 |
| | Tele2 AB | 2.125% | 5/15/28 | EUR | 1,692 | 1,528 |
| | Tele2 AB | 0.750% | 3/23/31 | EUR | 704 | 535 |
| | Telia Co. AB | 3.625% | 2/14/24 | EUR | 100 | 99 |
| | Telia Co. AB | 3.875% | 10/1/25 | EUR | 1,046 | 1,048 |
| | Telia Co. AB | 3.000% | 9/7/27 | EUR | 100 | 96 |
| | Telia Co. AB | 0.125% | 11/27/30 | EUR | 5,745 | 4,252 |
| | Telia Co. AB | 2.125% | 2/20/34 | EUR | 6,139 | 5,045 |
| | Telia Co. AB | 1.625% | 2/23/35 | EUR | 1,900 | 1,444 |
| | Telia Co. AB | 1.375% | 5/11/81 | EUR | 1,900 | 1,629 |
| | Telia Co. AB | 2.750% | 6/30/83 | EUR | 2,000 | 1,690 |
| | Vattenfall AB | 0.050% | 10/15/25 | EUR | 3,037 | 2,723 |
| | Vattenfall AB | 6.875% | 4/15/39 | GBP | 2,543 | 3,308 |
| | Volvo Treasury AB | 2.000% | 8/19/27 | EUR | 7,000 | 6,433 |
| | | | | | | 790,377 |
| Switzerland (1.0%) | | | |
| | ABB Finance BV | 0.000% | 1/19/30 | EUR | 8,984 | 6,753 |
| | Adecco International Financial Services BV | 1.000% | 12/2/24 | EUR | 448 | 420 |
| | Adecco International Financial Services BV | 0.125% | 9/21/28 | EUR | 7,500 | 5,897 |
| | Argentum Netherlands BV for Givaudan SA | 2.000% | 9/17/30 | EUR | 4,300 | 3,742 |
| | Argentum Netherlands BV for Swiss Life AG | 4.375% | 12/29/49 | EUR | 4,539 | 4,258 |
| | Argentum Netherlands BV for Zurich Insurance Co. Ltd. | 3.500% | 10/1/46 | EUR | 18,293 | 16,882 |
| | Argentum Netherlands BV for Zurich Insurance Co. Ltd. | 2.750% | 2/19/49 | EUR | 996 | 830 |
| | Basellandschaftliche Kantonalbank | 0.375% | 5/13/30 | CHF | 2,545 | 2,261 |
| | Basler Kantonalbank | 0.300% | 6/22/27 | CHF | 2,290 | 2,137 |
| | Cloverie plc for Zurich Insurance Co. Ltd. | 1.750% | 9/16/24 | EUR | 2,763 | 2,637 |
| | Credit Suisse AG | 0.250% | 1/5/26 | EUR | 11,200 | 9,609 |
| | Credit Suisse AG | 1.500% | 4/10/26 | EUR | 418 | 369 |
| | Credit Suisse Group AG | 1.250% | 7/17/25 | EUR | 3,541 | 3,219 |
| | Credit Suisse Group AG | 2.125% | 9/12/25 | GBP | 7,347 | 7,627 |
| | Credit Suisse Group AG | 3.250% | 4/2/26 | EUR | 19,003 | 17,582 |
| | Credit Suisse Group AG | 1.000% | 6/24/27 | EUR | 12,852 | 10,472 |
| | Credit Suisse Group AG | 0.650% | 1/14/28 | EUR | 14,875 | 11,585 |
| | Credit Suisse Group AG | 2.250% | 6/9/28 | GBP | 5,179 | 4,720 |
| | Credit Suisse Group AG | 0.650% | 9/10/29 | EUR | 9,777 | 6,771 |
| | Credit Suisse Group AG | 0.625% | 1/18/33 | EUR | 13,100 | 7,705 |
| | Credit Suisse Schweiz AG | 0.000% | 7/31/25 | CHF | 5,810 | 5,397 |
| | ELM BV for Helvetia Schweizerische Versicherungsgesellschaft AG | 3.375% | 9/29/47 | EUR | 5,892 | 5,066 |
| | ELM BV for Swiss Reinsurance Co. Ltd. | 2.600% | 12/29/49 | EUR | 8,701 | 7,833 |
| | Firmenich Productions Participations SAS | 1.375% | 10/30/26 | EUR | 5,087 | 4,571 |
| | Firmenich Productions Participations SAS | 1.750% | 4/30/30 | EUR | 5,087 | 4,272 |
| | Givaudan Finance Europe BV | 1.000% | 4/22/27 | EUR | 5,087 | 4,487 |
| | Helvetia Europe SA | 2.750% | 9/30/41 | EUR | 2,743 | 2,041 |
| | Holcim Finance Luxembourg SA | 3.000% | 1/22/24 | EUR | 2,872 | 2,818 |
| | Holcim Finance Luxembourg SA | 2.375% | 4/9/25 | EUR | 200 | 191 |
| | Holcim Finance Luxembourg SA | 0.500% | 11/29/26 | EUR | 2,214 | 1,897 |
| | Holcim Finance Luxembourg SA | 2.250% | 5/26/28 | EUR | 5,288 | 4,665 |
| | Holcim Finance Luxembourg SA | 0.625% | 4/6/30 | EUR | 2,214 | 1,608 |
| | Holcim Finance Luxembourg SA | 0.500% | 9/3/30 | EUR | 5,101 | 3,629 |
| | Holcim Finance Luxembourg SA | 0.500% | 4/23/31 | EUR | 7,631 | 5,250 |
| | Holcim Finance Luxembourg SA | 0.625% | 1/19/33 | EUR | 1,900 | 1,223 |
| | Holcim Sterling Finance Netherlands BV | 3.000% | 5/12/32 | GBP | 518 | 449 |
| | Holcim Sterling Finance Netherlands BV | 2.250% | 4/4/34 | GBP | 900 | 679 |
| | Luzerner Kantonalbank AG | 1.125% | 6/30/23 | CHF | 4,080 | 4,077 |
| | Luzerner Kantonalbank AG | 0.125% | 11/25/32 | CHF | 9,300 | 7,618 |
| | Novartis AG | 0.625% | 11/13/29 | CHF | 1,395 | 1,268 |
Total International Bond Index Fund
| | | Coupon | Maturity
Date | Currency | Face
Amount
(000) | Market
Value•
($000) |
| | Novartis Finance SA | 1.625% | 11/9/26 | EUR | 2,543 | 2,380 |
| | Novartis Finance SA | 0.625% | 9/20/28 | EUR | 100 | 86 |
| | Novartis Finance SA | 1.375% | 8/14/30 | EUR | 4,144 | 3,558 |
| | Pfandbriefbank schweizerischer Hypothekarinstitute AG | 2.375% | 1/25/24 | CHF | 1,780 | 1,804 |
| | Pfandbriefbank schweizerischer Hypothekarinstitute AG | 1.375% | 2/14/24 | CHF | 4,080 | 4,085 |
| | Pfandbriefbank schweizerischer Hypothekarinstitute AG | 0.125% | 3/25/24 | CHF | 2,545 | 2,504 |
| | Pfandbriefbank schweizerischer Hypothekarinstitute AG | 1.000% | 5/21/24 | CHF | 5,400 | 5,376 |
| | Pfandbriefbank schweizerischer Hypothekarinstitute AG | 0.375% | 10/15/25 | CHF | 2,545 | 2,463 |
| | Pfandbriefbank schweizerischer Hypothekarinstitute AG | 0.375% | 1/26/26 | CHF | 4,080 | 3,931 |
| | Pfandbriefbank schweizerischer Hypothekarinstitute AG | 2.500% | 3/30/26 | CHF | 6,065 | 6,256 |
| | Pfandbriefbank schweizerischer Hypothekarinstitute AG | 0.250% | 9/18/26 | CHF | 5,455 | 5,178 |
| | Pfandbriefbank schweizerischer Hypothekarinstitute AG | 2.750% | 12/15/26 | CHF | 1,525 | 1,593 |
| | Pfandbriefbank schweizerischer Hypothekarinstitute AG | 0.250% | 1/18/27 | CHF | 13,920 | 13,135 |
| | Pfandbriefbank schweizerischer Hypothekarinstitute AG | 2.500% | 2/16/27 | CHF | 1,015 | 1,051 |
| | Pfandbriefbank schweizerischer Hypothekarinstitute AG | 0.375% | 5/12/27 | CHF | 12,750 | 12,039 |
| | Pfandbriefbank schweizerischer Hypothekarinstitute AG | 0.000% | 6/15/27 | CHF | 16,275 | 15,063 |
| | Pfandbriefbank schweizerischer Hypothekarinstitute AG | 0.500% | 5/5/28 | CHF | 4,080 | 3,818 |
| | Pfandbriefbank schweizerischer Hypothekarinstitute AG | 0.375% | 7/10/28 | CHF | 2,545 | 2,351 |
| | Pfandbriefbank schweizerischer Hypothekarinstitute AG | 0.125% | 9/6/28 | CHF | 14,280 | 12,970 |
| | Pfandbriefbank schweizerischer Hypothekarinstitute AG | 0.625% | 10/9/28 | CHF | 7,645 | 7,150 |
| | Pfandbriefbank schweizerischer Hypothekarinstitute AG | 0.500% | 1/22/29 | CHF | 22,465 | 20,750 |
| | Pfandbriefbank schweizerischer Hypothekarinstitute AG | 0.125% | 5/8/29 | CHF | 3,820 | 3,423 |
| | Pfandbriefbank schweizerischer Hypothekarinstitute AG | 0.500% | 6/15/29 | CHF | 7,645 | 7,011 |
| | Pfandbriefbank schweizerischer Hypothekarinstitute AG | 1.375% | 9/20/29 | CHF | 1,015 | 983 |
| | Pfandbriefbank schweizerischer Hypothekarinstitute AG | 0.000% | 10/26/29 | CHF | 16,305 | 14,321 |
| | Pfandbriefbank schweizerischer Hypothekarinstitute AG | 0.000% | 2/26/30 | CHF | 9,155 | 7,967 |
| | Pfandbriefbank schweizerischer Hypothekarinstitute AG | 0.250% | 4/15/30 | CHF | 5,100 | 4,514 |
| | Pfandbriefbank schweizerischer Hypothekarinstitute AG | 1.625% | 7/3/30 | CHF | 1,015 | 994 |
| | Pfandbriefbank schweizerischer Hypothekarinstitute AG | 0.625% | 5/16/31 | CHF | 1,780 | 1,593 |
| | Pfandbriefbank schweizerischer Hypothekarinstitute AG | 0.125% | 7/15/31 | CHF | 4,715 | 4,018 |
| | Pfandbriefbank schweizerischer Hypothekarinstitute AG | 1.875% | 9/15/31 | CHF | 17,605 | 17,507 |
| | Pfandbriefbank schweizerischer Hypothekarinstitute AG | 0.125% | 12/19/31 | CHF | 6,510 | 5,520 |
| | Pfandbriefbank schweizerischer Hypothekarinstitute AG | 1.000% | 5/12/32 | CHF | 3,820 | 3,484 |
| | Pfandbriefbank schweizerischer Hypothekarinstitute AG | 2.250% | 8/13/32 | CHF | 5,200 | 5,309 |
| | Pfandbriefbank schweizerischer Hypothekarinstitute AG | 0.125% | 11/19/32 | CHF | 9,715 | 8,021 |
| | Pfandbriefbank schweizerischer Hypothekarinstitute AG | 0.625% | 4/25/33 | CHF | 2,545 | 2,202 |
| | Pfandbriefbank schweizerischer Hypothekarinstitute AG | 1.500% | 8/2/33 | CHF | 8,925 | 8,437 |
| | Pfandbriefbank schweizerischer Hypothekarinstitute AG | 0.750% | 11/28/34 | CHF | 12,500 | 10,706 |
| | Pfandbriefbank schweizerischer Hypothekarinstitute AG | 0.625% | 1/25/35 | CHF | 10,000 | 8,405 |
| | Pfandbriefbank schweizerischer Hypothekarinstitute AG | 0.875% | 5/7/35 | CHF | 16,015 | 13,837 |
| | Pfandbriefbank schweizerischer Hypothekarinstitute AG | 0.500% | 10/5/35 | CHF | 2,545 | 2,078 |
| | Pfandbriefbank schweizerischer Hypothekarinstitute AG | 0.250% | 10/14/36 | CHF | 2,060 | 1,587 |
| | Pfandbriefbank schweizerischer Hypothekarinstitute AG | 0.625% | 1/23/37 | CHF | 2,035 | 1,659 |
| | Pfandbriefbank schweizerischer Hypothekarinstitute AG | 0.875% | 6/25/37 | CHF | 2,800 | 2,353 |
| | Pfandbriefbank schweizerischer Hypothekarinstitute AG | 0.250% | 8/4/38 | CHF | 18,600 | 13,905 |
| | Pfandbriefbank schweizerischer Hypothekarinstitute AG | 0.375% | 7/8/39 | CHF | 4,235 | 3,185 |
| | Pfandbriefbank schweizerischer Hypothekarinstitute AG | 1.500% | 12/5/40 | CHF | 2,545 | 2,319 |
| | Pfandbriefbank schweizerischer Hypothekarinstitute AG | 0.500% | 6/17/41 | CHF | 4,195 | 3,181 |
| | Pfandbriefbank schweizerischer Hypothekarinstitute AG | 0.250% | 10/6/42 | CHF | 5,100 | 3,608 |
| | Pfandbriefzentrale der schweizerischen Kantonalbanken AG | 0.125% | 3/12/24 | CHF | 7,645 | 7,526 |
| | Pfandbriefzentrale der schweizerischen Kantonalbanken AG | 0.750% | 4/15/24 | CHF | 505 | 501 |
| | Pfandbriefzentrale der schweizerischen Kantonalbanken AG | 0.000% | 6/14/24 | CHF | 16,585 | 16,239 |
| | Pfandbriefzentrale der schweizerischen Kantonalbanken AG | 0.750% | 9/23/24 | CHF | 1,120 | 1,107 |
| | Pfandbriefzentrale der schweizerischen Kantonalbanken AG | 0.125% | 12/2/24 | CHF | 7,645 | 7,452 |
| | Pfandbriefzentrale der schweizerischen Kantonalbanken AG | 0.500% | 7/28/25 | CHF | 2,545 | 2,480 |
| | Pfandbriefzentrale der schweizerischen Kantonalbanken AG | 2.000% | 10/30/25 | CHF | 1,525 | 1,547 |
| | Pfandbriefzentrale der schweizerischen Kantonalbanken AG | 0.250% | 12/1/25 | CHF | 7,320 | 7,044 |
| | Pfandbriefzentrale der schweizerischen Kantonalbanken AG | 1.625% | 6/17/26 | CHF | 3,570 | 3,575 |
| | Pfandbriefzentrale der schweizerischen Kantonalbanken AG | 0.050% | 11/6/26 | CHF | 5,100 | 4,791 |
| | Pfandbriefzentrale der schweizerischen Kantonalbanken AG | 0.000% | 1/27/27 | CHF | 7,480 | 6,982 |
| | Pfandbriefzentrale der schweizerischen Kantonalbanken AG | 1.375% | 3/19/27 | CHF | 4,080 | 4,033 |
| | Pfandbriefzentrale der schweizerischen Kantonalbanken AG | 0.250% | 2/11/28 | CHF | 620 | 574 |
| | Pfandbriefzentrale der schweizerischen Kantonalbanken AG | 0.000% | 3/13/28 | CHF | 8,975 | 8,175 |
| | Pfandbriefzentrale der schweizerischen Kantonalbanken AG | 0.375% | 7/24/28 | CHF | 20,000 | 18,507 |
| | Pfandbriefzentrale der schweizerischen Kantonalbanken AG | 1.000% | 9/22/28 | CHF | 2,545 | 2,434 |
| | Pfandbriefzentrale der schweizerischen Kantonalbanken AG | 0.300% | 4/9/29 | CHF | 17,685 | 16,050 |
| | Pfandbriefzentrale der schweizerischen Kantonalbanken AG | 1.500% | 5/21/29 | CHF | 5,960 | 5,837 |
| | Pfandbriefzentrale der schweizerischen Kantonalbanken AG | 0.625% | 7/16/29 | CHF | 12,240 | 11,314 |
| | Pfandbriefzentrale der schweizerischen Kantonalbanken AG | 0.500% | 4/30/30 | CHF | 2,545 | 2,300 |
Total International Bond Index Fund
| | | Coupon | Maturity
Date | Currency | Face
Amount
(000) | Market
Value•
($000) |
| | Pfandbriefzentrale der schweizerischen Kantonalbanken AG | 0.000% | 7/19/30 | CHF | 19,060 | 16,477 |
| | Pfandbriefzentrale der schweizerischen Kantonalbanken AG | 0.500% | 9/20/30 | CHF | 8,925 | 7,991 |
| | Pfandbriefzentrale der schweizerischen Kantonalbanken AG | 0.550% | 1/29/31 | CHF | 4,845 | 4,332 |
| | Pfandbriefzentrale der schweizerischen Kantonalbanken AG | 0.300% | 6/6/31 | CHF | 3,820 | 3,315 |
| | Pfandbriefzentrale der schweizerischen Kantonalbanken AG | 0.125% | 9/2/31 | CHF | 15,070 | 12,822 |
| | Pfandbriefzentrale der schweizerischen Kantonalbanken AG | 0.650% | 2/15/33 | CHF | 5,100 | 4,439 |
| | Pfandbriefzentrale der schweizerischen Kantonalbanken AG | 0.000% | 3/18/33 | CHF | 7,500 | 6,058 |
| | Pfandbriefzentrale der schweizerischen Kantonalbanken AG | 0.500% | 5/15/34 | CHF | 3,055 | 2,560 |
| | Pfandbriefzentrale der schweizerischen Kantonalbanken AG | 0.200% | 6/12/35 | CHF | 8,000 | 6,293 |
| | Pfandbriefzentrale der schweizerischen Kantonalbanken AG | 0.200% | 7/13/35 | CHF | 7,645 | 6,004 |
| | Pfandbriefzentrale der schweizerischen Kantonalbanken AG | 0.600% | 12/11/35 | CHF | 6,630 | 5,472 |
| | Pfandbriefzentrale der schweizerischen Kantonalbanken AG | 0.000% | 2/15/36 | CHF | 14,965 | 11,267 |
| | Pfandbriefzentrale der schweizerischen Kantonalbanken AG | 0.700% | 3/4/39 | CHF | 2,545 | 2,039 |
| | Richemont International Holding SA | 1.000% | 3/26/26 | EUR | 7,850 | 7,246 |
| | Richemont International Holding SA | 1.125% | 5/26/32 | EUR | 6,316 | 5,009 |
| | Richemont International Holding SA | 2.000% | 3/26/38 | EUR | 7,850 | 5,993 |
| | Richemont International Holding SA | 1.625% | 5/26/40 | EUR | 5,087 | 3,453 |
| | Roche Finance Europe BV | 0.875% | 2/25/25 | EUR | 484 | 462 |
| | SIX Finance Luxembourg SA | 0.000% | 12/2/25 | EUR | 4,600 | 4,067 |
| | St. Galler Kantonalbank | 0.500% | 6/24/25 | CHF | 2,790 | 2,714 |
| | Swiss Life Finance I Ltd. | 3.250% | 8/31/29 | EUR | 5,000 | 4,570 |
| | Swiss Re Finance Luxembourg SA | 2.534% | 4/30/50 | EUR | 4,300 | 3,393 |
| | Swisscom AG | 1.750% | 7/10/24 | CHF | 1,015 | 1,017 |
| | Tyco Electronics Group SA | 0.000% | 2/14/25 | EUR | 3,156 | 2,900 |
| | Tyco Electronics Group SA | 0.000% | 2/16/29 | EUR | 4,644 | 3,608 |
| | UBS AG | 0.500% | 3/31/31 | EUR | 6,400 | 4,771 |
| | UBS Group AG | 2.125% | 3/4/24 | EUR | 200 | 194 |
| | UBS Group AG | 1.500% | 11/30/24 | EUR | 4,025 | 3,836 |
| | UBS Group AG | 1.250% | 4/17/25 | EUR | 10,723 | 10,124 |
| | UBS Group AG | 0.250% | 1/29/26 | EUR | 2,543 | 2,290 |
| | UBS Group AG | 1.250% | 9/1/26 | EUR | 13,541 | 11,947 |
| | UBS Group AG | 0.250% | 2/24/28 | EUR | 11,216 | 8,874 |
| | UBS Group AG | 0.250% | 11/5/28 | EUR | 20,041 | 15,959 |
| | UBS Group AG | 0.875% | 11/3/31 | EUR | 3,824 | 2,775 |
| | Zuercher Kantonalbank | 0.250% | 1/27/26 | CHF | 2,545 | 2,433 |
| | Zuercher Kantonalbank | 0.125% | 5/13/26 | CHF | 835 | 791 |
| | Zurich Finance Ireland DAC | 5.125% | 11/23/52 | GBP | 2,000 | 2,027 |
| | Zurich Finance Ireland Designated Activity Co. | 1.625% | 6/17/39 | EUR | 7,631 | 5,071 |
| | | | | | | 817,244 |
| United Arab Emirates (0.0%) | | | |
| | DP World Ltd. | 2.375% | 9/25/26 | EUR | 300 | 274 |
| | DP World Ltd. | 4.250% | 9/25/30 | GBP | 996 | 1,041 |
| | Emirates NBD Bank PJSC | 4.750% | 2/9/28 | AUD | 1,570 | 973 |
| | Emirates NBD Bank PJSC | 3.050% | 2/26/30 | AUD | 1,170 | 634 |
| | Emirates Telecommunications Group Co. PJSC | 2.750% | 6/18/26 | EUR | 5,855 | 5,580 |
| | First Abu Dhabi Bank PJSC | 0.125% | 2/16/26 | EUR | 2,053 | 1,779 |
| | MDGH - GMTN BV | 6.875% | 3/14/26 | GBP | 415 | 482 |
| | MDGH - GMTN BV | 1.000% | 3/10/34 | EUR | 2,000 | 1,357 |
| | | | | | | 12,120 |
| United Kingdom (2.3%) | | | |
| | 3i Group plc | 5.750% | 12/3/32 | GBP | 2,561 | 2,838 |
| | 3i Group plc | 3.750% | 6/5/40 | GBP | 1,300 | 1,039 |
| | A2Dominion Housing Group Ltd. | 3.500% | 11/15/28 | GBP | 3,102 | 3,162 |
| | AA Bond Co. Ltd. | 6.269% | 7/2/43 | GBP | 996 | 1,091 |
| | AA Bond Co. Ltd. | 3.250% | 7/31/50 | GBP | 500 | 421 |
| | ABP Finance plc | 6.250% | 12/14/26 | GBP | 2,159 | 2,507 |
| | Admiral Group plc | 5.500% | 7/25/24 | GBP | 1,216 | 1,359 |
| | Affinity Sutton Capital Markets plc | 4.250% | 10/8/42 | GBP | 723 | 684 |
| | Affinity Water Finance 2004 plc | 5.875% | 7/13/26 | GBP | 3,731 | 4,344 |
| | Affinity Water Finance plc | 4.500% | 3/31/36 | GBP | 2,269 | 2,350 |
| | Affordable Housing Finance plc | 3.800% | 5/20/44 | GBP | 2,543 | 2,606 |
| | Affordable Housing Finance plc | 2.893% | 8/11/45 | GBP | 1,366 | 1,213 |
| | Anchor Hanover Group | 2.000% | 7/21/51 | GBP | 1,509 | 914 |
| | Anglian Water Services Financing plc | 1.625% | 8/10/25 | GBP | 2,389 | 2,494 |
| | Anglian Water Services Financing plc | 4.500% | 2/22/26 | GBP | 1,619 | 1,810 |
| | Anglian Water Services Financing plc | 2.625% | 6/15/27 | GBP | 3,175 | 3,215 |
| | Anglian Water Services Financing plc | 4.500% | 10/5/27 | GBP | 1,432 | 1,567 |
| | Anglian Water Services Financing plc | 6.625% | 1/15/29 | GBP | 373 | 451 |
Total International Bond Index Fund
| | | Coupon | Maturity
Date | Currency | Face
Amount
(000) | Market
Value•
($000) |
| | Anglian Water Services Financing plc | 4.525% | 8/26/32 | CAD | 1,300 | 897 |
| | Annington Funding plc | 1.650% | 7/12/24 | EUR | 1,985 | 1,857 |
| | Annington Funding plc | 2.646% | 7/12/25 | GBP | 1,545 | 1,603 |
| | Annington Funding plc | 3.184% | 7/12/29 | GBP | 3,005 | 2,776 |
| | Annington Funding plc | 3.685% | 7/12/34 | GBP | 3,705 | 3,259 |
| | Annington Funding plc | 3.935% | 7/12/47 | GBP | 2,987 | 2,401 |
| | Arqiva Financing plc | 4.882% | 12/31/32 | GBP | 2,465 | 2,663 |
| | Artesian Finance II plc | 6.000% | 9/30/33 | GBP | 1,395 | 1,710 |
| | Aspire Defence Finance plc | 4.674% | 3/31/40 | GBP | 1,897 | 2,020 |
| | Aspire Defence Finance plc | 4.674% | 3/31/40 | GBP | 2,053 | 2,210 |
| | Assura Financing plc | 1.625% | 6/30/33 | GBP | 900 | 665 |
| | Aster Treasury plc | 4.500% | 12/18/43 | GBP | 1,381 | 1,401 |
| | AstraZeneca plc | 0.750% | 5/12/24 | EUR | 9,300 | 8,874 |
| | AstraZeneca plc | 1.250% | 5/12/28 | EUR | 100 | 88 |
| | AstraZeneca plc | 0.375% | 6/3/29 | EUR | 14,000 | 11,416 |
| | AstraZeneca plc | 5.750% | 11/13/31 | GBP | 2,044 | 2,495 |
| | Aviva plc | 1.875% | 11/13/27 | EUR | 2,094 | 1,887 |
| | Aviva plc | 4.000% | 10/2/30 | CAD | 1,663 | 1,063 |
| | Aviva plc | 3.875% | 7/3/44 | EUR | 1,249 | 1,203 |
| | Aviva plc | 3.375% | 12/4/45 | EUR | 3,092 | 2,866 |
| | Aviva plc | 4.375% | 9/12/49 | GBP | 2,538 | 2,447 |
| | Aviva plc | 5.125% | 6/4/50 | GBP | 996 | 982 |
| | Aviva plc | 4.000% | 6/3/55 | GBP | 1,971 | 1,623 |
| | Aviva plc | 6.875% | 5/20/58 | GBP | 4,469 | 4,958 |
| | Babcock International Group plc | 1.875% | 10/5/26 | GBP | 2,094 | 1,976 |
| | Babcock International Group plc | 1.375% | 9/13/27 | EUR | 383 | 308 |
| | Bank of Scotland plc | 4.875% | 12/20/24 | GBP | 716 | 825 |
| | Barclays plc | 3.125% | 1/17/24 | GBP | 3,485 | 3,889 |
| | Barclays plc | 3.375% | 4/2/25 | EUR | 4,367 | 4,237 |
| | Barclays plc | 1.375% | 1/24/26 | EUR | 6,953 | 6,355 |
| | Barclays plc | 3.000% | 5/8/26 | GBP | 2,835 | 2,899 |
| | Barclays plc | 3.250% | 2/12/27 | GBP | 11,624 | 11,694 |
| | Barclays plc | 2.166% | 6/23/27 | CAD | 1,409 | 894 |
| | Barclays plc | 0.877% | 1/28/28 | EUR | 9,800 | 8,073 |
| | Barclays plc | 0.577% | 8/9/29 | EUR | 7,048 | 5,362 |
| | Barclays plc | 3.750% | 11/22/30 | GBP | 2,739 | 2,830 |
| | Barclays plc | 1.125% | 3/22/31 | EUR | 3,321 | 2,746 |
| | Barclays plc | 1.106% | 5/12/32 | EUR | 7,448 | 5,218 |
| | Barclays plc | 3.250% | 1/17/33 | GBP | 400 | 347 |
| | BAT Capital Corp. | 2.125% | 8/15/25 | GBP | 613 | 627 |
| | BAT International Finance plc | 2.375% | 1/19/23 | EUR | 100 | 99 |
| | BAT International Finance plc | 2.750% | 3/25/25 | EUR | 3,092 | 2,941 |
| | BAT International Finance plc | 1.250% | 3/13/27 | EUR | 4,007 | 3,328 |
| | BAT International Finance plc | 2.250% | 6/26/28 | GBP | 8,300 | 7,336 |
| | BAT International Finance plc | 2.250% | 1/16/30 | EUR | 9,177 | 7,009 |
| | BAT International Finance plc | 6.000% | 11/24/34 | GBP | 5,037 | 4,961 |
| | BAT International Finance plc | 5.750% | 7/5/40 | GBP | 1,657 | 1,451 |
| | BAT International Finance plc | 2.250% | 9/9/52 | GBP | 1,541 | 771 |
| | BAT Netherlands Finance BV | 2.375% | 10/7/24 | EUR | 5,087 | 4,837 |
| | BAT Netherlands Finance BV | 3.125% | 4/7/28 | EUR | 3,577 | 3,139 |
| | Bazalgette Finance plc | 2.375% | 11/29/27 | GBP | 1,308 | 1,290 |
| | Beyond Housing Ltd. | 2.125% | 5/17/51 | GBP | 3,807 | 2,412 |
| | BG Energy Capital plc | 5.125% | 12/1/25 | GBP | 3,046 | 3,466 |
| | BG Energy Capital plc | 2.250% | 11/21/29 | EUR | 5,312 | 4,677 |
| | BG Energy Capital plc | 5.000% | 11/4/36 | GBP | 2,000 | 2,097 |
| | Blend Funding plc | 2.922% | 4/5/56 | GBP | 4,355 | 3,167 |
| | BP Capital Markets BV | 0.933% | 12/4/40 | EUR | 3,541 | 2,025 |
| | BP Capital Markets BV | 1.467% | 9/21/41 | EUR | 3,019 | 1,850 |
| | BP Capital Markets plc | 1.177% | 8/12/23 | GBP | 1,601 | 1,790 |
| | BP Capital Markets plc | 1.876% | 4/7/24 | EUR | 4,672 | 4,534 |
| | BP Capital Markets plc | 0.900% | 7/3/24 | EUR | 4,447 | 4,222 |
| | BP Capital Markets plc | 0.830% | 9/19/24 | EUR | 4,090 | 3,871 |
| | BP Capital Markets plc | 2.030% | 2/14/25 | GBP | 613 | 659 |
| | BP Capital Markets plc | 1.953% | 3/3/25 | EUR | 3,650 | 3,492 |
| | BP Capital Markets plc | 3.470% | 5/15/25 | CAD | 1,199 | 851 |
| | BP Capital Markets plc | 1.077% | 6/26/25 | EUR | 2,708 | 2,521 |
| | BP Capital Markets plc | 2.972% | 2/27/26 | EUR | 2,653 | 2,561 |
| | BP Capital Markets plc | 2.274% | 7/3/26 | GBP | 4,275 | 4,454 |
| | BP Capital Markets plc | 2.213% | 9/25/26 | EUR | 6,633 | 6,221 |
Total International Bond Index Fund
| | | Coupon | Maturity
Date | Currency | Face
Amount
(000) | Market
Value•
($000) |
| | BP Capital Markets plc | 1.573% | 2/16/27 | EUR | 13,498 | 12,224 |
| | BP Capital Markets plc | 0.831% | 11/8/27 | EUR | 7,631 | 6,572 |
| | BP Capital Markets plc | 2.519% | 4/7/28 | EUR | 8,233 | 7,612 |
| | BP Capital Markets plc | 2.822% | 4/7/32 | EUR | 7,401 | 6,599 |
| | BP Capital Markets plc | 1.104% | 11/15/34 | EUR | 3,700 | 2,590 |
| | BP Capital Markets plc | 3.250% | Perpetual | EUR | 4,529 | 4,110 |
| | BP Capital Markets plc | 3.625% | Perpetual | EUR | 8,911 | 7,528 |
| | BP Capital Markets plc | 4.250% | Perpetual | GBP | 5,087 | 5,059 |
| | BPHA Finance plc | 4.816% | 4/11/44 | GBP | 613 | 645 |
| | British Land Co. plc | 2.375% | 9/14/29 | GBP | 887 | 791 |
| | British Telecommunications plc | 1.500% | 6/23/27 | EUR | 5,087 | 4,478 |
| | British Telecommunications plc | 2.750% | 8/30/27 | EUR | 2,000 | 1,863 |
| | British Telecommunications plc | 2.125% | 9/26/28 | EUR | 100 | 89 |
| | British Telecommunications plc | 5.750% | 12/7/28 | GBP | 756 | 858 |
| | British Telecommunications plc | 1.125% | 9/12/29 | EUR | 4,000 | 3,234 |
| | British Telecommunications plc | 3.125% | 11/21/31 | GBP | 800 | 735 |
| | British Telecommunications plc | 3.375% | 8/30/32 | EUR | 1,000 | 898 |
| | British Telecommunications plc | 6.375% | 6/23/37 | GBP | 2,015 | 2,258 |
| 1 | Broadgate Financing plc | 4.999% | 10/5/33 | GBP | 3,330 | 3,586 |
| | Bromford Housing Group Ltd. | 3.125% | 5/3/48 | GBP | 943 | 750 |
| | BUPA Finance plc | 2.000% | 4/5/24 | GBP | 6,496 | 7,120 |
| | BUPA Finance plc | 5.000% | 12/8/26 | GBP | 2,599 | 2,755 |
| | Burberry Group plc | 1.125% | 9/21/25 | GBP | 2,543 | 2,573 |
| | Cadent Finance plc | 0.625% | 9/22/24 | EUR | 12,880 | 12,005 |
| | Cadent Finance plc | 2.125% | 9/22/28 | GBP | 5,585 | 5,184 |
| | Cadent Finance plc | 0.625% | 3/19/30 | EUR | 13,383 | 9,913 |
| | Cadent Finance plc | 0.750% | 3/11/32 | EUR | 643 | 444 |
| | Cadent Finance plc | 2.250% | 10/10/35 | GBP | 4,312 | 3,272 |
| | Cadent Finance plc | 2.625% | 9/22/38 | GBP | 1,910 | 1,425 |
| | Cadent Finance plc | 3.125% | 3/21/40 | GBP | 1,023 | 799 |
| | Cadent Finance plc | 2.750% | 9/22/46 | GBP | 482 | 330 |
| 3 | Canary Wharf Group Investment Holdings plc | 2.625% | 4/23/25 | GBP | 1,399 | 1,408 |
| 3 | Canary Wharf Group Investment Holdings plc | 1.750% | 4/7/26 | EUR | 4,471 | 3,659 |
| | Canary Wharf Group Investment Holdings plc | 1.750% | 4/7/26 | EUR | 865 | 708 |
| 3 | Canary Wharf Group Investment Holdings plc | 3.375% | 4/23/28 | GBP | 3,926 | 3,434 |
| | Cardiff University | 3.000% | 12/7/55 | GBP | 1,996 | 1,653 |
| | Catalyst Housing Ltd. | 3.125% | 10/31/47 | GBP | 1,509 | 1,166 |
| | CCEP Finance Ireland DAC | 0.500% | 9/6/29 | EUR | 5,938 | 4,738 |
| | CCEP Finance Ireland DAC | 0.875% | 5/6/33 | EUR | 3,724 | 2,675 |
| | CCEP Finance Ireland DAC | 1.500% | 5/6/41 | EUR | 704 | 445 |
| | Centrica plc | 4.375% | 3/13/29 | GBP | 3,376 | 3,462 |
| | Centrica plc | 7.000% | 9/19/33 | GBP | 1,545 | 1,847 |
| | Centrica plc | 4.250% | 9/12/44 | GBP | 4,183 | 3,577 |
| | Channel Link Enterprises Finance plc | 3.043% | 6/30/50 | GBP | 3,102 | 2,929 |
| | Church Commissioners for England | 3.625% | 7/14/52 | GBP | 1,500 | 1,416 |
| | Circle Anglia Social Housing plc | 7.250% | 11/12/38 | GBP | 2,460 | 3,254 |
| | Circle Anglia Social Housing plc | 5.200% | 3/2/44 | GBP | 1,450 | 1,554 |
| | Citizen Treasury plc | 3.250% | 10/20/48 | GBP | 3,278 | 2,700 |
| | CK Hutchison Europe Finance 18 Ltd. | 1.250% | 4/13/25 | EUR | 8,344 | 7,757 |
| | CK Hutchison Europe Finance 18 Ltd. | 2.000% | 4/13/30 | EUR | 2,800 | 2,309 |
| | CK Hutchison Europe Finance 21 Ltd. | 0.750% | 11/2/29 | EUR | 2,800 | 2,146 |
| | CK Hutchison Europe Finance 21 Ltd. | 1.000% | 11/2/33 | EUR | 1,900 | 1,264 |
| | CK Hutchison Finance 16 II Ltd. | 0.875% | 10/3/24 | EUR | 5,855 | 5,481 |
| | CK Hutchison Finance 16 Ltd. | 2.000% | 4/6/28 | EUR | 2,000 | 1,751 |
| | CK Hutchison Group Telecom Finance SA | 2.000% | 10/17/27 | GBP | 2,543 | 2,381 |
| | CK Hutchison Group Telecom Finance SA | 1.125% | 10/17/28 | EUR | 100 | 81 |
| | CK Hutchison Group Telecom Finance SA | 1.500% | 10/17/31 | EUR | 8,633 | 6,349 |
| | CK Hutchison Group Telecom Finance SA | 2.625% | 10/17/34 | GBP | 1,409 | 1,050 |
| | Clarion Funding plc | 2.625% | 1/18/29 | GBP | 752 | 736 |
| | Clarion Funding plc | 3.125% | 4/19/48 | GBP | 4,634 | 3,563 |
| | Clydesdale Bank plc | 4.625% | 6/8/26 | GBP | 6,633 | 7,593 |
| | CNH Industrial Finance Europe SA | 1.875% | 1/19/26 | EUR | 3,146 | 2,925 |
| | CNH Industrial Finance Europe SA | 1.750% | 3/25/27 | EUR | 2,800 | 2,534 |
| | CNH Industrial Finance Europe SA | 1.625% | 7/3/29 | EUR | 7,366 | 6,167 |
| | Coca-Cola Europacific Partners plc | 1.125% | 5/26/24 | EUR | 2,982 | 2,854 |
| | Coca-Cola Europacific Partners plc | 2.375% | 5/7/25 | EUR | 1,545 | 1,486 |
| | Coca-Cola Europacific Partners plc | 1.750% | 3/27/26 | EUR | 6,084 | 5,704 |
| | Coca-Cola Europacific Partners plc | 1.750% | 5/26/28 | EUR | 2,653 | 2,348 |
| | Coca-Cola Europacific Partners plc | 0.200% | 12/2/28 | EUR | 6,316 | 5,040 |
Total International Bond Index Fund
| | | Coupon | Maturity
Date | Currency | Face
Amount
(000) | Market
Value•
($000) |
| | Coca-Cola Europacific Partners plc | 0.700% | 9/12/31 | EUR | 4,364 | 3,293 |
| | Compass Group Finance Netherlands BV | 0.625% | 7/3/24 | EUR | 832 | 789 |
| | Compass Group plc | 2.000% | 9/5/25 | GBP | 200 | 211 |
| | Compass Group plc | 2.000% | 7/3/29 | GBP | 3,028 | 2,829 |
| 1 | Connect Plus M25 Issuer plc | 2.607% | 3/31/39 | GBP | 1,366 | 1,266 |
| | Coventry Building Society | 0.500% | 1/12/24 | EUR | 394 | 379 |
| | Coventry Building Society | 2.000% | 12/20/30 | GBP | 5,938 | 4,991 |
| | CPUK Finance Ltd. | 3.588% | 2/28/42 | GBP | 1,545 | 1,636 |
| | CPUK Finance Ltd. | 7.239% | 2/28/42 | GBP | 1,381 | 1,597 |
| | CPUK Finance Ltd. | 3.690% | 2/28/47 | GBP | 100 | 97 |
| | Crh Finance UK plc | 4.125% | 12/2/29 | GBP | 2,927 | 2,945 |
| 1,6 | CTRL Section 1 Finance plc | 5.234% | 5/2/35 | GBP | 551 | 672 |
| | Dali Capital plc | 4.799% | 12/21/37 | GBP | 350 | 393 |
| | Derby Healthcare plc | 5.564% | 6/30/41 | GBP | 725 | 851 |
| | Derwent London plc | 1.875% | 11/17/31 | GBP | 2,000 | 1,586 |
| | Diageo Capital BV | 0.125% | 9/28/28 | EUR | 9,300 | 7,635 |
| | Diageo Finance plc | 0.500% | 6/19/24 | EUR | 368 | 348 |
| | Diageo Finance plc | 1.750% | 9/23/24 | EUR | 9,400 | 9,054 |
| | Diageo Finance plc | 2.500% | 3/27/32 | EUR | 11,431 | 10,298 |
| | Diageo Finance plc | 1.250% | 3/28/33 | GBP | 3,541 | 2,858 |
| | DS Smith plc | 1.375% | 7/26/24 | EUR | 200 | 188 |
| | DS Smith plc | 0.875% | 9/12/26 | EUR | 3,019 | 2,539 |
| | DWR Cymru Financing UK plc | 1.625% | 3/31/26 | GBP | 1,107 | 1,123 |
| | DWR Cymru Financing UK plc | 6.015% | 3/31/28 | GBP | 375 | 439 |
| | DWR Cymru Financing UK plc | 1.375% | 3/31/33 | GBP | 500 | 397 |
| | DWR Cymru Financing UK plc | 2.375% | 3/31/34 | GBP | 1,058 | 862 |
| | DWR Cymru Financing UK plc | 2.500% | 3/31/36 | GBP | 383 | 321 |
| | Eastern Power Networks plc | 5.750% | 3/8/24 | GBP | 1,536 | 1,773 |
| | easyJet FinCo BV | 1.875% | 3/3/28 | EUR | 9,526 | 7,453 |
| | easyJet plc | 0.875% | 6/11/25 | EUR | 3,543 | 3,178 |
| | Electricity North West Ltd. | 8.875% | 3/25/26 | GBP | 1,023 | 1,292 |
| | EMH Treasury plc | 4.500% | 1/29/44 | GBP | 545 | 548 |
| 1 | Eversholt Funding plc | 6.697% | 2/22/35 | GBP | 800 | 932 |
| 1 | Eversholt Funding plc | 3.529% | 8/7/42 | GBP | 1,765 | 1,412 |
| | Experian Finance plc | 1.375% | 6/25/26 | EUR | 300 | 275 |
| | Experian Finance plc | 3.250% | 4/7/32 | GBP | 2,872 | 2,817 |
| | Fidelity International Ltd. | 7.125% | 2/13/24 | GBP | 613 | 713 |
| | Fidelity International Ltd. | 2.500% | 11/4/26 | EUR | 1,402 | 1,227 |
| | Firstgroup plc | 6.875% | 9/18/24 | GBP | 1,359 | 1,553 |
| | Flagship Finance plc | 1.875% | 7/14/61 | GBP | 946 | 527 |
| | Futures Treasury plc | 3.375% | 2/8/44 | GBP | 894 | 758 |
| | Gatwick Funding Ltd. | 5.250% | 1/23/26 | GBP | 448 | 508 |
| | Gatwick Funding Ltd. | 6.125% | 3/2/28 | GBP | 9,150 | 10,396 |
| | Gatwick Funding Ltd. | 2.500% | 4/15/32 | GBP | 2,800 | 2,468 |
| | Gatwick Funding Ltd. | 5.750% | 1/23/39 | GBP | 3,448 | 3,594 |
| | Gatwick Funding Ltd. | 3.125% | 9/28/41 | GBP | 2,159 | 1,605 |
| | Gatwick Funding Ltd. | 6.500% | 3/2/43 | GBP | ��2,000 | 2,242 |
| | Gatwick Funding Ltd. | 3.250% | 2/26/48 | GBP | 300 | 214 |
| | Gatwick Funding Ltd. | 2.625% | 10/7/48 | GBP | 658 | 417 |
| | Genfinance II plc | 6.064% | 12/21/39 | GBP | 3,037 | 3,574 |
| | GlaxoSmithKline Capital plc | 1.375% | 12/2/24 | EUR | 150 | 143 |
| | GlaxoSmithKline Capital plc | 4.000% | 6/16/25 | EUR | 512 | 517 |
| | GlaxoSmithKline Capital plc | 1.250% | 5/21/26 | EUR | 7,631 | 7,029 |
| | GlaxoSmithKline Capital plc | 1.000% | 9/12/26 | EUR | 400 | 362 |
| | GlaxoSmithKline Capital plc | 3.375% | 12/20/27 | GBP | 2,040 | 2,151 |
| | GlaxoSmithKline Capital plc | 1.250% | 10/12/28 | GBP | 3,724 | 3,439 |
| | GlaxoSmithKline Capital plc | 1.750% | 5/21/30 | EUR | 9,098 | 7,894 |
| | GlaxoSmithKline Capital plc | 5.250% | 12/19/33 | GBP | 3,760 | 4,444 |
| | GlaxoSmithKline Capital plc | 1.625% | 5/12/35 | GBP | 8,911 | 7,086 |
| | GlaxoSmithKline Capital plc | 6.375% | 3/9/39 | GBP | 578 | 756 |
| | GlaxoSmithKline Capital plc | 5.250% | 4/10/42 | GBP | 2,239 | 2,637 |
| | GlaxoSmithKline Capital plc | 4.250% | 12/18/45 | GBP | 383 | 395 |
| | Global Switch Finance BV | 1.375% | 10/7/30 | EUR | 2,300 | 1,861 |
| | Global Switch Holdings Ltd. | 1.500% | 1/31/24 | EUR | 887 | 848 |
| | Global Switch Holdings Ltd. | 2.250% | 5/31/27 | EUR | 400 | 355 |
| | Great Places Housing Group Ltd. | 4.750% | 10/22/42 | GBP | 1,545 | 1,634 |
| 1 | Great Rolling Stock Co. plc | 6.875% | 7/27/35 | GBP | 435 | 511 |
| 1 | Greater Gabbard OFTO plc | 4.137% | 11/29/32 | GBP | 771 | 825 |
| | Greene King Finance plc | 5.318% | 9/15/31 | GBP | 665 | 709 |
Total International Bond Index Fund
| | | Coupon | Maturity
Date | Currency | Face
Amount
(000) | Market
Value•
($000) |
| 1 | Greene King Finance plc | 4.064% | 3/15/35 | GBP | 1,001 | 971 |
| | Guinness Partnership Ltd. | 4.000% | 10/24/44 | GBP | 1,436 | 1,341 |
| | Guinness Partnership Ltd. | 2.000% | 4/22/55 | GBP | 800 | 465 |
| 1 | Gwynt y Mor OFTO plc | 2.778% | 2/17/34 | GBP | 1,278 | 1,238 |
| | Hammerson Ireland Finance DAC | 1.750% | 6/3/27 | EUR | 2,214 | 1,554 |
| | Hammerson plc | 7.250% | 4/21/28 | GBP | 2,049 | 2,019 |
| | Heathrow Funding Ltd. | 5.225% | 2/15/23 | GBP | 1,107 | 1,268 |
| | Heathrow Funding Ltd. | 1.500% | 10/12/27 | EUR | 6,316 | 5,713 |
| | Heathrow Funding Ltd. | 6.750% | 12/3/28 | GBP | 3,724 | 4,296 |
| | Heathrow Funding Ltd. | 2.694% | 10/13/29 | CAD | 4,268 | 2,740 |
| | Heathrow Funding Ltd. | 1.500% | 2/11/30 | EUR | 3,596 | 2,854 |
| | Heathrow Funding Ltd. | 3.400% | 3/8/30 | CAD | 3,441 | 2,257 |
| | Heathrow Funding Ltd. | 2.750% | 10/13/31 | GBP | 6,543 | 5,971 |
| | Heathrow Funding Ltd. | 6.450% | 12/10/31 | GBP | 1,523 | 1,755 |
| | Heathrow Funding Ltd. | 1.875% | 7/12/32 | EUR | 2,104 | 1,539 |
| | Heathrow Funding Ltd. | 3.782% | 9/4/32 | CAD | 1,281 | 828 |
| | Heathrow Funding Ltd. | 3.661% | 1/13/33 | CAD | 1,100 | 693 |
| | Heathrow Funding Ltd. | 3.726% | 4/13/35 | CAD | 1,607 | 970 |
| | Heathrow Funding Ltd. | 1.875% | 3/14/36 | EUR | 2,404 | 1,630 |
| | Heathrow Funding Ltd. | 5.875% | 5/13/43 | GBP | 4,469 | 4,790 |
| | Heathrow Funding Ltd. | 4.625% | 10/31/46 | GBP | 1,272 | 1,170 |
| | Heathrow Funding Ltd. | 2.750% | 8/9/51 | GBP | 521 | 343 |
| | Hexagon Housing Association Ltd. | 3.625% | 4/22/48 | GBP | 1,000 | 837 |
| | High Speed Rail Finance 1 plc | 4.375% | 11/1/38 | GBP | 3,376 | 3,481 |
| | Home Group Ltd. | 3.125% | 3/27/43 | GBP | 2,996 | 2,396 |
| 1 | Housing & Care 21 | 3.288% | 11/8/49 | GBP | 640 | 515 |
| | HSBC Bank Capital Funding Sterling 1 LP | 5.844% | 11/29/49 | GBP | 188 | 224 |
| | HSBC Bank plc | 5.375% | 11/4/30 | GBP | 512 | 569 |
| | HSBC Bank plc | 5.375% | 8/22/33 | GBP | 2,561 | 2,669 |
| | HSBC Bank plc | 6.250% | 1/30/41 | GBP | 1,552 | 1,739 |
| | HSBC Bank plc | 4.750% | 3/24/46 | GBP | 50 | 47 |
| | HSBC Holdings plc | 3.196% | 12/5/23 | CAD | 4,922 | 3,520 |
| | HSBC Holdings plc | 0.875% | 9/6/24 | EUR | 8,958 | 8,418 |
| | HSBC Holdings plc | 1.500% | 12/4/24 | EUR | 2,094 | 2,014 |
| | HSBC Holdings plc | 3.000% | 6/30/25 | EUR | 9,941 | 9,565 |
| | HSBC Holdings plc | 0.309% | 11/13/26 | EUR | 10,141 | 8,796 |
| | HSBC Holdings plc | 2.256% | 11/13/26 | GBP | 3,266 | 3,340 |
| | HSBC Holdings plc | 2.500% | 3/15/27 | EUR | 3,724 | 3,383 |
| | HSBC Holdings plc | 3.019% | 6/15/27 | EUR | 8,200 | 7,601 |
| | HSBC Holdings plc | 1.750% | 7/24/27 | GBP | 4,471 | 4,325 |
| | HSBC Holdings plc | 3.000% | 7/22/28 | GBP | 17,886 | 17,418 |
| | HSBC Holdings plc | 2.625% | 8/16/28 | GBP | 1,615 | 1,522 |
| | HSBC Holdings plc | 6.750% | 9/11/28 | GBP | 1,350 | 1,517 |
| | HSBC Holdings plc | 0.641% | 9/24/29 | EUR | 5,938 | 4,600 |
| | HSBC Holdings plc | 3.000% | 5/29/30 | GBP | 2,185 | 2,016 |
| | HSBC Holdings plc | 7.000% | 4/7/38 | GBP | 5,150 | 5,807 |
| | HSBC Holdings plc | 6.000% | 3/29/40 | GBP | 3,898 | 3,933 |
| | Hyde Housing Assn. Ltd. | 5.125% | 7/23/40 | GBP | 221 | 242 |
| | Hyde Housing Assn. Ltd. | 1.750% | 8/18/55 | GBP | 2,580 | 1,417 |
| | IG Group Holdings plc | 3.125% | 11/18/28 | GBP | 3,000 | 2,561 |
| | Imperial Brands Finance Netherlands BV | 1.750% | 3/18/33 | EUR | 5,053 | 3,252 |
| | Imperial Brands Finance plc | 1.375% | 1/27/25 | EUR | 448 | 413 |
| | Imperial Brands Finance plc | 3.375% | 2/26/26 | EUR | 383 | 354 |
| | Imperial Brands Finance plc | 2.125% | 2/12/27 | EUR | 7,905 | 6,792 |
| | Imperial Brands Finance plc | 4.875% | 6/7/32 | GBP | 3,870 | 3,592 |
| | Incommunities Treasury plc | 3.250% | 3/21/49 | GBP | 1,601 | 1,317 |
| | Informa plc | 3.125% | 7/5/26 | GBP | 581 | 589 |
| | Informa plc | 1.250% | 4/22/28 | EUR | 1,670 | 1,338 |
| | Intermediate Capital Group plc | 1.625% | 2/17/27 | EUR | 1,400 | 1,139 |
| | Just Group plc | 9.000% | 10/26/26 | GBP | 400 | 456 |
| | Juturna European Loan Conduit No. 16 plc | 5.064% | 8/10/33 | GBP | 3,662 | 4,127 |
| | Karbon Homes Ltd. | 3.375% | 11/15/47 | GBP | 3,815 | 3,243 |
| | Kennedy Wilson Europe Real Estate Ltd. | 3.250% | 11/12/25 | EUR | 700 | 510 |
| | Land Securities Capital Markets plc | 1.974% | 2/8/26 | GBP | 448 | 493 |
| | Land Securities Capital Markets plc | 2.375% | 3/29/29 | GBP | 418 | 424 |
| | Land Securities Capital Markets plc | 2.399% | 2/8/31 | GBP | 2,800 | 2,741 |
| | Land Securities Capital Markets plc | 2.625% | 9/22/39 | GBP | 904 | 757 |
| | Land Securities Capital Markets plc | 2.750% | 9/22/59 | GBP | 1,713 | 1,254 |
| | Leeds Building Society | 0.500% | 7/3/24 | EUR | 300 | 285 |
Total International Bond Index Fund
| | | Coupon | Maturity
Date | Currency | Face
Amount
(000) | Market
Value•
($000) |
| | Leeds Building Society | 1.375% | 10/6/27 | GBP | 14,904 | 13,913 |
| | Legal & General Finance plc | 5.875% | 12/11/31 | GBP | 3,587 | 4,312 |
| | Legal & General Group plc | 5.375% | 10/27/45 | GBP | 1,765 | 1,941 |
| | Legal & General Group plc | 5.125% | 11/14/48 | GBP | 548 | 560 |
| | Legal & General Group plc | 4.500% | 11/1/50 | GBP | 5,000 | 4,719 |
| | Legal & General Group plc | 5.500% | 6/27/64 | GBP | 1,702 | 1,626 |
| | Lendlease Europe Finance plc | 3.500% | 12/2/33 | GBP | 2,704 | 1,958 |
| | Liberty Living Finance plc | 2.625% | 11/28/24 | GBP | 996 | 1,053 |
| | Libra Longhurst Group Treasury No. 2 plc | 3.250% | 5/15/43 | GBP | 2,800 | 2,307 |
| | Libra Longhurst Group Treasury plc | 5.125% | 8/2/38 | GBP | 885 | 969 |
| | Linde Finance BV | 1.000% | 4/20/28 | EUR | 4,133 | 3,652 |
| | Linde Finance BV | 0.550% | 5/19/32 | EUR | 8,200 | 6,024 |
| | Linde plc | 1.000% | 9/30/51 | EUR | 6,700 | 3,348 |
| | LiveWest Treasury plc | 1.875% | 2/18/56 | GBP | 1,100 | 629 |
| | Lloyds Bank Corporate Markets plc | 2.375% | 4/9/26 | EUR | 5,000 | 4,681 |
| | Lloyds Bank plc | 0.250% | 3/25/24 | EUR | 4,090 | 3,901 |
| | Lloyds Bank plc | 7.500% | 4/15/24 | GBP | 5,180 | 6,143 |
| | Lloyds Bank plc | 5.125% | 3/7/25 | GBP | 7,740 | 8,939 |
| | Lloyds Bank plc | 0.625% | 3/26/25 | EUR | 300 | 280 |
| | Lloyds Bank plc | 0.125% | 6/18/26 | EUR | 5,087 | 4,526 |
| | Lloyds Bank plc | 4.875% | 3/30/27 | GBP | 1,590 | 1,816 |
| | Lloyds Bank plc | 6.000% | 2/8/29 | GBP | 5,278 | 6,383 |
| | Lloyds Bank plc | 0.125% | 9/23/29 | EUR | 20,450 | 16,424 |
| | Lloyds Banking Group plc | 0.482% | 12/14/23 | JPY | 800,000 | 5,349 |
| | Lloyds Banking Group plc | 2.250% | 10/16/24 | GBP | 996 | 1,073 |
| | Lloyds Banking Group plc | 3.500% | 2/3/25 | CAD | 1,226 | 852 |
| | Lloyds Banking Group plc | 4.000% | 3/7/25 | AUD | 6,060 | 3,717 |
| | Lloyds Banking Group plc | 0.824% | 5/30/25 | JPY | 700,000 | 4,704 |
| | Lloyds Banking Group plc | 0.500% | 11/12/25 | EUR | 5,361 | 4,901 |
| | Lloyds Banking Group plc | 3.500% | 4/1/26 | EUR | 5,000 | 4,827 |
| | Lloyds Banking Group plc | 4.250% | 11/22/27 | AUD | 2,520 | 1,451 |
| | Lloyds Banking Group plc | 4.500% | 3/18/30 | EUR | 1,821 | 1,719 |
| | Lloyds Banking Group plc | 3.125% | 8/24/30 | EUR | 7,000 | 6,192 |
| | Lloyds Banking Group plc | 2.707% | 12/3/35 | GBP | 1,545 | 1,267 |
| | Logicor 2019-1 UK plc | 1.875% | 11/17/31 | GBP | 5,014 | 4,910 |
| | London & Quadrant Housing Trust | 2.625% | 2/28/28 | GBP | 4,372 | 4,353 |
| | London & Quadrant Housing Trust | 2.250% | 7/20/29 | GBP | 2,800 | 2,619 |
| | London & Quadrant Housing Trust | 2.000% | 3/31/32 | GBP | 1,900 | 1,630 |
| | London & Quadrant Housing Trust | 4.625% | 12/5/33 | GBP | 400 | 423 |
| | London & Quadrant Housing Trust | 5.486% | 6/15/42 | GBP | 1,300 | 1,438 |
| | London & Quadrant Housing Trust | 3.750% | 10/27/49 | GBP | 1,985 | 1,684 |
| | London & Quadrant Housing Trust | 3.125% | 2/28/53 | GBP | 832 | 617 |
| | London & Quadrant Housing Trust | 2.750% | 7/20/57 | GBP | 996 | 673 |
| | London Power Networks plc | 6.125% | 6/7/27 | GBP | 362 | 422 |
| | London Stock Exchange Group plc | 1.750% | 12/6/27 | EUR | 6,798 | 6,053 |
| 1 | Longstone Finance plc | 4.791% | 4/19/36 | GBP | 476 | 536 |
| | Lseg Netherlands BV | 0.750% | 4/6/33 | EUR | 5,938 | 4,228 |
| | M&G plc | 5.625% | 10/20/51 | GBP | 704 | 698 |
| | M&G plc | 5.560% | 7/20/55 | GBP | 4,977 | 4,646 |
| | M&G plc | 6.340% | 12/19/63 | GBP | 1,710 | 1,636 |
| | Manchester Airport Group Funding plc | 4.125% | 4/2/24 | GBP | 996 | 1,118 |
| | Manchester Airport Group Funding plc | 4.750% | 3/31/34 | GBP | 996 | 1,011 |
| | Manchester Airport Group Funding plc | 2.875% | 9/30/44 | GBP | 2,094 | 1,460 |
| | Martlet Homes Ltd. | 3.000% | 5/9/52 | GBP | 1,765 | 1,339 |
| 1 | Meadowhall Finance plc | 4.986% | 7/12/37 | GBP | 1,477 | 1,561 |
| 1 | Merseylink Issuer plc | 3.842% | 3/31/43 | GBP | 200 | 208 |
| 1 | Metropolitan Funding plc | 4.125% | 4/5/48 | GBP | 996 | 906 |
| | Moat Homes Finance plc | 5.000% | 9/23/41 | GBP | 865 | 933 |
| | Morhomes plc | 3.400% | 2/19/40 | GBP | 887 | 776 |
| | Motability Operations Group plc | 1.625% | 6/9/23 | EUR | 3,321 | 3,247 |
| | Motability Operations Group plc | 0.375% | 1/3/26 | EUR | 3,988 | 3,543 |
| | Motability Operations Group plc | 4.375% | 2/8/27 | GBP | 4,419 | 4,929 |
| | Motability Operations Group plc | 0.125% | 7/20/28 | EUR | 8,944 | 7,107 |
| | Motability Operations Group plc | 1.750% | 7/3/29 | GBP | 4,956 | 4,607 |
| | Motability Operations Group plc | 5.625% | 11/29/30 | GBP | 996 | 1,189 |
| | Motability Operations Group plc | 2.375% | 3/14/32 | GBP | 3,218 | 2,979 |
| | Motability Operations Group plc | 3.625% | 3/10/36 | GBP | 4,100 | 4,048 |
| | Motability Operations Group plc | 2.375% | 7/3/39 | GBP | 100 | 82 |
| | Myriad Capital plc | 4.750% | 12/20/43 | GBP | 900 | 905 |
Total International Bond Index Fund
| | | Coupon | Maturity
Date | Currency | Face
Amount
(000) | Market
Value•
($000) |
| | National Express Group plc | 2.500% | 11/11/23 | GBP | 2,543 | 2,832 |
| | National Grid Electricity Transmission plc | 1.375% | 9/16/26 | GBP | 2,104 | 2,064 |
| | National Grid Electricity Transmission plc | 2.301% | 6/22/29 | CAD | 2,536 | 1,562 |
| | National Grid Electricity Transmission plc | 5.221% | 9/16/31 | CAD | 2,400 | 1,726 |
| | National Grid Electricity Transmission plc | 0.823% | 7/7/32 | EUR | 2,800 | 1,999 |
| | National Grid Electricity Transmission plc | 2.000% | 9/16/38 | GBP | 2,982 | 2,020 |
| | National Grid Electricity Transmission plc | 0.872% | 11/26/40 | EUR | 1,900 | 1,001 |
| | National Grid plc | 2.179% | 6/30/26 | EUR | 1,100 | 1,015 |
| | National Grid plc | 3.500% | 10/16/26 | GBP | 5,897 | 6,203 |
| | National Grid plc | 0.163% | 1/20/28 | EUR | 7,000 | 5,604 |
| | National Grid plc | 0.553% | 9/18/29 | EUR | 7,243 | 5,514 |
| | National Grid plc | 2.949% | 3/30/30 | EUR | 8,000 | 7,090 |
| | National Grid plc | 0.750% | 9/1/33 | EUR | 1,200 | 800 |
| | National Westminster Bank plc | 5.125% | 1/13/24 | GBP | 300 | 347 |
| | National Westminster Bank plc | 0.500% | 5/15/24 | EUR | 5,087 | 4,852 |
| | Nationwide Building Society | 1.250% | 3/3/25 | EUR | 300 | 281 |
| | Nationwide Building Society | 5.625% | 1/28/26 | GBP | 723 | 851 |
| | Nationwide Building Society | 1.500% | 3/8/26 | EUR | 7,576 | 6,950 |
| | Nationwide Building Society | 3.000% | 5/6/26 | GBP | 10,444 | 11,075 |
| | Nationwide Building Society | 0.625% | 3/25/27 | EUR | 19,395 | 17,234 |
| | Nationwide Building Society | 3.250% | 1/20/28 | GBP | 4,725 | 4,812 |
| | Nationwide Building Society | 0.250% | 9/14/28 | EUR | 18,406 | 14,402 |
| | Nationwide Building Society | 2.250% | 6/25/29 | EUR | 2,543 | 2,377 |
| | Nationwide Building Society | 2.000% | 7/25/29 | EUR | 12,947 | 11,954 |
| | Nationwide Building Society | 1.375% | 6/29/32 | EUR | 8,179 | 6,815 |
| | NatWest Group plc | 1.750% | 3/2/26 | EUR | 26,952 | 24,861 |
| | NatWest Group plc | 2.057% | 11/9/28 | GBP | 2,800 | 2,581 |
| | NatWest Group plc | 3.619% | 3/29/29 | GBP | 9,600 | 9,342 |
| | NatWest Group plc | 0.670% | 9/14/29 | EUR | 19,800 | 15,095 |
| | NatWest Markets plc | 1.000% | 5/28/24 | EUR | 5,087 | 4,809 |
| | NatWest Markets plc | 1.375% | 3/2/27 | EUR | 15,900 | 13,830 |
| 6 | Network Rail Infrastructure Finance plc | 4.750% | 1/22/24 | GBP | 3,591 | 4,153 |
| 6 | Network Rail Infrastructure Finance plc | 4.375% | 12/9/30 | GBP | 4,533 | 5,295 |
| 6 | Network Rail Infrastructure Finance plc | 4.750% | 11/29/35 | GBP | 2,154 | 2,569 |
| | NewRiver REIT plc | 3.500% | 3/7/28 | GBP | 887 | 786 |
| | Next Group plc | 3.625% | 5/18/28 | GBP | 3,541 | 3,381 |
| | NIE Finance plc | 2.500% | 10/27/25 | GBP | 4,043 | 4,279 |
| | Northern Gas Networks Finance plc | 4.875% | 6/30/27 | GBP | 241 | 270 |
| | Northern Gas Networks Finance plc | 4.875% | 11/15/35 | GBP | 1,535 | 1,586 |
| | Northern Powergrid Yorkshire plc | 5.125% | 5/4/35 | GBP | 791 | 868 |
| | Northern Powergrid Yorkshire plc | 2.250% | 10/9/59 | GBP | 778 | 501 |
| | Northumbrian Water Finance plc | 1.625% | 10/11/26 | GBP | 3,485 | 3,442 |
| | Northumbrian Water Finance plc | 2.375% | 10/5/27 | GBP | 300 | 293 |
| | Northumbrian Water Finance plc | 5.625% | 4/29/33 | GBP | 1,329 | 1,496 |
| | Northumbrian Water Finance plc | 5.125% | 1/23/42 | GBP | 486 | 509 |
| | Notting Hill Genesis | 3.750% | 12/20/32 | GBP | 2,762 | 2,760 |
| | Notting Hill Genesis | 2.000% | 6/3/36 | GBP | 803 | 603 |
| | Notting Hill Genesis | 5.250% | 7/7/42 | GBP | 723 | 782 |
| | Notting Hill Genesis | 3.250% | 10/12/48 | GBP | 150 | 117 |
| | Notting Hill Genesis | 4.375% | 2/20/54 | GBP | 1,758 | 1,688 |
| 1 | Octagon Healthcare Funding plc | 5.333% | 6/30/36 | GBP | 531 | 616 |
| | Optivo Finance plc | 2.857% | 10/7/35 | GBP | 2,100 | 1,809 |
| | Optivo Finance plc | 5.250% | 3/13/43 | GBP | 1,300 | 1,417 |
| | Optivo Finance plc | 3.283% | 3/22/48 | GBP | 900 | 720 |
| | Orbit Capital plc | 2.000% | 11/24/38 | GBP | 1,500 | 1,062 |
| | Orbit Capital plc | 3.500% | 3/24/45 | GBP | 1,977 | 1,643 |
| | Orbit Capital plc | 3.375% | 6/14/48 | GBP | 516 | 416 |
| | Paradigm Homes Charitable Housing Assn. Ltd. | 2.250% | 5/20/51 | GBP | 2,777 | 1,810 |
| | Paragon Treasury plc | 2.000% | 5/7/36 | GBP | 1,509 | 1,165 |
| 1 | Paragon Treasury plc | 3.625% | 1/21/47 | GBP | 996 | 868 |
| | Peabody Capital No. 2 plc | 2.750% | 3/2/34 | GBP | 2,000 | 1,772 |
| | Peabody Capital No. 2 plc | 4.625% | 12/12/53 | GBP | 150 | 150 |
| | Peabody Capital plc | 5.250% | 3/17/43 | GBP | 2,900 | 3,158 |
| | Pearson Funding plc | 1.375% | 5/6/25 | EUR | 283 | 262 |
| | Pearson Funding plc | 3.750% | 6/4/30 | GBP | 1,107 | 1,088 |
| 1 | Penarian Housing Finance plc | 3.212% | 6/7/52 | GBP | 723 | 585 |
| | Pension Insurance Corp. plc | 8.000% | 11/23/26 | GBP | 3,872 | 4,444 |
| | Pension Insurance Corp. plc | 5.625% | 9/20/30 | GBP | 3,809 | 3,710 |
| | Phoenix Group Holdings plc | 4.375% | 1/24/29 | EUR | 7,466 | 6,109 |
Total International Bond Index Fund
| | | Coupon | Maturity
Date | Currency | Face
Amount
(000) | Market
Value•
($000) |
| | Phoenix Group Holdings plc | 5.867% | 6/13/29 | GBP | 6,019 | 6,105 |
| | Phoenix Group Holdings plc | 5.625% | 4/28/31 | GBP | 1,381 | 1,321 |
| | Places For People Treasury plc | 2.875% | 8/17/26 | GBP | 3,037 | 3,170 |
| | Platform HG Financing plc | 1.625% | 8/10/55 | GBP | 2,348 | 1,256 |
| | Porterbrook Rail Finance Ltd. | 7.125% | 10/20/26 | GBP | 1,545 | 1,841 |
| | Principality Building Society | 2.375% | 11/23/23 | GBP | 448 | 494 |
| | Prs Finance plc | 1.750% | 11/24/26 | GBP | 10,445 | 10,788 |
| | Prs Finance plc | 2.000% | 1/23/29 | GBP | 8,131 | 8,038 |
| | Quadgas Finance plc | 3.375% | 9/17/29 | GBP | 2,379 | 2,149 |
| | RAC Bond Co. plc | 4.870% | 5/6/46 | GBP | 1,545 | 1,600 |
| 3 | Reckitt Benckiser Treasury Services Nederland BV | 0.375% | 5/19/26 | EUR | 2,543 | 2,278 |
| | Reckitt Benckiser Treasury Services Nederland BV | 0.750% | 5/19/30 | EUR | 5,053 | 4,084 |
| 3 | Reckitt Benckiser Treasury Services Nederland BV | 0.750% | 5/19/30 | EUR | 2,543 | 2,055 |
| 3 | Reckitt Benckiser Treasury Services plc | 1.750% | 5/19/32 | GBP | 2,159 | 1,872 |
| | RELX Capital Inc. | 1.300% | 5/12/25 | EUR | 996 | 933 |
| | RELX Finance BV | 0.000% | 3/18/24 | EUR | 1,335 | 1,259 |
| | RELX Finance BV | 0.500% | 3/10/28 | EUR | 7,631 | 6,393 |
| | RELX Finance BV | 0.875% | 3/10/32 | EUR | 3,108 | 2,350 |
| | Rentokil Initial Finance BV | 3.875% | 6/27/27 | EUR | 6,500 | 6,301 |
| | Rentokil Initial Finance BV | 4.375% | 6/27/30 | EUR | 3,000 | 2,913 |
| | Rentokil Initial plc | 0.950% | 11/22/24 | EUR | 2,599 | 2,441 |
| | Rio Tinto Finance plc | 2.875% | 12/11/24 | EUR | 100 | 98 |
| | Rio Tinto Finance plc | 4.000% | 12/11/29 | GBP | 4,600 | 4,872 |
| | Riverside Finance plc | 3.875% | 12/5/44 | GBP | 1,107 | 1,032 |
| | RL Finance Bonds No. 2 plc | 6.125% | 11/30/43 | GBP | 400 | 455 |
| | RL Finance Bonds No. 3 plc | 6.125% | 11/13/28 | GBP | 1,656 | 1,755 |
| | RL Finance Bonds No. 4 plc | 4.875% | 10/7/49 | GBP | 5,471 | 4,470 |
| 1 | RMPA Services plc | 5.337% | 9/30/38 | GBP | 1,374 | 1,596 |
| | Rothesay Life plc | 8.000% | 10/30/25 | GBP | 2,707 | 3,170 |
| | Rothesay Life plc | 3.375% | 7/12/26 | GBP | 6,011 | 6,023 |
| | Royal Bank of Scotland Group plc | 2.875% | 9/19/26 | GBP | 3,907 | 4,075 |
| | Royal Bank of Scotland Group plc | 3.125% | 3/28/27 | GBP | 3,092 | 3,178 |
| | Royal Mail plc | 1.250% | 10/8/26 | EUR | 2,543 | 2,210 |
| | RSL Finance No. 1 plc | 6.625% | 3/31/38 | GBP | 627 | 786 |
| | Sage Group plc | 1.625% | 2/25/31 | GBP | 4,608 | 3,816 |
| | Sanctuary Capital plc | 6.697% | 3/23/39 | GBP | 1,052 | 1,335 |
| | Sanctuary Capital plc | 5.000% | 4/26/47 | GBP | 2,055 | 2,194 |
| | Sanctuary Capital plc | 2.375% | 4/14/50 | GBP | 548 | 357 |
| | Santander UK Group Holdings plc | 0.391% | 2/28/25 | EUR | 3,266 | 3,050 |
| | Santander UK Group Holdings plc | 3.625% | 1/14/26 | GBP | 8,356 | 8,794 |
| | Santander UK Group Holdings plc | 2.920% | 5/8/26 | GBP | 7,401 | 7,773 |
| | Santander UK Group Holdings plc | 2.421% | 1/17/29 | GBP | 4,600 | 4,269 |
| | Santander UK Group Holdings plc | 0.603% | 9/13/29 | EUR | 8,958 | 6,760 |
| | Santander UK plc | 0.100% | 5/12/24 | EUR | 10,275 | 9,745 |
| | Santander UK plc | 1.250% | 9/18/24 | EUR | 3,376 | 3,235 |
| | Santander UK plc | 0.500% | 1/10/25 | EUR | 4,144 | 3,879 |
| | Santander UK plc | 5.750% | 3/2/26 | GBP | 3,012 | 3,586 |
| | Santander UK plc | 5.250% | 2/16/29 | GBP | 3,122 | 3,620 |
| | Santander UK plc | 3.875% | 10/15/29 | GBP | 4,648 | 4,812 |
| 1 | Saxon Weald Capital plc | 5.375% | 6/6/42 | GBP | 515 | 565 |
| | Scotland Gas Networks plc | 4.875% | 12/21/34 | GBP | 498 | 514 |
| | Scottish Hydro Electric Transmission plc | 2.250% | 9/27/35 | GBP | 300 | 236 |
| | Segro Capital Sarl | 0.500% | 9/22/31 | EUR | 3,724 | 2,381 |
| | Segro plc | 2.375% | 10/11/29 | GBP | 558 | 521 |
| | Segro plc | 2.875% | 10/11/37 | GBP | 200 | 164 |
| | Severn Trent Utilities Finance plc | 3.625% | 1/16/26 | GBP | 1,912 | 2,080 |
| | Severn Trent Utilities Finance plc | 2.750% | 12/5/31 | GBP | 613 | 571 |
| | Severn Trent Utilities Finance plc | 2.000% | 6/2/40 | GBP | 658 | 461 |
| | Severn Trent Utilities Finance plc | 4.875% | 1/24/42 | GBP | 2,291 | 2,427 |
| | Sky Ltd. | 1.875% | 11/24/23 | EUR | 2,817 | 2,748 |
| | Sky Ltd. | 2.250% | 11/17/25 | EUR | 300 | 286 |
| | Sky Ltd. | 2.500% | 9/15/26 | EUR | 20,774 | 19,726 |
| | Sky Ltd. | 6.000% | 5/21/27 | GBP | 150 | 177 |
| | Sky Ltd. | 4.000% | 11/26/29 | GBP | 2,434 | 2,579 |
| | Smith & Nephew plc | 4.565% | 10/11/29 | EUR | 1,000 | 980 |
| | Society of Lloyd's | 4.875% | 2/7/47 | GBP | 1,741 | 1,797 |
| | South Eastern Power Networks plc | 5.500% | 6/5/26 | GBP | 362 | 414 |
| | South Eastern Power Networks plc | 5.625% | 9/30/30 | GBP | 1,299 | 1,487 |
| | South Eastern Power Networks plc | 6.375% | 11/12/31 | GBP | 1,463 | 1,761 |
Total International Bond Index Fund
| | | Coupon | Maturity
Date | Currency | Face
Amount
(000) | Market
Value•
($000) |
| | South Eastern Power Networks plc | 1.750% | 9/30/34 | GBP | 785 | 610 |
| | Southern Electric Power Distribution plc | 4.625% | 2/20/37 | GBP | 3,864 | 3,845 |
| | Southern Gas Networks plc | 2.500% | 2/3/25 | GBP | 2,310 | 2,496 |
| | Southern Gas Networks plc | 6.375% | 5/15/40 | GBP | 338 | 396 |
| | Southern Housing Group Ltd. | 3.500% | 10/19/47 | GBP | 723 | 600 |
| | Southern Water Services Finance Ltd. | 6.640% | 3/31/26 | GBP | 7,638 | 8,989 |
| | Southern Water Services Finance Ltd. | 1.625% | 3/30/27 | GBP | 4,414 | 4,237 |
| | Southern Water Services Finance Ltd. | 6.192% | 3/31/29 | GBP | 1,536 | 1,794 |
| | Southern Water Services Finance Ltd. | 4.500% | 3/31/52 | GBP | 150 | 146 |
| | Southern Water Services Finance Ltd. | 5.125% | 9/30/56 | GBP | 50 | 54 |
| | Sovereign Housing Capital plc | 4.768% | 6/1/43 | GBP | 189 | 200 |
| | Sovereign Housing Capital plc | 2.375% | 11/4/48 | GBP | 2,345 | 1,593 |
| | SP Distribution plc | 5.875% | 7/17/26 | GBP | 613 | 706 |
| | SP Manweb plc | 4.875% | 9/20/27 | GBP | 200 | 221 |
| | SSE plc | 1.250% | 4/16/25 | EUR | 6,579 | 6,144 |
| | SSE plc | 0.875% | 9/6/25 | EUR | 778 | 713 |
| | SSE plc | 8.375% | 11/20/28 | GBP | 1,512 | 1,939 |
| | SSE plc | 1.750% | 4/16/30 | EUR | 2,500 | 2,064 |
| | SSE plc | 6.250% | 8/27/38 | GBP | 3,328 | 3,856 |
| | SSE plc | 4.000% | Perpetual | EUR | 6,633 | 5,789 |
| | Stagecoach Group plc | 4.000% | 9/29/25 | GBP | 200 | 213 |
| | Standard Chartered plc | 1.625% | 10/3/27 | EUR | 353 | 308 |
| | Standard Chartered plc | 0.850% | 1/27/28 | EUR | 3,092 | 2,559 |
| | Standard Chartered plc | 1.200% | 9/23/31 | EUR | �� 400 | 322 |
| | Standard Chartered plc | 4.375% | 1/18/38 | GBP | 1,545 | 1,567 |
| | Student Finance plc | 2.666% | 9/30/29 | GBP | 723 | 776 |
| | Sunderland SHG Finance plc | 6.380% | 3/31/42 | GBP | 195 | 233 |
| 1 | TC Dudgeon Ofto plc | 3.158% | 11/12/38 | GBP | 731 | 705 |
| 1 | Telereal Secured Finance plc | 4.010% | 12/10/33 | GBP | 2,950 | 3,097 |
| 1 | Telereal Securitisation plc | 6.165% | 12/10/33 | GBP | 579 | 659 |
| | Telereal Securitisation plc | 3.563% | 12/10/36 | GBP | 1,100 | 1,102 |
| | Tesco Corporate Treasury Services plc | 0.875% | 5/29/26 | EUR | 5,142 | 4,481 |
| | Tesco Corporate Treasury Services plc | 0.375% | 7/27/29 | EUR | 3,000 | 2,188 |
| 1 | Tesco Property Finance 1 plc | 7.623% | 7/13/39 | GBP | 1,477 | 1,780 |
| 1 | Tesco Property Finance 2 plc | 6.052% | 10/13/39 | GBP | 1,927 | 2,083 |
| 1 | Tesco Property Finance 3 plc | 5.744% | 4/13/40 | GBP | 975 | 1,004 |
| 1 | Tesco Property Finance 4 plc | 5.801% | 10/13/40 | GBP | 2,487 | 2,594 |
| 1 | Tesco Property Finance 6 plc | 5.411% | 7/13/44 | GBP | 3,307 | 3,290 |
| | Thames Water Utilities Finance plc | 1.875% | 1/24/24 | GBP | 723 | 794 |
| | Thames Water Utilities Finance plc | 2.875% | 12/12/24 | CAD | 346 | 241 |
| | Thames Water Utilities Finance plc | 4.000% | 6/19/25 | GBP | 4,090 | 4,514 |
| | Thames Water Utilities Finance plc | 0.875% | 1/31/28 | EUR | 4,600 | 3,764 |
| | Thames Water Utilities Finance plc | 3.500% | 2/25/28 | GBP | 613 | 622 |
| | Thames Water Utilities Finance plc | 6.750% | 11/16/28 | GBP | 1,840 | 2,175 |
| | Thames Water Utilities Finance plc | 2.625% | 1/24/32 | GBP | 1,717 | 1,512 |
| | Thames Water Utilities Finance plc | 1.250% | 1/31/32 | EUR | 2,300 | 1,669 |
| | Thames Water Utilities Finance plc | 6.500% | 2/9/32 | GBP | 700 | 825 |
| | Thames Water Utilities Finance plc | 4.375% | 7/3/34 | GBP | 1,433 | 1,411 |
| | Thames Water Utilities Finance plc | 5.125% | 9/28/37 | GBP | 721 | 738 |
| | Thames Water Utilities Finance plc | 2.375% | 4/22/40 | GBP | 4,199 | 2,881 |
| | Thames Water Utilities Finance plc | 5.500% | 2/11/41 | GBP | 3,802 | 4,003 |
| | Thames Water Utilities Finance plc | 4.625% | 6/4/46 | GBP | 1,607 | 1,493 |
| | Thames Water Utilities Finance plc | 7.738% | 4/9/58 | GBP | 603 | 875 |
| | THFC Funding No. 2 plc | 6.350% | 7/8/41 | GBP | 1,216 | 1,503 |
| | THFC Funding No. 2 plc | 5.200% | 10/11/43 | GBP | 4,163 | 4,525 |
| | THFC Funding, Plc | 5.125% | 12/21/37 | GBP | 2,000 | 2,227 |
| | Together Housing Finance plc | 4.500% | 12/17/42 | GBP | 330 | 330 |
| | Tritax EuroBox plc | 0.950% | 6/2/26 | EUR | 704 | 558 |
| | Unilever Finance Netherlands BV | 0.500% | 1/6/25 | EUR | 100 | 94 |
| | Unilever Finance Netherlands BV | 1.250% | 3/25/25 | EUR | 10,275 | 9,759 |
| | Unilever Finance Netherlands BV | 1.125% | 2/12/27 | EUR | 5,142 | 4,687 |
| | Unilever Finance Netherlands BV | 1.375% | 7/31/29 | EUR | 2,708 | 2,371 |
| | Unilever Finance Netherlands BV | 1.750% | 3/25/30 | EUR | 5,087 | 4,536 |
| | Unilever Finance Netherlands BV | 1.375% | 9/4/30 | EUR | 613 | 528 |
| | Unilever plc | 1.500% | 7/22/26 | GBP | 100 | 102 |
| | Unilever plc | 1.500% | 6/11/39 | EUR | 2,653 | 1,923 |
| | UNITE Group plc | 3.500% | 10/15/28 | GBP | 704 | 665 |
| | UNITE USAF II plc | 3.921% | 6/30/30 | GBP | 2,037 | 2,219 |
| | United Utilities Water Finance plc | 2.000% | 2/14/25 | GBP | 5,777 | 6,199 |
Total International Bond Index Fund
| | | Coupon | Maturity
Date | Currency | Face
Amount
(000) | Market
Value•
($000) |
| | United Utilities Water Finance plc | 0.875% | 10/28/29 | GBP | 519 | 442 |
| | United Utilities Water Finance plc | 2.625% | 2/12/31 | GBP | 4,034 | 3,804 |
| | United Utilities Water Finance plc | 2.000% | 7/3/33 | GBP | 996 | 837 |
| | United Utilities Water Finance plc | 1.875% | 6/3/42 | GBP | 371 | 250 |
| | United Utilities Water Ltd. | 5.625% | 12/20/27 | GBP | 3,489 | 4,028 |
| | University College London | 1.625% | 6/4/61 | GBP | 2,800 | 1,679 |
| | University of Cambridge | 3.750% | 10/17/52 | GBP | 494 | 500 |
| | University of Cambridge | 2.350% | 6/27/78 | GBP | 1,398 | 973 |
| | University of Leeds | 3.125% | 12/19/50 | GBP | 1,900 | 1,602 |
| | University of Liverpool | 3.375% | 6/25/55 | GBP | 200 | 181 |
| | University of Manchester | 4.250% | 7/4/53 | GBP | 943 | 990 |
| | University of Oxford | 2.544% | 12/8/17 | GBP | 3,541 | 2,383 |
| | University of Southampton | 2.250% | 4/11/57 | GBP | 100 | 68 |
| | Urenco Finance NV | 2.375% | 12/2/24 | EUR | 2,094 | 2,012 |
| | Utmost Group plc | 4.000% | 12/15/31 | GBP | 1,500 | 1,210 |
| | Virgin Money UK plc | 2.875% | 6/24/25 | EUR | 900 | 848 |
| | Virgin Money UK plc | 3.375% | 4/24/26 | GBP | 7,644 | 7,881 |
| | Virgin Money UK plc | 4.000% | 9/25/26 | GBP | 2,800 | 2,915 |
| | Virgin Money UK plc | 4.000% | 9/3/27 | GBP | 2,872 | 2,868 |
| | Virgin Money UK plc | 5.125% | 12/11/30 | GBP | 1,945 | 2,024 |
| | Vodafone Group plc | 0.500% | 1/30/24 | EUR | 200 | 192 |
| | Vodafone Group plc | 1.875% | 9/11/25 | EUR | 10,275 | 9,738 |
| | Vodafone Group plc | 1.125% | 11/20/25 | EUR | 7,923 | 7,342 |
| | Vodafone Group plc | 5.625% | 12/4/25 | GBP | 614 | 715 |
| | Vodafone Group plc | 2.200% | 8/25/26 | EUR | 2,049 | 1,939 |
| | Vodafone Group plc | 1.500% | 7/24/27 | EUR | 6,599 | 5,996 |
| | Vodafone Group plc | 4.200% | 12/13/27 | AUD | 4,760 | ���2,849 |
| | Vodafone Group plc | 1.875% | 11/20/29 | EUR | 2,000 | 1,756 |
| | Vodafone Group plc | 1.625% | 11/24/30 | EUR | 3,839 | 3,239 |
| | Vodafone Group plc | 1.600% | 7/29/31 | EUR | 10,000 | 8,254 |
| | Vodafone Group plc | 5.900% | 11/26/32 | GBP | 3,690 | 4,373 |
| | Vodafone Group plc | 2.875% | 11/20/37 | EUR | 3,146 | 2,567 |
| | Vodafone Group plc | 2.500% | 5/24/39 | EUR | 4,269 | 3,157 |
| | Vodafone Group plc | 3.375% | 8/8/49 | GBP | 3,291 | 2,623 |
| | Vodafone Group plc | 3.000% | 8/12/56 | GBP | 3,252 | 2,323 |
| | Wales & West Utilities Finance plc | 5.750% | 3/29/30 | GBP | 2,543 | 2,920 |
| | Wales & West Utilities Finance plc | 3.000% | 8/3/38 | GBP | 723 | 599 |
| | Wellcome Trust Finance plc | 4.625% | 7/25/36 | GBP | 1,754 | 2,004 |
| | Wellcome Trust Ltd. | 4.000% | 5/9/59 | GBP | 1,107 | 1,239 |
| | Wellcome Trust Ltd. | 2.517% | 2/7/18 | GBP | 2,159 | 1,449 |
| | Wessex Water Services Finance plc | 5.375% | 3/10/28 | GBP | 484 | 541 |
| | Wessex Water Services Finance plc | 1.250% | 1/12/36 | GBP | 2,214 | 1,467 |
| | Western Power Distribution East Midlands plc | 1.750% | 9/9/31 | GBP | 1,200 | 999 |
| | Western Power Distribution South Wales plc | 1.625% | 10/7/35 | GBP | 2,414 | 1,727 |
| | Western Power Distribution South Wales plc | 5.750% | 3/23/40 | GBP | 1,100 | 1,213 |
| | Western Power Distribution South West plc | 5.875% | 3/25/27 | GBP | 1,127 | 1,288 |
| | Western Power Distribution South West plc | 5.750% | 3/23/40 | GBP | 900 | 995 |
| | Western Power Distribution West Midlands plc | 3.875% | 10/17/24 | GBP | 3,431 | 3,812 |
| | Western Power Distribution West Midlands plc | 5.750% | 4/16/32 | GBP | 2,872 | 3,271 |
| | Westfield Stratford City Finance No. 2 plc | 1.642% | 8/4/31 | GBP | 1,272 | 1,253 |
| | Wheatley Group Capital plc | 4.375% | 11/28/44 | GBP | 869 | 844 |
| | WHG Treasury plc | 4.250% | 10/6/45 | GBP | 2,094 | 2,078 |
| 1 | Wods Transmission plc | 3.446% | 8/24/34 | GBP | 421 | 434 |
| | WPP Finance 2013 | 2.875% | 9/14/46 | GBP | 1,107 | 723 |
| | WPP Finance 2016 | 1.375% | 3/20/25 | EUR | 7,292 | 6,806 |
| | WPP Finance 2017 | 3.750% | 5/19/32 | GBP | 704 | 663 |
| | WPP Finance Deutschland GmbH | 1.625% | 3/23/30 | EUR | 5,531 | 4,493 |
| | WPP Finance SA | 2.250% | 9/22/26 | EUR | 200 | 185 |
| | WPP Finance SA | 2.375% | 5/19/27 | EUR | 2,553 | 2,345 |
| | Yorkshire Building Society | 3.000% | 4/18/25 | GBP | 1,216 | 1,329 |
| | Yorkshire Building Society | 0.625% | 9/21/25 | EUR | 4,137 | 3,682 |
| | Yorkshire Building Society | 3.500% | 4/21/26 | GBP | 503 | 538 |
| | Yorkshire Building Society | 0.010% | 10/13/27 | EUR | 9,722 | 8,227 |
| | Yorkshire Building Society | 0.500% | 7/1/28 | EUR | 3,019 | 2,379 |
| | Yorkshire Building Society | 3.375% | 9/13/28 | GBP | 3,724 | 3,512 |
| | Yorkshire Building Society | 1.500% | 9/15/29 | GBP | 2,214 | 1,900 |
| | Yorkshire Housing Finance plc | 4.125% | 10/31/44 | GBP | 1,509 | 1,404 |
| | Yorkshire Power Finance Ltd. | 7.250% | 8/4/28 | GBP | 149 | 183 |
| | Yorkshire Water Finance plc | 3.625% | 8/1/29 | GBP | 3,212 | 3,268 |
Total International Bond Index Fund
| | | Coupon | Maturity
Date | Currency | Face
Amount
(000) | Market
Value•
($000) |
| | Yorkshire Water Finance plc | 6.375% | 8/19/39 | GBP | 803 | 977 |
| | Yorkshire Water Finance plc | 2.750% | 4/18/41 | GBP | 4,961 | 3,853 |
| | Yorkshire Water Services Finance Ltd. | 5.500% | 5/28/37 | GBP | 700 | 790 |
| | | | | | | 1,817,061 |
| United States (2.9%) | | | |
| | 3M Co. | 1.500% | 11/9/26 | EUR | 200 | 183 |
| | 3M Co. | 1.750% | 5/15/30 | EUR | 786 | 662 |
| | Abbott Ireland Financing DAC | 1.500% | 9/27/26 | EUR | 9,067 | 8,427 |
| | Abbott Ireland Financing DAC | 0.375% | 11/19/27 | EUR | 5,087 | 4,382 |
| | AbbVie Inc. | 1.500% | 11/15/23 | EUR | 558 | 543 |
| | AbbVie Inc. | 1.375% | 5/17/24 | EUR | 15,484 | 14,893 |
| | AbbVie Inc. | 1.250% | 6/1/24 | EUR | 5,087 | 4,867 |
| | AbbVie Inc. | 0.750% | 11/18/27 | EUR | 11,943 | 10,216 |
| | AbbVie Inc. | 2.625% | 11/15/28 | EUR | 996 | 926 |
| | AbbVie Inc. | 2.125% | 11/17/28 | EUR | 10,219 | 9,184 |
| | AbbVie Inc. | 2.125% | 6/1/29 | EUR | 4,309 | 3,886 |
| | AbbVie Inc. | 1.250% | 11/18/31 | EUR | 1,216 | 974 |
| | Air Lease Corp. | 2.625% | 12/5/24 | CAD | 3,863 | 2,655 |
| | Air Products and Chemicals Inc. | 1.000% | 2/12/25 | EUR | 1,730 | 1,626 |
| | Air Products and Chemicals Inc. | 0.500% | 5/5/28 | EUR | 1,985 | 1,657 |
| | Air Products and Chemicals Inc. | 0.800% | 5/5/32 | EUR | 1,780 | 1,309 |
| | Altria Group Inc. | 1.700% | 6/15/25 | EUR | 1,601 | 1,488 |
| | Altria Group Inc. | 2.200% | 6/15/27 | EUR | 6,386 | 5,556 |
| | Altria Group Inc. | 3.125% | 6/15/31 | EUR | 9,780 | 7,897 |
| | American Honda Finance Corp. | 1.375% | 11/10/22 | EUR | 2,599 | 2,568 |
| | American Honda Finance Corp. | 0.750% | 1/17/24 | EUR | 3,650 | 3,505 |
| | American Honda Finance Corp. | 0.750% | 11/25/26 | GBP | 3,266 | 3,130 |
| | American Honda Finance Corp. | 0.300% | 7/7/28 | EUR | 6,000 | 4,900 |
| | American International Group Inc. | 1.875% | 6/21/27 | EUR | 2,708 | 2,399 |
| | American Medical Systems Europe BV | 1.625% | 3/8/31 | EUR | 12,500 | 10,333 |
| | American Medical Systems Europe BV | 1.875% | 3/8/34 | EUR | 4,400 | 3,468 |
| | American Tower Corp. | 1.950% | 5/22/26 | EUR | 7,489 | 6,845 |
| | American Tower Corp. | 0.450% | 1/15/27 | EUR | 4,618 | 3,844 |
| | American Tower Corp. | 0.400% | 2/15/27 | EUR | 3,643 | 3,005 |
| | American Tower Corp. | 0.500% | 1/15/28 | EUR | 5,653 | 4,484 |
| | American Tower Corp. | 0.875% | 5/21/29 | EUR | 4,335 | 3,341 |
| | American Tower Corp. | 0.950% | 10/5/30 | EUR | 3,402 | 2,476 |
| | Amgen Inc. | 2.000% | 2/25/26 | EUR | 1,326 | 1,256 |
| | Amgen Inc. | 5.500% | 12/7/26 | GBP | 2,214 | 2,555 |
| | Amgen Inc. | 4.000% | 9/13/29 | GBP | 2,269 | 2,409 |
| | Aon plc | 2.875% | 5/14/26 | EUR | 1,765 | 1,663 |
| | Apple Inc. | 3.350% | 1/10/24 | AUD | 460 | 291 |
| | Apple Inc. | 1.375% | 1/17/24 | EUR | 2,096 | 2,046 |
| | Apple Inc. | 2.513% | 8/19/24 | CAD | 11,407 | 8,072 |
| | Apple Inc. | 0.875% | 5/24/25 | EUR | 8,711 | 8,218 |
| | Apple Inc. | 0.000% | 11/15/25 | EUR | 4,480 | 4,077 |
| | Apple Inc. | 3.600% | 6/10/26 | AUD | 950 | 587 |
| | Apple Inc. | 2.000% | 9/17/27 | EUR | 3,584 | 3,388 |
| | Apple Inc. | 1.375% | 5/24/29 | EUR | 6,640 | 5,926 |
| | Apple Inc. | 0.750% | 2/25/30 | CHF | 2,800 | 2,560 |
| | Apple Inc. | 0.500% | 11/15/31 | EUR | 2,113 | 1,672 |
| | Apple Inc. | 3.600% | 7/31/42 | GBP | 1,936 | 1,915 |
| | Aptiv plc | 1.500% | 3/10/25 | EUR | 6,097 | 5,667 |
| | Archer-Daniels-Midland Co. | 1.750% | 6/23/23 | EUR | 5,087 | 4,992 |
| | Archer-Daniels-Midland Co. | 1.000% | 9/12/25 | EUR | 7,960 | 7,385 |
| | AT&T Inc. | 2.400% | 3/15/24 | EUR | 2,324 | 2,267 |
| | AT&T Inc. | 1.375% | 12/4/24 | CHF | 370 | 366 |
| | AT&T Inc. | 4.000% | 11/25/25 | CAD | 5,367 | 3,800 |
| | AT&T Inc. | 3.500% | 12/17/25 | EUR | 2,434 | 2,398 |
| | AT&T Inc. | 4.100% | 1/19/26 | AUD | 400 | 248 |
| | AT&T Inc. | 0.250% | 3/4/26 | EUR | 8,724 | 7,736 |
| | AT&T Inc. | 2.900% | 12/4/26 | GBP | 1,656 | 1,714 |
| | AT&T Inc. | 5.500% | 3/15/27 | GBP | 750 | 850 |
| | AT&T Inc. | 1.600% | 5/19/28 | EUR | 9,504 | 8,405 |
| | AT&T Inc. | 4.600% | 9/19/28 | AUD | 3,180 | 1,924 |
| | AT&T Inc. | 2.350% | 9/5/29 | EUR | 7,069 | 6,339 |
| | AT&T Inc. | 4.375% | 9/14/29 | GBP | 1,900 | 1,996 |
| | AT&T Inc. | 2.050% | 5/19/32 | EUR | 704 | 586 |
| | AT&T Inc. | 3.550% | 12/17/32 | EUR | 9,066 | 8,407 |
Total International Bond Index Fund
| | | Coupon | Maturity
Date | Currency | Face
Amount
(000) | Market
Value•
($000) |
| | AT&T Inc. | 5.200% | 11/18/33 | GBP | 3,072 | 3,359 |
| | AT&T Inc. | 3.375% | 3/15/34 | EUR | 1,436 | 1,284 |
| | AT&T Inc. | 2.450% | 3/15/35 | EUR | 2,599 | 2,065 |
| | AT&T Inc. | 3.150% | 9/4/36 | EUR | 9,266 | 7,848 |
| | AT&T Inc. | 2.600% | 5/19/38 | EUR | 3,601 | 2,780 |
| | AT&T Inc. | 7.000% | 4/30/40 | GBP | 4,400 | 5,616 |
| | AT&T Inc. | 4.250% | 6/1/43 | GBP | 3,053 | 2,834 |
| | AT&T Inc. | 4.875% | 6/1/44 | GBP | 2,174 | 2,196 |
| | AT&T Inc. | 4.850% | 5/25/47 | CAD | 5,587 | 3,416 |
| | AT&T Inc. | 5.100% | 11/25/48 | CAD | 1,950 | 1,234 |
| | Athene Global Funding | 3.127% | 3/10/25 | CAD | 3,000 | 2,070 |
| | Athene Global Funding | 2.100% | 9/24/25 | CAD | 1,428 | 944 |
| | Athene Global Funding | 0.366% | 9/10/26 | EUR | 2,214 | 1,852 |
| | Athene Global Funding | 0.832% | 1/8/27 | EUR | 6,500 | 5,448 |
| | Athene Global Funding | 1.750% | 11/24/27 | GBP | 3,019 | 2,751 |
| | Athene Global Funding | 0.625% | 1/12/28 | EUR | 16,287 | 12,871 |
| | Athene Global Funding | 2.470% | 6/9/28 | CAD | 2,244 | 1,386 |
| | Bank of America Corp. | 2.932% | 4/25/25 | CAD | 2,395 | 1,695 |
| | Bank of America Corp. | 2.300% | 7/25/25 | GBP | 3,092 | 3,289 |
| | Bank of America Corp. | 3.407% | 9/20/25 | CAD | 969 | 685 |
| | Bank of America Corp. | 3.515% | 3/24/26 | CAD | 1,529 | 1,071 |
| | Bank of America Corp. | 0.808% | 5/9/26 | EUR | 14,844 | 13,473 |
| | Bank of America Corp. | 1.949% | 10/27/26 | EUR | 3,000 | 2,767 |
| | Bank of America Corp. | 4.250% | 12/10/26 | GBP | 2,227 | 2,431 |
| | Bank of America Corp. | 1.776% | 5/4/27 | EUR | 11,327 | 10,254 |
| | Bank of America Corp. | 1.978% | 9/15/27 | CAD | 5,381 | 3,457 |
| | Bank of America Corp. | 3.615% | 3/16/28 | CAD | 6,602 | 4,477 |
| | Bank of America Corp. | 1.662% | 4/25/28 | EUR | 1,306 | 1,143 |
| | Bank of America Corp. | 0.583% | 8/24/28 | EUR | 16,511 | 13,593 |
| | Bank of America Corp. | 3.648% | 3/31/29 | EUR | 11,711 | 11,090 |
| | Bank of America Corp. | 2.598% | 4/4/29 | CAD | 1,901 | 1,207 |
| | Bank of America Corp. | 0.694% | 3/22/31 | EUR | 13,567 | 10,172 |
| | Bank of America Corp. | 3.584% | 4/27/31 | GBP | 2,800 | 2,751 |
| | Bank of America Corp. | 0.654% | 10/26/31 | EUR | 14,875 | 10,821 |
| | Bank of America Corp. | 2.824% | 4/27/33 | EUR | 2,800 | 2,377 |
| | Baxter International Inc. | 1.300% | 5/30/25 | EUR | 7,487 | 7,008 |
| | Baxter International Inc. | 1.300% | 5/15/29 | EUR | 3,705 | 3,058 |
| | Becton Dickinson and Co. | 0.034% | 8/13/25 | EUR | 2,777 | 2,492 |
| | Becton Dickinson and Co. | 1.900% | 12/15/26 | EUR | 5,985 | 5,515 |
| | Becton Dickinson Euro Finance Sarl | 0.632% | 6/4/23 | EUR | 5,471 | 5,342 |
| | Becton Dickinson Euro Finance Sarl | 1.208% | 6/4/26 | EUR | 4,144 | 3,757 |
| | Becton Dickinson Euro Finance Sarl | 0.334% | 8/13/28 | EUR | 1,751 | 1,412 |
| | Becton Dickinson Euro Finance Sarl | 1.336% | 8/13/41 | EUR | 2,294 | 1,347 |
| | Berkshire Hathaway Finance Corp. | 2.000% | 3/18/34 | EUR | 2,800 | 2,236 |
| | Berkshire Hathaway Finance Corp. | 2.375% | 6/19/39 | GBP | 4,441 | 3,521 |
| | Berkshire Hathaway Finance Corp. | 2.625% | 6/19/59 | GBP | 1,875 | 1,346 |
| | Berkshire Hathaway Inc. | 1.300% | 3/15/24 | EUR | 5,307 | 5,107 |
| | Berkshire Hathaway Inc. | 0.170% | 9/13/24 | JPY | 720,000 | 4,803 |
| | Berkshire Hathaway Inc. | 1.125% | 3/16/27 | EUR | 7,528 | 6,660 |
| | Berkshire Hathaway Inc. | 2.150% | 3/15/28 | EUR | 2,850 | 2,591 |
| | Berkshire Hathaway Inc. | 0.440% | 9/13/29 | JPY | 2,810,000 | 17,972 |
| | Berkshire Hathaway Inc. | 1.625% | 3/16/35 | EUR | 4,692 | 3,483 |
| | Berkshire Hathaway Inc. | 1.108% | 9/13/49 | JPY | 330,000 | 1,779 |
| | Berry Global Inc. | 1.500% | 1/15/27 | EUR | 2,214 | 1,826 |
| | Blackstone Holdings Finance Co. LLC | 2.000% | 5/19/25 | EUR | 100 | 95 |
| | Blackstone Holdings Finance Co. LLC | 1.000% | 10/5/26 | EUR | 387 | 341 |
| | Blackstone Holdings Finance Co. LLC | 1.500% | 4/10/29 | EUR | 3,049 | 2,539 |
| 3 | Blackstone Holdings Finance Co. LLC | 3.500% | 6/1/34 | EUR | 3,200 | 2,764 |
| | Blackstone Holdings Finance Co. LLC | 3.500% | 6/1/34 | EUR | 2,000 | 1,727 |
| | Blackstone Private Credit Fund | 1.750% | 11/30/26 | EUR | 3,000 | 2,410 |
| | Booking Holdings Inc. | 2.375% | 9/23/24 | EUR | 2,094 | 2,036 |
| | Booking Holdings Inc. | 0.100% | 3/8/25 | EUR | 14,753 | 13,483 |
| | Booking Holdings Inc. | 1.800% | 3/3/27 | EUR | 9,863 | 8,934 |
| | Booking Holdings Inc. | 0.500% | 3/8/28 | EUR | 7,406 | 6,127 |
| | BorgWarner Inc. | 1.000% | 5/19/31 | EUR | 4,471 | 3,161 |
| | Boston Scientific Corp. | 0.625% | 12/1/27 | EUR | 2,516 | 2,146 |
| | Bristol-Myers Squibb Co. | 1.000% | 5/15/25 | EUR | 790 | 743 |
| | Bristol-Myers Squibb Co. | 1.750% | 5/15/35 | EUR | 2,094 | 1,637 |
| | Brown-Forman Corp. | 1.200% | 7/7/26 | EUR | 1,304 | 1,191 |
Total International Bond Index Fund
| | | Coupon | Maturity
Date | Currency | Face
Amount
(000) | Market
Value•
($000) |
| | Brown-Forman Corp. | 2.600% | 7/7/28 | GBP | 4,713 | 4,670 |
| | Bunge Finance Europe BV | 1.850% | 6/16/23 | EUR | 7,944 | 7,772 |
| | Capital One Financial Corp. | 1.650% | 6/12/29 | EUR | 5,947 | 4,590 |
| | Celanese US Holdings LLC | 4.777% | 7/19/26 | EUR | 2,600 | 2,415 |
| | Celanese US Holdings LLC | 2.125% | 3/1/27 | EUR | 4,034 | 3,231 |
| | Celanese US Holdings LLC | 0.625% | 9/10/28 | EUR | 1,590 | 1,069 |
| | Celanese US Holdings LLC | 5.337% | 1/19/29 | EUR | 3,235 | 2,851 |
| | Chubb INA Holdings Inc. | 0.300% | 12/15/24 | EUR | 943 | 869 |
| | Chubb INA Holdings Inc. | 1.550% | 3/15/28 | EUR | 4,627 | 4,011 |
| | Chubb INA Holdings Inc. | 0.875% | 12/15/29 | EUR | 3,212 | 2,508 |
| | Chubb INA Holdings Inc. | 1.400% | 6/15/31 | EUR | 2,434 | 1,892 |
| | Chubb INA Holdings Inc. | 2.500% | 3/15/38 | EUR | 6,399 | 4,710 |
| | Citigroup Inc. | 2.750% | 1/24/24 | GBP | 5,910 | 6,598 |
| | Citigroup Inc. | 2.375% | 5/22/24 | EUR | 996 | 966 |
| | Citigroup Inc. | 4.090% | 6/9/25 | CAD | 1,501 | 1,057 |
| | Citigroup Inc. | 2.400% | 10/31/25 | JPY | 3,185,500 | 21,974 |
| | Citigroup Inc. | 1.250% | 7/6/26 | EUR | 7,600 | 6,952 |
| | Citigroup Inc. | 1.500% | 7/24/26 | EUR | 7,539 | 6,928 |
| | Citigroup Inc. | 2.125% | 9/10/26 | EUR | 2,763 | 2,508 |
| | Citigroup Inc. | 1.750% | 10/23/26 | GBP | 5,745 | 5,675 |
| | Citigroup Inc. | 2.800% | 6/25/27 | JPY | 66,600 | 475 |
| | Citigroup Inc. | 0.500% | 10/8/27 | EUR | 19,633 | 16,711 |
| | Citigroup Inc. | 1.625% | 3/21/28 | EUR | 3,000 | 2,598 |
| | Citigroup Inc. | 1.250% | 4/10/29 | EUR | 1,545 | 1,258 |
| | Citigroup Inc. | 4.500% | 3/3/31 | GBP | 498 | 493 |
| | Citigroup Inc. | 6.800% | 6/25/38 | GBP | 321 | 421 |
| | Citigroup Inc. | 7.375% | 9/1/39 | GBP | 338 | 467 |
| | Coca-Cola Co. | 0.500% | 3/8/24 | EUR | 2,982 | 2,854 |
| | Coca-Cola Co. | 3.250% | 6/11/24 | AUD | 830 | 521 |
| | Coca-Cola Co. | 1.125% | 3/9/27 | EUR | 6,688 | 6,068 |
| | Coca-Cola Co. | 0.125% | 3/9/29 | EUR | 2,389 | 1,941 |
| | Coca-Cola Co. | 0.400% | 5/6/30 | EUR | 5,530 | 4,420 |
| | Coca-Cola Co. | 0.500% | 3/9/33 | EUR | 3,071 | 2,267 |
| | Coca-Cola Co. | 0.375% | 3/15/33 | EUR | 12,873 | 9,307 |
| | Coca-Cola Co. | 1.625% | 3/9/35 | EUR | 2,900 | 2,323 |
| | Coca-Cola Co. | 0.950% | 5/6/36 | EUR | 3,244 | 2,297 |
| | Coca-Cola Co. | 0.800% | 3/15/40 | EUR | 3,037 | 1,892 |
| | Colgate-Palmolive Co. | 0.500% | 3/6/26 | EUR | 943 | 858 |
| | Colgate-Palmolive Co. | 0.300% | 11/10/29 | EUR | 4,000 | 3,259 |
| | Colgate-Palmolive Co. | 1.375% | 3/6/34 | EUR | 1,326 | 1,073 |
| | Colgate-Palmolive Co. | 0.875% | 11/12/39 | EUR | 383 | 254 |
| | Comcast Corp. | 0.000% | 9/14/26 | EUR | 3,694 | 3,195 |
| | Comcast Corp. | 1.500% | 2/20/29 | GBP | 2,231 | 2,036 |
| | Comcast Corp. | 0.250% | 9/14/29 | EUR | 6,482 | 5,139 |
| | Comcast Corp. | 5.500% | 11/23/29 | GBP | 2,044 | 2,366 |
| | Comcast Corp. | 0.750% | 2/20/32 | EUR | 1,600 | 1,222 |
| | Comcast Corp. | 1.875% | 2/20/36 | GBP | 3,358 | 2,654 |
| | Comcast Corp. | 1.250% | 2/20/40 | EUR | 4,248 | 2,814 |
| | Corning Inc. | 0.992% | 8/10/27 | JPY | 830,000 | 5,425 |
| | Danaher Corp. | 1.700% | 3/30/24 | EUR | 283 | 273 |
| | Danaher Corp. | 2.500% | 3/30/30 | EUR | 5,910 | 5,414 |
| | DH Europe Finance II Sarl | 0.200% | 3/18/26 | EUR | 7,796 | 6,926 |
| | DH Europe Finance II Sarl | 0.450% | 3/18/28 | EUR | 1,710 | 1,435 |
| | DH Europe Finance II Sarl | 0.750% | 9/18/31 | EUR | 3,815 | 2,932 |
| | DH Europe Finance II Sarl | 1.350% | 9/18/39 | EUR | 5,525 | 3,668 |
| | DH Europe Finance II Sarl | 1.800% | 9/18/49 | EUR | 3,092 | 1,955 |
| | Digital Dutch Finco BV | 1.500% | 3/15/30 | EUR | 2,800 | 2,084 |
| | Digital Dutch Finco BV | 1.250% | 2/1/31 | EUR | 6,316 | 4,372 |
| | Digital Dutch Finco BV | 1.000% | 1/15/32 | EUR | 1,250 | 825 |
| | Digital Euro Finco LLC | 2.625% | 4/15/24 | EUR | 2,599 | 2,469 |
| | Digital Euro Finco LLC | 1.125% | 4/9/28 | EUR | 13,367 | 10,406 |
| | Digital Stout Holding LLC | 4.250% | 1/17/25 | GBP | 1,107 | 1,212 |
| | Digital Stout Holding LLC | 3.300% | 7/19/29 | GBP | 3,515 | 3,250 |
| | Digital Stout Holding LLC | 3.750% | 10/17/30 | GBP | 2,094 | 1,953 |
| | Discovery Communications LLC | 2.500% | 9/20/24 | GBP | 3,815 | 4,097 |
| | Discovery Communications LLC | 1.900% | 3/19/27 | EUR | 7,041 | 5,934 |
| | Dover Corp. | 1.250% | 11/9/26 | EUR | 13,810 | 12,314 |
| | Dover Corp. | 0.750% | 11/4/27 | EUR | 1,900 | 1,606 |
| | Dow Chemical Co. | 0.500% | 3/15/27 | EUR | 9,122 | 7,623 |
Total International Bond Index Fund
| | | Coupon | Maturity
Date | Currency | Face
Amount
(000) | Market
Value•
($000) |
| | Dow Chemical Co. | 1.875% | 3/15/40 | EUR | 3,340 | 1,978 |
| | Duke Energy Corp. | 3.100% | 6/15/28 | EUR | 9,500 | 8,733 |
| | Duke Energy Corp. | 3.850% | 6/15/34 | EUR | 7,700 | 6,744 |
| | DXC Capital Funding DAC | 0.450% | 9/15/27 | EUR | 2,697 | 2,195 |
| | DXC Capital Funding DAC | 0.950% | 9/15/31 | EUR | 4,129 | 3,008 |
| | DXC Technology Co. | 1.750% | 1/15/26 | EUR | 4,237 | 3,854 |
| | Eastman Chemical Co. | 1.500% | 5/26/23 | EUR | 5,087 | 4,962 |
| | Eastman Chemical Co. | 1.875% | 11/23/26 | EUR | 12,471 | 10,828 |
| | Eaton Capital Unlimited Co. | 0.697% | 5/14/25 | EUR | 5,938 | 5,485 |
| | Eaton Capital Unlimited Co. | 0.577% | 3/8/30 | EUR | 1,900 | 1,485 |
| | Ecolab Inc. | 1.000% | 1/15/24 | EUR | 3,881 | 3,734 |
| | Eli Lilly & Co. | 2.125% | 6/3/30 | EUR | 4,144 | 3,733 |
| | Eli Lilly & Co. | 1.700% | 11/1/49 | EUR | 3,102 | 2,035 |
| | Eli Lilly & Co. | 1.375% | 9/14/61 | EUR | 3,000 | 1,546 |
| | Emerson Electric Co. | 0.375% | 5/22/24 | EUR | 1,025 | 964 |
| | Emerson Electric Co. | 1.250% | 10/15/25 | EUR | 996 | 920 |
| | Emerson Electric Co. | 2.000% | 10/15/29 | EUR | 996 | 868 |
| | Equinix Inc. | 0.250% | 3/15/27 | EUR | 2,214 | 1,836 |
| | Euronet Worldwide Inc. | 1.375% | 5/22/26 | EUR | 3,156 | 2,677 |
| | Exxon Mobil Corp. | 0.142% | 6/26/24 | EUR | 10,329 | 9,720 |
| | Exxon Mobil Corp. | 0.835% | 6/26/32 | EUR | 14,487 | 10,940 |
| | Exxon Mobil Corp. | 1.408% | 6/26/39 | EUR | 1,900 | 1,250 |
| | FedEx Corp. | 1.625% | 1/11/27 | EUR | 3,541 | 3,175 |
| | FedEx Corp. | 1.300% | 8/5/31 | EUR | 1,161 | 841 |
| | FedEx Corp. | 0.950% | 5/4/33 | EUR | 6,723 | 4,560 |
| | Fidelity National Information Services Inc. | 1.500% | 5/21/27 | EUR | 14,734 | 13,051 |
| | Fidelity National Information Services Inc. | 1.000% | 12/3/28 | EUR | 3,197 | 2,616 |
| | Fidelity National Information Services Inc. | 2.250% | 12/3/29 | GBP | 1,120 | 1,000 |
| | Fidelity National Information Services Inc. | 2.000% | 5/21/30 | EUR | 2,214 | 1,853 |
| | Fidelity National Information Services Inc. | 3.360% | 5/21/31 | GBP | 2,403 | 2,280 |
| | Fidelity National Information Services Inc. | 2.950% | 5/21/39 | EUR | 1,706 | 1,295 |
| | Fiserv Inc. | 2.250% | 7/1/25 | GBP | 700 | 733 |
| | Fiserv Inc. | 1.125% | 7/1/27 | EUR | 1,467 | 1,279 |
| | Fiserv Inc. | 1.625% | 7/1/30 | EUR | 6,285 | 5,095 |
| | Fiserv Inc. | 3.000% | 7/1/31 | GBP | 1,900 | 1,742 |
| | GE Capital Canada Funding Co. | 5.730% | 10/22/37 | CAD | 765 | 549 |
| | GE Capital European Funding Unlimited Co. | 6.025% | 3/1/38 | EUR | 1,408 | 1,581 |
| | GE Capital UK Funding Unlimited Co. | 5.875% | 1/18/33 | GBP | 4,579 | 5,244 |
| | General Electric Co. | 0.875% | 5/17/25 | EUR | 3,700 | 3,428 |
| | General Electric Co. | 1.500% | 5/17/29 | EUR | 2,278 | 1,929 |
| | General Electric Co. | 4.125% | 9/19/35 | EUR | 4,715 | 4,582 |
| | General Electric Co. | 2.125% | 5/17/37 | EUR | 2,994 | 2,261 |
| | General Electric Co. | 4.875% | 9/18/37 | GBP | 453 | 438 |
| | General Mills Inc. | 0.450% | 1/15/26 | EUR | 1,710 | 1,532 |
| | General Mills Inc. | 1.500% | 4/27/27 | EUR | 996 | 885 |
| | General Motors Financial Co. Inc. | 2.200% | 4/1/24 | EUR | 2,962 | 2,833 |
| | General Motors Financial Co. Inc. | 2.250% | 9/6/24 | GBP | 394 | 423 |
| | General Motors Financial Co. Inc. | 1.000% | 2/24/25 | EUR | 9,300 | 8,440 |
| | General Motors Financial Co. Inc. | 0.850% | 2/26/26 | EUR | 9,787 | 8,533 |
| | General Motors Financial Co. Inc. | 0.650% | 9/7/28 | EUR | 3,019 | 2,261 |
| | General Motors Financial of Canada Ltd. | 3.250% | 11/7/23 | CAD | 2,283 | 1,633 |
| | General Motors Financial of Canada Ltd. | 5.950% | 5/14/24 | CAD | 2,537 | 1,863 |
| | General Motors Financial of Canada Ltd. | 1.700% | 7/9/25 | CAD | 1,100 | 724 |
| | General Motors Financial of Canada Ltd. | 1.750% | 4/15/26 | CAD | 1,496 | 956 |
| | General Motors Financial of Canada Ltd. | 3.150% | 2/8/27 | CAD | 1,860 | 1,220 |
| | Goldman Sachs Group Inc. | 1.375% | 5/15/24 | EUR | 16,103 | 15,352 |
| | Goldman Sachs Group Inc. | 2.125% | 9/30/24 | EUR | 7,017 | 6,735 |
| | Goldman Sachs Group Inc. | 3.375% | 3/27/25 | EUR | 2,561 | 2,509 |
| | Goldman Sachs Group Inc. | 1.250% | 5/1/25 | EUR | 4,284 | 3,995 |
| | Goldman Sachs Group Inc. | 7.125% | 8/7/25 | GBP | 1,899 | 2,253 |
| | Goldman Sachs Group Inc. | 3.307% | 10/31/25 | CAD | 411 | 289 |
| | Goldman Sachs Group Inc. | 4.250% | 1/29/26 | GBP | 9,177 | 10,020 |
| | Goldman Sachs Group Inc. | 2.875% | 6/3/26 | EUR | 11,899 | 11,199 |
| | Goldman Sachs Group Inc. | 1.625% | 7/27/26 | EUR | 1,389 | 1,256 |
| | Goldman Sachs Group Inc. | 2.599% | 11/30/27 | CAD | 3,570 | 2,331 |
| | Goldman Sachs Group Inc. | 1.500% | 12/7/27 | GBP | 7,515 | 6,957 |
| | Goldman Sachs Group Inc. | 0.250% | 1/26/28 | EUR | 9,365 | 7,476 |
| | Goldman Sachs Group Inc. | 2.000% | 3/22/28 | EUR | 3,638 | 3,189 |
| | Goldman Sachs Group Inc. | 7.250% | 4/10/28 | GBP | 403 | 486 |
Total International Bond Index Fund
| | | Coupon | Maturity
Date | Currency | Face
Amount
(000) | Market
Value•
($000) |
| | Goldman Sachs Group Inc. | 2.000% | 11/1/28 | EUR | 5,226 | 4,520 |
| | Goldman Sachs Group Inc. | 2.013% | 2/28/29 | CAD | 4,951 | 3,042 |
| | Goldman Sachs Group Inc. | 0.875% | 5/9/29 | EUR | 9,300 | 7,233 |
| | Goldman Sachs Group Inc. | 3.125% | 7/25/29 | GBP | 3,211 | 3,067 |
| | Goldman Sachs Group Inc. | 3.625% | 10/29/29 | GBP | 934 | 928 |
| | Goldman Sachs Group Inc. | 1.875% | 12/16/30 | GBP | 375 | 318 |
| | Goldman Sachs Group Inc. | 0.750% | 3/23/32 | EUR | 11,206 | 7,792 |
| | Goldman Sachs Group Inc. | 1.000% | 3/18/33 | EUR | 9,769 | 6,732 |
| | Goldman Sachs Group Inc. | 6.875% | 1/18/38 | GBP | 1,263 | 1,497 |
| | GSK Consumer Healthcare Capital NL BV | 1.250% | 3/29/26 | EUR | 7,500 | 6,822 |
| | GSK Consumer Healthcare Capital NL BV | 2.125% | 3/29/34 | EUR | 2,800 | 2,196 |
| | Harley-Davidson Financial Services Inc. | 3.875% | 5/19/23 | EUR | 3,064 | 3,036 |
| | HCN Canadian Holdings-1 LP | 2.950% | 1/15/27 | CAD | 917 | 598 |
| | Highland Holdings Sarl | 0.318% | 12/15/26 | EUR | 10,300 | 8,732 |
| | Honeywell International Inc. | 2.250% | 2/22/28 | EUR | 13,772 | 12,558 |
| | Honeywell International Inc. | 0.750% | 3/10/32 | EUR | 2,000 | 1,489 |
| | Honeywell International Inc. | 4.125% | 11/2/34 | EUR | 2,507 | 2,440 |
| | Illinois Tool Works Inc. | 0.250% | 12/5/24 | EUR | 2,379 | 2,200 |
| | Illinois Tool Works Inc. | 0.625% | 12/5/27 | EUR | 5,617 | 4,760 |
| | Illinois Tool Works Inc. | 2.125% | 5/22/30 | EUR | 5,920 | 5,127 |
| | Illinois Tool Works Inc. | 1.000% | 6/5/31 | EUR | 3,102 | 2,385 |
| | International Business Machines Corp | 1.250% | 2/9/34 | EUR | 5,100 | 3,856 |
| | International Business Machines Corp. | 0.875% | 1/31/25 | EUR | 1,545 | 1,450 |
| | International Business Machines Corp. | 0.950% | 5/23/25 | EUR | 9,397 | 8,759 |
| | International Business Machines Corp. | 2.875% | 11/7/25 | EUR | 2,050 | 1,994 |
| | International Business Machines Corp. | 1.250% | 1/29/27 | EUR | 6,265 | 5,661 |
| | International Business Machines Corp. | 0.300% | 2/11/28 | EUR | 3,815 | 3,204 |
| | International Business Machines Corp. | 1.750% | 3/7/28 | EUR | 1,900 | 1,718 |
| | International Business Machines Corp. | 1.500% | 5/23/29 | EUR | 3,700 | 3,236 |
| | International Business Machines Corp. | 1.750% | 1/31/31 | EUR | 4,758 | 4,076 |
| | International Business Machines Corp. | 1.200% | 2/11/40 | EUR | 2,763 | 1,784 |
| | International Flavors & Fragrances Inc. | 1.800% | 9/25/26 | EUR | 4,502 | 3,875 |
| | John Deere Cash Management Sarl | 2.200% | 4/2/32 | EUR | 5,087 | 4,499 |
| | John Deere Cash Management Sarl | 1.650% | 6/13/39 | EUR | 2,543 | 1,816 |
| | John Deere Financial Inc. | 2.460% | 4/4/24 | CAD | 4,500 | 3,187 |
| | John Deere Financial Inc. | 1.090% | 7/17/24 | CAD | 1,488 | 1,023 |
| | John Deere Financial Inc. | 2.580% | 10/16/26 | CAD | 969 | 651 |
| | John Deere Financial Inc. | 1.340% | 9/8/27 | CAD | 4,030 | 2,505 |
| | Johnson & Johnson | 0.650% | 5/20/24 | EUR | 5,197 | 4,981 |
| | Johnson & Johnson | 1.150% | 11/20/28 | EUR | 558 | 495 |
| | Johnson & Johnson | 1.650% | 5/20/35 | EUR | 150 | 121 |
| | Johnson Controls International plc | 1.375% | 2/25/25 | EUR | 8,160 | 7,635 |
| | Johnson Controls International plc / Tyco Fire & Security Finance SCA | 0.375% | 9/15/27 | EUR | 2,532 | 2,110 |
| | Johnson Controls International plc / Tyco Fire & Security Finance SCA | 3.000% | 9/15/28 | EUR | 4,931 | 4,596 |
| | Johnson Controls International plc / Tyco Fire & Security Finance SCA | 1.000% | 9/15/32 | EUR | 1,875 | 1,391 |
| | JPMorgan Chase & Co. | 0.500% | 12/4/23 | CHF | 21,735 | 21,407 |
| | JPMorgan Chase & Co. | 3.000% | 2/19/26 | EUR | 2,872 | 2,735 |
| | JPMorgan Chase & Co. | 0.991% | 4/28/26 | GBP | 7,448 | 7,640 |
| | JPMorgan Chase & Co. | 3.500% | 12/18/26 | GBP | 2,543 | 2,726 |
| | JPMorgan Chase & Co. | 1.090% | 3/11/27 | EUR | 42,076 | 37,426 |
| | JPMorgan Chase & Co. | 0.389% | 2/24/28 | EUR | 16,892 | 14,088 |
| | JPMorgan Chase & Co. | 1.896% | 3/5/28 | CAD | 8,150 | 5,178 |
| | JPMorgan Chase & Co. | 1.638% | 5/18/28 | EUR | 2,084 | 1,827 |
| | JPMorgan Chase & Co. | 1.963% | 3/23/30 | EUR | 5,000 | 4,247 |
| | JPMorgan Chase & Co. | 1.001% | 7/25/31 | EUR | 3,800 | 2,904 |
| | JPMorgan Chase & Co. | 1.047% | 11/4/32 | EUR | 900 | 661 |
| | JPMorgan Chase & Co. | 1.895% | 4/28/33 | GBP | 3,000 | 2,540 |
| | Kellogg Co. | 1.250% | 3/10/25 | EUR | 2,599 | 2,455 |
| | Kinder Morgan Inc. | 2.250% | 3/16/27 | EUR | 3,578 | 3,279 |
| | KKR Group Finance Co. V LLC | 1.625% | 5/22/29 | EUR | 5,087 | 4,122 |
| 3 | KKR Group Finance Co. V LLC | 1.625% | 5/22/29 | EUR | 1,545 | 1,252 |
| | Kraft Heinz Foods Co. | 2.250% | 5/25/28 | EUR | 7,000 | 6,222 |
| | Liberty Mutual Group Inc. | 2.750% | 5/4/26 | EUR | 7,182 | 6,794 |
| | LYB International Finance II BV | 0.875% | 9/17/26 | EUR | 4,539 | 3,880 |
| | ManpowerGroup Inc. | 1.750% | 6/22/26 | EUR | 250 | 227 |
| | Mastercard Inc. | 2.100% | 12/1/27 | EUR | 4,165 | 3,876 |
| | Mastercard Inc. | 1.000% | 2/22/29 | EUR | 6,800 | 5,802 |
| | McDonald's Corp. | 2.000% | 6/1/23 | EUR | 900 | 887 |
| | McDonald's Corp. | 1.000% | 11/15/23 | EUR | 8,600 | 8,329 |
Total International Bond Index Fund
| | | Coupon | Maturity
Date | Currency | Face
Amount
(000) | Market
Value•
($000) |
| | McDonald's Corp. | 0.625% | 1/29/24 | EUR | 6,400 | 6,132 |
| | McDonald's Corp. | 3.000% | 3/8/24 | AUD | 11,070 | 6,921 |
| | McDonald's Corp. | 2.375% | 11/27/24 | EUR | 100 | 97 |
| | McDonald's Corp. | 3.125% | 3/4/25 | CAD | 5,101 | 3,597 |
| | McDonald's Corp. | 0.900% | 6/15/26 | EUR | 100 | 91 |
| | McDonald's Corp. | 1.875% | 5/26/27 | EUR | 100 | 92 |
| | McDonald's Corp. | 1.750% | 5/3/28 | EUR | 1,900 | 1,701 |
| | McDonald's Corp. | 0.250% | 10/4/28 | EUR | 9,300 | 7,560 |
| | McDonald's Corp. | 2.625% | 6/11/29 | EUR | 100 | 90 |
| | McDonald's Corp. | 1.500% | 11/28/29 | EUR | 7,200 | 6,103 |
| | McDonald's Corp. | 2.950% | 3/15/34 | GBP | 2,800 | 2,601 |
| | McDonald's Corp. | 3.000% | 5/31/34 | EUR | 4,900 | 4,356 |
| | McDonald's Corp. | 4.125% | 6/11/54 | GBP | 800 | 773 |
| | McKesson Corp. | 1.500% | 11/17/25 | EUR | 6,414 | 5,973 |
| | McKesson Corp. | 1.625% | 10/30/26 | EUR | ��� 5,197 | 4,746 |
| | McKesson Corp. | 3.125% | 2/17/29 | GBP | 398 | 384 |
| | Medtronic Global Holdings SCA | 0.250% | 7/2/25 | EUR | 1,491 | 1,362 |
| | Medtronic Global Holdings SCA | 2.625% | 10/15/25 | EUR | 1,083 | 1,051 |
| | Medtronic Global Holdings SCA | 0.375% | 10/15/28 | EUR | 10,196 | 8,408 |
| | Medtronic Global Holdings SCA | 3.000% | 10/15/28 | EUR | 1,725 | 1,648 |
| | Medtronic Global Holdings SCA | 1.625% | 3/7/31 | EUR | 4,144 | 3,520 |
| | Medtronic Global Holdings SCA | 1.000% | 7/2/31 | EUR | 1,436 | 1,142 |
| | Medtronic Global Holdings SCA | 3.125% | 10/15/31 | EUR | 1,200 | 1,129 |
| | Medtronic Global Holdings SCA | 0.750% | 10/15/32 | EUR | 5,087 | 3,791 |
| | Medtronic Global Holdings SCA | 3.375% | 10/15/34 | EUR | 1,547 | 1,454 |
| | Medtronic Global Holdings SCA | 2.250% | 3/7/39 | EUR | 1,601 | 1,215 |
| | Medtronic Global Holdings SCA | 1.500% | 7/2/39 | EUR | 6,297 | 4,201 |
| | Medtronic Global Holdings SCA | 1.375% | 10/15/40 | EUR | 9,934 | 6,330 |
| | Medtronic Global Holdings SCA | 1.750% | 7/2/49 | EUR | 7,796 | 4,858 |
| | Medtronic Global Holdings SCA | 1.625% | 10/15/50 | EUR | 7,158 | 4,250 |
| | Merck & Co. Inc. | 0.500% | 11/2/24 | EUR | 5,043 | 4,763 |
| | Merck & Co. Inc. | 1.875% | 10/15/26 | EUR | 1,710 | 1,607 |
| | Merck & Co. Inc. | 2.500% | 10/15/34 | EUR | 2,686 | 2,387 |
| | Merck & Co. Inc. | 1.375% | 11/2/36 | EUR | 1,216 | 913 |
| | MetLife Inc. | 5.375% | 12/9/24 | GBP | 2,237 | 2,575 |
| | MetLife Inc. | 0.769% | 5/23/29 | JPY | 670,000 | 4,499 |
| | Metropolitan Life Global Funding I | 0.375% | 4/9/24 | EUR | 2,543 | 2,406 |
| | Metropolitan Life Global Funding I | 4.000% | 7/13/27 | AUD | 1,281 | 764 |
| | Metropolitan Life Global Funding I | 0.625% | 12/8/27 | GBP | 4,471 | 4,060 |
| | Metropolitan Life Global Funding I | 1.950% | 3/20/28 | CAD | 2,843 | 1,775 |
| | Metropolitan Life Global Funding I | 2.450% | 1/12/29 | CAD | 1,650 | 1,036 |
| | Metropolitan Life Global Funding I | 3.394% | 4/9/30 | CAD | 2,128 | 1,378 |
| | Microsoft Corp. | 3.125% | 12/6/28 | EUR | 11,236 | 11,096 |
| | Microsoft Corp. | 2.625% | 5/2/33 | EUR | 2,094 | 1,944 |
| | Mohawk Capital Finance SA | 1.750% | 6/12/27 | EUR | 1,400 | 1,191 |
| | Molson Coors Beverage Co. | 1.250% | 7/15/24 | EUR | 4,429 | 4,174 |
| | Molson Coors International LP | 3.440% | 7/15/26 | CAD | 1,853 | 1,270 |
| 3 | Mondelez International Holdings Netherlands BV | 0.000% | 9/22/26 | EUR | 4,812 | 4,134 |
| 3 | Mondelez International Holdings Netherlands BV | 0.250% | 9/9/29 | EUR | 3,563 | 2,768 |
| 3 | Mondelez International Holdings Netherlands BV | 1.250% | 9/9/41 | EUR | 1,590 | 935 |
| | Mondelez International Inc. | 3.250% | 3/7/25 | CAD | 2,240 | 1,576 |
| | Mondelez International Inc. | 1.625% | 3/8/27 | EUR | 6,011 | 5,417 |
| | Mondelez International Inc. | 0.250% | 3/17/28 | EUR | 10,430 | 8,531 |
| | Mondelez International Inc. | 2.375% | 3/6/35 | EUR | 637 | 504 |
| | Moody's Corp. | 0.950% | 2/25/30 | EUR | 4,892 | 3,920 |
| | Morgan Stanley | 3.000% | 2/7/24 | CAD | 4,982 | 3,541 |
| | Morgan Stanley | 2.103% | 5/8/26 | EUR | 3,500 | 3,277 |
| | Morgan Stanley | 1.342% | 10/23/26 | EUR | 6,908 | 6,254 |
| | Morgan Stanley | 1.375% | 10/27/26 | EUR | 3,700 | 3,289 |
| | Morgan Stanley | 2.625% | 3/9/27 | GBP | 4,495 | 4,542 |
| | Morgan Stanley | 1.779% | 8/4/27 | CAD | 3,309 | 2,117 |
| | Morgan Stanley | 0.406% | 10/29/27 | EUR | 7,430 | 6,254 |
| | Morgan Stanley | 0.495% | 10/26/29 | EUR | 17,019 | 13,296 |
| | Morgan Stanley | 0.497% | 2/7/31 | EUR | 16,470 | 12,116 |
| | Morgan Stanley | 2.950% | 5/7/32 | EUR | 9,700 | 8,393 |
| | Morgan Stanley | 1.102% | 4/29/33 | EUR | 1,429 | 1,026 |
| | Morgan Stanley | 5.148% | 1/25/34 | EUR | 6,000 | 6,102 |
| | Mylan Inc. | 2.125% | 5/23/25 | EUR | 5,600 | 5,197 |
| | Nasdaq Inc. | 1.750% | 3/28/29 | EUR | 4,812 | 4,013 |
Total International Bond Index Fund
| | | Coupon | Maturity
Date | Currency | Face
Amount
(000) | Market
Value•
($000) |
| | Nasdaq Inc. | 0.875% | 2/13/30 | EUR | 8,864 | 6,761 |
| | National Grid North America Inc | 1.054% | 1/20/31 | EUR | 7,500 | 5,637 |
| | National Grid North America Inc. | 1.000% | 7/12/24 | EUR | 300 | 283 |
| | Nestle Finance International Ltd. | 2.250% | 11/30/23 | GBP | 461 | 518 |
| | Nestle Finance International Ltd. | 0.375% | 1/18/24 | EUR | 6,145 | 5,913 |
| | Nestle Finance International Ltd. | 0.000% | 11/12/24 | EUR | 7,515 | 7,059 |
| | Nestle Finance International Ltd. | 1.250% | 11/2/29 | EUR | 5,536 | 4,837 |
| | Nestle Finance International Ltd. | 1.500% | 4/1/30 | EUR | 5,124 | 4,519 |
| | Nestle Finance International Ltd. | 0.375% | 5/12/32 | EUR | 4,000 | 3,021 |
| | Nestle Finance International Ltd. | 0.000% | 3/3/33 | EUR | 4,455 | 3,142 |
| | Nestle Finance International Ltd. | 1.750% | 11/2/37 | EUR | 4,125 | 3,282 |
| | Nestle Finance International Ltd. | 0.375% | 12/3/40 | EUR | 3,587 | 2,098 |
| | Nestle Finance International Ltd. | 0.875% | 6/14/41 | EUR | 9,260 | 5,999 |
| | Nestle Holdings Inc. | 2.125% | 4/4/27 | GBP | 1,250 | 1,270 |
| | Nestle Holdings Inc. | 2.192% | 1/26/29 | CAD | 7,380 | 4,667 |
| | Nestle Holdings Inc. | 1.375% | 6/23/33 | GBP | 3,000 | 2,440 |
| | Nestle SA | 2.500% | 7/14/34 | CHF | 4,900 | 4,989 |
| | New York Life Global Funding | 1.250% | 12/17/26 | GBP | 3,724 | 3,642 |
| | New York Life Global Funding | 0.250% | 1/23/27 | EUR | 9,787 | 8,363 |
| | New York Life Global Funding | 2.000% | 4/17/28 | CAD | 2,993 | 1,892 |
| | NextEra Energy Capital Holdings Inc. | 2.200% | 12/2/26 | AUD | 2,290 | 1,299 |
| | Omnicom Capital Holdings plc | 2.250% | 11/22/33 | GBP | 2,429 | 1,991 |
| | Omnicom Finance Holdings plc | 0.800% | 7/8/27 | EUR | 7,904 | 6,847 |
| | Omnicom Finance Holdings plc | 1.400% | 7/8/31 | EUR | 2,269 | 1,794 |
| | Oracle Corp. | 3.125% | 7/10/25 | EUR | 448 | 436 |
| | Parker-Hannifin Corp. | 1.125% | 3/1/25 | EUR | 7,955 | 7,297 |
| | PepsiCo Inc. | 0.250% | 5/6/24 | EUR | 3,156 | 2,999 |
| | PepsiCo Inc. | 2.150% | 5/6/24 | CAD | 1,624 | 1,149 |
| | PepsiCo Inc. | 0.750% | 3/18/27 | EUR | 996 | 895 |
| | PepsiCo Inc. | 0.500% | 5/6/28 | EUR | 5,974 | 5,117 |
| | PepsiCo Inc. | 0.875% | 7/18/28 | EUR | 1,875 | 1,619 |
| | PepsiCo Inc. | 1.125% | 3/18/31 | EUR | 943 | 783 |
| | PepsiCo Inc. | 0.400% | 10/9/32 | EUR | 6,028 | 4,424 |
| | PepsiCo Inc. | 0.750% | 10/14/33 | EUR | 3,343 | 2,478 |
| | PepsiCo Inc. | 0.875% | 10/16/39 | EUR | 5,032 | 3,140 |
| | PepsiCo Inc. | 1.050% | 10/9/50 | EUR | 1,107 | 615 |
| | PerkinElmer Inc. | 1.875% | 7/19/26 | EUR | 2,323 | 2,125 |
| | Pfizer Inc. | 1.000% | 3/6/27 | EUR | 1,765 | 1,603 |
| | Pfizer Inc. | 2.735% | 6/15/43 | GBP | 4,634 | 3,836 |
| | Philip Morris International Inc. | 0.625% | 11/8/24 | EUR | 667 | 621 |
| | Philip Morris International Inc. | 2.875% | 5/14/29 | EUR | 1,272 | 1,099 |
| | Philip Morris International Inc. | 0.800% | 8/1/31 | EUR | 4,539 | 3,160 |
| | Philip Morris International Inc. | 3.125% | 6/3/33 | EUR | 548 | 434 |
| | Philip Morris International Inc. | 2.000% | 5/9/36 | EUR | 4,090 | 2,589 |
| | Philip Morris International Inc. | 1.875% | 11/6/37 | EUR | 7,763 | 4,556 |
| | Philip Morris International Inc. | 1.450% | 8/1/39 | EUR | 3,102 | 1,657 |
| | PPG Industries Inc. | 1.875% | 6/1/25 | EUR | 2,296 | 2,151 |
| | PPG Industries Inc. | 0.875% | 11/3/25 | EUR | 1,326 | 1,190 |
| | PPG Industries Inc. | 1.400% | 3/13/27 | EUR | 200 | 174 |
| | PPG Industries Inc. | 2.750% | 6/1/29 | EUR | 2,906 | 2,587 |
| | Praxair Inc. | 1.200% | 2/12/24 | EUR | 4,090 | 3,953 |
| | Praxair Inc. | 1.625% | 12/1/25 | EUR | 10,476 | 9,810 |
| | Procter & Gamble Co. | 1.125% | 11/2/23 | EUR | 5,976 | 5,814 |
| | Procter & Gamble Co. | 0.500% | 10/25/24 | EUR | 1,545 | 1,463 |
| | Procter & Gamble Co. | 0.625% | 10/30/24 | EUR | 2,050 | 1,944 |
| | Procter & Gamble Co. | 1.375% | 5/3/25 | GBP | 4,977 | 5,293 |
| | Procter & Gamble Co. | 1.200% | 10/30/28 | EUR | 2,379 | 2,110 |
| | Procter & Gamble Co. | 1.800% | 5/3/29 | GBP | 6,427 | 6,149 |
| | Procter & Gamble Co. | 1.250% | 10/25/29 | EUR | 3,541 | 3,091 |
| | Procter & Gamble Co. | 0.350% | 5/5/30 | EUR | 8,000 | 6,439 |
| | Procter & Gamble Co. | 1.875% | 10/30/38 | EUR | 1,216 | 981 |
| | Prologis Euro Finance LLC | 0.250% | 9/10/27 | EUR | 8,728 | 7,138 |
| | Prologis Euro Finance LLC | 0.375% | 2/6/28 | EUR | 1,729 | 1,402 |
| | Prologis Euro Finance LLC | 1.875% | 1/5/29 | EUR | 5,481 | 4,700 |
| | Prologis Euro Finance LLC | 1.000% | 2/8/29 | EUR | 5,300 | 4,246 |
| | Prologis Euro Finance LLC | 0.625% | 9/10/31 | EUR | 3,019 | 2,124 |
| | Prologis Euro Finance LLC | 0.500% | 2/16/32 | EUR | 4,197 | 2,855 |
| | Prologis Euro Finance LLC | 1.500% | 2/8/34 | EUR | 1,300 | 918 |
| | Prologis Euro Finance LLC | 1.000% | 2/6/35 | EUR | 1,710 | 1,111 |
Total International Bond Index Fund
| | | Coupon | Maturity
Date | Currency | Face
Amount
(000) | Market
Value•
($000) |
| | Prologis Euro Finance LLC | 1.000% | 2/16/41 | EUR | 2,130 | 1,129 |
| | Prologis Euro Finance LLC | 1.500% | 9/10/49 | EUR | 1,619 | 827 |
| | Prologis LP | 3.000% | 6/2/26 | EUR | 778 | 737 |
| | Prologis LP | 2.250% | 6/30/29 | GBP | 4,469 | 4,134 |
| | Prologis LP | 5.250% | 1/15/31 | CAD | 4,000 | 2,935 |
| | Public Storage | 0.500% | 9/9/30 | EUR | 3,241 | 2,315 |
| | Public Storage | 0.875% | 1/24/32 | EUR | 3,376 | 2,380 |
| | Raytheon Technologies Corp. | 2.150% | 5/18/30 | EUR | 6,316 | 5,427 |
| | Realty Income Corp. | 1.875% | 1/14/27 | GBP | 624 | 603 |
| | Realty Income Corp. | 1.125% | 7/13/27 | GBP | 5,938 | 5,441 |
| | Realty Income Corp. | 1.750% | 7/13/33 | GBP | 2,043 | 1,556 |
| | Realty Income Corp. | 2.500% | 1/14/42 | GBP | 946 | 658 |
| | Schlumberger Finance BV | 0.250% | 10/15/27 | EUR | 5,087 | 4,322 |
| | Schlumberger Finance BV | 0.500% | 10/15/31 | EUR | 5,087 | 3,820 |
| | Schlumberger Finance BV | 2.000% | 5/6/32 | EUR | 3,019 | 2,562 |
| | Schlumberger Finance France SAS | 1.000% | 2/18/26 | EUR | 1,765 | 1,625 |
| | Schneider Electric SE | 0.250% | 9/9/24 | EUR | 6,500 | 6,141 |
| | Schneider Electric SE | 0.875% | 3/11/25 | EUR | 1,500 | 1,414 |
| | Schneider Electric SE | 1.500% | 1/15/28 | EUR | 5,600 | 5,086 |
| | Schneider Electric SE | 0.250% | 3/11/29 | EUR | 7,600 | 6,214 |
| | Signify NV | 2.375% | 5/11/27 | EUR | 1,450 | 1,296 |
| | Simon International Finance SCA | 1.125% | 3/19/33 | EUR | 5,321 | 3,458 |
| | Southern Co. | 1.875% | 9/15/81 | EUR | 4,624 | 3,253 |
| | Southern Power Co. | 1.850% | 6/20/26 | EUR | 5,471 | 5,046 |
| | Stellantis NV | 2.000% | 3/20/25 | EUR | 1,900 | 1,803 |
| | Stellantis NV | 3.875% | 1/5/26 | EUR | 8,728 | 8,551 |
| | Stellantis NV | 2.750% | 5/15/26 | EUR | 4,600 | 4,318 |
| | Stellantis NV | 4.500% | 7/7/28 | EUR | 15,577 | 15,167 |
| | Stellantis NV | 1.250% | 6/20/33 | EUR | 7,448 | 5,075 |
| | Stryker Corp. | 0.250% | 12/3/24 | EUR | 1,985 | 1,837 |
| | Stryker Corp. | 2.125% | 11/30/27 | EUR | 943 | 861 |
| | Stryker Corp. | 2.625% | 11/30/30 | EUR | 1,052 | 932 |
| | Stryker Corp. | 1.000% | 12/3/31 | EUR | 5,635 | 4,242 |
| | Swiss Re Finance UK plc | 2.714% | 6/4/52 | EUR | 2,300 | 1,690 |
| | Sysco Canada Inc. | 3.650% | 4/25/25 | CAD | 1,804 | 1,274 |
| | Thermo Fisher Scientific Finance I BV | 0.000% | 11/18/25 | EUR | 8,714 | 7,815 |
| | Thermo Fisher Scientific Finance I BV | 0.800% | 10/18/30 | EUR | 9,372 | 7,517 |
| | Thermo Fisher Scientific Finance I BV | 1.125% | 10/18/33 | EUR | 3,693 | 2,810 |
| | Thermo Fisher Scientific Finance I BV | 1.625% | 10/18/41 | EUR | 10,753 | 6,963 |
| | Thermo Fisher Scientific Finance I BV | 2.000% | 10/18/51 | EUR | 5,000 | 3,127 |
| | Thermo Fisher Scientific Inc. | 0.750% | 9/12/24 | EUR | 2,367 | 2,240 |
| | Thermo Fisher Scientific Inc. | 0.125% | 3/1/25 | EUR | 3,212 | 2,963 |
| | Thermo Fisher Scientific Inc. | 2.000% | 4/15/25 | EUR | 3,092 | 2,965 |
| | Thermo Fisher Scientific Inc. | 1.400% | 1/23/26 | EUR | 8,427 | 7,834 |
| | Thermo Fisher Scientific Inc. | 1.750% | 4/15/27 | EUR | 1,545 | 1,423 |
| | Thermo Fisher Scientific Inc. | 0.500% | 3/1/28 | EUR | 6,201 | 5,254 |
| | Thermo Fisher Scientific Inc. | 1.375% | 9/12/28 | EUR | 448 | 392 |
| | Thermo Fisher Scientific Inc. | 2.875% | 7/24/37 | EUR | 3,333 | 2,860 |
| | Thermo Fisher Scientific Inc. | 1.500% | 10/1/39 | EUR | 2,094 | 1,378 |
| | Thermo Fisher Scientific Inc. | 1.875% | 10/1/49 | EUR | 5,581 | 3,466 |
| | Time Warner Cable LLC | 5.250% | 7/15/42 | GBP | 3,037 | 2,719 |
| | Toyota Motor Credit Corp. | 0.625% | 11/21/24 | EUR | 100 | 94 |
| | Toyota Motor Credit Corp. | 0.750% | 11/19/26 | GBP | 3,724 | 3,601 |
| | Toyota Motor Credit Corp. | 0.125% | 11/5/27 | EUR | 7,448 | 6,168 |
| | Trillium Windpower LP | 5.803% | 2/15/33 | CAD | 743 | 557 |
| | TWDC Enterprises 18 Corp. | 2.758% | 10/7/24 | CAD | 5,240 | 3,696 |
| | United Parcel Service Inc. | 0.375% | 11/15/23 | EUR | 3,761 | 3,622 |
| | United Parcel Service Inc. | 2.125% | 5/21/24 | CAD | 3,552 | 2,506 |
| | United Parcel Service Inc. | 1.625% | 11/15/25 | EUR | 6,030 | 5,693 |
| | United Parcel Service Inc. | 1.500% | 11/15/32 | EUR | 1,710 | 1,366 |
| | United Parcel Service Inc. | 5.125% | 2/12/50 | GBP | 850 | 1,032 |
| | Upjohn Finance BV | 1.362% | 6/23/27 | EUR | 4,090 | 3,415 |
| | Upjohn Finance BV | 1.908% | 6/23/32 | EUR | 7,790 | 5,452 |
| | US Bancorp | 0.850% | 6/7/24 | EUR | 7,544 | 7,141 |
| | Utah Acquisition Sub Inc. | 3.125% | 11/22/28 | EUR | 3,147 | 2,715 |
| | Ventas Canada Finance Ltd. | 2.800% | 4/12/24 | CAD | 3,163 | 2,226 |
| | Ventas Canada Finance Ltd. | 4.125% | 9/30/24 | CAD | 608 | 433 |
| | Ventas Canada Finance Ltd. | 2.450% | 1/4/27 | CAD | 1,200 | 772 |
| | Ventas Canada Finance Ltd. | 3.300% | 12/1/31 | CAD | 1,272 | 755 |
Total International Bond Index Fund
| | | Coupon | Maturity
Date | Currency | Face
Amount
(000) | Market
Value•
($000) |
| | Verizon Communications Inc. | 4.073% | 6/18/24 | GBP | 1,545 | 1,738 |
| | Verizon Communications Inc. | 4.050% | 2/17/25 | AUD | 780 | 489 |
| | Verizon Communications Inc. | 0.875% | 4/2/25 | EUR | 2,488 | 2,325 |
| | Verizon Communications Inc. | 3.250% | 2/17/26 | EUR | 1,326 | 1,294 |
| | Verizon Communications Inc. | 1.375% | 10/27/26 | EUR | 3,541 | 3,222 |
| | Verizon Communications Inc. | 0.875% | 4/8/27 | EUR | 12,799 | 11,208 |
| | Verizon Communications Inc. | 4.500% | 8/17/27 | AUD | 6,420 | 3,930 |
| | Verizon Communications Inc. | 2.375% | 3/22/28 | CAD | 3,693 | 2,364 |
| | Verizon Communications Inc. | 2.350% | 3/23/28 | AUD | 1,400 | 754 |
| | Verizon Communications Inc. | 1.375% | 11/2/28 | EUR | 4,977 | 4,284 |
| | Verizon Communications Inc. | 1.125% | 11/3/28 | GBP | 6,685 | 5,942 |
| | Verizon Communications Inc. | 0.375% | 3/22/29 | EUR | 7,917 | 6,312 |
| | Verizon Communications Inc. | 1.875% | 10/26/29 | EUR | 1,718 | 1,491 |
| | Verizon Communications Inc. | 1.250% | 4/8/30 | EUR | 9,787 | 8,006 |
| | Verizon Communications Inc. | 2.500% | 5/16/30 | CAD | 3,541 | 2,151 |
| | Verizon Communications Inc. | 1.875% | 9/19/30 | GBP | 778 | 688 |
| | Verizon Communications Inc. | 2.500% | 4/8/31 | GBP | 1,345 | 1,231 |
| | Verizon Communications Inc. | 2.625% | 12/1/31 | EUR | 3,509 | 3,105 |
| | Verizon Communications Inc. | 0.875% | 3/19/32 | EUR | 3,724 | 2,766 |
| | Verizon Communications Inc. | 0.750% | 3/22/32 | EUR | 6,902 | 5,050 |
| | Verizon Communications Inc. | 1.300% | 5/18/33 | EUR | 1,796 | 1,346 |
| | Verizon Communications Inc. | 4.750% | 10/31/34 | EUR | 6,167 | 6,319 |
| | Verizon Communications Inc. | 1.125% | 9/19/35 | EUR | 5,904 | 4,037 |
| | Verizon Communications Inc. | 3.125% | 11/2/35 | GBP | 2,671 | 2,383 |
| | Verizon Communications Inc. | 3.375% | 10/27/36 | GBP | 6,524 | 5,926 |
| | Verizon Communications Inc. | 2.875% | 1/15/38 | EUR | 5,515 | 4,503 |
| | Verizon Communications Inc. | 1.875% | 11/3/38 | GBP | 3,194 | 2,245 |
| | Verizon Communications Inc. | 1.500% | 9/19/39 | EUR | 1,155 | 743 |
| | Verizon Communications Inc. | 3.500% | 11/4/39 | AUD | 600 | 248 |
| | Verizon Communications Inc. | 1.850% | 5/18/40 | EUR | 704 | 478 |
| | Verizon Communications Inc. | 3.625% | 5/16/50 | CAD | 2,300 | 1,187 |
| | Verizon Communications Inc. | 4.050% | 3/22/51 | CAD | 791 | 441 |
| | VF Corp. | 0.250% | 2/25/28 | EUR | 723 | 585 |
| | Visa Inc. | 1.500% | 6/15/26 | EUR | 9,300 | 8,657 |
| | Visa Inc. | 2.000% | 6/15/29 | EUR | 4,700 | 4,253 |
| | Visa Inc. | 2.375% | 6/15/34 | EUR | 2,500 | 2,179 |
| | Wabtec Transportation Netherlands BV | 1.250% | 12/3/27 | EUR | 2,093 | ��� 1,687 |
| | Walgreens Boots Alliance Inc. | 3.600% | 11/20/25 | GBP | 626 | 676 |
| | Walmart Inc. | 2.550% | 4/8/26 | EUR | 943 | 910 |
| | Walmart Inc. | 4.875% | 9/21/29 | EUR | 5,498 | 5,884 |
| | Walmart Inc. | 5.625% | 3/27/34 | GBP | 7,590 | 9,410 |
| | Walmart Inc. | 5.250% | 9/28/35 | GBP | 512 | 614 |
| | Walt Disney Co. | 3.057% | 3/30/27 | CAD | 7,225 | 4,878 |
| | Waste Management of Canada Corp. | 2.600% | 9/23/26 | CAD | 1,903 | 1,272 |
| | Wells Fargo & Co. | 0.500% | 11/2/23 | CHF | 10,200 | 10,044 |
| | Wells Fargo & Co. | 2.125% | 12/20/23 | GBP | 418 | 463 |
| | Wells Fargo & Co. | 3.184% | 2/8/24 | CAD | 2,533 | 1,805 |
| | Wells Fargo & Co. | 2.125% | 6/4/24 | EUR | 9,300 | 8,938 |
| | Wells Fargo & Co. | 3.874% | 5/21/25 | CAD | 1,756 | 1,231 |
| | Wells Fargo & Co. | 2.000% | 7/28/25 | GBP | 14,035 | 14,696 |
| | Wells Fargo & Co. | 2.000% | 4/27/26 | EUR | 12,305 | 11,239 |
| | Wells Fargo & Co. | 4.168% | 4/28/26 | CAD | 1,500 | 1,063 |
| | Wells Fargo & Co. | 2.568% | 5/1/26 | CAD | 4,370 | 2,979 |
| | Wells Fargo & Co. | 2.975% | 5/19/26 | CAD | 5,152 | 3,477 |
| | Wells Fargo & Co. | 1.375% | 10/26/26 | EUR | 6,798 | 5,978 |
| | Wells Fargo & Co. | 1.000% | 2/2/27 | EUR | 12,065 | 10,344 |
| | Wells Fargo & Co. | 2.493% | 2/18/27 | CAD | 4,099 | 2,660 |
| | Wells Fargo & Co. | 1.500% | 5/24/27 | EUR | 10,275 | 8,943 |
| | Wells Fargo & Co. | 3.473% | 4/26/28 | GBP | 3,700 | 3,783 |
| | Wells Fargo & Co. | 3.500% | 9/12/29 | GBP | 2,175 | 2,133 |
| | Wells Fargo & Co. | 1.741% | 5/4/30 | EUR | 5,087 | 4,209 |
| | Wells Fargo & Co. | 4.625% | 11/2/35 | GBP | 1,263 | 1,309 |
| | Welltower Inc. | 4.800% | 11/20/28 | GBP | 3,705 | 3,848 |
| | Welltower Inc. | 4.500% | 12/1/34 | GBP | 2,434 | 2,259 |
| | Westlake Chemical Corp. | 1.625% | 7/17/29 | EUR | 1,900 | 1,442 |
| | Whirlpool Finance Luxembourg Sarl | 1.250% | 11/2/26 | EUR | 5,471 | 4,899 |
| | Whirlpool Finance Luxembourg Sarl | 1.100% | 11/9/27 | EUR | 1,875 | 1,588 |
| | WPC Eurobond BV | 2.250% | 7/19/24 | EUR | 3,156 | 2,955 |
| | WPC Eurobond BV | 2.250% | 4/9/26 | EUR | 2,050 | 1,802 |
Total International Bond Index Fund
| | | Coupon | Maturity
Date | Currency | Face
Amount
(000) | Market
Value•
($000) |
| | WPC Eurobond BV | 2.125% | 4/15/27 | EUR | 4,195 | 3,558 |
| | WPC Eurobond BV | 1.350% | 4/15/28 | EUR | 4,539 | 3,588 |
| | WPC Eurobond BV | 0.950% | 6/1/30 | EUR | 1,876 | 1,259 |
| | Zimmer Biomet Holdings Inc. | 1.414% | 12/13/22 | EUR | 2,937 | 2,901 |
| | | | | | | 2,331,075 |
| Total Corporate Bonds (Cost $20,179,886) | | | 15,575,092 |
| Sovereign Bonds (78.3%) | | | |
| Australia (3.1%) | | | |
| | Australian Capital Territory | 4.000% | 5/22/24 | AUD | 2,530 | 1,624 |
| | Australian Capital Territory | 1.250% | 5/22/25 | AUD | 630 | 379 |
| | Australian Capital Territory | 2.500% | 5/21/26 | AUD | 1,010 | 616 |
| | Australian Capital Territory | 3.000% | 4/18/28 | AUD | 290 | 176 |
| | Australian Capital Territory | 2.250% | 5/22/29 | AUD | 5,100 | 2,897 |
| | Australian Capital Territory | 1.750% | 5/17/30 | AUD | 1,110 | 593 |
| | Australian Capital Territory | 1.750% | 10/23/31 | AUD | 440 | 225 |
| | Commonwealth of Australia | 5.500% | 4/21/23 | AUD | 51,360 | 33,204 |
| | Commonwealth of Australia | 2.750% | 4/21/24 | AUD | 20,413 | 12,979 |
| | Commonwealth of Australia | 0.250% | 11/21/24 | AUD | 170,429 | 102,565 |
| | Commonwealth of Australia | 3.250% | 4/21/25 | AUD | 181,103 | 115,765 |
| | Commonwealth of Australia | 0.250% | 11/21/25 | AUD | 140,185 | 81,738 |
| | Commonwealth of Australia | 4.250% | 4/21/26 | AUD | 205,752 | 135,444 |
| | Commonwealth of Australia | 0.500% | 9/21/26 | AUD | 161,297 | 92,387 |
| | Commonwealth of Australia | 4.750% | 4/21/27 | AUD | 146,892 | 99,057 |
| | Commonwealth of Australia | 2.750% | 11/21/27 | AUD | 106,570 | 65,862 |
| | Commonwealth of Australia | 2.250% | 5/21/28 | AUD | 117,029 | 70,082 |
| | Commonwealth of Australia | 2.750% | 11/21/28 | AUD | 154,383 | 94,391 |
| | Commonwealth of Australia | 3.250% | 4/21/29 | AUD | 129,331 | 81,074 |
| | Commonwealth of Australia | 2.750% | 11/21/29 | AUD | 143,635 | 86,808 |
| | Commonwealth of Australia | 2.500% | 5/21/30 | AUD | 146,075 | 86,301 |
| | Commonwealth of Australia | 1.000% | 12/21/30 | AUD | 134,721 | 69,847 |
| | Commonwealth of Australia | 1.500% | 6/21/31 | AUD | 137,648 | 73,642 |
| | Commonwealth of Australia | 1.000% | 11/21/31 | AUD | 154,615 | 78,211 |
| | Commonwealth of Australia | 1.250% | 5/21/32 | AUD | 104,342 | 53,368 |
| | Commonwealth of Australia | 1.750% | 11/21/32 | AUD | 82,401 | 43,864 |
| | Commonwealth of Australia | 4.500% | 4/21/33 | AUD | 126,270 | 85,811 |
| | Commonwealth of Australia | 3.000% | 11/21/33 | AUD | 52,080 | 30,876 |
| | Commonwealth of Australia | 2.750% | 6/21/35 | AUD | 47,147 | 26,659 |
| | Commonwealth of Australia | 3.750% | 4/21/37 | AUD | 43,769 | 27,257 |
| | Commonwealth of Australia | 3.250% | 6/21/39 | AUD | 37,313 | 21,527 |
| | Commonwealth of Australia | 2.750% | 5/21/41 | AUD | 50,029 | 26,355 |
| | Commonwealth of Australia | 3.000% | 3/21/47 | AUD | 38,584 | 20,452 |
| | Commonwealth of Australia | 1.750% | 6/21/51 | AUD | 84,349 | 32,827 |
| | National Housing Finance and Investment Corp. | 2.380% | 3/28/29 | AUD | 1,485 | 855 |
| | National Housing Finance and Investment Corp. | 2.335% | 6/30/36 | AUD | 3,735 | 1,832 |
| | New South Wales Treasury Corp. | 1.000% | 2/8/24 | AUD | 15,820 | 9,784 |
| | New South Wales Treasury Corp. | 5.000% | 8/20/24 | AUD | 16,943 | 11,077 |
| | New South Wales Treasury Corp. | 1.250% | 3/20/25 | AUD | 20,413 | 12,336 |
| | New South Wales Treasury Corp. | 4.000% | 5/20/26 | AUD | 4,899 | 3,146 |
| | New South Wales Treasury Corp. | 3.000% | 5/20/27 | AUD | 66,841 | 40,986 |
| | New South Wales Treasury Corp. | 3.000% | 3/20/28 | AUD | 64,075 | 38,865 |
| | New South Wales Treasury Corp. | 3.000% | 11/15/28 | AUD | 10,206 | 6,132 |
| | New South Wales Treasury Corp. | 3.000% | 4/20/29 | AUD | 11,737 | 7,004 |
| | New South Wales Treasury Corp. | 3.000% | 2/20/30 | AUD | 28,558 | 16,793 |
| | New South Wales Treasury Corp. | 1.250% | 11/20/30 | AUD | 7,484 | 3,790 |
| | New South Wales Treasury Corp. | 2.000% | 3/20/31 | AUD | 21,309 | 11,337 |
| | New South Wales Treasury Corp. | 1.500% | 2/20/32 | AUD | 86,169 | 42,549 |
| | New South Wales Treasury Corp. | 2.000% | 3/8/33 | AUD | 20,288 | 10,200 |
| | New South Wales Treasury Corp. | 3.500% | 3/20/34 | AUD | 422 | 242 |
| | New South Wales Treasury Corp. | 3.500% | 11/20/37 | AUD | 3,742 | 2,041 |
| | New South Wales Treasury Corp. | 2.250% | 11/20/40 | AUD | 11,397 | 4,943 |
| | New South Wales Treasury Corp. | 2.450% | 8/24/50 | AUD | 261 | 104 |
| | Northern Territory Treasury Corp. | 2.750% | 10/21/24 | AUD | 2,600 | 1,627 |
| | Northern Territory Treasury Corp. | 2.750% | 4/21/27 | AUD | 5,200 | 3,150 |
| | Northern Territory Treasury Corp. | 3.500% | 4/21/28 | AUD | 800 | 496 |
| | Northern Territory Treasury Corp. | 3.500% | 5/21/30 | AUD | 2,300 | 1,384 |
| | Northern Territory Treasury Corp. | 2.000% | 4/21/31 | AUD | 500 | 264 |
| | Northern Territory Treasury Corp. | 3.750% | 4/21/33 | AUD | 3,600 | 2,119 |
| 3 | Queensland Treasury Corp. | 3.000% | 3/22/24 | AUD | 6,889 | 4,368 |
Total International Bond Index Fund
| | | Coupon | Maturity
Date | Currency | Face
Amount
(000) | Market
Value•
($000) |
| | Queensland Treasury Corp. | 5.750% | 7/22/24 | AUD | 23,577 | 15,595 |
| 3 | Queensland Treasury Corp. | 4.750% | 7/21/25 | AUD | 25,257 | 16,539 |
| 3 | Queensland Treasury Corp. | 3.250% | 7/21/26 | AUD | 31,895 | 19,953 |
| 3 | Queensland Treasury Corp. | 2.750% | 8/20/27 | AUD | 40,997 | 24,790 |
| 3 | Queensland Treasury Corp. | 3.250% | 7/21/28 | AUD | 41,599 | 25,472 |
| 3 | Queensland Treasury Corp. | 3.250% | 8/21/29 | AUD | 23,651 | 14,298 |
| 3 | Queensland Treasury Corp. | 3.500% | 8/21/30 | AUD | 40,817 | 24,751 |
| 3 | Queensland Treasury Corp. | 1.750% | 8/21/31 | AUD | 17,822 | 9,211 |
| 3 | Queensland Treasury Corp. | 1.500% | 3/2/32 | AUD | 9,300 | 4,606 |
| 3 | Queensland Treasury Corp. | 1.500% | 8/20/32 | AUD | 40,669 | 19,886 |
| | Queensland Treasury Corp. | 6.500% | 3/14/33 | AUD | 4,235 | 3,149 |
| 3 | Queensland Treasury Corp. | 1.750% | 7/20/34 | AUD | 15,225 | 7,162 |
| 3 | Queensland Treasury Corp. | 2.250% | 4/16/40 | AUD | 7,654 | 3,363 |
| 3 | Queensland Treasury Corp. | 2.250% | 11/20/41 | AUD | 7,552 | 3,219 |
| 3 | Queensland Treasury Corp. | 4.200% | 2/20/47 | AUD | 4,011 | 2,298 |
| | South Australian Government Financing Authority | 4.250% | 11/20/23 | AUD | 2,550 | 1,641 |
| | South Australian Government Financing Authority | 2.250% | 8/15/24 | AUD | 8,929 | 5,565 |
| | South Australian Government Financing Authority | 2.750% | 4/16/25 | AUD | 5,612 | 3,502 |
| | South Australian Government Financing Authority | 3.000% | 7/20/26 | AUD | 4,210 | 2,607 |
| | South Australian Government Financing Authority | 3.000% | 9/20/27 | AUD | 637 | 388 |
| | South Australian Government Financing Authority | 3.000% | 5/24/28 | AUD | 9,345 | 5,636 |
| | South Australian Government Financing Authority | 2.750% | 5/24/30 | AUD | 15,411 | 8,847 |
| | South Australian Government Financing Authority | 1.750% | 5/24/32 | AUD | 14,335 | 7,180 |
| | South Australian Government Financing Authority | 2.000% | 5/23/36 | AUD | 20,238 | 9,205 |
| | Tasmanian Public Finance Corp. | 3.250% | 2/19/26 | AUD | 4,900 | 3,078 |
| | Tasmanian Public Finance Corp. | 3.250% | 1/24/28 | AUD | 765 | 468 |
| | Tasmanian Public Finance Corp. | 2.000% | 1/24/30 | AUD | 785 | 428 |
| | Tasmanian Public Finance Corp. | 2.250% | 1/22/32 | AUD | 3,742 | 1,977 |
| | Treasury Corp. of Victoria | 5.500% | 12/17/24 | AUD | 7,144 | 4,725 |
| | Treasury Corp. of Victoria | 0.500% | 11/20/25 | AUD | 11,226 | 6,505 |
| | Treasury Corp. of Victoria | 5.500% | 11/17/26 | AUD | 26,537 | 17,981 |
| | Treasury Corp. of Victoria | 1.250% | 11/19/27 | AUD | 37,679 | 21,042 |
| | Treasury Corp. of Victoria | 3.000% | 10/20/28 | AUD | 19,456 | 11,705 |
| | Treasury Corp. of Victoria | 2.500% | 10/22/29 | AUD | 36,511 | 20,890 |
| | Treasury Corp. of Victoria | 1.500% | 11/20/30 | AUD | 33,760 | 17,416 |
| | Treasury Corp. of Victoria | 1.500% | 9/10/31 | AUD | 63,101 | 31,655 |
| | Treasury Corp. of Victoria | 4.250% | 12/20/32 | AUD | 21,518 | 13,417 |
| | Treasury Corp. of Victoria | 2.250% | 9/15/33 | AUD | 23,784 | 12,124 |
| | Treasury Corp. of Victoria | 2.250% | 11/20/34 | AUD | 27,218 | 13,401 |
| | Treasury Corp. of Victoria | 2.000% | 9/17/35 | AUD | 7,484 | 3,492 |
| | Treasury Corp. of Victoria | 2.000% | 11/20/37 | AUD | 7,484 | 3,308 |
| | Treasury Corp. of Victoria | 2.250% | 11/20/41 | AUD | 15,283 | 6,458 |
| | Western Australian Treasury Corp. | 2.500% | 7/23/24 | AUD | 24,493 | 15,357 |
| | Western Australian Treasury Corp. | 5.000% | 7/23/25 | AUD | 7,910 | 5,213 |
| | Western Australian Treasury Corp. | 3.000% | 10/21/26 | AUD | 12,674 | 7,840 |
| | Western Australian Treasury Corp. | 3.000% | 10/21/27 | AUD | 5,103 | 3,116 |
| | Western Australian Treasury Corp. | 3.250% | 7/20/28 | AUD | 16,293 | 9,982 |
| | Western Australian Treasury Corp. | 2.750% | 7/24/29 | AUD | 7,409 | 4,344 |
| | Western Australian Treasury Corp. | 1.500% | 10/22/30 | AUD | 18,600 | 9,659 |
| | Western Australian Treasury Corp. | 1.750% | 10/22/31 | AUD | 15,769 | 8,127 |
| | Western Australian Treasury Corp. | 2.000% | 10/24/34 | AUD | 7,821 | 3,783 |
| | Western Australian Treasury Corp. | 2.250% | 7/23/41 | AUD | 2,994 | 1,293 |
| | | | | | | 2,489,934 |
| Austria (1.0%) | | | |
| | Autobahnen- und Schnell- strassen-Finanzierungs AG | 0.250% | 10/18/24 | EUR | 17,456 | 16,441 |
| | Autobahnen- und Schnell- strassen-Finanzierungs AG | 3.375% | 9/22/25 | EUR | 1,046 | 1,051 |
| | Autobahnen- und Schnell- strassen-Finanzierungs AG | 0.100% | 7/9/29 | EUR | 4,539 | 3,742 |
| | Autobahnen- und Schnell- strassen-Finanzierungs AG | 1.500% | 9/15/30 | EUR | 5,000 | 4,454 |
| | Autobahnen- und Schnell- strassen-Finanzierungs AG | 0.125% | 6/2/31 | EUR | 3,700 | 2,878 |
| | Autobahnen- und Schnell- strassen-Finanzierungs AG | 2.750% | 6/11/32 | EUR | 400 | 387 |
| | Autobahnen- und Schnell- strassen-Finanzierungs AG | 2.750% | 6/20/33 | EUR | 658 | 634 |
| | Autobahnen- und Schnell- strassen-Finanzierungs AG | 0.100% | 7/16/35 | EUR | 2,250 | 1,533 |
| 2 | Oesterreichische Kontrollbank AG | 2.625% | 11/22/24 | CHF | 15,610 | 16,057 |
| 2 | Oesterreichische Kontrollbank AG | 3.200% | 8/25/25 | AUD | 765 | 474 |
| 2 | Oesterreichische Kontrollbank AG | 0.000% | 10/8/26 | EUR | 2,543 | 2,251 |
| 2 | Oesterreichische Kontrollbank AG | 2.875% | 2/25/30 | CHF | 2,290 | 2,482 |
| 3 | Republic of Austria | 0.000% | 7/15/24 | EUR | 35,869 | 34,264 |
| 3 | Republic of Austria | 1.650% | 10/21/24 | EUR | 3,479 | 3,415 |
| 3 | Republic of Austria | 0.000% | 4/20/25 | EUR | 160,905 | 150,647 |
Total International Bond Index Fund
| | | Coupon | Maturity
Date | Currency | Face
Amount
(000) | Market
Value•
($000) |
| 3 | Republic of Austria | 0.750% | 10/20/26 | EUR | 39,558 | 36,746 |
| 3 | Republic of Austria | 0.500% | 4/20/27 | EUR | 21,009 | 19,084 |
| 3 | Republic of Austria | 0.750% | 2/20/28 | EUR | 12,810 | 11,592 |
| 3 | Republic of Austria | 0.000% | 10/20/28 | EUR | 17,240 | 14,653 |
| 3 | Republic of Austria | 0.500% | 2/20/29 | EUR | 78,336 | 68,108 |
| 3 | Republic of Austria | 0.000% | 2/20/30 | EUR | 40,771 | 33,161 |
| 3 | Republic of Austria | 0.000% | 2/20/31 | EUR | 110,003 | 86,605 |
| 3 | Republic of Austria | 0.900% | 2/20/32 | EUR | 112,995 | 94,131 |
| 3 | Republic of Austria | 2.400% | 5/23/34 | EUR | 2,898 | 2,717 |
| 3 | Republic of Austria | 5.375% | 12/1/34 | CAD | 827 | 659 |
| 3 | Republic of Austria | 0.250% | 10/20/36 | EUR | 70,552 | 48,358 |
| 3 | Republic of Austria | 4.150% | 3/15/37 | EUR | 7,782 | 8,690 |
| 3 | Republic of Austria | 0.000% | 10/20/40 | EUR | 34,412 | 19,897 |
| 3 | Republic of Austria | 3.150% | 6/20/44 | EUR | 25,743 | 26,131 |
| 3 | Republic of Austria | 1.500% | 2/20/47 | EUR | 27,629 | 20,529 |
| 3 | Republic of Austria | 1.850% | 5/23/49 | EUR | 15,348 | 12,283 |
| 3 | Republic of Austria | 0.750% | 3/20/51 | EUR | 58,058 | 33,663 |
| 3 | Republic of Austria | 3.800% | 1/26/62 | EUR | 5,687 | 6,669 |
| 3 | Republic of Austria | 0.700% | 4/20/71 | EUR | 15,030 | 6,806 |
| 3 | Republic of Austria | 1.500% | 11/2/86 | EUR | 12,517 | 7,658 |
| 3 | Republic of Austria | 2.100% | 9/20/17 | EUR | 22,372 | 16,822 |
| 3 | Republic of Austria | 0.850% | 6/30/20 | EUR | 18,617 | 8,389 |
| | | | | | | 824,061 |
| Belgium (1.7%) | | | |
| | Communaute Francaise de Belgique | 0.625% | 6/11/35 | EUR | 14,000 | 10,034 |
| 3 | Kingdom of Belgium | 2.600% | 6/22/24 | EUR | 50,000 | 49,870 |
| 3 | Kingdom of Belgium | 0.500% | 10/22/24 | EUR | 26,646 | 25,576 |
| 3 | Kingdom of Belgium | 0.800% | 6/22/25 | EUR | 111,796 | 106,982 |
| 3 | Kingdom of Belgium | 1.000% | 6/22/26 | EUR | 136,622 | 129,696 |
| 3 | Kingdom of Belgium | 0.800% | 6/22/27 | EUR | 111,920 | 103,535 |
| 3 | Kingdom of Belgium | 0.000% | 10/22/27 | EUR | 82,727 | 72,834 |
| 3 | Kingdom of Belgium | 0.900% | 6/22/29 | EUR | 120,481 | 107,783 |
| 3 | Kingdom of Belgium | 0.100% | 6/22/30 | EUR | 97,359 | 80,305 |
| 3 | Kingdom of Belgium | 1.000% | 6/22/31 | EUR | 13,937 | 12,126 |
| 3 | Kingdom of Belgium | 0.000% | 10/22/31 | EUR | 83,694 | 65,449 |
| | Kingdom of Belgium | 4.000% | 3/28/32 | EUR | 20,659 | 22,574 |
| 3 | Kingdom of Belgium | 0.350% | 6/22/32 | EUR | 207,539 | 163,695 |
| 3 | Kingdom of Belgium | 3.000% | 6/22/34 | EUR | 13,251 | 13,206 |
| 3 | Kingdom of Belgium | 5.000% | 3/28/35 | EUR | 2,269 | 2,697 |
| 3 | Kingdom of Belgium | 1.450% | 6/22/37 | EUR | 33,102 | 26,365 |
| 3 | Kingdom of Belgium | 1.900% | 6/22/38 | EUR | 18,982 | 15,964 |
| 3 | Kingdom of Belgium | 2.750% | 4/22/39 | EUR | 43,586 | 41,003 |
| 3 | Kingdom of Belgium | 0.400% | 6/22/40 | EUR | 32,773 | 20,321 |
| 3 | Kingdom of Belgium | 4.250% | 3/28/41 | EUR | 21,716 | 24,508 |
| | Kingdom of Belgium | 3.750% | 6/22/45 | EUR | 28,923 | 30,996 |
| 3 | Kingdom of Belgium | 1.600% | 6/22/47 | EUR | 40,386 | 29,298 |
| 3,7 | Kingdom of Belgium | 1.700% | 6/22/50 | EUR | 36,354 | 26,314 |
| 3 | Kingdom of Belgium | 1.400% | 6/22/53 | EUR | 106,732 | 69,767 |
| 3 | Kingdom of Belgium | 2.250% | 6/22/57 | EUR | 7,993 | 6,593 |
| 3 | Kingdom of Belgium | 2.150% | 6/22/66 | EUR | 29,276 | 23,450 |
| 3 | Kingdom of Belgium | 0.650% | 6/22/71 | EUR | 18,467 | 8,187 |
| | Ministeries Van de Vlaamse Gemeenschap | 0.375% | 10/13/26 | EUR | 2,500 | 2,274 |
| | Ministeries Van de Vlaamse Gemeenschap | 0.010% | 6/23/27 | EUR | 4,700 | 4,137 |
| | Ministeries Van de Vlaamse Gemeenschap | 0.300% | 10/20/31 | EUR | 13,400 | 10,520 |
| | Ministeries Van de Vlaamse Gemeenschap | 1.000% | 10/13/36 | EUR | 5,200 | 3,848 |
| | Ministeries Van de Vlaamse Gemeenschap | 1.500% | 7/12/38 | EUR | 1,500 | 1,157 |
| | Ministeries Van de Vlaamse Gemeenschap | 1.875% | ��6/2/42 | EUR | 1,800 | 1,391 |
| | Ministeries Van de Vlaamse Gemeenschap | 1.500% | 4/11/44 | EUR | 1,600 | 1,130 |
| 7 | Ministeries Van de Vlaamse Gemeenschap | 1.000% | 1/23/51 | EUR | 8,400 | 4,835 |
| | Region Wallonne Belgium | 0.050% | 6/22/25 | EUR | 7,200 | 6,683 |
| | Region Wallonne Belgium | 0.250% | 5/3/26 | EUR | 26,200 | 23,974 |
| | Region Wallonne Belgium | 0.500% | 4/8/30 | EUR | 6,100 | 5,043 |
| | Region Wallonne Belgium | 0.375% | 10/22/31 | EUR | 2,400 | 1,888 |
| | Region Wallonne Belgium | 1.375% | 4/6/32 | EUR | 10,000 | 8,511 |
| | Region Wallonne Belgium | 1.250% | 5/3/34 | EUR | 7,900 | 6,342 |
| 7 | Region Wallonne Belgium | 0.650% | 1/16/51 | EUR | 1,900 | 934 |
| | Region Wallonne Belgium | 1.250% | 6/22/71 | EUR | 2,200 | 1,194 |
| | | | | | | 1,372,989 |
Total International Bond Index Fund
| | | Coupon | Maturity
Date | Currency | Face
Amount
(000) | Market
Value•
($000) |
| Bulgaria (0.0%) | | | |
| | Republic of Bulgaria | 2.950% | 9/3/24 | EUR | 418 | 413 |
| | Republic of Bulgaria | 2.625% | 3/26/27 | EUR | 1,545 | 1,441 |
| | Republic of Bulgaria | 3.000% | 3/21/28 | EUR | 12,816 | 11,528 |
| | Republic of Bulgaria | 3.125% | 3/26/35 | EUR | 2,543 | 1,983 |
| | Republic of Bulgaria | 1.375% | 9/23/50 | EUR | 3,587 | 1,696 |
| | Republic of Bulgaria | 4.125% | 9/23/29 | EUR | 3,800 | 3,499 |
| | Republic of Bulgaria | 0.375% | 9/23/30 | EUR | 1,500 | 1,025 |
| | Republic of Bulgaria | 4.625% | 9/23/34 | EUR | 2,500 | 2,263 |
| | | | | | | 23,848 |
| Canada (4.9%) | | | |
| | British Columbia Municipal Finance Authority | 2.800% | 12/3/23 | CAD | 3,108 | 2,247 |
| | British Columbia Municipal Finance Authority | 2.150% | 6/3/24 | CAD | 2,735 | 1,947 |
| | British Columbia Municipal Finance Authority | 2.950% | 10/14/24 | CAD | 3,037 | 2,180 |
| | British Columbia Municipal Finance Authority | 1.100% | 6/1/25 | CAD | 3,061 | 2,090 |
| | British Columbia Municipal Finance Authority | 2.650% | 10/2/25 | CAD | 7,037 | 4,969 |
| | British Columbia Municipal Finance Authority | 2.500% | 4/19/26 | CAD | 195 | 136 |
| | British Columbia Municipal Finance Authority | 1.350% | 6/30/26 | CAD | 747 | 501 |
| | British Columbia Municipal Finance Authority | 3.050% | 10/23/28 | CAD | 3,888 | 2,723 |
| | British Columbia Municipal Finance Authority | 2.550% | 10/9/29 | CAD | 609 | 408 |
| | British Columbia Municipal Finance Authority | 2.300% | 4/15/31 | CAD | 1,871 | 1,204 |
| | Canada | 0.500% | 11/1/23 | CAD | 19,110 | 13,529 |
| | Canada | 0.750% | 2/1/24 | CAD | 62,862 | 44,304 |
| | Canada | 0.250% | 4/1/24 | CAD | 58,816 | 40,991 |
| | Canada | 1.500% | 5/1/24 | CAD | 23,125 | 16,363 |
| | Canada | 2.500% | 6/1/24 | CAD | 3,046 | 2,187 |
| | Canada | 2.750% | 8/1/24 | CAD | 180,073 | 129,529 |
| | Canada | 1.500% | 9/1/24 | CAD | 41,070 | 28,884 |
| | Canada | 1.500% | 4/1/25 | CAD | 126,728 | 87,966 |
| | Canada | 2.250% | 6/1/25 | CAD | 6,900 | 4,877 |
| | Canada | 9.000% | 6/1/25 | CAD | 6,123 | 5,066 |
| | Canada | 0.500% | 9/1/25 | CAD | 29,015 | 19,428 |
| | Canada | 0.250% | 3/1/26 | CAD | 121,927 | 79,995 |
| | Canada | 1.000% | 9/1/26 | CAD | 53,531 | 35,686 |
| | Canada | 1.250% | 3/1/27 | CAD | 75,580 | 50,489 |
| | Canada | 8.000% | 6/1/27 | CAD | 2,603 | 2,280 |
| | Canada | 2.750% | 9/1/27 | CAD | 53,100 | 37,802 |
| | Canada | 2.000% | 6/1/28 | CAD | 21,148 | 14,500 |
| | Canada | 2.250% | 6/1/29 | CAD | 33,622 | 23,200 |
| | Canada | 5.750% | 6/1/29 | CAD | 20,608 | 17,310 |
| | Canada | 2.250% | 12/1/29 | CAD | 21,018 | 14,450 |
| | Canada | 1.250% | 6/1/30 | CAD | 92,520 | 58,723 |
| | Canada | 0.500% | 12/1/30 | CAD | 73,861 | 43,547 |
| | Canada | 1.500% | 6/1/31 | CAD | 112,430 | 71,502 |
| | Canada | 1.500% | 12/1/31 | CAD | 73,637 | 46,521 |
| | Canada | 2.000% | 6/1/32 | CAD | 89,966 | 59,151 |
| | Canada | 2.500% | 12/1/32 | CAD | 70,600 | 48,390 |
| | Canada | 5.750% | 6/1/33 | CAD | 35,263 | 31,357 |
| | Canada | 5.000% | 6/1/37 | CAD | 44,630 | 38,628 |
| | Canada | 4.000% | 6/1/41 | CAD | 41,529 | 32,791 |
| | Canada | 3.500% | 12/1/45 | CAD | 31,440 | 23,364 |
| | Canada | 2.750% | 12/1/48 | CAD | 16,284 | 10,666 |
| | Canada | 2.000% | 12/1/51 | CAD | 118,885 | 65,494 |
| | Canada | 1.750% | 12/1/53 | CAD | 89,995 | 45,983 |
| | Canada | 2.750% | 12/1/64 | CAD | 21,164 | 13,539 |
| 3 | Canada Housing Trust No. 1 | 2.550% | 12/15/23 | CAD | 33,590 | 24,253 |
| 3 | Canada Housing Trust No. 1 | 2.900% | 6/15/24 | CAD | 62,660 | 45,081 |
| 3 | Canada Housing Trust No. 1 | 1.800% | 12/15/24 | CAD | 39,355 | 27,536 |
| 3 | Canada Housing Trust No. 1 | 2.550% | 3/15/25 | CAD | 23,625 | 16,740 |
| 3 | Canada Housing Trust No. 1 | 0.950% | 6/15/25 | CAD | 42,770 | 29,164 |
| 3 | Canada Housing Trust No. 1 | 1.950% | 12/15/25 | CAD | 50,465 | 34,819 |
| 3 | Canada Housing Trust No. 1 | 2.250% | 12/15/25 | CAD | 11,080 | 7,716 |
| 3 | Canada Housing Trust No. 1 | 1.250% | 6/15/26 | CAD | 38,040 | 25,446 |
| 3 | Canada Housing Trust No. 1 | 1.900% | 9/15/26 | CAD | 23,060 | 15,732 |
| 3 | Canada Housing Trust No. 1 | 1.100% | 12/15/26 | CAD | 14,965 | 9,840 |
| 3 | Canada Housing Trust No. 1 | 1.550% | 12/15/26 | CAD | 12,345 | 8,271 |
| 3 | Canada Housing Trust No. 1 | 2.350% | 6/15/27 | CAD | 37,915 | 26,122 |
| 3 | Canada Housing Trust No. 1 | 3.800% | 6/15/27 | CAD | 13,950 | 10,287 |
| 3 | Canada Housing Trust No. 1 | 3.600% | 12/15/27 | CAD | 22,900 | 16,712 |
Total International Bond Index Fund
| | | Coupon | Maturity
Date | Currency | Face
Amount
(000) | Market
Value•
($000) |
| 3 | Canada Housing Trust No. 1 | 2.350% | 3/15/28 | CAD | 10,675 | 7,339 |
| 3 | Canada Housing Trust No. 1 | 2.650% | 3/15/28 | CAD | 29,555 | 20,717 |
| 3 | Canada Housing Trust No. 1 | 2.650% | 12/15/28 | CAD | 12,820 | 8,880 |
| 3 | Canada Housing Trust No. 1 | 2.100% | 9/15/29 | CAD | 19,310 | 12,825 |
| 3 | Canada Housing Trust No. 1 | 1.750% | 6/15/30 | CAD | 39,240 | 25,090 |
| 3 | Canada Housing Trust No. 1 | 1.100% | 3/15/31 | CAD | 9,810 | 5,855 |
| 3 | Canada Housing Trust No. 1 | 1.400% | 3/15/31 | CAD | 14,510 | 8,888 |
| 3 | Canada Housing Trust No. 1 | 1.900% | 3/15/31 | CAD | 10,545 | 6,737 |
| 3 | Canada Housing Trust No. 1 | 1.600% | 12/15/31 | CAD | 30,680 | 18,846 |
| 3 | Canada Housing Trust No. 1 | 2.150% | 12/15/31 | CAD | 11,260 | 7,268 |
| 3 | Canada Housing Trust No. 1 | 2.450% | 12/15/31 | CAD | 12,645 | 8,376 |
| 3 | Canada Housing Trust No. 1 | 3.550% | 9/15/32 | CAD | 28,300 | 20,442 |
| | Canada Post Corp. | 4.080% | 7/16/25 | CAD | 4,544 | 3,315 |
| | Canada Post Corp. | 4.360% | 7/16/40 | CAD | 1,861 | 1,346 |
| | CDP Financial Inc. | 1.125% | 4/6/27 | EUR | 37,100 | 33,619 |
| | City of Montreal | 3.500% | 9/1/24 | CAD | 111 | 80 |
| | City of Montreal | 3.000% | 9/1/25 | CAD | 3,572 | 2,541 |
| | City of Montreal | 2.750% | 9/1/26 | CAD | 3,400 | 2,332 |
| | City of Montreal | 3.000% | 9/1/27 | CAD | 2,550 | 1,791 |
| | City of Montreal | 3.150% | 9/1/28 | CAD | 1,555 | 1,089 |
| | City of Montreal | 2.300% | 9/1/29 | CAD | 1,169 | 766 |
| | City of Montreal | 1.750% | 9/1/30 | CAD | 3,051 | 1,876 |
| | City of Montreal | 2.000% | 9/1/31 | CAD | 3,442 | 2,114 |
| | City of Montreal | 4.250% | 12/1/32 | CAD | 2,046 | 1,494 |
| | City of Montreal | 4.100% | 12/1/34 | CAD | 1,629 | 1,146 |
| | City of Montreal | 3.150% | 12/1/36 | CAD | 3,054 | 1,895 |
| | City of Montreal | 3.500% | 12/1/38 | CAD | 3,061 | 1,937 |
| | City of Montreal | 2.400% | 12/1/41 | CAD | 2,776 | 1,459 |
| | City of Montreal | 4.700% | 12/1/41 | CAD | 2,046 | 1,488 |
| | City of Montreal | 6.000% | 6/1/43 | CAD | 2,070 | 1,763 |
| | City of Ottawa Ontario | 4.100% | 12/6/52 | CAD | 1,116 | 747 |
| | CPPIB Capital Inc. | 0.375% | 6/20/24 | EUR | 17,409 | 16,505 |
| | CPPIB Capital Inc. | 0.250% | 4/6/27 | EUR | 7,700 | 6,751 |
| | CPPIB Capital Inc. | 1.250% | 12/7/27 | GBP | 4,750 | 4,635 |
| | CPPIB Capital Inc. | 3.000% | 6/15/28 | CAD | 3,873 | 2,713 |
| | CPPIB Capital Inc. | 0.875% | 2/6/29 | EUR | 9,767 | 8,430 |
| | CPPIB Capital Inc. | 1.950% | 9/30/29 | CAD | 6,308 | 4,062 |
| | CPPIB Capital Inc. | 0.050% | 2/24/31 | EUR | 4,750 | 3,612 |
| | CPPIB Capital Inc. | 1.500% | 3/4/33 | EUR | 7,617 | 6,337 |
| | CPPIB Capital Inc. | 0.250% | 1/18/41 | EUR | 9,712 | 5,506 |
| 7 | CPPIB Capital Inc. | 0.750% | 7/15/49 | EUR | 2,273 | 1,297 |
| | CPPIB Capital Inc. | 1.625% | 10/22/71 | GBP | 3,050 | 1,612 |
| | Export Development Canada | 1.375% | 12/8/23 | GBP | 5,087 | 5,685 |
| | Export Development Canada | 1.650% | 7/31/24 | CAD | 2,110 | 1,485 |
| | Financement-Quebec | 5.250% | 6/1/34 | CAD | 5,327 | 4,241 |
| | First Nations Finance Authority | 3.050% | 6/1/28 | CAD | 528 | 370 |
| | First Nations Finance Authority | 1.710% | 6/16/30 | CAD | 1,706 | 1,063 |
| | First Nations Finance Authority | 2.850% | 6/1/32 | CAD | 3,255 | 2,148 |
| | Government of the Northwest Territories | 2.200% | 9/29/51 | CAD | 509 | 230 |
| | Greater Sudbury Canada | 2.416% | 3/12/50 | CAD | 443 | 213 |
| | Hydro-Quebec | 2.000% | 9/1/28 | CAD | 6,873 | 4,556 |
| | Hydro-Quebec | 6.000% | 8/15/31 | CAD | 4,740 | 3,971 |
| | Hydro-Quebec | 6.500% | 1/16/35 | CAD | 3,620 | 3,189 |
| | Hydro-Quebec | 6.500% | 2/15/35 | CAD | 13,992 | 12,438 |
| | Hydro-Quebec | 6.000% | 2/15/40 | CAD | 11,583 | 10,093 |
| | Hydro-Quebec | 5.000% | 2/15/45 | CAD | 18,675 | 14,744 |
| | Hydro-Quebec | 5.000% | 2/15/50 | CAD | 26,649 | 21,580 |
| | Hydro-Quebec | 4.000% | 2/15/55 | CAD | 23,955 | 16,589 |
| | Hydro-Quebec | 2.100% | 2/15/60 | CAD | 28,563 | 12,399 |
| | Hydro-Quebec | 4.000% | 2/15/63 | CAD | 4,557 | 3,160 |
| 3 | Labrador-Island Link Funding Trust | 3.760% | 6/1/33 | CAD | 4,035 | 2,878 |
| 3 | Labrador-Island Link Funding Trust | 3.860% | 12/1/45 | CAD | 2,179 | 1,485 |
| 3 | Labrador-Island Link Funding Trust | 3.850% | 12/1/53 | CAD | 3,502 | 2,404 |
| | Maritime Link Financing Trust | 3.500% | 12/1/52 | CAD | 3,454 | 2,315 |
| | Municipal Finance Authority of British Columbia | 3.300% | 4/8/32 | CAD | 3,874 | 2,664 |
| | Municipal Finance Authority of British Columbia | 2.500% | 9/27/41 | CAD | 1,547 | 838 |
| 3 | Muskrat Falls / Labrador Transmission Assets Funding Trust | 3.630% | 6/1/29 | CAD | 2,608 | 1,892 |
| 3 | Muskrat Falls / Labrador Transmission Assets Funding Trust | 3.830% | 6/1/37 | CAD | 3,545 | 2,487 |
| 3 | Muskrat Falls / Labrador Transmission Assets Funding Trust | 3.860% | 12/1/48 | CAD | 3,689 | 2,495 |
Total International Bond Index Fund
| | | Coupon | Maturity
Date | Currency | Face
Amount
(000) | Market
Value•
($000) |
| | Muskrat Falls / Labrador Transmission Assets Funding Trust | 3.382% | 6/1/57 | CAD | 1,860 | 1,124 |
| | New Brunswick F-M Project Co. Inc. | 6.470% | 11/30/27 | CAD | 518 | 390 |
| | Newfoundland & Labrador Hydro | 6.650% | 8/27/31 | CAD | 1,019 | 872 |
| | Newfoundland & Labrador Hydro | 3.600% | 12/1/45 | CAD | 1,529 | 936 |
| | OMERS Finance Trust | 0.450% | 5/13/25 | EUR | 6,908 | 6,404 |
| | OMERS Finance Trust | 1.550% | 4/21/27 | CAD | 3,097 | 2,027 |
| | OMERS Finance Trust | 2.600% | 5/14/29 | CAD | 1,395 | 934 |
| 3 | OMERS Finance Trust | 2.600% | 5/14/29 | CAD | 1,225 | 820 |
| | Ontario Electricity Financial Corp. | 8.250% | 6/22/26 | CAD | 7,161 | 5,990 |
| | Ontario Infrastructure & Lands Corp. | 4.700% | 6/1/37 | CAD | 915 | 671 |
| | Ontario School Boards Financing Corp. | 5.483% | 11/26/29 | CAD | 132 | 98 |
| | Ontario Teachers Finance Trust | 0.500% | 5/6/25 | EUR | 20,138 | 18,708 |
| | Ontario Teachers Finance Trust | 0.100% | 5/19/28 | EUR | 6,900 | 5,746 |
| 3 | Ontario Teachers Finance Trust | 1.850% | 5/3/32 | EUR | 3,700 | 3,169 |
| | Ontario Teachers Finance Trust | 1.850% | 5/3/32 | EUR | 10,250 | 8,779 |
| | Ontario Teachers Finance Trust | 0.900% | 5/20/41 | EUR | 7,770 | 4,953 |
| | OPB Finance Trust | 2.950% | 2/2/26 | CAD | 14,799 | 10,382 |
| | OPB Finance Trust | 2.980% | 1/25/27 | CAD | 2,543 | 1,772 |
| | Ottawa Ontario | 4.600% | 7/14/42 | CAD | 969 | 705 |
| | Ottawa Ontario | 3.250% | 11/10/47 | CAD | 907 | 522 |
| | Ottawa Ontario | 3.100% | 7/27/48 | CAD | 2,205 | 1,234 |
| | Ottawa Ontario | 2.500% | 5/11/51 | CAD | 2,000 | 973 |
| | Ottawa Ontario | 4.200% | 7/30/53 | CAD | 1,292 | 877 |
| | Province of Alberta | 3.400% | 12/1/23 | CAD | 1,521 | 1,106 |
| | Province of Alberta | 3.100% | 6/1/24 | CAD | 8,963 | 6,474 |
| | Province of Alberta | 0.625% | 4/18/25 | EUR | 5,417 | 5,071 |
| | Province of Alberta | 2.350% | 6/1/25 | CAD | 13,217 | 9,302 |
| | Province of Alberta | 0.625% | 1/16/26 | EUR | 2,599 | 2,392 |
| | Province of Alberta | 2.200% | 6/1/26 | CAD | 13,206 | 9,136 |
| | Province of Alberta | 3.100% | 12/14/26 | AUD | 952 | 573 |
| | Province of Alberta | 2.550% | 6/1/27 | CAD | 24,896 | 17,289 |
| | Province of Alberta | 3.600% | 4/11/28 | AUD | 325 | 194 |
| | Province of Alberta | 2.900% | 12/1/28 | CAD | 12,586 | 8,743 |
| | Province of Alberta | 1.403% | 2/20/29 | SEK | 64,000 | 5,086 |
| | Province of Alberta | 2.900% | 9/20/29 | CAD | 8,678 | 5,960 |
| | Province of Alberta | 2.050% | 6/1/30 | CAD | 28,559 | 18,340 |
| | Province of Alberta | 1.650% | 6/1/31 | CAD | 12,609 | 7,683 |
| | Province of Alberta | 3.500% | 6/1/31 | CAD | 2,346 | 1,656 |
| | Province of Alberta | 4.150% | 6/1/33 | CAD | 2,790 | 2,028 |
| | Province of Alberta | 3.900% | 12/1/33 | CAD | 9,373 | 6,686 |
| | Province of Alberta | 4.500% | 12/1/40 | CAD | 2,550 | 1,879 |
| | Province of Alberta | 3.450% | 12/1/43 | CAD | 9,733 | 6,159 |
| | Province of Alberta | 3.300% | 12/1/46 | CAD | 18,049 | 11,016 |
| | Province of Alberta | 3.050% | 12/1/48 | CAD | 24,456 | 14,164 |
| | Province of Alberta | 3.100% | 6/1/50 | CAD | 31,909 | 18,672 |
| | Province of Alberta | 2.950% | 6/1/52 | CAD | 14,229 | 8,101 |
| | Province of British Columbia | 3.300% | 12/18/23 | CAD | 7,092 | 5,150 |
| | Province of British Columbia | 4.250% | 11/27/24 | AUD | 1,770 | 1,129 |
| | Province of British Columbia | 2.850% | 6/18/25 | CAD | 17,309 | 12,340 |
| | Province of British Columbia | 2.300% | 6/18/26 | CAD | 9,514 | 6,605 |
| | Province of British Columbia | 2.550% | 6/18/27 | CAD | 11,826 | 8,218 |
| | Province of British Columbia | 2.950% | 12/18/28 | CAD | 8,858 | 6,172 |
| | Province of British Columbia | 5.700% | 6/18/29 | CAD | 6,926 | 5,607 |
| | Province of British Columbia | 2.200% | 6/18/30 | CAD | 18,390 | 11,950 |
| | Province of British Columbia | 1.550% | 6/18/31 | CAD | 16,315 | 9,866 |
| | Province of British Columbia | 6.350% | 6/18/31 | CAD | 7,654 | 6,579 |
| | Province of British Columbia | 3.200% | 6/18/32 | CAD | 7,905 | 5,424 |
| | Province of British Columbia | 4.700% | 6/18/37 | CAD | 4,251 | 3,226 |
| | Province of British Columbia | 4.950% | 6/18/40 | CAD | 7,127 | 5,564 |
| | Province of British Columbia | 4.300% | 6/18/42 | CAD | 12,237 | 8,817 |
| | Province of British Columbia | 3.200% | 6/18/44 | CAD | 14,120 | 8,585 |
| | Province of British Columbia | 2.800% | 6/18/48 | CAD | 19,003 | 10,525 |
| | Province of British Columbia | 4.900% | 6/18/48 | CAD | 1,529 | 1,196 |
| | Province of British Columbia | 2.950% | 6/18/50 | CAD | 27,953 | 15,909 |
| | Province of British Columbia | 2.750% | 6/18/52 | CAD | 16,981 | 9,276 |
| | Province of British Columbia | 4.250% | 12/18/53 | CAD | 4,092 | 3,010 |
| | Province of Manitoba | 3.300% | 6/2/24 | CAD | 1,521 | 1,102 |
| | Province of Manitoba | 4.250% | 3/3/25 | AUD | 509 | 324 |
| | Province of Manitoba | 2.450% | 6/2/25 | CAD | 9,100 | 6,417 |
Total International Bond Index Fund
| | | Coupon | Maturity
Date | Currency | Face
Amount
(000) | Market
Value•
($000) |
| | Province of Manitoba | 4.400% | 9/5/25 | CAD | 5,329 | 3,948 |
| | Province of Manitoba | 2.550% | 6/2/26 | CAD | 9,696 | 6,784 |
| | Province of Manitoba | 2.600% | 6/2/27 | CAD | 9,616 | 6,687 |
| | Province of Manitoba | 3.000% | 6/2/28 | CAD | 3,027 | 2,123 |
| | Province of Manitoba | 2.750% | 6/2/29 | CAD | 3,271 | 2,237 |
| | Province of Manitoba | 3.250% | 9/5/29 | CAD | 1,157 | 811 |
| | Province of Manitoba | 2.050% | 6/2/30 | CAD | 6,138 | 3,930 |
| | Province of Manitoba | 6.300% | 3/5/31 | CAD | 486 | 411 |
| | Province of Manitoba | 2.050% | 6/2/31 | CAD | 9,019 | 5,669 |
| | Province of Manitoba | 3.900% | 12/2/32 | CAD | 3,000 | 2,159 |
| | Province of Manitoba | 5.700% | 3/5/37 | CAD | 1,529 | 1,269 |
| | Province of Manitoba | 4.600% | 3/5/38 | CAD | 2,895 | 2,148 |
| | Province of Manitoba | 4.650% | 3/5/40 | CAD | 2,040 | 1,515 |
| | Province of Manitoba | 4.100% | 3/5/41 | CAD | 2,550 | 1,768 |
| | Province of Manitoba | 4.400% | 3/5/42 | CAD | 3,316 | 2,377 |
| | Province of Manitoba | 3.350% | 3/5/43 | CAD | 1,019 | 627 |
| | Province of Manitoba | 4.050% | 9/5/45 | CAD | 6,669 | 4,531 |
| | Province of Manitoba | 2.850% | 9/5/46 | CAD | 7,365 | 4,066 |
| | Province of Manitoba | 3.400% | 9/5/48 | CAD | 7,679 | 4,666 |
| | Province of Manitoba | 3.200% | 3/5/50 | CAD | 9,340 | 5,464 |
| | Province of Manitoba | 4.700% | 3/5/50 | CAD | 3,345 | 2,523 |
| | Province of Manitoba | 2.050% | 9/5/52 | CAD | 6,991 | 3,135 |
| | Province of Manitoba | 3.150% | 9/5/52 | CAD | 3,114 | 1,812 |
| | Province of Manitoba | 3.800% | 9/5/53 | CAD | 2,511 | 1,658 |
| | Province of Manitoba | 3.450% | 3/5/63 | CAD | 1,835 | 1,116 |
| | Province of New Brunswick | 3.650% | 6/3/24 | CAD | 5,582 | 4,066 |
| | Province of New Brunswick | 1.800% | 8/14/25 | CAD | 2,300 | 1,590 |
| | Province of New Brunswick | 2.600% | 8/14/26 | CAD | 5,102 | 3,568 |
| | Province of New Brunswick | 2.350% | 8/14/27 | CAD | 4,030 | 2,761 |
| | Province of New Brunswick | 3.100% | 8/14/28 | CAD | 4,211 | 2,959 |
| | Province of New Brunswick | 2.550% | 8/14/31 | CAD | 4,650 | 3,035 |
| | Province of New Brunswick | 5.500% | 1/27/34 | CAD | 2,040 | 1,671 |
| | Province of New Brunswick | 4.550% | 3/26/37 | CAD | 3,572 | 2,645 |
| | Province of New Brunswick | 4.800% | 9/26/39 | CAD | 3,234 | 2,455 |
| | Province of New Brunswick | 4.800% | 6/3/41 | CAD | 1,525 | 1,156 |
| | Province of New Brunswick | 3.550% | 6/3/43 | CAD | 4,059 | 2,584 |
| | Province of New Brunswick | 3.800% | 8/14/45 | CAD | 4,542 | 2,975 |
| | Province of New Brunswick | 3.100% | 8/14/48 | CAD | 8,409 | 4,838 |
| | Province of New Brunswick | 3.050% | 8/14/50 | CAD | 5,727 | 3,274 |
| | Province of New Brunswick | 2.900% | 8/14/52 | CAD | 3,581 | 1,985 |
| | Province of Newfoundland and Labrador | 2.300% | 6/2/25 | CAD | 2,550 | 1,789 |
| | Province of Newfoundland and Labrador | 3.000% | 6/2/26 | CAD | 5,102 | 3,619 |
| | Province of Newfoundland and Labrador | 1.250% | 6/2/27 | CAD | 1,600 | 1,039 |
| | Province of Newfoundland and Labrador | 6.150% | 4/17/28 | CAD | 509 | 410 |
| | Province of Newfoundland and Labrador | 2.850% | 6/2/28 | CAD | 7,654 | 5,282 |
| | Province of Newfoundland and Labrador | 2.850% | 6/2/29 | CAD | 5,593 | 3,831 |
| | Province of Newfoundland and Labrador | 1.750% | 6/2/30 | CAD | 5,585 | 3,458 |
| | Province of Newfoundland and Labrador | 2.050% | 6/2/31 | CAD | 6,169 | 3,817 |
| | Province of Newfoundland and Labrador | 5.700% | 10/17/35 | CAD | 509 | 411 |
| | Province of Newfoundland and Labrador | 4.650% | 10/17/40 | CAD | 2,720 | 1,962 |
| | Province of Newfoundland and Labrador | 3.300% | 10/17/46 | CAD | 7,758 | 4,488 |
| | Province of Newfoundland and Labrador | 3.700% | 10/17/48 | CAD | 5,564 | 3,426 |
| | Province of Newfoundland and Labrador | 2.650% | 10/17/50 | CAD | 7,520 | 3,738 |
| | Province of Newfoundland and Labrador | 3.150% | 12/2/52 | CAD | 2,971 | 1,649 |
| | Province of Nova Scotia | 2.100% | 6/1/27 | CAD | 7,347 | 4,996 |
| | Province of Nova Scotia | 1.100% | 6/1/28 | CAD | 3,813 | 2,415 |
| | Province of Nova Scotia | 2.000% | 9/1/30 | CAD | 6,787 | 4,304 |
| | Province of Nova Scotia | 2.400% | 12/1/31 | CAD | 800 | 514 |
| | Province of Nova Scotia | 6.600% | 12/1/31 | CAD | 33 | 29 |
| | Province of Nova Scotia | 5.800% | 6/1/33 | CAD | 1,019 | 843 |
| | Province of Nova Scotia | 4.500% | 6/1/37 | CAD | 2,550 | 1,879 |
| | Province of Nova Scotia | 4.700% | 6/1/41 | CAD | 3,750 | 2,814 |
| | Province of Nova Scotia | 4.400% | 6/1/42 | CAD | 5,034 | 3,613 |
| | Province of Nova Scotia | 3.450% | 6/1/45 | CAD | 2,924 | 1,812 |
| | Province of Nova Scotia | 3.150% | 12/1/51 | CAD | 7,675 | 4,454 |
| | Province of Nova Scotia | 3.500% | 6/2/62 | CAD | 4,296 | 2,583 |
| | Province of Ontario | 7.500% | 2/7/24 | CAD | 1,304 | 996 |
| | Province of Ontario | 1.875% | 5/21/24 | EUR | 2,543 | 2,477 |
| | Province of Ontario | 3.500% | 6/2/24 | CAD | 47,113 | 34,249 |
Total International Bond Index Fund
| | | Coupon | Maturity
Date | Currency | Face
Amount
(000) | Market
Value•
($000) |
| | Province of Ontario | 0.375% | 6/14/24 | EUR | 12,379 | 11,761 |
| | Province of Ontario | 4.250% | 8/22/24 | AUD | 505 | 323 |
| | Province of Ontario | 2.300% | 9/8/24 | CAD | 20,256 | 14,394 |
| | Province of Ontario | 0.875% | 1/21/25 | EUR | 2,543 | 2,405 |
| | Province of Ontario | 2.650% | 2/5/25 | CAD | 16,888 | 12,022 |
| | Province of Ontario | 0.625% | 4/17/25 | EUR | 6,753 | 6,321 |
| | Province of Ontario | 2.600% | 6/2/25 | CAD | 53,576 | 37,939 |
| | Province of Ontario | 3.100% | 8/26/25 | AUD | 1,015 | 627 |
| | Province of Ontario | 1.750% | 9/8/25 | CAD | 36,002 | 24,822 |
| | Province of Ontario | 2.400% | 6/2/26 | CAD | 38,393 | 26,747 |
| | Province of Ontario | 1.350% | 9/8/26 | CAD | 6,436 | 4,295 |
| | Province of Ontario | 3.500% | 1/27/27 | AUD | 505 | 306 |
| | Province of Ontario | 1.850% | 2/1/27 | CAD | 9,377 | 6,319 |
| | Province of Ontario | 0.375% | 4/8/27 | EUR | 943 | 831 |
| | Province of Ontario | 2.600% | 6/2/27 | CAD | 38,019 | 26,468 |
| | Province of Ontario | 7.600% | 6/2/27 | CAD | 7,654 | 6,527 |
| | Province of Ontario | 1.050% | 9/8/27 | CAD | 11,545 | 7,452 |
| | Province of Ontario | 2.900% | 6/2/28 | CAD | 34,157 | 23,855 |
| | Province of Ontario | 6.500% | 3/8/29 | CAD | 8,450 | 7,038 |
| | Province of Ontario | 2.700% | 6/2/29 | CAD | 28,116 | 19,177 |
| | Province of Ontario | 0.250% | 6/28/29 | CHF | 4,485 | 4,039 |
| | Province of Ontario | 1.550% | 11/1/29 | CAD | 36,004 | 22,606 |
| | Province of Ontario | 2.050% | 6/2/30 | CAD | 41,746 | 26,798 |
| | Province of Ontario | 0.010% | 11/25/30 | EUR | 8,886 | 6,781 |
| | Province of Ontario | 1.350% | 12/2/30 | CAD | 39,486 | 23,715 |
| | Province of Ontario | 2.150% | 6/2/31 | CAD | 27,588 | 17,523 |
| | Province of Ontario | 6.200% | 6/2/31 | CAD | 6,633 | 5,639 |
| | Province of Ontario | 0.250% | 6/9/31 | EUR | 1,900 | 1,453 |
| | Province of Ontario | 2.250% | 12/2/31 | CAD | 19,745 | 12,539 |
| | Province of Ontario | 3.750% | 6/2/32 | CAD | 33,400 | 23,929 |
| | Province of Ontario | 5.850% | 3/8/33 | CAD | 13,752 | 11,476 |
| | Province of Ontario | 5.600% | 6/2/35 | CAD | 19,902 | 16,413 |
| | Province of Ontario | 4.700% | 6/2/37 | CAD | 40,264 | 30,499 |
| | Province of Ontario | 4.600% | 6/2/39 | CAD | 38,304 | 28,649 |
| | Province of Ontario | 4.650% | 6/2/41 | CAD | 43,832 | 32,907 |
| | Province of Ontario | 3.500% | 6/2/43 | CAD | 45,955 | 29,346 |
| | Province of Ontario | 3.450% | 6/2/45 | CAD | 59,510 | 37,400 |
| | Province of Ontario | 2.900% | 12/2/46 | CAD | 58,629 | 33,203 |
| | Province of Ontario | 2.800% | 6/2/48 | CAD | 47,267 | 26,086 |
| | Province of Ontario | 2.900% | 6/2/49 | CAD | 49,578 | 27,813 |
| | Province of Ontario | 2.650% | 12/2/50 | CAD | 50,486 | 26,809 |
| | Province of Ontario | 1.900% | 12/2/51 | CAD | 45,094 | 19,796 |
| | Province of Ontario | 2.550% | 12/2/52 | CAD | 43,970 | 22,638 |
| | Province of Ontario | 3.750% | 12/2/53 | CAD | 22,041 | 14,642 |
| | Province of Prince Edward Island | 1.850% | 7/27/31 | CAD | 1,900 | 1,160 |
| | Province of Prince Edward Island | 3.650% | 6/27/42 | CAD | 816 | 518 |
| | Province of Prince Edward Island | 2.650% | 12/1/51 | CAD | 999 | 512 |
| | Province of Prince Edward Island | 3.600% | 1/17/53 | CAD | 1,527 | 946 |
| | Province of Quebec | 1.500% | 12/15/23 | GBP | 4,090 | 4,568 |
| | Province of Quebec | 2.375% | 1/22/24 | EUR | 448 | 441 |
| | Province of Quebec | 2.250% | 2/22/24 | CAD | 2,638 | 1,890 |
| | Province of Quebec | 3.750% | 9/1/24 | CAD | 22,917 | 16,712 |
| | Province of Quebec | 0.875% | 1/15/25 | EUR | 5,800 | 5,490 |
| | Province of Quebec | 4.200% | 3/10/25 | AUD | 768 | 490 |
| | Province of Quebec | 5.350% | 6/1/25 | CAD | 2,550 | 1,930 |
| | Province of Quebec | 2.600% | 7/6/25 | CAD | 4,936 | 3,495 |
| | Province of Quebec | 2.750% | 9/1/25 | CAD | 27,353 | 19,401 |
| | Province of Quebec | 8.500% | 4/1/26 | CAD | 5,102 | 4,255 |
| | Province of Quebec | 3.700% | 5/20/26 | AUD | 421 | 262 |
| | Province of Quebec | 2.500% | 9/1/26 | CAD | 19,136 | 13,352 |
| | Province of Quebec | 1.850% | 2/13/27 | CAD | 3,613 | 2,437 |
| | Province of Quebec | 0.875% | 5/4/27 | EUR | 17,851 | 16,093 |
| | Province of Quebec | 2.750% | 9/1/27 | CAD | 21,524 | 15,072 |
| | Province of Quebec | 0.875% | 7/5/28 | EUR | 21,256 | 18,639 |
| | Province of Quebec | 2.750% | 9/1/28 | CAD | 23,290 | 16,117 |
| | Province of Quebec | 2.300% | 9/1/29 | CAD | 33,617 | 22,325 |
| | Province of Quebec | 6.000% | 10/1/29 | CAD | 7,654 | 6,300 |
| | Province of Quebec | 1.900% | 9/1/30 | CAD | 36,000 | 22,776 |
| | Province of Quebec | 0.000% | 10/29/30 | EUR | 16,907 | 12,978 |
Total International Bond Index Fund
| | | Coupon | Maturity
Date | Currency | Face
Amount
(000) | Market
Value•
($000) |
| | Province of Quebec | 0.250% | 5/5/31 | EUR | 10,600 | 8,165 |
| | Province of Quebec | 1.500% | 9/1/31 | CAD | 32,996 | 19,766 |
| | Province of Quebec | 3.650% | 5/20/32 | CAD | 13,000 | 9,259 |
| | Province of Quebec | 6.250% | 6/1/32 | CAD | 11,006 | 9,449 |
| | Province of Quebec | 3.250% | 9/1/32 | CAD | 18,765 | 12,889 |
| | Province of Quebec | 5.750% | 12/1/36 | CAD | 10,131 | 8,537 |
| | Province of Quebec | 5.000% | 12/1/38 | CAD | 17,643 | 13,832 |
| | Province of Quebec | 5.000% | 12/1/41 | CAD | 28,086 | 22,067 |
| | Province of Quebec | 4.250% | 12/1/43 | CAD | 35,783 | 25,567 |
| | Province of Quebec | 3.500% | 12/1/45 | CAD | 37,111 | 23,557 |
| | Province of Quebec | 3.500% | 12/1/48 | CAD | 42,780 | 27,038 |
| | Province of Quebec | 3.100% | 12/1/51 | CAD | 52,276 | 30,613 |
| | Province of Quebec | 2.850% | 12/1/53 | CAD | 45,117 | 24,979 |
| | Province of Quebec | 4.400% | 12/1/55 | CAD | 4,400 | 3,312 |
| | Province of Saskatchewan | 3.200% | 6/3/24 | CAD | 4,821 | 3,488 |
| | Province of Saskatchewan | 0.800% | 9/2/25 | CAD | 3,826 | 2,568 |
| | Province of Saskatchewan | 2.550% | 6/2/26 | CAD | 5,678 | 3,974 |
| | Province of Saskatchewan | 2.650% | 6/2/27 | CAD | 5,102 | 3,556 |
| | Province of Saskatchewan | 3.050% | 12/2/28 | CAD | 3,807 | 2,664 |
| | Province of Saskatchewan | 5.750% | 3/5/29 | CAD | 3,061 | 2,454 |
| | Province of Saskatchewan | 2.200% | 6/2/30 | CAD | 4,520 | 2,930 |
| | Province of Saskatchewan | 2.150% | 6/2/31 | CAD | 2,615 | 1,658 |
| | Province of Saskatchewan | 6.400% | 9/5/31 | CAD | 3,441 | 2,960 |
| | Province of Saskatchewan | 5.800% | 9/5/33 | CAD | 1,860 | 1,549 |
| | Province of Saskatchewan | 5.000% | 3/5/37 | CAD | 179 | 139 |
| | Province of Saskatchewan | 4.750% | 6/1/40 | CAD | 3,776 | 2,865 |
| | Province of Saskatchewan | 3.400% | 2/3/42 | CAD | 7,550 | 4,753 |
| | Province of Saskatchewan | 3.900% | 6/2/45 | CAD | 4,984 | 3,341 |
| | Province of Saskatchewan | 2.750% | 12/2/46 | CAD | 7,448 | 4,078 |
| | Province of Saskatchewan | 3.300% | 6/2/48 | CAD | 8,635 | 5,221 |
| | Province of Saskatchewan | 3.100% | 6/2/50 | CAD | 8,853 | 5,152 |
| | Province of Saskatchewan | 2.800% | 12/2/52 | CAD | 7,845 | 4,234 |
| | Province of Saskatchewan | 3.750% | 3/5/54 | CAD | 1,936 | 1,267 |
| | Province of Saskatchewan | 2.950% | 6/2/58 | CAD | 1,428 | 765 |
| | PSP Capital Inc. | 2.090% | 11/22/23 | CAD | 2,029 | 1,455 |
| | PSP Capital Inc. | 3.290% | 4/4/24 | CAD | 9,978 | 7,238 |
| | PSP Capital Inc. | 3.000% | 11/5/25 | CAD | 3,087 | 2,197 |
| | PSP Capital Inc. | 0.900% | 6/15/26 | CAD | 4,550 | 2,994 |
| | PSP Capital Inc. | 1.500% | 3/15/28 | CAD | 3,700 | 2,401 |
| | PSP Capital Inc. | 2.050% | 1/15/30 | CAD | 6,972 | 4,489 |
| | PSP Capital Inc. | 2.600% | 3/1/32 | CAD | 3,000 | 1,946 |
| | Regional Municipality of Peel Ontario | 4.250% | 12/2/33 | CAD | 1,000 | 730 |
| | Regional Municipality of Peel Ontario | 5.100% | 6/29/40 | CAD | 3,561 | 2,728 |
| | Regional Municipality of Peel Ontario | 2.500% | 6/16/51 | CAD | ��� 747 | 365 |
| | Regional Municipality of York | 2.600% | 12/15/25 | CAD | 2,550 | 1,794 |
| | Regional Municipality of York | 2.500% | 6/2/26 | CAD | 1,529 | 1,067 |
| | Regional Municipality of York | 2.350% | 6/9/27 | CAD | 1 | 1 |
| | Regional Municipality of York | 1.700% | 5/27/30 | CAD | 1,512 | 937 |
| | Regional Municipality of York | 2.150% | 6/22/31 | CAD | 1,346 | 844 |
| | Regional Municipality of York | 4.000% | 5/31/32 | CAD | 2,365 | 1,724 |
| | Regional Municipality of York | 3.650% | 5/13/33 | CAD | 1,581 | 1,090 |
| | Regional Municipality of York | 4.050% | 5/1/34 | CAD | 1,223 | 865 |
| | Royal Office Finance LP | 5.209% | 11/12/37 | CAD | 3,717 | 2,783 |
| | South Coast British Columbia Transportation Authority | 3.050% | 6/4/25 | CAD | 3,143 | 2,244 |
| | South Coast British Columbia Transportation Authority | 3.150% | 11/16/48 | CAD | 4,793 | 2,694 |
| | South Coast British Columbia Transportation Authority | 2.650% | 10/29/50 | CAD | 504 | 253 |
| | TCHC Issuer Trust | 5.395% | 2/22/40 | CAD | 1,060 | 825 |
| | Toronto Canada | 2.450% | 2/6/25 | CAD | 2,410 | 1,706 |
| | Toronto Canada | 2.400% | 6/7/27 | CAD | 2,587 | 1,780 |
| | Toronto Canada | 2.650% | 11/9/29 | CAD | 2,170 | 1,485 |
| | Toronto Canada | 3.250% | 4/20/32 | CAD | 2,400 | 1,635 |
| | Toronto Canada | 2.950% | 4/28/35 | CAD | 3,188 | 1,984 |
| | Toronto Canada | 3.500% | 6/2/36 | CAD | 2,800 | 1,828 |
| | Toronto Canada | 2.600% | 9/24/39 | CAD | 1,023 | 566 |
| | Toronto Canada | 5.200% | 6/1/40 | CAD | 621 | 480 |
| | Toronto Canada | 2.150% | 8/25/40 | CAD | 2,582 | 1,314 |
| | Toronto Canada | 4.700% | 6/10/41 | CAD | 1,019 | 740 |
| | Toronto Canada | 3.800% | 12/13/42 | CAD | 1,160 | 747 |
| | Toronto Canada | 4.150% | 3/10/44 | CAD | 2,515 | 1,696 |
Total International Bond Index Fund
| | | Coupon | Maturity
Date | Currency | Face
Amount
(000) | Market
Value•
($000) |
| | Toronto Canada | 3.250% | 6/24/46 | CAD | 2,040 | 1,179 |
| | Toronto Canada | 3.200% | 8/1/48 | CAD | 927 | 529 |
| | Toronto Canada | 2.800% | 11/22/49 | CAD | 2,802 | 1,459 |
| | Toronto Canada | 2.900% | 4/29/51 | CAD | 2,796 | 1,480 |
| | Toronto Canada | 4.300% | 6/1/52 | CAD | 1,116 | 777 |
| | Vancouver Canada | 3.700% | 10/18/52 | CAD | 652 | 405 |
| | Winnipeg Canada | 4.100% | 6/1/45 | CAD | 1,160 | 764 |
| | Winnipeg Canada | 4.300% | 11/15/51 | CAD | 2,121 | 1,440 |
| | | | | | | 3,925,220 |
| Chile (0.1%) | | | |
| 3 | Bonos de la Tesoreria de la Republica en pesos | 5.800% | 6/1/24 | CLP | 8,175,000 | 8,239 |
| | Bonos de la Tesoreria de la Republica en pesos | 2.500% | 3/1/25 | CLP | 13,250,000 | 12,539 |
| | Bonos de la Tesoreria de la Republica en pesos | 4.500% | 3/1/26 | CLP | 18,940,000 | 18,619 |
| 3 | Bonos de la Tesoreria de la Republica en pesos | 5.000% | 10/1/28 | CLP | 10,500,000 | 10,128 |
| 3 | Bonos de la Tesoreria de la Republica en pesos | 4.700% | 9/1/30 | CLP | 11,650,000 | 10,872 |
| | Bonos de la Tesoreria de la Republica en pesos | 5.000% | 3/1/35 | CLP | 10,750,000 | 9,958 |
| | Bonos de la Tesoreria de la Republica en pesos | 6.000% | 1/1/43 | CLP | 15,000,000 | 15,032 |
| | Republic of Chile | 1.625% | 1/30/25 | EUR | 2,884 | 2,708 |
| | Republic of Chile | 1.750% | 1/20/26 | EUR | 100 | 92 |
| | Republic of Chile | 0.100% | 1/26/27 | EUR | 7,438 | 6,120 |
| | Republic of Chile | 0.555% | 1/21/29 | EUR | 3,400 | 2,622 |
| | Republic of Chile | 1.440% | 2/1/29 | EUR | 2,269 | 1,841 |
| | Republic of Chile | 0.830% | 7/2/31 | EUR | 5,659 | 4,059 |
| | Republic of Chile | 1.300% | 7/26/36 | EUR | 4,046 | 2,605 |
| | Republic of Chile | 1.250% | 1/29/40 | EUR | 4,868 | 2,859 |
| | Republic of Chile | 1.250% | 1/22/51 | EUR | 5,937 | 2,859 |
| | | | | | | 111,152 |
| China (1.1%) | | | |
| | Agricultural Development Bank of China | 3.190% | 3/3/24 | CNY | 150,000 | 20,862 |
| | Agricultural Development Bank of China | 4.000% | 11/12/25 | CNY | 39,900 | 5,731 |
| | Agricultural Development Bank of China | 3.630% | 7/19/26 | CNY | 50,000 | 7,130 |
| | Agricultural Development Bank of China | 3.750% | 1/25/29 | CNY | 375,200 | 54,257 |
| | Agricultural Development Bank of China | 3.520% | 5/24/31 | CNY | 20,000 | 2,866 |
| | Agricultural Development Bank of China | 3.300% | 11/5/31 | CNY | 100,000 | 14,116 |
| | Agricultural Development Bank of China | 3.060% | 6/6/32 | CNY | 170,000 | 23,553 |
| | China Development Bank | 0.875% | 1/24/24 | EUR | 778 | 747 |
| | China Development Bank | 3.300% | 2/1/24 | CNY | 299,900 | 41,752 |
| | China Development Bank | 2.730% | 11/11/24 | CNY | 20,000 | 2,771 |
| | China Development Bank | 3.340% | 7/14/25 | CNY | 30,000 | 4,225 |
| | China Development Bank | 3.680% | 2/26/26 | CNY | 391,800 | 55,915 |
| | China Development Bank | 3.300% | 3/3/26 | CNY | 10,000 | 1,411 |
| | China Development Bank | 3.500% | 8/13/26 | CNY | 235,300 | 33,458 |
| | China Development Bank | 3.430% | 1/14/27 | CNY | 50,000 | 7,104 |
| | China Development Bank | 3.390% | 7/10/27 | CNY | 100,000 | 14,178 |
| | China Development Bank | 3.400% | 1/8/28 | CNY | 100,000 | 14,233 |
| | China Development Bank | 2.990% | 3/1/29 | CNY | 100,000 | 13,867 |
| | China Development Bank | 3.450% | 9/20/29 | CNY | 50,000 | 7,121 |
| | China Development Bank | 3.070% | 3/10/30 | CNY | 25,000 | 3,476 |
| | China Development Bank | 3.700% | 10/20/30 | CNY | 50,000 | 7,246 |
| | China Development Bank | 3.660% | 3/1/31 | CNY | 60,000 | 8,680 |
| | China Development Bank | 3.410% | 6/7/31 | CNY | 150,000 | 21,327 |
| | China Development Bank | 3.120% | 9/13/31 | CNY | 120,000 | 16,698 |
| | China Development Bank | 4.010% | 1/9/37 | CNY | 74,900 | 11,288 |
| | China Government Bond | 2.880% | 11/5/23 | CNY | 50,000 | 6,927 |
| | China Government Bond | 2.470% | 9/2/24 | CNY | 115,000 | 15,880 |
| | China Government Bond | 3.020% | 10/22/25 | CNY | 85,000 | 11,902 |
| | China Government Bond | 3.220% | 12/6/25 | CNY | 243,600 | 34,317 |
| | China Government Bond | 3.250% | 6/6/26 | CNY | 52,800 | 7,460 |
| | China Government Bond | 2.740% | 8/4/26 | CNY | 85,000 | 11,807 |
| | China Government Bond | 0.125% | 11/12/26 | EUR | 2,300 | 1,982 |
| | China Government Bond | 3.120% | 12/5/26 | CNY | 100,000 | 14,087 |
| | China Government Bond | 2.850% | 6/4/27 | CNY | 130,000 | 18,147 |
| | China Government Bond | 3.010% | 5/13/28 | CNY | 160,000 | 22,484 |
| | China Government Bond | 2.910% | 10/14/28 | CNY | 100,000 | 13,957 |
| | China Government Bond | 0.125% | 11/17/28 | EUR | 5,000 | 3,995 |
| | China Government Bond | 2.680% | 5/21/30 | CNY | 60,000 | 8,207 |
| | China Government Bond | 3.270% | 11/19/30 | CNY | 40,000 | 5,722 |
| | China Government Bond | 3.020% | 5/27/31 | CNY | 115,000 | 16,186 |
Total International Bond Index Fund
| | | Coupon | Maturity
Date | Currency | Face
Amount
(000) | Market
Value•
($000) |
| | China Government Bond | 0.500% | 11/12/31 | EUR | 5,737 | 4,314 |
| | China Government Bond | 2.890% | 11/18/31 | CNY | 30,000 | 4,184 |
| | China Government Bond | 2.750% | 2/17/32 | CNY | 75,000 | 10,346 |
| | China Government Bond | 0.625% | 11/25/35 | EUR | 5,087 | 3,427 |
| | China Government Bond | 1.000% | 11/12/39 | EUR | 4,922 | 3,124 |
| | China Government Bond | 3.970% | 7/23/48 | CNY | 189,000 | 29,587 |
| | China Government Bond | 4.080% | 10/22/48 | CNY | 40,000 | 6,373 |
| | China Government Bond | 3.860% | 7/22/49 | CNY | 255,200 | 39,377 |
| | China Government Bond | 3.390% | 3/16/50 | CNY | 158,000 | 22,567 |
| | China Government Bond | 4.240% | 11/24/64 | CNY | 20,000 | 3,434 |
| | China Government Bond | 3.730% | 5/25/70 | CNY | 30,000 | 4,692 |
| | China Government Bond | 3.760% | 3/22/71 | CNY | 20,000 | 3,151 |
| | Export-Import Bank of China | 3.280% | 2/11/24 | CNY | 414,800 | 57,740 |
| | Export-Import Bank of China | 3.260% | 2/24/27 | CNY | 140,000 | 19,727 |
| | Export-Import Bank of China | 3.860% | 5/20/29 | CNY | 50,000 | 7,299 |
| | Export-Import Bank of China | 3.230% | 3/23/30 | CNY | 55,000 | 7,723 |
| | Export-Import Bank of China | 3.380% | 7/16/31 | CNY | 70,000 | 9,929 |
| | Export-Import Bank of China | 3.180% | 3/11/32 | CNY | 170,000 | 23,768 |
| | | | | | | 847,834 |
| Colombia (0.2%) | | | |
| | Colombian TES | 10.000% | 7/24/24 | COP | 102,170,000 | 19,883 |
| | Colombian TES | 6.250% | 11/26/25 | COP | 73,070,000 | 12,309 |
| | Colombian TES | 7.500% | 8/26/26 | COP | 109,275,000 | 18,290 |
| | Colombian TES | 5.750% | 11/3/27 | COP | 82,310,000 | 12,071 |
| | Colombian TES | 6.000% | 4/28/28 | COP | 117,605,000 | 16,963 |
| | Colombian TES | 7.750% | 9/18/30 | COP | 88,110,000 | 12,757 |
| | Colombian TES | 7.000% | 3/26/31 | COP | 77,500,000 | 10,492 |
| | Colombian TES | 7.000% | 6/30/32 | COP | 103,300,000 | 13,459 |
| | Colombian TES | 7.250% | 10/18/34 | COP | 133,945,000 | 16,956 |
| | Colombian TES | 9.250% | 5/28/42 | COP | 72,500,000 | 10,118 |
| | Colombian TES | 7.250% | 10/26/50 | COP | 60,000,000 | 6,483 |
| | | | | | | 149,781 |
| Croatia (0.1%) | | | |
| | Republic of Croatia | 3.000% | 3/11/25 | EUR | 996 | 985 |
| | Republic of Croatia | 3.000% | 3/20/27 | EUR | 3,541 | 3,480 |
| | Republic of Croatia | 2.700% | 6/15/28 | EUR | 2,982 | 2,825 |
| | Republic of Croatia | 1.125% | 6/19/29 | EUR | 3,541 | 2,940 |
| | Republic of Croatia | 2.750% | 1/27/30 | EUR | 4,541 | 4,097 |
| | Republic of Croatia | 1.500% | 6/17/31 | EUR | 22,361 | 17,802 |
| | Republic of Croatia | 2.875% | 4/22/32 | EUR | 4,600 | 4,016 |
| | Republic of Croatia | 1.125% | 3/4/33 | EUR | 4,000 | 2,887 |
| | Republic of Croatia | 1.750% | 3/4/41 | EUR | 5,053 | 3,313 |
| | | | | | | 42,345 |
| Czech Republic (0.4%) | | | |
| | Czech Republic | 0.450% | 10/25/23 | CZK | 510,640 | 19,372 |
| | Czech Republic | 5.700% | 5/25/24 | CZK | 112,260 | 4,495 |
| | Czech Republic | 0.000% | 12/12/24 | CZK | 538,920 | 19,254 |
| | Czech Republic | 2.400% | 9/17/25 | CZK | 531,660 | 19,368 |
| | Czech Republic | 6.000% | 2/26/26 | CZK | 2,379,110 | 95,482 |
| | Czech Republic | 1.000% | 6/26/26 | CZK | 946,570 | 31,865 |
| | Czech Republic | 0.250% | 2/10/27 | CZK | 251,570 | 7,938 |
| | Czech Republic | 2.500% | 8/25/28 | CZK | 188,810 | 6,312 |
| | Czech Republic | 2.750% | 7/23/29 | CZK | 1,627,470 | 54,116 |
| | Czech Republic | 0.950% | 5/15/30 | CZK | 811,930 | 22,897 |
| | Czech Republic | 1.200% | 3/13/31 | CZK | 548,580 | 15,413 |
| | Czech Republic | 2.000% | 10/13/33 | CZK | 190,090 | 5,335 |
| | Czech Republic | 4.200% | 12/4/36 | CZK | 49,580 | 1,699 |
| | Czech Republic | 1.500% | 4/24/40 | CZK | 99,250 | 2,144 |
| | Czech Republic | 4.850% | 11/26/57 | CZK | 46,430 | 1,652 |
| | | | | | | 307,342 |
| Denmark (0.4%) | | | |
| | Kingdom of Denmark | 1.500% | 11/15/23 | DKK | 123,779 | 16,346 |
| | Kingdom of Denmark | 7.000% | 11/10/24 | DKK | 37,910 | 5,505 |
| | Kingdom of Denmark | 1.750% | 11/15/25 | DKK | 345,649 | 45,278 |
| | Kingdom of Denmark | 0.500% | 11/15/27 | DKK | 388,364 | 47,088 |
| | Kingdom of Denmark | 0.500% | 11/15/29 | DKK | 588,247 | 68,355 |
| | Kingdom of Denmark | 0.000% | 11/15/31 | DKK | 441,612 | 46,750 |
| | Kingdom of Denmark | 4.500% | 11/15/39 | DKK | 381,645 | 63,104 |
Total International Bond Index Fund
| | | Coupon | Maturity
Date | Currency | Face
Amount
(000) | Market
Value•
($000) |
| | Kingdom of Denmark | 0.250% | 11/15/52 | DKK | 50,182 | 3,582 |
| | Kommunekredit | 0.250% | 2/16/24 | EUR | 996 | 955 |
| | Kommunekredit | 0.625% | 5/11/26 | EUR | 2,214 | 2,028 |
| | Kommunekredit | 2.900% | 11/27/26 | AUD | 2,131 | 1,273 |
| | Kommunekredit | 0.750% | 5/18/27 | EUR | 13,135 | 11,821 |
| | Kommunekredit | 0.010% | 5/4/34 | EUR | 14,000 | 9,687 |
| | | | | | | 321,772 |
| Finland (0.5%) | | | |
| | Finnvera OYJ | 0.500% | 4/13/26 | EUR | 3,266 | 2,982 |
| | Finnvera OYJ | 2.125% | 3/8/28 | EUR | 15,300 | 14,591 |
| | Finnvera OYJ | 0.375% | 4/9/29 | EUR | 5,831 | 4,906 |
| | Finnvera OYJ | 1.125% | 5/17/32 | EUR | 1,900 | 1,580 |
| | Kuntarahoitus OYJ | 0.000% | 4/21/28 | EUR | 4,600 | 3,894 |
| | Kuntarahoitus OYJ | 0.250% | 2/25/32 | EUR | ��� 17,200 | 13,232 |
| | Kuntarahoitus OYJ | 0.050% | 9/10/35 | EUR | 6,823 | 4,578 |
| | Municipality Finance plc | 5.000% | 3/20/24 | AUD | 2,092 | 1,352 |
| | Municipality Finance plc | 0.625% | 11/26/26 | EUR | 2,543 | 2,306 |
| | Municipality Finance plc | 1.250% | 2/23/33 | EUR | 5,087 | 4,236 |
| 3 | Republic of Finland | 2.000% | 4/15/24 | EUR | 14,859 | 14,686 |
| 3 | Republic of Finland | 0.000% | 9/15/24 | EUR | 25,620 | 24,410 |
| 3 | Republic of Finland | 4.000% | 7/4/25 | EUR | 22,373 | 23,223 |
| 3 | Republic of Finland | 0.875% | 9/15/25 | EUR | 5,380 | 5,143 |
| 3 | Republic of Finland | 0.500% | 9/15/27 | EUR | 26,133 | 23,520 |
| 3 | Republic of Finland | 2.750% | 7/4/28 | EUR | 5,818 | 5,804 |
| 3 | Republic of Finland | 0.500% | 9/15/29 | EUR | 58,950 | 50,534 |
| 3 | Republic of Finland | 0.000% | 9/15/30 | EUR | 55,510 | 44,675 |
| 3 | Republic of Finland | 0.750% | 4/15/31 | EUR | 33,047 | 27,986 |
| 3 | Republic of Finland | 0.125% | 9/15/31 | EUR | 14,549 | 11,522 |
| 3 | Republic of Finland | 1.500% | 9/15/32 | EUR | 32,031 | 28,147 |
| 3 | Republic of Finland | 1.125% | 4/15/34 | EUR | 16,396 | 13,405 |
| 3 | Republic of Finland | 0.250% | 9/15/40 | EUR | 38,836 | 23,998 |
| 3 | Republic of Finland | 2.625% | 7/4/42 | EUR | 17,532 | 16,397 |
| 3 | Republic of Finland | 0.500% | 4/15/43 | EUR | 14,007 | 8,703 |
| 3 | Republic of Finland | 0.125% | 4/15/52 | EUR | 16,853 | 7,982 |
| | | | | | | 383,792 |
| France (8.6%) | | | |
| | Action Logement Services | 1.375% | 4/13/32 | EUR | 7,500 | 6,364 |
| | Action Logement Services | 0.750% | 7/19/41 | EUR | 13,600 | 8,400 |
| | Agence Francaise de Developpement EPIC | 0.125% | 11/15/23 | EUR | 4,000 | 3,854 |
| | Agence Francaise de Developpement EPIC | 0.375% | 4/30/24 | EUR | 21,700 | 20,734 |
| | Agence Francaise de Developpement EPIC | 1.375% | 9/17/24 | EUR | 10,500 | 10,147 |
| | Agence Francaise de Developpement EPIC | 2.250% | 5/27/25 | EUR | 5,000 | 4,894 |
| | Agence Francaise de Developpement EPIC | 0.500% | 10/31/25 | EUR | 5,000 | 4,646 |
| | Agence Francaise de Developpement EPIC | 0.250% | 7/21/26 | EUR | 6,000 | 5,427 |
| | Agence Francaise de Developpement EPIC | 3.750% | 2/15/27 | EUR | 1,800 | 1,849 |
| | Agence Francaise de Developpement EPIC | 1.000% | 1/31/28 | EUR | 2,500 | 2,255 |
| | Agence Francaise de Developpement EPIC | 0.010% | 11/25/28 | EUR | 11,200 | 9,343 |
| | Agence Francaise de Developpement EPIC | 0.250% | 6/29/29 | EUR | 19,600 | 16,329 |
| | Agence Francaise de Developpement EPIC | 0.500% | 5/25/30 | EUR | 30,000 | 24,809 |
| | Agence Francaise de Developpement EPIC | 1.375% | 7/5/32 | EUR | 20,600 | 17,457 |
| | Agence Francaise de Developpement EPIC | 0.500% | 5/31/35 | EUR | 5,000 | 3,505 |
| | Agence Francaise de Developpement EPIC | 1.125% | 3/2/37 | EUR | 3,700 | 2,723 |
| | Agence France Locale | 0.500% | 6/20/24 | EUR | 4,900 | 4,682 |
| | Agence France Locale | 0.125% | 6/20/26 | EUR | 8,600 | 7,760 |
| | Agence France Locale | 1.125% | 6/20/28 | EUR | 4,500 | 4,071 |
| | Agence France Locale | 0.000% | 3/20/31 | EUR | 6,400 | 4,960 |
| | Bpifrance SACA | 0.125% | 11/25/23 | EUR | 1,200 | 1,156 |
| | Bpifrance SACA | 2.500% | 5/25/24 | EUR | 5,000 | 4,936 |
| | Bpifrance SACA | 0.750% | 11/25/24 | EUR | 8,100 | 7,721 |
| | Bpifrance SACA | 0.125% | 3/25/25 | EUR | 16,400 | 15,283 |
| | Bpifrance SACA | 0.500% | 5/25/25 | EUR | 4,900 | 4,594 |
| | Bpifrance SACA | 2.750% | 10/25/25 | EUR | 12,000 | 11,880 |
| | Bpifrance SACA | 2.125% | 11/29/27 | EUR | 12,500 | 11,940 |
| | Bpifrance SACA | 0.125% | 11/25/28 | EUR | 28,300 | 23,821 |
| | Bpifrance SACA | 0.050% | 9/26/29 | EUR | 5,000 | 4,066 |
| | Bpifrance SACA | 1.875% | 5/25/30 | EUR | 5,000 | 4,612 |
| | Bpifrance SACA | 0.250% | 6/4/31 | EUR | 9,300 | 7,325 |
| | Caisse d'Amortissement de la Dette Sociale | 1.375% | 11/25/24 | EUR | 35,869 | 34,589 |
Total International Bond Index Fund
| | | Coupon | Maturity
Date | Currency | Face
Amount
(000) | Market
Value•
($000) |
| | Caisse d'Amortissement de la Dette Sociale | 4.000% | 12/15/25 | EUR | 5,124 | 5,273 |
| | Caisse d'Amortissement de la Dette Sociale | 0.000% | 2/25/28 | EUR | ��� 9,300 | 7,939 |
| | Caisse d'Amortissement de la Dette Sociale | 0.000% | 5/25/29 | EUR | 31,300 | 25,778 |
| | Caisse d'Amortissement de la Dette Sociale | 0.600% | 11/25/29 | EUR | 30,800 | 26,147 |
| | Caisse d'Amortissement de la Dette Sociale | 0.000% | 5/25/31 | EUR | 90,700 | 70,064 |
| | Caisse d'Amortissement de la Dette Sociale | 0.125% | 9/15/31 | EUR | 30,800 | 23,750 |
| | Caisse d'Amortissement de la Dette Sociale | 0.450% | 1/19/32 | EUR | 18,700 | 14,716 |
| | Caisse des Depots et Consignations | 0.000% | 6/19/24 | EUR | 2,000 | 1,897 |
| | Caisse Francaise de Financement Local | 2.375% | 1/17/24 | EUR | 6,000 | 5,909 |
| | Caisse Francaise de Financement Local | 0.375% | 5/11/24 | EUR | 10,200 | 9,728 |
| | Caisse Francaise de Financement Local | 5.375% | 7/8/24 | EUR | 2,049 | 2,108 |
| | Caisse Francaise de Financement Local | 0.375% | 6/23/25 | EUR | 11,800 | 10,933 |
| | Caisse Francaise de Financement Local | 1.125% | 9/9/25 | EUR | 1,700 | 1,600 |
| | Caisse Francaise de Financement Local | 0.500% | 1/19/26 | EUR | 900 | 824 |
| | Caisse Francaise de Financement Local | 0.625% | 4/13/26 | EUR | 3,000 | 2,743 |
| | Caisse Francaise de Financement Local | 0.750% | 1/11/27 | EUR | 2,000 | 1,805 |
| | Caisse Francaise de Financement Local | 0.750% | 9/27/27 | EUR | 5,000 | 4,441 |
| | Caisse Francaise de Financement Local | 1.000% | 4/25/28 | EUR | 100 | 89 |
| | Caisse Francaise de Financement Local | 3.000% | 10/2/28 | EUR | 20,200 | 19,899 |
| | Caisse Francaise de Financement Local | 0.010% | 6/24/30 | EUR | 25,600 | 20,005 |
| | Caisse Francaise de Financement Local | 1.500% | 1/13/31 | EUR | 5,000 | 4,372 |
| | Caisse Francaise de Financement Local | 1.125% | 12/1/31 | EUR | 30,000 | 24,939 |
| | Caisse Francaise de Financement Local | 1.250% | 5/11/32 | EUR | 9,600 | 7,991 |
| | Caisse Francaise de Financement Local | 1.450% | 1/16/34 | EUR | 2,500 | 2,051 |
| | Caisse Francaise de Financement Local | 1.250% | 1/22/35 | EUR | 400 | 315 |
| | Caisse Francaise de Financement Local | 1.500% | 6/28/38 | EUR | 3,400 | 2,618 |
| | Caisse Francaise de Financement Local | 0.375% | 2/13/40 | EUR | 18,700 | 11,496 |
| | France | 0.000% | 2/25/24 | EUR | 251,025 | 241,540 |
| 8 | France | 0.000% | 3/25/24 | EUR | 232,616 | 223,255 |
| | France | 1.750% | 11/25/24 | EUR | 78,829 | 77,380 |
| | France | 0.000% | 2/25/25 | EUR | 243,280 | 228,777 |
| 8 | France | 0.000% | 3/25/25 | EUR | 220,000 | 206,611 |
| | France | 0.500% | 5/25/25 | EUR | 148,245 | 140,530 |
| 8 | France | 1.000% | 11/25/25 | EUR | 144,791 | 138,407 |
| | France | 0.000% | 2/25/26 | EUR | 162,410 | 149,357 |
| | France | 3.500% | 4/25/26 | EUR | 82,257 | 84,847 |
| | France | 0.500% | 5/25/26 | EUR | 178,321 | 166,142 |
| | France | 0.250% | 11/25/26 | EUR | 83,694 | 76,464 |
| 9 | France | 0.000% | 2/25/27 | EUR | 468,188 | 420,609 |
| | France | 1.000% | 5/25/27 | EUR | 64,689 | 60,519 |
| | France | 0.750% | 2/25/28 | EUR | 352,786 | 321,477 |
| 8 | France | 0.750% | 5/25/28 | EUR | 246,813 | 223,992 |
| 8 | France | 0.750% | 11/25/28 | EUR | 191,509 | 172,411 |
| | France | 5.500% | 4/25/29 | EUR | 76,812 | 89,712 |
| 8 | France | 0.500% | 5/25/29 | EUR | 176,702 | 155,143 |
| 8 | France | 0.000% | 11/25/29 | EUR | 213,459 | 178,397 |
| | France | 2.500% | 5/25/30 | EUR | 140,069 | 139,633 |
| 8 | France | 0.000% | 11/25/30 | EUR | 219,706 | 178,224 |
| | France | 1.500% | 5/25/31 | EUR | 150,885 | 138,462 |
| | France | 0.000% | 11/25/31 | EUR | 251,173 | 197,530 |
| | France | 0.000% | 5/25/32 | EUR | 142,980 | 110,179 |
| | France | 5.750% | 10/25/32 | EUR | 82,358 | 102,845 |
| | France | 2.000% | 11/25/32 | EUR | 80,000 | 74,313 |
| | France | 1.250% | 5/25/34 | EUR | 174,376 | 145,591 |
| | France | 4.750% | 4/25/35 | EUR | 106,535 | 124,965 |
| 3,8 | France | 1.250% | 5/25/36 | EUR | 142,099 | 113,967 |
| | France | 1.250% | 5/25/38 | EUR | 84,041 | 65,190 |
| | France | 4.000% | 10/25/38 | EUR | 95,869 | 106,003 |
| 3 | France | 1.750% | 6/25/39 | EUR | 7,084 | 5,921 |
| 3 | France | 0.500% | 5/25/40 | EUR | 88,590 | 57,599 |
| | France | 4.500% | 4/25/41 | EUR | 165,428 | 195,113 |
| 3 | France | 2.500% | 5/25/43 | EUR | 64,087 | 57,926 |
| 3 | France | 0.500% | 6/25/44 | EUR | 24,019 | 14,415 |
| | France | 3.250% | 5/25/45 | EUR | 129,509 | 130,744 |
| 3,8 | France | 2.000% | 5/25/48 | EUR | 126,607 | 100,954 |
| 3 | France | 1.500% | 5/25/50 | EUR | 103,205 | 72,750 |
| | France | 0.750% | 5/25/52 | EUR | 135,268 | 75,277 |
| 3 | France | 0.750% | 5/25/53 | EUR | 166,253 | 90,737 |
| 3 | France | 4.000% | 4/25/55 | EUR | 74,952 | 87,608 |
Total International Bond Index Fund
| | | Coupon | Maturity
Date | Currency | Face
Amount
(000) | Market
Value•
($000) |
| | France | 4.000% | 4/25/60 | EUR | 49,833 | 59,282 |
| 3 | France | 1.750% | 5/25/66 | EUR | 53,794 | 38,403 |
| 3 | France | 0.500% | 5/25/72 | EUR | 34,906 | 14,256 |
| | Ile-de-France Mobilites | 0.950% | 5/28/41 | EUR | 1,900 | 1,240 |
| | Ile-de-France Mobilites | 1.275% | 2/14/42 | EUR | 10,700 | 7,348 |
| | Regie Autonome des Transports Parisiens | 0.875% | 5/25/27 | EUR | 1,500 | 1,368 |
| | Region of Ile de France | 3.625% | 3/27/24 | EUR | 6,800 | 6,825 |
| | Region of Ile de France | 0.500% | 6/14/25 | EUR | 15,100 | 14,160 |
| | Region of Ile de France | 0.625% | 4/23/27 | EUR | 2,500 | 2,263 |
| | Region of Ile de France | 0.000% | 4/20/28 | EUR | 2,500 | 2,134 |
| | Region of Ile de France | 1.375% | 3/14/29 | EUR | 100 | 91 |
| | Region of Ile de France | 1.375% | 6/20/33 | EUR | 3,000 | 2,500 |
| | SFIL SA | 0.050% | 6/4/29 | EUR | 23,300 | 19,160 |
| | SNCF Reseau | 2.625% | 12/29/25 | EUR | 2,300 | 2,279 |
| | SNCF Reseau | 4.250% | 10/7/26 | EUR | 900 | 943 |
| | SNCF Reseau | 3.125% | 10/25/28 | EUR | 3,400 | 3,428 |
| | SNCF Reseau | 5.250% | 12/7/28 | GBP | 8,708 | 10,314 |
| | SNCF Reseau | 0.875% | 1/22/29 | EUR | 3,000 | 2,641 |
| | SNCF Reseau | 1.125% | 5/25/30 | EUR | 14,300 | 12,541 |
| | SNCF Reseau | 1.000% | 11/9/31 | EUR | 7,600 | 6,376 |
| | SNCF Reseau | 5.000% | 10/10/33 | EUR | 7,891 | 9,033 |
| | SNCF Reseau | 5.250% | 1/31/35 | GBP | 2,716 | 3,265 |
| | SNCF Reseau | 0.750% | 5/25/36 | EUR | 18,900 | 13,440 |
| | SNCF Reseau | 1.500% | 5/29/37 | EUR | 9,100 | 7,076 |
| | SNCF Reseau | 2.250% | 12/20/47 | EUR | 6,300 | 4,857 |
| | SNCF Reseau | 2.000% | 2/5/48 | EUR | 2,500 | 1,794 |
| | SNCF Reseau | 5.000% | 3/11/52 | GBP | 2,574 | 3,094 |
| | SNCF Reseau | 4.830% | 3/25/60 | GBP | 717 | 860 |
| | Societe Du Grand Paris EPIC | 1.125% | 10/22/28 | EUR | 5,200 | 4,682 |
| | Societe Du Grand Paris EPIC | 0.000% | 11/25/30 | EUR | 7,600 | 5,967 |
| | Societe Du Grand Paris EPIC | 1.125% | 5/25/34 | EUR | 23,200 | 18,203 |
| | Societe Du Grand Paris EPIC | 0.875% | 5/10/46 | EUR | 7,000 | 4,039 |
| | Societe Du Grand Paris EPIC | 1.700% | 5/25/50 | EUR | 8,500 | 5,752 |
| | Societe Du Grand Paris EPIC | 1.000% | 11/26/51 | EUR | 16,800 | 8,980 |
| | Societe Du Grand Paris EPIC | 0.700% | 10/15/60 | EUR | 5,100 | 2,041 |
| | Societe Du Grand Paris EPIC | 1.000% | 2/18/70 | EUR | 9,300 | 4,006 |
| | Societe Nationale SNCF SA | 4.125% | 2/19/25 | EUR | 400 | 408 |
| | Societe Nationale SNCF SA | 0.875% | 12/28/26 | GBP | 6,400 | 6,378 |
| | Societe Nationale SNCF SA | 5.375% | 3/18/27 | GBP | 4,134 | 4,867 |
| | Societe Nationale SNCF SA | 1.500% | 2/2/29 | EUR | 7,100 | 6,441 |
| | Societe Nationale SNCF SA | 1.000% | 5/25/40 | EUR | 14,900 | 9,710 |
| | Societe Nationale SNCF SA | 0.875% | 2/28/51 | EUR | 5,200 | 2,578 |
| | UNEDIC ASSEO | 2.375% | 5/25/24 | EUR | 1,500 | 1,478 |
| | UNEDIC ASSEO | 0.125% | 11/25/24 | EUR | 46,000 | 43,229 |
| | UNEDIC ASSEO | 0.625% | 2/17/25 | EUR | 4,500 | 4,263 |
| | UNEDIC ASSEO | 0.625% | 3/3/26 | EUR | 7,300 | 6,766 |
| | UNEDIC ASSEO | 0.100% | 11/25/26 | EUR | 43,800 | 39,077 |
| | UNEDIC ASSEO | 1.250% | 10/21/27 | EUR | 11,000 | 10,158 |
| | UNEDIC ASSEO | 0.500% | 3/20/29 | EUR | 12,200 | 10,506 |
| | UNEDIC ASSEO | 0.250% | 11/25/29 | EUR | 15,300 | 12,707 |
| | UNEDIC ASSEO | 0.000% | 11/19/30 | EUR | 9,500 | 7,481 |
| | UNEDIC ASSEO | 1.500% | 4/20/32 | EUR | 700 | 609 |
| | UNEDIC ASSEO | 1.250% | 5/25/33 | EUR | 1,000 | 826 |
| | UNEDIC ASSEO | 0.100% | 5/25/34 | EUR | 25,400 | 17,705 |
| | UNEDIC ASSEO | 0.250% | 7/16/35 | EUR | 45,200 | 30,863 |
| | | | | | | 6,867,769 |
| Germany (8.5%) | | | |
| | Bundesobligation | 0.000% | 4/11/25 | EUR | 218,276 | 205,821 |
| | Bundesobligation | 0.000% | 10/10/25 | EUR | 377,723 | 353,204 |
| | Bundesobligation | 0.000% | 10/9/26 | EUR | 250,000 | 228,584 |
| | Bundesobligation | 0.000% | 4/16/27 | EUR | 184,891 | 167,219 |
| | Bundesschatzanweisungen | 0.000% | 12/15/23 | EUR | 100,207 | 96,861 |
| | Bundesschatzanweisungen | 0.200% | 6/14/24 | EUR | 410,116 | 394,172 |
| | Bundesschatzanweisungen | 0.400% | 9/13/24 | EUR | 241,102 | 231,611 |
| | Federal Republic of Germany | 1.500% | 5/15/24 | EUR | 43,640 | 42,868 |
| | Federal Republic of Germany | 0.500% | 2/15/26 | EUR | 134,252 | 126,759 |
| | Federal Republic of Germany | 0.000% | 8/15/26 | EUR | 22,545 | 20,730 |
| | Federal Republic of Germany | 0.250% | 2/15/27 | EUR | 115,138 | 105,959 |
| | Federal Republic of Germany | 0.500% | 8/15/27 | EUR | 13,872 | 12,813 |
Total International Bond Index Fund
| | | Coupon | Maturity
Date | Currency | Face
Amount
(000) | Market
Value•
($000) |
| | Federal Republic of Germany | 0.000% | 11/15/27 | EUR | 109,252 | 97,751 |
| | Federal Republic of Germany | 5.625% | 1/4/28 | EUR | 59,562 | 68,958 |
| | Federal Republic of Germany | 0.500% | 2/15/28 | EUR | 157,946 | 144,710 |
| | Federal Republic of Germany | 4.750% | 7/4/28 | EUR | 48,175 | 54,328 |
| 8 | Federal Republic of Germany | 0.250% | 8/15/28 | EUR | 227,586 | 203,720 |
| | Federal Republic of Germany | 0.000% | 11/15/28 | EUR | 225,465 | 197,929 |
| | Federal Republic of Germany | 0.250% | 2/15/29 | EUR | 49,782 | 44,180 |
| | Federal Republic of Germany | 0.000% | 8/15/29 | EUR | 88,233 | 76,079 |
| | Federal Republic of Germany | 6.250% | 1/4/30 | EUR | 40,000 | 50,495 |
| | Federal Republic of Germany | 0.000% | 2/15/30 | EUR | 100,000 | 85,348 |
| | Federal Republic of Germany | 5.500% | 1/4/31 | EUR | 55,000 | 68,149 |
| | Federal Republic of Germany | 0.000% | 2/15/31 | EUR | 5,458 | 4,552 |
| | Federal Republic of Germany | 0.000% | 8/15/31 | EUR | 21,386 | 17,624 |
| | Federal Republic of Germany | 0.000% | 2/15/32 | EUR | 145,931 | 118,625 |
| | Federal Republic of Germany | 1.700% | 8/15/32 | EUR | 176,812 | 167,717 |
| 8 | Federal Republic of Germany | 0.000% | 5/15/35 | EUR | 264,473 | 196,957 |
| | Federal Republic of Germany | 0.000% | 5/15/36 | EUR | 274,943 | 200,076 |
| | Federal Republic of Germany | 1.000% | 5/15/38 | EUR | 102,717 | 84,029 |
| | Federal Republic of Germany | 4.250% | 7/4/39 | EUR | 45,000 | 55,740 |
| | Federal Republic of Germany | 4.750% | 7/4/40 | EUR | 53,000 | 70,237 |
| | Federal Republic of Germany | 3.250% | 7/4/42 | EUR | 35,000 | 39,599 |
| | Federal Republic of Germany | 2.500% | 7/4/44 | EUR | 99,968 | 102,348 |
| 8 | Federal Republic of Germany | 2.500% | 8/15/46 | EUR | 213,709 | 221,217 |
| 8 | Federal Republic of Germany | 1.250% | 8/15/48 | EUR | 137,990 | 111,060 |
| | Federal Republic of Germany | 0.000% | 8/15/50 | EUR | 97,517 | 53,215 |
| | Federal Republic of Germany | 1.800% | 8/15/53 | EUR | 76,416 | 68,304 |
| | FMS Wertmanagement | 1.375% | 3/7/25 | GBP | 10,200 | 10,996 |
| | FMS Wertmanagement | 0.375% | 4/29/30 | EUR | 5,600 | 4,590 |
| | Free and Hanseatic City of Hamburg | 0.250% | 1/20/25 | EUR | 11,784 | 11,043 |
| | Free and Hanseatic City of Hamburg | 0.375% | 4/1/25 | EUR | 3,235 | 3,027 |
| | Free and Hanseatic City of Hamburg | 0.010% | 6/15/28 | EUR | 7,500 | 6,361 |
| | Free and Hanseatic City of Hamburg | 0.800% | 4/11/34 | EUR | 1,023 | 792 |
| | Free and Hanseatic City of Hamburg | 1.450% | 11/5/38 | EUR | 7,686 | 6,042 |
| | Free and Hanseatic City of Hamburg | 0.250% | 2/18/41 | EUR | 14,000 | 8,384 |
| | Free State of Bavaria | 0.030% | 4/3/28 | EUR | 22,546 | 19,271 |
| | Free State of Bavaria | 0.150% | 4/3/30 | EUR | 5,036 | 4,082 |
| | Free State of Bavaria | 0.010% | 1/18/35 | EUR | 17,718 | 12,112 |
| | Free State of Saxony | 0.010% | 11/5/29 | EUR | 11,459 | 9,298 |
| | Free State of Saxony | 0.010% | 12/17/35 | EUR | 751 | 497 |
| | Gemeinsame Deutsche Bundeslaender | 0.250% | 3/18/24 | EUR | 12,810 | 12,273 |
| | Gemeinsame Deutsche Bundeslaender | 1.125% | 9/30/24 | EUR | 2,817 | 2,707 |
| | Gemeinsame Deutsche Bundeslaender | 0.500% | 2/5/25 | EUR | 8,608 | 8,110 |
| | Gemeinsame Deutsche Bundeslaender | 0.375% | 4/17/25 | EUR | 10,248 | 9,585 |
| | Gemeinsame Deutsche Bundeslaender | 0.625% | 2/13/29 | EUR | 2,049 | 1,771 |
| | Gemeinsame Deutsche Bundeslaender | 0.010% | 8/26/30 | EUR | 18,449 | 14,604 |
| 10 | KFW | 0.125% | 11/7/23 | EUR | 5,545 | 5,373 |
| 10 | KFW | 1.250% | 12/29/23 | GBP | 10,529 | 11,736 |
| 10 | KFW | 0.125% | 1/15/24 | EUR | 10,248 | 9,880 |
| 10 | KFW | 5.000% | 3/19/24 | AUD | 1,019 | 661 |
| 10 | KFW | 0.000% | 4/2/24 | EUR | 40,305 | 38,622 |
| 10 | KFW | 0.050% | 5/30/24 | EUR | 1,536 | 1,467 |
| 10 | KFW | 1.500% | 6/11/24 | EUR | 11,509 | 11,235 |
| 10 | KFW | 0.875% | 7/18/24 | GBP | 423 | 462 |
| 10 | KFW | 1.500% | 7/24/24 | AUD | 790 | 484 |
| 10 | KFW | 0.125% | 10/4/24 | EUR | 41,511 | 39,370 |
| 10 | KFW | 1.375% | 12/9/24 | GBP | 20,668 | 22,486 |
| 10 | KFW | 0.625% | 1/15/25 | EUR | 18,977 | 18,071 |
| 10 | KFW | 4.000% | 2/27/25 | AUD | 3,929 | 2,513 |
| 10 | KFW | 0.010% | 3/31/25 | EUR | 41,647 | 38,879 |
| 10 | KFW | 0.375% | 4/23/25 | EUR | 14,859 | 13,987 |
| 10 | KFW | 5.500% | 6/18/25 | GBP | 10,248 | 12,168 |
| 10 | KFW | 0.125% | 6/30/25 | EUR | 86,690 | 80,699 |
| 10 | KFW | 2.500% | 8/25/25 | CHF | 5,390 | 5,588 |
| 10 | KFW | 0.250% | 9/15/25 | EUR | 39,114 | 36,336 |
| 10 | KFW | 0.750% | 2/19/26 | CAD | 3,295 | 2,178 |
| 10 | KFW | 0.375% | 3/9/26 | EUR | 22,802 | 21,013 |
| 10 | KFW | 0.000% | 6/15/26 | EUR | 38,607 | 34,857 |
| 10 | KFW | 3.200% | 9/11/26 | AUD | 4,317 | 2,654 |
| 10 | KFW | 0.000% | 9/30/26 | EUR | 76,605 | 68,660 |
Total International Bond Index Fund
| | | Coupon | Maturity
Date | Currency | Face
Amount
(000) | Market
Value•
($000) |
| 10 | KFW | 2.000% | 2/15/27 | AUD | 9,300 | 5,394 |
| 10 | KFW | 0.625% | 2/22/27 | EUR | 19,471 | 17,706 |
| 10 | KFW | 0.000% | 3/31/27 | EUR | 5,919 | 5,219 |
| 10 | KFW | 1.250% | 6/30/27 | EUR | 25,000 | 23,257 |
| 10 | KFW | 0.500% | 9/15/27 | EUR | 42,644 | 38,077 |
| 10 | KFW | 0.000% | 12/15/27 | EUR | 41,672 | 36,013 |
| 10 | KFW | 0.625% | 1/7/28 | EUR | 20,497 | 18,277 |
| 10 | KFW | 1.375% | 2/2/28 | SEK | 56,730 | 4,662 |
| 10 | KFW | 3.200% | 3/15/28 | AUD | 14,325 | 8,566 |
| 10 | KFW | 0.750% | 6/28/28 | EUR | 15,810 | 14,080 |
| 10 | KFW | 0.000% | 9/15/28 | EUR | 922 | 780 |
| 10 | KFW | 6.000% | 12/7/28 | GBP | 5,124 | 6,422 |
| 10 | KFW | 0.750% | 1/15/29 | EUR | 29,123 | 25,606 |
| 10 | KFW | 2.875% | 12/28/29 | EUR | 40,000 | 39,742 |
| 10 | KFW | 0.000% | 9/17/30 | EUR | 38,887 | 30,885 |
| 10 | KFW | 0.000% | 1/10/31 | EUR | 22,546 | 17,731 |
| 10 | KFW | 0.125% | 1/9/32 | EUR | 28,014 | 21,627 |
| 10 | KFW | 1.375% | 6/7/32 | EUR | 10,000 | 8,646 |
| 10 | KFW | 5.750% | 6/7/32 | GBP | 5,380 | 7,001 |
| 10 | KFW | 1.125% | 5/9/33 | EUR | 19,984 | 16,549 |
| 10 | KFW | 0.050% | 9/29/34 | EUR | 13,002 | 9,157 |
| 10 | KFW | 1.375% | 7/31/35 | EUR | 7,173 | 5,870 |
| 10 | KFW | 5.000% | 6/9/36 | GBP | 3,735 | 4,622 |
| 10 | KFW | 1.250% | 7/4/36 | EUR | 11,784 | 9,293 |
| 10 | KFW | 4.875% | 3/15/37 | GBP | 1,017 | 1,240 |
| 10 | KFW | 1.125% | 3/31/37 | EUR | 21,007 | 16,072 |
| 10 | KFW | 4.700% | 6/2/37 | CAD | 1,198 | 915 |
| 10 | KFW | 1.125% | 6/15/37 | EUR | 5,124 | 3,895 |
| 10 | KFW | 2.600% | 6/20/37 | JPY | 18,000 | 154 |
| 10 | KFW | 0.875% | 7/4/39 | EUR | 2,561 | 1,814 |
| | Land Baden-Wuerttemberg | 2.000% | 11/13/23 | EUR | 4,099 | 4,030 |
| | Land Baden-Wuerttemberg | 0.625% | 2/9/27 | EUR | 5,124 | 4,637 |
| | Land Baden-Wuerttemberg | 0.800% | 4/5/28 | EUR | 5,124 | 4,559 |
| | Land Baden-Wuerttemberg | 0.010% | 7/9/32 | EUR | 16,396 | 12,257 |
| | Land Berlin | 0.500% | 2/10/25 | EUR | 10,760 | 10,133 |
| | Land Berlin | 0.250% | 4/22/25 | EUR | 5,124 | 4,776 |
| | Land Berlin | 0.625% | 3/20/26 | EUR | 20,497 | 18,908 |
| | Land Berlin | 0.625% | 2/8/27 | EUR | 2,869 | 2,595 |
| | Land Berlin | 0.010% | 5/18/27 | EUR | 18,140 | 15,837 |
| | Land Berlin | 1.250% | 6/1/28 | EUR | 9,000 | 8,201 |
| | Land Berlin | 0.010% | 10/26/28 | EUR | 13,835 | 11,588 |
| | Land Berlin | 0.010% | 7/2/30 | EUR | 18,085 | 14,367 |
| | Land Berlin | 1.000% | 5/19/32 | EUR | 7,686 | 6,371 |
| | Land Berlin | 1.300% | 6/13/33 | EUR | 1,023 | 853 |
| | Land Berlin | 0.750% | 4/3/34 | EUR | 10,499 | 8,076 |
| | Land Berlin | 0.125% | 6/4/35 | EUR | 5,124 | 3,509 |
| | Land Berlin | 0.625% | 8/25/36 | EUR | 1,281 | 912 |
| | Land Berlin | 1.375% | 6/5/37 | EUR | 2,561 | 2,015 |
| | Land Berlin | 1.375% | 8/27/38 | EUR | 2,561 | 1,982 |
| | Land Berlin | 0.050% | 8/6/40 | EUR | 7,686 | 4,453 |
| | Land Berlin | 0.100% | 1/18/41 | EUR | 17,561 | 10,236 |
| | Land Thueringen | 0.500% | 5/12/25 | EUR | 2,306 | 2,160 |
| | Land Thueringen | 0.200% | 10/26/26 | EUR | 7,686 | 6,906 |
| | Land Thueringen | 0.500% | 3/2/29 | EUR | 15,000 | 12,873 |
| | Land Thueringen | 0.250% | 3/5/40 | EUR | 4,201 | 2,566 |
| | Landeskreditbank Baden-Wuerttemberg Foerderbank | 4.250% | 8/7/25 | AUD | 6,020 | 3,831 |
| | Landeskreditbank Baden-Wuerttemberg Foerderbank | 0.375% | 4/13/26 | EUR | 7,686 | 6,997 |
| | Landeskreditbank Baden-Wuerttemberg Foerderbank | 1.000% | 12/15/26 | GBP | 20,000 | 20,222 |
| 10 | Landwirtschaftliche Rentenbank | 1.125% | 12/15/23 | GBP | 3,025 | 3,371 |
| 10 | Landwirtschaftliche Rentenbank | 0.375% | 1/22/24 | EUR | 14,852 | 14,342 |
| 10 | Landwirtschaftliche Rentenbank | 4.750% | 4/8/24 | AUD | 2,030 | 1,312 |
| 10 | Landwirtschaftliche Rentenbank | 4.250% | 1/9/25 | AUD | 8,410 | 5,407 |
| 10 | Landwirtschaftliche Rentenbank | 0.500% | 3/6/25 | EUR | 11,784 | 11,104 |
| | Landwirtschaftliche Rentenbank | 0.100% | 3/8/27 | EUR | 5,500 | 4,870 |
| 10 | Landwirtschaftliche Rentenbank | 2.600% | 3/23/27 | AUD | 2,390 | 1,418 |
| 10 | Landwirtschaftliche Rentenbank | 0.625% | 5/18/27 | EUR | 16,551 | 14,904 |
| 10 | Landwirtschaftliche Rentenbank | 0.375% | 2/14/28 | EUR | 5,124 | 4,483 |
| 10 | Landwirtschaftliche Rentenbank | 3.250% | 4/12/28 | AUD | 2,210 | 1,323 |
| 10 | Landwirtschaftliche Rentenbank | 0.000% | 7/19/28 | EUR | 5,110 | 4,327 |
Total International Bond Index Fund
| | | Coupon | Maturity
Date | Currency | Face
Amount
(000) | Market
Value•
($000) |
| 10 | Landwirtschaftliche Rentenbank | 0.500% | 2/28/29 | EUR | 10,916 | 9,377 |
| 10 | Landwirtschaftliche Rentenbank | 0.000% | 11/27/29 | EUR | 5,124 | 4,156 |
| 10 | Landwirtschaftliche Rentenbank | 0.050% | 12/18/29 | EUR | 22,546 | 18,311 |
| 10 | Landwirtschaftliche Rentenbank | 0.625% | 2/20/30 | EUR | 10,248 | 8,654 |
| 10 | Landwirtschaftliche Rentenbank | 0.050% | 1/31/31 | EUR | 14,941 | 11,745 |
| | Niedersachsen Invest GmbH | 0.250% | 7/16/35 | EUR | 10,000 | 6,882 |
| | NRW Bank | 0.375% | 12/16/24 | GBP | 15,000 | 15,938 |
| | NRW Bank | 0.250% | 3/10/25 | EUR | 7,686 | 7,164 |
| | NRW Bank | 0.625% | 2/11/26 | EUR | 7,686 | 7,089 |
| | NRW Bank | 0.500% | 5/11/26 | EUR | 6,145 | 5,610 |
| | NRW Bank | 0.250% | 9/28/26 | EUR | 3,049 | 2,735 |
| | NRW Bank | 0.625% | 2/23/27 | EUR | 7,686 | 6,952 |
| | NRW Bank | 0.250% | 3/16/27 | EUR | 2,895 | 2,566 |
| | NRW Bank | 0.125% | 4/12/27 | EUR | 8,352 | 7,330 |
| | NRW Bank | 0.500% | 9/13/27 | EUR | 7,686 | 6,800 |
| | NRW Bank | 0.625% | 1/4/28 | EUR | 3,587 | 3,156 |
| | NRW Bank | 0.375% | 5/16/29 | EUR | 3,715 | 3,126 |
| | NRW Bank | 0.125% | 2/4/30 | EUR | 25,000 | 20,299 |
| | NRW Bank | 0.000% | 7/28/31 | EUR | 14,007 | 10,724 |
| | NRW Bank | 0.875% | 4/12/34 | EUR | 4,669 | 3,638 |
| | NRW Bank | 0.100% | 7/9/35 | EUR | 3,697 | 2,497 |
| | NRW Bank | 0.500% | 6/17/41 | EUR | 14,279 | 8,950 |
| | NRW Bank | 1.250% | 5/13/49 | EUR | 5,124 | 3,629 |
| | State of Brandenburg | 0.010% | 6/26/28 | EUR | 2,104 | 1,779 |
| | State of Brandenburg | 0.750% | 8/8/36 | EUR | 5,124 | 3,736 |
| | State of Brandenburg | 1.450% | 11/26/38 | EUR | 7,225 | 5,655 |
| | State of Brandenburg | 0.300% | 10/4/49 | EUR | 512 | 263 |
| | State of Bremen | 0.500% | 3/3/25 | EUR | 6,661 | 6,262 |
| | State of Bremen | 1.200% | 1/30/34 | EUR | 300 | 244 |
| | State of Bremen | 1.500% | 11/12/38 | EUR | 2,526 | 1,989 |
| | State of Bremen | 1.000% | 5/27/39 | EUR | 6,403 | 4,605 |
| | State of Bremen | 0.500% | 5/6/41 | EUR | 5,260 | 3,302 |
| | State of Bremen | 0.550% | 2/4/50 | EUR | 6,365 | 3,529 |
| | State of Hesse | 0.125% | 1/25/24 | EUR | 1,022 | 981 |
| | State of Hesse | 1.375% | 6/10/24 | EUR | 2,049 | 1,990 |
| | State of Hesse | 0.125% | 6/20/24 | EUR | 6,763 | 6,425 |
| | State of Hesse | 0.000% | 9/15/24 | EUR | 12,024 | 11,328 |
| | State of Hesse | 0.500% | 2/17/25 | EUR | 5,380 | 5,068 |
| | State of Hesse | 0.250% | 6/10/25 | EUR | 12,810 | 11,903 |
| | State of Hesse | 0.000% | 4/14/26 | EUR | 922 | 830 |
| | State of Hesse | 0.375% | 7/6/26 | EUR | 30,693 | 27,861 |
| | State of Hesse | 0.625% | 8/2/28 | EUR | 5,124 | 4,486 |
| | State of Hesse | 0.010% | 3/11/30 | EUR | 28,821 | 23,156 |
| | State of Hesse | 0.000% | 11/8/30 | EUR | 12,810 | 10,070 |
| | State of Hesse | 1.300% | 10/10/33 | EUR | 4,099 | 3,407 |
| | State of Hesse | 0.750% | 8/4/36 | EUR | 6,145 | 4,488 |
| | State of Lower Saxony | 2.125% | 1/16/24 | EUR | 233 | 230 |
| | State of Lower Saxony | 0.000% | 8/2/24 | EUR | 12,306 | 11,640 |
| | State of Lower Saxony | 0.625% | 1/20/25 | EUR | 5,124 | 4,852 |
| | State of Lower Saxony | 0.125% | 3/7/25 | EUR | 2,049 | 1,911 |
| | State of Lower Saxony | 0.500% | 6/13/25 | EUR | 5,124 | 4,798 |
| | State of Lower Saxony | 0.375% | 1/9/26 | EUR | 10,600 | 9,744 |
| | State of Lower Saxony | 0.500% | 6/8/26 | EUR | 1,281 | 1,171 |
| | State of Lower Saxony | 0.010% | 9/8/26 | EUR | 12,731 | 11,343 |
| | State of Lower Saxony | 0.000% | 2/11/27 | EUR | 27,282 | 24,000 |
| | State of Lower Saxony | 0.125% | 4/8/27 | EUR | 1,023 | 902 |
| | State of Lower Saxony | 0.625% | 7/6/27 | EUR | 10,248 | 9,195 |
| | State of Lower Saxony | 0.010% | 11/25/27 | EUR | 33,879 | 29,177 |
| | State of Lower Saxony | 0.750% | 2/15/28 | EUR | 7,686 | 6,853 |
| | State of Lower Saxony | 0.010% | 2/19/29 | EUR | 10,002 | 8,306 |
| | State of Lower Saxony | 0.375% | 5/14/29 | EUR | 3,074 | 2,601 |
| | State of Lower Saxony | 0.125% | 1/10/30 | EUR | 5,124 | 4,166 |
| | State of Lower Saxony | 0.010% | 8/13/30 | EUR | 13,307 | 10,550 |
| | State of Lower Saxony | 0.010% | 1/10/31 | EUR | 4,669 | 3,652 |
| | State of Lower Saxony | 0.050% | 3/9/35 | EUR | 13,026 | 8,893 |
| | State of North Rhine-Westphalia Germany | 0.200% | 2/16/24 | EUR | 15,303 | 14,683 |
| | State of North Rhine-Westphalia Germany | 1.875% | 3/15/24 | EUR | 998 | 978 |
| | State of North Rhine-Westphalia Germany | 1.000% | 1/16/25 | EUR | 165 | 157 |
| | State of North Rhine-Westphalia Germany | 0.500% | 3/11/25 | EUR | 1,536 | 1,444 |
Total International Bond Index Fund
| | | Coupon | Maturity
Date | Currency | Face
Amount
(000) | Market
Value•
($000) |
| | State of North Rhine-Westphalia Germany | 2.000% | 10/15/25 | EUR | 1,536 | 1,488 |
| | State of North Rhine-Westphalia Germany | 0.750% | 1/16/26 | EUR | 7,686 | 7,144 |
| | State of North Rhine-Westphalia Germany | 0.250% | 3/13/26 | EUR | 53,968 | 49,194 |
| | State of North Rhine-Westphalia Germany | 0.500% | 4/16/26 | EUR | 5,124 | 4,701 |
| | State of North Rhine-Westphalia Germany | 0.500% | 2/16/27 | EUR | 10,453 | 9,404 |
| | State of North Rhine-Westphalia Germany | 0.200% | 3/31/27 | EUR | 17,695 | 15,642 |
| | State of North Rhine-Westphalia Germany | 0.950% | 3/13/28 | EUR | 14,348 | 12,914 |
| | State of North Rhine-Westphalia Germany | 0.000% | 1/15/29 | EUR | 3,119 | 2,595 |
| | State of North Rhine-Westphalia Germany | 0.200% | 4/9/30 | EUR | 4,035 | 3,281 |
| | State of North Rhine-Westphalia Germany | 1.625% | 10/24/30 | EUR | 5,124 | 4,610 |
| | State of North Rhine-Westphalia Germany | 0.625% | 7/21/31 | EUR | 7,686 | 6,274 |
| | State of North Rhine-Westphalia Germany | 2.375% | 5/13/33 | EUR | 18,652 | 17,439 |
| | State of North Rhine-Westphalia Germany | 1.100% | 3/13/34 | EUR | 13,832 | 11,131 |
| | State of North Rhine-Westphalia Germany | 0.000% | 10/12/35 | EUR | 20,755 | 13,803 |
| | State of North Rhine-Westphalia Germany | 1.250% | 5/12/36 | EUR | 7,173 | 5,648 |
| | State of North Rhine-Westphalia Germany | 1.650% | 2/22/38 | EUR | 23,506 | 19,077 |
| | State of North Rhine-Westphalia Germany | 0.500% | 11/25/39 | EUR | 12,776 | 8,298 |
| | State of North Rhine-Westphalia Germany | 1.500% | 6/12/40 | EUR | 1,742 | 1,353 |
| | State of North Rhine-Westphalia Germany | 0.600% | 6/4/41 | EUR | 8,427 | 5,438 |
| | State of North Rhine-Westphalia Germany | 0.750% | 8/16/41 | EUR | 1,023 | 677 |
| | State of North Rhine-Westphalia Germany | 1.450% | 2/16/43 | EUR | 2,561 | 1,913 |
| | State of North Rhine-Westphalia Germany | 1.000% | 10/16/46 | EUR | 3,735 | 2,477 |
| | State of North Rhine-Westphalia Germany | 1.650% | 5/16/47 | EUR | 23,800 | 18,361 |
| | State of North Rhine-Westphalia Germany | 1.550% | 6/16/48 | EUR | 5,124 | 3,848 |
| | State of North Rhine-Westphalia Germany | 0.800% | 7/30/49 | EUR | 1,683 | 1,015 |
| | State of North Rhine-Westphalia Germany | 0.200% | 1/27/51 | EUR | 16,266 | 7,818 |
| | State of North Rhine-Westphalia Germany | 0.500% | 1/15/52 | EUR | 7,470 | 3,932 |
| | State of North Rhine-Westphalia Germany | 1.750% | 10/26/57 | EUR | 14,734 | 11,071 |
| | State of North Rhine-Westphalia Germany | 1.750% | 7/11/68 | EUR | 10,732 | 7,709 |
| | State of North Rhine-Westphalia Germany | 1.950% | 9/26/78 | EUR | 10,515 | 7,943 |
| | State of North Rhine-Westphalia Germany | 2.150% | 3/21/19 | EUR | 9,512 | 6,953 |
| | State of North Rhine-Westphalia Germany | 1.375% | 1/15/20 | EUR | 10,651 | 5,501 |
| | State of North Rhine-Westphalia Germany | 0.950% | 1/10/21 | EUR | 15,344 | 6,095 |
| | State of North Rhine-Westphalia Germany | 1.450% | 1/19/22 | EUR | 4,202 | 2,257 |
| | State of Rhineland-Palatinate | 0.500% | 1/21/25 | EUR | 3,074 | 2,900 |
| | State of Rhineland-Palatinate | 0.100% | 8/18/26 | EUR | 5,124 | 4,591 |
| | State of Rhineland-Palatinate | 0.375% | 1/26/27 | EUR | 5,124 | 4,592 |
| | State of Rhineland-Palatinate | 0.700% | 1/26/28 | EUR | 5,124 | 4,549 |
| | State of Rhineland-Palatinate | 0.010% | 1/21/31 | EUR | 12,731 | 9,952 |
| | State of Rhineland-Palatinate | 0.750% | 2/23/32 | EUR | 32,683 | 26,590 |
| | State of Rhineland-Palatinate | 0.375% | 3/10/51 | EUR | 6,012 | 3,119 |
| | State of Saxony-Anhalt | 1.875% | 4/10/24 | EUR | 4,612 | 4,514 |
| | State of Saxony-Anhalt | 0.500% | 6/25/27 | EUR | 1,281 | 1,143 |
| | State of Saxony-Anhalt | 0.500% | 3/24/51 | EUR | 7,515 | 4,097 |
| | State of Schleswig-Holstein Germany | 0.500% | 5/19/26 | EUR | 13,442 | 12,286 |
| | State of Schleswig-Holstein Germany | 0.250% | 4/18/28 | EUR | 1,023 | 883 |
| | State of Schleswig-Holstein Germany | 0.625% | 8/31/28 | EUR | 3,509 | 3,063 |
| | State of Schleswig-Holstein Germany | 0.010% | 11/26/29 | EUR | 13,669 | 11,083 |
| | State of Schleswig-Holstein Germany | 0.010% | 5/22/30 | EUR | 1,502 | 1,198 |
| | State of Schleswig-Holstein Germany | 0.050% | 7/8/31 | EUR | 2,574 | 1,990 |
| | | | | | | 6,761,940 |
| Hong Kong (0.0%) | | | |
| | Hong Kong Government Bond Programme | 0.360% | 4/15/24 | HKD | 74,800 | 8,996 |
| | Hong Kong Government Bond Programme | 2.220% | 8/7/24 | HKD | 15,250 | 1,871 |
| | Hong Kong Government Bond Programme | 1.680% | 1/21/26 | HKD | 5,050 | 593 |
| | Hong Kong Government Bond Programme | 1.250% | 6/29/27 | HKD | 3,000 | 335 |
| | Hong Kong Government Bond Programme | 1.970% | 1/17/29 | HKD | 61,150 | 6,902 |
| | Hong Kong Government Bond Programme | 2.130% | 7/16/30 | HKD | 40,250 | 4,510 |
| | Hong Kong Government Bond Programme | 1.890% | 3/2/32 | HKD | 3,250 | 350 |
| | Hong Kong Government Bond Programme | 2.020% | 3/7/34 | HKD | 14,000 | 1,453 |
| | | | | | | 25,010 |
| Hungary (0.2%) | | | |
| | Republic of Hungary | 1.500% | 8/23/23 | HUF | 1,730,540 | 3,852 |
| | Republic of Hungary | 6.000% | 11/24/23 | HUF | 1,485,060 | 3,337 |
| | Republic of Hungary | 2.500% | 10/24/24 | HUF | 6,363,750 | 12,578 |
| | Republic of Hungary | 5.500% | 6/24/25 | HUF | 3,081,090 | 6,210 |
| | Republic of Hungary | 1.250% | 10/22/25 | EUR | 6,918 | 6,100 |
| | Republic of Hungary | 1.000% | 11/26/25 | HUF | 1,919,870 | 3,375 |
Total International Bond Index Fund
| | | Coupon | Maturity
Date | Currency | Face
Amount
(000) | Market
Value•
($000) |
| | Republic of Hungary | 1.500% | 4/22/26 | HUF | 5,563,460 | 9,530 |
| | Republic of Hungary | 2.750% | 12/22/26 | HUF | 3,546,820 | 6,032 |
| | Republic of Hungary | 1.750% | 10/10/27 | EUR | 2,254 | 1,894 |
| | Republic of Hungary | 3.000% | 10/27/27 | HUF | 10,167,150 | 16,833 |
| | Republic of Hungary | 4.500% | 3/23/28 | HUF | 15,525,090 | 27,219 |
| 3 | Republic of Hungary | 0.125% | 9/21/28 | EUR | 3,522 | 2,493 |
| | Republic of Hungary | 2.000% | 5/23/29 | HUF | 2,058,080 | 3,003 |
| | Republic of Hungary | 3.000% | 8/21/30 | HUF | 6,884,230 | 10,301 |
| 3 | Republic of Hungary | 4.250% | 6/16/31 | EUR | 2,200 | 1,852 |
| | Republic of Hungary | 3.250% | 10/22/31 | HUF | 484,810 | 708 |
| | Republic of Hungary | 1.625% | 4/28/32 | EUR | 17,162 | 11,492 |
| | Republic of Hungary | 2.250% | 4/20/33 | HUF | 2,472,710 | 3,064 |
| | Republic of Hungary | 1.750% | 6/5/35 | EUR | 1,131 | 682 |
| | Republic of Hungary | 3.000% | 10/27/38 | HUF | 1,531,000 | 1,768 |
| | Republic of Hungary | 3.000% | 4/25/41 | HUF | 1,902,090 | 2,077 |
| | Republic of Hungary | 1.500% | 11/17/50 | EUR | 3,819 | 1,679 |
| | | | | | | 136,079 |
| Iceland (0.0%) | | | |
| | Republic of Iceland | 0.625% | 6/3/26 | EUR | 2,310 | 2,073 |
| Indonesia (1.2%) | | | |
| | Indonesia Treasury Bond | 8.375% | 3/15/24 | IDR | 786,315,000 | 51,475 |
| | Indonesia Treasury Bond | 8.125% | 5/15/24 | IDR | 541,084,000 | 35,509 |
| | Indonesia Treasury Bond | 6.500% | 6/15/25 | IDR | 816,589,000 | 51,752 |
| | Indonesia Treasury Bond | 7.250% | 2/15/26 | IDR | 143,913,000 | 9,276 |
| | Indonesia Treasury Bond | 5.500% | 4/15/26 | IDR | 544,399,000 | 33,241 |
| | Indonesia Treasury Bond | 8.375% | 9/15/26 | IDR | 344,475,000 | 22,986 |
| | Indonesia Treasury Bond | 5.125% | 4/15/27 | IDR | 348,269,000 | 20,589 |
| | Indonesia Treasury Bond | 7.000% | 5/15/27 | IDR | 761,037,000 | 48,280 |
| | Indonesia Treasury Bond | 6.125% | 5/15/28 | IDR | 736,413,000 | 44,453 |
| | Indonesia Treasury Bond | 9.000% | 3/15/29 | IDR | 25,516,000 | 1,766 |
| | Indonesia Treasury Bond | 8.250% | 5/15/29 | IDR | 629,199,000 | 41,845 |
| | Indonesia Treasury Bond | 7.000% | 9/15/30 | IDR | 750,587,000 | 46,839 |
| | Indonesia Treasury Bond | 6.500% | 2/15/31 | IDR | 1,006,998,000 | 60,004 |
| | Indonesia Treasury Bond | 8.750% | 5/15/31 | IDR | 143,138,000 | 9,890 |
| | Indonesia Treasury Bond | 6.375% | 4/15/32 | IDR | 726,872,000 | 42,529 |
| | Indonesia Treasury Bond | 7.500% | 8/15/32 | IDR | 286,121,000 | 18,268 |
| | Indonesia Treasury Bond | 7.000% | 2/15/33 | IDR | 170,000,000 | 10,461 |
| | Indonesia Treasury Bond | 6.625% | 5/15/33 | IDR | 928,627,000 | 54,812 |
| | Indonesia Treasury Bond | 8.375% | 3/15/34 | IDR | 472,741,000 | 31,764 |
| | Indonesia Treasury Bond | 7.500% | 6/15/35 | IDR | 549,847,000 | 34,826 |
| | Indonesia Treasury Bond | 8.250% | 5/15/36 | IDR | 398,139,000 | 26,599 |
| | Indonesia Treasury Bond | 9.750% | 5/15/37 | IDR | 66,511,000 | 5,053 |
| | Indonesia Treasury Bond | 7.500% | 5/15/38 | IDR | 435,166,000 | 27,615 |
| | Indonesia Treasury Bond | 7.125% | 6/15/38 | IDR | 150,000,000 | 9,252 |
| | Indonesia Treasury Bond | 8.375% | 4/15/39 | IDR | 316,832,000 | 21,368 |
| | Indonesia Treasury Bond | 7.500% | 4/15/40 | IDR | 598,682,000 | 38,013 |
| | Indonesia Treasury Bond | 9.500% | 5/15/41 | IDR | 81,900,000 | 6,151 |
| | Indonesia Treasury Bond | 7.125% | 6/15/42 | IDR | 530,449,000 | 32,548 |
| | Indonesia Treasury Bond | 7.125% | 6/15/43 | IDR | 235,000,000 | 14,606 |
| | Indonesia Treasury Bond | 7.375% | 5/15/48 | IDR | 381,493,000 | 23,790 |
| | Indonesia Treasury Bond | 6.875% | 8/15/51 | IDR | 332,981,000 | 19,678 |
| | Republic of Indonesia | 2.150% | 7/18/24 | EUR | 1,020 | 970 |
| | Republic of Indonesia | 1.750% | 4/24/25 | EUR | 9,152 | 8,474 |
| | Republic of Indonesia | 1.450% | 9/18/26 | EUR | 2,224 | 1,920 |
| | Republic of Indonesia | 0.900% | 2/14/27 | EUR | 7,195 | 5,963 |
| | Republic of Indonesia | 3.750% | 6/14/28 | EUR | 9,561 | 8,782 |
| | Republic of Indonesia | 1.000% | 7/28/29 | EUR | 4,429 | 3,304 |
| | Republic of Indonesia | 1.100% | 3/12/33 | EUR | 4,791 | 3,103 |
| | | | | | | 927,754 |
| Ireland (0.6%) | | | |
| | Republic of Ireland | 3.400% | 3/18/24 | EUR | 52,881 | 53,163 |
| | Republic of Ireland | 1.000% | 5/15/26 | EUR | 47,116 | 44,917 |
| | Republic of Ireland | 0.200% | 5/15/27 | EUR | 61,450 | 55,508 |
| | Republic of Ireland | 0.900% | 5/15/28 | EUR | 11,726 | 10,752 |
| | Republic of Ireland | 1.100% | 5/15/29 | EUR | 25,620 | 23,440 |
| | Republic of Ireland | 0.200% | 10/18/30 | EUR | 45,492 | 37,669 |
| | Republic of Ireland | 1.350% | 3/18/31 | EUR | 20,497 | 18,622 |
Total International Bond Index Fund
| | | Coupon | Maturity
Date | Currency | Face
Amount
(000) | Market
Value•
($000) |
| | Republic of Ireland | 0.000% | 10/18/31 | EUR | 86,597 | 68,451 |
| | Republic of Ireland | 0.350% | 10/18/32 | EUR | 32,683 | 25,966 |
| | Republic of Ireland | 1.300% | 5/15/33 | EUR | 10,453 | 9,041 |
| | Republic of Ireland | 0.400% | 5/15/35 | EUR | 11,459 | 8,482 |
| | Republic of Ireland | 1.700% | 5/15/37 | EUR | 2,649 | 2,241 |
| | Republic of Ireland | 0.550% | 4/22/41 | EUR | 71,283 | 45,615 |
| | Republic of Ireland | 2.000% | 2/18/45 | EUR | 4,459 | 3,655 |
| | Republic of Ireland | 1.500% | 5/15/50 | EUR | 47,915 | 33,923 |
| | | | | | | 441,445 |
| Isle Of Man (0.0%) | | | |
| | Isle of Man | 1.625% | 9/14/51 | GBP | 4,968 | 3,020 |
| Israel (0.4%) | | | |
| | State of Israel | 4.250% | 3/31/23 | ILS | 37,248 | 10,587 |
| | State of Israel | 0.150% | 7/31/23 | ILS | 30,688 | 8,491 |
| | State of Israel | 1.500% | 11/30/23 | ILS | 27,960 | 7,774 |
| | State of Israel | 2.875% | 1/29/24 | EUR | 11,682 | 11,456 |
| | State of Israel | 3.750% | 3/31/24 | ILS | 18,873 | 5,373 |
| | State of Israel | 0.400% | 10/31/24 | ILS | 29,933 | 7,996 |
| | State of Israel | 0.500% | 4/30/25 | ILS | 122,478 | 32,366 |
| | State of Israel | 1.750% | 8/31/25 | ILS | 117,117 | 31,770 |
| | State of Israel | 6.250% | 10/30/26 | ILS | 28,757 | 9,031 |
| | State of Israel | 1.500% | 1/18/27 | EUR | 13,151 | 11,853 |
| | State of Israel | 2.000% | 3/31/27 | ILS | 82,667 | 22,176 |
| | State of Israel | 2.250% | 9/28/28 | ILS | 116,708 | 31,183 |
| | State of Israel | 1.500% | 1/16/29 | EUR | 5,561 | 4,736 |
| | State of Israel | 1.000% | 3/31/30 | ILS | 120,127 | 28,962 |
| | State of Israel | 0.625% | 1/18/32 | EUR | 1,934 | 1,403 |
| | State of Israel | 1.500% | 5/31/37 | ILS | 37,121 | 8,212 |
| | State of Israel | 5.500% | 1/31/42 | ILS | 33,676 | 12,253 |
| | State of Israel | 3.750% | 3/31/47 | ILS | 92,481 | 26,910 |
| | State of Israel | 2.500% | 1/16/49 | EUR | 1,281 | 961 |
| | State of Israel | 2.800% | 11/29/52 | ILS | 42,870 | 10,066 |
| | | | | | | 283,559 |
| Italy (6.5%) | | | |
| | Cassa Depositi e Prestiti SpA | 1.500% | 6/21/24 | EUR | 2,500 | 2,412 |
| | Cassa Depositi e Prestiti SpA | 1.500% | 4/9/25 | EUR | 3,800 | 3,589 |
| | Cassa Depositi e Prestiti SpA | 1.875% | 2/7/26 | EUR | 2,500 | 2,343 |
| | Cassa Depositi e Prestiti SpA | 2.000% | 4/20/27 | EUR | 7,600 | 6,998 |
| | Cassa Depositi e Prestiti SpA | 1.000% | 2/11/30 | EUR | 8,600 | 6,887 |
| | Italy Buoni Poliennali Del Tesoro | 0.000% | 1/15/24 | EUR | 59,430 | 56,943 |
| | Italy Buoni Poliennali Del Tesoro | 0.000% | 1/30/24 | EUR | 316,773 | 302,750 |
| | Italy Buoni Poliennali Del Tesoro | 0.000% | 4/15/24 | EUR | 11,999 | 11,410 |
| | Italy Buoni Poliennali Del Tesoro | 1.750% | 5/30/24 | EUR | 210,058 | 204,253 |
| | Italy Buoni Poliennali Del Tesoro | 1.750% | 7/1/24 | EUR | 88,874 | 86,476 |
| | Italy Buoni Poliennali Del Tesoro | 0.000% | 8/15/24 | EUR | 135,359 | 127,446 |
| | Italy Buoni Poliennali Del Tesoro | 1.450% | 11/15/24 | EUR | 30,189 | 29,064 |
| | Italy Buoni Poliennali Del Tesoro | 0.000% | 12/15/24 | EUR | 140,069 | 130,576 |
| 3 | Italy Buoni Poliennali Del Tesoro | 1.850% | 7/1/25 | EUR | 429,896 | 410,881 |
| | Italy Buoni Poliennali Del Tesoro | 1.200% | 8/15/25 | EUR | 267,226 | 250,460 |
| | Italy Buoni Poliennali Del Tesoro | 3.500% | 1/15/26 | EUR | 49,351 | 49,024 |
| | Italy Buoni Poliennali Del Tesoro | 0.000% | 4/1/26 | EUR | 50,000 | 44,175 |
| | Italy Buoni Poliennali Del Tesoro | 2.100% | 7/15/26 | EUR | 241,767 | 228,845 |
| | Italy Buoni Poliennali Del Tesoro | 0.000% | 8/1/26 | EUR | 47,626 | 41,580 |
| | Italy Buoni Poliennali Del Tesoro | 1.100% | 4/1/27 | EUR | 179,931 | 160,873 |
| | Italy Buoni Poliennali Del Tesoro | 2.050% | 8/1/27 | EUR | 139,510 | 129,408 |
| | Italy Buoni Poliennali Del Tesoro | 0.950% | 9/15/27 | EUR | 53,475 | 46,888 |
| | Italy Buoni Poliennali Del Tesoro | 2.650% | 12/1/27 | EUR | 116,724 | 109,832 |
| | Italy Buoni Poliennali Del Tesoro | 0.250% | 3/15/28 | EUR | 395,552 | 326,527 |
| | Italy Buoni Poliennali Del Tesoro | 0.500% | 7/15/28 | EUR | 113,864 | 94,155 |
| | Italy Buoni Poliennali Del Tesoro | 2.800% | 6/15/29 | EUR | 232,355 | 215,347 |
| | Italy Buoni Poliennali Del Tesoro | 3.000% | 8/1/29 | EUR | 84,675 | 79,822 |
| 3 | Italy Buoni Poliennali Del Tesoro | 3.500% | 3/1/30 | EUR | 52,219 | 50,583 |
| | Italy Buoni Poliennali Del Tesoro | 1.350% | 4/1/30 | EUR | 69,175 | 57,233 |
| | Italy Buoni Poliennali Del Tesoro | 0.950% | 8/1/30 | EUR | 105,700 | 83,612 |
| 3 | Italy Buoni Poliennali Del Tesoro | 1.650% | 12/1/30 | EUR | 302,586 | 251,096 |
| | Italy Buoni Poliennali Del Tesoro | 0.900% | 4/1/31 | EUR | 174,624 | 134,297 |
| 3 | Italy Buoni Poliennali Del Tesoro | 0.600% | 8/1/31 | EUR | 57,295 | 42,138 |
Total International Bond Index Fund
| | | Coupon | Maturity
Date | Currency | Face
Amount
(000) | Market
Value•
($000) |
| 3 | Italy Buoni Poliennali Del Tesoro | 1.650% | 3/1/32 | EUR | 66,412 | 53,268 |
| | Italy Buoni Poliennali Del Tesoro | 0.950% | 6/1/32 | EUR | 134,601 | 99,727 |
| | Italy Buoni Poliennali Del Tesoro | 2.500% | 12/1/32 | EUR | 251,513 | 212,906 |
| 3 | Italy Buoni Poliennali Del Tesoro | 2.450% | 9/1/33 | EUR | 12,354 | 10,216 |
| 3 | Italy Buoni Poliennali Del Tesoro | 3.350% | 3/1/35 | EUR | 61,300 | 54,395 |
| 3 | Italy Buoni Poliennali Del Tesoro | 4.000% | 4/30/35 | EUR | 82,326 | 78,606 |
| 3 | Italy Buoni Poliennali Del Tesoro | 4.000% | 2/1/37 | EUR | 22,454 | 21,370 |
| 3 | Italy Buoni Poliennali Del Tesoro | 0.950% | 3/1/37 | EUR | 120,596 | 77,132 |
| 3 | Italy Buoni Poliennali Del Tesoro | 3.250% | 3/1/38 | EUR | 185,515 | 158,365 |
| 3 | Italy Buoni Poliennali Del Tesoro | 2.950% | 9/1/38 | EUR | 55,169 | 45,417 |
| 3 | Italy Buoni Poliennali Del Tesoro | 3.100% | 3/1/40 | EUR | 57,451 | 47,560 |
| 3 | Italy Buoni Poliennali Del Tesoro | 5.000% | 9/1/40 | EUR | 8,910 | 9,370 |
| 3 | Italy Buoni Poliennali Del Tesoro | 1.800% | 3/1/41 | EUR | 174,107 | 115,725 |
| 3 | Italy Buoni Poliennali Del Tesoro | 4.750% | 9/1/44 | EUR | 52,768 | 54,286 |
| 3 | Italy Buoni Poliennali Del Tesoro | 1.500% | 4/30/45 | EUR | 112,138 | 65,948 |
| 3 | Italy Buoni Poliennali Del Tesoro | 3.250% | 9/1/46 | EUR | 60,807 | 50,259 |
| 3 | Italy Buoni Poliennali Del Tesoro | 3.450% | 3/1/48 | EUR | 66,690 | 56,799 |
| 3 | Italy Buoni Poliennali Del Tesoro | 3.850% | 9/1/49 | EUR | 83,843 | 75,632 |
| 3 | Italy Buoni Poliennali Del Tesoro | 2.450% | 9/1/50 | EUR | 67,209 | 46,086 |
| 3 | Italy Buoni Poliennali Del Tesoro | 1.700% | 9/1/51 | EUR | 3,253 | 1,882 |
| 3 | Italy Buoni Poliennali Del Tesoro | 2.150% | 9/1/52 | EUR | 104,958 | 66,151 |
| 3 | Italy Buoni Poliennali Del Tesoro | 2.800% | 3/1/67 | EUR | 43,717 | 30,228 |
| | Republic of Italy | 6.000% | 8/4/28 | GBP | 6,098 | 7,029 |
| | | | | | | 5,216,280 |
| Japan (15.9%) | | | |
| | Deposit Insurance Corp. of Japan | 0.100% | 8/6/24 | JPY | 3,000,000 | 20,200 |
| | Development Bank of Japan Inc. | 0.645% | 3/18/24 | JPY | 256,700 | 1,741 |
| | Development Bank of Japan Inc. | 0.466% | 12/12/24 | JPY | 307,500 | 2,086 |
| | Development Bank of Japan Inc. | 1.250% | 1/31/25 | GBP | 10,043 | 10,720 |
| | Development Bank of Japan Inc. | 0.450% | 3/13/25 | JPY | 205,000 | 1,392 |
| | Development Bank of Japan Inc. | 0.425% | 9/11/25 | JPY | 387,900 | 2,637 |
| | Development Bank of Japan Inc. | 0.875% | 10/10/25 | EUR | 26,269 | 24,393 |
| | Development Bank of Japan Inc. | 0.020% | 3/16/26 | JPY | 23,300 | 156 |
| | Fukuoka Prefecture | 0.432% | 6/18/49 | JPY | 180,000 | 944 |
| | Japan | 0.005% | 12/1/23 | JPY | 5,571,900 | 37,511 |
| | Japan | 0.100% | 12/20/23 | JPY | 11,587,600 | 78,094 |
| | Japan | 0.600% | 12/20/23 | JPY | 8,024,400 | 54,385 |
| | Japan | 1.900% | 12/20/23 | JPY | 922,450 | 6,343 |
| | Japan | 0.005% | 1/1/24 | JPY | 6,821,300 | 45,923 |
| | Japan | 0.005% | 2/1/24 | JPY | 14,006,900 | 94,297 |
| | Japan | 0.005% | 3/1/24 | JPY | 9,337,900 | 62,854 |
| | Japan | 0.100% | 3/20/24 | JPY | 17,964,300 | 121,096 |
| | Japan | 0.600% | 3/20/24 | JPY | 9,679,500 | 65,700 |
| | Japan | 1.900% | 3/20/24 | JPY | 256,200 | 1,770 |
| | Japan | 0.005% | 4/1/24 | JPY | 10,271,700 | 69,149 |
| | Japan | 0.005% | 5/1/24 | JPY | 11,205,500 | 75,434 |
| | Japan | 0.005% | 6/1/24 | JPY | 10,551,850 | 71,030 |
| | Japan | 0.100% | 6/20/24 | JPY | 9,184,100 | 61,917 |
| | Japan | 0.600% | 6/20/24 | JPY | 363,800 | 2,473 |
| | Japan | 0.005% | 7/1/24 | JPY | 22,141,700 | 149,040 |
| | Japan | 0.005% | 8/1/24 | JPY | 23,309,500 | 156,890 |
| | Japan | 0.005% | 9/1/24 | JPY | 6,000,000 | 40,382 |
| | Japan | 0.100% | 9/20/24 | JPY | 6,909,000 | 46,581 |
| | Japan | 0.500% | 9/20/24 | JPY | 6,507,700 | 44,205 |
| | Japan | 2.100% | 9/20/24 | JPY | 668,700 | 4,678 |
| | Japan | 0.005% | 10/1/24 | JPY | 11,000,000 | 74,027 |
| | Japan | 0.005% | 11/1/24 | JPY | 10,800,000 | 72,679 |
| | Japan | 0.100% | 12/20/24 | JPY | 8,332,300 | 56,186 |
| | Japan | 0.300% | 12/20/24 | JPY | 5,154,900 | 34,908 |
| | Japan | 0.500% | 12/20/24 | JPY | 3,960,950 | 26,936 |
| | Japan | 0.100% | 3/20/25 | JPY | 8,198,650 | 55,305 |
| | Japan | 0.400% | 3/20/25 | JPY | 5,055,000 | 34,343 |
| | Japan | 2.000% | 3/20/25 | JPY | 38,400 | 271 |
| | Japan | 0.100% | 6/20/25 | JPY | 4,152,600 | 28,023 |
| | Japan | 0.400% | 6/20/25 | JPY | 4,253,000 | 28,926 |
| | Japan | 1.900% | 6/20/25 | JPY | 589,200 | 4,164 |
| | Japan | 2.100% | 6/20/25 | JPY | 1,537,250 | 10,918 |
| | Japan | 0.100% | 9/20/25 | JPY | 15,445,900 | 104,276 |
| | Japan | 0.400% | 9/20/25 | JPY | 1,637,150 | 11,147 |
Total International Bond Index Fund
| | | Coupon | Maturity
Date | Currency | Face
Amount
(000) | Market
Value•
($000) |
| | Japan | 2.100% | 9/20/25 | JPY | 102,500 | 732 |
| | Japan | 0.100% | 12/20/25 | JPY | 14,991,100 | 101,229 |
| | Japan | 0.300% | 12/20/25 | JPY | 7,931,800 | 53,895 |
| | Japan | 2.000% | 12/20/25 | JPY | 1,711,450 | 12,242 |
| | Japan | 0.005% | 3/20/26 | JPY | 14,919,100 | 100,424 |
| | Japan | 0.100% | 3/20/26 | JPY | 2,613,300 | 17,647 |
| | Japan | 2.100% | 3/20/26 | JPY | 440,650 | 3,176 |
| | Japan | 2.200% | 3/20/26 | JPY | 409,950 | 2,964 |
| | Japan | 0.005% | 6/20/26 | JPY | 16,804,150 | 113,083 |
| | Japan | 0.100% | 6/20/26 | JPY | 2,784,100 | 18,800 |
| | Japan | 0.005% | 9/20/26 | JPY | 17,865,650 | 120,190 |
| | Japan | 0.100% | 9/20/26 | JPY | 3,558,700 | 24,029 |
| | Japan | 2.200% | 9/20/26 | JPY | 30,700 | 224 |
| | Japan | 2.300% | 9/20/26 | JPY | 17,900 | 131 |
| | Japan | 0.005% | 12/20/26 | JPY | 23,979,800 | 161,224 |
| | Japan | 0.100% | 12/20/26 | JPY | 9,358,350 | 63,165 |
| | Japan | 2.100% | 12/20/26 | JPY | 2,562,050 | 18,716 |
| | Japan | 0.005% | 3/20/27 | JPY | 28,750,650 | 193,123 |
| | Japan | 0.100% | 3/20/27 | JPY | 8,316,950 | 56,098 |
| | Japan | 0.100% | 3/20/27 | JPY | 8,731,150 | 58,892 |
| | Japan | 2.000% | 3/20/27 | JPY | 512,400 | 3,743 |
| | Japan | 2.100% | 3/20/27 | JPY | 179,300 | 1,315 |
| | Japan | 0.005% | 6/20/27 | JPY | 27,402,000 | 183,867 |
| | Japan | 0.100% | 6/20/27 | JPY | 7,347,850 | 49,519 |
| | Japan | 2.100% | 6/20/27 | JPY | 1,000,000 | 7,361 |
| | Japan | 2.300% | 6/20/27 | JPY | 1,010,200 | 7,499 |
| | Japan | 0.100% | 9/20/27 | JPY | 9,584,000 | 64,528 |
| | Japan | 0.100% | 9/20/27 | JPY | 10,000,000 | 67,343 |
| | Japan | 2.200% | 9/20/27 | JPY | 1,007,650 | 7,478 |
| | Japan | 0.100% | 12/20/27 | JPY | 8,264,400 | 55,597 |
| | Japan | 2.100% | 12/20/27 | JPY | 1,988,300 | 14,744 |
| | Japan | 0.100% | 3/20/28 | JPY | 8,412,050 | 56,550 |
| | Japan | 2.200% | 3/20/28 | JPY | 2,824,050 | 21,125 |
| | Japan | 2.400% | 3/20/28 | JPY | 2,997,600 | 22,639 |
| | Japan | 0.100% | 6/20/28 | JPY | 4,483,600 | 30,117 |
| | Japan | 2.300% | 6/20/28 | JPY | 760,000 | 5,736 |
| | Japan | 2.400% | 6/20/28 | JPY | 1,282,800 | 9,730 |
| | Japan | 0.100% | 9/20/28 | JPY | 7,030,450 | 47,185 |
| | Japan | 2.100% | 9/20/28 | JPY | 3,139,100 | 23,541 |
| | Japan | 2.200% | 9/20/28 | JPY | 614,850 | 4,635 |
| | Japan | 0.100% | 12/20/28 | JPY | 2,828,750 | 18,969 |
| | Japan | 1.900% | 12/20/28 | JPY | 3,709,800 | 27,616 |
| | Japan | 2.100% | 12/20/28 | JPY | 307,400 | 2,313 |
| | Japan | 0.100% | 3/20/29 | JPY | 8,704,400 | 58,317 |
| | Japan | 1.900% | 3/20/29 | JPY | 2,126,500 | 15,881 |
| | Japan | 2.100% | 3/20/29 | JPY | 2,312,500 | 17,467 |
| | Japan | 0.100% | 6/20/29 | JPY | 5,856,400 | 39,199 |
| | Japan | 2.100% | 6/20/29 | JPY | 2,833,600 | 21,477 |
| | Japan | 0.100% | 9/20/29 | JPY | 7,603,400 | 50,840 |
| | Japan | 2.100% | 9/20/29 | JPY | 3,705,350 | 28,182 |
| | Japan | 2.800% | 9/20/29 | JPY | 1,383,450 | 10,968 |
| | Japan | 0.100% | 12/20/29 | JPY | 10,251,550 | 68,461 |
| | Japan | 2.100% | 12/20/29 | JPY | 3,843,100 | 29,323 |
| | Japan | 2.200% | 12/20/29 | JPY | 2,941,200 | 22,581 |
| | Japan | 0.100% | 3/20/30 | JPY | 13,835,800 | 92,256 |
| | Japan | 2.100% | 3/20/30 | JPY | 3,040,950 | 23,271 |
| | Japan | 2.200% | 3/20/30 | JPY | 3,228,150 | 24,862 |
| | Japan | 2.300% | 5/20/30 | JPY | 87,100 | 676 |
| | Japan | 0.100% | 6/20/30 | JPY | 17,153,050 | 114,192 |
| | Japan | 1.600% | 6/20/30 | JPY | 292,050 | 2,167 |
| | Japan | 1.800% | 6/20/30 | JPY | 20,450 | 154 |
| | Japan | 2.000% | 6/20/30 | JPY | 2,562,050 | 19,530 |
| | Japan | 0.100% | 9/20/30 | JPY | 17,406,850 | 115,683 |
| | Japan | 1.800% | 9/20/30 | JPY | 717,350 | 5,407 |
| | Japan | 1.900% | 9/20/30 | JPY | 2,239,250 | 16,996 |
| | Japan | 0.100% | 12/20/30 | JPY | 24,308,400 | 161,359 |
| | Japan | 2.000% | 12/20/30 | JPY | 1,537,200 | 11,783 |
| | Japan | 2.100% | 12/20/30 | JPY | 4,186,400 | 32,317 |
| | Japan | 0.100% | 3/20/31 | JPY | 22,630,300 | 150,132 |
Total International Bond Index Fund
| | | Coupon | Maturity
Date | Currency | Face
Amount
(000) | Market
Value•
($000) |
| | Japan | 1.900% | 3/20/31 | JPY | 3,074,450 | 23,481 |
| | Japan | 2.000% | 3/20/31 | JPY | 6,241,250 | 48,015 |
| | Japan | 2.200% | 3/20/31 | JPY | 256,200 | 1,999 |
| | Japan | 0.100% | 6/20/31 | JPY | 29,168,350 | 193,403 |
| | Japan | 1.800% | 6/20/31 | JPY | 2,385,250 | 18,141 |
| | Japan | 1.900% | 6/20/31 | JPY | 3,048,850 | 23,363 |
| | Japan | 0.100% | 9/20/31 | JPY | 24,107,250 | 159,743 |
| | Japan | 1.700% | 9/20/31 | JPY | 12,810,350 | 96,983 |
| | Japan | 1.800% | 9/20/31 | JPY | 3,881,550 | 29,615 |
| | Japan | 0.100% | 12/20/31 | JPY | 14,944,700 | 98,916 |
| | Japan | 1.700% | 12/20/31 | JPY | 3,433,200 | 26,054 |
| | Japan | 1.800% | 12/20/31 | JPY | 12,944,650 | 99,021 |
| | Japan | 1.600% | 3/20/32 | JPY | 4,586,150 | 34,588 |
| | Japan | 1.700% | 3/20/32 | JPY | 2,639,700 | 20,073 |
| | Japan | 1.800% | 3/20/32 | JPY | 2,179,000 | 16,705 |
| | Japan | 0.200% | 6/20/32 | JPY | 13,300,000 | 88,587 |
| | Japan | 1.500% | 6/20/32 | JPY | 3,228,150 | 24,181 |
| | Japan | 1.600% | 6/20/32 | JPY | 3,792,600 | 28,651 |
| | Japan | 1.700% | 6/20/32 | JPY | 1,800,000 | 13,713 |
| | Japan | 1.700% | 9/20/32 | JPY | 10,717,100 | 81,794 |
| | Japan | 1.700% | 12/20/32 | JPY | 7,754,400 | 59,261 |
| | Japan | 1.800% | 12/20/32 | JPY | 4,074,450 | 31,411 |
| | Japan | 1.500% | 3/20/33 | JPY | 8,451,250 | 63,488 |
| | Japan | 1.600% | 3/20/33 | JPY | 7,461,150 | 56,561 |
| | Japan | 1.700% | 6/20/33 | JPY | 794,250 | 6,080 |
| | Japan | 1.700% | 6/20/33 | JPY | 6,138,450 | 46,989 |
| | Japan | 1.700% | 9/20/33 | JPY | 6,538,600 | 50,085 |
| | Japan | 1.600% | 12/20/33 | JPY | 7,503,300 | 56,956 |
| | Japan | 2.000% | 12/20/33 | JPY | 256,200 | 2,020 |
| | Japan | 1.500% | 3/20/34 | JPY | 8,799,050 | 66,157 |
| | Japan | 2.400% | 3/20/34 | JPY | 1,895,900 | 15,527 |
| | Japan | 1.500% | 6/20/34 | JPY | 7,776,150 | 58,463 |
| | Japan | 2.500% | 6/20/34 | JPY | 1,031,450 | 8,539 |
| | Japan | 1.400% | 9/20/34 | JPY | 13,928,950 | 103,629 |
| | Japan | 2.500% | 9/20/34 | JPY | 204,950 | 1,700 |
| | Japan | 1.200% | 12/20/34 | JPY | 10,626,650 | 77,347 |
| | Japan | 2.400% | 12/20/34 | JPY | 1,178,550 | 9,696 |
| | Japan | 1.200% | 3/20/35 | JPY | 10,380,300 | 75,487 |
| | Japan | 2.300% | 3/20/35 | JPY | 1,281,000 | 10,450 |
| | Japan | 1.300% | 6/20/35 | JPY | 6,640,850 | 48,786 |
| | Japan | 2.300% | 6/20/35 | JPY | 1,834,450 | 14,981 |
| | Japan | 1.200% | 9/20/35 | JPY | 7,898,000 | 57,310 |
| | Japan | 2.500% | 9/20/35 | JPY | 512,400 | 4,274 |
| | Japan | 1.000% | 12/20/35 | JPY | 4,360,050 | 30,857 |
| | Japan | 2.300% | 12/20/35 | JPY | 1,286,150 | 10,521 |
| | Japan | 0.400% | 3/20/36 | JPY | 7,084,800 | 46,384 |
| | Japan | 2.500% | 3/20/36 | JPY | 1,131,400 | 9,458 |
| | Japan | 0.200% | 6/20/36 | JPY | 13,197,900 | 83,805 |
| | Japan | 2.500% | 6/20/36 | JPY | 742,950 | 6,216 |
| | Japan | 0.500% | 9/20/36 | JPY | 8,247,850 | 54,371 |
| | Japan | 2.500% | 9/20/36 | JPY | 307,400 | 2,574 |
| | Japan | 0.600% | 12/20/36 | JPY | 8,945,400 | 59,589 |
| | Japan | 2.300% | 12/20/36 | JPY | 414,050 | 3,395 |
| | Japan | 0.700% | 3/20/37 | JPY | 14,995,500 | 100,969 |
| | Japan | 2.400% | 3/20/37 | JPY | 1,851,850 | 15,363 |
| | Japan | 0.600% | 6/20/37 | JPY | 8,159,250 | 54,013 |
| | Japan | 0.600% | 9/20/37 | JPY | 9,778,550 | 64,521 |
| | Japan | 2.500% | 9/20/37 | JPY | 298,650 | 2,508 |
| | Japan | 0.600% | 12/20/37 | JPY | 9,776,950 | 64,312 |
| | Japan | 0.500% | 3/20/38 | JPY | 14,605,050 | 94,371 |
| | Japan | 2.500% | 3/20/38 | JPY | 1,774,700 | 14,923 |
| | Japan | 0.500% | 6/20/38 | JPY | 16,468,800 | 106,067 |
| | Japan | 0.700% | 9/20/38 | JPY | 15,281,800 | 101,150 |
| | Japan | 2.400% | 9/20/38 | JPY | 1,572,400 | 13,082 |
| | Japan | 0.500% | 12/20/38 | JPY | 10,990,450 | 70,307 |
| | Japan | 0.400% | 3/20/39 | JPY | 13,014,900 | 81,633 |
| | Japan | 2.300% | 3/20/39 | JPY | 2,579,950 | 21,217 |
| | Japan | 0.300% | 6/20/39 | JPY | 17,732,400 | 108,911 |
| | Japan | 0.300% | 9/20/39 | JPY | 12,042,900 | 73,654 |
Total International Bond Index Fund
| | | Coupon | Maturity
Date | Currency | Face
Amount
(000) | Market
Value•
($000) |
| | Japan | 2.200% | 9/20/39 | JPY | 5,574,850 | 45,264 |
| | Japan | 0.300% | 12/20/39 | JPY | 12,164,800 | 74,082 |
| | Japan | 0.400% | 3/20/40 | JPY | 13,734,200 | 84,755 |
| | Japan | 2.300% | 3/20/40 | JPY | 3,986,850 | 32,785 |
| | Japan | 0.400% | 6/20/40 | JPY | 19,009,650 | 116,875 |
| | Japan | 0.400% | 9/20/40 | JPY | 18,396,800 | 112,635 |
| | Japan | 2.000% | 9/20/40 | JPY | 9,206,700 | 72,630 |
| | Japan | 0.500% | 12/20/40 | JPY | 18,147,250 | 112,656 |
| | Japan | 0.500% | 3/20/41 | JPY | 14,665,650 | 90,672 |
| | Japan | 2.200% | 3/20/41 | JPY | 6,798,700 | 55,078 |
| | Japan | 0.400% | 6/20/41 | JPY | 19,076,750 | 115,274 |
| | Japan | 0.500% | 9/20/41 | JPY | 18,102,750 | 110,974 |
| | Japan | 2.000% | 9/20/41 | JPY | 6,608,600 | 51,940 |
| | Japan | 0.500% | 12/20/41 | JPY | 19,386,400 | 118,330 |
| | Japan | 0.800% | 3/20/42 | JPY | 17,333,450 | 111,454 |
| | Japan | 2.000% | ��� 3/20/42 | JPY | 8,954,450 | 70,219 |
| | Japan | 0.900% | 6/20/42 | JPY | 11,864,000 | 77,382 |
| | Japan | 1.100% | 9/20/42 | JPY | 3,000,000 | 20,241 |
| | Japan | 1.900% | 9/20/42 | JPY | 9,701,050 | 74,711 |
| | Japan | 1.800% | 3/20/43 | JPY | 5,954,750 | 45,085 |
| | Japan | 1.900% | 6/20/43 | JPY | 4,897,750 | 37,673 |
| | Japan | 1.800% | 9/20/43 | JPY | 5,721,800 | 43,286 |
| | Japan | 1.700% | 12/20/43 | JPY | 4,389,800 | 32,641 |
| | Japan | 1.700% | 3/20/44 | JPY | 4,886,700 | 36,313 |
| | Japan | 1.700% | 6/20/44 | JPY | 4,962,200 | 36,847 |
| | Japan | 1.700% | 9/20/44 | JPY | 5,165,800 | 38,331 |
| | Japan | 1.500% | 12/20/44 | JPY | 5,336,800 | 38,174 |
| | Japan | 1.500% | 3/20/45 | JPY | 6,254,900 | 44,691 |
| | Japan | 1.600% | 6/20/45 | JPY | 3,205,100 | 23,299 |
| | Japan | 1.400% | 9/20/45 | JPY | 1,465,500 | 10,249 |
| | Japan | 1.400% | 12/20/45 | JPY | 2,772,150 | 19,358 |
| | Japan | 0.800% | 3/20/46 | JPY | 3,912,650 | 24,079 |
| | Japan | 0.300% | 6/20/46 | JPY | 3,982,000 | 21,698 |
| | Japan | 0.500% | 9/20/46 | JPY | 6,327,950 | 36,090 |
| | Japan | 0.600% | 12/20/46 | JPY | 5,457,150 | 31,773 |
| | Japan | 0.800% | 3/20/47 | JPY | 5,138,400 | 31,263 |
| | Japan | 0.800% | 6/20/47 | JPY | 4,745,400 | 28,787 |
| | Japan | 0.800% | 9/20/47 | JPY | 4,827,600 | 29,197 |
| | Japan | 0.800% | 12/20/47 | JPY | 7,432,550 | 44,827 |
| | Japan | 0.800% | 3/20/48 | JPY | 8,194,550 | 49,292 |
| | Japan | 2.400% | 3/20/48 | JPY | 709,950 | 5,920 |
| | Japan | 0.700% | 6/20/48 | JPY | 10,592,400 | 61,999 |
| | Japan | 0.900% | 9/20/48 | JPY | 6,863,500 | 42,078 |
| 7 | Japan | 0.700% | 12/20/48 | JPY | 8,966,600 | 52,177 |
| 7 | Japan | 0.500% | 3/20/49 | JPY | 7,576,050 | 41,691 |
| 7 | Japan | 2.200% | 3/20/49 | JPY | 832,650 | 6,698 |
| 7 | Japan | 0.400% | 6/20/49 | JPY | 10,398,550 | 55,457 |
| 7 | Japan | 0.400% | 9/20/49 | JPY | 9,446,200 | 50,141 |
| 7 | Japan | 0.400% | 12/20/49 | JPY | 8,540,250 | 45,158 |
| 7 | Japan | 0.400% | 3/20/50 | JPY | 9,362,550 | 49,313 |
| 7 | Japan | 2.200% | 3/20/50 | JPY | 1,147,800 | 9,224 |
| 7 | Japan | 0.600% | 6/20/50 | JPY | 12,758,350 | 70,936 |
| 7 | Japan | 0.600% | 9/20/50 | JPY | 12,050,000 | 66,770 |
| 7 | Japan | 0.700% | 12/20/50 | JPY | 13,545,450 | 76,924 |
| 7 | Japan | 0.700% | 3/20/51 | JPY | 10,403,400 | 58,894 |
| 7 | Japan | 2.200% | 3/20/51 | JPY | 2,017,000 | 16,186 |
| 7 | Japan | 0.700% | 6/20/51 | JPY | 10,596,800 | 59,798 |
| 7 | Japan | 0.700% | 9/20/51 | JPY | 11,110,300 | 62,493 |
| 7 | Japan | 0.700% | 12/20/51 | JPY | 12,830,100 | 71,935 |
| 7 | Japan | 1.000% | 3/20/52 | JPY | 11,784,000 | 71,566 |
| 7 | Japan | 2.000% | 3/20/52 | JPY | 3,667,350 | 28,192 |
| 7 | Japan | 1.300% | 6/20/52 | JPY | 9,211,000 | 60,270 |
| | Japan | 1.400% | 9/20/52 | JPY | 2,500,000 | 16,756 |
| | Japan | 1.900% | 3/20/53 | JPY | 3,782,450 | 28,406 |
| | Japan | 1.700% | 3/20/54 | JPY | 3,676,550 | 26,377 |
| | Japan | 1.400% | 3/20/55 | JPY | 4,776,950 | 31,757 |
| | Japan | 0.400% | 3/20/56 | JPY | 7,376,050 | 35,823 |
| | Japan | 0.900% | 3/20/57 | JPY | 8,775,400 | 50,061 |
| | Japan | 0.800% | 3/20/58 | JPY | 8,318,300 | 45,596 |
Total International Bond Index Fund
| | | Coupon | Maturity
Date | Currency | Face
Amount
(000) | Market
Value•
($000) |
| | Japan | 0.500% | 3/20/59 | JPY | 10,457,450 | 50,963 |
| | Japan | 0.500% | 3/20/60 | JPY | 13,564,950 | 65,300 |
| | Japan | 0.700% | 3/20/61 | JPY | 14,666,350 | 75,558 |
| | Japan | 1.000% | 3/20/62 | JPY | 8,462,700 | 48,329 |
| | Japan Expressway Holding and Debt Repayment Agency | 0.669% | 11/30/23 | JPY | 512,400 | 3,473 |
| | Japan Expressway Holding and Debt Repayment Agency | 0.693% | 12/28/23 | JPY | 256,200 | 1,736 |
| | Japan Expressway Holding and Debt Repayment Agency | 0.660% | 2/29/24 | JPY | 1,024,700 | 6,951 |
| | Japan Expressway Holding and Debt Repayment Agency | 0.645% | 3/29/24 | JPY | 542,400 | 3,680 |
| | Japan Expressway Holding and Debt Repayment Agency | 0.669% | 4/30/24 | JPY | 572,500 | 3,888 |
| | Japan Expressway Holding and Debt Repayment Agency | 0.660% | 5/31/24 | JPY | 576,100 | 3,883 |
| | Japan Expressway Holding and Debt Repayment Agency | 0.601% | 7/31/24 | JPY | 1,024,800 | 6,961 |
| | Japan Expressway Holding and Debt Repayment Agency | 0.544% | 9/30/24 | JPY | 12,700 | 86 |
| | Japan Expressway Holding and Debt Repayment Agency | 0.539% | 10/31/24 | JPY | 512,400 | 3,480 |
| | Japan Expressway Holding and Debt Repayment Agency | 0.495% | 11/29/24 | JPY | 778,800 | 5,287 |
| | Japan Expressway Holding and Debt Repayment Agency | 0.466% | 12/27/24 | JPY | 1,024,700 | 6,955 |
| | Japan Expressway Holding and Debt Repayment Agency | 0.320% | 1/31/25 | JPY | 205,000 | 1,387 |
| | Japan Expressway Holding and Debt Repayment Agency | 0.414% | 2/28/25 | JPY | 209,600 | 1,422 |
| | Japan Expressway Holding and Debt Repayment Agency | 0.450% | 3/31/25 | JPY | 293,800 | 1,995 |
| | Japan Expressway Holding and Debt Repayment Agency | 0.509% | 5/30/25 | JPY | 297,100 | 2,022 |
| | Japan Expressway Holding and Debt Repayment Agency | 0.557% | 7/31/25 | JPY | 7,100 | 48 |
| | Japan Expressway Holding and Debt Repayment Agency | 0.440% | 8/29/25 | JPY | 32,700 | 222 |
| | Japan Expressway Holding and Debt Repayment Agency | 0.320% | 1/30/26 | JPY | 384,700 | 2,611 |
| | Japan Expressway Holding and Debt Repayment Agency | 0.145% | 2/27/26 | JPY | 21,000 | 142 |
| | Japan Expressway Holding and Debt Repayment Agency | 2.450% | 3/19/26 | JPY | 90,000 | 642 |
| | Japan Expressway Holding and Debt Repayment Agency | 2.280% | 4/20/27 | JPY | 30,000 | 216 |
| | Japan Expressway Holding and Debt Repayment Agency | 0.140% | 4/30/27 | JPY | 1,216,600 | 8,189 |
| | Japan Expressway Holding and Debt Repayment Agency | 0.110% | 5/31/27 | JPY | 5,600 | 38 |
| | Japan Expressway Holding and Debt Repayment Agency | 0.130% | 6/30/27 | JPY | 650,400 | 4,371 |
| | Japan Expressway Holding and Debt Repayment Agency | 0.155% | 8/31/27 | JPY | 429,700 | 2,890 |
| | Japan Expressway Holding and Debt Repayment Agency | 0.090% | 9/30/27 | JPY | 1,521,300 | 10,195 |
| | Japan Expressway Holding and Debt Repayment Agency | 2.340% | 10/20/27 | JPY | 340,000 | 2,521 |
| | Japan Expressway Holding and Debt Repayment Agency | 0.170% | 10/29/27 | JPY | 614,800 | 4,136 |
| | Japan Expressway Holding and Debt Repayment Agency | 0.160% | 11/30/27 | JPY | 307,500 | 2,067 |
| | Japan Expressway Holding and Debt Repayment Agency | 2.250% | 12/20/27 | JPY | 40,000 | 290 |
| | Japan Expressway Holding and Debt Repayment Agency | 0.185% | 1/31/28 | JPY | 379,400 | 2,554 |
| | Japan Expressway Holding and Debt Repayment Agency | 2.420% | 6/20/28 | JPY | 750,000 | 5,640 |
| | Japan Expressway Holding and Debt Repayment Agency | 2.370% | 9/20/28 | JPY | 60,000 | 441 |
| | Japan Expressway Holding and Debt Repayment Agency | 2.410% | 4/20/29 | JPY | 320,000 | 2,370 |
| | Japan Expressway Holding and Debt Repayment Agency | 2.100% | 12/28/29 | JPY | 100,000 | 759 |
| | Japan Expressway Holding and Debt Repayment Agency | 1.427% | 7/31/34 | JPY | 200,000 | 1,475 |
| | Japan Expressway Holding and Debt Repayment Agency | 1.338% | 10/31/34 | JPY | 100,000 | 731 |
| | Japan Expressway Holding and Debt Repayment Agency | 0.970% | 1/31/35 | JPY | 1,000,000 | 7,010 |
| | Japan Expressway Holding and Debt Repayment Agency | 1.240% | 7/31/35 | JPY | 200,000 | 1,443 |
| | Japan Expressway Holding and Debt Repayment Agency | 1.119% | 10/31/35 | JPY | 300,000 | 2,136 |
| | Japan Expressway Holding and Debt Repayment Agency | 0.934% | 1/31/36 | JPY | 1,800,000 | 12,487 |
| | Japan Expressway Holding and Debt Repayment Agency | 0.306% | 4/30/36 | JPY | 100,000 | 640 |
| | Japan Expressway Holding and Debt Repayment Agency | 0.149% | 7/31/36 | JPY | 1,000,000 | 6,224 |
| | Japan Expressway Holding and Debt Repayment Agency | 0.397% | 10/31/36 | JPY | 100,000 | 643 |
| | Japan Expressway Holding and Debt Repayment Agency | 0.591% | 1/29/38 | JPY | 1,000,000 | 6,503 |
| | Japan Expressway Holding and Debt Repayment Agency | 0.538% | 5/31/38 | JPY | 100,000 | 642 |
| | Japan Expressway Holding and Debt Repayment Agency | 0.543% | 6/30/38 | JPY | 100,000 | 642 |
| | Japan Expressway Holding and Debt Repayment Agency | 0.500% | 9/17/38 | JPY | 100,000 | 628 |
| | Japan Expressway Holding and Debt Repayment Agency | 0.625% | 9/30/38 | JPY | 800,000 | 5,182 |
| | Japan Expressway Holding and Debt Repayment Agency | 0.500% | 3/18/39 | JPY | 100,000 | 622 |
| | Japan Expressway Holding and Debt Repayment Agency | 2.300% | 2/29/40 | JPY | 100,000 | 812 |
| | Japan Expressway Holding and Debt Repayment Agency | 2.960% | 3/19/46 | JPY | 170,000 | 1,487 |
| | Japan Expressway Holding and Debt Repayment Agency | 2.870% | 12/20/46 | JPY | 70,000 | 609 |
| | Japan Expressway Holding and Debt Repayment Agency | 2.700% | 3/20/48 | JPY | 1,050,000 | 8,829 |
| | Japan Expressway Holding and Debt Repayment Agency | 0.686% | 7/31/48 | JPY | 100,000 | 576 |
| | Japan Expressway Holding and Debt Repayment Agency | 0.542% | 5/31/49 | JPY | 300,000 | 1,633 |
| | Japan Expressway Holding and Debt Repayment Agency | 0.297% | 9/30/49 | JPY | 200,000 | 1,012 |
| | Japan Expressway Holding and Debt Repayment Agency | 0.306% | 3/31/50 | JPY | 100,000 | 502 |
| | Japan Expressway Holding and Debt Repayment Agency | 1.861% | 3/19/55 | JPY | 1,220,000 | 8,662 |
| | Japan Finance Corp. | 0.001% | 7/31/24 | JPY | 1,050,000 | 7,060 |
| | Japan Finance Organization for Municipalities | 0.669% | 11/17/23 | JPY | 809,000 | 5,478 |
| | Japan Finance Organization for Municipalities | 0.660% | 2/16/24 | JPY | 512,400 | 3,476 |
| | Japan Finance Organization for Municipalities | 0.669% | 4/12/24 | JPY | 794,200 | 5,353 |
| | Japan Finance Organization for Municipalities | 0.660% | 5/21/24 | JPY | 1,566,900 | 10,560 |
| | Japan Finance Organization for Municipalities | 0.391% | 4/25/25 | JPY | 115,200 | 780 |
Total International Bond Index Fund
| | | Coupon | Maturity
Date | Currency | Face
Amount
(000) | Market
Value•
($000) |
| | Japan Finance Organization for Municipalities | 0.484% | 6/13/25 | JPY | 103,400 | 703 |
| | Japan Finance Organization for Municipalities | 0.320% | 1/19/26 | JPY | 512,400 | 3,413 |
| | Japan Finance Organization for Municipalities | 0.145% | 2/16/26 | JPY | 46,000 | 305 |
| | Japan Finance Organization for Municipalities | 0.020% | 3/13/26 | JPY | 76,600 | 505 |
| | Japan Finance Organization for Municipalities | 0.140% | 4/16/27 | JPY | 128,000 | 861 |
| | Japan Finance Organization for Municipalities | 0.110% | 5/21/27 | JPY | 768,600 | 5,161 |
| | Japan Finance Organization for Municipalities | 0.160% | 7/16/27 | JPY | 542,400 | 3,649 |
| | Japan Finance Organization for Municipalities | 0.170% | 10/15/27 | JPY | 512,400 | 3,448 |
| | Japan Finance Organization for Municipalities | 0.160% | 11/15/27 | JPY | 1,024,800 | 6,705 |
| | Japan Finance Organization for Municipalities | 0.185% | 1/21/28 | JPY | 1,024,800 | 6,891 |
| | Japan Finance Organization for Municipalities | 0.195% | 2/15/28 | JPY | 22,500 | 151 |
| | Japan Finance Organization for Municipalities | 2.290% | 4/25/28 | JPY | 90,000 | 672 |
| | Japan Finance Organization for Municipalities | 2.290% | 4/27/29 | JPY | 30,000 | 221 |
| | Japan Finance Organization for Municipalities | 2.220% | 1/28/30 | JPY | 1,150,000 | 8,479 |
| | Japan Finance Organization for Municipalities | 0.224% | 3/28/31 | JPY | 900,000 | 5,945 |
| | Japan Finance Organization for Municipalities | 2.030% | 6/27/31 | JPY | 90,000 | 661 |
| | Japan Housing Finance Agency | 0.040% | 6/20/25 | JPY | 10,000 | 67 |
| | Japan Housing Finance Agency | 0.075% | 10/20/26 | JPY | 2,130,000 | 14,282 |
| | Japan Housing Finance Agency | 0.547% | 3/18/50 | JPY | 370,000 | 1,956 |
| | Major Joint Local Government Bond | 0.660% | 11/24/23 | JPY | 737,900 | 4,997 |
| | Major Joint Local Government Bond | 0.710% | 12/25/23 | JPY | 1,896,000 | 12,848 |
| | Major Joint Local Government Bond | 0.760% | 1/25/24 | JPY | 768,600 | 5,204 |
| | Major Joint Local Government Bond | 0.689% | 4/25/24 | JPY | 128,000 | 863 |
| | Major Joint Local Government Bond | 0.674% | 5/24/24 | JPY | 205,000 | 1,393 |
| | Major Joint Local Government Bond | 0.659% | 6/25/24 | JPY | 409,900 | 2,776 |
| | Major Joint Local Government Bond | 0.611% | 7/25/24 | JPY | 677,000 | 4,587 |
| | Major Joint Local Government Bond | 0.566% | 8/23/24 | JPY | 256,100 | 1,734 |
| | Major Joint Local Government Bond | 0.554% | 9/25/24 | JPY | 768,600 | 5,169 |
| | Major Joint Local Government Bond | 0.456% | 12/25/24 | JPY | 1,229,700 | 8,250 |
| | Major Joint Local Government Bond | 0.448% | 2/25/25 | JPY | 1,178,500 | 7,993 |
| | Major Joint Local Government Bond | 0.470% | 3/25/25 | JPY | 896,600 | 6,086 |
| | Major Joint Local Government Bond | 0.406% | 4/25/25 | JPY | 1,870,300 | 12,680 |
| | Major Joint Local Government Bond | 0.553% | 5/23/25 | JPY | 2,613,200 | 17,789 |
| | Major Joint Local Government Bond | 0.548% | 6/25/25 | JPY | 1,332,200 | 9,070 |
| | Major Joint Local Government Bond | 0.553% | 7/25/25 | JPY | 637,200 | 4,280 |
| | Major Joint Local Government Bond | 0.500% | 8/25/25 | JPY | 819,900 | 5,579 |
| | Major Joint Local Government Bond | 0.510% | 9/25/25 | JPY | 1,112,200 | 7,574 |
| | Major Joint Local Government Bond | 0.496% | 11/25/25 | JPY | 512,400 | 3,489 |
| | Major Joint Local Government Bond | 0.469% | 12/25/25 | JPY | 2,613,200 | 17,491 |
| | Major Joint Local Government Bond | 0.060% | 8/25/26 | JPY | 22,500 | 151 |
| | Major Joint Local Government Bond | 0.060% | 10/23/26 | JPY | 14,900 | 100 |
| | Major Joint Local Government Bond | 0.145% | 12/25/26 | JPY | 1,690,900 | 11,374 |
| | Major Joint Local Government Bond | 0.180% | 1/25/27 | JPY | 1,583,300 | 10,663 |
| | Major Joint Local Government Bond | 0.245% | 2/25/27 | JPY | 871,000 | 5,882 |
| | Major Joint Local Government Bond | 0.210% | 3/25/27 | JPY | 998,100 | 6,577 |
| | Major Joint Local Government Bond | 0.215% | 10/25/27 | JPY | 406,100 | 2,737 |
| | Major Joint Local Government Bond | 0.240% | 2/25/28 | JPY | 245,400 | 1,653 |
| | Major Joint Local Government Bond | 0.180% | 4/25/28 | JPY | 2,920,700 | 19,597 |
| | Major Joint Local Government Bond | 0.200% | 5/25/28 | JPY | 456,000 | 3,062 |
| | Major Joint Local Government Bond | 0.205% | 6/23/28 | JPY | 536,000 | 3,599 |
| | Major Joint Local Government Bond | 0.175% | 7/25/28 | JPY | 22,800 | 153 |
| | Major Joint Local Government Bond | 0.245% | 8/25/28 | JPY | 267,500 | 1,799 |
| | Major Joint Local Government Bond | 0.250% | 9/25/28 | JPY | 698,100 | 4,694 |
| | Major Joint Local Government Bond | 0.269% | 10/25/28 | JPY | 93,400 | 628 |
| | Major Joint Local Government Bond | 0.160% | 1/25/29 | JPY | 825,000 | 5,510 |
| | Major Joint Local Government Bond | 0.140% | 2/22/29 | JPY | 820,000 | 5,468 |
| | Major Joint Local Government Bond | 0.100% | 4/25/29 | JPY | 1,878,900 | 12,488 |
| | Major Joint Local Government Bond | 0.050% | 9/25/29 | JPY | 25,600 | 169 |
| | Major Joint Local Government Bond | 0.070% | 11/22/29 | JPY | 1,872,100 | 12,383 |
| | Major Joint Local Government Bond | 0.095% | 2/25/30 | JPY | 15,300 | 101 |
| | Major Joint Local Government Bond | 0.150% | 6/25/30 | JPY | 512,400 | 3,397 |
| | Major Joint Local Government Bond | 0.125% | 8/23/30 | JPY | 225,500 | 1,490 |
| | Major Joint Local Government Bond | 0.150% | 9/25/30 | JPY | 75,100 | 497 |
| | Major Joint Local Government Bond | 0.125% | 10/25/30 | JPY | 1,749,400 | 11,548 |
| | Major Joint Local Government Bond | 0.120% | 11/25/30 | JPY | 33,200 | 219 |
| | Major Joint Local Government Bond | 0.145% | 2/25/31 | JPY | 1,368,800 | 9,045 |
| | Major Joint Local Government Bond | 0.199% | 4/25/31 | JPY | 90,100 | 598 |
| | Major Joint Local Government Bond | 0.145% | 6/25/31 | JPY | 375,800 | 2,482 |
| | Major Joint Local Government Bond | 0.299% | 4/23/32 | JPY | 3,763,200 | 25,176 |
Total International Bond Index Fund
| | | Coupon | Maturity
Date | Currency | Face
Amount
(000) | Market
Value•
($000) |
| | Osaka Prefecture | 1.453% | 9/26/34 | JPY | 140,000 | 1,028 |
| | Osaka Prefecture | 0.366% | 9/28/35 | JPY | 840,000 | 5,432 |
| | Osaka Prefecture | 1.203% | 9/28/35 | JPY | 600,000 | 4,276 |
| | Tokyo Metropolitan Government | 0.720% | 12/20/23 | JPY | 15,300 | 104 |
| | Tokyo Metropolitan Government | 0.730% | 12/20/23 | JPY | 1,024,700 | 6,946 |
| | Tokyo Metropolitan Government | 0.635% | 3/19/24 | JPY | 358,600 | 2,411 |
| | Tokyo Metropolitan Government | 0.690% | 3/19/24 | JPY | 97,300 | 659 |
| | Tokyo Metropolitan Government | 0.505% | 9/20/24 | JPY | 358,700 | 2,406 |
| | Tokyo Metropolitan Government | 0.426% | 12/20/24 | JPY | 71,600 | 479 |
| | Tokyo Metropolitan Government | 0.386% | 3/19/25 | JPY | 512,400 | 3,430 |
| | Tokyo Metropolitan Government | 0.435% | 3/19/25 | JPY | 1,270,100 | 8,492 |
| | Tokyo Metropolitan Government | 0.499% | 6/20/25 | JPY | 384,300 | 2,575 |
| | Tokyo Metropolitan Government | 0.533% | 6/20/25 | JPY | 256,100 | 1,717 |
| | Tokyo Metropolitan Government | 0.456% | 9/19/25 | JPY | 256,100 | 1,715 |
| | Tokyo Metropolitan Government | 0.475% | 9/19/25 | JPY | 563,500 | 3,770 |
| | Tokyo Metropolitan Government | 0.444% | 12/19/25 | JPY | 343,300 | 2,296 |
| | Tokyo Metropolitan Government | 0.075% | 9/18/26 | JPY | 90,900 | 611 |
| | Tokyo Metropolitan Government | 0.210% | 3/19/27 | JPY | 1,024,800 | 6,914 |
| | Tokyo Metropolitan Government | 0.040% | 6/20/29 | JPY | 819,900 | 5,238 |
| | Tokyo Metropolitan Government | 0.095% | 9/20/30 | JPY | 1,219,200 | 8,022 |
| | Tokyo Metropolitan Government | 0.150% | 12/20/30 | JPY | 811,700 | 5,357 |
| | Tokyo Metropolitan Government | 0.080% | 3/20/31 | JPY | 45,000 | 295 |
| | Tokyo Metropolitan Government | 1.980% | 6/20/31 | JPY | 180,000 | 1,316 |
| | Tokyo Metropolitan Government | 1.293% | 6/20/35 | JPY | 40,000 | 289 |
| | | | | | | 12,669,125 |
| Jersey (0.0%) | | | |
| | Bailiwick of Jersey | 3.750% | 6/9/54 | GBP | 728 | 724 |
| Kazakhstan (0.0%) | | | |
| 3 | Republic of Kazakhstan | 1.550% | 11/9/23 | EUR | 1,628 | 1,572 |
| | Republic of Kazakhstan | 1.550% | 11/9/23 | EUR | 996 | 962 |
| | Republic of Kazakhstan | 0.600% | 9/30/26 | EUR | 812 | 687 |
| 3 | Republic of Kazakhstan | 0.600% | 9/30/26 | EUR | 3,156 | 2,668 |
| | Republic of Kazakhstan | 2.375% | 11/9/28 | EUR | 2,387 | 2,069 |
| 3 | Republic of Kazakhstan | 1.500% | 9/30/34 | EUR | 2,434 | 1,542 |
| | | | | | | 9,500 |
| Latvia (0.0%) | | | |
| | Republic of Latvia | 2.875% | 4/30/24 | EUR | 448 | 441 |
| | Republic of Latvia | 3.875% | 3/25/27 | EUR | 7,659 | 7,459 |
| | | | | | | 7,900 |
| Lithuania (0.0%) | | | |
| | Republic of Lithuania | 2.125% | 10/29/26 | EUR | 7,072 | 6,514 |
| | Republic of Lithuania | 4.125% | 4/25/28 | EUR | 4,500 | 4,410 |
| | Republic of Lithuania | 2.125% | 6/1/32 | EUR | 7,000 | 5,710 |
| | | | | | | 16,634 |
| Luxembourg (0.0%) | | | |
| | Grand Duchy of Luxembourg | 2.250% | 3/19/28 | EUR | 1,536 | 1,470 |
| Malaysia (0.8%) | | | |
| | Federation of Malaysia | 3.478% | 6/14/24 | MYR | 132,686 | 28,054 |
| | Federation of Malaysia | 4.181% | 7/15/24 | MYR | 72,466 | 15,482 |
| | Federation of Malaysia | 4.059% | 9/30/24 | MYR | 27,557 | 5,873 |
| | Federation of Malaysia | 3.882% | 3/14/25 | MYR | 75,079 | 15,903 |
| | Federation of Malaysia | 3.955% | 9/15/25 | MYR | 238,326 | 50,436 |
| | Federation of Malaysia | 4.392% | 4/15/26 | MYR | 35,723 | 7,636 |
| | Federation of Malaysia | 3.906% | 7/15/26 | MYR | 118,643 | 24,918 |
| | Federation of Malaysia | 3.900% | 11/30/26 | MYR | 67,108 | 14,115 |
| | Federation of Malaysia | 3.892% | 3/15/27 | MYR | 373 | 78 |
| | Federation of Malaysia | 3.899% | 11/16/27 | MYR | 49,502 | 10,338 |
| | Federation of Malaysia | 3.733% | 6/15/28 | MYR | 130,850 | 26,833 |
| | Federation of Malaysia | 3.885% | 8/15/29 | MYR | 77,460 | 15,850 |
| | Federation of Malaysia | 4.498% | 4/15/30 | MYR | 71,702 | 15,160 |
| | Federation of Malaysia | 2.632% | 4/15/31 | MYR | 32,034 | 5,887 |
| | Federation of Malaysia | 4.232% | 6/30/31 | MYR | 10,562 | 2,184 |
| | Federation of Malaysia | 4.127% | 4/15/32 | MYR | 12,757 | 2,612 |
| | Federation of Malaysia | 4.193% | 10/7/32 | MYR | 68,600 | 14,179 |
| | Federation of Malaysia | 3.844% | 4/15/33 | MYR | 103,536 | 20,518 |
| | Federation of Malaysia | 4.642% | 11/7/33 | MYR | 58,024 | 12,270 |
Total International Bond Index Fund
| | | Coupon | Maturity
Date | Currency | Face
Amount
(000) | Market
Value•
($000) |
| | Federation of Malaysia | 3.828% | 7/5/34 | MYR | 108,288 | 21,133 |
| | Federation of Malaysia | 4.254% | 5/31/35 | MYR | 54,605 | 11,050 |
| | Federation of Malaysia | 4.762% | 4/7/37 | MYR | 23,781 | 5,094 |
| | Federation of Malaysia | 4.893% | 6/8/38 | MYR | 100,791 | 21,404 |
| | Federation of Malaysia | 3.757% | 5/22/40 | MYR | 71,446 | 13,075 |
| | Federation of Malaysia | 4.696% | 10/15/42 | MYR | 18,600 | 3,865 |
| | Federation of Malaysia | 4.935% | 9/30/43 | MYR | 9,096 | 1,916 |
| | Federation of Malaysia | 4.736% | 3/15/46 | MYR | 17,860 | 3,649 |
| | Federation of Malaysia | 4.921% | 7/6/48 | MYR | 58,178 | 12,176 |
| | Federation of Malaysia | 4.065% | 6/15/50 | MYR | 93,261 | 17,032 |
| | Malaysia Government Investment Issue | 4.444% | 5/22/24 | MYR | 12,679 | 2,718 |
| | Malaysia Government Investment Issue | 3.655% | 10/15/24 | MYR | 5,987 | 1,266 |
| | Malaysia Government Investment Issue | 3.726% | 3/31/26 | MYR | 112,915 | 23,693 |
| | Malaysia Government Investment Issue | 3.422% | 9/30/27 | MYR | 134,278 | 27,430 |
| | Malaysia Government Investment Issue | 3.871% | 8/8/28 | MYR | 2,500 | 516 |
| | Malaysia Government Investment Issue | 4.369% | 10/31/28 | MYR | 144,150 | 30,514 |
| | Malaysia Government Investment Issue | 4.130% | 7/9/29 | MYR | 94,390 | 19,711 |
| | Malaysia Government Investment Issue | 3.465% | 10/15/30 | MYR | 139,340 | 27,492 |
| | Malaysia Government Investment Issue | 4.724% | 6/15/33 | MYR | 37,424 | 7,951 |
| | Malaysia Government Investment Issue | 4.582% | 8/30/33 | MYR | 13,950 | 2,926 |
| | Malaysia Government Investment Issue | 4.119% | 11/30/34 | MYR | 80,504 | 16,085 |
| | Malaysia Government Investment Issue | 3.447% | 7/15/36 | MYR | 150,232 | 27,535 |
| | Malaysia Government Investment Issue | 4.467% | 9/15/39 | MYR | 75,715 | 15,243 |
| | Malaysia Government Investment Issue | 4.417% | 9/30/41 | MYR | 104,838 | 20,836 |
| | Malaysia Government Investment Issue | 4.638% | 11/15/49 | MYR | 119,341 | 23,864 |
| | Malaysia Government Investment Issue | 5.357% | 5/15/52 | MYR | 29,650 | 6,578 |
| | | | | | | 653,078 |
| Mexico (0.8%) | | | |
| | Mexican Bonos | 8.000% | 12/7/23 | MXN | 805,140 | 39,500 |
| | Mexican Bonos | 8.000% | 9/5/24 | MXN | 1,096,190 | 53,292 |
| | Mexican Bonos | 10.000% | 12/5/24 | MXN | 887,120 | 44,595 |
| | Mexican Bonos | 5.750% | 3/5/26 | MXN | 1,662,140 | 74,265 |
| | Mexican Bonos | 5.500% | 3/4/27 | MXN | 587,700 | 25,227 |
| | Mexican Bonos | 7.500% | 6/3/27 | MXN | 1,144,730 | 53,012 |
| | Mexican Bonos | 8.500% | 5/31/29 | MXN | 1,098,190 | 52,033 |
| | Mexican Bonos | 7.750% | 5/29/31 | MXN | 1,547,460 | 69,124 |
| | Mexican Bonos | 7.750% | 11/23/34 | MXN | 368,830 | 15,932 |
| | Mexican Bonos | 10.000% | 11/20/36 | MXN | 253,420 | 12,921 |
| | Mexican Bonos | 8.500% | 11/18/38 | MXN | 904,560 | 40,429 |
| | Mexican Bonos | 7.750% | 11/13/42 | MXN | 861,640 | 35,232 |
| | Mexican Bonos | 8.000% | 11/7/47 | MXN | 1,017,010 | 42,269 |
| | United Mexican States | 1.375% | 1/15/25 | EUR | 5,509 | 5,207 |
| | United Mexican States | 1.625% | 4/8/26 | EUR | 2,052 | 1,884 |
| | United Mexican States | 1.350% | 9/18/27 | EUR | 3,030 | 2,624 |
| | United Mexican States | 1.750% | 4/17/28 | EUR | 9,453 | 8,020 |
| | United Mexican States | 3.625% | 4/9/29 | EUR | 4,648 | 4,302 |
| | United Mexican States | 1.125% | 1/17/30 | EUR | 3,886 | 2,977 |
| | United Mexican States | 2.375% | 2/11/30 | EUR | 4,600 | 3,816 |
| | United Mexican States | 3.375% | 2/23/31 | EUR | 6,377 | 5,529 |
| | United Mexican States | 1.450% | 10/25/33 | EUR | 8,935 | 5,976 |
| | United Mexican States | 2.250% | 8/12/36 | EUR | 3,724 | 2,458 |
| | United Mexican States | 2.875% | 4/8/39 | EUR | 6,024 | 4,082 |
| | United Mexican States | 3.000% | 3/6/45 | EUR | 2,872 | 1,914 |
| | United Mexican States | 2.125% | 10/25/51 | EUR | 6,382 | 3,215 |
| | United Mexican States | 5.625% | 3/19/14 | GBP | 3,095 | 2,420 |
| | United Mexican States | 4.000% | 3/15/15 | EUR | 1,765 | 1,131 |
| | | | | | | 613,386 |
| Netherlands (1.8%) | | | |
| | BNG Bank NV | 5.250% | 5/20/24 | AUD | 4,082 | 2,654 |
| | BNG Bank NV | 0.250% | 6/7/24 | EUR | 3,074 | 2,927 |
| | BNG Bank NV | 0.050% | 7/13/24 | EUR | 12,810 | 12,118 |
| | BNG Bank NV | 1.125% | 9/4/24 | EUR | 716 | 689 |
| | BNG Bank NV | 0.200% | 11/9/24 | EUR | 10,275 | 9,653 |
| | BNG Bank NV | 0.250% | 5/7/25 | EUR | 14,629 | 13,615 |
| | BNG Bank NV | 3.250% | 7/15/25 | AUD | 5,179 | 3,219 |
| | BNG Bank NV | 1.625% | 8/26/25 | GBP | 300 | 321 |
| | BNG Bank NV | 1.000% | 1/12/26 | EUR | 7,686 | 7,197 |
| | BNG Bank NV | 0.125% | 4/11/26 | EUR | 3,705 | 3,352 |
Total International Bond Index Fund
| | | Coupon | Maturity
Date | Currency | Face
Amount
(000) | Market
Value•
($000) |
| | BNG Bank NV | 3.250% | 8/24/26 | AUD | 373 | 227 |
| | BNG Bank NV | 0.625% | 6/19/27 | EUR | 7,521 | 6,746 |
| | BNG Bank NV | 3.500% | 7/19/27 | AUD | 3,980 | 2,422 |
| | BNG Bank NV | 0.750% | 1/11/28 | EUR | 11,876 | 10,556 |
| | BNG Bank NV | 3.300% | 7/17/28 | AUD | 10,104 | 5,966 |
| | BNG Bank NV | 5.200% | 12/7/28 | GBP | 1,550 | 1,829 |
| | BNG Bank NV | 0.100% | 1/15/30 | EUR | 7,631 | 6,157 |
| | BNG Bank NV | 1.375% | 10/21/30 | EUR | 3,074 | 2,696 |
| | BNG Bank NV | 0.250% | 1/12/32 | EUR | 5,900 | 4,549 |
| | BNG Bank NV | 1.875% | 7/13/32 | EUR | 6,000 | 5,361 |
| | BNG Bank NV | 0.125% | 4/19/33 | EUR | 13,448 | 9,808 |
| | BNG Bank NV | 0.125% | 7/9/35 | EUR | 34,808 | 23,704 |
| | BNG Bank NV | 0.875% | 10/17/35 | EUR | 2,543 | 1,907 |
| | BNG Bank NV | 0.875% | 10/24/36 | EUR | 9,300 | 6,836 |
| | BNG Bank NV | 0.250% | 11/22/36 | EUR | 9,300 | 6,159 |
| | BNG Bank NV | 1.250% | 3/30/37 | EUR | 9,300 | 7,131 |
| | BNG Bank NV | 1.500% | 3/29/38 | EUR | 1,545 | 1,212 |
| | BNG Bank NV | 1.500% | 7/15/39 | EUR | 2,094 | 1,621 |
| 7 | BNG Bank NV | 0.805% | 6/28/49 | EUR | 3,700 | 2,126 |
| 3 | Kingdom of Netherlands | 0.000% | 1/15/24 | EUR | 61,325 | �� 59,251 |
| 3 | Kingdom of Netherlands | 2.000% | 7/15/24 | EUR | 104,043 | 102,933 |
| 3 | Kingdom of Netherlands | 0.250% | 7/15/25 | EUR | 54,952 | 51,827 |
| | Kingdom of Netherlands | 0.000% | 1/15/26 | EUR | 25,000 | 23,129 |
| 3 | Kingdom of Netherlands | 0.500% | 7/15/26 | EUR | 31,742 | 29,646 |
| 3 | Kingdom of Netherlands | 0.000% | 1/15/27 | EUR | 101,614 | 91,880 |
| 3 | Kingdom of Netherlands | 0.750% | 7/15/27 | EUR | 91,458 | 84,866 |
| 3 | Kingdom of Netherlands | 0.750% | 7/15/28 | EUR | 51,539 | 47,023 |
| 3 | Kingdom of Netherlands | 0.250% | 7/15/29 | EUR | 81,217 | 70,334 |
| 3 | Kingdom of Netherlands | 0.000% | 7/15/30 | EUR | 110,169 | 91,551 |
| 3 | Kingdom of Netherlands | 0.000% | 7/15/31 | EUR | 57,762 | 46,952 |
| 3 | Kingdom of Netherlands | 0.500% | 7/15/32 | EUR | 88,710 | 73,091 |
| 3 | Kingdom of Netherlands | 2.500% | 1/15/33 | EUR | 20,752 | 20,553 |
| 3 | Kingdom of Netherlands | 4.000% | 1/15/37 | EUR | 63,551 | 73,002 |
| 3 | Kingdom of Netherlands | 0.000% | 1/15/38 | EUR | 29,356 | 19,741 |
| 3 | Kingdom of Netherlands | 0.500% | 1/15/40 | EUR | 49,063 | 34,652 |
| 3 | Kingdom of Netherlands | 3.750% | 1/15/42 | EUR | 55,786 | 64,816 |
| 3 | Kingdom of Netherlands | 2.750% | 1/15/47 | EUR | 71,146 | 73,473 |
| 3,7 | Kingdom of Netherlands | 0.000% | 1/15/52 | EUR | 49,318 | 24,887 |
| 3 | Kingdom of Netherlands | 2.000% | 1/15/54 | EUR | 45,000 | 40,435 |
| | Nederlandse Waterschapsbank NV | 0.125% | 1/17/24 | EUR | 12,818 | 12,298 |
| | Nederlandse Waterschapsbank NV | 5.250% | 4/18/24 | AUD | 4,150 | 2,693 |
| | Nederlandse Waterschapsbank NV | 5.200% | 3/31/25 | CAD | 870 | 653 |
| | Nederlandse Waterschapsbank NV | 3.400% | 7/22/25 | AUD | 1,770 | 1,104 |
| | Nederlandse Waterschapsbank NV | 0.250% | 12/15/25 | GBP | 8,398 | 8,560 |
| | Nederlandse Waterschapsbank NV | 3.150% | 9/2/26 | AUD | 4,560 | 2,776 |
| | Nederlandse Waterschapsbank NV | 0.000% | 11/16/26 | EUR | 12,782 | 11,295 |
| | Nederlandse Waterschapsbank NV | 3.250% | 3/9/27 | EUR | 5,087 | 5,108 |
| | Nederlandse Waterschapsbank NV | 1.000% | 3/1/28 | EUR | 3,092 | 2,775 |
| | Nederlandse Waterschapsbank NV | 3.450% | 7/17/28 | AUD | 2,030 | 1,211 |
| | Nederlandse Waterschapsbank NV | 3.300% | 5/2/29 | AUD | 2,290 | 1,334 |
| | Nederlandse Waterschapsbank NV | 0.500% | 4/29/30 | EUR | 2,700 | 2,233 |
| | Nederlandse Waterschapsbank NV | 0.000% | 9/8/31 | EUR | 11,700 | 8,903 |
| | Nederlandse Waterschapsbank NV | 3.000% | 9/11/31 | EUR | 3,000 | 2,964 |
| | Nederlandse Waterschapsbank NV | 0.250% | 1/19/32 | EUR | 9,300 | 7,181 |
| | Nederlandse Waterschapsbank NV | 5.375% | 6/7/32 | GBP | 5,124 | 6,426 |
| | Nederlandse Waterschapsbank NV | 1.250% | 5/27/36 | EUR | 9,287 | 7,208 |
| | Nederlandse Waterschapsbank NV | 0.000% | 2/16/37 | EUR | 16,300 | 10,313 |
| | Nederlandse Waterschapsbank NV | 1.500% | 6/15/39 | EUR | 2,543 | 1,972 |
| | Nederlandse Waterschapsbank NV | 0.750% | 10/4/41 | EUR | 21,712 | 14,240 |
| | | | | | | 1,398,047 |
| New Zealand (0.4%) | | | |
| | Auckland Council | 0.625% | 11/13/24 | EUR | 5,087 | 4,806 |
| | Auckland Council | 3.500% | 3/9/26 | AUD | 300 | 185 |
| | Auckland Council | 0.125% | 9/26/29 | EUR | 1,501 | 1,207 |
| | Housing New Zealand Ltd. | 3.360% | 6/12/25 | NZD | 5,390 | 2,992 |
| | Housing New Zealand Ltd. | 2.247% | 10/5/26 | NZD | 13,510 | 7,035 |
| | Housing New Zealand Ltd. | 2.183% | 4/24/30 | NZD | 3,720 | 1,760 |
| | Housing New Zealand Ltd. | 1.534% | 9/10/35 | NZD | 3,720 | 1,369 |
| | New Zealand | 0.500% | 5/15/24 | NZD | 43,200 | 23,698 |
Total International Bond Index Fund
| | | Coupon | Maturity
Date | Currency | Face
Amount
(000) | Market
Value•
($000) |
| | New Zealand | 2.750% | 4/15/25 | NZD | 69,821 | 39,116 |
| | New Zealand | 0.500% | 5/15/26 | NZD | 58,240 | 29,658 |
| | New Zealand | 4.500% | 4/15/27 | NZD | 76,170 | 44,662 |
| | New Zealand | 0.250% | 5/15/28 | NZD | 38,981 | 18,251 |
| | New Zealand | 3.000% | 4/20/29 | NZD | 43,255 | 23,432 |
| | New Zealand | 1.500% | 5/15/31 | NZD | 44,769 | 21,052 |
| | New Zealand | 2.000% | 5/15/32 | NZD | 11,164 | 5,385 |
| | New Zealand | 3.500% | 4/14/33 | NZD | 45,482 | 24,909 |
| | New Zealand | 2.750% | 4/15/37 | NZD | 39,636 | 19,054 |
| | New Zealand | 1.750% | 5/15/41 | NZD | 29,092 | 11,119 |
| | New Zealand | 2.750% | 5/15/51 | NZD | 15,397 | 6,529 |
| | New Zealand Local Government Funding Agency Bond | 2.250% | 4/15/24 | NZD | 5,705 | 3,179 |
| | New Zealand Local Government Funding Agency Bond | 2.750% | 4/15/25 | NZD | 4,589 | 2,515 |
| | New Zealand Local Government Funding Agency Bond | 1.500% | 4/15/26 | NZD | 5,097 | 2,617 |
| | New Zealand Local Government Funding Agency Bond | 4.500% | 4/15/27 | NZD | 1,016 | 574 |
| | New Zealand Local Government Funding Agency Bond | 1.500% | 4/20/29 | NZD | 14,855 | 6,879 |
| | New Zealand Local Government Funding Agency Bond | 3.500% | 4/14/33 | NZD | 7,381 | 3,667 |
| | | | | | | 305,650 |
| Norway (0.2%) | | | |
| 3 | Kingdom of Norway | 3.000% | 3/14/24 | NOK | 289,665 | 27,678 |
| 3 | Kingdom of Norway | 1.750% | 3/13/25 | NOK | 89,307 | 8,252 |
| 3 | Kingdom of Norway | 1.500% | 2/19/26 | NOK | 66,343 | 5,984 |
| 3 | Kingdom of Norway | 1.750% | 2/17/27 | NOK | 78,080 | 6,986 |
| 3 | Kingdom of Norway | 2.000% | 4/26/28 | NOK | 102,066 | 9,079 |
| 3 | Kingdom of Norway | 1.750% | 9/6/29 | NOK | 182,140 | 15,645 |
| 3 | Kingdom of Norway | 1.375% | 8/19/30 | NOK | 554,802 | 45,613 |
| 3 | Kingdom of Norway | 1.250% | 9/17/31 | NOK | 221,910 | 17,712 |
| | Kommunalbanken A/S | 1.500% | 12/15/23 | GBP | 7,631 | 8,528 |
| | Kommunalbanken A/S | 5.250% | 7/15/24 | AUD | 3,196 | 2,079 |
| | Kommunalbanken A/S | 4.250% | 7/16/25 | AUD | 632 | 403 |
| | Kommunalbanken A/S | 0.625% | 4/20/26 | EUR | 4,090 | 3,742 |
| | Kommunalbanken A/S | 0.600% | 6/1/26 | AUD | 9,300 | 5,197 |
| | Kommunalbanken A/S | 3.000% | 12/9/26 | AUD | 4,592 | 2,772 |
| | Kommunalbanken A/S | 0.875% | 5/24/27 | EUR | 14,748 | 13,295 |
| | Kommunalbanken A/S | 3.400% | 7/24/28 | AUD | 4,080 | 2,428 |
| | Kommunalbanken A/S | 0.050% | 10/24/29 | EUR | 4,758 | 3,831 |
| | | | | | | 179,224 |
| Peru (0.1%) | | | |
| | Republic of Peru | 5.700% | 8/12/24 | PEN | 25,355 | 6,191 |
| | Republic of Peru | 2.750% | 1/30/26 | EUR | 7,182 | 6,762 |
| | Republic of Peru | 8.200% | 8/12/26 | PEN | 63,040 | 16,272 |
| | Republic of Peru | 6.350% | 8/12/28 | PEN | 66,780 | 15,524 |
| | Republic of Peru | 5.940% | 2/12/29 | PEN | 61,875 | 13,847 |
| | Republic of Peru | 3.750% | 3/1/30 | EUR | 996 | 894 |
| | Republic of Peru | 6.950% | 8/12/31 | PEN | 52,125 | 11,931 |
| | Republic of Peru | 6.150% | 8/12/32 | PEN | 55,121 | 11,683 |
| | Republic of Peru | 1.250% | 3/11/33 | EUR | 4,699 | 3,082 |
| | Republic of Peru | 5.400% | 8/12/34 | PEN | 49,943 | 9,554 |
| | Republic of Peru | 1.950% | 11/17/36 | EUR | 4,339 | 2,735 |
| | Republic of Peru | 6.900% | 8/12/37 | PEN | 52,230 | 11,096 |
| | Republic of Peru | 5.350% | 8/12/40 | PEN | 33,749 | 5,905 |
| | Republic of Peru | 6.850% | 2/12/42 | PEN | 17,630 | 3,647 |
| | Republic of Peru | 6.714% | 2/12/55 | PEN | 10,725 | 2,130 |
| | | | | | | 121,253 |
| Philippines (0.0%) | | | |
| | Republic of Philippines | 0.250% | 4/28/25 | EUR | 2,683 | 2,411 |
| | Republic of Philippines | 0.875% | 5/17/27 | EUR | 4,013 | 3,396 |
| | Republic of Philippines | 0.700% | 2/3/29 | EUR | 2,599 | 2,004 |
| | Republic of Philippines | 1.200% | 4/28/33 | EUR | 4,613 | 3,117 |
| | | | | | | 10,928 |
| Poland (0.5%) | | | |
| | Bank Gospodarstwa Krajowego | 1.375% | 6/1/25 | EUR | 5,145 | 4,713 |
| | Bank Gospodarstwa Krajowego | 1.750% | 5/6/26 | EUR | 2,094 | 1,872 |
| | Bank Gospodarstwa Krajowego | 1.625% | 4/30/28 | EUR | 2,615 | 2,162 |
| | Bank Gospodarstwa Krajowego | 0.375% | 10/13/28 | EUR | 800 | 605 |
| | Bank Gospodarstwa Krajowego | 3.000% | 5/30/29 | EUR | 2,500 | 2,217 |
| | Bank Gospodarstwa Krajowego | 2.000% | 6/1/30 | EUR | 394 | 312 |
| | Bank Gospodarstwa Krajowego | 0.500% | 7/8/31 | EUR | 1,250 | 825 |
Total International Bond Index Fund
| | | Coupon | Maturity
Date | Currency | Face
Amount
(000) | Market
Value•
($000) |
| | Republic of Poland | 2.500% | 1/25/23 | PLN | 62,048 | 12,859 |
| | Republic of Poland | 4.000% | 10/25/23 | PLN | 129,306 | 26,207 |
| | Republic of Poland | 3.000% | 1/15/24 | EUR | 300 | 296 |
| | Republic of Poland | 2.500% | 4/25/24 | PLN | 56,105 | 10,830 |
| | Republic of Poland | 3.375% | 7/9/24 | EUR | 3,074 | 3,030 |
| | Republic of Poland | 2.250% | 10/25/24 | PLN | 25,516 | 4,749 |
| | Republic of Poland | 5.250% | 1/20/25 | EUR | 3,792 | 3,886 |
| | Republic of Poland | 0.000% | 2/10/25 | EUR | 7,686 | 6,993 |
| | Republic of Poland | 0.750% | 4/25/25 | PLN | 148,117 | 25,773 |
| | Republic of Poland | 3.250% | 7/25/25 | PLN | 66,853 | 12,210 |
| | Republic of Poland | 1.500% | 9/9/25 | EUR | 2,561 | 2,398 |
| | Republic of Poland | 1.500% | 1/19/26 | EUR | 24,494 | 22,820 |
| | Republic of Poland | 2.500% | 7/25/26 | PLN | 82,417 | 13,953 |
| | Republic of Poland | 1.125% | 8/7/26 | EUR | 1,794 | 1,628 |
| | Republic of Poland | 0.250% | 10/25/26 | PLN | 135,172 | 20,575 |
| | Republic of Poland | 0.875% | 5/10/27 | EUR | 16,806 | 14,814 |
| | Republic of Poland | 3.750% | 5/25/27 | PLN | 268,144 | 46,106 |
| | Republic of Poland | 2.500% | 7/25/27 | PLN | 79,101 | 12,788 |
| | Republic of Poland | 1.375% | 10/22/27 | EUR | 2,075 | 1,818 |
| | Republic of Poland | 2.750% | 4/25/28 | PLN | 134,365 | 21,391 |
| | Republic of Poland | 1.000% | 10/25/28 | EUR | 1,486 | 1,252 |
| | Republic of Poland | 5.750% | 4/25/29 | PLN | 13,192 | 2,398 |
| | Republic of Poland | 2.750% | 10/25/29 | PLN | 65,316 | 9,715 |
| | Republic of Poland | 1.250% | 10/25/30 | PLN | 117,376 | 14,719 |
| | Republic of Poland | 1.750% | 4/25/32 | PLN | 494,810 | 59,961 |
| | Republic of Poland | 2.750% | 5/25/32 | EUR | 9,633 | 8,118 |
| | Republic of Poland | 2.375% | 1/18/36 | EUR | 6,821 | 5,274 |
| | Republic of Poland | 2.000% | 10/25/46 | EUR | 225 | 149 |
| | Republic of Poland | 4.000% | 4/25/47 | PLN | 32,636 | 3,563 |
| | | | | | | 382,979 |
| Portugal (0.6%) | | | |
| 3 | Portugal Obrigacoes do Tesouro OT | 5.650% | 2/15/24 | EUR | 40,993 | 42,334 |
| 3 | Portugal Obrigacoes do Tesouro OT | 2.875% | 7/21/26 | EUR | 34,787 | 35,273 |
| 3 | Portugal Obrigacoes do Tesouro OT | 4.125% | 4/14/27 | EUR | 16,914 | 17,903 |
| 3 | Portugal Obrigacoes do Tesouro OT | 0.700% | 10/15/27 | EUR | 44,950 | 40,726 |
| 3 | Portugal Obrigacoes do Tesouro OT | 2.125% | 10/17/28 | EUR | 25,000 | 24,061 |
| 3 | Portugal Obrigacoes do Tesouro OT | 1.950% | 6/15/29 | EUR | 58,482 | 55,267 |
| 3 | Portugal Obrigacoes do Tesouro OT | 3.875% | 2/15/30 | EUR | 20,497 | 21,773 |
| 3 | Portugal Obrigacoes do Tesouro OT | 0.475% | 10/18/30 | EUR | 38,430 | 31,520 |
| 3 | Portugal Obrigacoes do Tesouro OT | 0.300% | 10/17/31 | EUR | 30,062 | 23,499 |
| 3 | Portugal Obrigacoes do Tesouro OT | 1.650% | 7/16/32 | EUR | 56,690 | 49,103 |
| 3 | Portugal Obrigacoes do Tesouro OT | 2.250% | 4/18/34 | EUR | 35,869 | 32,429 |
| 3 | Portugal Obrigacoes do Tesouro OT | 0.900% | 10/12/35 | EUR | 32,376 | 24,126 |
| 3 | Portugal Obrigacoes do Tesouro OT | 4.100% | 4/15/37 | EUR | 8,556 | 9,179 |
| 3 | Portugal Obrigacoes do Tesouro OT | 1.150% | 4/11/42 | EUR | 14,007 | 9,376 |
| 3 | Portugal Obrigacoes do Tesouro OT | 4.100% | 2/15/45 | EUR | 22,545 | 24,325 |
| | | | | | | 440,894 |
| Romania (0.2%) | | | |
| | Romania | 3.625% | 4/24/24 | EUR | 2,664 | 2,603 |
| | Romania | 2.750% | 10/29/25 | EUR | 8,652 | 7,984 |
| | Romania | 3.500% | 11/25/25 | RON | 54,750 | 9,407 |
| 3 | Romania | 2.750% | 2/26/26 | EUR | 1,906 | 1,709 |
| | Romania | 3.250% | 6/24/26 | RON | 49,260 | 8,143 |
| 3 | Romania | 2.000% | 12/8/26 | EUR | 1,869 | 1,600 |
| | Romania | 2.375% | 4/19/27 | EUR | 11,529 | 9,755 |
| | Romania | 5.800% | 7/26/27 | RON | 116,950 | 20,491 |
| | Romania | 2.500% | 10/25/27 | RON | 150,000 | 22,329 |
| 3 | Romania | 2.125% | 3/7/28 | EUR | 2,708 | 2,104 |
| | Romania | 2.125% | 3/7/28 | EUR | 1,868 | 1,452 |
| | Romania | 2.875% | 5/26/28 | EUR | 17,178 | 13,583 |
| | Romania | 4.850% | 7/25/29 | RON | 50,000 | 7,912 |
| 3 | Romania | 1.375% | 12/2/29 | EUR | 1,655 | 1,110 |
| | Romania | 1.375% | 12/2/29 | EUR | 4,100 | 2,751 |
| | Romania | 2.500% | 2/8/30 | EUR | 3,587 | 2,579 |
| 3 | Romania | 3.624% | 5/26/30 | EUR | 1,598 | 1,229 |
| | Romania | 3.624% | 5/26/30 | EUR | 10,320 | 7,938 |
| 3 | Romania | 1.750% | 7/13/30 | EUR | 4,366 | 2,894 |
| | Romania | 1.750% | 7/13/30 | EUR | 7,768 | 5,149 |
Total International Bond Index Fund
| | | Coupon | Maturity
Date | Currency | Face
Amount
(000) | Market
Value•
($000) |
| | Romania | 2.124% | 7/16/31 | EUR | 4,364 | 2,888 |
| 3 | Romania | 2.124% | 7/16/31 | EUR | 2,208 | 1,461 |
| | Romania | 2.000% | 1/28/32 | EUR | 2,785 | 1,762 |
| 3 | Romania | 2.000% | 1/28/32 | EUR | 2,306 | 1,459 |
| | Romania | 6.700% | 2/25/32 | RON | 104,000 | 17,671 |
| 3 | Romania | 2.000% | 4/14/33 | EUR | 3,392 | 2,033 |
| | Romania | 2.000% | 4/14/33 | EUR | 2,500 | 1,499 |
| 3 | Romania | 3.750% | 2/7/34 | EUR | 2,148 | 1,499 |
| | Romania | 3.750% | 2/7/34 | EUR | 5,136 | 3,584 |
| | Romania | 3.875% | 10/29/35 | EUR | 7,467 | 5,028 |
| | Romania | 4.250% | 4/28/36 | RON | 50,000 | 6,205 |
| | Romania | 4.125% | 3/11/39 | EUR | 1,536 | 1,000 |
| 3 | Romania | 2.625% | 12/2/40 | EUR | 1,023 | 524 |
| 3 | Romania | 2.750% | 4/14/41 | EUR | 4,774 | 2,457 |
| | Romania | 2.750% | 4/14/41 | EUR | 3,182 | 1,637 |
| 3 | Romania | 2.875% | 4/13/42 | EUR | 2,728 | 1,413 |
| 3 | Romania | 4.625% | 4/3/49 | EUR | 4,347 | 2,798 |
| | Romania | 4.625% | 4/3/49 | EUR | 5,124 | 3,299 |
| 3 | Romania | 3.375% | 1/28/50 | EUR | 5,124 | 2,673 |
| | | | | | | 193,612 |
| Saudi Arabia (0.0%) | | | |
| 3 | Kingdom of Saudi Arabia | 0.000% | 3/3/24 | EUR | 17,870 | 16,841 |
| 3 | Kingdom of Saudi Arabia | 0.750% | 7/9/27 | EUR | 5,087 | 4,383 |
| 3 | Kingdom of Saudi Arabia | 0.625% | 3/3/30 | EUR | 7,682 | 6,050 |
| | Kingdom of Saudi Arabia | 2.000% | 7/9/39 | EUR | 7,411 | 5,117 |
| | | | | | | 32,391 |
| Singapore (0.6%) | | | |
| | Housing & Development Board | 2.505% | 6/27/24 | SGD | 750 | 516 |
| | Housing & Development Board | 3.100% | 7/24/24 | SGD | 4,500 | 3,121 |
| | Housing & Development Board | 2.495% | 3/11/26 | SGD | 750 | 503 |
| | Housing & Development Board | 2.035% | 9/16/26 | SGD | 4,500 | 2,940 |
| | Housing & Development Board | 2.675% | 1/22/29 | SGD | 2,500 | 1,610 |
| | Housing & Development Board | 2.598% | 10/30/29 | SGD | 2,750 | 1,747 |
| | Housing & Development Board | 3.080% | 5/31/30 | SGD | 7,250 | 4,727 |
| | Housing & Development Board | 2.545% | 7/4/31 | SGD | 1,250 | 767 |
| | Housing & Development Board | 1.865% | 7/21/33 | SGD | 3,500 | 1,911 |
| | Republic of Singapore | 2.000% | 2/1/24 | SGD | 62,058 | 43,175 |
| | Republic of Singapore | 3.000% | 9/1/24 | SGD | 31,669 | 22,322 |
| | Republic of Singapore | 2.375% | 6/1/25 | SGD | 25,520 | 17,693 |
| | Republic of Singapore | 0.500% | 11/1/25 | SGD | 29,939 | 19,556 |
| | Republic of Singapore | 2.125% | 6/1/26 | SGD | 53,028 | 36,122 |
| | Republic of Singapore | 1.250% | 11/1/26 | SGD | 37,394 | 24,491 |
| | Republic of Singapore | 3.500% | 3/1/27 | SGD | 83,448 | 59,548 |
| | Republic of Singapore | 2.875% | 9/1/27 | SGD | 6,000 | 4,160 |
| | Republic of Singapore | 2.625% | 5/1/28 | SGD | 31,923 | 21,715 |
| | Republic of Singapore | 2.875% | 7/1/29 | SGD | 25,646 | 17,520 |
| | Republic of Singapore | 2.875% | 9/1/30 | SGD | 55,004 | 37,380 |
| | Republic of Singapore | 1.625% | 7/1/31 | SGD | 40,300 | 24,578 |
| | Republic of Singapore | 2.625% | 8/1/32 | SGD | 14,000 | 9,219 |
| | Republic of Singapore | 3.375% | 9/1/33 | SGD | 30,104 | 21,158 |
| | Republic of Singapore | 2.250% | 8/1/36 | SGD | 34,254 | 21,141 |
| | Republic of Singapore | 2.375% | 7/1/39 | SGD | 12,768 | 7,905 |
| | Republic of Singapore | 2.750% | 4/1/42 | SGD | 29,124 | 19,063 |
| | Republic of Singapore | 2.750% | 3/1/46 | SGD | 31,282 | 20,513 |
| | Republic of Singapore | 1.875% | 3/1/50 | SGD | 23,878 | 13,023 |
| | Republic of Singapore | 1.875% | 10/1/51 | SGD | 12,558 | 6,824 |
| | Republic of Singapore | 3.000% | 8/1/72 | SGD | 4,309 | 2,972 |
| | | | | | | 467,920 |
| Slovakia (0.2%) | | | |
| | Slovak Republic | 0.000% | 11/13/23 | EUR | 32,179 | 30,984 |
| | Slovak Republic | 0.000% | 6/17/24 | EUR | 4,965 | 4,692 |
| | Slovak Republic | 0.250% | 5/14/25 | EUR | 12,343 | 11,450 |
| | Slovak Republic | 0.625% | 5/22/26 | EUR | 6,661 | 6,106 |
| | Slovak Republic | 1.375% | 1/21/27 | EUR | 10,863 | 10,170 |
| | Slovak Republic | 1.000% | 6/12/28 | EUR | 17,304 | 15,289 |
| | Slovak Republic | 0.750% | 4/9/30 | EUR | 8,109 | 6,607 |
| | Slovak Republic | 1.000% | 5/14/32 | EUR | 28,704 | 22,481 |
| | Slovak Republic | 4.000% | 10/19/32 | EUR | 7,500 | 7,638 |
Total International Bond Index Fund
| | | Coupon | Maturity
Date | Currency | Face
Amount
(000) | Market
Value•
($000) |
| | Slovak Republic | 1.875% | 3/9/37 | EUR | 5,200 | 3,900 |
| | Slovak Republic | 2.000% | 10/17/47 | EUR | 7,595 | 5,385 |
| | Slovak Republic | 2.250% | 6/12/68 | EUR | 12,923 | 9,293 |
| | | | | | | 133,995 |
| Slovenia (0.1%) | | | |
| | Republic of Slovenia | 4.625% | 9/9/24 | EUR | 2,049 | 2,137 |
| | Republic of Slovenia | 2.125% | 7/28/25 | EUR | 2,561 | 2,548 |
| | Republic of Slovenia | 5.125% | 3/30/26 | EUR | 4,099 | 4,443 |
| | Republic of Slovenia | 1.250% | 3/22/27 | EUR | 7,173 | 6,728 |
| | Republic of Slovenia | 1.000% | 3/6/28 | EUR | 17,933 | 16,187 |
| | Republic of Slovenia | 1.188% | 3/14/29 | EUR | 5,124 | 4,483 |
| | Republic of Slovenia | 0.275% | 1/14/30 | EUR | 7,686 | 6,122 |
| | Republic of Slovenia | 0.000% | 2/12/31 | EUR | 22,280 | 16,589 |
| | Republic of Slovenia | 2.250% | 3/3/32 | EUR | 29,681 | 26,364 |
| | Republic of Slovenia | 1.500% | 3/25/35 | EUR | 6,145 | 4,728 |
| | Republic of Slovenia | 1.750% | 11/3/40 | EUR | 5,124 | 3,624 |
| | Republic of Slovenia | 3.125% | 8/7/45 | EUR | 5,124 | 4,473 |
| | Republic of Slovenia | 0.488% | 10/20/50 | EUR | 8,307 | 3,713 |
| | | | | | | 102,139 |
| South Korea (2.7%) | | | |
| | Export-Import Bank of Korea | 0.375% | 3/26/24 | EUR | 5,087 | 4,860 |
| | Export-Import Bank of Korea | 0.000% | 10/19/24 | EUR | 5,500 | 5,132 |
| | Export-Import Bank of Korea | 4.000% | 6/7/27 | AUD | 530 | 322 |
| | Korea Development Bank | 2.625% | 9/8/27 | EUR | 5,000 | 4,797 |
| | Korea Gas Corp. | 0.000% | 11/28/23 | CHF | 2,035 | 1,995 |
| 3 | Korea Housing Finance Corp | 1.963% | 7/19/26 | EUR | 14,400 | 13,543 |
| 3 | Korea Housing Finance Corp. | 0.750% | 10/30/23 | EUR | 2,434 | 2,358 |
| 3 | Korea Housing Finance Corp. | 0.010% | 2/5/25 | EUR | 2,543 | 2,341 |
| | Korea Housing Finance Corp. | 0.010% | 2/5/25 | EUR | 24,979 | 22,999 |
| 3 | Korea Housing Finance Corp. | 0.010% | 7/7/25 | EUR | 7,457 | 6,770 |
| | Korea Housing Finance Corp. | 0.010% | 6/29/26 | EUR | 6,542 | 5,748 |
| | Korea Monetary Stabilization Bond | 1.800% | 1/2/24 | KRW | 20,000,000 | 13,713 |
| | Korea National Housing Bond I | 1.750% | 4/30/24 | KRW | 8,800,000 | 5,971 |
| | Korea Treasury Bond | 1.875% | 12/10/24 | KRW | 103,000,000 | 68,999 |
| | Korea Treasury Bond | 1.750% | 9/10/26 | KRW | 57,500,000 | 36,769 |
| | Korea Treasury Bond | 3.125% | 9/10/27 | KRW | 30,000,000 | 20,012 |
| | Korea Treasury Bond | 2.375% | 12/10/31 | KRW | 105,000,000 | 63,562 |
| | Korea Treasury Bond | 3.375% | 6/10/32 | KRW | 30,000,000 | 19,649 |
| | Korea Treasury Bond | 1.875% | 9/10/41 | KRW | 58,000,000 | 28,496 |
| | Korea Treasury Bond | 3.250% | 9/10/42 | KRW | 10,000,000 | 6,128 |
| | Republic of Korea | 0.875% | 12/10/23 | KRW | 116,000,000 | 78,876 |
| | Republic of Korea | 1.875% | 3/10/24 | KRW | 75,000,000 | 51,255 |
| | Republic of Korea | 1.125% | 6/10/24 | KRW | 139,000,000 | 93,254 |
| | Republic of Korea | 1.375% | 9/10/24 | KRW | 50,000,000 | 33,406 |
| | Republic of Korea | 3.000% | 9/10/24 | KRW | 95,000,000 | 65,388 |
| | Republic of Korea | 1.500% | 3/10/25 | KRW | 77,500,000 | 51,165 |
| | Republic of Korea | 2.250% | 6/10/25 | KRW | 79,000,000 | 52,820 |
| | Republic of Korea | 3.125% | 6/10/25 | KRW | 65,000,000 | 44,435 |
| | Republic of Korea | 1.125% | 9/10/25 | KRW | 92,500,000 | 59,597 |
| | Republic of Korea | 0.000% | 9/16/25 | EUR | 6,298 | 5,686 |
| | Republic of Korea | 2.250% | 12/10/25 | KRW | 30,000,000 | 19,860 |
| | Republic of Korea | 1.250% | 3/10/26 | KRW | 87,500,000 | 55,729 |
| | Republic of Korea | 5.750% | 3/10/26 | KRW | 14,000,000 | 10,285 |
| | Republic of Korea | 1.875% | 6/10/26 | KRW | 72,000,000 | 46,549 |
| | Republic of Korea | 1.500% | 12/10/26 | KRW | 70,000,000 | 44,029 |
| | Republic of Korea | 2.375% | 3/10/27 | KRW | 50,000,000 | 32,460 |
| | Republic of Korea | 5.250% | 3/10/27 | KRW | 15,500,000 | 11,293 |
| | Republic of Korea | 2.125% | 6/10/27 | KRW | 75,000,000 | 47,949 |
| | Republic of Korea | 2.375% | 12/10/27 | KRW | 45,000,000 | 28,857 |
| | Republic of Korea | 5.500% | 3/10/28 | KRW | 20,000,000 | 14,853 |
| | Republic of Korea | 2.625% | 6/10/28 | KRW | 50,260,000 | 32,413 |
| | Republic of Korea | 2.375% | 12/10/28 | KRW | 50,000,000 | 31,567 |
| | Republic of Korea | 1.875% | 6/10/29 | KRW | 63,000,000 | 38,208 |
| | Republic of Korea | 1.375% | 12/10/29 | KRW | 75,000,000 | 43,448 |
| | Republic of Korea | 5.500% | 12/10/29 | KRW | 12,137,000 | 9,163 |
| | Republic of Korea | 1.375% | 6/10/30 | KRW | 94,000,000 | 53,808 |
| | Republic of Korea | 1.500% | 12/10/30 | KRW | 104,000,000 | 59,448 |
| | Republic of Korea | 4.750% | 12/10/30 | KRW | 28,000,000 | 20,344 |
Total International Bond Index Fund
| | | Coupon | Maturity
Date | Currency | Face
Amount
(000) | Market
Value•
($000) |
| | Republic of Korea | 2.000% | 6/10/31 | KRW | 83,003,340 | 48,943 |
| | Republic of Korea | 4.000% | 12/10/31 | KRW | 41,000,000 | 28,251 |
| | Republic of Korea | 3.750% | 12/10/33 | KRW | 86,500,000 | 58,201 |
| | Republic of Korea | 2.625% | 9/10/35 | KRW | 49,000,000 | 29,039 |
| | Republic of Korea | 1.500% | 9/10/36 | KRW | 40,000,000 | 20,187 |
| | Republic of Korea | 2.250% | 9/10/37 | KRW | 20,000,000 | 11,051 |
| | Republic of Korea | 2.375% | 9/10/38 | KRW | 36,600,000 | 20,330 |
| | Republic of Korea | 1.125% | 9/10/39 | KRW | 26,800,000 | 11,894 |
| | Republic of Korea | 1.500% | 9/10/40 | KRW | 39,700,000 | 18,506 |
| | Republic of Korea | 3.000% | 12/10/42 | KRW | 59,500,000 | 35,005 |
| | Republic of Korea | 2.750% | 12/10/44 | KRW | 57,990,000 | 32,093 |
| | Republic of Korea | 2.000% | 3/10/46 | KRW | 49,000,000 | 22,998 |
| | Republic of Korea | 2.125% | 3/10/47 | KRW | 52,955,000 | 25,176 |
| | Republic of Korea | 2.625% | 3/10/48 | KRW | 98,695,000 | 53,049 |
| | Republic of Korea | 2.000% | 3/10/49 | KRW | 91,360,000 | 41,449 |
| | Republic of Korea | 1.500% | 3/10/50 | KRW | 153,730,000 | 61,897 |
| | Republic of Korea | 1.875% | 3/10/51 | KRW | 182,145,380 | 80,360 |
| | Republic of Korea | 2.500% | 3/10/52 | KRW | 61,000,000 | 30,898 |
| | Republic of Korea | 2.000% | 9/10/68 | KRW | 35,697,000 | 14,102 |
| | Republic of Korea | 1.625% | 9/10/70 | KRW | 34,012,000 | 11,397 |
| | | | | | | 2,125,135 |
| Spain (4.5%) | | | |
| | Adif Alta Velocidad | 3.500% | 5/27/24 | EUR | 6,000 | 6,016 |
| | Adif Alta Velocidad | 1.875% | 1/28/25 | EUR | 7,600 | 7,383 |
| | Adif Alta Velocidad | 0.950% | 4/30/27 | EUR | 7,500 | 6,814 |
| | Adif Alta Velocidad | 0.550% | 10/31/31 | EUR | 4,000 | 3,069 |
| | Autonomous Community of Andalusia Spain | 0.500% | 4/30/31 | EUR | 22,546 | 17,676 |
| | Autonomous Community of Madrid Spain | 4.125% | 5/21/24 | EUR | 11,017 | 11,148 |
| | Autonomous Community of Madrid Spain | 0.997% | 9/30/24 | EUR | 881 | 846 |
| | Autonomous Community of Madrid Spain | 1.826% | 4/30/25 | EUR | 7,173 | 6,969 |
| | Autonomous Community of Madrid Spain | 4.300% | 9/15/26 | EUR | 10,901 | 11,417 |
| | Autonomous Community of Madrid Spain | 2.146% | 4/30/27 | EUR | 8,710 | 8,359 |
| | Autonomous Community of Madrid Spain | 1.773% | 4/30/28 | EUR | 6,981 | 6,491 |
| | Autonomous Community of Madrid Spain | 1.571% | 4/30/29 | EUR | 10,248 | 9,268 |
| | Autonomous Community of Madrid Spain | 2.080% | 3/12/30 | EUR | 2,561 | 2,362 |
| | Autonomous Community of Madrid Spain | 0.419% | 4/30/30 | EUR | 2,021 | 1,640 |
| | Autonomous Community of Madrid Spain | 0.420% | 4/30/31 | EUR | 14,052 | 10,959 |
| | Basque Government | 0.850% | 4/30/30 | EUR | 8,751 | 7,390 |
| | Basque Government | 0.450% | 4/30/32 | EUR | 2,813 | 2,151 |
| | Fondo De Titulizacion Del Deficit Del Sistema Electrico FTA | 0.850% | 12/17/23 | EUR | 2,500 | 2,429 |
| | Instituto de Credito Oficial | 0.000% | 4/30/26 | EUR | 13,227 | 11,987 |
| | Kingdom of Spain | 0.000% | 5/31/24 | EUR | 493,626 | 471,448 |
| | Kingdom of Spain | 0.000% | 1/31/25 | EUR | 70,034 | 65,832 |
| 3 | Kingdom of Spain | 1.600% | 4/30/25 | EUR | 25,000 | 24,314 |
| | Kingdom of Spain | 0.000% | 5/31/25 | EUR | 138,081 | 128,415 |
| | Kingdom of Spain | 0.000% | 1/31/26 | EUR | 409,278 | 374,182 |
| 3 | Kingdom of Spain | 1.950% | 4/30/26 | EUR | 53,054 | 51,642 |
| | Kingdom of Spain | 0.000% | 1/31/27 | EUR | 225,792 | 200,103 |
| 3 | Kingdom of Spain | 1.500% | 4/30/27 | EUR | 51,222 | 48,353 |
| 3 | Kingdom of Spain | 0.800% | 7/30/27 | EUR | 77,534 | 70,411 |
| | Kingdom of Spain | 0.000% | 1/31/28 | EUR | 266,032 | 228,189 |
| 3 | Kingdom of Spain | 1.400% | 4/30/28 | EUR | 62,566 | 57,643 |
| 3 | Kingdom of Spain | 1.400% | 7/30/28 | EUR | 61,318 | 56,284 |
| 3 | Kingdom of Spain | 5.150% | 10/31/28 | EUR | 157,682 | 175,773 |
| 3 | Kingdom of Spain | 1.450% | 4/30/29 | EUR | 73,522 | 66,859 |
| | Kingdom of Spain | 0.800% | 7/30/29 | EUR | 182,089 | 156,973 |
| 3 | Kingdom of Spain | 0.600% | 10/31/29 | EUR | 40,000 | 33,948 |
| 3 | Kingdom of Spain | 1.250% | 10/31/30 | EUR | 38,382 | 33,312 |
| 3 | Kingdom of Spain | 0.500% | 10/31/31 | EUR | 68,193 | 53,832 |
| 3 | Kingdom of Spain | 0.700% | 4/30/32 | EUR | 157,112 | 124,198 |
| 3 | Kingdom of Spain | 2.550% | 10/31/32 | EUR | 324,387 | 301,394 |
| 3 | Kingdom of Spain | 2.350% | 7/30/33 | EUR | 7,219 | 6,567 |
| 3 | Kingdom of Spain | 1.850% | 7/30/35 | EUR | 81,756 | 68,137 |
| 3 | Kingdom of Spain | 4.200% | 1/31/37 | EUR | 60,007 | 64,456 |
| 3 | Kingdom of Spain | 0.850% | 7/30/37 | EUR | 116,760 | 79,721 |
| 3 | Kingdom of Spain | 1.200% | 10/31/40 | EUR | 85,283 | 57,606 |
| 3 | Kingdom of Spain | 4.700% | 7/30/41 | EUR | 85,345 | 97,738 |
| 3 | Kingdom of Spain | 1.000% | 7/30/42 | EUR | 28,941 | 18,392 |
| 3 | Kingdom of Spain | 3.450% | 7/30/43 | EUR | 25,415 | 24,216 |
Total International Bond Index Fund
| | | Coupon | Maturity
Date | Currency | Face
Amount
(000) | Market
Value•
($000) |
| 3 | Kingdom of Spain | 5.150% | 10/31/44 | EUR | 56,520 | 68,962 |
| 3 | Kingdom of Spain | 2.900% | 10/31/46 | EUR | 53,405 | 47,009 |
| 3 | Kingdom of Spain | 2.700% | 10/31/48 | EUR | 20,351 | 17,022 |
| 3 | Kingdom of Spain | 1.000% | 10/31/50 | EUR | 33,127 | 17,747 |
| 3 | Kingdom of Spain | 1.900% | 10/31/52 | EUR | 150,444 | 99,902 |
| 3 | Kingdom of Spain | 3.450% | 7/30/66 | EUR | 53,292 | 49,284 |
| 3 | Kingdom of Spain | 1.450% | 10/31/71 | EUR | 36,946 | 18,056 |
| | | | | | | 3,592,294 |
| Supranational (4.0%) | | | |
| | African Development Bank | 0.250% | 1/24/24 | EUR | 4,150 | 3,983 |
| | African Development Bank | 4.750% | 3/6/24 | AUD | 3,367 | 2,171 |
| | African Development Bank | 0.250% | 11/21/24 | EUR | 11,580 | 10,877 |
| | African Development Bank | 0.875% | 12/16/24 | GBP | 3,758 | 4,032 |
| | African Development Bank | 4.000% | 1/10/25 | AUD | 7,312 | 4,656 |
| | African Development Bank | 4.500% | 6/2/26 | AUD | 3,178 | 2,040 |
| | African Development Bank | 0.500% | 6/22/26 | GBP | 16,308 | ��� 16,429 |
| | African Development Bank | 0.125% | 10/7/26 | EUR | 2,049 | 1,823 |
| | African Development Bank | 0.500% | 3/22/27 | EUR | 22,691 | 20,295 |
| | African Development Bank | 3.300% | 7/27/27 | AUD | 509 | 306 |
| | African Development Bank | 3.350% | 8/8/28 | AUD | 373 | 220 |
| | African Development Bank | 0.500% | 3/21/29 | EUR | 10,854 | 9,219 |
| | African Development Bank | 2.250% | 9/14/29 | EUR | 18,696 | 17,678 |
| | Asian Development Bank | 2.450% | 1/17/24 | AUD | 915 | 574 |
| | Asian Development Bank | 3.500% | 5/30/24 | NZD | 10,206 | 5,779 |
| | Asian Development Bank | 2.500% | 12/19/24 | GBP | 8,000 | 8,888 |
| | Asian Development Bank | 1.625% | 1/28/25 | CAD | 7,114 | 4,939 |
| | Asian Development Bank | 3.750% | 3/12/25 | AUD | 5,725 | 3,628 |
| | Asian Development Bank | 3.700% | 6/17/25 | AUD | 40,000 | 25,302 |
| | Asian Development Bank | 0.750% | 2/10/26 | CAD | 6,586 | 4,358 |
| | Asian Development Bank | 1.342% | 6/18/26 | NOK | 18,000 | 1,584 |
| | Asian Development Bank | 0.625% | 9/15/26 | GBP | 3,792 | 3,807 |
| | Asian Development Bank | 3.000% | 10/14/26 | AUD | 925 | 561 |
| | Asian Development Bank | 0.125% | 12/15/26 | GBP | 8,198 | 7,950 |
| | Asian Development Bank | 4.650% | 2/16/27 | CAD | 1,424 | 1,074 |
| | Asian Development Bank | 3.400% | 9/10/27 | AUD | 6,655 | 4,048 |
| | Asian Development Bank | 0.250% | 10/28/27 | GBP | 6,918 | 6,472 |
| | Asian Development Bank | 0.750% | 12/7/27 | GBP | 6,365 | 6,098 |
| | Asian Development Bank | 3.300% | 8/8/28 | AUD | 1,320 | 786 |
| | Asian Development Bank | 0.000% | 10/24/29 | EUR | 7,788 | 6,297 |
| | Asian Development Bank | 0.025% | 1/31/30 | EUR | 7,834 | 6,291 |
| | Asian Development Bank | 0.100% | 6/17/31 | EUR | 13,447 | 10,408 |
| | Asian Development Bank | 1.950% | 7/22/32 | EUR | 18,930 | 16,968 |
| | Asian Development Bank | 2.000% | 6/10/37 | EUR | 4,669 | 3,994 |
| | Asian Infrastructure Investment Bank | 1.000% | 5/6/26 | AUD | 3,742 | 2,121 |
| | Corp. Andina de Fomento | 0.750% | 6/13/23 | EUR | 2,543 | 2,482 |
| | Corp. Andina de Fomento | 1.125% | 2/13/25 | EUR | 7,631 | 7,155 |
| | Corp. Andina de Fomento | 1.625% | 6/3/25 | EUR | 3,965 | 3,731 |
| | Corp. Andina de Fomento | 0.250% | 2/4/26 | EUR | 100 | 88 |
| | Corp. Andina de Fomento | 0.500% | 2/26/26 | CHF | 4,435 | 4,187 |
| | Corp. Andina de Fomento | 4.500% | 9/14/27 | AUD | 816 | 485 |
| | Council of Europe Development Bank | 1.000% | 10/21/24 | CAD | 930 | 640 |
| | Council of Europe Development Bank | 0.750% | 6/9/25 | EUR | 3,593 | 3,376 |
| | Council of Europe Development Bank | 0.375% | 6/8/26 | EUR | 44,653 | 40,556 |
| | Council of Europe Development Bank | 0.000% | 4/9/27 | EUR | 4,760 | 4,160 |
| | Council of Europe Development Bank | 0.250% | 1/19/32 | EUR | 9,338 | 7,217 |
| | EUROFIMA | 3.000% | 5/22/24 | CHF | 2,545 | 2,614 |
| | EUROFIMA | 3.900% | 12/19/25 | AUD | 505 | 318 |
| | EUROFIMA | 3.000% | 5/15/26 | CHF | 3,315 | 3,487 |
| | EUROFIMA | 2.600% | 1/13/27 | AUD | 12,660 | 7,446 |
| | EUROFIMA | 4.550% | 3/30/27 | CAD | 1,372 | 1,026 |
| | EUROFIMA | 3.350% | 5/21/29 | AUD | 2,190 | 1,268 |
| | European Bank for Reconstruction & Development | 0.000% | 10/17/24 | EUR | 5,124 | 4,793 |
| | European Bank for Reconstruction & Development | 5.625% | 12/7/28 | GBP | 512 | 629 |
| 5 | European Financial Stability Facility | 0.200% | 1/17/24 | EUR | 974 | 938 |
| 5 | European Financial Stability Facility | 2.125% | 2/19/24 | EUR | 9,992 | 9,845 |
| 5 | European Financial Stability Facility | 0.000% | 4/19/24 | EUR | 73,892 | 70,575 |
| 5 | European Financial Stability Facility | 1.750% | 6/27/24 | EUR | 8,710 | 8,511 |
| 5 | European Financial Stability Facility | 0.400% | 2/17/25 | EUR | 7,788 | 7,343 |
| 5 | European Financial Stability Facility | 0.200% | 4/28/25 | EUR | 8,198 | 7,661 |
Total International Bond Index Fund
| | | Coupon | Maturity
Date | Currency | Face
Amount
(000) | Market
Value•
($000) |
| 5 | European Financial Stability Facility | 0.500% | 7/11/25 | EUR | 15,372 | 14,417 |
| 5 | European Financial Stability Facility | 0.000% | 10/15/25 | EUR | 6,012 | 5,523 |
| 5 | European Financial Stability Facility | 0.400% | ��5/31/26 | EUR | 40,993 | 37,524 |
| 5 | European Financial Stability Facility | 0.000% | 7/20/26 | EUR | 24,801 | 22,279 |
| 5 | European Financial Stability Facility | 0.750% | 5/3/27 | EUR | 28,413 | 25,823 |
| 5 | European Financial Stability Facility | 0.875% | 7/26/27 | EUR | 12,810 | 11,656 |
| 5 | European Financial Stability Facility | 0.000% | 10/13/27 | EUR | 49,007 | 42,449 |
| 5 | European Financial Stability Facility | 0.950% | 2/14/28 | EUR | 21,454 | 19,356 |
| 5 | European Financial Stability Facility | 0.875% | 9/5/28 | EUR | 7,003 | 6,207 |
| 5 | European Financial Stability Facility | 0.050% | 10/17/29 | EUR | 2,997 | 2,447 |
| 5 | European Financial Stability Facility | 2.750% | 12/3/29 | EUR | 2,817 | 2,768 |
| 5 | European Financial Stability Facility | 0.125% | 3/18/30 | EUR | 9,689 | 7,860 |
| 5 | European Financial Stability Facility | 0.000% | 1/20/31 | EUR | 46,917 | 36,711 |
| 5 | European Financial Stability Facility | 3.875% | 3/30/32 | EUR | 10,248 | 10,869 |
| 5 | European Financial Stability Facility | 1.250% | 5/24/33 | EUR | 23,345 | 19,349 |
| 5 | European Financial Stability Facility | 3.000% | 9/4/34 | EUR | 2,664 | 2,604 |
| 5 | European Financial Stability Facility | 0.875% | 4/10/35 | EUR | 31,787 | 24,083 |
| 5 | European Financial Stability Facility | 3.375% | 4/3/37 | EUR | 20,378 | 20,539 |
| 5 | European Financial Stability Facility | 1.450% | 9/5/40 | EUR | 10,447 | 7,915 |
| 5 | European Financial Stability Facility | 1.700% | 2/13/43 | EUR | 18,810 | 14,653 |
| 5 | European Financial Stability Facility | 2.350% | 7/29/44 | EUR | 6,968 | 6,097 |
| 5 | European Financial Stability Facility | 1.200% | 2/17/45 | EUR | 18,703 | 12,967 |
| 5 | European Financial Stability Facility | 1.375% | 5/31/47 | EUR | 21,083 | 14,979 |
| 5 | European Financial Stability Facility | 1.800% | 7/10/48 | EUR | 19,554 | 15,054 |
| 5 | European Financial Stability Facility | 0.700% | 1/20/50 | EUR | 15,370 | 8,659 |
| 5 | European Financial Stability Facility | 0.050% | 1/18/52 | EUR | 7,425 | 3,134 |
| 5 | European Financial Stability Facility | 0.700% | 1/17/53 | EUR | 3,735 | 2,008 |
| 5 | European Financial Stability Facility | 1.750% | 7/17/53 | EUR | 1,793 | 1,326 |
| 5 | European Financial Stability Facility | 2.000% | 2/28/56 | EUR | 10,211 | 8,074 |
| | European Investment Bank | 0.500% | 11/15/23 | EUR | 10,248 | 9,950 |
| | European Investment Bank | 0.050% | 12/15/23 | EUR | 28,182 | 27,169 |
| | European Investment Bank | 0.875% | 12/15/23 | GBP | 5,662 | 6,293 |
| | European Investment Bank | 2.125% | 1/15/24 | EUR | 8,710 | 8,583 |
| | European Investment Bank | 0.000% | 3/15/24 | EUR | 69,688 | 66,706 |
| | European Investment Bank | 0.050% | 5/24/24 | EUR | 15,851 | 15,097 |
| | European Investment Bank | 0.200% | 7/15/24 | EUR | 20,497 | 19,503 |
| | European Investment Bank | 1.750% | 7/30/24 | CAD | 7,105 | 5,000 |
| | European Investment Bank | 4.750% | 8/7/24 | AUD | 1,657 | 1,073 |
| | European Investment Bank | 0.875% | 9/13/24 | EUR | 16,908 | 16,224 |
| | European Investment Bank | 0.750% | 11/15/24 | GBP | 12,651 | 13,614 |
| | European Investment Bank | 1.625% | 2/4/25 | CHF | 1,265 | 1,277 |
| | European Investment Bank | 0.000% | 3/25/25 | EUR | 1,536 | 1,429 |
| | European Investment Bank | 0.125% | 4/15/25 | EUR | 15,372 | 14,349 |
| | European Investment Bank | 5.500% | 4/15/25 | GBP | 1,366 | 1,616 |
| | European Investment Bank | 0.375% | 7/16/25 | EUR | 11,837 | 11,053 |
| | European Investment Bank | 2.750% | 9/15/25 | EUR | 20,497 | 20,363 |
| | European Investment Bank | 4.500% | 10/15/25 | EUR | 7,686 | 8,005 |
| | European Investment Bank | 2.900% | 10/17/25 | AUD | 19,624 | 12,108 |
| | European Investment Bank | 0.000% | 3/13/26 | EUR | 5,124 | 4,648 |
| | European Investment Bank | 0.375% | 4/14/26 | EUR | 26,021 | 23,857 |
| | European Investment Bank | 3.100% | 8/17/26 | AUD | 17,970 | 11,008 |
| | European Investment Bank | 2.750% | 8/25/26 | PLN | 5,102 | 857 |
| | European Investment Bank | 1.000% | 9/21/26 | GBP | 1,640 | 1,674 |
| | European Investment Bank | 0.100% | 10/15/26 | EUR | 12,611 | 11,297 |
| | European Investment Bank | 1.250% | 11/13/26 | EUR | 3,074 | 2,879 |
| | European Investment Bank | 0.000% | 12/22/26 | EUR | 28,656 | 25,436 |
| | European Investment Bank | 0.500% | 1/15/27 | EUR | 27,516 | 24,905 |
| | European Investment Bank | 3.500% | 4/15/27 | EUR | 2,561 | 2,617 |
| | European Investment Bank | 0.375% | 9/15/27 | EUR | 28,014 | 24,866 |
| | European Investment Bank | 3.750% | 12/7/27 | GBP | 1,947 | 2,174 |
| | European Investment Bank | 0.875% | 1/14/28 | EUR | 23,828 | 21,509 |
| | European Investment Bank | 1.000% | 1/28/28 | CAD | 5,538 | 3,525 |
| | European Investment Bank | 3.300% | 2/3/28 | AUD | 1,147 | 691 |
| | European Investment Bank | 0.000% | 3/28/28 | EUR | 19,098 | 16,313 |
| | European Investment Bank | 1.375% | 5/12/28 | SEK | 38,260 | 3,143 |
| | European Investment Bank | 0.000% | 5/15/28 | EUR | 5,124 | 4,351 |
| | European Investment Bank | 0.000% | 9/28/28 | EUR | 11,672 | 9,830 |
| | European Investment Bank | 0.000% | 12/7/28 | GBP | 1,332 | 1,183 |
| | European Investment Bank | 6.000% | 12/7/28 | GBP | 8,198 | 10,259 |
Total International Bond Index Fund
| | | Coupon | Maturity
Date | Currency | Face
Amount
(000) | Market
Value•
($000) |
| | European Investment Bank | 0.625% | 1/22/29 | EUR | 15,372 | 13,340 |
| | European Investment Bank | 3.300% | 5/25/29 | AUD | 3,524 | 2,069 |
| | European Investment Bank | 0.125% | 6/20/29 | EUR | 5,894 | 4,896 |
| | European Investment Bank | 0.250% | 9/14/29 | EUR | 9,544 | 7,947 |
| | European Investment Bank | 0.050% | 1/16/30 | EUR | 61,660 | 50,145 |
| | European Investment Bank | 2.250% | 3/15/30 | EUR | 30,000 | 28,544 |
| | European Investment Bank | 4.000% | 4/15/30 | EUR | 3,650 | 3,888 |
| | European Investment Bank | 0.000% | 9/9/30 | EUR | 12,731 | 10,104 |
| | European Investment Bank | 2.750% | 9/13/30 | EUR | 15,373 | 15,085 |
| | European Investment Bank | 0.000% | 1/14/31 | EUR | 23,948 | 18,764 |
| | European Investment Bank | 1.300% | 1/27/31 | AUD | 6,510 | 3,134 |
| | European Investment Bank | 1.000% | 3/14/31 | EUR | 22,265 | 18,950 |
| | European Investment Bank | 1.000% | 4/14/32 | EUR | 16,396 | 13,662 |
| | European Investment Bank | 1.125% | 11/15/32 | EUR | 10,248 | 8,515 |
| | European Investment Bank | 1.125% | 4/13/33 | EUR | 15,372 | 12,622 |
| | European Investment Bank | 3.000% | 10/14/33 | EUR | 26,902 | 26,507 |
| | European Investment Bank | 0.050% | 10/13/34 | EUR | 3,504 | 2,418 |
| | European Investment Bank | 2.625% | 3/15/35 | EUR | 3,638 | 3,411 |
| | European Investment Bank | 0.010% | 11/15/35 | EUR | 16,341 | 10,797 |
| | European Investment Bank | 0.200% | 3/17/36 | EUR | 14,007 | 9,445 |
| | European Investment Bank | 3.125% | 6/30/36 | CHF | 505 | 574 |
| | European Investment Bank | 1.125% | 9/15/36 | EUR | 24,593 | 18,788 |
| | European Investment Bank | 3.875% | 6/8/37 | GBP | 2,767 | 3,024 |
| | European Investment Bank | 0.500% | 11/13/37 | EUR | 1,260 | 856 |
| | European Investment Bank | 5.000% | 4/15/39 | GBP | 3,584 | 4,461 |
| | European Investment Bank | 2.750% | 3/15/40 | EUR | 9,505 | 8,886 |
| | European Investment Bank | 0.250% | 6/15/40 | EUR | 11,552 | 6,990 |
| | European Investment Bank | 0.010% | 5/15/41 | EUR | 27,515 | 15,435 |
| | European Investment Bank | 3.625% | 3/14/42 | EUR | 2,869 | 3,047 |
| | European Investment Bank | 1.000% | 11/14/42 | EUR | 5,124 | 3,517 |
| | European Investment Bank | 4.500% | 3/7/44 | GBP | 4,355 | 5,150 |
| | European Investment Bank | 1.750% | 9/15/45 | EUR | 7,153 | 5,606 |
| | European Investment Bank | 0.875% | 9/13/47 | EUR | 5,124 | 3,235 |
| | European Investment Bank | 1.500% | 11/15/47 | EUR | 2,561 | 1,889 |
| | European Investment Bank | 1.500% | 10/16/48 | EUR | 1,575 | 1,152 |
| | European Investment Bank | 0.050% | 1/27/51 | EUR | 10,303 | 4,505 |
| | European Investment Bank | 4.625% | 10/12/54 | GBP | 3,945 | 4,964 |
| | European Stability Mechanism | 2.125% | 11/20/23 | EUR | 1,649 | 1,626 |
| | European Stability Mechanism | 0.125% | 4/22/24 | EUR | 32,794 | 31,357 |
| | European Stability Mechanism | 0.000% | 12/16/24 | EUR | 23,178 | 21,739 |
| | European Stability Mechanism | 0.000% | 3/14/25 | EUR | 34,984 | 32,593 |
| | European Stability Mechanism | 1.000% | 9/23/25 | EUR | 20,497 | 19,437 |
| | European Stability Mechanism | 0.500% | 3/2/26 | EUR | 23,929 | 22,074 |
| | European Stability Mechanism | 0.750% | 3/15/27 | EUR | 19,640 | 17,869 |
| | European Stability Mechanism | 0.750% | 9/5/28 | EUR | 9,456 | 8,324 |
| | European Stability Mechanism | 0.500% | 3/5/29 | EUR | 21,522 | 18,411 |
| | European Stability Mechanism | 0.010% | 3/4/30 | EUR | 26,804 | 21,519 |
| | European Stability Mechanism | 0.010% | 10/15/31 | EUR | 10,202 | 7,775 |
| | European Stability Mechanism | 1.125% | 5/3/32 | EUR | 2,680 | 2,244 |
| | European Stability Mechanism | 1.200% | 5/23/33 | EUR | 6,148 | 5,061 |
| | European Stability Mechanism | 1.625% | 11/17/36 | EUR | 20,471 | 16,648 |
| | European Stability Mechanism | 1.750% | 10/20/45 | EUR | 5,124 | 4,004 |
| | European Stability Mechanism | 1.800% | 11/2/46 | EUR | 8,320 | 6,533 |
| | European Stability Mechanism | 1.850% | 12/1/55 | EUR | 17,355 | 13,240 |
| | European Union | 0.625% | 11/4/23 | EUR | 13,835 | 13,467 |
| | European Union | 0.500% | 4/4/25 | EUR | 30,744 | 29,032 |
| | European Union | 0.800% | 7/4/25 | EUR | 23,424 | 22,171 |
| | European Union | 0.000% | 11/4/25 | EUR | 9,336 | 8,571 |
| | European Union | 0.000% | 3/4/26 | EUR | 52,608 | 47,808 |
| | European Union | 0.000% | 7/6/26 | EUR | 48,703 | 43,731 |
| | European Union | 3.000% | 9/4/26 | EUR | 3,650 | 3,658 |
| | European Union | 2.000% | 10/4/27 | EUR | 105,656 | 101,109 |
| | European Union | 2.500% | 11/4/27 | EUR | 9,736 | 9,535 |
| | European Union | 2.875% | 4/4/28 | EUR | 2,561 | 2,552 |
| | European Union | 0.000% | 6/2/28 | EUR | 49,300 | 41,910 |
| | European Union | 0.000% | 10/4/28 | EUR | 25,684 | 21,583 |
| | European Union | 0.000% | 7/4/29 | EUR | 30,922 | 25,428 |
| | European Union | 1.375% | 10/4/29 | EUR | 8,198 | 7,386 |
| | European Union | 1.625% | 12/4/29 | EUR | 73,705 | 67,143 |
Total International Bond Index Fund
| | | Coupon | Maturity
Date | Currency | Face
Amount
(000) | Market
Value•
($000) |
| | European Union | 0.000% | 10/4/30 | EUR | 2,148 | 1,696 |
| | European Union | 0.750% | 4/4/31 | EUR | 16,781 | 13,928 |
| | European Union | 0.000% | 4/22/31 | EUR | 20,237 | 15,669 |
| | European Union | 0.000% | 7/4/31 | EUR | 73,695 | 56,667 |
| | European Union | 1.000% | 7/6/32 | EUR | 38,440 | 31,689 |
| | European Union | 1.250% | 4/4/33 | EUR | 12,810 | 10,658 |
| | European Union | 0.000% | 7/4/35 | EUR | 39,174 | 26,139 |
| | European Union | 1.125% | 4/4/36 | EUR | 10,248 | 7,947 |
| | European Union | 0.250% | 4/22/36 | EUR | 21,290 | 14,421 |
| | European Union | 0.200% | 6/4/36 | EUR | 44,216 | 29,491 |
| | European Union | 0.400% | 2/4/37 | EUR | 48,342 | 32,612 |
| | European Union | 0.875% | 3/11/37 | EUR | 1,868 | 1,350 |
| | European Union | 1.125% | 6/4/37 | EUR | 4,482 | 3,373 |
| | European Union | 3.375% | 4/4/38 | EUR | 4,147 | 4,183 |
| | European Union | 0.100% | 10/4/40 | EUR | 22,559 | 12,705 |
| | European Union | 0.450% | 7/4/41 | EUR | 49,591 | 29,418 |
| | European Union | 3.750% | 4/4/42 | EUR | 5,124 | 5,438 |
| | European Union | 3.375% | 11/4/42 | EUR | 48,254 | 47,920 |
| | European Union | 1.250% | 2/4/43 | EUR | 2,147 | 1,477 |
| | European Union | 0.450% | 5/2/46 | EUR | 5,389 | 2,935 |
| | European Union | 0.750% | 1/4/47 | EUR | 21,887 | 12,849 |
| | European Union | 2.625% | 2/4/48 | EUR | 28,014 | 24,959 |
| | European Union | 0.300% | 11/4/50 | EUR | 14,661 | 6,770 |
| | European Union | 0.700% | 7/6/51 | EUR | 29,323 | 15,557 |
| | European Union | 2.500% | 10/4/52 | EUR | 55,317 | 47,517 |
| | Inter-American Development Bank | 1.950% | 4/23/24 | AUD | 1,633 | 1,013 |
| | Inter-American Development Bank | 4.750% | 8/27/24 | AUD | 10,931 | 7,065 |
| | Inter-American Development Bank | 1.700% | 10/10/24 | CAD | 6,283 | 4,400 |
| | Inter-American Development Bank | 1.375% | 12/15/24 | GBP | 14,089 | 15,292 |
| | Inter-American Development Bank | 0.750% | 10/15/25 | CAD | 2,411 | 1,608 |
| | Inter-American Development Bank | 2.750% | 10/30/25 | AUD | 5,562 | 3,414 |
| | Inter-American Development Bank | 1.250% | 12/15/25 | GBP | 12,544 | 13,243 |
| | Inter-American Development Bank | 4.400% | 1/26/26 | CAD | 37 | 27 |
| | Inter-American Development Bank | 4.250% | 6/11/26 | AUD | 663 | 422 |
| | Inter-American Development Bank | 1.000% | 6/29/26 | CAD | 4,800 | 3,169 |
| | Inter-American Development Bank | 0.500% | 9/15/26 | GBP | 5,124 | 5,124 |
| | Inter-American Development Bank | 0.875% | 8/27/27 | CAD | 3,219 | 2,057 |
| | Inter-American Development Bank | 2.125% | 12/15/28 | GBP | 4,669 | 4,731 |
| | Inter-American Development Bank | 3.290% | 6/28/32 | AUD | 5,238 | 2,932 |
| | International Bank for Reconstruction & Development | 2.200% | 2/27/24 | AUD | 11,430 | 7,147 |
| | International Bank for Reconstruction & Development | 1.800% | 7/26/24 | CAD | 5,877 | 4,146 |
| | International Bank for Reconstruction & Development | 1.900% | 1/16/25 | CAD | 3,916 | 2,740 |
| | International Bank for Reconstruction & Development | 4.250% | 6/24/25 | AUD | 6,430 | 4,125 |
| | International Bank for Reconstruction & Development | 0.750% | 7/2/25 | CAD | 3,010 | 2,026 |
| | International Bank for Reconstruction & Development | 2.900% | 11/26/25 | AUD | 5,307 | 3,269 |
| | International Bank for Reconstruction & Development | 0.625% | 1/14/26 | CAD | 3,178 | 2,097 |
| | International Bank for Reconstruction & Development | 0.750% | 6/10/26 | NZD | 2,993 | 1,494 |
| | International Bank for Reconstruction & Development | 0.250% | 7/22/26 | GBP | 2,561 | 2,545 |
| | International Bank for Reconstruction & Development | 1.200% | 7/22/26 | CAD | 6,735 | 4,475 |
| | International Bank for Reconstruction & Development | 3.000% | 10/19/26 | AUD | 8,419 | 5,123 |
| | International Bank for Reconstruction & Development | 0.750% | 12/15/26 | GBP | 7,107 | 7,091 |
| | International Bank for Reconstruction & Development | 0.000% | 1/15/27 | EUR | 23,660 | 20,830 |
| | International Bank for Reconstruction & Development | 1.800% | 1/19/27 | CAD | 2,918 | 1,966 |
| | International Bank for Reconstruction & Development | 0.250% | 9/23/27 | GBP | 10,248 | 9,705 |
| | International Bank for Reconstruction & Development | 0.625% | 9/24/27 | NZD | 4,490 | 2,114 |
| | International Bank for Reconstruction & Development | 0.875% | 9/28/27 | CAD | 2,761 | 1,761 |
| | International Bank for Reconstruction & Development | 0.625% | 11/22/27 | EUR | 5,635 | 4,999 |
| | International Bank for Reconstruction & Development | 0.010% | 4/24/28 | EUR | 26,829 | 22,719 |
| | International Bank for Reconstruction & Development | 1.625% | 5/10/28 | NZD | 6,735 | 3,270 |
| | International Bank for Reconstruction & Development | 0.625% | 7/14/28 | GBP | 11,122 | 10,411 |
| | International Bank for Reconstruction & Development | 3.300% | 8/14/28 | AUD | 1,683 | 1,004 |
| | International Bank for Reconstruction & Development | 4.875% | 12/7/28 | GBP | 300 | 355 |
| | International Bank for Reconstruction & Development | 1.250% | 12/13/28 | GBP | 6,012 | 5,798 |
| | International Bank for Reconstruction & Development | 1.950% | 9/20/29 | CAD | 919 | 600 |
| | International Bank for Reconstruction & Development | 1.000% | 12/21/29 | GBP | 1,720 | 1,590 |
| | International Bank for Reconstruction & Development | 0.000% | 2/21/30 | EUR | 5,854 | 4,683 |
| | International Bank for Reconstruction & Development | 0.500% | 4/16/30 | EUR | 2,767 | 2,292 |
| | International Bank for Reconstruction & Development | 5.750% | 6/7/32 | GBP | 3,074 | 3,970 |
| | International Bank for Reconstruction & Development | 0.625% | 1/12/33 | EUR | 23,743 | 18,560 |
Total International Bond Index Fund
| | | Coupon | Maturity
Date | Currency | Face
Amount
(000) | Market
Value•
($000) |
| | International Bank for Reconstruction & Development | 1.200% | 8/8/34 | EUR | 4,943 | 3,974 |
| | International Bank for Reconstruction & Development | 0.500% | 6/21/35 | EUR | 1,844 | 1,326 |
| | International Bank for Reconstruction & Development | 0.100% | 9/17/35 | EUR | 2,801 | 1,885 |
| | International Bank for Reconstruction & Development | 0.700% | 10/22/46 | EUR | 5,260 | 3,192 |
| | International Bank for Reconstruction & Development | 0.125% | 1/3/51 | EUR | 4,315 | 1,974 |
| | International Bank for Reconstruction & Development | 0.200% | 1/21/61 | EUR | 2,767 | 1,096 |
| | International Development Assn. | 0.750% | 9/21/28 | GBP | 1,502 | 1,398 |
| | International Development Assn. | 0.000% | 7/15/31 | EUR | 9,338 | 7,116 |
| | International Development Assn. | 0.350% | 4/22/36 | EUR | 12,139 | 8,344 |
| | International Development Assn. | 1.750% | 5/5/37 | EUR | 12,000 | 9,959 |
| | International Development Assn. | 0.700% | 1/17/42 | EUR | 5,789 | 3,770 |
| | International Finance Corp. | 1.250% | 12/15/23 | GBP | 7,071 | 7,882 |
| | International Finance Corp. | 1.450% | 7/22/24 | AUD | 1,759 | 1,077 |
| | International Finance Corp. | 1.375% | 9/13/24 | CAD | 1,707 | 1,193 |
| | International Finance Corp. | 1.375% | 3/7/25 | GBP | 5,032 | 5,417 |
| | International Finance Corp. | 4.000% | 4/3/25 | AUD | 4,156 | 2,654 |
| | International Finance Corp. | 0.250% | 12/15/25 | GBP | 5,226 | 5,353 |
| | International Finance Corp. | 3.200% | 7/22/26 | AUD | 12,741 | 7,846 |
| | International Finance Corp. | 0.875% | 9/15/26 | GBP | 7,515 | 7,623 |
| | International Finance Corp. | 1.850% | 1/28/27 | CAD | 5,138 | 3,470 |
| | International Finance Corp. | 0.750% | 7/22/27 | GBP | 5,124 | 5,003 |
| | International Finance Corp. | 3.200% | 10/18/27 | AUD | 611 | 368 |
| | International Finance Corp. | 3.150% | 6/26/29 | AUD | 4,864 | 2,827 |
| | International Finance Corp. | 1.500% | 4/15/35 | AUD | 13,020 | 5,511 |
| | Nordic Investment Bank | 1.125% | 12/15/23 | GBP | 9,811 | 10,926 |
| | Nordic Investment Bank | 4.750% | 2/28/24 | AUD | 2,672 | 1,724 |
| | Nordic Investment Bank | 0.125% | 6/10/24 | EUR | 12,657 | 12,008 |
| | Nordic Investment Bank | 0.500% | 11/3/25 | EUR | 10,055 | 9,299 |
| | Nordic Investment Bank | 0.125% | 12/15/26 | GBP | 13,368 | 12,998 |
| | | | | | | 3,183,794 |
| Sweden (0.3%) | | | |
| 3 | Kingdom of Sweden | 1.500% | 11/13/23 | SEK | 471,650 | 42,386 |
| | Kingdom of Sweden | 2.500% | 5/12/25 | SEK | 65,980 | 5,988 |
| | Kingdom of Sweden | 0.750% | 5/12/28 | SEK | 3,570 | 297 |
| 3 | Kingdom of Sweden | 0.750% | 11/12/29 | SEK | 198,515 | 16,186 |
| 3 | Kingdom of Sweden | 0.125% | 5/12/31 | SEK | 582,080 | 44,186 |
| | Kingdom of Sweden | 2.250% | 6/1/32 | SEK | 89,300 | 8,137 |
| | Kingdom of Sweden | 3.500% | 3/30/39 | SEK | 118,110 | 12,672 |
| | Kingdom of Sweden | 1.375% | 6/23/71 | SEK | 168,410 | 9,834 |
| | Kommuninvest I Sverige AB | 1.000% | 11/13/23 | SEK | 290,880 | 25,881 |
| | Kommuninvest I Sverige AB | 1.000% | 10/2/24 | SEK | 102,050 | 8,868 |
| | Kommuninvest I Sverige AB | 1.000% | 5/12/25 | SEK | 201,090 | 17,210 |
| | Kommuninvest I Sverige AB | 0.750% | 2/4/26 | SEK | 367,740 | 30,724 |
| | Kommuninvest I Sverige AB | 1.000% | 11/12/26 | SEK | 306,190 | 25,229 |
| | Region Stockholm | 0.750% | 2/26/25 | EUR | 2,543 | 2,387 |
| | | | | | | 249,985 |
| Switzerland (0.4%) | | | |
| | Canton of Basel-Landschaft | 1.375% | 9/29/34 | CHF | 8,465 | 7,961 |
| | Canton of Geneva Switzerland | 1.625% | 7/30/29 | CHF | 1,805 | 1,794 |
| | Canton of Geneva Switzerland | 1.500% | 3/5/32 | CHF | 810 | 787 |
| | Canton of Geneva Switzerland | 0.400% | 4/28/36 | CHF | 2,545 | 2,052 |
| | Canton of Geneva Switzerland | 0.600% | 7/4/46 | CHF | 1,520 | 1,130 |
| | Canton of Vaud | 2.000% | 10/24/33 | CHF | 4,540 | 4,614 |
| | Canton of Zurich | 1.250% | 12/3/32 | CHF | 1,525 | 1,439 |
| | Canton of Zurich | 2.000% | 7/29/38 | CHF | 5,100 | 5,101 |
| | Canton of Zurich | 0.250% | 7/12/39 | CHF | 6,375 | 4,900 |
| | Swiss Confederation | 4.000% | 2/11/23 | CHF | 1,226 | 1,237 |
| | Swiss Confederation | 1.250% | 6/11/24 | CHF | 10,818 | 10,930 |
| | Swiss Confederation | 1.500% | 7/24/25 | CHF | 8,904 | 9,115 |
| | Swiss Confederation | 1.250% | 5/28/26 | CHF | 71,517 | 72,899 |
| | Swiss Confederation | 3.250% | 6/27/27 | CHF | 4,593 | 5,098 |
| | Swiss Confederation | 4.000% | 4/8/28 | CHF | 298 | 346 |
| | Swiss Confederation | 0.000% | 6/22/29 | CHF | 22,568 | 21,125 |
| | Swiss Confederation | 2.250% | 6/22/31 | CHF | 29,389 | 32,149 |
| | Swiss Confederation | 0.500% | 6/27/32 | CHF | 7,246 | 6,844 |
| | Swiss Confederation | 3.500% | 4/8/33 | CHF | 10,512 | 12,993 |
| | Swiss Confederation | 0.000% | 6/26/34 | CHF | 7,655 | 6,725 |
| | Swiss Confederation | 0.250% | 6/23/35 | CHF | 18,711 | 16,742 |
Total International Bond Index Fund
| | | Coupon | Maturity
Date | Currency | Face
Amount
(000) | Market
Value•
($000) |
| | Swiss Confederation | 2.500% | 3/8/36 | CHF | 3,137 | 3,650 |
| | Swiss Confederation | 1.250% | 6/27/37 | CHF | 15,437 | 15,491 |
| | Swiss Confederation | 0.000% | 7/24/39 | CHF | 9,185 | 7,528 |
| | Swiss Confederation | 1.500% | 4/30/42 | CHF | 20,974 | 22,307 |
| | Swiss Confederation | 0.500% | 6/28/45 | CHF | 12,757 | 11,232 |
| | Swiss Confederation | 4.000% | 1/6/49 | CHF | 4,337 | 7,214 |
| | Swiss Confederation | 0.500% | 5/24/55 | CHF | 3,188 | 2,841 |
| | Swiss Confederation | 0.500% | 5/30/58 | CHF | 11,313 | 9,770 |
| | Swiss Confederation | 2.000% | 6/25/64 | CHF | 2,449 | 3,456 |
| | | | | | | 309,470 |
| Thailand (0.7%) | | | |
| | Kingdom of Thailand | 2.400% | 12/17/23 | THB | 970,657 | 25,743 |
| | Kingdom of Thailand | 0.750% | 6/17/24 | THB | 1,039,382 | 26,876 |
| | Kingdom of Thailand | 0.750% | 9/17/24 | THB | 440,000 | 11,329 |
| | Kingdom of Thailand | 1.450% | 12/17/24 | THB | 1,149,482 | 29,909 |
| | Kingdom of Thailand | 0.950% | 6/17/25 | THB | 1,007,774 | 25,773 |
| | Kingdom of Thailand | 3.850% | 12/12/25 | THB | 637,918 | 17,634 |
| | Kingdom of Thailand | 2.125% | 12/17/26 | THB | 496,408 | 12,827 |
| | Kingdom of Thailand | 1.000% | 6/17/27 | THB | 1,757,022 | 42,893 |
| | Kingdom of Thailand | 3.580% | 12/17/27 | THB | 466,275 | 12,748 |
| | Kingdom of Thailand | 5.670% | 3/13/28 | THB | 61,239 | 1,841 |
| | Kingdom of Thailand | 2.650% | 6/17/28 | THB | 600,000 | 15,641 |
| | Kingdom of Thailand | 2.875% | 12/17/28 | THB | 839,187 | 22,070 |
| | Kingdom of Thailand | 4.875% | 6/22/29 | THB | 887,982 | 26,111 |
| | Kingdom of Thailand | 1.600% | 12/17/29 | THB | 744,661 | 17,905 |
| | Kingdom of Thailand | 3.650% | 6/20/31 | THB | 627,711 | 17,212 |
| | Kingdom of Thailand | 2.000% | 12/17/31 | THB | 1,462,818 | 35,155 |
| | Kingdom of Thailand | 3.775% | 6/25/32 | THB | 769,585 | 21,175 |
| | Kingdom of Thailand | 1.600% | 6/17/35 | THB | 153,099 | 3,255 |
| | Kingdom of Thailand | 1.585% | 12/17/35 | THB | 1,231,603 | 25,848 |
| | Kingdom of Thailand | 3.400% | 6/17/36 | THB | 1,511,203 | 38,804 |
| | Kingdom of Thailand | 4.260% | 12/12/37 | THB | 141,362 | 3,888 |
| | Kingdom of Thailand | 3.300% | 6/17/38 | THB | 936,247 | 23,136 |
| | Kingdom of Thailand | 3.800% | 6/14/41 | THB | 76,549 | 1,989 |
| | Kingdom of Thailand | 2.000% | 6/17/42 | THB | 970,118 | 18,887 |
| | Kingdom of Thailand | 3.450% | 6/17/43 | THB | 210,000 | 5,219 |
| | Kingdom of Thailand | 4.675% | 6/29/44 | THB | 429,761 | 12,267 |
| | Kingdom of Thailand | 2.875% | 6/17/46 | THB | 576,435 | 12,175 |
| | Kingdom of Thailand | 3.140% | 6/17/47 | THB | 290,000 | 6,566 |
| | Kingdom of Thailand | 1.875% | 6/17/49 | THB | 472,937 | 7,810 |
| | Kingdom of Thailand | 2.750% | 6/17/52 | THB | 37,200 | 724 |
| | Kingdom of Thailand | 4.850% | 6/17/61 | THB | 9,492 | 261 |
| | Kingdom of Thailand | 4.000% | 6/17/66 | THB | 248,447 | 5,686 |
| | Kingdom of Thailand | 3.600% | 6/17/67 | THB | 1,195,459 | 24,812 |
| | Kingdom of Thailand | 2.500% | 6/17/71 | THB | 93,000 | 1,428 |
| | | | | | | 555,597 |
| United Kingdom (4.0%) | | | |
| 1 | Community Finance Co. 1 plc | 5.017% | 7/31/34 | GBP | 2,253 | 2,571 |
| 6 | LCR Finance plc | 4.500% | 12/7/28 | GBP | 3,843 | 4,464 |
| 6 | LCR Finance plc | 4.500% | 12/7/38 | GBP | 820 | 949 |
| 6 | LCR Finance plc | 5.100% | 3/7/51 | GBP | 3,433 | 4,604 |
| | Transport for London | 2.125% | 4/24/25 | GBP | 2,543 | 2,703 |
| | Transport for London | 3.875% | 7/23/42 | GBP | 518 | 469 |
| | Transport for London | 3.625% | 5/15/45 | GBP | 2,488 | 2,097 |
| | Transport for London | 4.000% | 4/7/64 | GBP | 2,296 | 2,115 |
| | United Kingdom Gilt | 0.125% | 1/31/24 | GBP | 203,554 | 224,557 |
| | United Kingdom Gilt | 0.250% | 1/31/25 | GBP | 276,378 | 294,689 |
| | United Kingdom Gilt | 5.000% | 3/7/25 | GBP | 64,414 | 76,429 |
| | United Kingdom Gilt | 0.375% | 10/22/26 | GBP | 81,655 | 82,541 |
| | United Kingdom Gilt | 4.125% | 1/29/27 | GBP | 50,952 | 59,235 |
| | United Kingdom Gilt | 4.250% | 12/7/27 | GBP | 7,775 | 9,139 |
| | United Kingdom Gilt | 0.125% | 1/31/28 | GBP | 111,983 | 106,982 |
| | United Kingdom Gilt | 0.500% | 1/31/29 | GBP | 180,241 | 170,312 |
| | United Kingdom Gilt | 0.875% | 10/22/29 | GBP | 40,000 | 38,248 |
| | United Kingdom Gilt | 4.750% | 12/7/30 | GBP | 84,895 | 105,841 |
| | United Kingdom Gilt | 0.250% | 7/31/31 | GBP | 150,992 | 130,388 |
| | United Kingdom Gilt | 1.000% | 1/31/32 | GBP | 108,000 | 98,704 |
| | United Kingdom Gilt | 4.250% | 6/7/32 | GBP | 98,346 | 119,446 |
Total International Bond Index Fund
| | | Coupon | Maturity
Date | Currency | Face
Amount
(000) | Market
Value•
($000) |
| | United Kingdom Gilt | 0.875% | 7/31/33 | GBP | 45,000 | 38,914 |
| | United Kingdom Gilt | 4.500% | 9/7/34 | GBP | 59,109 | 73,212 |
| | United Kingdom Gilt | 0.625% | 7/31/35 | GBP | 68,948 | 54,265 |
| | United Kingdom Gilt | 4.250% | 3/7/36 | GBP | 54,829 | 65,915 |
| | United Kingdom Gilt | 1.750% | 9/7/37 | GBP | 135,431 | 118,534 |
| | United Kingdom Gilt | 1.125% | 1/31/39 | GBP | 98,949 | 75,957 |
| | United Kingdom Gilt | 4.250% | 9/7/39 | GBP | 34,739 | 41,576 |
| | United Kingdom Gilt | 4.250% | 12/7/40 | GBP | 35,750 | 42,937 |
| | United Kingdom Gilt | 1.250% | 10/22/41 | GBP | 84,525 | 63,234 |
| | United Kingdom Gilt | 4.500% | 12/7/42 | GBP | 48,730 | 61,045 |
| | United Kingdom Gilt | 3.250% | 1/22/44 | GBP | 140,157 | 147,369 |
| | United Kingdom Gilt | 3.500% | 1/22/45 | GBP | 55,260 | 60,407 |
| | United Kingdom Gilt | 0.875% | 1/31/46 | GBP | 72,149 | 46,089 |
| | United Kingdom Gilt | 4.250% | 12/7/46 | GBP | 79,111 | 97,179 |
| | United Kingdom Gilt | 1.500% | 7/22/47 | GBP | 60,600 | 44,744 |
| | United Kingdom Gilt | 1.750% | 1/22/49 | GBP | 41,486 | 32,343 |
| | United Kingdom Gilt | 4.250% | 12/7/49 | GBP | 47,188 | 59,102 |
| | United Kingdom Gilt | 0.625% | 10/22/50 | GBP | 33,909 | 18,655 |
| | United Kingdom Gilt | 1.250% | 7/31/51 | GBP | 97,749 | 65,005 |
| | United Kingdom Gilt | 3.750% | 7/22/52 | GBP | 23,659 | 27,757 |
| | United Kingdom Gilt | 1.500% | 7/31/53 | GBP | 79,707 | 56,165 |
| | United Kingdom Gilt | 1.625% | 10/22/54 | GBP | 52,544 | 38,294 |
| | United Kingdom Gilt | 4.250% | 12/7/55 | GBP | 37,262 | 48,699 |
| | United Kingdom Gilt | 1.750% | 7/22/57 | GBP | 52,515 | 39,867 |
| | United Kingdom Gilt | 4.000% | 1/22/60 | GBP | 55,084 | 70,654 |
| | United Kingdom Gilt | 0.500% | 10/22/61 | GBP | 67,029 | 30,267 |
| | United Kingdom Gilt | 2.500% | 7/22/65 | GBP | 56,244 | 52,199 |
| | United Kingdom Gilt | 3.500% | 7/22/68 | GBP | 41,734 | 49,332 |
| | United Kingdom Gilt | 1.625% | 10/22/71 | GBP | 72,836 | 51,481 |
| | United Kingdom Gilt | 1.125% | 10/22/73 | GBP | 29,639 | 16,547 |
| | | | | | | 3,224,227 |
| Total Sovereign Bonds (Cost $81,167,736) | | | 62,446,350 |
Total International Bond Index Fund
| | | Coupon | | | Shares | Market
Value•
($000) |
| Temporary Cash Investments (0.3%) | | | |
| Money Market Fund (0.3%) | | | |
| 11 | Vanguard Market Liquidity Fund (Cost $253,490) | 3.117% | | | 2,535,427 | 253,492 |
| Total Investments (98.2%) (Cost $101,603,286) | | | 78,276,492 |
| Other Assets and Liabilities—Net (1.8%) | | | 1,455,737 |
| Net Assets (100.0%) | | | 79,732,229 |
| Cost is in $000. | | | |
| • | See Note A in Notes to Financial Statements. |
| 1 | The average or expected maturity is shorter than the final maturity shown because of the possibility of interim principal payments and prepayments or the possibility of the issue being called. |
| 2 | Guaranteed by the Republic of Austria. |
| 3 | Security exempt from registration under Rule 144A of the Securities Act of 1933. Such securities may be sold in transactions exempt from registration, normally to qualified institutional buyers. At October 31, 2022, the aggregate value was $9,280,970,000, representing 11.6% of net assets. |
| 4 | Guaranteed by the Republic of France. |
| 5 | Guaranteed by multiple countries. |
| 6 | Guaranteed by the Government of the United Kingdom. |
| 7 | Securities with a value of $944,498,000 have been pledged as collateral for open forward currency contracts. |
| 8 | Securities with a value of $1,036,290,000 have been segregated as collateral for open forward currency contracts. |
| 9 | Securities with a value of $2,619,000 have been segregated as initial margin for open futures contracts. |
| 10 | Guaranteed by the Federal Republic of Germany. |
| 11 | Affiliated money market fund available only to Vanguard funds and certain trusts and accounts managed by Vanguard. Rate shown is the 7-day yield. |
| DAC—Designated Activity Company. |
| GMTN—Global Medium Term Note. |
| REIT—Real Estate Investment Trust. |
| AUD—Australian dollar. |
| CAD—Canadian dollar. |
| CHF—Swiss franc. |
| CLP—Chilean peso. |
| CNY—Chinese renminbi. |
| COP—Colombia peso. |
| CZK—Czech koruna. |
| DKK—Danish krone. |
| EUR—euro. |
| GBP—British pound. |
| HKD—Hong Kong dollar. |
| HUF—Hungarian forint. |
| IDR—Indonesian rupiah. |
| ILS—Israeli shekel. |
| JPY—Japanese yen. |
| KRW—Korean won. |
| MXN—Mexican peso. |
| MYR—Malaysian ringgit. |
| NOK—Norwegian krone. |
| NZD—New Zealand dollar. |
| PEN—Peruvian sol. |
| PLN—Polish zloty. |
| RON—Romania new leu. |
| SEK—Swedish krona. |
| SGD—Singapore dollar. |
| THB—Thai baht. |
| USD—U.S. dollar. |
Derivative Financial Instruments Outstanding as of Period End
| Futures Contracts |
| | | | ($000) |
| | Expiration | Number of
Long (Short)
Contracts | Notional
Amount | Value and
Unrealized
Appreciation
(Depreciation) |
| Long Futures Contracts | | | | |
| 10-Year Japanese Government Bond | December 2022 | 23 | 23,012 | 95 |
| Euro-Schatz | December 2022 | 3,322 | 351,064 | (2,713) |
| Long Gilt | December 2022 | 62 | 7,262 | (570) |
| | | | | (3,188) |
Total International Bond Index Fund
| Futures Contracts (continued) |
| | | | ($000) |
| | Expiration | Number of
Long (Short)
Contracts | Notional
Amount | Value and
Unrealized
Appreciation
(Depreciation) |
| |
| Short Futures Contracts | | | | |
| Euro-Buxl | December 2022 | (11) | (1,568) | 12 |
| | | | | (3,176) |
| Forward Currency Contracts |
| | Contract
Settlement
Date | Contract Amount (000) | Unrealized
Appreciation
($000) | Unrealized
Depreciation
($000) |
| Counterparty | | Receive | Deliver | | |
| Commonwealth Bank of Australia | 11/2/22 | AUD | 75,000 | USD | 48,234 | — | (258) |
| Commonwealth Bank of Australia | 11/2/22 | AUD | 20,000 | USD | 12,534 | 260 | — |
| State Street Bank & Trust Co. | 11/2/22 | AUD | 15,000 | USD | 9,711 | — | (115) |
| Royal Bank of Canada | 12/2/22 | CAD | 38,344 | USD | 28,106 | 45 | — |
| Toronto-Dominion Bank | 11/2/22 | CAD | 37,000 | USD | 26,925 | 234 | — |
| State Street Bank & Trust Co. | 12/2/22 | CAD | 12,781 | USD | 9,372 | 12 | — |
| Bank of America, N.A. | 11/2/22 | CHF | 22,000 | USD | 22,410 | — | (435) |
| Toronto-Dominion Bank | 11/3/22 | CLP | 41,795,500 | USD | 43,582 | 701 | — |
| UBS AG | 11/3/22 | CLP | 33,720,592 | USD | 36,013 | — | (284) |
| Credit Suisse International | 11/3/22 | CLP | 27,556,543 | USD | 29,430 | — | (233) |
| State Street Bank & Trust Co. | 11/3/22 | CLP | 20,897,750 | USD | 22,161 | — | (19) |
| State Street Bank & Trust Co. | 11/3/22 | CLP | 20,897,750 | USD | 21,928 | 213 | — |
| Toronto-Dominion Bank | 11/3/22 | CLP | 11,159,399 | USD | 11,918 | — | (94) |
| Bank of America, N.A. | 11/3/22 | CLP | 11,154,467 | USD | 11,913 | — | (94) |
| Standard Chartered Bank | 11/2/22 | CNY | 4,367,314 | USD | 600,787 | — | (2,339) |
| HSBC Bank plc | 11/2/22 | CNY | 2,200,070 | USD | 302,124 | — | (652) |
| HSBC Bank plc | 12/2/22 | CNY | 437,256 | USD | 60,559 | — | (533) |
| HSBC Bank plc | 11/2/22 | COP | 332,772,923 | USD | 67,913 | — | (547) |
| Toronto-Dominion Bank | 11/2/22 | COP | 287,497,363 | USD | 58,639 | — | (440) |
| UBS AG | 11/2/22 | COP | 169,219,363 | USD | 34,772 | — | (517) |
| State Street Bank & Trust Co. | 11/2/22 | COP | 123,182,165 | USD | 24,860 | 77 | — |
| State Street Bank & Trust Co. | 11/2/22 | COP | 119,492,654 | USD | 24,796 | — | (606) |
| Credit Agricole CIB | 11/2/22 | COP | 100,678,342 | USD | 20,552 | — | (171) |
| Citibank, N.A. | 11/2/22 | COP | 56,000,000 | USD | 11,431 | — | (95) |
| Bank of America, N.A. | 12/5/22 | COP | 26,453,201 | USD | 5,377 | — | (54) |
| Deutsche Bank AG | 11/2/22 | CZK | 8,205,014 | USD | 332,884 | — | (1,664) |
| Deutsche Bank AG | 12/2/22 | CZK | 300,000 | USD | 12,092 | — | (10) |
| Bank of America, N.A. | 11/2/22 | CZK | 149,000 | USD | 5,924 | 91 | — |
| JPMorgan Chase Bank, N.A. | 12/2/22 | CZK | 122,566 | USD | 4,936 | — | — |
| Barclays Bank plc | 11/2/22 | DKK | 1,497,188 | USD | 200,226 | — | (1,480) |
Total International Bond Index Fund
| Forward Currency Contracts (continued) |
| | Contract
Settlement
Date | Contract Amount (000) | Unrealized
Appreciation
($000) | Unrealized
Depreciation
($000) |
| Counterparty | | Receive | Deliver | | |
| UBS AG | 11/2/22 | DKK | 147,000 | USD | 19,410 | 103 | — |
| Bank of America, N.A. | 11/2/22 | EUR | 4,950,000 | USD | 4,942,395 | — | (49,892) |
| HSBC Bank plc | 11/2/22 | EUR | 4,050,000 | USD | 4,060,800 | — | (57,843) |
| Toronto-Dominion Bank | 11/2/22 | EUR | 2,250,000 | USD | 2,251,170 | — | (27,305) |
| Morgan Stanley Capital Services Inc. | 11/2/22 | EUR | 2,250,000 | USD | 2,248,335 | — | (24,470) |
| BNP Paribas | 11/2/22 | EUR | 1,800,000 | USD | 1,797,352 | — | (18,260) |
| State Street Bank & Trust Co. | 11/2/22 | EUR | 900,000 | USD | 903,868 | — | (14,321) |
| UBS AG | 11/2/22 | EUR | 900,000 | USD | 902,866 | — | (13,320) |
| Deutsche Bank AG | 11/2/22 | EUR | 900,000 | USD | 902,490 | — | (12,944) |
| Royal Bank of Canada | 11/2/22 | EUR | 900,000 | USD | 900,000 | — | (10,454) |
| Credit Agricole CIB | 11/2/22 | EUR | 900,000 | USD | 888,607 | 941 | — |
| State Street Bank & Trust Co. | 11/2/22 | EUR | 900,000 | USD | 887,716 | 1,832 | — |
| Credit Agricole CIB | 11/2/22 | EUR | 450,000 | USD | 449,325 | — | (4,552) |
| Citibank, N.A. | 11/2/22 | EUR | 450,000 | USD | 447,750 | — | (2,977) |
| Bank of America, N.A. | 12/2/22 | EUR | 286,000 | USD | 283,512 | — | (209) |
| UBS AG | 11/2/22 | EUR | 30,000 | USD | 29,133 | 518 | — |
| Bank of Montreal | 11/2/22 | EUR | 5,000 | USD | 4,877 | 65 | — |
| Royal Bank of Canada | 11/2/22 | GBP | 13,000 | USD | 14,574 | 335 | — |
| State Street Bank & Trust Co. | 11/2/22 | GBP | 4,000 | USD | 4,468 | 119 | — |
| Bank of America, N.A. | 11/2/22 | GBP | 620 | USD | 693 | 19 | — |
| Standard Chartered Bank | 12/2/22 | HKD | 32,000 | USD | 4,079 | — | — |
| Deutsche Bank AG | 11/3/22 | HUF | 28,270,449 | USD | 68,099 | 78 | — |
| Deutsche Bank AG | 11/3/22 | HUF | 21,988,127 | USD | 53,501 | — | (475) |
| JPMorgan Chase Bank, N.A. | 12/2/22 | HUF | 2,442,376 | USD | 5,839 | — | (2) |
| UBS AG | 12/2/22 | HUF | 800,000 | USD | 1,916 | — | (4) |
| Deutsche Bank AG | 11/2/22 | IDR | 12,443,718,152 | USD | 797,312 | 464 | — |
| Deutsche Bank AG | 11/2/22 | IDR | 1,795,574,852 | USD | 115,140 | — | (20) |
| BNP Paribas | 11/2/22 | ILS | 452,480 | USD | 127,635 | 431 | — |
| UBS AG | 11/2/22 | ILS | 32,000 | USD | 9,019 | 38 | — |
| JPMorgan Chase Bank, N.A. | 12/2/22 | ILS | 7,000 | USD | 1,989 | — | (4) |
| JPMorgan Chase Bank, N.A. | 11/2/22 | JPY | 589,818,229 | USD | 4,011,834 | — | (44,346) |
| Bank of America, N.A. | 11/2/22 | JPY | 70,673,365 | USD | 474,860 | 534 | — |
| UBS AG | 11/2/22 | JPY | 60,000,000 | USD | 415,675 | — | (12,077) |
| Bank of America, N.A. | 11/2/22 | JPY | 55,937,123 | USD | 381,986 | — | (5,718) |
| JPMorgan Chase Bank, N.A. | 12/2/22 | JPY | 30,000,000 | USD | 202,610 | — | (113) |
| State Street Bank & Trust Co. | 11/2/22 | JPY | 28,043,000 | USD | 194,294 | — | (5,659) |
| BNP Paribas | 12/2/22 | JPY | 8,081,641 | USD | 54,537 | 13 | — |
| HSBC Bank plc | 11/2/22 | KRW | 1,042,161,710 | USD | 733,712 | — | (2,104) |
| BNP Paribas | 11/2/22 | KRW | 1,026,686,685 | USD | 722,503 | — | (1,758) |
| Deutsche Bank AG | 11/2/22 | KRW | 1,002,333,040 | USD | 706,100 | — | (2,452) |
Total International Bond Index Fund
| Forward Currency Contracts (continued) |
| | Contract
Settlement
Date | Contract Amount (000) | Unrealized
Appreciation
($000) | Unrealized
Depreciation
($000) |
| Counterparty | | Receive | Deliver | | |
| Standard Chartered Bank | 11/2/22 | KRW | 497,847,135 | USD | 350,054 | — | (561) |
| JPMorgan Chase Bank, N.A. | 11/2/22 | KRW | 478,323,720 | USD | 336,326 | — | (539) |
| JPMorgan Chase Bank, N.A. | 11/2/22 | KRW | 407,632,120 | USD | 285,817 | 345 | — |
| State Street Bank & Trust Co. | 11/2/22 | KRW | 342,912,110 | USD | 241,913 | — | (1,186) |
| HSBC Bank plc | 11/2/22 | KRW | 327,519,980 | USD | 229,581 | 341 | — |
| Morgan Stanley Capital Services Inc. | 11/2/22 | KRW | 26,591,000 | USD | 18,697 | — | (30) |
| Citibank, N.A. | 12/2/22 | KRW | 16,805,749 | USD | 11,760 | 40 | — |
| State Street Bank & Trust Co. | 11/3/22 | MXN | 249,000 | USD | 12,316 | 245 | — |
| BNP Paribas | 11/2/22 | MYR | 1,352,080 | USD | 286,609 | — | (622) |
| BNP Paribas | 11/2/22 | MYR | 1,329,839 | USD | 281,210 | 74 | — |
| Standard Chartered Bank | 11/2/22 | MYR | 654,990 | USD | 138,505 | 36 | — |
| Standard Chartered Bank | 12/2/22 | MYR | 136,887 | USD | 29,008 | — | (22) |
| State Street Bank & Trust Co. | 11/2/22 | NZD | 9,000 | USD | 5,091 | 142 | — |
| Toronto-Dominion Bank | 11/3/22 | PEN | 369,316 | USD | 92,505 | 193 | — |
| Citibank, N.A. | 11/3/22 | PEN | 159,507 | USD | 39,978 | 59 | — |
| Bank of America, N.A. | 11/3/22 | PEN | 138,937 | USD | 34,822 | 51 | — |
| Citibank, N.A. | 11/3/22 | PEN | 111,293 | USD | 28,019 | — | (85) |
| Toronto-Dominion Bank | 11/3/22 | PEN | 111,293 | USD | 27,963 | — | (29) |
| BNP Paribas | 11/3/22 | PLN | 761,553 | USD | 160,469 | — | (996) |
| HSBC Bank plc | 11/3/22 | PLN | 761,553 | USD | 160,241 | — | (769) |
| Bank of America, N.A. | 11/3/22 | PLN | 75,000 | USD | 15,116 | 589 | — |
| UBS AG | 12/2/22 | PLN | 37,348 | USD | 7,816 | — | (26) |
| State Street Bank & Trust Co. | 12/2/22 | PLN | 17,348 | USD | 3,626 | — | (7) |
| Barclays Bank plc | 11/2/22 | RON | 496,000 | USD | 100,324 | — | (521) |
| HSBC Bank plc | 11/2/22 | SEK | 1,774,211 | USD | 161,373 | — | (662) |
| Bank of America, N.A. | 11/2/22 | SEK | 295,000 | USD | 26,870 | — | (149) |
| State Street Bank & Trust Co. | 12/2/22 | SEK | 100,000 | USD | 9,076 | 1 | — |
| Bank of America, N.A. | 11/2/22 | SEK | 77,000 | USD | 6,948 | 27 | — |
| Morgan Stanley Capital Services Inc. | 11/2/22 | SGD | 13,000 | USD | 9,063 | 121 | — |
| BNP Paribas | 11/2/22 | THB | 7,554,940 | USD | 200,242 | — | (1,715) |
| Standard Chartered Bank | 11/2/22 | THB | 6,952,663 | USD | 183,075 | — | (375) |
| HSBC Bank plc | 11/2/22 | THB | 4,295,930 | USD | 114,080 | — | (1,193) |
| JPMorgan Chase Bank, N.A. | 11/2/22 | THB | 3,407,340 | USD | 89,490 | 47 | — |
| Commonwealth Bank of Australia | 12/2/22 | USD | 1,696,068 | AUD | 2,650,128 | — | (675) |
| Commonwealth Bank of Australia | 11/2/22 | USD | 1,346,421 | AUD | 2,093,457 | 7,269 | — |
| JPMorgan Chase Bank, N.A. | 11/2/22 | USD | 912,166 | AUD | 1,418,302 | 4,900 | — |
Total International Bond Index Fund
| Forward Currency Contracts (continued) |
| | Contract
Settlement
Date | Contract Amount (000) | Unrealized
Appreciation
($000) | Unrealized
Depreciation
($000) |
| Counterparty | | Receive | Deliver | | |
| JPMorgan Chase Bank, N.A. | 12/2/22 | USD | 865,963 | AUD | 1,353,077 | — | (344) |
| UBS AG | 11/2/22 | USD | 428,543 | AUD | 666,328 | 2,302 | — |
| UBS AG | 12/2/22 | USD | 295,751 | AUD | 462,115 | — | (118) |
| State Street Bank & Trust Co. | 11/2/22 | USD | 149,263 | AUD | 232,218 | 716 | — |
| BNP Paribas | 11/2/22 | USD | 58,426 | AUD | 90,849 | 311 | — |
| Commonwealth Bank of Australia | 11/2/22 | USD | 11,349 | AUD | 18,000 | — | (165) |
| Bank of New York | 11/2/22 | USD | 8,419 | AUD | 13,000 | 104 | — |
| State Street Bank & Trust Co. | 12/2/22 | USD | 5,120 | AUD | 8,000 | — | (2) |
| Toronto-Dominion Bank | 12/2/22 | USD | 2,142,536 | CAD | 2,922,334 | — | (2,982) |
| Royal Bank of Canada | 11/2/22 | USD | 1,888,635 | CAD | 2,590,613 | — | (12,944) |
| Standard Chartered Bank | 11/2/22 | USD | 1,227,368 | CAD | 1,685,419 | — | (9,774) |
| Bank of New York | 12/2/22 | USD | 1,042,967 | CAD | 1,424,250 | — | (2,687) |
| HSBC Bank plc | 11/2/22 | USD | 983,837 | CAD | 1,350,000 | — | (7,099) |
| Standard Chartered Bank | 12/2/22 | USD | 905,920 | CAD | 1,235,498 | — | (1,158) |
| Royal Bank of Canada | 12/2/22 | USD | 688,773 | CAD | 940,000 | — | (1,356) |
| Toronto-Dominion Bank | 11/2/22 | USD | 638,237 | CAD | 877,050 | — | (5,541) |
| Morgan Stanley Capital Services Inc. | 11/2/22 | USD | 359,864 | CAD | 494,000 | — | (2,745) |
| Bank of America, N.A. | 12/2/22 | USD | 344,109 | CAD | 470,000 | — | (955) |
| State Street Bank & Trust Co. | 11/2/22 | USD | 9,468 | CAD | 13,000 | — | (74) |
| UBS AG | 11/2/22 | USD | 939,078 | CHF | 920,722 | 19,407 | — |
| UBS AG | 12/2/22 | USD | 655,608 | CHF | 653,987 | 183 | — |
| Morgan Stanley Capital Services Inc. | 12/2/22 | USD | 292,910 | CHF | 292,449 | — | (182) |
| Morgan Stanley Capital Services Inc. | 11/2/22 | USD | 43,007 | CHF | 42,000 | 1,054 | — |
| BNP Paribas | 12/2/22 | USD | 11,816 | CHF | 11,786 | 3 | — |
| Toronto-Dominion Bank | 11/2/22 | USD | 9,167 | CHF | 9,000 | 178 | — |
| JPMorgan Chase Bank, N.A. | 12/2/22 | USD | 7,344 | CHF | 7,326 | 2 | — |
| Bank of New York | 11/2/22 | USD | 5,067 | CHF | 5,000 | 73 | — |
| State Street Bank & Trust Co. | 11/2/22 | USD | 2,500 | CHF | 2,500 | 3 | — |
| JPMorgan Chase Bank, N.A. | 11/2/22 | USD | 1,013 | CHF | 1,000 | 14 | — |
| Toronto-Dominion Bank | 11/3/22 | USD | 44,637 | CLP | 41,795,500 | 353 | — |
| Toronto-Dominion Bank | 12/5/22 | USD | 43,343 | CLP | 41,795,500 | — | (673) |
| UBS AG | 11/3/22 | USD | 34,002 | CLP | 33,720,592 | — | (1,727) |
| Credit Suisse International | 11/3/22 | USD | 28,605 | CLP | 27,556,543 | — | (592) |
| State Street Bank & Trust Co. | 12/5/22 | USD | 22,046 | CLP | 20,897,750 | 38 | — |
Total International Bond Index Fund
| Forward Currency Contracts (continued) |
| | Contract
Settlement
Date | Contract Amount (000) | Unrealized
Appreciation
($000) | Unrealized
Depreciation
($000) |
| Counterparty | | Receive | Deliver | | |
| State Street Bank & Trust Co. | 12/5/22 | USD | 21,815 | CLP | 20,897,750 | — | (193) |
| Toronto-Dominion Bank | 11/3/22 | USD | 11,231 | CLP | 11,159,399 | — | (592) |
| Bank of America, N.A. | 11/3/22 | USD | 11,249 | CLP | 11,154,467 | — | (569) |
| HSBC Bank plc | 11/2/22 | USD | 739,716 | CNY | 5,311,286 | 11,919 | — |
| Standard Chartered Bank | 12/2/22 | USD | 601,857 | CNY | 4,367,314 | 2,317 | — |
| HSBC Bank plc | 12/2/22 | USD | 302,665 | CNY | 2,200,070 | 641 | — |
| Standard Chartered Bank | 11/2/22 | USD | 239,004 | CNY | 1,693,354 | 6,966 | — |
| State Street Bank & Trust Co. | 11/2/22 | USD | 81,213 | COP | 371,307,403 | 6,047 | — |
| HSBC Bank plc | 11/2/22 | USD | 67,930 | COP | 332,772,923 | 565 | — |
| HSBC Bank plc | 12/5/22 | USD | 67,525 | COP | 332,772,923 | 573 | — |
| Toronto-Dominion Bank | 11/2/22 | USD | 61,485 | COP | 287,497,363 | 3,285 | — |
| State Street Bank & Trust Co. | 12/5/22 | USD | 49,516 | COP | 238,985,308 | 1,434 | — |
| UBS AG | 11/2/22 | USD | 37,059 | COP | 169,219,363 | 2,804 | — |
| Toronto-Dominion Bank | 12/5/22 | USD | 25,585 | COP | 126,274,037 | 180 | — |
| State Street Bank & Trust Co. | 12/5/22 | USD | 24,714 | COP | 123,182,165 | — | (70) |
| Credit Agricole CIB | 11/2/22 | USD | 22,095 | COP | 100,678,342 | 1,714 | — |
| Citibank, N.A. | 11/2/22 | USD | 12,377 | COP | 56,000,000 | 1,041 | — |
| Deutsche Bank AG | 12/2/22 | USD | 332,036 | CZK | 8,205,014 | 1,604 | — |
| BNP Paribas | 11/2/22 | USD | 138,367 | CZK | 3,477,007 | — | (1,992) |
| Deutsche Bank AG | 11/2/22 | USD | 135,896 | CZK | 3,477,007 | — | (4,464) |
| State Street Bank & Trust Co. | 11/2/22 | USD | 56,237 | CZK | 1,400,000 | — | (278) |
| Barclays Bank plc | 12/2/22 | USD | 400,918 | DKK | 2,994,376 | 2,479 | — |
| UBS AG | 11/2/22 | USD | 206,701 | DKK | 1,570,688 | — | (1,801) |
| Deutsche Bank AG | 11/2/22 | USD | 204,452 | DKK | 1,570,688 | — | (4,050) |
| JPMorgan Chase Bank, N.A. | 12/2/22 | USD | 5,125 | DKK | 38,520 | — | — |
| State Street Bank & Trust Co. | 11/2/22 | USD | 14,291,190 | EUR | 14,595,834 | — | (135,109) |
| State Street Bank & Trust Co. | 12/2/22 | USD | 10,404,456 | EUR | 10,509,200 | — | (5,649) |
| Bank of America, N.A. | 12/2/22 | USD | 7,434,180 | EUR | 7,450,000 | 54,429 | — |
| Morgan Stanley Capital Services Inc. | 11/2/22 | USD | 6,954,660 | EUR | 7,200,000 | — | (161,710) |
| Bank of America, N.A. | 11/2/22 | USD | 4,722,027 | EUR | 4,862,000 | — | (83,499) |
| HSBC Bank plc | 11/2/22 | USD | 4,174,549 | EUR | 4,308,531 | — | (83,935) |
| HSBC Bank plc | 12/2/22 | USD | 4,069,442 | EUR | 4,050,000 | 57,631 | — |
| UBS AG | 11/2/22 | USD | 3,765,634 | EUR | 3,854,000 | — | (43,600) |
| BNP Paribas | 12/2/22 | USD | 3,287,699 | EUR | 3,300,000 | 18,816 | — |
| Toronto-Dominion Bank | 11/2/22 | USD | 3,137,483 | EUR | 3,202,501 | — | (27,818) |
| Commonwealth Bank of Australia | 11/2/22 | USD | 2,793,334 | EUR | 2,863,000 | — | (36,411) |
| Toronto-Dominion Bank | 12/2/22 | USD | 2,753,960 | EUR | 2,750,000 | 29,892 | — |
| State Street Bank & Trust Co. | 12/2/22 | USD | 2,387,574 | EUR | 2,391,538 | 18,585 | — |
Total International Bond Index Fund
| Forward Currency Contracts (continued) |
| | Contract
Settlement
Date | Contract Amount (000) | Unrealized
Appreciation
($000) | Unrealized
Depreciation
($000) |
| Counterparty | | Receive | Deliver | | |
| Morgan Stanley Capital Services Inc. | 12/2/22 | USD | 2,253,080 | EUR | 2,250,000 | 24,297 | — |
| UBS AG | 12/2/22 | USD | 1,403,227 | EUR | 1,400,000 | 16,428 | — |
| Toronto-Dominion Bank | 12/2/22 | USD | 1,338,726 | EUR | 1,351,650 | — | (179) |
| HSBC Bank plc | 12/2/22 | USD | 1,080,827 | EUR | 1,091,250 | — | (133) |
| JPMorgan Chase Bank, N.A. | 12/2/22 | USD | 995,248 | EUR | 1,000,000 | 4,678 | — |
| Bank of New York | 12/2/22 | USD | 960,826 | EUR | 968,189 | 1,766 | — |
| Deutsche Bank AG | 12/2/22 | USD | 904,416 | EUR | 900,000 | 12,902 | — |
| Royal Bank of Canada | 12/2/22 | USD | 901,900 | EUR | 900,000 | 10,386 | — |
| Credit Agricole CIB | 12/2/22 | USD | 890,511 | EUR | 900,000 | — | (1,003) |
| Deutsche Bank AG | 11/2/22 | USD | 867,470 | EUR | 900,000 | — | (22,076) |
| BNP Paribas | 11/2/22 | USD | 865,499 | EUR | 881,734 | — | (5,993) |
| BNP Paribas | 12/2/22 | USD | 624,781 | EUR | 630,811 | — | (82) |
| Bank of New York | 11/2/22 | USD | 590,799 | EUR | 603,000 | — | (5,197) |
| Morgan Stanley Capital Services Inc. | 12/2/22 | USD | 495,152 | EUR | 500,000 | — | (134) |
| Credit Agricole CIB | 12/2/22 | USD | 450,272 | EUR | 450,000 | 4,515 | — |
| Citibank, N.A. | 12/2/22 | USD | 448,691 | EUR | 450,000 | 2,934 | — |
| Bank of America, N.A. | 12/2/22 | USD | 289,706 | EUR | 292,500 | — | (37) |
| UBS AG | 12/2/22 | USD | 57,770 | EUR | 58,332 | — | (12) |
| UBS AG | 11/2/22 | USD | 27,994 | EUR | 28,000 | 319 | — |
| Commonwealth Bank of Australia | 11/2/22 | USD | 2,471 | EUR | 2,500 | — | — |
| Toronto-Dominion Bank | 11/2/22 | USD | 2,734,769 | GBP | 2,448,320 | — | (73,110) |
| HSBC Bank plc | 11/2/22 | USD | 2,266,803 | GBP | 2,029,680 | — | (60,954) |
| HSBC Bank plc | 12/2/22 | USD | 2,312,751 | GBP | 2,007,077 | 8,920 | — |
| Toronto-Dominion Bank | 12/2/22 | USD | 1,568,172 | GBP | 1,360,914 | 6,041 | — |
| UBS AG | 12/2/22 | USD | 1,459,959 | GBP | 1,267,011 | 5,615 | — |
| State Street Bank & Trust Co. | 12/2/22 | USD | 151,536 | GBP | 131,631 | 443 | — |
| State Street Bank & Trust Co. | 11/2/22 | USD | 39,343 | GBP | 35,000 | — | (797) |
| BNP Paribas | 11/2/22 | USD | 38,182 | GBP | 34,000 | — | (812) |
| JPMorgan Chase Bank, N.A. | 11/2/22 | USD | 4,581 | GBP | 4,000 | — | (7) |
| Morgan Stanley Capital Services Inc. | 11/2/22 | USD | 3,312 | GBP | 3,000 | — | (129) |
| HSBC Bank plc | 11/2/22 | USD | 30,275 | HKD | 237,500 | 18 | — |
| HSBC Bank plc | 12/2/22 | USD | 30,275 | HKD | 237,500 | 1 | — |
| BNP Paribas | 11/3/22 | USD | 115,143 | HUF | 50,258,577 | — | (6,060) |
| Deutsche Bank AG | 12/2/22 | USD | 67,504 | HUF | 28,270,449 | — | (55) |
| Deutsche Bank AG | 12/2/22 | USD | 53,015 | HUF | 21,988,127 | 468 | — |
| Deutsche Bank AG | 12/2/22 | USD | 796,880 | IDR | 12,443,718,152 | — | (432) |
| Deutsche Bank AG | 11/2/22 | USD | 674,476 | IDR | 10,274,920,224 | 15,732 | — |
| Standard Chartered Bank | 11/2/22 | USD | 469,000 | IDR | 7,141,721,956 | 11,140 | — |
| Deutsche Bank AG | 12/2/22 | USD | 115,076 | IDR | 1,795,574,852 | 24 | — |
| BNP Paribas | 12/2/22 | USD | 256,104 | ILS | 904,960 | — | (544) |
Total International Bond Index Fund
| Forward Currency Contracts (continued) |
| | Contract
Settlement
Date | Contract Amount (000) | Unrealized
Appreciation
($000) | Unrealized
Depreciation
($000) |
| Counterparty | | Receive | Deliver | | |
| JPMorgan Chase Bank, N.A. | 11/2/22 | USD | 132,539 | ILS | 468,480 | — | (55) |
| Barclays Bank plc | 11/2/22 | USD | 108,273 | ILS | 384,154 | — | (455) |
| Barclays Bank plc | 11/2/22 | USD | 23,871 | ILS | 84,326 | 4 | — |
| JPMorgan Chase Bank, N.A. | 12/2/22 | USD | 5,908,259 | JPY | 868,558,039 | 45,564 | — |
| JPMorgan Chase Bank, N.A. | 11/2/22 | USD | 4,531,900 | JPY | 653,776,803 | 134,186 | — |
| BNP Paribas | 11/2/22 | USD | 2,780,630 | JPY | 401,044,586 | 82,952 | — |
| JPMorgan Chase Bank, N.A. | 12/2/22 | USD | 1,961,126 | JPY | 290,765,052 | — | (1,514) |
| Deutsche Bank AG | 11/2/22 | USD | 1,966,661 | JPY | 283,519,090 | 59,534 | — |
| BNP Paribas | 12/2/22 | USD | 1,597,474 | JPY | 236,426,417 | 1,615 | — |
| UBS AG | 11/2/22 | USD | 1,451,375 | JPY | 209,169,649 | 44,369 | — |
| Morgan Stanley Capital Services Inc. | 11/2/22 | USD | 1,436,891 | JPY | 206,744,635 | 46,197 | — |
| Standard Chartered Bank | 12/2/22 | USD | 1,105,204 | JPY | 163,729,013 | 47 | — |
| Royal Bank of Canada | 11/2/22 | USD | 1,097,774 | JPY | 158,471,891 | 31,792 | — |
| Standard Chartered Bank | 11/2/22 | USD | 1,085,504 | JPY | 156,700,662 | 31,437 | — |
| Bank of America, N.A. | 12/2/22 | USD | 966,722 | JPY | 143,364,840 | — | (979) |
| HSBC Bank plc | 12/2/22 | USD | 493,997 | JPY | 72,774,403 | 2,776 | — |
| UBS AG | 12/2/22 | USD | 492,584 | JPY | 72,713,457 | 1,774 | — |
| UBS AG | 12/2/22 | USD | 489,958 | JPY | 72,674,013 | — | (586) |
| BNP Paribas | 12/2/22 | USD | 489,984 | JPY | 72,663,015 | — | (485) |
| Toronto-Dominion Bank | 11/2/22 | USD | 473,013 | JPY | 68,221,054 | 14,115 | — |
| Bank of America, N.A. | 12/2/22 | USD | 244,076 | JPY | 35,937,123 | 1,503 | — |
| HSBC Bank plc | 11/2/22 | USD | 967,962 | KRW | 1,369,681,690 | 6,431 | — |
| State Street Bank & Trust Co. | 11/2/22 | USD | 522,184 | KRW | 745,915,540 | — | (1,457) |
| Deutsche Bank AG | 12/2/22 | USD | 505,304 | KRW | 716,624,500 | 2,097 | — |
| Deutsche Bank AG | 11/2/22 | USD | 503,885 | KRW | 716,624,500 | 808 | — |
| BNP Paribas | 12/2/22 | USD | 493,766 | KRW | 701,296,405 | 1,324 | — |
| BNP Paribas | 11/2/22 | USD | 493,106 | KRW | 701,296,405 | 789 | — |
| State Street Bank & Trust Co. | 12/2/22 | USD | 408,258 | KRW | 579,177,740 | 1,565 | — |
| Standard Chartered Bank | 11/2/22 | USD | 346,097 | KRW | 497,847,135 | — | (3,396) |
| JPMorgan Chase Bank, N.A. | 11/2/22 | USD | 332,809 | KRW | 478,323,720 | — | (2,980) |
| JPMorgan Chase Bank, N.A. | 11/2/22 | USD | 286,621 | KRW | 407,632,120 | 459 | — |
| HSBC Bank plc | 12/2/22 | USD | 236,410 | KRW | 334,843,590 | 1,286 | — |
| HSBC Bank plc | 12/2/22 | USD | 229,634 | KRW | 327,519,980 | — | (347) |
| BNP Paribas | 11/2/22 | USD | 228,027 | KRW | 325,390,280 | — | (400) |
| JPMorgan Chase Bank, N.A. | 12/2/22 | USD | 223,148 | KRW | 317,992,120 | — | (143) |
| Deutsche Bank AG | 11/2/22 | USD | 200,150 | KRW | 285,708,540 | — | (421) |
| Morgan Stanley Capital Services Inc. | 11/2/22 | USD | 18,456 | KRW | 26,591,000 | — | (211) |
| State Street Bank & Trust Co. | 12/2/22 | USD | 573,317 | MXN | 11,439,296 | — | (527) |
Total International Bond Index Fund
| Forward Currency Contracts (continued) |
| | Contract
Settlement
Date | Contract Amount (000) | Unrealized
Appreciation
($000) | Unrealized
Depreciation
($000) |
| Counterparty | | Receive | Deliver | | |
| Toronto-Dominion Bank | 11/3/22 | USD | 560,744 | MXN | 11,333,297 | — | (10,960) |
| State Street Bank & Trust Co. | 11/3/22 | USD | 17,623 | MXN | 355,000 | — | (285) |
| BNP Paribas | 11/2/22 | USD | 567,282 | MYR | 2,620,098 | 13,087 | — |
| BNP Paribas | 12/2/22 | USD | 281,469 | MYR | 1,329,839 | — | (130) |
| BNP Paribas | 12/2/22 | USD | 271,824 | MYR | 1,282,380 | 275 | — |
| Standard Chartered Bank | 11/2/22 | USD | 154,479 | MYR | 716,810 | 2,862 | — |
| Standard Chartered Bank | 12/2/22 | USD | 138,631 | MYR | 654,990 | — | (66) |
| BNP Paribas | 12/2/22 | USD | 131,896 | NOK | 1,370,000 | — | (20) |
| BNP Paribas | 11/2/22 | USD | 125,745 | NOK | 1,370,000 | — | (6,042) |
| BNP Paribas | 12/2/22 | USD | 11,129 | NOK | 115,393 | 18 | — |
| UBS AG | 11/2/22 | USD | 10,684 | NOK | 115,393 | — | (416) |
| Commonwealth Bank of Australia | 12/2/22 | USD | 231,377 | NZD | 398,078 | — | (187) |
| Commonwealth Bank of Australia | 11/2/22 | USD | 182,136 | NZD | 322,024 | — | (5,097) |
| JPMorgan Chase Bank, N.A. | 12/2/22 | USD | 86,012 | NZD | 147,982 | — | (70) |
| State Street Bank & Trust Co. | 11/2/22 | USD | 81,215 | NZD | 143,568 | — | (2,258) |
| JPMorgan Chase Bank, N.A. | 11/2/22 | USD | 50,610 | NZD | 89,469 | — | (1,409) |
| Toronto-Dominion Bank | 11/3/22 | USD | 83,682 | PEN | 333,880 | — | (123) |
| Citibank, N.A. | 11/3/22 | USD | 67,860 | PEN | 270,800 | — | (111) |
| Toronto-Dominion Bank | 12/5/22 | USD | 55,498 | PEN | 222,587 | — | (126) |
| Toronto-Dominion Bank | 11/3/22 | USD | 37,116 | PEN | 146,729 | 287 | — |
| Bank of America, N.A. | 11/3/22 | USD | 35,226 | PEN | 138,937 | 353 | — |
| Citibank, N.A. | 12/5/22 | USD | 27,909 | PEN | 111,293 | 97 | — |
| Toronto-Dominion Bank | 12/5/22 | USD | 27,851 | PEN | 111,293 | 39 | — |
| BNP Paribas | 11/3/22 | USD | 301,094 | PLN | 1,510,906 | — | (15,296) |
| BNP Paribas | 12/2/22 | USD | 159,928 | PLN | 761,553 | 1,096 | — |
| HSBC Bank plc | 12/2/22 | USD | 159,692 | PLN | 761,553 | 860 | — |
| Bank of New York | 11/3/22 | USD | 17,432 | PLN | 87,000 | — | (786) |
| State Street Bank & Trust Co. | 11/3/22 | USD | 41 | PLN | 200 | — | (1) |
| Barclays Bank plc | 12/5/22 | USD | 99,984 | RON | 496,000 | 490 | — |
| Barclays Bank plc | 11/2/22 | USD | 94,099 | RON | 475,000 | — | (1,478) |
| Morgan Stanley Capital Services Inc. | 11/2/22 | USD | 4,132 | RON | 21,000 | — | (93) |
| Toronto-Dominion Bank | 12/2/22 | USD | 448,803 | SEK | 4,950,000 | — | (500) |
| Toronto-Dominion Bank | 11/2/22 | USD | 426,314 | SEK | 4,725,000 | — | (1,682) |
| UBS AG | 11/2/22 | USD | 369,274 | SEK | 4,145,422 | — | (6,224) |
| HSBC Bank plc | 12/2/22 | USD | 161,681 | SEK | 1,774,211 | 639 | — |
| UBS AG | 12/2/22 | USD | 161,681 | SEK | 1,774,211 | 639 | — |
| UBS AG | 12/2/22 | USD | 7,044 | SEK | 77,694 | — | (8) |
| HSBC Bank plc | 12/2/22 | USD | 467,687 | SGD | 661,307 | 439 | — |
| BNP Paribas | 11/2/22 | USD | 441,478 | SGD | 631,307 | — | (4,492) |
Total International Bond Index Fund
| Forward Currency Contracts (continued) |
| | Contract
Settlement
Date | Contract Amount (000) | Unrealized
Appreciation
($000) | Unrealized
Depreciation
($000) |
| Counterparty | | Receive | Deliver | | |
| JPMorgan Chase Bank, N.A. | 11/2/22 | USD | 29,955 | SGD | 43,000 | — | (421) |
| Toronto-Dominion Bank | 12/2/22 | USD | 7,565 | SGD | 10,703 | 2 | — |
| JPMorgan Chase Bank, N.A. | 11/2/22 | USD | 204,998 | THB | 7,832,420 | — | (820) |
| BNP Paribas | 12/2/22 | USD | 200,729 | THB | 7,554,940 | 1,719 | — |
| Standard Chartered Bank | 12/2/22 | USD | 183,447 | THB | 6,952,663 | 302 | — |
| BNP Paribas | 11/2/22 | USD | 168,791 | THB | 6,408,337 | 395 | — |
| Standard Chartered Bank | 11/2/22 | USD | 106,829 | THB | 4,036,087 | 769 | — |
| JPMorgan Chase Bank, N.A. | 12/2/22 | USD | 89,643 | THB | 3,407,340 | — | (112) |
| HSBC Bank plc | 12/2/22 | USD | 90,044 | THB | 3,380,930 | 984 | — |
| HSBC Bank plc | 11/2/22 | USD | 58,321 | THB | 2,173,500 | 1,206 | — |
| Deutsche Bank AG | 11/2/22 | USD | 46,677 | THB | 1,760,530 | 414 | — |
| | | | | | | 935,489 | (1,225,854) |
At October 31, 2022, the counterparties had deposited in segregated accounts securities with a value of $138,150,000 and cash of $35,341,000 in connection with open forward currency contracts.
See accompanying Notes, which are an integral part of the Financial Statements.
Total International Bond Index Fund
Statement of Assets and Liabilities
| ($000s, except shares and per-share amounts) | Amount |
| Assets | |
| Investments in Securities, at Value | |
| Unaffiliated Issuers (Cost $101,349,796) | 78,023,000 |
| Affiliated Issuers (Cost $253,490) | 253,492 |
| Total Investments in Securities | 78,276,492 |
| Investment in Vanguard | 3,172 |
| Foreign Currency, at Value (Cost $758,357) | 700,910 |
| Receivables for Investment Securities Sold | 1,270,062 |
| Receivables for Accrued Income | 492,327 |
| Receivables for Capital Shares Issued | 19,967 |
| Variation Margin Receivable—Futures Contracts | 433 |
| Unrealized Appreciation—Forward Currency Contracts | 935,489 |
| Other Assets | 18,124 |
| Total Assets | 81,716,976 |
| Liabilities | |
| Payables for Investment Securities Purchased | 732,151 |
| Payables for Capital Shares Redeemed | 21,891 |
| Payables for Distributions | 2,011 |
| Payables to Vanguard | 2,840 |
| Unrealized Depreciation—Forward Currency Contracts | 1,225,854 |
| Total Liabilities | 1,984,747 |
| Net Assets | 79,732,229 |
| At October 31, 2022, net assets consisted of: | |
| | |
| Paid-in Capital | 91,015,530 |
| Total Distributable Earnings (Loss) | (11,283,301) |
| Net Assets | 79,732,229 |
| |
| Investor Shares—Net Assets | |
Applicable to 6,177,037 outstanding $.001 par value shares of
beneficial interest (unlimited authorization) | 59,147 |
| Net Asset Value Per Share—Investor Shares | $9.58 |
| |
| ETF Shares—Net Assets | |
Applicable to 935,426,799 outstanding $.001 par value shares of
beneficial interest (unlimited authorization) | 44,751,288 |
| Net Asset Value Per Share—ETF Shares | $47.84 |
| |
| Admiral Shares—Net Assets | |
Applicable to 1,250,463,088 outstanding $.001 par value shares of
beneficial interest (unlimited authorization) | 23,932,598 |
| Net Asset Value Per Share—Admiral Shares | $19.14 |
| |
| Institutional Shares—Net Assets | |
Applicable to 382,627,468 outstanding $.001 par value shares of
beneficial interest (unlimited authorization) | 10,989,196 |
| Net Asset Value Per Share—Institutional Shares | $28.72 |
See accompanying Notes, which are an integral part of the Financial Statements.
Total International Bond Index Fund
Statement of Operations
|
| | | Year Ended
October 31, 2022 |
| | | ($000) |
| Investment Income | | |
| Income | | |
| Interest1,2 | | 977,922 |
| Total Income | | 977,922 |
| Expenses | | |
| The Vanguard Group—Note B | | |
| Investment Advisory Services | | 3,670 |
Management and Administrative—
Investor Shares | | 11,110 |
Management and Administrative—
ETF Shares | | 25,537 |
Management and Administrative—
Admiral Shares | | 25,496 |
Management and Administrative—
Institutional Shares | | 7,077 |
Marketing and Distribution—
Investor Shares | | 889 |
Marketing and Distribution—
ETF Shares | | 1,771 |
Marketing and Distribution—
Admiral Shares | | 1,382 |
Marketing and Distribution—
Institutional Shares | | 537 |
| Custodian Fees | | 3,110 |
| Auditing Fees | | 82 |
| Shareholders’ Reports—Investor Shares | | 115 |
| Shareholders’ Reports—ETF Shares | | 1,497 |
| Shareholders’ Reports—Admiral Shares | | 445 |
| Shareholders’ Reports—Institutional Shares | | 22 |
| Trustees’ Fees and Expenses | | 36 |
| Other Expenses | | 86 |
| Total Expenses | | 82,862 |
| Expenses Paid Indirectly | | (7) |
| Net Expenses | | 82,855 |
| Net Investment Income | | 895,067 |
| Realized Net Gain (Loss) | | |
| Investment Securities Sold1,3 | | (4,268,215) |
| Futures Contracts | | (10,276) |
| Forward Currency Contracts | | 17,350,201 |
| Foreign Currencies | | (475,864) |
| Realized Net Gain (Loss) | | 12,595,846 |
| Change in Unrealized Appreciation (Depreciation) | | |
| Investment Securities1 | | (24,570,941) |
| Futures Contracts | | (2,349) |
| Forward Currency Contracts | | (639,164) |
| Foreign Currencies | | 66,579 |
| Change in Unrealized Appreciation (Depreciation) | | (25,145,875) |
| Net Increase (Decrease) in Net Assets Resulting from Operations | | (11,654,962) |
| | | |
| 1 | Interest income, realized net gain (loss), capital gain distributions received, and change in unrealized appreciation (depreciation) from an affiliated company of the fund were $2,701,000, ($235,000), $34,000, and ($18,000), respectively. Purchases and sales are for temporary cash investment purposes. |
| 2 | Interest is net of foreign withholding taxes of $24,876,000. |
| 3 | Includes ($723,511,000) of net gain (loss) resulting from in-kind redemptions. |
Statement of Changes in Net Assets
|
| | Year Ended October 31, |
| | 2022
($000) | 2021
($000) |
| Increase (Decrease) in Net Assets | | |
| Operations | | |
| Net Investment Income | 895,067 | 1,150,819 |
| Realized Net Gain (Loss) | 12,595,846 | 6,422,168 |
| Change in Unrealized Appreciation (Depreciation) | (25,145,875) | (10,454,014) |
| Net Increase (Decrease) in Net Assets Resulting from Operations | (11,654,962) | (2,881,027) |
| Distributions | | |
| Investor Shares | (904,557) | (315,494) |
| ETF Shares | (1,726,038) | (411,957) |
| Admiral Shares | (1,069,575) | (427,771) |
| Institutional Shares | (473,513) | (240,342) |
| Total Distributions | (4,173,683) | (1,395,564) |
| Capital Share Transactions | | |
| Investor Shares | (28,476,384) | (894,692) |
| ETF Shares | 7,014,128 | 12,638,785 |
| Admiral Shares | (755,230) | (20,249,604) |
| Institutional Shares | 478,429 | (27,279,588) |
| Net Increase (Decrease) from Capital Share Transactions | (21,739,057) | (35,785,099) |
| Total Increase (Decrease) | (37,567,702) | (40,061,690) |
| Net Assets | | |
| Beginning of Period | 117,299,931 | 157,361,621 |
| End of Period | 79,732,229 | 117,299,931 |
See accompanying Notes, which are an integral part of the Financial Statements.
Total International Bond Index Fund
| Investor Shares | | | | | |
For a Share Outstanding
Throughout Each Period | Year Ended October 31, |
| 2022 | 2021 | 2020 | 2019 | 2018 |
| Net Asset Value, Beginning of Period | $11.32 | $11.66 | $11.68 | $10.90 | $10.96 |
| Investment Operations | | | | | |
| Net Investment Income1 | .086 | .092 | .109 | .121 | .113 |
| Net Realized and Unrealized Gain (Loss) on Investments | (1.417) | (.320) | .240 | .988 | .068 |
| Total from Investment Operations | (1.331) | (.228) | .349 | 1.109 | .181 |
| Distributions | | | | | |
| Dividends from Net Investment Income | (.336) | (.094) | (.369) | (.329) | (.241) |
| Distributions from Realized Capital Gains | (.073) | (.018) | — | — | — |
| Total Distributions | (.409) | (.112) | (.369) | (.329) | (.241) |
| Net Asset Value, End of Period | $9.58 | $11.32 | $11.66 | $11.68 | $10.90 |
| Total Return2 | -12.16% | -1.97% | 3.09% | 10.39% | 1.68% |
| Ratios/Supplemental Data | | | | | |
| Net Assets, End of Period (Millions) | $59 | $30,174 | $32,054 | $30,053 | $27,299 |
| Ratio of Total Expenses to Average Net Assets | 0.13%3 | 0.13% | 0.13% | 0.13% | 0.13% |
| Ratio of Net Investment Income to Average Net Assets | 0.79% | 0.80% | 0.95% | 1.07% | 1.03% |
| Portfolio Turnover Rate | 27%4 | 25%4 | 31%4 | 26% | 22% |
| 1 | Calculated based on average shares outstanding. |
| 2 | Total returns do not include account service fees that may have applied in the periods shown. Fund prospectuses provide information about any applicable account service fees. |
| 3 | The ratio of expenses to average net assets for the period net of reduction from custody fee offset arrangements was 0.13%. |
| 4 | Excludes the value of portfolio securities received or delivered as a result of in-kind purchases or redemptions of the fund’s capital shares, including ETF Creation Units. |
| ETF Shares | | | | | |
For a Share Outstanding
Throughout Each Period | Year Ended October 31, |
| 2022 | 2021 | 2020 | 2019 | 2018 |
| Net Asset Value, Beginning of Period | $56.56 | $58.27 | $58.34 | $54.47 | $54.75 |
| Investment Operations | | | | | |
| Net Investment Income1 | .510 | .492 | .572 | .630 | .584 |
| Net Realized and Unrealized Gain (Loss) on Investments | (7.150) | (1.603) | 1.232 | 4.913 | .356 |
| Total from Investment Operations | (6.640) | (1.111) | 1.804 | 5.543 | .940 |
| Distributions | | | | | |
| Dividends from Net Investment Income | (1.713) | (.510) | (1.874) | (1.673) | (1.220) |
| Distributions from Realized Capital Gains | (.367) | (.089) | — | — | — |
| Total Distributions | (2.080) | (.599) | (1.874) | (1.673) | (1.220) |
| Net Asset Value, End of Period | $47.84 | $56.56 | $58.27 | $58.34 | $54.47 |
| Total Return | -12.16% | -1.92% | 3.20% | 10.40% | 1.74% |
| Ratios/Supplemental Data | | | | | |
| Net Assets, End of Period (Millions) | $44,751 | $45,348 | $33,941 | $23,911 | $12,092 |
| Ratio of Total Expenses to Average Net Assets | 0.07%2 | 0.07% | 0.08% | 0.08% | 0.09% |
| Ratio of Net Investment Income to Average Net Assets | 0.99% | 0.86% | 0.99% | 1.12% | 1.07% |
| Portfolio Turnover Rate | 27%3 | 25%3 | 31%3 | 26% | 22% |
| 1 | Calculated based on average shares outstanding. |
| 2 | The ratio of expenses to average net assets for the period net of reduction from custody fee offset arrangements was 0.07%. |
| 3 | Excludes the value of portfolio securities received or delivered as a result of in-kind purchases or redemptions of the fund’s capital shares, including ETF Creation Units. |
See accompanying Notes, which are an integral part of the Financial Statements.
Total International Bond Index Fund
| Admiral Shares | | | | | |
For a Share Outstanding
Throughout Each Period | Year Ended October 31, |
| 2022 | 2021 | 2020 | 2019 | 2018 |
| Net Asset Value, Beginning of Period | $22.64 | $23.32 | $23.35 | $21.79 | $21.91 |
| Investment Operations | | | | | |
| Net Investment Income1 | .195 | .191 | .223 | .246 | .230 |
| Net Realized and Unrealized Gain (Loss) on Investments | (2.864) | (.644) | .489 | 1.976 | .137 |
| Total from Investment Operations | (2.669) | (.453) | .712 | 2.222 | .367 |
| Distributions | | | | | |
| Dividends from Net Investment Income | (.684) | (.191) | (.742) | (.662) | (.487) |
| Distributions from Realized Capital Gains | (.147) | (.036) | — | — | — |
| Total Distributions | (.831) | (.227) | (.742) | (.662) | (.487) |
| Net Asset Value, End of Period | $19.14 | $22.64 | $23.32 | $23.35 | $21.79 |
| Total Return2 | -12.20% | -1.96% | 3.15% | 10.41% | 1.70% |
| Ratios/Supplemental Data | | | | | |
| Net Assets, End of Period (Millions) | $23,933 | $29,241 | $50,818 | $51,889 | $43,550 |
| Ratio of Total Expenses to Average Net Assets | 0.11%3 | 0.11% | 0.11% | 0.11% | 0.11% |
| Ratio of Net Investment Income to Average Net Assets | 0.94% | 0.83% | 0.97% | 1.09% | 1.05% |
| Portfolio Turnover Rate | 27%4 | 25%4 | 31%4 | 26% | 22% |
| 1 | Calculated based on average shares outstanding. |
| 2 | Total returns do not include account service fees that may have applied in the periods shown. Fund prospectuses provide information about any applicable account service fees. |
| 3 | The ratio of expenses to average net assets for the period net of reduction from custody fee offset arrangements was 0.11%. |
| 4 | Excludes the value of portfolio securities received or delivered as a result of in-kind purchases or redemptions of the fund’s capital shares, including ETF Creation Units. |
| Institutional Shares | | | | | |
For a Share Outstanding
Throughout Each Period | Year Ended October 31, |
| 2022 | 2021 | 2020 | 2019 | 2018 |
| Net Asset Value, Beginning of Period | $33.97 | $34.99 | $35.03 | $32.70 | $32.88 |
| Investment Operations | | | | | |
| Net Investment Income1 | .305 | .310 | .348 | .382 | .358 |
| Net Realized and Unrealized Gain (Loss) on Investments | (4.297) | (.977) | .739 | 2.954 | .206 |
| Total from Investment Operations | (3.992) | (.667) | 1.087 | 3.336 | .564 |
| Distributions | | | | | |
| Dividends from Net Investment Income | (1.038) | (.299) | (1.127) | (1.006) | (.744) |
| Distributions from Realized Capital Gains | (.220) | (.054) | — | — | — |
| Total Distributions | (1.258) | (.353) | (1.127) | (1.006) | (.744) |
| Net Asset Value, End of Period | $28.72 | $33.97 | $34.99 | $35.03 | $32.70 |
| Total Return | -12.17% | -1.92% | 3.21% | 10.42% | 1.74% |
| Ratios/Supplemental Data | | | | | |
| Net Assets, End of Period (Millions) | $10,989 | $12,538 | $40,548 | $34,596 | $28,196 |
| Ratio of Total Expenses to Average Net Assets | 0.07%2 | 0.07% | 0.07% | 0.07% | 0.07% |
| Ratio of Net Investment Income to Average Net Assets | 0.98% | 0.89% | 1.01% | 1.13% | 1.09% |
| Portfolio Turnover Rate | 27%3 | 25%3 | 31%3 | 26% | 22% |
| 1 | Calculated based on average shares outstanding. |
| 2 | The ratio of expenses to average net assets for the period net of reduction from custody fee offset arrangements was 0.07%. |
| 3 | Excludes the value of portfolio securities received or delivered as a result of in-kind purchases or redemptions of the fund’s capital shares, including ETF Creation Units. |
See accompanying Notes, which are an integral part of the Financial Statements.
Total International Bond Index Fund
Notes to Financial Statements
Vanguard Total International Bond Index Fund is registered under the Investment Company Act of 1940 as an open-end investment company, or mutual fund. The fund offers five classes of shares: Investor Shares, ETF Shares, Admiral Shares, Institutional Shares, and Institutional Select Shares. Each of the share classes has different eligibility and minimum purchase requirements, and is designed for different types of investors. ETF Shares are listed for trading on Nasdaq; they can be purchased and sold through a broker. The fund has not issued Institutional Select Shares through October 31, 2022.
Certain of the fund’s investments are in corporate debt instruments; the issuers' abilities to meet their obligations may be affected by economic developments in their respective industries. The fund invests in securities of foreign issuers, which may subject it to investment risks not normally associated with investing in securities of U.S. corporations. To minimize the currency risk associated with investment in securities denominated in currencies other than the U.S. dollar, the fund attempts to hedge its currency exposure. Significant market disruptions, such as those caused by pandemics (e.g., COVID-19 pandemic), natural or environmental disasters, war (e.g., Russia’s invasion of Ukraine), acts of terrorism, or other events, can adversely affect local and global markets and normal market operations. Any such disruptions could have an adverse impact on the value of the fund’s investments and fund performance.
| A. | The following significant accounting policies conform to generally accepted accounting principles for U.S. investment companies. The fund consistently follows such policies in preparing its financial statements. |
1. Security Valuation: Securities are valued as of the close of trading on the New York Stock Exchange (generally 4 p.m., Eastern time) on the valuation date. Bonds and temporary cash investments are valued using the latest bid prices or using valuations based on a matrix system (which considers such factors as security prices, yields, maturities, and ratings), both as furnished by independent pricing services. Structured debt securities, including mortgages and asset-backed securities, are valued using the latest bid prices or using valuations based on a matrix system that considers such factors as issuer, tranche, nominal or option-adjusted spreads, weighted average coupon, weighted average maturity, credit enhancements, and collateral, as furnished by independent pricing services.
Investments in Vanguard Market Liquidity Fund are valued at that fund's net asset value. Securities for which market quotations are not readily available, or whose values have been affected by events occurring before the fund’s pricing time but after the close of the securities’ primary markets, are valued by methods deemed by the valuation designee to represent fair value and subject to oversight by the board of trustees. These procedures include obtaining quotations from an independent pricing service, monitoring news to identify significant market- or security-specific events, and evaluating changes in the values of foreign market proxies (for example, ADRs, futures contracts, or exchange-traded funds), between the time the foreign markets close and the fund’s pricing time.
2. Foreign Currency: Securities and other assets and liabilities denominated in foreign currencies are translated into U.S. dollars using exchange rates obtained from an independent third party as of the fund’s pricing time on the valuation date. Realized gains (losses) and unrealized appreciation (depreciation) on investment securities include the effects of changes in exchange rates since the securities were purchased, combined with the effects of changes in security prices. Fluctuations in the value of other assets and liabilities resulting from changes in exchange rates are recorded as unrealized foreign currency gains (losses) until the assets or liabilities are settled in cash, at which time they are recorded as realized foreign currency gains (losses).
3. Futures Contracts: The fund uses futures contracts to invest in fixed income asset classes with greater efficiency and lower cost than is possible through direct investment, to add value when these instruments are attractively priced, or to adjust sensitivity to changes in interest rates. The primary risks associated with the use of futures contracts are imperfect correlation between changes in market values of bonds held by the fund and the prices of futures contracts, and the possibility of an illiquid market. Counterparty risk involving futures is mitigated because a regulated clearinghouse is the counterparty instead of the clearing broker. To further mitigate counterparty risk, the fund trades futures contracts on an exchange, monitors the financial strength of its clearing brokers and clearinghouse, and has entered into clearing agreements with its clearing brokers. The clearinghouse imposes initial margin requirements to secure the fund’s performance and requires daily settlement of variation margin representing changes in the market value of each contract. Any securities pledged as initial margin for open contracts are noted in the Schedule of Investments.
Futures contracts are valued at their quoted daily settlement prices. The notional amounts of the contracts are not recorded in the Statement of Assets and Liabilities. Fluctuations in the value of the contracts are recorded in the Statement of Assets and Liabilities as an asset (liability) and in the Statement of Operations as unrealized appreciation (depreciation) until the contracts are closed, when they are recorded as realized gains (losses) on futures contracts.
Total International Bond Index Fund
During the year ended October 31, 2022, the fund’s average investments in long and short futures contracts represented less than 1% of net assets, based on the average of the notional amounts at each quarter-end during the period.
4. Forward Currency Contracts: The fund enters into forward currency contracts to protect the value of securities and related receivables and payables against changes in future foreign exchange rates.
The fund’s risks in using these contracts include movement in the values of the foreign currencies relative to the U.S. dollar and the ability of the counterparties to fulfill their obligations under the contracts. The fund mitigates its counterparty risk by entering into forward currency contracts only with a diverse group of prequalified counterparties, monitoring their financial strength, entering into master netting arrangements with its counterparties, and requiring its counterparties to transfer collateral as security for their performance. In the absence of a default, the collateral pledged or received by the fund cannot be repledged, rehypothecated or (under master netting agreements) resold. The master netting arrangements provide that, in the event of a counterparty’s default (including bankruptcy), the fund may terminate the forward currency contracts, determine the net amount owed by either party in accordance with its master netting arrangements, and sell or retain any collateral held up to the net amount owed to the fund under the master netting arrangements. The forward currency contracts contain provisions whereby a counterparty may terminate open contracts if the fund’s net assets decline below a certain level, triggering a payment by the fund if the fund is in a net liability position at the time of the termination. The payment amount would be reduced by any collateral the fund has pledged. Any securities pledged as collateral for open contracts are noted in the Schedule of Investments. The value of collateral received or pledged is compared daily to the value of the forward currency contracts exposure with each counterparty, and any difference, if in excess of a specified minimum transfer amount, is adjusted and settled within two business days.
Forward currency contracts are valued at their quoted daily prices obtained from an independent third party, adjusted for currency risk based on the expiration date of each contract. The notional amounts of the contracts are not recorded in the Statement of Assets and Liabilities. Fluctuations in the value of the contracts are recorded in the Statement of Assets and Liabilities as an asset (liability) and in the Statement of Operations as unrealized appreciation (depreciation) until the contracts are closed, when they are recorded as realized gains (losses) on forward currency contracts.
During the year ended October 31, 2022, the fund’s average investment in forward currency contracts represented 159% of net assets, based on the average of the notional amounts at each quarter-end during the period.
The following table summarizes the fund’s derivative assets and liabilities by counterparty for derivatives subject to arrangements that provide for offsetting assets and liabilities. Exchange traded derivatives are listed separately.
| | Assets
Reflected in
Statement of
Assets and
Liabilities1
($000) | Liabilities
Reflected in
Statement of
Assets and
Liabilities1
($000) | Net Amount
Receivable
(Payable)
($000) | Amounts Not Offset in
the
Statement of Assets
and Liabilities | Net
Exposure3
(Not Less
Than $0)
($000) |
| | Collateral
Pledged2
($000) | Collateral
Received2
($000) |
Derivatives Subject to
Offsetting Arrangements, by Counterparty | | | | | | |
| Bank of America, N.A. | 57,596 | (142,590) | (84,994) | 124,529 | — | — |
| Bank of Montreal | 65 | — | 65 | — | — | 65 |
| Bank of New York | 1,943 | (8,670) | (6,727) | 11,055 | — | — |
| Barclays Bank plc | 2,973 | (3,934) | (961) | 2,557 | — | — |
| BNP Paribas | 122,918 | (65,699) | 57,219 | — | 20,620 | 36,599 |
| Citibank, N.A. | 4,171 | (3,268) | 903 | — | 740 | 163 |
| Commonwealth Bank of Australia | 7,529 | (42,793) | (35,264) | 58,054 | — | — |
| Credit Agricole CIB | 7,170 | (5,726) | 1,444 | — | 1,278 | 166 |
| Credit Suisse International | — | (825) | (825) | — | — | — |
| Deutsche Bank AG | 94,125 | (49,063) | 45,062 | — | 18,919 | 26,143 |
| HSBC Bank plc | 95,230 | (216,771) | (121,541) | 191,429 | — | — |
| JPMorgan Chase Bank, N.A. | 190,195 | (52,879) | 137,316 | — | 98,611 | 38,705 |
Total International Bond Index Fund
| | Assets
Reflected in
Statement of
Assets and
Liabilities1
($000) | Liabilities
Reflected in
Statement of
Assets and
Liabilities1
($000) | Net Amount
Receivable
(Payable)
($000) | Amounts Not Offset in
the
Statement of Assets
and Liabilities | Net
Exposure3
(Not Less
Than $0)
($000) |
| | Collateral
Pledged2
($000) | Collateral
Received2
($000) |
| Morgan Stanley Capital Services Inc. | 71,669 | (189,704) | (118,035) | 184,608 | — | — |
| Royal Bank of Canada | 42,558 | (24,754) | 17,804 | — | 10,413 | 7,391 |
| Standard Chartered Bank | 55,876 | (17,691) | 38,185 | — | 22,910 | 15,275 |
| State Street Bank & Trust Co. | 31,472 | (168,613) | (137,141) | 251,264 | — | — |
| Toronto-Dominion Bank | 55,500 | (152,154) | (96,654) | 168,300 | — | — |
| UBS AG | 94,499 | (80,720) | 13,779 | 44,494 | — | 13,779 |
Exchange-Traded
Futures Contracts | 433 | — | 433 | 2,619 | — | — |
| Total | 935,922 | (1,225,854) | (289,932) | 1,038,909 | 173,491 | 138,286 |
1 Absent an event of default or early termination, derivative assets and liabilities are presented gross and not offset in the Statement of Assets and Liabilities.
2 Securities or other assets pledged as collateral are noted in the Schedule of Investments and Statement of Assets and Liabilities. Securities or other assets received as collateral are held in a segregated account and not included in the fund’s security holdings in the Schedule of Investments, which may include amounts not subject to offsetting agreements.
3 Net Exposure represents the net amount receivable from the counterparty in the event of default. Counterparties are not required to exchange collateral if amount is below a specified minimum transfer amount.
5. Federal Income Taxes: The fund intends to continue to qualify as a regulated investment company and distribute virtually all of its taxable income. The fund’s tax returns are open to examination by the relevant tax authorities until expiration of the applicable statute of limitations, which is generally three years after the filing of the tax return. Management has analyzed the fund’s tax positions taken for all open federal and state income tax years, and has concluded that no provision for income tax is required in the fund’s financial statements.
6. Distributions: Distributions to shareholders are recorded on the ex-dividend date. Distributions are determined on a tax basis at the fiscal year-end and may differ from net investment income and realized capital gains for financial reporting purposes.
7. Credit Facilities and Interfund Lending Program: The fund and certain other funds managed by The Vanguard Group ("Vanguard") participate in a $4.4 billion committed credit facility provided by a syndicate of lenders pursuant to a credit agreement and an uncommitted credit facility provided by Vanguard. Both facilities may be renewed annually. Each fund is individually liable for its borrowings, if any, under the credit facilities. Borrowings may be utilized for temporary or emergency purposes and are subject to the fund’s regulatory and contractual borrowing restrictions. With respect to the committed credit facility, the participating funds are charged administrative fees and an annual commitment fee of 0.10% of the undrawn committed amount of the facility, which are allocated to the funds based on a method approved by the fund’s board of trustees and included in Management and Administrative expenses on the fund’s Statement of Operations. Any borrowings under either facility bear interest at an agreed-upon spread plus the higher of the federal funds effective rate, the overnight bank funding rate, or the Daily Simple Secured Overnight Financing Rate inclusive of an additional agreed-upon spread. However, borrowings under the uncommitted credit facility may bear interest based upon an alternate rate agreed to by the fund and Vanguard.
In accordance with an exemptive order (the “Order”) from the SEC, the fund may participate in a joint lending and borrowing program that allows registered open-end Vanguard funds to borrow money from and lend money to each other for temporary or emergency purposes (the “Interfund Lending Program”), subject to compliance with the terms and conditions of the Order, and to the extent permitted by the fund’s investment objective and investment policies. Interfund loans and borrowings normally extend overnight but can have a maximum duration of seven days. Loans may be called on one business day’s notice. The interest rate to be charged is governed by the conditions of the Order and internal procedures adopted by the board of trustees. The board of trustees is responsible for overseeing the Interfund Lending Program.
For the year ended October 31, 2022, the fund did not utilize the credit facilities or the Interfund Lending Program.
8. Other: Interest income includes income distributions received from Vanguard Market Liquidity Fund and is accrued daily. Premiums and discounts on debt securities are amortized and accreted, respectively, to interest income over the lives of the respective securities, except for premiums on
Total International Bond Index Fund
certain callable debt securities that are amortized to the earliest call date. Security transactions are accounted for on the date securities are bought or sold. Costs used to determine realized gains (losses) on the sale of investment securities are those of the specific securities sold.
Each class of shares has equal rights as to assets and earnings, except that each class separately bears certain class-specific expenses related to maintenance of shareholder accounts (included in Management and Administrative expenses) and shareholder reporting. Marketing and distribution expenses are allocated to each class of shares based on a method approved by the board of trustees. Income, other non-class-specific expenses, and gains and losses on investments are allocated to each class of shares based on its relative net assets.
| B. | In accordance with the terms of a Funds' Service Agreement (the “FSA”) between Vanguard and the fund, Vanguard furnishes to the fund investment advisory, corporate management, administrative, marketing, and distribution services at Vanguard’s cost of operations (as defined by the FSA). These costs of operations are allocated to the fund based on methods and guidelines approved by the board of trustees and are generally settled twice a month. |
Upon the request of Vanguard, the fund may invest up to 0.40% of its net assets as capital in Vanguard. At October 31, 2022, the fund had contributed to Vanguard capital in the amount of $3,172,000, representing less than 0.01% of the fund’s net assets and 1.27% of Vanguard’s capital received pursuant to the FSA. The fund’s trustees and officers are also directors and employees, respectively, of Vanguard.
| C. | The fund’s custodian bank has agreed to reduce its fees when the fund maintains cash on deposit in the non-interest-bearing custody account. For the year ended October 31, 2022, custodian fee offset arrangements reduced the fund’s expenses by $7,000 (an annual rate of less than 0.01% of average net assets). |
| D. | Various inputs may be used to determine the value of the fund’s investments and derivatives. These inputs are summarized in three broad levels for financial statement purposes. The inputs or methodologies used to value securities are not necessarily an indication of the risk associated with investing in those securities. |
Level 1—Quoted prices in active markets for identical securities.
Level 2—Other significant observable inputs (including quoted prices for similar securities, interest rates, prepayment speeds, credit risk, etc.).
Level 3—Significant unobservable inputs (including the fund’s own assumptions used to determine the fair value of investments). Any investments and derivatives valued with significant unobservable inputs are noted on the Schedule of Investments.
Total International Bond Index Fund
The following table summarizes the market value of the fund’s investments and derivatives as of October 31, 2022, based on the inputs used to value them:
| | Level 1
($000) | Level 2
($000) | Level 3
($000) | Total
($000) |
| Investments | | | | |
| Assets | | | | |
| U.S. Government and Agency Obligations | — | 894 | — | 894 |
| Asset-Backed/Commercial Mortgage-Backed Securities | — | 664 | — | 664 |
| Corporate Bonds | — | 15,575,092 | — | 15,575,092 |
| Sovereign Bonds | — | 62,446,350 | — | 62,446,350 |
| Temporary Cash Investments | 253,492 | — | — | 253,492 |
| Total | 253,492 | 78,023,000 | — | 78,276,492 |
| Derivative Financial Instruments | | | | |
| Assets | | | | |
| Futures Contracts1 | 107 | — | — | 107 |
| Forward Currency Contracts | — | 935,489 | — | 935,489 |
| Total | 107 | 935,489 | — | 935,596 |
| Liabilities | | | | |
| Futures Contracts1 | 3,283 | — | — | 3,283 |
| Forward Currency Contracts | — | 1,225,854 | — | 1,225,854 |
| Total | 3,283 | 1,225,854 | — | 1,229,137 |
| 1 | Includes cumulative appreciation (depreciation) on futures contracts and centrally cleared swaps, if any, as reported in the Schedule of Investments. Only current day’s variation margin is reported within the Statement of Assets and Liabilities. |
| E. | At October 31, 2022, the fair values of derivatives were reflected in the Statement of Assets and Liabilities as follows: |
| Statement of Assets and Liabilities | Interest Rate
Contracts
($000) | Foreign
Exchange
Contracts
($000) | Total
($000) |
| Unrealized Appreciation—Futures Contracts1 | 107 | — | 107 |
| Unrealized Appreciation—Forward Currency Contracts | — | 935,489 | 935,489 |
| Total Assets | 107 | 935,489 | 935,596 |
| | | | |
| Unrealized Depreciation—Futures Contracts1 | 3,283 | — | 3,283 |
| Unrealized Depreciation—Forward Currency Contracts | — | 1,225,854 | 1,225,854 |
| Total Liabilities | 3,283 | 1,225,854 | 1,229,137 |
| 1 | Includes cumulative appreciation (depreciation) on futures contracts and centrally cleared swaps, if any, as reported in the Schedule of Investments. Only current day’s variation margin is reported within the Statement of Assets and Liabilities. |
Realized net gain (loss) and the change in unrealized appreciation (depreciation) on derivatives for the year ended October 31, 2022, were:
| Realized Net Gain (Loss) on Derivatives | Interest Rate
Contracts
($000) | Foreign
Exchange
Contracts
($000) | Total
($000) |
| Futures Contracts | (10,276) | — | (10,276) |
| Forward Currency Contracts | — | 17,350,201 | 17,350,201 |
| Realized Net Gain (Loss) on Derivatives | (10,276) | 17,350,201 | 17,339,925 |
| Change in Unrealized Appreciation (Depreciation) on Derivatives |
| Futures Contracts | (2,349) | — | (2,349) |
| Forward Currency Contracts | — | (639,164) | (639,164) |
| Change in Unrealized Appreciation (Depreciation) on Derivatives | (2,349) | (639,164) | (641,513) |
| F. | Permanent differences between book-basis and tax-basis components of net assets are reclassified among capital accounts in the financial statements to reflect their tax character. These reclassifications have no effect on net assets or net asset value per share. As of period end, |
Total International Bond Index Fund
permanent differences primarily attributable to the accounting for applicable in-kind redemptions, foreign currency transactions, and tax expense on capital gains were reclassified between the following accounts:
| | Amount
($000) |
| Paid-in Capital | (82,450) |
| Total Distributable Earnings (Loss) | 82,450 |
Temporary differences between book-basis and tax-basis components of total distributable earnings (loss) arise when certain items of income, gain, or loss are recognized in different periods for financial statement and tax purposes; these differences will reverse at some time in the future. The differences are primarily related to the deferral of losses from wash sales; the recognition of unrealized gains or losses from certain derivative contracts; the inclusion of payables for distributions; the recognition of gain or loss from foreign currency hedges; and the treatment of amortization adjustments from certain fixed income securities. As of period end, the tax-basis components of total distributable earnings (loss) are detailed in the table as follows:
| | Amount
($000) |
| Undistributed Ordinary Income | 307,909 |
| Undistributed Long-Term Gains | — |
| Capital Loss Carryforwards | (1,345,128) |
| Qualified Late-Year Losses | — |
| Net Unrealized Gains (Losses) | (10,244,071) |
The tax character of distributions paid was as follows:
| | Year Ended October 31, |
| | 2022
Amount
($000) | 2021
Amount
($000) |
| Ordinary Income* | 3,419,545 | 1,147,385 |
| Long-Term Capital Gains | — | 248,179 |
| Total | 3,419,545 | 1,395,564 |
| * | Includes short-term capital gains, if any. |
As of October 31, 2022, gross unrealized appreciation and depreciation for investments and derivatives based on cost for U.S. federal income tax purposes were as follows:
| | Amount
($000) |
| Tax Cost | 88,436,700 |
| Gross Unrealized Appreciation | 13,649,284 |
| Gross Unrealized Depreciation | (23,809,492) |
| Net Unrealized Appreciation (Depreciation) | (10,160,208) |
| G. | During the year ended October 31, 2022, the fund purchased $44,125,156,000 of investment securities and sold $51,822,853,000 of investment securities, other than U.S. government securities and temporary cash investments. Purchases and sales of U.S. government securities were $0 and $418,000, respectively. Purchases and sales include $0 and $27,062,810,000, respectively, in connection with in-kind purchases and redemptions of the fund's capital shares. |
The fund purchased securities from and sold securities to other Vanguard funds or accounts managed by Vanguard or its affiliates, in accordance with procedures adopted by the board of trustees in compliance with Rule 17a-7 of the Investment Company Act of 1940. For the year ended October 31, 2022, such purchases were $20,273,000 and sales were $5,283,000, resulting in net realized gain of $76,000; these amounts, other than temporary cash investments, are included in the purchases and sales of investment securities noted above.
Total International Bond Index Fund
| H. | Capital share transactions for each class of shares were: |
| | Year Ended October 31, | |
| | 2022 | | 2021 |
| | Amount
($000) | Shares
(000) | | Amount
($000) | Shares
(000) |
| Investor Shares | | | | | |
| Issued | 14,939 | 1,334 | | 2,674,201 | 228,999 |
| Issued in Lieu of Cash Distributions | 904,557 | 81,691 | | 315,494 | 27,384 |
| Redeemed | (29,395,880) | (2,741,979) | | (3,884,387) | (339,539) |
| Net Increase (Decrease)—Investor Shares | (28,476,384) | (2,658,954) | | (894,692) | (83,156) |
| ETF Shares | | | | | |
| Issued | 7,295,220 | 139,392 | | 12,787,381 | 221,849 |
| Issued in Lieu of Cash Distributions | — | — | | — | — |
| Redeemed | (281,092) | (5,700) | | (148,596) | (2,575) |
| Net Increase (Decrease)—ETF Shares | 7,014,128 | 133,692 | | 12,638,785 | 219,274 |
| Admiral Shares | | | | | |
| Issued | 3,720,765 | 177,764 | | 7,576,473 | 327,289 |
| Issued in Lieu of Cash Distributions | 998,753 | 45,929 | | 408,933 | 17,736 |
| Redeemed | (5,474,748) | (264,888) | | (28,235,010) | (1,232,548) |
| Net Increase (Decrease)—Admiral Shares | (755,230) | (41,195) | | (20,249,604) | (887,523) |
| Institutional Shares | | | | | |
| Issued | 2,725,020 | 86,584 | | 6,785,466 | 195,333 |
| Issued in Lieu of Cash Distributions | 459,785 | 14,106 | | 236,584 | 6,798 |
| Redeemed | (2,706,376) | (87,134) | | (34,301,638) | (991,835) |
| Net Increase (Decrease)—Institutional Shares | 478,429 | 13,556 | | (27,279,588) | (789,704) |
| I. | Management has determined that no events or transactions occurred subsequent to October 31, 2022, that would require recognition or disclosure in these financial statements. |
Report of Independent Registered Public Accounting Firm
To the Board of Trustees of Vanguard Charlotte Funds and Shareholders of Vanguard Total International Bond Index Fund
Opinion on the Financial Statements
We have audited the accompanying statement of assets and liabilities, including the schedule of investments, of Vanguard Total International Bond Index Fund (one of the funds constituting Vanguard Charlotte Funds, referred to hereafter as the "Fund") as of October 31, 2022, the related statement of operations for the year ended October 31, 2022, the statement of changes in net assets for each of the two years in the period ended October 31, 2022, including the related notes, and the financial highlights for each of the five years in the period ended October 31, 2022 (collectively referred to as the "financial statements"). In our opinion, the financial statements present fairly, in all material respects, the financial position of the Fund as of October 31, 2022, the results of its operations for the year then ended, the changes in its net assets for each of the two years in the period ended October 31, 2022 and the financial highlights for each of the five years in the period ended October 31, 2022 in conformity with accounting principles generally accepted in the United States of America.
Basis for Opinion
These financial statements are the responsibility of the Fund’s management. Our responsibility is to express an opinion on the Fund’s financial statements based on our audits. We are a public accounting firm registered with the Public Company Accounting Oversight Board (United States) (PCAOB) and are required to be independent with respect to the Fund in accordance with the U.S. federal securities laws and the applicable rules and regulations of the Securities and Exchange Commission and the PCAOB.
We conducted our audits of these financial statements in accordance with the standards of the PCAOB. Those standards require that we plan and perform the audit to obtain reasonable assurance about whether the financial statements are free of material misstatement, whether due to error or fraud.
Our audits included performing procedures to assess the risks of material misstatement of the financial statements, whether due to error or fraud, and performing procedures that respond to those risks. Such procedures included examining, on a test basis, evidence regarding the amounts and disclosures in the financial statements. Our audits also included evaluating the accounting principles used and significant estimates made by management, as well as evaluating the overall presentation of the financial statements. Our procedures included confirmation of securities owned as of October 31, 2022 by correspondence with the custodian, transfer agent and brokers; when replies were not received from brokers, we performed other auditing procedures. We believe that our audits provide a reasonable basis for our opinion.
/s/PricewaterhouseCoopers LLP
Philadelphia, Pennsylvania
December 16, 2022
We have served as the auditor of one or more investment companies in The Vanguard Group of Funds since 1975.
Tax information (unaudited)
The fund hereby designates $936,000, or if subsequently determined to be different, the maximum amount allowable by law, of interest earned from obligations of the U.S. government which is generally exempt from state income tax.
For nonresident alien shareholders, 100% of short-term capital gain dividends distributed by the fund for the fiscal year are qualified short-term capital gains.
The fund distributed $754,138,000 as capital gain dividends (20% rate gain distributions) to shareholders during the fiscal year.
The fund hereby designates 27.2%, or if subsequently determined to be different, the maximum percentage allowable by law, of ordinary income dividends eligible to be treated as interest income for purposes of Section 163(j) and the regulations thereunder for the fiscal year.
The fund designates to shareholders foreign source income of $999,634,000 and foreign taxes paid of $26,032,000, or if subsequently determined to be different, the maximum amounts allowable by law. Shareholders will receive more detailed information with their Form 1099-DIV to determine the calendar-year amounts to be included on their tax returns.
"Bloomberg®" and Bloomberg Global Aggregate ex-USD Float Adjusted RIC Capped Index (USD Hedged) are service marks of Bloomberg Finance L.P. and its affiliates, including Bloomberg Index Services Limited (BISL), the administrator of the index (collectively, Bloomberg), and have been licensed for use for certain purposes by The Vanguard Group, Inc. (Vanguard).
The Total International Bond Index Fund is not sponsored, endorsed, sold or promoted by Bloomberg. Bloomberg does not make any representation or warranty, express or implied, to the owners of or counterparties to the Total International Bond Index Fund or any member of the public regarding the advisability of investing in securities generally or in the Total International Bond Index Fund particularly. The only relationship of Bloomberg to Vanguard is the licensing of certain trademarks, trade names and service marks and of the Bloomberg Global Aggregate ex-USD Float Adjusted RIC Capped Index (USD Hedged), which is determined, composed and calculated by BISL without regard to Vanguard or the Total International Bond Index Fund. Bloomberg has no obligation to take the needs of Vanguard or the owners of the Total International Bond Index Fund into consideration in determining, composing or calculating the Bloomberg Global Aggregate ex-USD Float Adjusted RIC Capped Index (USD Hedged). Bloomberg is not responsible for and has not participated in the determination of the timing of, prices at, or quantities of the Total International Bond Index Fund to be issued. Bloomberg shall not have any obligation or liability, including, without limitation, to Total International Bond Index Fund customers, in connection with the administration, marketing or trading of the Total International Bond Index Fund.
BLOOMBERG DOES NOT GUARANTEE THE ACCURACY AND/OR THE COMPLETENESS OF THE BLOOMBERG GLOBAL AGGREGATE EX-USD FLOAT ADJUSTED RIC CAPPED INDEX (USD HEDGED) OR ANY DATA RELATED THERETO AND SHALL HAVE NO LIABILITY FOR ANY ERRORS, OMISSIONS OR INTERRUPTIONS THEREIN. BLOOMBERG DOES NOT MAKE ANY WARRANTY, EXPRESS OR IMPLIED, AS TO RESULTS TO BE OBTAINED BY VANGUARD, OWNERS OF THE TOTAL INTERNATIONAL BOND INDEX FUND OR ANY OTHER PERSON OR ENTITY FROM THE USE OF THE BLOOMBERG GLOBAL AGGREGATE EX-USD FLOAT ADJUSTED RIC CAPPED INDEX (USD HEDGED) OR ANY DATA RELATED THERETO. BLOOMBERG DOES NOT MAKE ANY EXPRESS OR IMPLIED WARRANTIES AND EXPRESSLY DISCLAIMS ALL WARRANTIES OF MERCHANTABILITY OR FITNESS FOR A PARTICULAR PURPOSE OR USE WITH RESPECT TO THE BLOOMBERG GLOBAL AGGREGATE EX-USD FLOAT ADJUSTED RIC CAPPED INDEX (USD HEDGED) OR ANY DATA RELATED THERETO. WITHOUT LIMITING ANY OF THE FOREGOING, TO THE MAXIMUM EXTENT ALLOWED BY LAW, BLOOMBERG, ITS LICENSORS, AND ITS AND THEIR RESPECTIVE EMPLOYEES, CONTRACTORS, AGENTS, SUPPLIERS, AND VENDORS SHALL HAVE NO LIABILITY OR RESPONSIBILITY WHATSOEVER FOR ANY INJURY OR DAMAGES—WHETHER DIRECT, INDIRECT, CONSEQUENTIAL, INCIDENTAL, PUNITIVE OR OTHERWISE—ARISING IN CONNECTION WITH THE TOTAL INTERNATIONAL BOND INDEX FUND OR BLOOMBERG GLOBAL AGGREGATE EX-USD FLOAT ADJUSTED RIC CAPPED INDEX (USD HEDGED) OR ANY DATA OR VALUES RELATING THERETO—WHETHER ARISING FROM THEIR NEGLIGENCE OR OTHERWISE, EVEN IF NOTIFIED OF THE POSSIBILITY THEREOF.
© 2022 Bloomberg.
Used with Permission. Source: Bloomberg Index Services Limited. Copyright 2022, Bloomberg. All rights reserved.
This page intentionally left blank.
The People Who Govern Your Fund
The trustees of your mutual fund are there to see that the fund is operated and managed in your best interests since, as a shareholder, you are a part owner of the fund. Your fund’s trustees also serve on the board of directors of The Vanguard Group, Inc., which is owned by the Vanguard funds and provides services to them.
A majority of Vanguard’s board members are independent, meaning that they have no affiliation with Vanguard or the funds they oversee, apart from the sizable personal investments they have made as private individuals. The independent board members have distinguished backgrounds in business, academia, and public service. Each of the trustees and executive officers oversees 206 Vanguard funds.
Information for each trustee and executive officer of the fund appears below. That information, as well as the Vanguard fund count, is as of the date on the cover of this fund report. The mailing address of the trustees and officers is P.O. Box 876, Valley Forge, PA 19482. More information about the trustees is in the Statement of Additional Information, which can be obtained, without charge, by contacting Vanguard at 800-662-7447, or online at vanguard.com.
Interested Trustee1
Mortimer J. Buckley
Born in 1969. Trustee since January 2018. Principal occupation(s) during the past five years and other experience: chairman of the board (2019–present) of Vanguard and of each of the investment companies served by Vanguard; chief executive officer (2018–present) of Vanguard; chief executive officer, president, and trustee (2018–present) of each of the investment companies served by Vanguard; president and director (2017–present) of Vanguard; and president (2018–present) of Vanguard Marketing Corporation. Chief investment officer (2013–2017), managing director (2002–2017), head of the Retail Investor Group (2006–2012), and chief information officer (2001–2006) of Vanguard. Member of the board of governors of the Investment Company Institute and the board of governors of FINRA. Trustee and vice chair of The Shipley School.
Independent Trustees
Tara Bunch
Born in 1962. Trustee since November 2021. Principal occupation(s) during the past five years and other experience: head of global operations at Airbnb (2020–present). Vice president of AppleCare (2012–2020). Member of the board of directors of Out & Equal (2002–2006), the advisory board of the University of California, Berkeley School of Engineering (2020–present), and the advisory board of Santa Clara University’s Leavey School of Business (2018–present).
Emerson U. Fullwood
Born in 1948. Trustee since January 2008. Principal occupation(s) during the past five years and other experience: executive chief staff and marketing officer for North America and corporate vice president (retired 2008) of Xerox Corporation (document management products and services). Former president of the Worldwide Channels Group, Latin America, and Worldwide Customer Service and executive chief staff officer of Developing Markets of Xerox. Executive in residence and 2009–2010 Distinguished Minett Professor at the Rochester Institute of Technology. Member of the board of directors of the University of Rochester Medical Center, the Monroe Community College Foundation, the United Way of Rochester, North Carolina A&T University, Roberts Wesleyan College, and the Rochester Philharmonic Orchestra. Trustee of the University of Rochester.
F. Joseph Loughrey
Born in 1949. Trustee since October 2009. Principal occupation(s) during the past five years and other experience: president and chief operating officer (retired 2009) and vice chairman of the board (2008–2009) of Cummins Inc. (industrial machinery). Chairman of the board of Hillenbrand, Inc. (specialized consumer services). Director of the V Foundation. Member of the advisory council for the College of Arts and Letters at the University of Notre Dame. Chairman of the board of Saint Anselm College.
Mark Loughridge
Born in 1953. Trustee since March 2012. Principal occupation(s) during the past five years and other experience: senior vice president and chief financial officer (retired 2013) of IBM (information technology services). Fiduciary member of IBM’s Retirement Plan Committee (2004–2013), senior vice president and general manager (2002–2004) of IBM Global Financing, vice president and controller (1998–2002) of IBM, and a variety of other prior management roles at IBM. Member of the Council on Chicago Booth.
Scott C. Malpass
Born in 1962. Trustee since March 2012. Principal occupation(s) during the past five years and other experience: adjunct professor of finance at the University of Notre Dame (2020–present). Chief investment officer (retired 2020) and vice president (retired 2020) of the University of Notre Dame. Assistant professor (retired June 2020) of finance at the Mendoza College of Business, University of Notre Dame, and member of the Notre Dame 403(b) Investment Committee. Member of the board of Catholic Investment Services, Inc. (investment advisors), the board of superintendence of the Institute for the Works of Religion, and the board of directors of Paxos Trust Company (finance).
Deanna Mulligan
Born in 1963. Trustee since January 2018. Principal occupation(s) during the past five years and other experience: chief executive officer of Purposeful (advisory firm for CEOs and C-level executives; 2021–present). Board chair (2020), chief executive officer (2011–2020), and president (2010–2019) of The Guardian Life Insurance Company of America. Chief operating officer (2010–2011) and executive vice president (2008–2010) of Individual Life and Disability of the Guardian Life Insurance Company of America. Member of the board of the Economic Club of New York. Trustee of the Partnership for New York City
(business leadership), Chief Executives for Corporate Purpose, and the NewYork-Presbyterian Hospital.
André F. Perold
Born in 1952. Trustee since December 2004. Principal occupation(s) during the past five years and other experience: George Gund Professor of Finance and Banking, Emeritus at the Harvard Business School (retired 2011). Chief investment officer and co-managing partner of HighVista Strategies (private investment firm). Member of the board (2018–present) of RIT Capital Partners (investment firm). Member of the investment committee of Partners Health
Care System.
Sarah Bloom Raskin
Born in 1961. Trustee since January 2018. Principal occupation(s) during the past five years and other experience: deputy secretary (2014–2017) of the United States Department of the Treasury. Governor (2010–2014) of the Federal Reserve Board. Commissioner (2007–2010) of financial regulation for the State of Maryland. Colin W. Brown Distinguished Professor of the Practice of Law (2021–present), professor (2020–present), Distinguished Fellow of the Global Financial Markets Center (2020–present), and Rubenstein Fellow (2017–2020) at Duke University. Trustee (2017–present) of Amherst College and member of Amherst College Investment Committee (2019–present). Member of the Regenerative Crisis Response Committee (2020–present).
David A. Thomas
Born in 1956. Trustee since July 2021. Principal occupation(s) during the past five years and other experience: president of Morehouse College (2018–present). Professor of business administration, emeritus at Harvard University (2017–2018). Dean (2011–2016) and professor of management (2016–2017) at the Georgetown University McDonough School of Business. Director of DTE Energy Company (2013–present). Trustee of Common Fund (2019–present).
Peter F. Volanakis
Born in 1955. Trustee since July 2009. Principal occupation(s) during the past five years and other experience: president and chief operating officer (retired 2010) of Corning Incorporated (communications equipment) and director of Corning Incorporated (2000–2010) and Dow Corning (2001–2010). Director (2012) of SPX Corporation (multi-industry manufacturing). Overseer of the Amos Tuck School of Business Administration, Dartmouth
1 Mr. Buckley is considered an “interested person,” as defined in the Investment Company Act of 1940, because he is an officer of the Vanguard funds.
College (2001–2013). Member of the BMW Group Mobility Council.
Executive Officers
Christine M. Buchanan
Born in 1970. Principal occupation(s) during the past five years and other experience: principal of Vanguard. Chief financial officer (2021–present) and treasurer (2017–present) of each of the investment companies served by Vanguard. Partner (2005–2017) at KPMG (audit, tax, and advisory services).
John Galloway
Born in 1973. Principal occupation(s) during the past five years and other experience: principal of Vanguard. Investment stewardship officer (September 2020–present) of each of the investment companies served by Vanguard. Head of Investor Advocacy (February 2020–present) and head of Marketing Strategy and Planning (2017–2020) at Vanguard. Special assistant to the President of the United States (2015).
Ashley Grim
Born in 1984. Principal occupation(s) during the past five years and other experience: treasurer (February 2022–present) of each of the investment companies served by Vanguard. Fund transfer agent controller (2019–2022) and director of Audit Services (2017–2019) at Vanguard. Senior manager (2015–2017) at PriceWaterhouseCoopers (audit and assurance, consulting, and tax services).
Peter Mahoney
Born in 1974. Principal occupation(s) during the past five years and other experience: principal of Vanguard. Controller (2015–present) of each of the investment companies served by Vanguard. Head of International Fund Services (2008–2014) at Vanguard.
Anne E. Robinson
Born in 1970. Principal occupation(s) during the past five years and other experience: general counsel (2016–present) of Vanguard. Secretary (2016–present) of Vanguard and of each of the investment companies served by Vanguard. Managing director (2016–present) of Vanguard. Managing director and general counsel of Global Cards and Consumer Services (2014–2016) at Citigroup. Counsel (2003–2014) at American Express. Nonexecutive director of the board of National Grid (energy).
Michael Rollings
Born in 1963. Principal occupation(s) during the past five years and other experience: finance director (2017–present) and treasurer (2017) of each of the investment companies served by Vanguard. Managing director (2016–present) of Vanguard. Chief financial officer (2016–present) of Vanguard. Director (2016–present) of Vanguard Marketing Corporation. Executive vice president and chief financial officer (2006–2016) of MassMutual Financial Group.
John E. Schadl
Born in 1972. Principal occupation(s) during the past five years and other experience: principal of Vanguard. Chief compliance officer (2019–present) of Vanguard and of each of the investment companies served by Vanguard. Assistant vice president (2019–present) of Vanguard Marketing Corporation.
Vanguard Senior Management Team
| Matthew Benchener | Thomas M. Rampulla |
| Joseph Brennan | Karin A. Risi |
| Mortimer J. Buckley | Anne E. Robinson |
| Gregory Davis | Michael Rollings |
| John James | Nitin Tandon |
| Chris D. Mclsaac | Lauren Valente |
Connect with Vanguard®>vanguard.com
Fund Information > 800-662-7447
Direct Investor Account Services > 800-662-2739
Institutional Investor Services > 800-523-1036
Text Telephone for People Who Are Deaf or Hard of Hearing > 800-749-7273
This material may be used in conjunction with the offering of shares of any Vanguard fund only if preceded or accompanied by the fund’s current prospectus.
All comparative mutual fund data are from Morningstar, Inc., unless otherwise noted.
You can obtain a free copy of Vanguard’s proxy voting guidelines by visiting vanguard.com/proxyreporting or by calling Vanguard at 800-662-2739. The guidelines are also available from the SEC’s website, www.sec.gov. In addition, you may obtain a free report on how your fund voted the proxies for securities it owned during the 12 months ended June 30. To get the report, visit either vanguard.com/proxyreporting or www.sec.gov.
You can review information about your fund on the SEC’s website, and you can receive copies of this information, for a fee, by sending a request via email addressed to publicinfo@sec.gov.
© 2022 The Vanguard Group, Inc.
All rights reserved.
U.S. Patent Nos. 6,879,964.
Vanguard Marketing Corporation, Distributor.
Q12310 122022
Annual Report | October 31, 2022
Vanguard Total International Bond II Index Fund
Contents
Your Fund’s Performance at a Glance
| 1 |
About Your Fund’s Expenses
| 2 |
Performance Summary
| 3 |
Financial Statements
| 5 |
Please note: The opinions expressed in this report are just that—informed opinions. They should not be considered promises or advice. Also, please keep in mind that the information and opinions cover the period through the date on the front of this report. Of course, the risks of investing in your fund are spelled out in the prospectus.
Your Fund’s Performance at a Glance
| • | The 12 months ended October 31, 2022, were a volatile, challenging period for financial markets. In this environment, Vanguard Total International Bond II Index Fund returned –12.30% for Investor Shares and –12.24% for Institutional Shares, roughly in line with the –12.08% return of its expense-free benchmark index. |
| • | The economic backdrop deteriorated as inflation soared to multidecade highs, fueled in part by higher energy and food prices in the wake of Russia’s invasion of Ukraine. Then price increases broadened to other categories of goods and services, adding to concerns that inflation would remain stubbornly high. That prompted aggressive tightening by many central banks to bring inflation back in check, which weighed on bond prices and increased fears of recession. |
| • | Bond yields moved higher across much of the developed world during the fiscal year amid concerns about inflation and central bank tightening. In general, bonds in eastern Europe produced the worst results. Bonds in Great Britain and the European Union also lagged. Japanese issues, the largest in the benchmark by weight, held up somewhat better. |
| • | The fund regularly uses derivatives to hedge portfolio risks. Its holdings of forward currency contracts helped performance for the period. |
| • | At the end of the 12-month period, the fund’s 30-day SEC yield—a proxy for its income-generating potential over 12 months—stood at 2.91% for Investor Shares and 2.97% for Institutional Shares. |
Market Barometer
Average Annual Total Returns
Periods Ended October 31, 2022 |
| | One Year | Three Years | Five Years |
| Stocks | | | |
| Russell 1000 Index (Large-caps) | -16.38% | 9.99% | 10.19% |
| Russell 2000 Index (Small-caps) | -18.54 | 7.05 | 5.56 |
| Russell 3000 Index (Broad U.S. market) | -16.52 | 9.79 | 9.87 |
| FTSE All-World ex US Index (International) | -24.20 | -1.16 | -0.18 |
| Bonds | | | |
Bloomberg U.S. Aggregate Float Adjusted Index
(Broad taxable market) | -15.69% | -3.73% | -0.50% |
Bloomberg Municipal Bond Index
(Broad tax-exempt market) | -11.98 | -2.18 | 0.37 |
| FTSE Three-Month U.S. Treasury Bill Index | 0.88 | 0.59 | 1.15 |
| CPI | | | |
| Consumer Price Index | 7.75% | 5.01% | 3.85% |
About Your Fund’s Expenses
As a shareholder of the fund, you incur ongoing costs, which include costs for portfolio management, administrative services, and shareholder reports (like this one), among others. Operating expenses, which are deducted from a fund’s gross income, directly reduce the investment return of the fund.
A fund’s expenses are expressed as a percentage of its average net assets. This figure is known as the expense ratio. The following examples are intended to help you understand the ongoing costs (in dollars) of investing in your fund and to compare these costs with those of other mutual funds. The examples are based on an investment of $1,000 made at the beginning of the period shown and held for the entire period.
The accompanying table illustrates your fund’s costs in two ways:
| • | Based on actual fund return. This section helps you to estimate the actual expenses that you paid over the period. The ”Ending Account Value“ shown is derived from the fund‘s actual return, and the third column shows the dollar amount that would have been paid by an investor who started with $1,000 in the fund. You may use the information here, together with the amount you invested, to estimate the expenses that you paid over the period. |
To do so, simply divide your account value by $1,000 (for example, an $8,600 account value divided by $1,000 = 8.6), then multiply the result by the number given for your fund under the heading ”Expenses Paid During Period.“
| • | Based on hypothetical 5% yearly return. This section is intended to help you compare your fund‘s costs with those of other mutual funds. It assumes that the fund had a yearly return of 5% before expenses, but that the expense ratio is unchanged. In this case—because the return used is not the fund’s actual return—the results do not apply to your investment. The example is useful in making comparisons because the Securities and Exchange Commission requires all mutual funds to calculate expenses based on a 5% return. You can assess your fund’s costs by comparing this hypothetical example with the hypothetical examples that appear in shareholder reports of other funds. |
Note that the expenses shown in the table are meant to highlight and help you compare ongoing costs only and do not reflect transaction costs incurred by the fund for buying and selling securities. Further, the expenses do not include any purchase, redemption, or account service fees described in the fund prospectus. If such fees were applied to your account, your costs would be higher. Your fund does not carry a “sales load.”
The calculations assume no shares were bought or sold during the period. Your actual costs may have been higher or lower, depending on the amount of your investment and the timing of any purchases or redemptions.
You can find more information about the fund’s expenses, including annual expense ratios, in the Financial Statements section of this report. For additional information on operating expenses and other shareholder costs, please refer to your fund’s current prospectus.
| Six Months Ended October 31, 2022 | | | |
| | Beginning
Account Value
4/30/2022 | Ending
Account Value
10/31/2022 | Expenses
Paid During
Period |
| Based on Actual Fund Return | | | |
| Total International Bond II Index Fund | | | |
| Investor Shares | $1,000.00 | $945.50 | $0.64 |
| Institutional Shares | 1,000.00 | 945.50 | 0.34 |
| Based on Hypothetical 5% Yearly Return | | | |
| Total International Bond II Index Fund | | | |
| Investor Shares | $1,000.00 | $1,024.55 | $0.66 |
| Institutional Shares | 1,000.00 | 1,024.85 | 0.36 |
The calculations are based on expenses incurred in the most recent six-month period. The fund’s annualized six-month expense ratios for that period are 0.13% for Investor Shares, and 0.07% for Institutional Shares. The dollar amounts shown as “Expenses Paid” are equal to the annualized expense ratio multiplied by the average account value over the period, multiplied by the number of days in the most recent six-month period, then divided by the number of days in the most recent 12-month period (184/365).
Total International Bond II Index Fund
All of the returns in this report represent past performance, which is not a guarantee of future results that may be achieved by the fund. (Current performance may be lower or higher than the performance data cited. For performance data current to the most recent month-end, visit our website at vanguard.com/performance.) Note, too, that both investment returns and principal value can fluctuate widely, so an investor’s shares, when sold, could be worth more or less than their original cost. The returns shown do not reflect taxes that a shareholder would pay on fund distributions or on the sale of fund shares.
Cumulative Performance: February 26, 2021, Through October 31, 2022
Initial Investment of $10,000
| | | | Average Annual Total Returns
Periods Ended October 31, 2022 |
| | | One
Year | Since
Inception
(2/26/2021) | Final Value
of a $10,000
Investment |
 | Total International Bond II Index Fund Investor Shares | -12.30% | -7.69% | $8,745 |
 | Bloomberg Global Aggregate ex-USD Float
Adjusted RIC Capped Index Hedged | -12.08 | -7.50 | 8,774 |
“Since Inception” performance is calculated from the Investor Shares’ inception date for both the fund and its comparative standard(s).
| | | | |
| | | One
Year | Since
Inception
(2/17/2021) | Final Value
of a $5,000,000
Investment |
| Total International Bond II Index Fund Institutional Shares | -12.24% | -8.10% | $4,330,777 |
Bloomberg Global Aggregate ex-USD Float
Adjusted RIC Capped Index Hedged | -12.08 | -7.91 | 4,345,646 |
“Since Inception” performance is calculated from the Institutional Shares’ inception date for both the fund and its comparative standard(s).
See Financial Highlights for dividend and capital gains information.
Total International Bond II Index Fund
| Japan | 16.5% |
| France | 11.8 |
| Germany | 11.1 |
| Italy | 7.3 |
| Canada | 6.8 |
| United Kingdom | 6.4 |
| Spain | 5.3 |
| Supranational | 4.2 |
| Australia | 3.7 |
| United States | 2.9 |
| South Korea | 2.8 |
| Netherlands | 2.8 |
| Belgium | 2.1 |
| Switzerland | 1.5 |
| Sweden | 1.4 |
| Austria | 1.4 |
| China | 1.2 |
| Indonesia | 1.2 |
| Other | 9.6 |
The table reflects the fund’s investments, except for short-term investments and derivatives.
The fund may invest in derivatives (such as futures and swap contracts) for various reasons, including, but not limited to, attempting to remain fully invested and tracking its target index as closely as possible.
Total International Bond II Index Fund
The fund files its complete schedule of portfolio holdings with the Securities and Exchange Commission (SEC) for the first and third quarters of each fiscal year as an exhibit to its reports on Form N-PORT. The fund’s Form N-PORT reports are available on the SEC’s website at www.sec.gov.
| | | Coupon | Maturity
Date | Currency | Face
Amount
(000) | Market
Value•
($000) |
| U.S. Government and Agency Obligations (0.0%) | | | |
| | Tennessee Valley Authority (Cost $1,274) | 5.625% | 6/7/32 | GBP | 684 | 854 |
| Asset-Backed/Commercial Mortgage-Backed Securities (0.0%) | | | |
| United Kingdom (0.0%) | | | |
| 1 | Canary Wharf Finance II plc (Cost $1,028) | 5.952% | 10/22/37 | GBP | 650 | 757 |
| Corporate Bonds (19.8%) | | | |
| Australia (0.5%) | | | |
| | Amcor UK Finance plc | 1.125% | 6/23/27 | EUR | 2,457 | 2,076 |
| | Ampol Ltd. | 4.000% | 4/17/25 | AUD | 6,920 | 4,308 |
| | APA Infrastructure Ltd. | 2.000% | 7/15/30 | EUR | 5,000 | 4,024 |
| | APA Infrastructure Ltd. | 3.125% | 7/18/31 | GBP | 1,000 | 890 |
| | APT Pipelines Ltd. | 4.250% | 11/26/24 | GBP | 552 | 611 |
| | APT Pipelines Ltd. | 2.000% | 3/22/27 | EUR | 4,091 | 3,625 |
| | APT Pipelines Ltd. | 0.750% | 3/15/29 | EUR | 4,400 | 3,399 |
| | APT Pipelines Ltd. | 1.250% | 3/15/33 | EUR | 1,892 | 1,301 |
| | APT Pipelines Ltd. | 2.500% | 3/15/36 | GBP | 4,924 | 3,505 |
| | Aurizon Network Pty Ltd. | 4.000% | 6/21/24 | AUD | 570 | 359 |
| | Aurizon Network Pty Ltd. | 2.000% | 9/18/24 | EUR | 1,455 | 1,379 |
| | Aurizon Network Pty Ltd. | 3.125% | 6/1/26 | EUR | 19,081 | 17,986 |
| | Ausgrid Finance Pty Ltd. | 3.750% | 10/30/24 | AUD | 7,000 | 4,376 |
| | Ausgrid Finance Pty Ltd. | 1.250% | 7/30/25 | EUR | 1,590 | 1,468 |
| | Ausgrid Finance Pty Ltd. | 1.814% | 2/5/27 | AUD | 990 | 541 |
| | AusNet Services Holdings Pty Ltd. | 3.000% | 2/13/24 | EUR | 1,906 | 1,868 |
| | AusNet Services Holdings Pty Ltd. | 1.500% | 2/26/27 | EUR | 2,231 | 1,986 |
| | AusNet Services Holdings Pty Ltd. | 4.400% | 8/16/27 | AUD | 390 | 236 |
| | AusNet Services Holdings Pty Ltd. | 4.200% | 8/21/28 | AUD | 1,390 | 803 |
| | AusNet Services Holdings Pty Ltd. | 2.600% | 7/31/29 | AUD | 14,200 | 7,189 |
| | AusNet Services Holdings Pty Ltd. | 1.625% | 3/11/81 | EUR | 200 | 154 |
| | Australia & New Zealand Banking Group Ltd. | 5.000% | 8/16/23 | AUD | 2,750 | 1,770 |
| | Australia & New Zealand Banking Group Ltd. | 0.450% | 11/22/23 | EUR | 7,821 | 7,556 |
| | Australia & New Zealand Banking Group Ltd. | 2.500% | 1/16/24 | EUR | 2,457 | 2,421 |
| | Australia & New Zealand Banking Group Ltd. | 3.100% | 2/8/24 | AUD | 6,766 | 4,253 |
| | Australia & New Zealand Banking Group Ltd. | 0.669% | 5/5/31 | EUR | 4,400 | 3,641 |
| | Australia Pacific Airports Melbourne Pty Ltd. | 3.125% | 9/26/23 | EUR | 2,457 | 2,419 |
| | Australia Pacific Airports Melbourne Pty Ltd. | 1.750% | 10/15/24 | EUR | 6,818 | 6,434 |
| | Bank of Queensland Ltd. | 0.125% | 6/4/24 | EUR | 18,890 | 17,864 |
| | BHP Billiton Finance Ltd. | 3.250% | 9/25/24 | GBP | 3,000 | 3,345 |
| | BHP Billiton Finance Ltd. | 3.250% | 9/24/27 | EUR | 7,847 | 7,584 |
| | BHP Billiton Finance Ltd. | 1.500% | 4/29/30 | EUR | 2,801 | 2,286 |
| | BHP Billiton Finance Ltd. | 3.125% | 4/29/33 | EUR | 6,455 | 5,710 |
| | BHP Billiton Finance Ltd. | 4.300% | 9/25/42 | GBP | 7,316 | 7,072 |
| | Brambles Finance Ltd. | 2.375% | 6/12/24 | EUR | 200 | 193 |
| | Brisbane Airport Corp. Pty Ltd. | 3.900% | 4/24/25 | AUD | 1,880 | 1,165 |
| | CIMIC Finance Ltd. | 1.500% | 5/28/29 | EUR | 200 | 143 |
| | Coles Group Treasury Pty Ltd. | 2.650% | 11/6/29 | AUD | 890 | 461 |
| | Coles Group Treasury Pty Ltd. | 2.100% | 8/27/30 | AUD | 640 | 306 |
| | Commonwealth Bank of Australia | 3.000% | 1/11/24 | AUD | 8,700 | 5,470 |
| | Commonwealth Bank of Australia | 0.375% | 4/11/24 | EUR | 5,960 | 5,687 |
| | Commonwealth Bank of Australia | 0.500% | 7/27/26 | EUR | 13,235 | 11,896 |
| | Commonwealth Bank of Australia | 3.000% | 9/4/26 | GBP | 3,324 | 3,567 |
| | Commonwealth Bank of Australia | 0.750% | 2/28/28 | EUR | 7,000 | 6,104 |
| | Commonwealth Bank of Australia | 0.875% | 2/19/29 | EUR | 4,913 | 4,211 |
| | Commonwealth Bank of Australia | 1.936% | 10/3/29 | EUR | 4,568 | 4,236 |
| | CPIF Finance Pty Ltd. | 2.485% | 10/28/30 | AUD | 3,800 | 1,823 |
| | DBNGP Finance Co. Pty Ltd. | 4.225% | 5/28/25 | AUD | 1,430 | 891 |
| | DEXUS Finance Pty Ltd. | 3.000% | 2/3/32 | AUD | 2,780 | 1,343 |
| | ETSA Utilities Finance Pty Ltd. | 3.500% | 8/29/24 | AUD | 350 | 219 |
| | GAIF Bond Issuer Pty Ltd. | 2.584% | 11/18/27 | AUD | 2,200 | 1,228 |
Total International Bond II Index Fund
| | | Coupon | Maturity
Date | Currency | Face
Amount
(000) | Market
Value•
($000) |
| | GAIF Bond Issuer Pty Ltd. | 1.900% | 12/14/28 | AUD | 2,260 | 1,152 |
| | Glencore Capital Finance DAC | 1.125% | 3/10/28 | EUR | 7,930 | 6,371 |
| | Glencore Capital Finance DAC | 1.250% | 3/1/33 | EUR | 3,771 | 2,448 |
| | Glencore Finance Europe Ltd. | 1.875% | 9/13/23 | EUR | 200 | 194 |
| | Glencore Finance Europe Ltd. | 0.625% | 9/11/24 | EUR | 6,000 | 5,544 |
| | Glencore Finance Europe Ltd. | 1.750% | 3/17/25 | EUR | 2,592 | 2,412 |
| | Glencore Finance Europe Ltd. | 3.125% | 3/26/26 | GBP | 1,476 | 1,511 |
| | Glencore Finance Europe Ltd. | 3.750% | 4/1/26 | EUR | 100 | 96 |
| | Glencore Finance Europe Ltd. | 1.500% | 10/15/26 | EUR | 4,100 | 3,598 |
| | Goodman Australia Finance Pty Ltd. | 1.375% | 9/27/25 | EUR | 1,906 | 1,722 |
| | GTA Finance Co Pty Ltd. | 2.200% | 8/26/27 | AUD | 1,190 | 641 |
| | Lendlease Finance Ltd. | 3.400% | 10/27/27 | AUD | 2,070 | 1,162 |
| | Lendlease Finance Ltd. | 3.700% | 3/31/31 | AUD | 1,020 | 512 |
| | Lonsdale Finance Pty Ltd. | 3.900% | 10/15/25 | AUD | 2,480 | 1,530 |
| | Lonsdale Finance Pty Ltd. | 2.100% | 10/15/27 | AUD | 510 | 275 |
| | Macquarie Bank Ltd. | 1.700% | 2/12/25 | AUD | 3,000 | 1,784 |
| | Macquarie Group Ltd. | 1.250% | 3/5/25 | EUR | 7,821 | 7,446 |
| | Macquarie Group Ltd. | 0.350% | 3/3/28 | EUR | 9,684 | 7,595 |
| | Macquarie Group Ltd. | 4.080% | 5/31/29 | GBP | 4,300 | 4,272 |
| | Macquarie Group Ltd. | 2.723% | 8/21/29 | CAD | 1,605 | 984 |
| | Macquarie Group Ltd. | 0.950% | 5/21/31 | EUR | 4,786 | 3,401 |
| | National Australia Bank Ltd. | 2.900% | 2/26/24 | AUD | 8,156 | 5,112 |
| | National Australia Bank Ltd. | 5.000% | 3/11/24 | AUD | 3,500 | 2,252 |
| | National Australia Bank Ltd. | 0.250% | 5/20/24 | EUR | 4,913 | 4,633 |
| | National Australia Bank Ltd. | 0.300% | 10/31/25 | CHF | 4,855 | 4,599 |
| | National Australia Bank Ltd. | 3.000% | 9/4/26 | GBP | 100 | 108 |
| | National Australia Bank Ltd. | 0.875% | 2/19/27 | EUR | 5,913 | 5,319 |
| | National Australia Bank Ltd. | 2.900% | 2/25/27 | AUD | 10,454 | 6,119 |
| | National Australia Bank Ltd. | 0.010% | 1/6/29 | EUR | 20,000 | 16,236 |
| | National Australia Bank Ltd. | 3.515% | 6/12/30 | CAD | 4,102 | 2,808 |
| | National Australia Bank Ltd. | 1.699% | 9/15/31 | GBP | 4,036 | 3,748 |
| | NBN Co. Ltd. | 1.000% | 12/3/25 | AUD | 1,000 | 568 |
| | NBN Co. Ltd. | 2.150% | 6/2/28 | AUD | 350 | 188 |
| | NBN Co. Ltd. | 2.200% | 12/16/30 | AUD | 8,520 | 4,116 |
| | NSW Electricity Networks Finance Pty Ltd. | 2.732% | 4/23/29 | AUD | 760 | 393 |
| | Optus Finance Pty Ltd. | 2.500% | 7/1/30 | AUD | 10,200 | 5,186 |
| | Optus Finance Pty Ltd. Co. | 1.600% | 7/1/25 | AUD | 200 | 117 |
| | Optus Finance Pty Ltd. Co. | 2.600% | 11/24/28 | AUD | 500 | 271 |
| | Origin Energy Finance Ltd. | 1.000% | 9/17/29 | EUR | 2,501 | 1,838 |
| | Pacific National Finance Pty Ltd. | 5.000% | 9/19/23 | GBP | 200 | 225 |
| | Pacific National Finance Pty Ltd. | 3.700% | 9/24/29 | AUD | 5,000 | 2,635 |
| | Qantas Airways Ltd. | 3.150% | 9/27/28 | AUD | 4,440 | 2,372 |
| | Qantas Airways Ltd. | 2.950% | 11/27/29 | AUD | 5,260 | 2,604 |
| | Qantas Airways Ltd. | 5.250% | 9/9/30 | AUD | 6,470 | 3,674 |
| | Scentre Group Trust 1 | 2.250% | 7/16/24 | EUR | 1,859 | 1,774 |
| | Scentre Group Trust 1 | 3.875% | 7/16/26 | GBP | 2,259 | 2,398 |
| | Scentre Group Trust 1 / Scentre Group Trust 2 | 1.750% | 4/11/28 | EUR | 6,461 | 5,372 |
| | Scentre Group Trust 1 / Scentre Group Trust 2 | 1.450% | 3/28/29 | EUR | 3,042 | 2,357 |
| | SGSP Australia Assets Pty Ltd. | 1.843% | 9/15/28 | AUD | 2,000 | 1,016 |
| | Stockland Trust | 1.625% | 4/27/26 | EUR | 5,615 | 4,900 |
| | Suncorp-Metway Ltd. | 3.000% | 9/13/23 | AUD | 1,400 | 876 |
| | Suncorp-Metway Ltd. | 3.250% | 8/24/26 | AUD | 600 | 361 |
| | Telstra Corp. Ltd. | 1.125% | 4/14/26 | EUR | 5,590 | 5,144 |
| | Telstra Corp. Ltd. | 4.000% | 4/19/27 | AUD | 1,110 | 678 |
| | Telstra Corp. Ltd. | 1.375% | 3/26/29 | EUR | 2,737 | 2,374 |
| | Telstra Corp. Ltd. | 1.000% | 4/23/30 | EUR | 2,457 | 2,023 |
| | Toyota Finance Australia Ltd. | 3.300% | 11/22/23 | AUD | 219 | 138 |
| | Toyota Finance Australia Ltd. | 0.250% | 4/9/24 | EUR | 1,000 | 952 |
| | Toyota Finance Australia Ltd. | 2.280% | 10/21/27 | EUR | 7,369 | 6,848 |
| | Transurban Finance Co. Pty Ltd. | 1.875% | 9/16/24 | EUR | 1,455 | 1,386 |
| | Transurban Finance Co. Pty Ltd. | 4.555% | 11/14/28 | CAD | 787 | 552 |
| | Transurban Finance Co. Pty Ltd. | 3.000% | 4/8/30 | EUR | 4,461 | 3,912 |
| | Transurban Queensland Finance Pty Ltd. | 3.250% | 8/5/31 | AUD | 740 | 369 |
| | United Energy Distribution Pty Ltd. | 3.850% | 10/23/24 | AUD | 1,510 | 948 |
| | University of Technology Sydney | 3.750% | 7/20/27 | AUD | 80 | 49 |
| | Vicinity Centres Trust | 3.375% | 4/7/26 | GBP | 669 | 696 |
| | Vicinity Centres Trust | 1.125% | 11/7/29 | EUR | 2,188 | 1,583 |
| | Wesfarmers Ltd. | 0.954% | 10/21/33 | EUR | 13,264 | 9,261 |
| | WestConnex Finance Co. Pty Ltd. | 3.150% | 3/31/31 | AUD | 1,140 | 567 |
Total International Bond II Index Fund
| | | Coupon | Maturity
Date | Currency | Face
Amount
(000) | Market
Value•
($000) |
| | Westpac Banking Corp. | 3.250% | 11/16/23 | AUD | 300 | 190 |
| | Westpac Banking Corp. | 5.250% | 11/21/23 | AUD | 1,800 | 1,161 |
| | Westpac Banking Corp. | 0.500% | 12/4/23 | EUR | 10,202 | 9,848 |
| | Westpac Banking Corp. | 3.000% | 4/24/24 | AUD | 400 | 250 |
| | Westpac Banking Corp. | 0.500% | 5/17/24 | EUR | 1,228 | 1,171 |
| | Westpac Banking Corp. | 0.625% | 11/22/24 | EUR | 2,457 | 2,295 |
| | Westpac Banking Corp. | 4.125% | 6/4/26 | AUD | 1,500 | 934 |
| | Westpac Banking Corp. | 1.079% | 4/5/27 | EUR | 8,079 | 7,308 |
| | Westpac Banking Corp. | 0.875% | 4/17/27 | EUR | 100 | 87 |
| | Westpac Banking Corp. | 1.125% | 9/5/27 | EUR | 5,410 | 4,770 |
| | Westpac Banking Corp. | 1.450% | 7/17/28 | EUR | 382 | 332 |
| | Westpac Banking Corp. | 0.010% | 9/22/28 | EUR | 22,080 | 18,047 |
| | Westpac Banking Corp. | 0.766% | 5/13/31 | EUR | 3,000 | 2,497 |
| | Westpac Banking Corp. | 1.375% | 5/17/32 | EUR | 4,913 | 4,074 |
| | Woolworths Group Ltd. | 1.850% | 11/15/27 | AUD | 12,020 | 6,522 |
| | Woolworths Group Ltd. | 0.375% | 11/15/28 | EUR | 18,700 | 14,543 |
| | Woolworths Group Ltd. | 2.800% | 5/20/30 | AUD | 5,660 | 2,915 |
| | WSO Finance Pty Ltd. | 4.500% | 3/31/27 | AUD | 1,270 | 786 |
| | | | | | | 447,417 |
| Austria (0.3%) | | | |
| | BAWAG PSK Bank fuer Arbeit und Wirtschaft und Oesterreichische Postsparkasse AG | 1.125% | 7/31/28 | EUR | 26,700 | 23,746 |
| | BAWAG PSK Bank fuer Arbeit und Wirtschaft und Oesterreichische Postsparkasse AG | 0.010% | 10/2/29 | EUR | 5,600 | 4,478 |
| | BAWAG PSK Bank fuer Arbeit und Wirtschaft und Oesterreichische Postsparkasse AG | 1.750% | 3/8/30 | EUR | 10,000 | 8,998 |
| | BAWAG PSK Bank fuer Arbeit und Wirtschaft und Oesterreichische Postsparkasse AG | 0.375% | 3/25/41 | EUR | 12,000 | 7,166 |
| | Borealis AG | 1.750% | 12/10/25 | EUR | 75 | 71 |
| | Erste Group Bank AG | 0.750% | 2/5/25 | EUR | 1,300 | 1,225 |
| | Erste Group Bank AG | 1.500% | 4/7/26 | EUR | 5,000 | 4,572 |
| | Erste Group Bank AG | 0.625% | 4/17/26 | EUR | 7,400 | 6,756 |
| | Erste Group Bank AG | 0.750% | 1/17/28 | EUR | 8,000 | 7,041 |
| | Erste Group Bank AG | 0.250% | 9/14/29 | EUR | 800 | 601 |
| | Erste Group Bank AG | 0.875% | 5/15/34 | EUR | 7,400 | 5,638 |
| | HYPO NOE Landesbank fuer Niederoesterreich und Wien AG | 0.375% | 6/25/24 | EUR | 5,500 | 5,174 |
| | HYPO NOE Landesbank fuer Niederoesterreich und Wien AG | 0.500% | 9/4/25 | EUR | 2,500 | 2,308 |
| | HYPO NOE Landesbank fuer Niederoesterreich und Wien AG | 1.625% | 5/11/29 | EUR | 20,800 | 18,763 |
| | JAB Holdings BV | 1.250% | 5/22/24 | EUR | 13,000 | 12,278 |
| | JAB Holdings BV | 1.625% | 4/30/25 | EUR | 4,000 | 3,708 |
| | JAB Holdings BV | 1.750% | 6/25/26 | EUR | 6,900 | 6,216 |
| | JAB Holdings BV | 2.500% | 4/17/27 | EUR | 2,500 | 2,272 |
| | JAB Holdings BV | 2.500% | 6/25/29 | EUR | 5,900 | 4,959 |
| | JAB Holdings BV | 2.250% | 12/19/39 | EUR | 11,200 | 6,614 |
| | Mondi Finance plc | 1.500% | 4/15/24 | EUR | 5,612 | 5,337 |
| 2 | OeBB-Infrastruktur AG | 1.000% | 11/18/24 | EUR | 5,852 | 5,580 |
| 2 | OeBB-Infrastruktur AG | 3.875% | 6/30/25 | EUR | 4,876 | 4,946 |
| 2 | OeBB-Infrastruktur AG | 3.500% | 10/19/26 | EUR | 878 | 888 |
| 2 | OeBB-Infrastruktur AG | 2.250% | 5/28/29 | EUR | 1,464 | 1,387 |
| 2 | OeBB-Infrastruktur AG | 3.375% | 5/18/32 | EUR | 3,413 | 3,460 |
| 2 | OeBB-Infrastruktur AG | 3.000% | 10/24/33 | EUR | 38 | 37 |
| | OMV AG | 0.750% | 12/4/23 | EUR | 1,219 | 1,172 |
| | OMV AG | 1.500% | 4/9/24 | EUR | 7,000 | 6,757 |
| | OMV AG | 1.000% | 12/14/26 | EUR | 1,683 | 1,516 |
| | OMV AG | 3.500% | 9/27/27 | EUR | 1,500 | 1,493 |
| | OMV AG | 2.000% | 4/9/28 | EUR | 3,500 | 3,213 |
| | OMV AG | 1.875% | 12/4/28 | EUR | 1,073 | 965 |
| | OMV AG | 2.375% | 4/9/32 | EUR | 7,317 | 6,318 |
| | OMV AG | 6.250% | 12/29/49 | EUR | 1,610 | 1,616 |
| | OMV AG | 2.875% | Perpetual | EUR | 4,700 | 3,652 |
| | Raiffeisen Bank International AG | 0.250% | 1/22/25 | EUR | 3,200 | 2,839 |
| | Raiffeisen Bank International AG | 4.125% | 9/8/25 | EUR | 5,500 | 5,295 |
| | Raiffeisen Bank International AG | 0.050% | 9/1/27 | EUR | 1,500 | 1,153 |
| | Raiffeisen Bank International AG | 1.500% | 3/12/30 | EUR | 1,700 | 1,327 |
| | Raiffeisen Bank International AG | 2.875% | 6/18/32 | EUR | 4,500 | 3,376 |
| | Raiffeisenlandesbank Niederoesterreich-Wien AG | 0.625% | 3/3/25 | EUR | 100 | 94 |
| | Raiffeisenlandesbank Niederoesterreich-Wien AG | 0.625% | 8/28/26 | EUR | 2,500 | 2,260 |
| | Raiffeisenlandesbank Niederoesterreich-Wien AG | 1.250% | 4/21/27 | EUR | 20,500 | 18,745 |
| | Raiffeisenlandesbank Niederoesterreich-Wien AG | 0.875% | 1/24/28 | EUR | 1,500 | 1,325 |
| | Raiffeisenlandesbank Niederoesterreich-Wien AG | 0.875% | 1/30/29 | EUR | 6,100 | 5,260 |
| | Raiffeisen-Landesbank Steiermark AG | 2.375% | 6/14/28 | EUR | 100 | 95 |
| | Raiffeisen-Landesbank Steiermark AG | 1.375% | 5/11/33 | EUR | 2,500 | 2,054 |
| | Raiffeisenlandesbank Vorarlberg Waren-und Revisionsverband registrierte GenmbH | 0.500% | 9/17/25 | EUR | 2,500 | 2,306 |
Total International Bond II Index Fund
| | | Coupon | Maturity
Date | Currency | Face
Amount
(000) | Market
Value•
($000) |
| | UniCredit Bank Austria AG | 2.375% | 1/22/24 | EUR | 2,500 | 2,459 |
| | UniCredit Bank Austria AG | 0.750% | 2/25/25 | EUR | 200 | 188 |
| | UniCredit Bank Austria AG | 0.250% | 6/4/27 | EUR | 5,000 | 4,357 |
| | UNIQA Insurance Group AG | 6.875% | 7/31/43 | EUR | 1,400 | 1,361 |
| | UNIQA Insurance Group AG | 6.000% | 7/27/46 | EUR | 900 | 882 |
| | Vienna Insurance Group AG Wiener Versicherung Gruppe | 5.500% | 10/9/43 | EUR | 200 | 195 |
| | | | | | | 236,492 |
| Belgium (0.3%) | | | |
| | AG Insurance SA | 3.500% | 6/30/47 | EUR | 1,300 | 1,141 |
| | Ageas SA NV | 3.250% | 7/2/49 | EUR | 5,200 | 4,302 |
| | Ageas SA NV | 1.875% | 11/24/51 | EUR | 3,000 | 2,091 |
| | Anheuser-Busch InBev Finance Inc. | 4.320% | 5/15/47 | CAD | 4,696 | 2,740 |
| | Anheuser-Busch InBev SA NV | 9.750% | 7/30/24 | GBP | 932 | 1,146 |
| | Anheuser-Busch InBev SA NV | 2.875% | 9/25/24 | EUR | 2,194 | 2,161 |
| | Anheuser-Busch InBev SA NV | 4.000% | 9/24/25 | GBP | 5,455 | 6,040 |
| | Anheuser-Busch InBev SA NV | 2.700% | 3/31/26 | EUR | 100 | 96 |
| | Anheuser-Busch InBev SA NV | 1.150% | 1/22/27 | EUR | 12,089 | 10,920 |
| | Anheuser-Busch InBev SA NV | 1.125% | 7/1/27 | EUR | 8,362 | 7,461 |
| | Anheuser-Busch InBev SA NV | 2.125% | 12/2/27 | EUR | 8,913 | 8,265 |
| | Anheuser-Busch InBev SA NV | 2.000% | 3/17/28 | EUR | 11,166 | 10,224 |
| | Anheuser-Busch InBev SA NV | 1.500% | 4/18/30 | EUR | 439 | 373 |
| | Anheuser-Busch InBev SA NV | 1.650% | 3/28/31 | EUR | 10,142 | 8,521 |
| | Anheuser-Busch InBev SA NV | 2.875% | 4/2/32 | EUR | 4,913 | 4,476 |
| | Anheuser-Busch InBev SA NV | 3.250% | 1/24/33 | EUR | 2,501 | 2,322 |
| | Anheuser-Busch InBev SA NV | 2.000% | 1/23/35 | EUR | 3,459 | 2,740 |
| | Anheuser-Busch InBev SA NV | 2.750% | 3/17/36 | EUR | 12,755 | 10,812 |
| | Anheuser-Busch InBev SA NV | 2.850% | 5/25/37 | GBP | 5,876 | 4,965 |
| | Anheuser-Busch InBev SA NV | 3.700% | 4/2/40 | EUR | 11,198 | 10,129 |
| | Anheuser-Busch InBev Worldwide Inc. | 4.100% | 9/6/27 | AUD | 1,210 | 742 |
| | Argenta Spaarbank NV | 1.000% | 2/6/24 | EUR | 11,200 | 10,693 |
| | Argenta Spaarbank NV | 1.000% | 10/13/26 | EUR | 6,900 | 5,981 |
| | Argenta Spaarbank NV | 1.000% | 1/29/27 | EUR | 3,000 | 2,518 |
| | Barry Callebaut Services NV | 2.375% | 5/24/24 | EUR | 1,725 | 1,671 |
| | Belfius Bank SA | 1.750% | 6/24/24 | EUR | 300 | 292 |
| | Belfius Bank SA | 1.000% | 10/26/24 | EUR | 5,000 | 4,706 |
| | Belfius Bank SA | 0.750% | 2/10/25 | EUR | 100 | 94 |
| | Belfius Bank SA | 0.375% | 9/2/25 | EUR | 5,000 | 4,467 |
| | Belfius Bank SA | 0.010% | 10/15/25 | EUR | 3,000 | 2,683 |
| | Belfius Bank SA | 0.375% | 2/13/26 | EUR | 3,000 | 2,631 |
| | Belfius Bank SA | 3.125% | 5/11/26 | EUR | 5,800 | 5,386 |
| | Belfius Bank SA | 0.125% | 9/14/26 | EUR | 5,000 | 4,436 |
| | Belfius Bank SA | 0.125% | 2/8/28 | EUR | 8,700 | 7,111 |
| | Belgium ING SA | 1.500% | 5/19/29 | EUR | 5,800 | 5,207 |
| | BNP Paribas Fortis SA | 0.625% | 10/4/25 | EUR | 200 | 185 |
| | BNP Paribas Fortis SA | 0.875% | 3/22/28 | EUR | 5,000 | 4,424 |
| | Brussels Airport Co. NV SA | 1.000% | 5/3/24 | EUR | 4,600 | 4,315 |
| | Cofinimmo SA | 0.875% | 12/2/30 | EUR | 1,800 | 1,229 |
| | Elia Group SA NV | 1.500% | 9/5/28 | EUR | 1,300 | 1,140 |
| | Elia Group SA NV | 2.750% | 12/31/49 | EUR | 1,600 | 1,512 |
| | Elia Transmission Belgium SA | 1.375% | 1/14/26 | EUR | 7,100 | 6,562 |
| | Elia Transmission Belgium SA | 3.250% | 4/4/28 | EUR | 100 | 96 |
| | Elia Transmission Belgium SA | 3.000% | 4/7/29 | EUR | 100 | 93 |
| | Elia Transmission Belgium SA | 0.875% | 4/28/30 | EUR | 2,800 | 2,220 |
| | Ethias SA | 5.000% | 1/14/26 | EUR | 4,400 | 4,146 |
| | Euroclear Bank SA | 1.250% | 9/30/24 | GBP | 200 | 214 |
| | Euroclear Bank SA | 0.125% | 7/7/25 | EUR | 13,040 | 11,844 |
| | Euroclear Investments SA | 1.125% | 12/7/26 | EUR | 3,000 | 2,709 |
| | Euroclear Investments SA | 1.500% | 4/11/30 | EUR | 2,000 | 1,655 |
| | FLUVIUS System Operator CVBA | 1.750% | 12/4/26 | EUR | 2,900 | 2,660 |
| | FLUVIUS System Operator CVBA | 0.250% | 6/14/28 | EUR | 1,400 | 1,146 |
| | FLUVIUS System Operator CVBA | 2.875% | 5/7/29 | EUR | 2,600 | 2,431 |
| | FLUVIUS System Operator CVBA | 0.250% | 12/2/30 | EUR | 4,800 | 3,607 |
| | FLUVIUS System Operator CVBA | 0.625% | 11/24/31 | EUR | 5,500 | 4,070 |
| | Groupe Bruxelles Lambert NV | 1.875% | 6/19/25 | EUR | 2,000 | 1,893 |
| | Groupe Bruxelles Lambert SA | 1.375% | 5/23/24 | EUR | 1,400 | 1,340 |
| | ING Belgium SA | 0.625% | 5/30/25 | EUR | 11,300 | 10,547 |
| | KBC Bank NV | 0.750% | 10/24/27 | EUR | 3,700 | 3,283 |
| | KBC Group NV | 1.125% | 1/25/24 | EUR | 9,600 | 9,199 |
| | KBC Group NV | 1.500% | 3/29/26 | EUR | 5,400 | 5,007 |
Total International Bond II Index Fund
| | | Coupon | Maturity
Date | Currency | Face
Amount
(000) | Market
Value•
($000) |
| | KBC Group NV | 0.125% | 9/10/26 | EUR | 3,000 | 2,643 |
| | KBC Group NV | 0.750% | 1/21/28 | EUR | 14,600 | 12,339 |
| | KBC Group NV | 0.125% | 1/14/29 | EUR | 17,000 | 13,377 |
| | Proximus SADP | 2.375% | 4/4/24 | EUR | 1,600 | 1,565 |
| | Solvay SA | 2.750% | 12/2/27 | EUR | 600 | 553 |
| | Solvay SA | 0.500% | 9/6/29 | EUR | 4,000 | 2,951 |
| | VGP NV | 1.625% | 1/17/27 | EUR | 100 | 71 |
| | VGP NV | 1.500% | 4/8/29 | EUR | 3,100 | 1,817 |
| | VGP NV | 2.250% | 1/17/30 | EUR | 1,700 | 953 |
| | | | | | | 283,339 |
| Canada (1.7%) | | | |
| | 407 International Inc. | 3.350% | 5/16/24 | CAD | 2,500 | 1,795 |
| 3 | 407 International Inc. | 1.800% | 5/22/25 | CAD | 1,323 | 902 |
| | 407 International Inc. | 2.430% | 5/4/27 | CAD | 1,054 | 708 |
| | 407 International Inc. | 3.140% | 3/6/30 | CAD | 2,681 | 1,783 |
| 3 | 407 International Inc. | 2.590% | 5/25/32 | CAD | 1,471 | 902 |
| | 407 International Inc. | 3.430% | 6/1/33 | CAD | 2,000 | 1,288 |
| | 407 International Inc. | 5.750% | 2/14/36 | CAD | 978 | 732 |
| | 407 International Inc. | 4.450% | 11/15/41 | CAD | 2,450 | 1,623 |
| | 407 International Inc. | 4.190% | 4/25/42 | CAD | 2,695 | 1,722 |
| | 407 International Inc. | 3.650% | 9/8/44 | CAD | 4,898 | 2,852 |
| | 407 International Inc. | 3.300% | 3/27/45 | CAD | 500 | 274 |
| | 407 International Inc. | 3.830% | 5/11/46 | CAD | 4,898 | 2,924 |
| | 407 International Inc. | 3.600% | 5/21/47 | CAD | 3,368 | 1,922 |
| | 407 International Inc. | 3.720% | 5/11/48 | CAD | 9 | 5 |
| | 407 International Inc. | 3.670% | 3/8/49 | CAD | 981 | 565 |
| | 407 International Inc. | 2.840% | 3/7/50 | CAD | 2,008 | 976 |
| | 407 International Inc. | 3.980% | 9/11/52 | CAD | 1,600 | 959 |
| | 55 Ontario School Board Trust | 5.900% | 6/2/33 | CAD | 2,520 | 2,081 |
| | Aeroports de Montreal | 5.170% | 9/17/35 | CAD | 1,777 | 1,296 |
| | Aeroports de Montreal | 5.670% | 10/16/37 | CAD | 1,054 | 811 |
| | Aeroports de Montreal | 3.030% | 4/21/50 | CAD | 4,078 | 2,085 |
| | Aeroports de Montreal | 3.441% | 4/26/51 | CAD | 2,000 | 1,106 |
| | AIMCo Realty Investors LP | 2.266% | 6/26/24 | CAD | 2,463 | 1,729 |
| | AIMCo Realty Investors LP | 3.367% | 6/1/27 | CAD | 924 | 636 |
| | AIMCo Realty Investors LP | 3.043% | 6/1/28 | CAD | 981 | 655 |
| | AIMCo Realty Investors LP | 2.712% | 6/1/29 | CAD | 5,486 | 3,529 |
| | Alberta Powerline LP | 4.065% | 12/1/53 | CAD | 2,487 | 1,484 |
| | Alberta Powerline LP | 4.065% | 3/1/54 | CAD | 801 | 479 |
| | Alectra Inc. | 2.488% | 5/17/27 | CAD | 5,415 | 3,642 |
| | Alectra Inc. | 1.751% | 2/11/31 | CAD | 900 | 529 |
| | Alectra Inc. | 3.958% | 7/30/42 | CAD | 900 | 571 |
| | Alectra Inc. | 3.458% | 4/12/49 | CAD | 1,193 | 683 |
| | Algonquin Power Co. | 4.090% | 2/17/27 | CAD | 1,200 | 840 |
| 3 | Algonquin Power Co. | 4.090% | 2/17/27 | CAD | 319 | 223 |
| | Algonquin Power Co. | 4.600% | 1/29/29 | CAD | 1,111 | 786 |
| | Algonquin Power Co. | 2.850% | 7/15/31 | CAD | 1,804 | 1,089 |
| | Alimentation Couche-Tard Inc. | 3.056% | 7/26/24 | CAD | 4,146 | 2,933 |
| | Alimentation Couche-Tard Inc. | 3.600% | 6/2/25 | CAD | 4,016 | 2,823 |
| | Allied Properties REIT | 3.636% | 4/21/25 | CAD | 2,450 | 1,702 |
| | Allied Properties REIT | 1.726% | 2/12/26 | CAD | 2,504 | 1,606 |
| | Allied Properties REIT | 3.113% | 4/8/27 | CAD | 2,450 | 1,597 |
| | Allied Properties REIT | 3.394% | 8/15/29 | CAD | 733 | 455 |
| | Allied Properties REIT | 3.117% | 2/21/30 | CAD | 2,035 | 1,220 |
| | Allied Properties REIT | 3.095% | 2/6/32 | CAD | 2,004 | 1,131 |
| | AltaGas Canada Inc. | 3.150% | 4/6/26 | CAD | 890 | 610 |
| | AltaGas Canada Inc. | 4.260% | 12/5/28 | CAD | 1,335 | 927 |
| | AltaGas Ltd. | 1.227% | 3/18/24 | CAD | 1,129 | ��� 783 |
| | AltaGas Ltd. | 3.840% | 1/15/25 | CAD | 4,489 | 3,179 |
| | AltaGas Ltd. | 2.157% | 6/10/25 | CAD | 1,100 | 743 |
| | AltaGas Ltd. | 3.980% | 10/4/27 | CAD | 1,475 | 1,013 |
| | AltaGas Ltd. | 2.075% | 5/30/28 | CAD | 2,180 | 1,340 |
| | AltaGas Ltd. | 2.477% | 11/30/30 | CAD | 500 | 292 |
| | AltaGas Ltd. | 4.500% | 8/15/44 | CAD | 1,515 | 883 |
| | AltaGas Ltd. | 4.990% | 10/4/47 | CAD | 1,007 | 625 |
| | AltaLink LP | 3.668% | 11/6/23 | CAD | 52 | 38 |
| | AltaLink LP | 3.399% | 6/6/24 | CAD | 4,925 | 3,519 |
| | AltaLink LP | 4.872% | 11/15/40 | CAD | 2,501 | 1,783 |
| | AltaLink LP | 4.462% | 11/8/41 | CAD | 1,177 | 796 |
Total International Bond II Index Fund
| | | Coupon | Maturity
Date | Currency | Face
Amount
(000) | Market
Value•
($000) |
| | AltaLink LP | 3.990% | 6/30/42 | CAD | 2,334 | 1,477 |
| | AltaLink LP | 4.922% | 9/17/43 | CAD | 1,471 | 1,056 |
| | AltaLink LP | 4.054% | 11/21/44 | CAD | 1,089 | 690 |
| | AltaLink LP | 4.090% | 6/30/45 | CAD | 1,537 | 977 |
| | AltaLink LP | 3.717% | 12/3/46 | CAD | 2,232 | 1,332 |
| | ARC Resources Ltd. | 2.354% | 3/10/26 | CAD | 2,400 | 1,602 |
| | ARC Resources Ltd. | 3.465% | 3/10/31 | CAD | 2,147 | 1,353 |
| | Artis REIT | 5.600% | 4/29/25 | CAD | 800 | 566 |
| | Atco Ltd. | 5.500% | 11/1/78 | CAD | 501 | 344 |
| | Bank of Montreal | 2.850% | 3/6/24 | CAD | 10,548 | 7,511 |
| | Bank of Montreal | 2.280% | 7/29/24 | CAD | 7,012 | 4,904 |
| | Bank of Montreal | 2.700% | 9/11/24 | CAD | 6,912 | 4,875 |
| | Bank of Montreal | 2.370% | 2/3/25 | CAD | 5,877 | 4,059 |
| | Bank of Montreal | 4.609% | 9/10/25 | CAD | 2,450 | 1,784 |
| | Bank of Montreal | 1.758% | 3/10/26 | CAD | 4,015 | 2,642 |
| | Bank of Montreal | 1.000% | 4/5/26 | EUR | 13,440 | 12,395 |
| | Bank of Montreal | 1.551% | 5/28/26 | CAD | 4,813 | 3,121 |
| | Bank of Montreal | 1.000% | 9/9/26 | GBP | 1,700 | 1,637 |
| | Bank of Montreal | 2.700% | 12/9/26 | CAD | 4,898 | 3,310 |
| | Bank of Montreal | 3.650% | 4/1/27 | CAD | 7,764 | 5,350 |
| | Bank of Montreal | 4.309% | 6/1/27 | CAD | 8,767 | 6,205 |
| | Bank of Montreal | 3.190% | 3/1/28 | CAD | 9,461 | 6,412 |
| | Bank of Montreal | 0.050% | 6/8/29 | EUR | 14,819 | 11,934 |
| | Bank of Montreal | 2.880% | 9/17/29 | CAD | 2,650 | 1,846 |
| | Bank of Montreal | 2.077% | 6/17/30 | CAD | 5,616 | 3,751 |
| | Bank of Montreal | 1.928% | 7/22/31 | CAD | 6,087 | 3,878 |
| | Bank of Nova Scotia | 0.250% | 1/11/24 | EUR | 4,913 | 4,713 |
| | Bank of Nova Scotia | 0.500% | 4/30/24 | EUR | 5,000 | 4,719 |
| | Bank of Nova Scotia | 2.290% | 6/28/24 | CAD | 10,008 | 7,042 |
| | Bank of Nova Scotia | 2.490% | 9/23/24 | CAD | 11,267 | 7,876 |
| | Bank of Nova Scotia | 1.950% | 1/10/25 | CAD | 6,436 | 4,409 |
| | Bank of Nova Scotia | 2.160% | 2/3/25 | CAD | 5,388 | 3,702 |
| | Bank of Nova Scotia | 0.010% | 3/18/25 | EUR | 8,461 | 7,791 |
| | Bank of Nova Scotia | 0.125% | 9/4/26 | EUR | 4,062 | 3,453 |
| | Bank of Nova Scotia | 1.850% | 11/2/26 | CAD | 8,694 | 5,618 |
| | Bank of Nova Scotia | 2.620% | 12/2/26 | CAD | 7,346 | 4,949 |
| | Bank of Nova Scotia | 0.010% | 1/14/27 | EUR | 4,913 | 4,270 |
| | Bank of Nova Scotia | 2.950% | 3/8/27 | CAD | 15,103 | 10,113 |
| | Bank of Nova Scotia | 1.400% | 11/1/27 | CAD | 7,771 | 4,764 |
| | Bank of Nova Scotia | 0.010% | 12/15/27 | EUR | 10,597 | 8,912 |
| | Bank of Nova Scotia | 3.100% | 2/2/28 | CAD | 8,723 | 5,895 |
| | Bank of Nova Scotia | 3.890% | 1/18/29 | CAD | 3,979 | 2,858 |
| | Bank of Nova Scotia | 2.836% | 7/3/29 | CAD | 7,124 | 4,987 |
| | Bank of Nova Scotia | 3.934% | 5/3/32 | CAD | 8,020 | 5,412 |
| | BCI QuadReal Realty | 1.680% | 3/3/25 | CAD | 981 | 671 |
| | BCI QuadReal Realty | 1.747% | 7/24/30 | CAD | 3,686 | 2,150 |
| | bcIMC Realty Corp. | 2.840% | 6/3/25 | CAD | 3,428 | 2,384 |
| | bcIMC Realty Corp. | 3.000% | 3/31/27 | CAD | 3,574 | 2,395 |
| | Bell Telephone Co. of Canada or Bell Canada | 2.700% | 2/27/24 | CAD | 9,912 | 7,046 |
| | Bell Telephone Co. of Canada or Bell Canada | 2.750% | 1/29/25 | CAD | 1,213 | 847 |
| | Bell Telephone Co. of Canada or Bell Canada | 3.350% | 3/12/25 | CAD | 6,465 | 4,548 |
| | Bell Telephone Co. of Canada or Bell Canada | 3.550% | 3/2/26 | CAD | 1,471 | 1,031 |
| | Bell Telephone Co. of Canada or Bell Canada | 2.900% | 8/12/26 | CAD | 1,471 | 996 |
| | Bell Telephone Co. of Canada or Bell Canada | 1.650% | 8/16/27 | CAD | 2,700 | 1,689 |
| | Bell Telephone Co. of Canada or Bell Canada | 3.600% | 9/29/27 | CAD | 4,300 | 2,940 |
| | Bell Telephone Co. of Canada or Bell Canada | 2.200% | 5/29/28 | CAD | 2,600 | 1,636 |
| | Bell Telephone Co. of Canada or Bell Canada | 3.800% | 8/21/28 | CAD | 3,771 | 2,573 |
| | Bell Telephone Co. of Canada or Bell Canada | 2.900% | 9/10/29 | CAD | 2,450 | 1,557 |
| | Bell Telephone Co. of Canada or Bell Canada | 2.500% | 5/14/30 | CAD | 5,316 | 3,225 |
| | Bell Telephone Co. of Canada or Bell Canada | 3.000% | 3/17/31 | CAD | 5,300 | 3,271 |
| | Bell Telephone Co. of Canada or Bell Canada | 7.850% | 4/2/31 | CAD | 2,450 | 2,046 |
| | Bell Telephone Co. of Canada or Bell Canada | 6.170% | 2/26/37 | CAD | 400 | 300 |
| | Bell Telephone Co. of Canada or Bell Canada | 4.750% | 9/29/44 | CAD | 3,114 | 1,963 |
| | Bell Telephone Co. of Canada or Bell Canada | 4.350% | 12/18/45 | CAD | 3,137 | 1,853 |
| | Bell Telephone Co. of Canada or Bell Canada | 4.450% | 2/27/47 | CAD | 3,066 | 1,833 |
| | Bell Telephone Co. of Canada or Bell Canada | 3.500% | 9/30/50 | CAD | 6,543 | 3,253 |
| | Bell Telephone Co. of Canada or Bell Canada | 4.050% | 3/17/51 | CAD | 3,194 | 1,774 |
| | Bridging North America GP | 4.341% | 8/31/53 | CAD | 1,133 | 634 |
| | British Columbia Ferry Services Inc. | 4.702% | 10/23/43 | CAD | 2,746 | 1,910 |
Total International Bond II Index Fund
| | | Coupon | Maturity
Date | Currency | Face
Amount
(000) | Market
Value•
($000) |
| | British Columbia Ferry Services Inc. | 4.289% | 4/28/44 | CAD | 500 | 328 |
| | British Columbia Ferry Services Inc. | 2.794% | 10/15/49 | CAD | 950 | 467 |
| | Brookfield Asset Management Inc. | 5.040% | 3/8/24 | CAD | 739 | 542 |
| | Brookfield Asset Management Inc. | 4.820% | 1/28/26 | CAD | 7,215 | 5,197 |
| | Brookfield Asset Management Inc. | 3.800% | 3/16/27 | CAD | 2,075 | 1,432 |
| | Brookfield Asset Management Inc. | 5.950% | 6/14/35 | CAD | 1,000 | 741 |
| | Brookfield Infrastructure Finance ULC | 3.315% | 2/22/24 | CAD | 2,463 | 1,758 |
| | Brookfield Infrastructure Finance ULC | 4.193% | 9/11/28 | CAD | 2,082 | 1,437 |
| | Brookfield Infrastructure Finance ULC | 3.410% | 10/9/29 | CAD | 3,001 | 1,944 |
| | Brookfield Infrastructure Finance ULC | 2.855% | 9/1/32 | CAD | 1,681 | 974 |
| | Brookfield Infrastructure Finance ULC | 5.439% | 4/25/34 | CAD | 2,398 | 1,697 |
| | Brookfield Infrastructure Finance ULC | 5.789% | 4/25/52 | CAD | 770 | 533 |
| | Brookfield Renewable Partners ULC | 3.752% | 6/2/25 | CAD | 2,597 | 1,836 |
| | Brookfield Renewable Partners ULC | 3.630% | 1/15/27 | CAD | 1,910 | 1,316 |
| | Brookfield Renewable Partners ULC | 3.380% | 1/15/30 | CAD | 2,695 | 1,755 |
| | Brookfield Renewable Partners ULC | 4.290% | 11/5/49 | CAD | 1,910 | 1,135 |
| | Brookfield Renewable Partners ULC | 3.330% | 8/13/50 | CAD | 3,104 | 1,535 |
| | Bruce Power LP | 3.000% | 6/21/24 | CAD | 987 | 701 |
| | Bruce Power LP | 3.969% | 6/23/26 | CAD | 2,450 | 1,734 |
| | Bruce Power LP | 2.680% | 12/21/28 | CAD | 2,000 | 1,286 |
| | Bruce Power LP | 4.010% | 6/21/29 | CAD | 1,182 | 814 |
| | Bruce Power LP | 4.000% | 6/21/30 | CAD | 2,459 | 1,666 |
| | Bruce Power LP | 4.132% | 6/21/33 | CAD | 3,855 | 2,540 |
| | Bruce Power LP | 4.746% | 6/21/49 | CAD | 1,795 | 1,141 |
| | Calgary Airport Authority | 3.199% | 10/7/36 | CAD | 8,099 | 4,785 |
| | Calgary Airport Authority | 3.341% | 10/7/38 | CAD | 3,048 | 1,788 |
| | Cameco Corp. | 4.190% | 6/24/24 | CAD | 1,356 | 975 |
| | Cameco Corp. | 2.950% | 10/21/27 | CAD | 3,078 | 2,022 |
| | Canadian Imperial Bank of Commerce | 3.290% | 1/15/24 | CAD | 3,202 | 2,298 |
| | Canadian Imperial Bank of Commerce | 0.375% | 5/3/24 | EUR | 9,274 | 8,726 |
| | Canadian Imperial Bank of Commerce | 2.350% | 8/28/24 | CAD | 4,186 | 2,923 |
| | Canadian Imperial Bank of Commerce | 2.750% | 3/7/25 | CAD | 18,001 | 12,496 |
| | Canadian Imperial Bank of Commerce | 2.000% | 4/17/25 | CAD | 6,698 | 4,553 |
| | Canadian Imperial Bank of Commerce | 3.300% | 5/26/25 | CAD | 12,683 | 8,962 |
| | Canadian Imperial Bank of Commerce | 1.100% | 1/19/26 | CAD | 2,758 | 1,779 |
| | Canadian Imperial Bank of Commerce | 1.875% | 1/27/26 | GBP | 3,000 | 3,062 |
| | Canadian Imperial Bank of Commerce | 1.700% | 7/15/26 | CAD | 5,199 | 3,366 |
| | Canadian Imperial Bank of Commerce | 2.250% | 1/7/27 | CAD | 9,897 | 6,450 |
| | Canadian Imperial Bank of Commerce | 4.950% | 6/29/27 | CAD | 3,200 | 2,320 |
| | Canadian Imperial Bank of Commerce | 0.010% | 4/30/29 | EUR | 59,024 | 47,536 |
| | Canadian Imperial Bank of Commerce | 2.010% | 7/21/30 | CAD | 11,680 | 7,745 |
| | Canadian Imperial Bank of Commerce | 1.960% | 4/21/31 | CAD | 5,789 | 3,722 |
| | Canadian Imperial Bank of Commerce | 4.200% | 4/7/32 | CAD | 5,752 | 3,926 |
| | Canadian National Railway Co. | 2.800% | 9/22/25 | CAD | 2,446 | 1,703 |
| | Canadian National Railway Co. | 3.200% | 7/31/28 | CAD | 1,347 | 917 |
| | Canadian National Railway Co. | 3.000% | 2/8/29 | CAD | 2,000 | 1,334 |
| | Canadian National Railway Co. | 3.950% | 9/22/45 | CAD | 2,000 | 1,220 |
| | Canadian National Railway Co. | 3.600% | 8/1/47 | CAD | 4,892 | 2,794 |
| | Canadian National Railway Co. | 3.600% | 7/31/48 | CAD | 200 | 114 |
| | Canadian National Railway Co. | 3.600% | 2/8/49 | CAD | 1,048 | 595 |
| | Canadian National Railway Co. | 3.050% | 2/8/50 | CAD | 1,339 | 678 |
| | Canadian Natural Resources Ltd. | 3.550% | 6/3/24 | CAD | 4,925 | 3,553 |
| | Canadian Natural Resources Ltd. | 3.420% | 12/1/26 | CAD | 1,700 | 1,185 |
| | Canadian Natural Resources Ltd. | 2.500% | 1/17/28 | CAD | 2,464 | 1,619 |
| | Canadian Natural Resources Ltd. | 4.850% | 5/30/47 | CAD | 1,069 | 666 |
| | Canadian Pacific Railway Co. | 1.589% | 11/24/23 | CAD | 5,184 | 3,669 |
| | Canadian Pacific Railway Co. | 2.540% | 2/28/28 | CAD | 1,535 | 998 |
| | Canadian Pacific Railway Co. | 3.150% | 3/13/29 | CAD | 4,516 | 2,971 |
| | Canadian Pacific Railway Co. | 6.450% | 11/17/39 | CAD | 858 | 698 |
| | Canadian Pacific Railway Co. | 3.050% | 3/9/50 | CAD | 3,613 | 1,771 |
| | Canadian Tire Corp. Ltd. | 6.570% | 2/24/34 | CAD | 425 | 321 |
| | Canadian Tire Corp. Ltd. | 5.610% | 9/4/35 | CAD | 984 | 681 |
| | Canadian Utilities Ltd. | 4.851% | 6/3/52 | CAD | 620 | 422 |
| | Canadian Western Bank | 2.597% | 9/6/24 | CAD | 1,971 | 1,374 |
| | Canadian Western Bank | 2.606% | 1/30/25 | CAD | 3,233 | 2,227 |
| | Canadian Western Bank | 1.926% | 4/16/26 | CAD | 2,140 | 1,394 |
| | Canadian Western Bank | 5.146% | 9/2/27 | CAD | 2,200 | 1,586 |
| | Canadian Western Bank | 1.818% | 12/16/27 | CAD | 2,504 | 1,539 |
| | Capital City Link General Partnership | 4.386% | 3/31/46 | CAD | 401 | 259 |
Total International Bond II Index Fund
| | | Coupon | Maturity
Date | Currency | Face
Amount
(000) | Market
Value•
($000) |
| | Capital Power Corp. | 4.284% | 9/18/24 | CAD | 1,231 | 884 |
| | Capital Power Corp. | 4.986% | 1/23/26 | CAD | 823 | 595 |
| | Capital Power Corp. | 4.424% | 2/8/30 | CAD | 2,739 | 1,873 |
| | Capital Power Corp. | 3.147% | 10/1/32 | CAD | 1,466 | 860 |
| | CCL Industries Inc. | 3.864% | 4/13/28 | CAD | 795 | 543 |
| | Cenovus Energy Inc. | 3.600% | 3/10/27 | CAD | 3,002 | 2,089 |
| | Cenovus Energy Inc. | 3.500% | 2/7/28 | CAD | 5,290 | 3,615 |
| | Central 1 Credit Union | 2.584% | 12/6/23 | CAD | 2,884 | 2,050 |
| | Central 1 Credit Union | 2.391% | 6/30/31 | CAD | 2,104 | 1,357 |
| | CGI Inc. | 2.100% | 9/18/28 | CAD | 6,939 | 4,307 |
| | Chartwell Retirement Residences | 4.211% | 4/28/25 | CAD | 491 | 344 |
| | Choice Properties REIT | 3.556% | 9/9/24 | CAD | 1,986 | 1,406 |
| | Choice Properties REIT | 3.546% | 1/10/25 | CAD | 3,918 | 2,753 |
| | Choice Properties REIT | 2.848% | 5/21/27 | CAD | 3,409 | 2,227 |
| | Choice Properties REIT | 4.178% | 3/8/28 | CAD | 2,450 | 1,673 |
| | Choice Properties REIT | 3.532% | 6/11/29 | CAD | 3,477 | 2,246 |
| | Choice Properties REIT | 2.981% | 3/4/30 | CAD | 2,504 | 1,534 |
| | Choice Properties REIT | 6.003% | 6/24/32 | CAD | 1,600 | 1,179 |
| | CI Financial Corp. | 3.215% | 7/22/24 | CAD | 2,512 | 1,766 |
| | CI Financial Corp. | 3.759% | 5/26/25 | CAD | 1,471 | 1,021 |
| | CI Financial Corp. | 3.904% | 9/27/27 | CAD | 1,706 | 1,126 |
| | Clover LP | 4.216% | 3/31/34 | CAD | 430 | 301 |
| | Clover LP | 4.216% | 6/30/34 | CAD | 635 | 447 |
| | Cogeco Communications Inc. | 2.991% | 9/22/31 | CAD | 2,104 | 1,257 |
| | Concordia University | 6.550% | 9/2/42 | CAD | 1,471 | 1,283 |
| | Co-operators Financial Services Ltd. | 3.327% | 5/13/30 | CAD | 2,960 | 1,823 |
| 1 | Cordelio Amalco GP I | 4.087% | 6/30/34 | CAD | 1,502 | 1,031 |
| | Crombie REIT | 4.800% | 1/31/25 | CAD | 2,000 | 1,432 |
| | Crombie REIT | 3.677% | 8/26/26 | CAD | 1,471 | 999 |
| | Crombie REIT | 3.917% | 6/21/27 | CAD | 883 | 598 |
| | Crombie REIT | 2.686% | 3/31/28 | CAD | 858 | 537 |
| | Crombie REIT | 3.211% | 10/9/30 | CAD | 319 | 191 |
| | Crombie REIT | 3.133% | 8/12/31 | CAD | 2,000 | 1,162 |
| | Crosslinx Transit Solutions GP | 4.651% | 9/30/46 | CAD | 1,547 | 989 |
| | CSS FSCC Partnership | 6.915% | 7/31/42 | CAD | 7 | 6 |
| | CT REIT | 3.527% | 6/9/25 | CAD | 2,254 | 1,568 |
| | CT REIT | 3.289% | 6/1/26 | CAD | 2,000 | 1,355 |
| | CT REIT | 3.469% | 6/16/27 | CAD | 654 | 437 |
| | CT REIT | 2.371% | 1/6/31 | CAD | 981 | 554 |
| | CU Inc. | 4.543% | 10/24/41 | CAD | 2,381 | 1,602 |
| | CU Inc. | 3.805% | 9/10/42 | CAD | 4,199 | 2,544 |
| | CU Inc. | 4.722% | 9/9/43 | CAD | 3,471 | 2,383 |
| | CU Inc. | 4.085% | 9/2/44 | CAD | 3,245 | 2,028 |
| | CU Inc. | 3.964% | 7/27/45 | CAD | 1,471 | 900 |
| | CU Inc. | 3.763% | 11/19/46 | CAD | 1,535 | 904 |
| | CU Inc. | 3.548% | 11/22/47 | CAD | 1,333 | 753 |
| | CU Inc. | 3.950% | 11/23/48 | CAD | 2,177 | 1,324 |
| | CU Inc. | 2.963% | 9/7/49 | CAD | 2,204 | 1,113 |
| | CU Inc. | 3.174% | 9/5/51 | CAD | 1,677 | 863 |
| | CU Inc. | 3.857% | 11/14/52 | CAD | 400 | 236 |
| | CU Inc. | 4.211% | 10/29/55 | CAD | 7,346 | 4,550 |
| | CU Inc. | 4.593% | 10/24/61 | CAD | 218 | 143 |
| | Dollarama Inc. | 3.550% | 11/6/23 | CAD | 2,202 | 1,592 |
| | Dollarama Inc. | 1.871% | 7/8/26 | CAD | 2,504 | 1,639 |
| | Dollarama Inc. | 1.505% | 9/20/27 | CAD | 981 | 608 |
| | Dollarama Inc. | 2.443% | 7/9/29 | CAD | 2,356 | 1,460 |
| | Dream Industrial REIT | 1.662% | 12/22/25 | CAD | 4,504 | 2,912 |
| | Dream Industrial REIT | 2.057% | 6/17/27 | CAD | 2,305 | 1,442 |
| | Edmonton Regional Airports Authority | 7.214% | 11/1/30 | CAD | 198 | 152 |
| | Enbridge Gas Inc. | 3.150% | 8/22/24 | CAD | 3,192 | 2,275 |
| | Enbridge Gas Inc. | 3.310% | 9/11/25 | CAD | 1,588 | 1,117 |
| | Enbridge Gas Inc. | 2.810% | 6/1/26 | CAD | 1,153 | 793 |
| | Enbridge Gas Inc. | 2.500% | 8/5/26 | CAD | 984 | 667 |
| | Enbridge Gas Inc. | 2.880% | 11/22/27 | CAD | 1,700 | 1,146 |
| | Enbridge Gas Inc. | 2.370% | 8/9/29 | CAD | 1,500 | 953 |
| | Enbridge Gas Inc. | 2.900% | 4/1/30 | CAD | 2,450 | 1,587 |
| | Enbridge Gas Inc. | 2.350% | 9/15/31 | CAD | 2,100 | 1,258 |
| | Enbridge Gas Inc. | 4.150% | 8/17/32 | CAD | 1,300 | 895 |
| | Enbridge Gas Inc. | 5.200% | 7/23/40 | CAD | 700 | 509 |
Total International Bond II Index Fund
| | | Coupon | Maturity
Date | Currency | Face
Amount
(000) | Market
Value•
($000) |
| | Enbridge Gas Inc. | 4.880% | 6/21/41 | CAD | 1,691 | 1,182 |
| | Enbridge Gas Inc. | 4.500% | 11/23/43 | CAD | 200 | 132 |
| | Enbridge Gas Inc. | 4.200% | 6/2/44 | CAD | 2,947 | 1,867 |
| | Enbridge Gas Inc. | 4.000% | 8/22/44 | CAD | 984 | 604 |
| | Enbridge Gas Inc. | 3.800% | 6/1/46 | CAD | 1,471 | 868 |
| | Enbridge Gas Inc. | 3.590% | 11/22/47 | CAD | 1,183 | 669 |
| | Enbridge Gas Inc. | 3.510% | 11/29/47 | CAD | 2,305 | 1,285 |
| | Enbridge Gas Inc. | 3.010% | 8/9/49 | CAD | 1,671 | 839 |
| | Enbridge Gas Inc. | 3.650% | 4/1/50 | CAD | ��� 2,628 | 1,495 |
| | Enbridge Gas Inc. | 4.950% | 11/22/50 | CAD | 1,323 | 935 |
| | Enbridge Gas Inc. | 3.200% | 9/15/51 | CAD | 2,329 | 1,203 |
| | Enbridge Gas Inc. | 4.550% | 8/17/52 | CAD | 2,200 | 1,453 |
| | Enbridge Inc. | 3.950% | 11/19/24 | CAD | 1,479 | 1,057 |
| | Enbridge Inc. | 2.440% | 6/2/25 | CAD | 2,504 | 1,712 |
| | Enbridge Inc. | 3.200% | 6/8/27 | CAD | 7,088 | 4,755 |
| | Enbridge Inc. | 2.990% | 10/3/29 | CAD | 6,419 | 4,043 |
| | Enbridge Inc. | 3.100% | 9/21/33 | CAD | 5,010 | 2,903 |
| | Enbridge Inc. | 4.240% | 8/27/42 | CAD | 2,638 | 1,499 |
| | Enbridge Inc. | 4.570% | 3/11/44 | CAD | 3,299 | 1,947 |
| | Enbridge Inc. | 4.870% | 11/21/44 | CAD | 2,058 | 1,265 |
| | Enbridge Inc. | 4.100% | 9/21/51 | CAD | 1,603 | 851 |
| | Enbridge Pipelines Inc. | 3.450% | 9/29/25 | CAD | 2,571 | 1,798 |
| | Enbridge Pipelines Inc. | 3.000% | 8/10/26 | CAD | 1,700 | 1,155 |
| | Enbridge Pipelines Inc. | 3.520% | 2/22/29 | CAD | 3,931 | 2,621 |
| | Enbridge Pipelines Inc. | 2.820% | 5/12/31 | CAD | 2,207 | 1,333 |
| | Enbridge Pipelines Inc. | 4.550% | 8/17/43 | CAD | 992 | 594 |
| | Enbridge Pipelines Inc. | 4.550% | 9/29/45 | CAD | 2,744 | 1,629 |
| | Enbridge Pipelines Inc. | 4.130% | 8/9/46 | CAD | 2,452 | 1,357 |
| | Enbridge Pipelines Inc. | 4.330% | 2/22/49 | CAD | 2,621 | 1,482 |
| | Enbridge Pipelines Inc. | 4.200% | 5/12/51 | CAD | 1,849 | 1,014 |
| | Energir Inc. | 2.100% | 4/16/27 | CAD | 963 | 632 |
| | Energir Inc. | 3.530% | 5/16/47 | CAD | 1,227 | 703 |
| | Energir LP | 3.040% | 2/9/32 | CAD | 2,684 | 1,709 |
| | ENMAX Corp. | 3.836% | 6/5/28 | CAD | 1,054 | 712 |
| | ENMAX Corp. | 3.876% | 10/18/29 | CAD | 2,557 | 1,691 |
| | EPCOR Utilities Inc. | 2.411% | 6/30/31 | CAD | 1,500 | 918 |
| | EPCOR Utilities Inc. | 4.550% | 2/28/42 | CAD | 1,463 | 990 |
| | EPCOR Utilities Inc. | 3.554% | 11/27/47 | CAD | 3,429 | 1,953 |
| | EPCOR Utilities Inc. | 3.949% | 11/26/48 | CAD | 1,035 | 630 |
| | EPCOR Utilities Inc. | 3.106% | 7/8/49 | CAD | 528 | 274 |
| | EPCOR Utilities Inc. | 2.899% | 5/19/50 | CAD | 924 | 458 |
| | EPCOR Utilities Inc. | 3.287% | 6/28/51 | CAD | 953 | 508 |
| | EPCOR Utilities Inc. | 4.725% | 9/2/52 | CAD | 2,400 | 1,650 |
| | Equitable Bank | 1.983% | 5/9/24 | CAD | 240 | 166 |
| | Equitable Bank | 1.939% | 3/10/25 | CAD | 504 | 337 |
| | Equitable Bank | 1.876% | 11/26/25 | CAD | 981 | 638 |
| | Equitable Bank | 3.362% | 3/2/26 | CAD | 3,500 | 2,368 |
| | Fair Hydro Trust | 3.357% | 5/15/35 | CAD | 3,516 | 2,329 |
| | Fairfax Financial Holdings Ltd. | 4.950% | 3/3/25 | CAD | 1,989 | 1,431 |
| | Fairfax Financial Holdings Ltd. | 4.700% | 12/16/26 | CAD | 2,450 | 1,717 |
| | Fairfax Financial Holdings Ltd. | 4.250% | 12/6/27 | CAD | 3,208 | 2,179 |
| | Fairfax Financial Holdings Ltd. | 4.230% | 6/14/29 | CAD | 1,355 | 895 |
| | Fairfax Financial Holdings Ltd. | 3.950% | 3/3/31 | CAD | 3,183 | 1,975 |
| | Federated Co-Operatives Ltd. | 3.917% | 6/17/25 | CAD | 1,051 | 740 |
| | Federation des Caisses Desjardins du Quebec | 2.417% | 10/4/24 | CAD | 6,385 | 4,449 |
| | Federation des Caisses Desjardins du Quebec | 0.010% | 9/24/25 | EUR | 20,587 | 18,664 |
| | Federation des Caisses Desjardins du Quebec | 1.093% | 1/21/26 | CAD | 1,975 | 1,272 |
| | Federation des Caisses Desjardins du Quebec | 1.587% | 9/10/26 | CAD | 2,000 | 1,286 |
| | Federation des Caisses Desjardins du Quebec | 4.407% | 5/19/27 | CAD | 4,700 | 3,325 |
| | Federation des Caisses Desjardins du Quebec | 2.856% | 5/26/30 | CAD | 4,495 | 3,061 |
| | Federation des Caisses Desjardins du Quebec | 1.992% | 5/28/31 | CAD | 3,559 | 2,276 |
| | Federation des Caisses Desjardins du Quebec | 5.035% | 8/23/32 | CAD | 4,300 | 3,025 |
| | First Capital REIT | 4.790% | 8/30/24 | CAD | 2,456 | 1,754 |
| | First Capital REIT | 4.323% | 7/31/25 | CAD | 4,898 | 3,402 |
| | First Capital REIT | 3.604% | 5/6/26 | CAD | 1,700 | 1,137 |
| | First Capital REIT | 3.456% | 1/22/27 | CAD | 2,000 | 1,303 |
| | First Capital REIT | 3.753% | 7/12/27 | CAD | 1,422 | 928 |
| | First National Financial Corp. | 2.961% | 11/17/25 | CAD | 491 | 328 |
| | Fortis Inc. | 2.180% | 5/15/28 | CAD | 2,532 | 1,610 |
Total International Bond II Index Fund
| | | Coupon | Maturity
Date | Currency | Face
Amount
(000) | Market
Value•
($000) |
| | Fortis Inc. | 4.431% | 5/31/29 | CAD | 3,300 | 2,336 |
| | FortisAlberta Inc. | 6.220% | 10/31/34 | CAD | 18 | 14 |
| | FortisAlberta Inc. | 4.850% | 9/11/43 | CAD | 300 | 210 |
| | FortisAlberta Inc. | 3.672% | 9/9/47 | CAD | 2,052 | 1,188 |
| | FortisAlberta Inc. | 3.734% | 9/18/48 | CAD | 900 | 526 |
| | FortisAlberta Inc. | 2.632% | 6/8/51 | CAD | 652 | 300 |
| | FortisBC Energy Inc. | 6.500% | 5/1/34 | CAD | 4,898 | 3,998 |
| | FortisBC Energy Inc. | 6.050% | 2/15/38 | CAD | 4,898 | 3,916 |
| | FortisBC Energy Inc. | 2.820% | 8/9/49 | CAD | 700 | 348 |
| | FortisBC Energy Inc. | 2.540% | 7/13/50 | CAD | 800 | 368 |
| | FortisBC Inc. | 4.000% | 10/28/44 | CAD | 1,029 | 622 |
| | Gibson Energy Inc. | 2.450% | 7/14/25 | CAD | 883 | 599 |
| | Gibson Energy Inc. | 2.850% | 7/14/27 | CAD | 1,886 | 1,231 |
| | Gibson Energy Inc. | 3.600% | 9/17/29 | CAD | 1,747 | 1,129 |
| | Granite REIT Holdings LP | 3.873% | 11/30/23 | CAD | 2,388 | 1,720 |
| | Granite REIT Holdings LP | 3.062% | 6/4/27 | CAD | 1,051 | 693 |
| | Granite REIT Holdings LP | 2.194% | 8/30/28 | CAD | 2,504 | 1,527 |
| | Granite REIT Holdings LP | 2.378% | 12/18/30 | CAD | 2,172 | 1,240 |
| | Greater Toronto Airports Authority | 1.540% | 5/3/28 | CAD | 3,144 | 1,972 |
| | Greater Toronto Airports Authority | 2.730% | 4/3/29 | CAD | 4,391 | 2,892 |
| | Greater Toronto Airports Authority | 3.260% | 6/1/37 | CAD | 4,424 | 2,628 |
| | Greater Toronto Airports Authority | 2.750% | 10/17/39 | CAD | 4,546 | 2,442 |
| | Greater Toronto Airports Authority | 5.300% | 2/25/41 | CAD | 1,519 | 1,136 |
| | Greater Toronto Airports Authority | 5.300% | 2/25/41 | CAD | 2,450 | 1,668 |
| | Great-West Lifeco Inc. | 1.750% | 12/7/26 | EUR | 100 | 90 |
| | Great-West Lifeco Inc. | 2.379% | 5/14/30 | CAD | 6,136 | 3,735 |
| | Great-West Lifeco Inc. | 6.670% | 3/21/33 | CAD | 975 | 789 |
| | Great-West Lifeco Inc. | 5.998% | 11/16/39 | CAD | 5,388 | 4,166 |
| | Great-West Lifeco Inc. | 2.981% | 7/8/50 | CAD | 1,400 | 669 |
| | H&R REIT | 3.369% | 1/30/24 | CAD | 747 | 530 |
| | H&R REIT | 2.906% | 6/2/26 | CAD | 2,450 | 1,618 |
| | H&R REIT | 2.633% | 2/19/27 | CAD | 1,452 | 932 |
| | Halifax International Airport Authority | 5.503% | 7/19/41 | CAD | 52 | 38 |
| | Honda Canada Finance Inc. | 2.500% | 6/4/24 | CAD | 2,016 | 1,420 |
| | Honda Canada Finance Inc. | 3.444% | 5/23/25 | CAD | 2,111 | 1,482 |
| | Honda Canada Finance Inc. | 1.337% | 3/17/26 | CAD | 1,815 | 1,172 |
| | Honda Canada Finance Inc. | 1.711% | 9/28/26 | CAD | 1,706 | 1,097 |
| | Honda Canada Finance Inc. | 1.646% | 2/25/28 | CAD | 2,047 | 1,258 |
| | Hospital for Sick Children | 5.217% | 12/16/49 | CAD | 850 | 663 |
| | Hospital for Sick Children | 3.416% | 12/7/57 | CAD | 1,381 | 779 |
| | Hospital Infrastructure Partners NOH Partnership | 5.439% | 1/31/45 | CAD | 2,209 | 1,621 |
| | HSBC Bank Canada | 3.403% | 3/24/25 | CAD | 5,608 | 3,948 |
| | HSBC Bank Canada | 1.782% | 5/20/26 | CAD | 5,989 | 3,911 |
| | HSBC Bank Canada | 0.010% | 9/14/26 | EUR | 1,300 | 1,144 |
| | HSBC Bank Canada | 1.500% | 9/15/27 | EUR | 10,300 | 9,411 |
| | Hydro One Inc. | 2.540% | 4/5/24 | CAD | 1,159 | 824 |
| | Hydro One Inc. | 1.760% | 2/28/25 | CAD | 1,000 | 686 |
| | Hydro One Inc. | 2.970% | 6/26/25 | CAD | 62 | 44 |
| | Hydro One Inc. | 2.770% | 2/24/26 | CAD | 4,800 | 3,320 |
| | Hydro One Inc. | 3.020% | 4/5/29 | CAD | 4,461 | 2,993 |
| | Hydro One Inc. | 2.160% | 2/28/30 | CAD | 1,500 | 933 |
| | Hydro One Inc. | 7.350% | 6/3/30 | CAD | 981 | 824 |
| | Hydro One Inc. | 1.690% | 1/16/31 | CAD | 1,900 | 1,111 |
| | Hydro One Inc. | 2.230% | 9/17/31 | CAD | 1,854 | 1,114 |
| | Hydro One Inc. | 6.930% | 6/1/32 | CAD | 557 | 466 |
| | Hydro One Inc. | 5.360% | 5/20/36 | CAD | 491 | 365 |
| | Hydro One Inc. | 4.890% | 3/13/37 | CAD | 2,450 | 1,739 |
| | Hydro One Inc. | 5.490% | 7/16/40 | CAD | 1,727 | 1,312 |
| | Hydro One Inc. | 4.390% | 9/26/41 | CAD | 2,505 | 1,665 |
| | Hydro One Inc. | 4.590% | 10/9/43 | CAD | 2,695 | 1,821 |
| | Hydro One Inc. | 4.170% | 6/6/44 | CAD | 2,600 | 1,661 |
| | Hydro One Inc. | 3.910% | 2/23/46 | CAD | 1,567 | 953 |
| | Hydro One Inc. | 5.000% | 10/19/46 | CAD | 981 | 703 |
| | Hydro One Inc. | 3.720% | 11/18/47 | CAD | 1,907 | 1,119 |
| | Hydro One Inc. | 3.630% | 6/25/49 | CAD | 4,467 | 2,594 |
| | Hydro One Inc. | 2.710% | 2/28/50 | CAD | 1,877 | 896 |
| | Hydro One Inc. | 3.640% | 4/5/50 | CAD | 1,802 | 1,048 |
| | Hydro One Inc. | 3.100% | 9/15/51 | CAD | 2,530 | 1,300 |
| | Hydro One Inc. | 4.000% | 12/22/51 | CAD | 1,077 | 664 |
Total International Bond II Index Fund
| | | Coupon | Maturity
Date | Currency | Face
Amount
(000) | Market
Value•
($000) |
| | Hydro One Inc. | 3.790% | 7/31/62 | CAD | 981 | 550 |
| | Hydro One Ltd. | 1.410% | 10/15/27 | CAD | 5,541 | 3,484 |
| | Hydro Ottawa Holding Inc. | 3.991% | 5/14/43 | CAD | 1,029 | 623 |
| | Hyundai Capital Canada Inc. | 2.008% | 5/12/26 | CAD | 3,604 | 2,325 |
| | Hyundai Capital Canada Inc. | 3.196% | 2/16/27 | CAD | 926 | 610 |
| | iA Financial Corp Inc. | 3.187% | 2/25/32 | CAD | 1,700 | 1,129 |
| | iA Financial Corp. Inc. | 3.072% | 9/24/31 | CAD | 1,471 | 981 |
| | IGM Financial Inc. | 3.440% | 1/26/27 | CAD | 2,514 | 1,715 |
| | IGM Financial Inc. | 4.560% | 1/25/47 | CAD | 1,041 | 660 |
| | IGM Financial Inc. | 4.115% | 12/9/47 | CAD | 2,981 | 1,756 |
| | IGM Financial Inc. | 4.174% | 7/13/48 | CAD | 600 | 357 |
| | IGM Financial Inc. | 4.206% | 3/21/50 | CAD | 687 | 411 |
| | Independent Order of Foresters | 2.885% | 10/15/35 | CAD | 557 | 330 |
| | InPower BC General Partnership | 4.471% | 3/31/33 | CAD | 1,702 | 1,201 |
| | Intact Financial Corp. | 1.207% | 5/21/24 | CAD | 359 | 248 |
| | Intact Financial Corp. | 3.770% | 3/2/26 | CAD | 1,165 | 817 |
| | Intact Financial Corp. | 2.850% | 6/7/27 | CAD | 2,196 | 1,466 |
| | Intact Financial Corp. | 2.179% | 5/18/28 | CAD | 1,500 | 949 |
| | Intact Financial Corp. | 1.928% | 12/16/30 | CAD | 3,624 | 2,091 |
| | Intact Financial Corp. | 6.400% | 11/23/39 | CAD | 25 | 20 |
| | Intact Financial Corp. | 5.160% | 6/16/42 | CAD | 1,460 | 1,021 |
| | Intact Financial Corp. | 2.954% | 12/16/50 | CAD | 1,946 | 925 |
| | Integrated Team Solutions SJHC Partnership | 5.946% | 11/30/42 | CAD | 23 | 17 |
| | Inter Pipeline Ltd. | 2.734% | 4/18/24 | CAD | 1,350 | 952 |
| | Inter Pipeline Ltd. | 3.173% | 3/24/25 | CAD | 812 | 565 |
| | Inter Pipeline Ltd. | 3.484% | 12/16/26 | CAD | 1,225 | 825 |
| | Inter Pipeline Ltd. | 4.232% | 6/1/27 | CAD | 4,814 | 3,320 |
| | Inter Pipeline Ltd. | 3.983% | 11/25/31 | CAD | 2,782 | 1,733 |
| | Inter Pipeline Ltd. | 5.849% | 5/18/32 | CAD | 2,240 | 1,599 |
| | Inter Pipeline Ltd. | 4.637% | 5/30/44 | CAD | 1,943 | 1,076 |
| | Inter Pipeline Ltd. | 5.091% | 11/27/51 | CAD | 1,053 | 606 |
| | Ivanhoe Cambridge II Inc. | 2.296% | 12/12/24 | CAD | 2,512 | 1,755 |
| | Keyera Corp. | 3.934% | 6/21/28 | CAD | 1,679 | 1,132 |
| | Keyera Corp. | 3.959% | 5/29/30 | CAD | 1,378 | 895 |
| | Keyera Corp. | 5.022% | 3/28/32 | CAD | 1,812 | 1,233 |
| | Laurentian Bank of Canada | 1.950% | 3/17/25 | CAD | 2,000 | 1,349 |
| | Laurentian Bank of Canada | 4.600% | 9/2/25 | CAD | 2,000 | 1,427 |
| | Loblaw Cos. Ltd. | 4.488% | 12/11/28 | CAD | 3,631 | 2,591 |
| | Loblaw Cos. Ltd. | 2.284% | 5/7/30 | CAD | 6,067 | 3,659 |
| | Loblaw Cos. Ltd. | 5.008% | 9/13/32 | CAD | 3,700 | 2,647 |
| | Loblaw Cos. Ltd. | 5.900% | 1/18/36 | CAD | 1,228 | 903 |
| | Loblaw Cos. Ltd. | 5.336% | 9/13/52 | CAD | 300 | 210 |
| | Lower Mattagami Energy LP | 3.416% | 6/20/24 | CAD | 1,054 | 757 |
| | Lower Mattagami Energy LP | 2.433% | 5/14/31 | CAD | 3,241 | 2,007 |
| | Lower Mattagami Energy LP | 5.139% | 5/18/41 | CAD | 2,557 | 1,869 |
| | Lower Mattagami Energy LP | 4.944% | 9/21/43 | CAD | 277 | 198 |
| | Lower Mattagami Energy LP | 4.175% | 4/23/52 | CAD | 800 | 508 |
| | Manulife Bank of Canada | 2.378% | 11/19/24 | CAD | 1,429 | 992 |
| | Manulife Bank of Canada | 1.337% | 2/26/26 | CAD | 4,329 | 2,810 |
| | Manulife Bank of Canada | 1.536% | 9/14/26 | CAD | 1,504 | 964 |
| | Manulife Bank of Canada | 2.864% | 2/16/27 | CAD | 2,782 | 1,859 |
| | Manulife Finance Delaware LP | 5.059% | 12/15/41 | CAD | 1,857 | 1,239 |
| | Manulife Financial Corp. | 3.049% | 8/20/29 | CAD | 2,450 | 1,717 |
| | Manulife Financial Corp. | 2.237% | 5/12/30 | CAD | 6,577 | 4,434 |
| | Manulife Financial Corp. | 2.818% | 5/13/35 | CAD | 5,296 | 3,190 |
| | McGill University | 6.150% | 9/22/42 | CAD | 16 | 14 |
| | McGill University | 3.975% | 1/29/56 | CAD | 39 | 24 |
| | McGill University Health Centre | 5.360% | 12/31/43 | CAD | 306 | 240 |
| | Metro Inc. | 3.390% | 12/6/27 | CAD | 5,198 | 3,542 |
| | Metro Inc. | 5.970% | 10/15/35 | CAD | 2,473 | 1,849 |
| | Metro Inc. | 4.270% | 12/4/47 | CAD | 3,283 | 1,957 |
| | Metro Inc. | 3.413% | 2/28/50 | CAD | 1,681 | 846 |
| | Mountain View Partners GP | 3.974% | 3/31/51 | CAD | 30 | 18 |
| | National Bank of Canada | 0.375% | 1/15/24 | EUR | 2,457 | 2,359 |
| | National Bank of Canada | 2.983% | 3/4/24 | CAD | 8,045 | 5,736 |
| | National Bank of Canada | 2.545% | 7/12/24 | CAD | 4,531 | 3,185 |
| | National Bank of Canada | 2.580% | 2/3/25 | CAD | 3,282 | 2,274 |
| | National Bank of Canada | 0.750% | 3/13/25 | EUR | 4,461 | 4,188 |
| | National Bank of Canada | 1.534% | 6/15/26 | CAD | 2,799 | 1,812 |
Total International Bond II Index Fund
| | | Coupon | Maturity
Date | Currency | Face
Amount
(000) | Market
Value•
($000) |
| | National Bank of Canada | 1.573% | 8/18/26 | CAD | 3,200 | 2,125 |
| | National Bank of Canada | 2.237% | 11/4/26 | CAD | 3,033 | 1,987 |
| | National Bank of Canada | 5.426% | 8/16/32 | CAD | 3,700 | 2,648 |
| | NAV Canada | 0.555% | 2/9/24 | CAD | 443 | 309 |
| | NAV Canada | 0.937% | 2/9/26 | CAD | 1,700 | 1,111 |
| | NAV Canada | 2.063% | 5/29/30 | CAD | 2,106 | 1,298 |
| | NAV Canada | 3.534% | 2/23/46 | CAD | 491 | 289 |
| | NAV Canada | 3.293% | 3/30/48 | CAD | 3,428 | 1,900 |
| | NAV Canada | 2.924% | 9/29/51 | CAD | 1,650 | 832 |
| | Nissan Canada Inc. | 1.626% | 3/18/24 | CAD | 2,881 | 1,985 |
| | Nissan Canada Inc. | 2.103% | 9/22/25 | CAD | 4,221 | 2,745 |
| | North Battleford Power LP | 4.958% | 12/31/32 | CAD | 1,882 | 1,367 |
| | North West Redwater Partnership / NWR Financing Co. Ltd. | 1.200% | 12/1/23 | CAD | 2,500 | 1,760 |
| | North West Redwater Partnership / NWR Financing Co. Ltd. | 3.200% | 7/22/24 | CAD | 1,054 | 750 |
| | North West Redwater Partnership / NWR Financing Co. Ltd. | 3.200% | 4/24/26 | CAD | 982 | 679 |
| | North West Redwater Partnership / NWR Financing Co. Ltd. | 2.000% | 12/1/26 | CAD | 1,705 | 1,113 |
| | North West Redwater Partnership / NWR Financing Co. Ltd. | 2.800% | 6/1/27 | CAD | 3,730 | 2,501 |
| | North West Redwater Partnership / NWR Financing Co. Ltd. | 4.250% | 6/1/29 | CAD | 2,426 | 1,707 |
| | North West Redwater Partnership / NWR Financing Co. Ltd. | 2.800% | 6/1/31 | CAD | 4,899 | 3,021 |
| | North West Redwater Partnership / NWR Financing Co. Ltd. | 4.150% | 6/1/33 | CAD | 2,695 | 1,802 |
| | North West Redwater Partnership / NWR Financing Co. Ltd. | 3.650% | 6/1/35 | CAD | 2,807 | 1,744 |
| | North West Redwater Partnership / NWR Financing Co. Ltd. | 4.750% | 6/1/37 | CAD | 2,271 | 1,556 |
| | North West Redwater Partnership / NWR Financing Co. Ltd. | 4.350% | 1/10/39 | CAD | 1,706 | 1,094 |
| | North West Redwater Partnership / NWR Financing Co. Ltd. | 3.700% | 2/23/43 | CAD | 2,150 | 1,229 |
| | North West Redwater Partnership / NWR Financing Co. Ltd. | 4.050% | 7/22/44 | CAD | 2,828 | 1,692 |
| | North West Redwater Partnership / NWR Financing Co. Ltd. | 3.750% | 6/1/51 | CAD | 2,756 | 1,535 |
| | Northern Courier Pipeline LP | 3.365% | 6/30/42 | CAD | 790 | 506 |
| 3 | Northern Courier Pipeline LP | 3.365% | 6/30/42 | CAD | 1,394 | 900 |
| | Northwestern Hydro Acquisition Co. II LP | 3.877% | 12/31/36 | CAD | 2,040 | 1,255 |
| | Northwestern Hydro Acquisition Co. III LP | 3.940% | 12/31/38 | CAD | 2,147 | 1,302 |
| | Nouvelle Autoroute 30 Financement Inc. | 4.114% | 3/31/42 | CAD | 2,876 | 1,788 |
| | Nouvelle Autoroute 30 Financement Inc. | 4.115% | 6/30/42 | CAD | 897 | 552 |
| | Nova Scotia Power Inc. | 5.610% | 6/15/40 | CAD | 2,107 | 1,548 |
| | Nova Scotia Power Inc. | 4.150% | 3/6/42 | CAD | 400 | 244 |
| | Nova Scotia Power Inc. | 4.500% | 7/20/43 | CAD | 1,621 | 1,032 |
| | Nova Scotia Power Inc. | 3.612% | 5/1/45 | CAD | 500 | 276 |
| | Nova Scotia Power Inc. | 3.571% | 4/5/49 | CAD | 2,429 | 1,299 |
| | Nova Scotia Power Inc. | 3.307% | 4/25/50 | CAD | 1,054 | 533 |
| | OMERS Realty Corp. | 2.858% | 2/23/24 | CAD | 2,456 | 1,751 |
| | OMERS Realty Corp. | 3.328% | 11/12/24 | CAD | 520 | 369 |
| | OMERS Realty Corp. | 3.331% | 6/5/25 | CAD | 3,563 | 2,506 |
| | OMERS Realty Corp. | 3.244% | 10/4/27 | CAD | 3,312 | 2,165 |
| | OMERS Realty Corp. | 3.628% | 6/5/30 | CAD | 2,204 | 1,476 |
| | Ontario Power Generation Inc. | 1.170% | 4/22/26 | CAD | 1,900 | 1,230 |
| | Ontario Power Generation Inc. | 3.315% | 10/4/27 | CAD | 2,905 | 1,999 |
| | Ontario Power Generation Inc. | 2.977% | 9/13/29 | CAD | 3,918 | 2,566 |
| | Ontario Power Generation Inc. | 3.215% | 4/8/30 | CAD | 4,939 | 3,248 |
| | Ontario Power Generation Inc. | 3.838% | 6/22/48 | CAD | 2,939 | 1,717 |
| | Ontario Power Generation Inc. | 4.248% | 1/18/49 | CAD | 700 | 434 |
| | Ontario Power Generation Inc. | 3.651% | 9/13/50 | CAD | 1,277 | 709 |
| | Ontario Power Generation Inc. | 2.947% | 2/21/51 | CAD | 1,743 | 842 |
| | OPB Finance Trust | 3.890% | 7/4/42 | CAD | 1,000 | 644 |
| | Original Wempi Inc. | 4.056% | 2/13/24 | CAD | 602 | 428 |
| | Original Wempi Inc. | 4.309% | 2/13/24 | CAD | 926 | 653 |
| | Ottawa MacDonald-Cartier International Airport Authority | 3.933% | 6/9/45 | CAD | 667 | 423 |
| | Pembina Pipeline Corp. | 2.990% | 1/22/24 | CAD | 3,940 | 2,808 |
| | Pembina Pipeline Corp. | 3.540% | 2/3/25 | CAD | 1,500 | 1,058 |
| | Pembina Pipeline Corp. | 3.710% | 8/11/26 | CAD | 2,380 | 1,647 |
| | Pembina Pipeline Corp. | 4.240% | 6/15/27 | CAD | 1,475 | 1,032 |
| | Pembina Pipeline Corp. | 4.020% | 3/27/28 | CAD | 2,254 | 1,542 |
| | Pembina Pipeline Corp. | 3.620% | 4/3/29 | CAD | 2,071 | 1,364 |
| | Pembina Pipeline Corp. | 3.310% | 2/1/30 | CAD | 3,624 | 2,305 |
| | Pembina Pipeline Corp. | 3.530% | 12/10/31 | CAD | 2,000 | 1,242 |
| | Pembina Pipeline Corp. | 4.750% | 4/30/43 | CAD | 1,475 | 885 |
| | Pembina Pipeline Corp. | 4.810% | 3/25/44 | CAD | 2,720 | 1,635 |
| | Pembina Pipeline Corp. | 4.740% | 1/21/47 | CAD | 2,577 | 1,515 |
| | Pembina Pipeline Corp. | 4.750% | 3/26/48 | CAD | 2,811 | 1,645 |
| | Pembina Pipeline Corp. | 4.540% | 4/3/49 | CAD | 3,244 | 1,833 |
| | Pembina Pipeline Corp. | 4.670% | 5/28/50 | CAD | 1,572 | 904 |
Total International Bond II Index Fund
| | | Coupon | Maturity
Date | Currency | Face
Amount
(000) | Market
Value•
($000) |
| | Pembina Pipeline Corp. | 4.490% | 12/10/51 | CAD | 2,406 | 1,335 |
| | Plenary Health Care Partnerships Humber LP | 4.895% | 5/31/39 | CAD | 1,303 | 938 |
| | Plenary Properties LTAP LP | 6.288% | 1/31/44 | CAD | 2,497 | 1,974 |
| | Power Corp. of Canada | 4.455% | 7/27/48 | CAD | 1,664 | 1,047 |
| | Power Financial Corp. | 6.900% | 3/11/33 | CAD | 615 | 495 |
| | Reliance LP | 3.836% | 3/15/25 | CAD | 2,000 | 1,402 |
| | Reliance LP | 3.750% | 3/15/26 | CAD | 964 | 663 |
| | Reliance LP | 2.680% | 12/1/27 | CAD | 2,187 | 1,387 |
| | Reliance LP | 2.670% | 8/1/28 | CAD | 1,704 | 1,056 |
| | RioCan REIT | 3.287% | 2/12/24 | CAD | 1,912 | 1,357 |
| | RioCan REIT | 2.576% | 2/12/25 | CAD | 2,107 | 1,437 |
| | RioCan REIT | 1.974% | 6/15/26 | CAD | 1,471 | 941 |
| | RioCan REIT | 2.361% | 3/10/27 | CAD | 1,583 | 999 |
| | RioCan REIT | 2.829% | 11/8/28 | CAD | 1,776 | 1,092 |
| | RioCan REIT | 4.628% | 5/1/29 | CAD | 1,200 | 809 |
| | Rogers Communications Inc. | 4.000% | 3/13/24 | CAD | 4,088 | 2,945 |
| | Rogers Communications Inc. | 3.100% | 4/15/25 | CAD | 2,561 | 1,781 |
| | Rogers Communications Inc. | 3.650% | 3/31/27 | CAD | 6,092 | 4,168 |
| | Rogers Communications Inc. | 3.750% | 4/15/29 | CAD | 3,938 | 2,650 |
| | Rogers Communications Inc. | 3.250% | 5/1/29 | CAD | 5,206 | 3,357 |
| | Rogers Communications Inc. | 4.250% | 4/15/32 | CAD | 4,838 | 3,209 |
| | Rogers Communications Inc. | 6.680% | 11/4/39 | CAD | 1,891 | 1,436 |
| | Rogers Communications Inc. | 6.110% | 8/25/40 | CAD | 3,650 | 2,613 |
| | Rogers Communications Inc. | 6.560% | 3/22/41 | CAD | 1,698 | 1,275 |
| | Rogers Communications Inc. | 5.250% | 4/15/52 | CAD | 3,780 | 2,423 |
| | Royal Bank of Canada | 2.333% | 12/5/23 | CAD | 7,622 | 5,442 |
| | Royal Bank of Canada | 0.250% | 1/29/24 | EUR | 5,365 | 5,143 |
| | Royal Bank of Canada | 2.352% | 7/2/24 | CAD | 8,796 | 6,174 |
| | Royal Bank of Canada | 0.125% | 7/23/24 | EUR | 9,455 | 8,806 |
| | Royal Bank of Canada | 2.609% | 11/1/24 | CAD | 9,498 | 6,636 |
| | Royal Bank of Canada | 1.375% | 12/9/24 | GBP | 1,555 | 1,646 |
| | Royal Bank of Canada | 0.125% | 3/25/25 | EUR | 35,000 | 32,333 |
| | Royal Bank of Canada | 1.936% | 5/1/25 | CAD | 5,424 | 3,683 |
| | Royal Bank of Canada | 3.369% | 9/29/25 | CAD | 15,050 | 10,510 |
| | Royal Bank of Canada | 1.589% | 5/4/26 | CAD | 5,570 | 3,625 |
| | Royal Bank of Canada | 0.050% | 6/19/26 | EUR | 8,272 | 7,332 |
| | Royal Bank of Canada | 1.000% | 9/9/26 | GBP | 5,000 | 4,845 |
| | Royal Bank of Canada | 0.010% | 1/21/27 | EUR | 7,369 | 6,402 |
| | Royal Bank of Canada | 2.328% | 1/28/27 | CAD | 8,698 | 5,693 |
| | Royal Bank of Canada | 0.125% | 4/26/27 | EUR | 7,500 | 6,494 |
| | Royal Bank of Canada | 3.625% | 6/14/27 | GBP | 3,000 | 3,129 |
| | Royal Bank of Canada | 4.612% | 7/26/27 | CAD | 8,100 | 5,802 |
| | Royal Bank of Canada | 1.833% | 7/31/28 | CAD | 5,242 | 3,216 |
| | Royal Bank of Canada | 2.125% | 4/26/29 | EUR | 5,400 | 4,686 |
| | Royal Bank of Canada | 2.740% | 7/25/29 | CAD | 4,898 | 3,420 |
| | Royal Bank of Canada | 2.880% | 12/23/29 | CAD | 6,150 | 4,251 |
| | Royal Bank of Canada | 2.088% | 6/30/30 | CAD | 4,928 | 3,288 |
| | Royal Bank of Canada | 0.010% | 1/27/31 | EUR | 9,000 | 6,790 |
| | Royal Bank of Canada | 2.140% | 11/3/31 | CAD | 6,985 | 4,442 |
| | Royal Bank of Canada | 2.940% | 5/3/32 | CAD | 3,640 | 2,357 |
| | Royal Bank of Canada | 1.670% | 1/28/33 | CAD | 5,033 | 2,993 |
| | Sagen MI Canada Inc. | 4.242% | 4/1/24 | CAD | 506 | 364 |
| | Sagen MI Canada Inc. | 2.955% | 3/1/27 | CAD | 908 | 588 |
| | Sagen MI Canada Inc. | 3.261% | 3/5/31 | CAD | 700 | 419 |
| | Saputo Inc. | 2.876% | 11/19/24 | CAD | 158 | 111 |
| | Saputo Inc. | 3.603% | 8/14/25 | CAD | 3,480 | 2,440 |
| | Saputo Inc. | 1.415% | 6/19/26 | CAD | 981 | 628 |
| | Saputo Inc. | 2.242% | 6/16/27 | CAD | 2,610 | 1,681 |
| | Saputo Inc. | 2.297% | 6/22/28 | CAD | 1,600 | 1,005 |
| | Scotiabank Capital Trust | 5.650% | 12/31/56 | CAD | 1,933 | 1,443 |
| | SEC LP and Arci Ltd. | 5.188% | 8/29/33 | CAD | 1,017 | 714 |
| | Shaw Communications Inc. | 4.350% | 1/31/24 | CAD | 4,925 | 3,562 |
| | Shaw Communications Inc. | 3.800% | 3/1/27 | CAD | 2,800 | 1,922 |
| | Shaw Communications Inc. | 4.400% | 11/2/28 | CAD | 64 | 44 |
| | Shaw Communications Inc. | 3.300% | 12/10/29 | CAD | 2,700 | 1,714 |
| | Shaw Communications Inc. | 2.900% | 12/9/30 | CAD | 2,463 | 1,480 |
| | Shaw Communications Inc. | 6.750% | 11/9/39 | CAD | 5,507 | 4,176 |
| | Shaw Communications Inc. | 4.250% | 12/9/49 | CAD | 1,714 | 912 |
| | SmartCentres REIT | 3.444% | 8/28/26 | CAD | 107 | 72 |
Total International Bond II Index Fund
| | | Coupon | Maturity
Date | Currency | Face
Amount
(000) | Market
Value•
($000) |
| | SmartCentres REIT | 3.192% | 6/11/27 | CAD | 2,000 | 1,307 |
| | SmartCentres REIT | 3.834% | 12/21/27 | CAD | 2,450 | 1,627 |
| | SmartCentres REIT | 2.307% | 12/18/28 | CAD | 1,274 | 758 |
| | SmartCentres REIT | 3.526% | 12/20/29 | CAD | 3,184 | 1,988 |
| | SmartCentres REIT | 3.648% | 12/11/30 | CAD | 981 | 602 |
| | SSL Finance Inc. | 4.099% | 10/31/45 | CAD | 1,373 | 869 |
| | Stantec Inc. | 2.048% | 10/8/27 | CAD | 1,200 | 758 |
| | Summit Industrial Income REIT | 2.150% | 9/17/25 | CAD | 637 | 422 |
| | Summit Industrial Income REIT | 1.820% | 4/1/26 | CAD | 529 | 340 |
| | Summit Industrial Income REIT | 2.250% | 1/12/27 | CAD | 1,000 | 639 |
| | Summit Industrial Income REIT | 2.440% | 7/14/28 | CAD | 2,504 | 1,544 |
| | Sun Life Financial Inc. | 2.380% | 8/13/29 | CAD | 2,655 | 1,839 |
| | Sun Life Financial Inc. | 2.460% | 11/18/31 | CAD | 2,500 | 1,620 |
| | Sun Life Financial Inc. | 2.580% | 5/10/32 | CAD | 3,495 | 2,238 |
| | Sun Life Financial Inc. | 2.800% | 11/21/33 | CAD | 4,481 | 2,799 |
| | Sun Life Financial Inc. | 4.780% | 8/10/34 | CAD | 3,100 | 2,152 |
| | Sun Life Financial Inc. | 2.060% | 10/1/35 | CAD | 5,877 | 3,311 |
| | Sun Life Financial Inc. | 5.400% | 5/29/42 | CAD | 2,377 | 1,642 |
| | Suncor Energy Inc. | 4.340% | 9/13/46 | CAD | 1,113 | 651 |
| | Suncor Energy Inc. | 3.950% | 3/4/51 | CAD | 1,948 | 1,043 |
| | TELUS Corp. | 3.350% | 4/1/24 | CAD | 5,270 | 3,777 |
| | TELUS Corp. | 3.750% | 1/17/25 | CAD | 2,186 | 1,554 |
| | TELUS Corp. | 3.750% | 3/10/26 | CAD | 3,376 | 2,367 |
| | TELUS Corp. | 2.750% | 7/8/26 | CAD | 1,300 | 877 |
| | TELUS Corp. | 2.350% | 1/27/28 | CAD | 2,939 | 1,875 |
| | TELUS Corp. | 3.625% | 3/1/28 | CAD | 4,701 | 3,192 |
| | TELUS Corp. | 3.300% | 5/2/29 | CAD | 3,707 | 2,423 |
| | TELUS Corp. | 5.000% | 9/13/29 | CAD | 1,500 | 1,079 |
| | TELUS Corp. | 3.150% | 2/19/30 | CAD | 3,100 | 1,974 |
| | TELUS Corp. | 2.050% | 10/7/30 | CAD | 1,104 | 636 |
| | TELUS Corp. | 2.850% | 11/13/31 | CAD | 3,100 | 1,852 |
| | TELUS Corp. | 5.250% | 11/15/32 | CAD | 4,600 | 3,298 |
| | TELUS Corp. | 4.400% | 4/1/43 | CAD | 1,165 | 689 |
| | TELUS Corp. | 4.850% | 4/5/44 | CAD | 4,530 | 2,821 |
| | TELUS Corp. | 4.750% | 1/17/45 | CAD | 1,727 | 1,064 |
| | TELUS Corp. | 4.400% | 1/29/46 | CAD | 2,141 | 1,247 |
| | TELUS Corp. | 4.700% | 3/6/48 | CAD | 2,293 | 1,389 |
| | TELUS Corp. | 3.950% | 2/16/50 | CAD | 4,290 | 2,269 |
| | TELUS Corp. | 4.100% | 4/5/51 | CAD | 2,272 | 1,237 |
| | TELUS Corp. | 5.650% | 9/13/52 | CAD | 2,700 | 1,886 |
| | Teranet Holdings LP | 3.544% | 6/11/25 | CAD | 4,101 | 2,863 |
| | Teranet Holdings LP | 5.754% | 12/17/40 | CAD | 1,663 | 1,131 |
| | Teranet Holdings LP | 6.100% | 6/17/41 | CAD | 702 | 493 |
| | Thomson Reuters Corp. | 2.239% | 5/14/25 | CAD | 9,342 | 6,394 |
| | TMX Group Ltd. | 3.779% | 6/5/28 | CAD | 1,400 | 967 |
| | Toromont Industries Ltd. | 3.842% | 10/27/27 | CAD | 1,077 | 749 |
| | Toronto Hydro Corp. | 2.520% | 8/25/26 | CAD | 2,695 | 1,837 |
| | Toronto Hydro Corp. | 2.430% | 12/11/29 | CAD | 2,939 | 1,889 |
| | Toronto Hydro Corp. | 5.540% | 5/21/40 | CAD | 652 | 506 |
| | Toronto Hydro Corp. | 3.550% | 7/28/45 | CAD | 684 | 402 |
| | Toronto Hydro Corp. | 3.485% | 2/28/48 | CAD | 2,497 | 1,435 |
| | Toronto Hydro Corp. | 2.990% | 12/10/49 | CAD | 815 | 422 |
| | Toronto Hydro Corp. | 3.270% | 10/18/51 | CAD | 1,103 | 602 |
| | Toronto-Dominion Bank | 0.000% | 2/9/24 | EUR | 13,977 | 13,344 |
| | Toronto-Dominion Bank | 2.850% | 3/8/24 | CAD | 8,080 | 5,754 |
| | Toronto-Dominion Bank | 0.500% | 4/3/24 | EUR | 6,367 | 6,090 |
| | Toronto-Dominion Bank | 2.050% | 7/10/24 | AUD | 2,480 | 1,509 |
| | Toronto-Dominion Bank | 3.226% | 7/24/24 | CAD | 16,690 | 11,912 |
| | Toronto-Dominion Bank | 2.496% | 12/2/24 | CAD | 11,640 | 8,097 |
| | Toronto-Dominion Bank | 1.943% | 3/13/25 | CAD | 5,820 | 3,966 |
| | Toronto-Dominion Bank | 0.625% | 6/6/25 | EUR | 6,818 | 6,342 |
| | Toronto-Dominion Bank | 2.667% | 9/9/25 | CAD | 9,369 | 6,420 |
| | Toronto-Dominion Bank | 1.128% | 12/9/25 | CAD | 5,093 | 3,307 |
| | Toronto-Dominion Bank | 2.260% | 1/7/27 | CAD | 5,620 | 3,672 |
| | Toronto-Dominion Bank | 0.500% | 1/18/27 | EUR | 4,300 | 3,648 |
| | Toronto-Dominion Bank | 2.875% | 4/5/27 | GBP | 200 | 203 |
| | Toronto-Dominion Bank | 4.210% | 6/1/27 | CAD | 10,396 | 7,327 |
| | Toronto-Dominion Bank | 0.100% | 7/19/27 | EUR | 9,681 | 8,313 |
| | Toronto-Dominion Bank | 1.888% | 3/8/28 | CAD | 13,957 | 8,686 |
Total International Bond II Index Fund
| | | Coupon | Maturity
Date | Currency | Face
Amount
(000) | Market
Value•
($000) |
| | Toronto-Dominion Bank | 1.896% | 9/11/28 | CAD | 4,301 | 2,638 |
| | Toronto-Dominion Bank | 3.224% | 7/25/29 | CAD | 5,155 | 3,629 |
| | Toronto-Dominion Bank | 1.952% | 4/8/30 | EUR | 22,400 | 18,766 |
| | Toronto-Dominion Bank | 3.105% | 4/22/30 | CAD | 12,214 | 8,410 |
| | Toronto-Dominion Bank | 4.859% | 3/4/31 | CAD | 4,130 | 2,944 |
| | Toronto-Dominion Bank | 3.060% | 1/26/32 | CAD | 9,700 | 6,373 |
| | Toyota Credit Canada Inc. | 2.640% | 3/27/24 | CAD | 1,600 | 1,135 |
| | Toyota Credit Canada Inc. | 1.270% | 7/22/24 | CAD | 2,592 | 1,783 |
| | Toyota Credit Canada Inc. | 2.310% | 10/23/24 | CAD | 2,884 | 2,005 |
| | Toyota Credit Canada Inc. | 2.110% | 2/26/25 | CAD | 2,458 | 1,685 |
| | Toyota Credit Canada Inc. | 2.730% | 8/25/25 | CAD | 2,000 | 1,375 |
| | Toyota Credit Canada Inc. | 1.180% | 2/23/26 | CAD | 1,770 | 1,144 |
| | Toyota Credit Canada Inc. | 1.660% | 7/20/26 | CAD | 592 | 383 |
| | TransCanada PipeLines Ltd. | 3.300% | 7/17/25 | CAD | 3,849 | 2,688 |
| | TransCanada PipeLines Ltd. | 3.800% | 4/5/27 | CAD | 9,440 | 6,523 |
| | TransCanada PipeLines Ltd. | 3.390% | 3/15/28 | CAD | 2,575 | 1,719 |
| | TransCanada PipeLines Ltd. | 6.280% | 5/26/28 | CAD | 2,211 | 1,682 |
| | TransCanada PipeLines Ltd. | 3.000% | 9/18/29 | CAD | 3,275 | 2,083 |
| | TransCanada PipeLines Ltd. | 2.970% | 6/9/31 | CAD | 2,949 | 1,797 |
| | TransCanada PipeLines Ltd. | 5.330% | 5/12/32 | CAD | 4,205 | 3,029 |
| | TransCanada PipeLines Ltd. | 8.050% | 2/17/39 | CAD | 24 | 21 |
| | TransCanada PipeLines Ltd. | 4.550% | 11/15/41 | CAD | 3,929 | 2,364 |
| | TransCanada PipeLines Ltd. | 4.350% | 6/6/46 | CAD | 3,841 | 2,194 |
| | TransCanada PipeLines Ltd. | 4.330% | 9/16/47 | CAD | 4,004 | 2,265 |
| | TransCanada PipeLines Ltd. | 4.180% | 7/3/48 | CAD | 4,991 | 2,746 |
| | TransCanada PipeLines Ltd. | 4.340% | 10/15/49 | CAD | 4,040 | 2,269 |
| | TransCanada PipeLines Ltd. | 5.920% | 5/12/52 | CAD | 1,200 | 858 |
| | Trillium Health Partners Volunteers | 3.702% | 12/20/58 | CAD | 635 | 381 |
| | University of Ottawa | 2.635% | 2/13/60 | CAD | 1,811 | 804 |
| | University of Toronto | 5.841% | 12/15/43 | CAD | 34 | 28 |
| | University of Toronto | 4.251% | 12/7/51 | CAD | 1,225 | 806 |
| | University of Western Ontario | 4.798% | 5/24/47 | CAD | 47 | 34 |
| 3 | Vancouver Airport Authority | 7.425% | 12/7/26 | CAD | 7,346 | 5,918 |
| | Vancouver Airport Authority | 3.857% | 11/10/45 | CAD | 626 | 385 |
| | Vancouver Airport Authority | 2.874% | 10/18/49 | CAD | 1,026 | 518 |
| | Vancouver Airport Authority | 2.800% | 9/21/50 | CAD | 1,678 | 828 |
| | Westcoast Energy Inc. | 3.430% | 9/12/24 | CAD | 3,300 | 2,342 |
| | Westcoast Energy Inc. | 3.770% | 12/8/25 | CAD | 1,828 | 1,281 |
| | Westcoast Energy Inc. | 4.791% | 10/28/41 | CAD | 1,385 | 877 |
| | WSP Global Inc. | 2.408% | 4/19/28 | CAD | 2,079 | 1,321 |
| | York University | 6.480% | 3/7/42 | CAD | 846 | 731 |
| | | | | | | 1,554,740 |
| China (0.0%) | | | |
| | Bank of China Ltd. | 0.000% | 4/28/24 | EUR | 3,200 | 3,015 |
| | China Construction Bank Europe SA | 0.000% | 6/28/24 | EUR | 270 | 253 |
| | Industrial & Commercial Bank of China Ltd. | 0.125% | 10/28/24 | EUR | 4,960 | 4,604 |
| | Prosus NV | 1.539% | 8/3/28 | EUR | 796 | 583 |
| 3 | Prosus NV | 1.288% | 7/13/29 | EUR | 1,884 | 1,282 |
| | Prosus NV | 2.031% | 8/3/32 | EUR | 4,015 | 2,474 |
| 3 | Prosus NV | 1.985% | 7/13/33 | EUR | 2,786 | 1,647 |
| | Prosus NV | 2.778% | 1/19/34 | EUR | 6,400 | 4,091 |
| | State Grid Europe Development 2014 plc | 2.450% | 1/26/27 | EUR | 1,112 | 1,009 |
| | State Grid Overseas Investment BVI Ltd. | 1.375% | 5/2/25 | EUR | 3,459 | 3,222 |
| | State Grid Overseas Investment BVI Ltd. | 0.797% | 8/5/26 | EUR | 13,455 | 11,710 |
| | State Grid Overseas Investment BVI Ltd. | 2.125% | 5/2/30 | EUR | 3,415 | 2,819 |
| | | | | | | 36,709 |
| Czech Republic (0.0%) | | | |
| | CEZ A/S | 4.875% | 4/16/25 | EUR | 6,091 | 6,160 |
| | CEZ A/S | 3.000% | 6/5/28 | EUR | 6,141 | 5,425 |
| | CPI Property Group SA | 1.625% | 4/23/27 | EUR | 6,094 | 4,038 |
| | CPI Property Group SA | 2.750% | 1/22/28 | GBP | 1,293 | 995 |
| | CPI Property Group SA | 1.500% | 1/27/31 | EUR | 2,981 | 1,676 |
| | EP Infrastructure A/S | 1.659% | 4/26/24 | EUR | 456 | 385 |
| | EP Infrastructure A/S | 1.698% | 7/30/26 | EUR | 836 | 623 |
| | EP Infrastructure A/S | 2.045% | 10/9/28 | EUR | 3,808 | 2,471 |
| | EP Infrastructure A/S | 1.816% | 3/2/31 | EUR | 2,046 | 1,226 |
| | | | | | | 22,999 |
Total International Bond II Index Fund
| | | Coupon | Maturity
Date | Currency | Face
Amount
(000) | Market
Value•
($000) |
| Denmark (0.4%) | | | |
| | AP Moller - Maersk A/S | 4.000% | 4/4/25 | GBP | 12,000 | 13,186 |
| | AP Moller - Maersk A/S | 1.750% | 3/16/26 | EUR | 26,325 | 24,453 |
| | AP Moller - Maersk A/S | 0.750% | 11/25/31 | EUR | 12,786 | 9,310 |
| | Carlsberg Breweries A/S | 2.500% | 5/28/24 | EUR | 8,272 | 8,072 |
| | Carlsberg Breweries A/S | 0.375% | 6/30/27 | EUR | 4,000 | 3,423 |
| | Carlsberg Breweries A/S | 0.875% | 7/1/29 | EUR | 4,913 | 4,018 |
| | Carlsberg Breweries A/S | 0.625% | 3/9/30 | EUR | 400 | 314 |
| | Clearstream Banking AG | 0.000% | 12/1/25 | EUR | 2,200 | 1,983 |
| | Danfoss Finance I BV | 0.125% | 4/28/26 | EUR | 5,169 | 4,501 |
| | Danfoss Finance I BV | 0.375% | 10/28/28 | EUR | 2,200 | 1,752 |
| | Danica Pension Livsforsikrings AB | 4.375% | 9/29/45 | EUR | 1,635 | 1,530 |
| | Danmarks Skibskredit A/S | 0.250% | 6/21/28 | EUR | 700 | 584 |
| | Danske Bank A/S | 0.625% | 5/26/25 | EUR | 1,786 | 1,637 |
| | Danske Bank A/S | 0.500% | 8/27/25 | EUR | 10,400 | 9,556 |
| | Danske Bank A/S | 0.750% | 11/22/27 | EUR | 7,369 | 6,518 |
| | Danske Bank A/S | 2.250% | 1/14/28 | GBP | 9,315 | 8,882 |
| | Danske Bank A/S | 0.750% | 6/9/29 | EUR | 11,776 | 9,162 |
| | Danske Bank A/S | 1.375% | 2/12/30 | EUR | 10,136 | 8,995 |
| | DSV Panalpina Finance BV | 0.875% | 9/17/36 | EUR | 4,276 | 2,670 |
| | Eurogrid GmbH | 0.741% | 4/21/33 | EUR | 5,400 | 3,884 |
| | ISS Global A/S | 2.125% | 12/2/24 | EUR | 200 | 193 |
| | ISS Global A/S | 0.875% | 6/18/26 | EUR | 100 | 87 |
| | ISS Global A/S | 1.500% | 8/31/27 | EUR | 9,771 | 8,360 |
| | Jyske Bank A/S | 2.250% | 4/5/29 | EUR | 5,410 | 5,088 |
| | Jyske Realkredit A/S | 0.375% | 4/1/25 | EUR | 3,459 | 3,219 |
| | Jyske Realkredit A/S | 0.500% | 10/1/26 | EUR | 10,810 | 9,714 |
| | Nordea Kredit Realkreditaktieselskab | 1.000% | 4/1/26 | DKK | 26,000 | 3,209 |
| | Nordea Kredit Realkreditaktieselskab | 1.000% | 10/1/26 | DKK | 214,000 | 26,041 |
| | Nordea Kredit Realkreditaktieselskab | 3.500% | 10/1/44 | DKK | 58 | 8 |
| | Novo Nordisk Finance Netherlands BV | 0.000% | 6/4/24 | EUR | 7,855 | 7,429 |
| | Nykredit Realkredit A/S | 2.000% | 1/1/25 | DKK | 199,119 | 25,850 |
| | Nykredit Realkredit A/S | 0.500% | 7/10/25 | EUR | 9,947 | 9,030 |
| | Nykredit Realkredit A/S | 2.000% | 1/1/26 | DKK | 160,500 | 20,519 |
| | Nykredit Realkredit A/S | 1.000% | 7/1/26 | DKK | 137,560 | 16,835 |
| | Nykredit Realkredit A/S | 1.000% | 1/1/27 | DKK | 350,302 | 42,279 |
| | Nykredit Realkredit A/S | 0.375% | 1/17/28 | EUR | 17,004 | 13,341 |
| | Nykredit Realkredit A/S | 2.000% | 10/1/47 | DKK | 17,228 | 1,901 |
| | Orsted A/S | 1.500% | 11/26/29 | EUR | 21,318 | 18,353 |
| | Orsted A/S | 3.250% | 9/13/31 | EUR | 2,000 | 1,900 |
| | Orsted A/S | 4.875% | 1/12/32 | GBP | 7,401 | 8,160 |
| | Orsted A/S | 2.500% | 5/16/33 | GBP | 4,200 | 3,732 |
| | Orsted A/S | 5.750% | 4/9/40 | GBP | 502 | 584 |
| | Orsted A/S | ���6.250% | 6/26/13 | EUR | 510 | 503 |
| | Orsted A/S | 1.750% | 12/9/19 | EUR | 2,000 | 1,628 |
| | Orsted A/S | 2.500% | 2/18/21 | GBP | 1,100 | 781 |
| | Siemens Financieringsmaatschappij NV | 0.900% | 2/28/28 | EUR | 1,000 | 880 |
| | Vestas Wind Systems Finance BV | 2.000% | 6/15/34 | EUR | 1,915 | 1,527 |
| | | | | | | 355,581 |
| Estonia (0.0%) | | | |
| | Luminor Bank A/S | 0.539% | 9/23/26 | EUR | 23,485 | 20,266 |
| Finland (0.2%) | | | |
| | Aktia Bank OYJ | 0.375% | 3/5/26 | EUR | 5,000 | 4,551 |
| | Elenia Verkko OYJ | 0.375% | 2/6/27 | EUR | 4,913 | 4,105 |
| | Fortum OYJ | 1.625% | 2/27/26 | EUR | 700 | 629 |
| | Fortum OYJ | 2.125% | 2/27/29 | EUR | 1,100 | 920 |
| | Kojamo OYJ | 1.875% | 5/27/27 | EUR | 3,831 | 3,114 |
| | Kojamo OYJ | 0.875% | 5/28/29 | EUR | 3,762 | 2,531 |
| | Metso Outotec OYJ | 0.875% | 5/26/28 | EUR | 1,500 | 1,163 |
| | Nordea Bank Abp | 1.125% | 2/12/25 | EUR | 100 | 95 |
| | Nordea Bank Abp | 0.550% | 6/23/25 | CHF | 6,275 | 6,063 |
| | Nordea Bank Abp | 1.125% | 2/16/27 | EUR | 11,800 | 10,402 |
| | Nordea Bank Abp | 0.500% | 5/14/27 | EUR | 9,913 | 8,564 |
| | Nordea Bank Abp | 0.500% | 11/2/28 | EUR | 8,062 | 6,438 |
| | Nordea Bank Abp | 2.500% | 5/23/29 | EUR | 6,400 | 5,723 |
| | Nordea Bank Abp | 0.500% | 3/19/31 | EUR | 4,000 | 2,989 |
| | Nordea Bank Abp | 2.875% | 8/24/32 | EUR | 3,000 | 2,665 |
| | Nordea Bank Abp | 1.625% | 12/9/32 | GBP | 2,491 | 2,195 |
Total International Bond II Index Fund
| | | Coupon | Maturity
Date | Currency | Face
Amount
(000) | Market
Value•
($000) |
| | Nordea Kiinnitysluottopankki OYJ | 0.250% | 11/21/23 | EUR | 2,457 | 2,369 |
| | Nordea Kiinnitysluottopankki OYJ | 0.250% | 3/18/26 | EUR | 13,411 | 12,139 |
| | Nordea Kiinnitysluottopankki OYJ | 0.625% | 3/17/27 | EUR | 11,180 | 10,011 |
| | OP Corporate Bank plc | 0.375% | 2/26/24 | EUR | 6,369 | 6,056 |
| | OP Corporate Bank plc | 0.375% | 6/19/24 | EUR | 3,910 | 3,651 |
| | OP Corporate Bank plc | 0.125% | 7/1/24 | EUR | 2,552 | 2,385 |
| | OP Corporate Bank plc | 1.000% | 5/22/25 | EUR | 4,913 | 4,557 |
| | OP Corporate Bank plc | 0.500% | 8/12/25 | EUR | 1,568 | 1,421 |
| | OP Corporate Bank plc | 0.600% | 1/18/27 | EUR | 10,729 | 9,075 |
| | OP Corporate Bank plc | 0.100% | 11/16/27 | EUR | 9,981 | 8,178 |
| | OP Corporate Bank plc | 0.375% | 6/16/28 | EUR | 5,000 | 3,925 |
| | OP Corporate Bank plc | 1.625% | 6/9/30 | EUR | 12,182 | 10,885 |
| | OP Mortgage Bank | 0.250% | 3/13/24 | EUR | 14,638 | 13,995 |
| | OP Mortgage Bank | 1.000% | 11/28/24 | EUR | 3,459 | 3,294 |
| | OP Mortgage Bank | 0.010% | 11/19/26 | EUR | 4,913 | 4,319 |
| | OP Mortgage Bank | 0.625% | 2/15/29 | EUR | 4,913 | 4,197 |
| | OP Mortgage Bank | 0.010% | 11/19/30 | EUR | 14,638 | 11,329 |
| | Sampo OYJ | 3.375% | 5/23/49 | EUR | 6,836 | 5,752 |
| | Sampo OYJ | 2.500% | 9/3/52 | EUR | 10,873 | 7,782 |
| | SATO OYJ | 1.375% | 5/31/24 | EUR | 3,000 | 2,774 |
| | SATO OYJ | 1.375% | 2/24/28 | EUR | 7,200 | 5,149 |
| | Stora Enso OYJ | 2.500% | 6/7/27 | EUR | 2,231 | 2,075 |
| | Stora Enso OYJ | 2.500% | 3/21/28 | EUR | 2,806 | 2,581 |
| | | | | | | 200,046 |
| France (3.1%) | | | |
| | Aeroports de Paris | 3.125% | 6/11/24 | EUR | 1,500 | 1,485 |
| | Aeroports de Paris | 1.500% | 4/7/25 | EUR | 2,000 | 1,888 |
| | Aeroports de Paris | 2.125% | 10/2/26 | EUR | 9,300 | 8,731 |
| | Aeroports de Paris | 1.000% | 1/5/29 | EUR | 13,100 | 10,948 |
| | Aeroports de Paris | 2.750% | 4/2/30 | EUR | 9,300 | 8,390 |
| | Aeroports de Paris | 1.500% | 7/2/32 | EUR | 3,600 | 2,799 |
| | Aeroports de Paris | 1.125% | 6/18/34 | EUR | 1,500 | 1,037 |
| | Aeroports de Paris | 2.125% | 10/11/38 | EUR | 3,700 | 2,615 |
| | Air Liquide Finance SA | 1.000% | 4/2/25 | EUR | 12,000 | 11,290 |
| | Air Liquide Finance SA | 1.250% | 6/3/25 | EUR | 2,800 | 2,644 |
| | Air Liquide Finance SA | 1.250% | 6/13/28 | EUR | 500 | 442 |
| | Air Liquide Finance SA | 1.375% | 4/2/30 | EUR | 7,700 | 6,630 |
| | Air Liquide SA | 2.375% | 9/6/23 | EUR | 1,200 | 1,183 |
| | Airbus Finance BV | 2.375% | 4/2/24 | EUR | 4,597 | 4,522 |
| | Airbus Finance BV | 2.125% | 10/29/29 | EUR | 1,547 | 1,395 |
| | Airbus Finance BV | 1.375% | 5/13/31 | EUR | 6,731 | 5,467 |
| | Airbus SE | 1.625% | 4/7/25 | EUR | 2,296 | 2,179 |
| | Airbus SE | 1.375% | 6/9/26 | EUR | 4,094 | 3,799 |
| | Airbus SE | 1.625% | 6/9/30 | EUR | 4,800 | 4,116 |
| | Airbus SE | 2.375% | 4/7/32 | EUR | 7,986 | 7,045 |
| | Airbus SE | 2.375% | 6/9/40 | EUR | 6,487 | 4,850 |
| | ALD SA | 1.250% | 3/2/26 | EUR | 2,500 | 2,204 |
| | ALD SA | 4.000% | 7/5/27 | EUR | 4,600 | 4,358 |
| | Alstom SA | 0.250% | 10/14/26 | EUR | 7,100 | 6,138 |
| | Alstom SA | 0.000% | 1/11/29 | EUR | 3,400 | 2,589 |
| | Altarea SCA | 2.250% | 7/5/24 | EUR | 5,000 | 4,663 |
| | APRR SA | 1.500% | 1/15/24 | EUR | 300 | 290 |
| | APRR SA | 1.875% | 1/15/25 | EUR | 1,300 | 1,246 |
| | APRR SA | 1.125% | 1/9/26 | EUR | 5,300 | 4,908 |
| | APRR SA | 1.250% | 1/6/27 | EUR | 5,400 | 4,888 |
| | APRR SA | 1.250% | 1/18/28 | EUR | 3,500 | 3,094 |
| | APRR SA | 1.500% | 1/25/30 | EUR | 200 | 172 |
| | APRR SA | 1.875% | 1/6/31 | EUR | 100 | 87 |
| | APRR SA | 1.625% | 1/13/32 | EUR | 4,700 | 3,876 |
| | APRR SA | 1.500% | 1/17/33 | EUR | 100 | 80 |
| | Arkea Home Loans SFH SA | 0.375% | 3/4/24 | EUR | 500 | 479 |
| | Arkea Home Loans SFH SA | 0.750% | 10/5/27 | EUR | 25 | 22 |
| | Arkea Home Loans SFH SA | 1.500% | 6/1/33 | EUR | 5,000 | 4,171 |
| | Arkema SA | 1.500% | 1/20/25 | EUR | 200 | 188 |
| | Arkema SA | 0.125% | 10/14/26 | EUR | 10,000 | 8,569 |
| | Arkema SA | 1.500% | 4/20/27 | EUR | 9,700 | 8,630 |
| | Arkema SA | 1.500% | Perpetual | EUR | 3,000 | 2,482 |
| | Autoroutes du Sud de la France SA | 2.875% | 1/18/23 | EUR | 1,700 | 1,684 |
| | Autoroutes du Sud de la France SA | 2.950% | 1/17/24 | EUR | 2,600 | 2,563 |
Total International Bond II Index Fund
| | | Coupon | Maturity
Date | Currency | Face
Amount
(000) | Market
Value•
($000) |
| | Autoroutes du Sud de la France SA | 1.125% | 4/20/26 | EUR | 600 | 552 |
| | Autoroutes du Sud de la France SA | 1.000% | 5/13/26 | EUR | 5,300 | 4,837 |
| | Autoroutes du Sud de la France SA | 1.250% | 1/18/27 | EUR | 100 | 91 |
| | Autoroutes du Sud de la France SA | 1.375% | 6/27/28 | EUR | 11,000 | 9,775 |
| | Autoroutes du Sud de la France SA | 1.375% | 2/21/31 | EUR | 4,000 | 3,397 |
| | AXA Bank Europe SCF | 0.500% | 4/18/25 | EUR | 13,700 | 12,775 |
| | AXA Bank Europe SCF | 1.375% | 4/18/33 | EUR | 7,700 | 6,361 |
| | AXA Home Loan SFH SA | 0.010% | 10/16/29 | EUR | 5,000 | 3,991 |
| | AXA SA | 1.375% | 10/7/41 | EUR | 4,276 | 3,004 |
| | AXA SA | 1.875% | 7/10/42 | EUR | 7,100 | 5,019 |
| | AXA SA | 3.375% | 7/6/47 | EUR | 13,007 | 11,741 |
| | AXA SA | 3.875% | 5/20/49 | EUR | 7,576 | 7,112 |
| | AXA SA | 3.250% | 5/28/49 | EUR | 12,396 | 10,606 |
| | AXA SA | 6.686% | 7/29/49 | GBP | 2,913 | 3,233 |
| | AXA SA | 3.941% | 11/29/49 | EUR | 6,271 | 6,027 |
| | AXA SA | 5.453% | 11/29/49 | GBP | 3,076 | 3,320 |
| | AXA SA | 5.625% | 1/16/54 | GBP | 6,058 | 6,152 |
| | Banque Federative du Credit Mutuel SA | 3.000% | 11/28/23 | EUR | 4,000 | 3,939 |
| | Banque Federative du Credit Mutuel SA | 2.250% | 12/18/23 | GBP | 1,500 | 1,669 |
| | Banque Federative du Credit Mutuel SA | 2.625% | 3/18/24 | EUR | 5,000 | 4,885 |
| | Banque Federative du Credit Mutuel SA | 3.000% | 5/21/24 | EUR | 9,195 | 8,986 |
| | Banque Federative du Credit Mutuel SA | 0.250% | 10/10/24 | JPY | 1,000,000 | 6,696 |
| | Banque Federative du Credit Mutuel SA | 0.384% | 10/11/24 | JPY | 100,000 | 668 |
| | Banque Federative du Credit Mutuel SA | 1.750% | 12/19/24 | GBP | 4,700 | 5,021 |
| | Banque Federative du Credit Mutuel SA | 1.250% | 1/14/25 | EUR | 24,900 | 23,369 |
| | Banque Federative du Credit Mutuel SA | 0.010% | 3/7/25 | EUR | 25,400 | 23,102 |
| | Banque Federative du Credit Mutuel SA | 0.750% | 7/17/25 | EUR | 7,600 | 6,966 |
| | Banque Federative du Credit Mutuel SA | 3.000% | 9/11/25 | EUR | 2,500 | 2,404 |
| | Banque Federative du Credit Mutuel SA | 1.250% | 12/5/25 | GBP | 5,000 | 5,117 |
| | Banque Federative du Credit Mutuel SA | 1.625% | 1/19/26 | EUR | 100 | 93 |
| | Banque Federative du Credit Mutuel SA | 2.375% | 3/24/26 | EUR | 15,800 | 14,693 |
| | Banque Federative du Credit Mutuel SA | 0.010% | 5/11/26 | EUR | 25,500 | 22,103 |
| | Banque Federative du Credit Mutuel SA | 0.750% | 6/8/26 | EUR | 11,200 | 9,955 |
| | Banque Federative du Credit Mutuel SA | 1.000% | 7/16/26 | GBP | 7,500 | 7,369 |
| | Banque Federative du Credit Mutuel SA | 1.875% | 11/4/26 | EUR | 2,800 | 2,504 |
| | Banque Federative du Credit Mutuel SA | 2.625% | 3/31/27 | EUR | 500 | 457 |
| | Banque Federative du Credit Mutuel SA | 0.100% | 10/8/27 | EUR | 4,300 | 3,576 |
| | Banque Federative du Credit Mutuel SA | 1.625% | 11/15/27 | EUR | 2,500 | 2,142 |
| | Banque Federative du Credit Mutuel SA | 0.875% | 12/7/27 | GBP | 1,100 | 1,002 |
| | Banque Federative du Credit Mutuel SA | 2.500% | 5/25/28 | EUR | 2,500 | 2,192 |
| | Banque Federative du Credit Mutuel SA | 0.250% | 6/29/28 | EUR | 13,200 | 10,770 |
| | Banque Federative du Credit Mutuel SA | 0.250% | 7/19/28 | EUR | 10,400 | 8,121 |
| | Banque Federative du Credit Mutuel SA | 1.875% | 10/26/28 | GBP | 3,200 | 2,977 |
| | Banque Federative du Credit Mutuel SA | 0.625% | 11/3/28 | EUR | 28,400 | 22,412 |
| | Banque Federative du Credit Mutuel SA | 1.875% | 6/18/29 | EUR | 5,000 | 4,074 |
| | Banque Federative du Credit Mutuel SA | 0.750% | 1/17/30 | EUR | 1,200 | 912 |
| | Banque Federative du Credit Mutuel SA | 1.250% | 6/3/30 | EUR | 11,000 | 8,612 |
| | Banque Federative du Credit Mutuel SA | 0.625% | 2/21/31 | EUR | 13,200 | 9,568 |
| | BNP Paribas Cardif SA | 4.032% | 11/29/49 | EUR | 500 | 468 |
| | BNP Paribas Home Loan SFH SA | 0.875% | 11/14/24 | EUR | 2,439 | 2,319 |
| | BNP Paribas SA | 1.125% | 11/22/23 | EUR | 200 | 193 |
| | BNP Paribas SA | 2.375% | 5/20/24 | EUR | 4,145 | 4,046 |
| | BNP Paribas SA | 1.000% | 6/27/24 | EUR | 2,457 | 2,329 |
| | BNP Paribas SA | 1.125% | 8/28/24 | EUR | 3,000 | 2,845 |
| | BNP Paribas SA | 2.375% | 2/17/25 | EUR | 2,457 | 2,345 |
| | BNP Paribas SA | 1.250% | 3/19/25 | EUR | 4,913 | 4,585 |
| | BNP Paribas SA | 0.500% | 7/15/25 | EUR | 10,600 | 9,862 |
| | BNP Paribas SA | 1.500% | 11/17/25 | EUR | 10,051 | 9,252 |
| | BNP Paribas SA | 3.375% | 1/23/26 | GBP | 1,319 | 1,399 |
| | BNP Paribas SA | 1.125% | 6/11/26 | EUR | 7,697 | 6,840 |
| | BNP Paribas SA | 2.875% | 10/1/26 | EUR | 2,366 | 2,212 |
| | BNP Paribas SA | 2.125% | 1/23/27 | EUR | 14,200 | 13,022 |
| | BNP Paribas SA | 0.250% | 4/13/27 | EUR | 18,000 | 15,390 |
| | BNP Paribas SA | 0.375% | 10/14/27 | EUR | 10,700 | 9,032 |
| | BNP Paribas SA | 1.875% | 12/14/27 | GBP | 3,000 | 2,797 |
| | BNP Paribas SA | 0.500% | 2/19/28 | EUR | 16,200 | 13,430 |
| | BNP Paribas SA | 0.500% | 5/30/28 | EUR | 1,000 | 824 |
| | BNP Paribas SA | 2.750% | 7/25/28 | EUR | 10,000 | 9,060 |
| | BNP Paribas SA | 0.500% | 9/1/28 | EUR | 5,600 | 4,535 |
Total International Bond II Index Fund
| | | Coupon | Maturity
Date | Currency | Face
Amount
(000) | Market
Value•
($000) |
| | BNP Paribas SA | 1.125% | 4/17/29 | EUR | 5,000 | 4,087 |
| | BNP Paribas SA | 1.375% | 5/28/29 | EUR | 13,300 | 10,696 |
| | BNP Paribas SA | 2.538% | 7/13/29 | CAD | 2,491 | 1,509 |
| | BNP Paribas SA | 0.500% | 1/19/30 | EUR | 9,400 | 7,172 |
| | BNP Paribas SA | 0.875% | 7/11/30 | EUR | 5,400 | 4,153 |
| | BNP Paribas SA | 2.375% | 11/20/30 | EUR | 5,000 | 4,534 |
| | BNP Paribas SA | 1.625% | 7/2/31 | EUR | 3,200 | 2,382 |
| | BNP Paribas SA | 1.250% | 7/13/31 | GBP | 4,100 | 3,229 |
| | BNP Paribas SA | 1.125% | 1/15/32 | EUR | 7,000 | 5,724 |
| | BNP Paribas SA | 2.000% | 9/13/36 | GBP | 2,200 | 1,588 |
| | Bouygues SA | 5.500% | 10/6/26 | GBP | 3,050 | 3,494 |
| | Bouygues SA | 1.375% | 6/7/27 | EUR | 8,200 | 7,356 |
| | Bouygues SA | 1.125% | 7/24/28 | EUR | 200 | 172 |
| | Bouygues SA | 2.250% | 6/29/29 | EUR | 2,000 | 1,774 |
| | Bouygues SA | 0.500% | 2/11/30 | EUR | 2,500 | 1,924 |
| | Bouygues SA | 3.250% | 6/30/37 | EUR | 6,200 | 5,098 |
| | BPCE SA | 0.875% | 1/31/24 | EUR | 6,900 | 6,597 |
| | BPCE SA | 1.000% | 7/15/24 | EUR | 4,200 | 3,992 |
| | BPCE SA | 3.000% | 7/19/24 | EUR | 4,300 | 4,221 |
| | BPCE SA | 0.625% | 9/26/24 | EUR | 12,000 | 11,161 |
| | BPCE SA | 1.000% | 4/1/25 | EUR | 7,400 | 6,828 |
| | BPCE SA | 0.625% | 4/28/25 | EUR | 11,300 | 10,386 |
| | BPCE SA | 0.250% | 1/15/26 | EUR | 5,300 | 4,717 |
| | BPCE SA | 1.375% | 12/23/26 | GBP | 3,600 | 3,473 |
| | BPCE SA | 0.010% | 1/14/27 | EUR | 2,400 | 2,031 |
| | BPCE SA | 0.500% | 2/24/27 | EUR | 400 | 338 |
| | BPCE SA | 0.500% | 9/15/27 | EUR | 15,000 | 12,718 |
| | BPCE SA | 2.750% | 11/30/27 | EUR | 2,500 | 2,469 |
| | BPCE SA | 0.500% | 1/14/28 | EUR | 3,500 | 2,921 |
| | BPCE SA | 1.625% | 1/31/28 | EUR | 6,300 | 5,404 |
| | BPCE SA | 4.500% | 4/26/28 | AUD | 9,640 | 5,483 |
| | BPCE SA | 5.250% | 4/16/29 | GBP | 1,500 | 1,547 |
| | BPCE SA | 0.625% | 1/15/30 | EUR | 6,900 | 5,376 |
| | BPCE SA | 0.250% | 1/14/31 | EUR | 32,600 | 23,580 |
| | BPCE SA | 1.000% | 1/14/32 | EUR | 500 | 361 |
| | BPCE SA | 2.250% | 3/2/32 | EUR | 2,000 | 1,724 |
| | BPCE SA | 1.750% | 2/2/34 | EUR | 2,000 | 1,572 |
| | BPCE SFH SA | 2.375% | 11/29/23 | EUR | 2,500 | 2,464 |
| | BPCE SFH SA | 0.375% | 2/21/24 | EUR | 6,300 | 6,045 |
| | BPCE SFH SA | 1.750% | 6/27/24 | EUR | 9,800 | 9,525 |
| | BPCE SFH SA | 1.000% | 2/24/25 | EUR | 6,700 | 6,344 |
| | BPCE SFH SA | 0.398% | 4/24/25 | EUR | 9,800 | 9,118 |
| | BPCE SFH SA | 0.750% | 9/2/25 | EUR | 32,000 | 29,802 |
| | BPCE SFH SA | 0.625% | 9/22/27 | EUR | 2,500 | 2,205 |
| | BPCE SFH SA | 0.010% | 11/10/27 | EUR | 36,900 | 31,412 |
| | BPCE SFH SA | 0.875% | 4/13/28 | EUR | 6,100 | 5,381 |
| | BPCE SFH SA | 0.750% | 2/23/29 | EUR | 27,000 | 23,154 |
| | BPCE SFH SA | 1.000% | 6/8/29 | EUR | 2,400 | 2,080 |
| | BPCE SFH SA | 1.125% | 4/12/30 | EUR | 16,200 | 13,908 |
| | BPCE SFH SA | 0.125% | 12/3/30 | EUR | 23,500 | 18,326 |
| | BPCE SFH SA | 0.625% | 5/29/31 | EUR | 5,200 | 4,161 |
| 4 | Caisse Centrale du Credit Immobilier de France SA | 0.050% | 3/25/25 | EUR | 5,000 | 4,683 |
| | Caisse de Refinancement de l'Habitat SA | 3.600% | 3/8/24 | EUR | 5,656 | 5,654 |
| | Caisse de Refinancement de l'Habitat SA | 2.400% | 1/17/25 | EUR | 547 | 535 |
| | Caisse de Refinancement de l'Habitat SA | 0.010% | 2/7/28 | EUR | 5,000 | 4,220 |
| | Caisse de Refinancement de l'Habitat SA | 0.010% | 10/8/29 | EUR | 10,300 | 8,247 |
| | Caisse Nationale de Reassurance Mutuelle Agricole Groupama | 0.750% | 7/7/28 | EUR | 3,500 | 2,667 |
| | Caisse Nationale de Reassurance Mutuelle Agricole Groupama | 3.375% | 9/24/28 | EUR | 2,100 | 1,835 |
| | Caisse Nationale de Reassurance Mutuelle Agricole Groupama | 6.375% | 5/29/49 | EUR | 3,000 | 2,993 |
| | Capgemini SE | 1.000% | 10/18/24 | EUR | 3,200 | 3,034 |
| | Capgemini SE | 1.750% | 4/18/28 | EUR | 6,500 | 5,872 |
| | Capgemini SE | 2.000% | 4/15/29 | EUR | 3,000 | 2,696 |
| | Capgemini SE | 1.125% | 6/23/30 | EUR | 5,000 | 4,096 |
| | Capgemini SE | 2.375% | 4/15/32 | EUR | 5,800 | 5,001 |
| | Carmila SA | 2.125% | 3/7/28 | EUR | 1,600 | 1,107 |
| | Carmila SA | 1.625% | 4/1/29 | EUR | 1,200 | 778 |
| | Carrefour SA | 0.875% | 6/12/23 | EUR | 100 | 97 |
| | Carrefour SA | 0.750% | 4/26/24 | EUR | 4,507 | 4,270 |
| | Carrefour SA | 1.250% | 6/3/25 | EUR | 7,867 | 7,302 |
Total International Bond II Index Fund
| | | Coupon | Maturity
Date | Currency | Face
Amount
(000) | Market
Value•
($000) |
| | Carrefour SA | 1.750% | 5/4/26 | EUR | 5,500 | 5,072 |
| | Carrefour SA | 2.625% | 12/15/27 | EUR | 5,000 | 4,620 |
| | Cie de Financement Foncier SA | 2.000% | 5/7/24 | EUR | 7,000 | 6,841 |
| | Cie de Financement Foncier SA | 0.500% | 9/4/24 | EUR | 5,000 | 4,739 |
| | Cie de Financement Foncier SA | 0.375% | 12/11/24 | EUR | 600 | 563 |
| | Cie de Financement Foncier SA | 0.750% | 1/21/25 | EUR | 3,600 | 3,397 |
| | Cie de Financement Foncier SA | 4.000% | 10/24/25 | EUR | 12,336 | 12,560 |
| | Cie de Financement Foncier SA | 1.000% | 2/2/26 | EUR | 50 | 46 |
| | Cie de Financement Foncier SA | 0.750% | 5/29/26 | EUR | 1,100 | 1,008 |
| | Cie de Financement Foncier SA | 0.225% | 9/14/26 | EUR | 2,800 | 2,494 |
| | Cie de Financement Foncier SA | 5.500% | 1/26/27 | GBP | 1,146 | 1,336 |
| | Cie de Financement Foncier SA | 0.375% | 4/9/27 | EUR | 34,000 | 29,993 |
| | Cie de Financement Foncier SA | 0.010% | 11/10/27 | EUR | 23,000 | 19,547 |
| | Cie de Financement Foncier SA | 0.750% | 1/11/28 | EUR | 5,400 | 4,758 |
| | Cie de Financement Foncier SA | 0.500% | 3/16/28 | EUR | 11,400 | 9,866 |
| | Cie de Financement Foncier SA | 0.875% | 9/11/28 | EUR | 9,200 | 8,033 |
| | Cie de Financement Foncier SA | 0.010% | 4/16/29 | EUR | 16,800 | 13,651 |
| | Cie de Financement Foncier SA | 3.875% | 4/25/55 | EUR | 6,951 | 8,039 |
| | Cie de Saint-Gobain | 1.000% | 3/17/25 | EUR | 3,400 | 3,177 |
| | Cie de Saint-Gobain | 2.375% | 10/4/27 | EUR | 4,800 | 4,468 |
| | Cie de Saint-Gobain | 1.875% | 9/21/28 | EUR | 9,700 | 8,611 |
| | Cie de Saint-Gobain | 1.875% | 3/15/31 | EUR | 5,700 | 4,760 |
| | Cie de Saint-Gobain | 2.625% | 8/10/32 | EUR | 2,100 | 1,803 |
| | Cie Financiere et Industrielle des Autoroutes SA | 0.375% | 2/7/25 | EUR | 3,900 | 3,632 |
| | Cie Generale des Etablissements Michelin SCA | 0.000% | 11/2/28 | EUR | 7,700 | 6,325 |
| | Cie Generale des Etablissements Michelin SCA | 0.250% | 11/2/32 | EUR | 4,000 | 2,910 |
| | Cie Generale des Etablissements Michelin SCA | 2.500% | 9/3/38 | EUR | 2,500 | 2,094 |
| | CNP Assurances | 4.250% | 6/5/45 | EUR | 5,000 | 4,840 |
| | CNP Assurances | 4.500% | 6/10/47 | EUR | 3,800 | 3,641 |
| | CNP Assurances | 4.000% | 11/29/49 | EUR | 3,000 | 2,877 |
| | CNP Assurances | 2.500% | 6/30/51 | EUR | 3,400 | 2,653 |
| | Coentreprise de Transport d'Electricite SA | 2.125% | 7/29/32 | EUR | 8,000 | 6,451 |
| | Covivio | 1.875% | 5/20/26 | EUR | 100 | 92 |
| | Covivio | 1.500% | 6/21/27 | EUR | 2,000 | 1,742 |
| | Covivio | 2.375% | 2/20/28 | EUR | 100 | 87 |
| | Covivio | 1.625% | 6/23/30 | EUR | 6,800 | 5,275 |
| | Covivio Hotels SACA | 1.875% | 9/24/25 | EUR | 500 | 459 |
| | Covivio Hotels SACA | 1.000% | 7/27/29 | EUR | 5,400 | 3,963 |
| | Credit Agricole Assurances SA | 2.000% | 7/17/30 | EUR | 3,200 | 2,434 |
| | Credit Agricole Assurances SA | 1.500% | 10/6/31 | EUR | 3,000 | 2,101 |
| | Credit Agricole Assurances SA | 2.625% | 1/29/48 | EUR | 4,000 | 3,322 |
| | Credit Agricole Assurances SA | 4.750% | 9/27/48 | EUR | 2,400 | 2,218 |
| | Credit Agricole Assurances SA | 4.500% | 10/31/49 | EUR | 2,700 | 2,566 |
| | Credit Agricole Assurances SA | 4.250% | 12/31/49 | EUR | 8,200 | 7,853 |
| | Credit Agricole Home Loan SFH SA | 0.375% | 9/30/24 | EUR | 2,500 | 2,360 |
| | Credit Agricole Home Loan SFH SA | 0.500% | 4/3/25 | EUR | 2,500 | 2,336 |
| | Credit Agricole Home Loan SFH SA | 4.000% | 7/16/25 | EUR | 1,000 | 1,016 |
| | Credit Agricole Home Loan SFH SA | 0.500% | 2/19/26 | EUR | 600 | 548 |
| | Credit Agricole Home Loan SFH SA | 0.750% | 5/5/27 | EUR | 17,600 | 15,764 |
| | Credit Agricole Home Loan SFH SA | 0.875% | 8/31/27 | EUR | 500 | 447 |
| | Credit Agricole Home Loan SFH SA | 0.875% | 8/11/28 | EUR | 7,400 | 6,481 |
| | Credit Agricole Home Loan SFH SA | 1.000% | 1/16/29 | EUR | 7,400 | 6,465 |
| | Credit Agricole Home Loan SFH SA | 0.050% | 12/6/29 | EUR | 5,000 | 3,994 |
| | Credit Agricole Home Loan SFH SA | 1.625% | 5/31/30 | EUR | 9,000 | 8,005 |
| | Credit Agricole Home Loan SFH SA | 1.250% | 3/24/31 | EUR | 8,900 | 7,579 |
| | Credit Agricole Home Loan SFH SA | 0.010% | 11/3/31 | EUR | 5,000 | 3,735 |
| | Credit Agricole Home Loan SFH SA | 1.375% | 2/3/32 | EUR | 2,300 | 1,946 |
| | Credit Agricole Home Loan SFH SA | 0.875% | 5/6/34 | EUR | 7,400 | 5,646 |
| | Credit Agricole Home Loan SFH SA | 1.500% | 9/28/38 | EUR | 2,500 | 1,911 |
| | Credit Agricole Public Sector SCF SA | 0.500% | 10/10/25 | EUR | 10,600 | 9,773 |
| | Credit Agricole Public Sector SCF SA | 0.250% | 10/31/26 | EUR | 13,970 | 12,423 |
| | Credit Agricole Public Sector SCF SA | 0.875% | 8/2/27 | EUR | 20,257 | 18,141 |
| | Credit Agricole Public Sector SCF SA | 0.010% | 9/13/28 | EUR | 5,000 | 4,143 |
| | Credit Agricole Public Sector SCF SA | 0.625% | 3/29/29 | EUR | 6,900 | 5,853 |
| | Credit Agricole SA | 7.375% | 12/18/23 | GBP | 300 | 350 |
| | Credit Agricole SA | 2.375% | 5/20/24 | EUR | 6,900 | 6,713 |
| | Credit Agricole SA | 0.500% | 6/24/24 | EUR | 3,000 | 2,821 |
| | Credit Agricole SA | 1.000% | 9/16/24 | EUR | 1,000 | 952 |
| | Credit Agricole SA | 3.125% | 2/5/26 | EUR | 2,100 | 2,026 |
Total International Bond II Index Fund
| | | Coupon | Maturity
Date | Currency | Face
Amount
(000) | Market
Value•
($000) |
| | Credit Agricole SA | 1.000% | 4/22/26 | EUR | 14,300 | 13,110 |
| | Credit Agricole SA | 1.875% | 12/20/26 | EUR | 5,000 | 4,517 |
| | Credit Agricole SA | 2.625% | 3/17/27 | EUR | 9,771 | 8,942 |
| | Credit Agricole SA | 1.375% | 5/3/27 | EUR | 500 | 447 |
| | Credit Agricole SA | 0.514% | 7/6/27 | JPY | 1,100,000 | 7,184 |
| | Credit Agricole SA | 0.375% | 4/20/28 | EUR | 6,200 | 4,949 |
| | Credit Agricole SA | 1.750% | 3/5/29 | EUR | 11,000 | 9,295 |
| | Credit Agricole SA | 2.000% | 3/25/29 | EUR | 6,600 | 5,505 |
| | Credit Agricole SA | 1.000% | 7/3/29 | EUR | 7,700 | 6,373 |
| | Credit Agricole SA | 0.500% | 9/21/29 | EUR | 16,400 | 12,878 |
| | Credit Agricole SA | 1.625% | 6/5/30 | EUR | 15,500 | 13,934 |
| | Credit Agricole SA | 0.875% | 1/14/32 | EUR | 3,600 | 2,593 |
| | Credit Mutuel Arkea SA | 1.250% | 5/31/24 | EUR | 10,600 | 10,079 |
| | Credit Mutuel Arkea SA | 0.875% | 5/7/27 | EUR | 6,000 | 5,208 |
| | Credit Mutuel Arkea SA | 0.375% | 10/3/28 | EUR | 5,100 | 4,071 |
| | Credit Mutuel Arkea SA | 3.500% | 2/9/29 | EUR | 9,700 | 8,766 |
| | Credit Mutuel Arkea SA | 1.125% | 5/23/29 | EUR | 1,200 | 981 |
| | Credit Mutuel Home Loan SFH SA | 4.125% | 1/19/24 | EUR | 3,000 | 3,016 |
| | Credit Mutuel Home Loan SFH SA | 0.250% | 4/30/24 | EUR | 5,000 | 4,762 |
| | Credit Mutuel Home Loan SFH SA | 1.750% | 6/19/24 | EUR | 5,000 | 4,859 |
| | Credit Mutuel Home Loan SFH SA | 0.625% | 2/10/25 | EUR | 1,200 | 1,128 |
| | Credit Mutuel Home Loan SFH SA | 0.625% | 2/2/26 | EUR | 2,500 | 2,295 |
| | Credit Mutuel Home Loan SFH SA | 0.875% | 4/7/26 | EUR | 316 | 291 |
| | Credit Mutuel Home Loan SFH SA | 0.625% | 3/4/27 | EUR | 18,500 | 16,523 |
| | Credit Mutuel Home Loan SFH SA | 0.750% | 9/15/27 | EUR | 6,200 | 5,503 |
| | Credit Mutuel Home Loan SFH SA | 1.000% | 4/30/28 | EUR | 15,000 | 13,325 |
| | Credit Mutuel Home Loan SFH SA | 0.010% | 7/20/28 | EUR | 10,800 | 8,997 |
| | Credit Mutuel Home Loan SFH SA | 1.000% | 1/30/29 | EUR | 2,900 | 2,528 |
| | Danone SA | 2.600% | 6/28/23 | EUR | 2,900 | 2,863 |
| | Danone SA | 1.250% | 5/30/24 | EUR | 200 | 192 |
| | Danone SA | 0.709% | 11/3/24 | EUR | 6,700 | 6,335 |
| | Danone SA | 1.125% | 1/14/25 | EUR | 5,000 | 4,734 |
| | Danone SA | 0.000% | 12/1/25 | EUR | 5,000 | 4,491 |
| | Danone SA | 0.571% | 3/17/27 | EUR | 9,000 | 7,952 |
| | Danone SA | 0.395% | 6/10/29 | EUR | 700 | 568 |
| | Danone SA | 0.520% | 11/9/30 | EUR | 4,000 | 3,136 |
| | Dassault Systemes SE | 0.125% | 9/16/26 | EUR | 2,500 | 2,201 |
| | Dassault Systemes SE | 0.375% | 9/16/29 | EUR | 5,000 | 4,035 |
| 5 | Dexia Credit Local SA | 0.625% | 2/3/24 | EUR | 30,250 | 29,161 |
| 5 | Dexia Credit Local SA | 1.250% | 11/26/24 | EUR | 8,400 | 8,051 |
| 5 | Dexia Credit Local SA | 0.500% | 1/17/25 | EUR | 12,300 | 11,563 |
| 5 | Dexia Credit Local SA | 2.125% | 2/12/25 | GBP | 1,500 | 1,639 |
| 5 | Dexia Credit Local SA | 1.250% | 7/21/25 | GBP | 5,000 | 5,288 |
| 5 | Dexia Credit Local SA | 0.625% | 1/17/26 | EUR | 4,500 | 4,145 |
| 5 | Dexia Credit Local SA | 0.250% | 12/10/26 | GBP | 10,000 | 9,668 |
| 5 | Dexia Credit Local SA | 0.010% | 1/22/27 | EUR | 5,000 | 4,376 |
| 5 | Dexia Credit Local SA | 1.000% | 10/18/27 | EUR | 5,950 | 5,352 |
| 5 | Dexia Credit Local SA | 0.000% | 1/21/28 | EUR | 6,100 | 5,176 |
| | Edenred | ���1.375% | 3/10/25 | EUR | 300 | 282 |
| | Edenred | 1.375% | 6/18/29 | EUR | 3,000 | 2,525 |
| | Electricite de France SA | 4.625% | 9/11/24 | EUR | 10,250 | 10,333 |
| | Electricite de France SA | 0.300% | 10/14/24 | CHF | 5,465 | 5,302 |
| | Electricite de France SA | 4.000% | 11/12/25 | EUR | 6,200 | 6,177 |
| | Electricite de France SA | 1.000% | 10/13/26 | EUR | 8,000 | 7,097 |
| | Electricite de France SA | 4.125% | 3/25/27 | EUR | 8,600 | 8,517 |
| | Electricite de France SA | 4.625% | 4/26/30 | EUR | 5,050 | 5,001 |
| | Electricite de France SA | 2.000% | 10/2/30 | EUR | 1,000 | 814 |
| | Electricite de France SA | 5.875% | 7/18/31 | GBP | 1,512 | 1,699 |
| | Electricite de France SA | 5.625% | 2/21/33 | EUR | 4,293 | 4,506 |
| | Electricite de France SA | 1.000% | 11/29/33 | EUR | 6,900 | 4,610 |
| | Electricite de France SA | 6.125% | 6/2/34 | GBP | 10,550 | 11,963 |
| | Electricite de France SA | 1.875% | 10/13/36 | EUR | 5,300 | 3,612 |
| | Electricite de France SA | 5.500% | 3/27/37 | GBP | 5,800 | 6,122 |
| | Electricite de France SA | 4.500% | 11/12/40 | EUR | 2,000 | 1,825 |
| | Electricite de France SA | 5.500% | 10/17/41 | GBP | 5,000 | 5,221 |
| | Electricite de France SA | 2.000% | 12/9/49 | EUR | 6,200 | 3,286 |
| | Electricite de France SA | 5.125% | 9/22/50 | GBP | 150 | 149 |
| | Electricite de France SA | 6.000% | 1/23/14 | GBP | 5,900 | 6,186 |
| | ELO SACA | 2.375% | 12/12/22 | EUR | 1,000 | 987 |
Total International Bond II Index Fund
| | | Coupon | Maturity
Date | Currency | Face
Amount
(000) | Market
Value•
($000) |
| | ELO SACA | 2.375% | 4/25/25 | EUR | 4,000 | 3,743 |
| | Engie SA | 0.875% | 3/27/24 | EUR | 1,100 | 1,053 |
| | Engie SA | 0.875% | 9/19/25 | EUR | 6,700 | 6,179 |
| | Engie SA | 1.000% | 3/13/26 | EUR | 1,500 | 1,364 |
| | Engie SA | 2.375% | 5/19/26 | EUR | 100 | 94 |
| | Engie SA | 0.375% | 6/11/27 | EUR | 8,200 | 6,963 |
| | Engie SA | 1.750% | 3/27/28 | EUR | 3,700 | 3,308 |
| | Engie SA | 1.375% | 6/22/28 | EUR | 1,600 | 1,392 |
| | Engie SA | 7.000% | 10/30/28 | GBP | 2,000 | 2,413 |
| | Engie SA | 0.375% | 10/26/29 | EUR | 1,000 | 775 |
| | Engie SA | 2.125% | 3/30/32 | EUR | 6,400 | 5,316 |
| | Engie SA | 1.875% | 9/19/33 | EUR | 1,700 | 1,301 |
| | Engie SA | 1.500% | 3/13/35 | EUR | 2,000 | 1,412 |
| | Engie SA | 1.000% | 10/26/36 | EUR | 6,000 | 3,745 |
| | Engie SA | 2.000% | 9/28/37 | EUR | 4,100 | 2,865 |
| | Engie SA | 1.375% | 6/21/39 | EUR | 3,200 | 1,934 |
| | Engie SA | 1.250% | 10/24/41 | EUR | 4,400 | 2,432 |
| | Engie SA | 3.875% | 6/2/49 | EUR | 4,400 | 4,290 |
| | Engie SA | 5.000% | 10/1/60 | GBP | 2,500 | 2,590 |
| | Engie SA | 1.500% | Perpetual | EUR | 500 | 387 |
| | Engie SA | 1.625% | Perpetual | EUR | 4,700 | 4,201 |
| | Engie SA | 5.950% | 3/16/11 | EUR | 1,547 | 1,616 |
| | EssilorLuxottica SA | 2.625% | 2/10/24 | EUR | 7,552 | 7,460 |
| | EssilorLuxottica SA | 0.125% | 5/27/25 | EUR | 5,000 | 4,600 |
| | EssilorLuxottica SA | 0.500% | 6/5/28 | EUR | 9,800 | 8,333 |
| | Eutelsat SA | 2.000% | 10/2/25 | EUR | 2,000 | 1,714 |
| | Eutelsat SA | 2.250% | 7/13/27 | EUR | 500 | 408 |
| | Eutelsat SA | 1.500% | 10/13/28 | EUR | 600 | 444 |
| | Gecina SA | 1.500% | 1/20/25 | EUR | 4,600 | 4,313 |
| | Gecina SA | 1.375% | 1/26/28 | EUR | 800 | 693 |
| | Gecina SA | 1.000% | 1/30/29 | EUR | 1,200 | 973 |
| | Gecina SA | 1.625% | 3/14/30 | EUR | 4,000 | 3,282 |
| | Gecina SA | 0.875% | 1/25/33 | EUR | 600 | 421 |
| | Gecina SA | 0.875% | 6/30/36 | EUR | 4,200 | 2,586 |
| | GELF Bond Issuer I SA | 1.625% | 10/20/26 | EUR | 1,000 | 847 |
| | GELF Bond Issuer I SA | 1.125% | 7/18/29 | EUR | 2,096 | 1,554 |
| | Groupe des Assurances du Credit Mutuel SADIR | 1.850% | 4/21/42 | EUR | 2,800 | 1,949 |
| | Holding d'Infrastructures de Transport SASU | 2.250% | 3/24/25 | EUR | ��� 2,200 | 2,070 |
| | Holding d'Infrastructures de Transport SASU | 1.625% | 11/27/27 | EUR | 7,500 | 6,384 |
| | Holding d'Infrastructures de Transport SASU | 1.625% | 9/18/29 | EUR | 3,000 | 2,382 |
| | Holding d'Infrastructures de Transport SASU | 1.475% | 1/18/31 | EUR | 4,100 | 3,048 |
| | Holding d'Infrastructures des Metiers de l'Environnement | 0.125% | 9/16/25 | EUR | 5,230 | 4,523 |
| | Holding d'Infrastructures des Metiers de l'Environnement | 0.625% | 9/16/28 | EUR | 15,155 | 11,450 |
| | HSBC Continental Europe SA | 0.250% | 5/17/24 | EUR | 1,500 | 1,414 |
| | HSBC Continental Europe SA | 0.100% | 9/3/27 | EUR | 5,000 | 4,176 |
| | HSBC SFH France SA | 2.500% | 6/28/28 | EUR | 8,800 | 8,430 |
| | ICADE | 1.125% | 11/17/25 | EUR | 5,600 | 4,911 |
| | ICADE | 1.625% | 2/28/28 | EUR | 300 | 240 |
| | ICADE | 1.000% | 1/19/30 | EUR | 1,800 | 1,233 |
| | ICADE | 0.625% | 1/18/31 | EUR | 5,100 | 3,245 |
| | Icade Sante SAS | 0.875% | 11/4/29 | EUR | 8,400 | 5,913 |
| | Imerys SA | 2.000% | 12/10/24 | EUR | 300 | 284 |
| | Imerys SA | 1.500% | 1/15/27 | EUR | 500 | 428 |
| | Imerys SA | 1.000% | 7/15/31 | EUR | 500 | 306 |
| | Indigo Group SAS | 1.625% | 4/19/28 | EUR | 100 | 85 |
| | In'li SA | 1.125% | 7/2/29 | EUR | 900 | 685 |
| | JCDecaux SA | 2.625% | 4/24/28 | EUR | 2,500 | 2,118 |
| | JCDecaux SA | 1.625% | 2/7/30 | EUR | 1,100 | 827 |
| | Kering SA | 1.250% | 5/10/26 | EUR | 4,700 | 4,363 |
| | Klepierre SA | 1.875% | 2/19/26 | EUR | 3,800 | 3,431 |
| | Klepierre SA | 1.375% | 2/16/27 | EUR | 500 | 425 |
| | Klepierre SA | 2.000% | 5/12/29 | EUR | 2,300 | 1,812 |
| | Klepierre SA | 0.625% | 7/1/30 | EUR | 5,200 | 3,462 |
| | Klepierre SA | 0.875% | 2/17/31 | EUR | 2,100 | 1,399 |
| | Klepierre SA | 1.250% | 9/29/31 | EUR | 100 | 67 |
| | La Banque Postale Home Loan SFH SA | 2.375% | 1/15/24 | EUR | 2,500 | 2,461 |
| | La Banque Postale Home Loan SFH SA | 0.625% | 6/23/27 | EUR | 6,150 | 5,465 |
| | La Banque Postale Home Loan SFH SA | 0.875% | 2/7/28 | EUR | 4,500 | 3,987 |
| | La Banque Postale Home Loan SFH SA | 1.000% | 10/4/28 | EUR | 2,500 | 2,202 |
Total International Bond II Index Fund
| | | Coupon | Maturity
Date | Currency | Face
Amount
(000) | Market
Value•
($000) |
| | La Banque Postale Home Loan SFH SA | 0.010% | 10/22/29 | EUR | 27,000 | 21,587 |
| | La Banque Postale SA | 1.000% | 10/16/24 | EUR | 2,500 | 2,338 |
| | La Banque Postale SA | 0.500% | 6/17/26 | EUR | 1,000 | 896 |
| | La Banque Postale SA | 2.000% | 7/13/28 | EUR | 4,800 | 4,171 |
| | La Banque Postale SA | 1.375% | 4/24/29 | EUR | 1,800 | 1,467 |
| | La Banque Postale SA | 0.875% | 1/26/31 | EUR | 2,700 | 2,272 |
| | La Banque Postale SA | 0.750% | 6/23/31 | EUR | 10,000 | 7,126 |
| | La Banque Postale SA | 0.750% | 8/2/32 | EUR | 2,500 | 1,924 |
| | La Mondiale SAM | 5.050% | 12/29/49 | EUR | 3,369 | 3,207 |
| | La Poste SA | 2.750% | 11/26/24 | EUR | 2,200 | 2,156 |
| | La Poste SA | 1.125% | 6/4/25 | EUR | 5,000 | 4,703 |
| | La Poste SA | 0.625% | 10/21/26 | EUR | 4,800 | 4,265 |
| | La Poste SA | 0.375% | 9/17/27 | EUR | 9,700 | 8,274 |
| | La Poste SA | 1.450% | 11/30/28 | EUR | 1,100 | 970 |
| | La Poste SA | 0.000% | 7/18/29 | EUR | 5,800 | 4,503 |
| | La Poste SA | 1.375% | 4/21/32 | EUR | 20,800 | 16,760 |
| | Legrand SA | 0.750% | 7/6/24 | EUR | 100 | 96 |
| | Legrand SA | 0.750% | 5/20/30 | EUR | 8,500 | 6,787 |
| | Legrand SA | 0.375% | 10/6/31 | EUR | 800 | 588 |
| | Legrand SA | 1.875% | 7/6/32 | EUR | 600 | 496 |
| | LVMH Moet Hennessy Louis Vuitton SE | 1.000% | 2/11/23 | GBP | 2,000 | 2,276 |
| | LVMH Moet Hennessy Louis Vuitton SE | 0.000% | 2/11/24 | EUR | 9,000 | 8,602 |
| | LVMH Moet Hennessy Louis Vuitton SE | 0.750% | 5/26/24 | EUR | 5,411 | 5,212 |
| | LVMH Moet Hennessy Louis Vuitton SE | 0.000% | 2/11/26 | EUR | 9,300 | 8,376 |
| | LVMH Moet Hennessy Louis Vuitton SE | 1.125% | 2/11/27 | GBP | 7,600 | 7,432 |
| | LVMH Moet Hennessy Louis Vuitton SE | 0.125% | 2/11/28 | EUR | 5,000 | 4,266 |
| | LVMH Moet Hennessy Louis Vuitton SE | 0.375% | 2/11/31 | EUR | 7,400 | 5,778 |
| | Mercialys SA | 2.500% | 2/28/29 | EUR | 1,600 | 1,181 |
| | MMS USA Investments Inc. | 0.625% | 6/13/25 | EUR | 3,000 | 2,741 |
| | MMS USA Investments Inc. | 1.250% | 6/13/28 | EUR | 12,100 | 10,257 |
| | MMS USA Investments Inc. | 1.750% | 6/13/31 | EUR | 1,300 | 1,027 |
| | Nerval SAS | 2.875% | 4/14/32 | EUR | 3,100 | 2,396 |
| | Orange SA | 3.125% | 1/9/24 | EUR | 200 | 198 |
| | Orange SA | 1.125% | 7/15/24 | EUR | 4,800 | 4,588 |
| | Orange SA | 1.000% | 5/12/25 | EUR | 5,000 | 4,689 |
| | Orange SA | 1.000% | 9/12/25 | EUR | 6,700 | 6,238 |
| | Orange SA | 5.250% | 12/5/25 | GBP | 674 | 779 |
| | Orange SA | 0.000% | 6/29/26 | EUR | 3,000 | 2,642 |
| | Orange SA | 0.000% | 9/4/26 | EUR | 3,000 | 2,620 |
| | Orange SA | 0.875% | 2/3/27 | EUR | 600 | 537 |
| | Orange SA | 1.250% | 7/7/27 | EUR | 4,000 | 3,599 |
| | Orange SA | 1.375% | 3/20/28 | EUR | 17,800 | 15,923 |
| | Orange SA | 8.125% | 11/20/28 | GBP | 3,184 | 4,162 |
| | Orange SA | 2.000% | 1/15/29 | EUR | 200 | 183 |
| | Orange SA | 1.375% | 1/16/30 | EUR | 1,300 | 1,118 |
| | Orange SA | 1.875% | 9/12/30 | EUR | 14,400 | 12,648 |
| | Orange SA | 3.250% | 1/15/32 | GBP | 10,500 | 10,325 |
| | Orange SA | 1.625% | 4/7/32 | EUR | 7,300 | 6,096 |
| | Orange SA | 0.500% | 9/4/32 | EUR | 9,500 | 6,933 |
| | Orange SA | 8.125% | 1/28/33 | EUR | 238 | 311 |
| | Orange SA | 0.625% | 12/16/33 | EUR | 9,500 | 6,736 |
| | Orange SA | 5.625% | 1/23/34 | GBP | 1,900 | 2,240 |
| | Orange SA | 0.750% | 6/29/34 | EUR | 2,000 | 1,409 |
| | Orange SA | 1.375% | 9/4/49 | EUR | 1,000 | 645 |
| | Orange SA | 5.000% | 10/29/49 | EUR | 6,529 | 6,413 |
| | Orange SA | 5.250% | 12/29/49 | EUR | 3,731 | 3,701 |
| | Orange SA | 1.375% | Perpetual | EUR | 1,600 | 1,190 |
| | Orange SA | 1.750% | Perpetual | EUR | 3,200 | 2,499 |
| | Orange SA | 2.375% | Perpetual | EUR | 6,000 | 5,554 |
| | Pernod Ricard SA | 1.125% | 4/7/25 | EUR | 400 | 377 |
| | Pernod Ricard SA | 1.500% | 5/18/26 | EUR | 1,500 | 1,399 |
| | Pernod Ricard SA | 0.125% | 10/4/29 | EUR | 7,000 | 5,508 |
| | Pernod Ricard SA | 1.750% | 4/8/30 | EUR | 100 | 87 |
| | Pernod Ricard SA | 0.875% | 10/24/31 | EUR | 5,000 | 3,889 |
| | PSA Banque France SA | 0.625% | 6/21/24 | EUR | 3,000 | 2,817 |
| | PSA Tresorerie GIE | 6.000% | 9/19/33 | EUR | 1,926 | 1,988 |
| | Publicis Groupe SA | 0.500% | 11/3/23 | EUR | 200 | 192 |
| | RCI Banque SA | 1.000% | 5/17/23 | EUR | 3,121 | 3,047 |
| | RCI Banque SA | 1.375% | 3/8/24 | EUR | 5,365 | 5,146 |
Total International Bond II Index Fund
| | | Coupon | Maturity
Date | Currency | Face
Amount
(000) | Market
Value•
($000) |
| | RCI Banque SA | 1.625% | 4/11/25 | EUR | 9,826 | 9,100 |
| | RCI Banque SA | 1.750% | 4/10/26 | EUR | 7,110 | 6,414 |
| | RCI Banque SA | 1.625% | 5/26/26 | EUR | 3,634 | 3,207 |
| | RCI Banque SA | 4.750% | 7/6/27 | EUR | 4,000 | 3,886 |
| | RTE Reseau de Transport d'Electricite SADIR | 1.625% | 11/27/25 | EUR | 6,400 | 5,997 |
| | RTE Reseau de Transport d'Electricite SADIR | 0.000% | 9/9/27 | EUR | 15,900 | 13,209 |
| | RTE Reseau de Transport d'Electricite SADIR | 2.750% | 6/20/29 | EUR | 1,000 | 925 |
| | RTE Reseau de Transport d'Electricite SADIR | 1.500% | 9/27/30 | EUR | 2,500 | 2,066 |
| | RTE Reseau de Transport d'Electricite SADIR | 2.000% | 4/18/36 | EUR | 100 | 76 |
| | RTE Reseau de Transport d'Electricite SADIR | 1.875% | 10/23/37 | EUR | 3,000 | 2,163 |
| | RTE Reseau de Transport d'Electricite SADIR | 1.125% | 7/8/40 | EUR | 8,800 | 5,439 |
| | Safran SA | 0.125% | 3/16/26 | EUR | 1,800 | 1,585 |
| | Safran SA | 0.950% | 10/19/28 | EUR | 1,000 | 811 |
| | Sanofi | 2.500% | 11/14/23 | EUR | 2,500 | 2,463 |
| | Sanofi | 1.000% | 4/1/25 | EUR | 9,400 | 8,885 |
| | Sanofi | 1.750% | 9/10/26 | EUR | 3,600 | 3,372 |
| | Sanofi | 0.500% | 1/13/27 | EUR | 100 | 89 |
| | Sanofi | 1.125% | 4/5/28 | EUR | 5,200 | 4,619 |
| | Sanofi | 0.875% | 3/21/29 | EUR | 5,000 | 4,303 |
| | Sanofi | 1.500% | 4/1/30 | EUR | 13,400 | 11,862 |
| | Sanofi | 1.875% | 3/21/38 | EUR | 3,700 | 2,940 |
| | SCOR SE | 3.000% | 6/8/46 | EUR | 2,200 | 1,969 |
| | SCOR SE | 3.625% | 5/27/48 | EUR | 3,600 | 3,194 |
| | SCOR SE | 1.375% | 9/17/51 | EUR | 3,300 | 2,265 |
| | Societe Fonciere Lyonnaise SA | 1.500% | 6/5/27 | EUR | 3,000 | 2,564 |
| | Societe Fonciere Lyonnaise SA | 0.500% | 4/21/28 | EUR | 1,900 | 1,467 |
| | Societe Generale SA | 1.250% | 2/15/24 | EUR | 17,200 | 16,459 |
| | Societe Generale SA | 1.125% | 1/23/25 | EUR | 5,700 | 5,308 |
| | Societe Generale SA | 1.125% | 4/21/26 | EUR | 9,000 | 8,223 |
| | Societe Generale SA | 0.125% | 11/17/26 | EUR | 4,000 | 3,533 |
| | Societe Generale SA | 0.750% | 1/25/27 | EUR | 11,500 | 9,676 |
| | Societe Generale SA | 0.847% | 5/26/27 | JPY | 1,000,000 | 6,423 |
| | Societe Generale SA | 0.250% | 7/8/27 | EUR | 4,500 | 3,785 |
| | Societe Generale SA | 1.250% | 12/7/27 | GBP | 5,300 | 4,720 |
| | Societe Generale SA | 2.125% | 9/27/28 | EUR | 7,400 | 6,319 |
| | Societe Generale SA | 1.750% | 3/22/29 | EUR | 5,500 | 4,533 |
| | Societe Generale SA | 0.500% | 6/12/29 | EUR | 16,900 | 13,149 |
| | Societe Generale SA | 1.250% | 6/12/30 | EUR | 4,000 | 3,042 |
| | Societe Generale SA | 1.000% | 11/24/30 | EUR | 10,000 | 8,499 |
| | Societe Generale SFH SA | 2.000% | 4/29/24 | EUR | 6,600 | 6,450 |
| | Societe Generale SFH SA | 0.500% | 1/30/25 | EUR | 4,500 | 4,222 |
| | Societe Generale SFH SA | 0.500% | 1/28/26 | EUR | 5,500 | 5,032 |
| | Societe Generale SFH SA | 0.750% | 1/19/28 | EUR | 5,000 | 4,405 |
| | Societe Generale SFH SA | 1.375% | 5/5/28 | EUR | 12,500 | 11,329 |
| | Societe Generale SFH SA | 0.125% | 2/2/29 | EUR | 25,100 | 20,699 |
| | Societe Generale SFH SA | 0.125% | 7/18/29 | EUR | 1,000 | 814 |
| | Societe Generale SFH SA | 0.010% | 2/11/30 | EUR | 1,800 | 1,423 |
| | Societe Generale SFH SA | 0.010% | 2/5/31 | EUR | 40,500 | 30,968 |
| | Sodexo SA | 0.500% | 1/17/24 | EUR | 491 | 469 |
| | Sodexo SA | 0.750% | 4/27/25 | EUR | 9,086 | 8,422 |
| | Sodexo SA | 2.500% | 6/24/26 | EUR | 217 | 204 |
| | Sodexo SA | 0.750% | 4/14/27 | EUR | 4,086 | 3,542 |
| | Sodexo SA | 1.750% | 6/26/28 | GBP | 3,910 | 3,668 |
| | Sodexo SA | 1.000% | 4/27/29 | EUR | 3,300 | 2,695 |
| | Suez SA | 5.500% | 7/22/24 | EUR | 2,400 | 2,455 |
| | Suez SA | 1.000% | 4/3/25 | EUR | 5,100 | 4,783 |
| | Suez SA | 1.750% | 9/10/25 | EUR | 200 | 189 |
| | Suez SA | 1.250% | 4/2/27 | EUR | 9,800 | 8,816 |
| | Suez SA | 1.500% | 4/3/29 | EUR | 1,100 | 946 |
| | Suez SA | 1.625% | 9/17/30 | EUR | 200 | 167 |
| | Suez SA | 5.375% | 12/2/30 | GBP | 500 | 568 |
| | Suez SA | 2.875% | Perpetual | EUR | 6,100 | 5,730 |
| | Suez SACA | 2.375% | 5/24/30 | EUR | 2,000 | 1,678 |
| | Suez SACA | 2.875% | 5/24/34 | EUR | 1,100 | 886 |
| | TDF Infrastructure SAS | 2.500% | 4/7/26 | EUR | 400 | 352 |
| | TDF Infrastructure SAS | 1.750% | 12/1/29 | EUR | 3,200 | 2,405 |
| | Terega SA | 0.625% | 2/27/28 | EUR | 1,000 | 783 |
| | Terega SA | 0.875% | 9/17/30 | EUR | 2,500 | 1,819 |
| | Thales SA | 0.000% | 3/26/26 | EUR | 3,000 | 2,632 |
Total International Bond II Index Fund
| | | Coupon | Maturity
Date | Currency | Face
Amount
(000) | Market
Value•
($000) |
| | TotalEnergies Capital Canada Ltd. | 2.125% | 9/18/29 | EUR | 7,700 | 6,940 |
| | TotalEnergies Capital International SA | 0.625% | 10/4/24 | EUR | 5,800 | 5,489 |
| | TotalEnergies Capital International SA | 1.375% | 3/19/25 | EUR | 6,700 | 6,361 |
| | TotalEnergies Capital International SA | 1.750% | 7/7/25 | GBP | 4,517 | 4,786 |
| | TotalEnergies Capital International SA | 2.875% | 11/19/25 | EUR | 4,000 | 3,913 |
| | TotalEnergies Capital International SA | 2.500% | 3/25/26 | EUR | 2,200 | 2,121 |
| | TotalEnergies Capital International SA | 1.491% | 4/8/27 | EUR | 7,000 | 6,418 |
| | TotalEnergies Capital International SA | 0.696% | 5/31/28 | EUR | 11,000 | 9,418 |
| | TotalEnergies Capital International SA | 1.491% | 9/4/30 | EUR | 500 | 425 |
| | TotalEnergies Capital International SA | 0.952% | 5/18/31 | EUR | 3,000 | 2,388 |
| | TotalEnergies Capital International SA | 1.994% | 4/8/32 | EUR | 5,200 | 4,450 |
| | TotalEnergies Capital International SA | 1.618% | 5/18/40 | EUR | 6,000 | 4,027 |
| | TotalEnergies SE | 2.625% | 12/29/49 | EUR | 11,142 | 10,288 |
| | TotalEnergies SE | 3.369% | 12/29/49 | EUR | 3,550 | 3,289 |
| | TotalEnergies SE | 1.625% | Perpetual | EUR | 8,684 | 6,905 |
| | TotalEnergies SE | 1.750% | Perpetual | EUR | 3,956 | 3,676 |
| | TotalEnergies SE | 2.000% | Perpetual | EUR | 4,691 | 3,522 |
| | TotalEnergies SE | 2.125% | Perpetual | EUR | 7,781 | 5,447 |
| | TotalEnergies SE | 3.250% | Perpetual | EUR | 2,000 | 1,470 |
| | UMG Groupe VYV | 1.625% | 7/2/29 | EUR | 2,000 | 1,651 |
| | Unibail-Rodamco-Westfield SE | 2.500% | 2/26/24 | EUR | 953 | 919 |
| | Unibail-Rodamco-Westfield SE | 1.000% | 3/14/25 | EUR | 4,913 | 4,442 |
| | Unibail-Rodamco-Westfield SE | 1.125% | 9/15/25 | EUR | 5,700 | 5,041 |
| | Unibail-Rodamco-Westfield SE | 1.375% | 3/9/26 | EUR | 213 | 187 |
| | Unibail-Rodamco-Westfield SE | 2.500% | 6/4/26 | EUR | 100 | 89 |
| | Unibail-Rodamco-Westfield SE | 1.000% | 2/27/27 | EUR | 1,700 | 1,411 |
| | Unibail-Rodamco-Westfield SE | 0.625% | 5/4/27 | EUR | 14,800 | 11,941 |
| | Unibail-Rodamco-Westfield SE | 0.750% | 10/25/28 | EUR | 2,100 | 1,580 |
| | Unibail-Rodamco-Westfield SE | 1.500% | 5/29/29 | EUR | 100 | 76 |
| | Unibail-Rodamco-Westfield SE | 2.625% | 4/9/30 | EUR | 3,000 | 2,424 |
| | Unibail-Rodamco-Westfield SE | 1.375% | 4/15/30 | EUR | 4,685 | 3,395 |
| | Unibail-Rodamco-Westfield SE | 1.875% | 1/15/31 | EUR | 11,000 | 8,062 |
| | Unibail-Rodamco-Westfield SE | 1.375% | 12/4/31 | EUR | 4,100 | 2,796 |
| | Unibail-Rodamco-Westfield SE | 0.875% | 3/29/32 | EUR | 9,200 | 5,785 |
| | Unibail-Rodamco-Westfield SE | 2.000% | 6/29/32 | EUR | 1,400 | 994 |
| | Unibail-Rodamco-Westfield SE | 1.375% | 5/25/33 | EUR | 800 | 513 |
| | Unibail-Rodamco-Westfield SE | 2.000% | 4/28/36 | EUR | 687 | 434 |
| | Unibail-Rodamco-Westfield SE | 2.250% | 5/14/38 | EUR | 400 | 235 |
| | Unibail-Rodamco-Westfield SE | 1.750% | 7/1/49 | EUR | 4,400 | 2,021 |
| | Unibail-Rodamco-Westfield SE | 2.875% | Perpetual | EUR | 300 | 217 |
| | Veolia Environnement SA | 0.892% | 1/14/24 | EUR | 2,800 | 2,689 |
| | Veolia Environnement SA | 4.625% | 3/30/27 | EUR | 4,900 | 5,035 |
| | Veolia Environnement SA | 1.590% | 1/10/28 | EUR | 3,100 | 2,746 |
| | Veolia Environnement SA | 0.927% | 1/4/29 | EUR | 2,500 | 2,083 |
| | Veolia Environnement SA | 0.800% | 1/15/32 | EUR | 5,000 | 3,718 |
| | Veolia Environnement SA | 6.125% | 11/25/33 | EUR | 2,136 | 2,420 |
| | Vinci SA | 1.000% | 9/26/25 | EUR | 2,500 | 2,334 |
| | Vinci SA | 2.250% | 3/15/27 | GBP | 500 | 508 |
| | Vinci SA | 0.000% | 11/27/28 | EUR | 2,000 | 1,641 |
| | Vinci SA | 1.625% | 1/18/29 | EUR | 15,000 | 13,484 |
| | Vinci SA | 1.750% | 9/26/30 | EUR | 3,400 | 3,007 |
| | Vinci SA | 0.500% | 1/9/32 | EUR | 5,800 | 4,431 |
| | Vinci SA | 2.750% | 9/15/34 | GBP | 4,400 | 3,971 |
| | Vivendi SE | 1.125% | 12/11/28 | EUR | 2,700 | 2,258 |
| | Wendel SE | 1.375% | 4/26/26 | EUR | 3,000 | 2,674 |
| | Wendel SE | 1.000% | 6/1/31 | EUR | 3,200 | 2,225 |
| | Westfield America Management Ltd. | 2.625% | 3/30/29 | GBP | 1,600 | 1,348 |
| | | | | | | 2,794,255 |
| Germany (2.4%) | | | |
| | Aareal Bank AG | 0.125% | 2/1/24 | EUR | 2,439 | 2,335 |
| | Aareal Bank AG | 0.375% | 7/15/25 | EUR | 1,073 | 992 |
| | Aareal Bank AG | 0.010% | 2/1/28 | EUR | 18,800 | 15,891 |
| | Aareal Bank AG | 0.010% | 9/15/28 | EUR | 11,900 | 9,876 |
| | Allianz Finance II BV | 0.875% | 1/15/26 | EUR | 1,000 | 920 |
| | Allianz Finance II BV | 3.000% | 3/13/28 | EUR | 1,400 | 1,363 |
| | Allianz Finance II BV | 0.500% | 1/14/31 | EUR | 6,200 | 4,793 |
| | Allianz SE | 2.241% | 7/7/45 | EUR | 3,400 | 3,119 |
| | Allianz SE | 2.121% | 7/8/50 | EUR | 5,000 | 3,870 |
| | Allianz SE | 4.252% | 7/5/52 | EUR | 7,100 | 6,281 |
Total International Bond II Index Fund
| | | Coupon | Maturity
Date | Currency | Face
Amount
(000) | Market
Value•
($000) |
| | Allianz SE | 3.375% | Perpetual | EUR | 17,800 | 16,962 |
| | alstria office REIT AG | 1.500% | 11/15/27 | EUR | 4,700 | 3,063 |
| | Amprion GmbH | 0.625% | 9/23/33 | EUR | 5,200 | 3,560 |
| | Aroundtown SA | 1.000% | 1/7/25 | EUR | 200 | 171 |
| | Aroundtown SA | 0.625% | 7/9/25 | EUR | 1,000 | 812 |
| | Aroundtown SA | 4.625% | 9/18/25 | CAD | 850 | 589 |
| | Aroundtown SA | 1.500% | 5/28/26 | EUR | 7,900 | 6,219 |
| | Aroundtown SA | 0.000% | 7/16/26 | EUR | 7,400 | 5,444 |
| | Aroundtown SA | 0.375% | 4/15/27 | EUR | 6,400 | 4,556 |
| | Aroundtown SA | 1.625% | 1/31/28 | EUR | 100 | 71 |
| | Aroundtown SA | 1.450% | 7/9/28 | EUR | 5,000 | 3,471 |
| | Aroundtown SA | 3.000% | 10/16/29 | GBP | 4,417 | 3,561 |
| | Aroundtown SA | 3.625% | 4/10/31 | GBP | 1,500 | 1,209 |
| | Aroundtown SA | 1.625% | Perpetual | EUR | 3,000 | 1,370 |
| | Aroundtown SA | 2.125% | Perpetual | EUR | 6,000 | 2,917 |
| | Aroundtown SA | 2.875% | Perpetual | EUR | 900 | 412 |
| | Aroundtown SA | 3.375% | Perpetual | EUR | 2,800 | 1,330 |
| | BASF SE | 0.101% | 6/5/23 | EUR | 800 | 778 |
| | BASF SE | 0.875% | 10/6/23 | GBP | 125 | 138 |
| | BASF SE | 1.750% | 3/11/25 | GBP | 316 | 331 |
| | BASF SE | 0.875% | 11/15/27 | EUR | 25 | 22 |
| | BASF SE | 1.500% | 5/22/30 | EUR | 5,901 | 4,931 |
| | BASF SE | 1.500% | 3/17/31 | EUR | 3,000 | 2,439 |
| | BASF SE | 0.875% | 10/6/31 | EUR | 238 | 179 |
| | BASF SE | 1.450% | 12/13/32 | EUR | 8,100 | 6,136 |
| | BASF SE | 1.625% | 11/15/37 | EUR | 746 | 532 |
| | Bausparkasse Schwaebisch Hall | 2.000% | 5/17/34 | EUR | 23,100 | 20,274 |
| | Bayer AG | 0.050% | 1/12/25 | EUR | 6,700 | 6,125 |
| | Bayer AG | 0.750% | 1/6/27 | EUR | 6,500 | 5,623 |
| | Bayer AG | 0.375% | 1/12/29 | EUR | 4,000 | 3,095 |
| | Bayer AG | 1.125% | 1/6/30 | EUR | 700 | 551 |
| | Bayer AG | 0.625% | 7/12/31 | EUR | 4,600 | 3,289 |
| | Bayer AG | 1.375% | 7/6/32 | EUR | 12,000 | 8,934 |
| | Bayer AG | 1.000% | 1/12/36 | EUR | 4,600 | 2,881 |
| | Bayer Capital Corp. BV | 0.625% | 12/15/22 | EUR | 7,400 | 7,304 |
| | Bayer Capital Corp. BV | 1.500% | 6/26/26 | EUR | 100 | 91 |
| | Bayer Capital Corp. BV | 2.125% | 12/15/29 | EUR | 5,100 | 4,332 |
| | Bayerische Landesbank | 0.350% | 12/1/22 | EUR | 2,439 | 2,408 |
| | Bayerische Landesbank | 0.500% | 3/19/25 | EUR | 4,876 | 4,566 |
| | Bayerische Landesbank | 0.625% | 7/19/27 | EUR | 977 | 869 |
| | Bayerische Landesbank | 0.200% | 5/20/30 | EUR | 2,751 | 2,210 |
| | Bayerische Landesbodenkreditanstalt | 1.750% | 4/24/24 | EUR | 1,464 | 1,429 |
| | Berlin Hyp AG | 0.125% | 1/5/24 | EUR | 2,439 | 2,341 |
| | Berlin Hyp AG | 0.375% | 5/3/24 | EUR | 3,809 | 3,636 |
| | Berlin Hyp AG | 1.250% | 1/22/25 | EUR | 200 | 187 |
| | Berlin Hyp AG | 0.375% | 2/21/25 | EUR | 10,000 | 9,348 |
| | Berlin Hyp AG | 0.625% | 10/22/25 | EUR | 125 | 116 |
| | Berlin Hyp AG | 0.010% | 8/24/26 | EUR | 31,212 | 27,682 |
| | Berlin Hyp AG | 0.010% | 1/24/28 | EUR | 7,299 | 6,189 |
| | Berlin Hyp AG | 0.010% | 7/7/28 | EUR | 28,569 | 23,899 |
| | Berlin Hyp AG | 0.375% | 5/29/29 | EUR | 10,000 | 8,354 |
| | Berlin Hyp AG | 0.125% | 1/18/30 | EUR | 1,126 | 907 |
| | Berlin Hyp AG | 0.250% | 5/19/33 | EUR | 8,127 | 5,961 |
| | Bertelsmann SE & Co. KGaA | 1.750% | 10/14/24 | EUR | 2,900 | 2,806 |
| | Bertelsmann SE & Co. KGaA | 2.000% | 4/1/28 | EUR | 4,000 | 3,648 |
| | BMW Canada Inc. | 2.410% | 11/27/23 | CAD | 2,000 | 1,426 |
| | BMW Canada Inc. | 0.990% | 1/14/25 | CAD | 2,104 | 1,411 |
| | BMW Finance NV | 2.375% | 1/24/23 | EUR | 100 | 99 |
| | BMW Finance NV | 0.750% | 4/15/24 | EUR | 439 | 421 |
| | BMW Finance NV | 0.750% | 7/12/24 | EUR | 199 | 190 |
| | BMW Finance NV | 1.000% | 11/14/24 | EUR | 5,745 | 5,478 |
| | BMW Finance NV | 0.500% | 2/22/25 | EUR | 199 | 186 |
| | BMW Finance NV | 0.875% | 4/3/25 | EUR | 4,486 | 4,238 |
| | BMW Finance NV | 1.000% | 8/29/25 | EUR | 3,891 | 3,660 |
| | BMW Finance NV | 0.000% | 1/11/26 | EUR | 16,635 | 14,992 |
| | BMW Finance NV | 0.375% | 1/14/27 | EUR | 7,314 | 6,512 |
| | BMW Finance NV | 1.500% | 2/6/29 | EUR | 8,152 | 7,272 |
| | BMW Finance NV | 0.200% | 1/11/33 | EUR | 4,545 | 3,204 |
| | Brenntag Finance BV | 1.125% | 9/27/25 | EUR | 1,725 | 1,565 |
Total International Bond II Index Fund
| | | Coupon | Maturity
Date | Currency | Face
Amount
(000) | Market
Value•
($000) |
| | Commerzbank AG | 0.125% | 1/9/24 | EUR | 10,000 | 9,596 |
| | Commerzbank AG | 0.050% | 7/11/24 | EUR | 12,426 | 11,736 |
| | Commerzbank AG | 0.625% | 8/28/24 | EUR | 4,876 | 4,568 |
| | Commerzbank AG | 0.625% | 3/13/25 | EUR | 7,486 | 7,030 |
| | Commerzbank AG | 0.625% | 5/28/25 | EUR | 4,388 | 4,100 |
| | Commerzbank AG | 0.875% | 9/8/25 | EUR | 4,925 | 4,602 |
| | Commerzbank AG | 1.000% | 3/4/26 | EUR | 10,605 | 9,568 |
| | Commerzbank AG | 0.500% | 6/9/26 | EUR | 7,314 | 6,637 |
| | Commerzbank AG | 0.500% | 12/4/26 | EUR | 7,314 | 6,340 |
| | Commerzbank AG | 0.125% | 12/15/26 | EUR | 5,755 | 5,079 |
| | Commerzbank AG | 0.875% | 1/22/27 | EUR | 2,500 | 2,076 |
| | Commerzbank AG | 0.625% | 8/24/27 | EUR | 537 | 476 |
| | Commerzbank AG | 3.000% | 9/14/27 | EUR | 11,500 | 10,439 |
| | Commerzbank AG | 0.010% | 3/11/30 | EUR | 4,388 | 3,476 |
| | Commerzbank AG | 1.250% | 1/9/34 | EUR | 3,413 | 2,763 |
| | Covestro AG | 1.750% | 9/25/24 | EUR | 4,876 | 4,631 |
| | Covestro AG | 0.875% | 2/3/26 | EUR | 398 | 358 |
| | Covestro AG | 1.375% | 6/12/30 | EUR | 2,000 | 1,552 |
| | Daimler AG | 0.000% | 2/8/24 | EUR | 7,316 | 6,970 |
| | Daimler AG | 0.375% | 11/8/26 | EUR | 7,314 | 6,516 |
| | Daimler AG | 1.000% | 11/15/27 | EUR | 4,740 | 4,216 |
| | Daimler AG | 0.750% | 2/8/30 | EUR | 9,388 | 7,687 |
| | Daimler AG | 2.375% | 5/22/30 | EUR | 7,000 | 6,406 |
| | Daimler AG | 0.750% | 9/10/30 | EUR | 2,439 | 1,970 |
| | Daimler AG | 2.000% | 2/27/31 | EUR | 5,581 | 4,926 |
| | Daimler AG | 1.125% | 11/6/31 | EUR | 4,876 | 3,892 |
| | Daimler AG | 1.125% | 8/8/34 | EUR | 4,388 | 3,280 |
| | Daimler AG | 2.125% | 7/3/37 | EUR | 1,818 | 1,480 |
| | Daimler Canada Finance Inc. | 2.970% | 3/13/24 | CAD | 1,780 | 1,267 |
| | Daimler Canada Finance Inc. | 1.650% | 9/22/25 | CAD | 3,325 | 2,205 |
| | Daimler International Finance BV | 0.875% | 4/9/24 | EUR | 5,439 | 5,231 |
| | Daimler International Finance BV | 2.625% | 4/7/25 | EUR | 12,478 | 12,238 |
| | Daimler International Finance BV | 1.000% | 11/11/25 | EUR | 10,240 | 9,556 |
| | Daimler International Finance BV | 1.375% | 6/26/26 | EUR | 8,484 | 7,920 |
| | Daimler International Finance BV | 2.000% | 8/22/26 | EUR | 16,072 | 15,273 |
| | Daimler International Finance BV | 0.625% | 5/6/27 | EUR | 7,314 | 6,459 |
| | Daimler Trucks Finance Canada Inc. | 1.850% | 12/15/23 | CAD | 2,612 | 1,838 |
| | Daimler Trucks Finance Canada Inc. | 2.140% | 12/13/24 | CAD | 2,612 | 1,784 |
| | Daimler Trucks Finance Canada Inc. | 5.180% | 9/19/25 | CAD | 3,500 | 2,536 |
| | Daimler Trucks Finance Canada Inc. | 2.460% | 12/15/26 | CAD | 1,504 | 975 |
| | DekaBank Deutsche Girozentrale | 0.300% | 11/20/26 | EUR | 2,500 | 2,193 |
| | Deutsche Apotheker-und Aerztebank eG | 0.750% | 10/5/27 | EUR | 300 | 267 |
| | Deutsche Bahn Finance GmbH | 0.000% | 2/14/24 | EUR | 1,500 | 1,433 |
| | Deutsche Bahn Finance GmbH | 3.000% | 3/8/24 | EUR | 5,822 | 5,760 |
| | Deutsche Bahn Finance GmbH | 1.500% | 8/26/24 | CHF | 2,375 | 2,378 |
| | Deutsche Bahn Finance GmbH | 3.500% | 9/27/24 | AUD | 2,200 | 1,375 |
| | Deutsche Bahn Finance GmbH | 1.375% | 7/7/25 | GBP | 11,976 | 12,728 |
| | Deutsche Bahn Finance GmbH | 1.250% | 10/23/25 | EUR | 1,219 | 1,154 |
| | Deutsche Bahn Finance GmbH | 1.875% | 2/13/26 | GBP | 1,907 | 2,018 |
| | Deutsche Bahn Finance GmbH | 3.125% | 7/24/26 | GBP | 125 | 136 |
| | Deutsche Bahn Finance GmbH | 0.500% | 4/9/27 | EUR | 6,740 | 5,975 |
| | Deutsche Bahn Finance GmbH | 1.125% | 12/18/28 | EUR | 249 | 220 |
| | Deutsche Bahn Finance GmbH | 2.750% | 3/19/29 | EUR | 1,706 | 1,639 |
| | Deutsche Bahn Finance GmbH | 0.375% | 6/23/29 | EUR | 1,390 | 1,138 |
| | Deutsche Bahn Finance GmbH | 1.625% | 11/6/30 | EUR | 25 | 22 |
| | Deutsche Bahn Finance GmbH | 1.375% | 3/28/31 | EUR | 1,464 | 1,221 |
| | Deutsche Bahn Finance GmbH | 0.875% | 7/11/31 | EUR | 1,317 | 1,047 |
| | Deutsche Bahn Finance GmbH | 0.200% | 5/20/33 | CHF | 6,515 | 5,295 |
| | Deutsche Bahn Finance GmbH | 1.625% | 8/16/33 | EUR | 4,779 | 3,891 |
| | Deutsche Bahn Finance GmbH | 0.750% | 7/16/35 | EUR | 6,935 | 4,798 |
| | Deutsche Bahn Finance GmbH | 0.625% | 4/15/36 | EUR | 7,995 | 5,329 |
| | Deutsche Bahn Finance GmbH | 1.375% | 4/16/40 | EUR | 4,932 | 3,322 |
| | Deutsche Bahn Finance GmbH | 0.625% | 12/8/50 | EUR | 10,449 | 5,070 |
| | Deutsche Bahn Finance GmbH | 1.125% | 5/29/51 | EUR | 4,494 | 2,475 |
| | Deutsche Bahn Finance GmbH | 0.950% | Perpetual | EUR | 3,300 | 2,935 |
| | Deutsche Bahn Finance GmbH | 1.600% | Perpetual | EUR | 2,700 | 2,007 |
| | Deutsche Bank AG | 0.625% | 12/19/23 | CHF | 5,640 | 5,478 |
| | Deutsche Bank AG | 0.250% | 3/8/24 | EUR | 4,535 | 4,339 |
| | Deutsche Bank AG | 2.625% | 12/16/24 | GBP | 6,000 | 6,290 |
Total International Bond II Index Fund
| | | Coupon | Maturity
Date | Currency | Face
Amount
(000) | Market
Value•
($000) |
| | Deutsche Bank AG | 2.625% | 2/12/26 | EUR | 7,800 | 7,090 |
| | Deutsche Bank AG | 1.625% | 1/20/27 | EUR | 6,000 | 5,002 |
| | Deutsche Bank AG | 0.750% | 2/17/27 | EUR | 9,300 | 7,805 |
| | Deutsche Bank AG | 1.750% | 1/17/28 | EUR | 3,700 | 2,972 |
| | Deutsche Bank AG | 3.250% | 5/24/28 | EUR | 2,000 | 1,767 |
| | Deutsche Bank AG | 0.250% | 8/31/28 | EUR | 2,439 | 2,058 |
| | Deutsche Bank AG | 1.750% | 11/19/30 | EUR | 18,000 | 13,344 |
| | Deutsche Bank AG | 5.625% | 5/19/31 | EUR | 5,000 | 4,750 |
| | Deutsche Bank AG | 1.375% | 2/17/32 | EUR | 11,500 | 7,875 |
| | Deutsche Bank AG | 4.000% | 6/24/32 | EUR | 4,000 | 3,451 |
| | Deutsche Boerse AG | 0.000% | 2/22/26 | EUR | 5,700 | 5,057 |
| | Deutsche Boerse AG | 1.125% | 3/26/28 | EUR | 4,876 | 4,341 |
| | Deutsche Hypothekenbank AG | 0.250% | 5/17/24 | EUR | 5,100 | 4,850 |
| | Deutsche Hypothekenbank AG | 0.500% | 6/29/26 | EUR | 25 | 23 |
| | Deutsche Hypothekenbank AG | 0.750% | 3/5/29 | EUR | 39,655 | 34,113 |
| | Deutsche Kreditbank AG | 1.625% | 6/18/24 | EUR | 600 | 582 |
| | Deutsche Kreditbank AG | 0.500% | 3/19/27 | EUR | 900 | 801 |
| | Deutsche Pfandbriefbank AG | 0.010% | 10/16/25 | EUR | 9,800 | 8,895 |
| | Deutsche Pfandbriefbank AG | 0.010% | 8/25/26 | EUR | 18,000 | 15,938 |
| | Deutsche Pfandbriefbank AG | 0.625% | 8/30/27 | EUR | 32,700 | 28,948 |
| | Deutsche Pfandbriefbank AG | 2.375% | 5/29/28 | EUR | 2,975 | 2,844 |
| | Deutsche Pfandbriefbank AG | 1.250% | 4/20/35 | EUR | 4,876 | 3,848 |
| | Deutsche Post AG | 2.875% | 12/11/24 | EUR | 977 | 967 |
| | Deutsche Post AG | 1.250% | 4/1/26 | EUR | 4,000 | 3,728 |
| | Deutsche Post AG | 0.375% | 5/20/26 | EUR | 5,302 | 4,805 |
| | Deutsche Post AG | 1.625% | 12/5/28 | EUR | 13,535 | 12,185 |
| | Deutsche Post AG | 0.750% | 5/20/29 | EUR | 1,818 | 1,535 |
| | Deutsche Telekom AG | 0.500% | 7/5/27 | EUR | 12,348 | 10,845 |
| | Deutsche Telekom AG | 3.125% | 2/6/34 | GBP | 766 | 729 |
| | Deutsche Telekom AG | 1.375% | 7/5/34 | EUR | 1,710 | 1,325 |
| | Deutsche Telekom AG | 2.250% | 3/29/39 | EUR | �� 2,073 | 1,596 |
| | Deutsche Telekom AG | 1.750% | 12/9/49 | EUR | 4,007 | 2,574 |
| | Deutsche Telekom International Finance BV | 2.750% | 10/24/24 | EUR | 2,144 | 2,117 |
| | Deutsche Telekom International Finance BV | 4.875% | 4/22/25 | EUR | 6,010 | 6,209 |
| | Deutsche Telekom International Finance BV | 2.500% | 10/10/25 | GBP | 5,182 | 5,591 |
| | Deutsche Telekom International Finance BV | 1.375% | 12/1/25 | EUR | 10,760 | 10,141 |
| | Deutsche Telekom International Finance BV | 1.125% | 5/22/26 | EUR | 2,522 | 2,333 |
| | Deutsche Telekom International Finance BV | 1.375% | 1/30/27 | EUR | 3,051 | 2,807 |
| | Deutsche Telekom International Finance BV | 3.250% | 1/17/28 | EUR | 25 | 25 |
| | Deutsche Telekom International Finance BV | 1.500% | 4/3/28 | EUR | 12,950 | 11,662 |
| | Deutsche Telekom International Finance BV | 8.875% | 11/27/28 | GBP | 4,439 | 5,972 |
| | Deutsche Telekom International Finance BV | 2.250% | 4/13/29 | GBP | 2,132 | 2,035 |
| | Deutsche Telekom International Finance BV | 2.000% | 12/1/29 | EUR | 8,242 | 7,466 |
| | Deutsche Telekom International Finance BV | 7.625% | 6/15/30 | GBP | 498 | 659 |
| | Deutsche Telekom International Finance BV | 7.500% | 1/24/33 | EUR | 1,185 | 1,517 |
| | Deutsche Wohnen SE | 1.000% | 4/30/25 | EUR | 5,000 | 4,559 |
| | Deutsche Wohnen SE | 1.500% | 4/30/30 | EUR | 4,000 | 3,030 |
| | Deutsche Wohnen SE | 1.300% | 4/7/41 | EUR | 1,100 | 543 |
| | DZ HYP AG | 0.625% | 6/5/24 | EUR | 25 | 24 |
| | DZ HYP AG | 0.375% | 6/6/25 | EUR | 1,000 | 928 |
| | DZ HYP AG | 0.500% | 11/13/25 | EUR | 7,802 | 7,186 |
| | DZ HYP AG | 0.750% | 2/2/26 | EUR | 5,000 | 4,614 |
| | DZ HYP AG | 0.375% | 3/31/26 | EUR | 3,023 | 2,746 |
| | DZ HYP AG | 0.100% | 8/31/26 | EUR | 500 | 444 |
| | DZ HYP AG | 0.500% | 9/30/26 | EUR | 4,876 | 4,393 |
| | DZ HYP AG | 0.500% | 4/1/27 | EUR | 2,500 | 2,226 |
| | DZ HYP AG | 0.750% | 6/30/27 | EUR | 586 | 524 |
| | DZ HYP AG | 0.625% | 8/30/27 | EUR | 5,000 | 4,432 |
| | DZ HYP AG | 0.875% | 3/22/28 | EUR | 10,755 | 9,540 |
| | DZ HYP AG | 0.010% | 6/23/28 | EUR | 55,000 | 46,105 |
| | DZ HYP AG | 0.010% | 10/27/28 | EUR | 9,000 | 7,459 |
| | DZ HYP AG | 0.875% | 1/30/29 | EUR | 4,876 | 4,242 |
| | DZ HYP AG | 0.010% | 4/20/29 | EUR | 12,423 | 10,149 |
| | DZ HYP AG | 0.050% | 6/29/29 | EUR | 4,876 | 3,971 |
| | DZ HYP AG | 0.875% | 1/18/30 | EUR | 6,100 | 5,198 |
| | DZ HYP AG | 0.010% | 3/29/30 | EUR | 17,269 | 13,695 |
| | DZ HYP AG | 0.010% | 11/15/30 | EUR | 10,000 | 7,766 |
| | DZ HYP AG | 0.875% | 4/17/34 | EUR | 4,876 | 3,760 |
| | DZ HYP AG | 0.375% | 11/10/34 | EUR | 5,000 | 3,551 |
Total International Bond II Index Fund
| | | Coupon | Maturity
Date | Currency | Face
Amount
(000) | Market
Value•
($000) |
| | E.ON International Finance BV | 5.625% | 12/6/23 | GBP | 684 | 786 |
| | E.ON International Finance BV | 1.000% | 4/13/25 | EUR | 2,439 | 2,281 |
| | E.ON International Finance BV | 1.625% | 5/30/26 | EUR | 6,242 | 5,789 |
| | E.ON International Finance BV | 1.250% | 10/19/27 | EUR | 5,463 | 4,837 |
| | E.ON International Finance BV | 1.500% | 7/31/29 | EUR | 10,418 | 8,714 |
| | E.ON International Finance BV | 6.250% | 6/3/30 | GBP | 10,434 | 12,074 |
| | E.ON International Finance BV | 6.375% | 6/7/32 | GBP | 3,073 | 3,637 |
| | E.ON International Finance BV | 4.750% | 1/31/34 | GBP | 2,800 | 2,867 |
| | E.ON International Finance BV | 5.875% | 10/30/37 | GBP | 5,600 | 6,182 |
| | E.ON International Finance BV | 6.750% | 1/27/39 | GBP | 400 | 481 |
| | E.ON International Finance BV | 6.125% | 7/6/39 | GBP | 1,500 | 1,692 |
| | E.ON SE | 0.875% | 5/22/24 | EUR | 125 | 119 |
| | E.ON SE | 0.000% | 8/28/24 | EUR | 4,494 | 4,195 |
| | E.ON SE | 0.250% | 10/24/26 | EUR | 1,851 | 1,618 |
| | E.ON SE | 0.375% | 9/29/27 | EUR | 2,439 | 2,079 |
| | E.ON SE | 0.750% | 2/20/28 | EUR | 4,526 | 3,843 |
| | E.ON SE | 1.625% | 5/22/29 | EUR | 9,984 | 8,447 |
| | E.ON SE | 0.350% | 2/28/30 | EUR | 5,017 | 3,779 |
| | E.ON SE | 1.625% | 3/29/31 | EUR | 4,582 | 3,699 |
| | E.ON SE | 0.625% | 11/7/31 | EUR | 8,436 | 6,077 |
| | EnBW Energie Baden-Wuerttemberg AG | 1.625% | 8/5/79 | EUR | 1,600 | 1,148 |
| | EnBW Energie Baden-Wuerttemberg AG | 1.125% | 11/5/79 | EUR | 4,500 | 3,868 |
| | EnBW Energie Baden-Wuerttemberg AG | 1.875% | 6/29/80 | EUR | 5,300 | 4,182 |
| | EnBW International Finance BV | 0.625% | 4/17/25 | EUR | 17,891 | 16,600 |
| | EnBW International Finance BV | 2.500% | 6/4/26 | EUR | 977 | 921 |
| | EnBW International Finance BV | 0.250% | 10/19/30 | EUR | 6,881 | 4,903 |
| | EnBW International Finance BV | 0.500% | 3/1/33 | EUR | 2,650 | 1,734 |
| | EnBW International Finance BV | 6.125% | 7/7/39 | EUR | 2,090 | 2,280 |
| | Eurogrid GmbH | 1.625% | 11/3/23 | EUR | 5,700 | 5,545 |
| | Eurogrid GmbH | 1.875% | 6/10/25 | EUR | 9,700 | 9,225 |
| | Eurogrid GmbH | 1.500% | 4/18/28 | EUR | 3,100 | 2,727 |
| | Evonik Industries AG | 0.625% | 9/18/25 | EUR | 2,900 | 2,629 |
| | EWE AG | 0.250% | 6/8/28 | EUR | 8,000 | 6,389 |
| | EWE AG | 0.375% | 10/22/32 | EUR | 9,038 | 5,923 |
| | Fresenius Finance Ireland plc | 1.500% | 1/30/24 | EUR | 5,090 | 4,905 |
| | Fresenius Finance Ireland plc | 0.500% | 10/1/28 | EUR | 5,635 | 4,409 |
| | Fresenius Finance Ireland plc | 0.875% | 10/1/31 | EUR | 1,000 | 695 |
| | Fresenius Finance Ireland plc | 3.000% | 1/30/32 | EUR | 710 | 596 |
| | Fresenius Medical Care AG & Co. KGaA | 0.250% | 11/29/23 | EUR | 3,512 | 3,351 |
| | Fresenius Medical Care AG & Co. KGaA | 1.500% | 7/11/25 | EUR | 100 | 93 |
| | Fresenius Medical Care AG & Co. KGaA | 1.500% | 5/29/30 | EUR | 4,876 | 3,762 |
| | Fresenius SE & Co. KGaA | 4.000% | 2/1/24 | EUR | 4,388 | 4,354 |
| | Fresenius SE & Co. KGaA | 1.625% | 10/8/27 | EUR | 4,876 | 4,281 |
| | Fresenius SE & Co. KGaA | 0.750% | 1/15/28 | EUR | 5,608 | 4,660 |
| | Fresenius SE & Co. KGaA | 2.875% | 2/15/29 | EUR | 5,852 | 5,211 |
| | Grand City Properties SA | 1.375% | 8/3/26 | EUR | 8,800 | 7,197 |
| | Grand City Properties SA | 1.500% | 2/22/27 | EUR | 4,100 | 3,211 |
| | Grand City Properties SA | 0.125% | 1/11/28 | EUR | 2,900 | 1,978 |
| | Grand City Properties SA | 1.500% | Perpetual | EUR | 2,500 | 1,311 |
| | Grand City Properties SA | 2.500% | Perpetual | EUR | 400 | 289 |
| | Hamburg Commercial Bank AG | 0.375% | 3/9/26 | EUR | 3,300 | 2,746 |
| | Hamburg Commercial Bank AG | 0.500% | 9/22/26 | EUR | 10,100 | 8,432 |
| | Hamburg Commercial Bank AG | 0.010% | 1/19/27 | EUR | 2,700 | 2,358 |
| | Hannover Rueck SE | 1.750% | 10/8/40 | EUR | 6,000 | 4,465 |
| | Hannover Rueck SE | 3.375% | 6/29/49 | EUR | 3,000 | 2,791 |
| | HeidelbergCement AG | 2.250% | 6/3/24 | EUR | 5,218 | 5,057 |
| | HeidelbergCement AG | 1.500% | 2/7/25 | EUR | 6,827 | 6,443 |
| | HeidelbergCement Finance Luxembourg SA | 2.500% | 10/9/24 | EUR | 4,000 | 3,882 |
| | HeidelbergCement Finance Luxembourg SA | 1.625% | 4/7/26 | EUR | 3,755 | 3,448 |
| | HeidelbergCement Finance Luxembourg SA | 1.500% | 6/14/27 | EUR | 100 | 89 |
| | HeidelbergCement Finance Luxembourg SA | 1.125% | 12/1/27 | EUR | 8,373 | 7,202 |
| | HeidelbergCement Finance Luxembourg SA | 1.750% | 4/24/28 | EUR | 4,958 | 4,350 |
| | Hella GmbH & Co. KGaA | 1.000% | 5/17/24 | EUR | 316 | 298 |
| | HOCHTIEF AG | 0.625% | 4/26/29 | EUR | 1,498 | 1,035 |
| | HOWOGE Wohnungs-baugesellschaft mbH | 0.625% | 11/1/28 | EUR | 12,900 | 10,273 |
| | HOWOGE Wohnungs-baugesellschaft mbH | 1.125% | 11/1/33 | EUR | 5,600 | 3,892 |
| | Infineon Technologies AG | 1.625% | 6/24/29 | EUR | 4,200 | 3,580 |
| | Infineon Technologies AG | 2.000% | 6/24/32 | EUR | 1,800 | 1,458 |
| | ING-DiBa AG | 0.250% | 11/16/26 | EUR | 2,500 | 2,225 |
Total International Bond II Index Fund
| | | Coupon | Maturity
Date | Currency | Face
Amount
(000) | Market
Value•
($000) |
| | ING-DiBa AG | 0.125% | 5/23/27 | EUR | 17,500 | 15,241 |
| | ING-DiBa AG | 1.250% | 10/9/33 | EUR | 6,000 | 4,874 |
| | ING-DiBa AG | 1.000% | 5/23/39 | EUR | 9,400 | 6,611 |
| | Landesbank Baden-Wuerttemberg | 0.200% | 1/10/24 | EUR | 977 | 939 |
| | Landesbank Baden-Wuerttemberg | 0.375% | 5/24/24 | EUR | 600 | 562 |
| | Landesbank Baden-Wuerttemberg | 0.250% | 1/10/25 | EUR | 5,000 | 4,675 |
| | Landesbank Baden-Wuerttemberg | 1.500% | 2/3/25 | GBP | 7,800 | 8,137 |
| | Landesbank Baden-Wuerttemberg | 0.375% | 2/27/25 | EUR | 4,876 | 4,557 |
| | Landesbank Baden-Wuerttemberg | 0.375% | 2/18/27 | EUR | 27,200 | 22,888 |
| | Landesbank Baden-Wuerttemberg | 0.010% | 7/16/27 | EUR | 1,580 | 1,364 |
| | Landesbank Baden-Wuerttemberg | 0.010% | 9/18/28 | EUR | 4,003 | 3,329 |
| | Landesbank Baden-Wuerttemberg | 0.375% | 5/7/29 | EUR | 6,500 | 4,878 |
| | Landesbank Hessen-Thueringen Girozentrale | 0.375% | 2/8/24 | EUR | 5,000 | 4,802 |
| | Landesbank Hessen-Thueringen Girozentrale | 0.125% | 11/19/24 | EUR | 1,100 | 1,024 |
| | Landesbank Hessen-Thueringen Girozentrale | 0.375% | 5/12/25 | EUR | 4,500 | 4,101 |
| | Landesbank Hessen-Thueringen Girozentrale | 0.500% | 9/25/25 | EUR | 200 | 185 |
| | LANXESS AG | 1.125% | 5/16/25 | EUR | 2,501 | 2,337 |
| | LANXESS AG | 0.625% | 12/1/29 | EUR | 2,600 | 1,898 |
| | LEG Immobilien SE | 1.250% | 1/23/24 | EUR | 400 | 377 |
| | LEG Immobilien SE | 0.375% | 1/17/26 | EUR | 2,300 | 1,948 |
| | LEG Immobilien SE | 0.875% | 11/28/27 | EUR | 4,500 | 3,555 |
| | LEG Immobilien SE | 0.875% | 1/17/29 | EUR | 2,100 | 1,572 |
| | LEG Immobilien SE | 1.000% | 11/19/32 | EUR | 3,700 | 2,264 |
| | LEG Immobilien SE | 0.875% | 3/30/33 | EUR | 2,300 | 1,371 |
| | LEG Immobilien SE | 1.500% | 1/17/34 | EUR | 4,900 | 3,070 |
| | Merck Financial Services GmbH | 0.005% | 12/15/23 | EUR | 9,800 | 9,359 |
| | Merck Financial Services GmbH | 0.500% | 7/16/28 | EUR | 4,000 | 3,367 |
| | Merck Financial Services GmbH | 0.875% | 7/5/31 | EUR | 200 | 158 |
| | Merck KGaA | 3.375% | 12/12/74 | EUR | 75 | 72 |
| | Merck KGaA | 1.625% | 9/9/80 | EUR | 5,400 | 4,605 |
| | Muenchener Hypothekenbank eG | 0.500% | 4/22/26 | EUR | 10,425 | 9,503 |
| | Muenchener Hypothekenbank eG | 0.625% | 10/23/26 | EUR | 586 | 530 |
| | Muenchener Hypothekenbank eG | 0.625% | 5/7/27 | EUR | 6,339 | 5,662 |
| | Muenchener Hypothekenbank eG | 0.625% | 11/10/27 | EUR | 7,314 | 6,457 |
| | Muenchener Hypothekenbank eG | 2.500% | 7/4/28 | EUR | 6,217 | 5,992 |
| | Muenchener Hypothekenbank eG | 1.000% | 4/18/39 | EUR | 4,535 | 3,229 |
| | Muenchener Hypothekenbank eG | 0.010% | 11/2/40 | EUR | 3,635 | 2,046 |
| | Muenchener Rueckversicherungs-Gesellschaft AG in Muenchen | 1.250% | 5/26/41 | EUR | 6,700 | 4,743 |
| | Muenchener Rueckversicherungs-Gesellschaft AG in Muenchen | 3.250% | 5/26/49 | EUR | 2,200 | 1,904 |
| | Norddeutsche Landesbank-Girozentrale | 0.375% | 10/9/24 | EUR | 537 | 506 |
| | Norddeutsche Landesbank-Girozentrale | 0.010% | 9/23/26 | EUR | 14,600 | 12,889 |
| | Norddeutsche Landesbank-Girozentrale | 0.250% | 10/28/26 | EUR | 4,876 | 4,339 |
| | O2 Telefonica Deutschland Finanzierungs GmbH | 1.750% | 7/5/25 | EUR | 3,400 | 3,199 |
| | Roadster Finance DAC | 2.375% | 12/8/32 | EUR | 100 | 84 |
| | Robert Bosch GmbH | 1.750% | 7/8/24 | EUR | 100 | 97 |
| | Robert Bosch Investment Nederland BV | 2.625% | 5/24/28 | EUR | 500 | 466 |
| | RWE AG | 2.125% | 5/24/26 | EUR | 2,000 | 1,866 |
| | RWE AG | 0.500% | 11/26/28 | EUR | 8,695 | 7,001 |
| | RWE AG | 2.750% | 5/24/30 | EUR | 2,500 | 2,216 |
| | RWE AG | 0.625% | 6/11/31 | EUR | 7,491 | 5,444 |
| | RWE AG | 1.000% | 11/26/33 | EUR | 6,265 | 4,291 |
| | Santander Consumer Bank AG | 0.250% | 10/15/24 | EUR | 12,300 | 11,382 |
| | SAP SE | 0.750% | 12/10/24 | EUR | 500 | 477 |
| | SAP SE | 0.125% | 5/18/26 | EUR | 5,000 | 4,473 |
| | SAP SE | 1.750% | 2/22/27 | EUR | 3,000 | 2,817 |
| | SAP SE | 1.250% | 3/10/28 | EUR | 2,900 | 2,612 |
| | SAP SE | 0.375% | 5/18/29 | EUR | 6,900 | 5,701 |
| | SAP SE | 1.625% | 3/10/31 | EUR | 11,600 | 10,013 |
| | Siemens Financieringsmaatschappij NV | 0.250% | 6/5/24 | EUR | 10,300 | 9,751 |
| | Siemens Financieringsmaatschappij NV | 0.000% | 9/5/24 | EUR | 6,803 | 6,395 |
| | Siemens Financieringsmaatschappij NV | 2.250% | 3/10/25 | EUR | 3,000 | 2,915 |
| | Siemens Financieringsmaatschappij NV | 2.750% | 9/10/25 | GBP | 500 | 548 |
| | Siemens Financieringsmaatschappij NV | 1.000% | 9/6/27 | EUR | 1,000 | 902 |
| | Siemens Financieringsmaatschappij NV | 2.875% | 3/10/28 | EUR | 7,523 | 7,309 |
| | Siemens Financieringsmaatschappij NV | 0.250% | 2/20/29 | EUR | 15,200 | 12,433 |
| | Siemens Financieringsmaatschappij NV | 0.125% | 9/5/29 | EUR | 9,179 | 7,378 |
| | Siemens Financieringsmaatschappij NV | 1.375% | 9/6/30 | EUR | 4,275 | 3,664 |
| | Siemens Financieringsmaatschappij NV | 1.250% | 2/28/31 | EUR | 7,728 | 6,407 |
| | Siemens Financieringsmaatschappij NV | 0.500% | 2/20/32 | EUR | 3,800 | 2,863 |
Total International Bond II Index Fund
| | | Coupon | Maturity
Date | Currency | Face
Amount
(000) | Market
Value•
($000) |
| | Siemens Financieringsmaatschappij NV | 0.500% | 9/5/34 | EUR | 3,413 | 2,382 |
| | Siemens Financieringsmaatschappij NV | 1.250% | 2/25/35 | EUR | 2,800 | 2,102 |
| | Siemens Financieringsmaatschappij NV | 1.750% | 2/28/39 | EUR | 6,084 | 4,552 |
| | Siemens Financieringsmaatschappij NV | 3.750% | 9/10/42 | GBP | 2,300 | 2,292 |
| | Sirius Real Estate Ltd. | 1.125% | 6/22/26 | EUR | 100 | 75 |
| | Talanx AG | 2.250% | 12/5/47 | EUR | 5,100 | 4,277 |
| | Traton Finance Luxembourg SA | 0.000% | 6/14/24 | EUR | 6,000 | 5,561 |
| | Traton Finance Luxembourg SA | 0.125% | 3/24/25 | EUR | 6,700 | 6,018 |
| | Traton Finance Luxembourg SA | 1.250% | 3/24/33 | EUR | 4,600 | 3,135 |
| | UniCredit Bank AG | 1.875% | 4/9/24 | EUR | 2,486 | 2,427 |
| | UniCredit Bank AG | 0.625% | 2/12/25 | EUR | 25 | 23 |
| | UniCredit Bank AG | 0.625% | 11/20/25 | EUR | 10,400 | 9,598 |
| | UniCredit Bank AG | 0.500% | 5/4/26 | EUR | 125 | 114 |
| | UniCredit Bank AG | 0.500% | 2/23/27 | EUR | 27,000 | 24,061 |
| | UniCredit Bank AG | 0.010% | 11/19/27 | EUR | 10,000 | 8,527 |
| | UniCredit Bank AG | 0.010% | 9/15/28 | EUR | 7,545 | 6,269 |
| | UniCredit Bank AG | 0.875% | 1/11/29 | EUR | 6,192 | 5,382 |
| | UniCredit Bank AG | 0.125% | 11/22/29 | EUR | 7,000 | 5,647 |
| | UniCredit Bank AG | 0.010% | 6/24/30 | EUR | 6,242 | 4,910 |
| | UniCredit Bank AG | 0.250% | 1/15/32 | EUR | 9,508 | 7,286 |
| | UniCredit Bank AG | 0.850% | 5/22/34 | EUR | 17,363 | 13,300 |
| | Vantage Towers AG | 0.000% | 3/31/25 | EUR | 2,000 | 1,801 |
| | Vantage Towers AG | 0.375% | 3/31/27 | EUR | 2,700 | 2,242 |
| | Vantage Towers AG | 0.750% | 3/31/30 | EUR | 4,200 | 3,149 |
| | Vier Gas Transport GmbH | 3.125% | 7/10/23 | EUR | 3,956 | 3,896 |
| | Vier Gas Transport GmbH | 2.875% | 6/12/25 | EUR | 5,590 | 5,337 |
| | Vier Gas Transport GmbH | 0.125% | 9/10/29 | EUR | 4,000 | 2,920 |
| | Volkswagen Bank GmbH | 0.750% | 6/15/23 | EUR | 5,559 | 5,417 |
| | Volkswagen Bank GmbH | 1.250% | 6/10/24 | EUR | 22,400 | 21,313 |
| | Volkswagen Bank GmbH | 1.250% | 12/15/25 | EUR | 634 | 580 |
| | Volkswagen Bank GmbH | 2.500% | 7/31/26 | EUR | 2,700 | 2,512 |
| | Volkswagen Financial Services AG | 0.875% | 4/12/23 | EUR | 4,173 | 4,089 |
| | Volkswagen Financial Services AG | 1.500% | 10/1/24 | EUR | 2,926 | 2,779 |
| | Volkswagen Financial Services AG | 0.000% | 2/12/25 | EUR | 6,733 | 6,100 |
| | Volkswagen Financial Services AG | 2.250% | 10/16/26 | EUR | 4,703 | 4,377 |
| | Volkswagen Financial Services AG | 0.125% | 2/12/27 | EUR | 16,000 | 13,367 |
| | Volkswagen Financial Services AG | 0.875% | 1/31/28 | EUR | 8,083 | 6,742 |
| | Volkswagen Financial Services AG | 3.375% | 4/6/28 | EUR | 15,838 | 15,077 |
| | Volkswagen Financial Services AG | 0.375% | 2/12/30 | EUR | 3,397 | 2,523 |
| | Volkswagen Financial Services NV | 0.875% | 2/20/25 | GBP | 5,000 | 5,113 |
| | Volkswagen Financial Services NV | 2.250% | 4/12/25 | GBP | 238 | 252 |
| | Volkswagen Financial Services NV | 3.250% | 4/13/27 | GBP | 4,400 | 4,427 |
| | Volkswagen Financial Services NV | 2.125% | 1/18/28 | GBP | 8,700 | 8,068 |
| | Volkswagen Financial Services NV | 1.375% | 9/14/28 | GBP | 4,300 | 3,714 |
| | Volkswagen International Finance NV | 3.375% | 11/16/26 | GBP | 3,600 | 3,709 |
| | Volkswagen International Finance NV | 1.875% | 3/30/27 | EUR | 11,500 | 10,338 |
| | Volkswagen International Finance NV | 3.750% | 9/28/27 | EUR | 4,000 | 3,892 |
| | Volkswagen International Finance NV | 3.250% | 11/18/30 | EUR | 1,000 | 914 |
| | Volkswagen International Finance NV | 4.125% | 11/17/31 | GBP | 1,900 | 1,848 |
| | Volkswagen International Finance NV | 1.250% | 9/23/32 | EUR | 2,900 | 2,212 |
| | Volkswagen International Finance NV | 3.300% | 3/22/33 | EUR | 300 | 268 |
| | Volkswagen International Finance NV | 4.125% | 11/16/38 | EUR | 9,700 | 8,935 |
| | Volkswagen International Finance NV | 1.500% | 1/21/41 | EUR | 4,000 | 2,440 |
| | Volkswagen International Finance NV | 4.625% | 3/29/49 | EUR | 4,058 | 3,798 |
| | Volkswagen International Finance NV | 3.375% | Perpetual | EUR | 8,100 | 7,608 |
| | Volkswagen International Finance NV | 3.500% | Perpetual | EUR | 11,400 | 10,465 |
| | Volkswagen International Finance NV | 3.748% | Perpetual | EUR | 8,000 | 6,834 |
| | Volkswagen International Finance NV | 3.875% | Perpetual | EUR | 7,700 | 6,774 |
| | Volkswagen International Finance NV | 3.875% | Perpetual | EUR | 13,500 | 11,102 |
| | Volkswagen International Finance NV | 4.375% | Perpetual | EUR | 2,000 | 1,603 |
| | Volkswagen International Finance NV | 4.625% | Perpetual | EUR | 4,700 | 4,162 |
| | Volkswagen Leasing GmbH | 2.625% | 1/15/24 | EUR | 1,122 | 1,097 |
| | Volkswagen Leasing GmbH | 1.125% | 4/4/24 | EUR | 5,120 | 4,882 |
| | Volkswagen Leasing GmbH | 0.000% | 7/19/24 | EUR | 5,000 | 4,631 |
| | Volkswagen Leasing GmbH | 1.375% | 1/20/25 | EUR | 5,656 | 5,322 |
| | Volkswagen Leasing GmbH | 1.625% | 8/15/25 | EUR | 1,064 | 994 |
| | Volkswagen Leasing GmbH | 0.375% | 7/20/26 | EUR | 3,147 | 2,727 |
| | Volkswagen Leasing GmbH | 0.500% | 1/12/29 | EUR | 16,849 | 13,273 |
| | Volkswagen Leasing GmbH | 0.625% | 7/19/29 | EUR | 4,000 | 3,110 |
Total International Bond II Index Fund
| | | Coupon | Maturity
Date | Currency | Face
Amount
(000) | Market
Value•
($000) |
| | Vonovia Finance BV | 2.250% | 12/15/23 | EUR | 6,300 | 6,086 |
| | Vonovia Finance BV | 1.625% | 4/7/24 | EUR | 5,000 | 4,748 |
| | Vonovia Finance BV | 1.250% | 12/6/24 | EUR | 2,000 | 1,847 |
| | Vonovia Finance BV | 1.500% | 3/31/25 | EUR | 2,486 | 2,306 |
| | Vonovia Finance BV | 1.800% | 6/29/25 | EUR | 12,200 | 11,146 |
| | Vonovia Finance BV | 1.125% | 9/8/25 | EUR | 1,300 | 1,160 |
| | Vonovia Finance BV | 1.500% | 3/22/26 | EUR | 7,600 | 6,696 |
| | Vonovia Finance BV | 1.500% | 6/10/26 | EUR | 2,500 | 2,181 |
| | Vonovia Finance BV | 0.625% | 7/9/26 | EUR | 8,000 | 6,730 |
| | Vonovia Finance BV | 1.750% | 1/25/27 | EUR | 100 | 86 |
| | Vonovia Finance BV | 0.625% | 10/7/27 | EUR | 3,000 | 2,374 |
| | Vonovia Finance BV | 1.500% | 1/14/28 | EUR | 500 | 410 |
| | Vonovia Finance BV | 2.250% | 4/7/30 | EUR | 1,900 | 1,491 |
| | Vonovia Finance BV | 1.000% | 7/9/30 | EUR | 2,800 | 1,974 |
| | Vonovia Finance BV | 1.125% | 9/14/34 | EUR | 5,000 | 2,958 |
| | Vonovia Finance BV | 2.750% | 3/22/38 | EUR | 700 | 457 |
| | Vonovia Finance BV | 1.625% | 10/7/39 | EUR | 1,400 | 729 |
| | Vonovia Finance BV | 1.000% | 1/28/41 | EUR | 2,000 | 920 |
| | Vonovia SE | 0.000% | 12/1/25 | EUR | 5,000 | 4,258 |
| | Vonovia SE | 1.375% | 1/28/26 | EUR | 5,200 | 4,606 |
| | Vonovia SE | 1.875% | 6/28/28 | EUR | 400 | 330 |
| | Vonovia SE | 0.250% | 9/1/28 | EUR | 3,000 | 2,212 |
| | Vonovia SE | 0.625% | 12/14/29 | EUR | 11,300 | 7,960 |
| | Vonovia SE | 2.375% | 3/25/32 | EUR | 2,500 | 1,920 |
| | Vonovia SE | 0.750% | 9/1/32 | EUR | 4,900 | 3,087 |
| | Vonovia SE | 1.000% | 6/16/33 | EUR | 7,300 | 4,508 |
| | Vonovia SE | 1.500% | 6/14/41 | EUR | 6,000 | 3,076 |
| | VW Credit Canada Inc. | 2.850% | 9/26/24 | CAD | 835 | 577 |
| | VW Credit Canada Inc. | 2.050% | 12/10/24 | CAD | 2,170 | 1,485 |
| | VW Credit Canada Inc. | 1.500% | 9/23/25 | CAD | 3,040 | 1,993 |
| | VW Credit Canada Inc. | 2.450% | 12/10/26 | CAD | 1,785 | 1,164 |
| | Wintershall Dea Finance BV | 0.840% | 9/25/25 | EUR | 5,000 | 4,436 |
| | Wintershall Dea Finance BV | 1.332% | 9/25/28 | EUR | 3,500 | 2,821 |
| | Wintershall Dea Finance BV | 1.823% | 9/25/31 | EUR | 4,900 | 3,591 |
| | | | | | | 2,107,414 |
| Hong Kong (0.0%) | | | |
| | Cheung Kong Infrastructure Finance BVI Ltd. | 1.000% | 12/12/24 | EUR | 317 | 293 |
| | Hong Kong & Shanghai Banking Corp. Ltd. | 0.204% | 6/25/24 | JPY | 400,000 | 2,661 |
| | Prudential plc | 5.875% | 5/11/29 | GBP | 1,541 | 1,770 |
| | Prudential plc | 6.125% | 12/19/31 | GBP | 3,322 | 3,583 |
| | | | | | | 8,307 |
| Indonesia (0.0%) | | | |
| | Perusahaan Perseroan Persero PT Perusahaan Listrik Negara | 1.875% | 11/5/31 | EUR | 1,100 | 759 |
| Ireland (0.1%) | | | |
| | AIB Group plc | 3.625% | 7/4/26 | EUR | 5,000 | 4,770 |
| | Bank of Ireland Group plc | 1.000% | 11/25/25 | EUR | 10,729 | 9,778 |
| | CRH Finance DAC | 1.375% | 10/18/28 | EUR | 733 | 624 |
| | CRH Finland Services OYJ | 0.875% | 11/5/23 | EUR | 2,427 | 2,341 |
| | CRH Funding BV | 1.625% | 5/5/30 | EUR | 5,603 | 4,596 |
| | CRH SMW Finance DAC | 1.250% | 11/5/26 | EUR | 11,216 | 10,058 |
| | Dell Bank International DAC | 0.500% | 10/27/26 | EUR | 12,500 | 10,699 |
| | ESB Finance DAC | 3.494% | 1/12/24 | EUR | 552 | 545 |
| | ESB Finance DAC | 2.125% | 6/8/27 | EUR | 3,154 | 2,905 |
| | ESB Finance DAC | 1.875% | 6/14/31 | EUR | 8,037 | 6,697 |
| | ESB Finance DAC | 2.125% | 11/5/33 | EUR | 3,429 | 2,807 |
| | Experian Europe DAC | 1.560% | 5/16/31 | EUR | 1,800 | 1,467 |
| | Freshwater Finance plc | 5.182% | 4/20/35 | GBP | 977 | 1,056 |
| | Freshwater Finance plc | 4.607% | 10/17/36 | GBP | 2,108 | 1,986 |
| | GAS Networks Ireland | 1.375% | 12/5/26 | EUR | 1,228 | 1,113 |
| | Kerry Group Financial Services Unltd Co. | 2.375% | 9/10/25 | EUR | 5,139 | 4,952 |
| | PartnerRe Ireland Finance DAC | 1.250% | 9/15/26 | EUR | 3,396 | 3,036 |
| | Ryanair DAC | 1.125% | 3/10/23 | EUR | 100 | 98 |
| | Ryanair DAC | 2.875% | 9/15/25 | EUR | 10,172 | 9,707 |
| | Smurfit Kappa Acquisitions ULC | 2.875% | 1/15/26 | EUR | 5,286 | 5,014 |
| | Smurfit Kappa Treasury ULC | 1.500% | 9/15/27 | EUR | 6,500 | 5,642 |
| | Smurfit Kappa Treasury ULC | 1.000% | 9/22/33 | EUR | 6,571 | 4,367 |
| | | | | | | 94,258 |
Total International Bond II Index Fund
| | | Coupon | Maturity
Date | Currency | Face
Amount
(000) | Market
Value•
($000) |
| Italy (0.7%) | | | |
| | 2i Rete Gas SpA | 3.000% | 7/16/24 | EUR | 2,908 | 2,853 |
| | 2i Rete Gas SpA | 1.750% | 8/28/26 | EUR | 465 | 413 |
| | 2i Rete Gas SpA | 1.608% | 10/31/27 | EUR | 3,234 | 2,741 |
| | 2i Rete Gas SpA | 0.579% | 1/29/31 | EUR | 10,200 | 7,178 |
| | A2A SpA | 1.250% | 3/16/24 | EUR | 1,906 | 1,831 |
| | A2A SpA | 0.625% | 10/28/32 | EUR | 2,302 | 1,466 |
| | ACEA SpA | 1.000% | 10/24/26 | EUR | 3,063 | 2,664 |
| | ACEA SpA | 1.500% | 6/8/27 | EUR | 11,966 | 10,430 |
| | ACEA SpA | 0.500% | 4/6/29 | EUR | 16,904 | 12,750 |
| | ACEA SpA | 0.250% | 7/28/30 | EUR | 1,093 | 780 |
| | Aeroporti di Roma SpA | 1.625% | 6/8/27 | EUR | 1,860 | 1,594 |
| | Aeroporti di Roma SpA | 1.750% | 7/30/31 | EUR | 1,863 | 1,311 |
| | AMCO - Asset Management Co. SpA | 1.375% | 1/27/25 | EUR | 11,991 | 11,194 |
| | AMCO - Asset Management Co. SpA | 2.250% | 7/17/27 | EUR | 10,042 | 8,986 |
| | AMCO - Asset Management Co. SpA | 0.750% | 4/20/28 | EUR | 4,552 | 3,640 |
| | Assicurazioni Generali SpA | 5.125% | 9/16/24 | EUR | 3,536 | 3,585 |
| | Assicurazioni Generali SpA | 2.124% | 10/1/30 | EUR | 2,700 | 2,039 |
| | Assicurazioni Generali SpA | 2.429% | 7/14/31 | EUR | 2,000 | 1,496 |
| | Assicurazioni Generali SpA | 1.713% | 6/30/32 | EUR | 2,700 | 1,851 |
| | Assicurazioni Generali SpA | 5.800% | 7/6/32 | EUR | 3,000 | 2,852 |
| | Assicurazioni Generali SpA | 5.500% | 10/27/47 | EUR | 7,336 | 7,103 |
| | Assicurazioni Generali SpA | 6.269% | 6/29/49 | GBP | 6,100 | 6,571 |
| | Assicurazioni Generali SpA | 4.596% | 11/30/49 | EUR | 10,000 | 9,495 |
| | ASTM SpA | 1.625% | 2/8/28 | EUR | 3,182 | 2,608 |
| | ASTM SpA | 1.500% | 1/25/30 | EUR | 4,707 | 3,520 |
| | ASTM SpA | 2.375% | 11/25/33 | EUR | 3,200 | 2,216 |
| | Autostrade per l'Italia SpA | 2.000% | 12/4/28 | EUR | 5,000 | 4,069 |
| | Autostrade per l'Italia SpA | 1.875% | 9/26/29 | EUR | 4,000 | 3,137 |
| | Autostrade per l'Italia SpA | 2.250% | 1/25/32 | EUR | 4,000 | 2,962 |
| | Banca Monte dei Paschi di Siena SpA | 2.875% | 7/16/24 | EUR | 2,746 | 2,697 |
| | Banca Monte dei Paschi di Siena SpA | 2.125% | 11/26/25 | EUR | 4,461 | 4,243 |
| | Banco BPM SpA | 1.000% | 1/23/25 | EUR | 7,369 | 6,953 |
| | Banco di Desio e della Brianza SpA | 0.875% | 9/12/24 | EUR | 7,821 | 7,430 |
| | Coca-Cola HBC Finance BV | 1.875% | 11/11/24 | EUR | 100 | 96 |
| | Coca-Cola HBC Finance BV | 1.000% | 5/14/27 | EUR | 5,000 | 4,431 |
| | Credit Agricole Italia SpA | 0.250% | 9/30/24 | EUR | 5,400 | 5,069 |
| | Credit Agricole Italia SpA | 0.625% | 1/13/26 | EUR | 2,800 | 2,557 |
| | Credit Agricole Italia SpA | 1.000% | 3/25/27 | EUR | 7,400 | 6,653 |
| | Credit Agricole Italia SpA | 0.250% | 1/17/28 | EUR | 2,500 | 2,113 |
| | Credit Agricole Italia SpA | 1.625% | 3/21/29 | EUR | 1,000 | 892 |
| | Credit Agricole Italia SpA | 1.750% | 1/15/38 | EUR | 2,500 | 1,904 |
| | Credit Agricole Italia SpA | 1.000% | 1/17/45 | EUR | 300 | 182 |
| | Credito Emiliano SpA | 1.125% | 1/17/24 | EUR | 4,913 | 4,752 |
| | Enel Finance International NV | 0.000% | 6/17/24 | EUR | 4,778 | 4,465 |
| | Enel Finance International NV | 5.625% | 8/14/24 | GBP | 5,516 | 6,290 |
| | Enel Finance International NV | 1.000% | 9/16/24 | EUR | 1,815 | 1,716 |
| | Enel Finance International NV | 1.966% | 1/27/25 | EUR | 16,202 | 15,449 |
| | Enel Finance International NV | 1.375% | 6/1/26 | EUR | 18,270 | 16,434 |
| | Enel Finance International NV | 1.125% | 9/16/26 | EUR | 1,319 | 1,170 |
| | Enel Finance International NV | 0.000% | 6/17/27 | EUR | 3,000 | 2,423 |
| | Enel Finance International NV | 0.375% | 6/17/27 | EUR | 5,892 | 4,866 |
| | Enel Finance International NV | 1.000% | 10/20/27 | GBP | 12,199 | 10,803 |
| | Enel Finance International NV | 2.875% | 4/11/29 | GBP | 5,300 | 4,875 |
| | Enel Finance International NV | 0.375% | 5/28/29 | EUR | 8,000 | 5,956 |
| | Enel Finance International NV | 0.500% | 6/17/30 | EUR | 12,800 | 9,145 |
| | Enel Finance International NV | 0.875% | 9/28/34 | EUR | 3,100 | 1,896 |
| | Enel Finance International NV | 1.125% | 10/17/34 | EUR | 2,547 | 1,633 |
| | Enel Finance International NV | 1.250% | 1/17/35 | EUR | 3,000 | 1,915 |
| | Enel Finance International NV | 0.875% | 6/17/36 | EUR | 2,786 | 1,606 |
| | Enel Finance International NV | 5.750% | 9/14/40 | GBP | 3,390 | 3,486 |
| | Enel SpA | 5.625% | 6/21/27 | EUR | 1,060 | 1,100 |
| | Enel SpA | 5.750% | 6/22/37 | GBP | 1,455 | 1,520 |
| | Enel SpA | 3.500% | 5/24/80 | EUR | 11,386 | 10,240 |
| | Enel SpA | 3.375% | 11/24/81 | EUR | 8,120 | 6,862 |
| | Enel SpA | 1.375% | Perpetual | EUR | 5,552 | 4,103 |
| | Enel SpA | 2.250% | Perpetual | EUR | 13,023 | 10,340 |
| | Enel SpA | 2.500% | Perpetual | EUR | 5,410 | 5,082 |
| | Eni SpA | 1.750% | 1/18/24 | EUR | 7,347 | 7,119 |
Total International Bond II Index Fund
| | | Coupon | Maturity
Date | Currency | Face
Amount
(000) | Market
Value•
($000) |
| | Eni SpA | 0.625% | 9/19/24 | EUR | 4,913 | 4,617 |
| | Eni SpA | 3.750% | 9/12/25 | EUR | 3,279 | 3,242 |
| | Eni SpA | 1.500% | 2/2/26 | EUR | 931 | 863 |
| | Eni SpA | 1.250% | 5/18/26 | EUR | 8,000 | 7,303 |
| | Eni SpA | 1.500% | 1/17/27 | EUR | 2,457 | 2,227 |
| | Eni SpA | 1.625% | 5/17/28 | EUR | 1,209 | 1,059 |
| | Eni SpA | 0.375% | 6/14/28 | EUR | 4,807 | 3,915 |
| | Eni SpA | 1.125% | 9/19/28 | EUR | 2,683 | 2,261 |
| | Eni SpA | 3.625% | 1/29/29 | EUR | 7,400 | 7,035 |
| | Eni SpA | 0.625% | 1/23/30 | EUR | 11,089 | 8,487 |
| | Eni SpA | 1.000% | 10/11/34 | EUR | 2,908 | 1,978 |
| | Eni SpA | 2.000% | Perpetual | EUR | 2,000 | 1,592 |
| | Eni SpA | 2.625% | Perpetual | EUR | 3,910 | 3,426 |
| | Eni SpA | 2.750% | Perpetual | EUR | 6,276 | 4,535 |
| | Eni SpA | 3.375% | Perpetual | EUR | 6,437 | 4,986 |
| | FCA Bank SpA | 0.000% | 4/16/24 | EUR | 6,000 | 5,600 |
| | Hera SpA | 0.875% | 10/14/26 | EUR | 2,457 | 2,148 |
| | Hera SpA | 0.875% | 7/5/27 | EUR | 4,913 | 4,219 |
| | Hera SpA | 5.200% | 1/29/28 | EUR | 2,908 | 2,913 |
| | Hera SpA | 0.250% | 12/3/30 | EUR | 2,900 | 1,980 |
| | Hera SpA | 1.000% | 4/25/34 | EUR | 3,491 | 2,252 |
| | Intesa Sanpaolo SpA | 1.375% | 1/18/24 | EUR | 7,369 | 7,087 |
| | Intesa Sanpaolo SpA | 3.125% | 2/5/24 | EUR | 1,906 | 1,890 |
| | Intesa Sanpaolo SpA | 0.500% | 3/5/24 | EUR | 2,500 | 2,396 |
| | Intesa Sanpaolo SpA | 1.500% | 4/10/24 | EUR | 2,457 | 2,363 |
| | Intesa Sanpaolo SpA | 1.000% | 7/4/24 | EUR | 2,818 | 2,659 |
| | Intesa Sanpaolo SpA | 0.500% | 7/15/24 | EUR | 2,683 | 2,543 |
| | Intesa Sanpaolo SpA | 3.375% | 1/24/25 | EUR | 5,200 | 5,180 |
| | Intesa Sanpaolo SpA | 1.250% | 2/7/25 | EUR | 1,228 | 1,168 |
| | Intesa Sanpaolo SpA | 1.125% | 7/14/25 | EUR | 2,500 | 2,351 |
| | Intesa Sanpaolo SpA | 1.000% | 9/25/25 | EUR | 4,913 | 4,581 |
| | Intesa Sanpaolo SpA | 3.250% | 2/10/26 | EUR | 2,000 | 1,983 |
| | Intesa Sanpaolo SpA | 0.375% | 9/14/26 | EUR | 4,913 | 4,373 |
| | Intesa Sanpaolo SpA | 1.000% | 11/19/26 | EUR | 6,367 | 5,504 |
| | Intesa Sanpaolo SpA | 1.125% | 10/4/27 | EUR | 6,683 | 5,998 |
| | Intesa Sanpaolo SpA | 0.750% | 3/16/28 | EUR | 3,000 | 2,414 |
| | Intesa Sanpaolo SpA | 1.750% | 3/20/28 | EUR | 12,669 | 10,732 |
| | Intesa Sanpaolo SpA | 1.250% | 1/15/30 | EUR | 100 | 86 |
| | Intesa Sanpaolo SpA | 2.500% | 1/15/30 | GBP | 3,455 | 2,942 |
| | Intesa Sanpaolo SpA | 1.350% | 2/24/31 | EUR | 5,000 | 3,514 |
| | Intesa Sanpaolo SpA | 2.625% | 3/11/36 | GBP | 2,776 | 1,942 |
| | Iren SpA | 0.875% | 11/4/24 | EUR | 2,277 | 2,113 |
| | Iren SpA | 1.950% | 9/19/25 | EUR | 2,908 | 2,703 |
| | Italgas SpA | 0.875% | 4/24/30 | EUR | 3,908 | 2,906 |
| | Mediobanca Banca di Credito Finanziario SpA | 1.125% | 7/15/25 | EUR | 3,459 | 3,159 |
| | Mediobanca Banca di Credito Finanziario SpA | 1.375% | 11/10/25 | EUR | 5,275 | 4,946 |
| | Mediobanca Banca di Credito Finanziario SpA | 0.875% | 1/15/26 | EUR | 7,821 | 6,927 |
| | Mediobanca Banca di Credito Finanziario SpA | 0.750% | 11/2/28 | EUR | 5,000 | 3,891 |
| | Mediobanca Banca di Credito Finanziario SpA | 1.250% | 11/24/29 | EUR | 1,274 | 1,096 |
| | Snam SpA | 0.000% | 5/12/24 | EUR | 1,455 | 1,361 |
| | Snam SpA | 0.875% | 10/25/26 | EUR | 9,570 | 8,344 |
| | Snam SpA | 0.750% | 6/20/29 | EUR | 4,600 | 3,508 |
| | Snam SpA | 0.750% | 6/17/30 | EUR | 2,500 | 1,828 |
| | Snam SpA | 1.000% | 9/12/34 | EUR | 3,910 | 2,463 |
| | Terna - Rete Elettrica Nazionale | 1.375% | 7/26/27 | EUR | 4,796 | 4,233 |
| | Terna - Rete Elettrica Nazionale | 1.000% | 10/11/28 | EUR | 6,502 | 5,384 |
| | UniCredit SpA | 1.250% | 6/25/25 | EUR | 15,500 | 14,532 |
| | UniCredit SpA | 0.325% | 1/19/26 | EUR | 5,000 | 4,335 |
| | UniCredit SpA | 1.200% | 1/20/26 | EUR | 5,000 | 4,511 |
| | UniCredit SpA | 1.250% | 6/16/26 | EUR | 6,056 | 5,472 |
| | UniCredit SpA | 0.375% | 10/31/26 | EUR | 9,297 | 8,215 |
| | UniCredit SpA | 2.200% | 7/22/27 | EUR | 18,465 | 16,139 |
| | UniCredit SpA | 0.850% | 1/19/31 | EUR | 12,014 | 8,296 |
| | | | | | | 578,507 |
| Japan (0.4%) | | | |
| | Asahi Group Holdings Ltd. | 0.155% | 10/23/24 | EUR | 3,459 | 3,218 |
| | Asahi Group Holdings Ltd. | 0.336% | 4/19/27 | EUR | 3,000 | 2,570 |
| | Central Nippon Expressway Co. Ltd. | 0.040% | 8/19/24 | JPY | 20,000 | 134 |
| | Central Nippon Expressway Co. Ltd. | 0.030% | 10/30/24 | JPY | 500,000 | 3,356 |
Total International Bond II Index Fund
| | | Coupon | Maturity
Date | Currency | Face
Amount
(000) | Market
Value•
($000) |
| | Central Nippon Expressway Co. Ltd. | 0.070% | 10/21/25 | JPY | 450,000 | 3,016 |
| | Central Nippon Expressway Co. Ltd. | 0.050% | 5/8/26 | JPY | 4,600,000 | 30,763 |
| | Central Nippon Expressway Co. Ltd. | 0.050% | 7/27/26 | JPY | 480,000 | 3,208 |
| | Daiichi Sankyo Co. Ltd. | 0.810% | 7/25/36 | JPY | 700,000 | 4,564 |
| | Denso Corp. | 0.315% | 3/17/28 | JPY | 500,000 | 3,345 |
| | East Japan Railway Co. | 1.162% | 9/15/28 | GBP | 3,326 | 3,009 |
| | East Japan Railway Co. | 1.850% | 4/13/33 | EUR | 4,000 | 3,293 |
| | East Japan Railway Co. | 4.875% | 6/14/34 | GBP | 2,700 | 2,993 |
| | East Japan Railway Co. | 0.773% | 9/15/34 | EUR | 491 | 342 |
| | East Japan Railway Co. | 1.104% | 9/15/39 | EUR | 5,786 | 3,615 |
| | East Nippon Expressway Co. Ltd. | 0.070% | 6/20/25 | JPY | 650,000 | 4,360 |
| | East Nippon Expressway Co. Ltd. | 0.140% | 7/31/29 | JPY | 630,000 | 4,161 |
| | East Nippon Expressway Co. Ltd. | 0.140% | 11/29/29 | JPY | 400,000 | 2,636 |
| | East Nippon Expressway Co. Ltd. | 0.220% | 1/31/30 | JPY | 370,000 | 2,451 |
| | East Nippon Expressway Co. Ltd. | 0.140% | 7/15/31 | JPY | 10,000 | 65 |
| | Fast Retailing Co. Ltd. | 0.405% | 6/6/28 | JPY | 800,000 | 5,386 |
| | JT International Financial Services BV | 1.000% | 11/26/29 | EUR | 5,455 | 4,137 |
| | JT International Financial Services BV | 2.750% | 9/28/33 | GBP | 2,501 | 2,120 |
| | JT International Financial Services BV | 2.375% | 4/7/81 | EUR | 4,913 | 4,163 |
| | Kansai Electric Power Co. Inc. | 0.280% | 4/25/24 | JPY | 46,000 | 310 |
| | Kansai Electric Power Co. Inc. | 0.470% | 5/25/27 | JPY | 86,000 | 576 |
| | Kansai Electric Power Co. Inc. | 0.490% | 7/23/27 | JPY | 119,000 | 797 |
| | Kansai Electric Power Co. Inc. | 0.460% | 12/20/27 | JPY | 341,000 | 2,274 |
| | Kansai Electric Power Co. Inc. | 0.440% | 12/20/30 | JPY | 373,000 | 2,417 |
| | Kansai Electric Power Co. Inc. | 0.370% | 9/19/31 | JPY | 213,000 | 1,364 |
| | Kyushu Electric Power Co. Inc. | 1.064% | 2/23/24 | JPY | 98,000 | 667 |
| | Kyushu Electric Power Co. Inc. | 0.170% | 8/23/24 | JPY | 36,000 | 242 |
| | Kyushu Electric Power Co. Inc. | 0.430% | 5/25/29 | JPY | 89,000 | 585 |
| | Kyushu Electric Power Co. Inc. | 0.375% | 11/22/29 | JPY | 600,000 | 3,913 |
| | Mitsubishi UFJ Financial Group Inc. | 0.940% | 6/26/24 | JPY | 100,000 | 677 |
| | Mitsubishi UFJ Financial Group Inc. | 0.872% | 9/7/24 | EUR | 9,274 | 8,696 |
| | Mitsubishi UFJ Financial Group Inc. | 2.264% | 6/14/25 | EUR | 5,000 | 4,790 |
| | Mitsubishi UFJ Financial Group Inc. | 0.535% | 4/28/26 | JPY | 100,000 | 672 |
| | Mitsubishi UFJ Financial Group Inc. | 0.250% | 11/4/27 | JPY | 300,000 | 1,959 |
| | Mitsubishi UFJ Financial Group Inc. | 0.535% | 5/31/28 | JPY | 200,000 | 1,332 |
| | Mitsubishi UFJ Financial Group Inc. | 0.848% | 7/19/29 | EUR | 7,821 | 6,202 |
| | Mizuho Financial Group Inc. | 0.523% | 6/10/24 | EUR | 3,139 | 2,946 |
| | Mizuho Financial Group Inc. | 0.956% | 10/16/24 | EUR | 2,434 | 2,285 |
| | Mizuho Financial Group Inc. | 0.184% | 4/13/26 | EUR | 5,400 | 4,648 |
| | Mizuho Financial Group Inc. | 0.650% | 1/26/27 | JPY | 127,000 | 851 |
| | Mizuho Financial Group Inc. | 0.402% | 9/6/29 | EUR | 2,457 | 1,831 |
| | Mizuho Financial Group Inc. | 0.797% | 4/15/30 | EUR | 4,913 | 3,733 |
| | Mizuho Financial Group Inc. | 0.895% | 6/24/30 | JPY | 100,000 | 674 |
| | Mizuho Financial Group Inc. | 0.693% | 10/7/30 | EUR | 19,300 | 14,212 |
| | Mizuho Financial Group Inc. | 0.843% | 4/12/33 | EUR | 3,000 | 2,078 |
| | MUFG Bank Ltd. | 1.950% | 11/12/25 | JPY | 400,000 | 2,805 |
| 3 | Nissan Motor Co. Ltd. | 1.940% | 9/15/23 | EUR | 1,112 | 1,075 |
| | Nissan Motor Co. Ltd. | 2.652% | 3/17/26 | EUR | 5,413 | 4,862 |
| 3 | Nissan Motor Co. Ltd. | 2.652% | 3/17/26 | EUR | 3,279 | 2,944 |
| | Nissan Motor Co. Ltd. | 3.201% | 9/17/28 | EUR | 4,476 | 3,726 |
| 3 | Nissan Motor Co. Ltd. | 3.201% | 9/17/28 | EUR | 5,053 | 4,206 |
| | NTT Finance Corp. | 0.010% | 3/3/25 | EUR | 8,320 | 7,654 |
| | NTT Finance Corp. | 0.280% | 12/20/27 | JPY | 100,000 | 670 |
| | NTT Finance Corp. | 0.399% | 12/13/28 | EUR | 8,400 | 6,914 |
| | NTT Finance Corp. | 0.342% | 3/3/30 | EUR | 4,910 | 3,850 |
| | NTT Finance Corp. | 0.380% | 9/20/30 | JPY | 4,300,000 | 28,552 |
| | NTT Finance Corp. | 0.270% | 9/19/31 | JPY | 200,000 | 1,334 |
| | Panasonic Corp. | 0.934% | 3/19/25 | JPY | 700,000 | 4,784 |
| | Panasonic Corp. | 0.470% | 9/18/26 | JPY | 1,000,000 | 6,750 |
| | Shoko Chukin Bank Ltd. | 0.080% | 7/27/26 | JPY | 270,000 | 1,808 |
| | Shoko Chukin Bank Ltd. | 0.090% | 9/25/26 | JPY | 2,250,000 | 15,067 |
| | Shoko Chukin Bank Ltd. | 0.220% | 4/27/27 | JPY | 430,000 | 2,888 |
| | Sumitomo Mitsui Banking Corp. | 0.010% | 9/10/25 | EUR | 40,533 | 36,636 |
| | Sumitomo Mitsui Banking Corp. | 0.267% | 6/18/26 | EUR | 4,913 | 4,370 |
| | Sumitomo Mitsui Banking Corp. | 0.409% | 11/7/29 | EUR | 3,459 | 2,786 |
| | Sumitomo Mitsui Financial Group Inc. | 0.849% | 9/12/24 | JPY | 800,000 | 5,401 |
| | Sumitomo Mitsui Financial Group Inc. | 0.934% | 10/11/24 | EUR | 100 | 94 |
| | Sumitomo Mitsui Financial Group Inc. | 1.546% | 6/15/26 | EUR | 5,455 | 4,925 |
| | Sumitomo Mitsui Financial Group Inc. | 0.632% | 10/23/29 | EUR | ���5,365 | 4,072 |
Total International Bond II Index Fund
| | | Coupon | Maturity
Date | Currency | Face
Amount
(000) | Market
Value•
($000) |
| | Sumitomo Mitsui Trust Bank Ltd. | 0.010% | 10/15/27 | EUR | 8,868 | 7,446 |
| | Takeda Pharmaceutical Co. Ltd. | 2.250% | 11/21/26 | EUR | 4,181 | 3,945 |
| | Takeda Pharmaceutical Co. Ltd. | 0.750% | 7/9/27 | EUR | 5,000 | 4,349 |
| | Takeda Pharmaceutical Co. Ltd. | 1.000% | 7/9/29 | EUR | 6,773 | 5,600 |
| | Takeda Pharmaceutical Co. Ltd. | 3.000% | 11/21/30 | EUR | 15,786 | 14,645 |
| | Takeda Pharmaceutical Co. Ltd. | 1.375% | 7/9/32 | EUR | 3,000 | 2,345 |
| | Takeda Pharmaceutical Co. Ltd. | 2.000% | 7/9/40 | EUR | 4,136 | 2,910 |
| | Toyota Motor Finance Netherlands BV | 3.070% | 10/27/25 | EUR | 1,276 | 1,141 |
| | West Nippon Expressway Co. Ltd. | 0.050% | 3/19/26 | JPY | 1,000,000 | 6,693 |
| | West Nippon Expressway Co. Ltd. | 0.170% | 5/22/26 | JPY | 470,000 | 3,109 |
| | West Nippon Expressway Co. Ltd. | 0.175% | 8/28/26 | JPY | 1,440,000 | 9,665 |
| | West Nippon Expressway Co. Ltd. | 0.200% | 10/19/26 | JPY | 100,000 | 661 |
| | | | | | | 388,318 |
| Luxembourg (0.1%) | | | |
| | Acef Holding SCA | 0.750% | 6/14/28 | EUR | 1,393 | 1,009 |
| | Acef Holding SCA | 1.250% | 4/26/30 | EUR | 6,086 | 3,829 |
| | ArcelorMittal SA | 1.000% | 5/19/23 | EUR | 3,000 | 2,931 |
| | ArcelorMittal SA | 1.750% | 11/19/25 | EUR | 4,986 | 4,500 |
| | AXA Logistics Europe Master SCA | 0.375% | 11/15/26 | EUR | 3,000 | 2,396 |
| | AXA Logistics Europe Master SCA | 0.875% | 11/15/29 | EUR | 1,000 | 677 |
| | Bevco Lux Sarl | 1.000% | 1/16/30 | EUR | 2,786 | 1,906 |
| | Blackstone Property Partners Europe Holdings Sarl | 1.000% | 10/20/26 | EUR | 1,471 | 1,167 |
| | Blackstone Property Partners Europe Holdings Sarl | 1.250% | 4/26/27 | EUR | 4,710 | 3,645 |
| | Blackstone Property Partners Europe Holdings Sarl | 2.625% | 10/20/28 | GBP | 1,200 | 1,023 |
| | Blackstone Property Partners Europe Holdings Sarl | 1.750% | 3/12/29 | EUR | 10,272 | 7,499 |
| | Blackstone Property Partners Europe Holdings Sarl | 3.625% | 10/29/29 | EUR | 4,200 | 3,410 |
| | Blackstone Property Partners Europe Holdings Sarl | 4.875% | 4/29/32 | GBP | 4,200 | 3,838 |
| | CBRE Global Investors Open-Ended Fund SCA SICAV-SIF Pan European Core Fund | 0.500% | 1/27/28 | EUR | 4,658 | 3,434 |
| | CBRE Global Investors Open-Ended Fund SCA SICAV-SIF Pan European Core Fund | 0.900% | 10/12/29 | EUR | 1,600 | 1,110 |
| | Eurofins Scientific SE | 3.750% | 7/17/26 | EUR | 9,400 | 9,288 |
| | Logicor Financing Sarl | 2.250% | 5/13/25 | EUR | 1,499 | 1,314 |
| | Logicor Financing Sarl | 1.500% | 7/13/26 | EUR | 4,000 | 3,195 |
| | Logicor Financing Sarl | 1.625% | 7/15/27 | EUR | 4,913 | 3,776 |
| | Logicor Financing Sarl | 3.250% | 11/13/28 | EUR | 5,820 | 4,584 |
| | Logicor Financing Sarl | 2.750% | 1/15/30 | GBP | 4,000 | 3,400 |
| | Logicor Financing Sarl | 1.625% | 1/17/30 | EUR | 2,000 | 1,347 |
| | Logicor Financing Sarl | 0.875% | 1/14/31 | EUR | 1,986 | 1,158 |
| | NORD/LB Luxembourg SA Covered Bond Bank | 0.375% | 3/7/24 | EUR | 2,500 | 2,387 |
| | P3 Group Sarl | 0.875% | 1/26/26 | EUR | 300 | 232 |
| | P3 Group Sarl | 1.625% | 1/26/29 | EUR | 3,100 | 1,996 |
| | Prologis International Funding II SA | 1.750% | 3/15/28 | EUR | 375 | 326 |
| | Prologis International Funding II SA | 0.875% | 7/9/29 | EUR | 2,958 | 2,305 |
| | Prologis International Funding II SA | 3.125% | 6/1/31 | EUR | 3,000 | 2,590 |
| | Prologis International Funding II SA | 1.625% | 6/17/32 | EUR | 9,181 | 6,603 |
| | Prologis International Funding II SA | 3.000% | 2/22/42 | GBP | 800 | 621 |
| | SELP Finance Sarl | 1.500% | 12/20/26 | EUR | 2,552 | 2,064 |
| | SELP Finance Sarl | 0.875% | 5/27/29 | EUR | 1,000 | 696 |
| | SES SA | 0.875% | 11/4/27 | EUR | 1,810 | 1,449 |
| | SES SA | 2.000% | 7/2/28 | EUR | 2,100 | 1,735 |
| | | | | | | 93,440 |
| Mexico (0.0%) | | | |
| | America Movil SAB de CV | 1.500% | 3/10/24 | EUR | 317 | 305 |
| | America Movil SAB de CV | 5.000% | 10/27/26 | GBP | 1,139 | 1,265 |
| | America Movil SAB de CV | 0.750% | 6/26/27 | EUR | 2,141 | 1,853 |
| | America Movil SAB de CV | 2.125% | 3/10/28 | EUR | 2,501 | 2,265 |
| | America Movil SAB de CV | 5.750% | 6/28/30 | GBP | 1,910 | 2,174 |
| | America Movil SAB de CV | 4.948% | 7/22/33 | GBP | 1,100 | 1,172 |
| | America Movil SAB de CV | 4.375% | 8/7/41 | GBP | 3,704 | 3,534 |
| | | | | | | 12,568 |
| Netherlands (1.0%) | | | |
| | ABN AMRO Bank NV | 2.500% | 11/29/23 | EUR | 1,999 | 1,967 |
| | ABN AMRO Bank NV | 0.875% | 1/15/24 | EUR | 2,908 | 2,795 |
| | ABN AMRO Bank NV | 2.375% | 1/23/24 | EUR | 8,001 | 7,883 |
| | ABN AMRO Bank NV | 1.250% | 5/28/25 | EUR | 16,000 | 14,873 |
| | ABN AMRO Bank NV | 0.875% | 1/14/26 | EUR | 500 | 464 |
| | ABN AMRO Bank NV | 0.600% | 1/15/27 | EUR | 7,400 | 6,363 |
| | ABN AMRO Bank NV | 0.500% | 9/23/29 | EUR | 10,000 | 7,680 |
| | ABN AMRO Bank NV | 1.500% | 9/30/30 | EUR | 10,593 | 9,322 |
Total International Bond II Index Fund
| | | Coupon | Maturity
Date | Currency | Face
Amount
(000) | Market
Value•
($000) |
| | ABN AMRO Bank NV | 1.000% | 4/13/31 | EUR | 4,000 | 3,341 |
| | ABN AMRO Bank NV | 3.000% | 6/1/32 | EUR | 2,100 | 1,846 |
| | ABN AMRO Bank NV | 1.000% | 6/2/33 | EUR | 7,300 | 5,165 |
| | ABN AMRO Bank NV | 1.375% | 1/10/34 | EUR | 7,000 | 5,737 |
| | ABN AMRO Bank NV | 0.375% | 1/14/35 | EUR | 19,600 | 13,814 |
| | ABN AMRO Bank NV | 1.375% | 1/12/37 | EUR | 10,800 | 8,393 |
| | ABN AMRO Bank NV | 1.450% | 4/12/38 | EUR | 1,700 | 1,308 |
| | ABN AMRO Bank NV | 1.125% | 4/23/39 | EUR | 2,500 | 1,799 |
| | ABN AMRO Bank NV | 0.400% | 9/17/41 | EUR | 11,400 | 6,836 |
| | Aegon Bank NV | 0.375% | 11/21/56 | EUR | 5,000 | 4,695 |
| | Aegon Bank NV | 0.750% | 6/27/59 | EUR | 1,300 | 1,158 |
| | Aegon NV | 1.000% | 12/8/23 | EUR | 397 | 383 |
| | Aegon NV | 6.625% | 12/16/39 | GBP | 456 | 578 |
| | Aegon NV | 4.000% | 4/25/44 | EUR | 11,004 | 10,617 |
| | Akzo Nobel NV | 1.750% | 11/7/24 | EUR | 1,725 | 1,663 |
| | Akzo Nobel NV | 1.125% | 4/8/26 | EUR | 2,050 | 1,858 |
| | Akzo Nobel NV | 1.625% | 4/14/30 | EUR | 7,400 | 5,954 |
| | Alliander NV | 2.875% | 6/14/24 | EUR | 200 | 197 |
| | Alliander NV | 0.375% | 6/10/30 | EUR | 3,684 | 2,915 |
| | ASML Holding NV | 1.375% | 7/7/26 | EUR | 5,275 | 4,917 |
| | ASML Holding NV | 1.625% | 5/28/27 | EUR | 733 | 678 |
| | ASML Holding NV | 0.625% | 5/7/29 | EUR | 3,786 | 3,160 |
| | ASR Nederland NV | 5.125% | 9/29/45 | EUR | 1,455 | 1,402 |
| | ASR Nederland NV | 3.375% | 5/2/49 | EUR | 4,075 | 3,317 |
| | ASR Nederland NV | 5.000% | 9/30/49 | EUR | 1,443 | 1,390 |
| | Athora Netherlands NV | 2.250% | 7/15/31 | EUR | 2,260 | 1,812 |
| | Cooperatieve Rabobank UA | 0.625% | 2/27/24 | EUR | 3,000 | 2,865 |
| | Cooperatieve Rabobank UA | 1.250% | 1/14/25 | GBP | 2,000 | 2,092 |
| | Cooperatieve Rabobank UA | 4.125% | 7/14/25 | EUR | 4,752 | 4,829 |
| | Cooperatieve Rabobank UA | 1.250% | 3/23/26 | EUR | 2,829 | 2,635 |
| | Cooperatieve Rabobank UA | 4.250% | 5/12/26 | AUD | 500 | 313 |
| | Cooperatieve Rabobank UA | 3.125% | 9/15/26 | CHF | 6,470 | 6,736 |
| | Cooperatieve Rabobank UA | 1.375% | 2/3/27 | EUR | 2,146 | 1,956 |
| | Cooperatieve Rabobank UA | 0.000% | 6/21/27 | EUR | 22,600 | 19,528 |
| | Cooperatieve Rabobank UA | 5.250% | 9/14/27 | GBP | 7,645 | 8,180 |
| | Cooperatieve Rabobank UA | 0.375% | 12/1/27 | EUR | 11,400 | 9,641 |
| | Cooperatieve Rabobank UA | 0.875% | 2/8/28 | EUR | 18,500 | 16,432 |
| | Cooperatieve Rabobank UA | 0.875% | 5/5/28 | EUR | 8,900 | 7,563 |
| | Cooperatieve Rabobank UA | 1.875% | 7/12/28 | GBP | 8,500 | 8,065 |
| | Cooperatieve Rabobank UA | 0.875% | 2/1/29 | EUR | 5,000 | 4,346 |
| | Cooperatieve Rabobank UA | 4.625% | 5/23/29 | GBP | 4,688 | 4,700 |
| | Cooperatieve Rabobank UA | 4.550% | 8/30/29 | GBP | 3,466 | 3,780 |
| | Cooperatieve Rabobank UA | 1.250% | 5/31/32 | EUR | 3,700 | 3,088 |
| | Cooperatieve Rabobank UA | 0.625% | 2/25/33 | EUR | 11,800 | 8,108 |
| | Cooperatieve Rabobank UA | 1.500% | 4/26/38 | EUR | 3,500 | 2,715 |
| | Cooperatieve Rabobank UA | 0.750% | 6/21/39 | EUR | 6,000 | 4,027 |
| | Cooperatieve Rabobank UA | 5.250% | 5/23/41 | GBP | 316 | 376 |
| | CTP NV | 2.125% | 10/1/25 | EUR | 700 | 558 |
| | CTP NV | 0.875% | 1/20/26 | EUR | 1,500 | 1,178 |
| | CTP NV | 0.625% | 9/27/26 | EUR | 4,957 | 3,665 |
| | CTP NV | 0.750% | 2/18/27 | EUR | 5,786 | 3,923 |
| | CTP NV | 1.250% | 6/21/29 | EUR | 300 | 177 |
| | CTP NV | 1.500% | 9/27/31 | EUR | 1,296 | 675 |
| | de Volksbank NV | 0.500% | 1/30/26 | EUR | 3,700 | 3,383 |
| | de Volksbank NV | 0.250% | 6/22/26 | EUR | 7,000 | 5,956 |
| | de Volksbank NV | 2.375% | 5/4/27 | EUR | 6,700 | 6,132 |
| | de Volksbank NV | 0.750% | 5/18/27 | EUR | 2,500 | 2,239 |
| | de Volksbank NV | 0.375% | 3/3/28 | EUR | 7,300 | 5,773 |
| | de Volksbank NV | 0.750% | 10/24/31 | EUR | 2,457 | 1,980 |
| | Enexis Holding NV | 0.875% | 4/28/26 | EUR | 6,000 | 5,504 |
| | Euronext NV | 1.125% | 6/12/29 | EUR | 8,700 | 7,104 |
| | Euronext NV | 0.750% | 5/17/31 | EUR | 3,000 | 2,246 |
| | Euronext NV | 1.500% | 5/17/41 | EUR | 3,200 | 1,866 |
| | EXOR NV | 1.750% | 1/18/28 | EUR | 2,592 | 2,314 |
| | EXOR NV | 2.250% | 4/29/30 | EUR | 5,947 | 5,025 |
| | EXOR NV | 0.875% | 1/19/31 | EUR | 3,000 | 2,207 |
| | Heineken NV | 1.500% | 12/7/24 | EUR | 2,501 | 2,388 |
| | Heineken NV | 1.625% | 3/30/25 | EUR | 3,910 | 3,725 |
| | Heineken NV | 2.875% | 8/4/25 | EUR | 2,863 | 2,809 |
Total International Bond II Index Fund
| | | Coupon | Maturity
Date | Currency | Face
Amount
(000) | Market
Value•
($000) |
| | Heineken NV | 1.375% | 1/29/27 | EUR | 4,958 | 4,521 |
| | Heineken NV | 1.500% | 10/3/29 | EUR | 100 | 87 |
| | Heineken NV | 2.250% | 3/30/30 | EUR | 7,369 | 6,651 |
| | Heineken NV | 1.250% | 5/7/33 | EUR | 4,000 | 3,106 |
| | Heineken NV | 1.750% | 5/7/40 | EUR | 4,529 | 3,077 |
| | ING Bank NV | 0.875% | 4/11/28 | EUR | 7,700 | 6,820 |
| | ING Bank NV | 0.125% | 12/8/32 | EUR | 18,400 | 13,948 |
| | ING Groep NV | 1.000% | 9/20/23 | EUR | 3,100 | 2,998 |
| | ING Groep NV | 0.100% | 9/3/25 | EUR | 5,000 | 4,592 |
| | ING Groep NV | 2.125% | 1/10/26 | EUR | 7,700 | 7,181 |
| | ING Groep NV | 3.000% | 2/18/26 | GBP | 4,600 | 4,820 |
| | ING Groep NV | 1.250% | 2/16/27 | EUR | 21,700 | 19,290 |
| | ING Groep NV | 0.375% | 9/29/28 | EUR | 19,800 | 15,905 |
| | ING Groep NV | 2.500% | 2/15/29 | EUR | 5,000 | 4,753 |
| | ING Groep NV | 0.250% | 2/18/29 | EUR | 16,800 | 13,119 |
| | ING Groep NV | 1.625% | 9/26/29 | EUR | 13,200 | 12,126 |
| | ING Groep NV | 0.250% | 2/1/30 | EUR | 9,500 | 7,104 |
| | ING Groep NV | 1.000% | 11/13/30 | EUR | 5,000 | 4,292 |
| | ING Groep NV | 1.750% | 2/16/31 | EUR | 5,400 | 4,337 |
| | ING Groep NV | 0.875% | 6/9/32 | EUR | 3,000 | 2,441 |
| | JDE Peet's NV | 0.625% | 2/9/28 | EUR | 8,300 | 6,687 |
| | JDE Peet's NV | 0.500% | 1/16/29 | EUR | 7,500 | 5,699 |
| | JDE Peet's NV | 1.125% | 6/16/33 | EUR | 8,000 | 5,277 |
| | Koninklijke Ahold Delhaize NV | 1.750% | 4/2/27 | EUR | 5,000 | 4,578 |
| | Koninklijke Ahold Delhaize NV | 0.375% | 3/18/30 | EUR | 4,000 | 3,082 |
| | Koninklijke DSM NV | 2.375% | 4/3/24 | EUR | 1,868 | 1,823 |
| | Koninklijke DSM NV | 1.000% | 4/9/25 | EUR | 1,544 | 1,441 |
| | Koninklijke DSM NV | 0.750% | 9/28/26 | EUR | 10,700 | 9,426 |
| | Koninklijke DSM NV | 0.250% | 6/23/28 | EUR | 4,000 | 3,234 |
| | Koninklijke DSM NV | 0.625% | 6/23/32 | EUR | 8,500 | 6,114 |
| | Koninklijke KPN NV | 0.625% | 4/9/25 | EUR | 5,000 | 4,625 |
| | Koninklijke KPN NV | 5.750% | 9/17/29 | GBP | 1,944 | 2,181 |
| | Koninklijke KPN NV | 0.875% | 12/14/32 | EUR | 2,600 | 1,870 |
| | Koninklijke KPN NV | 0.875% | 11/15/33 | EUR | 1,800 | 1,255 |
| | Koninklijke Philips NV | 1.375% | 5/2/28 | EUR | 3,775 | 3,234 |
| | Koninklijke Philips NV | 2.000% | 3/30/30 | EUR | 4,913 | ��� 4,126 |
| | LeasePlan Corp. NV | 3.500% | 4/9/25 | EUR | 3,276 | 3,138 |
| | LeasePlan Corp. NV | 2.125% | 5/6/25 | EUR | 2,900 | 2,677 |
| | LeasePlan Corp. NV | 0.250% | 2/23/26 | EUR | 10,891 | 9,220 |
| | Nationale-Nederlanden Bank NV | 0.375% | 2/26/25 | EUR | 6,500 | 5,938 |
| | Nationale-Nederlanden Bank NV | 0.500% | 9/21/28 | EUR | 9,000 | 7,134 |
| | Nationale-Nederlanden Bank NV | 0.375% | 3/4/41 | EUR | 10,000 | 6,009 |
| | Nationale-Nederlanden Bank NV | 0.625% | 9/11/55 | EUR | 3,900 | 3,611 |
| | Nationale-Nederlanden Bank NV | 0.250% | 2/27/56 | EUR | 5,400 | 5,168 |
| | Nationale-Nederlanden Bank NV | 0.500% | 10/10/56 | EUR | 400 | 378 |
| | Nederlandse Gasunie NV | 1.000% | 5/11/26 | EUR | 8,293 | 7,579 |
| | Nederlandse Gasunie NV | 0.375% | 10/3/31 | EUR | 1,455 | 1,063 |
| | NIBC Bank NV | 3.125% | 11/15/23 | GBP | 6,000 | 6,682 |
| | NIBC Bank NV | 0.875% | 7/8/25 | EUR | 4,000 | 3,567 |
| | NIBC Bank NV | 0.625% | 6/1/26 | EUR | 5,700 | 5,185 |
| | NIBC Bank NV | 0.250% | 9/9/26 | EUR | 10,000 | 8,215 |
| | NIBC Bank NV | 0.500% | 3/19/27 | EUR | 7,600 | 6,734 |
| | NIBC Bank NV | 1.000% | 9/11/28 | EUR | 2,500 | 2,191 |
| | NIBC Bank NV | 0.010% | 10/15/29 | EUR | 5,000 | 3,987 |
| | NIBC Bank NV | 0.125% | 4/21/31 | EUR | 23,000 | 17,573 |
| | NN Group NV | 1.625% | 6/1/27 | EUR | 3,100 | 2,775 |
| | NN Group NV | 4.625% | 4/8/44 | EUR | 2,000 | 1,945 |
| | NN Group NV | 4.625% | 1/13/48 | EUR | 6,591 | 5,968 |
| | NN Group NV | 4.375% | 6/29/49 | EUR | 10,452 | 10,059 |
| | NN Group NV | 4.500% | 7/15/49 | EUR | 5,300 | 4,963 |
| | PostNL NV | 1.000% | 11/21/24 | EUR | 957 | 894 |
| | PostNL NV | 0.625% | 9/23/26 | EUR | 2,457 | 2,159 |
| | Royal Schiphol Group NV | 0.000% | 4/22/25 | EUR | 7,578 | 6,839 |
| | Royal Schiphol Group NV | 2.000% | 10/5/26 | EUR | 2,000 | 1,848 |
| | Royal Schiphol Group NV | 2.000% | 4/6/29 | EUR | 17,546 | 15,504 |
| | Royal Schiphol Group NV | 0.875% | 9/8/32 | EUR | 5,000 | 3,610 |
| | Shell International Finance BV | 1.125% | 4/7/24 | EUR | 5,139 | 4,948 |
| | Shell International Finance BV | 0.375% | 2/15/25 | EUR | 11,548 | 10,743 |
| | Shell International Finance BV | 1.625% | 1/20/27 | EUR | 11,925 | 11,013 |
Total International Bond II Index Fund
| | | Coupon | Maturity
Date | Currency | Face
Amount
(000) | Market
Value•
($000) |
| | Shell International Finance BV | 0.125% | 11/8/27 | EUR | 2,457 | 2,081 |
| | Shell International Finance BV | 1.500% | 4/7/28 | EUR | 8,000 | 7,217 |
| | Shell International Finance BV | 1.250% | 5/12/28 | EUR | 4,217 | 3,723 |
| | Shell International Finance BV | 0.750% | 8/15/28 | EUR | 4,913 | 4,191 |
| | Shell International Finance BV | 1.000% | 12/10/30 | GBP | 2,771 | 2,339 |
| | Shell International Finance BV | 1.875% | 4/7/32 | EUR | 8,913 | 7,625 |
| | Shell International Finance BV | 0.875% | 11/8/39 | EUR | 4,868 | 2,919 |
| | Shell International Finance BV | 1.750% | 9/10/52 | GBP | 2,457 | 1,422 |
| | Stedin Holding NV | 0.875% | 10/24/25 | EUR | 21,650 | 19,787 |
| | Stedin Holding NV | 0.500% | 11/14/29 | EUR | 2,457 | 1,943 |
| | Stedin Holding NV | 2.375% | 6/3/30 | EUR | 2,500 | 2,233 |
| | TenneT Holding BV | 1.000% | 6/13/26 | EUR | 100 | 91 |
| | TenneT Holding BV | 1.375% | 6/5/28 | EUR | 24,013 | 21,124 |
| | TenneT Holding BV | 1.375% | 6/26/29 | EUR | 5,149 | 4,377 |
| | TenneT Holding BV | 0.875% | 6/3/30 | EUR | 5,403 | 4,315 |
| | TenneT Holding BV | 0.500% | 6/9/31 | EUR | 4,000 | 2,976 |
| | TenneT Holding BV | 0.125% | 11/30/32 | EUR | 500 | 336 |
| | TenneT Holding BV | 1.250% | 10/24/33 | EUR | 822 | 607 |
| | TenneT Holding BV | 0.875% | 6/16/35 | EUR | 7,700 | 5,180 |
| | TenneT Holding BV | 1.875% | 6/13/36 | EUR | 2,737 | 2,051 |
| | TenneT Holding BV | 1.500% | 6/3/39 | EUR | 5,862 | 3,894 |
| | TenneT Holding BV | 0.500% | 11/30/40 | EUR | 5,916 | 3,135 |
| | TenneT Holding BV | 1.125% | 6/9/41 | EUR | 5,300 | 3,159 |
| | TenneT Holding BV | 2.750% | 5/17/42 | EUR | 5,100 | 3,986 |
| | Toyota Motor Finance Netherlands BV | 0.750% | 12/19/25 | GBP | 4,000 | 4,070 |
| | Universal Music Group NV | 3.000% | 6/30/27 | EUR | 4,028 | 3,835 |
| | Vesteda Finance BV | 1.500% | 5/24/27 | EUR | 1,906 | 1,653 |
| | Vesteda Finance BV | 0.750% | 10/18/31 | EUR | 2,786 | 1,959 |
| | VIA Outlets BV | 1.750% | 11/15/28 | EUR | 2,400 | 1,740 |
| | Wolters Kluwer NV | 0.250% | 3/30/28 | EUR | 1,500 | 1,238 |
| | Wolters Kluwer NV | 0.750% | 7/3/30 | EUR | 1,300 | 1,019 |
| | | | | | | 860,444 |
| New Zealand (0.1%) | | | |
| | ANZ New Zealand Int'l Ltd. | 0.200% | 9/23/27 | EUR | 16,876 | 13,858 |
| | ASB Bank Ltd. | 1.646% | 5/4/26 | NZD | 3,000 | 1,527 |
| | ASB Finance Ltd. | 0.625% | 10/18/24 | EUR | 1,737 | 1,640 |
| | ASB Finance Ltd. | 0.750% | 10/9/25 | EUR | 2,457 | 2,273 |
| | ASB Finance Ltd. | 0.250% | 5/21/31 | EUR | 34,362 | 26,342 |
| | Bank of New Zealand | 1.884% | 6/8/26 | NZD | 1,000 | 511 |
| | BNZ International Funding Ltd. | 0.500% | 7/3/24 | EUR | 15,500 | 14,718 |
| | BNZ International Funding Ltd. | 0.625% | 7/3/25 | EUR | 7,369 | 6,833 |
| | Chorus Ltd. | 3.625% | 9/7/29 | EUR | 2,000 | 1,923 |
| | Fonterra Co-operative Group Ltd. | 9.375% | 12/4/23 | GBP | 592 | 708 |
| | Fonterra Co-operative Group Ltd. | 0.750% | 11/8/24 | EUR | 837 | 783 |
| | Fonterra Co-operative Group Ltd. | 4.000% | 11/2/27 | AUD | 200 | 121 |
| | Westpac New Zealand Ltd. | 1.439% | 2/24/26 | NZD | 4,000 | 2,035 |
| | Westpac Securities NZ Ltd. | 0.500% | 1/17/24 | EUR | 4,913 | 4,725 |
| | Westpac Securities NZ Ltd. | 0.375% | 2/5/24 | CHF | 2,850 | 2,799 |
| | Westpac Securities NZ Ltd. | 0.300% | 6/25/24 | EUR | 3,910 | 3,672 |
| | | | | | | 84,468 |
| Norway (0.4%) | | | |
| | Aker BP ASA | 1.125% | 5/12/29 | EUR | 3,200 | 2,540 |
| | DNB Bank ASA | 2.625% | 6/10/26 | GBP | 15,300 | 16,384 |
| | DNB Bank ASA | 4.000% | 8/17/27 | GBP | 7,000 | 7,485 |
| | DNB Bank ASA | 0.375% | 1/18/28 | EUR | 200 | 172 |
| | DNB Bank ASA | 0.250% | 2/23/29 | EUR | 7,000 | 5,621 |
| | DNB Boligkreditt A/S | 0.375% | 11/20/24 | EUR | 4,913 | 4,623 |
| | DNB Boligkreditt A/S | 0.625% | 1/14/26 | EUR | 7,369 | 6,773 |
| | DNB Boligkreditt A/S | 0.250% | 9/7/26 | EUR | 20,576 | 18,346 |
| | DNB Boligkreditt A/S | 0.010% | 5/12/28 | EUR | 27,000 | 22,571 |
| | Eika Boligkreditt A/S | 0.375% | 2/26/25 | EUR | 822 | 767 |
| | Eika Boligkreditt A/S | 0.010% | 3/23/28 | EUR | 9,057 | 7,613 |
| | Equinor ASA | 2.875% | 9/10/25 | EUR | 16,016 | 15,787 |
| | Equinor ASA | 0.750% | 5/22/26 | EUR | 5,518 | 5,030 |
| | Equinor ASA | 0.750% | 11/9/26 | EUR | 6,953 | 6,279 |
| | Equinor ASA | 1.250% | 2/17/27 | EUR | 9,681 | 8,855 |
| | Equinor ASA | 6.125% | 11/27/28 | GBP | 4,302 | 5,132 |
| | Equinor ASA | 6.875% | 3/11/31 | GBP | 3,477 | 4,441 |
Total International Bond II Index Fund
| | | Coupon | Maturity
Date | Currency | Face
Amount
(000) | Market
Value•
($000) |
| | Equinor ASA | 1.375% | 5/22/32 | EUR | 12,567 | 10,285 |
| | Equinor ASA | 1.625% | 2/17/35 | EUR | 4,501 | 3,539 |
| | Equinor ASA | 1.625% | 11/9/36 | EUR | 1,004 | 760 |
| | Equinor ASA | 4.250% | 4/10/41 | GBP | 2,293 | 2,278 |
| | Norsk Hydro ASA | 1.125% | 4/11/25 | EUR | 642 | 591 |
| | Santander Consumer Bank A/S | 0.125% | 9/11/24 | EUR | 8,500 | 7,864 |
| | Santander Consumer Bank A/S | 0.500% | 8/11/25 | EUR | 400 | 361 |
| | Santander Consumer Bank A/S | 0.125% | 4/14/26 | EUR | 5,000 | 4,344 |
| | SpareBank 1 Boligkreditt A/S | 0.375% | 6/26/24 | EUR | 15,000 | 14,255 |
| | SpareBank 1 Boligkreditt A/S | 0.500% | 1/30/25 | EUR | 15,000 | 14,068 |
| | SpareBank 1 Boligkreditt A/S | 0.125% | 5/14/26 | EUR | 4,913 | 4,399 |
| | SpareBank 1 Boligkreditt A/S | 0.250% | 8/30/26 | EUR | 20,228 | 18,034 |
| | SpareBank 1 Boligkreditt A/S | 1.000% | 1/30/29 | EUR | 4,913 | 4,271 |
| | SpareBank 1 Boligkreditt A/S | 0.125% | 11/5/29 | EUR | 4,913 | 3,938 |
| | SpareBank 1 Boligkreditt AS | 0.125% | 1/20/28 | EUR | 20,000 | 16,985 |
| | SpareBank 1 SMN | 0.010% | 2/18/28 | EUR | 4,947 | 3,966 |
| | SpareBank 1 SR-Bank ASA | 0.625% | 3/25/24 | EUR | 1,906 | 1,807 |
| | Sparebanken Vest Boligkreditt A/S | 0.375% | 2/14/24 | EUR | 24,057 | 23,081 |
| | Sparebanken Vest Boligkreditt A/S | 0.750% | 2/27/25 | EUR | 4,913 | 4,626 |
| | Sparebanken Vest Boligkreditt A/S | 0.500% | 2/12/26 | EUR | 27,274 | 24,915 |
| | SR-Boligkreditt A/S | 0.375% | 10/3/24 | EUR | 12,264 | 11,571 |
| | SR-Boligkreditt A/S | 0.750% | 10/17/25 | EUR | 14,075 | 13,068 |
| | Statkraft A/S | 1.125% | 3/20/25 | EUR | 7,369 | 6,928 |
| | Statkraft A/S | 1.500% | 3/26/30 | EUR | 1,323 | 1,130 |
| | Statnett SF | 0.875% | 3/8/25 | EUR | 308 | 288 |
| | Statnett SF | 1.250% | 4/26/30 | EUR | 1,847 | 1,535 |
| | Storebrand Livsforsikring A/S | 1.875% | 9/30/51 | EUR | 4,321 | 2,955 |
| | Telenor ASA | 2.500% | 5/22/25 | EUR | 1,184 | 1,140 |
| | Telenor ASA | 0.750% | 5/31/26 | EUR | 7,911 | 7,112 |
| | Telenor ASA | 1.125% | 5/31/29 | EUR | 6,614 | 5,591 |
| | | | | | | 354,104 |
| Poland (0.0%) | | | |
| | ORLEN Capital AB | 2.500% | 6/7/23 | EUR | 2,773 | 2,723 |
| | Polski Koncern Naftowy ORLEN SA | 1.125% | 5/27/28 | EUR | 1,000 | 771 |
| | | | | | | 3,494 |
| Portugal (0.1%) | | | |
| | Banco Santander Totta SA | 1.250% | 9/26/27 | EUR | 4,600 | 4,165 |
| | Brisa-Concessao Rodoviaria SA | 2.000% | 3/22/23 | EUR | 100 | 98 |
| | Brisa-Concessao Rodoviaria SA | 2.375% | 5/10/27 | EUR | 6,500 | 6,199 |
| | Cia de Seguros Fidelidade SA | 4.250% | 9/4/31 | EUR | 7,300 | 5,723 |
| | EDP - Energias de Portugal SA | 1.625% | 4/15/27 | EUR | 8,200 | 7,417 |
| | EDP Finance BV | 8.625% | 1/4/24 | GBP | 4,414 | 5,270 |
| | EDP Finance BV | 1.125% | 2/12/24 | EUR | 5,545 | 5,329 |
| | EDP Finance BV | 2.000% | 4/22/25 | EUR | 7,811 | 7,428 |
| | EDP Finance BV | 1.625% | 1/26/26 | EUR | 12,849 | 11,903 |
| | EDP Finance BV | 0.375% | 9/16/26 | EUR | 4,913 | 4,295 |
| | EDP Finance BV | 1.500% | 11/22/27 | EUR | 1,398 | 1,241 |
| | Energias de Portugal SA | 2.875% | 6/1/26 | EUR | 5,900 | 5,661 |
| | Ren Finance BV | 1.750% | 1/18/28 | EUR | 1,296 | 1,156 |
| | | | | | | 65,885 |
| Romania (0.0%) | | | |
| | NE Property BV | 1.875% | 10/9/26 | EUR | 2,908 | 2,276 |
| | NE Property BV | 3.375% | 7/14/27 | EUR | 393 | 304 |
| | NE Property BV | 2.000% | 1/20/30 | EUR | 2,000 | 1,301 |
| | | | | | | 3,881 |
| Singapore (0.1%) | | | |
| | DBS Bank Ltd. | 0.375% | 1/23/24 | EUR | 5,365 | 5,149 |
| | DBS Group Holdings Ltd. | 3.980% | Perpetual | SGD | 1,250 | 859 |
| | Oversea-Chinese Banking Corp. Ltd. | 0.625% | 4/18/25 | EUR | 4,913 | 4,590 |
| | Temasek Financial I Ltd. | 0.500% | 11/20/31 | EUR | 10,829 | 8,191 |
| | Temasek Financial I Ltd. | 5.125% | 7/26/40 | GBP | 3,234 | 3,727 |
| | Temasek Financial I Ltd. | 1.250% | 11/20/49 | EUR | 2,444 | 1,522 |
| | United Overseas Bank Ltd. | 0.500% | 1/16/25 | EUR | 6,141 | 5,753 |
| | United Overseas Bank Ltd. | 0.100% | 5/25/29 | EUR | 15,348 | 12,449 |
| | | | | | | 42,240 |
| South Africa (0.0%) | | | |
| | Anglo American Capital plc | 1.625% | 9/18/25 | EUR | 100 | 92 |
Total International Bond II Index Fund
| | | Coupon | Maturity
Date | Currency | Face
Amount
(000) | Market
Value•
($000) |
| | Anglo American Capital plc | 1.625% | 3/11/26 | EUR | 1,315 | 1,195 |
| | | | | | | 1,287 |
| South Korea (0.0%) | | | |
| 3 | LG Chem Ltd. | 0.500% | 4/15/23 | EUR | 597 | 584 |
| Spain (0.7%) | | | |
| | Abertis Infraestructuras SA | 3.750% | 6/20/23 | EUR | 5,000 | 4,948 |
| | Abertis Infraestructuras SA | 2.500% | 2/27/25 | EUR | 100 | 95 |
| | Abertis Infraestructuras SA | 0.625% | 7/15/25 | EUR | 2,000 | 1,814 |
| | Abertis Infraestructuras SA | 1.375% | 5/20/26 | EUR | 300 | 271 |
| | Abertis Infraestructuras SA | 3.375% | 11/27/26 | GBP | 1,500 | 1,511 |
| | Abertis Infraestructuras SA | 1.000% | 2/27/27 | EUR | 600 | 513 |
| | Abertis Infraestructuras SA | 2.375% | 9/27/27 | EUR | 3,600 | 3,239 |
| | Abertis Infraestructuras SA | 1.250% | 2/7/28 | EUR | 1,800 | 1,495 |
| | Abertis Infraestructuras SA | 1.125% | 3/26/28 | EUR | 3,000 | 2,469 |
| | Abertis Infraestructuras SA | 2.250% | 3/29/29 | EUR | 13,500 | 11,465 |
| | Abertis Infraestructuras SA | 3.000% | 3/27/31 | EUR | 1,800 | 1,539 |
| | Abertis Infraestructuras SA | 1.875% | 3/26/32 | EUR | 3,000 | 2,300 |
| | Acciona Energia Financiacion Filiales SA | 1.375% | 1/26/32 | EUR | 3,200 | 2,460 |
| | ACS Servicios Comunicaciones y Energia SA | 1.875% | 4/20/26 | EUR | 2,000 | 1,798 |
| | Amadeus IT Group SA | 2.500% | 5/20/24 | EUR | 2,000 | 1,946 |
| | Amadeus IT Group SA | 1.875% | 9/24/28 | EUR | 3,300 | 2,873 |
| | AYT Cedulas Cajas Global FTA | 4.750% | 5/25/27 | EUR | 17,300 | 18,096 |
| | AyT Cedulas Cajas X Fondo de Titulizacion de Activos | 3.750% | 6/30/25 | EUR | 5,000 | 5,011 |
| | Banco Bilbao Vizcaya Argentaria SA | 1.125% | 2/28/24 | EUR | 1,500 | 1,440 |
| | Banco Bilbao Vizcaya Argentaria SA | 2.250% | 6/12/24 | EUR | 1,500 | 1,468 |
| | Banco Bilbao Vizcaya Argentaria SA | 0.375% | 10/2/24 | EUR | 1,500 | 1,398 |
| | Banco Bilbao Vizcaya Argentaria SA | 4.000% | 2/25/25 | EUR | 3,600 | 3,639 |
| | Banco Bilbao Vizcaya Argentaria SA | 0.875% | 11/22/26 | EUR | 7,400 | 6,715 |
| | Banco Bilbao Vizcaya Argentaria SA | 0.500% | 1/14/27 | EUR | 5,300 | 4,478 |
| | Banco Bilbao Vizcaya Argentaria SA | 3.500% | 2/10/27 | EUR | 3,700 | 3,511 |
| | Banco Bilbao Vizcaya Argentaria SA | 0.125% | 3/24/27 | EUR | 22,000 | 19,131 |
| | Banco Bilbao Vizcaya Argentaria SA | 2.575% | 2/22/29 | EUR | 8,600 | 8,184 |
| | Banco Bilbao Vizcaya Argentaria SA | 1.000% | 1/16/30 | EUR | 7,100 | 6,244 |
| | Banco de Sabadell SA | 1.625% | 3/7/24 | EUR | 9,200 | 8,812 |
| | Banco de Sabadell SA | 0.625% | 6/10/24 | EUR | 14,900 | 14,195 |
| | Banco de Sabadell SA | 1.125% | 3/11/27 | EUR | 8,700 | 7,683 |
| | Banco Santander SA | 1.375% | 7/31/24 | GBP | 2,000 | 2,149 |
| | Banco Santander SA | 1.125% | 11/27/24 | EUR | 7,200 | 6,857 |
| | Banco Santander SA | 0.463% | 12/5/24 | JPY | 1,000,000 | 6,664 |
| | Banco Santander SA | 1.125% | 1/17/25 | EUR | 2,000 | 1,866 |
| | Banco Santander SA | 2.500% | 3/18/25 | EUR | 4,800 | 4,559 |
| | Banco Santander SA | 1.000% | 4/7/25 | EUR | 21,100 | 19,895 |
| | Banco Santander SA | 1.375% | 1/5/26 | EUR | 2,000 | 1,805 |
| | Banco Santander SA | 1.500% | 1/25/26 | EUR | 12,700 | 11,973 |
| | Banco Santander SA | 3.875% | 2/6/26 | EUR | 100 | 101 |
| | Banco Santander SA | 3.250% | 4/4/26 | EUR | 5,500 | 5,196 |
| | Banco Santander SA | 0.300% | 10/4/26 | EUR | 5,000 | 4,336 |
| | Banco Santander SA | 0.500% | 2/4/27 | EUR | 4,500 | 3,775 |
| | Banco Santander SA | 0.500% | 3/24/27 | EUR | 10,800 | 9,349 |
| | Banco Santander SA | 4.625% | 5/4/27 | EUR | 900 | 946 |
| | Banco Santander SA | 2.375% | 9/8/27 | EUR | 20,000 | 19,100 |
| | Banco Santander SA | 2.125% | 2/8/28 | EUR | 1,400 | 1,207 |
| | Banco Santander SA | 0.200% | 2/11/28 | EUR | 7,300 | 5,953 |
| | Banco Santander SA | 0.310% | 6/9/28 | CHF | 3,465 | 2,985 |
| | Banco Santander SA | 1.125% | 10/25/28 | EUR | 2,500 | 2,198 |
| | Banco Santander SA | 1.625% | 10/22/30 | EUR | 8,000 | 5,963 |
| | Banco Santander SA | 0.875% | 5/9/31 | EUR | 5,100 | 4,111 |
| | Banco Santander SA | 0.100% | 2/27/32 | EUR | 8,000 | 5,838 |
| | Banco Santander SA | 2.000% | 11/27/34 | EUR | 5,700 | 4,830 |
| | Bankinter SA | 1.000% | 2/5/25 | EUR | 4,000 | 3,781 |
| | Bankinter SA | 1.250% | 2/7/28 | EUR | 100 | 90 |
| | CaixaBank SA | 2.375% | 2/1/24 | EUR | 3,400 | 3,305 |
| | CaixaBank SA | 2.625% | 3/21/24 | EUR | 2,800 | 2,758 |
| | CaixaBank SA | 1.125% | 5/17/24 | EUR | 4,000 | 3,815 |
| | CaixaBank SA | 0.625% | 10/1/24 | EUR | 2,000 | 1,853 |
| | CaixaBank SA | 0.375% | 2/3/25 | EUR | ��2,000 | 1,837 |
| | CaixaBank SA | 4.000% | 2/3/25 | EUR | 6,100 | 6,157 |
| | CaixaBank SA | 3.875% | 2/17/25 | EUR | 29,800 | 29,983 |
Total International Bond II Index Fund
| | | Coupon | Maturity
Date | Currency | Face
Amount
(000) | Market
Value•
($000) |
| | CaixaBank SA | 0.625% | 3/27/25 | EUR | 8,900 | 8,314 |
| | CaixaBank SA | 1.000% | 9/25/25 | EUR | 5,500 | 5,126 |
| | CaixaBank SA | 1.125% | 3/27/26 | EUR | 5,000 | 4,483 |
| | CaixaBank SA | 1.375% | 6/19/26 | EUR | 2,500 | 2,196 |
| | CaixaBank SA | 0.750% | 7/9/26 | EUR | 13,300 | 11,631 |
| | CaixaBank SA | 0.750% | 7/10/26 | EUR | 11,200 | 10,121 |
| | CaixaBank SA | 1.125% | 11/12/26 | EUR | 2,500 | 2,158 |
| | CaixaBank SA | 0.375% | 11/18/26 | EUR | 4,000 | 3,464 |
| | CaixaBank SA | 1.250% | 1/11/27 | EUR | 200 | 183 |
| | CaixaBank SA | 1.000% | 1/17/28 | EUR | 5,400 | 4,773 |
| | CaixaBank SA | 0.750% | 5/26/28 | EUR | 10,900 | 8,905 |
| | CaixaBank SA | 2.250% | 4/17/30 | EUR | 6,900 | 6,127 |
| | CaixaBank SA | 1.250% | 6/18/31 | EUR | 3,000 | 2,476 |
| | CaixaBank SA | 4.125% | 3/24/36 | EUR | 2,350 | 2,440 |
| | Caja Rural de Navarra SCC | 0.875% | 5/8/25 | EUR | 3,300 | 3,092 |
| | Canal de Isabel II Gestion SA | 1.680% | 2/26/25 | EUR | 1,700 | 1,598 |
| | Cedulas TDA 6 Fondo de Titulizacion de Activos | 3.875% | 5/23/25 | EUR | 500 | 503 |
| | Criteria Caixa SA | 0.875% | 10/28/27 | EUR | 3,300 | 2,752 |
| | Enagas Financiaciones SA | 1.250% | 2/6/25 | EUR | 2,600 | 2,440 |
| | Enagas Financiaciones SA | 1.375% | 5/5/28 | EUR | 100 | 87 |
| | Eurocaja Rural SCC | 0.875% | 5/27/24 | EUR | 2,500 | 2,392 |
| | FCC Aqualia SA | 2.629% | 6/8/27 | EUR | 1,893 | 1,688 |
| | Ferrovial Emisiones SA | 2.500% | 7/15/24 | EUR | 2,500 | 2,435 |
| | Iberdrola Finanzas SA | 7.375% | 1/29/24 | GBP | 2,300 | 2,699 |
| | Iberdrola Finanzas SA | 1.000% | 3/7/24 | EUR | 1,400 | 1,352 |
| | Iberdrola Finanzas SA | 1.000% | 3/7/25 | EUR | 100 | 94 |
| | Iberdrola Finanzas SA | 0.875% | 6/16/25 | EUR | 6,500 | 6,084 |
| | Iberdrola Finanzas SA | 1.621% | 11/29/29 | EUR | 2,100 | 1,865 |
| | Iberdrola International BV | 1.875% | 10/8/24 | EUR | 200 | 194 |
| | Iberdrola International BV | 0.375% | 9/15/25 | EUR | 8,300 | 7,630 |
| | Iberdrola International BV | 1.125% | 4/21/26 | EUR | 2,200 | 2,047 |
| | Iberdrola International BV | 1.450% | Perpetual | EUR | 6,000 | 4,867 |
| | Iberdrola International BV | 1.874% | Perpetual | EUR | 15,800 | 13,453 |
| | Iberdrola International BV | 2.250% | Perpetual | EUR | 3,300 | 2,495 |
| | Iberdrola International BV | 3.250% | Perpetual | EUR | 11,800 | 11,048 |
| | Inmobiliaria Colonial Socimi SA | 1.450% | 10/28/24 | EUR | 2,300 | 2,162 |
| | Inmobiliaria Colonial Socimi SA | 1.625% | 11/28/25 | EUR | 4,200 | 3,808 |
| | Inmobiliaria Colonial Socimi SA | 2.000% | 4/17/26 | EUR | 2,000 | 1,819 |
| | Inmobiliaria Colonial Socimi SA | 2.500% | 11/28/29 | EUR | 1,000 | 826 |
| | Lar Espana Real Estate Socimi SA | 1.843% | 11/3/28 | EUR | 1,300 | 818 |
| | Mapfre SA | 1.625% | 5/19/26 | EUR | 600 | 545 |
| | Mapfre SA | 4.375% | 3/31/47 | EUR | 2,300 | 2,064 |
| | Mapfre SA | 4.125% | 9/7/48 | EUR | 3,600 | 3,085 |
| | Merlin Properties Socimi SA | 1.750% | 5/26/25 | EUR | 4,764 | 4,345 |
| | Merlin Properties Socimi SA | 1.375% | 6/1/30 | EUR | 6,200 | 4,392 |
| | Merlin Properties Socimi SA | 1.875% | 12/4/34 | EUR | 3,000 | 1,858 |
| | Naturgy Capital Markets SA | 1.125% | 4/11/24 | EUR | 2,200 | 2,092 |
| | Naturgy Finance BV | 2.875% | 3/11/24 | EUR | 2,000 | 1,953 |
| | Naturgy Finance BV | 0.875% | 5/15/25 | EUR | 3,900 | 3,572 |
| | Naturgy Finance BV | 1.250% | 4/19/26 | EUR | 4,400 | 3,957 |
| | Naturgy Finance BV | 1.375% | 1/19/27 | EUR | 100 | 88 |
| | Naturgy Finance BV | 1.500% | 1/29/28 | EUR | 1,000 | 870 |
| | Naturgy Finance BV | 0.750% | 11/28/29 | EUR | 3,200 | 2,494 |
| | NorteGas Energia Distribucion SAU | 2.065% | 9/28/27 | EUR | 5,139 | 4,526 |
| | Programa Cedulas TDA Fondo de Titulizacion de Activos | 4.250% | 3/28/27 | EUR | 4,200 | 4,319 |
| | Programa Cedulas TDA Fondo de Titulizacion de Activos | 4.250% | 4/10/31 | EUR | 9,700 | 10,186 |
| | Prosegur Cash SA | 1.375% | 2/4/26 | EUR | 500 | 447 |
| | Red Electrica Financiaciones SAU | 1.125% | 4/24/25 | EUR | 100 | 94 |
| | Red Electrica Financiaciones SAU | 1.000% | 4/21/26 | EUR | 200 | 184 |
| | Red Electrica Financiaciones SAU | 1.250% | 3/13/27 | EUR | 200 | 183 |
| | Redexis Gas Finance BV | 1.875% | 5/28/25 | EUR | 4,000 | 3,708 |
| | Redexis Gas Finance BV | 1.875% | 4/27/27 | EUR | 7,596 | 6,643 |
| | Repsol Europe Finance Sarl | 0.375% | 7/6/29 | EUR | 2,000 | 1,582 |
| | Repsol Europe Finance Sarl | 0.875% | 7/6/33 | EUR | 2,900 | 2,050 |
| | Repsol International Finance BV | 2.250% | 12/10/26 | EUR | 5,000 | 4,732 |
| | Repsol International Finance BV | 0.250% | 8/2/27 | EUR | 500 | 429 |
| | Santander Consumer Finance SA | 1.000% | 2/27/24 | EUR | 5,400 | 5,166 |
| | Santander Consumer Finance SA | 0.375% | 6/27/24 | EUR | 5,000 | 4,696 |
| | Santander Consumer Finance SA | 0.375% | 1/17/25 | EUR | 9,600 | 8,840 |
Total International Bond II Index Fund
| | | Coupon | Maturity
Date | Currency | Face
Amount
(000) | Market
Value•
($000) |
| | Santander Consumer Finance SA | 0.000% | 2/23/26 | EUR | 2,000 | 1,747 |
| | Santander Consumer Finance SA | 0.500% | 1/14/27 | EUR | 10,700 | 9,182 |
| | Telefonica Emisiones SA | 1.069% | 2/5/24 | EUR | 8,500 | 8,212 |
| | Telefonica Emisiones SA | 5.375% | 2/2/26 | GBP | 707 | 793 |
| | Telefonica Emisiones SA | 1.460% | 4/13/26 | EUR | 2,000 | 1,850 |
| | Telefonica Emisiones SA | 1.447% | 1/22/27 | EUR | 10,100 | 9,173 |
| | Telefonica Emisiones SA | 2.318% | 10/17/28 | EUR | 400 | 364 |
| | Telefonica Emisiones SA | 1.788% | 3/12/29 | EUR | 4,300 | 3,780 |
| | Telefonica Emisiones SA | 5.445% | 10/8/29 | GBP | 2,850 | 3,120 |
| | Telefonica Emisiones SA | 2.932% | 10/17/29 | EUR | 5,600 | 5,207 |
| | Telefonica Emisiones SA | 0.664% | 2/3/30 | EUR | 5,900 | 4,672 |
| | Telefonica Emisiones SA | 2.592% | 5/25/31 | EUR | 8,900 | 7,936 |
| | Telefonica Emisiones SA | 1.807% | 5/21/32 | EUR | 7,900 | 6,363 |
| | Telefonica Emisiones SA | 1.864% | 7/13/40 | EUR | 3,900 | 2,595 |
| | Telefonica Europe BV | 5.875% | 2/14/33 | EUR | 3,152 | 3,482 |
| | Unicaja Banco SA | 4.500% | 6/30/25 | EUR | 400 | 392 |
| | Unicaja Banco SA | 1.000% | 12/1/26 | EUR | 2,700 | 2,327 |
| | | | | | | 648,916 |
| Sweden (1.0%) | | | |
| | Akelius Residential Property AB | 1.125% | 3/14/24 | EUR | 5,870 | 5,434 |
| | Akelius Residential Property AB | 1.750% | 2/7/25 | EUR | 777 | 700 |
| | Akelius Residential Property AB | 2.375% | 8/15/25 | GBP | 1,455 | 1,485 |
| | Akelius Residential Property Financing BV | 1.125% | 1/11/29 | EUR | 4,005 | 2,867 |
| | Akelius Residential Property Financing BV | 0.750% | 2/22/30 | EUR | 5,262 | 3,497 |
| | Alfa Laval Treasury International AB | 1.375% | 2/18/29 | EUR | 1,100 | 916 |
| | Atlas Copco AB | 0.625% | 8/30/26 | EUR | 100 | 89 |
| | Balder Finland OYJ | 1.000% | 1/20/29 | EUR | 3,000 | 1,766 |
| | Balder Finland OYJ | 1.375% | 5/24/30 | EUR | 1,071 | 588 |
| | Castellum Helsinki Finance Holding Abp | 2.000% | 3/24/25 | EUR | 2,000 | 1,678 |
| | Castellum Helsinki Finance Holding Abp | 0.875% | 9/17/29 | EUR | 2,230 | 1,299 |
| | Danske Hypotek AB | 1.000% | 12/21/22 | SEK | 99,000 | 8,955 |
| | Danske Hypotek AB | 1.000% | 12/17/25 | SEK | 268,000 | 22,486 |
| | EQT AB | 2.375% | 4/6/28 | EUR | 3,500 | 2,942 |
| | EQT AB | 2.875% | 4/6/32 | EUR | 5,400 | 4,118 |
| | Essity AB | 1.125% | 3/27/24 | EUR | 4,868 | 4,666 |
| | Essity AB | 1.625% | 3/30/27 | EUR | 822 | 748 |
| | Essity AB | 0.250% | 2/8/31 | EUR | 5,684 | 4,088 |
| | Fastighets AB Balder | 1.875% | 3/14/25 | EUR | 100 | 81 |
| | Fastighets AB Balder | 1.875% | 1/23/26 | EUR | 4,461 | 3,434 |
| | Fastighets AB Balder | 1.125% | 1/29/27 | EUR | 1,100 | 738 |
| | Fastighets AB Balder | 1.250% | 1/28/28 | EUR | 1,257 | 801 |
| | Heimstaden Bostad Treasury BV | 1.375% | 3/3/27 | EUR | 6,652 | 5,127 |
| | Heimstaden Bostad Treasury BV | 1.000% | 4/13/28 | EUR | 7,391 | 5,279 |
| | Heimstaden Bostad Treasury BV | 1.625% | 10/13/31 | EUR | 5,962 | 3,537 |
| | Investor AB | 0.375% | 10/29/35 | EUR | 4,500 | 2,849 |
| | Investor AB | 1.500% | 6/20/39 | EUR | 7,000 | 4,735 |
| | Lansforsakringar Hypotek AB | 0.375% | 3/14/24 | EUR | 733 | 702 |
| | Lansforsakringar Hypotek AB | 1.500% | 9/18/24 | SEK | 78,500 | 6,875 |
| | Lansforsakringar Hypotek AB | 1.000% | 9/15/27 | SEK | 420,800 | 33,569 |
| | Molnlycke Holding AB | 1.875% | 2/28/25 | EUR | 2,457 | 2,311 |
| | Nordea Hypotek AB | 1.000% | 9/18/24 | SEK | 643,100 | 56,038 |
| | Nordea Hypotek AB | 0.500% | 9/16/26 | SEK | 25,300 | 2,050 |
| | Nordea Hypotek AB | 1.000% | 6/16/27 | SEK | 390,000 | 31,223 |
| | Sagax AB | 2.250% | 3/13/25 | EUR | 491 | 442 |
| | Sagax Euro Mtn NL BV | 0.750% | 1/26/28 | EUR | 5,786 | 3,929 |
| | Sagax Euro Mtn NL BV | 1.000% | 5/17/29 | EUR | 100 | 65 |
| | Samhallsbyggnadsbolaget i Norden AB | 1.750% | 1/14/25 | EUR | 1,200 | 946 |
| | Samhallsbyggnadsbolaget i Norden AB | 1.000% | 8/12/27 | EUR | 2,913 | 1,821 |
| | Sandvik AB | 2.125% | 6/7/27 | EUR | 2,500 | 2,286 |
| | SBB Treasury OYJ | 0.750% | 12/14/28 | EUR | 6,713 | 3,591 |
| | SBB Treasury OYJ | 1.125% | 11/26/29 | EUR | 1,200 | 646 |
| | Skandinaviska Enskilda Banken AB | 1.000% | 12/20/23 | SEK | 100,000 | 8,862 |
| | Skandinaviska Enskilda Banken AB | 1.000% | 12/18/24 | SEK | 26,000 | 2,252 |
| | Skandinaviska Enskilda Banken AB | 1.000% | 12/17/25 | SEK | 570,000 | 47,832 |
| | Skandinaviska Enskilda Banken AB | 0.375% | 2/9/26 | EUR | 9,725 | 8,854 |
| | Skandinaviska Enskilda Banken AB | 0.500% | 12/16/26 | SEK | 180,000 | 14,323 |
| | Skandinaviska Enskilda Banken AB | 0.375% | 2/11/27 | EUR | 3,359 | 2,848 |
| | Skandinaviska Enskilda Banken AB | 0.750% | 11/15/27 | EUR | 597 | 528 |
| | Skandinaviska Enskilda Banken AB | 0.375% | 6/21/28 | EUR | 5,000 | 4,022 |
Total International Bond II Index Fund
| | | Coupon | Maturity
Date | Currency | Face
Amount
(000) | Market
Value•
($000) |
| | Skandinaviska Enskilda Banken AB | 1.375% | 10/31/28 | EUR | 15,349 | 14,616 |
| | Skandinaviska Enskilda Banken AB | 0.625% | 11/12/29 | EUR | 4,913 | 3,797 |
| | Skandinaviska Enskilda Banken AB | 1.000% | 12/19/29 | SEK | 26,000 | 1,932 |
| | SKF AB | 0.250% | 2/15/31 | EUR | 2,845 | 2,048 |
| | Stadshypotek AB | 0.375% | 2/21/24 | EUR | 3,415 | 3,275 |
| | Stadshypotek AB | 1.500% | 3/1/24 | SEK | 436,000 | 38,672 |
| | Stadshypotek AB | 1.500% | 12/3/24 | SEK | 602,000 | 52,474 |
| | Stadshypotek AB | 0.500% | 7/11/25 | EUR | 1,455 | 1,351 |
| | Stadshypotek AB | 0.375% | 3/13/26 | EUR | 16,804 | 15,270 |
| | Stadshypotek AB | 0.500% | 6/1/26 | SEK | 584,000 | 47,417 |
| | Stadshypotek AB | 0.125% | 10/5/26 | EUR | 100 | 89 |
| | Stadshypotek AB | 1.000% | 3/1/27 | SEK | 268,000 | 21,651 |
| | Stadshypotek AB | 0.750% | 11/1/27 | EUR | 3,459 | 3,066 |
| | Stadshypotek AB | 2.000% | 9/1/28 | SEK | 50,000 | 4,116 |
| | Svenska Handelsbanken AB | 0.125% | 6/18/24 | EUR | 2,457 | 2,307 |
| | Svenska Handelsbanken AB | 1.000% | 4/15/25 | EUR | 14,204 | 13,318 |
| | Svenska Handelsbanken AB | 0.050% | 9/3/26 | EUR | 9,958 | 8,509 |
| | Svenska Handelsbanken AB | 0.125% | 11/3/26 | EUR | 10,000 | 8,641 |
| | Svenska Handelsbanken AB | 1.375% | 2/23/29 | EUR | 5,500 | 4,580 |
| | Svenska Handelsbanken AB | 1.625% | 3/5/29 | EUR | 4,480 | 4,240 |
| | Svenska Handelsbanken AB | 0.500% | 2/18/30 | EUR | 4,913 | 3,706 |
| | Svenska Handelsbanken AB | 4.625% | 8/23/32 | GBP | 2,000 | 2,074 |
| | Sveriges Sakerstallda Obligationer AB | 1.000% | 6/12/24 | SEK | 174,000 | 15,253 |
| | Sveriges Sakerstallda Obligationer AB | 0.500% | 1/29/25 | EUR | 5,365 | 5,031 |
| | Sveriges Sakerstallda Obligationer AB | 0.500% | 6/11/25 | SEK | 656,000 | 55,239 |
| | Sveriges Sakerstallda Obligationer AB | 0.625% | 10/30/25 | EUR | 2,457 | 2,271 |
| | Sveriges Sakerstallda Obligationer AB | 2.000% | 6/17/26 | SEK | 59,000 | 5,071 |
| | Sveriges Sakerstallda Obligationer AB | 0.875% | 3/29/27 | EUR | 382 | 345 |
| | Sveriges Sakerstallda Obligationer AB | 0.250% | 6/9/27 | SEK | 300,000 | 23,183 |
| | Sveriges Sakerstallda Obligationer AB | 1.750% | 2/10/32 | EUR | 24,000 | 20,938 |
| | Swedbank AB | 0.750% | 5/5/25 | EUR | 7,908 | 7,309 |
| | Swedbank AB | 0.250% | 11/2/26 | EUR | 9,767 | 8,443 |
| | Swedbank AB | 0.300% | 5/20/27 | EUR | 13,262 | 11,401 |
| | Swedbank AB | 1.000% | 11/22/27 | EUR | 2,863 | 2,823 |
| | Swedbank AB | 1.375% | 12/8/27 | GBP | 6,100 | 5,812 |
| | Swedbank AB | 0.200% | 1/12/28 | EUR | 16,159 | 12,902 |
| | Swedbank Hypotek AB | 1.000% | 12/20/23 | SEK | 195,800 | 17,313 |
| | Swedbank Hypotek AB | 0.400% | 5/8/24 | EUR | 2,457 | 2,344 |
| | Swedbank Hypotek AB | 1.000% | 9/18/24 | SEK | 846,900 | 73,401 |
| | Swedbank Hypotek AB | 0.050% | 5/28/25 | EUR | 2,000 | 1,840 |
| | Swedbank Hypotek AB | 0.500% | 2/5/26 | EUR | 4,913 | 4,490 |
| | Swedbank Hypotek AB | 1.375% | 5/31/27 | EUR | 18,800 | 17,299 |
| | Tele2 AB | 1.125% | 5/15/24 | EUR | 4,046 | 3,859 |
| | Tele2 AB | 2.125% | 5/15/28 | EUR | 1,508 | 1,362 |
| | Tele2 AB | 0.750% | 3/23/31 | EUR | 896 | 681 |
| | Telefonaktiebolaget LM Ericsson | 1.000% | 5/26/29 | EUR | 1,300 | 901 |
| | Telia Co. AB | 3.875% | 10/1/25 | EUR | 954 | 956 |
| | Telia Co. AB | 0.125% | 11/27/30 | EUR | 8,255 | 6,110 |
| | Telia Co. AB | 2.125% | 2/20/34 | EUR | 5,961 | 4,899 |
| | Telia Co. AB | 1.625% | 2/23/35 | EUR | 1,100 | 836 |
| | Telia Co. AB | 1.375% | 5/11/81 | EUR | 2,100 | 1,801 |
| | Telia Co. AB | 2.750% | 6/30/83 | EUR | 2,000 | 1,690 |
| | Vattenfall AB | 0.050% | 10/15/25 | EUR | 2,863 | 2,567 |
| | Vattenfall AB | 6.875% | 4/15/39 | GBP | 2,457 | 3,196 |
| | Volvo Treasury AB | 2.000% | 8/19/27 | EUR | 1,000 | 919 |
| | | | | | | 910,552 |
| Switzerland (1.0%) | | | |
| | ABB Finance BV | 0.000% | 1/19/30 | EUR | 7,151 | 5,375 |
| | Adecco International Financial Services BV | 1.000% | 12/2/24 | EUR | 552 | 517 |
| | Adecco International Financial Services BV | 0.125% | 9/21/28 | EUR | 7,500 | 5,897 |
| | Argentum Netherlands BV for Givaudan SA | 2.000% | 9/17/30 | EUR | 1,600 | 1,392 |
| | Argentum Netherlands BV for Swiss Life AG | 4.375% | 12/29/49 | EUR | 7,461 | 7,000 |
| | Argentum Netherlands BV for Zurich Insurance Co. Ltd. | 3.500% | 10/1/46 | EUR | 17,657 | 16,295 |
| | Argentum Netherlands BV for Zurich Insurance Co. Ltd. | 2.750% | 2/19/49 | EUR | 1,004 | 837 |
| | Basellandschaftliche Kantonalbank | 0.375% | 5/13/30 | CHF | 2,455 | 2,181 |
| | Basler Kantonalbank | 0.300% | 6/22/27 | CHF | 2,210 | 2,062 |
| | Cloverie plc for Zurich Insurance Co. Ltd. | 1.750% | 9/16/24 | EUR | 2,637 | 2,517 |
| | Cloverie plc for Zurich Insurance Co. Ltd. | 1.500% | 12/15/28 | EUR | 3,000 | 2,590 |
| | Credit Suisse AG | 1.125% | 12/15/25 | GBP | 3,000 | 2,952 |
Total International Bond II Index Fund
| | | Coupon | Maturity
Date | Currency | Face
Amount
(000) | Market
Value•
($000) |
| | Credit Suisse AG | 0.250% | 1/5/26 | EUR | 10,800 | 9,266 |
| | Credit Suisse AG | 1.500% | 4/10/26 | EUR | 382 | 337 |
| | Credit Suisse Group AG | 1.250% | 7/17/25 | EUR | 18,459 | 16,779 |
| | Credit Suisse Group AG | 2.125% | 9/12/25 | GBP | 6,953 | 7,218 |
| | Credit Suisse Group AG | 3.250% | 4/2/26 | EUR | 17,997 | 16,651 |
| | Credit Suisse Group AG | 1.000% | 6/24/27 | EUR | 3,988 | 3,249 |
| | Credit Suisse Group AG | 0.650% | 1/14/28 | EUR | 17,725 | 13,804 |
| | Credit Suisse Group AG | 2.250% | 6/9/28 | GBP | 8,521 | 7,767 |
| | Credit Suisse Group AG | 0.650% | 9/10/29 | EUR | 9,241 | 6,400 |
| | Credit Suisse Group AG | 0.625% | 1/18/33 | EUR | 15,900 | 9,351 |
| | Credit Suisse Schweiz AG | 0.000% | 7/31/25 | CHF | 5,590 | 5,193 |
| | ELM BV for Helvetia Schweizerische Versicherungsgesellschaft AG | 3.375% | 9/29/47 | EUR | 3,108 | 2,672 |
| | ELM BV for Swiss Reinsurance Co. Ltd. | 2.600% | 12/29/49 | EUR | 13,249 | 11,927 |
| | Firmenich Productions Participations SAS | 1.375% | 10/30/26 | EUR | 4,913 | 4,414 |
| | Firmenich Productions Participations SAS | 1.750% | 4/30/30 | EUR | 4,913 | 4,126 |
| | Givaudan Finance Europe BV | 1.000% | 4/22/27 | EUR | 4,913 | 4,334 |
| | Givaudan Finance Europe BV | 1.625% | 4/22/32 | EUR | 4,000 | 3,252 |
| | Helvetia Europe SA | 2.750% | 9/30/41 | EUR | 6,257 | 4,655 |
| | Holcim Finance Luxembourg SA | 3.000% | 1/22/24 | EUR | 2,728 | 2,677 |
| | Holcim Finance Luxembourg SA | 2.375% | 4/9/25 | EUR | 4,100 | 3,921 |
| | Holcim Finance Luxembourg SA | 0.500% | 11/29/26 | EUR | 1,786 | 1,530 |
| | Holcim Finance Luxembourg SA | 0.125% | 7/19/27 | EUR | 3,000 | 2,464 |
| | Holcim Finance Luxembourg SA | 2.250% | 5/26/28 | EUR | 4,712 | 4,157 |
| | Holcim Finance Luxembourg SA | 0.625% | 4/6/30 | EUR | 2,786 | 2,024 |
| | Holcim Finance Luxembourg SA | 0.500% | 9/3/30 | EUR | 4,249 | 3,023 |
| | Holcim Finance Luxembourg SA | 0.500% | 4/23/31 | EUR | 7,369 | 5,070 |
| | Holcim Finance Luxembourg SA | 0.625% | 1/19/33 | EUR | 4,300 | 2,768 |
| | Holcim Sterling Finance Netherlands BV | 3.000% | 5/12/32 | GBP | 1,282 | 1,112 |
| | Holcim Sterling Finance Netherlands BV | 2.250% | 4/4/34 | GBP | 1,100 | 829 |
| | Luzerner Kantonalbank AG | 1.125% | 6/30/23 | CHF | 3,920 | 3,917 |
| | Luzerner Kantonalbank AG | 0.125% | 11/25/32 | CHF | 700 | 573 |
| | Novartis AG | 0.625% | 11/13/29 | CHF | 1,355 | 1,232 |
| | Novartis Finance SA | 1.625% | 11/9/26 | EUR | 2,457 | 2,299 |
| | Novartis Finance SA | 0.000% | 9/23/28 | EUR | 9,000 | 7,432 |
| | Novartis Finance SA | 1.375% | 8/14/30 | EUR | 3,956 | 3,397 |
| | Pfandbriefbank schweizerischer Hypothekarinstitute AG | 2.375% | 1/25/24 | CHF | 1,720 | 1,743 |
| | Pfandbriefbank schweizerischer Hypothekarinstitute AG | 1.375% | 2/14/24 | CHF | 3,920 | 3,924 |
| | Pfandbriefbank schweizerischer Hypothekarinstitute AG | 0.125% | 3/25/24 | CHF | 2,455 | 2,416 |
| | Pfandbriefbank schweizerischer Hypothekarinstitute AG | 1.000% | 5/21/24 | CHF | 5,200 | 5,177 |
| | Pfandbriefbank schweizerischer Hypothekarinstitute AG | 0.375% | 10/15/25 | CHF | 2,455 | 2,376 |
| | Pfandbriefbank schweizerischer Hypothekarinstitute AG | 0.375% | 1/26/26 | CHF | 3,920 | 3,777 |
| | Pfandbriefbank schweizerischer Hypothekarinstitute AG | 2.500% | 3/30/26 | CHF | 5,835 | 6,019 |
| | Pfandbriefbank schweizerischer Hypothekarinstitute AG | 0.250% | 9/18/26 | CHF | 5,245 | 4,979 |
| | Pfandbriefbank schweizerischer Hypothekarinstitute AG | 2.750% | 12/15/26 | CHF | 1,475 | 1,541 |
| | Pfandbriefbank schweizerischer Hypothekarinstitute AG | 0.250% | 1/18/27 | CHF | 10,080 | 9,511 |
| | Pfandbriefbank schweizerischer Hypothekarinstitute AG | 2.500% | 2/16/27 | CHF | 985 | 1,019 |
| | Pfandbriefbank schweizerischer Hypothekarinstitute AG | 0.375% | 5/12/27 | CHF | 12,250 | 11,567 |
| | Pfandbriefbank schweizerischer Hypothekarinstitute AG | 0.000% | 6/15/27 | CHF | 18,725 | 17,331 |
| | Pfandbriefbank schweizerischer Hypothekarinstitute AG | 0.250% | 10/12/27 | CHF | 10,000 | 9,317 |
| | Pfandbriefbank schweizerischer Hypothekarinstitute AG | 1.500% | 1/21/28 | CHF | 5,000 | 4,941 |
| | Pfandbriefbank schweizerischer Hypothekarinstitute AG | 0.500% | 5/5/28 | CHF | 3,920 | 3,668 |
| | Pfandbriefbank schweizerischer Hypothekarinstitute AG | 0.375% | 7/10/28 | CHF | 2,455 | 2,268 |
| | Pfandbriefbank schweizerischer Hypothekarinstitute AG | 0.125% | 9/6/28 | CHF | 13,720 | 12,462 |
| | Pfandbriefbank schweizerischer Hypothekarinstitute AG | 0.625% | 10/9/28 | CHF | 7,355 | 6,879 |
| | Pfandbriefbank schweizerischer Hypothekarinstitute AG | 0.500% | 1/22/29 | CHF | 29,435 | 27,188 |
| | Pfandbriefbank schweizerischer Hypothekarinstitute AG | 0.125% | 5/8/29 | CHF | 3,680 | 3,297 |
| | Pfandbriefbank schweizerischer Hypothekarinstitute AG | 0.500% | 6/15/29 | CHF | 7,355 | 6,745 |
| | Pfandbriefbank schweizerischer Hypothekarinstitute AG | 1.375% | 9/20/29 | CHF | 985 | 954 |
| | Pfandbriefbank schweizerischer Hypothekarinstitute AG | 0.000% | 10/26/29 | CHF | 46,990 | 41,273 |
| | Pfandbriefbank schweizerischer Hypothekarinstitute AG | 0.000% | 2/26/30 | CHF | 43,885 | 38,192 |
| | Pfandbriefbank schweizerischer Hypothekarinstitute AG | 0.250% | 4/15/30 | CHF | 4,900 | 4,337 |
| | Pfandbriefbank schweizerischer Hypothekarinstitute AG | 1.625% | 7/3/30 | CHF | 985 | 965 |
| | Pfandbriefbank schweizerischer Hypothekarinstitute AG | 0.125% | 3/19/31 | CHF | 15,000 | 12,875 |
| | Pfandbriefbank schweizerischer Hypothekarinstitute AG | 0.625% | 5/16/31 | CHF | 1,720 | 1,539 |
| | Pfandbriefbank schweizerischer Hypothekarinstitute AG | 0.125% | 7/15/31 | CHF | 4,535 | 3,864 |
| | Pfandbriefbank schweizerischer Hypothekarinstitute AG | 1.875% | 9/15/31 | CHF | 13,275 | 13,201 |
| | Pfandbriefbank schweizerischer Hypothekarinstitute AG | 0.125% | 12/19/31 | CHF | 7,490 | 6,351 |
| | Pfandbriefbank schweizerischer Hypothekarinstitute AG | 1.000% | 5/12/32 | CHF | 3,680 | 3,356 |
| | Pfandbriefbank schweizerischer Hypothekarinstitute AG | 2.250% | 8/13/32 | CHF | 5,000 | 5,105 |
Total International Bond II Index Fund
| | | Coupon | Maturity
Date | Currency | Face
Amount
(000) | Market
Value•
($000) |
| | Pfandbriefbank schweizerischer Hypothekarinstitute AG | 0.125% | 11/19/32 | CHF | 8,285 | 6,841 |
| | Pfandbriefbank schweizerischer Hypothekarinstitute AG | 0.625% | 4/25/33 | CHF | 2,455 | 2,125 |
| | Pfandbriefbank schweizerischer Hypothekarinstitute AG | 1.500% | 8/2/33 | CHF | 8,575 | 8,106 |
| | Pfandbriefbank schweizerischer Hypothekarinstitute AG | 0.750% | 11/28/34 | CHF | 12,500 | 10,706 |
| | Pfandbriefbank schweizerischer Hypothekarinstitute AG | 0.625% | 1/25/35 | CHF | 10,000 | 8,405 |
| | Pfandbriefbank schweizerischer Hypothekarinstitute AG | 0.875% | 5/7/35 | CHF | 985 | 851 |
| | Pfandbriefbank schweizerischer Hypothekarinstitute AG | 0.500% | 10/5/35 | CHF | 2,455 | 2,005 |
| | Pfandbriefbank schweizerischer Hypothekarinstitute AG | 0.250% | 10/14/36 | CHF | 1,990 | 1,533 |
| | Pfandbriefbank schweizerischer Hypothekarinstitute AG | 0.625% | 1/23/37 | CHF | 1,965 | 1,602 |
| | Pfandbriefbank schweizerischer Hypothekarinstitute AG | 0.875% | 6/25/37 | CHF | 2,700 | 2,269 |
| | Pfandbriefbank schweizerischer Hypothekarinstitute AG | 0.250% | 8/4/38 | CHF | 1,400 | 1,047 |
| | Pfandbriefbank schweizerischer Hypothekarinstitute AG | 0.375% | 7/8/39 | CHF | 4,065 | 3,057 |
| | Pfandbriefbank schweizerischer Hypothekarinstitute AG | 1.500% | 12/5/40 | CHF | 2,455 | 2,237 |
| | Pfandbriefbank schweizerischer Hypothekarinstitute AG | 0.500% | 6/17/41 | CHF | 4,045 | 3,068 |
| | Pfandbriefbank schweizerischer Hypothekarinstitute AG | 0.250% | 10/6/42 | CHF | 4,900 | 3,467 |
| | Pfandbriefzentrale der schweizerischen Kantonalbanken AG | 0.125% | 3/12/24 | CHF | 7,355 | 7,241 |
| | Pfandbriefzentrale der schweizerischen Kantonalbanken AG | 0.750% | 4/15/24 | CHF | 495 | 491 |
| | Pfandbriefzentrale der schweizerischen Kantonalbanken AG | 0.000% | 6/14/24 | CHF | 15,915 | 15,583 |
| | Pfandbriefzentrale der schweizerischen Kantonalbanken AG | 0.750% | 9/23/24 | CHF | 1,080 | 1,068 |
| | Pfandbriefzentrale der schweizerischen Kantonalbanken AG | 0.125% | 12/2/24 | CHF | 7,355 | 7,169 |
| | Pfandbriefzentrale der schweizerischen Kantonalbanken AG | 0.500% | 7/28/25 | CHF | 2,455 | 2,393 |
| | Pfandbriefzentrale der schweizerischen Kantonalbanken AG | 2.000% | 10/30/25 | CHF | 1,475 | 1,496 |
| | Pfandbriefzentrale der schweizerischen Kantonalbanken AG | 0.250% | 12/1/25 | CHF | 7,030 | 6,765 |
| | Pfandbriefzentrale der schweizerischen Kantonalbanken AG | 1.625% | 6/17/26 | CHF | 3,430 | 3,435 |
| | Pfandbriefzentrale der schweizerischen Kantonalbanken AG | 0.050% | 11/6/26 | CHF | 4,900 | 4,603 |
| | Pfandbriefzentrale der schweizerischen Kantonalbanken AG | 0.000% | 1/27/27 | CHF | 27,520 | 25,690 |
| | Pfandbriefzentrale der schweizerischen Kantonalbanken AG | 1.375% | 3/19/27 | CHF | 3,920 | 3,874 |
| | Pfandbriefzentrale der schweizerischen Kantonalbanken AG | 0.250% | 2/11/28 | CHF | 1,365 | 1,263 |
| | Pfandbriefzentrale der schweizerischen Kantonalbanken AG | 0.000% | 3/13/28 | CHF | 3,025 | 2,755 |
| | Pfandbriefzentrale der schweizerischen Kantonalbanken AG | 1.000% | 9/22/28 | CHF | 2,455 | 2,348 |
| | Pfandbriefzentrale der schweizerischen Kantonalbanken AG | 0.300% | 4/9/29 | CHF | 12,315 | 11,176 |
| | Pfandbriefzentrale der schweizerischen Kantonalbanken AG | 1.500% | 5/21/29 | CHF | 15,040 | 14,730 |
| | Pfandbriefzentrale der schweizerischen Kantonalbanken AG | 0.625% | 7/16/29 | CHF | 11,760 | 10,870 |
| | Pfandbriefzentrale der schweizerischen Kantonalbanken AG | 0.500% | 4/30/30 | CHF | 2,455 | 2,219 |
| | Pfandbriefzentrale der schweizerischen Kantonalbanken AG | 0.000% | 7/19/30 | CHF | 14,640 | 12,656 |
| | Pfandbriefzentrale der schweizerischen Kantonalbanken AG | 0.500% | 9/20/30 | CHF | 8,575 | 7,678 |
| | Pfandbriefzentrale der schweizerischen Kantonalbanken AG | 0.550% | 1/29/31 | CHF | 4,655 | 4,162 |
| | Pfandbriefzentrale der schweizerischen Kantonalbanken AG | 0.300% | 6/6/31 | CHF | 3,680 | 3,193 |
| | Pfandbriefzentrale der schweizerischen Kantonalbanken AG | 0.125% | 9/2/31 | CHF | 15,230 | 12,959 |
| | Pfandbriefzentrale der schweizerischen Kantonalbanken AG | 0.125% | 4/23/32 | CHF | 25,000 | 20,935 |
| | Pfandbriefzentrale der schweizerischen Kantonalbanken AG | 0.650% | 2/15/33 | CHF | 4,900 | 4,265 |
| | Pfandbriefzentrale der schweizerischen Kantonalbanken AG | 0.000% | 3/18/33 | CHF | 7,500 | 6,058 |
| | Pfandbriefzentrale der schweizerischen Kantonalbanken AG | 0.500% | 5/15/34 | CHF | 2,945 | 2,468 |
| | Pfandbriefzentrale der schweizerischen Kantonalbanken AG | 0.200% | 6/12/35 | CHF | 19,000 | 14,947 |
| | Pfandbriefzentrale der schweizerischen Kantonalbanken AG | 0.200% | 7/13/35 | CHF | 7,355 | 5,776 |
| | Pfandbriefzentrale der schweizerischen Kantonalbanken AG | 0.600% | 12/11/35 | CHF | 6,370 | 5,257 |
| | Pfandbriefzentrale der schweizerischen Kantonalbanken AG | 0.000% | 2/15/36 | CHF | 5,035 | 3,791 |
| | Pfandbriefzentrale der schweizerischen Kantonalbanken AG | 0.700% | 3/4/39 | CHF | 2,455 | 1,966 |
| | Pfandbriefzentrale der schweizerischen Kantonalbanken AG | 0.020% | 1/30/40 | CHF | 5,000 | 3,496 |
| | Richemont International Holding SA | 1.000% | 3/26/26 | EUR | 7,550 | 6,969 |
| | Richemont International Holding SA | 1.500% | 3/26/30 | EUR | 3,000 | 2,582 |
| | Richemont International Holding SA | 1.125% | 5/26/32 | EUR | 3,684 | 2,921 |
| | Richemont International Holding SA | 2.000% | 3/26/38 | EUR | 7,550 | 5,764 |
| | Richemont International Holding SA | 1.625% | 5/26/40 | EUR | 4,913 | 3,335 |
| | Roche Finance Europe BV | 0.875% | 2/25/25 | EUR | 316 | 302 |
| | SIX Finance Luxembourg SA | 0.000% | 12/2/25 | EUR | 5,400 | 4,775 |
| | St. Galler Kantonalbank | 0.500% | ���6/24/25 | CHF | 210 | 204 |
| | Swiss Life Finance I Ltd. | 3.250% | 8/31/29 | EUR | 5,000 | 4,570 |
| | Swiss Re Finance Luxembourg SA | 2.534% | 4/30/50 | EUR | 3,900 | 3,077 |
| | Swisscom AG | 1.750% | 7/10/24 | CHF | 985 | 987 |
| | Tyco Electronics Group SA | 0.000% | 2/14/25 | EUR | 3,144 | 2,889 |
| | Tyco Electronics Group SA | 0.000% | 2/16/29 | EUR | 2,756 | 2,141 |
| | UBS AG | 0.500% | 3/31/31 | EUR | 4,600 | 3,429 |
| | UBS Group AG | 2.125% | 3/4/24 | EUR | 600 | 582 |
| | UBS Group AG | 1.500% | 11/30/24 | EUR | 3,675 | 3,502 |
| | UBS Group AG | 1.250% | 4/17/25 | EUR | 15,277 | 14,424 |
| | UBS Group AG | 0.250% | 1/29/26 | EUR | 2,457 | 2,213 |
| | UBS Group AG | 1.250% | 9/1/26 | EUR | 12,959 | 11,434 |
| | UBS Group AG | 0.250% | 2/24/28 | EUR | 13,784 | 10,906 |
Total International Bond II Index Fund
| | | Coupon | Maturity
Date | Currency | Face
Amount
(000) | Market
Value•
($000) |
| | UBS Group AG | 0.250% | 11/5/28 | EUR | 10,959 | 8,727 |
| | UBS Group AG | 0.875% | 11/3/31 | EUR | 12,176 | 8,835 |
| | UBS Group AG | 0.625% | 2/24/33 | EUR | 3,000 | 2,050 |
| | Zuercher Kantonalbank | 0.250% | 1/27/26 | CHF | 2,455 | 2,346 |
| | Zuercher Kantonalbank | 0.125% | 5/13/26 | CHF | 805 | 762 |
| | Zuercher Kantonalbank | 0.300% | 1/25/28 | CHF | 10,000 | 9,255 |
| | Zurich Finance Ireland DAC | 5.125% | 11/23/52 | GBP | 2,000 | 2,027 |
| | Zurich Finance Ireland Designated Activity Co. | 1.625% | 6/17/39 | EUR | 7,369 | 4,897 |
| | | | | | | 927,592 |
| United Arab Emirates (0.0%) | | | |
| | DP World Ltd. | 2.375% | 9/25/26 | EUR | 100 | 91 |
| | DP World Ltd. | 4.250% | 9/25/30 | GBP | 1,004 | 1,050 |
| | Emirates NBD Bank PJSC | 4.750% | 2/9/28 | AUD | 1,530 | 948 |
| | Emirates NBD Bank PJSC | 3.050% | 2/26/30 | AUD | 1,130 | 612 |
| | Emirates Telecommunications Group Co. PJSC | 2.750% | 6/18/26 | EUR | 8,145 | 7,762 |
| | Emirates Telecommunications Group Co. PJSC | 0.375% | 5/17/28 | EUR | 2,265 | 1,866 |
| | First Abu Dhabi Bank PJSC | 0.125% | 2/16/26 | EUR | 3,247 | 2,814 |
| | MDGH - GMTN BV | 6.875% | 3/14/26 | GBP | 225 | 261 |
| | MDGH - GMTN BV | 1.000% | 3/10/34 | EUR | 2,000 | 1,357 |
| | | | | | | 16,761 |
| United Kingdom (2.3%) | | | |
| | 3i Group plc | 5.750% | 12/3/32 | GBP | 2,439 | 2,703 |
| | 3i Group plc | 3.750% | 6/5/40 | GBP | 1,300 | 1,039 |
| | A2Dominion Housing Group Ltd. | 3.500% | 11/15/28 | GBP | 3,098 | 3,158 |
| | AA Bond Co. Ltd. | 6.269% | 7/2/43 | GBP | 1,404 | 1,537 |
| | AA Bond Co. Ltd. | 4.875% | 7/31/43 | GBP | 500 | 545 |
| | AA Bond Co. Ltd. | 3.250% | 7/31/50 | GBP | 500 | 421 |
| | AA Bond Co. Ltd. | 5.500% | 7/31/50 | GBP | 500 | 490 |
| | ABP Finance plc | 6.250% | 12/14/26 | GBP | 2,141 | 2,486 |
| | Admiral Group plc | 5.500% | 7/25/24 | GBP | 1,184 | 1,323 |
| | Affinity Sutton Capital Markets plc | 5.981% | 9/17/38 | GBP | 1,000 | 1,173 |
| | Affinity Sutton Capital Markets plc | 4.250% | 10/8/42 | GBP | 777 | 735 |
| | Affinity Water Finance 2004 plc | 5.875% | 7/13/26 | GBP | 4,219 | 4,912 |
| | Affinity Water Finance plc | 4.500% | 3/31/36 | GBP | 2,231 | 2,310 |
| | Affordable Housing Finance plc | 3.800% | 5/20/44 | GBP | 2,457 | 2,518 |
| | Affordable Housing Finance plc | 2.893% | 8/11/45 | GBP | 1,307 | 1,161 |
| | Anchor Hanover Group | 2.000% | 7/21/51 | GBP | 1,491 | 903 |
| | Anglian Water Services Financing plc | 1.625% | 8/10/25 | GBP | 1,411 | 1,473 |
| | Anglian Water Services Financing plc | 4.500% | 2/22/26 | GBP | 8,381 | 9,372 |
| | Anglian Water Services Financing plc | 2.625% | 6/15/27 | GBP | 14,425 | 14,606 |
| | Anglian Water Services Financing plc | 4.500% | 10/5/27 | GBP | 1,360 | 1,489 |
| | Anglian Water Services Financing plc | 6.625% | 1/15/29 | GBP | 242 | 293 |
| | Anglian Water Services Financing plc | 4.525% | 8/26/32 | CAD | 1,500 | 1,035 |
| | Annington Funding plc | 1.650% | 7/12/24 | EUR | 4,815 | 4,505 |
| | Annington Funding plc | 2.646% | 7/12/25 | GBP | 1,455 | 1,510 |
| | Annington Funding plc | 3.184% | 7/12/29 | GBP | 4,526 | 4,181 |
| | Annington Funding plc | 3.685% | 7/12/34 | GBP | 3,595 | 3,162 |
| | Annington Funding plc | 3.935% | 7/12/47 | GBP | 3,513 | 2,824 |
| | Arqiva Financing plc | 4.882% | 12/31/32 | GBP | 1,385 | 1,495 |
| | Artesian Finance II plc | 6.000% | 9/30/33 | GBP | 1,495 | 1,832 |
| | Aspire Defence Finance plc | 4.674% | 3/31/40 | GBP | 2,936 | 3,126 |
| | Aspire Defence Finance plc | 4.674% | 3/31/40 | GBP | 1,388 | 1,494 |
| | Assura Financing plc | 1.625% | 6/30/33 | GBP | 1,100 | 813 |
| | Aster Treasury plc | 1.405% | 1/27/36 | GBP | 2,000 | 1,441 |
| | Aster Treasury plc | 4.500% | 12/18/43 | GBP | 1,319 | 1,338 |
| | AstraZeneca plc | 0.750% | 5/12/24 | EUR | 8,700 | 8,302 |
| | AstraZeneca plc | 0.375% | 6/3/29 | EUR | 15,000 | 12,232 |
| | AstraZeneca plc | 5.750% | 11/13/31 | GBP | 1,956 | 2,387 |
| | Aviva plc | 1.875% | 11/13/27 | EUR | 4,906 | 4,422 |
| | Aviva plc | 4.000% | 10/2/30 | CAD | 1,537 | 983 |
| | Aviva plc | 3.875% | 7/3/44 | EUR | 1,210 | 1,165 |
| | Aviva plc | 3.375% | 12/4/45 | EUR | 2,908 | 2,695 |
| | Aviva plc | 4.375% | 9/12/49 | GBP | 2,453 | 2,366 |
| | Aviva plc | 5.125% | 6/4/50 | GBP | 1,104 | 1,089 |
| | Aviva plc | 4.000% | 6/3/55 | GBP | 1,804 | 1,485 |
| | Aviva plc | 6.875% | 5/20/58 | GBP | 4,223 | 4,685 |
| | Babcock International Group plc | 1.875% | 10/5/26 | GBP | 1,906 | 1,799 |
| | Babcock International Group plc | 1.375% | 9/13/27 | EUR | 217 | 174 |
Total International Bond II Index Fund
| | | Coupon | Maturity
Date | Currency | Face
Amount
(000) | Market
Value•
($000) |
| | Backward 2017 Ltd. | 2.125% | 3/25/53 | GBP | 2,000 | 1,227 |
| | Bank of Scotland plc | 4.875% | 12/20/24 | GBP | 684 | 789 |
| | Barclays plc | 3.125% | 1/17/24 | GBP | 3,415 | 3,811 |
| | Barclays plc | 3.375% | 4/2/25 | EUR | 3,633 | 3,524 |
| | Barclays plc | 0.750% | 6/9/25 | EUR | 5,000 | 4,623 |
| | Barclays plc | 1.375% | 1/24/26 | EUR | 8,047 | 7,355 |
| | Barclays plc | 3.000% | 5/8/26 | GBP | 6,165 | 6,305 |
| | Barclays plc | 3.250% | 2/12/27 | GBP | 11,031 | 11,097 |
| | Barclays plc | 2.166% | 6/23/27 | CAD | 1,591 | 1,009 |
| | Barclays plc | 0.877% | 1/28/28 | EUR | 7,200 | 5,931 |
| | Barclays plc | 4.000% | 6/26/29 | AUD | 1,000 | 535 |
| | Barclays plc | 0.577% | 8/9/29 | EUR | 13,552 | 10,311 |
| | Barclays plc | 3.750% | 11/22/30 | GBP | 2,261 | 2,336 |
| | Barclays plc | 1.125% | 3/22/31 | EUR | 4,179 | 3,456 |
| | Barclays plc | 1.106% | 5/12/32 | EUR | 5,552 | 3,890 |
| | Barclays plc | 3.250% | 1/17/33 | GBP | 100 | ��� 87 |
| | BAT Capital Corp. | 2.125% | 8/15/25 | GBP | 687 | 703 |
| | BAT International Finance plc | 2.750% | 3/25/25 | EUR | 2,908 | 2,766 |
| | BAT International Finance plc | 1.250% | 3/13/27 | EUR | 3,843 | 3,191 |
| | BAT International Finance plc | 2.250% | 6/26/28 | GBP | 14,600 | 12,904 |
| | BAT International Finance plc | 2.250% | 1/16/30 | EUR | 8,823 | 6,738 |
| | BAT International Finance plc | 6.000% | 11/24/34 | GBP | 2,313 | 2,278 |
| | BAT International Finance plc | 5.750% | 7/5/40 | GBP | 1,414 | 1,239 |
| | BAT International Finance plc | 2.250% | 9/9/52 | GBP | 1,559 | 780 |
| | BAT Netherlands Finance BV | 2.375% | 10/7/24 | EUR | 14,913 | 14,179 |
| | BAT Netherlands Finance BV | 3.125% | 4/7/28 | EUR | 8,923 | 7,830 |
| | Bazalgette Finance plc | 2.375% | 11/29/27 | GBP | 1,392 | 1,373 |
| | Beyond Housing Ltd. | 2.125% | 5/17/51 | GBP | 1,981 | 1,255 |
| | BG Energy Capital plc | 5.125% | 12/1/25 | GBP | 2,962 | 3,370 |
| | BG Energy Capital plc | 2.250% | 11/21/29 | EUR | 6,099 | 5,370 |
| | BG Energy Capital plc | 5.000% | 11/4/36 | GBP | 2,000 | 2,097 |
| | Blend Funding plc | 3.459% | 9/21/49 | GBP | 2,500 | 2,123 |
| | Blend Funding plc | 2.922% | 4/5/56 | GBP | 2,545 | 1,851 |
| | BP Capital Markets BV | 0.933% | 12/4/40 | EUR | 4,459 | 2,551 |
| | BP Capital Markets BV | 1.467% | 9/21/41 | EUR | ��� 981 | 601 |
| | BP Capital Markets plc | 1.177% | 8/12/23 | GBP | 1,499 | 1,676 |
| | BP Capital Markets plc | 1.876% | 4/7/24 | EUR | 6,572 | 6,378 |
| | BP Capital Markets plc | 0.900% | 7/3/24 | EUR | 9,053 | 8,596 |
| | BP Capital Markets plc | 0.830% | 9/19/24 | EUR | 3,910 | 3,700 |
| | BP Capital Markets plc | 2.030% | 2/14/25 | GBP | 687 | 739 |
| | BP Capital Markets plc | 1.953% | 3/3/25 | EUR | 3,550 | 3,397 |
| | BP Capital Markets plc | 3.470% | 5/15/25 | CAD | 1,351 | 959 |
| | BP Capital Markets plc | 1.077% | 6/26/25 | EUR | 2,592 | 2,413 |
| | BP Capital Markets plc | 2.972% | 2/27/26 | EUR | 2,547 | 2,458 |
| | BP Capital Markets plc | 2.274% | 7/3/26 | GBP | 5,462 | 5,690 |
| | BP Capital Markets plc | 2.213% | 9/25/26 | EUR | 6,367 | 5,972 |
| | BP Capital Markets plc | 1.573% | 2/16/27 | EUR | 14,084 | 12,755 |
| | BP Capital Markets plc | 0.831% | 11/8/27 | EUR | 7,369 | 6,346 |
| | BP Capital Markets plc | 2.519% | 4/7/28 | EUR | 1,767 | 1,634 |
| | BP Capital Markets plc | 2.822% | 4/7/32 | EUR | 10,599 | 9,450 |
| | BP Capital Markets plc | 1.104% | 11/15/34 | EUR | 8,300 | 5,809 |
| | BP Capital Markets plc | 3.250% | Perpetual | EUR | 7,471 | 6,779 |
| | BP Capital Markets plc | 3.625% | Perpetual | EUR | 9,089 | 7,678 |
| | BP Capital Markets plc | 4.250% | Perpetual | GBP | 4,913 | 4,886 |
| | BPHA Finance plc | 4.816% | 4/11/44 | GBP | 987 | 1,039 |
| | British Land Co. plc | 2.375% | 9/14/29 | GBP | 913 | 814 |
| | British Telecommunications plc | 1.750% | 3/10/26 | EUR | 1,720 | 1,590 |
| | British Telecommunications plc | 1.500% | 6/23/27 | EUR | 5,113 | 4,501 |
| | British Telecommunications plc | 5.750% | 12/7/28 | GBP | 474 | 538 |
| | British Telecommunications plc | 1.125% | 9/12/29 | EUR | 3,000 | 2,425 |
| | British Telecommunications plc | 3.125% | 11/21/31 | GBP | 800 | 735 |
| | British Telecommunications plc | 3.375% | 8/30/32 | EUR | 1,500 | 1,347 |
| | British Telecommunications plc | 6.375% | 6/23/37 | GBP | 2,585 | 2,897 |
| 1 | Broadgate Financing plc | 4.999% | 10/5/33 | GBP | 3,170 | 3,414 |
| | Bromford Housing Group Ltd. | 3.125% | 5/3/48 | GBP | 957 | 761 |
| | BUPA Finance plc | 2.000% | 4/5/24 | GBP | 6,254 | 6,855 |
| | BUPA Finance plc | 5.000% | 12/8/26 | GBP | 2,501 | 2,651 |
| | Burberry Group plc | 1.125% | 9/21/25 | GBP | 2,457 | 2,486 |
| | Cadent Finance plc | 0.625% | 9/22/24 | EUR | 14,740 | 13,739 |
Total International Bond II Index Fund
| | | Coupon | Maturity
Date | Currency | Face
Amount
(000) | Market
Value•
($000) |
| | Cadent Finance plc | 2.125% | 9/22/28 | GBP | 5,323 | 4,941 |
| | Cadent Finance plc | 0.625% | 3/19/30 | EUR | 22,317 | 16,530 |
| | Cadent Finance plc | 0.750% | 3/11/32 | EUR | 857 | 592 |
| | Cadent Finance plc | 2.250% | 10/10/35 | GBP | 4,778 | 3,626 |
| | Cadent Finance plc | 2.625% | 9/22/38 | GBP | 1,690 | 1,261 |
| | Cadent Finance plc | 3.125% | 3/21/40 | GBP | 3,553 | 2,775 |
| | Cadent Finance plc | 2.750% | 9/22/46 | GBP | 502 | 343 |
| 3 | Canary Wharf Group Investment Holdings plc | 2.625% | 4/23/25 | GBP | 4,201 | 4,227 |
| 3 | Canary Wharf Group Investment Holdings plc | 1.750% | 4/7/26 | EUR | 2,529 | 2,070 |
| | Canary Wharf Group Investment Holdings plc | 1.750% | 4/7/26 | EUR | 1,335 | 1,093 |
| 3 | Canary Wharf Group Investment Holdings plc | 3.375% | 4/23/28 | GBP | 2,274 | 1,989 |
| | Cardiff University | 3.000% | 12/7/55 | GBP | 1,004 | 831 |
| | Catalyst Housing Ltd. | 3.125% | 10/31/47 | GBP | 1,491 | 1,152 |
| | CCEP Finance Ireland DAC | 0.000% | 9/6/25 | EUR | 5,000 | 4,496 |
| | CCEP Finance Ireland DAC | 0.500% | 9/6/29 | EUR | 4,062 | 3,241 |
| | CCEP Finance Ireland DAC | 0.875% | 5/6/33 | EUR | 3,276 | 2,354 |
| | CCEP Finance Ireland DAC | 1.500% | 5/6/41 | EUR | 1,296 | 818 |
| | Centrica plc | 4.375% | 3/13/29 | GBP | 7,324 | 7,511 |
| | Centrica plc | 7.000% | 9/19/33 | GBP | 1,455 | 1,739 |
| | Centrica plc | 4.250% | 9/12/44 | GBP | 5,567 | 4,760 |
| | Channel Link Enterprises Finance plc | 3.043% | 6/30/50 | GBP | 3,336 | 3,149 |
| | Church Commissioners for England | 3.625% | 7/14/52 | GBP | 2,000 | 1,888 |
| | Circle Anglia Social Housing plc | 7.250% | 11/12/38 | GBP | 2,390 | 3,161 |
| | Circle Anglia Social Housing plc | 5.200% | 3/2/44 | GBP | 1,000 | 1,072 |
| | Citizen Treasury plc | 3.250% | 10/20/48 | GBP | 4,322 | 3,560 |
| | CK Hutchison Europe Finance 18 Ltd. | 1.250% | 4/13/25 | EUR | 7,956 | 7,396 |
| | CK Hutchison Europe Finance 18 Ltd. | 2.000% | 4/13/30 | EUR | 200 | 165 |
| | CK Hutchison Europe Finance 21 Ltd. | 0.750% | 11/2/29 | EUR | 3,200 | 2,453 |
| | CK Hutchison Europe Finance 21 Ltd. | 1.000% | 11/2/33 | EUR | 3,100 | 2,062 |
| | CK Hutchison Finance 16 II Ltd. | 0.875% | 10/3/24 | EUR | 5,545 | 5,191 |
| | CK Hutchison Finance 16 Ltd. | 2.000% | 4/6/28 | EUR | 100 | 88 |
| | CK Hutchison Group Telecom Finance SA | 2.000% | 10/17/27 | GBP | 5,457 | 5,108 |
| | CK Hutchison Group Telecom Finance SA | 1.125% | 10/17/28 | EUR | 100 | 81 |
| | CK Hutchison Group Telecom Finance SA | 1.500% | 10/17/31 | EUR | 7,867 | 5,786 |
| | CK Hutchison Group Telecom Finance SA | 2.625% | 10/17/34 | GBP | 1,591 | 1,186 |
| | Clarion Funding plc | 2.625% | 1/18/29 | GBP | 802 | 785 |
| | Clarion Funding plc | 1.250% | 11/13/32 | GBP | 4,900 | 3,850 |
| | Clarion Funding plc | 1.875% | 1/22/35 | GBP | 3,000 | 2,303 |
| | Clarion Funding plc | 3.125% | 4/19/48 | GBP | 1,076 | 827 |
| | Close Brothers Finance plc | 1.625% | 12/3/30 | GBP | 5,000 | 4,179 |
| | Clydesdale Bank plc | 4.625% | 6/8/26 | GBP | 6,367 | 7,289 |
| | CNH Industrial Finance Europe SA | 1.875% | 1/19/26 | EUR | 9,454 | 8,789 |
| | CNH Industrial Finance Europe SA | 1.750% | 3/25/27 | EUR | 2,200 | 1,991 |
| | CNH Industrial Finance Europe SA | 1.625% | 7/3/29 | EUR | 7,484 | 6,265 |
| | Coca-Cola Europacific Partners plc | 1.125% | 5/26/24 | EUR | 2,818 | 2,697 |
| | Coca-Cola Europacific Partners plc | 2.375% | 5/7/25 | EUR | 1,455 | 1,399 |
| | Coca-Cola Europacific Partners plc | 1.750% | 3/27/26 | EUR | 5,916 | 5,546 |
| | Coca-Cola Europacific Partners plc | 1.750% | 5/26/28 | EUR | 2,547 | 2,254 |
| | Coca-Cola Europacific Partners plc | 0.200% | 12/2/28 | EUR | 6,684 | 5,334 |
| | Coca-Cola Europacific Partners plc | 0.700% | 9/12/31 | EUR | 4,136 | 3,121 |
| | Compass Group Finance Netherlands BV | 0.625% | 7/3/24 | EUR | 868 | 823 |
| | Compass Group Finance Netherlands BV | 1.500% | 9/5/28 | EUR | 4,000 | 3,542 |
| | Compass Group plc | 2.000% | 9/5/25 | GBP | 200 | 211 |
| | Compass Group plc | 2.000% | 7/3/29 | GBP | 3,072 | 2,870 |
| 1 | Connect Plus M25 Issuer plc | 2.607% | 3/31/39 | GBP | 1,122 | 1,040 |
| | Coventry Building Society | 0.500% | 1/12/24 | EUR | 506 | 487 |
| | Coventry Building Society | 2.000% | 12/20/30 | GBP | 5,062 | 4,255 |
| | CPUK Finance Ltd. | 3.588% | 2/28/42 | GBP | 1,455 | 1,540 |
| | CPUK Finance Ltd. | 7.239% | 2/28/42 | GBP | 1,319 | 1,525 |
| | Crh Finance UK plc | 4.125% | 12/2/29 | GBP | 2,773 | 2,790 |
| 1,6 | CTRL Section 1 Finance plc | 5.234% | 5/2/35 | GBP | 122 | 149 |
| | Dali Capital plc | 4.799% | 12/21/37 | GBP | 200 | 225 |
| | Derby Healthcare plc | 5.564% | 6/30/41 | GBP | 376 | 442 |
| | Derwent London plc | 1.875% | 11/17/31 | GBP | 1,400 | 1,110 |
| | Diageo Capital BV | 0.125% | 9/28/28 | EUR | 700 | 575 |
| | Diageo Finance plc | 0.500% | 6/19/24 | EUR | 486 | 460 |
| | Diageo Finance plc | 1.750% | 9/23/24 | EUR | 800 | 771 |
| | Diageo Finance plc | 2.875% | 3/27/29 | GBP | 5,000 | 5,070 |
| | Diageo Finance plc | 2.500% | 3/27/32 | EUR | 11,569 | 10,422 |
Total International Bond II Index Fund
| | | Coupon | Maturity
Date | Currency | Face
Amount
(000) | Market
Value•
($000) |
| | Diageo Finance plc | 1.250% | 3/28/33 | GBP | 3,459 | 2,791 |
| | Direct Line Insurance Group plc | 4.000% | 6/5/32 | GBP | 1,000 | 856 |
| | DS Smith plc | 1.375% | 7/26/24 | EUR | 200 | 188 |
| | DS Smith plc | 0.875% | 9/12/26 | EUR | 4,981 | 4,189 |
| | DWR Cymru Financing UK plc | 1.625% | 3/31/26 | GBP | 1,893 | 1,921 |
| | DWR Cymru Financing UK plc | 6.015% | 3/31/28 | GBP | 125 | 146 |
| | DWR Cymru Financing UK plc | 1.375% | 3/31/33 | GBP | 500 | 397 |
| | DWR Cymru Financing UK plc | 2.375% | 3/31/34 | GBP | 1,182 | 963 |
| | DWR Cymru Financing UK plc | 2.500% | 3/31/36 | GBP | 1,217 | 1,022 |
| | Eastern Power Networks plc | 5.750% | 3/8/24 | GBP | 1,464 | 1,690 |
| | Eastern Power Networks plc | 1.875% | 6/1/35 | GBP | 2,000 | 1,546 |
| | easyJet FinCo BV | 1.875% | 3/3/28 | EUR | 10,474 | 8,194 |
| | easyJet plc | 0.875% | 6/11/25 | EUR | 2,457 | 2,204 |
| | Electricity North West Ltd. | 8.875% | 3/25/26 | GBP | 977 | 1,233 |
| | EMH Treasury plc | 4.500% | 1/29/44 | GBP | 449 | 452 |
| 1 | Eversholt Funding plc | 6.697% | 2/22/35 | GBP | 807 | 940 |
| 1 | Eversholt Funding plc | 3.529% | 8/7/42 | GBP | 1,635 | 1,308 |
| | Experian Finance plc | 1.375% | 6/25/26 | EUR | 100 | 92 |
| | Experian Finance plc | 3.250% | 4/7/32 | GBP | 3,128 | 3,068 |
| | Fidelity International Ltd. | 7.125% | 2/13/24 | GBP | 687 | 799 |
| | Fidelity International Ltd. | 2.500% | 11/4/26 | EUR | 1,337 | 1,170 |
| | Firstgroup plc | 6.875% | 9/18/24 | GBP | 1,301 | 1,487 |
| | Flagship Finance plc | 1.875% | 7/14/61 | GBP | 1,254 | 699 |
| | Futures Treasury plc | 3.375% | 2/8/44 | GBP | 806 | 684 |
| | Gatwick Funding Ltd. | 5.250% | 1/23/26 | GBP | 552 | 626 |
| | Gatwick Funding Ltd. | 6.125% | 3/2/28 | GBP | 8,800 | 9,999 |
| | Gatwick Funding Ltd. | 2.500% | 4/15/32 | GBP | 200 | 176 |
| | Gatwick Funding Ltd. | 5.750% | 1/23/39 | GBP | 4,052 | 4,224 |
| | Gatwick Funding Ltd. | 3.125% | 9/28/41 | GBP | 2,141 | 1,592 |
| | Gatwick Funding Ltd. | 3.250% | 2/26/48 | GBP | 2,100 | 1,499 |
| | Gatwick Funding Ltd. | 2.625% | 10/7/48 | GBP | 542 | 343 |
| | Genfinance II plc | 6.064% | 12/21/39 | GBP | 2,863 | 3,369 |
| | GlaxoSmithKline Capital plc | 1.375% | 12/2/24 | EUR | 200 | 191 |
| | GlaxoSmithKline Capital plc | 4.000% | 6/16/25 | EUR | 488 | 493 |
| | GlaxoSmithKline Capital plc | 1.250% | 5/21/26 | EUR | 9,369 | 8,630 |
| | GlaxoSmithKline Capital plc | 1.000% | 9/12/26 | EUR | 100 | 90 |
| | GlaxoSmithKline Capital plc | 3.375% | 12/20/27 | GBP | 1,860 | 1,961 |
| | GlaxoSmithKline Capital plc | 1.250% | 10/12/28 | GBP | 10,376 | 9,582 |
| | GlaxoSmithKline Capital plc | 1.750% | 5/21/30 | EUR | 7,302 | 6,336 |
| | GlaxoSmithKline Capital plc | 5.250% | 12/19/33 | GBP | 3,579 | 4,230 |
| | GlaxoSmithKline Capital plc | 1.625% | 5/12/35 | GBP | 12,189 | 9,692 |
| | GlaxoSmithKline Capital plc | 6.375% | 3/9/39 | GBP | 567 | 741 |
| | GlaxoSmithKline Capital plc | 5.250% | 4/10/42 | GBP | 2,116 | 2,492 |
| | GlaxoSmithKline Capital plc | 4.250% | 12/18/45 | GBP | 3,217 | 3,318 |
| | Global Switch Finance BV | 1.375% | 10/7/30 | EUR | 2,800 | 2,266 |
| | Global Switch Holdings Ltd. | 1.500% | 1/31/24 | EUR | 913 | 873 |
| | Global Switch Holdings Ltd. | 2.250% | 5/31/27 | EUR | 100 | 89 |
| | Grainger plc | 3.000% | 7/3/30 | GBP | 900 | 755 |
| | Great Places Housing Group Ltd. | 4.750% | 10/22/42 | GBP | 2,955 | 3,126 |
| 1 | Great Rolling Stock Co. plc | 6.875% | 7/27/35 | GBP | 157 | 184 |
| 1 | Greater Gabbard OFTO plc | 4.137% | 11/29/32 | GBP | 346 | 369 |
| | Greene King Finance plc | 5.318% | 9/15/31 | GBP | 207 | 221 |
| | Greene King Finance plc | 5.106% | 3/15/34 | GBP | 468 | 469 |
| 1 | Greene King Finance plc | 4.064% | 3/15/35 | GBP | 428 | 415 |
| | Guinness Partnership Ltd. | 4.000% | 10/24/44 | GBP | 2,242 | 2,094 |
| | Guinness Partnership Ltd. | 2.000% | 4/22/55 | GBP | 100 | 58 |
| 1 | Gwynt y Mor OFTO plc | 2.778% | 2/17/34 | GBP | 729 | 706 |
| | Hammerson Ireland Finance DAC | 1.750% | 6/3/27 | EUR | 3,786 | 2,657 |
| | Hammerson plc | 7.250% | 4/21/28 | GBP | 1,951 | 1,923 |
| | Heathrow Funding Ltd. | 5.225% | 2/15/23 | GBP | 1,093 | 1,252 |
| | Heathrow Funding Ltd. | 3.250% | 5/21/27 | CAD | 2,000 | 1,384 |
| | Heathrow Funding Ltd. | 1.500% | 10/12/27 | EUR | 11,684 | 10,568 |
| | Heathrow Funding Ltd. | 2.625% | 3/16/28 | GBP | 8,000 | 7,119 |
| | Heathrow Funding Ltd. | 6.750% | 12/3/28 | GBP | 2,888 | 3,331 |
| | Heathrow Funding Ltd. | 2.694% | 10/13/29 | CAD | 2,232 | 1,433 |
| | Heathrow Funding Ltd. | 1.500% | 2/11/30 | EUR | 6,504 | 5,162 |
| | Heathrow Funding Ltd. | 3.400% | 3/8/30 | CAD | 3,559 | 2,335 |
| | Heathrow Funding Ltd. | 2.750% | 10/13/31 | GBP | 2,457 | 2,242 |
| | Heathrow Funding Ltd. | 6.450% | 12/10/31 | GBP | 1,527 | 1,759 |
Total International Bond II Index Fund
| | | Coupon | Maturity
Date | Currency | Face
Amount
(000) | Market
Value•
($000) |
| | Heathrow Funding Ltd. | 1.875% | 7/12/32 | EUR | 2,096 | 1,533 |
| | Heathrow Funding Ltd. | 3.782% | 9/4/32 | CAD | 1,419 | 917 |
| | Heathrow Funding Ltd. | 3.661% | 1/13/33 | CAD | 2,100 | 1,323 |
| | Heathrow Funding Ltd. | 3.726% | 4/13/35 | CAD | 2,493 | 1,505 |
| | Heathrow Funding Ltd. | 1.875% | 3/14/36 | EUR | 1,696 | 1,150 |
| | Heathrow Funding Ltd. | 5.875% | 5/13/43 | GBP | 6,231 | 6,679 |
| | Heathrow Funding Ltd. | 4.625% | 10/31/46 | GBP | 1,228 | 1,130 |
| | Heathrow Funding Ltd. | 2.750% | 8/9/51 | GBP | 429 | 282 |
| | Hexagon Housing Association Ltd. | 3.625% | 4/22/48 | GBP | 900 | 754 |
| | High Speed Rail Finance 1 plc | 4.375% | 11/1/38 | GBP | 3,324 | 3,427 |
| | Home Group Ltd. | 3.125% | 3/27/43 | GBP | 3,004 | 2,403 |
| 1 | Housing & Care 21 | 3.288% | 11/8/49 | GBP | 980 | 789 |
| | HSBC Bank Capital Funding Sterling 1 LP | 5.844% | 11/29/49 | GBP | 62 | 74 |
| | HSBC Bank plc | 5.375% | 11/4/30 | GBP | 488 | 542 |
| | HSBC Bank plc | 5.375% | 8/22/33 | GBP | 2,439 | 2,542 |
| | HSBC Bank plc | 6.250% | 1/30/41 | GBP | 514 | 576 |
| | HSBC Bank plc | 4.750% | 3/24/46 | GBP | 50 | 47 |
| | HSBC Holdings plc | 3.196% | 12/5/23 | CAD | 4,868 | 3,481 |
| | HSBC Holdings plc | 0.875% | 9/6/24 | EUR | 13,642 | 12,820 |
| | HSBC Holdings plc | 1.500% | 12/4/24 | EUR | 1,906 | 1,833 |
| | HSBC Holdings plc | 3.000% | 6/30/25 | EUR | 9,459 | 9,101 |
| | HSBC Holdings plc | 0.309% | 11/13/26 | EUR | 19,859 | 17,224 |
| | HSBC Holdings plc | 2.256% | 11/13/26 | GBP | 3,234 | 3,307 |
| | HSBC Holdings plc | 2.500% | 3/15/27 | EUR | 1,276 | 1,159 |
| | HSBC Holdings plc | 3.019% | 6/15/27 | EUR | 5,400 | 5,005 |
| | HSBC Holdings plc | 1.750% | 7/24/27 | GBP | 9,029 | 8,734 |
| | HSBC Holdings plc | 3.000% | 7/22/28 | GBP | 19,044 | 18,546 |
| | HSBC Holdings plc | 2.625% | 8/16/28 | GBP | 1,510 | 1,423 |
| | HSBC Holdings plc | 6.750% | 9/11/28 | GBP | 1,400 | 1,573 |
| | HSBC Holdings plc | 0.641% | 9/24/29 | EUR | 6,062 | 4,696 |
| | HSBC Holdings plc | 3.000% | 5/29/30 | GBP | 4,815 | 4,442 |
| | HSBC Holdings plc | 7.000% | 4/7/38 | GBP | 4,950 | 5,581 |
| | HSBC Holdings plc | 6.000% | 3/29/40 | GBP | 3,752 | 3,785 |
| | Hyde Housing Assn. Ltd. | 5.125% | 7/23/40 | GBP | 54 | 59 |
| | Hyde Housing Assn. Ltd. | 1.750% | 8/18/55 | GBP | 1,920 | 1,055 |
| | IG Group Holdings plc | 3.125% | 11/18/28 | GBP | 2,000 | 1,707 |
| | Imperial Brands Finance Netherlands BV | 1.750% | 3/18/33 | EUR | 4,947 | 3,184 |
| | Imperial Brands Finance plc | 1.375% | 1/27/25 | EUR | 552 | 508 |
| | Imperial Brands Finance plc | 3.375% | 2/26/26 | EUR | 217 | 200 |
| | Imperial Brands Finance plc | 2.125% | 2/12/27 | EUR | 7,595 | 6,525 |
| | Imperial Brands Finance plc | 4.875% | 6/7/32 | GBP | 3,730 | 3,462 |
| | Incommunities Treasury plc | 3.250% | 3/21/49 | GBP | 1,499 | 1,233 |
| | Informa plc | 3.125% | 7/5/26 | GBP | 919 | 931 |
| | Informa plc | 1.250% | 4/22/28 | EUR | 2,030 | 1,626 |
| | Intermediate Capital Group plc | 1.625% | 2/17/27 | EUR | 1,600 | 1,301 |
| | Just Group plc | 9.000% | 10/26/26 | GBP | 100 | 114 |
| | Juturna European Loan Conduit No. 16 plc | 5.064% | 8/10/33 | GBP | 1,958 | 2,207 |
| | Karbon Homes Ltd. | 3.375% | 11/15/47 | GBP | 2,685 | 2,282 |
| | Kennedy Wilson Europe Real Estate Ltd. | 3.250% | 11/12/25 | EUR | 500 | 364 |
| | Land Securities Capital Markets plc | 1.974% | 2/8/26 | GBP | 552 | 608 |
| | Land Securities Capital Markets plc | 2.375% | 3/29/29 | GBP | 382 | 388 |
| | Land Securities Capital Markets plc | 2.399% | 2/8/31 | GBP | 2,400 | 2,349 |
| | Land Securities Capital Markets plc | 2.625% | 9/22/39 | GBP | 996 | 834 |
| | Land Securities Capital Markets plc | 2.750% | 9/22/59 | GBP | 1,787 | 1,308 |
| | Leeds Building Society | 0.500% | 7/3/24 | EUR | 200 | 190 |
| | Leeds Building Society | 1.500% | 3/16/27 | GBP | 1,724 | 1,682 |
| | Leeds Building Society | 1.375% | 10/6/27 | GBP | 15,606 | 14,569 |
| | Legal & General Finance plc | 5.875% | 12/11/31 | GBP | 3,413 | 4,103 |
| | Legal & General Group plc | 5.375% | 10/27/45 | GBP | 1,635 | 1,798 |
| | Legal & General Group plc | 5.125% | 11/14/48 | GBP | 452 | 462 |
| | Legal & General Group plc | 4.500% | 11/1/50 | GBP | 5,000 | 4,719 |
| | Legal & General Group plc | 5.500% | 6/27/64 | GBP | 2,098 | 2,004 |
| | Lendlease Europe Finance plc | 3.500% | 12/2/33 | GBP | 1,896 | 1,373 |
| | Liberty Living Finance plc | 2.625% | 11/28/24 | GBP | 1,004 | 1,061 |
| | Libra Longhurst Group Treasury No. 2 plc | 3.250% | 5/15/43 | GBP | 2,603 | 2,145 |
| | Libra Longhurst Group Treasury plc | 5.125% | 8/2/38 | GBP | 912 | 999 |
| | Linde Finance BV | 1.000% | 4/20/28 | EUR | 1,367 | 1,208 |
| | Linde Finance BV | 0.550% | 5/19/32 | EUR | 9,800 | 7,200 |
| | Linde plc | 1.000% | 9/30/51 | EUR | 8,300 | 4,147 |
Total International Bond II Index Fund
| | | Coupon | Maturity
Date | Currency | Face
Amount
(000) | Market
Value•
($000) |
| | LiveWest Treasury plc | 1.875% | 2/18/56 | GBP | 1,100 | 629 |
| | Lloyds Bank Corporate Markets plc | 2.375% | 4/9/26 | EUR | 5,000 | 4,681 |
| | Lloyds Bank plc | 0.250% | 3/25/24 | EUR | 3,910 | 3,729 |
| | Lloyds Bank plc | 7.500% | 4/15/24 | GBP | 4,990 | 5,918 |
| | Lloyds Bank plc | 5.125% | 3/7/25 | GBP | 7,460 | 8,615 |
| | Lloyds Bank plc | 0.625% | 3/26/25 | EUR | 200 | 187 |
| | Lloyds Bank plc | 0.125% | 6/18/26 | EUR | 4,913 | 4,371 |
| | Lloyds Bank plc | 4.875% | 3/30/27 | GBP | 1,491 | 1,703 |
| | Lloyds Bank plc | 6.000% | 2/8/29 | GBP | 5,072 | 6,134 |
| | Lloyds Bank plc | 0.125% | 9/23/29 | EUR | 19,550 | 15,701 |
| | Lloyds Banking Group plc | 0.482% | 12/14/23 | JPY | 1,000,000 | 6,686 |
| | Lloyds Banking Group plc | 2.250% | 10/16/24 | GBP | 1,004 | 1,081 |
| | Lloyds Banking Group plc | 3.500% | 2/3/25 | CAD | 1,374 | 955 |
| | Lloyds Banking Group plc | 4.000% | 3/7/25 | AUD | 5,840 | 3,582 |
| | Lloyds Banking Group plc | 0.824% | 5/30/25 | JPY | 900,000 | 6,048 |
| | Lloyds Banking Group plc | 0.500% | 11/12/25 | EUR | 5,139 | 4,698 |
| | Lloyds Banking Group plc | 3.500% | 4/1/26 | EUR | 5,000 | 4,827 |
| | Lloyds Banking Group plc | 4.250% | 11/22/27 | AUD | 2,440 | 1,405 |
| | Lloyds Banking Group plc | 4.500% | 3/18/30 | EUR | 1,679 | 1,585 |
| | Lloyds Banking Group plc | 3.125% | 8/24/30 | EUR | 8,500 | 7,519 |
| | Lloyds Banking Group plc | 2.707% | 12/3/35 | GBP | 2,455 | 2,014 |
| | Logicor 2019-1 UK plc | 1.875% | 11/17/31 | GBP | 3,486 | 3,414 |
| | London & Quadrant Housing Trust | 2.625% | 2/28/28 | GBP | 2,028 | 2,019 |
| | London & Quadrant Housing Trust | 2.250% | 7/20/29 | GBP | 3,200 | 2,993 |
| | London & Quadrant Housing Trust | 2.000% | 3/31/32 | GBP | 2,800 | 2,403 |
| | London & Quadrant Housing Trust | 4.625% | 12/5/33 | GBP | 100 | 106 |
| | London & Quadrant Housing Trust | 5.500% | 1/27/40 | GBP | 400 | 444 |
| | London & Quadrant Housing Trust | 5.486% | 6/15/42 | GBP | 2,500 | 2,766 |
| | London & Quadrant Housing Trust | 3.750% | 10/27/49 | GBP | 1,815 | 1,540 |
| | London & Quadrant Housing Trust | 3.125% | 2/28/53 | GBP | 868 | 643 |
| | London & Quadrant Housing Trust | 2.750% | 7/20/57 | GBP | 1,004 | 678 |
| | London Power Networks plc | 6.125% | 6/7/27 | GBP | 238 | 278 |
| | London Power Networks plc | 2.625% | 3/1/29 | GBP | 1,500 | 1,443 |
| | London Stock Exchange Group plc | 1.750% | 12/6/27 | EUR | 6,502 | 5,790 |
| | London Stock Exchange Group plc | 1.625% | 4/6/30 | GBP | 3,000 | 2,698 |
| 1 | Longstone Finance plc | 4.791% | 4/19/36 | GBP | 71 | 80 |
| | Lseg Netherlands BV | 0.000% | 4/6/25 | EUR | 5,000 | 4,541 |
| | Lseg Netherlands BV | 0.750% | 4/6/33 | EUR | 6,062 | 4,317 |
| | M&G plc | 5.625% | 10/20/51 | GBP | 2,496 | 2,474 |
| | M&G plc | 5.560% | 7/20/55 | GBP | 4,823 | 4,503 |
| | M&G plc | 6.340% | 12/19/63 | GBP | 2,590 | 2,478 |
| | Manchester Airport Group Funding plc | 4.125% | 4/2/24 | GBP | 1,004 | 1,127 |
| | Manchester Airport Group Funding plc | 4.750% | 3/31/34 | GBP | 1,004 | 1,019 |
| | Manchester Airport Group Funding plc | 2.875% | 9/30/44 | GBP | 1,906 | 1,329 |
| | Martlet Homes Ltd. | 3.000% | 5/9/52 | GBP | 2,635 | 1,999 |
| 1 | Meadowhall Finance plc | 4.986% | 7/12/37 | GBP | 451 | 477 |
| 1 | Merseylink Issuer plc | 3.842% | 3/31/43 | GBP | 100 | 104 |
| 1 | Metropolitan Funding plc | 4.125% | 4/5/48 | GBP | 1,004 | 913 |
| | Metropolitan Housing Trust Ltd. | 1.875% | 7/28/36 | GBP | 600 | 442 |
| | Moat Homes Finance plc | 5.000% | 9/23/41 | GBP | 1,035 | 1,117 |
| | Morhomes plc | 3.400% | 2/19/40 | GBP | 913 | 798 |
| | Motability Operations Group plc | 1.625% | 6/9/23 | EUR | 1,179 | 1,153 |
| | Motability Operations Group plc | 0.375% | 1/3/26 | EUR | 3,828 | 3,401 |
| | Motability Operations Group plc | 4.375% | 2/8/27 | GBP | 4,181 | 4,663 |
| | Motability Operations Group plc | 0.125% | 7/20/28 | EUR | 9,056 | 7,196 |
| | Motability Operations Group plc | 1.750% | 7/3/29 | GBP | 4,806 | 4,468 |
| | Motability Operations Group plc | 5.625% | 11/29/30 | GBP | 1,004 | 1,198 |
| | Motability Operations Group plc | 2.375% | 3/14/32 | GBP | 582 | 539 |
| | Motability Operations Group plc | 3.625% | 3/10/36 | GBP | 1,400 | 1,382 |
| | Motability Operations Group plc | 1.500% | 1/20/41 | GBP | 5,000 | 3,371 |
| | Motability Operations Group plc | 2.125% | 1/18/42 | GBP | 3,000 | 2,231 |
| | Myriad Capital plc | 4.750% | 12/20/43 | GBP | 500 | 503 |
| | National Express Group plc | 2.500% | 11/11/23 | GBP | 2,457 | 2,736 |
| | National Grid Electricity Transmission plc | 1.375% | 9/16/26 | GBP | 2,096 | 2,056 |
| | National Grid Electricity Transmission plc | 2.301% | 6/22/29 | CAD | 2,764 | 1,702 |
| | National Grid Electricity Transmission plc | 5.221% | 9/16/31 | CAD | 2,700 | 1,942 |
| | National Grid Electricity Transmission plc | 0.823% | 7/7/32 | EUR | 3,200 | 2,285 |
| | National Grid Electricity Transmission plc | 2.000% | 9/16/38 | GBP | 2,818 | 1,909 |
| | National Grid Electricity Transmission plc | 0.872% | 11/26/40 | EUR | 1,600 | 843 |
Total International Bond II Index Fund
| | | Coupon | Maturity
Date | Currency | Face
Amount
(000) | Market
Value•
($000) |
| | National Grid plc | 2.179% | 6/30/26 | EUR | 1,000 | 923 |
| | National Grid plc | 3.500% | 10/16/26 | GBP | 19,097 | 20,087 |
| | National Grid plc | 0.163% | 1/20/28 | EUR | 13,000 | 10,407 |
| | National Grid plc | 0.553% | 9/18/29 | EUR | 16,607 | 12,642 |
| | National Grid plc | 2.949% | 3/30/30 | EUR | 6,300 | 5,584 |
| | National Grid plc | 0.750% | 9/1/33 | EUR | 1,100 | 734 |
| | National Westminster Bank plc | 5.125% | 1/13/24 | GBP | 200 | 231 |
| | National Westminster Bank plc | 0.500% | 5/15/24 | EUR | 4,913 | 4,686 |
| | Nationwide Building Society | 1.250% | 3/3/25 | EUR | 200 | 188 |
| | Nationwide Building Society | 5.625% | 1/28/26 | GBP | 777 | 915 |
| | Nationwide Building Society | 1.500% | 3/8/26 | EUR | 10,324 | 9,471 |
| | Nationwide Building Society | 3.000% | 5/6/26 | GBP | 9,866 | 10,462 |
| | Nationwide Building Society | 0.625% | 3/25/27 | EUR | 21,095 | 18,745 |
| | Nationwide Building Society | 3.250% | 1/20/28 | GBP | 7,493 | 7,630 |
| | Nationwide Building Society | 0.250% | 9/14/28 | EUR | 13,194 | 10,324 |
| | Nationwide Building Society | 2.250% | 6/25/29 | EUR | 2,457 | 2,297 |
| | Nationwide Building Society | 2.000% | 7/25/29 | EUR | 17,288 | 15,962 |
| | Nationwide Building Society | 1.375% | 6/29/32 | EUR | 7,821 | 6,516 |
| | NatWest Group plc | 1.750% | 3/2/26 | EUR | 19,048 | 17,570 |
| | NatWest Group plc | 2.057% | 11/9/28 | GBP | 200 | 184 |
| | NatWest Group plc | 3.619% | 3/29/29 | GBP | 9,400 | 9,147 |
| | NatWest Group plc | 0.670% | 9/14/29 | EUR | 27,400 | 20,888 |
| | NatWest Markets plc | 1.000% | 5/28/24 | EUR | 4,913 | 4,645 |
| | NatWest Markets plc | 1.375% | 3/2/27 | EUR | 19,100 | 16,614 |
| 6 | Network Rail Infrastructure Finance plc | 4.750% | 1/22/24 | GBP | 3,409 | 3,942 |
| 6 | Network Rail Infrastructure Finance plc | 4.375% | 12/9/30 | GBP | 4,367 | 5,101 |
| 6 | Network Rail Infrastructure Finance plc | 4.750% | 11/29/35 | GBP | 2,046 | 2,440 |
| | NewRiver REIT plc | 3.500% | 3/7/28 | GBP | 913 | 809 |
| | Next Group plc | 3.625% | 5/18/28 | GBP | 3,459 | 3,303 |
| | NIE Finance plc | 2.500% | 10/27/25 | GBP | 3,357 | 3,553 |
| | NIE Finance plc | 6.375% | 6/2/26 | GBP | 2,000 | 2,355 |
| | Northern Gas Networks Finance plc | 4.875% | 6/30/27 | GBP | 59 | 66 |
| | Northern Gas Networks Finance plc | 4.875% | 11/15/35 | GBP | 1,465 | 1,514 |
| | Northern Powergrid Yorkshire plc | 5.125% | 5/4/35 | GBP | 742 | 814 |
| | Northern Powergrid Yorkshire plc | 2.250% | 10/9/59 | GBP | 822 | 529 |
| | Northumbrian Water Finance plc | 1.625% | 10/11/26 | GBP | 3,415 | 3,373 |
| | Northumbrian Water Finance plc | 2.375% | 10/5/27 | GBP | 100 | 98 |
| | Northumbrian Water Finance plc | 5.625% | 4/29/33 | GBP | 1,266 | 1,425 |
| | Northumbrian Water Finance plc | 5.125% | 1/23/42 | GBP | 264 | 277 |
| | Notting Hill Genesis | 3.750% | 12/20/32 | GBP | 2,637 | 2,635 |
| | Notting Hill Genesis | 2.000% | 6/3/36 | GBP | 319 | 240 |
| | Notting Hill Genesis | 5.250% | 7/7/42 | GBP | 777 | 840 |
| | Notting Hill Genesis | 3.250% | 10/12/48 | GBP | 100 | 78 |
| | Notting Hill Genesis | 4.375% | 2/20/54 | GBP | 2,142 | 2,056 |
| 1 | Octagon Healthcare Funding plc | 5.333% | 6/30/36 | GBP | 222 | 258 |
| | Optivo Finance plc | 2.857% | 10/7/35 | GBP | 2,500 | 2,153 |
| | Optivo Finance plc | 5.250% | 3/13/43 | GBP | 3,200 | 3,488 |
| | Orbit Capital plc | 2.000% | 11/24/38 | GBP | 1,500 | 1,062 |
| | Orbit Capital plc | 3.500% | 3/24/45 | GBP | 3,090 | 2,568 |
| | Orbit Capital plc | 3.375% | 6/14/48 | GBP | 126 | 102 |
| | Paradigm Homes Charitable Housing Assn. Ltd. | 2.250% | 5/20/51 | GBP | 2,923 | 1,905 |
| | Paragon Treasury plc | 2.000% | 5/7/36 | GBP | 2,091 | 1,614 |
| 1 | Paragon Treasury plc | 3.625% | 1/21/47 | GBP | 1,004 | 875 |
| | Peabody Capital No. 2 plc | 2.750% | 3/2/34 | GBP | 1,000 | 886 |
| | Peabody Capital No. 2 plc | 4.625% | 12/12/53 | GBP | 1,700 | 1,706 |
| | Peabody Capital plc | 5.250% | 3/17/43 | GBP | 2,750 | 2,994 |
| | Pearson Funding plc | 1.375% | 5/6/25 | EUR | 317 | 293 |
| | Pearson Funding plc | 3.750% | 6/4/30 | GBP | 1,293 | 1,271 |
| 1 | Penarian Housing Finance plc | 3.212% | 6/7/52 | GBP | 777 | 629 |
| | Pension Insurance Corp. plc | 8.000% | 11/23/26 | GBP | 1,428 | 1,639 |
| | Pension Insurance Corp. plc | 5.625% | 9/20/30 | GBP | 5,680 | 5,532 |
| | Pension Insurance Corp. plc | 4.625% | 5/7/31 | GBP | 2,000 | 1,793 |
| | Phoenix Group Holdings plc | 4.375% | 1/24/29 | EUR | 7,234 | 5,919 |
| | Phoenix Group Holdings plc | 5.867% | 6/13/29 | GBP | 5,981 | 6,067 |
| | Phoenix Group Holdings plc | 5.625% | 4/28/31 | GBP | 1,319 | 1,262 |
| | Places For People Treasury plc | 2.875% | 8/17/26 | GBP | 4,263 | 4,450 |
| | Platform HG Financing plc | 1.625% | 8/10/55 | GBP | 2,452 | 1,311 |
| | Porterbrook Rail Finance Ltd. | 7.125% | 10/20/26 | GBP | 1,455 | 1,734 |
| | Principality Building Society | 2.375% | 11/23/23 | GBP | 552 | 608 |
Total International Bond II Index Fund
| | | Coupon | Maturity
Date | Currency | Face
Amount
(000) | Market
Value•
($000) |
| | Prs Finance plc | 1.750% | 11/24/26 | GBP | 9,052 | 9,349 |
| | Prs Finance plc | 2.000% | 1/23/29 | GBP | 8,669 | 8,570 |
| | Quadgas Finance plc | 3.375% | 9/17/29 | GBP | 2,321 | 2,096 |
| | RAC Bond Co. plc | 4.870% | 5/6/46 | GBP | 1,455 | 1,507 |
| 3 | Reckitt Benckiser Treasury Services Nederland BV | 0.375% | 5/19/26 | EUR | 2,457 | 2,201 |
| | Reckitt Benckiser Treasury Services Nederland BV | 0.750% | 5/19/30 | EUR | 5,947 | 4,806 |
| 3 | Reckitt Benckiser Treasury Services Nederland BV | 0.750% | 5/19/30 | EUR | 2,457 | 1,986 |
| 3 | Reckitt Benckiser Treasury Services plc | 1.750% | 5/19/32 | GBP | 2,141 | 1,857 |
| | RELX Capital Inc. | 1.300% | 5/12/25 | EUR | 1,004 | 941 |
| | RELX Finance BV | 0.000% | 3/18/24 | EUR | 2,565 | 2,419 |
| | RELX Finance BV | 0.500% | 3/10/28 | EUR | 9,369 | 7,849 |
| | RELX Finance BV | 0.875% | 3/10/32 | EUR | 1,892 | 1,431 |
| | Rentokil Initial Finance BV | 3.875% | 6/27/27 | EUR | 7,500 | 7,270 |
| | Rentokil Initial Finance BV | 4.375% | 6/27/30 | EUR | 3,000 | 2,913 |
| | Rentokil Initial plc | 0.950% | 11/22/24 | EUR | 2,501 | 2,349 |
| | Rio Tinto Finance plc | 2.875% | 12/11/24 | EUR | 200 | 197 |
| | Rio Tinto Finance plc | 4.000% | 12/11/29 | GBP | 400 | 424 |
| | Riverside Finance plc | 3.875% | 12/5/44 | GBP | 1,093 | 1,019 |
| | RL Finance Bonds No. 2 plc | 6.125% | 11/30/43 | GBP | 100 | 114 |
| | RL Finance Bonds No. 3 plc | 6.125% | 11/13/28 | GBP | 1,544 | 1,637 |
| | RL Finance Bonds No. 4 plc | 4.875% | 10/7/49 | GBP | 5,229 | 4,273 |
| 1 | RMPA Services plc | 5.337% | 9/30/38 | GBP | 1,996 | 2,319 |
| | Rothesay Life plc | 8.000% | 10/30/25 | GBP | 2,200 | 2,576 |
| | Rothesay Life plc | 3.375% | 7/12/26 | GBP | 3,989 | 3,997 |
| | Royal Bank of Scotland Group plc | 2.875% | 9/19/26 | GBP | 4,293 | 4,478 |
| | Royal Bank of Scotland Group plc | 3.125% | 3/28/27 | GBP | 2,908 | 2,989 |
| | Royal Mail plc | 1.250% | 10/8/26 | EUR | 2,457 | 2,135 |
| | RSL Finance No. 1 plc | 6.625% | 3/31/38 | GBP | 281 | 353 |
| | Sage Group plc | 1.625% | 2/25/31 | GBP | 5,392 | 4,466 |
| | Sanctuary Capital plc | 6.697% | 3/23/39 | GBP | 2,048 | 2,598 |
| | Sanctuary Capital plc | 5.000% | 4/26/47 | GBP | 2,057 | 2,196 |
| | Sanctuary Capital plc | 2.375% | 4/14/50 | GBP | 452 | 295 |
| | Santander UK Group Holdings plc | 0.391% | 2/28/25 | EUR | 3,234 | 3,020 |
| | Santander UK Group Holdings plc | 3.625% | 1/14/26 | GBP | 8,099 | 8,523 |
| | Santander UK Group Holdings plc | 2.920% | 5/8/26 | GBP | 6,999 | 7,350 |
| | Santander UK Group Holdings plc | 2.421% | 1/17/29 | GBP | 3,400 | 3,156 |
| | Santander UK Group Holdings plc | 0.603% | 9/13/29 | EUR | 13,042 | 9,842 |
| | Santander UK plc | 0.100% | 5/12/24 | EUR | 9,725 | 9,223 |
| | Santander UK plc | 1.250% | 9/18/24 | EUR | 3,324 | 3,186 |
| | Santander UK plc | 0.500% | 1/10/25 | EUR | 3,956 | 3,703 |
| | Santander UK plc | 5.750% | 3/2/26 | GBP | 2,843 | 3,385 |
| | Santander UK plc | 5.250% | 2/16/29 | GBP | 4,696 | 5,446 |
| | Santander UK plc | 3.875% | 10/15/29 | GBP | 7,552 | 7,818 |
| 1 | Saxon Weald Capital plc | 5.375% | 6/6/42 | GBP | 281 | 308 |
| | Scotland Gas Networks plc | 3.250% | 3/8/27 | GBP | 1,655 | 1,737 |
| | Scotland Gas Networks plc | 4.875% | 12/21/34 | GBP | 502 | 519 |
| | Scottish Hydro Electric Transmission plc | 2.250% | 9/27/35 | GBP | 200 | 157 |
| | Scottish Widows Ltd. | 7.000% | 6/16/43 | GBP | 2,000 | 2,260 |
| | Segro Capital Sarl | 0.500% | 9/22/31 | EUR | 4,276 | 2,734 |
| | Segro plc | 2.375% | 10/11/29 | GBP | 642 | 599 |
| | Segro plc | 2.875% | 10/11/37 | GBP | 1,600 | 1,315 |
| | Severn Trent Utilities Finance plc | 3.625% | 1/16/26 | GBP | 2,688 | 2,925 |
| | Severn Trent Utilities Finance plc | 2.750% | 12/5/31 | GBP | 687 | 640 |
| | Severn Trent Utilities Finance plc | 2.000% | 6/2/40 | GBP | 542 | 379 |
| | Severn Trent Utilities Finance plc | 4.875% | 1/24/42 | GBP | 2,249 | 2,382 |
| | Skipton Building Society | 2.000% | 10/2/26 | GBP | 300 | 306 |
| | Sky Ltd. | 1.875% | 11/24/23 | EUR | 2,683 | 2,617 |
| | Sky Ltd. | 2.250% | 11/17/25 | EUR | 200 | 191 |
| | Sky Ltd. | 2.500% | 9/15/26 | EUR | 22,426 | 21,295 |
| | Sky Ltd. | 6.000% | 5/21/27 | GBP | 50 | 59 |
| | Sky Ltd. | 4.000% | 11/26/29 | GBP | 2,366 | 2,507 |
| | Smith & Nephew plc | 4.565% | 10/11/29 | EUR | 1,000 | 980 |
| | Society of Lloyd's | 4.875% | 2/7/47 | GBP | 1,321 | 1,364 |
| | South Eastern Power Networks plc | 5.500% | 6/5/26 | GBP | 238 | 272 |
| | South Eastern Power Networks plc | 5.625% | 9/30/30 | GBP | 1,251 | 1,432 |
| | South Eastern Power Networks plc | 6.375% | 11/12/31 | GBP | 1,387 | 1,669 |
| | South Eastern Power Networks plc | 1.750% | 9/30/34 | GBP | 1,315 | 1,022 |
| | Southern Electric Power Distribution plc | 4.625% | 2/20/37 | GBP | 3,736 | 3,717 |
| | Southern Gas Networks plc | 2.500% | 2/3/25 | GBP | 2,265 | 2,448 |
Total International Bond II Index Fund
| | | Coupon | Maturity
Date | Currency | Face
Amount
(000) | Market
Value•
($000) |
| | Southern Gas Networks plc | 6.375% | 5/15/40 | GBP | 82 | 96 |
| | Southern Housing Group Ltd. | 3.500% | 10/19/47 | GBP | 777 | 645 |
| | Southern Water Services Finance Ltd. | 6.640% | 3/31/26 | GBP | 11,362 | 13,372 |
| | Southern Water Services Finance Ltd. | 1.625% | 3/30/27 | GBP | 10,186 | 9,776 |
| | Southern Water Services Finance Ltd. | 6.192% | 3/31/29 | GBP | 1,464 | 1,710 |
| | Southern Water Services Finance Ltd. | 3.000% | 5/28/37 | GBP | 1,500 | 1,195 |
| | Southern Water Services Finance Ltd. | 4.500% | 3/31/52 | GBP | 50 | 49 |
| | Southern Water Services Finance Ltd. | 5.125% | 9/30/56 | GBP | 50 | 54 |
| | Sovereign Housing Capital plc | 4.768% | 6/1/43 | GBP | 100 | 106 |
| | Sovereign Housing Capital plc | 2.375% | 11/4/48 | GBP | 2,455 | 1,668 |
| | SP Distribution plc | 5.875% | 7/17/26 | GBP | 687 | 792 |
| | SP Manweb plc | 4.875% | 9/20/27 | GBP | 100 | 110 |
| | SSE plc | 1.250% | 4/16/25 | EUR | 6,321 | 5,904 |
| | SSE plc | 0.875% | 9/6/25 | EUR | 822 | 754 |
| | SSE plc | 8.375% | 11/20/28 | GBP | 1,518 | 1,947 |
| | SSE plc | 1.750% | 4/16/30 | EUR | 9,500 | 7,845 |
| | SSE plc | 6.250% | 8/27/38 | GBP | 3,272 | 3,791 |
| | SSE plc | 4.000% | Perpetual | EUR | 3,467 | 3,026 |
| | Stagecoach Group plc | 4.000% | 9/29/25 | GBP | 100 | 106 |
| | Standard Chartered plc | 2.900% | 6/28/25 | AUD | 2,000 | 1,223 |
| | Standard Chartered plc | 1.625% | 10/3/27 | EUR | 347 | 303 |
| | Standard Chartered plc | 0.850% | 1/27/28 | EUR | 2,908 | 2,407 |
| | Standard Chartered plc | 1.200% | 9/23/31 | EUR | 100 | 80 |
| | Standard Chartered plc | 4.375% | 1/18/38 | GBP | 1,455 | 1,476 |
| | Student Finance plc | 2.666% | 9/30/29 | GBP | 777 | 834 |
| | Sunderland SHG Finance plc | 6.380% | 3/31/42 | GBP | 65 | 78 |
| 1 | TC Dudgeon Ofto plc | 3.158% | 11/12/38 | GBP | 442 | 426 |
| 1 | Telereal Secured Finance plc | 4.010% | 12/10/33 | GBP | 1,226 | 1,287 |
| 1 | Telereal Securitisation plc | 6.165% | 12/10/33 | GBP | 292 | 332 |
| | Tesco Corporate Treasury Services plc | 0.875% | 5/29/26 | EUR | 4,958 | 4,321 |
| | Tesco Corporate Treasury Services plc | 1.875% | 11/2/28 | GBP | 2,000 | 1,781 |
| | Tesco Corporate Treasury Services plc | 0.375% | 7/27/29 | EUR | 2,000 | 1,459 |
| 1 | Tesco Property Finance 1 plc | 7.623% | 7/13/39 | GBP | 930 | 1,120 |
| 1 | Tesco Property Finance 2 plc | 6.052% | 10/13/39 | GBP | 1,531 | 1,654 |
| 1 | Tesco Property Finance 3 plc | 5.744% | 4/13/40 | GBP | 2,248 | 2,313 |
| 1 | Tesco Property Finance 4 plc | 5.801% | 10/13/40 | GBP | 2,840 | 2,963 |
| 1 | Tesco Property Finance 6 plc | 5.411% | 7/13/44 | GBP | 2,775 | 2,760 |
| | Thames Water Utilities Finance plc | 1.875% | 1/24/24 | GBP | 777 | 854 |
| | Thames Water Utilities Finance plc | 2.875% | 12/12/24 | CAD | 829 | 578 |
| | Thames Water Utilities Finance plc | 4.000% | 6/19/25 | GBP | 3,910 | 4,315 |
| | Thames Water Utilities Finance plc | 0.875% | 1/31/28 | EUR | 5,400 | 4,418 |
| | Thames Water Utilities Finance plc | 3.500% | 2/25/28 | GBP | 687 | 698 |
| | Thames Water Utilities Finance plc | 6.750% | 11/16/28 | GBP | 1,750 | 2,068 |
| | Thames Water Utilities Finance plc | 2.625% | 1/24/32 | GBP | 993 | 874 |
| | Thames Water Utilities Finance plc | 1.250% | 1/31/32 | EUR | 2,500 | 1,814 |
| | Thames Water Utilities Finance plc | 6.500% | 2/9/32 | GBP | 2,300 | 2,710 |
| | Thames Water Utilities Finance plc | 4.375% | 7/3/34 | GBP | 1,362 | 1,341 |
| | Thames Water Utilities Finance plc | 5.125% | 9/28/37 | GBP | 2,686 | 2,748 |
| | Thames Water Utilities Finance plc | 2.375% | 4/22/40 | GBP | 3,401 | 2,333 |
| | Thames Water Utilities Finance plc | 5.500% | 2/11/41 | GBP | 3,674 | 3,868 |
| | Thames Water Utilities Finance plc | 4.625% | 6/4/46 | GBP | 2,538 | 2,357 |
| | Thames Water Utilities Finance plc | 7.738% | 4/9/58 | GBP | 497 | 721 |
| | THFC Funding No. 2 plc | 6.350% | 7/8/41 | GBP | 1,184 | 1,463 |
| | THFC Funding No. 2 plc | 5.200% | 10/11/43 | GBP | 7,737 | 8,410 |
| | Together Housing Finance plc | 4.500% | 12/17/42 | GBP | 1,400 | 1,402 |
| | Tritax Big Box REIT plc | 1.500% | 11/27/33 | GBP | 1,500 | 1,083 |
| | Tritax EuroBox plc | 0.950% | 6/2/26 | EUR | 1,796 | 1,423 |
| | Unilever Finance Netherlands BV | 1.250% | 3/25/25 | EUR | 9,725 | 9,236 |
| | Unilever Finance Netherlands BV | 1.125% | 2/12/27 | EUR | 4,958 | 4,519 |
| | Unilever Finance Netherlands BV | 1.375% | 7/31/29 | EUR | 2,592 | 2,269 |
| | Unilever Finance Netherlands BV | 1.750% | 3/25/30 | EUR | 4,913 | 4,381 |
| | Unilever Finance Netherlands BV | 1.375% | 9/4/30 | EUR | 687 | 592 |
| | Unilever plc | 1.500% | 7/22/26 | GBP | 100 | 102 |
| | Unilever plc | 1.500% | 6/11/39 | EUR | 2,547 | 1,846 |
| | UNITE Group plc | 3.500% | 10/15/28 | GBP | 1,296 | 1,225 |
| | UNITE USAF II plc | 3.921% | 6/30/30 | GBP | 1,859 | 2,025 |
| | United Utilities Water Finance plc | 2.000% | 2/14/25 | GBP | 6,443 | 6,914 |
| | United Utilities Water Finance plc | 0.875% | 10/28/29 | GBP | 751 | 640 |
| | United Utilities Water Finance plc | 2.625% | 2/12/31 | GBP | 5,866 | 5,532 |
Total International Bond II Index Fund
| | | Coupon | Maturity
Date | Currency | Face
Amount
(000) | Market
Value•
($000) |
| | United Utilities Water Finance plc | 2.000% | 7/3/33 | GBP | 1,004 | 844 |
| | United Utilities Water Finance plc | 1.875% | 6/3/42 | GBP | 235 | 158 |
| | United Utilities Water Ltd. | 5.625% | 12/20/27 | GBP | 3,321 | 3,834 |
| | University College London | 1.625% | 6/4/61 | GBP | 2,200 | 1,319 |
| | University of Cambridge | 3.750% | 10/17/52 | GBP | 406 | 411 |
| | University of Cambridge | 2.350% | 6/27/78 | GBP | 1,452 | 1,011 |
| | University of Leeds | 3.125% | 12/19/50 | GBP | 2,100 | 1,771 |
| | University of Liverpool | 3.375% | 6/25/55 | GBP | 100 | 91 |
| | University of Manchester | 4.250% | 7/4/53 | GBP | 957 | 1,004 |
| | University of Oxford | 2.544% | 12/8/17 | GBP | 4,459 | 3,000 |
| | Urenco Finance NV | 2.375% | 12/2/24 | EUR | 1,906 | 1,831 |
| | Utmost Group plc | 4.000% | 12/15/31 | GBP | 2,000 | 1,613 |
| | Virgin Money UK plc | 2.875% | 6/24/25 | EUR | 3,100 | 2,920 |
| | Virgin Money UK plc | 3.375% | 4/24/26 | GBP | 7,658 | 7,896 |
| | Virgin Money UK plc | 4.000% | 9/25/26 | GBP | 3,200 | 3,332 |
| | Virgin Money UK plc | 4.000% | 9/3/27 | GBP | 2,728 | 2,724 |
| | Virgin Money UK plc | 5.125% | 12/11/30 | GBP | 1,555 | 1,618 |
| | Vodafone Group plc | 0.500% | 1/30/24 | EUR | 200 | 192 |
| | Vodafone Group plc | 1.875% | 9/11/25 | EUR | 9,725 | 9,216 |
| | Vodafone Group plc | 1.125% | 11/20/25 | EUR | 12,277 | 11,376 |
| | Vodafone Group plc | 5.625% | 12/4/25 | GBP | 586 | 682 |
| | Vodafone Group plc | 2.200% | 8/25/26 | EUR | 2,251 | 2,130 |
| | Vodafone Group plc | 1.500% | 7/24/27 | EUR | 4,401 | 3,999 |
| | Vodafone Group plc | 4.200% | 12/13/27 | AUD | 4,590 | 2,747 |
| | Vodafone Group plc | 1.875% | 11/20/29 | EUR | 2,000 | 1,756 |
| | Vodafone Group plc | 1.625% | 11/24/30 | EUR | 5,761 | 4,861 |
| | Vodafone Group plc | 1.600% | 7/29/31 | EUR | 10,300 | 8,502 |
| | Vodafone Group plc | 5.900% | 11/26/32 | GBP | 4,110 | 4,871 |
| | Vodafone Group plc | 2.875% | 11/20/37 | EUR | 4,654 | 3,797 |
| | Vodafone Group plc | 2.500% | 5/24/39 | EUR | 3,931 | 2,907 |
| | Vodafone Group plc | 3.375% | 8/8/49 | GBP | 3,709 | 2,956 |
| | Vodafone Group plc | 3.000% | 8/12/56 | GBP | 3,848 | 2,748 |
| | Wales & West Utilities Finance plc | 5.750% | 3/29/30 | GBP | 2,457 | 2,821 |
| | Wales & West Utilities Finance plc | 3.000% | 8/3/38 | GBP | 777 | 644 |
| | Wellcome Trust Finance plc | 4.625% | 7/25/36 | GBP | 3,716 | 4,245 |
| | Wellcome Trust Ltd. | 4.000% | 5/9/59 | GBP | 1,093 | 1,223 |
| | Wellcome Trust Ltd. | 1.500% | 7/14/71 | GBP | 1,000 | 539 |
| | Wellcome Trust Ltd. | 2.517% | 2/7/18 | GBP | 2,141 | 1,437 |
| | Wessex Water Services Finance plc | 5.375% | 3/10/28 | GBP | 316 | 353 |
| | Wessex Water Services Finance plc | 1.250% | 1/12/36 | GBP | 1,786 | 1,184 |
| | Western Power Distribution East Midlands plc | 1.750% | 9/9/31 | GBP | 1,000 | 833 |
| | Western Power Distribution South Wales plc | 1.625% | 10/7/35 | GBP | 2,486 | 1,779 |
| | Western Power Distribution South Wales plc | 5.750% | 3/23/40 | GBP | 1,100 | 1,213 |
| | Western Power Distribution South West plc | 5.875% | 3/25/27 | GBP | 1,073 | 1,226 |
| | Western Power Distribution South West plc | 5.750% | 3/23/40 | GBP | 850 | 940 |
| | Western Power Distribution West Midlands plc | 3.875% | 10/17/24 | GBP | 3,369 | 3,743 |
| | Western Power Distribution West Midlands plc | 5.750% | 4/16/32 | GBP | 2,728 | 3,107 |
| | Westfield Stratford City Finance No. 2 plc | 1.642% | 8/4/31 | GBP | 1,228 | 1,209 |
| | Wheatley Group Capital plc | 4.375% | 11/28/44 | GBP | 1,131 | 1,098 |
| | WHG Treasury plc | 4.250% | 10/6/45 | GBP | 1,906 | 1,892 |
| 1 | Wods Transmission plc | 3.446% | 8/24/34 | GBP | 76 | 78 |
| | WPP Finance 2013 | 2.875% | 9/14/46 | GBP | 1,393 | 910 |
| | WPP Finance 2016 | 1.375% | 3/20/25 | EUR | 6,908 | 6,448 |
| | WPP Finance 2017 | 3.750% | 5/19/32 | GBP | 2,067 | 1,947 |
| | WPP Finance Deutschland GmbH | 1.625% | 3/23/30 | EUR | 3,769 | 3,062 |
| | WPP Finance SA | 2.250% | 9/22/26 | EUR | 100 | 92 |
| | WPP Finance SA | 2.375% | 5/19/27 | EUR | 5,947 | 5,461 |
| | Wrekin Housing Group Ltd. | 2.500% | 10/22/48 | GBP | 1,000 | 680 |
| | Yorkshire Building Society | 3.000% | 4/18/25 | GBP | 1,184 | 1,294 |
| | Yorkshire Building Society | 0.625% | 9/21/25 | EUR | 4,377 | 3,896 |
| | Yorkshire Building Society | 3.500% | 4/21/26 | GBP | 597 | 639 |
| | Yorkshire Building Society | 0.010% | 10/13/27 | EUR | 16,178 | 13,690 |
| | Yorkshire Building Society | 0.500% | 7/1/28 | EUR | 6,981 | 5,502 |
| | Yorkshire Building Society | 3.375% | 9/13/28 | GBP | 9,610 | 9,064 |
| | Yorkshire Building Society | 1.500% | 9/15/29 | GBP | 2,786 | 2,391 |
| | Yorkshire Housing Finance plc | 4.125% | 10/31/44 | GBP | 1,791 | 1,666 |
| | Yorkshire Power Finance Ltd. | 7.250% | 8/4/28 | GBP | 51 | 63 |
| | Yorkshire Water Finance plc | 3.625% | 8/1/29 | GBP | 3,188 | 3,243 |
| | Yorkshire Water Finance plc | 6.375% | 8/19/39 | GBP | 574 | 698 |
Total International Bond II Index Fund
| | | Coupon | Maturity
Date | Currency | Face
Amount
(000) | Market
Value•
($000) |
| | Yorkshire Water Finance plc | 2.750% | 4/18/41 | GBP | 6,739 | 5,233 |
| | Yorkshire Water Services Finance Ltd. | 5.500% | 5/28/37 | GBP | 400 | 452 |
| | | | | | | 2,039,839 |
| United States (2.9%) | | | |
| | 3M Co. | 1.500% | 11/9/26 | EUR | 100 | 92 |
| | 3M Co. | 1.750% | 5/15/30 | EUR | 831 | 700 |
| | Abbott Ireland Financing DAC | 1.500% | 9/27/26 | EUR | 8,733 | 8,117 |
| | Abbott Ireland Financing DAC | 0.375% | 11/19/27 | EUR | 4,913 | 4,232 |
| | AbbVie Inc. | 1.500% | 11/15/23 | EUR | 642 | 625 |
| | AbbVie Inc. | 1.375% | 5/17/24 | EUR | 6,516 | 6,267 |
| | AbbVie Inc. | 1.250% | 6/1/24 | EUR | 9,913 | 9,484 |
| | AbbVie Inc. | 0.750% | 11/18/27 | EUR | 3,057 | 2,615 |
| | AbbVie Inc. | 2.625% | 11/15/28 | EUR | 1,004 | 934 |
| | AbbVie Inc. | 2.125% | 11/17/28 | EUR | 9,681 | 8,701 |
| | AbbVie Inc. | 2.125% | 6/1/29 | EUR | 6,341 | 5,718 |
| | AbbVie Inc. | 1.250% | 11/18/31 | EUR | 1,184 | 948 |
| | Air Lease Corp. | 2.625% | 12/5/24 | CAD | 4,037 | 2,774 |
| | Air Products and Chemicals Inc. | 1.000% | 2/12/25 | EUR | 1,607 | 1,510 |
| | Air Products and Chemicals Inc. | 0.500% | 5/5/28 | EUR | 1,815 | 1,515 |
| | Air Products and Chemicals Inc. | 0.800% | 5/5/32 | EUR | 1,647 | 1,211 |
| | Altria Group Inc. | 1.700% | 6/15/25 | EUR | 1,499 | 1,393 |
| | Altria Group Inc. | 2.200% | 6/15/27 | EUR | 6,164 | 5,363 |
| | Altria Group Inc. | 3.125% | 6/15/31 | EUR | 9,320 | 7,525 |
| | American Honda Finance Corp. | 1.375% | 11/10/22 | EUR | 2,501 | 2,471 |
| | American Honda Finance Corp. | 0.750% | 1/17/24 | EUR | 3,550 | 3,409 |
| | American Honda Finance Corp. | 0.750% | 11/25/26 | GBP | 3,234 | 3,100 |
| | American Honda Finance Corp. | 0.300% | 7/7/28 | EUR | 5,100 | 4,165 |
| | American International Group Inc. | 1.875% | 6/21/27 | EUR | 2,592 | 2,296 |
| | American Medical Systems Europe BV | 1.625% | 3/8/31 | EUR | 12,500 | 10,333 |
| | American Medical Systems Europe BV | 1.875% | 3/8/34 | EUR | 5,700 | 4,493 |
| | American Tower Corp. | 1.950% | 5/22/26 | EUR | 9,811 | 8,967 |
| | American Tower Corp. | 0.450% | 1/15/27 | EUR | 6,882 | 5,729 |
| | American Tower Corp. | 0.400% | 2/15/27 | EUR | 1,857 | 1,532 |
| | American Tower Corp. | 0.500% | 1/15/28 | EUR | 5,757 | 4,567 |
| | American Tower Corp. | 0.875% | 5/21/29 | EUR | 4,765 | 3,672 |
| | American Tower Corp. | 0.950% | 10/5/30 | EUR | 2,998 | 2,182 |
| | American Tower Corp. | 1.250% | 5/21/33 | EUR | 1,000 | 698 |
| | Amgen Inc. | 2.000% | 2/25/26 | EUR | 1,274 | 1,207 |
| | Amgen Inc. | 5.500% | 12/7/26 | GBP | 2,186 | 2,522 |
| | Amgen Inc. | 4.000% | 9/13/29 | GBP | 2,231 | 2,368 |
| | Amphenol Technologies Holding GmbH | 2.000% | 10/8/28 | EUR | 2,000 | 1,787 |
| | Aon plc | 2.875% | 5/14/26 | EUR | 1,635 | 1,541 |
| | Apple Inc. | 3.350% | 1/10/24 | AUD | 290 | 184 |
| | Apple Inc. | 1.375% | 1/17/24 | EUR | 758 | 740 |
| | Apple Inc. | 2.513% | 8/19/24 | CAD | 13,875 | 9,818 |
| | Apple Inc. | 0.875% | 5/24/25 | EUR | 16,289 | 15,367 |
| | Apple Inc. | 0.000% | 11/15/25 | EUR | 4,420 | 4,022 |
| | Apple Inc. | 3.600% | 6/10/26 | AUD | 940 | 581 |
| | Apple Inc. | 2.000% | 9/17/27 | EUR | 3,496 | 3,305 |
| | Apple Inc. | 1.375% | 5/24/29 | EUR | 9,260 | 8,264 |
| | Apple Inc. | 0.750% | 2/25/30 | CHF | 2,700 | 2,469 |
| | Apple Inc. | 0.500% | 11/15/31 | EUR | 2,587 | 2,047 |
| | Apple Inc. | 3.600% | 7/31/42 | GBP | 1,564 | 1,547 |
| | Aptiv plc | 1.500% | 3/10/25 | EUR | 5,925 | 5,507 |
| | Archer-Daniels-Midland Co. | 1.750% | 6/23/23 | EUR | 4,913 | 4,821 |
| | Archer-Daniels-Midland Co. | 1.000% | 9/12/25 | EUR | 7,640 | 7,088 |
| | AT&T Inc. | 2.400% | 3/15/24 | EUR | 2,676 | 2,610 |
| | AT&T Inc. | 2.850% | 5/25/24 | CAD | 2,000 | 1,418 |
| | AT&T Inc. | 1.375% | 12/4/24 | CHF | 130 | 129 |
| | AT&T Inc. | 4.000% | 11/25/25 | CAD | 5,233 | 3,706 |
| | AT&T Inc. | 3.500% | 12/17/25 | EUR | 2,366 | 2,331 |
| | AT&T Inc. | 4.100% | 1/19/26 | AUD | 250 | 155 |
| | AT&T Inc. | 0.250% | 3/4/26 | EUR | 1,276 | 1,132 |
| | AT&T Inc. | 2.900% | 12/4/26 | GBP | 1,344 | 1,391 |
| | AT&T Inc. | 5.500% | 3/15/27 | GBP | 750 | 850 |
| | AT&T Inc. | 1.600% | 5/19/28 | EUR | 9,496 | 8,398 |
| | AT&T Inc. | 4.600% | 9/19/28 | AUD | 5,060 | 3,062 |
| | AT&T Inc. | 2.350% | 9/5/29 | EUR | 6,931 | 6,215 |
| | AT&T Inc. | 4.375% | 9/14/29 | GBP | 2,300 | 2,417 |
Total International Bond II Index Fund
| | | Coupon | Maturity
Date | Currency | Face
Amount
(000) | Market
Value•
($000) |
| | AT&T Inc. | 0.800% | 3/4/30 | EUR | 1,906 | 1,508 |
| | AT&T Inc. | 2.050% | 5/19/32 | EUR | 2,796 | 2,327 |
| | AT&T Inc. | 3.550% | 12/17/32 | EUR | 6,896 | 6,395 |
| | AT&T Inc. | 5.200% | 11/18/33 | GBP | 1,528 | 1,671 |
| | AT&T Inc. | 3.375% | 3/15/34 | EUR | 1,364 | 1,219 |
| | AT&T Inc. | 2.450% | 3/15/35 | EUR | 2,501 | 1,987 |
| | AT&T Inc. | 3.150% | 9/4/36 | EUR | 11,534 | 9,769 |
| | AT&T Inc. | 2.600% | 5/19/38 | EUR | 5,399 | 4,168 |
| | AT&T Inc. | 1.800% | 9/14/39 | EUR | 1,000 | 668 |
| | AT&T Inc. | 7.000% | 4/30/40 | GBP | 4,850 | 6,190 |
| | AT&T Inc. | 4.250% | 6/1/43 | GBP | 6,514 | 6,046 |
| | AT&T Inc. | 4.875% | 6/1/44 | GBP | 1,376 | 1,390 |
| | AT&T Inc. | 4.850% | 5/25/47 | CAD | 5,613 | 3,432 |
| | AT&T Inc. | 5.100% | 11/25/48 | CAD | 2,850 | 1,804 |
| | Athene Global Funding | 3.127% | 3/10/25 | CAD | 2,000 | 1,380 |
| | Athene Global Funding | 2.100% | 9/24/25 | CAD | 1,372 | 907 |
| | Athene Global Funding | 0.366% | 9/10/26 | EUR | 11,786 | 9,859 |
| | Athene Global Funding | 0.832% | 1/8/27 | EUR | 8,500 | 7,124 |
| | Athene Global Funding | 1.750% | 11/24/27 | GBP | 9,981 | 9,096 |
| | Athene Global Funding | 0.625% | 1/12/28 | EUR | 15,713 | 12,418 |
| | Athene Global Funding | 2.470% | 6/9/28 | CAD | 2,356 | 1,455 |
| | Bank of America Corp. | 1.379% | 2/7/25 | EUR | 14,600 | 13,962 |
| | Bank of America Corp. | 2.932% | 4/25/25 | CAD | 4,703 | 3,328 |
| | Bank of America Corp. | 2.300% | 7/25/25 | GBP | 2,908 | 3,093 |
| | Bank of America Corp. | 3.407% | 9/20/25 | CAD | 3,071 | 2,170 |
| | Bank of America Corp. | 3.515% | 3/24/26 | CAD | 1,471 | 1,030 |
| | Bank of America Corp. | 0.808% | 5/9/26 | EUR | 17,256 | 15,663 |
| | Bank of America Corp. | 1.949% | 10/27/26 | EUR | 3,000 | 2,767 |
| | Bank of America Corp. | 4.250% | 12/10/26 | GBP | 2,196 | 2,397 |
| | Bank of America Corp. | 1.776% | 5/4/27 | EUR | 10,773 | 9,752 |
| | Bank of America Corp. | 1.978% | 9/15/27 | CAD | 4,404 | 2,830 |
| | Bank of America Corp. | 3.615% | 3/16/28 | CAD | 7,098 | 4,813 |
| | Bank of America Corp. | 1.662% | 4/25/28 | EUR | 1,100 | 962 |
| | Bank of America Corp. | 0.583% | 8/24/28 | EUR | 16,789 | 13,822 |
| | Bank of America Corp. | 3.648% | 3/31/29 | EUR | 2,289 | 2,168 |
| | Bank of America Corp. | 2.598% | 4/4/29 | CAD | 2,499 | 1,586 |
| | Bank of America Corp. | 1.667% | 6/2/29 | GBP | 9,000 | 8,264 |
| | Bank of America Corp. | 0.694% | 3/22/31 | EUR | 11,133 | 8,347 |
| | Bank of America Corp. | 3.584% | 4/27/31 | GBP | 200 | 196 |
| | Bank of America Corp. | 0.654% | 10/26/31 | EUR | 27,125 | 19,732 |
| | Bank of America Corp. | 1.102% | 5/24/32 | EUR | 2,000 | 1,484 |
| | Bank of America Corp. | 2.824% | 4/27/33 | EUR | 6,200 | 5,263 |
| | Baxter International Inc. | 1.300% | 5/30/25 | EUR | 7,068 | 6,616 |
| | Baxter International Inc. | 1.300% | 5/15/29 | EUR | 3,595 | 2,967 |
| | Becton Dickinson and Co. | 0.034% | 8/13/25 | EUR | 2,623 | 2,354 |
| | Becton Dickinson and Co. | 1.900% | 12/15/26 | EUR | 5,833 | 5,375 |
| | Becton Dickinson Euro Finance Sarl | 0.632% | 6/4/23 | EUR | 5,229 | 5,106 |
| | Becton Dickinson Euro Finance Sarl | 1.208% | 6/4/26 | EUR | 13,956 | 12,652 |
| | Becton Dickinson Euro Finance Sarl | 0.334% | 8/13/28 | EUR | 1,349 | 1,088 |
| | Becton Dickinson Euro Finance Sarl | 1.213% | 2/12/36 | EUR | 3,000 | 2,024 |
| | Becton Dickinson Euro Finance Sarl | 1.336% | 8/13/41 | EUR | 1,706 | 1,002 |
| | Berkshire Hathaway Finance Corp. | 2.000% | 3/18/34 | EUR | 3,200 | 2,555 |
| | Berkshire Hathaway Finance Corp. | 2.375% | 6/19/39 | GBP | 3,559 | 2,822 |
| | Berkshire Hathaway Finance Corp. | 2.625% | 6/19/59 | GBP | 1,725 | 1,238 |
| | Berkshire Hathaway Inc. | 0.750% | 3/16/23 | EUR | 452 | 445 |
| | Berkshire Hathaway Inc. | 1.300% | 3/15/24 | EUR | 5,093 | 4,901 |
| | Berkshire Hathaway Inc. | 0.170% | 9/13/24 | JPY | 780,000 | 5,203 |
| | Berkshire Hathaway Inc. | 1.125% | 3/16/27 | EUR | 7,574 | 6,700 |
| | Berkshire Hathaway Inc. | 2.150% | 3/15/28 | EUR | 4,200 | 3,819 |
| | Berkshire Hathaway Inc. | 0.440% | 9/13/29 | JPY | 2,690,000 | 17,204 |
| | Berkshire Hathaway Inc. | 0.437% | 4/15/31 | JPY | 500,000 | 3,157 |
| | Berkshire Hathaway Inc. | 1.625% | 3/16/35 | EUR | 4,408 | 3,272 |
| | Berkshire Hathaway Inc. | 1.108% | 9/13/49 | JPY | 470,000 | 2,534 |
| | Berry Global Inc. | 1.500% | 1/15/27 | EUR | 2,786 | 2,298 |
| | Blackstone Holdings Finance Co. LLC | 1.000% | 10/5/26 | EUR | 502 | 442 |
| | Blackstone Holdings Finance Co. LLC | 1.500% | 4/10/29 | EUR | 4,938 | 4,111 |
| 3 | Blackstone Holdings Finance Co. LLC | 3.500% | 6/1/34 | EUR | 3,800 | 3,282 |
| | Blackstone Holdings Finance Co. LLC | 3.500% | 6/1/34 | EUR | 2,000 | 1,727 |
| | Blackstone Private Credit Fund | 1.750% | 11/30/26 | EUR | 5,000 | 4,017 |
Total International Bond II Index Fund
| | | Coupon | Maturity
Date | Currency | Face
Amount
(000) | Market
Value•
($000) |
| | Booking Holdings Inc. | 2.375% | 9/23/24 | EUR | 1,906 | 1,853 |
| | Booking Holdings Inc. | 0.100% | 3/8/25 | EUR | 16,447 | 15,032 |
| | Booking Holdings Inc. | 1.800% | 3/3/27 | EUR | 5,275 | 4,778 |
| | Booking Holdings Inc. | 0.500% | 3/8/28 | EUR | 11,594 | 9,591 |
| | BorgWarner Inc. | 1.000% | 5/19/31 | EUR | 4,629 | 3,273 |
| | Boston Scientific Corp. | 0.625% | 12/1/27 | EUR | 2,434 | 2,076 |
| | Bristol-Myers Squibb Co. | 1.000% | 5/15/25 | EUR | 835 | 786 |
| | Bristol-Myers Squibb Co. | 1.750% | 5/15/35 | EUR | 1,906 | 1,490 |
| | Brown-Forman Corp. | 1.200% | 7/7/26 | EUR | 1,256 | 1,147 |
| | Brown-Forman Corp. | 2.600% | 7/7/28 | GBP | 4,607 | 4,565 |
| | Bunge Finance Europe BV | 1.850% | 6/16/23 | EUR | 7,626 | 7,461 |
| | Capital One Financial Corp. | 1.650% | 6/12/29 | EUR | 5,803 | 4,479 |
| | Celanese US Holdings LLC | 4.777% | 7/19/26 | EUR | 2,500 | 2,322 |
| | Celanese US Holdings LLC | 2.125% | 3/1/27 | EUR | 3,866 | 3,097 |
| | Celanese US Holdings LLC | 0.625% | 9/10/28 | EUR | 1,510 | 1,015 |
| | Celanese US Holdings LLC | 5.337% | 1/19/29 | EUR | 1,156 | 1,019 |
| | Chubb INA Holdings Inc. | 0.300% | 12/15/24 | EUR | 957 | 882 |
| | Chubb INA Holdings Inc. | 1.550% | 3/15/28 | EUR | 4,535 | 3,931 |
| | Chubb INA Holdings Inc. | 0.875% | 12/15/29 | EUR | 3,188 | 2,489 |
| | Chubb INA Holdings Inc. | 1.400% | 6/15/31 | EUR | 2,366 | 1,839 |
| | Chubb INA Holdings Inc. | 2.500% | 3/15/38 | EUR | 6,175 | 4,545 |
| | Citigroup Inc. | 2.750% | 1/24/24 | GBP | 5,590 | 6,241 |
| | Citigroup Inc. | 2.375% | 5/22/24 | EUR | 1,004 | 973 |
| | Citigroup Inc. | 4.090% | 6/9/25 | CAD | 1,599 | 1,126 |
| | Citigroup Inc. | 2.400% | 10/31/25 | JPY | 3,164,500 | 21,829 |
| | Citigroup Inc. | 1.250% | 7/6/26 | EUR | 5,400 | 4,940 |
| | Citigroup Inc. | 1.500% | 7/24/26 | EUR | 9,461 | 8,694 |
| | Citigroup Inc. | 2.125% | 9/10/26 | EUR | 2,637 | 2,394 |
| | Citigroup Inc. | 1.750% | 10/23/26 | GBP | 5,455 | 5,389 |
| | Citigroup Inc. | 2.800% | 6/25/27 | JPY | 63,400 | 452 |
| | Citigroup Inc. | 0.500% | 10/8/27 | EUR | 18,367 | 15,633 |
| | Citigroup Inc. | 1.625% | 3/21/28 | EUR | 3,000 | 2,598 |
| | Citigroup Inc. | 1.250% | 4/10/29 | EUR | 1,455 | 1,185 |
| | Citigroup Inc. | 4.500% | 3/3/31 | GBP | 502 | 497 |
| | Citigroup Inc. | 6.800% | 6/25/38 | GBP | 2,079 | 2,728 |
| | Citigroup Inc. | 7.375% | 9/1/39 | GBP | 262 | 362 |
| | Coca-Cola Co. | 0.500% | 3/8/24 | EUR | 2,818 | 2,697 |
| | Coca-Cola Co. | 3.250% | 6/11/24 | AUD | 840 | 527 |
| | Coca-Cola Co. | 1.125% | 3/9/27 | EUR | 6,412 | 5,818 |
| | Coca-Cola Co. | 0.125% | 3/9/29 | EUR | 2,911 | 2,366 |
| | Coca-Cola Co. | 0.125% | 3/15/29 | EUR | 4,600 | 3,738 |
| | Coca-Cola Co. | 0.400% | 5/6/30 | EUR | 5,670 | 4,532 |
| | Coca-Cola Co. | 0.500% | 3/9/33 | EUR | 3,129 | 2,310 |
| | Coca-Cola Co. | 0.375% | 3/15/33 | EUR | 8,413 | 6,082 |
| | Coca-Cola Co. | 1.625% | 3/9/35 | EUR | 2,750 | 2,203 |
| | Coca-Cola Co. | 0.950% | 5/6/36 | EUR | 3,356 | 2,376 |
| | Coca-Cola Co. | 0.800% | 3/15/40 | EUR | 3,013 | 1,877 |
| | Colgate-Palmolive Co. | 0.500% | 3/6/26 | EUR | 4,957 | 4,511 |
| | Colgate-Palmolive Co. | 0.300% | 11/10/29 | EUR | 5,000 | 4,074 |
| | Colgate-Palmolive Co. | 1.375% | 3/6/34 | EUR | 1,274 | 1,031 |
| | Colgate-Palmolive Co. | 0.875% | 11/12/39 | EUR | 217 | 144 |
| | Comcast Corp. | 0.000% | 9/14/26 | EUR | 3,606 | 3,119 |
| | Comcast Corp. | 1.500% | 2/20/29 | GBP | 3,269 | 2,984 |
| | Comcast Corp. | 0.250% | 9/14/29 | EUR | 6,118 | 4,850 |
| | Comcast Corp. | 5.500% | 11/23/29 | GBP | 1,956 | 2,265 |
| | Comcast Corp. | 0.750% | 2/20/32 | EUR | 2,500 | 1,909 |
| | Comcast Corp. | 1.875% | 2/20/36 | GBP | 3,542 | 2,800 |
| | Comcast Corp. | 1.250% | 2/20/40 | EUR | 4,702 | 3,114 |
| | Corning Inc. | 0.992% | 8/10/27 | JPY | 870,000 | 5,687 |
| | Danaher Corp. | 1.700% | 3/30/24 | EUR | 317 | 306 |
| | Danaher Corp. | 2.500% | 3/30/30 | EUR | 5,590 | 5,121 |
| | DH Europe Finance II Sarl | 0.200% | 3/18/26 | EUR | 7,504 | 6,666 |
| | DH Europe Finance II Sarl | 0.450% | 3/18/28 | EUR | 1,590 | 1,334 |
| | DH Europe Finance II Sarl | 0.750% | 9/18/31 | EUR | 3,685 | 2,832 |
| | DH Europe Finance II Sarl | 1.350% | 9/18/39 | EUR | 5,275 | 3,502 |
| | DH Europe Finance II Sarl | 1.800% | 9/18/49 | EUR | 2,908 | 1,838 |
| | Digital Dutch Finco BV | 1.500% | 3/15/30 | EUR | 2,500 | 1,861 |
| | Digital Dutch Finco BV | 1.250% | 2/1/31 | EUR | 8,684 | 6,012 |
| | Digital Euro Finco LLC | 2.625% | 4/15/24 | EUR | 2,501 | 2,376 |
Total International Bond II Index Fund
| | | Coupon | Maturity
Date | Currency | Face
Amount
(000) | Market
Value•
($000) |
| | Digital Euro Finco LLC | 1.125% | 4/9/28 | EUR | 12,633 | 9,835 |
| | Digital Intrepid Holding BV | 0.625% | 7/15/31 | EUR | 1,200 | 775 |
| �� | Digital Stout Holding LLC | 4.250% | 1/17/25 | GBP | 1,093 | 1,197 |
| | Digital Stout Holding LLC | 3.300% | 7/19/29 | GBP | 4,938 | 4,566 |
| | Digital Stout Holding LLC | 3.750% | 10/17/30 | GBP | 1,906 | 1,778 |
| | Discovery Communications LLC | 2.500% | 9/20/24 | GBP | 3,685 | 3,957 |
| | Discovery Communications LLC | 1.900% | 3/19/27 | EUR | 8,701 | 7,333 |
| | Dover Corp. | 1.250% | 11/9/26 | EUR | 10,890 | 9,711 |
| | Dover Corp. | 0.750% | 11/4/27 | EUR | 5,100 | 4,311 |
| | Dow Chemical Co. | 0.500% | 3/15/27 | EUR | 8,778 | 7,336 |
| | Dow Chemical Co. | 1.125% | 3/15/32 | EUR | 4,000 | 2,796 |
| | Dow Chemical Co. | 1.875% | 3/15/40 | EUR | 2,360 | 1,397 |
| | Duke Energy Corp. | 3.100% | 6/15/28 | EUR | 10,450 | 9,606 |
| | Duke Energy Corp. | 3.850% | 6/15/34 | EUR | 8,400 | 7,357 |
| | DXC Capital Funding DAC | 0.450% | 9/15/27 | EUR | 2,903 | 2,362 |
| | DXC Capital Funding DAC | 0.950% | 9/15/31 | EUR | 4,171 | 3,038 |
| | DXC Technology Co. | 1.750% | 1/15/26 | EUR | 7,863 | 7,153 |
| | Eastman Chemical Co. | 1.500% | 5/26/23 | EUR | 4,913 | 4,792 |
| | Eastman Chemical Co. | 1.875% | 11/23/26 | EUR | 10,229 | 8,881 |
| | Eaton Capital Unlimited Co. | 0.697% | 5/14/25 | EUR | 8,062 | 7,448 |
| | Eaton Capital Unlimited Co. | 0.577% | 3/8/30 | EUR | 1,600 | 1,251 |
| | Ecolab Inc. | 1.000% | 1/15/24 | EUR | 3,739 | 3,597 |
| | Eli Lilly & Co. | 2.125% | 6/3/30 | EUR | 3,956 | 3,564 |
| | Eli Lilly & Co. | 0.500% | 9/14/33 | EUR | 4,000 | 2,934 |
| | Eli Lilly & Co. | 1.700% | 11/1/49 | EUR | 3,098 | 2,032 |
| | Eli Lilly & Co. | 1.375% | 9/14/61 | EUR | 3,000 | 1,546 |
| | Emerson Electric Co. | 0.375% | 5/22/24 | EUR | 1,025 | 964 |
| | Emerson Electric Co. | 1.250% | 10/15/25 | EUR | 3,004 | 2,775 |
| | Emerson Electric Co. | 2.000% | 10/15/29 | EUR | 1,004 | 875 |
| | Equinix Inc. | 0.250% | 3/15/27 | EUR | 2,086 | 1,729 |
| | Euronet Worldwide Inc. | 1.375% | 5/22/26 | EUR | 3,144 | 2,667 |
| | Exxon Mobil Corp. | 0.142% | 6/26/24 | EUR | 11,771 | 11,078 |
| | Exxon Mobil Corp. | 0.835% | 6/26/32 | EUR | 17,513 | 13,226 |
| | Exxon Mobil Corp. | 1.408% | 6/26/39 | EUR | 3,100 | 2,040 |
| | FedEx Corp. | 1.625% | 1/11/27 | EUR | 3,459 | 3,101 |
| | FedEx Corp. | 1.300% | 8/5/31 | EUR | 1,139 | 825 |
| | FedEx Corp. | 0.950% | 5/4/33 | EUR | 8,109 | 5,500 |
| | Fidelity National Information Services Inc. | 0.625% | 12/3/25 | EUR | 2,000 | 1,799 |
| | Fidelity National Information Services Inc. | 1.500% | 5/21/27 | EUR | 13,291 | 11,773 |
| | Fidelity National Information Services Inc. | 1.000% | 12/3/28 | EUR | 5,003 | 4,094 |
| | Fidelity National Information Services Inc. | 2.250% | 12/3/29 | GBP | 1,080 | 965 |
| | Fidelity National Information Services Inc. | 2.000% | 5/21/30 | EUR | 1,986 | 1,662 |
| | Fidelity National Information Services Inc. | 3.360% | 5/21/31 | GBP | 2,858 | 2,712 |
| | Fidelity National Information Services Inc. | 2.950% | 5/21/39 | EUR | 1,714 | 1,301 |
| | Fiserv Inc. | 2.250% | 7/1/25 | GBP | 100 | 105 |
| | Fiserv Inc. | 1.125% | 7/1/27 | EUR | 2,008 | 1,751 |
| | Fiserv Inc. | 1.625% | 7/1/30 | EUR | 6,415 | 5,201 |
| | Fiserv Inc. | 3.000% | 7/1/31 | GBP | 2,600 | 2,384 |
| | GE Capital Canada Funding Co. | 5.730% | 10/22/37 | CAD | 735 | 528 |
| | GE Capital European Funding Unlimited Co. | 6.025% | 3/1/38 | EUR | 1,341 | 1,506 |
| | GE Capital UK Funding Unlimited Co. | 5.875% | 1/18/33 | GBP | 4,959 | 5,679 |
| | General Electric Co. | 0.875% | 5/17/25 | EUR | 300 | 278 |
| | General Electric Co. | 1.500% | 5/17/29 | EUR | 4,771 | 4,039 |
| | General Electric Co. | 4.125% | 9/19/35 | EUR | 6,585 | 6,399 |
| | General Electric Co. | 2.125% | 5/17/37 | EUR | 3,706 | 2,798 |
| | General Electric Co. | 4.875% | 9/18/37 | GBP | 465 | 450 |
| | General Mills Inc. | 0.450% | 1/15/26 | EUR | 1,590 | 1,425 |
| | General Mills Inc. | 1.500% | 4/27/27 | EUR | 1,004 | 892 |
| | General Motors Financial Co. Inc. | 2.200% | 4/1/24 | EUR | 2,984 | 2,854 |
| | General Motors Financial Co. Inc. | 2.250% | 9/6/24 | GBP | 506 | 543 |
| | General Motors Financial Co. Inc. | 1.000% | 2/24/25 | EUR | 700 | 635 |
| | General Motors Financial Co. Inc. | 0.850% | 2/26/26 | EUR | 10,213 | 8,904 |
| | General Motors Financial Co. Inc. | 0.650% | 9/7/28 | EUR | 2,981 | 2,232 |
| | General Motors Financial of Canada Ltd. | 3.250% | 11/7/23 | CAD | 2,217 | 1,586 |
| | General Motors Financial of Canada Ltd. | 5.950% | 5/14/24 | CAD | 2,463 | 1,809 |
| | General Motors Financial of Canada Ltd. | 1.700% | 7/9/25 | CAD | 2,000 | 1,316 |
| | General Motors Financial of Canada Ltd. | 1.750% | 4/15/26 | CAD | 1,804 | 1,153 |
| | General Motors Financial of Canada Ltd. | 3.150% | 2/8/27 | CAD | 1,840 | 1,207 |
| | Goldman Sachs Group Inc. | 1.375% | 5/15/24 | EUR | 15,897 | 15,156 |
Total International Bond II Index Fund
| | | Coupon | Maturity
Date | Currency | Face
Amount
(000) | Market
Value•
($000) |
| | Goldman Sachs Group Inc. | 2.125% | 9/30/24 | EUR | 7,122 | 6,836 |
| | Goldman Sachs Group Inc. | 3.375% | 3/27/25 | EUR | 2,439 | 2,390 |
| | Goldman Sachs Group Inc. | 1.250% | 5/1/25 | EUR | 15,656 | 14,598 |
| | Goldman Sachs Group Inc. | 7.125% | 8/7/25 | GBP | 1,835 | 2,177 |
| | Goldman Sachs Group Inc. | 3.307% | 10/31/25 | CAD | 379 | 266 |
| | Goldman Sachs Group Inc. | 4.250% | 1/29/26 | GBP | 8,823 | 9,634 |
| | Goldman Sachs Group Inc. | 2.875% | 6/3/26 | EUR | 13,101 | 12,330 |
| | Goldman Sachs Group Inc. | 1.625% | 7/27/26 | EUR | 1,324 | 1,198 |
| | Goldman Sachs Group Inc. | 2.599% | 11/30/27 | CAD | 4,330 | 2,828 |
| | Goldman Sachs Group Inc. | 1.500% | 12/7/27 | GBP | 8,485 | 7,855 |
| | Goldman Sachs Group Inc. | 0.250% | 1/26/28 | EUR | 18,635 | 14,876 |
| | Goldman Sachs Group Inc. | 2.000% | 3/22/28 | EUR | 3,462 | 3,035 |
| | Goldman Sachs Group Inc. | 7.250% | 4/10/28 | GBP | 297 | 358 |
| | Goldman Sachs Group Inc. | 2.000% | 11/1/28 | EUR | 4,974 | 4,302 |
| | Goldman Sachs Group Inc. | 2.013% | 2/28/29 | CAD | 4,799 | 2,948 |
| | Goldman Sachs Group Inc. | 0.875% | 5/9/29 | EUR | 700 | 544 |
| | Goldman Sachs Group Inc. | 3.125% | 7/25/29 | GBP | 2,789 | 2,664 |
| | Goldman Sachs Group Inc. | 3.625% | 10/29/29 | GBP | 5,066 | 5,036 |
| | Goldman Sachs Group Inc. | 1.875% | 12/16/30 | GBP | 625 | 530 |
| | Goldman Sachs Group Inc. | 0.750% | 3/23/32 | EUR | 10,794 | 7,505 |
| | Goldman Sachs Group Inc. | 1.000% | 3/18/33 | EUR | 11,231 | 7,739 |
| | Goldman Sachs Group Inc. | 6.875% | 1/18/38 | GBP | 737 | 874 |
| | GSK Consumer Healthcare Capital NL BV | 1.250% | 3/29/26 | EUR | 4,500 | 4,093 |
| | GSK Consumer Healthcare Capital NL BV | 2.125% | 3/29/34 | EUR | 3,200 | 2,509 |
| | Harley-Davidson Financial Services Inc. | 3.875% | 5/19/23 | EUR | 3,067 | 3,039 |
| | HCN Canadian Holdings-1 LP | 2.950% | 1/15/27 | CAD | 883 | 576 |
| | Highland Holdings Sarl | 0.318% | 12/15/26 | EUR | 8,700 | 7,376 |
| | Honeywell International Inc. | 0.000% | 3/10/24 | EUR | 5,000 | 4,722 |
| | Honeywell International Inc. | 2.250% | 2/22/28 | EUR | 14,318 | 13,056 |
| | Honeywell International Inc. | 0.750% | 3/10/32 | EUR | 3,000 | 2,233 |
| | Honeywell International Inc. | 4.125% | 11/2/34 | EUR | 2,508 | 2,441 |
| | Illinois Tool Works Inc. | 0.250% | 12/5/24 | EUR | 2,321 | 2,146 |
| | Illinois Tool Works Inc. | 0.625% | 12/5/27 | EUR | 2,883 | 2,443 |
| | Illinois Tool Works Inc. | 2.125% | 5/22/30 | EUR | 12,280 | 10,636 |
| | Illinois Tool Works Inc. | 1.000% | 6/5/31 | EUR | 3,098 | 2,381 |
| | International Business Machines Corp | 1.250% | 2/9/34 | EUR | 4,900 | 3,704 |
| | International Business Machines Corp. | 0.875% | 1/31/25 | EUR | 1,455 | 1,366 |
| | International Business Machines Corp. | 0.950% | 5/23/25 | EUR | 7,003 | 6,528 |
| | International Business Machines Corp. | 2.875% | 11/7/25 | EUR | 2,050 | 1,994 |
| | International Business Machines Corp. | 1.250% | 1/29/27 | EUR | 7,235 | 6,537 |
| | International Business Machines Corp. | 0.300% | 2/11/28 | EUR | 3,685 | 3,095 |
| | International Business Machines Corp. | 1.750% | 3/7/28 | EUR | 2,100 | 1,899 |
| | International Business Machines Corp. | 1.500% | 5/23/29 | EUR | 3,300 | 2,886 |
| | International Business Machines Corp. | 0.875% | 2/9/30 | EUR | 3,000 | 2,458 |
| | International Business Machines Corp. | 1.750% | 1/31/31 | EUR | 4,642 | 3,976 |
| | International Business Machines Corp. | 0.650% | 2/11/32 | EUR | 1,000 | 753 |
| | International Business Machines Corp. | 1.200% | 2/11/40 | EUR | 2,637 | 1,703 |
| | International Flavors & Fragrances Inc. | 1.800% | 9/25/26 | EUR | 4,898 | 4,216 |
| | John Deere Cash Management Sarl | 2.200% | 4/2/32 | EUR | 4,913 | 4,345 |
| | John Deere Cash Management Sarl | 1.650% | 6/13/39 | EUR | 2,457 | 1,754 |
| | John Deere Financial Inc. | 2.460% | 4/4/24 | CAD | 2,000 | 1,416 |
| | John Deere Financial Inc. | 1.090% | 7/17/24 | CAD | 512 | 352 |
| | John Deere Financial Inc. | 2.410% | 1/14/25 | CAD | 2,000 | 1,387 |
| | John Deere Financial Inc. | 1.630% | 4/9/26 | CAD | 2,000 | 1,312 |
| | John Deere Financial Inc. | 2.580% | 10/16/26 | CAD | 931 | 625 |
| | John Deere Financial Inc. | 1.340% | 9/8/27 | CAD | 3,870 | 2,405 |
| | Johnson & Johnson | 0.650% | 5/20/24 | EUR | 5,003 | 4,795 |
| | Johnson & Johnson | 1.150% | 11/20/28 | EUR | 642 | 569 |
| | Johnson Controls International plc | 1.375% | 2/25/25 | EUR | 7,805 | 7,303 |
| | Johnson Controls International plc / Tyco Fire & Security Finance SCA | 0.375% | 9/15/27 | EUR | 2,448 | 2,040 |
| | Johnson Controls International plc / Tyco Fire & Security Finance SCA | 3.000% | 9/15/28 | EUR | 4,931 | 4,596 |
| | Johnson Controls International plc / Tyco Fire & Security Finance SCA | 1.000% | 9/15/32 | EUR | 1,725 | 1,280 |
| | JPMorgan Chase & Co. | 0.500% | 12/4/23 | CHF | 20,865 | 20,550 |
| | JPMorgan Chase & Co. | 3.000% | 2/19/26 | EUR | 2,728 | 2,598 |
| | JPMorgan Chase & Co. | 0.991% | 4/28/26 | GBP | 7,552 | 7,746 |
| | JPMorgan Chase & Co. | 3.500% | 12/18/26 | GBP | 2,457 | 2,634 |
| | JPMorgan Chase & Co. | 1.090% | 3/11/27 | EUR | 47,224 | 42,005 |
| | JPMorgan Chase & Co. | 0.389% | 2/24/28 | EUR | 14,212 | 11,852 |
| | JPMorgan Chase & Co. | 1.896% | 3/5/28 | CAD | 7,350 | 4,670 |
Total International Bond II Index Fund
| | | Coupon | Maturity
Date | Currency | Face
Amount
(000) | Market
Value•
($000) |
| | JPMorgan Chase & Co. | 1.638% | 5/18/28 | EUR | 2,079 | 1,822 |
| | JPMorgan Chase & Co. | 1.963% | 3/23/30 | EUR | 11,250 | 9,555 |
| | JPMorgan Chase & Co. | 1.001% | 7/25/31 | EUR | 4,950 | 3,783 |
| | JPMorgan Chase & Co. | 1.047% | 11/4/32 | EUR | 4,647 | 3,413 |
| | JPMorgan Chase & Co. | 1.895% | 4/28/33 | GBP | 6,000 | 5,080 |
| | Kellogg Co. | 1.250% | 3/10/25 | EUR | 2,501 | 2,362 |
| | Kinder Morgan Inc. | 2.250% | 3/16/27 | EUR | 3,489 | 3,197 |
| | KKR Group Finance Co. V LLC | 1.625% | 5/22/29 | EUR | 4,913 | 3,981 |
| 3 | KKR Group Finance Co. V LLC | 1.625% | 5/22/29 | EUR | 1,455 | 1,179 |
| | Kraft Heinz Foods Co. | 2.250% | 5/25/28 | EUR | 3,000 | 2,667 |
| | Liberty Mutual Group Inc. | 2.750% | 5/4/26 | EUR | 6,818 | 6,449 |
| | LYB International Finance II BV | 0.875% | 9/17/26 | EUR | 4,461 | 3,814 |
| | ManpowerGroup Inc. | 1.750% | 6/22/26 | EUR | 100 | 91 |
| | Mastercard Inc. | 2.100% | 12/1/27 | EUR | 3,975 | 3,699 |
| | Mastercard Inc. | 1.000% | 2/22/29 | EUR | 10,500 | 8,959 |
| | McDonald's Corp. | 2.000% | 6/1/23 | EUR | 600 | 591 |
| | McDonald's Corp. | 1.000% | 11/15/23 | EUR | 8,400 | 8,135 |
| | McDonald's Corp. | 0.625% | 1/29/24 | EUR | 9,200 | 8,815 |
| | McDonald's Corp. | 3.000% | 3/8/24 | AUD | 10,630 | 6,646 |
| | McDonald's Corp. | 3.125% | 3/4/25 | CAD | 6,899 | 4,865 |
| | McDonald's Corp. | 1.750% | 5/3/28 | EUR | 1,200 | 1,075 |
| | McDonald's Corp. | 0.250% | 10/4/28 | EUR | 10,700 | 8,698 |
| | McDonald's Corp. | 1.500% | 11/28/29 | EUR | 7,700 | 6,526 |
| | McDonald's Corp. | 2.950% | 3/15/34 | GBP | 6,200 | 5,760 |
| | McDonald's Corp. | 3.000% | 5/31/34 | EUR | 4,900 | 4,356 |
| | McDonald's Corp. | 4.125% | 6/11/54 | GBP | 600 | 580 |
| | McKesson Corp. | 1.500% | 11/17/25 | EUR | 6,186 | 5,761 |
| | McKesson Corp. | 1.625% | 10/30/26 | EUR | 5,003 | 4,569 |
| | McKesson Corp. | 3.125% | 2/17/29 | GBP | 511 | 493 |
| | Medtronic Global Holdings SCA | 0.250% | 7/2/25 | EUR | 1,409 | 1,287 |
| | Medtronic Global Holdings SCA | 0.000% | 10/15/25 | EUR | 10,000 | 8,975 |
| | Medtronic Global Holdings SCA | 2.625% | 10/15/25 | EUR | 763 | 740 |
| | Medtronic Global Holdings SCA | 1.125% | 3/7/27 | EUR | 6,000 | 5,393 |
| | Medtronic Global Holdings SCA | 0.375% | 10/15/28 | EUR | 6,904 | 5,693 |
| | Medtronic Global Holdings SCA | 3.000% | 10/15/28 | EUR | 1,730 | 1,653 |
| | Medtronic Global Holdings SCA | 1.625% | 3/7/31 | EUR | 3,956 | 3,361 |
| | Medtronic Global Holdings SCA | 1.000% | 7/2/31 | EUR | 1,364 | 1,084 |
| | Medtronic Global Holdings SCA | 3.125% | 10/15/31 | EUR | 960 | 903 |
| | Medtronic Global Holdings SCA | 0.750% | 10/15/32 | EUR | 4,913 | 3,661 |
| | Medtronic Global Holdings SCA | 3.375% | 10/15/34 | EUR | 1,547 | 1,454 |
| | Medtronic Global Holdings SCA | 2.250% | 3/7/39 | EUR | 1,499 | 1,137 |
| | Medtronic Global Holdings SCA | 1.500% | 7/2/39 | EUR | 6,103 | 4,072 |
| | Medtronic Global Holdings SCA | 1.375% | 10/15/40 | EUR | 14,866 | 9,473 |
| | Medtronic Global Holdings SCA | 1.750% | 7/2/49 | EUR | 7,504 | 4,676 |
| | Medtronic Global Holdings SCA | 1.625% | 10/15/50 | EUR | 7,042 | 4,181 |
| | Merck & Co. Inc. | 0.500% | 11/2/24 | EUR | 4,877 | 4,606 |
| | Merck & Co. Inc. | 1.875% | 10/15/26 | EUR | 1,590 | 1,494 |
| | Merck & Co. Inc. | 2.500% | 10/15/34 | EUR | 2,574 | 2,287 |
| | Merck & Co. Inc. | 1.375% | 11/2/36 | EUR | 1,184 | 889 |
| | MetLife Inc. | 5.375% | 12/9/24 | GBP | 5,113 | 5,886 |
| | MetLife Inc. | 0.769% | 5/23/29 | JPY | 730,000 | 4,902 |
| | Metropolitan Life Global Funding I | 0.375% | 4/9/24 | EUR | 2,457 | 2,325 |
| | Metropolitan Life Global Funding I | 4.000% | 7/13/27 | AUD | 1,419 | 847 |
| | Metropolitan Life Global Funding I | 0.625% | 12/8/27 | GBP | 4,529 | 4,113 |
| | Metropolitan Life Global Funding I | 1.950% | 3/20/28 | CAD | 3,152 | 1,968 |
| | Metropolitan Life Global Funding I | 2.450% | 1/12/29 | CAD | 750 | 471 |
| | Metropolitan Life Global Funding I | 3.394% | 4/9/30 | CAD | 3,372 | 2,184 |
| | Microsoft Corp. | 3.125% | 12/6/28 | EUR | 7,964 | 7,865 |
| | Microsoft Corp. | 2.625% | 5/2/33 | EUR | 2,906 | 2,698 |
| | Mohawk Capital Finance SA | 1.750% | 6/12/27 | EUR | 1,400 | 1,191 |
| | Molson Coors Beverage Co. | 1.250% | 7/15/24 | EUR | 4,371 | 4,120 |
| | Molson Coors International LP | 3.440% | 7/15/26 | CAD | 1,397 | 957 |
| 3 | Mondelez International Holdings Netherlands BV | 0.000% | 9/22/26 | EUR | 4,688 | 4,028 |
| 3 | Mondelez International Holdings Netherlands BV | 0.250% | 9/9/29 | EUR | 4,637 | 3,602 |
| 3 | Mondelez International Holdings Netherlands BV | 1.250% | 9/9/41 | EUR | 1,410 | 829 |
| | Mondelez International Inc. | 3.250% | 3/7/25 | CAD | 1,576 | 1,109 |
| | Mondelez International Inc. | 1.625% | 3/8/27 | EUR | 5,854 | 5,276 |
| | Mondelez International Inc. | 0.250% | 3/17/28 | EUR | 20,135 | 16,468 |
| | Mondelez International Inc. | 0.750% | 3/17/33 | EUR | 700 | 496 |
Total International Bond II Index Fund
| | | Coupon | Maturity
Date | Currency | Face
Amount
(000) | Market
Value•
($000) |
| | Mondelez International Inc. | 2.375% | 3/6/35 | EUR | 525 | 416 |
| | Moody's Corp. | 0.950% | 2/25/30 | EUR | 6,108 | 4,894 |
| | Morgan Stanley | 3.000% | 2/7/24 | CAD | 5,008 | 3,560 |
| | Morgan Stanley | 0.637% | 7/26/24 | EUR | 8,875 | 8,559 |
| | Morgan Stanley | 2.103% | 5/8/26 | EUR | 3,100 | 2,903 |
| | Morgan Stanley | 1.342% | 10/23/26 | EUR | 6,592 | 5,967 |
| | Morgan Stanley | 1.375% | 10/27/26 | EUR | 4,300 | 3,822 |
| | Morgan Stanley | 2.625% | 3/9/27 | GBP | 4,243 | 4,287 |
| | Morgan Stanley | 1.875% | 4/27/27 | EUR | 4,887 | 4,352 |
| | Morgan Stanley | 1.779% | 8/4/27 | CAD | 3,891 | 2,489 |
| | Morgan Stanley | 0.406% | 10/29/27 | EUR | 8,920 | 7,508 |
| | Morgan Stanley | 0.495% | 10/26/29 | EUR | 15,981 | 12,485 |
| | Morgan Stanley | 0.497% | 2/7/31 | EUR | 14,880 | 10,946 |
| | Morgan Stanley | 2.950% | 5/7/32 | EUR | 10,100 | 8,739 |
| | Morgan Stanley | 1.102% | 4/29/33 | EUR | 2,571 | 1,845 |
| | Morgan Stanley | 5.148% | 1/25/34 | EUR | 7,000 | 7,118 |
| | Mylan Inc. | 2.125% | 5/23/25 | EUR | 3,400 | 3,155 |
| | Nasdaq Inc. | 1.750% | 3/28/29 | EUR | 4,688 | 3,910 |
| | Nasdaq Inc. | 0.875% | 2/13/30 | EUR | 11,882 | 9,063 |
| | National Grid North America Inc | 1.054% | 1/20/31 | EUR | 7,500 | 5,637 |
| | National Grid North America Inc. | 1.000% | 7/12/24 | EUR | 200 | 189 |
| | Nestle Finance International Ltd. | 2.250% | 11/30/23 | GBP | 439 | 493 |
| | Nestle Finance International Ltd. | 0.375% | 1/18/24 | EUR | 5,855 | 5,634 |
| | Nestle Finance International Ltd. | 0.000% | 11/12/24 | EUR | 12,485 | 11,728 |
| | Nestle Finance International Ltd. | 0.000% | 6/14/26 | EUR | 5,000 | 4,460 |
| | Nestle Finance International Ltd. | 0.125% | 11/12/27 | EUR | 6,000 | 5,183 |
| | Nestle Finance International Ltd. | 1.250% | 11/2/29 | EUR | 1,464 | 1,279 |
| | Nestle Finance International Ltd. | 1.500% | 4/1/30 | EUR | 4,876 | 4,301 |
| | Nestle Finance International Ltd. | 0.375% | 5/12/32 | EUR | 4,000 | 3,021 |
| | Nestle Finance International Ltd. | 0.000% | 3/3/33 | EUR | 8,545 | 6,027 |
| | Nestle Finance International Ltd. | 1.750% | 11/2/37 | EUR | 2,975 | 2,367 |
| | Nestle Finance International Ltd. | 0.375% | 12/3/40 | EUR | 3,413 | 1,996 |
| | Nestle Finance International Ltd. | 0.875% | 6/14/41 | EUR | 11,740 | 7,605 |
| | Nestle Holdings Inc. | 0.875% | 7/18/25 | EUR | 4,000 | 3,772 |
| | Nestle Holdings Inc. | 2.125% | 4/4/27 | GBP | 1,250 | 1,270 |
| | Nestle Holdings Inc. | 2.192% | 1/26/29 | CAD | 9,220 | 5,831 |
| | Nestle Holdings Inc. | 2.500% | 4/4/32 | GBP | 5,000 | 4,699 |
| | Nestle Holdings Inc. | 1.375% | 6/23/33 | GBP | 5,000 | 4,067 |
| | Nestle SA | 2.500% | 7/14/34 | CHF | 4,900 | 4,989 |
| | New York Life Global Funding | 1.250% | 12/17/26 | GBP | 1,276 | 1,248 |
| | New York Life Global Funding | 0.250% | 1/23/27 | EUR | 8,513 | 7,274 |
| | New York Life Global Funding | 2.000% | 4/17/28 | CAD | 5,207 | 3,292 |
| | New York Life Global Funding | 0.750% | 12/14/28 | GBP | 2,000 | 1,762 |
| | NextEra Energy Capital Holdings Inc. | 2.200% | 12/2/26 | AUD | 2,210 | 1,253 |
| | Omnicom Capital Holdings plc | 2.250% | 11/22/33 | GBP | 2,271 | 1,862 |
| | Omnicom Finance Holdings plc | 0.800% | 7/8/27 | EUR | 6,896 | 5,974 |
| | Omnicom Finance Holdings plc | 1.400% | 7/8/31 | EUR | 2,231 | 1,764 |
| | Oracle Corp. | 3.125% | 7/10/25 | EUR | 552 | 538 |
| | Paccar Financial Ltd. | 0.985% | 5/14/24 | CAD | 2,000 | 1,377 |
| | Parker-Hannifin Corp. | 1.125% | 3/1/25 | EUR | 6,545 | 6,004 |
| | PepsiCo Inc. | 0.250% | 5/6/24 | EUR | 3,144 | 2,987 |
| | PepsiCo Inc. | 2.150% | 5/6/24 | CAD | 1,576 | 1,115 |
| | PepsiCo Inc. | 0.750% | 3/18/27 | EUR | 1,004 | 902 |
| | PepsiCo Inc. | 0.500% | 5/6/28 | EUR | 5,826 | 4,990 |
| | PepsiCo Inc. | 0.875% | 7/18/28 | EUR | 1,725 | 1,489 |
| | PepsiCo Inc. | 1.125% | 3/18/31 | EUR | 957 | 794 |
| | PepsiCo Inc. | 0.400% | 10/9/32 | EUR | 6,172 | 4,530 |
| | PepsiCo Inc. | 0.750% | 10/14/33 | EUR | 3,455 | 2,561 |
| | PepsiCo Inc. | 0.875% | 10/16/39 | EUR | 4,868 | 3,037 |
| | PepsiCo Inc. | 1.050% | 10/9/50 | EUR | 3,093 | 1,717 |
| | PerkinElmer Inc. | 1.875% | 7/19/26 | EUR | 2,277 | 2,083 |
| | Pfizer Inc. | 1.000% | 3/6/27 | EUR | 1,635 | 1,485 |
| | Pfizer Inc. | 2.735% | 6/15/43 | GBP | 5,207 | 4,310 |
| | Philip Morris International Inc. | 0.625% | 11/8/24 | EUR | 733 | 682 |
| | Philip Morris International Inc. | 2.875% | 5/14/29 | EUR | 1,228 | 1,061 |
| | Philip Morris International Inc. | 0.800% | 8/1/31 | EUR | 4,461 | 3,106 |
| | Philip Morris International Inc. | 3.125% | 6/3/33 | EUR | 452 | 358 |
| | Philip Morris International Inc. | 2.000% | 5/9/36 | EUR | 3,910 | 2,475 |
| | Philip Morris International Inc. | 1.875% | 11/6/37 | EUR | 7,637 | 4,482 |
Total International Bond II Index Fund
| | | Coupon | Maturity
Date | Currency | Face
Amount
(000) | Market
Value•
($000) |
| | Philip Morris International Inc. | 1.450% | 8/1/39 | EUR | 3,098 | 1,655 |
| | PPG Industries Inc. | 1.875% | 6/1/25 | EUR | 2,695 | 2,525 |
| | PPG Industries Inc. | 0.875% | 11/3/25 | EUR | 1,274 | 1,143 |
| | PPG Industries Inc. | 1.400% | 3/13/27 | EUR | 100 | 87 |
| | PPG Industries Inc. | 2.750% | 6/1/29 | EUR | 3,306 | 2,943 |
| | Praxair Inc. | 1.200% | 2/12/24 | EUR | 3,910 | 3,779 |
| | Praxair Inc. | 1.625% | 12/1/25 | EUR | 10,074 | 9,434 |
| | Procter & Gamble Co. | 1.125% | 11/2/23 | EUR | 5,644 | 5,491 |
| | Procter & Gamble Co. | 0.500% | 10/25/24 | EUR | 1,455 | 1,378 |
| | Procter & Gamble Co. | 0.625% | 10/30/24 | EUR | 2,050 | 1,944 |
| | Procter & Gamble Co. | 1.375% | 5/3/25 | GBP | 4,823 | 5,129 |
| | Procter & Gamble Co. | 1.200% | 10/30/28 | EUR | 2,321 | 2,059 |
| | Procter & Gamble Co. | 1.800% | 5/3/29 | GBP | 6,198 | 5,930 |
| | Procter & Gamble Co. | 1.250% | 10/25/29 | EUR | 3,459 | 3,020 |
| | Procter & Gamble Co. | 0.350% | 5/5/30 | EUR | 10,000 | 8,049 |
| | Procter & Gamble Co. | 1.875% | 10/30/38 | EUR | 1,184 | 955 |
| | Prologis Euro Finance LLC | 0.250% | 9/10/27 | EUR | 8,272 | 6,765 |
| | Prologis Euro Finance LLC | 0.375% | 2/6/28 | EUR | 2,771 | 2,246 |
| | Prologis Euro Finance LLC | 1.875% | 1/5/29 | EUR | 5,579 | 4,784 |
| | Prologis Euro Finance LLC | 1.000% | 2/8/29 | EUR | 5,700 | 4,566 |
| | Prologis Euro Finance LLC | 0.625% | 9/10/31 | EUR | 3,031 | 2,133 |
| | Prologis Euro Finance LLC | 0.500% | 2/16/32 | EUR | 4,603 | 3,132 |
| | Prologis Euro Finance LLC | 1.500% | 2/8/34 | EUR | 2,100 | 1,483 |
| | Prologis Euro Finance LLC | 1.000% | 2/6/35 | EUR | 1,590 | 1,033 |
| | Prologis Euro Finance LLC | 1.000% | 2/16/41 | EUR | 3,470 | 1,840 |
| | Prologis Euro Finance LLC | 1.500% | 9/10/49 | EUR | 1,481 | 756 |
| | Prologis LP | 3.000% | 6/2/26 | EUR | 822 | 778 |
| | Prologis LP | 2.250% | 6/30/29 | GBP | 4,549 | 4,208 |
| | Prologis LP | 5.250% | 1/15/31 | CAD | 1,000 | 734 |
| | Public Storage | 0.500% | 9/9/30 | EUR | 4,259 | 3,042 |
| | Public Storage | 0.875% | 1/24/32 | EUR | 3,324 | 2,343 |
| | Raytheon Technologies Corp. | 2.150% | 5/18/30 | EUR | 4,684 | 4,025 |
| | Realty Income Corp. | 1.875% | 1/14/27 | GBP | 1,176 | 1,137 |
| | Realty Income Corp. | 1.125% | 7/13/27 | GBP | 6,862 | 6,288 |
| | Realty Income Corp. | 1.625% | 12/15/30 | GBP | 2,000 | 1,661 |
| | Realty Income Corp. | 1.750% | 7/13/33 | GBP | 1,257 | 957 |
| | Realty Income Corp. | 2.500% | 1/14/42 | GBP | 1,254 | 873 |
| | Schlumberger Finance BV | 0.250% | 10/15/27 | EUR | 6,913 | 5,873 |
| | Schlumberger Finance BV | 0.500% | 10/15/31 | EUR | 4,913 | 3,690 |
| | Schlumberger Finance BV | 2.000% | 5/6/32 | EUR | 2,981 | 2,530 |
| | Schlumberger Finance France SAS | 1.000% | 2/18/26 | EUR | 1,635 | 1,505 |
| | Schneider Electric SE | 0.250% | 9/9/24 | EUR | 4,800 | 4,535 |
| | Schneider Electric SE | 0.875% | 3/11/25 | EUR | 1,700 | 1,602 |
| | Schneider Electric SE | 1.375% | 6/21/27 | EUR | 5,000 | 4,572 |
| | Schneider Electric SE | 1.500% | 1/15/28 | EUR | 5,400 | 4,904 |
| | Schneider Electric SE | 0.250% | 3/11/29 | EUR | 7,400 | 6,051 |
| | Signify NV | 2.375% | 5/11/27 | EUR | 1,450 | 1,296 |
| | Simon International Finance SCA | 1.125% | 3/19/33 | EUR | 7,179 | 4,665 |
| | Southern Co. | 1.875% | 9/15/81 | EUR | 3,776 | 2,657 |
| | Southern Power Co. | 1.850% | 6/20/26 | EUR | 5,229 | 4,823 |
| | Stellantis NV | 2.000% | 3/20/25 | EUR | 1,800 | 1,708 |
| | Stellantis NV | 3.875% | 1/5/26 | EUR | 8,272 | 8,105 |
| | Stellantis NV | 2.750% | 5/15/26 | EUR | 3,400 | 3,192 |
| | Stellantis NV | 4.500% | 7/7/28 | EUR | 16,423 | 15,991 |
| | Stellantis NV | 1.125% | 9/18/29 | EUR | 4,000 | 3,250 |
| | Stellantis NV | 1.250% | 6/20/33 | EUR | 7,052 | 4,805 |
| | Stryker Corp. | 0.250% | 12/3/24 | EUR | 1,815 | 1,679 |
| | Stryker Corp. | 2.125% | 11/30/27 | EUR | 957 | 874 |
| | Stryker Corp. | 2.625% | 11/30/30 | EUR | 1,048 | 929 |
| | Stryker Corp. | 1.000% | 12/3/31 | EUR | 5,365 | 4,039 |
| | Swiss Re Finance UK plc | 2.714% | 6/4/52 | EUR | 2,900 | 2,131 |
| | Sysco Canada Inc. | 3.650% | 4/25/25 | CAD | 1,256 | 887 |
| | Thermo Fisher Scientific Finance I BV | 0.000% | 11/18/25 | EUR | 4,327 | 3,881 |
| | Thermo Fisher Scientific Finance I BV | 0.800% | 10/18/30 | EUR | 13,336 | 10,697 |
| | Thermo Fisher Scientific Finance I BV | 1.125% | 10/18/33 | EUR | 10,231 | 7,785 |
| | Thermo Fisher Scientific Finance I BV | 1.625% | 10/18/41 | EUR | 12,747 | 8,254 |
| | Thermo Fisher Scientific Finance I BV | 2.000% | 10/18/51 | EUR | 7,000 | 4,378 |
| | Thermo Fisher Scientific Inc. | 0.750% | 9/12/24 | EUR | 2,313 | 2,189 |
| | Thermo Fisher Scientific Inc. | 0.125% | 3/1/25 | EUR | 3,188 | 2,941 |
Total International Bond II Index Fund
| | | Coupon | Maturity
Date | Currency | Face
Amount
(000) | Market
Value•
($000) |
| | Thermo Fisher Scientific Inc. | 2.000% | 4/15/25 | EUR | 2,908 | 2,789 |
| | Thermo Fisher Scientific Inc. | 1.400% | 1/23/26 | EUR | 8,025 | 7,461 |
| | Thermo Fisher Scientific Inc. | 1.750% | 4/15/27 | EUR | 1,455 | 1,340 |
| | Thermo Fisher Scientific Inc. | 0.500% | 3/1/28 | EUR | 1,899 | 1,609 |
| | Thermo Fisher Scientific Inc. | 1.375% | 9/12/28 | EUR | 552 | 483 |
| | Thermo Fisher Scientific Inc. | 2.875% | 7/24/37 | EUR | 3,289 | 2,822 |
| | Thermo Fisher Scientific Inc. | 1.500% | 10/1/39 | EUR | 1,906 | 1,254 |
| | Thermo Fisher Scientific Inc. | 1.875% | 10/1/49 | EUR | 5,319 | 3,304 |
| | Time Warner Cable LLC | 5.250% | 7/15/42 | GBP | 2,863 | 2,563 |
| | Toyota Motor Credit Corp. | 0.625% | 11/21/24 | EUR | 100 | 94 |
| | Toyota Motor Credit Corp. | 0.750% | 11/19/26 | GBP | 4,376 | 4,232 |
| | Toyota Motor Credit Corp. | 0.125% | 11/5/27 | EUR | 11,552 | 9,566 |
| | Trillium Windpower LP | 5.803% | 2/15/33 | CAD | 288 | 216 |
| | TWDC Enterprises 18 Corp. | 2.758% | 10/7/24 | CAD | 6,885 | 4,857 |
| | United Parcel Service Inc. | 0.375% | 11/15/23 | EUR | 3,639 | 3,505 |
| | United Parcel Service Inc. | 2.125% | 5/21/24 | CAD | 5,448 | 3,844 |
| | United Parcel Service Inc. | 1.625% | 11/15/25 | EUR | 5,870 | 5,542 |
| | United Parcel Service Inc. | 1.500% | 11/15/32 | EUR | 1,590 | 1,270 |
| | United Parcel Service Inc. | 5.125% | 2/12/50 | GBP | 500 | 607 |
| | Upjohn Finance BV | 1.023% | 6/23/24 | EUR | 3,000 | 2,813 |
| | Upjohn Finance BV | 1.362% | 6/23/27 | EUR | 6,910 | 5,769 |
| | Upjohn Finance BV | 1.908% | 6/23/32 | EUR | 8,210 | 5,746 |
| | US Bancorp | 0.850% | 6/7/24 | EUR | 7,299 | 6,909 |
| | Utah Acquisition Sub Inc. | 2.250% | 11/22/24 | EUR | 5,000 | 4,728 |
| | Utah Acquisition Sub Inc. | 3.125% | 11/22/28 | EUR | 4,833 | 4,169 |
| | Ventas Canada Finance Ltd. | 2.800% | 4/12/24 | CAD | 4,137 | 2,911 |
| | Ventas Canada Finance Ltd. | 4.125% | 9/30/24 | CAD | 592 | 421 |
| | Ventas Canada Finance Ltd. | 2.450% | 1/4/27 | CAD | 1,000 | 644 |
| | Ventas Canada Finance Ltd. | 3.300% | 12/1/31 | CAD | 1,328 | 788 |
| | Verizon Communications Inc. | 4.073% | 6/18/24 | GBP | 1,455 | 1,637 |
| | Verizon Communications Inc. | 4.050% | 2/17/25 | AUD | 770 | 482 |
| | Verizon Communications Inc. | 0.875% | 4/2/25 | EUR | 2,412 | 2,254 |
| | Verizon Communications Inc. | 3.250% | 2/17/26 | EUR | 1,274 | 1,243 |
| | Verizon Communications Inc. | 1.375% | 10/27/26 | EUR | 11,059 | 10,062 |
| | Verizon Communications Inc. | 0.875% | 4/8/27 | EUR | 12,101 | 10,596 |
| | Verizon Communications Inc. | 4.500% | 8/17/27 | AUD | 7,000 | 4,285 |
| | Verizon Communications Inc. | 2.375% | 3/22/28 | CAD | 4,107 | 2,629 |
| | Verizon Communications Inc. | 2.350% | 3/23/28 | AUD | 600 | 323 |
| | Verizon Communications Inc. | 1.375% | 11/2/28 | EUR | 6,823 | 5,873 |
| | Verizon Communications Inc. | 1.125% | 11/3/28 | GBP | 12,303 | 10,936 |
| | Verizon Communications Inc. | 0.375% | 3/22/29 | EUR | 12,083 | 9,634 |
| | Verizon Communications Inc. | 1.875% | 10/26/29 | EUR | 951 | 825 |
| | Verizon Communications Inc. | 1.250% | 4/8/30 | EUR | 5,213 | 4,264 |
| | Verizon Communications Inc. | 2.500% | 5/16/30 | CAD | 2,727 | 1,657 |
| | Verizon Communications Inc. | 1.875% | 9/19/30 | GBP | 2,322 | 2,053 |
| | Verizon Communications Inc. | 2.500% | 4/8/31 | GBP | 466 | 426 |
| | Verizon Communications Inc. | 2.625% | 12/1/31 | EUR | 3,291 | 2,912 |
| | Verizon Communications Inc. | 0.875% | 3/19/32 | EUR | 7,276 | 5,405 |
| | Verizon Communications Inc. | 0.750% | 3/22/32 | EUR | 10,098 | 7,389 |
| | Verizon Communications Inc. | 1.300% | 5/18/33 | EUR | 2,229 | 1,670 |
| | Verizon Communications Inc. | 4.750% | 2/17/34 | GBP | 2,000 | 2,152 |
| | Verizon Communications Inc. | 4.750% | 10/31/34 | EUR | 5,167 | 5,294 |
| | Verizon Communications Inc. | 1.125% | 9/19/35 | EUR | 5,296 | 3,622 |
| | Verizon Communications Inc. | 3.125% | 11/2/35 | GBP | 2,029 | 1,810 |
| | Verizon Communications Inc. | 3.375% | 10/27/36 | GBP | 5,326 | 4,838 |
| | Verizon Communications Inc. | 2.875% | 1/15/38 | EUR | 4,785 | 3,907 |
| | Verizon Communications Inc. | 1.875% | 11/3/38 | GBP | 2,106 | 1,480 |
| | Verizon Communications Inc. | 1.500% | 9/19/39 | EUR | 2,345 | 1,509 |
| | Verizon Communications Inc. | 3.500% | 11/4/39 | AUD | 5,500 | 2,274 |
| | Verizon Communications Inc. | 1.850% | 5/18/40 | EUR | 496 | 337 |
| | Verizon Communications Inc. | 3.625% | 5/16/50 | CAD | 2,880 | 1,487 |
| | Verizon Communications Inc. | 4.050% | 3/22/51 | CAD | 1,148 | 640 |
| | VF Corp. | 0.250% | 2/25/28 | EUR | 777 | 629 |
| | Visa Inc. | 1.500% | 6/15/26 | EUR | 2,700 | 2,513 |
| | Visa Inc. | 2.000% | 6/15/29 | EUR | 5,500 | 4,977 |
| | Visa Inc. | 2.375% | 6/15/34 | EUR | 4,500 | 3,922 |
| | Wabtec Transportation Netherlands BV | 1.250% | 12/3/27 | EUR | 2,757 | 2,222 |
| | Walgreens Boots Alliance Inc. | 3.600% | 11/20/25 | GBP | 699 | 755 |
| | Walmart Inc. | 2.550% | 4/8/26 | EUR | 957 | 923 |
Total International Bond II Index Fund
| | | Coupon | Maturity
Date | Currency | Face
Amount
(000) | Market
Value•
($000) |
| | Walmart Inc. | 4.875% | 9/21/29 | EUR | 5,252 | 5,621 |
| | Walmart Inc. | 5.625% | 3/27/34 | GBP | 7,245 | 8,982 |
| | Walmart Inc. | 5.250% | 9/28/35 | GBP | 488 | 585 |
| | Walt Disney Co. | 3.057% | 3/30/27 | CAD | 7,275 | 4,912 |
| | Waste Management of Canada Corp. | 2.600% | 9/23/26 | CAD | 1,897 | 1,268 |
| | Wells Fargo & Co. | 0.500% | 11/2/23 | CHF | 9,800 | 9,650 |
| | Wells Fargo & Co. | 2.125% | 12/20/23 | GBP | 382 | 423 |
| | Wells Fargo & Co. | 3.184% | 2/8/24 | CAD | 2,467 | 1,758 |
| | Wells Fargo & Co. | 2.125% | 6/4/24 | EUR | 10,700 | 10,284 |
| | Wells Fargo & Co. | 3.874% | 5/21/25 | CAD | 1,994 | 1,397 |
| | Wells Fargo & Co. | 2.000% | 7/28/25 | GBP | 13,365 | 13,994 |
| | Wells Fargo & Co. | 2.000% | 4/27/26 | EUR | 11,925 | 10,892 |
| | Wells Fargo & Co. | 4.168% | 4/28/26 | CAD | 5,400 | 3,828 |
| | Wells Fargo & Co. | 2.568% | 5/1/26 | CAD | 4,330 | 2,952 |
| | Wells Fargo & Co. | 2.975% | 5/19/26 | CAD | 4,948 | 3,339 |
| | Wells Fargo & Co. | 1.375% | 10/26/26 | EUR | 16,502 | 14,511 |
| | Wells Fargo & Co. | 1.000% | 2/2/27 | EUR | 11,763 | 10,085 |
| | Wells Fargo & Co. | 2.493% | 2/18/27 | CAD | 3,596 | 2,334 |
| | Wells Fargo & Co. | 1.500% | 5/24/27 | EUR | 9,725 | 8,465 |
| | Wells Fargo & Co. | 3.473% | 4/26/28 | GBP | 300 | 307 |
| | Wells Fargo & Co. | 3.500% | 9/12/29 | GBP | 2,155 | 2,113 |
| | Wells Fargo & Co. | 1.741% | 5/4/30 | EUR | 4,913 | 4,065 |
| | Wells Fargo & Co. | 0.625% | 8/14/30 | EUR | 3,610 | 2,636 |
| | Wells Fargo & Co. | 4.625% | 11/2/35 | GBP | 1,737 | 1,800 |
| | Welltower Inc. | 4.800% | 11/20/28 | GBP | 3,595 | 3,734 |
| | Welltower Inc. | 4.500% | 12/1/34 | GBP | 2,366 | 2,196 |
| | Westlake Chemical Corp. | 1.625% | 7/17/29 | EUR | 3,100 | 2,352 |
| | Whirlpool Finance Luxembourg Sarl | 1.250% | 11/2/26 | EUR | 5,229 | 4,682 |
| | Whirlpool Finance Luxembourg Sarl | 1.100% | 11/9/27 | EUR | 1,725 | 1,461 |
| | WPC Eurobond BV | 2.250% | 7/19/24 | EUR | 3,144 | 2,944 |
| | WPC Eurobond BV | 2.250% | 4/9/26 | EUR | 2,050 | 1,802 |
| | WPC Eurobond BV | 2.125% | 4/15/27 | EUR | 8,339 | 7,072 |
| | WPC Eurobond BV | 1.350% | 4/15/28 | EUR | 4,461 | 3,526 |
| | WPC Eurobond BV | 0.950% | 6/1/30 | EUR | 1,024 | 687 |
| | Zimmer Biomet Holdings Inc. | 1.414% | 12/13/22 | EUR | 2,963 | 2,927 |
| | | | | | | 2,574,017 |
| Total Corporate Bonds (Cost $23,674,689) | | | 17,769,479 |
| Sovereign Bonds (78.5%) | | | |
| Australia (3.2%) | | | |
| | Australian Capital Territory | 4.000% | 5/22/24 | AUD | 2,470 | 1,585 |
| | Australian Capital Territory | 1.250% | 5/22/25 | AUD | 370 | 223 |
| | Australian Capital Territory | 2.500% | 5/21/26 | AUD | 990 | 604 |
| | Australian Capital Territory | 3.000% | 4/18/28 | AUD | 110 | 67 |
| | Australian Capital Territory | 2.250% | 5/22/29 | AUD | 4,650 | 2,641 |
| | Australian Capital Territory | 1.750% | 5/17/30 | AUD | 390 | 208 |
| | Australian Capital Territory | 1.750% | 10/23/31 | AUD | 4,160 | 2,127 |
| | Commonwealth of Australia | 2.250% | 11/21/22 | AUD | 56,707 | 36,261 |
| | Commonwealth of Australia | 5.500% | 4/21/23 | AUD | 49,280 | 31,859 |
| | Commonwealth of Australia | 2.750% | 4/21/24 | AUD | 150,587 | 95,747 |
| | Commonwealth of Australia | 0.250% | 11/21/24 | AUD | 187,412 | 112,785 |
| | Commonwealth of Australia | 3.250% | 4/21/25 | AUD | 142,687 | 91,208 |
| | Commonwealth of Australia | 0.250% | 11/21/25 | AUD | 150,115 | 87,528 |
| | Commonwealth of Australia | 4.250% | 4/21/26 | AUD | 200,212 | 131,797 |
| | Commonwealth of Australia | 0.500% | 9/21/26 | AUD | 175,603 | 100,581 |
| | Commonwealth of Australia | 4.750% | 4/21/27 | AUD | 135,559 | 91,414 |
| | Commonwealth of Australia | 2.750% | 11/21/27 | AUD | 169,680 | 104,866 |
| | Commonwealth of Australia | 2.250% | 5/21/28 | AUD | 131,071 | 78,491 |
| | Commonwealth of Australia | 2.750% | 11/21/28 | AUD | 123,332 | 75,406 |
| | Commonwealth of Australia | 3.250% | 4/21/29 | AUD | 134,969 | 84,608 |
| | Commonwealth of Australia | 2.750% | 11/21/29 | AUD | 138,415 | 83,653 |
| | Commonwealth of Australia | 2.500% | 5/21/30 | AUD | 150,425 | 88,871 |
| | Commonwealth of Australia | 1.000% | 12/21/30 | AUD | 146,081 | 75,736 |
| | Commonwealth of Australia | 1.500% | 6/21/31 | AUD | 154,052 | 82,418 |
| | Commonwealth of Australia | 1.000% | 11/21/31 | AUD | 163,185 | 82,547 |
| | Commonwealth of Australia | 1.250% | 5/21/32 | AUD | 126,458 | 64,679 |
| | Commonwealth of Australia | 1.750% | 11/21/32 | AUD | 108,599 | 57,810 |
| | Commonwealth of Australia | 4.500% | 4/21/33 | AUD | 144,730 | 98,356 |
| | Commonwealth of Australia | 3.000% | 11/21/33 | AUD | 35,670 | 21,147 |
Total International Bond II Index Fund
| | | Coupon | Maturity
Date | Currency | Face
Amount
(000) | Market
Value•
($000) |
| | Commonwealth of Australia | 2.750% | 6/21/35 | AUD | 45,718 | 25,851 |
| | Commonwealth of Australia | 3.750% | 4/21/37 | AUD | 48,531 | 30,223 |
| | Commonwealth of Australia | 3.250% | 6/21/39 | AUD | 43,137 | 24,887 |
| | Commonwealth of Australia | 2.750% | 5/21/41 | AUD | 55,669 | 29,327 |
| | Commonwealth of Australia | 3.000% | 3/21/47 | AUD | 63,016 | 33,403 |
| | Commonwealth of Australia | 1.750% | 6/21/51 | AUD | 78,851 | 30,687 |
| | National Housing Finance and Investment Corp. | 2.380% | 3/28/29 | AUD | 1,435 | 826 |
| | National Housing Finance and Investment Corp. | 1.520% | 5/27/30 | AUD | 4,500 | 2,357 |
| | National Housing Finance and Investment Corp. | 1.410% | 6/29/32 | AUD | 400 | 193 |
| | National Housing Finance and Investment Corp. | 2.335% | 6/30/36 | AUD | 1,265 | 620 |
| | New South Wales Treasury Corp. | 1.000% | 2/8/24 | AUD | 15,180 | 9,388 |
| | New South Wales Treasury Corp. | 5.000% | 8/20/24 | AUD | 16,257 | 10,628 |
| | New South Wales Treasury Corp. | 1.250% | 3/20/25 | AUD | 19,587 | 11,837 |
| | New South Wales Treasury Corp. | 4.000% | 5/20/26 | AUD | 4,701 | 3,019 |
| | New South Wales Treasury Corp. | 3.000% | 5/20/27 | AUD | 64,134 | 39,326 |
| | New South Wales Treasury Corp. | 3.000% | 3/20/28 | AUD | 79,668 | 48,323 |
| | New South Wales Treasury Corp. | 3.000% | 11/15/28 | AUD | 9,794 | 5,885 |
| | New South Wales Treasury Corp. | 3.000% | 4/20/29 | AUD | 18,463 | 11,018 |
| | New South Wales Treasury Corp. | 3.000% | 2/20/30 | AUD | 67,903 | 39,930 |
| | New South Wales Treasury Corp. | 1.250% | 11/20/30 | AUD | 2,516 | 1,274 |
| | New South Wales Treasury Corp. | 2.000% | 3/20/31 | AUD | 45,691 | 24,308 |
| | New South Wales Treasury Corp. | 1.500% | 2/20/32 | AUD | 39,231 | 19,372 |
| | New South Wales Treasury Corp. | 2.500% | 11/22/32 | AUD | 15,000 | 8,029 |
| | New South Wales Treasury Corp. | 2.000% | 3/8/33 | AUD | 25,212 | 12,675 |
| | New South Wales Treasury Corp. | 1.750% | 3/20/34 | AUD | 29,000 | 13,745 |
| | New South Wales Treasury Corp. | 3.500% | 3/20/34 | AUD | 278 | 160 |
| | New South Wales Treasury Corp. | 3.500% | 11/20/37 | AUD | 2,158 | 1,177 |
| | New South Wales Treasury Corp. | 2.250% | 11/20/40 | AUD | 8,603 | 3,731 |
| | New South Wales Treasury Corp. | 2.250% | 5/7/41 | AUD | 5,500 | 2,355 |
| | New South Wales Treasury Corp. | 2.450% | 8/24/50 | AUD | 89 | 35 |
| | Northern Territory Treasury Corp. | 2.750% | 10/21/24 | AUD | 3,100 | 1,939 |
| | Northern Territory Treasury Corp. | 2.750% | 4/21/27 | AUD | 6,900 | 4,180 |
| | Northern Territory Treasury Corp. | 3.500% | 4/21/28 | AUD | 1,100 | 682 |
| | Northern Territory Treasury Corp. | 2.000% | 5/21/29 | AUD | 5,000 | 2,794 |
| | Northern Territory Treasury Corp. | 3.500% | 5/21/30 | AUD | 1,900 | 1,144 |
| | Northern Territory Treasury Corp. | 2.000% | 4/21/31 | AUD | ��� 1,600 | 844 |
| | Northern Territory Treasury Corp. | 3.750% | 4/21/33 | AUD | 1,400 | 824 |
| | Northern Territory Treasury Corp. | 4.100% | 11/21/42 | AUD | 500 | 280 |
| 3 | Queensland Treasury Corp. | 3.000% | 3/22/24 | AUD | 6,611 | 4,192 |
| | Queensland Treasury Corp. | 5.750% | 7/22/24 | AUD | 22,623 | 14,964 |
| 3 | Queensland Treasury Corp. | 4.750% | 7/21/25 | AUD | 24,243 | 15,875 |
| 3 | Queensland Treasury Corp. | 3.250% | 7/21/26 | AUD | 30,605 | 19,146 |
| 3 | Queensland Treasury Corp. | 2.750% | 8/20/27 | AUD | 33,503 | 20,259 |
| 3 | Queensland Treasury Corp. | 3.250% | 7/21/28 | AUD | 44,701 | 27,371 |
| 3 | Queensland Treasury Corp. | 3.250% | 8/21/29 | AUD | 32,949 | 19,918 |
| 3 | Queensland Treasury Corp. | 3.500% | 8/21/30 | AUD | 36,883 | 22,366 |
| 3 | Queensland Treasury Corp. | 1.250% | 3/10/31 | AUD | 15,000 | 7,510 |
| 3 | Queensland Treasury Corp. | 1.750% | 8/21/31 | AUD | 44,678 | 23,090 |
| 3 | Queensland Treasury Corp. | 1.500% | 3/2/32 | AUD | 10,700 | 5,299 |
| 3 | Queensland Treasury Corp. | 1.500% | 8/20/32 | AUD | 17,131 | 8,377 |
| | Queensland Treasury Corp. | 6.500% | 3/14/33 | AUD | 4,065 | 3,023 |
| | Queensland Treasury Corp. | 2.000% | 8/22/33 | AUD | 5,000 | 2,499 |
| 3 | Queensland Treasury Corp. | 1.750% | 7/20/34 | AUD | 20,875 | 9,820 |
| 3 | Queensland Treasury Corp. | 2.250% | 4/16/40 | AUD | 7,346 | 3,227 |
| 3 | Queensland Treasury Corp. | 2.250% | 11/20/41 | AUD | 7,248 | 3,089 |
| 3 | Queensland Treasury Corp. | 4.200% | 2/20/47 | AUD | 8,749 | 5,012 |
| | South Australian Government Financing Authority | 4.250% | 11/20/23 | AUD | 2,450 | 1,576 |
| | South Australian Government Financing Authority | 2.250% | 8/15/24 | AUD | 8,571 | 5,342 |
| | South Australian Government Financing Authority | 2.750% | 4/16/25 | AUD | 5,388 | 3,362 |
| | South Australian Government Financing Authority | 3.000% | 7/20/26 | AUD | 4,040 | 2,502 |
| | South Australian Government Financing Authority | 3.000% | 9/20/27 | AUD | 613 | 374 |
| | South Australian Government Financing Authority | 3.000% | 5/24/28 | AUD | 6,545 | 3,948 |
| | South Australian Government Financing Authority | 2.750% | 5/24/30 | AUD | 22,989 | 13,197 |
| | South Australian Government Financing Authority | 1.750% | 5/24/32 | AUD | 25,665 | 12,855 |
| | South Australian Government Financing Authority | 2.000% | 5/23/36 | AUD | 6,762 | 3,075 |
| | Tasmanian Public Finance Corp. | 3.250% | 2/19/26 | AUD | 4,700 | 2,952 |
| | Tasmanian Public Finance Corp. | 3.250% | 1/24/28 | AUD | 735 | 450 |
| | Tasmanian Public Finance Corp. | 2.000% | 1/24/30 | AUD | 265 | 145 |
| | Tasmanian Public Finance Corp. | 2.250% | 1/22/32 | AUD | 4,258 | 2,249 |
Total International Bond II Index Fund
| | | Coupon | Maturity
Date | Currency | Face
Amount
(000) | Market
Value•
($000) |
| | Treasury Corp. of Victoria | 5.500% | 12/17/24 | AUD | 6,856 | 4,535 |
| | Treasury Corp. of Victoria | 0.500% | 11/20/25 | AUD | 80,774 | 46,807 |
| | Treasury Corp. of Victoria | 5.500% | 11/17/26 | AUD | 40,463 | 27,417 |
| | Treasury Corp. of Victoria | 1.250% | 11/19/27 | AUD | 22,321 | 12,465 |
| | Treasury Corp. of Victoria | 3.000% | 10/20/28 | AUD | 35,964 | 21,636 |
| | Treasury Corp. of Victoria | 2.500% | 10/22/29 | AUD | 32,889 | 18,818 |
| | Treasury Corp. of Victoria | 1.500% | 11/20/30 | AUD | 31,540 | 16,271 |
| | Treasury Corp. of Victoria | 1.500% | 9/10/31 | AUD | 34,099 | 17,106 |
| | Treasury Corp. of Victoria | 4.250% | 12/20/32 | AUD | 35,982 | 22,436 |
| | Treasury Corp. of Victoria | 2.250% | 9/15/33 | AUD | 22,516 | 11,477 |
| | Treasury Corp. of Victoria | 2.250% | 11/20/34 | AUD | 28,782 | 14,172 |
| | Treasury Corp. of Victoria | 2.000% | 9/17/35 | AUD | 20,116 | 9,385 |
| | Treasury Corp. of Victoria | 2.000% | 11/20/37 | AUD | 7,516 | 3,322 |
| | Treasury Corp. of Victoria | 2.250% | 11/20/41 | AUD | 17,167 | 7,255 |
| | Western Australian Treasury Corp. | 2.500% | 7/23/24 | AUD | 23,507 | 14,738 |
| | Western Australian Treasury Corp. | 5.000% | 7/23/25 | AUD | 7,590 | 5,003 |
| | Western Australian Treasury Corp. | 3.000% | 10/21/26 | AUD | 12,162 | 7,523 |
| | Western Australian Treasury Corp. | 3.000% | 10/21/27 | AUD | 4,897 | 2,990 |
| | Western Australian Treasury Corp. | 3.250% | 7/20/28 | AUD | 24,607 | 15,077 |
| | Western Australian Treasury Corp. | 2.750% | 7/24/29 | AUD | 17,991 | 10,549 |
| | Western Australian Treasury Corp. | 1.500% | 10/22/30 | AUD | 1,400 | 727 |
| | Western Australian Treasury Corp. | 1.750% | 10/22/31 | AUD | 30,131 | 15,529 |
| | Western Australian Treasury Corp. | 2.000% | 10/24/34 | AUD | 7,629 | 3,690 |
| | Western Australian Treasury Corp. | 2.250% | 7/23/41 | AUD | 1,006 | 435 |
| | | | | | | 2,818,926 |
| Austria (1.1%) | | | |
| | Autobahnen- und Schnell- strassen-Finanzierungs AG | 0.250% | 10/18/24 | EUR | 16,544 | 15,582 |
| | Autobahnen- und Schnell- strassen-Finanzierungs AG | 3.375% | 9/22/25 | EUR | 954 | 958 |
| | Autobahnen- und Schnell- strassen-Finanzierungs AG | 0.100% | 7/9/29 | EUR | 4,461 | 3,678 |
| | Autobahnen- und Schnell- strassen-Finanzierungs AG | 1.500% | 9/15/30 | EUR | 5,000 | 4,454 |
| | Autobahnen- und Schnell- strassen-Finanzierungs AG | 0.125% | 6/2/31 | EUR | 4,300 | 3,344 |
| | Autobahnen- und Schnell- strassen-Finanzierungs AG | 2.750% | 6/11/32 | EUR | 100 | 97 |
| | Autobahnen- und Schnell- strassen-Finanzierungs AG | 2.750% | 6/20/33 | EUR | 542 | 522 |
| | Autobahnen- und Schnell- strassen-Finanzierungs AG | 0.100% | 7/16/35 | EUR | 2,750 | 1,873 |
| 2 | Oesterreichische Kontrollbank AG | 2.625% | 11/22/24 | CHF | 15,000 | 15,429 |
| 2 | Oesterreichische Kontrollbank AG | 3.200% | 8/25/25 | AUD | 735 | 455 |
| 2 | Oesterreichische Kontrollbank AG | 0.000% | 10/8/26 | EUR | 2,457 | 2,175 |
| 2 | Oesterreichische Kontrollbank AG | 2.875% | 2/25/30 | CHF | 2,210 | 2,396 |
| 3 | Republic of Austria | 0.000% | 7/15/24 | EUR | 34,131 | 32,604 |
| 3 | Republic of Austria | 1.650% | 10/21/24 | EUR | 3,312 | 3,251 |
| 3 | Republic of Austria | 0.000% | 4/20/25 | EUR | 192,131 | 179,883 |
| 3 | Republic of Austria | 0.750% | 10/20/26 | EUR | 79,642 | 73,980 |
| 3 | Republic of Austria | 0.500% | 4/20/27 | EUR | 19,991 | 18,159 |
| 3 | Republic of Austria | 0.750% | 2/20/28 | EUR | 12,190 | 11,031 |
| 3 | Republic of Austria | 0.000% | 10/20/28 | EUR | 92,760 | 78,839 |
| 3 | Republic of Austria | 0.500% | 2/20/29 | EUR | 74,540 | 64,808 |
| 3 | Republic of Austria | 0.000% | 2/20/30 | EUR | 35,904 | 29,203 |
| 3 | Republic of Austria | 0.000% | 2/20/31 | EUR | 71,491 | 56,284 |
| 3 | Republic of Austria | 0.900% | 2/20/32 | EUR | 115,302 | 96,053 |
| 3 | Republic of Austria | 2.400% | 5/23/34 | EUR | 2,758 | 2,585 |
| 3 | Republic of Austria | 5.375% | 12/1/34 | CAD | 798 | 636 |
| 3 | Republic of Austria | 0.250% | 10/20/36 | EUR | 87,278 | 59,823 |
| 3 | Republic of Austria | 4.150% | 3/15/37 | EUR | 18,732 | 20,917 |
| 3 | Republic of Austria | 0.000% | 10/20/40 | EUR | 68,567 | 39,645 |
| 3 | Republic of Austria | 3.150% | 6/20/44 | EUR | 24,502 | 24,871 |
| 3 | Republic of Austria | 1.500% | 2/20/47 | EUR | 26,373 | 19,596 |
| 3 | Republic of Austria | 1.850% | 5/23/49 | EUR | 17,899 | 14,325 |
| 3 | Republic of Austria | 0.750% | 3/20/51 | EUR | 60,488 | 35,072 |
| 3 | Republic of Austria | 3.800% | 1/26/62 | EUR | 8,303 | 9,737 |
| 3 | Republic of Austria | 0.700% | 4/20/71 | EUR | 21,170 | 9,587 |
| 3 | Republic of Austria | 1.500% | 11/2/86 | EUR | 11,911 | 7,287 |
| 3 | Republic of Austria | 2.100% | 9/20/17 | EUR | 15,380 | 11,565 |
| 3 | Republic of Austria | 0.850% | 6/30/20 | EUR | 28,316 | 12,760 |
| | | | | | | 963,464 |
| Belgium (1.8%) | | | |
| | Communaute Francaise de Belgique | 0.625% | 6/11/35 | EUR | 14,100 | 10,105 |
| 3 | Kingdom of Belgium | 0.500% | 10/22/24 | EUR | 25,354 | 24,336 |
| 3 | Kingdom of Belgium | 0.800% | 6/22/25 | EUR | 203,714 | 194,943 |
Total International Bond II Index Fund
| | | Coupon | Maturity
Date | Currency | Face
Amount
(000) | Market
Value•
($000) |
| 3 | Kingdom of Belgium | 1.000% | 6/22/26 | EUR | 234,591 | 222,698 |
| 3 | Kingdom of Belgium | 0.800% | 6/22/27 | EUR | 115,380 | 106,736 |
| 3 | Kingdom of Belgium | 0.000% | 10/22/27 | EUR | 98,754 | 86,944 |
| 3 | Kingdom of Belgium | 0.900% | 6/22/29 | EUR | 121,750 | 108,919 |
| 3 | Kingdom of Belgium | 0.100% | 6/22/30 | EUR | 119,211 | 98,329 |
| 3 | Kingdom of Belgium | 1.000% | 6/22/31 | EUR | 13,263 | 11,540 |
| 3 | Kingdom of Belgium | 0.000% | 10/22/31 | EUR | 126,306 | 98,772 |
| | Kingdom of Belgium | 4.000% | 3/28/32 | EUR | 19,661 | 21,483 |
| 3 | Kingdom of Belgium | 0.350% | 6/22/32 | EUR | 145,461 | 114,731 |
| 3 | Kingdom of Belgium | 3.000% | 6/22/34 | EUR | 12,608 | 12,565 |
| 3 | Kingdom of Belgium | 5.000% | 3/28/35 | EUR | 2,161 | 2,568 |
| 3 | Kingdom of Belgium | 1.450% | 6/22/37 | EUR | 67,118 | 53,457 |
| 3 | Kingdom of Belgium | 1.900% | 6/22/38 | EUR | 18,062 | 15,191 |
| 3 | Kingdom of Belgium | 2.750% | 4/22/39 | EUR | 71,598 | 67,356 |
| 3 | Kingdom of Belgium | 0.400% | 6/22/40 | EUR | 86,096 | 53,385 |
| | Kingdom of Belgium | 3.750% | 6/22/45 | EUR | 44,522 | 47,713 |
| 3 | Kingdom of Belgium | 1.600% | 6/22/47 | EUR | 10,980 | 7,966 |
| 3,7 | Kingdom of Belgium | 1.700% | 6/22/50 | EUR | 56,369 | 40,801 |
| 3 | Kingdom of Belgium | 1.400% | 6/22/53 | EUR | 82,299 | 53,796 |
| 3 | Kingdom of Belgium | 2.250% | 6/22/57 | EUR | 7,607 | 6,275 |
| 3 | Kingdom of Belgium | 2.150% | 6/22/66 | EUR | 32,130 | 25,736 |
| 3 | Kingdom of Belgium | 0.650% | 6/22/71 | EUR | 21,294 | 9,440 |
| | Ministeries Van de Vlaamse Gemeenschap | 0.375% | 10/13/26 | EUR | 2,500 | 2,274 |
| | Ministeries Van de Vlaamse Gemeenschap | 0.010% | 6/23/27 | EUR | 4,300 | 3,785 |
| | Ministeries Van de Vlaamse Gemeenschap | 0.300% | 10/20/31 | EUR | 12,000 | 9,421 |
| | Ministeries Van de Vlaamse Gemeenschap | 1.000% | 10/13/36 | EUR | 5,200 | 3,848 |
| | Ministeries Van de Vlaamse Gemeenschap | 1.500% | 7/12/38 | EUR | 1,500 | 1,157 |
| | Ministeries Van de Vlaamse Gemeenschap | 1.875% | 6/2/42 | EUR | 1,700 | 1,314 |
| | Ministeries Van de Vlaamse Gemeenschap | 1.500% | 4/11/44 | EUR | 3,200 | 2,259 |
| 7 | Ministeries Van de Vlaamse Gemeenschap | 1.000% | 1/23/51 | EUR | 8,100 | 4,663 |
| | Region Wallonne Belgium | 0.050% | 6/22/25 | EUR | 4,400 | 4,084 |
| | Region Wallonne Belgium | 0.250% | 5/3/26 | EUR | 18,800 | 17,202 |
| | Region Wallonne Belgium | 0.500% | 4/8/30 | EUR | 6,400 | 5,290 |
| | Region Wallonne Belgium | 0.375% | 10/22/31 | EUR | 2,800 | 2,202 |
| | Region Wallonne Belgium | 1.250% | 5/3/34 | EUR | 12,900 | 10,355 |
| | Region Wallonne Belgium | 0.500% | 6/22/37 | EUR | 7,000 | 4,615 |
| | Region Wallonne Belgium | 1.050% | 6/22/40 | EUR | 3,000 | 2,008 |
| 7 | Region Wallonne Belgium | 0.650% | 1/16/51 | EUR | 4,500 | 2,213 |
| | Region Wallonne Belgium | 1.250% | 6/22/71 | EUR | 2,800 | 1,520 |
| | | | | | | 1,573,995 |
| Bulgaria (0.0%) | | | |
| | Republic of Bulgaria | 2.950% | 9/3/24 | EUR | 382 | 377 |
| | Republic of Bulgaria | 2.625% | 3/26/27 | EUR | 1,455 | 1,357 |
| | Republic of Bulgaria | 3.000% | 3/21/28 | EUR | 12,184 | 10,960 |
| | Republic of Bulgaria | 3.125% | 3/26/35 | EUR | 4,457 | 3,476 |
| | Republic of Bulgaria | 1.375% | 9/23/50 | EUR | 3,413 | 1,614 |
| | Republic of Bulgaria | 4.125% | 9/23/29 | EUR | 3,200 | 2,946 |
| | Republic of Bulgaria | 0.375% | 9/23/30 | EUR | 1,000 | 683 |
| | Republic of Bulgaria | 4.625% | 9/23/34 | EUR | 2,500 | 2,263 |
| | | | | | | 23,676 |
| Canada (4.9%) | | | |
| | British Columbia Municipal Finance Authority | 2.800% | 12/3/23 | CAD | 3,017 | 2,181 |
| | British Columbia Municipal Finance Authority | 2.150% | 6/3/24 | CAD | 2,655 | 1,890 |
| | British Columbia Municipal Finance Authority | 2.950% | 10/14/24 | CAD | 2,948 | 2,116 |
| | British Columbia Municipal Finance Authority | 1.100% | 6/1/25 | CAD | 2,939 | 2,006 |
| | British Columbia Municipal Finance Authority | 2.650% | 10/2/25 | CAD | 5,863 | 4,140 |
| | British Columbia Municipal Finance Authority | 2.500% | 4/19/26 | CAD | 2,255 | 1,575 |
| | British Columbia Municipal Finance Authority | 1.350% | 6/30/26 | CAD | 1,253 | 841 |
| | British Columbia Municipal Finance Authority | 3.050% | 10/23/28 | CAD | 3,732 | 2,614 |
| | British Columbia Municipal Finance Authority | 2.550% | 10/9/29 | CAD | 1,686 | 1,130 |
| | British Columbia Municipal Finance Authority | 2.300% | 4/15/31 | CAD | 2,129 | 1,370 |
| | Canada | 0.500% | 11/1/23 | CAD | 48,695 | 34,473 |
| | Canada | 0.750% | 2/1/24 | CAD | 51,883 | 36,567 |
| | Canada | 2.250% | 3/1/24 | CAD | 8,940 | 6,414 |
| | Canada | 0.250% | 4/1/24 | CAD | 46,069 | 32,107 |
| | Canada | 1.500% | 5/1/24 | CAD | 43,875 | 31,046 |
| | Canada | 2.500% | 6/1/24 | CAD | 30,247 | 21,721 |
| | Canada | 2.750% | 8/1/24 | CAD | 231,217 | 166,318 |
Total International Bond II Index Fund
| | | Coupon | Maturity
Date | Currency | Face
Amount
(000) | Market
Value•
($000) |
| | Canada | 1.500% | 9/1/24 | CAD | 31,649 | 22,259 |
| | Canada | 0.750% | 10/1/24 | CAD | 37,100 | 25,669 |
| | Canada | 1.250% | 3/1/25 | CAD | 42,565 | 29,438 |
| | Canada | 1.500% | 4/1/25 | CAD | 98,772 | 68,561 |
| | Canada | 2.250% | 6/1/25 | CAD | 2,620 | 1,852 |
| | Canada | 9.000% | 6/1/25 | CAD | 5,877 | 4,863 |
| | Canada | 0.500% | 9/1/25 | CAD | 85,060 | 56,956 |
| | Canada | 0.250% | 3/1/26 | CAD | 73,365 | 48,134 |
| | Canada | 1.000% | 9/1/26 | CAD | 21,617 | 14,411 |
| | Canada | 1.250% | 3/1/27 | CAD | 32,706 | 21,848 |
| | Canada | 8.000% | 6/1/27 | CAD | 2,497 | 2,187 |
| | Canada | 2.750% | 9/1/27 | CAD | 59,900 | 42,643 |
| | Canada | 2.000% | 6/1/28 | CAD | 66,252 | 45,424 |
| | Canada | 2.250% | 6/1/29 | CAD | 21,105 | 14,563 |
| | Canada | 5.750% | 6/1/29 | CAD | 19,776 | 16,612 |
| | Canada | 2.250% | 12/1/29 | CAD | 24,182 | 16,625 |
| | Canada | 1.250% | 6/1/30 | CAD | 76,331 | 48,448 |
| | Canada | 0.500% | 12/1/30 | CAD | 87,721 | 51,719 |
| | Canada | 1.500% | 6/1/31 | CAD | 111,544 | 70,938 |
| | Canada | 1.500% | 12/1/31 | CAD | 114,205 | 72,150 |
| | Canada | 2.000% | 6/1/32 | CAD | 127,699 | 83,960 |
| | Canada | 2.500% | 12/1/32 | CAD | 36,800 | 25,223 |
| | Canada | 5.750% | 6/1/33 | CAD | 52,282 | 46,491 |
| | Canada | 5.000% | 6/1/37 | CAD | 40,030 | 34,646 |
| | Canada | 4.000% | 6/1/41 | CAD | 78,201 | 61,746 |
| | Canada | 3.500% | 12/1/45 | CAD | 27,408 | 20,367 |
| | Canada | 2.750% | 12/1/48 | CAD | 15,914 | 10,424 |
| | Canada | 2.000% | 12/1/51 | CAD | 137,725 | 75,873 |
| | Canada | 1.750% | 12/1/53 | CAD | 98,785 | 50,474 |
| | Canada | 2.750% | 12/1/64 | CAD | 27,930 | 17,868 |
| 3 | Canada Housing Trust No. 1 | 2.550% | 12/15/23 | CAD | 41,205 | 29,751 |
| 3 | Canada Housing Trust No. 1 | 2.900% | 6/15/24 | CAD | 65,290 | 46,973 |
| 3 | Canada Housing Trust No. 1 | 1.800% | 12/15/24 | CAD | 36,235 | 25,353 |
| 3 | Canada Housing Trust No. 1 | 2.550% | 3/15/25 | CAD | 25,785 | 18,270 |
| 3 | Canada Housing Trust No. 1 | 0.950% | 6/15/25 | CAD | 41,045 | 27,988 |
| 3 | Canada Housing Trust No. 1 | 1.950% | 12/15/25 | CAD | 66,280 | 45,731 |
| 3 | Canada Housing Trust No. 1 | 2.250% | 12/15/25 | CAD | 10,645 | 7,413 |
| 3 | Canada Housing Trust No. 1 | 1.250% | 6/15/26 | CAD | 45,845 | 30,667 |
| 3 | Canada Housing Trust No. 1 | 1.900% | 9/15/26 | CAD | 23,515 | 16,042 |
| 3 | Canada Housing Trust No. 1 | 1.100% | 12/15/26 | CAD | 21,135 | 13,897 |
| 3 | Canada Housing Trust No. 1 | 1.550% | 12/15/26 | CAD | 14,155 | 9,484 |
| 3 | Canada Housing Trust No. 1 | 2.350% | 6/15/27 | CAD | 35,285 | 24,310 |
| 3 | Canada Housing Trust No. 1 | 3.800% | 6/15/27 | CAD | 20,450 | 15,080 |
| 3 | Canada Housing Trust No. 1 | 3.600% | 12/15/27 | CAD | 23,000 | 16,785 |
| 3 | Canada Housing Trust No. 1 | 2.350% | 3/15/28 | CAD | 10,250 | 7,047 |
| 3 | Canada Housing Trust No. 1 | 2.650% | 3/15/28 | CAD | 46,150 | 32,349 |
| 3 | Canada Housing Trust No. 1 | 2.650% | 12/15/28 | CAD | 31,080 | 21,528 |
| 3 | Canada Housing Trust No. 1 | 2.100% | 9/15/29 | CAD | 18,540 | 12,314 |
| 3 | Canada Housing Trust No. 1 | 1.750% | 6/15/30 | CAD | 35,805 | 22,893 |
| 3 | Canada Housing Trust No. 1 | 1.100% | 3/15/31 | CAD | 21,815 | 13,019 |
| 3 | Canada Housing Trust No. 1 | 1.400% | 3/15/31 | CAD | 16,490 | 10,101 |
| 3 | Canada Housing Trust No. 1 | 1.900% | 3/15/31 | CAD | 12,190 | 7,788 |
| 3 | Canada Housing Trust No. 1 | 1.600% | 12/15/31 | CAD | 17,470 | 10,731 |
| 3 | Canada Housing Trust No. 1 | 2.150% | 12/15/31 | CAD | 16,690 | 10,773 |
| 3 | Canada Housing Trust No. 1 | 2.450% | 12/15/31 | CAD | 13,955 | 9,244 |
| 3 | Canada Housing Trust No. 1 | 3.550% | 9/15/32 | CAD | 28,430 | 20,536 |
| | Canada Post Corp. | 4.080% | 7/16/25 | CAD | 4,363 | 3,183 |
| | Canada Post Corp. | 4.360% | 7/16/40 | CAD | 1,789 | 1,294 |
| | CDP Financial Inc. | 1.125% | 4/6/27 | EUR | 45,900 | 41,593 |
| | City of Montreal | 3.500% | 9/1/24 | CAD | 389 | 282 |
| | City of Montreal | 3.000% | 9/1/25 | CAD | 3,428 | 2,439 |
| | City of Montreal | 3.000% | 9/1/27 | CAD | 2,450 | 1,721 |
| | City of Montreal | 3.150% | 9/1/28 | CAD | 2,795 | 1,958 |
| | City of Montreal | 2.300% | 9/1/29 | CAD | 2,131 | 1,396 |
| | City of Montreal | 1.750% | 9/1/30 | CAD | 3,449 | 2,121 |
| | City of Montreal | 2.000% | 9/1/31 | CAD | 5,458 | 3,351 |
| | City of Montreal | 4.250% | 12/1/32 | CAD | 2,154 | 1,573 |
| | City of Montreal | 4.100% | 12/1/34 | CAD | 1,566 | 1,102 |
| | City of Montreal | 3.150% | 12/1/36 | CAD | 2,931 | 1,818 |
Total International Bond II Index Fund
| | | Coupon | Maturity
Date | Currency | Face
Amount
(000) | Market
Value•
($000) |
| | City of Montreal | 3.500% | 12/1/38 | CAD | 4,239 | 2,683 |
| | City of Montreal | 2.400% | 12/1/41 | CAD | 2,924 | 1,536 |
| | City of Montreal | 4.700% | 12/1/41 | CAD | 2,354 | 1,712 |
| | City of Montreal | 6.000% | 6/1/43 | CAD | 1,987 | 1,692 |
| | City of Ottawa Ontario | 4.100% | 12/6/52 | CAD | 1,384 | 927 |
| | City of Toronto | 3.400% | 5/21/24 | CAD | 1,300 | 943 |
| | CPPIB Capital Inc. | 0.375% | 6/20/24 | EUR | 16,591 | 15,730 |
| | CPPIB Capital Inc. | 0.250% | 4/6/27 | EUR | 7,700 | 6,751 |
| | CPPIB Capital Inc. | 1.250% | 12/7/27 | GBP | 5,250 | 5,123 |
| | CPPIB Capital Inc. | 3.000% | 6/15/28 | CAD | 4,097 | 2,869 |
| | CPPIB Capital Inc. | 0.875% | 2/6/29 | EUR | 9,133 | 7,883 |
| | CPPIB Capital Inc. | 1.950% | 9/30/29 | CAD | 7,192 | 4,631 |
| | CPPIB Capital Inc. | 1.125% | 12/14/29 | GBP | 8,000 | 7,365 |
| | CPPIB Capital Inc. | 0.050% | 2/24/31 | EUR | 5,250 | 3,993 |
| | CPPIB Capital Inc. | 1.500% | 3/4/33 | EUR | 7,633 | 6,350 |
| | CPPIB Capital Inc. | 0.250% | 1/18/41 | EUR | 3,288 | 1,864 |
| 7 | CPPIB Capital Inc. | 0.750% | 7/15/49 | EUR | 2,327 | 1,327 |
| | CPPIB Capital Inc. | 1.625% | 10/22/71 | GBP | 3,250 | 1,717 |
| | Export Development Canada | 1.375% | 12/8/23 | GBP | 4,913 | 5,490 |
| | Export Development Canada | 1.650% | 7/31/24 | CAD | 2,060 | 1,450 |
| | Financement-Quebec | 5.250% | 6/1/34 | CAD | 6,253 | 4,978 |
| | First Nations Finance Authority | 3.050% | 6/1/28 | CAD | 507 | 355 |
| | First Nations Finance Authority | 1.710% | 6/16/30 | CAD | 1,639 | 1,021 |
| | First Nations Finance Authority | 2.850% | 6/1/32 | CAD | 3,845 | 2,537 |
| | Government of the Northwest Territories | 2.200% | 9/29/51 | CAD | 491 | 221 |
| | Greater Sudbury Canada | 2.416% | 3/12/50 | CAD | 427 | 205 |
| | Hydro-Quebec | 2.000% | 9/1/28 | CAD | 8,727 | 5,785 |
| | Hydro-Quebec | 6.000% | 8/15/31 | CAD | 4,550 | 3,812 |
| | Hydro-Quebec | 6.500% | 1/16/35 | CAD | 2,035 | 1,793 |
| | Hydro-Quebec | 6.500% | 2/15/35 | CAD | 18,308 | 16,274 |
| | Hydro-Quebec | 6.000% | 2/15/40 | CAD | 13,732 | 11,965 |
| | Hydro-Quebec | 5.000% | 2/15/45 | CAD | 19,795 | 15,629 |
| | Hydro-Quebec | 5.000% | 2/15/50 | CAD | 29,576 | 23,950 |
| | Hydro-Quebec | 4.000% | 2/15/55 | CAD | 26,807 | 18,564 |
| | Hydro-Quebec | 2.100% | 2/15/60 | CAD | 31,187 | 13,538 |
| | Hydro-Quebec | 4.000% | 2/15/63 | CAD | 7,043 | 4,884 |
| 3 | Labrador-Island Link Funding Trust | 3.760% | 6/1/33 | CAD | 4,412 | 3,147 |
| 3 | Labrador-Island Link Funding Trust | 3.860% | 12/1/45 | CAD | 3,311 | 2,256 |
| 3 | Labrador-Island Link Funding Trust | 3.850% | 12/1/53 | CAD | 3,339 | 2,292 |
| | Maritime Link Financing Trust | 3.500% | 12/1/52 | CAD | 3,838 | 2,573 |
| | Municipal Finance Authority of British Columbia | 4.950% | 12/1/27 | CAD | 2,700 | 2,073 |
| | Municipal Finance Authority of British Columbia | 3.300% | 4/8/32 | CAD | 4,226 | 2,906 |
| | Municipal Finance Authority of British Columbia | 2.500% | 9/27/41 | CAD | 1,153 | 624 |
| 3 | Muskrat Falls / Labrador Transmission Assets Funding Trust | 3.630% | 6/1/29 | CAD | 2,692 | 1,953 |
| 3 | Muskrat Falls / Labrador Transmission Assets Funding Trust | 3.830% | 6/1/37 | CAD | 2,150 | 1,508 |
| 3 | Muskrat Falls / Labrador Transmission Assets Funding Trust | 3.860% | 12/1/48 | CAD | 5,482 | 3,708 |
| | Muskrat Falls / Labrador Transmission Assets Funding Trust | 3.382% | 6/1/57 | CAD | 2,140 | 1,294 |
| | New Brunswick F-M Project Co. Inc. | 6.470% | 11/30/27 | CAD | 168 | 127 |
| | Newfoundland & Labrador Hydro | 6.650% | 8/27/31 | CAD | 981 | 840 |
| | Newfoundland & Labrador Hydro | 3.600% | 12/1/45 | CAD | 1,771 | 1,084 |
| | OMERS Finance Trust | 0.450% | 5/13/25 | EUR | 6,592 | 6,111 |
| | OMERS Finance Trust | 1.550% | 4/21/27 | CAD | 3,003 | 1,965 |
| | OMERS Finance Trust | 2.600% | 5/14/29 | CAD | 3,005 | 2,012 |
| 3 | OMERS Finance Trust | 2.600% | 5/14/29 | CAD | 1,525 | 1,021 |
| | Ontario Electricity Financial Corp. | 8.250% | 6/22/26 | CAD | 6,872 | 5,748 |
| | Ontario Electricity Financial Corp. | 0.000% | 4/11/31 | CAD | 1,600 | 829 |
| | Ontario Infrastructure & Lands Corp. | 4.700% | 6/1/37 | CAD | 878 | 644 |
| | Ontario School Boards Financing Corp. | 5.483% | 11/26/29 | CAD | 18 | 14 |
| | Ontario Teachers Finance Trust | 0.500% | 5/6/25 | EUR | 30,512 | 28,346 |
| | Ontario Teachers Finance Trust | 0.100% | 5/19/28 | EUR | 6,900 | 5,746 |
| 3 | Ontario Teachers Finance Trust | 1.850% | 5/3/32 | EUR | 4,300 | 3,683 |
| | Ontario Teachers Finance Trust | 1.850% | 5/3/32 | EUR | 10,250 | 8,779 |
| | Ontario Teachers Finance Trust | 0.900% | 5/20/41 | EUR | 8,330 | 5,310 |
| | OPB Finance Trust | 2.950% | 2/2/26 | CAD | 14,201 | 9,962 |
| | OPB Finance Trust | 2.980% | 1/25/27 | CAD | 2,442 | 1,701 |
| | Ottawa Ontario | 4.600% | 7/14/42 | CAD | 931 | 678 |
| | Ottawa Ontario | 3.250% | 11/10/47 | CAD | 1,173 | 675 |
| | Ottawa Ontario | 3.100% | 7/27/48 | CAD | 1,841 | 1,030 |
| | Ottawa Ontario | 2.500% | 5/11/51 | CAD | 2,620 | 1,275 |
Total International Bond II Index Fund
| | | Coupon | Maturity
Date | Currency | Face
Amount
(000) | Market
Value•
($000) |
| | Ottawa Ontario | 4.200% | 7/30/53 | CAD | 1,648 | 1,118 |
| | Province of Alberta | 3.400% | 12/1/23 | CAD | 4,879 | 3,548 |
| | Province of Alberta | 3.100% | 6/1/24 | CAD | 11,637 | 8,406 |
| | Province of Alberta | 0.625% | 4/18/25 | EUR | 5,183 | 4,852 |
| | Province of Alberta | 2.350% | 6/1/25 | CAD | 15,183 | 10,686 |
| | Province of Alberta | 0.625% | 1/16/26 | EUR | 2,501 | 2,302 |
| | Province of Alberta | 2.200% | 6/1/26 | CAD | 15,094 | 10,442 |
| | Province of Alberta | 3.100% | 12/14/26 | AUD | 1,148 | 691 |
| | Province of Alberta | 2.550% | 6/1/27 | CAD | 25,504 | 17,711 |
| | Province of Alberta | 3.600% | 4/11/28 | AUD | 110 | 66 |
| | Province of Alberta | 2.900% | 12/1/28 | CAD | 12,079 | 8,391 |
| | Province of Alberta | 0.375% | 2/7/29 | CHF | 10,000 | 9,111 |
| | Province of Alberta | 1.403% | 2/20/29 | SEK | 106,000 | 8,424 |
| | Province of Alberta | 2.900% | 9/20/29 | CAD | 7,122 | 4,891 |
| | Province of Alberta | 2.050% | 6/1/30 | CAD | 35,396 | 22,731 |
| | Province of Alberta | 1.650% | 6/1/31 | CAD | 12,891 | 7,854 |
| | Province of Alberta | 3.500% | 6/1/31 | CAD | 4,554 | 3,214 |
| | Province of Alberta | 4.150% | 6/1/33 | CAD | 3,210 | 2,334 |
| | Province of Alberta | 3.900% | 12/1/33 | CAD | 7,402 | 5,280 |
| | Province of Alberta | 4.500% | 12/1/40 | CAD | 2,450 | 1,805 |
| | Province of Alberta | 3.450% | 12/1/43 | CAD | 9,342 | 5,911 |
| | Province of Alberta | 3.300% | 12/1/46 | CAD | 21,716 | 13,254 |
| | Province of Alberta | 3.050% | 12/1/48 | CAD | 27,175 | 15,739 |
| | Province of Alberta | 3.100% | 6/1/50 | CAD | 40,126 | 23,480 |
| | Province of Alberta | 2.950% | 6/1/52 | CAD | 14,771 | 8,410 |
| | Province of British Columbia | 3.300% | 12/18/23 | CAD | 12,483 | 9,066 |
| | Province of British Columbia | 4.250% | 11/27/24 | AUD | 1,730 | 1,103 |
| | Province of British Columbia | 2.850% | 6/18/25 | CAD | 18,576 | 13,244 |
| | Province of British Columbia | 2.300% | 6/18/26 | CAD | 9,486 | 6,586 |
| | Province of British Columbia | 2.550% | 6/18/27 | CAD | 14,234 | 9,891 |
| | Province of British Columbia | 2.950% | 12/18/28 | CAD | 11,974 | 8,343 |
| | Province of British Columbia | 5.700% | 6/18/29 | CAD | 6,649 | 5,382 |
| | Province of British Columbia | 2.200% | 6/18/30 | CAD | 19,775 | 12,850 |
| | Province of British Columbia | 1.550% | 6/18/31 | CAD | 14,285 | 8,639 |
| | Province of British Columbia | 6.350% | 6/18/31 | CAD | 7,346 | 6,314 |
| | Province of British Columbia | 3.200% | 6/18/32 | CAD | 6,695 | 4,594 |
| | Province of British Columbia | 5.400% | 6/18/35 | CAD | 3,000 | 2,437 |
| | Province of British Columbia | 4.700% | 6/18/37 | CAD | 3,409 | 2,587 |
| | Province of British Columbia | 4.950% | 6/18/40 | CAD | 6,373 | 4,975 |
| | Province of British Columbia | 4.300% | 6/18/42 | CAD | 18,568 | 13,378 |
| | Province of British Columbia | 3.200% | 6/18/44 | CAD | 17,315 | 10,528 |
| | Province of British Columbia | 2.800% | 6/18/48 | CAD | 21,063 | 11,665 |
| | Province of British Columbia | 4.900% | 6/18/48 | CAD | 1,471 | 1,151 |
| | Province of British Columbia | 2.950% | 6/18/50 | CAD | 28,010 | 15,941 |
| | Province of British Columbia | 2.750% | 6/18/52 | CAD | 22,419 | 12,246 |
| | Province of British Columbia | 4.250% | 12/18/53 | CAD | 3,708 | 2,727 |
| | Province of Manitoba | 3.300% | 6/2/24 | CAD | 2,979 | 2,159 |
| | Province of Manitoba | 4.250% | 3/3/25 | AUD | 491 | 313 |
| | Province of Manitoba | 2.450% | 6/2/25 | CAD | 11,435 | 8,063 |
| | Province of Manitoba | 4.400% | 9/5/25 | CAD | 3,471 | 2,571 |
| | Province of Manitoba | 2.550% | 6/2/26 | CAD | 9,304 | 6,510 |
| | Province of Manitoba | 2.600% | 6/2/27 | CAD | 7,584 | 5,274 |
| | Province of Manitoba | 3.000% | 6/2/28 | CAD | 5,018 | 3,520 |
| | Province of Manitoba | 2.750% | 6/2/29 | CAD | 4,669 | 3,194 |
| | Province of Manitoba | 3.250% | 9/5/29 | CAD | 2,213 | 1,552 |
| | Province of Manitoba | 2.050% | 6/2/30 | CAD | 9,482 | 6,072 |
| | Province of Manitoba | 6.300% | 3/5/31 | CAD | 469 | 396 |
| | Province of Manitoba | 2.050% | 6/2/31 | CAD | 10,481 | 6,588 |
| | Province of Manitoba | 3.900% | 12/2/32 | CAD | 6,000 | 4,318 |
| | Province of Manitoba | 5.700% | 3/5/37 | CAD | 3,171 | 2,632 |
| | Province of Manitoba | 4.600% | 3/5/38 | CAD | 2,780 | 2,063 |
| | Province of Manitoba | 4.650% | 3/5/40 | CAD | 1,960 | 1,455 |
| | Province of Manitoba | 4.100% | 3/5/41 | CAD | 3,250 | 2,253 |
| | Province of Manitoba | 4.400% | 3/5/42 | CAD | 3,184 | 2,283 |
| | Province of Manitoba | 3.350% | 3/5/43 | CAD | 1,581 | 973 |
| | Province of Manitoba | 4.050% | 9/5/45 | CAD | 4,226 | 2,871 |
| | Province of Manitoba | 2.850% | 9/5/46 | CAD | 8,155 | 4,503 |
| | Province of Manitoba | 3.400% | 9/5/48 | CAD | 9,070 | 5,511 |
| | Province of Manitoba | 3.200% | 3/5/50 | CAD | 13,225 | 7,736 |
Total International Bond II Index Fund
| | | Coupon | Maturity
Date | Currency | Face
Amount
(000) | Market
Value•
($000) |
| | Province of Manitoba | 4.700% | 3/5/50 | CAD | 990 | 747 |
| | Province of Manitoba | 2.050% | 9/5/52 | CAD | 8,409 | 3,771 |
| | Province of Manitoba | 3.150% | 9/5/52 | CAD | 3,936 | 2,290 |
| | Province of Manitoba | 3.800% | 9/5/53 | CAD | 3,189 | 2,106 |
| | Province of Manitoba | 3.450% | 3/5/63 | CAD | 1,762 | 1,071 |
| | Province of New Brunswick | 3.650% | 6/3/24 | CAD | 5,418 | 3,947 |
| | Province of New Brunswick | 1.800% | 8/14/25 | CAD | 5,400 | 3,734 |
| | Province of New Brunswick | 2.600% | 8/14/26 | CAD | 4,898 | 3,425 |
| | Province of New Brunswick | 2.350% | 8/14/27 | CAD | 4,770 | 3,268 |
| | Province of New Brunswick | 3.100% | 8/14/28 | CAD | 4,044 | 2,841 |
| | Province of New Brunswick | 2.550% | 8/14/31 | CAD | 6,250 | 4,079 |
| | Province of New Brunswick | 5.500% | 1/27/34 | CAD | 1,960 | 1,605 |
| | Province of New Brunswick | 4.550% | 3/26/37 | CAD | 3,428 | 2,539 |
| | Province of New Brunswick | 4.800% | 9/26/39 | CAD | 1,186 | 900 |
| | Province of New Brunswick | 4.800% | 6/3/41 | CAD | 3,765 | 2,854 |
| | Province of New Brunswick | 3.550% | 6/3/43 | CAD | 4,641 | 2,955 |
| | Province of New Brunswick | 3.800% | 8/14/45 | CAD | 5,713 | 3,742 |
| | Province of New Brunswick | 3.100% | 8/14/48 | CAD | 8,071 | 4,644 |
| | Province of New Brunswick | 3.050% | 8/14/50 | CAD | 8,688 | 4,967 |
| | Province of New Brunswick | 2.900% | 8/14/52 | CAD | 2,419 | 1,341 |
| | Province of New Brunswick | 3.550% | 6/3/55 | CAD | 900 | 552 |
| | Province of Newfoundland and Labrador | 2.300% | 6/2/25 | CAD | 4,150 | 2,912 |
| | Province of Newfoundland and Labrador | 3.000% | 6/2/26 | CAD | 4,898 | 3,475 |
| | Province of Newfoundland and Labrador | 1.250% | 6/2/27 | CAD | 1,700 | 1,104 |
| | Province of Newfoundland and Labrador | 6.150% | 4/17/28 | CAD | 491 | 395 |
| | Province of Newfoundland and Labrador | 2.850% | 6/2/28 | CAD | 7,346 | 5,069 |
| | Province of Newfoundland and Labrador | 2.850% | 6/2/29 | CAD | 7,407 | 5,073 |
| | Province of Newfoundland and Labrador | 1.750% | 6/2/30 | CAD | 7,215 | 4,467 |
| | Province of Newfoundland and Labrador | 2.050% | 6/2/31 | CAD | 4,131 | 2,556 |
| | Province of Newfoundland and Labrador | 5.700% | 10/17/35 | CAD | 491 | 396 |
| | Province of Newfoundland and Labrador | 4.650% | 10/17/40 | CAD | 2,550 | 1,839 |
| | Province of Newfoundland and Labrador | 3.300% | 10/17/46 | CAD | 9,147 | 5,291 |
| | Province of Newfoundland and Labrador | 3.700% | 10/17/48 | CAD | 5,940 | 3,658 |
| | Province of Newfoundland and Labrador | 2.650% | 10/17/50 | CAD | 9,380 | 4,663 |
| | Province of Newfoundland and Labrador | 3.150% | 12/2/52 | CAD | 3,729 | 2,070 |
| | Province of Nova Scotia | 2.100% | 6/1/27 | CAD | 4,169 | 2,835 |
| | Province of Nova Scotia | 1.100% | 6/1/28 | CAD | 5,287 | 3,349 |
| | Province of Nova Scotia | 2.000% | 9/1/30 | CAD | 8,313 | 5,272 |
| | Province of Nova Scotia | 2.400% | 12/1/31 | CAD | 4,700 | 3,018 |
| | Province of Nova Scotia | 6.600% | 12/1/31 | CAD | 12 | 10 |
| | Province of Nova Scotia | 5.800% | 6/1/33 | CAD | 981 | 811 |
| | Province of Nova Scotia | 4.500% | 6/1/37 | CAD | 2,450 | 1,805 |
| | Province of Nova Scotia | 4.700% | 6/1/41 | CAD | 4,150 | 3,114 |
| | Province of Nova Scotia | 4.400% | 6/1/42 | CAD | 4,866 | 3,493 |
| | Province of Nova Scotia | 3.450% | 6/1/45 | CAD | 2,376 | 1,472 |
| | Province of Nova Scotia | 3.150% | 12/1/51 | CAD | 10,525 | 6,108 |
| | Province of Nova Scotia | 3.500% | 6/2/62 | CAD | 4,124 | 2,479 |
| | Province of Ontario | 7.500% | 2/7/24 | CAD | 1,266 | 967 |
| | Province of Ontario | 1.875% | 5/21/24 | EUR | 2,457 | 2,393 |
| | Province of Ontario | 3.500% | 6/2/24 | CAD | 50,582 | 36,771 |
| | Province of Ontario | 0.375% | 6/14/24 | EUR | 11,821 | 11,231 |
| | Province of Ontario | 4.250% | 8/22/24 | AUD | 495 | 316 |
| | Province of Ontario | 2.300% | 9/8/24 | CAD | 22,144 | 15,736 |
| | Province of Ontario | 0.875% | 1/21/25 | EUR | 2,457 | 2,324 |
| | Province of Ontario | 2.650% | 2/5/25 | CAD | 16,212 | 11,541 |
| | Province of Ontario | 0.625% | 4/17/25 | EUR | 6,647 | 6,222 |
| | Province of Ontario | 2.600% | 6/2/25 | CAD | 56,589 | 40,073 |
| | Province of Ontario | 3.100% | 8/26/25 | AUD | 985 | 608 |
| | Province of Ontario | 1.750% | 9/8/25 | CAD | 39,298 | 27,094 |
| | Province of Ontario | 2.400% | 6/2/26 | CAD | 31,887 | 22,215 |
| | Province of Ontario | 1.350% | 9/8/26 | CAD | 11,564 | 7,717 |
| | Province of Ontario | 3.500% | 1/27/27 | AUD | 495 | 300 |
| | Province of Ontario | 1.850% | 2/1/27 | CAD | 13,498 | 9,096 |
| | Province of Ontario | 0.375% | 4/8/27 | EUR | 957 | 843 |
| | Province of Ontario | 2.600% | 6/2/27 | CAD | 36,481 | 25,397 |
| | Province of Ontario | 7.600% | 6/2/27 | CAD | 7,346 | 6,264 |
| | Province of Ontario | 1.050% | 9/8/27 | CAD | 10,255 | 6,619 |
| | Province of Ontario | 3.600% | 3/8/28 | CAD | 16,100 | 11,664 |
| | Province of Ontario | 2.900% | 6/2/28 | CAD | 37,175 | 25,962 |
Total International Bond II Index Fund
| | | Coupon | Maturity
Date | Currency | Face
Amount
(000) | Market
Value•
($000) |
| | Province of Ontario | 6.500% | 3/8/29 | CAD | 8,110 | 6,755 |
| | Province of Ontario | 2.700% | 6/2/29 | CAD | 52,731 | 35,966 |
| | Province of Ontario | 0.250% | 6/28/29 | CHF | 5,515 | 4,966 |
| | Province of Ontario | 1.550% | 11/1/29 | CAD | 21,996 | 13,811 |
| | Province of Ontario | 2.050% | 6/2/30 | CAD | 44,799 | 28,758 |
| | Province of Ontario | 0.010% | ��11/25/30 | EUR | 10,214 | 7,794 |
| | Province of Ontario | 1.350% | 12/2/30 | CAD | 25,904 | 15,558 |
| | Province of Ontario | 2.150% | 6/2/31 | CAD | 52,612 | 33,417 |
| | Province of Ontario | 6.200% | 6/2/31 | CAD | 6,367 | 5,413 |
| | Province of Ontario | 0.250% | 6/9/31 | EUR | 7,600 | 5,813 |
| | Province of Ontario | 2.250% | 12/2/31 | CAD | 22,555 | 14,323 |
| | Province of Ontario | 3.750% | 6/2/32 | CAD | 35,300 | 25,290 |
| | Province of Ontario | 5.850% | 3/8/33 | CAD | 13,198 | 11,014 |
| | Province of Ontario | 5.600% | 6/2/35 | CAD | 23,098 | 19,049 |
| | Province of Ontario | 4.700% | 6/2/37 | CAD | 41,136 | 31,160 |
| | Province of Ontario | 4.600% | 6/2/39 | CAD | 38,496 | 28,793 |
| | Province of Ontario | 4.650% | 6/2/41 | CAD | 59,443 | 44,627 |
| | Province of Ontario | 3.500% | 6/2/43 | CAD | 39,795 | 25,412 |
| | Province of Ontario | 3.450% | 6/2/45 | CAD | 63,625 | 39,987 |
| | Province of Ontario | 2.900% | 12/2/46 | CAD | 66,145 | 37,459 |
| | Province of Ontario | 2.800% | 6/2/48 | CAD | 50,869 | 28,074 |
| | Province of Ontario | 2.900% | 6/2/49 | CAD | 55,273 | 31,008 |
| | Province of Ontario | 2.650% | 12/2/50 | CAD | 60,479 | 32,115 |
| | Province of Ontario | 1.900% | 12/2/51 | CAD | 53,256 | 23,379 |
| | Province of Ontario | 2.550% | 12/2/52 | CAD | 46,080 | 23,724 |
| | Province of Ontario | 3.750% | 12/2/53 | CAD | 26,659 | 17,709 |
| | Province of Prince Edward Island | 4.600% | 5/19/41 | CAD | 800 | 580 |
| | Province of Prince Edward Island | 3.650% | 6/27/42 | CAD | 1,284 | 814 |
| | Province of Prince Edward Island | 2.650% | 12/1/51 | CAD | 1,261 | 646 |
| | Province of Prince Edward Island | 3.600% | 1/17/53 | CAD | 1,467 | 909 |
| | Province of Quebec | 1.500% | 12/15/23 | GBP | 3,910 | 4,367 |
| | Province of Quebec | 2.375% | 1/22/24 | EUR | 552 | 543 |
| | Province of Quebec | 2.250% | 2/22/24 | CAD | 4,262 | 3,053 |
| | Province of Quebec | 3.750% | 9/1/24 | CAD | 21,833 | 15,922 |
| | Province of Quebec | 0.875% | 1/15/25 | EUR | 5,500 | 5,206 |
| | Province of Quebec | 4.200% | 3/10/25 | AUD | 739 | 471 |
| | Province of Quebec | 5.350% | 6/1/25 | CAD | 10,450 | 7,910 |
| | Province of Quebec | 2.600% | 7/6/25 | CAD | 3,099 | 2,194 |
| | Province of Quebec | 2.750% | 9/1/25 | CAD | 32,027 | 22,716 |
| | Province of Quebec | 8.500% | 4/1/26 | CAD | 4,898 | 4,085 |
| | Province of Quebec | 3.700% | 5/20/26 | AUD | 279 | 173 |
| | Province of Quebec | 2.500% | 9/1/26 | CAD | 22,964 | 16,023 |
| | Province of Quebec | 1.850% | 2/13/27 | CAD | 3,112 | 2,099 |
| | Province of Quebec | 0.875% | 5/4/27 | EUR | 17,049 | 15,370 |
| | Province of Quebec | 2.750% | 9/1/27 | CAD | 31,554 | 22,096 |
| | Province of Quebec | 0.875% | 7/5/28 | EUR | 20,214 | 17,726 |
| | Province of Quebec | 2.750% | 9/1/28 | CAD | 22,350 | 15,467 |
| | Province of Quebec | 2.300% | 9/1/29 | CAD | 24,778 | 16,455 |
| | Province of Quebec | 6.000% | 10/1/29 | CAD | 7,346 | 6,047 |
| | Province of Quebec | 1.900% | 9/1/30 | CAD | 41,650 | 26,350 |
| | Province of Quebec | 0.000% | 10/29/30 | EUR | 16,093 | 12,353 |
| | Province of Quebec | 0.250% | 5/5/31 | EUR | 12,300 | 9,475 |
| | Province of Quebec | 2.100% | 5/27/31 | CAD | 15,300 | 9,727 |
| | Province of Quebec | 1.500% | 9/1/31 | CAD | 52,164 | 31,249 |
| | Province of Quebec | 6.250% | 6/1/32 | CAD | 10,564 | 9,070 |
| | Province of Quebec | 3.250% | 9/1/32 | CAD | 19,135 | 13,143 |
| | Province of Quebec | 5.750% | 12/1/36 | CAD | 14,609 | 12,311 |
| | Province of Quebec | 5.000% | 12/1/38 | CAD | 18,957 | 14,862 |
| | Province of Quebec | 5.000% | 12/1/41 | CAD | 35,004 | 27,502 |
| | Province of Quebec | 4.250% | 12/1/43 | CAD | 27,842 | 19,894 |
| | Province of Quebec | 3.500% | 12/1/45 | CAD | 37,714 | 23,940 |
| | Province of Quebec | 3.500% | 12/1/48 | CAD | 45,671 | 28,866 |
| | Province of Quebec | 3.100% | 12/1/51 | CAD | 67,005 | 39,238 |
| | Province of Quebec | 2.850% | 12/1/53 | CAD | 56,883 | 31,493 |
| | Province of Quebec | 4.400% | 12/1/55 | CAD | 3,600 | 2,709 |
| | Province of Saskatchewan | 3.200% | 6/3/24 | CAD | 7,679 | 5,556 |
| | Province of Saskatchewan | 0.800% | 9/2/25 | CAD | 5,074 | 3,406 |
| | Province of Saskatchewan | 2.550% | 6/2/26 | CAD | 4,997 | 3,498 |
| | Province of Saskatchewan | 2.650% | 6/2/27 | CAD | 6,898 | 4,807 |
Total International Bond II Index Fund
| | | Coupon | Maturity
Date | Currency | Face
Amount
(000) | Market
Value•
($000) |
| | Province of Saskatchewan | 3.050% | 12/2/28 | CAD | 6,693 | 4,684 |
| | Province of Saskatchewan | 5.750% | 3/5/29 | CAD | 2,939 | 2,356 |
| | Province of Saskatchewan | 2.200% | 6/2/30 | CAD | 5,140 | 3,332 |
| | Province of Saskatchewan | 2.150% | 6/2/31 | CAD | 7,585 | 4,809 |
| | Province of Saskatchewan | 6.400% | 9/5/31 | CAD | 259 | 223 |
| | Province of Saskatchewan | 5.800% | 9/5/33 | CAD | 140 | 117 |
| | Province of Saskatchewan | 5.000% | 3/5/37 | CAD | 61 | 48 |
| | Province of Saskatchewan | 4.750% | 6/1/40 | CAD | 3,624 | 2,750 |
| | Province of Saskatchewan | 3.400% | 2/3/42 | CAD | 3,250 | 2,046 |
| | Province of Saskatchewan | 3.900% | 6/2/45 | CAD | 6,816 | 4,569 |
| | Province of Saskatchewan | 2.750% | 12/2/46 | CAD | 10,666 | 5,839 |
| | Province of Saskatchewan | 3.300% | 6/2/48 | CAD | 8,685 | 5,251 |
| | Province of Saskatchewan | 3.100% | 6/2/50 | CAD | 13,142 | 7,648 |
| | Province of Saskatchewan | 2.800% | 12/2/52 | CAD | 8,455 | 4,563 |
| | Province of Saskatchewan | 3.750% | 3/5/54 | CAD | 1,859 | 1,216 |
| | Province of Saskatchewan | 2.950% | 6/2/58 | CAD | 1,872 | 1,003 |
| | PSP Capital Inc. | 2.090% | 11/22/23 | CAD | 1,971 | 1,414 |
| | PSP Capital Inc. | 3.290% | 4/4/24 | CAD | 9,847 | 7,143 |
| | PSP Capital Inc. | 3.000% | 11/5/25 | CAD | 5,383 | 3,831 |
| | PSP Capital Inc. | 0.900% | 6/15/26 | CAD | 2,450 | 1,612 |
| | PSP Capital Inc. | 1.500% | 3/15/28 | CAD | 7,700 | 4,997 |
| | PSP Capital Inc. | 2.050% | 1/15/30 | CAD | 8,828 | 5,684 |
| | PSP Capital Inc. | 2.600% | 3/1/32 | CAD | 500 | 324 |
| | Regional Municipality of Peel Ontario | 4.250% | 12/2/33 | CAD | 700 | 511 |
| | Regional Municipality of Peel Ontario | 5.100% | 6/29/40 | CAD | 3,419 | 2,619 |
| | Regional Municipality of Peel Ontario | 2.500% | 6/16/51 | CAD | 1,653 | 809 |
| | Regional Municipality of York | 2.600% | 12/15/25 | CAD | 2,450 | 1,724 |
| | Regional Municipality of York | 2.500% | 6/2/26 | CAD | 1,471 | 1,027 |
| | Regional Municipality of York | 2.350% | 6/9/27 | CAD | 2 | 1 |
| | Regional Municipality of York | 1.700% | 5/27/30 | CAD | 1,453 | 901 |
| | Regional Municipality of York | 2.150% | 6/22/31 | CAD | 1,954 | 1,226 |
| | Regional Municipality of York | 4.000% | 5/31/32 | CAD | 2,135 | 1,556 |
| | Regional Municipality of York | 3.650% | 5/13/33 | CAD | 1,519 | 1,048 |
| | Regional Municipality of York | 4.050% | 5/1/34 | CAD | 1,577 | 1,116 |
| | Royal Office Finance LP | 5.209% | 11/12/37 | CAD | 2,475 | 1,853 |
| | South Coast British Columbia Transportation Authority | 3.050% | 6/4/25 | CAD | 2,657 | 1,897 |
| | South Coast British Columbia Transportation Authority | 3.250% | 11/23/28 | CAD | 1,300 | 917 |
| | South Coast British Columbia Transportation Authority | 4.450% | 6/9/44 | CAD | 500 | 350 |
| | South Coast British Columbia Transportation Authority | 3.150% | 11/16/48 | CAD | 4,601 | 2,586 |
| | South Coast British Columbia Transportation Authority | 2.650% | 10/29/50 | CAD | 486 | 244 |
| | TCHC Issuer Trust | 5.395% | 2/22/40 | CAD | 1,018 | 793 |
| | Toronto Canada | 2.450% | 2/6/25 | CAD | 2,690 | 1,904 |
| | Toronto Canada | 2.400% | 6/7/27 | CAD | 2,484 | 1,709 |
| | Toronto Canada | 2.650% | 11/9/29 | CAD | 2,630 | 1,800 |
| | Toronto Canada | 3.250% | 4/20/32 | CAD | 3,000 | 2,043 |
| | Toronto Canada | 2.950% | 4/28/35 | CAD | 3,062 | 1,906 |
| | Toronto Canada | 3.500% | 6/2/36 | CAD | 2,000 | 1,306 |
| | Toronto Canada | 2.600% | 9/24/39 | CAD | 2,977 | 1,647 |
| | Toronto Canada | 5.200% | 6/1/40 | CAD | 599 | 463 |
| | Toronto Canada | 2.150% | 8/25/40 | CAD | 2,873 | 1,462 |
| | Toronto Canada | 4.700% | 6/10/41 | CAD | 981 | 713 |
| | Toronto Canada | 2.850% | 11/23/41 | CAD | 500 | 281 |
| | Toronto Canada | 3.800% | 12/13/42 | CAD | 1,240 | 799 |
| | Toronto Canada | 4.150% | 3/10/44 | CAD | 2,415 | 1,629 |
| | Toronto Canada | 3.250% | 6/24/46 | CAD | 1,960 | 1,133 |
| | Toronto Canada | 3.200% | 8/1/48 | CAD | 893 | 509 |
| | Toronto Canada | 2.800% | 11/22/49 | CAD | 2,898 | 1,509 |
| | Toronto Canada | 2.900% | 4/29/51 | CAD | 3,204 | 1,696 |
| | Toronto Canada | 4.300% | 6/1/52 | CAD | 884 | 616 |
| | Vancouver Canada | 3.700% | 10/18/52 | CAD | 628 | 390 |
| | Winnipeg Canada | 4.100% | 6/1/45 | CAD | 1,240 | 817 |
| | Winnipeg Canada | 4.300% | 11/15/51 | CAD | 2,537 | 1,723 |
| | | | | | | 4,417,200 |
| Chile (0.1%) | | | |
| 3 | Bonos de la Tesoreria de la Republica en pesos | 5.800% | 6/1/24 | CLP | 8,175,000 | 8,239 |
| | Bonos de la Tesoreria de la Republica en pesos | 2.500% | 3/1/25 | CLP | 13,250,000 | 12,539 |
| | Bonos de la Tesoreria de la Republica en pesos | 4.500% | 3/1/26 | CLP | 18,945,000 | 18,623 |
| 3 | Bonos de la Tesoreria de la Republica en pesos | 5.000% | 10/1/28 | CLP | 10,500,000 | 10,128 |
| 3 | Bonos de la Tesoreria de la Republica en pesos | 4.700% | 9/1/30 | CLP | 18,650,000 | 17,405 |
Total International Bond II Index Fund
| | | Coupon | Maturity
Date | Currency | Face
Amount
(000) | Market
Value•
($000) |
| | Bonos de la Tesoreria de la Republica en pesos | 5.000% | 3/1/35 | CLP | 10,755,000 | 9,963 |
| | Bonos de la Tesoreria de la Republica en pesos | 6.000% | 1/1/43 | CLP | 15,590,000 | 15,623 |
| | Republic of Chile | 1.625% | 1/30/25 | EUR | 2,736 | 2,570 |
| | Republic of Chile | 0.100% | 1/26/27 | EUR | 7,762 | 6,387 |
| | Republic of Chile | 0.555% | 1/21/29 | EUR | 6,600 | 5,089 |
| | Republic of Chile | 1.440% | 2/1/29 | EUR | 2,231 | 1,810 |
| | Republic of Chile | 0.830% | 7/2/31 | EUR | 5,384 | 3,862 |
| | Republic of Chile | 1.300% | 7/26/36 | EUR | 6,554 | 4,219 |
| | Republic of Chile | 1.250% | 1/29/40 | EUR | 4,732 | 2,779 |
| | Republic of Chile | 1.250% | 1/22/51 | EUR | 5,795 | 2,791 |
| | | | | | | 122,027 |
| China (1.1%) | | | |
| | Agricultural Development Bank of China | 3.190% | 3/3/24 | CNY | 150,000 | 20,862 |
| | Agricultural Development Bank of China | 3.240% | 8/14/24 | CNY | 50,000 | 6,979 |
| | Agricultural Development Bank of China | 2.610% | 3/9/25 | CNY | 20,000 | 2,762 |
| | Agricultural Development Bank of China | 2.250% | 4/22/25 | CNY | 50,000 | 6,847 |
| | Agricultural Development Bank of China | 3.450% | 9/23/25 | CNY | 50,000 | 7,066 |
| | Agricultural Development Bank of China | 3.350% | 3/24/26 | CNY | 50,000 | 7,059 |
| | Agricultural Development Bank of China | 3.630% | 7/19/26 | CNY | 40,000 | 5,704 |
| | Agricultural Development Bank of China | 2.990% | 8/11/26 | CNY | 50,000 | 6,975 |
| | Agricultural Development Bank of China | 2.870% | 5/14/27 | CNY | 50,000 | 6,937 |
| | Agricultural Development Bank of China | 3.480% | 2/4/28 | CNY | 60,000 | 8,553 |
| | Agricultural Development Bank of China | 3.190% | 8/12/28 | CNY | 80,000 | 11,234 |
| | Agricultural Development Bank of China | 2.960% | 4/17/30 | CNY | 30,000 | 4,137 |
| | Agricultural Development Bank of China | 3.790% | 10/26/30 | CNY | 50,000 | 7,286 |
| | Agricultural Development Bank of China | 3.520% | 5/24/31 | CNY | 20,000 | 2,866 |
| | Agricultural Development Bank of China | 3.300% | 11/5/31 | CNY | 90,000 | 12,705 |
| | Agricultural Development Bank of China | 3.060% | 6/6/32 | CNY | 180,000 | 24,939 |
| | Agricultural Development Bank of China | 3.920% | 6/18/51 | CNY | 30,000 | 4,643 |
| | China Development Bank | 2.980% | 1/8/24 | CNY | 100,000 | 13,862 |
| | China Development Bank | 0.875% | 1/24/24 | EUR | 822 | 789 |
| | China Development Bank | 2.730% | 11/11/24 | CNY | 160,000 | 22,165 |
| | China Development Bank | 3.230% | 1/10/25 | CNY | 20,000 | 2,800 |
| | China Development Bank | 2.590% | 3/17/25 | CNY | 100,000 | 13,819 |
| | China Development Bank | 3.340% | 7/14/25 | CNY | 20,000 | 2,817 |
| | China Development Bank | 3.430% | 1/14/27 | CNY | 110,000 | 15,629 |
| | China Development Bank | 4.240% | 8/24/27 | CNY | 120,000 | 17,694 |
| | China Development Bank | 3.400% | 1/8/28 | CNY | 300,000 | 42,699 |
| | China Development Bank | 3.090% | 8/9/28 | CNY | 130,000 | 18,167 |
| | China Development Bank | 3.480% | 1/8/29 | CNY | 50,000 | 7,124 |
| | China Development Bank | 2.990% | 3/1/29 | CNY | 130,000 | 18,026 |
| | China Development Bank | 3.070% | 3/10/30 | CNY | 65,000 | 9,038 |
| | China Development Bank | 3.090% | 6/18/30 | CNY | 125,000 | 17,393 |
| | China Development Bank | 3.700% | 10/20/30 | CNY | 30,000 | 4,347 |
| | China Development Bank | 3.660% | 3/1/31 | CNY | 145,000 | 20,976 |
| | China Development Bank | 3.410% | 6/7/31 | CNY | 50,000 | 7,109 |
| | China Development Bank | 3.120% | 9/13/31 | CNY | 120,000 | 16,698 |
| | China Development Bank | 3.000% | 1/17/32 | CNY | 50,000 | 6,903 |
| | China Development Bank | 3.800% | 1/25/36 | CNY | 30,000 | 4,438 |
| | China Development Bank | 3.900% | 8/3/40 | CNY | 160,000 | 24,126 |
| | China Development Bank | 3.560% | 11/19/51 | CNY | 50,000 | 7,049 |
| | China Government Bond | 2.880% | 11/5/23 | CNY | 120,000 | 16,625 |
| | China Government Bond | 2.840% | 4/8/24 | CNY | 250,000 | 34,704 |
| | China Government Bond | 2.470% | 9/2/24 | CNY | 300,000 | 41,426 |
| | China Government Bond | 2.940% | 10/17/24 | CNY | 80,000 | 11,142 |
| | China Government Bond | 1.990% | 4/9/25 | CNY | 160,000 | 21,835 |
| | China Government Bond | 2.240% | 5/25/25 | CNY | 200,000 | 27,443 |
| | China Government Bond | 3.020% | 10/22/25 | CNY | 135,000 | 18,903 |
| | China Government Bond | 3.030% | 3/11/26 | CNY | 110,000 | 15,422 |
| | China Government Bond | 2.690% | 8/12/26 | CNY | 220,000 | 30,501 |
| | China Government Bond | 0.125% | 11/12/26 | EUR | 2,700 | 2,326 |
| | China Government Bond | 2.850% | 6/4/27 | CNY | 40,000 | 5,584 |
| | China Government Bond | 3.280% | 12/3/27 | CNY | 80,000 | 11,396 |
| | China Government Bond | 3.010% | 5/13/28 | CNY | 130,000 | 18,268 |
| | China Government Bond | 2.910% | 10/14/28 | CNY | 145,000 | 20,238 |
| | China Government Bond | 0.125% | 11/17/28 | EUR | 5,000 | 3,995 |
| | China Government Bond | 2.800% | 3/24/29 | CNY | 100,000 | 13,854 |
| | China Government Bond | 3.290% | 5/23/29 | CNY | 90,000 | 12,826 |
| | China Government Bond | 2.750% | 6/15/29 | CNY | 50,000 | 6,901 |
Total International Bond II Index Fund
| | | Coupon | Maturity
Date | Currency | Face
Amount
(000) | Market
Value•
($000) |
| | China Government Bond | 3.130% | 11/21/29 | CNY | 40,000 | 5,641 |
| | China Government Bond | 2.680% | 5/21/30 | CNY | 90,000 | 12,311 |
| | China Government Bond | 3.270% | 11/19/30 | CNY | 50,000 | 7,152 |
| | China Government Bond | 3.020% | 5/27/31 | CNY | 133,000 | 18,720 |
| | China Government Bond | 0.500% | 11/12/31 | EUR | 10,447 | 7,856 |
| | China Government Bond | 2.890% | 11/18/31 | CNY | 110,000 | 15,342 |
| | China Government Bond | 0.625% | 11/25/35 | EUR | 4,913 | 3,310 |
| | China Government Bond | 4.270% | 5/17/37 | CNY | 30,000 | 4,822 |
| | China Government Bond | 1.000% | 11/12/39 | EUR | 4,778 | 3,033 |
| | China Government Bond | 3.520% | 4/25/46 | CNY | 20,000 | 2,918 |
| | China Government Bond | 3.770% | 2/20/47 | CNY | 20,000 | 3,031 |
| | China Government Bond | 4.050% | 7/24/47 | CNY | 20,000 | 3,161 |
| | China Government Bond | 3.970% | 7/23/48 | CNY | 20,000 | 3,131 |
| | China Government Bond | 4.080% | 10/22/48 | CNY | 25,000 | 3,983 |
| | China Government Bond | 3.860% | 7/22/49 | CNY | 70,000 | 10,801 |
| | China Government Bond | 3.390% | 3/16/50 | CNY | 60,000 | 8,570 |
| | China Government Bond | 3.810% | 9/14/50 | CNY | 40,000 | 6,140 |
| | China Government Bond | 3.720% | 4/12/51 | CNY | 85,000 | 12,869 |
| | China Government Bond | 3.530% | 10/18/51 | CNY | 85,000 | 12,659 |
| | China Government Bond | 4.240% | 11/24/64 | CNY | 30,000 | 5,151 |
| | China Government Bond | 3.730% | 5/25/70 | CNY | 30,000 | 4,692 |
| | China Government Bond | 3.760% | 3/22/71 | CNY | 40,000 | 6,303 |
| | Export-Import Bank of China | 3.140% | 4/2/24 | CNY | 60,000 | 8,345 |
| | Export-Import Bank of China | 2.760% | 11/5/24 | CNY | 230,000 | 31,860 |
| | Export-Import Bank of China | 3.430% | 10/23/25 | CNY | 50,000 | 7,070 |
| | Export-Import Bank of China | 3.220% | 5/14/26 | CNY | 70,000 | 9,850 |
| | Export-Import Bank of China | 3.400% | 1/11/28 | CNY | 90,000 | 12,766 |
| | Export-Import Bank of China | 3.860% | 5/20/29 | CNY | 40,000 | 5,839 |
| | Export-Import Bank of China | 3.740% | 11/16/30 | CNY | 80,000 | 11,614 |
| | Export-Import Bank of China | 3.180% | 3/11/32 | CNY | �� 140,000 | 19,574 |
| | | | | | | 1,023,125 |
| Colombia (0.2%) | | | |
| | Colombian TES | 10.000% | 7/24/24 | COP | 95,100,000 | 18,508 |
| | Colombian TES | 6.250% | 11/26/25 | COP | 79,000,000 | 13,307 |
| | Colombian TES | 7.500% | 8/26/26 | COP | 123,500,000 | 20,671 |
| | Colombian TES | 5.750% | 11/3/27 | COP | 85,000,000 | 12,465 |
| | Colombian TES | 6.000% | 4/28/28 | COP | 131,000,000 | 18,895 |
| | Colombian TES | 7.750% | 9/18/30 | COP | 95,300,000 | 13,798 |
| | Colombian TES | 7.000% | 3/26/31 | COP | 90,000,000 | 12,184 |
| | Colombian TES | 7.000% | 6/30/32 | COP | 118,700,000 | 15,466 |
| | Colombian TES | 7.250% | 10/18/34 | COP | 115,250,000 | 14,589 |
| | Colombian TES | 6.250% | 7/9/36 | COP | 68,000,000 | 7,502 |
| | Colombian TES | 9.250% | 5/28/42 | COP | 77,500,000 | 10,816 |
| | Colombian TES | 7.250% | 10/26/50 | COP | 62,500,000 | 6,753 |
| | | | | | | 164,954 |
| Croatia (0.1%) | | | |
| | Republic of Croatia | 3.000% | 3/11/25 | EUR | 1,004 | 993 |
| | Republic of Croatia | 3.000% | 3/20/27 | EUR | 3,459 | 3,399 |
| | Republic of Croatia | 2.700% | 6/15/28 | EUR | 2,818 | 2,670 |
| | Republic of Croatia | 1.125% | 6/19/29 | EUR | 8,459 | 7,023 |
| | Republic of Croatia | 2.750% | 1/27/30 | EUR | 4,459 | 4,023 |
| | Republic of Croatia | 1.500% | 6/17/31 | EUR | 27,639 | 22,004 |
| | Republic of Croatia | 2.875% | 4/22/32 | EUR | 5,400 | 4,715 |
| | Republic of Croatia | 1.125% | 3/4/33 | EUR | 4,000 | 2,887 |
| | Republic of Croatia | 1.750% | 3/4/41 | EUR | 4,947 | 3,244 |
| | | | | | | 50,958 |
| Czech Republic (0.4%) | | | |
| | Czech Republic | 0.450% | 10/25/23 | CZK | 490,310 | 18,601 |
| | Czech Republic | 5.700% | 5/25/24 | CZK | 107,740 | 4,315 |
| | Czech Republic | 0.000% | 12/12/24 | CZK | 561,080 | 20,046 |
| | Czech Republic | 1.250% | 2/14/25 | CZK | 1,050,000 | 38,035 |
| | Czech Republic | 2.400% | 9/17/25 | CZK | 353,340 | 12,872 |
| | Czech Republic | 6.000% | 2/26/26 | CZK | 1,901,590 | 76,318 |
| | Czech Republic | 1.000% | 6/26/26 | CZK | 908,230 | 30,575 |
| | Czech Republic | 0.250% | 2/10/27 | CZK | 401,400 | 12,665 |
| | Czech Republic | 2.500% | 8/25/28 | CZK | 181,190 | 6,057 |
| | Czech Republic | 2.750% | 7/23/29 | CZK | 1,957,870 | 65,102 |
| | Czech Republic | 0.950% | 5/15/30 | CZK | 779,080 | 21,970 |
Total International Bond II Index Fund
| | | Coupon | Maturity
Date | Currency | Face
Amount
(000) | Market
Value•
($000) |
| | Czech Republic | 1.200% | 3/13/31 | CZK | 541,410 | 15,212 |
| | Czech Republic | 2.000% | 10/13/33 | CZK | 278,500 | 7,816 |
| | Czech Republic | 4.200% | 12/4/36 | CZK | 48,170 | 1,650 |
| | Czech Republic | 1.500% | 4/24/40 | CZK | 100,340 | 2,167 |
| | Czech Republic | 4.850% | 11/26/57 | CZK | 44,570 | 1,586 |
| | | | | | | 334,987 |
| Denmark (0.4%) | | | |
| | Kingdom of Denmark | 1.500% | 11/15/23 | DKK | 118,766 | 15,684 |
| | Kingdom of Denmark | 7.000% | 11/10/24 | DKK | 36,375 | 5,282 |
| | Kingdom of Denmark | 1.750% | 11/15/25 | DKK | 331,651 | 43,444 |
| | Kingdom of Denmark | 0.500% | 11/15/27 | DKK | 492,636 | 59,730 |
| | Kingdom of Denmark | 0.500% | 11/15/29 | DKK | 561,753 | 65,277 |
| | Kingdom of Denmark | 0.000% | 11/15/31 | DKK | 608,388 | 64,405 |
| | Kingdom of Denmark | 4.500% | 11/15/39 | DKK | 373,185 | 61,705 |
| | Kingdom of Denmark | 0.250% | 11/15/52 | DKK | 99,818 | 7,126 |
| | Kommunekredit | 0.250% | 2/16/24 | EUR | 1,004 | 963 |
| | Kommunekredit | 0.625% | 5/11/26 | EUR | 2,186 | 2,002 |
| | Kommunekredit | 2.900% | 11/27/26 | AUD | 2,047 | 1,223 |
| | Kommunekredit | 0.750% | 5/18/27 | EUR | 12,443 | 11,198 |
| | Kommunekredit | 0.000% | 3/3/31 | EUR | 5,000 | 3,852 |
| | Kommunekredit | 0.010% | 5/4/34 | EUR | 1,000 | 692 |
| | Kommunekredit | 0.875% | 11/3/36 | EUR | 2,500 | 1,827 |
| | | | | | | 344,410 |
| Finland (0.5%) | | | |
| | Finnvera OYJ | 0.500% | 4/13/26 | EUR | 3,234 | 2,952 |
| | Finnvera OYJ | 2.125% | 3/8/28 | EUR | 20,400 | 19,454 |
| | Finnvera OYJ | 0.375% | 4/9/29 | EUR | 4,169 | 3,508 |
| | Finnvera OYJ | 1.125% | 5/17/32 | EUR | 3,100 | 2,578 |
| | Kuntarahoitus OYJ | 0.000% | 4/21/28 | EUR | 5,400 | 4,571 |
| | Kuntarahoitus OYJ | 0.000% | 3/2/31 | EUR | 15,800 | 12,222 |
| | Kuntarahoitus OYJ | 0.250% | 2/25/32 | EUR | 17,800 | 13,693 |
| | Kuntarahoitus OYJ | 0.050% | 9/10/35 | EUR | 11,277 | 7,567 |
| | Municipality Finance plc | 5.000% | 3/20/24 | AUD | 2,008 | 1,298 |
| | Municipality Finance plc | 0.625% | 11/26/26 | EUR | 2,457 | 2,228 |
| | Municipality Finance plc | 1.250% | 2/23/33 | EUR | 4,913 | 4,092 |
| 3 | Republic of Finland | 2.000% | 4/15/24 | EUR | 14,141 | 13,976 |
| 3 | Republic of Finland | 0.000% | 9/15/24 | EUR | 24,380 | 23,228 |
| 3 | Republic of Finland | 4.000% | 7/4/25 | EUR | 21,290 | 22,099 |
| 3 | Republic of Finland | 0.875% | 9/15/25 | EUR | 5,120 | 4,894 |
| 3 | Republic of Finland | 0.000% | 9/15/26 | EUR | 35,000 | 31,626 |
| 3 | Republic of Finland | 1.375% | 4/15/27 | EUR | 25,000 | 23,608 |
| 3 | Republic of Finland | 0.500% | 9/15/27 | EUR | 24,867 | 22,381 |
| 3 | Republic of Finland | 2.750% | 7/4/28 | EUR | 5,535 | 5,522 |
| 3 | Republic of Finland | 0.500% | 9/15/29 | EUR | 10,581 | 9,071 |
| 3 | Republic of Finland | 0.000% | 9/15/30 | EUR | 39,490 | 31,782 |
| 3 | Republic of Finland | 0.750% | 4/15/31 | EUR | 24,445 | 20,702 |
| 3 | Republic of Finland | 0.125% | 9/15/31 | EUR | 38,750 | 30,688 |
| 3 | Republic of Finland | 1.500% | 9/15/32 | EUR | 57,364 | 50,407 |
| 3 | Republic of Finland | 1.125% | 4/15/34 | EUR | 15,604 | 12,757 |
| 3 | Republic of Finland | 0.125% | 4/15/36 | EUR | 13,000 | 8,828 |
| 3 | Republic of Finland | 0.250% | 9/15/40 | EUR | 72,995 | 45,107 |
| 3 | Republic of Finland | 2.625% | 7/4/42 | EUR | 16,683 | 15,603 |
| 3 | Republic of Finland | 0.500% | 4/15/43 | EUR | 993 | 617 |
| 3 | Republic of Finland | 1.375% | 4/15/47 | EUR | 10,000 | 7,394 |
| 3 | Republic of Finland | 0.125% | 4/15/52 | EUR | 11,677 | 5,531 |
| | | | | | | 459,984 |
| France (8.5%) | | | |
| | Action Logement Services | 1.375% | 4/13/32 | EUR | 12,500 | 10,607 |
| | Action Logement Services | 0.750% | 7/19/41 | EUR | 15,600 | 9,635 |
| | Agence Francaise de Developpement EPIC | 0.125% | 11/15/23 | EUR | 4,000 | 3,854 |
| | Agence Francaise de Developpement EPIC | 3.125% | 1/4/24 | EUR | 3,000 | 2,983 |
| | Agence Francaise de Developpement EPIC | 0.375% | 4/30/24 | EUR | 20,700 | 19,779 |
| | Agence Francaise de Developpement EPIC | 1.375% | 9/17/24 | EUR | 10,000 | 9,664 |
| | Agence Francaise de Developpement EPIC | 2.250% | 5/27/25 | EUR | 5,000 | 4,894 |
| | Agence Francaise de Developpement EPIC | 0.500% | 10/31/25 | EUR | 5,000 | 4,646 |
| | Agence Francaise de Developpement EPIC | 0.250% | 7/21/26 | EUR | 6,100 | 5,517 |
| | Agence Francaise de Developpement EPIC | 3.750% | 2/15/27 | EUR | 1,800 | 1,849 |
| | Agence Francaise de Developpement EPIC | 1.000% | 1/31/28 | EUR | 2,500 | 2,255 |
Total International Bond II Index Fund
| | | Coupon | Maturity
Date | Currency | Face
Amount
(000) | Market
Value•
($000) |
| | Agence Francaise de Developpement EPIC | 0.010% | 11/25/28 | EUR | 13,800 | 11,512 |
| | Agence Francaise de Developpement EPIC | 0.250% | 6/29/29 | EUR | 27,200 | 22,660 |
| | Agence Francaise de Developpement EPIC | 0.500% | 5/25/30 | EUR | 36,300 | 30,019 |
| | Agence Francaise de Developpement EPIC | 1.375% | 7/5/32 | EUR | 20,400 | 17,287 |
| | Agence Francaise de Developpement EPIC | 0.500% | 5/31/35 | EUR | 5,000 | 3,505 |
| | Agence Francaise de Developpement EPIC | 1.125% | 3/2/37 | EUR | 14,300 | 10,523 |
| | Agence France Locale | 0.500% | 6/20/24 | EUR | 4,900 | 4,682 |
| | Agence France Locale | 0.125% | 6/20/26 | EUR | 8,400 | 7,580 |
| | Agence France Locale | 0.000% | 9/20/27 | EUR | 15,000 | 12,997 |
| | Agence France Locale | 1.125% | 6/20/28 | EUR | 4,500 | 4,071 |
| | Agence France Locale | 0.000% | 3/20/31 | EUR | 500 | 388 |
| | Bpifrance SACA | 0.125% | 11/25/23 | EUR | 41,400 | 39,882 |
| | Bpifrance SACA | 2.500% | 5/25/24 | EUR | 5,000 | 4,936 |
| | Bpifrance SACA | 0.750% | 11/25/24 | EUR | 8,000 | 7,626 |
| | Bpifrance SACA | 0.125% | 3/25/25 | EUR | 15,800 | 14,723 |
| | Bpifrance SACA | 0.500% | 5/25/25 | EUR | 5,600 | 5,251 |
| | Bpifrance SACA | 2.750% | 10/25/25 | EUR | 11,000 | 10,890 |
| | Bpifrance SACA | 2.125% | 11/29/27 | EUR | 12,500 | 11,940 |
| | Bpifrance SACA | 0.125% | 11/25/28 | EUR | 28,300 | 23,821 |
| | Bpifrance SACA | 0.050% | 9/26/29 | EUR | 5,000 | 4,067 |
| | Bpifrance SACA | 1.875% | 5/25/30 | EUR | 5,000 | 4,612 |
| | Bpifrance SACA | 0.250% | 6/4/31 | EUR | 700 | 551 |
| | Caisse d'Amortissement de la Dette Sociale | 1.375% | 11/25/24 | EUR | 49,131 | 47,378 |
| | Caisse d'Amortissement de la Dette Sociale | 4.000% | 12/15/25 | EUR | 4,876 | 5,018 |
| | Caisse d'Amortissement de la Dette Sociale | 0.000% | 11/25/26 | EUR | 10,000 | 8,886 |
| | Caisse d'Amortissement de la Dette Sociale | 0.000% | 2/25/28 | EUR | 5,700 | 4,866 |
| | Caisse d'Amortissement de la Dette Sociale | 0.000% | 5/25/29 | EUR | 43,700 | 35,990 |
| | Caisse d'Amortissement de la Dette Sociale | 0.600% | 11/25/29 | EUR | 30,800 | 26,147 |
| | Caisse d'Amortissement de la Dette Sociale | 0.000% | 5/25/31 | EUR | 87,300 | 67,437 |
| | Caisse d'Amortissement de la Dette Sociale | 0.125% | 9/15/31 | EUR | 45,200 | 34,854 |
| | Caisse d'Amortissement de la Dette Sociale | 0.450% | 1/19/32 | EUR | 21,300 | 16,762 |
| | Caisse des Depots et Consignations | 0.000% | 6/19/24 | EUR | 2,200 | 2,087 |
| | Caisse Francaise de Financement Local | 2.375% | 1/17/24 | EUR | 6,000 | 5,909 |
| | Caisse Francaise de Financement Local | 0.375% | 5/11/24 | EUR | 9,800 | 9,347 |
| | Caisse Francaise de Financement Local | 5.375% | 7/8/24 | EUR | 1,951 | 2,008 |
| | Caisse Francaise de Financement Local | 0.375% | 6/23/25 | EUR | 11,300 | 10,470 |
| | Caisse Francaise de Financement Local | 1.125% | 9/9/25 | EUR | 1,700 | 1,600 |
| | Caisse Francaise de Financement Local | 0.500% | 1/19/26 | EUR | 600 | 550 |
| | Caisse Francaise de Financement Local | 0.625% | 4/13/26 | EUR | 3,000 | 2,743 |
| | Caisse Francaise de Financement Local | 0.750% | 1/11/27 | EUR | 2,000 | 1,805 |
| | Caisse Francaise de Financement Local | 0.750% | 9/27/27 | EUR | 5,000 | 4,441 |
| | Caisse Francaise de Financement Local | 1.000% | 4/25/28 | EUR | 100 | 89 |
| | Caisse Francaise de Financement Local | 3.000% | 10/2/28 | EUR | 22,300 | 21,968 |
| | Caisse Francaise de Financement Local | 0.010% | 6/24/30 | EUR | 54,400 | 42,510 |
| | Caisse Francaise de Financement Local | 1.500% | 1/13/31 | EUR | 5,000 | 4,373 |
| | Caisse Francaise de Financement Local | 1.250% | 5/11/32 | EUR | 9,400 | 7,824 |
| | Caisse Francaise de Financement Local | 1.450% | 1/16/34 | EUR | 2,500 | 2,051 |
| | Caisse Francaise de Financement Local | 1.250% | 1/22/35 | EUR | 100 | 79 |
| | Caisse Francaise de Financement Local | 1.500% | 6/28/38 | EUR | 3,600 | 2,772 |
| | Caisse Francaise de Financement Local | 0.375% | 2/13/40 | EUR | 21,300 | 13,094 |
| | France | 0.000% | 2/25/24 | EUR | 226,702 | 218,136 |
| | France | 0.000% | 3/25/24 | EUR | 269,096 | 258,267 |
| | France | 1.750% | 11/25/24 | EUR | 125,011 | 122,713 |
| | France | 0.000% | 2/25/25 | EUR | 520,386 | 489,364 |
| | France | 0.000% | 3/25/25 | EUR | 60,000 | 56,348 |
| | France | 0.500% | 5/25/25 | EUR | 69,695 | 66,068 |
| | France | 1.000% | 11/25/25 | EUR | 340,209 | 325,208 |
| | France | 0.000% | 2/25/26 | EUR | 128,703 | 118,359 |
| | France | 3.500% | 4/25/26 | EUR | 54,610 | 56,329 |
| 8 | France | 0.500% | 5/25/26 | EUR | 169,679 | 158,090 |
| | France | 0.250% | 11/25/26 | EUR | 51,306 | 46,874 |
| 9 | France | 0.000% | 2/25/27 | EUR | 585,977 | 526,428 |
| | France | 1.000% | 5/25/27 | EUR | 65,450 | 61,231 |
| | France | 0.750% | 2/25/28 | EUR | 277,214 | 252,612 |
| | France | 0.750% | 5/25/28 | EUR | 242,187 | 219,793 |
| 8 | France | 0.750% | 11/25/28 | EUR | 420,393 | 378,470 |
| | France | 5.500% | 4/25/29 | EUR | 32,522 | 37,984 |
| | France | 0.500% | 5/25/29 | EUR | 59,931 | 52,619 |
| 8 | France | 0.000% | 11/25/29 | EUR | 362,327 | 302,813 |
Total International Bond II Index Fund
| | | Coupon | Maturity
Date | Currency | Face
Amount
(000) | Market
Value•
($000) |
| | France | 2.500% | 5/25/30 | EUR | 159,931 | 159,434 |
| 8 | France | 0.000% | 11/25/30 | EUR | 232,374 | 188,501 |
| | France | 1.500% | 5/25/31 | EUR | 207,411 | 190,333 |
| | France | 0.000% | 11/25/31 | EUR | 265,253 | 208,602 |
| | France | 0.000% | 5/25/32 | EUR | 83,573 | 64,401 |
| | France | 5.750% | 10/25/32 | EUR | 60,000 | 74,926 |
| | France | 2.000% | 11/25/32 | EUR | 150,000 | 139,336 |
| | France | 1.250% | 5/25/34 | EUR | 301,529 | 251,754 |
| | France | 4.750% | 4/25/35 | EUR | 30,221 | 35,449 |
| 3 | France | 1.250% | 5/25/36 | EUR | 210,705 | 168,991 |
| | France | 1.250% | 5/25/38 | EUR | 65,959 | 51,164 |
| | France | 4.000% | 10/25/38 | EUR | 96,951 | 107,199 |
| 3 | France | 1.750% | 6/25/39 | EUR | 2,930 | 2,449 |
| 3 | France | 0.500% | 5/25/40 | EUR | 106,332 | 69,134 |
| | France | 4.500% | 4/25/41 | EUR | 153,442 | 180,976 |
| 3 | France | 2.500% | 5/25/43 | EUR | 88,927 | 80,379 |
| 3 | France | 0.500% | 6/25/44 | EUR | 69,874 | 41,934 |
| | France | 3.250% | 5/25/45 | EUR | 143,276 | 144,642 |
| 3 | France | 2.000% | 5/25/48 | EUR | 82,607 | 65,869 |
| 3 | France | 1.500% | 5/25/50 | EUR | 122,558 | 86,392 |
| 8 | France | 0.750% | 5/25/52 | EUR | 136,375 | 75,893 |
| 3 | France | 0.750% | 5/25/53 | EUR | 263,224 | 143,662 |
| 3 | France | 4.000% | 4/25/55 | EUR | 60,930 | 71,219 |
| | France | 4.000% | 4/25/60 | EUR | 67,417 | 80,200 |
| 3 | France | 1.750% | 5/25/66 | EUR | 58,468 | 41,740 |
| 3 | France | 0.500% | 5/25/72 | EUR | 40,287 | 16,453 |
| | Ile-de-France Mobilites | 0.950% | 5/28/41 | EUR | 100 | 65 |
| | Ile-de-France Mobilites | 1.275% | 2/14/42 | EUR | 14,800 | 10,163 |
| | Regie Autonome des Transports Parisiens | 0.875% | 5/25/27 | EUR | 1,500 | 1,368 |
| | Region of Ile de France | 3.625% | 3/27/24 | EUR | 6,500 | 6,524 |
| | Region of Ile de France | 0.500% | 6/14/25 | EUR | 17,900 | 16,785 |
| | Region of Ile de France | 0.625% | 4/23/27 | EUR | 2,500 | 2,263 |
| | Region of Ile de France | 0.000% | 4/20/28 | EUR | 2,500 | 2,134 |
| | Region of Ile de France | 1.375% | 6/20/33 | EUR | 3,000 | 2,500 |
| | SFIL SA | 0.050% | 6/4/29 | EUR | 1,700 | 1,398 |
| | SNCF Reseau | 2.625% | 12/29/25 | EUR | 2,500 | 2,477 |
| | SNCF Reseau | 4.250% | 10/7/26 | EUR | 600 | 628 |
| | SNCF Reseau | 3.125% | 10/25/28 | EUR | 3,600 | 3,629 |
| | SNCF Reseau | 5.250% | 12/7/28 | GBP | 8,292 | 9,822 |
| | SNCF Reseau | 0.875% | 1/22/29 | EUR | 3,000 | 2,641 |
| | SNCF Reseau | 1.125% | 5/25/30 | EUR | 13,800 | 12,103 |
| | SNCF Reseau | 1.000% | 11/9/31 | EUR | 7,400 | 6,208 |
| | SNCF Reseau | 5.000% | 10/10/33 | EUR | 7,509 | 8,596 |
| | SNCF Reseau | 5.250% | 1/31/35 | GBP | 2,684 | 3,227 |
| | SNCF Reseau | 0.750% | 5/25/36 | EUR | 18,200 | 12,943 |
| | SNCF Reseau | 1.500% | 5/29/37 | EUR | 8,900 | 6,921 |
| | SNCF Reseau | 2.250% | 12/20/47 | EUR | 6,200 | 4,780 |
| | SNCF Reseau | 2.000% | 2/5/48 | EUR | 2,500 | 1,794 |
| | SNCF Reseau | 5.000% | 3/11/52 | GBP | 2,451 | 2,946 |
| | SNCF Reseau | 4.830% | 3/25/60 | GBP | 683 | 819 |
| | Societe Du Grand Paris EPIC | 1.125% | 10/22/28 | EUR | 5,200 | 4,683 |
| | Societe Du Grand Paris EPIC | 0.000% | 11/25/30 | EUR | 17,400 | 13,662 |
| | Societe Du Grand Paris EPIC | 1.125% | 5/25/34 | EUR | 23,000 | 18,046 |
| | Societe Du Grand Paris EPIC | 0.875% | 5/10/46 | EUR | 10,000 | 5,770 |
| | Societe Du Grand Paris EPIC | 1.700% | 5/25/50 | EUR | 6,500 | 4,398 |
| | Societe Du Grand Paris EPIC | 1.000% | 11/26/51 | EUR | 22,200 | 11,866 |
| | Societe Du Grand Paris EPIC | 0.700% | 10/15/60 | EUR | 5,900 | 2,361 |
| | Societe Du Grand Paris EPIC | 1.000% | 2/18/70 | EUR | 11,000 | 4,738 |
| | Societe Nationale SNCF SA | 4.125% | 2/19/25 | EUR | 300 | 306 |
| | Societe Nationale SNCF SA | 5.375% | 3/18/27 | GBP | 3,935 | 4,632 |
| | Societe Nationale SNCF SA | 1.500% | 2/2/29 | EUR | 6,900 | 6,259 |
| | Societe Nationale SNCF SA | 1.000% | 5/25/40 | EUR | 17,000 | 11,078 |
| | Societe Nationale SNCF SA | 0.875% | 2/28/51 | EUR | 10,800 | 5,354 |
| | UNEDIC ASSEO | 2.375% | 5/25/24 | EUR | 1,500 | 1,478 |
| | UNEDIC ASSEO | 0.125% | 11/25/24 | EUR | 44,000 | 41,350 |
| | UNEDIC ASSEO | 0.625% | 2/17/25 | EUR | 5,500 | 5,210 |
| | UNEDIC ASSEO | 0.625% | 3/3/26 | EUR | 7,000 | 6,488 |
| | UNEDIC ASSEO | 0.100% | 11/25/26 | EUR | 41,200 | 36,757 |
| | UNEDIC ASSEO | 1.250% | 10/21/27 | EUR | 10,500 | 9,696 |
Total International Bond II Index Fund
| | | Coupon | Maturity
Date | Currency | Face
Amount
(000) | Market
Value•
($000) |
| | UNEDIC ASSEO | 0.500% | 3/20/29 | EUR | 11,800 | 10,162 |
| | UNEDIC ASSEO | 0.250% | 11/25/29 | EUR | 14,700 | 12,209 |
| | UNEDIC ASSEO | 0.000% | 3/5/30 | EUR | 10,000 | 8,063 |
| | UNEDIC ASSEO | 0.000% | 11/19/30 | EUR | 5,500 | 4,331 |
| | UNEDIC ASSEO | 1.500% | 4/20/32 | EUR | 500 | 435 |
| | UNEDIC ASSEO | 1.250% | 5/25/33 | EUR | 1,000 | 826 |
| | UNEDIC ASSEO | 0.100% | 5/25/34 | EUR | 34,600 | 24,118 |
| | UNEDIC ASSEO | 0.250% | 7/16/35 | EUR | 34,800 | 23,762 |
| | | | | | | 7,601,774 |
| Germany (8.6%) | | | |
| | Bundesobligation | 0.000% | 4/5/24 | EUR | 16,192 | 15,572 |
| | Bundesobligation | 0.000% | 10/18/24 | EUR | 169,217 | 161,161 |
| | Bundesobligation | 0.000% | 4/11/25 | EUR | 410,476 | 387,054 |
| | Bundesobligation | 0.000% | 10/10/25 | EUR | 582,277 | 544,480 |
| | Bundesobligation | 0.000% | 4/10/26 | EUR | 172,000 | 159,254 |
| | Bundesobligation | 0.000% | 10/9/26 | EUR | 90,000 | 82,290 |
| | Bundesobligation | 0.000% | 4/16/27 | EUR | 70,109 | 63,408 |
| | Bundesschatzanweisungen | 0.200% | 6/14/24 | EUR | 576,330 | 553,924 |
| | Bundesschatzanweisungen | 0.400% | 9/13/24 | EUR | 47,007 | 45,156 |
| 8 | Federal Republic of Germany | 1.000% | 8/15/25 | EUR | 200,000 | 192,808 |
| | Federal Republic of Germany | 0.500% | 2/15/26 | EUR | 44,383 | 41,906 |
| | Federal Republic of Germany | 0.000% | 8/15/26 | EUR | 21,455 | 19,728 |
| | Federal Republic of Germany | 0.250% | 2/15/27 | EUR | 87,560 | 80,579 |
| | Federal Republic of Germany | 0.500% | 8/15/27 | EUR | 4,587 | 4,237 |
| | Federal Republic of Germany | 0.000% | 11/15/27 | EUR | 45,542 | 40,748 |
| | Federal Republic of Germany | 5.625% | 1/4/28 | EUR | 68,082 | 78,822 |
| | Federal Republic of Germany | 0.500% | 2/15/28 | EUR | 181,655 | 166,433 |
| | Federal Republic of Germany | 0.250% | 8/15/28 | EUR | 445,770 | 399,024 |
| | Federal Republic of Germany | 0.000% | 11/15/28 | EUR | 246,535 | 216,425 |
| | Federal Republic of Germany | 0.250% | 2/15/29 | EUR | 163,530 | 145,129 |
| | Federal Republic of Germany | 0.000% | 8/15/29 | EUR | 6,256 | 5,394 |
| | Federal Republic of Germany | 0.000% | 2/15/30 | EUR | 115,000 | 98,150 |
| | Federal Republic of Germany | 0.000% | 8/15/30 | EUR | 70,000 | 59,038 |
| | Federal Republic of Germany | 0.000% | 2/15/31 | EUR | 387 | 323 |
| | Federal Republic of Germany | 0.000% | 8/15/31 | EUR | 1,516 | 1,249 |
| | Federal Republic of Germany | 0.000% | 2/15/32 | EUR | 60,569 | 49,236 |
| | Federal Republic of Germany | 1.700% | 8/15/32 | EUR | 392,670 | 372,471 |
| 8 | Federal Republic of Germany | 0.000% | 5/15/35 | EUR | 233,609 | 173,972 |
| | Federal Republic of Germany | 0.000% | 5/15/36 | EUR | 314,097 | 228,569 |
| | Federal Republic of Germany | 1.000% | 5/15/38 | EUR | 57,283 | 46,861 |
| | Federal Republic of Germany | 4.250% | 7/4/39 | EUR | 50,000 | 61,933 |
| | Federal Republic of Germany | 4.750% | 7/4/40 | EUR | 12,079 | 16,007 |
| | Federal Republic of Germany | 3.250% | 7/4/42 | EUR | 79,116 | 89,512 |
| | Federal Republic of Germany | 2.500% | 7/4/44 | EUR | 135,032 | 138,246 |
| | Federal Republic of Germany | 2.500% | 8/15/46 | EUR | 228,941 | 236,985 |
| 8 | Federal Republic of Germany | 1.250% | 8/15/48 | EUR | 194,362 | 156,430 |
| | Federal Republic of Germany | 0.000% | 8/15/50 | EUR | 102,657 | 56,020 |
| | Federal Republic of Germany | 1.800% | 8/15/53 | EUR | 85,944 | 76,820 |
| | FMS Wertmanagement | 1.375% | 3/7/25 | GBP | 9,800 | 10,564 |
| | FMS Wertmanagement | 0.375% | 4/29/30 | EUR | 5,400 | 4,426 |
| | Free and Hanseatic City of Hamburg | 0.250% | 1/20/25 | EUR | 11,216 | 10,511 |
| | Free and Hanseatic City of Hamburg | 0.375% | 4/1/25 | EUR | 3,080 | 2,882 |
| | Free and Hanseatic City of Hamburg | 0.010% | 6/15/28 | EUR | 7,500 | 6,361 |
| | Free and Hanseatic City of Hamburg | 0.010% | 6/30/28 | EUR | 20,000 | 16,900 |
| | Free and Hanseatic City of Hamburg | 0.800% | 4/11/34 | EUR | 977 | 756 |
| | Free and Hanseatic City of Hamburg | 1.450% | 11/5/38 | EUR | 7,314 | 5,750 |
| | Free and Hanseatic City of Hamburg | 0.250% | 2/18/41 | EUR | 4,750 | 2,845 |
| | Free and Hanseatic City of Hamburg | 0.400% | 11/23/51 | EUR | 8,000 | 4,084 |
| | Free State of Bavaria | 0.030% | 4/3/28 | EUR | 28,454 | 24,321 |
| | Free State of Bavaria | 0.150% | 4/3/30 | EUR | 4,794 | 3,886 |
| | Free State of Bavaria | 0.010% | 1/18/35 | EUR | 19,182 | 13,113 |
| | Free State of Saxony | 0.010% | 11/5/29 | EUR | 20,541 | 16,667 |
| | Free State of Saxony | 0.010% | 12/17/35 | EUR | 2,349 | 1,554 |
| | Gemeinsame Deutsche Bundeslaender | 0.250% | 3/18/24 | EUR | 12,190 | 11,679 |
| | Gemeinsame Deutsche Bundeslaender | 1.125% | 9/30/24 | EUR | 2,683 | 2,578 |
| | Gemeinsame Deutsche Bundeslaender | 0.500% | 2/5/25 | EUR | 8,192 | 7,718 |
| | Gemeinsame Deutsche Bundeslaender | 0.375% | 4/17/25 | EUR | 9,752 | 9,121 |
| | Gemeinsame Deutsche Bundeslaender | 0.625% | 2/13/29 | EUR | 1,951 | 1,687 |
| | Gemeinsame Deutsche Bundeslaender | 0.010% | 8/26/30 | EUR | 17,551 | 13,893 |
Total International Bond II Index Fund
| | | Coupon | Maturity
Date | Currency | Face
Amount
(000) | Market
Value•
($000) |
| 10 | KFW | 0.125% | 11/7/23 | EUR | 5,278 | 5,114 |
| 10 | KFW | 1.250% | 12/29/23 | GBP | 10,021 | 11,170 |
| 10 | KFW | 0.125% | 1/15/24 | EUR | 9,752 | 9,401 |
| 10 | KFW | 5.000% | 3/19/24 | AUD | 981 | 636 |
| 10 | KFW | 0.000% | 4/2/24 | EUR | 10,395 | 9,961 |
| 10 | KFW | 0.050% | 5/30/24 | EUR | 1,464 | 1,398 |
| 10 | KFW | 1.500% | 6/11/24 | EUR | 10,951 | 10,690 |
| 10 | KFW | 0.875% | 7/18/24 | GBP | 277 | 302 |
| 10 | KFW | 1.500% | 7/24/24 | AUD | 760 | 466 |
| 10 | KFW | 0.125% | 10/4/24 | EUR | 39,500 | 37,463 |
| 10 | KFW | 1.375% | 12/9/24 | GBP | 17,332 | 18,857 |
| 10 | KFW | 0.625% | 1/15/25 | EUR | 13,848 | 13,187 |
| 10 | KFW | 0.000% | 2/18/25 | EUR | 70,000 | 65,533 |
| 10 | KFW | 4.000% | 2/27/25 | AUD | 13,771 | 8,809 |
| 10 | KFW | 0.010% | 3/31/25 | EUR | 37,553 | 35,057 |
| 10 | KFW | 0.375% | 4/23/25 | EUR | 14,141 | 13,311 |
| 10 | KFW | 5.500% | 6/18/25 | GBP | 9,752 | 11,579 |
| 10 | KFW | 0.125% | 6/30/25 | EUR | 113,310 | 105,480 |
| 10 | KFW | 2.500% | 8/25/25 | CHF | 5,185 | 5,376 |
| 10 | KFW | 0.250% | 9/15/25 | EUR | 55,886 | 51,916 |
| 10 | KFW | 0.750% | 2/19/26 | CAD | 4,905 | 3,242 |
| 10 | KFW | 0.375% | 3/9/26 | EUR | 21,698 | 19,996 |
| 10 | KFW | 0.000% | 6/15/26 | EUR | 39,860 | 35,988 |
| 10 | KFW | 3.200% | 9/11/26 | AUD | 9,143 | 5,620 |
| 10 | KFW | 0.000% | 9/30/26 | EUR | 39,395 | 35,309 |
| 10 | KFW | 2.000% | 2/15/27 | AUD | 700 | 406 |
| 10 | KFW | 0.625% | 2/22/27 | EUR | 18,529 | 16,849 |
| 10 | KFW | 0.000% | 3/31/27 | EUR | 3,381 | 2,981 |
| 10 | KFW | 0.500% | 9/15/27 | EUR | 32,356 | 28,891 |
| 10 | KFW | 0.750% | 12/7/27 | GBP | 20,000 | 19,243 |
| 10 | KFW | 0.000% | 12/15/27 | EUR | 42,228 | 36,493 |
| 10 | KFW | 0.625% | 1/7/28 | EUR | 19,503 | 17,391 |
| 10 | KFW | 1.375% | 2/2/28 | SEK | 65,270 | 5,364 |
| 10 | KFW | 3.200% | 3/15/28 | AUD | 5,295 | 3,166 |
| 10 | KFW | 0.750% | 6/28/28 | EUR | 36,890 | 32,853 |
| 10 | KFW | 0.000% | 9/15/28 | EUR | �� 78 | 66 |
| 10 | KFW | 6.000% | 12/7/28 | GBP | 4,876 | 6,111 |
| 10 | KFW | 0.750% | 1/15/29 | EUR | 40,577 | 35,677 |
| 10 | KFW | 0.000% | 6/15/29 | EUR | 20,000 | 16,549 |
| 10 | KFW | 2.875% | 12/28/29 | EUR | 45,000 | 44,710 |
| 10 | KFW | 0.375% | 4/23/30 | EUR | 10,000 | 8,289 |
| 10 | KFW | 0.000% | 9/17/30 | EUR | 44,113 | 35,036 |
| 10 | KFW | 0.000% | 1/10/31 | EUR | 37,454 | 29,455 |
| 10 | KFW | 0.125% | 1/9/32 | EUR | 31,986 | 24,693 |
| 10 | KFW | 1.375% | 6/7/32 | EUR | 10,000 | 8,646 |
| 10 | KFW | 5.750% | 6/7/32 | GBP | 5,120 | 6,663 |
| 10 | KFW | 1.125% | 5/9/33 | EUR | 19,016 | 15,748 |
| 10 | KFW | 0.050% | 9/29/34 | EUR | 12,373 | 8,714 |
| 10 | KFW | 1.375% | 7/31/35 | EUR | 6,827 | 5,587 |
| 10 | KFW | 0.375% | 5/20/36 | EUR | 1,670 | 1,168 |
| 10 | KFW | 5.000% | 6/9/36 | GBP | 4,265 | 5,278 |
| 10 | KFW | 1.250% | 7/4/36 | EUR | 11,216 | 8,845 |
| 10 | KFW | 4.875% | 3/15/37 | GBP | 969 | 1,182 |
| 10 | KFW | 1.125% | 3/31/37 | EUR | 22,993 | 17,592 |
| 10 | KFW | 4.700% | 6/2/37 | CAD | 1,152 | 880 |
| 10 | KFW | 1.125% | 6/15/37 | EUR | 4,876 | 3,706 |
| 10 | KFW | 2.600% | 6/20/37 | JPY | 12,000 | 102 |
| 10 | KFW | 0.875% | 7/4/39 | EUR | 2,439 | 1,728 |
| | Land Baden-Wuerttemberg | 2.000% | 11/13/23 | EUR | 3,901 | 3,835 |
| | Land Baden-Wuerttemberg | 0.625% | 1/16/25 | EUR | 4,000 | 3,780 |
| | Land Baden-Wuerttemberg | 0.625% | 2/9/27 | EUR | 4,876 | 4,412 |
| | Land Baden-Wuerttemberg | 0.800% | 4/5/28 | EUR | 4,876 | 4,338 |
| | Land Baden-Wuerttemberg | 0.010% | 7/9/32 | EUR | 15,604 | 11,665 |
| | Land Berlin | 0.500% | 2/10/25 | EUR | 10,240 | 9,643 |
| | Land Berlin | 0.250% | 4/22/25 | EUR | 4,876 | 4,544 |
| | Land Berlin | 0.625% | 3/20/26 | EUR | 19,503 | 17,992 |
| | Land Berlin | 0.625% | 2/8/27 | EUR | 2,731 | 2,470 |
| | Land Berlin | 0.010% | 5/18/27 | EUR | 43,860 | 38,293 |
| | Land Berlin | 1.250% | 6/1/28 | EUR | 9,000 | 8,201 |
Total International Bond II Index Fund
| | | Coupon | Maturity
Date | Currency | Face
Amount
(000) | Market
Value•
($000) |
| | Land Berlin | 0.010% | 10/26/28 | EUR | 13,165 | 11,027 |
| | Land Berlin | 0.010% | 7/2/30 | EUR | 18,115 | 14,391 |
| | Land Berlin | 1.000% | 5/19/32 | EUR | 7,314 | 6,063 |
| | Land Berlin | 1.300% | 6/13/33 | EUR | 977 | 815 |
| | Land Berlin | 0.750% | 4/3/34 | EUR | 9,991 | 7,686 |
| | Land Berlin | 0.125% | 6/4/35 | EUR | 4,876 | 3,339 |
| | Land Berlin | 0.625% | 8/25/36 | EUR | 1,219 | 867 |
| | Land Berlin | 1.375% | 6/5/37 | EUR | 2,439 | 1,919 |
| | Land Berlin | 1.375% | 8/27/38 | EUR | 2,439 | 1,887 |
| | Land Berlin | 0.050% | 8/6/40 | EUR | 14,314 | 8,292 |
| | Land Berlin | 0.100% | 1/18/41 | EUR | 15,939 | 9,290 |
| | Land Thueringen | 0.500% | 5/12/25 | EUR | 2,194 | 2,055 |
| | Land Thueringen | 0.200% | 10/26/26 | EUR | 7,314 | 6,572 |
| | Land Thueringen | 0.500% | 3/2/29 | EUR | 15,000 | 12,873 |
| | Land Thueringen | 0.010% | 3/24/31 | EUR | 5,000 | 3,886 |
| | Land Thueringen | 0.250% | 3/5/40 | EUR | 3,999 | 2,443 |
| | Landeskreditbank Baden-Wuerttemberg Foerderbank | 4.250% | 8/7/25 | AUD | 5,780 | 3,679 |
| | Landeskreditbank Baden-Wuerttemberg Foerderbank | 0.375% | 4/13/26 | EUR | 7,314 | 6,658 |
| 10 | Landwirtschaftliche Rentenbank | 1.125% | 12/15/23 | GBP | 4,575 | 5,098 |
| 10 | Landwirtschaftliche Rentenbank | 0.375% | 1/22/24 | EUR | 14,133 | 13,648 |
| 10 | Landwirtschaftliche Rentenbank | 4.750% | 4/8/24 | AUD | 1,970 | 1,273 |
| 10 | Landwirtschaftliche Rentenbank | 4.250% | 1/9/25 | AUD | 8,090 | 5,202 |
| 10 | Landwirtschaftliche Rentenbank | 0.500% | 3/6/25 | EUR | 11,216 | 10,569 |
| 10 | Landwirtschaftliche Rentenbank | 0.100% | 3/8/27 | EUR | 5,500 | 4,870 |
| 10 | Landwirtschaftliche Rentenbank | 2.600% | 3/23/27 | AUD | 2,310 | 1,370 |
| 10 | Landwirtschaftliche Rentenbank | 0.625% | 5/18/27 | EUR | 15,749 | 14,182 |
| 10 | Landwirtschaftliche Rentenbank | 0.375% | 2/14/28 | EUR | 4,876 | 4,266 |
| 10 | Landwirtschaftliche Rentenbank | 3.250% | 4/12/28 | AUD | 2,140 | 1,281 |
| 10 | Landwirtschaftliche Rentenbank | 0.000% | 7/19/28 | EUR | 5,690 | 4,818 |
| 10 | Landwirtschaftliche Rentenbank | 0.000% | 12/13/28 | EUR | 10,000 | 8,357 |
| 10 | Landwirtschaftliche Rentenbank | 0.500% | 2/28/29 | EUR | 12,084 | 10,381 |
| 10 | Landwirtschaftliche Rentenbank | 0.000% | 11/27/29 | EUR | 4,876 | 3,955 |
| 10 | Landwirtschaftliche Rentenbank | 0.050% | 12/18/29 | EUR | 27,454 | 22,297 |
| 10 | Landwirtschaftliche Rentenbank | 0.625% | 2/20/30 | EUR | 9,752 | 8,235 |
| 10 | Landwirtschaftliche Rentenbank | 0.050% | 1/31/31 | EUR | 25,059 | 19,699 |
| | Niedersachsen Invest GmbH | 0.250% | 7/16/35 | EUR | 10,000 | 6,882 |
| | NRW Bank | 0.375% | 12/16/24 | GBP | 25,000 | 26,563 |
| | NRW Bank | 0.250% | 3/10/25 | EUR | 7,314 | 6,817 |
| | NRW Bank | 0.625% | 2/11/26 | EUR | 7,314 | 6,746 |
| | NRW Bank | 0.500% | 5/11/26 | EUR | 5,855 | 5,346 |
| | NRW Bank | 0.250% | 9/28/26 | EUR | 2,901 | 2,603 |
| | NRW Bank | 0.625% | 2/23/27 | EUR | 7,314 | 6,616 |
| | NRW Bank | 0.250% | 3/16/27 | EUR | 205 | 182 |
| | NRW Bank | 0.125% | 4/12/27 | EUR | 7,948 | 6,975 |
| | NRW Bank | 0.500% | 9/13/27 | EUR | 7,314 | 6,471 |
| | NRW Bank | 0.625% | 1/4/28 | EUR | 3,413 | 3,003 |
| | NRW Bank | 0.375% | 5/16/29 | EUR | 3,535 | 2,975 |
| | NRW Bank | 0.125% | 2/4/30 | EUR | 25,000 | 20,299 |
| | NRW Bank | 0.000% | 7/28/31 | EUR | 15,993 | 12,245 |
| | NRW Bank | 0.875% | 4/12/34 | EUR | 331 | 258 |
| | NRW Bank | 0.100% | 7/9/35 | EUR | 3,519 | 2,377 |
| | NRW Bank | 1.200% | 3/28/39 | EUR | 5,000 | 3,708 |
| | NRW Bank | 0.500% | 6/17/41 | EUR | 17,696 | 11,091 |
| | NRW Bank | 1.250% | 5/13/49 | EUR | 4,876 | 3,453 |
| | State of Brandenburg | 0.010% | 6/26/28 | EUR | 15,696 | 13,273 |
| | State of Brandenburg | 0.750% | 8/8/36 | EUR | 4,876 | 3,555 |
| | State of Brandenburg | 1.450% | 11/26/38 | EUR | 6,875 | 5,381 |
| | State of Brandenburg | 0.300% | 10/4/49 | EUR | 488 | 250 |
| | State of Bremen | 0.500% | 3/3/25 | EUR | 6,339 | 5,959 |
| | State of Bremen | 1.200% | 1/30/34 | EUR | 100 | 81 |
| | State of Bremen | 1.500% | 11/12/38 | EUR | 2,404 | 1,893 |
| | State of Bremen | 1.000% | 5/27/39 | EUR | 6,097 | 4,385 |
| | State of Bremen | 0.500% | 5/6/41 | EUR | 9,740 | 6,114 |
| | State of Bremen | 0.550% | 2/4/50 | EUR | 8,635 | 4,788 |
| | State of Hesse | 0.125% | 1/25/24 | EUR | 973 | 934 |
| | State of Hesse | 1.375% | 6/10/24 | EUR | 1,951 | 1,895 |
| | State of Hesse | 0.125% | 6/20/24 | EUR | 4,337 | 4,120 |
| | State of Hesse | 0.000% | 9/15/24 | EUR | 17,976 | 16,935 |
| | State of Hesse | 0.500% | 2/17/25 | EUR | 5,120 | 4,823 |
Total International Bond II Index Fund
| | | Coupon | Maturity
Date | Currency | Face
Amount
(000) | Market
Value•
($000) |
| | State of Hesse | 0.000% | 3/10/25 | EUR | 10,000 | 9,287 |
| | State of Hesse | 0.250% | 6/10/25 | EUR | 12,190 | 11,327 |
| | State of Hesse | 0.000% | 4/14/26 | EUR | 878 | 791 |
| | State of Hesse | 0.375% | 7/6/26 | EUR | 29,207 | 26,512 |
| | State of Hesse | 0.625% | 8/2/28 | EUR | 4,876 | 4,269 |
| | State of Hesse | 0.010% | 3/11/30 | EUR | 12,829 | 10,307 |
| | State of Hesse | 0.000% | 11/8/30 | EUR | 12,190 | 9,582 |
| | State of Hesse | 1.300% | 10/10/33 | EUR | 3,901 | 3,242 |
| | State of Hesse | 0.750% | 8/4/36 | EUR | 5,855 | 4,276 |
| | State of Lower Saxony | 2.125% | 1/16/24 | EUR | 77 | 76 |
| | State of Lower Saxony | 0.000% | 8/2/24 | EUR | 10,194 | 9,642 |
| | State of Lower Saxony | 0.625% | 1/20/25 | EUR | 4,876 | ��� 4,617 |
| | State of Lower Saxony | 0.125% | 3/7/25 | EUR | 1,951 | 1,820 |
| | State of Lower Saxony | 0.500% | 6/13/25 | EUR | 4,876 | 4,565 |
| | State of Lower Saxony | 0.375% | 1/9/26 | EUR | 10,087 | 9,273 |
| | State of Lower Saxony | 0.500% | 6/8/26 | EUR | 1,219 | 1,114 |
| | State of Lower Saxony | 0.010% | 9/8/26 | EUR | 14,269 | 12,713 |
| | State of Lower Saxony | 0.000% | 2/11/27 | EUR | 29,868 | 26,275 |
| | State of Lower Saxony | 0.125% | 4/8/27 | EUR | 977 | 862 |
| | State of Lower Saxony | 0.625% | 7/6/27 | EUR | 9,752 | 8,750 |
| | State of Lower Saxony | 0.010% | 11/25/27 | EUR | 37,521 | 32,314 |
| | State of Lower Saxony | 0.750% | 2/15/28 | EUR | 7,314 | 6,521 |
| | State of Lower Saxony | 0.010% | 2/19/29 | EUR | 9,518 | 7,905 |
| | State of Lower Saxony | 0.375% | 5/14/29 | EUR | 2,926 | 2,476 |
| | State of Lower Saxony | 0.125% | 1/10/30 | EUR | 4,876 | 3,964 |
| | State of Lower Saxony | 0.010% | 8/13/30 | EUR | 33,963 | 26,926 |
| | State of Lower Saxony | 0.010% | 1/10/31 | EUR | 5,331 | 4,170 |
| | State of Lower Saxony | 0.050% | 3/9/35 | EUR | 9,974 | 6,810 |
| | State of North Rhine-Westphalia Germany | 0.200% | 2/16/24 | EUR | 14,563 | 13,973 |
| | State of North Rhine-Westphalia Germany | 1.875% | 3/15/24 | EUR | 952 | 933 |
| | State of North Rhine-Westphalia Germany | 1.000% | 1/16/25 | EUR | 55 | 52 |
| | State of North Rhine-Westphalia Germany | 0.500% | 3/11/25 | EUR | 1,464 | 1,377 |
| | State of North Rhine-Westphalia Germany | 2.000% | 10/15/25 | EUR | 1,464 | 1,418 |
| | State of North Rhine-Westphalia Germany | 0.750% | 1/16/26 | EUR | 7,314 | 6,798 |
| | State of North Rhine-Westphalia Germany | 0.250% | 3/13/26 | EUR | 70,352 | 64,128 |
| | State of North Rhine-Westphalia Germany | 0.500% | 4/16/26 | EUR | 4,876 | 4,473 |
| | State of North Rhine-Westphalia Germany | 0.500% | 2/16/27 | EUR | 9,947 | 8,949 |
| | State of North Rhine-Westphalia Germany | 0.200% | 3/31/27 | EUR | 20,205 | 17,861 |
| | State of North Rhine-Westphalia Germany | 0.950% | 3/13/28 | EUR | 13,652 | 12,288 |
| | State of North Rhine-Westphalia Germany | 0.000% | 1/15/29 | EUR | 6,681 | 5,558 |
| | State of North Rhine-Westphalia Germany | 0.200% | 4/9/30 | EUR | 3,840 | 3,123 |
| | State of North Rhine-Westphalia Germany | 1.625% | 10/24/30 | EUR | 4,876 | 4,387 |
| | State of North Rhine-Westphalia Germany | 0.625% | 7/21/31 | EUR | 7,314 | 5,970 |
| | State of North Rhine-Westphalia Germany | 2.375% | 5/13/33 | EUR | 17,748 | 16,593 |
| | State of North Rhine-Westphalia Germany | 1.100% | 3/13/34 | EUR | 13,168 | 10,597 |
| | State of North Rhine-Westphalia Germany | 0.000% | 10/12/35 | EUR | 31,655 | 21,052 |
| | State of North Rhine-Westphalia Germany | 1.250% | 5/12/36 | EUR | 6,827 | 5,376 |
| | State of North Rhine-Westphalia Germany | 1.650% | 2/22/38 | EUR | 22,494 | 18,256 |
| | State of North Rhine-Westphalia Germany | 0.500% | 11/25/39 | EUR | 18,224 | 11,837 |
| | State of North Rhine-Westphalia Germany | 1.500% | 6/12/40 | EUR | 2,258 | 1,754 |
| | State of North Rhine-Westphalia Germany | 0.600% | 6/4/41 | EUR | 11,573 | 7,468 |
| | State of North Rhine-Westphalia Germany | 0.750% | 8/16/41 | EUR | 977 | 646 |
| | State of North Rhine-Westphalia Germany | 1.450% | 2/16/43 | EUR | 2,439 | 1,822 |
| | State of North Rhine-Westphalia Germany | 1.000% | 10/16/46 | EUR | 265 | 176 |
| | State of North Rhine-Westphalia Germany | 1.650% | 5/16/47 | EUR | 26,200 | 20,213 |
| | State of North Rhine-Westphalia Germany | 1.550% | 6/16/48 | EUR | 4,876 | 3,661 |
| | State of North Rhine-Westphalia Germany | 0.800% | 7/30/49 | EUR | 5,792 | 3,493 |
| | State of North Rhine-Westphalia Germany | 0.200% | 1/27/51 | EUR | 18,134 | 8,716 |
| | State of North Rhine-Westphalia Germany | 0.500% | 1/15/52 | EUR | 8,530 | 4,490 |
| | State of North Rhine-Westphalia Germany | 1.750% | 10/26/57 | EUR | 8,266 | 6,211 |
| | State of North Rhine-Westphalia Germany | 1.750% | 7/11/68 | EUR | 15,018 | 10,788 |
| | State of North Rhine-Westphalia Germany | 1.950% | 9/26/78 | EUR | 14,185 | 10,715 |
| | State of North Rhine-Westphalia Germany | 2.150% | 3/21/19 | EUR | 9,518 | 6,957 |
| | State of North Rhine-Westphalia Germany | 1.375% | 1/15/20 | EUR | 12,019 | 6,208 |
| | State of North Rhine-Westphalia Germany | 0.950% | 1/10/21 | EUR | 18,536 | 7,363 |
| | State of North Rhine-Westphalia Germany | 1.450% | 1/19/22 | EUR | 5,283 | 2,838 |
| | State of Rhineland-Palatinate | 0.500% | 1/21/25 | EUR | 2,926 | 2,761 |
| | State of Rhineland-Palatinate | 0.100% | 8/18/26 | EUR | 4,876 | 4,369 |
| | State of Rhineland-Palatinate | 0.375% | 1/26/27 | EUR | 4,876 | 4,369 |
Total International Bond II Index Fund
| | | Coupon | Maturity
Date | Currency | Face
Amount
(000) | Market
Value•
($000) |
| | State of Rhineland-Palatinate | 0.700% | 1/26/28 | EUR | 4,876 | 4,329 |
| | State of Rhineland-Palatinate | 0.010% | 1/21/31 | EUR | 17,269 | 13,500 |
| | State of Rhineland-Palatinate | 0.750% | 2/23/32 | EUR | 37,317 | 30,360 |
| | State of Rhineland-Palatinate | 0.375% | 4/1/41 | EUR | 3,400 | 2,098 |
| | State of Rhineland-Palatinate | 0.375% | 3/10/51 | EUR | 3,988 | 2,069 |
| | State of Saxony-Anhalt | 1.875% | 4/10/24 | EUR | 4,388 | 4,295 |
| | State of Saxony-Anhalt | 0.500% | 6/25/27 | EUR | 1,219 | 1,087 |
| | State of Saxony-Anhalt | 0.500% | 3/24/51 | EUR | 7,185 | 3,917 |
| | State of Schleswig-Holstein Germany | 0.500% | 5/19/26 | EUR | 17,458 | 15,957 |
| | State of Schleswig-Holstein Germany | 0.250% | 4/18/28 | EUR | 977 | 843 |
| | State of Schleswig-Holstein Germany | 0.625% | 8/31/28 | EUR | 3,341 | 2,917 |
| | State of Schleswig-Holstein Germany | 0.010% | 11/26/29 | EUR | 14,331 | 11,620 |
| | State of Schleswig-Holstein Germany | 0.010% | 5/22/30 | EUR | 6,998 | 5,580 |
| | State of Schleswig-Holstein Germany | 0.050% | 7/8/31 | EUR | 5,852 | 4,524 |
| | | | | | | 7,667,484 |
| Hong Kong (0.0%) | | | |
| | Hong Kong Government Bond Programme | 0.510% | 10/23/23 | HKD | 68,350 | 8,397 |
| | Hong Kong Government Bond Programme | 0.360% | 4/15/24 | HKD | 75,200 | 9,044 |
| | Hong Kong Government Bond Programme | 2.220% | 8/7/24 | HKD | 14,750 | 1,810 |
| | Hong Kong Government Bond Programme | 1.680% | 1/21/26 | HKD | 4,950 | 582 |
| | Hong Kong Government Bond Programme | 1.250% | 6/29/27 | HKD | 3,000 | 335 |
| | Hong Kong Government Bond Programme | 1.970% | 1/17/29 | HKD | 58,850 | 6,643 |
| | Hong Kong Government Bond Programme | 2.130% | 7/16/30 | HKD | 45,500 | 5,098 |
| | Hong Kong Government Bond Programme | 1.890% | 3/2/32 | HKD | 3,200 | 344 |
| | Hong Kong Government Bond Programme | 2.020% | 3/7/34 | HKD | 13,600 | 1,411 |
| | | | | | | 33,664 |
| Hungary (0.2%) | | | |
| | Republic of Hungary | 1.500% | 8/23/23 | HUF | 1,660,450 | 3,696 |
| | Republic of Hungary | 6.000% | 11/24/23 | HUF | 1,424,940 | 3,203 |
| | Republic of Hungary | 3.000% | 6/26/24 | HUF | 2,000,000 | 4,108 |
| | Republic of Hungary | 2.500% | 10/24/24 | HUF | 6,103,250 | 12,063 |
| | Republic of Hungary | 5.500% | 6/24/25 | HUF | 2,956,340 | 5,958 |
| | Republic of Hungary | 1.250% | 10/22/25 | EUR | 6,582 | 5,804 |
| | Republic of Hungary | 1.000% | 11/26/25 | HUF | 1,842,120 | 3,238 |
| | Republic of Hungary | 1.500% | 4/22/26 | HUF | 5,341,310 | 9,150 |
| | Republic of Hungary | 2.750% | 12/22/26 | HUF | 3,403,180 | 5,788 |
| | Republic of Hungary | 1.750% | 10/10/27 | EUR | 2,146 | 1,803 |
| | Republic of Hungary | 3.000% | 10/27/27 | HUF | 9,755,340 | 16,152 |
| | Republic of Hungary | 4.500% | 3/23/28 | HUF | 20,673,470 | 36,246 |
| 3 | Republic of Hungary | 0.125% | 9/21/28 | EUR | 3,728 | 2,639 |
| | Republic of Hungary | 2.000% | 5/23/29 | HUF | 1,974,720 | 2,882 |
| | Republic of Hungary | 3.000% | 8/21/30 | HUF | 6,879,200 | 10,293 |
| 3 | Republic of Hungary | 4.250% | 6/16/31 | EUR | 2,800 | 2,357 |
| | Republic of Hungary | 3.250% | 10/22/31 | HUF | 465,190 | 679 |
| | Republic of Hungary | 1.625% | 4/28/32 | EUR | 19,413 | 12,999 |
| | Republic of Hungary | 2.250% | 4/20/33 | HUF | 2,847,290 | 3,528 |
| | Republic of Hungary | 1.750% | 6/5/35 | EUR | 2,869 | 1,731 |
| | Republic of Hungary | 3.000% | 10/27/38 | HUF | 1,469,000 | 1,696 |
| | Republic of Hungary | 3.000% | 4/25/41 | HUF | 2,620,910 | 2,862 |
| | Republic of Hungary | 1.500% | 11/17/50 | EUR | 3,681 | 1,618 |
| | | | | | | 150,493 |
| Iceland (0.0%) | | | |
| | Republic of Iceland | 0.625% | 6/3/26 | EUR | 2,265 | 2,033 |
| Indonesia (1.2%) | | | |
| | Indonesia Treasury Bond | 8.375% | 3/15/24 | IDR | 754,470,000 | 49,390 |
| | Indonesia Treasury Bond | 8.125% | 5/15/24 | IDR | 738,916,000 | 48,492 |
| | Indonesia Treasury Bond | 6.500% | 6/15/25 | IDR | 945,611,000 | 59,929 |
| | Indonesia Treasury Bond | 7.250% | 2/15/26 | IDR | 138,087,000 | 8,901 |
| | Indonesia Treasury Bond | 5.500% | 4/15/26 | IDR | ���938,101,000 | 57,281 |
| | Indonesia Treasury Bond | 8.375% | 9/15/26 | IDR | 330,525,000 | 22,055 |
| | Indonesia Treasury Bond | 5.125% | 4/15/27 | IDR | 565,731,000 | 33,445 |
| | Indonesia Treasury Bond | 7.000% | 5/15/27 | IDR | 730,214,000 | 46,325 |
| | Indonesia Treasury Bond | 6.125% | 5/15/28 | IDR | 706,587,000 | 42,652 |
| | Indonesia Treasury Bond | 9.000% | 3/15/29 | IDR | 24,484,000 | 1,695 |
| | Indonesia Treasury Bond | 8.250% | 5/15/29 | IDR | 710,151,000 | 47,228 |
| | Indonesia Treasury Bond | 7.000% | 9/15/30 | IDR | 978,735,000 | 61,076 |
| | Indonesia Treasury Bond | 6.500% | 2/15/31 | IDR | 1,253,002,000 | 74,662 |
Total International Bond II Index Fund
| | | Coupon | Maturity
Date | Currency | Face
Amount
(000) | Market
Value•
($000) |
| | Indonesia Treasury Bond | 8.750% | 5/15/31 | IDR | 187,925,000 | 12,985 |
| | Indonesia Treasury Bond | 6.375% | 4/15/32 | IDR | 684,458,000 | 40,048 |
| | Indonesia Treasury Bond | 7.500% | 8/15/32 | IDR | 318,879,000 | 20,359 |
| | Indonesia Treasury Bond | 7.000% | 2/15/33 | IDR | 194,000,000 | 11,938 |
| | Indonesia Treasury Bond | 6.625% | 5/15/33 | IDR | 795,898,000 | 46,977 |
| | Indonesia Treasury Bond | 8.375% | 3/15/34 | IDR | 674,148,000 | 45,297 |
| | Indonesia Treasury Bond | 7.500% | 6/15/35 | IDR | 577,006,000 | 36,546 |
| | Indonesia Treasury Bond | 8.250% | 5/15/36 | IDR | 509,661,000 | 34,050 |
| | Indonesia Treasury Bond | 9.750% | 5/15/37 | IDR | 63,792,000 | 4,846 |
| | Indonesia Treasury Bond | 7.500% | 5/15/38 | IDR | 446,806,000 | 28,353 |
| | Indonesia Treasury Bond | 8.375% | 4/15/39 | IDR | 523,168,000 | 35,284 |
| | Indonesia Treasury Bond | 7.500% | 4/15/40 | IDR | 811,318,000 | 51,514 |
| | Indonesia Treasury Bond | 9.500% | 5/15/41 | IDR | 81,900,000 | 6,151 |
| | Indonesia Treasury Bond | 7.125% | 6/15/42 | IDR | 475,210,000 | 29,158 |
| | Indonesia Treasury Bond | 7.125% | 6/15/43 | IDR | 250,000,000 | 15,538 |
| | Indonesia Treasury Bond | 7.375% | 5/15/48 | IDR | 415,395,000 | 25,905 |
| | Indonesia Treasury Bond | 6.875% | 8/15/51 | IDR | 352,019,000 | 20,803 |
| | Republic of Indonesia | 2.150% | 7/18/24 | EUR | 1,530 | 1,455 |
| | Republic of Indonesia | 1.750% | 4/24/25 | EUR | 9,248 | 8,563 |
| | Republic of Indonesia | 1.450% | 9/18/26 | EUR | 2,196 | 1,896 |
| | Republic of Indonesia | 0.900% | 2/14/27 | EUR | 10,565 | 8,756 |
| | Republic of Indonesia | 3.750% | 6/14/28 | EUR | 11,139 | 10,232 |
| | Republic of Indonesia | 1.000% | 7/28/29 | EUR | 4,571 | 3,410 |
| | Republic of Indonesia | 1.100% | 3/12/33 | EUR | 4,669 | 3,024 |
| | | | | | | 1,056,219 |
| Ireland (0.5%) | | | |
| | Republic of Ireland | 3.400% | 3/18/24 | EUR | 50,319 | 50,587 |
| | Republic of Ireland | 1.000% | 5/15/26 | EUR | 44,834 | 42,742 |
| | Republic of Ireland | 0.200% | 5/15/27 | EUR | 58,472 | 52,818 |
| | Republic of Ireland | 0.900% | 5/15/28 | EUR | 11,158 | 10,231 |
| | Republic of Ireland | 1.100% | 5/15/29 | EUR | 24,380 | 22,305 |
| | Republic of Ireland | 0.200% | 10/18/30 | EUR | 34,508 | 28,574 |
| | Republic of Ireland | 1.350% | 3/18/31 | EUR | 19,503 | 17,719 |
| | Republic of Ireland | 0.000% | 10/18/31 | EUR | 161,403 | 127,582 |
| | Republic of Ireland | 0.350% | 10/18/32 | EUR | 42,317 | 33,621 |
| | Republic of Ireland | 1.300% | 5/15/33 | EUR | 19,947 | 17,252 |
| | Republic of Ireland | 0.400% | 5/15/35 | EUR | 10,906 | 8,073 |
| | Republic of Ireland | 1.700% | 5/15/37 | EUR | 2,523 | 2,134 |
| | Republic of Ireland | 0.550% | 4/22/41 | EUR | 81,592 | 52,212 |
| | Republic of Ireland | 2.000% | 2/18/45 | EUR | 4,244 | 3,478 |
| | Republic of Ireland | 1.500% | 5/15/50 | EUR | 25,611 | 18,132 |
| | | | | | | 487,460 |
| Isle Of Man (0.0%) | | | |
| | Isle of Man | 1.625% | 9/14/51 | GBP | 5,732 | 3,484 |
| Israel (0.3%) | | | |
| | State of Israel | 4.250% | 3/31/23 | ILS | 35,752 | 10,162 |
| | State of Israel | 0.150% | 7/31/23 | ILS | 29,312 | 8,110 |
| | State of Israel | 1.500% | 11/30/23 | ILS | 26,840 | 7,463 |
| | State of Israel | 2.875% | 1/29/24 | EUR | 11,068 | 10,854 |
| | State of Israel | 3.750% | 3/31/24 | ILS | 18,127 | 5,161 |
| | State of Israel | 0.400% | 10/31/24 | ILS | 36,067 | 9,634 |
| | State of Israel | 0.500% | 4/30/25 | ILS | ��� 117,522 | 31,056 |
| | State of Israel | 1.750% | 8/31/25 | ILS | 112,383 | 30,486 |
| | State of Israel | 6.250% | 10/30/26 | ILS | 27,603 | 8,669 |
| | State of Israel | 1.500% | 1/18/27 | EUR | 12,456 | 11,227 |
| | State of Israel | 2.000% | 3/31/27 | ILS | 79,333 | 21,282 |
| | State of Israel | 2.250% | 9/28/28 | ILS | 166,992 | 44,619 |
| | State of Israel | 1.500% | 1/16/29 | EUR | 5,439 | 4,632 |
| | State of Israel | 1.000% | 3/31/30 | ILS | 133,975 | 32,300 |
| | State of Israel | 0.625% | 1/18/32 | EUR | 2,066 | 1,498 |
| | State of Israel | 1.500% | 5/31/37 | ILS | 35,629 | 7,882 |
| | State of Israel | 5.500% | 1/31/42 | ILS | 32,324 | 11,761 |
| | State of Israel | 3.750% | 3/31/47 | ILS | 131,154 | 38,164 |
| | State of Israel | 2.500% | 1/16/49 | EUR | 3,219 | 2,414 |
| | State of Israel | 2.800% | 11/29/52 | ILS | 57,330 | 13,461 |
| | | | | | | 310,835 |
Total International Bond II Index Fund
| | | Coupon | Maturity
Date | Currency | Face
Amount
(000) | Market
Value•
($000) |
| Italy (6.6%) | | | |
| | Cassa Depositi e Prestiti SpA | 1.500% | 6/21/24 | EUR | 2,500 | 2,412 |
| | Cassa Depositi e Prestiti SpA | 1.500% | 4/9/25 | EUR | 3,900 | 3,683 |
| | Cassa Depositi e Prestiti SpA | 1.875% | 2/7/26 | EUR | 2,500 | 2,343 |
| | Cassa Depositi e Prestiti SpA | 2.000% | 4/20/27 | EUR | 7,400 | 6,814 |
| | Cassa Depositi e Prestiti SpA | 1.000% | 2/11/30 | EUR | 8,400 | 6,727 |
| | Italy Buoni Poliennali Del Tesoro | 0.000% | 1/30/24 | EUR | 405,161 | 387,226 |
| | Italy Buoni Poliennali Del Tesoro | 0.000% | 4/15/24 | EUR | 11,111 | 10,565 |
| | Italy Buoni Poliennali Del Tesoro | 1.750% | 5/30/24 | EUR | 271,742 | 264,232 |
| | Italy Buoni Poliennali Del Tesoro | 1.750% | 7/1/24 | EUR | 93,432 | 90,911 |
| | Italy Buoni Poliennali Del Tesoro | 0.000% | 8/15/24 | EUR | 191,959 | 180,737 |
| | Italy Buoni Poliennali Del Tesoro | 1.450% | 11/15/24 | EUR | 28,252 | 27,199 |
| | Italy Buoni Poliennali Del Tesoro | 0.000% | 12/15/24 | EUR | 79,931 | 74,514 |
| | Italy Buoni Poliennali Del Tesoro | 1.450% | 5/15/25 | EUR | 145,000 | 137,670 |
| 3 | Italy Buoni Poliennali Del Tesoro | 1.850% | 7/1/25 | EUR | 464,062 | 443,536 |
| | Italy Buoni Poliennali Del Tesoro | 1.200% | 8/15/25 | EUR | 183,866 | 172,330 |
| | Italy Buoni Poliennali Del Tesoro | 3.500% | 1/15/26 | EUR | 46,637 | 46,328 |
| | Italy Buoni Poliennali Del Tesoro | 0.000% | 4/1/26 | EUR | 75,000 | 66,262 |
| | Italy Buoni Poliennali Del Tesoro | 1.600% | 6/1/26 | EUR | 50,000 | 46,664 |
| | Italy Buoni Poliennali Del Tesoro | 2.100% | 7/15/26 | EUR | 191,650 | 181,407 |
| | Italy Buoni Poliennali Del Tesoro | 0.000% | 8/1/26 | EUR | 125,660 | 109,709 |
| | Italy Buoni Poliennali Del Tesoro | 1.100% | 4/1/27 | EUR | 374,304 | 334,658 |
| | Italy Buoni Poliennali Del Tesoro | 2.050% | 8/1/27 | EUR | 112,001 | 103,891 |
| | Italy Buoni Poliennali Del Tesoro | 0.950% | 9/15/27 | EUR | 51,525 | 45,178 |
| | Italy Buoni Poliennali Del Tesoro | 2.650% | 12/1/27 | EUR | 23,276 | 21,902 |
| | Italy Buoni Poliennali Del Tesoro | 0.250% | 3/15/28 | EUR | 425,158 | 350,966 |
| | Italy Buoni Poliennali Del Tesoro | 0.500% | 7/15/28 | EUR | 178,277 | 147,419 |
| | Italy Buoni Poliennali Del Tesoro | 2.800% | 6/15/29 | EUR | 103,291 | 95,730 |
| | Italy Buoni Poliennali Del Tesoro | 3.000% | 8/1/29 | EUR | 95,403 | 89,936 |
| 3 | Italy Buoni Poliennali Del Tesoro | 3.500% | 3/1/30 | EUR | 71,781 | 69,532 |
| | Italy Buoni Poliennali Del Tesoro | 1.350% | 4/1/30 | EUR | 40,825 | 33,777 |
| | Italy Buoni Poliennali Del Tesoro | 0.950% | 8/1/30 | EUR | 90,750 | 71,786 |
| 3 | Italy Buoni Poliennali Del Tesoro | 1.650% | 12/1/30 | EUR | 282,233 | 234,206 |
| | Italy Buoni Poliennali Del Tesoro | 0.900% | 4/1/31 | EUR | 434,376 | 334,063 |
| 3 | Italy Buoni Poliennali Del Tesoro | 0.600% | 8/1/31 | EUR | 179,705 | 132,166 |
| 3 | Italy Buoni Poliennali Del Tesoro | 0.950% | 12/1/31 | EUR | 72,000 | 54,066 |
| 3 | Italy Buoni Poliennali Del Tesoro | 1.650% | 3/1/32 | EUR | 62,846 | 50,408 |
| | Italy Buoni Poliennali Del Tesoro | 0.950% | 6/1/32 | EUR | 65,399 | 48,455 |
| | Italy Buoni Poliennali Del Tesoro | 2.500% | 12/1/32 | EUR | 118,987 | 100,723 |
| 3 | Italy Buoni Poliennali Del Tesoro | 2.450% | 9/1/33 | EUR | 14,386 | 11,896 |
| 3 | Italy Buoni Poliennali Del Tesoro | 3.350% | 3/1/35 | EUR | 96,075 | 85,253 |
| 3 | Italy Buoni Poliennali Del Tesoro | 4.000% | 4/30/35 | EUR | 213,405 | 203,761 |
| 3 | Italy Buoni Poliennali Del Tesoro | 1.450% | 3/1/36 | EUR | 21,814 | 15,402 |
| 3 | Italy Buoni Poliennali Del Tesoro | 4.000% | 2/1/37 | EUR | 21,368 | 20,336 |
| 3 | Italy Buoni Poliennali Del Tesoro | 0.950% | 3/1/37 | EUR | 101,606 | 64,986 |
| 3 | Italy Buoni Poliennali Del Tesoro | 3.250% | 3/1/38 | EUR | 191,341 | 163,338 |
| 3 | Italy Buoni Poliennali Del Tesoro | 2.950% | 9/1/38 | EUR | 59,597 | 49,062 |
| 3 | Italy Buoni Poliennali Del Tesoro | 3.100% | 3/1/40 | EUR | 47,884 | 39,641 |
| 3 | Italy Buoni Poliennali Del Tesoro | 5.000% | 9/1/40 | EUR | 8,479 | 8,917 |
| 3 | Italy Buoni Poliennali Del Tesoro | 1.800% | 3/1/41 | EUR | 175,508 | 116,656 |
| 3 | Italy Buoni Poliennali Del Tesoro | 4.750% | 9/1/44 | EUR | 80,212 | 82,520 |
| 3 | Italy Buoni Poliennali Del Tesoro | 1.500% | 4/30/45 | EUR | 106,713 | 62,757 |
| 3 | Italy Buoni Poliennali Del Tesoro | 3.250% | 9/1/46 | EUR | 73,973 | 61,141 |
| 3 | Italy Buoni Poliennali Del Tesoro | 2.700% | 3/1/47 | EUR | 82,000 | 61,198 |
| 3 | Italy Buoni Poliennali Del Tesoro | 3.450% | 3/1/48 | EUR | 14,310 | 12,188 |
| 3 | Italy Buoni Poliennali Del Tesoro | 3.850% | 9/1/49 | EUR | 79,047 | 71,306 |
| 3 | Italy Buoni Poliennali Del Tesoro | 2.450% | 9/1/50 | EUR | 27,796 | 19,060 |
| 3 | Italy Buoni Poliennali Del Tesoro | 1.700% | 9/1/51 | EUR | 4,184 | 2,421 |
| 3 | Italy Buoni Poliennali Del Tesoro | 2.150% | 9/1/52 | EUR | 143,329 | 90,335 |
| 3 | Italy Buoni Poliennali Del Tesoro | 2.800% | 3/1/67 | EUR | 47,014 | 32,508 |
| | Republic of Italy | 6.000% | 8/4/28 | GBP | 5,802 | 6,687 |
| | | | | | | 5,861,500 |
| Japan (15.8%) | | | |
| | Deposit Insurance Corp. of Japan | 0.100% | 8/6/24 | JPY | 2,000,000 | 13,467 |
| | Deposit Insurance Corp. of Japan | 0.100% | 12/10/24 | JPY | 1,500,000 | 10,099 |
| | Development Bank of Japan Inc. | 0.645% | 3/18/24 | JPY | 244,300 | 1,657 |
| | Development Bank of Japan Inc. | 0.466% | 12/12/24 | JPY | 292,500 | 1,984 |
| | Development Bank of Japan Inc. | 1.250% | 1/31/25 | GBP | 15,005 | 16,016 |
| | Development Bank of Japan Inc. | 0.450% | 3/13/25 | JPY | 195,000 | 1,325 |
Total International Bond II Index Fund
| | | Coupon | Maturity
Date | Currency | Face
Amount
(000) | Market
Value•
($000) |
| | Development Bank of Japan Inc. | 0.425% | 9/11/25 | JPY | 369,100 | 2,509 |
| | Development Bank of Japan Inc. | 0.875% | 10/10/25 | EUR | 28,731 | 26,679 |
| | Development Bank of Japan Inc. | 0.020% | 3/16/26 | JPY | 22,200 | 149 |
| | Fukuoka Prefecture | 0.432% | 6/18/49 | JPY | 180,000 | 944 |
| | Japan | 0.005% | 11/1/23 | JPY | 7,500,000 | 50,491 |
| | Japan | 0.005% | 12/1/23 | JPY | 2,128,100 | 14,327 |
| | Japan | 0.100% | 12/20/23 | JPY | 11,026,150 | 74,310 |
| | Japan | 0.600% | 12/20/23 | JPY | 7,635,600 | 51,750 |
| | Japan | 1.900% | 12/20/23 | JPY | 877,550 | 6,034 |
| | Japan | 0.005% | 1/1/24 | JPY | 7,628,700 | 51,358 |
| | Japan | 0.005% | 2/1/24 | JPY | 17,493,100 | 117,767 |
| | Japan | 0.005% | 3/1/24 | JPY | 662,100 | 4,457 |
| | Japan | 0.100% | 3/20/24 | JPY | 14,305,700 | 96,434 |
| | Japan | 0.600% | 3/20/24 | JPY | 9,210,500 | 62,516 |
| | Japan | 1.900% | 3/20/24 | JPY | 243,800 | 1,684 |
| | Japan | 0.005% | 4/1/24 | JPY | 23,183,300 | 156,071 |
| | Japan | 0.005% | 5/1/24 | JPY | 10,794,500 | 72,667 |
| | Japan | 0.005% | 6/1/24 | JPY | 12,248,150 | 82,449 |
| | Japan | 0.100% | 6/20/24 | JPY | 11,065,900 | 74,604 |
| | Japan | 0.600% | 6/20/24 | JPY | 346,200 | 2,353 |
| | Japan | 0.005% | 7/1/24 | JPY | 13,878,350 | 93,418 |
| | Japan | 0.005% | 8/1/24 | JPY | 22,000,000 | 148,076 |
| | Japan | 0.005% | 9/1/24 | JPY | 26,429,000 | 177,876 |
| | Japan | 0.100% | 9/20/24 | JPY | 11,241,000 | 75,787 |
| | Japan | 0.500% | 9/20/24 | JPY | 6,192,300 | 42,062 |
| | Japan | 2.100% | 9/20/24 | JPY | 636,300 | 4,451 |
| | Japan | 0.005% | 10/1/24 | JPY | 10,000,000 | 67,297 |
| | Japan | 0.005% | 11/1/24 | JPY | 10,000,000 | 67,295 |
| | Japan | 0.100% | 12/20/24 | JPY | 9,867,700 | 66,539 |
| | Japan | 0.300% | 12/20/24 | JPY | 4,905,100 | 33,216 |
| | Japan | 0.500% | 12/20/24 | JPY | 3,769,050 | 25,631 |
| | Japan | 0.100% | 3/20/25 | JPY | 7,801,350 | 52,625 |
| | Japan | 0.400% | 3/20/25 | JPY | 4,810,000 | 32,678 |
| | Japan | 2.000% | 3/20/25 | JPY | 36,600 | 258 |
| | Japan | 0.100% | 6/20/25 | JPY | 9,996,400 | 67,458 |
| | Japan | 0.400% | 6/20/25 | JPY | 4,047,000 | 27,525 |
| | Japan | 1.900% | 6/20/25 | JPY | 560,800 | 3,963 |
| | Japan | 2.100% | 6/20/25 | JPY | 1,462,750 | 10,389 |
| | Japan | 0.100% | 9/20/25 | JPY | 13,414,700 | 90,564 |
| | Japan | 0.400% | 9/20/25 | JPY | 1,557,850 | 10,608 |
| | Japan | 2.100% | 9/20/25 | JPY | 97,500 | 696 |
| | Japan | 0.100% | 12/20/25 | JPY | 18,368,900 | 124,037 |
| | Japan | 0.300% | 12/20/25 | JPY | 4,368,200 | 29,681 |
| | Japan | 2.000% | 12/20/25 | JPY | 1,628,550 | 11,649 |
| | Japan | 0.005% | 3/20/26 | JPY | 27,610,900 | 185,855 |
| | Japan | 0.100% | 3/20/26 | JPY | 2,486,700 | 16,792 |
| | Japan | 2.100% | 3/20/26 | JPY | 419,350 | 3,023 |
| | Japan | 2.200% | 3/20/26 | JPY | 390,050 | 2,820 |
| | Japan | 0.005% | 6/20/26 | JPY | 28,035,850 | 188,667 |
| | Japan | 0.100% | 6/20/26 | JPY | 2,649,200 | 17,889 |
| | Japan | 0.005% | 9/20/26 | JPY | 24,059,350 | 161,857 |
| | Japan | 0.100% | 9/20/26 | JPY | 3,391,300 | 22,899 |
| | Japan | 2.200% | 9/20/26 | JPY | 29,300 | 214 |
| | Japan | 2.300% | 9/20/26 | JPY | 17,100 | 125 |
| | Japan | 0.005% | 12/20/26 | JPY | 28,000,200 | 188,255 |
| | Japan | 0.100% | 12/20/26 | JPY | 6,316,650 | 42,635 |
| | Japan | 2.100% | 12/20/26 | JPY | 2,437,950 | 17,809 |
| | Japan | 0.005% | 3/20/27 | JPY | 36,313,350 | 243,923 |
| | Japan | 0.100% | 3/20/27 | JPY | 5,478,050 | 36,950 |
| | Japan | 0.100% | 3/20/27 | JPY | 9,608,850 | 64,812 |
| | Japan | 2.000% | 3/20/27 | JPY | 487,600 | 3,562 |
| | Japan | 2.100% | 3/20/27 | JPY | 170,700 | 1,252 |
| | Japan | 0.005% | 6/20/27 | JPY | 27,604,000 | 185,222 |
| | Japan | 0.100% | 6/20/27 | JPY | 9,557,150 | 64,408 |
| | Japan | 2.300% | 6/20/27 | JPY | 9,800 | 73 |
| | Japan | 0.100% | 9/20/27 | JPY | 10,587,000 | 71,282 |
| | Japan | 0.100% | 9/20/27 | JPY | 15,000,000 | 101,014 |
| | Japan | 2.200% | 9/20/27 | JPY | 1,007,350 | 7,476 |
| | Japan | 0.100% | 12/20/27 | JPY | 10,492,600 | 70,587 |
Total International Bond II Index Fund
| | | Coupon | Maturity
Date | Currency | Face
Amount
(000) | Market
Value•
($000) |
| | Japan | 2.100% | 12/20/27 | JPY | 1,092,700 | 8,103 |
| | Japan | 0.100% | 3/20/28 | JPY | 4,007,950 | 26,944 |
| | Japan | 2.200% | 3/20/28 | JPY | 1,925,950 | 14,407 |
| | Japan | 2.400% | 3/20/28 | JPY | 2,852,400 | 21,542 |
| | Japan | 0.100% | 6/20/28 | JPY | 4,266,400 | 28,658 |
| | Japan | 2.400% | 6/20/28 | JPY | 502,200 | 3,809 |
| | Japan | 0.100% | 9/20/28 | JPY | 6,689,800 | 44,898 |
| | Japan | 2.100% | 9/20/28 | JPY | 2,986,900 | 22,399 |
| | Japan | 2.200% | 9/20/28 | JPY | 585,150 | 4,411 |
| | Japan | 0.100% | 12/20/28 | JPY | 6,523,850 | 43,747 |
| | Japan | 1.900% | 12/20/28 | JPY | 3,530,200 | 26,279 |
| | Japan | 2.100% | 12/20/28 | JPY | 292,600 | 2,202 |
| | Japan | 0.100% | 3/20/29 | JPY | 8,240,600 | 55,210 |
| | Japan | 1.900% | 3/20/29 | JPY | 2,023,500 | 15,112 |
| | Japan | 2.100% | 3/20/29 | JPY | 2,200,500 | 16,621 |
| | Japan | 0.100% | 6/20/29 | JPY | 10,181,850 | 68,150 |
| | Japan | 2.100% | 6/20/29 | JPY | 2,696,400 | 20,438 |
| | Japan | 0.100% | 9/20/29 | JPY | 10,205,600 | 68,240 |
| | Japan | 2.100% | 9/20/29 | JPY | 5,792,650 | 44,058 |
| | Japan | 2.800% | 9/20/29 | JPY | 1,316,550 | 10,437 |
| | Japan | 0.100% | 12/20/29 | JPY | 11,308,450 | 75,519 |
| | Japan | 2.100% | 12/20/29 | JPY | 6,356,900 | 48,503 |
| | Japan | 2.200% | 12/20/29 | JPY | 2,798,800 | 21,488 |
| | Japan | 0.100% | 3/20/30 | JPY | 13,589,200 | 90,612 |
| | Japan | 2.100% | 3/20/30 | JPY | 3,539,050 | 27,082 |
| | Japan | 2.200% | 3/20/30 | JPY | 4,771,850 | 36,751 |
| | Japan | 2.300% | 5/20/30 | JPY | 82,900 | 644 |
| | Japan | 0.100% | 6/20/30 | JPY | 7,666,950 | 51,041 |
| | Japan | 1.600% | 6/20/30 | JPY | 277,950 | 2,062 |
| | Japan | 1.800% | 6/20/30 | JPY | 19,550 | 147 |
| | Japan | 2.000% | 6/20/30 | JPY | 2,437,950 | 18,584 |
| | Japan | 0.100% | 9/20/30 | JPY | 13,713,150 | 91,135 |
| | Japan | 1.800% | 9/20/30 | JPY | 682,650 | 5,145 |
| | Japan | 1.900% | 9/20/30 | JPY | 2,130,750 | 16,172 |
| | Japan | 0.100% | 12/20/30 | JPY | 25,679,600 | 170,461 |
| | Japan | 2.000% | 12/20/30 | JPY | 1,462,800 | 11,213 |
| | Japan | 2.100% | 12/20/30 | JPY | 3,983,600 | 30,751 |
| | Japan | 0.100% | 3/20/31 | JPY | 31,077,700 | 206,173 |
| | Japan | 1.900% | 3/20/31 | JPY | 2,925,550 | 22,344 |
| | Japan | 2.000% | 3/20/31 | JPY | 5,938,750 | 45,688 |
| | Japan | 2.200% | 3/20/31 | JPY | 243,800 | 1,903 |
| | Japan | 0.100% | 6/20/31 | JPY | 40,895,650 | 271,162 |
| | Japan | 1.800% | 6/20/31 | JPY | 2,269,750 | 17,263 |
| | Japan | 1.900% | 6/20/31 | JPY | 2,901,150 | 22,231 |
| | Japan | 0.100% | 9/20/31 | JPY | 28,622,500 | 189,662 |
| | Japan | 1.700% | 9/20/31 | JPY | 12,189,650 | 92,284 |
| | Japan | 1.800% | 9/20/31 | JPY | 3,693,450 | 28,180 |
| | Japan | 0.100% | 12/20/31 | JPY | 18,498,300 | 122,436 |
| | Japan | 1.700% | 12/20/31 | JPY | 6,066,800 | 46,041 |
| | Japan | 1.800% | 12/20/31 | JPY | 13,117,350 | 100,342 |
| | Japan | 1.600% | 3/20/32 | JPY | 4,363,850 | 32,912 |
| | Japan | 1.700% | 3/20/32 | JPY | 1,560,300 | 11,865 |
| | Japan | 1.800% | 3/20/32 | JPY | 2,151,000 | 16,490 |
| | Japan | 0.200% | 6/20/32 | JPY | 17,000,000 | 113,232 |
| | Japan | 1.500% | 6/20/32 | JPY | 3,971,850 | 29,752 |
| | Japan | 1.600% | 6/20/32 | JPY | 4,015,400 | 30,334 |
| | Japan | 1.700% | 9/20/32 | JPY | 10,537,900 | 80,427 |
| | Japan | 1.700% | 12/20/32 | JPY | 7,875,600 | 60,187 |
| | Japan | 1.800% | 12/20/32 | JPY | 4,625,550 | 35,659 |
| | Japan | 1.500% | 3/20/33 | JPY | 8,438,850 | 63,395 |
| | Japan | 1.600% | 3/20/33 | JPY | 7,493,850 | 56,809 |
| | Japan | 1.700% | 6/20/33 | JPY | 755,750 | 5,785 |
| | Japan | 1.700% | 6/20/33 | JPY | 8,224,550 | 62,957 |
| | Japan | 1.700% | 9/20/33 | JPY | 5,562,400 | 42,608 |
| | Japan | 1.600% | 12/20/33 | JPY | 7,508,700 | 56,997 |
| | Japan | 2.000% | 12/20/33 | JPY | 243,800 | 1,922 |
| | Japan | 1.500% | 3/20/34 | JPY | 8,735,200 | 65,677 |
| | Japan | 2.400% | 3/20/34 | JPY | 1,804,100 | 14,776 |
| | Japan | 1.500% | 6/20/34 | JPY | 11,287,850 | 84,865 |
Total International Bond II Index Fund
| | | Coupon | Maturity
Date | Currency | Face
Amount
(000) | Market
Value•
($000) |
| | Japan | 2.500% | 6/20/34 | JPY | 981,550 | 8,126 |
| | Japan | 1.400% | 9/20/34 | JPY | 16,614,050 | 123,606 |
| | Japan | 2.500% | 9/20/34 | JPY | 195,050 | 1,618 |
| | Japan | 1.200% | 12/20/34 | JPY | 12,236,350 | 89,063 |
| | Japan | 2.400% | 12/20/34 | JPY | 1,121,450 | 9,226 |
| | Japan | 1.200% | 3/20/35 | JPY | 16,379,700 | 119,115 |
| | Japan | 2.300% | 3/20/35 | JPY | 1,219,000 | 9,945 |
| | Japan | 1.300% | 6/20/35 | JPY | 8,294,150 | 60,932 |
| | Japan | 2.300% | 6/20/35 | JPY | 1,745,550 | 14,255 |
| | Japan | 1.200% | 9/20/35 | JPY | 10,302,000 | 74,754 |
| | Japan | 2.500% | 9/20/35 | JPY | 487,600 | 4,067 |
| | Japan | 1.000% | 12/20/35 | JPY | 6,979,950 | 49,398 |
| | Japan | 2.300% | 12/20/35 | JPY | 1,223,850 | 10,012 |
| | Japan | 0.400% | 3/20/36 | JPY | 8,935,200 | 58,498 |
| | Japan | 2.500% | 3/20/36 | JPY | 1,076,600 | 9,000 |
| | Japan | 0.200% | 6/20/36 | JPY | 14,442,100 | 91,705 |
| | Japan | 2.500% | 6/20/36 | JPY | 707,050 | 5,916 |
| | Japan | 0.500% | 9/20/36 | JPY | 11,532,150 | 76,021 |
| | Japan | 2.500% | 9/20/36 | JPY | 292,600 | 2,450 |
| | Japan | 0.600% | 12/20/36 | JPY | 13,634,600 | 90,825 |
| | Japan | 2.300% | 12/20/36 | JPY | 393,950 | 3,230 |
| | Japan | 0.700% | 3/20/37 | JPY | 11,279,500 | 75,948 |
| | Japan | 2.400% | 3/20/37 | JPY | 1,762,150 | 14,618 |
| | Japan | 0.600% | 6/20/37 | JPY | 10,660,750 | 70,573 |
| | Japan | 0.600% | 9/20/37 | JPY | 14,276,450 | 94,199 |
| | Japan | 2.500% | 9/20/37 | JPY | 8,350 | 70 |
| | Japan | 0.600% | 12/20/37 | JPY | 9,088,600 | 59,784 |
| | Japan | 0.500% | 3/20/38 | JPY | 15,764,950 | 101,866 |
| | Japan | 2.500% | 3/20/38 | JPY | 1,422,300 | 11,960 |
| | Japan | 0.500% | 6/20/38 | JPY | 15,423,200 | 99,333 |
| | Japan | 0.700% | 9/20/38 | JPY | 15,738,200 | 104,171 |
| | Japan | 2.400% | 9/20/38 | JPY | 1,234,600 | 10,272 |
| | Japan | 0.500% | 12/20/38 | JPY | 16,441,150 | 105,176 |
| | Japan | 0.400% | 3/20/39 | JPY | 12,384,200 | 77,678 |
| | Japan | 2.300% | 3/20/39 | JPY | 2,198,050 | 18,077 |
| | Japan | 0.300% | 6/20/39 | JPY | 18,087,600 | 111,093 |
| | Japan | 0.300% | 9/20/39 | JPY | 10,005,100 | 61,191 |
| | Japan | 2.200% | 9/20/39 | JPY | 4,353,150 | 35,345 |
| | Japan | 0.300% | 12/20/39 | JPY | 14,248,200 | 86,769 |
| | Japan | 0.400% | 3/20/40 | JPY | 13,226,800 | 81,624 |
| | Japan | 2.300% | 3/20/40 | JPY | 3,683,150 | 30,288 |
| | Japan | 0.400% | 6/20/40 | JPY | 21,311,350 | 131,026 |
| | Japan | 0.400% | 9/20/40 | JPY | 20,756,200 | 127,080 |
| | Japan | 2.000% | 9/20/40 | JPY | 8,765,300 | 69,148 |
| | Japan | 0.500% | 12/20/40 | JPY | 19,946,750 | 123,828 |
| | Japan | 0.500% | 3/20/41 | JPY | 22,345,350 | 138,153 |
| | Japan | 2.200% | 3/20/41 | JPY | 6,469,300 | 52,410 |
| | Japan | 0.400% | 6/20/41 | JPY | 23,701,250 | 143,218 |
| | Japan | 0.500% | 9/20/41 | JPY | 22,867,250 | 140,182 |
| | Japan | 2.000% | 9/20/41 | JPY | 6,288,400 | 49,423 |
| | Japan | 0.500% | 12/20/41 | JPY | 22,466,600 | 137,131 |
| | Japan | 0.800% | 3/20/42 | JPY | 21,438,550 | 137,850 |
| | Japan | 2.000% | 3/20/42 | JPY | 8,742,400 | 68,556 |
| | Japan | 0.900% | 6/20/42 | JPY | 11,491,000 | 74,949 |
| | Japan | 1.100% | 9/20/42 | JPY | 2,500,000 | 16,868 |
| | Japan | 1.900% | 9/20/42 | JPY | 10,532,950 | 81,117 |
| | Japan | 1.800% | 3/20/43 | JPY | 7,270,250 | 55,046 |
| | Japan | 1.900% | 6/20/43 | JPY | 3,610,900 | 27,775 |
| | Japan | 1.800% | 9/20/43 | JPY | 4,908,950 | 37,137 |
| | Japan | 1.700% | 12/20/43 | JPY | 7,751,900 | 57,641 |
| | Japan | 1.700% | 3/20/44 | JPY | 5,901,000 | 43,850 |
| | Japan | 1.700% | 6/20/44 | JPY | 5,029,200 | 37,345 |
| | Japan | 1.700% | 9/20/44 | JPY | 7,417,700 | 55,040 |
| | Japan | 1.500% | 12/20/44 | JPY | 6,315,200 | 45,172 |
| | Japan | 1.500% | 3/20/45 | JPY | 7,010,100 | 50,086 |
| | Japan | 1.600% | 6/20/45 | JPY | 2,047,900 | 14,887 |
| | Japan | 1.400% | 9/20/45 | JPY | 1,744,500 | 12,200 |
| | Japan | 1.400% | 12/20/45 | JPY | 4,637,850 | 32,387 |
| | Japan | 0.800% | 3/20/46 | JPY | 5,202,350 | 32,016 |
Total International Bond II Index Fund
| | | Coupon | Maturity
Date | Currency | Face
Amount
(000) | Market
Value•
($000) |
| | Japan | 0.300% | 6/20/46 | JPY | 6,878,000 | 37,478 |
| | Japan | 0.500% | 9/20/46 | JPY | 6,752,050 | 38,509 |
| | Japan | 0.600% | 12/20/46 | JPY | 5,542,850 | 32,272 |
| | Japan | 0.800% | 3/20/47 | JPY | 6,007,600 | 36,552 |
| | Japan | 0.800% | 6/20/47 | JPY | 5,680,600 | 34,460 |
| | Japan | 0.800% | 9/20/47 | JPY | 6,410,400 | 38,770 |
| | Japan | 0.800% | 12/20/47 | JPY | 8,596,450 | 51,847 |
| | Japan | 0.800% | 3/20/48 | JPY | 9,740,450 | 58,591 |
| 7 | Japan | 2.400% | 3/20/48 | JPY | 390,050 | 3,252 |
| 7 | Japan | 0.700% | 6/20/48 | JPY | 10,837,600 | 63,434 |
| 7 | Japan | 0.900% | 9/20/48 | JPY | 6,530,950 | 40,039 |
| 7 | Japan | 0.700% | 12/20/48 | JPY | 10,141,900 | 59,016 |
| 7 | Japan | 0.500% | 3/20/49 | JPY | 7,208,950 | 39,671 |
| 7 | Japan | 2.200% | 3/20/49 | JPY | 792,350 | 6,373 |
| 7 | Japan | 0.400% | 6/20/49 | JPY | 9,325,050 | 49,732 |
| 7 | Japan | 0.400% | 9/20/49 | JPY | 10,210,800 | 54,200 |
| 7 | Japan | 0.400% | 12/20/49 | JPY | 9,461,750 | 50,030 |
| 7 | Japan | 0.400% | 3/20/50 | JPY | 9,579,450 | 50,455 |
| 7 | Japan | 2.200% | 3/20/50 | JPY | 1,092,200 | 8,777 |
| 7 | Japan | 0.600% | 6/20/50 | JPY | 14,465,650 | 80,429 |
| 7 | Japan | 0.600% | 9/20/50 | JPY | 10,871,950 | 60,242 |
| 7 | Japan | 0.700% | 12/20/50 | JPY | 14,111,550 | 80,138 |
| 7 | Japan | 0.700% | 3/20/51 | JPY | 14,341,600 | 81,189 |
| 7 | Japan | 2.200% | 3/20/51 | JPY | 2,001,000 | 16,058 |
| 7 | Japan | 0.700% | 6/20/51 | JPY | 14,625,200 | 82,531 |
| 7 | Japan | 0.700% | 9/20/51 | JPY | 13,652,500 | 76,793 |
| 7 | Japan | 0.700% | 12/20/51 | JPY | 14,209,900 | 79,671 |
| 7 | Japan | 1.000% | 3/20/52 | JPY | 14,497,000 | 88,043 |
| 7 | Japan | 2.000% | 3/20/52 | JPY | 4,327,650 | 33,268 |
| 7 | Japan | 1.300% | 6/20/52 | JPY | 9,743,000 | 63,751 |
| | Japan | 1.400% | 9/20/52 | JPY | 1,400,000 | 9,383 |
| | Japan | 1.900% | 3/20/53 | JPY | 4,000,550 | 30,044 |
| | Japan | 1.700% | 3/20/54 | JPY | 3,498,450 | 25,100 |
| | Japan | 1.400% | 3/20/55 | JPY | 4,707,050 | 31,292 |
| | Japan | 0.400% | 3/20/56 | JPY | 7,303,950 | 35,472 |
| | Japan | 0.900% | 3/20/57 | JPY | 10,991,900 | 62,706 |
| | Japan | 0.800% | 3/20/58 | JPY | 10,735,650 | 58,846 |
| | Japan | 0.500% | 3/20/59 | JPY | 10,717,500 | 52,230 |
| | Japan | 0.500% | 3/20/60 | JPY | 15,850,050 | 76,300 |
| | Japan | 0.700% | 3/20/61 | JPY | 16,688,650 | 85,977 |
| | Japan | 1.000% | 3/20/62 | JPY | 9,547,300 | 54,523 |
| | Japan Expressway Holding and Debt Repayment Agency | 0.669% | 11/30/23 | JPY | 487,600 | 3,305 |
| | Japan Expressway Holding and Debt Repayment Agency | 0.693% | 12/28/23 | JPY | 243,800 | 1,652 |
| | Japan Expressway Holding and Debt Repayment Agency | 0.660% | 2/29/24 | JPY | 975,300 | 6,616 |
| | Japan Expressway Holding and Debt Repayment Agency | 0.645% | 3/29/24 | JPY | 497,600 | 3,376 |
| | Japan Expressway Holding and Debt Repayment Agency | 0.669% | 4/30/24 | JPY | 507,500 | 3,446 |
| | Japan Expressway Holding and Debt Repayment Agency | 0.660% | 5/31/24 | JPY | 523,900 | 3,531 |
| | Japan Expressway Holding and Debt Repayment Agency | 0.601% | 7/31/24 | JPY | 975,200 | 6,624 |
| | Japan Expressway Holding and Debt Repayment Agency | 0.544% | 9/30/24 | JPY | 12,300 | 84 |
| | Japan Expressway Holding and Debt Repayment Agency | 0.539% | 10/31/24 | JPY | 487,600 | 3,312 |
| | Japan Expressway Holding and Debt Repayment Agency | 0.495% | 11/29/24 | JPY | 741,200 | 5,032 |
| | Japan Expressway Holding and Debt Repayment Agency | 0.466% | 12/27/24 | JPY | 975,300 | 6,620 |
| | Japan Expressway Holding and Debt Repayment Agency | 0.320% | 1/31/25 | JPY | 195,000 | 1,320 |
| | Japan Expressway Holding and Debt Repayment Agency | 0.414% | 2/28/25 | JPY | 199,400 | 1,353 |
| | Japan Expressway Holding and Debt Repayment Agency | 0.450% | 3/31/25 | JPY | 256,200 | 1,740 |
| | Japan Expressway Holding and Debt Repayment Agency | 0.509% | 5/30/25 | JPY | 282,900 | 1,926 |
| | Japan Expressway Holding and Debt Repayment Agency | 0.557% | 7/31/25 | JPY | 6,900 | 47 |
| | Japan Expressway Holding and Debt Repayment Agency | 0.440% | 8/29/25 | JPY | 31,300 | 213 |
| | Japan Expressway Holding and Debt Repayment Agency | 0.320% | 1/30/26 | JPY | 366,300 | 2,486 |
| | Japan Expressway Holding and Debt Repayment Agency | 0.145% | 2/27/26 | JPY | 7,000 | 47 |
| | Japan Expressway Holding and Debt Repayment Agency | 2.450% | 3/19/26 | JPY | 90,000 | 642 |
| | Japan Expressway Holding and Debt Repayment Agency | 2.280% | 4/20/27 | JPY | 50,000 | 360 |
| | Japan Expressway Holding and Debt Repayment Agency | 0.140% | 4/30/27 | JPY | 1,143,400 | 7,697 |
| | Japan Expressway Holding and Debt Repayment Agency | 0.110% | 5/31/27 | JPY | 5,400 | 36 |
| | Japan Expressway Holding and Debt Repayment Agency | 0.130% | 6/30/27 | JPY | 241,600 | 1,624 |
| | Japan Expressway Holding and Debt Repayment Agency | 0.160% | 7/30/27 | JPY | 100,000 | 673 |
| | Japan Expressway Holding and Debt Repayment Agency | 0.155% | 8/31/27 | JPY | 301,300 | 2,027 |
| | Japan Expressway Holding and Debt Repayment Agency | 0.090% | 9/30/27 | JPY | 1,447,700 | 9,702 |
| | Japan Expressway Holding and Debt Repayment Agency | 2.340% | 10/20/27 | JPY | 360,000 | 2,670 |
Total International Bond II Index Fund
| | | Coupon | Maturity
Date | Currency | Face
Amount
(000) | Market
Value•
($000) |
| | Japan Expressway Holding and Debt Repayment Agency | 0.170% | 10/29/27 | JPY | 585,200 | 3,936 |
| | Japan Expressway Holding and Debt Repayment Agency | 0.160% | 11/30/27 | JPY | 292,500 | 1,966 |
| | Japan Expressway Holding and Debt Repayment Agency | 2.250% | 12/20/27 | JPY | 60,000 | 435 |
| | Japan Expressway Holding and Debt Repayment Agency | 0.185% | 1/31/28 | JPY | 305,800 | 2,059 |
| | Japan Expressway Holding and Debt Repayment Agency | 2.420% | 6/20/28 | JPY | 760,000 | 5,716 |
| | Japan Expressway Holding and Debt Repayment Agency | 2.370% | 9/20/28 | JPY | 60,000 | 441 |
| | Japan Expressway Holding and Debt Repayment Agency | 2.410% | 4/20/29 | JPY | 230,000 | 1,703 |
| | Japan Expressway Holding and Debt Repayment Agency | 2.100% | 12/28/29 | JPY | 400,000 | 3,034 |
| | Japan Expressway Holding and Debt Repayment Agency | 1.427% | 7/31/34 | JPY | 500,000 | 3,689 |
| | Japan Expressway Holding and Debt Repayment Agency | 1.338% | 10/31/34 | JPY | 1,600,000 | 11,691 |
| | Japan Expressway Holding and Debt Repayment Agency | 0.970% | 1/31/35 | JPY | 1,000,000 | 7,010 |
| | Japan Expressway Holding and Debt Repayment Agency | 1.240% | 7/31/35 | JPY | 400,000 | 2,885 |
| | Japan Expressway Holding and Debt Repayment Agency | 1.119% | 10/31/35 | JPY | 200,000 | 1,424 |
| | Japan Expressway Holding and Debt Repayment Agency | 0.934% | 1/31/36 | JPY | 1,800,000 | 12,487 |
| | Japan Expressway Holding and Debt Repayment Agency | 0.306% | 4/30/36 | JPY | 100,000 | 640 |
| | Japan Expressway Holding and Debt Repayment Agency | 0.149% | 7/31/36 | JPY | 1,100,000 | 6,846 |
| | Japan Expressway Holding and Debt Repayment Agency | 0.397% | 10/31/36 | JPY | 700,000 | 4,498 |
| | Japan Expressway Holding and Debt Repayment Agency | 0.591% | 1/29/38 | JPY | 1,400,000 | 9,104 |
| | Japan Expressway Holding and Debt Repayment Agency | 0.538% | 5/31/38 | JPY | 400,000 | 2,568 |
| | Japan Expressway Holding and Debt Repayment Agency | 0.625% | 8/31/38 | JPY | 400,000 | 2,595 |
| | Japan Expressway Holding and Debt Repayment Agency | 0.500% | 9/17/38 | JPY | 100,000 | 628 |
| | Japan Expressway Holding and Debt Repayment Agency | 0.625% | 9/30/38 | JPY | 600,000 | 3,886 |
| | Japan Expressway Holding and Debt Repayment Agency | 0.500% | 3/18/39 | JPY | 100,000 | 622 |
| | Japan Expressway Holding and Debt Repayment Agency | 2.300% | 2/29/40 | JPY | 100,000 | 812 |
| | Japan Expressway Holding and Debt Repayment Agency | 2.960% | 3/19/46 | JPY | 180,000 | 1,574 |
| | Japan Expressway Holding and Debt Repayment Agency | 2.870% | 12/20/46 | JPY | 50,000 | 435 |
| | Japan Expressway Holding and Debt Repayment Agency | 2.700% | 3/20/48 | JPY | 1,010,000 | 8,493 |
| | Japan Expressway Holding and Debt Repayment Agency | 0.686% | 7/31/48 | JPY | 200,000 | 1,151 |
| | Japan Expressway Holding and Debt Repayment Agency | 0.542% | 5/31/49 | JPY | 600,000 | 3,267 |
| | Japan Expressway Holding and Debt Repayment Agency | 0.297% | 9/30/49 | JPY | 400,000 | 2,024 |
| | Japan Expressway Holding and Debt Repayment Agency | 0.422% | 12/28/49 | JPY | 500,000 | 2,612 |
| | Japan Expressway Holding and Debt Repayment Agency | 0.306% | 3/31/50 | JPY | 200,000 | 1,004 |
| | Japan Expressway Holding and Debt Repayment Agency | 1.861% | 3/19/55 | JPY | 1,180,000 | 8,378 |
| | Japan Finance Corp. | 0.001% | 7/31/24 | JPY | 1,000,000 | 6,723 |
| | Japan Finance Organization for Municipalities | 0.669% | 11/17/23 | JPY | 770,000 | 5,214 |
| | Japan Finance Organization for Municipalities | 0.660% | 2/16/24 | JPY | 487,600 | 3,307 |
| | Japan Finance Organization for Municipalities | 0.669% | 4/12/24 | JPY | 755,800 | 5,094 |
| | Japan Finance Organization for Municipalities | 0.660% | 5/21/24 | JPY | 1,491,100 | 10,049 |
| | Japan Finance Organization for Municipalities | 0.391% | 4/25/25 | JPY | 109,800 | 744 |
| | Japan Finance Organization for Municipalities | 0.484% | 6/13/25 | JPY | 98,600 | 671 |
| | Japan Finance Organization for Municipalities | 0.320% | 1/19/26 | JPY | 487,600 | 3,248 |
| | Japan Finance Organization for Municipalities | 0.145% | 2/16/26 | JPY | 44,000 | 291 |
| | Japan Finance Organization for Municipalities | 0.020% | 3/13/26 | JPY | 73,100 | 482 |
| | Japan Finance Organization for Municipalities | 0.140% | 4/16/27 | JPY | 122,000 | 821 |
| | Japan Finance Organization for Municipalities | 0.110% | 5/21/27 | JPY | 831,400 | 5,583 |
| | Japan Finance Organization for Municipalities | 0.160% | 7/16/27 | JPY | 497,600 | 3,347 |
| | Japan Finance Organization for Municipalities | 0.170% | 10/15/27 | JPY | 487,600 | 3,281 |
| | Japan Finance Organization for Municipalities | 0.160% | 11/15/27 | JPY | 975,200 | 6,380 |
| | Japan Finance Organization for Municipalities | 0.155% | 12/17/27 | JPY | 200,000 | 1,307 |
| | Japan Finance Organization for Municipalities | 0.185% | 1/21/28 | JPY | 975,200 | 6,557 |
| | Japan Finance Organization for Municipalities | 0.195% | 2/15/28 | JPY | 7,500 | 50 |
| | Japan Finance Organization for Municipalities | 0.145% | 3/14/28 | JPY | 116,000 | 756 |
| | Japan Finance Organization for Municipalities | 2.290% | 4/25/28 | JPY | 10,000 | 75 |
| | Japan Finance Organization for Municipalities | 2.290% | 4/27/29 | JPY | 50,000 | 368 |
| | Japan Finance Organization for Municipalities | 2.220% | 1/28/30 | JPY | 1,710,000 | 12,608 |
| | Japan Finance Organization for Municipalities | 0.224% | 3/28/31 | JPY | 350,000 | 2,312 |
| | Japan Finance Organization for Municipalities | 2.030% | 6/27/31 | JPY | 10,000 | 73 |
| | Japan Housing Finance Agency | 0.040% | 6/20/25 | JPY | 20,000 | 134 |
| | Japan Housing Finance Agency | 0.075% | 10/20/26 | JPY | 2,050,000 | 13,745 |
| | Japan Housing Finance Agency | 0.547% | 3/18/50 | JPY | 630,000 | 3,331 |
| | Major Joint Local Government Bond | 0.660% | 11/24/23 | JPY | 702,100 | 4,754 |
| | Major Joint Local Government Bond | 0.710% | 12/25/23 | JPY | 1,804,000 | 12,225 |
| | Major Joint Local Government Bond | 0.760% | 1/25/24 | JPY | 731,400 | 4,952 |
| | Major Joint Local Government Bond | 0.689% | 4/25/24 | JPY | 122,000 | 823 |
| | Major Joint Local Government Bond | 0.674% | 5/24/24 | JPY | 195,000 | 1,325 |
| | Major Joint Local Government Bond | 0.659% | 6/25/24 | JPY | 390,100 | 2,642 |
| | Major Joint Local Government Bond | 0.611% | 7/25/24 | JPY | 523,000 | 3,544 |
| | Major Joint Local Government Bond | 0.566% | 8/23/24 | JPY | 243,900 | 1,652 |
| | Major Joint Local Government Bond | 0.554% | 9/25/24 | JPY | 731,400 | 4,919 |
Total International Bond II Index Fund
| | | Coupon | Maturity
Date | Currency | Face
Amount
(000) | Market
Value•
($000) |
| | Major Joint Local Government Bond | 0.456% | 12/25/24 | JPY | 1,170,300 | 7,852 |
| | Major Joint Local Government Bond | 0.448% | 2/25/25 | JPY | 1,121,500 | 7,606 |
| | Major Joint Local Government Bond | 0.470% | 3/25/25 | JPY | 853,400 | 5,793 |
| | Major Joint Local Government Bond | 0.406% | 4/25/25 | JPY | 1,779,700 | 12,066 |
| | Major Joint Local Government Bond | 0.553% | 5/23/25 | JPY | 2,486,800 | 16,928 |
| | Major Joint Local Government Bond | 0.548% | 6/25/25 | JPY | 1,267,800 | 8,632 |
| | Major Joint Local Government Bond | 0.553% | 7/25/25 | JPY | 606,500 | 4,074 |
| | Major Joint Local Government Bond | 0.500% | 8/25/25 | JPY | 780,100 | 5,308 |
| | Major Joint Local Government Bond | 0.510% | 9/25/25 | JPY | 1,058,400 | 7,208 |
| | Major Joint Local Government Bond | 0.496% | 11/25/25 | JPY | 487,600 | 3,320 |
| | Major Joint Local Government Bond | 0.469% | 12/25/25 | JPY | 2,486,800 | 16,645 |
| | Major Joint Local Government Bond | 0.060% | 8/25/26 | JPY | 7,500 | 50 |
| | Major Joint Local Government Bond | 0.060% | 10/23/26 | JPY | 5,100 | 34 |
| | Major Joint Local Government Bond | 0.145% | 12/25/26 | JPY | 1,609,100 | 10,823 |
| | Major Joint Local Government Bond | 0.180% | 1/25/27 | JPY | 1,506,700 | 10,148 |
| | Major Joint Local Government Bond | 0.245% | 2/25/27 | JPY | 829,000 | 5,599 |
| | Major Joint Local Government Bond | 0.210% | 3/25/27 | JPY | 949,900 | 6,260 |
| | Major Joint Local Government Bond | 0.215% | 10/25/27 | JPY | 386,300 | 2,603 |
| | Major Joint Local Government Bond | 0.240% | 2/25/28 | JPY | 233,600 | 1,574 |
| | Major Joint Local Government Bond | 0.180% | 4/25/28 | JPY | 2,779,300 | 18,648 |
| | Major Joint Local Government Bond | 0.200% | 5/25/28 | JPY | 434,000 | 2,914 |
| | Major Joint Local Government Bond | 0.205% | 6/23/28 | JPY | 510,000 | 3,424 |
| | Major Joint Local Government Bond | 0.175% | 7/25/28 | JPY | 1,167,200 | 7,820 |
| | Major Joint Local Government Bond | 0.245% | 8/25/28 | JPY | 272,500 | 1,832 |
| | Major Joint Local Government Bond | 0.250% | 9/25/28 | JPY | 664,400 | 4,467 |
| | Major Joint Local Government Bond | 0.269% | 10/25/28 | JPY | 6,600 | 44 |
| | Major Joint Local Government Bond | 0.160% | 1/25/29 | JPY | 1,085,000 | 7,246 |
| | Major Joint Local Government Bond | 0.140% | 2/22/29 | JPY | 780,000 | 5,201 |
| | Major Joint Local Government Bond | 0.100% | 4/25/29 | JPY | 1,201,100 | 7,983 |
| | Major Joint Local Government Bond | 0.110% | 5/25/29 | JPY | 1,500,000 | 9,973 |
| | Major Joint Local Government Bond | 0.050% | 9/25/29 | JPY | 24,400 | 161 |
| | Major Joint Local Government Bond | 0.070% | 11/22/29 | JPY | 1,627,900 | 10,768 |
| | Major Joint Local Government Bond | 0.095% | 2/25/30 | JPY | 314,700 | 2,082 |
| | Major Joint Local Government Bond | 0.150% | 6/25/30 | JPY | 487,600 | 3,232 |
| | Major Joint Local Government Bond | 0.125% | 8/23/30 | JPY | 74,500 | 492 |
| | Major Joint Local Government Bond | 0.150% | 9/25/30 | JPY | 24,900 | 165 |
| | Major Joint Local Government Bond | 0.125% | 10/25/30 | JPY | 1,038,500 | 6,855 |
| | Major Joint Local Government Bond | 0.120% | 11/25/30 | JPY | 31,800 | 210 |
| | Major Joint Local Government Bond | 0.130% | 1/24/31 | JPY | 200,000 | 1,320 |
| | Major Joint Local Government Bond | 0.145% | 2/25/31 | JPY | 781,200 | 5,162 |
| | Major Joint Local Government Bond | 0.204% | 3/25/31 | JPY | 2,150,000 | 14,275 |
| | Major Joint Local Government Bond | 0.199% | 4/25/31 | JPY | 2,169,900 | 14,401 |
| | Major Joint Local Government Bond | 0.145% | 6/25/31 | JPY | 584,200 | 3,858 |
| | Major Joint Local Government Bond | 0.299% | 4/23/32 | JPY | 3,766,800 | 25,200 |
| | Osaka Prefecture | 1.453% | 9/26/34 | JPY | 130,000 | 954 |
| | Osaka Prefecture | 0.366% | 9/28/35 | JPY | 1,790,000 | 11,576 |
| | Osaka Prefecture | 1.203% | 9/28/35 | JPY | 220,000 | 1,568 |
| | Tokyo Metropolitan Government | 0.720% | 12/20/23 | JPY | 14,700 | 100 |
| | Tokyo Metropolitan Government | 0.730% | 12/20/23 | JPY | 975,300 | 6,611 |
| | Tokyo Metropolitan Government | 0.635% | 3/19/24 | JPY | 341,400 | 2,295 |
| | Tokyo Metropolitan Government | 0.690% | 3/19/24 | JPY | 92,700 | 628 |
| | Tokyo Metropolitan Government | 0.505% | 9/20/24 | JPY | 341,300 | 2,289 |
| | Tokyo Metropolitan Government | 0.426% | 12/20/24 | JPY | 68,400 | 458 |
| | Tokyo Metropolitan Government | 0.386% | 3/19/25 | JPY | 487,600 | 3,264 |
| | Tokyo Metropolitan Government | 0.435% | 3/19/25 | JPY | 1,207,900 | 8,077 |
| | Tokyo Metropolitan Government | 0.499% | 6/20/25 | JPY | 365,700 | 2,450 |
| | Tokyo Metropolitan Government | 0.533% | 6/20/25 | JPY | 243,900 | 1,635 |
| | Tokyo Metropolitan Government | 0.456% | 9/19/25 | JPY | 243,900 | 1,633 |
| | Tokyo Metropolitan Government | 0.475% | 9/19/25 | JPY | 536,500 | 3,589 |
| | Tokyo Metropolitan Government | 0.444% | 12/19/25 | JPY | 326,700 | 2,185 |
| | Tokyo Metropolitan Government | 0.075% | 9/18/26 | JPY | 86,500 | 581 |
| | Tokyo Metropolitan Government | 0.210% | 3/19/27 | JPY | 975,200 | 6,579 |
| | Tokyo Metropolitan Government | 0.040% | 6/20/29 | JPY | 1,580,100 | 10,096 |
| | Tokyo Metropolitan Government | 0.095% | 9/20/30 | JPY | 1,275,800 | 8,395 |
| | Tokyo Metropolitan Government | 0.150% | 12/20/30 | JPY | 868,300 | 5,730 |
| | Tokyo Metropolitan Government | 0.080% | 3/20/31 | JPY | 15,000 | 98 |
| | Tokyo Metropolitan Government | 1.980% | 6/20/31 | JPY | 110,000 | 804 |
| | Tokyo Metropolitan Government | 1.293% | 6/20/35 | JPY | 60,000 | 433 |
| | | | | | | 14,106,821 |
Total International Bond II Index Fund
| | | Coupon | Maturity
Date | Currency | Face
Amount
(000) | Market
Value•
($000) |
| Jersey (0.0%) | | | |
| | Bailiwick of Jersey | 3.750% | 6/9/54 | GBP | 782 | 778 |
| Kazakhstan (0.0%) | | | |
| 3 | Republic of Kazakhstan | 1.550% | 11/9/23 | EUR | 1,522 | 1,470 |
| | Republic of Kazakhstan | 1.550% | 11/9/23 | EUR | 1,004 | 969 |
| | Republic of Kazakhstan | 0.600% | 9/30/26 | EUR | 858 | 726 |
| 3 | Republic of Kazakhstan | 0.600% | 9/30/26 | EUR | 3,144 | 2,658 |
| | Republic of Kazakhstan | 2.375% | 11/9/28 | EUR | 3,713 | 3,218 |
| 3 | Republic of Kazakhstan | 1.500% | 9/30/34 | EUR | 2,366 | 1,499 |
| | | | | | | 10,540 |
| Latvia (0.0%) | | | |
| | Republic of Latvia | 2.875% | 4/30/24 | EUR | 552 | 543 |
| | Republic of Latvia | 3.875% | 3/25/27 | EUR | 7,660 | 7,460 |
| | | | | | | 8,003 |
| Lithuania (0.0%) | | | |
| | Republic of Lithuania | 2.125% | 10/29/26 | EUR | 6,728 | 6,197 |
| | Republic of Lithuania | 4.125% | 4/25/28 | EUR | 5,500 | 5,391 |
| | Republic of Lithuania | 2.125% | 6/1/32 | EUR | 8,000 | 6,525 |
| | | | | | | 18,113 |
| Luxembourg (0.0%) | | | |
| | Grand Duchy of Luxembourg | 2.250% | 3/19/28 | EUR | 1,464 | 1,401 |
| Malaysia (0.9%) | | | |
| | Federation of Malaysia | 3.478% | 6/14/24 | MYR | 127,314 | 26,918 |
| | Federation of Malaysia | 4.181% | 7/15/24 | MYR | 69,534 | 14,855 |
| | Federation of Malaysia | 4.059% | 9/30/24 | MYR | 26,443 | 5,636 |
| | Federation of Malaysia | 3.882% | 3/14/25 | MYR | 69,921 | 14,810 |
| | Federation of Malaysia | 3.955% | 9/15/25 | MYR | 228,674 | 48,393 |
| | Federation of Malaysia | 4.392% | 4/15/26 | MYR | 34,277 | 7,327 |
| | Federation of Malaysia | 3.906% | 7/15/26 | MYR | 125,357 | 26,329 |
| | Federation of Malaysia | 3.900% | 11/30/26 | MYR | 164,392 | 34,576 |
| | Federation of Malaysia | 3.892% | 3/15/27 | MYR | 127 | 27 |
| | Federation of Malaysia | 3.899% | 11/16/27 | MYR | 77,498 | 16,185 |
| | Federation of Malaysia | 3.733% | 6/15/28 | MYR | 125,550 | 25,747 |
| | Federation of Malaysia | 4.504% | 4/30/29 | MYR | 175,000 | 37,430 |
| | Federation of Malaysia | 3.885% | 8/15/29 | MYR | 107,325 | 21,961 |
| | Federation of Malaysia | 4.498% | 4/15/30 | MYR | 68,798 | 14,546 |
| | Federation of Malaysia | 2.632% | 4/15/31 | MYR | 38,316 | 7,041 |
| | Federation of Malaysia | 4.232% | 6/30/31 | MYR | 10,138 | 2,096 |
| | Federation of Malaysia | 4.127% | 4/15/32 | MYR | 12,243 | 2,507 |
| | Federation of Malaysia | 4.193% | 10/7/32 | MYR | 21,400 | 4,423 |
| | Federation of Malaysia | 3.844% | 4/15/33 | MYR | 90,014 | 17,839 |
| | Federation of Malaysia | 4.642% | 11/7/33 | MYR | 63,176 | 13,360 |
| | Federation of Malaysia | 3.828% | 7/5/34 | MYR | 113,902 | 22,228 |
| | Federation of Malaysia | 4.254% | 5/31/35 | MYR | 52,395 | 10,603 |
| | Federation of Malaysia | 4.762% | 4/7/37 | MYR | 57,819 | 12,385 |
| | Federation of Malaysia | 4.893% | 6/8/38 | MYR | 96,709 | 20,538 |
| | Federation of Malaysia | 3.757% | 5/22/40 | MYR | 68,554 | 12,546 |
| | Federation of Malaysia | 4.696% | 10/15/42 | MYR | 53,400 | 11,096 |
| | Federation of Malaysia | 4.935% | 9/30/43 | MYR | 9,296 | 1,959 |
| | Federation of Malaysia | 4.736% | 3/15/46 | MYR | 17,140 | 3,501 |
| | Federation of Malaysia | 4.921% | 7/6/48 | MYR | 55,822 | 11,683 |
| | Federation of Malaysia | 4.065% | 6/15/50 | MYR | 80,259 | 14,657 |
| | Malaysia Government Investment Issue | 4.444% | 5/22/24 | MYR | 7,321 | 1,569 |
| | Malaysia Government Investment Issue | 3.655% | 10/15/24 | MYR | 156,013 | 32,983 |
| | Malaysia Government Investment Issue | 3.726% | 3/31/26 | MYR | 152,085 | 31,912 |
| | Malaysia Government Investment Issue | 3.422% | 9/30/27 | MYR | 115,722 | 23,640 |
| | Malaysia Government Investment Issue | 3.871% | 8/8/28 | MYR | 3,500 | 722 |
| | Malaysia Government Investment Issue | 4.369% | 10/31/28 | MYR | 102,850 | 21,772 |
| | Malaysia Government Investment Issue | 4.130% | 7/9/29 | MYR | 70,610 | 14,745 |
| | Malaysia Government Investment Issue | 3.465% | 10/15/30 | MYR | 274,660 | 54,190 |
| | Malaysia Government Investment Issue | 4.724% | 6/15/33 | MYR | 47,576 | 10,107 |
| | Malaysia Government Investment Issue | 4.582% | 8/30/33 | MYR | 16,050 | 3,366 |
| | Malaysia Government Investment Issue | 4.119% | 11/30/34 | MYR | 84,996 | 16,983 |
| | Malaysia Government Investment Issue | 4.786% | 10/31/35 | MYR | 17,000 | 3,607 |
| | Malaysia Government Investment Issue | 3.447% | 7/15/36 | MYR | 102,768 | 18,836 |
| | Malaysia Government Investment Issue | 4.755% | 8/4/37 | MYR | 20,000 | 4,200 |
Total International Bond II Index Fund
| | | Coupon | Maturity
Date | Currency | Face
Amount
(000) | Market
Value•
($000) |
| | Malaysia Government Investment Issue | 4.467% | 9/15/39 | MYR | 105,285 | 21,196 |
| | Malaysia Government Investment Issue | 4.417% | 9/30/41 | MYR | 68,162 | 13,547 |
| | Malaysia Government Investment Issue | 4.638% | 11/15/49 | MYR | 146,959 | 29,386 |
| | Malaysia Government Investment Issue | 5.357% | 5/15/52 | MYR | 31,350 | 6,955 |
| | | | | | | 772,918 |
| Mexico (0.8%) | | | |
| | Mexican Bonos | 8.000% | 12/7/23 | MXN | 915,210 | 44,900 |
| | Mexican Bonos | 8.000% | 9/5/24 | MXN | 1,274,310 | 61,952 |
| | Mexican Bonos | 10.000% | 12/5/24 | MXN | 1,011,380 | 50,841 |
| | Mexican Bonos | 5.750% | 3/5/26 | MXN | 1,964,910 | 87,793 |
| | Mexican Bonos | 5.500% | 3/4/27 | MXN | 652,300 | 28,000 |
| | Mexican Bonos | 7.500% | 6/3/27 | MXN | 1,341,270 | 62,113 |
| | Mexican Bonos | 8.500% | 5/31/29 | MXN | 1,236,810 | 58,601 |
| | Mexican Bonos | 7.750% | 5/29/31 | MXN | 1,714,540 | 76,587 |
| | Mexican Bonos | 7.750% | 11/23/34 | MXN | 471,170 | 20,352 |
| | Mexican Bonos | 10.000% | 11/20/36 | MXN | 280,880 | 14,322 |
| | Mexican Bonos | 8.500% | 11/18/38 | MXN | 957,940 | 42,815 |
| | Mexican Bonos | 7.750% | 11/13/42 | MXN | 1,001,360 | 40,945 |
| | Mexican Bonos | 8.000% | 11/7/47 | MXN | 1,136,490 | 47,235 |
| | United Mexican States | 1.375% | 1/15/25 | EUR | 5,261 | 4,973 |
| | United Mexican States | 1.625% | 4/8/26 | EUR | 2,053 | 1,885 |
| | United Mexican States | 1.350% | 9/18/27 | EUR | 3,040 | 2,633 |
| | United Mexican States | 1.750% | 4/17/28 | EUR | 9,047 | 7,675 |
| | United Mexican States | 3.625% | 4/9/29 | EUR | 4,552 | 4,213 |
| | United Mexican States | 1.125% | 1/17/30 | EUR | 3,744 | 2,868 |
| | United Mexican States | 2.375% | 2/11/30 | EUR | 5,400 | 4,480 |
| | United Mexican States | 3.375% | 2/23/31 | EUR | 5,623 | 4,875 |
| | United Mexican States | 1.450% | 10/25/33 | EUR | 8,784 | 5,875 |
| | United Mexican States | 2.250% | 8/12/36 | EUR | 6,276 | 4,142 |
| | United Mexican States | 2.875% | 4/8/39 | EUR | 5,861 | 3,971 |
| | United Mexican States | 3.000% | 3/6/45 | EUR | 2,728 | 1,819 |
| | United Mexican States | 2.125% | 10/25/51 | EUR | 10,432 | 5,256 |
| | United Mexican States | 5.625% | 3/19/14 | GBP | 3,146 | 2,460 |
| | United Mexican States | 4.000% | 3/15/15 | EUR | 1,635 | 1,048 |
| | | | | | | 694,629 |
| Netherlands (1.8%) | | | |
| | BNG Bank NV | 5.250% | 5/20/24 | AUD | 3,918 | 2,547 |
| | BNG Bank NV | 0.250% | 6/7/24 | EUR | 2,926 | 2,786 |
| | BNG Bank NV | 0.050% | 7/13/24 | EUR | 12,190 | 11,531 |
| | BNG Bank NV | 1.125% | 9/4/24 | EUR | 684 | 658 |
| | BNG Bank NV | 0.200% | 11/9/24 | EUR | 9,725 | 9,136 |
| | BNG Bank NV | 0.250% | 5/7/25 | EUR | 13,921 | 12,956 |
| | BNG Bank NV | 3.250% | 7/15/25 | AUD | 4,971 | 3,090 |
| | BNG Bank NV | 1.625% | 8/26/25 | GBP | 200 | 214 |
| | BNG Bank NV | 1.000% | 1/12/26 | EUR | 7,314 | 6,849 |
| | BNG Bank NV | 0.125% | 4/11/26 | EUR | 3,595 | 3,253 |
| | BNG Bank NV | 3.250% | 8/24/26 | AUD | 127 | 77 |
| | BNG Bank NV | 0.625% | 6/19/27 | EUR | 7,279 | 6,529 |
| | BNG Bank NV | 3.500% | 7/19/27 | AUD | 3,820 | 2,325 |
| | BNG Bank NV | 0.750% | 1/11/28 | EUR | 11,224 | 9,977 |
| | BNG Bank NV | 3.300% | 7/17/28 | AUD | 12,696 | 7,496 |
| | BNG Bank NV | 5.200% | 12/7/28 | GBP | 1,650 | 1,947 |
| | BNG Bank NV | 0.100% | 1/15/30 | EUR | 7,369 | 5,946 |
| | BNG Bank NV | 1.375% | 10/21/30 | EUR | 2,926 | 2,566 |
| | BNG Bank NV | 0.250% | 1/12/32 | EUR | 7,200 | 5,551 |
| | BNG Bank NV | 1.875% | 7/13/32 | EUR | 5,600 | 5,004 |
| | BNG Bank NV | 2.450% | 7/21/32 | AUD | 10,000 | 5,027 |
| | BNG Bank NV | 0.125% | 4/19/33 | EUR | 28,552 | 20,824 |
| | BNG Bank NV | 0.125% | 7/9/35 | EUR | 40,892 | 27,847 |
| | BNG Bank NV | 0.875% | 10/17/35 | EUR | 2,457 | 1,842 |
| | BNG Bank NV | 0.875% | 10/24/36 | EUR | 18,700 | 13,745 |
| | BNG Bank NV | 0.250% | 11/22/36 | EUR | 700 | 464 |
| | BNG Bank NV | 1.250% | 3/30/37 | EUR | 10,700 | 8,205 |
| | BNG Bank NV | 1.500% | 3/29/38 | EUR | 1,455 | 1,141 |
| | BNG Bank NV | 1.500% | 7/15/39 | EUR | 1,906 | 1,475 |
| 7 | BNG Bank NV | 0.805% | 6/28/49 | EUR | 4,300 | 2,471 |
| 3 | Kingdom of Netherlands | 0.000% | 1/15/24 | EUR | 40,175 | 38,816 |
| 3 | Kingdom of Netherlands | 2.000% | 7/15/24 | EUR | 98,858 | 97,803 |
Total International Bond II Index Fund
| | | Coupon | Maturity
Date | Currency | Face
Amount
(000) | Market
Value•
($000) |
| 3 | Kingdom of Netherlands | 0.250% | 7/15/25 | EUR | 102,268 | 96,452 |
| | Kingdom of Netherlands | 0.000% | 1/15/26 | EUR | 75,000 | 69,386 |
| 3 | Kingdom of Netherlands | 0.500% | 7/15/26 | EUR | 45,482 | 42,480 |
| 3 | Kingdom of Netherlands | 0.000% | 1/15/27 | EUR | 141,182 | 127,657 |
| 3 | Kingdom of Netherlands | 0.750% | 7/15/27 | EUR | 15,661 | 14,532 |
| 3 | Kingdom of Netherlands | 0.750% | 7/15/28 | EUR | 49,043 | 44,746 |
| | Kingdom of Netherlands | 0.000% | 1/15/29 | EUR | 90,000 | 77,376 |
| 3 | Kingdom of Netherlands | 0.250% | 7/15/29 | EUR | 77,283 | 66,928 |
| 3 | Kingdom of Netherlands | 0.000% | 7/15/30 | EUR | 104,831 | 87,115 |
| 3 | Kingdom of Netherlands | 0.000% | 7/15/31 | EUR | 100,671 | 81,830 |
| 3 | Kingdom of Netherlands | 0.500% | 7/15/32 | EUR | 76,290 | 62,858 |
| 3 | Kingdom of Netherlands | 2.500% | 1/15/33 | EUR | 19,748 | 19,559 |
| 3 | Kingdom of Netherlands | 4.000% | 1/15/37 | EUR | 42,257 | 48,541 |
| 3 | Kingdom of Netherlands | 0.000% | 1/15/38 | EUR | 100,944 | 67,883 |
| 3 | Kingdom of Netherlands | 0.500% | 1/15/40 | EUR | 46,688 | 32,975 |
| 3 | Kingdom of Netherlands | 3.750% | 1/15/42 | EUR | 78,084 | 90,723 |
| 3 | Kingdom of Netherlands | 2.750% | 1/15/47 | EUR | 72,561 | 74,934 |
| 3,7 | Kingdom of Netherlands | 0.000% | 1/15/52 | EUR | 49,682 | 25,070 |
| 3 | Kingdom of Netherlands | 2.000% | 1/15/54 | EUR | 25,000 | 22,464 |
| | Nederlandse Waterschapsbank NV | 0.125% | 1/17/24 | EUR | 12,182 | 11,688 |
| | Nederlandse Waterschapsbank NV | 5.250% | 4/18/24 | AUD | 4,350 | 2,823 |
| | Nederlandse Waterschapsbank NV | 5.200% | 3/31/25 | CAD | 530 | 398 |
| | Nederlandse Waterschapsbank NV | 3.400% | 7/22/25 | AUD | 1,730 | 1,079 |
| | Nederlandse Waterschapsbank NV | 0.250% | 12/15/25 | GBP | 7,802 | 7,952 |
| | Nederlandse Waterschapsbank NV | 3.150% | 9/2/26 | AUD | 4,420 | 2,691 |
| | Nederlandse Waterschapsbank NV | 0.000% | 11/16/26 | EUR | 12,218 | 10,796 |
| | Nederlandse Waterschapsbank NV | 3.250% | 3/9/27 | EUR | 4,913 | 4,933 |
| | Nederlandse Waterschapsbank NV | 1.000% | 3/1/28 | EUR | 2,908 | 2,610 |
| | Nederlandse Waterschapsbank NV | 3.450% | 7/17/28 | AUD | 1,970 | 1,175 |
| | Nederlandse Waterschapsbank NV | 3.300% | 5/2/29 | AUD | 2,210 | 1,288 |
| | Nederlandse Waterschapsbank NV | 0.050% | 1/28/30 | EUR | 1,500 | 1,207 |
| | Nederlandse Waterschapsbank NV | 0.500% | 4/29/30 | EUR | 2,800 | 2,315 |
| | Nederlandse Waterschapsbank NV | 0.000% | 9/8/31 | EUR | 800 | 609 |
| | Nederlandse Waterschapsbank NV | 3.000% | 9/11/31 | EUR | 3,000 | 2,964 |
| | Nederlandse Waterschapsbank NV | 0.250% | 1/19/32 | EUR | 10,700 | 8,262 |
| | Nederlandse Waterschapsbank NV | 5.375% | 6/7/32 | GBP | 4,876 | 6,115 |
| | Nederlandse Waterschapsbank NV | 1.250% | 5/27/36 | EUR | 8,913 | 6,918 |
| | Nederlandse Waterschapsbank NV | 0.000% | 2/16/37 | EUR | 26,700 | 16,894 |
| | Nederlandse Waterschapsbank NV | 1.500% | 6/15/39 | EUR | 2,457 | 1,905 |
| | Nederlandse Waterschapsbank NV | 0.750% | 10/4/41 | EUR | 20,588 | 13,503 |
| | | | | | | 1,581,732 |
| New Zealand (0.4%) | | | |
| | Auckland Council | 0.625% | 11/13/24 | EUR | 4,913 | 4,642 |
| | Auckland Council | 3.500% | 3/9/26 | AUD | 200 | 123 |
| | Auckland Council | 0.125% | 9/26/29 | EUR | 1,599 | 1,286 |
| | Housing New Zealand Ltd. | 3.360% | 6/12/25 | NZD | 5,260 | 2,920 |
| | Housing New Zealand Ltd. | 2.247% | 10/5/26 | NZD | 13,040 | 6,790 |
| | Housing New Zealand Ltd. | 2.183% | 4/24/30 | NZD | 1,280 | 605 |
| | Housing New Zealand Ltd. | 1.534% | 9/10/35 | NZD | 9,280 | 3,415 |
| | New Zealand | 0.500% | 5/15/24 | NZD | 47,300 | 25,947 |
| | New Zealand | 2.750% | 4/15/25 | NZD | 71,679 | 40,157 |
| | New Zealand | 0.500% | 5/15/26 | NZD | 50,760 | 25,849 |
| | New Zealand | 4.500% | 4/15/27 | NZD | 79,830 | 46,808 |
| | New Zealand | 0.250% | 5/15/28 | NZD | 31,019 | 14,523 |
| | New Zealand | 3.000% | 4/20/29 | NZD | 75,545 | 40,924 |
| | New Zealand | 1.500% | 5/15/31 | NZD | 37,161 | 17,474 |
| | New Zealand | 2.000% | 5/15/32 | NZD | 18,030 | 8,698 |
| | New Zealand | 3.500% | 4/14/33 | NZD | 53,786 | 29,456 |
| | New Zealand | 2.750% | 4/15/37 | NZD | 42,399 | 20,382 |
| | New Zealand | 1.750% | 5/15/41 | NZD | 36,308 | 13,877 |
| | New Zealand | 2.750% | 5/15/51 | NZD | 16,523 | 7,007 |
| | New Zealand Local Government Funding Agency Bond | 2.250% | 4/15/24 | NZD | 5,495 | 3,062 |
| | New Zealand Local Government Funding Agency Bond | 2.750% | 4/15/25 | NZD | 4,411 | 2,418 |
| | New Zealand Local Government Funding Agency Bond | 1.500% | 4/15/26 | NZD | 4,903 | 2,517 |
| | New Zealand Local Government Funding Agency Bond | 4.500% | 4/15/27 | NZD | 984 | 556 |
| | New Zealand Local Government Funding Agency Bond | 1.500% | 4/20/29 | NZD | 10,145 | 4,698 |
| | New Zealand Local Government Funding Agency Bond | 2.250% | 5/15/31 | NZD | 10,000 | 4,631 |
| | New Zealand Local Government Funding Agency Bond | 3.500% | 4/14/33 | NZD | 7,091 | 3,523 |
Total International Bond II Index Fund
| | | Coupon | Maturity
Date | Currency | Face
Amount
(000) | Market
Value•
($000) |
| | New Zealand Local Government Funding Agency Bond | 2.000% | 4/15/37 | NZD | 5,000 | 1,880 |
| | | | | | | 334,168 |
| Norway (0.2%) | | | |
| 3 | Kingdom of Norway | 3.000% | 3/14/24 | NOK | 527,935 | 50,445 |
| 3 | Kingdom of Norway | 1.750% | 3/13/25 | NOK | 85,693 | 7,918 |
| 3 | Kingdom of Norway | 1.500% | 2/19/26 | NOK | 63,657 | 5,741 |
| 3 | Kingdom of Norway | 1.750% | 2/17/27 | NOK | 74,920 | 6,704 |
| 3 | Kingdom of Norway | 2.000% | 4/26/28 | NOK | 97,934 | 8,712 |
| 3 | Kingdom of Norway | 1.750% | 9/6/29 | NOK | 274,764 | 23,601 |
| 3 | Kingdom of Norway | 1.375% | 8/19/30 | NOK | 542,457 | 44,598 |
| 3 | Kingdom of Norway | 1.250% | 9/17/31 | NOK | 228,090 | 18,205 |
| | Kommunalbanken A/S | 1.500% | 12/15/23 | GBP | 7,369 | 8,235 |
| | Kommunalbanken A/S | 5.250% | 7/15/24 | AUD | 3,074 | 1,999 |
| | Kommunalbanken A/S | 4.250% | 7/16/25 | AUD | 368 | 235 |
| | Kommunalbanken A/S | 0.250% | 12/15/25 | GBP | 5,000 | 5,119 |
| | Kommunalbanken A/S | 0.625% | 4/20/26 | EUR | 3,910 | 3,577 |
| | Kommunalbanken A/S | 0.600% | 6/1/26 | AUD | 9,942 | 5,556 |
| | Kommunalbanken A/S | 3.000% | 12/9/26 | AUD | 4,408 | 2,661 |
| | Kommunalbanken A/S | 0.875% | 5/24/27 | EUR | 13,952 | 12,577 |
| | Kommunalbanken A/S | 3.400% | 7/24/28 | AUD | 3,920 | 2,332 |
| | Kommunalbanken A/S | 0.050% | 10/24/29 | EUR | 4,642 | 3,738 |
| | | | | | | 211,953 |
| Peru (0.1%) | | | |
| | Republic of Peru | 5.700% | 8/12/24 | PEN | 10,000 | 2,442 |
| | Republic of Peru | 2.750% | 1/30/26 | EUR | 6,818 | 6,420 |
| | Republic of Peru | 8.200% | 8/12/26 | PEN | 27,500 | 7,098 |
| | Republic of Peru | 6.350% | 8/12/28 | PEN | 58,500 | 13,599 |
| | Republic of Peru | 5.940% | 2/12/29 | PEN | 37,875 | 8,476 |
| | Republic of Peru | 3.750% | 3/1/30 | EUR | 1,004 | 902 |
| | Republic of Peru | 6.950% | 8/12/31 | PEN | 101,500 | 23,232 |
| | Republic of Peru | 6.150% | 8/12/32 | PEN | 25,724 | 5,452 |
| | Republic of Peru | 1.250% | 3/11/33 | EUR | 4,781 | 3,135 |
| | Republic of Peru | 5.400% | 8/12/34 | PEN | 23,307 | 4,459 |
| | Republic of Peru | 1.950% | 11/17/36 | EUR | 5,021 | 3,165 |
| | Republic of Peru | 6.900% | 8/12/37 | PEN | 56,400 | 11,982 |
| | Republic of Peru | 5.350% | 8/12/40 | PEN | 36,001 | 6,299 |
| | Republic of Peru | 6.850% | 2/12/42 | PEN | 35,500 | 7,344 |
| | | | | | | 104,005 |
| Philippines (0.0%) | | | |
| | Republic of Philippines | 0.250% | 4/28/25 | EUR | 2,669 | 2,398 |
| | Republic of Philippines | 0.875% | 5/17/27 | EUR | 3,847 | 3,255 |
| | Republic of Philippines | 0.700% | 2/3/29 | EUR | 2,501 | 1,928 |
| | Republic of Philippines | 1.200% | 4/28/33 | EUR | 4,837 | 3,269 |
| | | | | | | 10,850 |
| Poland (0.5%) | | | |
| | Bank Gospodarstwa Krajowego | 1.375% | 6/1/25 | EUR | 5,040 | 4,616 |
| | Bank Gospodarstwa Krajowego | 1.750% | 5/6/26 | EUR | 1,906 | 1,704 |
| | Bank Gospodarstwa Krajowego | 1.625% | 4/30/28 | EUR | 4,515 | 3,733 |
| | Bank Gospodarstwa Krajowego | 0.375% | 10/13/28 | EUR | 1,100 | 832 |
| | Bank Gospodarstwa Krajowego | 3.000% | 5/30/29 | EUR | 2,500 | 2,217 |
| | Bank Gospodarstwa Krajowego | 2.000% | 6/1/30 | EUR | 506 | 400 |
| | Bank Gospodarstwa Krajowego | 0.500% | 7/8/31 | EUR | 1,250 | 825 |
| | Republic of Poland | 2.500% | 1/25/23 | PLN | 23,833 | 4,939 |
| | Republic of Poland | 4.000% | 10/25/23 | PLN | 125,069 | 25,348 |
| | Republic of Poland | 3.000% | 1/15/24 | EUR | 100 | 99 |
| | Republic of Poland | 2.500% | 4/25/24 | PLN | 53,835 | 10,392 |
| | Republic of Poland | 3.375% | 7/9/24 | EUR | 2,926 | 2,884 |
| | Republic of Poland | 2.250% | 10/25/24 | PLN | 24,484 | 4,557 |
| | Republic of Poland | 5.250% | 1/20/25 | EUR | 3,608 | 3,697 |
| | Republic of Poland | 0.000% | 2/10/25 | EUR | 7,314 | 6,655 |
| | Republic of Poland | 0.750% | 4/25/25 | PLN | 213,883 | 37,216 |
| | Republic of Poland | 3.250% | 7/25/25 | PLN | 64,147 | 11,716 |
| | Republic of Poland | 1.500% | 9/9/25 | EUR | 2,439 | 2,284 |
| | Republic of Poland | 1.500% | 1/19/26 | EUR | 23,306 | 21,713 |
| | Republic of Poland | 2.500% | 7/25/26 | PLN | 79,080 | 13,388 |
| | Republic of Poland | 1.125% | 8/7/26 | EUR | 1,706 | 1,548 |
| | Republic of Poland | 0.250% | 10/25/26 | PLN | 245,540 | 37,375 |
| | Republic of Poland | 0.875% | 5/10/27 | EUR | 15,994 | 14,099 |
Total International Bond II Index Fund
| | | Coupon | Maturity
Date | Currency | Face
Amount
(000) | Market
Value•
($000) |
| | Republic of Poland | 3.750% | 5/25/27 | PLN | 255,056 | 43,856 |
| | Republic of Poland | 2.500% | 7/25/27 | PLN | 75,899 | 12,271 |
| | Republic of Poland | 1.375% | 10/22/27 | EUR | 1,975 | 1,730 |
| | Republic of Poland | 2.750% | 4/25/28 | PLN | 128,925 | 20,525 |
| | Republic of Poland | 1.000% | 10/25/28 | EUR | 1,414 | 1,191 |
| | Republic of Poland | 1.000% | 3/7/29 | EUR | 2,000 | 1,634 |
| | Republic of Poland | 5.750% | 4/25/29 | PLN | 12,658 | 2,301 |
| | Republic of Poland | 2.750% | 10/25/29 | PLN | 112,704 | 16,764 |
| | Republic of Poland | 1.250% | 10/25/30 | PLN | 132,624 | 16,632 |
| | Republic of Poland | 1.750% | 4/25/32 | PLN | 618,190 | 74,912 |
| | Republic of Poland | 2.750% | 5/25/32 | EUR | 12,867 | 10,843 |
| | Republic of Poland | 2.375% | 1/18/36 | EUR | 8,492 | 6,566 |
| | Republic of Poland | 2.000% | 10/25/46 | EUR | 75 | 50 |
| | Republic of Poland | 4.000% | 4/25/47 | PLN | 31,318 | 3,419 |
| | | | | | | 424,931 |
| Portugal (0.5%) | | | |
| 3 | Portugal Obrigacoes do Tesouro OT | 5.650% | 2/15/24 | EUR | 39,007 | 40,283 |
| 3 | Portugal Obrigacoes do Tesouro OT | 2.875% | 7/21/26 | EUR | 33,254 | 33,719 |
| 3 | Portugal Obrigacoes do Tesouro OT | 4.125% | 4/14/27 | EUR | 16,095 | 17,036 |
| 3 | Portugal Obrigacoes do Tesouro OT | 0.700% | 10/15/27 | EUR | 78,774 | 71,371 |
| 3 | Portugal Obrigacoes do Tesouro OT | 1.950% | 6/15/29 | EUR | 55,647 | 52,587 |
| 3 | Portugal Obrigacoes do Tesouro OT | 3.875% | 2/15/30 | EUR | 19,503 | 20,717 |
| 3 | Portugal Obrigacoes do Tesouro OT | 0.475% | 10/18/30 | EUR | 36,570 | 29,995 |
| 3 | Portugal Obrigacoes do Tesouro OT | 0.300% | 10/17/31 | EUR | 44,938 | 35,128 |
| 3 | Portugal Obrigacoes do Tesouro OT | 1.650% | 7/16/32 | EUR | 73,310 | 63,498 |
| 3 | Portugal Obrigacoes do Tesouro OT | 2.250% | 4/18/34 | EUR | 34,131 | 30,858 |
| 3 | Portugal Obrigacoes do Tesouro OT | 0.900% | 10/12/35 | EUR | 40,808 | 30,410 |
| 3 | Portugal Obrigacoes do Tesouro OT | 4.100% | 4/15/37 | EUR | 8,144 | 8,736 |
| 3 | Portugal Obrigacoes do Tesouro OT | 1.150% | 4/11/42 | EUR | 25,993 | 17,399 |
| 3 | Portugal Obrigacoes do Tesouro OT | 4.100% | 2/15/45 | EUR | 21,455 | 23,149 |
| 3 | Portugal Obrigacoes do Tesouro OT | 1.000% | 4/12/52 | EUR | 5,000 | 2,600 |
| | | | | | | 477,486 |
| Romania (0.2%) | | | |
| | Romania | 3.625% | 4/24/24 | EUR | 2,536 | 2,478 |
| | Romania | 2.750% | 10/29/25 | EUR | 8,233 | 7,598 |
| | Romania | 3.500% | 11/25/25 | RON | 54,760 | 9,409 |
| | Romania | 2.750% | 2/26/26 | EUR | 10,000 | 8,964 |
| 3 | Romania | 2.750% | 2/26/26 | EUR | 1,814 | 1,626 |
| | Romania | 3.250% | 6/24/26 | RON | 49,260 | 8,143 |
| 3 | Romania | 2.000% | 12/8/26 | EUR | 1,781 | 1,524 |
| | Romania | 2.375% | 4/19/27 | EUR | 10,971 | 9,283 |
| | Romania | 5.800% | 7/26/27 | RON | 116,950 | 20,491 |
| | Romania | 2.500% | 10/25/27 | RON | 150,000 | 22,329 |
| 3 | Romania | 2.125% | 3/7/28 | EUR | 1,892 | 1,470 |
| | Romania | 2.125% | 3/7/28 | EUR | 3,132 | 2,434 |
| | Romania | 2.875% | 5/26/28 | EUR | 16,347 | 12,926 |
| | Romania | 4.850% | 7/25/29 | RON | 50,000 | 7,912 |
| 3 | Romania | 1.375% | 12/2/29 | EUR | 1,575 | 1,057 |
| | Romania | 1.375% | 12/2/29 | EUR | 2,900 | 1,946 |
| | Romania | 2.500% | 2/8/30 | EUR | 3,413 | 2,453 |
| 3 | Romania | 3.624% | 5/26/30 | EUR | 1,522 | 1,171 |
| | Romania | 3.624% | 5/26/30 | EUR | 9,680 | 7,445 |
| 3 | Romania | ���1.750% | 7/13/30 | EUR | 4,594 | 3,045 |
| | Romania | 1.750% | 7/13/30 | EUR | 10,232 | 6,782 |
| | Romania | 2.124% | 7/16/31 | EUR | 3,686 | 2,440 |
| 3 | Romania | 2.124% | 7/16/31 | EUR | 2,102 | 1,391 |
| | Romania | 2.000% | 1/28/32 | EUR | 6,185 | 3,913 |
| 3 | Romania | 2.000% | 1/28/32 | EUR | 2,194 | 1,388 |
| | Romania | 6.700% | 2/25/32 | RON | 93,000 | 15,802 |
| 3 | Romania | 2.000% | 4/14/33 | EUR | 3,538 | 2,121 |
| | Romania | 2.000% | 4/14/33 | EUR | 2,500 | 1,499 |
| 3 | Romania | 3.750% | 2/7/34 | EUR | 1,302 | 909 |
| | Romania | 3.750% | 2/7/34 | EUR | 5,864 | 4,092 |
| | Romania | 3.875% | 10/29/35 | EUR | 7,533 | 5,072 |
| | Romania | 4.250% | 4/28/36 | RON | 30,000 | 3,723 |
| | Romania | 3.375% | 2/8/38 | EUR | 2,500 | 1,533 |
| | Romania | 4.125% | 3/11/39 | EUR | 3,464 | 2,255 |
| 3 | Romania | 2.625% | 12/2/40 | EUR | 977 | 500 |
Total International Bond II Index Fund
| | | Coupon | Maturity
Date | Currency | Face
Amount
(000) | Market
Value•
($000) |
| 3 | Romania | 2.750% | 4/14/41 | EUR | 4,726 | 2,432 |
| | Romania | 2.750% | 4/14/41 | EUR | 5,818 | 2,994 |
| 3 | Romania | 2.875% | 4/13/42 | EUR | 3,012 | 1,560 |
| | Romania | 2.875% | 4/13/42 | EUR | 1,470 | 761 |
| 3 | Romania | 4.625% | 4/3/49 | EUR | 4,138 | 2,664 |
| | Romania | 4.625% | 4/3/49 | EUR | 4,876 | 3,139 |
| 3 | Romania | 3.375% | 1/28/50 | EUR | 4,876 | 2,543 |
| | | | | | | 203,217 |
| Saudi Arabia (0.0%) | | | |
| 3 | Kingdom of Saudi Arabia | 0.000% | 3/3/24 | EUR | 17,450 | 16,445 |
| 3 | Kingdom of Saudi Arabia | 0.750% | 7/9/27 | EUR | 4,913 | 4,233 |
| 3 | Kingdom of Saudi Arabia | 0.625% | 3/3/30 | EUR | 7,468 | 5,882 |
| | Kingdom of Saudi Arabia | 0.625% | 3/3/30 | EUR | 3,000 | 2,363 |
| | Kingdom of Saudi Arabia | 2.000% | 7/9/39 | EUR | 7,189 | 4,964 |
| | | | | | | 33,887 |
| Singapore (0.5%) | | | |
| | Housing & Development Board | 2.505% | 6/27/24 | SGD | 1,250 | 859 |
| | Housing & Development Board | 3.100% | 7/24/24 | SGD | 4,750 | 3,295 |
| | Housing & Development Board | 2.495% | 3/11/26 | SGD | 1,250 | 838 |
| | Housing & Development Board | 2.035% | 9/16/26 | SGD | 5,250 | 3,430 |
| | Housing & Development Board | 2.675% | 1/22/29 | SGD | 2,500 | 1,610 |
| | Housing & Development Board | 2.598% | 10/30/29 | SGD | 3,250 | 2,064 |
| | Housing & Development Board | 3.080% | 5/31/30 | SGD | 7,750 | 5,053 |
| | Housing & Development Board | 2.545% | 7/4/31 | SGD | 1,500 | 920 |
| | Housing & Development Board | 1.865% | 7/21/33 | SGD | 15,500 | 8,463 |
| | Republic of Singapore | 2.000% | 2/1/24 | SGD | 56,942 | 39,616 |
| | Republic of Singapore | 3.000% | 9/1/24 | SGD | 27,831 | 19,617 |
| | Republic of Singapore | 2.375% | 6/1/25 | SGD | 24,480 | 16,972 |
| | Republic of Singapore | 0.500% | 11/1/25 | SGD | 36,061 | 23,555 |
| | Republic of Singapore | 2.125% | 6/1/26 | SGD | 62,812 | 42,787 |
| | Republic of Singapore | 1.250% | 11/1/26 | SGD | 47,306 | 30,983 |
| | Republic of Singapore | 3.500% | 3/1/27 | SGD | 48,452 | 34,575 |
| | Republic of Singapore | 2.875% | 9/1/27 | SGD | 30,000 | 20,801 |
| | Republic of Singapore | 2.625% | 5/1/28 | SGD | 25,552 | 17,381 |
| | Republic of Singapore | 2.875% | 7/1/29 | SGD | 47,999 | 32,790 |
| | Republic of Singapore | 2.875% | 9/1/30 | SGD | 37,296 | 25,346 |
| | Republic of Singapore | 1.625% | 7/1/31 | SGD | 20,700 | 12,624 |
| | Republic of Singapore | 2.625% | 8/1/32 | SGD | 12,000 | 7,902 |
| | Republic of Singapore | 3.375% | 9/1/33 | SGD | 39,146 | 27,513 |
| | Republic of Singapore | 2.250% | 8/1/36 | SGD | 46,386 | 28,629 |
| | Republic of Singapore | 2.375% | 7/1/39 | SGD | 18,832 | 11,659 |
| | Republic of Singapore | 2.750% | 4/1/42 | SGD | 30,361 | 19,873 |
| | Republic of Singapore | 2.750% | 3/1/46 | SGD | 37,968 | 24,897 |
| | Republic of Singapore | 1.875% | 3/1/50 | SGD | 26,122 | 14,247 |
| | Republic of Singapore | 1.875% | 10/1/51 | SGD | 17,042 | 9,261 |
| | Republic of Singapore | 3.000% | 8/1/72 | SGD | 4,742 | 3,271 |
| | | | | | | 490,831 |
| Slovakia (0.2%) | | | |
| | Slovak Republic | 0.000% | 11/13/23 | EUR | 30,621 | 29,484 |
| | Slovak Republic | 0.000% | 6/17/24 | EUR | 10,635 | 10,051 |
| | Slovak Republic | 0.250% | 5/14/25 | EUR | 16,557 | 15,360 |
| | Slovak Republic | 0.625% | 5/22/26 | EUR | 6,339 | 5,810 |
| | Slovak Republic | 1.375% | 1/21/27 | EUR | 10,337 | 9,678 |
| | Slovak Republic | 1.000% | 6/12/28 | EUR | 16,466 | 14,548 |
| | Slovak Republic | 0.750% | 4/9/30 | EUR | 11,716 | 9,546 |
| | Slovak Republic | 1.000% | 5/14/32 | EUR | 27,091 | 21,217 |
| | Slovak Republic | 4.000% | 10/19/32 | EUR | 10,000 | 10,184 |
| | Slovak Republic | 1.875% | 3/9/37 | EUR | 4,950 | 3,713 |
| | Slovak Republic | 2.000% | 10/17/47 | EUR | 7,530 | 5,339 |
| | Slovak Republic | 2.250% | 6/12/68 | EUR | 2,044 | 1,470 |
| | | | | | | 136,400 |
| Slovenia (0.1%) | | | |
| | Republic of Slovenia | 4.625% | 9/9/24 | EUR | 1,951 | 2,035 |
| | Republic of Slovenia | 2.125% | 7/28/25 | EUR | 2,439 | 2,427 |
| | Republic of Slovenia | 5.125% | 3/30/26 | EUR | 3,901 | 4,229 |
| | Republic of Slovenia | 1.250% | 3/22/27 | EUR | 6,827 | 6,403 |
| | Republic of Slovenia | 1.000% | 3/6/28 | EUR | 17,067 | 15,405 |
| | Republic of Slovenia | 1.188% | 3/14/29 | EUR | 4,876 | 4,266 |
Total International Bond II Index Fund
| | | Coupon | Maturity
Date | Currency | Face
Amount
(000) | Market
Value•
($000) |
| | Republic of Slovenia | 0.275% | 1/14/30 | EUR | 7,314 | 5,826 |
| | Republic of Slovenia | 0.000% | 2/12/31 | EUR | 23,720 | 17,661 |
| | Republic of Slovenia | 2.250% | 3/3/32 | EUR | 44,548 | 39,570 |
| | Republic of Slovenia | 1.500% | 3/25/35 | EUR | 5,855 | 4,505 |
| | Republic of Slovenia | 1.750% | 11/3/40 | EUR | 7,376 | 5,217 |
| | Republic of Slovenia | 3.125% | 8/7/45 | EUR | 4,876 | 4,256 |
| | Republic of Slovenia | 0.488% | 10/20/50 | EUR | 8,733 | 3,903 |
| | | | | | | 115,703 |
| South Korea (2.7%) | | | |
| | Export-Import Bank of Korea | 0.375% | 3/26/24 | EUR | 4,913 | 4,694 |
| | Export-Import Bank of Korea | 0.000% | 10/19/24 | EUR | 12,200 | 11,384 |
| | Export-Import Bank of Korea | 4.000% | 6/7/27 | AUD | 320 | 195 |
| | Korea Development Bank | 2.625% | 9/8/27 | EUR | 5,000 | 4,797 |
| | Korea Gas Corp. | 0.000% | 11/28/23 | CHF | 1,965 | 1,927 |
| 3 | Korea Housing Finance Corp | 1.963% | 7/19/26 | EUR | 9,600 | 9,028 |
| 3 | Korea Housing Finance Corp. | 0.750% | 10/30/23 | EUR | 2,366 | 2,292 |
| 3 | Korea Housing Finance Corp. | 0.010% | 2/5/25 | EUR | 2,457 | 2,262 |
| | Korea Housing Finance Corp. | 0.010% | 2/5/25 | EUR | 33,821 | 31,140 |
| 3 | Korea Housing Finance Corp. | 0.010% | 7/7/25 | EUR | 7,043 | 6,394 |
| | Korea Housing Finance Corp. | 0.010% | 6/29/26 | EUR | 38,458 | 33,793 |
| | Korea Monetary Stabilization Bond | 1.800% | 1/2/24 | KRW | 80,000,000 | 54,850 |
| | Korea Treasury Bond | 1.750% | 12/10/23 | KRW | 65,000,000 | 44,626 |
| | Korea Treasury Bond | 2.125% | 3/10/24 | KRW | 40,000,000 | 27,428 |
| | Korea Treasury Bond | 3.500% | 3/10/24 | KRW | 40,000,000 | 27,932 |
| | Korea Treasury Bond | 3.125% | 9/10/24 | KRW | 70,000,000 | 48,300 |
| | Korea Treasury Bond | 1.875% | 12/10/24 | KRW | 120,000,000 | 80,387 |
| | Korea Treasury Bond | 1.750% | 9/10/26 | KRW | 90,000,000 | 57,552 |
| | Korea Treasury Bond | 3.125% | 9/10/27 | KRW | 50,000,000 | 33,353 |
| | Korea Treasury Bond | 2.375% | 12/10/31 | KRW | 105,000,000 | 63,562 |
| | Korea Treasury Bond | 3.375% | 6/10/32 | KRW | 35,000,000 | 22,924 |
| | Korea Treasury Bond | 1.875% | 9/10/41 | KRW | 75,400,000 | 37,044 |
| | Republic of Korea | 0.875% | 12/10/23 | KRW | 123,000,000 | 83,635 |
| | Republic of Korea | 1.875% | 3/10/24 | KRW | 65,000,000 | 44,421 |
| | Republic of Korea | 1.125% | 6/10/24 | KRW | 50,000,000 | 33,545 |
| | Republic of Korea | 2.875% | 6/10/24 | KRW | 15,000,000 | 10,347 |
| | Republic of Korea | 1.375% | 9/10/24 | KRW | 60,000,000 | 40,087 |
| | Republic of Korea | 3.000% | 9/10/24 | KRW | 15,000,000 | 10,324 |
| | Republic of Korea | 1.500% | 3/10/25 | KRW | 130,000,000 | 85,825 |
| | Republic of Korea | 2.250% | 6/10/25 | KRW | 15,000,000 | 10,029 |
| | Republic of Korea | 3.125% | 6/10/25 | KRW | 45,000,000 | 30,762 |
| | Republic of Korea | 1.125% | 9/10/25 | KRW | 144,000,000 | 92,778 |
| | Republic of Korea | 0.000% | 9/16/25 | EUR | 6,092 | 5,500 |
| | Republic of Korea | 2.250% | 12/10/25 | KRW | 20,000,000 | 13,240 |
| | Republic of Korea | 1.250% | 3/10/26 | KRW | 160,000,000 | 101,904 |
| | Republic of Korea | 1.875% | 6/10/26 | KRW | 55,000,000 | 35,559 |
| | Republic of Korea | 1.500% | 12/10/26 | KRW | 30,000,000 | 18,870 |
| | Republic of Korea | 2.375% | 3/10/27 | KRW | 150,000,000 | 97,381 |
| | Republic of Korea | 2.125% | 6/10/27 | KRW | 60,000,000 | 38,359 |
| | Republic of Korea | 2.375% | 12/10/27 | KRW | 25,000,000 | 16,032 |
| | Republic of Korea | 5.500% | 3/10/28 | KRW | 25,000,000 | 18,566 |
| | Republic of Korea | 2.625% | 6/10/28 | KRW | 55,000,000 | 35,470 |
| | Republic of Korea | 2.375% | 12/10/28 | KRW | 40,000,000 | 25,254 |
| | Republic of Korea | 1.875% | 6/10/29 | KRW | 40,000,000 | 24,259 |
| | Republic of Korea | 1.375% | 12/10/29 | KRW | 70,000,000 | 40,551 |
| | Republic of Korea | 5.500% | 12/10/29 | KRW | 43,000,000 | 32,464 |
| | Republic of Korea | 1.375% | 6/10/30 | KRW | 130,000,000 | 74,415 |
| | Republic of Korea | 1.500% | 12/10/30 | KRW | 120,000,000 | 68,594 |
| | Republic of Korea | 4.750% | 12/10/30 | KRW | 20,000,000 | 14,532 |
| | Republic of Korea | 2.000% | 6/10/31 | KRW | 134,709,350 | 79,432 |
| | Republic of Korea | 4.000% | 12/10/31 | KRW | 30,000,000 | 20,672 |
| | Republic of Korea | 3.750% | 12/10/33 | KRW | 60,000,000 | 40,371 |
| | Republic of Korea | 2.625% | 9/10/35 | KRW | 45,000,000 | 26,668 |
| | Republic of Korea | 1.500% | 9/10/36 | KRW | 40,000,000 | 20,187 |
| | Republic of Korea | 2.250% | 9/10/37 | KRW | 35,000,000 | 19,339 |
| | Republic of Korea | 2.375% | 9/10/38 | KRW | 31,000,000 | 17,219 |
| | Republic of Korea | 1.125% | 9/10/39 | KRW | 45,000,000 | 19,972 |
| | Republic of Korea | 1.500% | 9/10/40 | KRW | 86,500,000 | 40,321 |
| | Republic of Korea | 3.000% | 12/10/42 | KRW | 65,000,000 | 38,241 |
| | Republic of Korea | 2.750% | 12/10/44 | KRW | 45,000,000 | 24,904 |
Total International Bond II Index Fund
| | | Coupon | Maturity
Date | Currency | Face
Amount
(000) | Market
Value•
($000) |
| | Republic of Korea | 2.000% | 3/10/46 | KRW | 52,000,000 | 24,406 |
| | Republic of Korea | 2.125% | 3/10/47 | KRW | 85,000,000 | 40,411 |
| | Republic of Korea | 2.625% | 3/10/48 | KRW | 94,950,000 | 51,036 |
| | Republic of Korea | 2.000% | 3/10/49 | KRW | 119,000,000 | 53,989 |
| | Republic of Korea | 1.500% | 3/10/50 | KRW | 180,000,000 | 72,474 |
| | Republic of Korea | 1.875% | 3/10/51 | KRW | 190,454,410 | 84,025 |
| | Republic of Korea | 2.500% | 3/10/52 | KRW | 77,000,000 | 39,002 |
| | Republic of Korea | 1.500% | 9/10/66 | KRW | 3,000,000 | 984 |
| | Republic of Korea | 2.000% | 9/10/68 | KRW | 9,000,000 | 3,555 |
| | Republic of Korea | 1.625% | 9/10/70 | KRW | 51,968,000 | 17,414 |
| | | | | | | 2,443,189 |
| Spain (4.5%) | | | |
| | Adif Alta Velocidad | 3.500% | 5/27/24 | EUR | 6,000 | 6,016 |
| | Adif Alta Velocidad | 1.875% | 1/28/25 | EUR | 7,500 | 7,286 |
| | Adif Alta Velocidad | 0.950% | 4/30/27 | EUR | 7,500 | 6,814 |
| | Adif Alta Velocidad | 0.550% | 10/31/31 | EUR | 4,000 | 3,069 |
| | Autonomous Community of Andalusia Spain | 0.500% | 4/30/31 | EUR | 22,454 | 17,604 |
| | Autonomous Community of Madrid Spain | 4.125% | 5/21/24 | EUR | 10,483 | 10,607 |
| | Autonomous Community of Madrid Spain | 0.997% | 9/30/24 | EUR | 839 | 806 |
| | Autonomous Community of Madrid Spain | 1.826% | 4/30/25 | EUR | 6,827 | 6,633 |
| | Autonomous Community of Madrid Spain | 4.300% | 9/15/26 | EUR | 10,373 | 10,864 |
| | Autonomous Community of Madrid Spain | 2.146% | 4/30/27 | EUR | 8,290 | 7,956 |
| | Autonomous Community of Madrid Spain | 1.773% | 4/30/28 | EUR | 6,644 | 6,178 |
| | Autonomous Community of Madrid Spain | 1.571% | 4/30/29 | EUR | 9,752 | 8,819 |
| | Autonomous Community of Madrid Spain | 2.080% | 3/12/30 | EUR | 2,439 | 2,249 |
| | Autonomous Community of Madrid Spain | 0.419% | 4/30/30 | EUR | 1,923 | 1,560 |
| | Autonomous Community of Madrid Spain | 0.420% | 4/30/31 | EUR | 22,948 | 17,896 |
| | Basque Government | 0.850% | 4/30/30 | EUR | 7,749 | 6,544 |
| | Basque Government | 0.450% | 4/30/32 | EUR | 4,187 | 3,202 |
| | Fondo De Titulizacion Del Deficit Del Sistema Electrico FTA | 0.850% | 12/17/23 | EUR | 11,900 | 11,562 |
| | Instituto de Credito Oficial | 0.000% | 4/30/26 | EUR | 16,773 | 15,201 |
| | Kingdom of Spain | 0.000% | 5/31/24 | EUR | 758,993 | 724,893 |
| | Kingdom of Spain | 0.000% | 1/31/25 | EUR | 4,966 | 4,668 |
| | Kingdom of Spain | 0.000% | 5/31/25 | EUR | 50,741 | 47,189 |
| | Kingdom of Spain | 0.000% | 1/31/26 | EUR | 393,750 | 359,985 |
| 3 | Kingdom of Spain | 1.950% | 4/30/26 | EUR | 50,198 | 48,862 |
| | Kingdom of Spain | 0.000% | 1/31/27 | EUR | 233,494 | 206,929 |
| 3 | Kingdom of Spain | 0.800% | 7/30/27 | EUR | 121,896 | 110,698 |
| | Kingdom of Spain | 0.000% | 1/31/28 | EUR | 400,877 | 343,852 |
| 3 | Kingdom of Spain | 1.400% | 4/30/28 | EUR | 59,534 | 54,849 |
| 3 | Kingdom of Spain | 1.400% | 7/30/28 | EUR | 58,348 | 53,558 |
| 3 | Kingdom of Spain | 5.150% | 10/31/28 | EUR | 149,822 | 167,011 |
| 3 | Kingdom of Spain | 1.450% | 4/30/29 | EUR | 70,481 | 64,094 |
| | Kingdom of Spain | 0.800% | 7/30/29 | EUR | 307,911 | 265,441 |
| 3 | Kingdom of Spain | 1.950% | 7/30/30 | EUR | 80,000 | 73,646 |
| 3 | Kingdom of Spain | 1.250% | 10/31/30 | EUR | 32,549 | 28,249 |
| 3 | Kingdom of Spain | 0.100% | 4/30/31 | EUR | 40,000 | 30,936 |
| 3 | Kingdom of Spain | 0.500% | 10/31/31 | EUR | 84,714 | 66,874 |
| 3 | Kingdom of Spain | 0.700% | 4/30/32 | EUR | 163,092 | 128,925 |
| 3 | Kingdom of Spain | 2.550% | 10/31/32 | EUR | 290,059 | 269,499 |
| 3 | Kingdom of Spain | 2.350% | 7/30/33 | EUR | 8,715 | 7,928 |
| 3 | Kingdom of Spain | 1.850% | 7/30/35 | EUR | 22,325 | 18,606 |
| 3 | Kingdom of Spain | 4.200% | 1/31/37 | EUR | 57,102 | 61,336 |
| 3 | Kingdom of Spain | 0.850% | 7/30/37 | EUR | 202,007 | 137,926 |
| 3 | Kingdom of Spain | 1.200% | 10/31/40 | EUR | 115,373 | 77,930 |
| 3 | Kingdom of Spain | 4.700% | 7/30/41 | EUR | 87,312 | 99,991 |
| 3 | Kingdom of Spain | 1.000% | 7/30/42 | EUR | 27,236 | 17,308 |
| 3 | Kingdom of Spain | 3.450% | 7/30/43 | EUR | 23,767 | 22,646 |
| 3 | Kingdom of Spain | 5.150% | 10/31/44 | EUR | 59,750 | 72,903 |
| 3 | Kingdom of Spain | 2.900% | 10/31/46 | EUR | 85,819 | 75,541 |
| 3 | Kingdom of Spain | 2.700% | 10/31/48 | EUR | 47,236 | 39,510 |
| 3 | Kingdom of Spain | 1.000% | 10/31/50 | EUR | 39,061 | 20,926 |
| 3 | Kingdom of Spain | 1.900% | 10/31/52 | EUR | 142,629 | 94,713 |
| 3 | Kingdom of Spain | 3.450% | 7/30/66 | EUR | 53,737 | 49,696 |
| 3 | Kingdom of Spain | 1.450% | 10/31/71 | EUR | 42,435 | 20,739 |
| | | | | | | 4,018,723 |
Total International Bond II Index Fund
| | | Coupon | Maturity
Date | Currency | Face
Amount
(000) | Market
Value•
($000) |
| Supranational (4.2%) | | | |
| | African Development Bank | 0.250% | 1/24/24 | EUR | 3,950 | 3,791 |
| | African Development Bank | 4.750% | 3/6/24 | AUD | 3,233 | 2,085 |
| | African Development Bank | 0.250% | 11/21/24 | EUR | 11,020 | 10,350 |
| | African Development Bank | 0.875% | 12/16/24 | GBP | 3,242 | 3,478 |
| | African Development Bank | 4.000% | 1/10/25 | AUD | 7,018 | 4,469 |
| | African Development Bank | 4.500% | 6/2/26 | AUD | 3,052 | 1,960 |
| | African Development Bank | 0.500% | 6/22/26 | GBP | 19,692 | 19,838 |
| | African Development Bank | 0.125% | 10/7/26 | EUR | 1,951 | 1,736 |
| | African Development Bank | 0.500% | 3/22/27 | EUR | 27,909 | 24,962 |
| | African Development Bank | 3.300% | 7/27/27 | AUD | 491 | 295 |
| | African Development Bank | 3.350% | 8/8/28 | AUD | 127 | 75 |
| | African Development Bank | 0.500% | 3/21/29 | EUR | 17,477 | 14,844 |
| | African Development Bank | 2.250% | 9/14/29 | EUR | 21,400 | 20,235 |
| | Asian Development Bank | 2.450% | 1/17/24 | AUD | 885 | 556 |
| | Asian Development Bank | 3.500% | 5/30/24 | NZD | 9,794 | 5,546 |
| | Asian Development Bank | 2.500% | 12/19/24 | GBP | 8,000 | 8,888 |
| | Asian Development Bank | 1.625% | 1/28/25 | CAD | 5,536 | 3,844 |
| | Asian Development Bank | 3.750% | 3/12/25 | AUD | 5,505 | 3,489 |
| | Asian Development Bank | 3.700% | 6/17/25 | AUD | 20,000 | 12,651 |
| | Asian Development Bank | 0.750% | 2/10/26 | CAD | 5,214 | 3,450 |
| | Asian Development Bank | 1.342% | 6/18/26 | NOK | 58,000 | 5,103 |
| | Asian Development Bank | 0.625% | 9/15/26 | GBP | 3,608 | 3,623 |
| | Asian Development Bank | 3.000% | 10/14/26 | AUD | 900 | 546 |
| | Asian Development Bank | 0.125% | 12/15/26 | GBP | 7,802 | 7,566 |
| | Asian Development Bank | 4.650% | 2/16/27 | CAD | 1,368 | 1,032 |
| | Asian Development Bank | 3.400% | 9/10/27 | AUD | 4,300 | 2,615 |
| | Asian Development Bank | 0.250% | 10/28/27 | GBP | 6,582 | 6,158 |
| | Asian Development Bank | 0.750% | 12/7/27 | GBP | 10,635 | 10,188 |
| | Asian Development Bank | 1.100% | 3/2/28 | AUD | 8,535 | 4,550 |
| | Asian Development Bank | 1.500% | 5/4/28 | CAD | 2,600 | 1,694 |
| | Asian Development Bank | 3.300% | 8/8/28 | AUD | 1,280 | 762 |
| | Asian Development Bank | 3.100% | 6/15/29 | AUD | 4,500 | 2,604 |
| | Asian Development Bank | 0.000% | 10/24/29 | EUR | 7,412 | 5,993 |
| | Asian Development Bank | 0.025% | 1/31/30 | EUR | 3,566 | 2,864 |
| | Asian Development Bank | 0.100% | 6/17/31 | EUR | 10,953 | 8,478 |
| | Asian Development Bank | 1.950% | 7/22/32 | EUR | 19,175 | 17,188 |
| | Asian Development Bank | 2.000% | 6/10/37 | EUR | 5,331 | 4,560 |
| | Asian Infrastructure Investment Bank | 1.000% | 5/6/26 | AUD | 6,258 | 3,547 |
| | Corp. Andina de Fomento | 0.750% | 6/13/23 | EUR | 2,457 | 2,398 |
| | Corp. Andina de Fomento | 1.125% | 2/13/25 | EUR | 7,369 | 6,909 |
| | Corp. Andina de Fomento | 1.625% | 6/3/25 | EUR | 5,335 | 5,021 |
| | Corp. Andina de Fomento | 0.250% | 2/4/26 | EUR | 300 | 265 |
| | Corp. Andina de Fomento | 0.500% | 2/26/26 | CHF | 4,265 | 4,027 |
| | Corp. Andina de Fomento | 4.500% | 9/14/27 | AUD | 784 | 466 |
| | Council of Europe Development Bank | 1.000% | 10/21/24 | CAD | 1,070 | 736 |
| | Council of Europe Development Bank | 0.750% | 6/9/25 | EUR | 23,409 | 21,995 |
| | Council of Europe Development Bank | 0.375% | 6/8/26 | EUR | 52,357 | 47,554 |
| | Council of Europe Development Bank | 0.000% | 4/9/27 | EUR | 4,530 | 3,959 |
| | Council of Europe Development Bank | 0.250% | 1/19/32 | EUR | 10,662 | 8,240 |
| | EUROFIMA | 3.000% | 5/22/24 | CHF | 2,455 | 2,521 |
| | EUROFIMA | 3.900% | 12/19/25 | AUD | 495 | 312 |
| | EUROFIMA | 3.000% | 5/15/26 | CHF | 3,185 | 3,351 |
| | EUROFIMA | 2.600% | 1/13/27 | AUD | 12,160 | 7,152 |
| | EUROFIMA | 4.550% | 3/30/27 | CAD | 1,330 | 994 |
| | EUROFIMA | 3.350% | 5/21/29 | AUD | 2,130 | 1,234 |
| | European Bank for Reconstruction & Development | 0.000% | 10/17/24 | EUR | 4,876 | 4,561 |
| | European Bank for Reconstruction & Development | 5.625% | 12/7/28 | GBP | 488 | 600 |
| 5 | European Financial Stability Facility | 0.200% | 1/17/24 | EUR | 926 | 892 |
| 5 | European Financial Stability Facility | 2.125% | 2/19/24 | EUR | 9,508 | 9,368 |
| 5 | European Financial Stability Facility | 0.000% | 4/19/24 | EUR | 131,320 | 125,424 |
| 5 | European Financial Stability Facility | 1.750% | 6/27/24 | EUR | 8,290 | 8,101 |
| 5 | European Financial Stability Facility | 0.400% | 2/17/25 | EUR | 30,363 | 28,627 |
| 5 | European Financial Stability Facility | 0.200% | 4/28/25 | EUR | 7,802 | 7,291 |
| 5 | European Financial Stability Facility | 0.500% | 7/11/25 | EUR | 14,628 | 13,719 |
| 5 | European Financial Stability Facility | 0.000% | 10/15/25 | EUR | 23,988 | 22,037 |
| 5 | European Financial Stability Facility | 0.400% | 5/31/26 | EUR | 39,783 | 36,417 |
| 5 | European Financial Stability Facility | 0.000% | 7/20/26 | EUR | 30,199 | 27,128 |
| 5 | European Financial Stability Facility | 0.750% | 5/3/27 | EUR | 22,287 | 20,255 |
Total International Bond II Index Fund
| | | Coupon | Maturity
Date | Currency | Face
Amount
(000) | Market
Value•
($000) |
| 5 | European Financial Stability Facility | 0.875% | 7/26/27 | EUR | 12,190 | 11,092 |
| 5 | European Financial Stability Facility | 0.000% | 10/13/27 | EUR | 48,993 | 42,437 |
| 5 | European Financial Stability Facility | 0.950% | 2/14/28 | EUR | 10,546 | 9,515 |
| 5 | European Financial Stability Facility | 0.875% | 9/5/28 | EUR | 7,997 | 7,088 |
| 5 | European Financial Stability Facility | 0.050% | 10/17/29 | EUR | 2,853 | 2,330 |
| 5 | European Financial Stability Facility | 2.750% | 12/3/29 | EUR | 2,683 | 2,636 |
| 5 | European Financial Stability Facility | 0.125% | 3/18/30 | EUR | 16,054 | 13,023 |
| 5 | European Financial Stability Facility | 0.000% | 1/20/31 | EUR | 50,851 | 39,789 |
| 5 | European Financial Stability Facility | 3.875% | 3/30/32 | EUR | 9,752 | 10,343 |
| 5 | European Financial Stability Facility | 1.250% | 5/24/33 | EUR | 26,655 | 22,092 |
| 5 | European Financial Stability Facility | 3.000% | 9/4/34 | EUR | 2,536 | 2,479 |
| 5 | European Financial Stability Facility | 0.875% | 4/10/35 | EUR | 33,133 | 25,103 |
| 5 | European Financial Stability Facility | 3.375% | 4/3/37 | EUR | 20,095 | 20,253 |
| 5 | European Financial Stability Facility | 1.450% | 9/5/40 | EUR | 12,046 | 9,127 |
| 5 | European Financial Stability Facility | 1.700% | 2/13/43 | EUR | 18,100 | 14,100 |
| 5 | European Financial Stability Facility | 2.350% | 7/29/44 | EUR | 8,632 | 7,553 |
| 5 | European Financial Stability Facility | 1.200% | 2/17/45 | EUR | 19,797 | 13,725 |
| 5 | European Financial Stability Facility | 1.375% | 5/31/47 | EUR | 24,282 | 17,251 |
| 5 | European Financial Stability Facility | 1.800% | 7/10/48 | EUR | 21,896 | 16,857 |
| 5 | European Financial Stability Facility | 0.700% | 1/20/50 | EUR | 22,235 | 12,527 |
| 5 | European Financial Stability Facility | 0.050% | 1/18/52 | EUR | 13,710 | 5,786 |
| 5 | European Financial Stability Facility | 0.700% | 1/17/53 | EUR | 265 | 142 |
| 5 | European Financial Stability Facility | 1.750% | 7/17/53 | EUR | 4,262 | 3,152 |
| 5 | European Financial Stability Facility | 2.000% | 2/28/56 | EUR | 11,569 | 9,148 |
| | European Investment Bank | 0.500% | 11/15/23 | EUR | 9,752 | 9,469 |
| | European Investment Bank | 0.050% | 12/15/23 | EUR | 26,818 | 25,854 |
| | European Investment Bank | 0.875% | 12/15/23 | GBP | 5,388 | 5,988 |
| | European Investment Bank | 2.125% | 1/15/24 | EUR | 8,290 | 8,169 |
| | European Investment Bank | 0.000% | 3/15/24 | EUR | 66,312 | 63,475 |
| | European Investment Bank | 0.050% | 5/24/24 | EUR | 38,149 | 36,335 |
| | European Investment Bank | 0.200% | 7/15/24 | EUR | 19,503 | 18,557 |
| | European Investment Bank | 1.750% | 7/30/24 | CAD | 6,895 | 4,852 |
| | European Investment Bank | 4.750% | 8/7/24 | AUD | 1,593 | 1,031 |
| | European Investment Bank | 0.875% | 9/13/24 | EUR | 16,092 | 15,441 |
| | European Investment Bank | 0.750% | 11/15/24 | GBP | 14,349 | 15,441 |
| | European Investment Bank | 1.900% | 1/22/25 | CAD | 8,900 | 6,228 |
| | European Investment Bank | 1.625% | 2/4/25 | CHF | 1,235 | 1,246 |
| | European Investment Bank | 0.000% | 3/25/25 | EUR | 11,464 | 10,667 |
| | European Investment Bank | 0.125% | 4/15/25 | EUR | 14,628 | 13,655 |
| | European Investment Bank | 5.500% | 4/15/25 | GBP | 1,634 | 1,933 |
| | European Investment Bank | 0.375% | 7/16/25 | EUR | 11,263 | 10,517 |
| | European Investment Bank | 2.750% | 9/15/25 | EUR | 19,503 | 19,376 |
| | European Investment Bank | 4.500% | 10/15/25 | EUR | 7,314 | 7,618 |
| | European Investment Bank | 2.900% | 10/17/25 | AUD | 37,662 | 23,237 |
| | European Investment Bank | 0.000% | 3/13/26 | EUR | 4,876 | 4,423 |
| | European Investment Bank | 0.375% | 4/14/26 | EUR | 26,979 | 24,736 |
| | European Investment Bank | 3.100% | 8/17/26 | AUD | 17,243 | 10,562 |
| | European Investment Bank | 2.750% | 8/25/26 | PLN | 4,898 | 822 |
| | European Investment Bank | 1.000% | 9/21/26 | GBP | 1,560 | 1,593 |
| | European Investment Bank | 0.100% | 10/15/26 | EUR | 12,889 | 11,546 |
| | European Investment Bank | 1.250% | 11/13/26 | EUR | 2,926 | 2,740 |
| | European Investment Bank | 0.125% | 12/14/26 | GBP | 15,000 | 14,570 |
| | European Investment Bank | 0.000% | 12/22/26 | EUR | 32,032 | 28,433 |
| | European Investment Bank | 0.500% | 1/15/27 | EUR | 26,184 | 23,699 |
| | European Investment Bank | 3.500% | 4/15/27 | EUR | 2,439 | 2,492 |
| | European Investment Bank | 0.000% | 6/17/27 | EUR | 10,000 | 8,737 |
| | European Investment Bank | 0.375% | 9/15/27 | EUR | 21,986 | 19,515 |
| | European Investment Bank | 3.750% | 12/7/27 | GBP | 1,853 | 2,069 |
| | European Investment Bank | 0.875% | 1/14/28 | EUR | 22,672 | 20,465 |
| | European Investment Bank | 1.000% | 1/28/28 | CAD | 4,462 | 2,840 |
| | European Investment Bank | 3.300% | 2/3/28 | AUD | 1,103 | 664 |
| | European Investment Bank | 0.000% | 3/28/28 | EUR | 43,652 | 37,287 |
| | European Investment Bank | 1.375% | 5/12/28 | SEK | 36,740 | 3,018 |
| | European Investment Bank | 0.000% | 5/15/28 | EUR | 4,876 | 4,141 |
| | European Investment Bank | 0.000% | 9/28/28 | EUR | 13,328 | 11,225 |
| | European Investment Bank | 0.000% | 12/7/28 | GBP | 1,268 | 1,126 |
| | European Investment Bank | 6.000% | 12/7/28 | GBP | 7,802 | 9,763 |
| | European Investment Bank | 0.625% | 1/22/29 | EUR | 24,628 | 21,373 |
| | European Investment Bank | 3.300% | 5/25/29 | AUD | 11,476 | 6,737 |
Total International Bond II Index Fund
| | | Coupon | Maturity
Date | Currency | Face
Amount
(000) | Market
Value•
($000) |
| | European Investment Bank | 0.125% | 6/20/29 | EUR | 5,606 | 4,657 |
| | European Investment Bank | 0.250% | 9/14/29 | EUR | 13,856 | 11,537 |
| | European Investment Bank | 0.050% | 1/16/30 | EUR | 73,917 | 60,113 |
| | European Investment Bank | 2.250% | 3/15/30 | EUR | 30,000 | 28,544 |
| | European Investment Bank | 4.000% | 4/15/30 | EUR | 3,475 | 3,702 |
| | European Investment Bank | 0.000% | 9/9/30 | EUR | 7,269 | 5,769 |
| | European Investment Bank | 2.750% | 9/13/30 | EUR | 14,627 | 14,353 |
| | European Investment Bank | 0.000% | 1/14/31 | EUR | 49,156 | 38,515 |
| | European Investment Bank | 1.300% | 1/27/31 | AUD | 5,490 | 2,643 |
| | European Investment Bank | 1.000% | 3/14/31 | EUR | 26,035 | 22,158 |
| | European Investment Bank | 1.000% | 4/14/32 | EUR | 15,604 | 13,002 |
| | European Investment Bank | 1.125% | 11/15/32 | EUR | 9,752 | 8,103 |
| | European Investment Bank | 1.125% | 4/13/33 | EUR | 14,628 | 12,011 |
| | European Investment Bank | 3.000% | 10/14/33 | EUR | 29,742 | 29,305 |
| | European Investment Bank | 0.050% | 10/13/34 | EUR | 13,336 | 9,201 |
| | European Investment Bank | 2.625% | 3/15/35 | EUR | 3,462 | 3,246 |
| | European Investment Bank | 0.010% | 11/15/35 | EUR | 18,659 | 12,328 |
| | European Investment Bank | 0.200% | 3/17/36 | EUR | 20,993 | 14,156 |
| | European Investment Bank | 3.125% | 6/30/36 | CHF | 495 | 562 |
| | European Investment Bank | 1.125% | 9/15/36 | EUR | 23,407 | 17,882 |
| | European Investment Bank | 3.875% | 6/8/37 | GBP | 2,633 | 2,878 |
| | European Investment Bank | 0.500% | 11/13/37 | EUR | 720 | 489 |
| | European Investment Bank | 5.000% | 4/15/39 | GBP | 3,416 | 4,252 |
| | European Investment Bank | 2.750% | 3/15/40 | EUR | 9,045 | 8,456 |
| | European Investment Bank | 0.250% | 6/15/40 | EUR | 10,993 | 6,651 |
| | European Investment Bank | 0.010% | 5/15/41 | EUR | 32,485 | 18,222 |
| | European Investment Bank | 3.625% | 3/14/42 | EUR | 2,731 | 2,901 |
| | European Investment Bank | 1.000% | 11/14/42 | EUR | 4,876 | 3,347 |
| | European Investment Bank | 4.500% | 3/7/44 | GBP | 4,145 | 4,901 |
| | European Investment Bank | 1.750% | 9/15/45 | EUR | 6,847 | 5,366 |
| | European Investment Bank | 0.875% | 9/13/47 | EUR | 4,876 | 3,079 |
| | European Investment Bank | 1.500% | 11/15/47 | EUR | 2,439 | 1,799 |
| | European Investment Bank | 1.500% | 10/16/48 | EUR | 1,500 | 1,097 |
| | European Investment Bank | 0.050% | 1/27/51 | EUR | 12,351 | 5,400 |
| | European Investment Bank | 4.625% | 10/12/54 | GBP | 3,755 | 4,725 |
| | European Stability Mechanism | 2.125% | 11/20/23 | EUR | 1,571 | 1,549 |
| | European Stability Mechanism | 0.125% | 4/22/24 | EUR | 31,206 | 29,838 |
| | European Stability Mechanism | 0.000% | 12/16/24 | EUR | 28,544 | 26,772 |
| | European Stability Mechanism | 0.000% | 3/14/25 | EUR | 51,016 | 47,529 |
| | European Stability Mechanism | 1.000% | 9/23/25 | EUR | 19,503 | 18,495 |
| | European Stability Mechanism | 0.500% | 3/2/26 | EUR | 22,771 | 21,005 |
| | European Stability Mechanism | 0.000% | 12/15/26 | EUR | 42,500 | 37,678 |
| | European Stability Mechanism | 0.750% | 3/15/27 | EUR | 21,175 | 19,265 |
| | European Stability Mechanism | 0.750% | 9/5/28 | EUR | 12,598 | 11,089 |
| | European Stability Mechanism | 0.500% | 3/5/29 | EUR | 20,478 | 17,518 |
| | European Stability Mechanism | 0.010% | 3/4/30 | EUR | 33,146 | 26,611 |
| | European Stability Mechanism | 0.010% | 10/15/31 | EUR | 4,798 | 3,657 |
| | European Stability Mechanism | 1.125% | 5/3/32 | EUR | 2,550 | 2,135 |
| | European Stability Mechanism | 1.200% | 5/23/33 | EUR | 5,852 | 4,818 |
| | European Stability Mechanism | 1.625% | 11/17/36 | EUR | 19,479 | 15,841 |
| | European Stability Mechanism | 1.750% | 10/20/45 | EUR | 4,876 | 3,811 |
| | European Stability Mechanism | 1.800% | 11/2/46 | EUR | 11,955 | 9,387 |
| | European Stability Mechanism | 1.850% | 12/1/55 | EUR | 17,645 | 13,461 |
| | European Union | 0.625% | 11/4/23 | EUR | 13,165 | 12,815 |
| | European Union | 0.500% | 4/4/25 | EUR | 29,256 | 27,627 |
| | European Union | 0.800% | 7/4/25 | EUR | 26,741 | 25,310 |
| | European Union | 0.000% | 11/4/25 | EUR | 48,884 | 44,877 |
| | European Union | 0.000% | 3/4/26 | EUR | 47,392 | 43,068 |
| | European Union | 0.000% | 7/6/26 | EUR | 53,409 | 47,957 |
| | European Union | 3.000% | 9/4/26 | EUR | 3,475 | 3,483 |
| | European Union | 2.000% | 10/4/27 | EUR | 120,841 | 115,641 |
| | European Union | 2.500% | 11/4/27 | EUR | 9,264 | 9,072 |
| | European Union | 2.875% | 4/4/28 | EUR | 2,439 | 2,431 |
| | European Union | 0.000% | 6/2/28 | EUR | 63,700 | 54,151 |
| | European Union | 0.000% | 10/4/28 | EUR | 30,216 | 25,392 |
| | European Union | 0.000% | 7/4/29 | EUR | 35,098 | 28,862 |
| | European Union | 1.375% | 10/4/29 | EUR | 7,802 | 7,029 |
| | European Union | 1.625% | 12/4/29 | EUR | 97,522 | 88,840 |
| | European Union | 0.000% | 10/4/30 | EUR | 3,000 | �� 2,368 |
Total International Bond II Index Fund
| | | Coupon | Maturity
Date | Currency | Face
Amount
(000) | Market
Value•
($000) |
| | European Union | 0.750% | 4/4/31 | EUR | 25,969 | 21,554 |
| | European Union | 0.000% | 4/22/31 | EUR | 17,863 | 13,831 |
| | European Union | 0.000% | 7/4/31 | EUR | 84,195 | 64,740 |
| | European Union | 1.000% | 7/6/32 | EUR | 36,210 | 29,851 |
| | European Union | 1.250% | 4/4/33 | EUR | 12,190 | 10,142 |
| | European Union | 0.000% | 7/4/35 | EUR | 36,676 | 24,472 |
| | European Union | 1.125% | 4/4/36 | EUR | 9,752 | 7,562 |
| | European Union | 0.250% | 4/22/36 | EUR | 25,620 | 17,354 |
| | European Union | 0.200% | 6/4/36 | EUR | 51,634 | 34,439 |
| | European Union | 0.400% | 2/4/37 | EUR | 46,958 | 31,678 |
| | European Union | 0.875% | 3/11/37 | EUR | 3,132 | 2,264 |
| | European Union | 1.125% | 6/4/37 | EUR | 5,168 | 3,889 |
| | European Union | 3.375% | 4/4/38 | EUR | 3,948 | 3,982 |
| | European Union | 0.100% | 10/4/40 | EUR | 28,358 | 15,971 |
| | European Union | 0.450% | 7/4/41 | EUR | 31,314 | 18,575 |
| | European Union | 3.750% | 4/4/42 | EUR | 4,876 | 5,175 |
| | European Union | 3.375% | 11/4/42 | EUR | 60,197 | 59,780 |
| | European Union | 1.250% | 2/4/43 | EUR | 2,911 | 2,002 |
| | European Union | 0.450% | 5/2/46 | EUR | 7,311 | 3,982 |
| | European Union | 0.750% | 1/4/47 | EUR | 32,693 | 19,193 |
| | European Union | 2.625% | 2/4/48 | EUR | 31,926 | 28,444 |
| | European Union | 0.300% | 11/4/50 | EUR | 15,943 | 7,362 |
| | European Union | 0.700% | 7/6/51 | EUR | 34,138 | 18,112 |
| | European Union | 2.500% | 10/4/52 | EUR | 62,861 | 53,998 |
| | Inter-American Development Bank | 1.950% | 4/23/24 | AUD | 1,567 | 972 |
| | Inter-American Development Bank | 4.750% | 8/27/24 | AUD | 13,989 | 9,042 |
| | Inter-American Development Bank | 1.700% | 10/10/24 | CAD | 6,097 | 4,270 |
| | Inter-American Development Bank | 1.375% | 12/15/24 | GBP | 13,411 | 14,556 |
| | Inter-American Development Bank | 0.750% | 10/15/25 | CAD | 2,314 | 1,543 |
| | Inter-American Development Bank | 2.750% | 10/30/25 | AUD | 5,338 | 3,277 |
| | Inter-American Development Bank | 1.250% | 12/15/25 | GBP | 11,956 | 12,622 |
| | Inter-American Development Bank | 4.400% | 1/26/26 | CAD | 13 | 10 |
| | Inter-American Development Bank | 4.250% | 6/11/26 | AUD | 637 | 406 |
| | Inter-American Development Bank | 1.000% | 6/29/26 | CAD | 3,300 | 2,179 |
| | Inter-American Development Bank | 0.500% | 9/15/26 | GBP | 4,876 | 4,876 |
| | Inter-American Development Bank | 0.875% | 8/27/27 | CAD | 3,091 | 1,975 |
| | Inter-American Development Bank | 2.125% | 12/15/28 | GBP | 5,331 | 5,402 |
| | Inter-American Development Bank | 3.290% | 6/28/32 | AUD | 1,762 | 986 |
| | International Bank for Reconstruction & Development | 2.200% | 2/27/24 | AUD | 10,970 | 6,859 |
| | International Bank for Reconstruction & Development | 1.800% | 7/26/24 | CAD | 5,703 | 4,024 |
| | International Bank for Reconstruction & Development | 1.900% | 1/16/25 | CAD | 11,459 | 8,017 |
| | International Bank for Reconstruction & Development | 4.250% | 6/24/25 | AUD | 6,170 | 3,959 |
| | International Bank for Reconstruction & Development | 0.750% | 7/2/25 | CAD | 7,990 | 5,378 |
| | International Bank for Reconstruction & Development | 2.900% | 11/26/25 | AUD | 5,093 | 3,137 |
| | International Bank for Reconstruction & Development | 0.625% | 1/14/26 | CAD | 3,052 | 2,014 |
| | International Bank for Reconstruction & Development | 0.750% | 6/10/26 | NZD | 1,007 | 503 |
| | International Bank for Reconstruction & Development | 0.250% | 7/22/26 | GBP | 2,439 | 2,424 |
| | International Bank for Reconstruction & Development | 1.200% | 7/22/26 | CAD | 2,265 | 1,505 |
| | International Bank for Reconstruction & Development | 3.000% | 10/19/26 | AUD | 8,081 | 4,917 |
| | International Bank for Reconstruction & Development | 0.750% | 12/15/26 | GBP | 6,763 | 6,748 |
| | International Bank for Reconstruction & Development | 0.000% | 1/15/27 | EUR | 22,515 | 19,822 |
| | International Bank for Reconstruction & Development | 1.800% | 1/19/27 | CAD | 5,282 | 3,559 |
| | International Bank for Reconstruction & Development | 0.250% | 9/23/27 | GBP | 9,752 | 9,235 |
| | International Bank for Reconstruction & Development | 0.625% | 9/24/27 | NZD | 1,510 | 711 |
| | International Bank for Reconstruction & Development | 0.875% | 9/28/27 | CAD | 2,649 | 1,690 |
| | International Bank for Reconstruction & Development | 0.625% | 11/22/27 | EUR | 5,365 | 4,759 |
| | International Bank for Reconstruction & Development | 0.010% | 4/24/28 | EUR | 29,171 | 24,702 |
| | International Bank for Reconstruction & Development | 1.625% | 5/10/28 | NZD | 12,265 | 5,955 |
| | International Bank for Reconstruction & Development | 0.625% | 7/14/28 | GBP | 19,078 | 17,859 |
| | International Bank for Reconstruction & Development | 3.300% | 8/14/28 | AUD | 1,617 | 965 |
| | International Bank for Reconstruction & Development | 4.875% | 12/7/28 | GBP | 100 | 118 |
| | International Bank for Reconstruction & Development | 1.250% | 12/13/28 | GBP | 14,488 | 13,973 |
| | International Bank for Reconstruction & Development | 0.250% | 5/21/29 | EUR | 10,300 | 8,597 |
| | International Bank for Reconstruction & Development | 1.950% | 9/20/29 | CAD | 886 | 578 |
| | International Bank for Reconstruction & Development | 1.000% | 12/21/29 | GBP | 2,130 | 1,969 |
| | International Bank for Reconstruction & Development | 0.000% | 2/21/30 | EUR | 5,571 | 4,457 |
| | International Bank for Reconstruction & Development | 0.500% | 4/16/30 | EUR | 2,633 | 2,181 |
| | International Bank for Reconstruction & Development | 5.750% | 6/7/32 | GBP | 2,926 | 3,779 |
| | International Bank for Reconstruction & Development | 0.625% | 1/12/33 | EUR | 25,257 | 19,743 |
Total International Bond II Index Fund
| | | Coupon | Maturity
Date | Currency | Face
Amount
(000) | Market
Value•
($000) |
| | International Bank for Reconstruction & Development | 1.200% | 8/8/34 | EUR | 4,703 | 3,781 |
| | International Bank for Reconstruction & Development | 0.500% | 6/21/35 | EUR | 2,156 | 1,550 |
| | International Bank for Reconstruction & Development | 0.100% | 9/17/35 | EUR | 3,699 | 2,489 |
| | International Bank for Reconstruction & Development | 0.700% | 10/22/46 | EUR | 8,840 | 5,365 |
| | International Bank for Reconstruction & Development | 0.125% | 1/3/51 | EUR | 3,206 | 1,467 |
| | International Bank for Reconstruction & Development | 0.200% | 1/21/61 | EUR | 2,633 | 1,043 |
| | International Development Assn. | 0.750% | 9/21/28 | GBP | 2,498 | 2,325 |
| | International Development Assn. | 0.000% | 7/15/31 | EUR | 10,662 | 8,125 |
| | International Development Assn. | 0.350% | 4/22/36 | EUR | 10,861 | 7,466 |
| | International Development Assn. | 1.750% | 5/5/37 | EUR | 15,000 | 12,449 |
| | International Development Assn. | 0.700% | 1/17/42 | EUR | 7,760 | 5,054 |
| | International Finance Corp. | 1.250% | 12/15/23 | GBP | 6,729 | 7,501 |
| | International Finance Corp. | 1.450% | 7/22/24 | AUD | 1,691 | 1,035 |
| | International Finance Corp. | 1.375% | 9/13/24 | CAD | 1,658 | 1,158 |
| | International Finance Corp. | 1.375% | 3/7/25 | GBP | 4,789 | 5,155 |
| | International Finance Corp. | 4.000% | 4/3/25 | AUD | 4,314 | 2,755 |
| | International Finance Corp. | 0.625% | 9/16/25 | CAD | 2,400 | 1,599 |
| | International Finance Corp. | 0.250% | 12/15/25 | GBP | 4,974 | 5,095 |
| | International Finance Corp. | 3.200% | 7/22/26 | AUD | 24,659 | 15,185 |
| | International Finance Corp. | 0.875% | 9/15/26 | GBP | 7,310 | 7,415 |
| | International Finance Corp. | 1.850% | 1/28/27 | CAD | 2,212 | 1,494 |
| | International Finance Corp. | 0.750% | 7/22/27 | GBP | 4,876 | 4,761 |
| | International Finance Corp. | 3.200% | 10/18/27 | AUD | 589 | 354 |
| | International Finance Corp. | 0.750% | 5/24/28 | AUD | 10,000 | 5,184 |
| | International Finance Corp. | 3.150% | 6/26/29 | AUD | 2,336 | 1,358 |
| | International Finance Corp. | 1.250% | 2/6/31 | AUD | 10,000 | 4,795 |
| | International Finance Corp. | 1.500% | 4/15/35 | AUD | 6,322 | 2,676 |
| | Nordic Investment Bank | 1.125% | 12/15/23 | GBP | 9,339 | 10,401 |
| | Nordic Investment Bank | 4.750% | 2/28/24 | AUD | 2,568 | 1,657 |
| | Nordic Investment Bank | 1.875% | 4/10/24 | NOK | 150,000 | 14,057 |
| | Nordic Investment Bank | 0.125% | 6/10/24 | EUR | 12,043 | 11,426 |
| | Nordic Investment Bank | 0.500% | 11/3/25 | EUR | 9,545 | 8,828 |
| | Nordic Investment Bank | 0.125% | 12/15/26 | GBP | 17,632 | 17,144 |
| | Nordic Investment Bank | 1.375% | 1/27/28 | SEK | 8,000 | 655 |
| | | | | | | 3,720,519 |
| Sweden (0.3%) | | | |
| 3 | Kingdom of Sweden | 1.500% | 11/13/23 | SEK | 752,550 | 67,630 |
| | Kingdom of Sweden | 2.500% | 5/12/25 | SEK | 63,320 | 5,747 |
| | Kingdom of Sweden | 0.750% | 5/12/28 | SEK | 3,430 | 285 |
| 3 | Kingdom of Sweden | 0.750% | 11/12/29 | SEK | 190,485 | 15,531 |
| 3 | Kingdom of Sweden | 0.125% | 5/12/31 | SEK | 967,920 | 73,476 |
| | Kingdom of Sweden | 2.250% | 6/1/32 | SEK | 85,700 | 7,809 |
| | Kingdom of Sweden | 3.500% | 3/30/39 | SEK | 8,895 | 954 |
| | Kingdom of Sweden | 1.375% | 6/23/71 | SEK | 206,590 | 12,064 |
| | Kommuninvest I Sverige AB | 1.000% | 11/13/23 | SEK | 279,120 | 24,835 |
| | Kommuninvest I Sverige AB | 1.000% | 10/2/24 | SEK | 97,950 | 8,511 |
| | Kommuninvest I Sverige AB | 1.000% | 5/12/25 | SEK | 192,960 | 16,514 |
| | Kommuninvest I Sverige AB | 0.750% | 2/4/26 | SEK | 346,410 | 28,942 |
| | Kommuninvest I Sverige AB | 1.000% | 11/12/26 | SEK | 293,810 | 24,209 |
| | Kommuninvest I Sverige AB | 0.875% | 5/16/29 | SEK | 50,000 | 3,796 |
| | Region Stockholm | 0.750% | 2/26/25 | EUR | 2,457 | 2,306 |
| | | | | | | 292,609 |
| Switzerland (0.4%) | | | |
| | Canton of Basel-Landschaft | 1.375% | 9/29/34 | CHF | 8,135 | 7,651 |
| | Canton of Geneva Switzerland | 1.625% | 7/30/29 | CHF | 1,745 | 1,734 |
| | Canton of Geneva Switzerland | 0.030% | 6/28/30 | CHF | 13,000 | 11,355 |
| | Canton of Geneva Switzerland | 1.500% | 3/5/32 | CHF | 790 | 767 |
| | Canton of Geneva Switzerland | 0.400% | 4/28/36 | CHF | 2,455 | 1,980 |
| | Canton of Geneva Switzerland | 0.600% | 7/4/46 | CHF | 1,470 | 1,093 |
| | Canton of Vaud | 2.000% | 10/24/33 | CHF | 4,365 | 4,436 |
| | Canton of Zurich | 1.250% | 12/3/32 | CHF | 1,475 | 1,392 |
| | Canton of Zurich | 2.000% | 7/29/38 | CHF | 4,900 | 4,901 |
| | Canton of Zurich | 0.250% | 7/12/39 | CHF | 6,125 | 4,708 |
| | Swiss Confederation | 4.000% | 2/11/23 | CHF | 1,179 | 1,189 |
| | Swiss Confederation | 1.250% | 6/11/24 | CHF | 10,382 | 10,490 |
| | Swiss Confederation | 1.500% | 7/24/25 | CHF | 8,546 | 8,749 |
| | Swiss Confederation | 1.250% | 5/28/26 | CHF | 91,283 | 93,046 |
| | Swiss Confederation | 3.250% | 6/27/27 | CHF | 24,407 | 27,089 |
Total International Bond II Index Fund
| | | Coupon | Maturity
Date | Currency | Face
Amount
(000) | Market
Value•
($000) |
| | Swiss Confederation | 4.000% | 4/8/28 | CHF | 102 | 118 |
| | Swiss Confederation | 0.000% | 6/22/29 | CHF | 23,432 | 21,933 |
| | Swiss Confederation | 2.250% | 6/22/31 | CHF | 18,111 | 19,812 |
| | Swiss Confederation | 0.500% | 6/27/32 | CHF | 6,954 | 6,569 |
| | Swiss Confederation | 3.500% | 4/8/33 | CHF | 10,088 | 12,469 |
| | Swiss Confederation | 0.000% | 6/26/34 | CHF | 10,459 | 9,188 |
| | Swiss Confederation | 0.250% | 6/23/35 | CHF | 6,289 | 5,627 |
| | Swiss Confederation | 2.500% | 3/8/36 | CHF | 3,013 | 3,505 |
| | Swiss Confederation | 1.250% | 6/27/37 | CHF | 14,813 | 14,865 |
| | Swiss Confederation | 0.000% | 7/24/39 | CHF | 8,815 | 7,225 |
| | Swiss Confederation | 1.500% | 4/30/42 | CHF | 20,126 | 21,405 |
| | Swiss Confederation | 0.500% | 6/28/45 | CHF | 25,243 | 22,225 |
| | Swiss Confederation | 4.000% | 1/6/49 | CHF | 4,163 | 6,925 |
| | Swiss Confederation | 0.500% | 5/24/55 | CHF | 10,062 | 8,968 |
| | Swiss Confederation | 0.500% | 5/30/58 | CHF | 10,857 | 9,377 |
| | Swiss Confederation | 2.000% | 6/25/64 | CHF | 2,351 | 3,318 |
| | | | | | | 354,109 |
| Thailand (0.7%) | | | |
| | Kingdom of Thailand | 2.400% | 12/17/23 | THB | 931,343 | 24,700 |
| | Kingdom of Thailand | 0.750% | 6/17/24 | THB | 1,635,618 | 42,294 |
| | Kingdom of Thailand | 0.750% | 9/17/24 | THB | 510,000 | 13,131 |
| | Kingdom of Thailand | 1.450% | 12/17/24 | THB | 1,110,518 | 28,896 |
| | Kingdom of Thailand | 0.950% | 6/17/25 | THB | 1,672,226 | 42,766 |
| | Kingdom of Thailand | 3.850% | 12/12/25 | THB | 612,082 | 16,920 |
| | Kingdom of Thailand | 2.125% | 12/17/26 | THB | 703,592 | 18,181 |
| | Kingdom of Thailand | 1.000% | 6/17/27 | THB | 1,732,978 | 42,306 |
| | Kingdom of Thailand | 3.580% | 12/17/27 | THB | 470,725 | 12,870 |
| | Kingdom of Thailand | 5.670% | 3/13/28 | THB | 58,761 | 1,766 |
| | Kingdom of Thailand | 2.875% | 12/17/28 | THB | 1,067,863 | 28,084 |
| | Kingdom of Thailand | 4.875% | 6/22/29 | THB | 852,018 | 25,054 |
| | Kingdom of Thailand | 1.600% | 12/17/29 | THB | 1,106,839 | 26,613 |
| | Kingdom of Thailand | 3.650% | 6/20/31 | THB | 602,289 | 16,515 |
| | Kingdom of Thailand | 2.000% | 12/17/31 | THB | 2,049,182 | 49,247 |
| | Kingdom of Thailand | 3.775% | 6/25/32 | THB | 738,415 | 20,317 |
| | Kingdom of Thailand | 1.600% | 6/17/35 | THB | 196,901 | 4,186 |
| | Kingdom of Thailand | 1.585% | 12/17/35 | THB | 1,280,397 | 26,872 |
| | Kingdom of Thailand | 3.400% | 6/17/36 | THB | 1,449,997 | 37,232 |
| | Kingdom of Thailand | 4.260% | 12/12/37 | THB | 135,638 | 3,731 |
| | Kingdom of Thailand | 3.300% | 6/17/38 | THB | 1,278,753 | 31,600 |
| | Kingdom of Thailand | 3.800% | 6/14/41 | THB | 73,451 | 1,908 |
| | Kingdom of Thailand | 2.000% | 6/17/42 | THB | 1,009,882 | 19,661 |
| | Kingdom of Thailand | 3.450% | 6/17/43 | THB | 490,000 | 12,179 |
| | Kingdom of Thailand | 4.675% | 6/29/44 | THB | 451,239 | 12,880 |
| | Kingdom of Thailand | 2.875% | 6/17/46 | THB | 553,090 | 11,682 |
| | Kingdom of Thailand | 3.140% | 6/17/47 | THB | 40,000 | 906 |
| | Kingdom of Thailand | 1.875% | 6/17/49 | THB | 656,063 | 10,834 |
| | Kingdom of Thailand | 2.750% | 6/17/52 | THB | 52,800 | 1,027 |
| | Kingdom of Thailand | 4.850% | 6/17/61 | THB | 7,038 | 193 |
| | Kingdom of Thailand | 4.000% | 6/17/66 | THB | 450,778 | 10,317 |
| | Kingdom of Thailand | 3.600% | 6/17/67 | THB | 1,147,041 | 23,807 |
| | Kingdom of Thailand | 2.500% | 6/17/71 | THB | 217,737 | 3,342 |
| | | | | | | 622,017 |
| United Kingdom (4.0%) | | | |
| 1 | Community Finance Co. 1 plc | 5.017% | 7/31/34 | GBP | 347 | 396 |
| 6 | LCR Finance plc | 4.500% | 12/7/28 | GBP | 3,657 | 4,248 |
| 6 | LCR Finance plc | 4.500% | 12/7/38 | GBP | 780 | 903 |
| 6 | LCR Finance plc | 5.100% | 3/7/51 | GBP | 3,267 | 4,381 |
| | Transport for London | 2.125% | 4/24/25 | GBP | 2,457 | 2,612 |
| | Transport for London | 3.875% | 7/23/42 | GBP | 282 | 256 |
| | Transport for London | 3.625% | 5/15/45 | GBP | 2,812 | 2,370 |
| | Transport for London | 4.000% | 4/7/64 | GBP | 2,354 | 2,169 |
| | United Kingdom Gilt | 0.125% | 1/31/24 | GBP | 254,083 | 280,300 |
| | United Kingdom Gilt | 0.250% | 1/31/25 | GBP | 194,930 | 207,845 |
| | United Kingdom Gilt | 5.000% | 3/7/25 | GBP | 61,293 | 72,726 |
| | United Kingdom Gilt | 0.375% | 10/22/26 | GBP | 91,579 | 92,573 |
| | United Kingdom Gilt | 4.125% | 1/29/27 | GBP | 53,063 | 61,689 |
| | United Kingdom Gilt | 4.250% | 12/7/27 | GBP | 21,584 | 25,370 |
| | United Kingdom Gilt | 0.125% | 1/31/28 | GBP | 132,987 | 127,048 |
Total International Bond II Index Fund
| | | Coupon | Maturity
Date | Currency | Face
Amount
(000) | Market
Value•
($000) |
| | United Kingdom Gilt | 0.500% | 1/31/29 | GBP | 245,016 | 231,519 |
| | United Kingdom Gilt | 0.875% | 10/22/29 | GBP | 24,924 | 23,832 |
| | United Kingdom Gilt | 4.750% | 12/7/30 | GBP | 197,466 | 246,186 |
| | United Kingdom Gilt | 0.250% | 7/31/31 | GBP | 92,008 | 79,453 |
| | United Kingdom Gilt | 1.000% | 1/31/32 | GBP | 150,867 | 137,881 |
| | United Kingdom Gilt | 4.250% | 6/7/32 | GBP | 67,195 | 81,611 |
| | United Kingdom Gilt | 4.500% | 9/7/34 | GBP | 36,116 | 44,733 |
| | United Kingdom Gilt | 0.625% | 7/31/35 | GBP | 123,742 | 97,390 |
| | United Kingdom Gilt | 4.250% | 3/7/36 | GBP | 100,887 | 121,285 |
| | United Kingdom Gilt | 1.750% | 9/7/37 | GBP | 223,869 | 195,939 |
| | United Kingdom Gilt | 1.125% | 1/31/39 | GBP | 49,557 | 38,042 |
| | United Kingdom Gilt | 4.250% | 9/7/39 | GBP | 33,057 | 39,563 |
| | United Kingdom Gilt | 4.250% | 12/7/40 | GBP | 30,453 | 36,575 |
| | United Kingdom Gilt | 1.250% | 10/22/41 | GBP | 161,249 | 120,633 |
| | United Kingdom Gilt | 4.500% | 12/7/42 | GBP | 46,370 | 58,089 |
| | United Kingdom Gilt | 3.250% | 1/22/44 | GBP | 118,143 | 124,222 |
| | United Kingdom Gilt | 3.500% | 1/22/45 | GBP | 11,740 | 12,833 |
| | United Kingdom Gilt | 0.875% | 1/31/46 | GBP | 94,976 | 60,671 |
| | United Kingdom Gilt | 4.250% | 12/7/46 | GBP | 96,489 | 118,526 |
| | United Kingdom Gilt | 1.500% | 7/22/47 | GBP | 87,700 | 64,753 |
| | United Kingdom Gilt | 1.750% | 1/22/49 | GBP | 56,167 | 43,788 |
| | United Kingdom Gilt | 4.250% | 12/7/49 | GBP | 50,608 | 63,386 |
| | United Kingdom Gilt | 0.625% | 10/22/50 | GBP | 19,212 | 10,570 |
| | United Kingdom Gilt | 1.250% | 7/31/51 | GBP | 96,446 | 64,138 |
| | United Kingdom Gilt | 3.750% | 7/22/52 | GBP | 31,376 | 36,810 |
| | United Kingdom Gilt | 1.500% | 7/31/53 | GBP | 108,152 | 76,208 |
| | United Kingdom Gilt | 1.625% | 10/22/54 | GBP | 49,998 | 36,439 |
| | United Kingdom Gilt | 4.250% | 12/7/55 | GBP | 55,379 | 72,377 |
| | United Kingdom Gilt | 1.750% | 7/22/57 | GBP | 62,276 | 47,277 |
| | United Kingdom Gilt | 4.000% | 1/22/60 | GBP | 52,416 | 67,232 |
| | United Kingdom Gilt | 0.500% | 10/22/61 | GBP | 80,268 | 36,245 |
| | United Kingdom Gilt | 2.500% | 7/22/65 | GBP | 59,956 | 55,644 |
| | United Kingdom Gilt | 3.500% | 7/22/68 | GBP | 60,330 | 71,313 |
| | United Kingdom Gilt | 1.625% | 10/22/71 | GBP | 76,164 | 53,833 |
| | United Kingdom Gilt | 1.125% | 10/22/73 | GBP | 23,509 | 13,124 |
| | | | | | | 3,567,006 |
| Total Sovereign Bonds (Cost $92,086,210) | | | 70,229,190 |
Total International Bond II Index Fund
| | | Coupon | | | Shares | Market
Value•
($000) |
| Temporary Cash Investments (0.1%) | | | |
| Money Market Fund (0.1%) | | | |
| 11 | Vanguard Market Liquidity Fund (Cost $74,740) | 3.117% | | | 747,580 | 74,743 |
| Total Investments (98.4%) (Cost $115,837,941) | | | 88,075,023 |
| Other Assets and Liabilities—Net (1.6%) | | | 1,405,047 |
| Net Assets (100.0%) | | | 89,480,070 |
| Cost is in $000. | | | |
| • | See Note A in Notes to Financial Statements. |
| 1 | The average or expected maturity is shorter than the final maturity shown because of the possibility of interim principal payments and prepayments or the possibility of the issue being called. |
| 2 | Guaranteed by the Republic of Austria. |
| 3 | Security exempt from registration under Rule 144A of the Securities Act of 1933. Such securities may be sold in transactions exempt from registration, normally to qualified institutional buyers. At October 31, 2022, the aggregate value was $10,506,288,000, representing 11.7% of net assets. |
| 4 | Guaranteed by the Republic of France. |
| 5 | Guaranteed by multiple countries. |
| 6 | Guaranteed by the Government of the United Kingdom. |
| 7 | Securities with a value of $1,183,445,000 have been pledged as collateral for open forward currency contracts. |
| 8 | Securities with a value of $1,205,014,000 have been segregated as collateral for open forward currency contracts. |
| 9 | Securities with a value of $7,140,000 have been segregated as initial margin for open futures contracts. |
| 10 | Guaranteed by the Federal Republic of Germany. |
| 11 | Affiliated money market fund available only to Vanguard funds and certain trusts and accounts managed by Vanguard. Rate shown is the 7-day yield. |
| DAC—Designated Activity Company. |
| GMTN—Global Medium Term Note. |
| REIT—Real Estate Investment Trust. |
| AUD—Australian dollar. |
| CAD—Canadian dollar. |
| CHF—Swiss franc. |
| CLP—Chilean peso. |
| CNY—Chinese renminbi. |
| COP—Colombia peso. |
| CZK—Czech koruna. |
| DKK—Danish krone. |
| EUR—euro. |
| GBP—British pound. |
| HKD—Hong Kong dollar. |
| HUF—Hungarian forint. |
| IDR—Indonesian rupiah. |
| ILS—Israeli shekel. |
| JPY—Japanese yen. |
| KRW—Korean won. |
| MXN—Mexican peso. |
| MYR—Malaysian ringgit. |
| NOK—Norwegian krone. |
| NZD—New Zealand dollar. |
| PEN—Peruvian sol. |
| PLN—Polish zloty. |
| RON—Romania new leu. |
| SEK—Swedish krona. |
| SGD—Singapore dollar. |
| THB—Thai baht. |
| USD—U.S. dollar. |
Total International Bond II Index Fund
Derivative Financial Instruments Outstanding as of Period End
| Futures Contracts |
| | | | ($000) |
| | Expiration | Number of
Long (Short)
Contracts | Notional
Amount | Value and
Unrealized
Appreciation
(Depreciation) |
| Long Futures Contracts | | | | |
| 10-Year Japanese Government Bond | December 2022 | 37 | 37,019 | 147 |
| Euro-Buxl | December 2022 | 148 | 21,093 | 9 |
| Euro-Schatz | December 2022 | 3,181 | 336,163 | 8 |
| KRW 3-Year Treasury Bond | December 2022 | 396 | 28,387 | (267) |
| | | | | (103) |
| |
| Short Futures Contracts | | | | |
| Euro-Bobl | December 2022 | (789) | (93,310) | (813) |
| Euro-Bund | December 2022 | (390) | (53,357) | (515) |
| | | | | (1,328) |
| | | | | (1,431) |
| Forward Currency Contracts |
| | Contract
Settlement
Date | Contract Amount (000) | Unrealized
Appreciation
($000) | Unrealized
Depreciation
($000) |
| Counterparty | | Receive | Deliver | | |
| Commonwealth Bank of Australia | 11/2/22 | AUD | 82,531 | USD | 53,078 | — | (284) |
| State Street Bank & Trust Co. | 11/2/22 | AUD | 42,000 | USD | 27,190 | — | (323) |
| Commonwealth Bank of Australia | 11/2/22 | AUD | 27,000 | USD | 16,915 | 357 | — |
| Toronto-Dominion Bank | 11/2/22 | CAD | 47,168 | USD | 34,324 | 298 | — |
| Royal Bank of Canada | 12/2/22 | CAD | 44,250 | USD | 32,435 | 52 | — |
| State Street Bank & Trust Co. | 12/2/22 | CAD | 14,750 | USD | 10,815 | 13 | — |
| State Street Bank & Trust Co. | 11/2/22 | CHF | 25,432 | USD | 25,905 | — | (502) |
| UBS AG | 11/3/22 | CLP | 63,349,631 | USD | 67,655 | — | (535) |
| Toronto-Dominion Bank | 11/3/22 | CLP | 45,311,000 | USD | 47,248 | 760 | — |
| State Street Bank & Trust Co. | 11/3/22 | CLP | 22,655,500 | USD | 24,025 | — | (21) |
| State Street Bank & Trust Co. | 11/3/22 | CLP | 22,655,500 | USD | 23,773 | 231 | — |
| Toronto-Dominion Bank | 11/3/22 | CLP | 13,638,611 | USD | 14,566 | — | (115) |
| Bank of America, N.A. | 11/3/22 | CLP | 13,633,758 | USD | 14,561 | — | (115) |
| Standard Chartered Bank | 11/2/22 | CNY | 4,904,074 | USD | 674,626 | — | (2,627) |
| HSBC Bank plc | 11/2/22 | CNY | 2,470,470 | USD | 339,257 | — | (732) |
| HSBC Bank plc | 11/2/22 | COP | 369,892,162 | USD | 75,488 | — | (608) |
| Toronto-Dominion Bank | 11/2/22 | COP | 314,240,960 | USD | 64,093 | — | (479) |
| UBS AG | 11/2/22 | COP | 205,324,607 | USD | 42,175 | — | (611) |
| State Street Bank & Trust Co. | 11/2/22 | COP | 136,922,551 | USD | 27,633 | 85 | — |
| State Street Bank & Trust Co. | 11/2/22 | COP | 132,821,492 | USD | 27,562 | — | (674) |
| Credit Agricole CIB | 11/2/22 | COP | 123,042,698 | USD | 25,117 | — | (209) |
| Citibank, N.A. | 11/2/22 | COP | 60,000,000 | USD | 12,248 | — | (102) |
Total International Bond II Index Fund
| Forward Currency Contracts (continued) |
| | Contract
Settlement
Date | Contract Amount (000) | Unrealized
Appreciation
($000) | Unrealized
Depreciation
($000) |
| Counterparty | | Receive | Deliver | | |
| Bank of America, N.A. | 12/5/22 | COP | 30,185,000 | USD | 6,135 | — | (62) |
| Deutsche Bank AG | 11/2/22 | CZK | 8,868,508 | USD | 359,803 | — | (1,799) |
| Deutsche Bank AG | 12/2/22 | CZK | 283,000 | USD | 11,406 | — | (9) |
| Bank of America, N.A. | 11/2/22 | CZK | 158,812 | USD | 6,314 | 97 | — |
| JPMorgan Chase Bank, N.A. | 12/2/22 | CZK | 126,000 | USD | 5,075 | — | — |
| Barclays Bank plc | 11/2/22 | DKK | 1,744,264 | USD | 233,268 | — | (1,725) |
| Bank of America, N.A. | 11/2/22 | DKK | 165,785 | USD | 21,889 | 118 | — |
| UBS AG | 12/2/22 | DKK | 9,300 | USD | 1,238 | — | — |
| Bank of America, N.A. | 11/2/22 | EUR | 6,050,000 | USD | 6,040,705 | — | (60,982) |
| HSBC Bank plc | 11/2/22 | EUR | 4,950,000 | USD | 4,963,200 | — | (70,700) |
| Toronto-Dominion Bank | 11/2/22 | EUR | 2,750,000 | USD | 2,751,430 | — | (33,374) |
| Morgan Stanley Capital Services Inc. | 11/2/22 | EUR | 2,750,000 | USD | 2,747,965 | — | (29,910) |
| BNP Paribas | 11/2/22 | EUR | 2,200,000 | USD | 2,196,763 | — | (22,319) |
| UBS AG | 11/2/22 | EUR | 1,139,000 | USD | 1,142,494 | — | (16,724) |
| State Street Bank & Trust Co. | 11/2/22 | EUR | 1,100,000 | USD | 1,104,727 | — | (17,503) |
| Deutsche Bank AG | 11/2/22 | EUR | 1,100,000 | USD | 1,103,043 | — | (15,821) |
| Royal Bank of Canada | 11/2/22 | EUR | 1,100,000 | USD | 1,100,000 | — | (12,778) |
| Credit Agricole CIB | 11/2/22 | EUR | 1,100,000 | USD | 1,086,075 | 1,149 | — |
| State Street Bank & Trust Co. | 11/2/22 | EUR | 1,100,000 | USD | 1,084,986 | 2,238 | — |
| Bank of America, N.A. | 12/2/22 | EUR | 745,000 | USD | 738,519 | — | (543) |
| Credit Agricole CIB | 11/2/22 | EUR | 550,000 | USD | 549,175 | — | (5,564) |
| Citibank, N.A. | 11/2/22 | EUR | 550,000 | USD | 547,250 | — | (3,639) |
| Bank of New York | 11/2/22 | EUR | 123,000 | USD | 121,561 | 10 | — |
| JPMorgan Chase Bank, N.A. | 11/2/22 | GBP | 26,000 | USD | 29,774 | 44 | — |
| Royal Bank of Canada | 11/2/22 | GBP | 8,000 | USD | 8,971 | 203 | — |
| Toronto-Dominion Bank | 11/2/22 | GBP | 6,523 | USD | 7,287 | 194 | — |
| Standard Chartered Bank | 12/2/22 | HKD | 70,000 | USD | 8,923 | — | — |
| Deutsche Bank AG | 11/3/22 | HUF | 31,037,887 | USD | 74,765 | 86 | — |
| Deutsche Bank AG | 11/3/22 | HUF | 24,140,578 | USD | 58,738 | — | (521) |
| JPMorgan Chase Bank, N.A. | 12/2/22 | HUF | 2,145,000 | USD | 5,128 | — | (2) |
| UBS AG | 12/2/22 | HUF | 945,000 | USD | 2,263 | — | (5) |
| Deutsche Bank AG | 11/2/22 | IDR | 14,136,378,564 | USD | 905,768 | 520 | — |
| Deutsche Bank AG | 11/2/22 | IDR | 2,039,818,440 | USD | 130,800 | — | (24) |
| BNP Paribas | 11/2/22 | ILS | 500,285 | USD | 141,120 | 476 | — |
| Bank of America, N.A. | 11/2/22 | ILS | 36,599 | USD | 10,315 | 43 | — |
| JPMorgan Chase Bank, N.A. | 12/2/22 | ILS | 7,900 | USD | 2,245 | — | (4) |
| JPMorgan Chase Bank, N.A. | 11/2/22 | JPY | 774,062,804 | USD | 5,279,773 | — | (72,942) |
| Bank of America, N.A. | 11/2/22 | JPY | 78,087,680 | USD | 524,677 | 590 | — |
Total International Bond II Index Fund
| Forward Currency Contracts (continued) |
| | Contract
Settlement
Date | Contract Amount (000) | Unrealized
Appreciation
($000) | Unrealized
Depreciation
($000) |
| Counterparty | | Receive | Deliver | | |
| Bank of America, N.A. | 11/2/22 | JPY | 48,784,391 | USD | 332,197 | — | (4,042) |
| Deutsche Bank AG | 11/2/22 | JPY | 45,520,000 | USD | 316,337 | — | (10,141) |
| State Street Bank & Trust Co. | 11/2/22 | JPY | 32,049,055 | USD | 222,049 | — | (6,467) |
| JPMorgan Chase Bank, N.A. | 12/2/22 | JPY | 20,000,000 | USD | 135,074 | — | (75) |
| BNP Paribas | 12/2/22 | JPY | 9,622,000 | USD | 64,932 | 15 | — |
| BNP Paribas | 11/2/22 | KRW | 1,246,674,331 | USD | 877,324 | — | (2,146) |
| HSBC Bank plc | 11/2/22 | KRW | 1,181,258,530 | USD | 831,645 | — | (2,391) |
| JPMorgan Chase Bank, N.A. | 11/2/22 | KRW | 1,001,795,670 | USD | 704,399 | — | (1,128) |
| Deutsche Bank AG | 11/2/22 | KRW | 816,189,240 | USD | 575,399 | — | (2,426) |
| Standard Chartered Bank | 11/2/22 | KRW | 538,313,304 | USD | 378,507 | — | (606) |
| State Street Bank & Trust Co. | 11/2/22 | KRW | 484,592,700 | USD | 339,032 | 1,156 | — |
| JPMorgan Chase Bank, N.A. | 11/2/22 | KRW | 440,442,580 | USD | 308,880 | 315 | — |
| State Street Bank & Trust Co. | 11/2/22 | KRW | 390,554,840 | USD | 275,524 | — | (1,350) |
| HSBC Bank plc | 11/2/22 | KRW | 373,024,190 | USD | 261,478 | 389 | — |
| Morgan Stanley Capital Services Inc. | 11/2/22 | KRW | 30,933,000 | USD | 21,750 | — | (35) |
| Citibank, N.A. | 12/2/22 | KRW | 18,778,000 | USD | 13,141 | 45 | — |
| Bank of America, N.A. | 11/3/22 | MXN | 283,656 | USD | 14,030 | 278 | — |
| Bank of Montreal | 11/3/22 | MXN | 145,000 | USD | 7,221 | 93 | — |
| BNP Paribas | 11/2/22 | MYR | 1,576,030 | USD | 334,079 | — | (721) |
| BNP Paribas | 11/2/22 | MYR | 1,550,762 | USD | 327,926 | 86 | — |
| Standard Chartered Bank | 11/2/22 | MYR | 763,810 | USD | 161,516 | 42 | — |
| BNP Paribas | 12/2/22 | MYR | 85,920 | USD | 18,210 | — | (16) |
| Bank of America, N.A. | 11/2/22 | NZD | 10,000 | USD | 5,681 | 133 | — |
| Toronto-Dominion Bank | 11/3/22 | PEN | 331,054 | USD | 82,926 | 169 | — |
| Citibank, N.A. | 11/3/22 | PEN | 133,935 | USD | 33,569 | 49 | — |
| Bank of America, N.A. | 11/3/22 | PEN | 113,642 | USD | 28,483 | 42 | — |
| Citibank, N.A. | 11/3/22 | PEN | 92,167 | USD | 23,204 | — | (70) |
| Toronto-Dominion Bank | 11/3/22 | PEN | 92,167 | USD | 23,158 | — | (24) |
| BNP Paribas | 11/3/22 | PEN | 25,630 | USD | 6,417 | 16 | — |
| BNP Paribas | 11/3/22 | PLN | 859,563 | USD | 181,121 | — | (1,125) |
| HSBC Bank plc | 11/3/22 | PLN | 859,563 | USD | 180,864 | — | (868) |
| UBS AG | 11/3/22 | PLN | 69,890 | USD | 14,085 | 550 | — |
| UBS AG | 12/2/22 | PLN | 38,500 | USD | 8,064 | — | (35) |
| State Street Bank & Trust Co. | 12/2/22 | PLN | 28,000 | USD | 5,852 | — | (12) |
| Barclays Bank plc | 11/2/22 | RON | 460,000 | USD | 93,042 | — | (484) |
| UBS AG | 12/5/22 | RON | 7,300 | USD | 1,465 | — | — |
| HSBC Bank plc | 11/2/22 | SEK | 1,985,082 | USD | 180,552 | — | (741) |
| UBS AG | 11/2/22 | SEK | 368,000 | USD | 33,941 | — | (607) |
| State Street Bank & Trust Co. | 12/2/22 | SEK | 97,500 | USD | 8,849 | 1 | — |
Total International Bond II Index Fund
| Forward Currency Contracts (continued) |
| | Contract
Settlement
Date | Contract Amount (000) | Unrealized
Appreciation
($000) | Unrealized
Depreciation
($000) |
| Counterparty | | Receive | Deliver | | |
| Morgan Stanley Capital Services Inc. | 11/2/22 | SEK | 87,180 | USD | 7,866 | 31 | — |
| Bank of America, N.A. | 11/2/22 | SGD | 17,971 | USD | 12,529 | 166 | — |
| HSBC Bank plc | 12/2/22 | SGD | 2,500 | USD | 1,766 | — | — |
| BNP Paribas | 11/2/22 | THB | 8,470,450 | USD | 224,508 | — | (1,923) |
| Standard Chartered Bank | 11/2/22 | THB | 7,795,198 | USD | 205,260 | — | (420) |
| HSBC Bank plc | 11/2/22 | THB | 4,785,876 | USD | 127,091 | — | (1,329) |
| JPMorgan Chase Bank, N.A. | 11/2/22 | THB | 3,820,250 | USD | 100,335 | 53 | — |
| HSBC Bank plc | 12/2/22 | THB | 49,583 | USD | 1,320 | — | (14) |
| Commonwealth Bank of Australia | 12/2/22 | USD | 1,924,846 | AUD | 3,007,594 | — | (766) |
| Commonwealth Bank of Australia | 11/2/22 | USD | 1,570,324 | AUD | 2,441,588 | 8,478 | — |
| JPMorgan Chase Bank, N.A. | 11/2/22 | USD | 1,063,855 | AUD | 1,654,158 | 5,716 | — |
| JPMorgan Chase Bank, N.A. | 12/2/22 | USD | 982,364 | AUD | 1,534,956 | — | (391) |
| UBS AG | 11/2/22 | USD | 499,807 | AUD | 777,136 | 2,686 | — |
| UBS AG | 12/2/22 | USD | 335,671 | AUD | 524,490 | — | (134) |
| Morgan Stanley Capital Services Inc. | 11/2/22 | USD | 70,710 | AUD | 110,000 | 345 | — |
| BNP Paribas | 11/2/22 | USD | 68,142 | AUD | 105,957 | 363 | — |
| State Street Bank & Trust Co. | 11/2/22 | USD | 42,918 | AUD | 66,733 | 230 | — |
| Bank of New York | 11/2/22 | USD | 9,715 | AUD | 15,000 | 119 | — |
| State Street Bank & Trust Co. | 12/2/22 | USD | 5,120 | AUD | 8,000 | — | (2) |
| Toronto-Dominion Bank | 12/2/22 | USD | 2,389,462 | CAD | 3,259,137 | — | (3,327) |
| Royal Bank of Canada | 11/2/22 | USD | 1,870,038 | CAD | 2,566,258 | — | (13,663) |
| Standard Chartered Bank | 11/2/22 | USD | 1,500,116 | CAD | 2,059,957 | — | (11,946) |
| HSBC Bank plc | 11/2/22 | USD | 1,202,467 | CAD | 1,650,000 | — | (8,677) |
| Bank of New York | 12/2/22 | USD | 1,125,561 | CAD | 1,537,029 | — | (2,893) |
| Standard Chartered Bank | 12/2/22 | USD | 1,090,196 | CAD | 1,486,831 | — | (1,404) |
| Toronto-Dominion Bank | 11/2/22 | USD | 780,068 | CAD | 1,071,950 | — | (6,772) |
| Royal Bank of Canada | 12/2/22 | USD | 776,701 | CAD | 1,060,000 | — | (1,529) |
| Morgan Stanley Capital Services Inc. | 11/2/22 | USD | 400,669 | CAD | 550,000 | — | (3,046) |
| Bank of America, N.A. | 12/2/22 | USD | 388,038 | CAD | 530,000 | — | (1,077) |
| State Street Bank & Trust Co. | 11/2/22 | USD | 16,023 | CAD | 22,000 | — | (126) |
| UBS AG | 11/2/22 | USD | 1,078,670 | CHF | 1,057,817 | 22,060 | — |
| UBS AG | 12/2/22 | USD | 742,270 | CHF | 740,435 | 207 | — |
| Morgan Stanley Capital Services Inc. | 12/2/22 | USD | 331,628 | CHF | 331,106 | — | (206) |
| Morgan Stanley Capital Services Inc. | 11/2/22 | USD | 32,767 | CHF | 32,000 | 803 | — |
Total International Bond II Index Fund
| Forward Currency Contracts (continued) |
| | Contract
Settlement
Date | Contract Amount (000) | Unrealized
Appreciation
($000) | Unrealized
Depreciation
($000) |
| Counterparty | | Receive | Deliver | | |
| BNP Paribas | 12/2/22 | USD | 13,377 | CHF | 13,344 | 4 | — |
| Toronto-Dominion Bank | 11/2/22 | USD | 11,205 | CHF | 11,000 | 217 | — |
| JPMorgan Chase Bank, N.A. | 12/2/22 | USD | 8,020 | CHF | 8,000 | 2 | — |
| Bank of New York | 11/2/22 | USD | 6,080 | CHF | 6,000 | 87 | — |
| JPMorgan Chase Bank, N.A. | 11/2/22 | USD | 2,026 | CHF | 2,000 | 29 | — |
| State Street Bank & Trust Co. | 11/2/22 | USD | 1,500 | CHF | 1,500 | 2 | — |
| UBS AG | 11/3/22 | USD | 64,522 | CLP | 63,349,631 | — | (2,598) |
| Toronto-Dominion Bank | 11/3/22 | USD | 48,391 | CLP | 45,311,000 | 383 | — |
| Toronto-Dominion Bank | 12/5/22 | USD | 46,988 | CLP | 45,311,000 | — | (730) |
| State Street Bank & Trust Co. | 12/5/22 | USD | 23,900 | CLP | 22,655,500 | 41 | — |
| State Street Bank & Trust Co. | 12/5/22 | USD | 23,650 | CLP | 22,655,500 | — | (209) |
| Toronto-Dominion Bank | 11/3/22 | USD | 13,726 | CLP | 13,638,611 | — | (724) |
| Bank of America, N.A. | 11/3/22 | USD | 13,749 | CLP | 13,633,758 | — | (696) |
| HSBC Bank plc | 11/2/22 | USD | 754,541 | CNY | 5,414,180 | 12,643 | — |
| Standard Chartered Bank | 12/2/22 | USD | 675,827 | CNY | 4,904,074 | 2,601 | — |
| HSBC Bank plc | 12/2/22 | USD | 339,864 | CNY | 2,470,470 | 720 | — |
| Standard Chartered Bank | 11/2/22 | USD | 276,682 | CNY | 1,960,365 | 8,056 | — |
| State Street Bank & Trust Co. | 11/2/22 | USD | 85,988 | COP | 393,109,010 | 6,408 | — |
| HSBC Bank plc | 11/2/22 | USD | 75,508 | COP | 369,892,162 | 627 | — |
| HSBC Bank plc | 12/5/22 | USD | 75,058 | COP | 369,892,162 | 637 | — |
| Toronto-Dominion Bank | 11/2/22 | USD | 67,171 | COP | 314,240,960 | 3,557 | — |
| State Street Bank & Trust Co. | 12/5/22 | USD | 55,040 | COP | 265,642,984 | 1,594 | — |
| UBS AG | 11/2/22 | USD | 44,989 | COP | 205,324,607 | 3,424 | — |
| Toronto-Dominion Bank | 12/5/22 | USD | 28,439 | COP | 140,359,307 | 200 | — |
| State Street Bank & Trust Co. | 12/5/22 | USD | 27,470 | COP | 136,922,551 | — | (78) |
| Credit Agricole CIB | 11/2/22 | USD | 27,003 | COP | 123,042,698 | 2,094 | — |
| Citibank, N.A. | 11/2/22 | USD | 13,138 | COP | 60,000,000 | 991 | — |
| Deutsche Bank AG | 12/2/22 | USD | 358,887 | CZK | 8,868,508 | 1,734 | — |
| BNP Paribas | 11/2/22 | USD | 168,558 | CZK | 4,235,660 | — | (2,427) |
| Deutsche Bank AG | 11/2/22 | USD | 165,547 | CZK | 4,235,660 | — | (5,438) |
| State Street Bank & Trust Co. | 11/2/22 | USD | 22,334 | CZK | 556,000 | — | (110) |
| Barclays Bank plc | 12/2/22 | USD | 467,080 | DKK | 3,488,528 | 2,888 | — |
| UBS AG | 11/2/22 | USD | 240,452 | DKK | 1,827,157 | — | (2,095) |
| Deutsche Bank AG | 11/2/22 | USD | 237,835 | DKK | 1,827,157 | — | (4,712) |
| JPMorgan Chase Bank, N.A. | 12/2/22 | USD | 6,387 | DKK | 48,000 | — | — |
| State Street Bank & Trust Co. | 11/2/22 | USD | 16,763,511 | EUR | 17,117,211 | — | (154,876) |
| State Street Bank & Trust Co. | 12/2/22 | USD | 11,946,779 | EUR | 12,066,800 | — | (6,239) |
Total International Bond II Index Fund
| Forward Currency Contracts (continued) |
| | Contract
Settlement
Date | Contract Amount (000) | Unrealized
Appreciation
($000) | Unrealized
Depreciation
($000) |
| Counterparty | | Receive | Deliver | | |
| Morgan Stanley Capital Services Inc. | 11/2/22 | USD | 8,500,137 | EUR | 8,800,000 | — | (197,644) |
| Bank of America, N.A. | 12/2/22 | USD | 8,534,810 | EUR | 8,550,000 | 65,431 | — |
| Bank of America, N.A. | 11/2/22 | USD | 5,581,258 | EUR | 5,748,000 | — | (99,976) |
| HSBC Bank plc | 12/2/22 | USD | 4,973,763 | EUR | 4,950,000 | 70,437 | — |
| UBS AG | 11/2/22 | USD | 4,362,597 | EUR | 4,466,000 | — | (51,529) |
| HSBC Bank plc | 11/2/22 | USD | 3,613,626 | EUR | 3,751,862 | — | (94,654) |
| BNP Paribas | 12/2/22 | USD | 3,687,955 | EUR | 3,700,000 | 22,843 | — |
| Toronto-Dominion Bank | 11/2/22 | USD | 3,524,736 | EUR | 3,598,549 | — | (32,014) |
| Toronto-Dominion Bank | 12/2/22 | USD | 3,255,278 | EUR | 3,250,000 | 35,922 | — |
| Commonwealth Bank of Australia | 11/2/22 | USD | 3,124,959 | EUR | 3,205,000 | — | (42,812) |
| Morgan Stanley Capital Services Inc. | 12/2/22 | USD | 2,753,766 | EUR | 2,750,000 | 29,696 | — |
| State Street Bank & Trust Co. | 12/2/22 | USD | 2,691,489 | EUR | 2,694,440 | 22,454 | — |
| Toronto-Dominion Bank | 12/2/22 | USD | 1,619,715 | EUR | 1,635,350 | — | (215) |
| UBS AG | 12/2/22 | USD | 1,604,289 | EUR | 1,600,000 | 19,376 | — |
| HSBC Bank plc | 12/2/22 | USD | 1,321,011 | EUR | 1,333,750 | — | (162) |
| Deutsche Bank AG | 12/2/22 | USD | 1,105,397 | EUR | 1,100,000 | 15,769 | — |
| Royal Bank of Canada | 12/2/22 | USD | 1,102,323 | EUR | 1,100,000 | 12,695 | — |
| Credit Agricole CIB | 12/2/22 | USD | 1,088,401 | EUR | 1,100,000 | — | (1,226) |
| Deutsche Bank AG | 11/2/22 | USD | 1,060,240 | EUR | 1,100,000 | — | (26,982) |
| BNP Paribas | 11/2/22 | USD | 1,051,071 | EUR | 1,070,786 | — | (7,277) |
| JPMorgan Chase Bank, N.A. | 12/2/22 | USD | 995,248 | EUR | 1,000,000 | 4,678 | — |
| BNP Paribas | 12/2/22 | USD | 763,621 | EUR | 770,991 | — | (100) |
| Bank of New York | 11/2/22 | USD | 563,677 | EUR | 576,000 | — | (5,634) |
| Credit Agricole CIB | 12/2/22 | USD | 550,333 | EUR | 550,000 | 5,519 | — |
| Citibank, N.A. | 12/2/22 | USD | 548,400 | EUR | 550,000 | 3,586 | — |
| Morgan Stanley Capital Services Inc. | 12/2/22 | USD | 495,152 | EUR | 500,000 | — | (134) |
| Bank of America, N.A. | 12/2/22 | USD | 329,323 | EUR | 332,500 | — | (42) |
| UBS AG | 12/2/22 | USD | 61,462 | EUR | 62,060 | — | (13) |
| Bank of New York | 12/2/22 | USD | 29,294 | EUR | 29,518 | 54 | — |
| Toronto-Dominion Bank | 11/2/22 | USD | 3,188,891 | GBP | 2,854,876 | — | (85,250) |
| HSBC Bank plc | 12/2/22 | USD | 2,553,303 | GBP | 2,215,836 | 9,847 | — |
| HSBC Bank plc | 11/2/22 | USD | 2,404,628 | GBP | 2,152,760 | — | (64,284) |
| Toronto-Dominion Bank | 12/2/22 | USD | 1,733,318 | GBP | 1,504,234 | 6,677 | — |
| UBS AG | 12/2/22 | USD | 1,611,337 | GBP | 1,398,383 | 6,198 | — |
| State Street Bank & Trust Co. | 12/2/22 | USD | 266,430 | GBP | 231,660 | 519 | — |
| BNP Paribas | 11/2/22 | USD | 41,551 | GBP | 37,000 | — | (883) |
| State Street Bank & Trust Co. | 11/2/22 | USD | 11,312 | GBP | 10,000 | — | (157) |
| HSBC Bank plc | 11/2/22 | USD | 35,693 | HKD | 280,000 | 21 | — |
| HSBC Bank plc | 12/2/22 | USD | 35,693 | HKD | 280,000 | 1 | — |
Total International Bond II Index Fund
| Forward Currency Contracts (continued) |
| | Contract
Settlement
Date | Contract Amount (000) | Unrealized
Appreciation
($000) | Unrealized
Depreciation
($000) |
| Counterparty | | Receive | Deliver | | |
| BNP Paribas | 11/3/22 | USD | 126,415 | HUF | 55,178,465 | — | (6,654) |
| Deutsche Bank AG | 12/2/22 | USD | 74,113 | HUF | 31,037,887 | — | (61) |
| Deutsche Bank AG | 12/2/22 | USD | 58,204 | HUF | 24,140,578 | 514 | — |
| Deutsche Bank AG | 12/2/22 | USD | 905,276 | IDR | 14,136,378,564 | — | (492) |
| Deutsche Bank AG | 11/2/22 | USD | 749,528 | IDR | 11,418,264,464 | 17,500 | — |
| Standard Chartered Bank | 11/2/22 | USD | 539,448 | IDR | 8,214,488,640 | 12,812 | — |
| Deutsche Bank AG | 12/2/22 | USD | 130,728 | IDR | 2,039,818,440 | 32 | — |
| BNP Paribas | 12/2/22 | USD | 283,161 | ILS | 1,000,570 | — | (601) |
| JPMorgan Chase Bank, N.A. | 11/2/22 | USD | 146,715 | ILS | 518,585 | — | (61) |
| Barclays Bank plc | 11/2/22 | USD | 119,853 | ILS | 425,240 | — | (504) |
| Barclays Bank plc | 11/2/22 | USD | 26,424 | ILS | 93,345 | 5 | — |
| JPMorgan Chase Bank, N.A. | 12/2/22 | USD | 6,410,400 | JPY | 942,235,605 | 50,387 | — |
| JPMorgan Chase Bank, N.A. | 11/2/22 | USD | 4,786,968 | JPY | 690,546,717 | 141,916 | — |
| BNP Paribas | 11/2/22 | USD | 3,363,985 | JPY | 485,202,893 | 100,205 | — |
| Deutsche Bank AG | 11/2/22 | USD | 2,115,768 | JPY | 305,006,291 | 64,103 | — |
| JPMorgan Chase Bank, N.A. | 12/2/22 | USD | 2,018,713 | JPY | 299,303,157 | — | (1,559) |
| BNP Paribas | 12/2/22 | USD | 1,857,530 | JPY | 274,945,348 | 1,671 | — |
| UBS AG | 11/2/22 | USD | 1,662,143 | JPY | 239,569,122 | 50,650 | — |
| Morgan Stanley Capital Services Inc. | 11/2/22 | USD | 1,600,059 | JPY | 230,217,249 | 51,472 | — |
| Standard Chartered Bank | 12/2/22 | USD | 1,350,805 | JPY | 200,113,238 | 57 | — |
| Royal Bank of Canada | 11/2/22 | USD | 1,341,723 | JPY | 193,687,867 | 38,857 | — |
| Standard Chartered Bank | 11/2/22 | USD | 1,326,727 | JPY | 191,523,031 | 38,423 | — |
| Bank of America, N.A. | 12/2/22 | USD | 1,031,102 | JPY | 152,913,688 | — | (1,052) |
| Toronto-Dominion Bank | 11/2/22 | USD | 542,398 | JPY | 78,228,062 | 16,186 | — |
| HSBC Bank plc | 12/2/22 | USD | 508,503 | JPY | 74,911,371 | 2,857 | — |
| UBS AG | 12/2/22 | USD | 507,048 | JPY | 74,848,635 | 1,826 | — |
| UBS AG | 12/2/22 | USD | 504,345 | JPY | 74,808,033 | — | (603) |
| BNP Paribas | 12/2/22 | USD | 504,372 | JPY | 74,796,712 | — | (499) |
| Bank of America, N.A. | 12/2/22 | USD | 251,243 | JPY | 36,992,391 | 1,547 | — |
| HSBC Bank plc | 11/2/22 | USD | 1,098,401 | KRW | 1,554,282,720 | 7,278 | — |
| State Street Bank & Trust Co. | 11/2/22 | USD | 861,755 | KRW | 1,231,217,788 | — | (2,572) |
| JPMorgan Chase Bank, N.A. | 11/2/22 | USD | 696,860 | KRW | 1,001,795,670 | — | (6,410) |
| BNP Paribas | 12/2/22 | USD | 630,007 | KRW | 894,835,571 | 1,663 | — |
| BNP Paribas | 11/2/22 | USD | 629,191 | KRW | 894,835,571 | 1,008 | — |
| Deutsche Bank AG | 12/2/22 | USD | 575,508 | KRW | 816,189,240 | 2,388 | — |
| Deutsche Bank AG | 11/2/22 | USD | 573,892 | KRW | 816,189,240 | 919 | — |
| State Street Bank & Trust Co. | 12/2/22 | USD | 397,340 | KRW | 563,542,150 | 1,626 | — |
| Standard Chartered Bank | 11/2/22 | USD | 374,229 | KRW | 538,313,304 | — | (3,672) |
| JPMorgan Chase Bank, N.A. | 11/2/22 | USD | 309,691 | KRW | 440,442,580 | 496 | — |
| HSBC Bank plc | 12/2/22 | USD | 269,255 | KRW | 381,365,310 | 1,465 | — |
Total International Bond II Index Fund
| Forward Currency Contracts (continued) |
| | Contract
Settlement
Date | Contract Amount (000) | Unrealized
Appreciation
($000) | Unrealized
Depreciation
($000) |
| Counterparty | | Receive | Deliver | | |
| HSBC Bank plc | 12/2/22 | USD | 261,538 | KRW | 373,024,190 | — | (395) |
| JPMorgan Chase Bank, N.A. | 12/2/22 | USD | 254,151 | KRW | 362,172,580 | — | (163) |
| BNP Paribas | 11/2/22 | USD | 246,562 | KRW | 351,838,760 | — | (432) |
| Morgan Stanley Capital Services Inc. | 11/2/22 | USD | 21,469 | KRW | 30,933,000 | — | (246) |
| Toronto-Dominion Bank | 11/3/22 | USD | 667,400 | MXN | 13,488,949 | — | (13,045) |
| State Street Bank & Trust Co. | 12/2/22 | USD | 654,558 | MXN | 13,060,294 | — | (601) |
| BNP Paribas | 11/2/22 | USD | 689,330 | MYR | 3,183,902 | 15,882 | — |
| BNP Paribas | 12/2/22 | USD | 328,228 | MYR | 1,550,762 | — | (152) |
| BNP Paribas | 12/2/22 | USD | 316,984 | MYR | 1,495,430 | 321 | — |
| Standard Chartered Bank | 12/2/22 | USD | 161,663 | MYR | 763,810 | — | (77) |
| Standard Chartered Bank | 11/2/22 | USD | 152,332 | MYR | 706,700 | 2,853 | — |
| BNP Paribas | 12/2/22 | USD | 161,207 | NOK | 1,674,445 | — | (25) |
| BNP Paribas | 11/2/22 | USD | 153,689 | NOK | 1,674,445 | — | (7,385) |
| BNP Paribas | 12/2/22 | USD | 29,377 | NOK | 304,607 | 47 | — |
| UBS AG | 11/2/22 | USD | 28,203 | NOK | 304,607 | — | (1,099) |
| Commonwealth Bank of Australia | 12/2/22 | USD | 255,942 | NZD | 440,342 | — | (207) |
| Commonwealth Bank of Australia | 11/2/22 | USD | 203,673 | NZD | 360,140 | — | (5,721) |
| JPMorgan Chase Bank, N.A. | 12/2/22 | USD | 95,144 | NZD | 163,694 | — | (77) |
| State Street Bank & Trust Co. | 11/2/22 | USD | 88,485 | NZD | 156,418 | — | (2,460) |
| JPMorgan Chase Bank, N.A. | 11/2/22 | USD | 55,140 | NZD | 97,477 | — | (1,535) |
| Toronto-Dominion Bank | 11/3/22 | USD | 69,300 | PEN | 276,501 | — | (102) |
| Citibank, N.A. | 11/3/22 | USD | 56,659 | PEN | 226,102 | — | (93) |
| Toronto-Dominion Bank | 12/5/22 | USD | 45,961 | PEN | 184,334 | — | (104) |
| Toronto-Dominion Bank | 11/3/22 | USD | 37,114 | PEN | 146,720 | 287 | — |
| Bank of America, N.A. | 11/3/22 | USD | 28,813 | PEN | 113,642 | 289 | — |
| Citibank, N.A. | 12/5/22 | USD | 23,113 | PEN | 92,167 | 80 | — |
| Toronto-Dominion Bank | 12/5/22 | USD | 23,065 | PEN | 92,167 | 32 | — |
| BNP Paribas | 11/3/22 | USD | 6,424 | PEN | 25,630 | — | (9) |
| BNP Paribas | 11/3/22 | USD | 347,747 | PLN | 1,745,016 | — | (17,667) |
| BNP Paribas | 12/2/22 | USD | 180,510 | PLN | 859,563 | 1,237 | — |
| HSBC Bank plc | 12/2/22 | USD | 180,244 | PLN | 859,563 | 970 | — |
| Bank of New York | 11/3/22 | USD | 8,816 | PLN | 44,000 | — | (398) |
| Barclays Bank plc | 12/5/22 | USD | 92,727 | RON | 460,000 | 455 | — |
| Barclays Bank plc | 11/2/22 | USD | 77,260 | RON | 390,000 | — | (1,214) |
| Morgan Stanley Capital Services Inc. | 11/2/22 | USD | 13,774 | RON | 70,000 | — | (311) |
| Toronto-Dominion Bank | 12/2/22 | USD | 548,537 | SEK | 6,050,000 | — | (611) |
| Toronto-Dominion Bank | 11/2/22 | USD | 521,051 | SEK | 5,775,000 | — | (2,056) |
| UBS AG | 11/2/22 | USD | 418,706 | SEK | 4,700,344 | — | (7,057) |
Total International Bond II Index Fund
| Forward Currency Contracts (continued) |
| | Contract
Settlement
Date | Contract Amount (000) | Unrealized
Appreciation
($000) | Unrealized
Depreciation
($000) |
| Counterparty | | Receive | Deliver | | |
| HSBC Bank plc | 12/2/22 | USD | 180,898 | SEK | 1,985,082 | 715 | — |
| UBS AG | 12/2/22 | USD | 180,898 | SEK | 1,985,082 | 715 | — |
| JPMorgan Chase Bank, N.A. | 12/2/22 | USD | 8,251 | SEK | 91,000 | — | (9) |
| HSBC Bank plc | 12/2/22 | USD | 492,386 | SGD | 696,232 | 462 | — |
| BNP Paribas | 11/2/22 | USD | 470,778 | SGD | 673,203 | — | (4,788) |
| JPMorgan Chase Bank, N.A. | 11/2/22 | USD | 28,561 | SGD | 41,000 | — | (402) |
| Commonwealth Bank of Australia | 12/2/22 | USD | 7,774 | SGD | 11,000 | 2 | — |
| JPMorgan Chase Bank, N.A. | 11/2/22 | USD | 230,216 | THB | 8,795,940 | — | (921) |
| BNP Paribas | 12/2/22 | USD | 225,054 | THB | 8,470,450 | 1,927 | — |
| Standard Chartered Bank | 12/2/22 | USD | 205,679 | THB | 7,795,198 | 339 | — |
| BNP Paribas | 11/2/22 | USD | 189,556 | THB | 7,196,679 | 443 | — |
| Standard Chartered Bank | 11/2/22 | USD | 118,075 | THB | 4,461,164 | 845 | — |
| JPMorgan Chase Bank, N.A. | 12/2/22 | USD | 100,506 | THB | 3,820,250 | — | (126) |
| HSBC Bank plc | 12/2/22 | USD | 100,956 | THB | 3,790,640 | 1,104 | — |
| HSBC Bank plc | 11/2/22 | USD | 65,495 | THB | 2,440,880 | 1,354 | — |
| Deutsche Bank AG | 11/2/22 | USD | 52,419 | THB | 1,977,110 | 465 | — |
| | | | | | | 1,071,549 | (1,456,190) |
At October 31, 2022, the counterparties had deposited in segregated accounts securities with a value of $119,247,000 and cash of $44,239,000 in connection with open forward currency contracts.
See accompanying Notes, which are an integral part of the Financial Statements.
Total International Bond II Index Fund
Statement of Assets and Liabilities
| ($000s, except shares and per-share amounts) | Amount |
| Assets | |
| Investments in Securities, at Value | |
| Unaffiliated Issuers (Cost $115,763,201) | 88,000,280 |
| Affiliated Issuers (Cost $74,740) | 74,743 |
| Total Investments in Securities | 88,075,023 |
| Investment in Vanguard | 3,600 |
| Foreign Currency, at Value (Cost $514,604) | 466,734 |
| Receivables for Investment Securities Sold | 1,621,400 |
| Receivables for Accrued Income | 515,858 |
| Receivables for Capital Shares Issued | 11,144 |
| Unrealized Appreciation—Forward Currency Contracts | 1,071,549 |
| Other Assets | 8,261 |
| Total Assets | 91,773,569 |
| Liabilities | |
| Due to Custodian | 21 |
| Payables for Investment Securities Purchased | 834,151 |
| Payables to Vanguard | 2,876 |
| Variation Margin Payable—Futures Contracts | 261 |
| Unrealized Depreciation—Forward Currency Contracts | 1,456,190 |
| Total Liabilities | 2,293,499 |
| Net Assets | 89,480,070 |
| At October 31, 2022, net assets consisted of: | |
| | |
| Paid-in Capital | 103,181,615 |
| Total Distributable Earnings (Loss) | (13,701,545) |
| Net Assets | 89,480,070 |
| |
| Investor Shares—Net Assets | |
Applicable to 699,842,877 outstanding $.001 par value shares of
beneficial interest (unlimited authorization) | 6,048,432 |
| Net Asset Value Per Share—Investor Shares | $8.64 |
| |
| Institutional Shares—Net Assets | |
Applicable to 3,252,941,496 outstanding $.001 par value shares of
beneficial interest (unlimited authorization) | 83,431,638 |
| Net Asset Value Per Share—Institutional Shares | $25.65 |
See accompanying Notes, which are an integral part of the Financial Statements.
Total International Bond II Index Fund
Statement of Operations
|
| | Year Ended
October 31, 2022 |
| | ($000) |
| Investment Income | |
| Income | |
| Interest1,2 | 733,506 |
| Total Income | 733,506 |
| Expenses | |
| The Vanguard Group—Note B | |
| Investment Advisory Services | 3,467 |
Management and Administrative—
Investor Shares | 3,990 |
Management and Administrative—
Admiral Shares | 8,440 |
Management and Administrative—
Institutional Shares | 44,670 |
Marketing and Distribution—
Investor Shares | 269 |
Marketing and Distribution—
Admiral Shares | 531 |
Marketing and Distribution—
Institutional Shares | 1,890 |
| Custodian Fees | 2,994 |
| Auditing Fees | 89 |
| Shareholders’ Reports—Investor Shares | 31 |
| Shareholders’ Reports—Admiral Shares | 101 |
| Shareholders’ Reports—Institutional Shares | 344 |
| Trustees’ Fees and Expenses | 32 |
| Other Expenses | 42 |
| Total Expenses | 66,890 |
| Expenses Paid Indirectly | (6) |
| Net Expenses | 66,884 |
| Net Investment Income | 666,622 |
| Realized Net Gain (Loss) | |
| Investment Securities Sold1 | (4,296,076) |
| Futures Contracts | (11,737) |
| Forward Currency Contracts | 17,048,927 |
| Foreign Currencies | (333,159) |
| Realized Net Gain (Loss) | 12,407,955 |
| Change in Unrealized Appreciation (Depreciation) | |
| Investment Securities1 | (24,510,378) |
| Futures Contracts | (208) |
| Forward Currency Contracts | (587,735) |
| Foreign Currencies | 25,082 |
| Change in Unrealized Appreciation (Depreciation) | (25,073,239) |
| Net Increase (Decrease) in Net Assets Resulting from Operations | (11,998,662) |
| 1 | Interest income, realized net gain (loss), capital gain distributions received, and change in unrealized appreciation (depreciation) from an affiliated company of the fund were $2,120,000, ($316,000), $6,000, and $3,000, respectively. Purchases and sales are for temporary cash investment purposes. |
| 2 | Interest is net of foreign withholding taxes of $14,371,000. |
Statement of Changes in Net Assets
|
| | Year Ended October 31, 2022 | | February 17, 20211 to
October 31, 2021 |
| | ($000) | | ($000) |
| Increase (Decrease) in Net Assets | | | |
| Operations | | | |
| Net Investment Income | 666,622 | | 144,837 |
| Realized Net Gain (Loss) | 12,407,955 | | 2,320,020 |
| Change in Unrealized Appreciation (Depreciation) | (25,073,239) | | (3,145,962) |
| Net Increase (Decrease) in Net Assets Resulting from Operations | (11,998,662) | | (681,105) |
| Distributions | | | |
| Investor Shares | (37,383) | | (2,106) |
| Admiral Shares | (121,120) | | (47,157) |
| Institutional Shares | (718,541) | | (95,471) |
| Total Distributions | (877,044) | | (144,734) |
| Capital Share Transactions | | | |
| Investor Shares | 5,666,052 | | 1,336,360 |
| Admiral Shares | (29,572,710) | | 30,841,795 |
| Institutional Shares | 55,194,074 | | 39,716,044 |
| Net Increase (Decrease) from Capital Share Transactions | 31,287,416 | | 71,894,199 |
| Total Increase (Decrease) | 18,411,710 | | 71,068,360 |
| Net Assets | | | |
| Beginning of Period | 71,068,360 | | — |
| End of Period | 89,480,070 | | 71,068,360 |
See accompanying Notes, which are an integral part of the Financial Statements.
Total International Bond II Index Fund
| Investor Shares | | |
For a Share Outstanding
Throughout Each Period | Year
Ended
October 31,
2022 | February 26,
20211 to
October 31,
2021 |
| | |
| Net Asset Value, Beginning of Period | $9.95 | $10.00 |
| Investment Operations | | |
| Net Investment Income2 | .071 | .023 |
| Net Realized and Unrealized Gain (Loss) on Investments | (1.288) | (.051) |
| Total from Investment Operations | (1.217) | (.028) |
| Distributions | | |
| Dividends from Net Investment Income | (.093) | (.022) |
| Distributions from Realized Capital Gains | — | — |
| Total Distributions | (.093) | (.022) |
| Net Asset Value, End of Period | $8.64 | $9.95 |
| Total Return3 | -12.30% | -0.28% |
| Ratios/Supplemental Data | | |
| Net Assets, End of Period (Millions) | $6,048 | $1,326 |
| Ratio of Total Expenses to Average Net Assets | 0.13%4 | 0.13%5 |
| Ratio of Net Investment Income to Average Net Assets | 0.77% | 0.34%5 |
| Portfolio Turnover Rate6 | 28% | 19% |
| 1 | Inception. |
| 2 | Calculated based on average shares outstanding. |
| 3 | Total returns do not include account service fees that may have applied in the periods shown. Fund prospectuses provide information about any applicable account service fees. |
| 4 | The ratio of expenses to average net assets for the period net of reduction from custody fee offset arrangements was 0.13%. |
| 5 | Annualized. |
| 6 | Excludes the value of portfolio securities received or delivered as a result of in-kind purchases or redemptions of the fund’s capital shares. |
| Admiral Shares | | |
For a Share Outstanding
Throughout Each Period | November 1,
2021 to
February 10,
20222 | February 26,
20211to
October 31,
2021 |
| | |
| Net Asset Value, Beginning of Period | $19.90 | $20.00 |
| Investment Operations | | |
| Net Investment Income3 | .024 | .051 |
| Net Realized and Unrealized Gain (Loss) on Investments | (.626) | (.104) |
| Total from Investment Operations | (.602) | (.053) |
| Distributions | | |
| Dividends from Net Investment Income | (.078) | (.047) |
| Distributions from Realized Capital Gains | — | — |
| Total Distributions | (.078) | (.047) |
| Net Asset Value, End of Period | $19.222 | $19.90 |
| Total Return4 | -3.04% | -0.27% |
| Ratios/Supplemental Data | | |
| Net Assets, End of Period (Millions) | $— | $30,595 |
| Ratio of Total Expenses to Average Net Assets | 0.11%5 | 0.11%5 |
| Ratio of Net Investment Income to Average Net Assets | 0.44%5 | 0.38%5 |
| Portfolio Turnover Rate6 | 28%7 | 19% |
| 1 | Inception. |
| 2 | Net asset value as of February 10, 2022, on which date the remaining Admiral Shares were converted to Institutional Shares. |
| 3 | Calculated based on average shares outstanding. |
| 4 | Total returns do not include account service fees that may have applied in the periods shown. Fund prospectuses provide information about any applicable account service fees. |
| 5 | Annualized. |
| 6 | Excludes the value of portfolio securities received or delivered as a result of in-kind purchases or redemptions of the fund’s capital shares. |
| 7 | Reflects the fund’s portfolio turnover for the fiscal year ended October 31, 2022. |
See accompanying Notes, which are an integral part of the Financial Statements.
Total International Bond II Index Fund
| Institutional Shares | | |
For a Share Outstanding
Throughout Each Period | Year
Ended
October 31,
2022 | February 17
20211 to
October 31,
2021 |
| | |
| Net Asset Value, Beginning of Period | $29.53 | $30.00 |
| Investment Operations | | |
| Net Investment Income2 | .218 | .080 |
| Net Realized and Unrealized Gain (Loss) on Investments | (3.810) | (.472) |
| Total from Investment Operations | (3.592) | (.392) |
| Distributions | | |
| Dividends from Net Investment Income | (.288) | (.078) |
| Distributions from Realized Capital Gains | — | — |
| Total Distributions | (.288) | (.078) |
| Net Asset Value, End of Period | $25.65 | $29.53 |
| Total Return | -12.24% | -1.31% |
| Ratios/Supplemental Data | | |
| Net Assets, End of Period (Millions) | $83,432 | $39,147 |
| Ratio of Total Expenses to Average Net Assets | 0.07%3 | 0.07%4 |
| Ratio of Net Investment Income to Average Net Assets | 0.80% | 0.38%4 |
| Portfolio Turnover Rate5 | 28% | 19% |
| 1 | Inception. |
| 2 | Calculated based on average shares outstanding. |
| 3 | The ratio of expenses to average net assets for the period net of reduction from custody fee offset arrangements was 0.07%. |
| 4 | Annualized. |
| 5 | Excludes the value of portfolio securities received or delivered as a result of in-kind purchases or redemptions of the fund’s capital shares. |
See accompanying Notes, which are an integral part of the Financial Statements.
Total International Bond II Index Fund
Notes to Financial Statements
Vanguard Total International Bond II Index Fund is registered under the Investment Company Act of 1940 as an open-end investment company, or mutual fund. The fund has been established by Vanguard as an investment vehicle for Vanguard funds of funds as well as certain similar trusts and accounts ("eligible investors"). The fund is not available to other investors. The fund offers two classes of shares: Investor Shares and Institutional Shares. Each of the share classes has different eligibility and minimum purchase requirements, and is designed for different types of investors. Prior to February 10, 2022, the fund offered Admiral Shares. Effective at the close of business on February 10, 2022, the Admiral Shares were closed and converted to Institutional Shares.
Certain of the fund’s investments are in corporate debt instruments; the issuers' abilities to meet their obligations may be affected by economic developments in their respective industries. The fund invests in securities of foreign issuers, which may subject it to investment risks not normally associated with investing in securities of U.S. corporations. To minimize the currency risk associated with investment in securities denominated in currencies other than the U.S. dollar, the fund attempts to hedge its currency exposure. Significant market disruptions, such as those caused by pandemics (e.g., COVID-19 pandemic), natural or environmental disasters, war (e.g., Russia’s invasion of Ukraine), acts of terrorism, or other events, can adversely affect local and global markets and normal market operations. Any such disruptions could have an adverse impact on the value of the fund’s investments and fund performance.
| A. | The following significant accounting policies conform to generally accepted accounting principles for U.S. investment companies. The fund consistently follows such policies in preparing its financial statements. |
1. Security Valuation: Securities are valued as of the close of trading on the New York Stock Exchange (generally 4 p.m., Eastern time) on the valuation date. Bonds and temporary cash investments are valued using the latest bid prices or using valuations based on a matrix system (which considers such factors as security prices, yields, maturities, and ratings), both as furnished by independent pricing services. Structured debt securities, including mortgages and asset-backed securities, are valued using the latest bid prices or using valuations based on a matrix system that considers such factors as issuer, tranche, nominal or option-adjusted spreads, weighted average coupon, weighted average maturity, credit enhancements, and collateral, as furnished by independent pricing services.
Investments in Vanguard Market Liquidity Fund are valued at that fund's net asset value. Securities for which market quotations are not readily available, or whose values have been affected by events occurring before the fund’s pricing time but after the close of the securities’ primary markets, are valued by methods deemed by the valuation designee to represent fair value and subject to oversight by the board of trustees. These procedures include obtaining quotations from an independent pricing service, monitoring news to identify significant market- or security-specific events, and evaluating changes in the values of foreign market proxies (for example, ADRs, futures contracts, or exchange-traded funds), between the time the foreign markets close and the fund’s pricing time.
2. Foreign Currency: Securities and other assets and liabilities denominated in foreign currencies are translated into U.S. dollars using exchange rates obtained from an independent third party as of the fund’s pricing time on the valuation date. Realized gains (losses) and unrealized appreciation (depreciation) on investment securities include the effects of changes in exchange rates since the securities were purchased, combined with the effects of changes in security prices. Fluctuations in the value of other assets and liabilities resulting from changes in exchange rates are recorded as unrealized foreign currency gains (losses) until the assets or liabilities are settled in cash, at which time they are recorded as realized foreign currency gains (losses).
3. Futures Contracts: The fund uses futures contracts to invest in fixed income asset classes with greater efficiency and lower cost than is possible through direct investment, to add value when these instruments are attractively priced, or to adjust sensitivity to changes in interest rates. The primary risks associated with the use of futures contracts are imperfect correlation between changes in market values of bonds held by the fund and the prices of futures contracts, and the possibility of an illiquid market. Counterparty risk involving futures is mitigated because a regulated clearinghouse is the counterparty instead of the clearing broker. To further mitigate counterparty risk, the fund trades futures contracts on an exchange, monitors the financial strength of its clearing brokers and clearinghouse, and has entered into clearing agreements with its clearing brokers. The clearinghouse imposes initial margin requirements to secure the fund’s performance and requires daily settlement of variation margin representing changes in the market value of each contract. Any securities pledged as initial margin for open contracts are noted in the Schedule of Investments.
Futures contracts are valued at their quoted daily settlement prices. The notional amounts of the contracts are not recorded in the Statement of Assets and Liabilities. Fluctuations in the value of the contracts are recorded in the Statement of Assets and Liabilities as an asset (liability) and in the
Total International Bond II Index Fund
Statement of Operations as unrealized appreciation (depreciation) until the contracts are closed, when they are recorded as realized gains (losses) on futures contracts.
During the year ended October 31, 2022, the fund’s average investments in long and short futures contracts represented less than 1% of net assets, based on the average of the notional amounts at each quarter-end during the period.
4. Forward Currency Contracts: The fund enters into forward currency contracts to protect the value of securities and related receivables and payables against changes in future foreign exchange rates.
The fund’s risks in using these contracts include movement in the values of the foreign currencies relative to the U.S. dollar and the ability of the counterparties to fulfill their obligations under the contracts. The fund mitigates its counterparty risk by entering into forward currency contracts only with a diverse group of prequalified counterparties, monitoring their financial strength, entering into master netting arrangements with its counterparties, and requiring its counterparties to transfer collateral as security for their performance. In the absence of a default, the collateral pledged or received by the fund cannot be repledged, rehypothecated or (under master netting agreements) resold. The master netting arrangements provide that, in the event of a counterparty’s default (including bankruptcy), the fund may terminate the forward currency contracts, determine the net amount owed by either party in accordance with its master netting arrangements, and sell or retain any collateral held up to the net amount owed to the fund under the master netting arrangements. The forward currency contracts contain provisions whereby a counterparty may terminate open contracts if the fund’s net assets decline below a certain level, triggering a payment by the fund if the fund is in a net liability position at the time of the termination. The payment amount would be reduced by any collateral the fund has pledged. Any securities pledged as collateral for open contracts are noted in the Schedule of Investments. The value of collateral received or pledged is compared daily to the value of the forward currency contracts exposure with each counterparty, and any difference, if in excess of a specified minimum transfer amount, is adjusted and settled within two business days.
Forward currency contracts are valued at their quoted daily prices obtained from an independent third party, adjusted for currency risk based on the expiration date of each contract. The notional amounts of the contracts are not recorded in the Statement of Assets and Liabilities. Fluctuations in the value of the contracts are recorded in the Statement of Assets and Liabilities as an asset (liability) and in the Statement of Operations as unrealized appreciation (depreciation) until the contracts are closed, when they are recorded as realized gains (losses) on forward currency contracts.
During the year ended October 31, 2022, the fund’s average investment in forward currency contracts represented 161% of net assets, based on the average of the notional amounts at each quarter-end during the period.
The following table summarizes the fund’s derivative assets and liabilities by counterparty for derivatives subject to arrangements that provide for offsetting assets and liabilities. Exchange-traded and centrally cleared derivatives are listed separately.
| | Assets
Reflected in
Statement of
Assets and
Liabilities1
($000) | Liabilities
Reflected in
Statement of
Assets and
Liabilities1
($000) | Net Amount
Receivable
(Payable)
($000) | Amounts Not Offset in
the
Statement of Assets
and Liabilities | Net
Exposure3
(Not Less
Than $0)
($000) |
| | Collateral
Pledged2
($000) | Collateral
Received2
($000) |
Derivatives Subject to
Offsetting Arrangements, by Counterparty | | | | | | |
| Bank of America, N.A. | 68,734 | (168,587) | (99,853) | 147,163 | — | — |
| Bank of Montreal | 93 | — | 93 | — | — | 93 |
| Bank of New York | 270 | (8,925) | (8,655) | 9,683 | — | — |
| Barclays Bank plc | 3,348 | (3,927) | (579) | 2,228 | — | — |
| BNP Paribas | 148,207 | (77,149) | 71,058 | — | 27,511 | 43,547 |
| Citibank, N.A. | 4,751 | (3,904) | 847 | — | 670 | 177 |
| Commonwealth Bank of Australia | 8,837 | (49,790) | (40,953) | 65,556 | — | — |
| Credit Agricole CIB | 8,762 | (6,999) | 1,763 | — | 1,559 | 204 |
| Deutsche Bank AG | 104,030 | (68,426) | 35,604 | — | 8,562 | 27,042 |
| HSBC Bank plc | 111,527 | (245,555) | (134,028) | 212,321 | — | — |
| JPMorgan Chase Bank, N.A. | 203,636 | (85,805) | 117,831 | — | 83,174 | 34,657 |
Total International Bond II Index Fund
| | Assets
Reflected in
Statement of
Assets and
Liabilities1
($000) | Liabilities
Reflected in
Statement of
Assets and
Liabilities1
($000) | Net Amount
Receivable
(Payable)
($000) | Amounts Not Offset in
the
Statement of Assets
and Liabilities | Net
Exposure3
(Not Less
Than $0)
($000) |
| | Collateral
Pledged2
($000) | Collateral
Received2
($000) |
| Morgan Stanley Capital Services Inc. | 82,347 | (231,532) | (149,185) | 235,686 | — | — |
| Royal Bank of Canada | 51,807 | (27,970) | 23,837 | — | 14,910 | 8,927 |
| Standard Chartered Bank | 66,028 | (20,752) | 45,276 | — | 27,100 | 18,176 |
| State Street Bank & Trust Co. | 36,598 | (194,282) | (157,684) | 289,180 | — | — |
| Toronto-Dominion Bank | 64,882 | (178,942) | (114,060) | 202,273 | — | — |
| UBS AG | 107,692 | (83,645) | 24,047 | 40,924 | — | 24,047 |
Exchange-Traded
Futures Contracts | — | (261) | (261) | 7,140 | — | — |
| Total | 1,071,549 | (1,456,451) | (384,902) | 1,212,154 | 163,486 | 156,870 |
1 Absent an event of default or early termination, derivative assets and liabilities are presented gross and not offset in the Statement of Assets and Liabilities.
2 Securities or other assets pledged as collateral are noted in the Schedule of Investments and Statement of Assets and Liabilities. Securities or other assets received as collateral are held in a segregated account and not included in the fund’s security holdings in the Schedule of Investments.
3 Net Exposure represents the net amount receivable from the counterparty in the event of default. Counterparties are not required to exchange collateral if amount is below a specified minimum transfer amount.
5. Federal Income Taxes: The fund intends to qualify as a regulated investment company and distribute virtually all of its income. The fund’s tax returns are open to examination by the relevant tax authorities until expiration of the applicable statute of limitations, which is generally three years after the filing of the tax return. Management has analyzed the fund’s tax positions taken for the open federal and state income tax year, and has concluded that no provision for income tax is required in the fund’s financial statements.
6. Distributions: Distributions to shareholders are recorded on the ex-dividend date. Distributions are determined on a tax basis at the fiscal year-end and may differ from net investment income and realized capital gains for financial reporting purposes.
7. Credit Facilities and Interfund Lending Program: The fund and certain other funds managed by The Vanguard Group ("Vanguard") participate in a $4.4 billion committed credit facility provided by a syndicate of lenders pursuant to a credit agreement and an uncommitted credit facility provided by Vanguard. Both facilities may be renewed annually. Each fund is individually liable for its borrowings, if any, under the credit facilities. Borrowings may be utilized for temporary or emergency purposes and are subject to the fund’s regulatory and contractual borrowing restrictions. With respect to the committed credit facility, the participating funds are charged administrative fees and an annual commitment fee of 0.10% of the undrawn committed amount of the facility, which are allocated to the funds based on a method approved by the fund’s board of trustees and included in Management and Administrative expenses on the fund’s Statement of Operations. Any borrowings under either facility bear interest at an agreed-upon spread plus the higher of the federal funds effective rate, the overnight bank funding rate, or the Daily Simple Secured Overnight Financing Rate inclusive of an additional agreed-upon spread. However, borrowings under the uncommitted credit facility may bear interest based upon an alternate rate agreed to by the fund and Vanguard.
In accordance with an exemptive order (the “Order”) from the SEC, the fund may participate in a joint lending and borrowing program that allows registered open-end Vanguard funds to borrow money from and lend money to each other for temporary or emergency purposes (the “Interfund Lending Program”), subject to compliance with the terms and conditions of the Order, and to the extent permitted by the fund’s investment objective and investment policies. Interfund loans and borrowings normally extend overnight but can have a maximum duration of seven days. Loans may be called on one business day’s notice. The interest rate to be charged is governed by the conditions of the Order and internal procedures adopted by the board of trustees. The board of trustees is responsible for overseeing the Interfund Lending Program.
For the year ended October 31, 2022, the fund did not utilize the credit facilities or the Interfund Lending Program.
8. Other: Interest income includes income distributions received from Vanguard Market Liquidity Fund and is accrued daily. Premiums and discounts on debt securities are amortized and accreted, respectively, to interest income over the lives of the respective securities, except for premiums on
Total International Bond II Index Fund
certain callable debt securities that are amortized to the earliest call date. Security transactions are accounted for on the date securities are bought or sold. Costs used to determine realized gains (losses) on the sale of investment securities are those of the specific securities sold.
Each class of shares has equal rights as to assets and earnings, except that each class separately bears certain class-specific expenses related to maintenance of shareholder accounts (included in Management and Administrative expenses) and shareholder reporting. Marketing and distribution expenses are allocated to each class of shares based on a method approved by the board of trustees. Income, other non-class-specific expenses, and gains and losses on investments are allocated to each class of shares based on its relative net assets.
| B. | In accordance with the terms of a Funds' Service Agreement (the “FSA”) between Vanguard and the fund, Vanguard furnishes to the fund investment advisory, corporate management, administrative, marketing, and distribution services at Vanguard’s cost of operations (as defined by the FSA). These costs of operations are allocated to the fund based on methods and guidelines approved by the board of trustees and are generally settled twice a month. |
Upon the request of Vanguard, the fund may invest up to 0.40% of its net assets as capital in Vanguard. At October 31, 2022, the fund had contributed to Vanguard capital in the amount of $3,600,000, representing less than 0.01% of the fund’s net assets and 1.44% of Vanguard’s capital received pursuant to the FSA. The fund’s trustees and officers are also directors and employees, respectively, of Vanguard.
| C. | The fund’s custodian bank has agreed to reduce its fees when the fund maintains cash on deposit in the non-interest-bearing custody account. For the period ended October 31, 2022, custodian fee offset arrangements reduced the fund’s expenses by $6,000 (an annual rate of less than 0.01% of average net assets). |
| D. | Various inputs may be used to determine the value of the fund’s investments and derivatives. These inputs are summarized in three broad levels for financial statement purposes. The inputs or methodologies used to value securities are not necessarily an indication of the risk associated with investing in those securities. |
Level 1—Quoted prices in active markets for identical securities.
Level 2—Other significant observable inputs (including quoted prices for similar securities, interest rates, prepayment speeds, credit risk, etc.).
Level 3—Significant unobservable inputs (including the fund’s own assumptions used to determine the fair value of investments). Any investments and derivatives valued with significant unobservable inputs are noted on the Schedule of Investments.
Total International Bond II Index Fund
The following table summarizes the market value of the fund’s investments and derivatives as of October 31, 2022, based on the inputs used to value them:
| | Level 1
($000) | Level 2
($000) | Level 3
($000) | Total
($000) |
| Investments | | | | |
| Assets | | | | |
| U.S. Government and Agency Obligations | — | 854 | — | 854 |
| Asset-Backed/Commercial Mortgage-Backed Securities | — | 757 | — | 757 |
| Corporate Bonds | — | 17,769,479 | — | 17,769,479 |
| Sovereign Bonds | — | 70,229,190 | — | 70,229,190 |
| Temporary Cash Investments | 74,743 | — | — | 74,743 |
| Total | 74,743 | 88,000,280 | — | 88,075,023 |
| Derivative Financial Instruments | | | | |
| Assets | | | | |
| Futures Contracts1 | 164 | — | — | 164 |
| Forward Currency Contracts | — | 1,071,549 | — | 1,071,549 |
| Total | 164 | 1,071,549 | — | 1,071,713 |
| Liabilities | | | | |
| Futures Contracts1 | 1,595 | — | — | 1,595 |
| Forward Currency Contracts | — | 1,456,190 | — | 1,456,190 |
| Total | 1,595 | 1,456,190 | — | 1,457,785 |
| 1 | Includes cumulative appreciation (depreciation) on futures contracts and centrally cleared swaps, if any, as reported in the Schedule of Investments. Only current day’s variation margin is reported within the Statement of Assets and Liabilities. |
| E. | At October 31, 2022, the fair values of derivatives were reflected in the Statement of Assets and Liabilities as follows: |
| Statement of Assets and Liabilities | Interest Rate
Contracts
($000) | Foreign
Exchange
Contracts
($000) | Total
($000) |
| Unrealized Appreciation—Futures Contracts1 | 164 | — | 164 |
| Unrealized Appreciation—Forward Currency Contracts | — | 1,071,549 | 1,071,549 |
| Total Assets | 164 | 1,071,549 | 1,071,713 |
| | | | |
| Unrealized Depreciation—Futures Contracts1 | 1,595 | — | 1,595 |
| Unrealized Depreciation—Forward Currency Contracts | — | 1,456,190 | 1,456,190 |
| Total Liabilities | 1,595 | 1,456,190 | 1,457,785 |
| 1 | Includes cumulative appreciation (depreciation) on futures contracts and centrally cleared swaps, if any, as reported in the Schedule of Investments. Only current day’s variation margin is reported within the Statement of Assets and Liabilities. |
Realized net gain (loss) and the change in unrealized appreciation (depreciation) on derivatives for the year ended October 31, 2022, were:
| Realized Net Gain (Loss) on Derivatives | Interest Rate
Contracts
($000) | Foreign
Exchange
Contracts
($000) | Total
($000) |
| Futures Contracts | (11,737) | — | (11,737) |
| Forward Currency Contracts | — | 17,048,927 | 17,048,927 |
| Realized Net Gain (Loss) on Derivatives | (11,737) | 17,048,927 | 17,037,190 |
| Change in Unrealized Appreciation (Depreciation) on Derivatives |
| Futures Contracts | (208) | — | (208) |
| Forward Currency Contracts | — | (587,735) | (587,735) |
| Change in Unrealized Appreciation (Depreciation) on Derivatives | (208) | (587,735) | (587,943) |
| F. | Permanent differences between book-basis and tax-basis components of net assets are reclassified among capital accounts in the financial statements to reflect their tax character. These reclassifications have no effect on net assets or net asset value per share. As of period end, |
Total International Bond II Index Fund
permanent differences primarily attributable to the accounting for applicable foreign currency transactions and tax expense on capital gains were reclassified between the individual components of total distributable earnings (loss).
Temporary differences between book-basis and tax-basis components of total distributable earnings (loss) arise when certain items of income, gain, or loss are recognized in different periods for financial statement and tax purposes; these differences will reverse at some time in the future. The differences are primarily related to the deferral of losses from wash sales; the recognition of unrealized gains or losses from certain derivative contracts; the recognition of gain or loss from foreign currency hedges; and the treatment of amortization adjustments from certain fixed income securities. As of period end, the tax-basis components of total distributable earnings (loss) are detailed in the table as follows:
| | Amount
($000) |
| Undistributed Ordinary Income | 743 |
| Undistributed Long-Term Gains | — |
| Capital Loss Carryforwards | (1,487,326) |
| Qualified Late-Year Losses | — |
| Net Unrealized Gains (Losses) | (12,214,962) |
The tax character of distributions paid was as follows:
| | Year Ended October 31, |
| | 2022
Amount
($000) | 2021
Amount
($000) |
| Ordinary Income* | 877,044 | 144,734 |
| Long-Term Capital Gains | — | — |
| Total | 877,044 | 144,734 |
| * | Includes short-term capital gains, if any. |
As of October 31, 2022, gross unrealized appreciation and depreciation for investments and derivatives based on cost for U.S. federal income tax purposes were as follows:
| | Amount
($000) |
| Tax Cost | 100,242,410 |
| Gross Unrealized Appreciation | 16,123,257 |
| Gross Unrealized Depreciation | (28,290,644) |
| Net Unrealized Appreciation (Depreciation) | (12,167,387) |
| G. | During the year ended October 31, 2022, the fund purchased $71,601,902,000 of investment securities and sold $23,823,539,000 of investment securities, other than temporary cash investments. Purchases and sales include $27,062,531,000 and $0, respectively, in connection with in-kind purchases and redemptions of the fund's capital shares. |
The fund purchased securities from and sold securities to other Vanguard funds or accounts managed by Vanguard or its affiliates, in accordance with procedures adopted by the board of trustees in compliance with Rule 17a-7 of the Investment Company Act of 1940. For the year ended October 31, 2022, such purchases were $24,187,000 and sales were $10,256,000, resulting in net realized loss of $225,000; these amounts, other than temporary cash investments, are included in the purchases and sales of investment securities noted above.
| H. | Capital share transactions for each class of shares were: |
| | Year Ended October 31, 2022 | | February 17, 20211 to October 31, 2021 |
| | Amount
($000) | Shares
(000) | | Amount
($000) | Shares
(000) |
| Investor Shares | | | | | |
| Issued | 29,836,924 | 3,083,561 | | 1,334,255 | 132,981 |
| Issued in Lieu of Cash Distributions | 37,383 | 4,061 | | 2,106 | 210 |
| Redeemed | (24,208,255) | (2,520,970) | | (1) | — |
| Net Increase (Decrease)—Investor Shares | 5,666,052 | 566,652 | | 1,336,360 | 133,191 |
Total International Bond II Index Fund
| | Year Ended October 31, 2022 | | February 17, 20211 to October 31, 2021 |
| | Amount
($000) | Shares
(000) | | Amount
($000) | Shares
(000) |
| Admiral Shares | | | | | |
| Issued | 1,076,656 | 54,717 | | 30,794,638 | 1,535,052 |
| Issued in Lieu of Cash Distributions | 121,120 | 6,059 | | 47,157 | 2,348 |
| Redeemed2 | (30,770,486) | (1,598,176) | | — | — |
| Net Increase (Decrease)—Admiral Shares | (29,572,710) | (1,537,400) | | 30,841,795 | 1,537,400 |
| Institutional Shares | | | | | |
| Issued2 | 60,616,965 | 2,129,907 | | 39,949,299 | 1,333,258 |
| Issued in Lieu of Cash Distributions | 718,541 | 26,329 | | 95,471 | 3,208 |
| Redeemed | (6,141,432) | (228,841) | | (328,726) | (10,920) |
| Net Increase (Decrease)—Institutional Shares | 55,194,074 | 1,927,395 | | 39,716,044 | 1,325,546 |
| 1 | Inception date for the Institutional Shares, Investor Shares and Admiral Shares inception date was February 26, 2021. |
| 2 | In February 2022, the fund closed Admiral shares. All the outstanding Admiral Shares automatically converted to Institutional Shares on February 10, 2020. Admiral Shares—Redeemed and Institutional Shares—Issued include 1,463,403,000 and 986,206,000 shares, respectively, in the amount of $28,126,605,000. |
| I. | Management has determined that no events or transactions occurred subsequent to October 31, 2022, that would require recognition or disclosure in these financial statements. |
Report of Independent Registered Public Accounting Firm
To the Board of Trustees of Vanguard Charlotte Funds and Shareholders of Vanguard Total International Bond II Index Fund
Opinion on the Financial Statements
We have audited the accompanying statement of assets and liabilities, including the schedule of investments, of Vanguard Total International Bond II Index Fund (one of the funds constituting Vanguard Charlotte Funds, referred to hereafter as the "Fund") as of October 31, 2022, the related statement of operations for the year ended October 31, 2022, the statement of changes in net assets for the year ended October 31, 2022 and for the period February 17, 2021 (inception) through October 31, 2021, including the related notes, and the financial highlights for each of the periods indicated therein (collectively referred to as the "financial statements"). In our opinion, the financial statements present fairly, in all material respects, the financial position of the Fund as of October 31, 2022, and the results of its operations for the year ended October 31, 2022, the changes in its net assets for the year ended October 31, 2022 and the period February 17, 2021 (inception) through October 31, 2021 and the financial highlights for each of the periods indicated therein in conformity with accounting principles generally accepted in the United States of America.
Basis for Opinion
These financial statements are the responsibility of the Fund's management. Our responsibility is to express an opinion on the Fund's financial statements based on our audits. We are a public accounting firm registered with the Public Company Accounting Oversight Board (United States) (PCAOB) and are required to be independent with respect to the Fund in accordance with the U.S. federal securities laws and the applicable rules and regulations of the Securities and Exchange Commission and the PCAOB.
We conducted our audits of these financial statements in accordance with the standards of the PCAOB. Those standards require that we plan and perform the audit to obtain reasonable assurance about whether the financial statements are free of material misstatement, whether due to error or fraud.
Our audits included performing procedures to assess the risks of material misstatement of the financial statements, whether due to error or fraud, and performing procedures that respond to those risks. Such procedures included examining, on a test basis, evidence regarding the amounts and disclosures in the financial statements. Our audits also included evaluating the accounting principles used and significant estimates made by management, as well as evaluating the overall presentation of the financial statements. Our procedures included confirmation of securities owned as of October 31, 2022 by correspondence with the custodian, transfer agent and brokers; when replies were not received from brokers, we performed other auditing procedures. We believe that our audits provide a reasonable basis for our opinion.
/s/PricewaterhouseCoopers LLP
Philadelphia, Pennsylvania
December 16, 2022
We have served as the auditor of one or more investment companies in The Vanguard Group of Funds since 1975.
Tax information (unaudited)
The fund hereby designates $695,000, or if subsequently determined to be different, the maximum amount allowable by law, of interest earned from obligations of the U.S. government which is generally exempt from state income tax.
The fund hereby designates 76.4%, or if subsequently determined to be different, the maximum percentage allowable by law, of ordinary income dividends eligible to be treated as interest income for purposes of Section 163(j) and the regulations thereunder for the fiscal year.
The fund designates to shareholders foreign source income of $745,942,000 and foreign taxes paid of $12,631,000, or if subsequently determined to be different, the maximum amounts allowable by law. Shareholders will receive more detailed information with their Form 1099-DIV to determine the calendar-year amounts to be included on their tax returns.
"Bloomberg®" and Bloomberg Global Aggregate ex-USD Float Adjusted RIC Capped Index (USD Hedged) are service marks of Bloomberg Finance L.P. and its affiliates, including Bloomberg Index Services Limited (BISL), the administrator of the index (collectively, Bloomberg), and have been licensed for use for certain purposes by The Vanguard Group, Inc. (Vanguard).
The Total International Bond II Index Fund is not sponsored, endorsed, sold or promoted by Bloomberg. Bloomberg does not make any representation or warranty, express or implied, to the owners of or counterparties to the Total International Bond II Index Fund or any member of the public regarding the advisability of investing in securities generally or in the Total International Bond II Index Fund particularly. The only relationship of Bloomberg to Vanguard is the licensing of certain trademarks, trade names and service marks and of the Bloomberg Global Aggregate ex-USD Float Adjusted RIC Capped Index (USD Hedged), which is determined, composed and calculated by BISL without regard to Vanguard or the Total International Bond II Index Fund. Bloomberg has no obligation to take the needs of Vanguard or the owners of the Total International Bond II Index Fund into consideration in determining, composing or calculating the Bloomberg Global Aggregate ex-USD Float Adjusted RIC Capped Index (USD Hedged). Bloomberg is not responsible for and has not participated in the determination of the timing of, prices at, or quantities of the Total International Bond II Index Fund to be issued. Bloomberg shall not have any obligation or liability, including, without limitation, to Total International Bond II Index Fund customers, in connection with the administration, marketing or trading of the Total International Bond II Index Fund.
BLOOMBERG DOES NOT GUARANTEE THE ACCURACY AND/OR THE COMPLETENESS OF THE BLOOMBERG GLOBAL AGGREGATE EX-USD FLOAT ADJUSTED RIC CAPPED INDEX (USD HEDGED) OR ANY DATA RELATED THERETO AND SHALL HAVE NO LIABILITY FOR ANY ERRORS, OMISSIONS OR INTERRUPTIONS THEREIN. BLOOMBERG DOES NOT MAKE ANY WARRANTY, EXPRESS OR IMPLIED, AS TO RESULTS TO BE OBTAINED BY VANGUARD, OWNERS OF THE TOTAL INTERNATIONAL BOND II INDEX FUND OR ANY OTHER PERSON OR ENTITY FROM THE USE OF THE BLOOMBERG GLOBAL AGGREGATE EX-USD FLOAT ADJUSTED RIC CAPPED INDEX (USD HEDGED) OR ANY DATA RELATED THERETO. BLOOMBERG DOES NOT MAKE ANY EXPRESS OR IMPLIED WARRANTIES AND EXPRESSLY DISCLAIMS ALL WARRANTIES OF MERCHANTABILITY OR FITNESS FOR A PARTICULAR PURPOSE OR USE WITH RESPECT TO THE BLOOMBERG GLOBAL AGGREGATE EX-USD FLOAT ADJUSTED RIC CAPPED INDEX (USD HEDGED) OR ANY DATA RELATED THERETO. WITHOUT LIMITING ANY OF THE FOREGOING, TO THE MAXIMUM EXTENT ALLOWED BY LAW, BLOOMBERG, ITS LICENSORS, AND ITS AND THEIR RESPECTIVE EMPLOYEES, CONTRACTORS, AGENTS, SUPPLIERS, AND VENDORS SHALL HAVE NO LIABILITY OR RESPONSIBILITY WHATSOEVER FOR ANY INJURY OR DAMAGES—WHETHER DIRECT, INDIRECT, CONSEQUENTIAL, INCIDENTAL, PUNITIVE OR OTHERWISE—ARISING IN CONNECTION WITH THE TOTAL INTERNATIONAL BOND II INDEX FUND OR BLOOMBERG GLOBAL AGGREGATE EX-USD FLOAT ADJUSTED RIC CAPPED INDEX (USD HEDGED) OR ANY DATA OR VALUES RELATING THERETO—WHETHER ARISING FROM THEIR NEGLIGENCE OR OTHERWISE, EVEN IF NOTIFIED OF THE POSSIBILITY THEREOF.
© 2022 Bloomberg.
Used with Permission. Source: Bloomberg Index Services Limited. Copyright 2022, Bloomberg. All rights reserved
This page intentionally left blank.
The People Who Govern Your Fund
The trustees of your mutual fund are there to see that the fund is operated and managed in your best interests since, as a shareholder, you are a part owner of the fund. Your fund’s trustees also serve on the board of directors of The Vanguard Group, Inc., which is owned by the Vanguard funds and provides services to them.
A majority of Vanguard’s board members are independent, meaning that they have no affiliation with Vanguard or the funds they oversee, apart from the sizable personal investments they have made as private individuals. The independent board members have distinguished backgrounds in business, academia, and public service. Each of the trustees and executive officers oversees 206 Vanguard funds.
Information for each trustee and executive officer of the fund appears below. That information, as well as the Vanguard fund count, is as of the date on the cover of this fund report. The mailing address of the trustees and officers is P.O. Box 876, Valley Forge, PA 19482. More information about the trustees is in the Statement of Additional Information, which can be obtained, without charge, by contacting Vanguard at 800-662-7447, or online at vanguard.com.
Interested Trustee1
Mortimer J. Buckley
Born in 1969. Trustee since January 2018. Principal occupation(s) during the past five years and other experience: chairman of the board (2019–present) of Vanguard and of each of the investment companies served by Vanguard; chief executive officer (2018–present) of Vanguard; chief executive officer, president, and trustee (2018–present) of each of the investment companies served by Vanguard; president and director (2017–present) of Vanguard; and president (2018–present) of Vanguard Marketing Corporation. Chief investment officer (2013–2017), managing director (2002–2017), head of the Retail Investor Group (2006–2012), and chief information officer (2001–2006) of Vanguard. Member of the board of governors of the Investment Company Institute and the board of governors of FINRA. Trustee and vice chair of The Shipley School.
Independent Trustees
Tara Bunch
Born in 1962. Trustee since November 2021. Principal occupation(s) during the past five years and other experience: head of global operations at Airbnb (2020–present). Vice president of AppleCare (2012–2020). Member of the board of directors of Out & Equal (2002–2006), the advisory board of the University of California, Berkeley School of Engineering (2020–present), and the advisory board of Santa Clara University’s Leavey School of Business (2018–present).
Emerson U. Fullwood
Born in 1948. Trustee since January 2008. Principal occupation(s) during the past five years and other experience: executive chief staff and marketing officer for North America and corporate vice president (retired 2008) of Xerox Corporation (document management products and services). Former president of the Worldwide Channels Group, Latin America, and Worldwide Customer Service and executive chief staff officer of Developing Markets of Xerox. Executive in residence and 2009–2010 Distinguished Minett Professor at the Rochester Institute of Technology. Member of the board of directors of the University of Rochester Medical Center, the Monroe Community College Foundation, the United Way of Rochester, North Carolina A&T University, Roberts Wesleyan College, and the Rochester Philharmonic Orchestra. Trustee of the University of Rochester.
F. Joseph Loughrey
Born in 1949. Trustee since October 2009. Principal occupation(s) during the past five years and other experience: president and chief operating officer (retired 2009) and vice chairman of the board (2008–2009) of Cummins Inc. (industrial machinery). Chairman of the board of Hillenbrand, Inc. (specialized consumer services). Director of the V Foundation. Member of the advisory council for the College of Arts and Letters at the University of Notre Dame. Chairman of the board of Saint Anselm College.
Mark Loughridge
Born in 1953. Trustee since March 2012. Principal occupation(s) during the past five years and other experience: senior vice president and chief financial officer (retired 2013) of IBM (information technology services). Fiduciary member of IBM’s Retirement Plan Committee (2004–2013), senior vice president and general manager (2002–2004) of IBM Global Financing, vice president and controller (1998–2002) of IBM, and a variety of other prior management roles at IBM. Member of the Council on Chicago Booth.
Scott C. Malpass
Born in 1962. Trustee since March 2012. Principal occupation(s) during the past five years and other experience: adjunct professor of finance at the University of Notre Dame (2020–present). Chief investment officer (retired 2020) and vice president (retired 2020) of the University of Notre Dame. Assistant professor (retired June 2020) of finance at the Mendoza College of Business, University of Notre Dame, and member of the Notre Dame 403(b) Investment Committee. Member of the board of Catholic Investment Services, Inc. (investment advisors), the board of superintendence of the Institute for the Works of Religion, and the board of directors of Paxos Trust Company (finance).
Deanna Mulligan
Born in 1963. Trustee since January 2018. Principal occupation(s) during the past five years and other experience: chief executive officer of Purposeful (advisory firm for CEOs and C-level executives; 2021–present). Board chair (2020), chief executive officer (2011–2020), and president (2010–2019) of The Guardian Life Insurance Company of America. Chief operating officer (2010–2011) and executive vice president (2008–2010) of Individual Life and Disability of the Guardian Life Insurance Company of America. Member of the board of the Economic Club of New York. Trustee of the Partnership for New York City
(business leadership), Chief Executives for Corporate Purpose, and the NewYork-Presbyterian Hospital.
André F. Perold
Born in 1952. Trustee since December 2004. Principal occupation(s) during the past five years and other experience: George Gund Professor of Finance and Banking, Emeritus at the Harvard Business School (retired 2011). Chief investment officer and co-managing partner of HighVista Strategies (private investment firm). Member of the board (2018–present) of RIT Capital Partners (investment firm). Member of the investment committee of Partners Health
Care System.
Sarah Bloom Raskin
Born in 1961. Trustee since January 2018. Principal occupation(s) during the past five years and other experience: deputy secretary (2014–2017) of the United States Department of the Treasury. Governor (2010–2014) of the Federal Reserve Board. Commissioner (2007–2010) of financial regulation for the State of Maryland. Colin W. Brown Distinguished Professor of the Practice of Law (2021–present), professor (2020–present), Distinguished Fellow of the Global Financial Markets Center (2020–present), and Rubenstein Fellow (2017–2020) at Duke University. Trustee (2017–present) of Amherst College and member of Amherst College Investment Committee (2019–present). Member of the Regenerative Crisis Response Committee (2020–present).
David A. Thomas
Born in 1956. Trustee since July 2021. Principal occupation(s) during the past five years and other experience: president of Morehouse College (2018–present). Professor of business administration, emeritus at Harvard University (2017–2018). Dean (2011–2016) and professor of management (2016–2017) at the Georgetown University McDonough School of Business. Director of DTE Energy Company (2013–present). Trustee of Common Fund (2019–present).
Peter F. Volanakis
Born in 1955. Trustee since July 2009. Principal occupation(s) during the past five years and other experience: president and chief operating officer (retired 2010) of Corning Incorporated (communications equipment) and director of Corning Incorporated (2000–2010) and Dow Corning (2001–2010). Director (2012) of SPX Corporation (multi-industry manufacturing). Overseer of the Amos Tuck School of Business Administration, Dartmouth
1 Mr. Buckley is considered an “interested person,” as defined in the Investment Company Act of 1940, because he is an officer of the Vanguard funds.
College (2001–2013). Member of the BMW Group Mobility Council.
Executive Officers
Christine M. Buchanan
Born in 1970. Principal occupation(s) during the past five years and other experience: principal of Vanguard. Chief financial officer (2021–present) and treasurer (2017–present) of each of the investment companies served by Vanguard. Partner (2005–2017) at KPMG (audit, tax, and advisory services).
John Galloway
Born in 1973. Principal occupation(s) during the past five years and other experience: principal of Vanguard. Investment stewardship officer (September 2020–present) of each of the investment companies served by Vanguard. Head of Investor Advocacy (February 2020–present) and head of Marketing Strategy and Planning (2017–2020) at Vanguard. Special assistant to the President of the United States (2015).
Ashley Grim
Born in 1984. Principal occupation(s) during the past five years and other experience: treasurer (February 2022–present) of each of the investment companies served by Vanguard. Fund transfer agent controller (2019–2022) and director of Audit Services (2017–2019) at Vanguard. Senior manager (2015–2017) at PriceWaterhouseCoopers (audit and assurance, consulting, and tax services).
Peter Mahoney
Born in 1974. Principal occupation(s) during the past five years and other experience: principal of Vanguard. Controller (2015–present) of each of the investment companies served by Vanguard. Head of International Fund Services (2008–2014) at Vanguard.
Anne E. Robinson
Born in 1970. Principal occupation(s) during the past five years and other experience: general counsel (2016–present) of Vanguard. Secretary (2016–present) of Vanguard and of each of the investment companies served by Vanguard. Managing director (2016–present) of Vanguard. Managing director and general counsel of Global Cards and Consumer Services (2014–2016) at Citigroup. Counsel (2003–2014) at American Express. Nonexecutive director of the board of National Grid (energy).
Michael Rollings
Born in 1963. Principal occupation(s) during the past five years and other experience: finance director (2017–present) and treasurer (2017) of each of the investment companies served by Vanguard. Managing director (2016–present) of Vanguard. Chief financial officer (2016–present) of Vanguard. Director (2016–present) of Vanguard Marketing Corporation. Executive vice president and chief financial officer (2006–2016) of MassMutual Financial Group.
John E. Schadl
Born in 1972. Principal occupation(s) during the past five years and other experience: principal of Vanguard. Chief compliance officer (2019–present) of Vanguard and of each of the investment companies served by Vanguard. Assistant vice president (2019–present) of Vanguard Marketing Corporation.
Vanguard Senior Management Team
| Matthew Benchener | Thomas M. Rampulla |
| Joseph Brennan | Karin A. Risi |
| Mortimer J. Buckley | Anne E. Robinson |
| Gregory Davis | Michael Rollings |
| John James | Nitin Tandon |
| Chris D. Mclsaac | Lauren Valente |
Connect with Vanguard®>vanguard.com
Fund Information > 800-662-7447
Direct Investor Account Services > 800-662-2739
Institutional Investor Services > 800-523-1036
Text Telephone for People Who Are Deaf or Hard of Hearing > 800-749-7273
This material may be used in conjunction with the offering of shares of any Vanguard fund only if preceded or accompanied by the fund’s current prospectus.
All comparative mutual fund data are from Morningstar, Inc., unless otherwise noted.
You can obtain a free copy of Vanguard’s proxy voting guidelines by visiting vanguard.com/proxyreporting or by calling Vanguard at 800-662-2739. The guidelines are also available from the SEC’s website, www.sec.gov. In addition, you may obtain a free report on how your fund voted the proxies for securities it owned during the 12 months ended June 30. To get the report, visit either vanguard.com/proxyreporting or www.sec.gov.
You can review information about your fund on the SEC’s website, and you can receive copies of this information, for a fee, by sending a request via email addressed to publicinfo@sec.gov.
© 2022 The Vanguard Group, Inc.
All rights reserved.
Vanguard Marketing Corporation, Distributor.
Q44380 122022
Annual Report | October 31, 2022
Vanguard Global Credit Bond Fund
Contents
Please note: The opinions expressed in this report are just that—informed opinions. They should not be considered promises or advice. Also, please keep in mind that the information and opinions cover the period through the date on the front of this report. Of course, the risks of investing in your fund are spelled out in the prospectus.
Your Fund’s Performance at a Glance
| • | The 12 months ended October 31, 2022, were a volatile, challenging period for financial markets. Vanguard Global Credit Bond Fund returned –16.15% for Investor Shares and –16.02% for Admiral Shares, outpacing the –16.91% return of its benchmark index and the –16.74% average return of its fund peer group. |
| • | The economic backdrop deteriorated as inflation soared to multidecade highs, driven by pandemic-period government spending as well as higher energy and food prices in the wake of Russia’s invasion of Ukraine. Then price increases broadened to other categories of goods and services, adding to concerns that inflation would remain stubbornly high. That prompted aggressive tightening by many central banks to bring inflation back in check, which weighed on bond prices and increased fears of recession. |
| • | The advisor’s investment decisions in U.S. and European investment-grade corporate bonds helped the fund lose less ground than its benchmark. |
| • | The fund’s positioning in emerging markets also helped, as did having a slightly shorter duration when rates were rising dramatically. |
| • | The fund regularly uses derivatives to hedge portfolio risks. For this period, the fund’s derivatives position made a net positive contribution to performance. |
Market Barometer
| | Average Annual Total Returns
Periods Ended October 31, 2022 |
| | One Year | Three Years | Five Years |
| Stocks | | | |
| Russell 1000 Index (Large-caps) | -16.38% | 9.99% | 10.19% |
| Russell 2000 Index (Small-caps) | -18.54 | 7.05 | 5.56 |
| Russell 3000 Index (Broad U.S. market) | -16.52 | 9.79 | 9.87 |
| FTSE All-World ex US Index (International) | -24.20 | -1.16 | -0.18 |
| Bonds | | | |
Bloomberg U.S. Aggregate Float Adjusted Index
(Broad taxable market) | -15.69% | -3.73% | -0.50% |
Bloomberg Municipal Bond Index
(Broad tax-exempt market) | -11.98 | -2.18 | 0.37 |
| FTSE Three-Month U.S. Treasury Bill Index | 0.88 | 0.59 | 1.15 |
| CPI | | | |
| Consumer Price Index | 7.75% | 5.01% | 3.85% |
For the 12 months ended October 31, 2022, Vanguard Global Credit Bond Fund returned –16.15% for Investor Shares and –16.02% for Admiral Shares. The fund outperformed its benchmark, which returned –16.91%. The fund also outpaced the average return of its peers, which was –16.74%.
With interest rates rising significantly, the 30-day SEC yield for Investor Shares ended the period at 4.95%, up from 1.46% a year earlier, and the 30-day yield for Admiral Shares climbed to 5.07%, up from 1.56%.
The investment environment
The period was defined by a historic rise in interest rates, which caused ripple effects across every sector of the financial markets and brought with it renewed volatility.
Concerns that had been weighing on market sentiment in late 2021 carried into 2022. Supply-chain bottlenecks persisted, labor remained in short supply in some sectors of the economy as unemployment rates continued to fall, and year-on-year inflation readings—which had been accelerating—climbed to multidecade highs across much of the world.
In late February, Russia’s invasion of Ukraine injected more uncertainty into the markets. Oil headed north of $100 per barrel and staple food prices soared. Energy prices eventually began to cool amid slowing economic growth and the U.S. government releasing some of its strategic oil reserves to boost supply. But price increases broadened to other
categories of goods and services, heightening concerns that inflation might remain stubbornly high.
In response, major central banks wound down their bond-purchasing programs and began raising short-term interest rates. The Federal Reserve was especially aggressive, raising the federal funds rate target by 3 percentage points over six months. By the end of the period, the European Central Bank (ECB) was hiking rates by three-quarters of a percentage point increments and the Bank of England by half a percentage point increments.
In this challenging global environment, government bond yields rose across the maturity spectrum in major markets, resulting in a fall in prices and negative returns for the 12 months.
Risk premiums increased as well, causing spread sectors including investment-grade corporates, mortgage-backed securities, high yield, and emerging markets to post returns even further in the red than those of government bonds.
Management of the fund
Overall, the fund benefited from opportunistic and tactical positioning in the more volatile credit sectors. That volatility allowed us to buy into parts of the market when they appeared to be oversold and to turn more defensive when we felt we were no longer being compensated for the risk involved.
Much of the fund is made up of U.S. and European investment-grade corporate credit. We began the period with an
underweight to Europe, which worked out well as that region underperformed the U.S. European credit was hit particularly hard by the withdrawal of the unprecedented monetary and fiscal stimulus made available to the economy in the wake of the pandemic, as well as by heightened risk aversion after the outbreak of war in Ukraine. By the end of the period, though, we had closed out that underweight as European credit had fallen to attractive levels.
Emerging markets was another area where the fund did better than its index. Even though we did not expect Russia's full-scale invasion of Ukraine, we managed our risk against such a scenario and were defensively positioned in Russian assets. Our holdings in U.S. high yield also made a modest positive contribution.
Duration added some value. (Duration is a measure of a portfolio’s sensitivity to changes in interest rates). We don’t typically rely on directional bets on interest rate movements, but we did shorten the duration of the fund a little compared with its benchmark when it looked like interest rates were set to move higher.
Outlook
With the repricing that has occurred, the outlook for fixed income is substantially better than it was a year ago. In fact, the outright level of yields in investment-grade corporate bonds today is probably one of the most attractive levels we’ve seen for a
long time, which is likely to attract flows back into this asset class.
Our overall positioning remains modestly conservative for the time being. Now that yields are stabilizing at higher levels, fundamentals should again take center stage, giving us opportunities to generate more alpha through selection.
We are rotating into some issuers that have underperformed and should continue to trade defensively relative to other parts of the market. In particular, we have started to cover some underweights in higher-quality bonds issued by companies with less recession-sensitive businesses that had underperformed to the same extent on a risk-adjusted basis as some lower rates and more cyclical companies. We are less keen on weaker assets given the prospect of an economic slowdown.
By segment, emerging markets seem to be pricing in a very gloomy outlook, making their valuations look very attractive. We remain positive on Europe as the ECB is likely to end its rate hiking cycle at a level well below that of the Fed. And we are still holding a small overweight in U.S. high yield.
With our global fixed income team of portfolio managers, analysts, and traders and our bottom-up, fundamentals-based research process and disciplined approach to risk-taking, we are well positioned to identify and invest in potential pockets of outperformance as opportunities present themselves.
Samuel C. Martinez, CFA
Portfolio Manager
Daniel Shaykevich, Principal and
Portfolio Manager
Arvind Narayanan, CFA
Portfolio Manager
Vanguard Fixed Income Group
November 4, 2022
About Your Fund’s Expenses
As a shareholder of the fund, you incur ongoing costs, which include costs for portfolio management, administrative services, and shareholder reports (like this one), among others. Operating expenses, which are deducted from a fund’s gross income, directly reduce the investment return of the fund.
A fund‘s expenses are expressed as a percentage of its average net assets. This figure is known as the expense ratio. The following examples are intended to help you understand the ongoing costs (in dollars) of investing in your fund and to compare these costs with those of other mutual funds. The examples are based on an investment of $1,000 made at the beginning of the period shown and held for the entire period.
The accompanying table illustrates your fund’s costs in two ways:
| • | Based on actual fund return. This section helps you to estimate the actual expenses that you paid over the period. The ”Ending Account Value“ shown is derived from the fund’s actual return, and the third column shows the dollar amount that would have been paid by an investor who started with $1,000 in the fund. You may use the information here, together with the amount you invested, to estimate the expenses that you paid over the period. |
To do so, simply divide your account value by $1,000 (for example, an $8,600 account value divided by $1,000 = 8.6), then multiply the result by the number given for your fund under the heading ”Expenses Paid During Period.“
| • | Based on hypothetical 5% yearly return. This section is intended to help you compare your fund‘s costs with those of other mutual funds. It assumes that the fund had a yearly return of 5% before expenses, but that the expense ratio is unchanged. In this case—because the return used is not the fund’s actual return—the results do not apply to your investment. The example is useful in making comparisons because the Securities and Exchange Commission requires all mutual funds to calculate expenses based on a 5% return. You can assess your fund’s costs by comparing this hypothetical example with the hypothetical examples that appear in shareholder reports of other funds. |
Note that the expenses shown in the table are meant to highlight and help you compare ongoing costs only and do not reflect transaction costs incurred by the fund for buying and selling securities. Further, the expenses do not include any purchase, redemption, or account service fees described in the fund prospectus. If such fees were applied to your account, your costs would be higher. Your fund does not carry a “sales load.”
The calculations assume no shares were bought or sold during the period. Your actual costs may have been higher or lower, depending on the amount of your investment and the timing of any purchases or redemptions.
You can find more information about the fund’s expenses, including annual expense ratios, in the Financial Statements section of this report. For additional information on operating expenses and other shareholder costs, please refer to your fund’s current prospectus.
| Six Months Ended October 31, 2022 | | | |
| | Beginning
Account Value
4/30/2022 | Ending
Account Value
10/31/2022 | Expenses
Paid During
Period |
| Based on Actual Fund Return | | | |
| Global Credit Bond Fund | | | |
| Investor Shares | $1,000.00 | $ 933.80 | $1.71 |
| Admiral™ Shares | 1,000.00 | 934.80 | 1.22 |
| Based on Hypothetical 5% Yearly Return | | | |
| Global Credit Bond Fund | | | |
| Investor Shares | $1,000.00 | $1,023.44 | $1.79 |
| Admiral Shares | 1,000.00 | 1,023.94 | 1.28 |
The calculations are based on expenses incurred in the most recent six-month period. The fund's annualized six-month expense ratios for that period are 0.35% for Investor Shares and 0.25% for Admiral Shares. The dollar amounts shown as “Expenses Paid” are equal to the annualized expense ratio multiplied by the average account value over the period, multiplied by the number of days in the most recent six-month period, then divided by the number of days in the most recent 12-month period (184/365).
All of the returns in this report represent past performance, which is not a guarantee of future results that may be achieved by the fund. (Current performance may be lower or higher than the performance data cited. For performance data current to the most recent month-end, visit our website at vanguard.com/performance.) Note, too, that both investment returns and principal value can fluctuate widely, so an investor’s shares, when sold, could be worth more or less than their original cost. The returns shown do not reflect taxes that a shareholder would pay on fund distributions or on the sale of fund shares.
Cumulative Performance: November 15, 2018, Through October 31, 2022
Initial Investment of $10,000
| | | Average Annual Total Returns
Periods Ended October 31, 2022 | |
| | | One
Year | Since
Inception
(11/15/2018) | Final Value
of a $10,000
Investment |
 | Global Credit Bond Fund Investor Shares | -16.15% | 1.23% | $10,496 |
 | Bloomberg Global Aggregate Credit Index (USD Hedged) | -16.91 | 0.06 | 10,025 |
“Since Inception” performance is calculated from the Investor Shares’ inception date for both the fund and its comparative standard(s).
| | | | |
| | | One
Year | Since
Inception
(11/15/2018) | Final Value
of a $50,000
Investment |
| Global Credit Bond Fund Admiral Shares | -16.02% | 1.35% | $52,717 |
| Bloomberg Global Aggregate Credit Index (USD Hedged) | -16.91 | 0.06 | 50,126 |
“Since Inception” performance is calculated from the Admiral Shares’ inception date for both the fund and its comparative standard(s).
See Financial Highlights for dividend and capital gains information.
| |
| United States | 61.3% |
| Germany | 8.8 |
| United Kingdom | 7.3 |
| Canada | 2.6 |
| Australia | 1.8 |
| France | 1.6 |
| Netherlands | 1.5 |
| Switzerland | 1.4 |
| Mexico | 1.3 |
| Belgium | 1.0 |
| Other | 11.4 |
The table reflects the fund’s investments, except for short-term investments and derivatives.
The fund files its complete schedule of portfolio holdings with the Securities and Exchange Commission (SEC) for the first and third quarters of each fiscal year as an exhibit to its reports on Form N-PORT. The fund’s Form N-PORT reports are available on the SEC’s website at www.sec.gov.
| | | | Coupon | Maturity
Date | Face
Amount
($000) | Market
Value•
($000) |
| U.S. Government and Agency Obligations (15.9%) |
| | United States Treasury Note/Bond | 1.750% | 8/15/41 | 50 | 33 |
| | United States Treasury Note/Bond | 2.375% | 2/15/42 | 600 | 438 |
| | United States Treasury Note/Bond | 2.625% | 7/31/29 | 80 | 73 |
| 1,2,3 | United States Treasury Note/Bond | 2.750% | 5/15/25–8/15/32 | 6,197 | 5,789 |
| | United States Treasury Note/Bond | 2.875% | 6/15/25–5/15/32 | 2,860 | 2,746 |
| 3 | United States Treasury Note/Bond | 3.000% | 7/31/24–8/15/52 | 13,244 | 12,333 |
| | United States Treasury Note/Bond | 3.125% | 8/15/25–8/31/29 | 2,103 | 2,021 |
| | United States Treasury Note/Bond | 3.250% | 5/15/42 | 168 | 142 |
| | United States Treasury Note/Bond | 3.375% | 8/15/42 | 2,200 | 1,898 |
| 3 | United States Treasury Note/Bond | 3.500% | 9/15/25 | 4,902 | 4,779 |
| | United States Treasury Note/Bond | 3.875% | 9/30/29 | 3,295 | 3,236 |
| 3 | United States Treasury Note/Bond | 4.125% | 9/30/27 | 3,849 | 3,827 |
| | United States Treasury Note/Bond | 4.250% | 9/30/24 | 3,522 | 3,504 |
| | United States Treasury Note/Bond | 4.375% | 2/15/38 | 1,150 | 1,169 |
| Total U.S. Government and Agency Obligations (Cost $43,027) | 41,988 |
| Asset-Backed/Commercial Mortgage-Backed Securities (0.4%) |
| United States (0.4%) |
| 4,5 | BAMLL Commercial Mortgage Securities Trust Series 2019-BPR | 3.112% | 11/5/32 | 100 | 92 |
| 5 | CD Mortgage Trust Series 2018-CD7 | 4.850% | 8/15/51 | 50 | 44 |
| 5 | COMM Mortgage Trust Series 2015-CR27 | 4.449% | 10/10/48 | 135 | 120 |
| 4,5 | EDvestinU Private Education Loan Issue No. 1 LLC Series 2019-A | 3.580% | 11/25/38 | 37 | 34 |
| 4,5 | Ford Credit Auto Owner Trust Series 2022-1 | 4.670% | 11/15/34 | 100 | 95 |
| 4,5 | Navient Private Education Loan Trust Series 2018-BA | 3.610% | 12/15/59 | 299 | 289 |
| 4,5 | Progress Residential Trust Series 2022-SFR5 | 4.896% | 6/17/39 | 100 | 94 |
| 5 | Santander Drive Auto Receivables Trust Series 2022-3 | 4.130% | 8/16/27 | 50 | 49 |
| 5 | Santander Drive Auto Receivables Trust Series 2022-3 | 4.490% | 8/15/29 | 35 | 32 |
| 4,5 | Santander Retail Auto Lease Trust Series 2020-A | 2.520% | 11/20/24 | 20 | 20 |
| 4,5 | Santander Retail Auto Lease Trust Series 2020-B | 1.980% | 10/20/25 | 100 | 94 |
| 4,5 | Toyota Auto Loan Extended Note Trust Series 2022-1A | 3.820% | 4/25/35 | 40 | 37 |
| Total Asset-Backed/Commercial Mortgage-Backed Securities (Cost $1,060) | 1,000 |
| Corporate Bonds (69.6%) |
| Australia (1.8%) |
| 5,6 | Aurizon Finance Pty. Ltd. | 3.000% | 3/9/28 | 1,000 | 528 |
| | | | Coupon | Maturity
Date | Face
Amount
($000) | Market
Value•
($000) |
| 4 | Australia & New Zealand Banking Group Ltd. | 2.950% | 7/22/30 | 550 | 490 |
| 4 | CSL Finance plc | 4.750% | 4/27/52 | 370 | 310 |
| 6,7 | Macquarie Bank Ltd., 3M Australian Bank Bill Rate + 2.900% | 5.333% | 5/28/30 | 1,250 | 806 |
| 5,6 | Pacific National Finance Pty. Ltd. | 5.400% | 5/12/27 | 1,190 | 729 |
| 5,6 | Qantas Airways Ltd. | 4.750% | 10/12/26 | 1,100 | 676 |
| | Rio Tinto Finance USA Ltd. | 5.200% | 11/2/40 | 250 | 238 |
| | Westpac Banking Corp. | 1.953% | 11/20/28 | 200 | 166 |
| 5,6 | Westpac Banking Corp. | 4.334% | 8/16/29 | 500 | 313 |
| 5 | Westpac Banking Corp. | 2.894% | 2/4/30 | 500 | 457 |
| | Westpac Banking Corp. | 2.963% | 11/16/40 | 75 | 45 |
| | | | | | | 4,758 |
| Austria (0.4%) |
| 8 | JAB Holdings BV | 1.000% | 12/20/27 | 1,100 | 906 |
| 8 | JAB Holdings BV | 2.250% | 12/19/39 | 100 | 59 |
| | | | | | | 965 |
| Belgium (1.0%) |
| 8 | Aliaxis Finance SA | 0.875% | 11/8/28 | 700 | 496 |
| 5 | Anheuser-Busch Cos. LLC | 4.700% | 2/1/36 | 230 | 208 |
| 5 | Anheuser-Busch Cos. LLC | 4.900% | 2/1/46 | 25 | 22 |
| | Anheuser-Busch InBev Finance Inc. | 4.625% | 2/1/44 | 468 | 390 |
| 5,9 | Anheuser-Busch InBev SA/NV | 2.850% | 5/25/37 | 800 | 676 |
| 5,8 | Anheuser-Busch InBev SA/NV | 3.700% | 4/2/40 | 100 | 91 |
| | Anheuser-Busch InBev Worldwide Inc. | 5.875% | 6/15/35 | 240 | 238 |
| | Anheuser-Busch InBev Worldwide Inc. | 5.450% | 1/23/39 | 244 | 230 |
| | Anheuser-Busch InBev Worldwide Inc. | 3.750% | 7/15/42 | 89 | 67 |
| | Anheuser-Busch InBev Worldwide Inc. | 4.600% | 4/15/48 | 175 | 145 |
| | Anheuser-Busch InBev Worldwide Inc. | 4.750% | 4/15/58 | 89 | 72 |
| | | | | | | 2,635 |
| Bermuda (0.1%) |
| | Triton Container International Ltd. | 3.250% | 3/15/32 | 260 | 186 |
| Brazil (0.1%) |
| 5 | Embraer Netherlands Finance BV | 6.950% | 1/17/28 | 350 | 331 |
| Canada (1.6%) |
| 4 | 1011778 BC ULC | 3.875% | 1/15/28 | 7 | 6 |
| 4 | 1011778 BC ULC | 4.375% | 1/15/28 | 38 | 33 |
| 4 | 1375209 BC Ltd. | 9.000% | 1/30/28 | 1 | 1 |
| 4 | Air Canada | 3.875% | 8/15/26 | 20 | 18 |
| | Bank of Nova Scotia | 3.450% | 4/11/25 | 270 | 257 |
| | Canadian National Railway Co. | 3.850% | 8/5/32 | 200 | 181 |
| | Canadian National Railway Co. | 4.400% | 8/5/52 | 230 | 191 |
| | Canadian Natural Resources Ltd. | 2.950% | 7/15/30 | 100 | 82 |
| | Canadian Natural Resources Ltd. | 6.250% | 3/15/38 | 290 | 279 |
| | Canadian Pacific Railway Co. | 2.450% | 12/2/31 | 100 | 79 |
| | Canadian Pacific Railway Co. | 4.800% | 8/1/45 | 220 | 188 |
| | Cenovus Energy Inc. | 6.750% | 11/15/39 | 50 | 49 |
| | Cenovus Energy Inc. | 5.400% | 6/15/47 | 100 | 85 |
| | Enbridge Inc. | 3.125% | 11/15/29 | 42 | 36 |
| 4 | Hudbay Minerals Inc. | 4.500% | 4/1/26 | 35 | 31 |
| 4 | MEG Energy Corp. | 5.875% | 2/1/29 | 5 | 5 |
| | Nutrien Ltd. | 4.200% | 4/1/29 | 125 | 115 |
| | Nutrien Ltd. | 4.125% | 3/15/35 | 70 | 59 |
| 4 | Parkland Corp. | 4.500% | 10/1/29 | 20 | 17 |
| 4 | Rogers Communications Inc. | 3.800% | 3/15/32 | 85 | 72 |
| | | | Coupon | Maturity
Date | Face
Amount
($000) | Market
Value•
($000) |
| 4 | Rogers Communications Inc. | 4.550% | 3/15/52 | 80 | 62 |
| 5 | Royal Bank of Canada | 3.970% | 7/26/24 | 250 | 244 |
| | Suncor Energy Inc. | 6.500% | 6/15/38 | 145 | 143 |
| | Suncor Energy Inc. | 3.750% | 3/4/51 | 175 | 119 |
| 10 | Toronto-Dominion Bank | 2.850% | 3/8/24 | 1,650 | 1,175 |
| | TransCanada PipeLines Ltd. | 2.500% | 10/12/31 | 150 | 115 |
| | TransCanada PipeLines Ltd. | 4.625% | 3/1/34 | 398 | 348 |
| | TransCanada PipeLines Ltd. | 6.200% | 10/15/37 | 120 | 117 |
| 4 | Videotron Ltd. | 3.625% | 6/15/29 | 20 | 17 |
| | | | | | | 4,124 |
| Chile (0.1%) |
| 4 | Antofagasta plc | 5.625% | 5/13/32 | 350 | 323 |
| Denmark (0.1%) |
| 4 | Danske Bank A/S | 1.171% | 12/8/23 | 300 | 298 |
| France (1.6%) |
| 5,8 | AXA SA | 3.875% | Perpetual | 1,188 | 1,115 |
| 5,8 | Credit Mutuel Arkea SA | 1.375% | 1/17/25 | 1,000 | 942 |
| 5,8 | Engie SA | 2.000% | 9/28/37 | 800 | 559 |
| 4 | SPCM SA | 3.125% | 3/15/27 | 10 | 9 |
| 4 | SPCM SA | 3.375% | 3/15/30 | 22 | 18 |
| 9 | Westfield America Management Ltd. | 2.125% | 3/30/25 | 1,637 | 1,641 |
| | | | | | | 4,284 |
| Germany (3.4%) |
| 5,8 | Aroundtown SA | 0.000% | 7/16/26 | 700 | 515 |
| 5,8 | Aroundtown SA | 2.875% | Perpetual | 110 | 51 |
| 8 | ATF Netherlands BV | 3.750% | Perpetual | 500 | 360 |
| 5 | Deutsche Bank AG | 2.222% | 9/18/24 | 150 | 142 |
| 4 | Mercedes-Benz Finance North America LLC | 0.750% | 3/1/24 | 465 | 438 |
| 5,8 | RWE AG | 2.125% | 5/24/26 | 1,100 | 1,026 |
| 5,8 | RWE AG | 2.750% | 5/24/30 | 900 | 798 |
| 4 | Siemens Financieringsmaatschappij NV | 1.200% | 3/11/26 | 520 | 454 |
| 5,8 | Siemens Financieringsmaatschappij NV | 0.500% | 2/20/32 | 500 | 377 |
| 5,6 | Volkswagen Financial Services Australia Pty. Ltd. | 3.100% | 4/17/23 | 500 | 318 |
| 5,9 | Volkswagen Financial Services NV | 1.125% | 9/18/23 | 2,700 | 2,984 |
| 4 | Volkswagen Group of America Finance LLC | 1.625% | 11/24/27 | 150 | 120 |
| 5,8 | Volkswagen Leasing GmbH | 0.375% | 7/20/26 | 675 | 585 |
| 5,8 | Vonovia SE | 0.000% | 12/1/25 | 600 | 511 |
| 8 | Vonovia SE | 1.500% | 6/14/41 | 500 | 256 |
| | | | | | | 8,935 |
| India (0.2%) |
| 4 | JSW Infrastructure Ltd. | 4.950% | 1/21/29 | 585 | 437 |
| Indonesia (0.2%) |
| 4 | Freeport Indonesia PT | 6.200% | 4/14/52 | 300 | 224 |
| | Indofood CBP Sukses Makmur Tbk. PT | 4.745% | 6/9/51 | 375 | 234 |
| | | | | | | 458 |
| Ireland (0.4%) |
| | AerCap Ireland Capital DAC | 4.500% | 9/15/23 | 455 | 447 |
| | AerCap Ireland Capital DAC | 1.150% | 10/29/23 | 300 | 284 |
| | AerCap Ireland Capital DAC | 3.850% | 10/29/41 | 150 | 100 |
| 4 | Avolon Holdings Funding Ltd. | 2.125% | 2/21/26 | 150 | 123 |
| | | | | | | 954 |
| | | | Coupon | Maturity
Date | Face
Amount
($000) | Market
Value•
($000) |
| Italy (0.3%) |
| 5,8 | Enel Finance International NV | 0.375% | 5/28/29 | 1,100 | 819 |
| Japan (0.5%) |
| | Honda Motor Co. Ltd. | 2.967% | 3/10/32 | 160 | 133 |
| 4 | Nissan Motor Co. Ltd. | 3.043% | 9/15/23 | 450 | 437 |
| | Nomura Holdings Inc. | 2.710% | 1/22/29 | 250 | 201 |
| | Sumitomo Mitsui Financial Group Inc. | 3.544% | 1/17/28 | 130 | 116 |
| 8 | Takeda Pharmaceutical Co. Ltd. | 2.000% | 7/9/40 | 200 | 141 |
| | Takeda Pharmaceutical Co. Ltd. | 3.025% | 7/9/40 | 100 | 69 |
| | Takeda Pharmaceutical Co. Ltd. | 3.175% | 7/9/50 | 100 | 64 |
| | Takeda Pharmaceutical Co. Ltd. | 3.375% | 7/9/60 | 200 | 124 |
| | | | | | | 1,285 |
| Kazakhstan (0.1%) |
| 11 | Kazakhstan Temir Zholy National Co. JSC | 3.250% | 12/5/23 | 275 | 254 |
| Luxembourg (0.7%) |
| 5,8 | Blackstone Property Partners Europe Holdings Sarl | 2.000% | 2/15/24 | 700 | 646 |
| 5,8 | Blackstone Property Partners Europe Holdings Sarl | 1.000% | 10/20/26 | 775 | 615 |
| 5,8 | Prologis International Funding II SA | 1.625% | 6/17/32 | 976 | 702 |
| | | | | | | 1,963 |
| Macao (0.0%) |
| 4 | Studio City Co. Ltd. | 7.000% | 2/15/27 | 10 | 8 |
| Malaysia (0.1%) |
| 5 | Petronas Capital Ltd. | 3.500% | 4/21/30 | 445 | 396 |
| Netherlands (1.5%) |
| 4 | ABN AMRO Bank NV | 2.470% | 12/13/29 | 100 | 77 |
| 5,8 | Cooperatieve Rabobank UA | 0.625% | 2/25/33 | 500 | 344 |
| | Cooperatieve Rabobank UA | 5.250% | 8/4/45 | 250 | 204 |
| 5,8 | Koninklijke DSM NV | 0.625% | 6/23/32 | 600 | 432 |
| 5,9 | NIBC Bank NV | 3.125% | 11/15/23 | 2,300 | 2,561 |
| | Shell International Finance BV | 2.375% | 11/7/29 | 190 | 160 |
| | Shell International Finance BV | 2.750% | 4/6/30 | 170 | 146 |
| | Shell International Finance BV | 4.375% | 5/11/45 | 70 | 58 |
| | Shell International Finance BV | 3.750% | 9/12/46 | 141 | 105 |
| 4 | VZ Secured Financing BV | 5.000% | 1/15/32 | 15 | 12 |
| | | | | | | 4,099 |
| Norway (1.0%) |
| 5,8 | DNB Bank ASA | 1.625% | 5/31/26 | 2,719 | 2,549 |
| Poland (0.0%) |
| 4 | Canpack SA | 3.875% | 11/15/29 | 37 | 29 |
| Spain (0.4%) |
| | Banco Santander SA | 5.147% | 8/18/25 | 400 | 385 |
| | Banco Santander SA | 5.294% | 8/18/27 | 300 | 277 |
| | Telefonica Emisiones SA | 4.103% | 3/8/27 | 235 | 215 |
| | Telefonica Emisiones SA | 4.665% | 3/6/38 | 250 | 189 |
| | | | | | | 1,066 |
| Sweden (0.2%) |
| 8 | Svenska Handelsbanken AB | 0.500% | 2/18/30 | 600 | 453 |
| Switzerland (1.4%) |
| 5,8 | Cloverie plc for Zurich Insurance Co. Ltd. | 1.750% | 9/16/24 | 1,138 | 1,086 |
| | | | Coupon | Maturity
Date | Face
Amount
($000) | Market
Value•
($000) |
| | Credit Suisse AG | 4.750% | 8/9/24 | 700 | 665 |
| 8 | Credit Suisse Group AG | 2.125% | 10/13/26 | 641 | 562 |
| | Novartis Capital Corp. | 2.750% | 8/14/50 | 60 | 39 |
| 4 | Roche Holdings Inc. | 2.076% | 12/13/31 | 215 | 170 |
| | Tyco Electronics Group SA | 2.500% | 2/4/32 | 150 | 120 |
| 5,8 | Wizz Air Finance Co. BV | 1.350% | 1/19/24 | 700 | 645 |
| 5,9 | Zurich Finance Ireland Designated Activity Co. | 5.125% | 11/23/52 | 500 | 507 |
| | | | | | | 3,794 |
| Thailand (0.2%) |
| 4 | GC Treasury Center Co. Ltd. | 4.400% | 3/30/32 | 590 | 474 |
| United Arab Emirates (0.2%) |
| 4 | MDGH GMTN RSC Ltd. | 5.500% | 4/28/33 | 625 | 621 |
| United Kingdom (6.2%) |
| | AstraZeneca Finance LLC | 1.200% | 5/28/26 | 75 | 65 |
| | AstraZeneca Finance LLC | 1.750% | 5/28/28 | 115 | 96 |
| | AstraZeneca plc | 4.000% | 1/17/29 | 104 | 98 |
| | AstraZeneca plc | 1.375% | 8/6/30 | 100 | 77 |
| | AstraZeneca plc | 4.000% | 9/18/42 | 160 | 132 |
| | Barclays plc | 4.375% | 9/11/24 | 250 | 238 |
| | Barclays plc | 1.007% | 12/10/24 | 240 | 225 |
| 5 | Barclays plc | 2.852% | 5/7/26 | 200 | 180 |
| | Barclays plc | 5.304% | 8/9/26 | 200 | 190 |
| 12 | Barclays plc | 7.325% | 11/2/26 | 200 | 200 |
| 12 | Barclays plc | 7.385% | 11/2/28 | 200 | 199 |
| 12 | Barclays plc | 7.437% | 11/2/33 | 220 | 219 |
| | BAT Capital Corp. | 4.390% | 8/15/37 | 200 | 145 |
| | BAT Capital Corp. | 4.540% | 8/15/47 | 135 | 87 |
| 5,9 | BG Energy Capital plc | 5.000% | 11/4/36 | 300 | 315 |
| | BP Capital Markets plc | 3.279% | 9/19/27 | 23 | 21 |
| 8 | BP Capital Markets plc | 0.831% | 11/8/27 | 1,800 | 1,552 |
| 5,9 | Centrica plc | 4.375% | 3/13/29 | 500 | 513 |
| 8 | CK Hutchison Europe Finance 18 Ltd. | 2.000% | 4/13/30 | 1,100 | 907 |
| 9 | CK Hutchison Group Telecom Finance SA | 2.625% | 10/17/34 | 200 | 149 |
| | Diageo Capital plc | 5.200% | 10/24/25 | 250 | 251 |
| 9 | Diageo Finance plc | 2.750% | 6/8/38 | 500 | 429 |
| 8 | Heathrow Funding Ltd. | 1.500% | 10/12/25 | 1,200 | 1,085 |
| | HSBC Holdings plc | 0.976% | 5/24/25 | 500 | 455 |
| | HSBC Holdings plc | 2.999% | 3/10/26 | 400 | 363 |
| 5 | HSBC Holdings plc | 2.099% | 6/4/26 | 255 | 224 |
| | HSBC Holdings plc | 1.589% | 5/24/27 | 210 | 173 |
| 12 | HSBC Holdings plc | 7.390% | 11/3/28 | 215 | 215 |
| 8 | HSBC Holdings plc | 0.641% | 9/24/29 | 500 | 387 |
| 5 | HSBC Holdings plc | 6.500% | 9/15/37 | 125 | 110 |
| 5,9 | HSBC Holdings plc | 6.000% | 3/29/40 | 500 | 504 |
| | HSBC Holdings plc | 5.250% | 3/14/44 | 200 | 155 |
| 4 | INEOS Quattro Finance 2 plc | 3.375% | 1/15/26 | 10 | 8 |
| 5,8 | Linde plc | 1.000% | 9/30/51 | 200 | 100 |
| | Lloyds Banking Group plc | 0.695% | 5/11/24 | 405 | 393 |
| 5 | Lloyds Banking Group plc | 3.870% | 7/9/25 | 275 | 262 |
| | Lloyds Banking Group plc | 4.716% | 8/11/26 | 200 | 189 |
| 5,8 | National Grid plc | 2.179% | 6/30/26 | 1,100 | 1,015 |
| 5 | NatWest Group plc | 4.269% | 3/22/25 | 270 | 260 |
| 5 | NatWest Group plc | 3.073% | 5/22/28 | 225 | 191 |
| 5 | NatWest Group plc | 4.892% | 5/18/29 | 200 | 178 |
| | | | Coupon | Maturity
Date | Face
Amount
($000) | Market
Value•
($000) |
| | RELX Capital Inc. | 3.000% | 5/22/30 | 100 | 83 |
| 4 | Rolls-Royce plc | 5.750% | 10/15/27 | 45 | 41 |
| 9 | Rothesay Life plc | 8.000% | 10/30/25 | 700 | 820 |
| 9 | Scottish Widows Ltd. | 5.500% | 6/16/23 | 1,475 | 1,688 |
| 9 | Utmost Group plc | 4.000% | 12/15/31 | 300 | 242 |
| | Vodafone Group plc | 6.150% | 2/27/37 | 220 | 208 |
| 5,8 | Vodafone Group plc | 2.500% | 5/24/39 | 500 | 370 |
| | Vodafone Group plc | 5.250% | 5/30/48 | 340 | 277 |
| | Vodafone Group plc | 4.125% | 6/4/81 | 115 | 82 |
| | | | | | | 16,366 |
| United States (45.8%) |
| | Abbott Laboratories | 4.900% | 11/30/46 | 125 | 116 |
| | AbbVie Inc. | 2.600% | 11/21/24 | 120 | 114 |
| | AbbVie Inc. | 3.800% | 3/15/25 | 190 | 184 |
| | AbbVie Inc. | 3.600% | 5/14/25 | 39 | 37 |
| | AbbVie Inc. | 4.050% | 11/21/39 | 1,008 | 812 |
| | AbbVie Inc. | 4.250% | 11/21/49 | 240 | 186 |
| 4 | Advanced Drainage Systems Inc. | 6.375% | 6/15/30 | 5 | 5 |
| | Advanced Micro Devices Inc. | 4.393% | 6/1/52 | 160 | 129 |
| 5 | AdventHealth Obligated Group | 2.795% | 11/15/51 | 300 | 179 |
| | AEP Transmission Co. LLC | 3.750% | 12/1/47 | 130 | 93 |
| | AEP Transmission Co. LLC | 4.250% | 9/15/48 | 100 | 77 |
| 5 | AEP Transmission Co. LLC | 3.650% | 4/1/50 | 70 | 49 |
| 5 | AEP Transmission Co. LLC | 2.750% | 8/15/51 | 100 | 59 |
| | Aflac Inc. | 1.125% | 3/15/26 | 55 | 48 |
| | Aflac Inc. | 4.750% | 1/15/49 | 200 | 165 |
| | Agree LP | 2.000% | 6/15/28 | 50 | 40 |
| | Agree LP | 2.600% | 6/15/33 | 60 | 43 |
| 5 | Air Lease Corp. | 2.875% | 1/15/26 | 125 | 111 |
| 5 | Air Lease Corp. | 3.750% | 6/1/26 | 100 | 91 |
| | Air Products and Chemicals Inc. | 2.700% | 5/15/40 | 125 | 87 |
| | Alabama Power Co. | 4.150% | 8/15/44 | 50 | 39 |
| | Albemarle Corp. | 4.650% | 6/1/27 | 50 | 47 |
| | Albemarle Corp. | 5.050% | 6/1/32 | 80 | 73 |
| | Alexandria Real Estate Equities Inc. | 3.000% | 5/18/51 | 130 | 75 |
| 4 | Alliant Holdings Intermediate LLC | 6.750% | 10/15/27 | 12 | 11 |
| 5 | Allina Health System | 3.887% | 4/15/49 | 130 | 97 |
| 4 | Allison Transmission Inc. | 4.750% | 10/1/27 | 24 | 22 |
| | Ally Financial Inc. | 1.450% | 10/2/23 | 120 | 115 |
| | Altria Group Inc. | 4.400% | 2/14/26 | 101 | 97 |
| | Altria Group Inc. | 4.800% | 2/14/29 | 135 | 124 |
| | Altria Group Inc. | 3.400% | 5/6/30 | 25 | 20 |
| | Altria Group Inc. | 3.400% | 2/4/41 | 70 | 43 |
| | Altria Group Inc. | 5.375% | 1/31/44 | 100 | 80 |
| | Altria Group Inc. | 5.950% | 2/14/49 | 100 | 81 |
| | Altria Group Inc. | 4.450% | 5/6/50 | 40 | 26 |
| | Amazon.com Inc. | 2.500% | 6/3/50 | 115 | 68 |
| | Amazon.com Inc. | 3.950% | 4/13/52 | 85 | 67 |
| | Ameren Corp. | 2.500% | 9/15/24 | 100 | 95 |
| | Ameren Corp. | 3.500% | 1/15/31 | 120 | 102 |
| | Ameren Illinois Co. | 1.550% | 11/15/30 | 70 | 53 |
| | Ameren Illinois Co. | 4.150% | 3/15/46 | 75 | 59 |
| 4 | American Airlines Inc. | 11.750% | 7/15/25 | 5 | 5 |
| 4 | American Airlines Inc. | 5.500% | 4/20/26 | 25 | 24 |
| 4 | American Airlines Inc. | 5.750% | 4/20/29 | 60 | 55 |
| | | | Coupon | Maturity
Date | Face
Amount
($000) | Market
Value•
($000) |
| 4 | American Builders & Contractors Supply Co. Inc. | 3.875% | 11/15/29 | 10 | 8 |
| | American Electric Power Co. Inc. | 2.031% | 3/15/24 | 100 | 95 |
| | American Express Co. | 3.950% | 8/1/25 | 600 | 576 |
| 12 | American Express Co. | 5.850% | 11/5/27 | 300 | 300 |
| | American Express Co. | 4.420% | 8/3/33 | 50 | 44 |
| 5 | American Honda Finance Corp. | 1.200% | 7/8/25 | 66 | 60 |
| | American International Group Inc. | 4.800% | 7/10/45 | 32 | 26 |
| | American International Group Inc. | 4.375% | 6/30/50 | 105 | 82 |
| | American Tower Corp. | 3.375% | 10/15/26 | 170 | 154 |
| | American Tower Corp. | 3.600% | 1/15/28 | 100 | 89 |
| | AmerisourceBergen Corp. | 2.700% | 3/15/31 | 230 | 183 |
| | AmerisourceBergen Corp. | 4.300% | 12/15/47 | 80 | 62 |
| | Amgen Inc. | 2.200% | 2/21/27 | 125 | 111 |
| | Amgen Inc. | 3.350% | 2/22/32 | 240 | 204 |
| | Amgen Inc. | 5.150% | 11/15/41 | 61 | 54 |
| | Amgen Inc. | 3.375% | 2/21/50 | 340 | 227 |
| | Amgen Inc. | 4.663% | 6/15/51 | 70 | 58 |
| | Amgen Inc. | 2.770% | 9/1/53 | 147 | 84 |
| | Amgen Inc. | 4.400% | 2/22/62 | 140 | 106 |
| 4 | Antero Resources Corp. | 5.375% | 3/1/30 | 16 | 15 |
| | Aon Global Ltd. | 4.600% | 6/14/44 | 35 | 28 |
| | Aon Global Ltd. | 4.750% | 5/15/45 | 70 | 57 |
| 5 | Appalachian Power Co. | 4.500% | 8/1/32 | 410 | 367 |
| 5 | Appalachian Power Co. | 4.500% | 3/1/49 | 30 | 23 |
| | Apple Inc. | 3.250% | 8/8/29 | 520 | 473 |
| | Apple Inc. | 3.350% | 8/8/32 | 190 | 168 |
| | Apple Inc. | 2.375% | 2/8/41 | 175 | 117 |
| | Apple Inc. | 3.850% | 8/4/46 | 196 | 157 |
| | Apple Inc. | 2.650% | 5/11/50 | 70 | 44 |
| | Apple Inc. | 2.700% | 8/5/51 | 225 | 141 |
| | Apple Inc. | 4.100% | 8/8/62 | 250 | 194 |
| 4 | Aramark Services Inc. | 6.375% | 5/1/25 | 10 | 10 |
| 4 | Arconic Corp. | 6.000% | 5/15/25 | 7 | 7 |
| 4 | Arconic Corp. | 6.125% | 2/15/28 | 15 | 14 |
| 4 | Ardagh Packaging Finance plc | 5.250% | 4/30/25 | 14 | 13 |
| | Asbury Automotive Group Inc. | 4.500% | 3/1/28 | 46 | 40 |
| 4 | Asbury Automotive Group Inc. | 5.000% | 2/15/32 | 5 | 4 |
| 4 | ASP Unifrax Holdings Inc. | 5.250% | 9/30/28 | 15 | 12 |
| | AT&T Inc. | 3.800% | 2/15/27 | 140 | 131 |
| | AT&T Inc. | 4.350% | 3/1/29 | 273 | 253 |
| 5 | AT&T Inc. | 4.300% | 2/15/30 | 56 | 51 |
| | AT&T Inc. | 4.500% | 5/15/35 | 130 | 112 |
| | AT&T Inc. | 4.900% | 8/15/37 | 55 | 48 |
| | AT&T Inc. | 3.500% | 9/15/53 | 235 | 151 |
| | AT&T Inc. | 3.550% | 9/15/55 | 213 | 135 |
| | AT&T Inc. | 3.800% | 12/1/57 | 111 | 73 |
| | AT&T Inc. | 3.650% | 9/15/59 | 130 | 82 |
| 4 | Athene Global Funding | 0.950% | 1/8/24 | 195 | 184 |
| 5,8 | Athene Global Funding | 1.125% | 9/2/25 | 2,929 | 2,631 |
| 4 | Avient Corp. | 7.125% | 8/1/30 | 15 | 14 |
| 4 | Axalta Coating Systems LLC | 4.750% | 6/15/27 | 10 | 9 |
| | Ball Corp. | 2.875% | 8/15/30 | 12 | 9 |
| | Ball Corp. | 3.125% | 9/15/31 | 15 | 12 |
| 5 | Bank of America Corp. | 3.864% | 7/23/24 | 115 | 113 |
| 5 | Bank of America Corp. | 0.810% | 10/24/24 | 285 | 270 |
| | | | Coupon | Maturity
Date | Face
Amount
($000) | Market
Value•
($000) |
| 5 | Bank of America Corp. | 4.000% | 1/22/25 | 75 | 72 |
| 5 | Bank of America Corp. | 0.981% | 9/25/25 | 570 | 518 |
| 5 | Bank of America Corp. | 3.366% | 1/23/26 | 239 | 225 |
| 5 | Bank of America Corp. | 1.319% | 6/19/26 | 135 | 119 |
| | Bank of America Corp. | 1.734% | 7/22/27 | 365 | 312 |
| | Bank of America Corp. | 4.948% | 7/22/28 | 140 | 134 |
| 5 | Bank of America Corp. | 3.419% | 12/20/28 | 235 | 208 |
| 5 | Bank of America Corp. | 3.194% | 7/23/30 | 165 | 138 |
| 5 | Bank of America Corp. | 2.496% | 2/13/31 | 150 | 118 |
| 5 | Bank of America Corp. | 1.898% | 7/23/31 | 115 | 85 |
| 5,8 | Bank of America Corp. | 0.654% | 10/26/31 | 600 | 436 |
| | Bank of America Corp. | 2.687% | 4/22/32 | 200 | 154 |
| | Bank of America Corp. | 5.015% | 7/22/33 | 250 | 229 |
| 5 | Bank of America Corp. | 2.676% | 6/19/41 | 170 | 108 |
| | Bank of America Corp. | 3.311% | 4/22/42 | 60 | 41 |
| 5 | Bank of America Corp. | 4.875% | 4/1/44 | 75 | 62 |
| 5 | Bank of America Corp. | 3.946% | 1/23/49 | 35 | 25 |
| 5 | Bank of America Corp. | 4.083% | 3/20/51 | 125 | 93 |
| 5 | Bank of America Corp. | 2.831% | 10/24/51 | 70 | 41 |
| | Bank of New York Mellon Corp. | 4.414% | 7/24/26 | 300 | 291 |
| | Bank of New York Mellon Corp. | 5.802% | 10/25/28 | 250 | 252 |
| | Bank of New York Mellon Corp. | 4.596% | 7/26/30 | 200 | 187 |
| | Bank of New York Mellon Corp. | 5.834% | 10/25/33 | 500 | 501 |
| | Bath & Body Works Inc. | 7.500% | 6/15/29 | 15 | 14 |
| 4 | Bausch Health Cos. Inc. | 11.000% | 9/30/28 | 2 | 2 |
| | Baxter International Inc. | 3.132% | 12/1/51 | 135 | 82 |
| | Becton Dickinson & Co. | 4.685% | 12/15/44 | 36 | 30 |
| | Becton Dickinson & Co. | 4.669% | 6/6/47 | 40 | 33 |
| | Berkshire Hathaway Energy Co. | 2.850% | 5/15/51 | 100 | 60 |
| | Berkshire Hathaway Finance Corp. | 2.875% | 3/15/32 | 100 | 83 |
| | Berkshire Hathaway Finance Corp. | 4.200% | 8/15/48 | 45 | 36 |
| | Berkshire Hathaway Finance Corp. | 2.500% | 1/15/51 | 315 | 179 |
| | Berkshire Hathaway Finance Corp. | 3.850% | 3/15/52 | 250 | 184 |
| 9 | Berkshire Hathaway Finance Corp. | 2.625% | 6/19/59 | 400 | 287 |
| 4 | Berry Global Inc. | 4.875% | 7/15/26 | 28 | 26 |
| 5 | Beth Israel Lahey Health Inc. | 3.080% | 7/1/51 | 180 | 105 |
| 4 | Big River Steel LLC | 6.625% | 1/31/29 | 22 | 21 |
| | Boeing Co. | 2.800% | 3/1/24 | 30 | 29 |
| | Boeing Co. | 4.875% | 5/1/25 | 265 | 259 |
| | Boeing Co. | 2.750% | 2/1/26 | 125 | 113 |
| | Boeing Co. | 2.250% | 6/15/26 | 10 | 9 |
| | Boeing Co. | 5.150% | 5/1/30 | 76 | 70 |
| | Boeing Co. | 3.550% | 3/1/38 | 100 | 68 |
| | Boeing Co. | 5.705% | 5/1/40 | 160 | 139 |
| | Boeing Co. | 5.805% | 5/1/50 | 175 | 150 |
| | Boeing Co. | 5.930% | 5/1/60 | 50 | 42 |
| | Boston Properties LP | 3.250% | 1/30/31 | 300 | 239 |
| | Boston Properties LP | 2.450% | 10/1/33 | 300 | 207 |
| | Boyd Gaming Corp. | 4.750% | 12/1/27 | 30 | 27 |
| 5 | BP Capital Markets America Inc. | 3.017% | 1/16/27 | 120 | 110 |
| | BP Capital Markets America Inc. | 4.234% | 11/6/28 | 300 | 282 |
| | BP Capital Markets America Inc. | 2.721% | 1/12/32 | 110 | 89 |
| | BP Capital Markets America Inc. | 2.939% | 6/4/51 | 120 | 74 |
| | BP Capital Markets America Inc. | 3.001% | 3/17/52 | 50 | 31 |
| | Bristol-Myers Squibb Co. | 3.400% | 7/26/29 | 718 | 652 |
| | | | Coupon | Maturity
Date | Face
Amount
($000) | Market
Value•
($000) |
| | Bristol-Myers Squibb Co. | 1.450% | 11/13/30 | 15 | 11 |
| | Bristol-Myers Squibb Co. | 2.950% | 3/15/32 | 150 | 127 |
| 8 | Bristol-Myers Squibb Co. | 1.750% | 5/15/35 | 400 | 313 |
| | Bristol-Myers Squibb Co. | 2.550% | 11/13/50 | 70 | 42 |
| 4 | Broadcom Inc. | 1.950% | 2/15/28 | 50 | 41 |
| | Broadcom Inc. | 5.000% | 4/15/30 | 120 | 111 |
| 4 | Broadcom Inc. | 3.137% | 11/15/35 | 360 | 250 |
| 4 | Broadcom Inc. | 3.187% | 11/15/36 | 145 | 99 |
| 4 | Broadcom Inc. | 3.500% | 2/15/41 | 60 | 40 |
| | Burlington Northern Santa Fe LLC | 5.750% | 5/1/40 | 325 | 321 |
| 4 | Cable One Inc. | 4.000% | 11/15/30 | 20 | 16 |
| 4 | Caesars Resort Collection LLC | 5.750% | 7/1/25 | 17 | 17 |
| 4 | Calpine Corp. | 5.125% | 3/15/28 | 25 | 22 |
| | Camden Property Trust | 3.350% | 11/1/49 | 110 | 72 |
| 4 | Camelot Return Merger Sub Inc. | 8.750% | 8/1/28 | 30 | 25 |
| 4 | Cameron LNG LLC | 3.701% | 1/15/39 | 180 | 135 |
| | Campbell Soup Co. | 2.375% | 4/24/30 | 468 | 375 |
| | Capital One Financial Corp. | 2.618% | 11/2/32 | 175 | 128 |
| 5 | Capital One NA | 2.280% | 1/28/26 | 300 | 275 |
| 4 | Cargill Inc. | 4.875% | 10/10/25 | 95 | 94 |
| 4 | Cargill Inc. | 5.125% | 10/11/32 | 65 | 63 |
| 4 | Cargo Aircraft Management Inc. | 4.750% | 2/1/28 | 10 | 9 |
| 4 | Carnival Corp. | 5.750% | 3/1/27 | 45 | 31 |
| 4 | Carnival Corp. | 4.000% | 8/1/28 | 25 | 20 |
| 4 | Carnival Holdings Bermuda Ltd. | 10.375% | 5/1/28 | 5 | 5 |
| | Carrier Global Corp. | 2.700% | 2/15/31 | 350 | 280 |
| | Carrier Global Corp. | 3.377% | 4/5/40 | 100 | 71 |
| | Cboe Global Markets Inc. | 1.625% | 12/15/30 | 92 | 69 |
| 4 | CCO Holdings LLC | 5.000% | 2/1/28 | 20 | 18 |
| 4 | CCO Holdings LLC | 6.375% | 9/1/29 | 45 | 42 |
| 4 | CCO Holdings LLC | 4.750% | 3/1/30 | 45 | 37 |
| 4 | Cedar Fair LP | 5.500% | 5/1/25 | 32 | 32 |
| | Celanese US Holdings LLC | 5.900% | 7/5/24 | 135 | 133 |
| | Celanese US Holdings LLC | 6.050% | 3/15/25 | 45 | 44 |
| | Celanese US Holdings LLC | 6.165% | 7/15/27 | 90 | 85 |
| | Centene Corp. | 2.450% | 7/15/28 | 145 | 119 |
| | Centene Corp. | 3.000% | 10/15/30 | 14 | 11 |
| | Centene Corp. | 2.625% | 8/1/31 | 60 | 46 |
| 5 | CenterPoint Energy Houston Electric LLC | 2.350% | 4/1/31 | 30 | 24 |
| 5 | CenterPoint Energy Houston Electric LLC | 3.000% | 3/1/32 | 218 | 182 |
| 5 | CenterPoint Energy Houston Electric LLC | 4.450% | 10/1/32 | 90 | 84 |
| | CenterPoint Energy Houston Electric LLC | 3.550% | 8/1/42 | 65 | 48 |
| | CenterPoint Energy Inc. | 2.950% | 3/1/30 | 10 | 8 |
| | CenterPoint Energy Inc. | 2.650% | 6/1/31 | 190 | 151 |
| | CenterPoint Energy Resources Corp. | 1.750% | 10/1/30 | 200 | 152 |
| | CenterPoint Energy Resources Corp. | 4.100% | 9/1/47 | 50 | 38 |
| | Charles Schwab Corp. | 2.450% | 3/3/27 | 130 | 116 |
| 5 | Charter Communications Operating LLC | 4.500% | 2/1/24 | 425 | 418 |
| | Charter Communications Operating LLC | 4.200% | 3/15/28 | 70 | 63 |
| | Charter Communications Operating LLC | 5.050% | 3/30/29 | 80 | 74 |
| | Charter Communications Operating LLC | 3.500% | 3/1/42 | 330 | 207 |
| | Charter Communications Operating LLC | 6.484% | 10/23/45 | 85 | 75 |
| | Charter Communications Operating LLC | 5.375% | 5/1/47 | 285 | 220 |
| | Charter Communications Operating LLC | 4.800% | 3/1/50 | 100 | 71 |
| 4 | Chemours Co. | 4.625% | 11/15/29 | 27 | 21 |
| | | | Coupon | Maturity
Date | Face
Amount
($000) | Market
Value•
($000) |
| | Cheniere Corpus Christi Holdings LLC | 7.000% | 6/30/24 | 100 | 101 |
| | Cheniere Corpus Christi Holdings LLC | 3.700% | 11/15/29 | 70 | 61 |
| | Cheniere Energy Inc. | 4.625% | 10/15/28 | 25 | 23 |
| | Cheniere Energy Partners LP | 4.000% | 3/1/31 | 25 | 21 |
| | Cheniere Energy Partners LP | 3.250% | 1/31/32 | 10 | 8 |
| | Chevron Corp. | 2.236% | 5/11/30 | 75 | 62 |
| | Chevron USA Inc. | 3.250% | 10/15/29 | 50 | 45 |
| 5 | Children's Hospital of Philadelphia | 2.704% | 7/1/50 | 150 | 87 |
| | Chubb INA Holdings Inc. | 4.350% | 11/3/45 | 82 | 67 |
| 4 | Churchill Downs Inc. | 5.500% | 4/1/27 | 33 | 32 |
| 4 | Churchill Downs Inc. | 4.750% | 1/15/28 | 41 | 36 |
| | Cigna Corp. | 1.250% | 3/15/26 | 150 | 131 |
| | Cigna Corp. | 2.375% | 3/15/31 | 75 | 60 |
| | Cigna Corp. | 4.800% | 8/15/38 | 155 | 137 |
| | Cigna Corp. | 3.400% | 3/15/50 | 150 | 100 |
| | Citigroup Inc. | 0.981% | 5/1/25 | 210 | 194 |
| | Citigroup Inc. | 2.014% | 1/25/26 | 150 | 137 |
| | Citigroup Inc. | 3.200% | 10/21/26 | 100 | 91 |
| | Citigroup Inc. | 4.300% | 11/20/26 | 150 | 142 |
| | Citigroup Inc. | 4.450% | 9/29/27 | 125 | 116 |
| | Citigroup Inc. | 4.658% | 5/24/28 | 95 | 90 |
| 5 | Citigroup Inc. | 3.668% | 7/24/28 | 415 | 372 |
| 5 | Citigroup Inc. | 2.976% | 11/5/30 | 140 | 114 |
| | Citigroup Inc. | 2.561% | 5/1/32 | 165 | 126 |
| | Citigroup Inc. | 4.650% | 7/30/45 | 90 | 72 |
| | Citigroup Inc. | 4.650% | 7/23/48 | 55 | 44 |
| 5 | City of Hope | 4.378% | 8/15/48 | 80 | 62 |
| 4 | Civitas Resources Inc. | 5.000% | 10/15/26 | 10 | 9 |
| 4 | Clarios Global LP | 6.750% | 5/15/25 | 5 | 5 |
| 4 | Clarios Global LP | 8.500% | 5/15/27 | 22 | 22 |
| 4 | Clarivate Science Holdings Corp. | 4.875% | 7/1/29 | 25 | 21 |
| 4 | Clean Harbors Inc. | 4.875% | 7/15/27 | 17 | 16 |
| | CME Group Inc. | 2.650% | 3/15/32 | 200 | 161 |
| | CMS Energy Corp. | 3.450% | 8/15/27 | 260 | 235 |
| | CMS Energy Corp. | 4.875% | 3/1/44 | 135 | 112 |
| | CNH Industrial Capital LLC | 1.950% | 7/2/23 | 200 | 195 |
| 4 | CNX Resources Corp. | 7.375% | 1/15/31 | 5 | 5 |
| | Coca-Cola Co. | 1.000% | 3/15/28 | 150 | 123 |
| | Coca-Cola Co. | 3.000% | 3/5/51 | 50 | 34 |
| 4 | Cogent Communications Group Inc. | 7.000% | 6/15/27 | 15 | 14 |
| 4 | Colgate Energy Partners III LLC | 7.750% | 2/15/26 | 10 | 10 |
| 4 | Colgate Energy Partners III LLC | 5.875% | 7/1/29 | 25 | 23 |
| | Colgate-Palmolive Co. | 3.250% | 8/15/32 | 170 | 150 |
| 12 | Comcast Corp. | 5.250% | 11/7/25 | 120 | 120 |
| 8 | Comcast Corp. | 0.000% | 9/14/26 | 2,000 | 1,730 |
| | Comcast Corp. | 3.150% | 2/15/28 | 225 | 203 |
| | Comcast Corp. | 4.150% | 10/15/28 | 70 | 66 |
| | Comcast Corp. | 2.650% | 2/1/30 | 275 | 230 |
| 12 | Comcast Corp. | 5.500% | 11/15/32 | 310 | 308 |
| | Comcast Corp. | 4.400% | 8/15/35 | 90 | 79 |
| 9 | Comcast Corp. | 1.875% | 2/20/36 | 500 | 395 |
| | Comcast Corp. | 3.250% | 11/1/39 | 145 | 105 |
| | Comcast Corp. | 4.500% | 1/15/43 | 140 | 112 |
| | Comcast Corp. | 4.700% | 10/15/48 | 134 | 112 |
| | Comcast Corp. | 4.950% | 10/15/58 | 65 | 55 |
| | | | Coupon | Maturity
Date | Face
Amount
($000) | Market
Value•
($000) |
| | Comcast Corp. | 2.650% | 8/15/62 | 263 | 138 |
| | Comcast Corp. | 2.987% | 11/1/63 | 413 | 233 |
| 5 | CommonSpirit Health | 4.350% | 11/1/42 | 220 | 171 |
| | Commonwealth Edison Co. | 3.800% | 10/1/42 | 115 | 87 |
| 4 | CommScope Inc. | 6.000% | 3/1/26 | 8 | 8 |
| 4 | CommScope Inc. | 7.125% | 7/1/28 | 21 | 18 |
| 4 | Condor Merger Sub Inc. | 7.375% | 2/15/30 | 25 | 21 |
| | ConocoPhillips Co. | 6.950% | 4/15/29 | 100 | 109 |
| | ConocoPhillips Co. | 4.300% | 11/15/44 | 65 | 54 |
| | ConocoPhillips Co. | 3.800% | 3/15/52 | 180 | 135 |
| 5 | Consolidated Edison Co. of New York Inc. | 3.950% | 4/1/50 | 100 | 74 |
| | Constellation Brands Inc. | 2.250% | 8/1/31 | 290 | 223 |
| | Constellation Energy Generation LLC | 6.250% | 10/1/39 | 100 | ��96 |
| | Consumers Energy Co. | 3.600% | 8/15/32 | 115 | 101 |
| 4 | Continental Resources Inc. | 2.268% | 11/15/26 | 100 | 85 |
| 4 | Continental Resources Inc. | 2.875% | 4/1/32 | 40 | 29 |
| 4 | Corebridge Financial Inc. | 3.500% | 4/4/25 | 100 | 94 |
| 4 | Corebridge Financial Inc. | 3.650% | 4/5/27 | 90 | 82 |
| 4 | Corebridge Financial Inc. | 3.850% | 4/5/29 | 170 | 149 |
| 4 | Corebridge Financial Inc. | 3.900% | 4/5/32 | 100 | 84 |
| 4 | Corebridge Financial Inc. | 4.350% | 4/5/42 | 100 | 75 |
| 4 | Corebridge Financial Inc. | 4.400% | 4/5/52 | 150 | 110 |
| | Corporate Office Properties LP | 2.250% | 3/15/26 | 175 | 151 |
| | Corporate Office Properties LP | 2.750% | 4/15/31 | 105 | 76 |
| 4 | Coterra Energy Inc. | 3.900% | 5/15/27 | 40 | 37 |
| 4 | Coterra Energy Inc. | 4.375% | 3/15/29 | 130 | 120 |
| 4 | Cox Communications Inc. | 4.800% | 2/1/35 | 100 | 87 |
| | Crown Castle Inc. | 3.800% | 2/15/28 | 68 | 61 |
| | Crown Castle Inc. | 4.750% | 5/15/47 | 125 | 98 |
| | Crown Castle Inc. | 5.200% | 2/15/49 | 85 | 71 |
| 4 | CrownRock LP | 5.625% | 10/15/25 | 10 | 10 |
| 4 | CrownRock LP | 5.000% | 5/1/29 | 10 | 9 |
| 4 | CSC Holdings LLC | 5.375% | 2/1/28 | 40 | 37 |
| 4 | CSC Holdings LLC | 4.625% | 12/1/30 | 16 | 12 |
| 4 | CSC Holdings LLC | 3.375% | 2/15/31 | 10 | 7 |
| | CSX Corp. | 4.750% | 11/15/48 | 190 | 162 |
| | CubeSmart LP | 2.250% | 12/15/28 | 225 | 180 |
| | CVS Health Corp. | 4.875% | 7/20/35 | 80 | 72 |
| | CVS Health Corp. | 4.780% | 3/25/38 | 259 | 225 |
| | CVS Health Corp. | 4.125% | 4/1/40 | 135 | 106 |
| | CVS Health Corp. | 5.125% | 7/20/45 | 75 | 64 |
| | Dana Inc. | 4.500% | 2/15/32 | 40 | 30 |
| 4 | DaVita Inc. | 3.750% | 2/15/31 | 25 | 18 |
| | DCP Midstream Operating LP | 5.625% | 7/15/27 | 6 | 6 |
| | DCP Midstream Operating LP | 5.125% | 5/15/29 | 21 | 20 |
| | Dell International LLC | 6.020% | 6/15/26 | 80 | 80 |
| | Dell International LLC | 6.100% | 7/15/27 | 120 | 120 |
| | Dell International LLC | 5.300% | 10/1/29 | 28 | 26 |
| | Dell International LLC | 6.200% | 7/15/30 | 125 | 123 |
| | Delta Air Lines Inc. | 2.900% | 10/28/24 | 12 | 11 |
| 4 | Delta Air Lines Inc. | 4.750% | 10/20/28 | 256 | 238 |
| | Delta Air Lines Inc. | 3.750% | 10/28/29 | 15 | 12 |
| | Devon Energy Corp. | 5.850% | 12/15/25 | 40 | 40 |
| | Devon Energy Corp. | 5.250% | 10/15/27 | 29 | 29 |
| | Devon Energy Corp. | 5.875% | 6/15/28 | 9 | 9 |
| | | | Coupon | Maturity
Date | Face
Amount
($000) | Market
Value•
($000) |
| | Devon Energy Corp. | 4.500% | 1/15/30 | 81 | 74 |
| | Devon Energy Corp. | 5.600% | 7/15/41 | 50 | 46 |
| | Devon Energy Corp. | 5.000% | 6/15/45 | 30 | 25 |
| | DH Europe Finance II Sarl | 2.600% | 11/15/29 | 125 | 106 |
| | Diamondback Energy Inc. | 3.125% | 3/24/31 | 65 | 53 |
| | Diamondback Energy Inc. | 4.250% | 3/15/52 | 100 | 72 |
| 8 | Digital Euro Finco LLC | 2.625% | 4/15/24 | 2,092 | 1,987 |
| 4 | Directv Financing LLC | 5.875% | 8/15/27 | 30 | 27 |
| | Discovery Communications LLC | 4.900% | 3/11/26 | 337 | 320 |
| | Discovery Communications LLC | 6.350% | 6/1/40 | 50 | 43 |
| | Discovery Communications LLC | 4.000% | 9/15/55 | 62 | 36 |
| 4 | DISH DBS Corp. | 5.250% | 12/1/26 | 15 | 13 |
| 4 | DISH DBS Corp. | 5.750% | 12/1/28 | 10 | 8 |
| | DISH DBS Corp. | 5.125% | 6/1/29 | 15 | 10 |
| 5 | Dominion Energy Inc. | 4.050% | 9/15/42 | 170 | 127 |
| | Dominion Energy South Carolina Inc. | 4.600% | 6/15/43 | 240 | 201 |
| | Dow Chemical Co. | 2.100% | 11/15/30 | 100 | 76 |
| 8 | Dow Chemical Co. | 1.875% | 3/15/40 | 600 | 355 |
| | Dow Chemical Co. | 4.375% | 11/15/42 | 180 | 138 |
| 4 | DT Midstream Inc. | 4.125% | 6/15/29 | 26 | 22 |
| 4 | DT Midstream Inc. | 4.375% | 6/15/31 | 20 | 17 |
| | DTE Electric Co. | 4.300% | 7/1/44 | 120 | 97 |
| | DTE Electric Co. | 3.700% | 6/1/46 | 75 | 55 |
| | Duke Energy Carolinas LLC | 2.450% | 2/1/30 | 85 | 70 |
| | Duke Energy Carolinas LLC | 2.550% | 4/15/31 | 45 | 37 |
| | Duke Energy Carolinas LLC | 5.300% | 2/15/40 | 20 | 19 |
| | Duke Energy Carolinas LLC | 4.250% | 12/15/41 | 125 | 101 |
| 8 | Duke Energy Corp. | 3.100% | 6/15/28 | 1,033 | 950 |
| 8 | Duke Energy Corp. | 3.850% | 6/15/34 | 600 | 525 |
| | Duke Energy Corp. | 3.500% | 6/15/51 | 100 | 65 |
| | Duke Energy Corp. | 5.000% | 8/15/52 | 160 | 132 |
| | Duke Energy Florida LLC | 3.400% | 10/1/46 | 35 | 24 |
| | Duke Energy Indiana LLC | 2.750% | 4/1/50 | 75 | 44 |
| | Duke Energy Progress LLC | 3.400% | 4/1/32 | 100 | 86 |
| | Duke Energy Progress LLC | 4.100% | 5/15/42 | 100 | 78 |
| | Duke Energy Progress LLC | 2.500% | 8/15/50 | 170 | 96 |
| | Duke Energy Progress LLC | 4.000% | 4/1/52 | 100 | 76 |
| | DuPont de Nemours Inc. | 5.319% | 11/15/38 | 40 | 36 |
| 4 | Element Solutions Inc. | 3.875% | 9/1/28 | 16 | 14 |
| | Elevance Health Inc. | 3.125% | 5/15/50 | 190 | 122 |
| 12 | Elevance Health Inc. | 6.100% | 10/15/52 | 155 | 158 |
| | Eli Lilly & Co. | 2.500% | 9/15/60 | 100 | 58 |
| | Emerson Electric Co. | 2.200% | 12/21/31 | 90 | 71 |
| | Encompass Health Corp. | 4.500% | 2/1/28 | 36 | 32 |
| 4 | Endeavor Energy Resources LP | 5.750% | 1/30/28 | 15 | 15 |
| 4 | Energizer Holdings Inc. | 4.750% | 6/15/28 | 33 | 27 |
| 4 | Energizer Holdings Inc. | 4.375% | 3/31/29 | 30 | 24 |
| | Energy Transfer LP | 3.750% | 5/15/30 | 70 | 60 |
| | Energy Transfer LP | 6.050% | 6/1/41 | 65 | 57 |
| | Energy Transfer LP | 6.500% | 2/1/42 | 100 | 92 |
| | Energy Transfer LP | 5.300% | 4/1/44 | 75 | 59 |
| | Energy Transfer LP | 5.150% | 3/15/45 | 85 | 66 |
| | Energy Transfer LP | 6.250% | 4/15/49 | 70 | 61 |
| 4 | EnLink Midstream LLC | 5.625% | 1/15/28 | 7 | 7 |
| | EnLink Midstream LLC | 5.375% | 6/1/29 | 15 | 14 |
| | | | Coupon | Maturity
Date | Face
Amount
($000) | Market
Value•
($000) |
| | Enstar Group Ltd. | 4.950% | 6/1/29 | 140 | 124 |
| 4 | Entegris Escrow Corp. | 4.750% | 4/15/29 | 190 | 170 |
| 4 | Entegris Escrow Corp. | 5.950% | 6/15/30 | 45 | 41 |
| | Entergy Arkansas LLC | 2.650% | 6/15/51 | 100 | 57 |
| | Entergy Corp. | 2.800% | 6/15/30 | 90 | 72 |
| | Entergy Louisiana LLC | 3.250% | 4/1/28 | 593 | 527 |
| | Enterprise Products Operating LLC | 4.850% | 3/15/44 | 215 | 177 |
| | Enterprise Products Operating LLC | 4.900% | 5/15/46 | 30 | 25 |
| | Enterprise Products Operating LLC | 4.250% | 2/15/48 | 50 | 37 |
| | Enterprise Products Operating LLC | 3.700% | 1/31/51 | 70 | 47 |
| | EOG Resources Inc. | 3.900% | 4/1/35 | 20 | 17 |
| 4 | EQM Midstream Partners LP | 7.500% | 6/1/27 | 10 | 10 |
| 4 | EQM Midstream Partners LP | 6.500% | 7/1/27 | 16 | 16 |
| | EQM Midstream Partners LP | 5.500% | 7/15/28 | 15 | 13 |
| 4 | EQM Midstream Partners LP | 7.500% | 6/1/30 | 10 | 10 |
| | EQT Corp. | 5.678% | 10/1/25 | 145 | 143 |
| 4 | EQT Corp. | 3.125% | 5/15/26 | 7 | 6 |
| | EQT Corp. | 3.900% | 10/1/27 | 96 | 86 |
| | EQT Corp. | 5.000% | 1/15/29 | 25 | 23 |
| 4 | EQT Corp. | 3.625% | 5/15/31 | 55 | 46 |
| | Equitable Holdings Inc. | 5.000% | 4/20/48 | 115 | 92 |
| | Essex Portfolio LP | 4.500% | 3/15/48 | 60 | 45 |
| | Everest Reinsurance Holdings Inc. | 3.500% | 10/15/50 | 96 | 61 |
| | Evergy Kansas Central Inc. | 3.250% | 9/1/49 | 150 | 98 |
| | Eversource Energy | 4.200% | 6/27/24 | 163 | 160 |
| 5 | Eversource Energy | 1.400% | 8/15/26 | 300 | 258 |
| | Exelon Corp. | 3.400% | 4/15/26 | 125 | 117 |
| 4 | Exelon Corp. | 3.350% | 3/15/32 | 200 | 166 |
| | Exelon Corp. | 4.450% | 4/15/46 | 165 | 129 |
| 4 | Exelon Corp. | 4.100% | 3/15/52 | 100 | 74 |
| | Expedia Group Inc. | 2.950% | 3/15/31 | 38 | 29 |
| | Exxon Mobil Corp. | 3.482% | 3/19/30 | 445 | 404 |
| | Exxon Mobil Corp. | 4.227% | 3/19/40 | 155 | 133 |
| | Exxon Mobil Corp. | 4.114% | 3/1/46 | 55 | 44 |
| | FedEx Corp. | 3.875% | 8/1/42 | 30 | 22 |
| | FirstEnergy Corp. | 2.650% | 3/1/30 | 150 | 121 |
| 5 | FirstEnergy Corp. | 2.250% | 9/1/30 | 60 | 46 |
| 4 | FirstEnergy Transmission LLC | 4.550% | 4/1/49 | 100 | 76 |
| | Florida Power & Light Co. | 5.625% | 4/1/34 | 165 | 165 |
| | Florida Power & Light Co. | 3.800% | 12/15/42 | 150 | 116 |
| | FMC Corp. | 4.100% | 2/1/24 | 200 | 197 |
| | FMC Corp. | 4.500% | 10/1/49 | 30 | 22 |
| | Ford Motor Credit Co. LLC | 4.950% | 5/28/27 | 45 | 41 |
| | Ford Motor Credit Co. LLC | 4.125% | 8/17/27 | 5 | 4 |
| | Ford Motor Credit Co. LLC | 3.815% | 11/2/27 | 22 | 19 |
| | Ford Motor Credit Co. LLC | 2.900% | 2/10/29 | 53 | 42 |
| | Ford Motor Credit Co. LLC | 4.000% | 11/13/30 | 10 | 8 |
| | Ford Motor Credit Co. LLC | 3.625% | 6/17/31 | 45 | 35 |
| | Fox Corp. | 5.476% | 1/25/39 | 150 | 129 |
| | Freeport-McMoRan Inc. | 4.125% | 3/1/28 | 62 | 56 |
| | Freeport-McMoRan Inc. | 4.375% | 8/1/28 | 30 | 27 |
| | Freeport-McMoRan Inc. | 5.250% | 9/1/29 | 50 | 47 |
| | Freeport-McMoRan Inc. | 4.250% | 3/1/30 | 10 | 9 |
| | Freeport-McMoRan Inc. | 4.625% | 8/1/30 | 40 | 35 |
| | Freeport-McMoRan Inc. | 5.450% | 3/15/43 | 10 | 8 |
| | | | Coupon | Maturity
Date | Face
Amount
($000) | Market
Value•
($000) |
| 4 | Frontier Communications Holdings LLC | 5.875% | 10/15/27 | 7 | 6 |
| 4 | Frontier Communications Holdings LLC | 5.000% | 5/1/28 | 16 | 14 |
| 4 | Frontier Communications Holdings LLC | 6.000% | 1/15/30 | 15 | 12 |
| | FS KKR Capital Corp. | 3.400% | 1/15/26 | 220 | 194 |
| 4 | Gates Global LLC | 6.250% | 1/15/26 | 5 | 5 |
| | GATX Corp. | 3.500% | 6/1/32 | 100 | 80 |
| | GE Capital International Funding Co. Unlimited Co. | 4.418% | 11/15/35 | 700 | 617 |
| | General Dynamics Corp. | 3.250% | 4/1/25 | 40 | 38 |
| | General Dynamics Corp. | 4.250% | 4/1/40 | 95 | 82 |
| 5 | General Electric Co. | 6.750% | 3/15/32 | 61 | 66 |
| 8 | General Electric Co. | 2.125% | 5/17/37 | 200 | 151 |
| | General Mills Inc. | 4.150% | 2/15/43 | 70 | 55 |
| | General Motors Co. | 5.400% | 10/2/23 | 106 | 106 |
| | General Motors Co. | 6.125% | 10/1/25 | 150 | 149 |
| | General Motors Co. | 5.200% | 4/1/45 | 88 | 68 |
| | General Motors Financial Co. Inc. | 3.500% | 11/7/24 | 400 | 382 |
| | General Motors Financial Co. Inc. | 2.750% | 6/20/25 | 390 | 359 |
| | General Motors Financial Co. Inc. | 6.050% | 10/10/25 | 700 | 695 |
| | General Motors Financial Co. Inc. | 1.250% | 1/8/26 | 455 | 389 |
| 4 | Georgia-Pacific LLC | 1.750% | 9/30/25 | 245 | 222 |
| | Gilead Sciences Inc. | 4.150% | 3/1/47 | 190 | 148 |
| | Global Payments Inc. | 1.500% | 11/15/24 | 120 | 110 |
| | Goldman Sachs Group Inc. | 1.431% | 3/9/27 | 265 | 227 |
| | Goldman Sachs Group Inc. | 2.640% | 2/24/28 | 170 | 147 |
| 5,9 | Goldman Sachs Group Inc. | 7.250% | 4/10/28 | 800 | 965 |
| 5 | Goldman Sachs Group Inc. | 4.223% | 5/1/29 | 135 | 122 |
| | Goldman Sachs Group Inc. | 1.992% | 1/27/32 | 180 | 131 |
| | Goldman Sachs Group Inc. | 2.650% | 10/21/32 | 150 | 113 |
| 5 | Goldman Sachs Group Inc. | 4.411% | 4/23/39 | 85 | 69 |
| | Goldman Sachs Group Inc. | 3.210% | 4/22/42 | 100 | 66 |
| | Goldman Sachs Group Inc. | 4.750% | 10/21/45 | 85 | 69 |
| 5,6,7 | Goldman Sachs Group Inc., 3M Australian Bank Bill Rate + 1.550% | 3.732% | 5/2/24 | 300 | 193 |
| | Goodyear Tire & Rubber Co. | 5.000% | 7/15/29 | 12 | 10 |
| 4 | Graham Packaging Co. Inc. | 7.125% | 8/15/28 | 15 | 12 |
| 4 | Graphic Packaging International LLC | 3.500% | 3/15/28 | 3 | 3 |
| 4 | GSK Consumer Healthcare Capital US LLC | 3.625% | 3/24/32 | 190 | 160 |
| 4 | GSK Consumer Healthcare Capital US LLC | 4.000% | 3/24/52 | 80 | 57 |
| 4 | Harley-Davidson Financial Services Inc. | 3.050% | 2/14/27 | 230 | 196 |
| | HCA Inc. | 5.250% | �� 6/15/49 | 115 | 93 |
| | Helmerich & Payne Inc. | 2.900% | 9/29/31 | 130 | 102 |
| 4 | Hess Midstream Operations LP | 5.500% | 10/15/30 | 6 | 5 |
| 4 | Hilcorp Energy I LP | 5.750% | 2/1/29 | 5 | 5 |
| 4 | Hilcorp Energy I LP | 6.000% | 2/1/31 | 6 | 5 |
| 4 | Hilton Domestic Operating Co. Inc. | 5.750% | 5/1/28 | 10 | 10 |
| | Home Depot Inc. | 4.000% | 9/15/25 | 90 | 88 |
| | Home Depot Inc. | 3.900% | 12/6/28 | 130 | 123 |
| | Home Depot Inc. | 2.950% | 6/15/29 | 85 | 75 |
| | Home Depot Inc. | 2.700% | 4/15/30 | 15 | 13 |
| | Home Depot Inc. | 4.500% | 9/15/32 | 125 | 118 |
| | Home Depot Inc. | 4.250% | 4/1/46 | 225 | 185 |
| | Home Depot Inc. | 3.900% | 6/15/47 | 125 | 96 |
| | Home Depot Inc. | 4.500% | 12/6/48 | 75 | 64 |
| | Home Depot Inc. | 2.750% | 9/15/51 | 493 | 301 |
| | Home Depot Inc. | 4.950% | 9/15/52 | 55 | 49 |
| | | | Coupon | Maturity
Date | Face
Amount
($000) | Market
Value•
($000) |
| | Home Depot Inc. | 3.500% | 9/15/56 | 70 | 48 |
| 12 | Honeywell International Inc. | 5.000% | 2/15/33 | 295 | 292 |
| 8,12 | Honeywell International Inc. | 4.125% | 11/2/34 | 419 | 408 |
| | Honeywell International Inc. | 5.700% | 3/15/37 | 430 | 441 |
| | Hormel Foods Corp. | 1.700% | 6/3/28 | 50 | 42 |
| | Hormel Foods Corp. | 1.800% | 6/11/30 | 10 | 8 |
| | HP Inc. | 4.000% | 4/15/29 | 220 | 193 |
| | HP Inc. | 2.650% | 6/17/31 | 86 | 63 |
| | HP Inc. | 4.200% | 4/15/32 | 160 | 131 |
| 4 | Ingevity Corp. | 3.875% | 11/1/28 | 15 | 13 |
| | Intel Corp. | 4.150% | 8/5/32 | 100 | 89 |
| | Intel Corp. | 4.750% | 3/25/50 | 228 | 185 |
| | Intel Corp. | 3.050% | 8/12/51 | 200 | 121 |
| | Intel Corp. | 4.900% | 8/5/52 | 200 | 166 |
| | Intercontinental Exchange Inc. | 4.950% | 6/15/52 | 70 | 61 |
| | Intercontinental Exchange Inc. | 5.200% | 6/15/62 | 55 | 49 |
| | International Business Machines Corp. | 3.300% | 5/15/26 | 160 | 150 |
| 4 | International Game Technology plc | 6.250% | 1/15/27 | 3 | 3 |
| | International Paper Co. | 4.800% | 6/15/44 | 45 | 36 |
| | Interpublic Group of Cos. Inc. | 3.375% | 3/1/41 | 100 | 65 |
| | Invesco Finance plc | 5.375% | 11/30/43 | 55 | 48 |
| 4 | ITC Holdings Corp. | 4.950% | 9/22/27 | 50 | 49 |
| | ITC Holdings Corp. | 3.350% | 11/15/27 | 320 | 288 |
| 4 | ITC Holdings Corp. | 2.950% | 5/14/30 | 150 | 123 |
| 4 | JBS USA LUX SA | 5.750% | 4/1/33 | 417 | 376 |
| 5 | John Deere Capital Corp. | 4.850% | 10/11/29 | 4,000 | 3,932 |
| | Johnson & Johnson | 2.450% | 9/1/60 | 100 | 56 |
| 5 | JPMorgan Chase & Co. | 4.023% | 12/5/24 | 270 | 265 |
| | JPMorgan Chase & Co. | 4.080% | 4/26/26 | 200 | 192 |
| | JPMorgan Chase & Co. | 1.578% | 4/22/27 | 100 | 86 |
| | JPMorgan Chase & Co. | 4.323% | 4/26/28 | 270 | 251 |
| | JPMorgan Chase & Co. | 4.851% | 7/25/28 | 140 | 133 |
| 5 | JPMorgan Chase & Co. | 3.509% | 1/23/29 | 50 | 44 |
| 5 | JPMorgan Chase & Co. | 4.005% | 4/23/29 | 212 | 191 |
| | JPMorgan Chase & Co. | 2.580% | 4/22/32 | 300 | 231 |
| | JPMorgan Chase & Co. | 2.963% | 1/25/33 | 130 | 101 |
| | JPMorgan Chase & Co. | 4.586% | 4/26/33 | 100 | 89 |
| | JPMorgan Chase & Co. | 4.912% | 7/25/33 | 100 | 92 |
| 5 | JPMorgan Chase & Co. | 3.882% | 7/24/38 | 62 | 48 |
| | JPMorgan Chase & Co. | 5.600% | 7/15/41 | 81 | 76 |
| | JPMorgan Chase & Co. | 2.525% | 11/19/41 | 190 | 117 |
| 5 | JPMorgan Chase & Co. | 3.964% | 11/15/48 | 70 | 51 |
| 5 | JPMorgan Chase & Co. | 3.109% | 4/22/51 | 70 | 44 |
| | JPMorgan Chase & Co. | 3.328% | 4/22/52 | 290 | 188 |
| 4 | Kaiser Aluminum Corp. | 4.500% | 6/1/31 | 30 | 24 |
| | Kaiser Foundation Hospitals | 3.150% | 5/1/27 | 347 | 318 |
| | KB Home | 7.250% | 7/15/30 | 20 | 18 |
| | Keurig Dr Pepper Inc. | 4.500% | 11/15/45 | 330 | 259 |
| 5 | KeyBank NA | 4.150% | 8/8/25 | 250 | 242 |
| | Kimco Realty Corp. | 4.250% | 4/1/45 | 75 | 54 |
| | Kimco Realty Corp. | 3.700% | 10/1/49 | 70 | 45 |
| | Kinder Morgan Energy Partners LP | 5.800% | 3/15/35 | 385 | 360 |
| | KLA Corp. | 5.000% | 3/15/49 | 116 | 102 |
| | Kraft Heinz Foods Co. | 3.875% | 5/15/27 | 236 | 221 |
| | Kraft Heinz Foods Co. | 3.750% | 4/1/30 | 80 | 71 |
| | | | Coupon | Maturity
Date | Face
Amount
($000) | Market
Value•
($000) |
| | Kraft Heinz Foods Co. | 4.875% | 10/1/49 | 27 | 22 |
| | Kroger Co. | 2.200% | 5/1/30 | 225 | 177 |
| | Kroger Co. | 3.875% | 10/15/46 | 125 | 90 |
| 5 | L3Harris Technologies Inc. | 4.400% | 6/15/28 | 210 | 197 |
| | L3Harris Technologies Inc. | 5.054% | 4/27/45 | 30 | 25 |
| 4 | Ladder Capital Finance Holdings LLLP | 4.750% | 6/15/29 | 20 | 16 |
| 4 | Lamb Weston Holdings Inc. | 4.875% | 5/15/28 | 16 | 15 |
| 4 | Level 3 Financing Inc. | 4.625% | 9/15/27 | 22 | 19 |
| 4 | Level 3 Financing Inc. | 3.625% | 1/15/29 | 20 | 15 |
| 4 | Lithia Motors Inc. | 4.625% | 12/15/27 | 15 | 14 |
| 4 | Lithia Motors Inc. | 3.875% | 6/1/29 | 52 | 42 |
| 4 | Lithia Motors Inc. | 4.375% | 1/15/31 | 2 | 2 |
| 4 | Live Nation Entertainment Inc. | 5.625% | 3/15/26 | 3 | 3 |
| 4 | Live Nation Entertainment Inc. | 6.500% | 5/15/27 | 31 | 31 |
| | Lockheed Martin Corp. | 4.500% | 5/15/36 | 665 | 604 |
| | Lockheed Martin Corp. | 4.700% | 5/15/46 | 70 | 62 |
| | Lockheed Martin Corp. | 4.300% | 6/15/62 | 295 | 236 |
| | Lowe's Cos. Inc. | 3.100% | 5/3/27 | 433 | 395 |
| | Lowe's Cos. Inc. | 1.300% | 4/15/28 | 100 | 81 |
| | Lowe's Cos. Inc. | 1.700% | 9/15/28 | 90 | 74 |
| | Lowe's Cos. Inc. | 4.450% | 4/1/62 | 190 | 139 |
| | LYB International Finance III LLC | 3.375% | 10/1/40 | 50 | 33 |
| 5 | Marriott International Inc. | 4.625% | 6/15/30 | 300 | 270 |
| | Marsh & McLennan Cos. Inc. | 2.900% | 12/15/51 | 150 | 89 |
| 4 | Mattel Inc. | 3.375% | 4/1/26 | 10 | 9 |
| 4 | Mattel Inc. | 5.875% | 12/15/27 | 10 | 10 |
| 8 | McDonald's Corp. | 1.750% | 5/3/28 | 800 | 719 |
| 5,9 | McDonald's Corp. | 3.750% | 5/31/38 | 400 | 380 |
| 4 | Medline Borrower LP | 3.875% | 4/1/29 | 10 | 8 |
| 8 | Medtronic Global Holdings SCA | 3.000% | 10/15/28 | 1,500 | 1,439 |
| | Merck & Co. Inc. | 1.900% | 12/10/28 | 5 | 4 |
| | Merck & Co. Inc. | 3.400% | 3/7/29 | 40 | 37 |
| | Merck & Co. Inc. | 2.150% | 12/10/31 | 400 | 318 |
| 4 | Meritage Homes Corp. | 3.875% | 4/15/29 | 60 | 49 |
| 4 | Meta Platforms Inc. | 3.500% | 8/15/27 | 570 | 524 |
| 4 | Meta Platforms Inc. | 3.850% | 8/15/32 | 260 | 222 |
| | MetLife Inc. | 4.125% | 8/13/42 | 75 | 59 |
| | MetLife Inc. | 4.875% | 11/13/43 | 75 | 65 |
| | MetLife Inc. | 5.000% | 7/15/52 | 115 | 100 |
| 4 | Midcap Financial Issuer Trust | 5.625% | 1/15/30 | 17 | 13 |
| 4 | Mileage Plus Holdings LLC | 6.500% | 6/20/27 | 444 | 439 |
| 4 | MIWD Holdco II LLC | 5.500% | 2/1/30 | 10 | 8 |
| | Mondelez International Inc. | 1.500% | 2/4/31 | 200 | 147 |
| 5 | Morgan Stanley | 2.720% | 7/22/25 | 480 | 453 |
| | Morgan Stanley | 4.679% | 7/17/26 | 100 | 97 |
| | Morgan Stanley | 3.950% | 4/23/27 | 270 | 250 |
| | Morgan Stanley | 1.593% | 5/4/27 | 195 | 167 |
| | Morgan Stanley | 2.475% | 1/21/28 | 200 | 173 |
| 5 | Morgan Stanley | 3.591% | 7/22/28 | 275 | 247 |
| 5 | Morgan Stanley | 2.699% | 1/22/31 | 135 | 108 |
| | Morgan Stanley | 4.889% | 7/20/33 | 70 | 64 |
| 5,8 | Morgan Stanley | 5.148% | 1/25/34 | 500 | 508 |
| 5 | Morgan Stanley | 3.971% | 7/22/38 | 90 | 71 |
| 5 | Morgan Stanley | 4.457% | 4/22/39 | 75 | 62 |
| | Morgan Stanley | 3.217% | 4/22/42 | 135 | 92 |
| | | | Coupon | Maturity
Date | Face
Amount
($000) | Market
Value•
($000) |
| | Morgan Stanley | 4.300% | 1/27/45 | 30 | 23 |
| 5 | Morgan Stanley | 2.802% | 1/25/52 | 90 | 53 |
| | Mosaic Co. | 4.875% | 11/15/41 | 30 | 24 |
| 5 | Mount Sinai Hospitals Group Inc. | 3.737% | 7/1/49 | 200 | 139 |
| | MPLX LP | 1.750% | 3/1/26 | 150 | 131 |
| | MPLX LP | 4.500% | 4/15/38 | 290 | 232 |
| | MPLX LP | 4.950% | 3/14/52 | 50 | 39 |
| | MPT Operating Partnership LP | 3.500% | 3/15/31 | 25 | 17 |
| 4 | MSCI Inc. | 3.625% | 9/1/30 | 15 | 13 |
| 4 | Mueller Water Products Inc. | 4.000% | 6/15/29 | 12 | 10 |
| | Nasdaq Inc. | 2.500% | 12/21/40 | 100 | 60 |
| | Nasdaq Inc. | 3.950% | 3/7/52 | 30 | 22 |
| 4 | Nationwide Financial Services Inc. | 3.900% | 11/30/49 | 65 | 43 |
| 4 | Nationwide Mutual Insurance Co. | 4.350% | 4/30/50 | 125 | 89 |
| 4 | NCL Corp. Ltd. | 5.875% | 2/15/27 | 14 | 13 |
| 4 | NCL Corp. Ltd. | 7.750% | 2/15/29 | 10 | 8 |
| 4 | Nestle Holdings Inc. | 1.000% | 9/15/27 | 325 | 270 |
| 5,9 | Nestle Holdings Inc. | 1.375% | 6/23/33 | 600 | 488 |
| 4 | Nestle Holdings Inc. | 4.000% | 9/24/48 | 150 | 120 |
| 4 | Netflix Inc. | 3.625% | 6/15/25 | 40 | 38 |
| | Netflix Inc. | 4.875% | 4/15/28 | 175 | 166 |
| | Netflix Inc. | 5.875% | 11/15/28 | 40 | 40 |
| | Netflix Inc. | 6.375% | 5/15/29 | 90 | 92 |
| | Newell Brands Inc. | 4.450% | 4/1/26 | 3 | 3 |
| | Newell Brands Inc. | 6.375% | 9/15/27 | 2 | 2 |
| | Newell Brands Inc. | 6.625% | 9/15/29 | 5 | 5 |
| | Newmont Corp. | 2.800% | 10/1/29 | 130 | 107 |
| | Newmont Corp. | 2.250% | 10/1/30 | 160 | 124 |
| 4 | News Corp. | 3.875% | 5/15/29 | 33 | 28 |
| 4 | Nexstar Media Inc. | 5.625% | 7/15/27 | 15 | 14 |
| 4 | Nexstar Media Inc. | 4.750% | 11/1/28 | 22 | 19 |
| | NextEra Energy Capital Holdings Inc. | 2.250% | 6/1/30 | 120 | 95 |
| | NextEra Energy Capital Holdings Inc. | 5.000% | 7/15/32 | 250 | 238 |
| | NiSource Inc. | 3.950% | 3/30/48 | 50 | 36 |
| | Norfolk Southern Corp. | 3.050% | 5/15/50 | 120 | 76 |
| | Northern States Power Co. | 6.250% | 6/1/36 | 144 | 150 |
| | Northrop Grumman Corp. | 3.200% | 2/1/27 | 170 | 157 |
| | Northrop Grumman Corp. | 5.250% | 5/1/50 | 125 | 116 |
| 4 | Novelis Corp. | 4.750% | 1/30/30 | 15 | 13 |
| | NRG Energy Inc. | 6.625% | 1/15/27 | 4 | 4 |
| | Nucor Corp. | 4.400% | 5/1/48 | 70 | 54 |
| | Nucor Corp. | 3.850% | 4/1/52 | 50 | 35 |
| | NuStar Logistics LP | 5.750% | 10/1/25 | 5 | 5 |
| | NuStar Logistics LP | 6.375% | 10/1/30 | 20 | 19 |
| | NVIDIA Corp. | 3.500% | 4/1/40 | 100 | 76 |
| | Occidental Petroleum Corp. | 5.550% | 3/15/26 | 16 | 16 |
| | Occidental Petroleum Corp. | 6.375% | 9/1/28 | 45 | 46 |
| | Occidental Petroleum Corp. | 6.125% | 1/1/31 | 10 | 10 |
| | Occidental Petroleum Corp. | 7.500% | 5/1/31 | 30 | 32 |
| 4 | Olympus Water US Holding Corp. | 4.250% | 10/1/28 | 4 | 3 |
| | Omega Healthcare Investors Inc. | 3.375% | 2/1/31 | 305 | 230 |
| | Oncor Electric Delivery Co. LLC | 3.800% | 9/30/47 | 153 | 116 |
| | OneMain Finance Corp. | 3.500% | 1/15/27 | 15 | 12 |
| | ONEOK Inc. | 4.000% | 7/13/27 | 100 | 91 |
| | ONEOK Inc. | 3.400% | 9/1/29 | 430 | 360 |
| | | | Coupon | Maturity
Date | Face
Amount
($000) | Market
Value•
($000) |
| | ONEOK Inc. | 4.950% | 7/13/47 | 50 | 38 |
| | ONEOK Partners LP | 6.125% | 2/1/41 | 135 | 119 |
| | Oracle Corp. | 2.400% | 9/15/23 | 808 | 788 |
| | Oracle Corp. | 2.500% | 4/1/25 | 520 | 486 |
| | Oracle Corp. | 2.800% | 4/1/27 | 200 | 177 |
| | Oracle Corp. | 2.300% | 3/25/28 | 189 | 158 |
| | Oracle Corp. | 2.950% | 4/1/30 | 40 | 33 |
| | Oracle Corp. | 2.875% | 3/25/31 | 270 | 213 |
| | Oracle Corp. | 3.600% | 4/1/40 | 430 | 291 |
| | Oracle Corp. | 3.650% | 3/25/41 | 150 | 102 |
| | Oracle Corp. | 3.950% | 3/25/51 | 200 | 131 |
| | Oracle Corp. | 4.375% | 5/15/55 | 185 | 125 |
| 4 | Organon & Co. | 4.125% | 4/30/28 | 25 | 22 |
| | PACCAR Financial Corp. | 2.850% | 4/7/25 | 525 | 500 |
| | Pacific Gas & Electric Co. | 3.150% | 1/1/26 | 200 | 180 |
| | Pacific Gas & Electric Co. | 3.000% | 6/15/28 | 100 | 83 |
| | Pacific Gas & Electric Co. | 2.500% | 2/1/31 | 140 | 105 |
| | Pacific Gas & Electric Co. | 4.500% | 7/1/40 | 100 | 74 |
| | Pacific Gas & Electric Co. | 3.500% | 8/1/50 | 100 | 61 |
| | PacifiCorp | 4.100% | 2/1/42 | 65 | 50 |
| | PacifiCorp | 4.150% | 2/15/50 | 200 | 153 |
| | Packaging Corp. of America | 3.400% | 12/15/27 | 20 | 18 |
| | Packaging Corp. of America | 4.050% | 12/15/49 | 50 | 36 |
| | Paramount Global | 4.750% | 5/15/25 | 158 | 154 |
| | Paramount Global | 4.200% | 6/1/29 | 135 | 118 |
| | Paramount Global | 6.875% | 4/30/36 | 136 | 127 |
| | Paramount Global | 4.375% | 3/15/43 | 425 | 285 |
| | Parker-Hannifin Corp. | 3.650% | 6/15/24 | 260 | 253 |
| | PayPal Holdings Inc. | 3.900% | 6/1/27 | 50 | 48 |
| | PECO Energy Co. | 4.150% | 10/1/44 | 130 | 103 |
| 4 | Penn Entertainment Inc. | 5.625% | 1/15/27 | 5 | 5 |
| | PepsiCo Inc. | 3.600% | 2/18/28 | 75 | 71 |
| | PepsiCo Inc. | 2.625% | 7/29/29 | 305 | 264 |
| | PepsiCo Inc. | 2.750% | 3/19/30 | 25 | 22 |
| | PepsiCo Inc. | 3.900% | 7/18/32 | 20 | 19 |
| 9 | PepsiCo Inc. | 3.550% | 7/22/34 | 600 | 605 |
| | PepsiCo Inc. | 3.450% | 10/6/46 | 75 | 56 |
| | PepsiCo Inc. | 4.200% | 7/18/52 | 25 | 21 |
| 4 | Performance Food Group Inc. | 6.875% | 5/1/25 | 10 | 10 |
| 4 | Performance Food Group Inc. | 5.500% | 10/15/27 | 24 | 23 |
| | Pfizer Inc. | 2.625% | 4/1/30 | 75 | 64 |
| | Pfizer Inc. | 1.750% | 8/18/31 | 30 | 23 |
| | Pfizer Inc. | 2.550% | 5/28/40 | 225 | 156 |
| | Philip Morris International Inc. | 4.250% | 11/10/44 | 165 | 115 |
| | Phillips 66 | 3.900% | 3/15/28 | 34 | 31 |
| | Phillips 66 | 4.650% | 11/15/34 | 80 | 72 |
| 4 | Phillips 66 Co. | 3.150% | 12/15/29 | 207 | 175 |
| | Pioneer Natural Resources Co. | 1.900% | 8/15/30 | 150 | 116 |
| | Plains All American Pipeline LP | 4.900% | 2/15/45 | 30 | 22 |
| 8 | PPG Industries Inc. | 2.750% | 6/1/29 | 1,000 | 890 |
| | Progressive Corp. | 2.500% | 3/15/27 | 100 | 89 |
| | Prologis LP | 4.625% | 1/15/33 | 100 | 93 |
| | Prudential Financial Inc. | 3.935% | 12/7/49 | 260 | 191 |
| 5 | Prudential Financial Inc. | 4.350% | 2/25/50 | 65 | 51 |
| 5 | Prudential Financial Inc. | 3.700% | 3/13/51 | 70 | 50 |
| | | | Coupon | Maturity
Date | Face
Amount
($000) | Market
Value•
($000) |
| 5 | Public Service Co. of Colorado | 6.250% | 9/1/37 | 60 | 63 |
| 5 | Public Service Electric & Gas Co. | 3.000% | 5/15/25 | 38 | 36 |
| 5 | Public Service Electric & Gas Co. | 3.600% | 12/1/47 | 100 | 71 |
| | Public Storage | 1.950% | 11/9/28 | 200 | 165 |
| | Raytheon Technologies Corp. | 4.625% | 11/16/48 | 160 | 135 |
| | Realty Income Corp. | 2.200% | 6/15/28 | 160 | 133 |
| | Republic Services Inc. | 1.750% | 2/15/32 | 58 | 43 |
| | Rockwell Automation Inc. | 2.800% | 8/15/61 | 230 | 128 |
| 4 | Royal Caribbean Cruises Ltd. | 11.500% | 6/1/25 | 3 | 3 |
| 4 | Royal Caribbean Cruises Ltd. | 8.250% | 1/15/29 | 4 | 4 |
| | RPM International Inc. | 4.550% | 3/1/29 | 115 | 104 |
| 4 | S&P Global Inc. | 2.900% | 3/1/32 | 110 | 91 |
| 4 | S&P Global Inc. | 3.700% | 3/1/52 | 45 | 33 |
| | Sabine Pass Liquefaction LLC | 5.875% | 6/30/26 | 110 | 110 |
| | Sabine Pass Liquefaction LLC | 4.200% | 3/15/28 | 110 | 100 |
| | Sabine Pass Liquefaction LLC | 4.500% | 5/15/30 | 250 | 228 |
| | Sabra Health Care LP | 5.125% | 8/15/26 | 775 | 701 |
| 4 | Sabre GLBL Inc. | 7.375% | 9/1/25 | 11 | 10 |
| | Salesforce Inc. | 2.700% | 7/15/41 | 595 | 406 |
| | SBA Communications Corp. | 3.125% | 2/1/29 | 32 | 26 |
| 4 | Scripps Escrow II Inc. | 5.375% | 1/15/31 | 15 | 12 |
| 4 | Scripps Escrow Inc. | 5.875% | 7/15/27 | 15 | 14 |
| | Sempra Energy | 3.700% | 4/1/29 | 285 | 251 |
| | Sherwin-Williams Co. | 4.500% | 6/1/47 | 80 | 63 |
| | Simon Property Group LP | 3.500% | 9/1/25 | 270 | 256 |
| 4 | Sirius XM Radio Inc. | 3.125% | 9/1/26 | 5 | 4 |
| 4 | Sirius XM Radio Inc. | 5.000% | 8/1/27 | 10 | 9 |
| | Skyworks Solutions Inc. | 1.800% | 6/1/26 | 60 | 51 |
| | Skyworks Solutions Inc. | 3.000% | 6/1/31 | 230 | 171 |
| 5 | Southern California Edison Co. | 4.200% | 3/1/29 | 100 | 92 |
| | Southern California Edison Co. | 4.500% | 9/1/40 | 50 | 40 |
| 5 | Southern California Edison Co. | 3.900% | 3/15/43 | 50 | 36 |
| | Southern California Edison Co. | 4.000% | 4/1/47 | 50 | 36 |
| | Southern California Edison Co. | 3.450% | 2/1/52 | 50 | 33 |
| 5 | Southern California Gas Co. | 2.550% | 2/1/30 | 330 | 273 |
| | Southern California Gas Co. | 3.750% | 9/15/42 | 50 | 36 |
| | Southern Co. | 4.475% | 8/1/24 | 520 | 510 |
| | Southern Co. | 5.150% | 10/6/25 | 130 | 129 |
| 5 | Southern Co. | 3.700% | 4/30/30 | 30 | 26 |
| | Southern Co. | 4.400% | 7/1/46 | 30 | 23 |
| | Southwest Airlines Co. | 5.250% | 5/4/25 | 70 | 70 |
| | Southwest Airlines Co. | 5.125% | 6/15/27 | 80 | 78 |
| | Southwest Airlines Co. | 2.625% | 2/10/30 | 250 | 199 |
| 4 | Spirit AeroSystems Inc. | 7.500% | 4/15/25 | 6 | 6 |
| | Spirit AeroSystems Inc. | 4.600% | 6/15/28 | 7 | 5 |
| | Sprint Corp. | 7.125% | 6/15/24 | 50 | 51 |
| | Sprint Corp. | 7.625% | 3/1/26 | 40 | 42 |
| 4 | SS&C Technologies Inc. | 5.500% | 9/30/27 | 9 | 8 |
| | Stanley Black & Decker Inc. | 2.300% | 3/15/30 | 125 | 100 |
| | Starbucks Corp. | 3.500% | 11/15/50 | 125 | 85 |
| | Steel Dynamics Inc. | 2.400% | 6/15/25 | 35 | 32 |
| | Steel Dynamics Inc. | 3.450% | 4/15/30 | 100 | 84 |
| | Sun Communities Operating LP | 2.300% | 11/1/28 | 200 | 160 |
| | SVB Financial Group | 2.100% | 5/15/28 | 230 | 182 |
| | Take-Two Interactive Software Inc. | 4.000% | 4/14/32 | 125 | 108 |
| | | | Coupon | Maturity
Date | Face
Amount
($000) | Market
Value•
($000) |
| | Tampa Electric Co. | 3.875% | 7/12/24 | 70 | 68 |
| 4 | Tap Rock Resources LLC | 7.000% | 10/1/26 | 20 | 19 |
| | Targa Resources Partners LP | 6.500% | 7/15/27 | 50 | 50 |
| | Targa Resources Partners LP | 5.000% | 1/15/28 | 50 | 46 |
| | Targa Resources Partners LP | 6.875% | 1/15/29 | 30 | 30 |
| | Targa Resources Partners LP | 4.875% | 2/1/31 | 50 | 44 |
| | Teledyne Technologies Inc. | 2.750% | 4/1/31 | 400 | 313 |
| 4 | Tenet Healthcare Corp. | 4.625% | 9/1/24 | 5 | 5 |
| 4 | Tenet Healthcare Corp. | 4.875% | 1/1/26 | 40 | 38 |
| 4 | Tenet Healthcare Corp. | 6.250% | 2/1/27 | 10 | 10 |
| 4 | Tenet Healthcare Corp. | 6.125% | 10/1/28 | 15 | 13 |
| 4 | Tenet Healthcare Corp. | 4.250% | 6/1/29 | 13 | 11 |
| | Thermo Fisher Scientific Inc. | 1.750% | 10/15/28 | 50 | 42 |
| | Thermo Fisher Scientific Inc. | 2.000% | 10/15/31 | 100 | 78 |
| | Thermo Fisher Scientific Inc. | 2.800% | 10/15/41 | 170 | 117 |
| | Time Warner Cable LLC | 5.875% | 11/15/40 | 353 | 287 |
| | Time Warner Cable LLC | 4.500% | 9/15/42 | 55 | 38 |
| | T-Mobile USA Inc. | 2.625% | 2/15/29 | 290 | 241 |
| | T-Mobile USA Inc. | 3.375% | 4/15/29 | 245 | 212 |
| | T-Mobile USA Inc. | 3.875% | 4/15/30 | 170 | 150 |
| | T-Mobile USA Inc. | 2.875% | 2/15/31 | 55 | 44 |
| | T-Mobile USA Inc. | 3.600% | 11/15/60 | 255 | 164 |
| | Toll Brothers Finance Corp. | 4.350% | 2/15/28 | 227 | 198 |
| | Toll Brothers Finance Corp. | 3.800% | 11/1/29 | 130 | 105 |
| 4 | TopBuild Corp. | 3.625% | 3/15/29 | 5 | 4 |
| 4 | TopBuild Corp. | 4.125% | 2/15/32 | 10 | 8 |
| 5 | Toyota Motor Credit Corp. | 4.400% | 9/20/24 | 850 | 842 |
| | Toyota Motor Credit Corp. | 3.950% | 6/30/25 | 960 | 936 |
| 5 | Toyota Motor Credit Corp. | 1.900% | 1/13/27 | 270 | 237 |
| | Toyota Motor Credit Corp. | 3.050% | 3/22/27 | 300 | 275 |
| | Transcontinental Gas Pipe Line Co. LLC | 4.000% | 3/15/28 | 5 | 5 |
| | Transcontinental Gas Pipe Line Co. LLC | 3.250% | 5/15/30 | 90 | 76 |
| | Transcontinental Gas Pipe Line Co. LLC | 4.600% | 3/15/48 | 40 | 32 |
| 4 | TransDigm Inc. | 8.000% | 12/15/25 | 30 | 31 |
| 4 | TransDigm Inc. | 6.250% | 3/15/26 | 49 | 48 |
| | TransDigm Inc. | 5.500% | 11/15/27 | 37 | 34 |
| | TransDigm Inc. | 4.875% | 5/1/29 | 35 | 30 |
| | TWDC Enterprises 18 Corp. | 3.000% | 2/13/26 | 165 | 154 |
| 5 | UDR Inc. | 2.950% | 9/1/26 | 15 | 13 |
| | Union Electric Co. | 4.000% | 4/1/48 | 65 | 48 |
| | Union Electric Co. | 3.250% | 10/1/49 | 75 | 49 |
| | Union Electric Co. | 3.900% | 4/1/52 | 150 | 113 |
| | Union Pacific Corp. | 3.950% | 9/10/28 | 150 | 141 |
| | Union Pacific Corp. | 3.250% | 2/5/50 | 270 | 184 |
| | Union Pacific Corp. | 3.839% | 3/20/60 | 35 | 25 |
| | Union Pacific Corp. | 3.850% | 2/14/72 | 185 | 126 |
| 4 | United Airlines Inc. | 4.375% | 4/15/26 | 42 | 38 |
| 4 | United Airlines Inc. | 4.625% | 4/15/29 | 35 | 30 |
| 5 | United Airlines Pass-Through Trust Class A Series 2020-1 | 5.875% | 10/15/27 | 47 | 46 |
| | United Parcel Service Inc. | 6.200% | 1/15/38 | 260 | 276 |
| | United Parcel Service Inc. | 5.300% | 4/1/50 | 60 | 59 |
| | United States Steel Corp. | 6.875% | 3/1/29 | 3 | 3 |
| | UnitedHealth Group Inc. | 5.250% | 2/15/28 | 205 | 205 |
| | UnitedHealth Group Inc. | 5.300% | 2/15/30 | 845 | 845 |
| | UnitedHealth Group Inc. | 5.350% | 2/15/33 | 360 | 361 |
| | | | Coupon | Maturity
Date | Face
Amount
($000) | Market
Value•
($000) |
| | UnitedHealth Group Inc. | 2.750% | 5/15/40 | 100 | 69 |
| | UnitedHealth Group Inc. | 4.375% | 3/15/42 | 215 | 181 |
| | UnitedHealth Group Inc. | 3.250% | 5/15/51 | 100 | 68 |
| | UnitedHealth Group Inc. | 6.050% | 2/15/63 | 200 | 206 |
| 4 | Uniti Group LP | 7.875% | 2/15/25 | 12 | 12 |
| 4 | Univision Communications Inc. | 7.375% | 6/30/30 | 15 | 15 |
| | US Bancorp | 5.727% | 10/21/26 | 245 | 246 |
| | US Bancorp | 4.548% | 7/22/28 | 500 | 475 |
| | US Bancorp | 4.967% | 7/22/33 | 325 | 296 |
| | US Bancorp | 5.850% | 10/21/33 | 700 | 699 |
| 4 | Vail Resorts Inc. | 6.250% | 5/15/25 | 66 | 66 |
| | Valero Energy Corp. | 4.350% | 6/1/28 | 48 | 45 |
| | Valero Energy Corp. | 3.650% | 12/1/51 | 200 | 133 |
| 4 | Venture Global Calcasieu Pass LLC | 3.875% | 8/15/29 | 20 | 17 |
| | Verisk Analytics Inc. | 5.500% | 6/15/45 | 100 | 89 |
| 5,8 | Verizon Communications Inc. | 3.250% | 2/17/26 | 2,283 | 2,228 |
| | Verizon Communications Inc. | 2.100% | 3/22/28 | 590 | 496 |
| | Verizon Communications Inc. | 1.500% | 9/18/30 | 285 | 212 |
| 8 | Verizon Communications Inc. | 4.250% | 10/31/30 | 234 | 235 |
| | Verizon Communications Inc. | 4.400% | 11/1/34 | 140 | 121 |
| | Verizon Communications Inc. | 5.250% | 3/16/37 | 170 | 158 |
| 5,8 | Verizon Communications Inc. | 2.875% | 1/15/38 | 400 | 327 |
| | Verizon Communications Inc. | 4.812% | 3/15/39 | 150 | 130 |
| | Verizon Communications Inc. | 2.650% | 11/20/40 | 75 | 48 |
| | Verizon Communications Inc. | 3.850% | 11/1/42 | 30 | 22 |
| | Verizon Communications Inc. | 4.862% | 8/21/46 | 250 | 209 |
| | Verizon Communications Inc. | 3.875% | 3/1/52 | 130 | 92 |
| | Verizon Communications Inc. | 3.000% | 11/20/60 | 70 | 39 |
| | Verizon Communications Inc. | 3.700% | 3/22/61 | 105 | 69 |
| 4 | VICI Properties LP | 5.625% | 5/1/24 | 8 | 8 |
| 4 | VICI Properties LP | 4.625% | 6/15/25 | 35 | 33 |
| 5 | Virginia Electric & Power Co. | 3.150% | 1/15/26 | 75 | 70 |
| 5 | Virginia Electric & Power Co. | 2.950% | 11/15/26 | 533 | 485 |
| 5 | Virginia Electric & Power Co. | 3.800% | 4/1/28 | 228 | 212 |
| 5 | Virginia Electric & Power Co. | 2.875% | 7/15/29 | 65 | 56 |
| 5 | Virginia Electric & Power Co. | 4.200% | 5/15/45 | 50 | 39 |
| 4 | Vistra Operations Co. LLC | 5.625% | 2/15/27 | 20 | 19 |
| 4 | Vistra Operations Co. LLC | 5.000% | 7/31/27 | 8 | 7 |
| | VMware Inc. | 1.800% | 8/15/28 | 190 | 150 |
| | VMware Inc. | 4.700% | 5/15/30 | 130 | 116 |
| | Walmart Inc. | 1.500% | 9/22/28 | 90 | 75 |
| | Walmart Inc. | 3.950% | 6/28/38 | 415 | 362 |
| | Walt Disney Co. | 6.650% | 11/15/37 | 70 | 76 |
| | Walt Disney Co. | 3.500% | 5/13/40 | 125 | 96 |
| | Walt Disney Co. | 2.750% | 9/1/49 | 45 | 28 |
| | Walt Disney Co. | 3.600% | 1/13/51 | 45 | 33 |
| 4 | Warnermedia Holdings Inc. | 3.428% | 3/15/24 | 80 | 77 |
| 4 | Warnermedia Holdings Inc. | 3.755% | 3/15/27 | 180 | 160 |
| 4 | Warnermedia Holdings Inc. | 5.050% | 3/15/42 | 34 | 25 |
| 4 | Warnermedia Holdings Inc. | 5.141% | 3/15/52 | 130 | 91 |
| 4 | Warnermedia Holdings Inc. | 5.391% | 3/15/62 | 165 | 115 |
| | WEC Energy Group Inc. | 5.000% | 9/27/25 | 405 | 403 |
| 5 | Wells Fargo & Co. | 2.164% | 2/11/26 | 200 | 183 |
| 5 | Wells Fargo & Co. | 2.188% | 4/30/26 | 475 | 432 |
| 5 | Wells Fargo & Co. | 3.196% | 6/17/27 | 50 | 45 |
| | | | Coupon | Maturity
Date | Face
Amount
($000) | Market
Value•
($000) |
| 5 | Wells Fargo & Co. | 4.808% | 7/25/28 | 140 | 133 |
| 5 | Wells Fargo & Co. | 2.879% | 10/30/30 | 270 | 221 |
| 5 | Wells Fargo & Co. | 4.897% | 7/25/33 | 75 | 68 |
| 9 | Wells Fargo & Co. | 4.625% | 11/2/35 | 400 | 415 |
| 5 | Wells Fargo & Co. | 3.068% | 4/30/41 | 320 | 217 |
| | Wells Fargo & Co. | 5.375% | 11/2/43 | 90 | 76 |
| 5 | Wells Fargo & Co. | 4.650% | 11/4/44 | 75 | 58 |
| 5 | Wells Fargo & Co. | 4.400% | 6/14/46 | 60 | 44 |
| 5 | Wells Fargo & Co. | 5.013% | 4/4/51 | 80 | 68 |
| 5 | Wells Fargo & Co. | 4.611% | 4/25/53 | 50 | 40 |
| 5,9 | Wells Fargo Bank NA | 5.250% | 8/1/23 | 2,400 | 2,751 |
| | Welltower Inc. | 4.250% | 4/1/26 | 50 | 47 |
| 4 | WESCO Distribution Inc. | 7.250% | 6/15/28 | 15 | 16 |
| | Western Midstream Operating LP | 4.500% | 3/1/28 | 49 | 45 |
| | Western Midstream Operating LP | 4.750% | 8/15/28 | 100 | 92 |
| | Western Midstream Operating LP | 4.300% | 2/1/30 | 40 | 35 |
| | Westlake Corp. | 3.125% | 8/15/51 | 150 | 88 |
| | Weyerhaeuser Co. | 4.000% | 11/15/29 | 131 | 116 |
| | Weyerhaeuser Co. | 3.375% | 3/9/33 | 130 | 104 |
| | Williams Cos. Inc. | 4.650% | 8/15/32 | 80 | 72 |
| | Williams Cos. Inc. | 6.300% | 4/15/40 | 65 | 63 |
| 4 | Williams Scotsman International Inc. | 4.625% | 8/15/28 | 9 | 8 |
| | Willis North America Inc. | 4.500% | 9/15/28 | 75 | 69 |
| | Willis North America Inc. | 2.950% | 9/15/29 | 85 | 69 |
| | Willis North America Inc. | 3.875% | 9/15/49 | 70 | 46 |
| 4 | WMG Acquisition Corp. | 3.750% | 12/1/29 | 60 | 51 |
| | Workday Inc. | 3.700% | 4/1/29 | 140 | 125 |
| 4 | Wyndham Hotels & Resorts Inc. | 4.375% | 8/15/28 | 30 | 26 |
| 4 | Wynn Resorts Finance LLC | 7.750% | 4/15/25 | 15 | 15 |
| | Xcel Energy Inc. | 3.500% | 12/1/49 | 320 | 216 |
| 4 | Zayo Group Holdings Inc. | 4.000% | 3/1/27 | 27 | 21 |
| | Zoetis Inc. | 4.700% | 2/1/43 | 129 | 110 |
| | Zoetis Inc. | 3.950% | 9/12/47 | 70 | 53 |
| | | | | | | 120,808 |
| Total Corporate Bonds (Cost $212,775) | 183,672 |
| Floating Rate Loan Interests (0.1%) |
| Ireland (0.0%) |
| 7 | Setanta Aircraft Leasing DAC Term Loan, 3M USD LIBOR + 2.000% | 5.674% | 11/5/28 | 85 | 84 |
| United States (0.1%) |
| 7 | AAdvantage Loyalty IP Ltd. Initial Term Loan, 3M USD LIBOR + 4.750% | 8.993% | 4/20/28 | 5 | 5 |
| 7 | Bausch Health Cos. Inc. Second Amendment Term Loan, TSFR1M + 5.250% | 8.624% | 2/1/27 | 25 | 18 |
| 7 | Central Parent Inc. First Lien Initial Term Loan, TSFR3M + 4.500% | 8.112% | 7/6/29 | 10 | 10 |
| 7 | Directv Financing LLC Term Loan, 1M USD LIBOR + 5.000% | 8.754% | 8/2/27 | 9 | 9 |
| 7 | First Student Bidco Inc. Incremental Term Loan B, TSFR3M + 4.000% | 7.653% | 7/21/28 | 20 | 19 |
| 7 | First Student Bidco Inc. Incremental Term Loan C, TSFR3M + 4.000% | 7.653% | 7/21/28 | 2 | 2 |
| 7 | McAfee Corp. Tranche B-1 Term Loan, TSFR1M + 3.750% | 6.870% | 3/1/29 | 10 | 9 |
| | | | Coupon | Maturity
Date | Face
Amount
($000) | Market
Value•
($000) |
| 7 | Medline Borrower LP Initial Dollar Term Loan, 1M USD LIBOR + 3.250% | 7.004% | 10/23/28 | 10 | 9 |
| 7 | SS&C Technologies Holdings Inc. Term Loan B-6, TSFR1M + 2.250% | 6.079% | 3/22/29 | 5 | 5 |
| 7 | SS&C Technologies Holdings Inc. Term Loan B-7, TSFR1M + 2.250% | 6.079% | 3/22/29 | 8 | 7 |
| | | | | | | 93 |
| Total Floating Rate Loan Interests (Cost $186) | 177 |
| Sovereign Bonds (15.5%) |
| Bermuda (0.3%) |
| 4,5 | Bermuda Government International Bond | 5.000% | 7/15/32 | 900 | 831 |
| Canada (1.1%) |
| 10 | Canadian Government Bond | 3.000% | 11/1/24 | 1,400 | 1,009 |
| 10 | Canadian Government Bond | 2.000% | 6/1/32 | 120 | 79 |
| 10 | Canadian Government Bond | 4.000% | 6/1/41 | 585 | 462 |
| 10 | Canadian Government Bond | 2.750% | 12/1/48 | 300 | 196 |
| 10 | Canadian Government Bond | 1.750% | 12/1/53 | 150 | 77 |
| 4,5 | Ontario Teachers' Cadillac Fairview Properties Trust | 3.875% | 3/20/27 | 800 | 726 |
| 4,5 | Ontario Teachers' Cadillac Fairview Properties Trust | 4.125% | 2/1/29 | 350 | 316 |
| | | | | | | 2,865 |
| Chile (0.1%) |
| 5 | Empresa Nacional del Petroleo | 3.750% | 8/5/26 | 250 | 222 |
| Colombia (0.4%) |
| 5 | Republic of Colombia | 4.500% | 1/28/26 | 1,215 | 1,093 |
| Croatia (0.6%) |
| 5 | Republic of Croatia | 5.500% | 4/4/23 | 460 | 461 |
| 8 | Republic of Croatia | 2.750% | 1/27/30 | 900 | 812 |
| 8 | Republic of Croatia | 1.500% | 6/17/31 | 350 | 279 |
| | | | | | | 1,552 |
| Dominican Republic (0.1%) |
| 5 | Dominican Republic | 5.500% | 2/22/29 | 300 | 262 |
| El Salvador (0.1%) |
| 5 | Republic of El Salvador | 8.625% | 2/28/29 | 300 | 120 |
| 5 | Republic of El Salvador | 9.500% | 7/15/52 | 200 | 76 |
| | | | | | | 196 |
| Germany (5.5%) |
| 8 | Federal Republic of Germany | 0.000% | 12/15/23 | 3,600 | 3,480 |
| 8 | Federal Republic of Germany | 0.000% | 3/15/24 | 449 | 432 |
| 5,8 | Federal Republic of Germany | ��� 0.000% | 4/11/25 | 4,121 | 3,886 |
| 5,8 | Federal Republic of Germany | 0.000% | 10/9/26 | 400 | 366 |
| 5,8 | Federal Republic of Germany | 0.000% | 4/16/27 | 506 | 458 |
| 8 | Federal Republic of Germany | 0.500% | 2/15/28 | 1,000 | 916 |
| 8 | Federal Republic of Germany | 0.000% | 11/15/28 | 2,073 | 1,820 |
| 8 | Federal Republic of Germany | 0.250% | 2/15/29 | 1,840 | 1,633 |
| 8 | Federal Republic of Germany | 0.000% | 2/15/32 | 430 | 350 |
| 8 | Federal Republic of Germany | 0.000% | 5/15/36 | 299 | 218 |
| 8 | Federal Republic of Germany | 1.000% | 5/15/38 | 195 | 159 |
| | | | Coupon | Maturity
Date | Face
Amount
($000) | Market
Value•
($000) |
| 8 | Federal Republic of Germany | 2.500% | 8/15/46 | 600 | 621 |
| 8 | Federal Republic of Germany | 0.000% | 8/15/52 | 599 | 314 |
| | | | | | | 14,653 |
| Hungary (0.2%) |
| 8 | Republic of Hungary | 1.625% | 4/28/32 | 700 | 469 |
| Indonesia (0.5%) |
| 5 | Perusahaan Perseroan Persero PT Perusahaan Listrik Negara | 4.125% | 5/15/27 | 200 | 184 |
| 4,5,8 | Perusahaan Perseroan Persero PT Perusahaan Listrik Negara | 1.875% | 11/5/31 | 370 | 255 |
| 5 | Republic of Indonesia | 4.650% | 9/20/32 | 875 | 808 |
| 5 | Republic of Indonesia | 4.300% | 3/31/52 | 300 | 228 |
| | | | | | | 1,475 |
| Israel (0.1%) |
| | State of Israel | 4.500% | 4/3/20 | 325 | 246 |
| Japan (0.3%) |
| 5,13 | Japan | 0.100% | 6/20/24 | 65,000 | 438 |
| 5,13 | Japan | 0.100% | 12/20/26 | 30,000 | 203 |
| 5,13 | Japan | 0.100% | 6/20/29 | 10,000 | 67 |
| 5,13 | Japan | 1.700% | 9/20/33 | 6,000 | 46 |
| | | | | | | 754 |
| Kazakhstan (0.1%) |
| 5 | Republic of Kazakhstan | 4.875% | 10/14/44 | 370 | 282 |
| Mexico (1.3%) |
| 5 | Comision Federal de Electricidad | 4.688% | 5/15/29 | 200 | 169 |
| | Petroleos Mexicanos | 6.625% | 6/15/35 | 210 | 145 |
| | Petroleos Mexicanos | 6.750% | 9/21/47 | 1,452 | 875 |
| 5,14 | United Mexican States | 7.750% | 5/29/31 | 25,000 | 1,117 |
| 5,14 | United Mexican States | 10.000% | 11/20/36 | 12,000 | 612 |
| 5 | United Mexican States | 4.400% | 2/12/52 | 800 | 549 |
| | | | | | | 3,467 |
| Nigeria (0.1%) |
| 4,5 | Federal Republic of Nigeria | 8.250% | 9/28/51 | 280 | 161 |
| Panama (0.2%) |
| 5 | Republic of Panama | 3.362% | 6/30/31 | 457 | 369 |
| 5 | Republic of Panama | 3.870% | 7/23/60 | 200 | 116 |
| | | | | | | 485 |
| Peru (0.5%) |
| 5 | Petroleos del Peru SA | 5.625% | 6/19/47 | 650 | 410 |
| 5 | Republic of Peru | 2.392% | 1/23/26 | 700 | 632 |
| 5 | Republic of Peru | 2.783% | 1/23/31 | 275 | 217 |
| | | | | | | 1,259 |
| Philippines (0.4%) |
| | Republic of the Philippines | 5.170% | 10/13/27 | 650 | 648 |
| 8 | Republic of the Philippines | 1.750% | 4/28/41 | 786 | 448 |
| | | | | | | 1,096 |
| Republic of North Macedonia (0.0%) |
| 5,8 | Republic of North Macedonia | 2.750% | 1/18/25 | 100 | 90 |
| Romania (0.7%) |
| 5,8 | Republic of Romania | 2.125% | 3/7/28 | 764 | 594 |
| 5,8 | Republic of Romania | 1.375% | 12/2/29 | 300 | 201 |
| | | | Coupon | Maturity
Date | Face
Amount
($000) | Market
Value•
($000) |
| 4,5,8 | Republic of Romania | 1.750% | 7/13/30 | 830 | 550 |
| 5,8 | Republic of Romania | 1.750% | 7/13/30 | 250 | 166 |
| 4,5 | Republic of Romania | 6.000% | 5/25/34 | 335 | 284 |
| 5,8 | Republic of Romania | 3.375% | 1/28/50 | �� 300 | 156 |
| | | | | | | 1,951 |
| Saudi Arabia (0.5%) |
| 4,5 | Kingdom of Saudi Arabia | 5.500% | 10/25/32 | 353 | 358 |
| 5 | Kingdom of Saudi Arabia | 4.500% | 10/26/46 | 805 | 642 |
| 5 | Kingdom of Saudi Arabia | 4.625% | 10/4/47 | 500 | 402 |
| | | | | | | 1,402 |
| Serbia (0.4%) |
| 5,8 | Republic of Serbia | 3.125% | 5/15/27 | 611 | 513 |
| 5,8 | Republic of Serbia | 1.650% | 3/3/33 | 281 | 163 |
| 4,5,8 | Republic of Serbia | 2.050% | 9/23/36 | 719 | 391 |
| | | | | | | 1,067 |
| South Africa (0.1%) |
| 5 | Eskom Holdings SOC Ltd. | 6.750% | 8/6/23 | 200 | 196 |
| South Korea (0.6%) |
| 4,5 | Korea Electric Power Corp. | 5.375% | 4/6/26 | 930 | 922 |
| 4,5 | Korea Electric Power Corp. | 4.000% | 6/14/27 | 600 | 561 |
| | | | | | | 1,483 |
| United Arab Emirates (0.1%) |
| 4,5 | Finance Department Government of Sharjah | 4.000% | 7/28/50 | 350 | 203 |
| United Kingdom (1.2%) |
| 9 | United Kingdom | 2.750% | 9/7/24 | 1,085 | 1,232 |
| 9 | United Kingdom | 1.250% | 7/22/27 | 475 | 489 |
| 9 | United Kingdom | 0.500% | 1/31/29 | 350 | 331 |
| 9 | United Kingdom | 0.250% | 7/31/31 | 532 | 459 |
| 9 | United Kingdom | 4.500% | 12/7/42 | 125 | 157 |
| 9 | United Kingdom | 3.250% | 1/22/44 | 150 | 158 |
| 9 | United Kingdom | 1.500% | 7/22/47 | 145 | 107 |
| 9 | United Kingdom | 0.625% | 10/22/50 | 108 | 59 |
| 9 | United Kingdom | 3.500% | 7/22/68 | 90 | 106 |
| | | | | | | 3,098 |
| Total Sovereign Bonds (Cost $49,980) | 40,858 |
| Taxable Municipal Bonds (0.1%) |
| United States (0.1%) |
| | New York Metropolitan Transportation Authority Revenue (Build America Bonds) (Cost $318) | 5.871% | 11/15/39 | 300 | 281 |
| Temporary Cash Investments (2.0%) |
| Commercial Paper (0.2%) |
| 15 | Enbridge US Inc. | 2.993% | 12/30/22 | 650 | 645 |
| | | | | | Shares | |
| Money Market Fund (1.8%) |
| 16 | Vanguard Market Liquidity Fund
| 3.117% | | 47,096 | 4,708 |
| Total Temporary Cash Investments (Cost $5,355) | 5,353 |
| | | Counterparty | Expiration
Date | Exercise
Rate | Notional
Amount on
Underlying
Swap
($000) | Market
Value•
($000) |
| Options Purchased (0.0%) |
| Over-the-Counter Swaptions (0.0%) |
| Call Swaptions |
| | 2-Year Interest Rate Swap, Pays 3M USD LIBOR Quarterly, Receives 0.603% Semiannually | NGFP | 1/13/23 | 0.603% | 2,422 | — |
| | 2-Year Interest Rate Swap, Pays 3M USD LIBOR Quarterly, Receives 0.608% Semiannually | CITNA | 1/17/23 | 0.608% | 2,429 | — |
| | 2-Year Interest Rate Swap, Pays 3M USD LIBOR Quarterly, Receives 0.603% Semiannually | BNPSW | 2/3/23 | 0.603% | 2,432 | — |
| | 2-Year Interest Rate Swap, Pays 3M USD LIBOR Quarterly, Receives 0.630% Semiannually | MSCS | 2/3/23 | 0.630% | 2,432 | — |
| | | | | | | — |
| | | Counterparty | Expiration
Date | Exercise
Rate | Notional
Amount on
Underlying
Swap
($000) | Market
Value•
($000) |
| Put Swaptions |
| | 5-Year CDX-NA-IG-S38-V1, Credit Protection Purchased, Pays 1.000% Quarterly | GSI | 11/16/22 | 1.000% | 3,680 | 1 |
| Total Options Purchased (Cost $55) | 1 |
| Total Investments (103.6%) (Cost $312,756) | | 273,330 |
| Other Assets and Liabilities—Net (-3.6%) | | (9,432) |
| Net Assets (100%) | | 263,898 |
| • | See Note A in Notes to Financial Statements. |
| 1 | Securities with a value of $475,000 have been segregated as initial margin for open centrally cleared swap contracts. |
| 2 | Securities with a value of $641,000 have been segregated as initial margin for open futures contracts. |
| 3 | Securities with a value of $1,699,000 have been segregated as collateral for open forward currency contracts and over-the-counter swap contracts. |
| 4 | Security exempt from registration under Rule 144A of the Securities Act of 1933. Such securities may be sold in transactions exempt from registration, normally to qualified institutional buyers. At October 31, 2022, the aggregate value was $20,372,000, representing 7.7% of net assets. |
| 5 | The average or expected maturity is shorter than the final maturity shown because of the possibility of interim principal payments and prepayments or the possibility of the issue being called. |
| 6 | Face amount denominated in Australian dollars. |
| 7 | Variable-rate security; rate shown is effective rate at period end. Certain variable-rate securities are not based on a published reference rate and spread but are determined by the issuer or agent based on current market conditions. |
| 8 | Face amount denominated in euro. |
| 9 | Face amount denominated in British pounds. |
| 10 | Face amount denominated in Canadian dollars. |
| 11 | Face amount denominated in Swiss francs. |
| 12 | Includes securities purchased on a when-issued or delayed-delivery basis for which the fund has not taken delivery as of October 31, 2022. |
| 13 | Face amount denominated in Japanese yen. |
| 14 | Face amount denominated in Mexican pesos. |
| 15 | Security exempt from registration under Section 4(2) of the Securities Act of 1933. Such securities may be sold in transactions exempt from registration only to dealers in that program or other "accredited investors." At October 31, 2022, the aggregate value of these securities was $645,000, representing 0.2% of net assets. |
| 16 | Affiliated money market fund available only to Vanguard funds and certain trusts and accounts managed by Vanguard. Rate shown is the 7-day yield. |
| | 1M—1-month. |
| | 3M—3-month. |
| | BNPSW—BNP Paribas. |
| | CITNA—Citibank, N.A. |
| | DAC—Designated Activity Company. |
| | GMTN—Global Medium Term Note. |
| | GSI—Goldman Sachs International. |
| | LIBOR—London Interbank Offered Rate. |
| | MSCS—Morgan Stanley Capital Services LLC. |
| | NGFP—Nomura Global Financial Products Inc. |
| | TSFR1M—CME Term Secured Overnight Financing Rate 1-Month. |
| | TSFR3M—CME Term Secured Overnight Financing Rate 3-Month. |
| | USD—U.S. dollar. |
Derivative Financial Instruments Outstanding as of Period End
| Options Written |
| | Counterparty | Expiration
Date | Excercise
Rate | Notional
Amount on
Underlying
Swap
($000) | Market
Value
($000) |
| Over-the-Counter Swaptions | | | | |
| Put Swaptions |
| 5-Year CDX-NA-IG-S38-V1, Credit Protection Sold, Receives 1.000% Quarterly (Premiums Received $4) | GSI | 11/16/22 | 1.400% | 3,680 | — |
| GSI—Goldman Sachs International. |
| Futures Contracts |
| | | | ($000) |
| | Expiration | Number of
Long (Short)
Contracts | Notional
Amount | Value and
Unrealized
Appreciation
(Depreciation) |
| Long Futures Contracts |
| 5-Year Government of Canada Bond | December 2022 | 31 | 2,546 | (2) |
| 5-Year U.S. Treasury Note | December 2022 | 73 | 7,781 | (17) |
| 10-Year Government of Canada Bond | December 2022 | 17 | 1,535 | (26) |
| Euro-Bobl | December 2022 | 21 | 2,484 | 3 |
| Euro-Bund | December 2022 | 23 | 3,147 | 20 |
| Euro-Buxl | December 2022 | 4 | 570 | 16 |
| Euro-Schatz | December 2022 | 6 | 634 | — |
| | | | | (6) |
| |
| Short Futures Contracts |
| 2-Year U.S. Treasury Note | December 2022 | (41) | (8,380) | 2 |
| 10-Year Japanese Government Bond | December 2022 | (2) | (2,001) | (5) |
| 10-Year U.S. Treasury Note | December 2022 | (7) | (774) | — |
| AUD 10-Year Treasury Bond | December 2022 | (4) | (303) | 3 |
| Long Gilt | December 2022 | (21) | (2,459) | (147) |
| Long U.S. Treasury Bond | December 2022 | (24) | (2,892) | 51 |
| Mini 10-Year Japanese Government Bond | December 2022 | (7) | (700) | (1) |
| Ultra 10-Year U.S. Treasury Note | December 2022 | (25) | (2,900) | (1) |
| | | | | (98) |
| | | | | (104) |
| Forward Currency Contracts |
| | Contract
Settlement
Date | Contract Amount (000) | Unrealized
Appreciation
($000) | Unrealized
(Depreciation)
($000) |
| Counterparty | | Receive | | Deliver |
| State Street Bank & Trust Co. | 11/2/22 | AUD | 5,596 | USD | 3,596 | — | (17) |
| Standard Chartered Bank | 11/2/22 | AUD | 33 | USD | 21 | — | — |
| Toronto-Dominion Bank | 11/2/22 | AUD | 21 | USD | 13 | — | — |
| HSBC Bank plc | 11/2/22 | CAD | 4,306 | USD | 3,165 | — | (4) |
| Toronto-Dominion Bank | 11/2/22 | CAD | 44 | USD | 32 | — | — |
| Credit Agricole CIB | 11/2/22 | CAD | 31 | USD | 23 | — | — |
| Bank of America, N.A. | 11/2/22 | CAD | 26 | USD | 19 | — | — |
| HSBC Bank plc | 12/2/22 | CAD | 25 | USD | 19 | — | — |
| JPMorgan Chase Bank, N.A. | 11/2/22 | CAD | 23 | USD | 17 | — | — |
| Standard Chartered Bank | 11/2/22 | CAD | 23 | USD | 17 | — | — |
| Credit Agricole CIB | 11/2/22 | CAD | 22 | USD | 16 | — | — |
| Morgan Stanley Capital Services LLC | 11/2/22 | CAD | 17 | USD | 13 | — | — |
| Morgan Stanley Capital Services LLC | 11/2/22 | CHF | 260 | USD | 261 | — | (2) |
| Toronto-Dominion Bank | 11/2/22 | EUR | 54,985 | USD | 54,910 | — | (572) |
| JPMorgan Chase Bank, N.A. | 11/2/22 | EUR | 3,794 | USD | 3,722 | 28 | — |
| Credit Agricole CIB | 11/2/22 | EUR | 1,306 | USD | 1,308 | — | (17) |
| Bank of America, N.A. | 11/2/22 | EUR | 823 | USD | 807 | 7 | — |
| State Street Bank & Trust Co. | 11/2/22 | EUR | 405 | USD | 395 | 5 | — |
| UBS AG | 11/2/22 | EUR | 113 | USD | 112 | — | (1) |
| UBS AG | 12/2/22 | EUR | 70 | USD | 69 | — | — |
| UBS AG | 11/2/22 | EUR | 43 | USD | 42 | — | — |
| UBS AG | 11/2/22 | GBP | 19,338 | USD | 22,386 | — | (209) |
| Standard Chartered Bank | 11/2/22 | GBP | 1,468 | USD | 1,669 | 15 | — |
| BNP Paribas | 11/2/22 | GBP | 683 | USD | 767 | 16 | — |
| JPMorgan Chase Bank, N.A. | 11/2/22 | GBP | 552 | USD | 638 | — | (6) |
| Credit Agricole CIB | 11/2/22 | GBP | 193 | USD | 224 | — | (3) |
| UBS AG | 11/2/22 | GBP | 54 | USD | 61 | 1 | — |
| Morgan Stanley Capital Services LLC | 11/2/22 | GBP | 27 | USD | 30 | 1 | — |
| Bank of America, N.A. | 11/2/22 | JPY | 115,868 | USD | 786 | — | (6) |
| UBS AG | 11/2/22 | JPY | 2,323 | USD | 16 | — | — |
| Morgan Stanley Capital Services LLC | 11/2/22 | JPY | 1,807 | USD | 12 | — | — |
| Forward Currency Contracts (continued) |
| | Contract
Settlement
Date | Contract Amount (000) | Unrealized
Appreciation
($000) | Unrealized
(Depreciation)
($000) |
| Counterparty | | Receive | | Deliver |
| Morgan Stanley Capital Services LLC | 11/3/22 | MXN | 39,794 | USD | 2,006 | 2 | — |
| HSBC Bank plc | 11/2/22 | SEK | 21 | USD | 2 | — | — |
| Morgan Stanley Capital Services LLC | 11/2/22 | ZAR | 1 | USD | — | — | — |
| Morgan Stanley Capital Services LLC | 12/2/22 | ZAR | 1 | USD | — | — | — |
| Morgan Stanley Capital Services LLC | 11/2/22 | USD | 3,647 | AUD | 5,650 | 34 | — |
| State Street Bank & Trust Co. | 12/2/22 | USD | 3,599 | AUD | 5,596 | 17 | — |
| Morgan Stanley Capital Services LLC | 12/2/22 | USD | 8 | AUD | 13 | — | — |
| HSBC Bank plc | 12/2/22 | USD | 3,108 | CAD | 4,229 | 4 | — |
| Bank of America, N.A. | 11/2/22 | USD | 1,912 | CAD | 2,628 | — | (17) |
| Morgan Stanley Capital Services LLC | 11/2/22 | USD | 1,247 | CAD | 1,709 | — | (7) |
| Credit Agricole CIB | 11/2/22 | USD | 41 | CAD | 56 | — | (1) |
| Toronto-Dominion Bank | 11/2/22 | USD | 30 | CAD | 41 | — | — |
| JPMorgan Chase Bank, N.A. | 11/2/22 | USD | 21 | CAD | 29 | — | — |
| Citibank, N.A. | 11/2/22 | USD | 21 | CAD | 29 | — | — |
| Toronto-Dominion Bank | 11/2/22 | USD | 265 | CHF | 260 | 6 | — |
| Morgan Stanley Capital Services LLC | 12/2/22 | USD | 262 | CHF | 260 | 2 | — |
| Toronto-Dominion Bank | 12/2/22 | USD | 55,026 | EUR | 54,985 | 572 | — |
| Bank of America, N.A. | 11/2/22 | USD | 50,869 | EUR | 52,173 | — | (691) |
| State Street Bank & Trust Co. | 12/2/22 | USD | 5,142 | EUR | 5,195 | — | (3) |
| JPMorgan Chase Bank, N.A. | 11/2/22 | USD | 4,794 | EUR | 4,940 | — | (88) |
| State Street Bank & Trust Co. | 11/2/22 | USD | 2,338 | EUR | 2,374 | — | (8) |
| Toronto-Dominion Bank | 11/2/22 | USD | 1,192 | EUR | 1,219 | — | (14) |
| JPMorgan Chase Bank, N.A. | 11/2/22 | USD | 583 | EUR | 584 | 6 | — |
| Morgan Stanley Capital Services LLC | 11/2/22 | USD | 112 | EUR | 115 | — | (2) |
| Standard Chartered Bank | 11/2/22 | USD | 37 | EUR | 38 | — | (1) |
| HSBC Bank plc | 11/2/22 | USD | 25 | EUR | 26 | — | — |
| UBS AG | 12/2/22 | USD | 22,404 | GBP | 19,338 | 208 | — |
| State Street Bank & Trust Co. | 11/2/22 | USD | 21,686 | GBP | 19,730 | — | (941) |
| UBS AG | 11/2/22 | USD | 1,849 | GBP | 1,666 | — | (62) |
| Forward Currency Contracts (continued) |
| | Contract
Settlement
Date | Contract Amount (000) | Unrealized
Appreciation
($000) | Unrealized
(Depreciation)
($000) |
| Counterparty | | Receive | | Deliver |
| Standard Chartered Bank | 12/2/22 | USD | 766 | GBP | 666 | 3 | — |
| State Street Bank & Trust Co. | 11/2/22 | USD | 421 | GBP | 367 | 1 | — |
| HSBC Bank plc | 11/2/22 | USD | 414 | GBP | 363 | — | (2) |
| Morgan Stanley Capital Services LLC | 11/2/22 | USD | 211 | GBP | 188 | — | (5) |
| Bank of America, N.A. | 11/2/22 | USD | 797 | JPY | 114,932 | 24 | — |
| Bank of America, N.A. | 12/2/22 | USD | 788 | JPY | 115,868 | 6 | — |
| JPMorgan Chase Bank, N.A. | 11/2/22 | USD | 27 | JPY | 3,872 | — | — |
| Credit Agricole CIB | 11/2/22 | USD | 8 | JPY | 1,195 | — | — |
| Standard Chartered Bank | 12/2/22 | USD | 8 | JPY | 1,122 | — | — |
| Morgan Stanley Capital Services LLC | 12/2/22 | USD | 1,996 | MXN | 39,794 | — | (2) |
| BNP Paribas | 11/3/22 | USD | 1,954 | MXN | 39,794 | — | (54) |
| Bank of America, N.A. | 11/2/22 | USD | 2 | SEK | 21 | — | — |
| HSBC Bank plc | 12/2/22 | USD | 2 | SEK | 21 | — | — |
| Morgan Stanley Capital Services LLC | 11/2/22 | USD | — | ZAR | 1 | — | — |
| | | | | | | 958 | (2,735) |
| AUD—Australian dollar. |
| CAD—Canadian dollar. |
| CHF—Swiss franc. |
| EUR—euro. |
| GBP—British pound. |
| JPY—Japanese yen. |
| MXN—Mexican peso. |
| SEK—Swedish krona. |
| USD—U.S. dollar. |
| ZAR—South African rand. |
| Centrally Cleared Credit Default Swaps |
| Reference Entity | Termination
Date | | Notional
Amount
($000) | Periodic
Premium
Received
(Paid)1
(%) | Value
($000) | Unrealized
Appreciation
(Depreciation)
($000) |
| Credit Protection Sold |
| CDX-NA-IG-S39-V1 | 12/20/27 | USD | 14,420 | 1.000 | 19 | 19 |
| 1 Periodic premium received/paid quarterly. |
| USD—U.S. dollar. |
| Over-the-Counter Credit Default Swaps |
Reference
Entity | Termination
Date | Counterparty | Notional
Amount
($000) | Periodic
Premium
Received
(Paid)1
(%) | Value
($000) | Remaining
Up-Front
Premium
Paid
(Received)
($000) | Unrealized
Appreciation
($000) | Unrealized
(Depreciation)
($000) |
| Credit Protection Sold/Moody's Rating |
| AT&T Inc./Baa2 | 12/20/23 | BARC | 640 | 1.000 | — | 4 | — | (4) |
| AT&T Inc./Baa2 | 12/20/23 | BARC | 160 | 1.000 | — | 1 | — | (1) |
| Credit Suisse Group Finance Guernsey Ltd./WR | 6/20/27 | JPMC | 500 2 | 1.000 | (31) | (6) | — | (25) |
| Federation of Malaysia/A3 | 12/20/27 | MSCS | 950 | 1.000 | (95) | (6) | — | (89) |
| People's Republic of China/A1 | 12/20/27 | JPMC | 1,530 | 1.000 | (15) | (23) | 8 | — |
| People's Republic of China/A1 | 12/20/27 | JPMC | 1,040 | 1.000 | (10) | (15) | 5 | — |
| People's Republic of China/A1 | 12/20/27 | MSCS | 552 | 1.000 | (5) | (9) | 4 | — |
| Republic of Chile/A2 | 12/20/27 | MSCS | 1,720 | 1.000 | (39) | (16) | — | (23) |
| Republic of Indonesia/Baa2 | 12/20/27 | GSI | 1,200 | 1.000 | (19) | (29) | 10 | — |
| United Mexican States/Baa2 | 12/20/27 | GSI | 1,400 | 1.000 | (36) | (44) | 8 | — |
| United Mexican States/Baa2 | 12/20/27 | MSCS | 2,230 | 1.000 | (58) | (93) | 35 | — |
| | | | | | (308) | (236) | 70 | (142) |
| Credit Protection Purchased |
| Republic of Colombia | 6/20/27 | BARC | 520 | (1.000) | 47 | 42 | 5 | — |
| Republic of Colombia | 6/20/27 | BARC | 450 | (1.000) | 39 | 35 | 4 | — |
| Standard Chartered plc | 12/20/27 | JPMC | 950 2 | (1.000) | 15 | 7 | 8 | — |
| | | | | | 101 | 84 | 17 | — |
| | | | | | (207) | (152) | 87 | (142) |
| 1 Periodic premium received/paid quarterly. |
| 2 Notional amount denominated in euro. |
| BARC—Barclays Bank plc. |
| GSI—Goldman Sachs International. |
| JPMC—JPMorgan Chase Bank, N.A. |
| MSCS—Morgan Stanley Capital Services LLC. |
The notional amount represents the maximum potential amount the fund could be required to pay as a seller of credit protection if the reference entity was subject to a credit event.
At October 31, 2022, the counterparties had deposited in segregated accounts securities with a value of $83,000 in connection with open forward currency contracts and over-the-counter swap contracts.
| Centrally Cleared Interest Rate Swaps |
| Termination Date | Future
Effective
Date1 | Notional
Amount
(000)2 | Interest
Rate
Received3
(%) | Interest
Rate
(Paid)4
(%) | Value
($000) | Unrealized
Appreciation
(Depreciation)
($000) |
| 12/21/24 | 12/21/22 | 2,350 | 0.000 | (4.274) | 19 | 19 |
| 1 Forward interest rate swap. In a forward interest rate swap, the fund and the counterparty agree to make periodic net payments beginning on a specified future effective date. |
| 2 Notional amount denominated in British pound. |
| 3 Based on 1-Day Sterling Overnight Index Average Rate (SONIA) as of the most recent payment date. Interest payment received/paid annually. |
| 4 Interest payment received/paid annually. |
See accompanying Notes, which are an integral part of the Financial Statements.
Statement of Assets and Liabilities
|
| ($000s, except shares and per-share amounts) | Amount |
| Assets | |
| Investments in Securities, at Value | |
| Unaffiliated Issuers (Cost $308,048) | 268,622 |
| Affiliated Issuers (Cost $4,708) | 4,708 |
| Total Investments in Securities | 273,330 |
| Investment in Vanguard | 9 |
| Foreign Currency, at Value (Cost $189) | 187 |
| Cash Collateral Pledged—Futures Contracts | 10 |
| Receivables for Investment Securities Sold | 1,547 |
| Receivables for Accrued Income | 2,473 |
| Receivables for Capital Shares Issued | 553 |
| Swap Premiums Paid | 89 |
| Unrealized Appreciation—Forward Currency Contracts | 958 |
| Unrealized Appreciation—Over-the-Counter Swap Contracts | 87 |
| Total Assets | 279,243 |
| Liabilities | |
| Due to Custodian | 78 |
| Payables for Investment Securities Purchased | 11,106 |
| Payables for Capital Shares Redeemed | 993 |
| Payables to Vanguard | 30 |
| Options Written, at Value (Premiums Received $4) | — |
| Swap Premiums Received | 241 |
| Variation Margin Payable—Futures Contracts | 7 |
| Variation Margin Payable—Centrally Cleared Swap Contracts | 13 |
| Unrealized Depreciation—Forward Currency Contracts | 2,735 |
| Unrealized Depreciation—Over-the-Counter Swap Contracts | 142 |
| Total Liabilities | 15,345 |
| Net Assets | 263,898 |
Statement of Assets and Liabilities (continued)
|
At October 31, 2022, net assets consisted of: |
|
| ($000s, except shares and per-share amounts) | Amount |
| Paid-in Capital | 311,214 |
| Total Distributable Earnings (Loss) | (47,316) |
| Net Assets | 263,898 |
| |
| Investor Shares—Net Assets | |
Applicable to 4,028,753 outstanding $.001 par value shares of
beneficial interest (unlimited authorization) | 35,989 |
| Net Asset Value Per Share—Investor Shares | $8.93 |
| |
| Admiral Shares—Net Assets | |
Applicable to 12,755,261 outstanding $.001 par value shares of
beneficial interest (unlimited authorization) | 227,909 |
| Net Asset Value Per Share—Admiral Shares | $17.87 |
See accompanying Notes, which are an integral part of the Financial Statements.
|
| | Year Ended
October 31, 2022 |
| | ($000) |
| Investment Income | |
| Income | |
| Interest 1 | 6,399 |
| Total Income | 6,399 |
| Expenses | |
| The Vanguard Group—Note B | |
| Investment Advisory Services | 18 |
| Management and Administrative—Investor Shares | 102 |
| Management and Administrative—Admiral Shares | 405 |
| Marketing and Distribution—Investor Shares | 4 |
| Marketing and Distribution—Admiral Shares | 12 |
| Custodian Fees | 41 |
| Auditing Fees | 46 |
| Shareholders’ Reports—Investor Shares | 17 |
| Shareholders’ Reports—Admiral Shares | 9 |
| Trustees’ Fees and Expenses | — |
| Other Expenses | 27 |
| Total Expenses | 681 |
| Expenses Paid Indirectly | (1) |
| Net Expenses | 680 |
| Net Investment Income | 5,719 |
| Realized Net Gain (Loss) | |
| Investment Securities Sold1 | (20,869) |
| Futures Contracts | (3,296) |
| Options Purchased | 26 |
| Options Written | 75 |
| Swap Contracts | 344 |
| Forward Currency Contracts | 15,869 |
| Foreign Currencies | 615 |
| Realized Net Gain (Loss) | (7,236) |
| Statement of Operations (continued) |
| | Year Ended
October 31, 2022 |
| | ($000) |
| Change in Unrealized Appreciation (Depreciation) | |
| Investment Securities1 | (40,566) |
| Futures Contracts | 14 |
| Options Purchased | (20) |
| Options Written | — |
| Swap Contracts | 12 |
| Forward Currency Contracts | (2,213) |
| Foreign Currencies | (5) |
| Change in Unrealized Appreciation (Depreciation) | (42,778) |
| Net Increase (Decrease) in Net Assets Resulting from Operations | (44,295) |
| 1 | Interest income, realized net gain (loss), capital gain distributions received, and change in unrealized appreciation (depreciation) from an affiliated company of the fund were $133,000, ($4,000), $1,000, and less than $1,000, respectively. Purchases and sales are for temporary cash investment purposes. |
See accompanying Notes, which are an integral part of the Financial Statements.
Statement of Changes in Net Assets
|
| | Year Ended October 31, |
| | 2022
($000) | 2021
($000) |
| Increase (Decrease) in Net Assets | | |
| Operations | | |
| Net Investment Income | 5,719 | 4,601 |
| Realized Net Gain (Loss) | (7,236) | 5,628 |
| Change in Unrealized Appreciation (Depreciation) | (42,778) | (4,920) |
| Net Increase (Decrease) in Net Assets Resulting from Operations | (44,295) | 5,309 |
| Distributions | | |
| Investor Shares | (1,447) | (1,802) |
| Admiral Shares | (7,712) | (10,060) |
| Total Distributions | (9,159) | (11,862) |
| Capital Share Transactions | | |
| Investor Shares | (1,531) | 6,448 |
| Admiral Shares | 39,841 | 17,406 |
| Net Increase (Decrease) from Capital Share Transactions | 38,310 | 23,854 |
| Total Increase (Decrease) | (15,144) | 17,301 |
| Net Assets | | |
| Beginning of Period | 279,042 | 261,741 |
| End of Period | 263,898 | 279,042 |
See accompanying Notes, which are an integral part of the Financial Statements.
| Investor Shares | | | | |
For a Share Outstanding
Throughout Each Period | Year Ended October 31, | November 15,
20181 to
October 31,
2019 |
| 2022 | 2021 | 2020 |
| Net Asset Value, Beginning of Period | $11.02 | $11.26 | $11.09 | $10.00 |
| Investment Operations | | | | |
| Net Investment Income2 | .214 | .176 | .231 | .287 |
| Net Realized and Unrealized Gain (Loss) on Investments | (1.956) | .059 | .619 | 1.045 |
| Total from Investment Operations | (1.742) | .235 | .850 | 1.332 |
| Distributions | | | | |
| Dividends from Net Investment Income | (.182) | (.217) | (.338) | (.242) |
| Distributions from Realized Capital Gains | (.166) | (.258) | (.342) | — |
| Total Distributions | (.348) | (.475) | (.680) | (.242) |
| Net Asset Value, End of Period | $8.93 | $11.02 | $11.26 | $11.09 |
| Total Return3 | -16.15% | 2.07% | 8.10% | 13.46% |
| Ratios/Supplemental Data | | | | |
| Net Assets, End of Period (Millions) | $36 | $46 | $41 | $31 |
| Ratio of Total Expenses to Average Net Assets | 0.35% 4 | 0.35% | 0.35% | 0.35% 5 |
| Ratio of Net Investment Income to Average Net Assets | 2.14% | 1.59% | 2.11% | 2.78% 5 |
| Portfolio Turnover Rate | 124% | 128% 6 | 264% | 284% |
| 1 | Inception. |
| 2 | Calculated based on average shares outstanding. |
| 3 | Total returns do not include account service fees that may have applied in the periods shown. Fund prospectuses provide information about any applicable account service fees. |
| 4 | The ratio of expenses to average net assets for the period net of reduction from custody fee offset arrangements was 0.35%. |
| 5 | Annualized. |
| 6 | Includes 13% attributable to mortgage-dollar-roll activity. |
See accompanying Notes, which are an integral part of the Financial Statements.
| Admiral Shares | | | | |
For a Share Outstanding
Throughout Each Period | Year Ended October 31, | November 15,
20181 to
October 31,
2019 |
| 2022 | 2021 | 2020 |
| Net Asset Value, Beginning of Period | $22.04 | $22.52 | $22.19 | $20.00 |
| Investment Operations | | | | |
| Net Investment Income2 | .449 | .375 | .485 | .591 |
| Net Realized and Unrealized Gain (Loss) on Investments | (3.901) | .117 | 1.228 | 2.101 |
| Total from Investment Operations | (3.452) | .492 | 1.713 | 2.692 |
| Distributions | | | | |
| Dividends from Net Investment Income | (.385) | (.456) | (.699) | (.502) |
| Distributions from Realized Capital Gains | (.333) | (.516) | (.684) | — |
| Total Distributions | (.718) | (.972) | (1.383) | (.502) |
| Net Asset Value, End of Period | $17.87 | $22.04 | $22.52 | $22.19 |
| Total Return3 | -16.02% | 2.18% | 8.16% | 13.60% |
| Ratios/Supplemental Data | | | | |
| Net Assets, End of Period (Millions) | $228 | $233 | $221 | $177 |
| Ratio of Total Expenses to Average Net Assets | 0.25% 4 | 0.25% | 0.25% | 0.25% 5 |
| Ratio of Net Investment Income to Average Net Assets | 2.26% | 1.69% | 2.21% | 2.88% 5 |
| Portfolio Turnover Rate | 124% | 128% 6 | 264% | 284% |
| 1 | Inception. |
| 2 | Calculated based on average shares outstanding. |
| 3 | Total returns do not include account service fees that may have applied in the periods shown. Fund prospectuses provide information about any applicable account service fees. |
| 4 | The ratio of expenses to average net assets for the period net of reduction from custody fee offset arrangements was 0.25%. |
| 5 | Annualized. |
| 6 | Includes 13% attributable to mortgage-dollar-roll activity. |
See accompanying Notes, which are an integral part of the Financial Statements.
Notes to Financial Statements
Vanguard Global Credit Bond Fund is registered under the Investment Company Act of 1940 as an open-end investment company, or mutual fund. The fund offers two classes of shares: Investor Shares and Admiral Shares. Each of the share classes has different eligibility and minimum purchase requirements, and is designed for different types of investors.
Certain of the fund's investments are in corporate debt instruments; the issuers' abilities to meet their obligations may be affected by economic developments in their respective industries. The fund invests in securities of foreign issuers, which may subject it to investment risks not normally associated with investing in securities of U.S. corporations. To minimize the currency risk associated with investment in securities denominated in currencies other than the U.S. dollar, the fund attempts to hedge its currency exposures. Significant market disruptions, such as those caused by pandemics (e.g., COVID-19 pandemic), natural or environmental disasters, war (e.g., Russia's invasion of Ukraine), acts of terrorism, or other events, can adversely affect local and global markets and normal market operations. Any such disruptions could have an adverse impact on the value of the fund's investments and fund performance.
A. The following significant accounting policies conform to generally accepted accounting principles for U.S. investment companies. The fund consistently follows such policies in preparing its financial statements.
1. Security Valuation: Securities are valued as of the close of trading on the New York Stock Exchange (generally 4 p.m., Eastern time) on the valuation date. Bonds and temporary cash investments are valued using the latest bid prices or using valuations based on a matrix system (which considers such factors as security prices, yields, maturities, and ratings), both as furnished by independent pricing services. Structured debt securities, including mortgages and asset-backed securities, are valued using the latest bid prices or using valuations based on a matrix system that considers such factors as issuer, tranche, nominal or option-adjusted spreads, weighted average coupon, weighted average maturity, credit enhancements, and collateral, as furnished by independent pricing services. Investments in Vanguard Market Liquidity Fund are valued at that fund's net asset value. Securities for which market quotations are not readily available, or whose values have been affected by events occurring before the fund’s pricing time but after the close of the securities’ primary markets, are valued by methods deemed by the valuation designee to represent fair value and subject to oversight by the board of trustees. These procedures include obtaining quotations from an independent pricing service, monitoring news to identify significant market- or security-specific events, and evaluating changes in the values of foreign market proxies (for example, ADRs, futures contracts, or exchange-traded funds), between the time the foreign markets close and the fund’s pricing time.
2. Foreign Currency: Securities and other assets and liabilities denominated in foreign currencies are translated into U.S. dollars using exchange rates obtained from an independent third party as of the fund’s pricing time on the valuation date. Realized gains (losses) and unrealized appreciation (depreciation) on investment securities include the effects of changes in exchange rates since the securities were purchased, combined with the effects of changes in security prices. Fluctuations in the value of other assets and liabilities resulting from changes in exchange rates are recorded as unrealized foreign currency gains (losses) until the assets or liabilities are settled in cash, at which time they are recorded as realized foreign currency gains (losses).
3. Mortgage Dollar Rolls: The fund enters into mortgage-dollar-roll transactions, in which the fund sells mortgage-backed securities to a dealer and simultaneously agrees to purchase similar securities in the future at a predetermined price. The proceeds of the securities sold in
mortgage-dollar-roll transactions are typically invested in high-quality short-term fixed income securities. The fund forgoes principal and interest paid on the securities sold, and is compensated by interest earned on the proceeds of the sale and by a lower price on the securities to be repurchased. The fund also enters into mortgage-dollar-roll transactions in which the fund buys mortgage-backed securities from a dealer pursuant to a TBA transaction and simultaneously agrees to sell similar securities in the future at a predetermined price. The securities bought in mortgage-dollar-roll transactions are used to cover an open TBA sell position. The fund continues to earn interest on mortgage-backed security pools already held and receives a lower price on the securities to be sold in the future. The fund accounts for mortgage-dollar-roll transactions as purchases and sales; as such, these transactions may increase the fund’s portfolio turnover rate. Amounts to be received or paid in connection with open mortgage dollar rolls are included in Receivables for Investment Securities Sold or Payables for Investment Securities Purchased in the Statement of Assets and Liabilities.
4. Floating Rate Loan Interests: Floating rate loan interests represent interests in amounts owed by corporate or other borrowers. These instruments may be in the form of loans, trade claims or other receivables and may include standby financing commitments such as revolving credit facilities that obligate the fund to supply additional cash to the borrower on demand. Floating rate loan interests may be made directly with a borrower or acquired through assignment or participation. The fund's right to enforce a borrower’s compliance with the terms of the loan agreement, or benefit directly from the collateral supporting the loan, varies when the loan is a direct borrowing, an assignment, or a participation. Floating rate loan interests involve various risks including risk of loss in case of default, insolvency, or the bankruptcy of the borrower and are generally subject to restrictions on transfer with limited opportunities to sell them in secondary markets. The fund may also invest in loan commitments, which are contractual obligations for a future funding. The fund may earn a commitment fee on any unfunded portion of these commitments which is amortized to interest income over the commitment period. Both the funded portion of a floating rate loan interest as well as its unfunded commitment, if any, is reflected on the Schedule of Investments.
5. Swaptions: The fund invests in options on swaps, which are transacted over-the-counter (OTC) and not on an exchange. The fund enters into swaptions to adjust the fund's sensitivity to interest rates or to adjust its exposure to the underlying investments. The fund may purchase a swaption from a counterparty whereby the fund has the right to enter into a swap in which the fund will pay either a fixed percentage rate or a floating rate, which is reset periodically based on short-term interest rates, and receive a different floating rate, each applied to a notional amount. The fund may also sell a swaption to a counterparty whereby the fund grants the counterparty the right to enter into a swap in which the fund will pay a floating rate and receive a fixed rate, each applied to a notional amount. Swaptions also include options that allow an existing swap to be terminated or extended by one of the counterparties. Unlike exchange-traded options, which are standardized with respect to the underlying instrument, expiration date, contract size, and strike price, the terms of OTC options generally are established through negotiation with the other party to the option contract. Although this type of arrangement allows the purchaser or writer greater flexibility to tailor an option to its needs, OTC options generally involve greater credit risk than exchange-traded options. Credit risk involves the possibility that a counterparty may default on its obligation to pay net amounts due to the fund. The fund mitigates its counterparty risk by entering into swaptions with a diverse group of prequalified counterparties and monitoring their financial strength.
The primary risk associated with purchasing swaptions is that interest rates or the value of the underlying investments move in such a way that the exercise price of the swaption exceeds the value of the underlying investment, the position is worthless at expiration, and the fund loses the premium paid. The primary risk associated with selling swaptions is that interest rates or the value of the underlying investments move in such a way that the exercise price of the swaption exceeds the value of the underlying investment, the counterparty exercises the swaption, and the resulting interest rate swap results in a negative cash flow to the fund in an amount greater than the premium received. A risk associated with all types of swaptions is the possibility that a counterparty may default on its obligations under the swaption contract.
Swaptions are valued based on market quotations received from independent pricing services or recognized dealers. The premium paid for a purchased swaption is recorded in the Statement of Assets and Liabilities as an asset and is subsequently adjusted daily based on the current market value of the swaption. The premium received for a written swaption is recorded in the Statement of Assets and Liabilities as an asset with an equal liability and is subsequently adjusted daily based on the current market value of the swaption. The notional amounts of option contracts are not recorded in the Statement of Assets and Liabilities. Fluctuations in the value of swaptions are recorded in the Statement of Operations as unrealized appreciation (depreciation) until expired, closed, or exercised, at which time realized gains (losses) are recognized.
During the year ended October 31, 2022, the fund’s average value of investments in swaptions purchased and swaptions written represented less than 1% of net assets, based on the average market values at each quarter-end during the period.
6. Futures Contracts: The fund uses futures contracts to invest in fixed income asset classes with greater efficiency and lower cost than is possible through direct investment, to add value when these instruments are attractively priced, or to adjust sensitivity to changes in interest rates. The primary risks associated with the use of futures contracts are imperfect correlation between changes in market values of bonds held by the fund and the prices of futures contracts, and the possibility of an illiquid market. Counterparty risk involving futures is mitigated because a regulated clearinghouse is the counterparty instead of the clearing broker. To further mitigate counterparty risk, the fund trades futures contracts on an exchange, monitors the financial strength of its clearing brokers and clearinghouse, and has entered into clearing agreements with its clearing brokers. The clearinghouse imposes initial margin requirements to secure the fund’s performance and requires daily settlement of variation margin representing changes in the market value of each contract. Any securities pledged as initial margin for open contracts are noted in the Schedule of Investments.
Futures contracts are valued at their quoted daily settlement prices. The notional amounts of the contracts are not recorded in the Statement of Assets and Liabilities. Fluctuations in the value of the contracts are recorded in the Statement of Assets and Liabilities as an asset (liability) and in the Statement of Operations as unrealized appreciation (depreciation) until the contracts are closed, when they are recorded as realized gains (losses) on futures contracts.
During the year ended October 31, 2022, the fund’s average investments in long and short futures contracts represented 11% and 6% of net assets, respectively, based on the average of the notional amounts at each quarter-end during the period.
7. Forward Currency Contracts: The fund enters into forward currency contracts to protect the value of securities and related receivables and payables against changes in future foreign exchange
rates. The fund’s risks in using these contracts include movement in the values of the foreign currencies relative to the U.S. dollar and the ability of the counterparties to fulfill their obligations under the contracts. The fund mitigates its counterparty risk by entering into forward currency contracts only with a diverse group of prequalified counterparties, monitoring their financial strength, entering into master netting arrangements with its counterparties, and requiring its counterparties to transfer collateral as security for their performance. In the absence of a default, the collateral pledged or received by the fund cannot be repledged, resold, or rehypothecated. The master netting arrangements provide that, in the event of a counterparty’s default (including bankruptcy), the fund may terminate the forward currency contracts, determine the net amount owed by either party in accordance with its master netting arrangements, and sell or retain any collateral held up to the net amount owed to the fund under the master netting arrangements. The forward currency contracts contain provisions whereby a counterparty may terminate open contracts if the fund’s net assets decline below a certain level, triggering a payment by the fund if the fund is in a net liability position at the time of the termination. The payment amount would be reduced by any collateral the fund has pledged. Any securities pledged as collateral for open contracts are noted in the Schedule of Investments. The value of collateral received or pledged is compared daily to the value of the forward currency contracts exposure with each counterparty, and any difference, if in excess of a specified minimum transfer amount, is adjusted and settled within two business days.
Forward currency contracts are valued at their quoted daily prices obtained from an independent third party, adjusted for currency risk based on the expiration date of each contract. The notional amounts of the contracts are not recorded in the Statement of Assets and Liabilities. Fluctuations in the value of the contracts are recorded in the Statement of Assets and Liabilities as an asset (liability) and in the Statement of Operations as unrealized appreciation (depreciation) until the contracts are closed, when they are recorded as realized gains (losses) on forward currency contracts.
During the year ended October 31, 2022, the fund’s average investment in forward currency contracts represented 83% of net assets, based on the average of the notional amounts at each quarter-end during the period.
8. Swap Contracts: The fund invests in credit default swaps to adjust the overall credit risk of the fund or to actively overweight or underweight credit risk to a specific issuer or group of issuers. The fund may sell credit protection through credit default swaps to simulate investments in long positions that are either unavailable or considered to be less attractively priced in the bond market. The fund may purchase credit protection through credit default swaps to reduce credit exposure to a given issuer or issuers. Under the terms of the swaps, an up-front payment may be exchanged between the seller and buyer. In addition, the seller of the credit protection receives a periodic payment of premium from the buyer that is a fixed percentage applied to a notional amount. If, for example, the reference entity is subject to a credit event (such as bankruptcy, failure to pay, or obligation acceleration) during the term of the swap, the seller agrees to either physically settle or cash settle the swap contract. If the swap is physically settled, the seller agrees to pay the buyer an amount equal to the notional amount and take delivery of a debt instrument of the reference issuer with a par amount equal to such notional amount. If the swap is cash settled, the seller agrees to pay the buyer the difference between the notional amount and the final price for the relevant debt instrument, as determined either in a market auction or pursuant to a pre-agreed-upon valuation procedure.
The fund enters into interest rate swap transactions to adjust the fund’s sensitivity to changes in interest rates and maintain the ability to generate income at prevailing market rates. Under the terms of the swaps, one party pays the other either an amount that is a fixed percentage rate or a floating rate, which is reset periodically based on short-term interest rates, applied to a notional amount. In return, the counterparty agrees to pay a different floating rate, which is reset periodically based on short-term interest rates, applied to the same notional amount.
The fund enters into centrally cleared credit default and interest rate swaps to achieve the same objectives specified with respect to the equivalent over-the-counter swaps but with less counterparty risk because a regulated clearinghouse is the counterparty instead of the clearing broker or executing broker. The clearinghouse imposes initial margin requirements to secure the fund's performance, and requires daily settlement of variation margin representing changes in the market value of each contract. To further mitigate counterparty risk, the fund trades with a diverse group of prequalified executing brokers; monitors the financial strength of its clearing brokers, executing brokers, and clearinghouse; and has entered into agreements with its clearing brokers and executing brokers.
The primary risk associated with selling credit protection is that, upon the occurrence of a defined credit event, the market value of the debt instrument received by the fund (or, in a cash settled swap, the debt instruments used to determine the settlement payment by the fund) will be significantly less than the amount paid by the fund and, in a physically settled swap, the fund may receive an illiquid debt instrument. A risk associated with all types of swaps is the possibility that a counterparty may default on its obligation to pay net amounts due to the fund. The fund’s maximum amount subject to counterparty risk is the unrealized appreciation on the swap contract. The fund mitigates its counterparty risk by entering into swaps only with a diverse group of prequalified counterparties, monitoring their financial strength, entering into master netting arrangements with its counterparties, and requiring its counterparties to transfer collateral as security for their performance. In the absence of a default, the collateral pledged or received by the fund cannot be repledged, resold, or rehypothecated. In the event of a counterparty’s default (including bankruptcy), the fund may terminate any swap contracts with that counterparty, determine the net amount owed by either party in accordance with its master netting arrangements, and sell or retain any collateral held up to the net amount owed to the fund under the master netting arrangements. The swap contracts contain provisions whereby a counterparty may terminate open contracts if the fund's net assets decline below a certain level, triggering a payment by the fund if the fund is in a net liability position at the time of the termination. The payment amount would be reduced by any collateral the fund has pledged. Any securities pledged as collateral for open contracts are noted in the Schedule of Investments. The value of collateral received or pledged is compared daily to the value of the swap contracts exposure with each counterparty, and any difference, if in excess of a specified minimum transfer amount, is adjusted and settled within two business days.
The notional amounts of swap contracts are not recorded in the Statement of Assets and Liabilities. Swaps are valued daily based on market quotations received from independent pricing services or recognized dealers and the change in value is recorded in the Statement of Assets and Liabilities as an asset (liability) and in the Statement of Operations as unrealized appreciation (depreciation) until the seller of credit protection is required to take delivery (or, in a cash settled swap, pay the settlement amount determined) upon occurrence of a credit event, periodic payments are made, or the swap terminates, at which time realized gain (loss) is recorded. The net premium to be received or paid by the fund under swap contracts is accrued daily and recorded as realized gain (loss) over the life of the contract.
During the year ended October 31, 2022, the fund's average amounts of investments in credit protection sold and credit protection purchased represented 5% and 1% of net assets, respectively, based on the average of notional amounts at each quarter-end during the period. The average amount of investments in interest rate swaps represented 1% of net assets, based on the average of notional amounts at each quarter-end during the period.
The following table summarizes the fund’s derivative assets and liabilities by counterparty for derivatives subject to arrangements that provide for offsetting assets and liabilities. Exchange-traded and centrally cleared derivatives are listed separately.
| | Assets
Reflected in
Statement of
Assets
and Liabilities1
($000) | Liabilities
Reflected in
Statement of
Assets and
Liabilities1
($000) | Net Amount
Receivable
(Payable)
($000) | Amounts Not Offset in the
Statement of Assets
and Liabilities | Net
Exposure3
(Not Less
Than $0)
($000) |
| | Collateral
Pledged2
($000) | Collateral
Received2
($000) |
Derivatives Subject to
Offsettings Arrangements,
by Counterparty |
| Bank of America, N.A. | 37 | 714 | (677) | 1,059 | — | — |
| Barclays Bank plc | 9 | 5 | 4 | — | 83 | — |
| BNP Paribas | 16 | 54 | (38) | — | — | — |
| Citibank, N.A. | — | — | — | 20 | — | — |
| Credit Agricole CIB | — | 21 | (21) | — | — | — |
| Goldman Sachs International | 19 | — | 19 | 91 | — | 19 |
| HSBC Bank plc | 4 | 6 | (2) | — | — | — |
| JPMorgan Chase Bank, N.A. | 55 | 119 | (64) | — | — | — |
| Morgan Stanley Capital Services LLC | 78 | 130 | (52) | — | — | — |
| Standard Chartered Bank | 18 | 1 | 17 | — | — | 17 |
| State Street Bank & Trust Co. | 23 | 969 | (946) | 519 | — | — |
| Toronto-Dominion Bank | 578 | 586 | (8) | 10 | — | — |
| UBS AG | 209 | 272 | (63) | — | — | — |
| Centrally Cleared Swap Contracts | — | 13 | (13) | 475 | — | — |
| Exchange-Traded Futures Contracts | — | 7 | (7) | 651 | — | — |
| Total | 1,046 | 2,897 | (1,851) | 2,825 | 83 | 36 |
| 1 | Absent an event of default or early termination, derivative assets and liabilities are presented gross and not offset in the Statement of Assets and Liabilities. |
| 2 | Securities or other assets pledged as collateral are noted in the Schedule of Investments and Statement of Assets and Liabilities. Securities or other assets received as collateral are held in a segregated account and not included in the fund's security holdings in the Schedule of Investments. |
| 3 | Net exposure represents the net amount receivable from the counterparty in the event of default. Counterparties are not required to exchange collateral if amount is below a specified minimum transfer amount. |
9. Federal Income Taxes: The fund intends to continue to qualify as a regulated investment company and distribute virtually all of its taxable income. The fund’s tax returns are open to examination by the relevant tax authorities until expiration of the applicable statute of limitations, which is generally three years after the filing of the tax return. Management has analyzed the fund’s tax positions taken for all open federal and state income tax years, and has concluded that no provision for income tax is required in the fund’s financial statements.
10. Distributions: Distributions to shareholders are recorded on the ex-dividend date. Distributions are determined on a tax basis at the fiscal year-end and may differ from net investment income and realized capital gains for financial reporting purposes.
11. Credit Facilities and Interfund Lending Program: The fund and certain other funds managed by The Vanguard Group ("Vanguard") participate in a $4.4 billion committed credit facility provided by a syndicate of lenders pursuant to a credit agreement and an uncommitted credit facility provided by Vanguard. Both facilities may be renewed annually. Each fund is individually liable for its borrowings, if any, under the credit facilities. Borrowings may be utilized for temporary or emergency purposes and are subject to the fund’s regulatory and contractual borrowing restrictions. With respect to the committed credit facility, the participating funds are charged administrative fees and an annual commitment fee of 0.10% of the undrawn committed amount of the facility, which are allocated to the funds based on a method approved by the fund’s board of trustees and included in Management and Administrative expenses on the fund’s Statement of Operations. Any borrowings under either facility bear interest at an agreed-upon spread plus the higher of the federal funds effective rate, the overnight bank funding rate, or the Daily Simple Secured Overnight Financing Rate inclusive of an additional agreed-upon spread. However, borrowings under the uncommitted credit facility may bear interest based upon an alternate rate agreed to by the fund and Vanguard.
In accordance with an exemptive order (the “Order”) from the SEC, the fund may participate in a joint lending and borrowing program that allows registered open-end Vanguard funds to borrow money from and lend money to each other for temporary or emergency purposes (the “Interfund Lending Program”), subject to compliance with the terms and conditions of the Order, and to the extent permitted by the fund’s investment objective and investment policies. Interfund loans and borrowings normally extend overnight but can have a maximum duration of seven days. Loans may be called on one business day’s notice. The interest rate to be charged is governed by the conditions of the Order and internal procedures adopted by the board of trustees. The board of trustees is responsible for overseeing the Interfund Lending Program.
For the year ended October 31, 2022, the fund did not utilize the credit facilities or the Interfund Lending Program.
12. Other: Interest income includes income distributions received from Vanguard Market Liquidity Fund and is accrued daily. Premiums and discounts on debt securities are amortized and accreted, respectively, to interest income over the lives of the respective securities, except for premiums on certain callable debt securities that are amortized to the earliest call date. Security transactions are accounted for on the date securities are bought or sold. Costs used to determine realized gains (losses) on the sale of investment securities are those of the specific securities sold.
Each class of shares has equal rights as to assets and earnings, except that each class separately bears certain class-specific expenses related to maintenance of shareholder accounts (included in Management and Administrative expenses) and shareholder reporting. Marketing and distribution
expenses are allocated to each class of shares based on a method approved by the board of trustees. Income, other non-class-specific expenses, and gains and losses on investments are allocated to each class of shares based on its relative net assets.
B. In accordance with the terms of a Funds’ Service Agreement (the “FSA”) between Vanguard and the fund, Vanguard furnishes to the fund investment advisory, corporate management, administrative, marketing, and distribution services at Vanguard’s cost of operations (as defined by the FSA). These costs of operations are allocated to the fund based on methods and guidelines approved by the board of trustees and are generally settled twice a month.
Upon the request of Vanguard, the fund may invest up to 0.40% of its net assets as capital in Vanguard. At October 31, 2022, the fund had contributed to Vanguard capital in the amount of $9,000, representing less than 0.01% of the fund’s net assets and less than 0.01% of Vanguard’s capital received pursuant to the FSA. The fund’s trustees and officers are also directors and employees, respectively, of Vanguard.
C. The fund’s custodian bank has agreed to reduce its fees when the fund maintains cash on deposit in the non-interest-bearing custody account. For the year ended October 31, 2022, custodian fee offset arrangements reduced the fund’s expenses by $1,000 (an annual rate of less than 0.01% of average net assets).
D. Various inputs may be used to determine the value of the fund’s investments and derivatives. These inputs are summarized in three broad levels for financial statement purposes. The inputs or methodologies used to value securities are not necessarily an indication of the risk associated with investing in those securities.
Level 1—Quoted prices in active markets for identical securities.
Level 2—Other significant observable inputs (including quoted prices for similar securities, interest rates, prepayment speeds, credit risk, etc.).
Level 3—Significant unobservable inputs (including the fund’s own assumptions used to determine the fair value of investments). Any investments and derivatives valued with significant unobservable inputs are noted on the Schedule of Investments.
The following table summarizes the market value of the fund's investments and derivatives as of October 31, 2022, based on the inputs used to value them:
| | Level 1
($000) | Level 2
($000) | Level 3
($000) | Total
($000) |
| Investments | | | | |
| Assets | | | | |
| U.S. Government and Agency Obligations | — | 41,988 | — | 41,988 |
| Asset-Backed/Commercial Mortgage-Backed Securities | — | 1,000 | — | 1,000 |
| Corporate Bonds | — | 183,672 | — | 183,672 |
| Floating Rate Loan Interests | — | 177 | — | 177 |
| Sovereign Bonds | — | 40,858 | — | 40,858 |
| Taxable Municipal Bonds | — | 281 | — | 281 |
| Temporary Cash Investments | 4,708 | 645 | — | 5,353 |
| | Level 1
($000) | Level 2
($000) | Level 3
($000) | Total
($000) |
| Investments | | | | |
| Options Purchased | — | 1 | — | 1 |
| Total | 4,708 | 268,622 | — | 273,330 |
| | | | |
| Derivative Financial Instruments | | | | |
| Assets | | | | |
| Futures Contracts1 | 95 | — | — | 95 |
| Forward Currency Contracts | — | 958 | — | 958 |
| Swap Contracts | 38 1 | 87 | — | 125 |
| Total | 133 | 1,045 | — | 1,178 |
| Liabilities | | | | |
| Options Written | — | — | — | — |
| Futures Contracts1 | 199 | — | — | 199 |
| Forward Currency Contracts | — | 2,735 | — | 2,735 |
| Swap Contracts | — | 142 | — | 142 |
| Total | 199 | 2,877 | — | 3,076 |
| 1 | Includes cumulative appreciation (depreciation) on futures contracts and centrally cleared swaps, if any, as reported in the Schedule of Investments. Only current day’s variation margin is reported within the Statement of Assets and Liabilities. |
E. At October 31, 2022, the fair values of derivatives were reflected in the Statement of Assets and Liabilities as follows:
| Statement of Assets and Liabilities | Interest
Rate
Contracts
($000) | Foreign
Exchange
Contracts
($000) | Credit
Contracts
($000) | Total
($000) |
| Investments in Securities, at Value—Unaffiliated Issuers (Options Purchased) | — | — | 1 | 1 |
| Swap Premiums Paid | — | — | 89 | 89 |
| Unrealized Appreciation—Futures Contracts1 | 95 | — | — | 95 |
| Unrealized Appreciation—Centrally Cleared Swap Contracts1 | 19 | — | 19 | 38 |
| Unrealized Appreciation—Forward Currency Contracts | — | 958 | — | 958 |
| Unrealized Appreciation—Over-the-Counter Swap Contracts | — | — | 87 | 87 |
| Total Assets | 114 | 958 | 196 | 1,268 |
| | | | | |
| Options Written, at Value | — | — | — | — |
| Swap Premiums Received | — | — | 241 | 241 |
| Unrealized Depreciation—Futures Contracts1 | 199 | — | — | 199 |
| Unrealized Depreciation—Forward Currency Contracts | — | 2,735 | — | 2,735 |
| Unrealized Depreciation—Over-the-Counter Swap Contracts | — | — | 142 | 142 |
| Total Liabilities | 199 | 2,735 | 383 | 3,317 |
| 1 | Includes cumulative appreciation (depreciation) on futures contracts and centrally cleared swaps, if any, as reported in the Schedule of Investments. Only current day’s variation margin is reported within the Statement of Assets and Liabilities. |
Realized net gain (loss) and the change in unrealized appreciation (depreciation) on derivatives for the year ended October 31, 2022, were:
| Realized Net Gain (Loss) on Derivatives | Interest
Rate
Contracts
($000) | Foreign
Exchange
Contracts
($000) | Credit
Contracts
($000) | Total
($000) |
| Futures Contracts | (3,296) | — | — | (3,296) |
| Options Purchased | — | — | 26 | 26 |
| Options Written | — | — | 75 | 75 |
| Swap Contracts | 217 | — | 127 | 344 |
| Forward Currency Contracts | — | 15,869 | — | 15,869 |
| Realized Net Gain (Loss) on Derivatives | (3,079) | 15,869 | 228 | 13,018 |
| |
| Change in Unrealized Appreciation (Depreciation) on Derivatives |
| Futures Contracts | 14 | — | — | 14 |
| Options Purchased | (14) | — | (6) | (20) |
| Options Written | — | — | — | — |
| Swap Contracts | 70 | — | (58) | 12 |
| Forward Currency Contracts | — | (2,213) | — | (2,213) |
| Change in Unrealized Appreciation (Depreciation) on Derivatives | 70 | (2,213) | (64) | (2,207) |
F. Permanent differences between book-basis and tax-basis components of net assets are reclassified among capital accounts in the financial statements to reflect their tax character. These reclassifications have no effect on net assets or net asset value per share. As of period end, permanent differences primarily attributable to the accounting for applicable foreign currency transactions and swap agreements were reclassified between the individual components of total distributable earnings (loss).
Temporary differences between book-basis and tax-basis components of total distributable earnings (loss) arise when certain items of income, gain, or loss are recognized in different periods for financial statement and tax purposes; these differences will reverse at some time in the future. The differences are primarily related to the deferral of losses from wash sales; the recognition of unrealized gains or losses from certain derivative contracts; and the recognition of gain or loss from foreign currency hedges. As of period end, the tax-basis components of total distributable earnings (loss) are detailed in the table as follows:
| | Amount
($000) |
| Undistributed Ordinary Income | 1,080 |
| Undistributed Long-Term Gains | — |
| Capital Loss Carryforwards | (16,566) |
| Qualified Late-Year Losses | — |
| Net Unrealized Gains (Losses) | (31,830) |
The tax character of distributions paid was as follows:
| | Year Ended October 31, |
| | 2022
Amount
($000) | 2021
Amount
($000) |
| Ordinary Income* | 7,662 | 11,168 |
| Long-Term Capital Gains | 1,497 | 694 |
| Total | 9,159 | 11,862 |
| * | Includes short-term capital gains, if any. |
As of October 31, 2022, gross unrealized appreciation and depreciation for investments and derivatives based on cost for U.S. federal income tax purposes were as follows:
| | Amount
($000) |
| Tax Cost | 304,991 |
| Gross Unrealized Appreciation | 8,852 |
| Gross Unrealized Depreciation | (40,682) |
| Net Unrealized Appreciation (Depreciation) | (31,830) |
G. During the year ended October 31, 2022, the fund purchased $285,405,000 of investment securities and sold $245,089,000 of investment securities, other than U.S. government securities and temporary cash investments. Purchases and sales of U.S. government securities were $80,072,000 and $54,509,000, respectively.
The fund purchased securities from and sold securities to other Vanguard funds or accounts managed by Vanguard or its affiliates, in accordance with procedures adopted by the board of trustees in compliance with Rule 17a-7 of the Investment Company Act of 1940. For the year ended October 31, 2022, such purchases were $155,000 and sales were $9,620,000, resulting in net realized loss of $338,000; these amounts, other than temporary cash investments, are included in the purchases and sales of investment securities noted above.
H. Capital share transactions for each class of shares were:
| | Year Ended October 31, |
| | 2022 | | 2021 |
| | Amount
($000) | Shares
(000) | | Amount
($000) | Shares
(000) |
| Investor Shares | | | | | |
| Issued | 14,508 | 1,413 | | 32,478 | 2,913 |
| Issued in Lieu of Cash Distributions | 1,243 | 122 | | 1,530 | 138 |
| Redeemed | (17,282) | (1,699) | | (27,560) | (2,477) |
| Net Increase (Decrease)—Investor Shares | (1,531) | (164) | | 6,448 | 574 |
| | Year Ended October 31, |
| | 2022 | | 2021 |
| | Amount
($000) | Shares
(000) | | Amount
($000) | Shares
(000) |
| Admiral Shares | | | | | |
| Issued | 125,480 | 6,506 | | 95,639 | 4,281 |
| Issued in Lieu of Cash Distributions | 6,233 | 307 | | 8,185 | 367 |
| Redeemed | (91,872) | (4,622) | | (86,418) | (3,898) |
| Net Increase (Decrease)—Admiral Shares | 39,841 | 2,191 | | 17,406 | 750 |
I. Management has determined that no events or transactions occurred subsequent to October 31, 2022, that would require recognition or disclosure in these financial statements.
Report of Independent Registered
Public Accounting Firm
To the Board of Trustees of Vanguard Charlotte Funds and Shareholders of Vanguard Global Credit Bond Fund
Opinion on the Financial Statements
We have audited the accompanying statement of assets and liabilities, including the schedule of investments, of Vanguard Global Credit Bond Fund (one of the funds constituting Vanguard Charlotte Funds, referred to hereafter as the "Fund") as of October 31, 2022, the related statement of operations for the year ended October 31, 2022, the statement of changes in net assets for each of the two years in the period ended October 31, 2022, including the related notes, and the financial highlights for each of the periods indicated therein (collectively referred to as the "financial statements"). In our opinion, the financial statements present fairly, in all material respects, the financial position of the Fund as of October 31, 2022, the results of its operations for the year then ended, the changes in its net assets for each of the two years in the period ended October 31, 2022 and the financial highlights for each of the periods indicated therein in conformity with accounting principles generally accepted in the United States of America.
Basis for Opinion
These financial statements are the responsibility of the Fund’s management. Our responsibility is to express an opinion on the Fund’s financial statements based on our audits. We are a public accounting firm registered with the Public Company Accounting Oversight Board (United States) (PCAOB) and are required to be independent with respect to the Fund in accordance with the U.S. federal securities laws and the applicable rules and regulations of the Securities and Exchange Commission and the PCAOB.
We conducted our audits of these financial statements in accordance with the standards of the PCAOB. Those standards require that we plan and perform the audit to obtain reasonable assurance about whether the financial statements are free of material misstatement, whether due to error or fraud.
Our audits included performing procedures to assess the risks of material misstatement of the financial statements, whether due to error or fraud, and performing procedures that respond to those risks. Such procedures included examining, on a test basis, evidence regarding the amounts and disclosures in the financial statements. Our audits also included evaluating the accounting principles used and significant estimates made by management, as well as evaluating the overall presentation of the financial statements. Our procedures included confirmation of securities owned as of October 31, 2022 by correspondence with the custodian, transfer agent and brokers; when replies were not received from brokers, we performed other auditing procedures. We believe that our audits provide a reasonable basis for our opinion.
/s/PricewaterhouseCoopers LLP
Philadelphia, Pennsylvania
December 16, 2022
We have served as the auditor of one or more investment companies in The Vanguard Group of Funds since 1975.
Tax information (unaudited)
The fund hereby designates $347,000, or if subsequently determined to be different, the maximum amount allowable by law, of interest earned from obligations of the U.S. government which is generally exempt from state income tax.
For nonresident alien shareholders, 100% of short-term capital gain dividends distributed by the fund for the fiscal year are qualified short-term capital gains.
The fund distributed $1,497,000 as capital gain dividends (20% rate gain distributions) to shareholders during the fiscal year.
The fund hereby designates 74.7%, or if subsequently determined to be different, the maximum percentage allowable by law, of ordinary income dividends eligible to be treated as interest income for purposes of section 163(j) and the regulations thereunder for the fiscal year.
"Bloomberg®" and Bloomberg Global Aggregate Credit Index (USD Hedged) are service marks of Bloomberg Finance L.P. and its affiliates, including Bloomberg Index Services Limited (BISL), the administrator of the index (collectively, Bloomberg), and have been licensed for use for certain purposes by The Vanguard Group, Inc. (Vanguard).
The Global Credit Bond Fund is not sponsored, endorsed, sold or promoted by Bloomberg. Bloomberg does not make any representation or warranty, express or implied, to the owners of or counterparties to the Global Credit Bond Fund or any member of the public regarding the advisability of investing in securities generally or in the Global Credit Bond Fund particularly. The only relationship of Bloomberg to Vanguard is the licensing of certain trademarks, trade names and service marks and of the Bloomberg Global Aggregate Credit Index (USD Hedged), which is determined, composed and calculated by BISL without regard to Vanguard or the Global Credit Bond Fund. Bloomberg has no obligation to take the needs of Vanguard or the owners of the Global Credit Bond Fund into consideration in determining, composing or calculating the Bloomberg Global Aggregate Credit Index (USD Hedged). Bloomberg is not responsible for and has not participated in the determination of the timing of, prices at, or quantities of the Global Credit Bond Fund to be issued. Bloomberg shall not have any obligation or liability, including, without limitation, to Global Credit Bond Fund customers, in connection with the administration, marketing or trading of the Global Credit Bond Fund.
BLOOMBERG DOES NOT GUARANTEE THE ACCURACY AND/OR THE COMPLETENESS OF THE BLOOMBERG GLOBAL AGGREGATE CREDIT INDEX (USD HEDGED) OR ANY DATA RELATED THERETO AND SHALL HAVE NO LIABILITY FOR ANY ERRORS, OMISSIONS OR INTERRUPTIONS THEREIN. BLOOMBERG DOES NOT MAKE ANY WARRANTY, EXPRESS OR IMPLIED, AS TO RESULTS TO BE OBTAINED BY VANGUARD, OWNERS OF THE GLOBAL CREDIT BOND FUND OR ANY OTHER PERSON OR ENTITY FROM THE USE OF THE BLOOMBERG GLOBAL AGGREGATE CREDIT INDEX (USD HEDGED) OR ANY DATA RELATED THERETO. BLOOMBERG DOES NOT MAKE ANY EXPRESS OR IMPLIED WARRANTIES AND EXPRESSLY DISCLAIMS ALL WARRANTIES OF MERCHANTABILITY OR FITNESS FOR A PARTICULAR PURPOSE OR USE WITH RESPECT TO THE BLOOMBERG GLOBAL AGGREGATE CREDIT INDEX (USD HEDGED) OR ANY DATA RELATED THERETO. WITHOUT LIMITING ANY OF THE FOREGOING, TO THE MAXIMUM EXTENT ALLOWED BY LAW, BLOOMBERG, ITS LICENSORS, AND ITS AND THEIR RESPECTIVE EMPLOYEES, CONTRACTORS, AGENTS, SUPPLIERS, AND VENDORS SHALL HAVE NO LIABILITY OR RESPONSIBILITY WHATSOEVER FOR ANY INJURY OR DAMAGES—WHETHER DIRECT, INDIRECT, CONSEQUENTIAL, INCIDENTAL, PUNITIVE OR OTHERWISE—ARISING IN CONNECTION WITH THE GLOBAL CREDIT BOND FUND OR BLOOMBERG GLOBAL AGGREGATE CREDIT INDEX (USD HEDGED) OR ANY DATA OR VALUES RELATING THERETO—WHETHER ARISING FROM THEIR NEGLIGENCE OR OTHERWISE, EVEN IF NOTIFIED OF THE POSSIBILITY THEREOF.
© 2022 Bloomberg.
Used with Permission. Source: Bloomberg Index Services Limited. Copyright 2022, Bloomberg. All rights reserved
This page intentionally left blank.
The People Who Govern Your Fund
The trustees of your mutual fund are there to see that the fund is operated and managed in your best interests since, as a shareholder, you are a part owner of the fund. Your fund’s trustees also serve on the board of directors of The Vanguard Group, Inc., which is owned by the Vanguard funds and provides services to them.
A majority of Vanguard’s board members are independent, meaning that they have no affiliation with Vanguard or the funds they oversee, apart from the sizable personal investments they have made as private individuals. The independent board members have distinguished backgrounds in business, academia, and public service. Each of the trustees and executive officers oversees 206 Vanguard funds.
Information for each trustee and executive officer of the fund appears below. That information, as well as the Vanguard fund count, is as of the date on the cover of this fund report. The mailing address of the trustees and officers is P.O. Box 876, Valley Forge, PA 19482. More information about the trustees is in the Statement of Additional Information, which can be obtained, without charge, by contacting Vanguard at 800-662-7447, or online at vanguard.com.
Interested Trustee1
Mortimer J. Buckley
Born in 1969. Trustee since January 2018. Principal occupation(s) during the past five years and other experience: chairman of the board (2019–present) of Vanguard and of each of the investment companies served by Vanguard; chief executive officer (2018–present) of Vanguard; chief executive officer, president, and trustee (2018–present) of each of the investment companies served by Vanguard; president and director (2017–present) of Vanguard; and president (2018–present) of Vanguard Marketing Corporation. Chief investment officer (2013–2017), managing director (2002–2017), head of the Retail Investor Group (2006–2012), and chief information officer (2001–2006) of Vanguard. Member of the board of governors of the Investment Company Institute and the board of governors of FINRA. Trustee and vice chair of The Shipley School.
Independent Trustees
Tara Bunch
Born in 1962. Trustee since November 2021. Principal occupation(s) during the past five years and other experience: head of global operations at Airbnb (2020–present). Vice president of AppleCare (2012–2020). Member of the board of directors of Out & Equal (2002–2006), the advisory board of the University of California, Berkeley School of Engineering (2020–present), and the advisory board of Santa Clara University’s Leavey School of Business (2018–present).
Emerson U. Fullwood
Born in 1948. Trustee since January 2008. Principal occupation(s) during the past five years and other experience: executive chief staff and marketing officer for North America and corporate vice president (retired 2008) of Xerox Corporation (document management products and services). Former president of the Worldwide Channels Group, Latin America, and Worldwide Customer Service and executive chief staff officer of Developing Markets of Xerox. Executive in residence and 2009–2010 Distinguished Minett Professor at the Rochester Institute of Technology. Member of the board of directors of the University of Rochester Medical Center, the Monroe Community College Foundation, the United Way of Rochester, North Carolina A&T University, Roberts Wesleyan College, and the Rochester Philharmonic Orchestra. Trustee of the University of Rochester.
1 Mr. Buckley is considered an “interested person,” as defined in the Investment Company Act of 1940, because he is an officer of the Vanguard funds.
F. Joseph Loughrey
Born in 1949. Trustee since October 2009. Principal occupation(s) during the past five years and other experience: president and chief operating officer (retired 2009) and vice chairman of the board (2008–2009) of Cummins Inc. (industrial machinery). Chairman of the board of Hillenbrand, Inc. (specialized consumer services). Director of the V Foundation. Member of the advisory council for the College of Arts and Letters at the University of Notre Dame. Chairman of the board of Saint Anselm College.
Mark Loughridge
Born in 1953. Trustee since March 2012. Principal occupation(s) during the past five years and other experience: senior vice president and chief financial officer (retired 2013) of IBM (information technology services). Fiduciary member of IBM’s Retirement Plan Committee (2004–2013), senior vice president and general manager (2002–2004) of IBM Global Financing, vice president and controller (1998–2002) of IBM, and a variety of other prior management roles at IBM. Member of the Council on Chicago Booth.
Scott C. Malpass
Born in 1962. Trustee since March 2012. Principal occupation(s) during the past five years and other experience: adjunct professor of finance at the University of Notre Dame (2020–present). Chief investment officer (retired 2020) and vice president (retired 2020) of the University of Notre Dame. Assistant professor (retired June 2020) of finance at the Mendoza College of Business, University of Notre Dame, and member of the Notre Dame 403(b) Investment Committee. Member of the board of Catholic Investment Services, Inc. (investment advisors), the board of superintendence of the Institute for the Works of Religion, and the board of directors of Paxos Trust Company (finance).
Deanna Mulligan
Born in 1963. Trustee since January 2018. Principal occupation(s) during the past five years and other experience: chief executive officer of Purposeful (advisory firm for CEOs and C-level executives; 2021–present). Board chair (2020), chief executive officer (2011–2020), and president (2010–2019) of The Guardian Life Insurance Company of America. Chief operating officer (2010–2011) and executive vice president (2008–2010) of Individual Life and Disability of the Guardian Life Insurance Company of America. Member of the board of the Economic Club of New York. Trustee of the Partnership for New York City (business leadership), Chief Executives for Corporate Purpose, and the NewYork-Presbyterian Hospital.
André F. Perold
Born in 1952. Trustee since December 2004. Principal occupation(s) during the past five years and other experience: George Gund Professor of Finance and Banking, Emeritus at the Harvard Business School (retired 2011). Chief investment officer and co-managing partner of HighVista Strategies (private investment firm). Member of the board (2018–present) of RIT Capital Partners (investment firm). Member of the investment committee of Partners Health Care System.
Sarah Bloom Raskin
Born in 1961. Trustee since January 2018. Principal occupation(s) during the past five years and other experience: deputy secretary (2014–2017) of the United States Department of the Treasury. Governor (2010–2014) of the Federal Reserve Board. Commissioner (2007–2010) of financial regulation for the State of Maryland. Colin W. Brown Distinguished Professor of the Practice of Law (2021–present), professor (2020–present), Distinguished Fellow of the Global Financial Markets Center (2020–present), and Rubenstein Fellow (2017–2020) at Duke University. Trustee (2017–present) of Amherst College and member of Amherst College Investment Committee (2019–present). Member of the Regenerative Crisis Response Committee (2020–present).
David A. Thomas
Born in 1956. Trustee since July 2021. Principal occupation(s) during the past five years and other experience: president of Morehouse College (2018–present). Professor of business administration, emeritus at Harvard University (2017–2018). Dean (2011–2016) and professor of management (2016–2017) at the Georgetown University McDonough School of Business. Director of DTE Energy Company (2013–present). Trustee of Common Fund (2019–present).
Peter F. Volanakis
Born in 1955. Trustee since July 2009. Principal occupation(s) during the past five years and other experience: president and chief operating officer (retired 2010) of Corning Incorporated (communications equipment) and director of Corning Incorporated (2000–2010) and Dow Corning (2001–2010). Director (2012) of SPX Corporation (multi-industry manufacturing). Overseer of the Amos Tuck School of Business Administration, Dartmouth College (2001–2013). Member of the BMW Group Mobility Council.
Executive Officers
Christine M. Buchanan
Born in 1970. Principal occupation(s) during the past five years and other experience: principal of Vanguard. Chief financial officer (2021–present) and treasurer (2017–present) of each of the investment companies served by Vanguard. Partner (2005–2017) at KPMG (audit, tax, and advisory services).
John Galloway
Born in 1973. Principal occupation(s) during the past five years and other experience: principal of Vanguard. Investment stewardship officer (September 2020–present) of each of the investment companies served by Vanguard. Head of Investor Advocacy (February 2020–present) and head of Marketing Strategy and Planning (2017–2020) at Vanguard. Special assistant to the President of the United States (2015).
Ashley Grim
Born in 1984. Principal occupation(s) during the past five years and other experience: treasurer (February 2022–present) of each of the investment companies served by Vanguard. Fund transfer agent controller (2019–2022) and director of Audit Services (2017–2019) at Vanguard. Senior manager (2015–2017) at PriceWaterhouseCoopers (audit and assurance, consulting, and tax services).
Peter Mahoney
Born in 1974. Principal occupation(s) during the past five years and other experience: principal of Vanguard. Controller (2015–present) of each of the investment companies served by Vanguard. Head of International Fund Services (2008–2014) at Vanguard.
Anne E. Robinson
Born in 1970. Principal occupation(s) during the past five years and other experience: general counsel (2016–present) of Vanguard. Secretary (2016–present) of Vanguard and of each of the investment companies served by Vanguard. Managing director (2016–present) of Vanguard. Managing director and general counsel of Global Cards and Consumer Services (2014–2016) at Citigroup. Counsel (2003–2014) at American Express. Nonexecutive director of the board of National Grid (energy).
Michael Rollings
Born in 1963. Principal occupation(s) during the past five years and other experience: finance director (2017–present) and treasurer (2017) of each of the investment companies served by Vanguard. Managing director (2016–present) of Vanguard. Chief financial officer (2016–present) of Vanguard. Director (2016–present) of Vanguard Marketing Corporation. Executive vice president and chief financial officer (2006–2016) of MassMutual Financial Group.
John E. Schadl
Born in 1972. Principal occupation(s) during the past five years and other experience: principal of Vanguard. Chief compliance officer (2019–present) of Vanguard and of each of the investment companies served by Vanguard. Assistant vice president (2019–present) of Vanguard Marketing Corporation.
Vanguard Senior Management Team
| Matthew Benchener | Thomas M. Rampulla |
| Joseph Brennan | Karin A. Risi |
| Mortimer J. Buckley | Anne E. Robinson |
| Gregory Davis | Michael Rollings |
| John James | Nitin Tandon |
| Chris D. McIsaac | Lauren Valente |
Connect with Vanguard®>vanguard.com
Fund Information > 800-662-7447
Direct Investor Account Services > 800-662-2739
Institutional Investor Services > 800-523-1036
Text Telephone for People
Who Are Deaf or Hard of Hearing > 800-749-7273
This material may be used in conjunction with the offering of shares of any Vanguard fund only if preceded or accompanied by the fund’s current prospectus.
All comparative mutual fund data are from Morningstar, Inc., unless otherwise noted.
You can obtain a free copy of Vanguard’s proxy voting guidelines by visiting vanguard.com/proxyreporting or by calling Vanguard at 800-662-2739. The guidelines are also available from the SEC’s website, www.sec.gov. In addition, you may obtain a free report on how your fund voted the proxies for securities it owned during the 12 months ended June 30. To get the report, visit either vanguard.com/proxyreporting or www.sec.gov.
You can review information about your fund on the SEC’s website, and you can receive copies of this information, for a fee, by sending a request via email addressed to publicinfo@sec.gov.
CFA® is a registered trademark owned by CFA Institute.
© 2022 The Vanguard Group, Inc.
All rights reserved.
Vanguard Marketing Corporation, Distributor.
Q20250 122022
Item 2: Code of Ethics.
The Registrant has adopted a code of ethics that applies to the Registrant’s principal executive officer, principal financial officer, principal accounting officer or controller or persons performing similar functions. The Code of Ethics was amended during the reporting period covered by this report to make certain technical, non-material changes.
Item 3: Audit Committee Financial Expert.
All members of the Audit Committee have been determined by the Registrant’s Board of Trustees to be Audit Committee Financial Experts and to be independent: F. Joseph Loughrey, Mark Loughridge, Sarah Bloom Raskin, and Peter F. Volanakis.
Item 4: Principal Accountant Fees and Services.
(a) Audit Fees.
Audit Fees of the Registrant.
Fiscal Year Ended October 31, 2022: $217,000
Fiscal Year Ended October 31, 2021: $264,000
Aggregate Audit Fees of Registered Investment Companies in the Vanguard Group.
Fiscal Year Ended October 31, 2022: $10,494,508
Fiscal Year Ended October 31, 2021: $11,244,694
Includes fees billed in connection with audits of the Registrant, other registered investment companies in the Vanguard complex, The Vanguard Group, Inc., and Vanguard Marketing Corporation.
(b) Audit-Related Fees.
Fiscal Year Ended October 31, 2022: $2,757,764
Fiscal Year Ended October 31, 2021: $2,955,181
Includes fees billed in connection with assurance and related services provided to the Registrant, other registered investment companies in the Vanguard complex, The Vanguard Group, Inc., and Vanguard Marketing Corporation.
(c) Tax Fees.
Fiscal Year Ended October 31, 2022: $5,202,689
Fiscal Year Ended October 31, 2021: $2,047,574
Includes fees billed in connection with tax compliance, planning, and advice services provided to the Registrant, other registered investment companies in the Vanguard complex, The Vanguard Group, Inc., and Vanguard Marketing Corporation.
(d) All Other Fees.
Fiscal Year Ended October 31, 2022: $298,000
Fiscal Year Ended October 31, 2021: $280,000
Includes fees billed for services related to tax reported information provided to the Registrant, other registered investment companies in the Vanguard complex, The Vanguard Group, Inc., and Vanguard Marketing Corporation.
(e) (1) Pre-Approval Policies. The policy of the Registrant’s Audit Committee is to consider, and, if appropriate, approve before the principal accountant is engaged for such services, all specific audit and non-audit services provided to: the Registrant, other registered investment companies in the Vanguard complex, The Vanguard Group, Inc., and entities controlled by The Vanguard Group, Inc. that provide ongoing services to the Registrant. In making a determination, the Audit Committee considers whether the services are consistent with maintaining the principal accountant’s independence.
In the event of a contingency situation in which the principal accountant is needed to provide services in between scheduled Audit Committee meetings, the Chairman of the Audit Committee would be called on to consider and, if appropriate, pre-approve audit or permitted non-audit services in an amount sufficient to complete services through the next Audit Committee meeting, and to determine if such services would be consistent with maintaining the accountant’s independence. At the next scheduled Audit Committee meeting, services and fees would be presented to the Audit Committee for formal consideration, and, if appropriate, approval by the entire Audit Committee. The Audit Committee would again consider whether such services and fees are consistent with maintaining the principal accountant’s independence.
The Registrant’s Audit Committee is informed at least annually of all audit and non-audit services provided by the principal accountant to the Vanguard complex, whether such services are provided to: the Registrant, other registered investment companies in the Vanguard complex, The Vanguard Group, Inc., or other entities controlled by The Vanguard Group, Inc. that provide ongoing services to the Registrant.
(2) No percentage of the principal accountant’s fees or services were approved pursuant to the waiver provision of paragraph (c)(7)(i)(C) of Rule 2-01 of Regulation S-X.
(f) For the most recent fiscal year, over 50% of the hours worked under the principal accountant’s engagement were not performed by persons other than full-time, permanent employees of the principal accountant.
(g) Aggregate Non-Audit Fees.
Fiscal Year Ended October 31, 2022: $5,500,689
Fiscal Year Ended October 31, 2021: $2,327,574
Includes fees billed for non-audit services provided to the Registrant, other registered investment companies in the Vanguard complex, The Vanguard Group, Inc., and Vanguard Marketing Corporation.
(h) For the most recent fiscal year, the Audit Committee has determined that the provision of all non-audit services was consistent with maintaining the principal accountant’s independence.
Item 5: Audit Committee of Listed Registrants.
The Registrant is a listed issuer as defined in rule 10A-3 under the Securities Exchange Act of 1934 (“Exchange Act”). The Registrant has a separately-designated standing audit committee established in accordance with Section 3(a)(58)(A) of the Exchange Act. The Registrant’s audit committee members are: F. Joseph Loughrey, Mark Loughridge, Sarah Bloom Raskin, and Peter F. Volanakis.
Item 6: Investments.
Not applicable. The complete schedule of investments is included as part of the report to shareholders filed under Item 1 of this Form.
Item 7: Disclosure of Proxy Voting Policies and Procedures for Closed-End Management Investment Companies.
Not applicable.
Item 8: Portfolio Managers of Closed-End Management Investment Companies.
Not applicable.
Item 9: Purchase of Equity Securities by Closed-End Management Investment Company and Affiliated Purchasers.
Not applicable.
Item 10: Submission of Matters to a Vote of Security Holders.
Not applicable.
Item 11: Controls and Procedures.
(a) Disclosure Controls and Procedures. The Principal Executive and Financial Officers concluded that the Registrant’s Disclosure Controls and Procedures are effective based on their evaluation of the Disclosure Controls and Procedures as of a date within 90 days of the filing date of this report.
(b) Internal Control Over Financial Reporting. There were no significant changes in the Registrant’s Internal Control Over Financial Reporting or in other factors that could significantly affect this control subsequent to the date of the evaluation, including any corrective actions with regard to significant deficiencies and material weaknesses.
Item 12: Disclosure of Securities Lending Activities for Closed-End Management Investment Companies.
Not applicable.
Item 13: Exhibits.
Pursuant to the requirements of the Securities Exchange Act of 1934 and the Investment Company Act of 1940, the registrant has duly caused this report to be signed on its behalf by the undersigned, thereunto duly authorized.
| | VANGUARD CHARLOTTE FUNDS |
| | | |
| BY: | /s/ MORTIMER J. BUCKLEY* | |
| | MORTIMER J. BUCKLEY | |
| | CHIEF EXECUTIVE OFFICER | |
Date: December 19, 2022
Pursuant to the requirements of the Securities Exchange Act of 1934 and the Investment Company Act of 1940, this report has been signed below by the following persons on behalf of the registrant and in the capacities and on the dates indicated.
| | VANGUARD CHARLOTTE FUNDS |
| | | |
| BY: | /s/ MORTIMER J. BUCKLEY* | |
| | MORTIMER J. BUCKLEY | |
| | CHIEF EXECUTIVE OFFICER | |
Date: December 19, 2022
| | VANGUARD CHARLOTTE FUNDS |
| | | |
| BY: | /s/ CHRISTINE BUCHANAN* | |
| | CHRISTINE BUCHANAN | |
| | CHIEF FINANCIAL OFFICER | |
Date: December 19, 2022
| * By: | /s/ Anne E. Robinson | |
Anne E. Robinson, pursuant to a Power of Attorney filed on October 11, 2022 (see File Number 333-11763), Incorporated by Reference.