UNITED STATES
SECURITIES AND EXCHANGE COMMISSION
Washington, D.C. 20549
FORM N-CSR
CERTIFIED SHAREHOLDER REPORT
OF
REGISTERED MANAGEMENT INVESTMENT COMPANIES
Investment Company Act file number: 811-22619
| Name of Registrant: | Vanguard Charlotte Funds |
| Address of Registrant: | P.O. Box 2600 |
| | Valley Forge, PA 19482 |
| Name and address of agent for service: | John E. Schadl, Esquire |
| | P.O. Box 876 |
| | Valley Forge, PA 19482 |
Registrant’s telephone number, including area code: (610) 669-1000
Date of fiscal year end: October 31
Date of reporting period: November 1, 2023—October 31, 2024
Item 1: Reports to Shareholders.
TABLE OF CONTENTS
Vanguard Global Credit Bond Fund
Investor Shares - VGCIX |
| | |
Vanguard Global Credit Bond Fund
Admiral™ Shares - VGCAX |
| | |
Vanguard Global Credit Bond Fund
Annual Shareholder Report | October 31, 2024
This annual shareholder report contains important information about Vanguard Global Credit Bond Fund (the "Fund") for the period of November 1, 2023, to October 31, 2024. You can find additional information about the Fund at https://personal1.vanguard.com/ngf-next-gen-form-webapp/fund-literature. You can also request this information by contacting us at 800-662-7447.
What were the Fund costs for the last year?
(based on a hypothetical $10,000 investment)
| Share Class Name | Costs of a $10,000 investment | Costs paid as a percentage of a $10,000 investment |
| Investor Shares | $37 | 0.35% |
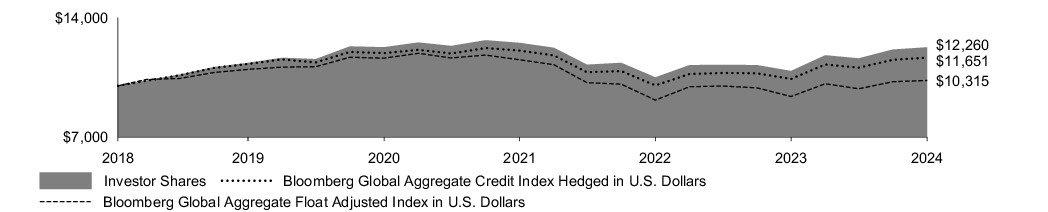
How did the Fund perform during the reporting period?
For the 12 months ended October 31, 2024, the Fund outperformed its benchmark, the Bloomberg Global Aggregate Credit Index hedged in U.S. dollars.
Global economic growth appeared relatively stable at around 3% during the period, and U.S. recession fears faded. With inflation continuing to moderate across much of the world, major central banks including the European Central Bank, the Bank of England, and the U.S. Federal Reserve began lowering policy rates.
The Fund’s outperformance was driven by a number of factors, including an overweight to credit and tactical plays in emerging markets bonds. Issuer selection, primarily among corporate and emerging markets bonds, added value, as did selective investments in the supranational and agency sectors.
Since the Fund’s inception on November 15, 2018, its annualized return has outpaced that of its benchmark.
How did the Fund perform since inception?
Keep in mind that the Fund's past performance does not indicate how the Fund will perform in the future. Updated performance information is available on our website at vanguard.com/performance or by calling Vanguard toll-free at 800-662-7447. The graph and returns shown do not reflect taxes that a shareholder would pay on fund distributions or on the sale of fund shares.
Cumulative Performance: November 15, 2018, Through October 31, 2024
Initial Investment of $ 10,000
| Average Annual Total Returns | | | |
| 1 Year | 5 Years | Since Inception
(11/15/2018) |
| Investor Shares | 12.76% | 1.56% | 3.48% |
| Bloomberg Global Aggregate Credit Index Hedged in U.S. Dollars | 11.97% | 0.64% | 2.60% |
| Bloomberg Global Aggregate Float Adjusted Index in U.S Dollars | 10.02% | -1.22% | 0.52% |
This table reflects the Fund’s investments, including short-term investments, derivatives and other assets and liabilities.
Fund Statistics
(as of October 31, 2024) | |
Fund Net Assets
(in millions) | $603 |
| Number of Portfolio Holdings | 1,592 |
| Portfolio Turnover Rate | 157% |
Total Investment Advisory Fees
(in thousands) | $90 |
Portfolio Composition % of Net Assets
(as of October 31, 2024) |
| Africa | 0.6% |
| Asia | 3.4% |
| Europe | 37.9% |
| North America | 46.6% |
| Oceania | 4.7% |
| South America | 1.7% |
| Other Assets and Liabilities—Net | 5.1% |
Where can I find additional information about the Fund?
Additional information about the Fund, including its prospectus, financial information, holdings, and proxy voting information is available at https://personal1.vanguard.com/ngf-next-gen-form-webapp/fund-literature.
Connect with Vanguard ® • vanguard.com
Fund Information • 800-662-7447
Direct Investor Account Services • 800-662-2739
Text Telephone for People Who Are Deaf or Hard of Hearing • 800-749-7273
© 2024 The Vanguard Group, Inc.
All rights reserved.
Vanguard Marketing Corporation, Distributor.
AR2025
Vanguard Global Credit Bond Fund
Annual Shareholder Report | October 31, 2024
This annual shareholder report contains important information about Vanguard Global Credit Bond Fund (the "Fund") for the period of November 1, 2023, to October 31, 2024. You can find additional information about the Fund at https://personal1.vanguard.com/ngf-next-gen-form-webapp/fund-literature. You can also request this information by contacting us at 800-662-7447.
What were the Fund costs for the last year?
(based on a hypothetical $10,000 investment)
| Share Class Name | Costs of a $10,000 investment | Costs paid as a percentage of a $10,000 investment |
| Admiral Shares | $27 | 0.25% |
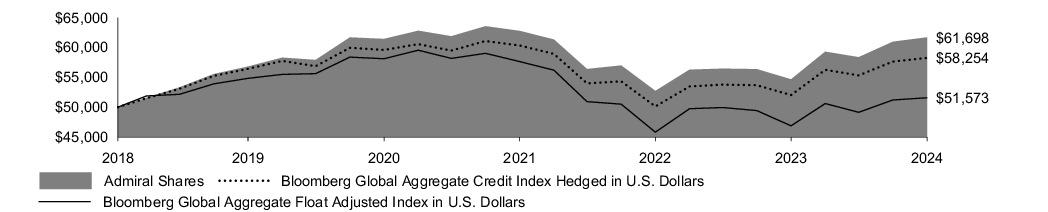
How did the Fund perform during the reporting period?
For the 12 months ended October 31, 2024, the Fund outperformed its benchmark, the Bloomberg Global Aggregate Credit Index hedged in U.S. dollars.
Global economic growth appeared relatively stable at around 3% during the period, and U.S. recession fears faded. With inflation continuing to moderate across much of the world, major central banks including the European Central Bank, the Bank of England, and the U.S. Federal Reserve began lowering policy rates.
The Fund’s outperformance was driven by a number of factors, including an overweight to credit and tactical plays in emerging markets bonds. Issuer selection, primarily among corporate and emerging markets bonds, added value, as did selective investments in the supranational and agency sectors.
Since the Fund’s inception on November 15, 2018, its annualized return has outpaced that of its benchmark.
How did the Fund perform since inception?
Keep in mind that the Fund's past performance does not indicate how the Fund will perform in the future. Updated performance information is available on our website at vanguard.com/performance or by calling Vanguard toll-free at 800-662-7447. The graph and returns shown do not reflect taxes that a shareholder would pay on fund distributions or on the sale of fund shares.
Cumulative Performance: November 15, 2018, Through October 31, 2024
Initial Investment of $ 50,000
| Average Annual Total Returns | | | |
| 1 Year | 5 Years | Since Inception
(11/15/2018) |
| Admiral Shares | 12.88% | 1.67% | 3.59% |
| Bloomberg Global Aggregate Credit Index Hedged in U.S. Dollars | 11.97% | 0.64% | 2.60% |
| Bloomberg Global Aggregate Float Adjusted Index in U.S Dollars | 10.02% | -1.22% | 0.52% |
This table reflects the Fund’s investments, including short-term investments, derivatives and other assets and liabilities.
Fund Statistics
(as of October 31, 2024) | |
Fund Net Assets
(in millions) | $603 |
| Number of Portfolio Holdings | 1,592 |
| Portfolio Turnover Rate | 157% |
Total Investment Advisory Fees
(in thousands) | $90 |
Portfolio Composition % of Net Assets
(as of October 31, 2024) |
| Africa | 0.6% |
| Asia | 3.4% |
| Europe | 37.9% |
| North America | 46.6% |
| Oceania | 4.7% |
| South America | 1.7% |
| Other Assets and Liabilities—Net | 5.1% |
Where can I find additional information about the Fund?
Additional information about the Fund, including its prospectus, financial information, holdings, and proxy voting information is available at https://personal1.vanguard.com/ngf-next-gen-form-webapp/fund-literature.
Connect with Vanguard ® • vanguard.com
Fund Information • 800-662-7447
Direct Investor Account Services • 800-662-2739
Text Telephone for People Who Are Deaf or Hard of Hearing • 800-749-7273
© 2024 The Vanguard Group, Inc.
All rights reserved.
Vanguard Marketing Corporation, Distributor.
AR525
Item 2: Code of Ethics.
The Registrant has adopted a code of ethics that applies to the Registrant’s principal executive officer, principal financial officer, principal accounting officer or controller or persons performing similar functions. The Code of Ethics was amended during the reporting period covered by this report to make certain technical, non-material changes.
Item 3: Audit Committee Financial Expert.
All members of the Audit Committee have been determined by the Registrant’s Board of Trustees to be Audit Committee Financial Experts and to be independent: F. Joseph Loughrey, Mark Loughridge, Sarah Bloom Raskin, and Peter F. Volanakis.
Item 4: Principal Accountant Fees and Services.
Includes fees billed in connection with services to the Registrant only.
| | | Fiscal Year Ended
October 31, 2024 | | | Fiscal Year Ended
October 31, 2023 | |
| (a) Audit Fees. | | $ | 235,000 | | | $ | 231,000 | |
| (b) Audit-Related Fees. | | | 0 | | | | 0 | |
| (c) Tax Fees. | | | 0 | | | | 0 | |
| (d) All Other Fees. | | | 0 | | | | 0 | |
| Total. | | $ | 235,000 | | | $ | 231,000 | |
| (e) | (1) Pre-Approval Policies. The audit committee is responsible for pre-approving all audit and non-audit services provided by PwC to: (i) the Vanguard funds; and (ii) Vanguard, or any entity controlled by Vanguard that provides ongoing services to the Vanguard funds. All services provided to Vanguard entities by the independent auditor, whether or not they are subject to preapproval, must be disclosed to the audit committee. The audit committee chair may preapprove any permissible audit and non-audit services as long as any preapproval is brought to the attention of the full audit committee at the next scheduled meeting. |
(2) No percentage of the principal accountant’s fees or services were approved pursuant to the waiver provision of paragraph (c)(7)(i)(C) of Rule 2-01 of Regulation S-X.
| (f) | For the most recent fiscal year, over 50% of the hours worked under the principal accountant’s engagement were not performed by persons other than full-time, permanent employees of the principal accountant. |
| (g) | Aggregate Non-Audit Fees. |
Includes fees billed for non-audit services provided to the Registrant, other registered investment companies in the Vanguard complex, The Vanguard Group, Inc., and Vanguard Marketing Corporation.
| | | Fiscal Year Ended
October 31, 2024 | | | Fiscal Year Ended
October 31, 2023 | |
| Non-audit fees to the Registrant only, listed as (b) through (d) above. | | $ | 0 | | | $ | 0 | |
| | | | | | | | | |
| Non-audit Fees to other registered investment companies in the Vanguard complex, The Vanguard Group, Inc., and Vanguard Marketing Corporation. | | | | | | | | |
| Audit-Related Fees. | | $ | 1,517,669 | | | $ | 3,295,934 | |
| Tax Fees. | | $ | 1,916,879 | | | $ | 1,678,928 | |
| All Other Fees. | | $ | 268,000 | | | $ | 25,000 | |
| Total. | | $ | 3,702,548 | | | $ | 4,999,862 | |
| (h) | For the most recent fiscal year, the Audit Committee has determined that the provision of all non-audit services was consistent with maintaining the principal accountant’s independence. |
Item 5: Audit Committee of Listed Registrants.
The Registrant is a listed issuer as defined in rule 10A-3 under the Securities Exchange Act of 1934 (“Exchange Act”). The Registrant has a separately-designated standing audit committee established in accordance with Section 3(a)(58)(A) of the Exchange Act. The Registrant’s audit committee members are: F. Joseph Loughrey, Mark Loughridge, Sarah Bloom Raskin, and Peter F. Volanakis.
Item 6: Investments.
Not applicable. The complete schedule of investments is included in the financial statements filed under Item 7 of this Form.
Item 7: Financial Statements and Financial Highlights for Open-End Management Investment Companies.
Financial Statements
For the year ended October 31, 2024
Vanguard Global Credit Bond Fund
Contents
Financial Statements
| 1 |
Report of Independent Registered
Public Accounting Firm
| 43 |
Tax information
| 44 |
| | |
Schedule of Investments
As of October 31, 2024
The fund files its complete schedule of portfolio holdings with the Securities and Exchange Commission (SEC) for the first and third quarters of each fiscal year as an exhibit to its reports on Form N-PORT. The fund’s Form N-PORT reports are available on the SEC’s website at www.sec.gov.
| | | | Coupon | Maturity
Date | Face
Amount
($000) | Market
Value•
($000) |
| U.S. Government and Agency Obligations (2.8%) |
| | United States Treasury Note/Bond | 0.750% | 1/31/28 | 1,000 | 898 |
| | United States Treasury Note/Bond | 2.500% | 2/15/45 | 1,000 | 720 |
| 1 | United States Treasury Note/Bond | 2.625% | 5/31/27 | 2,500 | 2,408 |
| | United States Treasury Note/Bond | 2.750% | 7/31/27 | 2,000 | 1,928 |
| 1 | United States Treasury Note/Bond | 3.000% | 5/15/45–11/15/45 | 2,000 | 1,567 |
| 1 | United States Treasury Note/Bond | 3.125% | 8/15/44 | 1,000 | 805 |
| 2 | United States Treasury Note/Bond | 3.375% | 9/15/27 | 1,000 | 980 |
| 1 | United States Treasury Note/Bond | 3.625% | 8/15/43–2/15/44 | 2,000 | 1,752 |
| | United States Treasury Note/Bond | 3.750% | 8/15/27 | 1,000 | 990 |
| 3 | United States Treasury Note/Bond | 4.125% | 8/15/44 | 1,000 | 939 |
| | United States Treasury Note/Bond | 4.250% | 6/30/31 | 1,000 | 1,001 |
| 2 | United States Treasury Note/Bond | 4.500% | 5/15/27 | 2,500 | 2,521 |
| Total U.S. Government and Agency Obligations (Cost $16,726) | 16,509 |
| Asset-Backed/Commercial Mortgage-Backed Securities (0.0%) |
| United States (0.0%) |
| 4 | CD Mortgage Trust Series 2018-CD7 | 4.842% | 8/15/51 | 50 | 45 |
| 4,5 | Ford Credit Auto Owner Trust Series 2022-1 | 4.670% | 11/15/34 | 100 | 98 |
| Total Asset-Backed/Commercial Mortgage-Backed Securities (Cost $148) | 143 |
| Corporate Bonds (74.9%) |
| Australia (4.7%) |
| 4,6 | AGI Finance Pty Ltd. | 6.109% | 6/28/30 | 2,560 | 1,725 |
| 4,6 | Aurizon Finance Pty Ltd. | 3.000% | 3/9/28 | 2,000 | 1,216 |
| 4,6 | Aurizon Network Pty Ltd. | 2.900% | 9/2/30 | 2,000 | 1,125 |
| 4,6 | Aurizon Network Pty Ltd. | 6.100% | 9/12/31 | 890 | 592 |
| 4,6 | Ausgrid Finance Pty Ltd. | 1.814% | 2/5/27 | 2,150 | 1,317 |
| 4,6 | AusNet Services Holdings Pty Ltd. | 2.600% | 7/31/29 | 2,370 | 1,373 |
| 5 | Australia & New Zealand Banking Group Ltd. | 2.950% | 7/22/30 | 550 | 540 |
| 5 | Australia & New Zealand Banking Group Ltd. | 5.204% | 9/30/35 | 270 | 263 |
| 4,6,7 | Australia & New Zealand Banking Group Ltd., 3M Australian Bank Bill Rate + 1.950% | 6.343% | 1/16/34 | 1,625 | 1,088 |
| 4,6 | Australian Gas Networks Ltd. | 2.149% | 4/28/28 | 400 | 237 |
| 4,6 | Coles Group Treasury Pty Ltd. | 2.100% | 8/27/30 | 470 | 257 |
| 5 | Glencore Finance Canada Ltd. | 5.550% | 10/25/42 | 35 | 34 |
| 5 | Glencore Funding LLC | 6.125% | 10/6/28 | 120 | 125 |
| 5 | Glencore Funding LLC | 5.700% | 5/8/33 | 58 | 59 |
| 4,6 | Lonsdale Finance Pty Ltd. | 2.450% | 11/20/26 | 3,330 | 2,078 |
| 5 | Macquarie Bank Ltd. | 3.624% | 6/3/30 | 80 | 73 |
| 6 | Macquarie Bank Ltd. | 5.953% | 3/1/34 | 3,000 | 1,994 |
| 6,7 | Macquarie Bank Ltd., 3M Australian Bank Bill Rate + 1.950% | 6.347% | 3/1/34 | 2,870 | 1,910 |
| 5 | Macquarie Group Ltd. | 4.098% | 6/21/28 | 330 | 323 |
| 4,6 | Network Finance Co. Pty Ltd. | 2.579% | 10/3/28 | 760 | 451 |
| 4,6 | Pacific National Finance Pty Ltd. | 5.400% | 5/12/27 | 1,190 | 772 |
| 4,6 | Pacific National Finance Pty Ltd. | 3.700% | 9/24/29 | 1,500 | 881 |
| 4,6 | Perth Airport Pty Ltd. | 5.600% | 3/5/31 | 810 | 533 |
| 4,6 | Qantas Airways Ltd. | 2.950% | 11/27/29 | 1,130 | 652 |
| | Rio Tinto Finance USA Ltd. | 5.200% | 11/2/40 | 250 | 247 |
| 4,6 | Stockland Trust | 2.300% | 3/24/28 | 800 | 475 |
| 4,6 | Sydney Airport Finance Co. Pty Ltd. | 5.900% | 4/19/34 | 1,500 | 990 |
| 4,6 | Victoria Power Networks Finance Pty Ltd. | 5.057% | 3/14/29 | 1,500 | 978 |
| 4,6 | WestConnex Finance Co. Pty Ltd. | 6.150% | 10/9/30 | 3,380 | 2,286 |
| 4 | Westpac Banking Corp. | 2.894% | 2/4/30 | 500 | 496 |
| | Westpac Banking Corp. | 2.963% | 11/16/40 | 75 | 55 |
| 4,6,7 | Westpac Banking Corp., 3M Australian Bank Bill Rate + 1.000% | 5.404% | 1/15/29 | 3,200 | 2,123 |
| 4,6 | Woolworths Group Ltd. | 1.850% | 11/15/27 | 2,070 | 1,247 |
| | | | | | | 28,515 |
| Austria (0.2%) |
| 4,8 | Raiffeisen Bank International AG | 4.625% | 8/21/29 | 200 | 223 |
| 4,8 | Raiffeisen Bank International AG | 4.500% | 5/31/30 | 1,100 | 1,229 |
| | | | | | | 1,452 |
| | | | Coupon | Maturity
Date | Face
Amount
($000) | Market
Value•
($000) |
| Belgium (1.4%) |
| 4 | Anheuser-Busch Cos. LLC | 4.700% | 2/1/36 | 230 | 222 |
| 4 | Anheuser-Busch Cos. LLC | 4.900% | 2/1/46 | 25 | 23 |
| | Anheuser-Busch InBev Finance Inc. | 4.625% | 2/1/44 | 468 | 425 |
| 4,8 | Anheuser-Busch InBev SA/NV | 2.750% | 3/17/36 | 1,700 | 1,724 |
| | Anheuser-Busch InBev Worldwide Inc. | 5.000% | 6/15/34 | 2,000 | 2,009 |
| | Anheuser-Busch InBev Worldwide Inc. | 5.875% | 6/15/35 | 240 | 256 |
| | Anheuser-Busch InBev Worldwide Inc. | 5.450% | 1/23/39 | 244 | 249 |
| | Anheuser-Busch InBev Worldwide Inc. | 4.750% | 4/15/58 | 219 | 198 |
| 4,8 | Argenta Spaarbank NV | 1.000% | 1/29/27 | 1,000 | 1,037 |
| 8 | Crelan SA | 5.250% | 1/23/32 | 2,100 | 2,439 |
| | | | | | | 8,582 |
| Brazil (0.2%) |
| 4 | Braskem Netherlands Finance BV | 4.500% | 1/31/30 | 200 | 174 |
| 5 | Braskem Netherlands Finance BV | 8.000% | 10/15/34 | 740 | 738 |
| 5 | Embraer Netherlands Finance BV | 7.000% | 7/28/30 | 200 | 212 |
| | | | | | | 1,124 |
| Canada (1.4%) |
| 5 | 1011778 BC ULC | 3.875% | 1/15/28 | 38 | 36 |
| 5 | 1011778 BC ULC | 6.125% | 6/15/29 | 5 | 5 |
| 5 | 1011778 BC ULC | 5.625% | 9/15/29 | 3 | 3 |
| 5 | Air Canada | 3.875% | 8/15/26 | 20 | 19 |
| | Bell Telephone Co. of Canada or Bell Canada | 5.100% | 5/11/33 | 4 | 4 |
| | Bell Telephone Co. of Canada or Bell Canada | 4.300% | 7/29/49 | 4 | 3 |
| | Bell Telephone Co. of Canada or Bell Canada | 3.650% | 8/15/52 | 4 | 3 |
| 5 | Bombardier Inc. | 7.250% | 7/1/31 | 5 | 5 |
| 5 | Bombardier Inc. | 7.000% | 6/1/32 | 5 | 5 |
| | Canadian National Railway Co. | 4.400% | 8/5/52 | 230 | 201 |
| | Canadian Natural Resources Ltd. | 2.950% | 7/15/30 | 125 | 112 |
| | Canadian Natural Resources Ltd. | 6.250% | 3/15/38 | 140 | 145 |
| | Canadian Pacific Railway Co. | 4.800% | 8/1/45 | 60 | 55 |
| | Cenovus Energy Inc. | 6.750% | 11/15/39 | 15 | 16 |
| | Cenovus Energy Inc. | 5.400% | 6/15/47 | 30 | 28 |
| | Enbridge Inc. | 6.000% | 11/15/28 | 300 | 313 |
| | Enbridge Inc. | 5.300% | 4/5/29 | 115 | 117 |
| | Enbridge Inc. | 3.125% | 11/15/29 | 42 | 39 |
| | Enbridge Inc. | 6.200% | 11/15/30 | 229 | 243 |
| | Enbridge Inc. | 6.700% | 11/15/53 | 140 | 157 |
| | Enbridge Inc. | 5.950% | 4/5/54 | 835 | 852 |
| 5 | Garda World Security Corp. | 8.250% | 8/1/32 | 14 | 14 |
| 5 | Hudbay Minerals Inc. | 4.500% | 4/1/26 | 35 | 35 |
| 5 | NOVA Chemicals Corp. | 9.000% | 2/15/30 | 41 | 44 |
| | Nutrien Ltd. | 4.200% | 4/1/29 | 125 | 122 |
| | Nutrien Ltd. | 5.400% | 6/21/34 | 498 | 500 |
| | Nutrien Ltd. | 4.125% | 3/15/35 | 70 | 63 |
| | Nutrien Ltd. | 5.800% | 3/27/53 | 90 | 92 |
| 5 | Ontario Gaming GTA LP | 8.000% | 8/1/30 | 5 | 5 |
| | Rogers Communications Inc. | 3.200% | 3/15/27 | 320 | 309 |
| | Rogers Communications Inc. | 5.000% | 2/15/29 | 540 | 540 |
| | Rogers Communications Inc. | 3.800% | 3/15/32 | 40 | 37 |
| | Rogers Communications Inc. | 5.300% | 2/15/34 | 280 | 278 |
| | Rogers Communications Inc. | 4.550% | 3/15/52 | 138 | 114 |
| 4 | Royal Bank of Canada | 4.969% | 8/2/30 | 770 | 772 |
| 4 | Royal Bank of Canada | 4.650% | 10/18/30 | 600 | 594 |
| 5 | South Bow Canadian Infrastructure Holdings Ltd. | 7.500% | 3/1/55 | 10 | 10 |
| 5 | South Bow Canadian Infrastructure Holdings Ltd. | 7.625% | 3/1/55 | 5 | 5 |
| | Suncor Energy Inc. | 3.750% | 3/4/51 | 40 | 29 |
| | TELUS Corp. | 3.700% | 9/15/27 | 360 | 349 |
| | TELUS Corp. | 4.300% | 6/15/49 | 89 | 71 |
| | TransCanada PipeLines Ltd. | 4.250% | 5/15/28 | 1,405 | 1,377 |
| | TransCanada PipeLines Ltd. | 4.100% | 4/15/30 | 520 | 497 |
| | TransCanada PipeLines Ltd. | 6.200% | 10/15/37 | 80 | 84 |
| | | | | | | 8,302 |
| China (0.1%) |
| | NXP BV | 5.000% | 1/15/33 | 310 | 305 |
| Czech Republic (0.2%) |
| 4,8 | EPH Financing International A/S | 6.651% | 11/13/28 | 1,000 | 1,168 |
| | | | Coupon | Maturity
Date | Face
Amount
($000) | Market
Value•
($000) |
| Denmark (0.0%) |
| 5 | Danske Bank A/S | 5.427% | 3/1/28 | 200 | 202 |
| Finland (0.0%) |
| 5 | Amer Sports Co. | 6.750% | 2/16/31 | 5 | 5 |
| France (3.0%) |
| 4,8 | Ayvens SA | 4.875% | 10/6/28 | 500 | 571 |
| 8 | Ayvens SA | 4.000% | 1/24/31 | 2,300 | 2,543 |
| 5 | BNP Paribas SA | 5.497% | 5/20/30 | 300 | 304 |
| 5 | BNP Paribas SA | 5.738% | 2/20/35 | 150 | 152 |
| 9 | BPCE SA | 2.500% | 11/30/32 | 4,400 | 5,127 |
| 5 | BPCE SA | 5.936% | 5/30/35 | 50 | 51 |
| 8 | Credit Agricole Assurances SA | 1.500% | 10/6/31 | 200 | 185 |
| 8 | Credit Agricole Assurances SA | 2.625% | 1/29/48 | 800 | 837 |
| 5 | Credit Agricole SA | 4.631% | 9/11/28 | 250 | 248 |
| 4,8 | Engie SA | 3.875% | 1/6/31 | 200 | 223 |
| 4,8 | Engie SA | 4.000% | 1/11/35 | 1,500 | 1,676 |
| 4,8 | Engie SA | 4.250% | 1/11/43 | 300 | 332 |
| 8 | Groupe des Assurances du Credit Mutuel SADIR | 1.850% | 4/21/42 | 800 | 730 |
| 8 | Groupe des Assurances du Credit Mutuel SADIR | 5.000% | 10/30/44 | 500 | 557 |
| 4,8 | RCI Banque SA | 4.875% | 9/21/28 | 2,700 | 3,077 |
| 5 | SNF Group SACA | 3.125% | 3/15/27 | 10 | 10 |
| 5 | SNF Group SACA | 3.375% | 3/15/30 | 22 | 20 |
| 5 | Societe Generale SA | 2.797% | 1/19/28 | 540 | 511 |
| 5 | Societe Generale SA | 3.000% | 1/22/30 | 155 | 138 |
| 5 | Societe Generale SA | 4.027% | 1/21/43 | 80 | 56 |
| | TotalEnergies Capital SA | 5.275% | 9/10/54 | 225 | 216 |
| 4,8 | TotalEnergies SE | 2.000% | Perpetual | 300 | 313 |
| 4,8 | Unibail-Rodamco-Westfield SE | 2.000% | 4/28/36 | 200 | 180 |
| | | | | | | 18,057 |
| Germany (3.8%) |
| 4,8 | Allianz SE | 4.597% | 9/7/38 | 500 | 562 |
| 4,8 | Aroundtown SA | 0.000% | 7/16/26 | 300 | 308 |
| 4,8 | Aroundtown SA | 1.450% | 7/9/28 | 1,300 | 1,301 |
| 4,8 | Aroundtown SA | 4.800% | 7/16/29 | 1,000 | 1,113 |
| 4,9 | Aroundtown SA | 3.625% | 4/10/31 | 100 | 108 |
| 8 | Bayer AG | 0.625% | 7/12/31 | 600 | 532 |
| | Deutsche Bank AG | 7.146% | 7/13/27 | 100 | 103 |
| | Deutsche Bank AG | 5.706% | 2/8/28 | 220 | 222 |
| | Deutsche Bank AG | 6.720% | 1/18/29 | 200 | 208 |
| | Deutsche Bank AG | 6.819% | 11/20/29 | 210 | 221 |
| 4,8 | Deutsche Bank AG | 5.625% | 5/19/31 | 3,800 | 4,219 |
| 4,8 | Deutsche Bank AG | 4.000% | 6/24/32 | 2,100 | 2,278 |
| | Deutsche Bank AG | 7.079% | 2/10/34 | 200 | 210 |
| 4,8 | Deutsche Lufthansa AG | 2.875% | 5/16/27 | 1,300 | 1,394 |
| 5 | Deutsche Telekom International Finance BV | 4.875% | 3/6/42 | 75 | 69 |
| 4,8 | Fresenius Finance Ireland plc | 0.875% | 10/1/31 | 992 | 902 |
| 5 | Siemens Financieringsmaatschappij NV | 2.875% | 3/11/41 | 370 | 275 |
| 4,9 | Traton Finance Luxembourg SA | 5.625% | 1/16/29 | 1,900 | 2,439 |
| 4,8 | Volkswagen Bank GmbH | 4.250% | 1/7/26 | 1,500 | 1,650 |
| 4,9 | Volkswagen Financial Services NV | 5.875% | 5/23/29 | 100 | 130 |
| 5 | Volkswagen Group of America Finance LLC | 1.625% | 11/24/27 | 150 | 135 |
| 4,8 | Volkswagen International Finance NV | 3.875% | 3/29/26 | 500 | 548 |
| 8 | Volkswagen International Finance NV | 3.875% | Perpetual | 1,300 | 1,369 |
| 8 | Vonovia SE | 1.875% | 6/28/28 | 1,500 | 1,556 |
| 4,8 | Vonovia SE | 0.250% | 9/1/28 | 800 | 775 |
| 8 | Vonovia SE | 1.500% | 6/14/41 | 200 | 146 |
| | | | | | | 22,773 |
| Ireland (0.4%) |
| | AerCap Ireland Capital DAC | 6.100% | 1/15/27 | 880 | 902 |
| | AerCap Ireland Capital DAC | 4.625% | 10/15/27 | 150 | 149 |
| | AerCap Ireland Capital DAC | 3.000% | 10/29/28 | 380 | 353 |
| | AerCap Ireland Capital DAC | 3.400% | 10/29/33 | 100 | 86 |
| | AerCap Ireland Capital DAC | 3.850% | 10/29/41 | 150 | 120 |
| 5 | Avolon Holdings Funding Ltd. | 2.125% | 2/21/26 | 150 | 144 |
| 5 | Flutter Treasury DAC | 6.375% | 4/29/29 | 5 | 5 |
| 5 | GGAM Finance Ltd. | 8.000% | 2/15/27 | 7 | 7 |
| 5 | GGAM Finance Ltd. | 8.000% | 6/15/28 | 47 | 50 |
| | | | Coupon | Maturity
Date | Face
Amount
($000) | Market
Value•
($000) |
| 5 | Smurfit Kappa Treasury ULC | 5.200% | 1/15/30 | 220 | 222 |
| 5 | Smurfit Kappa Treasury ULC | 5.438% | 4/3/34 | 200 | 201 |
| 5 | Smurfit Kappa Treasury ULC | 5.777% | 4/3/54 | 335 | 339 |
| | | | | | | 2,578 |
| Israel (0.0%) |
| | Teva Pharmaceutical Finance Netherlands III BV | 3.150% | 10/1/26 | 20 | 19 |
| | Teva Pharmaceutical Finance Netherlands III BV | 4.100% | 10/1/46 | 4 | 3 |
| | | | | | | 22 |
| Italy (0.6%) |
| 4,8 | CA Auto Bank SpA | 4.375% | 6/8/26 | 500 | 553 |
| 5 | Enel Finance International NV | 1.625% | 7/12/26 | 200 | 189 |
| 5 | Enel Finance International NV | 4.750% | 5/25/47 | 200 | 175 |
| 4,9 | Intesa Sanpaolo SpA | 6.625% | 5/31/33 | 1,900 | 2,593 |
| | | | | | | 3,510 |
| Japan (1.0%) |
| | Mitsubishi UFJ Financial Group Inc. | 5.258% | 4/17/30 | 660 | 669 |
| | Mitsubishi UFJ Financial Group Inc. | 2.048% | 7/17/30 | 600 | 516 |
| | Mitsubishi UFJ Financial Group Inc. | 5.426% | 4/17/35 | 400 | 406 |
| | Mizuho Financial Group Inc. | 5.667% | 5/27/29 | 250 | 256 |
| | Nomura Holdings Inc. | 5.594% | 7/2/27 | 466 | 473 |
| | Nomura Holdings Inc. | 5.783% | 7/3/34 | 811 | 827 |
| | Sumitomo Mitsui Financial Group Inc. | 5.316% | 7/9/29 | 1,051 | 1,072 |
| | Sumitomo Mitsui Financial Group Inc. | 5.710% | 1/13/30 | 200 | 207 |
| | Sumitomo Mitsui Financial Group Inc. | 5.558% | 7/9/34 | 600 | 617 |
| | Sumitomo Mitsui Financial Group Inc. | 5.836% | 7/9/44 | 364 | 378 |
| | Takeda Pharmaceutical Co. Ltd. | 3.025% | 7/9/40 | 100 | 75 |
| | Takeda Pharmaceutical Co. Ltd. | 3.175% | 7/9/50 | 100 | 68 |
| | Takeda Pharmaceutical Co. Ltd. | 3.375% | 7/9/60 | 200 | 133 |
| | | | | | | 5,697 |
| Kazakhstan (0.1%) |
| 5 | Development Bank of Kazakhstan JSC | 5.500% | 4/15/27 | 485 | 489 |
| Luxembourg (1.8%) |
| 4,8 | Blackstone Property Partners Europe Holdings Sarl | 1.000% | 10/20/26 | 5,135 | 5,325 |
| 4,8 | Blackstone Property Partners Europe Holdings Sarl | 1.250% | 4/26/27 | 673 | 695 |
| 4,8 | Blackstone Property Partners Europe Holdings Sarl | 1.000% | 5/4/28 | 1,979 | 1,966 |
| 4,9 | Blackstone Property Partners Europe Holdings Sarl | 2.625% | 10/20/28 | 900 | 1,039 |
| 8 | Blackstone Property Partners Europe Holdings Sarl | 3.625% | 10/29/29 | 1,200 | 1,294 |
| 4,8 | Prologis International Funding II SA | 4.625% | 2/21/35 | 700 | 805 |
| | | | | | | 11,124 |
| Macao (0.0%) |
| 5 | MGM China Holdings Ltd. | 7.125% | 6/26/31 | 13 | 13 |
| 5 | Studio City Co. Ltd. | 7.000% | 2/15/27 | 10 | 10 |
| 5 | Studio City Finance Ltd. | 5.000% | 1/15/29 | 5 | 4 |
| 5 | Wynn Macau Ltd. | 5.625% | 8/26/28 | 37 | 36 |
| 5 | Wynn Macau Ltd. | 5.125% | 12/15/29 | 4 | 4 |
| | | | | | | 67 |
| Malaysia (0.1%) |
| 4 | Petronas Capital Ltd. | 3.500% | 4/21/30 | 445 | 416 |
| Mexico (0.1%) |
| 5 | FIEMEX Energia - Banco Actinver SA Institucion de Banca Multiple | 7.250% | 1/31/41 | 752 | 754 |
| Netherlands (1.5%) |
| 4,8 | ABN AMRO Bank NV | 5.125% | 2/22/33 | 1,100 | 1,241 |
| 4,8 | ABN AMRO Bank NV | 5.500% | 9/21/33 | 1,400 | 1,605 |
| | Cooperatieve Rabobank UA | 4.494% | 10/17/29 | 250 | 247 |
| 8 | ING Groep NV | 1.000% | 11/13/30 | 1,200 | 1,272 |
| 4,8 | NIBC Bank NV | 6.000% | 11/16/28 | 4,000 | 4,734 |
| 5 | Sunrise FinCo I BV | 4.875% | 7/15/31 | 15 | 14 |
| 5 | VZ Secured Financing BV | 5.000% | 1/15/32 | 15 | 13 |
| | | | | | | 9,126 |
| Peru (0.1%) |
| 5 | Banco de Credito del Peru S.A. | 5.800% | 3/10/35 | 177 | 174 |
| 5 | Niagara Energy SAC | 5.746% | 10/3/34 | 492 | 481 |
| | | | | | | 655 |
| | | | Coupon | Maturity
Date | Face
Amount
($000) | Market
Value•
($000) |
| Poland (0.0%) |
| 5 | Canpack SA | 3.875% | 11/15/29 | 37 | 34 |
| Saudi Arabia (0.2%) |
| | Gaci First Investment Co. | 5.000% | 1/29/29 | 1,190 | 1,185 |
| Spain (0.3%) |
| 4 | Banco Santander SA | 5.365% | 7/15/28 | 400 | 403 |
| | Banco Santander SA | 6.607% | 11/7/28 | 340 | 361 |
| | Banco Santander SA | 6.921% | 8/8/33 | 75 | 81 |
| | Banco Santander SA | 6.938% | 11/7/33 | 75 | 83 |
| 4,8 | CaixaBank SA | 1.250% | 6/18/31 | 800 | 841 |
| | | | | | | 1,769 |
| Sweden (0.6%) |
| 4,8 | Castellum AB | 4.125% | 12/10/30 | 200 | 217 |
| 4,8 | Swedbank AB | 3.625% | 8/23/32 | 2,850 | 3,103 |
| | | | | | | 3,320 |
| Switzerland (1.1%) |
| | Credit Suisse USA LLC | 7.125% | 7/15/32 | 350 | 393 |
| | Novartis Capital Corp. | 4.700% | 9/18/54 | 155 | 143 |
| 4,8 | Raiffeisen Schweiz Genossenschaft | 5.230% | 11/1/27 | 1,900 | 2,184 |
| | UBS AG | 7.500% | 2/15/28 | 400 | 431 |
| 5 | UBS Group AG | 6.327% | 12/22/27 | 560 | 576 |
| 5 | UBS Group AG | 4.282% | 1/9/28 | 1,120 | 1,096 |
| 5 | UBS Group AG | 4.253% | 3/23/28 | 200 | 196 |
| 5 | UBS Group AG | 5.617% | 9/13/30 | 163 | 166 |
| 5 | UBS Group AG | 3.091% | 5/14/32 | 290 | 256 |
| 5 | UBS Group AG | 5.379% | 9/6/45 | 1,350 | 1,322 |
| | | | | | | 6,763 |
| United Arab Emirates (0.3%) |
| 4 | Abu Dhabi Developmental Holding Co. PJSC | 5.375% | 5/8/29 | 1,510 | 1,540 |
| 4 | MDGH GMTN RSC Ltd. | 3.000% | 3/28/27 | 300 | 288 |
| | | | | | | 1,828 |
| United Kingdom (10.9%) |
| | AstraZeneca plc | 4.000% | 9/18/42 | 160 | 137 |
| 4,9 | Aviva plc | 6.875% | 5/20/58 | 501 | 660 |
| 5 | BAE Systems plc | 5.000% | 3/26/27 | 3,000 | 3,018 |
| 5 | BAE Systems plc | 5.125% | 3/26/29 | 2,090 | 2,110 |
| 5 | BAE Systems plc | 5.250% | 3/26/31 | 1,410 | 1,432 |
| 5 | BAE Systems plc | 5.300% | 3/26/34 | 1,200 | 1,214 |
| 5 | BAE Systems plc | 5.500% | 3/26/54 | 650 | 655 |
| | Barclays plc | 5.304% | 8/9/26 | 200 | 200 |
| | Barclays plc | 5.829% | 5/9/27 | 1,000 | 1,012 |
| | Barclays plc | 5.674% | 3/12/28 | 560 | 569 |
| | Barclays plc | 4.836% | 5/9/28 | 300 | 296 |
| | Barclays plc | 4.837% | 9/10/28 | 390 | 388 |
| | Barclays plc | 7.385% | 11/2/28 | 600 | 639 |
| 9 | Barclays plc | 3.750% | 11/22/30 | 1,900 | 2,399 |
| 8 | Barclays plc | 4.506% | 1/31/33 | 1,000 | 1,136 |
| | Barclays plc | 7.119% | 6/27/34 | 200 | 217 |
| | Barclays plc | 3.330% | 11/24/42 | 200 | 148 |
| | BAT Capital Corp. | 3.215% | 9/6/26 | 900 | 875 |
| | BAT Capital Corp. | 3.557% | 8/15/27 | 235 | 228 |
| | BAT Capital Corp. | 2.259% | 3/25/28 | 1,930 | 1,771 |
| | BAT Capital Corp. | 2.726% | 3/25/31 | 75 | 65 |
| | BAT Capital Corp. | 4.742% | 3/16/32 | 585 | 567 |
| | BAT Capital Corp. | 4.390% | 8/15/37 | 560 | 488 |
| | BAT Capital Corp. | 7.079% | 8/2/43 | 165 | 180 |
| | BAT Capital Corp. | 4.540% | 8/15/47 | 124 | 99 |
| | BAT Capital Corp. | 5.650% | 3/16/52 | 110 | 102 |
| 4,8 | BAT Netherlands Finance BV | 5.375% | 2/16/31 | 300 | 354 |
| 5 | Belron UK Finance plc | 5.750% | 10/15/29 | 5 | 5 |
| 4,8 | British American Tobacco plc | 3.000% | Perpetual | 4,400 | 4,675 |
| 9 | CK Hutchison Group Telecom Finance SA | 2.625% | 10/17/34 | 1,869 | 1,749 |
| 4,9 | Close Brothers Finance plc | 1.625% | 12/3/30 | 1,700 | 1,651 |
| 4,8 | easyJet plc | 3.750% | 3/20/31 | 1,325 | 1,441 |
| 4,8 | Heathrow Funding Ltd. | 1.125% | 10/8/30 | 600 | 570 |
| 5 | Howden UK Refinance plc | 7.250% | 2/15/31 | 5 | 5 |
| | | | Coupon | Maturity
Date | Face
Amount
($000) | Market
Value•
($000) |
| 5 | Howden UK Refinance plc | 8.125% | 2/15/32 | 40 | 40 |
| | HSBC Holdings plc | 5.887% | 8/14/27 | 2,200 | 2,238 |
| 4 | HSBC Holdings plc | 3.973% | 5/22/30 | 460 | 438 |
| | HSBC Holdings plc | 5.733% | 5/17/32 | 500 | 512 |
| 8 | HSBC Holdings plc | 6.364% | 11/16/32 | 3,700 | 4,322 |
| 4 | HSBC Holdings plc | 6.500% | 9/15/37 | 125 | 132 |
| 4,9 | HSBC Holdings plc | 7.000% | 4/7/38 | 1,000 | 1,367 |
| | HSBC Holdings plc | 6.332% | 3/9/44 | 300 | 324 |
| | HSBC Holdings plc | 5.250% | 3/14/44 | 200 | 190 |
| 5 | Imperial Brands Finance plc | 6.125% | 7/27/27 | 200 | 205 |
| | Lloyds Banking Group plc | 4.582% | 12/10/25 | 520 | 516 |
| | Lloyds Banking Group plc | 4.716% | 8/11/26 | 200 | 199 |
| | Lloyds Banking Group plc | 7.953% | 11/15/33 | 140 | 159 |
| | Lloyds Banking Group plc | 4.344% | 1/9/48 | 40 | 32 |
| 5 | Lseg US Fin Corp. | 4.875% | 3/28/27 | 200 | 201 |
| 4,8 | Motability Operations Group plc | 3.500% | 7/17/31 | 992 | 1,082 |
| 4,8 | Motability Operations Group plc | 3.875% | 1/24/34 | 900 | 995 |
| 4,9 | Motability Operations Group plc | 4.875% | 1/17/43 | 300 | 350 |
| 4,8 | Nationwide Building Society | 3.828% | 7/24/32 | 4,000 | 4,399 |
| | NatWest Group plc | 4.964% | 8/15/30 | 600 | 595 |
| 5 | NatWest Markets plc | 5.416% | 5/17/27 | 2,200 | 2,233 |
| | RELX Capital Inc. | 3.000% | 5/22/30 | 100 | 91 |
| 9 | Rothesay Life plc | 8.000% | 10/30/25 | 600 | 792 |
| 9 | Rothesay Life plc | 3.375% | 7/12/26 | 2,087 | 2,607 |
| 4,9 | Rothesay Life plc | 7.734% | 5/16/33 | 100 | 138 |
| | Santander UK Group Holdings plc | 6.833% | 11/21/26 | 100 | 102 |
| 4,8 | Severn Trent Utilities Finance plc | 4.000% | 3/5/34 | 1,500 | 1,653 |
| 5 | Standard Chartered plc | 5.688% | 5/14/28 | 200 | 203 |
| 5 | Standard Chartered plc | 7.767% | 11/16/28 | 850 | 913 |
| 4,8 | United Utilities Water Finance plc | 3.750% | 5/23/34 | 3,100 | 3,338 |
| | Vodafone Group plc | 6.150% | 2/27/37 | 121 | 129 |
| | Vodafone Group plc | 5.625% | 2/10/53 | 260 | 252 |
| | Vodafone Group plc | 5.750% | 6/28/54 | 320 | 316 |
| 9 | Yorkshire Water Finance plc | 1.750% | 11/26/26 | 1,243 | 1,472 |
| 4,9 | Yorkshire Water Finance plc | 1.750% | 10/27/32 | 900 | 845 |
| 4,9 | Yorkshire Water Finance plc | 2.750% | 4/18/41 | 1,700 | 1,393 |
| | | | | | | 65,828 |
| United States (40.8%) |
| | AbbVie Inc. | 4.950% | 3/15/31 | 1,600 | 1,616 |
| | AbbVie Inc. | 4.050% | 11/21/39 | 418 | 367 |
| | AbbVie Inc. | 4.250% | 11/21/49 | 240 | 204 |
| | AbbVie Inc. | 5.400% | 3/15/54 | 955 | 963 |
| 5 | Advanced Drainage Systems Inc. | 6.375% | 6/15/30 | 5 | 5 |
| | Advanced Micro Devices Inc. | 4.393% | 6/1/52 | 160 | 140 |
| 4 | AdventHealth Obligated Group | 2.795% | 11/15/51 | 300 | 196 |
| | AEP Texas Inc. | 5.450% | 5/15/29 | 265 | 270 |
| | AEP Texas Inc. | 5.400% | 6/1/33 | 140 | 140 |
| | AEP Transmission Co. LLC | 4.250% | 9/15/48 | 100 | 83 |
| 4 | AEP Transmission Co. LLC | 3.650% | 4/1/50 | 70 | 53 |
| 4 | AEP Transmission Co. LLC | 2.750% | 8/15/51 | 100 | 62 |
| | AEP Transmission Co. LLC | 5.400% | 3/15/53 | 90 | 89 |
| | AES Corp. | 5.450% | 6/1/28 | 150 | 151 |
| | Aflac Inc. | 4.750% | 1/15/49 | 50 | 44 |
| | Agilent Technologies Inc. | 4.750% | 9/9/34 | 155 | 150 |
| | Agree LP | 2.000% | 6/15/28 | 50 | 45 |
| 4 | Air Lease Corp. | 2.875% | 1/15/26 | 105 | 103 |
| 4 | Air Lease Corp. | 3.750% | 6/1/26 | 100 | 98 |
| | Air Lease Corp. | 4.625% | 10/1/28 | 20 | 20 |
| | Air Products and Chemicals Inc. | 2.700% | 5/15/40 | 125 | 92 |
| | Alabama Power Co. | 4.150% | 8/15/44 | 50 | 42 |
| 5 | Alcon Finance Corp. | 3.800% | 9/23/49 | 200 | 154 |
| | Alexandria Real Estate Equities Inc. | 4.750% | 4/15/35 | 100 | 96 |
| | Alexandria Real Estate Equities Inc. | 3.000% | 5/18/51 | 130 | 83 |
| | Alexandria Real Estate Equities Inc. | 5.150% | 4/15/53 | 100 | 92 |
| | Alexandria Real Estate Equities Inc. | 5.625% | 5/15/54 | 230 | 227 |
| | Alleghany Corp. | 3.625% | 5/15/30 | 250 | 236 |
| 5 | Alliant Holdings Intermediate LLC | 6.500% | 10/1/31 | 10 | 10 |
| 5 | Alliant Holdings Intermediate LLC | 7.375% | 10/1/32 | 2 | 2 |
| 4 | Allina Health System | 3.887% | 4/15/49 | 130 | 102 |
| | | | Coupon | Maturity
Date | Face
Amount
($000) | Market
Value•
($000) |
| 5 | Allison Transmission Inc. | 4.750% | 10/1/27 | 24 | 23 |
| | Allstate Corp. | 5.250% | 3/30/33 | 550 | 554 |
| | Allstate Corp. | 5.350% | 6/1/33 | 121 | 122 |
| | Allstate Corp. | 4.500% | 6/15/43 | 230 | 201 |
| 5 | Alpha Generation LLC | 6.750% | 10/15/32 | 2 | 2 |
| | Altria Group Inc. | 2.450% | 2/4/32 | 165 | 137 |
| | Altria Group Inc. | 3.400% | 2/4/41 | 70 | 52 |
| | Altria Group Inc. | 5.375% | 1/31/44 | 100 | 97 |
| | Altria Group Inc. | 5.950% | 2/14/49 | 100 | 101 |
| | Altria Group Inc. | 4.450% | 5/6/50 | 40 | 32 |
| | Amazon.com Inc. | 3.875% | 8/22/37 | 50 | 45 |
| | Amazon.com Inc. | 2.500% | 6/3/50 | 115 | 71 |
| | Amazon.com Inc. | 3.950% | 4/13/52 | 85 | 70 |
| 5 | AMC Networks Inc. | 10.250% | 1/15/29 | 2 | 2 |
| | Ameren Illinois Co. | 4.150% | 3/15/46 | 75 | 63 |
| | Ameren Illinois Co. | 5.900% | 12/1/52 | 130 | 139 |
| 5 | American Airlines Inc. | 5.500% | 4/20/26 | 10 | 10 |
| 5 | American Airlines Inc. | 7.250% | 2/15/28 | 6 | 6 |
| 5 | American Airlines Inc. | 5.750% | 4/20/29 | 36 | 36 |
| 5 | American Airlines Inc. | 8.500% | 5/15/29 | 15 | 16 |
| | American Axle & Manufacturing Inc. | 5.000% | 10/1/29 | 15 | 14 |
| 5 | American Builders & Contractors Supply Co. Inc. | 4.000% | 1/15/28 | 5 | 5 |
| 5 | American Builders & Contractors Supply Co. Inc. | 3.875% | 11/15/29 | 3 | 3 |
| | American Express Co. | 5.043% | 7/26/28 | 403 | 405 |
| | American Express Co. | 5.915% | 4/25/35 | 275 | 284 |
| | American Express Co. | 5.284% | 7/26/35 | 1,427 | 1,429 |
| | American Tower Corp. | 3.600% | 1/15/28 | 100 | 96 |
| | Amgen Inc. | 5.150% | 3/2/28 | 935 | 948 |
| | Amgen Inc. | 6.375% | 6/1/37 | 460 | 503 |
| | Amgen Inc. | 5.150% | 11/15/41 | 61 | 59 |
| | Amgen Inc. | 5.600% | 3/2/43 | 250 | 250 |
| | Amgen Inc. | 3.375% | 2/21/50 | 340 | 246 |
| | Amgen Inc. | 5.650% | 3/2/53 | 85 | 85 |
| | Amgen Inc. | 2.770% | 9/1/53 | 147 | 90 |
| | Amgen Inc. | 5.750% | 3/2/63 | 76 | 76 |
| 5 | AmWINS Group Inc. | 6.375% | 2/15/29 | 7 | 7 |
| 5 | AmWINS Group Inc. | 4.875% | 6/30/29 | 2 | 2 |
| 5 | Antero Midstream Partners LP | 6.625% | 2/1/32 | 5 | 5 |
| | Aon Global Ltd. | 4.600% | 6/14/44 | 35 | 31 |
| | Aon Global Ltd. | 4.750% | 5/15/45 | 70 | 62 |
| | Aon North America Inc. | 5.150% | 3/1/29 | 510 | 515 |
| | Aon North America Inc. | 5.750% | 3/1/54 | 420 | 425 |
| | Apollo Global Management Inc. | 5.800% | 5/21/54 | 489 | 501 |
| | Apollo Global Management Inc. | 6.000% | 12/15/54 | 330 | 325 |
| 4 | Appalachian Power Co. | 4.500% | 3/1/49 | 30 | 25 |
| 5 | Arcosa Inc. | 6.875% | 8/15/32 | 3 | 3 |
| 5 | Ardagh Metal Packaging Finance USA LLC | 4.000% | 9/1/29 | 33 | 29 |
| | Ares Capital Corp. | 5.875% | 3/1/29 | 150 | 151 |
| | Ares Capital Corp. | 5.950% | 7/15/29 | 600 | 606 |
| | Asbury Automotive Group Inc. | 4.500% | 3/1/28 | 46 | 44 |
| 5 | Ascent Resources Utica Holdings LLC | 6.625% | 10/15/32 | 15 | 15 |
| 4 | AT&T Inc. | 4.300% | 2/15/30 | 56 | 55 |
| | AT&T Inc. | 5.400% | 2/15/34 | 276 | 280 |
| | AT&T Inc. | 4.500% | 5/15/35 | 130 | 122 |
| | AT&T Inc. | 4.900% | 8/15/37 | 245 | 234 |
| | AT&T Inc. | 3.500% | 6/1/41 | 95 | 75 |
| | AT&T Inc. | 4.750% | 5/15/46 | 70 | 62 |
| | AT&T Inc. | 3.500% | 9/15/53 | 455 | 317 |
| | AT&T Inc. | 3.550% | 9/15/55 | 213 | 148 |
| | AT&T Inc. | 3.800% | 12/1/57 | 111 | 80 |
| | AT&T Inc. | 3.650% | 9/15/59 | 340 | 233 |
| | Athene Holding Ltd. | 6.250% | 4/1/54 | 840 | 862 |
| | Athene Holding Ltd. | 6.625% | 10/15/54 | 801 | 789 |
| 5 | Atkore Inc. | 4.250% | 6/1/31 | 5 | 4 |
| | Atlassian Corp. | 5.250% | 5/15/29 | 630 | 638 |
| | Atlassian Corp. | 5.500% | 5/15/34 | 540 | 549 |
| | Atmos Energy Corp. | 6.200% | 11/15/53 | 110 | 122 |
| | Atmos Energy Corp. | 5.000% | 12/15/54 | 580 | 541 |
| 5 | Axalta Coating Systems Dutch Holding B BV | 7.250% | 2/15/31 | 5 | 5 |
| 5 | B&G Foods Inc. | 8.000% | 9/15/28 | 6 | 6 |
| | | | Coupon | Maturity
Date | Face
Amount
($000) | Market
Value•
($000) |
| | Ball Corp. | 2.875% | 8/15/30 | 12 | 10 |
| | Ball Corp. | 3.125% | 9/15/31 | 15 | 13 |
| | Bank of America Corp. | 5.933% | 9/15/27 | 1,400 | 1,430 |
| | Bank of America Corp. | 6.204% | 11/10/28 | 440 | 457 |
| 4 | Bank of America Corp. | 3.970% | 3/5/29 | 200 | 194 |
| 4 | Bank of America Corp. | 2.087% | 6/14/29 | 100 | 91 |
| 4 | Bank of America Corp. | 3.974% | 2/7/30 | 300 | 288 |
| 4 | Bank of America Corp. | 3.194% | 7/23/30 | 165 | 153 |
| 4 | Bank of America Corp. | 2.496% | 2/13/31 | 150 | 133 |
| | Bank of America Corp. | 2.687% | 4/22/32 | 675 | 585 |
| | Bank of America Corp. | 4.571% | 4/27/33 | 200 | 192 |
| | Bank of America Corp. | 5.518% | 10/25/35 | 580 | 576 |
| 4 | Bank of America Corp. | 4.078% | 4/23/40 | 200 | 174 |
| 4 | Bank of America Corp. | 2.676% | 6/19/41 | 560 | 400 |
| | Bank of America Corp. | 3.311% | 4/22/42 | 60 | 46 |
| 4 | Bank of New York Mellon Corp. | 4.975% | 3/14/30 | 180 | 181 |
| | Bank of New York Mellon Corp. | 4.596% | 7/26/30 | 200 | 198 |
| | Bank of New York Mellon Corp. | 5.060% | 7/22/32 | 360 | 362 |
| 4 | Bank of New York Mellon Corp. | 6.474% | 10/25/34 | 170 | 186 |
| 4 | Bank of New York Mellon Corp. | 5.188% | 3/14/35 | 690 | 692 |
| 5 | Bausch + Lomb Corp. | 8.375% | 10/1/28 | 41 | 43 |
| 5 | Beacon Roofing Supply Inc. | 6.500% | 8/1/30 | 2 | 2 |
| | Becton Dickinson & Co. | 4.693% | 2/13/28 | 100 | 100 |
| | Becton Dickinson & Co. | 4.874% | 2/8/29 | 275 | 275 |
| 8 | Becton Dickinson & Co. | 3.519% | 2/8/31 | 2,045 | 2,240 |
| | Becton Dickinson & Co. | 4.685% | 12/15/44 | 36 | 32 |
| | Becton Dickinson & Co. | 4.669% | 6/6/47 | 40 | 35 |
| 8 | Becton Dickinson Euro Finance Sarl | 4.029% | 6/7/36 | 1,885 | 2,108 |
| 8 | Becton Dickinson Euro Finance Sarl | 1.336% | 8/13/41 | 500 | 373 |
| | Berkshire Hathaway Energy Co. | 2.850% | 5/15/51 | 100 | 64 |
| | Berkshire Hathaway Finance Corp. | 3.850% | 3/15/52 | 250 | 197 |
| 4 | Beth Israel Lahey Health Inc. | 3.080% | 7/1/51 | 180 | 115 |
| 5 | Big River Steel LLC | 6.625% | 1/31/29 | 22 | 22 |
| | Black Hills Corp. | 6.000% | 1/15/35 | 790 | 820 |
| | BlackRock Funding Inc. | 5.350% | 1/8/55 | 700 | 701 |
| | Blackrock Inc. | 4.750% | 5/25/33 | 300 | 299 |
| 5 | Blackstone Holdings Finance Co. LLC | 2.000% | 1/30/32 | 149 | 122 |
| 5 | Block Inc. | 6.500% | 5/15/32 | 18 | 18 |
| | Blue Owl Capital Corp. | 5.950% | 3/15/29 | 160 | 161 |
| 5 | Blue Racer Midstream LLC | 7.000% | 7/15/29 | 12 | 12 |
| 5 | Blue Racer Midstream LLC | 7.250% | 7/15/32 | 2 | 2 |
| 5 | Boeing Co. | 6.298% | 5/1/29 | 20 | 21 |
| | Boeing Co. | 5.150% | 5/1/30 | 277 | 274 |
| | Boeing Co. | 3.625% | 2/1/31 | 341 | 308 |
| 5 | Boeing Co. | 6.388% | 5/1/31 | 1,169 | 1,223 |
| 5 | Boeing Co. | 6.528% | 5/1/34 | 694 | 732 |
| | Boeing Co. | 5.805% | 5/1/50 | 445 | 420 |
| 5 | Boeing Co. | 6.858% | 5/1/54 | 190 | 204 |
| 5 | Boeing Co. | 7.008% | 5/1/64 | 220 | 237 |
| 5 | Boost Newco Borrower LLC | 7.500% | 1/15/31 | 5 | 5 |
| | BorgWarner Inc. | 4.950% | 8/15/29 | 120 | 120 |
| | BorgWarner Inc. | 5.400% | 8/15/34 | 235 | 233 |
| 8 | BP Capital Markets BV | 1.467% | 9/21/41 | 100 | 76 |
| | Bristol-Myers Squibb Co. | 5.750% | 2/1/31 | 290 | 305 |
| | Bristol-Myers Squibb Co. | 2.550% | 11/13/50 | 120 | 72 |
| | Bristol-Myers Squibb Co. | 5.650% | 2/22/64 | 465 | 468 |
| 5 | Broadcom Inc. | 1.950% | 2/15/28 | 1,160 | 1,062 |
| | Broadcom Inc. | 4.150% | 2/15/28 | 690 | 677 |
| | Broadcom Inc. | 4.350% | 2/15/30 | 700 | 682 |
| | Broadcom Inc. | 5.000% | 4/15/30 | 120 | 121 |
| | Broadcom Inc. | 4.150% | 11/15/30 | 530 | 508 |
| 5 | Broadcom Inc. | 4.150% | 4/15/32 | 185 | 175 |
| 5 | Broadcom Inc. | 3.187% | 11/15/36 | 145 | 118 |
| | Brown & Brown Inc. | 5.650% | 6/11/34 | 350 | 355 |
| 5 | Builders FirstSource Inc. | 6.375% | 3/1/34 | 10 | 10 |
| | Burlington Northern Santa Fe LLC | 5.750% | 5/1/40 | 325 | 341 |
| | Burlington Northern Santa Fe LLC | 5.500% | 3/15/55 | 135 | 138 |
| 5 | Cable One Inc. | 4.000% | 11/15/30 | 2 | 2 |
| | Cadence Design Systems Inc. | 4.700% | 9/10/34 | 235 | 229 |
| 5 | Caesars Entertainment Inc. | 6.500% | 2/15/32 | 5 | 5 |
| | | | Coupon | Maturity
Date | Face
Amount
($000) | Market
Value•
($000) |
| 5 | Calpine Corp. | 4.500% | 2/15/28 | 16 | 15 |
| 5 | Calpine Corp. | 5.125% | 3/15/28 | 10 | 10 |
| | Camden Property Trust | 3.350% | 11/1/49 | 110 | 78 |
| | Campbell Soup Co. | 5.400% | 3/21/34 | 730 | 738 |
| | Capital One Financial Corp. | 7.149% | 10/29/27 | 2,300 | 2,399 |
| | Capital One Financial Corp. | 5.468% | 2/1/29 | 90 | 91 |
| | Capital One Financial Corp. | 6.312% | 6/8/29 | 264 | 274 |
| | Capital One Financial Corp. | 5.700% | 2/1/30 | 400 | 408 |
| | Capital One Financial Corp. | 3.273% | 3/1/30 | 400 | 371 |
| 4 | Capital One Financial Corp. | 7.624% | 10/30/31 | 370 | 411 |
| | Capital One Financial Corp. | 2.618% | 11/2/32 | 175 | 146 |
| | Capital One Financial Corp. | 5.817% | 2/1/34 | 500 | 507 |
| | Capital One Financial Corp. | 5.884% | 7/26/35 | 530 | 538 |
| 5 | Cargill Inc. | 4.750% | 4/24/33 | 130 | 128 |
| 5 | Carnival Corp. | 5.750% | 3/1/27 | 24 | 24 |
| 5 | Carnival Corp. | 4.000% | 8/1/28 | 25 | 24 |
| 5 | Carnival Corp. | 6.000% | 5/1/29 | 1 | 1 |
| 5 | Carnival Holdings Bermuda Ltd. | 10.375% | 5/1/28 | 7 | 8 |
| 5 | Catalent Pharma Solutions Inc. | 3.125% | 2/15/29 | 18 | 17 |
| 5 | Catalent Pharma Solutions Inc. | 3.500% | 4/1/30 | 33 | 32 |
| | Cboe Global Markets Inc. | 1.625% | 12/15/30 | 61 | 51 |
| | Cboe Global Markets Inc. | 3.000% | 3/16/32 | 33 | 29 |
| 5 | CCO Holdings LLC | 5.375% | 6/1/29 | 40 | 38 |
| 5 | CCO Holdings LLC | 4.750% | 3/1/30 | 62 | 56 |
| | CDW LLC | 5.100% | 3/1/30 | 470 | 467 |
| | Cencora Inc. | 2.700% | 3/15/31 | 230 | 201 |
| | Cencora Inc. | 4.300% | 12/15/47 | 80 | 67 |
| | Centene Corp. | 2.450% | 7/15/28 | 145 | 130 |
| | Centene Corp. | 3.000% | 10/15/30 | 14 | 12 |
| | Centene Corp. | 2.625% | 8/1/31 | 60 | 50 |
| 4 | CenterPoint Energy Houston Electric LLC | 2.350% | 4/1/31 | 30 | 26 |
| | CenterPoint Energy Houston Electric LLC | 3.550% | 8/1/42 | 65 | 51 |
| | CenterPoint Energy Houston Electric LLC | 5.300% | 4/1/53 | 40 | 39 |
| | CenterPoint Energy Inc. | 5.400% | 6/1/29 | 1,910 | 1,944 |
| | CenterPoint Energy Inc. | 2.950% | 3/1/30 | 10 | 9 |
| | CenterPoint Energy Inc. | 2.650% | 6/1/31 | 190 | 165 |
| | CenterPoint Energy Resources Corp. | 1.750% | 10/1/30 | 200 | 168 |
| | CenterPoint Energy Resources Corp. | 5.400% | 3/1/33 | 47 | 48 |
| | CenterPoint Energy Resources Corp. | 4.100% | 9/1/47 | 50 | 40 |
| 5 | Central Parent Inc. | 7.250% | 6/15/29 | 4 | 4 |
| 5 | Central Parent LLC | 8.000% | 6/15/29 | 2 | 2 |
| | Charles Schwab Corp. | 5.643% | 5/19/29 | 35 | 36 |
| | Charles Schwab Corp. | 6.196% | 11/17/29 | 200 | 210 |
| | Charles Schwab Corp. | 6.136% | 8/24/34 | 784 | 831 |
| 5 | Chart Industries Inc. | 7.500% | 1/1/30 | 5 | 5 |
| 5 | Chart Industries Inc. | 9.500% | 1/1/31 | 2 | 2 |
| | Charter Communications Operating LLC | 3.750% | 2/15/28 | 140 | 133 |
| | Charter Communications Operating LLC | 2.250% | 1/15/29 | 40 | 35 |
| | Charter Communications Operating LLC | 5.050% | 3/30/29 | 480 | 471 |
| | Charter Communications Operating LLC | 2.300% | 2/1/32 | 270 | 213 |
| | Charter Communications Operating LLC | 6.650% | 2/1/34 | 382 | 392 |
| | Charter Communications Operating LLC | 3.500% | 3/1/42 | 200 | 135 |
| | Charter Communications Operating LLC | 6.484% | 10/23/45 | 85 | 80 |
| | Charter Communications Operating LLC | 5.375% | 5/1/47 | 395 | 322 |
| 5 | Chemours Co. | 4.625% | 11/15/29 | 32 | 28 |
| | Cheniere Corpus Christi Holdings LLC | 3.700% | 11/15/29 | 70 | 66 |
| | Cheniere Energy Inc. | 4.625% | 10/15/28 | 25 | 25 |
| | Cheniere Energy Partners LP | 4.000% | 3/1/31 | 25 | 23 |
| | Cheniere Energy Partners LP | 3.250% | 1/31/32 | 770 | 670 |
| | Cheniere Energy Partners LP | 5.950% | 6/30/33 | 35 | 36 |
| 4 | Children's Hospital of Philadelphia | 2.704% | 7/1/50 | 150 | 97 |
| | Chubb INA Holdings LLC | 4.350% | 11/3/45 | 82 | 71 |
| 5 | Churchill Downs Inc. | 5.500% | 4/1/27 | 23 | 23 |
| 5 | Churchill Downs Inc. | 4.750% | 1/15/28 | 41 | 40 |
| 5 | Churchill Downs Inc. | 5.750% | 4/1/30 | 5 | 5 |
| | Cigna Group | 2.375% | 3/15/31 | 75 | 64 |
| | Cigna Group | 4.800% | 8/15/38 | 155 | 144 |
| | Cigna Group | 3.400% | 3/15/50 | 150 | 103 |
| 4 | Citibank NA | 5.570% | 4/30/34 | 2,750 | 2,834 |
| | Citigroup Inc. | 4.542% | 9/19/30 | 1,340 | 1,313 |
| | | | Coupon | Maturity
Date | Face
Amount
($000) | Market
Value•
($000) |
| 4 | Citigroup Inc. | 2.976% | 11/5/30 | 140 | 127 |
| 4 | Citigroup Inc. | 2.572% | 6/3/31 | 500 | 439 |
| | Citigroup Inc. | 2.520% | 11/3/32 | 250 | 211 |
| | Citigroup Inc. | 5.411% | 9/19/39 | 290 | 281 |
| | Citigroup Inc. | 4.650% | 7/30/45 | 90 | 80 |
| | Citigroup Inc. | 4.650% | 7/23/48 | 55 | 49 |
| 4 | City of Hope | 4.378% | 8/15/48 | 80 | 66 |
| 5 | Civitas Resources Inc. | 8.375% | 7/1/28 | 4 | 4 |
| 5 | Civitas Resources Inc. | 8.625% | 11/1/30 | 35 | 37 |
| 5 | Civitas Resources Inc. | 8.750% | 7/1/31 | 6 | 6 |
| 5 | Clarios Global LP | 8.500% | 5/15/27 | 17 | 17 |
| 5 | Clearway Energy Operating LLC | 4.750% | 3/15/28 | 25 | 24 |
| 5 | Clearway Energy Operating LLC | 3.750% | 1/15/32 | 2 | 2 |
| 5 | Cleveland-Cliffs Inc. | 7.000% | 3/15/32 | 20 | 20 |
| 5 | Cleveland-Cliffs Inc. | 7.375% | 5/1/33 | 20 | 20 |
| 5 | Cloud Software Group Inc. | 6.500% | 3/31/29 | 5 | 5 |
| 5 | Cloud Software Group Inc. | 8.250% | 6/30/32 | 21 | 22 |
| | CMS Energy Corp. | 4.875% | 3/1/44 | 135 | 124 |
| 5 | CNX Resources Corp. | 7.375% | 1/15/31 | 5 | 5 |
| 5 | CNX Resources Corp. | 7.250% | 3/1/32 | 5 | 5 |
| 8 | Coca-Cola Co. | 3.750% | 8/15/53 | 500 | 545 |
| | Coca-Cola Co. | 5.200% | 1/14/55 | 390 | 388 |
| 5 | Columbia Pipelines Holding Co. LLC | 5.681% | 1/15/34 | 195 | 194 |
| | Comcast Corp. | 2.650% | 2/1/30 | 275 | 248 |
| | Comcast Corp. | 4.400% | 8/15/35 | 90 | 84 |
| | Comcast Corp. | 6.550% | 7/1/39 | 80 | 88 |
| | Comcast Corp. | 3.250% | 11/1/39 | 145 | 113 |
| | Comcast Corp. | 4.500% | 1/15/43 | 140 | 120 |
| | Comcast Corp. | 4.700% | 10/15/48 | 134 | 121 |
| | Comcast Corp. | 4.950% | 10/15/58 | 65 | 59 |
| | Comcast Corp. | 2.650% | 8/15/62 | 263 | 146 |
| | Comcast Corp. | 2.987% | 11/1/63 | 413 | 247 |
| 4 | CommonSpirit Health | 4.350% | 11/1/42 | 220 | 189 |
| | Commonwealth Edison Co. | 3.800% | 10/1/42 | 115 | 93 |
| 4 | Commonwealth Edison Co. | 3.125% | 3/15/51 | 50 | 34 |
| | Commonwealth Edison Co. | 5.300% | 2/1/53 | 180 | 176 |
| 5 | Community Health Systems Inc. | 5.625% | 3/15/27 | 35 | 34 |
| 5 | Community Health Systems Inc. | 10.875% | 1/15/32 | 14 | 15 |
| | Conagra Brands Inc. | 5.300% | 10/1/26 | 175 | 177 |
| | ConocoPhillips Co. | 4.300% | 11/15/44 | 65 | 56 |
| | ConocoPhillips Co. | 3.800% | 3/15/52 | 40 | 30 |
| | ConocoPhillips Co. | 5.300% | 5/15/53 | 75 | 72 |
| | ConocoPhillips Co. | 5.700% | 9/15/63 | 40 | 40 |
| 4 | Consolidated Edison Co. of New York Inc. | 5.500% | 12/1/39 | 65 | 66 |
| | Consolidated Edison Co. of New York Inc. | 5.700% | 6/15/40 | 160 | 164 |
| 4 | Consolidated Edison Co. of New York Inc. | 3.950% | 4/1/50 | 100 | 81 |
| | Consolidated Edison Co. of New York Inc. | 5.900% | 11/15/53 | 400 | 423 |
| 5 | Continental Resources Inc. | 2.268% | 11/15/26 | 100 | 94 |
| 5 | Continental Resources Inc. | 2.875% | 4/1/32 | 40 | 33 |
| | COPT Defense Properties LP | 2.250% | 3/15/26 | 175 | 168 |
| | COPT Defense Properties LP | 2.750% | 4/15/31 | 105 | 90 |
| | Corebridge Financial Inc. | 3.650% | 4/5/27 | 90 | 88 |
| | Corebridge Financial Inc. | 3.850% | 4/5/29 | 170 | 163 |
| | Corebridge Financial Inc. | 3.900% | 4/5/32 | 194 | 177 |
| | Corebridge Financial Inc. | 4.350% | 4/5/42 | 100 | 85 |
| | Corebridge Financial Inc. | 4.400% | 4/5/52 | 150 | 123 |
| | Coterra Energy Inc. | 4.375% | 3/15/29 | 130 | 126 |
| | Cotiviti Corp. | 7.625% | 5/1/31 | 2 | 2 |
| 5 | Cox Communications Inc. | 4.800% | 2/1/35 | 100 | 92 |
| 5 | Cox Communications Inc. | 5.800% | 12/15/53 | 180 | 169 |
| | Crown Castle Inc. | 4.750% | 5/15/47 | 125 | 108 |
| 5 | CSC Holdings LLC | 11.750% | 1/31/29 | 8 | 8 |
| 5 | CSC Holdings LLC | 3.375% | 2/15/31 | 10 | 7 |
| | CSX Corp. | 4.750% | 11/15/48 | 190 | 173 |
| | CubeSmart LP | 2.250% | 12/15/28 | 225 | 203 |
| | CVS Health Corp. | 1.300% | 8/21/27 | 900 | 815 |
| | CVS Health Corp. | 5.400% | 6/1/29 | 600 | 606 |
| | CVS Health Corp. | 5.125% | 2/21/30 | 365 | 362 |
| | CVS Health Corp. | 5.550% | 6/1/31 | 315 | 318 |
| | CVS Health Corp. | 5.700% | 6/1/34 | 240 | 241 |
| | | | Coupon | Maturity
Date | Face
Amount
($000) | Market
Value•
($000) |
| | CVS Health Corp. | 4.875% | 7/20/35 | 80 | 75 |
| | CVS Health Corp. | 4.780% | 3/25/38 | 419 | 373 |
| | CVS Health Corp. | 4.125% | 4/1/40 | 135 | 109 |
| | CVS Health Corp. | 5.125% | 7/20/45 | 85 | 74 |
| | CVS Health Corp. | 6.000% | 6/1/63 | 130 | 125 |
| | Dana Inc. | 4.250% | 9/1/30 | 10 | 9 |
| | Dana Inc. | 4.500% | 2/15/32 | 2 | 2 |
| 5 | DaVita Inc. | 3.750% | 2/15/31 | 10 | 9 |
| 5 | DaVita Inc. | 6.875% | 9/1/32 | 10 | 10 |
| | DCP Midstream Operating LP | 3.250% | 2/15/32 | 700 | 607 |
| 5 | DCP Midstream Operating LP | 6.750% | 9/15/37 | 300 | 317 |
| | Dell International LLC | 4.350% | 2/1/30 | 1,244 | 1,209 |
| | Dell International LLC | 6.200% | 7/15/30 | 219 | 232 |
| | Dell International LLC | 5.400% | 4/15/34 | 1,152 | 1,165 |
| | Dell International LLC | 8.350% | 7/15/46 | 44 | 57 |
| 5 | Delta Air Lines Inc. | 4.750% | 10/20/28 | 1,188 | 1,174 |
| | Delta Air Lines Inc. | 3.750% | 10/28/29 | 9 | 8 |
| | Devon Energy Corp. | 5.850% | 12/15/25 | 40 | 40 |
| | Devon Energy Corp. | 5.600% | 7/15/41 | 50 | 47 |
| 5 | Diamond Foreign Asset Co. | 8.500% | 10/1/30 | 10 | 10 |
| | Diamondback Energy Inc. | 5.200% | 4/18/27 | 740 | 748 |
| | Diamondback Energy Inc. | 3.125% | 3/24/31 | 15 | 13 |
| | Diamondback Energy Inc. | 5.400% | 4/18/34 | 365 | 364 |
| | Diamondback Energy Inc. | 5.750% | 4/18/54 | 470 | 456 |
| | Diamondback Energy Inc. | 5.900% | 4/18/64 | 255 | 248 |
| 8 | Digital Dutch Finco BV | 1.500% | 3/15/30 | 1,600 | 1,565 |
| 8 | Digital Dutch Finco BV | 1.250% | 2/1/31 | 600 | 566 |
| 8 | Digital Dutch Finco BV | 1.000% | 1/15/32 | 2,200 | 1,990 |
| 5 | Directv Financing LLC | 5.875% | 8/15/27 | 12 | 12 |
| | Discovery Communications LLC | 4.900% | 3/11/26 | 157 | 156 |
| | Discovery Communications LLC | 6.350% | 6/1/40 | 156 | 146 |
| 5 | DISH Network Corp. | 11.750% | 11/15/27 | 11 | 12 |
| 4 | Dominion Energy Inc. | 4.050% | 9/15/42 | 170 | 137 |
| | Dominion Energy South Carolina Inc. | 5.450% | 2/1/41 | 40 | 40 |
| | Dominion Energy South Carolina Inc. | 4.600% | 6/15/43 | 240 | 214 |
| | Dominion Energy South Carolina Inc. | 6.250% | 10/15/53 | 185 | 207 |
| | Dow Chemical Co. | 2.100% | 11/15/30 | 100 | 86 |
| | Dow Chemical Co. | 4.375% | 11/15/42 | 120 | 101 |
| | DR Horton Inc. | 5.000% | 10/15/34 | 465 | 454 |
| 5 | DT Midstream Inc. | 4.125% | 6/15/29 | 26 | 24 |
| 5 | DT Midstream Inc. | 4.375% | 6/15/31 | 15 | 14 |
| | DTE Electric Co. | 3.700% | 6/1/46 | 75 | 59 |
| | DTE Energy Co. | 5.100% | 3/1/29 | 1,890 | 1,905 |
| | Duke Energy Carolinas LLC | 2.450% | 2/1/30 | 85 | 76 |
| | Duke Energy Carolinas LLC | 5.300% | 2/15/40 | 20 | 20 |
| | Duke Energy Carolinas LLC | 4.250% | 12/15/41 | 125 | 109 |
| | Duke Energy Corp. | 3.400% | 6/15/29 | 1,910 | 1,795 |
| | Duke Energy Corp. | 3.500% | 6/15/51 | 100 | 70 |
| | Duke Energy Florida LLC | 5.875% | 11/15/33 | 160 | 170 |
| | Duke Energy Florida LLC | 3.400% | 10/1/46 | 35 | 25 |
| | Duke Energy Florida LLC | 6.200% | 11/15/53 | 110 | 120 |
| | Duke Energy Indiana LLC | 2.750% | 4/1/50 | 75 | 47 |
| | Duke Energy Ohio Inc. | 5.650% | 4/1/53 | 90 | 91 |
| | Duke Energy Ohio Inc. | 5.550% | 3/15/54 | 540 | 541 |
| | Duke Energy Progress LLC | 4.100% | 5/15/42 | 200 | 168 |
| | Duke Energy Progress LLC | 2.500% | 8/15/50 | 170 | 103 |
| 10 | Edison International | 5.250% | 3/15/32 | 820 | 818 |
| 5 | Element Solutions Inc. | 3.875% | 9/1/28 | 11 | 11 |
| | Elevance Health Inc. | 5.150% | 6/15/29 | 230 | 233 |
| | Elevance Health Inc. | 3.125% | 5/15/50 | 190 | 127 |
| | Elevance Health Inc. | 6.100% | 10/15/52 | 155 | 163 |
| | Elevance Health Inc. | 5.650% | 6/15/54 | 435 | 432 |
| | Elevance Health Inc. | 5.700% | 2/15/55 | 835 | 840 |
| | Eli Lilly & Co. | 5.050% | 8/14/54 | 645 | 627 |
| | Eli Lilly & Co. | 2.500% | 9/15/60 | 100 | 56 |
| | Enbridge Energy Partners LP | 7.375% | 10/15/45 | 230 | 266 |
| 5 | Endo Finance Holdings Inc. | 8.500% | 4/15/31 | 36 | 38 |
| 5 | Energizer Holdings Inc. | 4.750% | 6/15/28 | 33 | 32 |
| | Energy Transfer LP | 4.400% | 3/15/27 | 240 | 238 |
| | Energy Transfer LP | 5.250% | 7/1/29 | 230 | 232 |
| | | | Coupon | Maturity
Date | Face
Amount
($000) | Market
Value•
($000) |
| | Energy Transfer LP | 3.750% | 5/15/30 | 30 | 28 |
| | Energy Transfer LP | 6.400% | 12/1/30 | 230 | 244 |
| | Energy Transfer LP | 5.750% | 2/15/33 | 130 | 133 |
| | Energy Transfer LP | 6.550% | 12/1/33 | 230 | 247 |
| | Energy Transfer LP | 6.050% | 6/1/41 | 535 | 535 |
| | Energy Transfer LP | 6.500% | 2/1/42 | 100 | 105 |
| | Energy Transfer LP | 5.300% | 4/1/44 | 75 | 69 |
| | Energy Transfer LP | 5.150% | 3/15/45 | 55 | 49 |
| | Energy Transfer LP | 6.250% | 4/15/49 | 70 | 71 |
| | Energy Transfer LP | 5.950% | 5/15/54 | 565 | 556 |
| 5 | Entegris Inc. | 4.750% | 4/15/29 | 190 | 184 |
| 5 | Entegris Inc. | 5.950% | 6/15/30 | 45 | 45 |
| | Entergy Arkansas LLC | 5.750% | 6/1/54 | 560 | 578 |
| | Entergy Louisiana LLC | 3.250% | 4/1/28 | 593 | 566 |
| | Entergy Texas Inc. | 5.550% | 9/15/54 | 545 | 542 |
| | Enterprise Products Operating LLC | 4.850% | 3/15/44 | 215 | 197 |
| | Enterprise Products Operating LLC | 4.900% | 5/15/46 | 59 | 54 |
| | Enterprise Products Operating LLC | 4.250% | 2/15/48 | 50 | 41 |
| | Enterprise Products Operating LLC | 3.700% | 1/31/51 | 70 | 52 |
| 5 | EQM Midstream Partners LP | 7.500% | 6/1/27 | 10 | 10 |
| 5 | EQM Midstream Partners LP | 6.500% | 7/1/27 | 16 | 16 |
| | EQM Midstream Partners LP | 5.500% | 7/15/28 | 15 | 15 |
| 5 | EQM Midstream Partners LP | 7.500% | 6/1/30 | 10 | 11 |
| | EQT Corp. | 3.900% | 10/1/27 | 96 | 93 |
| | Equitable Holdings Inc. | 5.594% | 1/11/33 | 148 | 151 |
| | Equitable Holdings Inc. | 5.000% | 4/20/48 | 79 | 72 |
| 5 | ERAC USA Finance LLC | 7.000% | 10/15/37 | 180 | 208 |
| | ERP Operating LP | 4.500% | 7/1/44 | 135 | 119 |
| | Essential Utilities Inc. | 4.800% | 8/15/27 | 2,685 | 2,686 |
| | Essex Portfolio LP | 4.500% | 3/15/48 | 60 | 51 |
| | Everest Reinsurance Holdings Inc. | 3.500% | 10/15/50 | 96 | 66 |
| | Evergy Kansas Central Inc. | 3.250% | 9/1/49 | 150 | 104 |
| 4 | Eversource Energy | 1.400% | 8/15/26 | 110 | 104 |
| | Exelon Corp. | 5.150% | 3/15/28 | 210 | 212 |
| | Exelon Corp. | 3.350% | 3/15/32 | 200 | 180 |
| | Exelon Corp. | 4.450% | 4/15/46 | 165 | 141 |
| | Exelon Corp. | 4.100% | 3/15/52 | 100 | 79 |
| | Exelon Corp. | 5.600% | 3/15/53 | 390 | 387 |
| | Extra Space Storage LP | 5.500% | 7/1/30 | 70 | 71 |
| | Extra Space Storage LP | 5.900% | 1/15/31 | 370 | 383 |
| | Extra Space Storage LP | 2.400% | 10/15/31 | 80 | 67 |
| | Exxon Mobil Corp. | 4.227% | 3/19/40 | 155 | 138 |
| | Exxon Mobil Corp. | 4.114% | 3/1/46 | 55 | 46 |
| | FedEx Corp. | 3.875% | 8/1/42 | 30 | 24 |
| | FedEx Corp. | 4.550% | 4/1/46 | 70 | 59 |
| | FedEx Corp. | 4.050% | 2/15/48 | 70 | 55 |
| | Fifth Third Bancorp | 1.707% | 11/1/27 | 100 | 94 |
| | Fifth Third Bancorp | 3.950% | 3/14/28 | 350 | 340 |
| | Fifth Third Bancorp | 6.339% | 7/27/29 | 310 | 324 |
| | Fifth Third Bancorp | 4.895% | 9/6/30 | 390 | 386 |
| | Fifth Third Bancorp | 5.631% | 1/29/32 | 370 | 376 |
| | FirstEnergy Corp. | 2.650% | 3/1/30 | 150 | 134 |
| 4 | FirstEnergy Corp. | 2.250% | 9/1/30 | 60 | 52 |
| 5 | FirstEnergy Pennsylvania Electric Co. | 5.150% | 3/30/26 | 60 | 60 |
| 5 | FirstEnergy Transmission LLC | 2.866% | 9/15/28 | 260 | 241 |
| 5 | FirstEnergy Transmission LLC | 4.550% | 1/15/30 | 460 | 451 |
| 5 | FirstEnergy Transmission LLC | 4.550% | 4/1/49 | 405 | 351 |
| 8 | Fiserv Inc. | 4.500% | 5/24/31 | 3,400 | 3,890 |
| | Fiserv Inc. | 5.600% | 3/2/33 | 120 | 123 |
| 5 | Five Corners Funding Trust IV | 5.997% | 2/15/53 | 220 | 230 |
| | FMC Corp. | 5.150% | 5/18/26 | 100 | 100 |
| 5 | Focus Financial Partners LLC | 6.750% | 9/15/31 | 5 | 5 |
| 4,9 | Ford Motor Credit Co. LLC | 6.860% | 6/5/26 | 500 | 654 |
| | Ford Motor Credit Co. LLC | 4.950% | 5/28/27 | 45 | 44 |
| | Ford Motor Credit Co. LLC | 4.125% | 8/17/27 | 5 | 5 |
| | Ford Motor Credit Co. LLC | 3.815% | 11/2/27 | 22 | 21 |
| | Ford Motor Credit Co. LLC | 6.800% | 5/12/28 | 20 | 21 |
| | Ford Motor Credit Co. LLC | 6.798% | 11/7/28 | 200 | 208 |
| | Ford Motor Credit Co. LLC | 2.900% | 2/10/29 | 53 | 47 |
| | Ford Motor Credit Co. LLC | 7.200% | 6/10/30 | 10 | 11 |
| | | | Coupon | Maturity
Date | Face
Amount
($000) | Market
Value•
($000) |
| 10 | Ford Motor Credit Co. LLC | 6.054% | 11/5/31 | 505 | 505 |
| | Ford Motor Credit Co. LLC | 7.122% | 11/7/33 | 200 | 212 |
| | Freeport-McMoRan Inc. | 4.250% | 3/1/30 | 10 | 10 |
| | Freeport-McMoRan Inc. | 5.450% | 3/15/43 | 10 | 10 |
| 5 | Frontier Communications Holdings LLC | 8.625% | 3/15/31 | 10 | 11 |
| 5 | Garrett Motion Holdings Inc. | 7.750% | 5/31/32 | 11 | 11 |
| 5 | Gates Corp. | 6.875% | 7/1/29 | 5 | 5 |
| | GE HealthCare Technologies Inc. | 4.800% | 8/14/29 | 155 | 155 |
| | GE HealthCare Technologies Inc. | 5.857% | 3/15/30 | 110 | 115 |
| | GE HealthCare Technologies Inc. | 6.377% | 11/22/52 | 100 | 111 |
| | General Dynamics Corp. | 4.250% | 4/1/40 | 95 | 85 |
| 4,8 | General Electric Co. | 4.125% | 9/19/35 | 900 | 1,016 |
| | General Motors Co. | 6.125% | 10/1/25 | 150 | 151 |
| | General Motors Co. | 5.200% | 4/1/45 | 88 | 79 |
| | General Motors Financial Co. Inc. | 6.050% | 10/10/25 | 555 | 561 |
| | General Motors Financial Co. Inc. | 1.250% | 1/8/26 | 1,255 | 1,203 |
| 8 | General Motors Financial Co. Inc. | 0.850% | 2/26/26 | 1,300 | 1,372 |
| | General Motors Financial Co. Inc. | 1.500% | 6/10/26 | 191 | 181 |
| | General Motors Financial Co. Inc. | 5.350% | 7/15/27 | 225 | 227 |
| | General Motors Financial Co. Inc. | 5.550% | 7/15/29 | 575 | 583 |
| | General Motors Financial Co. Inc. | 5.850% | 4/6/30 | 192 | 197 |
| | General Motors Financial Co. Inc. | 5.750% | 2/8/31 | 450 | 458 |
| | General Motors Financial Co. Inc. | 6.400% | 1/9/33 | 170 | 179 |
| 5 | Genesee & Wyoming Inc. | 6.250% | 4/15/32 | 10 | 10 |
| | Genesis Energy LP | 8.250% | 1/15/29 | 5 | 5 |
| | Genesis Energy LP | 7.875% | 5/15/32 | 5 | 5 |
| | Georgia Power Co. | 4.300% | 3/15/42 | 130 | 113 |
| | Georgia Power Co. | 5.125% | 5/15/52 | 70 | 67 |
| 5 | Georgia-Pacific LLC | 2.300% | 4/30/30 | 165 | 145 |
| | Gilead Sciences Inc. | 4.150% | 3/1/47 | 190 | 158 |
| 5 | Glatfelter Corp. | 7.250% | 11/15/31 | 5 | 5 |
| 5 | Global Atlantic Fin Co. | 7.950% | 6/15/33 | 700 | 780 |
| 5 | Global Atlantic Fin Co. | 6.750% | 3/15/54 | 240 | 245 |
| | Goldman Sachs Group Inc. | 5.727% | 4/25/30 | 2,500 | 2,570 |
| | Goldman Sachs Group Inc. | 4.692% | 10/23/30 | 380 | 375 |
| | Goldman Sachs Group Inc. | 6.750% | 10/1/37 | 300 | 329 |
| 4 | Goldman Sachs Group Inc. | 4.411% | 4/23/39 | 255 | 229 |
| | Goldman Sachs Group Inc. | 3.210% | 4/22/42 | 100 | 76 |
| 4 | Goldman Sachs Group Inc. | 4.800% | 7/8/44 | 90 | 83 |
| | Goodyear Tire & Rubber Co. | 5.000% | 7/15/29 | 55 | 50 |
| 5 | Graphic Packaging International LLC | 3.500% | 3/15/28 | 1 | 1 |
| 5 | Graphic Packaging International LLC | 3.750% | 2/1/30 | 2 | 2 |
| 5 | Hanesbrands Inc. | 9.000% | 2/15/31 | 7 | 8 |
| 5 | Harley-Davidson Financial Services Inc. | 3.050% | 2/14/27 | 130 | 123 |
| | HCA Inc. | 5.450% | 4/1/31 | 530 | 536 |
| | HCA Inc. | 5.250% | 6/15/49 | 115 | 104 |
| | HCA Inc. | 4.625% | 3/15/52 | 205 | 168 |
| | HCA Inc. | 6.000% | 4/1/54 | 285 | 286 |
| | Healthpeak OP LLC | 5.250% | 12/15/32 | 170 | 171 |
| | Helmerich & Payne Inc. | 2.900% | 9/29/31 | 220 | 185 |
| 5 | Herc Holdings Inc. | 6.625% | 6/15/29 | 5 | 5 |
| | Hess Corp. | 7.300% | 8/15/31 | 5 | 6 |
| 5 | Hess Midstream Operations LP | 6.500% | 6/1/29 | 6 | 6 |
| | Hewlett Packard Enterprise Co. | 4.550% | 10/15/29 | 1,601 | 1,571 |
| | Hewlett Packard Enterprise Co. | 5.000% | 10/15/34 | 294 | 285 |
| | Hewlett Packard Enterprise Co. | 5.600% | 10/15/54 | 405 | 390 |
| | Highwoods Realty LP | 7.650% | 2/1/34 | 429 | 481 |
| 5 | Hilcorp Energy I LP | 5.750% | 2/1/29 | 5 | 5 |
| 5 | Hilcorp Energy I LP | 6.000% | 2/1/31 | 6 | 6 |
| 5 | Hilton Domestic Operating Co. Inc. | 5.875% | 4/1/29 | 2 | 2 |
| 5 | Hilton Domestic Operating Co. Inc. | 5.875% | 3/15/33 | 15 | 15 |
| | Home Depot Inc. | 3.900% | 6/15/47 | 125 | 101 |
| | Home Depot Inc. | 4.500% | 12/6/48 | 75 | 66 |
| | Home Depot Inc. | 4.950% | 9/15/52 | 55 | 52 |
| | Home Depot Inc. | 5.300% | 6/25/54 | 930 | 923 |
| | Home Depot Inc. | 3.500% | 9/15/56 | 70 | 51 |
| | Honeywell International Inc. | 2.800% | 6/1/50 | 1,710 | 1,145 |
| | Host Hotels & Resorts LP | 5.700% | 7/1/34 | 215 | 215 |
| 5 | HUB International Ltd. | 7.250% | 6/15/30 | 5 | 5 |
| 5 | HUB International Ltd. | 7.375% | 1/31/32 | 5 | 5 |
| | | | Coupon | Maturity
Date | Face
Amount
($000) | Market
Value•
($000) |
| | Huntington Bancshares Inc. | 6.208% | 8/21/29 | 350 | 363 |
| | Huntington Bancshares Inc. | 5.023% | 5/17/33 | 286 | 277 |
| | Huntington Bancshares Inc. | 5.709% | 2/2/35 | 1,460 | 1,478 |
| | Huntington Bancshares Inc. | 2.487% | 8/15/36 | 150 | 121 |
| | Hyatt Hotels Corp. | 5.250% | 6/30/29 | 45 | 45 |
| | Idaho Power Co. | 5.200% | 8/15/34 | 195 | 195 |
| 5 | Imola Merger Corp. | 4.750% | 5/15/29 | 13 | 13 |
| 4 | Indiana Michigan Power Co. | 3.750% | 7/1/47 | 250 | 188 |
| | Ingersoll Rand Inc. | 5.176% | 6/15/29 | 100 | 101 |
| | Ingersoll Rand Inc. | 5.314% | 6/15/31 | 140 | 143 |
| | Ingersoll Rand Inc. | 5.450% | 6/15/34 | 200 | 204 |
| | Intel Corp. | 2.450% | 11/15/29 | 1,148 | 1,009 |
| | Intel Corp. | 5.125% | 2/10/30 | 160 | 160 |
| | Intel Corp. | 2.000% | 8/12/31 | 158 | 128 |
| | Intel Corp. | 4.150% | 8/5/32 | 279 | 258 |
| | Intel Corp. | 5.200% | 2/10/33 | 206 | 202 |
| | Intel Corp. | 5.150% | 2/21/34 | 857 | 837 |
| | Intel Corp. | 5.625% | 2/10/43 | 80 | 76 |
| | Intel Corp. | 4.900% | 8/5/52 | 100 | 83 |
| | Intel Corp. | 5.700% | 2/10/53 | 420 | 392 |
| | Intel Corp. | 5.900% | 2/10/63 | 60 | 57 |
| | Intercontinental Exchange Inc. | 3.625% | 9/1/28 | 86 | 83 |
| | Intercontinental Exchange Inc. | 5.250% | 6/15/31 | 350 | 357 |
| | Intercontinental Exchange Inc. | 4.950% | 6/15/52 | 70 | 66 |
| | Intercontinental Exchange Inc. | 3.000% | 9/15/60 | 50 | 31 |
| | Intercontinental Exchange Inc. | 5.200% | 6/15/62 | 20 | 19 |
| 8 | International Business Machines Corp. | 4.000% | 2/6/43 | 200 | 222 |
| | Interpublic Group of Cos. Inc. | 3.375% | 3/1/41 | 100 | 75 |
| | Invesco Finance plc | 5.375% | 11/30/43 | 55 | 53 |
| 5 | ITC Holdings Corp. | 4.950% | 9/22/27 | 50 | 50 |
| | ITC Holdings Corp. | 3.350% | 11/15/27 | 320 | 307 |
| 5 | ITC Holdings Corp. | 2.950% | 5/14/30 | 150 | 135 |
| | Jacobs Engineering Group Inc. | 5.900% | 3/1/33 | 110 | 113 |
| 5 | JBS USA Holding Lux Sarl | 6.750% | 3/15/34 | 488 | 524 |
| 5 | JBS USA Holding Lux Sarl | 7.250% | 11/15/53 | 265 | 297 |
| 5 | JetBlue Airways Corp. | 9.875% | 9/20/31 | 14 | 15 |
| 4 | John Deere Capital Corp. | 3.900% | 6/7/32 | 95 | 90 |
| 4 | John Deere Capital Corp. | 5.150% | 9/8/33 | 95 | 97 |
| | JPMorgan Chase & Co. | 4.979% | 7/22/28 | 413 | 415 |
| | JPMorgan Chase & Co. | 4.851% | 7/25/28 | 140 | 140 |
| | JPMorgan Chase & Co. | 4.505% | 10/22/28 | 740 | 735 |
| | JPMorgan Chase & Co. | 5.012% | 1/23/30 | 730 | 733 |
| | JPMorgan Chase & Co. | 5.581% | 4/22/30 | 2,710 | 2,779 |
| | JPMorgan Chase & Co. | 4.995% | 7/22/30 | 1,000 | 1,003 |
| | JPMorgan Chase & Co. | 4.603% | 10/22/30 | 470 | 464 |
| | JPMorgan Chase & Co. | 4.586% | 4/26/33 | 100 | 97 |
| | JPMorgan Chase & Co. | 5.350% | 6/1/34 | 130 | 131 |
| | JPMorgan Chase & Co. | 5.294% | 7/22/35 | 415 | 417 |
| | JPMorgan Chase & Co. | 4.946% | 10/22/35 | 1,130 | 1,108 |
| | JPMorgan Chase & Co. | 6.400% | 5/15/38 | 150 | 168 |
| 4 | JPMorgan Chase & Co. | 3.882% | 7/24/38 | 62 | 54 |
| 4 | JPMorgan Chase & Co. | 3.109% | 4/22/41 | 379 | 291 |
| | JPMorgan Chase & Co. | 5.600% | 7/15/41 | 81 | 84 |
| | JPMorgan Chase & Co. | 2.525% | 11/19/41 | 190 | 133 |
| 5 | Kaiser Aluminum Corp. | 4.625% | 3/1/28 | 10 | 10 |
| 5 | KeHE Distributors LLC | 9.000% | 2/15/29 | 19 | 20 |
| | Kenvue Inc. | 5.100% | 3/22/43 | 95 | 93 |
| | Keurig Dr Pepper Inc. | 4.500% | 11/15/45 | 330 | 286 |
| | KeyBank NA | 5.000% | 1/26/33 | 100 | 96 |
| | KeyCorp | 6.401% | 3/6/35 | 110 | 116 |
| | Keysight Technologies Inc. | 4.950% | 10/15/34 | 266 | 258 |
| | Kimco Realty OP LLC | 4.250% | 4/1/45 | 75 | 62 |
| | Kimco Realty OP LLC | 3.700% | 10/1/49 | 70 | 52 |
| 5 | Kinetik Holdings LP | 6.625% | 12/15/28 | 5 | 5 |
| 5 | Kinetik Holdings LP | 5.875% | 6/15/30 | 2 | 2 |
| | Kraft Heinz Foods Co. | 3.750% | 4/1/30 | 340 | 323 |
| | Kraft Heinz Foods Co. | 4.875% | 10/1/49 | 27 | 24 |
| | Kroger Co. | 2.200% | 5/1/30 | 120 | 104 |
| | Kroger Co. | 5.000% | 9/15/34 | 340 | 334 |
| | Kroger Co. | 5.500% | 9/15/54 | 205 | 199 |
| | | | Coupon | Maturity
Date | Face
Amount
($000) | Market
Value•
($000) |
| | Kyndryl Holdings Inc. | 6.350% | 2/20/34 | 100 | 104 |
| | L3Harris Technologies Inc. | 5.250% | 6/1/31 | 1,180 | 1,196 |
| | L3Harris Technologies Inc. | 5.054% | 4/27/45 | 30 | 28 |
| 5 | Ladder Capital Finance Holdings LLLP | 4.750% | 6/15/29 | 12 | 11 |
| 5 | Ladder Capital Finance Holdings LLLP | 7.000% | 7/15/31 | 18 | 19 |
| 5 | Lamb Weston Holdings Inc. | 4.875% | 5/15/28 | 6 | 6 |
| 5 | Level 3 Financing Inc. | 4.625% | 9/15/27 | 2 | 2 |
| 5 | Level 3 Financing Inc. | 3.875% | 11/15/29 | 5 | 3 |
| 5 | Level 3 Financing Inc. | 10.500% | 5/15/30 | 5 | 5 |
| 5 | Level 3 Financing Inc. | 10.000% | 10/15/32 | 5 | 5 |
| 5 | LifePoint Health Inc. | 11.000% | 10/15/30 | 3 | 3 |
| 5 | Lithia Motors Inc. | 4.625% | 12/15/27 | 10 | 10 |
| 5 | Lithia Motors Inc. | 3.875% | 6/1/29 | 52 | 48 |
| 5 | Lithia Motors Inc. | 4.375% | 1/15/31 | 12 | 11 |
| 5 | Live Nation Entertainment Inc. | 5.625% | 3/15/26 | 3 | 3 |
| 5 | Live Nation Entertainment Inc. | 6.500% | 5/15/27 | 31 | 31 |
| | Lockheed Martin Corp. | 4.500% | 5/15/36 | 665 | 635 |
| | Lockheed Martin Corp. | 4.300% | 6/15/62 | 295 | 244 |
| | Lockheed Martin Corp. | 5.200% | 2/15/64 | 520 | 504 |
| | Lowe's Cos. Inc. | 4.450% | 4/1/62 | 190 | 152 |
| | LPL Holdings Inc. | 6.750% | 11/17/28 | 430 | 453 |
| | LYB International Finance III LLC | 3.375% | 10/1/40 | 50 | 38 |
| | M&T Bank Corp. | 7.413% | 10/30/29 | 316 | 340 |
| | M&T Bank Corp. | 6.082% | 3/13/32 | 1,138 | 1,177 |
| | Manufacturers & Traders Trust Co. | 4.650% | 1/27/26 | 1,300 | 1,295 |
| | Manufacturers & Traders Trust Co. | 4.700% | 1/27/28 | 370 | 366 |
| | Marathon Oil Corp. | 5.300% | 4/1/29 | 380 | 386 |
| | Marriott International Inc. | 4.875% | 5/15/29 | 250 | 250 |
| | Marriott International Inc. | 4.800% | 3/15/30 | 410 | 407 |
| 5 | Mars Inc. | 3.875% | 4/1/39 | 178 | 153 |
| | Marsh & McLennan Cos. Inc. | 4.900% | 3/15/49 | 75 | 69 |
| | Marsh & McLennan Cos. Inc. | 2.900% | 12/15/51 | 150 | 96 |
| | Marsh & McLennan Cos. Inc. | 6.250% | 11/1/52 | 110 | 122 |
| 10 | Martin Marietta Materials Inc. | 5.500% | 12/1/54 | 558 | 546 |
| 5 | McAfee Corp. | 7.375% | 2/15/30 | 8 | 8 |
| 5 | Medline Borrower LP | 3.875% | 4/1/29 | 3 | 3 |
| 5 | Medline Borrower LP | 6.250% | 4/1/29 | 41 | 42 |
| 5 | Medline Borrower LP | 5.250% | 10/1/29 | 3 | 3 |
| 8 | Medtronic Global Holdings SCA | 2.250% | 3/7/39 | 200 | 183 |
| | Merck & Co. Inc. | 5.150% | 5/17/63 | 160 | 154 |
| | Meta Platforms Inc. | 4.650% | 8/15/62 | 42 | 37 |
| | MetLife Inc. | 4.125% | 8/13/42 | 60 | 51 |
| | MetLife Inc. | 4.875% | 11/13/43 | 60 | 56 |
| | MetLife Inc. | 5.250% | 1/15/54 | 60 | 59 |
| | MGM Resorts International | 6.500% | 4/15/32 | 5 | 5 |
| | MidAmerican Energy Co. | 5.300% | 2/1/55 | 530 | 521 |
| 5 | Midcontinent Communications | 8.000% | 8/15/32 | 15 | 15 |
| 5 | Mileage Plus Holdings LLC | 6.500% | 6/20/27 | 2,347 | 2,372 |
| 5 | Miter Brands Acquisition Holdco Inc. | 6.750% | 4/1/32 | 5 | 5 |
| | Mondelez International Inc. | 1.500% | 2/4/31 | 200 | 165 |
| | Morgan Stanley | 2.475% | 1/21/28 | 700 | 666 |
| 4 | Morgan Stanley | 5.652% | 4/13/28 | 530 | 540 |
| | Morgan Stanley | 5.173% | 1/16/30 | 740 | 746 |
| | Morgan Stanley | 4.654% | 10/18/30 | 740 | 730 |
| 4 | Morgan Stanley | 2.511% | 10/20/32 | 730 | 619 |
| | Morgan Stanley | 2.943% | 1/21/33 | 400 | 347 |
| | Morgan Stanley | 5.466% | 1/18/35 | 120 | 122 |
| | Morgan Stanley | 5.320% | 7/19/35 | 950 | 955 |
| 4,9 | Morgan Stanley | 5.213% | 10/24/35 | 800 | 1,002 |
| 4 | Morgan Stanley | 3.971% | 7/22/38 | 90 | 78 |
| 4 | Morgan Stanley | 4.457% | 4/22/39 | 165 | 152 |
| | Morgan Stanley | 6.375% | 7/24/42 | 150 | 168 |
| 4 | Morgan Stanley | 4.375% | 1/22/47 | 200 | 175 |
| 4 | Morgan Stanley Bank NA | 5.504% | 5/26/28 | 250 | 254 |
| 4 | Morgan Stanley Bank NA | 4.968% | 7/14/28 | 1,239 | 1,245 |
| 4 | Mount Sinai Hospital | 3.737% | 7/1/49 | 200 | 132 |
| | MPLX LP | 1.750% | 3/1/26 | 150 | 144 |
| | MPT Operating Partnership LP | 3.500% | 3/15/31 | 25 | 18 |
| 8 | MSD Netherlands Capital BV | 3.700% | 5/30/44 | 1,300 | 1,425 |
| 8 | MSD Netherlands Capital BV | 3.750% | 5/30/54 | 991 | 1,079 |
| | | | Coupon | Maturity
Date | Face
Amount
($000) | Market
Value•
($000) |
| | Nasdaq Inc. | 5.350% | 6/28/28 | 178 | 182 |
| | Nasdaq Inc. | 2.500% | 12/21/40 | 100 | 68 |
| | Nasdaq Inc. | 3.950% | 3/7/52 | 30 | 23 |
| | Nasdaq Inc. | 5.950% | 8/15/53 | 175 | 182 |
| 5 | Nationstar Mortgage Holdings Inc. | 6.500% | 8/1/29 | 5 | 5 |
| 5 | Nationstar Mortgage Holdings Inc. | 5.125% | 12/15/30 | 4 | 4 |
| 5 | Nationstar Mortgage Holdings Inc. | 7.125% | 2/1/32 | 1 | 1 |
| 5 | Nationwide Financial Services Inc. | 3.900% | 11/30/49 | 65 | 49 |
| 5 | Nationwide Mutual Insurance Co. | 4.350% | 4/30/50 | 125 | 97 |
| | Navient Corp. | 4.875% | 3/15/28 | 2 | 2 |
| | Navient Corp. | 9.375% | 7/25/30 | 3 | 3 |
| 5 | NCL Corp. Ltd. | 5.875% | 2/15/27 | 14 | 14 |
| 5 | NCL Corp. Ltd. | 8.125% | 1/15/29 | 3 | 3 |
| 5 | NCL Corp. Ltd. | 7.750% | 2/15/29 | 10 | 11 |
| | Netflix Inc. | 5.400% | 8/15/54 | 330 | 332 |
| | Nevada Power Co. | 6.000% | 3/15/54 | 180 | 191 |
| | Newell Brands Inc. | 6.375% | 9/15/27 | 4 | 4 |
| | Newell Brands Inc. | 6.625% | 9/15/29 | 15 | 15 |
| 10 | Newell Brands Inc. | 6.375% | 5/15/30 | 5 | 5 |
| 10 | Newell Brands Inc. | 6.625% | 5/15/32 | 5 | 5 |
| | Newell Brands Inc. | 6.875% | 4/1/36 | 6 | 6 |
| | Newell Brands Inc. | 7.000% | 4/1/46 | 4 | 4 |
| | Newmont Corp. | 2.250% | 10/1/30 | 100 | 87 |
| 5 | News Corp. | 3.875% | 5/15/29 | 33 | 31 |
| 5 | Nexstar Media Inc. | 4.750% | 11/1/28 | 40 | 38 |
| 5 | Niagara Mohawk Power Corp. | 5.664% | 1/17/54 | 160 | 159 |
| | NiSource Inc. | 5.250% | 3/30/28 | 100 | 101 |
| | NiSource Inc. | 5.200% | 7/1/29 | 700 | 709 |
| | NiSource Inc. | 5.400% | 6/30/33 | 60 | 61 |
| | NiSource Inc. | 5.350% | 4/1/34 | 400 | 401 |
| | NiSource Inc. | 4.800% | 2/15/44 | 630 | 568 |
| | NiSource Inc. | 3.950% | 3/30/48 | 50 | 40 |
| | Norfolk Southern Corp. | 3.050% | 5/15/50 | 120 | 80 |
| | Norfolk Southern Corp. | 5.950% | 3/15/64 | 150 | 159 |
| | Northern States Power Co. | 6.250% | 6/1/36 | 144 | 159 |
| | Northrop Grumman Corp. | 5.250% | 5/1/50 | 545 | 530 |
| | Northrop Grumman Corp. | 5.200% | 6/1/54 | 700 | 678 |
| 5 | Novelis Corp. | 4.750% | 1/30/30 | 15 | 14 |
| 5 | Novelis Corp. | 3.875% | 8/15/31 | 18 | 16 |
| 5 | NRG Energy Inc. | 6.250% | 11/1/34 | 5 | 5 |
| | Nucor Corp. | 4.400% | 5/1/48 | 70 | 60 |
| | Nucor Corp. | 3.850% | 4/1/52 | 50 | 39 |
| | NuStar Logistics LP | 6.375% | 10/1/30 | 20 | 20 |
| | Occidental Petroleum Corp. | 5.550% | 3/15/26 | 16 | 16 |
| | Occidental Petroleum Corp. | 6.375% | 9/1/28 | 138 | 143 |
| | Occidental Petroleum Corp. | 5.200% | 8/1/29 | 315 | 314 |
| | Occidental Petroleum Corp. | 6.625% | 9/1/30 | 59 | 62 |
| | Occidental Petroleum Corp. | 6.125% | 1/1/31 | 39 | 40 |
| | Occidental Petroleum Corp. | 7.500% | 5/1/31 | 44 | 49 |
| | Occidental Petroleum Corp. | 6.450% | 9/15/36 | 15 | 16 |
| | Occidental Petroleum Corp. | 6.600% | 3/15/46 | 10 | 10 |
| | Occidental Petroleum Corp. | 6.050% | 10/1/54 | 385 | 373 |
| | OGE Energy Corp. | 5.450% | 5/15/29 | 150 | 153 |
| | Oglethorpe Power Corp. | 6.200% | 12/1/53 | 130 | 138 |
| 5 | Oglethorpe Power Corp. | 5.800% | 6/1/54 | 930 | 942 |
| 5 | Olympus Water US Holding Corp. | 4.250% | 10/1/28 | 2 | 2 |
| 5 | Olympus Water US Holding Corp. | 9.750% | 11/15/28 | 20 | 21 |
| 5 | Olympus Water US Holding Corp. | 7.250% | 6/15/31 | 5 | 5 |
| | Omega Healthcare Investors Inc. | 3.625% | 10/1/29 | 152 | 141 |
| | Omega Healthcare Investors Inc. | 3.375% | 2/1/31 | 185 | 165 |
| | Oncor Electric Delivery Co. LLC | 3.800% | 9/30/47 | 153 | 119 |
| | Oncor Electric Delivery Co. LLC | 4.950% | 9/15/52 | 100 | 93 |
| | OneMain Finance Corp. | 3.500% | 1/15/27 | 15 | 14 |
| | OneMain Finance Corp. | 3.875% | 9/15/28 | 35 | 32 |
| | OneMain Finance Corp. | 7.125% | 11/15/31 | 2 | 2 |
| | ONEOK Inc. | 5.550% | 11/1/26 | 130 | 132 |
| | ONEOK Inc. | 5.650% | 11/1/28 | 135 | 139 |
| | ONEOK Partners LP | 6.125% | 2/1/41 | 135 | 137 |
| | Oracle Corp. | 2.300% | 3/25/28 | 189 | 175 |
| 4 | Oracle Corp. | 4.200% | 9/27/29 | 2,282 | 2,223 |
| | | | Coupon | Maturity
Date | Face
Amount
($000) | Market
Value•
($000) |
| | Oracle Corp. | 2.950% | 4/1/30 | 40 | 36 |
| | Oracle Corp. | 2.875% | 3/25/31 | 270 | 239 |
| | Oracle Corp. | 3.850% | 7/15/36 | 250 | 217 |
| | Oracle Corp. | 3.600% | 4/1/40 | 430 | 342 |
| | Oracle Corp. | 3.650% | 3/25/41 | 150 | 119 |
| 5 | Organon & Co. | 4.125% | 4/30/28 | 13 | 12 |
| 5 | Organon & Co. | 6.750% | 5/15/34 | 5 | 5 |
| 5 | Organon & Co. | 7.875% | 5/15/34 | 2 | 2 |
| 5 | Outfront Media Capital LLC | 7.375% | 2/15/31 | 5 | 5 |
| 5 | Owens-Brockway Glass Container Inc. | 7.250% | 5/15/31 | 11 | 11 |
| 5 | Owens-Brockway Glass Container Inc. | 7.375% | 6/1/32 | 9 | 9 |
| | Pacific Gas & Electric Co. | 3.150% | 1/1/26 | 200 | 196 |
| | Pacific Gas & Electric Co. | 3.000% | 6/15/28 | 100 | 94 |
| | Pacific Gas & Electric Co. | 5.550% | 5/15/29 | 1,320 | 1,344 |
| | Pacific Gas & Electric Co. | 2.500% | 2/1/31 | 140 | 120 |
| | Pacific Gas & Electric Co. | 6.150% | 1/15/33 | 130 | 136 |
| | Pacific Gas & Electric Co. | 6.950% | 3/15/34 | 180 | 200 |
| | Pacific Gas & Electric Co. | 4.500% | 7/1/40 | 430 | 373 |
| | Pacific Gas & Electric Co. | 4.750% | 2/15/44 | 40 | 34 |
| | Pacific Gas & Electric Co. | 3.500% | 8/1/50 | 100 | 70 |
| | PacifiCorp | 6.250% | 10/15/37 | 80 | 85 |
| | PacifiCorp | 4.100% | 2/1/42 | 5 | 4 |
| | PacifiCorp | 4.150% | 2/15/50 | 12 | 9 |
| 5 | Pactiv Evergreen Group Issuer LLC | 4.375% | 10/15/28 | 15 | 14 |
| 5 | Panther Escrow Issuer LLC | 7.125% | 6/1/31 | 5 | 5 |
| | Paramount Global | 4.950% | 1/15/31 | 38 | 35 |
| | Paramount Global | 4.600% | 1/15/45 | 260 | 188 |
| 5 | Park Intermediate Holdings LLC | 7.000% | 2/1/30 | 5 | 5 |
| | Parker-Hannifin Corp. | 3.250% | 6/14/29 | 2,190 | 2,057 |
| 5 | Pattern Energy Operations LP | 4.500% | 8/15/28 | 2 | 2 |
| | PayPal Holdings Inc. | 5.050% | 6/1/52 | 40 | 38 |
| 5 | Pebblebrook Hotel LP | 6.375% | 10/15/29 | 3 | 3 |
| | PECO Energy Co. | 4.150% | 10/1/44 | 130 | 110 |
| 5 | Penn Entertainment Inc. | 5.625% | 1/15/27 | 5 | 5 |
| 5 | Penske Truck Leasing Co. LP | 5.350% | 1/12/27 | 900 | 908 |
| 5 | Penske Truck Leasing Co. LP | 6.050% | 8/1/28 | 155 | 160 |
| 5 | Penske Truck Leasing Co. LP | 6.200% | 6/15/30 | 56 | 59 |
| | PepsiCo Inc. | 4.200% | 7/18/52 | 25 | 21 |
| 5 | Performance Food Group Inc. | 6.125% | 9/15/32 | 10 | 10 |
| 5 | Permian Resources Operating LLC | 5.875% | 7/1/29 | 25 | 25 |
| | Pfizer Investment Enterprises Pte. Ltd. | 5.110% | 5/19/43 | 260 | 252 |
| | Pfizer Investment Enterprises Pte. Ltd. | 5.340% | 5/19/63 | 155 | 149 |
| | Philip Morris International Inc. | 4.875% | 2/13/29 | 1,475 | 1,480 |
| | Philip Morris International Inc. | 5.125% | 2/15/30 | 105 | 106 |
| | Philip Morris International Inc. | 5.500% | 9/7/30 | 10 | 10 |
| | Philip Morris International Inc. | 5.750% | 11/17/32 | 224 | 233 |
| 8 | Philip Morris International Inc. | 1.450% | 8/1/39 | 800 | 603 |
| | Philip Morris International Inc. | 4.250% | 11/10/44 | 165 | 138 |
| | Phillips 66 | 4.650% | 11/15/34 | 40 | 38 |
| | Phillips 66 Co. | 3.150% | 12/15/29 | 177 | 163 |
| 5 | Phinia Inc. | 6.625% | 10/15/32 | 5 | 5 |
| | Pioneer Natural Resources Co. | 1.900% | 8/15/30 | 150 | 128 |
| | Pioneer Natural Resources Co. | 2.150% | 1/15/31 | 145 | 124 |
| | Plains All American Pipeline LP | 4.900% | 2/15/45 | 30 | 26 |
| 4 | PNC Bank NA | 2.700% | 10/22/29 | 289 | 259 |
| | PNC Financial Services Group Inc. | 5.492% | 5/14/30 | 1,400 | 1,429 |
| | PNC Financial Services Group Inc. | 4.812% | 10/21/32 | 180 | 177 |
| | PNC Financial Services Group Inc. | 5.068% | 1/24/34 | 390 | 385 |
| | PNC Financial Services Group Inc. | 5.939% | 8/18/34 | 160 | 167 |
| | PNC Financial Services Group Inc. | 6.875% | 10/20/34 | 585 | 650 |
| | PNC Financial Services Group Inc. | 5.676% | 1/22/35 | 700 | 719 |
| | PNC Financial Services Group Inc. | 5.401% | 7/23/35 | 190 | 191 |
| 5 | Post Holdings Inc. | 6.250% | 2/15/32 | 5 | 5 |
| 5 | Post Holdings Inc. | 6.375% | 3/1/33 | 15 | 15 |
| 5 | Post Holdings Inc. | 6.250% | 10/15/34 | 5 | 5 |
| | Principal Financial Group Inc. | 5.500% | 3/15/53 | 219 | 215 |
| 8 | Prologis Euro Finance LLC | 1.000% | 2/16/41 | 200 | 141 |
| | Prologis LP | 1.750% | 2/1/31 | 157 | 131 |
| | Prologis LP | 5.125% | 1/15/34 | 37 | 37 |
| | Prologis LP | 5.250% | 6/15/53 | 267 | 258 |
| | | | Coupon | Maturity
Date | Face
Amount
($000) | Market
Value•
($000) |
| | Prologis LP | 5.250% | 3/15/54 | 570 | 550 |
| | Prudential Financial Inc. | 3.935% | 12/7/49 | 260 | 204 |
| 4 | Prudential Financial Inc. | 4.350% | 2/25/50 | 65 | 55 |
| 4 | Prudential Financial Inc. | 3.700% | 3/13/51 | 70 | 53 |
| | Prudential Financial Inc. | 6.500% | 3/15/54 | 130 | 136 |
| | Public Service Co. of Colorado | 4.050% | 9/15/49 | 230 | 181 |
| 4 | Public Service Electric & Gas Co. | 3.600% | 12/1/47 | 100 | 76 |
| 4 | Public Service Electric & Gas Co. | 5.125% | 3/15/53 | 160 | 156 |
| | Public Service Enterprise Group Inc. | 5.200% | 4/1/29 | 1,010 | 1,025 |
| | Range Resources Corp. | 8.250% | 1/15/29 | 10 | 10 |
| 5,10 | Raven Acquisition Holdings LLC | 6.875% | 11/15/31 | 5 | 5 |
| | Realty Income Corp. | 2.200% | 6/15/28 | 160 | 146 |
| | Realty Income Corp. | 4.850% | 3/15/30 | 165 | 165 |
| 8 | Realty Income Corp. | 4.875% | 7/6/30 | 2,100 | 2,427 |
| | Regions Financial Corp. | 5.722% | 6/6/30 | 1,257 | 1,275 |
| | Regions Financial Corp. | 5.502% | 9/6/35 | 1,810 | 1,794 |
| 5 | RHP Hotel Properties LP | 6.500% | 4/1/32 | 5 | 5 |
| 5 | Roche Holdings Inc. | 4.909% | 3/8/31 | 1,035 | 1,046 |
| 5 | Roche Holdings Inc. | 2.076% | 12/13/31 | 215 | 181 |
| 5 | Roche Holdings Inc. | 4.985% | 3/8/34 | 235 | 236 |
| 5 | Roche Holdings Inc. | 5.218% | 3/8/54 | 440 | 439 |
| 5 | Rocket Software Inc. | 9.000% | 11/28/28 | 5 | 5 |
| 5 | Roller Bearing Co. of America Inc. | 4.375% | 10/15/29 | 5 | 5 |
| 5 | Royal Caribbean Cruises Ltd. | 5.625% | 9/30/31 | 5 | 5 |
| | RPM International Inc. | 4.550% | 3/1/29 | 115 | 114 |
| | RTX Corp. | 4.875% | 10/15/40 | 557 | 524 |
| | RTX Corp. | 5.375% | 2/27/53 | 140 | 137 |
| 5 | Ryan Specialty LLC | 5.875% | 8/1/32 | 3 | 3 |
| | Sabine Pass Liquefaction LLC | 5.875% | 6/30/26 | 110 | 111 |
| | Sabine Pass Liquefaction LLC | 4.200% | 3/15/28 | 110 | 108 |
| | Sabine Pass Liquefaction LLC | 4.500% | 5/15/30 | 1,840 | 1,790 |
| | Sabra Health Care LP | 3.900% | 10/15/29 | 65 | 60 |
| | Sabra Health Care LP | 3.200% | 12/1/31 | 320 | 276 |
| | San Diego Gas & Electric Co. | 5.550% | 4/15/54 | 1,140 | 1,147 |
| | SBA Communications Corp. | 3.125% | 2/1/29 | 17 | 15 |
| 5 | Scripps Escrow Inc. | 5.875% | 7/15/27 | 17 | 15 |
| 5 | Scripps Escrow II Inc. | 3.875% | 1/15/29 | 6 | 5 |
| 5 | Scripps Escrow II Inc. | 5.375% | 1/15/31 | 3 | 2 |
| 5 | Sealed Air Corp. | 6.125% | 2/1/28 | 5 | 5 |
| 5 | Sealed Air Corp. | 5.000% | 4/15/29 | 7 | 7 |
| 5 | Sealed Air Corp. | 7.250% | 2/15/31 | 5 | 5 |
| | Service Properties Trust | 5.500% | 12/15/27 | 5 | 5 |
| | Service Properties Trust | 8.375% | 6/15/29 | 11 | 11 |
| 4 | Shell Finance US Inc. | 4.375% | 5/11/45 | 70 | 60 |
| 4 | Shell Finance US Inc. | 3.750% | 9/12/46 | 141 | 110 |
| | Sherwin-Williams Co. | 4.500% | 6/1/47 | 80 | 69 |
| 5 | Shift4 Payments LLC | 6.750% | 8/15/32 | 3 | 3 |
| 5 | Sirius XM Radio Inc. | 5.000% | 8/1/27 | 10 | 10 |
| 5 | Six Flags Entertainment Corp. | 6.625% | 5/1/32 | 5 | 5 |
| | Southern California Edison Co. | 5.650% | 10/1/28 | 600 | 619 |
| 4 | Southern California Edison Co. | 4.200% | 3/1/29 | 100 | 98 |
| | Southern California Edison Co. | 5.450% | 6/1/31 | 1,140 | 1,168 |
| | Southern California Edison Co. | 4.500% | 9/1/40 | 50 | 45 |
| 4 | Southern California Edison Co. | 3.900% | 3/15/43 | 50 | 40 |
| | Southern California Edison Co. | 4.000% | 4/1/47 | 50 | 40 |
| 4 | Southern California Gas Co. | 2.550% | 2/1/30 | 330 | 296 |
| | Southern California Gas Co. | 3.750% | 9/15/42 | 50 | 40 |
| 4 | Southern Co. | 3.700% | 4/30/30 | 30 | 28 |
| | Southern Co. | 5.700% | 10/15/32 | 100 | 104 |
| | Southern Co. | 4.400% | 7/1/46 | 30 | 25 |
| | Southwest Airlines Co. | 2.625% | 2/10/30 | 250 | 222 |
| 5 | Spirit AeroSystems Inc. | 9.375% | 11/30/29 | 7 | 8 |
| 5 | Spirit AeroSystems Inc. | 9.750% | 11/15/30 | 12 | 13 |
| | Sprint Capital Corp. | 6.875% | 11/15/28 | 1,900 | 2,038 |
| | Sprint Capital Corp. | 8.750% | 3/15/32 | 790 | 955 |
| 5 | SS&C Technologies Inc. | 5.500% | 9/30/27 | 9 | 9 |
| | Stanley Black & Decker Inc. | 2.300% | 3/15/30 | 45 | 39 |
| 5 | Star Parent Inc. | 9.000% | 10/1/30 | 8 | 8 |
| | Starbucks Corp. | 3.500% | 11/15/50 | 125 | 90 |
| 5 | Starwood Property Trust Inc. | 7.250% | 4/1/29 | 2 | 2 |
| | | | Coupon | Maturity
Date | Face
Amount
($000) | Market
Value•
($000) |
| 5 | Starwood Property Trust Inc. | 6.000% | 4/15/30 | 10 | 10 |
| | State Street Corp. | 4.530% | 2/20/29 | 240 | 238 |
| | State Street Corp. | 4.675% | 10/22/32 | 570 | 561 |
| 8 | Stryker Corp. | 3.375% | 9/11/32 | 800 | 870 |
| | Stryker Corp. | 4.625% | 9/11/34 | 70 | 68 |
| 8 | Stryker Corp. | 3.625% | 9/11/36 | 700 | 760 |
| 5 | Summit Materials LLC | 7.250% | 1/15/31 | 3 | 3 |
| | Sun Communities Operating LP | 2.300% | 11/1/28 | 200 | 180 |
| 5 | Sunoco LP | 7.000% | 9/15/28 | 10 | 10 |
| | Synovus Bank | 5.625% | 2/15/28 | 250 | 249 |
| 10 | Synovus Financial Corp. | 6.168% | 11/1/30 | 670 | 670 |
| 5 | Tallgrass Energy Partners LP | 7.375% | 2/15/29 | 10 | 10 |
| 5 | Tallgrass Energy Partners LP | 6.000% | 12/31/30 | 12 | 11 |
| | Targa Resources Corp. | 6.150% | 3/1/29 | 310 | 324 |
| | Targa Resources Corp. | 6.125% | 3/15/33 | 153 | 160 |
| | Targa Resources Corp. | 6.500% | 3/30/34 | 600 | 644 |
| | Targa Resources Corp. | 6.500% | 2/15/53 | 28 | 30 |
| | Targa Resources Partners LP | 4.875% | 2/1/31 | 50 | 49 |
| | Target Corp. | 4.800% | 1/15/53 | 60 | 56 |
| | Tenet Healthcare Corp. | 4.250% | 6/1/29 | 13 | 12 |
| | Tenet Healthcare Corp. | 6.750% | 5/15/31 | 15 | 15 |
| 5 | Terex Corp. | 6.250% | 10/15/32 | 4 | 4 |
| | Thermo Fisher Scientific Inc. | 2.800% | 10/15/41 | 170 | 123 |
| | Time Warner Cable LLC | 5.875% | 11/15/40 | 343 | 303 |
| | Time Warner Cable LLC | 4.500% | 9/15/42 | 75 | 56 |
| 8 | Timken Co. | 4.125% | 5/23/34 | 900 | 978 |
| | T-Mobile USA Inc. | 3.375% | 4/15/29 | 245 | 230 |
| | T-Mobile USA Inc. | 3.875% | 4/15/30 | 170 | 161 |
| | T-Mobile USA Inc. | 6.000% | 6/15/54 | 230 | 242 |
| | T-Mobile USA Inc. | 3.600% | 11/15/60 | 255 | 175 |
| | Toll Brothers Finance Corp. | 3.800% | 11/1/29 | 65 | 62 |
| 5 | TopBuild Corp. | 3.625% | 3/15/29 | 5 | 5 |
| 5 | TopBuild Corp. | 4.125% | 2/15/32 | 10 | 9 |
| | Toyota Motor Credit Corp. | 5.050% | 5/16/29 | 1,220 | 1,236 |
| | Toyota Motor Credit Corp. | 5.100% | 3/21/31 | 590 | 598 |
| 4 | Toyota Motor Credit Corp. | 4.600% | 10/10/31 | 150 | 147 |
| | Transcontinental Gas Pipe Line Co. LLC | 4.000% | 3/15/28 | 5 | 5 |
| 5 | TransDigm Inc. | 6.750% | 8/15/28 | 5 | 5 |
| 5 | TransDigm Inc. | 6.375% | 3/1/29 | 13 | 13 |
| 5 | TransDigm Inc. | 6.875% | 12/15/30 | 10 | 10 |
| 5 | TransDigm Inc. | 7.125% | 12/1/31 | 10 | 10 |
| 5 | TransDigm Inc. | 6.625% | 3/1/32 | 2 | 2 |
| 5 | TransDigm Inc. | 6.000% | 1/15/33 | 20 | 20 |
| 5 | Transocean Inc. | 8.250% | 5/15/29 | 2 | 2 |
| 5 | Transocean Inc. | 8.750% | 2/15/30 | 10 | 11 |
| 5 | Transocean Inc. | 8.500% | 5/15/31 | 15 | 15 |
| | Travelers Cos. Inc. | 3.750% | 5/15/46 | 260 | 205 |
| 5 | Triumph Group Inc. | 9.000% | 3/15/28 | 10 | 10 |
| | Uber Technologies Inc. | 4.300% | 1/15/30 | 210 | 204 |
| | Uber Technologies Inc. | 4.800% | 9/15/34 | 105 | 102 |
| | Uber Technologies Inc. | 5.350% | 9/15/54 | 650 | 618 |
| 4 | UDR Inc. | 2.950% | 9/1/26 | 15 | 14 |
| 5 | UKG Inc. | 6.875% | 2/1/31 | 10 | 10 |
| | Union Electric Co. | 4.000% | 4/1/48 | 65 | 52 |
| | Union Electric Co. | 3.250% | 10/1/49 | 75 | 53 |
| | Union Electric Co. | 3.900% | 4/1/52 | 150 | 118 |
| | Union Electric Co. | 5.250% | 1/15/54 | 250 | 243 |
| | Union Pacific Corp. | 3.250% | 2/5/50 | 270 | 192 |
| | Union Pacific Corp. | 3.839% | 3/20/60 | 35 | 26 |
| 5 | United Airlines Inc. | 4.375% | 4/15/26 | 22 | 22 |
| 5 | United Airlines Inc. | 4.625% | 4/15/29 | 55 | 53 |
| 4 | United Airlines Pass-Through Trust Class A Series 2020-1 | 5.875% | 10/15/27 | 27 | 28 |
| | UnitedHealth Group Inc. | 5.350% | 2/15/33 | 360 | 370 |
| | UnitedHealth Group Inc. | 5.000% | 4/15/34 | 45 | 45 |
| | UnitedHealth Group Inc. | 2.750% | 5/15/40 | 100 | 72 |
| | UnitedHealth Group Inc. | 4.375% | 3/15/42 | 215 | 191 |
| | UnitedHealth Group Inc. | 3.250% | 5/15/51 | 100 | 70 |
| | UnitedHealth Group Inc. | 5.375% | 4/15/54 | 265 | 259 |
| | UnitedHealth Group Inc. | 6.050% | 2/15/63 | 200 | 212 |
| 5 | Univision Communications Inc. | 8.000% | 8/15/28 | 1 | 1 |
| | | | Coupon | Maturity
Date | Face
Amount
($000) | Market
Value•
($000) |
| 5 | Univision Communications Inc. | 4.500% | 5/1/29 | 2 | 2 |
| 5 | Univision Communications Inc. | 7.375% | 6/30/30 | 18 | 17 |
| 5 | Univision Communications Inc. | 8.500% | 7/31/31 | 9 | 9 |
| | US Bancorp | 5.775% | 6/12/29 | 350 | 360 |
| | US Bancorp | 5.384% | 1/23/30 | 190 | 193 |
| 8 | US Bancorp | 4.009% | 5/21/32 | 1,725 | 1,908 |
| | US Bancorp | 5.850% | 10/21/33 | 400 | 414 |
| | US Bancorp | 4.839% | 2/1/34 | 220 | 213 |
| | US Bancorp | 5.836% | 6/12/34 | 276 | 285 |
| 5 | US Foods Inc. | 6.875% | 9/15/28 | 2 | 2 |
| 5 | US Foods Inc. | 4.750% | 2/15/29 | 9 | 9 |
| 5 | US Foods Inc. | 5.750% | 4/15/33 | 5 | 5 |
| 5 | USI Inc. | 7.500% | 1/15/32 | 2 | 2 |
| 5 | Vail Resorts Inc. | 6.500% | 5/15/32 | 13 | 13 |
| 5 | Valaris Ltd. | 8.375% | 4/30/30 | 16 | 16 |
| | Valero Energy Corp. | 4.350% | 6/1/28 | 48 | 47 |
| 5 | Venture Global Calcasieu Pass LLC | 3.875% | 8/15/29 | 20 | 18 |
| 5 | Venture Global Calcasieu Pass LLC | 6.250% | 1/15/30 | 5 | 5 |
| 5 | Venture Global LNG Inc. | 8.125% | 6/1/28 | 3 | 3 |
| 5 | Venture Global LNG Inc. | 9.500% | 2/1/29 | 12 | 13 |
| 5 | Venture Global LNG Inc. | 7.000% | 1/15/30 | 5 | 5 |
| 5 | Venture Global LNG Inc. | 8.375% | 6/1/31 | 30 | 31 |
| 5 | Venture Global LNG Inc. | 9.875% | 2/1/32 | 5 | 5 |
| | Verisk Analytics Inc. | 5.500% | 6/15/45 | 100 | 97 |
| | Verizon Communications Inc. | 1.500% | 9/18/30 | 285 | 237 |
| 8 | Verizon Communications Inc. | 4.250% | 10/31/30 | 900 | 1,031 |
| | Verizon Communications Inc. | 4.400% | 11/1/34 | 140 | 131 |
| | Verizon Communications Inc. | 5.250% | 3/16/37 | 170 | 168 |
| 9 | Verizon Communications Inc. | 1.875% | 11/3/38 | 200 | 165 |
| | Verizon Communications Inc. | 4.812% | 3/15/39 | 110 | 103 |
| | Verizon Communications Inc. | 2.650% | 11/20/40 | 75 | 52 |
| | Verizon Communications Inc. | 3.850% | 11/1/42 | 30 | 24 |
| | Verizon Communications Inc. | 3.875% | 3/1/52 | 130 | 100 |
| | Verizon Communications Inc. | 2.987% | 10/30/56 | 990 | 613 |
| | Verizon Communications Inc. | 3.000% | 11/20/60 | 50 | 30 |
| | Verizon Communications Inc. | 3.700% | 3/22/61 | 85 | 60 |
| 5 | Viper Energy Inc. | 7.375% | 11/1/31 | 5 | 5 |
| 4 | Virginia Electric & Power Co. | 2.875% | 7/15/29 | 65 | 60 |
| | Virginia Electric & Power Co. | 5.300% | 8/15/33 | 56 | 57 |
| 4 | Virginia Electric & Power Co. | 4.200% | 5/15/45 | 150 | 124 |
| | Virginia Electric & Power Co. | 5.450% | 4/1/53 | 100 | 99 |
| | Virginia Electric & Power Co. | 5.350% | 1/15/54 | 350 | 342 |
| 5 | Vistra Operations Co. LLC | 5.625% | 2/15/27 | 22 | 22 |
| 5 | Vistra Operations Co. LLC | 5.000% | 7/31/27 | 8 | 7 |
| 5 | Vistra Operations Co. LLC | 7.750% | 10/15/31 | 3 | 3 |
| 5 | Vital Energy Inc. | 7.750% | 7/31/29 | 5 | 5 |
| 5 | Vital Energy Inc. | 7.875% | 4/15/32 | 9 | 9 |
| | VMware LLC | 1.800% | 8/15/28 | 400 | 358 |
| | VMware LLC | 4.700% | 5/15/30 | 130 | 128 |
| | VMware LLC | 2.200% | 8/15/31 | 220 | 183 |
| | Walgreens Boots Alliance Inc. | 8.125% | 8/15/29 | 5 | 5 |
| | Walt Disney Co. | 6.650% | 11/15/37 | 70 | 79 |
| | Walt Disney Co. | 3.500% | 5/13/40 | 125 | 101 |
| | Walt Disney Co. | 2.750% | 9/1/49 | 45 | 29 |
| | Walt Disney Co. | 3.600% | 1/13/51 | 45 | 34 |
| | Warnermedia Holdings Inc. | 5.050% | 3/15/42 | 674 | 539 |
| 10 | Waste Management Inc. | 5.350% | 10/15/54 | 300 | 300 |
| 5 | Wayfair LLC | 7.250% | 10/31/29 | 3 | 3 |
| 4 | Wells Fargo & Co. | 2.393% | 6/2/28 | 340 | 320 |
| 4 | Wells Fargo & Co. | 3.350% | 3/2/33 | 400 | 356 |
| | Wells Fargo & Co. | 5.389% | 4/24/34 | 250 | 252 |
| 4 | Wells Fargo & Co. | 3.068% | 4/30/41 | 320 | 240 |
| | Wells Fargo & Co. | 5.375% | 11/2/43 | 90 | 86 |
| 4 | Wells Fargo & Co. | 4.400% | 6/14/46 | 60 | 50 |
| 4 | Wells Fargo & Co. | 5.013% | 4/4/51 | 80 | 75 |
| 4 | Wells Fargo & Co. | 4.611% | 4/25/53 | 50 | 44 |
| 4 | Wells Fargo Bank NA | 6.600% | 1/15/38 | 100 | 111 |
| 5 | WESCO Distribution Inc. | 6.375% | 3/15/29 | 10 | 10 |
| 5 | WESCO Distribution Inc. | 6.625% | 3/15/32 | 5 | 5 |
| | Western Midstream Operating LP | 4.500% | 3/1/28 | 49 | 48 |
| | | | Coupon | Maturity
Date | Face
Amount
($000) | Market
Value•
($000) |
| | Western Midstream Operating LP | 4.750% | 8/15/28 | 104 | 102 |
| | Weyerhaeuser Co. | 4.000% | 11/15/29 | 91 | 87 |
| | Williams Cos. Inc. | 5.300% | 8/15/28 | 225 | 228 |
| | Williams Cos. Inc. | 4.800% | 11/15/29 | 425 | 422 |
| | Williams Cos. Inc. | 4.650% | 8/15/32 | 80 | 77 |
| | Williams Cos. Inc. | 5.150% | 3/15/34 | 195 | 192 |
| | Williams Cos. Inc. | 6.300% | 4/15/40 | 65 | 68 |
| | Willis North America Inc. | 2.950% | 9/15/29 | 85 | 78 |
| | Willis North America Inc. | 3.875% | 9/15/49 | 70 | 53 |
| 5 | WMG Acquisition Corp. | 3.750% | 12/1/29 | 60 | 55 |
| | Workday Inc. | 3.700% | 4/1/29 | 140 | 134 |
| 5 | WR Grace Holdings LLC | 5.625% | 8/15/29 | 5 | 5 |
| 5 | WR Grace Holdings LLC | 7.375% | 3/1/31 | 6 | 6 |
| 5 | Wyndham Hotels & Resorts Inc. | 4.375% | 8/15/28 | 15 | 14 |
| | Zoetis Inc. | 4.700% | 2/1/43 | 129 | 117 |
| | Zoetis Inc. | 3.950% | 9/12/47 | 70 | 56 |
| | | | | | | 245,862 |
| Total Corporate Bonds (Cost $454,367) | 451,512 |
| Floating Rate Loan Interests (0.0%) |
| Ireland (0.0%) |
| 7 | Setanta Aircraft Leasing DAC First Lien Term Loan B, TSFR3M + 1.750% | 6.354% | 11/6/28 | 45 | 44 |
| United States (0.0%) |
| 7 | AAdvantage Loyalty IP Ltd. First Lien Initial Term Loan, TSFR3M + 4.750% | 9.629% | 4/20/28 | 24 | 25 |
| 7 | Bausch & Lomb Inc. First Lien Initial Term Loan, TSFR1M + 3.250% | 8.095% | 5/10/27 | 5 | 5 |
| 7 | Cotiviti Corp. First Lien Initial Term Loan, TSFR1M + 3.250% | 8.094% | 5/1/31 | 3 | 3 |
| 7 | Endo Finance Holdings Inc. First Lien Initial Term Loan, TSFR1M + 4.500% | 9.245% | 4/9/31 | 7 | 7 |
| 7 | First Student Bidco Inc. First Lien Incremental Term Loan B, TSFR3M + 3.000% | 7.704% | 7/21/28 | 20 | 20 |
| 7 | Frontier Communications Holdings LLC First Lien Term Loan, TSFR6M + 3.500% | 8.763% | 7/1/31 | 2 | 2 |
| 7 | Hub International Ltd. First Lien Incremental Term Loan, TSFR3M + 2.750% | 7.367% | 6/20/30 | 2 | 2 |
| 7 | McAfee Corp. First Lien Tranche B-1 Term Loan, TSFR1M + 3.250% | 8.100% | 3/1/29 | 10 | 10 |
| 7 | Medline Borrower LP First Lien Initial Term Loan, TSFR1M + 2.750% | 7.595% | 10/23/28 | 14 | 14 |
| | | | | | | 88 |
| Total Floating Rate Loan Interests (Cost $131) | 132 |
| Sovereign Bonds (17.2%) |
| Azerbaijan (0.1%) |
| 4,11 | Southern Gas Corridor CJSC | 6.875% | 3/24/26 | 475 | 483 |
| Belgium (0.2%) |
| 5 | Kingdom of Belgium | 4.875% | 6/10/55 | 1,286 | 1,263 |
| Bermuda (0.1%) |
| 4 | Bermuda | 5.000% | 7/15/32 | 500 | 491 |
| Canada (0.4%) |
| 12 | Canadian Government Bond | 3.500% | 12/1/45 | 536 | 397 |
| 12 | Canadian Government Bond | 2.750% | 12/1/48 | 474 | 309 |
| 12 | Canadian Government Bond | 1.750% | 12/1/53 | 573 | 294 |
| 4,5 | Ontario Teachers' Cadillac Fairview Properties Trust | 3.875% | 3/20/27 | 800 | 782 |
| 4,5 | Ontario Teachers' Cadillac Fairview Properties Trust | 4.125% | 2/1/29 | 350 | 339 |
| | | | | | | 2,121 |
| Chile (0.2%) |
| 4,5 | Corp. Nacional del Cobre de Chile | 5.950% | 1/8/34 | 620 | 627 |
| 4 | Empresa Nacional del Petroleo | 5.250% | 11/6/29 | 570 | 565 |
| | | | | | | 1,192 |
| Colombia (0.6%) |
| 4 | Republic of Colombia | 3.000% | 1/30/30 | 1,570 | 1,307 |
| 4,10 | Republic of Colombia | 7.750% | 11/7/36 | 2,426 | 2,387 |
| | | | | | | 3,694 |
| Cyprus (0.2%) |
| 4,8 | Republic of Cyprus | 3.250% | 6/27/31 | 1,182 | 1,313 |
| Dominican Republic (0.1%) |
| 4 | Dominican Republic | 6.875% | 1/29/26 | 400 | 405 |
| | | | Coupon | Maturity
Date | Face
Amount
($000) | Market
Value•
($000) |
| France (1.2%) |
| | Agence Francaise de Developpement EPIC | 4.000% | 6/15/27 | 5,600 | 5,550 |
| 4,5 | Electricite de France SA | 5.700% | 5/23/28 | 315 | 323 |
| 4,5 | Electricite de France SA | 6.250% | 5/23/33 | 240 | 254 |
| 4,8 | Societe Des Grands Projets EPIC | 0.700% | 10/15/60 | 500 | 214 |
| 8 | Ville de Paris | 3.750% | 6/22/48 | 800 | 874 |
| | | | | | | 7,215 |
| Georgia (0.1%) |
| 4 | Republic of Georgia | 2.750% | 4/22/26 | 500 | 468 |
| Germany (1.1%) |
| 8 | Federal Republic of Germany | 2.600% | 5/15/41 | 3,000 | 3,254 |
| 8 | Federal Republic of Germany | 3.250% | 7/4/42 | 250 | 296 |
| 8 | Federal Republic of Germany | 1.250% | 8/15/48 | 750 | 625 |
| 8 | Federal Republic of Germany | 1.800% | 8/15/53 | 378 | 346 |
| 8 | Free and Hanseatic City of Hamburg | 2.375% | 10/2/29 | 2,104 | 2,276 |
| | | | | | | 6,797 |
| Greece (0.6%) |
| 5,8 | Hellenic Republic | 3.375% | 6/15/34 | 2,614 | 2,860 |
| 8 | Hellenic Republic | 4.200% | 1/30/42 | 213 | 244 |
| 5,8 | Hellenic Republic | 4.125% | 6/15/54 | 459 | 507 |
| | | | | | | 3,611 |
| Hungary (0.1%) |
| 4 | Republic of Hungary | 5.500% | 3/26/36 | 800 | 770 |
| Iceland (0.2%) |
| 8 | Republic of Iceland | 3.500% | 3/21/34 | 1,240 | 1,400 |
| Indonesia (0.1%) |
| 4,8 | Perusahaan Perseroan Persero PT Perusahaan Listrik Negara | 1.875% | 11/5/31 | 370 | 340 |
| 8 | Republic of Indonesia | 1.450% | 9/18/26 | 545 | 571 |
| | | | | | | 911 |
| Israel (0.1%) |
| 4 | State of Israel | 5.500% | 3/12/34 | 200 | 195 |
| 4 | State of Israel | 5.750% | 3/12/54 | 520 | 475 |
| | | | | | | 670 |
| Italy (1.2%) |
| 4,5 | Cassa Depositi e Prestiti SpA | 5.875% | 4/30/29 | 2,944 | 3,017 |
| 4 | Cassa Depositi e Prestiti SpA | 5.875% | 4/30/29 | 2,059 | 2,109 |
| 4,5,8 | Republic of Italy | 4.050% | 10/30/37 | 1,289 | 1,445 |
| 4,5,8 | Republic of Italy | 4.300% | 10/1/54 | 393 | 434 |
| | | | | | | 7,005 |
| Ivory Coast (0.5%) |
| 4,5 | Ivory Coast Government Bond | 8.250% | 1/30/37 | 3,000 | 2,986 |
| Japan (0.2%) |
| 4,13 | Japan | 1.200% | 6/20/53 | 112,450 | 588 |
| 4,13 | Japan | 2.200% | 6/20/54 | 112,450 | 741 |
| | | | | | | 1,329 |
| Latvia (0.1%) |
| 4,5 | Republic of Latvia | 5.125% | 7/30/34 | 565 | 561 |
| Lithuania (0.1%) |
| 8 | Republic of Lithuania | 3.500% | 7/3/31 | 528 | 588 |
| Mexico (1.0%) |
| | Comision Federal de Electricidad | 5.000% | 9/29/36 | 199 | 179 |
| | Petroleos Mexicanos | 4.500% | 1/23/26 | 170 | 166 |
| | Petroleos Mexicanos | 6.875% | 8/4/26 | 560 | 559 |
| | Petroleos Mexicanos | 6.500% | 3/13/27 | 1,910 | 1,875 |
| | Petroleos Mexicanos | 6.375% | 1/23/45 | 781 | 547 |
| 4 | United Mexican States | 4.750% | 4/27/32 | 1,204 | 1,120 |
| 4 | United Mexican States | 6.350% | 2/9/35 | 1,600 | 1,607 |
| | | | | | | 6,053 |
| Morocco (0.1%) |
| 4 | Kingdom of Morocco | 2.375% | 12/15/27 | 500 | 457 |
| | | | Coupon | Maturity
Date | Face
Amount
($000) | Market
Value•
($000) |
| Oman (0.4%) |
| 4 | Oman Government Bond | 4.750% | 6/15/26 | 405 | 401 |
| 4 | Oman Government Bond | 6.750% | 10/28/27 | 1,990 | 2,067 |
| | | | | | | 2,468 |
| Panama (0.0%) |
| 4 | Republic of Panama | 4.300% | 4/29/53 | 250 | 159 |
| Peru (0.5%) |
| 4 | Petroleos del Peru SA | 4.750% | 6/19/32 | 280 | 213 |
| 4 | Petroleos del Peru SA | 5.625% | 6/19/47 | 250 | 163 |
| 4 | Republic of Peru | 2.783% | 1/23/31 | 2,075 | 1,800 |
| 4 | Republic of Peru | 5.875% | 8/8/54 | 1,120 | 1,110 |
| | | | | | | 3,286 |
| Poland (0.2%) |
| 4,5,14 | Bank Gospodarstwa Krajowego | 5.750% | 7/9/34 | 995 | 1,004 |
| Romania (0.6%) |
| 4,8 | Republic of Romania | 5.500% | 9/18/28 | 2,000 | 2,268 |
| 5,8 | Republic of Romania | 5.375% | 3/22/31 | 1,130 | 1,245 |
| | | | | | | 3,513 |
| Saudi Arabia (0.4%) |
| 4,5 | Kingdom of Saudi Arabia | 5.750% | 1/16/54 | 2,627 | 2,543 |
| South Korea (0.2%) |
| 4 | Korea Electric Power Corp. | 5.375% | 4/6/26 | 930 | 937 |
| Supranational (5.2%) |
| 4 | Asian Development Bank | 3.625% | 8/28/29 | 4,064 | 3,963 |
| 4,5 | Central American Bank for Economic Integration | 5.000% | 1/25/27 | 1,340 | 1,347 |
| | Corp. Andina de Fomento | 4.125% | 1/7/28 | 1,259 | 1,245 |
| | Corp. Andina de Fomento | 5.000% | 1/24/29 | 1,560 | 1,581 |
| 1,3 | European Investment Bank | 3.750% | 11/15/29 | 5,919 | 5,797 |
| 4,8 | European Investment Bank | 3.000% | 7/15/33 | 1,056 | 1,169 |
| 4,8 | European Investment Bank | 2.625% | 9/4/34 | 2,215 | 2,362 |
| 4,8 | European Union | 2.750% | 10/5/26 | 7,655 | 8,363 |
| 4,8 | European Union | 2.625% | 2/4/48 | 2,508 | 2,437 |
| 4,8 | European Union | 0.300% | 11/4/50 | 1,484 | 822 |
| 4,8 | European Union | 0.700% | 7/6/51 | 1,000 | 603 |
| 4,8 | European Union | 3.000% | 3/4/53 | 315 | 320 |
| 4,8 | European Union | 3.375% | 10/5/54 | 1,250 | 1,353 |
| | | | | | | 31,362 |
| United Kingdom (0.8%) |
| 9 | United Kingdom | 1.625% | 10/22/28 | 662 | 778 |
| 9 | United Kingdom | 0.500% | 1/31/29 | 600 | 666 |
| 9 | United Kingdom | 4.125% | 7/22/29 | 965 | 1,238 |
| 9 | United Kingdom | 0.375% | 10/22/30 | 615 | 638 |
| 9 | United Kingdom | 4.500% | 12/7/42 | 570 | 714 |
| 9 | United Kingdom | 1.500% | 7/22/47 | 295 | 209 |
| 9 | United Kingdom | 3.750% | 10/22/53 | 355 | 382 |
| 9 | United Kingdom | 3.500% | 7/22/68 | 90 | 91 |
| | | | | | | 4,716 |
| Uzbekistan (0.3%) |
| 4 | Republic of Uzbekistan International Bond | 7.850% | 10/12/28 | 213 | 222 |
| 4 | Republic of Uzbekistan International Bond | 5.375% | 2/20/29 | 1,787 | 1,697 |
| | | | | | | 1,919 |
| Total Sovereign Bonds (Cost $103,630) | 103,690 |
| | | | | | Shares | |
| Temporary Cash Investments (2.3%) |
| Money Market Fund (2.3%) |
| 15 | Vanguard Market Liquidity Fund (Cost $14,076) | 4.834% | | 140,777 | 14,076 |
| | | Counterparty | Expiration
Date | Exercise
Price | Notional
Amount
($000) | Market
Value•
($000) |
| Options Purchased (0.0%) |
| Foreign Currency Options (0.0%) |
| Put Options |
| | USD | HSBC | 11/22/24 | EUR 1.081 | 2,025 | 13 |
| | | | | Exercise
Rate | Notional
Amount on
Underlying
Swap
($000) | |
| Over-the-Counter Swaptions (0.0%) |
| Put Swaptions |
| | 5-Year CDX-NA-IG-S43-V1, Credit Protection Purchased, Pays 1.000% Quarterly | JPMC | 11/20/24 | 0.58% | 12,790 | 8 |
| Total Options Purchased (Cost $23) | 21 |
| Total Investments (97.2%) (Cost $589,101) | | 586,083 |
| Other Assets and Liabilities—Net (2.8%) | | 16,986 |
| Net Assets (100%) | | 603,069 |
| • | See Note A in Notes to Financial Statements. |
| 1 | Securities with a value of $1,517,000 have been segregated as initial margin for open futures contracts. |
| 2 | Securities with a value of $1,075,000 have been segregated as initial margin for open centrally cleared swap contracts. |
| 3 | Securities with a value of $108,000 have been segregated as collateral for open forward currency contracts and over-the-counter swap contracts. |
| 4 | The average or expected maturity is shorter than the final maturity shown because of the possibility of interim principal payments and prepayments or the possibility of the issue being called. |
| 5 | Security exempt from registration under Rule 144A of the Securities Act of 1933. Such securities may be sold in transactions exempt from registration, normally to qualified institutional buyers. At October 31, 2024, the aggregate value was $65,171,000, representing 10.8% of net assets. |
| 6 | Face amount denominated in Australian dollars. |
| 7 | Variable-rate security; rate shown is effective rate at period end. Certain variable-rate securities are not based on a published reference rate and spread but are determined by the issuer or agent based on current market conditions. |
| 8 | Face amount denominated in euro. |
| 9 | Face amount denominated in British pounds. |
| 10 | Includes securities purchased on a when-issued or delayed-delivery basis for which the fund has not taken delivery as of October 31, 2024. |
| 11 | Guaranteed by the Republic of Azerbaijan. |
| 12 | Face amount denominated in Canadian dollars. |
| 13 | Face amount denominated in Japanese yen. |
| 14 | Guaranteed by the Republic of Poland. |
| 15 | Affiliated money market fund available only to Vanguard funds and certain trusts and accounts managed by Vanguard. Rate shown is the 7-day yield. |
| | 3M—3-month. |
| | DAC—Designated Activity Company. |
| | EUR—Euro. |
| | HSBC—HSBC Bank USA, N.A. |
| | JPMC—JPMorgan Chase Bank, N.A. |
| | TSFR1M—CME Term Secured Overnight Financing Rate 1-Month. |
| | TSFR3M—CME Term Secured Overnight Financing Rate 3-Month. |
| | TSFR6M—CME Term Secured Overnight Financing Rate 6-Month. |
| | USD—U.S. dollar. |
Derivative Financial Instruments Outstanding as of Period End
| | Counterparty | Expiration
Date | Exercise
Rate | Notional
Amount on
Underlying
Swap
($000) | Market
Value
($000) |
| Over-the-Counter Swaptions |
| Put Swaptions |
| 2-Year Interest Rate Swap, Pays SOFR Annually, Receives 3.928% Annually (Premiums Received $71) | BNPSW | 1/30/25 | 3.93% | 23,700 | (88) |
| BNPSW—BNP Paribas. |
| SOFR—Secured Overnight Financing Rate. |
| Futures Contracts |
| | | | ($000) |
| | Expiration | Number of
Long (Short)
Contracts | Notional
Amount | Value and
Unrealized
Appreciation
(Depreciation) |
| Long Futures Contracts |
| 2-Year U.S. Treasury Note | December 2024 | 106 | 21,830 | (156) |
| 5-Year Government of Canada Bond | December 2024 | 93 | 7,600 | (56) |
| 10-Year Government of Canada Bond | December 2024 | 49 | 4,293 | (59) |
| 10-Year U.S. Treasury Note | December 2024 | 149 | 16,460 | (341) |
| AUD 5-Year Treasury Bond | December 2024 | 5 | 297 | (8) |
| Euro-Bobl | December 2024 | 128 | 16,450 | (83) |
| Euro-Bund | December 2024 | 4 | 573 | — |
| Long U.S. Treasury Bond | December 2024 | 80 | 9,438 | (407) |
| Ultra Long U.S. Treasury Bond | December 2024 | 33 | 4,146 | (38) |
| | | | | (1,148) |
| |
| Short Futures Contracts |
| 5-Year U.S. Treasury Note | December 2024 | (196) | (21,018) | 223 |
| 10-Year Japanese Government Bond | December 2024 | (6) | (5,694) | (4) |
| AUD 3-Year Treasury Bond | December 2024 | (145) | (10,074) | 155 |
| AUD 10-Year Treasury Bond | December 2024 | (66) | (4,858) | 204 |
| Euro-Buxl | December 2024 | (27) | (3,887) | 51 |
| Euro-OAT | December 2024 | (13) | (1,763) | 11 |
| Euro-Schatz | December 2024 | (8) | (927) | 4 |
| Long Gilt | December 2024 | (31) | (3,759) | 59 |
| Mini 10-Year Japanese Government Bond | December 2024 | (23) | (2,180) | 1 |
| Ultra 10-Year U.S. Treasury Note | December 2024 | (94) | (10,693) | 200 |
| | | | | 904 |
| | | | | (244) |
| Forward Currency Contracts |
| | Contract
Settlement
Date | Contract Amount (000) | Unrealized
Appreciation
($000) | Unrealized
(Depreciation)
($000) |
| Counterparty | | Receive | | Deliver |
| State Street Bank & Trust Co. | 11/4/24 | AUD | 40,453 | USD | 26,591 | 31 | — |
| Canadian Imperial Bank of Commerce | 11/4/24 | AUD | 358 | USD | 242 | — | (8) |
| Toronto-Dominion Bank | 11/4/24 | AUD | 335 | USD | 224 | — | (4) |
| HSBC Bank plc | 11/4/24 | AUD | 92 | USD | 61 | — | (1) |
| HSBC Bank plc | 11/4/24 | AUD | 65 | USD | 43 | — | — |
| Morgan Stanley Capital Services LLC | 11/4/24 | AUD | 59 | USD | 40 | — | (2) |
| State Street Bank & Trust Co. | 11/1/24 | CAD | 1,600 | USD | 1,150 | — | (1) |
| Toronto-Dominion Bank | 11/1/24 | CAD | 93 | USD | 68 | — | (1) |
| Standard Chartered Bank | 11/1/24 | CAD | 88 | USD | 64 | — | (1) |
| Forward Currency Contracts (continued) |
| | Contract
Settlement
Date | Contract Amount (000) | Unrealized
Appreciation
($000) | Unrealized
(Depreciation)
($000) |
| Counterparty | | Receive | | Deliver |
| JPMorgan Chase Bank, N.A. | 11/1/24 | CAD | 28 | USD | 20 | — | — |
| Deutsche Bank AG | 11/1/24 | CAD | 26 | USD | 19 | — | — |
| Royal Bank of Canada | 11/4/24 | CHF | 6 | USD | 7 | — | — |
| JPMorgan Chase Bank, N.A. | 12/3/24 | CHF | 6 | USD | 7 | — | — |
| Royal Bank of Canada | 11/4/24 | EUR | 151,196 | USD | 164,652 | — | (189) |
| UBS AG | 11/4/24 | EUR | 15,514 | USD | 16,776 | 99 | — |
| UBS AG | 11/4/24 | EUR | 2,609 | USD | 2,867 | — | (30) |
| State Street Bank & Trust Co. | 11/4/24 | EUR | 1,994 | USD | 2,194 | — | (24) |
| Toronto-Dominion Bank | 11/4/24 | EUR | 771 | USD | 854 | — | (15) |
| HSBC Bank plc | 11/26/24 | EUR | 460 | USD | 506 | — | (5) |
| BNP Paribas | 11/4/24 | EUR | 319 | USD | 352 | — | (5) |
| Bank of America, N.A. | 11/4/24 | EUR | 263 | USD | 292 | — | (5) |
| State Street Bank & Trust Co. | 12/3/24 | EUR | 207 | USD | 225 | — | — |
| Bank of America, N.A. | 11/4/24 | GBP | 25,338 | USD | 32,914 | — | (241) |
| Standard Chartered Bank | 11/4/24 | GBP | 1,740 | USD | 2,290 | — | (46) |
| Toronto-Dominion Bank | 11/4/24 | GBP | 1,440 | USD | 1,901 | — | (45) |
| HSBC Bank plc | 11/4/24 | GBP | 495 | USD | 643 | — | (7) |
| Toronto-Dominion Bank | 12/3/24 | GBP | 368 | USD | 479 | — | (4) |
| Bank of America, N.A. | 11/5/24 | JPY | 225,103 | USD | 1,472 | 9 | — |
| Canadian Imperial Bank of Commerce | 11/5/24 | JPY | 8,503 | USD | 58 | — | (2) |
| Morgan Stanley Capital Services LLC | 11/5/24 | JPY | 4,722 | USD | 33 | — | (2) |
| JPMorgan Chase Bank, N.A. | 11/5/24 | JPY | 3,227 | USD | 22 | — | — |
| HSBC Bank plc | 11/4/24 | MXN | 1,927 | USD | 98 | — | (1) |
| Goldman Sachs Bank USA | 12/3/24 | MXN | 1,927 | USD | 96 | — | — |
| State Street Bank & Trust Co. | 11/4/24 | USD | 26,844 | AUD | 38,753 | 1,341 | — |
| State Street Bank & Trust Co. | 12/3/24 | USD | 26,599 | AUD | 40,453 | — | (31) |
| BNP Paribas | 11/4/24 | USD | 1,059 | AUD | 1,582 | 18 | — |
| JPMorgan Chase Bank, N.A. | 11/4/24 | USD | 624 | AUD | 947 | — | — |
| Canadian Imperial Bank of Commerce | 11/4/24 | USD | 33 | AUD | 49 | 1 | — |
| Citibank, N.A. | 11/4/24 | USD | 21 | AUD | 31 | — | — |
| UBS AG | 12/3/24 | USD | 21 | AUD | 32 | — | — |
| State Street Bank & Trust Co. | 12/2/24 | USD | 1,151 | CAD | 1,600 | 1 | — |
| State Street Bank & Trust Co. | 11/1/24 | USD | 1,012 | CAD | 1,367 | 30 | — |
| UBS AG | 11/1/24 | USD | 160 | CAD | 216 | 4 | — |
| Toronto-Dominion Bank | 11/1/24 | USD | 52 | CAD | 73 | — | — |
| Canadian Imperial Bank of Commerce | 11/1/24 | USD | 46 | CAD | 63 | 1 | — |
| HSBC Bank plc | 11/1/24 | USD | 38 | CAD | 52 | — | — |
| JPMorgan Chase Bank, N.A. | 11/1/24 | USD | 30 | CAD | 41 | 1 | — |
| Standard Chartered Bank | 12/2/24 | USD | 19 | CAD | 27 | — | — |
| Deutsche Bank AG | 11/1/24 | USD | 16 | CAD | 22 | — | — |
| HSBC Bank plc | 12/18/24 | USD | 539 | CHF | 450 | 15 | — |
| JPMorgan Chase Bank, N.A. | 11/4/24 | USD | 7 | CHF | 6 | — | — |
| State Street Bank & Trust Co. | 11/4/24 | USD | 178,906 | EUR | 159,705 | 5,187 | — |
| Royal Bank of Canada | 12/3/24 | USD | 164,847 | EUR | 151,196 | 189 | — |
| BNP Paribas | 11/4/24 | USD | 2,941 | EUR | 2,719 | — | (16) |
| State Street Bank & Trust Co. | 11/4/24 | USD | 2,563 | EUR | 2,359 | — | (3) |
| Toronto-Dominion Bank | 11/4/24 | USD | 2,077 | EUR | 1,926 | — | (18) |
| JPMorgan Chase Bank, N.A. | 11/4/24 | USD | 2,013 | EUR | 1,802 | 53 | — |
| UBS AG | 11/4/24 | USD | 1,771 | EUR | 1,610 | 20 | — |
| Morgan Stanley Capital Services LLC | 12/18/24 | USD | 1,271 | EUR | 1,155 | 12 | — |
| BNP Paribas | 11/4/24 | USD | 1,146 | EUR | 1,027 | 29 | — |
| Citibank, N.A. | 11/4/24 | USD | 1,120 | EUR | 1,027 | 3 | — |
| JPMorgan Chase Bank, N.A. | 11/26/24 | USD | 506 | EUR | 460 | 5 | — |
| Forward Currency Contracts (continued) |
| | Contract
Settlement
Date | Contract Amount (000) | Unrealized
Appreciation
($000) | Unrealized
(Depreciation)
($000) |
| Counterparty | | Receive | | Deliver |
| Morgan Stanley Capital Services LLC | 11/4/24 | USD | 284 | EUR | 263 | — | (2) |
| JPMorgan Chase Bank, N.A. | 11/4/24 | USD | 247 | EUR | 228 | — | (1) |
| Bank of America, N.A. | 12/3/24 | USD | 32,913 | GBP | 25,338 | 241 | — |
| State Street Bank & Trust Co. | 11/4/24 | USD | 32,376 | GBP | 24,211 | 1,161 | — |
| Barclays Bank plc | 11/4/24 | USD | 3,817 | GBP | 2,941 | 24 | — |
| UBS AG | 11/4/24 | USD | 1,295 | GBP | 990 | 18 | — |
| JPMorgan Chase Bank, N.A. | 11/4/24 | USD | 1,140 | GBP | 871 | 17 | — |
| BNP Paribas | 11/5/24 | USD | 1,670 | JPY | 237,473 | 107 | — |
| Bank of America, N.A. | 12/3/24 | USD | 1,478 | JPY | 225,103 | — | (9) |
| Deutsche Bank AG | 11/5/24 | USD | 28 | JPY | 4,081 | 1 | — |
| Goldman Sachs Bank USA | 11/4/24 | USD | 96 | MXN | 1,927 | — | — |
| Bank of America, N.A. | 12/18/24 | GBP | 285 | SEK | 3,810 | 9 | — |
| | | | | | | 8,627 | (719) |
| AUD—Australian dollar. |
| CAD—Canadian dollar. |
| CHF—Swiss franc. |
| EUR—euro. |
| GBP—British pound. |
| JPY—Japanese yen. |
| MXN—Mexican peso. |
| SEK—Swedish krona. |
| USD—U.S. dollar. |
| Centrally Cleared Credit Default Swaps |
| Reference Entity | Termination
Date | | Notional
Amount
(000) | Periodic
Premium
Received
(Paid)1
(%) | Value
($000) | Unrealized
Appreciation
(Depreciation)
($000) |
| Credit Protection Sold | | | | | |
| CDX-NA-HY-S43-V1 | 12/20/29 | USD | 6,100 | 5.000 | 459 | 13 |
| CDX-NA-IG-S43-V1 | 12/20/29 | USD | 9,842 | 1.000 | 221 | 3 |
| iTraxx Europe-S42-V1 | 12/20/29 | EUR | 10,000 | 1.000 | 229 | (1) |
| | | | | | | 15 |
| |
| Credit Protection Purchased | | | | | |
| iTraxx Europe Crossover-S42-V1 | 12/20/29 | EUR | 5,750 | (5.000) | (538) | (14) |
| | | | | | | 1 |
| 1 Periodic premium received/paid quarterly. |
| EUR—euro. |
| USD—U.S. dollar. |
| Over-the-Counter Credit Default Swaps |
Reference
Entity | Termination
Date | Counterparty | Notional
Amount
($000) | Periodic
Premium
Received
(Paid)1
(%) | Value
($000) | Remaining
Up-Front
Premium
Paid
(Received)
($000) | Unrealized
Appreciation
($000) | Unrealized
(Depreciation)
($000) |
| Credit Protection Purchased | | | | | | |
| Bouygues SA | 6/20/28 | JPMC | 3,5002 | (1.000) | (99) | (53) | — | (46) |
| Republic of Peru | 12/20/29 | BANA | 640 | (1.000) | (6) | (4) | — | (2) |
| Standard Chartered plc | 12/20/28 | MSCS | 4002 | (1.000) | (10) | (2) | — | (8) |
| Unibail-Rodamco-Westfield SE | 6/20/28 | BARC | 6002 | (1.000) | (11) | 34 | — | (45) |
| Unibail-Rodamco-Westfield SE | 6/20/28 | JPMC | 6002 | (1.000) | (11) | 24 | — | (35) |
| | | | | | (137) | (1) | — | (136) |
| 1 Periodic premium received/paid quarterly. |
| 2 Notional amount denominated in euro. |
| BANA—Bank of America, N.A. |
| BARC—Barclays Bank plc. |
| JPMC—JPMorgan Chase Bank, N.A. |
| MSCS—Morgan Stanley Capital Services LLC. |
At October 31, 2024, the counterparties had deposited in segregated accounts securities with a value of $7,894,000 in connection with open forward currency contracts and over-the-counter swap contracts.
| Centrally Cleared Interest Rate Swaps |
| Termination Date | Future
Effective
Date | Notional
Amount
(000) | Interest
Rate
Received
(%) | Interest
Rate
(Paid)
(%) | Value
($000) | Unrealized
Appreciation
(Depreciation)
($000) |
| 12/21/24 | N/A | 2,3501 | 4.9502 | (4.274)3 | 28 | 28 |
| 9/11/25 | N/A | 17,0004 | 4.0033 | (4.900)5 | (60) | (60) |
| 9/11/26 | N/A | 8,5004 | 4.9005 | (3.464)3 | 94 | 94 |
| 7/26/27 | N/A | 6,5004 | 4.0163 | (4.900)5 | 1 | 1 |
| 8/30/27 | N/A | 5,3004 | 4.9005 | (3.476)3 | 71 | 71 |
| 5/21/28 | 5/21/276 | 16,0104 | 3.7727 | (0.000)8 | 14 | 14 |
| 2/28/29 | 12/2/246 | 3,7804 | 3.2733 | (0.000)5 | (75) | (75) |
| 7/5/29 | N/A | 2,3904 | 2.5307 | (0.000)9 | 12 | 12 |
| 7/5/29 | N/A | 2,2104 | 2.5237 | (0.000)9 | 10 | 10 |
| 7/5/29 | N/A | 2,2004 | 2.5257 | (0.000)9 | 10 | 10 |
| 7/10/29 | N/A | 2,7904 | 2.4917 | (0.000)9 | 8 | 8 |
| 7/10/29 | N/A | 2,4504 | 2.4847 | (0.000)9 | 6 | 6 |
| 7/15/29 | N/A | 2,4504 | 2.4207 | (0.000)9 | (2) | (2) |
| 7/18/29 | N/A | 2,4504 | 2.4497 | (0.000)9 | 2 | 2 |
| 7/19/29 | N/A | 2,4504 | 2.4377 | (0.000)9 | — | — |
| 7/26/29 | N/A | 4,0004 | 4.9005 | (3.837)3 | 8 | 8 |
| 8/1/29 | N/A | 2,4504 | 2.3947 | (0.000)9 | (6) | (6) |
| 8/5/29 | N/A | 2,4434 | 2.3637 | (0.000)9 | (10) | (10) |
| 3/11/34 | N/A | 87010 | 3.3263 | (3.155)11 | 82 | 82 |
| 5/21/34 | 5/21/296 | 3,7354 | 0.0005 | (3.877)3 | (18) | (18) |
| 2/15/40 | 12/2/246 | 1,9754 | 3.4003 | (0.000)5 | (94) | (94) |
| 7/5/54 | N/A | 5304 | 0.0009 | (2.522)7 | (9) | (9) |
| 7/5/54 | N/A | 4804 | 0.0009 | (2.519)7 | (8) | (8) |
| 7/5/54 | N/A | 4804 | 0.0009 | (2.524)7 | (8) | (8) |
| 7/10/54 | N/A | 6004 | 0.0009 | (2.510)7 | (9) | (9) |
| 7/10/54 | N/A | 5304 | 0.0009 | (2.499)7 | (6) | (6) |
| 7/15/54 | N/A | 5254 | 0.0009 | (2.469)7 | (3) | (3) |
| 7/18/54 | N/A | 5254 | 0.0009 | (2.501)7 | (7) | (7) |
| 7/19/54 | N/A | 5254 | 0.0009 | (2.482)7 | (4) | (4) |
| Centrally Cleared Interest Rate Swaps (continued) |
| Termination Date | Future
Effective
Date | Notional
Amount
(000) | Interest
Rate
Received
(%) | Interest
Rate
(Paid)
(%) | Value
($000) | Unrealized
Appreciation
(Depreciation)
($000) |
| 8/1/54 | N/A | 5304 | 0.0009 | (2.454)7 | (1) | (1) |
| 8/5/54 | N/A | 5254 | 0.0009 | (2.411)7 | 4 | 4 |
| | | | | | 30 | 30 |
| 1 Notional amount denominated in British pound. |
| 2 Based on Sterling Overnight Index Average Rate (SONIA) as of the most recent reset date. Interest payment received/paid annually. |
| 3 Interest payment received/paid annually. |
| 4 Notional amount denominated in U.S. dollar. |
| 5 Based on Secured Overnight Financing Rate (SOFR) as of the most recent reset date. Interest payment received/paid annually. |
| 6 Forward interest rate swap. In a forward interest rate swap, the fund and the counterparty agree to make periodic net payments beginning on a specified future effective date. |
| 7 Interest payment received/paid at maturity. |
| 8 Based on Secured Overnight Financing Rate (SOFR) as of the most recent reset date. Interest payment received/paid at maturity. |
| 9 Zero-coupon. Based on the return of US Consumer Price Index for All Urban Consumers (USCPIU). Interest payment received/paid at maturity. |
| 10 Notional amount denominated in euro. |
| 11 Based on Euro Short Term Rate (ESTR) as of the most recent reset date. Interest payment received/paid annually. |
See accompanying Notes, which are an integral part of the Financial Statements.
Statement of Assets and Liabilities
|
| ($000s, except shares, footnotes, and per-share amounts) | Amount |
| Assets | |
| Investments in Securities, at Value | |
| Unaffiliated Issuers (Cost $575,025) | 572,007 |
| Affiliated Issuers (Cost $14,076) | 14,076 |
| Total Investments in Securities | 586,083 |
| Investment in Vanguard | 16 |
| Cash | 43 |
| Foreign Currency, at Value (Cost $877) | 876 |
| Receivables for Investment Securities Sold | 8,947 |
| Receivables for Accrued Income | 7,578 |
| Receivables for Capital Shares Issued | 802 |
| Swap Premiums Paid | 58 |
| Variation Margin Receivable—Futures Contracts | 30 |
| Unrealized Appreciation—Forward Currency Contracts | 8,627 |
| Total Assets | 613,060 |
| Liabilities | |
| Due to Broker | 343 |
| Payables for Investment Securities Purchased | 8,037 |
| Payables for Capital Shares Redeemed | 494 |
| Payables to Vanguard | 68 |
| Options Written, at Value (Premiums Received $71) | 88 |
| Swap Premiums Received | 59 |
| Variation Margin Payable—Centrally Cleared Swap Contracts | 47 |
| Unrealized Depreciation—Forward Currency Contracts | 719 |
| Unrealized Depreciation—Over-the-Counter Swap Contracts | 136 |
| Total Liabilities | 9,991 |
| Net Assets | 603,069 |
At October 31, 2024, net assets consisted of: |
|
| | |
| Paid-in Capital | 625,337 |
| Total Distributable Earnings (Loss) | (22,268) |
| Net Assets | 603,069 |
| |
| Investor Shares—Net Assets | |
Applicable to 4,749,026 outstanding $.001 par value shares of
beneficial interest (unlimited authorization) | 45,559 |
| Net Asset Value Per Share—Investor Shares | $9.59 |
| |
| Admiral™ Shares—Net Assets | |
Applicable to 29,056,602 outstanding $.001 par value shares of
beneficial interest (unlimited authorization) | 557,510 |
| Net Asset Value Per Share—Admiral Shares | $19.19 |
See accompanying Notes, which are an integral part of the Financial Statements.
|
| | Year Ended
October 31, 2024 |
| | ($000) |
| Investment Income | |
| Income | |
| Interest1 | 23,054 |
| Total Income | 23,054 |
| Expenses | |
| The Vanguard Group—Note B | |
| Investment Advisory Services | 90 |
| Management and Administrative—Investor Shares | 121 |
| Management and Administrative—Admiral Shares | 861 |
| Marketing and Distribution—Investor Shares | 3 |
| Marketing and Distribution—Admiral Shares | 23 |
| Custodian Fees | 57 |
| Auditing Fees | 50 |
| Shareholders’ Reports and Proxy Fees—Investor Shares | 12 |
| Shareholders’ Reports and Proxy Fees—Admiral Shares | 16 |
| Trustees’ Fees and Expenses | — |
| Other Expenses | 25 |
| Total Expenses | 1,258 |
| Net Investment Income | 21,796 |
| Realized Net Gain (Loss) | |
| Investment Securities Sold1 | 4,268 |
| Futures Contracts | 949 |
| Options Purchased | (40) |
| Swap Contracts | 553 |
| Forward Currency Contracts | (8,540) |
| Foreign Currencies | 32 |
| Realized Net Gain (Loss) | (2,778) |
| Change in Unrealized Appreciation (Depreciation) | |
| Investment Securities1 | 24,329 |
| Futures Contracts | (243) |
| Options Purchased | (2) |
| Options Written | (17) |
| Swap Contracts | (150) |
| Forward Currency Contracts | 7,318 |
| Foreign Currencies | 9 |
| Change in Unrealized Appreciation (Depreciation) | 31,244 |
| Net Increase (Decrease) in Net Assets Resulting from Operations | 50,262 |
| 1 | Interest income, realized net gain (loss), capital gain distributions received, and change in unrealized appreciation (depreciation) from an affiliated company of the fund were $400,000, $2,000, less than $1,000, and less than $1,000, respectively. Purchases and sales are for temporary cash investment purposes. |
See accompanying Notes, which are an integral part of the Financial Statements.
Statement of Changes in Net Assets
|
| | Year Ended October 31, |
| | 2024
($000) | 2023
($000) |
| Increase (Decrease) in Net Assets | | |
| Operations | | |
| Net Investment Income | 21,796 | 12,044 |
| Realized Net Gain (Loss) | (2,778) | (17,600) |
| Change in Unrealized Appreciation (Depreciation) | 31,244 | 14,595 |
| Net Increase (Decrease) in Net Assets Resulting from Operations | 50,262 | 9,039 |
| Distributions | | |
| Investor Shares | (1,956) | (1,525) |
| Admiral Shares | (20,367) | (10,405) |
| Total Distributions | (22,323) | (11,930) |
| Capital Share Transactions | | |
| Investor Shares | 4,888 | 1,882 |
| Admiral Shares | 260,002 | 47,351 |
| Net Increase (Decrease) from Capital Share Transactions | 264,890 | 49,233 |
| Total Increase (Decrease) | 292,829 | 46,342 |
| Net Assets | | |
| Beginning of Period | 310,240 | 263,898 |
| End of Period | 603,069 | 310,240 |
See accompanying Notes, which are an integral part of the Financial Statements.
| Investor Shares | | | | | |
For a Share Outstanding
Throughout Each Period | Year Ended October 31, |
| 2024 | 2023 | 2022 | 2021 | 2020 |
| Net Asset Value, Beginning of Period | $8.89 | $8.93 | $11.02 | $11.26 | $11.09 |
| Investment Operations | | | | | |
| Net Investment Income1 | .417 | .370 | .214 | .176 | .231 |
| Net Realized and Unrealized Gain (Loss) on Investments | .707 | (.044) | (1.956) | .059 | .619 |
| Total from Investment Operations | 1.124 | .326 | (1.742) | .235 | .850 |
| Distributions | | | | | |
| Dividends from Net Investment Income | (.424) | (.366) | (.182) | (.217) | (.338) |
| Distributions from Realized Capital Gains | — | — | (.166) | (.258) | (.342) |
| Total Distributions | (.424) | (.366) | (.348) | (.475) | (.680) |
| Net Asset Value, End of Period | $9.59 | $8.89 | $8.93 | $11.02 | $11.26 |
| Total Return2 | 12.76% | 3.58% | -16.15% | 2.07% | 8.10% |
| Ratios/Supplemental Data | | | | | |
| Net Assets, End of Period (Millions) | $46 | $38 | $36 | $46 | $41 |
| Ratio of Total Expenses to Average Net Assets | 0.35% | 0.35%3 | 0.35%3 | 0.35% | 0.35% |
| Ratio of Net Investment Income to Average Net Assets | 4.40% | 4.00% | 2.14% | 1.59% | 2.11% |
| Portfolio Turnover Rate | 157% | 178%4 | 124% | 128%4 | 264% |
| 1 | Calculated based on average shares outstanding. |
| 2 | Total returns do not include account service fees that may have applied in the periods shown. Fund prospectuses provide information about any applicable account service fees. |
| 3 | The ratio of expenses to average net assets for the period net of reduction from custody fee offset arrangements was 0.35%. |
| 4 | Includes 12% and 13%, respectively, attributable to mortgage-dollar-roll activity. |
See accompanying Notes, which are an integral part of the Financial Statements.
| Admiral Shares | | | | | |
For a Share Outstanding
Throughout Each Period | Year Ended October 31, |
| 2024 | 2023 | 2022 | 2021 | 2020 |
| Net Asset Value, Beginning of Period | $17.79 | $17.87 | $22.04 | $22.52 | $22.19 |
| Investment Operations | | | | | |
| Net Investment Income1 | .855 | .760 | .449 | .375 | .485 |
| Net Realized and Unrealized Gain (Loss) on Investments | 1.413 | (.089) | (3.901) | .117 | 1.228 |
| Total from Investment Operations | 2.268 | .671 | (3.452) | .492 | 1.713 |
| Distributions | | | | | |
| Dividends from Net Investment Income | (.868) | (.751) | (.385) | (.456) | (.699) |
| Distributions from Realized Capital Gains | — | — | (.333) | (.516) | (.684) |
| Total Distributions | (.868) | (.751) | (.718) | (.972) | (1.383) |
| Net Asset Value, End of Period | $19.19 | $17.79 | $17.87 | $22.04 | $22.52 |
| Total Return2 | 12.88% | 3.69% | -16.02% | 2.18% | 8.16% |
| Ratios/Supplemental Data | | | | | |
| Net Assets, End of Period (Millions) | $558 | $273 | $228 | $233 | $221 |
| Ratio of Total Expenses to Average Net Assets | 0.25% | 0.25%3 | 0.25%3 | 0.25% | 0.25% |
| Ratio of Net Investment Income to Average Net Assets | 4.50% | 4.12% | 2.26% | 1.69% | 2.21% |
| Portfolio Turnover Rate | 157% | 178%4 | 124% | 128%4 | 264% |
| 1 | Calculated based on average shares outstanding. |
| 2 | Total returns do not include account service fees that may have applied in the periods shown. Fund prospectuses provide information about any applicable account service fees. |
| 3 | The ratio of expenses to average net assets for the period net of reduction from custody fee offset arrangements was 0.25%. |
| 4 | Includes 12% and 13%, respectively, attributable to mortgage-dollar-roll activity. |
See accompanying Notes, which are an integral part of the Financial Statements.
Notes to Financial Statements
Vanguard Global Credit Bond Fund is registered under the Investment Company Act of 1940 as an open-end investment company, or mutual fund. The fund offers two classes of shares: Investor Shares and Admiral Shares. Each of the share classes has different eligibility and minimum purchase requirements, and is designed for different types of investors.
A. The following significant accounting policies conform to generally accepted accounting principles for U.S. investment companies. The fund consistently follows such policies in preparing its financial statements.
1. Security Valuation: Securities are valued as of the close of trading on the New York Stock Exchange (generally 4 p.m., Eastern time) on the valuation date. Bonds and other temporary cash investments are valued using the latest bid prices or using valuations based on a matrix system (which considers such factors as security prices, yields, maturities, and ratings), both as furnished by independent pricing services. Structured debt securities, including mortgages and asset-backed securities, are valued using the latest bid prices or using valuations based on a matrix system that considers such factors as issuer, tranche, nominal or option-adjusted spreads, weighted average coupon, weighted average maturity, credit enhancements, and collateral, as furnished by independent pricing services. Investments in Vanguard Market Liquidity Fund are valued at that fund's net asset value. Securities for which market quotations are not readily available, or whose values have been affected by events occurring before the fund’s pricing time but after the close of the securities’ primary markets, are valued by methods deemed by the valuation designee to represent fair value and subject to oversight by the board of trustees. These procedures include obtaining quotations from an independent pricing service, monitoring news to identify significant market- or security-specific events, and evaluating changes in the values of foreign market proxies (for example, fixed income benchmark curves, foreign exchange rates, futures contracts, or exchange-traded funds), between the time the foreign markets close and the fund’s pricing time.
2. Foreign Currency: Securities and other assets and liabilities denominated in foreign currencies are translated into U.S. dollars using exchange rates obtained from an independent third party as of the fund’s pricing time on the valuation date. Realized gains (losses) and unrealized appreciation (depreciation) on investment securities include the effects of changes in exchange rates since the securities were purchased, combined with the effects of changes in security prices. Fluctuations in the value of other assets and liabilities resulting from changes in exchange rates are recorded as unrealized foreign currency gains (losses) until the assets or liabilities are settled in cash, at which time they are recorded as realized foreign currency gains (losses).
3. Mortgage Dollar Rolls: The fund enters into mortgage-dollar-roll transactions, in which the fund sells mortgage-backed securities to a dealer and simultaneously agrees to purchase substantially similar securities in the future at a predetermined price on a predetermined date. The fund forgoes principal and interest paid on the securities sold. In exchange for the forgone principal and interest paid, the fund is compensated by investing the proceeds of the sale, typically in high-quality short-term fixed income securities, and earning interest on such investments. Further the fund receives a lower price on the securities to be repurchased. The fund also enters into mortgage-dollar-roll transactions in which the fund buys mortgage-backed securities from a dealer pursuant to a TBA transaction and simultaneously agrees to sell substantially similar securities in the future at a predetermined price. The securities bought in mortgage-dollar-roll transactions are used to cover an open TBA sell position. The fund continues to earn interest on mortgage-backed security pools already held and receives a lower price on the securities to be sold in the future. The fund accounts for mortgage-dollar-roll transactions as purchases and sales; as such, these transactions may increase the fund’s portfolio turnover rate. Amounts to be received or paid in connection with open mortgage dollar rolls are included in Receivables for Investment Securities Sold or Payables for Investment Securities Purchased in the Statement of Assets and Liabilities.
4. Floating Rate Loan Interests: Floating rate loan interests represent interests in amounts owed by corporate or other borrowers. These instruments may be in the form of loans, trade claims or other receivables and may include standby financing commitments such as revolving credit facilities that obligate the fund to supply additional cash to the borrower on demand. Floating rate loan interests may be made directly with a borrower or acquired through assignment or participation. The fund's right to enforce a borrower’s compliance with the terms of the loan agreement, or benefit directly from the collateral supporting the loan, varies when the loan is a direct borrowing, an assignment, or a participation. Floating rate loan interests involve various risks including risk of loss in case of default, insolvency, or the bankruptcy of the borrower and are generally subject to restrictions on transfer with limited opportunities to sell them in secondary markets. The fund may also invest in loan commitments, which are contractual obligations for a future funding. The fund may earn a commitment fee on any unfunded portion of these commitments which is amortized to interest income over the commitment period. Both the funded portion of a floating rate loan interest as well as its unfunded commitment, if any, is reflected on the Schedule of Investments.
5. Options: The fund invests in options contracts on futures to adjust its exposure to the underlying investments. The primary risk associated with purchasing options is that if interest rates move in such a way that the option is out-of-the-money, the position is worthless at expiration, and the fund loses the premium paid. The primary risk associated with selling options is that if interest rates move in such a way that the option is in-the-money, the counterparty exercises the option, and the fund loses an amount equal to the market value of the option written less the premium received. Counterparty risk involving options on futures contracts is mitigated because a regulated clearinghouse is the counterparty instead of the clearing broker. To further mitigate counterparty risk, the fund trades options on futures contracts on an exchange, monitors the financial strength of its clearing brokers and clearinghouses, and has entered into clearing agreements with its clearing brokers.
The fund invests in options on foreign currency, which are transacted over-the-counter (OTC) and not on an exchange. Unlike exchange-traded options, which are standardized with respect to the underlying instrument, expiration date, contract size, and strike price, the terms of OTC options generally are established through negotiation with the other party to the option contract. Although this type of arrangement allows the purchaser or writer greater flexibility to tailor an option to its needs, OTC options generally involve greater credit risk than exchange-traded options. Credit risk involves the possibility that a counterparty may default on its obligation to pay net amounts due to the fund. The fund mitigates its counterparty risk by entering into options with a diverse group of prequalified counterparties and monitoring their financial strength. The primary risk associated with purchasing options on foreign currency is that the value of the underlying foreign currencies may move in such a way that the exercise price of the option exceeds the value of the underlying investment, the position is worthless at expiration, and the fund loses the premium paid. The primary risk associated with selling options on
foreign currency is that the value of the underlying foreign currencies may move in such a way that the exercise price of the option exceeds the value of the underlying investment, the counterparty exercises the option, and the fund loses an amount equal to the market value of the option written less the premium received.
Options contracts on futures and foreign currency are valued at their quoted daily settlement prices. The premium paid for a purchased option is recorded in the Statement of Assets and Liabilities as an asset that is subsequently adjusted daily to the current market value of the option purchased. The premium received for a written option is recorded in the Statement of Assets and Liabilities as an asset with an equal liability that is subsequently adjusted daily to the current market value of the option written. The notional amounts of option contracts are not recorded in the Statement of Assets and Liabilities. Fluctuations in the value of the options are recorded in the Statement of Operations as unrealized appreciation (depreciation) until expired, closed, or exercised, at which time realized gains (losses) are recognized.
During the year ended October 31, 2024, the fund’s average value of investments in options purchased and options written represented less than 1% of net assets, respectively, based on the average market values at each quarter-end during the period. The fund had no open options contracts on futures at October 31, 2024.
6. Swaptions: The fund invests in options on swaps, which are transacted over-the-counter (OTC) and not on an exchange. The fund enters into swaptions to adjust the fund's sensitivity to interest rates or to adjust its exposure to the underlying investments. The fund may purchase a swaption from a counterparty whereby the fund has the right to enter into a swap in which the fund will pay either a fixed percentage rate or a floating rate, which is reset periodically based on short-term interest rates, and receive a different floating rate, each applied to a notional amount. The fund may also sell a swaption to a counterparty whereby the fund grants the counterparty the right to enter into a swap in which the fund will pay a floating rate and receive a fixed rate, each applied to a notional amount. Swaptions also include options that allow an existing swap to be terminated or extended by one of the counterparties. Unlike exchange-traded options, which are standardized with respect to the underlying instrument, expiration date, contract size, and strike price, the terms of OTC options generally are established through negotiation with the other party to the option contract. Although this type of arrangement allows the purchaser or writer greater flexibility to tailor an option to its needs, OTC options generally involve greater credit risk than exchange-traded options. Credit risk involves the possibility that a counterparty may default on its obligation to pay net amounts due to the fund. The fund mitigates its counterparty risk by entering into swaptions with a diverse group of prequalified counterparties and monitoring their financial strength.
The primary risk associated with purchasing swaptions is that interest rates or the value of the underlying investments move in such a way that the exercise price of the swaption exceeds the value of the underlying investment, the position is worthless at expiration, and the fund loses the premium paid. The primary risk associated with selling swaptions is that interest rates or the value of the underlying investments move in such a way that the exercise price of the swaption exceeds the value of the underlying investment, the counterparty exercises the swaption, and the resulting interest rate swap results in a negative cash flow to the fund in an amount greater than the premium received. A risk associated with all types of swaptions is the possibility that a counterparty may default on its obligations under the swaption contract.
Swaptions are valued based on market quotations received from independent pricing services or recognized dealers. The premium paid for a purchased swaption is recorded in the Statement of Assets and Liabilities as an asset and is subsequently adjusted daily based on the current market value of the swaption. The premium received for a written swaption is recorded in the Statement of Assets and Liabilities as an asset with an equal liability and is subsequently adjusted daily based on the current market value of the swaption. The notional amounts of option contracts are not recorded in the Statement of Assets and Liabilities. Fluctuations in the value of swaptions are recorded in the Statement of Operations as unrealized appreciation (depreciation) until expired, closed, or exercised, at which time realized gains (losses) are recognized.
During the year ended October 31, 2024, the fund’s average value of investments in swaptions purchased and swaptions written represented less than 1% of net assets, respectively, based on the average market values at each quarter-end during the period.
7. Futures Contracts: The fund uses futures contracts to invest in fixed income asset classes with greater efficiency and lower cost than is possible through direct investment, to add value when these instruments are attractively priced, or to adjust sensitivity to changes in interest rates. The primary risks associated with the use of futures contracts are imperfect correlation between changes in market values of bonds held by the fund and the prices of futures contracts, and the possibility of an illiquid market. Counterparty risk involving futures is mitigated because a regulated clearinghouse is the counterparty instead of the clearing broker. To further mitigate counterparty risk, the fund trades futures contracts on an exchange, monitors the financial strength of its clearing brokers and clearinghouse, and has entered into clearing agreements with its clearing brokers. The clearinghouse imposes initial margin requirements to secure the fund’s performance and requires daily settlement of variation margin representing changes in the market value of each contract. Any securities pledged as initial margin for open contracts are noted in the Schedule of Investments.
Futures contracts are valued at their quoted daily settlement prices. The notional amounts of the contracts are not recorded in the Statement of Assets and Liabilities. Fluctuations in the value of the contracts are recorded in the Statement of Assets and Liabilities as an asset (liability) and in the Statement of Operations as unrealized appreciation (depreciation) until the contracts are closed, when they are recorded as realized gains (losses) on futures contracts.
During the year ended October 31, 2024, the fund’s average investments in long and short futures contracts represented 12% and 9% of net assets, respectively, based on the average of the notional amounts at each quarter-end during the period.
8. Forward Currency Contracts: The fund enters into forward currency contracts to protect the value of securities and related receivables and payables against changes in future foreign exchange rates. Risks associated with these types of forward currency contracts include movement in the values of the foreign currencies relative to the U.S. dollar and the ability of the counterparties to fulfill their obligations under the contracts. The fund mitigates its counterparty risk by entering into forward currency contracts only with a diverse group of prequalified counterparties, monitoring their financial strength, entering into master netting arrangements with its counterparties, and requiring its counterparties to transfer collateral as security for their performance. In the absence of a default, the collateral pledged or received by the fund cannot be repledged, resold, or rehypothecated. The master netting arrangements provide that, in the event of a counterparty’s default (including bankruptcy), the fund may terminate the forward currency contracts,
determine the net amount owed by either party in accordance with its master netting arrangements, and sell or retain any collateral held up to the net amount owed to the fund under the master netting arrangements. The forward currency contracts contain provisions whereby a counterparty may terminate open contracts if the fund’s net assets decline below a certain level, triggering a payment by the fund if the fund is in a net liability position at the time of the termination. The payment amount would be reduced by any collateral the fund has pledged. Any securities pledged as collateral for open contracts are noted in the Schedule of Investments. The value of collateral received or pledged is compared daily to the value of the forward currency contracts exposure with each counterparty, and any difference, if in excess of a specified minimum transfer amount, is adjusted and settled within two business days.
Forward currency contracts are valued at their quoted daily prices obtained from an independent third party, adjusted for currency risk based on the expiration date of each contract. The notional amounts of the contracts are not recorded in the Statement of Assets and Liabilities. Fluctuations in the value of the contracts are recorded in the Statement of Assets and Liabilities as an asset (liability) and in the Statement of Operations as unrealized appreciation (depreciation) until the contracts are closed, when they are recorded as realized gains (losses) on forward currency contracts.
During the year ended October 31, 2024, the fund’s average investment in forward currency contracts represented 125% of net assets, based on the average of the notional amounts at each quarter-end during the period.
9. Swap Contracts: The fund invests in credit default swaps to adjust the overall credit risk of the fund or to actively overweight or underweight credit risk to a specific issuer or group of issuers. The fund may sell credit protection through credit default swaps to simulate investments in long positions that are either unavailable or considered to be less attractively priced in the bond market. The fund may purchase credit protection through credit default swaps to reduce credit exposure to a given issuer or issuers. Under the terms of the swaps, an up-front payment may be exchanged between the seller and buyer. In addition, the seller of the credit protection receives a periodic payment of premium from the buyer that is a fixed percentage applied to a notional amount. If, for example, the reference entity is subject to a credit event (such as bankruptcy, failure to pay, or obligation acceleration) during the term of the swap, the seller agrees to either physically settle or cash settle the swap contract. If the swap is physically settled, the seller agrees to pay the buyer an amount equal to the notional amount and take delivery of a debt instrument of the reference issuer with a par amount equal to such notional amount. If the swap is cash settled, the seller agrees to pay the buyer the difference between the notional amount and the final price for the relevant debt instrument, as determined either in a market auction or pursuant to a pre-agreed-upon valuation procedure.
The fund enters into interest rate swap transactions to adjust the fund’s sensitivity to changes in interest rates and maintain the ability to generate income at prevailing market rates. Under the terms of the swaps, one party pays the other either an amount that is a fixed percentage rate or a floating rate, which is reset periodically based on short-term interest rates, applied to a notional amount. In return, the counterparty agrees to pay a different floating rate, which is reset periodically based on short-term interest rates, applied to the same notional amount.
The fund enters into centrally cleared credit default and interest rate swaps to achieve the same objectives specified with respect to the equivalent over-the-counter swaps but with less counterparty risk because a regulated clearinghouse is the counterparty instead of the clearing broker or executing broker. The clearinghouse imposes initial margin requirements to secure the fund's performance, and requires daily settlement of variation margin representing changes in the market value of each contract. To further mitigate counterparty risk, the fund trades with a diverse group of prequalified executing brokers; monitors the financial strength of its clearing brokers, executing brokers, and clearinghouse; and has entered into agreements with its clearing brokers and executing brokers.
The primary risk associated with selling credit protection is that, upon the occurrence of a defined credit event, the market value of the debt instrument received by the fund (or, in a cash settled swap, the debt instruments used to determine the settlement payment by the fund) will be significantly less than the amount paid by the fund and, in a physically settled swap, the fund may receive an illiquid debt instrument. A risk associated with all types of swaps is the possibility that a counterparty may default on its obligation to pay net amounts due to the fund. The fund’s maximum amount subject to counterparty risk is the unrealized appreciation on the swap contract. The fund mitigates its counterparty risk by entering into swaps only with a diverse group of prequalified counterparties, monitoring their financial strength, entering into master netting arrangements with its counterparties, and requiring its counterparties to transfer collateral as security for their performance. In the absence of a default, the collateral pledged or received by the fund cannot be repledged, resold, or rehypothecated. In the event of a counterparty’s default (including bankruptcy), the fund may terminate any swap contracts with that counterparty, determine the net amount owed by either party in accordance with its master netting arrangements, and sell or retain any collateral held up to the net amount owed to the fund under the master netting arrangements. The swap contracts contain provisions whereby a counterparty may terminate open contracts if the fund's net assets decline below a certain level, triggering a payment by the fund if the fund is in a net liability position at the time of the termination. The payment amount would be reduced by any collateral the fund has pledged. Any securities pledged as collateral for open contracts are noted in the Schedule of Investments. The value of collateral received or pledged is compared daily to the value of the swap contracts exposure with each counterparty, and any difference, if in excess of a specified minimum transfer amount, is adjusted and settled within two business days.
The notional amounts of swap contracts are not recorded in the Statement of Assets and Liabilities. Swaps are valued daily based on market quotations received from independent pricing services or recognized dealers and the change in value is recorded in the Statement of Assets and Liabilities as an asset (liability) and in the Statement of Operations as unrealized appreciation (depreciation) until the seller of credit protection is required to take delivery (or, in a cash settled swap, pay the settlement amount determined) upon occurrence of a credit event, periodic payments are made, or the swap terminates, at which time realized gain (loss) is recorded. The net premium to be received or paid by the fund under swap contracts is accrued daily and recorded as realized gain (loss) over the life of the contract.
During the year ended October 31, 2024, the fund's average amounts of investments in credit protection sold and credit protection purchased represented 5% and 2% of net assets, respectively, based on the average of notional amounts at each quarter-end during the period. The average amount of investments in interest rate swaps represented 10% of net assets, based on the average of notional amounts at each quarter-end during the period.
The following table summarizes the fund’s derivative assets and liabilities by counterparty for derivatives subject to arrangements that provide for offsetting assets and liabilities. Exchange-traded and centrally cleared derivatives are listed separately.
| | | | | Amounts Not Offset in the
Statement of Assets
and Liabilities | |
| | Assets Reflected in Statement
of Assets and Liabilities1
($000) | Liabilities Reflected in Statement
of Assets and Liabilities1
($000) | Net Amount
Receivable (Payable)
($000) | Collateral
Pledged2
($000) | Collateral
Received2
($000) | Net Exposure3
(Not Less Than $0)
($000) |
Derivatives Subject to Offsettings
Arrangements, by Counterparty |
| Bank of America, N.A. | 259 | (257) | 2 | — | — | 2 |
| Barclays Bank plc | 24 | (45) | (21) | 27 | — | — |
| BNP Paribas | 154 | (109) | 45 | — | 190 | — |
| Canadian Imperial Bank of Commerce | 2 | (10) | (8) | — | — | — |
| Citibank, N.A. | 3 | — | 3 | — | — | 3 |
| Deutsche Bank AG | 1 | — | 1 | — | — | 1 |
| HSBC Bank plc | 15 | (14) | 1 | — | — | 1 |
| HSBC Bank USA, N.A. | 13 | — | 13 | — | — | 13 |
| JPMorgan Chase Bank, N.A. | 84 | (82) | 2 | — | — | 2 |
| Morgan Stanley Capital Services LLC | 12 | (14) | (2) | 29 | — | — |
| Royal Bank of Canada | 189 | (189) | — | — | — | — |
| Standard Chartered Bank | — | (47) | (47) | — | — | — |
| State Street Bank & Trust Co. | 7,751 | (59) | 7,692 | — | 7,704 | — |
| Toronto-Dominion Bank | — | (87) | (87) | 52 | — | — |
| UBS AG | 141 | (30) | 111 | — | — | 111 |
| Centrally Cleared Swap Contracts | — | (47) | (47) | 1,075 | — | — |
| Exchange-Traded Futures Contracts | 30 | — | 30 | 1,517 | — | — |
| Total | 8,678 | (990) | 7,688 | 2,700 | 7,894 | 133 |
| 1 | Absent an event of default or early termination, derivative assets and liabilities are presented gross and not offset in the Statement of Assets and Liabilities. |
| 2 | Securities or other assets pledged as collateral are noted in the Schedule of Investments and Statement of Assets and Liabilities. Securities or other assets received as collateral are held in a segregated account and not included in the fund's security holdings in the Schedule of Investments. |
| 3 | Net exposure represents the net amount receivable from the counterparty in the event of default. Counterparties are not required to exchange collateral if amount is below a specified minimum transfer amount. |
10. Federal Income Taxes: The fund intends to continue to qualify as a regulated investment company and distribute virtually all of its taxable income. The fund’s tax returns are open to examination by the relevant tax authorities until expiration of the applicable statute of limitations, which is generally three years after the filing of the tax return. Management has analyzed the fund’s tax positions taken for all open federal and state income tax years, and has concluded that no provision for income tax is required in the fund’s financial statements.
11. Distributions: Distributions to shareholders are recorded on the ex-dividend date. Distributions are determined on a tax basis at the fiscal year-end and may differ from net investment income and realized capital gains for financial reporting purposes.
12. Credit Facilities and Interfund Lending Program: The fund and certain other funds managed by The Vanguard Group ("Vanguard") participate in a $4.3 billion committed credit facility provided by a syndicate of lenders pursuant to a credit agreement and an uncommitted credit facility provided by Vanguard. Both facilities may be renewed annually. Each fund is individually liable for its borrowings, if any, under the credit facilities. Borrowings may be utilized for temporary or emergency purposes and are subject to the fund’s regulatory and contractual borrowing restrictions. With respect to the committed credit facility, the participating funds are charged administrative fees and an annual commitment fee of 0.10% of the undrawn committed amount of the facility, which are allocated to the funds based on a method approved by the fund’s board of trustees and included in Management and Administrative expenses on the fund’s Statement of Operations. Any borrowings under either facility bear interest at an agreed-upon spread plus the higher of the federal funds effective rate, the overnight bank funding rate, or the Daily Simple Secured Overnight Financing Rate inclusive of an additional agreed-upon spread. However, borrowings under the uncommitted credit facility may bear interest based upon an alternate rate agreed to by the fund and Vanguard.
In accordance with an exemptive order (the “Order”) from the SEC, the fund may participate in a joint lending and borrowing program that allows registered open-end Vanguard funds to borrow money from and lend money to each other for temporary or emergency purposes (the “Interfund Lending Program”), subject to compliance with the terms and conditions of the Order, and to the extent permitted by the fund’s investment objective and investment policies. Interfund loans and borrowings normally extend overnight but can have a maximum duration of seven days. Loans may be called on one business day’s notice. The interest rate to be charged is governed by the conditions of the Order and internal procedures adopted by the board of trustees. The board of trustees is responsible for overseeing the Interfund Lending Program.
For the year ended October 31, 2024, the fund did not utilize the credit facilities or the Interfund Lending Program.
13. Other: Interest income includes income distributions received from Vanguard Market Liquidity Fund and is accrued daily. Premiums and discounts on debt securities are amortized and accreted, respectively, to interest income over the lives of the respective securities, except for premiums on certain
callable debt securities that are amortized to the earliest call date. Security transactions are accounted for on the date securities are bought or sold. Costs used to determine realized gains (losses) on the sale of investment securities are those of the specific securities sold.
Each class of shares has equal rights as to assets and earnings, except that each class separately bears certain class-specific expenses related to maintenance of shareholder accounts (included in Management and Administrative expenses), shareholder reporting, and proxy fees. Marketing and distribution expenses are allocated to each class of shares based on a method approved by the board of trustees. Income, other non-class-specific expenses, and gains and losses on investments are allocated to each class of shares based on its relative net assets.
B. In accordance with the terms of a Funds’ Service Agreement (the “FSA”) between Vanguard and the fund, Vanguard furnishes to the fund investment advisory, corporate management, administrative, marketing, and distribution services at Vanguard’s cost of operations (as defined by the FSA). These costs of operations are allocated to the fund based on methods and guidelines approved by the board of trustees and are generally settled twice a month.
Upon the request of Vanguard, the fund may invest up to 0.40% of its net assets as capital in Vanguard. At October 31, 2024, the fund had contributed to Vanguard capital in the amount of $16,000, representing less than 0.01% of the fund’s net assets and 0.01% of Vanguard’s capital received pursuant to the FSA. The fund’s trustees and officers are also directors and employees, respectively, of Vanguard.
C. Various inputs may be used to determine the value of the fund’s investments and derivatives. These inputs are summarized in three broad levels for financial statement purposes. The inputs or methodologies used to value securities are not necessarily an indication of the risk associated with investing in those securities.
Level 1—Quoted prices in active markets for identical securities.
Level 2—Other significant observable inputs (including quoted prices for similar securities, interest rates, prepayment speeds, credit risk, etc.).
Level 3—Significant unobservable inputs (including the fund’s own assumptions used to determine the fair value of investments). Any investments and derivatives valued with significant unobservable inputs are noted on the Schedule of Investments.
The following table summarizes the market value of the fund's investments and derivatives as of October 31, 2024, based on the inputs used to value them:
| | Level 1
($000) | Level 2
($000) | Level 3
($000) | Total
($000) |
| Investments | | | | |
| Assets | | | | |
| U.S. Government and Agency Obligations | — | 16,509 | — | 16,509 |
| Asset-Backed/Commercial Mortgage-Backed Securities | — | 143 | — | 143 |
| Corporate Bonds | — | 451,512 | — | 451,512 |
| Floating Rate Loan Interests | — | 132 | — | 132 |
| Sovereign Bonds | — | 103,690 | — | 103,690 |
| Temporary Cash Investments | 14,076 | — | — | 14,076 |
| Options Purchased | — | 21 | — | 21 |
| Total | 14,076 | 572,007 | — | 586,083 |
| | | | |
| Derivative Financial Instruments | | | | |
| Assets | | | | |
| Futures Contracts1 | 908 | — | — | 908 |
| Forward Currency Contracts | — | 8,627 | — | 8,627 |
| Swap Contracts | 3661 | — | — | 366 |
| Total | 1,274 | 8,627 | — | 9,901 |
| Liabilities | | | | |
| Options Written | — | (88) | — | (88) |
| Futures Contracts1 | (1,152) | — | — | (1,152) |
| Forward Currency Contracts | — | (719) | — | (719) |
| Swap Contracts | (335)1 | (136) | — | (471) |
| Total | (1,487) | (943) | — | (2,430) |
| 1 | Includes cumulative appreciation (depreciation) on futures contracts and centrally cleared swaps, if any, as reported in the Schedule of Investments. Only current day’s variation margin is reported within the Statement of Assets and Liabilities. |
D. At October 31, 2024, the fair values of derivatives were reflected in the Statement of Assets and Liabilities as follows:
| Statement of Assets and Liabilities | Interest
Rate
Contracts
($000) | Foreign
Exchange
Contracts
($000) | Credit
Contracts
($000) | Total
($000) |
| Investments in Securities, at Value—Unaffiliated Issuers (Options Purchased) | — | 13 | 8 | 21 |
| Swap Premiums Paid | — | — | 58 | 58 |
| Unrealized Appreciation—Futures Contracts1 | 908 | — | — | 908 |
| Unrealized Appreciation—Centrally Cleared Swap Contracts1 | 350 | — | 16 | 366 |
| Unrealized Appreciation—Forward Currency Contracts | — | 8,627 | — | 8,627 |
| Total Assets | 1,258 | 8,640 | 82 | 9,980 |
| | | | | |
| Options Written, at Value | (88) | — | — | (88) |
| Swap Premiums Received | — | — | (59) | (59) |
| Unrealized Depreciation—Futures Contracts1 | (1,152) | — | — | (1,152) |
| Unrealized Depreciation—Centrally Cleared Swap Contracts1 | (320) | — | (15) | (335) |
| Unrealized Depreciation—Forward Currency Contracts | — | (719) | — | (719) |
| Unrealized Depreciation—Over-the-Counter Swap Contracts | — | — | (136) | (136) |
| Total Liabilities | (1,560) | (719) | (210) | (2,489) |
| 1 | Includes cumulative appreciation (depreciation) on futures contracts and centrally cleared swaps, if any, as reported in the Schedule of Investments. Only current day’s variation margin is reported within the Statement of Assets and Liabilities. |
Realized net gain (loss) and the change in unrealized appreciation (depreciation) on derivatives for the year ended October 31, 2024, were:
| Realized Net Gain (Loss) on Derivatives | Interest
Rate
Contracts
($000) | Foreign
Exchange
Contracts
($000) | Credit
Contracts
($000) | Total
($000) |
| Futures Contracts | 949 | — | — | 949 |
| Options Purchased | (25) | (7) | (8) | (40) |
| Swap Contracts | 175 | — | 378 | 553 |
| Forward Currency Contracts | — | (8,540) | — | (8,540) |
| Realized Net Gain (Loss) on Derivatives | 1,099 | (8,547) | 370 | (7,078) |
| |
| Change in Unrealized Appreciation (Depreciation) on Derivatives | | | | |
| Futures Contracts | (243) | — | — | (243) |
| Options Purchased | — | 4 | (6) | (2) |
| Options Written | (17) | — | — | (17) |
| Swap Contracts | (44) | — | (106) | (150) |
| Forward Currency Contracts | — | 7,318 | — | 7,318 |
| Change in Unrealized Appreciation (Depreciation) on Derivatives | (304) | 7,322 | (112) | 6,906 |
E. Permanent differences between book-basis and tax-basis components of net assets are reclassified among capital accounts in the financial statements to reflect their tax character. These reclassifications have no effect on net assets or net asset value per share. As of period end, permanent differences primarily attributable to the accounting for foreign currency transactions and swap agreements were reclassified between the individual components of total distributable earnings (loss).
Temporary differences between book-basis and tax-basis components of total distributable earnings (loss) arise when certain items of income, gain, or loss are recognized in different periods for financial statement and tax purposes; these differences will reverse at some time in the future. The differences are primarily related to capital loss carryforwards; the deferral of losses from wash sales; the recognition of unrealized gains or losses from certain derivative contracts; the recognition of gain or loss from foreign currency hedges; and the treatment of amortization adjustments from certain fixed income securities. As of period end, the tax-basis components of total distributable earnings (loss) are detailed in the table as follows:
| | Amount
($000) |
| Undistributed Ordinary Income | 5,082 |
| Undistributed Long-Term Gains | — |
| Net Unrealized Gains (Losses) | (2,943) |
| Capital Loss Carryforwards | (24,407) |
| Qualified Late-Year Losses | — |
| Other Temporary Differences | — |
| Total | (22,268) |
The tax character of distributions paid was as follows:
| | Year Ended October 31, |
| | 2024
Amount
($000) | 2023
Amount
($000) |
| Ordinary Income* | 22,323 | 11,930 |
| Long-Term Capital Gains | — | — |
| Total | 22,323 | 11,930 |
| * | Includes short-term capital gains, if any. |
As of October 31, 2024, gross unrealized appreciation and depreciation for investments and derivatives based on cost for U.S. federal income tax purposes were as follows:
| | Amount
($000) |
| Tax Cost | 588,956 |
| Gross Unrealized Appreciation | 8,218 |
| Gross Unrealized Depreciation | (11,161) |
| Net Unrealized Appreciation (Depreciation) | (2,943) |
F. During the year ended October 31, 2024, the fund purchased $853,929,000 of investment securities and sold $597,854,000 of investment securities, other than U.S. government securities and temporary cash investments. Purchases and sales of U.S. government securities were $136,683,000 and $141,927,000, respectively.
G. Capital share transactions for each class of shares were:
| | Year Ended October 31, |
| | 2024 | | 2023 |
| | Amount
($000) | Shares
(000) | | Amount
($000) | Shares
(000) |
| Investor Shares | | | | | |
| Issued | 19,489 | 2,066 | | 12,449 | 1,345 |
| Issued in Lieu of Cash Distributions | 1,587 | 167 | | 1,281 | 140 |
| Redeemed | (16,188) | (1,715) | | (11,848) | (1,283) |
| Net Increase (Decrease)—Investor Shares | 4,888 | 518 | | 1,882 | 202 |
| Admiral Shares | | | | | |
| Issued | 322,335 | 17,025 | | 115,437 | 6,260 |
| Issued in Lieu of Cash Distributions | 15,636 | 822 | | 7,143 | 389 |
| Redeemed | (77,969) | (4,116) | | (75,229) | (4,078) |
| Net Increase (Decrease)—Admiral Shares | 260,002 | 13,731 | | 47,351 | 2,571 |
H. Significant market disruptions, such as those caused by pandemics, natural or environmental disasters, war, acts of terrorism, or other events, can adversely affect local and global markets and normal market operations. Any such disruptions could have an adverse impact on the value of the fund’s investments and fund performance.
To the extent the fund’s investment portfolio reflects concentration in a particular market, industry, sector, country or asset class, the fund may be adversely affected by the performance of these concentrations and may be subject to increased price volatility and other risks.
Credit risk is the risk that a counterparty to a transaction or an issuer of a financial instrument will fail to pay interest and principal when due, or that perceptions of the issuer’s ability to make such payments will cause the price of an investment to decline. Investment in debt securities will generally increase credit risk.
The use of derivatives may expose the fund to various risks. Derivatives can be highly volatile, and any initial investment is generally small relative to the notional amount so that transactions may be leveraged in terms of market exposure. A relatively small market movement may have a potentially larger impact on derivatives than on standard securities. Leveraged derivatives positions can, therefore, increase volatility. Additional information regarding the fund’s use of derivative(s) and the specific risks associated is described under significant accounting policies.
I. Management has determined that no events or transactions occurred subsequent to October 31, 2024, that would require recognition or disclosure in these financial statements.
Report of Independent Registered
Public Accounting Firm
To the Board of Trustees of Vanguard Charlotte Funds and Shareholders of Vanguard Global Credit Bond Fund
Opinion on the Financial Statements
We have audited the accompanying statement of assets and liabilities, including the schedule of investments, of Vanguard Global Credit Bond Fund (one of the funds constituting Vanguard Charlotte Funds, referred to hereafter as the "Fund") as of October 31, 2024, the related statement of operations for the year ended October 31, 2024, the statement of changes in net assets for each of the two years in the period ended October 31, 2024, including the related notes, and the financial highlights for each of the five years in the period ended October 31, 2024 (collectively referred to as the "financial statements"). In our opinion, the financial statements present fairly, in all material respects, the financial position of the Fund as of October 31, 2024, the results of its operations for the year then ended, the changes in its net assets for each of the two years in the period ended October 31, 2024 and the financial highlights for each of the five years in the period ended October 31, 2024 in conformity with accounting principles generally accepted in the United States of America.
Basis for Opinion
These financial statements are the responsibility of the Fund’s management. Our responsibility is to express an opinion on the Fund’s financial statements based on our audits. We are a public accounting firm registered with the Public Company Accounting Oversight Board (United States) (PCAOB) and are required to be independent with respect to the Fund in accordance with the U.S. federal securities laws and the applicable rules and regulations of the Securities and Exchange Commission and the PCAOB.
We conducted our audits of these financial statements in accordance with the standards of the PCAOB. Those standards require that we plan and perform the audit to obtain reasonable assurance about whether the financial statements are free of material misstatement, whether due to error or fraud.
Our audits included performing procedures to assess the risks of material misstatement of the financial statements, whether due to error or fraud, and performing procedures that respond to those risks. Such procedures included examining, on a test basis, evidence regarding the amounts and disclosures in the financial statements. Our audits also included evaluating the accounting principles used and significant estimates made by management, as well as evaluating the overall presentation of the financial statements. Our procedures included confirmation of securities owned as of October 31, 2024 by correspondence with the custodian, transfer agent and brokers; when replies were not received from brokers, we performed other auditing procedures. We believe that our audits provide a reasonable basis for our opinion.
/s/PricewaterhouseCoopers LLP
Philadelphia, Pennsylvania
December 20, 2024
We have served as the auditor of one or more investment companies in The Vanguard Group of Funds since 1975.
Tax information (unaudited)
The fund hereby designates for the fiscal year $741,000, or if subsequently determined to be different, the maximum amount allowable by law, of interest earned from obligations of the U.S. government which is generally exempt from state income tax.
The fund hereby designates 100%, or if subsequently determined to be different, the maximum percentage allowable by law, of ordinary income dividends eligible to be treated as interest income for purposes of section 163(j) and the regulations thereunder for the fiscal year.
Q20250 122024
Item 8: Changes in and Disagreements with Accountants for Open-End Management Investment Companies.
Not applicable.
Item 9: Proxy Disclosures for Open-End Management Investment Companies.
Not applicable.
Item 10: Remuneration Paid to Directors, Officers, and Others of Open-End Management Investment Companies.
Not applicable. The Trustees’ Fees and Expenses are included in the financial statements filed under Item 7 of this Form.
Item 11: Statement Regarding Basis for Approval of Investment Advisory Contracts.
Not applicable.
Item 12: Disclosure of Proxy Voting Policies and Procedures for Closed-End Management Investment Companies.
Not applicable.
Item 13: Portfolio Managers of Closed-End Management Investment Companies.
Not applicable.
Item 14: Purchase of Equity Securities by Closed-End Management Investment Company and Affiliated Purchasers.
Not applicable.
Item 15: Submission of Matters to a Vote of Security Holders.
Not applicable.
Item 16: Controls and Procedures.
(a) Disclosure Controls and Procedures. The Principal Executive and Financial Officers concluded that the Registrant’s disclosure controls and procedures are effective based on their evaluation of the disclosure controls and procedures as of a date within 90 days of the filing date of this report.
(b) Internal Control Over Financial Reporting. In February 2024, a third-party service provider began performing security pricing services for the Registrant. There were no other changes in the Registrant’s internal control over financial reporting or in other factors that could significantly affect this control during the period covered by this report, including any corrective actions with regard to significant deficiencies and material weaknesses.
Item 17: Disclosure of Securities Lending Activities for Closed-End Management Investment Companies.
Not applicable.
Item 18: Recovery of Erroneously Awarded Compensation.
Not applicable.
Item 19: Exhibits.
Pursuant to the requirements of the Securities Exchange Act of 1934 and the Investment Company Act of 1940, the registrant has duly caused this report to be signed on its behalf by the undersigned, thereunto duly authorized.
| | |
| | VANGUARD CHARLOTTE FUNDS | |
| | |
| BY: | /s/ SALIM RAMJI* | |
| | SALIM RAMJI | |
| | CHIEF EXECUTIVE OFFICER | |
Date: December 23, 2024
Pursuant to the requirements of the Securities Exchange Act of 1934 and the Investment Company Act of 1940, this report has been signed below by the following persons on behalf of the registrant and in the capacities and on the dates indicated.
| | VANGUARD CHARLOTTE FUNDS | |
| | |
| BY: | /s/ SALIM RAMJI* | |
| | SALIM RAMJI | |
| | CHIEF EXECUTIVE OFFICER | |
Date: December 23, 2024
| | VANGUARD CHARLOTTE FUNDS | |
| | |
| BY: | /s/ CHRISTINE BUCHANAN* | |
| | CHRISTINE BUCHANAN | |
| | CHIEF FINANCIAL OFFICER | |
Date: December 23, 2024
John E. Schadl, pursuant to a Power of Attorney filed on December 20, 2024 (see File Number 33-49023) and a Power of Attorney filed on July 25, 2024 (see File Number 33-48863), each Incorporated by Reference.