 Citi 2016 Global Energy & Utilities Conference May 11, 2016 On May 11, 2016, Western Refining, Inc. (“Western”) made available on its website the following presentation, which it presented later that day at the Citi 2016 Global Energy & Utilities Conference. The same presentation will be presented by Western at the Morgan Stanley Refining Corporate Access Day on May 12, 2016. Filed by Western Refining, Inc. Pursuant to Rule 425 under the Securities Act of 1933 and deemed filed pursuant to Rule 14a-12 under the Securities Exchange Act of 1934 Subject Company: Northern Tier Energy LP Form S-4 File No.: 333-209031 |
 2 Cautionary Statements Important Notice to Investors This communication does not constitute an offer to sell or the solicitation of an offer to buy any securities or a solicitation of any vote or approval in any jurisdiction where such an offer or solicitation is unlawful. Any such offer will be made only by means of a prospectus meeting the requirements of Section 10 of the Securities Act of 1933, pursuant to a registration statement filed with the SEC. The proposed acquisition will be submitted to NTI's unitholders for their consideration. On January 19, 2016, Western filed a registration statement on Form S-4 with the SEC that included a preliminary prospectus of Western and a preliminary proxy statement of NTI. Western and NTI will also file other documents with the SEC regarding the proposed transaction, including a definitive prospectus and proxy statement. INVESTORS AND SECURITY HOLDERS OF NTI ARE URGED TO READ THE DEFINITIVE PROXY STATEMENT/PROSPECTUS AND ANY OTHER RELEVANT DOCUMENTS THAT WILL BE FILED WITH THE SEC CAREFULLY AND IN THEIR ENTIRETY WHEN THEY BECOME AVAILABLE BECAUSE THEY WILL CONTAIN IMPORTANT INFORMATION ABOUT THE PROPOSED TRANSACTION. Investors and security holders may obtain free copies of the definitive proxy statement/prospectus and other documents containing important information about Western and NTI once such documents are filed with the SEC through the website maintained by the SEC at www.sec.gov. Copies of the documents filed with the SEC by Western will be available free of charge on Western's website at www.wnr.com under the "Investor Relations" section or by contacting Western's Investor Relations Department at (602) 286-1530. Copies of the documents filed with the SEC by NTI will be available free of charge on NTI's website at www.northerntier.com under the "Investors" section or by contacting NTI's Investor Relations Department at (651) 769-6700. Participants in Solicitation Relating to the Merger Western, NTI and certain of their respective directors and executive officers may be deemed to be participants in the solicitation of proxies from the unitholders of NTI in connection with the proposed transaction. Information about the directors and executive officers of Western is set forth in the Proxy Statement on Schedule 14A for Western's 2016 annual meeting of shareholders, which was filed with the SEC on April 22, 2016. Information about the directors and executive officers of the general partner of NTI is set forth in the 2015 Annual Report on Form 10-K for NTI, which was filed with the SEC on February 26, 2016. These documents can be obtained free of charge from the sources indicated above. Other information regarding the participants in the proxy solicitation and a description of their direct and indirect interests, by security holdings or otherwise, will be contained in the proxy statement/prospectus and other relevant materials to be filed with the SEC when they become available. This presentation includes “forward-looking statements” by Western Refining, Inc. (“Western” or “WNR”) which are protected as forward-looking statements under the Private Securities Litigation Reform Act of 1995. The forward-looking statements reflect Western’s current expectations regarding future events, results or outcomes. Words such as “anticipate,” “assume,” “believe,” “budget,” “continue,” “could,” “estimate,” “expect,” “forecast,” “intend,” “may,” “plan,” “position,” “potential,” “predict,” “project,” “strategy,” “will,” “future” and similar terms and phrases are used to identify forward-looking statements. The forward-looking statements contained herein include statements related to, among other things: WNR’s attractive geographies with pipeline access to advantaged crude oil production and historically strong refined product regions; Western’s integrated distribution network including a fully integrated crude oil pipeline system to serve refineries, refined product distribution to wholesale end-user, and extensive retail network; growth opportunities for its refining and logistics growth platforms, including enhancements to refining profitability and expansion of logistics footprint; WNR’s capital allocation discipline, including reinvestment in its businesses to grow EBITDA / cash flows, ability to continue to grow dividends, and efficient capital structure; Western’s and Northern Tier Energy LP’s (“NTI”) plans and expectations with respect to a merger, including the anticipated timing for closing and financing of the merger; the anticipated benefits of the merger including a diversified asset base with pipeline access to advantaged crude oil combined with strong refined product regions, potential financial and operational synergies, a simplified organizational structure that facilitates easier-to-understand financial reporting and valuation of equity, flexibility for potential NTI logistics assets drop-downs to Western Refining Logistics, LP (“WNRL”), lower cost of capital, and more competitive acquisition currency; WNR’s access to attractive refined product outlets; WNR’s strong gross margin in comparison to its peers; growth opportunities at NTI’s St. Paul Park refinery, including organic projects such as the replacement of the crude unit desalters, modification to the crude unit/hydrotreater and solvent deasphalter and the anticipated capital expenditure and estimated EBITDA for such projects; potential WNR and NTI logistics asset sales to WNRL, including the estimated annual EBITDA from such sales, which may include the economics associated with crude oil throughput on the TexNew Mex pipeline above 13,000 bpd, the Bobcat crude oil pipeline, a proposed crude oil pipeline from Wink, Texas to Crane, Texas, the Jal/Wingate/Clearbrook crude oil and liquefied petroleum gas (“LPG”) storage and rail logistics facilities, and NTI traditional logistics assets including storage tanks, terminals, pipelines and trucking operations; WNR’s strong dividend growth and ability to continue to return cash to shareholders. These statements are subject to the risk that a merger between Western and NTI is not consummated at all, including due to the inability of Western or NTI to obtain all approvals necessary or the failure of other closing conditions, as well as to the general risks inherent in Western’s and NTI’s businesses and the merged company’s ability to compete in a highly competitive industry. Such expectations may or may not be realized and some expectations may be based upon assumptions or judgments that prove to be incorrect. In addition, Western’s business and operations involve numerous risks and uncertainties, many of which are beyond Western’s control, which could materially affect its financial condition, results of operations and cash flows and those of the merged company. Additional information relating to the uncertainties affecting Western’s businesses is contained in its filings with the Securities and Exchange Commission (the “SEC”). The forward-looking statements are only as of the date made, and Western does not undertake any obligation to (and each expressly disclaims any obligation to) update any forward-looking statements to reflect events or circumstances after the date such statements were made, or to reflect the occurrence of unanticipated events. |
 3 Investment Considerations Pipeline access to advantaged crude oil production Permian, Four Corners, Bakken and western Canada Historically strong refined product regions Attractive Geographies Fully integrated crude oil pipeline system to serve refineries Refined product distribution to wholesale end-user Extensive retail network Integrated Distribution Network Two growth platforms: Refining and Logistics Enhance refining profitability Expand logistics footprint Growth Opportunities Reinvest in business to grow EBITDA/ cash flow Shareholder friendly Dividends/ special dividends Share repurchase program Efficient capital structure Capital Allocation Discipline Pipeline access to advantaged crude oil production Permian, Four Corners, Bakken and western Canada Historically strong refined product regions Attractive Geographies Fully integrated crude oil pipeline system to serve refineries Refined product distribution to wholesale end-user Extensive retail network Integrated Distribution Network Two growth platforms: Refining and Logistics Enhance refining profitability Expand logistics footprint Growth Opportunities Reinvest in business to grow EBITDA/ cash flow Shareholder friendly Dividends/ special dividends Share repurchase program Efficient capital structure Capital Allocation Discipline |
 4 WNR/NTI Strategic Combination On December 21, 2015, WNR and Northern Tier Energy announced a merger on the following terms: On April 19th, WNR filed a second amendment to S-4 Registration Statement that is currently undergoing the customary SEC review. In connection with this amendment, Northern Tier established a special unitholder meeting date of June 23 rd , WNR anticipates closing shortly thereafter. Key benefits of the combination: Diversified asset base with pipeline access to advantaged crude oil combined with strong refined product regions $10+ million in identified potential financial/operational synergies Facilitates easier-to-understand financial reporting and valuation of equity Provides more flexibility around pace of NTI logistic asset drop-downs to WNRL Expected lower cost of capital and more competitive acquisition currency WNR Shares per NTI Unit 0.2986 WNR Price (Oct 23,2015) 44.68 $ Equity Value per NTI Unit 13.34 $ Cash per NTI Unit 15.00 $ Implied Consideration 28.34 $ Premium to NTI 20-day Undisturbed VWAP Price (10/23) 18% |
 5 Organizational Structure • $300 mm Revolving Credit Facility • $300 mm Senior Unsecured Notes due February 2023 Northern Tier Energy LLC Northern Tier Energy LLC Operating Subs Western Refining Logistics Operating Subs Western Refining Logistics, LP • $500 mm Revolving Credit Facility • $350 mm Senior Secured Notes due November 2020 Western Refining, Inc. Western Refining, Inc. Operating Subs • $900 mm Revolving Credit Facility • $538 mm Senior Secured Term Loan due November 2020 • $350 mm Senior Unsecured Notes due April 2021 Public Unitholders 38.3% Limited Partner Interest 100% of General Partner 66.4% Limited Partner Interest 100% of General Partner Public Unitholders Public Stockholders 33.6% LP Interest 61.7% LP Interest Northern Tier Holdings LLC WNRL Finance Corp. Note: Debt levels shown are at face value, excluding the netting effect of unamortized financing costs and premiums |
 6 Diversified Asset Base WNR/ WNRL Combined with NTI Refineries 2 3 Capacity (bpd) 156,000 253,800 Basin Exposure Permian, Four Corners Bakken, Canada, Permian, Four Corners Retail Stores ¹ 258 541 Pipelines (miles) ² 725 1,025 Storage (mm bbls) 8.2 12.0 1 Includes 114 NTI franchised SuperAmerica Stores. 2 NTI has a 17% interest in the Minnesota Pipeline. |
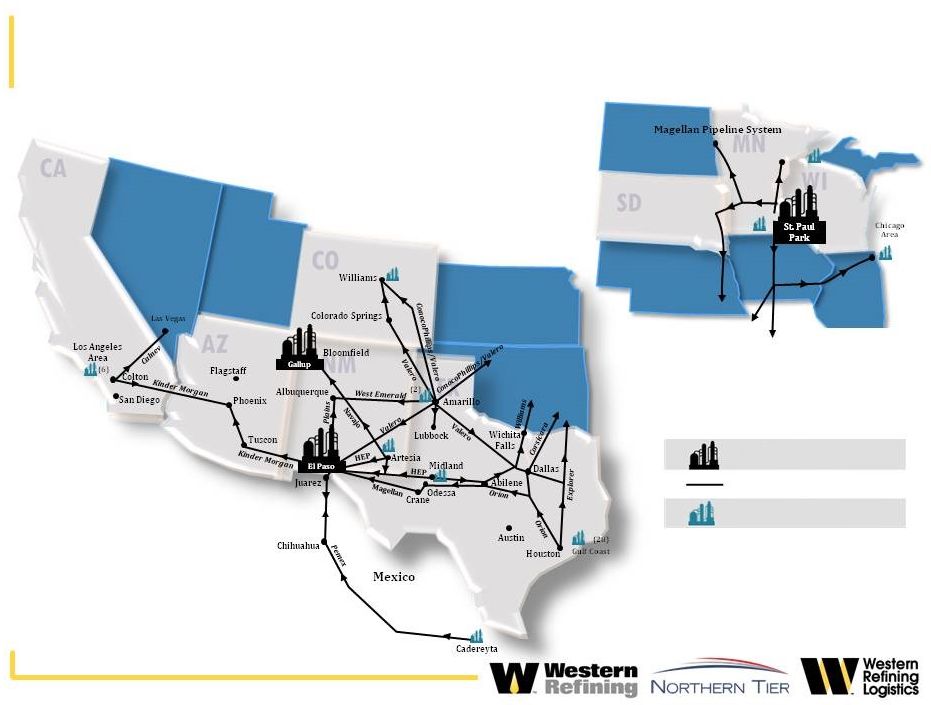 Attractive Refined Product Locations 7 WNR/NTI Refinery Third-Party Refinery Third party Product Pipeline |
 8 Independent Refineries Gross Margin Comparison Source: Company Filings Western and NTI have top quartile refineries FY 2015 Gross Margin Per Throughput Barrel Q1 2016 Gross Margin Per Throughput Barrel |
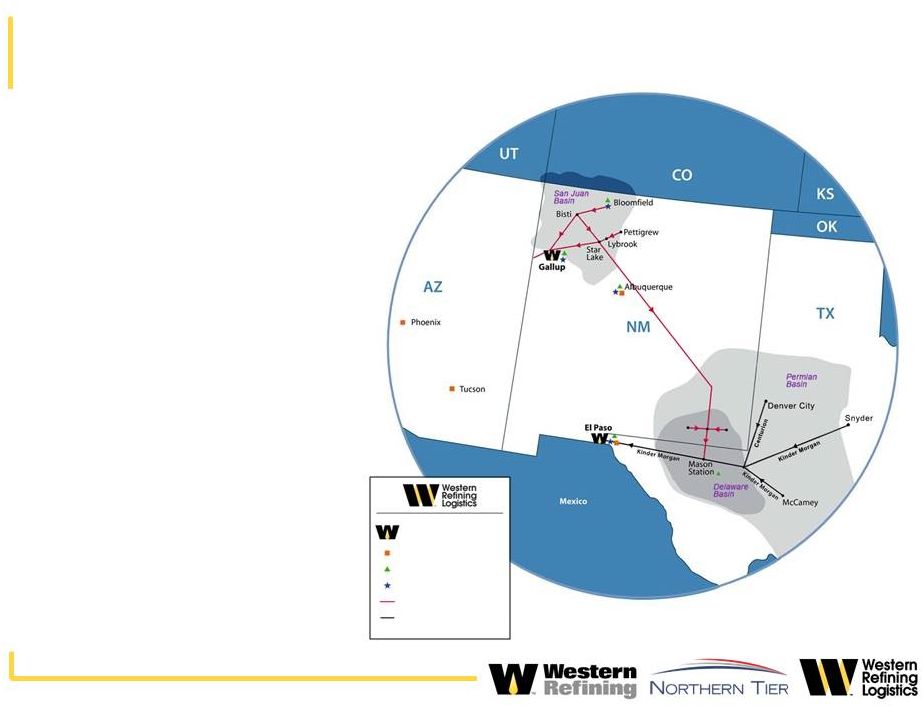 9 WNRL Asset Base WNR Refineries Asphalt Plant/Terminal Transportation & Storage Refined Products Terminal WNRL Pipelines Third Party Pipeline • 685 miles of pipelines and gathering systems in the Southwestern U.S. • 8.2 million barrels of active storage capacity for refined products, crude oil and other products • Four refined products terminals • Four fee-based asphalt terminalling facilities • Wholesale fuel / lubricant distribution • Crude oil trucking |
 10 Growth Opportunities Refinery Investments Project Capital ($ mm) Est EBITDA ($ mm) Replace Crude Unit Desalters $ 30 $ 22 Crude Unit/Hydrotreater Modification 19 10 Solvent Deasphalter 63 27 $ 112 $ 59 St. Paul Park organic projects -5 0 5 10 15 20 25 30 35 Jan-11 Jul-11 Jan-12 Jul-12 Jan-13 Jul-13 Jan-14 Jul-14 Jan-15 Jul-15 Jan-16 $/bbl Historic Incremental Crude Margins Syncrude & North Dakota Light Syncrude North Dakota Light Avg Syncrude Avg North Dakota Light |
 11 Growth Opportunities WNR/NTI Potential Logistics Sales to WNRL Project Description TexNew Mex Crude Oil Pipeline (WNR) Economics associated with crude oil throughput on TexNew Mex pipeline above 13,000 bpd (TexNew Mex Units) Bobcat Crude Oil Pipeline (WNR) 40 mile crude oil pipeline flowing from Mason Station, TX to Wink, TX plus two crude oil terminals Wink to Crane Crude Oil Pipeline (WNR) Proposed ~60 mile crude oil pipeline connecting Wink Jackrabbit Station to Crane, TX [Project deferred] Jal / Wingate / Clearbrook (WNR) Crude oil and LPG storage; rail logistics Northern Tier (Traditional Logistics) Storage tanks / Terminals / Pipelines / Trucking $100 - $125 mm annual EBITDA potential |
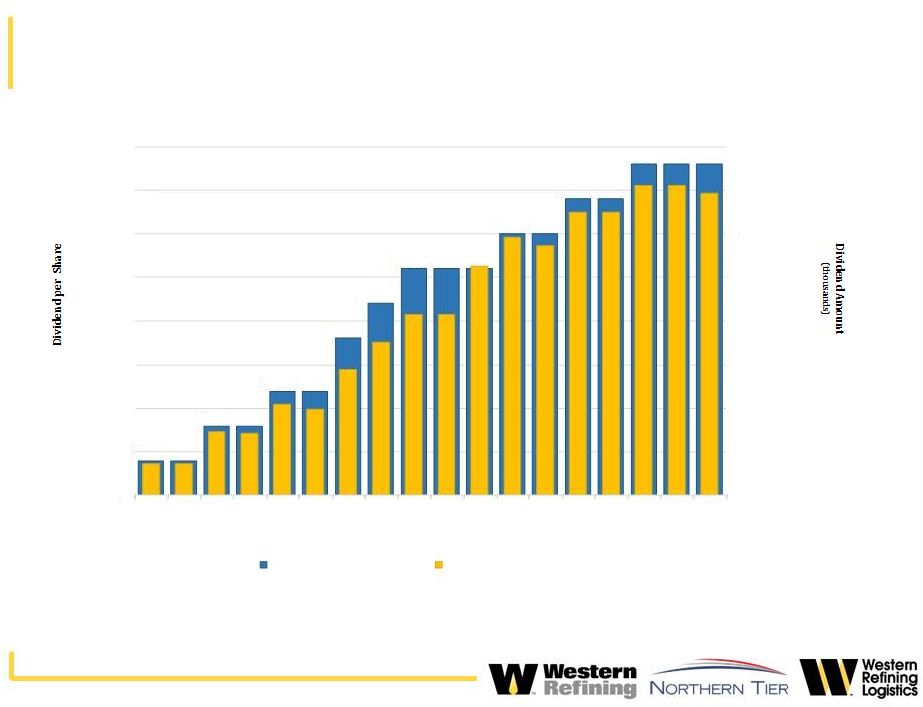 12 WNR Capital Allocation Discipline Strong Dividend Growth Note: Excludes one-time special dividends $0.04 $0.08 $0.12 $0.18 $0.22 $0.26 $0.30 $0.34 $0.38 $- $5,000 $10,000 $15,000 $20,000 $25,000 $30,000 $35,000 $40,000 $- $0.05 $0.10 $0.15 $0.20 $0.25 $0.30 $0.35 $0.40 Q1 '12 Q2 '12 Q3 '12 Q4 '12 Q1 '13 Q2 '13 Q3 '13 Q4 '13 Q1 '14 Q2 '14 Q3 '14 Q4 '14 Q1 '15 Q2 '15 Q3 '15 Q4 '15 Q1 '16 Q2 '16 Dividend per Share Dividend Amount (thousands) |
 13 WNR - Shareholder Friendly Return of Cash to Shareholders $1.2 billion returned to shareholders since 2013 1 Through May 6, 2016 $305 $553 $234 $145 $0 $100 $200 $300 $400 $500 $600 2013 2014 2015 Special Dividends Regular Dividends Share Repurchases 2016 1 |
 14 Investment Considerations Pipeline access to advantaged crude oil production Permian, Four Corners, Bakken and western Canada Historically strong refined product regions Attractive Geographies Fully integrated crude oil pipeline system to serve refineries Refined product distribution to wholesale end-user Extensive retail network Integrated Distribution Network Two growth platforms: Refining and Logistics Enhance refining profitability Expand logistics footprint Growth Opportunities Reinvest in business to grow EBITDA/ cash flow Shareholder friendly Dividends/ special dividends Share repurchase program Efficient capital structure Capital Allocation Discipline Pipeline access to advantaged crude oil production Permian, Four Corners, Bakken and western Canada Historically strong refined product regions Attractive Geographies Fully integrated crude oil pipeline system to serve refineries Refined product distribution to wholesale end-user Extensive retail network Integrated Distribution Network Two growth platforms: Refining and Logistics Enhance refining profitability Expand logistics footprint Growth Opportunities Reinvest in business to grow EBITDA/ cash flow Shareholder friendly Dividends/ special dividends Share repurchase program Efficient capital structure Capital Allocation Discipline |
 Appendix |
 16 WNR Consolidated Adjusted EBITDA Reconciliation Three Month Period Ending Twelve Months Ended (In thousands) Consolidated Western Refining, Inc. June 2015 Sep 2015 Dec 2015 Mar 2016 Mar 2016 Net income attributable to Western Refining, Inc. $ 133,919 $ 153,303 $ 13,545 $ 30,538 $ 331,305 Net income attributable to non-controlling interests 79,948 64,795 (6,047) 9,047 147,743 Interest and debt expense 27,316 26,896 26,434 26,681 107,327 Provision for income taxes 78,435 92,117 (6,034) 18,629 183,147 Depreciation and amortization 51,143 51,377 52,845 52,651 208,016 Maintenance turnaround expense 593 490 836 125 2,044 Loss (gain) on disposal of assets, net (387) (52) 208 (130 (361) Net change in lower of cost or market inventory reserve (38,204) 36,795 113,667 (51,734 60,524 Unrealized (gain) loss on commodity hedging transactions 22,287 (271) 8,160 12,483 42,659 Adjusted EBITDA $ 355,050 $ 425,450 $ 203,614 $ 98,290 $ 1,082,404 1 |
 17 WNR Standalone Adjusted EBITDA Reconciliation Three Month Period Ending Twelve Months Ended (In thousands) Jun-15 Sep-15 Dec-15 Mar-16 Mar-16 Net income attributable to Western Refining, Inc. $ 74,904 $ 102,279 $ 9,840 $ 18,010 $ 205,033 Net income attributable to non-controlling interest - - - - - Interest expense and other financing costs 14,321 13,960 14,310 13,879 56,470 Provision for income taxes 78,287 92,114 (5,727) 18,368 183,042 Depreciation and amortization 26,891 26,648 26,257 25,538 105,334 Maintenance turnaround expense 593 490 836 125 2,044 Loss (gain) on disposal of assets, net 69 (6) 176 (26) 213 Net change in lower of cost or market inventory reserve - - 40,689 (40,689) - Unrealized (gain) loss on commodity hedging transactions 22,795 (1,531) 3,024 16,271 40,559 Adjusted EBITDA 217,860 233,954 89,405 51,476 592,695 Distributions from WNRL 10,902 11,628 12,611 13,392 48,533 Distributions from NTI 38,472 42,391 37,047 13,537 131,447 Adjusted EBITDA plus distributions $ 267,234 $ 287,973 $ 139,063 $ 78,405 $ 772,675 1 See page 18 for definition of Adjusted EBITDA 1 |
 18 NTI Adjusted EBITDA Reconciliation 1 See page 18 for definition of Adjusted EBITDA 1 Three Month Period Ending Twelve Months Ended (In thousands) Jun-15 Sep-15 Dec-15 Mar-16 Mar-16 Net income attributable to Western Refining, Inc. $ 48,490 $ 40,117 $ (6,141) $ 3,224 $ 85,690 Net income attributable to non-controlling interest 74,558 59,209 (11,043) 4,344 127,068 Interest Expense 6,747 6,732 5,433 5,750 24,662 Income Tax Provision (Benefit) - - - - - Depreciation and Amortization 19,515 19,746 20,111 19,969 79,341 Maintenance turnaround expense - - - - - Loss on extinguishment of debt - - - - - Loss (gain) on disposal of assets, net (296) (33) 53 (5) (281) Net change in lower of cost or market inventory reserve (38,204) 36,795 72,978 (11,045) 60,524 Unrealized (gain) loss on commodity hedging transactions (508) 1,260 5,136 (3,788) 2,100 Adjusted EBITDA $ 110,302 $ 163,826 $ 86,527 $ 18,449 $ 379,104 |
 19 Adjusted EBITDA The tables on the previous pages reconcile net income to Adjusted EBITDA for the periods presented. Adjusted EBITDA represents earnings before interest and debt expense, provision for income taxes, depreciation, amortization, maintenance turnaround expense and certain other non-cash income and expense items. However, Adjusted EBITDA is not a recognized measurement under U.S. generally accepted accounting principles ("GAAP"). Our management believes that the presentation of Adjusted EBITDA is useful to investors because it is frequently used by securities analysts, investors and other interested parties in the evaluation of companies in our industry. In addition, our management believes that Adjusted EBITDA is useful in evaluating our operating performance compared to that of other companies in our industry because the calculation of Adjusted EBITDA generally eliminates the effects of financings, income taxes, the accounting effects of significant turnaround activities (that many of our competitors capitalize and thereby exclude from their measures of EBITDA) and certain non-cash charges that are items that may vary for different companies for reasons unrelated to overall operating performance. Adjusted EBITDA has limitations as an analytical tool, and you should not consider it in isolation, or as a substitute for analysis of our results as reported under GAAP. Some of these limitations are: • Adjusted EBITDA does not reflect our cash expenditures or future requirements for significant turnaround activities, capital expenditures or contractual commitments; • Adjusted EBITDA does not reflect the interest expense or the cash requirements necessary to service interest or principal payments on our debt; • Adjusted EBITDA does not reflect changes in, or cash requirements for, our working capital needs; and • Adjusted EBITDA, as we calculate it, may differ from the Adjusted EBITDA calculations of other companies in our industry, thereby limiting its usefulness as a comparative measure. Because of these limitations, Adjusted EBITDA should not be considered a measure of discretionary cash available to us to invest in the growth of our business. We compensate for these limitations by relying primarily on our GAAP results and using Adjusted EBITDA only supplementally. |
 20 WNRL EBITDA Reconciliation Three Month Period Ending Twelve Months Ended (In thousands) Jun-15 Sep-15 Dec-15 Mar-16 Mar-16 Net income attributable to Western Refining, Inc. $ 10,525 $ 10,907 $ 9,846 $ 9,304 $ 40,582 Net income attributable to non-controlling interest 5,390 5,586 4,996 4,703 20,675 Interest expense and other financing costs 6,248 6,204 6,691 7,052 26,195 Provision for income taxes 148 3 (307) 261 105 Depreciation and amortization 4,737 4,983 6,477 7,144 23,341 Loss (gain) on disposal of assets, net (160) (13) (21) (99) (293) EBITDA 1 $ 27,670 $ 27,682 $ 28,365 $ 110,605 1 See page 20 for definition of EBITDA $ 26,888 |
 21 EBITDA We define EBITDA as earnings before interest and debt expense, provision for income taxes and depreciation and amortization. We define Distributable Cash Flow as EBITDA plus the change in deferred revenues, less debt interest accruals, income taxes paid, maintenance capital expenditures and distributions declared on our TexNew Mex units. EBITDA has limitations as an analytical tool, and you should not consider it in isolation, or as a substitute for analysis of our results as reported under GAAP. Some of these limitations are: • EBITDA does not reflect our cash expenditures or future requirements for capital expenditures or contractual commitments; • EBITDA does not reflect the interest expense or the cash requirements necessary to service interest or principal payments on our debt; • EBITDA does not reflect changes in, or cash requirements for, our working capital needs; and • EBITDA, as we calculate it, may differ from the EBITDA calculations of our affiliates or other companies in our industry, thereby limiting its usefulness as a comparative measure. EBITDA and Distributable Cash Flow are used as supplemental financial measures by management and by external users of our financial statements, such as investors and commercial banks, to assess: • our operating performance as compared to those of other companies in the midstream energy industry, without regard to financial methods, historical cost basis or capital structure; • the ability of our assets to generate sufficient cash to make distributions to our unitholders; • our ability to incur and service debt and fund capital expenditures; and • the viability of acquisitions and other capital expenditure projects and the returns on investment of various investment opportunities. Distributable Cash Flow is also a quantitative standard used by the investment community with respect to publicly traded partnerships because the value of a partnership unit is, in part, measured by its yield. Yield is based on the amount of cash distributions a partnership can pay to a unitholder. We believe that the presentation of these non-GAAP measures provides useful information to investors in assessing our financial condition and results of operations. The GAAP measure most directly comparable to EBITDA and Distributable Cash Flow is net income attributable to limited partners. These non-GAAP measures should not be considered as alternatives to net income or any other measure of financial performance presented in accordance with GAAP. EBITDA excludes some, but not all, items that affect net income attributable to limited partners. These non- GAAP measures may vary from those of other companies. As a result, EBITDA and Distributable Cash Flow as presented herein may not be comparable to similarly titled measures of other companies. |