UNITED STATES
SECURITIES AND EXCHANGE COMMISSION
Washington, DC 20549
FORMN-CSRS
CERTIFIED SHAREHOLDER REPORT OF REGISTERED MANAGEMENT INVESTMENT
COMPANIES
Investment Company Act file number 811-22641
Franklin Alternative Strategies Funds
(Exact name of registrant as specified in charter)
One Franklin Parkway, San Mateo, CA 94403-1906
(Address of principal executive offices) (Zip code)
Craig S. Tyle, One Franklin Parkway, San Mateo, CA 94403-1906
(Name and address of agent for service)
Registrant’s telephone number, including area code:650312-2000
Date of fiscal year end:5/31
Date of reporting period:11/30/19
Item 1. Reports to Stockholders.
SEMIANNUAL REPORT AND SHAREHOLDER LETTER
FRANKLIN K2 ALTERNATIVE STRATEGIES FUND
A Series of Franklin Alternative Strategies Funds
November 30, 2019


Sign up for electronic delivery at franklintempleton.com/edelivery
Internet Delivery of Fund Reports Unless You Request Paper Copies: Effective January 1, 2021, as permitted by the SEC, paper copies of the Fund’s shareholder reports will no longer be sent by mail, unless you specifically request them from the Fund or your financial intermediary. Instead, the reports will be made available on a website, and you will be notified by mail each time a report is posted and provided with a website link to access the report.
If you already elected to receive shareholder reports electronically, you will not be affected by this change and you need not take any action. If you have not signed up for electronic delivery, we would encourage you to join fellow shareholders who have. You may elect to receive shareholder reports and other communications electronically from the Fund by calling(800) 632-2301 or by contacting your financial intermediary.
You may elect to continue to receive paper copies of all your future shareholder reports free of charge by contacting your financial intermediary or, if you invest directly with a Fund, calling(800) 632-2301 to let the Fund know of your request. Your election to receive reports in paper will apply to all funds held in your account.
FRANKLIN TEMPLETON
Successful investing begins with ambition. And achievement only comes when you reach for it. That’s why we continually strive to deliver better outcomes for investors. No matter what your goals are, our deep, global investment expertise allows us to offer solutions that can help.
During our more than 70 years of experience, we’ve managed through all kinds of markets—up, down and those in between. We’re always preparing for what may come next. It’s because of this, combined with our strength as one of the world’s largest asset managers that we’ve earned the trust of millions of investors around the world.
Dear Fellow Shareholder:
During the six months ended November 30, 2019, global markets benefited from upbeat economic data in certain regions, encouraging corporate earnings reports, generally accommodative monetary policies by major central banks and periods of optimism about a potential U.S.-China trade agreement. However, global markets also reflected investor concerns about ongoing U.S. trade disputes with China and other trading partners, political uncertainties in the U.S. and the European Union, and slower global economic growth. In this environment, global developed market stocks, as measured by the MSCI World Index, posted a +13.21% total return for the period.1 Global emerging market stocks, as measured by the MSCI Emerging Markets Index, posted a +6.13% total return.1 Global government bonds, as measured by the FTSE World Government Bond Index, posted a +2.55% total return.1
We are committed to our long-term perspective and disciplined investment approach as we conduct a rigorous analysis of Fund subadvisors and markets with a strong emphasis on investment risk management.
We believe active, professional investment management serves investors well. We also recognize the important role of financial advisors in today’s markets and encourage investors to continue to seek their advice. Amid changing markets and economic conditions, we are confident investors with a well-diversified portfolio and a patient, long-term outlook should be well positioned for the years ahead.
CFA® is a trademark owned by CFA Institute.
1. Source: Morningstar.
See www.franklintempletondatasources.com for additional data provider information.
On the following pages, the Fund’s portfolio management team reviews investment decisions that pertain to performance during the past six months in light of the economic environment and other factors. Please remember all securities markets fluctuate, as do mutual fund share prices.
We thank you for investing with Franklin Templeton, welcome your questions and comments, and look forward to continuing to serve your investment needs in the future.
Sincerely,

Madison S. Gulley, CFA
President and Chief Executive Officer –
Investment Management
Franklin Alternative Strategies Funds
This letter reflects our analysis and opinions as of November 30, 2019, unless otherwise indicated. The information is not a complete analysis of every aspect of any market, country, industry, security or fund. Statements of fact are from sources considered reliable.
| | | | | | | | |
| Not FDIC Insured | | | | | May Lose Value | | | | | No Bank Guarantee |
| | | | | | |
| | | |
| franklintempleton.com | | Not part of the semiannual report | | | 1 | |
| | | | | | |
| | | |
| | 2 | | | Semiannual Report | | franklintempleton.com |
Visitfranklintempleton.comfor fund updates, to access your account, or to find helpful financial planning tools.
SEMIANNUAL REPORT
Franklin K2 Alternative Strategies Fund
This semiannual report for Franklin K2 Alternative Strategies Fund covers the period ended November 30, 2019.
Your Fund’s Goal and Main Investments
The Fund seeks capital appreciation with lower volatility relative to the broad equity markets. The Fund seeks to achieve its investment goal by allocating its assets across multiple non-traditional or alternative strategies, including, but not limited to, some or all of the following strategies: long short equity, relative value, event driven and global macro. The Fund is structured as a multi-manager fund, meaning the Fund’s assets are independently managed by multiple subadvisors, while the Fund’s investment manager retains overall responsibility for the Fund’s investments. The Fund may invest in a wide range of securities and other investments including, but not limited to: equity securities including common stocks, preferred stocks, convertible securities, rights and warrants, private and registered investment vehicles and exchange-traded funds (ETFs); debt securities including bonds, notes, debentures, banker’s acceptances and commercial paper; loans and loan participations; and mortgage-backed or other asset-backed securities, including collateralized debt obligations; as well as derivatives, commodities and currencies.
Performance Overview
The Fund’s Class A shares posted a +1.95% cumulative total return for the six months under review. For comparison, the Fund’s primary benchmark, the HFRX Global Hedge Fund Index, which is designed to be representative of the overall composition of the hedge fund universe, posted a +4.63% total return for the same period.1 Also for comparison, the Fund’s secondary benchmark, the ICE BofAML U.S.3-Month Treasury Bill Index, which tracks the performance of short-term U.S. government securities with a remaining term to final maturity of less than three months, posted a +1.10% total return for the same period.2You can find more of the Fund’s performance data in the Performance Summary beginning on page 7.
Performance data represent past performance, which does not guarantee future results. Investment return and principal value will fluctuate, and you may have a gain or loss when you sell your shares. Current performance may differ from figures shown. For most recentmonth-end performance, go tofranklintempleton.comorcall(800)342-5236.
Economic and Market Overview
The global economy expanded during the six months ended November 30, 2019, despite weakness in Europe and Asia. Global stocks were aided by upbeat economic data in some regions, encouraging corporate earnings reports, periods of optimism about a potential U.S.-China trade deal and monetary policy easing by major central banks.
However, markets also reflected concerns about political uncertainties in the U.S. (including the impeachment inquiry into President Donald Trump), geopolitical tensions in certain regions, and the impact of U.S. trade disputes with China and other trading partners on global growth and corporate earnings. Overall, global developed and emerging market stocks, as measured by the MSCI All Country World Index, posted a +12.37% total return, slightly lower than the +13.21% total return for global developed market stocks, as measured by the MSCI World Index, for the six months under review.2
The U.S. economy expanded during the six months ended November 30, 2019. After moderating in 2019’s second quarter, the economy grew faster in the third quarter, aided by consumer spending, housing investment, government spending and exports. The manufacturing sector expanded at the start of the period, but contracted during the last four months, while the services sector expanded throughout the period. The unemployment rate decreased slightly from 3.6% in May 2019 to 3.5% atperiod-end.3 The annual inflation rate, as measured by the Consumer Price Index, increased from 1.8% in May 2019 to 2.1% atperiod-end.3
At its July 2019 meeting, the U.S. Federal Reserve (Fed) lowered its target range for the federal funds rate for the first time since December 2008, to 2.00%–2.25%, citing muted inflation pressures and the potential effects of global trade
1. Source: FactSet. Hedge Fund Research, Inc. – www.hedgefundresearch.com. The HFRX Global Hedge Fund Index is being used under license from Hedge Fund Research, Inc., which does not endorse or approve of any of the contents of this report.
2. Source: Morningstar.
The indexes are unmanaged and include reinvestment of any income or distributions. They do not reflect any fees, expenses or sales charges. One cannot invest directly in an index, and an index is not representative of the Fund’s portfolio. Unlike most asset class indexes, HFR Index returns reflect fees and expenses.
3. Source: U.S. Bureau of Labor Statistics.
See www.franklintempletondatasources.com for additional data provider information.
The dollar value, number of shares or principal amount, and names of all portfolio holdings are listed in the Fund’s Consolidated Statement of Investments (SOI). The Consolidated SOI begins on page 15.
| | | | | | |
| | | |
| franklintempleton.com | | Semiannual Report | | | 3 | |
FRANKLIN K2 ALTERNATIVE STRATEGIES FUND
tensions on economic growth. Furthermore, the Fed ended its balance sheet normalization program earlier than previously indicated. The Fed further lowered the federal funds target rate range by 0.25% at its September and October meetings, to 1.50%–1.75%, reiterating the rationale cited at the July meeting.
In Europe, the U.K.’s quarter-on-quarter gross domestic product (GDP) growth contracted in 2019’s second quarter but recovered in the third quarter. The Bank of England kept its key policy rate unchanged during thesix-month period and lowered its GDP forecasts for 2019 and 2020, amid Brexit uncertainties. The eurozone’s quarter-on-quarter GDP growth moderated in 2019’s second quarter and remained stable in the third quarter. The bloc’s annual inflation rate ended the period lower. The European Central Bank (ECB) kept its benchmark interest rate unchanged during the period. In November, the ECB resumed its asset purchase program in an effort to boost the economy.
In developed Asia, Japan’s quarter-on-quarter GDP growth moderated in 2019’s second and third quarters. The Bank of Japan left its benchmark interest rate unchanged and continued its stimulus measures during the review period.
In larger emerging markets, Brazil’s quarter-on-quarter GDP growth accelerated in 2019’s second and third quarters. The Central Bank of Brazil lowered its benchmark interest rate three times during the period. Russia’s annual GDP growth accelerated in 2019’s second and third quarters. The Bank of Russia cut its key interest rate four times during the period. China’s annual GDP growth moderated in 2019’s second and third quarters. The People’s Bank of China implemented an interest-rate reform in August, designating the loan prime rate as the new benchmark for household and business loans, effectively lowering interest rates several times during the period. Overall, global emerging market stocks, as measured by the MSCI Emerging Markets Index, posted a +6.13% total return for the six months under review.2
Investment Strategy
We manage the Fund using a multi-manager approach. While we are responsible for the Fund’s overall investments, we allocate assets to multiple subadvisors, each of whom independently manages a separate portion of the Fund’s portfolio in accordance with some or all of the following strategies: long short equity, relative value, event driven and global macro. We allocate the Fund’s assets among these strategies utilizing atop-down approach, generating the Fund’s strategy weightings by taking into account market conditions, risk factors, diversification, liquidity, transparency, and availability of various subadvisors and other investment
options, among other things. We allocate the Fund’s assets to specific subadvisors utilizing abottom-up approach, selecting subadvisors and their weighting within the Fund’s portfolio by taking into account their correlations to various markets and to each other, their risk profiles and their return expectations. Long short equity strategies generally seek to produce returns from investments in the equity markets by taking long and short positions in stocks and stock indexes (through the use of derivatives or through a position in an ETF). Relative value strategies encompass a wide range of investment techniques that are intended to profit from pricing inefficiencies. Event driven strategies generally invest in securities of companies undergoing significant corporate events. Global macro strategies generally focus on broad-based economic opportunities across numerous markets and investments. In addition, the debt securities in which the Fund may invest may have variable or fixed interest rates, may be of any maturity or credit rating, and may include sovereign debt, high yield (“junk”) bonds and distressed debt securities (securities of companies that are, or are about to be, involved in reorganizations, financial restructurings, or
bankruptcy) and securities that are in default.
The Fund may take long and/or short positions in a wide range of asset classes, including equities, fixed income, commodities and currencies, among others. Long positions benefit from an increase in the price of the underlying instrument or asset class, while short positions benefit from a decrease in that price. The Fund may use derivatives for hedging andnon-hedging (investment) purposes, although no subadvisor is required to hedge any of the Fund’s positions or to use derivatives. Such derivative investments may include futures contracts, swaps, options and currency forward contracts. As a result of the Fund’s use of derivatives, the Fund may have economic leverage, which means the sum of the Fund’s investment exposures through its use of derivatives may significantly exceed the amount of assets invested in the Fund, although these exposures may vary over time. The Fund may engage in active and frequent trading as part of its investment strategies.
What is a futures contract?
A futures contract is an agreement between the Fund and a counterparty made through a U.S. or foreign futures exchange to buy or sell an underlying instrument or asset at a specific price on a future date.
| | | | |
| | | |
| 4 | | Semiannual Report | | franklintempleton.com |
FRANKLIN K2 ALTERNATIVE STRATEGIES FUND
What are swap agreements?
Swap agreements, such as interest rate, currency and credit default swaps, are contracts between the Fund and another party (the swap counterparty). In a basic swap transaction, the Fund agrees with the swap counterparty to exchange the returns (or differentials in rates of return) earned or realized on a particular “notional amount” of underlying instruments. The notional amount is the set amount selected by the parties as the basis on which to calculate the obligations that they have agreed to exchange. The parties typically do not actually exchange the notional amount. Instead, they agree to exchange the returns that would be earned or realized if the notional amount were invested in given instruments or at given interest rates.
What is an option?
An option is a contract to buy or sell a specific financial product known as the option’s underlying instrument at a specific price. The buyer of an option has the right, but not the obligation, to buy or sell the underlying instrument at or until a specified expiration date. Conversely, the seller (“writer”) of an option who opens a transaction is obligated to buy or sell the underlying instrument should the option holder exercise that right.
What is a currency forward contract?
A currency forward contract is an agreement between the Fund and a counterparty to buy or sell a foreign currency in exchange for another currency at a specific exchange rate on a future date. Currency forward contracts are privately traded in the interbank market, not on a centralized exchange.
| | | | | | | | |
| Strategy Allocation* | |
|
| Based on Total Net Assets as of 11/30/19 | |
| | |
| Strategy | | Long
Positions | | | Short
Positions | |
Long Short Equity | | | 34.36% | | | | -18.29% | |
Relative Value | | | 24.18% | | | | -5.14% | |
Event Driven | | | 20.39% | | | | -7.97% | |
Global Macro | | | 136.50% | | | | -37.46% | |
Risk Overlay | | | 0.00% | | | | -13.74% | |
| | |
| Total | | | 215.43% | | | | -82.60% | |
*Figures include the effect of gross notional exposure of derivatives.
| | | | |
| Subadvisors | | | |
| |
| 11/30/19 | | | |
| |
| Long Short Equity | | | | |
| |
Chilton Investment Company, LLC | | | | |
| |
Impala Asset Management LLC | | | | |
| |
Jennison Associates, LLC | | | | |
| |
Portland Hill Asset Management Limited | | | | |
| |
Wellington Management Company, LLP | | | | |
| |
| Relative Value | | | | |
| |
Apollo Credit Management LLC | | | | |
| |
Chatham Asset Management, LLC | | | | |
| |
Ellington Global Asset Management, LLC | | | | |
| |
Lazard Asset Management, LLC | | | | |
| |
Loomis Sayles & Company, L.P. | | | | |
| |
| Event Driven | | | | |
| |
Bardin Hill Arbitrage IC Management LP | | | | |
| |
P. Schoenfeld Asset Management L.P. | | | | |
| |
| Global Macro | | | | |
| |
Emso Asset Management Limited | | | | |
| |
Graham Capital Management, L.P. | | | | |
| |
Grantham, Mayo, Van Otterloo & Co. LLC | | | | |
| |
H2O AM LLP | | | | |
Manager’s Discussion
During the six months under review, all of the four underlying strategies in which we allocated assets, long short equity, relative value, event driven and global macro, contributed to the Fund’s positive performance. The allocation percentages for each strategy are listed in the Strategy Allocation table on this page. A conditional risk overlay (CRO), implemented for part of the review period to help mitigate downside risk, detracted from Fund results for thesix-month period. The CRO was active atperiod-end.
What is the conditional risk overlay (CRO) strategy?
From time to time, the Fund’s investment manager may implement its CRO strategy, which seeks to neutralize certain market sensitivities that may exist in the Fund. The CRO strategy involves investing in derivatives or other instruments in an effort to reduce volatility and provide a hedge against market declines. When implemented, the strategy will reduce the Fund’s ability to benefit from positive market movements.
The Fund’s long short equity strategy subadvisors were Chilton Investment, Impala Asset Management, Jennison Associates, Portland Hill Asset Management and Wellington Management. All five subadvisors contributed to gains for the period, led by Portland Hill and Chilton. All asset classes represented in the strategy made positive contributions, led by equity exposures. In terms of sector exposures, industrials,
| | | | | | |
| | | |
| franklintempleton.com | | Semiannual Report | | | 5 | |
FRANKLIN K2 ALTERNATIVE STRATEGIES FUND
consumer discretionary, health care and information technology (IT) contributed to returns. In contrast, equity index hedges had a negative impact on performance.
The Fund allocated assets to two new relative value strategy subadvisors—Ellington Global Asset Management, which invests in structured and corporate credit markets, and Apollo Credit Management, which seeks to take advantage of market volatility, inefficiencies and liquidity premiums. Both subadvisors have managed similar fixed income-focused sleeves of Franklin K2 Long Short Credit Fund since 2015. The Fund’s other relative value strategy subadvisors were Chatham Asset Management, Lazard Asset Management and Loomis Sayles & Company. Lazard was the key contributor to the strategy’s positive performance, and four of the five subadvisors lifted returns. Loomis’ slight decline was the only exception. On a sector level, IT, consumer discretionary and industrials benefited returns. In contrast, health care and energy detracted from strategy performance.
The Fund’s event driven strategy subadvisors were Bardin Hill Arbitrage IC Management and P. Schoenfeld Asset Management. Both subadvisors benefited performance. One of the positions that contributed to positive returns was a German utilities provider, which traded higher as the company continued to sell businesses that do not fit into its new renewable energy-focused business plan. In contrast, a global pharmaceutical company traded lower, although there were no significant company news, dampening performance.
The Fund’s global macro strategy subadvisors were Emso Asset Management; Graham Capital Management; Grantham, Mayo, Van Otterloo & Co. (GMO); and H2O AM. Three of the four subadvisors posted gains for thesix-month period, led by Graham and H2O. In contrast, GMO experienced a slight decline and was the only detractor from strategy performance. By asset class,interest-rate derivatives, equity and credit contributed to positive performance, while commodities and currency exposures weakened returns. In terms of sector exposure, contributors included long exposures to European interest-rate derivatives and long exposures to European equity indexes. Conversely, long exposures to emerging market sovereign debt (particularly in Argentina) hindered performance.
Thank you for your participation in Franklin K2 Alternative Strategies Fund. We look forward to continuing to serve your investment needs.
| | |
 | | 
Brooks Ritchey Co-Lead Portfolio Manager |
| | |
 | | 
Robert Christian Co-Lead Portfolio Manager |
| | |
 | | 
Anthony Zanolla, CFA Portfolio Manager |
The foregoing information reflects our analysis, opinions and portfolio holdings as of November 30, 2019, the end of the reporting period. The way we implement our main investment strategies and the resulting portfolio holdings may change depending on factors such as market and economic conditions. These opinions may not be relied upon as investment advice or an offer for a particular security. The information is not a complete analysis of every aspect of any market, country, industry, security or the Fund. Statements of fact are from sources considered reliable, but the investment manager makes no representation or warranty as to their completeness or accuracy. Although historical performance is no guarantee of future results, these insights may help you understand our investment management philosophy.
| | | | |
| | | |
| 6 | | Semiannual Report | | franklintempleton.com |
FRANKLIN K2 ALTERNATIVE STRATEGIES FUND
Performance Summary as of November 30, 2019
The performance table does not reflect any taxes that a shareholder would pay on Fund dividends, capital gain distributions, if any, or any realized gains on the sale of Fund shares. Total return reflects reinvestment of the Fund’s dividends and capital gain distributions, if any, and any unrealized gains or losses. Your dividend income will vary depending on dividends or interest paid by securities in the Fund’s portfolio, adjusted for operating expenses of each class. Capital gain distributions are net profits realized from the sale of portfolio securities.
Performance as of 11/30/191
Cumulative total return excludes sales charges. Average annual total return includes maximum sales charges. Sales charges will vary depending on the size of the investment and the class of share purchased. The maximum is 5.50% and the minimum is 0%.Class A: 5.50% maximum initial sales charge;Advisor Class: no sales charges. For other share classes, visit franklintempleton.com.
| | | | | | | | |
| | |
| Share Class | | Cumulative
Total Return2 | | | Average Annual
Total Return3 | |
| | |
| A4 | | | | | | | | |
6-Month | | | +1.95% | | | | -3.69% | |
1-Year | | | +4.33% | | | | -1.43% | |
5-Year | | | +12.28% | | | | +1.18% | |
Since Inception (10/11/13) | | | +23.09% | | | | +2.50% | |
| | |
| Advisor | | | | | | | | |
6-Month | | | +2.13% | | | | +2.13% | |
1-Year | | | +4.50% | | | | +4.50% | |
5-Year | | | +13.71% | | | | +2.60% | |
Since Inception (10/11/13) | | | +25.00% | | | | +3.70% | |
Performance data represent past performance, which does not guarantee future results. Investment return and principal value will fluctuate, and you may have a gain or loss when you sell your shares. Current performance may differ from figures shown. For most recentmonth-end performance, go tofranklintempleton.comor call(800)342-5236.
See page 8 for Performance Summary footnotes.
| | | | | | |
| | | |
| franklintempleton.com | | Semiannual Report | | | 7 | |
FRANKLIN K2 ALTERNATIVE STRATEGIES FUND
PERFORMANCE SUMMARY
Total Annual Operating Expenses5
| | | | | | | | |
| | |
| Share Class | | With Fee
Waiver | | | Without Fee
Waiver | |
A | | | 2.59% | | | | 2.79% | |
Advisor | | | 2.34% | | | | 2.54% | |
Each class of shares is available to certain eligible investors and has different annual fees and expenses, as described in the prospectus.
All investments involve risks, including possible loss of principal. The market values of securities owned by the Fund will go up or down, sometimes rapidly or unpredictably. The Fund’s performance depends on the manager’s skill in selecting, overseeing and allocating Fund assets to the subadvisors. The Fund is actively managed and could experience losses if the investment manager’s and subadvisors’ judgment about particular investments made for the Fund’s portfolio prove to be incorrect. Some subadvisors may have little or no experience managing the assets of a registered investment company. Foreign investments are subject to greater investment risk such as political, economic, credit and information risks as well as risk of currency fluctuations. Investments in derivatives involve costs and create economic leverage, which may result in significant volatility and cause the Fund to participate in losses (as well as gains) that significantly exceed the Fund’s initial investment. Lower-rated or high-yield debt securities involve greater credit risk, including the possibility of default or bankruptcy. Currency management strategies could result in losses to the Fund if currencies do not perform as the investment manager or subadvisor expects. The Fund may make short sales of securities, which involves the risk that losses may exceed the original amount invested. Merger arbitrage investments risk loss if a proposed reorganization in which the Fund invests is renegotiated or terminated. Liquidity risk exists when securities have become more difficult to sell, or are unable to be sold, at the price at which they have been valued. The Fund’s prospectus also includes a description of the main investment risks.
1. The Fund has an expense reduction contractually guaranteed through 9/30/20 and a fee waiver related to the management fee paid by a subsidiary. Fund investment results reflect the expense reduction and fee waiver; without these reductions, the results would have been lower.
2. Cumulative total return represents the change in value of an investment over the periods indicated.
3. Average annual total return represents the average annual change in value of an investment over the periods indicated. Return for less than one year, if any, has not been annualized.
4. Prior to 9/10/18, these shares were offered at a higher initial sales charge of 5.75%, thus actual returns (with sales charges) would have differed. Average annual total returns (with sales charges) have been restated to reflect the current maximum initial sales charge of 5.50%.
5. Figures are as stated in the Fund’s current prospectus and may differ from the expense ratios disclosed in the Your Fund’s Expenses and Consolidated Financial Highlights sections in this report. In periods of market volatility, assets may decline significantly, causing total annual Fund operating expenses to become higher than the figures shown.
| | | | |
| | | |
| 8 | | Semiannual Report | | franklintempleton.com |
FRANKLIN K2 ALTERNATIVE STRATEGIES FUND
Your Fund’s Expenses
As a Fund shareholder, you can incur two types of costs: (1) transaction costs, including sales charges (loads) on Fund purchases and redemptions; and (2) ongoing Fund costs, including management fees, distribution and service(12b-1) fees, and other Fund expenses. All mutual funds have ongoing costs, sometimes referred to as operating expenses. The table below shows ongoing costs of investing in the Fund and can help you understand these costs and compare them with those of other mutual funds. The table assumes a $1,000 investment held for the six months indicated.
Actual Fund Expenses
The table below provides information about actual account values and actual expenses in the columns under the heading “Actual.” In these columns the Fund’s actual return, which includes the effect of Fund expenses, is used to calculate the “Ending Account Value” for each class of shares. You can estimate the expenses you paid during the period by following these steps (of course, your account value and expenses will differ from those in this illustration): Divide your account value by $1,000 (if your account had an $8,600 value, then $8,600÷ $1,000 = 8.6). Then multiply the result by the number in the row for your class of shares under the headings “Actual” and “Expenses Paid During Period” (if Actual Expenses Paid During Period were $7.50, then 8.6 x $7.50 =$64.50). In this illustration, the actual expenses paid this period are $64.50.
Hypothetical Example for Comparison with Other Funds
Under the heading “Hypothetical” in the table, information is provided about hypothetical account values and hypothetical expenses based on the Fund’s actual expense ratio and an assumed rate of return of 5% per year before expenses, which is not the Fund’s actual return. This information may not be used to estimate the actual ending account balance or expenses you paid for the period, but it can help you compare ongoing costs of investing in the Fund with those of other funds. To do so, compare this 5% hypothetical example for the class of shares you hold with the 5% hypothetical examples that appear in the shareholder reports of other funds.
Please note that expenses shown in the table are meant to highlight ongoing costs and do not reflect any transactional costs. Therefore, information under the heading “Hypothetical” is useful in comparing ongoing costs only, and will not help you compare total costs of owning different funds. In addition, if transactional costs were included, your total costs would have been higher.
| | | | | | | | | | | | | | | | | | | | | | | | |
| | | | |
| | | | | | Actual
(actual return after expenses) | | | Hypothetical
(5% annual return before expenses) | | | | |
Share
Class | | Beginning
Account
Value 6/1/19 | | | Ending
Account
Value 11/30/19 | | | Expenses
Paid During
Period
6/1/19–11/30/191,2 | | | Ending
Account
Value 11/30/19 | | | Expenses
Paid During
Period
6/1/19–11/30/191,2 | | | Net
Annualized
Expense
Ratio2 | |
| A | | $ | 1,000 | | | $ | 1,020.40 | | | $ | 11.82 | | | $ | 1,013.30 | | | $ | 11.78 | | | | 2.34 | % |
| C | | $ | 1,000 | | | $ | 1,016.30 | | | $ | 15.58 | | | $ | 1,009.55 | | | $ | 15.52 | | | | 3.09 | % |
| R | | $ | 1,000 | | | $ | 1,018.60 | | | $ | 13.07 | | | $ | 1,012.05 | | | $ | 13.03 | | | | 2.59 | % |
| R6 | | $ | 1,000 | | | $ | 1,022.00 | | | $ | 10.16 | | | $ | 1,014.95 | | | $ | 10.13 | | | | 2.01 | % |
| Advisor | | $ | 1,000 | | | $ | 1,022.10 | | | $ | 10.57 | | | $ | 1,014.55 | | | $ | 10.53 | | | | 2.09 | % |
1. Expenses are equal to the annualized expense ratio for thesix-month period as indicated above—in the far right column—multiplied by the simple average account value over the period indicated, and then multiplied by 183/366 to reflect theone-half year period.
2. Reflects expenses after fee waivers and expense reimbursements. Does not include acquired fund fees and expenses.
| | | | | | |
| | | |
| franklintempleton.com | | Semiannual Report | | | 9 | |
FRANKLIN ALTERNATIVE STRATEGIES FUNDS
Consolidated Financial Highlights
Franklin K2 Alternative Strategies Fund
| | | | | | | | | | | | | | | | | | | | | | | | |
| | | Six Months Ended
November 30, 2019
(unaudited) | | | Year Ended May 31, | |
| | | 2019 | | | 2018 | | | 2017 | | | 2016 | | | 2015 | |
| | | | | | |
| Class A | | | | | | | | | | | | | | | | | | | | | | | | |
Per share operating performance
(for a share outstanding throughout the period) | | | | | | | | | | | | | | | | | | | | | | | | |
| | | | | | |
Net asset value, beginning of period | | $ | 11.28 | | | $ | 11.38 | | | $ | 11.14 | | | $ | 10.55 | | | $ | 11.16 | | | $ | 10.64 | |
| | | | |
| | | | | | |
| Income from investment operationsa: | | | | | | | | | | | | | | | | | | | | | | | | |
| | | | | | |
Net investment income (loss)b | | | (— | )c | | | 0.04 | | | | 0.01 | | | | 0.03 | | | | (0.05 | ) | | | (0.11 | ) |
| | | | | | |
Net realized and unrealized gains (losses) | | | 0.22 | | | | 0.11 | | | | 0.38 | | | | 0.61 | | | | (0.38 | ) | | | 0.70 | |
| | | | |
| | | | | | |
Total from investment operations | | | 0.22 | | | | 0.15 | | | | 0.39 | | | | 0.64 | | | | (0.43 | ) | | | 0.59 | |
| | | | |
| | | | | | |
| Less distributions from: | | | | | | | | | | | | | | | | | | | | | | | | |
| | | | | | |
Net investment income | | | — | | | | — | | | | (0.15 | ) | | | (0.05 | ) | | | (0.14 | ) | | | (0.07 | ) |
| | | | | | |
Net realized gains | | | — | | | | (0.25 | ) | | | — | | | | — | | | | (0.04 | ) | | | — | |
| | | | |
| | | | | | |
Total distributions | | | — | | | | (0.25 | ) | | | (0.15 | ) | | | (0.05 | ) | | | (0.18 | ) | | | (0.07 | ) |
| | | | |
| | | | | | |
Net asset value, end of period | | $ | 11.50 | | | $ | 11.28 | | | $ | 11.38 | | | $ | 11.14 | | | $ | 10.55 | | | $ | 11.16 | |
| | | | |
| | | | | | |
Total returnd | | | 1.95% | | | | 1.35% | | | | 3.57% | | | | 6.07% | | | | (3.89)% | | | | 5.53% | |
| | | | | | |
| Ratios to average net assetse | | | | | | | | | | | | | | | | | | | | | | | | |
| | | | | | |
Expenses before waiver, payments by affiliates and expense reductionf | | | 2.50% | | | | 2.73% | | | | 2.81% | | | | 3.07% | | | | 3.22% | | | | 3.40% | |
| | | | | | |
Expenses net of waiver, payments by affiliates and expense reductionf | | | 2.34% | 9 | | | 2.56% | | | | 2.59% | | | | 2.73% | | | | 2.88% | g | | | 2.99% | g |
| | | | | | |
Expenses incurred in connection with securities sold short | | | 0.14% | | | | 0.36% | | | | 0.39% | | | | 0.53% | | | | 0.67% | | | | 0.65% | |
| | | | | | |
Net investment income (loss) | | | (0.07)% | | | | 0.36% | | | | 0.06% | | | | 0.10% | | | | (0.44)% | | | | (0.95)% | |
| | | | | | |
| Supplemental data | | | | | | | | | | | | | | | | | | | | | | | | |
| | | | | | |
Net assets, end of period (000’s) | | | $105,112 | | | | $104,452 | | | | $119,214 | | | | $119,385 | | | | $177,412 | | | | $148,991 | |
| | | | | | |
Portfolio turnover rate | | | 126.17% | | | | 235.47% | | | | 234.77% | | | | 209.45% | | | | 229.90% | | | | 295.81% | |
aThe amount shown for a share outstanding throughout the period may not correlate with the Consolidated Statement of Operations for the period due to the timing of sales and repurchases of the Fund’s shares in relation to income earned and/or fluctuating fair value of the investments of the Fund.
bBased on average daily shares outstanding.
cAmount rounds to less than $0.01 per share.
dTotal return does not reflect sales commissions or contingent deferred sales charges, if applicable, and is not annualized for periods less than one year.
eRatios are annualized for periods less than one year.
fIncludes dividend and/or interest expense on securities sold short and security borrowing fees, if any. See below for the ratios of such expenses to average net assets for the periods presented. See Note 1(i).
gBenefit of expense reduction rounds to less than 0.01%.
| | | | |
| | | |
| 10 | | Semiannual Report | The accompanying notes are an integral part of these consolidated financial statements. | | franklintempleton.com |
FRANKLIN ALTERNATIVE STRATEGIES FUNDS
CONSOLIDATED FINANCIAL HIGHLIGHTS
Franklin K2 Alternative Strategies Fund(continued)
| | | | | | | | | | | | | | | | | | | | | | | | |
| | | Six Months Ended
November 30, 2019
(unaudited) | | | Year Ended May 31, | |
| | | 2019 | | | 2018 | | | 2017 | | | 2016 | | | 2015 | |
| | | | | | |
| Class C | | | | | | | | | | | | | | | | | | | | | | | | |
Per share operating performance
(for a share outstanding throughout the period) | | | | | | | | | | | | | | | | | | | | | | | | |
| | | | | | |
Net asset value, beginning of period | | $ | 11.05 | | | $ | 11.25 | | | $ | 11.00 | | | $ | 10.45 | | | $ | 11.09 | | | $ | 10.60 | |
| | | | |
| | | | | | |
| Income from investment operationsa: | | | | | | | | | | | | | | | | | | | | | | | | |
| | | | | | |
Net investment income (loss)b | | | (0.05 | ) | | | (0.05 | ) | | | (0.08 | ) | | | (0.04 | ) | | | (0.12 | ) | | | (0.17 | ) |
| | | | | | |
Net realized and unrealized gains (losses) | | | 0.23 | | | | 0.10 | | | | 0.39 | | | | 0.59 | | | | (0.39 | ) | | | 0.69 | |
| | | | |
| | | | | | |
Total from investment operations | | | 0.18 | | | | 0.05 | | | | 0.31 | | | | 0.55 | | | | (0.51 | ) | | | 0.52 | |
| | | | |
| | | | | | |
| Less distributions from: | | | | | | | | | | | | | | | | | | | | | | | | |
| | | | | | |
Net investment income | | | — | | | | — | | | | (0.06 | )�� | | | — | | | | (0.09 | ) | | | (0.03 | ) |
| | | | | | |
Net realized gains | | | — | | | | (0.25 | ) | | | — | | | | — | | | | (0.04 | ) | | | — | |
| | | | |
| | | | | | |
Total distributions | | | — | | | | (0.25 | ) | | | (0.06 | ) | | | — | | | | (0.13 | ) | | | (0.03 | ) |
| | | | |
| | | | | | |
Net asset value, end of period | | $ | 11.23 | | | $ | 11.05 | | | $ | 11.25 | | | $ | 11.00 | | | $ | 10.45 | | | $ | 11.09 | |
| | | | |
| | | | | | |
Total returnc | | | 1.63% | | | | 0.56% | | | | 2.82% | | | | 5.26% | | | | (4.62)% | | | | 4.87% | |
| | | | | | |
| Ratios to average net assetsd | | | | | | | | | | | | | | | | | | | | | | | | |
| | | | | | |
Expenses before waiver, payments by affiliates and expense reductione | | | 3.25% | | | | 3.48% | | | | 3.56% | | | | 3.79% | | | | 3.96% | | | | 4.04% | |
| | | | | | |
Expenses net of waiver, payments by affiliates and expense reductione | | | 3.09% | f | | | 3.31% | | | | 3.34% | | | | 3.45% | | | | 3.62% | f | | | 3.63% | f |
| | | | | | |
Expenses incurred in connection with securities sold short | | | 0.14% | | | | 0.36% | | | | 0.39% | | | | 0.53% | | | | 0.67% | | | | 0.65% | |
| | | | | | |
Net investment income (loss) | | | (0.82)% | | | | (0.39)% | | | | (0.69)% | | | | (0.62)% | | | | (1.18)% | | | | (1.59)% | |
| | | | | | |
| Supplemental data | | | | | | | | | | | | | | | | | | | | | | | | |
| | | | | | |
Net assets, end of period (000’s) | | | $41,576 | | | | $44,897 | | | | $53,196 | | | | $55,496 | | | | $71,154 | | | | $37,937 | |
| | | | | | |
Portfolio turnover rate | | | 126.17% | | | | 235.47% | | | | 234.77% | | | | 209.45% | | | | 229.90% | | | | 295.81% | |
aThe amount shown for a share outstanding throughout the period may not correlate with the Consolidated Statement of Operations for the period due to the timing of sales and repurchases of the Fund’s shares in relation to income earned and/or fluctuating fair value of the investments of the Fund.
bBased on average daily shares outstanding.
cTotal return does not reflect sales commissions or contingent deferred sales charges, if applicable, and is not annualized for periods less than one year.
dRatios are annualized for periods less than one year.
eIncludes dividend and/or interest expense on securities sold short and security borrowing fees, if any. See below for the ratios of such expenses to average net assets for the periods presented. See Note 1(i).
fBenefit of expense reduction rounds to less than 0.01%.
| | | | | | |
| | | |
| franklintempleton.com | | The accompanying notes are an integral part of these consolidated financial statements. | Semiannual Report | | | 11 | |
FRANKLIN ALTERNATIVE STRATEGIES FUNDS
CONSOLIDATED FINANCIAL HIGHLIGHTS
Franklin K2 Alternative Strategies Fund(continued)
| | | | | | | | | | | | | | | | | | | | | | | | |
| | | Six Months Ended
November 30, 2019
(unaudited) | | | Year Ended May 31, | |
| | | 2019 | | | 2018 | | | 2017 | | | 2016 | | | 2015 | |
| | | | | | |
| Class R | | | | | | | | | | | | | | | | | | | | | | | | |
Per share operating performance
(for a share outstanding throughout the period) | | | | | | | | | | | | | | | | | | | | | | | | |
| | | | | | |
Net asset value, beginning of period | | $ | 11.28 | | | $ | 11.42 | | | $ | 11.17 | | | $ | 10.61 | | | $ | 11.15 | | | $ | 10.62 | |
| | | | |
| | | | | | |
| Income from investment operationsa: | | | | | | | | | | | | | | | | | | | | | | | | |
| | | | | | |
Net investment income (loss)b | | | (0.02 | ) | | | 0.02 | | | | (0.02 | ) | | | (0.25 | ) | | | (0.10 | ) | | | (0.16 | ) |
| | | | | | |
Net realized and unrealized gains (losses) | | | 0.23 | | | | 0.09 | | | | 0.39 | | | | 0.86 | | | | (0.40 | ) | | | 0.73 | |
| | | | |
| | | | | | |
Total from investment operations | | | 0.21 | | | | 0.11 | | | | 0.37 | | | | 0.61 | | | | (0.50 | ) | | | 0.57 | |
| | | | |
| | | | | | |
| Less distributions from: | | | | | | | | | | | | | | | | | | | | | | | | |
| | | | | | |
Net investment income | | | — | | | | — | | | | (0.12 | ) | | | (0.05 | ) | | | — | | | | (0.04 | ) |
| | | | | | |
Net realized gains | | | — | | | | (0.25 | ) | | | — | | | | — | | | | (0.04 | ) | | | — | |
| | | | |
| | | | | | |
Total distributions | | | — | | | | (0.25 | ) | | | (0.12 | ) | | | (0.05 | ) | | | (0.04 | ) | | | (0.04 | ) |
| | | | |
| | | | | | |
Net asset value, end of period | | $ | 11.49 | | | $ | 11.28 | | | $ | 11.42 | | | $ | 11.17 | | | $ | 10.61 | | | $ | 11.15 | |
| | | | |
| | | | | | |
Total returnc | | | 1.86% | | | | 1.08% | | | | 3.28% | | | | 5.79% | | | | (4.51)% | | | | 5.39% | |
| | | | | | |
| Ratios to average net assetsd | | | | | | | | | | | | | | | | | | | | | | | | |
| | | | | | |
Expenses before waiver, payments by affiliates and expense reductione | | | 2.75% | | | | 2.98% | | | | 3.06% | | | | 3.32% | | | | 3.46% | | | | 3.57% | |
| | | | | | |
Expenses net of waiver, payments by affiliates and expense reductione | | | 2.59% | f | | | 2.81% | | | | 2.84% | | | | 2.98% | | | | 3.12% | f | | | 3.16% | f |
| | | | | | |
Expenses incurred in connection with securities sold short | | | 0.14% | | | | 0.36% | | | | 0.39% | | | | 0.53% | | | | 0.67% | | | | 0.65% | |
| | | | | | |
Net investment income (loss) | | | (0.32)% | | | | 0.11% | | | | (0.19)% | | | | (0.15)% | | | | (0.68)% | | | | (1.12)% | |
| | | | | | |
| Supplemental data | | | | | | | | | | | | | | | | | | | | | | | | |
| | | | | | |
Net assets, end of period (000’s) | | | $956 | | | | $844 | | | | $648 | | | | $597 | | | | $341 | | | | $9,173 | |
| | | | | | |
Portfolio turnover rate | | | 126.17% | | | | 235.47% | | | | 234.77% | | | | 209.45% | | | | 229.90% | | | | 295.81% | |
aThe amount shown for a share outstanding throughout the period may not correlate with the Consolidated Statement of Operations for the period due to the timing of sales and repurchases of the Fund’s shares in relation to income earned and/or fluctuating fair value of the investments of the Fund.
bBased on average daily shares outstanding.
cTotal return is not annualized for periods less than one year.
dRatios are annualized for periods less than one year.
eIncludes dividend and/or interest expense on securities sold short and security borrowing fees, if any. See below for the ratios of such expenses to average net assets for the periods presented. See Note 1(i).
fBenefit of expense reduction rounds to less than 0.01%.
| | | | |
| | | |
| 12 | | Semiannual Report | The accompanying notes are an integral part of these consolidated financial statements. | | franklintempleton.com |
FRANKLIN ALTERNATIVE STRATEGIES FUNDS
CONSOLIDATED FINANCIAL HIGHLIGHTS
Franklin K2 Alternative Strategies Fund(continued)
| | | | | | | | | | | | | | | | | | | | | | | | |
| | | Six Months Ended
November 30, 2019
(unaudited) | | | Year Ended May 31, | |
| | | 2019 | | | 2018 | | | 2017 | | | 2016 | | | 2015 | |
| | | | | | |
| Class R6 | | | | | | | | | | | | | | | | | | | | | | | | |
Per share operating performance
(for a share outstanding throughout the period) | | | | | | | | | | | | | | | | | | | | | | | | |
| | | | | | |
Net asset value, beginning of period | | $ | 11.34 | | | $ | 11.41 | | | $ | 11.17 | | | $ | 10.59 | | | $ | 11.18 | | | $ | 10.66 | |
| | | | |
| | | | | | |
| Income from investment operationsa: | | | | | | | | | | | | | | | | | | | | | | | | |
| | | | | | |
Net investment income (loss)b | | | 0.02 | | | | 0.08 | | | | 0.03 | | | | 0.02 | | | | (0.01 | ) | | | (0.08 | ) |
| | | | | | |
Net realized and unrealized gains (losses) | | | 0.23 | | | | 0.10 | | | | 0.40 | | | | 0.65 | | | | (0.37 | ) | | | 0.70 | |
| | | | |
| | | | | | |
Total from investment operations | | | 0.25 | | | | 0.18 | | | | 0.43 | | | | 0.67 | | | | (0.38 | ) | | | 0.62 | |
| | | | |
| | | | | | |
| Less distributions from: | | | | | | | | | | | | | | | | | | | | | | | | |
| | | | | | |
Net investment income | | | — | | | | — | | | | (0.19 | ) | | | (0.09 | ) | | | (0.17 | ) | | | (0.10 | ) |
| | | | | | |
Net realized gains | | | — | | | | (0.25 | ) | | | — | | | | — | | | | (0.04 | ) | | | — | |
| | | | |
| | | | | | |
Total distributions | | | — | | | | (0.25 | ) | | | (0.19 | ) | | | (0.09 | ) | | | (0.21 | ) | | | (0.10 | ) |
| | | | |
| | | | | | |
Net asset value, end of period | | $ | 11.59 | | | $ | 11.34 | | | $ | 11.41 | | | $ | 11.17 | | | $ | 10.59 | | | $ | 11.18 | |
| | | | |
| | | | | | |
Total returnc | | | 2.20% | | | | 1.70% | | | | 3.83% | | | | 6.40% | | | | (3.45)% | | | | 5.80% | |
| | | | | | |
| Ratios to average net assetsd | | | | | | | | | | | | | | | | | | | | | | | | |
| | | | | | |
Expenses before waiver, payments by affiliates and expense reductione | | | 2.17% | | | | 2.41% | | | | 2.46% | | | | 2.73% | | | | 2.87% | | | | 2.98% | |
| | | | | | |
Expenses net of waiver, payments by affiliates and expense reductione | | | 2.01% | f | | | 2.23% | | | | 2.24% | | | | 2.39% | | | | 2.53% | f | | | 2.60% | f |
| | | | | | |
Expenses incurred in connection with securities sold short | | | 0.14% | | | | 0.36% | | | | 0.39% | | | | 0.53% | | | | 0.67% | | | | 0.65% | |
| | | | | | |
Net investment income (loss) | | | 0.26% | | | | 0.69% | | | | 0.41% | | | | 0.44% | | | | (0.09)% | | | | (0.56)% | |
| | | | | | |
| Supplemental data | | | | | | | | | | | | | | | | | | | | | | | | |
| | | | | | |
Net assets, end of period (000’s) | | | $41,930 | | | | $42,842 | | | | $31,805 | | | | $265,247 | | | | $265,517 | | | | $239,754 | |
| | | | | | |
Portfolio turnover rate | | | 126.17% | | | | 235.47% | | | | 234.77% | | | | 209.45% | | | | 229.90% | | | | 295.81% | |
aThe amount shown for a share outstanding throughout the period may not correlate with the Consolidated Statement of Operations for the period due to the timing of sales and repurchases of the Fund’s shares in relation to income earned and/or fluctuating fair value of the investments of the Fund.
bBased on average daily shares outstanding.
cTotal return is not annualized for periods less than one year.
dRatios are annualized for periods less than one year.
eIncludes dividend and/or interest expense on securities sold short and security borrowing fees, if any. See below for the ratios of such expenses to average net assets for the periods presented. See Note 1(i).
fBenefit of expense reduction rounds to less than 0.01%.
| | | | | | |
| | | |
| franklintempleton.com | | The accompanying notes are an integral part of these consolidated financial statements. | Semiannual Report | | | 13 | |
FRANKLIN ALTERNATIVE STRATEGIES FUNDS
CONSOLIDATED FINANCIAL HIGHLIGHTS
Franklin K2 Alternative Strategies Fund(continued)
| | | | | | | | | | | | | | | | | | | | | | | | |
| | | Six Months Ended
November 30, 2019
(unaudited) | | | Year Ended May 31, | |
| | | 2019 | | | 2018 | | | 2017 | | | 2016 | | | 2015 | |
| | | | | | |
| Advisor Class | | | | | | | | | | | | | | | | | | | | | | | | |
Per share operating performance
(for a share outstanding throughout the period) | | | | | | | | | | | | | | | | | | | | | | | | |
| | | | | | |
Net asset value, beginning of period | | $ | 11.33 | | | $ | 11.40 | | | $ | 11.16 | | | $ | 10.58 | | | $ | 11.18 | | | $ | 10.65 | |
| | | | |
| | | | | | |
| Income from investment operationsa: | | | | | | | | | | | | | | | | | | | | | | | | |
| | | | | | |
Net investment income (loss)b | | | 0.01 | | | | 0.07 | | | | 0.04 | | | | 0.04 | | | | (0.02 | ) | | | (0.02 | ) |
| | | | | | |
Net realized and unrealized gains (losses) | | | 0.23 | | | | 0.11 | | | | 0.38 | | | | 0.62 | | | | (0.38 | ) | | | 0.64 | |
| | | | |
| | | | | | |
Total from investment operations | | | 0.24 | | | | 0.18 | | | | 0.42 | | | | 0.66 | | | | (0.40 | ) | | | 0.62 | |
| | | | |
| | | | | | |
| Less distributions from: | | | | | | | | | | | | | | | | | | | | | | | | |
| | | | | | |
Net investment income | | | — | | | | — | | | | (0.18 | ) | | | (0.08 | ) | | | (0.16 | ) | | | (0.09 | ) |
| | | | | | |
Net realized gains | | | — | | | | (0.25 | ) | | | — | | | | — | | | | (0.04 | ) | | | — | |
| | | | |
| | | | | | |
Total distributions | | | — | | | | (0.25 | ) | | | (0.18 | ) | | | (0.08 | ) | | | (0.20 | ) | | | (0.09 | ) |
| | | | |
| | | | | | |
Net asset value, end of period | | $ | 11.57 | | | $ | 11.33 | | | $ | 11.40 | | | $ | 11.16 | | | $ | 10.58 | | | $ | 11.18 | |
| | | | |
| | | | | | |
Total returnc | | | 2.13% | | | | 1.61% | | | | 3.75% | | | | 6.29% | | | | (3.58)% | | | | 5.88% | |
| | | | | | |
| Ratios to average net assetsd | | | | | | | | | | | | | | | | | | | | | | | | |
| | | | | | |
Expenses before waiver, payments by affiliates and expense reductione | | | 2.25% | | | | 2.48% | | | | 2.56% | | | | 2.82% | | | | 2.96% | | | | 3.07% | |
| | | | | | |
Expenses net of waiver, payments by affiliates and expense reductione | | | 2.09% | f | | | 2.31% | | | | 2.34% | | | | 2.48% | | | | 2.62% | f | | | 2.66% | f |
| | | | | | |
Expenses incurred in connection with securities sold short | | | 0.14% | | | | 0.36% | | | | 0.39% | | | | 0.53% | | | | 0.67% | | | | 0.65% | |
| | | | | | |
Net investment income (loss) | | | 0.18% | | | | 0.61% | | | | 0.31% | | | | 0.35% | | | | (0.18)% | | | | (0.62)% | |
| | | | | | |
| Supplemental data | | | | | | | | | | | | | �� | | | | | | | | | | | |
| | | | | | |
Net assets, end of period (000’s) | | | $1,091,953 | | | | $1,046,252 | | | | $896,278 | | | | $674,828 | | | | $722,216 | | | | $329,139 | |
| | | | | | |
Portfolio turnover rate | | | 126.17% | | | | 235.47% | | | | 234.77% | | | | 209.45% | | | | 229.90% | | | | 295.81% | |
aThe amount shown for a share outstanding throughout the period may not correlate with the Consolidated Statement of Operations for the period due to the timing of sales and repurchases of the Fund’s shares in relation to income earned and/or fluctuating fair value of the investments of the Fund.
bBased on average daily shares outstanding.
cTotal return is not annualized for periods less than one year.
dRatios are annualized for periods less than one year.
eIncludes dividend and/or interest expense on securities sold short and security borrowing fees, if any. See below for the ratios of such expenses to average net assets for the periods presented. See Note 1(i).
fBenefit of expense reduction rounds to less than 0.01%.
| | | | |
| | | |
| 14 | | Semiannual Report | The accompanying notes are an integral part of these consolidated financial statements. | | franklintempleton.com |
FRANKLIN ALTERNATIVE STRATEGIES FUNDS
Consolidated Statement of Investments, November 30, 2019 (unaudited)
Franklin K2 Alternative Strategies Fund
| | | | | | | | | | | | | | | | | | |
| | | | | |
| | | | | Country | | | Shares/
Rights | | | | | | Value | |
| | | Common Stocks and Other Equity Interests 39.5% | | | |
| | | Aerospace & Defense 1.1% | |
| a | | The Boeing Co. | | | United States | | | | 7,043 | | | | | | | $ | 2,579,006 | |
| a | | General Dynamics Corp. | | | United States | | | | 23,244 | | | | | | | | 4,224,364 | |
| a | | Heico Corp. | | | United States | | | | 23,807 | | | | | | | | 3,092,291 | |
| | L3harris Technologies Inc. | | | United States | | | | 5,063 | | | | | | | | 1,018,119 | |
| | Lockheed Martin Corp. | | | United States | | | | 32 | | | | | | | | 12,513 | |
| | United Technologies Corp. | | | United States | | | | 19,505 | | | | | | | | 2,893,372 | |
| | | | | | | | | | | | | | | | | | |
| | | | | | | | | | | | | | | | | 13,819,665 | |
| | | | | | | | | | | | | | | | | | |
| | | Air Freight & Logistics 0.5% | |
| | DSV Panalpina A/S | | | Denmark | | | | 47,688 | | | | | | | | 5,192,521 | |
| | United Parcel Service Inc., B | | | United States | | | | 6,806 | | | | | | | | 814,882 | |
| | | | | | | | | | | | | | | | | | |
| | | | | | | | | | | | | | | | | 6,007,403 | |
| | | | | | | | | | | | | | | | | | |
| | | Airlines 0.7% | |
| | Delta Air Lines Inc. | | | United States | | | | 25,039 | | | | | | | | 1,434,985 | |
| | WestJet Airlines Ltd. | | | Canada | | | | 328,199 | | | | | | | | 7,506,351 | |
| | | | | | | | | | | | | | | | | | |
| | | | | | | | | | | | | | | | | 8,941,336 | |
| | | | | | | | | | | | | | | | | | |
| | | Auto Components 0.2% | |
| | Freni Brembo SpA | | | Italy | | | | 87,092 | | | | | | | | 1,078,563 | |
| | Lear Corp. | | | United States | | | | 13,068 | | | | | | | | 1,572,211 | |
| | | | | | | | | | | | | | | | | | |
| | | | | | | | | | | | | | | | | 2,650,774 | |
| | | | | | | | | | | | | | | | | | |
| | | Banks 0.8% | |
| a | | Bank of America Corp. | | | United States | | | | 115,746 | | | | | | | | 3,856,657 | |
| | Barclays PLC | | | United Kingdom | | | | 108,406 | | | | | | | | 240,500 | |
| | Citigroup Inc. | | | United States | | | | 177 | | | | | | | | 13,296 | |
| a | | JPMorgan Chase & Co. | | | United States | | | | 26,522 | | | | | | | | 3,494,539 | |
| | SunTrust Banks Inc. | | | United States | | | | 39,931 | | | | | | | | 2,828,712 | |
| | | | | | | | | | | | | | | | | | |
| | | | | | | | | | | | | | | | | 10,433,704 | |
| | | | | | | | | | | | | | | | | | |
| | | Beverages 0.3% | |
| | Davide Campari-Milano SpA | | | Italy | | | | 320,814 | | | | | | | | 2,928,509 | |
| | Remy Cointreau SA | | | France | | | | 7,857 | | | | | | | | 1,011,980 | |
| | | | | | | | | | | | | | | | | | |
| | | | | | | | | | | | | | | | | 3,940,489 | |
| | | | | | | | | | | | | | | | | | |
| | | Biotechnology 2.4% | |
| b | | AbbVie Inc. | | | United States | | | | 165 | | | | | | | | 14,475 | |
| c | | Acadia Pharmaceuticals Inc. | | | United States | | | | 4,333 | | | | | | | | 196,242 | |
| c | | Agios Pharmaceuticals Inc. | | | United States | | | | 13,547 | | | | | | | | 526,978 | |
| c,d,e | | Alder Biopharmaceuticals Inc., rts., 2/20/49 | | | United States | | | | 50,624 | | | | | | | | 44,549 | |
| c | | Alexion Pharmaceuticals Inc. | | | United States | | | | 8,965 | | | | | | | | 1,021,472 | |
| | Amgen Inc. | | | United States | | | | 60 | | | | | | | | 14,083 | |
| c | | Amicus Therapeutics Inc. | | | United States | | | | 103,605 | | | | | | | | 1,085,780 | |
| c | | Apellis Pharmaceuticals Inc. | | | United States | | | | 27,790 | | | | | | | | 746,995 | |
| c,e | | Argenx SE, ADR | | | Netherlands | | | | 5,586 | | | | | | | | 827,007 | |
| c | | Assembly Biosciences Inc. | | | United States | | | | 54,198 | | | | | | | | 879,092 | |
| c | | BioMarin Pharmaceutical Inc. | | | United States | | | | 36,574 | | | | | | | | 2,951,888 | |
| c | | Cytokinetics Inc. | | | United States | | | | 14,108 | | | | | | | | 136,424 | |
| c | | DBV Technologies SA, ADR | | | France | | | | 13,159 | | | | | | | | 102,640 | |
| c | | Exact Sciences Corp. | | | United States | | | | 19,058 | | | | | | | | 1,543,889 | |
| c | | Fate Therapeutics Inc. | | | United States | | | | 30,784 | | | | | | | | 480,846 | |
| | Gilead Sciences Inc. | | | United States | | | | 188 | | | | | | | | 12,641 | |
| c | | Gossamer Bio Inc. | | | United States | | | | 16,762 | | | | | | | | 427,431 | |
| c | | Immunomedics Inc. | | | United States | | | | 66,092 | | | | | | | | 1,241,208 | |
| c,f | | Innovent Biologics Inc., 144A | | | China | | | | 50,260 | | | | | | | | 175,918 | |
| c,e | | Intercept Pharmaceuticals Inc. | | | United States | | | | 3,125 | | | | | | | | 338,656 | |
| c | | Invitae Corp. | | | United States | | | | 8,635 | | | | | | | | 171,836 | |
| | | | | | |
| | | |
| franklintempleton.com | | Semiannual Report | | | 15 | |
FRANKLIN ALTERNATIVE STRATEGIES FUNDS
CONSOLIDATED STATEMENT OF INVESTMENTS (UNAUDITED)
Franklin K2 Alternative Strategies Fund(continued)
| | | | | | | | | | | | | | | | | | |
| | | | | |
| | | | | Country | | | Shares/
Rights | | | | | | Value | |
| | | Common Stocks and Other Equity Interests (continued) | | | |
| | | Biotechnology (continued) | |
| c | | Madrigal Pharmaceuticals Inc. | | | United States | | | | 4,719 | | | | | | | $ | 522,346 | |
| c | | The Medicines Co. | | | United States | | | | 14,779 | | | | | | | | 1,244,392 | |
| c | | Mirati Therapeutics Inc. | | | United States | | | | 9,129 | | | | | | | | 919,929 | |
| c | | Natera Inc. | | | United States | | | | 45,411 | | | | | | | | 1,657,047 | |
| c | | Neurocrine Biosciences Inc. | | | United States | | | | 6,407 | | | | | | | | 747,120 | |
| c | | Precision Biosciences Inc. | | | United States | | | | 15,877 | | | | | | | | 282,134 | |
| c | | Principia Biopharma Inc. | | | United States | | | | 5,914 | | | | | | | | 211,899 | |
| c | | ProQR Therapeutics NV | | | Netherlands | | | | 46,914 | | | | | | | | 400,646 | |
| c | | Ra Pharmaceuticals Inc. | | | United States | | | | 38,948 | | | | | | | | 1,820,040 | |
| a,c | | Sage Therapeutics Inc. | | | United States | | | | 18,506 | | | | | | | | 2,864,174 | |
| c | | Sangamo Therapeutics Inc. | | | United States | | | | 11,500 | | | | | | | | 124,200 | |
| c | | Sarepta Therapeutics Inc. | | | United States | | | | 27,356 | | | | | | | | 3,077,276 | |
| c,f | | Shanghai Junshi Biosciences Co. Ltd., H, 144A | | | China | | | | 10,287 | | | | | | | | 33,707 | |
| c | | Spark Therapeutics Inc. | | | United States | | | | 10,099 | | | | | | | | 1,122,403 | |
| c,e | | SpringWorks Therapeutics Inc. | | | United States | | | | 6,838 | | | | | | | | 155,975 | |
| c | | Sutro Biopharma Inc. | | | United States | | | | 3,932 | | | | | | | | 43,567 | |
| c | | Turning Point Therapeutics Inc. | | | United States | | | | 7,921 | | | | | | | | 445,319 | |
| c | | Vertex Pharmaceuticals Inc. | | | United States | | | | 9,306 | | | | | | | | 2,063,606 | |
| c | | Zai Lab Ltd., ADR | | | China | | | | 5,100 | | | | | | | | 202,980 | |
| | | | | | | | | | | | | | | | | | |
| | | | | | | | | | | | | | | | | 30,878,810 | |
| | | | | | | | | | | | | | | | | | |
| | | Building Products 0.1% | |
| | Advanced Drainage Systems Inc. | | | United States | | | | 22,028 | | | | | | | | 840,588 | |
| | | | | | | | | | | | | | | | | | |
| | | Capital Markets 0.7% | |
| f | | Amundi SA, 144A | | | France | | | | 29,038 | | | | | | | | 2,197,982 | |
| f | | Anima Holding SpA, 144A | | | Italy | | | | 102,616 | | | | | | | | 525,964 | |
| | The Blackstone Group Inc., A | | | United States | | | | 70,000 | | | | | | | | 3,795,400 | |
| | Bolsas y Mercados Espanoles Shmsf SA | | | Spain | | | | 13,107 | | | | | | | | 512,952 | |
| | LPL Financial Holdings Inc. | | | United States | | | | 132 | | | | | | | | 12,190 | |
| | Moody’s Corp. | | | United States | | | | 10,197 | | | | | | | | 2,311,354 | |
| | | | | | | | | | | | | | | | | | |
| | | | | | | | | | | | | | | | | 9,355,842 | |
| | | | | | | | | | | | | | | | | | |
| | | Chemicals 0.8% | |
| | CF Industries Holdings Inc. | | | United States | | | | 251 | | | | | | | | 11,599 | |
| | Ecolab Inc. | | | United States | | | | 1,875 | | | | | | | | 350,006 | |
| c | | Ingevity Corp. | | | United States | | | | 10,721 | | | | | | | | 968,214 | |
| c | | Livent Corp. | | | United States | | | | 44,076 | | | | | | | | 343,793 | |
| | LyondellBasell Industries NV, A | | | United States | | | | 21 | | | | | | | | 1,943 | |
| | The Sherwin-Williams Co. | | | United States | | | | 15,603 | | | | | | | | 9,098,577 | |
| c,d,g | | TerraVia Holdings Inc., Contingent Distribution | | | United States | | | | 1,117,000 | | | | | | | | — | |
| | | | | | | | | | | | | | | | | | |
| | | | | | | | | | | | | | | | | 10,774,132 | |
| | | | | | | | | | | | | | | | | | |
| | | Commercial Services & Supplies 1.0% | |
| c | | Advanced Disposal Services Inc. | | | United States | | | | 149,080 | | | | | | | | 4,912,186 | |
| | Cintas Corp. | | | United States | | | | 15,123 | | | | | | | | 3,887,518 | |
| | Edenred | | | France | | | | 14,783 | | | | | | | | 733,767 | |
| | Republic Services Inc., A | | | United States | | | | 32,764 | | | | | | | | 2,904,529 | |
| | Waste Management Inc. | | | United States | | | | 14 | | | | | | | | 1,581 | |
| | | | | | | | | | | | | | | | | | |
| | | | | | | | | | | | | | | | | 12,439,581 | |
| | | | | | | | | | | | | | | | | | |
| | | Communications Equipment 0.1% | |
| b | | Cisco Systems Inc. | | | United States | | | | 263 | | | | | | | | 11,916 | |
| c | | Lumentum Holdings Inc. | | | United States | | | | 12,009 | | | | | | | | 884,583 | |
| | | | | | | | | | | | | | | | | | |
| | | | | | | | | | | | | | | | | 896,499 | |
| | | | | | | | | | | | | | | | | | |
| | | Construction Materials 0.4% | |
| | Buzzi Unicem SpA | | | Italy | | | | 28,945 | | | | | | | | 716,920 | |
| | | | |
| | | |
| 16 | | Semiannual Report | | franklintempleton.com |
FRANKLIN ALTERNATIVE STRATEGIES FUNDS
CONSOLIDATED STATEMENT OF INVESTMENTS (UNAUDITED)
Franklin K2 Alternative Strategies Fund(continued)
| | | | | | | | | | | | | | | | | | |
| | | | | |
| | | | | Country | | | Shares/
Rights | | | | | | Value | |
| | | Common Stocks and Other Equity Interests (continued) | | | |
| | | Construction Materials (continued) | |
| | Cemex SAB de CV, ADR | | | Mexico | | | | 72,599 | | | | | | | $ | 270,794 | |
| | LafargeHolcim Ltd., B | | | Switzerland | | | | 70,300 | | | | | | | | 3,625,574 | |
| | | | | | | | | | | | | | | | | | |
| | | | | |
| | | | | | | | | | | | | | | | | 4,613,288 | |
| | | | | | | | | | | | | | | | | | |
| | | Consumer Finance 0.0%† | |
| b | | Synchrony Financial | | | United States | | | | 361 | | | | | | | | 13,505 | |
| | | | | | | | | | | | | | | | | | |
| | | Containers & Packaging 0.5% | |
| a | | Ball Corp. | | | United States | | | | 103,438 | | | | | | | | 6,833,114 | |
| | | | | | | | | | | | | | | | | | |
| | | Distributors 0.1% | |
| | Pool Corp. | | | United States | | | | 7,884 | | | | | | | | 1,627,652 | |
| | | | | | | | | | | | | | | | | | |
| | | Diversified Consumer Services 0.1% | |
| c | | Frontdoor Inc. | | | United States | | | | 37,341 | | | | | | | | 1,690,054 | |
| | | | | | | | | | | | | | | | | | |
| | | Diversified Financial Services 0.1% | |
| c | | ARYA Sciences Acquisition Corp. | | | United States | | | | 20,099 | | | | | | | | 225,310 | |
| c,d,aa | | One Call Corp. | | | United States | | | | 4,970 | | | | | | | | 596,214 | |
| | | | | | | | | | | | | | | | | | |
| | | | | |
| | | | | | | | | | | | | | | | | 821,524 | |
| | | | | | | | | | | | | | | | | | |
| | | Diversified Telecommunication Services 1.0% | |
| | AT&T Inc. | | | United States | | | | 323 | | | | | | | | 12,074 | |
| c | | Bandwidth Inc., A | | | United States | | | | 5,415 | | | | | | | | 302,861 | |
| f | | China Tower Corp. Ltd., H, 144A | | | China | | | | 1,300,000 | | | | | | | | 265,706 | |
| c | | ORBCOMM Inc. | | | United States | | | | 50,623 | | | | | | | | 202,998 | |
| c | | Telecom Italia SpA | | | Italy | | | | 97,946 | | | | | | | | 61,318 | |
| b | | Verizon Communications Inc. | | | United States | | | | 204 | | | | | | | | 12,289 | |
| a,c | | Zayo Group Holdings Inc. | | | United States | | | | 356,070 | | | | | | | | 12,191,837 | |
| | | | | | | | | | | | | | | | | | |
| | | | | |
| | | | | | | | | | | | | | | | | 13,049,083 | |
| | | | | | | | | | | | | | | | | | |
| | | Electric Utilities 0.7% | |
| | Duke Energy Corp. | | | United States | | | | 129 | | | | | | | | 11,374 | |
| | Edp - Energias de Portugal SA | | | Portugal | | | | 627,796 | | | | | | | | 2,538,548 | |
| | El Paso Electric Co. | | | United States | | | | 101,793 | | | | | | | | 6,903,601 | |
| b | | FirstEnergy Corp. | | | United States | | | | 155 | | | | | | | | 7,392 | |
| | | | | | | | | | | | | | | | | | |
| | | | | |
| | | | | | | | | | | | | | | | | 9,460,915 | |
| | | | | | | | | | | | | | | | | | |
| | | Electrical Equipment 0.1% | |
| | AMETEK Inc. | | | United States | | | | 6,075 | | | | | | | | 601,486 | |
| b | | Eaton Corp. PLC | | | United States | | | | 146 | | | | | | | | 13,505 | |
| | Osram Licht AG | | | Germany | | | | 27,012 | | | | | | | | 1,164,872 | |
| | | | | | | | | | | | | | | | | | |
| | | | | |
| | | | | | | | | | | | | | | | | 1,779,863 | |
| | | | | | | | | | | | | | | | | | |
| | | Electronic Equipment, Instruments & Components 0.3% | |
| c | | Anixter International Inc. | | | United States | | | | 26,038 | | | | | | | | 2,235,101 | |
| a,c | | Coherent Inc. | | | United States | | | | 1,865 | | | | | | | | 281,354 | |
| c | | Flex Ltd. | | | United States | | | | 96,960 | | | | | | | | 1,150,915 | |
| c | | Itron Inc. | | | United States | | | | 3,972 | | | | | | | | 318,078 | |
| c | | Zebra Technologies Corp., A | | | United States | | | | 1,407 | | | | | | | | 353,073 | |
| | | | | | | | | | | | | | | | | | |
| | | | | |
| | | | | | | | | | | | | | | | | 4,338,521 | |
| | | | | | | | | | | | | | | | | | |
| | | Entertainment 0.5% | |
| | Entertainment One Ltd. | | | Canada | | | | 281,646 | | | | | | | | 2,025,234 | |
| c | | Spotify Technology SA | | | United States | | | | 2,461 | | | | | | | | 350,816 | |
| c | | Take-Two Interactive Software Inc. | | | United States | | | | 9,500 | | | | | | | | 1,152,825 | |
| | The Walt Disney Co. | | | United States | | | | 20,483 | | | | | | | | 3,104,813 | |
| | | | | | | | | | | | | | | | | | |
| | | | | |
| | | | | | | | | | | | | | | | | 6,633,688 | |
| | | | | | | | | | | | | | | | | | |
| | | | | | |
| | | |
| franklintempleton.com | | Semiannual Report | | | 17 | |
FRANKLIN ALTERNATIVE STRATEGIES FUNDS
CONSOLIDATED STATEMENT OF INVESTMENTS (UNAUDITED)
Franklin K2 Alternative Strategies Fund(continued)
| | | | | | | | | | | | | | | | | | |
| | | | | |
| | | | | Country | | | Shares/
Rights | | | | | | Value | |
| | | Common Stocks and Other Equity Interests (continued) | | | |
| | | Equity Real Estate Investment Trusts (REITs) 0.1% | |
| b | | Iron Mountain Inc. | | | United States | | | | 374 | | | | | | | $ | 12,013 | |
| | VICI Properties Inc. | | | United States | | | | 32,376 | | | | | | | | 800,658 | |
| | | | | | | | | | | | | | | | | | |
| | | | | |
| | | | | | | | | | | | | | | | | 812,671 | |
| | | | | | | | | | | | | | | | | | |
| | | Food & Staples Retailing 0.3% | |
| | Costco Wholesale Corp. | | | United States | | | | 12,902 | | | | | | | | 3,868,149 | |
| | | | | | | | | | | | | | | | | | |
| | | Food Products 0.0%† | |
| | Chocoladefabriken Lindt & Spruengli AG | | | Switzerland | | | | 7 | | | | | | | | 597,249 | |
| | General Mills Inc. | | | United States | | | | 213 | | | | | | | | 11,357 | |
| | | | | | | | | | | | | | | | | | |
| | | | | |
| | | | | | | | | | | | | | | | | 608,606 | |
| | | | | | | | | | | | | | | | | | |
| | | Gas Utilities 0.2% | |
| | AltaGas Canada Inc. | | | Canada | | | | 97,519 | | | | | | | | 2,455,778 | |
| | | | | | | | | | | | | | | | | | |
| | | Health Care Equipment & Supplies 1.6% | |
| | Abbott Laboratories | | | United States | | | | 19,906 | | | | | | | | 1,700,968 | |
| c | | Align Technology Inc. | | | United States | | | | 1,240 | | | | | | | | 343,902 | |
| c | | Boston Scientific Corp. | | | United States | | | | 44,647 | | | | | | | | 1,930,983 | |
| | Danaher Corp., W | | | United States | | | | 5,988 | | | | | | | | 874,128 | |
| c | | DexCom Inc. | | | United States | | | | 9,786 | | | | | | | | 2,224,456 | |
| c | | Edwards Lifesciences Corp. | | | United States | | | | 7,446 | | | | | | | | 1,823,823 | |
| c | | Glaukos Corp. | | | United States | | | | 2,250 | | | | | | | | 144,292 | |
| c | | IDEXX Laboratories Inc. | | | United States | | | | 8,767 | | | | | | | | 2,205,602 | |
| c | | Intuitive Surgical Inc. | | | United States | | | | 4,497 | | | | | | | | 2,666,271 | |
| c | | iRhythm Technologies Inc. | | | United States | | | | 3,743 | | | | | | | | 269,833 | |
| | Medtronic PLC | | | United States | | | | 58 | | | | | | | | 6,461 | |
| c,e | | Shockwave Medical Inc. | | | United States | | | | 13,067 | | | | | | | | 511,704 | |
| c | | Silk Road Medical Inc. | | | United States | | | | 15,000 | | | | | | | | 540,300 | |
| c | | Tandem Diabetes Care Inc. | | | United States | | | | 7,645 | | | | | | | | 527,734 | |
| | Teleflex Inc. | | | United States | | | | 1,812 | | | | | | | | 640,252 | |
| c | | Wright Medical Group NV | | | United States | | | | 154,827 | | | | | | | | 4,609,199 | |
| | | | | | | | | | | | | | | | | | |
| | | | | |
| | | | | | | | | | | | | | | | | 21,019,908 | |
| | | | | | | | | | | | | | | | | | |
| | | Health Care Providers & Services 1.6% | |
| b | | AmerisourceBergen Corp., A | | | United States | | | | 138 | | | | | | | | 12,132 | |
| | Anthem Inc. | | | United States | | | | 3,815 | | | | | | | | 1,101,238 | |
| c | | Centene Corp. | | | United States | | | | 6,570 | | | | | | | | 397,288 | |
| | Cigna Corp. | | | United States | | | | 6,309 | | | | | | | | 1,261,295 | |
| c | | Guardant Health Inc. | | | United States | | | | 10,655 | | | | | | | | 827,574 | |
| | Humana Inc. | | | United States | | | | 5,035 | | | | | | | | 1,718,093 | |
| c,f | | Jinxin Fertility Group Ltd., 144A | | | China | | | | 117,677 | | | | | | | | 178,886 | |
| | McKesson Corp. | | | United States | | | | 75 | | | | | | | | 10,848 | |
| | UnitedHealth Group Inc. | | | United States | | | | 8,325 | | | | | | | | 2,329,918 | |
| c | | WellCare Health Plans Inc. | | | United States | | | | 40,321 | | | | | | | | 12,986,184 | |
| | | | | | | | | | | | | | | | | | |
| | | | | |
| | | | | | | | | | | | | | | | | 20,823,456 | |
| | | | | | | | | | | | | | | | | | |
| | | Health Care Technology 0.1% | |
| c,e | | Tabula Rasa HealthCare Inc. | | | United States | | | | 8,547 | | | | | | | | 381,282 | |
| c | | Teladoc Health Inc. | | | United States | | | | 4,810 | | | | | | | | 402,789 | |
| | | | | | | | | | | | | | | | | | |
| | | | | |
| | | | | | | | | | | | | | | | | 784,071 | |
| | | | | | | | | | | | | | | | | | |
| | | Hotels, Restaurants & Leisure 0.9% | |
| c | | Caesars Entertainment Corp. | | | United States | | | | 310,863 | | | | | | | | 4,053,654 | |
| | Domino’s Pizza Inc. | | | United States | | | | 8,297 | | | | | | | | 2,441,807 | |
| | McDonald’s Corp. | | | United States | | | | 54 | | | | | | | | 10,502 | |
| | SIX Flags Entertainment Corp. | | | United States | | | | 1,523 | | | | | | | | 66,220 | |
| b | | Starbucks Corp. | | | United States | | | | 142 | | | | | | | | 12,131 | |
| | | | |
| | | |
| 18 | | Semiannual Report | | franklintempleton.com |
FRANKLIN ALTERNATIVE STRATEGIES FUNDS
CONSOLIDATED STATEMENT OF INVESTMENTS (UNAUDITED)
Franklin K2 Alternative Strategies Fund(continued)
| | | | | | | | | | | | | | | | | | |
| | | | | |
| | | | | Country | | | Shares/
Rights | | | | | | Value | |
| | | Common Stocks and Other Equity Interests (continued) | | | |
| | | Hotels, Restaurants & Leisure (continued) | |
| c | | The Stars Group Inc. | | | Canada | | | | 147,421 | | | | | | | $ | 3,580,856 | |
| | Yum! Brands Inc. | | | United States | | | | 8,546 | | | | | | | | 860,326 | |
| | | | | | | | | | | | | | | | | | |
| | | | | |
| | | | | | | | | | | | | | | | | 11,025,496 | |
| | | | | | | | | | | | | | | | | | |
| | | Household Durables 0.5% | |
| a | | D.R. Horton Inc. | | | United States | | | | 40,918 | | | | | | | | 2,264,811 | |
| b | | Garmin Ltd. | | | United States | | | | 143 | | | | | | | | 13,970 | |
| a | | KB Home | | | United States | | | | 67,596 | | | | | | | | 2,337,470 | |
| a,c | | NVR Inc. | | | United States | | | | 500 | | | | | | | | 1,895,945 | |
| | Sony Corp. | | | Japan | | | | 2,493 | | | | | | | | 157,299 | |
| | | | | | | | | | | | | | | | | | |
| | | | | |
| | | | | | | | | | | | | | | | | 6,669,495 | |
| | | | | | | | | | | | | | | | | | |
| | | Household Products 0.0%† | |
| | The Procter & Gamble Co. | | | United States | | | | 105 | | | | | | | | 12,816 | |
| | | | | | | | | | | | | | | | | | |
| | | Independent Power & Renewable Electricity Producers 0.1% | |
| | Clearway Energy Inc., C | | | United States | | | | 59,714 | | | | | | | | 1,184,129 | |
| | Pattern Energy Group Inc., A | | | United States | | | | 3,820 | | | | | | | | 105,126 | |
| | | | | | | | | | | | | | | | | | |
| | | | | |
| | | | | | | | | | | | | | | | | 1,289,255 | |
| | | | | | | | | | | | | | | | | | |
| | | Industrial Conglomerates 0.1% | |
| | General Electric Co. | | | United States | | | | 64,289 | | | | | | | | 724,537 | |
| | Honeywell International Inc. | | | United States | | | | 72 | | | | | | | | 12,855 | |
| | Smiths Group PLC | | | United Kingdom | | | | 17,888 | | | | | | | | 384,263 | |
| | | | | | | | | | | | | | | | | | |
| | | | | |
| | | | | | | | | | | | | | | | | 1,121,655 | |
| | | | | | | | | | | | | | | | | | |
| | | Insurance 0.2% | |
| | Aflac Inc. | | | United States | | | | 209 | | | | | | | | 11,462 | |
| b | | MetLife Inc. | | | United States | | | | 264 | | | | | | | | 13,176 | |
| | The Progressive Corp. | | | United States | | | | 173 | | | | | | | | 12,638 | |
| | Prudential Financial Inc. | | | United States | | | | 117 | | | | | | | | 10,953 | |
| | RSA Insurance Group PLC | | | United Kingdom | | | | 44,331 | | | | | | | | 316,134 | |
| c,e | | Trupanion Inc. | | | United States | | | | 45,942 | | | | | | | | 1,565,703 | |
| | | | | | | | | | | | | | | | | | |
| | | | | |
| | | | | | | | | | | | | | | | | 1,930,066 | |
| | | | | | | | | | | | | | | | | | |
| | | Interactive Media & Services 1.2% | |
| a,c | | Alphabet Inc., A | | | United States | | | | 3,753 | | | | | | | | 4,894,250 | |
| c | | Alphabet Inc., C | | | United States | | | | 994 | | | | | | | | 1,297,130 | |
| a,c | | Facebook Inc., A | | | United States | | | | 21,843 | | | | | | | | 4,404,422 | |
| | Tencent Holdings Ltd. | | | China | | | | 98,368 | | | | | | | | 4,169,350 | |
| c | | Yandex NV, A | | | Russia | | | | 23,092 | | | | | | | | 969,171 | |
| | | | | | | | | | | | | | | | | | |
| | | | | |
| | | | | | | | | | | | | | | | | 15,734,323 | |
| | | | | | | | | | | | | | | | | | |
| | | Internet & Direct Marketing Retail 0.7% | |
| a,c | | Alibaba Group Holding Ltd., ADR | | | China | | | | 27,479 | | | | | | | | 5,495,800 | |
| c | | Amazon.com Inc. | | | United States | | | | 1,234 | | | | | | | | 2,222,187 | |
| a | | eBay Inc. | | | United States | | | | 36,698 | | | | | | | | 1,303,513 | |
| | Expedia Group Inc. | | | United States | | | | 89 | | �� | | | | | | 9,048 | |
| c,f | | Takeaway.com NV, 144A | | | Netherlands | | | | 3,708 | | | | | | | | 333,373 | |
| | | | | | | | | | | | | | | | | | |
| | | | | |
| | | | | | | | | | | | | | | | | 9,363,921 | |
| | | | | | | | | | | | | | | | | | |
| | | IT Services 3.4% | |
| | Accenture PLC, A | | | United States | | | | 2,701 | | | | | | | | 543,333 | |
| | Automatic Data Processing Inc. | | | United States | | | | 3,110 | | | | | | | | 531,126 | |
| | Booz Allen Hamilton Holding Corp., A | | | United States | | | | 116 | | | | | | | | 8,440 | |
| b,c | | Carbonite Inc. | | | United States | | | | 105,534 | | | | | | | | 2,427,282 | |
| c | | EPAM Systems Inc. | | | United States | | | | 5,201 | | | | | | | | 1,101,832 | |
| c | | ExlService Holdings Inc. | | | United States | | | | 26,594 | | | | | | | | 1,856,527 | |
| | | | | | |
| | | |
| franklintempleton.com | | Semiannual Report | | | 19 | |
FRANKLIN ALTERNATIVE STRATEGIES FUNDS
CONSOLIDATED STATEMENT OF INVESTMENTS (UNAUDITED)
Franklin K2 Alternative Strategies Fund(continued)
| | | | | | | | | | | | | | | | | | |
| | | | | |
| | | | | Country | | | Shares/
Rights | | | | | | Value | |
| | | Common Stocks and Other Equity Interests (continued) | | | |
| | | IT Services (continued) | |
| | Fidelity National Information Services Inc. | | | United States | | | | 94 | | | | | | | $ | 12,986 | |
| c | | FleetCor Technologies Inc. | | | United States | | | | 11,447 | | | | | | | | 3,513,313 | |
| | Genpact Ltd. | | | United States | | | | 69,946 | | | | | | | | 2,846,802 | |
| a | | Global Payments Inc. | | | United States | | | | 37,219 | | | | | | | | 6,740,361 | |
| c | | GoDaddy Inc., A | | | United States | | | | 17,418 | | | | | | | | 1,156,207 | |
| c | | InterXion Holding NV | | | Netherlands | | | | 13,620 | | | | | | | | 1,158,245 | |
| b | | Leidos Holdings Inc. | | | United States | | | | 141 | | | | | | | | 12,808 | |
| a | | MasterCard Inc., A | | | United States | | | | 26,527 | | | | | | | | 7,751,985 | |
| | Paychex Inc. | | | United States | | | | 146 | | | | | | | | 12,574 | |
| a,c | | PayPal Holdings Inc. | | | United States | | | | 46,432 | | | | | | | | 5,015,120 | |
| c | | StoneCo. Ltd. | | | Brazil | | | | 16,174 | | | | | | | | 662,811 | |
| a,c | | VeriSign Inc. | | | United States | | | | 6,917 | | | | | | | | 1,319,349 | |
| | Visa Inc., A | | | United States | | | | 13,000 | | | | | | | | 2,398,630 | |
| c | | WEX Inc. | | | United States | | | | 14,410 | | | | | | | | 2,898,283 | |
| | Wirecard AG | | | Germany | | | | 14,941 | | | | | | | | 1,972,138 | |
| | | | | | | | | | | | | | | | | | |
| | | | | |
| | | | | | | | | | | | | | | | | 43,940,152 | |
| | | | | | | | | | | | | | | | | | |
| | | Leisure Products 0.1% | |
| a | | Polaris Inc. | | | United States | | | | 8,170 | | | | | | | | 798,209 | |
| | | | | | | | | | | | | | | | | | |
| | | Life Sciences Tools & Services 1.7% | |
| c | | Avantor Inc. | | | United States | | | | 30,265 | | | | | | | | 518,439 | |
| | Eurofins Scientific SE | | | Luxembourg | | | | 4,408 | | | | | | | | 2,314,709 | |
| | Gerresheimer AG | | | Germany | | | | 61,603 | | | | | | | | 4,530,581 | |
| a,c | | Illumina Inc. | | | United States | | | | 8,835 | | | | | | | | 2,833,915 | |
| c | | IQVIA Holdings Inc. | | | United States | | | | 7,725 | | | | | | | | 1,127,695 | |
| c | | Mettler-Toledo International Inc. | | | United States | | | | 3,700 | | | | | | | | 2,661,817 | |
| c | | QIAGEN NV | | | United States | | | | 87,187 | | | | | | | | 3,731,604 | |
| c | | Repligen Corp. | | | United States | | | | 5,221 | | | | | | | | 463,364 | |
| | Thermo Fisher Scientific Inc. | | | United States | | | | 8,674 | | | | | | | | 2,723,202 | |
| c,f | | Wuxi Biologics Cayman Inc., 144A | | | China | | | | 50,031 | | | | | | | | 565,295 | |
| | | | | | | | | | | | | | | | | | |
| | | | | |
| | | | | | | | | | | | | | | | | 21,470,621 | |
| | | | | | | | | | | | | | | | | | |
| | | Machinery 1.9% | |
| | Caterpillar Inc. | | | United States | | | | 11,734 | | | | | | | | 1,698,261 | |
| | Cummins Inc. | | | United States | | | | 73 | | | | | | | | 13,349 | |
| | Deere & Co. | | | United States | | | | 9,592 | | | | | | | | 1,611,936 | |
| a | | The Greenbrier Cos. Inc. | | | United States | | | | 36,493 | | | | | | | | 1,026,913 | |
| | Illinois Tool Works Inc. | | | United States | | | | 78 | | | | | | | | 13,598 | |
| a | | ITT Inc. | | | United States | | | | 16,106 | | | | | | | | 1,123,877 | |
| | Kion Group AG | | | Germany | | | | 28,132 | | | | | | | | 1,866,561 | |
| | PACCAR Inc. | | | United States | | | | 28,250 | | | | | | | | 2,298,702 | |
| | Sandvik AB | | | Sweden | | | | 32,786 | | | | | | | | 596,227 | |
| | The Toro Co. | | | United States | | | | 18,736 | | | | | | | | 1,464,780 | |
| a | | Trinity Industries Inc. | | | United States | | | | 56,142 | | | | | | | | 1,181,228 | |
| | Volvo AB, B | | | Sweden | | | | 37,966 | | | | | | | | 586,953 | |
| a,c | | Wabco Holdings Inc. | | | United States | | | | 78,729 | | | | | | | | 10,608,733 | |
| | | | | | | | | | | | | | | | | | |
| | | | | |
| | | | | | | | | | | | | | | | | 24,091,118 | |
| | | | | | | | | | | | | | | | | | |
| | | Marine 0.2% | |
| a,c | | Kirby Corp. | | | United States | | | | 12,889 | | | | | | | | 1,087,445 | |
| | Star Bulk Carriers Corp. | | | Greece | | | | 145,002 | | | | | | | | 1,593,572 | |
| | | | | | | | | | | | | | | | | | |
| | | | | |
| | | | | | | | | | | | | | | | | 2,681,017 | |
| | | | | | | | | | | | | | | | | | |
| | | Media 0.4% | |
| a,b | | CBS Corp., B | | | United States | | | | 32,035 | | | | | | | | 1,293,573 | |
| b | | Comcast Corp., A | | | United States | | | | 263 | | | | | | | | 11,612 | |
| | | | |
| | | |
| 20 | | Semiannual Report | | franklintempleton.com |
FRANKLIN ALTERNATIVE STRATEGIES FUNDS
CONSOLIDATED STATEMENT OF INVESTMENTS (UNAUDITED)
Franklin K2 Alternative Strategies Fund(continued)
| | | | | | | | | | | | | | | | | | |
| | | | | |
| | | | | Country | | | Shares/
Rights | | | | | | Value | |
| | | Common Stocks and Other Equity Interests (continued) | | | |
| | | Media (continued) | |
| c | | DISH Network Corp., rts., 12/12/19 | | | United States | | | | 453 | | | | | | | $ | 308 | |
| a | | Fox Corp. | | | United States | | | | 52,049 | | | | | | | | 1,861,272 | |
| | ITV PLC | | | United Kingdom | | | | 293,248 | | | | | | | | 550,300 | |
| | Omnicom Group Inc. | | | United States | | | | 158 | | | | | | | | 12,558 | |
| c | | Postmedia Network Canada Corp., B | | | Canada | | | | 666,338 | | | | | | | | 777,553 | |
| | Stroeer SE & Co. KGaA | | | Germany | | | | 998 | | | | | | | | 78,016 | |
| | | | | | | | | | | | | | | | | | |
| | | | | |
| | | | | | | | | | | | | | | | | 4,585,192 | |
| | | | | | | | | | | | | | | | | | |
| | | Metals & Mining 0.3% | |
| | Teck Resources Ltd., B | | | Canada | | | | 235,874 | | | | | | | | 3,703,222 | |
| | | | | | | | | | | | | | | | | | |
| | | Multiline Retail 0.0%† | |
| | Target Corp. | | | United States | | | | 110 | | | | | | | | 13,751 | |
| | | | | | | | | | | | | | | | | | |
| | | Oil, Gas & Consumable Fuels 0.3% | |
| c,d | | Bellatrix Exploration Ltd. | | | Canada | | | | 56,646 | | | | | | | | — | |
| c | | Carrizo Oil & Gas Inc. | | | United States | | | | 22,898 | | | | | | | | 146,776 | |
| | Continental Resources, Inc. | | | United States | | | | 7,142 | | | | | | | | 220,545 | |
| | CVR Energy Inc. | | | United States | | | | 280 | | | | | | | | 12,149 | |
| b | | Enterprise Products Partners LP | | | United States | | | | 440 | | | | | | | | 11,581 | |
| c,d | | Halcon Resources Corp. | | | United States | | | | 3,790 | | | | | | | | 75,312 | |
| | Magellan Midstream Partners LP | | | United States | | | | 132 | | | | | | | | 7,718 | |
| a,b | | Occidental Petroleum Corp. | | | United States | | | | 42,636 | | | | | | | | 1,644,471 | |
| | Phillips 66 | | | United States | | | | 114 | | | | | | | | 13,078 | |
| b | | Plains GP Holdings LP, A | | | United States | | | | 628 | | | | | | | | 10,971 | |
| b | | Tallgrass Energy LP, A | | | United States | | | | 74,589 | | | | | | | | 1,335,889 | |
| c | | Whiting Petroleum Corp. | | | United States | | | | 4,509 | | | | | | | | 20,651 | |
| | | | | | | | | | | | | | | | | | |
| | | | | |
| | | | | | | | | | | | | | | | | 3,499,141 | |
| | | | | | | | | | | | | | | | | | |
| | | Paper & Forest Products 0.3% | |
| c | | Canfor Corp. | | | Canada | | | | 45,714 | | | | | | | | 546,173 | |
| a | | Louisiana-Pacific Corp. | | | United States | | | | 73,304 | | | | | | | | 2,174,197 | |
| | West Fraser Timber Co. Ltd. | | | Canada | | | | 20,219 | | | | | | | | 879,358 | |
| | | | | | | | | | | | | | | | | | |
| | | | | |
| | | | | | | | | | | | | | | | | 3,599,728 | |
| | | | | | | | | | | | | | | | | | |
| | | Pharmaceuticals 1.3% | |
| | Allergan PLC | | | United States | | | | 43,207 | | | | | | | | 7,990,703 | |
| | AstraZeneca PLC, ADR | | | United Kingdom | | | | 41,505 | | | | | | | | 2,012,162 | |
| c | | Axsome Therapeutics Inc. | | | United States | | | | 3,868 | | | | | | | | 152,283 | |
| | Bristol-Myers Squibb Co. | | | United States | | | | 237 | | | | | | | | 13,495 | |
| | Eli Lilly & Co., W | | | United States | | | | 14,499 | | | | | | | | 1,701,457 | |
| | Hikma Pharmaceuticals PLC | | | Jordan | | | | 17,997 | | | | | | | | 445,724 | |
| | Johnson & Johnson | | | United States | | | | 87 | | | | | | | | 11,962 | |
| b | | Merck & Co. Inc. | | | United States | | | | 7,609 | | | | | | | | 663,353 | |
| | Novartis AG, ADR | | | Switzerland | | | | 16,193 | | | | | | | | 1,494,614 | |
| | Novo Nordisk AS, ADR | | | Denmark | | | | 28,364 | | | | | | | | 1,592,639 | |
| | Zoetis Inc., A | | | United States | | | | 9,820 | | | | | | | | 1,183,506 | |
| | | | | | | | | | | | | | | | | | |
| | | | | |
| | | | | | | | | | | | | | | | | 17,261,898 | |
| | | | | | | | | | | | | | | | | | |
| | | Professional Services 1.1% | |
| c | | CoStar Group Inc. | | | United States | | | | 1,475 | | | | | | | | 903,968 | |
| | Equifax Inc. | | | United States | | | | 12,739 | | | | | | | | 1,778,874 | |
| | Experian PLC | | | United Kingdom | | | | 34,144 | | | | | | | | 1,131,775 | |
| c | | Huron Consulting Group Inc. | | | United States | | | | 16,926 | | | | | | | | 1,134,888 | |
| | Insperity Inc. | | | United States | | | | 118 | | | | | | | | 9,177 | |
| f | | Intertrust NV, 144A | | | Netherlands | | | | 258,818 | | | | | | | | 4,864,904 | |
| a | | TransUnion | | | United States | | | | 17,979 | | | | | | | | 1,551,767 | |
| | | | | | |
| | | |
| franklintempleton.com | | Semiannual Report | | | 21 | |
FRANKLIN ALTERNATIVE STRATEGIES FUNDS
CONSOLIDATED STATEMENT OF INVESTMENTS (UNAUDITED)
Franklin K2 Alternative Strategies Fund(continued)
| | | | | | | | | | | | | | | | | | |
| | | | | |
| | | | | Country | | | Shares/
Rights | | | | | | Value | |
| | | Common Stocks and Other Equity Interests (continued) | | | |
| | | Professional Services (continued) | |
| c | | TriNet Group Inc. | | | United States | | | | 43,147 | | | | | | | $ | 2,362,298 | |
| | | | | | | | | | | | | | | | | | |
| | | | | |
| | | | | | | | | | | | | | | | | 13,737,651 | |
| | | | | | | | | | | | | | | | | | |
| | | Real Estate Management & Development 0.1% | |
| | Savills PLC | | | United Kingdom | | | | 94,600 | | | | | | | | 1,211,221 | |
| | | | | | | | | | | | | | | | | | |
| | | Road & Rail 2.4% | |
| | Canadian Pacific Railway Ltd. | | | Canada | | | | 5,599 | | | | | | | | 1,333,906 | |
| a | | CSX Corp. | | | United States | | | | 65,511 | | | | | | | | 4,686,657 | |
| a,c | | Genesee & Wyoming Inc., A | | | United States | | | | 133,418 | | | | | | | | 14,869,436 | |
| a | | Kansas City Southern | | | United States | | | | 18,074 | | | | | | | | 2,754,839 | |
| a | | Norfolk Southern Corp. | | | United States | | | | 10,110 | | | | | | | | 1,956,285 | |
| c | | Uber Technologies Inc. | | | United States | | | | 6,337 | | | | | | | | 187,575 | |
| | Union Pacific Corp. | | | United States | | | | 24,445 | | | | | | | | 4,302,076 | |
| | | | | | | | | | | | | | | | | | |
| | | | | |
| | | | | | | | | | | | | | | | | 30,090,774 | |
| | | | | | | | | | | | | | | | | | |
| | | Semiconductors & Semiconductor Equipment 1.1% | |
| c | | Advanced Micro Devices Inc. | | | United States | | | | 40,383 | | | | | | | | 1,580,994 | |
| | ASM International NV | | | Netherlands | | | | 3,136 | | | | | | | | 348,805 | |
| | ASM Pacific Technology Ltd. | | | Hong Kong | | | | 44,600 | | | | | | | | 582,269 | |
| | BE Semiconductor Industries NV | | | Netherlands | | | | 19,410 | | | | | | | | 716,212 | |
| | Broadcom Inc. | | | United States | | | | 43 | | | | | | | | 13,597 | |
| c | | FormFactor Inc. | | | United States | | | | 21,861 | | | | | | | | 505,864 | |
| c | | Inphi Corp. | | | United States | | | | 5,008 | | | | | | | | 348,707 | |
| | Intel Corp. | | | United States | | | | 234 | | | | | | | | 13,584 | |
| | KLA Corp. | | | United States | | | | 6,648 | | | | | | | | 1,089,341 | |
| | LAM Research Corp. | | | United States | | | | 15 | | | | | | | | 4,002 | |
| c | | Lattice Semiconductor Corp. | | | United States | | | | 51,085 | | | | | | | | 964,996 | |
| | Marvell Technology Group Ltd. | | | Bermuda | | | | 35,030 | | | | | | | | 923,741 | |
| | Mediatek Inc. | | | Taiwan | | | | 108,635 | | | | | | | | 1,500,783 | |
| c | | Micron Technology Inc. | | | United States | | | | 12,815 | | | | | | | | 608,841 | |
| | QUALCOMM Inc. | | | United States | | | | 29,641 | | | | | | | | 2,476,506 | |
| | Realtek Semiconductor Corp. | | | Taiwan | | | | 38,000 | | | | | | | | 287,082 | |
| c | | Renesas Electronics Corp. | | | Japan | | | | 201,500 | | | | | | | | 1,313,010 | |
| | SK Hynix Inc., QUICS | | | South Korea | | | | 9,224 | | | | | | | | 631,775 | |
| | Skyworks Solutions Inc. | | | United States | | | | 6,283 | | | | | | | | 617,619 | |
| c,f,g | | SunEdison Inc., Contingent Distribution, 144A | | | United States | | | | 35,000 | | | | | | | | 787 | |
| | Texas Instruments Inc. | | | United States | | | | 94 | | | | | | | | 11,300 | |
| | | | | | | | | | | | | | | | | | |
| | | | | |
| | | | | | | | | | | | | | | | | 14,539,815 | |
| | | | | | | | | | | | | | | | | | |
| | | Software 2.6% | |
| c | | Adobe Inc. | | | United States | | | | 3,035 | | | | | | | | 939,423 | |
| c | | Atlassian Corp. PLC, A | | | United States | | | | 8,305 | | | | | | | | 1,055,648 | |
| | Blackbaud Inc. | | | United States | | | | 8,041 | | | | | | | | 666,438 | |
| c | | Ceridian Hcm Holding Inc. | | | United States | | | | 23,416 | | | | | | | | 1,413,390 | |
| c | | Guidewire Software Inc. | | | United States | | | | 13,716 | | | | | | | | 1,671,020 | |
| c | | HubSpot Inc. | | | United States | | | | 3,952 | | | | | | | | 596,752 | |
| | Intuit Inc. | | | United States | | | | 12,082 | | | | | | | | 3,127,909 | |
| a | | Microsoft Corp. | | | United States | | | | 55,397 | | | | | | | | 8,385,998 | |
| | NortonLifeLock Inc. | | | United States | | | | 120,790 | | | | | | | | 3,007,671 | |
| b | | Oracle Corp. | | | United States | | | | 220 | | | | | | | | 12,351 | |
| c | | Pivotal Software Inc., A | | | United States | | | | 402,841 | | | | | | | | 6,050,672 | |
| a,c | | Salesforce.com Inc. | | | United States | | | | 8,640 | | | | | | | | 1,407,370 | |
| a,c | | ServiceNow Inc. | | | United States | | | | 5,549 | | | | | | | | 1,570,589 | |
| c,e | | Slack Technologies Inc., A | | | United States | | | | 19,600 | | | | | | | | 447,272 | |
| c | | Splunk Inc. | | | United States | | | | 7,243 | | | | | | | | 1,080,800 | |
| c | | SVMK Inc. | | | United States | | | | 25,100 | | | | | | | | 428,457 | |
| | | | |
| | | |
| 22 | | Semiannual Report | | franklintempleton.com |
FRANKLIN ALTERNATIVE STRATEGIES FUNDS
CONSOLIDATED STATEMENT OF INVESTMENTS (UNAUDITED)
Franklin K2 Alternative Strategies Fund(continued)
| | | | | | | | | | | | | | | | | | |
| | | | | |
| | | | | Country | | | Shares/
Rights | | | | | | Value | |
| | | Common Stocks and Other Equity Interests (continued) | | | |
| | | Software (continued) | |
| c | | Workday Inc., A | | | United States | | | | 7,255 | | | | | | | $ | 1,299,516 | |
| c | | Zscaler Inc. | | | United States | | | | 6,175 | | | | | | | | 321,903 | |
| | | | | | | | | | | | | | | | | | |
| | | | | |
| | | | | | | | | | | | | | | | | 33,483,179 | |
| | | | | | | | | | | | | | | | | | |
| | | Specialty Retail 1.1% | |
| b | | Best Buy Co. Inc. | | | United States | | | | 180 | | | | | | | | 14,515 | |
| | The Home Depot Inc. | | | United States | | | | 29,827 | | | | | | | | 6,577,152 | |
| | Pets at Home Group PLC | | | United Kingdom | | | | 166,908 | | | | | | | | 543,970 | |
| c | | Sports Direct International PLC | | | United Kingdom | | | | 180,900 | | | | | | | | 788,902 | |
| b | | Tiffany & Co. | | | United States | | | | 37,723 | | | | | | | | 5,047,337 | |
| c | | Ulta Beauty Inc. | | | United States | | | | 4,257 | | | | | | | | 995,542 | |
| | | | | | | | | | | | | | | | | | |
| | | | | |
| | | | | | | | | | | | | | | | | 13,967,418 | |
| | | | | | | | | | | | | | | | | | |
| | | Technology Hardware, Storage & Peripherals 0.2% | |
| | Apple Inc. | | | United States | | | | 14 | | | | | | | | 3,741 | |
| b | | Hewlett Packard Enterprise Co. | | | United States | | | | 340 | | | | | | | | 5,382 | |
| | HP Inc. | | | United States | | | | 206 | | | | | | | | 4,136 | |
| c | | Pure Storage Inc., A | | | United States | | | | 34,351 | | | | | | | | 552,021 | |
| | Western Digital Corp. | | | United States | | | | 35,623 | | | | | | | | 1,792,906 | |
| | | | | | | | | | | | | | | | | | |
| | | | | |
| | | | | | | | | | | | | | | | | 2,358,186 | |
| | | | | | | | | | | | | | | | | | |
| | | Textiles, Apparel & Luxury Goods 0.3% | |
| c | | Capri Holdings Ltd. | | | United States | | | | 44,997 | | | | | | | | 1,671,188 | |
| | LVMH Moet Hennessy Louis Vuitton SE | | | France | | | | 1,981 | | | | | | | | 888,996 | |
| a | | Tapestry Inc. | | | United States | | | | 41,882 | | | | | | | | 1,126,207 | |
| | | | | | | | | | | | | | | | | | |
| | | | | |
| | | | | | | | | | | | | | | | | 3,686,391 | |
| | | | | | | | | | | | | | | | | | |
| | | Tobacco 0.0%† | |
| b | | Altria Group Inc. | | | United States | | | | 282 | | | | | | | | 14,016 | |
| | Philip Morris International Inc. | | | United States | | | | 155 | | | | | | | | 12,854 | |
| | | | | | | | | | | | | | | | | | |
| | | | | |
| | | | | | | | | | | | | | | | | 26,870 | |
| | | | | | | | | | | | | | | | | | |
| | | Trading Companies & Distributors 0.5% | |
| | Brenntag AG | | | Germany | | | | 100,901 | | | | | | | | 5,381,846 | |
| | Imcd NV | | | Netherlands | | | | 15,786 | | | | | | | | 1,313,167 | |
| | | | | | | | | | | | | | | | | | |
| | | | | |
| | | | | | | | | | | | | | | | | 6,695,013 | |
| | | | | | | | | | | | | | | | | | |
| | | Wireless Telecommunication Services 0.1% | |
| c | | T-Mobile U.S. Inc. | | | United States | | | | 7,569 | | | | | | | | 594,545 | |
| a,b | | Vodafone Group PLC, ADR | | | United Kingdom | | | | 36,378 | | | | | | | | 721,012 | |
| | | | | | | | | | | | | | | | | | |
| | | | | |
| | | | | | | | | | | | | | | | | 1,315,557 | |
| | | | | | | | | | | | | | | | | | |
| | Total Common Stocks and Other Equity Interests
(Cost $384,734,549) | | | | | | | | | | | | | | | 506,115,820 | |
| | | | | | | | | | | | | | | | | | |
| | | Exchange Traded Funds (Cost $38,682) 0.0%† | | | |
| | ETFMG Alternative Harvest ETF | | | United States | | | | 2,203 | | | | | | | | 38,024 | |
| | | | | | | | | | | | | | | | | | |
| | | Convertible Preferred Stocks 0.3% | | | |
| | | Diversified Financial Services 0.3% | | | | | | | | | | | | |
| c,d,aa | | One Call Corp., cvt. pfd. | | | United States | | | | 33,337 | | | | | | | | 3,999,100 | |
| | | | | | | | | | | | | | | | | | |
| | | Food Products 0.0%† | |
| | Bunge Ltd., 4.875%, cvt. pfd. | | | United States | | | | 3,947 | | | | | | | | 396,673 | |
| | | | | | | | | | | | | | | | | | |
| | | Gas Utilities 0.0%† | |
| | El Paso Energy Capital Trust I, 4.75%, cvt. pfd. | | | United States | | | | 114 | | | | | | | | 5,633 | |
| | | | | | | | | | | | | | | | | | |
| | | Oil, Gas & Consumable Fuels 0.0%† | |
| | Chesapeake Energy Corp., 5.75%, cvt. pfd. | | | United States | | | | 139 | | | | | | | | 20,694 | |
| | | | | | | | | | | | | | | | | | |
| | Total Convertible Preferred Stocks (Cost $2,037,108) | | | | | | | | | | | | | | | 4,422,100 | |
| | | | | | | | | | | | | | | | | | |
| | | | | | |
| | | |
| franklintempleton.com | | Semiannual Report | | | 23 | |
FRANKLIN ALTERNATIVE STRATEGIES FUNDS
CONSOLIDATED STATEMENT OF INVESTMENTS (UNAUDITED)
Franklin K2 Alternative Strategies Fund(continued)
| | | | | | | | | | | | | | | | | | |
| | | | | |
| | | | | Country | | | Shares/
Rights | | | | | | Value | |
| | | Preferred Stocks 0.0%† | | | |
| | | Electric Utilities 0.0%† | |
| | SCE Trust II, 5.10%, pfd. | | | United States | | | | 10,072 | | | | | | | $ | 245,052 | |
| | SCE Trust VI, 5.00%, pfd. | | | United States | | | | 4,317 | | | | | | | | 100,154 | |
| | | | | | | | | | | | | | | | | | |
| | Total Preferred Stocks (Cost $340,098) | | | | | | | | | | | | | | | 345,206 | |
| | | | | | | | | | | | | | | | | | |
| | | | |
| | | | | | | | Principal Amount* | | | | |
| | | Convertible Bonds 9.2% | | | |
| | | Air Freight & Logistics 0.2% | | | | | | | | | | | | |
| a | | Air Transport Services Group Inc., senior note, 1.125%, 10/15/24 | | | United States | | | | 1,498,000 | | | | | | | | 1,491,220 | |
| a | | Atlas Air Worldwide Holdings Inc., senior note, 1.875%, 6/01/24 | | | United States | | | | 1,533,000 | | | | | | | | 1,262,007 | |
| | | | | | | | | | | | | | | | | | |
| | | | | |
| | | | | | | | | | | | | | | | | 2,753,227 | |
| | | | | | | | | | | | | | | | | | |
| | | Automobiles 0.1% | |
| f | | Winnebago Industries Inc., senior note, 144A, 1.50%, 4/01/25 | | | United States | | | | 987,000 | | | | | | | | 991,338 | |
| | | | | | | | | | | | | | | | | | |
| | | Banks 0.1% | |
| | Hope Bancorp Inc., senior bond, 2.00%, 5/15/38 | | | United States | | | | 1,622,000 | | | | | | | | 1,523,996 | |
| | | | | | | | | | | | | | | | | | |
| | | Biotechnology 1.0% | |
| | BioMarin Pharmaceutical Inc., senior sub. note, 0.599%, 8/01/24 | | | United States | | | | 415,000 | | | | | | | | 427,937 | |
| | Cytokinetics Inc., senior note, 4.00%, 11/15/26 | | | United States | | | | 404,000 | | | | | | | | 452,580 | |
| | Flexion Therapeutics Inc., senior note, 3.375%, 5/01/24 | | | United States | | | | 25,000 | | | | | | | | 24,391 | |
| f | | Halozyme Therapeutics Inc., senior note, 144A, 1.25%, 12/01/24 | | | United States | | | | 731,000 | | | | | | | | 759,353 | |
| | Insmed Inc., senior note, 1.75%, 1/15/25 | | | United States | | | | 1,498,000 | | | | | | | | 1,413,863 | |
| | Intercept Pharmaceuticals Inc., senior note, 2.00%, 5/15/26 | | | United States | | | | 1,498,000 | | | | | | | | 1,795,017 | |
| | Ionis Pharmaceuticals Inc., senior note, 1.00%, 11/15/21 | | | United States | | | | 384,000 | | | | | | | | 448,560 | |
| | Ironwood Pharmaceuticals Inc., senior note, | | | | | | | | | | | | | | | | |
| | 2.25%, 6/15/22 | | | United States | | | | 1,007,000 | | | | | | | | 1,127,421 | |
| | f 144A, 1.50%, 6/15/26 | | | United States | | | | 1,203,000 | | | | | | | | 1,362,072 | |
| | Karyopharm Therapeutics Inc., senior note, 3.00%, 10/15/25 | | | United States | | | | 374,000 | | | | | | | | 496,373 | |
| a | | Ligand Pharmaceuticals Inc., senior note, 0.75%, 5/15/23 | | | United States | | | | 1,247,000 | | | | | | | | 1,089,005 | |
| | Neurocrine Biosciences Inc., senior note, 2.25%, 5/15/24 | | | United States | | | | 1,086,000 | | | | | | | | 1,772,154 | |
| | PDL BioPharma Inc., senior note, 2.75%, 12/01/24 | | | United States | | | | 846,000 | | | | | | | | 907,335 | |
| | | | | | | | | | | | | | | | | | |
| | | | | |
| | | | | | | | | | | | | | | | | 12,076,061 | |
| | | | | | | | | | | | | | | | | | |
| | | Building Products 0.1% | |
| | Patrick Industries Inc., senior note, 1.00%, 2/01/23 | | | United States | | | | 1,371,000 | | | | | | | | 1,297,309 | |
| | | | | | | | | | | | | | | | | | |
| | | Commercial Services & Supplies 0.1% | |
| a | | Team Inc., senior note, 5.00%, 8/01/23 | | | United States | | | | 1,255,000 | | | | | | | | 1,315,464 | |
| | | | | | | | | | | | | | | | | | |
| | | Communications Equipment 0.0%† | |
| | CalAmp Corp., senior note, 2.00%, 8/01/25 | | | United States | | | | 260,000 | | | | | | | | 215,063 | |
| | | | | | | | | | | | | | | | | | |
| | | Construction Materials 0.2% | |
| | Cemex SAB de CV, sub. note, 3.72%, 3/15/20 | | | Mexico | | | | 2,140,000 | | | | | | | | 2,152,227 | |
| | | | | | | | | | | | | | | | | | |
| | | Consumer Finance 0.4% | |
| | Encore Capital Group Inc., senior note,
3.25%, 3/15/22 | | | United States | | | | 1,415,000 | | | | | | | | 1,483,048 | |
| | f 144A, 3.25%, 10/01/25 | | | United States | | | | 536,000 | | | | | | | | 588,260 | |
| | EZCORP Inc., senior note, 2.375%, 5/01/25 | | | United States | | | | 855,000 | | | | | | | | 636,558 | |
| | PRA Group Inc., senior note,
a 3.00%, 8/01/20 | | | United States | | | | 1,226,000 | | | | | | | | 1,226,826 | |
| | 3.50%, 6/01/23 | | | United States | | | | 1,497,000 | | | | | | | | 1,567,146 | |
| | | | | | | | | | | | | | | | | | |
| | | | | |
| | | | | | | | | | | | | | | | | 5,501,838 | |
| | | | | | | | | | | | | | | | | | |
| | | Diversified Consumer Services 0.1% | |
| f | | Chegg Inc., senior note, 144A, 0.125%, 3/15/25 | | | United States | | | | 624,000 | | | | | | | | 645,016 | |
| | | | | | | | | | | | | | | | | | |
| | | | |
| | | |
| 24 | | Semiannual Report | | franklintempleton.com |
FRANKLIN ALTERNATIVE STRATEGIES FUNDS
CONSOLIDATED STATEMENT OF INVESTMENTS (UNAUDITED)
Franklin K2 Alternative Strategies Fund(continued)
| | | | | | | | | | | | | | | | | | |
| | | | |
| | | | | Country | | | Principal Amount* | | | Value | |
| | | Convertible Bonds (continued) | | | |
| | | Diversified Financial Services 0.2% | |
| | Element Fleet Management Corp., sub. note,
4.25%, 6/30/20 | | | Canada | | | | 468,000 | | | | CAD | | | $ | 354,229 | |
| | 4.25%, 6/30/24 | | | Canada | | | | 811,000 | | | | CAD | | | | 712,847 | |
| | Horizon Pharma Investment Ltd., senior note, 2.50%, 3/15/22 | | | United States | | | | 1,496,000 | | | | | | | | 1,897,610 | |
| | | | | | | | | | | | | | | | | | |
| | | | | | | | | | | | | | | | | 2,964,686 | |
| | | | | | | | | | | | | | | | | | |
| | | Electronic Equipment, Instruments & Components 0.5% | |
| | II-VI Inc., senior note, 0.25%, 9/01/22 | | | United States | | | | 1,497,000 | | | | | | | | 1,461,446 | |
| a | | Knowles Corp., senior note, 3.25%, 11/01/21 | | | United States | | | | 1,175,000 | | | | | | | | 1,570,386 | |
| | OSI Systems Inc., senior note, 1.25%, 9/01/22 | | | United States | | | | 835,000 | | | | | | | | 911,809 | |
| | TTM Technologies Inc., senior note, 1.75%, 12/15/20 | | | United States | | | | 1,010,000 | | | | | | | | 1,440,939 | |
| a | | Vishay Intertechnology Inc., senior note, 2.25%, 6/15/25 | | | United States | | | | 1,440,000 | | | | | | | | 1,410,162 | |
| | | | | | | | | | | | | | | | | | |
| | | | | | | | | | | | | | | | | 6,794,742 | |
| | | | | | | | | | | | | | | | | | |
| | | Energy Equipment & Services 0.0%† | |
| | Nabors Industries Inc., senior note, 0.75%, 1/15/24 | | | United States | | | | 25,000 | | | | | | | | 16,373 | |
| | | | | | | | | | | | | | | | | | |
| | | Entertainment 0.4% | |
| f | | Liberty Media Corp., senior bond, 144A,
2.25%, 12/01/48 | | | United States | | | | 1,751,000 | | | | | | | | 2,047,576 | |
| | 2.75%, 12/01/49 | | | United States | | | | 1,825,000 | | | | | | | | 1,872,450 | |
| f | | Sea Ltd., senior note, 144A, 1.00%, 12/01/24 | | | Taiwan | | | | 713,000 | | | | | | | | 735,826 | |
| f | | Zynga Inc., senior note, 144A, 0.25%, 6/01/24 | | | United States | | | | 691,000 | | | | | | | | 709,903 | |
| | | | | | | | | | | | | | | | | | |
| | | | | |
| | | | | | | | | | | | | | | | | 5,365,755 | |
| | | | | | | | | | | | | | | | | | |
| | | Equity Real Estate Investment Trusts (REITs) 0.1% | |
| f | | IIP Operating Partnership LP, senior note, 144A, 3.75%, 2/21/24 | | | United States | | | | 1,352,000 | | | | | | | | 1,717,885 | |
| | | | | | | | | | | | | | | | | | |
| | | Food & Staples Retailing 0.1% | |
| f | | The Chefs’ Warehouse Inc., senior note, 144A, 1.875%, 12/01/24 | | | United States | | | | 585,000 | | | | | | | | 608,731 | |
| | | | | | | | | | | | | | | | | | |
| | | Health Care Equipment & Supplies 0.4% | |
| f | | DexCom Inc., senior note, 144A, 0.75%, 12/01/23 | | | United States | | | | 1,247,000 | | | | | | | | 1,895,674 | |
| | Wright Medical Group Inc., senior note, 1.625%, 6/15/23 | | | United States | | | | 805,000 | | | | | | | | 834,817 | |
| | Wright Medical Group NV, senior note, 2.25%, 11/15/21 | | | United States | | | | 1,309,000 | | | | | | | | 1,863,339 | |
| | | | | | | | | | | | | | | | | | |
| | | | | | | | | | | | | | | | | 4,593,830 | |
| | | | | | | | | | | | | | | | | | |
| | | Health Care Technology 0.3% | |
| | Allscripts Healthcare Solutions Inc., senior note, 1.25%, 7/01/20 | | | United States | | | | 2,628,000 | | | | | | | | 2,616,480 | |
| | Evolent Health Inc., senior note, 1.50%, 10/15/25 | | | United States | | | | 192,000 | | | | | | | | 123,932 | |
| f | | Tabula Rasa Healthcare Inc., senior sub. note, 144A, 1.75%, 2/15/26 | | | United States | | | | 807,000 | | | | | | | | 773,682 | |
| | | | | | | | | | | | | | | | | | |
| | | | | |
| | | | | | | | | | | | | | | | | 3,514,094 | |
| | | | | | | | | | | | | | | | | | |
| | | Hotels, Restaurants & Leisure 0.1% | |
| | Marriott Vacations Worldwide Corp., senior note, 1.50%, 9/15/22 | | | United States | | | | 1,623,000 | | | | | | | | 1,703,424 | |
| | | | | | | | | | | | | | | | | | |
| | | Independent Power & Renewable Electricity Producers 0.0%† | |
| a | | NRG Energy Inc., senior bond, 2.75%, 6/01/48 | | | United States | | | | 374,000 | | | | | | | | 422,276 | |
| | | | | | | | | | | | | | | | | | |
| | | Interactive Media & Services 0.3% | |
| | Zillow Group Inc., senior note,
2.00%, 12/01/21 | | | United States | | | | 1,248,000 | | | | | | | | 1,325,862 | |
| | 1.50%, 7/01/23 | | | United States | | | | 1,497,000 | | | | | | | | 1,377,623 | |
| | f 144A, 0.75%, 9/01/24 | | | United States | | | | 772,000 | | | | | | | | 855,596 | |
| | | | | | | | | | | | | | | | | | |
| | | | | | | | | | | | | | | | | 3,559,081 | |
| | | | | | | | | | | | | | | | | | |
| | | Internet & Direct Marketing Retail 0.1% | |
| f | | Pinduoduo Inc., senior note, 144A, zero cpn., 10/01/24 | | | China | | | | 109,000 | | | | | | | | 120,391 | |
| | Wayfair Inc., senior note, 0.375%, 9/01/22 | | | United States | | | | 998,000 | | | | | | | | 1,052,266 | |
| | | | | | | | | | | | | | | | | | |
| | | | | |
| | | | | | | | | | | | | | | | | 1,172,657 | |
| | | | | | | | | | | | | | | | | | |
| | | | | | |
| | | |
| franklintempleton.com | | Semiannual Report | | | 25 | |
FRANKLIN ALTERNATIVE STRATEGIES FUNDS
CONSOLIDATED STATEMENT OF INVESTMENTS (UNAUDITED)
Franklin K2 Alternative Strategies Fund(continued)
| | | | | | | | | | | | | | | | | | |
| | | | |
| | | | | Country | | | Principal Amount* | | | Value | |
| | | Convertible Bonds (continued) | | | |
| | | IT Services 0.6% | |
| | Cardtronics Inc., senior note, 1.00%, 12/01/20 | | | United States | | | | 1,997,000 | | | | | | | $ | 2,089,358 | |
| | CSG Systems International Inc., senior bond, 4.25%, 3/15/36 | | | United States | | | | 1,497,000 | | | | | | | | 1,766,726 | |
| f | | KBR Inc., senior note, 144A, 2.50%, 11/01/23 | | | United States | | | | 1,123,000 | | | | | | | | 1,462,390 | |
| f | | Okta Inc., senior note, 144A, 0.125%, 9/01/25 | | | United States | | | | 1,498,000 | | | | | | | | 1,517,661 | |
| | Perficient Inc., senior note, 2.375%, 9/15/23 | | | United States | | | | 572,000 | | | | | | | | 731,421 | |
| | | | | | | | | | | | | | | | | | |
| | | | | |
| | | | | | | | | | | | | | | | | 7,567,556 | |
| | | | | | | | | | | | | | | | | | |
| | | Machinery 0.0%† | |
| | The Greenbrier Cos. Inc., senior note, 2.875%, 2/01/24 | | | United States | | | | 45,000 | | | | | | | | 42,725 | |
| | | | | | | | | | | | | | | | | | |
| | | Media 0.2% | |
| | DISH Network Corp.,
senior bond, 3.375%, 8/15/26 | | | United States | | | | 325,000 | | | | | | | | 307,328 | |
| | senior note, 2.375%, 3/15/24 | | | United States | | | | 280,000 | | | | | | | | 253,838 | |
| | Liberty Interactive LLC,
senior bond, 4.00%, 11/15/29 | | | United States | | | | 1,249,000 | | | | | | | | 885,229 | |
| | senior note, 3.75%, 2/15/30 | | | United States | | | | 407,000 | | | | | | | | 281,339 | |
| f | | Liberty Latin America Ltd., senior note, 144A, 2.00%, 7/15/24 | | | Chile | | | | 998,000 | | | | | | | | 1,019,786 | |
| | | | | | | | | | | | | | | | | | |
| | | | | |
| | | | | | | | | | | | | | | | | 2,747,520 | |
| | | | | | | | | | | | | | | | | | |
| | | Metals & Mining 0.1% | |
| | First Majestic Silver Corp., senior note, 1.875%, 3/01/23 | | | Canada | | | | 1,267,000 | | | | | | | | 1,662,937 | |
| | | | | | | | | | | | | | | | | | |
| | | Mortgage Real Estate Investment Trusts (REITs) 0.3% | |
| f | | Arbor Realty Trust Inc., senior note, 144A, 4.75%, 11/01/22 | | | United States | | | | 624,000 | | | | | | | | 624,213 | |
| f | | PennyMac Corp., senior note, 144A, 5.50%, 11/01/24 | | | United States | | | | 1,248,000 | | | | | | | | 1,257,413 | |
| | Redwood Trust Inc., senior note, 4.75%, 8/15/23 | | | United States | | | | 1,422,000 | | | | | | | | 1,436,139 | |
| | | | | | | | | | | | | | | | | | |
| | | | | |
| | | | | | | | | | | | | | | | | 3,317,765 | |
| | | | | | | | | | | | | | | | | | |
| | | Oil, Gas & Consumable Fuels 0.1% | |
| | Chesapeake Energy Corp., senior note, 5.50%, 9/15/26 | | | United States | | | | 95,000 | | | | | | | | 42,002 | |
| a | | Ship Finance International Ltd., senior note, 5.75%, 10/15/21 | | | Norway | | | | 1,430,000 | | | | | | | | 1,503,385 | |
| | | | | | | | | | | | | | | | | | |
| | | | | |
| | | | | | | | | | | | | | | | | 1,545,387 | |
| | | | | | | | | | | | | | | | | | |
| | | Personal Products 0.1% | |
| | Herbalife Nutrition Ltd., senior note, 2.625%, 3/15/24 | | | United States | | | | 1,325,000 | | | | | | | | 1,343,066 | |
| | | | | | | | | | | | | | | | | | |
| | | Pharmaceuticals 0.7% | |
| f | | Aerie Pharmaceuticals Inc., senior note, 144A, 1.50%, 10/01/24 | | | United States | | | | 1,246,000 | | | | | | | | 1,270,417 | |
| f | | Aphria Inc., senior note, 144A, 5.25%, 6/01/24 | | | Canada | | | | 1,132,000 | | | | | | | | 733,423 | |
| a,f | | Aurora Cannabis Inc., senior note, 144A, 5.50%, 2/28/24 | | | Canada | | | | 1,802,000 | | | | | | | | 1,206,214 | |
| f | | Canopy Growth Corp., senior note, 144A, 4.25%, 7/15/23 | | | Canada | | | | 2,031,000 | | | | CAD | | | | 1,337,894 | |
| a | | Innoviva Inc., sub. note, 2.125%, 1/15/23 | | | United States | | | | 1,496,000 | | | | | | | | 1,493,195 | |
| | Pacira Biosciences Inc., senior note, 2.375%, 4/01/22 | | | United States | | | | 1,241,000 | | | | | | | | 1,301,499 | |
| | Tilray Inc., senior note, 5.00%, 10/01/23 | | | Canada | | | | 2,060,000 | | | | | | | | 1,138,150 | |
| | | | | | | | | | | | | | | | | | |
| | | | | |
| | | | | | | | | | | | | | | | | 8,480,792 | |
| | | | | | | | | | | | | | | | | | |
| | | Real Estate Management & Development 0.1% | |
| | Redfin Corp., senior note, 1.75%, 7/15/23 | | | United States | | | | 1,879,000 | | | | | | | | 1,795,155 | |
| | | | | | | | | | | | | | | | | | |
| | | Semiconductors & Semiconductor Equipment 0.6% | |
| | Cree Inc., senior note, 0.875%, 9/01/23 | | | United States | | | | 734,000 | | | | | | | | 766,571 | |
| f | | Enphase Energy Inc., senior note, 144A, 1.00%, 6/01/24 | | | United States | | | | 504,000 | | | | | | | | 681,975 | |
| | Inphi Corp., senior note, 0.75%, 9/01/21 | | | United States | | | | 1,496,000 | | | | | | | | 2,026,834 | |
| a | | Microchip Technology Inc., senior sub. bond, 1.625%, 2/15/27 | | | United States | | | | 1,496,000 | | | | | | | | 1,957,496 | |
| | Silicon Laboratories Inc., senior note, 1.375%, 3/01/22 | | | United States | | | | 365,000 | | | | | | | | 458,185 | |
| | Synaptics Inc., senior note, 0.50%, 6/15/22 | | | United States | | | | 998,000 | | | | | | | | 1,039,305 | |
| | | | | | | | | | | | | | | | | | |
| | | | | |
| | | | | | | | | | | | | | | | | 6,930,366 | |
| | | | | | | | | | | | | | | | | | |
| | | | |
| | | |
| 26 | | Semiannual Report | | franklintempleton.com |
FRANKLIN ALTERNATIVE STRATEGIES FUNDS
CONSOLIDATED STATEMENT OF INVESTMENTS (UNAUDITED)
Franklin K2 Alternative Strategies Fund(continued)
| | | | | | | | | | | | | | | | | | |
| | | | |
| | | | | Country | | | Principal Amount* | | | Value | |
| | | Convertible Bonds (continued) | | | |
| | | Software 1.3% | |
| f | | 8x8 Inc., senior note, 144A, 0.50%, 2/01/24 | | | United States | | | | 1,247,000 | | | | | | | $ | 1,309,435 | |
| | Altair Engineering Inc., senior note, 0.25%, 6/01/24 | | | United States | | | | 1,247,000 | | | | | | | | 1,228,122 | |
| f | | Benefitfocus Inc., senior note, 144A, 1.25%, 12/15/23 | | | United States | | | | 1,248,000 | | | | | | | | 1,098,969 | |
| f | | Blackline Inc., senior note, 144A, 0.125%, 8/01/24 | | | United States | | | | 292,000 | | | | | | | | 297,920 | |
| f | | Coupa Software Inc., senior note, 144A, 0.125%, 6/15/25 | | | United States | | | | 1,496,000 | | | | | | | | 1,808,511 | |
| f | | J2 Global Inc., senior note, 144A, 1.75%, 11/01/26 | | | United States | | | | 183,000 | | | | | | | | 186,923 | |
| f | | LivePerson Inc., senior note, 144A, 0.75%, 3/01/24 | | | United States | | | | 367,000 | | | | | | | | 459,430 | |
| a | | Nuance Communications Inc., senior bond, 1.00%, 12/15/35 | | | United States | | | | 2,905,000 | | | | | | | | 2,898,555 | |
| | Nutanix Inc., senior note, zero cpn., 1/15/23 | | | United States | | | | 1,870,000 | | | | | | | | 1,983,895 | |
| | Palo Alto Networks Inc., senior note, 0.75%, 7/01/23 | | | United States | | | | 374,000 | | | | | | | | 410,975 | |
| f | | Pluralsight Inc., senior note, 144A, 0.375%, 3/01/24 | | | United States | | | | 1,870,000 | | | | | | | | 1,618,200 | |
| f | | PROS Holdings Inc., senior note, 144A, 1.00%, 5/15/24 | | | United States | | | | 394,000 | | | | | | | | 461,405 | |
| | Rapid7 Inc., senior note, 1.25%, 8/01/23 | | | United States | | | | 930,000 | | | | | | | | 1,386,804 | |
| f | | SailPoint Technologies Holding Inc., senior note, 144A, 0.125%, 9/15/24 | | | United States | | | | 998,000 | | | | | | | | 1,103,604 | |
| | Splunk Inc., senior note,
0.50%, 9/15/23 | | | United States | | | | 365,000 | | | | | | | | 439,714 | |
| | 1.125%, 9/15/25 | | | United States | | | | 183,000 | | | | | | | | 226,184 | |
| | Verint Systems Inc., senior note, 1.50%, 6/01/21 | | | United States | | | | 146,000 | | | | | | | | 150,459 | |
| | | | | | | | | | | | | | | | | | |
| | | | | |
| | | | | | | | | | | | | | | | | 17,069,105 | |
| | | | | | | | | | | | | | | | | | |
| | | Specialty Retail 0.1% | |
| f | | RH, senior note, 144A, zero cpn., 9/15/24 | | | United States | | | | 1,496,000 | | | | | | | | 1,717,595 | |
| | | | | | | | | | | | | | | | | | |
| | | Technology Hardware, Storage & Peripherals 0.1% | |
| | Pure Storage Inc., senior note, 0.125%, 4/15/23 | | | United States | | | | 1,124,000 | | | | | | | | 1,102,807 | |
| | | | | | | | | | | | | | | | | | |
| | | Tobacco 0.1% | |
| f | | Turning Point Brands Inc., senior note, 144A, 2.50%, 7/15/24 | | | United States | | | | 1,268,000 | | | | | | | | 1,114,984 | |
| | | | | | | | | | | | | | | | | | |
| | | Trading Companies & Distributors 0.0%† | |
| | Kaman Corp., senior note, 3.25%, 5/01/24 | | | United States | | | | 398,000 | | | | | | | | 470,436 | |
| | | | | | | | | | | | | | | | | | |
| | Total Convertible Bonds (Cost $113,693,922) | | | | | | | | | | | | | | | 117,813,269 | |
| | | | | | | | | | | | | | | | | | |
| | | Corporate Bonds and Notes 7.1% | | | |
| | | Aerospace & Defense 0.1% | |
| | The Boeing Co., senior note, 2.70%, 5/01/22 | | | United States | | | | 375,000 | | | | | | | | 381,470 | |
| f | | Leonardo US Holdings Inc., senior bond, 144A, 6.25%, 1/15/40 | | | Italy | | | | 236,000 | | | | | | | | 259,718 | |
| f | | Rolls-Royce PLC, senior note, 144A, 2.375%, 10/14/20 | | | United Kingdom | | | | 400,000 | | | | | | | | 400,802 | |
| | Triumph Group Inc., senior note, 5.25%, 6/01/22 | | | United States | | | | 365,000 | | | | | | | | 366,026 | |
| | | | | | | | | | | | | | | | | | |
| | | | | |
| | | | | | | | | | | | | | | | | 1,408,016 | |
| | | | | | | | | | | | | | | | | | |
| | | Air Freight & Logistics 0.0%† | |
| | FedEx Corp., senior note, 3.40%, 1/14/22 | | | United States | | | | 170,000 | | | | | | | | 174,637 | |
| | | | | | | | | | | | | | | | | | |
| | | Airlines 0.0%† | |
| | United Airlines Pass-Through Trust,2019-2, B, 3.50%, 5/01/28 | | | United States | | | | 410,000 | | | | | | | | 416,412 | |
| | | | | | | | | | | | | | | | | | |
| | | Automobiles 0.3% | |
| | American Honda Finance Corp., senior note, 1.95%, 5/20/22 | | | United States | | | | 325,000 | | | | | | | | 324,869 | |
| f,h | | BMW US Capital LLC, senior note, 144A, FRN, 2.411%,(3-Month USD LIBOR + 0.41%), 4/12/21 | | | Germany | | | | 465,000 | | | | | | | | 465,863 | |
| f | | Daimler Finance North America LLC, senior note, 144A,
3.40%, 2/22/22 | | | Germany | | | | 385,000 | | | | | | | | 394,435 | |
| | h FRN, 2.81%,(3-Month USD LIBOR + 0.90%), 2/15/22 | | | Germany | | | | 400,000 | | | | | | | | 402,837 | |
| | General Motors Financial Co. Inc., senior note,
3.70%, 11/24/20 | | | United States | | | | 155,000 | | | | | | | | 156,867 | |
| | h FRN, 2.862%,(3-Month USD LIBOR + 0.85%), 4/09/21 | | | United States | | | | 275,000 | | | | | | | | 275,226 | |
| f | | Hyundai Capital America, senior note, 144A, 3.95%, 2/01/22 | | | United States | | | | 375,000 | | | | | | | | 385,442 | |
| f | | Nissan Motor Acceptance Corp., senior note, 144A, 3.65%, 9/21/21 | | | United States | | | | 375,000 | | | | | | | | 383,185 | |
| f | | Tesla Inc., senior note, 144A, 5.30%, 8/15/25 | | | United States | | | | 928,000 | | | | | | | | 892,031 | |
| | | | | | |
| | | |
| franklintempleton.com | | Semiannual Report | | | 27 | |
FRANKLIN ALTERNATIVE STRATEGIES FUNDS
CONSOLIDATED STATEMENT OF INVESTMENTS (UNAUDITED)
Franklin K2 Alternative Strategies Fund(continued)
| | | | | | | | | | | | | | | | | | |
| | | | |
| | | | | Country | | | Principal Amount* | | | Value | |
| | | Corporate Bonds and Notes (continued) | | | |
| | | Automobiles (continued) | |
| | Toyota Motor Credit Corp., senior note,
3.05%, 1/08/21 | | | United States | | | | 325,000 | | | | | | | $ | 329,223 | |
| | h FRN, 2.333%,(3-Month USD LIBOR + 0.29%), 10/07/21 | | | United States | | | | 415,000 | | | | | | | | 416,007 | |
| f,h | | Volkswagen Group of America Finance LLC, senior note, 144A, FRN, 2.972%,(3-Month USD LIBOR + 0.86%), 9/24/21 | | | Germany | | | | 410,000 | | | | | | | | 412,716 | |
| | | | | | | | | | | | | | | | | | |
| | | | | |
| | | | | | | | | | | | | | | | | 4,838,701 | |
| | | | | | | | | | | | | | | | | | |
| | | Banks 0.5% | |
| f | | Banco Macro SA, senior note, 144A, 17.50%, 5/08/22 | | | Argentina | | | | 1,740,000 | | | | ARS | | | | 10,939 | |
| | Capital One NA, senior note, 2.15%, 9/06/22 | | | United States | | | | 440,000 | | | | | | | | 439,131 | |
| | Citibank NA, senior note,
3.05%, 5/01/20 | | | United States | | | | 435,000 | | | | | | | | 436,613 | |
| | h FRN, 3.165%,(3-Month USD LIBOR + 0.53%), 2/19/22 | | | United States | | | | 250,000 | | | | | | | | 252,741 | |
| h | | Citigroup Inc., senior note, FRN, 2.428%, (SOFR + 0.87%), 11/04/22 | | | United States | | | | 205,000 | | | | | | | | 205,945 | |
| h | | HSBC Holdings PLC, senior note, FRN, 2.782%,(3-Month USD LIBOR + 0.65%), 9/11/21 | | | United Kingdom | | | | 375,000 | | | | | | | | 376,103 | |
| h | | JPMorgan Chase & Co., senior note, FRN, 2.587%,(3-Month USD LIBOR + 0.68%), 6/01/21 | | | United States | | | | 140,000 | | | | | | | | 140,301 | |
| | Keybank NA, senior note, 3.30%, 2/01/22 | | | United States | | | | 250,000 | | | | | | | | 256,819 | |
| h | | Mitsubishi UFJ Financial Group Inc., senior note, FRN, 2.586%,(3-Month USD LIBOR + 0.65%), 7/26/21 | | | Japan | | | | 380,000 | | | | | | | | 381,944 | |
| h | | PNC Bank NA, senior note, FRN, 2.403%,(3-Month USD LIBOR + 0.45%), 7/22/22 | | | United States | | | | 835,000 | | | | | | | | 836,507 | |
| f,h | | Standard Chartered PLC, senior note, 144A, FRN,
3.334%,(3-Month USD LIBOR + 1.20%), 9/10/22 | | | United Kingdom | | | | 410,000 | | | | | | | | 413,192 | |
| | 3.116%,(3-Month USD LIBOR + 1.15%), 1/20/23 | | | United Kingdom | | | | 200,000 | | | | | | | | 201,274 | |
| | 4.247%,(3-Month USD LIBOR + 1.15%), 1/20/23 | | | United Kingdom | | | | 200,000 | | | | | | | | 206,781 | |
| h | | Sumitomo Mitsui Financial Group Inc., senior note, FRN, 2.954%,(3-Month USD LIBOR + 0.97%), 1/11/22 | | | Japan | | | | 115,000 | | | | | | | | 116,163 | |
| | US Bank NA, senior note, 3.00%, 2/04/21 | | | United States | | | | 375,000 | | | | | | | | 379,488 | |
| i,j | | VTB Bank OJSC Via VTB Capital SA, loan participation, sub. senior note, Reg S, 6.95%, 10/17/22 | | | Russia | | | | 486,000 | | | | | | | | 526,275 | |
| h | | Wells Fargo & Co., senior note, FRN,
3.473%,(3-Month USD LIBOR + 1.34%), 3/04/21 | | | United States | | | | 230,000 | | | | | | | | 233,153 | |
| | 2.831%,(3-Month USD LIBOR + 0.93%), 2/11/22 | | | United States | | | | 495,000 | | | | | | | | 498,603 | |
| | Wells Fargo Bank NA, senior note, 3.625%, 10/22/21 | | | United States | | | | 250,000 | | | | | | | | 257,481 | |
| | | | | | | | | | | | | | | | | | |
| | | | | |
| | | | | | | | | | | | | | | | | 6,169,453 | |
| | | | | | | | | | | | | | | | | | |
| | | Biotechnology 0.0%† | |
| f,h | | AbbVie Inc., senior note, 144A, FRN, 2.545%,(3-Month USD LIBOR + 0.65%), 11/21/22 | | | United States | | | | 415,000 | | | | | | | | 416,689 | |
| | | | | | | | | | | | | | | | | | |
| | | Capital Markets 0.1% | |
| h | | The Bank of New York Mellon, senior note, FRN, 2.433%,(3-Month USD LIBOR + 0.30%), 12/04/20 | | | United States | | | | 385,000 | | | | | | | | 385,002 | |
| f | | eG Global Finance PLC, senior secured note, 144A,
4.375%, 2/07/25 | | | United Kingdom | | | | 100,000 | | | | EUR | | | | 109,491 | |
| | 6.25%, 10/30/25 | | | United Kingdom | | | | 144,000 | | | | EUR | | | | 166,861 | |
| | 8.50%, 10/30/25 | | | United Kingdom | | | | 284,000 | | | | | | | | 298,200 | |
| f | | MSCI Inc., senior bond, 144A, 4.00%, 11/15/29 | | | United States | | | | 80,000 | | | | | | | | 80,600 | |
| | | | | | | | | | | | | | | | | | |
| | | | | |
| | | | | | | | | | | | | | | | | 1,040,154 | |
| | | | | | | | | | | | | | | | | | |
| | | Chemicals 0.1% | |
| | Methanex Corp., senior bond, 5.25%, 12/15/29 | | | Canada | | | | 455,000 | | | | | | | | 463,223 | |
| f | | TPC Group Inc., senior secured note, 144A, 10.50%, 8/01/24 | | | United States | | | | 259,000 | | | | | | | | 260,940 | |
| | | | | | | | | | | | | | | | | | |
| | | | | |
| | | | | | | | | | | | | | | | | 724,163 | |
| | | | | | | | | | | | | | | | | | |
| | | | |
| | | |
| 28 | | Semiannual Report | | franklintempleton.com |
FRANKLIN ALTERNATIVE STRATEGIES FUNDS
CONSOLIDATED STATEMENT OF INVESTMENTS (UNAUDITED)
Franklin K2 Alternative Strategies Fund(continued)
| | | | | | | | | | | | | | | | | | |
| | | | |
| | | | | Country | | | Principal Amount* | | | Value | |
| | | Corporate Bonds and Notes (continued) | | | |
| | | Commercial Services & Supplies 1.4% | |
| f | | Harland Clarke Holdings Corp., 144A,
a senior note, 9.25%, 3/01/21 | | | United States | | | | 12,338,500 | | | | | | | $ | 11,479,740 | |
| | senior secured note, 8.375%, 8/15/22 | | | United States | | | | 3,207,000 | | | | | | | | 2,414,268 | |
| | R.R. Donnelley & Sons Co., senior bond,
6.50%, 11/15/23 | | | United States | | | | 1,728,000 | | | | | | | | 1,784,877 | |
| | 6.00%, 4/01/24 | | | United States | | | | 2,630,000 | | | | | | | | 2,720,959 | |
| | | | | | | | | | | | | | | | | | |
| | | | | |
| | | | | | | | | | | | | | | | | 18,399,844 | |
| | | | | | | | | | | | | | | | | | |
| | | Communications Equipment 0.0%† | |
| f | | CommScope Technologies LLC, senior bond, 144A,
6.00%, 6/15/25 | | | United States | | | | 25,000 | | | | | | | | 24,188 | |
| | 5.00%, 3/15/27 | | | United States | | | | 430,000 | | | | | | | | 378,419 | |
| | | | | | | | | | | | | | | | | | |
| | | | | |
| | | | | | | | | | | | | | | | | 402,607 | |
| | | | | | | | | | | | | | | | | | |
| | | Construction & Engineering 0.0%† | |
| j | | GMR Hyderabad International Airport Ltd., senior secured note, Reg S, 5.375%, 4/10/24 | | | India | | | | 200,000 | | | | | | | | 206,605 | |
| | | | | | | | | | | | | | | | | | |
| | | Consumer Finance 0.1% | |
| | American Express Co., senior note,
3.00%, 2/22/21 | | | United States | | | | 165,000 | | | | | | | | 167,089 | |
| | h FRN, 2.491%,(3-Month USD LIBOR + 0.60%), 11/05/21 | | | United States | | | | 260,000 | | | | | | | | 261,582 | |
| | PACCAR Financial Corp., senior note, 2.65%, 5/10/22 | | | United States | | | | 420,000 | | | | | | | | 427,378 | |
| | | | | | | | | | | | | | | | | | |
| | | | | |
| | | | | | | | | | | | | | | | | 856,049 | |
| | | | | | | | | | | | | | | | | | |
| | | Containers & Packaging 0.0%† | |
| j | | Lecta SA, senior secured note, Reg S, 6.50%, 8/01/23 | | | Spain | | | | 288,000 | | | | EUR | | | | 152,504 | |
| | | | | | | | | | | | | | | | | | |
| | | Distributors 0.1% | |
| f,k | | American News Co. LLC, senior note, 144A, PIK, 8.50%, 9/01/26 | | | United States | | | | 1,499,545 | | | | | | | | 1,593,075 | |
| | | | | | | | | | | | | | | | | | |
| | | Diversified Financial Services 0.5% | |
| f,h | | Banco Supervielle SA, senior note, 144A, FRN, 52.771%, (ARS Badlar + 4.50%), 8/09/20 | | | Argentina | | | | 3,800,000 | | | | ARS | | | | 50,465 | |
| | Citizens Bank NA, senior note, 3.25%, 2/14/22 | | | United States | | | | 390,000 | | | | | | | | 399,235 | |
| f | | Financiera de Desarrollo Territorial SA Findeter, senior bond, 144A, 7.875%, 8/12/24 | | | Colombia | | | | 795,000,000 | | | | COP | | | | 241,797 | |
| j | | MDC-GMTN BV, senior bond, Reg S, 4.50%, 11/07/28 | | | United Arab Emirates | | | | 261,000 | | | | | | | | 295,380 | |
| f | | Mitsubishi UFJ Lease & Finance Co. Ltd., senior note, 144A, 3.406%, 2/28/22 | | | Japan | | | | 320,000 | | | | | | | | 326,611 | |
| f | | One Call Corp., senior secured note, first lien, 144A, 7.50%, 7/01/24 | | | United States | | | | 4,092,583 | | | | | | | | 4,031,194 | |
| f | | Refinitiv U.S. Holdings Inc., senior note, 144A, 8.25%, 11/15/26 | | | United States | | | | 215,000 | | | | | | | | 241,074 | |
| f | | USAA Capital Corp., senior note, 144A, 2.625%, 6/01/21 | | | United States | | | | 180,000 | | | | | | | | 182,006 | |
| | | | | | | | | | | | | | | | | | |
| | | | | |
| | | | | | | | | | | | | | | | | 5,767,762 | |
| | | | | | | | | | | | | | | | | | |
| | | Diversified Telecommunication Services 0.3% | |
| | AT&T Inc., senior note,
3.80%, 3/15/22 | | | United States | | | | 530,000 | | | | | | | | 550,039 | |
| | h FRN, 2.657%,(3-Month USD LIBOR + 0.75%), 6/01/21 | | | United States | | | | 155,000 | | | | | | | | 156,030 | |
| f | | Cincinnati Bell Inc., senior note, 144A, | | | | | | | | | | | | | | | | |
| | 7.00%, 7/15/24 | | | United States | | | | 176,000 | | | | | | | | 165,218 | |
| | 8.00%, 10/15/25 | | | United States | | | | 360,000 | | | | | | | | 329,549 | |
| | Frontier Communications Corp., | | | | | | | | | | | | | | | | |
| | senior bond, 7.125%, 1/15/23 | | | United States | | | | 132,000 | | | | | | | | 60,885 | |
| | senior bond, 7.625%, 4/15/24 | | | United States | | | | 84,000 | | | | | | | | 39,480 | |
| | senior bond, 6.875%, 1/15/25 | | | United States | | | | 33,000 | | | | | | | | 15,111 | |
| | | | | | |
| | | |
| franklintempleton.com | | Semiannual Report | | | 29 | |
FRANKLIN ALTERNATIVE STRATEGIES FUNDS
CONSOLIDATED STATEMENT OF INVESTMENTS (UNAUDITED)
Franklin K2 Alternative Strategies Fund(continued)
| | | | | | | | | | | | | | | | | | |
| | | | |
| | | | | Country | | | Principal Amount* | | | Value | |
| | | Corporate Bonds and Notes (continued) | | | |
| | | Diversified Telecommunication Services (continued) | |
| | senior bond, 9.00%, 8/15/31 | | | United States | | | | 271,000 | | | | | | | $ | 123,992 | |
| | f senior secured note, 144A, 8.00%, 4/01/27 | | | United States | | | | 791,000 | | | | | | | | 818,545 | |
| f | | Intelsat Jackson Holdings SA, senior secured note, 144A, | | | | | | | | | | | | | | | | |
| | 9.50%, 9/30/22 | | | Luxembourg | | | | 1,244,000 | | | | | | | | 1,393,668 | |
| | 8.00%, 2/15/24 | | | Luxembourg | | | | 214,000 | | | | | | | | 218,813 | |
| f | | Kenbourne Invest SA, senior note, 144A, 6.875%, 11/26/24 | | | Chile | | | | 200,000 | | | | | | | | 203,250 | |
| | | | | | | | | | | | | | | | | | |
| | | | | |
| | | | | | | | | | | | | | | | | 4,074,580 | |
| | | | | | | | | | | | | | | | | | |
| | | Electric Utilities 0.2% | |
| f | | Enel SpA, sub. bond, 144A, 8.75% to 9/24/23, FRN thereafter, 9/24/73 | | | Italy | | | | 545,000 | | | | | | | | 639,067 | |
| j | | Eskom Holdings SOC Ltd., senior bond, Reg S, | | | | | | | | | | | | | | | | |
| | 5.75%, 1/26/21 | | | South Africa | | | | 214,000 | | | | | | | | 214,076 | |
| | 8.45%, 8/10/28 | | | South Africa | | | | 692,000 | | | | | | | | 738,011 | |
| h | | Florida Power & Light Co., senior note, FRN, 2.308%,(3-Month USD LIBOR + 0.40%), 5/06/22 | | | United States | | | | 415,000 | | | | | | | | 415,013 | |
| f | | Vistra Operations Co. LLC, senior secured note, 144A, 3.70%, 1/30/27 | | | United States | | | | 590,000 | | | | | | | | 584,095 | |
| | | | | | | | | | | | | | | | | | |
| | | | | |
| | | | | | | | | | | | | | | | | 2,590,262 | |
| | | | | | | | | | | | | | | | | | |
| | | Energy Equipment & Services 0.1% | |
| f | | Transocean Inc., senior note, 144A, 7.50%, 1/15/26 | | | United States | | | | 434,000 | | | | | | | | 390,677 | |
| f | | Vantage Drilling International, senior secured note, 144A, 9.25%, 11/15/23 | | | United States | | | | 330,000 | | | | | | | | 310,063 | |
| | | | | | | | | | | | | | | | | | |
| | | | | |
| | | | | | | | | | | | | | | | | 700,740 | |
| | | | | | | | | | | | | | | | | | |
| | | Entertainment 0.1% | |
| h | | The Walt Disney Co., senior note, FRN, 2.297%,(3-Month USD LIBOR + 0.39%), 9/01/22 | | | United States | | | | 800,000 | | | | | | | | 804,926 | |
| | | | | | | | | | | | | | | | | | |
| | | Equity Real Estate Investment Trusts (REITs) 0.0%† | |
| f | | Neiman Marcus Group Ltd. LLC / Neiman Marcus Group LLC / Mariposa Borrower, secured note, 144A, 8.00%, 10/25/24 | | | United States | | | | 718,000 | | | | | | | | 201,040 | |
| | | | | | | | | | | | | | | | | | |
| | | Food & Staples Retailing 0.1% | |
| f | | Albertsons Cos. Inc. / Safeway Inc. / New Albertsons LP / Albertsons LLC, senior note, 144A, 4.625%, 1/15/27 | | | United States | | | | 825,000 | | | | | | | | 816,832 | |
| j | | Casino Guichard Perrachon SA, Reg S, | | | | | | | | | | | | | | | | |
| | h,l junior sub. bond, E, FRN, 3.992%, (EUR 5 Year Swap + 3.82%), Perpetual | | | France | | | | 200,000 | | | | EUR | | | | 131,939 | |
| | senior bond, E, 4.048%, 8/05/26 | | | France | | | | 100,000 | | | | EUR | | | | 93,659 | |
| f | | NBM US Holdings Inc., senior note, 144A, 7.00%, 5/14/26 | | | Brazil | | | | 325,000 | | | | | | | | 345,843 | |
| | Unilever Capital Corp., senior note, 3.00%, 3/07/22 | | | United Kingdom | | | | 380,000 | | | | | | | | 389,284 | |
| | | | | | | | | | | | | | | | | | |
| | | | | |
| | | | | | | | | | | | | | | | | 1,777,557 | |
| | | | | | | | | | | | | | | | | | |
| | | Food Products 0.1% | |
| f | | BRF SA, senior bond, 144A, 4.875%, 1/24/30 | | | Brazil | | | | 265,000 | | | | | | | | 264,337 | |
| h | | Campbell Soup Co., senior note, FRN, 2.619%,(3-Month USD LIBOR + 0.50%), 3/16/20 | | | United States | | | | 235,000 | | | | | | | | 235,120 | |
| f | | JBS USA LUX SA / JBS USA Food Co. / JBS USA Finance Inc., senior bond, 144A, 5.50%, 1/15/30 | | | United States | | | | 160,000 | | | | | | | | 171,056 | |
| | | | | | | | | | | | | | | | | | |
| | | | | |
| | | | | | | | | | | | | | | | | 670,513 | |
| | | | | | | | | | | | | | | | | | |
| | | Health Care Providers & Services 0.1% | |
| f,m | | Aveanna Healthcare LLC, senior secured note, 144A, 9.75%, 12/15/26 | | | United States | | | | 415,000 | | | | | | | | 433,675 | |
| | Cigna Corp., senior note, 3.40%, 9/17/21 | | | United States | | | | 380,000 | | | | | | | | 388,460 | |
| | | | |
| | | |
| 30 | | Semiannual Report | | franklintempleton.com |
FRANKLIN ALTERNATIVE STRATEGIES FUNDS
CONSOLIDATED STATEMENT OF INVESTMENTS (UNAUDITED)
Franklin K2 Alternative Strategies Fund(continued)
| | | | | | | | | | | | | | | | | | |
| | | | |
| | | | | Country | | | Principal Amount* | | | Value | |
| | | Corporate Bonds and Notes (continued) | | | |
| | | Health Care Providers & Services (continued) | |
| | CVS Health Corp., senior note,
2.80%, 7/20/20 | | | United States | | | | 390,000 | | | | | | | $ | 391,841 | |
| | 2.125%, 6/01/21 | | | United States | | | | 400,000 | | | | | | | | 400,220 | |
| | | | | | | | | | | | | | | | | | |
| | | | | |
| | | | | | | | | | | | | | | | | 1,614,196 | |
| | | | | | | | | | | | | | | | | | |
| | | Hotels, Restaurants & Leisure 0.6% | |
| f | | 1011778 Bc Ulc / New Red Finance Inc., secured note, 144A, 4.375%, 1/15/28 | | | Canada | | | | 310,000 | | | | | | | | 311,937 | |
| f,m | | Boyd Gaming Corp., senior note, 144A, 4.75%, 12/01/27 | | | United States | | | | 235,000 | | | | | | | | 237,968 | |
| | Marriott International Inc./Md, senior note, 2.125%, 10/03/22 | | | United States | | | | 200,000 | | | | | | | | 199,969 | |
| f | | Mohegan Gaming & Entertainment, senior note, 144A, 7.875%, 10/15/24 | | | United States | | | | 7,728,000 | | | | | | | | 7,518,687 | |
| | | | | | | | | | | | | | | | | | |
| | | | | |
| | | | | | | | | | | | | | | | | 8,268,561 | |
| | | | | | | | | | | | | | | | | | |
| | | Household Durables 0.0%† | |
| f | | K Hovnanian Enterprises Inc., secured note, 144A, 10.50%, 7/15/24 | | | United States | | | | 359,000 | | | | | | | | 252,198 | |
| | | | | | | | | | | | | | | | | | |
| | | Industrial Conglomerates 0.1% | |
| | Honeywell International Inc., senior note,
2.15%, 8/08/22 | | | United States | | | | 415,000 | | | | | | | | 417,935 | |
| | h FRN, 2.274%,(3-Month USD LIBOR + 0.37%), 8/08/22 | | | United States | | | | 415,000 | | | | | | | | 416,828 | |
| | | | | | | | | | | | | | | | | | |
| | | | | |
| | | | | | | | | | | | | | | | | 834,763 | |
| | | | | | | | | | | | | | | | | | |
| | | Insurance 0.3% | |
| | AEGON Funding Co. LLC, senior bond, 5.75%, 12/15/20 | | | Netherlands | | | | 220,000 | | | | | | | | 228,468 | |
| f,h | | AIA Group Ltd., senior note, 144A, FRN, 2.676%,(3-Month USD LIBOR + 0.52%), 9/20/21 | | | Hong Kong | | | | 200,000 | | | | | | | | 200,294 | |
| f | | AIG Global Funding, secured note, 144A, 2.30%, 7/01/22 | | | United States | | | | 220,000 | | | | | | | | 221,000 | |
| e,h | | Genworth Holdings Inc., senior bond, FRN, 3.912%,(3-Month USD LIBOR + 2.00%), 11/15/36 | | | United States | | | | 1,623,000 | | | | | | | | 946,915 | |
| f | | Jackson National Life Global Funding, secured note, 144A, 3.30%, 2/01/22 | | | United States | | | | 375,000 | | | | | | | | 385,272 | |
| | Marsh & McLennan Cos. Inc., senior note, 3.50%, 12/29/20 | | | United States | | | | 185,000 | | | | | | | | 188,109 | |
| f | | Metropolitan Life Global Funding I, secured note, 144A,
3.375%, 1/11/22 | | | United States | | | | 210,000 | | | | | | | | 216,034 | |
| | 2.40%, 6/17/22 | | | United States | | | | 290,000 | | | | | | | | 293,512 | |
| f | | New York Life Global Funding, 144A,
secured note, 2.95%, 1/28/21 | | | United States | | | | 230,000 | | | | | | | | 232,774 | |
| | h secured note, FRN, 2.228%,(3-Month USD LIBOR + 0.32%), 8/06/21 | | | United States | | | | 380,000 | | | | | | | | 381,180 | |
| | h senior secured note, FRN, 2.233%,(3-Month USD LIBOR + 0.28%), 1/21/22 | | | United States | | | | 155,000 | | | | | | | | 155,305 | |
| | | | | | | | | | | | | | | | | | |
| | | | | |
| | | | | | | | | | | | | | | | | 3,448,863 | |
| | | | | | | | | | | | | | | | | | |
| | | IT Services 0.1% | |
| | International Business Machines Corp., senior note, 2.50%, 1/27/22 | | | United States | | | | 785,000 | | | | | | | | 793,666 | |
| | | | | | | | | | | | | | | | | | |
| | | Leisure Products 0.0%† | |
| | Hasbro Inc., senior bond, 3.90%, 11/19/29 | | | United States | | | | 415,000 | | | | | | | | 417,547 | |
| | | | | | | | | | | | | | | | | | |
| | | Machinery 0.1% | |
| | Caterpillar Financial Services Corp., senior note, 3.15%, 9/07/21 | | | United States | | | | 265,000 | | | | | | | | 270,667 | |
| | John Deere Capital Corp., senior note, 3.125%, 9/10/21 | | | United States | | | | 750,000 | | | | | | | | 765,902 | |
| | | | | | | | | | | | | | | | | | |
| | | | | |
| | | | | | | | | | | | | | | | | 1,036,569 | |
| | | | | | | | | | | | | | | | | | |
| | | Media 0.5% | |
| f | | Fox Corp., senior note, 144A, 3.666%, 1/25/22 | | | United States | | | | 230,000 | | | | | | | | 237,465 | |
| f | | iHeartCommunications Inc., senior secured note, 144A, 4.75%, 1/15/28 | | | United States | | | | 175,000 | | | | | | | | 176,540 | |
| | The McClatchy Co.,
f senior secured bond, 144A, 6.875%, 7/15/31 | | | United States | | | | 4,095,000 | | | | | | | | 3,286,237 | |
| | senior secured note, 9.00%, 7/15/26 | | | United States | | | | 3,521,000 | | | | | | | | 3,168,451 | |
| | | | | | |
| | | |
| franklintempleton.com | | Semiannual Report | | | 31 | |
FRANKLIN ALTERNATIVE STRATEGIES FUNDS
CONSOLIDATED STATEMENT OF INVESTMENTS (UNAUDITED)
Franklin K2 Alternative Strategies Fund(continued)
| | | | | | | | | | | | | | | | | | |
| | | | |
| | | | | Country | | | Principal Amount* | | | Value | |
| | | Corporate Bonds and Notes (continued) | | | |
| | | Media (continued) | |
| f | | Outfront Media Capital LLC / Outfront Media Capital Corp., senior bond, 144A, 4.625%, 3/15/30 | | | United States | | | | 65,000 | | | | | | | $ | 65,772 | |
| | | | | | | | | | | | | | | | | | |
| | | | | |
| | | | | | | | | | | | | | | | | 6,934,465 | |
| | | | | | | | | | | | | | | | | | |
| | | Metals & Mining 0.1% | |
| f | | Minera Mexico SA de CV, senior bond, 144A, 4.50%, 1/26/50 | | | Mexico | | | | 220,000 | | | | | | | | 216,906 | |
| f | | POSCO, senior note, 144A, 2.375%, 11/12/22 | | | South Korea | | | | 415,000 | | | | | | | | 413,208 | |
| | | | | | | | | | | | | | | | | | |
| | | | | |
| | | | | | | | | | | | | | | | | 630,114 | |
| | | | | | | | | | | | | | | | | | |
| | | Oil, Gas & Consumable Fuels 0.4% | |
| f | | Bruin E&P Partners LLC, senior note, 144A, 8.875%, 8/01/23 | | | United States | | | | 590,000 | | | | | | | | 379,320 | |
| e,f | | California Resources Corp., secured note, second lien, 144A, 8.00%, 12/15/22 | | | United States | | | | 785,000 | | | | | | | | 198,212 | |
| f | | Cheniere Corpus Christi Holdings LLC, senior secured bond, 144A,
3.70%, 11/15/29 | | | United States | | | | 335,000 | | | | | | | | 338,643 | |
| e,h | | Exxon Mobil Corp., senior note, FRN, 2.234%,(3-Month USD LIBOR +
0.33%), 8/16/22 | | | United States | | | | 405,000 | | | | | | | | 407,123 | |
| | Gulfport Energy Corp., senior note, 6.00%, 10/15/24 | | | United States | | | | 505,000 | | | | | | | | 347,036 | |
| f | | Lonestar Resources America Inc., senior note, 144A, 11.25%, 1/01/23 | | | United States | | | | 95,000 | | | | | | | | 66,975 | |
| | Montage Resources Corp., senior note, 8.875%, 7/15/23 | | | United States | | | | 195,000 | | | | | | | | 159,411 | |
| f | | Moss Creek Resources Holdings Inc., senior note, 144A,
7.50%, 1/15/26 | | | United States | | | | 19,000 | | | | | | | | 12,689 | |
| | 10.50%, 5/15/27 | | | United States | | | | 460,000 | | | | | | | | 339,410 | |
| | Petrobras Global Finance BV,
senior bond, 5.75%, 2/01/29 | | | Brazil | | | | 270,000 | | | | | | | | 297,149 | |
| | senior bond, 6.90%, 3/19/49 | | | Brazil | | | | 545,000 | | | | | | | | 624,407 | |
| | senior note, 8.75%, 5/23/26 | | | Brazil | | | | 509,000 | | | | | | | | 648,313 | |
| f | | Saudi Arabian Oil Co., senior bond, 144A, 3.50%, 4/16/29 | | | Saudi Arabia | | | | 200,000 | | | | | | | | 208,616 | |
| f | | Sinopec Group Overseas Development 2018 Ltd., senior note, 144A,
2.50%, 11/12/24 | | | China | | | | 415,000 | | | | | | | | 414,389 | |
| f | | Vine Oil & Gas LP / Vine Oil & Gas Finance Corp., senior note, 144A,
8.75%, 4/15/23 | | | United States | | | | 415,000 | | | | | | | | 171,499 | |
| | 9.75%, 4/15/23 | | | United States | | | | 190,000 | | | | | | | | 80,275 | |
| f | | YPF Sociedad Anonima, 144A,
senior bond, 6.95%, 7/21/27 | | | Argentina | | | | 105,000 | | | | | | | | 80,361 | |
| | h senior note, FRN, 63.354%, (ARS Badlar + 4.00%), 7/07/20 | | | Argentina | | | | 245,000 | | | | | | | | 29,040 | |
| | | | | | | | | | | | | | | | | | |
| | | | | |
| | | | | | | | | | | | | | | | | 4,802,868 | |
| | | | | | | | | | | | | | | | | | |
| | | Pharmaceuticals 0.2% | |
| f | | Bristol-Myers Squibb Co., senior note, 144A, 2.60%, 5/16/22 | | | United States | | | | 410,000 | | | | | | | | 417,047 | |
| | | | | |
| | Mylan Inc., senior bond, | | | | | | | | | | | | | | | | |
| | 5.40%, 11/29/43 | | | United States | | | | 85,000 | | | | | | | | 93,437 | |
| | 5.20%, 4/15/48 | | | United States | | | | 45,000 | | | | | | | | 48,951 | |
| | Mylan NV, senior bond, 5.25%, 6/15/46 | | | United States | | | | 245,000 | | | | | | | | 269,976 | |
| | Pfizer Inc., senior note, 3.00%, 9/15/21 | | | United States | | | | 755,000 | | | | | | | | 770,595 | |
| f | | Teva Pharmaceutical Finance Netherlands II BV, senior note, 144A, 6.00%, 1/31/25 | | | Israel | | | | 155,000 | | | | EUR | | | | 178,527 | |
| | | | | |
| | Teva Pharmaceutical Finance Netherlands III BV, | | | | | | | | | | | | | | | | |
| | senior bond, 3.15%, 10/01/26 | | | Israel | | | | 220,000 | | | | | | | | 180,955 | |
| | senior bond, 4.10%, 10/01/46 | | | Israel | | | | 1,145,000 | | | | | | | | 835,965 | |
| | f senior note, 144A, 7.125%, 1/31/25 | | | Israel | | | | 200,000 | | | | | | | | 204,000 | |
| | | | | | | | | | | | | | | | | | |
| | | | | |
| | | | | | | | | | | | | | | | | 2,999,453 | |
| | | | | | | | | | | | | | | | | | |
| | | Real Estate Management & Development 0.1% | |
| j | | Easy Tactic Ltd., senior secured note, Reg S, 8.125%, 2/27/23 | | | China | | | | 200,000 | | | | | | | | 199,737 | |
| f | | Kaisa Group Holdings Ltd., senior secured note, 144A, 11.95%, 10/22/22 | | | China | | | | 345,000 | | | | | | | | 354,056 | |
| | | | |
| | | |
| 32 | | Semiannual Report | | franklintempleton.com |
FRANKLIN ALTERNATIVE STRATEGIES FUNDS
CONSOLIDATED STATEMENT OF INVESTMENTS (UNAUDITED)
Franklin K2 Alternative Strategies Fund(continued)
| | | | | | | | | | | | | | | | | | |
| | | | |
| | | | | Country | | | Principal Amount* | | | Value | |
| | | Corporate Bonds and Notes (continued) | | | |
| | | Real Estate Management & Development (continued) | |
| j | | Sunac China Holdings Ltd., senior secured note, Reg S, 7.25%, 6/14/22 | | | China | | | | 200,000 | | | | | | | $ | 203,043 | |
| | | | | | | | | | | | | | | | | | |
| | | | | |
| | | | | | | | | | | | | | | | | 756,836 | |
| | | | | | | | | | | | | | | | | | |
| | | Road & Rail 0.1% | |
| f | | Penske Truck Leasing Co. LP / PTL Finance Corp., senior note, 144A, 3.65%, 7/29/21 | | | United States | | | | 285,000 | | | | | | | | 291,387 | |
| f | | Uber Technologies Inc., senior note, 144A,
8.00%, 11/01/26 | | | United States | | | | 240,000 | | | | | | | | 244,157 | |
| | 7.50%, 9/15/27 | | | United States | | | | 365,000 | | | | | | | | 362,728 | |
| | Union Pacific Corp., senior note, 2.95%, 3/01/22 | | | United States | | | | 230,000 | | | | | | | | 235,084 | |
| | | | | | | | | | | | | | | | | | |
| | | | | |
| | | | | | | | | | | | | | | | | 1,133,356 | |
| | | | | | | | | | | | | | | | | | |
| | | Semiconductors & Semiconductor Equipment 0.1% | |
| f | | Broadcom Inc., senior bond, 144A, 4.75%, 4/15/29 | | | United States | | | | 635,000 | | | | | | | | 679,650 | |
| | | | | | | | | | | | | | | | | | |
| | | Specialty Retail 0.1% | |
| f | | Carvana Co., senior note, 144A, 8.875%, 10/01/23 | | | United States | | | | 936,000 | | | | | | | | 972,261 | |
| h | | The Home Depot Inc., senior note, FRN, 2.217%,(3-Month USD LIBOR + 0.31%), 3/01/22 | | | United States | | | | 310,000 | | | | | | | | 310,930 | |
| f | | Staples Inc., senior secured note, 144A, 7.50%, 4/15/26 | | | United States | | | | 430,000 | | | | | | | | 450,693 | |
| | | | | | | | | | | | | | | | | | |
| | | | | |
| | | | | | | | | | | | | | | | | 1,733,884 | |
| | | | | | | | | | | | | | | | | | |
| | | Technology Hardware, Storage & Peripherals 0.1% | |
| | Apple Inc., senior note, 1.70%, 9/11/22 | | | United States | | | | 530,000 | | | | | | | | 528,442 | |
| h | | Hewlett Packard Enterprise Co., senior note, FRN, 2.807%,(3-Month USD LIBOR + 0.68%), 3/12/21 | | | United States | | | | 415,000 | | | | | | | | 416,773 | |
| | Western Digital Corp., senior note, 4.75%, 2/15/26 | | | United States | | | | 209,000 | | | | | | | | 215,662 | |
| | | | | | | | | | | | | | | | | | |
| | | | | |
| | | | | | | | | | | | | | | | | 1,160,877 | |
| | | | | | | | | | | | | | | | | | |
| | | Tobacco 0.0%† | |
| | Pyxus International Inc., senior note, 9.875%, 7/15/21 | | | United States | | | | 170,000 | | | | | | | | 99,407 | |
| | | | | | | | | | | | | | | | | | |
| | | Trading Companies & Distributors 0.0%† | |
| | Aircastle Ltd., senior note, 4.25%, 6/15/26 | | | United States | | | | 310,000 | | | | | | | | 325,805 | |
| | | | | | | | | | | | | | | | | | |
| | | Wireless Telecommunication Services 0.0%† | |
| j | | Bharti Airtel Ltd., senior note, Reg S, 4.375%, 6/10/25 | | | India | | | | 200,000 | | | | | | | | 201,530 | |
| | | | | | | | | | | | | | | | | | |
| | Total Corporate Bonds and Notes (Cost $93,208,932) | | | | | | | | | | | | | | | 91,510,897 | |
| | | | | | | | | | | | | | | | | | |
| | | Corporate Bonds and Notes in Reorganization 0.8% | | | |
| | | Electric Utilities 0.8% | |
| n | | Bruce Mansfield Unit 1 2007 Pass-Through Trust, secured bond, 6.85%, 6/01/34 | | | United States | | | | 2,762,968 | | | | | | | | 2,299,599 | |
| n | | Pacific Gas & Electric Co.,
senior bond, 5.80%, 3/01/37 | | | United States | | | | 1,875,000 | | | | | | | | 1,954,875 | |
| | senior bond, 5.40%, 1/15/40 | | | United States | | | | 575,000 | | | | | | | | 596,620 | |
| | senior bond, 4.45%, 4/15/42 | | | United States | | | | 1,164,000 | | | | | | | | 1,156,358 | |
| | e senior bond, 4.75%, 2/15/44 | | | United States | | | | 2,611,000 | | | | | | | | 2,637,371 | |
| | senior note, 3.75%, 2/15/24 | | | United States | | | | 809,000 | | | | | | | | 803,268 | |
| | senior note, 3.30%, 12/01/27 | | | United States | | | | 359,000 | | | | | | | | 349,137 | |
| | | | | | | | | | | | | | | | | | |
| | | | | |
| | | | | | | | | | | | | | | | | 9,797,228 | |
| | | | | | | | | | | | | | | | | | |
| | | Oil, Gas & Consumable Fuels 0.0%† | |
| d,n | | Bellatrix Exploration Ltd., secured note,
8.50%, 9/11/23 | | | Canada | | | | 141,000 | | | | | | | | 84,600 | |
| | 12.50%, 12/15/23 | | | Canada | | | | 154,000 | | | | | | | | — | |
| | | | | | |
| | | |
| franklintempleton.com | | Semiannual Report | | | 33 | |
FRANKLIN ALTERNATIVE STRATEGIES FUNDS
CONSOLIDATED STATEMENT OF INVESTMENTS (UNAUDITED)
Franklin K2 Alternative Strategies Fund(continued)
| | | | | | | | | | | | | | | | | | |
| | | | |
| | | | | Country | | | Principal Amount* | | | Value | |
| | | Corporate Bonds and Notes in Reorganization
(continued) | | | |
| | | Oil, Gas & Consumable Fuels (continued) | |
| j,n | | Petroleos de Venezuela SA, senior note, Reg S, 6.00%, 10/28/22 | | | Venezuela | | | | 506,036 | | | | | | | $ | 30,362 | |
| | | | | | | | | | | | | | | | | | |
| | | | | |
| | | | | | | | | | | | | | | | | 114,962 | |
| | | | | | | | | | | | | | | | | | |
| | Total Corporate Bonds and Notes in Reorganization
(Cost $8,955,065) | | | | | | | | | | | | | | | 9,912,190 | |
| | | | | | | | | | | | | | | | | | |
| h,o | | Senior Floating Rate Interests 0.2% | | | |
| | | Automobiles 0.0%† | |
| | SAIC Motor Corp. Ltd., Term Loan, 3.452%,(1-Month USD LIBOR + 1.75%), 10/31/25 | | | United States | | | | 17,628 | | | | | | | | 17,663 | |
| | | | | | | | | | | | | | | | | | |
| | | Building Products 0.0%† | |
| | Jeld-Wen Inc., Term Loan B, 4.104%,(3-Month USD LIBOR + 2.00%), 12/14/24 | | | United States | | | | 188,082 | | | | | | | | 188,432 | |
| | | | | | | | | | | | | | | | | | |
| | | Chemicals 0.0%† | |
| | Axalta Coating Systems Dutch Holding BV, Term Loan B, 3.854%,(3-Month USD LIBOR + 1.75%), 6/01/24 | | | United States | | | | 146,461 | | | | | | | | 146,723 | |
| | | | | | | | | | | | | | | | | | |
| | | Construction Materials 0.0%† | |
| | ABC Supply, Term Loan B, 3.702%,(1-Month USD LIBOR + 2.00%), 1/15/27 | | | United States | | | | 110,000 | | | | | | | | 109,991 | |
| | | | | | | | | | | | | | | | | | |
| | | Diversified Financial Services 0.1% | |
| | The AES Corp., Term Loan B, 3.659%,(3-Month USD LIBOR + 1.75%), 5/31/22 | | | United States | | | | 10,591 | | | | | | | | 10,607 | |
| | Ziggo BV,
4.265%,(1-Month USD LIBOR + 2.50%), 4/15/25 | | | United States | | | | 200,522 | | | | | | | | 201,170 | |
| | 3.00%,(3-Month EURIBOR + 3.00%), 1/31/29 | | | United States | | | | 115,000 | | | | | | | | 126,304 | |
| | | | | | | | | | | | | | | | | | |
| | | | | |
| | | | | | | | | | | | | | | | | 338,081 | |
| | | | | | | | | | | | | | | | | | |
| | | Equity Real Estate Investment Trusts (REITs) 0.0%† | |
| | Iron Mountain Inc., Term Loan B, 3.452%,(1-Month USD LIBOR + 1.75%), 1/02/26 | | | United States | | | | 216,700 | | | | | | | | 214,714 | |
| | | | | | | | | | | | | | | | | | |
| | | Life Sciences Tools & Services 0.0%† | |
| | IQVIA Holdings Inc., Term Loan B, 3.854%,(3-Month USD LIBOR + 1.75%), 6/11/25 | | | United States | | | | 202,438 | | | | | | | | 203,155 | |
| | | | | | | | | | | | | | | | | | |
| | | Media 0.0%† | |
| | ALTICE USA, Term LoanB-5, 4.327%,(2-Month USD LIBOR + 2.50%), 4/15/27 | | | United States | | | | 55,324 | | | | | | | | 55,508 | |
| | | | | | | | | | | | | | | | | | |
| | | Oil, Gas & Consumable Fuels 0.1% | |
| | California Resources Corp., Initial Term Loan, 6.452%,(1-Month USD LIBOR + 4.75%), 12/31/22 | | | United States | | | | 873,000 | | | | | | | | 739,867 | |
| | Gavilan Resources LLC, Initial Term Loan, second lien, 7.702%,(1-Month USD LIBOR + 6.00%), 3/01/24 | | | United States | | | | 200,000 | | | | | | | | 75,000 | |
| | | | | | | | | | | | | | | | | | |
| | | | | |
| | | | | | | | | | | | | | | | | 814,867 | |
| | | | | | | | | | | | | | | | | | |
| | | Road & Rail 0.0%† | |
| | Uber Technologies Inc., Term Loan, 5.202%,(1-Month USD LIBOR + 3.50%), 7/13/23 | | | United States | | | | 170,966 | | | | | | | | 167,760 | |
| | | | | | | | | | | | | | | | | | |
| | Total Senior Floating Rate Interests (Cost $2,478,521) | | | | | | | | | | | | | | | 2,256,894 | |
| | | | | | | | | | | | | | | | | | |
| p | | Credit-Linked Notes 0.2% | | | |
| d,f | | ICBC Standard Bank PLC, (Ukraine), 144A, 15.36%, 10/01/21 | | | Ukraine | | | | 21,939,000 | | | | UAH | | | | 964,474 | |
| f | | JPMorgan Chase Bank NA, senior note, (Egypt Treasury Bill), 144A, 16.00%, 6/13/22 | | | Egypt | | | | 7,267,000 | | | | EGP | | | | 466,936 | |
| | | | |
| | | |
| 34 | | Semiannual Report | | franklintempleton.com |
FRANKLIN ALTERNATIVE STRATEGIES FUNDS
CONSOLIDATED STATEMENT OF INVESTMENTS (UNAUDITED)
Franklin K2 Alternative Strategies Fund(continued)
| | | | | | | | | | | | | | | | | | |
| | | | |
| | | | | Country | | | Principal Amount* | | | Value | |
| p | | Credit-Linked Notes (continued) | | | |
| f | | JPMorgan Chase Bank NA, senior note, (Egypt Treasury Bill), 144A, 14.35%, 9/12/24 | | | Egypt | | | | 14,270,000 | | | | EGP | | | $ | 887,723 | |
| | | | | | | | | | | | | | | | | | |
| | Total Credit-Linked Notes (Cost $2,255,602) | | | | | | | | | | | | | | | 2,319,133 | |
| | | | | | | | | | | | | | | | | | |
| | | Foreign Government and Agency Securities 1.5% | | | |
| h | | The Export-Import Bank of Korea, senior note, FRN, 2.631%,(3-Month USD LIBOR + 0.53%), 6/25/22 | | | South Korea | | | | 215,000 | | | | | | | | 215,616 | |
| f | | Government of Angola, senior bond, 144A, 8.00%, 11/26/29 | | | Angola | | | | 328,000 | | | | | | | | 327,395 | |
| | Government of Argentina, | | | | | | | | | | | | | | | | |
| | senior bond, 3.38%, 12/31/38 | | | Argentina | | | | 151,632 | | | | EUR | | | | 64,321 | |
| | h senior note, FRN, 70.941%, (ARLLMONP), 6/21/20 | | | Argentina | | | | 2,275,000 | | | | ARS | | | | 9,463 | |
| j | | Government of Bahrain, senior bond, Reg S, 7.00%, 1/26/26 | | | Bahrain | | | | 467,000 | | | | | | | | 539,721 | |
| | Government of Brazil, senior bond, 4.75%, 1/14/50 | | | Brazil | | | | 412,000 | | | | | | | | 398,523 | |
| | Government of Ecuador, senior note, | | | | | | | | | | | | | | | | |
| | f 144A, 7.875%, 3/27/25 | | | Ecuador | | | | 301,000 | | | | | | | | 237,263 | |
| | j Reg S, 10.75%, 3/28/22 | | | Ecuador | | | | 316,000 | | | | | | | | 278,969 | |
| f | | Government of Egypt, senior bond, 144A, | | | | | | | | | | | | | | | | |
| | 7.053%, 1/15/32 | | | Egypt | | | | 293,000 | | | | | | | | 297,835 | |
| | 8.15%, 11/20/59 | | | Egypt | | | | 215,000 | | | | | | | | 220,079 | |
| | Government of Italy, senior note, 2.375%, 10/17/24 | | | Italy | | | | 350,000 | | | | | | | | 343,109 | |
| j | | Government of Nigeria, senior note, Reg S, 7.625%, 11/21/25 | | | Nigeria | | | | 363,000 | | | | | | | | 395,934 | |
| j | | Government of Paraguay, senior bond, Reg S, 4.625%, 1/25/23 | | | Paraguay | | | | 945,000 | | | | | | | | 998,312 | |
| | Government of Poland, senior bond, 2.75%, 10/25/29 | | | Poland | | | | 2,828,000 | | | | PLN | | | | 770,869 | |
| | Government of Russia, | | | | | | | | | | | | | | | | |
| | senior bond, 7.25%, 5/10/34 | | | Russia | | | | 363,838,000 | | | | RUB | | | | 6,014,791 | |
| | senior note, 7.40%, 7/17/24 | | | Russia | | | | 102,212,000 | | | | RUB | | | | 1,670,018 | |
| | Government of South Africa, senior bond, | | | | | | | | | | | | | | | | |
| | 8.75%, 1/31/44 | | | South Africa | | | | 19,160,000 | | | | ZAR | | | | 1,133,408 | |
| | R186, 10.50%, 12/21/26 | | | South Africa | | | | 36,324,317 | | | | ZAR | | | | 2,745,678 | |
| | Government of Turkey, | | | | | | | | | | | | | | | | |
| | senior bond, 5.75%, 5/11/47 | | | Turkey | | | | 677,000 | | | | | | | | 580,760 | |
| | senior note, 6.35%, 8/10/24 | | | Turkey | | | | 788,000 | | | | | | | | 818,199 | |
| | Provincia de Buenos Aires, | | | | | | | | | | | | | | | | |
| | h FRN, 48.839%, (ARS Badlar + 3.83%), 5/31/22 | | | Argentina | | | | 18,295,000 | | | | ARS | | | | 35,728 | |
| | h,j FRN, Reg S, 53.398%, (ARS Badlar + 3.75%), 4/12/25 | | | Argentina | | | | 3,670,000 | | | | ARS | | | | 14,128 | |
| | f senior note, 144A, 6.50%, 2/15/23 | | | Argentina | | | | 185,000 | | | | | | | | 65,675 | |
| j | | ZAR Sovereign Capital Fund Property Ltd., senior note, Reg S, 3.903%, 6/24/20 | | | South Africa | | | | 573,000 | | | | | | | | 576,779 | |
| | | | | | | | | | | | | | | | | | |
| | Total Foreign Government and Agency Securities
(Cost $19,613,034) | | | | | | | | | | | | | | | 18,752,573 | |
| | | | | | | | | | | | | | | | | | |
| | | Asset-Backed Securities and Commercial
Mortgage-Backed Securities 5.5% | | | |
| | | Airlines 0.0%† | |
| | Latam Airlines Pass Through Trust,2015-1, B, secured note, 4.50%, 8/15/25 | | | Chile | | | | 495,602 | | | | | | | | 498,080 | |
| | | | | | | | | | | | | | | | | | |
| | | Banks 0.0%† | |
| f,q | | Banco Hipotecario SA, senior note, 144A, FRN, | | | | | | | | | | | | | | | | |
| | 50.667%, (ARS Badlar + 2.50%), 1/12/20 | | | Argentina | | | | 1,299,260 | | | | ARS | | | | 4,883 | |
| | 48.563%, (ARS Badlar + 4.00%), 11/07/22 | | | Argentina | | | | 3,160,000 | | | | ARS | | | | 37,474 | |
| | | | | | | | | | | | | | | | | | |
| | | | | |
| | | | | | | | | | | | | | | | | 42,357 | |
| | | | | | | | | | | | | | | | | | |
| | | Consumer Finance 0.1% | |
| | American Express Credit Account Master Trust,2019-1, A, 2.87%, 10/15/24 | | | United States | | | | 115,000 | | | | | | | | 117,912 | |
| | Capital One Multi-Asset Execution Trust,2019-A1, A1, 2.84%, 12/15/24 | | | United States | | | | 165,000 | | | | | | | | 168,652 | |
| | | | | | |
| | | |
| franklintempleton.com | | Semiannual Report | | | 35 | |
FRANKLIN ALTERNATIVE STRATEGIES FUNDS
CONSOLIDATED STATEMENT OF INVESTMENTS (UNAUDITED)
Franklin K2 Alternative Strategies Fund(continued)
| | | | | | | | | | | | | | | | | | |
| | | | |
| | | | | Country | | | Principal Amount* | | | Value | |
| | | Asset-Backed Securities and Commercial
Mortgage-Backed Securities (continued) | | | |
| | | Consumer Finance (continued) | |
| | Citibank Credit Card Issuance Trust,2017-A8, A8, 1.86%, 8/08/22 | | | United States | | | | 425,000 | | | | | | | $ | 424,947 | |
| | Discover Card Execution Note Trust, | | | | | | | | | | | | | | | | |
| | q 2018-A3, A3, FRN, 1.995%,(1-Month USD LIBOR + 0.23%), 12/15/23 | | | United States | | | | 345,000 | | | | | | | | 345,539 | |
| | 2019-A1, A1, 3.04%, 7/15/24 | | | United States | | | | 155,000 | | | | | | | | 159,040 | |
| | World Financial Network Credit Card Master Trust,2019-C, M, 2.71%, 7/15/26 | | | United States | | | | 415,000 | | | | | | | | 415,432 | |
| | | | | | | | | | | | | | | | | | |
| | | | | |
| | | | | | | | | | | | | | | | | 1,631,522 | |
| | | | | | | | | | | | | | | | | | |
| | | Diversified Financial Services 3.8% | |
| f | | Accelerated Assets LLC,2018-1, B, 144A, 4.51%, 12/02/33 | | | United States | | | | 74,517 | | | | | | | | 76,536 | |
| f,q | | Acis CLO Ltd.,2014-3A, D, 144A, FRN, 5.029%,(3-Month USD LIBOR + 3.12%), 2/01/26 | | | United States | | | | 1,140,000 | | | | | | | | 1,109,665 | |
| f | | Adams Outdoor Advertising LP,2018-1, A, 144A, 4.81%, 11/15/48 | | | United States | | | | 187,280 | | | | | | | | 195,923 | |
| f | | AIM Aviation Finance Ltd.,2015-1A, B1, 144A, 5.072%, 2/15/40 | | | Cayman Islands | | | | 184,835 | | | | | | | | 184,848 | |
| | AmeriCredit Automobile Receivables Trust, | | | | | | | | | | | | | | | | |
| | 2018-2, D, 4.01%, 7/18/24 | | | United States | | | | 155,000 | | | | | | | | 161,928 | |
| | q 2018-3, A2B, FRN, 2.013%,(1-Month USD LIBOR + 0.25%), 1/18/22 | | | United States | | | | 100,460 | | | | | | | | 100,451 | |
| | 2018-3, D, 4.04%, 11/18/24 | | | United States | | | | 205,000 | | | | | | | | 215,049 | |
| f,q | | Anchorage Capital CLO 7 Ltd.,2017-7A, DR, 144A, FRN, 4.701%,(3-Month USD LIBOR + 2.70%), 10/15/27 | | | United States | | | | 2,000,000 | | | | | | | | 1,977,716 | |
| q | | Argent Securities Inc.,2004-W3, M4, FRN, 4.018%,(1-Month USD LIBOR + 4.58%), 2/25/34 | | | United States | | | | 258,604 | | | | | | | | 260,072 | |
| f | | Ascentium Equipment Receivables Trust,2017-2A, C, 144A, 2.87%, 8/10/22 | | | United States | | | | 25,000 | | | | | | | | 25,229 | |
| f,m,r | | BANK, 2019-BN23, XF, 144A, FRN, 0.876%, 12/15/52 | | | United States | | | | 7,900,000 | | | | | | | | 520,871 | |
| f | | Bayview Opportunity Master Fund IVA Trust,2019-RN2, A1, 144A, 3.967%, 3/28/34 | | | United States | | | | 81,710 | | | | | | | | 82,364 | |
| f | | Bayview Opportunity Master Fund IVB Trust,2019-RN1, A1, 144A, 4.09%, 2/28/34 | | | United States | | | | 65,446 | | | | | | | | 66,340 | |
| f | | Blackbird Capital Aircraft Lease Securitization Ltd.,2016-1A, A, 144A, 4.213%, 12/16/41 | | | United States | | | | 209,844 | | | | | | | | 215,843 | |
| | California Republic Auto Receivables Trust,2018-1, D, 4.33%, 4/15/25 | | | United States | | | | 115,000 | | | | | | | | 119,421 | |
| f,q | | Carlyle Global Market Strategies CLO Ltd.,2018-2A, A1R, 144A, FRN, 2.716%,(3-Month USD LIBOR + 0.78%), 4/27/27 | | | United States | | | | 224,307 | | | | | | | | 224,322 | |
| | Carmax Auto Owner Trust, | | | | | | | | | | | | | | | | |
| | 2018-2, D, 3.99%, 4/15/25 | | | United States | | | | 100,000 | | | | | | | | 103,294 | |
| | 2018-4, D, 4.15%, 4/15/25 | | | United States | | | | 60,000 | | | | | | | | 62,437 | |
| | 2019-1, A3, 3.05%, 3/15/24 | | | United States | | | | 355,000 | | | | | | | | 361,416 | |
| f | | Chesapeake Funding II LLC, 144A, | | | | | | | | | | | | | | | | |
| | q 2017-4A, A2, FRN, 2.105%,(1-Month USD LIBOR + 0.34%), 11/15/29 | | | Canada | | | | 93,809 | | | | | | | | 93,856 | |
| | 2018-1A, D, 3.92%, 4/15/30 | | | Canada | | | | 115,000 | | | | | | | | 117,878 | |
| | CHL Mortgage Pass-Through Trust, | | | | | | | | | | | | | | | | |
| | q 2003-15, 1A1, FRN, 2.208%,(1-Month USD LIBOR + 0.50%), 6/25/42 | | | United States | | | | 103,065 | | | | | | | | 100,090 | |
| | 2004-4, M, 5.50%, 5/25/34 | | | United States | | | | 1,729,721 | | | | | | | | 1,235,866 | |
| | r 2006-HYB4, 3B, FRN, 4.366%, 6/20/36 | | | United States | | | | 2,399,775 | | | | | | | | 2,198,907 | |
| f | | CIG Auto Receivables Trust,2017-1A, A, 144A, 2.71%, 5/15/23 | | | United States | | | | 7,276 | | | | | | | | 7,287 | |
| f | | Coinstar Funding LLC,2017-1A, A2, 144A, 5.216%, 4/25/47 | | | United States | | | | 238,875 | | | | | | | | 245,842 | |
| f | | CoreVest American Finance Trust,2019-2, B, 144A, 3.424%, 6/15/52 | | | United States | | | | 100,000 | | | | | | | | 103,535 | |
| f | | CPS Auto Receivables Trust, 144A, | | | | | | | | | | | | | | | | |
| | 2018-D, C, 3.83%, 9/15/23 | | | United States | | | | 100,000 | | | | | | | | 102,044 | |
| | 2019-D, D, 2.72%, 9/15/25 | | | United States | | | | 105,000 | | | | | | | | 104,904 | |
| | | | |
| | | |
| 36 | | Semiannual Report | | franklintempleton.com |
FRANKLIN ALTERNATIVE STRATEGIES FUNDS
CONSOLIDATED STATEMENT OF INVESTMENTS (UNAUDITED)
Franklin K2 Alternative Strategies Fund(continued)
| | | | | | | | | | | | | | | | | | |
| | | | |
| | | | | Country | | | Principal Amount* | | | Value | |
| | | Asset-Backed Securities and Commercial
Mortgage-Backed Securities (continued) | | | |
| | | Diversified Financial Services (continued) | |
| f | | CSMC Trust, 2018-RPL2, A1, 144A, 4.03%, 8/25/62 | | | United States | | | | 202,027 | | | | | | | $ | 203,438 | |
| f,q | | CVP Cascade Ltd.,2017-2A, A1R, 144A, FRN, 3.203%,(3-Month USD LIBOR + 1.20%), 7/18/26 | | | United States | | | | 148,872 | | | | | | | | 148,873 | |
| f,r | | DBUBS Mortgage Trust, 2017-BRBK, D, 144A, FRN, 3.648%, 10/10/34 | | | United States | | | | 100,000 | | | | | | | | 102,063 | |
| f | | Domino’s Pizza Master Issuer LLC, 144A, | | | | | | | | | | | | | | | | |
| | 2018-1A, A2II, 4.328%, 7/25/48 | | | United States | | | | 79,000 | | | | | | | | 83,223 | |
| | 2019-1A, A2, 3.668%, 10/25/49 | | | United States | | | | 120,000 | | | | | | | | 120,211 | |
| | Drive Auto Receivables Trust, | | | | | | | | | | | | | | | | |
| | 2018-1, D, 3.81%, 5/15/24 | | | United States | | | | 220,000 | | | | | | | | 223,523 | |
| | 2018-3, D, 4.30%, 9/16/24 | | | United States | | | | 25,000 | | | | | | | | 25,700 | |
| | 2018-5, D, 4.30%, 4/15/26 | | | United States | | | | 125,000 | | | | | | | | 129,495 | |
| f | | Driven Brands Funding LLC,2018-1A, A2, 144A, 4.739%, 4/20/48 | | | United States | | | | 59,100 | | | | | | | | 61,738 | |
| f | | DT Auto Owner Trust, 144A, | | | | | | | | | | | | | | | | |
| | 2016-1A, D, 4.66%, 12/15/22 | | | United States | | | | 88,987 | | | | | | | | 89,120 | |
| | 2018-2A, D, 4.15%, 3/15/24 | | | United States | | | | 90,000 | | | | | | | | 92,519 | |
| | 2018-3A, C, 3.79%, 7/15/24 | | | United States | | | | 120,000 | | | | | | | | 122,267 | |
| f,q | | Elevation CLO Ltd.,2019-4A, AR, 144A, FRN, 2.993%,(3-Month USD LIBOR + 0.99%), 4/18/27 | | | United States | | | | 251,052 | | | | | | | | 251,042 | |
| f | | Fairstone Financial Issuance Trust I,2019-1A, A, 144A, 3.948%, 3/21/33 | | | Canada | | | | 150,000 | | | | CAD | | | | 113,739 | |
| f | | First Investors Auto Owner Trust,2019-2A, D, 144A, 2.80%, 12/15/25 | | | United States | | | | 40,000 | | | | | | | | 40,046 | |
| f | | Five Guys Funding LLC,2017-1A, A2, 144A, 4.60%, 7/25/47 | | | United States | | | | 129,025 | | | | | | | | 134,486 | |
| f | | Flagship Credit Auto Trust, 144A, | | | | | | | | | | | | | | | | |
| | 2019-2, D, 3.53%, 5/15/25 | | | United States | | | | 165,000 | | | | | | | | 168,459 | |
| | 2019-4, D, 3.12%, 1/15/26 | | | United States | | | | 90,000 | | | | | | | | 90,343 | |
| f,q | | FS Rialto,2019-FL1, C, 144A, FRN, 4.274%,(1-Month USD LIBOR + 2.50%), 12/16/36 | | | United States | | | | 2,300,000 | | | | | | | | 2,322,091 | |
| f,r | | GCAT Trust, 2019-RPL1, A1, 144A, FRN, 2.65%, 10/25/68 | | | United States | | | | 179,556 | | | | | | | | 179,921 | |
| f | | GLS Auto Receivables Trust, 144A, | | | | | | | | | | | | | | | | |
| | 2018-3A, B, 3.78%, 8/15/23 | | | United States | | | | 70,000 | | | | | | | | 71,113 | |
| | 2019-2A, C, 3.54%, 2/18/25 | | | United States | | | | 255,000 | | | | | | | | 260,700 | |
| f,q | | Gosforth Funding PLC,2018-1A, A1, 144A, FRN, 2.36%,
(3-Month USD LIBOR + 0.45%), 8/25/60 | | | United Kingdom | | | | 132,231 | | | | | | | | 132,231 | |
| f,q | | GPMT Ltd., 144A, FRN, | | | | | | | | | | | | | | | | |
| | 2018-FL1, C, 3.872%,(1-Month USD LIBOR + 2.15%), 11/19/35 | | | United States | | | | 1,250,000 | | | | | | | | 1,253,075 | |
| | 2019-FL2, D, 4.715%,(1-Month USD LIBOR + 2.95%), 2/22/36 | | | United States | | | | 1,000,000 | | | | | | | | 1,000,500 | |
| j,q | | Great Hall Mortgages No 1 PLC,2006-1, DA, FRN, Reg S, 1.596%,(3-Month GBP LIBOR + 0.82%), 6/18/38 | | | United Kingdom | | | | 1,330,000 | | | | GBP | | | | 1,529,872 | |
| f,q | | GSRPM Mortgage Loan Trust,2002-1A, M1, 144A, FRN, 3.658%,(1-Month USD LIBOR + 1.95%), 11/25/31 | | | United States | | | | 1,109,505 | | | | | | | | 1,111,917 | |
| f,q | | Halcyon Loan Advisors Funding Ltd., 144A, FRN, | | | | | | | | | | | | | | | | |
| | 2014-1A, D, 5.503%,(3-Month USD LIBOR + 3.50%), 4/18/26 | | | United States | | | | 2,190,000 | | | | | | | | 2,185,482 | |
| | 2017-2A, A1BR, 3.116%,(3-Month USD LIBOR + 1.18%), 4/28/25 | | | United States | | | | 95,684 | | | | | | | | 95,729 | |
| f | | Hertz Vehicle Financing II LP,2017-2A, A, 144A, 3.29%, 10/25/23 | | | United States | | | | 100,000 | | | | | | | | 102,526 | |
| | Honda Auto Receivables Owner Trust, | | | | | | | | | | | | | | | | |
| | 2017-3, A3, 1.79%, 9/20/21 | | | United States | | | | 65,659 | | | | | | | | 65,619 | |
| | 2019-1, A3, 2.83%, 3/20/23 | | | United States | | | | 150,000 | | | | | | | | 152,431 | |
| f | | Horizon Aircraft Finance I Ltd.,2018-1, A, 144A, 4.458%, 12/15/38 | | | United States | | | | 243,585 | | | | | | | | 252,174 | |
| f,q | | HPLY Trust,2019-HIT, C, 144A, FRN, 3.365%,
(1-Month USD LIBOR + 1.60%), 11/15/36 | | | United States | | | | 98,705 | | | | | | | | 98,778 | |
| f,q | | Jamestown CLO VII Ltd.,2017-7A, A1R, 144A, FRN, 2.77%,(3-Month USD LIBOR + 0.83%), 7/25/27 | | | United States | | | | 233,910 | | | | | | | | 233,283 | |
| | | | | | |
| | | |
| franklintempleton.com | | Semiannual Report | | | 37 | |
FRANKLIN ALTERNATIVE STRATEGIES FUNDS
CONSOLIDATED STATEMENT OF INVESTMENTS (UNAUDITED)
Franklin K2 Alternative Strategies Fund(continued)
| | | | | | | | | | | | | | | | | | |
| | | | |
| | | | | Country | | | Principal Amount* | | | Value | |
| | | Asset-Backed Securities and Commercial
Mortgage-Backed Securities (continued) | | | |
| | | Diversified Financial Services (continued) | |
| f | | Kestrel Aircraft Funding Ltd.,2018-1A, A, 144A, 4.25%, 12/15/38 | | | United States | | | | 232,176 | | | | | | | $ | 236,863 | |
| f | | Legacy Mortgage Asset Trust,2019-GS3, A1, 144A, 3.75%, 4/25/59 | | | United States | | | | 120,519 | | | | | | | | 121,929 | |
| f,q | | LoanCore Issuer Ltd., 2018-CRE1, D, 144A, FRN, 4.715%,(1-Month USD LIBOR + 2.95%), 5/15/28 | | | United States | | | | 1,600,000 | | | | | | | | 1,600,800 | |
| f | | Marlette Funding Trust,2019-3A, A, 144A, 2.69%, 9/17/29 | | | United States | | | | 163,329 | | | | | | | | 164,015 | |
| q | | Merrill Lynch Mortgage Investors Trust Series, 2007-MLN1, A2D, FRN, 2.028%,(1-Month USD LIBOR + 0.32%), 3/25/37 | | | United States | | | | 1,173,557 | | | | | | | | 1,114,728 | |
| r | | Morgan Stanley Mortgage Loan Trust, 2004-11AR, 2A, FRN, 3.323%, 1/25/35 | | | United States | | | | 457,660 | | | | | | | | 445,728 | |
| f | | Navient Private Education Refi Loan Trust,2019-FA, B, 144A, 3.12%, 8/15/68 | | | United States | | | | 210,000 | | | | | | | | 208,526 | |
| f,q | | Navistar Financial Dealer Note Master Owner Trust II,2018-1, A, 144A, FRN, 2.338%,(1-Month USD LIBOR + 0.63%), 9/25/23 | | | United States | | | | 60,000 | | | | | | | | 60,082 | |
| f,r | | New Residential Mortgage Loan Trust,2015-2A, B5, 144A, FRN, 5.531%, 8/25/55 | | | United States | | | | 1,565,057 | | | | | | | | 1,639,921 | |
| f,q | | NextGear Floorplan Master Owner Trust, 144A, FRN, | | | | | | | | | | | | | | | | |
| | 2017-1A, A1, 2.615%,(1-Month USD LIBOR + 0.85%), 4/18/22 | | | United States | | | | 240,000 | | | | | | | | 240,440 | |
| | 2017-2A, A1, 2.445%,(1-Month USD LIBOR + 0.68%), 10/17/22 | | | United States | | | | 220,000 | | | | | | | | 220,537 | |
| | 2018-1A, A1, 2.405%,(1-Month USD LIBOR + 0.64%), 2/15/23 | | | United States | | | | 500,000 | | | | | | | | 501,368 | |
| | Nissan Auto Receivables Owner Trust, | | | | | | | | | | | | | | | | |
| | 2016-C, A3, 1.18%, 1/15/21 | | | United States | | | | 8,320 | | | | | | | | 8,313 | |
| | 2018-A, A3, 2.65%, 5/16/22 | | | United States | | | | 250,000 | | | | | | | | 251,117 | |
| | q 2018-C, A2B, FRN, 1.935%,(1-Month USD LIBOR + 0.17%), 10/15/21 | | | United States | | | | 233,393 | | | | | | | | 233,428 | |
| q | | Nomura Home Equity Loan Inc. Home Equity Loan Trust Series,2006-WF1, M4, FRN, 2.078%,(1-Month USD LIBOR + 0.37%), 3/25/36 | | | United States | | | | 1,293,940 | | | | | | | | 1,238,466 | |
| f,r | | OBX Trust, 2019-EXP3, 1A8, 144A, FRN, 3.50%, 10/25/59 | | | United States | | | | 142,718 | | | | | | | | 144,217 | |
| f,q | | OFSI Fund VII Ltd.,2017-7A, AR, 144A, FRN, 2.903%,(3-Month USD LIBOR + 0.90%), 10/18/26 | | | United States | | | | 75,322 | | | | | | | | 75,323 | |
| f | | OneMain Financial Issuance Trust,2015-3A, B, 144A, 4.16%, 11/20/28 | | | United States | | | | 155,000 | | | | | | | | 155,872 | |
| f | | Oxford Finance Funding LLC,2019-1A, A2, 144A, 4.459%, 2/15/27 | | | United States | | | | 50,000 | | | | | | | | 51,202 | |
| f | | Planet Fitness Master Issuer LLC, 144A, | | | | | | | | | | | | | | | | |
| | 2018-1A, A2I, 4.262%, 9/05/48 | | | United States | | | | 168,300 | | | | | | | | 172,009 | |
| | 2019-1A, A2, 3.858%, 12/05/49 | | | United States | | | | 150,000 | | | | | | | | 150,759 | |
| f | | Progress Residential Trust, 2019-SFR1, E, 144A, 4.466%, 8/17/35 | | | United States | | | | 115,000 | | | | | | | | 117,983 | |
| | RALI Series Trust,2007-QS2, AP, zero cpn., 1/25/37 | | | United States | | | | 228,680 | | | | | | | | 168,442 | |
| f,r | | RBSSP Resecuritization Trust,2009-12, 17A2, 144A, FRN, 3.846%, 10/25/35 | | | United States | | | | 2,424,758 | | | | | | | | 2,433,655 | |
| f | | RCO V Mortgage LLC,2019-1, A1, 144A, 3.721%, 5/24/24 | | | United States | | | | 174,267 | | | | | | | | 175,048 | |
| f | | Republic Finance Issuance Trust,2019-A, A, 144A, 3.43%, 11/22/27 | | | United States | | | | 240,000 | | | | | | | | 240,175 | |
| | Santander Drive Auto Receivables Trust, | | | | | | | | | | | | | | | | |
| | 2018-2, D, 3.88%, 2/15/24 | | | United States | | | | 275,000 | | | | | | | | 281,627 | |
| | 2018-3, D, 4.07%, 8/15/24 | | | United States | | | | 210,000 | | | | | | | | 216,112 | |
| | 2018-5, C, 3.81%, 12/16/24 | | | United States | | | | 150,000 | | | | | | | | 152,315 | |
| | 2019-2, D, 3.22%, 7/15/25 | | | United States | | | | 210,000 | | | | | | | | 214,999 | |
| f | | SCF Equipment Leasing LLC,2018-1A, C, 144A, 4.21%, 4/20/27 | | | United States | | | | 255,000 | | | | | | | | 257,169 | |
| f,r | | Security National Mortgage Loan Trust,2004-1A, AF3, 144A, FRN, 6.42%, 6/25/32 | | | United States | | | | 2,063,472 | | | | | | | | 1,794,578 | |
| f,r | | Sequoia Mortgage Trust, 144A, FRN, | | | | | | | | | | | | | | | | |
| | 2018-CH1, A1, 4.00%, 2/25/48 | | | United States | | | | 66,621 | | | | | | | | 68,255 | |
| | 2019-CH1, A1, 4.50%, 3/25/49 | | | United States | | | | 252,790 | | | | | | | | 258,106 | |
| f | | S-Jets Ltd.,2017-1, A, 144A, 3.967%, 8/15/42 | | | Bermuda | | | | 232,899 | | | | | | | | 235,097 | |
| q | | SLM Private Credit Student Loan Trust, FRN, | | | | | | | | | | | | | | | | |
| | 2003-B, A3, 5.233%,(28-DayT-Bill + 1.00%), 3/15/33 | | | United States | | | | 300,000 | | | | | | | | 298,927 | |
| | 2003-B, A4, 5.04%,(28-DayT-Bill + 1.00%), 3/15/33 | | | United States | | | | 50,000 | | | | | | | | 49,821 | |
| | | | |
| | | |
| 38 | | Semiannual Report | | franklintempleton.com |
FRANKLIN ALTERNATIVE STRATEGIES FUNDS
CONSOLIDATED STATEMENT OF INVESTMENTS (UNAUDITED)
Franklin K2 Alternative Strategies Fund(continued)
| | | | | | | | | | | | | | | | | | |
| | | | |
| | | | | Country | | | Principal Amount* | | | Value | |
| | | Asset-Backed Securities and Commercial
Mortgage-Backed Securities (continued) | | | |
| | | Diversified Financial Services (continued) | |
| f,q | | SMB Private Education Loan Trust,2017-B, A2B, 144A, FRN, 2.515%,(1-Month USD LIBOR + 0.75%), 10/15/35 | | | United States | | | | 91,448 | | | | | | | $ | 91,473 | |
| f | | SoFi Consumer Loan Program Trust, 144A, | | | | | | | | | | | | | | | | |
| | 2018-1, B, 3.65%, 2/25/27 | | | United States | | | | 100,000 | | | | | | | | 102,240 | |
| | 2018-2, A2, 3.35%, 4/26/27 | | | United States | | | | 155,000 | | | | | | | | 156,150 | |
| | 2019-4, C, 2.84%, 8/25/28 | | | United States | | | | 130,000 | | | | | | | | 130,258 | |
| f | | SoFi Professional Loan Program LLC,2016-A, B, 144A, 3.57%, 1/26/38 | | | United States | | | | 69,206 | | | | | | | | 70,397 | |
| q | | Soundview Home Loan Trust,2006-WF2, M3, FRN, 2.158%,
(1-Month USD LIBOR + 0.45%), 12/25/36 | | | United States | | | | 1,750,925 | | | | | | | | 1,883,324 | |
| f | | Sprite Ltd.,2017-1, B, 144A, 5.75%, 12/15/37 | | | Cayman Islands | | | | 173,838 | | | | | | | | 181,254 | |
| f | | Stack Infrastructure Issuer LLC,2019-1A, A2, 144A, 4.54%, 2/25/44 | | | United States | | | | 124,063 | | | | | | | | 130,775 | |
| f,q | | Staniford Street CLO Ltd.,2017-1A, AR, 144A, FRN, 3.299%,(3-Month USD LIBOR + 1.18%), 6/15/25 | | | United States | | | | 108,968 | | | | | | | | 108,969 | |
| f,q | | Starwood Retail Property Trust, 2014-STAR, E, 144A, FRN, 5.915%,(1-Month USD LIBOR + 4.15%), 11/15/27 | | | United States | | | | 200,000 | | | | | | | | 157,764 | |
| f | | TAL Advantage V LLC,2013-2A, A, 144A, 3.55%, 11/20/38 | | | United States | | | | 40,000 | | | | | | | | 40,016 | |
| f,r | | Towd Point Mortgage Trust,2015-2, 1A13, 144A, FRN, 2.50%, 11/25/60 | | | United States | | | | 92,354 | | | | | | | | 92,651 | |
| f | | Tricon American Homes Trust, 2019-SFR1, A, 144A, 2.75%, 3/17/38 | | | United States | | | | 100,000 | | | | | | | | 100,786 | |
| f,q | | TRTX Issuer Ltd., 144A, FRN, | | | | | | | | | | | | | | | | |
| | 2019-FL3, B, 3.573%,(1-Month USD LIBOR + 1.75%), 9/15/34 | | | United States | | | | 1,300,000 | | | | | | | | 1,300,390 | |
| | 2019-FL3, C, 3.923%,(1-Month USD LIBOR + 2.10%), 9/15/34 | | | United States | | | | 1,160,000 | | | | | | | | 1,164,060 | |
| f | | United Auto Credit Securitization Trust,2019-1, C, 144A, 3.16%, 8/12/24 | | | United States | | | | 155,000 | | | | | | | | 156,393 | |
| f,q | | Venture XII CLO Ltd.,2018-12A, ARR, 144A, FRN, 2.714%,(3-Month USD LIBOR + 0.80%), 2/28/26 | | | United States | | | | 202,047 | | | | | | | | 201,678 | |
| f | | Vericrest Opportunity Loan Trust, 2019-NPL3, A1, 144A, 3.967%, 3/25/49 | | | United States | | | | 108,527 | | | | | | | | 109,427 | |
| f,q | | Verizon Owner Trust, 144A, FRN, | | | | | | | | | | | | | | | | |
| | 2017-3A, A1B, 1.994%,(1-Month USD LIBOR + 0.27%), 4/20/22 | | | United States | | | | 261,767 | | | | | | | | 262,120 | |
| | 2018-1A, A1B, 1.984%,(1-Month USD LIBOR + 0.26%), 9/20/22 | | | United States | | | | 175,000 | | | | | | | | 175,064 | |
| f,q | | VMC Finance LLC, 144A, FRN, | | | | | | | | | | | | | | | | |
| | 2018-FL1, C, 4.013%,(1-Month USD LIBOR + 2.25%), 3/15/35 | | | United States | | | | 1,100,000 | | | | | | | | 1,100,687 | |
| | 2019-FL3, C, 3.813%,(1-Month USD LIBOR + 2.05%), 9/15/36 | | | United States | | | | 591,229 | | | | | | | | 593,312 | |
| f | | VOLT LXXII LLC, 2018-NPL8, A1A, 144A, 4.213%, 10/26/48 | | | United States | | | | 399,408 | | | | | | | | 400,632 | |
| f | | VOLT LXXV LLC, 2019-NPL1, A1A, 144A, 4.336%, 1/25/49 | | | United States | | | | 152,840 | | | | | | | | 154,364 | |
| f | | VOLT LXXXIII LLC, 2019-NPL9, A1A, 144A, 3.327%, 11/26/49 | | | United States | | | | 109,512 | | | | | | | | 109,703 | |
| f,q | | West CLO Ltd.,2017-1A, A1R, 144A, FRN, 2.923%,(3-Month USD LIBOR + 0.92%), 7/18/26 | | | United States | | | | 171,083 | | | | | | | | 171,060 | |
| f | | Westlake Automobile Receivables Trust, 144A,
2018-1A, D, 3.41%, 5/15/23 | | | United States | | | | 60,000 | | | | | | | | 60,697 | |
| | 2018-2A, D, 4.00%, 1/16/24 | | | United States | | | | 50,000 | | | | | | | | 51,260 | |
| | q 2018-3A, A2B, FRN, 2.115%,(1-Month USD LIBOR + 0.35%), 1/18/22 | | | United States | | | | 137,993 | | | | | | | | 138,022 | |
| | | | | | | | | | | | | | | | | | |
| | | | | |
| | | | | | | | | | | | | | | | | 49,014,539 | |
| | | | | | | | | | | | | | | | | | |
| | | Equity Real Estate Investment Trusts (REITs) 0.1% | |
| f | | American Homes 4 Rent, 144A,
2014-SFR2, E, 6.231%, 10/17/36 | | | United States | | | | 250,000 | | | | | | | | 276,751 | |
| | 2014-SFR3, E, 6.418%, 12/17/36 | | | United States | | | | 100,000 | | | | | | | | 111,650 | |
| | 2015-SFR1, E, 5.639%, 4/17/52 | | | United States | | | | 210,000 | | | | | | | | 228,032 | |
| f | | Colony American Finance Ltd.,2015-1, D, 144A, 5.649%, 10/15/47 | | | United States | | | | 115,000 | | | | | | | | 116,366 | |
| | | | | |
| f | | Diamond Resorts Owner Trust, 144A, | | | | | | | | | | | | | | | | |
| | 2017-1A, C, 6.07%, 10/22/29 | | | United States | | | | 34,395 | | | | | | | | 35,315 | |
| | 2018-1, C, 4.53%, 1/21/31 | | | United States | | | | 91,256 | | | | | | | | 93,306 | |
| | | | | | |
| | | |
| franklintempleton.com | | Semiannual Report | | | 39 | |
FRANKLIN ALTERNATIVE STRATEGIES FUNDS
CONSOLIDATED STATEMENT OF INVESTMENTS (UNAUDITED)
Franklin K2 Alternative Strategies Fund(continued)
| | | | | | | | | | | | | | | | | | |
| | | | |
| | | | | Country | | | Principal Amount* | | | Value | |
| | | Asset-Backed Securities and Commercial
Mortgage-Backed Securities (continued) | | | |
| | | Equity Real Estate Investment Trusts (REITs) (continued) | |
| | | | | |
| f | | Diamond Resorts Owner Trust, 144A, (continued) | | | | | | | | | | | | | | | | |
| | 2019-1A, B, 3.53%, 2/20/32 | | | United States | | | | 96,733 | | | | | | | $ | 96,974 | |
| | | | | | | | | | | | | | | | | | |
| | | | | |
| | | | | | | | | | | | | | | | | 958,394 | |
| | | | | | | | | | | | | | | | | | |
| | | Mortgage Real Estate Investment Trusts (REITs) 1.2% | |
| f,r | | Ajax Mortgage Loan Trust,2017-B, A, 144A, FRN, 3.163%, 9/25/56 | | | United States | | | | 103,135 | | | | | | | | 103,691 | |
| q | | American Home Mortgage Investment Trust,2006-1, 11A1, FRN, 1.988%,(1-Month USD LIBOR + 0.28%), 3/25/46 | | | United States | | | | 230,675 | | | | | | | | 220,516 | |
| | Banc of America Alternative Loan Trust,2003-8, 1CB1, 5.50%, 10/25/33 | | | United States | | | | 6,428 | | | | | | | | 6,808 | |
| | Banc of America Funding Trust,
2003-1, B2, 6.00%, 5/20/33 | | | United States | | | | 313,735 | | | | | | | | 229,213 | |
| | 2007-4, 5A1, 5.50%, 11/25/34 | | | United States | | | | 99,722 | | | | | | | | 100,309 | |
| r | | Banc of America Mortgage Trust,2005-A, 2A1, FRN, 4.458%, 2/25/35 | | | United States | | | | 5,255 | | | | | | | | 5,341 | |
| r | | Bear Stearns ARM Trust,2007-4, 12A1, FRN, 4.832%, 5/25/37 | | | United States | | | | 2,190,255 | | | | | | | | 2,162,876 | |
| f,r | | CCRESG Commercial Mortgage Trust, 2016-HEAT, D, 144A, FRN,
5.671%, 4/10/29 | | | United States | | | | 100,000 | | | | | | | | 102,084 | |
| f | | Citigroup Mortgage Loan Trust, 144A,
r 2009-10, 6A2, FRN, 4.606%, 9/25/34 | | | United States | | | | 28,947 | | | | | | | | 30,041 | |
| | r 2018-A, A1, FRN, 4.00%, 1/25/68 | | | United States | | | | 94,615 | | | | | | | | 95,153 | |
| | 2018-C, A1, 4.125%, 3/25/59 | | | United States | | | | 155,529 | | | | | | | | 156,724 | |
| | r 2019-B, A1, FRN, 3.258%, 4/25/66 | | | United States | | | | 111,436 | | | | | | | | 112,158 | |
| | 2019-E, A1, 3.228%, 11/25/70 | | | United States | | | | 248,817 | | | | | | | | 249,446 | |
| | Countrywide Alternative Loan Trust,
2003-22CB, 1A1, 5.75%, 12/25/33 | | | United States | | | | 44,074 | | | | | | | | 46,005 | |
| | 2004-16CB, 1A1, 5.50%, 7/25/34 | | | United States | | | | 27,864 | | | | | | | | 29,245 | |
| | 2004-16CB, 3A1, 5.50%, 8/25/34 | | | United States | | | | 29,344 | | | | | | | | 30,731 | |
| | 2004-J10, 2CB1, 6.00%, 9/25/34 | | | United States | | | | 80,649 | | | | | | | | 86,531 | |
| | 2005-J1, 2A1, 5.50%, 2/25/25 | | | United States | | | | 4,348 | | | | | | | | 4,473 | |
| | 2005-J14, A3, 5.50%, 12/25/35 | | | United States | | | | 416,019 | | | | | | | | 355,764 | |
| q | | Countrywide Asset-Backed Certificates, 2005-15, M3, FRN, 2.228% (1-Month USD LIBOR + 0.52%), 4/25/36 | | | United States | | | | 2,340,000 | | | | | | | | 2,106,467 | |
| r | | Countrywide Home Loans Mortgage Pass-Through Trust,2004-HYB4, 2A1, FRN, 4.224%, 9/20/34 | | | United States | | | | 64,281 | | | | | | | | 63,932 | |
| | Credit Suisse First Boston Mortgage Securities Corp.,
2002-10, 1B, 7.00%, 5/25/32 | | | United States | | | | 155,681 | | | | | | | | 134,276 | |
| | 2003-27, 4A4, 5.75%, 11/25/33 | | | United States | | | | 18,906 | | | | | | | | 19,866 | |
| f | | CSMC OA LLC,2014-USA, E, 144A, 4.373%, 9/15/37 | | | United States | | | | 400,000 | | | | | | | | 380,620 | |
| q | | DSLA Mortgage Loan Trust,2005-AR5, 2A1A, FRN, 2.063%,(1-Month USD LIBOR + 0.33%), 9/19/45 | | | United States | | | | 41,758 | | | | | | | | 34,525 | |
| j,q | | Dukinfield II PLC,2016-2, A, FRN, Reg S, 2.026%,(3-Month GBP LIBOR + 1.25%), 12/20/52 | | | United Kingdom | | | | 162,150 | | | | GBP | | | | 211,462 | |
| j,q | | Eurosail-UK PLC,2007-2X, A3C, FRN, Reg S, 0.935%,(3-Month GBP LIBOR + 0.15%), 3/13/45 | | | United Kingdom | | | | 44,126 | | | | GBP | | | | 55,859 | |
| q | | FHLMC Structured Agency Credit Risk Debt Notes, FRN, | | | | | | | | | | | | | | | | |
| | 2015-DNA1, M2, 3.558%,(1-Month USD LIBOR + 1.85%), 10/25/27 | | | United States | | | | 122,069 | | | | | | | | 122,777 | |
| | 2015-DNA1, M3, 5.008%,(1-Month USD LIBOR + 3.30%), 10/25/27 | | | United States | | | | 250,000 | | | | | | | | 266,921 | |
| f,r | | GS Mortgage Securities Trust,2011-GC5, D, 144A, FRN, 5.556%, 8/10/44 | | | United States | | | | 195,000 | | | | | | | | 194,441 | |
| | GSR Mortgage Loan Trust, | | | | | | | | | | | | | | | | |
| | 2005-4F, 6A1, 6.50%, 2/25/35 | | | United States | | | | 9,079 | | | | | | | | 9,154 | |
| | r 2005-AR6, 4A5, FRN, 4.541%, 9/25/35 | | | United States | | | | 58,022 | | | | | | | | 59,604 | |
| | | | |
| | | |
| 40 | | Semiannual Report | | franklintempleton.com |
FRANKLIN ALTERNATIVE STRATEGIES FUNDS
CONSOLIDATED STATEMENT OF INVESTMENTS (UNAUDITED)
Franklin K2 Alternative Strategies Fund(continued)
| | | | | | | | | | | | | | | | | | |
| | | | |
| | | | | Country | | | Principal Amount* | | | Value | |
| | | Asset-Backed Securities and Commercial
Mortgage-Backed Securities (continued) | | | |
| | | Mortgage Real Estate Investment Trusts (REITs) (continued) | |
| q | | Harborview Mortgage Loan Trust,2004-11, 2A2A, FRN, 2.373%,(1-Month USD LIBOR + 0.64%), 1/19/35 | | | United States | | | | 94,849 | | | | | | | $ | 92,203 | |
| | IndyMac Index Mortgage Loan Trust, FRN, | | | | | | | | | | | | | | | | |
| | q 2004-AR12, A1, 2.488%,(1-Month USD LIBOR + 0.78%), 12/25/34 | | | United States | | | | 2,031,598 | | | | | | | | 1,800,382 | |
| | q 2004-AR7, A5, 2.928%,(1-Month USD LIBOR + 1.22%), 9/25/34 | | | United States | | | | 49,406 | | | | | | | | 46,944 | |
| | r 2005-AR11, A3, 3.859%, 8/25/35 | | | United States | | | | 53,159 | | | | | | | | 48,428 | |
| | q 2006-AR2, 2A1, 1.918%,(1-Month USD LIBOR + 0.21%), 2/25/46 | | | United States | | | | 244,183 | | | | | | | | 209,320 | |
| f,q | | Invitation Homes Trust, 144A, FRN, | | | | | | | | | | | | | | | | |
| | 2018-SFR1, E, 3.763%,(1-Month USD LIBOR + 2.00%), 3/17/37 | | | United States | | | | 99,986 | | | | | | | | 100,384 | |
| | 2018-SFR2, E, 3.765%,(1-Month USD LIBOR + 2.00%), 6/17/37 | | | United States | | | | 200,000 | | | | | | | | 200,948 | |
| | JP Morgan Mortgage Trust, | | | | | | | | | | | | | | | | |
| | 2004-S1, 2A1, 6.00%, 9/25/34 | | | United States | | | | 98,660 | | | | | | | | 105,506 | |
| | r 2007-A1, 4A2, FRN, 4.658%, 7/25/35 | | | United States | | | | 3,750 | | | | | | | | 3,911 | |
| q | | Lehman XS Trust Series,2006-2N, 1A1, FRN, 1.968%,
(1-Month USD LIBOR + 0.26%), 2/25/46 | | | United States | | | | 44,375 | | | | | | | | 41,474 | |
| j,q | | Ludgate Funding PLC, FRN, Reg S, | | | | | | | | | | | | | | | | |
| | 2007-1, A2B, 0.665%,(3-Month EURIBOR + 0.16%), 1/01/61 | | | United Kingdom | | | | 29,291 | | | | EUR | | | | 30,656 | |
| | 2008-W1X, A1, 1.36%,(3-Month GBP LIBOR + 0.60%), 1/01/61 | | | United Kingdom | | | | 133,043 | | | | GBP | | | | 167,065 | |
| | MASTR Alternative Loan Trust, | | | | | | | | | | | | | | | | |
| | 2004-2, 8A4, 5.50%, 3/25/34 | | | United States | | | | 167,159 | | | | | | | | 170,812 | |
| | 2004-8, 2A1, 6.00%, 9/25/34 | | | United States | | | | 51,420 | | | | | | | | 55,413 | |
| r | | Merrill Lynch Mortgage Investors MLCC,2006-2, 2A, FRN, 3.962%, 5/25/36 | | | United States | | | | 5,002 | | | | | | | | 5,140 | |
| f,r | | Morgan Stanley Capital I Trust,2011-C2, E, 144A, FRN, 5.671%, 6/15/44 | | | United States | | | | 150,000 | | | | | | | | 146,029 | |
| j,q | | Newgate Funding PLC,2007-3X, A2B, FRN, Reg S, 0.167%,(3-Month EURIBOR + 0.60%), 12/15/50 | | | United Kingdom | | | | 62,107 | | | | EUR | | | | 66,511 | |
| f | | PRPM LLC, 144A, | | | | | | | | | | | | | | | | |
| | r 2017-3A, A1, FRN, 3.47%, 11/25/22 | | | United States | | | | 64,692 | | | | | | | | 64,930 | |
| | 2019-4A, A1, 3.351%, 11/25/24 | | | United States | | | | 115,000 | | | | | | | | 114,999 | |
| r | | RFMSI Trust,2005-SA1, 1A1, FRN, 4.528%, 3/25/35 | | | United States | | | | 106,038 | | | | | | | | 78,425 | |
| j,q | | RMAC Securities PLC, 2006-NS1X, A2C, FRN, Reg S, 0.229%,(3-Month EURIBOR + 0.15%), 6/12/44 | | | United Kingdom | | | | 40,904 | | | | EUR | | | | 43,385 | |
| q | | Structured ARM Loan Trust,2005-14, A1, FRN, 2.018%,(1-Month USD LIBOR + 0.31%), 7/25/35 | | | United States | | | | 259,760 | | | | | | | | 208,505 | |
| r | | Wachovia Mortgage Loan Trust LLC Series Trust, 2007-A, 2A1, FRN, 4.668%, 3/20/37 | | | United States | | | | 2,205,966 | | | | | | | | 2,155,283 | |
| f | | Wells Fargo Commercial Mortgage Trust, 2019-JWDR, C, 144A, 3.139%, 9/15/31 | | | United States | | | | 290,000 | | | | | | | | 288,205 | |
| r | | WF-RBS Commercial Mortgage Trust, FRN,
f 2011-C2, D, 144A, 5.839%, 2/15/44 | | | United States | | | | 35,000 | | | | | | | | 35,723 | |
| | f 2011-C3, D, 144A, 5.856%, 3/15/44 | | | United States | | | | 90,000 | | | | | | | | 67,951 | |
| | f 2012-C6, D, 144A, 5.767%, 4/15/45 | | | United States | | | | 150,000 | | | | | | | | 158,059 | |
| | 2012-C7, C, 4.968%, 6/15/45 | | | United States | | | | 25,000 | | | | | | | | 25,607 | |
| | f 2012-C7, E, 144A, 4.968%, 6/15/45 | | | United States | | | | 75,000 | | | | | | | | 56,690 | |
| | | | | | | | | | | | | | | | | | |
| | | | | |
| | | | | | | | | | | | | | | | | 14,375,901 | |
| | | | | | | | | | | | | | | | | | |
| | | Thrifts & Mortgage Finance 0.3% | |
| f,q | | BX Commercial Mortgage Trust, 144A, FRN,
2019-XL, E, 3.565%,(1-Month USD LIBOR + 1.80%), 10/15/36 | | | United States | | | | 1,300,000 | | | | | | | | 1,302,989 | |
| | | | | | |
| | | |
| franklintempleton.com | | Semiannual Report | | | 41 | |
FRANKLIN ALTERNATIVE STRATEGIES FUNDS
CONSOLIDATED STATEMENT OF INVESTMENTS (UNAUDITED)
Franklin K2 Alternative Strategies Fund(continued)
| | | | | | | | | | | | | | | | | | |
| | | | |
| | | | | Country | | | Principal Amount* | | | Value | |
| | | Asset-Backed Securities and Commercial
Mortgage-Backed Securities (continued) | | | |
| | | Thrifts & Mortgage Finance (continued) | |
| | 2019-XL, F, 3.765%,(1-Month USD LIBOR + 2.00%), 10/15/36 | | | United States | | | | 2,000,000 | | | | | | | $ | 2,005,279 | |
| | | | | | | | | | | | | | | | | | |
| | | | | |
| | | | | | | | | | | | | | | | | 3,308,268 | |
| | | | | | | | | | | | | | | | | | |
| | Total Asset-Backed Securities and Commercial
Mortgage-Backed Securities (Cost $69,603,275) | | | | | | | | | | | | | | | 69,829,061 | |
| | | | | | | | | | | | | | | | | | |
| | | Municipal Bonds in Reorganization 0.7% | | | |
| | | Puerto Rico 0.7% | |
| n | | Puerto Rico Commonwealth GO, Public Improvement, Refunding, Series A,
5.50%, 7/01/39 | | | United States | | | | 715,000 | | | | | | | | 480,838 | |
| | 5.00%, 7/01/41 | | | United States | | | | 1,000,000 | | | | | | | | 640,000 | |
| n | | Puerto Rico Commonwealth GO, Refunding, Series A, 8.00%, 7/01/35 | | | United States | | | | 5,300,000 | | | | | | | | 3,286,000 | |
| n | | Puerto Rico Electric Power Authority Power Revenue, | | | | | | | | | | | | | | | | |
| | A-RSA-1, 5.00%, 7/01/42 | | | United States | | | | 1,608,000 | | | | | | | | 1,234,140 | |
| | TT-RSA-1, 5.00%, 7/01/32 | | | United States | | | | 430,000 | | | | | | | | 330,025 | |
| | TT-RSA-1, 5.00%, 7/01/37 | | | United States | | | | 865,000 | | | | | | | | 663,887 | |
| | WW-RSA-1, 5.25%, 7/01/33 | | | United States | | | | 20,000 | | | | | | | | 15,350 | |
| | WW-RSA-1, 5.50%, 7/01/38 | | | United States | | | | 194,000 | | | | | | | | 149,380 | |
| | a XX, 5.25%, 7/01/40 | | | United States | | | | 2,180,000 | | | | | | | | 1,673,150 | |
| | | | | | | | | | | | | | | | | | |
| | Total Municipal Bonds in Reorganization
(Cost $7,671,566) | | | | | | | | | | | | | | | 8,472,770 | |
| | | | | | | | | | | | | | | | | | |
| | | | |
| | | | | Number of
Contracts | | | Notional Amount# | | | | |
| | | Options Purchased 0.0%† | | | |
| | Calls – Exchange-Traded 0.0%† | | | | | | | | | | | | | | | | |
| | Aurora Cannabis Inc., January Strike Price $5.00, Expires 1/17/20 | | | 114 | | | | 11,400 | | | | | | | | 570 | |
| | BP PLC, December Strike Price 5.40 GBP, Expires 12/20/19 | | | 42 | | | | 42,000 | | | | | | | | 136 | |
| | CBS Corp., March Strike Price $37.50, Expires 3/20/20 | | | 132 | | | | 13,200 | | | | | | | | 57,090 | |
| | DJ EURO STOXX 50 Index, December Strike Price 3,700.00 EUR, Expires 12/20/19 | | | 55 | | | | 550 | | | | | | | | 24,664 | |
| | DJ EURO STOXX Banks, December Strike Price 105.00 EUR, Expires 12/20/19 | | | 200 | | | | 10,000 | | | | | | | | 551 | |
| | DJ EURO STOXX Banks, December Strike Price 115.00 EUR, Expires 12/20/19 | | | 600 | | | | 30,000 | | | | | | | | 1,653 | |
| | DJ EURO STOXX Banks, December Strike Price 120.00 EUR,
Expires 12/20/19 | | | 137 | | | | 6,850 | | | | | | | | 377 | |
| | Evolent Health Inc., A, December Strike Price $12.50, Expires 12/20/19 | | | 150 | | | | 15,000 | | | | | | | | 300 | |
| | Fitbit Inc., A, January Strike Price $7.00, Expires 1/17/20 | | | 1,524 | | | | 152,400 | | | | | | | | 24,384 | |
| | Industrial Select Sector SPDR Fund, January Strike Price $84.00,
Expires 1/17/20 | | | 143 | | | | 14,300 | | | | | | | | 10,439 | |
| | Occidental Petroleum Corp., January Strike Price $42.50,
Expires 1/17/20 | | | 103 | | | | 10,300 | | | | | | | | 5,768 | |
| | Royal Dutch Petroleum Co., December Strike Price 27.00 EUR,
Expires 12/20/19 | | | 94 | | | | 9,400 | | | | | | | | 828 | |
| | Spark Therapeutics Inc., December Strike Price $100.00,
Expires 12/20/19 | | | 176 | | | | 17,600 | | | | | | | | 212,960 | |
| | Team Inc., December Strike Price $20.00, Expires 12/20/19 | | | 77 | | | | 7,700 | | | | | | | | 1,155 | |
| | thyssenkrupp AG, December Strike Price 14.00 EUR, Expires 12/20/19 | | | 657 | | | | 65,700 | | | | | | | | 1,448 | |
| | TOTAL SA, December Strike Price 50.00 EUR, Expires 12/20/19 | | | 52 | | | | 5,200 | | | | | | | | 687 | |
| | Vishay Intertechnology Inc., December Strike Price $20.00,
Expires 12/20/19 | | | 154 | | | | 15,400 | | | | | | | | 7,700 | |
| | Vodafone Group PLC, January Strike Price 1.55 GBP,
Expires 1/17/20 | | | 1,554 | | | | 1,554,000 | | | | | | | | 75,367 | |
| | | | |
| | | |
| 42 | | Semiannual Report | | franklintempleton.com |
FRANKLIN ALTERNATIVE STRATEGIES FUNDS
CONSOLIDATED STATEMENT OF INVESTMENTS (UNAUDITED)
Franklin K2 Alternative Strategies Fund(continued)
| | | | | | | | | | | | | | | | | | |
| | | | |
| | | | | Number of
Contracts | | | Notional Amount# | | | Value | |
| | | Options Purchased (continued) | | | |
| | Calls – Exchange-Traded(continued) | | | | | | | | | | | | | | | | |
| | Vodafone Group PLC, ADR, January Strike Price $20.00,
Expires 1/17/20 | | | 364 | | | | 36,400 | | | | | | | $ | 18,564 | |
| | | | | | | | | | | | | | | | | | |
| | | | | |
| | | | | | | | | | | | | | | | | 444,641 | |
| | | | | | | | | | | | | | | | | | |
| | Calls –Over-the-Counter 0.0%† | | | | |
| | | Currency Options 0.0%† | | | | | | | | | | | | |
| | EUR/CHF, Counterparty JPHQ, May Strike Price 1.12 CHF,
Expires 5/14/20 | | | 1 | | | | 4,000,000 | | | | EUR | | | | 20,318 | |
| | EUR/JPY, Counterparty JPHQ, February Strike Price 123.50 JPY, Expires 2/19/20 | | | 1 | | | | 2,500,000 | | | | EUR | | | | 6,718 | |
| | EUR/USD, Counterparty JPHQ, January Strike Price $1.16,
Expires 1/13/20 | | | 1 | | | | 12,000,000 | | | | EUR | | | | 724 | |
| | EUR/USD, Counterparty JPHQ, February Strike Price $1.15,
Expires 2/17/20 | | | 1 | | | | 10,000,000 | | | | EUR | | | | 7,383 | |
| | USD/HKD, Counterparty JPHQ, January Strike Price 7.98 HKD,
Expires 1/20/20 | | | 1 | | | | 2,000,000 | | | | | | | | 204 | |
| | | | | | | | | | | | | | | | | | |
| | | | | |
| | | | | | | | | | | | | | | | | 35,347 | |
| | | | | | | | | | | | | | | | | | |
| | Puts – Exchange-Traded 0.0%† | | | | |
| | Allergan PLC, January Strike Price $140.00, Expires 1/17/20 | | | 162 | | | | 16,200 | | | | | | | | 10,125 | |
| | DJ EURO STOXX 50 Index, January Strike Price 3,550.00 EUR, Expires 1/17/20 | | | 43 | | | | 430 | | | | | | | | 11,512 | |
| | Invesco QQQ Series 1 ETF, December Strike Price $196.00,
Expires 12/20/19 | | | 591 | | | | 59,100 | | | | | | | | 38,415 | |
| | The Medicines Co., January Strike Price $20.00, Expires 1/17/20 | | | 41 | | | | 4,100 | | | | | | | | 410 | |
| | Raytheon Co., January Strike Price $175.00, Expires 1/17/20 | | | 14 | | | | 1,400 | | | | | | | | 665 | |
| | S&P 500 Index, January Strike Price $2,900.00, Expires 1/17/20 | | | 11 | | | | 1,100 | | | | | | | | 11,968 | |
| | S&P 500 Index, January Strike Price $2,950.00, Expires 1/17/20 | | | 11 | | | | 1,100 | | | | | | | | 16,280 | |
| | STOXX Europe 600 Food & Beverage Index, December Strike Price 740.00 EUR, Expires 12/20/19 | | | 100 | | | | 5,000 | | | | | | | | 11,018 | |
| | Tallgrass Energy Partners LP, A, January Strike Price $17.00,
Expires 1/17/20 | | | 229 | | | | 22,900 | | | | | | | | 18,320 | |
| | Tiffany & Co., January Strike Price $100.00, Expires 1/17/20 | | | 126 | | | | 12,600 | | | | | | | | 756 | |
| | | | | | | | | | | | | | | | | | |
| | | | | |
| | | | | | | | | | | | | | | | | 119,469 | |
| | | | | | | | | | | | | | | | | | |
| | Puts –Over-the-Counter 0.0%† | | | | |
| | | Currency Options 0.0%† | | | | | | | | | | | | |
| | EUR/SEK, Counterparty JPHQ, January Strike Price 10.45 SEK, Expires 1/14/20 | | | 1 | | | | 3,000,000 | | | | EUR | | | | 11,618 | |
| | USD/CLP, Counterparty JPHQ, January Strike Price 725.00 CLP, Expires 1/20/20 | | | 1 | | | | 700,000 | | | | | | | | 5,008 | |
| | | | | | | | | | | | | | | | | | |
| | | | | |
| | | | | | | | | | | | | | | | | 16,626 | |
| | | | | | | | | | | | | | | | | | |
| | Total Options Purchased (Cost $1,114,728) | | | | | | | | | | | | | | | 616,083 | |
| | | | | | | | | | | | | | | | | | |
| | Total Investments before Short Term Investments
(Cost $705,745,082) | | | | | | | | | | | | | | | 832,404,020 | |
| | | | | | | | | | | | | | | | | | |
| | | | |
| | | | | Country | | | Principal Amount* | | | | |
| | | Short Term Investments 30.1% | | | | | | | | | |
| | Corporate Bonds and Notes (Cost $196,346) 0.0%† | | | | |
| | | Pharmaceuticals 0.0%† | |
| f | | Bristol-Myers Squibb Co., senior note, 144A, 2.875%, 8/15/20 | | | United States | | | | 195,000 | | | | | | | | 196,352 | |
| | | | | | | | | | | | | | | | | | |
| | | | | | |
| | | |
| franklintempleton.com | | Semiannual Report | | | 43 | |
FRANKLIN ALTERNATIVE STRATEGIES FUNDS
CONSOLIDATED STATEMENT OF INVESTMENTS (UNAUDITED)
Franklin K2 Alternative Strategies Fund(continued)
| | | | | | | | | | | | | | | | | | |
| | | | |
| | | | | Country | | | Principal Amount* | | | Value | |
| | | Short Term Investments(continued) | | | | | | | | | |
| | |
| p | | Credit-Linked Notes 0.5% | | | | |
| f | | Citigroup Global Markets Holdings Inc., senior note, 144A,
d (Arab Republic of Egypt), zero cpn., 1/09/20 | | | Egypt | | | | 17,430,185 | | | | EGP | | | $ | 1,062,895 | |
| | d (Arab Republic of Egypt), zero cpn., 3/19/20 | | | Egypt | | | | 16,767,729 | | | | EGP | | | | 993,644 | |
| | (The Federal Republic of Nigeria), zero cpn., 1/13/20 | | | Nigeria | | | | 196,853,998 | | | | NGN | | | | 534,914 | |
| | d (Ukraine), 15.70%, 1/10/20 | | | Ukraine | | | | 21,995,293 | | | | UAH | | | | 862,053 | |
| | d (Ukraine), 15.74%, 1/17/20 | | | Ukraine | | | | 21,104,702 | | | | UAH | | | | 918,126 | |
| f | | HSBC Bank PLC, senior note, (Arab Republic of Egypt), zero cpn., 144A 5/07/20 | | | Egypt | | | | 16,550,000 | | | | EGP | | | | 968,360 | |
| | JPMorgan Chase Bank NA, senior note,
(The Federal Republic of Nigeria), zero cpn., 1/13/20 | | | Nigeria | | | | 138,000,000 | | | | NGN | | | | 375,114 | |
| | f (Egypt Treasury Bill), 144A, zero cpn., 7/09/20 | | | Egypt | | | | 8,316,000 | | | | EGP | | | | 473,790 | |
| | | | | | | | | | | | | | | | | | |
| | | | | |
| | Total Credit-Linked Notes (Cost $6,084,917) | | | | | | | | | | | | | | | 6,188,896 | |
| | | | | | | | | | | | | | | | | | |
| | | | | |
| | | | | | | | Shares | | | | | | | |
| | Money Market Funds 23.9% | | | | |
| s,t | | Dreyfus Government Cash Management, Institutional, 1.56% | | | United States | | | | 18,455,114 | | | | | | | | 18,455,114 | |
| s | | Fidelity Investments Money Market Government Portfolio, Institutional, 1.53% | | | United States | | | | 287,809,659 | | | | | | | | 287,809,659 | |
| | | | | | | | | | | | | | | | | | |
| | | | | |
| | Total Money Market Funds (Cost $306,264,773) | | | | | | | | | | | | | | | 306,264,773 | |
| | | | | | | | | | | | | | | | | | |
| | | | |
| | | | | | | | Principal Amount* | | | | |
| | Repurchase Agreements (Cost $18,057,281) 1.4% | | | | |
| u | | Joint Repurchase Agreement, 1.618%, 12/02/19 (Maturity Value $18,059,716) | | | United States | | | | 18,057,281 | | | | | | | | 18,057,281 | |
| | | | | | | | | | | | | | | | | | |
| | BNP Paribas Securities Corp. (Maturity Value $11,673,800) Deutsche Bank Securities Inc. (Maturity Value $3,050,467) HSBC Securities (USA) Inc. (Maturity Value $3,335,449)
Collateralized by U.S. Government Agency Securities,
4.50%, 1/20/49; v U.S. Treasury Bills, 5/14/20 – 8/13/20;
U.S. Treasury Bonds, 7.875%–8.75%, 5/15/20–2/15/21; and
U.S. Treasury Notes, 1.625%–2.875%, 6/30/20–11/15/21
(valued at $18,415,849) | | | | | | | | | | | | | | | | |
| | | | | |
| | | | | | | | Shares | | | | | | | |
| | |
| w | | Investments from Cash Collateral Received for
Loaned Securities 0.4% | | | |
| | | Money Market Funds 0.3% | | | | | | | | | | | | |
| s,x | | Institutional Fiduciary Trust Money Market Portfolio, 1.35% | | | United States | | | | 3,404,000 | | | | | | | | 3,404,000 | |
| | | | | | | | | | | | | | | | | | |
| | | | |
| | | | | | | | Principal Amount* | | | | |
| | |
| | | Repurchase Agreements 0.1% | | | | | | | | | | | | |
| u | | Joint Repurchase Agreement, 1.63%, 12/02/19 (Maturity Value $1,186,681) | | | United States | | | | 1,186,520 | | | | | | | | 1,186,520 | |
| | | | | | | | | | | | | | | | | | |
| | J.P. Morgan Securities LLC Collateralized by a U.S. Government Agency Obligation, 2.13%, 6/30/21 (valued at $1,199,793) | | | | | | | | | | | | | | | | |
| | Total Investments from Cash Collateral Received for Loaned Securities (Cost $4,590,520) | | | | | | | | | | | | | | | 4,590,520 | |
| | | | | | | | | | | | | | | | | | |
| | | | |
| | | |
| 44 | | Semiannual Report | | franklintempleton.com |
FRANKLIN ALTERNATIVE STRATEGIES FUNDS
CONSOLIDATED STATEMENT OF INVESTMENTS (UNAUDITED)
Franklin K2 Alternative Strategies Fund(continued)
| | | | | | | | | | | | | | | | | | |
| | | | |
| | | | | Country | | | Principal Amount* | | | Value | |
| | | U.S. Government and Agency Securities 1.6% | |
| | v U.S. Treasury Bill, | | | | | | | | | | | | | | | | |
| | a 12/05/19 | | | United States | | | | 14,395,000 | | | | | | | $ | 14,393,335 | |
| | 2/20/20–10/08/20 | | | United States | | | | 5,905,000 | | | | | | | | 5,858,402 | |
| | | | | | | | | | | | | | | | | | |
| | Total U.S. Government and Agency Securities
(Cost $20,245,176) | | | | | | | | | | | | | | | 20,251,737 | |
| | | | | | | | | | | | | | | | | | |
| | Total Investments (Cost $1,061,184,095) 92.8% | | | | | | | | | | | | | | | 1,187,953,579 | |
| | Options Written (0.0)%† | | | | | | | | | | | | | | | (512,165 | ) |
| | Securities Sold Short (14.3)% | | | | | | | | | | | | | | | (183,639,252 | ) |
| | Other Assets, less Liabilities 21.5% | | | | | | | | | | | | | | | 277,724,495 | |
| | | | | | | | | | | | | | | | | | |
| | Net Assets 100.0% | | | | | | | | | | | | | | $ | 1,281,526,657 | |
| | | | | | | | | | | | | | | | | | |
| | | | |
| | | | | Number of
Contracts | | | Notional Amount# | | | | |
| y | | Options Written (0.0)%† | | | |
| | Calls – Exchange-Traded (0.0)%† | | | | |
| | AbbVie Inc., December Strike Price $80.00, Expires 12/20/19 | | | 1 | | | | 100 | | | | | | | | (777 | ) |
| | Altria Group Inc., December Strike Price $47.50, Expires 12/20/19 | | | 1 | | | | 100 | | | | | | | | (258 | ) |
| | Altria Group Inc., December Strike Price $50.00, Expires 12/20/19 | | | 1 | | | | 100 | | | | | | | | (85 | ) |
| | AmerisourceBergen Corp., December Strike Price $90.00, Expires 12/20/19 | | | 1 | | | | 100 | | | | | | | | (138 | ) |
| | Best Buy Co. Inc., December Strike Price $77.50, Expires 12/20/19 | | | 1 | | | | 100 | | | | | | | | (445 | ) |
| | Carbonite Inc., December Strike Price $22.50, Expires 12/20/19 | | | 792 | | | | 79,200 | | | | | | | | (39,600 | ) |
| | Cisco Systems Inc., December Strike Price $50.00, Expires 12/20/19 | | | 1 | | | | 100 | | | | | | | | (3 | ) |
| | Comcast Corp., December Strike Price $47.50, Expires 12/20/19 | | | 1 | | | | 100 | | | | | | | | (2 | ) |
| | DJ EURO STOXX 50 Index, December Strike Price 3,750.00 EUR, Expires 12/20/19 | | | 55 | | | | 550 | | | | | | | | (10,605 | ) |
| | DJ EURO STOXX Banks, December Strike Price 125.00 EUR,
Expires 12/20/19 | | | 937 | | | | 46,850 | | | | | | | | (2,581 | ) |
| | Eaton Corp. PLC, December Strike Price $87.50, Expires 12/20/19 | | | 1 | | | | 100 | | | | | | | | (475 | ) |
| | Enterprise Products Partners LP, December Strike Price $28.00,
Expires 12/20/19 | | | 4 | | | | 400 | | | | | | | | (20 | ) |
| | FirstEnergy Corp., December Strike Price $50.00, Expires 12/20/19 | | | 1 | | | | 100 | | | | | | | | (1 | ) |
| | Fitbit Inc., A, January Strike Price $6.00, Expires 1/17/20 | | | 1,513 | | | | 151,300 | | | | | | | | (155,839 | ) |
| | Garmin Ltd., December Strike Price $90.00, Expires 12/20/19 | | | 1 | | | | 100 | | | | | | | | (844 | ) |
| | Hewlett Packard Enterprise Co., December Strike Price $17.00,
Expires 12/20/19 | | | 3 | | | | 300 | | | | | | | | (18 | ) |
| | Iron Mountain Inc., December Strike Price $35.00, Expires 12/20/19 | | | 3 | | | | 300 | | | | | | | | (3 | ) |
| | Leidos Holdings Inc., December Strike Price $85.00, Expires 12/20/19 | | | 1 | | | | 100 | | | | | | | | (600 | ) |
| | Merck & Co. Inc., December Strike Price $87.50, Expires 12/20/19 | | | 1 | | | | 100 | | | | | | | | (109 | ) |
| | MetLife Inc., December Strike Price $50.00, Expires 12/20/19 | | | 1 | | | | 100 | | | | | | | | (86 | ) |
| | Oracle Corp., December Strike Price $57.50, Expires 12/20/19 | | | 1 | | | | 100 | | | | | | | | (85 | ) |
| | Plains GP Holdings LP, December Strike Price $21.00,
Expires 12/20/19 | | | 2 | | | | 200 | | | | | | | | (10 | ) |
| | Spark Therapeutics Inc., December Strike Price $110.00,
Expires 12/20/19 | | | 176 | | | | 17,600 | | | | | | | | (59,840 | ) |
| | Starbucks Corp., December Strike Price $90.00, Expires 12/20/19 | | | 1 | | | | 100 | | | | | | | | (18 | ) |
| | STOXX Europe 600 Food & Beverage Index, December Strike Price 740.00 EUR, Expires 12/20/19 | | | 100 | | | | 5,000 | | | | | | | | (166,922 | ) |
| | Synchrony Financial, December Strike Price $37.00, Expires 12/20/19 | | | 2 | | | | 200 | | | | | | | | (194 | ) |
| | thyssenkrupp AG, December Strike Price 16.00 EUR, Expires 12/20/19 | | | 657 | | | | 65,700 | | | | | | | | (724 | ) |
| | Tiffany & Co., December Strike Price $135.00, Expires 12/20/19 | | | 126 | | | | 12,600 | | | | | | | | (1,260 | ) |
| | Tiffany & Co., January Strike Price $135.00, Expires 1/17/20 | | | 56 | | | | 5,600 | | | | | | | | (1,120 | ) |
| | | | | | |
| | | |
| franklintempleton.com | | Semiannual Report | | | 45 | |
FRANKLIN ALTERNATIVE STRATEGIES FUNDS
CONSOLIDATED STATEMENT OF INVESTMENTS (UNAUDITED)
Franklin K2 Alternative Strategies Fund(continued)
| | | | | | | | | | | | | | | | | | |
| | | | |
| | | | | Number of
Contracts | | | Notional Amount# | | | Value | |
| y | | Options Written (continued) | | | |
| | Calls – Exchange-Traded (continued) | | | | |
| | Verizon Communications Inc., December Strike Price $62.50,
Expires 12/20/19 | | | 1 | | | | 100 | | | | | | | $ | (9 | ) |
| | | | | | | | | | | | | | | | | | |
| | | | | | | | | | | | | | | | | (442,671 | ) |
| | | | | | | | | | | | | | | | | | |
| | Calls –Over-the-Counter (0.0)%† | | | | |
| | | Currency Options (0.0)%† | | | | | | | | | | | | |
| | EUR/GBP, Counterparty JPHQ, December Strike Price 0.88 GBP,
Expires 12/17/19 | | | 1 | | | | 1,000,000 | | | | EUR | | | | (2,927 | ) |
| | EUR/SEK, Counterparty JPHQ, January Strike Price 11.25 SEK,
Expires 1/14/20 | | | 1 | | | | 750,000 | | | | EUR | | | | (57 | ) |
| | EUR/USD, Counterparty JPHQ, January Strike Price $1.14,
Expires 1/13/20 | | | 1 | | | | 4,000,000 | | | | EUR | | | | (1,185 | ) |
| | GBP/USD, Counterparty JPHQ, December Strike Price $1.32,
Expires 12/17/19 | | | 1 | | | | 1,000,000 | | | | GBP | | | | (5,546 | ) |
| | USD/CLP, Counterparty JPHQ, January Strike Price 850.00 CLP,
Expires 1/20/20 | | | 1 | | | | 175,000 | | | | | | | | (3,454 | ) |
| | USD/HKD, Counterparty JPHQ, January Strike Price 7.85 HKD,
Expires 1/20/20 | | | 1 | | | | 1,000,000 | | | | | | | | (876 | ) |
| | USD/ZAR, Counterparty JPHQ, May Strike Price 16.50 ZAR,
Expires 5/15/20 | | | 1 | | | | 500,000 | | | | | | | | (5,585 | ) |
| | | | | | | | | | | | | | | | | | |
| | | | | | | | | | | | | | | | | (19,630 | ) |
| | | | | | | | | | | | | | | | | | |
| | Puts – Exchange-Traded (0.0)%† | | | | |
| | Allergan PLC, January Strike Price $125.00, Expires 1/17/20 | | | 162 | | | | 16,200 | | | | | | | | (1,944 | ) |
| | Cardtronics PLC, A, January Strike Price $35.00, Expires 1/17/20 | | | 20 | | | | 2,000 | | | | | | | | (1,500 | ) |
| | CBS Corp., March Strike Price $32.50, Expires 3/20/20 | | | 132 | | | | 13,200 | | | | | | | | (5,346 | ) |
| | DJ EURO STOXX 50 Index, January Strike Price 3,300.00 EUR, Expires 1/17/20 | | | 43 | | | | 430 | | | | | | | | (2,653 | ) |
| | DJ EURO STOXX Banks, December Strike Price 65.00 EUR, Expires 12/20/19 | | | 80 | | | | 4,000 | | | | | | | | (220 | ) |
| | DJ EURO STOXX Banks, December Strike Price 70.00 EUR, Expires 12/20/19 | | | 40 | | | | 2,000 | | | | | | | | (110 | ) |
| | S&P 500 Index, January Strike Price $2,700.00, Expires 1/17/20 | | | 11 | | | | 1,100 | | | | | | | | (3,542 | ) |
| | S&P 500 Index, January Strike Price $2,750.00, Expires 1/17/20 | | | 11 | | | | 1,100 | | | | | | | | (4,697 | ) |
| | | | | | | | | | | | | | | | | | |
| | | | | |
| | | | | | | | | | | | | | | | | (20,012 | ) |
| | | | | | | | | | | | | | | | | | |
| | Puts –Over-the-Counter (0.0)%† | | | | |
| | | Currency Options (0.0)%† | |
| | EUR/GBP, Counterparty JPHQ, December Strike Price 0.84 GBP, Expires 12/17/19 | | | 1 | | | | 1,000,000 | | | | EUR | | | | (5,971 | ) |
| | EUR/JPY, Counterparty JPHQ, February Strike Price 116.00 JPY, Expires 2/19/20 | | | 1 | | | | 2,500,000 | | | | EUR | | | | (5,272 | ) |
| | GBP/USD, Counterparty JPHQ, December Strike Price $1.26, Expires 12/17/19 | | | 1 | | | | 1,000,000 | | | | GBP | | | | (4,535 | ) |
| | GBP/USD, Counterparty JPHQ, February Strike Price $1.26, Expires 2/20/20 | | | 1 | | | | 800,000 | | | | GBP | | | | (8,438 | ) |
| | USD/CLP, Counterparty JPHQ, January Strike Price 660.00 CLP, Expires 1/20/20 | | | 1 | | | | 700,000 | | | | | | | | (546 | ) |
| | USD/ZAR, Counterparty JPHQ, May Strike Price 14.00 ZAR, Expires 5/15/20 | | | 1 | | | | 500,000 | | | | | | | | (5,090 | ) |
| | | | | | | | | | | | | | | | | | |
| | | | | |
| | | | | | | | | | | | | | | | | (29,852 | ) |
| | | | | | | | | | | | | | | | | | |
| | Total Options Written
(Premiums Received $617,001) | | | | | | | | | | | | | | | (512,165 | ) |
| | | | | | | | | | | | | | | | | | |
| | | | |
| | | |
| 46 | | Semiannual Report | | franklintempleton.com |
FRANKLIN ALTERNATIVE STRATEGIES FUNDS
CONSOLIDATED STATEMENT OF INVESTMENTS (UNAUDITED)
Franklin K2 Alternative Strategies Fund(continued)
| | | | | | | | | | | | | | | | | | |
| | | | | |
| | | | | Country | | | Shares | | | | | | Value | |
| z | | Securities Sold Short (14.3)% | | | |
| | Common Stocks (6.2)% | | | | |
| | | Aerospace & Defense (0.3)% | |
| | The Boeing Co. | | | United States | | | | 4,886 | | | | | | | $ | (1,789,155 | ) |
| | Raytheon Co. | | | United States | | | | 8,354 | | | | | | | | (1,816,327 | ) |
| | Spirit AeroSystems Holdings Inc., A | | | United States | | | | 5,329 | | | | | | | | (463,570 | ) |
| | | | | | | | | | | | | | | | | | |
| | | | | |
| | | | | | | | | | | | | | | | | (4,069,052 | ) |
| | | | | | | | | | | | | | | | | | |
| | | Air Freight & Logistics (0.3)% | |
| | Air Transport Services Group Inc. | | | United States | | | | 25,828 | | | | | | | | (635,627 | ) |
| | Atlas Air Worldwide Holdings Inc. | | | United States | | | | 8,173 | | | | | | | | (213,234 | ) |
| | C.H. Robinson Worldwide Inc. | | | United States | | | | 18,432 | | | | | | | | (1,416,499 | ) |
| | FedEx Corp. | | | United States | | | | 2,948 | | | | | | | | (471,827 | ) |
| | XPO Logistics Inc. | | | United States | | | | 10,337 | | | | | | | | (854,767 | ) |
| | | | | | | | | | | | | | | | | | |
| | | | | |
| | | | | | | | | | | | | | | | | (3,591,954 | ) |
| | | | | | | | | | | | | | | | | | |
| | | Airlines (0.1)% | |
| | Spirit Airlines Inc. | | | United States | | | | 15,812 | | | | | | | | (617,775 | ) |
| | | | | | | | | | | | | | | | | | |
| | | Automobiles (0.0)%† | |
| | Winnebago Industries Inc. | | | United States | | | | 9,855 | | | | | | | | (468,408 | ) |
| | | | | | | | | | | | | | | | | | |
| | | Banks (0.1)% | |
| | BB&T Corp. | | | United States | | | | 25,030 | | | | | | | | (1,369,642 | ) |
| | Hope Bancorp Inc. | | | United States | | | | 7,001 | | | | | | | | (101,584 | ) |
| | | | | | | | | | | | | | | | | | |
| | | | | | | | | | | | | | | | | (1,471,226 | ) |
| | | | | | | | | | | | | | | | | | |
| | | Biotechnology (0.7)% | |
| | AbbVie Inc. | | | United States | | | | 27,135 | | | | | | | | (2,380,554 | ) |
| | Cytokinetics Inc. | | | United States | | | | 28,719 | | | | | | | | (277,713 | ) |
| | Halozyme Therapeutics Inc. | | | United States | | | | 18,770 | | | | | | | | (363,950 | ) |
| | Insmed Inc. | | | United States | | | | 19,183 | | | | | | | | (442,168 | ) |
| | Intercept Pharmaceuticals Inc. | | | United States | | | | 11,194 | | | | | | | | (1,213,094 | ) |
| | Ionis Pharmaceuticals Inc. | | | United States | | | | 3,745 | | | | | | | | (239,530 | ) |
| | Ironwood Pharmaceuticals Inc., A | | | United States | | | | 112,412 | | | | | | | | (1,351,192 | ) |
| | Karyopharm Therapeutics Inc. | | | United States | | | | 18,284 | | | | | | | | (320,336 | ) |
| | Ligand Pharmaceuticals Inc. | | | United States | | | | 1,870 | | | | | | | | (211,310 | ) |
| | Neurocrine Biosciences Inc. | | | United States | | | | 11,789 | | | | | | | | (1,374,715 | ) |
| | PDL BioPharma Inc. | | | United States | | | | 143,131 | | | | | | | | (443,706 | ) |
| | | | | | | | | | | | | | | | | | |
| | | | | | | | | | | | | | | | | (8,618,268 | ) |
| | | | | | | | | | | | | | | | | | |
| | | Building Products (0.0)%† | |
| | Patrick Industries Inc. | | | United States | | | | 6,095 | | | | | | | | (301,824 | ) |
| | | | | | | | | | | | | | | | | | |
| | | Chemicals (0.1)% | |
| | Air Products & Chemicals Inc. | | | United States | | | | 5,132 | | | | | | | | (1,212,846 | ) |
| | Dow Inc. | | | United States | | | | 8,760 | | | | | | | | (467,521 | ) |
| | | | | | | | | | | | | | | | | | |
| | | | | | | | | | | | | | | | | (1,680,367 | ) |
| | | | | | | | | | | | | | | | | | |
| | | Commercial Services & Supplies (0.1)% | |
| | Team Inc. | | | United States | | | | 38,125 | | | | | | | | (616,481 | ) |
| | | | | | | | | | | | | | | | | | |
| | | Communications Equipment (0.1)% | |
| | Acacia Communications Inc. | | | United States | | | | 9,249 | | | | | | | | (616,353 | ) |
| | | | | | | | | | | | | | | | | | |
| | | Consumer Finance (0.1)% | |
| | Encore Capital Group Inc. | | | United States | | | | 26,261 | | | | | | | | (957,739 | ) |
| | EZCORP Inc., A | | | United States | | | | 21,164 | | | | | | | | (108,360 | ) |
| | PRA Group Inc. | | | United States | | | | 19,532 | | | | | | | | (715,652 | ) |
| | | | | | | | | | | | | | | | | | |
| | | | | | | | | | | | | | | | | (1,781,751 | ) |
| | | | | | | | | | | | | | | | | | |
| | | Diversified Consumer Services (0.0)%† | |
| | Chegg Inc. | | | United States | | | | 5,753 | | | | | | | | (223,044 | ) |
| | | | | | | | | | | | | | | | | | |
| | | | | | |
| | | |
| franklintempleton.com | | Semiannual Report | | | 47 | |
FRANKLIN ALTERNATIVE STRATEGIES FUNDS
CONSOLIDATED STATEMENT OF INVESTMENTS (UNAUDITED)
Franklin K2 Alternative Strategies Fund(continued)
| | | | | | | | | | | | | | | | | | |
| | | | | |
| | | | | Country | | | Shares | | | | | | Value | |
| z | | Securities Sold Short (continued) | | | |
| | Common Stocks (continued) | | | | | | | | | | | | | | | | |
| | | Diversified Financial Services (0.0)%† | |
| | Element Fleet Management Corp. | | | Canada | | | | 40,382 | | | | | | | $ | (348,398 | ) |
| | | | | | | | | | | | | | | | | | |
| | | Electronic Equipment, Instruments & Components (0.3)% | |
| | II-VI Inc. | | | United States | | | | 13,639 | | | | | | | | (398,122 | ) |
| | Knowles Corp. | | | United States | | | | 49,085 | | | | | | | | (1,074,961 | ) |
| | OSI Systems Inc. | | | United States | | | | 5,079 | | | | | | | | (505,310 | ) |
| | TTM Technologies Inc. | | | United States | | | | 92,093 | | | | | | | | (1,234,967 | ) |
| | Vishay Intertechnology Inc. | | | United States | | | | 21,077 | | | | | | | | (419,222 | ) |
| | | | | | | | | | | | | | | | | | |
| | | | | | | | | | | | | | | | | (3,632,582 | ) |
| | | | | | | | | | | | | | | | | | |
| | | Entertainment (0.1)% | |
| | Live Nation Entertainment Inc. | | | United States | | | | 17,678 | | | | | | | | (1,234,101 | ) |
| | Sea Ltd., ADR | | | Taiwan | | | | 7,884 | | | | | | | | (292,024 | ) |
| | Zynga Inc., A | | | United States | | | | 48,910 | | | | | | | | (304,709 | ) |
| | | | | | | | | | | | | | | | | | |
| | | | | | | | | | | | | | | | | (1,830,834 | ) |
| | | | | | | | | | | | | | | | | | |
| | | Equity Real Estate Investment Trusts (REITs) (0.1)% | |
| | Innovative Industrial Properties Inc., A | | | United States | | | | 15,702 | | | | | | | | (1,215,492 | ) |
| | | | | | | | | | | | | | | | | | |
| | | Food & Staples Retailing (0.0)%† | |
| | The Chefs’ Warehouse Inc. | | | United States | | | | 8,176 | | | | | | | | (290,739 | ) |
| | | | | | | | | | | | | | | | | | |
| | | Food Products (0.1)% | |
| | Campbell Soup Co. | | | United States | | | | 8,159 | | | | | | | | (379,965 | ) |
| | The Hershey Co. | | | United States | | | | 385 | | | | | | | | (57,042 | ) |
| | Mondelez International Inc., A | | | United States | | | | 8,225 | | | | | | | | (432,141 | ) |
| | | | | | | | | | | | | | | | | | |
| | | | | | | | | | | | | | | | | (869,148 | ) |
| | | | | | | | | | | | | | | | | | |
| | | Health Care Equipment & Supplies (0.2)% | |
| | DexCom Inc. | | | United States | | | | 6,016 | | | | | | | | (1,367,497 | ) |
| | Wright Medical Group NV | | | United States | | | | 50,775 | | | | | | | | (1,511,572 | ) |
| | | | | | | | | | | | | | | | | | |
| | | | | | | | | | | | | | | | | (2,879,069 | ) |
| | | | | | | | | | | | | | | | | | |
| | | Health Care Providers & Services (0.4)% | |
| | Centene Corp. | | | United States | | | | 93,597 | | | | | | | | (5,659,811 | ) |
| | | | | | | | | | | | | | | | | | |
| | | Health Care Technology (0.0)%† | |
| | Allscripts Healthcare Solutions Inc. | | | United States | | | | 11,037 | | | | | | | | (118,979 | ) |
| | Evolent Health Inc., A | | | United States | | | | 3,055 | | | | | | | | (22,026 | ) |
| | Tabula Rasa HealthCare Inc. | | | United States | | | | 8,344 | | | | | | | | (372,226 | ) |
| | | | | | | | | | | | | | | | | | |
| | | | | | | | | | | | | | | | | (513,231 | ) |
| | | | | | | | | | | | | | | | | | |
| | | Hotels, Restaurants & Leisure (0.1)% | |
| | Eldorado Resorts Inc. | | | United States | | | | 18,205 | | | | | | | | (974,149 | ) |
| | Marriott Vacations Worldwide Corp. | | | United States | | | | 3,834 | | | | | | | | (470,969 | ) |
| | Starbucks Corp. | | | United States | | | | 4,804 | | | | | | | | (410,406 | ) |
| | | | | | | | | | | | | | | | | | |
| | | | | | | | | | | | | | | | | (1,855,524 | ) |
| | | | | | | | | | | | | | | | | | |
| | | Household Durables (0.1)% | |
| | PulteGroup Inc. | | | United States | | | | 15,095 | | | | | | | | (598,517 | ) |
| | Toll Brothers Inc. | | | United States | | | | 18,086 | | | | | | | | (726,514 | ) |
| | | | | | | | | | | | | | | | | | |
| | | | | | | | | | | | | | | | | (1,325,031 | ) |
| | | | | | | | | | | | | | | | | | |
| | | Household Products (0.0)%† | |
| | The Procter & Gamble Co. | | | United States | | | | 3,560 | | | | | | | | (434,534 | ) |
| | | | | | | | | | | | | | | | | | |
| | | Independent Power & Renewable Electricity Producers (0.0)%† | |
| | NRG Energy Inc. | | | United States | | | | 4,569 | | | | | | | | (181,526 | ) |
| | | | | | | | | | | | | | | | | | |
| | | Interactive Media & Services (0.1)% | |
| | Zillow Group Inc., C | | | United States | | | | 29,545 | | | | | | | | (1,156,687 | ) |
| | | | | | | | | | | | | | | | | | |
| | | | |
| | | |
| 48 | | Semiannual Report | | franklintempleton.com |
FRANKLIN ALTERNATIVE STRATEGIES FUNDS
CONSOLIDATED STATEMENT OF INVESTMENTS (UNAUDITED)
Franklin K2 Alternative Strategies Fund(continued)
| | | | | | | | | | | | | | | | | | |
| | | | | |
| | | | | Country | | | Shares | | | | | | Value | |
| z | | Securities Sold Short (continued) | | | |
| | Common Stocks (continued) | | | | | | | | | | | | | | | | |
| | | Internet & Direct Marketing Retail (0.1)% | |
| | Pinduoduo Inc., ADR | | | China | | | | 1,656 | | | | | | | $ | (59,533 | ) |
| | Wayfair Inc., A | | | United States | | | | 7,387 | | | | | | | | (627,304 | ) |
| | | | | | | | | | | | | | | | | | |
| | | | | | | | | | | | | | | | | (686,837 | ) |
| | | | | | | | | | | | | | | | | | |
| | | IT Services (0.3)% | |
| | Cardtronics PLC, A | | | United States | | | | 13,044 | | | | | | | | (550,718 | ) |
| | CSG Systems International Inc. | | | United States | | | | 13,629 | | | | | | | | (779,443 | ) |
| | KBR Inc. | | | United States | | | | 34,652 | | | | | | | | (1,031,590 | ) |
| | Okta Inc., A | | | United States | | | | 4,435 | | | | | | | | (575,574 | ) |
| | Perficient Inc. | | | United States | | | | 12,004 | | | | | | | | (507,529 | ) |
| | | | | | | | | | | | | | | | | | |
| | | | | | | | | | | | | | | | | (3,444,854 | ) |
| | | | | | | | | | | | | | | | | | |
| | | Machinery (0.2)% | |
| | Kennametal Inc. | | | United States | | | | 31,611 | | | | | | | | (1,101,011 | ) |
| | Stadler Rail AG | | | Switzerland | | | | 14,687 | | | | | | | | (718,668 | ) |
| | Terex Corp. | | | United States | | | | 18,734 | | | | | | | | (525,863 | ) |
| | | | | | | | | | | | | | | | | | |
| | | | | | | | | | | | | | | | | (2,345,542 | ) |
| | | | | | | | | | | | | | | | | | |
| | | Marine (0.0)%† | |
| | A.P. Moeller-Maersk AS, B | | | Denmark | | | | 331 | | | | | | | | (462,618 | ) |
| | | | | | | | | | | | | | | | | | |
| | | Media (0.1)% | |
| | Liberty Latin America Ltd., C | | | Chile | | | | 29,122 | | | | | | | | (522,449 | ) |
| | Sirius XM Holdings, Inc. | | | United States | | | | 67,901 | | | | | | | | (473,949 | ) |
| | | | | | | | | | | | | | | | | | |
| | | | | | | | | | | | | | | | | (996,398 | ) |
| | | | | | | | | | | | | | | | | | |
| | | Metals & Mining (0.1)% | |
| | First Majestic Silver Corp. | | | Canada | | | | 100,549 | | | | | | | | (1,081,907 | ) |
| | Kaiser Aluminum Corp. | | | United States | | | | 1,363 | | | | | | | | (149,358 | ) |
| | | | | | | | | | | | | | | | | | |
| | | | | | | | | | | | | | | | | (1,231,265 | ) |
| | | | | | | | | | | | | | | | | | |
| | | Mortgage Real Estate Investment Trusts (REITs) (0.1)% | |
| | Arbor Realty Trust Inc. | | | United States | | | | 10,495 | | | | | | | | (159,104 | ) |
| | PennyMac Mortgage Investment Trust | | | United States | | | | 8,508 | | | | | | | | (196,450 | ) |
| | Redwood Trust Inc. | | | United States | | | | 22,242 | | | | | | | | (359,875 | ) |
| | | | | | | | | | | | | | | | | | |
| | | | | | | | | | | | | | | | | (715,429 | ) |
| | | | | | | | | | | | | | | | | | |
| | | Oil, Gas & Consumable Fuels (0.1)% | |
| | Callon Petroleum Co. | | | United States | | | | 40,071 | | | | | | | | (146,259 | ) |
| | Diamondback Energy Inc. | | | United States | | | | 2,829 | | | | | | | | (218,795 | ) |
| | SFL Corp Ltd. | | | Norway | | | | 43,013 | | | | | | | | (609,064 | ) |
| | | | | | | | | | | | | | | | | | |
| | | | | | | | | | | | | | | | | (974,118 | ) |
| | | | | | | | | | | | | | | | | | |
| | | Personal Products (0.0)%† | |
| | Herbalife Nutrition Ltd. | | | United States | | | | 12,127 | | | | | | | | (553,112 | ) |
| | | | | | | | | | | | | | | | | | |
| | | Pharmaceuticals (0.2)% | |
| | Aerie Pharmaceuticals Inc. | | | United States | | | | 34,627 | | | | | | | | (657,567 | ) |
| | Aphria Inc. | | | Canada | | | | 37,589 | | | | | | | | (178,172 | ) |
| | Aurora Cannabis Inc. | | | Canada | | | | 59,287 | | | | | | | | (148,217 | ) |
| | Canopy Growth Corp. | | | Canada | | | | 11,346 | | | | | | | | (209,358 | ) |
| | Horizon Therapeutics PLC | | | United States | | | | 28,531 | | | | | | | | (935,246 | ) |
| | Innoviva Inc. | | | United States | | | | 31,502 | | | | | | | | (424,647 | ) |
| | Pacira Biosciences Inc. | | | United States | | | | 7,657 | | | | | | | | (353,907 | ) |
| | | | | | | | | | | | | | | | | | |
| | | | | | | | | | | | | | | | | (2,907,114 | ) |
| | | | | | | | | | | | | | | | | | |
| | | Real Estate Management & Development (0.1)% | |
| | Redfin Corp. | | | United States | | | | 30,764 | | | | | | | | (593,130 | ) |
| | | | | | | | | | | | | | | | | | |
| | | | | | |
| | | |
| franklintempleton.com | | Semiannual Report | | | 49 | |
FRANKLIN ALTERNATIVE STRATEGIES FUNDS
CONSOLIDATED STATEMENT OF INVESTMENTS (UNAUDITED)
Franklin K2 Alternative Strategies Fund(continued)
| | | | | | | | | | | | | | | | | | |
| | | | | |
| | | | | Country | | | Shares | | | | | | Value | |
| z | | Securities Sold Short (continued) | | | |
| | Common Stocks (continued) | | | | | | | | | | | | | | | | |
| | | Road & Rail (0.2)% | |
| | Avis Budget Group Inc. | | | United States | | | | 45,277 | | | | | | | $ | (1,346,991 | ) |
| | Ryder System Inc. | | | United States | | | | 3,386 | | | | | | | | (177,731 | ) |
| | Saia Inc. | | | United States | | | | 4,629 | | | | | | | | (439,292 | ) |
| | | | | | | | | | | | | | | | | | |
| | | | | | | | | | | | | | | | | (1,964,014 | ) |
| | | | | | | | | | | | | | | | | | |
| | | Semiconductors & Semiconductor Equipment (0.4)% | |
| | Cree Inc. | | | United States | | | | 6,623 | | | | | | | | (292,803 | ) |
| | Enphase Energy Inc. | | | United States | | | | 19,824 | | | | | | | | (433,551 | ) |
| | Inphi Corp. | | | United States | | | | 20,136 | | | | | | | | (1,402,069 | ) |
| | Microchip Technology Inc. | | | United States | | | | 17,368 | | | | | | | | (1,641,971 | ) |
| | Silicon Laboratories Inc. | | | United States | | | | 2,819 | | | | | | | | (298,616 | ) |
| | Synaptics Inc. | | | United States | | | | 6,542 | | | | | | | | (373,941 | ) |
| | | | | | | | | | | | | | | | | | |
| | | | | | | | | | | | | | | | | (4,442,951 | ) |
| | | | | | | | | | | | | | | | | | |
| | | Software (0.6)% | |
| | 8x8 Inc. | | | United States | | | | 28,869 | | | | | | | | (592,392 | ) |
| | Altair Engineering Inc., A | | | United States | | | | 16,478 | | | | | | | | (546,575 | ) |
| | Benefitfocus Inc. | | | United States | | | | 4,857 | | | | | | | | (116,471 | ) |
| | Blackline Inc. | | | United States | | | | 2,478 | | | | | | | | (133,366 | ) |
| | Coupa Software Inc. | | | United States | | | | 6,950 | | | | | | | | (1,066,756 | ) |
| | J2 Global Inc. | | | United States | | | | 468 | | | | | | | | (45,405 | ) |
| | LivePerson Inc. | | | United States | | | | 7,052 | | | | | | | | (279,894 | ) |
| | Nuance Communications Inc. | | | United States | | | | 48,174 | | | | | | | | (863,760 | ) |
| | Nutanix Inc., A | | | United States | | | | 22,518 | | | | | | | | (841,047 | ) |
| | Palo Alto Networks Inc. | | | United States | | | | 756 | | | | | | | | (171,778 | ) |
| | Pluralsight Inc., A | | | United States | | | | 14,498 | | | | | | | | (246,321 | ) |
| | PROS Holdings Inc. | | | United States | | | | 4,388 | | | | | | | | (273,329 | ) |
| | Rapid7 Inc. | | | United States | | | | 18,104 | | | | | | | | (1,015,091 | ) |
| | SailPoint Technologies Holding Inc. | | | United States | | | | 25,482 | | | | | | | | (637,815 | ) |
| | Splunk Inc. | | | United States | | | | 2,532 | | | | | | | | (377,825 | ) |
| | Verint Systems Inc. | | | United States | | | | 615 | | | | | | | | (29,895 | ) |
| | | | | | | | | | | | | | | | | | |
| | | | | | | | | | | | | | | | | (7,237,720 | ) |
| | | | | | | | | | | | | | | | | | |
| | | Specialty Retail (0.1)% | |
| | RH | | | United States | | | | 5,264 | | | | | | | | (1,082,226 | ) |
| | | | | | | | | | | | | | | | | | |
| | | Technology Hardware, Storage & Peripherals (0.1)% | |
| | Apple Inc. | | | United States | | | | 2,949 | | | | | | | | (788,120 | ) |
| | Pure Storage Inc., A | | | United States | | | | 17,160 | | | | | | | | (275,761 | ) |
| | | | | | | | | | | | | | | | | | |
| | | | | | | | | | | | | | | | | (1,063,881 | ) |
| | | | | | | | | | | | | | | | | | |
| | | Tobacco (0.0)%† | |
| | Turning Point Brands Inc. | | | United States | | | | 12,398 | | | | | | | | (342,309 | ) |
| | | | | | | | | | | | | | | | | | |
| | | Trading Companies & Distributors (0.1)% | |
| | Fastenal Co. | | | United States | | | | 5,977 | | | | | | | | (212,303 | ) |
| | GATX Corp. | | | United States | | | | 7,490 | | | | | | | | (605,417 | ) |
| | Kaman Corp. | | | United States | | | | 3,172 | | | | | | | | (201,739 | ) |
| | WESCO International Inc. | | | United States | | | | 8,615 | | | | | | | | (453,321 | ) |
| | | | | | | | | | | | | | | | | | |
| | | | | | | | | | | | | | | | | (1,472,780 | ) |
| | | | | | | | | | | | | | | | | | |
| | | Transportation Infrastructure (0.0)%† | |
| | Westshore Terminals Investment Corp. | | | Canada | | | | 20,034 | | | | | | | | (326,082 | ) |
| | | | | | | | | | | | | | | | | | |
| | | Water Utilities (0.0)%† | |
| | American Water Works Co. Inc. | | | United States | | | | 1,918 | | | | | | | | (232,136 | ) |
| | | | | | | | | | | | | | | | | | |
| | Total Common Stocks (Proceeds $76,998,530) | | | | | | | | | | | | | | | (79,323,625 | ) |
| | | | | | | | | | | | | | | | | | |
| | | | |
| | | |
| 50 | | Semiannual Report | | franklintempleton.com |
FRANKLIN ALTERNATIVE STRATEGIES FUNDS
CONSOLIDATED STATEMENT OF INVESTMENTS (UNAUDITED)
Franklin K2 Alternative Strategies Fund(continued)
| | | | | | | | | | | | | | | | | | |
| | | | | |
| | | | | Country | | | Shares | | | | | | Value | |
| z | | Securities Sold Short (continued) | | | |
| | | Exchange Traded Funds (8.1)% | | | |
| | Consumer Discretionary Select Sector SPDR Fund | | | United States | | | | 4,913 | | | | | | | $ | (601,597 | ) |
| | ETFMG Prime Cyber Security ETF | | | United States | | | | 50,673 | | | | | | | | (2,146,508 | ) |
| | Health Care Select Sector SPDR Fund | | | United States | | | | 24,614 | | | | | | | | (2,448,847 | ) |
| | Invesco QQQ Series 1 ETF | | | United States | | | | 16,984 | | | | | | | | (3,483,418 | ) |
| | iShares Core S&PSmall-Cap ETF | | | United States | | | | 28,686 | | | | | | | | (2,346,802 | ) |
| | iShares NASDAQ Biotechnology ETF | | | United States | | | | 15,618 | | | | | | | | (1,868,694 | ) |
| | iShares North American Tech ETF | | | United States | | | | 23,347 | | | | | | | | (5,482,109 | ) |
| | iShares North American Tech-Multimedia Networking ETF | | | United States | | | | 66,626 | | | | | | | | (3,642,443 | ) |
| | iShares North American Tech-Software ETF | | | United States | | | | 13,719 | | | | | | | | (3,182,739 | ) |
| | iShares PHLX Semiconductor ETF | | | United States | | | | 25,654 | | | | | | | | (5,989,439 | ) |
| | iShares Russell 2000 Growth ETF | | | United States | | | | 14,765 | | | | | | | | (3,100,207 | ) |
| | iShares RussellMid-Cap Growth ETF | | | United States | | | | 7,909 | | | | | | | | (1,194,655 | ) |
| | iShares S&PSmall-Cap 600 Growth ETF | | | United States | | | | 6,732 | | | | | | | | (1,266,626 | ) |
| | iShares U.S. Technology ETF | | | United States | | | | 12,072 | | | | | | | | (2,700,265 | ) |
| | SPDR S&P 500 ETF Trust | | | United States | | | | 191,054 | | | | | | | | (60,050,183 | ) |
| | SPDR S&P MidCap 400 ETF Trust | | | United States | | | | 3,958 | | | | | | | | (1,451,161 | ) |
| | SPDR S&P Oil & Gas Exploration & Production ETF | | | United States | | | | 5,050 | | | | | | | | (102,818 | ) |
| | VanguardSmall-Cap Growth ETF | | | United States | | | | 16,601 | | | | | | | | (3,257,116 | ) |
| | | | | | | | | | | | | | | | | | |
| | Total Exchange Traded Funds
(Proceeds $98,322,107) | | | | | | | | | | | | | | | (104,315,627 | ) |
| | | | | | | | | | | | | | | | | | |
| | Total Securities Sold Short (Proceeds $175,320,637) | | | | | | | | | | | | | | $ | (183,639,252 | ) |
| | | | | | | | | | | | | | | | | | |
†Rounds to less than 0.1% of net assets.
*The principal amount is stated in U.S. dollars unless otherwise indicated.
#Notional amount is the number of units specified in the contract, and can include currency units, bushels, shares, pounds, barrels or other units. Currency units are stated in U.S. dollars unless otherwise indicated.
aA portion or all of the security has been segregated as collateral for securities sold short, open swap contracts, open forward exchange contracts, open futures contracts and/or open written option contracts. At November 30, 2019, the aggregate value of these securities and/or cash pledged amounted to $214,363,087, representing 16.7% of net assets.
bA portion or all of the security is held in connection with written option contracts open at period end.
cNon-income producing.
dFair valued using significant unobservable inputs. See Note 12 regarding fair value measurements.
eA portion or all of the security is on loan at November 30, 2019. See Note 1(j).
fSecurity was purchased pursuant to Rule 144A under the Securities Act of 1933 and may be sold in transactions exempt from registration only to qualified institutional buyers or in public offering registered under the Securities Act of 1933. At November 30, 2019, the aggregate value of these securities was $154,657,852, representing 12.1% of net assets.
gContingent distributions represent the right to receive additional distributions, if any, during the reorganization of the underlying company.
hThe coupon rate shown represents the rate at period end.
iSee Note 1(g) regarding loan participation notes.
jSecurity was purchased pursuant to Regulation S under the Securities Act of 1933, which exempts from registration securities offered and sold outside of the United States. Such a security cannot be sold in the United States without either an effective registration statement filed pursuant to the Securities Act of 1933, or pursuant to an exemption from registration. At November 30, 2019, the aggregate value of these securities was $7,901,774, representing 0.6% of net assets.
kIncome may be received in additional securities and/or cash.
lPerpetual security with no stated maturity date.
mA portion or all of the security purchased on a delayed delivery basis. See Note 1(d).
nSee Note 7 regarding defaulted securities.
oSee Note 1(l) regarding senior floating rate interests.
pSee Note 1(h) regarding credit-linked notes.
qThe coupon rate shown represents the rate inclusive of any caps or floors, if applicable, in effect at period end.
rAdjustable rate security with an interest rate that is not based on a published reference index and spread. The rate is based on the structure of the agreement and current market conditions. The coupon rate shown represents the rate at period end.
sThe rate shown is the annualizedseven-day effective yield at period end.
tA portion or all of the security is owned by K2 Holdings Investment Corp., a wholly-owned subsidiary of the Fund. See Note 1(k).
| | | | | | |
| | | |
| franklintempleton.com | | Semiannual Report | | | 51 | |
FRANKLIN ALTERNATIVE STRATEGIES FUNDS
CONSOLIDATED STATEMENT OF INVESTMENTS (UNAUDITED)
Franklin K2 Alternative Strategies Fund(continued)
uSee Note 1(c) regarding joint repurchase agreement.
vThe security was issued on a discount basis with no stated coupon rate.
wSee Note 1(j) regarding securities on loan.
xSee Note 3(f) regarding investments in affiliated management investment companies.
ySee Note 1(e) regarding written options.
zSee Note 1(i) regarding securities sold short.
aaSee Note 8 regarding restricted securities.
At November 30, 2019, the Fund had the following futures contracts outstanding. See Note 1(e).
| | | | | | | | | | | | | | | | | | | | |
| Futures Contracts | | | | | | | | | | | | | | | |
| | | | | |
| Description | | Type | | | Number of
Contracts | | | Notional
Amount* | | | Expiration
Date | | | Value/Unrealized
Appreciation
(Depreciation) | |
| Commodity Contractsa | | | | | | | | | | | | | | | |
Aluminum | | | Long | | | | 54 | | | $ | 2,403,000 | | | | 12/16/19 | | | $ | (57,550 | ) |
Aluminum | | | Short | | | | 54 | | | | 2,403,000 | | | | 12/16/19 | | | | (4,310 | ) |
Aluminum | | | Long | | | | 13 | | | | 576,712 | | | | 3/16/20 | | | | (2,950 | ) |
Aluminum | | | Short | | | | 46 | | | | 2,040,675 | | | | 3/16/20 | | | | 50,020 | |
Brent Crude Oil | | | Long | | | | 45 | | | | 2,722,050 | | | | 12/30/19 | | | | (37,958 | ) |
Cocoa | | | Long | | | | 10 | | | | 243,268 | | | | 3/16/20 | | | | (110 | ) |
Coffee | | | Short | | | | 5 | | | | 223,219 | | | | 3/19/20 | | | | (13,139 | ) |
Copper | | | Long | | | | 33 | | | | 4,828,931 | | | | 12/16/19 | | | | 6,853 | |
Copper | | | Short | | | | 33 | | | | 4,828,931 | | | | 12/16/19 | | | | (107,446 | ) |
Copper | | | Long | | | | 10 | | | | 1,466,813 | | | | 3/16/20 | | | | (7,929 | ) |
Copper | | | Short | | | | 20 | | | | 2,933,625 | | | | 3/16/20 | | | | 25,915 | |
Corn | | | Short | | | | 22 | | | | 419,375 | | | | 3/13/20 | | | | (4,021 | ) |
Hard Red Winter Wheat | | | Short | | | | 43 | | | | 961,050 | | | | 3/13/20 | | | | (46,902 | ) |
Low Sulphur Gas Oil | | | Short | | | | 3 | | | | 171,525 | | | | 1/10/20 | | | | (1,355 | ) |
Natural Gas | | | Short | | | | 14 | | | | 319,340 | | | | 12/27/19 | | | | 34,388 | |
Silver | | | Long | | | | 50 | | | | 4,276,500 | | | | 3/27/20 | | | | (33,266 | ) |
Soybean Meal | | | Short | | | | 10 | | | | 297,100 | | | | 3/13/20 | | | | 1,413 | |
Zinc | | | Long | | | | 33 | | | | 1,894,200 | | | | 12/16/19 | | | | (179,702 | ) |
Zinc | | | Short | | | | 33 | | | | 1,894,200 | | | | 12/16/19 | | | | (42,118 | ) |
Zinc | | | Short | | �� | | 23 | | | | 1,303,813 | | | | 3/16/20 | | | | 145,226 | |
| | | | | | | | | | | | | | | | | | | | |
| | | | | | | | | | | | | | | | | | | (274,941 | ) |
| | | | | | | | | | | | | | | | | | | | |
| Equity Contracts | | | | | | | | | | | | | | | |
CAC 40 10 Euro Indexa | | | Long | | | | 101 | | | | 6,564,483 | | | | 12/20/19 | | | | (5,493 | ) |
CMEE-Mini Russell 2000 Indexa | | | Long | | | | 1 | | | | 81,190 | | | | 12/20/19 | | | | 23 | |
CMEE-Mini Russell 2000 Index | | | Short | | | | 138 | | | | 11,204,220 | | | | 12/20/19 | | | | (279,442 | ) |
DAX Indexa | | | Long | | | | 58 | | | | 21,162,642 | | | | 12/20/19 | | | | 1,379,934 | |
DJ EURO STOXX 50 Indexa | | | Long | | | | 304 | | | | 12,399,687 | | | | 12/20/19 | | | | 635,709 | |
DJ EURO STOXX 50 Index | | | Short | | | | 456 | | | | 18,599,531 | | | | 12/20/19 | | | | (1,005,664 | ) |
FTSE 100 Indexa | | | Long | | | | 164 | | | | 15,621,168 | | | | 12/20/19 | | | | 220,665 | |
FTSE 100 Index | | | Short | | | | 85 | | | | 8,096,337 | | | | 12/20/19 | | | | (89,904 | ) |
FTSE/JSE Top 40 Index | | | Long | | | | 5 | | | | 168,117 | | | | 12/19/19 | | | | (4,883 | ) |
FTSE/MIB Index | | | Short | | | | 4 | | | | 512,841 | | | | 12/20/19 | | | | (32,509 | ) |
Hang Seng Indexa | | | Long | | | | 48 | | | | 8,073,274 | | | | 12/30/19 | | | | (211,581 | ) |
JPX-Nikkei 400 Index | | | Long | | | | 49 | | | | 678,889 | | | | 12/12/19 | | | | 53,779 | |
MSCI Emerging Market Index | | | Long | | | | 219 | | | | 11,366,100 | | | | 12/20/19 | | | | 103,669 | |
MSCI Singapore Index | | | Long | | | | 64 | | | | 1,723,545 | | | | 12/30/19 | | | | (8,324 | ) |
MSCI Taiwan Index | | | Long | | | | 12 | | | | 522,000 | | | | 12/30/19 | | | | (4,881 | ) |
NASDAQ 100E-Mini Indexa | | | Long | | | | 33 | | | | 5,555,550 | | | | 12/20/19 | | | | 283,330 | |
NASDAQ 100E-Mini Index | | | Short | | | | 206 | | | | 34,680,100 | | | | 12/20/19 | | | | (2,177,964 | ) |
Nikkei 225 Indexa | | | Long | | | | 34 | | | | 6,598,748 | | | | 12/12/19 | | | | 412,802 | |
S&P 500E-Mini Indexa | | | Long | | | | 127 | | | | 19,962,495 | | | | 12/20/19 | | | | 628,419 | |
S&P 500E-Mini Index | | | Short | | | | 1,131 | | | | 177,776,235 | | | | 12/20/19 | | | | (7,914,319 | ) |
STOXX 600 Banks Index | | | Long | | | | 1,929 | | | | 14,633,119 | | | | 12/20/19 | | | | 627,325 | |
STOXX 600 Banks Index | | | Short | | | | 129 | | | | 978,576 | | | | 12/20/19 | | | | (55,720 | ) |
STOXX Europe 600 Index | | | Short | | | | 13 | | | | 291,838 | | | | 12/20/19 | | | | (14,786 | ) |
| | | | |
| | | |
| 52 | | Semiannual Report | | franklintempleton.com |
FRANKLIN ALTERNATIVE STRATEGIES FUNDS
CONSOLIDATED STATEMENT OF INVESTMENTS (UNAUDITED)
Franklin K2 Alternative Strategies Fund(continued)
| | | | | | | | | | | | | | | | | | | | |
| Futures Contracts(continued) | | | | | | | | | | | | | | | |
| | | | | |
| Description | | Type | | | Number of
Contracts | | | Notional
Amount* | | | Expiration
Date | | | Value/Unrealized
Appreciation
(Depreciation) | |
| Equity Contracts(continued) | | | | | | | | | | | | | | | |
TOPIX Indexa | | | Long | | | | 81 | | | $ | 12,562,328 | | | | 12/12/19 | | | $ | 391,088 | |
TOPIX Index | | | Short | | | | 55 | | | | 8,529,976 | | | | 12/12/19 | | | | (798,458 | ) |
| | | | | | | | | | | | | | | | | | | | |
| | | | | | | | | | | | | | | | | | | (7,867,185 | ) |
| | | | | | | | | | | | | | | | | | | | |
| Interest Rate Contracts | | | | | | | | | | | | | | | |
3 Month EURIBORa | | | Long | | | | 317 | | | | 87,675,240 | | | | 12/14/20 | | | | (34,261 | ) |
90 Day Eurodollara | | | Long | | | | 634 | | | | 156,074,950 | | | | 12/14/20 | | | | 66,725 | |
90 Day Sterlinga | | | Long | | | | 475 | | | | 76,251,746 | | | | 12/16/20 | | | | 4,992 | |
Australian 10 Yr. Bonda | | | Long | | | | 65 | | | | 6,467,780 | | | | 12/16/19 | | | | 90,221 | |
Australian 10 Yr. Bond | | | Short | | | | 63 | | | | 6,268,771 | | | | 12/16/19 | | | | (20,318 | ) |
Canadian 10 Yr. Bonda | | | Long | | | | 6 | | | | 632,703 | | | | 3/20/20 | | | | 307 | |
Canadian 10 Yr. Bond | | | Short | | | | 97 | | | | 10,228,706 | | | | 3/20/20 | | | | (3,753 | ) |
Euro-BOBL | | | Short | | | | 45 | | | | 6,659,689 | | | | 12/06/19 | | | | 53,142 | |
Euro-BTP | | | Long | | | | 136 | | | | 21,471,161 | | | | 3/06/20 | | | | (6,979 | ) |
Euro-Bund | | | Long | | | | 27 | | | | 5,089,069 | | | | 12/06/19 | | | | 26,221 | |
Euro-Bund | | | Short | | | | 44 | | | | 8,293,298 | | | | 12/06/19 | | | | 251,796 | |
Euro-Bund | | | Short | | | | 22 | | | | 4,195,128 | | | | 3/06/20 | | | | 6,530 | |
Euro-SCHATZ | | | Short | | | | 140 | | | | 17,273,058 | | | | 12/06/19 | | | | 108,726 | |
Euro-SCHATZ | | | Short | | | | 124 | | | | 15,298,311 | | | | 3/06/20 | | | | 1,176 | |
Long Gilt | | | Short | | | | 77 | | | | 13,220,713 | | | | 3/27/20 | | | | 3,115 | |
U.S. Treasury 5 Yr. Note | | | Short | | | | 333 | | | | 39,616,594 | | | | 3/31/20 | | | | 30,217 | |
U.S. Treasury 10 Yr. Note | | | Long | | | | 193 | | | | 24,966,359 | | | | 3/20/20 | | | | (40,248 | ) |
U.S. Treasury 10 Yr. Note | | | Short | | | | 21 | | | | 2,716,547 | | | | 3/20/20 | | | | 4,765 | |
U.S. Treasury Long Bonda | | | Long | | | | 163 | | | | 25,911,906 | | | | 3/20/20 | | | | (26,435 | ) |
U.S. Treasury Long Bond | | | Short | | | | 19 | | | | 3,020,406 | | | | 3/20/20 | | | | 8,786 | |
U.S. Treasury Ultra Bond | | | Long | | | | 19 | | | | 3,566,656 | | | | 3/20/20 | | | | 3,995 | |
U.S. Treasury Ultra Bond | | | Short | | | | 12 | | | | 2,252,625 | | | | 3/20/20 | | | | (719 | ) |
| | | | | | | | | | | | | | | | | | | | |
| | | | | | | | | | | | | | | | | | | 528,001 | |
| | | | | | | | | | | | | | | | | | | | |
Total Futures Contracts | | | $ | (7,614,125 | ) |
| | | | | |
*As of period end.
aA portion or all of the contracts are owned by K2 Holdings Investment Corp., a wholly-owned subsidiary of the Fund. See Note 1(k).
At November 30, 2019, the Fund had the following forward exchange contracts outstanding. See Note 1(e).
| | | | | | | | | | | | | | | | | | | | | | | | | | | | |
| Forward Exchange Contracts | | | | | | | |
| | | | | | | |
| Currency | | Counterpartya | | | Type | | | Quantity | | | Contract
Amount | | | Settlement
Date | | | Unrealized
Appreciation | | | Unrealized
Depreciation | |
| OTC Forward Exchange Contracts | | | | | | | | | | | | | | | | | | | |
Brazilian Real | | | JPHQ | | | | Buy | | | | 21,968,258 | | | $ | 5,342,534 | | | | 12/03/19 | | | $ | — | | | $ | (154,464 | ) |
Brazilian Real | | | JPHQ | | | | Sell | | | | 21,968,258 | | | | 5,191,006 | | | | 12/03/19 | | | | 6,374 | | | | (3,438 | ) |
Canadian Dollar | | | MSCO | | | | Buy | | | | 12,885,071 | | | | 9,676,743 | | | | 12/09/19 | | | | 25,335 | | | | (604 | ) |
Canadian Dollar | | | UBSW | | | | Buy | | | | 222,962 | | | | 169,634 | | | | 12/09/19 | | | | — | | | | (1,761 | ) |
British Pound | | | BNYM | | | | Sell | | | | 3,044,401 | | | | 3,908,694 | | | | 12/13/19 | | | | — | | | | (31,061 | ) |
Euro | | | BNYM | | | | Buy | | | | 1,258,377 | | | | 1,388,166 | | | | 12/13/19 | | | | — | | | | (180 | ) |
Euro | | | BNYM | | | | Sell | | | | 22,477,895 | | | | 24,768,730 | | | | 12/13/19 | | | | — | | | | (24,326 | ) |
Hong Kong Dollar | | | BNYM | | | | Sell | | | | 19,547,118 | | | | 2,493,339 | | | | 12/13/19 | | | | — | | | | (3,247 | ) |
Swiss Franc | | | BNYM | | | | Sell | | | | 3,652,663 | | | | 3,696,742 | | | | 12/13/19 | | | | 38,481 | | | | — | |
British Pound | | | MSCO | | | | Buy | | | | 74,000 | | | | 95,977 | | | | 12/16/19 | | | | — | | | | (200 | ) |
British Pound | | | MSCO | | | | Sell | | | | 525,000 | | | | 642,371 | | | | 12/16/19 | | | | — | | | | (37,128 | ) |
Chilean Peso | | | JPHQ | | | | Buy | | | | 147,189,700 | | | | 185,000 | | | | 12/16/19 | | | | — | | | | (1,683 | ) |
Malaysian Ringgit | | | UBSW | | | | Buy | | | | 3,445,000 | | | | 818,776 | | | | 12/16/19 | | | | 5,883 | | | | — | |
British Pound | | | BNYM | | | | Sell | | | | 866,536 | | | | 1,114,296 | | | | 12/18/19 | | | | — | | | | (7,356 | ) |
Chilean Peso | | | JPHQ | | | | Buy | | | | 1,650,756,836 | | | | 2,238,435 | | | | 12/18/19 | | | | — | | | | (182,235 | ) |
| | | | | | |
| | | |
| franklintempleton.com | | Semiannual Report | | | 53 | |
FRANKLIN ALTERNATIVE STRATEGIES FUNDS
CONSOLIDATED STATEMENT OF INVESTMENTS (UNAUDITED)
Franklin K2 Alternative Strategies Fund(continued)
| | | | | | | | | | | | | | | | | | | | | | | | | | | | |
| Forward Exchange Contracts(continued) | | | | | | | |
| | | | | | | |
| Currency | | Counterpartya | | | Type | | | Quantity | | | Contract
Amount | | | Settlement
Date | | | Unrealized
Appreciation | | | Unrealized
Depreciation | |
| OTC Forward Exchange Contracts(continued) | | | | | | | | | | | | | | | | | | | |
Chilean Peso | | | JPHQ | | | | Sell | | | | 1,347,748,968 | | | $ | 1,779,988 | | | | 12/18/19 | | | $ | 101,219 | | | $ | — | |
Chinese Yuan | | | JPHQ | | | | Buy | | | | 14,763,731 | | | | 2,086,599 | | | | 12/18/19 | | | | 12,216 | | | | — | |
Colombian Peso | | | JPHQ | | | | Buy | | | | 3,143,595,000 | | | | 910,000 | | | | 12/18/19 | | | | — | | | | (17,181 | ) |
Euro | | | BNYM | | | | Sell | | | | 4,348,487 | | | | 4,822,258 | | | | 12/18/19 | | | | 24,534 | | | | (656 | ) |
Euro | | | BOFA | | | | Sell | | | | 982,467 | | | | 1,089,754 | | | | 12/18/19 | | | | 6,655 | | | | (1,014 | ) |
Euro | | | BZWS | | | | Sell | | | | 9,380,668 | | | | 10,425,032 | | | | 12/18/19 | | | | 74,657 | | | | (814 | ) |
Euro | | | JPHQ | | | | Buy | | | | 1,156,048 | | | | 1,278,847 | | | | 12/18/19 | | | | 849 | | | | (4,045 | ) |
Euro | | | JPHQ | | | | Sell | | | | 2,061,029 | | | | 2,286,444 | | | | 12/18/19 | | | | 12,182 | | | | — | |
Euro | | | MSCO | | | | Sell | | | | 2,002,024 | | | | 2,208,152 | | | | 12/18/19 | | | | 6,338 | | | | (7,339 | ) |
Euro | | | UBSW | | | | Sell | | | | 6,533 | | | | 7,229 | | | | 12/18/19 | | | | 20 | | | | — | |
Indonesian Rupiah | | | JPHQ | | | | Buy | | | | 12,955,016,497 | | | | 909,858 | | | | 12/18/19 | | | | 6,994 | | | | — | |
Indonesian Rupiah | | | JPHQ | | | | Sell | | | | 60,863,352,374 | | | | 4,274,562 | | | | 12/18/19 | | | | — | | | | (32,859 | ) |
Mexican Peso | | | JPHQ | | | | Buy | | | | 17,592,361 | | | | 900,763 | | | | 12/18/19 | | | | — | | | | (4,141 | ) |
Polish Zloty | | | JPHQ | | | | Buy | | | | 5,307,710 | | | | 1,369,703 | | | | 12/18/19 | | | | 16 | | | | (14,207 | ) |
Polish Zloty | | | JPHQ | | | | Sell | | | | 8,372,410 | | | | 2,137,406 | | | | 12/18/19 | | | | — | | | | (787 | ) |
Russian Ruble | | | JPHQ | | | | Buy | | | | 210,592,313 | | | | 3,271,831 | | | | 12/18/19 | | | | 2,881 | | | | (9,753 | ) |
Russian Ruble | | | JPHQ | | | | Sell | | | | 563,242,087 | | | | 8,498,717 | | | | 12/18/19 | | | | — | | | | (233,615 | ) |
South African Rand | | | JPHQ | | | | Buy | | | | 12,914,260 | | | | 872,532 | | | | 12/18/19 | | | | 6,627 | | | | — | |
South African Rand | | | JPHQ | | | | Sell | | | | 68,865,450 | | | | 4,601,174 | | | | 12/18/19 | | | | — | | | | (86,951 | ) |
Swiss Franc | | | BNYM | | | | Buy | | | | 633,403 | | | | 638,782 | | | | 12/18/19 | | | | — | | | | (4,096 | ) |
Swiss Franc | | | BNYM | | | | Sell | | | | 1,130,057 | | | | 1,143,922 | | | | 12/18/19 | | | | 11,576 | | | | — | |
Turkish Lira | | | JPHQ | | | | Buy | | | | 4,914,244 | | | | 828,290 | | | | 12/18/19 | | | | 22,259 | | | | — | |
Canadian Dollar | | | BNYM | | | | Sell | | | | 3,556,000 | | | | 2,694,559 | | | | 12/19/19 | | | | 16,840 | | | | — | |
Indian Rupee | | | JPHQ | | | | Sell | | | | 92,845,062 | | | | 1,272,085 | | | | 12/19/19 | | | | — | | | | (19,898 | ) |
Swiss Franc | | | BOFA | | | | Sell | | | | 8,228,843 | | | | 8,346,067 | | | | 12/19/19 | | | | 99,739 | | | | — | |
Swiss Franc | | | BZWS | | | | Sell | | | | 303,253 | | | | 306,672 | | | | 12/19/19 | | | | 2,775 | | | | — | |
Swiss Franc | | | GSCO | | | | Sell | | | | 601,837 | | | | 610,730 | | | | 12/19/19 | | | | 7,614 | | | | — | |
Swiss Franc | | | MSCO | | | | Sell | | | | 1,527,510 | | | | 1,544,539 | | | | 12/19/19 | | | | 13,784 | | | | — | |
Australian Dollar | | | JPHQ | | | | Buy | | | | 679,932 | | | | 460,527 | | | | 12/20/19 | | | | — | | | | (349 | ) |
Australian Dollar | | | JPHQ | | | | Sell | | | | 2,321,078 | | | | 1,582,745 | | | | 12/20/19 | | | | 11,837 | | | | — | |
Australian Dollarb | | | MSCO | | | | Buy | | | | 3,163,000 | | | | 2,151,150 | | | | 12/20/19 | | | | 1,620 | | | | (12,048 | ) |
Australian Dollarb | | | MSCO | | | | Sell | | | | 26,027,000 | | | | 17,851,177 | | | | 12/20/19 | | | | 236,318 | | | | (233 | ) |
British Pound | | | BZWS | | | | Buy | | | | 73,000 | | | | 94,161 | | | | 12/20/19 | | | | 351 | | | | (11 | ) |
British Pound | | | BZWS | | | | Sell | | | | 1,711,000 | | | | 2,206,704 | | | | 12/20/19 | | | | 10 | | | | (8,251 | ) |
British Pound | | | DBAB | | | | Buy | | | | 76,000 | | | | 94,412 | | | | 12/20/19 | | | | 3,973 | | | | — | |
British Pound | | | DBAB | | | | Sell | | | | 256,000 | | | | 322,689 | | | | 12/20/19 | | | | — | | | | (8,711 | ) |
British Pound | | | JPHQ | | | | Buy | | | | 2,539,731 | | | | 3,273,906 | | | | 12/20/19 | | | | 13,858 | | | | — | |
British Poundb | | | MSCO | | | | Buy | | | | 12,547,000 | | | | 16,018,872 | | | | 12/20/19 | | | | 230,645 | | | | (7,019 | ) |
British Poundb | | | MSCO | | | | Sell | | | | 16,715,000 | | | | 20,942,040 | | | | 12/20/19 | | | | 5,246 | | | | (701,316 | ) |
Canadian Dollar | | | BZWS | | | | Buy | | | | 5,239,000 | | | | 3,981,253 | | | | 12/20/19 | | | | — | | | | (36,164 | ) |
Canadian Dollar | | | BZWS | | | | Sell | | | | 19,000 | | | | 14,301 | | | | 12/20/19 | | | | — | | | | (6 | ) |
Canadian Dollar | | | DBAB | | | | Buy | | | | 1,811,000 | | | | 1,369,030 | | | | 12/20/19 | | | | — | | | | (5,305 | ) |
Canadian Dollar | | | DBAB | | | | Sell | | | | 14,302,000 | | | | 10,817,045 | | | | 12/20/19 | | | | 47,304 | | | | — | |
Canadian Dollar | | | JPHQ | | | | Sell | | | | 4,621,698 | | | | 3,480,935 | | | | 12/20/19 | | | | 688 | | | | — | |
Canadian Dollarb | | | MSCO | | | | Buy | | | | 13,153,000 | | | | 9,995,127 | | | | 12/20/19 | | | | — | | | | (90,610 | ) |
Canadian Dollarb | | | MSCO | | | | Sell | | | | 18,032,000 | | | | 13,559,507 | | | | 12/20/19 | | | | 5,944 | | | | (24,956 | ) |
Euro | | | BZWS | | | | Buy | | | | 1,555,000 | | | | 1,721,132 | | | | 12/20/19 | | | | 301 | | | | (5,267 | ) |
Euro | | | BZWS | | | | Sell | | | | 1,334,000 | | | | 1,473,424 | | | | 12/20/19 | | | | 1,596 | | | | (434 | ) |
Euro | | | DBAB | | | | Buy | | | | 4,790,000 | | | | 5,345,988 | | | | 12/20/19 | | | | 1,595 | | | | (61,126 | ) |
Euro | | | DBAB | | | | Sell | | | | 5,853,000 | | | | 6,511,419 | | | | 12/20/19 | | | | 52,624 | | | | (835 | ) |
Euro | | | JPHQ | | | | Sell | | | | 3,410,454 | | | | 3,776,564 | | | | 12/20/19 | | | | 12,635 | | | | — | |
Eurob | | | MSCO | | | | Buy | | | | 9,433,000 | | | | 10,470,414 | | | | 12/20/19 | | | | 2,821 | | | | (62,554 | ) |
Eurob | | | MSCO | | | | Sell | | | | 28,191,000 | | | | 31,230,939 | | | | 12/20/19 | | | | 131,857 | | | | (13,766 | ) |
Hungarian Forint | | | JPHQ | | | | Buy | | | | 130,668,969 | | | | 433,900 | | | | 12/20/19 | | | | — | | | | (2,960 | ) |
Japanese Yen | | | JPHQ | | | | Sell | | | | 838,970,127 | | | | 7,736,468 | | | | 12/20/19 | | | | 54,511 | | | | — | |
Japanese Yenb | | | MSCO | | | | Buy | | | | 1,665,798,000 | | | | 15,486,771 | | | | 12/20/19 | | | | — | | | | (234,037 | ) |
Japanese Yenb | | | MSCO | | | | Sell | | | | 1,919,529,000 | | | | 17,781,248 | | | | 12/20/19 | | | | 209,498 | | | | (4,251 | ) |
| | | | |
| | | |
| 54 | | Semiannual Report | | franklintempleton.com |
FRANKLIN ALTERNATIVE STRATEGIES FUNDS
CONSOLIDATED STATEMENT OF INVESTMENTS (UNAUDITED)
Franklin K2 Alternative Strategies Fund(continued)
| | | | | | | | | | | | | | | | | | | | | | | | | | | | |
| Forward Exchange Contracts(continued) | | | | | | | |
| | | | | | | |
| Currency | | Counterpartya | | | Type | | | Quantity | | | Contract
Amount | | | Settlement
Date | | | Unrealized
Appreciation | | | Unrealized
Depreciation | |
| OTC Forward Exchange Contracts(continued) | | | | | | | | | | | | | | | | | | | |
Mexican Peso | | | JPHQ | | | | Buy | | | | 318,341,389 | | | $ | 16,290,843 | | | | 12/20/19 | | | $ | — | | | $ | (70,529 | ) |
Mexican Pesob | | | MSCO | | | | Buy | | | | 46,367,000 | | | | 2,346,379 | | | | 12/20/19 | | | | 21,144 | | | | (5,006 | ) |
Mexican Pesob | | | MSCO | | | | Sell | | | | 39,690,000 | | | | 2,030,317 | | | | 12/20/19 | | | | 8,567 | | | | (559 | ) |
New Israeli Shekel | | | JPHQ | | | | Sell | | | | 1,590,045 | | | | 458,649 | | | | 12/20/19 | | | | 542 | | | | — | |
New Zealand Dollar | | | JPHQ | | | | Sell | | | | 4,342,188 | | | | 2,789,075 | | | | 12/20/19 | | | | 513 | | | | (82 | ) |
New Zealand Dollarb | | | MSCO | | | | Buy | | | | 7,121,000 | | | | 4,552,520 | | | | 12/20/19 | | | | 24,955 | | | | (4,219 | ) |
New Zealand Dollarb | | | MSCO | | | | Sell | | | | 3,667,000 | | | | 2,341,760 | | | | 12/20/19 | | | | 1,982 | | | | (15,246 | ) |
Norwegian Krone | | | JPHQ | | | | Buy | | | | 51,313,123 | | | | 5,596,813 | | | | 12/20/19 | | | | — | | | | (30,239 | ) |
Swedish Krona | | | JPHQ | | | | Buy | | | | 9,858,632 | | | | 1,021,175 | | | | 12/20/19 | | | | 9,826 | | | | — | |
Swiss Franc | | | JPHQ | | | | Sell | | | | 8,967,094 | | | | 9,047,680 | | | | 12/20/19 | | | | 60,647 | | | | — | |
Swiss Francb | | | MSCO | | | | Buy | | | | 1,641,000 | | | | 1,657,921 | | | | 12/20/19 | | | | — | | | | (13,272 | ) |
Swiss Francb | | | MSCO | | | | Sell | | | | 7,524,000 | | | | 7,628,641 | | | | 12/20/19 | | | | 87,915 | | | | — | |
Thai Baht | | | JPHQ | | | | Sell | | | | 13,900,275 | | | | 460,489 | | | | 12/20/19 | | | | 271 | | | | — | |
Turkish Lira | | | JPHQ | | | | Buy | | | | 6,872,641 | | | | 1,195,923 | | | | 12/20/19 | | | | — | | | | (7,050 | ) |
Chilean Peso | | | JPHQ | | | | Buy | | | | 262,011,575 | | | | 362,791 | | | | 12/23/19 | | | | — | | | | (36,322 | ) |
Chilean Peso | | | JPHQ | | | | Sell | | | | 262,011,575 | | | | 368,467 | | | | 12/23/19 | | | | 41,998 | | | | — | |
Australian Dollar | | | MSCO | | | | Buy | | | | 100,990 | | | | 69,257 | | | | 12/27/19 | | | | — | | | | (893 | ) |
Australian Dollar | | | MSCO | | | | Sell | | | | 211,818 | | | | 144,143 | | | | 12/27/19 | | | | 755 | | | | — | |
Brazilian Real | | | JPHQ | | | | Buy | | | | 3,458,364 | | | | 822,948 | | | | 12/27/19 | | | | 992 | | | | (8,253 | ) |
Brazilian Real | | | JPHQ | | | | Sell | | | | 3,458,364 | | | | 821,855 | | | | 12/27/19 | | | | 6,168 | | | | — | |
British Pound | | | MSCO | | | | Buy | | | | 118,787 | | | | 153,003 | | | | 12/27/19 | | | | 822 | | | | — | |
British Pound | | | MSCO | | | | Sell | | | | 246,621 | | | | 317,751 | | | | 12/27/19 | | | | — | | | | (1,615 | ) |
Canadian Dollar | | | MSCO | | | | Buy | | | | 449,763 | | | | 343,286 | | | | 12/27/19 | | | | — | | | | (4,576 | ) |
Canadian Dollar | | | MSCO | | | | Sell | | | | 1,173,610 | | | | 885,958 | | | | 12/27/19 | | | | 2,128 | | | | — | |
Danish Krone | | | MSCO | | | | Buy | | | | 10,415,624 | | | | 1,551,810 | | | | 12/27/19 | | | | 297 | | | | (12,353 | ) |
Danish Krone | | | MSCO | | | | Sell | | | | 42,491,225 | | | | 6,339,692 | | | | 12/27/19 | | | | 58,323 | | | | (162 | ) |
Euro | | | MSCO | | | | Buy | | | | 1,525,929 | | | | 1,693,955 | | | | 12/27/19 | | | | 71 | | | | (8,955 | ) |
Euro | | | MSCO | | | | Sell | | | | 4,852,554 | | | | 5,403,015 | | | | 12/27/19 | | | | 44,534 | | | | (157 | ) |
Japanese Yen | | | MSCO | | | | Sell | | | | 16,553,520 | | | | 152,396 | | | | 12/27/19 | | | | 725 | | | | — | |
Swedish Krona | | | MSCO | | | | Buy | | | | 6,231,755 | | | | 644,870 | | | | 12/27/19 | | | | 7,175 | | | | — | |
Swedish Krona | | | MSCO | | | | Sell | | | | 17,666,707 | | | | 1,829,217 | | | | 12/27/19 | | | | — | | | | (19,297 | ) |
Swiss Franc | | | MSCO | | | | Buy | | | | 1,063,167 | | | | 1,078,908 | | | | 12/27/19 | | | | — | | �� | | (12,643 | ) |
Swiss Franc | | | MSCO | | | | Sell | | | | 333,811 | | | | 335,076 | | | | 12/27/19 | | | | 330 | | | | (38 | ) |
British Pound | | | BNYM | | | | Sell | | | | 589,000 | | | | 729,182 | | | | 12/31/19 | | | | — | | | | (33,685 | ) |
British Pound | | | MSCS | | | | Buy | | | | 100,000 | | | | 129,086 | | | | 12/31/19 | | | | 433 | | | | — | |
British Pound | | | MSCS | | | | Sell | | | | 100,000 | | | | 123,891 | | | | 12/31/19 | | | | — | | | | (5,628 | ) |
Canadian Dollar | | | BNYM | | | | Buy | | | | 395,080 | | | | 298,000 | | | | 12/31/19 | | | | — | | | | (459 | ) |
Canadian Dollar | | | BNYM | | | | Sell | | | | 7,911,000 | | | | 5,970,112 | | | | 12/31/19 | | | | 14,315 | | | | (2,104 | ) |
Euro | | | BNYM | | | | Buy | | | | 1,550,000 | | | | 1,700,699 | | | | 12/31/19 | | | | 11,495 | | | | — | |
Euro | | | BNYM | | | | Sell | | | | 5,305,000 | | | | 5,840,911 | | | | 12/31/19 | | | | — | | | | (19,211 | ) |
Colombian Peso | | | MSCS | | | | Sell | | | | 780,000,000 | | | | 224,383 | | | | 1/02/20 | | | | 3,052 | | | | — | |
Brazilian Real | | | JPHQ | | | | Buy | | | | 10,984,129 | | | | 2,586,388 | | | | 1/03/20 | | | | 3,464 | | | | — | |
Hungarian Forint | | | UBSW | | | | Buy | | | | 125,270,000 | | | | 417,559 | | | | 1/15/20 | | | | — | | | | (3,845 | ) |
Norwegian Krone | | | BOFA | | | | Buy | | | | 7,175,000 | | | | 787,142 | | | | 1/15/20 | | | | — | | | | (8,629 | ) |
Australian Dollar | | | BOFA | | | | Sell | | | | 341,609 | | | | 234,235 | | | | 1/21/20 | | | | 2,840 | | | | — | |
Australian Dollar | | | JPHQ | | | | Buy | | | | 4,814,692 | | | | 3,271,062 | | | | 1/21/20 | | | | — | | | | (9,740 | ) |
Australian Dollar | | | UBSW | | | | Sell | | | | 599,600 | | | | 411,264 | | | | 1/21/20 | | | | 5,113 | | | | — | |
Canadian Dollar | | | BOFA | | | | Sell | | | | 145,000 | | | | 109,769 | | | | 1/21/20 | | | | 561 | | | | — | |
Euro | | | BZWS | | | | Sell | | | | 115,000 | | | | 128,777 | | | | 1/21/20 | | | | 1,570 | | | | — | |
South Korean Won | | | JPHQ | | | | Sell | | | | 453,204,615 | | | | 389,290 | | | | 1/21/20 | | | | 5,076 | | | | — | |
Australian Dollar | | | HSBC | | | | Buy | | | | 600,000 | | | | 411,884 | | | | 1/22/20 | | | | — | | | | (5,453 | ) |
Thai Baht | | | UBSW | | | | Sell | | | | 25,860,000 | | | | 853,367 | | | | 1/22/20 | | | | — | | | | (3,446 | ) |
Japanese Yen | | | JPHQ | | | | Buy | | | | 265,552,992 | | | | 2,454,550 | | | | 1/27/20 | | | | — | | | | (17,133 | ) |
Euro | | | BZWS | | | | Sell | | | | 760,702 | | | | 851,185 | | | | 1/28/20 | | | | 9,355 | | | | — | |
Euro | | | MSCO | | | | Sell | | | | 498,204 | | | | 552,426 | | | | 1/28/20 | | | | 1,089 | | | | — | |
Euro | | | UBSW | | | | Sell | | | | 9,778,799 | | | | 10,954,537 | | | | 1/28/20 | | | | 132,884 | | | | (48 | ) |
Swiss Franc | | | BZWS | | | | Sell | | | | 2,885,910 | | | | 2,937,627 | | | | 1/28/20 | | | | 36,290 | | | | — | |
| | | | | | |
| | | |
| franklintempleton.com | | Semiannual Report | | | 55 | |
FRANKLIN ALTERNATIVE STRATEGIES FUNDS
CONSOLIDATED STATEMENT OF INVESTMENTS (UNAUDITED)
Franklin K2 Alternative Strategies Fund(continued)
| | | | | | | | | | | | | | | | | | | | | | | | | | | | |
| Forward Exchange Contracts(continued) | | | | | | | |
| | | | | | | |
| Currency | | Counterpartya | | | Type | | | Quantity | | | Contract
Amount | | | Settlement
Date | | | Unrealized
Appreciation | | | Unrealized
Depreciation | |
| OTC Forward Exchange Contracts(continued) | | | | | | | | | | | | | | | | | | | |
Swiss Franc | | | MSCO | | | | Sell | | | | 492,148 | | | $ | 502,314 | | | | 1/28/20 | | | $ | 7,535 | | | $ | — | |
Swiss Franc | | | UBSW | | | | Sell | | | | 909,221 | | | | 927,148 | | | | 1/28/20 | | | | 13,067 | | | | — | |
Brazilian Real | | | CITI | | | | Buy | | | | 1,690,000 | | | | 422,131 | | | | 1/30/20 | | | | — | | | | (24,115 | ) |
British Pound | | | DBAB | | | | Buy | | | | 150,000 | | | | 193,936 | | | | 1/31/20 | | | | 516 | | | | — | |
British Pound | | | DBAB | | | | Sell | | | | 481,000 | | | | 620,262 | | | | 1/31/20 | | | | — | | | | (3,281 | ) |
Canadian Dollar | | | JPHQ | | | | Buy | | | | 9,000,000 | | | | 6,850,149 | | | | 1/31/20 | | | | — | | | | (71,581 | ) |
Euro | | | DBAB | | | | Sell | | | | 183,000 | | | | 204,347 | | | | 1/31/20 | | | | 1,793 | | | | — | |
Euro | | | JPHQ | | | | Sell | | | | 300,000 | | | | 331,499 | | | | 1/31/20 | | | | — | | | | (557 | ) |
South African Rand | | | MSCS | | | | Sell | | | | 17,835,000 | | | | 1,205,516 | | | | 1/31/20 | | | | — | | | | (1,061 | ) |
Brazilian Real | | | JPHQ | | | | Buy | | | | 6,080,545 | | | | 1,440,000 | | | | 2/03/20 | | | | 3,768 | | | | (11,945 | ) |
Brazilian Real | | | JPHQ | | | | Sell | | | | 7,710,259 | | | | 1,978,215 | | | | 2/03/20 | | | | 163,619 | | | | (986 | ) |
Taiwan Dollar | | | JPHQ | | | | Sell | | | | 61,540,395 | | | | 1,997,287 | | | | 2/04/20 | | | | — | | | | (25,984 | ) |
Canadian Dollar | | | BOFA | | | | Buy | | | | 8,201,353 | | | | 6,241,540 | | | | 2/05/20 | | | | — | | | | (64,422 | ) |
Canadian Dollar | | | BZWS | | | | Buy | | | | 192,588 | | | | 146,692 | | | | 2/05/20 | | | | — | | | | (1,638 | ) |
British Pound | | | BOFA | | | | Sell | | | | 7,492,079 | | | | 9,648,157 | | | | 2/18/20 | | | | — | | | | (68,861 | ) |
British Pound | | | BZWS | | | | Buy | | | | 463,255 | | | | 601,490 | | | | 2/18/20 | | | | — | | | | (661 | ) |
British Pound | | | UBSW | | | | Buy | | | | 628,068 | | | | 813,896 | | | | 2/18/20 | | | | 690 | | | | — | |
Singapore Dollar | | | CITI | | | | Sell | | | | 2,275,000 | | | | 1,670,798 | | | | 2/18/20 | | | | 5,888 | | | | — | |
South Korean Won | | | JPHQ | | | | Sell | | | | 4,258,651,367 | | | | 3,660,161 | | | | 2/18/20 | | | | 47,513 | | | | — | |
Euro | | | BOFA | | | | Sell | | | | 155,000 | | | | 172,781 | | | | 2/21/20 | | | | 1,002 | | | | — | |
Euro | | | BZWS | | | | Sell | | | | 5,995,043 | | | | 6,683,556 | | | | 2/25/20 | | | | 37,924 | | | | — | |
Euro | | | UBSW | | | | Sell | | | | 396,451 | | | | 439,994 | | | | 2/25/20 | | | | 827 | | | | (308 | ) |
Taiwan Dollar | | | JPHQ | | | | Sell | | | | 85,411,010 | | | | 2,828,929 | | | | 2/25/20 | | | | 18,209 | | | | — | |
Swiss Franc | | | MSCO | | | | Sell | | | | 5,296,171 | | | | 5,342,918 | | | | 2/28/20 | | | | 7,371 | | | | — | |
| | | | | | | | | | | | | | | | | | | | | | | | |
Total Forward Exchange Contracts | | | $ | 2,449,019 | | | $ | (2,801,495 | ) |
| | | | | | | | | | | | | | | | | | | | | | | | |
Net unrealized appreciation (depreciation) | | | | | | | $ | (352,476 | ) |
| | | | | | | | | | | | | | | | | | | | | | | | | | | | |
aMay be comprised of multiple contracts with the same counterparty, currency and settlement date.
bA portion or all of the contracts are owned by K2 Holdings Investment Corp., a wholly-owned subsidiary of the Fund. See Note 1(k).
At November 30, 2019, the Fund had the following credit default swap contracts outstanding. See Note 1(e).
| | | | | | | | | | | | | | | | | | | | | | | | | | | | | | | | | | | | | | | | |
| Credit Default Swap Contracts | | | | | | | | | | | | | | | | |
| | | | | | | | | | |
| Description | | Periodic
Payment
Rate
Received
(Paid) | | | Payment
Frequency | | | | | | Maturity
Date | | | Notional
Amounta | | | | | | Value | | | Unamortized
Upfront
Payments
(Receipts) | | | Unrealized
Appreciation
(Depreciation) | | | Ratingb | |
| Centrally Cleared Swap Contracts | | | | | | | | | | | | | | | | | | | |
| Contracts to Buy Protectionc | | | | | | | | | | | | | | | | | | | |
| Single Name | | | | | | | | | | | | | | | | | | | |
Government of Mexico | | | (1.00)% | | | | Quarterly | | | | | | | | 6/20/23 | | | | 1,763,000 | | | | | | | $ | (23,510 | ) | | $ | (441 | ) | | | $(23,069) | | | | | |
Government of Mexico | | | (1.00)% | | | | Quarterly | | | | | | | | 12/20/23 | | | | 1,917,000 | | | | | | | | (23,532 | ) | | | 22,904 | | | | (46,436) | | | | | |
Government of South Africa | | | (1.00)% | | | | Quarterly | | | | | | | | 6/20/22 | | | | 1,047,000 | | | | | | | | 5,575 | | | | 53,152 | | | | (47,577) | | | | | |
Government of South Africa | | | (1.00)% | | | | Quarterly | | | | | | | | 6/20/24 | | | | 4,478,000 | | | | | | | | 141,993 | | | | 196,352 | | | | (54,359) | | | | | |
Government of South Korea | | | (1.00)% | | | | Quarterly | | | | | | | | 6/20/24 | | | | 1,910,026 | | | | | | | | (63,925 | ) | | | (64,789 | ) | | | 864 | | | | | |
Government of Turkey | | | (1.00)% | | | | Quarterly | | | | | | | | 9/20/20 | | | | 1,976,000 | | | | | | | | 2,348 | | | | 157,717 | | | | (155,369) | | | | | |
Government of Turkey | | | (1.00)% | | | | Quarterly | | | | | | | | 6/20/24 | | | | 141,000 | | | | | | | | 11,948 | | | | 14,153 | | | | (2,205) | | | | | |
Neiman Marcus Group
LLC (The) | | | (5.00)% | | | | Quarterly | | | | | | | | 6/20/24 | | | | 718,000 | | | | | | | | 535,322 | | | | 556,178 | | | | (20,856 | ) | | | | |
| Contracts to Sell Protectionc,d | | | | | | | | | | | | | | | | | | | |
| Single Name | | | | | | | | | | | | | | | | | | | |
Government of South Africa | | | 1.00% | | | | Quarterly | | | | | | | | 12/20/22 | | | | 874,000 | | | | | | | | (8,098 | ) | | | (17,002 | ) | | | 8,904 | | | | BB+ | |
Government of Turkey | | | 1.00% | | | | Quarterly | | | | | | | | 12/20/22 | | | | 826,000 | | | | | | | | (37,619 | ) | | | (37,352 | ) | | | (267) | | | | B+ | |
| | | | | | | | | | | | | | | | | | | | | | | | | | | | | | | | |
Total Centrally Cleared Swap Contracts | | | | | | | | | | | $ | 540,502 | | | $ | 880,872 | | | | $(340,370) | | | | | |
| | | | | | | | | | | | | | | | | | | | | | | | | | | | | | | | |
| | | | |
| | | |
| 56 | | Semiannual Report | | franklintempleton.com |
FRANKLIN ALTERNATIVE STRATEGIES FUNDS
CONSOLIDATED STATEMENT OF INVESTMENTS (UNAUDITED)
Franklin K2 Alternative Strategies Fund(continued)
| | | | | | | | | | | | | | | | | | | | | | | | | | | | | | | | | | | | | | | | |
| Credit Default Swap Contracts(continued) | | | | | | | | | | | | | | | | |
| | | | | | | | | | |
| Description | | Periodic
Payment
Rate
Received
(Paid) | | | Payment
Frequency | | | Counterparty | | | Maturity
Date | | | Notional
Amounta | | | | | | Value | | | Unamortized
Upfront
Payments
(Receipts) | | | Unrealized
Appreciation
(Depreciation) | | | Ratingb | |
| OTC Swap Contracts | | | | | | | | | | | | | | | | | | | |
| Contracts to Buy Protectionc | | | | | | | | | | | | | | | | | | | |
| Single Name | | | | | | | | | | | | | | | | | | | | | | | | | | | | | | | | | | | | | | | | |
Enel SpA | | | (1.00)% | | | | Quarterly | | | | BOFA | | | | 6/20/23 | | | | 550,000 | | | | EUR | | | $ | (13,880 | ) | | $ | (225 | ) | | | $ (13,655) | | | | | |
Enel SpA | | | (1.00)% | | | | Quarterly | | | | MSCS | | | | 12/20/23 | | | | 330,000 | | | | EUR | | | | (8,427 | ) | | | 1,785 | | | | (10,212) | | | | | |
| Traded Index | | | | | | | | | | | | | | | | | | | | | | | | | | | | | | |
CDX.EM.32 | | | (1.00)% | | | | Quarterly | | | | MSCO | | | | 12/20/24 | | | | 1,660,000 | | | | | | | | 75,649 | | | | 83,126 | | | | (7,477) | | | | | |
| Contracts to Sell Protectionc,d | | | | | | | | | | | | | | | | | | | |
| Single Name | | | | | | | | | | | | | | | | | | | |
Altice Luxembourg S.A. | | | 5.00% | | | | Quarterly | | | | GSCO | | | | 12/20/24 | | | | 128,000 | | | | | | | | (16,755 | ) | | | (14,240 | ) | | | (2,515) | | | | NR | |
Dish DBS Corp. | | | 5.00% | | | | Quarterly | | | | GSCO | | | | 12/20/24 | | | | 399,000 | | | | | | | | (24,818 | ) | | | (19,278 | ) | | | (5,540) | | | | B- | |
Government of Italy | | | 1.00% | | | | Quarterly | | | | JPHQ | | | | 6/20/24 | | | | 218,000 | | | | | | | | 2,240 | | | | 2,176 | | | | 64 | | | | BBBu | |
Groupe Casino | | | 5.00% | | | | Quarterly | | | | BZWS | | | | 12/20/24 | | | | 210,000 | | | | | | | | 16,199 | | | | 20,213 | | | | (4,014) | | | | B | |
Hertz Corp. (The) | | | 5.00% | | | | Quarterly | | | | BZWS | | | | 12/20/21 | | | | 674,000 | | | | | | | | (65,288 | ) | | | (57,088 | ) | | | (8,200) | | | | B+ | |
Hertz Corp. (The) | | | 5.00% | | | | Quarterly | | | | BZWS | | | | 12/20/24 | | | | 719,000 | | | | | | | | (73,819 | ) | | | (62,512 | ) | | | (11,307) | | | | B+ | |
Intrum AB | | | 5.00% | | | | Quarterly | | | | GSCO | | | | 12/20/24 | | | | 183,000 | | | | | | | | (23,158 | ) | | | (18,859 | ) | | | (4,299) | | | | BB+ | |
K. Hovnanian Enterprises Inc. | | | 5.00% | | | | Quarterly | | | | BZWS | | | | 12/20/24 | | | | 360,000 | | | | | | | | 98,100 | | | | 104,118 | | | | (6,018) | | | | NR | |
Kimco Realty Corp. | | | 1.00% | | | | Quarterly | | | | JPHQ | | | | 6/20/24 | | | | 122,000 | | | | | | | | (884 | ) | | | — | | | | (884) | | | | BBB+ | |
Kohl’s Corp. | | | 1.00% | | | | Quarterly | | | | GSCO | | | | 12/20/24 | | | | 1,151,000 | | | | | | | | 17,930 | | | | 25,034 | | | | (7,104) | | | | BBB | |
Lloyds Bank PLC | | | 1.00% | | | | Quarterly | | | | JPHQ | | | | 12/20/24 | | | | 540,000 | | | | | | | | (561 | ) | | | 2,375 | | | | (2,936) | | | | BBB+ | |
MBIA Inc. | | | 1.00% | | | | Quarterly | | | | CITI | | | | 6/20/21 | | | | 340,000 | | | | | | | | (27,817 | ) | | | (24,146 | ) | | | (3,671) | | | | NR | |
MBIA Inc. | | | 5.00% | | | | Quarterly | | | | CITI | | | | 12/20/24 | | | | 216,000 | | | | | | | | (41,317 | ) | | | (38,411 | ) | | | (2,906) | | | | NR | |
NRG Energy Inc. | | | 5.00% | | | | Quarterly | | | | BZWS | | | | 6/20/24 | | | | 288,000 | | | | | | | | (57,050 | ) | | | (53,444 | ) | | | (3,606) | | | | BB | |
Simon Property Group LP | | | 1.00% | | | | Quarterly | | | | BZWS | | | | 12/20/24 | | | | 540,000 | | | | | | | | (16,007 | ) | | | (14,608 | ) | | | (1,399) | | | | A | |
Staples Inc. | | | 5.00% | | | | Quarterly | | | | GSCO | | | | 6/20/25 | | | | 353,000 | | | | | | | | (5,179 | ) | | | 6,719 | | | | (11,898) | | | | B+ | |
Telecom Italia SpA | | | 1.00% | | | | Quarterly | | | | GSCO | | | | 12/20/24 | | | | 122,000 | | | | | | | | 2,501 | | | | 3,385 | | | | (884) | | | | BB+ | |
Transocean Inc. | | | 5.00% | | | | Quarterly | | | | JPHQ | | | | 12/20/24 | | | | 434,000 | | | | | | | | 58,751 | | | | 73,580 | | | | (14,829) | | | | CCC+ | |
| Traded Index | | | | | | | | | | | | | | | | | | | | | | | | | | | | | | |
CMBX.NA | | | 2.00% | | | | Quarterly | | | | BZWS | | | | 11/18/54 | | | | 2,100,000 | | | | | | | | (1,036 | ) | | | 8,865 | | | | (9,901) | | |
| Investment
Grade |
|
CMBX.NA | | | 2.00% | | | | Quarterly | | | | BZWS | | | | 8/17/61 | | | | 3,200,000 | | | | | | | | (41,802 | ) | | | (22,064 | ) | | | (19,738) | | |
| Investment
Grade |
|
CMBX.NA | | | 2.00% | | | | Quarterly | | | | GSCO | | | | 11/18/54 | | | | 1,100,000 | | | | | | | | (542 | ) | | | 4,643 | | | | (5,185) | | |
| Investment
Grade |
|
ITRX.EUR.32 | | | 1.00% | | | | Quarterly | | | | JPHQ | | | | 12/20/24 | | | | 1,800,000 | | | | EUR | | | | 56,493 | | | | 13,575 | | | | 42,918 | | |
| Investment
Grade |
|
| | | | | | | | | | | | | | | | | | | | | | | | | | | | | | | | |
Total OTC Swap Contracts | | | | | | | | | | | $ | (90,477 | ) | | $ | 24,719 | | | | $(115,196) | | | | | |
| | | | | | | | | | | | | | | | | | | | | | | | | | | | | | | | |
Total Credit Default Swap Contracts | | | | | | | | | | | $ | 450,025 | | | $ | 905,591 | | | | $(455,566) | | | | | |
| | | | | | | | | | | | | | | | | | | | | | | | | | | | | | | | |
aIn U.S. dollars unless otherwise indicated. For contracts to sell protection, the notional amount is equal to the maximum potential amount of the future payments and no recourse provisions have been entered into in association with the contracts.
bBased on Standard and Poor’s (S&P) Rating for single name swaps and internal ratings for index swaps. Internal ratings based on mapping into equivalent ratings from external vendors.
cPerformance triggers for settlement of contract include default, bankruptcy or restructuring for single name swaps and failure to pay or bankruptcy of the underlying securities for traded index swaps.
dThe Fund enters contracts to sell protection to create a long credit position.
| | | | | | |
| | | |
| franklintempleton.com | | Semiannual Report | | | 57 | |
FRANKLIN ALTERNATIVE STRATEGIES FUNDS
CONSOLIDATED STATEMENT OF INVESTMENTS (UNAUDITED)
Franklin K2 Alternative Strategies Fund(continued)
At November 30, 2019, the Fund had the following interest rate swap contracts outstanding. See Note 1(e).
| | | | | | | | | | | | | | | | |
| Interest Rate Swap Contracts | |
| | | | |
| Description | | Payment
Frequency | | | Maturity
Date | | | Notional
Amount | | | Value/Unrealized
Appreciation
(Depreciation) | |
| Centrally Cleared Swap Contracts | | | | | | | | | | | | | |
Receive Fixed 5.88%
Pay Floating BZDIOVRA Index | | | Annually | | | | 1/02/23 | | | | 12,922,100 | BRL | | $ | 10,281 | |
Receive Fixed 2.81%
Pay Floating CFETS China Fixing Repo 7 Day rate | | | Quarterly | | | | 12/18/24 | | | | 13,037,476 | CNY | | | (9,487 | ) |
Receive Fixed 2.90%
Pay Floating CFETS China Fixing Repo 7 Day rate | | | Quarterly | | | | 12/18/24 | | | | 9,551,023 | CNY | | | (1,520 | ) |
Receive Fixed 2.90%
Pay Floating CFETS China Fixing Repo 7 Day rate | | | Quarterly | | | | 12/18/24 | | | | 9,552,138 | CNY | | | (1,681 | ) |
Receive Floating rate 6 MonthGBP-LIBOR
Pay Fixed rate 0.86% | | | Semi-Annually | | | | 3/18/70 | | | | 1,216,906 | GBP | | | 74,401 | |
| | | | | | | | | | | | | | | | |
Total Interest Rate Swap Contracts | | | $ | 71,994 | |
| | | | | | | | | | | | | | | | |
At November 30, 2019, the Fund had the following total return swap contracts outstanding. See Note 1(e).
| | | | | | | | | | | | | | | | | | | | | | |
| Total Return Swap Contracts | | | | |
| | | | | | |
| Underlying Instrument | | Financing Rate | | Payment
Frequency | | | Counter-
party | | | Maturity
Date | | | Notional
Value* | | | Value/Unrealized
Appreciation
(Depreciation) | |
| OTC Swap Contracts | | | | | | | | | | | | | | | | | |
| Commodity Contracts – Shorta | | | | | | | | | | | | | | | | | |
Bloomberg Commodity Indexb | | 0.15% | | | Monthly | | | | MSCI | | | | 9/10/20 | | | | 2,156,393 | | | $ | 52,348 | |
| | | | | | | | | | | | | | | | | | | | | | |
| Equity Contracts – Longc | | | | | | | | | | | | | | | | | |
Allergan PLC | | 1-Day FEDEF + 0.40% | | | Monthly | | | | MSCS | | | | 12/23/20 | | | | 5,555,263 | | | | 668,545 | |
Altran Technologies SA | | 1-Month LIBOR + 0.35% | | | Monthly | | | | BZWS | | | | 8/16/20 | | | | 2,689,238 | EUR | | | 18,964 | |
Altran Technologies SA | | 1-Day EONIA + 0.65% | | | Monthly | | | | MSCS | | | | 9/04/20 | | | | 1,177,889 | EUR | | | (16,620 | ) |
Anglo American PLC | | 1-Month LIBOR + 0.50% | | | Monthly | | | | MSCS | | | | 1/20/20 | | | | 1,362,590 | GBP | | | 73,998 | |
Anima Holding SpA | | 1-Month LIBOR + 0.40% | | | Monthly | | | | MSCS | | | | 12/21/20 | | | | 1,033,575 | EUR | | | 107,746 | |
Ashtead Group PLC | | 1-Month LIBOR + 0.50% | | | Monthly | | | | MSCS | | | | 1/20/20 | | | | 616,706 | GBP | | | 49,180 | |
Axel Springer SE | | 1-Day EONIA + 0.65% | | | Monthly | | | | MSCS | | | | 9/04/20 | | | | 1,283,593 | EUR | | | (1,617 | ) |
Barclays PLC | | 1-Month LIBOR + 0.40% | | | Monthly | | | | MSCS | | | | 4/16/20 | | | | 893,736 | GBP | | | (1,308 | ) |
BNP Paribas SA | | 1-Month LIBOR + 0.40% | | | Monthly | | | | MSCS | | | | 12/21/20 | | | | 1,904,200 | EUR | | | 18,743 | |
Bolsas y Mercados Espanoles SHMSF SA | | 1-Month LIBOR + 0.48% | | | Monthly | | | | BZWS | | | | 12/21/20 | | | | 641,105 | EUR | | | (6,697 | ) |
Builders FirstSource Inc. | | 1-Month LIBOR + 0.50% | | | Monthly | | | | MSCS | | | | 9/22/20 | | | | 930,564 | | | | 111,094 | |
Bureau Veritas SA | | 1-Month EURIBOR + 0.40% | | | Monthly | | | | MSCS | | | | 12/21/20 | | | | 727,208 | EUR | | | 38,546 | |
Caesars Entertainment Corp. | | 1-Month LIBOR + 0.35% | | | Monthly | | | | BZWS | | | | 8/17/20 | | | | 1,365,487 | | | | (4,330 | ) |
Caesars Entertainment Corp. | | 1-Day FEDEF + 0.40% | | | Monthly | | | | MSCS | | | | 12/23/20 | | | | 2,824,848 | | | | 358,125 | |
Carnival PLC | | 1-Day FEDEF + 0.65% | | | Monthly | | | | MSCS | | | | 3/17/21 | | | | 1,332,707 | | | | (194,691 | ) |
Celesio AG | | 1-Day EONIA + 0.65% | | | Monthly | | | | MSCS | | | | 11/04/20 | | | | 3,737,659 | EUR | | | (16,996 | ) |
Cie Plastic Omnium SA | | 1-Month EURIBOR + 0.50% | | | Monthly | | | | MSCS | | | | 1/10/20 | | | | 1,708,627 | EUR | | | (28,078 | ) |
Cobham PLC | | 1-Day SONIA + 0.65% | | | Monthly | | | | MSCS | | | | 2/06/20 | | | | 877,181 | GBP | | | (19,940 | ) |
Cobham PLC | | 1-Month LIBOR + 0.45% | | | Monthly | | | | BZWS | | | | 10/18/20 | | | | 5,610,304 | GBP | | | (25,598 | ) |
CRH PLC | | 1-Month EURIBOR + 0.50% | | | Monthly | | | | MSCS | | | | 1/10/20 | | | | 621,017 | EUR | | | 48,860 | |
Croda International PLC | | 1-Month LIBOR + 0.40% | | | Monthly | | | | MSCS | | | | 4/16/20 | | | | 635,936 | GBP | | | 35,758 | |
Danone SA | | 1-Month LIBOR + 0.40% | | | Monthly | | | | MSCS | | | | 12/21/20 | | | | 3,376,395 | EUR | | | 33,251 | |
EDP Renovaveis SA | | 1-Day EONIA + 0.65% | | | Monthly | | | | MSCS | | | | 9/04/20 | | | | 797,888 | EUR | | | 286,078 | |
Energy Transfer Equity LP | | 1-Month LIBOR + 0.65% | | | Monthly | | | | CITI | | | | 6/22/20 | | | | 706,909 | | | | (27,161 | ) |
Entertainment One Ltd. | | 1-Day SONIA + 0.65% | | | Monthly | | | | MSCS | | | | 2/06/20 | | | | 395,609 | GBP | | | (2,507 | ) |
Eurofins Scientific SE | | 1-Month EURIBOR + 0.40% | | | Monthly | | | | MSCS | | | | 12/21/20 | | | | 1,940,569 | EUR | | | 119,419 | |
Faurecia SE | | 1-Day EONIA + 0.65% | | | Monthly | | | | MSCS | | | | 9/04/20 | | | | 100,002 | EUR | | | 4,280 | |
Faurecia SE | | 1-Month LIBOR + 0.35% | | | Monthly | | | | BZWS | | | | 12/08/20 | | | | 227,867 | EUR | | | (2,885 | ) |
Fiat Chrysler Automobiles NV | | 1-Day EONIA + 0.65% | | | Monthly | | | | MSCS | | | | 9/04/20 | | | | 694,138 | EUR | | | (32,561 | ) |
| | | | |
| | | |
| 58 | | Semiannual Report | | franklintempleton.com |
FRANKLIN ALTERNATIVE STRATEGIES FUNDS
CONSOLIDATED STATEMENT OF INVESTMENTS (UNAUDITED)
Franklin K2 Alternative Strategies Fund(continued)
| | | | | | | | | | | | | | | | | | | | | | |
| Total Return Swap Contracts(continued) | | | | |
| | | | | | |
| Underlying Instrument | | Financing Rate | | Payment
Frequency | | | Counter-
party | | | Maturity
Date | | | Notional
Value* | | | Value/Unrealized
Appreciation
(Depreciation) | |
| OTC Swap Contracts(continued) | | | | | | | | | | | | | | | | | |
| Equity Contracts – Longc(continued) | | | | | | | | | | | | | | | | | |
Fiat Chrysler Automobiles NV | | 1-Month LIBOR + 0.35% | | | Monthly | | | | BZWS | | | | 12/08/20 | | | | 1,564,916 | EUR | | $ | (24,556 | ) |
Fortescue Metals Group Ltd. | | 1-Month BBSW + 0.55% | | | Monthly | | | | MSCS | | | | 1/29/21 | | | | 2,076,478 | AUD | | | 62,899 | |
GrandVision NV | | 1-Day EONIA + 0.65% | | | Monthly | | | | MSCS | | | | 9/04/20 | | | | 2,645,513 | EUR | | | 11,923 | |
HeidelbergCement AG | | 1-Month EURIBOR + 0.40% | | | Monthly | | | | MSCS | | | | 12/21/20 | | | | 2,156,125 | EUR | | | 58,836 | |
Hess Corp. | | 1-Month LIBOR + 0.50% | | | Monthly | | | | MSCS | | | | 9/22/20 | | | | 3,738,076 | | | | (331,819 | ) |
Hikma Pharmaceuticals PLC | | 1-Month LIBOR + 0.40% | | | Monthly | | | | MSCS | | | | 4/16/20 | | | | 87,723 | GBP | | | 1,774 | |
Hitachi High-Technologies Corp. | | 1-Month LIBOR + 0.55% | | | Monthly | | | | MSCS | | | | 11/24/21 | | | | 27,988,691 | JPY | | | 11,551 | |
Huaneng Renewables Corp. Ltd. | | 1-Month HIBOR + 0.55% | | | Monthly | | | | MSCS | | | | 11/24/21 | | | | 992,961 | HKD | | | 99 | |
Iliad SA | | 1-Month LIBOR + 0.40% | | | Monthly | | | | MSCS | | | | 12/21/20 | | | | 2,472,701 | EUR | | | 587,313 | |
Inmarsat PLC | | 1-Month LIBOR + 0.45% | | | Monthly | | | | BZWS | | | | 12/07/20 | | | | 6,041,517 | | | | (13,263 | ) |
Inmarsat PLC | | 1-Day FEDEF + 0.65% | | | Monthly | | | | MSCS | | | | 3/17/21 | | | | 945,094 | | | | 304 | |
Innogy SE | | 1-Day EONIA + 0.65% | | | Monthly | | | | MSCS | | | | 9/04/20 | | | | 1,038,961 | EUR | | | 166,078 | |
ITV PLC | | 1-Month LIBOR + 0.40% | | | Monthly | | | | MSCS | | | | 4/16/20 | | | | 1,827,966 | GBP | | | 203,030 | |
Just Eat PLC | | 1-Month LIBOR + 0.45% | | | Monthly | | | | BZWS | | | | 11/24/20 | | | | 1,467,283 | GBP | | | 1,867 | |
Kering SA | | 1-Month EURIBOR + 0.40% | | | Monthly | | | | MSCS | | | | 12/21/20 | | | | 1,626,354 | EUR | | | 89,884 | |
Knight-Swift Transportation Holdings Inc. | | 1-Month LIBOR + 0.55% | | | Monthly | | | | MSCS | | | | 9/22/20 | | | | 4,147,702 | | | | 568,301 | |
Liberty Property Trust | | 1-Day FEDEF + 0.40% | | | Monthly | | | | MSCS | | | | 12/23/20 | | | | 1,132,655 | | | | 5,220 | |
LINE Corp. | | 1-Month LIBOR + 0.55% | | | Monthly | | | | MSCS | | | | 11/24/21 | | | | 63,562,120 | JPY | | | (3,114 | ) |
Mitsubishi Tanabe Pharma Corp. | | 1-Month LIBOR + 0.55% | | | Monthly | | | | MSCS | | | | 11/24/21 | | | | 6,559 | JPY | | | 13 | |
NVR Inc. | | 1-Month LIBOR + 0.50% | | | Monthly | | | | MSCS | | | | 9/22/20 | | | | 2,463,246 | | | | 1,067,004 | |
Pets at Home Group PLC | | 1-Month LIBOR + 0.40% | | | Monthly | | | | MSCS | | | | 4/16/20 | | | | 593,117 | GBP | | | 173,609 | |
QIAGEN NV | | 1-Day EONIA + 0.65% | | | Monthly | | | | MSCS | | | | 9/04/20 | | | | 349,738 | EUR | | | 16,487 | |
Rio Tinto PLC | | 1-Month LIBOR + 0.50% | | | Monthly | | | | MSCS | | | | 9/22/20 | | | | 4,020,635 | | | | 241,047 | |
RSA Insurance Group PLC | | 1-Month LIBOR + 0.40% | | | Monthly | | | | MSCS | | | | 4/16/20 | | | | 1,164,744 | GBP | | | 11,290 | |
Ryanair Holdings PLC | | 1-Month EURIBOR + 0.40% | | | Monthly | | | | MSCS | | | | 12/21/20 | | | | 1,202,159 | EUR | | | 7,713 | |
Smiths Group PLC | | 1-Month LIBOR + 0.40% | | | Monthly | | | | MSCS | | | | 4/16/20 | | | | 1,048,315 | GBP | | | 22,081 | |
Societe Generale SA | | 1-Month LIBOR + 0.40% | | | Monthly | | | | MSCS | | | | 12/21/20 | | | | 1,450,194 | EUR | | | (11,069 | ) |
Sophos Group PLC | | 1-Day FEDEF + 0.65% | | | Monthly | | | | MSCS | | | | 3/17/21 | | | | 407,249 | | | | 1,386 | |
Sports Direct International PLC | | 1-Month LIBOR + 0.40% | | | Monthly | | | | MSCS | | | | 4/16/20 | | | | 1,546,224 | GBP | | | 90,702 | |
Stars Group Inc. (The) | | 1-Day SONIA + 0.40% | | | Monthly | | | | MSCS | | | | 10/19/21 | | | | 942,241 | GBP | | | 239,073 | |
Stroeer SE & Co. KGaA | | 1-Month EURIBOR + 0.40% | | | Monthly | | | | MSCS | | | | 12/21/20 | | | | 3,364,128 | EUR | | | (53,957 | ) |
SunTrust Banks Inc. | | 1-Day FEDEF + 0.40% | | | Monthly | | | | MSCS | | | | 12/23/20 | | | | 3,740,131 | | | | 514,307 | |
Tallgrass Energy Partners LP | | 1-Month LIBOR + 0.40% | | | Monthly | | | | BZWS | | | | 10/01/20 | | | | 2,446,182 | | | | (12,515 | ) |
TeamViewer AG | | 1-Month EURIBOR + 0.40% | | | Monthly | | | | MSCS | | | | 12/21/20 | | | | 26,052 | EUR | | | (76 | ) |
Telefonica SA | | 1-Day EONIA + 0.65% | | | Monthly | | | | MSCS | | | | 9/04/20 | | | | 630,832 | EUR | | | (7,851 | ) |
TLG Immobilien AG | | 1-Day EONIA + 0.65% | | | Monthly | | | | MSCS | | | | 9/04/20 | | | | 193,962 | EUR | | | 1,520 | |
United Technologies Corp. | | 1-Day FEDEF + 0.40% | | | Monthly | | | | MSCS | | | | 12/23/20 | | | | 2,258,133 | | | | 466,213 | |
Vodafone Group PLC | | 1-Day SONIA + 0.65% | | | Monthly | | | | MSCS | | | | 2/06/20 | | | | 1,226,971 | GBP | | | 195,832 | |
WellCare Health Plans Inc. | | 1-Day FEDEF + 0.40% | | | Monthly | | | | MSCS | | | | 12/23/20 | | | | 3,187,600 | | | | 563,871 | |
| | | | | | | | | | | | | | | | | | | | | | |
| |
| | | | 6,514,605 | |
| | | | | | | | | | | | | | | | | | | | | | |
| Equity Contracts – Shorta | | | | | | | | | | | | | | | | | |
AbbVie Inc. | | 1-Month LIBOR - 0.35% | | | Monthly | | | | BZWS | | | | 8/20/20 | | | | 901,937 | | | | (36 | ) |
AbbVie Inc. | | 1-Day FEDEF - 0.35% | | | Monthly | | | | MSCS | | | | 2/04/21 | | | | 1,974,585 | | | | (618,275 | ) |
Aroundtown SA | | 1-Day EONIA - 0.40% | | | Monthly | | | | MSCS | | | | 9/04/20 | | | | 194,851 | EUR | | | (2,032 | ) |
BB&T Corp. | | 1-Month LIBOR - 0.35% | | | Monthly | | | | BZWS | | | | 8/20/20 | | | | 1,451,811 | | | | (19,629 | ) |
BB&T Corp. | | 1-Day FEDEF - 0.35% | | | Monthly | | | | MSCS | | | | 2/04/21 | | | | 3,758,162 | | | | (532,630 | ) |
Carnival Corp. | | 1-Day FEDEF - 0.35% | | | Monthly | | | | MSCS | | | | 2/04/21 | | | | 1,332,327 | | | | 138,587 | |
Centene Corp. | | 1-Month LIBOR - 0.35% | | | Monthly | | | | BZWS | | | | 9/03/20 | | | | 2,562,134 | | | | (19,018 | ) |
Centene Corp. | | 1-Day FEDEF - 0.35% | | | Monthly | | | | MSCS | | | | 2/04/21 | | | | 1,865,191 | | | | (515,452 | ) |
Colruyt SA | | 1-Day EONIA - 0.40% | | | Monthly | | | | MSCS | | | | 12/21/20 | | | | 1,714,559 | EUR | | | 61,324 | |
Digital Realty Trust Inc. | | 1-Month LIBOR - 0.35% | | | Monthly | | | | BZWS | | | | 2/12/20 | | | | 1,160,968 | | | | (3,090 | ) |
Eldorado Resorts Inc. | | 1-Month LIBOR - 0.50% | | | Monthly | | | | BZWS | | | | 8/17/20 | | | | 1,026,684 | | | | 3,320 | |
| | | | | | |
| | | |
| franklintempleton.com | | Semiannual Report | | | 59 | |
FRANKLIN ALTERNATIVE STRATEGIES FUNDS
CONSOLIDATED STATEMENT OF INVESTMENTS (UNAUDITED)
Franklin K2 Alternative Strategies Fund(continued)
| | | | | | | | | | | | | | | | | | | | | | |
| Total Return Swap Contracts(continued) | | | | |
| | | | | | |
| Underlying Instrument | | Financing Rate | | Payment
Frequency | | | Counter-
party | | | Maturity
Date | | | Notional
Value* | | | Value/Unrealized
Appreciation
(Depreciation) | |
| OTC Swap Contracts(continued) | | | | | | | | | | | | | | | | | |
| Equity Contracts – Shorta(continued) | | | | | | | | | | | | | | | | | |
Eldorado Resorts Inc. | | 1-Day FEDEF - 1.77% | | | Monthly | | | | MSCS | | | | 2/04/21 | | | | 878,982 | | | $ | (295,242 | ) |
Elisa Oyj | | 1-Day EONIA - 0.40% | | | Monthly | | | | MSCS | | | | 12/21/20 | | | | 403,574 | EUR | | | 2,604 | |
Flutter Entertainment PLC | | 1-Day SONIA - 0.35% | | | Monthly | | | | MSCS | | | | 2/06/20 | | | | 1,018,572 | GBP | | | (214,795 | ) |
Flutter Entertainment PLC | | 1-Month LIBOR - 0.43% | | | Monthly | | | | BZWS | | | | 11/04/20 | | | | 3,786,721 | | | | 6,908 | |
Glencore PLC | | 1-Day SONIA - 0.35% | | | Monthly | | | | MSCS | | | | 1/20/20 | | | | 421,886 | GBP | | | 15,629 | |
Hannover Rueck SE | | 1-Day EONIA - 0.35% | | | Monthly | | | | MSCS | | | | 12/21/20 | | | | 729,690 | EUR | | | (14,170 | ) |
Hennes & Mauritz AB | | 1-Week STIBOR - 0.40% | | | Monthly | | | | MSCS | | | | 11/10/20 | | | | 7,173,000 | SEK | | | 10,391 | |
Hermes International | | 1-Day EONIA - 0.40% | | | Monthly | | | | MSCS | | | | 1/10/20 | | | | 29,548 | EUR | | | (4,156 | ) |
JD Sports Fashion PLC | | 1-Day SONIA - 0.30% | | | Monthly | | | | MSCS | | | | 4/16/20 | | | | 463,043 | GBP | | | (7,432 | ) |
Marks & Spencer Group PLC | | 1-Day SONIA - 0.30% | | | Monthly | | | | MSCS | | | | 4/16/20 | | | | 303,868 | GBP | | | (20,356 | ) |
Morgan Stanley MSPSSPY Index | | 1-Day FEDEF - 0.35% | | | Monthly | | | | MSCS | | | | 9/22/20 | | | | 130,576 | | | | (734 | ) |
Morgan Stanley MSPSXOP Index | | 1-Day FEDEF - 0.45% | | | Monthly | | | | MSCS | | | | 9/22/20 | | | | 1,411,476 | | | | (14,582 | ) |
Next PLC | | 1-Day SONIA - 0.30% | | | Monthly | | | | MSCS | | | | 4/16/20 | | | | 527,784 | GBP | | | (16,837 | ) |
Peugeot SA | | 1-Day EONIA - 0.40% | | | Monthly | | | | MSCS | | | | 9/04/20 | | | | 642,528 | EUR | | | 16,602 | |
Peugeot SA | | 1-Month LIBOR - 0.35% | | | Monthly | | | | BZWS | | | | 12/08/20 | | | | 1,467,057 | EUR | | | 36,676 | |
PG&E Corp. | | 1-Day FEDEF - 0.35% | | | Monthly | | | | MSCS | | | | 2/04/21 | | | | 208,599 | | | | (10,233 | ) |
Prologis Inc. | | 1-Day FEDEF - 0.35% | | | Monthly | | | | MSCS | | | | 2/04/21 | | | | 1,133,556 | | | | (7,523 | ) |
Raytheon Co | | 1-Day FEDEF - 0.35% | | | Monthly | | | | MSCS | | | | 2/04/21 | | | | 705,423 | | | | (63,157 | ) |
S&P High Beta Total Return Index | | 1-Month LIBOR | | | Monthly | | | | BZWS | | | | 5/04/20 | | | | 2,528,105 | | | | (117,953 | ) |
Swisscom AG | | 1-Day SARON - 0.35% | | | Monthly | | | | MSCS | | | | 7/14/20 | | | | 773,934 | CHF | | | (8,590 | ) |
Valeo SA | | 1-Day EONIA - 0.40% | | | Monthly | | | | MSCS | | | | 1/10/20 | | | | 356,778 | EUR | | | (67,886 | ) |
WESCO International Inc. | | 1-Day FEDEF - 0.35% | | | Monthly | | | | MSCS | | | | 2/04/21 | | | | 293,325 | | | | 968 | |
| | | | | | | | | | | | | | | | | | | | | | |
| |
| | | | (2,280,799 | ) |
| | | | | | | | | | | | | | | | | | | | | | |
| Interest Rate Contracts – Longc | | | | | | | | | | | | | | | | | |
Egyptian Treasury Bill | | 3-Month LIBOR + 0.40% | | | Monthly | | | | DBAB | | | | 5/12/20 | | | | 593,025 | | | | 7,228 | |
Egyptian Treasury Bill | | 3-Month LIBOR + 0.40% | | | Monthly | | | | GSCO | | | | 5/12/20 | | | | 590,182 | | | | 7,164 | |
Government of Indonesia | | 3-Month LIBOR + 0.60% | | | Monthly | | | | BOFA | | | | 4/15/20 | | | | 1,784,968 | | | | 10,815 | |
Government of Indonesia | | 3-Month LIBOR + 0.60% | | | Quarterly | | | | BOFA | | | | 6/22/20 | | | | 260,257 | | | | 11,597 | |
Government of Indonesia | | 3-Month LIBOR + 0.60% | | | Quarterly | | | | DBAB | | | | 5/15/24 | | | | 352,062 | | | | 15,588 | |
Government of Indonesia | | 3-Month LIBOR + 0.60% | | | Monthly | | | | DBAB | | | | 6/15/32 | | | | 1,913,884 | | | | 32,475 | |
Government of Indonesia | | 3-Month LIBOR + 0.60% | | | Monthly | | | | DBAB | | | | 5/15/48 | | | | 928,803 | | | | (5,162 | ) |
| | | | | | | | | | | | | | | | | | | | | | |
| |
| | | | 79,705 | |
| | | | | | | | | | | | | | | | | | | | | | |
Total Return Swap Contracts | | | $ | 4,365,859 | |
| | | | | | | | | | | | | | | | | | | | | | |
*In U.S. dollars unless otherwise indicated.
aThe Fund receives the variable financing rate and pays the total return on the underlying instrument.
bA portion or all of the contracts are owned by K2 Holdings Investment Corp., a wholly-owned subsidiary of the Fund. See Note 1(k).
cThe Fund receives the total return on the underlying instrument and pays a variable financing rate.
See Note 10 regarding other derivative information.
See Abbreviations on page 81.
| | | | |
| | | |
| 60 | | Semiannual Report | The accompanying notes are an integral part of these consolidated financial statements. | | franklintempleton.com |
FRANKLIN ALTERNATIVE STRATEGIES FUNDS
CONSOLIDATED FINANCIAL STATEMENTS
Consolidated Statement of Assets and Liabilities
November 30, 2019 (unaudited)
Franklin K2 Alternative Strategies Fund
| | | | |
| |
Assets: | | | | |
Investments in securities: | | | | |
Cost – Unaffiliated issuers | | $ | 1,038,536,294 | |
Cost –Non-controlled affiliates (Note 3f) | | | 3,404,000 | |
Cost – Unaffiliated repurchase agreements | | | 19,243,801 | |
| | | | |
Value – Unaffiliated issuers† | | $ | 1,165,305,778 | |
Value –Non-controlled affiliates (Note 3f) | | | 3,404,000 | |
Value – Unaffiliated repurchase agreements | | | 19,243,801 | |
Cash | | | 35,130,351 | |
Restricted cash for OTC derivatives (Note 1f) | | | 325,000 | |
Foreign currency, at value (cost $5,928,236) | | | 5,975,757 | |
Receivables: | | | | |
Investment securities sold | | | 19,278,337 | |
Capital shares sold | | | 2,405,722 | |
Dividends and interest | | | 3,672,138 | |
Deposits with brokers for: | | | | |
Exchange traded options written | | | 743,355 | |
Securities sold short | | | 185,655,393 | |
OTC derivative contracts | | | 19,508,267 | |
Futures contracts | | | 23,927,654 | |
Centrally cleared swap contracts | | | 931,629 | |
Due from brokers | | | 23,897,218 | |
Variation margin on centrally cleared swap contracts | | | 18,670 | |
OTC swap contracts (upfront payments $352,281) | | | 349,594 | |
Unrealized appreciation on OTC forward exchange contracts | | | 2,449,019 | |
Unrealized appreciation on OTC swap contracts | | | 7,842,338 | |
Unrealized appreciation on unfunded loan commitments (Note 8) | | | 404 | |
Other assets | | | 19,291 | |
| | | | |
Total assets | | | 1,520,083,716 | |
| | | | |
Liabilities: | | | | |
Payables: | | | | |
Investment securities purchased | | | 24,026,641 | |
Capital shares redeemed | | | 1,472,250 | |
Management fees | | | 1,802,365 | |
Distribution fees | | | 55,886 | |
Transfer agent fees | | | 208,633 | |
Variation margin on futures contracts | | | 172,009 | |
Deposits from brokers for: | | | | |
OTC derivative contracts | | | 325,000 | |
Due to brokers | | | 14,688,686 | |
OTC swap contracts (upfront receipts $326,164) | | | 324,875 | |
Options written, at value (premiums received $617,001) | | | 512,165 | |
Securities sold short, at value (proceeds $175,320,637) | | | 183,639,252 | |
Payable upon return of securities loaned | | | 4,590,520 | |
Unrealized depreciation on OTC forward exchange contracts | | | 2,801,495 | |
Unrealized depreciation on OTC swap contracts | | | 3,591,675 | |
Accrued expenses and other liabilities | | | 345,607 | |
| | | | |
Total liabilities | | | 238,557,059 | |
| | | | |
Net assets, at value | | $ | 1,281,526,657 | |
| | | | |
Net assets consist of: | | | | |
Paid-in capital | | $ | 1,188,488,536 | |
Total distributable earnings (loss) | | | 93,038,121 | |
| | | | |
Net assets, at value | | $ | 1,281,526,657 | |
| | | | |
†Includes securities loaned . . . . . . . . . . . . . . . . . . . . . . . . . . . . . . . . . . . . . . . . . . . . . . . . . . . . . . . . . . . . . . . . | | $ | 4,473,424 | |
| | | | | | |
| | | |
| franklintempleton.com | | The accompanying notes are an integral part of these consolidated financial statements. | Semiannual Report | | | 61 | |
FRANKLIN ALTERNATIVE STRATEGIES FUNDS
CONSOLIDATED FINANCIAL STATEMENTS
Consolidated Statement of Assets and Liabilities (continued)
November 30, 2019 (unaudited)
Franklin K2 Alternative Strategies Fund
| | | | |
| |
| Class A: | | | | |
Net assets, at value | | | $105,112,062 | |
| | | | |
Shares outstanding | | | 9,138,249 | |
| | | | |
Net asset value per sharea | | | $11.50 | |
| | | | |
Maximum offering price per share (net asset value per share ÷ 94.50%) | | | $12.17 | |
| | | | |
| |
| Class C: | | | | |
Net assets, at value | | | $41,575,852 | |
| | | | |
Shares outstanding | | | 3,701,926 | |
| | | | |
Net asset value and maximum offering price per sharea | | | $11.23 | |
| | | | |
| |
| Class R: | | | | |
Net assets, at value | | | $955,507 | |
| | | | |
Shares outstanding | | | 83,153 | |
| | | | |
Net asset value and maximum offering price per share | | | $11.49 | |
| | | | |
| |
| Class R6: | | | | |
Net assets, at value | | | $41,930,320 | |
| | | | |
Shares outstanding | | | 3,617,724 | |
| | | | |
Net asset value and maximum offering price per share | | | $11.59 | |
| | | | |
| |
| Advisor Class: | | | | |
Net assets, at value | | | $1,091,952,916 | |
| | | | |
Shares outstanding | | | 94,408,113 | |
| | | | |
Net asset value and maximum offering price per share | | | $11.57 | |
| | | | |
aRedemption price is equal to net asset value less contingent deferred sales charges, if applicable.
| | | | |
| | | |
| 62 | | Semiannual Report | The accompanying notes are an integral part of these consolidated financial statements. | | franklintempleton.com |
FRANKLIN ALTERNATIVE STRATEGIES FUNDS
CONSOLIDATED FINANCIAL STATEMENTS
Consolidated Statement of Operations
for the six months ended November 30, 2019 (unaudited)
Franklin K2 Alternative Strategies Fund
| | | | |
| |
Investment income: | | | | |
Dividends: (net of foreign taxes)* | | | | |
Unaffiliated issuers | | $ | 5,203,610 | |
Interest: | | | | |
Unaffiliated issuers | | | 9,014,053 | |
Income from securities loaned: | | | | |
Unaffiliated issuers (net of fees and rebates) | | | 33,048 | |
Non-controlled affiliates (Note 3f) | | | 43,477 | |
| | | | |
Total investment income | | | 14,294,188 | |
| | | | |
Expenses: | | | | |
Management fees (Note 3a) | | | 11,938,480 | |
Distribution fees: (Note 3c) | | | | |
Class A | | | 131,752 | |
Class C | | | 216,317 | |
Class R | | | 2,173 | |
Transfer agent fees: (Note 3e) | | | | |
Class A | | | 53,367 | |
Class C | | | 21,986 | |
Class R | | | 440 | |
Class R6 | | | 5,203 | |
Advisor Class | | | 540,843 | |
Custodian fees (Note 4) | | | 108,320 | |
Reports to shareholders | | | 48,747 | |
Registration and filing fees | | | 69,801 | |
Professional fees | | | 226,754 | |
Trustees’ fees and expenses | | | 162,941 | |
Dividends and interest on securities sold short | | | 883,627 | |
Other | | | 60,250 | |
| | | | |
Total expenses | | | 14,471,001 | |
Expense reductions (Note 4) | | | (17,207 | ) |
Expenses waived/paid by affiliates (Note 3f and 3g) | | | (985,020 | ) |
| | | | |
Net expenses | | | 13,468,774 | |
| | | | |
Net investment income | | | 825,414 | |
| | | | |
Realized and unrealized gains (losses): | | | | |
Net realized gain (loss) from: | | | | |
Investments: | | | | |
Unaffiliated issuers | | | 19,919,705 | |
Written options | | | 494,873 | |
Foreign currency transactions | | | 119,429 | |
Forward exchange contracts | | | 3,412,788 | |
Futures contracts | | | 5,803,646 | |
Securities sold short | | | (16,260,177 | ) |
Swap contracts | | | 3,619,125 | |
| | | | |
Net realized gain (loss) | | | 17,109,389 | |
| | | | |
Net change in unrealized appreciation (depreciation) on: | | | | |
Investments: | | | | |
Unaffiliated issuers | | | 32,236,489 | |
Translation of other assets and liabilities denominated in foreign currencies | | | 631,549 | |
Forward exchange contracts | | | (1,910,030 | ) |
Written options | | | (152,114 | ) |
Futures contracts | | | (12,022,274 | ) |
Securities sold short | | | (14,779,779 | ) |
Swap contracts | | | 4,124,043 | |
| | | | |
Net change in unrealized appreciation (depreciation) | | | 8,127,884 | |
| | | | |
Net realized and unrealized gain (loss) | | | 25,237,273 | |
| | | | |
Net increase (decrease) in net assets resulting from operations | | $ | 26,062,687 | |
| | | | |
* Foreign taxes withheld on dividends | | $ | 73,492 | |
| | | | | | |
| | | |
| franklintempleton.com | | The accompanying notes are an integral part of these consolidated financial statements. | Semiannual Report | | | 63 | |
FRANKLIN ALTERNATIVE STRATEGIES FUNDS
CONSOLIDATED FINANCIAL STATEMENTS
Consolidated Statements of Changes in Net Assets
Franklin K2 Alternative Strategies Fund
| | | | | | | | |
| | |
| | | Six Months Ended
November 30, 2019
(unaudited) | | | Year Ended
May 31, 2019 | |
Increase (decrease) in net assets: | | | | | | | | |
Operations: | | | | | | | | |
Net investment income | | $ | 825,414 | | | $ | 6,523,460 | |
Net realized gain (loss) | | | 17,109,389 | | | | 8,805,411 | |
Net change in unrealized appreciation (depreciation) | | | 8,127,884 | | | | 640,752 | |
| | | | |
Net increase (decrease) in net assets resulting from operations | | | 26,062,687 | | | | 15,969,623 | |
| | | | |
Distributions to shareholders: | | | | | | | | |
Class A | | | — | | | | (2,359,116 | ) |
Class C | | | — | | | | (1,085,438 | ) |
Class R | | | — | | | | (16,101 | ) |
Class R6 | | | — | | | | (817,934 | ) |
Advisor Class | | | — | | | | (21,685,004 | ) |
| | | | |
Total distributions to shareholders | | | — | | | | (25,963,593 | ) |
| | | | |
Capital share transactions: (Note 2) | | | | | | | | |
Class A | | | (1,410,813 | ) | | | (13,877,422 | ) |
Class C | | | (4,046,331 | ) | | | (7,442,314 | ) |
Class R | | | 95,602 | | | | 189,631 | |
Class R6 | | | (1,825,524 | ) | | | 11,235,421 | |
Advisor Class | | | 23,363,860 | | | | 158,034,578 | |
| | | | |
Total capital share transactions | | | 16,176,794 | | | | 148,139,894 | |
| | | | |
Net increase (decrease) in net assets | | | 42,239,481 | | | | 138,145,924 | |
Net assets: | | | | | | | | |
Beginning of period | | | 1,239,287,176 | | | | 1,101,141,252 | |
| | | | |
End of period | | $ | 1,281,526,657 | | | $ | 1,239,287,176 | |
| | | | |
| | | | |
| | | |
| 64 | | Semiannual Report | The accompanying notes are an integral part of these consolidated financial statements. | | franklintempleton.com |
FRANKLIN ALTERNATIVE STRATEGIES FUNDS
Notes to Consolidated Financial Statements (unaudited)
Franklin K2 Alternative Strategies Fund
1. Organization and Significant Accounting Policies
Franklin Alternative Strategies Funds (Trust) is registered under the Investment Company Act of 1940 (1940 Act) as anopen-end management investment company, consisting of two separate funds and applies the specialized accounting and reporting guidance in U.S. Generally Accepted Accounting Principles (U.S. GAAP). Franklin K2 Alternative Strategies Fund (Fund) is included in this report. The Fund offers five classes of shares: Class A, Class C, Class R, Class R6 and Advisor Class. Class C shares automatically convert to Class A shares after they have been held for 10 years. Each class of shares may differ by its initial sales load, contingent deferred sales charges, voting rights on matters affecting a single class, its exchange privilege and fees due to differing arrangements for distribution and transfer agent fees.
The following summarizes the Fund’s significant accounting policies.
a. Financial Instrument Valuation
The Fund’s investments in financial instruments are carried at fair value daily. Fair value is the price that would be received to sell an asset or paid to transfer a liability in an orderly transaction between market participants on the measurement date. The Fund calculates the net asset value (NAV) per share each business day as of 4 p.m. Eastern time or the regularly scheduled close of the New York Stock Exchange (NYSE), whichever is earlier. Under compliance policies and procedures approved by the Trust’s Board of Trustees (the Board), the Fund’s administrator has responsibility for oversight of valuation, including leading the cross-functional Valuation Committee (VC). The Fund may utilize independent pricing services, quotations from securities and financial instrument dealers, and other market sources to determine fair value.
Equity securities, exchange traded funds and derivative financial instruments listed on an exchange or on the NASDAQ National Market System are valued at the last quoted sale price or the official closing price of the day, respectively. Foreign equity securities are valued as of the close of trading on the foreign stock exchange on which the security is primarily traded or as of 4 p.m. Eastern time. The value is then converted into its U.S. dollar equivalent at the foreign exchange rate in effect at 4 p.m. Eastern time on the day that the value of the security is determined.Over-the-counter (OTC) securities are valued within the range of the most recent quoted bid
and ask prices. Securities that trade in multiple markets or on multiple exchanges are valued according to the broadest and most representative market. Certain equity securities are valued based upon fundamental characteristics or relationships to similar securities.
Debt securities generally trade in the OTC market rather than on a securities exchange. The Fund’s pricing services use multiple valuation techniques to determine fair value. In instances where sufficient market activity exists, the pricing services may utilize a market-based approach through which quotes from market makers are used to determine fair value. In instances where sufficient market activity may not exist or is limited, the pricing services also utilize proprietary valuation models which may consider market characteristics such as benchmark yield curves, credit spreads, estimated default rates, anticipated market interest rate volatility, coupon rates, anticipated timing of principal repayments, underlying collateral, and other unique security features in order to estimate the relevant cash flows, which are then discounted to calculate the fair value. Securities denominated in a foreign currency are converted into their U.S. dollar equivalent at the foreign exchange rate in effect at 4 p.m. Eastern time on the date that the values of the foreign debt securities are determined.
Investments inopen-end mutual funds are valued at the closing NAV. Investments in repurchase agreements are valued at cost, which approximates fair value.
Certain derivative financial instruments are centrally cleared or trade in the OTC market. The Fund’s pricing services use various techniques including industry standard option pricing models and proprietary discounted cash flow models to determine the fair value of those instruments. The Fund’s net benefit or obligation under the derivative contract, as measured by the fair value of the contract, is included in net assets.
The Fund has procedures to determine the fair value of financial instruments for which market prices are not reliable or readily available. Under these procedures, the Fund primarily employs a market-based approach which may use related or comparable assets or liabilities, recent transactions, market multiples, book values, and other relevant information for the investment to determine the fair value of the investment. An income-based valuation approach may also be used in which the anticipated future cash flows of the investment are discounted to calculate fair value. Discounts may also be applied due to the nature or duration of any restrictions on the disposition of the investments. Due to the inherent
| | | | | | |
| | | |
| franklintempleton.com | | Semiannual Report | | | 65 | |
FRANKLIN ALTERNATIVE STRATEGIES FUNDS
NOTES TO CONSOLIDATED FINANCIAL STATEMENTS (UNAUDITED)
Franklin K2 Alternative Strategies Fund(continued)
1. Organization and Significant Accounting Policies(continued)
a. Financial Instrument Valuation(continued)
uncertainty of valuations of such investments, the fair values may differ significantly from the values that would have been used had an active market existed.
Trading in securities on foreign securities stock exchanges and OTC markets may be completed before 4 p.m. Eastern time. In addition, trading in certain foreign markets may not take place on every Fund’s business day. Occasionally, events occur between the time at which trading in a foreign security is completed and 4 p.m. Eastern time that might call into question the reliability of the value of a portfolio security held by the Fund. As a result, differences may arise between the value of the Fund’s portfolio securities as determined at the foreign market close and the latest indications of value at 4 p.m. Eastern time. In order to minimize the potential for these differences, the VC monitors price movements following the close of trading in foreign stock markets through a series of country specific market proxies (such as baskets of American Depositary Receipts, futures contracts and exchange traded funds). These price movements are measured against established trigger thresholds for each specific market proxy to assist in determining if an event has occurred that may call into question the reliability of the values of the foreign securities held by the Fund. If such an event occurs, the securities may be valued using fair value procedures, which may include the use of independent pricing services.
When the last day of the reporting period is anon-business day, certain foreign markets may be open on those days that the Fund’s NAV is not calculated, which could result in differences between the value of the Fund’s portfolio securities on the last business day and the last calendar day of the reporting period. Any significant security valuation changes due to an open foreign market are adjusted and reflected by the Fund for financial reporting purposes.
b. Foreign Currency Translation
Portfolio securities and other assets and liabilities denominated in foreign currencies are translated into U.S. dollars based on the exchange rate of such currencies against U.S. dollars on the date of valuation. The Fund may enter into foreign currency exchange contracts to facilitate transactions denominated in a foreign currency. Purchases and sales of
securities, income and expense items denominated in foreign currencies are translated into U.S. dollars at the exchange rate in effect on the transaction date. Portfolio securities and assets and liabilities denominated in foreign currencies contain risks that those currencies will decline in value relative to the U.S. dollar. Occasionally, events may impact the availability or reliability of foreign exchange rates used to convert the U.S. dollar equivalent value. If such an event occurs, the foreign exchange rate will be valued at fair value using procedures established and approved by the Board.
The Fund does not separately report the effect of changes in foreign exchange rates from changes in market prices on securities held. Such changes are included in net realized and unrealized gain or loss from investments in the Consolidated Statement of Operations.
Realized foreign exchange gains or losses arise from sales of foreign currencies, currency gains or losses realized between the trade and settlement dates on securities transactions and the difference between the recorded amounts of dividends, interest, and foreign withholding taxes and the U.S. dollar equivalent of the amounts actually received or paid. Net unrealized foreign exchange gains and losses arise from changes in foreign exchange rates on foreign denominated assets and liabilities other than investments in securities held at the end of the reporting period.
c. Joint Repurchase Agreement
The Fund enters into a joint repurchase agreement whereby its uninvested cash balance is deposited into a joint cash account with other funds managed by the investment manager or an affiliate of the investment manager and is used to invest in one or more repurchase agreements. The value and face amount of the joint repurchase agreement are allocated to the funds based on theirpro-rata interest. A repurchase agreement is accounted for as a loan by the Fund to the seller, collateralized by securities which are delivered to the Fund’s custodian. The fair value, including accrued interest, of the initial collateralization is required to be at least 102% of the dollar amount invested by the funds, with the value of the underlying securities marked to market daily to maintain coverage of at least 100%. Repurchase agreements are subject to the terms of Master Repurchase Agreements (MRAs) with approved counterparties (sellers). The MRAs contain various provisions, including but not limited to events of default and maintenance of collateral for repurchase agreements. In the event of default by either the seller or the Fund, certain
| | | | |
| | | |
| 66 | | Semiannual Report | | franklintempleton.com |
FRANKLIN ALTERNATIVE STRATEGIES FUNDS
NOTES TO CONSOLIDATED FINANCIAL STATEMENTS (UNAUDITED)
Franklin K2 Alternative Strategies Fund(continued)
MRAs may permit thenon-defaulting party to net andclose-out all transactions, if any, traded under such agreements. The Fund may sell securities it holds as collateral and apply the proceeds towards the repurchase price and any other amounts owed by the seller to the Fund in the event of default by the seller. This could involve costs or delays in addition to a loss on the securities if their value falls below the repurchase price owed by the seller. The joint repurchase agreement held by the Fund at period end, as indicated in the Consolidated Statement of Investments, had been entered into on November 29, 2019.
d. Securities Purchased on a Delayed Delivery Basis
The Fund purchases securities on a delayed delivery basis, with payment and delivery scheduled for a future date. These transactions are subject to market fluctuations and are subject to the risk that the value at delivery may be more or less than the trade date purchase price. Although the Fund will generally purchase these securities with the intention of holding the securities, it may sell the securities before the settlement date. Sufficient assets have been segregated for these securities.
e. Derivative Financial Instruments
The Fund invested in derivative financial instruments in order to manage risk or gain exposure to various other investments or markets. Derivatives are financial contracts based on an underlying or notional amount, require no initial investment or an initial net investment that is smaller than would normally be required to have a similar response to changes in market factors, and require or permit net settlement. Derivatives contain various risks including the potential inability of the counterparty to fulfill their obligations under the terms of the contract, the potential for an illiquid secondary market, and/or the potential for market movements which expose the Fund to gains or losses in excess of the amounts shown in the Consolidated Statement of Assets and Liabilities. Realized gain and loss and unrealized appreciation and depreciation on these contracts for the period are included in the Consolidated Statement of Operations.
Derivative counterparty credit risk is managed through a formal evaluation of the creditworthiness of all potential counterparties. The Fund attempts to reduce its exposure to counterparty credit risk on OTC derivatives, whenever possible, by entering into International Swaps and Derivatives Association (ISDA) master agreements with certain counterparties. These agreements contain various provisions,
including but not limited to collateral requirements, events of default, or early termination. Termination events applicable to the counterparty include certain deteriorations in the credit quality of the counterparty. Termination events applicable to the Fund include failure of the Fund to maintain certain net asset levels and/or limit the decline in net assets over various periods of time. In the event of default or early termination, the ISDA master agreement gives thenon-defaulting party the right to net andclose-out all transactions traded, whether or not arising under the ISDA agreement, to one net amount payable by one counterparty to the other. However, absent an event of default or early termination, OTC derivative assets and liabilities are presented gross and not offset in the Consolidated Statement of Assets and Liabilities. Early termination by the counterparty may result in an immediate payment by the Fund of any net liability owed to that counterparty under the ISDA agreement.
Collateral requirements differ by type of derivative. Collateral or initial margin requirements are set by the broker or exchange clearing house for exchange traded and centrally cleared derivatives. Initial margin deposited is held at the exchange and can be in the form of cash and/or securities.
For OTC derivatives traded under an ISDA master agreement, posting of collateral is required by either the Fund or the applicable counterparty if the total net exposure of all OTC derivatives with the applicable counterparty exceeds the minimum transfer amount, which typically ranges from $100,000 to $250,000, and can vary depending on the counterparty and the type of the agreement. Generally, collateral is determined at the close of Fund business each day and any additional collateral required due to changes in derivative values may be delivered by the Fund or the counterparty the next business day, or within a few business days. Collateral pledged and/or received by the Fund for OTC derivatives, if any, is held in segregated accounts with the Fund’s custodian/counterparty broker and can be in the form of cash and/or securities. Unrestricted cash may be invested according to the Fund’s investment objectives. To the extent that the amounts due to the Fund from its counterparties are not subject to collateralization or are not fully collateralized, the Fund bears the risk of loss from counterpartynon-performance.
The Fund entered into exchange traded futures contracts primarily to manage and/or gain exposure to commodity price, interest rate and equity price risk. A futures contract is an agreement between the Fund and a counterparty to buy or sell an asset at a specified price on a future date. Required
| | | | | | |
| | | |
| franklintempleton.com | | Semiannual Report | | | 67 | |
FRANKLIN ALTERNATIVE STRATEGIES FUNDS
NOTES TO CONSOLIDATED FINANCIAL STATEMENTS (UNAUDITED)
Franklin K2 Alternative Strategies Fund(continued)
1. Organization and Significant Accounting Policies(continued)
e. Derivative Financial Instruments(continued)
initial margins are pledged by the Fund, and the daily change in fair value is accounted for as a variation margin payable or receivable in the Consolidated Statement of Assets and Liabilities.
The Fund entered into OTC forward exchange contracts primarily to manage and/or gain exposure to certain foreign currencies. A forward exchange contract is an agreement between the Fund and a counterparty to buy or sell a foreign currency at a specific exchange rate on a future date.
The Fund entered into credit default swap contracts primarily to manage and/or gain exposure to credit risk. A credit default swap is an agreement between the Fund and a counterparty whereby the buyer of the contract receives credit protection and the seller of the contract guarantees the credit worthiness of a referenced debt obligation. These agreements may be privately negotiated in theover-the-counter market (OTC credit default swaps) or may be executed in a multilateral trade facility platform, such as a registered exchange (centrally cleared credit default swaps). The underlying referenced debt obligation may be a single issuer of corporate or sovereign debt, a credit index, a basket of issuers or indices, or a tranche of a credit index or basket of issuers or indices. In the event of a default of the underlying referenced debt obligation, the buyer is entitled to receive the notional amount of the credit default swap contract from the seller in exchange for the referenced debt obligation, a net settlement amount equal to the notional amount of the credit default swap less the recovery value of the referenced debt obligation, or other agreed upon amount. For centrally cleared credit default swaps, required initial margins are pledged by the Fund, and the daily change in fair value is accounted for as a variation margin payable or receivable in the Consolidated Statement of Assets and Liabilities. Over the term of the contract, the buyer pays the seller a periodic stream of payments, provided that no event of default has occurred. Such periodic payments are accrued daily as an unrealized appreciation or depreciation until the payments are made, at which time they are realized. Upfront payments and receipts are reflected in the Consolidated Statement of Assets and Liabilities and represent compensating factors between stated terms of the credit default swap agreement and prevailing market conditions (credit spreads and other
relevant factors). These upfront payments and receipts are amortized over the term of the contract as a realized gain or loss in the Consolidated Statement of Operations.
The Fund entered into interest rate swap contracts primarily to manage interest rate risk. An interest rate swap is an agreement between the Fund and a counterparty to exchange cash flows based on the difference between two interest rates, applied to a notional amount. These agreements may be privately negotiated in theover-the-counter market (OTC interest rate swaps) or may be executed on a registered exchange (centrally cleared interest rate swaps). For centrally cleared interest rate swaps, required initial margins are pledged by the Fund, and the daily change in fair value is accounted for as a variation margin payable or receivable in the Consolidated Statement of Assets and Liabilities. Over the term of the contract, contractually required payments to be paid and to be received are accrued daily and recorded as unrealized depreciation and appreciation until the payments are made, at which time they are realized.
The Fund entered into OTC total return swap contracts primarily to manage and/or gain exposure to interest rate, equity price, commodity price and credit risk of an underlying instrument such as a stock, bond, index or basket of securities or indices. A total return swap is an agreement between the Fund and a counterparty to exchange a return linked to an underlying instrument for a floating or fixed rate payment, both based upon a notional amount. Over the term of the contract, contractually required payments to be paid or received are accrued daily and recorded as unrealized appreciation or depreciation until the payments are made, at which time they are recognized as realized gain or loss.
The Fund purchased or wrote exchange traded and/or OTC option contracts primarily to manage and/or gain exposure to interest rate, equity price and foreign exchange rate risk. An option is a contract entitling the holder to purchase or sell a specific amount of shares or units of an asset or notional amount of a swap (swaption), at a specified price. When an option is purchased or written, an amount equal to the premium paid or received is recorded as an asset or liability, respectively. Upon exercise of an option, the acquisition cost or sales proceeds of the underlying investment is adjusted by any premium received or paid. Upon expiration of an option, any premium received or paid is recorded as a realized gain or loss. Upon closing an option other than through expiration
| | | | |
| | | |
| 68 | | Semiannual Report | | franklintempleton.com |
FRANKLIN ALTERNATIVE STRATEGIES FUNDS
NOTES TO CONSOLIDATED FINANCIAL STATEMENTS (UNAUDITED)
Franklin K2 Alternative Strategies Fund(continued)
or exercise, the difference between the premium received or paid and the cost to close the position is recorded as a realized gain or loss.
See Notes 6 and 10 regarding investment transactions and other derivative information, respectively.
f. Restricted Cash
At November 30, 2019, the Fund held restricted cash in connection with investments in certain derivative securities. Restricted cash is held in a segregated account with the Fund’s custodian/counterparty broker and is reflected in the Consolidated Statement of Assets and Liabilities.
g. Loan Participation Notes
The Fund invests in loan participation notes (Participations). Participations are loans originally issued to a borrower by one or more financial institutions (the Lender) and subsequently sold to other investors, such as the Fund. Participations typically result in the Fund having a contractual relationship only with the Lender and not with the borrower. The Fund has the right to receive from the Lender any payments of principal, interest and fees which the Lender received from the borrower. The Fund generally has no rights to either enforce compliance by the borrower with the terms of the loan agreement or to any collateral relating to the original loan. As a result, the Fund assumes the credit risk of both the borrower and the Lender that is selling the Participation. The Participations may also involve interest rate risk and liquidity risk, including the potential default or insolvency of the borrower and/or the Lender.
h. Credit-Linked Notes
The Fund purchases credit-linked notes. Credit-linked notes are intended to replicate the economic effects that would apply had the Fund directly purchased the underlying reference asset. The risks of credit-linked notes include the potential default of the underlying reference asset, the movement in the value of the currency of the underlying reference asset relative to the credit-linked note, the potential inability of the Fund to dispose of the credit-linked note in the normal course of business, and the possible inability of the counterparties to fulfill their obligations under the contracts.
i. Securities Sold Short
The Fund is engaged in selling securities short, which obligates the Fund to replace a borrowed security with the same
security at current fair value. The Fund incurs a loss if the price of the security increases between the date of the short sale and the date on which the Fund replaces the borrowed security. The Fund realizes a gain if the price of the security declines between those dates. Gains are limited to the price at which the Fund sold the security short, while losses are potentially unlimited in size.
The Fund is required to establish a margin account with the broker lending the security sold short. While the short sale is outstanding, the broker retains the proceeds of the short sale to the extent necessary to meet margin requirements until the short position is closed out. A deposit must also be maintained with the Fund’s custodian/counterparty broker consisting of cash and/or securities having a value equal to a specified percentage of the value of the securities sold short. The Fund is obligated to pay fees for borrowing the securities sold short and is required to pay the counterparty any dividends and/or interest due on securities sold short. Such dividends and/or interest and any security borrowing fees are recorded as an expense to the Fund.
j. Securities Lending
The Fund participates in an agency based securities lending program to earn additional income. The Fund receives cash collateral against the loaned securities in an amount equal to at least 102% of the fair value of the loaned securities. Collateral is maintained over the life of the loan in an amount not less than 100% of the fair value of loaned securities, as determined at the close of Fund business each day; any additional collateral required due to changes in security values is delivered to the Fund on the next business day. The collateral is deposited into a joint cash account with other funds and is used to invest in a money market fund managed by Franklin Advisers, Inc., an affiliate of the Fund, and/or a joint repurchase agreement. The Fund may receive income from the investment cash collateral, in addition to lending fees and rebates paid by the borrower. Income from securities loaned, net of fees paid to the securities lending agent and/or third party vendor, is reported separately in the Consolidated Statement of Operations. The Fund bears the market risk with respect to the collateral investment, securities loaned, and the risk that the agent may default on its obligations to the Fund. If the borrower defaults on its obligations to return the securities loaned, the Fund has the right to repurchase the securities in the open market using the collateral received. The securities lending agent has agreed to indemnify the Fund in the event of default by a third party borrower.
| | | | | | |
| | | |
| franklintempleton.com | | Semiannual Report | | | 69 | |
FRANKLIN ALTERNATIVE STRATEGIES FUNDS
NOTES TO CONSOLIDATED FINANCIAL STATEMENTS (UNAUDITED)
Franklin K2 Alternative Strategies Fund(continued)
1. Organization and Significant Accounting Policies(continued)
k. Investments in K2 Holdings Investment Corp. (K2 Subsidiary)
The Fund invests in certain financial instruments and commodity-linked derivative investments through its investment in the K2 Subsidiary. The K2 Subsidiary is a Cayman Islands exempted company with limited liability, is a whollyowned subsidiary of the Fund, and is able to invest in certain financial instruments and commodity-linked derivative investments consistent with the investment objective of the Fund. At November 30, 2019, the K2 Subsidiary’s investments, as well as any other assets and liabilities of the K2 Subsidiary, are reflected in the Fund’s Consolidated Statement of Investments and Consolidated Statement of Assets and Liabilities. All intercompany transactions and balances have been eliminated. For tax purposes, the Fund is required to increase its taxable income by its share of the K2 Subsidiary’s income. Net losses incurred by the K2 Subsidiary cannot offset income earned by the Fund and cannot be carried back or forward by the K2 Subsidiary to offset income from prior or future years. At November 30, 2019, the net assets of the K2 Subsidiary were $24,510,038 representing 1.9% of the Fund’s consolidated net assets. The Fund’s investment in the K2 Subsidiary is limited to 25% of consolidated assets.
l. Senior Floating Rate Interests
The Fund invests in senior secured corporate loans that pay interest at rates which are periodically reset by reference to a base lending rate plus a spread. These base lending rates are generally the prime rate offered by a designated U.S. bank or the London InterBank Offered Rate (LIBOR). Senior secured corporate loans often require prepayment of principal from excess cash flows or at the discretion of the borrower. As a result, actual maturity may be substantially less than the stated maturity. Senior secured corporate loans in which the Fund invests are generally readily marketable, but may be subject to certain restrictions on resale. On July 27, 2017, the United Kingdom’s Financial Conduct Authority announced its intention to cease sustaining LIBOR after 2021. There remains uncertainty regarding the future utilization of LIBOR and the nature of any replacement rate. As such, the potential effect of a transition away from LIBOR on the Fund or the Fund’s investments that use or may use a floating rate based on LIBOR cannot yet be determined.
m. Income and Deferred Taxes
It is the Fund’s policy to qualify as a regulated investment company under the Internal Revenue Code. The Fund intends to distribute to shareholders substantially all of its taxable income and net realized gains to relieve it from federal income and excise taxes. As a result, no provision for U.S. federal income taxes is required.
The Fund may be subject to foreign taxation related to income received, capital gains on the sale of securities and certain foreign currency transactions in the foreign jurisdictions in which it invests. Foreign taxes, if any, are recorded based on the tax regulations and rates that exist in the foreign markets in which the Fund invests. When a capital gain tax is determined to apply, the Fund records an estimated deferred tax liability in an amount that would be payable if the securities were disposed of on the valuation date.
The Fund may recognize an income tax liability related to its uncertain tax positions under U.S. GAAP when the uncertain tax position has a less than 50% probability that it will be sustained upon examination by the tax authorities based on its technical merits. As of November 30, 2019, the Fund has determined that no tax liability is required in its consolidated financial statements related to uncertain tax positions for any open tax years (or expected to be taken in future tax years). Open tax years are those that remain subject to examination and are based on the statute of limitations in each jurisdiction in which the Fund invests.
n. Security Transactions, Investment Income, Expenses and Distributions
Security transactions are accounted for on trade date. Realized gains and losses on security transactions are determined on a specific identification basis. Interest income and estimated expenses are accrued daily. Amortization of premium and accretion of discount on debt securities are included in interest income. Facility fees are recognized as income over the expected term of the loan. Dividend income and dividends declared on securities sold short are recorded on theex-dividend date except for certain dividends from securities where the dividend rate is not available. In such cases, the dividend is recorded as soon as the information is received by the Fund. Distributions to shareholders are recorded on theex-dividend date. Distributable earnings are determined according to income tax regulations (tax basis) and may differ from earnings recorded in accordance with U.S. GAAP. These differences may be permanent or
| | | | |
| | | |
| 70 | | Semiannual Report | | franklintempleton.com |
FRANKLIN ALTERNATIVE STRATEGIES FUNDS
NOTES TO CONSOLIDATED FINANCIAL STATEMENTS (UNAUDITED)
Franklin K2 Alternative Strategies Fund(continued)
temporary. Permanent differences are reclassified among capital accounts to reflect their tax character. These reclassifications have no impact on net assets or the results of operations. Temporary differences are not reclassified, as they may reverse in subsequent periods.
Common expenses incurred by the Trust are allocated among the Funds based on the ratio of net assets of each Fund to the combined net assets of the Trust or based on the ratio of number of shareholders of each Fund to the combined number of shareholders of the Trust. Fund specific expenses are charged directly to the Fund that incurred the expense.
Realized and unrealized gains and losses and net investment income, excluding class specific expenses, are allocated daily to each class of shares based upon the relative proportion of net assets of each class. Differences in per share distributions by class are generally due to differences in class specific expenses.
o. Accounting Estimates
The preparation of financial statements in accordance with U.S. GAAP requires management to make estimates and assumptions that affect the reported amounts of assets and liabilities at the date of the financial statements and the amounts of income and expenses during the reporting period. Actual results could differ from those estimates.
p. Guarantees and Indemnifications
Under the Trust’s organizational documents, its officers and trustees are indemnified by the Trust against certain liabilities arising out of the performance of their duties to the Trust. Additionally, in the normal course of business, the Trust, on behalf of the Fund, enters into contracts with service providers that contain general indemnification clauses. The Trust’s maximum exposure under these arrangements is unknown as this would involve future claims that may be made against the Trust that have not yet occurred. Currently, the Trust expects the risk of loss to be remote.
2. Shares of Beneficial Interest
At November 30, 2019, there were an unlimited number of shares authorized (without par value). Transactions in the Fund’s shares were as follows:
| | | | | | | | | | | | | | | | | | | | |
| | | |
| | | Six Months Ended
November 30, 2019 | | | | | | Year Ended
May 31, 2019 | |
| | | | | |
| | | Shares | | | Amount | | | | | | Shares | | | Amount | |
| | | | | |
| Class A Shares: | | | | | | | | | | | | | | | | | | | | |
Shares solda | | | 967,589 | | | $ | 11,112,808 | | | | | | | | 2,351,885 | | | $ | 26,666,136 | |
Shares issued in reinvestment of distributions | | | — | | | | — | | | | | | | | 207,339 | | | | 2,233,039 | |
Shares redeemed | | | (1,091,828 | ) | | | (12,523,621 | ) | | | | | | | (3,768,289 | ) | | | (42,776,597 | ) |
| | | | |
Net increase (decrease) | | | (124,239 | ) | | $ | (1,410,813 | ) | | | | | | | (1,209,065 | ) | | $ | (13,877,422 | ) |
| | | | |
| | | | | |
| Class C Shares: | | | | | | | | | | | | | | | | | | | | |
Shares sold | | | 191,913 | | | $ | 2,154,886 | | | | | | | | 660,253 | | | $ | 7,380,998 | |
Shares issued in reinvestment of distributions | | | — | | | | — | | | | | | | | 93,730 | | | | 992,601 | |
Shares redeemeda | | | (552,321 | ) | | | (6,201,217 | ) | | | | | | | (1,421,875 | ) | | | (15,815,913 | ) |
| | | | |
Net increase (decrease) | | | (360,408 | ) | | $ | (4,046,331 | ) | | | | | | | (667,892 | ) | | $ | (7,442,314 | ) |
| | | | |
| | | | | |
| Class R Shares: | | | | | | | | | | | | | | | | | | | | |
Shares sold | | | 11,077 | | | $ | 126,906 | | | | | | | | 128,380 | | | $ | 1,438,887 | |
Shares issued in reinvestment of distributions | | | — | | | | — | | | | | | | | 1,492 | | | | 16,101 | |
Shares redeemed | | | (2,724 | ) | | | (31,304 | ) | | | | | | | (111,838 | ) | | | (1,265,357 | ) |
| | | | |
Net increase (decrease) | | | 8,353 | | | $ | 95,602 | | | | | | | | 18,034 | | | $ | 189,631 | |
| | | | |
| | | | | | |
| | | |
| franklintempleton.com | | Semiannual Report | | | 71 | |
FRANKLIN ALTERNATIVE STRATEGIES FUNDS
NOTES TO CONSOLIDATED FINANCIAL STATEMENTS (UNAUDITED)
Franklin K2 Alternative Strategies Fund(continued)
2. Shares of Beneficial Interest(continued)
| | | | | | | | | | | | | | | | | | | | |
| | | |
| | | Six Months Ended
November 30, 2019 | | | | | | Year Ended
May 31, 2019 | |
| | | | | |
| | | Shares | | | Amount | | | | | | Shares | | | Amount | |
| | | | | |
| Class R6 Shares: | | | | | | | | | | | | | | | | | | | | |
Shares sold | | | 235,647 | | | $ | 2,723,922 | | | | | | | | 1,328,232 | | | $ | 15,139,519 | |
Shares issued in reinvestment of distributions | | | — | | | | — | | | | | | | | 74,668 | | | | 807,913 | |
Shares redeemed | | | (394,470 | ) | | | (4,549,446 | ) | | | | | | | (412,633 | ) | | | (4,712,011 | ) |
| | | | |
Net increase (decrease) | | | (158,823 | ) | | $ | (1,825,524 | ) | | | | | | | 990,267 | | | $ | 11,235,421 | |
| | | | |
| | | | | |
| Advisor Class Shares: | | | | | | | | | | | | | | | | | | | | |
Shares sold | | | 13,201,802 | | | $ | 152,117,879 | | | | | | | | 38,287,620 | | | $ | 435,094,092 | |
Shares issued in reinvestment of distributions | | | — | | | | — | | | | | | | | 1,729,893 | | | | 18,700,140 | |
Shares redeemed | | | (11,174,770 | ) | | | (128,754,019 | ) | | | | | | | (26,229,040 | ) | | | (295,759,654 | ) |
| | | | |
Net increase (decrease) | | | 2,027,032 | | | $ | 23,363,860 | | | | | | | | 13,788,473 | | | $ | 158,034,578 | |
| | | | |
aMay include a portion of Class C shares that were automatically converted to Class A.
3. Transactions with Affiliates
Franklin Resources, Inc. is the holding company for various subsidiaries that together are referred to as Franklin Templeton. Certain officers and trustees of the Trust are also officers and/or directors of the following subsidiaries:
| | |
| |
| Subsidiary | | Affiliation |
K2/D&S Management Co., L.L.C. (K2 Advisors) | | Investment manager |
Franklin Templeton Services, LLC (FT Services) | | Administrative manager |
Franklin Templeton Distributors, Inc. (Distributors) | | Principal underwriter |
Franklin Templeton Investor Services, LLC (Investor Services) | | Transfer agent |
a. Management Fees
The Fund and K2 Subsidiary pay an investment management fee to K2 Advisors of 1.90% per year of the average daily net assets of the Fund and K2 Subsidiary. Management fees paid by the Fund are reduced on assets invested in the K2 Subsidiary, in an amount not to exceed the management fees paid by the K2 Subsidiary.
Under each subadvisory agreement, the below entities provide subadvisory services to the Fund or K2 Subsidiary. The subadvisory fees are paid by K2 Advisors based on the Fund and K2 Subsidiary average daily net assets, and are not an additional expense of the Fund or K2 Subsidiary.
|
|
| Subadvisors |
Apollo Credit Management LLC |
Bardin Hill Arbitrage IC Management LP |
Chatham Asset Management, LLC |
Chilton Investment Company, LLC |
Ellington Global Asset Management, LLC |
| | | | |
| | | |
| 72 | | Semiannual Report | | franklintempleton.com |
FRANKLIN ALTERNATIVE STRATEGIES FUNDS
NOTES TO CONSOLIDATED FINANCIAL STATEMENTS (UNAUDITED)
Franklin K2 Alternative Strategies Fund(continued)
|
|
| Subadvisors |
Emso Asset Management Limited |
Graham Capital Management, L.P. |
Grantham, Mayo, Van Otterloo & Co. LLC |
H2O AM LLP |
Impala Asset Management LLC |
Jennison Associates, LLC |
Lazard Asset Management, LLC |
Loomis Sayles & Company, L.P. |
P. Schoenfeld Asset Management L.P. |
Portland Hill Asset Management Limited |
Wellington Management Company, LLP |
b. Administrative Fees
Under an agreement with K2 Advisors, FT Services provides administrative services to the Fund and K2 Subsidiary. The fee is paid by K2 Advisors based on the Fund and K2 Subsidiary average daily net assets, and is not an additional expense of the Fund or K2 Subsidiary.
c. Distribution Fees
The Board has adopted distribution plans for each share class, with the exception of Class R6 and Advisor Class shares, pursuant to Rule12b-1 under the 1940 Act. Under the Fund’s Class A reimbursement distribution plan, the Fund reimburses Distributors for costs incurred in connection with the servicing, sale and distribution of the Fund’s shares up to the maximum annual plan rate. Under the Class A reimbursement distribution plan, costs exceeding the maximum for the current plan year cannot be reimbursed in subsequent periods. In addition, under the Fund’s Class C and R compensation distribution plans, the Fund pays Distributors for costs incurred in connection with the servicing, sale and distribution of the Fund’s shares up to the maximum annual plan rate for each class. The plan year, for purposes of monitoring compliance with the maximum annual plan rates, is February 1 through January 31.
The maximum annual plan rates, based on the average daily net assets, for each class, are as follows:
| | | | |
Class A | | | 0.30% | |
Class C | | | 1.00% | |
Class R | | | 0.50% | |
The Board has set the current rate at 0.25% per year for Class A shares until further notice and approval by the Board.
d. Sales Charges/Underwriting Agreements
Front-end sales charges and contingent deferred sales charges (CDSC) do not represent expenses of the Fund. These charges are deducted from the proceeds of sales of Fund shares prior to investment or from redemption proceeds prior to remittance, as applicable. Distributors has advised the Fund of the following commission transactions related to the sales and
redemptions of the Fund’s shares for the period:
| | | | |
Sales charges retained net of commissions paid to unaffiliated brokers/dealers | | $ | 10,041 | |
CDSC retained | | $ | 624 | |
| | | | | | |
| | | |
| franklintempleton.com | | Semiannual Report | | | 73 | |
FRANKLIN ALTERNATIVE STRATEGIES FUNDS
NOTES TO CONSOLIDATED FINANCIAL STATEMENTS (UNAUDITED)
Franklin K2 Alternative Strategies Fund(continued)
3. Transactions with Affiliates(continued)
e. Transfer Agent Fees
Each class of shares pays transfer agent fees to Investor Services for its performance of shareholder servicing obligations. The fees are based on an annualized asset based fee of 0.02% plus a transaction based fee. In addition, each class reimburses Investor Services for out of pocket expenses incurred and, except for Class R6, reimburses shareholder servicing fees paid to third parties. These fees are allocated daily based upon their relative proportion of such classes’ aggregate net assets. Class R6 pays Investor Services transfer agent fees specific to that class.
For the period ended November 30, 2019, the Fund paid transfer agent fees of $621,839, of which $192,819 was retained by Investor Services.
f. Investments in Affiliated Management Investment Companies
The Fund invests in one or more affiliated management investment companies for purposes other than exercising a controlling influence over the management or policies. Management fees paid by the Fund are waived on assets invested in the affiliated management investment companies, as noted in the Consolidated Statement of Operations, in an amount not to exceed the management and administrative fees paid directly or indirectly by each affiliate. During the period ended November 30, 2019, the Fund held investments in affiliated management investment companies as follows:
| | | | | | | | | | | | | | | | | | | | | | | | | | | | | | | | |
| | | | | | | | |
| | | Value at
Beginning
of Period | | | Purchases | | | Sales | | | Realized
Gain
(Loss) | | | Net Change
in Unrealized
Appreciation
(Depreciation) | | | Value
at End
of Period | | | Number
of Shares
Held at
End
of Period | | | Income
from
Securities
Loaned | |
| Non-Controlled Affiliates | | | | | | | | | | | | | | | | | | | | | | | | | | | | | | | | |
Institutional Fiduciary Trust Money Market Portfolio, 1.35% . . . . . | | $ | 4,871,000 | | | $ | 30,198,000 | | | $ | (31,665,000 | ) | | $ | — | | | $ | — | | | $ | 3,404,000 | | | | 3,404,000 | | | $ | 43,477 | |
| | | | |
g. Waiver and Expense Reimbursements
K2 Advisors and Investor Services have contractually agreed in advance to waive or limit their respective fees and to assume as their own expense certain expenses otherwise payable by the Fund so that the expenses (excluding distribution fees, acquired fund fees and expenses, expenses related to securities sold short and certainnon-routine expenses or costs, including those relating to litigation, indemnification, reorganizations and liquidations) for each class of the Fund do not exceed 1.95%, and Class R6 does not exceed 1.87% based on the average net assets of each class until September 30, 2020. Total expenses waived or paid are not subject to recapture subsequent to the Fund’s fiscal year end.
4. Expense Offset Arrangement
The Fund has entered into an arrangement with its custodian whereby credits realized as a result of uninvested cash balances are used to reduce a portion of the Fund’s custodian expenses. During the period ended November 30, 2019, the custodian fees were reduced as noted in the Consolidated Statement of Operations.
| | | | |
| | | |
| 74 | | Semiannual Report | | franklintempleton.com |
FRANKLIN ALTERNATIVE STRATEGIES FUNDS
NOTES TO CONSOLIDATED FINANCIAL STATEMENTS (UNAUDITED)
Franklin K2 Alternative Strategies Fund(continued)
5. Income Taxes
At November 30, 2019, the cost of investments and net unrealized appreciation (depreciation) were as follows:
| | | | |
Cost of investments | | $ | 904,905,586 | |
| | | | |
Unrealized appreciation | | $ | 142,652,143 | |
Unrealized depreciation | | | (46,828,006 | ) |
| | | | |
Net unrealized appreciation (depreciation) | | $ | 95,824,137 | |
| | | | |
Differences between income and/or capital gains as determined on a book basis and a tax basis are primarily due to differing treatments of wash sales and investments in the K2 Subsidiary.
6. Investment Transactions
Purchases and sales of investments and securities sold short (excluding short term securities) for the period ended November 30, 2019, aggregated $1,296,077,413 and $1,238,345,365, respectively.
At November 30, 2019, in connection with securities lending transactions, the Fund loaned equity investments and corporate bonds and notes and received $4,590,520 of cash collateral. The gross amounts of recognized liability for such transactions is included in payable upon return of securities loaned in the Consolidated Statement of Assets and Liabilities. The agreements can be terminated at any time.
The Fund sold certain long positions held in the portfolio and simultaneously entered into total return swaps on the positions, retaining substantially all of the exposure to the economic return and the related risks on the long positions. At November 30, 2019, the transfers of financial assets accounted for as sales were as follows:
| | | | | | | | | | | | | | | | | | | | |
| | | At Original Transactions Dates | | | At Period Ended November 30, 2019 | |
| | | | | |
| | | Cost Basis
of Positions Sold | | | Gross
Cash Received
for Positions Sold | | | Fair Value of
Transferred
Assetsa | | | Gross
Derivative Assets
Recordedb | | | Gross
Derivative Liabilities
Recordedb | |
Sales and total
return swaps | | $ | 5,246,692 | | | $ | 6,694,932 | | | $ | 6,904,159 | | | $ | 6,904,159 | | | $ | (6,694,932 | ) |
| | | | | | | | |
a$209,227 of fair value of transferred assets are included as unrealized appreciation on OTC swap contracts in the Consolidated Statement of Assets and Liabilities.
bBalances are presented on a gross basis, based on each leg of the swap contract, before the application of counterparty and cash collateral offsetting.
See Notes 1(e) and 10 regarding derivative financial instruments and other derivative information, respectively.
7. Credit Risk and Defaulted Securities
The Fund may purchase thepre-default or defaulted debt of distressed companies. Distressed companies are financially troubled and could be or are already involved in financial restructuring or bankruptcy. Risks associated with purchasing these securities include the possibility that the bankruptcy or other restructuring process takes longer than expected, or that distributions in restructuring are less than anticipated, either or both of which may result in unfavorable consequences to the Fund. If it becomes probable that the income on debt securities, including those of distressed companies, will not be collected, the Fund discontinues accruing income and recognizes an adjustment for uncollectible interest.
At November 30, 2019, the aggregate long value of distressed company securities for which interest recognition has been discontinued was $18,384,960 representing 1.4% of the Fund’s net assets. For information as to specific securities, see the accompanying Consolidated Statement of Investments.
| | | | | | |
| | | |
| franklintempleton.com | | Semiannual Report | | | 75 | |
FRANKLIN ALTERNATIVE STRATEGIES FUNDS
NOTES TO CONSOLIDATED FINANCIAL STATEMENTS (UNAUDITED)
Franklin K2 Alternative Strategies Fund(continued)
8. Restricted Securities
The Fund invests in securities that are restricted under the Securities Act of 1933 (1933 Act). Restricted securities are often purchased in private placement transactions, and cannot be sold without prior registration unless the sale is pursuant to an exemption under the 1933 Act. Disposal of these securities may require greater effort and expense, and prompt sale at an acceptable price may be difficult. The Fund may have registration rights for restricted securities. The issuer generally incurs all registration costs.
At November 30, 2019, investments in restricted securities, excluding securities exempt from registration under the 1933 Act, were as follows:
| | | | | | | | | | | | | | | | |
| | | | |
| Shares | | | Issuer | | Acquisition Date | | | Cost | | | Value | |
| | 4,970 | | | aOne Call Corp. | | | 10/28/19 | | | $ | 232,975 | | | $ | 596,214 | |
| | 33,337 | | | aOne Call Corp., cvt. pfd. | | | 10/28/19 | | | | 1,562,669 | | | | 3,999,100 | |
| | | | | | | | | | | | |
| | Total Restricted Securities (Value is 0.4% of Net Assets) | | | $ | 1,795,644 | | | $ | 4,595,314 | |
| | | | | | | | | | | | |
aThe Fund also invests in unrestricted securities of this issuer, valued at $4,031,194 as of November 30, 2019.
9. Unfunded Loan Commitments
The Fund enters into certain credit agreements, all or a portion of which may be unfunded. The Fund is obligated to fund these loan commitments at the borrowers’ discretion. Unfunded loan commitments and funded portions of credit agreements are marked to market daily and any unrealized appreciation or depreciation is included in the Consolidated Statement of Assets and Liabilities and the Consolidated Statement of Operations. Funded portions of credit agreements are presented in the Consolidated Statement of Investments.
At November 30, 2019, unfunded commitments were as follows:
| | | | |
| |
| Borrower | | Unfunded
Commitment | |
Burger King, Term Loan B | | $ | 124,049 | |
10. Other Derivative Information
At November 30, 2019, the investments in derivative contracts are reflected in the Consolidated Statement of Assets and Liabilities as follows:
| | | | | | | | | | | | |
| | |
| | | Asset Derivatives | | | Liability Derivatives | |
| | | | |
Derivative Contracts
Not Accounted for as
Hedging Instruments | | Consolidated Statement of
Assets and Liabilities
Location | | Fair Value | | | Consolidated Statement of
Assets and Liabilities
Location | | Fair Value | |
| | | | |
Interest rate contracts | | Variation margin on futures contracts | | $ | 660,714 | a | | Variation margin on futures contracts | | $ | 132,713 | a |
| | Variation margin on centrally cleared swap contracts | | | 84,682 | a | | Variation margin on centrally cleared swap contracts | | | 12,688 | a |
| | Unrealized appreciation on OTC swap contracts | | | 84,867 | | | Unrealized depreciation on OTC swap contracts | | | 5,162 | |
| | | | |
Foreign exchange contracts | | Investments in securities, at value | | | 51,973 | b | | Options written, at value | | | 49,482 | |
| | Unrealized appreciation on OTC forward exchange contracts | | | 2,449,019 | | | Unrealized depreciation on OTC forward exchange contracts | | | 2,801,495 | |
| | | | |
| | | |
| 76 | | Semiannual Report | | franklintempleton.com |
FRANKLIN ALTERNATIVE STRATEGIES FUNDS
NOTES TO CONSOLIDATED FINANCIAL STATEMENTS (UNAUDITED)
Franklin K2 Alternative Strategies Fund(continued)
| | | | | | | | | | | | |
| | | | |
| | | Asset Derivatives | | | | | Liability Derivatives | | | |
| | | | |
Derivative Contracts
Not Accounted for as
Hedging Instruments | | Consolidated Statement of
Assets and Liabilities
Location | | Fair Value | | | Consolidated Statement of
Assets and Liabilities
Location | | Fair Value | |
| | | | |
Credit contracts | | Variation margin on centrally cleared swap contracts | | $ | 9,768 | a | | Variation margin on centrally cleared swap contracts | | $ | 350,138 | a |
| | OTC swap contracts (upfront payments) | | | 349,594 | | | OTC swap contracts (upfront receipts) | | | 324,875 | |
| | Unrealized appreciation on OTC swap contracts | | | 42,982 | | | Unrealized depreciation on OTC swap contracts | | | 158,178 | |
| | | | |
Equity contracts | | Investments in securities, at value | | | 564,110 | b | | Options written, at value | | | 462,683 | |
| | Variation margin on futures contracts | | | 4,736,743 | a | | Variation margin on futures contracts | | | 12,603,928 | a |
| | Unrealized appreciation on OTC swap contracts | | | 7,662,141 | | | Unrealized depreciation on OTC swap contracts | | | 3,428,335 | |
| | | | |
Commodity contracts | | Variation margin on futures contracts | | | 263,815 | a | | Variation margin on futures contracts | | | 538,756 | a |
| | Unrealized appreciation on OTC swap contracts | | | 52,348 | | | | | | | |
| | | | | | | | | | | | |
Totals | | | | $ | 17,012,756 | | | | | $ | 20,868,433 | |
| | | | | | | | | | | | |
aThis amount reflects the cumulative appreciation (depreciation) of futures contracts and centrally cleared swap contracts as reported in the Consolidated Statement of Investments. Only the variation margin receivable/payable at period end is separately reported within the Consolidated Statement of Assets and Liabilities. Prior variation margin movements were recorded to cash upon receipt or payment.
bPurchased option contracts are included in investments in securities, at value in the Consolidated Statement of Assets and Liabilities.
For the period ended November 30, 2019, the effect of derivative contracts in the Consolidated Statement of Operations was as follows:
| | | | | | | | | | | | |
| | | | |
Derivative Contracts
Not Accounted for as
Hedging Instruments | | Consolidated Statement of
Operations Location | | Net Realized
Gain (Loss)
for the Period | | | Consolidated Statement of
Operations Location | | Net Change in
Unrealized
Appreciation
(Depreciation)
for the Period | |
| | Net realized gain (loss) from: | | | | | | | | | | |
| | | | |
Interest rate contracts | | Investments | | $ | (44,741 | )a | | | | | | |
| | Written options | | | 39,473 | | | | | | | |
| | Futures contracts | | | 5,458,350 | | | Futures contracts | | $ | (1,959,601 | ) |
| | Swap contracts | | | (56,659 | ) | | Swap contracts | | | 185,404 | |
| | | | |
Foreign exchange contracts | | Investments | | | (178,636 | )a | | Investments | | | 57,228 | a |
| | Written options | | | 166,988 | | | Written options | | | (32,913 | ) |
| | Forward exchange contracts | | | 3,412,788 | | | Forward exchange contracts | | | (1,910,030 | ) |
| | | | |
Credit contracts | | Swap contracts | | | (31,735 | ) | | Swap contracts | | | (270,118 | ) |
| | | | |
Equity contracts | | Investments | | | (3,482,561 | )a | | Investments | | | 709,564 | a |
| | Written options | | | 288,412 | | | Written options | | | (119,201 | ) |
| | Futures contracts | | | 803,247 | | | Futures contracts | | | (10,801,408 | ) |
| | Swap contracts | | | 3,718,713 | | | Swap contracts | | | 4,168,255 | |
| | | | |
Commodity contracts | | Futures contracts | | | (457,951 | ) | | Futures contracts | | | 738,735 | |
| | Swap contracts | | | (11,194 | ) | | Swap contracts | | | 40,502 | |
| | | | | | | | | | | | |
Totals | | | | $ | 9,624,494 | | | | | $ | (9,193,583 | ) |
| | | | | | | | | | | | |
aPurchased option contracts are included in net realized gain (loss) from investments and net change in unrealized appreciation (depreciation) on investments in the Consolidated Statement of Operations.
| | | | | | |
| | | |
| franklintempleton.com | | Semiannual Report | | | 77 | |
FRANKLIN ALTERNATIVE STRATEGIES FUNDS
NOTES TO CONSOLIDATED FINANCIAL STATEMENTS (UNAUDITED)
Franklin K2 Alternative Strategies Fund(continued)
10. Other Derivative Information(continued)
For the period ended November 30, 2019, the average month end notional amount of futures contracts, options and swap contracts represented $895,074,317, 34,544,663 shares/units and $174,543,675, respectively. The average month end contract value of forward exchange contracts was $459,032,236.
At November 30, 2019, OTC derivative assets and liabilities are as follows:
| | | | | | | | |
| |
| | | Gross Amounts of Assets
and Liabilities Presented in
the Consolidated Statement
of Assets and Liabilities | |
| | |
| | | Assetsa | | | Liabilitiesa | |
| Derivatives | | | | | | |
Forward Exchange Contracts | | $ | 2,449,019 | | | $ | 2,801,495 | |
Options Purchased | | | 51,973 | | | | — | |
Options Written | | | — | | | | 49,482 | |
Swap Contracts | | | 8,191,932 | | | | 3,916,550 | |
| | | | |
Total | | $ | 10,692,924 | | | $ | 6,767,527 | |
| | | | |
aAbsent an event of default or early termination, OTC derivative assets and liabilities are presented gross and not offset in the Consolidated Statement of Assets and Liabilities
At November 30, 2019, OTC derivative assets, which may be offset against OTC derivative liabilities and collateral received from the counterparty, are as follows:
| | | | | | | | | | | | | | | | | | | | |
| | | |
| | | | | | Amounts Not Offset in the Consolidated
Statement of Assets and Liabilities | | | | |
| | | | | |
| | | Gross Amounts of Assets
Presented in the
Consolidated Statement of
Assets and Liabilities | | | Financial
Instruments
Available for Offset | | | Financials
Instruments
Collateral
Received | | | Cash
Collateral
Receiveda | | | Net Amount (Not
Less than Zero) | |
| Counterparty | | | | | | | | | | | | | | | |
BNYM | | $ | 117,241 | | | $ | (117,241 | ) | | $ | — | | | $ | — | | | $ | — | |
BOFA | | | 133,209 | | | | (133,209 | ) | | | — | | | | — | | | | — | |
BZWS | | | 365,760 | | | | (365,760 | ) | | | — | | | | — | | | | — | |
CITI | | | 5,888 | | | | (5,888 | ) | | | — | | | | — | | | | — | |
DBAB | | | 163,096 | | | | (84,420 | ) | | | — | | | | (78,676 | ) | | | — | |
GSCO | | | 54,559 | | | | (54,559 | ) | | | — | | | | — | | | | — | |
HSBC | | | — | | | | — | | | | — | | | | — | | | | — | |
JPHQ | | | 186,661 | | | | (167,142 | ) | | | — | | | | — | | | | 19,519 | |
JPHQc | | | 627,752 | | | | — | | | | — | | | | — | | | | 627,752 | |
MSCId | | | 52,348 | | | | — | | | | — | | | | — | | | | 52,348 | |
MSCO | | | 259,738 | | | | (113,437 | ) | | | — | | | | — | | | | 146,301 | |
MSCOd | | | 968,512 | | | | (968,512 | ) | | | — | | | | — | | | | — | |
MSCS | | | 5,270 | | | | (5,270 | ) | | | — | | | | — | | | | — | |
MSCSc | | | 7,594,406 | | | | — | | | | — | | | | — | | | | 7,594,406 | |
UBSW | | | 158,484 | | | | (9,408 | ) | | | — | | | | — | | | | 149,076 | |
| | | | |
Total | | $ | 10,692,924 | | | $ | (2,024,846 | ) | | $ | — | | | $ | (78,676 | ) | | $ | 8,589,402 | |
| | | | |
| | | | |
| | | |
| 78 | | Semiannual Report | | franklintempleton.com |
FRANKLIN ALTERNATIVE STRATEGIES FUNDS
NOTES TO CONSOLIDATED FINANCIAL STATEMENTS (UNAUDITED)
Franklin K2 Alternative Strategies Fund(continued)
At November 30, 2019, OTC derivative liabilities, which may be offset against OTC derivative assets and collateral pledged to the counterparty, are as follows:
| | | | | | | | | | | | | | | | | | | | |
| | | |
| | | | | | Amounts Not Offset in the Consolidated
Statement of Assets and Liabilities | | | | |
| | | | | |
| | | Gross Amounts of Liabilities
Presented in the
Consolidated Statement of
Assets and Liabilities | | | Financial
Instruments
Available for Offset | | | Financials
Instruments
Collateral
Pledgedb | | | Cash
Collateral
Pledgeda | | | Net Amount (Not
Less than Zero) | |
| Counterparty | | | | | | | | | | | | | | | |
BNYM | | $ | 126,381 | | | $ | (117,241 | ) | | $ | — | | | $ | (9,140 | ) | | $ | — | |
BOFA | | | 156,806 | | | | (133,209 | ) | | | — | | | | (23,597 | ) | | | — | |
BZWS | | | 576,715 | | | | (365,760 | ) | | | — | | | | (210,955 | ) | | | — | |
CITI | | | 120,410 | | | | (5,888 | ) | | | — | | | | — | | | | 114,522 | |
DBAB | | | 84,420 | | | | (84,420 | ) | | | — | | | | — | | | | — | |
GSCO | | | 89,802 | | | | (54,559 | ) | | | — | | | | (35,243 | ) | | | — | |
HSBC | | | 5,453 | | | | — | | | | — | | | | — | | | | 5,453 | |
JPHQ | | | 167,142 | | | | (167,142 | ) | | | — | | | | — | | | | — | |
JPHQc | | | 959,956 | | | | — | | | | — | | | | — | | | | 959,956 | |
MSCId | | | — | | | | — | | | | — | | | | — | | | | — | |
MSCO | | | 113,437 | | | | (113,437 | ) | | | — | | | | — | | | | — | |
MSCOd | | | 1,189,092 | | | | (968,512 | ) | | | — | | | | (220,580 | ) | | | — | |
MSCS | | | 16,901 | | | | (5,270 | ) | | | — | | | | — | | | | 11,631 | |
MSCSc | | | 3,151,604 | | | | — | | | | — | | | | — | | | | 3,151,604 | |
UBSW | | | 9,408 | | | | (9,408 | ) | | | — | | | | — | | | | — | |
| | | | |
Total | | $ | 6,767,527 | | | $ | (2,024,846 | ) | | $ | — | | | $ | (499,515 | ) | | $ | 4,243,166 | |
| | | | |
aIn some instances, the collateral amounts disclosed in the table above were adjusted due to the requirement to limit the collateral amounts to avoid the effect of overcollateralization. Actual collateral received and/or pledged may be more than the amounts disclosed herein.
bSee the accompanying Consolidated Statement of Investments for securities pledged as collateral for derivatives.
cRepresents derivatives not subject to an ISDA master agreement.
dRepresents derivatives owned by the K2 Holdings Investment Corp., a wholly-owned subsidiary of the Fund. See Note 1(k).
See Notes 1(e) and 6 regarding derivative financial instruments and investment transactions, respectively.
See Abbreviations on page 81.
11. Credit Facility
The Fund, together with other U.S. registered and foreign investment funds (collectively, Borrowers), managed by Franklin Templeton, are borrowers in a joint syndicated senior unsecured credit facility totaling $2 billion (Global Credit Facility) which matures on February 7, 2020. This Global Credit Facility provides a source of funds to the Borrowers for temporary and emergency purposes, including the ability to meet future unanticipated or unusually large redemption requests.
Under the terms of the Global Credit Facility, the Fund shall, in addition to interest charged on any borrowings made by the Fund and other costs incurred by the Fund, pay its share of fees and expenses incurred in connection with the implementation and maintenance of the Global Credit Facility, based upon its relative share of the aggregate net assets of all of the Borrowers, including an annual commitment fee of 0.15% based upon the unused portion of the Global Credit Facility. These fees are reflected in other expenses in the Consolidated Statement of Operations. During the period ended November 30, 2019, the Fund did not use the Global Credit Facility.
| | | | | | |
| | | |
| franklintempleton.com | | Semiannual Report | | | 79 | |
FRANKLIN ALTERNATIVE STRATEGIES FUNDS
NOTES TO CONSOLIDATED FINANCIAL STATEMENTS (UNAUDITED)
Franklin K2 Alternative Strategies Fund(continued)
12. Fair Value Measurements
The Fund follows a fair value hierarchy that distinguishes between market data obtained from independent sources (observable inputs) and the Fund’s own market assumptions (unobservable inputs). These inputs are used in determining the value of the Fund’s financial instruments and are summarized in the following fair value hierarchy:
| | • | | Level 1 – quoted prices in active markets for identical financial instruments |
| | • | | Level 2 – other significant observable inputs (including quoted prices for similar financial instruments, interest rates, prepayment speed, credit risk, etc.) |
| | • | | Level 3 – significant unobservable inputs (including the Fund’s own assumptions in determining the fair value of financial instruments) |
The input levels are not necessarily an indication of the risk or liquidity associated with financial instruments at that level.
A summary of inputs used as of November 30, 2019, in valuing the Fund’s assets and liabilities carried at fair value, is as follows:
| | | | | | | | | | | | | | | | |
| | | | |
| | | Level 1 | | | Level 2 | | | Level 3 | | | Total | |
| | | | |
| Assets: | | | | | | | | | | | | | | | | |
Investments in Securities:a | | | | | | | | | | | | | | | | |
Equity Investmentsb | | $ | 506,184,494 | | | $ | 21,481 | | | $ | 4,715,175 | c | | $ | 510,921,150 | |
Convertible Bonds | | | — | | | | 117,813,269 | | | | — | | | | 117,813,269 | |
Corporate Bonds and Notes | | | — | | | | 91,510,897 | | | | — | | | | 91,510,897 | |
Corporate Bonds and Notes in Reorganization | | | — | | | | 9,827,590 | | | | 84,600 | c | | | 9,912,190 | |
Senior Floating Rate Interests | | | — | | | | 2,256,894 | | | | — | | | | 2,256,894 | |
Credit-Linked Notes | | | — | | | | 1,354,659 | | | | 964,474 | | | | 2,319,133 | |
Foreign Government and Agency Securities | | | — | | | | 18,752,573 | | | | — | | | | 18,752,573 | |
Asset-Backed Securities and Commercial Mortgage-Backed Securities | | | — | | | | 69,829,061 | | | | — | | | | 69,829,061 | |
Municipal Bonds in Reorganization | | | — | | | | 8,472,770 | | | | — | | | | 8,472,770 | |
Options Purchased | | | 564,110 | | | | 51,973 | | | | — | | | | 616,083 | |
Short Term Investments | | | 329,920,510 | | | | 21,792,331 | | | | 3,836,718 | | | | 355,549,559 | |
| | | | |
Total Investments in Securities | | $ | 836,669,114 | | | $ | 341,683,498 | | | $ | 9,600,967 | | | $ | 1,187,953,579 | |
| | | | |
Other Financial Instruments: | | | | |
Futures Contracts | | $ | 5,661,272 | | | $ | — | | | $ | — | | | $ | 5,661,272 | |
Forward Exchange Contracts | | | — | | | | 2,449,019 | | | | — | | | | 2,449,019 | |
Swap Contracts | | | — | | | | 7,936,788 | | | | — | | | | 7,936,788 | |
Unfunded Loan Commitments | | | — | | | | 404 | | | | — | | | | 404 | |
| | | | |
Total Other Financial Instruments | | $ | 5,661,272 | | | $ | 10,386,211 | | | $ | — | | | $ | 16,047,483 | |
| | | | |
|
| Liabilities: | |
Other Financial Instruments: | |
Options Written | | $ | 462,683 | | | $ | 49,482 | | | $ | — | | | $ | 512,165 | |
Securities Sold Shorta | | | 183,639,252 | | | | — | | | | — | | | | 183,639,252 | |
Futures Contracts | | | 13,275,397 | | | | — | | | | — | | | | 13,275,397 | |
Forward Exchange Contracts | | | — | | | | 2,801,495 | | | | — | | | | 2,801,495 | |
Swap Contracts | | | — | | | | 3,954,501 | | | | — | | | | 3,954,501 | |
| | | | |
Total Other Financial Instruments | | $ | 197,377,332 | | | $ | 6,805,478 | | | $ | — | | | $ | 204,182,810 | |
| | | | |
aFor detailed categories, see the accompanying Consolidated Statement of Investments.
bIncludes common, preferred and convertible preferred stocks and exchange traded funds as well as other equity interests.
cIncludes securities determined to have no value at November 30, 2019.
A reconciliation of assets in which Level 3 inputs are used in determining fair value is presented when there are significant Level 3 financial instruments at the beginning and/or end of the period.
| | | | |
| | | |
| 80 | | Semiannual Report | | franklintempleton.com |
FRANKLIN ALTERNATIVE STRATEGIES FUNDS
NOTES TO CONSOLIDATED FINANCIAL STATEMENTS (UNAUDITED)
Franklin K2 Alternative Strategies Fund(continued)
13. Subsequent Events
The Fund has evaluated subsequent events through the issuance of the consolidated financial statements and determined that no events have occurred that require disclosure.
Abbreviations
| | | | | | | | | | |
Counterparty/Exchange | | Currency | | Selected Portfolio |
| BNYM | | The Bank of New York Mellon Corp. | | ARS | | Argentine Peso | | ADR | | American Depositary Receipt |
| BOFA | | Bank of America Corp. | | AUD | | Australian Dollar | | ARLLMONP | | Argentina Blended Policy Rate |
| BZWS | | Barclays Bank PLC | | BRL | | Brazilian Real | | ARM | | Adjustable Rate Mortgage |
| CITI | | Citigroup, Inc. | | CAD | | Canadian Dollar | | BADLAR | | Argentina Deposit Rates Badlar Private Banks ARS |
| DBAB | | Deutsche Bank AG | | CHF | | Swiss Franc | | BBSW | | Bank Bill Swap Rate |
| GSCO | | The Goldman Sachs Group, Inc. | | CLP | | Chilean Peso | | BZDIOVRA | | Brazil Interbank Deposit Rate |
| HSBC | | HSBC Bank USA, N.A. | | CNY | | Chinese Yuan | | CAC | | Cotation Assistee en Continu |
| JPHQ | | JP Morgan Chase & Co. | | COP | | Colombian Peso | | CFETS | | China Foreign Exchange Trade System |
| MSCI | | Morgan Stanley Capital International PLC | | EGP | | Egyptian Pound | | CLO | | Collateralized Loan Obligation |
| MSCO | | Morgan Stanley | | EUR | | Euro | | CME | | Chicago Mercantile Exchange |
| MSCS | | Morgan Stanley Capital Services LLC | | GBP | | British Pound | | DAX | | Deutscher Aktienindex |
| UBSW | | UBS AG | | HKD | | Hong Kong Dollar | | EONIA | | Euro OverNight Index Average |
| | | | JPY | | Japanese Yen | | ETF | | Exchange Traded Fund |
| | | | NGN | | Nigerian Naira | | EURIBOR | | Euro Interbank Offered Rate |
Index | | PLN | | Polish Zloty | | FEDEF | | Federal Funds Effective Rate |
| | RUB | | Russian Ruble | | FHLMC | | Federal Home Loan Mortgage Corp. |
| CDX.EM | | CDX Emerging Markets Index | | SEK | | Swedish Krona | | FRN | | Floating Rate Note |
CMBX.NA | | Commerical Mortgage Backed North America Index | | UAH | | Ukraine Hryvnia | | FTSE | | Financial Times Stock Exchange |
| | USD | | United States Dollar | | GO | | General Obligation |
| ITRX.EUR | | iTraxx Europe Index | | ZAR | | South African Rand | | HIBOR | | Hong Kong Interbank Offer Rate |
| | | | | | | | JSE | | Johannesburg Stock Exchange Index |
| | | | | | | | LIBOR | | London InterBank Offered Rate |
| | | | | | | | MIB | | Milano Italia Borsa |
| | | | | | | | PIK | | PaymentIn-Kind |
| | | | | | | | REIT | | Real Estate Investment Trust |
| | | | | | | | SARON | | Swiss Average Rate Overnight |
| | | | | | | | SFR | | Single Family Revenue |
| | | | | | | | SONIA | | Sterling Overnight Index Average |
| | | | | | | | SPDR | | Standard & Poor’s Depositary Receipt |
| | | | | | | | STIBOR | | Stockholm Interbank Offered Rate |
| | | | | | | | TOPIX | | Tokyo Price Index |
| | | | | | |
| | | |
| franklintempleton.com | | Semiannual Report | | | 81 | |
FRANKLIN ALTERNATIVE STRATEGIES FUNDS
FRANKLIN K2 ALTERNATIVE STRATEGIES FUND
Shareholder Information
Board Approval ofSub-Advisory Agreement
FRANKLIN ALTERNATIVE STRATEGIES FUNDS
Franklin K2 Alternative Strategies Fund
(Fund)
The Board of Trustees (Board) of Franklin Alternative Strategies Funds (the Trust), including a majority of trustees that are not “interested persons” as such term is defined in section 2(a)(19) of the Investment Company Act of 1940 (hereinafter referred to as “independent trustees”), at anin-person meeting held on October 22, 2019, unanimously approved thesub-advisory agreement (the “NewSub-Advisory Agreement”) with Elementum Advisors, LLC (“Elementum”).
In approving the NewSub-Advisory Agreement, the Board, including the independent trustees, determined that fees to be paid under the NewSub-Advisory Agreement were fair and reasonable and that approval of the NewSub-Advisory Agreement was in the best interests of the Fund and its shareholders. As part of the approval process, the trustees considered the process undertaken and information provided during their consideration and approval on May 22, 2019 of the investment management agreement between K2/D&S Management Co., L.L.C., the Fund’s investment manager (“K2 Advisors”), and the Trust, on behalf of the Fund, and thesub-advisory agreements between K2 Advisors and each of the Fund’s existingsub-advisors.
At an independent trustees’ meeting held on July 16, 2019 the independent trustees met with representatives ofElementum. In making the foregoing approvals, the independent trustees received assistance and advice from their independent counsel and, in addition to the materials provided at prior meetings, considered various materials related to the NewSub-Advisory Agreement including: (1) a copy of the proposed form of NewSub-Advisory Agreement for Elementum; (2) information describing the nature, quality and extent of services that Elementum would provide to the Fund, and the proposedsub-advisory fees payable to Elementum; (3) a report from K2 Advisors on the diligence conducted on Elementum and the reasons for recommending Elementum as asub-advisor for the Fund, including, but not limited to, Elementum’s background, experience, personnel, operations, policies, procedures and compliance functions and plans for the integration of such operations, policies, procedures and compliance functions with those of K2 Advisors; and (4) a report from the Fund’s Chief Compliance Officer regarding Elementum’s compliance program
and capabilities, including Elementum’s policies and procedures in place to address potential conflicts of interest, and the diligence undertaken by the Fund’s Chief Compliance Officer with respect thereto. The Board noted that the terms of the NewSub-Advisory Agreement were substantially similar to the terms of thesub-advisory agreements with the Fund’s existingsub-advisors.
The Board’s consideration of whether to approve the NewSub-Advisory Agreement on behalf of the Fund took into account several factors including, but not limited to, the following: (1) the nature and quality of the services to be provided by Elementum to the Fund under the NewSub-Advisory Agreement; (2) Elementum’s experience as a manager of other accounts; (3) Elementum’s strength and reputation within the industry; (4) the fairness of the compensation under the NewSub-Advisory Agreement; (5) the personnel, operations, financial condition, and investment management capabilities, methodologies and resources of Elementum; (6) profitability matters; (7) reports from K2 Advisors on the diligence conducted on Elementum and the reasons for recommending Elementum as asub-advisor for the Fund, including, but not limited to, Elementum’s background, experience, personnel, operations, policies, procedures and compliance functions and plans for the integration of such operations, policies, procedures and compliance functions with those of K2 Advisors; and (8) a report from the Trust’s Chief Compliance Officer regarding Elementum’s compliance program and capabilities, including Elementum’s policies and procedures in place to address potential conflicts of interest, and the diligence undertaken by the Trust’s Chief Compliance Officer with respect thereto. Particular attention was given to the due diligence and risk management procedures of K2 Advisors with respect to selecting and overseeingsub-advisors of the Fund, as well as Elementum’s risk management program and to derivatives and other complex instruments that are expected to be held by the Fund and how such instruments are expected to be used to pursue the Fund’s investment goals.
The following discussion relates to certain primary factors relevant to the Board’s decision to approve the NewSub-Advisory Agreement. This discussion of the information and factors considered by the Board (including the information and factors discussed above) is not intended to be exhaustive, but rather summarizes certain factors considered by the Board. In view of the wide variety of factors considered, the Board did not, unless otherwise noted, find it practicable to quantify or otherwise assign relative weights to the following factors. In addition, individual trustees may have assigned different weights to various factors.
| | | | |
| | | |
| 82 | | Semiannual Report | | franklintempleton.com |
FRANKLIN ALTERNATIVE STRATEGIES FUNDS
FRANKLIN K2 ALTERNATIVE STRATEGIES FUND
NATURE, EXTENT AND QUALITY OF SERVICES. The trustees reviewed the nature, extent and quality of the services to be provided by Elementum. In this regard, they reviewed the Fund’s investment goal and Elementum’s proposed investment strategy, and Elementum’s ability to implement such investment goal and/or investment strategy, including, but not limited to, Elementum’s trading practices and investment decision processes.
With respect to thesub-advisory services to be provided by Elementum, the Board noted the responsibilities that Elementum would have with respect to the Fund’s assets to be allocated to Elementum byK2-Advisors (the“Sub-Advised Portion”), including, among others, implementing the investment strategies with respect to theSub-Advised Portion and ensuring compliance with the investment strategies, policies, and limitations of theSub-Advised Portion. The trustees considered the successful performance of Elementum in managing other investment products with investment strategies similar to the investment strategies of theSub-Advised Portion of the Fund.
The trustees reviewed the portfolio management team at Elementum that would be responsible for managing theSub-Advised Portion, including the team’s performance, staffing, skills and compensation program. The trustees considered various other products, portfolios and entities that are advised by Elementum, their relative fees and reasons for differences with respect thereto and any potential conflicts. The Board also considered a report from the Trust’s Chief Compliance Officer regarding Elementum’s compliance program as such policies relate to the operations of the Fund. The Board considered the selection and due diligence process employed by K2 Advisors in proposing Elementum as asub-advisor to the Fund, including the due diligence undertaken with respect to Elementum’s compliance capabilities, and efforts to integrate Elementum’s operations, policies, procedures and compliance functions with those of K2 Advisors.
Based on their review, the trustees were satisfied with the nature and quality of the overall services to be provided by Elementum to the Fund and its shareholders and were confident in the abilities of Elementum to implement its proposed investment strategy, and to provide quality services to the Fund and its shareholders.
INVESTMENT PERFORMANCE. The Board noted that, as Elementum had not provided any services to the Fund, there was no investment performance of Elementum with respect to the Fund. The Board considered the investment performance of Elementum in managing other investment products
with similar investment strategies to the investment strategies of theSub-Advised Portion. The Board also considered the performance benchmarks for the Fund and how such benchmarks would be utilized to measure the performance of Elementum in managing theSub-Advised Portion.
COMPARATIVE EXPENSES AND PROFITABILITY. The Board considered the cost of the services to be provided by Elementum. The Board also noted that it could not evaluate Elementum’s profitability with respect to the Fund since no assets had yet been allocated to Elementum.
The Board noted that thesub-advisory fees would be paid by K2 Advisors to Elementum and would not be additional fees to be borne by the Fund. The Board also noted that thesub-advisory fees to be paid by K2 Advisors to Elementum were the product of arms-length negotiations between K2 Advisors and Elementum and the Board considered the allocation of the investment management fee charged to the Fund between K2 Advisors and Elementum in light of the nature, extent and quality of the investment management services expected to be provided by K2 Advisors and Elementum. The trustees considered various other products, portfolios and entities that are advised by Elementum and the allocation of assets and expenses among and within them, as well as their relative fees and reasons for differences with respect thereto and any potential conflicts. The Board considered the extent to which Elementum may derive ancillary benefits from the Fund’s operations.
With respect to the impact on K2 Advisors’ and its affiliates’ profitability as a result of hiring Elementum as asub-advisor to the Fund, the Board considered the following: (1) the fee waiver and expense limitation arrangements in effect, and the amount of Fund expenses that were absorbed since the inception of the Fund by K2 Advisors through such arrangements, (2) the level ofsub-advisory fees to be paid to Elementum, and (3) K2 Advisors’ belief that the hiring of Elementum as asub-advisor will not have a material impact on K2 Advisors’ profitability with respect to the Fund.
Based upon its consideration of all these factors, the Board determined that thesub-advisory fee structure for Elementum was fair and reasonable.
ECONOMIES OF SCALE. The Board considered economies of scale that may be realized by Elementum as the Fund grows larger and the extent to which such economies of scale may be shared with Fund shareholders, as for example, in the level of thesub-advisory fees charged, in the quality and efficiency of services rendered and in increased
| | | | | | |
| | | |
| franklintempleton.com | | Semiannual Report | | | 83 | |
FRANKLIN ALTERNATIVE STRATEGIES FUNDS
FRANKLIN K2 ALTERNATIVE STRATEGIES FUND
capital commitments benefiting the Fund directly or indirectly. The Board concluded that economies of scale were deemed not to be a significant factor at that time in light of, among other matters, the fee waiver and expense limitation arrangement in effect
CONCLUSION. After consideration of the foregoing factors, and such other matters as were deemed relevant, and with no single factor being determinative to their decision, the trustees—including a majority of the independent trustees—with the assistance of independent counsel approved the NewSub-Advisory Agreement, including the fees payable thereunder, with Elementum for the Fund.
Proxy Voting Policies and Procedures
The Fund’s investment manager has established Proxy Voting Policies and Procedures (Policies) that the Fund uses to determine how to vote proxies relating to portfolio securities. Shareholders may view the Fund’s complete Policies online at franklintempleton.com. Alternatively, shareholders may request copies of the Policies free of charge by calling the Proxy Group collect at (954)527-7678 or by sending a written request to: Franklin Templeton Companies, LLC, 300 S.E. 2nd Street, Fort Lauderdale, FL 33301, Attention: Proxy Group. Copies of the Fund’s proxy voting records are also made available online at franklintempleton.com and posted on the U.S. Securities and Exchange Commission’s website at sec.gov and reflect the most recent12-month period ended June 30.
Quarterly Consolidated Statement of Investments
The Trust, on behalf of the Fund, files a complete statement of investments with the U.S. Securities and Exchange Commission for the first and third quarters for each fiscal year as an exhibit to its report on FormN-PORT. Shareholders may view the filed FormN-PORT by visiting the Commission’s website at sec.gov. The filed form may also be viewed and copied at the Commission’s Public Reference Room in Washington, DC. Information regarding the operations of the Public Reference Room may be obtained by calling(800) SEC-0330.
| | | | |
| | | |
| 84 | | Semiannual Report | | franklintempleton.com |
Authorized for distribution only when accompanied or preceded by a summary prospectus and/or prospectus. Investors should carefully consider a fund’s investment goals, risks, charges and expenses before investing. A prospectus contains this and other information; please read it carefully before investing.
To help ensure we provide you with quality service, all calls to and from our service areas are monitored and/or recorded.
| | | | | | |
 | | Semiannual Report and Shareholder Letter Franklin K2 Alternative Strategies Fund | | |
| | | |
| | Investment Manager | | Distributor | | Shareholder Services |
| | K2/D&S Management Co., L.L.C. | | Franklin Templeton Distributors, Inc. (800) DIAL BEN®/342-5236 franklintempleton.com | | (800) 632-2301 |
| © 2019-2020 Franklin Templeton Investments. All rights reserved. | | | | 068 S 01/20 |
SEMIANNUAL REPORT AND SHAREHOLDER LETTER
FRANKLIN K2 LONG SHORT CREDIT FUND
A Series of Franklin Alternative Strategies Funds
November 30, 2019


Sign up for electronic delivery at franklintempleton.com/edelivery
Internet Delivery of Fund Reports Unless You Request Paper Copies: Effective January 1, 2021, as permitted by the SEC, paper copies of the Fund’s shareholder reports will no longer be sent by mail, unless you specifically request them from the Fund or your financial intermediary. Instead, the reports will be made available on a website, and you will be notified by mail each time a report is posted and provided with a website link to access the report.
If you already elected to receive shareholder reports electronically, you will not be affected by this change and you need not take any action. If you have not signed up for electronic delivery, we would encourage you to join fellow shareholders who have. You may elect to receive shareholder reports and other communications electronically from the Fund by calling(800) 632-2301 or by contacting your financial intermediary.
You may elect to continue to receive paper copies of all your future shareholder reports free of charge by contacting your financial intermediary or, if you invest directly with a Fund, calling(800) 632-2301 to let the Fund know of your request. Your election to receive reports in paper will apply to all funds held in your account.
FRANKLIN TEMPLETON
Successful investing begins with ambition. And achievement only comes when you reach for it. That’s why we continually strive to deliver better outcomes for investors. No matter what your goals are, our deep, global investment expertise allows us to offer solutions that can help.
During our more than 70 years of experience, we’ve managed through all kinds of markets—up, down and those in between. We’re always preparing for what may come next. It’s because of this, combined with our strength as one of the world’s largest asset managers that we’ve earned the trust of millions of investors around the world.
Dear Fellow Shareholder:
During the six months ended November 30, 2019, global markets benefited from upbeat economic data in certain regions, encouraging corporate earnings reports, generally accommodative monetary policies by major central banks and periods of optimism about a potential U.S.-China trade agreement. However, global markets also reflected investor concerns about ongoing U.S. trade disputes with China and other trading partners, political uncertainties in the U.S. and the European Union, and slower global economic growth. In this environment, global developed market stocks, as measured by the MSCI World Index, posted a +13.21% total return for the period.1 Global emerging market stocks, as measured by the MSCI Emerging Markets Index, posted a +6.13% total return.1 Global government bonds, as measured by the FTSE World Government Bond Index, posted a +2.55% total return.1
We are committed to our long-term perspective and disciplined investment approach as we conduct a rigorous analysis of Fund subadvisors and markets with a strong emphasis on investment risk management.
We believe active, professional investment management serves investors well. We also recognize the important role of financial advisors in today’s markets and encourage investors to continue to seek their advice. Amid changing markets and economic conditions, we are confident investors with a well-diversified portfolio and a patient, long-term outlook should be well positioned for the years ahead.
CFA® is a trademark owned by CFA Institute.
1. Source: Morningstar.
See www.franklintempletondatasources.com for additional data provider information.
On the following pages, the Fund’s portfolio management team reviews investment decisions that pertain to performance during the past six months in light of the economic environment and other factors. Please remember all securities markets fluctuate, as do mutual fund share prices.
We thank you for investing with Franklin Templeton, welcome your questions and comments, and look forward to continuing to serve your investment needs in the future.
Sincerely,

Madison S. Gulley, CFA
President and Chief Executive Officer –
Investment Management
Franklin Alternative Strategies Funds
This letter reflects our analysis and opinions as of November 30, 2019, unless otherwise indicated. The information is not a complete analysis of every aspect of any market, country, industry, security or fund. Statements of fact are from sources considered reliable.
| | | | | | | | |
| Not FDIC Insured | | | | | May Lose Value | | | | | No Bank Guarantee |
| | | | | | |
| | | |
| franklintempleton.com | | Not part of the semiannual report | | | 1 | |
Visitfranklintempleton.comfor fund
updates, to access your account, or to find helpful financial planning tools.
| | | | | | |
| | | |
| | 2 | | | Semiannual Report | | franklintempleton.com |
SEMIANNUAL REPORT
Franklin K2 Long Short Credit Fund
This semiannual report for Franklin K2 Long Short Credit Fund covers the period ended November 30, 2019.
Your Fund’s Goal and Main Investments
The Fund seeks total return through a combination of current income, capital preservation and capital appreciation. The Fund seeks to achieve its investment goal by allocating its assets across multiplenon-traditional or alternative strategies in the fixed income and credit areas, including, but not limited to, some or all of the following: credit long short, structured credit and emerging market fixed income. The Fund is structured as a multi-manager fund, meaning the Fund’s assets are managed by multiple subadvisors, and the Fund’s investment manager has overall responsibility for the Fund’s investments.
Under normal market conditions, the Fund invests at least 80% of its net assets, plus the amount of any borrowings for investment purposes, in credit-related investments. The Fund invests in a wide range of securities and other investments including, but not limited to: corporate bonds, mortgage-backed securities (MBS) and asset-backed securities (ABS), U.S. government and agency securities, collateralized debt and loan obligations, foreign government and supranational debt securities, loans and loan participations and derivatives with similar economic characteristics. The Fund may also invest in repurchase agreements, reverse repurchase agreements, mortgage real estate investment trusts (REITs) and other similar transactions.
Performance Overview
The Fund’s Class A shares posted a +1.34% cumulative total return for the six months under review. For comparison, the Fund’s primary benchmark, the HFRX Fixed Income - Credit Index, which measures performance of strategies with exposure to credit across a broad continuum of credit substrategies, posted a +2.92% total return for the same period.1 The Fund’s strategy, which results in a relatively low risk profile, differs from that of the credit index, which has a generally higher risk profile in a rising market environment. This difference may occasionally lead to wide performance discrepancies, especially in periods when investors focus on
|
| Portfolio Composition* |
|
| Based on Total Net Assets as of 11/30/19 |
|
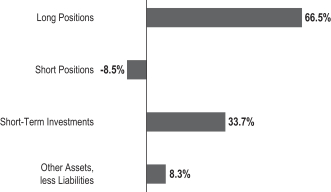 |
*Figures represent the net Fund exposure and include certain derivatives held in the portfolio (or their underlying reference assets) or unsettled trades and may not total 100% or may be negative due to rounding, use of any derivatives or other factors.
risk assets with higher return potential or, conversely, when investors focus on less risky assets to potentially avoid volatile returns. Also for comparison, the Fund’s secondary benchmark, the ICE BofAML U.S.3-Month Treasury Bill Index, which is an index of short-term U.S. government securities with a remaining term to final maturity of less than three months, posted a +1.10% total return.2 You can find more of the Fund’s performance data in the Performance Summary beginning on page 7.
Performance data represent past performance, which does not guarantee future results. Investment return and principal value will fluctuate, and you may have a gain or loss when you sell your shares. Current performance may differ from figures shown. For most recentmonth-end performance, go tofranklintempleton.com or call(800)342-5236.
Economic and Market Overview
The global economy expanded during the six months ended November 30, 2019, despite weakness in Europe and Asia. Global stocks were aided by upbeat economic data in some regions, encouraging corporate earnings reports, periods of optimism about a potential U.S.-China trade deal and monetary policy easing by major central banks.
1. Source: FactSet. Hedge Fund Research, Inc. – www.hedgefundresearch.com. The HFRX Fixed Income - Credit Index is being used under license from Hedge Fund Research, Inc., which does not endorse or approve of any of the contents of this report.
2. Source: Morningstar.
The indexes are unmanaged and include reinvestment of any income or distributions. They do not reflect any fees, expenses or sales charges. One cannot invest directly in an index, and an index is not representative of the Fund’s portfolio. Unlike most asset class indexes, HFR Index returns reflect fees and expenses.
The dollar value, number of shares or principal amount, and names of all portfolio holdings are listed in the Fund’s Statement of Investments (SOI). The SOI begins on page 15.
| | | | | | |
| | | |
| franklintempleton.com | | Semiannual Report | | | 3 | |
FRANKLIN K2 LONG SHORT CREDIT FUND
However, markets also reflected concerns about political uncertainties in the U.S. (including the impeachment inquiry into President Donald Trump), geopolitical tensions in certain regions, and the impact of U.S. trade disputes with China and other trading partners on global growth and corporate earnings. Overall, global developed and emerging market stocks, as measured by the MSCI All Country World Index, posted a +12.37% total return, slightly lower than the +13.21% total return for global developed market stocks, as measured by the MSCI World Index, for the six months under review.2
The U.S. economy expanded during the six months ended November 30, 2019. After moderating in 2019’s second quarter, the economy grew faster in the third quarter, aided by consumer spending, housing investment, government spending and exports. The manufacturing sector expanded at the start of the period, but contracted during the last four months, while the services sector expanded throughout the period. The unemployment rate decreased slightly from 3.6% in May 2019 to 3.5% atperiod-end.3 The annual inflation rate, as measured by the Consumer Price Index, increased from 1.8% in May 2019 to 2.1% atperiod-end.3
At its July 2019 meeting, the U.S. Federal Reserve (Fed) lowered its target range for the federal funds rate for the first time since December 2008, to 2.00%–2.25%, citing muted inflation pressures and the potential effects of global trade tensions on economic growth. Furthermore, the Fed ended its balance sheet normalization program earlier than previously indicated. The Fed further lowered the federal funds target rate range by 0.25% at its September and October meetings, to 1.50%–1.75%, reiterating the rationale cited at the July meeting.
In Europe, the U.K.’s quarter-on-quarter gross domestic product (GDP) growth contracted in 2019’s second quarter but recovered in the third quarter. The Bank of England kept its key policy rate unchanged during thesix-month period and lowered its GDP forecasts for 2019 and 2020, amid Brexit uncertainties. The eurozone’s quarter-on-quarter GDP growth moderated in 2019’s second quarter and remained stable in the third quarter. The bloc’s annual inflation rate ended the period lower. The European Central Bank (ECB) kept its benchmark interest rate unchanged during the period. In November, the ECB resumed its asset purchase program in an effort to boost the economy.
In developed Asia, Japan’s quarter-on-quarter GDP growth moderated in 2019’s second and third quarters. The Bank of Japan left its benchmark interest rate unchanged and continued its stimulus measures during the review period.
In larger emerging markets, Brazil’s quarter-on-quarter GDP growth accelerated in 2019’s second and third quarters. The Central Bank of Brazil lowered its benchmark interest rate three times during the period. Russia’s annual GDP growth accelerated in 2019’s second and third quarters. The Bank of Russia cut its key interest rate four times during the period. China’s annual GDP growth moderated in 2019’s second and third quarters. The People’s Bank of China implemented an interest-rate reform in August, designating the loan prime rate as the new benchmark for household and business loans, effectively lowering interest rates several times during the period. Overall, global emerging market stocks, as measured by the MSCI Emerging Markets Index, posted a +6.13% total return for the six months under review.2
Investment Strategy
We manage the Fund using a multi-manager approach. While we have overall responsibility for the Fund’s investments, we allocate the Fund’s assets to multiple subadvisors, each of whom independently manages a separate portion of the Fund’s portfolio in accordance with some or all of the following strategies: credit long short, structured credit and emerging market fixed income. We allocate the Fund’s assets among these strategies utilizing atop-down approach, generating the Fund’s strategy and subadvisor weightings by taking into account market conditions, risk factors, diversification, liquidity, transparency, and other investment options, among other things. We allocate the Fund’s assets to specific subadvisors utilizing abottom-up approach, selecting subadvisors and their weighting within the Fund’s portfolio by taking into account their correlation to various markets and to each other, risk profiles and their return expectations.
Credit long short strategies seek to isolate issuer-specific exposure, while limiting general market risks, by taking long and/or short positions in debt securities and other related instruments. Structured credit strategies aim to profit from trading in interest-rate sensitive securities such as residential and commercial MBS, REITs, credit default swaps on various indexes, collateralized loan obligations (CLOs) and ABS. Emerging market fixed income strategies invest in corporate and/or sovereign securities in emerging markets countries with a focus on fixed income. The Fund may invest in debt securities of any credit quality or rating, including high-yield (“junk”) bonds, distressed debt securities (securities of companies that are, or are about to be, involved in reorganizations, financial restructurings, or bankruptcy) and securities that are in default. The Fund may engage in active and frequent trading as part of its investment strategies.
3. Source: U.S. Bureau of Labor Statistics.
See www.franklintempletondatasources.com for additional data provider information.
| | | | |
| | | |
| 4 | | Semiannual Report | | franklintempleton.com |
FRANKLIN K2 LONG SHORT CREDIT FUND
What are swap agreements?
Swap agreements, such as interest rate, currency and credit default swaps, are contracts between the Fund and another party (the swap counterparty). In a basic swap transaction, the Fund agrees with the swap counterparty to exchange the returns (or differentials in rates of return) earned or realized on a particular “notional amount” of underlying instruments. The notional amount is the set amount selected by the parties as the basis on which to calculate the obligations that they have agreed to exchange. The parties typically do not actually exchange the notional amount. Instead, they agree to exchange the returns that would be earned or realized if the notional amount were invested in given instruments or at given interest rates.
The Fund takes long and/or short positions in a wide range of asset classes, including credit, fixed income, equities and currencies, among others. The Fund may gain long or short exposure to select instruments by utilizing derivatives, engaging in short sales or entering into a series of purchase and sale contracts or repurchase agreements. Long positions benefit from an increase in the price of the underlying instrument, while short positions benefit from a decrease in that price. The Fund may also use derivatives for hedging and nonhedging (investment) purposes, although no subadvisor is required to hedge any of the Fund’s positions or to use derivatives. Such derivative investments may include currency forward contracts; futures contracts; put and call
options on currencies, securities, indexes and exchange-traded funds; and swaps. The Fund may engage in active and frequent trading as part of its investment strategies.
What is a currency forward contract?
A currency forward contract is an agreement between the Fund and a counterparty to buy or sell a foreign currency in exchange for another currency at a specific exchange rate on a future date. Currency forward contracts are privately traded in the interbank market, not on a centralized exchange.
What is a futures contract?
A futures contract is an agreement between the Fund and a counterparty made through a U.S. or foreign futures exchange to buy or sell an underlying instrument or asset at a specific price on a future date.
What is an option?
An option is a contract to buy or sell a specific financial product known as the option’s underlying instrument at a specific price. The buyer of an option has the right, but not the obligation, to buy or sell the underlying instrument at or until a specified expiration date. Conversely, the seller (“writer”) of an option who opens a transaction is obligated to buy or sell the underlying instrument should the option holder exercise that right.
| | | | |
| Subadvisors | | | |
| |
| 11/30/19 | | | |
| |
| Credit Long Short | | | | |
| |
Apollo Credit Management LLC | | | | |
| |
Chatham Asset Management, LLC | | | | |
| |
| Structured Credit | | | | |
| |
Ellington Global Asset Management, L.L.C. | | | | |
| |
Medalist Partners, LP | | | | |
| |
| Emerging Markets Fixed Income | | | | |
| |
Emso Asset Management Limited | | | | |
Manager’s Discussion
The Fund’s subadvisors for the six months under review were Apollo Credit Management, Chatham Asset Management, Ellington Global Asset Management, Emso Asset Management and Medalist Partners. These subadvisors are also listed in the Subadvisors table on this page. Four of the five subadvisors posted gains for thesix-month period—Apollo, Medalist, Ellington and Emso. In contrast, Chatham experienced a slight loss.
All three strategies strengthened Fund performance for thesix-month period: credit long short, structured credit and emerging markets fixed income. By asset class, the top contributors to the Fund’s aggregate returns were credit and equity. Conversely, currency exposures and interest-rate derivatives detracted from performance.
In terms of aggregate sector exposures, the top performance drivers for the Fund were mortgage-backed securities (MBS), consumer discretionary and consumer staples. In contrast, equity index hedges and health care hindered returns.
The credit long short strategy benefited from long positions in the consumer discretionary and utilities sectors. In addition, long and then short positions in consumer staples positively contributed to strategy performance. Conversely, health care long positions and equity index hedges were net detractors from strategy results.
In the structured credit strategy, MBS led contributors, with collateralized loan obligations and other asset-backed securities also supporting performance. In contrast, credit index hedges against high-yield bonds detracted from strategy performance.
In the emerging markets fixed income strategy, the drawdown from long positions in U.S. dollar-denominated Argentine sovereign bonds more than offset gains from long positioning in Russian sovereign bonds. Outside of emerging markets, long positions in Puerto Rico general obligation bonds supported strategy performance.
| | | | | | |
| | | |
| franklintempleton.com | | Semiannual Report | | | 5 | |
FRANKLIN K2 LONG SHORT CREDIT FUND
Thank you for your participation in Franklin K2 Long Short Credit Fund. We look forward to continuing to serve your future investment needs.
| | |
 | | 
Robert Christian |
| | Co-Lead Portfolio Manager |
| | |
 | | 
Brooks Ritchey |
| | Co-Lead Portfolio Manager |
| | |
 | | 
Art Vinokur |
| | Portfolio Manager |
The foregoing information reflects our analysis, opinions and portfolio holdings as of November 30, 2019, the end of the reporting period. The way we implement our main investment strategies and the resulting portfolio holdings may change depending on factors such as market and economic conditions. These opinions may not be relied upon as investment advice or an offer for a particular security. The information is not a complete analysis of every aspect of any market, country, industry, security or the Fund. Statements of fact are from sources considered reliable, but the investment manager makes no representation or warranty as to their completeness or accuracy. Although historical performance is no guarantee of future results, these insights may help you understand our investment management philosophy.
| | | | |
| | | |
| 6 | | Semiannual Report | | franklintempleton.com |
FRANKLIN K2 LONG SHORT CREDIT FUND
Performance Summary as of November 30, 2019
The performance table does reflect any taxes that a shareholder would pay on Fund dividends, capital gain distributions, if any, or any realized gains on the sale of Fund shares. Total return reflects reinvestment of the Fund’s dividends and capital gain distributions, if any, and any unrealized gains or losses. Your dividend income will vary depending on dividends or interest paid by securities in the Fund’s portfolio, adjusted for operating expenses of each class. Capital gain distributions are net profits realized from the sale of portfolio securities.
Performance as of 11/30/191
Cumulative total return excludes sales charges. Average annual total return includes maximum sales charges. Sales charges will vary depending on the size of the investment and the class of share purchased. The maximum is 5.50% and the minimum is 0%.Class A: 5.50% maximum initial sales charge;Advisor Class: no sales charges. For other share classes, visitfranklintempleton.com.
| | | | | | | | |
| | |
| Share Class | | Cumulative
Total Return2 | | | Average Annual
Total Return3 | |
| | |
| A4 | | | | | | | | |
6-Month | | | +1.34% | | | | -4.25% | |
1-Year | | | +3.91% | | | | -1.83% | |
3-Year | | | +11.89% | | | | +1.87% | |
Since Inception (9/8/15) | | | +20.34% | | | | +3.09% | |
| | |
| Advisor | | | | | | | | |
6-Month | | | +1.43% | | | | +1.43% | |
1-Year | | | +4.09% | | | | +4.09% | |
3-Year | | | +12.33% | | | | +3.95% | |
Since Inception (9/8/15) | | | +20.93% | | | | +4.60% | |
Performance data represent past performance, which does not guarantee future results. Investment return and principal value will fluctuate, and you may have a gain or loss when you sell your shares. Current performance may differ from figures shown. For most recentmonth-end performance, go tofranklintempleton.com or call(800)342-5236.
See page 8 for Performance Summary footnotes.
| | | | | | |
| | | |
| franklintempleton.com | | Semiannual Report | | | 7 | |
FRANKLIN K2 LONG SHORT CREDIT FUND
PERFORMANCE SUMMARY
Total Annual Operating Expenses5
| | | | | | | | |
| | |
| Share Class | | With Fee
Waiver | | | Without Fee
Waiver | |
A | | | 2.84% | | | | 3.30% | |
Advisor | | | 2.59% | | | | 3.05% | |
Each class of shares is available to certain eligible investors and has different annual fees and expenses, as described in the prospectus.
All investments involve risks, including possible loss of principal. The market values of securities owned by the Fund will go up or down, sometimes rapidly or unpredictably. The Fund’s performance depends on the manager’s skill in selecting, overseeing and allocating Fund assets to the subadvisors. The Fund is actively managed and could experience losses if the manager’s and subadvisors’ judgment about particular Fund portfolio investments prove to be incorrect. Some subadvisors may have little or no experience managing the assets of a registered investment company. Bond prices generally move in the opposite direction of interest rates. Changes in the financial strength of a bond issuer or in a bond’s credit rating may affect its value. Lower-rated or high-yield debt securities (junk bonds) involve greater credit risk, including the possibility of default or bankruptcy. Liquidity risk exists when securities become more difficult to sell, or are unable to be sold, at the price at which they’ve been valued. Investments in derivatives involve costs and create economic leverage, which may result in significant volatility and cause the Fund to participate in losses (as well as gains) that significantly exceed the Fund’s initial investment. The Fund may make short sales of securities, which involves the risk that losses may exceed the original amount invested. The Fund’s prospectus also includes a description of the main investment risks.
1. The Fund has an expense reduction contractually guaranteed through 9/30/20. Fund investment results reflect the expense reduction; without this reduction, the results would have been lower.
2. Cumulative total return represents the change in value of an investment over the periods indicated.
3. Average annual total return represents the average annual change in value of an investment over the periods indicated. Return for less than one year, if any, has not been annualized.
4. Prior to 9/10/18, these shares were offered at a higher initial sales charge of 5.75%, thus actual returns (with sales charges) would have differed. Average annual total returns (with sales charges) have been restated to reflect the current maximum initial sales charge of 5.50%.
5. Figures are as stated in the Fund’s current prospectus and may differ from the expense ratios disclosed in the Your Fund’s Expenses and Financial Highlights sections in this report. In periods of market volatility, assets may decline significantly, causing total annual Fund operating expenses to become higher than the figures shown.
| | | | |
| | | |
| 8 | | Semiannual Report | | franklintempleton.com |
FRANKLIN K2 LONG SHORT CREDIT FUND
Your Fund’s Expenses
As a Fund shareholder, you can incur two types of costs: (1) transaction costs, including sales charges (loads) on Fund purchases and redemptions; and (2) ongoing Fund costs, including management fees, distribution and service(12b-1) fees, and other Fund expenses. All mutual funds have ongoing costs, sometimes referred to as operating expenses. The table below shows ongoing costs of investing in the Fund and can help you understand these costs and compare them with those of other mutual funds. The table assumes a $1,000 investment held for the six months indicated.
Actual Fund Expenses
The table below provides information about actual account values and actual expenses in the columns under the heading “Actual.” In these columns the Fund’s actual return, which includes the effect of Fund expenses, is used to calculate the “Ending Account Value” for each class of shares. You can estimate the expenses you paid during the period by following these steps (of course, your account value and expenses will differ from those in this illustration): Divide your account value by $1,000 (if your account had an $8,600 value, then $8,600 ÷ $1,000 = 8.6). Then multiply the result by the number in the row for your class of shares under the headings “Actual” and “Expenses Paid During Period” (if Actual Expenses Paid During Period were $7.50, then 8.6 x $7.50 =$64.50). In this illustration, the actual expenses paid this period are $64.50.
Hypothetical Example for Comparison with Other Funds
Under the heading “Hypothetical” in the table, information is provided about hypothetical account values and hypothetical expenses based on the Fund’s actual expense ratio and an assumed rate of return of 5% per year before expenses, which is not the Fund’s actual return. This information may not be used to estimate the actual ending account balance or expenses you paid for the period, but it can help you compare ongoing costs of investing in the Fund with those of other funds. To do so, compare this 5% hypothetical example for the class of shares you hold with the 5% hypothetical examples that appear in the shareholder reports of other funds.
Please note that expenses shown in the table are meant to highlight ongoing costs and do not reflect any transactional costs. Therefore, information under the heading “Hypothetical” is useful in comparing ongoing costs only, and will not help you compare total costs of owning different funds. In addition, if transactional costs were included, your total costs would have been higher.
| | | | | | | | | | | | | | | | | | | | | | | | |
| | | | |
| | | | | | Actual
(actual return after expenses) | | | Hypothetical
(5% annual return before expenses) | | | | |
Share
Class | | Beginning
Account
Value 6/1/19 | | | Ending
Account
Value 11/30/19 | | | Expenses
Paid During
Period
6/1/19–11/30/191,2 | | | Ending
Account
Value 11/30/19 | | | Expenses
Paid During
Period
6/1/19–11/30/191,2 | | | Net
Annualized
Expense
Ratio2 | |
| A | | $ | 1,000 | | | $ | 1,013.40 | | | $ | 13.93 | | | $ | 1,011.16 | | | $ | 13.92 | | | | 2.77 | % |
| C | | $ | 1,000 | | | $ | 1,008.80 | | | $ | 17.71 | | | $ | 1,007.37 | | | $ | 17.69 | | | | 3.53 | % |
| R | | $ | 1,000 | | | $ | 1,011.60 | | | $ | 15.23 | | | $ | 1,009.86 | | | $ | 15.21 | | | | 3.03 | % |
| R6 | | $ | 1,000 | | | $ | 1,015.30 | | | $ | 12.59 | | | $ | 1,012.51 | | | $ | 12.57 | | | | 2.50 | % |
| Advisor | | $ | 1,000 | | | $ | 1,014.40 | | | $ | 12.73 | | | $ | 1,012.36 | | | $ | 12.72 | | | | 2.53 | % |
1. Expenses are equal to the annualized expense ratio for thesix-month period as indicated above—in the far right column—multiplied by the simple average account value over the period indicated, and then multiplied by 183/366 to reflect theone-half year period.
2. Reflects expenses after fee waivers and expense reimbursements. Does not include acquired fund fees and expenses.
| | | | | | |
| | | |
| franklintempleton.com | | Semiannual Report | | | 9 | |
FRANKLIN ALTERNATIVE STRATEGIES FUNDS
Financial Highlights
Franklin K2 Long Short Credit Fund
| | | | | | | | | | | | | | | | | | | | |
| | | Six Months Ended
November 30, 2019
(unaudited) | | | Year Ended May 31, | |
| | | 2019 | | | 2018 | | | 2017 | | | 2016a | |
| | | | | |
| Class A | | | | | | | | | | | | | | | | | | | | |
| | | | | |
Per share operating performance
(for a share outstanding throughout the period) | | | | | | | | | | | | | | | | | | | | |
| | | | | |
Net asset value, beginning of period | | $ | 10.45 | | | $ | 10.50 | | | $ | 10.49 | | | $ | 10.15 | | | $ | 10.00 | |
| | | | |
| | | | | |
| Income from investment operationsb: | | | | | | | | | | | | | | | | | | | | |
| | | | | |
Net investment incomec | | | 0.13 | | | | 0.37 | | | | 0.29 | | | | 0.23 | | | | 0.21 | |
| | | | | |
Net realized and unrealized gains (losses) | | | 0.01 | | | | (0.02 | ) | | | 0.08 | | | | 0.53 | | | | 0.08 | |
| | | | |
| | | | | |
Total from investment operations | | | 0.14 | | | | 0.35 | | | | 0.37 | | | | 0.76 | | | | 0.29 | |
| | | | |
| | | | | |
| Less distributions from: | | | | | | | | | | | | | | | | | | | | |
| | | | | |
Net investment income | | | — | | | | (0.31 | ) | | | (0.19 | ) | | | (0.32 | ) | | | (0.08 | ) |
| | | | | |
Net realized gains | | | — | | | | (0.09 | ) | | | (0.17 | ) | | | (0.10 | ) | | | (0.06 | ) |
| | | | |
| | | | | |
Total distributions | | | — | | | | (0.40 | ) | | | (0.36 | ) | | | (0.42 | ) | | | (0.14 | ) |
| | | | |
| | | | | |
Net asset value, end of period | | $ | 10.59 | | | $ | 10.45 | | | $ | 10.50 | | | $ | 10.49 | | | $ | 10.15 | |
| | | | |
| | | | | |
Total returnd | | | 1.34% | | | | 3.42% | | | | 3.63% | | | | 7.58% | | | | 2.99% | |
| | | | | |
| Ratios to average net assetse | | | | | | | | | | | | | | | | | | | | |
| | | | | |
Expenses before waiver, payments by affiliates and expense reductionf | | | 3.18% | | | | 3.15% | | | | 3.51% | | | | 3.50% | | | | 3.37% | |
| | | | | |
Expenses net of waiver, payments by affiliates and expense reductionf | | | 2.77% | | | | 2.69% | | | | 2.98% | g | | | 2.75% | | | | 2.30% | g |
| | | | | |
Expenses incurred in connection with securities sold short | | | 0.58% | | | | 0.62% | | | | 0.89% | | | | 0.76% | | | | 0.40% | |
| | | | | |
Net investment income | | | 2.47% | | | | 3.49% | | | | 2.71% | | | | 2.24% | | | | 2.85% | |
| | | | | |
| Supplemental data | | | | | | | | | | | | | | | | | | | | |
| | | | | |
Net assets, end of period (000’s) | | | $30,651 | | | | $27,870 | | | | $45,088 | | | | $41,001 | | | | $28,198 | |
| | | | | |
Portfolio turnover rate | | | 75.16% | | | | 158.66% | | | | 251.81% | | | | 317.70% | | | | 511.62% | |
aFor the period September 8, 2015 (commencement of operations) to May 31, 2016.
bThe amount shown for a share outstanding throughout the period may not correlate with the Statement of Operations for the period due to the timing of sales and repurchases of the Fund’s shares in relation to income earned and/or fluctuating fair value of the investments of the Fund.
cBased on average daily shares outstanding.
dTotal return does not reflect sales commissions or contingent deferred sales charges, if applicable, and is not annualized for periods less than one year.
eRatios are annualized for periods less than one year, except for non-recurring expenses, if any.
fIncludes dividend and/or interest expense on securities sold short and security borrowing fees, if any. See below for the ratios of such expenses to average net assets for the periods presented. See Note 1(h).
gBenefit of expense reduction rounds to less than 0.01%.
| | | | |
| | | |
| 10 | | Semiannual Report | The accompanying notes are an integral part of these financial statements. | | franklintempleton.com |
FRANKLIN ALTERNATIVE STRATEGIES FUNDS
FINANCIAL HIGHLIGHTS
Franklin K2 Long Short Credit Fund(continued)
| | | | | | | | | | | | | | | | | | | | |
| | | Six Months Ended
November 30, 2019
(unaudited) | | | Year Ended May 31, | |
| | | 2019 | | | 2018 | | | 2017 | | | 2016a | |
| | | | | |
| Class C | | | | | | | | | | | | | | | | | | | | |
| | | | | |
Per share operating performance
(for a share outstanding throughout the period) | | | | | | | | | | | | | | | | | | | | |
| | | | | |
Net asset value, beginning of period | | $ | 10.26 | | | $ | 10.34 | | | $ | 10.35 | | | $ | 10.07 | | | $ | 10.00 | |
| | | | |
| | | | | |
| Income from investment operationsb: | | | | | | | | | | | | | | | | | | | | |
| | | | | |
Net investment incomec | | | 0.09 | | | | 0.27 | | | | 0.19 | | | | 0.14 | | | | 0.09 | |
| | | | | |
Net realized and unrealized gains (losses) | | | 0.01 | | | | (0.01 | ) | | | 0.07 | | | | 0.52 | | | | 0.12 | |
| | | | |
| | | | | |
Total from investment operations | | | 0.10 | | | | 0.26 | | | | 0.26 | | | | 0.66 | | | | 0.21 | |
| | | | |
| | | | | |
| Less distributions from: | | | | | | | | | | | | | | | | | | | | |
| | | | | |
Net investment income | | | — | | | | (0.25 | ) | | | (0.10 | ) | | | (0.28 | ) | | | (0.08 | ) |
| | | | | |
Net realized gains | | | — | | | | (0.09 | ) | | | (0.17 | ) | | | (0.10 | ) | | | (0.06 | ) |
| | | | |
| | | | | |
Total distributions | | | — | | | | (0.34 | ) | | | (0.27 | ) | | | (0.38 | ) | | | (0.14 | ) |
| | | | |
| | | | | |
Net asset value, end of period | | $ | 10.36 | | | $ | 10.26 | | | $ | 10.34 | | | $ | 10.35 | | | $ | 10.07 | |
| | | | |
| | | | | |
Total returnd | | | 0.97% | | | | 2.61% | | | | 2.70% | | | | 6.56% | | | | 2.20% | |
| | | | | |
| Ratios to average net assetse | | | | | | | | | | | | | | | | | | | | |
| | | | | |
Expenses before waiver, payments by affiliates and expense reductionf | | | 3.94% | | | | 4.03% | | | | 4.37% | | | | 4.44% | | | | 3.62% | |
| | | | | |
Expenses net of waiver, payments by affiliates and expense reductionf | | | 3.53% | | | | 3.57% | | | | 3.84% | g | | | 3.69% | | | | 2.55% | g |
| | | | | |
Expenses incurred in connection with securities sold short | | | 0.58% | | | | 0.62% | | | | 0.89% | | | | 0.76% | | | | 0.40% | |
| | | | | |
Net investment income | | | 1.71% | | | | 2.61% | | | | 1.85% | | | | 1.30% | | | | 2.60% | |
| | | | | |
| Supplemental data | | | | | | | | | | | | | | | | | | | | |
| | | | | |
Net assets, end of period (000’s) | | | $2,776 | | | | $2,893 | | | | $2,503 | | | | $1,507 | | | | $270 | |
| | | | | |
Portfolio turnover rate | | | 75.16% | | | | 158.66% | | | | 251.81% | | | | 317.70% | | | | 511.62% | |
aFor the period September 8, 2015 (commencement of operations) to May 31, 2016.
bThe amount shown for a share outstanding throughout the period may not correlate with the Statement of Operations for the period due to the timing of sales and repurchases of the Fund’s shares in relation to income earned and/or fluctuating fair value of the investments of the Fund.
cBased on average daily shares outstanding.
dTotal return does not reflect sales commissions or contingent deferred sales charges, if applicable, and is not annualized for periods less than one year.
eRatios are annualized for periods less than one year.
fIncludes dividend and/or interest expense on securities sold short and security borrowing fees, if any. See below for the ratios of such expenses to average net assets for the periods presented. See Note 1(h).
gBenefit of expense reduction rounds to less than 0.01%.
| | | | | | |
| | | |
| franklintempleton.com | | The accompanying notes are an integral part of these financial statements. | Semiannual Report | | | 11 | |
FRANKLIN ALTERNATIVE STRATEGIES FUNDS
FINANCIAL HIGHLIGHTS
Franklin K2 Long Short Credit Fund(continued)
| | | | | | | | | | | | | | | | | | | | |
| | | Six Months Ended
November 30, 2019
(unaudited) | | | Year Ended May 31, | |
| | | 2019 | | | 2018 | | | 2017 | | | 2016a | |
| | | | | |
| Class R | | | | | | | | | | | | | | | | | | | | |
| | | | | |
Per share operating performance
(for a share outstanding throughout the period) | | | | | | | | | | | | | | | | | | | | |
| | | | | |
Net asset value, beginning of period | | $ | 10.36 | | | $ | 10.41 | | | $ | 10.41 | | | $ | 10.10 | | | $ | 10.00 | |
| | | | |
| | | | | |
| Income from investment operationsb: | | | | | | | | | | | | | | | | | | | | |
| | | | | |
Net investment incomec | | | 0.12 | | | | 0.33 | | | | 0.25 | | | | 0.20 | | | | 0.08 | |
| | | | | |
Net realized and unrealized gains (losses) | | | (0.01 | ) | | | (0.01 | ) | | | 0.09 | | | | 0.53 | | | | 0.16 | |
| | | | |
| | | | | |
Total from investment operations | | | 0.11 | | | | 0.32 | | | | 0.34 | | | | 0.73 | | | | 0.24 | |
| | | | |
| | | | | |
| Less distributions from: | | | | | | | | | | | | | | | | | | | | |
| | | | | |
Net investment income | | | — | | | | (0.28 | ) | | | (0.17 | ) | | | (0.32 | ) | | | (0.08 | ) |
| | | | | |
Net realized gains | | | — | | | | (0.09 | ) | | | (0.17 | ) | | | (0.10 | ) | | | (0.06 | ) |
| | | | |
| | | | | |
Total distributions | | | — | | | | (0.37 | ) | | | (0.34 | ) | | | (0.42 | ) | | | (0.14 | ) |
| | | | |
| | | | | |
Net asset value, end of period | | $ | 10.47 | | | $ | 10.36 | | | $ | 10.41 | | | $ | 10.41 | | | $ | 10.10 | |
| | | | |
| | | | | |
Total returnd | | | 1.06% | | | | 3.12% | | | | 3.29% | | | | 7.29% | | | | 2.48% | |
| | | | | |
| Ratios to average net assetse | | | | | | | | | | | | | | | | | | | | |
| | | | | |
Expenses before waiver, payments by affiliates and expense reductionf | | | 3.44% | | | | 3.50% | | | | 3.82% | | | | 3.83% | | | | 3.37% | |
| | | | | |
Expenses net of waiver, payments by affiliates and expense reductionf | | | 3.03% | | | | 3.04% | | | | 3.29% | g | | | 3.08% | | | | 2.30% | g |
| | | | | |
Expenses incurred in connection with securities sold short | | | 0.58% | | | | 0.62% | | | | 0.89% | | | | 0.76% | | | | 0.40% | |
| | | | | |
Net investment income | | | 2.21% | | | | 3.14% | | | | 2.40% | | | | 1.91% | | | | 2.85% | |
| | | | | |
| Supplemental data | | | | | | | | | | | | | | | | | | | | |
| | | | | |
Net assets, end of period (000’s) | | | $216 | | | | $166 | | | | $162 | | | | $127 | | | | $12 | |
| | | | | |
Portfolio turnover rate | | | 75.16% | | | | 158.66% | | | | 251.81% | | | | 317.70% | | | | 511.62% | |
aFor the period September 8, 2015 (commencement of operations) to May 31, 2016.
bThe amount shown for a share outstanding throughout the period may not correlate with the Statement of Operations for the period due to the timing of sales and repurchases of the Fund’s shares in relation to income earned and/or fluctuating fair value of the investments of the Fund.
cBased on average daily shares outstanding.
dTotal return is not annualized for periods less than one year.
eRatios are annualized for periods less than one year.
fIncludes dividend and/or interest expense on securities sold short and security borrowing fees, if any. See below for the ratios of such expenses to average net assets for the periods presented. See Note 1(h).
gBenefit of expense reduction rounds to less than 0.01%.
| | | | |
| | | |
| 12 | | Semiannual Report | The accompanying notes are an integral part of these financial statements. | | franklintempleton.com |
FRANKLIN ALTERNATIVE STRATEGIES FUNDS
FINANCIAL HIGHLIGHTS
Franklin K2 Long Short Credit Fund(continued)
| | | | | | | | | | | | | | | | | | | | |
| | | Six Months Ended
November 30, 2019
(unaudited) | | | Year Ended May 31, | |
| | | 2019 | | | 2018 | | | 2017 | | | 2016a | |
| | | | | |
| Class R6 | | | | | | | | | | | | | | | | | | | | |
| | | | | |
Per share operating performance
(for a share outstanding throughout the period) | | | | | | | | | | | | | | | | | | | | |
| | | | | |
Net asset value, beginning of period | | $ | 10.45 | | | $ | 10.51 | | | $ | 10.50 | | | $ | 10.15 | | | $ | 10.00 | |
| | | | |
| | | | | |
| Income from investment operationsb: | | | | | | | | | | | | | | | | | | | | |
| | | | | |
Net investment incomec | | | 0.14 | | | | 0.36 | | | | 0.31 | | | | 0.24 | | | | 0.23 | |
| | | | | |
Net realized and unrealized gains (losses) | | | 0.01 | | | | — | g | | | 0.08 | | | | 0.53 | | | | 0.06 | |
| | | | |
| | | | | |
Total from investment operations | | | 0.15 | | | | 0.36 | | | | 0.39 | | | | 0.77 | | | | 0.29 | |
| | | | |
| | | | | |
| Less distributions from: | | | | | | | | | | | | | | | | | | | | |
| | | | | |
Net investment income | | | — | | | | (0.33 | ) | | | (0.21 | ) | | | (0.32 | ) | | | (0.08 | ) |
| | | | | |
Net realized gains | | | — | | | | (0.09 | ) | | | (0.17 | ) | | | (0.10 | ) | | | (0.06 | ) |
| | | | |
| | | | | |
Total distributions | | | — | | | | (0.42 | ) | | | (0.38 | ) | | | (0.42 | ) | | | (0.14 | ) |
| | | | |
| | | | | |
Net asset value, end of period | | $ | 10.60 | | | $ | 10.45 | | | $ | 10.51 | | | $ | 10.50 | | | $ | 10.15 | |
| | | | |
| | | | | |
Total returnd | | | 1.44% | | | | 3.53% | | | | 3.76% | | | | 7.71% | | | | 3.01% | |
| | | | | |
| Ratios to average net assetse | | | | | | | | | | | | | | | | | | | | |
| | | | | |
Expenses before waiver, payments by affiliates and expense reductionf | | | 3.00% | | | | 3.10% | | | | 3.35% | | | | 3.43% | | | | 3.35% | |
| | | | | |
Expenses net of waiver, payments by affiliates and expense reductionf | | | 2.50% | | | | 2.55% | | | | 2.83% | h | | | 2.68% | | | | 2.28% | h |
| | | | | |
Expenses incurred in connection with securities sold short | | | 0.58% | | | | 0.62% | | | | 0.89% | | | | 0.76% | | | | 0.40% | |
| | | | | |
Net investment income | | | 2.74% | | | | 3.63% | | | | 2.86% | | | | 2.31% | | | | 2.87% | |
| | | | | |
| Supplemental data | | | | | | | | | | | | | | | | | | | | |
| | | | | |
Net assets, end of period (000’s) | | | $469 | | | | $233 | | | | $13 | | | | $13,052 | | | | $12,384 | |
| | | | | |
Portfolio turnover rate | | | 75.16% | | | | 158.66% | | | | 251.81% | | | | 317.70% | | | | 511.62% | |
aFor the period September 8, 2015 (commencement of operations) to May 31, 2016.
bThe amount shown for a share outstanding throughout the period may not correlate with the Statement of Operations for the period due to the timing of sales and repurchases of the Fund’s shares in relation to income earned and/or fluctuating fair value of the investments of the Fund.
cBased on average daily shares outstanding.
dTotal return is not annualized for periods less than one year.
eRatios are annualized for periods less than one year.
fIncludes dividend and/or interest expense on securities sold short and security borrowing fees, if any. See below for the ratios of such expenses to average net assets for the periods presented. See Note 1(h).
gAmount rounds to less than $0.01 per share.
hBenefit of expense reduction rounds to less than 0.01%.
| | | | | | |
| | | |
| franklintempleton.com | | The accompanying notes are an integral part of these financial statements. | Semiannual Report | | | 13 | |
FRANKLIN ALTERNATIVE STRATEGIES FUNDS
FINANCIAL HIGHLIGHTS
Franklin K2 Long Short Credit Fund(continued)
| | | | | | | | | | | | | | | | | | | | |
| | | Six Months Ended
November 30, 2019
(unaudited) | | | Year Ended May 31, | |
| | | 2019 | | | 2018 | | | 2017 | | | 2016a | |
| | | | | |
| Advisor Class | | | | | | | | | | | | | | | | | | | | |
| | | | | |
Per share operating performance
(for a share outstanding throughout the period) | | | | | | | | | | | | | | | | | | | | |
| | | | | |
Net asset value, beginning of period | | $ | 10.46 | | | $ | 10.51 | | | $ | 10.50 | | | $ | 10.15 | | | $ | 10.00 | |
| | | | |
| | | | | |
| Income from investment operationsb: | | | | | | | | | | | | | | | | | | | | |
| | | | | |
Net investment incomec | | | 0.14 | | | | 0.38 | | | | 0.30 | | | | 0.24 | | | | 0.20 | |
| | | | | |
Net realized and unrealized gains (losses) | | | 0.01 | | | | (0.01 | ) | | | 0.09 | | | | 0.53 | | | | 0.09 | |
| | | | |
| | | | | |
Total from investment operations | | | 0.15 | | | | 0.37 | | | | 0.39 | | | | 0.77 | | | | 0.29 | |
| | | | |
| | | | | |
| Less distributions from: | | | | | | | | | | | | | | | | | | | | |
| | | | | |
Net investment income | | | — | | | | (0.33 | ) | | | (0.21 | ) | | | (0.32 | ) | | | (0.08 | ) |
| | | | | |
Net realized gains | | | — | | | | (0.09 | ) | | | (0.17 | ) | | | (0.10 | ) | | | (0.06 | ) |
| | | | |
| | | | | |
Total distributions | | | — | | | | (0.42 | ) | | | (0.38 | ) | | | (0.42 | ) | | | (0.14 | ) |
| | | | |
| | | | | |
Net asset value, end of period | | $ | 10.61 | | | $ | 10.46 | | | $ | 10.51 | | | $ | 10.50 | | | $ | 10.15 | |
| | | | |
| | | | | |
Total returnd | | | 1.43% | | | | 3.60% | | | | 3.75% | | | | 7.70% | | | | 2.99% | |
| | | | | |
| Ratios to average net assetse | | | | | | | | | | | | | | | | | | | | |
| | | | | |
Expenses before waiver, payments by affiliates and expense reductionf | | | 2.94% | | | | 3.03% | | | | 3.37% | | | | 3.44% | | | | 3.36% | |
| | | | | |
Expenses net of waiver, payments by affiliates and expense reductionf | | | 2.53% | | | | 2.57% | | | | 2.84% | g | | | 2.69% | | | | 2.29% | g |
| | | | | |
Expenses incurred in connection with securities sold short | | | 0.58% | | | | 0.62% | | | | 0.89% | | | | 0.76% | | | | 0.40% | |
| | | | | |
Net investment income | | | 2.71% | | | | 3.61% | | | | 2.85% | | | | 2.30% | | | | 2.86% | |
| | | | | |
| Supplemental data | | | | | | | | | | | | | | | | | | | | |
| | | | | |
Net assets, end of period (000’s) | | | $92,441 | | | | $86,868 | | | | $45,514 | | | | $25,125 | | | | $23,058 | |
| | | | | |
Portfolio turnover rate | | | 75.16% | | | | 158.66% | | | | 251.81% | | | | 317.70% | | | | 511.62% | |
aFor the period September 8, 2015 (commencement of operations) to May 31, 2016.
bThe amount shown for a share outstanding throughout the period may not correlate with the Statement of Operations for the period due to the timing of sales and repurchases of the Fund’s shares in relation to income earned and/or fluctuating fair value of the investments of the Fund.
cBased on average daily shares outstanding.
dTotal return is not annualized for periods less than one year.
eRatios are annualized for periods less than one year.
fIncludes dividend and/or interest expense on securities sold short and security borrowing fees, if any. See below for the ratios of such expenses to average net assets for the periods presented. See Note 1(h).
gBenefit of expense reduction rounds to less than 0.01%.
| | | | |
| | | |
| 14 | | Semiannual Report | The accompanying notes are an integral part of these financial statements. | | franklintempleton.com |
FRANKLIN ALTERNATIVE STRATEGIES FUNDS
Statement of Investments, November 30, 2019 (unaudited)
Franklin K2 Long Short Credit Fund
| | | | | | | | | | | | | | | | | | |
| | | | | |
| | | | | Country | | | Shares/
Rights | | | | | | Value | |
| | | Common Stocks and Other Equity Interests 1.7% | | | |
| | | Diversified Financial Services 0.1% | |
| a,b,u | | One Call Corp. | | | United States | | | | 947 | | | | | | | $ | 113,545 | |
| | | | | | | | | | | | | | | | | | |
| | | Diversified Telecommunication Services 0.1% | |
| b | | Telecom Italia SpA | | | Italy | | | | 92,213 | | | | | | | | 57,729 | |
| | | | | | | | | | | | | | | | | | |
| | | Energy Equipment & Services 0.0%† | |
| b | | Weatherford International PLC | | | United States | | | | 534,155 | | | | | | | | 12,125 | |
| | | | | | | | | | | | | | | | | | |
| | | Equity Real Estate Investment Trusts (REITs) 0.6% | |
| c | | Vici Properties Inc. | | | United States | | | | 31,543 | | | | | | | | 780,058 | |
| | | | | | | | | | | | | | | | | | |
| | | Food Products 0.0%† | |
| b | | Dean Foods Co. | | | United States | | | | 46,977 | | | | | | | | 4,872 | |
| | | | | | | | | | | | | | | | | | |
| | | Independent Power & Renewable Electricity Producers 0.7% | |
| c | | Clearway Energy Inc., A | | | United States | | | | 31,181 | | | | | | | | 591,815 | |
| | Clearway Energy Inc., C | | | United States | | | | 11,144 | | | | | | | | 220,986 | |
| | | | | | | | | | | | | | | | | | |
| | | | | |
| | | | | | | | | | | | | | | | | 812,801 | |
| | | | | | | | | | | | | | | | | | |
| | | Media 0.1% | |
| b | | Liberty Global PLC, C | | | United Kingdom | | | | 3,816 | | | | | | | | 82,044 | |
| b | | Postmedia Network Canada Corp., B | | | Canada | | | | 56,068 | | | | | | | | 65,426 | |
| | | | | | | | | | | | | | | | | | |
| | | | | |
| | | | | | | | | | | | | | | | | 147,470 | |
| | | | | | | | | | | | | | | �� | | | |
| | | Metals & Mining 0.0%† | |
| | Vedanta Ltd., ADR | | | India | | | | 3,457 | | | | | | | | 27,829 | |
| | | | | | | | | | | | | | | | | | |
| | | Multiline Retail 0.1% | |
| c | | Nordstrom Inc. | | | United States | | | | 3,640 | | | | | | | | 138,939 | |
| | | | | | | | | | | | | | | | | | |
| | | Pharmaceuticals 0.0%† | |
| b | | Sanofi, Contingent Value, rts., 12/31/20 | | | France | | | | 27,126 | | | | | | | | 23,328 | |
| | | | | | | | | | | | | | | | | | |
| | Total Common Stocks and Other Equity Interests
(Cost $1,677,905) | | | | | | | | | | | | | | | 2,118,696 | |
| | | | | | | | | | | | | | | | | | |
| | | Convertible Preferred Stocks (Cost $179,099) 0.4% | | | | | | | | | | | | |
| | | Diversified Financial Services 0.4% | |
| a,b,u | | One Call Corp., cvt. pfd. | | | United States | | | | 3,821 | | | | | | | | 458,341 | |
| | | | | | | | | | | | | | | | | | |
| | | Preferred Stocks 0.2% | | | |
| | | Electric Utilities 0.2% | |
| | SCE Trust II, 5.10%, pfd. | | | United States | | | | 2,616 | | | | | | | | 63,647 | |
| | SCE Trust III, 5.75%, pfd., H | | | United States | | | | 1,468 | | | | | | | | 35,511 | |
| | SCE Trust IV, 5.375%, pfd., J | | | United States | | | | 4,659 | | | | | | | | 111,630 | |
| | SCE Trust V, 5.45%, pfd., K | | | United States | | | | 1,849 | | | | | | | | 44,894 | |
| | SCE Trust VI, 5.00%, pfd. | | | United States | | | | 3,162 | | | | | | | | 73,358 | |
| | | | | | | | | | | | | | | | | | |
| | Total Preferred Stocks (Cost $284,707) | | | | | | | | | | | | | | | 329,040 | |
| | | | | | | | | | | | | | | | | | |
| | | | |
| | | | | | | | Principal Amount* | | | | |
| | | Convertible Bonds 1.2% | | | | | | | | | | | | |
| | | Independent Power & Renewable Electricity Producers 0.4% | | | | | | | | | | | | |
| c | | Pattern Energy Group Inc., senior note, 4.00%, 7/15/20 | | | United States | | | | 540,000 | | | | | | | | 551,717 | |
| | | | | | | | | | | | | | | | | | |
| | | Internet & Direct Marketing Retail 0.1% | | | | | | | | | | | | |
| | Wayfair Inc., senior note, 0.375%, 9/01/22 | | | United States | | | | 144,000 | | | | | | | | 151,830 | |
| | | | | | | | | | | | | | | | | | |
| | | Media 0.6% | | | | | | | | | | | | |
| c | | Gannett Co. Inc., senior note, 4.75%, 4/15/24 | | | United States | | | | 746,000 | | | | | | | | 749,208 | |
| | | | | | | | | | | | | | | | | | |
| | | | | | |
| | | |
| franklintempleton.com | | Semiannual Report | | | 15 | |
FRANKLIN ALTERNATIVE STRATEGIES FUNDS
STATEMENT OF INVESTMENTS (UNAUDITED)
Franklin K2 Long Short Credit Fund(continued)
| | | | | | | | | | | | | | | | | | |
| | | | |
| | | | | Country | | | Principal Amount* | | | Value | |
| | | Convertible Bonds (continued) | | | | | | | | | | | | |
| | | Pharmaceuticals 0.1% | | | | | | | | | | | | |
| | Teva Pharmaceutical Finance Co. LLC, C, senior bond, 0.25%, 2/01/26 | | | Israel | | | | 78,000 | | | | | | | $ | 74,716 | |
| | | | | | | | | | | | | | | | | | |
| | Total Convertible Bonds (Cost $1,500,319) | | | | | | | | | | | | | | | 1,527,471 | |
| | | | | | | | | | | | | | | | | | |
| | | Corporate Bonds and Notes 14.5% | | | | | | | | | | | | |
| | | Aerospace & Defense 0.3% | | | | | | | | | | | | |
| | Triumph Group Inc., senior note, 5.25%, 6/01/22 | | | United States | | | | 357,000 | | | | | | | | 358,004 | |
| | | | | | | | | | | | | | | | | | |
| | | Automobiles 0.7% | | | | | | | | | | | | |
| c,d | | Tesla Inc., senior note, 144A, 5.30%, 8/15/25 | | | United States | | | | 931,000 | | | | | | | | 894,914 | |
| | | | | | | | | | | | | | | | | | |
| | | Capital Markets 0.7% | | | | | | | | | | | | |
| | | | | |
| d | | eG Global Finance PLC, senior secured note, 144A, | | | | | | | | | | | | | | | | |
| | 4.375%, 2/07/25 | | | United Kingdom | | | | 192,000 | | | | EUR | | | | 210,222 | |
| | 6.75%, 2/07/25 | | | United Kingdom | | | | 139,000 | | | | | | | | 137,610 | |
| | 6.25%, 10/30/25 | | | United Kingdom | | | | 261,000 | | | | EUR | | | | 302,436 | |
| | 8.50%, 10/30/25 | | | United Kingdom | | | | 263,000 | | | | | | | | 276,150 | |
| | | | | | | | | | | | | | | | | | |
| | | | | | | | | | | | | | | | | 926,418 | |
| | | | | | | | | | | | | | | | | | |
| | | Chemicals 0.2% | | | | | | | | | | | | |
| d | | TPC Group Inc., senior secured note, 144A, 10.50%, 8/01/24 | | | United States | | | | 252,000 | | | | | | | | 253,887 | |
| | | | | | | | | | | | | | | | | | |
| | | Commercial Services & Supplies 2.6% | | | | | | | | | | | | |
| | | | | |
| d | | Harland Clarke Holdings Corp., 144A, | | | | | | | | | | | | | | | | |
| | senior note, 9.25%, 3/01/21 | | | United States | | | | 2,349,500 | | | | | | | | 2,185,975 | |
| | senior secured note, 8.375%, 8/15/22 | | | United States | | | | 533,000 | | | | | | | | 401,249 | |
| | | | | |
| | R.R. Donnelley & Sons Co., senior bond, | | | | | | | | | | | | | | | | |
| | 6.50%, 11/15/23 | | | United States | | | | 263,000 | | | | | | | | 271,657 | |
| | 6.00%, 4/01/24 | | | United States | | | | 447,000 | | | | | | | | 462,459 | |
| | | | | | | | | | | | | | | | | | |
| | | | | | | | | | | | | | | | | 3,321,340 | |
| | | | | | | | | | | | | | | | | | |
| | | Communications Equipment 0.1% | | | | | | | | | | | | |
| d | | Riverbed Technology Inc., senior note, 144A, 8.875%, 3/01/23 | | | United States | | | | 298,000 | | | | | | | | 137,080 | |
| | | | | | | | | | | | | | | | | | |
| | | Containers & Packaging 0.1% | | | | | | | | | | | | |
| | | | | |
| e | | Lecta SA, senior secured note, Reg S, | | | | | | | | | | | | | | | | |
| | f FRN, 6.375%,(3-Month EURIBOR + 6.38%), 8/01/22 | | | Spain | | | | 100,000 | | | | EUR | | | | 53,316 | |
| | 6.50%, 8/01/23 | | | Spain | | | | 100,000 | | | | EUR | | | | 52,953 | |
| | | | | | | | | | | | | | | | | | |
| | | | | | | | | | | | | | | | | 106,269 | |
| | | | | | | | | | | | | | | | | | |
| | | Distributors 0.2% | | | | | | | | | | | | |
| d,g | | American News Co. LLC, senior note, 144A, PIK, 8.50%, 9/01/26 | | | United States | | | | 248,771 | | | | | | | | 264,287 | |
| | | | | | | | | | | | | | | | | | |
| | | Diversified Financial Services 0.4% | | | | | | | | | | | | |
| d | | One Call Corp., senior secured note, first lien, 144A, 7.50%, 7/01/24 | | | United States | | | | 469,056 | | | | | | | | 462,020 | |
| | | | | | | | | | | | | | | | | | |
| | | Diversified Telecommunication Services 2.6% | | | | | | | | | | | | |
| d | | Altice France SA, senior secured note, 144A, 3.375%, 1/15/28 | | | France | | | | 158,000 | | | | EUR | | | | 177,768 | |
| | | | | |
| d | | Cincinnati Bell Inc., senior note, 144A, | | | | | | | | | | | | | | | | |
| | 7.00%, 7/15/24 | | | United States | | | | 163,000 | | | | | | | | 153,015 | |
| | 8.00%, 10/15/25 | | | United States | | | | 353,000 | | | | | | | | 323,142 | |
| d | | Digicel International Finance Ltd. / Digicel Holdings Bermuda Ltd., senior secured note, 144A, 8.75%, 5/25/24 | | | Saint Lucia | | | | 37,000 | | | | | | | | 35,412 | |
| | | | | |
| | Frontier Communications Corp., | | | | | | | | | | | | | | | | |
| | senior bond, 7.125%, 1/15/23 | | | United States | | | | 125,000 | | | | | | | | 57,656 | |
| | senior bond, 7.625%, 4/15/24 | | | United States | | | | 79,000 | | | | | | | | 37,130 | |
| | senior bond, 6.875%, 1/15/25 | | | United States | | | | 32,000 | | | | | | | | 14,653 | |
| | senior bond, 9.00%, 8/15/31 | | | United States | | | | 245,000 | | | | | | | | 112,096 | |
| | c,dsenior secured note, 144A, 8.00%, 4/01/27 | | | United States | | | | 920,000 | | | | | | | | 952,037 | |
| | Hughes Satellite Systems Corp., senior secured note, 5.25%, 8/01/26 | | | United States | | | | 183,000 | | | | | | | | 199,076 | |
| d | | Intelsat Jackson Holdings SA, senior secured note, 144A, | | | | | | | | | | | | | | | | |
| | c 9.50%, 9/30/22 | | | Luxembourg | | | | 884,000 | | | | | | | | 990,356 | |
| | 8.00%, 2/15/24 | | | Luxembourg | | | | 172,000 | | | | | | | | 175,868 | |
| | | | | | | | | | | | | | | | | | |
| | | | | |
| | | | | | | | | | | | | | | | | 3,228,209 | |
| | | | | | | | | | | | | | | | | | |
| | | | |
| | | |
| 16 | | Semiannual Report | | franklintempleton.com |
FRANKLIN ALTERNATIVE STRATEGIES FUNDS
STATEMENT OF INVESTMENTS (UNAUDITED)
Franklin K2 Long Short Credit Fund(continued)
| | | | | | | | | | | | | | | | | | |
| | | | |
| | | | | Country | | | Principal Amount* | | | Value | |
| | | Corporate Bonds and Notes (continued) | | | | | | | | | | | | |
| | | Electric Utilities 0.3% | | | | | | | | | | | | |
| e | | Eskom Holdings SOC Ltd., senior bond, Reg S, 8.45%, 8/10/28 | | | South Africa | | | | 200,000 | | | | | | | $ | 213,298 | |
| d | | Swissport Financing SARL, senior note, 144A, 9.00%, 2/15/25 | | | Luxembourg | | | | 100,000 | | | | | | | | 115,093 | |
| | | | | | | | | | | | | | | | | | |
| | | | | |
| | | | | | | | | | | | | | | | | 328,391 | |
| | | | | | | | | | | | | | | | | | |
| | | Energy Equipment & Services 0.7% | | | | | | | | | | | | |
| d | | KCA Deutag UK Finance PLC, senior secured note, 144A, 9.625%, 4/01/23 | | | United Kingdom | | | | 100,000 | | | | | | | | 66,781 | |
| c,d | | Transocean Inc., senior note, 144A, 7.50%, 1/15/26 | | | United States | | | | 677,000 | | | | | | | | 609,420 | |
| d | | Vantage Drilling International, senior secured note, 144A, 9.25%, 11/15/23 | | | United States | | | | 260,000 | | | | | | | | 244,292 | |
| | | | | | | | | | | | | | | | | | |
| | | | | |
| | | | | | | | | | | | | | | | | 920,493 | |
| | | | | | | | | | | | | | | | | | |
| | | Equity Real Estate Investment Trusts (REITs) 0.1% | | | | | | | | | | | | |
| d | | VICI Properties LP / VICI Note Co. Inc., senior bond, 144A, 4.625%, 12/01/29 | | | United States | | | | 68,000 | | | | | | | | 70,288 | |
| | | | | | | | | | | | | | | | | | |
| | | Food & Staples Retailing 0.2% | | | | | | | | | | | | |
| e | | Casino Guichard Perrachon SA, Reg S, | | | | | | | | | | | | | | | | |
| | f,h junior sub. bond, E, FRN, 3.992%, (EUR 5 Year Swap + 3.82%), Perpetual | | | France | | | | 300,000 | | | | EUR | | | | 197,908 | |
| | senior bond, E, 4.048%, 8/05/26 | | | France | | | | 100,000 | | | | EUR | | | | 93,659 | |
| | | | | | | | | | | | | | | | | | |
| | | | | |
| | | | | | | | | | | | | | | | | 291,567 | |
| | | | | | | | | | | | | | | | | | |
| | | Food Products 0.1% | | | | | | | | | | | | |
| d | | JBS USA LUX SA / JBS USA Food Co. / JBS USA Finance Inc., senior bond, 144A, 5.50%, 1/15/30 | | | United States | | | | 118,000 | | | | | | | | 126,154 | |
| | | | | | | | | | | | | | | | | | |
| | | Gas Utilities 0.0%† | | | | | | | | | | | | |
| | Clearway Energy Operating LLC, senior note, 5.375%, 8/15/24 | | | United States | | | | 45,000 | | | | | | | | 46,238 | |
| | | | | | | | | | | | | | | | | | |
| | | Health Care Providers & Services 0.6% | | | | | | | | | | | | |
| d,i | | Aveanna Healthcare LLC, senior secured note, 144A, 9.75%, 12/15/26 | | | United States | | | | 381,000 | | | | | | | | 398,145 | |
| d,i | | Centene Corp., senior bond, 144A, 4.625%, 12/15/29 | | | United States | | | | 78,000 | | | | | | | | 81,998 | |
| d | | Envision Healthcare Corp., senior note, 144A, 8.75%, 10/15/26 | | | United States | | | | 306,000 | | | | | | | | 125,566 | |
| d | | Mallinckrodt International Finance SA / Mallinckrodt CB LLC, senior note, 144A, 5.75%, 8/01/22 | | | United States | | | | 290,000 | | | | | | | | 101,319 | |
| | | | | | | | | | | | | | | | | | |
| | | | | |
| | | | | | | | | | | | | | | | | 707,028 | |
| | | | | | | | | | | | | | | | | | |
| | | Hotels, Restaurants & Leisure 1.1% | | | | | | | | | | | | |
| c,d | | Mohegan Gaming & Entertainment, senior note, 144A, 7.875%, 10/15/24 | | | United States | | | | 1,428,000 | | | | | | | | 1,389,323 | |
| | | | | | | | | | | | | | | | | | |
| | | Household Durables 0.2% | | | | | | | | | | | | |
| d | | K Hovnanian Enterprises Inc., secured note, 144A, 10.50%, 7/15/24 | | | United States | | | | 285,000 | | | | | | | | 200,212 | |
| | | | | | | | | | | | | | | | | | |
| | | Insurance 0.0%† | | | | | | | | | | | | |
| d | | Ambac Assurance Corp., sub. bond, 144A, 5.10%, 6/07/20 | | | United States | | | | 2 | | | | | | | | 4 | |
| d,f | | Ambac LSNI LLC, senior secured note, 144A, FRN, 7.104%,(3-Month USD LIBOR + 5.00%), 2/12/23 | | | Cayman Islands | | | | 8 | | | | | | | | 8 | |
| | | | | | | | | | | | | | | | | | |
| | | | | |
| | | | | | | | | | | | | | | | | 12 | |
| | | | | | | | | | | | | | | | | | |
| | | Media 0.7% | | | | | | �� | | | | | | |
| | The McClatchy Co., | | | | | | | | | | | | | | | | |
| | d senior secured bond, 144A, 6.875%, 7/15/31 | | | United States | | | | 566,000 | | | | | | | | 454,215 | |
| | senior secured note, 9.00%, 7/15/26 | | | United States | | | | 254,000 | | | | | | | | 228,567 | |
| d | | Univision Communications Inc., senior secured note, 144A, 5.125%, 2/15/25 | | | United States | | | | 227,000 | | | | | | | | 219,339 | |
| | | | | | | | | | | | | | | | | | |
| | | | | |
| | | | | | | | | | | | | | | | | 902,121 | |
| | | | | | | | | | | | | | | | | | |
| | | Multiline Retail 0.0%† | | | | | | | | | | | | |
| | Nordstrom Inc., senior bond, 5.00%, 1/15/44 | | | United States | | | | 46,000 | | | | | | | | 44,947 | |
| | | | | | | | | | | | | | | | | | |
| | | | | | |
| | | |
| franklintempleton.com | | Semiannual Report | | | 17 | |
FRANKLIN ALTERNATIVE STRATEGIES FUNDS
STATEMENT OF INVESTMENTS (UNAUDITED)
Franklin K2 Long Short Credit Fund(continued)
| | | | | | | | | | | | | | | | | | |
| | | | |
| | | | | Country | | | Principal Amount* | | | Value | |
| | | Corporate Bonds and Notes (continued) | | | | | | | | | | | | |
| | | Oil, Gas & Consumable Fuels 1.1% | | | | | | | | | | | | |
| c,d | | American Energy- Permian Basin LLC, senior secured note, 144A, 12.00%, 10/01/24 | | | United States | | | | 962,000 | | | | | | | $ | 601,250 | |
| d | | Moss Creek Resources Holdings Inc., senior note, 144A, | | | | | | | | | | | | | | | | |
| | 7.50%, 1/15/26 | | | United States | | | | 20,000 | | | | | | | | 13,357 | |
| | 10.50%, 5/15/27 | | | United States | | | | 472,000 | | | | | | | | 348,264 | |
| | Petrobras Global Finance BV, | | | | | | | | | | | | | | | | |
| | senior bond, 6.90%, 3/19/49 | | | Brazil | | | | 117,000 | | | | | | | | 134,047 | |
| | senior note, 8.75%, 5/23/26 | | | Brazil | | | | 109,000 | | | | | | | | 138,833 | |
| | Southwestern Energy Co., senior bond, 6.20%, 1/23/25 | | | United States | | | | 158,000 | | | | | | | | 137,857 | |
| | | | | | | | | | | | | | | | | | |
| | | | | |
| | | | | | | | | | | | | | | | | 1,373,608 | |
| | | | | | | | | | | | | | | | | | |
| | | Pharmaceuticals 0.1% | | | | | | | | | | | | |
| | Teva Pharmaceutical Finance Netherlands III BV, senior note, 2.20%, 7/21/21 | | | Israel | | | | 130,000 | | | | | | | | 125,970 | |
| | | | | | | | | | | | | | | | | | |
| | | Specialty Retail 1.0% | | | | | | | | | | | | |
| | Bed Bath & Beyond Inc., senior bond, 5.165%, 8/01/44 | | | United States | | | | 361,000 | | | | | | | | 246,606 | |
| c,d | | Carvana Co., senior note, 144A, 8.875%, 10/01/23 | | | United States | | | | 693,000 | | | | | | | | 719,847 | |
| c,d | | Staples Inc., senior secured note, 144A, 7.50%, 4/15/26 | | | United States | | | | 329,000 | | | | | | | | 344,833 | |
| | | | | | | | | | | | | | | | | | |
| | | | | |
| | | | | | | | | | | | | | | | | 1,311,286 | |
| | | | | | | | | | | | | | | | | | |
| | | Wireless Telecommunication Services 0.4% | | | | | | | | | | | | |
| d,i | | SSL Robotics LLC, senior secured note, 144A, 9.75%, 12/31/23 | | | United States | | | | 485,000 | | | | | | | | 505,613 | |
| | | | | | | | | | | | | | | | | | |
| | Total Corporate Bonds and Notes (Cost $18,669,132) | | | | | | | | | | | | | | | 18,295,679 | |
| | | | | | | | | | | | | | | | | | |
| | | Corporate Bonds and Notes in Reorganization 1.8% | | | | | | | | | | | | |
| | | Electric Utilities 1.8% | | | | | | | | | | | | |
| j | | Pacific Gas & Electric Co., | | | | | | | | | | | | | | | | |
| | senior bond, 3.85%, 11/15/23 | | | United States | | | | 11,000 | | | | | | | | 10,840 | |
| | senior bond, 3.50%, 6/15/25 | | | United States | | | | 119,000 | | | | | | | | 116,321 | |
| | senior bond, 2.95%, 3/01/26 | | | United States | | | | 197,000 | | | | | | | | 192,050 | |
| | senior bond, 3.30%, 3/15/27 | | | United States | | | | 186,000 | | | | | | | | 181,355 | |
| | senior bond, 6.05%, 3/01/34 | | | United States | | | | 107,000 | | | | | | | | 113,155 | |
| | senior bond, 5.80%, 3/01/37 | | | United States | | | | 458,000 | | | | | | | | 477,511 | |
| | senior bond, 4.45%, 4/15/42 | | | United States | | | | 55,000 | | | | | | | | 54,639 | |
| | senior bond, 3.75%, 8/15/42 | | | United States | | | | 28,000 | | | | | | | | 27,186 | |
| | senior bond, 4.60%, 6/15/43 | | | United States | | | | 83,000 | | | | | | | | 82,663 | |
| | senior bond, 4.75%, 2/15/44 | | | United States | | | | 329,000 | | | | | | | | 332,323 | |
| | senior bond, 4.30%, 3/15/45 | | | United States | | | | 44,000 | | | | | | | | 43,381 | |
| | senior bond, 4.25%, 3/15/46 | | | United States | | | | 24,000 | | | | | | | | 23,662 | |
| | senior note, 3.75%, 2/15/24 | | | United States | | | | 194,000 | | | | | | | | 192,625 | |
| | senior note, 3.30%, 12/01/27 | | | United States | | | | 226,000 | | | | | | | | 219,791 | |
| | d senior note, 144A, 4.25%, 8/01/23 | | | United States | | | | 39,000 | | | | | | | | 38,919 | |
| | d senior note, 144A, 4.65%, 8/01/28 | | | United States | | | | 145,000 | | | | | | | | 146,500 | |
| | | | | | | | | | | | | | | | | | |
| | | | | |
| | | | | | | | | | | | | | | | | 2,252,921 | |
| | | | | | | | | | | | | | | | | | |
| | | Oil, Gas & Consumable Fuels 0.0%† | | | | | | | | | | | | |
| e,j | | Petroleos de Venezuela SA, senior note, Reg S, 6.00%, 10/28/22 | | | Venezuela | | | | 98,020 | | | | | | | | 5,881 | |
| | | | | | | | | | | | | | | | | | |
| | Total Corporate Bonds and Notes in Reorganization
(Cost $2,191,926) | | | | | | | | | | | | | | | 2,258,802 | |
| | | | | | | | | | | | | | | | | | |
| f,k | | Senior Floating Rate Interests 3.3% | | | | | | | | | | | | |
| | | Communications Equipment 0.3% | | | | | | | | | | | | |
| l | | Riverbed Technology Inc., Term Loan B, 4.96%,(1-Month USD LIBOR + 3.25%), 4/24/22 | | | United States | | | | 486,895 | | | | | | | | 390,472 | |
| | | | | | | | | | | | | | | | | | |
| | | Containers & Packaging 0.1% | | | | | | | | | | | | |
| | Flex Acquisition Co. Inc., Term Loan B, 5.349%,(1-Month USD LIBOR + 3.25%), 6/29/25 | | | United States | | | | 193,721 | | | | | | | | 188,515 | |
| | | | | | | | | | | | | | | | | | |
| | | | |
| | | |
| 18 | | Semiannual Report | | franklintempleton.com |
FRANKLIN ALTERNATIVE STRATEGIES FUNDS
STATEMENT OF INVESTMENTS (UNAUDITED)
Franklin K2 Long Short Credit Fund(continued)
| | | | | | | | | | | | | | | | | | |
| | | | |
| | | | | Country | | | Principal Amount* | | | Value | |
| f,k | | Senior Floating Rate Interests (continued) | | | | | | | | | | | | |
| | | Diversified Consumer Services 0.4% | | | | | | | | | | | | |
| | | | | |
| l | | Advantage Sales & Marketing Inc., | | | | | | | | | | | | | | | | |
| | Term Loan 1L, 4.952%,(1-Month USD LIBOR + 3.25%), 7/23/21 | | | United States | | | | 302,406 | | | | | | | $ | 284,963 | |
| | Term Loan B2, 4.952%,(1-Month USD LIBOR + 3.25%), 7/23/21 | | | United States | | | | 244,870 | | | | | | | | 230,747 | |
| | | | | | | | | | | | | | | | | | |
| | | | | | | | | | | | | | | | | 515,710 | |
| | | | | | | | | | | | | | | | | | |
| | | Diversified Telecommunication Services 0.9% | | | | | | | | | | | | |
| | CenturyLink Inc., Term Loan B, 4.452%,(3-Month USD LIBOR + 2.75%), 1/31/25 | | | United States | | | | 572,822 | | | | | | | | 573,359 | |
| | Digicel International Finance Ltd., Term Loan B, 5.34%,(1-Month USD LIBOR + 3.25%), 5/27/24 | | | Saint Lucia | | | | 283,049 | | | | | | | | 238,646 | |
| | Intelsat Jackson Holdings SA, Term Loan B5, 6.625%, 1/02/24 | | | Luxembourg | | | | 329,824 | | | | | | | | 327,969 | |
| | | | | | | | | | | | | | | | | | |
| | | | | |
| | | | | | | | | | | | | | | | | 1,139,974 | |
| | | | | | | | | | | | | | | | | | |
| | | Electronic Equipment, Instruments & Components 0.3% | | | | | | | | | | | | |
| | | | | |
| | Veritas U.S. Inc., Term Loan B1, | | | | | | | | | | | | | | | | |
| | 6.202%,(1-Month USD LIBOR + 4.50%), 1/27/23 | | | United States | | | | 254,064 | | | | | | | | 238,079 | |
| | 6.604%,(1-Month USD LIBOR + 4.50%), 1/27/23 | | | United States | | | | 90,744 | | | | | | | | 85,034 | |
| | | | | | | | | | | | | | | | | | |
| | | | | |
| | | | | | | | | | | | | | | | | 323,113 | |
| | | | | | | | | | | | | | | | | | |
| | | Multiline Retail 0.2% | | | | | | | | | | | | |
| l | | The Neiman Marcus Group LLC, Term Loan, 7.771%,(1-Month USD LIBOR + 3.25%), 10/25/23 | | | United States | | | | 307,452 | | | | | | | | 225,593 | |
| | | | | | | | | | | | | | | | | | |
| | | Professional Services 0.0%† | | | | | | | | | | | | |
| | Acosta Inc., Term Loan B1, 7.00%, (PRIME + 2.25%), 9/26/21 | | | United States | | | | 185,429 | | | | | | | | 34,652 | |
| | | | | | | | | | | | | | | | | | |
| | | Specialty Retail 1.1% | | | | | | | | | | | | |
| l | | PETCO Animal Supplies Inc., Term Loan B1, 5.177%,(3-Month USD LIBOR + 3.25%), 1/26/23 | | | United States | | | | 311,563 | | | | | | | | 247,381 | |
| | PetSmart Inc., Term Loan B2, 5.77%,(1-Month USD LIBOR + 4.00%), 3/11/22 | | | United States | | | | 802,366 | | | | | | | | 781,805 | |
| | Staples Inc., Term Loan B, 6.781%,(1-Month USD LIBOR + 5.00%), 4/16/26 | | | United States | | | | 379,231 | | | | | | | | 374,998 | |
| | | | | | | | | | | | | | | | | | |
| | | | | |
| | | | | | | | | | | | | | | | | 1,404,184 | |
| | | | | | | | | | | | | | | | | | |
| | Total Senior Floating Rate Interests (Cost $4,211,337) | | | | | | | | | | | | | | | 4,222,213 | |
| | | | | | | | | | | | | | | | | | |
| m | | Credit-Linked Notes 0.5% | | | | | | | | | | | | |
| a,d | | ICBC Standard Bank PLC, (Ukraine), 144A, 15.36%, 10/01/21 | | | Ukraine | | | | 5,336,000 | | | | UAH | | | | 234,579 | |
| d | | JPMorgan Chase Bank NA, senior note, (Egypt Treasury Bill), 144A, 16.00%, 6/13/22 | | | Egypt | | | | 2,500,000 | | | | EGP | | | | 160,636 | |
| d | | JPMorgan Chase Bank NA, senior note, (Egypt Treasury Bill), 144A, 14.35%, 9/12/24 | | | Egypt | | | | 3,471,000 | | | | EGP | | | | 215,927 | |
| | | | | | | | | | | | | | | | | | |
| | Total Credit-Linked Notes (Cost $594,084) | | | | | | | | | | | | | | | 611,142 | |
| | | | | | | | | | | | | | | | | | |
| | | Foreign Government and Agency Securities 3.4% | | | | | | | | | | | | |
| | Government of Argentina, senior bond, 3.38%, 12/31/38 | | | Argentina | | | | 36,899 | | | | EUR | | | | 15,652 | |
| e | | Government of Bahrain, senior bond, Reg S, 7.00%, 1/26/26 | | | Bahrain | | | | 200,000 | | | | | | | | 231,144 | |
| | Government of Brazil, senior bond, 4.75%, 1/14/50 | | | Brazil | | | | 200,000 | | | | | | | | 193,458 | |
| e | | Government of Ecuador, senior note, Reg S, 10.75%, 3/28/22 | | | Ecuador | | | | 200,000 | | | | | | | | 176,562 | |
| | Government of Italy, senior note, 2.375%, 10/17/24 | | | Italy | | | | 373,000 | | | | | | | | 365,657 | |
| e | | Government of Paraguay, senior bond, Reg S, 4.625%, 1/25/23 | | | Paraguay | | | | 200,000 | | | | | | | | 211,283 | |
| | Government of Poland, senior bond, 2.75%, 10/25/29 | | | Poland | | | | 687,000 | | | | PLN | | | | 187,265 | |
| | | | | |
| | Government of Russia, | | | | | | | | | | | | | | | | |
| | senior bond, 7.25%, 5/10/34 | | | Russia | | | | 88,432,000 | | | | RUB | | | | 1,461,914 | |
| | senior note, 7.40%, 7/17/24 | | | Russia | | | | 24,043,000 | | | | RUB | | | | 392,833 | |
| | Government of South Africa, R186, senior bond, 10.50%, 12/21/26 | | | South Africa | | | | 8,549,107 | | | | ZAR | | | | 646,209 | |
| | | | | | |
| | | |
| franklintempleton.com | | Semiannual Report | | | 19 | |
FRANKLIN ALTERNATIVE STRATEGIES FUNDS
STATEMENT OF INVESTMENTS (UNAUDITED)
Franklin K2 Long Short Credit Fund(continued)
| | | | | | | | | | | | | | | | | | |
| | | | |
| | | | | Country | | | Principal Amount* | | | Value | |
| | | Foreign Government and Agency Securities (continued) | | | | | | | | | | | | |
| | | | | |
| | Government of Turkey, | | | | | | | | | | | | | | | | |
| | senior bond, 5.75%, 5/11/47 | | | Turkey | | | | 200,000 | | | | | | | $ | 171,569 | |
| | senior note, 6.35%, 8/10/24 | | | Turkey | | | | 200,000 | | | | | | | | 207,665 | |
| | | | | | | | | | | | | | | | | | |
| | Total Foreign Government and Agency Securities
(Cost $4,091,420) | | | | | | | | | | | | | | | 4,261,211 | |
| | | | | | | | | | | | | | | | | | |
| | | U.S. Government and Agency Securities 0.6% | | | | | | | | | | | | |
| | U.S. Treasury Bond, 3.00%, 2/15/48 | | | United States | | | | 291,000 | | | | | | | | 339,345 | |
| | | | | |
| | U.S. Treasury Note, | | | | | | | | | | | | | | | | |
| | 1.50%, 9/30/24 | | | United States | | | | 56,900 | | | | | | | | 56,538 | |
| | 1.50%, 10/31/24 | | | United States | | | | 216,000 | | | | | | | | 214,591 | |
| | 1.625%, 8/15/29 | | | United States | | | | 100,000 | | | | | | | | 98,537 | |
| | 1.75%, 11/15/29 | | | United States | | | | 13,000 | | | | | | | | 12,968 | |
| | | | | | | | | | | | | | | | | | |
| | Total U.S. Government and Agency Securities
(Cost $673,372) | | | | | | | | | | | | | | | 721,979 | |
| | | | | | | | | | | | | | | | | | |
| | | Asset-Backed Securities and Commercial Mortgage-
Backed Securities 38.1% | | | | | | | | | | | | |
| | | Diversified Financial Services 19.7% | | | | | | | | | | | | |
| n | | Adjustable Rate Mortgage Trust,2005-4, 3A1, FRN, 4.935%, 8/25/35 | | | United States | | | | 70,499 | | | | | | | | 70,760 | |
| | Alternative Loan Trust,2005-J10, 2A4, 6.00%, 10/25/35 | | | United States | | | | 439,235 | | | | | | | | 327,151 | |
| | | | | |
| d | | AMSR Trust, 144A, | | | | | | | | | | | | | | | | |
| | 2019-SFR1, H, 6.04%, 1/17/27 | | | United States | | | | 750,000 | | | | | | | | 749,961 | |
| | 2019-SFR1, I, 8.976%, 1/17/27 | | | United States | | | | 750,000 | | | | | | | | 749,968 | |
| d,o | | Ashford Hospitality Trust, 2018-ASHF, E, 144A, FRN, 4.865%,(1-Month USD LIBOR + 3.10%), 4/15/35 | | | United States | | | | 1,250,000 | | | | | | | | 1,254,162 | |
| d | | BANK, 2017-BNK9, D, 144A, 2.80%, 11/15/54 | | | United States | | | | 1,100,000 | | | | | | | | 969,565 | |
| | | | | |
| | Bear StearnsALT-A Trust, FRN, | | | | | | | | | | | | | | | | |
| | n 2004-12, 2A4, 3.833%, 1/25/35 | | | United States | | | | 320,625 | | | | | | | | 316,902 | |
| | o 2004-6, B1, 4.558%,(1-Month USD LIBOR + 2.85%), 7/25/34 | | | United States | | | | 346,495 | | | | | | | | 377,332 | |
| d,o | | Carlyle Global Market Strategies CLO Ltd.,2018-1A, CR, 144A, FRN, 4.716%,(3-Month USD LIBOR + 2.75%), 4/20/27 | | | United States | | | | 2,500,000 | | | | | | | | 2,376,898 | |
| d | | Castlelake Aircraft Securitization Trust,2018-1, A, 144A, 4.125%, 6/15/43 | | | United States | | | | 593,568 | | | | | | | | 605,420 | |
| | Chaseflex Trust,2005-2, 1A1, 6.00%, 6/25/35 | | | United States | | | | 504,288 | | | | | | | | 487,196 | |
| | Citimortgage Alternative Loan Trust,2007-A1, 2A1, 5.50%, 1/25/22 | | | United States | | | | 38,278 | | | | | | | | 38,560 | |
| d,o | | CVP Cascade Ltd.,2014-2A, C, 144A, FRN, 5.803%,(3-Month USD LIBOR + 3.80%), 7/18/26 | | | United States | | | | 700,000 | | | | | | | | 693,642 | |
| | Delta Funding Home Equity Loan Trust,2000-2, M2, 8.86%, 8/15/30 | | | United States | | | | 323,921 | | | | | | | | 286,195 | |
| o,p | | FNMA,2011-11, SA, IO, FRN, 4.742%, (6.45% –1-Month USD LIBOR), 11/25/41 | | | United States | | | | 2,335,598 | | | | | | | | 482,590 | |
| d,o | | Goldentree Loan Management US CLO 1 Ltd.,2017-1A, D, 144A, FRN, 5.316%,(3-Month USD LIBOR + 3.35%), 4/20/29 | | | United States | | | | 1,000,000 | | | | | | | | 1,001,269 | |
| d,i,o | | Goldentree Loan Management US CLO 6 Ltd.,2019-6A, C, 144A, FRN,(3-Month USD LIBOR + 2.60%) 1/20/33 | | | United States | | | | 1,000,000 | | | | | | | | 1,000,000 | |
| d,o | | GPMT Ltd.,2019-FL2, D, 144A, FRN, 4.715%,(1-Month USD LIBOR + 2.95%), 2/22/36 | | | United States | | | | 1,000,000 | | | | | | | | 1,000,500 | |
| d,o | | Grippen Park CLO Ltd.,2017-1A, D, 144A, FRN, 5.266%,(3-Month USD LIBOR + 3.30%), 1/20/30 | | | United States | | | | 500,000 | | | | | | | | 490,906 | |
| | | | | |
| d | | GSMSC Pass-Through Trust, 144A, FRN, | | | | | | | | | | | | | | | | |
| | o 2009-4R, 2A3, 2.273%,(1-Month USD LIBOR + 0.45%), 12/26/36 | | | United States | | | | 818,558 | | | | | | | | 470,447 | |
| | n 2009-5R, 3A2, 5.50%, 10/26/35 | | | United States | | | | 231,855 | | | | | | | | 226,207 | |
| | | | | |
| d,o | | Home Partners of America Trust, 144A, FRN, | | | | | | | | | | | | | | | | |
| | 2017-1, F, 5.302%,(1-Month USD LIBOR + 3.54%), 7/17/34 | | | United States | | | | 500,000 | | | | | | | | 501,927 | |
| | 2018-1, E, 3.613%,(1-Month USD LIBOR + 1.85%), 7/17/37 | | | United States | | | | 1,200,000 | | | | | | | | 1,201,974 | |
| | JPMorgan Mortgage Acquisition Trust,2007-CH2, AF2, 4.608%, 1/25/37 | | | United States | | | | 180,859 | | | | | | | | 135,397 | |
| | | | |
| | | |
| 20 | | Semiannual Report | | franklintempleton.com |
FRANKLIN ALTERNATIVE STRATEGIES FUNDS
STATEMENT OF INVESTMENTS (UNAUDITED)
Franklin K2 Long Short Credit Fund(continued)
| | | | | | | | | | | | | | | | | | |
| | | | |
| | | | | Country | | | Principal Amount* | | | Value | |
| | | Asset-Backed Securities and Commercial Mortgage-
Backed Securities (continued) | | | | | | | | | | | | |
| | | Diversified Financial Services (continued) | | | | | | | | | | | | |
| | | | | |
| d,n,p | | JPMorgan Mortgage Trust, IO, 144A, FRN, | | | | | | | | | | | | | | | | |
| | 2019-8, B1X, 1.25%, 3/25/50 | | | United States | | | | 829,700 | | | | | | | $ | 55,922 | |
| | 2019-8, B2X, 1.00%, 3/25/50 | | | United States | | | | 1,242,669 | | | | | | | | 67,104 | |
| | 2019-8, B3X, 0.75%, 3/25/50 | | | United States | | | | 796,462 | | | | | | | | 32,416 | |
| d,o | | KREF Ltd.,2018-FL1, D, 144A, FRN, 4.313%,(1-Month USD LIBOR + 2.55%), 6/15/36 | | | United States | | | | 300,000 | | | | | | | | 301,290 | |
| d,o | | Madison Park Funding XXIII Ltd.,2017-23A, C, 144A, FRN, 4.286%,(3-Month USD LIBOR + 2.35%), 7/27/30 | | | United States | | | | 700,000 | | | | | | | | 690,404 | |
| o | | Morgan Stanley ABS Capital I Inc. Trust,2004-NC6, M3, FRN, 3.883%,(1-Month USD LIBOR + 2.18%), 7/25/34 | | | United States | | | | 40,985 | | | | | | | | 41,378 | |
| d,o | | Morgan StanleyRE-REMIC Trust,2013-R8, 2B2, 144A, FRN, 2.663%,(1-Month USD LIBOR + 0.42%), 9/26/36 | | | United States | | | | 995,050 | | | | | | | | 708,393 | |
| o | | National Collegiate Student Loan Trust,2006-1, A5, FRN, 2.058%,(1-Month USD LIBOR + 0.35%), 3/25/33 | | | United States | | | | 150,417 | | | | | | | | 141,685 | |
| d | | Sapphire Aviation Finance I Ltd.,2018-1A, B, 144A, 5.926%, 3/15/40 | | | United States | | | | 794,219 | | | | | | | | 820,705 | |
| | | | | |
| n | | Seasoned Credit Risk Transfer Trust, FRN, | | | | | | | | | | | | | | | | |
| | d 2016-1, M2, 144A, 3.75%, 9/25/55 | | | United States | | | | 500,000 | | | | | | | | 480,883 | |
| | 2017-3, M1, 4.00%, 7/25/56 | | | United States | | | | 40,000 | | | | | | | | 40,370 | |
| d | | S-Jets Ltd.,2017-1, A, 144A, 3.967%, 8/15/42 | | | Bermuda | | | | 817,189 | | | | | | | | 824,903 | |
| | | | | |
| d,o | | STACR Trust, 144A, FRN, | | | | | | | | | | | | | | | | |
| | 2018-HRP1, B1, 5.458%,(1-Month USD LIBOR + 3.75%), 4/25/43 | | | United States | | | | 800,000 | | | | | | | | 837,439 | |
| | 2018-HRP1, B2, 13.458%,(1-Month USD LIBOR + 11.75%), 4/25/43 | | | United States | | | | 1,235,179 | | | | | | | | 1,499,134 | |
| n | | STARM Mortgage Loan Trust,2007-2, 4A1, FRN, 4.831%, 4/25/37 | | | United States | | | | 88,078 | | | | | | | | 69,694 | |
| o | | Suntrust Alternative Loan Trust,2005-1F, 1A1, FRN, 2.358%,(1-Month USD LIBOR + 0.65%), 12/25/35 | | | United States | | | | 240,768 | | | | | | | | 204,291 | |
| o | | Terwin Mortgage Trust,2003-6HE, M2, FRN, 4.333%,(1-Month USD LIBOR + 2.63%), 11/25/33 | | | United States | | | | 153,949 | | | | | | | | 145,998 | |
| d,o | | TPG Real Estate Finance Issuer Ltd.,2018-FL2, D, 144A, FRN, 4.463%,(1-Month USD LIBOR + 2.70%), 11/15/37 | | | United States | | | | 300,000 | | | | | | | | 301,327 | |
| | Wells Fargo Alternative Loan Trust,2007-PA3, 2A2, 6.00%, 7/25/37 | | | United States | | | | 187,836 | | | | | | | | 187,939 | |
| d | | Wendys Funding LLC,2018-1A, A2I, 144A, 3.573%, 3/15/48 | | | United States | | | | 491,250 | | | | | | | | 497,179 | |
| d,o | | Westchester CLO Ltd.,2007-1A, E, 144A, FRN, 6.209%,(3-Month USD LIBOR + 4.30%), 8/01/22 | | | United States | | | | 683,547 | | | | | | | | 685,991 | |
| d,o | | Zais CLO 1 Ltd.,2018-1A, CR, 144A, FRN, 5.411%,(3-Month USD LIBOR + 3.41%), 4/15/28 | | | United States | | | | 500,000 | | | | | | | | 477,513 | |
| | | | | | | | | | | | | | | | | | |
| | | | | |
| | | | | | | | | | | | | | | | | 24,926,887 | |
| | | | | | | | | | | | | | | | | | |
| | | Mortgage Real Estate Investment Trusts (REITs) 18.4% | | | | | | | | | | | | |
| n | | American Home Mortgage Assets Trust,2005-1, 1A1, FRN, 3.957%, 11/25/35 | | | United States | | | | 147,832 | | | | | | | | 132,156 | |
| | | | | |
| n | | Banc of America Mortgage Trust, FRN, | | | | | | | | | | | | | | | | |
| | 2005-K, 2A1, 3.978%, 12/25/35 | | | United States | | | | 224,907 | | | | | | | | 223,673 | |
| | 2005-L, 1A1, 4.129%, 1/25/36 | | | United States | | | | 148,926 | | | | | | | | 138,280 | |
| | 2005-L, 3A1, 4.645%, 1/25/36 | | | United States | | | | 314,999 | | | | | | | | 306,831 | |
| d,n | | BCAP LLC Trust,2010-RR1, 1A4, 144A, FRN, 4.11%, 3/26/37 | | | United States | | | | 333,820 | | | | | | | | 298,213 | |
| | | | | |
| n | | Bear Stearns ARM Trust, FRN, | | | | | | | | | | | | | | | | |
| | 2002-11, 1A2, 4.431%, 2/25/33 | | | United States | | | | 4,745 | | | | | | | | 4,530 | |
| | 2006-2, 4A1, 4.13%, 7/25/36 | | | United States | | | | 56,897 | | | | | | | | 53,124 | |
| | | | | |
| d,o | | BX Trust, 144A, FRN, | | | | | | | | | | | | | | | | |
| | 2017-APPL, E, 4.915%,(1-Month USD LIBOR + 3.15%), 7/15/34 | | | United States | | | | 1,530,000 | | | | | | | | 1,535,639 | |
| | 2017-SLCT, E, 4.915%,(1-Month USD LIBOR + 3.15%), 7/15/34 | | | United States | | | | 637,500 | | | | | | | | 639,849 | |
| | | | | |
| | Citigroup Mortgage Loan Trust, | | | | | | | | | | | | | | | | |
| | o2004-OPT1, M4, FRN, 2.713%,(1-Month USD LIBOR + 1.01%), 10/25/34 | | | United States | | | | 588,602 | | | | | | | | 566,679 | |
| | 2006-WF1, A2E, 4.866%, 3/25/36 | | | United States | | | | 465,091 | | | | | | | | 323,744 | |
| | n2007-AR5, 2A1A, FRN, 4.566%, 4/25/37 | | | United States | | | | 135,209 | | | | | | | | 132,151 | |
| | d,o2008-RR1, A1A1, 144A, FRN, 1.778%,(1-Month USD LIBOR + 0.07%), 1/25/37 | | | United States | | | | 722,344 | | | | | | | | 671,796 | |
| | | | | | |
| | | |
| franklintempleton.com | | Semiannual Report | | | 21 | |
FRANKLIN ALTERNATIVE STRATEGIES FUNDS
STATEMENT OF INVESTMENTS (UNAUDITED)
Franklin K2 Long Short Credit Fund(continued)
| | | | | | | | | | | | | | | | | | |
| | | | |
| | | | | Country | | | Principal Amount* | | | Value | |
| | | Asset-Backed Securities and Commercial Mortgage-
Backed Securities (continued) | | | | | | | | | | | | |
| | | Mortgage Real Estate Investment Trusts (REITs) (continued) | | | | | | | | | | | | |
| | | | | |
| | Countrywide Alternative Loan Trust, | | | | | | | | | | | | | | | | |
| | 2005-73CB, 1A2, 6.25%, 1/25/36 | | | United States | | | | 192,641 | | | | | | | $ | 201,165 | |
| | o2005-IM1, A1, FRN, 2.308%,(1-Month USD LIBOR + 0.60%), 1/25/36 | | | United States | | | | 165,737 | | | | | | | | 163,207 | |
| | 2006-4CB, 2A3, 5.50%, 4/25/36 | | | United States | | | | 83,584 | | | | | | | | 81,979 | |
| | | | | |
| | CS First Boston Mortgage Securities Corp., | | | | | | | | | | | | | | | | |
| | 2002-9, 1A2, 7.50%, 3/25/32 | | | United States | | | | 497,114 | | | | | | | | 526,622 | |
| | n2004-AR3, CB2, FRN, 4.479%, 4/25/34 | | | United States | | | | 144,447 | | | | | | | | 138,599 | |
| | d,o2004-CF2, 2M2, 144A, FRN, 3.108%,(1-Month USD LIBOR + 1.40%), 5/25/44 | | | United States | | | | 286,604 | | | | | | | | 283,349 | |
| | CSMC Mortgage-Backed Trust,2006-4, 9A1, 6.50%, 5/25/36 | | | United States | | | | 819,676 | | | | | | | | 467,301 | |
| | | | | |
| d | | FHLMC, 144A, FRN, | | | | | | | | | | | | | | | | |
| | n2018-SPI3, B, 4.156%, 8/25/48 | | | United States | | | | 250,000 | | | | | | | | 184,172 | |
| | o2019-FTR1, B2, 10.058%,(1-Month USD LIBOR + 8.35%), 1/25/48 | | | United States | | | | 350,000 | | | | | | | | 411,694 | |
| d,n | | FHLMC Seasoned Credit Risk Transfer Trust,2017-2, M1, 144A, FRN, 4.00%, 8/25/56 | | | United States | | | | 2,170,000 | | | | | | | | 2,198,275 | |
| | | | | |
| d,n | | FHLMC Structured Agency Credit Risk Debt Notes, 144A, FRN, | | | | | | | | | | | | | | | | |
| | 2017-SPI1, M2, 3.98%, 9/25/47 | | | United States | | | | 150,000 | | | | | | | | 148,673 | |
| | 2018-SPI1, M2, 3.739%, 2/25/48 | | | United States | | | | 693,000 | | | | | | | | 666,793 | |
| | 2018-SPI2, M2, 3.814%, 5/25/48 | | | United States | | | | 350,000 | | | | | | | | 340,017 | |
| | 2018-SPI3, M2, 4.156%, 8/25/48 | | | United States | | | | 400,000 | | | | | | | | 402,368 | |
| n | | First Horizon Alternative Mortgage Securities Trust,2004-AA2, 2A1, FRN, 4.43%, 8/25/34 | | | United States | | | | 264,707 | | | | | | | | 267,690 | |
| | | | | |
| | GSR Mortgage Loan Trust, | | | | | | | | | | | | | | | | |
| | 2004-6F, 2A4, 5.50%, 5/25/34 | | | United States | | | | 214,539 | | | | | | | | 222,861 | |
| | n2004-9, B1, FRN, 4.395%, 8/25/34 | | | United States | | | | 166,950 | | | | | | | | 163,157 | |
| | n2005-AR6, B1, FRN, 4.671%, 9/25/35 | | | United States | | | | 631,281 | | | | | | | | 586,532 | |
| | 2007-1F, 1A1, 5.00%, 12/25/35 | | | United States | | | | 226,121 | | | | | | | | 252,283 | |
| | Home Equity Mortgage Trust,2004-6, M2, 5.821%, 4/25/35 | | | United States | | | | 1,562 | | | | | | | | 1,562 | |
| | | | | |
| | Impac CMB Trust, | | | | | | | | | | | | | | | | |
| | 2004-4, 2A2, 4.84%, 9/25/34 | | | United States | | | | 174,682 | | | | | | | | 187,803 | |
| | o2004-8, 3B, FRN, 4.333%,(1-Month USD LIBOR + 2.63%), 8/25/34 | | | United States | | | | 139,110 | | | | | | | | 138,882 | |
| | o2005-2, 2B, FRN, 4.183%,(1-Month USD LIBOR + 2.48%), 4/25/35 | | | United States | | | | 120,874 | | | | | | | | 118,255 | |
| | o2005-4, 2B1, FRN, 4.183%,(1-Month USD LIBOR + 2.48%), 5/25/35 | | | United States | | | | 147,439 | | | | | | | | 145,871 | |
| | o2005-4, 2M1, FRN, 2.458%,(1-Month USD LIBOR + 0.75%), 5/25/35 | | | United States | | | | 172,012 | | | | | | | | 162,617 | |
| | o2005-8, 2B, FRN, 3.958%,(1-Month USD LIBOR + 2.25%), 2/25/36 | | | United States | | | | 145,931 | | | | | | | | 144,437 | |
| | | | | |
| | IndyMac INDX Mortgage Loan Trust, FRN, | | | | | | | | | | | | | | | | |
| | o2004-AR14, 2A1A, 2.428%,(1-Month USD LIBOR + 0.72%), 1/25/35 | | | United States | | | | 636,585 | | | | | | | | 548,886 | |
| | n2005-AR21, 4A1, 3.899%, 10/25/35 | | | United States | | | | 393,237 | | | | | | | | 377,684 | |
| | o2006-AR12, A1, 1.898%,(1-Month USD LIBOR + 0.19%), 9/25/46 | | | United States | | | | 125,042 | | | | | | | | 120,399 | |
| | o2006-AR29, A2, 1.788%,(1-Month USD LIBOR + 0.08%), 11/25/36 | | | United States | | | | 164,297 | | | | | | | | 159,322 | |
| | | | | |
| n | | J.P. Morgan Mortgage Trust, FRN, | | | | | | | | | | | | | | | | |
| | 2006-A5, 6A1, 3.929%, 8/25/36 | | | United States | | | | 339,778 | | | | | | | | 314,724 | |
| | 2006-A7, 2A3, 3.873%, 1/25/37 | | | United States | | | | 147,729 | | | | | | | | 144,467 | |
| | 2007-A2, 2A1, 4.345%, 4/25/37 | | | United States | | | | 210,303 | | | | | | | | 198,118 | |
| | d2019-2, B4, 144A, 4.668%, 8/25/49 | | | United States | | | | 592,730 | | | | | | | | 598,162 | |
| d,o | | JPMorgan Chase Commercial Mortgage Securities Trust, 2018-ASH8, F, 144A, FRN, 5.765%,(1-Month USD LIBOR + 4.00%), 2/15/35 | | | United States | | | | 1,000,000 | | | | | | | | 1,007,597 | |
| | Lehman Mortgage Trust,2005-3, 2A3, 5.50%, 1/25/36 | | | United States | | | | 91,030 | | | | | | | | 94,430 | |
| | | | | |
| | MASTR Adjustable Rate Mortgages Trust, FRN, | | | | | | | | | | | | | | | | |
| | n2004-10, B1, 4.151%, 10/25/34 | | | United States | | | | 551,348 | | | | | | | | 347,360 | |
| | o2006-OA1, 1A1, 1.918%,(1-Month USD LIBOR + 0.21%), 4/25/46 | | | United States | | | | 374,108 | | | | | | | | 344,609 | |
| n | | MASTR Seasoned Securitization Trust,2004-1, 4A1, FRN, 4.466%, 10/25/32 | | | United States | | | | 63,194 | | | | | | | | 65,611 | |
| d,o | | Motel 6 Trust, 2017-MTL6, F, 144A, FRN, 6.015%,(1-Month USD LIBOR + 4.25%), 8/15/34 | | | United States | | | | 583,715 | | | | | | | | 588,972 | |
| | | | |
| | | |
| 22 | | Semiannual Report | | franklintempleton.com |
FRANKLIN ALTERNATIVE STRATEGIES FUNDS
STATEMENT OF INVESTMENTS (UNAUDITED)
Franklin K2 Long Short Credit Fund(continued)
| | | | | | | | | | | | | | | | | | |
| | | | |
| | | | | Country | | | Principal Amount* | | | Value | |
| | | Asset-Backed Securities and Commercial Mortgage-
Backed Securities (continued) | | | | | | | | | | | | |
| | | Mortgage Real Estate Investment Trusts (REITs) (continued) | | | | | | | | | | | | |
| o | | New Century Home Equity Loan Trust,2003-4, M1, FRN, 2.833%,(1-Month USD LIBOR + 1.13%), 10/25/33 | | | United States | | | | 568,296 | | | | | | | $ | 572,269 | |
| | | | | |
| n | | Provident Funding Mortgage Loan Trust, FRN, | | | | | | | | | | | | | | | | |
| | 2003-1, B1, 4.875%, 8/25/33 | | | United States | | | | 64,886 | | | | | | | | 63,224 | |
| | 2004-1, B1, 4.824%, 4/25/34 | | | United States | | | | 33,417 | | | | | | | | 32,227 | |
| | | | | |
| n | | RALI Trust, FRN, | | | | | | | | | | | | | | | | |
| | 2005-QA2, NB1, 4.212%, 2/25/35 | | | United States | | | | 5,416 | | | | | | | | 5,022 | |
| | 2005-QA8, NB2, 3.696%, 7/25/35 | | | United States | | | | 79,183 | | | | | | | | 70,405 | |
| | 2005-QA8, NB3, 3.585%, 7/25/35 | | | United States | | | | 9,193 | | | | | | | | 7,361 | |
| | Residential Asset Securitization Trust,2006-A1, 1A1, 6.00%, 4/25/36 | | | United States | | | | 428,650 | | | | | | | | 311,117 | |
| n | | RFMSI Trust,2007-SA2, 3A, FRN, 4.272%, 4/25/37 | | | United States | | | | 1,249,385 | | | | | | | | 584,905 | |
| d,n | | Seasoned Credit Risk Transfer Trust Series,2017-2, M2, 144A, FRN, 4.00%, 8/25/56 | | | United States | | | | 230,000 | | | | | | | | 229,383 | |
| o | | Securitized Asset Backed Receivables LLC Trust,2004-OP2, A2, FRN, 2.408%,(1-Month USD LIBOR + 0.70%), 8/25/34 | | | United States | | | | 199,024 | | | | | | | | 194,416 | |
| | | | | |
| n | | Structured ARM Loan Trust, FRN, | | | | | | | | | | | | | | | | |
| | 2004-2, 1A1, 4.727%, 3/25/34 | | | United States | | | | 133,944 | | | | | | | | 136,240 | |
| | 2004-4, B1, 4.327%, 4/25/34 | | | United States | | | | 450,412 | | | | | | | | 425,234 | |
| n | | Wachovia Mortgage Loan Trust LLC,2005-B, 1A1, FRN, 4.253%, 10/20/35 | | | United States | | | | 545,513 | | | | | | | | 542,294 | |
| o | | WaMu Mortgage Pass-Through Certificates Trust,2007-OA3, 2A1A, FRN, 3.086%, (1 Year CMT + 0.76%), 4/25/47 | | | United States | | | | 65,185 | | | | | | | | 65,786 | |
| o | | Washington Mutual Mortgage Pass-Through Certificates,2006-4, 3A2B, FRN, 1.788%,(1-Month USD LIBOR + 0.08%), 5/25/36 | | | United States | | | | 316,661 | | | | | | | | 249,897 | |
| | | | | |
| n | | Washington Mutual MSC Mortgage Pass-Through Certificates Series Trust, FRN, | | | | | | | | | | | | | | | | |
| | 2003-AR2, M, 3.516%, 5/25/33 | | | United States | | | | 995,567 | | | | | | | | 969,164 | |
| | 2003-AR3, B1, 3.959%, 6/25/33 | | | United States | | | | 270,801 | | | | | | | | 253,638 | |
| | | | | | | | | | | | | | | | | | |
| | | | | |
| | | | | | | | | | | | | | | | | 23,255,752 | |
| | | | | | | | | | | | | | | | | | |
| | Total Asset-Backed Securities and Commercial Mortgage-Backed Securities (Cost $46,913,047) | | | | | | | | | | | | | | | 48,182,639 | |
| | | | | | | | | | | | | | | | | | |
| | | Municipal Bonds in Reorganization 0.8% | | | | | | | | | | | | |
| | | Puerto Rico 0.8% | | | | | | | | | | | | |
| | | | | |
| j | | Puerto Rico Commonwealth GO, Public Improvement, Refunding, Series A, | | | | | | | | | | | | | | | | |
| | 5.50%, 7/01/39 | | | United States | | | | 155,000 | | | | | | | | 104,237 | |
| | 5.00%, 7/01/41 | | | United States | | | | 225,000 | | | | | | | | 144,000 | |
| j | | Puerto Rico Commonwealth GO, Refunding, Series A, 8.00%, 7/01/35 | | | United States | | | | 1,330,000 | | | | | | | | 824,600 | |
| | | | | | | | | | | | | | | | | | |
| | Total Municipal Bonds in Reorganization (Cost $873,250) | | | | | | | | | | | | | | | 1,072,837 | |
| | | | | | | | | | | | | | | | | | |
| | | | |
| | | | | Number of
Contracts | | | Notional Amount# | | | | |
| | | Options Purchased 0.0%† | | | | | | | | | | | | |
| | | Calls – Exchange-Traded 0.0%† | | | | | | | | | | | | |
| | At Home Group Inc., December Strike Price $10.00, Expires 12/20/19 | | | 59 | | | | 5,900 | | | | | | | | 1,770 | |
| | Clearway Energy Inc., C, February Strike Price $20.00, Expires 2/21/20 | | | 28 | | | | 2,800 | | | | | | | | 2,520 | |
| | Energy Transfer LP, January Strike Price $14.00, Expires 1/17/20 | | | 90 | | | | 9,000 | | | | | | | | 630 | |
| | Energy Transfer LP, January Strike Price $15.00, Expires 1/17/20 | | | 45 | | | | 4,500 | | | | | | | | 135 | |
| | Tenneco Inc., A, January Strike Price $13.00, Expires 1/17/20 | | | 141 | | | | 14,100 | | | | | | | | 13,042 | |
| | | | | | | | | | | | | | | | | | |
| | | | | | | | | | | | | | | | | 18,097 | |
| | | | | | | | | | | | | | | | | | |
| | | | | | |
| | | |
| franklintempleton.com | | Semiannual Report | | | 23 | |
FRANKLIN ALTERNATIVE STRATEGIES FUNDS
STATEMENT OF INVESTMENTS (UNAUDITED)
Franklin K2 Long Short Credit Fund(continued)
| | | | | | | | | | | | | | | | | | |
| | | | |
| | | | | Number of
Contracts | | | Notional Amount# | | | Value | |
| | | Options Purchased†(continued) | | | | | | | | | | | | |
| | | Puts –Over-the-Counter 0.0%† | | | | | | | | | | | | |
| | Softbank Group Corp., January Strike Price 4,350.00 JPY, Counterparty GSCO, Expires 1/09/20 | | | 3,000 | | | | 3,000 | | | | | | | $ | 14,226 | |
| | | | | | | | | | | | | | | | | | |
| | | Interest Rate Swaptions – Puts –Over-the-Counter 0.0%† | | | | | | | | | | | | |
| | Pay fixed 2.24%, receive3-Month USD LIBOR, Counterparty JPHQ, Expires 4/30/20 | | | 1 | | | | 806,000 | | | | | | | | 1,720 | |
| | | | | | | | | | | | | | | | | | |
| | Total Options Purchased (Cost $51,509) | | | | | | | | | | | | | | | 34,043 | |
| | | | | | | | | | | | | | | | | | |
| | Total Investments before Short Term Investments
(Cost $81,911,109) | | | | | | | | | | | | | | | 84,094,093 | |
| | | | | | | | | | | | | | | | | | |
| | | | |
| | | | | Country | | | Principal Amount* | | | | |
| | | Short Term Investments 33.7% | | | | | | | | | | | | |
| | Convertible Bonds (Cost $66,834) 0.0%† | | | | | | | | | | | | | | | | |
| | | Independent Power & Renewable Electricity Producers 0.0%† | | | | | | | | | | | | |
| d | | Clearway Energy Inc., senior note, 144A, 3.25%, 6/01/20 | | | United States | | | | 68,000 | | | | | | | | 66,855 | |
| | | | | | | | | | | | | | | | | | |
| m | | Credit-Linked Notes 1.2% | | | | | | | | | | | | | | | | |
| | | | | |
| a,d | | Citigroup Global Markets Holdings Inc., senior note, 144A, | | | | | | | | | | | | | | | | |
| | (Arab Republic of Egypt), zero cpn., 1/09/20 | | | Egypt | | | | 5,000,000 | | | | EGP | | | | 304,901 | |
| | (Arab Republic of Egypt), zero cpn., 3/19/20 | | | Egypt | | | | 3,848,385 | | | | EGP | | | | 228,052 | |
| | (Ukraine), 15.70%, 1/10/20 | | | Ukraine | | | | 5,349,761 | | | | UAH | | | | 209,671 | |
| | (Ukraine), 15.74%, 1/17/20 | | | Ukraine | | | | 5,133,254 | | | | UAH | | | | 223,314 | |
| d | | HSBC Bank PLC, senior note, (Arab Republic of Egypt), 144A 5/07/20 | | | Egypt | | | | 4,750,000 | | | | EGP | | | | 277,928 | |
| | | | | |
| | JPMorgan Chase Bank NA, senior note, | | | | | | | | | | | | | | | | |
| | (The Federal Republic of Nigeria), 1/13/20 | | | Nigeria | | | | 81,000,000 | | | | NGN | | | | 220,176 | |
| | d(Egypt Treasury Bill), 144A, zero cpn., 7/09/20 | | | Egypt | | | | 1,500,000 | | | | EGP | | | | 85,460 | |
| | | | | | | | | | | | | | | | | | |
| | Total Credit-Linked Notes (Cost $1,523,942) | | | | | | | | | | | | | | | 1,549,502 | |
| | | | | | | | | | | | | | | | | | |
| | | | | |
| | | | | | | | Shares | | | | | | | |
| | Money Market Funds (Cost $34,107,020) 27.0% | | | | | | | | | | | | | | | | |
| q | | Fidelity Investments Money Market Government Portfolio, Institutional, 1.53% | | | United States | | | | 34,107,020 | | | | | | | | 34,107,020 | |
| | | | | | | | | | | | | | | | | | |
| | | | |
| | | | | | | | Principal Amount* | | | | |
| | Repurchase Agreements (Cost $6,982,216) 5.5% | | | | | | | | | | | | | | | | |
| r | | Joint Repurchase Agreement, 1.618%, 12/02/19 (Maturity Value $6,983,158) | | | United States | | | | 6,982,216 | | | | | | | | 6,982,216 | |
| | | | | | | | | | | | | | | | | | |
| | BNP Paribas Securities Corp. (Maturity Value $4,513,913) Deutsche Bank Securities Inc. (Maturity Value $1,179,525) HSBC Securities (USA) Inc. (Maturity Value $1,289,720)
Collateralized by U.S. Government Agency Securities, 4.50%, 1/20/49;
s U.S. Treasury Bills, 5/14/20 – 8/13/20; U.S. Treasury Bonds, 7.875% – 8.75%, 5/15/20 – 2/15/21; and U.S. Treasury Notes, 1.625% – 2.875%,6/30/20 – 11/15/21 (valued at $7,120,864) | | | | | | | | | | | | | | | | |
| | Total Investments (Cost $124,591,121) 100.2% | | | | | | | | | | | | | | | 126,799,686 | |
| | Securities Sold Short (8.5)% | | | | | | | | | | | | | | | (10,748,382 | ) |
| | Other Assets, less Liabilities 8.3% | | | | | | | | | | | | | | | 10,502,604 | |
| | | | | | | | | | | | | | | | | | |
| | Net Assets 100.0% | | | | | | | | | | | | | | $ | 126,553,908 | |
| | | | | | | | | | | | | | | | | | |
| | | | |
| | | |
| 24 | | Semiannual Report | | franklintempleton.com |
FRANKLIN ALTERNATIVE STRATEGIES FUNDS
STATEMENT OF INVESTMENTS (UNAUDITED)
Franklin K2 Long Short Credit Fund(continued)
| | | | | | | | | | | | | | | | | | |
| | | | | |
| | | | | Country | | | Shares | | | | | | Value | |
| t | | Securities Sold Short (8.5)% | | | | | | | | | | | | |
| | | Common Stocks (0.3)% | | | | | | | | | | | | |
| | | Equity Real Estate Investment Trusts (REITs) (0.2)% | | | | | | | | | | | | |
| | Seritage Growth Properties, A | | | United States | | | | 4,907 | | | | | | | $ | (207,468 | ) |
| | Simon Property Group Inc. | | | United States | | | | 759 | | | | | | | | (114,768 | ) |
| | | | | | | | | | | | | | | | | | |
| | | | | |
| | | | | | | | | | | | | | | | | (322,236 | ) |
| | | | | | | | | | | | | | | | | | |
| | | Food Products (0.0)%† | | | | | | | | | | | | |
| | Dean Foods Co. | | | United States | | | | 46,977 | | | | | | | | (4,872 | ) |
| | | | | | | | | | | | | | | | | | |
| | | Internet & Direct Marketing Retail (0.1)% | | | | | | | | | | | | |
| | Wayfair Inc., A | | | United States | | | | 847 | | | | | | | | (71,927 | ) |
| | | | | | | | | | | | | | | | | | |
| | Total Common Stocks (Proceeds $480,520) | | | | | | | | | | | | | | | (399,035 | ) |
| | | | | | | | | | | | | | | | | | |
| | | | |
| | | | | | | | Principal Amount* | | | | |
| | | Corporate Bonds and Notes (7.4)% | | | |
| | | Auto Components (0.1)% | |
| e | | Garrett LX I Sarl / Garrett Borrowing LLC, senior note, Reg S, 5.125%, 10/15/26 | | | Switzerland | | | | 100,000 | | | | EUR | | | | (109,105 | ) |
| | | | | | | | | | | | | | | | | | |
| | | Automobiles (0.1)% | | | | | | | | | | | | |
| e | | Jaguar Land Rover Automotive PLC, Reg S, 5.625%, 2/01/23 | | | United Kingdom | | | | 107,000 | | | | | | | | (107,801 | ) |
| | | | | | | | | | | | | | | | | | |
| | | Banks (0.1)% | | | | | | | | | | | | |
| e,f,h | | China Zheshang Bank Co. Ltd., junior sub. bond, FRN, Reg S, 5.45%, (US 5 Year CMTT-Note + 3.52%), Perpetual | | | China | | | | 72,000 | | | | | | | | (71,640 | ) |
| | | | | | | | | | | | | | | | | | |
| | | Building Products (0.3)% | | | | | | | | | | | | |
| d | | Resideo Funding Inc., senior note, 144A, 6.125%, 11/01/26 | | | United States | | | | 342,000 | | | | | | | | (329,184 | ) |
| | | | | | | | | | | | | | | | | | |
| | | Chemicals (0.2)% | | | | | | | | | | | | |
| d | | Hexion Inc., senior note, 144A, 7.875%, 7/15/27 | | | United States | | | | 201,000 | | | | | | | | (203,015 | ) |
| | | | | | | | | | | | | | | | | | |
| | | Commercial Services & Supplies (0.5)% | | | | | | | | | | | | |
| | APX Group Inc., senior note, 7.625%, 9/01/23 | | | United States | | | | 29,000 | | | | | | | | (25,387 | ) |
| e | | Intrum AB, senior note, Reg S, 3.125%, 7/15/24 | | | Sweden | | | | 251,000 | | | | EUR | | | | (280,721 | ) |
| d | | KAR Auction Services Inc., senior note, 144A, 5.125%, 6/01/25 | | | United States | | | | 289,000 | | | | | | | | (294,416 | ) |
| | | | | | | | | | | | | | | | | | |
| | | | | | | | | | | | | | | | | (600,524 | ) |
| | | | | | | | | | | | | | | | | | |
| | | Communications Equipment (0.2)% | | | | | | | | | | | | |
| | | | | |
| d | | Entercom Media Corp., 144A, | | | | | | | | | | | | | | | | |
| | secured note, 6.50%, 5/01/27 | | | United States | | | | 114,000 | | | | | | | | (120,595 | ) |
| | senior note, 7.25%, 11/01/24 | | | United States | | | | 124,000 | | | | | | | | (131,181 | ) |
| | | | | | | | | | | | | | | | | | |
| | | | | |
| | | | | | | | | | | | | | | | | (251,776 | ) |
| | | | | | | | | | | | | | | | | | |
| | | Construction & Engineering (0.3)% | | | | | | | | | | | | |
| | | | | |
| | Fluor Corp., senior bond, | | | | | | | | | | | | | | | | |
| | 3.50%, 12/15/24 | | | United States | | | | 281,000 | | | | | | | | (279,175 | ) |
| | 4.25%, 9/15/28 | | | United States | | | | 139,000 | | | | | | | | (137,212 | ) |
| | | | | | | | | | | | | | | | | | |
| | | | | |
| | | | | | | | | | | | | | | | | (416,387 | ) |
| | | | | | | | | | | | | | | | | | |
| | | Containers & Packaging (0.0)%† | | | | | | | | | | | | |
| d | | Flex Acquisition Co. Inc., senior note, 144A, 7.875%, 7/15/26 | | | United States | | | | 22,000 | | | | | | | | (21,061 | ) |
| | | | | | | | | | | | | | | | | | |
| | | Diversified Telecommunication Services (0.3)% | | | | | | | | | | | | |
| | Hughes Satellite Systems Corp., senior note, 6.625%, 8/01/26 | | | United States | | | | 183,000 | | | | | | | | (201,364 | ) |
| | Sprint Capital Corp., senior bond, 6.875%, 11/15/28 | | | United States | | | | 170,000 | | | | | | | | (181,695 | ) |
| | | | | | | | | | | | | | | | | | |
| | | | | |
| | | | | | | | | | | | | | | | | (383,059 | ) |
| | | | | | | | | | | | | | | | | | |
| | | Equity Real Estate Investment Trusts (REITs) (0.6)% | | | | | | | | | | | | |
| | Intu Metrocentre Finance PLC, senior secured bond, 4.125%, 12/06/28 | | | United Kingdom | | | | 696,000 | | | | GBP | | | | (829,769 | ) |
| | | | | | | | | | | | | | | | | | |
| | | | | | |
| | | |
| franklintempleton.com | | Semiannual Report | | | 25 | |
FRANKLIN ALTERNATIVE STRATEGIES FUNDS
STATEMENT OF INVESTMENTS (UNAUDITED)
Franklin K2 Long Short Credit Fund(continued)
| | | | | | | | | | | | | | | | | | |
| | | | |
| | | | | Country | | | Principal Amount* | | | Value | |
| t | | Securities Sold Short(continued) | | | |
| | | Corporate Bonds and Notes (continued) | | | |
| | | Food Products (0.2)% | | | | | | | | | | | | |
| | | | | |
| | B&G Foods Inc., senior note, | | | | | | | | | | | | | | | | |
| | 5.25%, 4/01/25 | | | United States | | | | 116,000 | | | | | | | $ | (117,450 | ) |
| | 5.25%, 9/15/27 | | | United States | | | | 174,000 | | | | | | | | (170,302 | ) |
| | | | | | | | | | | | | | | | | | |
| | | | | |
| | | | | | | | | | | | | | | | | (287,752 | ) |
| | | | | | | | | | | | | | | | | | |
| | | Health Care Providers & Services (0.1)% | | | | | | | | | | | | |
| d | | Mallinckrodt International Finance SA / Mallinckrodt CB LLC, senior note, 144A, 5.625%, 10/15/23 | | | United States | | | | 290,000 | | | | | | | | (82,045 | ) |
| | | | | | | | | | | | | | | | | | |
| | | Independent Power & Renewable Electricity Producers (0.8)% | | | | | | | | | | | | |
| | | | | |
| | NRG Energy Inc., | | | | | | | | | | | | | | | | |
| | dsenior bond, 144A, 5.25%, 6/15/29 | | | United States | | | | 978,000 | | | | | | | | (1,050,492 | ) |
| | senior note, 5.75%, 1/15/28 | | | United States | | | | 17,000 | | | | | | | | (18,403 | ) |
| | | | | | | | | | | | | | | | | | |
| | | | | |
| | | | | | | | | | | | | | | | | (1,068,895 | ) |
| | | | | | | | | | | | | | | | | | |
| | | Machinery (0.4)% | | | | | | | | | | | | |
| e | | Ansaldo Energia SpA, senior note, Reg S, 2.75%, 5/31/24 | | | Italy | | | | 100,000 | | | | EUR | | | | (110,082 | ) |
| | | | | |
| e | | Tereos Finance Groupe I SA, senior note, Reg S, | | | | | | | | | | | | | | | | |
| | 4.25%, 3/04/20 | | | France | | | | 250,000 | | | | EUR | | | | (268,268 | ) |
| | 4.125%, 6/16/23 | | | France | | | | 100,000 | | | | EUR | | | | (83,259 | ) |
| | | | | | | | | | | | | | | | | | |
| | | | | |
| | | | | | | | | | | | | | | | | (461,609 | ) |
| | | | | | | | | | | | | | | | | | |
| | | Marine (0.2)% | | | | | | | | | | | | |
| e | | CMA CGM SA, senior note, Reg S, 6.50%, 7/15/22 | | | France | | | | 300,000 | | | | EUR | | | | (292,871 | ) |
| | | | | | | | | | | | | | | | | | |
| | | Media (1.8)% | | | | | | | | | | | | |
| | | | | |
| | Altice Luxembourg SA, senior bond, | | | | | | | | | | | | | | | | |
| | d144A, 7.625%, 2/15/25 | | | Luxembourg | | | | 358,000 | | | | | | | | (373,662 | ) |
| | eReg S, 6.25%, 2/15/25 | | | Luxembourg | | | | 525,000 | | | | EUR | | | | (599,555 | ) |
| d | | Diamond Sports Group LLC / Diamond Sports Finance Co., senior note, 144A, 6.625%, 8/15/27 | | | United States | | | | 1,062,000 | | | | | | | | (1,037,824 | ) |
| e | | Virgin Media Finance PLC, senior note, Reg S, 4.50%, 1/15/25 | | | United Kingdom | | | | 255,000 | | | | EUR | | | | (288,447 | ) |
| | | | | | | | | | | | | | | | | | |
| | | | | |
| | | | | | | | | | | | | | | | | (2,299,488 | ) |
| | | | | | | | | | | | | | | | | | |
| | | Oil, Gas & Consumable Fuels (0.4)% | | | | | | | | | | | | |
| | Southwestern Energy Co., senior bond, 7.75%, 10/01/27 | | | United States | | | | 526,000 | | | | | | | | (458,291 | ) |
| | | | | | | | | | | | | | | | | | |
| | | Pharmaceuticals (0.2)% | | | | | | | | | | | | |
| | Teva Pharmaceutical Finance Netherlands III BV, senior note, 6.75%, 3/01/28 | | | Israel | | | | 278,000 | | | | | | | | (273,754 | ) |
| | | | | | | | | | | | | | | | | | |
| | | Professional Services (0.1)% | | | | | | | | | | | | |
| e | | The House of Finance NV, senior secured note, Reg S, 4.375%, 7/15/26 | | | Belgium | | | | 100,000 | | | | EUR | | | | (110,746 | ) |
| | | | | | | | | | | | | | | | | | |
| | | Software (0.1)% | | | | | | | | | | | | |
| d | | Veritas U.S. Inc. / Veritas Bermuda Ltd., senior note, 144A, 10.50%, 2/01/24 | | | United States | | | | 204,000 | | | | | | | | (188,275 | ) |
| | | | | | | | | | | | | | | | | | |
| | | Specialty Retail (0.1)% | | | | | | | | | | | | |
| | | | | |
| | Bed Bath & Beyond Inc., senior bond, | | | | | | | | | | | | | | | | |
| | 3.749%, 8/01/24 | | | United States | | | | 132,000 | | | | | | | | (130,020 | ) |
| | 4.915%, 8/01/34 | | | United States | | | | 15,000 | | | | | | | | (10,661 | ) |
| | | | | | | | | | | | | | | | | | |
| | | | | |
| | | | | | | | | | | | | | | | | (140,681 | ) |
| | | | | | | | | | | | | | | | | | |
| | | Wireless Telecommunication Services (0.3)% | | | | | | | | | | | | |
| e | | Softbank Group Corp., senior bond, Reg S, 5.125%, 9/19/27 | | | Japan | | | | 300,000 | | | | | | | | (304,515 | ) |
| | Sprint Corp., senior note, 7.625%, 3/01/26 | | | United States | | | | 113,000 | | | | | | | | (123,591 | ) |
| | | | | | | | | | | | | | | | | | |
| | | | | |
| | | | | | | | | | | | | | | | | (428,106 | ) |
| | | | | | | | | | | | | | | | | | |
| | Total Corporate Bonds and Notes (Proceeds $9,446,551) | | | | | | | | | | | | | | | (9,415,834 | ) |
| | | | | | | | | | | | | | | | | | |
| | | | |
| | | |
| 26 | | Semiannual Report | | franklintempleton.com |
FRANKLIN ALTERNATIVE STRATEGIES FUNDS
STATEMENT OF INVESTMENTS (UNAUDITED)
Franklin K2 Long Short Credit Fund(continued)
| | | | | | | | | | | | | | | | | | |
| | | | |
| | | | | Country | | | Principal Amount* | | | Value | |
| t | | Securities Sold Short(continued) | | | |
| | | Foreign Government and Agency Securities
(Proceeds $689,886) (0.6)% | | | | | | | | | | | | |
| | Government of Italy, senior bond, 5.25%, 11/01/29 | | | Italy | | | | 455,000 | | | | EUR | | | $ | (686,192 | ) |
| | | | | | | | | | | | | | | | | | |
| | | U.S. Government and Agency Securities (0.2)% | | | | | | | | | | | | |
| | | | | |
| | U.S. Treasury Note, | | | | | | | | | | | | | | | | |
| | 2.00%, 5/31/24 | | | United States | | | | 101,000 | | | | | | | | (102,616 | ) |
| | 2.875%, 5/15/28 | | | United States | | | | 133,000 | | | | | | | | (144,705 | ) |
| | | | | | | | | | | | | | | | | | |
| | Total U.S. Government and Agency Securities
(Proceeds $235,501) | | | | | | | | | | | | | | | (247,321 | ) |
| | | | | | | | | | | | | | | | | | |
| | Total Securities Sold Short (Proceeds $10,852,458) | | | | | | | | | | | | | | $ | (10,748,382 | ) |
| | | | | | | | | | | | | | | | | | |
†Rounds to less than 0.1% of net assets.
*The principal amount is stated in U.S. dollars unless otherwise indicated.
#Notional amount is the number of units specified in the contract, and can include currency units, bushels, shares, pounds, barrels or other units. Currency units are stated in U.S. dollars unless otherwise indicated.
aFair valued using significant unobservable inputs. See Note 12 regarding fair value measurements.
bNon-income producing.
cA portion or all of the security has been segregated as collateral for securities sold short, open swap contracts, open forward exchange contracts and/or open futures contracts. At November 30, 2019, the aggregate value of these securities and/or cash pledged amounted to $9,853,120, representing 7.8% of net assets.
dSecurity was purchased pursuant to Rule 144A under the Securities Act of 1933 and may be sold in transactions exempt from registration only to qualified institutional buyers or in public offering registered under the Securities Act of 1933. At November 30, 2019, the net value of these securities was $45,208,142, representing 35.7% of net assets.
eSecurity was purchased pursuant to Regulation S under the Securities Act of 1933, which exempts from registration securities offered and sold outside of the United States. Such a security cannot be sold in the United States without either an effective registration statement filed pursuant to the Securities Act of 1933, or pursuant to an exemption from registration. At November 30, 2019, the net value of these securities was $(1,391,006), representing (1.1)% of net assets.
fThe coupon rate shown represents the rate at period end.
gIncome may be received in additional securities and/or cash.
hPerpetual security with no stated maturity date.
iA portion or all of the security purchased on a delayed delivery basis. See Note 1(d).
jSee Note 7 regarding defaulted securities.
kSee Note 1(i) regarding senior floating rate interests.
lSee Note 9 regarding unfunded loan commitments.
mSee Note 1(g) regarding credit-linked notes.
nAdjustable rate security with an interest rate that is not based on a published reference index and spread. The rate is based on the structure of the agreement and current market conditions. The coupon rate shown represents the rate at period end.
oThe coupon rate shown represents the rate inclusive of any caps or floors, if applicable, in effect at period end.
pInvestment in an interest-only security entitles holders to receive only the interest payment on the underlying instruments. The principal amount shown is the notional amount of the underlying instruments.
qThe rate shown is the annualizedseven-day effective yield at period end.
rSee Note 1(c) regarding joint repurchase agreement.
sThe security was issued on a discount basis with no stated coupon rate.
tSee Note 1(h) regarding securities sold short.
uSee Note 8 regarding restricted securities.
At November 30, 2019, the Fund had the following futures contracts outstanding. See Note 1(e).
| | | | | | | | | | | | | | | | | | | | |
| Futures Contracts | | | | | | | | | | | | | | | |
| | | | | |
| Description | | Type | | | Number of
Contracts | | | Notional
Amount* | | | Expiration
Date | | | Value/Unrealized
Appreciation
(Depreciation) | |
| Equity Contracts | | | | | | | | | | | | | | | | | | | | |
S&P 500E-Mini Index | | | Short | | | | 2 | | | $ | 314,370 | | | | 12/20/19 | | | $ | (13,528 | ) |
| Interest Rate Contracts | | | | | | | | | | | | | | | | | | | | |
U.S. Treasury Long Bond | | | Long | | | | 1 | | | | 158,969 | | | | 3/20/20 | | | | 162 | |
| | | | | | | | | | | | | | | | | | | | |
Total Futures Contracts | | | $ | (13,366 | ) |
| | | | | |
*As of period end.
| | | | | | |
| | | |
| franklintempleton.com | | Semiannual Report | | | 27 | |
FRANKLIN ALTERNATIVE STRATEGIES FUNDS
STATEMENT OF INVESTMENTS (UNAUDITED)
Franklin K2 Long Short Credit Fund(continued)
At November 30, 2019, the Fund had the following forward exchange contracts outstanding. See Note 1(e).
| | | | | | | | | | | | | | | | | | | | | | | | | | | | |
| Forward Exchange Contracts | | | | |
| | | | | | | |
| Currency | | Counterpartya | | | Type | | | Quantity | | | Contract
Amount | | | Settlement
Date | | | Unrealized
Appreciation | | | Unrealized
Depreciation | |
| OTC Forward Exchange Contracts | | | | | | | | | | | | | | | | | | | |
Brazilian Real | | | JPHQ | | | | Buy | | | | 5,180,134 | | | $ | 1,259,774 | | | | 12/03/19 | | | $ | — | | | $ | (36,422 | ) |
Brazilian Real | | | JPHQ | | | | Sell | | | | 5,180,134 | | | | 1,224,044 | | | | 12/03/19 | | | | 1,503 | | | | (811 | ) |
Chilean Peso | | | JPHQ | | | | Buy | | | | 327,812,171 | | | | 452,026 | | | | 12/18/19 | | | | — | | | | (43,700 | ) |
Chilean Peso | | | JPHQ | | | | Sell | | | | 327,812,170 | | | | 432,947 | | | | 12/18/19 | | | | 24,620 | | | | — | |
Chinese Yuan | | | JPHQ | | | | Buy | | | | 3,591,823 | | | | 507,642 | | | | 12/18/19 | | | | 2,972 | | | | — | |
Euro | | | JPHQ | | | | Buy | | | | 208,093 | | | | 230,446 | | | | 12/18/19 | | | | 47 | | | | (870 | ) |
Euro | | | JPHQ | | | | Sell | | | | 413,651 | | | | 458,994 | | | | 12/18/19 | | | | 2,546 | | | | — | |
Indonesian Rupiah | | | JPHQ | | | | Buy | | | | 2,997,688,158 | | | | 210,534 | | | | 12/18/19 | | | | 1,618 | | | | — | |
Indonesian Rupiah | | | JPHQ | | | | Sell | | | | 14,319,101,885 | | | | 1,005,661 | | | | 12/18/19 | | | | — | | | | (7,730 | ) |
Mexican Peso | | | JPHQ | | | | Buy | | | | 4,278,916 | | | | 219,089 | | | | 12/18/19 | | | | — | | | | (1,008 | ) |
Polish Zloty | | | JPHQ | | | | Buy | | | | 1,279,683 | | | | 330,230 | | | | 12/18/19 | | | | 4 | | | | (3,421 | ) |
Polish Zloty | | | JPHQ | | | | Sell | | | | 2,024,076 | | | | 516,730 | | | | 12/18/19 | | | | — | | | | (190 | ) |
Russian Ruble | | | JPHQ | | | | Buy | | | | 45,307,608 | | | | 703,696 | | | | 12/18/19 | | | | 699 | | | | (1,959 | ) |
Russian Ruble | | | JPHQ | | | | Sell | | | | 137,078,715 | | | | 2,068,537 | | | | 12/18/19 | | | | — | | | | (56,689 | ) |
South African Rand | | | JPHQ | | | | Buy | | | | 3,038,931 | | | | 205,321 | | | | 12/18/19 | | | | 1,559 | | | | — | |
South African Rand | | | JPHQ | | | | Sell | | | | 16,311,880 | | | | 1,089,914 | | | | 12/18/19 | | | | — | | | | (20,543 | ) |
Turkish Lira | | | JPHQ | | | | Buy | | | | 1,195,530 | | | | 201,505 | | | | 12/18/19 | | | | 5,415 | | | | — | |
Brazilian Real | | | JPHQ | | | | Buy | | | | 2,590,067 | | | | 609,872 | | | | 1/03/20 | | | | 817 | | | | — | |
British Pound | | | JPHQ | | | | Sell | | | | 50,000 | | | | 62,749 | | | | 1/31/20 | | | | — | | | | (2,068 | ) |
Euro | | | JPHQ | | | | Sell | | | | 1,520,000 | | | | 1,692,429 | | | | 1/31/20 | | | | 12,061 | | | | (2,051 | ) |
Japanese Yen | | | JPHQ | | | | Sell | | | | 12,670,000 | | | | 118,325 | | | | 1/31/20 | | | | 2,007 | | | | — | |
| | | | | | | | | | | | | | | | | | | | | | | | |
Total Forward Exchange Contracts | | | $ | 55,868 | | | $ | (177,462 | ) |
| | | | | | | | | |
Net unrealized appreciation (depreciation) | | | | | | | $ | (121,594 | ) |
| | | | | | | | | | | | | |
aMay be comprised of multiple contracts with the same counterparty, currency and settlement date.
At November 30, 2019, the Fund had the following credit default swap contracts outstanding. See Note 1(e).
| | | | | | | | | | | | | | | | | | | | | | | | | | | | | | | | | | | | | | | | |
| Credit Default Swap Contracts | | | | | | | | | | | | | | | | |
| | | | | | | | | | |
| Description | | Periodic
Payment
Rate
Received
(Paid) | | | Payment
Frequency | | | | | | Maturity
Date | | | Notional
Amounta | | | | | | Value | | | Unamortized
Upfront
Payments
(Receipts) | | | Unrealized
Appreciation
(Depreciation) | | | Ratingb | |
| Centrally Cleared Swap Contracts | | | | | | | | | | | | | | | | | | | | | | |
| Contracts to Buy Protectionc | | | | | | | | | | | | | | | | | | | | | | |
| Single Name | | | | | | | | | | | | | | | | | | | |
Government of Mexico | | | (1.00)% | | | | Quarterly | | | | | | | | 6/20/23 | | | | 449,000 | | | | | | | $ | (5,987 | ) | | $ | (63 | ) | | $ | (5,924 | ) | | | | |
Government of Mexico | | | (1.00)% | | | | Quarterly | | | | | | | | 12/20/23 | | | | 417,000 | | | | | | | | (5,118 | ) | | | 4,899 | | | | (10,017 | ) | | | | |
Government of South Africa | | | (1.00)% | | | | Quarterly | | | | | | | | 6/20/22 | | | | 376,000 | | | | | | | | 2,002 | | | | 19,788 | | | | (17,786 | ) | | | | |
Government of South Africa | | | (1.00)% | | | | Quarterly | | | | | | | | 6/20/24 | | | | 900,000 | | | | | | | | 28,538 | | | | 39,510 | | | | (10,972 | ) | | | | |
Government of South Korea | | | (1.00)% | | | | Quarterly | | | | | | | | 6/20/24 | | | | 405,474 | | | | | | | | (13,571 | ) | | | (13,756 | ) | | | 185 | | | | | |
Government of Turkey | | | (1.00)% | | | | Quarterly | | | | | | | | 6/20/22 | | | | 6,000 | | | | | | | | 204 | | | | 316 | | | | (112 | ) | | | | |
Government of Turkey | | | (1.00)% | | | | Quarterly | | | | | | | | 6/20/24 | | | | 462,000 | | | | | | | | 39,148 | | | | 46,375 | | | | (7,227 | ) | | | | |
| Traded Index | | | | | | | | | | | | | | | | | | | |
CDX.NA.HY.25 | | | (5.00)% | | | | Quarterly | | | | | | | | 12/20/20 | | | | 1,357,800 | | | | | | | | (28,033 | ) | | | 13,578 | | | | (41,611 | ) | | | | |
CDX.NA.HY.32 | | | (5.00)% | | | | Quarterly | | | | | | | | 6/20/24 | | | | 1,762,200 | | | | | | | | (142,185 | ) | | | (104,621 | ) | | | (37,564 | ) | | | | |
| | | | |
| | | |
| 28 | | Semiannual Report | | franklintempleton.com |
FRANKLIN ALTERNATIVE STRATEGIES FUNDS
STATEMENT OF INVESTMENTS (UNAUDITED)
Franklin K2 Long Short Credit Fund(continued)
| | | | | | | | | | | | | | | | | | | | | | | | | | | | | | | | | | | | | | |
| Credit Default Swap Contracts(continued) | | | | | | | | | | | | | | | |
| | | | | | | | | | |
| Description | | Periodic
Payment
Rate
Received
(Paid) | | | Payment
Frequency | | | | | | Maturity
Date | | | Notional
Amounta | | | | | | Value | | | Unamortized
Upfront
Payments
(Receipts) | | | Unrealized
Appreciation
(Depreciation) | | | Ratingb |
| Centrally Cleared Swap Contracts(continued) | | | | | | | | | | | | | | | | | | | | | |
| Contracts to Sell Protectionc,d | | | | | | | | | | | | | | | | | | | | | |
| Single Name | | | | | | | | | | | | | | | | | | |
Government of South Africa | | | 1.00% | | | | Quarterly | | | | | | | | 12/20/22 | | | | 184,000 | | | | | | | $ | (1,705 | ) | | $ | (3,412 | ) | | $ | 1,707 | | | BB |
Government of Turkey | | | 1.00% | | | | Quarterly | | | | | | | | 12/20/22 | | | | 136,000 | | | | | | | | (6,194 | ) | | | (6,150 | ) | | | (44 | ) | | B+ |
| | | | | | | | | | | | | | | | | | | | | | | | | | | | | | |
Total Centrally Cleared Swap Contracts | | | | | | | | | | | | | | | | | | | $ | (132,901 | ) | | $ | (3,536 | ) | | $ | (129,365 | ) | | |
| | | | | | | | | | | | | | | | | | | | | | | | | | | | | | |
| OTC Swap Contracts | | | | | | | | | | | | | | | | | | | | | | | | |
| Contracts to Buy Protectionc | | | | | | | | | | | | | | | | | | | | | |
| Single Name | | | | | | | | | | | Counterparty | | | | | | | | | | | | | | | | | | | | | | | | | | | |
Altice Luxembourg S.A. | | | (5.00)% | | | | Quarterly | | | | BZWS | | | | 12/20/22 | | | | 18,000 | | | | EUR | | | | (2,296 | ) | | | 218 | | | | (2,514 | ) | | |
Altice Luxembourg S.A. | | | (5.00)% | | | | Quarterly | | | | BZWS | | | | 12/20/22 | | | | 74,000 | | | | EUR | | | | (9,441 | ) | | | 677 | | | | (10,118 | ) | | |
Altice Luxembourg S.A. | | | (5.00)% | | | | Quarterly | | | | GSCO | | | | 12/20/24 | | | | 132,000 | | | | EUR | | | | (17,278 | ) | | | (12,165 | ) | | | (5,113 | ) | | |
Altice Luxembourg S.A. | | | (5.00)% | | | | Quarterly | | | | JPHQ | | | | 12/20/22 | | | | 94,000 | | | | EUR | | | | (11,992 | ) | | | 1,417 | | | | (13,409 | ) | | |
CenturyLink Inc. | | | (1.00)% | | | | Quarterly | | | | BZWS | | | | 12/20/23 | | | | 63,000 | | | | | | | | 1,429 | | | | 5,611 | | | | (4,182 | ) | | |
CenturyLink Inc. | | | (1.00)% | | | | Quarterly | | | | BZWS | | | | 12/20/23 | | | | 63,000 | | | | | | | | 1,429 | | | | 5,665 | | | | (4,236 | ) | | |
CenturyLink Inc. | | | (1.00)% | | | | Quarterly | | | | CITI | | | | 12/20/23 | | | | 38,000 | | | | | | | | 862 | | | | 3,325 | | | | (2,463 | ) | | |
CenturyLink Inc. | | | (1.00)% | | | | Quarterly | | | | CITI | | | | 12/20/23 | | | | 63,000 | | | | | | | | 1,429 | | | | 5,707 | | | | (4,278 | ) | | |
CenturyLink Inc. | | | (1.00)% | | | | Quarterly | | | | GSCO | | | | 12/20/23 | | | | 63,000 | | | | | | | | 1,429 | | | | 5,555 | | | | (4,126 | ) | | |
CenturyLink Inc. | | | (1.00)% | | | | Quarterly | | | | JPHQ | | | | 12/20/23 | | | | 89,000 | | | | | | | | 2,019 | | | | 7,955 | | | | (5,936 | ) | | |
Dish DBS Corp. | | | (5.00)% | | | | Quarterly | | | | CITI | | | | 12/20/24 | | | | 365,000 | | | | | | | | (22,703 | ) | | | (2,037 | ) | | | (20,666 | ) | | |
Government of Italy | | | (1.00)% | | | | Quarterly | | | | BOFA | | | | 6/20/24 | | | | 233,000 | | | | | | | | 2,394 | | | | 2,226 | | | | 168 | | | |
Government of Mexico | | | (1.00)% | | | | Quarterly | | | | CITI | | | | 6/20/24 | | | | 301,000 | | | | | | | | (3,040 | ) | | | 1,504 | | | | (4,544 | ) | | |
Groupe Casino | | | (5.00)% | | | | Quarterly | | | | BZWS | | | | 12/20/24 | | | | 40,000 | | | | EUR | | | | 3,085 | | | | 3,631 | | | | (546 | ) | | |
Groupe Casino | | | (5.00)% | | | | Quarterly | | | | BZWS | | | | 12/20/24 | | | | 60,000 | | | | EUR | | | | 4,628 | | | | 5,777 | | | | (1,149 | ) | | |
Groupe Casino | | | (5.00)% | | | | Quarterly | | | | JPHQ | | | | 12/20/24 | | | | 55,000 | | | | EUR | | | | 4,243 | | | | 5,452 | | | | (1,209 | ) | | |
Hertz Corp. (The) | | | (5.00)% | | | | Quarterly | | | | BZWS | | | | 6/20/20 | | | | 62,000 | | | | | | | | (2,241 | ) | | | (87 | ) | | | (2,154 | ) | | |
Hertz Corp. (The) | | | (5.00)% | | | | Quarterly | | | | BZWS | | | | 12/20/21 | | | | 27,000 | | | | | | | | (2,615 | ) | | | 97 | | | | (2,712 | ) | | |
Hertz Corp. (The) | | | (5.00)% | | | | Quarterly | | | | BZWS | | | | 12/20/21 | | | | 68,000 | | | | | | | | (6,587 | ) | | | 609 | | | | (7,196 | ) | | |
Hertz Corp. (The) | | | (5.00)% | | | | Quarterly | | | | GSCO | | | | 6/20/20 | | | | 59,000 | | | | | | | | (2,133 | ) | | | — | | | | (2,133 | ) | | |
Hertz Corp. (The) | | | (5.00)% | | | | Quarterly | | | | GSCO | | | | 12/20/21 | | | | 68,000 | | | | | | | | (6,587 | ) | | | (989 | ) | | | (5,598 | ) | | |
Hertz Corp. (The) | | | (5.00)% | | | | Quarterly | | | | GSCO | | | | 12/20/21 | | | | 68,000 | | | | | | | | (6,587 | ) | | | 968 | | | | (7,555 | ) | | |
Hertz Corp. (The) | | | (5.00)% | | | | Quarterly | | | | GSCO | | | | 12/20/21 | | | | 68,000 | | | | | | | | (6,587 | ) | | | 1,087 | | | | (7,674 | ) | | |
Hertz Corp. (The) | | | (5.00)% | | | | Quarterly | | | | GSCO | | | | 12/20/21 | | | | 136,000 | | | | | | | | (13,174 | ) | | | 1,215 | | | | (14,389 | ) | | |
Hertz Corp. (The) | | | (5.00)% | | | | Quarterly | | | | GSCO | | | | 12/20/24 | | | | 280,000 | | | | | | | | (33,305 | ) | | | (25,637 | ) | | | (7,668 | ) | | |
Hertz Corp. (The) | | | (5.00)% | | | | Quarterly | | | | GSCO | | | | 12/20/24 | | | | 303,000 | | | | | | | | (31,109 | ) | | | (17,832 | ) | | | (13,277 | ) | | |
Intrum AB | | | (5.00)% | | | | Quarterly | | | | GSCO | | | | 12/20/24 | | | | 169,000 | | | | EUR | | | | (21,387 | ) | | | (16,971 | ) | | | (4,416 | ) | | |
Itochu Corp. | | | (1.00)% | | | | Quarterly | | | | GSCO | | | | 6/20/22 | | | | 17,300,000 | | | | JPY | | | | (3,822 | ) | | | (2,642 | ) | | | (1,180 | ) | | |
Itochu Corp. | | | (1.00)% | | | | Quarterly | | | | JPHQ | | | | 6/20/22 | | | | 4,307,000 | | | | JPY | | | | (952 | ) | | | (679 | ) | | | (273 | ) | | |
Jaguar Land Rover Automotive PLC | | | (5.00)% | | | | Quarterly | | | | GSCO | | | | 12/20/24 | | | | 18,000 | | | | EUR | | | | (266 | ) | | | 166 | | | | (432 | ) | | |
Jaguar Land Rover Automotive PLC | | | (5.00)% | | | | Quarterly | | | | GSCO | | | | 12/20/24 | | | | 26,000 | | | | EUR | | | | (385 | ) | | | 240 | | | | (625 | ) | | |
JFE Holdings Inc. | | | (1.00)% | | | | Quarterly | | | | GSCO | | | | 6/20/22 | | | | 5,746,000 | | | | JPY | | | | (1,194 | ) | | | (905 | ) | | | (289 | ) | | |
JFE Holdings Inc. | | | (1.00)% | | | | Quarterly | | | | JPHQ | | | | 6/20/22 | | | | 3,802,000 | | | | JPY | | | | (790 | ) | | | (608 | ) | | | (182 | ) | | |
K. Hovnanian Enterprises Inc. | | | (5.00)% | | | | Quarterly | | | | BZWS | | | | 6/20/24 | | | | 38,000 | | | | | | | | 9,542 | | | | 14,696 | | | | (5,154 | ) | | |
K. Hovnanian Enterprises Inc. | | | (5.00)% | | | | Quarterly | | | | BZWS | | | | 12/20/24 | | | | 113,000 | | | | | | | | 30,792 | | | | 37,830 | | | | (7,038 | ) | | |
K. Hovnanian Enterprises Inc. | | | (5.00)% | | | | Quarterly | | | | GSCO | | | | 9/20/24 | | | | 68,000 | | | | | | | | 17,834 | | | | 24,417 | | | | (6,583 | ) | | |
K. Hovnanian Enterprises Inc. | | | (5.00)% | | | | Quarterly | | | | GSCO | | | | 12/20/24 | | | | 57,000 | | | | | | | | 15,532 | | | | 19,082 | | | | (3,550 | ) | | |
K. Hovnanian Enterprises Inc. | | | (5.00)% | | | | Quarterly | | | | MSCO | | | | 12/20/24 | | | | 34,000 | | | | | | | | 9,265 | | | | 12,553 | | | | (3,288 | ) | | |
| | | | | | |
| | | |
| franklintempleton.com | | Semiannual Report | | | 29 | |
FRANKLIN ALTERNATIVE STRATEGIES FUNDS
STATEMENT OF INVESTMENTS (UNAUDITED)
Franklin K2 Long Short Credit Fund(continued)
| | | | | | | | | | | | | | | | | | | | | | | | | | | | | | | | | | | | | | | | |
| Credit Default Swap Contracts(continued) | | | | | | | | | | | | | | | | |
| | | | | | | | | |
| Description | | Periodic
Payment
Rate
Received
(Paid) | | | Payment
Frequency | | | Counterparty | | | Maturity
Date | | | Notional
Amounta | | | Value | | | Unamortized
Upfront
Payments
(Receipts) | | | Unrealized
Appreciation
(Depreciation) | | | Ratingb | |
| OTC Swap Contracts(continued) | | | | | | | | | | | | | | | | | | | | | | | | | |
| Contracts to Buy Protectionc(continued) | | | | | | | | | | | | | | | | | | | | | | |
| Single Name(continued) | | | | | | | | | | | | | | | | | | | |
K. Hovnanian Enterprises Inc. | | | (5.00)% | | | | Quarterly | | | | MSCS | | | | 12/20/23 | | | | 21,000 | | | | | | | $ | 4,749 | | | $ | 5,393 | | | $ | (644 | ) | | | | |
Kimco Realty Corp. | | | (1.00)% | | | | Quarterly | | | | JPHQ | | | | 6/20/24 | | | | 121,000 | | | | | | | | (877 | ) | | | 252 | | | | (1,129 | ) | | | | |
Kohl’s Corp. | | | (1.00)% | | | | Quarterly | | | | BOFA | | | | 6/20/24 | | | | 24,000 | | | | | | | | 149 | | | | 697 | | | | (548 | ) | | | | |
Kohl’s Corp. | | | (1.00)% | | | | Quarterly | | | | CITI | | | | 6/20/24 | | | | 24,000 | | | | | | | | 149 | | | | 716 | | | | (567 | ) | | | | |
Kohl’s Corp. | | | (1.00)% | | | | Quarterly | | | | GSCO | | | | 6/20/24 | | | | 913,000 | | | | | | | | 5,662 | | | | 9,446 | | | | (3,784 | ) | | | | |
Kohl’s Corp. | | | (1.00)% | | | | Quarterly | | | | JPHQ | | | | 6/20/24 | | | | 24,000 | | | | | | | | 149 | | | | 794 | | | | (645 | ) | | | | |
Kohl’s Corp. | | | (1.00)% | | | | Quarterly | | | | MSCS | | | | 12/20/24 | | | | 24,000 | | | | | | | | 149 | | | | 827 | | | | (678 | ) | | | | |
Lloyds Bank PLC | | | (1.00)% | | | | Quarterly | | | | BOFA | | | | 12/20/22 | | | | 196,000 | | | | EUR | | | | (4,079 | ) | | | (1,496 | ) | | | (2,583 | ) | | | | |
Lloyds Bank PLC | | | (1.00)% | | | | Quarterly | | | | GSCO | | | | 12/20/23 | | | | 210,000 | | | | EUR | | | | (4,328 | ) | | | 289 | | | | (4,617 | ) | | | | |
Lloyds Bank PLC | | | (1.00)% | | | | Quarterly | | | | GSCO | | | | 6/20/24 | | | | 127,000 | | | | EUR | | | | (4,655 | ) | | | 902 | | | | (5,557 | ) | | | | |
Lloyds Bank PLC | | | (1.00)% | | | | Quarterly | | | | JPHQ | | | | 12/20/22 | | | | 196,000 | | | | EUR | | | | (4,079 | ) | | | (1,628 | ) | | | (2,451 | ) | | | | |
Lloyds Bank PLC | | | (1.00)% | | | | Quarterly | | | | JPHQ | | | | 12/20/23 | | | | 67,000 | | | | EUR | | | | (1,381 | ) | | | 898 | | | | (2,279 | ) | | | | |
Lloyds Bank PLC | | | (1.00)% | | | | Quarterly | | | | JPHQ | | | | 12/20/24 | | | | 121,000 | | | | EUR | | | | (126 | ) | | | 3,677 | | | | (3,803 | ) | | | | |
Marubeni Corp. | | | (1.00)% | | | | Quarterly | | | | GSCO | | | | 6/20/22 | | | | 27,269,000 | | | | JPY | | | | (5,603 | ) | | | (3,446 | ) | | | (2,157 | ) | | | | |
Marubeni Corp. | | | (1.00)% | | | | Quarterly | | | | JPHQ | | | | 6/20/22 | | | | 6,291,000 | | | | JPY | | | | (1,293 | ) | | | (840 | ) | | | (453 | ) | | | | |
MBIA Inc. | | | (5.00)% | | | | Quarterly | | | | JPHQ | | | | 6/20/21 | | | | 269,000 | | | | | | | | (22,008 | ) | | | (13,290 | ) | | | (8,718 | ) | | | | |
MBIA Inc. | | | (5.00)% | | | | Quarterly | | | | JPHQ | | | | 12/20/24 | | | | 174,000 | | | | | | | | (33,284 | ) | | | (24,806 | ) | | | (8,478 | ) | | | | |
Mitsui O.S.K. Lines Ltd. | | | (1.00)% | | | | Quarterly | | | | JPHQ | | | | 6/20/22 | | | | 9,678,000 | | | | JPY | | | | (1,543 | ) | | | (380 | ) | | | (1,163 | ) | | | | |
Mitsui O.S.K. Lines Ltd. | | | (1.00)% | | | | Quarterly | | | | JPHQ | | | | 6/20/22 | | | | 3,618,000 | | | | JPY | | | | (577 | ) | | | (142 | ) | | | (435 | ) | | | | |
Nordstrom Inc. | | | (1.00)% | | | | Quarterly | | | | GSCO | | | | 6/20/24 | | | | 4,000 | | | | | | | | 24 | | | | 191 | | | | (167 | ) | | | | |
Nordstrom Inc. | | | (1.00)% | | | | Quarterly | | | | GSCO | | | | 6/20/24 | | | | 22,000 | | | | | | | | 130 | | | | 1,050 | | | | (920 | ) | | | | |
Nordstrom Inc. | | | (1.00)% | | | | Quarterly | | | | GSCO | | | | 6/20/24 | | | | 60,800 | | | | | | | | 360 | | | | 3,098 | | | | (2,738 | ) | | | | |
NRG Energy Inc. | | | (5.00)% | | | | Quarterly | | | | GSCO | | | | 6/20/24 | | | | 24,000 | | | | | | | | (4,754 | ) | | | (3,810 | ) | | | (944 | ) | | | | |
Simon Property Group LP | | | (1.00)% | | | | Quarterly | | | | JPHQ | | | | 12/20/24 | | | | 542,000 | | | | | | | | (16,066 | ) | | | (13,019 | ) | | | (3,047 | ) | | | | |
Softbank Group Corp. | | | (1.00)% | | | | Quarterly | | | | BZWS | | | | 12/20/23 | | | | 12,747,000 | | | | JPY | | | | 3,487 | | | | 4,547 | | | | (1,060 | ) | | | | |
Softbank Group Corp. | | | (1.00)% | | | | Quarterly | | | | BZWS | | | | 6/20/24 | | | | 6,374,000 | | | | JPY | | | | 2,516 | | | | 1,854 | | | | 662 | | | | | |
Softbank Group Corp. | | | (1.00)% | | | | Quarterly | | | | BZWS | | | | 6/20/24 | | | | 12,747,000 | | | | JPY | | | | 5,032 | | | | 4,531 | | | | 501 | | | | | |
Softbank Group Corp. | | | (1.00)% | | | | Quarterly | | | | BZWS | | | | 6/20/24 | | | | 25,494,000 | | | | JPY | | | | 10,065 | | | | 7,450 | | | | 2,615 | | | | | |
Softbank Group Corp. | | | (1.00)% | | | | Quarterly | | | | CITI | | | | 6/20/24 | | | | 12,746,000 | | | | JPY | | | | 5,032 | | | | 3,978 | | | | 1,054 | | | | | |
Softbank Group Corp. | | | (1.00)% | | | | Quarterly | | | | GSCO | | | | 12/20/23 | | | | 12,747,000 | | | | JPY | | | | 3,487 | | | | 4,279 | | | | (792 | ) | | | | |
Softbank Group Corp. | | | (1.00)% | | | | Quarterly | | | | GSCO | | | | 12/20/23 | | | | 12,747,000 | | | | JPY | | | | 3,487 | | | | 4,459 | | | | (972 | ) | | | | |
Staples Inc. | | | (5.00)% | | | | Quarterly | | | | GSCO | | | | 6/20/25 | | | | 361,000 | | | | | | | | (5,296 | ) | | | 9,847 | | | | (15,143 | ) | | | | |
Telecom Italia SpA | | | (1.00)% | | | | Quarterly | | | | BZWS | | | | 12/20/24 | | | | 116,000 | | | | EUR | | | | 2,378 | | | | 4,899 | | | | (2,521 | ) | | | | |
Transocean Inc. | | | (5.00)% | | | | Quarterly | | | | BZWS | | | | 6/20/22 | | | | 2,000 | | | | | | | | 48 | | | | 40 | | | | 8 | | | | | |
Transocean Inc. | | | (5.00)% | | | | Quarterly | | | | GSCO | | | | 6/20/22 | | | | 33,000 | | | | | | | | 784 | | | | 826 | | | | (42 | ) | | | | |
Transocean Inc. | | | (5.00)% | | | | Quarterly | | | | GSCO | | | | 6/20/23 | | | | 98,000 | | | | | | | | 7,078 | | | | (2,328 | ) | | | 9,406 | | | | | |
Transocean Inc. | | | (5.00)% | | | | Quarterly | | | | GSCO | | | | 6/20/23 | | | | 109,000 | | | | | | | | 7,873 | | | | (1,844 | ) | | | 9,717 | | | | | |
Transocean Inc. | | | (5.00)% | | | | Quarterly | | | | GSCO | | | | 6/20/23 | | | | 34,000 | | | | | | | | 2,456 | | | | (1,583 | ) | | | 4,039 | | | | | |
Transocean Inc. | | | (5.00)% | | | | Quarterly | | | | GSCO | | | | 12/20/24 | | | | 239,000 | | | | | | | | 32,354 | | | | 20,670 | | | | 11,684 | | | | | |
Transocean Inc. | | | (5.00)% | | | | Quarterly | | | | JPHQ | | | | 12/20/24 | | | | 4,000 | | | | | | | | 541 | | | | 677 | | | | (136 | ) | | | | |
Transocean Inc. | | | (5.00)% | | | | Quarterly | | | | JPHQ | | | | 12/20/24 | | | | 138,000 | | | | | | | | 18,681 | | | | 23,397 | | | | (4,716 | ) | | | | |
Transocean Inc. | | | (5.00)% | | | | Quarterly | | | | MSCO | | | | 12/20/24 | | | | 20,000 | | | | | | | | 2,707 | | | | 3,195 | | | | (488 | ) | | | | |
| Contracts to Sell Protectionc,d | | | | | | | | | | | | | | | | | | | | | | |
| Single Name | | | | | | | | | | | | | | | | | | | |
CMA CGM S.A. | | | 5.00% | | | | Quarterly | | | | BZWS | | | | 6/20/20 | | | | 58,000 | | | | EUR | | | | (1,088 | ) | | | (4,063 | ) | | | 2,975 | | | | B+ | |
CMA CGM S.A. | | | 5.00% | | | | Quarterly | | | | GSCO | | | | 6/20/20 | | | | 50,000 | | | | EUR | | | | (938 | ) | | | (2,684 | ) | | | 1,746 | | | | B+ | |
K. Hovnanian Enterprises Inc. | | | 5.00% | | | | Quarterly | | | | BZWS | | | | 12/20/23 | | | | 9,000 | | | | | | | | (2,035 | ) | | | (3,795 | ) | | | 1,760 | | | | CC | |
| | | | |
| | | |
| 30 | | Semiannual Report | | franklintempleton.com |
FRANKLIN ALTERNATIVE STRATEGIES FUNDS
STATEMENT OF INVESTMENTS (UNAUDITED)
Franklin K2 Long Short Credit Fund(continued)
| | | | | | | | | | | | | | | | | | | | | | | | | | | | | | | | | | | | | | | | |
| Credit Default Swap Contracts(continued) | | | | | | | | | | | | | | | | |
| | | | | | | | | |
| Description | | Periodic
Payment
Rate
Received
(Paid) | | | Payment
Frequency | | | Counterparty | | | Maturity
Date | | | Notional
Amounta | | | Value | | | Unamortized
Upfront
Payments
(Receipts) | | | Unrealized
Appreciation
(Depreciation) | | | Ratingb | |
| OTC Swap Contracts(continued) | | | | | | | | | | | | | | | | | | | | | | | | | |
| Contracts to Sell Protectionc,d(continued) | | | | | | | | | | | | | | | | | | | | | | |
| Single Name(continued) | | | | | | | | | | | | | | | | | | | |
K. Hovnanian Enterprises Inc. | | | 5.00% | | | | Quarterly | | | | GSCO | | | | 12/20/23 | | | | 12,000 | | | | | | | $ | (2,714 | ) | | $ | (4,261 | ) | | $ | 1,547 | | | | CC | |
| | | | | | | | | | | | | | | | | | | | | | | | | | | | | | | | |
Total OTC Swap Contracts | | | | | | | | | | | $ | (97,756 | ) | | $ | 126,592 | | | $ | (224,348 | ) | | | | |
| | | | | | | | | | | | | | | | | | | | | | | | | | | | | | | | |
Total Credit Default Swap Contracts | | | | | | | | | | | $ | (230,657 | ) | | $ | 123,056 | | | $ | (353,713 | ) | | | | |
| | | | | | | | | | | | | | | | | | | | | | | | | | | | | | | | |
aIn U.S. dollars unless otherwise indicated. For contracts to sell protection, the notional amount is equal to the maximum potential amount of the future payments and no recourse provisions have been entered into in association with the contracts.
bBased on Standard and Poor’s (S&P) Rating for single name swaps.
cPerformance triggers for settlement of contract include default, bankruptcy or restructuring for single name swaps and failure to pay or bankruptcy of the underlying securities for traded index swaps.
dThe Fund enters contracts to sell protection to create a long credit position.
At November 30, 2019, the Fund had the following interest rate swap contracts outstanding. See Note 1(e).
| | | | | | | | | | | | | | | | |
| Interest Rate Swap Contracts | | | | | | | | | | | | |
| | | | |
| Description | | Payment
Frequency | | | Maturity
Date | | | Notional
Amount* | | | Value/Unrealized
Appreciation
(Depreciation) | |
| Centrally Cleared Swap Contracts | | | | | | | | | | | | | | | | |
Receive Floating rate 3 MonthUSD-LIBOR
Pay Fixed rate 1.75% | | | Semi-Annually | | | | 3/21/20 | | | | 1,012,000 | | | $ | (6,027 | ) |
Receive Floating rate 3 MonthUSD-LIBOR
Pay Fixed rate 1.75% | | | Semi-Annually | | | | 6/20/20 | | | | 1,500,000 | | | | (30,668 | ) |
Receive Floating rate 3 MonthUSD-LIBOR
Pay Fixed rate 1.75% | | | Semi-Annually | | | | 9/18/21 | | | | 1,500,000 | | | | (56 | ) |
Receive Fixed 5.88%
Pay Floating BZDIOVRA Index | | | Annually | | | | 1/02/23 | | | | 3,144,633 | BRL | | | 2,502 | |
Receive Fixed 2.81%
Pay Floating CFETS China Fixing Repo 7 Day rate | | | Quarterly | | | | 12/18/24 | | | | 3,332,157 | CNY | | | (2,425 | ) |
Receive Fixed 2.90%
Pay Floating CFETS China Fixing Repo 7 Day rate | | | Quarterly | | | | 12/18/24 | | | | 2,247,088 | CNY | | | (358 | ) |
Receive Fixed 2.90%
Pay Floating CFETS China Fixing Repo 7 Day rate | | | Quarterly | | | | 12/18/24 | | | | 2,248,189 | CNY | | | (395 | ) |
Receive Floating rate 3 MonthUSD-LIBOR
Pay Fixed rate 2.25% | | | Semi-Annually | | | | 6/20/28 | | | | 1,100,000 | | | | (127,203 | ) |
Receive Floating rate 3 MonthUSD-LIBOR
Pay Fixed rate 1.68% | | | Semi-Annually | | | | 10/22/29 | | | | 800,000 | | | | 1,414 | |
Receive Floating rate 6 MonthGBP-LIBOR
Pay Fixed rate 0.86% | | | Semi-Annually | | | | 3/18/70 | | | | 361,637 | GBP | | | 22,101 | |
| | | | | | | | | | | | | | | | |
Total Interest Rate Swap Contracts | | | $ | (141,115 | ) |
| | | | | | | | | | | | | | | | |
*In U.S. dollars unless otherwise indicated.
| | | | | | |
| | | |
| franklintempleton.com | | Semiannual Report | | | 31 | |
FRANKLIN ALTERNATIVE STRATEGIES FUNDS
STATEMENT OF INVESTMENTS (UNAUDITED)
Franklin K2 Long Short Credit Fund(continued)
At November 30, 2019, the Fund had the following total return swap contracts outstanding. See Note 1(e).
| | | | | | | | | | | | | | | | | | | | | | |
| Total Return Swap Contracts | | | | |
| | | | | | |
| Underlying Instrument | | Financing Rate | | Payment
Frequency | | | Counterparty | | | Maturity
Date | | | Notional
Value | | | Value/Unrealized
Appreciation
(Depreciation) | |
| OTC Swap Contracts | | | | | | | | | | | | | | | | | | | | | | |
| Equity Contracts – Longa | | | | | | | | | | | | | | | | | | | | | | |
Clearway Energy Inc. | | 1-Month LIBOR + 0.40% | | | Monthly | | | | GSCO | | | | 10/07/20 | | | $ | 6,290 | | | $ | 305 | |
Clearway Energy Inc. | | 1-Month LIBOR + 0.40% | | | Monthly | | | | GSCO | | | | 10/09/20 | | | | 809 | | | | 33 | |
Clearway Energy Inc. | | 1-Month LIBOR + 0.40% | | | Monthly | | | | GSCO | | | | 10/14/20 | | | | 2,422 | | | | 121 | |
Clearway Energy Inc. | | 1-Month LIBOR + 0.40% | | | Monthly | | | | GSCO | | | | 10/15/20 | | | | 1,766 | | | | 90 | |
Clearway Energy Inc. | | 1-Month LIBOR + 0.40% | | | Monthly | | | | GSCO | | | | 10/15/20 | | | | 347 | | | | 16 | |
Clearway Energy Inc. | | 1-Month LIBOR + 0.40% | | | Monthly | | | | GSCO | | | | 10/19/20 | | | | 1,424 | | | | 68 | |
Clearway Energy Inc. | | 1-Month LIBOR + 0.40% | | | Monthly | | | | GSCO | | | | 10/20/20 | | | | 13,238 | | | | 529 | |
Clearway Energy Inc. | | 1-Month LIBOR + 0.40% | | | Monthly | | | | GSCO | | | | 10/21/20 | | | | 1,301 | | | | 19 | |
Clearway Energy Inc. | | 1-Month LIBOR + 0.40% | | | Monthly | | | | GSCO | | | | 10/21/20 | | | | 2,199 | | | | 77 | |
Clearway Energy Inc. | | 1-Month LIBOR + 0.40% | | | Monthly | | | | GSCO | | | | 10/23/20 | | | | 988 | | | | 6 | |
Clearway Energy Inc. | | 1-Month LIBOR + 0.40% | | | Monthly | | | | GSCO | | | | 10/26/20 | | | | 365 | | | | (2 | ) |
Clearway Energy Inc. | | 1-Month LIBOR + 0.40% | | | Monthly | | | | GSCO | | | | 10/27/20 | | | | 1,540 | | | | (10 | ) |
Clearway Energy Inc. | | 1-Month LIBOR + 0.40% | | | Monthly | | | | GSCO | | | | 10/28/20 | | | | 1,881 | | | | (5 | ) |
Clearway Energy Inc. | | 1-Month LIBOR + 0.40% | | | Monthly | | | | GSCO | | | | 11/03/20 | | | | 18,876 | | | | 1,939 | |
Energy Transfer Equity LP | | 1-Month LIBOR + 0.65% | | | Monthly | | | | CITI | | | | 6/22/20 | | | | 396,589 | | | | (71,706 | ) |
Energy Transfer Equity LP | | 1-Month LIBOR + 0.80% | | | Monthly | | | | GSCO | | | | 11/17/20 | | | | 99,000 | | | | 4,813 | |
Energy Transfer Equity LP | | 1-Month LIBOR + 0.50% | | | Monthly | | | | BOFA | | | | 12/31/20 | | | | 344,263 | | | | (8,960 | ) |
| | | | | | | | | | | | | | | | | | | | | | |
| | | | | | | | | | | | | | | | | | | | | (72,667 | ) |
| | | | | | | | | | | | | | | | | | | | | | |
| Interest Rate Contracts – Longa | | | | | | | | | | | | | | | | | | | | | | |
Egyptian Treasury Bill | | 3-Month LIBOR + 0.40% | | | Monthly | | | | DBAB | | | | 5/12/20 | | | | 126,359 | | | | 1,540 | |
Egyptian Treasury Bill | | 3-Month LIBOR + 0.40% | | | Monthly | | | | GSCO | | | | 5/12/20 | | | | 123,493 | | | | 1,499 | |
Government of Indonesia | | 3-Month LIBOR + 0.60% | | | Monthly | | | | BOFA | | | | 4/15/20 | | | | 437,914 | | | | 2,654 | |
Government of Indonesia | | 3-Month LIBOR + 0.60% | | | Quarterly | | | | BOFA | | | | 6/22/20 | | | | 54,205 | | | | 2,415 | |
Government of Indonesia | | 3-Month LIBOR + 0.60% | | | Quarterly | | | | DBAB | | | | 5/15/24 | | | | 73,343 | | | | 3,248 | |
Government of Indonesia | | 3-Month LIBOR + 0.60% | | | Monthly | | | | DBAB | | | | 6/15/32 | | | | 450,326 | | | | 7,641 | |
Government of Indonesia | | 3-Month LIBOR + 0.60% | | | Monthly | | | | DBAB | | | | 5/15/48 | | | | 218,570 | | | | (1,215 | ) |
| | | | | | | | | | | | | | | | | | | | | | |
| | | | | | | | | | | | | | | | | | | | | 17,782 | |
| | | | | | | | | | | | | | | | | | | | | | |
Total Total Return Swap Contracts | | | | | | | $ | (54,885 | ) |
| | | | | | | | | | | | | | | | | | | | | | |
aThe Fund receives the total return on the underlying instrument and pays a variable financing rate.
See Note 10 regarding other derivative information.
See Abbreviations on page 51.
| | | | |
| | | |
| 32 | | Semiannual Report | The accompanying notes are an integral part of these financial statements. | | franklintempleton.com |
FRANKLIN ALTERNATIVE STRATEGIES FUNDS
FINANCIAL STATEMENTS
Statement of Assets and Liabilities
November 30, 2019 (unaudited)
Franklin K2 Long Short Credit Fund
| | | | |
| |
Assets: | | | | |
Investments in securities: | | | | |
Cost – Unaffiliated issuers | | $ | 117,608,905 | |
Cost – Unaffiliated repurchase agreements | | | 6,982,216 | |
| | | | |
Value – Unaffiliated issuers | | $ | 119,817,470 | |
Value – Unaffiliated repurchase agreements | | | 6,982,216 | |
Cash | | | 686,388 | |
Restricted cash for OTC derivatives (Note 1f) | | | 50,000 | |
Foreign currency, at value (cost $366,520) | | | 450,282 | |
Receivables: | | | | |
Investment securities sold | | | 2,549,575 | |
Capital shares sold | | | 182,603 | |
Dividends and interest | | | 504,666 | |
Affiliates | | | 10,430 | |
Deposits with brokers for: | | | | |
Securities sold short | | | 10,609,124 | |
OTC derivative contracts | | | 853,413 | |
Futures contracts | | | 15,300 | |
Centrally cleared swap contracts | | | 403,430 | |
Due from brokers | | | 400,800 | |
Variation margin on futures contracts | | | 666 | |
Variation margin on centrally cleared swap contracts | | | 5,611 | |
OTC swap contracts (upfront payments $312,527) | | | 290,559 | |
Unrealized appreciation on OTC forward exchange contracts | | | 55,868 | |
Unrealized appreciation on OTC swap contracts | | | 74,895 | |
Unrealized appreciation on unfunded loan commitments (Note 8) | | | 29,161 | |
Other assets | | | 24 | |
| | | | |
Total assets | | | 143,972,481 | |
| | | | |
Liabilities: | | | | |
Payables: | | | | |
Investment securities purchased | | | 5,460,073 | |
Capital shares redeemed | | | 23,008 | |
Management fees | | | 147,163 | |
Distribution fees | | | 21,139 | |
Deposits from brokers for: | | | | |
OTC derivative contracts | | | 50,000 | |
Due to brokers | | | 156,846 | |
OTC swap contracts (upfront receipts $192,257) | | | 163,967 | |
Securities sold short, at value (proceeds $10,852,458) | | | 10,748,382 | |
Unrealized depreciation on OTC forward exchange contracts | | | 177,462 | |
Unrealized depreciation on OTC swap contracts | | | 354,128 | |
Accrued expenses and other liabilities | | | 116,405 | |
| | | | |
Total liabilities | | | 17,418,573 | |
| | | | |
Net assets, at value | | $ | 126,553,908 | |
| | | | |
Net assets consist of: | | | | |
Paid-in capital | | $ | 122,010,040 | |
Total distributable earnings (loss) | | | 4,543,868 | |
| | | | |
Net assets, at value | | $ | 126,553,908 | |
| | | | |
| | | | | | |
| | | |
| franklintempleton.com | | The accompanying notes are an integral part of these financial statements. | Semiannual Report | | | 33 | |
FRANKLIN ALTERNATIVE STRATEGIES FUNDS
FINANCIAL STATEMENTS
Statement of Assets and Liabilities(continued)
November 30, 2019 (unaudited)
Franklin K2 Long Short Credit Fund
| | | | |
| |
Class A: | | | | |
Net assets, at value | | | $30,651,297 | |
| | | | |
Shares outstanding | | | 2,895,637 | |
| | | | |
Net asset value per sharea | | | $10.59 | |
| | | | |
Maximum offering price per share (net asset value per share ÷ 94.50%) | | | $11.20 | |
| | | | |
Class C: | | | | |
Net assets, at value | | | $2,776,324 | |
| | | | |
Shares outstanding | | | 268,086 | |
| | | | |
Net asset value and maximum offering price per sharea | | | $10.36 | |
| | | | |
Class R: | | | | |
Net assets, at value | | | $216,115 | |
| | | | |
Shares outstanding | | | 20,634 | |
| | | | |
Net asset value and maximum offering price per share | | | $10.47 | |
| | | | |
Class R6: | | | | |
Net assets, at value | | | $469,331 | |
| | | | |
Shares outstanding | | | 44,275 | |
| | | | |
Net asset value and maximum offering price per share | | | $10.60 | |
| | | | |
Advisor Class: | | | | |
Net assets, at value | | | $92,440,841 | |
| | | | |
Shares outstanding | | | 8,716,400 | |
| | | | |
Net asset value and maximum offering price per share | | | $10.61 | |
| | | | |
aRedemption price is equal to net asset value less contingent deferred sales charges, if applicable.
| | | | |
| | | |
| 34 | | Semiannual Report | The accompanying notes are an integral part of these financial statements. | | franklintempleton.com |
FRANKLIN ALTERNATIVE STRATEGIES FUNDS
FINANCIAL STATEMENTS
Statement of Operations
for the six months ended November 30, 2019 (unaudited)
Franklin K2 Long Short Credit Fund
| | | | |
| |
Investment income: | | | | |
Dividends: | | | | |
Unaffiliated issuers | | $ | 300,347 | |
Interest: | | | | |
Unaffiliated issuers | | | 2,908,601 | |
| | | | |
Total investment income | | | 3,208,948 | |
| | | | |
Expenses: | | | | |
Management fees (Note 3a) | | | 1,162,483 | |
Distribution fees: (Note 3c) | | | | |
Class A | | | 42,858 | |
Class C | | | 14,363 | |
Class R | | | 484 | |
Transfer agent fees: (Note 3e) | | | | |
Class A | | | 12,718 | |
Class C | | | 1,239 | |
Class R | | | 84 | |
Class R6 | | | 260 | |
Advisor Class | | | 38,737 | |
Custodian fees (Note 4) . | | | 36,892 | |
Reports to shareholders | | | 19,161 | |
Registration and filing fees | | | 43,221 | |
Professional fees | | | 79,025 | |
Trustees’ fees and expenses | | | 14,979 | |
Dividends and interest on securities sold short | | | 308,590 | |
Security borrowing fees | | | 47,377 | |
Other | | | 34,008 | |
| | | | |
Total expenses | | | 1,856,479 | |
Expense reductions (Note 4) | | | (21,111 | ) |
Expenses waived/paid by affiliates (Note 3f) | | | (228,686 | ) |
| | | | |
Net expenses | | | 1,606,682 | |
| | | | |
Net investment income | | | 1,602,266 | |
| | | | |
Realized and unrealized gains (losses): | | | | |
Net realized gain (loss) from: | | | | |
Investments: | | | | |
Unaffiliated issuers | | | (23,500 | ) |
Written options | | | (44,499 | ) |
Foreign currency transactions | | | (44,361 | ) |
Forward exchange contracts | | | 50,064 | |
Futures contracts | | | (62,683 | ) |
Securities sold short | | | 949,376 | |
Swap contracts | | | (25,811 | ) |
| | | | |
Net realized gain (loss) | | | 798,586 | |
| | | | |
Net change in unrealized appreciation (depreciation) on: | | | | |
Investments: | | | | |
Unaffiliated issuers | | | (55,996 | ) |
Translation of other assets and liabilities denominated in foreign currencies | | | (67,856 | ) |
Forward exchange contracts | | | (105,712 | ) |
Written options | | | 7,025 | |
Futures contracts | | | (711 | ) |
Securities sold short | | | (246,771 | ) |
Swap contracts | | | (302,865 | ) |
| | | | |
Net change in unrealized appreciation (depreciation) | | | (772,886 | ) |
| | | | |
Net realized and unrealized gain (loss) | | | 25,700 | |
| | | | |
Net increase (decrease) in net assets resulting from operations | | $ | 1,627,966 | |
| | | | |
| | | | | | |
| | | |
| franklintempleton.com | | The accompanying notes are an integral part of these financial statements. | Semiannual Report | | | 35 | |
FRANKLIN ALTERNATIVE STRATEGIES FUNDS
FINANCIAL STATEMENTS
Statements of Changes in Net Assets
Franklin K2 Long Short Credit Fund
| | | | | | | | |
| | |
| | | Six Months Ended
November 30, 2019
(unaudited) | | | Year Ended
May 31, 2019 | |
Increase (decrease) in net assets: | | | | | | | | |
Operations: | | | | | | | | |
Net investment income | | $ | 1,602,266 | | | $ | 3,762,777 | |
Net realized gain (loss) | | | 798,586 | | | | 306,833 | |
Net change in unrealized appreciation (depreciation) | | | (772,886 | ) | | | (199,299 | ) |
| | | | |
Net increase (decrease) in net assets resulting from operations | | | 1,627,966 | | | | 3,870,311 | |
| | | | |
Distributions to shareholders: | | | | | | | | |
Class A | | | — | | | | (1,424,776 | ) |
Class C | | | — | | | | (100,011 | ) |
Class R | | | — | | | | (5,804 | ) |
Class R6 | | | — | | | | (7,008 | ) |
Advisor Class | | | — | | | | (2,656,330 | ) |
| | | | |
Total distributions to shareholders | | | — | | | | (4,193,929 | ) |
| | | | |
Capital share transactions: (Note 2) | | | | | | | | |
Class A | | | 2,428,906 | | | | (17,059,204 | ) |
Class C | | | (142,238 | ) | | | 409,512 | |
Class R | | | 47,679 | | | | 5,307 | |
Class R6 | | | 231,608 | | | | 221,435 | |
Advisor Class | | | 4,328,957 | | | | 41,498,540 | |
| | | | |
Total capital share transactions | | | 6,894,912 | | | | 25,075,590 | |
| | | | |
Net increase (decrease) in net assets | | | 8,522,878 | | | | 24,751,972 | |
Net assets: | | | | | | | | |
Beginning of period | | | 118,031,030 | | | | 93,279,058 | |
| | | | |
End of period | | $ | 126,553,908 | | | $ | 118,031,030 | |
| | | | |
| | | | |
| | | |
| 36 | | Semiannual Report | The accompanying notes are an integral part of these financial statements. | | franklintempleton.com |
FRANKLIN ALTERNATIVE STRATEGIES FUNDS
FRANKLIN K2 LONG SHORT CREDIT FUND
Notes to Financial Statements (unaudited)
1. Organization and Significant Accounting Policies
Franklin Alternative Strategies Funds (Trust) is registered under the Investment Company Act of 1940 (1940 Act) as anopen-end management investment company, consisting of two separate funds and applies the specialized accounting and reporting guidance in U.S. Generally Accepted Accounting Principles (U.S. GAAP). Franklin K2 Long Short Credit Fund (Fund) is included in this report. The Fund offers five classes of shares: Class A, Class C, Class R, Class R6 and Advisor Class. Class C shares automatically convert to Class A shares after they have been held for 10 years. Each class of shares may differ by its initial sales load, contingent deferred sales charges, voting rights on matters affecting a single class, its exchange privilege and fees due to differing arrangements for distribution and transfer agent fees.
The following summarizes the Fund’s significant accounting policies.
a. Financial Instrument Valuation
The Fund’s investments in financial instruments are carried at fair value daily. Fair value is the price that would be received to sell an asset or paid to transfer a liability in an orderly transaction between market participants on the measurement date. The Fund calculates the net asset value (NAV) per share each business day as of 4 p.m. Eastern time or the regularly scheduled close of the New York Stock Exchange (NYSE), whichever is earlier. Under compliance policies and procedures approved by the Trust’s Board of Trustees (the Board), the Fund’s administrator has responsibility for oversight of valuation, including leading the cross-functional Valuation Committee (VC). The Fund may utilize independent pricing services, quotations from securities and financial instrument dealers, and other market sources to determine fair value.
Equity securities and derivative financial instruments listed on an exchange or on the NASDAQ National Market System are valued at the last quoted sale price or the official closing price of the day, respectively. Foreign equity securities are valued as of the close of trading on the foreign stock exchange on which the security is primarily traded or as of 4 p.m. Eastern time. The value is then converted into its U.S. dollar equivalent at the foreign exchange rate in effect at 4 p.m. Eastern time on the day that the value of the security is determined.Over-the-counter (OTC) securities are valued within the range of the most recent quoted bid and ask prices.
Securities that trade in multiple markets or on multiple exchanges are valued according to the broadest and most representative market. Certain equity securities are valued based upon fundamental characteristics or relationships to similar securities.
Debt securities generally trade in the OTC market rather than on a securities exchange. The Fund’s pricing services use multiple valuation techniques to determine fair value. In instances where sufficient market activity exists, the pricing services may utilize a market-based approach through which quotes from market makers are used to determine fair value. In instances where sufficient market activity may not exist or is limited, the pricing services also utilize proprietary valuation models which may consider market characteristics such as benchmark yield curves, credit spreads, estimated default rates, anticipated market interest rate volatility, coupon rates, anticipated timing of principal repayments, underlying collateral, and other unique security features in order to estimate the relevant cash flows, which are then discounted to calculate the fair value. Securities denominated in a foreign currency are converted into their U.S. dollar equivalent at the foreign exchange rate in effect at 4 p.m. Eastern time on the date that the values of the foreign debt securities are determined.
Investments inopen-end mutual funds are valued at the closing NAV. Investments in repurchase agreements are valued at cost, which approximates fair value.
Certain derivative financial instruments are centrally cleared or trade in the OTC market. The Fund’s pricing services use various techniques including industry standard option pricing models and proprietary discounted cash flow models to determine the fair value of those instruments. The Fund’s net benefit or obligation under the derivative contract, as measured by the fair value of the contract, is included in net assets.
The Fund has procedures to determine the fair value of financial instruments for which market prices are not reliable or readily available. Under these procedures, the Fund primarily employs a market-based approach which may use related or comparable assets or liabilities, recent transactions, market multiples, book values, and other relevant information for the investment to determine the fair value of the investment. An income-based valuation approach may also be used in which the anticipated future cash flows of the investment are discounted to calculate fair value. Discounts may also be applied due to the nature or duration of any restrictions on the disposition of the investments. Due to the inherent uncertainty of valuations of such investments, the fair values
| | | | | | |
| | | |
| franklintempleton.com | | Semiannual Report | | | 37 | |
FRANKLIN ALTERNATIVE STRATEGIES FUNDS
NOTES TO FINANCIAL STATEMENTS (UNAUDITED)
Franklin K2 Long Short Credit Fund(continued)
1. Organization and Significant Accounting Policies(continued)
a. Financial Instrument Valuation(continued)
may differ significantly from the values that would have been used had an active market existed.
Trading in securities on foreign securities stock exchanges and OTC markets may be completed before 4 p.m. Eastern time. In addition, trading in certain foreign markets may not take place on every Fund’s business day. Occasionally, events occur between the time at which trading in a foreign security is completed and 4 p.m. Eastern time that might call into question the reliability of the value of a portfolio security held by the Fund. As a result, differences may arise between the value of the Fund’s portfolio securities as determined at the foreign market close and the latest indications of value at 4 p.m. Eastern time. In order to minimize the potential for these differences, the VC monitors price movements following the close of trading in foreign stock markets through a series of country specific market proxies (such as baskets of American Depositary Receipts, futures contracts and exchange traded funds). These price movements are measured against established trigger thresholds for each specific market proxy to assist in determining if an event has occurred that may call into question the reliability of the values of the foreign securities held by the Fund. If such an event occurs, the securities may be valued using fair value procedures, which may include the use of independent pricing services.
When the last day of the reporting period is anon-business day, certain foreign markets may be open on those days that the Fund’s NAV is not calculated, which could result in differences between the value of the Fund’s portfolio securities on the last business day and the last calendar day of the reporting period. Any significant security valuation changes due to an open foreign market are adjusted and reflected by the Fund for financial reporting purposes.
b. Foreign Currency Translation
Portfolio securities and other assets and liabilities denominated in foreign currencies are translated into U.S. dollars based on the exchange rate of such currencies against U.S. dollars on the date of valuation. The Fund may enter into foreign currency exchange contracts to facilitate transactions denominated in a foreign currency. Purchases and sales of securities, income and expense items denominated in foreign
currencies are translated into U.S. dollars at the exchange rate in effect on the transaction date. Portfolio securities and assets and liabilities denominated in foreign currencies contain risks that those currencies will decline in value relative to the U.S. dollar. Occasionally, events may impact the availability or reliability of foreign exchange rates used to convert the U.S. dollar equivalent value. If such an event occurs, the foreign exchange rate will be valued at fair value using procedures established and approved by the Board.
The Fund does not separately report the effect of changes in foreign exchange rates from changes in market prices on securities held. Such changes are included in net realized and unrealized gain or loss from investments in the Statement of Operations.
Realized foreign exchange gains or losses arise from sales of foreign currencies, currency gains or losses realized between the trade and settlement dates on securities transactions and the difference between the recorded amounts of dividends, interest, and foreign withholding taxes and the U.S. dollar equivalent of the amounts actually received or paid. Net unrealized foreign exchange gains and losses arise from changes in foreign exchange rates on foreign denominated assets and liabilities other than investments in securities held at the end of the reporting period.
c. Joint Repurchase Agreement
The Fund enters into a joint repurchase agreement whereby its uninvested cash balance is deposited into a joint cash account with other funds managed by the investment manager or an affiliate of the investment manager and is used to invest in one or more repurchase agreements. The value and face amount of the joint repurchase agreement are allocated to the funds based on theirpro-rata interest. A repurchase agreement is accounted for as a loan by the Fund to the seller, collateralized by securities which are delivered to the Fund’s custodian. The fair value, including accrued interest, of the initial collateralization is required to be at least 102% of the dollar amount invested by the funds, with the value of the underlying securities marked to market daily to maintain coverage of at least 100%. Repurchase agreements are subject to the terms of Master Repurchase Agreements (MRAs) with approved counterparties (sellers). The MRAs contain various provisions, including but not limited to events of default and maintenance of collateral for repurchase agreements. In the event of default by either the seller or the Fund, certain MRAs may permit thenon-defaulting party to net and
| | | | |
| | | |
| 38 | | Semiannual Report | | franklintempleton.com |
FRANKLIN ALTERNATIVE STRATEGIES FUNDS
NOTES TO FINANCIAL STATEMENTS (UNAUDITED)
Franklin K2 Long Short Credit Fund(continued)
close-out all transactions, if any, traded under such agreements. The Fund may sell securities it holds as collateral and apply the proceeds towards the repurchase price and any other amounts owed by the seller to the Fund in the event of default by the seller. This could involve costs or delays in addition to a loss on the securities if their value falls below the repurchase price owed by the seller. The joint repurchase agreement held by the Fund at period end, as indicated in the Statement of Investments, had been entered into on November 29, 2019.
d. Securities Purchased on a Delayed Delivery Basis
The Fund purchases securities on a delayed delivery basis, with payment and delivery scheduled for a future date. These transactions are subject to market fluctuations and are subject to the risk that the value at delivery may be more or less than the trade date purchase price. Although the Fund will generally purchase these securities with the intention of holding the securities, it may sell the securities before the settlement date. Sufficient assets have been segregated for these securities.
e. Derivative Financial Instruments
The Fund invested in derivative financial instruments in order to manage risk or gain exposure to various other investments or markets. Derivatives are financial contracts based on an underlying or notional amount, require no initial investment or an initial net investment that is smaller than would normally be required to have a similar response to changes in market factors, and require or permit net settlement. Derivatives contain various risks including the potential inability of the counterparty to fulfill their obligations under the terms of the contract, the potential for an illiquid secondary market, and/or the potential for market movements which expose the Fund to gains or losses in excess of the amounts shown in the Statement of Assets and Liabilities. Realized gain and loss and unrealized appreciation and depreciation on these contracts for the period are included in the Statement of Operations.
Derivative counterparty credit risk is managed through a formal evaluation of the creditworthiness of all potential counterparties. The Fund attempts to reduce its exposure to counterparty credit risk on OTC derivatives, whenever possible, by entering into International Swaps and Derivatives Association (ISDA) master agreements with certain counterparties. These agreements contain various provisions, including but not limited to collateral requirements, events of default, or early termination. Termination events applicable to the counterparty include certain deteriorations in the credit
quality of the counterparty. Termination events applicable to the Fund include failure of the Fund to maintain certain net asset levels and/or limit the decline in net assets over various periods of time. In the event of default or early termination, the ISDA master agreement gives thenon-defaulting party the right to net andclose-out all transactions traded, whether or not arising under the ISDA agreement, to one net amount payable by one counterparty to the other. However, absent an event of default or early termination, OTC derivative assets and liabilities are presented gross and not offset in the Statement of Assets and Liabilities. Early termination by the counterparty may result in an immediate payment by the Fund of any net liability owed to that counterparty under the ISDA agreement.
Collateral requirements differ by type of derivative. Collateral or initial margin requirements are set by the broker or exchange clearing house for exchange traded and centrally cleared derivatives. Initial margin deposited is held at the exchange and can be in the form of cash and/or securities. For OTC derivatives traded under an ISDA master agreement, posting of collateral is required by either the Fund or the applicable counterparty if the total net exposure of all OTC derivatives with the applicable counterparty exceeds the minimum transfer amount, which typically ranges from $100,000 to $250,000, and can vary depending on the counterparty and the type of the agreement. Generally, collateral is determined at the close of Fund business each day and any additional collateral required due to changes in derivative values may be delivered by the Fund or the counterparty the next business day, or within a few business days. Collateral pledged and/or received by the Fund for OTC derivatives, if any, is held in segregated accounts with the Fund’s custodian/counterparty broker and can be in the form of cash and/or securities. Unrestricted cash may be invested according to the Fund’s investment objectives. To the extent that the amounts due to the Fund from its counterparties are not subject to collateralization or are not fully collateralized, the Fund bears the risk of loss from counterpartynon-performance.
The Fund entered into exchange traded futures contracts primarily to manage and/or gain exposure to interest rate and equity price risk. A futures contract is an agreement between the Fund and a counterparty to buy or sell an asset at a specified price on a future date. Required initial margins are pledged by the Fund, and the daily change in fair value is accounted for as a variation margin payable or receivable in the Statement of Assets and Liabilities.
| | | | | | |
| | | |
| franklintempleton.com | | Semiannual Report | | | 39 | |
FRANKLIN ALTERNATIVE STRATEGIES FUNDS
NOTES TO FINANCIAL STATEMENTS (UNAUDITED)
Franklin K2 Long Short Credit Fund(continued)
1. Organization and Significant Accounting Policies(continued)
e. Derivative Financial Instruments(continued)
The Fund entered into OTC forward exchange contracts primarily to manage and/or gain exposure to certain foreign currencies. A forward exchange contract is an agreement between the Fund and a counterparty to buy or sell a foreign currency at a specific exchange rate on a future date.
The Fund entered into credit default swap contracts primarily to manage and/or gain exposure to credit risk. A credit default swap is an agreement between the Fund and a counterparty whereby the buyer of the contract receives credit protection and the seller of the contract guarantees the credit worthiness of a referenced debt obligation. These agreements may be privately negotiated in theover-the-counter market (OTC credit default swaps) or may be executed in a multilateral trade facility platform, such as a registered exchange (centrally cleared credit default swaps). The underlying referenced debt obligation may be a single issuer of corporate or sovereign debt, a credit index, a basket of issuers or indices, or a tranche of a credit index or basket of issuers or indices. In the event of a default of the underlying referenced debt obligation, the buyer is entitled to receive the notional amount of the credit default swap contract from the seller in exchange for the referenced debt obligation, a net settlement amount equal to the notional amount of the credit default swap less the recovery value of the referenced debt obligation, or other agreed upon amount. For centrally cleared credit default swaps, required initial margins are pledged by the Fund, and the daily change in fair value is accounted for as a variation margin payable or receivable in the Statement of Assets and Liabilities. Over the term of the contract, the buyer pays the seller a periodic stream of payments, provided that no event of default has occurred. Such periodic payments are accrued daily as an unrealized appreciation or depreciation until the payments are made, at which time they are realized. Upfront payments and receipts are reflected in the Statement of Assets and Liabilities and represent compensating factors between stated terms of the credit default swap agreement and prevailing market conditions (credit spreads and other relevant factors). These upfront payments and receipts are amortized over the term of the contract as a realized gain or loss in the Statement of Operations.
The Fund entered into interest rate swap contracts primarily to manage interest rate risk. An interest rate swap is an agreement between the Fund and a counterparty to exchange cash flows based on the difference between two interest rates, applied to a notional amount. These agreements may be privately negotiated in theover-the-counter market (OTC interest rate swaps) or may be executed on a registered exchange (centrally cleared interest rate swaps). For centrally cleared interest rate swaps, required initial margins are pledged by the Fund, and the daily change in fair value is accounted for as a variation margin payable or receivable in the Statement of Assets and Liabilities. Over the term of the contract, contractually required payments to be paid and to be received are accrued daily and recorded as unrealized depreciation and appreciation until the payments are made, at which time they are realized.
The Fund entered into OTC total return swap contracts primarily to manage and/or gain exposure to interest rate, equity price and credit risk of an underlying instrument such as a stock, bond, index or basket of securities or indices. A total return swap is an agreement between the Fund and a counterparty to exchange a return linked to an underlying instrument for a floating or fixed rate payment, both based upon a notional amount. Over the term of the contract, contractually required payments to be paid or received are accrued daily and recorded as unrealized appreciation or depreciation until the payments are made, at which time they are recognized as realized gain or loss.
The Fund purchased or wrote exchange traded and/or OTC option contracts primarily to manage and/or gain exposure to interest rate and equity price risk. An option is a contract entitling the holder to purchase or sell a specific amount of shares or units of an asset or notional amount of a swap (swaption), at a specified price. When an option is purchased or written, an amount equal to the premium paid or received is recorded as an asset or liability, respectively. Upon exercise of an option, the acquisition cost or sales proceeds of the underlying investment is adjusted by any premium received or paid. Upon expiration of an option, any premium received or paid is recorded as a realized gain or loss. Upon closing an option other than through expiration or exercise, the difference between the premium received or paid and the cost to close the position is recorded as a realized gain or loss.
See Note 10 regarding other derivative information.
| | | | |
| | | |
| 40 | | Semiannual Report | | franklintempleton.com |
FRANKLIN ALTERNATIVE STRATEGIES FUNDS
NOTES TO FINANCIAL STATEMENTS (UNAUDITED)
Franklin K2 Long Short Credit Fund(continued)
f. Restricted Cash
At November 30, 2019, the Fund held restricted cash in connection with investments in certain derivative securities. Restricted cash is held in a segregated account with the Fund’s custodian/counterparty broker and is reflected in the Statement of Assets and Liabilities.
g. Credit-Linked Notes
The Fund purchases credit-linked notes. Credit-linked notes are intended to replicate the economic effects that would apply had the Fund directly purchased the underlying reference asset. The risks of credit-linked notes include the potential default of the underlying reference asset, the movement in the value of the currency of the underlying reference asset relative to the credit-linked note, the potential inability of the Fund to dispose of the credit-linked note in the normal course of business, and the possible inability of the counterparties to fulfill their obligations under the contracts.
h. Securities Sold Short
The Fund is engaged in selling securities short, which obligates the Fund to replace a borrowed security with the same security at current fair value. The Fund incurs a loss if the price of the security increases between the date of the short sale and the date on which the Fund replaces the borrowed security. The Fund realizes a gain if the price of the security declines between those dates. Gains are limited to the price at which the Fund sold the security short, while losses are potentially unlimited in size.
The Fund is required to establish a margin account with the broker lending the security sold short. While the short sale is outstanding, the broker retains the proceeds of the short sale to the extent necessary to meet margin requirements until the short position is closed out. A deposit must also be maintained with the Fund’s custodian/counterparty broker consisting of cash and/or securities having a value equal to a specified percentage of the value of the securities sold short. The Fund is obligated to pay fees for borrowing the securities sold short and is required to pay the counterparty any dividends and/or interest due on securities sold short. Such dividends and/or interest and any security borrowing fees are recorded as an expense to the Fund.
i. Senior Floating Rate Interests
The Fund invests in senior secured corporate loans that pay interest at rates which are periodically reset by reference to a
base lending rate plus a spread. These base lending rates are generally the prime rate offered by a designated U.S. bank or the London InterBank Offered Rate (LIBOR). Senior secured corporate loans often require prepayment of principal from excess cash flows or at the discretion of the borrower. As a result, actual maturity may be substantially less than the stated maturity. Senior secured corporate loans in which the Fund invests are generally readily marketable, but may be subject to certain restrictions on resale. On July 27, 2017, the United Kingdom’s Financial Conduct Authority announced its intention to cease sustaining LIBOR after 2021. There remains uncertainty regarding the future utilization of LIBOR and the nature of any replacement rate. As such, the potential effect of a transition away from LIBOR on the Fund or the Fund’s investments that use or may use a floating rate based on LIBOR cannot yet be determined.
j. Income and Deferred Taxes
It is the Fund’s policy to qualify as a regulated investment company under the Internal Revenue Code. The Fund intends to distribute to shareholders substantially all of its taxable income and net realized gains to relieve it from federal income and excise taxes. As a result, no provision for U.S. federal income taxes is required.
The Fund may be subject to foreign taxation related to income received, capital gains on the sale of securities and certain foreign currency transactions in the foreign jurisdictions in which it invests. Foreign taxes, if any, are recorded based on the tax regulations and rates that exist in the foreign markets in which the Fund invests. When a capital gain tax is determined to apply, the Fund records an estimated deferred tax liability in an amount that would be payable if the securities were disposed of on the valuation date.
The Fund may recognize an income tax liability related to its uncertain tax positions under U.S. GAAP when the uncertain tax position has a less than 50% probability that it will be sustained upon examination by the tax authorities based on its technical merits. As of November 30, 2019, the Fund has determined that no tax liability is required in its financial statements related to uncertain tax positions for any open tax years (or expected to be taken in future tax years). Open tax years are those that remain subject to examination and are based on the statute of limitations in each jurisdiction in which the Fund invests.
| | | | | | |
| | | |
| franklintempleton.com | | Semiannual Report | | | 41 | |
FRANKLIN ALTERNATIVE STRATEGIES FUNDS
NOTES TO FINANCIAL STATEMENTS (UNAUDITED)
Franklin K2 Long Short Credit Fund(continued)
1. Organization and Significant Accounting Policies(continued)
k. Security Transactions, Investment Income, Expenses and Distributions
Security transactions are accounted for on trade date. Realized gains and losses on security transactions are determined on a specific identification basis. Interest income and estimated expenses are accrued daily. Amortization of premium and accretion of discount on debt securities are included in interest income. Paydown gains and losses are recorded as an adjustment to interest income separately on the Statement of Operations. Facility fees are recognized as income over the expected term of the loan. Dividend income and dividends declared on securities sold short are recorded on theex-dividend date except for certain dividends from securities where the dividend rate is not available. In such cases, the dividend is recorded as soon as the information is received by the Fund. Distributions to shareholders are recorded on theex-dividend date. Distributable earnings are determined according to income tax regulations (tax basis) and may differ from earnings recorded in accordance with U.S. GAAP. These differences may be permanent or temporary. Permanent differences are reclassified among capital accounts to reflect their tax character. These reclassifications have no impact on net assets or the results of operations. Temporary differences are not reclassified, as they may reverse in subsequent periods.
Common expenses incurred by the Trust are allocated among the Funds based on the ratio of net assets of each Fund to the combined net assets of the Trust or based on the
ratio of number of shareholders of each Fund to the combined number of shareholders of the Trust. Fund specific expenses are charged directly to the Fund that incurred the expense.
Realized and unrealized gains and losses and net investment income, excluding class specific expenses, are allocated daily to each class of shares based upon the relative proportion of net assets of each class. Differences in per share distributions by class are generally due to differences in class specific expenses.
l. Accounting Estimates
The preparation of financial statements in accordance with U.S. GAAP requires management to make estimates and assumptions that affect the reported amounts of assets and liabilities at the date of the financial statements and the amounts of income and expenses during the reporting period. Actual results could differ from those estimates.
m. Guarantees and Indemnifications
Under the Trust’s organizational documents, its officers and trustees are indemnified by the Trust against certain liabilities arising out of the performance of their duties to the Trust. Additionally, in the normal course of business, the Trust, on behalf of the Fund, enters into contracts with service providers that contain general indemnification clauses. The Trust’s maximum exposure under these arrangements is unknown as this would involve future claims that may be made against the Trust that have not yet occurred. Currently, the Trust expects the risk of loss to be remote.
2. Shares of Beneficial Interest
At November 30, 2019, there were an unlimited number of shares authorized (without par value). Transactions in the Fund’s shares were as follows:
| | | | | | | | | | | | | | | | | | | | |
| | | |
| | | Six Months Ended
November 30, 2019 | | | | | | Year Ended
May 31, 2019 | |
| | | | | |
| | | Shares | | | Amount | | | | | | Shares | | | Amount | |
|
| Class A Shares: | |
Shares solda | | | 318,112 | | | $ | 3,357,767 | | | | | | | | 518,127 | | | $ | 5,443,153 | |
Shares issued in reinvestment of distributions | | | — | | | | — | | | | | | | | 49,211 | | | | 498,509 | |
Shares redeemed | | | (88,301 | ) | | | (928,861 | ) | | | | | | | (2,195,001 | ) | | | (23,000,866 | ) |
| | | | |
Net increase (decrease) | | | 229,811 | | | $ | 2,428,906 | | | | | | | | (1,627,663 | ) | | $ | (17,059,204 | ) |
| | | | |
| | | | |
| | | |
| 42 | | Semiannual Report | | franklintempleton.com |
FRANKLIN ALTERNATIVE STRATEGIES FUNDS
NOTES TO FINANCIAL STATEMENTS (UNAUDITED)
Franklin K2 Long Short Credit Fund(continued)
| | | | | | | | | | | | | | | | | | | | |
| | | |
| | | Six Months Ended
November 30, 2019 | | | | | | Year Ended
May 31, 2019 | |
| | | | | |
| | | Shares | | | Amount | | | | | | Shares | | | Amount | |
|
| Class C Shares: | |
Shares sold | | | 24,437 | | | $ | 252,709 | | | | | | | | 176,881 | | | $ | 1,824,644 | |
Shares issued in reinvestment of distributions | | | — | | | | — | | | | | | | | 10,021 | | | | 100,011 | |
Shares redeemeda | | | (38,210 | ) | | | (394,947 | ) | | | | | | | (147,058 | ) | | | (1,515,143 | ) |
| | | | |
Net increase (decrease) | | | (13,773 | ) | | $ | (142,238 | ) | | | | | | | 39,844 | | | $ | 409,512 | |
| | | | |
|
| Class R Shares: | |
Shares sold | | | 5,832 | | | $ | 60,910 | | | | | | | | 1,059 | | | $ | 10,958 | |
Shares issued in reinvestment of distributions | | | — | | | | — | | | | | | | | 533 | | | | 5,358 | |
Shares redeemed | | | (1,273 | ) | | | (13,231 | ) | | | | | | | (1,066 | ) | | | (11,009 | ) |
| | | | |
Net increase (decrease) | | | 4,559 | | | $ | 47,679 | | | | | | | | 526 | | | $ | 5,307 | |
| | | | |
|
| Class R6 Shares: | |
Shares sold | | | 21,947 | | | $ | 231,608 | | | | | | | | 22,273 | | | $ | 233,301 | |
Shares issued in reinvestment of distributions | | | — | | | | — | | | | | | | | 642 | | | | 6,497 | |
Shares redeemed | | | — | | | | — | | | | | | | | (1,782 | ) | | | (18,363 | ) |
| | | | |
Net increase (decrease) | | | 21,947 | | | $ | 231,608 | | | | | | | | 21,133 | | | $ | 221,435 | |
| | | | |
|
| Advisor Class Shares: | |
Shares sold | | | 1,747,757 | | | $ | 18,435,082 | | | | | | | | 5,072,991 | | | $ | 52,995,139 | |
Shares issued in reinvestment of distributions | | | — | | | | — | | | | | | | | 166,635 | | | | 1,688,016 | |
Shares redeemed | | | (1,336,710 | ) | | | (14,106,125 | ) | | | | | | | (1,263,815 | ) | | | (13,184,615 | ) |
| | | | |
Net increase (decrease) | | | 411,047 | | | $ | 4,328,957 | | | | | | | | 3,975,811 | | | $ | 41,498,540 | |
| | | | |
aMay include a portion of Class C shares that were automatically converted to Class A.
3. Transactions with Affiliates
Franklin Resources, Inc. is the holding company for various subsidiaries that together are referred to as Franklin Templeton. Certain officers and trustees of the Trust are also officers and/or directors of the following subsidiaries:
| | |
| |
| Subsidiary | | Affiliation |
K2/D&S Management Co., L.L.C. (K2 Advisors) | | Investment manager |
Franklin Templeton Services, LLC (FT Services) | | Administrative manager |
Franklin Templeton Distributors, Inc. (Distributors) | | Principal underwriter |
Franklin Templeton Investor Services, LLC (Investor Services) | | Transfer agent |
a. Management Fees
The Fund pays an investment management fee to K2 Advisors of 1.90% per year of the average daily net assets of the Fund.
Under each subadvisory agreement, the below entities provide subadvisory services to the Fund. The subadvisory fees are paid by K2 Advisors based on the Fund’s average daily net assets, and is not an additional expense of the Fund.
| | | | | | |
| | | |
| franklintempleton.com | | Semiannual Report | | | 43 | |
FRANKLIN ALTERNATIVE STRATEGIES FUNDS
NOTES TO FINANCIAL STATEMENTS (UNAUDITED)
Franklin K2 Long Short Credit Fund(continued)
3. Transactions with Affiliates(continued)
a. Management Fees(continued)
|
|
| Subadvisors |
Apollo Credit Management LLC |
Chatham Asset Management, LLC |
Ellington Global Asset Management, L.L.C. |
Emso Asset Management Limited |
Medalist Partners, LP |
b. Administrative Fees
Under an agreement with K2 Advisors, FT Services provides administrative services to the Fund. The fee is paid by K2 Advisors based on the Fund’s average daily net assets, and is not an additional expense of the Fund.
c. Distribution Fees
The Board has adopted distribution plans for each share class, with the exception of Class R6 and Advisor Class shares, pursuant to Rule12b-1 under the 1940 Act. Under the Fund’s Class A reimbursement distribution plan, the Fund reimburses Distributors for costs incurred in connection with the servicing, sale and distribution of the Fund’s shares up to the maximum annual plan rate. Under the Class A reimbursement distribution plan, costs exceeding the maximum for the current plan year cannot be reimbursed in subsequent periods. In addition, under the Fund’s Class C and R compensation distribution plans, the Fund pays Distributors for costs incurred in connection with the servicing, sale and distribution of the Fund’s shares up to the maximum annual plan rate for each class. The plan year, for purposes of monitoring compliance with the maximum annual plan rates, is February 1 through January 31.
The maximum annual plan rates, based on the average daily net assets, for each class, are as follows:
| | | | |
Class A | | | 0.25% | |
Class C | | | 1.00% | |
Class R | | | 0.50% | |
d. Sales Charges/Underwriting Agreements
Front-end sales charges and contingent deferred sales charges (CDSC) do not represent expenses of the Fund. These charges are deducted from the proceeds of sales of Fund shares prior to investment or from redemption proceeds prior to remittance, as applicable. Distributors has advised the Fund of the following commission transactions related to the sales and redemptions of the Fund’s shares for the period:
| | | | |
Sales charges retained net of commissions paid to unaffiliated brokers/dealers | | $ | 505 | |
CDSC retained | | $ | 842 | |
e. Transfer Agent Fees
Each class of shares pays transfer agent fees to Investor Services for its performance of shareholder servicing obligations. The fees are based on an annualized asset based fee of 0.02% plus a transaction based fee. In addition, each class reimburses Investor Services for out of pocket expenses incurred and, except for Class R6, reimburses shareholder servicing fees paid to third parties. These fees are allocated daily based upon their relative proportion of such classes’ aggregate net assets. Class R6 pays Investor Services transfer agent fees specific to that class.
| | | | |
| | | |
| 44 | | Semiannual Report | | franklintempleton.com |
FRANKLIN ALTERNATIVE STRATEGIES FUNDS
NOTES TO FINANCIAL STATEMENTS (UNAUDITED)
Franklin K2 Long Short Credit Fund(continued)
For the period ended November 30, 2019, the Fund paid transfer agent fees of $53,038 of which $21,112 was retained by Investor Services.
f. Waiver and Expense Reimbursements
K2 Advisors and Investor Services have contractually agreed in advance to waive or limit their respective fees and to assume as their own expense certain expenses otherwise payable by the Fund so that the expenses (excluding distribution fees, acquired fund fees and expenses, expenses related to securities sold short, and certain non-routine expenses or costs, including those relating to litigation, indemnification, reorganizations, and liquidations) for Class A, Class C, Class R and Advisor Class of the Fund does not exceed 1.95%, and Class R6 does not exceed 1.89% based on the average net assets of each class until September 30, 2020. Total expenses waived or paid are not subject to recapture subsequent to the Fund’s fiscal year end.
Prior to October 1, 2019, expenses (excluding certain fees and expenses as previously disclosed) for Class R6 were limited to 1.93% based on the average net assets of the class.
g. Other Affiliated Transactions
At November 30, 2019, Franklin Resources, Inc. owned 29.5% of the Fund’s outstanding shares.
4. Expense Offset Arrangement
The Fund has entered into an arrangement with its custodian whereby credits realized as a result of uninvested cash balances are used to reduce a portion of the Fund’s custodian expenses. During the period ended November 30, 2019, the custodian fees were reduced as noted in the Statement of Operations.
5. Income Taxes
At November 30, 2019, the cost of investments and net unrealized appreciation (depreciation) were as follows:
| | | | |
Cost of investments | | $ | 114,149,495 | |
| | | | |
Unrealized appreciation | | $ | 3,796,419 | |
Unrealized depreciation | | | (2,456,221 | ) |
| | | | |
Net unrealized appreciation (depreciation) | | $ | 1,340,198 | |
| | | | |
Differences between income and/or capital gains as determined on a book basis and a tax basis are primarily due to differing treatments of bond discounts and premiums, foreign currency transactions, paydown losses and wash sales.
6. Investment Transactions
Purchases and sales of investments and securities sold short (excluding short term securities) for the period ended November 30, 2019, aggregated $73,689,367 and $79,084,657, respectively.
7. Credit Risk and Defaulted Securities
At November 30, 2019, the Fund had 17.8% of its portfolio invested in high yield, senior secured floating rate loans, or other securities rated below investment grade and unrated securities, if any. These securities may be more sensitive to economic conditions causing greater price volatility and are potentially subject to a greater risk of loss due to default than higher rated securities.
The Fund may purchase thepre-default or defaulted debt of distressed companies. Distressed companies are financially troubled and could be or are already involved in financial restructuring or bankruptcy. Risks associated with purchasing these securities include the possibility that the bankruptcy or other restructuring process takes longer than expected, or that distributions in restructuring are less than anticipated, either or both of which may result in unfavorable consequences to the Fund. If it
| | | | | | |
| | | |
| franklintempleton.com | | Semiannual Report | | | 45 | |
FRANKLIN ALTERNATIVE STRATEGIES FUNDS
NOTES TO FINANCIAL STATEMENTS (UNAUDITED)
Franklin K2 Long Short Credit Fund(continued)
7. Credit Risk and Defaulted Securities(continued)
becomes probable that the income on debt securities, including those of distressed companies, will not be collected, the Fund discontinues accruing income and recognizes an adjustment for uncollectible interest.
At November 30, 2019, the aggregate long value of distressed company securities for which interest recognition has been discontinued was $3,331,639, representing 2.6% of the Fund’s net assets. For information as to specific securities, see the accompanying Statement of Investments.
8. Restricted Securities
The Fund invests in securities that are restricted under the Securities Act of 1933 (1933 Act). Restricted securities are often purchased in private placement transactions, and cannot be sold without prior registration unless the sale is pursuant to an exemption under the 1933 Act. Disposal of these securities may require greater effort and expense, and prompt sale at an acceptable price may be difficult. The Fund may have registration rights for restricted securities. The issuer generally incurs all registration costs.
At November 30, 2019, investments in restricted securities, excluding securities exempt from registration under the 1933 Act, were as follows:
| | | | | | | | | | | | | | | | |
| | | | |
| Shares | | | Issuer | | Acquisition Date | | | Cost | | | Value | |
| | 947 | | | aOne Call Corp. | | | 10/28/19 | | | $ | 44,369 | | | $ | 113,545 | |
| | 3,821 | | | aOne Call Corp., cvt. pfd. | | | 10/28/19 | | | | 179,099 | | | | 458,341 | |
| | | | | | | | | | | | |
| | Total Restricted Securities (Value is 0.5% of Net Assets) | | | $ | 223,468 | | | $ | 571,886 | |
| | | | | | | | | | | | |
aThe Fund also invests in unrestricted securities of this issuer, valued at $462,020 as of November 30, 2019.
9. Unfunded Loan Commitments
The Fund enters into certain credit agreements, all or a portion of which may be unfunded. The Fund is obligated to fund these loan commitments at the borrowers’ discretion. Unfunded loan commitments and funded portions of credit agreements are marked to market daily and any unrealized appreciation or depreciation is included in the Statement of Assets and Liabilities and Statement of Operations. Funded portions of credit agreements are presented in the Statement of Investments.
At November 30, 2019, unfunded commitments were as follows:
| | | | |
| |
| Borrower | | Unfunded
Commitment | |
Advantage Sales & Marketing Inc., Term Loan 1L | | $ | 69,996 | |
Advantage Sales & Marketing Inc., Term Loan B2 | | | 32,922 | |
Frontier Communications Corp., Term Loan B | | | 221,402 | |
Groupe Casino, Term Loan B | | | 114,184 | |
Intelsat Jackson Holdings SA, Term Loan | | | 231,011 | |
Macdonald Dett, Term Loan B | | | 199,714 | |
Mallinckrodt International Finance SA, Term Loan B | | | 226,861 | |
The Neiman Marcus Group LLC, Term Loan | | | 14,208 | |
Party City HoldCo., Term Loan | | | 247,073 | |
PETCO Animal Supplies Inc., Term Loan | | | 195,915 | |
Riverbed Technology Inc., Term Loan B | | | 26,328 | |
| | | | |
| | $ | 1,579,614 | |
| | | | |
| | | | |
| | | |
| 46 | | Semiannual Report | | franklintempleton.com |
FRANKLIN ALTERNATIVE STRATEGIES FUNDS
NOTES TO FINANCIAL STATEMENTS (UNAUDITED)
Franklin K2 Long Short Credit Fund(continued)
10. Other Derivative Information
At November 30, 2019, the investments in derivative contracts are reflected in the Statement of Assets and Liabilities as follows:
| | | | | | | | | | | | |
| | |
Derivative Contracts
Not Accounted for as
Hedging Instruments | | Asset Derivatives | | | Liability Derivatives | |
| | Statement of Assets and
Liabilities Location | | Fair Value | | | Statement of Assets and
Liabilities Location | | Fair Value | |
| | | | |
Interest rate contracts | | Investments in securities, at value | | $ | 1,720 | a | | | | | | |
| | | | |
| | Variation margin on futures contracts | | | 162 | b | | | | | | |
| | | | |
| | Variation margin on centrally cleared swap contracts | | | 26,017 | b | | Variation margin on centrally cleared swap contracts | | $ | 167,132 | b |
| | | | |
| | Unrealized appreciation on OTC swap contracts | | | 18,997 | | | Unrealized depreciation on OTC swap contracts | | | 1,215 | |
| | | | |
Foreign exchange contracts | | Unrealized appreciation on OTC forward exchange contracts | | | 55,868 | | | Unrealized depreciation on OTC forward exchange contracts | | | 177,462 | |
| | | | |
Credit contracts | | Variation margin centrally cleared swap contracts | | | 1,892 | b | | Variation margin centrally cleared swap contracts | | | 131,257 | b |
| | | | |
| | OTC swap contracts (upfront payments) | | | 290,559 | | | OTC swap contracts (upfront receipts) | | | 163,967 | |
| | | | |
| | Unrealized appreciation on OTC swap contracts | | | 47,882 | | | Unrealized depreciation on OTC swap contracts | | | 272,230 | |
| | | | |
Equity contracts | | Investments in securities, at value | | | 32,323 | a | | | | | | |
| | | | |
| | Unrealized appreciation on OTC swap contracts | | | 8,016 | | | Unrealized depreciation on OTC swap contracts | | | 80,683 | |
| | | | |
| | | | | | | | Variation margin on futures contracts | | | 13,528 | b |
| | | | | | | | | | | | |
Totals | | | | $ | 483,436 | | | | | $ | 1,007,474 | |
| | | | | | | | | | | | |
aPurchased option contracts are included in investments in securities, at value in the Statement of Assets and Liabilities.
bThis amount reflects the cumulative appreciation (depreciation) of futures contracts and centrally cleared swap contracts as reported in the Statement of Investments. Only the variation margin receivable/payable at period end is separately reported within the Statement of Assets and Liabilities. Prior variation margin movements were recorded to cash upon receipt or payment.
For the period ended November 30, 2019, the effect of derivative contracts in the Statement of Operations was as follows:
| | | | | | | | | | | | |
| | | | |
Derivative Contracts
Not Accounted for as
Hedging Instruments | | Statement of
Operations Location | | Net Realized
Gain (Loss)
for the Period | | | Statement of
Operations Location | | Net Change in
Unrealized
Appreciation
(Depreciation)
for the Period | |
| | Net realized gain (loss) from: | | | | | | Net change in unrealized
appreciation (depreciation) on: | | | | |
| | | | |
Interest rate contracts | | | | | | | | Investments | | $ | (6,300 | )a |
| | Futures contracts | | $ | (37,938 | ) | | Futures contracts | | | 13,053 | |
| | Swap contracts | | | 18,326 | | | Swap contracts | | | (9,367 | ) |
| | | | |
Foreign exchange contracts | | Forward exchange contracts | | | 50,064 | | | Forward exchange contracts | | | (105,712 | ) |
| | | | |
Credit contracts | | Swap contracts | | | (38,132 | ) | | Swap contracts | | | (261,690 | ) |
| | | | |
Equity contracts | | Investments | | | (173,439 | )a | | Investments | | | (60,769 | )a |
| | Written options | | | (44,499 | ) | | Written options | | | 7,025 | |
| | Futures contracts | | | (24,745 | ) | | Futures contracts | | | (13,764 | ) |
| | Swap contracts | | | (6,005 | ) | | Swap contracts | | | (31,808 | ) |
| | | | | | | | | | | | |
Totals | | | | $ | (256,368 | ) | | | | $ | (469,332 | ) |
| | | | | | | | | | | | |
a Purchased option contracts are included in net realized gain (loss) from investments and net change in unrealized appreciation (depreciation) on investments in the Statement of Operations.
| | | | | | |
| | | |
| franklintempleton.com | | Semiannual Report | | | 47 | |
FRANKLIN ALTERNATIVE STRATEGIES FUNDS
NOTES TO FINANCIAL STATEMENTS (UNAUDITED)
Franklin K2 Long Short Credit Fund(continued)
10. Other Derivative Information(continued)
For the period ended November 30, 2019, the average month end notional amount of futures contracts, options and swap contracts represented $578,100, 749,967 shares and $27,863,502, respectively. The average month end contract value of forward exchange contracts was $9,980,154.
At November 30, 2019, OTC derivative assets and liabilities are as follows:
| | | | | | | | |
| |
| | | Gross Amounts of
Assets and Liabilities
Presented in the
Statement of
Assets and Liabilities | |
| | |
| | | Assetsa | | | Liabilitiesa | |
| Derivatives | | | | | | |
Forward Exchange Contracts | | $ | 55,868 | | | $ | 177,462 | |
Options Purchased | | | 15,946 | | | | — | |
Swap Contracts | | | 365,454 | | | | 518,095 | |
| | | | |
Total | | $ | 437,268 | | | $ | 695,557 | |
| | | | |
aAbsent an event of default or early termination, OTC derivative assets and liabilities are presented gross and not offset in the Statement of Assets and Liabilities.
At November 30, 2019, OTC derivative assets, which may be offset against OTC derivative liabilities, and collateral received from the counterparty, are as follows:
| | | | | | | | | | | | | | | | | | | | |
| | | |
| | | | | | Amounts Not Offset in the
Statement of Assets and Liabilities | | | | |
| | | | | |
| | | Gross Amounts
of Assets Presented
in the Statement of
Assets and Liabilities | | | Financial
Instruments
Available for Offset | | | Financial
Instruments
Collateral
Received | | | Cash
Collateral
Receiveda | | | Net Amount (Not
less than zero) | |
| Counterparty | | | | | | | | | | | | | | | |
BOFA | | $ | 8,160 | | | $ | (8,160 | ) | | $ | — | | | $ | — | | | $ | — | |
BZWS | | | 106,653 | | | | (58,525 | ) | | | — | | | | — | | | | 48,128 | |
CITI | | | 16,284 | | | | (16,284 | ) | | | — | | | | — | | | | — | |
DBAB | | | 12,429 | | | | (1,215 | ) | | | — | | | | (11,214 | ) | | | — | |
GSCO | | | 169,667 | | | | (169,667 | ) | | | — | | | | — | | | | — | |
JPHQ | | | 15,788 | | | | (4,119 | ) | | | — | | | | — | | | | 11,669 | |
JPHQc | | | 86,319 | | | | — | | | | — | | | | — | | | | 86,319 | |
MSCO | | | 15,748 | | | | (3,776 | ) | | | — | | | | — | | | | 11,972 | |
MSCS | | | 6,220 | | | | (1,322 | ) | | | — | | | | — | | | | 4,898 | |
| | | | |
Total | | $ | 437,268 | | | $ | (263,068 | ) | | $ | — | | | $ | (11,214 | ) | | $ | 162,986 | |
| | | | |
| | | | |
| | | |
| 48 | | Semiannual Report | | franklintempleton.com |
FRANKLIN ALTERNATIVE STRATEGIES FUNDS
NOTES TO FINANCIAL STATEMENTS (UNAUDITED)
Franklin K2 Long Short Credit Fund(continued)
At November 30, 2019, OTC derivative liabilities, which may be offset against OTC derivative assets, and collateral pledged to the counterparty, are as follows:
| | | | | | | | | | | | | | | | | | | | |
| | | |
| | | | | | Amounts Not Offset in the
Statement of Assets and Liabilities | | | | |
| | | | | |
| | | Gross Amounts of
Liabilities Presented
in the Statement of
Assets and Liabilities | | | Financial
Instruments
Available for Offset | | | Financial
Instruments
Collateral
Pledgedb | | | Cash
Collateral
Pledgeda | | | Net Amount (Not
less than zero) | |
| Counterparty | | | | | | | | | | | | | | | |
BOFA | | $ | 13,587 | | | $ | (8,160 | ) | | $ | — | | | $ | (5,427 | ) | | $ | — | |
BZWS | | | 58,525 | | | | (58,525 | ) | | | — | | | | — | | | | — | |
CITI | | | 106,261 | | | | (16,284 | ) | | | — | | | | — | | | | 89,977 | |
DBAB | | | 1,215 | | | | (1,215 | ) | | | — | | | | — | | | | — | |
GSCO | | | 219,555 | | | | (169,667 | ) | | | — | | | | (49,888 | ) | | | — | |
JPHQ | | | 4,119 | | | | (4,119 | ) | | | — | | | | — | | | | — | |
JPHQc | | | 287,197 | | | | — | | | | — | | | | — | | | | 287,197 | |
MSCO | | | 3,776 | | | | (3,776 | ) | | | — | | | | — | | | | — | |
MSCS | | | 1,322 | | | | (1,322 | ) | | | — | | | | — | | | | — | |
| | | | |
Total | | $ | 695,557 | | | $ | (263,068 | ) | | $ | — | | | $ | (55,315 | ) | | $ | 377,174 | |
| | | | |
aIn some instances, the collateral amounts disclosed in the table above were adjusted due to the requirement to limit the collateral amounts to avoid the effect of over collateralization. Actual collateral received and/or pledged may be more than the amounts disclosed herein.
bSee the accompanying Statement of Investments for securities pledged as collateral for derivatives.
cRepresents derivatives not subject to an ISDA master agreement.
See Note 1(e) regarding derivative financial instruments.
See Abbreviations on page 51.
11. Credit Facility
The Fund, together with other U.S. registered and foreign investment funds (collectively, Borrowers), managed by Franklin Templeton, are borrowers in a joint syndicated senior unsecured credit facility totaling $2 billion (Global Credit Facility) which matures on February 7, 2020. This Global Credit Facility provides a source of funds to the Borrowers for temporary and emergency purposes, including the ability to meet future unanticipated or unusually large redemption requests.
Under the terms of the Global Credit Facility, the Fund shall, in addition to interest charged on any borrowings made by the Fund and other costs incurred by the Fund, pay its share of fees and expenses incurred in connection with the implementation and maintenance of the Global Credit Facility, based upon its relative share of the aggregate net assets of all of the Borrowers, including an annual commitment fee of 0.15% based upon the unused portion of the Global Credit Facility. These fees are reflected in other expenses in the Statement of Operations. During the period ended November 30, 2019, the Fund did not use the Global Credit Facility.
12. Fair Value Measurements
The Fund follows a fair value hierarchy that distinguishes between market data obtained from independent sources (observable inputs) and the Fund’s own market assumptions (unobservable inputs). These inputs are used in determining the value of the Fund’s financial instruments and are summarized in the following fair value hierarchy:
| | • | | Level 1 – quoted prices in active markets for identical financial instruments |
| | • | | Level 2 – other significant observable inputs (including quoted prices for similar financial instruments, interest rates, prepayment speed, credit risk, etc.) |
| | | | | | |
| | | |
| franklintempleton.com | | Semiannual Report | | | 49 | |
FRANKLIN ALTERNATIVE STRATEGIES FUNDS
NOTES TO FINANCIAL STATEMENTS (UNAUDITED)
Franklin K2 Long Short Credit Fund(continued)
12. Fair Value Measurements(continued)
| | • | | Level 3 – significant unobservable inputs (including the Fund’s own assumptions in determining the fair value of financial instruments) |
The input levels are not necessarily an indication of the risk or liquidity associated with financial instruments at that level.
A summary of inputs used as of November 30, 2019, in valuing the Fund’s assets and liabilities carried at fair value, is as follows:
| | | | | | | | | | | | | | | | |
| | | | |
| | | Level 1 | | | Level 2 | | | Level 3 | | | Total | |
| | | | |
| Assets: | | | | | | | | | | | | | | | | |
Investments in Securities:a | | | | | | | | | | | | | | | | |
Equity Investmentsb | | $ | 2,334,191 | | | $ | — | | | $ | 571,886 | | | $ | 2,906,077 | |
Convertible Bonds | | | — | | | | 1,527,471 | | | | — | | | | 1,527,471 | |
Corporate Bonds and Notes | | | — | | | | 18,295,679 | | | | — | | | | 18,295,679 | |
Corporate Bonds and Notes in Reorganization | | | — | | | | 2,258,802 | | | | — | | | | 2,258,802 | |
Senior Floating Rate Interests | | | — | | | | 4,222,213 | | | | — | | | | 4,222,213 | |
Credit-Linked Notes | | | — | | | | 376,563 | | | | 234,579 | | | | 611,142 | |
Foreign Government and Agency Securities | | | — | | | | 4,261,211 | | | | — | | | | 4,261,211 | |
U.S. Government and Agency Securities | | | — | | | | 721,979 | | | | — | | | | 721,979 | |
Asset-Backed Securities and Commercial Mortgage-Backed Securities | | | — | | | | 48,182,639 | | | | — | | | | 48,182,639 | |
Municipal Bonds in Reorganization | | | — | | | | 1,072,837 | | | | — | | | | 1,072,837 | |
Options Purchased | | | 18,097 | | | | 15,946 | | | | — | | | | 34,043 | |
Short Term Investments | | | 34,107,020 | | | | 7,632,635 | | | | 965,938 | | | | 42,705,593 | |
| | | | |
Total Investments in Securities | | $ | 36,459,308 | | | $ | 88,567,975 | | | $ | 1,772,403 | | | $ | 126,799,686 | |
| | | | |
Other Financial Instruments: | | | | | | | | | | | | | | | | |
Futures Contracts | | $ | 162 | | | $ | — | | | $ | — | | | $ | 162 | |
Forward Exchange Contracts | | | — | | | | 55,868 | | | | — | | | | 55,868 | |
Swap Contracts | | | — | | | | 102,804 | | | | — | | | | 102,804 | |
Unfunded Loan Commitments | | | — | | | | 29,161 | | | | — | | | | 29,161 | |
| | | | |
Total Other Financial Instruments | | $ | 162 | | | $ | 187,833 | | | $ | — | | | $ | 187,995 | |
| | | | |
| | | | |
| Liabilities: | | | | | | | | | | | | | | | | |
Other Financial Instruments: | | | | | | | | | | | | | | | | |
Securities Sold Shorta | | $ | 399,035 | | | $ | 10,349,347 | | | $ | — | | | $ | 10,748,382 | |
Futures Contracts | | | 13,528 | | | | — | | | | — | | | | 13,528 | |
Forward Exchange Contracts | | | — | | | | 177,462 | | | | — | | | | 177,462 | |
Swap Contracts | | | — | | | | 652,517 | | | | — | | | | 652,517 | |
| | | | |
Total Other Financial Instruments | | $ | 412,563 | | | $ | 11,179,326 | | | $ | — | | | $ | 11,591,889 | |
| | | | |
aFor detailed categories, see the accompanying Statement of Investments.
bIncludes common, preferred and convertible preferred stocks as well as other equity interests.
| | | | |
| | | |
| 50 | | Semiannual Report | | franklintempleton.com |
FRANKLIN ALTERNATIVE STRATEGIES FUNDS
NOTES TO FINANCIAL STATEMENTS (UNAUDITED)
Franklin K2 Long Short Credit Fund(continued)
A reconciliation of assets in which Level 3 inputs are used in determining fair value is presented when there are significant Level 3 financial instruments at the beginning and/or end of the period. At November 30, 2019, the reconciliation of assets, is as follows:
| | | | | | | | | | | | | | | | | | | | | | | | | | | | | | | | | | | | |
| | | | | | | | | |
| | | Balance at
Beginning of
Period | | | Purchases | | | Sales | | | Transfer
Into
(Out of)
Level 3a | | | Cost Basis
Adjustments | | | Net
Realized
Gain (Loss) | | | Net
Unrealized
Appreciation
(Depreciation) | | | Balance at
End of Period | | | Net Change
in Unrealized
Appreciation
(Depreciation) on
Assets Held at
Period End | |
| | | | | | | | | |
| Assets: | | | | | | | | | | | | | | | | | | | | | | | | | | | | | | | | | | | | |
Investments in Securities: | | | | | | | | | | | | | | | | | | | | | | | | | | | | | | | | | | | | |
Equity Investmentsb | | $ | — | | | $ | — | | | $ | — | | | $ | 571,886 | | | $ | — | | | $ | — | | | $ | — | | | $ | 571,886 | | | $ | — | |
Credit-Linked Notes | | | — | | | | 220,265 | | | | — | | | | — | | | | — | | | | — | | | | 14,314 | | | | 234,579 | | | | 14,314 | |
Short Term Investments | | | — | | | | 924,182 | | | | — | | | | — | | | | — | | | | — | | | | 41,756 | | | | 965,938 | | | | 41,756 | |
Total Investments in Securities | | $ | — | | | $ | 1,144,447 | | | $ | — | | | $ | 571,886 | | | $ | — | | | $ | — | | | $ | 56,070 | | | $ | 1,772,403 | | | $ | 56,070 | |
aThe investments were transferred into Level 3 as a result of the unavailability of other significant observable valuation inputs. May include amounts related to a corporate action.
bIncludes common and preferred stocks.
Level 3 investments in securities include financial instruments with values derived using private transaction prices ornon-public third party pricing information which is unobservable. They may also include fair value of immaterial financial instruments and/or other assets developed using various valuation techniques and unobservable inputs.
13. Subsequent Events
The Fund has evaluated subsequent events through the issuance of the financial statements and determined that no events have occurred that require disclosure.
Abbreviations
| | | | | | | | | | | | | | |
| Counterparty | | Currency | | Selected Portfolio | | Index | | |
| BOFA | | Bank of America Corp. | | BRL | | Brazilian Real | | ADR | | American Depositary Receipt | | CDX.NA.HY | | CDX North America High Yield Index |
| BZWS | | Barclays Bank PLC | | CNY | | Chinese Yuan | | ARM | | Adjustable Rate Mortgage | | |
| CITI | | Citigroup, Inc. | | EGP | | Egyptian Pound | | BZDIOVRA | | Brazil Interbank Deposit Rate | | |
| DBAB | | Deutsche Bank AG | | EUR | | Euro | | CFETS | | China Foreign Exchange Trade System | | |
| GSCO | | The Goldman Sachs Group, Inc. | | GBP | | British Pound | | |
| JPHQ | | JP Morgan Chase & Co. | | JPY | | Japanese Yen | | CLO | | Collateralized Loan Obligation | | | | |
| MSCO | | Morgan Stanley | | NGN | | Nigerian Naira | | CMT | | Constant Maturity Treasury Index | | | | |
| MSCS | | Morgan Stanley Capital Services LLC | | PLN | | Polish Zloty | | EURIBOR | | Euro Interbank Offered Rate | | | | |
| | RUB | | Russian Ruble | | FHLMC | | Federal Home Loan Mortgage Corp. | | | | |
| | | | UAH | | Ukraine Hryvnia | | | | |
| | | | USD | | United States Dollar | | FNMA | | Federal National Mortgage Association | | | | |
| | | | ZAR | | South African Rand | | | | |
| | | | | | | | FRN | | Floating Rate Note | | | | |
| | | | | | | | GO | | General Obligation | | | | |
| | | | | | | | IO | | Interest-Only | | | | |
| | | | | | | | LIBOR | | London InterBank Offered Rate | | | | |
| | | | | | | | PIK | | Payment-In-Kind | | | | |
| | | | | | | | PRIME | | United States Prime Rate | | | | |
| | | | | | | | REIT | | Real Estate Investment Trust | | | | |
| | | | | | |
| | | |
| franklintempleton.com | | Semiannual Report | | | 51 | |
FRANKLIN ALTERNATIVE STRATEGIES FUNDS
FRANKLIN K2 LONG SHORT CREDIT FUND
Shareholder Information
Proxy Voting Policies and Procedures
The Fund’s investment manager has established Proxy Voting Policies and Procedures (Policies) that the Fund uses to determine how to vote proxies relating to portfolio securities. Shareholders may view the Fund’s complete Policies online at franklintempleton.com. Alternatively, shareholders may request copies of the Policies free of charge by calling the Proxy Group collect at (954)527-7678 or by sending a written request to: Franklin Templeton Companies, LLC, 300 S.E. 2nd Street, Fort Lauderdale, FL 33301, Attention: Proxy Group. Copies of the Fund’s proxy voting records are also made available online at franklintempleton.com and posted on the U.S. Securities and Exchange Commission’s website at sec.gov and reflect the most recent12-month period ended June 30.
Quarterly Statement of Investments
The Trust, on behalf of the Fund, files a complete statement of investments with the U.S. Securities and Exchange Commission for the first and third quarters for each fiscal year as an exhibit to its report on FormN-PORT. Shareholders may view the filed FormN-PORT by visiting the Commission’s website at sec.gov. The filed form may also be viewed and copied at the Commission’s Public Reference Room in Washington, DC. Information regarding the operations of the Public Reference Room may be obtained by calling(800) SEC-0330.
| | | | |
| | | |
| 52 | | Semiannual Report | | franklintempleton.com |
Authorized for distribution only when accompanied or preceded by a summary prospectus and/or prospectus. Investors should carefully consider a fund’s investment goals, risks, charges and expenses before investing. A prospectus contains this and other information; please read it carefully before investing.
To help ensure we provide you with quality service, all calls to and from our service areas are monitored and/or recorded.
| | | | | | |
 | | Semiannual Report and Shareholder Letter Franklin K2 Long Short Credit Fund | | |
| | | |
| | Investment Manager | | Distributor | | Shareholder Services |
| | K2/D&S Management Co., L.L.C. | | Franklin Templeton Distributors, Inc. (800) DIAL BEN®/342-5236 franklintempleton.com | | (800) 632-2301 |
| © 2019-2020 Franklin Templeton Investments. All rights reserved. | | | | 948 S 01/20 |
Item 2. Code of Ethics.
(a) The Registrant has adopted a code of ethics that applies to its principal executive officers and principal financial and accounting officer.
(c) N/A
(d) N/A
(f) Pursuant to Item 13(a)(1), the Registrant is attaching as an exhibit a copy of its code of ethics that applies to its principal executive officers and principal financial and accounting officer.
Item 3. Audit Committee Financial Expert.
(a)(1) The Registrant has an audit committee financial expert serving on its audit committee.
((2) The audit committee financial experts are Edward I. Altman, Ann Torre Bates and David W. Niemiec and they are “independent” as defined under the relevant Securities and Exchange Commission Rules and Releases.
Item 4. Principal Accountant Fees and Services. N/A
Item 5. Audit Committee of Listed Registrants. N/A
Item 6. Schedule of Investments. N/A
Item 7. Disclosure of Proxy Voting Policies and Procedures forClosed-End Management Investment Companies. N/A
Item 8. Portfolio Managers ofClosed-End Management Investment Companies. N/A
Item 9. Purchases of Equity Securities byClosed-End Management Investment Company and Affiliated Purchasers. N/A
Item 10. Submission of Matters to a Vote of Security Holders.
There have been no changes to the procedures by which shareholders may recommend nominees to the Registrant’s Board of Trustees that would require disclosure herein.
Item 11. Controls and Procedures.
(a)Evaluation of Disclosure Controls and Procedures. The Registrant maintains disclosure controls and procedures that are designed to provide reasonable assurance that information required to be disclosed in the Registrant’s filings under the Securities Exchange Act of 1934, as amended, and the Investment Company Act of 1940 is recorded, processed, summarized and reported within the periods specified in the rules and forms of the Securities and Exchange Commission. Such information is accumulated and communicated to the Registrant’s management, including its principal executive officer and principal financial officer, as appropriate, to allow timely decisions regarding required disclosure. The Registrant’s management, including the principal executive officer and the principal financial officer, recognizes that any set of controls and procedures, no matter how well designed and operated, can provide only reasonable assurance of achieving the desired control objectives.
Within 90 days prior to the filing date of this Shareholder Report onForm N-CSR, the Registrant had carried out an evaluation, under the supervision and with the participation of the Registrant’s management,
including the Registrant’s principal executive officer and the Registrant’s principal financial officer, of the effectiveness of the design and operation of the Registrant’s disclosure controls and procedures. Based on such evaluation, the Registrant’s principal executive officer and principal financial officer concluded that the Registrant’s disclosure controls and procedures are effective.
(b)Changes in Internal Controls. There have been no changes in the Registrant’s internal control over financial reporting that occurred during the period covered by this report that has materially affected, or is reasonably likely to materially affect the internal control over financial reporting.
Item 12. Disclosure of Securities Lending Activities forClosed-End Management Investment Company. N/A
Item 13. Exhibits.
(a) (1) Code of Ethics
(a) (2) Certifications pursuant to Section 302 of the Sarbanes-Oxley Act of 2002 of Matthew T. Hinkle, Chief Executive Officer - Finance and Administration, and Robert G. Kubilis, Chief Financial Officer and Chief Accounting Officer
(b) Certifications pursuant to Section 906 of the Sarbanes-Oxley Act of 2002 of Matthew T. Hinkle, Chief Executive Officer - Finance and Administration, and Robert G. Kubilis, Chief Financial Officer and Chief Accounting Officer
SIGNATURES
Pursuant to the requirements of the Securities Exchange Act of 1934 and the Investment Company Act of 1940, the registrant has duly caused this report to be signed on its behalf by the undersigned, thereunto duly authorized.
FRANKLIN ALTERNATIVE STRATEGIES FUNDS
| | | | |
By | | /S/ MATTHEW T. HINKLE | | |
| | Matthew T. Hinkle | | |
| | Chief Executive Officer - Finance and Administration | | |
Date January 31, 2020 | | |
Pursuant to the requirements of the Securities Exchange Act of 1934 and the Investment Company Act of 1940, this report has been signed below by the following persons on behalf of the registrant and in the capacities and on the dates indicated.
| | | | |
| By | | /S/ MATTHEW T. HINKLE | | |
| | Matthew T. Hinkle | | |
| | Chief Executive Officer - Finance and Administration | | |
| Date January 31, 2020 | | |
| | |
| By | | /S/ ROBERT G. KUBILIS | | |
| | Robert G. Kubilis | | |
| | Chief Financial Officer and Chief Accounting Officer | | |
| Date January 31, 2020 | | |