UNITED STATES
SECURITIES AND EXCHANGE COMMISSION
Washington, DC 20549
FORM N-CSRS
CERTIFIED SHAREHOLDER REPORT OF REGISTERED MANAGEMENT INVESTMENT
COMPANIES
Investment Company Act file number_811-22641
__Franklin Alternative Strategies Funds
(Exact name of registrant as specified in charter)
One Franklin Parkway, San Mateo, CA 94403-1906
(Address of principal executive offices) (Zip code)
Craig S. Tyle, One Franklin Parkway, San Mateo, CA 94403-1906
(Name and address of agent for service)
Registrant's telephone number, including area code: 650 312-2000
Date of fiscal year end: 5/31
Date of reporting period: 11/30/16
Item 1. Reports to Stockholders.
| |
| Contents | |
| Semiannual Report | |
| Franklin K2 Alternative Strategies Fund | 3 |
| Performance Summary | 7 |
| Your Fund’s Expenses | 9 |
| Consolidated Financial Highlights and Consolidated | |
| Statement of Investments | 10 |
| Consolidated Financial Statements | 72 |
| Notes to Consolidated Financial Statements | 76 |
| Shareholder Information | 92 |
Visit franklintempleton.com for fund updates, to access your account, or to find helpful financial planning tools.
2 Semiannual Report
franklintempleton.com
Semiannual Report
Franklin K2 Alternative Strategies Fund
This semiannual report for Franklin K2 Alternative Strategies Fund covers the period ended November 30, 2016.
Your Fund’s Goal and Main Investments
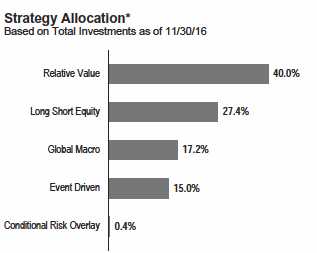
The Fund seeks capital appreciation with lower volatility relative to the broad equity markets. The Fund seeks to achieve its investment goal by allocating its assets across multiple non-traditional or “alternative” strategies, including but not limited to relative value, long short equity, global macro and event driven. The Fund is structured as a multi-manager fund, meaning the Fund’s assets are independently managed by multiple investment managers (subadvisors), while the Fund’s investment manager retains overall responsibility for the Fund’s investments. The Fund may invest in a wide range of securities and other investments including, but not limited to: equity securities including common stocks, preferred stocks, convertible securities, rights and warrants, private and registered investment vehicles and exchange-traded funds (ETFs); and debt securities including bonds, notes, debentures, banker’s acceptances and commercial paper; loans and loan participations; and mortgage-backed or other asset-backed securities, including collateralized debt obligations; as well as derivatives, commodities and currencies.
Performance Overview
The Fund’s Class A shares delivered a +1.90% cumulative total return for the six months under review. For comparison, the Fund’s primary benchmark, the BofA Merrill Lynch 3-Month U.S. Treasury Bill (T-Bill) Index, which tracks the performance of short-term U.S. government securities with a remaining term to final maturity of less than three months, posted a +0.18% total return for the same period.1 Also for comparison, the Fund’s secondary benchmark, the HFRX Global Hedge Fund Index, which is designed to be representative of the overall composition of the hedge fund universe, generated a +2.68% total return for the same period.2 You can find more of the Fund’s performance data in the Performance Summary beginning on page 7.
*Figures represent the net Fund exposure and include certain derivatives held in the portfolio (or their underlying reference assets) or unsettled trades and may not total 100% or may be negative due to rounding, use of any derivatives or other factors.
Performance data represent past performance, which does not guarantee future results. Investment return and principal value will fluctuate, and you may have a gain or loss when you sell your shares. Current performance may differ from figures shown. For most recent month-end performance, go to franklintempleton.com or call (800) 342-5236.
Economic and Market Overview
The global economy expanded during the six months under review. In this environment, global developed and emerging market stocks, as measured by the MSCI All Country World Index, rose. Global markets were aided by accommodative monetary policies of various central banks, an improvement in commodity prices, generally encouraging economic data across regions, expectations of higher interest rates and inflation in the U.S. driven by hopes of expansionary fiscal policies under the new U.S. President Donald Trump, and an Organization of the Petroleum Exporting Countries deal to curb oil production. However, the impact of these factors was partially offset by global economic concerns, the U.K.’s historic referendum to leave the European Union (also known as “Brexit”), uncertainty
1. Source: Morningstar.
2. Source: FactSet. Hedge Fund Research, Inc. — www.hedgefundresearch.com. The HFRX Global Hedge Fund Index is being used under license from Hedge Fund
Research, Inc., which does not endorse or approve of any of the contents of this report.
The indexes are unmanaged and include reinvestment of any income or distributions. They do not reflect any fees, expenses or sales charges. One cannot invest directly in an
index, and an index is not representative of the Fund’s portfolio. Unlike most asset class indexes, HFR Index returns reflect fees and expenses.
See www.franklintempletondatasources.com for additional data provider information.
The dollar value, number of shares or principal amount, and names of all portfolio holdings are listed in the Fund’s Consolidated Statement of Investments (SOI).
The Consolidated SOI begins on page 15.
franklintempleton.com
Semiannual Report 3
FRANKLIN K2 ALTERNATIVE STRATEGIES FUND
about the U.S. Federal Reserve’s (Fed’s) timing for raising interest rates and worries about the health of European banks.
The U.S. economy strengthened during the six months under review. The economy grew at a faster pace in 2016’s third quarter compared to the second quarter, mainly due to personal consumption expenditure, exports, private inventory investment, federal government spending and nonresidential fixed investment. Although the Fed kept its target interest rate unchanged during the review period, and lowered its forecast for 2016 U.S. economic growth at the September meeting, it maintained its stance that the case for a U.S. interest rate increase had strengthened. Further, the Fed Chair Janet Yellen, at her testimony to the Congress’ Joint Economic Committee in November, set the stage for an interest rate hike in December, as long as data continued to provide evidence of economic resilience.
In Europe, the U.K.’s economy moderated in the third quarter, supported by growth in services. Immediate effects of the Brexit vote in June materialized as U.K. stocks initially declined, the pound sterling hit a three-decade low amid intensified selling and the U.K.’s credit rating was downgraded. In the eurozone, despite investors’ concerns about banking sector weakness, low corporate earnings and post-Brexit political repercussions, some regions benefited due to rising consumer spending, resulting from a cheaper euro, low inflation and signs of sustained economic growth. The eurozone’s economic growth held steady in the third quarter from the second quarter, while the region’s annual inflation rate rose to its highest level since April 2014 toward period-end. The European Central Bank cut its benchmark interest rate and expanded its massive bond-buying program in August 2016 to boost the region’s growth.
In Asia, Japan’s economic growth slowed in the second quarter compared to the first quarter, amid falling exports and weak corporate investment. However, the Japanese economy grew significantly in the third quarter, largely due to a rise in exports. After announcing additional monetary easing measures in July, the Bank of Japan, at its September meeting, overhauled its monetary stimulus program to adjust Japanese government bond purchases with the aim of keeping the 10-year rate near the current level of 0%.
In emerging markets, economic growth generally moderated during the review period. Although the pace of contraction in Brazil’s economy had slowed in 2016’s second quarter, third-quarter gross domestic product declined faster than in the second quarter, despite improved business sentiment near the end of August with the expected impeachment of President Dilma Rousseff. Russia’s economic contraction continued to ease in 2016’s third quarter. The Bank of Russia reduced its key interest rates in June and September in an attempt to revive its economy. China’s economy grew at a stable rate in 2016’s third quarter, and remained within the government’s targeted range. The People’s Bank of China weakened its currency during the review period as the U.S. dollar strengthened. Elsewhere, India’s economic growth marginally increased from July to September due to slower private consumption growth and increasing government spending. Overall, emerging market stocks, as measured by the MSCI Emerging Markets Index, rose for the review period.
Investment Strategy
We manage the Fund using a multi-manager approach. While we are responsible for the Fund’s overall investments, we allocate assets to multiple subadvisors, each of whom independently manages a separate portion of the Fund’s portfolio in accordance with some or all of the following strategies: long short equity, relative value, event driven and global macro. We allocate the Fund’s assets among these strategies utilizing a top-down approach, generating the Fund’s strategy weightings by taking into account market conditions, risk factors, diversification, liquidity, transparency, and availability of various subadvisors and other investment options, among other things. The allocations to specific subadvisors may change from time to time based upon our assessment of their correlations to various markets and to each other, their risk profiles and return expectations. Long short equity strategies generally seek to produce returns from investments in the equity markets by taking long and short positions in stocks and common stock indexes (through the use of derivatives or ETFs). Relative value strategies encompass a wide range of investment techniques that are intended to profit from pricing inefficiencies. Event driven strategies generally invest in securities of companies undergoing significant corporate events. Global macro strategies generally focus on broad-based economic opportunities across numerous markets and investments.
The Fund may take long and/or short positions in a wide range of asset classes, including equities, fixed income, commodities and currencies, among others. Long positions benefit from an increase in the price of the underlying instrument or asset class, while short positions benefit from a decrease in that price. The Fund may use derivatives for hedging and nonhedging (investment) purposes. Such derivative investments may include futures contracts, swaps, options and currency forward contracts. The Fund may engage in active and frequent trading as part of its investment strategies.
What is a futures contract?
A futures contract is an agreement between the Fund and a counterparty made through a U.S. or foreign futures exchange to buy or sell an underlying instrument or asset at a specific price on a future date.
4 Semiannual Report
franklintempleton.com
FRANKLIN K2 ALTERNATIVE STRATEGIES FUND
What are swap agreements?
Swap agreements, such as interest rate, currency and credit default swaps, are contracts between the Fund and another party (the swap counterparty). In a basic swap transaction, the Fund agrees with the swap counterparty to exchange the returns (or differentials in rates of return) earned or realized on a particular “notional amount” of underlying instruments. The notional amount is the set amount selected by the parties as the basis on which to calculate the obligations that they have agreed to exchange. The parties typically do not actually exchange the notional amount. Instead, they agree to exchange the returns that would be earned or realized if the notional amount were invested in given instruments or at given interest rates.
What is an option?
An option is a contract to buy or sell a specific financial product known as the option’s underlying instrument at a specific price. The buyer of an option has the right, but not the obligation, to buy or sell the underlying instrument at or until a specified expiration date. Conversely, the seller (“writer”) of an option who opens a transaction is obligated to buy or sell the underlying instrument should the option holder exercise that right.
What is a currency forward contract?
A currency forward contract is an agreement between the Fund and a counterparty to buy or sell a foreign currency in exchange for another currency at a specific exchange rate on a future date.
Manager’s Discussion
The Fund generated fairly consistent positive performance for the six-month review period, with October the only month showing a performance decline. Among the four underlying strategies, relative value delivered the most robust performance. The event driven and long short equity strategies also contributed positively to returns, while the global macro strategy modestly detracted from Fund performance. A conditional risk overlay was active during the review period, and it hindered the Fund’s results as financial markets trended up amid increased investor risk appetite.
What is a conditional risk overlay (CRO) strategy?
From time to time, the Fund’s Investment Manager may implement its CRO Strategy, which seeks to neutralize certain market sensitivities that may exist in the Fund. The CRO Strategy involves investing in derivatives or other instruments in an effort to provide a hedge against negative market events. When implemented, the strategy will reduce the Fund’s ability to benefit from positive market movements
The Fund’s long short equity strategy subadvisors were Chilton Investment, Impala Asset Management, Jennison Associates, Portland Hill Capital and Wellington Management. Impala, a subadvisor focused on global cyclical equities, provided the
largest positive contribution to returns. Jennison and Portland Hill modestly benefited results. In contrast, Chilton, a U.S.-focused subadvisor, hindered performance, as did technology-focused Wellington to a lesser extent. Overall, basic materials, industrials and technology positions benefited performance, while equity indexes detracted from results.
A significant individual contributor was a long position in a Canada-based metals and mining company. Rising metallurgical coal prices in parts of the review period supported the company’s stock price. In addition, an analyst report highlighted improved pricing dynamics for the company’s steelmaking coal business, and the company’s chief financial officer noted that the company would seek to reduce its debt load, with the goal of securing an investment-grade credit rating. Conversely, short positions in equity indexes such as the Standard & Poor’s 500® Index (S&P 500®) impaired results as equities generally rallied during the review period.
All relative value strategy subadvisors delivered positive returns, with the largest contribution to performance provided by a subadvisor focused on high yield credit. Communications, basic materials and energy positions aided performance. In contrast, hedges in the form of equity indexes, including the S&P 500, detracted from relative performance.
Looking at individual positions, a U.S. newspaper and magazine publisher aided results as the company completed a debt exchange in August that substantially reduced interest expenses, benefiting the company’s capital structure. A bond issued by a
|
| Subadvisors |
| 11/30/16 |
| |
| Long Short Equity |
| Chilton Investment Company, LLC |
| Impala Asset Management LLC |
| Jennison Associates, LLC |
| Portland Hill Capital LLP |
| Wellington Management Company, LLP |
| Relative Value |
| Basso Capital Management, L.P. |
| Chatham Asset Management, LLC |
| Lazard Asset Management, LLC |
| Loomis Sayles & Company, L.P. |
| Event Driven |
| Halcyon Arbitrage IC Management LP |
| P. Schoenfeld Asset Management L.P. |
| York Registered Holdings, L.P. |
| Global Macro |
| Emso Asset Management Limited |
| Graham Capital Management, L.P. |
franklintempleton.com
Semiannual Report 5
FRANKLIN K2 ALTERNATIVE STRATEGIES FUND
steel company also strengthened returns after the company announced healthy earnings and a larger-than-expected equity offering that would further deleverage the company’s capital structure. The underlying subadvisor believed there was persistent performance potential and increased its long position in the issuer. Conversely, equity index positions tended to weigh on performance. For example, S&P 500 Index options hindered returns as U.S. equities advanced for the review period.
In June, we allocated to Halcyon Arbitrage IC Management, a new event driven subadvisor. This adjustment provided the event-driven strategy with more exposure to merger and acquisition activity. Contributors tended to come from the technology, consumer cyclical and health care sectors, while hedges through equity indexes dampened returns as risk assets generally gained over the period.
A position in a biopharmaceuticals company, which specializes in treating serious diseases, gained after a large global pharmaceutical company announced that it would acquire the company for an amount exceeding industry expectations. A communications company also strengthened performance after announcing plans for a wireless product. The subadvisor holding the position continued to believe this company would benefit from its larger footprint and secular shifts toward broadband adoption. In contrast, a long position in a global pharmaceuticals company detracted from returns amid investor concerns over potential controls on drug pricing power and focus from politicians during the U.S. election cycle.
Graham Capital Management and Emso Asset Management represented our global macro exposure. Graham, which follows a quantitative, trend-following model, experienced negative results in the review period, and the global macro strategy overall modestly detracted from performance. However, the other strategy subadvisor, emerging-markets focused Emso, delivered gains.
Energy positions for systematic subadvisor Graham Capital Management hindered performance, particularly long positions in Brent crude oil and gas when oil prices waned during parts of the review period. In the agricultural space, returns were weakened by long positions in soy beans and soy meal. In contrast, emerging markets-focused discretionary subadvisor Emso Asset Management’s long positions in a quasi-sovereign oil producer’s credit in Brazil contributed positively to results. For systematic subadvisor Graham Capital Management, a long position in a U.S. small-capitalization stock index benefited returns as the equity space rallied following the election of Donald Trump as president, as the markets anticipate large tax cuts and infrastructure spending, which may boost U.S. growth and inflation. Short positioning in the British pound and subadvisor positioning in interest-rate derivatives also contributed positively to results.
Thank you for your participation in Franklin K2 Alternative Strategies Fund. We look forward to continuing to serve your investment needs.

The foregoing information reflects our analysis, opinions and portfolio holdings as of November 30, 2016, the end of the reporting period. The way we implement our main investment strategies and the resulting portfolio holdings may change depending on factors such as market and economic conditions. These opinions may not be relied upon as investment advice or an offer for a particular security. The information is not a complete analysis of every aspect of any market, country, industry, security or the Fund. Statements of fact are from sources considered reliable, but the investment manager makes no representation or warranty as to their completeness or accuracy. Although historical performance is no guarantee of future results, these insights may help you understand our investment management philosophy.
6 Semiannual Report
franklintempleton.com
FRANKLIN K2 ALTERNATIVE STRATEGIES FUND
Performance Summary as of November 30, 2016
The performance table does not reflect any taxes that a shareholder would pay on Fund dividends, capital gain distributions, if any, or any realized gains on the sale of Fund shares. Total return reflects reinvestment of the Fund’s dividends and capital gain distributions, if any, and any unrealized gains or losses.
Performance as of 11/30/161
Cumulative total return excludes sales charges. Average annual total return includes maximum sales charges. Sales charges will vary depending on the size of the investment and the class of share purchased. The maximum is 5.75% and the minimum is 0%. Class A: 5.75% maximum initial sales charge; Advisor Class: no sales charges. For other share classes, visit franklintempleton.com.
| | | | |
| | Cumulative | | Average Annual | |
| Share Class | Total Return2 | | Total Return3 | |
| A | | | | |
| 6-Month | +1.90 | % | -3.93 | % |
| 1-Year | +0.17 | % | -5.62 | % |
| 3-Year | +7.91 | % | +0.58 | % |
| Since Inception (10/11/13) | +10.39 | % | +1.27 | % |
| Advisor | | | | |
| 6-Month | +1.98 | % | +1.98 | % |
| 1-Year | +0.40 | % | +0.40 | % |
| 3-Year | +8.81 | % | +2.85 | % |
| Since Inception (10/11/13) | +11.31 | % | +3.48 | % |
Performance data represent past performance, which does not guarantee future results. Investment return and principal value will fluctuate, and you may have a gain or loss when you sell your shares. Current performance may differ from figures shown. For most recent month-end performance, go to franklintempleton.com or call (800) 342-5236.
See page 8 for Performance Summary footnotes.
franklintempleton.com
Semiannual Report 7
FRANKLIN K2 ALTERNATIVE STRATEGIES FUND
PERFORMANCE SUMMARY
| | | | |
| Total Annual Operating Expenses4 | | | |
| Share Class | With Waiver | | Without Waiver | |
| A | 2.88 | % | 3.40 | % |
| Advisor | 2.63 | % | 3.15 | % |
Each class of shares is available to certain eligible investors and has different annual fees and expenses, as described in the prospectus.
All investments involve risks, including possible loss of principal. The market values of securities owned by the Fund will go up or down, sometimes rapidly or
unpredictably. The Fund’s performance depends on the manager’s skill in selecting, overseeing, and allocating Fund assets to the subadvisors. The Fund is
actively managed and could experience losses if the investment manager’s and subadvisors’ judgment about particular investments made for the Fund’s portfo-
lio prove to be incorrect. Some subadvisors may have little or no experience managing the assets of a registered investment company. Foreign investments are
subject to greater investment risk such as political, economic, credit and information risks as well as risk of currency fluctuations. Investments in derivatives
involve costs and create economic leverage, which may result in significant volatility and cause the Fund to participate in losses (as well as gains) that signifi-
cantly exceed the Fund’s initial investment. Lower rated or high yield debt securities involve greater credit risk, including the possibility of default or bankruptcy.
Currency management strategies could result in losses to the Fund if currencies do not perform as the investment manager or subadvisor expects. The Fund
may make short sales of securities, which involves the risk that losses may exceed the original amount invested. Merger arbitrage investments risk loss if a pro-
posed reorganization in which the Fund invests is renegotiated or terminated. Liquidity risk exists when securities have become more difficult to sell, or are
unable to be sold, at the price at which they have been valued. The Fund’s prospectus also includes a description of the main investment risks.
1. The Fund has an expense reduction contractually guaranteed through 9/30/17 and a fee waiver related to the management fee paid by a subsidiary. Fund investment
results reflect the expense reduction and fee waiver; without these reductions, the results would have been lower.
2. Cumulative total return represents the change in value of an investment over the periods indicated.
3. Average annual total return represents the average annual change in value of an investment over the periods indicated. Return for less than one year, if any, has not
been annualized.
4. Figures are as stated in the Fund’s current prospectus and may differ from the expense ratios disclosed in the Your Fund’s Expenses and Consolidated Financial Highlights
sections in this report. In periods of market volatility, assets may decline significantly, causing total annual Fund operating expenses to become higher than the figures shown.
8 Semiannual Report
franklintempleton.com
FRANKLIN K2 ALTERNATIVE STRATEGIES FUND
Your Fund’s Expenses
As a Fund shareholder, you can incur two types of costs: (1) transaction costs, including sales charges (loads) on Fund purchases and redemptions; and (2) ongoing Fund costs, including management fees, distribution and service (12b-1) fees, and other Fund expenses. All mutual funds have ongoing costs, sometimes referred to as operating expenses. The table below shows ongoing costs of investing in the Fund and can help you understand these costs and compare them with those of other mutual funds. The table assumes a $1,000 investment held for the six months indicated.
Actual Fund Expenses
The table below provides information about actual account values and actual expenses in the columns under the heading “Actual.” In these columns the Fund’s actual return, which includes the effect of Fund expenses, is used to calculate the “Ending Account Value” for each class of shares. You can estimate the expenses you paid during the period by following these steps (of course, your account value and expenses will differ from those in this illustration): Divide your account value by $1,000 (if your account had an $8,600 value, then $8,600 ÷ $1,000 = 8.6). Then multiply the result by the number in the row for your class of shares under the headings “Actual” and “Expenses Paid During Period” (if Actual Expenses Paid During Period were $7.50, then 8.6 x $7.50 = $64.50). In this illustration, the actual expenses paid this period are $64.50.
Hypothetical Example for Comparison with Other Funds
Under the heading “Hypothetical” in the table, information is provided about hypothetical account values and hypothetical expenses based on the Fund’s actual expense ratio and an assumed rate of return of 5% per year before expenses, which is not the Fund’s actual return. This information may not be used to estimate the actual ending account balance or expenses you paid for the period, but it can help you compare ongoing costs of investing in the Fund with those of other funds. To do so, compare this 5% hypothetical example for the class of shares you hold with the 5% hypothetical examples that appear in the shareholder reports of other funds.
Please note that expenses shown in the table are meant to highlight ongoing costs and do not reflect any transactional costs. Therefore, information under the heading “Hypothetical” is useful in comparing ongoing costs only, and will not help you compare total costs of owning different funds. In addition, if transactional costs were included, your total costs would have been higher.
| | | | | | | | | | | | |
| | | | | | | Actual | | Hypothetical | | |
| | | | | (actual return after expenses) | | (5% annual return before expenses) | | |
| | | | | | | Expenses | | | | Expenses | Net | |
| | | Beginning | | Ending | | Paid During | | Ending | | Paid During | Annualized | |
| Share | | Account | | Account | | Period | | Account | | Period | Expense | |
| Class | | Value 6/1/16 | | Value 11/30/16 | | 6/1/16–11/30/161,2 | | Value 11/30/16 | | 6/1/16–11/30/161,2 | Ratio2 | |
| A | $ | 1,000 | $ | 1,019.00 | $ | 13.92 | $ | 1,011.28 | $ | 13.87 | 2.75 | % |
| C | $ | 1,000 | $ | 1,015.30 | $ | 17.43 | $ | 1,007.77 | $ | 17.36 | 3.45 | % |
| R | $ | 1,000 | $ | 1,017.90 | $ | 15.18 | $ | 1,010.03 | $ | 15.12 | 3.00 | % |
| R6 | $ | 1,000 | $ | 1,019.80 | $ | 12.20 | $ | 1,012.99 | $ | 12.16 | 2.41 | % |
| Advisor | $ | 1,000 | $ | 1,019.80 | $ | 12.66 | $ | 1,012.53 | $ | 12.61 | 2.50 | % |
1. Expenses are equal to the annualized expense ratio for the six-month period as indicated above–in the far right column–multiplied by the simple average account value over
the period indicated, and then multiplied by 183/365 to reflect the one-half year period.
2. Reflects expenses after fee waivers and expense reimbursements. Does not include acquired fund fees and expenses.
franklintempleton.com
Semiannual Report 9
FRANKLIN ALTERNATIVE STRATEGIES FUNDS
| | | | | | | | | | | | |
| Consolidated Financial Highlights | | | | | | | | | | | | |
| Franklin K2 Alternative Strategies Fund | | | | | | | | | | | | |
| | | Six Months Ended | | | Year Ended May 31, | | | | |
| | | November 30, 2016 | | | | | | | | | | |
| | | (unaudited) | | | 2016 | | | 2015 | | | 2014 | a |
| Class A | | | | | | | | | | | | |
| Per share operating performance | | | | | | | | | | | | |
| (for a share outstanding throughout the period) | | | | | | | | | | | | |
| Net asset value, beginning of period | $ | 10.55 | | $ | 11.16 | | $ | 10.64 | | $ | 10.00 | |
| Income from investment operationsb: | | | | | | | | | | | | |
| Net investment income (loss)c | | (0.01 | ) | | (0.05 | ) | | (0.11 | ) | | (0.02 | ) |
| Net realized and unrealized gains (losses) | | 0.21 | | | (0.38 | ) | | 0.70 | | | 0.70 | |
| Total from investment operations | | 0.20 | | | (0.43 | ) | | 0.59 | | | 0.68 | |
| Less distributions from: | | | | | | | | | | | | |
| Net investment income | | — | | | (0.14 | ) | | (0.07 | ) | | (0.04 | ) |
| Net realized gains | | — | | | (0.04 | ) | | — | | | — | |
| Total distributions | | — | | | (0.18 | ) | | (0.07 | ) | | (0.04 | ) |
| Net asset value, end of period | $ | 10.75 | | $ | 10.55 | | $ | 11.16 | | $ | 10.64 | |
| |
| Total returnd | | 1.90 | % | | (3.89 | )% | | 5.53 | % | | 6.82 | % |
| |
| Ratios to average net assetse | | | | | | | | | | | | |
| Expenses before waiver, payments by affiliates and expense | | | | | | | | | | | | |
| reductionf | | 3.09 | % | | 3.22 | % | | 3.40 | % | | 3.33 | % |
| Expenses net of waiver, payments by affiliates and expense | | | | | | | | | | | | |
| reductionf | | 2.75 | %g | | 2.88 | %g | | 2.99 | %g | | 2.83 | % |
| Expenses incurred in connection with securities | | | | | | | | | | | | |
| sold short | | 0.55 | % | | 0.67 | % | | 0.65 | % | | 0.56 | % |
| Net investment income (loss) | | (0.10 | )% | | (0.44 | )% | | (0.95 | )% | | (0.35 | )% |
| |
| Supplemental data | | | | | | | | | | | | |
| Net assets, end of period (000’s) | $ | 142,705 | | $ | 177,412 | | $ | 148,991 | | $ | 96,889 | |
| Portfolio turnover rate | | 105.92 | % | | 229.90 | % | | 295.81 | % | | 181.06 | % |
aFor the period October 11, 2013 (commencement of operations) to May 31, 2014.
bThe amount shown for a share outstanding throughout the period may not correlate with the Consolidated Statement of Operations for the period due to the timing of sales
and repurchases of the Fund’s shares in relation to income earned and/or fluctuating fair value of the investments of the Fund.
cBased on average daily shares outstanding.
dTotal return does not reflect sales commissions or contingent deferred sales charges, if applicable, and is not annualized for periods less than one year.
eRatios are annualized for periods less than one year.
fIncludes dividend and/or interest expense on securities sold short and security borrowing fees, if any. See below for the ratios of such expenses to average net assets for the
periods presented. See Note 1(f).
gBenefit of expense reduction rounds to less than 0.01%.
10 Semiannual Report | The accompanying notes are an integral part of these financial statements.
franklintempleton.com
FRANKLIN ALTERNATIVE STRATEGIES FUNDS
CONSOLIDATED FINANCIAL HIGHLIGHTS
| | | | | | | | | | | | |
| Franklin K2 Alternative Strategies Fund (continued) | | | | | | | | | | | | |
| | | Six Months Ended | | | Year Ended May 31, | |
| | | November 30, 2016 | | | | | | | | | | |
| | | (unaudited) | | | 2016 | | | 2015 | | | 2014 | a |
| Class C | | | | | | | | | | | | |
| Per share operating performance | | | | | | | | | | | | |
| (for a share outstanding throughout the period) | | | | | | | | | | | | |
| Net asset value, beginning of period | $ | 10.45 | | $ | 11.09 | | $ | 10.60 | | $ | 10.00 | |
| Income from investment operationsb: | | | | | | | | | | | | |
| Net investment income (loss)c | | (0.04 | ) | | (0.12 | ) | | (0.17 | ) | | (0.08 | ) |
| Net realized and unrealized gains (losses) | | 0.20 | | | (0.39 | ) | | 0.69 | | | 0.72 | |
| Total from investment operations | | 0.16 | | | (0.51 | ) | | 0.52 | | | 0.64 | |
| Less distributions from: | | | | | | | | | | | | |
| Net investment income | | — | | | (0.09 | ) | | (0.03 | ) | | (0.04 | ) |
| Net realized gains | | — | | | (0.04 | ) | | — | | | — | |
| Total distributions | | — | | | (0.13 | ) | | (0.03 | ) | | (0.04 | ) |
| Net asset value, end of period | $ | 10.61 | | $ | 10.45 | | $ | 11.09 | | $ | 10.60 | |
| |
| Total returnd | | 1.53 | % | | (4.62 | )% | | 4.87 | % | | 6.42 | % |
| |
| Ratios to average net assetse | | | | | | | | | | | | |
| Expenses before waiver, payments by affiliates and expense reductionf | | 3.79 | % | | 3.96 | % | | 4.04 | % | | 4.03 | % |
| Expenses net of waiver, payments by affiliates and expense reductionf | | 3.45 | %g | | 3.62 | %g | | 3.63 | %g | | 3.53 | % |
| Expenses incurred in connection with securities sold short | | 0.55 | % | | 0.67 | % | | 0.65 | % | | 0.56 | % |
| Net investment income (loss) | | (0.80 | )% | | (1.18 | )% | | (1.59 | )% | | (1.05 | )% |
| |
| Supplemental data | | | | | | | | | | | | |
| Net assets, end of period (000’s) | $ | 61,465 | | $ | 71,154 | | $ | 37,937 | | $ | 16,618 | |
| Portfolio turnover rate | | 105.92 | % | | 229.90 | % | | 295.81 | % | | 181.06 | % |
aFor the period October 11, 2013 (commencement of operations) to May 31, 2014.
bThe amount shown for a share outstanding throughout the period may not correlate with the Consolidated Statement of Operations for the period due to the timing of sales
and repurchases of the Fund’s shares in relation to income earned and/or fluctuating fair value of the investments of the Fund.
cBased on average daily shares outstanding.
dTotal return does not reflect sales commissions or contingent deferred sales charges, if applicable, and is not annualized for periods less than one year.
eRatios are annualized for periods less than one year.
fIncludes dividend and/or interest expense on securities sold short and security borrowing fees, if any. See below for the ratios of such expenses to average net assets for the
periods presented. See Note 1(f).
gBenefit of expense reduction rounds to less than 0.01%.
franklintempleton.com
The accompanying notes are an integral part of these financial statements. | Semiannual Report 11
FRANKLIN ALTERNATIVE STRATEGIES FUNDS
CONSOLIDATED FINANCIAL HIGHLIGHTS
| | | | | | | | | | | | |
| Franklin K2 Alternative Strategies Fund (continued) | | | | | | | | | | | | |
| | | Six Months Ended | | | Year Ended May 31, | |
| | | November 30, 2016 | | | | | | | | | | |
| | | (unaudited) | | | 2016 | | | 2015 | | | 2014 | a |
| Class R | | | | | | | | | | | | |
| Per share operating performance | | | | | | | | | | | | |
| (for a share outstanding throughout the period) | | | | | | | | | | | | |
| Net asset value, beginning of period | $ | 10.61 | | $ | 11.15 | | $ | 10.62 | | $ | 10.00 | |
| Income from investment operationsb: | | | | | | | | | | | | |
| Net investment income (loss)c | | (0.02 | ) | | (0.10 | ) | | (0.16 | ) | | (0.05 | ) |
| Net realized and unrealized gains (losses) | | 0.21 | | | (0.40 | ) | | 0.73 | | | 0.71 | |
| Total from investment operations | | 0.19 | | | (0.50 | ) | | 0.57 | | | 0.66 | |
| Less distributions from: | | | | | | | | | | | | |
| Net investment income | | — | | | — | | | (0.04 | ) | | (0.04 | ) |
| Net realized gains | | — | | | (0.04 | ) | | — | | | — | |
| Total distributions | | — | | | (0.04 | ) | | (0.04 | ) | | (0.04 | ) |
| Net asset value, end of period | $ | 10.80 | | $ | 10.61 | | $ | 11.15 | | $ | 10.62 | |
| |
| Total returnd | | 1.79 | % | | (4.51 | )% | | 5.39 | % | | 6.62 | % |
| |
| Ratios to average net assetse | | | | | | | | | | | | |
| Expenses before waiver, payments by affiliates and expense reductionf | | 3.34 | % | | 3.46 | % | | 3.57 | % | | 3.63 | % |
| Expenses net of waiver, payments by affiliates and expense reductionf | | 3.00 | %g | | 3.12 | %g | | 3.16 | %g | | 3.13 | % |
| Expenses incurred in connection with securities sold short | | 0.55 | % | | 0.67 | % | | 0.65 | % | | 0.56 | % |
| Net investment income (loss) | | (0.35 | )% | | (0.68 | )% | | (1.12 | )% | | (0.65 | )% |
| |
| Supplemental data | | | | | | | | | | | | |
| Net assets, end of period (000’s) | $ | 495 | | $ | 341 | | $ | 9,173 | | $ | 11,660 | |
| Portfolio turnover rate | | 105.92 | % | | 229.90 | % | | 295.81 | % | | 181.06 | % |
aFor the period October 11, 2013 (commencement of operations) to May 31, 2014.
bThe amount shown for a share outstanding throughout the period may not correlate with the Consolidated Statement of Operations for the period due to the timing of sales
and repurchases of the Fund’s shares in relation to income earned and/or fluctuating fair value of the investments of the Fund.
cBased on average daily shares outstanding.
dTotal return is not annualized for periods less than one year.
eRatios are annualized for periods less than one year.
fIncludes dividend and/or interest expense on securities sold short and security borrowing fees, if any. See below for the ratios of such expenses to average net assets for the
periods presented. See Note 1(f).
gBenefit of expense reduction rounds to less than 0.01%.
12 Semiannual Report | The accompanying notes are an integral part of these financial statements.
franklintempleton.com
FRANKLIN ALTERNATIVE STRATEGIES FUNDS
CONSOLIDATED FINANCIAL HIGHLIGHTS
| | | | | | | | | | | | |
| Franklin K2 Alternative Strategies Fund (continued) | | | | | | | | | | | | |
| | | Six Months Ended | | | | | | Year Ended May 31, | | | | |
| | | November 30, 2016 | | | | | | | | | | |
| | | (unaudited) | | | 2016 | | | 2015 | | | 2014 | a |
| Class R6 | | | | | | | | | | | | |
| Per share operating performance | | | | | | | | | | | | |
| (for a share outstanding throughout the period) | | | | | | | | | | | | |
| Net asset value, beginning of period | $ | 10.59 | | $ | 11.18 | | $ | 10.66 | | $ | 10.00 | |
| Income from investment operationsb: | | | | | | | | | | | | |
| Net investment income (loss)c | | 0.01 | | | (0.01 | ) | | (0.08 | ) | | (0.01 | ) |
| Net realized and unrealized gains (losses) | | 0.20 | | | (0.37 | ) | | 0.70 | | | 0.71 | |
| Total from investment operations | | 0.21 | | | (0.38 | ) | | 0.62 | | | 0.70 | |
| Less distributions from: | | | | | | | | | | | | |
| Net investment income | | — | | | (0.17 | ) | | (0.10 | ) | | (0.04 | ) |
| Net realized gains | | — | | | (0.04 | ) | | — | | | — | |
| Total distributions | | — | | | (0.21 | ) | | (0.10 | ) | | (0.04 | ) |
| Net asset value, end of period | $ | 10.80 | | $ | 10.59 | | $ | 11.18 | | $ | 10.66 | |
| |
| Total returnd | | 1.98 | % | | (3.45 | )% | | 5.80 | % | | 7.02 | % |
| |
| Ratios to average net assetse | | | | | | | | | | | | |
| Expenses before waiver, payments by affiliates and expense | | | | | | | | | | | | |
| reductionf | | 2.75 | % | | 2.87 | % | | 2.98 | % | | 3.19 | % |
| Expenses net of waiver, payments by affiliates and expense | | | | | | | | | | | | |
| reductionf | | 2.41 | %g | | 2.53 | %g | | 2.60 | %g | | 2.69 | % |
| Expenses incurred in connection with securities sold short | | 0.55 | % | | 0.67 | % | | 0.65 | % | | 0.56 | % |
| Net investment income (loss) | | 0.24 | % | | (0.09 | )% | | (0.56 | )% | | (0.21 | )% |
| |
| Supplemental data | | | | | | | | | | | | |
| Net assets, end of period (000’s) | $ | 257,955 | | $ | 265,517 | | $ | 239,754 | | $ | 215,526 | |
| Portfolio turnover rate | | 105.92 | % | | 229.90 | % | | 295.81 | % | | 181.06 | % |
aFor the period October 11, 2013 (commencement of operations) to May 31, 2014.
bThe amount shown for a share outstanding throughout the period may not correlate with the Consolidated Statement of Operations for the period due to the timing of sales
and repurchases of the Fund’s shares in relation to income earned and/or fluctuating fair value of the investments of the Fund.
cBased on average daily shares outstanding.
dTotal return is not annualized for periods less than one year.
eRatios are annualized for periods less than one year.
fIncludes dividend and/or interest expense on securities sold short and security borrowing fees, if any. See below for the ratios of such expenses to average net assets for the
periods presented. See Note 1(f).
gBenefit of expense reduction rounds to less than 0.01%.
franklintempleton.com
The accompanying notes are an integral part of these financial statements. | Semiannual Report 13
FRANKLIN ALTERNATIVE STRATEGIES FUNDS
CONSOLIDATED FINANCIAL HIGHLIGHTS
| | | | | | | | | | | | |
| Franklin K2 Alternative Strategies Fund (continued) | | | | | | | | | | | | |
| | | Six Months Ended | | | Year Ended May 31, | |
| | | November 30, 2016 | | | | | | | | | | |
| | | (unaudited) | | | 2016 | | | 2015 | | | 2014 | a |
| Advisor Class | | | | | | | | | | | | |
| Per share operating performance | | | | | | | | | | | | |
| (for a share outstanding throughout the period) | | | | | | | | | | | | |
| Net asset value, beginning of period | $ | 10.58 | | $ | 11.18 | | $ | 10.65 | | $ | 10.00 | |
| Income from investment operationsb: | | | | | | | | | | | | |
| Net investment income (loss)c | | 0.01 | | | (0.02 | ) | | (0.02 | ) | | (0.02 | ) |
| Net realized and unrealized gains (losses) | | 0.20 | | | (0.38 | ) | | 0.64 | | | 0.71 | |
| Total from investment operations | | 0.21 | | | (0.40 | ) | | 0.62 | | | 0.69 | |
| Less distributions from: | | | | | | | | | | | | |
| Net investment income | | — | | | (0.16 | ) | | (0.09 | ) | | (0.04 | ) |
| Net realized gains | | — | | | (0.04 | ) | | — | | | — | |
| Total distributions | | — | | | (0.20 | ) | | (0.09 | ) | | (0.04 | ) |
| Net asset value, end of period | $ | 10.79 | | $ | 10.58 | | $ | 11.18 | | $ | 10.65 | |
| |
| Total returnd | | 1.98 | % | | (3.58 | )% | | 5.88 | % | | 6.92 | % |
| |
| Ratios to average net assetse | | | | | | | | | | | | |
| Expenses before waiver, payments by affiliates and expense reductionf | | 2.84 | % | | 2.96 | % | | 3.07 | % | | 3.21 | % |
| Expenses net of waiver, payments by affiliates and expense reductionf | | 2.50 | %g | | 2.62 | %g | | 2.66 | %g | | 2.71 | % |
| Expenses incurred in connection with securities sold short | | 0.55 | % | | 0.67 | % | | 0.65 | % | | 0.56 | % |
| Net investment income (loss) | | 0.15 | % | | (0.18 | )% | | (0.62 | )% | | (0.23 | )% |
| |
| Supplemental data | | | | | | | | | | | | |
| Net assets, end of period (000’s) | $ | 648,675 | | $ | 722,216 | | $ | 329,139 | | $ | 54,593 | |
| Portfolio turnover rate | | 105.92 | % | | 229.90 | % | | 295.81 | % | | 181.06 | % |
aFor the period October 11, 2013 (commencement of operations) to May 31, 2014.
bThe amount shown for a share outstanding throughout the period may not correlate with the Consolidated Statement of Operations for the period due to the timing of sales
and repurchases of the Fund’s shares in relation to income earned and/or fluctuating fair value of the investments of the Fund.
cBased on average daily shares outstanding.
dTotal return is not annualized for periods less than one year.
eRatios are annualized for periods less than one year.
fIncludes dividend and/or interest expense on securities sold short and security borrowing fees, if any. See below for the ratios of such expenses to average net assets for the
periods presented. See Note 1(f).
gBenefit of expense reduction rounds to less than 0.01%.
14 Semiannual Report | The accompanying notes are an integral part of these financial statements.
franklintempleton.com
FRANKLIN ALTERNATIVE STRATEGIES FUNDS
Consolidated Statement of Investments, November 30, 2016 (unaudited)
| | | | |
| Franklin K2 Alternative Strategies Fund | | | | |
| | Country | Shares/Warrants | | Value |
| Common Stocks and Other Equity Interests 32.5% | | | | |
| Aerospace & Defense 0.1% | | | | |
| B/E Aerospace Inc | United States | 21,029 | $ | 1,262,581 |
| United Technologies Corp | United States | 729 | | 78,528 |
| | | | | 1,341,109 |
| Air Freight & Logistics 0.2% | | | | |
| a FedEx Corp | United States | 13,662 | | 2,618,596 |
| Airlines 0.4% | | | | |
| Copa Holdings SA | Panama | 3,036 | | 269,810 |
| a Delta Air Lines Inc | United States | 36,249 | | 1,746,477 |
| a,b Hawaiian Holdings Inc | United States | 5,338 | | 274,106 |
| a,b Latam Airlines, ADR | Chile | 23,337 | | 202,565 |
| Southwest Airlines Co | United States | 21,651 | | 1,009,153 |
| b United Continental Holdings Inc | United States | 12,940 | | 892,213 |
| b Virgin America Inc | United States | 2,400 | | 135,600 |
| | | | | 4,529,924 |
| Auto Components 0.1% | | | | |
| Adient PLC | United States | 28,713 | | 1,537,868 |
| Delphi Automotive PLC | United Kingdom | 476 | | 30,464 |
| | | | | 1,568,332 |
| Automobiles 0.2% | | | | |
| General Motors Co | United States | 1,544 | | 53,314 |
| a Harley-Davidson Inc | United States | 19,656 | | 1,196,854 |
| b Peugeot SA | France | 20,062 | | 295,977 |
| b Tesla Motors Inc | United States | 4,028 | | 762,816 |
| | | | | 2,308,961 |
| Banks 0.1% | | | | |
| Barclays PLC, ADR | United Kingdom | 108,406 | | 292,910 |
| BB&T Corp | United States | 1,399 | | 63,305 |
| b Israel Discount Bank Ltd | Israel | 64,119 | | 130,872 |
| JPMorgan Chase & Co | United States | 2,656 | | 212,932 |
| PNC Financial Services Group Inc | United States | 794 | | 87,769 |
| US Bancorp | United States | 1,400 | | 69,468 |
| Wells Fargo & Co | United States | 3,534 | | 187,019 |
| | | | | 1,044,275 |
| Beverages 0.8% | | | | |
| a Anheuser-Busch InBev SA/NV, ADR | Belgium | 24,130 | | 2,491,905 |
| a Brown-Forman Corp., B | United States | 48,078 | | 2,180,337 |
| Coca-Cola Co | United States | 3,433 | | 138,522 |
| Constellation Brands Inc., A | United States | 319 | | 48,214 |
| Davide Campari-Milano SpA | Italy | 189,757 | | 1,830,136 |
| Heineken NV | Netherlands | 11,205 | | 839,844 |
| Molson Coors Brewing Co | United States | 11,842 | | 1,160,871 |
| PepsiCo Inc | United States | 1,266 | | 126,727 |
| | | | | 8,816,556 |
| Biotechnology 2.4% | | | | |
| b ACADIA Pharmaceuticals Inc | United States | 32,494 | | 877,013 |
| b Aeglea BioTherapeutics Inc | United States | 13,829 | | 71,496 |
| a,b Agios Pharmaceuticals Inc | United States | 2,859 | | 166,422 |
| a,b Alexion Pharmaceuticals Inc | United States | 12,919 | | 1,583,740 |
franklintempleton.com
Semiannual Report 15
FRANKLIN ALTERNATIVE STRATEGIES FUNDS
CONSOLIDATED STATEMENT OF INVESTMENTS (UNAUDITED)
| | | | |
| Franklin K2 Alternative Strategies Fund (continued) | | | | |
| |
| | Country | Shares/Warrants | | Value |
| Common Stocks and Other Equity Interests (continued) | | | | |
| Biotechnology (continued) | | | | |
| b Amicus Therapeutics Inc | United States | 79,676 | $ | 476,463 |
| b ARIAD Pharmaceuticals Inc | United States | 27,941 | | 376,645 |
| b Audentes Therapeutics Inc | United States | 5,590 | | 91,844 |
| b Avexis Inc | United States | 3,345 | | 197,756 |
| b BioCryst Pharmaceuticals Inc | United States | 19,513 | | 109,078 |
| b Biogen Inc | United States | 5,786 | | 1,701,489 |
| b BioMarin Pharmaceutical Inc | United States | 36,544 | | 3,129,263 |
| b Bluebird Bio Inc | United States | 16,058 | | 969,100 |
| b Celgene Corp | United States | 24,700 | | 2,927,197 |
| b Clovis Oncology Inc | United States | 12,173 | | 417,169 |
| b Corvus Pharmaceuticals Inc | United States | 4,562 | | 70,392 |
| b DBV Technologies SA, ADR | France | 8,052 | | 294,059 |
| b Epizyme Inc | United States | 32,473 | | 360,450 |
| b Exelixis Inc | United States | 26,863 | | 454,522 |
| a,b Incyte Corp. Ltd | United States | 20,357 | | 2,082,318 |
| b Inotek Pharmaceuticals Corp | United States | 25,253 | | 161,619 |
| b Insmed Inc | United States | 18,832 | | 257,057 |
| b Kite Pharma Inc | United States | 10,484 | | 533,950 |
| b MacroGenics Inc | United States | 4,141 | | 107,376 |
| b Mast Therapeutics Inc., wts., 6/14/18 | United States | 68,920 | | 138 |
| b Medgenics Inc | United States | 26,026 | | 133,774 |
| b Natera Inc | United States | 11,086 | | 133,032 |
| b Neurocrine Biosciences Inc | United States | 6,544 | | 303,969 |
| b Otonomy Inc | United States | 20,111 | | 341,887 |
| b OvaScience Inc | United States | 33,867 | | 113,454 |
| b ProQR Therapeutics NV | Netherlands | 37,569 | | 159,668 |
| b Proteostasis Therapeutics Inc | United States | 36,072 | | 379,838 |
| b Prothena Corp. PLC | Ireland | 8,682 | | 512,412 |
| b Ra Pharmaceuticals Inc | United States | 3,379 | | 44,231 |
| b Radius Health Inc | United States | 4,274 | | 227,462 |
| b Regeneron Pharmaceuticals Inc | United States | 3,442 | | 1,305,344 |
| b REGENXBIO Inc | United States | 2,716 | | 60,431 |
| b Retrophin Inc | United States | 12,435 | | 254,544 |
| b Sage Therapeutics Inc | United States | 14,259 | | 714,519 |
| a,b Sarepta Therapeutics Inc | United States | 10,290 | | 352,535 |
| a Shire PLC, ADR | United States | 12,955 | | 2,261,943 |
| b Syndax Pharmaceuticals Inc | United States | 2,165 | | 20,957 |
| b Tesaro Inc | United States | 5,354 | | 726,484 |
| b Trevena Inc | United States | 10,717 | | 58,729 |
| b Ultragenyx Pharmaceutical Inc | United States | 9,639 | | 754,637 |
| b Vertex Pharmaceuticals Inc | United States | 3,649 | | 297,795 |
| | | | | 26,574,201 |
| Building Products 0.0%† | | | | |
| a AO Smith Corp | United States | 6,172 | | 300,144 |
| Johnson Controls International PLC | United States | 2,103 | | 94,593 |
| | | | | 394,737 |
| Capital Markets 0.3% | | | | |
| a Moody’s Corp | United States | 23,172 | | 2,328,786 |
| a SEI Investments Co | United States | 29,367 | | 1,385,535 |
| | | | | 3,714,321 |
16 Semiannual Report
franklintempleton.com
FRANKLIN ALTERNATIVE STRATEGIES FUNDS
CONSOLIDATED STATEMENT OF INVESTMENTS (UNAUDITED)
| | | | |
| Franklin K2 Alternative Strategies Fund (continued) | | | | |
| |
| | Country | Shares/Warrants | | Value |
| Common Stocks and Other Equity Interests (continued) | | | | |
| Chemicals 1.1% | | | | |
| Axalta Coating Systems Ltd | United States | 11,216 | $ | 296,327 |
| Croda International PLC | United Kingdom | 21,384 | | 872,772 |
| E. I. du Pont de Nemours & Co | United States | 941 | | 69,267 |
| b Ingevity Corp | United States | 32,929 | | 1,724,492 |
| PPG Industries Inc | United States | 344 | | 33,000 |
| a Sherwin-Williams Co | United States | 21,516 | | 5,780,704 |
| a Syngenta AG, ADR | Switzerland | 23,169 | | 1,770,575 |
| Trinseo SA | United States | 23,791 | | 1,392,963 |
| | | | | 11,940,100 |
| Commercial Services & Supplies 0.4% | | | | |
| b Atento SA | Spain | 81,572 | | 693,362 |
| Edenred | France | 30,138 | | 635,481 |
| G&K Services Inc., A | United States | 7,570 | | 726,115 |
| b Gategroup Holding AG | Switzerland | 36,384 | | 1,823,673 |
| West Corp | United States | 18,356 | | 437,974 |
| | | | | 4,316,605 |
| Communications Equipment 0.3% | | | | |
| b Arista Networks Inc | United States | 9,040 | | 857,083 |
| b Ciena Corp | United States | 32,152 | | 689,660 |
| b Oclaro Inc | United States | 128,070 | | 1,144,946 |
| b Quantenna Communications Inc | United States | 7,700 | | 146,223 |
| | | | | 2,837,912 |
| Construction & Engineering 0.1% | | | | |
| a Fluor Corp | United States | 10,997 | | 588,449 |
| Construction Materials 0.3% | | | | |
| Buzzi Unicem SpA | Italy | 20,495 | | 435,519 |
| HeidelbergCement AG | Germany | 7,994 | | 716,853 |
| a Martin Marietta Materials Inc | United States | 6,096 | | 1,337,767 |
| b Summit Materials Inc., A | United States | 16,740 | | 397,910 |
| | | | | 2,888,049 |
| Containers & Packaging 0.1% | | | | |
| Ball Corp | United States | 17,085 | | 1,282,400 |
| International Paper Co | United States | 891 | | 43,409 |
| WestRock Co | United States | 528 | | 27,034 |
| | | | | 1,352,843 |
| Diversified Consumer Services 0.1% | | | | |
| b LifeLock Inc | United States | 25,543 | | 608,179 |
| Sotheby’s | United States | 5,074 | | 198,190 |
| | | | | 806,369 |
| Diversified Financial Services 0.0%† | | | | |
| b ECN Capital Corp | Canada | 16,284 | | 36,610 |
| Diversified Telecommunication Services 0.6% | | | | |
| AT&T Inc | United States | 1,688 | | 65,207 |
| CenturyLink Inc | United States | 8,848 | | 208,105 |
| b Level 3 Communications Inc | United States | 48,924 | | 2,694,245 |
| b ORBCOMM Inc | United States | 17,540 | | 147,511 |
franklintempleton.com
Semiannual Report 17
FRANKLIN ALTERNATIVE STRATEGIES FUNDS
CONSOLIDATED STATEMENT OF INVESTMENTS (UNAUDITED)
| | | | |
| Franklin K2 Alternative Strategies Fund (continued) | | | | |
| |
| | Country | Shares/Warrants | | Value |
| Common Stocks and Other Equity Interests (continued) | | | | |
| Diversified Telecommunication Services (continued) | | | | |
| SFR Group SA | France | 45,273 | $ | 1,143,905 |
| Telecom Italia SpA | Italy | 3,776,043 | | 2,357,201 |
| Verizon Communications Inc | United States | 3,009 | | 150,149 |
| | | | | 6,766,323 |
| Electric Utilities 0.0%† | | | | |
| Exelon Corp | United States | 1,932 | | 62,809 |
| NextEra Energy Inc | United States | 949 | | 108,404 |
| PG&E Corp | United States | 2,093 | | 123,069 |
| | | | | 294,282 |
| Electronic Equipment, Instruments & Components 0.7% | | | | |
| b Coherent Inc | United States | 3,443 | | 449,311 |
| Ingram Micro Inc., A | United States | 106,586 | | 3,990,580 |
| b Itron Inc | United States | 10,530 | | 676,026 |
| Largan Precision Co. Ltd | Taiwan | 2,650 | | 306,796 |
| Tongda Group Holdings Ltd | Hong Kong | 1,170,000 | | 343,918 |
| a,b VeriFone Systems Inc | United States | 92,216 | | 1,557,528 |
| | | | | 7,324,159 |
| Energy Equipment & Services 0.4% | | | | |
| b FMC Technologies Inc | United States | 135,214 | | 4,632,431 |
| Halliburton Co | United States | 1,876 | | 99,597 |
| | | | | 4,732,028 |
| Food & Staples Retailing 0.7% | | | | |
| a Casey’s General Stores Inc | United States | 33,546 | | 4,040,616 |
| Costco Wholesale Corp | United States | 17,327 | | 2,600,956 |
| CVS Health Corp | United States | 646 | | 49,671 |
| Kroger Co | United States | 1,675 | | 54,102 |
| a,b,d Rite Aid Corp | United States | 86,884 | | 691,597 |
| | | | | 7,436,942 |
| Food Products 0.6% | | | | |
| The Hershey Co | United States | 16,281 | | 1,573,396 |
| Lindt & Spruengli AG | Switzerland | 63 | | 3,662,762 |
| Mead Johnson Nutrition Co | United States | 618 | | 44,551 |
| a,b The WhiteWave Foods Co | United States | 33,812 | | 1,862,703 |
| | | | | 7,143,412 |
| Health Care Equipment & Supplies 1.2% | | | | |
| b Alere Inc | United States | 10,104 | | 401,331 |
| a Becton Dickinson and Co | United States | 13,842 | | 2,340,682 |
| b Boston Scientific Corp | United States | 32,213 | | 659,078 |
| DENTSPLY SIRONA Inc | United States | 13,167 | | 766,056 |
| b Derma Sciences Inc | United States | 15,810 | | 75,888 |
| b DexCom Inc | United States | 9,788 | | 639,059 |
| b Edwards Lifesciences Corp | United States | 1,497 | | 124,026 |
| b GenMark Diagnostics Inc | United States | 27,031 | | 314,100 |
| a,b IDEXX Laboratories Inc | United States | 17,940 | | 2,110,641 |
| b iRhythm Technologies Inc | United States | 1,485 | | 45,293 |
| Medtronic PLC | United States | 309 | | 22,560 |
| Smith & Nephew PLC | United Kingdom | 72,763 | | 1,026,036 |
18 Semiannual Report
franklintempleton.com
FRANKLIN ALTERNATIVE STRATEGIES FUNDS
CONSOLIDATED STATEMENT OF INVESTMENTS (UNAUDITED)
| | | | |
| Franklin K2 Alternative Strategies Fund (continued) | | | | |
| |
| | Country | Shares/Warrants | | Value |
| Common Stocks and Other Equity Interests (continued) | | | | |
| Health Care Equipment & Supplies (continued) | | | | |
| a St. Jude Medical Inc | United States | 64,738 | $ | 5,127,250 |
| b TearLab Corp | United States | 56,223 | | 30,360 |
| | | | | 13,682,360 |
| Health Care Providers & Services 1.2% | | | | |
| b Acadia Healthcare Co. Inc | United States | 10,301 | | 391,541 |
| a Aetna Inc | United States | 16,373 | | 2,142,243 |
| Celesio AG | Germany | 61,856 | | 1,661,897 |
| b Centene Corp | United States | 13,078 | | 753,685 |
| Cigna Corp | United States | 8,876 | | 1,195,952 |
| b Envision Healthcare Holdings Inc | United States | 28,049 | | 637,273 |
| a Humana Inc | United States | 14,599 | | 3,104,332 |
| a UnitedHealth Group Inc | United States | 16,758 | | 2,653,127 |
| Universal Health Services Inc., B | United States | 2,346 | | 288,605 |
| | | | | 12,828,655 |
| Health Care Technology 0.0%† | | | | |
| b Tabula Rasa HealthCare Inc | United States | 4,863 | | 67,498 |
| Hotels, Restaurants & Leisure 0.6% | | | | |
| Carnival Corp | United States | 26,863 | | 1,381,027 |
| a Domino’s Pizza Inc | United States | 12,047 | | 2,024,378 |
| Hilton Worldwide Holdings Inc | United States | 2,693 | | 67,513 |
| McDonald’s Corp | United States | 718 | | 85,636 |
| a Sonic Corp | United States | 43,947 | | 1,147,017 |
| Wynn Resorts Ltd | United States | 2,645 | | 269,764 |
| Yum! Brands Inc | United States | 21,824 | | 1,383,423 |
| | | | | 6,358,758 |
| Household Durables 0.1% | | | | |
| a CalAtlantic Group Inc | United States | 23,441 | | 782,695 |
| Harman International Industries Inc | United States | 5,583 | | 610,612 |
| Whirlpool Corp | United States | 213 | | 34,600 |
| | | | | 1,427,907 |
| Independent Power & Renewable Electricity Producers 0.0%† | | | | |
| TerraForm Global Inc., A | United States | 92,129 | | 350,090 |
| Industrial Conglomerates 0.1% | | | | |
| General Electric Co | United States | 4,562 | | 140,327 |
| Honeywell International Inc | United States | 662 | | 75,428 |
| Roper Technologies Inc | United States | 550 | | 99,610 |
| Smiths Group PLC | United Kingdom | 17,888 | | 315,804 |
| | | | | 631,169 |
| Insurance 0.4% | | | | |
| Chubb Ltd | United States | 487 | | 62,336 |
| Delta Lloyd NV | Netherlands | 157,293 | | 905,719 |
| Endurance Specialty Holdings | United States | 20,266 | | 1,868,525 |
| MetLife Inc | United States | 1,240 | | 68,213 |
| RSA Insurance Group PLC | United Kingdom | 44,331 | | 299,800 |
| a W.R. Berkley Corp | United States | 20,475 | | 1,265,150 |
| | | | | 4,469,743 |
franklintempleton.com
Semiannual Report 19
FRANKLIN ALTERNATIVE STRATEGIES FUNDS
CONSOLIDATED STATEMENT OF INVESTMENTS (UNAUDITED)
| | | | |
| Franklin K2 Alternative Strategies Fund (continued) | | | | |
| |
| | Country | Shares/Warrants | | Value |
| Common Stocks and Other Equity Interests (continued) | | | | |
| Internet & Direct Marketing Retail 0.8% | | | | |
| a,b Amazon.com Inc | United States | 2,329 | $ | 1,748,078 |
| a Expedia Inc | United States | 12,826 | | 1,591,065 |
| a,b Netflix Inc | United States | 7,890 | | 923,130 |
| b The Priceline Group Inc | United States | 724 | | 1,088,664 |
| a,b TripAdvisor Inc | United States | 15,751 | | 760,458 |
| a,b Wayfair Inc., A | United States | 61,446 | | 2,239,707 |
| | | | | 8,351,102 |
| Internet Software & Services 2.4% | | | | |
| b Akamai Technologies Inc | United States | 14,218 | | 948,340 |
| a,b Alibaba Group Holding Ltd., ADR | China | 16,552 | | 1,556,219 |
| a,b Alphabet Inc., A | United States | 1,284 | | 996,230 |
| a,b Alphabet Inc., C | United States | 1,306 | | 990,000 |
| b Baidu Inc., ADR | China | 2,300 | | 383,985 |
| b Benefitfocus Inc | United States | 11,353 | | 309,937 |
| a,b eBay Inc | United States | 37,281 | | 1,036,785 |
| a,b Facebook Inc | United States | 37,309 | | 4,418,132 |
| b GrubHub Inc | United States | 17,100 | | 633,213 |
| j2 Global Inc | United States | 10,688 | | 785,675 |
| b Just Eat PLC | United Kingdom | 93,564 | | 685,431 |
| a,b LinkedIn Corp., A | United States | 47,074 | | 9,190,728 |
| Tencent Holdings Ltd | China | 17,600 | | 439,518 |
| b VeriSign Inc | United States | 11,079 | | 873,579 |
| a,b Yahoo! Inc | United States | 74,499 | | 3,055,949 |
| b Zillow Group Inc., A | United States | 8,017 | | 281,797 |
| b Zillow Group Inc., C | United States | 17,102 | | 614,304 |
| | | | | 27,199,822 |
| IT Services 3.2% | | | | |
| Accenture PLC, A | United States | 8,972 | | 1,071,526 |
| a Alliance Data Systems Corp | United States | 14,062 | | 3,217,104 |
| a Automatic Data Processing Inc | United States | 25,230 | | 2,422,585 |
| b Blackhawk Network Holdings Inc | United States | 9,800 | | 352,800 |
| a Cardtronics PLC, A | United States | 19,967 | | 987,767 |
| a,b Cognizant Technology Solutions Corp., A | United States | 23,186 | | 1,277,085 |
| a Computer Sciences Corp | United States | 17 | | 1,031 |
| a,b EPAM Systems Inc | United States | 15,489 | | 1,020,725 |
| a,b ExlService Holdings Inc | United States | 55,867 | | 2,657,035 |
| b FleetCor Technologies Inc | United States | 11,700 | | 1,747,278 |
| b Genpact Ltd | United States | 106,065 | | 2,538,135 |
| a Global Payments Inc | United States | 52,238 | | 3,580,915 |
| a MasterCard Inc., A | United States | 33,266 | | 3,399,785 |
| b,e Nets AS, 144A | Denmark | 25,555 | | 436,816 |
| a,b PayPal Holdings Inc | United States | 63,675 | | 2,501,154 |
| Total System Services Inc | United States | 26,000 | | 1,279,720 |
| a,b Vantiv Inc., A | United States | 20,986 | | 1,184,240 |
| Visa Inc., A | United States | 29,356 | | 2,269,806 |
| a,b WEX Inc | United States | 24,187 | | 2,672,905 |
| e Worldpay Group PLC, 144A | United Kingdom | 112,257 | | 378,109 |
| | | | | 34,996,521 |
20 Semiannual Report
franklintempleton.com
FRANKLIN ALTERNATIVE STRATEGIES FUNDS
CONSOLIDATED STATEMENT OF INVESTMENTS (UNAUDITED)
| | | | |
| Franklin K2 Alternative Strategies Fund (continued) | | | | |
| |
| | Country | Shares/Warrants | | Value |
| Common Stocks and Other Equity Interests (continued) | | | | |
| Life Sciences Tools & Services 0.6% | | | | |
| Gerresheimer AG | Germany | 23,577 | $ | 1,720,429 |
| b Illumina Inc | United States | 7,574 | | 1,008,402 |
| a,b Mettler-Toledo International Inc | United States | 1,732 | | 713,619 |
| b NanoString Technologies Inc | United States | 5,354 | | 117,788 |
| Thermo Fisher Scientific Inc | United States | 20,432 | | 2,862,728 |
| | | | | 6,422,966 |
| Machinery 0.2% | | | | |
| a Caterpillar Inc | United States | 10,249 | | 979,395 |
| Dover Corp | United States | 735 | | 53,368 |
| b KUKA AG | Germany | 5,169 | | 577,967 |
| b Manitowoc Foodservice Inc | United States | 7,180 | | 127,373 |
| Trinity Industries Inc | United States | 17,228 | | 478,766 |
| | | | | 2,216,869 |
| Marine 0.2% | | | | |
| Irish Continental Group PLC | Ireland | 410,345 | | 1,817,899 |
| Media 1.3% | | | | |
| a,b Carmike Cinemas Inc | United States | 63,881 | | 2,159,178 |
| a CBS Corp., B | United States | 16,258 | | 987,186 |
| a,b Charter Communications Inc., A | United States | 3,698 | | 1,018,096 |
| Comcast Corp., A | United States | 938 | | 65,200 |
| a,b Dish Network Corp., A | United States | 37,297 | | 2,142,713 |
| Entertainment One Ltd | Canada | 112,518 | | 309,019 |
| ITV PLC | United Kingdom | 293,248 | | 616,414 |
| b Liberty Global PLC LiLAC, A | United Kingdom | 11,067 | | 238,826 |
| b Liberty Global PLC LiLAC, C | United Kingdom | 3,003 | | 63,574 |
| b Liberty Global PLC, A | United Kingdom | 32,966 | | 1,032,495 |
| b Liberty Global PLC, C | United Kingdom | 24,352 | | 741,518 |
| b Live Nation Entertainment Inc | United States | 4,173 | | 115,509 |
| b Postmedia Network Canada Corp | Canada | 666,338 | | 327,390 |
| Stroeer SE & Co. KGaA | Germany | 44,132 | | 1,673,548 |
| Time Warner Inc | United States | 4,798 | | 440,552 |
| Walt Disney Co | United States | 22,400 | | 2,220,288 |
| | | | | 14,151,506 |
| Metals & Mining 1.4% | | | | |
| Boliden AB | Sweden | 38,793 | | 1,001,918 |
| First Quantum Minerals Ltd | Canada | 60,371 | | 689,415 |
| a Freeport-McMoRan Inc | United States | 114,823 | | 1,762,533 |
| a Newmont Mining Corp | United States | 49,258 | | 1,597,930 |
| Teck Resources Ltd | Canada | 247,226 | | 6,264,707 |
| ThyssenKrupp AG | Germany | 51,931 | | 1,178,937 |
| a United States Steel Corp | United States | 72,509 | | 2,344,941 |
| Voestalpine AG | Austria | 21,316 | | 807,768 |
| | | | | 15,648,149 |
| Multi-Utilities 0.0%† | | | | |
| Sempra Energy | United States | 1,098 | | 109,580 |
| Oil, Gas & Consumable Fuels 0.6% | | | | |
| Chevron Corp | United States | 1,001 | | 111,672 |
| DHT Holdings Inc | United States | 55,300 | | 196,315 |
franklintempleton.com
Semiannual Report 21
FRANKLIN ALTERNATIVE STRATEGIES FUNDS
CONSOLIDATED STATEMENT OF INVESTMENTS (UNAUDITED)
| | | | |
| Franklin K2 Alternative Strategies Fund (continued) | | | | |
| |
| | Country | Shares/Warrants | | Value |
| Common Stocks and Other Equity Interests (continued) | | | | |
| Oil, Gas & Consumable Fuels (continued) | | | | |
| Encana Corp | Canada | 4,163 | $ | 52,454 |
| EQT Corp | United States | 406 | | 28,452 |
| Exxon Mobil Corp | United States | 2,622 | | 228,901 |
| Golar LNG Ltd | Bermuda | 1,384 | | 33,770 |
| b Halcon Resources Corp | United States | 7,948 | | 75,586 |
| b Halcon Resources Corp., wts., 9/09/20 | United States | 2,159 | | 5,376 |
| Hess Corp | United States | 10,920 | | 611,083 |
| b InterOil Corp | Singapore | 24,093 | | 1,170,920 |
| Kinder Morgan Inc | United States | 2,467 | | 54,767 |
| a,b Kinder Morgan Inc., wts., 5/25/17 | United States | 52,317 | | 340 |
| b Pacific Exploration and Production Corp | Colombia | 4,655 | | 183,144 |
| b PDC Energy Inc | United States | 407 | | 30,301 |
| SM Energy Co | United States | 4,547 | | 181,243 |
| a Spectra Energy Corp | United States | 29,112 | | 1,192,136 |
| TonenGeneral Sekiyu K.K | Japan | 120,264 | | 1,144,771 |
| Valero Energy Corp | United States | 322 | | 19,822 |
| Western Refining Inc | United States | 32,730 | | 1,174,025 |
| b Whiting Petroleum Corp | United States | 18,987 | | 232,021 |
| | | | | 6,727,099 |
| Paper & Forest Products 0.3% | | | | |
| b Canfor Corp | Canada | 188,794 | | 2,064,605 |
| West Fraser Timber Co. Ltd | Canada | 39,190 | | 1,397,163 |
| | | | | 3,461,768 |
| Pharmaceuticals 1.1% | | | | |
| b Aerie Pharmaceuticals Inc | United States | 41,896 | | 1,556,436 |
| b Allergan PLC | United States | 21,559 | | 4,188,914 |
| b Assembly Biosciences Inc | United States | 29,400 | | 377,790 |
| AstraZeneca PLC, ADR | United Kingdom | 18,988 | | 496,346 |
| a Bristol-Myers Squibb Co | United States | 26,998 | | 1,523,767 |
| b,e Cassiopea SpA, 144A | Italy | 4,184 | | 119,343 |
| b Dermira Inc | United States | 16,370 | | 523,513 |
| Eli Lilly & Co | United States | 24,924 | | 1,672,899 |
| a,b Flex Pharma Inc | United States | 3,355 | | 20,633 |
| b GW Pharmaceuticals PLC, ADR | United Kingdom | 2,409 | | 268,965 |
| Hikma Pharmaceuticals PLC | United Kingdom | 10,168 | | 216,405 |
| b Intra-Cellular Therapies Inc | United States | 22,475 | | 313,302 |
| Johnson & Johnson | United States | 2,146 | | 238,850 |
| b Ocular Therapeutix Inc | United States | 42,865 | | 398,216 |
| Pfizer Inc | United States | 4,507 | | 144,855 |
| b Steadymed Ltd | Israel | 7,603 | | 25,850 |
| | | | | 12,086,084 |
| Professional Services 0.8% | | | | |
| a Equifax Inc | United States | 9,951 | | 1,138,892 |
| Experian PLC | Ireland | 61,716 | | 1,166,012 |
| b Huron Consulting Group Inc | United States | 21,939 | | 1,157,282 |
| a ManpowerGroup Inc | United States | 6,503 | | 555,421 |
| a Robert Half International Inc | United States | 24,817 | | 1,113,539 |
| a,b TransUnion | United States | 38,184 | | 1,139,029 |
| b TriNet Group Inc | United States | 50,415 | | 1,271,970 |
22 Semiannual Report
franklintempleton.com
FRANKLIN ALTERNATIVE STRATEGIES FUNDS
CONSOLIDATED STATEMENT OF INVESTMENTS (UNAUDITED)
| | | | |
| Franklin K2 Alternative Strategies Fund (continued) | | | | |
| |
| | Country | Shares/Warrants | | Value |
| Common Stocks and Other Equity Interests (continued) | | | | |
| Professional Services (continued) | | | | |
| a,b WageWorks Inc | United States | 20,007 | $ | 1,477,517 |
| | | | | 9,019,662 |
| Real Estate Management & Development 0.1% | | | | |
| b CBRE Group Inc., A | United States | 27,744 | | 805,686 |
| Grand City Properties SA | Germany | 32,078 | | 535,806 |
| | | | | 1,341,492 |
| Road & Rail 0.7% | | | | |
| a CSX Corp | United States | 63,216 | | 2,263,765 |
| a Kansas City Southern | United States | 23,829 | | 2,113,871 |
| b Old Dominion Freight Line Inc | United States | 15,253 | | 1,331,587 |
| a Union Pacific Corp | United States | 21,535 | | 2,182,141 |
| | | | | 7,891,364 |
| Semiconductors & Semiconductor Equipment 0.9% | | | | |
| b Advanced Process Systems Corp | South Korea | 441 | | 9,072 |
| Advanced Semiconductor Engineering Inc | Taiwan | 170,000 | | 182,678 |
| Analog Devices Inc | United States | 10,207 | | 757,768 |
| Broadcom Ltd | Singapore | 3,565 | | 607,797 |
| b Cavium Inc | United States | 13,896 | | 792,489 |
| Cypress Semiconductor Corp | United States | 5,483 | | 61,684 |
| Intel Corp | United States | 1,498 | | 51,981 |
| b MaxLinear Inc., A | United States | 9,900 | | 202,257 |
| a Microchip Technology Inc | United States | 10,231 | | 677,087 |
| b Micron Technology Inc | United States | 30,717 | | 599,903 |
| a NVIDIA Corp | United States | 10,612 | | 978,426 |
| b NXP Semiconductors NV | Netherlands | 21,560 | | 2,137,674 |
| QUALCOMM Inc | United States | 15,705 | | 1,069,982 |
| b Semiconductor Manufacturing International Corp | China | 4,195,000 | | 567,878 |
| b Siltronic AG | Germany | 1,871 | | 75,066 |
| a Taiwan Semiconductor Manufacturing Co. Ltd., ADR | Taiwan | 20,159 | | 598,521 |
| Win Semiconductors Corp | Taiwan | 85,471 | | 243,222 |
| | | | | 9,613,485 |
| Software 1.1% | | | | |
| Activision Blizzard Inc | United States | 24,963 | | 913,895 |
| a,b Adobe Systems Inc | United States | 5,910 | | 607,607 |
| Atlassian Corp. PLC | Australia | 12,900 | | 350,106 |
| Blackbaud Inc | United States | 6,600 | | 414,348 |
| b BroadSoft Inc | United States | 4,934 | | 204,761 |
| b Guidewire Software Inc | United States | 14,561 | | 811,193 |
| b HubSpot Inc | United States | 9,266 | | 519,823 |
| a Intuit Inc | United States | 5,700 | | 647,976 |
| Mentor Graphics Corp | United States | 22,456 | | 820,767 |
| Microsoft Corp | United States | 77,573 | | 4,674,549 |
| Mobileye NV | Israel | 6,706 | | 249,664 |
| Oracle Corp | United States | 2,280 | | 91,633 |
| b Paylocity Holding Corp | United States | 8,400 | | 278,124 |
| b Proofpoint Inc | United States | 2,860 | | 220,249 |
| b Red Hat Inc | United States | 2,223 | | 175,862 |
| a,b Salesforce.com Inc | United States | 11,579 | | 833,688 |
| b ServiceNow Inc | United States | 2,987 | | 248,369 |
franklintempleton.com
Semiannual Report 23
FRANKLIN ALTERNATIVE STRATEGIES FUNDS
CONSOLIDATED STATEMENT OF INVESTMENTS (UNAUDITED)
| | | | |
| Franklin K2 Alternative Strategies Fund (continued) | | | | |
| |
| | Country | Shares/Warrants | | Value |
| Common Stocks and Other Equity Interests (continued) | | | | |
| Software (continued) | | | | |
| Square Enix Holdings Co. Ltd | Japan | 11,638 | $ | 293,277 |
| | | | | 12,355,891 |
| Specialty Retail 1.9% | | | | |
| a,b AutoNation Inc | United States | 116,791 | | 5,215,886 |
| a,b Autozone Inc | United States | 6,331 | | 4,958,313 |
| b Cabela’s Inc | United States | 51,086 | | 3,179,593 |
| CST Brands Inc | United States | 8,135 | | 390,724 |
| a Foot Locker Inc | United States | 15,255 | | 1,093,326 |
| Home Depot Inc | United States | 41,343 | | 5,349,784 |
| a,b MarineMax Inc | United States | 42,883 | | 806,200 |
| b Sports Direct International PLC | United Kingdom | 155,760 | | 615,845 |
| | | | | 21,609,671 |
| Technology Hardware, Storage & Peripherals 0.6% | | | | |
| Apple Inc | United States | 6,394 | | 706,665 |
| a Hewlett Packard Enterprise Co | United States | 55,891 | | 1,330,206 |
| b Pure Storage Inc., A | United States | 101,117 | | 1,410,582 |
| Samsung Electronics Co. Ltd | South Korea | 686 | | 1,024,555 |
| Seagate Technology PLC | United States | 45,193 | | 1,812,239 |
| Western Digital Corp | United States | 9,615 | | 612,091 |
| | | | | 6,896,338 |
| Textiles, Apparel & Luxury Goods 0.2% | | | | |
| Michael Kors Holdings Ltd | United States | 19,385 | | 901,209 |
| Moncler SpA | Italy | 23,079 | | 375,221 |
| a NIKE Inc., B | United States | 13,178 | | 659,822 |
| | | | | 1,936,252 |
| Tobacco 0.5% | | | | |
| Altria Group Inc | United States | 787 | | 50,313 |
| Philip Morris International Inc | United States | 692 | | 61,090 |
| Reynolds American Inc | United States | 95,365 | | 5,159,246 |
| | | | | 5,270,649 |
| Trading Companies & Distributors 0.0%† | | | | |
| Air Lease Corp | United States | 4,692 | | 168,255 |
| Brenntag AG | Germany | 386 | | 20,318 |
| b Herc Holdings Inc | United States | 7,920 | | 314,741 |
| | | | | 503,314 |
| Wireless Telecommunication Services 0.0%† | | | | |
| NTT DoCoMo Inc | Japan | 16,700 | | 383,032 |
| Total Common Stocks and Other Equity Interests | | | | |
| (Cost $326,256,862) | | | | 361,201,790 |
| Exchange Traded Funds (Cost $364,552) 0.0%† | | | | |
| SPDR S&P Bank ETF | United States | 9,954 | | 409,607 |
| Convertible Preferred Stocks 0.7% | | | | |
| Electric Utilities 0.0%† | | | | |
| b Great Plains Energy Inc., cvt. pfd., 7.00% | United States | 692 | | 33,908 |
24 Semiannual Report
franklintempleton.com
FRANKLIN ALTERNATIVE STRATEGIES FUNDS
CONSOLIDATED STATEMENT OF INVESTMENTS (UNAUDITED)
| | | | | |
| Franklin K2 Alternative Strategies Fund (continued) | | | | | |
| |
| | Country | Shares/Warrants | | | Value |
| Convertible Preferred Stocks (continued) | | | | | |
| Electronic Equipment, Instruments & Components 0.2% | | | | | |
| b,c Belden Inc., cvt. pfd., 5.92% | United States | 4,338 | | $ | 464,383 |
| b MTS Systems Corp., cvt. pfd., 8.75% | United States | 13,715 | | | 1,700,249 |
| | | | | | 2,164,632 |
| Equity Real Estate Investment Trusts (REITs) 0.0%† | | | | | |
| b EPR Properties, cvt. pfd., C, 5.75% | United States | 1,859 | | | 51,494 |
| Welltower Inc., cvt. pfd., I, 6.50% | United States | 2,088 | | | 121,501 |
| | | | | | 172,995 |
| Food Products 0.2% | | | | | |
| a Post Holdings Inc., cvt. pfd., 2.50% | United States | 14,400 | | | 2,091,600 |
| Household Durables 0.0%† | | | | | |
| b William Lyon Homes, cvt. pfd., 6.50% | United States | 2,862 | | | 280,247 |
| Internet Software & Services 0.3% | | | | | |
| a,e Mandatory Exchangeable Trust, cvt. pfd., 144A, 5.75% | China | 27,286 | | | 3,153,852 |
| Tobacco 0.0%† | | | | | |
| Universal Corp., cvt. pfd., 6.75% | United States | 330 | | | 409,076 |
| Total Convertible Preferred Stocks (Cost $7,151,098) | | | | | 8,306,310 |
| Preferred Stocks 0.3% | | | | | |
| Food Products 0.1% | | | | | |
| Bunge Ltd., pfd., 4.875% | United States | 8,598 | | | 857,651 |
| Machinery 0.0%† | | | | | |
| MAN SE, pfd., 3.30% | Germany | 3,186 | | | 312,005 |
| Pharmaceuticals 0.2% | | | | | |
| Allergan PLC, pfd., 5.50% | United States | 2,057 | | | 1,474,869 |
| Teva Pharmaceutical Industries Ltd., pfd., 7.00% | Israel | 698 | | | 456,492 |
| | | | | | 1,931,361 |
| Total Preferred Stocks (Cost $3,758,491) | | | | | 3,101,017 |
| |
| | | Principal | | | |
| | | Amount* | | | |
| Convertible Bonds 17.3% | | | | | |
| Automobiles 0.0%† | | | | | |
| Tesla Motors Inc., senior note, 0.25%, 3/01/19 | United States | 477,000 | | | 432,579 |
| Biotechnology 0.8% | | | | | |
| f Ablynx NV, senior note, Reg S, 3.25%, 5/27/20 | Belgium | 200,000 | EUR | | 220,714 |
| a Acorda Therapeutics Inc., senior note, 1.75%, 6/15/21 | United States | 1,995,000 | | | 1,574,803 |
| a AMAG Pharmaceuticals Inc., senior note, 2.50%, 2/15/19 | United States | 917,000 | | | 1,251,705 |
| a BioMarin Pharmaceutical Inc., senior sub. note, 1.50%, 10/15/20 | United States | 1,052,000 | | | 1,272,263 |
| Clovis Oncology Inc., senior note, 2.50%, 9/15/21 | United States | 409,000 | | | 365,799 |
| a Emergent BioSolutions Inc., senior note, 2.875%, 1/15/21 | United States | 817,000 | | | 930,869 |
| Intercept Pharmaceuticals Inc., senior note, 3.25%, 7/01/23 | United States | 630,000 | | | 566,606 |
| Ionis Pharmaceuticals Inc., senior note, 1.00%, 11/15/21 | United States | 420,000 | | | 412,388 |
| Ligand Pharmaceuticals Inc., senior note, 0.75%, 8/15/19 | United States | 823,000 | | | 1,220,612 |
| PDL BioPharma Inc., senior note, 2.75%, 12/01/21 | United States | 960,000 | | | 792,000 |
| PTC Therapeutics Inc., senior note, 3.00%, 8/15/22 | United States | 623,000 | | | 363,287 |
| | | | | | 8,971,046 |
franklintempleton.com
Semiannual Report 25
FRANKLIN ALTERNATIVE STRATEGIES FUNDS
CONSOLIDATED STATEMENT OF INVESTMENTS (UNAUDITED)
| | | | | |
| Franklin K2 Alternative Strategies Fund (continued) | | | | | |
| |
| | | Principal | | | |
| | Country | Amount* | | | Value |
| Convertible Bonds (continued) | | | | | |
| Building Products 0.1% | | | | | |
| a,e Griffon Corp., sub. note, 144A, 4.00%, 1/15/17 | United States | 805,000 | $ | | 1,341,331 |
| Capital Markets 0.2% | | | | | |
| Ares Capital Corp., senior note, 4.75%, 1/15/18 | United States | 947,000 | | | 976,002 |
| a Cowen Group Inc., senior note, 3.00%, 3/15/19 | United States | 1,274,000 | | | 1,243,742 |
| FXCM Inc., senior note, 2.25%, 6/15/18 | United States | 700,000 | | | 308,000 |
| | | | | | 2,527,744 |
| Chemicals 0.1% | | | | | |
| a Solazyme Inc., senior sub. note, 5.00%, 10/01/19 | United States | 1,390,000 | | | 569,900 |
| Commercial Services & Supplies 0.0%† | | | | | |
| RWT Holdings Inc., senior note, 5.625%, 11/15/19 | United States | 530,000 | | | 537,950 |
| Communications Equipment 0.6% | | | | | |
| CalAmp Corp., senior note, 1.625%, 5/15/20 | United States | 40,000 | | | 38,400 |
| Ciena Corp., senior note, 4.00%, 12/15/20 | United States | 307,000 | | | 406,583 |
| a InterDigital Inc., senior note, 1.50%, 3/01/20 | United States | 778,000 | | | 945,756 |
| Palo Alto Networks Inc., senior note, zero cpn., 7/01/19 | United States | 3,395,000 | | | 4,549,300 |
| Viavi Solutions Inc., senior bond, 0.625%, 8/15/33 | United States | 576,000 | | | 587,160 |
| | | | | | 6,527,199 |
| Construction & Engineering 0.0%† | | | | | |
| Dycom Industries Inc., senior note, 0.75%, 9/15/21 | United States | 479,000 | | | 503,549 |
| Construction Materials 0.3% | | | | | |
| Cemex SAB de CV, sub. note, | | | | | |
| a 3.75%, 3/15/18 | Mexico | 1,764,000 | | | 1,974,577 |
| 3.72%, 3/15/20 | Mexico | 1,101,000 | | | 1,159,491 |
| | | | | | 3,134,068 |
| Consumer Finance 0.2% | | | | | |
| Encore Capital Group Inc., senior note, | | | | | |
| 3.00%, 11/27/17 | United States | 941,000 | | | 1,000,401 |
| a 2.875%, 3/15/21 | United States | 371,000 | | | 317,901 |
| a PRA Group Inc., senior note, 3.00%, 8/01/20 | United States | 845,000 | | | 774,759 |
| | | | | | 2,093,061 |
| Diversified Consumer Services 0.4% | | | | | |
| Ascent Capital Group Inc., senior note, 4.00%, 7/15/20 | United States | 396,000 | | | 292,545 |
| a Carriage Services Inc., sub. note, 2.75%, 3/15/21 | United States | 945,000 | | | 1,213,144 |
| TAL Education Group, senior note, 2.50%, 5/15/19 | China | 828,000 | | | 2,413,102 |
| | | | | | 3,918,791 |
| Diversified Financial Services 0.2% | | | | | |
| e Element Financial Corp., sub. note, 144A, | | | | | |
| 5.125%, 6/30/19 | Canada | 821,000 | | CAD | 667,104 |
| 4.25%, 6/30/20 | Canada | 1,628,000 | | CAD | 1,236,180 |
| | | | | | 1,903,284 |
| Electrical Equipment 0.1% | | | | | |
| a General Cable Corp., sub. bond, 4.50%, 11/15/29 | United States | 745,000 | | | 570,391 |
| Electronic Equipment, Instruments & Components 0.4% | | | | | |
| a,e Knowles Corp., senior note, 144A, 3.25%, 11/01/21 | United States | 1,022,000 | | | 1,163,803 |
| TTM Technologies Inc., senior note, 1.75%, 12/15/20 | United States | 911,000 | | | 1,388,706 |
26 Semiannual Report
franklintempleton.com
FRANKLIN ALTERNATIVE STRATEGIES FUNDS
CONSOLIDATED STATEMENT OF INVESTMENTS (UNAUDITED)
| | | | | |
| Franklin K2 Alternative Strategies Fund (continued) | | | | | |
| |
| | | Principal | | | |
| | Country | Amount* | | | Value |
| Convertible Bonds (continued) | | | | | |
| Electronic Equipment, Instruments & Components (continued) | | | | | |
| a Vishay Intertechnology Inc., senior bond, 2.25%, 11/15/40 | United States | 1,930,000 | | $ | 2,323,237 |
| | | | | | 4,875,746 |
| Energy Equipment & Services 0.2% | | | | | |
| Hornbeck Offshore Services Inc., senior note, 1.50%, 9/01/19 | United States | 634,000 | | | 378,815 |
| SEACOR Holdings Inc., senior bond, 3.00%, 11/15/28 | United States | 1,192,000 | | | 1,014,690 |
| Weatherford International Ltd., senior note, 5.875%, 7/01/21 | United States | 953,000 | | | 1,034,005 |
| | | | | | 2,427,510 |
| Equity Real Estate Investment Trusts (REITs) 0.9% | | | | | |
| a,e American Residential Properties Inc., senior note, 144A, 3.25%, 11/15/18 | United States | 1,042,000 | | | 1,294,034 |
| a Colony Starwood Homes, senior note, 4.50%, 10/15/17 | United States | 1,447,000 | | | 1,606,170 |
| a Forest City Enterprises Inc., senior note, 3.625%, 8/15/20 | United States | 1,453,000 | | | 1,443,919 |
| Forest City Realty Trust Inc., senior note, 4.25%, 8/15/18 | United States | 624,000 | | | 660,660 |
| e GPT Property Trust LP, senior note, 144A, 3.75%, 3/15/19 | United States | 1,582,000 | | | 1,941,905 |
| a National Health Investors Inc., senior note, 3.25%, 4/01/21 | United States | 1,030,000 | | | 1,131,069 |
| a Starwood Waypoint Residential Trust, senior note, 3.00%, 7/01/19 | United States | 1,044,000 | | | 1,182,982 |
| VEREIT Inc., senior note, 3.00%, 8/01/18 | United States | 1,269,000 | | | 1,270,586 |
| | | | | | 10,531,325 |
| Health Care Equipment & Supplies 0.5% | | | | | |
| a Hologic Inc., senior bond, zero cpn., 12/15/43 | United States | 1,052,000 | | | 1,288,700 |
| e Insulet Corp., senior note, 144A, 1.25%, 9/15/21 | United States | 585,000 | | | 528,694 |
| f Nipro Corp., senior note, Reg S, zero cpn., 1/29/21 | Japan | 40,000,000 | JPY | | 379,354 |
| a,e NuVasive Inc., senior note, 144A, 2.25%, 3/15/21 | United States | 736,000 | | | 913,560 |
| Quidel Corp., senior note, 3.25%, 12/15/20 | United States | 418,000 | | | 424,792 |
| a Wright Medical Group Inc., senior note, 2.00%, 2/15/20 | United States | 1,195,000 | | | 1,246,534 |
| e Wright Medical Group NV, senior note, 144A, 2.25%, 11/15/21 | United States | 997,000 | | | 1,249,989 |
| | | | | | 6,031,623 |
| Health Care Providers & Services 0.8% | | | | | |
| Aceto Corp., senior note, 2.00%, 11/01/20 | United States | 914,000 | | | 857,446 |
| Brookdale Senior Living Inc., senior note, 2.75%, 6/15/18 | United States | 900,000 | | | 874,688 |
| a HealthSouth Corp., senior sub. bond, 2.00%, 12/01/43 | United States | 2,604,000 | | | 3,106,897 |
| Healthways Inc., senior note, 1.50%, 7/01/18 | United States | 1,148,000 | | | 1,495,988 |
| a Molina Healthcare Inc., senior note, 1.125%, 1/15/20 | United States | 1,500,000 | | | 2,119,687 |
| | | | | | 8,454,706 |
| Health Care Technology 0.0%† | | | | | |
| a Allscripts Healthcare Solutions Inc., senior note, 1.25%, 7/01/20 | United States | 285,000 | | | 275,559 |
| e Evolent Health Inc., senior note, 144A, 2.00%, 12/01/21 | United States | 50,000 | | | 50,000 |
| | | | | | 325,559 |
| Household Durables 0.7% | | | | | |
| a CalAtlantic Group Inc., | | | | | |
| senior bond, 1.25%, 8/01/32 | United States | 1,430,000 | | | 1,492,562 |
| senior note, 0.25%, 6/01/19 | United States | 1,706,000 | | | 1,595,110 |
| LGI Homes Inc., sub. note, 4.25%, 11/15/19 | United States | 639,000 | | | 1,016,809 |
| M/I Homes Inc., senior sub. note, 3.25%, 9/15/17 | United States | 844,000 | | | 928,400 |
| Meritage Homes Corp., senior bond, 1.875%, 9/15/32 | United States | 1,240,000 | | | 1,253,175 |
| Toll Brothers Finance Corp., senior bond, 0.50%, 9/15/32 | United States | 1,244,000 | | | 1,226,118 |
| | | | | | 7,512,174 |
franklintempleton.com
Semiannual Report 27
FRANKLIN ALTERNATIVE STRATEGIES FUNDS
CONSOLIDATED STATEMENT OF INVESTMENTS (UNAUDITED)
| | | | |
| Franklin K2 Alternative Strategies Fund (continued) | | | | |
| |
| | | Principal | | |
| | Country | Amount* | | Value |
| Convertible Bonds (continued) | | | | |
| Independent Power & Renewable Electricity Producers 0.1% | | | | |
| a Pattern Energy Group Inc., senior note, 4.00%, 7/15/20 | United States | 681,000 | $ | 666,954 |
| Insurance 0.1% | | | | |
| AmTrust Financial Services Inc., senior bond, 2.75%, 12/15/44 | United States | 1,246,000 | | 1,032,623 |
| Internet & Direct Marketing Retail 1.4% | | | | |
| Ctrip.com International Ltd., senior note, | | | | |
| 1.25%, 10/15/18 | China | 3,565,000 | | 4,487,444 |
| e 144A, 1.25%, 9/15/22 | China | 635,000 | | 637,381 |
| The Priceline Group Inc., senior note, | | | | |
| a 1.00%, 3/15/18 | United States | 4,200,000 | | 6,790,875 |
| 0.90%, 9/15/21 | United States | 472,000 | | 507,695 |
| a Shutterfly Inc., senior note, 0.25%, 5/15/18 | United States | 3,103,000 | | 3,135,969 |
| | | | | 15,559,364 |
| Internet Software & Services 2.1% | | | | |
| a Blucora Inc., senior note, 4.25%, 4/01/19 | United States | 851,000 | | 843,554 |
| a Cornerstone OnDemand Inc., senior note, 1.50%, 7/01/18 | United States | 822,000 | | 836,385 |
| j2 Global Inc., senior bond, 3.25%, 6/15/29 | United States | 1,507,000 | | 1,863,029 |
| LinkedIn Corp., senior note, 0.50%, 11/01/19 | United States | 1,271,000 | | 1,268,617 |
| a MercadoLibre Inc., senior note, 2.25%, 7/01/19 | Argentina | 1,031,000 | | 1,435,667 |
| e Pandora Media Inc., senior note, 144A, 1.75%, 12/01/20 | United States | 257,000 | | 250,254 |
| SINA Corp., senior note, 1.00%, 12/01/18 | China | 3,000,000 | | 3,000,000 |
| Twitter Inc., senior note, | | | | |
| 0.25%, 9/15/19 | United States | 1,332,000 | | 1,254,577 |
| a 1.00%, 9/15/21 | United States | 291,000 | | 270,812 |
| VeriSign Inc., junior sub. bond, 4.485%, 8/15/37 | United States | 3,424,000 | | 7,911,580 |
| WebMD Health Corp., senior note, 1.50%, 12/01/20 | United States | 484,000 | | 583,523 |
| a Yahoo! Inc., senior note, zero cpn., 12/01/18 | United States | 3,824,000 | | 3,874,190 |
| | | | | 23,392,188 |
| IT Services 0.4% | | | | |
| e Blackhawk Network Holdings Inc., senior note, 144A, 1.50%, 1/15/22 | United States | 654,000 | | 670,350 |
| Cardtronics Inc., senior note, 1.00%, 12/01/20 | United States | 748,000 | | 832,150 |
| a,e CSG Systems International Inc., senior bond, 144A, 4.25%, 3/15/36 | United States | 1,243,000 | | 1,370,407 |
| Euronet Worldwide Inc., senior bond, 1.50%, 10/01/44 | United States | 1,062,000 | | 1,230,593 |
| | | | | 4,103,500 |
| Leisure Products 0.0%† | | | | |
| e JAKKS Pacific Inc., senior note, 144A, 4.25%, 8/01/18 | United States | 253,000 | | 255,056 |
| Life Sciences Tools & Services 0.1% | | | | |
| Albany Molecular Research Inc., senior note, 2.25%, 11/15/18 | United States | 457,000 | | 559,254 |
| Fluidigm Corp., senior bond, 2.75%, 2/01/34 | United States | 771,000 | | 478,502 |
| | | | | 1,037,756 |
| Machinery 0.6% | | | | |
| a Altra Industrial Motion Corp., senior bond, 2.75%, 3/01/31 | United States | 810,000 | | 1,110,713 |
| Greenbrier Cos Inc., senior note, 3.50%, 4/01/18 | United States | 1,071,000 | | 1,277,837 |
| f Hyundai Heavy Industries Co. Ltd., senior note, Reg S, zero cpn., 6/29/20 | South Korea | 1,000,000 | | 960,000 |
| Navistar International Corp., senior sub. note, 4.75%, 4/15/19 | United States | 1,426,000 | | 1,375,199 |
| a Trinity Industries Inc., senior sub. bond, 3.875%, 6/01/36 | United States | 1,087,000 | | 1,400,871 |
| Wabash National Corp., senior note, 3.375%, 5/01/18 | United States | 522,000 | | 675,011 |
| | | | | 6,799,631 |
28 Semiannual Report
franklintempleton.com
FRANKLIN ALTERNATIVE STRATEGIES FUNDS
CONSOLIDATED STATEMENT OF INVESTMENTS (UNAUDITED)
| | | | |
| Franklin K2 Alternative Strategies Fund (continued) | | | | |
| |
| | | Principal | | |
| | Country | Amount* | | Value |
| |
| Convertible Bonds (continued) | | | | |
| Media 0.6% | | | | |
| a,e Dish Network Corp., A, senior bond, 144A, 3.375%, 8/15/26 | United States | 3,044,000 | $ | 3,416,890 |
| Liberty Interactive LLC, senior bond, 4.00%, 11/15/29 | United States | 1,122,000 | | 673,200 |
| Liberty Media Corp., senior bond, | | | | |
| a1.375%, 10/15/23 | United States | 1,354,000 | | 1,485,169 |
| e144A, 2.25%, 9/30/46 | United States | 80,000 | | 83,200 |
| Live Nation Entertainment Inc., senior note, 2.50%, 5/15/19 | United States | 629,000 | | 680,499 |
| | | | | 6,338,958 |
| Metals & Mining 0.3% | | | | |
| a AK Steel Corp., senior note, 5.00%, 11/15/19 | United States | 1,264,000 | | 2,366,050 |
| RTI International Metals Inc., senior note, 1.625%, 10/15/19 | United States | 629,000 | | 660,843 |
| | | | | 3,026,893 |
| Mortgage Real Estate Investment Trusts (REITs) 0.7% | | | | |
| Apollo Commercial Real Estate Finance Inc., senior note, 5.50%, 3/15/19 | United States | 329,000 | | 346,686 |
| a Colony Capital Inc., senior note, 3.875%, 1/15/21 | United States | 1,544,000 | | 1,546,895 |
| a Redwood Trust Inc., senior note, 4.625%, 4/15/18 | United States | 1,269,000 | | 1,271,379 |
| a Starwood Property Trust Inc., senior note, | | | | |
| 3.75%, 10/15/17 | United States | 4,308,000 | | 4,448,010 |
| 4.55%, 3/01/18 | United States | 447,000 | | 489,744 |
| | | | | 8,102,714 |
| Oil, Gas & Consumable Fuels 1.0% | | | | |
| a Aegean Marine Petroleum Network Inc., senior note, 4.00%, 11/01/18 | Greece | 1,510,000 | | 1,581,725 |
| e Chesapeake Energy Corp., senior note, 144A, 5.50%, 9/15/26 | United States | 1,412,000 | | 1,500,250 |
| f Golar LNG Ltd., secured note, Reg S, 3.75%, 3/07/17 | Bermuda | 1,200,000 | | 1,198,500 |
| Green Plains Inc., senior note, | | | | |
| a3.25%, 10/01/18 | United States | 753,000 | | 1,061,259 |
| e144A, 4.125%, 9/01/22 | United States | 913,000 | | 1,065,928 |
| e Renewable Energy Group Inc., senior bond, 144A, 4.00%, 6/15/36 | United States | 472,000 | | 502,975 |
| e Scorpio Tankers Inc., senior note, 144A, 2.375%, 7/01/19 | Monaco | 48,000 | | 37,410 |
| Ship Finance International Ltd., senior note, 5.75%, 10/15/21 | Norway | 2,769,000 | | 2,729,196 |
| SM Energy Co., senior note, 1.50%, 7/01/21 | United States | 1,084,000 | | 1,334,675 |
| Whiting Petroleum Corp., senior note, 1.25%, 6/05/20 | United States | 411,000 | | 533,786 |
| | | | | 11,545,704 |
| Pharmaceuticals 0.4% | | | | |
| Depomed Inc., senior note, 2.50%, 9/01/21 | United States | 510,000 | | 609,450 |
| Impax Laboratories Inc., senior note, 2.00%, 6/15/22 | United States | 295,000 | | 237,106 |
| Medicines Co., senior note, | | | | |
| a2.50%, 1/15/22 | United States | 1,776,000 | | 2,192,250 |
| e144A, 2.75%, 7/15/23 | United States | 769,000 | | 757,946 |
| Theravance Inc., senior note, 2.125%, 1/15/23 | United States | 985,000 | | 827,400 |
| | | | | 4,624,152 |
| Professional Services 0.1% | | | | |
| 51job Inc., senior note, 3.25%, 4/15/19 | China | 222,000 | | 238,234 |
| Huron Consulting Group Inc., senior note, 1.25%, 10/01/19 | United States | 783,000 | | 771,744 |
| | | | | 1,009,978 |
| Real Estate Management & Development 0.1% | | | | |
| f AYC Finance Ltd., senior note, Reg S, 0.50%, 5/02/19 | Philippines | 200,000 | | 206,500 |
| f Cosmos Boom Investment Ltd., senior note, Reg S, 0.50%, 6/23/20 | China | 400,000 | | 390,000 |
| | | | | 596,500 |
franklintempleton.com
Semiannual Report 29
FRANKLIN ALTERNATIVE STRATEGIES FUNDS
CONSOLIDATED STATEMENT OF INVESTMENTS (UNAUDITED)
| | | | |
| Franklin K2 Alternative Strategies Fund (continued) | | | | |
| |
| | | Principal | | |
| | Country | Amount* | | Value |
| Convertible Bonds (continued) | | | | |
| Semiconductors & Semiconductor Equipment 1.0% | | | | |
| a Advanced Micro Devices Inc., senior note, 2.125%, 9/01/26 | United States | 1,683,000 | $ | 2,188,952 |
| e Cypress Semiconductor Corp., senior note, 144A, 4.50%, 1/15/22 | United States | 863,000 | | 968,178 |
| e Inphi Corp., senior note, 144A, 0.75%, 9/01/21 | United States | 510,000 | | 551,756 |
| a Intel Corp., junior sub. bond, 3.25%, 8/01/39 | United States | 616,000 | | 1,049,898 |
| a Microchip Technology Inc., junior sub. bond, 2.125%, 12/15/37 | United States | 775,000 | | 2,151,594 |
| a NVIDIA Corp., senior note, 1.00%, 12/01/18 | United States | 879,000 | | 4,060,980 |
| a ON Semiconductor Corp., senior sub. bond, Series B, 2.625%, 12/15/26 | United States | 508,000 | | 571,183 |
| | | | | 11,542,541 |
| Software 1.3% | | | | |
| Bottomline Technologies de Inc., senior note, 1.50%, 12/01/17 | United States | 858,000 | | 890,711 |
| BroadSoft Inc., senior note, 1.00%, 9/01/22 | United States | 1,119,000 | | 1,372,873 |
| FireEye Inc., senior bond, 1.625%, 6/01/35 | United States | 275,000 | | 248,703 |
| Nuance Communications Inc., senior bond, 2.75%, 11/01/31 | United States | 1,279,000 | | 1,289,392 |
| Proofpoint Inc., senior note, 0.75%, 6/15/20 | United States | 246,000 | | 292,433 |
| Rovi Corp., senior note, 0.50%, 3/01/20 | United States | 610,000 | | 619,150 |
| Salesforce.com Inc., senior note, 0.25%, 4/01/18 | United States | 2,756,000 | | 3,288,252 |
| ServiceNow Inc., senior note, zero cpn., 11/01/18 | United States | 681,000 | | 859,337 |
| a Take-Two Interactive Software Inc., senior note, 1.00%, 7/01/18 | United States | 2,385,000 | | 5,469,103 |
| | | | | 14,329,954 |
| Specialty Retail 0.0%† | | | | |
| e Vitamin Shoppe Inc., senior note, 144A, 2.25%, 12/01/20 | United States | 401,000 | | 376,188 |
| Textiles, Apparel & Luxury Goods 0.2% | | | | |
| a Iconix Brand Group Inc., senior sub. note, 1.50%, 3/15/18 | United States | 1,856,000 | | 1,698,240 |
| Trading Companies & Distributors 0.1% | | | | |
| e Kaman Corp., senior note, 144A, 3.25%, 11/15/17 | United States | 497,000 | | 728,726 |
| Transportation Infrastructure 0.2% | | | | |
| f DP World Ltd., senior bond, Reg S, 1.75%, 6/19/24 | United Arab Emirates | 1,800,000 | | 1,766,250 |
| Total Convertible Bonds (Cost $177,911,159) | | | | 191,723,406 |
| Convertible Bonds in Reorganization 0.0%† | | | | |
| Semiconductors & Semiconductor Equipment 0.0%† | | | | |
| g SunEdison Inc., senior note, | | | | |
| e144A, 0.25%, 1/15/20 | United States | 126,000 | | 4,599 |
| 2.375%, 4/15/22 | United States | 247,000 | | 9,016 |
| Total Convertible Bonds in Reorganization | | | | |
| (Cost $337,664) | | | | 13,615 |
| Corporate Bonds and Notes 18.2% | | | | |
| Aerospace & Defense 0.3% | | | | |
| e Bombardier Inc., senior note, 144A, 8.75%, 12/01/21 | Canada | 2,605,000 | | 2,591,975 |
| Embraer Netherlands Finance BV, senior bond, 5.05%, 6/15/25 | Brazil | 95,000 | | 93,765 |
| e Embraer Overseas Ltd., senior bond, 144A, 5.696%, 9/16/23 | Brazil | 90,000 | | 94,275 |
| e Meccanica Holdings USA Inc., senior bond, 144A, 6.25%, 1/15/40 | Italy | 555,000 | | 556,388 |
| h Rockwell Collins Inc., senior note, FRN, 1.20%, 12/15/16 | United States | 40,000 | | 40,004 |
| | | | | 3,376,407 |
30 Semiannual Report
franklintempleton.com
FRANKLIN ALTERNATIVE STRATEGIES FUNDS
CONSOLIDATED STATEMENT OF INVESTMENTS (UNAUDITED)
| | | | |
| Franklin K2 Alternative Strategies Fund (continued) | | | | |
| |
| | | Principal | | |
| | Country | Amount* | | Value |
| Corporate Bonds and Notes (continued) | | | | |
| Auto Components 0.0%† | | | | |
| e Midas Intermediate Holdco II LLC / Midas Intermediate Holdco II Finance Inc., | | | | |
| senior note, 144A, 7.875%, 10/01/22 | United States | 170,000 | $ | 171,700 |
| Automobiles 0.1% | | | | |
| e,h BMW U.S. Capital LLC, senior note, 144A, FRN, 1.26%, 9/13/19 | Germany | 520,000 | | 519,799 |
| e,h Daimler Finance North America LLC, senior note, 144A, FRN, 1.195%, 3/10/17 | Germany | 150,000 | | 150,105 |
| h Ford Motor Credit Co. LLC, senior note, FRN, 1.66%, 1/17/17 | United States | 40,000 | | 40,031 |
| e,h Nissan Motor Acceptance Corp., senior note, 144A, FRN, 1.484%, 3/03/17 | Japan | 105,000 | | 105,112 |
| | | | | 815,047 |
| Banks 0.1% | | | | |
| h Bank of America Corp., senior note, FRN, 1.92%, 1/15/19 | United States | 20,000 | | 20,169 |
| h Citigroup Inc., senior note, FRN, 1.63%, 11/24/17 | United States | 403,000 | | 404,053 |
| h Toyota Motor Credit Corp., senior note, FRN, | | | | |
| 1.27%, 1/17/19 | United States | 40,000 | | 40,046 |
| 1.322%, 10/18/19 | United States | 255,000 | | 256,402 |
| h Wells Fargo & Co., senior note, FRN, 1.234%, 6/02/17 | United States | 115,000 | | 115,034 |
| | | | | 835,704 |
| Beverages 0.0%† | | | | |
| h Anheuser-Busch InBev Finance Inc., senior note, FRN, 1.076%, 1/27/17 | Belgium | 45,000 | | 45,014 |
| h PepsiCo Inc., senior note, FRN, 1.134%, 10/04/19 | United States | 260,000 | | 260,314 |
| | | | | 305,328 |
| Biotechnology 0.0%† | | | | |
| h Amgen Inc., senior note, FRN, 1.296%, 5/22/17 | United States | 125,000 | | 125,143 |
| Capital Markets 0.0%† | | | | |
| e Donnelley Financial Solutions Inc., senior note, 144A, 8.25%, 10/15/24 | United States | 295,000 | | 300,900 |
| Commercial Services & Supplies 0.4% | | | | |
| RR Donnelley & Sons Co., | | | | |
| senior bond, 6.50%, 11/15/23 | United States | 840,000 | | 798,000 |
| asenior bond, 6.00%, 4/01/24 | United States | 4,073,000 | | 3,696,247 |
| senior bond, 6.625%, 4/15/29 | United States | 110,000 | | 94,600 |
| senior note, 7.00%, 2/15/22 | United States | 43,000 | | 41,710 |
| | | | | 4,630,557 |
| Communications Equipment 0.4% | | | | |
| Alcatel-Lucent USA Inc., senior bond, | | | | |
| 6.50%, 1/15/28 | France | 150,000 | | 157,500 |
| 6.45%, 3/15/29 | France | 495,000 | | 520,987 |
| a,e Avaya Inc., senior note, first lien, 144A, 7.00%, 4/01/19 | United States | 3,368,000 | | 2,947,000 |
| h Cisco Systems Inc., senior note, FRN, | | | | |
| 1.214%, 3/03/17 | United States | 100,000 | | 100,077 |
| 1.197%, 9/20/19 | United States | 510,000 | | 511,559 |
| | | | | 4,237,123 |
| Construction & Engineering 0.4% | | | | |
| e Engility Corp., senior note, 144A, 8.875%, 9/01/24 | United States | 4,440,000 | | 4,578,750 |
franklintempleton.com
Semiannual Report 31
FRANKLIN ALTERNATIVE STRATEGIES FUNDS
CONSOLIDATED STATEMENT OF INVESTMENTS (UNAUDITED)
| | | | | | |
| Franklin K2 Alternative Strategies Fund (continued) | | | | | | |
| |
| | | Principal | | | | |
| | Country | Amount* | | | | Value |
| |
| Corporate Bonds and Notes (continued) | | | | | | |
| Construction Materials 0.1% | | | | | | |
| e Cemex SAB de CV, senior secured bond, 144A, | | | | | | |
| 7.75%, 4/16/26 | Mexico | 300,000 | | $ | | 321,000 |
| first lien, 6.125%, 5/05/25 | Mexico | 365,000 | | | | 360,438 |
| | | | | | | 681,438 |
| Consumer Finance 0.0%† | | | | | | |
| e Unifin Financiera SAB de CV SOFOM ENR, senior note, 144A, | | | | | | |
| 7.25%, 9/27/23 | Mexico | 320,000 | | | | 303,200 |
| Diversified Financial Services 2.1% | | | | | | |
| Ally Financial Inc., | | | | | | |
| senior note, 4.25%, 4/15/21 | United States | 200,000 | | | | 197,500 |
| sub. bond, 5.75%, 11/20/25 | United States | 245,000 | | | | 242,856 |
| h American Honda Finance Corp., senior note, FRN, 1.307%, 9/20/17 | United States | 180,000 | | | | 180,584 |
| e,h Banco Hipotecario SA, senior note, 144A, FRN, 24.729%, 1/12/20 | Argentina | 3,890,000 | ARS | | | 248,872 |
| e,h Bank of Tokyo-Mitsubishi UFJ Ltd., senior note, 144A, FRN, | | | | | | |
| 1.876%, 9/14/18 | Japan | 335,000 | | | | 337,316 |
| Everi Payments Inc., senior note, 10.00%, 1/15/22 | United States | 6,275,000 | | | | 6,024,000 |
| e Financiera de Desarrollo Territorial SA Findeter, senior bond, 144A, | | | | | | |
| 7.875%, 8/12/24 | Colombia | 795,000,000 | COP | 240,690 |
| e,h Hyundai Capital Services Inc., senior note, 144A, FRN, 1.657%, 3/18/17 | South Korea | 200,000 | | | | 200,146 |
| e iPayment Inc., secured note, second lien, 144A, 9.50%, 12/15/19 | United States | 9,898,166 | | | | 10,182,738 |
| h JPMorgan Chase Bank NA, senior note, FRN, 1.453%, 9/23/19 | United States | 515,000 | | | | 516,144 |
| e Ladder Capital Finance Holdings LLP, senior note, 144A, 5.875%, 8/01/21 | United States | 225,000 | | | | 213,469 |
| e Opal Acquisition Inc., senior note, 144A, 8.875%, 12/15/21 | United States | 4,310,000 | | | | 3,404,900 |
| e Quicken Loans Inc., senior note, 144A, 5.75%, 5/01/25 | United States | 505,000 | | | | 487,325 |
| h Shell International Finance BV, senior note, FRN, 1.202%, 5/10/17 | Netherlands | 390,000 | | | | 390,442 |
| | | | | | | 22,866,982 |
| Diversified Telecommunication Services 0.8% | | | | | | |
| Frontier Communications Corp., senior note, | | | | | | |
| 10.50%, 9/15/22 | United States | 869,000 | | | | 898,329 |
| 11.00%, 9/15/25 | United States | 5,457,000 | | | | 5,491,106 |
| a Intelsat Jackson Holdings SA, senior note, 7.25%, 4/01/19 | Luxembourg | 684,000 | | | | 540,360 |
| Intelsat Luxembourg SA, senior note, | | | | | | |
| a6.75%, 6/01/18 | Luxembourg | 1,684,000 | | | | 1,229,320 |
| 7.75%, 6/01/21 | Luxembourg | 1,392,000 | | | | 488,940 |
| h Verizon Communications Inc., senior note, FRN, 1.234%, 6/09/17 | United States | 125,000 | | | | 125,160 |
| | | | | | | 8,773,215 |
| Electric Utilities 0.2% | | | | | | |
| h Duke Energy Corp., senior note, FRN, 1.226%, 4/03/17 | United States | 100,000 | | | | 100,118 |
| h Duke Energy Progress Inc., secured note, FRN, 1.035%, 3/06/17 | United States | 50,000 | | | | 50,031 |
| e Enel SpA, sub. bond, 144A, 8.75% to 9/24/23, FRN thereafter, 9/24/73 | Italy | 745,000 | | | | 848,071 |
| GenOn Americas Generation LLC, senior bond, 9.125%, 5/01/31 | United States | 407,000 | | | | 335,775 |
| a,e Terraform Global Operating LLC, senior note, 144A, 13.75%, 8/15/22 | United States | 1,083,000 | | | | 1,161,517 |
| | | | | | | 2,495,512 |
| Energy Equipment & Services 0.2% | | | | | | |
| Noble Holding International Ltd., senior bond, | | | | | | |
| 5.25%, 3/15/42 | United Kingdom | 190,000 | | | | 106,400 |
| 8.20%, 4/01/45 | United Kingdom | 270,000 | | | | 181,237 |
| Petroleos Mexicanos, | | | | | | |
| fsenior bond, Reg S, 6.875%, 8/04/26 | Mexico | 327,000 | | | | 338,118 |
| senior note, 4.25%, 1/15/25 | Mexico | 581,000 | | | | 518,136 |
32 Semiannual Report
franklintempleton.com
FRANKLIN ALTERNATIVE STRATEGIES FUNDS
CONSOLIDATED STATEMENT OF INVESTMENTS (UNAUDITED)
| | | | |
| Franklin K2 Alternative Strategies Fund (continued) | | | | |
| |
| | | Principal | | |
| | Country | Amount* | | Value |
| Corporate Bonds and Notes (continued) | | | | |
| Energy Equipment & Services (continued) | | | | |
| Targa Resources Partners LP / Targa Resources Partners Finance Corp., | | | | |
| senior bond, 6.375%, 8/01/22 | United States | 25,000 | $ | 25,875 |
| senior bond, 5.25%, 5/01/23 | United States | 15,000 | | 15,113 |
| senior bond, 4.25%, 11/15/23 | United States | 350,000 | | 331,625 |
| senior note, 6.75%, 3/15/24 | United States | 590,000 | | 628,350 |
| Western Refining Logistics LP / WNRL Finance Corp., senior note, | | | | |
| 7.50%, 2/15/23 | United States | 80,000 | | 86,400 |
| | | | | 2,231,254 |
| Equity Real Estate Investment Trusts (REITs) 0.0%† | | | | |
| e Hilton Grand Vacations Borrower LLC/Hilton Grand Vacations Borrower Inc., | | | | |
| senior note, 144A, 6.125%, 12/01/24 | United States | 120,000 | | 123,900 |
| Food & Staples Retailing 0.1% | | | | |
| e BRF GmbH, senior bond, 144A, 4.35%, 9/29/26 | Brazil | 530,000 | | 496,875 |
| Food Products 0.2% | | | | |
| e Cosan Luxembourg SA, senior bond, 144A, 7.00%, 1/20/27 | Brazil | 545,000 | | 543,638 |
| e JBS USA LLC / JBS USA Finance Inc., senior bond, 144A, | | | | |
| 7.25%, 6/01/21 | Brazil | 10,000 | | 10,375 |
| 5.75%, 6/15/25 | Brazil | 215,000 | | 211,775 |
| a WhiteWave Foods Co., senior note, 5.375%, 10/01/22 | United States | 1,616,000 | | 1,787,700 |
| | | | | 2,553,488 |
| Gas Utilities 0.1% | | | | |
| NGL Energy Partners LP / NGL Energy Finance Corp., senior note, | | | | |
| 5.125%, 7/15/19 | United States | 230,000 | | 225,400 |
| 6.875%, 10/15/21 | United States | 30,000 | | 30,075 |
| e144A, 7.50%, 11/01/23 | United States | 825,000 | | 827,063 |
| | | | | 1,082,538 |
| Health Care Equipment & Supplies 0.2% | | | | |
| Universal Hospital Services Inc., senior note, 7.625%, 8/15/20 | United States | 2,258,000 | | 2,160,906 |
| Health Care Providers & Services 0.2% | | | | |
| h Aetna Inc., senior note, FRN, 1.491%, 12/08/17 | United States | 475,000 | | 476,861 |
| Kindred Healthcare Inc., senior note, 8.75%, 1/15/23 | United States | 1,885,000 | | 1,684,719 |
| e,i Tenet Healthcare Corp., secured note, second lien, 144A, 7.50%, 1/01/22 | United States | 65,000 | | 67,072 |
| | | | | 2,228,652 |
| Hotels, Restaurants & Leisure 0.9% | | | | |
| Choice Hotels International Inc., senior bond, 5.70%, 8/28/20 | United States | 125,000 | | 137,500 |
| e Downstream Development Authority of the Quapaw Tribe of Oklahoma, | | | | |
| secured note, 144A, 10.50%, 7/01/19 | United States | 6,047,000 | | 6,198,175 |
| e Jack Ohio Finance LLC / Jack Ohio Finance 1 Corp., senior secured note, first lien, | | | | |
| 144A, 6.75%, 11/15/21 | United States | 1,303,000 | | 1,309,515 |
| e Mohegan Tribal Gaming Authority, senior note, 144A, 7.875%, 10/15/24 | United States | 537,000 | | 539,685 |
| e Viking Cruises Ltd., 144A, | | | | |
| senior bond, 6.25%, 5/15/25 | United States | 652,000 | | 591,690 |
| senior note, 8.50%, 10/15/22 | United States | 1,273,000 | | 1,301,642 |
| | | | | 10,078,207 |
| Household Durables 0.0%† | | | | |
| PulteGroup Inc., senior bond, 5.00%, 1/15/27 | United States | 515,000 | | 486,675 |
franklintempleton.com
Semiannual Report 33
FRANKLIN ALTERNATIVE STRATEGIES FUNDS
CONSOLIDATED STATEMENT OF INVESTMENTS (UNAUDITED)
| | | | |
| Franklin K2 Alternative Strategies Fund (continued) | | | | |
| |
| | | Principal | | |
| | Country | Amount* | | Value |
| Corporate Bonds and Notes (continued) | | | | |
| Independent Power & Renewable Electricity Producers 0.1% | | | | |
| a GenOn Energy Inc., senior note, | | | | |
| 9.50%, 10/15/18 | United States | 406,000 | $ | 285,215 |
| 9.875%, 10/15/20 | United States | 1,786,000 | | 1,205,550 |
| | | | | 1,490,765 |
| Insurance 0.1% | | | | |
| e,h Metropolitan Life Global Funding I, secured note, 144A, FRN, 1.19%, 9/14/18 | United States | 520,000 | | 520,373 |
| Machinery 0.9% | | | | |
| h Caterpillar Financial Services Corp., senior note, FRN, | | | | |
| 1.164%, 3/03/17 | United States | 110,000 | | 110,052 |
| 1.004%, 6/09/17 | United States | 300,000 | | 300,094 |
| 1.62%, 2/23/18 | United States | 505,000 | | 508,201 |
| Navistar International Corp., senior bond, 8.25%, 11/01/21 | United States | 9,025,000 | | 9,070,125 |
| | | | | 9,988,472 |
| Media 3.8% | | | | |
| e American Media Inc., 144A, | | | | |
| secured note, second lien, 5.50%, 9/01/21 | United States | 3,355,845 | | 3,070,598 |
| sub. note, zero cpn., 3/01/22 | United States | 25,960,513 | | 16,939,235 |
| e Cablevision SA, senior note, 144A, 6.50%, 6/15/21 | Argentina | 150,000 | | 152,625 |
| Clear Channel Worldwide Holdings Inc., senior sub. note, B, 7.625%, 3/15/20 | United States | 1,095,000 | | 1,084,050 |
| e Cox Communications Inc., senior bond, 144A, | | | | |
| 4.70%, 12/15/42 | United States | 120,000 | | 103,609 |
| 4.50%, 6/30/43 | United States | 220,000 | | 183,735 |
| CSC Holdings LLC, senior bond, 7.625%, 7/15/18 | United States | 245,000 | | 260,313 |
| DISH DBS Corp., senior note, | | | | |
| 5.875%, 11/15/24 | United States | 405,000 | | 412,087 |
| 7.75%, 7/01/26 | United States | 250,000 | | 276,562 |
| e Lee Enterprises Inc., senior secured note, first lien, 144A, 9.50%, 3/15/22 | United States | 3,433,000 | | 3,621,815 |
| The McClatchy Co., | | | | |
| asenior bond, 7.15%, 11/01/27 | United States | 383,000 | | 326,220 |
| senior bond, 6.875%, 3/15/29 | United States | 4,471,000 | | 3,688,575 |
| senior secured note, first lien, 9.00%, 12/15/22 | United States | 1,158,000 | | 1,227,480 |
| e,j Postmedia Network Inc., secured note, second lien, 144A, PIK, 10.25%, 7/15/23 | Canada | 5,001,000 | | 5,276,055 |
| e Time Inc., senior note, 144A, 5.75%, 4/15/22 | United States | 5,542,000 | | 5,611,275 |
| Time Warner Cable Inc., senior bond, 4.50%, 9/15/42 | United States | 240,000 | | 212,034 |
| e Ziggo Secured Finance BV, secured bond, first lien, 144A, 5.50%, 1/15/27 | Netherlands | 250,000 | | 240,625 |
| | | | | 42,686,893 |
| Metals & Mining 1.4% | | | | |
| AK Steel Corp., | | | | |
| senior bond, 7.625%, 5/15/20 | United States | 7,555,000 | | 7,762,762 |
| senior bond, 8.375%, 4/01/22 | United States | 2,281,000 | | 2,403,604 |
| senior note, 7.625%, 10/01/21 | United States | 5,237,000 | | 5,485,758 |
| | | | | 15,652,124 |
| Oil, Gas & Consumable Fuels 3.3% | | | | |
| Anadarko Petroleum Corp., senior bond, 4.50%, 7/15/44 | United States | 370,000 | | 327,917 |
| e Baytex Energy Corp., senior note, 144A, | | | | |
| 5.125%, 6/01/21 | Canada | 30,000 | | 26,025 |
| 5.625%, 6/01/24 | Canada | 890,000 | | 749,825 |
| e Bellatrix Exploration Ltd., senior note, 144A, 8.50%, 5/15/20 | Canada | 150,000 | | 143,250 |
34 Semiannual Report
franklintempleton.com
FRANKLIN ALTERNATIVE STRATEGIES FUNDS
CONSOLIDATED STATEMENT OF INVESTMENTS (UNAUDITED)
| | | | |
| Franklin K2 Alternative Strategies Fund (continued) | | | | |
| |
| | | Principal | | |
| | Country | Amount* | | Value |
| Corporate Bonds and Notes (continued) | | | | |
| Oil, Gas & Consumable Fuels (continued) | | | | |
| Bonanza Creek Energy Inc., senior note, | | | | |
| 6.75%, 4/15/21 | United States | 115,000 | $ | 60,663 |
| 5.75%, 2/01/23 | United States | 415,000 | | 217,875 |
| h BP Capital Markets PLC, senior note, FRN, 1.327%, 2/13/18 | United Kingdom | 105,000 | | 105,165 |
| California Resources Corp., | | | | |
| esecured note, second lien, 144A, 8.00%, 12/15/22 | United States | 4,920,000 | | 3,985,200 |
| senior note, 5.50%, 9/15/21 | United States | 9,000 | | 5,850 |
| senior note, 6.00%, 11/15/24 | United States | 112,000 | | 69,440 |
| e Callon Petroleum Co., senior note, 144A, 6.125%, 10/01/24 | United States | 520,000 | | 535,600 |
| Calumet Specialty Products Partners LP / Calumet Finance Corp., senior note, | | | | |
| 6.50%, 4/15/21 | United States | 1,436,000 | | 1,181,110 |
| Canadian Natural Resources Ltd., senior bond, 3.90%, 2/01/25 | Canada | 20,000 | | 19,653 |
| Chesapeake Energy Corp., | | | | |
| esecured note, second lien, 144A, 8.00%, 12/15/22 | United States | 125,000 | | 129,687 |
| senior bond, 6.625%, 8/15/20 | United States | 1,000 | | 975 |
| senior bond, 6.125%, 2/15/21 | United States | 3,000 | | 2,768 |
| senior note, 4.875%, 4/15/22 | United States | 20,000 | | 17,150 |
| h Chevron Corp., senior note, FRN, 1.076%, 11/15/17 | United States | 145,000 | | 145,193 |
| Concho Resources Inc., senior bond, | | | | |
| 5.50%, 10/01/22 | United States | 75,000 | | 78,094 |
| 5.50%, 4/01/23 | United States | 395,000 | | 408,094 |
| Continental Resources Inc., | | | | |
| senior bond, 5.00%, 9/15/22 | United States | 1,535,000 | | 1,536,919 |
| senior bond, 4.90%, 6/01/44 | United States | 335,000 | | 286,425 |
| senior note, 4.50%, 4/15/23 | United States | 35,000 | | 34,213 |
| senior note, 3.80%, 6/01/24 | United States | 405,000 | | 376,650 |
| Crestwood Midstream Partners LP / Crestwood Midstream Finance Corp., | | | | |
| senior note, 6.125%, 3/01/22 | United States | 415,000 | | 421,225 |
| Devon Energy Corp., senior bond, | | | | |
| 5.85%, 12/15/25 | United States | 375,000 | | 415,327 |
| 5.00%, 6/15/45 | United States | 427,000 | | 398,592 |
| Eclipse Resources Corp., senior note, 8.875%, 7/15/23 | United States | 545,000 | | 553,175 |
| Enable Midstream Partners LP, senior bond, 5.00%, 5/15/44 | United States | 400,000 | | 324,266 |
| Encana Corp., senior bond, 3.90%, 11/15/21 | Canada | 565,000 | | 560,113 |
| Energy Transfer Equity LP, secured bond, first lien, 7.50%, 10/15/20 | United States | 200,000 | | 224,500 |
| Energy Transfer Partners LP, senior bond, | | | | |
| 5.15%, 3/15/45 | United States | 230,000 | | 206,751 |
| 6.125%, 12/15/45 | United States | 540,000 | | 545,135 |
| EnLink Midstream Partners LP, senior bond, | | | | |
| 4.85%, 7/15/26 | United States | 210,000 | | 206,622 |
| 5.60%, 4/01/44 | United States | 145,000 | | 131,180 |
| 5.05%, 4/01/45 | United States | 245,000 | | 207,381 |
| f,h EP PetroEcuador via Noble Sovereign Funding I Ltd., secured note, FRN, Reg S, | | | | |
| 6.487%, 9/24/19 | Ecuador | 509,685 | | 507,442 |
| h Exxon Mobil Corp., senior note, FRN, 0.89%, 3/15/17 | United States | 110,000 | | 110,033 |
| e Halcon Resources Corp., secured note, second lien, 144A, 8.625%, 2/01/20 | United States | 505,000 | | 520,402 |
| e Hilcorp Energy I LP / Hilcorp Finance Co., senior bond, 144A, 5.00%, 12/01/24 | United States | 590,000 | | 598,850 |
| Kinder Morgan Energy Partners LP, senior bond, | | | | |
| 5.625%, 9/01/41 | United States | 130,000 | | 124,072 |
| 5.00%, 8/15/42 | United States | 300,000 | | 273,424 |
| 4.70%, 11/01/42 | United States | 150,000 | | 130,956 |
| 5.00%, 3/01/43 | United States | 145,000 | | 132,959 |
franklintempleton.com
Semiannual Report 35
FRANKLIN ALTERNATIVE STRATEGIES FUNDS
CONSOLIDATED STATEMENT OF INVESTMENTS (UNAUDITED)
| | | | | |
| Franklin K2 Alternative Strategies Fund (continued) | | | | | |
| |
| | | Principal | | | |
| | Country | Amount* | | | Value |
| Corporate Bonds and Notes (continued) | | | | | |
| Oil, Gas & Consumable Fuels (continued) | | | | | |
| Marathon Oil Corp., senior bond, 5.20%, 6/01/45 | United States | 345,000 | | $ | 304,153 |
| Matador Resources Co., senior note, 6.875%, 4/15/23 | United States | 497,000 | | | 529,305 |
| e MEG Energy Corp., 144A, | | | | | |
| senior bond, 6.375%, 1/30/23 | Canada | 180,000 | | | 159,750 |
| senior bond, 7.00%, 3/31/24 | Canada | 665,000 | | | 583,537 |
| senior note, 6.50%, 3/15/21 | Canada | 230,000 | | | 208,150 |
| MPLX LP, | | | | | |
| senior bond, 4.00%, 2/15/25 | United States | 30,000 | | | 28,559 |
| senior note, 4.50%, 7/15/23 | United States | 55,000 | | | 55,081 |
| senior note, 4.875%, 12/01/24 | United States | 960,000 | | | 970,916 |
| Oasis Petroleum Inc., | | | | | |
| senior bond, 6.875%, 1/15/23 | United States | 70,000 | | | 72,100 |
| senior note, 6.875%, 3/15/22 | United States | 725,000 | | | 750,375 |
| e Parsley Energy LLC / Parsley Finance Corp., senior note, 144A, | | | | | |
| 7.50%, 2/15/22 | United States | 45,000 | | | 47,869 |
| 6.25%, 6/01/24 | United States | 270,000 | | | 280,800 |
| e PDC Energy Inc., senior note, 144A, 6.125%, 9/15/24 | United States | 130,000 | | | 133,575 |
| Petrobras Global Finance BV, | | | | | |
| senior bond, 5.75%, 1/20/20 | Brazil | 372,000 | | | 373,860 |
| senior bond, 5.625%, 5/20/43 | Brazil | 80,000 | | | 57,200 |
| senior note, 3.00%, 1/15/19 | Brazil | 1,521,000 | | | 1,484,420 |
| fsenior note, Reg S, 3.25%, 4/01/19 | Brazil | 353,000 | EUR | | 375,898 |
| senior note, 4.875%, 3/17/20 | Brazil | 3,069,000 | | | 3,009,768 |
| senior note, 5.375%, 1/27/21 | Brazil | 745,000 | | | 727,120 |
| senior note, 8.375%, 5/23/21 | Brazil | 1,023,000 | | | 1,099,725 |
| senior note, 8.75%, 5/23/26 | Brazil | 75,000 | | | 80,662 |
| f Petroleos de Venezuela SA, Reg S, | | | | | |
| senior bond, 6.00%, 11/15/26 | Venezuela | 3,104,000 | | | 1,149,101 |
| senior note, 6.00%, 5/16/24 | Venezuela | 1,459,777 | | | 549,387 |
| Rice Energy Inc., senior note, 6.25%, 5/01/22 | United States | 815,000 | | | 837,412 |
| Rose Rock Midstream LP / Rose Rock Finance Corp., senior note, | | | | | |
| 5.625%, 11/15/23 | United States | 285,000 | | | 272,175 |
| RSP Permian Inc., senior note, 6.625%, 10/01/22 | United States | 1,250,000 | | | 1,318,125 |
| Sabine Pass Liquefaction LLC, senior secured note, first lien, 5.625%, 3/01/25 | United States | 455,000 | | | 476,044 |
| SM Energy Co., | | | | | |
| senior bond, 6.50%, 1/01/23 | United States | 85,000 | | | 85,850 |
| senior bond, 5.625%, 6/01/25 | United States | 10,000 | | | 9,650 |
| senior bond, 6.75%, 9/15/26 | United States | 90,000 | | | 92,644 |
| senior note, 6.50%, 11/15/21 | United States | 10,000 | | | 10,138 |
| senior note, 6.125%, 11/15/22 | United States | 220,000 | | | 221,650 |
| senior note, 5.00%, 1/15/24 | United States | 230,000 | | | 217,925 |
| e Transocean Proteus Ltd., senior note, 144A, 6.25%, 12/01/24 | United States | 340,000 | | | 340,850 |
| e Ultrapar International SA, senior bond, 144A, 5.25%, 10/06/26 | Brazil | 260,000 | | | 257,075 |
| Whiting Petroleum Corp., senior note, | | | | | |
| 6.50%, 10/01/18 | United States | 145,000 | | | 145,544 |
| 5.00%, 3/15/19 | United States | 25,000 | | | 24,813 |
| 5.75%, 3/15/21 | United States | 790,000 | | | 782,100 |
| Williams Partners LP, senior bond, | | | | | |
| 3.90%, 1/15/25 | United States | 355,000 | | | 341,502 |
36 Semiannual Report
franklintempleton.com
FRANKLIN ALTERNATIVE STRATEGIES FUNDS
CONSOLIDATED STATEMENT OF INVESTMENTS (UNAUDITED)
| | | | | |
| Franklin K2 Alternative Strategies Fund (continued) | | | | | |
| |
| | | Principal | | | |
| | Country | Amount* | | | Value |
| Corporate Bonds and Notes (continued) | | | | | |
| Oil, Gas & Consumable Fuels (continued) | | | | | |
| Williams Partners LP, senior bond, | | | | | |
| 4.00%, 9/15/25 | United States | 125,000 | $ | | 120,641 |
| 6.30%, 4/15/40 | United States | 535,000 | | | 541,819 |
| 5.10%, 9/15/45 | United States | 615,000 | | | 558,424 |
| e,h YPF SA, senior note, 144A, FRN, 26.333%, 7/07/20 | Argentina | 245,000 | | | 281,750 |
| | | | | | 37,003,588 |
| Paper & Forest Products 0.8% | | | | | |
| Resolute Forest Products Inc., senior note, 5.875%, 5/15/23 | United States | 10,628,000 | | | 8,289,840 |
| Pharmaceuticals 0.2% | | | | | |
| h Merck & Co. Inc., senior note, FRN, 1.007%, 2/10/17 | United States | 165,000 | | | 165,020 |
| e Valeant Pharmaceuticals International Inc., 144A, | | | | | |
| asenior bond, 6.125%, 4/15/25 | United States | 983,000 | | | 729,878 |
| senior note, 5.875%, 5/15/23 | United States | 1,620,000 | | | 1,205,887 |
| | | | | | 2,100,785 |
| Professional Services 0.2% | | | | | |
| a,e Altegrity Inc., senior note, first lien, 144A, 9.50%, 7/01/19 | United States | 2,073,000 | | | 2,130,008 |
| Real Estate Management & Development 0.0%† | | | | | |
| e Rialto Holdings LLC / Rialto Corp., senior note, 144A, 7.00%, 12/01/18 | United States | 178,000 | | | 181,115 |
| Software 0.1% | | | | | |
| e Open Text Corp., senior bond, 144A, 5.875%, 6/01/26 | Canada | 1,110,000 | | | 1,157,175 |
| h Oracle Corp., senior note, FRN, 1.068%, 7/07/17 | United States | 135,000 | | | 135,186 |
| | | | | | 1,292,361 |
| Specialty Retail 0.3% | | | | | |
| a CST Brands Inc., senior note, 5.00%, 5/01/23 | United States | 1,915,000 | | | 1,991,600 |
| a,e Guitar Center Inc., senior secured note, first lien, 144A, 6.50%, 4/15/19 | United States | 1,069,000 | | | 948,738 |
| h Lowe’s Cos. Inc., senior note, FRN, 1.456%, 9/14/18 | United States | 255,000 | | | 257,227 |
| | | | | | 3,197,565 |
| Technology Hardware, Storage & Peripherals 0.1% | | | | | |
| e Diamond 1 Finance Corp. / Diamond 2 Finance Corp., senior secured bond, first | | | | | |
| lien, 144A, 6.02%, 6/15/26 | United States | 1,170,000 | | | 1,227,273 |
| Thrifts & Mortgage Finance 0.0%† | | | | | |
| Santander Holdings USA Inc., senior bond, 4.50%, 7/17/25 | United States | 475,000 | | | 466,241 |
| Wireless Telecommunication Services 0.1% | | | | | |
| f GTH Finance BV, senior note, Reg S, 6.25%, 4/26/20 | Netherlands | 511,000 | | | 531,721 |
| Total Corporate Bonds and Notes (Cost $182,004,689) | | | | | 202,698,625 |
| Corporate Bonds and Notes in Reorganization 0.2% | | | | | |
| Diversified Telecommunication Services 0.0%† | | | | | |
| e,g Oi SA, senior note, 144A, 9.75%, 9/15/16 | Brazil | 300,000 | BRL | 16,410 |
| Energy Equipment & Services 0.1% | | | | | |
| a,e,g Paragon Offshore PLC, 144A, | | | | | |
| senior bond, 7.25%, 8/15/24 | United States | 387,000 | | | 75,465 |
| senior note, 6.75%, 7/15/22 | United States | 3,081,000 | | | 600,795 |
| | | | | | 676,260 |
franklintempleton.com
Semiannual Report 37
FRANKLIN ALTERNATIVE STRATEGIES FUNDS
CONSOLIDATED STATEMENT OF INVESTMENTS (UNAUDITED)
| | | | |
| Franklin K2 Alternative Strategies Fund (continued) | | | | |
| |
| | | Principal | | |
| | Country | Amount* | | Value |
| Corporate Bonds and Notes in Reorganization (continued) | | | | |
| Oil, Gas & Consumable Fuels 0.1% | | | | |
| g Linn Energy LLC / Linn Energy Finance Corp., | | | | |
| senior bond, 8.625%, 4/15/20 | United States | 3,062,000 | $ | 1,018,115 |
| asenior bond, 7.75%, 2/01/21 | United States | 1,501,000 | | 500,959 |
| senior note, 6.50%, 5/15/19 | United States | 257,000 | | 82,883 |
| g Peabody Energy Corp., senior note, 6.00%, 11/15/18 | United States | 236,000 | | 151,040 |
| | | | | 1,752,997 |
| Total Corporate Bonds and Notes in Reorganization | | | | |
| (Cost $1,952,334) | | | | 2,445,667 |
| h,k Senior Floating Rate Interests 0.5% | | | | |
| Aerospace & Defense 0.0%† | | | | |
| s TransDigm Inc., Term Loan F, 3.75%, 6/09/23 | United States | 170,000 | | 170,468 |
| Auto Components 0.0%† | | | | |
| Gates Global Inc., Term Loan B, 4.25%, 7/06/21 | United States | 178,437 | | 177,483 |
| Building Products 0.0%† | | | | |
| Ply Gem Holdings Inc., Term Loan, 4.00%, 2/01/21 | United States | 27,461 | | 27,624 |
| Capital Markets 0.0%† | | | | |
| Donnelley Financial Solutions Inc., Term Loan B, 5.00%, 9/29/23 | United States | 115,000 | | 116,150 |
| Thomson Reuters, Term Loan B, 4.75%, 10/03/23 | Canada | 131,300 | | 131,874 |
| | | | | 248,024 |
| Commercial Services & Supplies 0.0%† | | | | |
| GFL Environmental, Term Loan B, 3.75%, 9/29/23 | Canada | 70,000 | | 69,956 |
| Communications Equipment 0.0%† | | | | |
| Presidio Holdings, Term Loan B, 5.25%, 2/02/22 | United States | 187,150 | | 187,715 |
| Construction & Engineering 0.0%† | | | | |
| Engility Corp., Term Loan B2, 7.25%, 8/14/23 | United States | 104,477 | | 105,832 |
| Construction Materials 0.0%† | | | | |
| Headwaters Inc., Term Loan B, 4.00%, 3/24/22 | United States | 189,520 | | 190,468 |
| Diversified Financial Services 0.0%† | | | | |
| Harbor Frieght Tools USA Inc., Term Loan B, 4.137%, 8/18/23 | United States | 118,871 | | 119,943 |
| Serta Simmons Holdings LLC, Term Loan, second lien, 9.00%, 10/21/24 | United States | 199,727 | | 200,393 |
| | | | | 320,336 |
| Diversified Telecommunication Services 0.0%† | | | | |
| Integra Telecom, Term Loan, 5.25%, 8/14/20 | United States | 222,120 | | 222,009 |
| Electric Utilities 0.0%† | | | | |
| Power Buyer LLC, Delayed Draw, Term Loan, 4.25%, 5/06/20 | United States | 66,274 | | 66,191 |
| Health Care Providers & Services 0.1% | | | | |
| Inventiv Health Inc., Term Loan, 4.75%, 11/09/23 | United States | 485,000 | | 484,280 |
| Universal Services, Delayed Draw, Term Loan B, 4.75%, 7/28/22 | United States | 119,100 | | 119,398 |
| | | | | 603,678 |
| Hotels, Restaurants & Leisure 0.0%† | | | | |
| Boyd Gaming Corp., Term Loan B, 3.61%, 9/15/23 | United States | 65,223 | | 65,712 |
| Insurance 0.1% | | | | |
| Asurion LLC, Term Loan, 10.00%, 8/31/21 | United States | 525,000 | | 529,594 |
38 Semiannual Report
franklintempleton.com
FRANKLIN ALTERNATIVE STRATEGIES FUNDS
CONSOLIDATED STATEMENT OF INVESTMENTS (UNAUDITED)
| | | | | |
| Franklin K2 Alternative Strategies Fund (continued) | | | | | |
| |
| | | Principal | | | |
| | Country | Amount* | | | Value |
| h,k Senior Floating Rate Interests (continued) | | | | | |
| Insurance (continued) | | | | | |
| Hyperion Insurance Group Ltd., Term Loan B, 5.50%, 4/29/22 | United States | 44,325 | $ | | 43,937 |
| | | | | | 573,531 |
| Internet Software & Services 0.1% | | | | | |
| Rackspace Hosting Inc., Term Loan B, 5.00%, 11/03/23 | United States | 85,000 | | | 85,751 |
| Uber Technologies Inc., Term Loan, 5.00%, 7/13/23 | United States | 260,000 | | | 261,393 |
| | | | | | 347,144 |
| IT Services 0.0%† | | | | | |
| Aptean Inc., Term Loan, first lien, 5.25%, 2/26/20 | United States | 48,750 | | | 48,781 |
| Machinery 0.0%† | | | | | |
| North American Lifting Holdings Inc., Initial Term Loan, 5.50%, 11/27/20 | United States | 15,577 | | | 13,367 |
| Media 0.0%† | | | | | |
| Cablevision SA, Term Loan B, 3.876%, 10/11/24 | Argentina | 35,000 | | | 35,131 |
| CBS Radio Inc., Term Loan B, 4.50%, 10/17/23 | United States | 95,755 | | | 96,443 |
| Cequel/SuddenLink, Term Loan, 3.882%, 1/15/25 | United States | 24,299 | | | 24,421 |
| Ziggo BV, | | | | | |
| Term Loan B-1, 3.50%, 1/15/22 | Netherlands | 145,145 | | | 145,236 |
| Term Loan B-2, 3.50%, 1/15/22 | Netherlands | 27,875 | | | 27,892 |
| Term Loan B-3, 3.701%, 1/15/22 | Netherlands | 8,180 | | | 8,185 |
| | | | | | 337,308 |
| Oil, Gas & Consumable Fuels 0.1% | | | | | |
| California Resources Corp., Term Loan L, 11.375%, 12/31/21 | United States | 635,000 | | | 676,275 |
| Chesapeake Energy Corp., Term Loan, 8.50%, 8/23/21 | United States | 468,445 | | | 498,191 |
| Energy Transfer Equity LP, Term Loan 2013, 3.387%, 12/02/19 | United States | 33,128 | | | 33,011 |
| Energy Transfer Partners LP, Term Loan C, 4.137%, 12/02/19 | United States | 39,998 | | | 40,109 |
| OSG Bulk Ships, Term Loan B, 5.25%, 8/05/19 | United States | 9,079 | | | 8,863 |
| Southcross Energy Partners LP, senior secured, Term Loan B, first lien | | | | | |
| guaranteed, 5.25%, 8/04/21 | United States | 29,472 | | | 23,087 |
| | | | | | 1,279,536 |
| Retailing 0.0%† | | | | | |
| Talbots Inc., Initial Term Loan, first lien, 5.50%, 3/19/20 | United States | 66,882 | | | 65,572 |
| Semiconductors & Semiconductor Equipment 0.0%† | | | | | |
| Cavium Inc., Term Loan B, 3.75%, 8/16/22 | United States | 75,000 | | | 75,045 |
| NXP BV, Term Loan F, 3.405%, 12/07/20 | Netherlands | 25,000 | | | 25,113 |
| | | | | | 100,158 |
| Specialty Retail 0.0%† | | | | | |
| PetSmart Inc., Term Loan B, 4.00%, 3/11/22 | United States | 244,380 | | | 245,366 |
| Technology Hardware, Storage & Peripherals 0.1% | | | | | |
| Western Digital Co., Term Loan B, 4.50%, 4/29/23 | United States | 335,982 | | | 340,332 |
| Trading Companies & Distributors 0.0%† | | | | | |
| HD Supply Inc., Term Loan B, 3.63%, 10/17/23 | United States | 145,000 | | | 145,793 |
| Total Senior Floating Rate Interests (Cost $5,843,513) | | | | | 5,952,384 |
| Foreign Government and Agency Securities 2.2% | | | | | |
| Argentine Bonos del Tesoro, | | | | | |
| senior note, 16.00%, 10/17/23 | Argentina | 23,373,724 | ARS | 1,423,383 |
| senior note, 15.50%, 10/17/26 | Argentina | 5,727,486 | ARS | 349,690 |
franklintempleton.com
Semiannual Report 39
FRANKLIN ALTERNATIVE STRATEGIES FUNDS
CONSOLIDATED STATEMENT OF INVESTMENTS (UNAUDITED)
| | | | |
| Franklin K2 Alternative Strategies Fund (continued) | | | | |
| |
| | | Principal | | |
| | Country | Amount* | | Value |
| Foreign Government and Agency Securities (continued) | | | | |
| Government of Argentina, | | | | |
| fReg S, 5.00%, 1/15/27 | Argentina | 811,000 | EUR | $ | 753,170 |
| 7.82%, 12/31/33 | Argentina | 1,801,320 | EUR | 1,887,173 |
| 2.26% to 3/31/19, 3.38% to 3/31/29, 4.74% thereafter, 12/31/38 | Argentina | 2,313,071 | EUR | 1,383,263 |
| senior note, 8.75%, 6/02/17 | Argentina | 2,083,173 | | 2,160,250 |
| fsenior note, Reg S, 3.875%, 1/15/22 | Argentina | 470,000 | EUR | 469,920 |
| Government of Brazil, senior note, 10.00%, 1/01/17 | Brazil | 3,300,000 | BRL | 972,630 |
| f Government of Cyprus, senior note, Reg S, 3.875%, 5/06/22 | Cyprus | 423,000 | EUR | 464,819 |
| Government of Hellenic Republic, | | | | |
| fsenior bond, Reg S, 3.00% to 2/24/20, 3.65% to 2/24/21, 4.30% | | | | |
| thereafter, 2/24/42 | Greece | 2,430,460 | EUR | 1,867,948 |
| esenior note, 144A, 4.75%, 4/17/19 | Greece | 385,000 | EUR | 392,807 |
| f Government of Iraq, senior bond, Reg S, 5.80%, 1/15/28 | Iraq | 814,000 | | 649,165 |
| f Government of Pakistan, senior note, Reg S, 6.75%, 12/03/19 | Pakistan | 648,000 | | 681,056 |
| f Government of Paraguay, senior note, Reg S, 4.625%, 1/25/23 | Paraguay | 945,000 | | 945,576 |
| Government of Poland, 4.75%, 4/25/17 | Poland | 3,900,000 | PLN | 940,040 |
| Government of Russia, | | | | |
| 6.40%, 5/27/20 | Russia | 107,072,000 | RUB | 1,564,545 |
| fReg S, 4.75%, 5/27/26 | Russia | 2,000,000 | | 2,041,120 |
| f Government of Ukraine, senior note, Reg S, 7.75%, 9/01/19 | Ukraine | 1,030,000 | | 999,898 |
| Letras del Banco Central de la Republica Argentina, Strip, 1/11/17 - 1/25/17 | Argentina | 37,094,511 l | ARS | 2,264,421 |
| Mexican Bonos, senior bond, Series M, 5.75%, 3/05/26 | Mexico | 100,000 | MXN | 436,365 |
| Mexico Cetes, senior note, zero cpn., 1/05/17 | Mexico | 1,985,000 | MXN | 959,323 |
| Mexico City Airport Trust, senior bond, 5.50%, 10/31/46 | Mexico | 600,000 | | 528,180 |
| e Provincia de Buenos Aires/Argentina, senior note, 144A, 5.75%, 6/15/19 | Argentina | 250,000 | | 250,313 |
| Total Foreign Government and Agency Securities | | | | |
| (Cost $23,616,049) | | | | 24,385,055 |
| Asset-Backed Securities and Commercial Mortgage- | | | | |
| Backed Securities 2.3% | | | | |
| Airlines 0.1% | | | | |
| e Air Canada 2015-2 Class B Pass Through Trust, third lien note, 144A, | | | | |
| 5.00%, 6/15/25 | Canada | 505,000 | | 506,894 |
| Latam Airlines 2015-1 Pass Through Trust B, secured note, 4.50%, 8/15/25 | Chile | 750,345 | | 735,338 |
| | | | | 1,242,232 |
| Banks 0.0%† | | | | |
| Capital One Multi-Asset Execution Trust, | | | | |
| 2014-A2, 1.26%, 1/15/20 | United States | 40,000 | | 40,026 |
| 2014-A5, 1.48%, 7/15/20 | United States | 90,000 | | 90,240 |
| h Wells Fargo Mortgage Backed Securities 2003-M Trust, A1, FRN, | | | | |
| 2.992%, 12/25/33 | United States | 30,649 | | 30,761 |
| h Wells Fargo Mortgage Backed Securities 2004-0 Trust, A1, FRN, | | | | |
| 3.176%, 8/25/34 | United States | 12,183 | | 12,384 |
| Wells Fargo Mortgage Backed Securities 2005-16 Trust, A18, | | | | |
| 6.00%, 1/25/36 | United States | 6,232 | | 6,181 |
| h Wells Fargo Mortgage Backed Securities 2005-AR10 Trust, 2A4, FRN, | | | | |
| 2.987%, 6/25/35 | United States | 19,217 | | 19,849 |
| | | | | 199,441 |
| Commercial Services & Supplies 0.0%† | | | | |
| e Shenton Aircraft Investment I Ltd., 2015-A, 144A, 4.75%, 10/15/42 | Cayman Islands | 320,503 | | 316,230 |
40 Semiannual Report
franklintempleton.com
FRANKLIN ALTERNATIVE STRATEGIES FUNDS
CONSOLIDATED STATEMENT OF INVESTMENTS (UNAUDITED)
| | | | |
| Franklin K2 Alternative Strategies Fund (continued) | | | | |
| |
| | | Principal | | |
| | Country | Amount* | | Value |
| Asset-Backed Securities and Commercial Mortgage-Backed | | | | |
| Securities (continued) | | | | |
| Consumer Finance 0.1% | | | | |
| American Express Credit Account Master Trust, | | | | |
| h2012-A, FRN, 0.808%, 1/15/20 | United States | 100,000 | $ | 100,091 |
| h2012-4A, FRN, 0.778%, 5/15/20 | United States | 355,000 | | 355,429 |
| 2014-A, 1.26%, 1/15/20 | United States | 100,000 | | 100,105 |
| 2014-A, 1.49%, 4/15/20 | United States | 100,000 | | 100,275 |
| h2014-A, FRN, 0.828%, 5/15/20 | United States | 100,000 | | 100,143 |
| h Bank of America Credit Card Trust, FRN, | | | | |
| A, 0.808%, 9/16/19 | United States | 120,000 | | 120,086 |
| A, 0.918%, 6/15/21 | United States | 100,000 | | 100,310 |
| A, 0.928%, 10/15/21 | United States | 85,000 | | 85,312 |
| A3, 0.828%, 1/15/20 | United States | 100,000 | | 100,119 |
| | | | | 1,161,870 |
| Diversified Financial Services 1.9% | | | | |
| e AIM Aviation Finance Ltd., 2015-B1, 144A, 5.072%, 2/15/40 | Cayman Islands | 328,125 | | 315,820 |
| e Ajax Mortgage Loan 2016-B Trust, A, 144A, 4.00%, 9/25/65 | United States | 169,052 | | 169,125 |
| e Ajax Mortgage Loan 2016-C Trust, Series 2016-A, 144A, 4.00%, 10/25/57, C | United States | 154,367 | | 155,015 |
| h Alliance Bancorp 2007-OA1 Trust, A1, FRN, 0.832%, 7/25/37 | United States | 342,646 | | 249,372 |
| Ally Auto Receivables 2016-3 Trust, A3, 1.44%, 8/17/20 | United States | 180,000 | | 180,262 |
| h American Express Issuance Trust II, 2013-A, FRN, 0.968%, 8/15/19 | United States | 240,000 | | 241,048 |
| h American Home Mortgage Investment 2005-2 Trust, 1A1, FRN, | | | | |
| 0.834%, 9/25/45 | United States | 96,013 | | 79,819 |
| h American Home Mortgage Investment 2006-1 Trust, 11A1, FRN, | | | | |
| 0.814%, 3/25/46 | United States | 337,558 | | 279,566 |
| Banc of America Alternative Loan 2003-8 Trust, 1CB1, 5.50%, 10/25/33 | United States | 10,871 | | 11,123 |
| Banc of America Alternative Loan 2004-6 Trust, 2A1, 6.00%, 7/25/34 | United States | 267,942 | | 282,610 |
| Banc of America Alternative Loan 2004-9 Trust, 2CB1, 6.00%, 10/25/34 | United States | 11,894 | | 12,141 |
| Banc of America Alternative Loan 2005-6 Trust, CB7, 5.25%, 7/25/35 | United States | 21,175 | | 19,482 |
| h Banc of America Funding 2004-B Trust, 1A2, FRN, 2.981%, 12/20/34 | United States | 63,418 | | 59,043 |
| Banc of America Funding 2005-5 Trust, 1A1, 5.50%, 9/25/35 | United States | 17,586 | | 18,301 |
| Banc of America Funding 2007-4 Trust, 5A1, 5.50%, 11/25/34 | United States | 196,354 | | 195,155 |
| h Banc of America Mortgage 2005-A Trust, 2A1, FRN, 2.961%, 2/25/35 | United States | 12,062 | | 12,050 |
| e Bayview Opportunity Master Fund 2016-LT1 Trust, Series 2016-A1, 144A, | | | | |
| 3.475%, 10/28/31 | United States | 166,941 | | 166,947 |
| e Bayview Opportunity Master Fund IIA 2016-RPL3 Trust, A1, 144A, | | | | |
| 3.475%, 7/28/31 | United States | 81,398 | | 81,299 |
| e Bayview Opportunity Master Fund IIIA 2016-RN3 Trust, Series 2016-A1, 144A, | | | | |
| 3.598%, 9/29/31 | United States | 95,239 | | 95,222 |
| BCAP LLC 2007-AA2 Trust, 22A1, 6.00%, 3/25/22 | United States | 217,429 | | 215,554 |
| h Bear Stearns ARM 2004-6 Trust, 2A1, FRN, 3.321%, 9/25/34 | United States | 80,168 | | 74,050 |
| h Bear Stearns ARM 2005-12 Trust, 11A1, FRN, 3.577%, 2/25/36 | United States | 24,113 | | 20,519 |
| e Blackbird Capital Aircraft Lease Securitization Ltd., 2016-1, A, 144A, | | | | |
| 4.213%, 12/16/41 | United States | 255,000 | | 256,680 |
| e,h BLCP Hotel 2014-CLRN Trust, E, 144A, FRN, 4.208%, 8/15/29 | United States | 100,000 | | 99,295 |
| BMW Vehicle Owner Trust, 2014-A3, 0.97%, 11/26/18 | United States | 35,302 | | 35,292 |
| BXHT 2015-DRMZ Mortgage Trust, 8.738%, 7/15/29 | United States | 239,031 | | 232,286 |
| e CAM Mortgage 2016-1 Trust, 144A, | | | | |
| A, 4.00%, 1/15/56 | United States | 67,535 | | 67,376 |
| h M, FRN, 5.00%, 1/15/56 | United States | 150,000 | | 145,003 |
franklintempleton.com
Semiannual Report 41
FRANKLIN ALTERNATIVE STRATEGIES FUNDS
CONSOLIDATED STATEMENT OF INVESTMENTS (UNAUDITED)
| | | | | | |
| Franklin K2 Alternative Strategies Fund (continued) | | | | | | |
| |
| | | | Principal | | | |
| | | Country | Amount* | | | Value |
| Asset-Backed Securities and Commercial Mortgage-Backed | | | | | | |
| Securities (continued) | | | | | | |
| Diversified Financial Services (continued) | | | | | | |
| e CAM Mortgage LLC, 144A, | | | | | | |
| h 2015-1, M, FRN, 4.75%, 7/15/64 | | United States | 100,000 | | $ | 99,081 |
| 2015-A, 3.50%, 7/15/64 | | United States | 13,497 | | | 13,531 |
| e,h CCRESG Commercial Mortgage 2016-HEAT Trust, D, 144A, FRN, | | | | | | |
| 5.671%, 4/10/29 | | United States | 100,000 | | | 98,824 |
| Chase Issuance Trust, | | | | | | |
| h 2007-A12, FRN, 0.588%, 8/15/19 | | United States | 330,000 | | | 329,741 |
| 2014-A6, 1.26%, 7/15/19 | | United States | 100,000 | | | 100,115 |
| h 2015-A1, FRN, 0.858%, 2/18/20 | | United States | 110,000 | | | 110,230 |
| 2015-A2, 1.59%, 2/18/20 | | United States | 135,000 | | | 135,512 |
| 2015-A7, 1.62%, 7/15/20 | | United States | 300,000 | | | 301,231 |
| 2016-A, 1.37%, 6/15/21 | | United States | 260,000 | | | 258,137 |
| 2016-A5, 1.27%, 7/15/21 | | United States | 250,000 | | | 247,593 |
| h A5, FRN, 0.908%, 4/15/21 | | United States | 120,000 | | | 120,561 |
| e CLI Funding LLC, 2014-2A, 144A, 3.38%, 10/18/29 | | United States | 79,000 | | | 75,914 |
| e Colony American Homes, 144A, | | | | | | |
| h 2014-2, FRN, 3.77%, 7/17/31 | | United States | 100,000 | | | 101,200 |
| 2015-1, D, 5.649%, 10/15/47 | | United States | 115,000 | | | 113,214 |
| e,h COMM 2016-SAVA Mortgage Trust, Series 2016-C, 144A, FRN, | | | | | | |
| 3.539%, 10/15/34 | | United States | 155,000 | | | 155,603 |
| Countrywide Alternative Loan Trust, | | | | | | |
| 2003-1A1, 5.75%, 12/25/33 | | United States | 70,234 | | | 72,167 |
| 2003-2A1, 5.75%, 10/25/33 | | United States | 22,173 | | | 22,942 |
| 2003-A7, 5.50%, 7/25/33 | | United States | 23,603 | | | 23,427 |
| 2004-1A1, 5.50%, 4/25/34 | | United States | 52,399 | | | 53,398 |
| 2004-5A1, 5.75%, 1/25/35 | | United States | 9,310 | | | 9,395 |
| 2004-J10, 6.00%, 9/25/34 | | United States | 128,212 | | | 132,642 |
| 2005-2A1, 5.50%, 2/25/25 | | United States | 10,277 | | | 10,511 |
| h 2005-2A1, FRN, 0.802%, 5/25/35 | | United States | 53,947 | | | 45,107 |
| h Countrywide Home Loans Mortgage Pass-Through 2004-12 Trust, 8A1, FRN, | | | | | | |
| 3.223%, 8/25/34 | | United States | 14,948 | | | 12,956 |
| h Countrywide Home Loans Mortgage Pass-Through 2004-HYB4 Trust, 2A1, FRN, | | | | | | |
| 3.056%, 9/20/34 | | United States | 126,249 | | | 121,989 |
| Countrywide Home Loans Mortgage Pass-Through 2005-21 Trust, A17, | | | | | | |
| 5.50%, 10/25/35 | | United States | 16,266 | | | 14,718 |
| e CPS Auto Receivables 2014-B Trust, D, 144A, 4.62%, 5/15/20 | | United States | 110,000 | | | 109,329 |
| e CPS Auto Receivables 2016-B Trust, E, 144A, 8.14%, 5/15/23 | | United States | 500,000 | | | 522,465 |
| e,h Credit Suisse Mortgage Capital Certificates, 2015-A, 144A, FRN, | | | | | | |
| 1.788%, 3/15/17 | | United States | 110,000 | | | 110,111 |
| h Deutsche Alt-A Securities Inc. Mortgage Loan 2005-5 Trust, 1A4, FRN, | | | | | | |
| 5.50%, 11/25/35 | | United States | 11,819 | | | 11,265 |
| h Deutsche Mortgage Securities Inc. Mortgage Loan 2004-7 Trust, AR1, FRN, | | | | | | |
| 0.942%, 6/25/34 | | United States | 101,498 | | | 92,982 |
| h DSLA Mortgage Loan 2005-AR5 Trust, 2A1A, FRN, 0.892%, 9/19/45 | | United States | 64,860 | | | 48,724 |
| e DT Auto Owner 2014-3 Trust, D, 144A, 4.47%, 11/15/21 | | United States | 50,000 | | | 51,104 |
| e DT Auto Owner 2016-1 Trust, D, 144A, 4.66%, 12/15/22 | | United States | 180,000 | | | 183,338 |
| e DT Auto Owner 2016-2 Trust, D, 144A, 5.43%, 11/15/22 | | United States | 240,000 | | | 248,945 |
| f,h Dukinfield 2 PLC, FRN, Reg S, 1.612%, 12/20/52 | | United Kingdom | 245,000 | GBP | | 307,457 |
| f,h Eurosail-UK 2007-2np PLC, Series 2007-A3C, FRN, Reg S, 0.529%, 3/13/45 | | United Kingdom | 73,464 | GBP | | 88,957 |
| e First Investors Auto Owner 2016-1 Trust, D, 144A, 4.70%, 4/18/22 | | United States | 110,000 | | | 113,579 |
42 Semiannual Report
franklintempleton.com
FRANKLIN ALTERNATIVE STRATEGIES FUNDS
CONSOLIDATED STATEMENT OF INVESTMENTS (UNAUDITED)
| | | | | |
| Franklin K2 Alternative Strategies Fund (continued) | | | | | |
| |
| | | Principal | | | |
| | Country | Amount* | | | Value |
| Asset-Backed Securities and Commercial Mortgage-Backed | | | | | |
| Securities (continued) | | | | | |
| Diversified Financial Services (continued) | | | | | |
| Ford Credit Auto Owner Trust, | | | | | |
| e 2014-A, 144A, 2.31%, 4/15/26 | United States | 100,000 | | $ | 101,197 |
| 2014-A3, 0.90%, 10/15/18 | United States | 42,926 | | | 42,908 |
| 2014-A3, 1.06%, 5/15/19 | United States | 36,698 | | | 36,692 |
| 2015-A3, 1.28%, 9/15/19 | United States | 79,172 | | | 79,236 |
| 2015-B, A3, 1.16%, 11/15/19 | United States | 170,000 | | | 169,993 |
| h Freddie Mac Structured Agency Credit Risk Debt Notes, FRN, | | | | | |
| 2013-M2, 4.842%, 11/25/23 | United States | 250,000 | | | 263,837 |
| 2015-M2, 2.442%, 10/25/27 | United States | 250,000 | | | 252,937 |
| 2015-M3, 3.892%, 10/25/27 | United States | 250,000 | | | 258,418 |
| h GMACM Mortgage Loan 2005-AR4 Trust, 3A1, FRN, 3.557%, 7/19/35 | United States | 202,543 | | | 183,877 |
| e,h GP Portfolio 2014-GGP Trust, A, 144A, FRN, 1.488%, 2/15/27 | United States | 72,789 | | | 72,921 |
| GSR Mortgage Loan 2005-4F Trust, 6A1, 6.50%, 2/25/35 | United States | 30,966 | | | 31,137 |
| h GSR Mortgage Loan 2005-AR6 Trust, 4A5, FRN, 3.076%, 9/25/35 | United States | 178,597 | | | 179,171 |
| h Harborview Mortgage Loan 2003-2 Trust, 1A, FRN, 1.302%, 10/19/33 | United States | 127,626 | | | 120,091 |
| h Harborview Mortgage Loan 2004-11 Trust, 2A2A, FRN, 1.202%, 1/19/35 | United States | 160,749 | | | 137,303 |
| h Harborview Mortgage Loan 2004-2 Trust, 1A1, FRN, 1.082%, 6/19/34 | United States | 165,504 | | | 151,095 |
| h Harborview Mortgage Loan 2006-7 Trust, 2A1A, FRN, 0.762%, 9/19/46 | United States | 44,383 | | | 32,289 |
| Honda Auto Receivables 2014-2 Owner Trust, A3, 0.77%, 3/19/18 | United States | 28,323 | | | 28,295 |
| Honda Auto Receivables 2014-3 Owner Trust, | | | | | |
| A3, 0.88%, 6/15/18 | United States | 19,869 | | | 19,859 |
| A4, 1.31%, 10/15/20 | United States | 30,000 | | | 30,033 |
| Honda Auto Receivables 2014-4 Owner Trust, A3, 0.99%, 9/17/18 | United States | 31,463 | | | 31,447 |
| Honda Auto Receivables 2015-1 Owner Trust, A3, 1.05%, 10/15/18 | United States | 48,162 | | | 48,137 |
| Honda Auto Receivables 2015-3 Owner Trust, A3, 1.27%, 4/18/19 | United States | 135,000 | | | 135,098 |
| Honda Auto Receivables 2016-2 Owner Trust, A3, 1.39%, 4/15/20 | United States | 180,000 | | | 179,987 |
| Hyundai Auto Receivables 2014-4 Owner Trust, A3, 0.79%, 7/16/18 | United States | 22,448 | | | 22,439 |
| Hyundai Auto Receivables 2015-A Owner Trust, A3, 1.05%, 4/15/19 | United States | 42,566 | | | 42,550 |
| Hyundai Auto Receivables 2015-B Owner Trust, A3, 1.12%, 11/15/19 | United States | 230,000 | | | 229,810 |
| h IndyMac Index Mortgage Loan 2004-AR12 Trust, A1, FRN, 1.372%, 12/25/34 | United States | 110,435 | | | 93,191 |
| h IndyMac Index Mortgage Loan 2006-AR2 Trust, 2A1, FRN, 0.802%, 2/25/46 | United States | 366,889 | | | 290,663 |
| h IndyMac Mortgage Loan 2005-AR11 Trust, A3, FRN, 2.956%, 8/25/35 | United States | 88,804 | | | 73,804 |
| h JP Morgan Alternative Loan 2006-A1 Trust, 3A1, FRN, 2.832%, 3/25/36 | United States | 257,741 | | | 214,494 |
| h JP Morgan Chase Commercial Mortgage Securities 2007-LDP10 Trust, AM, FRN, | | | | | |
| 5.464%, 1/15/49 | United States | 80,000 | | | 78,694 |
| e,h JP Morgan Chase Commercial Mortgage Securities 2015-SGP Trust, D, 144A, | | | | | |
| FRN, 5.038%, 7/15/36 | United States | 180,000 | | | 181,570 |
| h JP Morgan Mortgage 2003-A2 Trust, 3A1, FRN, 2.77%, 11/25/33 | United States | 15,293 | | | 14,615 |
| JP Morgan Mortgage 2004-S1 Trust, 2A1, 6.00%, 9/25/34 | United States | 173,779 | | | 176,127 |
| h JP Morgan Mortgage 2005-A1 Trust, 6T1, FRN, 3.147%, 2/25/35 | United States | 25,038 | | | 24,715 |
| h JP Morgan Mortgage 2005-A3 Trust, 4A1, FRN, 3.048%, 6/25/35 | United States | 12,632 | | | 12,709 |
| h JP Morgan Mortgage 2006-A1 Trust, 1A2, FRN, 3.091%, 2/25/36 | United States | 47,678 | | | 42,391 |
| h JP Morgan Mortgage 2006-A7 Trust, 2A4, FRN, 3.136%, 1/25/37 | United States | 37,805 | | | 34,023 |
| h JP Morgan Mortgage 2007-A1 Trust, 4A2, FRN, 3.184%, 7/25/35 | United States | 8,957 | | | 8,972 |
| h Lehman XS Trust Series 2006-2N, Series 2006-1A1, FRN, 0.852%, 2/25/46 | United States | 74,314 | | | 55,375 |
| f,h Ludgate Funding PLC, FRN, Reg S, | | | | | |
| 2007-A2B, 1/01/61, 0.00% | United Kingdom | 38,491 | EUR | | 38,229 |
| 2008-A1, 0.983%, 1/01/61 | United Kingdom | 187,215 | GBP | | 222,587 |
| h MASTR Adjustable Rate Mortgages 2004-7 Trust, 3A1, FRN, 2.855%, 7/25/34 | United States | 49,200 | | | 47,773 |
| MASTR Alternative Loan 2004-2 Trust, 8A4, 5.50%, 3/25/34 | United States | 245,000 | | | 250,548 |
franklintempleton.com
Semiannual Report 43
FRANKLIN ALTERNATIVE STRATEGIES FUNDS
CONSOLIDATED STATEMENT OF INVESTMENTS (UNAUDITED)
| | | | | |
| Franklin K2 Alternative Strategies Fund (continued) | | | | | |
| |
| | | Principal | | | |
| | Country | Amount* | | | Value |
| Asset-Backed Securities and Commercial Mortgage-Backed | | | | | |
| Securities (continued) | | | | | |
| Diversified Financial Services (continued) | | | | | |
| MASTR Alternative Loan 2004-8 Trust, 2A1, 6.00%, 9/25/34 | United States | 93,520 | | $ | 99,883 |
| h Merrill Lynch Mortgage Investors MLCC, FRN, | | | | | |
| 2006-1A, 2.986%, 2/25/36 | United States | 130,560 | | | 121,130 |
| 2006-2A, 2.689%, 5/25/36 | United States | 12,946 | | | 12,558 |
| e,h Morgan Stanley Capital I 2011-C2 Trust, E, 144A, FRN, 5.655%, 6/15/44 | United States | 150,000 | | | 153,620 |
| e Motel 6 2015-M6MZ Trust, M, 144A, 8.23%, 2/05/20 | United States | 994,613 | | | 1,002,381 |
| National City Mortgage Capital 2008-1 Trust, 2A1, 6.00%, 3/25/38 | United States | 57,740 | | | 60,258 |
| h New York Mortgage 2006-1 Trust, 2A2, FRN, 3.045%, 5/25/36 | United States | 33,096 | | | 30,030 |
| f,h Newgate Fund PLC, 2007-A2B, FRN, Reg S, 0.298%, 12/15/50 | United Kingdom | 83,256 | EUR | | 84,847 |
| Nissan Auto Lease 2014-B Trust, A3, 1.12%, 9/15/17 | United States | 21,353 | | | 21,353 |
| Nissan Auto Receivables 2013-C Owner Trust, A3, 0.67%, 8/15/18 | United States | 5,005 | | | 4,994 |
| Nissan Auto Receivables 2016-C Owner Trust, A3, 1.18%, 1/15/21 | United States | 85,000 | | | 84,547 |
| e Oak Hill Advisors Residential Loan Trust, 2015-NPL2, A1, 144A, | | | | | |
| 3.721%, 7/25/55 | United States | 149,311 | | | 150,067 |
| e OneMain Financial Issuance 2014-A Trust, 144A, 3.19%, 3/18/26 | United States | 150,000 | | | 151,355 |
| e OneMain Financial Issuance 2015-3 Trust, B, 144A, 4.16%, 11/20/28 | United States | 155,000 | | | 150,080 |
| e OneMain Financial Issuance 2015-D Trust, 144A, 5.64%, 7/18/25 | United States | 285,000 | | | 282,877 |
| e OneMain Financial Issuance 2016-2 Trust, B, 144A, 5.94%, 3/20/28 | United States | 235,000 | | | 248,774 |
| e Prestige Auto Receivables 2016-1 Trust, E, 144A, 7.69%, 3/15/23 | United States | 200,000 | | | 210,026 |
| h RALI 2006-QO4 Trust, 2A1, FRN, 0.782%, 4/25/46 | United States | 98,895 | | | 80,382 |
| h RALI 2006-QO7 Trust, 3A2, FRN, 0.797%, 9/25/46 | United States | 47,011 | | | 35,034 |
| h RALI 2007-QO4 Trust, A1A, FRN, 0.782%, 5/25/47 | United States | 80,008 | | | 67,208 |
| e,h RCO Depositor II LLC 2015-2A Trust, FRN, 144A, | | | | | |
| A, 4.50%, 11/25/45 | United States | 106,591 | | | 106,743 |
| M, 5.00%, 11/25/45 | United States | 213,000 | | | 204,767 |
| h RFMSI 2005-SA1 Trust, FRN, 3.947%, 3/25/35 | United States | 140,807 | | | 114,428 |
| f,h RMAC Securities PLC, FRN, Reg S, | | | | | |
| 2005-A2C, 0.056%, 6/12/43 | United Kingdom | 22,758 | EUR | | 22,857 |
| 2006-A2C, zero cpn., 6/12/44 | United Kingdom | 53,961 | EUR | | 53,835 |
| e,h SCG Trust 2013-SRP1, FRN, 144A, | | | | | |
| A, 1.938%, 11/15/26 | United States | 100,000 | | | 99,722 |
| B, 3.038%, 11/15/26 | United States | 100,000 | | | 96,827 |
| C, 3.788%, 11/15/26 | United States | 100,000 | | | 97,356 |
| D, 3.882%, 11/15/26 | United States | 245,000 | | | 235,000 |
| e Sierra Timeshare 2013-3 Receivables Funding LLC, A, 144A, 2.20%, 10/20/30 | United States | 42,236 | | | 42,260 |
| e Sofi Professional Loan Program 2016-A LLC, B, 144A, 3.57%, 1/26/38 | United States | 230,000 | | | 231,353 |
| h Structured Adjustable Rate Mortgage Loan Trust, FRN, | | | | | |
| 1A, 2.993%, 6/25/34 | United States | 18,829 | | | 18,644 |
| 7A3, 3.165%, 9/25/34 | United States | 37,995 | | | 37,872 |
| 2005-A1, 0.902%, 7/25/35 | United States | 349,469 | | | 258,955 |
| Structured Asset Securities Corp. 2005-1 Trust, 7A7, 5.50%, 2/25/35 | United States | 19,259 | | | 19,584 |
| e TAL Advantage V LLC, A, 144A, 3.55%, 11/20/38 | United States | 70,000 | | | 68,058 |
| f,h Towd Point Mortgage Funding 2016-Granite1 PLC, 2016-B, FRN, Reg S, | | | | | |
| 1.802%, 7/20/46 | United Kingdom | 100,000 | GBP | | 125,486 |
| Toyota Auto Receivables 2014-C Owner Trust, A3, 0.93%, 7/16/18 | United States | 20,459 | | | 20,451 |
| Toyota Auto Receivables 2015-B Owner Trust, A3, 1.27%, 5/15/19 | United States | 255,000 | | | 255,177 |
| Toyota Auto Receivables 2015-C Owner Trust, A3, 1.34%, 6/17/19 | United States | 135,000 | | | 135,201 |
| Toyota Auto Receivables 2016-C Owner Trust, A3, 1.14%, 8/17/20 | United States | 70,000 | | | 69,663 |
| h Toyota Auto Receivables 2016-D Owner Trust, A2B, FRN, 0.668%, 5/15/19 | United States | 165,000 | | | 165,034 |
| e US Residential Opportunity Fund III 2016-1 Trust, A, 144A, 3.475%, 7/27/36 | United States | 96,202 | | | 96,256 |
44 Semiannual Report
franklintempleton.com
FRANKLIN ALTERNATIVE STRATEGIES FUNDS
CONSOLIDATED STATEMENT OF INVESTMENTS (UNAUDITED)
| | | | | |
| | Franklin K2 Alternative Strategies Fund (continued) | | | | |
| |
| | | | Principal | | |
| | | Country | Amount* | | Value |
| | Asset-Backed Securities and Commercial Mortgage-Backed | | | | |
| | Securities (continued) | | | | |
| | Diversified Financial Services (continued) | | | | |
| | USAA Auto Owner 2015-1 Trust, A3, 1.20%, 6/17/19 | United States | 150,000 | $ | 150,132 |
| | USAA Auto Owner 2016-1 Trust, A3, 1.20%, 6/15/20 | United States | 120,000 | | 119,699 |
| | e VOLT LLC, 2015-NPL2 A1, 144A, 3.375%, 2/25/55 | United States | 93,899 | | 94,376 |
| | e VOLT XL LLC, 2015-A2, 144A, 4.875%, 11/27/45 | United States | 140,000 | | 134,816 |
| | e VOLT XLVIII LLC, 2016-A1, 144A, 3.50%, 7/25/46 | United States | 95,473 | | 95,487 |
| | e VOLT XXVI LLC, 2014-A1, 144A, 3.125%, 9/25/43 | United States | 250,550 | | 250,682 |
| | e VOLT XXXIII LLC, 2015-A1, 144A, 3.50%, 3/25/55 | United States | 109,515 | | 110,133 |
| | e VOLT XXXV, 2016-A1, 144A, 3.50%, 9/25/46 | United States | 97,673 | | 97,838 |
| | h WaMu Mortgage Pass-Through Certificates, 2007-HY5 Trust, 2A3, FRN, | | | | |
| | 2.354%, 5/25/37 | United States | 147,497 | | 123,470 |
| | e,h Wedgewood Real Estate 2016-1 Trust, A2, 144A, FRN, 5.00%, 7/15/46 | United States | 100,000 | | 99,862 |
| | h Wells Fargo Bank, N.A., Adjustable Rate Mortgage 2004-4 Trust, 3A1, FRN, | | | | |
| | 3.238%, 3/25/35 | United States | 52,678 | | 51,000 |
| e,h WF-RBS Commercial Mortgage 2012-C6 Trust, D, 144A, FRN, 5.776%, 4/15/45 | United States | 150,000 | | 151,006 |
| | h World Financial Network Credit Card Master Trust, 2015-A, FRN, 1.018%, 2/15/22 | United States | 120,000 | | 120,277 |
| | | | | | 20,404,398 |
| | Equity Real Estate Investment Trusts (REITs) 0.1% | | | | |
| | e American Homes 4 Rent, 144A, | | | | |
| | h 2014-E, FRN, 3.05%, 6/17/31 | United States | 100,000 | | 99,474 |
| | 2014-E, 6.231%, 10/17/36 | United States | 250,000 | | 266,629 |
| | 2014-E, 6.418%, 12/17/36 | United States | 100,000 | | 107,915 |
| | 2015-E, 5.639%, 4/17/52 | United States | 210,000 | | 215,227 |
| | | | | | 689,245 |
| | Mortgage Real Estate Investment Trusts (REITs) 0.0%† | | | | |
| | h Citigroup Mortgage Loan 2005-2 Trust, 1A4, FRN, 2.972%, 5/25/35 | United States | 22,426 | | 21,036 |
| | e,h Citigroup Mortgage Loan 2009-10 Trust, 6A2, 144A, FRN, 3.189%, 9/25/34 | United States | 107,113 | | 101,354 |
| | e,h Citigroup Mortgage Loan 2015-2 Trust, 1A1, 144A, FRN, 0.734%, 6/25/47 | United States | 86,133 | | 75,243 |
| | h Citigroup Mortgage Loan Trust Inc., FRN, | | | | |
| | e 2A1, 144A, 0.674%, 8/25/36 | United States | 76,288 | | 69,521 |
| | 2A3, 2.999%, 8/25/35 | United States | 109,685 | | 95,198 |
| | | | | | 362,352 |
| | Thrifts & Mortgage Finance 0.1% | | | | |
| | Citibank Credit Card Issuance Trust, | | | | |
| | h 2013-A2, FRN, 0.872%, 5/26/20 | United States | 125,000 | | 125,258 |
| | h 2013-A7, FRN, 0.967%, 9/10/20 | United States | 200,000 | | 200,816 |
| | 2014-A2, 1.02%, 2/22/19 | United States | 100,000 | | 100,022 |
| | 2014-A4, 1.23%, 4/24/19 | United States | 100,000 | | 100,072 |
| | 2014-A8, 1.73%, 4/09/20 | United States | 100,000 | | 100,574 |
| | Credit Suisse First Boston Mortgage Securities Corp., | | | | |
| | h 2003-4A1, FRN, 3.253%, 12/25/33 | United States | 6,296 | | 6,218 |
| | 2003-4A4, 5.75%, 11/25/33 | United States | 28,014 | | 29,457 |
| | h 2003-7A1, FRN, 3.136%, 11/25/33 | United States | 9,258 | | 8,972 |
| | h 2004-3A1, FRN, 3.085%, 5/25/34 | United States | 23,200 | | 21,942 |
| | 2005-2A1, 5.25%, 11/25/20 | United States | 53,537 | | 52,719 |
| | h GS Mortgage Securities 2007-GG10 Trust, AM, FRN, 5.988%, 8/10/45 | United States | 510,000 | | 494,570 |
| | | | | | 1,240,620 |
| | Total Asset-Backed Securities and Commercial | | | | |
| | Mortgage-Backed Securities (Cost $25,335,462) | | | | 25,616,388 |
franklintempleton.com
Semiannual Report 45
FRANKLIN ALTERNATIVE STRATEGIES FUNDS
CONSOLIDATED STATEMENT OF INVESTMENTS (UNAUDITED)
| | | | |
| Franklin K2 Alternative Strategies Fund (continued) | | | | |
| |
| | | Number of | | |
| | Country | Contracts | | Value |
| |
| Options Purchased 0.2% | | | | |
| Calls – Exchange-Traded | | | | |
| Building Products 0.0%† | | | | |
| Johnson Controls International PLC, January Strike Price $46.00, | | | | |
| Expires 1/20/17 | United States | 623 | $ | 311,500 |
| Capital Markets 0.0%† | | | | |
| Deutsche Bank AG, January Strike Price $13.00, Expires 1/20/17 | Germany | 133 | | 39,900 |
| Construction Materials 0.0%† | | | | |
| Cemex SAB de CV, ADR, January Strike Price $9.00, Expires 1/20/17 | Mexico | 332 | | 4,316 |
| Diversified Telecommunication Services 0.0%† | | | | |
| Frontier Communications Corp., February Strike Price $3.50, Expires 2/17/17 | United States | 380 | | 11,400 |
| Frontier Communications Corp., May Strike Price $4.50, Expires 5/19/17 | United States | 251 | | 2,510 |
| | | | | 13,910 |
| Household Durables 0.0%† | | | | |
| CalAtlantic Group Inc., March Strike Price $35.00, Expires 3/17/17 | United States | 23 | | 3,680 |
| Internet & Direct Marketing Retail 0.0%† | | | | |
| Netflix Inc., December Strike Price $130.00, Expires 12/16/16 | United States | 145 | | 3,335 |
| Machinery 0.0%† | | | | |
| Trinity Industries Inc., January Strike Price $35.00, Expires 1/20/17 | United States | 64 | | 320 |
| Media 0.1% | | | | |
| Charter Communications Inc., January Strike Price $300.00, Expires 1/20/17 | United States | 1 | | 430 |
| Charter Communications Inc., March Strike Price $275.00, Expires 3/17/17 | United States | 234 | | 451,620 |
| Charter Communications Inc., January Strike Price $300.00, Expires 1/19/18 | United States | 54 | | 148,500 |
| DISH Network Corp., January Strike Price $62.50, Expires 1/20/17 | United States | 95 | | 11,875 |
| Vivendi SA, September Strike Price 22.00 EUR, Expires 9/15/17 | France | 189 | | 4,206 |
| | | | | 616,631 |
| Metals & Mining 0.0%† | | | | |
| AK Steel Holding Corp., December Strike Price $6.00, Expires 12/16/16 | United States | 223 | | 76,043 |
| Freeport-McMoRan Inc., January Strike Price $12.00, Expires 1/20/17 | United States | 73 | | 25,550 |
| Freeport-McMoRan Inc., January Strike Price $13.00, Expires 1/20/17 | United States | 439 | | 117,652 |
| Freeport-McMoRan Inc., January Strike Price $14.00, Expires 1/20/17 | United States | 240 | | 46,080 |
| Teck Resources Ltd., January Strike Price $23.00, Expires 1/20/17 | Canada | 64 | | 23,360 |
| Teck Resources Ltd., February Strike Price $26.00, Expires 2/17/17 | Canada | 49 | | 12,397 |
| | | | | 301,082 |
| Oil, Gas & Consumable Fuels 0.0%† | | | | |
| Chesapeake Energy Corp., December Strike Price $6.50, Expires 12/02/16 | United States | 64 | | 3,456 |
| Green Plains Inc., January Strike Price $27.00, Expires 1/20/17 | United States | 100 | | 14,600 |
| The Williams Cos Inc., January Strike Price $32.00, Expires 1/20/17 | United States | 294 | | 29,400 |
| | | | | 47,456 |
| Pharmaceuticals 0.0%† | | | | |
| Allergan PLC, January Strike Price $225.00, Expires 1/20/17 | United States | 49 | | 5,757 |
| Allergan PLC, May Strike Price $220.00, Expires 5/19/17 | United States | 14 | | 10,430 |
| Allergan PLC, May Strike Price $250.00, Expires 5/19/17 | United States | 40 | | 9,600 |
| | | | | 25,787 |
| Semiconductors & Semiconductor Equipment 0.0%† | | | | |
| Cypress Semiconductor Corp., December Strike Price $13.00, Expires 12/16/16 | United States | 48 | | 240 |
| Cypress Semiconductor Corp., January Strike Price $12.00, Expires 1/20/17 | United States | 162 | | 7,290 |
| | | | | 7,530 |
46 Semiannual Report
franklintempleton.com
FRANKLIN ALTERNATIVE STRATEGIES FUNDS
CONSOLIDATED STATEMENT OF INVESTMENTS (UNAUDITED)
| | | | | |
| Franklin K2 Alternative Strategies Fund (continued) | | | | | |
| |
| | | | Number of | | |
| | Country | | Contracts | | Value |
| Options Purchased (continued) | | | | | |
| Calls – Exchange-Traded (continued) | | | | | |
| Textiles, Apparel & Luxury Goods 0.0%† | | | | | |
| Cie Financiere Richemont SA, March Strike Price 64.00 | | | | | |
| CHF, Expires 3/17/17 | Switzerland | | 118 | $ | 58,263 |
| Wireless Telecommunication Services 0.0%† | | | | | |
| Vodafone Group PLC, ADR, January Strike Price $40.00, | | | | | |
| Expires 1/20/17 | United Kingdom | | 79 | | 79 |
| Vodafone Group PLC, ADR, January Strike Price $40.00, | | | | | |
| Expires 1/19/18 | United Kingdom | | 36 | | 180 |
| | | | | | 259 |
| |
| | | | Notional | | |
| | | Counterparty | Amount* | | |
| Calls – Over-the-Counter | | | | | |
| Currency Options 0.0%† | | | | | |
| USD/TWD, January Strike Price $31.78, Expires 1/17/17 | Taiwan | MSCO | 3,465,000 | | 46,966 |
| |
| | | | Number of | | |
| | | | Contracts | | |
| Puts – Exchange-Traded | | | | | |
| Diversified Financial Services 0.1% | | | | | |
| CAC 40 Index, January Strike Price 4,250.00 EUR, | | | | | |
| Expires 1/20/17 | France | | 40 | | 16,394 |
| Deutsche Boerse AG German Stock Index DAX, December | | | | | |
| Strike Price 10,000.00 EUR, Expires 12/16/16 | Germany | | 54 | | 8,299 |
| EURO STOXX 50 Price EUR, December Strike Price | | | | | |
| 2,850.00 EUR, Expires 12/16/16 | Germany | | 135 | | 12,162 |
| EURO STOXX Utilities Price EUR, December Strike Price | | | | | |
| 225.00 EUR, Expires 12/16/16 | Germany | | 148 | | 22,744 |
| S&P 500 E-Mini Index, December Strike Price $2,100.00, | | | | | |
| Expires 12/16/16 | United States | | 8 | | 1,440 |
| S&P 500 E-Mini Index, December Strike Price $2,120.00, | | | | | |
| Expires 12/16/16 | United States | | 8 | | 1,960 |
| S&P 500 Index, December Strike Price $2,000.00, | | | | | |
| Expires 12/02/16 | United States | | 118 | | 590 |
| S&P 500 Index, December Strike Price $2,050.00, | | | | | |
| Expires 12/16/16 | United States | | 504 | | 93,240 |
| S&P 500 Index, December Strike Price $2,075.00, | | | | | |
| Expires 12/16/16 | United States | | 162 | | 37,908 |
| S&P 500 Index, December Strike Price $2,080.00, | | | | | |
| Expires 12/16/16 | United States | | 7 | | 1,785 |
| S&P 500 Index, December Strike Price $2,100.00, | | | | | |
| Expires 12/16/16 | United States | | 98 | | 34,790 |
| S&P 500 Index, December Strike Price $2,075.00, | | | | | |
| Expires 12/30/16 | United States | | 87 | | 48,720 |
| S&P 500 Index, December Strike Price $2,100.00, | | | | | |
| Expires 12/30/16 | United States | | 199 | | 151,240 |
| S&P 500 Index, January Strike Price $2,150.00, | | | | | |
| Expires 1/20/17 | United States | | 43 | | 97,610 |
| | | | | | 528,882 |
franklintempleton.com
Semiannual Report 47
FRANKLIN ALTERNATIVE STRATEGIES FUNDS
CONSOLIDATED STATEMENT OF INVESTMENTS (UNAUDITED)
| | | | | | |
| Franklin K2 Alternative Strategies Fund (continued) | | | | | | |
| |
| | | | Number of | | | |
| | Country | | Contracts | | | Value |
| |
| Options Purchased (continued) | | | | | | |
| Puts – Exchange-Traded (continued) | | | | | | |
| Diversified Telecommunication Services 0.0%† | | | | | | |
| Telecom Italia SpA, January Strike Price 0.66 EUR, | | | | | | |
| Expires 1/20/17 | Italy | | 3,760 | $ | | 89,265 |
| |
| Equity Real Estate Investment Trusts (REITs) 0.0%† | | | | | | |
| Spirit Realty Capital Inc., January Strike Price $10.00, | | | | | | |
| Expires 1/20/17 | United States | | 127 | | | 5,398 |
| |
| Exchange Traded Funds 0.0%† | | | | | | |
| Financial Select Sector SPDR Fund, December Strike Price | | | | | | |
| $21.00, Expires 12/16/16 | United States | | 254 | | | 1,270 |
| Industrial Select Sector SPDR ETF, December Strike Price | | | | | | |
| $55.00, Expires 12/16/16 | United States | | 163 | | | 489 |
| iShares iBoxx High Yield Corporate Bond ETF, January | | | | | | |
| Strike Price $84.00, Expires 1/20/17 | United States | | 621 | | | 50,922 |
| iShares Russell 2000 ETF, February Strike Price $125.00, | | | | | | |
| Expires 2/17/17 | United States | | 110 | | | 26,620 |
| SPDR S&P 500 ETF Trust, December Strike Price $208.00, | | | | | | |
| Expires 12/16/16 | United States | | 164 | | | 5,576 |
| SPDR S&P Oil & Gas Exploration & Production ETF, December | | | | | | |
| Strike Price $36.00, Expires 12/16/16 | United States | | 131 | | | 1,572 |
| SPDR S&P Oil & Gas Exploration & Production ETF, January | | | | | | |
| Strike Price $36.00, Expires 1/20/17 | United States | | 131 | | | 5,764 |
| SPDR S&P Oil & Gas Exploration & Production ETF, January | | | | | | |
| Strike Price $37.00, Expires 1/20/17 | United States | | 271 | | | 15,718 |
| |
| | | | | | | 107,931 |
| |
| Independent Power & Renewable Electricity | | | | | | |
| Producers 0.0%† | | | | | | |
| Pattern Energy Group Inc., December Strike Price $17.50, | | | | | | |
| Expires 12/16/16 | United States | | 60 | | | 900 |
| |
| Independent Power Producers & Energy Traders 0.0%† | | | | | | |
| Dynegy Inc., December Strike Price $7.50, Expires 12/16/16 | United States | | 34 | | | 510 |
| |
| Media 0.0%† | | | | | | |
| Liberty Global PLC, April Strike Price $30.00, Expires 4/21/17 | United Kingdom | | 329 | | | 64,155 |
| |
| Metals & Mining 0.0%† | | | | | | |
| ThyssenKrupp AG, December Strike Price 20.00 EUR, | | | | | | |
| Expires 12/16/16 | Germany | | 483 | | | 8,190 |
| |
| Oil, Gas & Consumable Fuels 0.0%† | | | | | | |
| Scorpio Tankers Inc., April Strike Price $2.50, Expires 4/21/17 | Monaco | | 157 | | | 1,570 |
| WPX Energy Inc., February Strike Price $9.00, Expires 2/17/17 | United States | | 64 | | | 1,920 |
| |
| | | | | | | 3,490 |
| |
| Pharmaceuticals 0.0%† | | | | | | |
| Teva Pharmaceutical Industries Ltd., ADR, January Strike Price | | | | | | |
| $32.50, Expires 1/20/17 | Israel | | 26 | | | 663 |
| |
| | | | Notional | | | |
| | | Counterparty | Amount* | | | |
| |
| Puts – Over-the-Counter | | | | | | |
| Currency Options 0.0%† | | | | | | |
| EUR/TRY, January Strike Price 3.40 EUR, Expires 1/20/17 | Turkey | DBAB | 3,588,000 | EUR | 2,230 |
| |
| Total Options Purchased (Cost $8,731,625) | | | | | | 2,292,549 |
| |
| Total Investments before Short Term Investments | | | | | | |
| (Cost $763,263,498) | | | | | | 828,146,413 |
48 Semiannual Report
franklintempleton.com
FRANKLIN ALTERNATIVE STRATEGIES FUNDS
CONSOLIDATED STATEMENT OF INVESTMENTS (UNAUDITED)
| | | | | |
| Franklin K2 Alternative Strategies Fund (continued) | | | | | |
| |
| | | Principal | | | |
| | Country | Amount* | | Value | |
| Short Term Investments 25.0% | | | | | |
| U.S. Government and Agency Securities 1.5% | | | | | |
| a,m U.S. Treasury Bill, | | | | | |
| 12/29/16 | United States | 15,500,000 | $ | 15,495,536 | |
| 4/06/17 | United States | 600,000 | | 598,934 | |
| Total U.S. Government and Agency Securities | | | | | |
| (Cost $16,095,108) | | | | 16,094,470 | |
| |
| | | Shares | | | |
| Money Market Funds 20.5% | | | | | |
| n,o Dreyfus Government Cash Management, Institutional Shares, 0.28% | United States | 94,914,214 | | 94,914,214 | |
| o Fidelity Investments Money Market Funds, 0.268% | United States | 133,148,114 | | 133,148,114 | |
| Total Money Market Funds (Cost $228,062,328) | | | | 228,062,328 | |
| |
| | | Principal | | | |
| | | Amount* | | | |
| Repurchase Agreements (Cost $32,842,067) 3.0% | | | | | |
| p Joint Repurchase Agreement, 0.265%, 12/01/16 | | | | | |
| (Maturity Value $32,842,309) | United States | 32,842,067 | | 32,842,067 | |
| BNP Paribas Securities Corp. (Maturity Value $15,899,947) | | | | | |
| Deutsche Bank Securities Inc. (Maturity Value $645,023) | | | | | |
| HSBC Securities (USA) Inc. (Maturity Value $15,899,947) | | | | | |
| Merrill Lynch, Pierce, Fenner & Smith Inc. (Maturity Value $397,392) | | | | | |
| Collateralized by U.S. Government Agency Securities, 0.476%, 8/03/17; | | | | | |
| mU.S. Treasury Bill, 4/27/17; U.S. Treasury Note, 0.689% - 1.625%, | | | | | |
| 7/31/18 - 11/30/20; and U.S. Treasury Note, Index Linked, 2.625%, 7/15/17 | | | | | |
| (valued at $33,499,350) | | | | | |
| Total Investments (Cost $1,040,263,001) 99.4% | | | | 1,105,145,278 | |
| Options Written (0.0)%† | | | | (221,653 | ) |
| Securities Sold Short (24.7)% | | | | (274,134,512 | ) |
| Other Assets, less Liabilities 25.3% | | | | 280,506,206 | |
| Net Assets 100.0% | | | $ | 1,111,295,319 | |
| |
| | | Number of | | | |
| | | Contracts | | | |
| q Options Written (0.0)%† | | | | | |
| Calls – Exchange-Traded | | | | | |
| Food & Staples Retailing (0.0)%† | | | | | |
| Rite Aid Corp., January Strike Price $8.00, Expires 1/20/17 | United States | 869 | | (45,188 | ) |
| Oil, Gas & Consumable Fuels (0.0)%† | | | | | |
| Ship Finance International Ltd., January Strike Price $15.00, Expires 1/20/17 | Norway | 84 | | (1,680 | ) |
| Puts – Exchange-Traded | | | | | |
| Construction Materials (0.0)%† | | | | | |
| Cemex SAB de CV, January Strike Price $8.00, Expires 1/20/17 | Mexico | 332 | | (18,924 | ) |
| Diversified Financial Services (0.0)%† | | | | | |
| CAC 40 Index, January Strike Price 3,900.00 EUR, Expires 1/20/17 | France | 40 | | (4,295 | ) |
| S&P 500 Index, January Strike Price $2,050.00, Expires 1/20/17 | United States | 43 | | (38,270 | ) |
| | | | | (42,565 | ) |
franklintempleton.com
Semiannual Report 49
FRANKLIN ALTERNATIVE STRATEGIES FUNDS
CONSOLIDATED STATEMENT OF INVESTMENTS (UNAUDITED)
| | | | | |
| Franklin K2 Alternative Strategies Fund (continued) | | | | | |
| |
| | | Number of | | | |
| | Country | Contracts | | Value | |
| q Options Written (continued) | | | | | |
| Puts – Exchange-Traded | | | | | |
| Exchange Traded Funds (0.0)%† | | | | | |
| Industrial Select Sector SPDR ETF, December Strike Price $51.00, Expires 12/16/16 | United States | 165 | $ | (495 | ) |
| iShares iBoxx High Yield Corporate Bond ETF, January Strike Price $81.00, | | | | | |
| Expires 1/20/17 | United States | 621 | | (16,146 | ) |
| iShares Russell 2000 ETF, February Strike Price $115.00, Expires 2/17/17 | United States | 110 | | (9,350 | ) |
| SPDR S&P Oil & Gas Exploration & Production ETF, January Strike Price $32.00, | | | | | |
| Expires 1/20/17 | United States | 131 | | (1,572 | ) |
| SPDR S&P Oil & Gas Exploration & Production ETF, January Strike Price $34.00, | | | | | |
| Expires 1/20/17 | United States | 271 | | (6,233 | ) |
| | | | | (33,796 | ) |
| Household Durables (0.0)%† | | | | | |
| CalAtlantic Group Inc., March Strike Price $31.00, Expires 3/17/17 | United States | 23 | | (2,990 | ) |
| Toll Brothers Inc., December Strike Price $28.50, Expires 12/23/16 | United States | 14 | | (770 | ) |
| | | | | (3,760 | ) |
| Media (0.0)%† | | | | | |
| DISH Network Corp., January Strike Price $52.50, Expires 1/20/17 | United States | 95 | | (9,975 | ) |
| Metals & Mining (0.0)%† | | | | | |
| Teck Resources Ltd., January Strike Price $18.00, Expires 1/20/17 | Canada | 64 | | (1,728 | ) |
| Teck Resources Ltd., February Strike Price $21.00, Expires 2/17/17 | Canada | 49 | | (5,145 | ) |
| | | | | (6,873 | ) |
| Oil, Gas & Consumable Fuels (0.0)%† | | | | | |
| Green Plains Inc., January Strike Price $25.00, Expires 1/20/17 | United States | 100 | | (10,100 | ) |
| Real Estate Management & Development (0.0)%† | | | | | |
| Vonovia SE, March Strike Price 32.00 EUR, Expires 3/17/17 | Germany | 74 | | (19,372 | ) |
| Vonovia SE, March Strike Price 33.00 EUR, Expires 3/17/17 | Germany | 74 | | (24,940 | ) |
| | | | | (44,312 | ) |
| Semiconductors & Semiconductor Equipment (0.0)%† | | | | | |
| Cypress Semiconductor Corp., January Strike Price $10.00, Expires 1/20/17 | United States | 32 | | (800 | ) |
| Software (0.0)%† | | | | | |
| Workday Inc., December Strike Price $80.00, Expires 12/16/16 | United States | 16 | | (3,680 | ) |
| Total Options Written (Premiums Received $325,311) | | | | (221,653 | ) |
| |
| | | Shares | | | |
| r Securities Sold Short (24.7)% | | | | | |
| Common Stocks (12.0)% | | | | | |
| Aerospace & Defense (0.0)%† | | | | | |
| Arconic Inc | United States | 5,002 | | (96,438 | ) |
| Rockwell Collins Inc | United States | 3,154 | | (292,439 | ) |
| | | | | (388,877 | ) |
| Air Freight & Logistics (0.1)% | | | | | |
| CH Robinson Worldwide Inc | United States | 19,527 | | (1,461,596 | ) |
| XPO Logistics Inc | United States | 3,180 | | (141,605 | ) |
| | | | | (1,603,201 | ) |
50 Semiannual Report
franklintempleton.com
FRANKLIN ALTERNATIVE STRATEGIES FUNDS
CONSOLIDATED STATEMENT OF INVESTMENTS (UNAUDITED)
| | | | | |
| Franklin K2 Alternative Strategies Fund (continued) | | | | | |
| |
| | Country | Shares | | Value | |
| r Securities Sold Short (continued) | | | | | |
| Common Stocks (continued) | | | | | |
| Airlines (0.1)% | | | | | |
| Allegiant Travel Co | United States | 1,566 | $ | (255,884 | ) |
| Deutsche Lufthansa AG | Germany | 25,387 | | (328,931 | ) |
| | | | | (584,815 | ) |
| Auto Components (0.0)%† | | | | | |
| Lear Corp | United States | 1,753 | | (227,031 | ) |
| Magna International Inc | Canada | 2,508 | | (101,449 | ) |
| | | | | (328,480 | ) |
| Automobiles (0.1)% | | | | | |
| Fiat Chrysler Automobiles NV | United Kingdom | 69,019 | | (533,262 | ) |
| Tesla Motors Inc | United States | 5,829 | | (1,104,012 | ) |
| | | | | (1,637,274 | ) |
| Beverages (0.0)%† | | | | | |
| Brown-Forman Corp., B | United States | 4,680 | | (212,238 | ) |
| Biotechnology (0.4)% | | | | | |
| Ablynx NV | Belgium | 9,105 | | (95,003 | ) |
| Acorda Therapeutics Inc | United States | 25,627 | | (533,042 | ) |
| AMAG Pharmaceuticals Inc | United States | 24,995 | | (829,834 | ) |
| BioMarin Pharmaceutical Inc | United States | 4,910 | | (420,443 | ) |
| Clovis Oncology Inc | United States | 4,622 | | (158,396 | ) |
| Emergent BioSolutions Inc | United States | 17,984 | | (481,252 | ) |
| Intercept Pharmaceuticals Inc | United States | 2,284 | | (230,958 | ) |
| Ligand Pharmaceuticals Inc | United States | 9,126 | | (952,754 | ) |
| PDL BioPharma Inc | United States | 73,732 | | (161,473 | ) |
| PTC Therapeutics Inc | United States | 11,376 | | (126,729 | ) |
| | | | | (3,989,884 | ) |
| Building Products (0.1)% | | | | | |
| Griffon Corp | United States | 42,654 | | (1,019,431 | ) |
| Capital Markets (0.0)%† | | | | | |
| Cowen Group Inc., A | United States | 123,781 | | (451,801 | ) |
| Chemicals (0.1)% | | | | | |
| Albemarle Corp | United States | 5,256 | | (461,371 | ) |
| Mosaic Co | United States | 3,645 | | (103,518 | ) |
| TerraVia Holdings Inc | United States | 75,622 | | (102,090 | ) |
| | | | | (666,979 | ) |
| Communications Equipment (0.4)% | | | | | |
| ARRIS International PLC | United States | 7,788 | | (223,438 | ) |
| Ciena Corp | United States | 8,286 | | (177,734 | ) |
| InterDigital Inc | United States | 5,981 | | (473,695 | ) |
| Palo Alto Networks Inc | United States | 23,832 | | (3,202,306 | ) |
| Viavi Solutions Inc | United States | 7,114 | | (55,845 | ) |
| | | | | (4,133,018 | ) |
| Construction & Engineering (0.0)%† | | | | | |
| Dycom Industries Inc | United States | 3,157 | | (231,187 | ) |
| Construction Materials (0.1)% | | | | | |
| Cemex SAB de CV, ADR | Mexico | 152,397 | | (1,190,221 | ) |
franklintempleton.com
Semiannual Report 51
FRANKLIN ALTERNATIVE STRATEGIES FUNDS
CONSOLIDATED STATEMENT OF INVESTMENTS (UNAUDITED)
| | | | | |
| Franklin K2 Alternative Strategies Fund (continued) | | | | | |
| |
| | Country | Shares | | Value | |
| r Securities Sold Short (continued) | | | | | |
| Common Stocks (continued) | | | | | |
| Construction Materials (continued) | | | | | |
| Vulcan Materials Co | United States | 1,566 | $ | (196,768 | ) |
| | | | | (1,386,989 | ) |
| Consumer Finance (0.1)% | | | | | |
| Encore Capital Group Inc | United States | 14,732 | | (404,393 | ) |
| PRA Group Inc | United States | 4,007 | | (144,052 | ) |
| | | | | (548,445 | ) |
| Containers & Packaging (0.0)%† | | | | | |
| International Paper Co | United States | 8,286 | | (403,694 | ) |
| Diversified Consumer Services (0.4)% | | | | | |
| Ascent Capital Group Inc | United States | 4,815 | | (87,007 | ) |
| Carriage Services Inc | United States | 33,826 | | (918,038 | ) |
| ServiceMaster Global Holdings Inc | United States | 21,200 | | (810,264 | ) |
| TAL Education Group, ADR | China | 31,517 | | (2,411,996 | ) |
| | | | | (4,227,305 | ) |
| Diversified Financial Services (0.0)%† | | | | | |
| Element Financial Corp | Canada | 38,949 | | (324,744 | ) |
| Diversified Telecommunication Services (0.2)% | | | | | |
| AT&T Inc | United States | 4,798 | | (185,347 | ) |
| CenturyLink Inc | United States | 69,890 | | (1,643,813 | ) |
| Verizon Communications Inc | United States | 5,165 | | (257,733 | ) |
| | | | | (2,086,893 | ) |
| Electric Utilities (0.0)%† | | | | | |
| Great Plains Energy Inc | United States | 793 | | (20,927 | ) |
| Electrical Equipment (0.0)%† | | | | | |
| General Cable Corp | United States | 19,646 | | (368,363 | ) |
| Electronic Equipment, Instruments & Components (0.5)% | | | | | |
| Knowles Corp | United States | 40,172 | | (643,957 | ) |
| MTS Systems Corp | United States | 25,198 | | (1,356,912 | ) |
| TTM Technologies Inc | United States | 79,515 | | (1,079,019 | ) |
| Vishay Intertechnology Inc | United States | 127,640 | | (1,933,746 | ) |
| | | | | (5,013,634 | ) |
| Energy Equipment & Services (0.1)% | | | | | |
| Hornbeck Offshore Services Inc | United States | 4,681 | | (23,920 | ) |
| SEACOR Holdings Inc | United States | 4,559 | | (282,612 | ) |
| Weatherford International PLC | United States | 92,304 | | (471,674 | ) |
| | | | | (778,206 | ) |
| Equity Real Estate Investment Trusts (REITs) (0.5)% | | | | | |
| American Homes 4 Rent | United States | 36,931 | | (778,134 | ) |
| Colony Starwood Homes | United States | 30,360 | | (927,498 | ) |
| EPR Properties | United States | 609 | | (42,350 | ) |
| Forest City Realty Trust Inc | United States | 36,945 | | (683,113 | ) |
| Gramercy Property Trust | United States | 149,539 | | (1,306,969 | ) |
| National Health Investors Inc | United States | 7,586 | | (536,785 | ) |
| Omega Healthcare Investors Inc | United States | 16,335 | | (481,229 | ) |
| VEREIT Inc | United States | 1,822 | | (15,104 | ) |
52 Semiannual Report
franklintempleton.com
FRANKLIN ALTERNATIVE STRATEGIES FUNDS
CONSOLIDATED STATEMENT OF INVESTMENTS (UNAUDITED)
| | | | | |
| Franklin K2 Alternative Strategies Fund (continued) | | | | | |
| |
| | Country | Shares | | Value | |
| r Securities Sold Short (continued) | | | | | |
| Common Stocks (continued) | | | | | |
| Equity Real Estate Investment Trusts (REITs) (continued) | | | | | |
| Welltower Inc | United States | 3,307 | $ | (207,614 | ) |
| | | | | (4,978,796 | ) |
| Food Products (0.2)% | | | | | |
| Bunge Ltd | United States | 4,722 | | (322,418 | ) |
| Post Holdings Inc | United States | 25,245 | | (1,926,951 | ) |
| | | | | (2,249,369 | ) |
| Health Care Equipment & Supplies (0.4)% | | | | | |
| Abbott Laboratories | United States | 56,378 | | (2,146,311 | ) |
| Hologic Inc | United States | 5,997 | | (229,565 | ) |
| Insulet Corp | United States | 6,477 | | (217,951 | ) |
| Nipro Corp | Japan | 10,500 | | (115,458 | ) |
| NuVasive Inc | United States | 7,409 | | (480,844 | ) |
| Quidel Corp | United States | 7,603 | | (174,337 | ) |
| Varian Medical Systems Inc | United States | 2,035 | | (182,804 | ) |
| Wright Medical Group NV | United States | 57,758 | | (1,330,744 | ) |
| | | | | (4,878,014 | ) |
| Health Care Providers & Services (0.6)% | | | | | |
| Aceto Corp | United States | 13,160 | | (268,859 | ) |
| Aetna Inc | United States | 5,289 | | (692,013 | ) |
| Amsurg Corp | United States | 9,368 | | (638,148 | ) |
| Brookdale Senior Living Inc | United States | 3,920 | | (45,589 | ) |
| HealthSouth Corp | United States | 45,800 | | (1,908,486 | ) |
| Healthways Inc | United States | 43,409 | | (1,007,089 | ) |
| Molina Healthcare Inc | United States | 29,051 | | (1,535,636 | ) |
| | | | | (6,095,820 | ) |
| Health Care Technology (0.0)%† | | | | | |
| Allscripts Healthcare Solutions Inc | United States | 2,795 | | (30,689 | ) |
| Hotels, Restaurants & Leisure (0.2)% | | | | | |
| Brinker International Inc | United States | 11,212 | | (595,469 | ) |
| Chipotle Mexican Grill Inc | United States | 560 | | (221,945 | ) |
| Hilton Worldwide Holdings Inc | United States | 23,357 | | (585,560 | ) |
| Wyndham Worldwide Corp | United States | 3,589 | | (258,372 | ) |
| | | | | (1,661,346 | ) |
| Household Durables (0.2)% | | | | | |
| CalAtlantic Group Inc | United States | 10,771 | | (359,644 | ) |
| LGI Homes Inc | United States | 25,929 | | (846,582 | ) |
| M/I Homes Inc | United States | 17,017 | | (397,517 | ) |
| Newell Brands Inc | United States | 8,254 | | (388,020 | ) |
| Toll Brothers Inc | United States | 1,336 | | (39,626 | ) |
| William Lyon Homes, A | United States | 8,394 | | (166,201 | ) |
| | | | | (2,197,590 | ) |
| Independent Power & Renewable Electricity Producers (0.0)%† | | | | | |
| Pattern Energy Group Inc | United States | 10,186 | | (199,951 | ) |
| Insurance (0.0)%† | | | | | |
| AmTrust Financial Services Inc | United States | 16,943 | | (431,369 | ) |
franklintempleton.com
Semiannual Report 53
FRANKLIN ALTERNATIVE STRATEGIES FUNDS
CONSOLIDATED STATEMENT OF INVESTMENTS (UNAUDITED)
| | | | | |
| Franklin K2 Alternative Strategies Fund (continued) | | | | | |
| |
| | Country | Shares | | Value | |
| r Securities Sold Short (continued) | | | | | |
| Common Stocks (continued) | | | | | |
| Internet & Direct Marketing Retail (1.1)% | | | | | |
| Ctrip.com International Ltd., ADR | China | 70,326 | $ | (3,180,845 | ) |
| Netflix Inc | United States | 14,484 | | (1,694,628 | ) |
| The Priceline Group Inc | United States | 4,316 | | (6,489,883 | ) |
| Shutterfly Inc | United States | 14,007 | | (709,735 | ) |
| | | | | (12,075,091 | ) |
| Internet Software & Services (1.5)% | | | | | |
| Alibaba Group Holding Ltd., ADR | China | 51,747 | | (4,865,253 | ) |
| Blucora Inc | United States | 5,880 | | (83,202 | ) |
| Cornerstone OnDemand Inc | United States | 3,034 | | (108,951 | ) |
| j2 Global Inc | United States | 16,227 | | (1,192,847 | ) |
| MercadoLibre Inc | Argentina | 6,714 | | (1,059,604 | ) |
| Pandora Media Inc | United States | 8,620 | | (100,164 | ) |
| VeriSign Inc | United States | 99,465 | | (7,842,815 | ) |
| WebMD Health Corp | United States | 6,320 | | (337,109 | ) |
| Yahoo! Inc | United States | 19,011 | | (779,831 | ) |
| | | | | (16,369,776 | ) |
| IT Services (0.2)% | | | | | |
| Blackhawk Network Holdings Inc | United States | 7,250 | | (261,000 | ) |
| Cardtronics PLC | United States | 9,986 | | (494,008 | ) |
| CSG Systems International Inc | United States | 9,596 | | (427,022 | ) |
| Euronet Worldwide Inc | United States | 10,239 | | (734,341 | ) |
| International Business Machines Corp | United States | 1,656 | | (268,636 | ) |
| The Western Union Co | United States | 19,109 | | (401,862 | ) |
| | | | | (2,586,869 | ) |
| Leisure Products (0.0)%† | | | | | |
| JAKKS Pacific Inc | United States | 17,920 | | (126,336 | ) |
| Polaris Industries Inc | United States | 1,497 | | (130,029 | ) |
| | | | | (256,365 | ) |
| Life Sciences Tools & Services (0.0)%† | | | | | |
| Albany Molecular Research Inc | United States | 20,467 | | (344,869 | ) |
| Fluidigm Corp | United States | 2,306 | | (14,828 | ) |
| | | | | (359,697 | ) |
| Machinery (0.4)% | | | | | |
| Altra Industrial Motion Corp | United States | 28,611 | | (1,001,385 | ) |
| Cummins Inc | United States | 3,300 | | (467,874 | ) |
| Donaldson Co. Inc | United States | 4,861 | | (197,162 | ) |
| Greenbrier Cos Inc | United States | 17,701 | | (686,799 | ) |
| Navistar International Corp | United States | 13,187 | | (405,633 | ) |
| Trinity Industries Inc | United States | 29,422 | | (817,637 | ) |
| Wabash National Corp | United States | 26,619 | | (367,076 | ) |
| | | | | (3,943,566 | ) |
| Media (0.5)% | | | | | |
| Altice NV | Netherlands | 72,437 | | (1,247,551 | ) |
| AMC Entertainment Holdings Inc., A | United States | 20,734 | | (703,919 | ) |
| Dish Network Corp., A | United States | 42,004 | | (2,413,130 | ) |
| Liberty Braves Group | United States | 1,471 | | (29,641 | ) |
54 Semiannual Report
franklintempleton.com
FRANKLIN ALTERNATIVE STRATEGIES FUNDS
CONSOLIDATED STATEMENT OF INVESTMENTS (UNAUDITED)
| | | | | |
| Franklin K2 Alternative Strategies Fund (continued) | | | | | |
| |
| | Country | Shares | | Value | |
| r Securities Sold Short (continued) | | | | | |
| Common Stocks (continued) | | | | | |
| Media (continued) | | | | | |
| Liberty Media Group | United States | 3,898 | $ | (121,969 | ) |
| Liberty SiriusXM Group | United States | 16,118 | | (585,083 | ) |
| Live Nation Entertainment Inc | United States | 6,530 | | (180,750 | ) |
| Regal Entertainment Group, A | United States | 10,444 | | (239,272 | ) |
| Walt Disney Co | United States | 2,878 | | (285,267 | ) |
| | | | | (5,806,582 | ) |
| Metals & Mining (0.2)% | | | | | |
| AK Steel Holding Corp | United States | 224,719 | | (2,051,684 | ) |
| Mortgage Real Estate Investment Trusts (REITs) (0.1)% | | | | | |
| Apollo Commercial Real Estate Finance Inc | United States | 5,738 | | (98,464 | ) |
| Colony Capital Inc | United States | 19,267 | | (395,166 | ) |
| Redwood Trust Inc | United States | 2,347 | | (35,722 | ) |
| Starwood Property Trust Inc | United States | 48,562 | | (1,091,188 | ) |
| | | | | (1,620,540 | ) |
| Oil, Gas & Consumable Fuels (0.7)% | | | | | |
| Aegean Marine Petroleum Network Inc | Greece | 55,574 | | (625,207 | ) |
| Chesapeake Energy Corp | United States | 135,513 | | (948,591 | ) |
| Enbridge Inc | Canada | 28,646 | | (1,204,278 | ) |
| Golar LNG Ltd | Bermuda | 500 | | (12,200 | ) |
| Green Plains Inc | United States | 69,673 | | (1,888,138 | ) |
| JX Holdings Inc | Japan | 304,200 | | (1,160,377 | ) |
| Renewable Energy Group Inc | United States | 38,029 | | (370,783 | ) |
| Scorpio Tankers Inc | Monaco | 9,342 | | (39,517 | ) |
| SM Energy Co | United States | 21,321 | | (849,855 | ) |
| Tesoro Corp | United States | 12,814 | | (1,042,419 | ) |
| | | | | (8,141,365 | ) |
| Paper & Forest Products (0.1)% | | | | | |
| Domtar Corp | United States | 20,171 | | (792,115 | ) |
| Pharmaceuticals (0.3)% | | | | | |
| Allergan PLC | United States | 87 | | (16,904 | ) |
| Depomed Inc | United States | 21,432 | | (409,351 | ) |
| Innoviva Inc | United States | 31,820 | | (329,019 | ) |
| Medicines Co | United States | 49,823 | | (1,748,787 | ) |
| Teva Pharmaceutical Industries Ltd., ADR | Israel | 6,612 | | (249,273 | ) |
| | | | | (2,753,334 | ) |
| Professional Services (0.0)%† | | | | | |
| 51job Inc., ADR | China | 2,625 | | (92,846 | ) |
| Huron Consulting Group Inc | United States | 3,486 | | (183,887 | ) |
| | | | | (276,733 | ) |
| Road & Rail (0.1)% | | | | | |
| Ryder System Inc | United States | 3,364 | | (263,401 | ) |
| Werner Enterprises Inc | United States | 11,043 | | (298,713 | ) |
| | | | | (562,114 | ) |
| Semiconductors & Semiconductor Equipment (0.9)% | | | | | |
| Advanced Micro Devices Inc | United States | 181,502 | | (1,617,183 | ) |
franklintempleton.com
Semiannual Report 55
FRANKLIN ALTERNATIVE STRATEGIES FUNDS
CONSOLIDATED STATEMENT OF INVESTMENTS (UNAUDITED)
| | | | | |
| Franklin K2 Alternative Strategies Fund (continued) | | | | | |
| |
| | Country | Shares | | Value | |
| r Securities Sold Short (continued) | | | | | |
| Common Stocks (continued) | | | | | |
| Semiconductors & Semiconductor Equipment (continued) | | | | | |
| Cypress Semiconductor Corp | United States | 22,051 | $ | (248,073 | ) |
| Inphi Corp | United States | 5,558 | | (251,055 | ) |
| Intel Corp | United States | 24,844 | | (862,087 | ) |
| Intersil Corp | United States | 28,103 | | (622,481 | ) |
| Microchip Technology Inc | United States | 32,482 | | (2,149,659 | ) |
| NVIDIA Corp | United States | 43,809 | | (4,039,190 | ) |
| ON Semiconductor Corp | United States | 43,631 | | (513,973 | ) |
| | | | | (10,303,701 | ) |
| Software (0.9)% | | | | | |
| Bottomline Technologies de Inc | United States | 9,105 | | (228,171 | ) |
| BroadSoft Inc | United States | 23,009 | | (954,874 | ) |
| Electronic Arts Inc | United States | 2,373 | | (188,037 | ) |
| FireEye Inc | United States | 1,873 | | (24,049 | ) |
| Proofpoint Inc | United States | 2,013 | | (155,021 | ) |
| Salesforce.com Inc | United States | 28,822 | | (2,075,184 | ) |
| ServiceNow Inc | United States | 6,549 | | (544,549 | ) |
| Take-Two Interactive Software Inc | United States | 107,519 | | (5,293,161 | ) |
| TiVo Corp | United States | 7,576 | | (153,414 | ) |
| | | | | (9,616,460 | ) |
| Specialty Retail (0.0)%† | | | | | |
| Vitamin Shoppe Inc | United States | 6,041 | | (150,119 | ) |
| Textiles, Apparel & Luxury Goods (0.0)%† | | | | | |
| Iconix Brand Group Inc | United States | 17,344 | | (155,576 | ) |
| Tobacco (0.1)% | | | | | |
| British American Tobacco PLC, ADR | United Kingdom | 6,530 | | (712,031 | ) |
| Universal Corp | United States | 6,820 | | (375,441 | ) |
| | | | | (1,087,472 | ) |
| Trading Companies & Distributors (0.1)% | | | | | |
| Kaman Corp | United States | 14,394 | | (701,276 | ) |
| WW Grainger Inc | United States | 622 | | (143,414 | ) |
| | | | | (844,690 | ) |
| Wireless Telecommunication Services (0.0)%† | | | | | |
| T-Mobile U.S. Inc | United States | 140 | | (7,589 | ) |
| Total Common Stocks (Proceeds $125,618,221) | | | | (132,890,767 | ) |
| Exchange Traded Funds (11.1)% | | | | | |
| Consumer Discretionary Select Sector SPDR ETF | United States | 40,695 | | (3,330,886 | ) |
| Consumer Staples Select Sector SPDR ETF | United States | 10,189 | | (515,360 | ) |
| Health Care Select Sector SPDR Fund | United States | 120,799 | | (8,304,931 | ) |
| Industrial Select Sector SPDR ETF | United States | 20,694 | | (1,291,513 | ) |
| iShares 20+ Year Treasury Bond ETF | United States | 2,260 | | (271,742 | ) |
| iShares Core S&P Small-Cap ETF | United States | 27,016 | | (3,607,446 | ) |
| iShares Edge MSCI USA Momentum Factor ETF | United States | 47,083 | | (3,551,000 | ) |
| iShares MSCI Japan ETF | Japan | 15,813 | | (788,911 | ) |
| iShares Nasdaq Biotechnology ETF | United States | 37,176 | | (10,188,826 | ) |
| iShares North American Tech ETF | United States | 35,209 | | (4,327,890 | ) |
| iShares North American Tech-Multimedia Networking ETF | United States | 53,201 | | (2,294,559 | ) |
56 Semiannual Report
franklintempleton.com
FRANKLIN ALTERNATIVE STRATEGIES FUNDS
CONSOLIDATED STATEMENT OF INVESTMENTS (UNAUDITED)
| | | | | |
| Franklin K2 Alternative Strategies Fund (continued) | | | | | |
| |
| | Country | Shares | | Value | |
| r Securities Sold Short (continued) | | | | | |
| Exchange Traded Funds (continued) | | | | | |
| iShares North American Tech-Software ETF | United States | 13,815 | $ | (1,544,655 | ) |
| iShares PHLX Semiconductor ETF | United States | 27,068 | | (3,231,378 | ) |
| iShares Russell 2000 ETF | United States | 43,222 | | (5,688,447 | ) |
| iShares Russell 2000 Growth ETF | United States | 23,126 | | (3,522,321 | ) |
| iShares Russell Mid-Cap Growth ETF | United States | 13,072 | | (1,273,866 | ) |
| iShares S&P Small-Cap 600 Growth ETF | United States | 11,549 | | (1,678,878 | ) |
| iShares STOXX Europe 600 UCITS ETF | Germany | 21,543 | | (782,921 | ) |
| iShares Transportation Average ETF | United States | 3,739 | | (605,344 | ) |
| iShares U.S. Consumer Goods ETF | United States | 14,893 | | (1,619,018 | ) |
| iShares U.S. Telecommunications ETF | United States | 40,001 | | (1,278,032 | ) |
| Powershares QQQ Trust Series 1 | United States | 6,300 | | (740,250 | ) |
| PureFunds ISE Cyber Security ETF | United States | 148,371 | | (4,017,887 | ) |
| SPDR S&P 500 ETF Trust | United States | 225,957 | | (49,796,404 | ) |
| SPDR S&P MidCap 400 ETF Trust | United States | 8,188 | | (2,427,169 | ) |
| SPDR S&P Retail ETF | United States | 8,397 | | (383,827 | ) |
| SPDR S&P Transportation ETF | United States | 16,834 | | (906,343 | ) |
| Utilities Select Sector SPDR Fund | United States | 19,295 | | (902,041 | ) |
| Vanguard Consumer Staples ETF | United States | 8,901 | | (1,163,450 | ) |
| Vanguard Small-Cap Growth ETF | United States | 26,076 | | (3,463,154 | ) |
| Total Exchange Traded Funds (Proceeds $120,781,015) | | | | (123,498,449 | ) |
| |
| | | Principal | | | |
| | | Amount* | | | |
| |
| Convertible Bonds and Notes (0.2)% | | | | | |
| Internet & Direct Marketing Retail (0.1)% | | | | | |
| The Priceline Group Inc., senior note, 0.90%, 9/15/21 | United States | 617,000 | | (663,661 | ) |
| Machinery (0.0)%† | | | | | |
| Trinity Industries Inc., sub. bond, 3.875%, 6/01/36 | United States | 315,000 | | (405,956 | ) |
| Media (0.0)%† | | | | | |
| Live Nation Entertainment Inc., senior note, 2.50%, 5/15/19 | United States | 322,000 | | (348,364 | ) |
| Oil, Gas & Consumable Fuels (0.0)%† | | | | | |
| SM Energy Co., senior note, 1.50%, 7/01/21 | United States | 246,000 | | (302,887 | ) |
| Software (0.1)% | | | | | |
| Proofpoint Inc., senior note, 0.75%, 6/15/20 | United States | 400,000 | | (475,500 | ) |
| Red Hat Inc., senior note, 0.25%, 10/01/19 | United States | 267,000 | | (335,586 | ) |
| | | | | (811,086 | ) |
| Trading Companies & Distributors (0.0)%† | | | | | |
| Air Lease Corp., senior note, 3.875%, 12/01/18 | United States | 188,000 | | (261,555 | ) |
| Total Convertible Bonds and Notes (Proceeds $2,701,381) | | | | (2,793,509 | ) |
| Corporate Bonds and Notes (1.1)% | | | | | |
| Chemicals (0.4)% | | | | | |
| e CVR Partners LP / CVR Nitrogen Finance Corp., senior note, 144A, 9.25%, 6/15/23 | United States | 3,755,000 | | (3,731,531 | ) |
| Electronic Equipment, Instruments & Components (0.1)% | | | | | |
| e Inception Merger Sub Inc. / Rackspace Hosting Inc., senior note, 144A, | | | | | |
| 8.625%, 11/15/24 | United States | 1,385,000 | | (1,388,463 | ) |
| Equity Real Estate Investment Trusts (REITs) (0.1)% | | | | | |
| Communications Sales & Leasing Inc., 8.25%, 10/15/23 | United States | 374,000 | | (393,635 | ) |
franklintempleton.com
Semiannual Report 57
FRANKLIN ALTERNATIVE STRATEGIES FUNDS
CONSOLIDATED STATEMENT OF INVESTMENTS (UNAUDITED)
| | | | | |
| Franklin K2 Alternative Strategies Fund (continued) | | | | | |
| | | Principal | | | |
| | Country | Amount* | | Value | |
| r Securities Sold Short (continued) | | | | | |
| Corporate Bonds and Notes (continued) | | | | | |
| Health Care Providers & Services (0.1)% | | | | | |
| Centene Corp., senior note, 4.75%, 1/15/25 | United States | 1,332,000 | $ | (1,278,720 | ) |
| Hotels, Restaurants & Leisure (0.0)%† | | | | | |
| e Wynn Macau Ltd., senior note, 144A, 5.25%, 10/15/21 | Monaco | 267,000 | | (269,670 | ) |
| Media (0.0)%† | | | | | |
| e CCO Holdings LLC / CCO Holdings Capital Corp., senior note, 144A, 5.875%, 4/01/24 | United States | 334,000 | | (354,457 | ) |
| Multiline Retail (0.2)% | | | | | |
| Dollar Tree Inc., senior note, 5.75%, 3/01/23 | United States | 1,167,000 | | (1,245,773 | ) |
| Kohl’s Corp., senior bond, 4.25%, 7/17/25 | United States | 786,000 | | (792,218 | ) |
| Nordstrom Inc., senior bond, 5.00%, 1/15/44 | United States | 337,000 | | (335,116 | ) |
| | | | | (2,373,107 | ) |
| Oil, Gas & Consumable Fuels (0.0)%† | | | | | |
| WPX Energy Inc., senior note, 6.00%, 1/15/22 | United States | 107,000 | | (110,177 | ) |
| Utilities (0.0)%† | | | | | |
| Talen Energy Supply LLC, senior note, | | | | | |
| e144A, 4.625%, 7/15/19 | United States | 182,000 | | (174,037 | ) |
| 6.50%, 6/01/25 | United States | 116,000 | | (92,220 | ) |
| | | | | (266,257 | ) |
| Wireless Telecommunication Services (0.2)% | | | | | |
| T-Mobile U.S. Inc., senior bond, 6.50%, 1/15/26 | United States | 1,596,000 | | (1,727,670 | ) |
| Total Corporate Bonds and Notes (Proceeds $11,917,092) | | | | (11,893,687 | ) |
| U.S. Government & Agency Securities (0.3)% | | | | | |
| U.S. Treasury Note, | | | | | |
| 0.75%, 4/30/18 | United States | 1,915,000 | | (1,908,529 | ) |
| 1.75%, 9/30/22 | United States | 1,170,000 | | (1,149,571 | ) |
| Total U.S. Government and Agency Securities | | | | | |
| (Proceeds $3,111,057) | | | | (3,058,100 | ) |
| Total Securities Sold Short (Proceeds $264,128,766) | | | $ | (274,134,512 | ) |
58 Semiannual Report
franklintempleton.com
FRANKLIN ALTERNATIVE STRATEGIES FUNDS
CONSOLIDATED STATEMENT OF INVESTMENTS (UNAUDITED)
Franklin K2 Alternative Strategies Fund (continued)
See Abbreviations on page 91.
† Rounds to less than 0.1% of net assets.
* The principal/notional amount is stated in U.S. dollars unless otherwise indicated.
a A portion or all of the security has been segregated as collateral for securities sold short, open swap, forward, futures and written options contracts. At November 30, 2016,
the aggregate value of these securities and/or cash pledged amounted to $466,492,199, representing 42.0% of net assets.
b Non-income producing.
c Variable rate security. The rate shown represents the yield at period end.
d A portion or all of the security is held in connection with written option contracts open at period end.
e Security was purchased pursuant to Rule 144A under the Securities Act of 1933 and may be sold in transactions exempt from registration only to qualified institutional buyers
or in public offering registered under the Securities Act of 1933. These securities have been deemed liquid under guidelines approved by the Trust’s Board of Trustees. At
November 30, 2016, the net value of these securities was $128,223,068, representing 11.5% of net assets.
f Security was purchased pursuant to Regulation S under the Securities Act of 1933, which exempts from registration securities offered and sold outside of the United States.
Such a security cannot be sold in the United States without either an effective registration statement filed pursuant to the Securities Act of 1933, or pursuant to an exemption
from registration. These securities have been deemed liquid under guidelines approved by the Trust’s Board of Trustees. At November 30, 2016, the aggregate value of these
securities was $18,389,912, representing 1.7% of net assets.
g See Note 7 regarding credit risk and defaulted securities.
h The coupon rate shown represents the rate at period end.
i A portion or all of the security purchased on a delayed delivery basis. See Note 1(d).
j Income may be received in additional securities and/or cash.
k See Note 1(h) regarding senior floating rate interests.
l Principal amount is stated in 1,000 Argentine Peso Units.
m The security was issued on a discount basis with no stated coupon rate.
n A portion or all of the security is owned by K2 Holdings Investment Corp., a wholly-owned subsidiary of the Fund. See Note 1(g).
o The rate shown is the annualized seven-day yield at period end.
p See Note 1(c) regarding joint repurchase agreement.
q See Note 1(e) regarding written options.
r See Note 1(f) regarding securities sold short.
s See Note 8 regarding unfunded loan commitments.
franklintempleton.com
The accompanying notes are an integral part of these financial statements. | Semiannual Report 59
FRANKLIN ALTERNATIVE STRATEGIES FUNDS
CONSOLIDATED STATEMENT OF INVESTMENTS (UNAUDITED)
| | | | | | | | | | |
| At November 30, 2016, the Fund had the following futures contracts outstanding. See Note 1(e). | | | | | | |
| |
| Futures Contracts | | | | | | | | | | |
| | | Number of | | Notional | Expiration | | Unrealized | | Unrealized | |
| Description | Type | Contracts | | Value | Date | | Appreciation | | Depreciation | |
| Commodity Contractsa | | | | | | | | | | |
| Aluminum | Long | 78 | $ | 3,379,837 | 12/19/16 | $ | 134,299 | $ | — | |
| Aluminum | Short | 78 | | 3,379,838 | 12/19/16 | | — | | (53,670 | ) |
| Aluminum | Long | 95 | | 4,115,281 | 3/13/17 | | 40,652 | | — | |
| Brent Crude Oil | Short | 130 | | 6,739,200 | 12/29/16 | | — | | (490,228 | ) |
| Cocoa | Short | 21 | | 513,945 | 3/16/17 | | 312 | | — | |
| Coffee | Long | 35 | | 1,976,625 | 3/21/17 | | — | | (223,014 | ) |
| Copper | Long | 104 | | 15,117,050 | 12/19/16 | | 1,692,792 | | — | |
| Copper | Short | 104 | | 15,117,050 | 12/19/16 | | — | | (2,956,984 | ) |
| Copper | Long | 55 | | 8,011,781 | 3/13/17 | | 220,265 | | — | |
| Corn | Short | 96 | | 1,672,800 | 3/14/17 | | 29,114 | | — | |
| Cotton | Long | 34 | | 1,216,860 | 3/09/17 | | 29,393 | | — | |
| Gold 100 Oz | Short | 28 | | 3,286,920 | 2/24/17 | | 122,509 | | — | |
| Kansas City Wheat | Short | 43 | | 882,038 | 3/14/17 | | 37,196 | | — | |
| Low Sulphur Diesel | Short | 15 | | 993,069 | 12/30/16 | | — | | (78,656 | ) |
| Low Sulphur Gas Oil | Long | 21 | | 949,200 | 1/12/17 | | 64,168 | | — | |
| Natural Gas | Short | 34 | | 1,139,680 | 12/28/16 | | — | | (140,753 | ) |
| RBOB Gasoline | Long | 35 | | 2,179,275 | 12/30/16 | | 180,999 | | — | |
| Silver | Long | 3 | | 247,230 | 3/29/17 | | — | | (1,176 | ) |
| Soybean Meal | Short | 40 | | 1,284,400 | 3/14/17 | | — | | (25,046 | ) |
| Soybean Oil | Long | 19 | | 424,650 | 3/14/17 | | 8,030 | | — | |
| Soybeans | Long | 77 | | 4,008,812 | 3/14/17 | | 13,141 | | — | |
| Sugar | Long | 73 | | 1,619,666 | 2/28/17 | | — | | (28,915 | ) |
| Wheat | Short | 96 | | 1,933,200 | 3/14/17 | | 113,239 | | — | |
| WTI Crude Oil | Short | 102 | | 5,042,880 | 12/20/16 | | — | | (445,282 | ) |
| Zinc | Long | 88 | | 5,920,200 | 12/19/16 | | 848,382 | | — | |
| Zinc | Short | 88 | | 5,920,200 | 12/19/16 | | — | | (525,068 | ) |
| Zinc | Long | 63 | | 4,261,950 | 3/13/17 | | 235,549 | | — | |
| | | | | 101,333,637 | | | 3,770,040 | | (4,968,792 | ) |
| Equity Contracts | | | | | | | | | | |
| CAC 40 10 Euro Indexa | Long | 99 | | 4,801,373 | 12/16/16 | | 75,425 | | — | |
| CBOE Volatility Index | Long | 14 | | 241,850 | 2/15/17 | | — | | (4,388 | ) |
| DAX Indexa | Long | 7 | | 1,972,976 | 12/16/16 | | 48,913 | | — | |
| DJIA Mini E-CBOT Indexa | Long | 99 | | 9,470,340 | 12/16/16 | | 79,109 | | — | |
| EURO STOXX 50 Price EUR | Short | 127 | | 4,106,674 | 12/16/16 | | — | | (79,003 | ) |
| FTSE 100 Indexa | Long | 109 | | 9,248,696 | 12/16/16 | | 77,920 | | — | |
| FTSE 100 Index | Short | 52 | | 4,412,222 | 12/16/16 | | — | | (89,989 | ) |
| Hang Seng Indexa | Long | 75 | | 11,033,649 | 12/29/16 | | 93,492 | | — | |
| Nasdaq 100 E-Mini Indexa | Long | 105 | | 10,113,600 | 12/16/16 | | 101,496 | | — | |
| Nikkei 225 Indexa | Long | 7 | | 1,124,601 | 12/08/16 | | 47,458 | | — | |
| Russell 2000 Mini Indexa | Long | 39 | | 5,156,970 | 12/16/16 | | 458,092 | | — | |
| Russell 2000 Mini Index | Short | 4 | | 528,920 | 12/16/16 | | — | | (11,130 | ) |
| S&P 500 E-Mini Indexa | Short | 266 | | 29,244,040 | 12/16/16 | | — | | (905,246 | ) |
| STOXX 600 Bank Index | Short | 81 | | 679,915 | 12/16/16 | | — | | (63,771 | ) |
| TOPIX Indexa | Long | 10 | | 1,288,405 | 12/08/16 | | 3,995 | | — | |
| | | | | 93,424,231 | | | 985,900 | | (1,153,527 | ) |
| Interest Rate Contracts | | | | | | | | | | |
| 3 Month Euribora | Long | 726 | | 192,872,484 | 12/18/17 | | — | | (66,341 | ) |
| 10 Yr. Mini Japan Government Bonda | Long | 13 | | 1,710,266 | 12/12/16 | | — | | (7,106 | ) |
| 90 Day Eurodollara | Short | 1,470 | | 362,373,375 | 12/18/17 | | 722,856 | | — | |
| 90 Day Sterlinga | Short | 333 | | 51,800,139 | 12/20/17 | | 1,600 | | — | |
| 90 Day Sterlinga | Short | 109 | | 16,936,849 | 6/20/18 | | 1,995 | | — | |
| Australian 10 Yr. Bonda | Short | 68 | | 6,470,293 | 12/15/16 | | 108,663 | | — | |
| Canadian 10 Yr. Bonda | Long | 32 | | 3,308,390 | 3/22/17 | | — | | (8,541 | ) |
| Euro BOBL | Short | 13 | | 1,830,827 | 3/08/17 | | 807 | | — | |
| Euro-BTP Italian Government Bond | Short | 4 | | 573,718 | 12/08/16 | | 37,848 | | — | |
60 Semiannual Report
franklintempleton.com
FRANKLIN ALTERNATIVE STRATEGIES FUNDS
CONSOLIDATED STATEMENT OF INVESTMENTS (UNAUDITED)
| | | | | | | | | | | | |
| Futures Contracts (continued) | | | | | | | | | | | | |
| | | | Number of | | Notional | Expiration | | | Unrealized | | Unrealized | |
| Description | | Type | Contracts | | Value | Date | | | Appreciation | | Depreciation | |
| Interest Rate Contracts (continued) | | | | | | | | | | | | |
| Euro-Bunda | | Long | 49 | $ | 8,364,270 | 12/08/16 | $ | | — | $ | (101,606 | ) |
| Euro-Buxl 30 Yr. Bond | | Short | 9 | | 1,672,697 | 12/08/16 | | | 33,398 | | — | |
| Japanese 10 Yr. Bonda | | Long | 4 | | 5,264,106 | 12/13/16 | | | — | | (15,809 | ) |
| Long Gilta | | Short | 51 | | 7,871,139 | 3/29/17 | | | — | | (42,855 | ) |
| U.S. Treasury 5 Yr. Notea | | Short | 37 | | 4,360,219 | 3/31/17 | | | — | | (169 | ) |
| U.S. Treasury 10 Yr. Notea | | Short | 92 | | 11,455,437 | 3/22/17 | | | 34,914 | | (70 | ) |
| U.S. Treasury Long Bonda | | Short | 68 | | 10,287,125 | 3/22/17 | | | 47,006 | | — | |
| U.S. Treasury Ultra 10 Yr. Note | | Short | 21 | | 2,823,187 | 3/22/17 | | | 12,300 | | — | |
| U.S. Treasury Ultra Bond | | Short | 7 | | 1,129,844 | 3/22/17 | | | 7,466 | | — | |
| | | | | | 691,104,365 | | | | 1,008,853 | | (242,497 | ) |
| Total Futures Contracts | | | | $ | 885,862,233 | | $ | | 5,764,793 | $ | (6,364,816 | ) |
| Net unrealized appreciation (depreciation) | | | | | | | | | $ | (600,023 | ) |
| |
| aA portion or all of the contracts are owned by K2 Holdings Investment Corp., a wholly-owned subsidiary of the Fund. See Note 1(g). | | | | | | |
| |
| At November 30, 2016, the Fund had the following forward exchange contracts outstanding. See Note 1(e). | | | | | | |
| |
| Forward Exchange Contracts | | | | | | | | | | | | |
| | | | | | Contract | Settlement | | | Unrealized | | Unrealized | |
| Currency | Counterpartya Type | Quantity | | Amount* | Date | | | Appreciation | | Depreciation | |
| OTC Forward Exchange Contracts | | | | | | | | | | | | |
| South Korean Won | BOFA | Sell | 893,198,985 | | 780,086 | 12/05/16 | | $ | 16,054 | $ | — | |
| Euro | BOFA | Sell | 1,395,000 | | 1,550,403 | 12/07/16 | | | 71,279 | | — | |
| Hungarian Forint | BOFA | Buy | 433,500,000 | | 1,565,717 | 12/07/16 | | | — | | (96,737 | ) |
| British Pound | DBAB | Sell | 481,000 | | 593,804 | 12/12/16 | | | — | | (8,288 | ) |
| Swiss Franc | DBAB | Sell | 1,928,000 | | 1,964,884 | 12/13/16 | | | 66,494 | | — | |
| Brazilian Real | BOFA | Sell | 275,000 | | 85,179 | 12/14/16 | | | 4,215 | | — | |
| New Zealand Dollar | CBOA | Sell | 1,300,000 | | 948,773 | 12/14/16 | | | 28,562 | | — | |
| New Zealand Dollar | DBAB | Sell | 805,000 | | 587,650 | 12/14/16 | | | 17,827 | | — | |
| South Korean Won | BOFA | Sell | 1,710,000,000 | | 1,505,653 | 12/14/16 | | | 42,956 | | — | |
| South Korean Won | MSCO | Sell | 864,462,439 | | 740,439 | 12/14/16 | | | 997 | | — | |
| Swedish Krona | MSCS | Buy | 13,100,000 | | 1,441,208 | 12/14/16 | | | — | | (19,375 | ) |
| Taiwan Dollar | BNYM | Buy | 132,103,000 | | 4,159,414 | 12/15/16 | | | — | | (12,664 | ) |
| Taiwan Dollar | BNYM | Sell | 132,103,000 | | 4,130,478 | 12/15/16 | | | 10,220 | | (26,495 | ) |
| British Pound | BNYM | Sell | 2,305,000 | | 2,898,876 | 12/16/16 | | | 18,986 | | (5,811 | ) |
| Euro | BNYM | Sell | 5,022,000 | | 5,440,655 | 12/16/16 | | | 112,875 | | — | |
| Euro | DBAB | Sell | 183,000 | | 196,747 | 12/16/16 | | | 2,604 | | — | |
| Swiss Franc | BNYM | Sell | 56,000 | | 56,760 | 12/16/16 | | | 1,606 | | — | |
| British Pound | DBAB | Buy | 201,000 | | 251,383 | 12/20/16 | | | 2,967 | | (2,676 | ) |
| British Pound | DBAB | Sell | 486,000 | | 618,060 | 12/20/16 | | | 12,112 | | (2,577 | ) |
| Euro | DBAB | Buy | 2,664,000 | | 2,897,125 | 12/20/16 | | | 460 | | (70,685 | ) |
| Euro | DBAB | Sell | 8,622,000 | | 9,586,703 | 12/20/16 | | | 438,392 | | (903 | ) |
| Canadian Dollar | BNYM | Sell | 2,875,000 | | 2,178,024 | 12/21/16 | | | 37,226 | | — | |
| Chinese Yuan | MSCO | Sell | 21,245,970 | | 3,154,561 | 12/21/16 | | | 89,842 | | — | |
| Euro | BNYM | Buy | 480,275 | | 525,525 | 12/21/16 | | | — | | (15,850 | ) |
| Euro | BNYM | Sell | 3,359,844 | | 3,747,806 | 12/21/16 | | | 182,298 | | — | |
| Euro | DBAB | Buy | 1,254,636 | | 1,351,025 | 12/21/16 | | | — | | (19,591 | ) |
| Euro | DBAB | Sell | 292,522 | | 312,476 | 12/21/16 | | | 2,163 | | (116 | ) |
| Euro | MSCO | Buy | 4,319,877 | | 4,776,839 | 12/21/16 | | | 1,542 | | (194,069 | ) |
| Euro | MSCO | Sell | 12,885,364 | | 14,452,184 | 12/21/16 | | | 778,072 | | — | |
| Israeli Shekel | BNYM | Buy | 208,800 | | 54,540 | 12/21/16 | | | — | | (14 | ) |
| Israeli Shekel | BNYM | Sell | 707,886 | | 183,740 | 12/21/16 | | | — | | (1,119 | ) |
| Japanese Yen | BNYM | Buy | 49,000,000 | | 452,892 | 12/21/16 | | | — | | (23,974 | ) |
| Japanese Yen | BNYM | Sell | 110,000,000 | | 1,078,474 | 12/21/16 | | | 115,596 | | — | |
| Japanese Yen | MSCO | Buy | 144,037,030 | | 1,335,531 | 12/21/16 | | | — | | (74,712 | ) |
| Japanese Yen | MSCO | Sell | 144,037,030 | | 1,422,531 | 12/21/16 | | | 161,712 | | — | |
franklintempleton.com
Semiannual Report 61
FRANKLIN ALTERNATIVE STRATEGIES FUNDS
CONSOLIDATED STATEMENT OF INVESTMENTS (UNAUDITED)
| | | | | | | | | | |
| Forward Exchange Contracts (continued) | | | | | | | | | |
| | | | | Contract | Settlement | | Unrealized | | Unrealized | |
| Currency | Counterpartya Type | Quantity | Amount* | Date | | Appreciation | | Depreciation | |
| OTC Forward Exchange Contracts (continued) | | | | | | | | | |
| Mexican Peso | BOFA | Buy | 44,849,783 | 2,271,863 | 12/21/16 | $ | — | $ | (97,869 | ) |
| Mexican Peso | BOFA | Sell | 44,849,783 | 2,289,570 | 12/21/16 | | 121,169 | | (5,595 | ) |
| Mexican Peso | MSCO | Buy | 44,573,783 | 2,244,994 | 12/21/16 | | — | | (84,377 | ) |
| Mexican Peso | MSCO | Sell | 44,573,783 | 2,204,074 | 12/21/16 | | 43,458 | | — | |
| Russian Ruble | BOFA | Buy | 48,156,915 | 741,223 | 12/21/16 | | 5,436 | | — | |
| Russian Ruble | MSCO | Buy | 215,612,525 | 3,305,897 | 12/21/16 | | 50,506 | | (13,391 | ) |
| Russian Ruble | MSCO | Sell | 116,047,952 | 1,765,928 | 12/21/16 | | — | | (33,363 | ) |
| South African Rand | MSCO | Sell | 10,761,201 | 757,767 | 12/21/16 | | — | | (3,212 | ) |
| Swiss Franc | BNYM | Buy | 612,770 | 619,943 | 12/21/16 | | — | | (16,181 | ) |
| Swiss Franc | BNYM | Sell | 4,409,780 | 4,523,872 | 12/21/16 | | 178,922 | | — | |
| Turkish Lira | BOFA | Sell | 5,297,622 | 1,747,519 | 12/21/16 | | 213,364 | | — | |
| Turkish Lira | MSCO | Buy | 2,931,835 | 915,197 | 12/21/16 | | — | | (66,158 | ) |
| Japanese Yenb | MSCO | Buy | 2,694,257,000 | 26,373,944 | 12/22/16 | | — | | (2,788,332 | ) |
| Japanese Yenb | MSCO | Sell | 3,067,165,000 | 28,342,937 | 12/22/16 | | 1,492,877 | | — | |
| Australian Dollarb | MSCO | Buy | 33,265,000 | 25,259,866 | 12/23/16 | | — | | (710,652 | ) |
| Australian Dollarb | MSCO | Sell | 13,230,000 | 9,864,788 | 12/23/16 | | 114,436 | | (13,246 | ) |
| British Poundb | MSCO | Buy | 7,598,000 | 9,580,567 | 12/23/16 | | 91,635 | | (157,611 | ) |
| British Poundb | MSCO | Sell | 23,814,000 | 30,899,632 | 12/23/16 | | 1,176,801 | | (98,242 | ) |
| Canadian Dollarb | MSCO | Buy | 9,669,000 | 7,309,423 | 12/23/16 | | 3,506 | | (112,968 | ) |
| Canadian Dollarb | MSCO | Sell | 38,667,000 | 29,341,211 | 12/23/16 | | 552,487 | | (4,409 | ) |
| Eurob | MSCO | Buy | 28,938,000 | 32,365,767 | 12/23/16 | | — | | (1,652,646 | ) |
| Eurob | MSCO | Sell | 53,689,000 | 59,367,230 | 12/23/16 | | 2,384,821 | | — | |
| Mexican Pesob | MSCO | Buy | 27,171,000 | 1,413,860 | 12/23/16 | | 1,938 | | (99,073 | ) |
| Mexican Pesob | MSCO | Sell | 151,014,000 | 7,716,440 | 12/23/16 | | 398,445 | | (248 | ) |
| New Zealand Dollarb | MSCO | Buy | 17,749,000 | 12,842,117 | 12/23/16 | | 5,450 | | (287,809 | ) |
| New Zealand Dollarb | MSCO | Sell | 2,855,000 | 2,064,691 | 12/23/16 | | 44,402 | | — | |
| Swiss Francb | MSCO | Buy | 4,765,000 | 4,902,151 | 12/23/16 | | — | | (206,421 | ) |
| Swiss Francb | MSCO | Sell | 20,240,000 | 20,856,860 | 12/23/16 | | 911,091 | | — | |
| South Korean Won | BOFA | Sell | 887,324,377 | 753,247 | 12/27/16 | | — | | (5,738 | ) |
| Canadian Dollar | MSCS | Sell | 2,600,000 | 1,937,609 | 12/28/16 | | 1,418 | | — | |
| Euro | BOFA | Sell | 2,800,000 | 2,976,456 | 12/28/16 | | 3,789 | | — | |
| Mexican Peso | MSCS | Buy | 36,800,000 | 1,793,311 | 12/28/16 | | — | | (11,075 | ) |
| Norwegian Krone | MSCS | Buy | 20,300,000 | 2,365,940 | 12/29/16 | | 18,872 | | — | |
| British Pound | BNYM | Sell | 264,000 | 342,575 | 12/30/16 | | 12,036 | | (139 | ) |
| British Pound | MSCO | Buy | 630,435 | 787,530 | 12/30/16 | | 3,325 | | (1,192 | ) |
| British Pound | MSCO | Sell | 1,564,871 | 1,930,947 | 12/30/16 | | 178 | | (29,338 | ) |
| Canadian Dollar | MSCO | Buy | 838,721 | 626,463 | 12/30/16 | | 229 | | (2,091 | ) |
| Canadian Dollar | MSCO | Sell | 6,403,462 | 4,839,000 | 12/30/16 | | 71,804 | | (1,508 | ) |
| Canadian Dollar | MSCS | Sell | 3,150,000 | 2,348,888 | 12/30/16 | | 3,061 | | — | |
| Danish Krone | BNYM | Buy | 391,500 | 57,702 | 12/30/16 | | — | | (1,831 | ) |
| Danish Krone | BNYM | Sell | 391,500 | 59,377 | 12/30/16 | | 3,507 | | — | |
| Euro | BNYM | Buy | 267,000 | 294,234 | 12/30/16 | | — | | (10,734 | ) |
| Euro | BNYM | Sell | 5,858,000 | 6,516,613 | 12/30/16 | | 298,850 | | (2,241 | ) |
| Euro | MSCO | Buy | 1,137,785 | 1,218,665 | 12/30/16 | | 638 | | (11,208 | ) |
| Euro | MSCO | Sell | 1,363,313 | 1,489,259 | 12/30/16 | | 41,699 | | — | |
| Japanese Yen | BNYM | Buy | 87,163,000 | 842,236 | 12/30/16 | | — | | (78,791 | ) |
| Japanese Yen | BNYM | Sell | 87,163,000 | 870,238 | 12/30/16 | | 106,793 | | — | |
| Japanese Yen | MSCO | Buy | 34,257,730 | 324,442 | 12/30/16 | | — | | (24,385 | ) |
| Japanese Yen | MSCO | Sell | 70,510,100 | 679,432 | 12/30/16 | | 61,847 | | — | |
| Mexican Peso | MSCS | Sell | 335,125 | 16,272 | 12/30/16 | | 46 | | — | |
| Norwegian Krone | MSCS | Buy | 12,600,000 | 1,566,147 | 12/30/16 | | — | | (85,910 | ) |
| South African Rand | MSCO | Buy | 4,802,046 | 339,406 | 12/30/16 | | — | | (488 | ) |
| South African Rand | MSCO | Sell | 4,802,046 | 339,950 | 12/30/16 | | 1,032 | | — | |
| Swedish Krona | MSCO | Buy | 426,723 | 46,552 | 12/30/16 | | — | | (183 | ) |
| Swedish Krona | MSCO | Sell | 9,651,698 | 1,086,107 | 12/30/16 | | 37,763 | | (431 | ) |
| Swiss Franc | MSCO | Buy | 336,021 | 340,377 | 12/30/16 | | — | | (9,047 | ) |
| Swiss Franc | MSCO | Sell | 336,021 | 341,445 | 12/30/16 | | 10,116 | | — | |
| Brazilian Real | MSCS | Sell | 3,350,000 | 995,542 | 1/05/17 | | 15,854 | | — | |
62 Semiannual Report
franklintempleton.com
FRANKLIN ALTERNATIVE STRATEGIES FUNDS
CONSOLIDATED STATEMENT OF INVESTMENTS (UNAUDITED)
| | | | | | | | | | | |
| Forward Exchange Contracts (continued) | | | | | | | | | | |
| | | | | Contract | | Settlement | | Unrealized | | Unrealized | |
| Currency | Counterpartya Type | Quantity | Amount* | | Date | | Appreciation | | Depreciation | |
| OTC Forward Exchange Contracts (continued) | | | | | | | | | | |
| Mexican Peso | MSCS | Sell | 19,600,000 | 1,014,239 | | 1/09/17 | $ | 66,427 | $ | — | |
| South African Rand | MSCO | Buy | 13,022,466 | 3,454,235 | | 1/19/17 | | 14,738 | | — | |
| South African Rand | MSCO | Sell | 13,022,466 | 3,391,267 | | 1/19/17 | | — | | (77,706 | ) |
| Colombian Peso | CSFB | Sell | 780,000,000 | 243,807 | | 1/27/17 | | — | | (7,394 | ) |
| British Pound | MSCS | Sell | 100,000 | 124,106 | | 2/09/17 | | — | | (1,254 | ) |
| Indonesian Rupiah | CSFB | Sell | 11,300,000,000 | 818,544 | | 2/23/17 | | — | | (3,373 | ) |
| Indonesian Rupiah | MSCS | Sell | 1,500,000,000 | 108,853 | | 2/23/17 | | — | | (251 | ) |
| Czech Koruna | JPHQ | Sell | 51,064,109 | 1,893,297 | EUR | 2/28/17 | | 714 | | — | |
| Polish Zloty | DBAB | Sell | 4,000,000 | 1,038,354 | | 4/28/17 | | 88,261 | | — | |
| Chinese Yuan | BOFA | Sell | 11,100,000 | 1,616,780 | | 9/19/17 | | 46,422 | | — | |
| Chinese Yuan | MSCS | Sell | 4,300,000 | 627,234 | | 9/19/17 | | 18,897 | | — | |
| Euro | JPHQ | Sell | 1,893,297 | 50,638,117 | CZK | 11/29/17 | | 31,820 | | (32,413 | ) |
| Total Forward Exchange Contracts | | | | | | $ | 10,967,937 | $ | (7,426,180 | ) |
| Net unrealized appreciation (depreciation) | | | | | | $ | 3,541,757 | | | |
| | | | | | | | | | | | | | | | | | | |
| *In U.S. dollars unless otherwise indicated. | | | | | | | | | | | | | | | | | | | |
| aMay be comprised of multiple contracts with the same counterparty, currency and settlement date. | | | | | | | | | | | | | |
| bA portion or all of the contracts are owned by K2 Holdings Investment Corp., a wholly-owned subsidiary of the Fund. See 1(g). | | | | | | | |
| |
| At November 30, 2016, the Fund had the following credit default swap contracts outstanding. See Note 1(e). | | | | | | | |
| |
| Credit Default Swap Contracts | | | | | | | | | | | | | | | | | | | |
| |
| | | | | | | | | Unamortized | | | | | | | | | | | |
| Periodic | | | | | | | Upfront | | | | | | | | | | | |
| Payment | Counterparty/ | Notional | | Expiration | | Payments | | | Unrealized | | Unrealized | | | | | |
| Description | Rate | | Exchange | Amounta | | Date | | (Receipts) | | | Appreciation | | Depreciation | | | Value | | Ratingb |
| Centrally Cleared Swap Contracts | | | | | | | | | | | | | | | | | | | |
| Contracts to Buy Protection | | | | | | | | | | | | | | | | | | | |
| Single Name | | | | | | | | | | | | | | | | | | | |
| Government of South Africa | 1.00 | % | ICE | 2,667,000 | | 12/20/21 | $ | 182,890 | | | $ | — | $ | (13,305 | ) | $ | 169,585 | | |
| Government of South Korea | 1.00 | % | ICE | 1,947,567 | | 12/20/21 | | (56,447 | ) | | | 9,070 | | — | | | (47,377 | ) | |
| Government of Turkey | 1.00 | % | ICE | 1,976,000 | | 9/20/20 | | 157,717 | | | | — | | (62,913 | ) | | 94,804 | | |
| Government of Turkey | 1.00 | % | ICE | 3,068,000 | | 12/20/20 | | 209,737 | | | | — | | (44,417 | ) | | 165,320 | | |
| Government of Turkey | 1.00 | % | ICE | 739,000 | | 6/20/21 | | 48,577 | | | | 2,845 | | — | | | 51,422 | | |
| Traded Index | | | | | | | | | | | | | | | | | | | |
| CDX.NA.HY.27 | 5.00 | % | ICE | 5,100,000 | | 12/20/21 | | (204,000 | ) | | | — | | (40,959 | ) | | (244,959 | ) | |
| CDX.NA.HY.27 | 5.00 | % | ICE | 2,000,000 | | 12/20/21 | | (80,000 | ) | | | — | | (16,062 | ) | | (96,062 | ) | |
| CDX.NA.HY.27 | 5.00 | % | ICE | 6,300,000 | | 12/20/21 | | (252,000 | ) | | | — | | (50,596 | ) | | (302,596 | ) | |
| iTraxx Europe Crossover | 5.00 | % | ICE | 350,374 | EUR | 12/20/20 | | (22,263 | ) | | | — | | (8,502 | ) | | (30,765 | ) | |
| Contracts to Sell Protectionc | | | | | | | | | | | | | | | | | | | |
| Single Name | | | | | | | | | | | | | | | | | | | |
| Government of Brazil | 1.00 | % | ICE | 3,993,000 | | 6/20/21 | | (384,549 | ) | | | 101,369 | | — | | | (283,180 | ) | BB |
| Government of Russia | 1.00 | % | ICE | 2,800,131 | | 9/20/20 | | (339,145 | ) | | | 261,520 | | — | | | (77,625 | ) | BB+ |
| Government of Russia | 1.00 | % | ICE | 413,000 | | 6/20/21 | | (30,563 | ) | | | 11,902 | | — | | | (18,661 | ) | BB+ |
| Total Centrally Cleared Swap Contracts | | | | | | | $ | (770,046 | ) | $ | 386,706 | $ | (236,754 | ) | $ | (620,094 | ) | |
| |
| OTC Swap Contracts | | | | | | | | | | | | | | | | | | | |
| Contracts to Buy Protection | | | | | | | | | | | | | | | | | | | |
| Single Name | | | | | | | | | | | | | | | | | | | |
| Enel SpA | 1.00 | % | BZWS | 450,000 | EUR | 12/20/21 | | 2,105 | | | | — | | (1,634 | ) | | 471 | | |
| Enel SpA | 1.00 | % | BZWS | 450,000 | EUR | 12/20/21 | | 2,570 | | | | — | | — | | | 2,570 | | |
| Government of Argentina | 5.00 | % | MSCO | 2,137,000 | | 6/20/17 | | (45,502 | ) | | | — | | (23,598 | ) | | (69,100 | ) | |
| Government of China | 1.00 | % | DBAB | 500,000 | | 6/20/21 | | 2,365 | | | | — | | (1,893 | ) | | 472 | | |
franklintempleton.com
Semiannual Report 63
FRANKLIN ALTERNATIVE STRATEGIES FUNDS
CONSOLIDATED STATEMENT OF INVESTMENTS (UNAUDITED)
| | | | | | | | | | | | | | | | | |
| Credit Default Swap Contracts (continued) | | | | | | | | | | | | | | |
| | | | | | | | | Unamortized | | | | | | | | | |
| | Periodic | | | | | | | Upfront | | | | | | | | | |
| | Payment | | Counterparty/ | Notional | | Expiration | | Payments | | | Unrealized | | Unrealized | | | | |
| Description | Rate | | Exchange | Amounta | | Date | | (Receipts) | | | Appreciation | | Depreciation | | | Value Ratingb | |
| OTC Swap Contracts (continued) | | | | | | | | | | | | | | | | | |
| Contracts to Buy Protection (continued) | | | | | | | | | | | | | | | | |
| Single Name (continued) | | | | | | | | | | | | | | | | | |
| Government of Turkey | 1.00 | % | BOFA | 1,050,000 | | 12/20/21 | $ | 81,822 | | $ | 4,988 | $ | — | | $ | 86,810 | |
| Intesa Sanpaolo SpA | 1.00 | % | BZWS | 450,000 | EUR | 12/20/21 | | 15,733 | | | — | | — | | | 15,733 | |
| Intesa Sanpaolo SpA | 1.00 | % | BZWS | 450,000 | EUR | 12/20/21 | | 16,847 | | | — | | (1,978 | ) | | 14,869 | |
| Traded Index | | | | | | | | | | | | | | | | | |
| iTraxx Asia Ex Japan | 1.00 | % | BZWS | 310,000 | | 6/20/21 | | 5,496 | | | — | | (4,826 | ) | | 670 | |
| iTraxx Asia Ex Japan | 1.00 | % | MSCS | 635,000 | | 6/20/21 | | 11,652 | | | — | | (10,281 | ) | | 1,371 | |
| Total OTC Swap Contracts | | | | | | | $ | 93,088 | | $ | 4,988 | $ | (44,210 | ) | $ | 53,866 | |
| Total Credit Default Swap Contracts | | | | | | $ | (676,958 | ) | $ | 391,694 | $ | (280,964 | ) | $ | (566,228 | ) |
| Net unrealized appreciation (depreciation) | | | | | | | | | $ | 110,730 | | | | | | |
| | | | | | | | | | |
| aIn U.S. dollars unless otherwise indicated. For contracts to sell protection, the notional amount is equal to the maximum potential amount of the future payments and no | |
| recourse provisions have been entered into in association with the contracts. | | | | | | | | | | |
| bBased on Standard and Poor’s (S&P) Rating for single name swaps. | | | | | | | | | | |
| cThe Fund enters contracts to sell protection to create a long credit position. Performance triggers include default, bankruptcy or restructuring for single name swaps and fail- | |
| ure to pay or bankruptcy of the underlying securities for traded index swaps. | | | | | | | | | | |
| |
| See Notes 1(e) and 9 regarding derivative financial instruments and other derivative information, respectively. | | | | | | |
| |
| At November 30, 2016, the Fund had the following interest rate swap contracts outstanding. See Note 1(e). | | | | | | |
| |
| Interest Rate Swap Contracts | | | | | | | | | | |
| |
| Counterparty/ | Notional | | Expiration | | Unrealized | | Unrealized | |
| Description | Exchange | Amount* | | Date | | Appreciation | | Depreciation | |
| Centrally Cleared Swap Contracts | | | | | | | | | | |
| Receive Fixed rate 0.50% | | | | | | | | | | |
| Pay Floating rate 6 Month GBP-LIBOR | CME | 5,700,000 | GBP | 7/22/18 | | $ | — | $ | (15,145 | ) |
| Receive Floating rate 6 Month GBP-LIBOR | | | | | | | | | | |
| Pay Fixed rate 0.59% | CME | 1,900,000 | GBP | 7/22/21 | | | 35,440 | | — | |
| Receive Fixed rate 0.86% | | | | | | | | | | |
| Pay Floating rate 3 Month USD-LIBOR | CME | 29,900,000 | | 7/18/18 | | | — | | (120,002 | ) |
| Receive Floating rate 3 Month USD-LIBOR | | | | | | | | | | |
| Pay Fixed rate 1.08% | CME | 11,270,000 | | 7/18/21 | | | 309,110 | | — | |
| Receive Fixed rate 0.53% | | | | | | | | | | |
| Pay Floating rate 6 Month GBP-LIBOR | CME | 5,700,000 | GBP | 7/21/18 | | | — | | (11,166 | ) |
| Receive Floating rate 6 Month GBP-LIBOR | | | | | | | | | | |
| Pay Fixed rate 0.62% | CME | 1,900,000 | GBP | 7/21/21 | | | 31,684 | | — | |
| Receive Floating rate 3 Month USD-LIBOR | | | | | | | | | | |
| Pay Fixed rate 1.41% | CME | 1,663,200 | | 7/18/26 | | | 106,453 | | — | |
| Receive Floating rate 6 Month GBP-LIBOR | | | | | | | | | | |
| Pay Fixed rate 1.56% | CME | 761,018 | GBP | 11/29/46 | | | 3,749 | | — | |
| Receive Floating rate 6 Month GBP-LIBOR | | | | | | | | | | |
| Pay Fixed rate 1.55% | CME | 758,289 | GBP | 11/28/46 | | | 3,991 | | — | |
| Total Centrally Cleared Swap Contracts | | | | | $ | 490,427 | $ | (146,313 | ) |
| |
| OTC Swap Contracts | | | | | | | | | | |
| Receive Fixed rate 0.32% | | | | | | | | | | |
| Pay Floating rate 6 Month CZK-PRIBOR | BOFA | 151,000,000 | CZK | 7/29/18 | | | — | | (6,877 | ) |
| Receive Fixed rate 0.30% | | | | | | | | | | |
| Pay Floating rate 6 Month CZK-PRIBOR | BOFA | 249,000,000 | CZK | 8/03/18 | | | — | | (15,427 | ) |
| Receive Floating rate 6 Month CZK-PRIBOR | | | | | | | | | | |
| Pay Fixed rate 0.35% | BOFA | 75,000,000 | CZK | 8/03/21 | | | 29,668 | | — | |
| Receive Fixed rate 0.31% | | | | | | | | | | |
| Pay Floating rate 6 Month CZK-PRIBOR | BOFA | 30,000,000 | CZK | 8/04/18 | | | — | | (1,736 | ) |
64 Semiannual Report
franklintempleton.com
FRANKLIN ALTERNATIVE STRATEGIES FUNDS
CONSOLIDATED STATEMENT OF INVESTMENTS (UNAUDITED)
| | | | | | | | | | |
| Interest Rate Swap Contracts (continued) | | | | | | | | | |
| | | Counterparty/ | Notional | | Expiration | | Unrealized | | Unrealized | |
| Description | | Exchange | Amount* | | Date | | Appreciation | | Depreciation | |
| OTC Swap Contracts (continued) | | | | | | | | | | |
| Receive Floating rate 6 Month CZK-PRIBOR | | | | | | | | | |
| Pay Fixed rate 0.35% | | BOFA | 12,500,000 | CZK | 8/04/21 | $ | 4,821 | $ | — | |
| Receive Fixed rate 0.33% | | | | | | | | | | |
| Pay Floating rate 6 Month CZK-PRIBOR | | DBAB | 148,000,000 | CZK | 7/29/18 | | — | | (6,138 | ) |
| Receive Floating rate 6 Month CZK-PRIBOR | | | | | | | | | |
| Pay Fixed rate 0.38% | | DBAB | 58,000,000 | CZK | 7/29/21 | | 19,780 | | — | |
| Receive Fixed rate 6.14% | | | | | | | | | | |
| Pay Floating rate 1 Month MXN TIIE | | DBAB | 9,000,000 | MXN | 7/03/26 | | — | | (45,533 | ) |
| Receive Fixed rate 6.13% | | | | | | | | | | |
| Pay Floating rate 1 Month MXN TIIE | | BOFA | 28,653,000 | MXN | 7/03/26 | | — | | (145,473 | ) |
| Receive Floating rate 3 Month ZAR-JIBAR-SAFEX | | | | | | | | | |
| Pay Fixed rate 7.95% | | BZWS | 12,500,000 | ZAR | 5/05/25 | | 25,451 | | — | |
| Receive Floating rate 6 Month CZK-PRIBOR | | | | | | | | | |
| Pay Fixed rate 0.37% | | BOFA | 60,000,000 | CZK | 7/29/21 | | 21,080 | | — | |
| Receive Fixed rate 11.27% | | | | | | | | | | |
| Pay Floating rate BRL-Brazil Cetip DI Interbank | | | | | | | | | |
| Deposit Rate | | BOFA | 2,455,036 | BRL | 1/02/20 | | — | | (5,157 | ) |
| Receive Fixed rate 11.30% | | | | | | | | | | |
| Pay Floating rate BRL-Brazil Cetip DI Interbank | | | | | | | | | |
| Deposit Rate | | BOFA | 2,574,345 | BRL | 1/02/20 | | — | | (4,880 | ) |
| Receive Fixed rate 12.05% | | | | | | | | | | |
| Pay Floating rate BRL-Brazil Cetip DI Interbank | | | | | | | | | |
| Deposit Rate | | MSCO | 5,268,000 | BRL | 1/02/20 | | 13,602 | | — | |
| Total OTC Swap Contracts | | | | | | $ | 114,402 | $ | (231,221 | ) |
| Total Interest Rate Swap Contracts | | | | | | $ | 604,829 | $ | (377,534 | ) |
| Net unrealized appreciation (depreciation) | | | | | $ | 227,295 | | | |
| |
| *In U.S. dollars unless otherwise indicated. | | | | | | | | | | |
| |
| At November 30, 2016, the Fund had the following total return swap contracts outstanding. See Note 1(e). | | | | | |
| |
| Total Return Swap Contracts | | | | | | | | | | |
| | | Counter- | Notional | | Expiration | | Unrealized | | Unrealized | |
| Underlying Instrument | Financing Rate | Party | Value* | | Date | | Appreciation | | Depreciation | |
| OTC Swap Contracts | | | | | | | | | | |
| Equity Contracts - Long | | | | | | | | | | |
| Anglo American PLC | LIBOR + 50 | MSCS | 634,633 | GBP | 1/18/17 | $ | 557,813 | $ | — | |
| Antofagasta PLC | LIBOR + 50 | MSCS | 494,872 | GBP | 1/18/17 | | 345,721 | | — | |
| International Consolidated Airlines | | | | | | | | | | |
| Group SA | LIBOR + 50 | MSCS | 474,092 | GBP | 1/18/17 | | 20,560 | | — | |
| Rio Tinto PLC | LIBOR + 50 | MSCS | 615,910 | GBP | 1/18/17 | | 324,687 | | — | |
| Wizz Air Holdings PLC | LIBOR + 50 | MSCS | 282,584 | GBP | 1/18/17 | | — | | (11,105 | ) |
| Coach Inc | LIBOR + 50 | MSCS | 662,465 | | 4/17/17 | | — | | (6,240 | ) |
| Mead Johnson Nutrition Co | LIBOR + 50 | MSCS | 656,710 | | 4/17/17 | | 12,722 | | — | |
| Valeo SA | LIBOR + 100 | DBAB | 231,325 | EUR | 4/18/17 | | 4,314 | | — | |
| Anima Holding SpA | LIBOR + 50 | MSCS | 33,944 | EUR | 4/18/17 | | 4,421 | | — | |
| Barclays PLC | LIBOR + 50 | MSCS | 327,005 | GBP | 4/18/17 | | 30,068 | | — | |
| BNP Paribas SA | LIBOR + 50 | MSCS | 1,081,437 | EUR | 4/18/17 | | — | | (13,096 | ) |
| Croda International PLC | LIBOR + 50 | MSCS | 732,835 | GBP | 4/18/17 | | 34,087 | | — | |
| Hikma Pharmaceuticals PLC | LIBOR + 50 | MSCS | 258,352 | GBP | 4/18/17 | | 1,221 | | — | |
| Iliad SA | LIBOR + 50 | MSCS | 1,632,050 | EUR | 4/18/17 | | 66,450 | | — | |
| ITV PLC | LIBOR + 50 | MSCS | 739,427 | GBP | 4/18/17 | | — | | (880 | ) |
| Remy Cointreau SA | LIBOR + 50 | MSCS | 883,789 | EUR | 4/18/17 | | 120,134 | | — | |
| RSA Insurance Group PLC | LIBOR + 50 | MSCS | 358,413 | GBP | 4/18/17 | | 1,088 | | — | |
| Smith & Nephew PLC | LIBOR + 50 | MSCS | 68,510 | GBP | 4/18/17 | | 4,116 | | — | |
| Smiths Group PLC | LIBOR + 50 | MSCS | 387,991 | GBP | 4/18/17 | | — | | (11,923 | ) |
| Societe Generale SA | LIBOR + 50 | MSCS | 1,154,607 | EUR | 4/18/17 | | 11,497 | | — | |
| Sports Direct International PLC | LIBOR + 50 | MSCS | 727,318 | GBP | 4/18/17 | | 13,416 | | — | |
franklintempleton.com
Semiannual Report 65
FRANKLIN ALTERNATIVE STRATEGIES FUNDS
CONSOLIDATED STATEMENT OF INVESTMENTS (UNAUDITED)
| | | | | | | | | | |
| Total Return Swap Contracts (continued) | | | | | | | | | |
| | | Counter- | | | Expiration | | Unrealized | | Unrealized | |
| Underlying Instrument | Financing Rate | Party | Notional Value* | | Date | | Appreciation | | Depreciation | |
| OTC Swap Contracts (continued) | | | | | | | | | | |
| Equity Contracts - Long (continued) | | | | | | | | | | |
| Alphabet Inc | LIBOR + 50 | MSCS | 1,377,347 | | 5/25/17 | $ | — | $ | (47,002 | ) |
| Brunswick Corp | LIBOR + 50 | MSCS | 1,856,704 | | 5/25/17 | | 169,001 | | — | |
| Constellation Brands Inc | LIBOR + 50 | MSCS | 1,210,783 | | 5/25/17 | | 35,488 | | — | |
| Continental Resources Inc | LIBOR + 50 | MSCS | 516,459 | | 5/25/17 | | 129,663 | | — | |
| Monster Beverage Corp | LIBOR + 50 | MSCS | 2,008,741 | | 5/25/17 | | — | | (210,682 | ) |
| Newfield Exploration Co | LIBOR + 50 | MSCS | 1,372,667 | | 5/25/17 | | 59,475 | | — | |
| NVR Inc | LIBOR + 50 | MSCS | 3,277,859 | | 5/25/17 | | 236,582 | | — | |
| Rio Tinto PLC | LIBOR + 50 | MSCS | 1,351,831 | | 5/25/17 | | 134,941 | | — | |
| Swift Transportation Co | LIBOR + 50 | MSCS | 1,497,311 | | 5/25/17 | | 287,860 | | — | |
| Take-Two Interactive | | | | | | | | | | |
| Software Inc | LIBOR + 50 | MSCS | 2,251,583 | | 5/25/17 | | 279,708 | | — | |
| Lavendon Group PLC | LIBOR + 45 | DBAB | 421,035 | GBP | 7/03/17 | | 52,192 | | — | |
| Spire Healthcare Group PLC | LIBOR + 45 | DBAB | 140,451 | GBP | 7/03/17 | | — | | (4,949 | ) |
| Weichai Power Co Ltd | HONIX + 95 | MSCS | 2,417,263 | HKD | 7/13/17 | | 69,675 | | — | |
| Evonik Industries AG | LIBOR + 40 | DBAB | 21,125 | EUR | 7/19/17 | | 85 | | — | |
| Actelion Ltd | TOIS + 65 | MSCS | 701,288 | CHF | 7/19/17 | | — | | — | |
| LafargeHolcim Ltd | LIBOR + 50 | MSCS | 1,724,674 | CHF | 7/26/17 | | — | | (92,113 | ) |
| Syngenta AG | LIBOR + 50 | MSCS | 1,398,167 | CHF | 7/26/17 | | 26,123 | | — | |
| Allergan PLC | LIBOR + 75 | DBAB | 439,419 | | 7/31/17 | | 20,841 | | — | |
| Belden Inc | LIBOR + 75 | DBAB | 528,495 | | 7/31/17 | | 28,237 | | — | |
| Black Hills Corp | LIBOR + 75 | DBAB | 3,118,875 | | 7/31/17 | | 68,471 | | — | |
| EPR Properties | LIBOR + 75 | DBAB | 362,188 | | 7/31/17 | | 12,705 | | — | |
| Frontier Communications Corp | LIBOR + 75 | DBAB | 2,436,902 | | 7/31/17 | | 217,424 | | — | |
| Great Plains Energy Inc | LIBOR + 75 | DBAB | 1,730,989 | | 7/31/17 | | — | | (32,727 | ) |
| Hess Corp | LIBOR + 75 | DBAB | 3,464,987 | | 7/31/17 | | 420,801 | | — | |
| Siliconware Precision Industries | | | | | | | | | | |
| Co. Ltd | LIBOR + 40 | DBAB | 71,243 | | 7/31/17 | | 3,453 | | — | |
| T-Mobile U.S. Inc | LIBOR + 75 | DBAB | 712,290 | | 7/31/17 | | 17,907 | | — | |
| Welltower Inc | LIBOR + 75 | DBAB | 2,932,608 | | 7/31/17 | | — | | (4,678 | ) |
| WPX Energy Inc | LIBOR + 75 | DBAB | 378,321 | | 7/31/17 | | 68,016 | | — | |
| Air France | EURIBOR + 50 | MSCS | 244,386 | EUR | 8/23/17 | | — | | (12,757 | ) |
| Peugeot SA | EURIBOR + 50 | MSCS | 368,031 | EUR | 8/23/17 | | 6,614 | | — | |
| Plastic Omnium SA | EURIBOR + 50 | MSCS | 645,141 | EUR | 8/23/17 | | — | | (202 | ) |
| Conwert Immobilien Invest SE | EONIA + 65 | MSCS | 898,793 | EUR | 10/30/17 | | — | | (154 | ) |
| Vivendi SA | EONIA + 65 | MSCS | 2,181,144 | EUR | 10/30/17 | | — | | (597 | ) |
| Celesio AG | EONIA + 65 | MSCS | 586,853 | EUR | 11/02/17 | | — | | (158 | ) |
| E. ON SE | EONIA + 65 | MSCS | 1,354,179 | EUR | 11/02/17 | | — | | (303 | ) |
| KUKA AG | EONIA + 65 | MSCS | 197,074 | EUR | 11/02/17 | | — | | (15 | ) |
| ThyssenKrupp AG | EONIA + 65 | MSCS | 1,873,436 | EUR | 11/02/17 | | — | | (493 | ) |
| SunCoke Energy Partners LP | LIBOR + 85 | DBAB | 197,413 | | 11/06/17 | | — | | (15,699 | ) |
| Hess Corp | LIBOR + 75 | BNPP | 267,981 | | 11/30/17 | | 13,760 | | — | |
| Tatts Group Ltd | RBACR + 50 | MSCS | 352,589 | AUD | 12/05/17 | | — | | (335 | ) |
| FMC Technologies Inc | FEDEF + 40 | MSCS | 1,507,783 | | 12/21/17 | | — | | (915 | ) |
| Yahoo! Inc | FEDEF + 40 | MSCS | 209,489 | | 12/21/17 | | — | | (137 | ) |
| Siemens AG | EURIBOR + 80 | BNPP | 240,400 | EUR | 12/29/17 | | — | | (29,322 | ) |
| Moncler SpA | EURIBOR + 50 | MSCS | 72,516 | EUR | 1/10/18 | | 10,818 | | — | |
| Calsonic Kansei Corp | MUTSCALM + 55 | MSCS | 86,181,036 | JPY | 11/01/18 | | — | | (10 | ) |
| TonenGeneral Sekiyu KK | MUTSCALM + 55 | MSCS | 150,357,141 | JPY | 11/01/18 | | — | | (174 | ) |
| | | | | | | | 3,922,155 | | (496,666 | ) |
| |
| OTC Swap Contracts | | | | | | | | | | |
| Equity Contracts - Short | | | | | | | | | | |
| British Land Co. PLC | LIBOR - 40 | DBAB | 290,241 | GBP | 1/18/17 | | 8,962 | | — | |
| Carillion PLC | LIBOR - 125 | DBAB | 286,000 | GBP | 1/18/17 | | 18,032 | | — | |
| Enterprise Inns PLC | LIBOR - 40 | DBAB | 53,408 | GBP | 1/18/17 | | — | | (3,761 | ) |
| Great Portland Estates PLC | LIBOR - 40 | DBAB | 591,563 | GBP | 1/18/17 | | 23,185 | | — | |
| Helical Bar PLC | LIBOR - 40 | DBAB | 2,788 | GBP | 1/18/17 | | — | | (456 | ) |
| Mediclinic International PLC | LIBOR - 40 | DBAB | 111,451 | GBP | 1/18/17 | | 6,457 | | — | |
| Mol Hungarian Oil And Gas | LIBOR - 40 | DBAB | 401,797 | EUR | 1/18/17 | | 3,803 | | — | |
66 Semiannual Report
franklintempleton.com
FRANKLIN ALTERNATIVE STRATEGIES FUNDS
CONSOLIDATED STATEMENT OF INVESTMENTS (UNAUDITED)
| | | | | | | | | | |
| Total Return Swap Contracts (continued) | | | | | | | | | |
| | | Counter- | | | Expiration | | Unrealized | | Unrealized | |
| Underlying Instrument | Financing Rate | Party | Notional Value* | | Date | | Appreciation | | Depreciation | |
| OTC Swap Contracts (continued) | | | | | | | | | | |
| Equity Contracts - Short (continued) | | | | | | | | | | |
| Primary Health Properties PLC | LIBOR - 250 | DBAB | 296,081 | GBP | 1/18/17 | $ | — | $ | (3,476 | ) |
| Richter Gedeon Nyrt | LIBOR - 40 | DBAB | 770,038 | EUR | 1/18/17 | | 25,831 | | — | |
| St. Modwen Properties PLC | LIBOR - 40 | DBAB | 9,068 | GBP | 1/18/17 | | — | | (178 | ) |
| UNITE Group PLC | LIBOR - 40 | DBAB | 1,273,725 | GBP | 1/18/17 | | — | | (23,224 | ) |
| Burberry Group PLC | SONIA - 35 | MSCS | 297,283 | GBP | 1/18/17 | | — | | (53,726 | ) |
| Thomas Cook Group PLC | SONIA - 35 | MSCS | 76,800 | GBP | 1/18/17 | | — | | (21,888 | ) |
| APERAM SA | LIBOR - 40 | DBAB | 128,427 | | 2/01/17 | | 3,145 | | — | |
| Larsen & Toubro Ltd | LIBOR - 200 | DBAB | 32,495 | | 3/17/17 | | — | | (249 | ) |
| Adidas AG | EONIA - 35 | MSCS | 559,988 | EUR | 4/18/17 | | — | | (33,099 | ) |
| JD Sports Fashion PLC | SONIA - 30 | MSCS | 154,193 | GBP | 4/18/17 | | — | | (11,024 | ) |
| Industrivarden AB | LIBOR - 40 | DBAB | 293,291 | EUR | 4/21/17 | | — | | (2,726 | ) |
| Galp Energia SGPS SA | LIBOR - 40 | DBAB | 91,897 | EUR | 6/06/17 | | — | | (5,980 | ) |
| Alstria office REIT-AG | LIBOR - 40 | DBAB | 1,686,475 | EUR | 7/19/17 | | — | | (36,245 | ) |
| Aroundtown Property Holdings PLC | LIBOR - 450 | DBAB | 293,164 | EUR | 7/19/17 | | — | | (13,612 | ) |
| Aurubis AG | LIBOR - 40 | DBAB | 246,251 | EUR | 7/19/17 | | 5,718 | | — | |
| Deutsche EuroShop AG | LIBOR - 40 | DBAB | 501,831 | EUR | 7/19/17 | | — | | (1,904 | ) |
| Deutsche Post AG | LIBOR - 35 | DBAB | 971,486 | EUR | 7/19/17 | | — | | (20,779 | ) |
| Deutsche Wohnen AG | LIBOR - 40 | DBAB | 1,725,169 | EUR | 7/19/17 | | — | | (56,488 | ) |
| Drillisch AG | LIBOR - 400 | DBAB | 3,197,401 | EUR | 7/19/17 | | 209,452 | | — | |
| ENN Energy Holdings Ltd | LIBOR - 41 | DBAB | 345,000 | HKD | 7/19/17 | | — | | (1,548 | ) |
| Fonciere Des Regions | LIBOR - 40 | DBAB | 1,223,545 | EUR | 7/19/17 | | 9,893 | | — | |
| Fresenius SE & Co KGaA | LIBOR - 40 | DBAB | 742,948 | EUR | 7/19/17 | | — | | (5,476 | ) |
| Hansteen Holdings PLC | LIBOR - 100 | DBAB | 920,057 | EUR | 7/19/17 | | — | | (30,012 | ) |
| Kloeckner & Co. SE | LIBOR - 40 | DBAB | 252,913 | EUR | 7/19/17 | | 6,505 | | — | |
| Koninklijke KPN NV | LIBOR - 40 | DBAB | 185,284 | EUR | 7/19/17 | | — | | (7,716 | ) |
| OCI NV | LIBOR - 40 | DBAB | 79,395 | EUR | 7/19/17 | | — | | (2,070 | ) |
| Playtech PLC | LIBOR - 40 | DBAB | 886,996 | EUR | 7/19/17 | | 32,936 | | — | |
| Shenzhou International Group | | | | | | | | | | |
| Holdings Ltd | LIBOR - 47 | DBAB | 22,548,070 | HKD | 7/19/17 | | — | | (21,604 | ) |
| Siemens AG | LIBOR - 40 | DBAB | 1,184,720 | EUR | 7/19/17 | | 20,691 | | — | |
| Steinhoff International Holdings NV | LIBOR - 75 | DBAB | 541,136 | EUR | 7/19/17 | | — | | (11,204 | ) |
| Yuexiu Transport Infrastructure Ltd | LIBOR - 150 | DBAB | 712,080 | HKD | 7/19/17 | | — | | (2,175 | ) |
| Cie Financiere Richemont SA | TOIS - 40 | MSCS | 784,110 | CHF | 7/19/17 | | — | | (539 | ) |
| Iberdrola SA | LIBOR - 40 | DBAB | 820,054 | EUR | 7/20/17 | | — | | (3,886 | ) |
| NH Hotel Group SA | LIBOR - 40 | DBAB | 253,223 | EUR | 7/20/17 | | 16,434 | | — | |
| Ayala Land Inc | LIBOR - 500 | DBAB | 102,491 | | 7/21/17 | | — | | (3,525 | ) |
| Advanced Semiconductor | | | | | | | | | | |
| Engineering Inc | LIBOR - 35 | DBAB | 412,379 | | 7/31/17 | | — | | (8,615 | ) |
| Allergan PLC | LIBOR - 35 | DBAB | 313,685 | | 7/31/17 | | 3,399 | | — | |
| Apollo Commercial Real Estate | | | | | | | | | | |
| Finance Inc | LIBOR - 35 | DBAB | 98,803 | | 7/31/17 | | — | | (276 | ) |
| Belden Inc | LIBOR - 35 | DBAB | 413,504 | | 7/31/17 | | — | | (9,786 | ) |
| Black Hills Corp | LIBOR - 35 | DBAB | 2,713,125 | | 7/31/17 | | — | | (21,181 | ) |
| Colony Starwood Homes | LIBOR - 35 | DBAB | 383,934 | | 7/31/17 | | — | | (9,787 | ) |
| DHT Holdings Inc | LIBOR - 35 | DBAB | 1,043,204 | | 7/31/17 | | 39,603 | | — | |
| EPR Properties | LIBOR - 35 | DBAB | 254,666 | | 7/31/17 | | — | | (6,884 | ) |
| Frontier Communications Corp | LIBOR - 35 | DBAB | 1,926,068 | | 7/31/17 | | — | | (194,951 | ) |
| General Cable Corp | LIBOR - 35 | DBAB | 57,358 | | 7/31/17 | | — | | (3,747 | ) |
| Great Plains Energy Inc | LIBOR - 35 | DBAB | 1,216,159 | | 7/31/17 | | 31,352 | | — | |
| Hess Corp | LIBOR - 35 | DBAB | 3,033,794 | | 7/31/17 | | — | | (280,100 | ) |
| Intel Corp | LIBOR - 35 | DBAB | 716,428 | | 7/31/17 | | 2,771 | | — | |
| Pattern Energy Group Inc | LIBOR - 35 | DBAB | 89,700 | | 7/31/17 | | — | | (596 | ) |
| Scorpio Tankers Inc | LIBOR - 35 | DBAB | 57,889 | | 7/31/17 | | — | | (4,512 | ) |
| Ship Finance International Ltd | LIBOR - 90 | DBAB | 1,697,441 | | 7/31/17 | | — | | (88,926 | ) |
| Spirit Realty Capital Inc | LIBOR - 35 | DBAB | 91,932 | | 7/31/17 | | — | | (1,733 | ) |
| T-Mobile U.S. Inc | LIBOR - 35 | DBAB | 683,379 | | 7/31/17 | | — | | (9,572 | ) |
| Welltower Inc | LIBOR - 35 | DBAB | 1,962,138 | | 7/31/17 | | — | | (1,327 | ) |
| WPX Energy Inc | LIBOR - 35 | DBAB | 321,031 | | 7/31/17 | | — | | (65,475 | ) |
| Technip SA | LIBOR - 50 | DBAB | 4,466,794 | EUR | 8/15/17 | | 48,872 | | — | |
franklintempleton.com
Semiannual Report 67
FRANKLIN ALTERNATIVE STRATEGIES FUNDS
CONSOLIDATED STATEMENT OF INVESTMENTS (UNAUDITED)
| | | | | | | | | | |
| Total Return Swap Contracts (continued) | | | | | | | | | |
| | | Counter- | | | | Expiration | | Unrealized | | Unrealized |
| Underlying Instrument | Financing Rate | Party | Notional Value* | | | Date | | Appreciation | | Depreciation |
| OTC Swap Contracts (continued) | | | | | | | | | | |
| Equity Contracts - Short (continued) | | | | | | | | | | |
| Advanced Semiconductor | | | | | | | | | | |
| Engineering Inc | LIBOR - 125 | DBAB | 1,329,005 | | | 9/19/17 | $ | — | $ | (36,205 |
| IHH Healthcare Bhd | LIBOR - 311 | DBAB | | 573,584 | SGD | | �� 9/20/17 | | — | | (11,530) |
| Gramercy Property Trust | LIBOR - 35 | DBAB | 343,138 | | | 9/27/17 | | — | | (11,769 |
| Outokumpu OYJ | LIBOR - 175 | DBAB | 748,221 | EUR | | 10/02/17 | | 8,576 | | — |
| Marine Harvest ASA | LIBOR - 40 | DBAB | 6,576,038 | EUR | | 10/19/17 | | — | | (305,556) |
| SubseaSA | LIBOR - 75 | DBAB | 3,558,737 | EUR | | 10/19/17 | | 9,574 | | — |
| Tenaga Nasional Bhd | LIBOR - 50 | DBAB | 357,293 | | | 10/19/17 | | 13,308 | | — |
| Airbus Group SE | EONIA - 40 | MSCS | 239,754 | EUR | | 10/30/17 | | — | | (70) |
| Fiat Chrysler Automobiles NV | EONIA - 50 | MSCS | 297,490 | EUR | | 10/30/17 | | — | | (194) |
| Kone OYJ | EONIA - 50 | MSCS | 1,171,036 | EUR | | 10/30/17 | | — | | (844) |
| Proximus SADP | EONIA - 50 | MSCS | 142,845 | EUR | | 11/02/17 | | — | | (100) |
| Volkswagen AG | EONIA - 40 | MSCS | 146,647 | EUR | | 11/02/17 | | — | | (95) |
| Vonovia SE | EONIA - 40 | MSCS | 448,934 | EUR | | 11/02/17 | | — | | (298) |
| SunCoke Energy Inc | LIBOR - 35 | DBAB | 189,080 | | | 11/06/17 | | 15,786 | | — |
| Advantest Corp | LIBOR - 40 | DBAB | 34,040,400 | JPY | | 11/17/17 | | — | | (14,197) |
| Bank of Nagoya Ltd | LIBOR - 150 | DBAB | 140,360 | | | 11/17/17 | | 2,875 | | — |
| DCM Holdings Co. Ltd | LIBOR - 40 | DBAB | 50,596,384 | JPY | | 11/17/17 | | — | | (42,673) |
| Ebara Corp | LIBOR - 40 | DBAB | 187,699,600 | JPY | | 11/17/17 | | — | | (28,173) |
| EDION Corp | LIBOR - 350 | DBAB | 96,882,016 | JPY | | 11/17/17 | | — | | (85,511) |
| Japan Airport Terminal Co. Ltd | LIBOR - 600 | DBAB | 15,432,874 | JPY | | 11/17/17 | | — | | (79) |
| K’s Holdings Corp | LIBOR - 40 | DBAB | 358,051,505 | JPY | | 11/17/17 | | — | | (246,074) |
| Kansai Paint Co. Ltd | LIBOR - 40 | DBAB | 28,135,219 | JPY | | 11/17/17 | | — | | (6,410) |
| LIXIL Group Corp | LIBOR - 40 | DBAB | 11,097,240 | JPY | | 11/17/17 | | — | | (5,304) |
| Maeda Corp | LIBOR - 40 | DBAB | 179,756,111 | JPY | | 11/17/17 | | — | | (160,423) |
| Nagoya Railroad Co. Ltd | LIBOR - 40 | DBAB | 14,622,854 | JPY | | 11/17/17 | | — | | (8,524) |
| Nippon Ceramic Co. Ltd | LIBOR - 650 | DBAB | 22,594,800 | JPY | | 11/17/17 | | — | | (12,916) |
| Nippon Light Metal Holdings Co. Ltd | LIBOR - 40 | DBAB | 636,487,041 | JPY | | 11/17/17 | | — | | (261,640) |
| Oita Bank Ltd | LIBOR - 40 | DBAB | 864,865 | | | 11/17/17 | | 9,007 | | — |
| OSG Corp | LIBOR - 125 | DBAB | 137,416,500 | JPY | | 11/17/17 | | 30,123 | | — |
| Resorttrust Inc | LIBOR - 40 | DBAB | 1,665,600 | JPY | | 11/17/17 | | — | | (1,093) |
| Sankyo Co. Ltd | LIBOR - 40 | DBAB | 20,024,456 | JPY | | 11/17/17 | | — | | (5,158) |
| SBI Holdings Inc | LIBOR - 40 | DBAB | 5,810,027 | JPY | | 11/17/17 | | — | | (3,281) |
| Shionogi & Co. Ltd | LIBOR - 40 | DBAB | 58,588,777 | JPY | | 11/17/17 | | — | | (6,672) |
| Suzuki Motor Corp | LIBOR - 40 | DBAB | 30,568,900 | JPY | | 11/17/17 | | 173 | | — |
| Teijin Ltd | LIBOR - 40 | DBAB | 128,592,232 | JPY | | 11/17/17 | | — | | (83,768) |
| Terumo Corp | LIBOR - 40 | DBAB | 83,245,934 | JPY | | 11/17/17 | | — | | (32,152) |
| Toho Holdings Co. Ltd | LIBOR - 40 | DBAB | 69,087,534 | JPY | | 11/17/17 | | — | | (39,462) |
| Tohoku Electric Power Co. Inc | LIBOR - 40 | DBAB | 51,139,799 | JPY | | 11/17/17 | | — | | (36,723) |
| Toppan Printing Co. Ltd | LIBOR - 40 | DBAB | 41,154,315 | JPY | | 11/17/17 | | — | | (18,296) |
| Transcosmos Inc | LIBOR - 40 | DBAB | 261,400 | JPY | | 11/17/17 | | — | | (146) |
| Unicharm Corp | LIBOR - 40 | DBAB | 57,667,115 | JPY | | 11/17/17 | | — | | (15,238) |
| Yamada Denki Co. Ltd | LIBOR - 40 | DBAB | 435,183,406 | JPY | | 11/17/17 | | — | | (389,113) |
| Yamagata Bank Ltd | LIBOR - 150 | DBAB | 703,267 | | | 11/17/17 | | 12,855 | | — |
| Yamaguchi Financial Group Inc | LIBOR - 40 | DBAB | 2,286,256 | | | 11/17/17 | | 18,825 | | — |
| British American Tobacco PLC | LIBOR - 40 | DBAB | 1,976,988 | | | 11/27/17 | | — | | (51,084) |
| British Land Co. PLC | LIBOR - 35 | BNPP | 147,995 | GBP | | 11/29/17 | | 312 | | — |
| Enterprise Inns PLC | LIBOR - 40 | BNPP | 21,055 | GBP | | 11/29/17 | | — | | (818) |
| Evonik Industries AG | LIBOR - 35 | BNPP | 179,618 | EUR | | 11/29/17 | | — | | (1,319) |
| Fresenius SE & Co. KGaA | LIBOR - 35 | BNPP | 385,672 | EUR | | 11/29/17 | | — | | (3,853) |
| General Cable Corp | LIBOR - 30 | BNPP | 98,454 | | | 11/30/17 | | 523 | | — |
| Hess Corp | LIBOR - 30 | BNPP | 213,831 | | | 11/30/17 | | — | | (21,255) |
| Lam Research Corp | LIBOR - 30 | BNPP | 973,452 | | | 11/30/17 | | 13,766 | | — |
| Terumo Corp | LIBOR - 40 | BNPP | 41,740,988 | JPY | | 11/30/17 | | 2,468 | | — |
| Suzuki Motor Corp | LIBOR - 40 | BNPP | 89,394,800 | JPY | | 12/02/17 | | 2,961 | | — |
| Tabcorp Holdings Ltd | RBACR - 150 | MSCS | 315,731 | AUD | | 12/05/17 | | — | | (33) |
| Takashimaya Co. Ltd | LIBOR - 40 | BNPP | 5,754,000 | JPY | | 12/27/17 | | 523 | | — |
| Toray Industries Inc | LIBOR - 40 | BNPP | 21,237,220 | JPY | | 12/27/17 | | 2,030 | | — |
| Ayala Land Inc | LIBOR - 400 | BNPP | 247,900 | | | 12/28/17 | | — | | (4,867) |
68 Semiannual Report
franklintempleton.com
FRANKLIN ALTERNATIVE STRATEGIES FUNDS
CONSOLIDATED STATEMENT OF INVESTMENTS (UNAUDITED)
| | | | | | | | | | | |
| Total Return Swap Contracts (continued) | | | | | | | | | | |
| | | Counter- | | | | Expiration | | Unrealized | | Unrealized | |
| Underlying Instrument | Financing Rate | Party | Notional Value* | | | Date | | Appreciation | | Depreciation | |
| OTC Swap Contracts (continued) | | | | | | | | | | | |
| Equity Contracts - Short (continued) | | | | | | | | | | | |
| CapitaLand Ltd | SIBOR - 40 | BNPP | 134,088 | SGD | 12/28/17 | $ | — | $ | (1,857 | ) |
| Nippon Light Metal Holdings Co. Ltd | LIBOR - 40 | BNPP | 28,194,000 | | JPY | 12/28/17 | | — | | (977 | ) |
| Senko Co. Ltd | LIBOR - 75 | BNPP | 54,377,036 | | JPY | 12/28/17 | | — | | (7,800 | ) |
| Deutsche Post AG | LIBOR - 35 | BNPP | 480,825 | EUR | 12/29/17 | | — | | (3,063 | ) |
| Elekta AB | STIBOR - 50 | BNPP | 486,675 | SEK | 12/29/17 | | 1,706 | | — | |
| Galp Energia SGPS SA | LIBOR - 40 | BNPP | 93,043 | EUR | 12/29/17 | | — | | (979 | ) |
| J Sainsbury PLC | LIBOR - 35 | BNPP | 65,490 | GBP | 12/29/17 | | 1,736 | | — | |
| Koninklijke KPN NV | LIBOR - 50 | BNPP | 5,023 | EUR | 12/29/17 | | — | | (72 | ) |
| Outokumpu OYJ | LIBOR - 50 | BNPP | 11,084 | EUR | 12/29/17 | | 381 | | — | �� |
| Richter Gideon Nyrt | LIBOR - 50 | BNPP | 198,622 | EUR | 12/29/17 | | 2,130 | | — | |
| Siemens AG | LIBOR - 35 | BNPP | 337,506 | EUR | 12/29/17 | | 2,144 | | — | |
| Rolls-Royce Holdings PLC | SONIA - 35 | MSCS | 1,282 | GBP | 2/06/18 | | — | | — | |
| SPDR S&P 500 ETF Trust | FEDEF - 35 | MSCS | 4,526,482 | | | 2/27/18 | | — | | (123,578 | ) |
| Janus Capital Group Inc | LIBOR - 30 | CITI | 529,322 | | | 5/29/18 | | — | | (29,748 | ) |
| Technip SA | FEDEF - 40 | MSCS | 1,521,900 | | | 8/10/18 | | — | | (3,742 | ) |
| Alibaba Group Holding Ltd | FEDEF - 35 | MSCS | 152,971 | | | 8/16/18 | | 2 | | — | |
| JX Holdings Inc | MUTSCALM - 40 | MSCS | 154,680,671 | | JPY | 11/01/18 | | — | | (163 | ) |
| | | | | | | | | 668,825 | | (3,210,933 | ) |
| |
| OTC Swap Contracts | | | | | | | | | | | |
| Fixed Income Contracts - Long | | | | | | | | | | | |
| Bank of Nagoya Ltd | LIBOR + 90 | DBAB | 307,875 | | | 12/19/16 | | 3,576 | | — | |
| Oita Bank Ltd | LIBOR + 90 | DBAB | 2,357,500 | | | 12/19/16 | | 10,171 | | — | |
| Toppan Printing Co. Ltd | LIBOR + 90 | DBAB | 29,952,999 | | JPY | 12/19/16 | | 739 | | — | |
| Yamagata Bank Ltd | LIBOR + 90 | DBAB | 2,852,500 | | | 12/19/16 | | — | | (5,109 | ) |
| Yamaguchi Financial Group Inc | LIBOR + 90 | DBAB | 4,291,950 | | | 12/19/16 | | 34,630 | | — | |
| APERAM SA | LIBOR + 90 | DBAB | 249,271 | | | 1/18/17 | | — | | (2,915 | ) |
| CEZ MH BV | LIBOR + 90 | DBAB | 834,490 | EUR | 1/18/17 | | 4,177 | | — | |
| Dana Gas Sukuk Ltd | LIBOR + 90 | DBAB | 119,236 | | | 1/18/17 | | 2,932 | | — | |
| Magyar Nemzeti Vagyonkezelo ZRT | LIBOR + 90 | DBAB | 1,757,985 | EUR | 1/18/17 | | — | | (20,428 | ) |
| ACS Actividades Finance BV | LIBOR + 90 | DBAB | 1,661,272 | EUR | 2/09/17 | | 12,885 | | — | |
| Green Plains Inc | LIBOR + 100 | DBAB | 290,973 | | | 2/09/17 | | 69,450 | | — | |
| OCI NV | LIBOR + 90 | DBAB | 1,502,281 | EUR | 2/09/17 | | 63,855 | | — | |
| DP World Ltd | LIBOR + 90 | DBAB | 199,939 | | | 2/17/17 | | — | | (2,227 | ) |
| Shenzhou International Group | | | | | | | | | | | |
| Holdings Ltd | LIBOR + 90 | DBAB | 31,699,667 | HKD | 2/17/17 | | 10,213 | | — | |
| Larsen & Toubro Ltd | LIBOR + 150 | DBAB | 141,896 | | | 2/20/17 | | — | | (1,794 | ) |
| Industrivarden AB | LIBOR + 90 | DBAB | 3,051,224 | EUR | 2/27/17 | | — | | (5,264 | ) |
| PT Jersey Ltd | LIBOR + 90 | DBAB | 1,481,517 | EUR | 2/27/17 | | — | | (39,341 | ) |
| Golar LNG Ltd | LIBOR + 80 | BNPP | 303,560 | | | 3/07/17 | | — | | (1,339 | ) |
| Golar LNG Ltd | LIBOR + 90 | DBAB | 1,799,630 | | | 3/07/17 | | 12,894 | | — | |
| Fonciere Des Regions | LIBOR + 90 | DBAB | 1,246,774 | EUR | 3/15/17 | | — | | (21,421 | ) |
| Premier Oil Finance Jersey Ltd | LIBOR + 90 | DBAB | 485,560 | | | 3/17/17 | | 14,179 | | — | |
| Elekta AB | STIBOR + 50 | BNPP | 13,866,159 | SEK | 4/25/17 | | — | | (5,312 | ) |
| NH Hotel Group SA | LIBOR + 90 | DBAB | 988,180 | EUR | 4/25/17 | | — | | (21,176 | ) |
| AYC Finance Ltd | LIBOR + 90 | DBAB | 401,083 | | | 5/17/17 | | 11,852 | | — | |
| ENN Energy Holdings Ltd | LIBOR + 90 | DBAB | 256,133 | | | 5/17/17 | | 1,535 | | — | |
| Parpublica-Participacoes Publicas | | | | | | | | | | | |
| SGPS SA | LIBOR + 90 | DBAB | 577,935 | EUR | 6/06/17 | | 2,449 | | — | |
| Resorttrust Inc | LIBOR + 90 | DBAB | 10,317,500 | | JPY | 6/19/17 | | 2,112 | | — | |
| Siem Industries Inc | LIBOR + 90 | DBAB | 4,686,264 | EUR | 6/19/17 | | 45,549 | | — | |
| Aabar Investments PJSC | LIBOR + 90 | DBAB | 481,387 | EUR | 7/19/17 | | — | | (10,541 | ) |
| Aabar Investments PJSC | LIBOR + 90 | DBAB | 501,340 | EUR | 7/19/17 | | — | | (408 | ) |
| Alstria Office REIT AG | LIBOR + 90 | DBAB | 2,247,003 | EUR | 7/19/17 | | 72,122 | | — | |
| Aroundtown Property Holdings PLC | LIBOR + 90 | DBAB | 490,974 | EUR | 7/19/17 | | 24,789 | | — | |
| British Land Jersey Ltd | LIBOR + 90 | DBAB | 1,227,681 | GBP | 7/19/17 | | 4,316 | | — | |
| Carillion Finance White 2015 Ltd | LIBOR + 90 | DBAB | 1,078,306 | GBP | 7/19/17 | | 393 | | — | |
| Deutsche EuroShop AG | LIBOR + 90 | DBAB | 617,529 | EUR | 7/19/17 | | 384 | | — | |
| Deutsche Post AG | LIBOR + 90 | DBAB | 1,266,952 | EUR | 7/19/17 | | 28,052 | | — | |
franklintempleton.com
Semiannual Report 69
FRANKLIN ALTERNATIVE STRATEGIES FUNDS
CONSOLIDATED STATEMENT OF INVESTMENTS (UNAUDITED)
| | | | | | | | | | | |
| Total Return Swap Contracts (continued) | | | | | | | | | | |
| | | Counter- | | | | Expiration | | Unrealized | | Unrealized | |
| Underlying Instrument | Financing Rate | Party | Notional Value* | | | Date | | Appreciation | | Depreciation | |
| OTC Swap Contracts (continued) | | | | | | | | | | | |
| Fixed Income Contracts - Long (continued) | | | | | | | | | | |
| Deutsche Wohnen AG | LIBOR + 90 | DBAB | 1,897,718 | EUR | 7/19/17 | $ | 149,403 | $ | — | |
| Drillisch AG | LIBOR + 90 | DBAB | 3,448,952 | EUR | 7/19/17 | | — | | (82,724 | ) |
| Enterprise Funding Corp | LIBOR + 90 | DBAB | 170,333 | GBP | 7/19/17 | | 12,472 | | — | |
| Fresenius SE & Co KGaA | LIBOR + 90 | DBAB | 968,450 | EUR | 7/19/17 | | 17,969 | | — | |
| Great Portland Estates Capital | | | | | | | | | | | |
| Jersey Ltd | LIBOR + 90 | DBAB | 1,579,693 | GBP | 7/19/17 | | — | | (5,316 | ) |
| Hansteen Jersey Securities Ltd | LIBOR + 90 | DBAB | 1,519,163 | EUR | 7/19/17 | | 123,018 | | — | |
| Helical Bar Jersey Ltd | LIBOR + 90 | DBAB | 283,266 | GBP | 7/19/17 | | 10,551 | | — | |
| PHP Finance Jersey Ltd | LIBOR + 90 | DBAB | 578,698 | GBP | 7/19/17 | | — | | (5,388 | ) |
| Remgro Jersey GBP Ltd | LIBOR + 90 | DBAB | 493,418 | GBP | 7/19/17 | | — | | (2,424 | ) |
| Salzgitter Finance BV | LIBOR + 90 | DBAB | 463,080 | EUR | 7/19/17 | | — | | (5,586 | ) |
| St. Modwen Properties Securities | | | | | | | | | | | |
| Jersey Ltd | LIBOR + 90 | DBAB | 191,769 | GBP | 7/19/17 | | — | | (1,111 | ) |
| Steinhoff Finance Holding GmbH | LIBOR + 90 | DBAB | 1,081,888 | EUR | 7/19/17 | | 10,014 | | — | |
| Unite Jersey Issuer Ltd | LIBOR + 90 | DBAB | 2,281,159 | GBP | 7/19/17 | | — | | (4,929 | ) |
| Gulf Keystone Petroleum Ltd | LIBOR + 90 | DBAB | 192,500 | | | 7/20/17 | | — | | (4,970 | ) |
| America Movil SAB de CV | LIBOR + 90 | DBAB | 3,268,829 | EUR | 7/25/17 | | 25,711 | | — | |
| Klockner & Co. Financial | | | | | | | | | | | |
| Services SA | LIBOR + 90 | DBAB | 587,620 | EUR | 7/25/17 | | — | | (1,924 | ) |
| Apollo Commercial Real Estate | | | | | | | | | | | |
| Finance Inc | LIBOR + 75 | DBAB | 361,103 | | | 7/31/17 | | 5,230 | | — | |
| Colony Starwood Homes | LIBOR + 75 | DBAB | 680,051 | | | 7/31/17 | | 15,857 | | — | |
| DHT Holdings Inc | LIBOR + 75 | DBAB | 3,827,904 | | | 7/31/17 | | 119,464 | | — | |
| General Cable Corp | LIBOR + 75 | DBAB | 95,038 | | | 7/31/17 | | 6,244 | | — | |
| GPT Property Trust LP | LIBOR + 75 | DBAB | 523,717 | | | 7/31/17 | | 15,913 | | — | |
| Intel Corp | LIBOR + 75 | DBAB | 880,280 | | | 7/31/17 | | — | | (4,141 | ) |
| Pattern Energy Group Inc | LIBOR + 75 | DBAB | 254,610 | | | 7/31/17 | | 2,842 | | — | |
| Scorpio Tankers Inc | LIBOR + 75 | DBAB | 437,884 | | | 7/31/17 | | 15,740 | | — | |
| Ship Finance International Ltd | LIBOR + 75 | DBAB | 1,097,216 | | | 7/31/17 | | 40,543 | | — | |
| Spirit Realty Capital Inc | LIBOR + 75 | DBAB | 378,682 | | | 7/31/17 | | 5,009 | | — | |
| CEZ MH BV | EURIBOR + 50 | BNPP | 104,525 | EUR | 8/04/17 | | 317 | | — | |
| Cahaya Capital Ltd | LIBOR + 100 | DBAB | 1,947,500 | | | 8/17/17 | | — | | (21,674 | ) |
| Asia View Ltd | LIBOR + 90 | DBAB | 264,614 | | | 8/18/17 | | 2,361 | | — | |
| British Land Jersey Ltd | LIBOR + 80 | BNPP | 719,240 | GBP | 9/10/17 | | — | | (1,005 | ) |
| Advanced Semiconductor | | | | | | | | | | | |
| Engineering Inc | LIBOR + 100 | DBAB | 2,952,300 | | | 9/19/17 | | 64,845 | | — | |
| Indah Capital Ltd | LIBOR + 100 | DBAB | 821,813 | SGD | 9/19/17 | | 10,403 | | — | |
| Marine Harvest ASA | LIBOR + 90 | DBAB | 6,540,167 | EUR | 9/19/17 | | 437,325 | | — | |
| Siliconware Precision Industries | | | | | | | | | | | |
| Co. Ltd | LIBOR + 100 | DBAB | 3,416,563 | | | 9/19/17 | | 10,128 | | — | |
| Parpublica-Participacoes Publicas | | | | | | | | | | | |
| SGPS SA | EURIBOR + 80 | BNPP | 688,507 | EUR | 9/28/17 | | — | | (2,798 | ) |
| Outokumpu OYJ | LIBOR + 90 | DBAB | 1,377,107 | EUR | 10/02/17 | | — | | (1,474 | ) |
| SBI Holdings Inc | LIBOR + 90 | DBAB | 21,236,660 | | JPY | 11/02/17 | | 5,300 | | — | |
| Golden Ocean Group Ltd | LIBOR + 90 | DBAB | 759,252 | | | 11/07/17 | | 20,749 | | — | |
| Advantest Corp | LIBOR + 90 | DBAB | 89,170,000 | | JPY | 11/17/17 | | 15,741 | | — | |
| DCM Holdings Co. Ltd | LIBOR + 90 | DBAB | 93,345,000 | | JPY | 11/17/17 | | 48,376 | | — | |
| Ebara Corp | LIBOR + 90 | DBAB | 192,180,000 | | JPY | 11/17/17 | | — | | (21,789 | ) |
| EDION Corp | LIBOR + 90 | DBAB | 139,710,000 | | JPY | 11/17/17 | | 89,944 | | — | |
| Japan Airport Terminal Co. Ltd | LIBOR + 90 | DBAB | 201,700,000 | | JPY | 11/17/17 | | 4,231 | | — | |
| K’s Holdings Corp | LIBOR + 90 | DBAB | 555,006,080 | | JPY | 11/17/17 | | 208,023 | | — | |
| Kansai Paint Co. Ltd | LIBOR + 90 | DBAB | 133,098,290 | | JPY | 11/17/17 | | 378 | | — | |
| LIXIL Group Corp | LIBOR + 90 | DBAB | 61,537,500 | | JPY | 11/17/17 | | 6,052 | | — | |
| Maeda Corp | LIBOR + 90 | DBAB | 204,435,000 | | JPY | 11/17/17 | | 188,573 | | — | |
| Nagoya Railroad Co. Ltd | LIBOR + 90 | DBAB | 33,357,720 | | JPY | 11/17/17 | | 7,595 | | — | |
| Nippon Ceramic Co. Ltd | LIBOR + 90 | DBAB | 29,092,200 | | JPY | 11/17/17 | | 23,422 | | — | |
| Nippon Light Metal Holdings | | | | | | | | | | | |
| Co. Ltd | LIBOR + 90 | DBAB | 697,906,250 | | JPY | 11/17/17 | | 276,430 | | — | |
| OSG Corp | LIBOR + 90 | DBAB | 176,130,000 | | JPY | 11/17/17 | | — | | (41,673 | ) |
70 Semiannual Report
franklintempleton.com
FRANKLIN ALTERNATIVE STRATEGIES FUNDS
CONSOLIDATED STATEMENT OF INVESTMENTS (UNAUDITED)
| | | | | | | | | | |
| Total Return Swap Contracts (continued) | | | | | | | | | |
| | | Counter- | | | Expiration | | Unrealized | | Unrealized | |
| Underlying Instrument | Financing Rate | Party | Notional Value* | | Date | | Appreciation | | Depreciation | |
| OTC Swap Contracts (continued) | | | | | | | | | | |
| Fixed Income Contracts - Long (continued) | | | | | | | | | | |
| Sankyo Co. Ltd | LIBOR + 90 | DBAB | 110,000,000 | JPY | 11/17/17 | $ | 7,378 | $ | — | |
| Shionogi & Co. Ltd | LIBOR + 90 | DBAB | 82,050,000 | JPY | 11/17/17 | | 8,288 | | — | |
| Suzuki Motor Corp | LIBOR + 90 | DBAB | 69,079,980 | JPY | 11/17/17 | | — | | (2,208 | ) |
| Teijin Ltd | LIBOR + 90 | DBAB | 270,595,000 | JPY | 11/17/17 | | 82,426 | | — | |
| Terumo Corp | LIBOR + 90 | DBAB | 153,681,710 | JPY | 11/17/17 | | 25,507 | | — | |
| Toho Holdings Co. Ltd | LIBOR + 90 | DBAB | 146,412,500 | JPY | 11/17/17 | | 36,512 | | — | |
| Tohoku Electric Power Co. Inc | LIBOR + 90 | DBAB | 209,335,833 | JPY | 11/17/17 | | 18,654 | | — | |
| Tohoku Electric Power Co. Inc | LIBOR + 90 | DBAB | 210,044,310 | JPY | 11/17/17 | | 31,136 | | — | |
| Toppan Printing Co. Ltd | LIBOR + 90 | DBAB | 97,200,000 | JPY | 11/17/17 | | 22,929 | | — | |
| Unicharm Corp | LIBOR + 90 | DBAB | 116,390,000 | JPY | 11/17/17 | | 15,926 | | — | |
| Yamada Denki Co. Ltd | LIBOR + 90 | DBAB | 717,176,250 | JPY | 11/17/17 | | 413,023 | | — | |
| AYC Finance Ltd | LIBOR + 100 | BNPP | 1,209,450 | | 11/29/17 | | 29,925 | | — | |
| Enterprise Funding Ltd | LIBOR + 80 | BNPP | 89,456 | GBP | 11/29/17 | | 909 | | — | |
| Fresenius SE & Co. KGaA | EURIBOR + 80 | BNPP | 418,381 | EUR | 11/29/17 | | 4,249 | | — | |
| RAG-Stiftung | EURIBOR + 80 | BNPP | 1,214,080 | EUR | 11/29/17 | | — | | (1,599 | ) |
| Sacyr SA | EURIBOR + 50 | BNPP | 247,023 | EUR | 11/29/17 | | — | | (132 | ) |
| ENN Energy Holdings Ltd | LIBOR + 90 | BNPP | 255,625 | | 11/30/17 | | 2,187 | | — | |
| General Cable Corp | LIBOR + 75 | BNPP | 147,653 | | 11/30/17 | | 1,255 | | — | |
| Lam Research Corp | LIBOR + 75 | BNPP | 1,036,773 | | 11/30/17 | | — | | (11,844 | ) |
| Terumo Corp | LIBOR + 75 | BNPP | 35,998,890 | JPY | 11/30/17 | | — | | (6,230 | ) |
| Suzuki Motor Corp | LIBOR + 75 | BNPP | 206,730,000 | JPY | 12/01/17 | | — | | (1,573 | ) |
| Takashimaya Co. Ltd | LIBOR + 75 | BNPP | 31,716,210 | JPY | 12/27/17 | | — | | (589 | ) |
| Toray Industries Inc | LIBOR + 75 | BNPP | 37,475,490 | JPY | 12/27/17 | | — | | (2,552 | ) |
| CapitaLand Ltd | SIBOR + 90 | BNPP | 1,492,359 | SGD | 12/28/17 | | 1,478 | | — | |
| Senko Co. Ltd | LIBOR + 75 | BNPP | 69,754,685 | JPY | 12/28/17 | | 11,978 | | — | |
| Terumo Corp | LIBOR + 75 | BNPP | 36,815,640 | JPY | 12/28/17 | | — | | (5,830 | ) |
| America Movil SAB de CV | EURIBOR + 80 | BNPP | 192,660 | EUR | 12/29/17 | | 1,150 | | — | |
| Deutsche Post AG | EURIBOR + 80 | BNPP | 286,220 | EUR | 12/29/17 | | 1,332 | | — | |
| J Sainsbury PLC | LIBOR + 80 | BNPP | 303,923 | GBP | 12/29/17 | | — | | (1,873 | ) |
| Magyar Nemzeti Vagyonkezelo ZRT | EURIBOR + 80 | BNPP | 581,980 | EUR | 12/29/17 | | — | | (2,423 | ) |
| DP World Ltd | LIBOR + 80 | BNPP | 198,802 | | 1/29/18 | | — | | (992 | ) |
| Janus Capital Group Inc | LIBOR + 75 | CITI | 708,205 | | 5/29/18 | | 32,319 | | — | |
| | | | | | | | 3,177,988 | | (384,046 | ) |
| |
| OTC Swap Contracts | | | | | | | | | | |
| Fixed Income Contracts - Short | | | | | | | | | | |
| iBoxx USD Liquid Investment Grade Index | LIBOR | JPHQ | 3,028,000 | | 12/20/16 | | 87,878 | | — | |
| iBoxx USD Liquid Investment Grade Index | LIBOR | JPHQ | 2,850,000 | | 12/20/16 | | 77,577 | | — | |
| iBoxx USD Liquid Investment Grade Index | LIBOR | JPHQ | 3,028,000 | | 12/20/16 | | 83,716 | | — | |
| iBoxx USD Liquid Investment Grade Index | LIBOR | JPHQ | 1,304,000 | | 3/20/17 | | 3,021 | | — | |
| iBoxx USD Liquid Investment Grade Index | LIBOR | JPHQ | 3,028,000 | | 3/20/17 | | 87,878 | | — | |
| iBoxx USD Liquid Investment Grade Index | LIBOR | JPHQ | 3,028,000 | | 3/20/17 | | 83,716 | | — | |
| iBoxx USD Liquid Investment Grade Index | LIBOR | JPHQ | 1,514,000 | | 3/20/17 | | 37,335 | | — | |
| iBoxx USD Liquid Investment Grade Index | LIBOR | MSCS | 1,491,000 | | 3/20/17 | | 17,501 | | — | |
| iBoxx USD Liquid Investment Grade Index | LIBOR | MSCS | 2,850,000 | | 3/20/17 | | 78,795 | | — | |
| iBoxx USD Liquid Investment Grade Index | LIBOR | MSCS | 1,491,000 | | 3/20/17 | | 14,720 | | — | |
| | | | | | | | 572,137 | | — | |
| Total Return Swap Contracts | | | | | | $ | 8,341,105 | $ | (4,091,645 | ) |
| Net unrealized appreciation (depreciation) | | | | | $ | 4,249,460 | | | |
| |
| *In U.S. dollars unless otherwise indicated. | | | | | | | | | | |
| |
| See Abbreviations on page 91. | | | | | | | | | | |
franklintempleton.com
Semiannual Report 71
FRANKLIN ALTERNATIVE STRATEGIES FUNDS
Consolidated Financial Statements
Consolidated Statement of Assets and Liabilities
November 30, 2016 (unaudited)
| | | |
| Franklin K2 Alternative Strategies Fund | | | |
| |
| Assets: | | | |
| Investments in securities: | | | |
| Cost - Unaffiliated issuers | $ | 1,007,420,934 | |
| Cost - Repurchase agreements | | 32,842,067 | |
| Total cost of investments | $ | 1,040,263,001 | |
| Value - Unaffiliated issuers | $ | 1,072,303,211 | |
| Value - Repurchase agreements | | 32,842,067 | |
| Total value of investments | | 1,105,145,278 | |
| Cash | | 52,950,722 | |
| Foreign currency, at value (cost $1,052,824) | | 1,010,021 | |
| Receivables: | | | |
| Investment securities sold | | 26,859,280 | |
| Capital shares sold | | 2,216,153 | |
| Dividends and interest | | 5,242,866 | |
| Due from brokers | | 224,558,707 | |
| OTC swap contracts (upfront payments $142,158) | | 138,590 | |
| Unrealized appreciation on OTC forward exchange contracts | | 10,967,937 | |
| Unrealized appreciation on OTC swap contracts | | 8,460,495 | |
| Unrealized appreciation on unfunded loan commitments (Note 8) | | 12,345 | |
| Other assets | | 316 | |
| Total assets | | 1,437,562,710 | |
| Liabilities: | | | |
| Payables: | | | |
| Investment securities purchased | | 22,618,835 | |
| Capital shares redeemed | | 11,197,378 | |
| Management fees | | 1,578,893 | |
| Distribution fees | | 71,697 | |
| Transfer agent fees | | 94,403 | |
| Trustees’ fees and expenses | | 53,704 | |
| Variation margin | | 412,327 | |
| OTC swap contracts (upfront receipts $65,649) | | 45,502 | |
| Options written, at value (premiums received $325,311) | | 221,653 | |
| Securities sold short, at value (proceeds $264,128,766) | | 274,134,512 | |
| Due to brokers | | 3,717,957 | |
| Unrealized depreciation on OTC forward exchange contracts | | 7,426,180 | |
| Unrealized depreciation on OTC swap contracts | | 4,367,076 | |
| Accrued expenses and other liabilities | | 327,274 | |
| Total liabilities | | 326,267,391 | |
| Net assets, at value | $ | 1,111,295,319 | |
| Net assets consist of: | | | |
| Paid-in capital | $ | 1,100,387,050 | |
| Undistributed net investment income | | 3,461,654 | |
| Net unrealized appreciation (depreciation) | | 62,475,178 | |
| Accumulated net realized gain (loss) | | (55,028,563 | ) |
| Net assets, at value | $ | 1,111,295,319 | |
72 Semiannual Report | The accompanying notes are an integral part of these financial statements.
franklintempleton.com
FRANKLIN ALTERNATIVE STRATEGIES FUNDS
CONSOLIDATED FINANCIAL STATEMENTS
Consolidated Statement of Assets and Liabilities (continued)
November 30, 2016 (unaudited)
| | |
| Franklin K2 Alternative Strategies Fund | | |
| |
| Class A: | | |
| Net assets, at value | $ | 142,705,095 |
| Shares outstanding | | 13,275,902 |
| Net asset value per sharea | $ | 10.75 |
| Maximum offering price per share (net asset value per share ÷ 94.25%) | $ | 11.41 |
| Class C: | | |
| Net assets, at value | $ | 61,465,341 |
| Shares outstanding | | 5,793,560 |
| Net asset value and maximum offering price per sharea | $ | 10.61 |
| Class R: | | |
| Net assets, at value | $ | 495,084 |
| Shares outstanding | | 45,861 |
| Net asset value and maximum offering price per share | $ | 10.80 |
| Class R6: | | |
| Net assets, at value | $ | 257,954,795 |
| Shares outstanding | | 23,879,436 |
| Net asset value and maximum offering price per share | $ | 10.80 |
| Advisor Class: | | |
| Net assets, at value | $ | 648,675,004 |
| Shares outstanding | | 60,124,472 |
| Net asset value and maximum offering price per share | $ | 10.79 |
aRedemption price is equal to net asset value less contingent deferred sales charges, if applicable.
franklintempleton.com
The accompanying notes are an integral part of these financial statements. | Semiannual Report 73
FRANKLIN ALTERNATIVE STRATEGIES FUNDS
CONSOLIDATED FINANCIAL STATEMENTS
| | | |
| Consolidated Statement of Operations | | | |
| for the six months ended November 30, 2016 (unaudited) | | | |
| |
| Franklin K2 Alternative Strategies Fund | | | |
| |
| Investment income: | | | |
| Dividends | $ | 2,010,121 | |
| Interest | | 13,743,522 | |
| Total investment income | | 15,753,643 | |
| Expenses: | | | |
| Management fees (Note 3a) | | 12,148,416 | |
| Distribution fees: (Note 3c) | | | |
| Class A | | 196,042 | |
| Class C | | 320,863 | |
| Class R | | 876 | |
| Transfer agent fees: (Note 3e) | | | |
| Class A | | 70,722 | |
| Class C | | 30,493 | |
| Class R | | 158 | |
| Class R6 | | 530 | |
| Advisor Class | | 311,795 | |
| Custodian fees (Note 4) | | 99,659 | |
| Reports to shareholders | | 51,641 | |
| Registration and filing fees | | 123,612 | |
| Professional fees | | 218,005 | |
| Trustees’ fees and expenses | | 265,038 | |
| Dividends and/or interest on securities sold short | | 2,022,939 | |
| Security borrowing fees | | 1,230,651 | |
| Other | | 167,731 | |
| Total expenses | | 17,259,171 | |
| Expense reductions (Note 4) | | (100,208 | ) |
| Expenses waived/paid by affiliates (Note 3f) | | (1,919,253 | ) |
| Net expenses | | 15,239,710 | |
| Net investment income | | 513,933 | |
| Realized and unrealized gains (losses): | | | |
| Net realized gain (loss) from: | | | |
| Investments | | 23,866,237 | |
| Written options | | 1,645,354 | |
| Foreign currency transactions | | 1,457,380 | |
| Futures contracts | | (5,639,569 | ) |
| Securities sold short | | (14,104,520 | ) |
| Swap contracts | | (147,876 | ) |
| Net realized gain (loss) | | 7,077,006 | |
| Net change in unrealized appreciation (depreciation) on: | | | |
| Investments | | 10,905,731 | |
| Translation of other assets and liabilities denominated in foreign currencies | | 3,494,612 | |
| Written options | | (135,917 | ) |
| Futures contracts | | (988,191 | ) |
| Swap contracts | | 2,768,339 | |
| Net change in unrealized appreciation (depreciation) | | 16,044,574 | |
| Net realized and unrealized gain (loss) | | 23,121,580 | |
| Net increase (decrease) in net assets resulting from operations | $ | 23,635,513 | |
74 Semiannual Report | The accompanying notes are an integral part of these financial statements.
franklintempleton.com
FRANKLIN ALTERNATIVE STRATEGIES FUNDS
CONSOLIDATED FINANCIAL STATEMENTS
| | | | | | |
| Consolidated Statements of Changes in Net Assets | | | | | | |
| |
| Franklin K2 Alternative Strategies Fund | | | | | | |
| |
| | | Six Months Ended | | | | |
| | | November 30, 2016 | | | Year Ended | |
| | | (unaudited) | | | May 31, 2016 | |
| Increase (decrease) in net assets: | | | | | | |
| Operations: | | | | | | |
| Net investment income (loss) | $ | 513,933 | | $ | (2,799,208 | ) |
| Net realized gain (loss) | | 7,077,006 | | | (53,359,785 | ) |
| Net change in unrealized appreciation (depreciation) | | 16,044,574 | | | 18,801,300 | |
| Net increase (decrease) in net assets resulting from operations | | 23,635,513 | | | (37,357,693 | ) |
| Distributions to shareholders from: | | | | | | |
| Class A | | — | | | (2,592,416 | ) |
| Class C | | — | | | (644,384 | ) |
| Class R6 | | — | | | (4,016,413 | ) |
| Advisor Class | | — | | | (10,110,090 | ) |
| Net realized gains: | | | | | | |
| Class A | | — | | | (696,387 | ) |
| Class C | | — | | | (262,371 | ) |
| Class R | | — | | | (1,174 | ) |
| Class R6 | | — | | | (894,391 | ) |
| Advisor Class | | — | | | (2,315,995 | ) |
| Total distributions to shareholders | | — | | | (21,533,621 | ) |
| Capital share transactions: (Note 2) | | | | | | |
| Class A | | (37,815,538 | ) | | 38,612,258 | |
| Class C | | (10,747,452 | ) | | 37,013,071 | |
| Class R | | 148,393 | | | (8,810,100 | ) |
| Class R6 | | (12,932,373 | ) | | 39,418,868 | |
| Advisor Class | | (87,633,266 | ) | | 424,302,558 | |
| Total capital share transactions | | (148,980,236 | ) | | 530,536,655 | |
| Net increase (decrease) in net assets | | (125,344,723 | ) | | 471,645,341 | |
| Net assets: | | | | | | |
| Beginning of period | | 1,236,640,042 | | | 764,994,701 | |
| End of period | $ | 1,111,295,319 | | $ | 1,236,640,042 | |
| Undistributed net investment income included in net assets: | | | | | | |
| End of period | $ | 3,461,654 | | $ | 2,947,721 | |
franklintempleton.com
The accompanying notes are an integral part of these financial statements. | Semiannual Report 75
FRANKLIN ALTERNATIVE STRATEGIES FUNDS
Notes to Consolidated Financial Statements (unaudited)
Franklin K2 Alternative Strategies Fund
1. Organization and Significant Accounting Policies
Franklin Alternative Strategies Funds (Trust) is registered under the Investment Company Act of 1940 (1940 Act) as an open-end management investment company, consisting of four separate funds and applies the specialized accounting and reporting guidance in U.S. Generally Accepted Accounting Principles (U.S. GAAP). Franklin K2 Alternative Strategies Fund (Fund) is included in this report. The financial statements of the remaining funds in the Trust are presented separately. The Fund offers five classes of shares: Class A, Class C, Class R, Class R6 and Advisor Class. Each class of shares differs by its initial sales load, contingent deferred sales charges, voting rights on matters affecting a single class, its exchange privilege and fees primarily due to differing arrangements for distribution and transfer agent fees.
The following summarizes the Fund’s significant accounting policies.
a. Financial Instrument Valuation
The Fund’s investments in financial instruments are carried at fair value daily. Fair value is the price that would be received to sell an asset or paid to transfer a liability in an orderly transaction between market participants on the measurement date. The Fund calculates the net asset value (NAV) per share as of 4 p.m. Eastern time each day the New York Stock Exchange (NYSE) is open for trading. Under compliance policies and procedures approved by the Trust’s Board of Trustees (the Board), the Fund’s administrator has responsibility for oversight of valuation, including leading the cross-functional Valuation Committee (VC). The VC provides administration and oversight of the Fund’s valuation policies and procedures, which are approved annually by the Board. Among other things, these procedures allow the Fund to utilize independent pricing services, quotations from securities and financial instrument dealers, and other market sources to determine fair value.
Equity securities, exchange traded funds and derivative financial instruments (derivatives) listed on an exchange or on the NASDAQ National Market System are valued at the last quoted sale price or the official closing price of the day, respectively. Foreign equity securities are valued as of the close of trading on the foreign stock exchange on which the security is primarily traded or as of 4 p.m. Eastern time. The value is then converted into its U.S. dollar equivalent at the foreign exchange rate in effect at 4 p.m. Eastern time on the day that the value of the security is determined. Over-the-counter (OTC) securities are valued within the range of the most recent quoted bid and ask prices. Securities that trade in multiple markets or on multiple exchanges are valued according to the broadest and most representative market. Certain equity securities are valued based upon fundamental characteristics or relationships to similar securities.
Debt securities generally trade in the OTC market rather than on a securities exchange. The Fund’s pricing services use multi ple valuation techniques to determine fair value. In instances where sufficient market activity exists, the pricing services may utilize a market-based approach through which quotes from market makers are used to determine fair value. In instances where sufficient market activity may not exist or is limited, the pricing services also utilize proprietary valuation models which may consider market characteristics such as benchmark yield curves, credit spreads, estimated default rates, anticipated mar ket interest rate volatility, coupon rates, anticipated timing of principal repayments, underlying collateral, and other unique security features in order to estimate the relevant cash flows, which are then discounted to calculate the fair value. Securities denominated in a foreign currency are converted into their U.S. dollar equivalent at the foreign exchange rate in effect at 4 p.m. Eastern time on the date that the values of the foreign debt securities are determined.
Investments in open-end mutual funds are valued at the closing NAV. Investments in repurchase agreements are valued at cost, which approximates fair value.
Certain derivatives trade in the OTC market. The Fund’s pricing services use various techniques including industry standard option pricing models and proprietary discounted cash flow models to determine the fair value of those instruments. The Fund’s net benefit or obligation under the derivative contract, as measured by the fair value of the contract, is included in net assets.
The Fund has procedures to determine the fair value of financial instruments for which market prices are not reliable or readily available. Under these procedures, the VC convenes on a regular basis to review such financial instruments and considers a number of factors, including significant unobservable valuation inputs, when arriving at fair value. The VC primarily employs a market-based approach which may use related or comparable assets or liabilities, recent transactions, market multiples, book values, and other relevant information for the
76 Semiannual Report
franklintempleton.com
FRANKLIN ALTERNATIVE STRATEGIES FUNDS
NOTES TO CONSOLIDATED FINANCIAL STATEMENTS (UNAUDITED)
Franklin K2 Alternative Strategies Fund (continued)
investment to determine the fair value of the investment. An income-based valuation approach may also be used in which the anticipated future cash flows of the investment are discounted to calculate fair value. Discounts may also be applied due to the nature or duration of any restrictions on the disposition of the investments. Due to the inherent uncertainty of valuations of such investments, the fair values may differ significantly from the values that would have been used had an active market existed. The VC employs various methods for calibrating these valuation approaches including a regular review of key inputs and assumptions, transactional back-testing or disposition analysis, and reviews of any related market activity.
Trading in securities on foreign securities stock exchanges and OTC markets may be completed before 4 p.m. Eastern time. In addition, trading in certain foreign markets may not take place on every Fund’s business day. Occasionally, events occur between the time at which trading in a foreign security is completed and 4 p.m. Eastern time that might call into question the reliability of the value of a portfolio security held by the Fund. As a result, differences may arise between the value of the Fund’s portfolio securities as determined at the foreign market close and the latest indications of value at 4 p.m. Eastern time. In order to minimize the potential for these differences, the VC monitors price movements following the close of trading in foreign stock markets through a series of country specific market proxies (such as baskets of American Depositary Receipts, futures contracts and exchange traded funds). These price movements are measured against established trigger thresholds for each specific market proxy to assist in determining if an event has occurred that may call into question the reliability of the values of the foreign securities held by the Fund. If such an event occurs, the securities may be valued using fair value procedures, which may include the use of independent pricing services.
When the last day of the reporting period is a non-business day, certain foreign markets may be open on those days that the Fund’s NAV is not calculated, which could result in differences between the value of the Fund’s portfolio securities on the last business day and the last calendar day of the reporting period. Any significant security valuation changes due to an open foreign market are adjusted and reflected by the Fund for financial reporting purposes.
b. Foreign Currency Translation
Portfolio securities and other assets and liabilities denominated in foreign currencies are translated into U.S. dollars based on the exchange rate of such currencies against U.S. dollars on the date of valuation. The Fund may enter into foreign currency exchange contracts to facilitate transactions denominated in a foreign currency. Purchases and sales of securities, income and expense items denominated in foreign currencies are translated into U.S. dollars at the exchange rate in effect on the transaction date. Portfolio securities and assets and liabilities denominated in foreign currencies contain risks that those currencies will decline in value relative to the U.S. dollar. Occasionally, events may impact the availability or reliability of foreign exchange rates used to convert the U.S. dollar equivalent value. If such an event occurs, the foreign exchange rate will be valued at fair value using procedures established and approved by the Board.
The Fund does not separately report the effect of changes in foreign exchange rates from changes in market prices on securities held. Such changes are included in net realized and unrealized gain or loss from investments in the Consolidated Statement of Operations.
Realized foreign exchange gains or losses arise from sales of foreign currencies, currency gains or losses realized between the trade and settlement dates on securities transactions and the difference between the recorded amounts of dividends, interest, and foreign withholding taxes and the U.S. dollar equivalent of the amounts actually received or paid. Net unrealized foreign exchange gains and losses arise from changes in foreign exchange rates on foreign denominated assets and liabilities other than investments in securities held at the end of the reporting period.
c. Joint Repurchase Agreement
The Fund enters into a joint repurchase agreement whereby its uninvested cash balance is deposited into a joint cash account with other funds managed by the investment manager or an affiliate of the investment manager and is used to invest in one or more repurchase agreements. The value and face amount of the joint repurchase agreement are allocated to the funds based on their pro-rata interest. A repurchase agreement is accounted for as a loan by the Fund to the seller, collateralized by securities which are delivered to the Fund’s custodian. The fair value, including accrued interest, of the initial collateralization is required to be at least 102% of the dollar amount invested by the funds, with the value of the underlying securities marked to market daily to maintain coverage of at least 100%. Repurchase agreements are subject to the terms of Master Repurchase Agreements (MRAs) with approved counterparties (sellers).
franklintempleton.com
Semiannual Report 77
NOTES TO CONSOLIDATED FINANCIAL STATEMENTS (UNAUDITED)
Franklin K2 Alternative Strategies Fund (continued)
1. Organization and Significant Accounting
Policies (continued)
c. Joint Repurchase Agreement (continued)
The MRAs contain various provisions, including but not limited to events of default and maintenance of collateral for repurchase agreements. In the event of default by either the seller or the Fund, certain MRAs may permit the non-defaulting party to net and close-out all transactions, if any, traded under such agreements. The Fund may sell securities it holds as collateral and apply the proceeds towards the repurchase price and any other amounts owed by the seller to the Fund in the event of default by the seller. This could involve costs or delays in addition to a loss on the securities if their value falls below the repurchase price owed by the seller. The joint repurchase agreement held by the Fund at period end, as indicated in the Consolidated Statement of Investments, had been entered into on November 30, 2016.
d. Securities Purchased on a Delayed Delivery Basis
The Fund purchases securities on a delayed delivery basis, with payment and delivery scheduled for a future date. These transactions are subject to market fluctuations and are subject to the risk that the value at delivery may be more or less than the trade date purchase price. Although the Fund will generally purchase these securities with the intention of holding the securities, it may sell the securities before the settlement date. Sufficient assets have been segregated for these securities.
e. Derivative Financial Instruments
The Fund invested in derivatives in order to manage risk and/or gain exposure to various other investments or markets. Derivatives are financial contracts based on an underlying or notional amount, require no initial investment or an initial net investment that is smaller than would normally be required to have a similar response to changes in market factors, and require or permit net settlement. Derivatives contain various risks including the potential inability of the counterparty to fulfill their obligations under the terms of the contract, the potential for an illiquid secondary market, and/or the potential for market movements which expose the Fund to gains or losses in excess of the amounts shown in the Consolidated Statement of Assets and Liabilities. Realized gain and loss and unrealized appreciation and depreciation on these contracts for the period are included in the Consolidated Statement of Operations.
Derivative counterparty credit risk is managed through a formal evaluation of the creditworthiness of all potential counterparties.
The Fund attempts to reduce its exposure to counterparty credit risk on OTC derivatives, whenever possible, by entering into International Swaps and Derivatives Association (ISDA) master agreements with certain counterparties. These agreements contain various provisions, including but not limited to collateral requirements, events of default, or early termination. Termination events applicable to the counterparty include certain deteriorations in the credit quality of the counterparty. Termination events applicable to the Fund include failure of the Fund to maintain certain net asset levels and/or limit the decline in net assets over various periods of time. In the event of default or early termination, the ISDA master agreement gives the non-defaulting party the right to net and close-out all transactions traded, whether or not arising under the ISDA agreement, to one net amount payable by one counterparty to the other. However, absent an event of default or early termination, OTC derivative assets and liabilities are presented gross and not offset in the Consolidated Statement of Assets and Liabilities. Early termination by the counterparty may result in an immediate payment by the Fund of any net liability owed to that counterparty under the ISDA agreement.
Collateral requirements differ by type of derivative. Collateral or initial margin requirements are set by the broker or exchange clearing house for exchange traded and centrally cleared derivatives. Initial margin deposited is held at the exchange and can be in the form of cash and/or securities. For OTC derivatives traded under an ISDA master agreement, posting of collateral is required by either the Fund or the applicable counterparty if the total net exposure of all OTC derivatives with the applicable counterparty exceeds the minimum transfer amount, which typically ranges from $100,000 to $250,000, and can vary depending on the counterparty and the type of the agreement. Generally, collateral is determined at the close of Fund business each day and any additional collateral required due to changes in derivative values may be delivered by the Fund or the coun-terparty within a few business days. Collateral pledged and/or received by the Fund for OTC derivatives, if any, is held in segregated accounts with the Fund’s custodian/counterparty broker and can be in the form of cash and/or securities. Unrestricted cash may be invested according to the Fund’s investment objectives. To the extent that the amounts due to the Fund from its counterparties are not subject to collateralization or are not fully collateralized, the Fund bears the risk of loss from counterparty non-performance.
The Fund entered into exchange traded futures contracts primarily to manage and/or gain exposure to commodity price,
78 Semiannual Report
franklintempleton.com
FRANKLIN ALTERNATIVE STRATEGIES FUNDS
NOTES TO CONSOLIDATED FINANCIAL STATEMENTS (UNAUDITED)
Franklin K2 Alternative Strategies Fund (continued)
interest rate, certain foreign currencies and equity price risk. A futures contract is an agreement between the Fund and a coun-terparty to buy or sell an asset at a specified price on a future date. Required initial margins are pledged by the Fund, and the daily change in fair value is accounted for as a variation margin payable or receivable in the Consolidated Statement of Assets and Liabilities.
The Fund entered into OTC forward exchange contracts primarily to manage and/or gain exposure to certain foreign currencies. A forward exchange contract is an agreement between the Fund and a counterparty to buy or sell a foreign currency at a specific exchange rate on a future date.
The Fund entered into credit default swap contracts primarily to manage and/or gain exposure to credit risk. A credit default swap is an agreement between the Fund and a counterparty whereby the buyer of the contract receives credit protection and the seller of the contract guarantees the credit worthiness of a referenced debt obligation. These agreements may be privately negotiated in the over-the-counter market (OTC credit default swaps) or may be executed in a multilateral trade facility platform, such as a registered exchange (centrally cleared credit default swaps). The underlying referenced debt obligation may be a single issuer of corporate or sovereign debt, a credit index, a basket of issuers or indices, or a tranche of a credit index or basket of issuers or indices. In the event of a default of the underlying referenced debt obligation, the buyer is entitled to receive the notional amount of the credit default swap contract from the seller in exchange for the referenced debt obligation, a net settlement amount equal to the notional amount of the credit default swap less the recovery value of the referenced debt obligation, or other agreed upon amount. For centrally cleared credit default swaps, required initial margins are pledged by the Fund, and the daily change in fair value is accounted for as a variation margin payable or receivable in the Consolidated Statement of Assets and Liabilities. Over the term of the contract, the buyer pays the seller a periodic stream of payments, provided that no event of default has occurred. Such periodic payments are accrued daily as an unrealized appreciation or depreciation until the payments are made, at which time they are realized. Upfront payments and receipts are reflected in the Consolidated Statement of Assets and Liabilities and represent compensating factors between stated terms of the credit default swap agreement and prevailing market conditions (credit spreads and other relevant factors). These upfront payments and receipts are amortized over the term of the contract as a realized gain or loss in the Consolidated Statement of Operations.
The Fund entered into interest rate swap contracts primarily to manage interest rate risk. An interest rate swap is an agreement between the Fund and a counterparty to exchange cash flows based on the difference between two interest rates, applied to a notional amount. These agreements may be privately negotiated in the over-the-counter market (OTC interest rate swaps) or may be executed on a registered exchange (centrally cleared interest rate swaps). For centrally cleared interest rate swaps, required initial margins are pledged by the Fund, and the daily change in fair value is accounted for as a variation margin payable or receivable in the Consolidated Statement of Assets and Liabilities. Over the term of the contract, contractually required payments to be paid and to be received are accrued daily and recorded as unrealized depreciation and appreciation until the payments are made, at which time they are realized.
The Fund entered into OTC total return swap contracts primarily to manage and/or gain exposure to interest rate, equity price and credit risk of an underlying instrument such as a stock, bond, index or basket of securities or indices. A total return swap is an agreement between the Fund and a counterparty to exchange a return linked to an underlying instrument for a floating or fixed rate payment, both based upon a notional amount. Over the term of the contract, contractually required payments to be paid or received are accrued daily and recorded as unrealized appreciation or depreciation until the payments are made, at which time they are recognized as realized gain or loss.
The Fund purchased or wrote exchange traded and/or OTC option contracts primarily to manage and/or gain exposure to equity price, interest rate and foreign exchange rate risk. An option is a contract entitling the holder to purchase or sell a specific amount of shares or units of an asset or notional amount of a swap (swaption), at a specified price. When an option is purchased or written, an amount equal to the premium paid or received is recorded as an asset or liability, respectively. Upon exercise of an option, the acquisition cost or sales proceeds of the underlying investment is adjusted by any premium received or paid. Upon expiration of an option, any premium received or paid is recorded as a realized gain or loss. Upon closing an option other than through expiration or exercise, the difference between the premium received or paid and the cost to close the position is recorded as a realized gain or loss.
See Notes 6 and 9 regarding investment transactions and other derivative information, respectively.
franklintempleton.com
Semiannual Report 79
FRANKLIN ALTERNATIVE STRATEGIES FUNDS
NOTES TO CONSOLIDATED FINANCIAL STATEMENTS (UNAUDITED)
Franklin K2 Alternative Strategies Fund (continued)
1. Organization and Significant Accounting Policies (continued)
f. Securities Sold Short
The Fund is engaged in selling securities short, which obligates the Fund to replace a borrowed security with the same security at current fair value. The Fund incurs a loss if the price of the security increases between the date of the short sale and the date on which the Fund replaces the borrowed security. The Fund realizes a gain if the price of the security declines between those dates. Gains are limited to the price at which the Fund sold the security short, while losses are potentially unlimited in size.
The Fund is required to establish a margin account with the broker lending the security sold short. While the short sale is outstanding, the broker retains the proceeds of the short sale to the extent necessary to meet margin requirements until the short position is closed out. A deposit must also be maintained with the Fund’s custodian/counterparty broker consisting of cash and/or securities having a value equal to a specified percentage of the value of the securities sold short. The Fund is obligated to pay fees for borrowing the securities sold short and is required to pay the counterparty any dividends and/or interest due on securities sold short. Such dividends and/or interest and any security borrowing fees are recorded as an expense to the Fund.
g. Investments in K2 Holdings Investment Corp. (K2 Subsidiary)
The Fund invests in certain financial instruments and commodity-linked derivative investments through its investment in the K2 Subsidiary. The K2 Subsidiary is a Cayman Islands exempted company with limited liability, is a wholly-owned subsidiary of the Fund, and is able to invest in certain financial instruments and commodity-linked derivative investments consistent with the investment objective of the Fund. At November 30, 2016, the K2 Subsidiary’s investments, as well as any other assets and liabilities of the K2 Subsidiary, are reflected in the Fund’s Consolidated Statement of Investments and Consolidated Statement of Assets and Liabilities. The financial statements have been consolidated and include the accounts of the Fund and the K2 Subsidiary. All inter-company transactions and balances have been eliminated. At November 30, 2016, the net assets of the K2 Subsidiary were $19,108,506, representing 1.7% of the Fund’s consolidated net assets. The Fund’s investment in the K2 Subsidiary is limited to 25% of consolidated assets.
The results from operations of the K2 Subsidiary, for the six months ended November 30, 2016, were as follows:
| | | |
| Net investment income (loss) | $ | (654,696 | ) |
| Net realized gain (loss) | | (3,066,189 | ) |
| Net change in unrealized appreciation (depreciation) | | 237,746 | |
| Net increase (decrease) in net assets resulting from operations | $ | (3,483,139 | ) |
h. Senior Floating Rate Interests
The Fund invests in senior secured corporate loans that pay interest at rates which are periodically reset by reference to a base lending rate plus a spread. These base lending rates are generally the prime rate offered by a designated U.S. bank or the London InterBank Offered Rate (LIBOR). Senior secured corporate loans often require prepayment of principal from excess cash flows or at the discretion of the borrower. As a result, actual maturity may be substantially less than the stated maturity. Senior secured corporate loans in which the Fund invests are generally readily marketable, but may be subject to certain restrictions on resale.
i. Income and Deferred Taxes
It is the Fund’s policy to qualify as a regulated investment company under the Internal Revenue Code. The Fund intends to distribute to shareholders substantially all of its taxable income and net realized gains to relieve it from federal income and excise taxes. As a result, no provision for U.S. federal income taxes is required.
The Fund may be subject to foreign taxation related to income received, capital gains on the sale of securities and certain foreign currency transactions in the foreign jurisdictions in which it invests. Foreign taxes, if any, are recorded based on the tax regulations and rates that exist in the foreign markets in which the Fund invests. When a capital gain tax is determined to apply, the Fund records an estimated deferred tax liability in an amount that would be payable if the securities were disposed of on the valuation date.
The Fund may recognize an income tax liability related to its uncertain tax positions under U.S. GAAP when the uncertain tax position has a less than 50% probability that it will be sustained upon examination by the tax authorities based on its technical merits. As of November 30, 2016, the Fund has determined that no tax liability is required in its consolidated financial statements related to uncertain tax positions for any open tax years (or expected to be taken in future tax years). Open tax years are those that remain subject to examination and are based on each tax jurisdiction’s statute of limitation.
80 Semiannual Report
franklintempleton.com
FRANKLIN ALTERNATIVE STRATEGIES FUNDS
NOTES TO CONSOLIDATED FINANCIAL STATEMENTS (UNAUDITED)
Franklin K2 Alternative Strategies Fund (continued)
j. Security Transactions, Investment Income, Expenses and Distributions
Security transactions are accounted for on trade date. Realized gains and losses on security transactions are determined on a specific identification basis. Interest income and estimated expenses are accrued daily. Amortization of premium and accretion of discount on debt securities are included in interest income. Dividend income and dividends declared on securities sold short are recorded on the ex-dividend date except for certain dividends from securities where the dividend rate is not available. In such cases, the dividend is recorded as soon as the information is received by the Fund. Distributions to shareholders are recorded on the ex-dividend date and are determined according to income tax regulations (tax basis). Distributable earnings determined on a tax basis may differ from earnings recorded in accordance with U.S. GAAP. These differences may be permanent or temporary. Permanent differences are reclassified among capital accounts to reflect their tax character. These reclassifications have no impact on net assets or the results of operations. Temporary differences are not reclassified, as they may reverse in subsequent periods.
Common expenses incurred by the Trust are allocated among the funds based on the ratio of net assets of each fund to the combined net assets of the Trust. Fund specific expenses are charged directly to the fund that incurred the expense.
Realized and unrealized gains and losses and net investment income, not including class specific expenses, are allocated daily to each class of shares based upon the relative proportion of net assets of each class. Differences in per share distributions, by class, are generally due to differences in class specific expenses.
k. Accounting Estimates
The preparation of financial statements in accordance with U.S. GAAP requires management to make estimates and assumptions that affect the reported amounts of assets and liabilities at the date of the financial statements and the amounts of income and expenses during the reporting period. Actual results could differ from those estimates.
l. Guarantees and Indemnifications
Under the Trust’s organizational documents, its officers and trustees are indemnified by the Trust against certain liabilities arising out of the performance of their duties to the Trust. Additionally, in the normal course of business, the Trust, on behalf of the Fund, enters into contracts with service providers that contain general indemnification clauses. The Trust’s maximum exposure under these arrangements is unknown as this would involve future claims that may be made against the Trust that have not yet occurred. Currently, the Trust expects the risk of loss to be remote.
2. Shares of Beneficial Interest
At November 30, 2016, there were an unlimited number of shares authorized (without par value). Transactions in the Fund’s shares were as follows:
| | | | | | | | | | | |
| | Six Months Ended | | Year Ended | |
| | November 30, 2016 | | May 31, 2016 | |
| | Shares | | | Amount | | Shares | | | Amount | |
| |
| Class A Shares: | | | | | | | | | | | |
| Shares sold | 1,581,025 | | $ | 16,950,993 | | 13,295,280 | | $ | 143,673,278 | |
| Shares issued in reinvestment of distributions | — | | | | — | | 298,189 | | | 3,172,727 | |
| Shares redeemed | (5,116,657 | ) | | (54,766,531 | ) | (10,133,166 | ) | | (108,233,747 | ) |
| Net increase (decrease) | (3,535,632 | ) | $ | (37,815,538 | ) | 3,460,303 | | $ | 38,612,258 | |
| Class C Shares: | | | | | | | | | | | |
| Shares sold | 370,319 | | | $ | 3,924,311 | | 5,119,256 | | $ | 55,145,221 | |
| Shares issued in reinvestment of distributions | — | | | | — | | 79,128 | | | 836,381 | |
| Shares redeemed | (1,384,483 | ) | | (14,671,763 | ) | (1,811,936 | ) | | (18,968,531 | ) |
| Net increase (decrease) | (1,014,164 | ) | $ | (10,747,452 | ) | 3,386,448 | | $ | 37,013,071 | |
| Class R Shares: | | | | | | | | | | | |
| Shares sold | 16,228 | | | $ | 175,444 | | 13,984 | | $ | 149,262 | |
| Shares issued in reinvestment of distributions | — | | | | — | | 106 | | | 1,140 | |
| Shares redeemed | (2,516 | ) | | | (27,051 | ) | (804,855 | ) | | (8,960,502 | ) |
| Net increase (decrease) | 13,712 | | | $ | 148,393 | | (790,765 | ) | $ | (8,810,100 | ) |
franklintempleton.com
Semiannual Report 81
FRANKLIN ALTERNATIVE STRATEGIES FUNDS
NOTES TO CONSOLIDATED FINANCIAL STATEMENTS (UNAUDITED)
| | | | | | | | | | |
| Franklin K2 Alternative Strategies Fund (continued) | | | | | | | | | | |
| |
| 2. Shares of Beneficial Interest (continued) | | | | | | | | | | |
| |
| | Six Months Ended | | Year Ended | |
| | November 30, 2016 | | May 31, 2016 | |
| |
| | Shares | | | Amount | | Shares | | | Amount | |
| Class R6 Shares: | | | | | | | | | | |
| Shares sold | 475,077 | | $ | 5,115,242 | | 5,337,514 | | $ | 57,004,431 | |
| Shares issued in reinvestment of distributions | — | | | — | | 459,924 | | | 4,902,787 | |
| Shares redeemed | (1,674,305 | ) | | (18,047,615 | ) | (2,155,223 | ) | | (22,488,350 | ) |
| Net increase (decrease) | (1,199,228 | ) | $ | (12,932,373 | ) | 3,642,215 | | $ | 39,418,868 | |
| Advisor Class Shares: | | | | | | | | | | |
| Shares sold | 8,864,618 | | $ | 95,367,258 | | 64,566,684 | | $ | 695,799,599 | |
| Shares issued in reinvestment of distributions | — | | | — | | 966,546 | | | 10,303,451 | |
| Shares redeemed | (17,010,490 | ) | | (183,000,524 | ) | (26,703,118 | ) | | (281,800,492 | ) |
| Net increase | (8,145,872 | ) | $ | (87,633,266 | ) | 38,830,112 | | $ | 424,302,558 | |
3. Transactions with Affiliates
Franklin Resources, Inc. is the holding company for various subsidiaries that together are referred to as Franklin Templeton Investments. Certain officers and trustees of the Trust are also officers and/or directors of the following subsidiaries:
| | |
| Subsidiary | | Affiliation |
| K2/D&S Management Co., L.L.C. (K2 Advisors) | | Investment manager |
| Franklin Templeton Services, LLC (FT Services) | | Administrative manager |
| Franklin Templeton Distributors, Inc. (Distributors) | | Principal underwriter |
| Franklin Templeton Investor Services, LLC (Investor Services) | | Transfer agent |
a. Management Fees
The Fund and K2 Subsidiary pay an investment management fee to K2 Advisors of 2.05% per year of the average daily net assets of the Fund and K2 Subsidiary. Management fees paid by the Fund are reduced on assets invested in the K2 Subsidiary, in an amount not to exceed the management fees paid by K2 Subsidiary.
Under each subadvisory agreement, the below entities provide subadvisory services to the Fund or K2 Subsidiary. The subadvisory fees are paid by K2 Advisors based on the Fund and K2 Subsidiary average daily net assets, and is not an additional expense of the Fund or K2 Subsidiary.
|
| Subadvisors |
| Basso Capital Management, L.P. |
| Chatham Asset Management, LLC |
| Chilton Investment Company, LLC |
| Emso Asset Management Limited |
| Graham Capital Management, L.P. |
| Halcyon Arbitrage IC Management LP |
| Impala Asset Management, LLC |
| Jennison Associates, LLC |
| Lazard Asset Management, LLC |
| Loomis Sayles & Company, L.P. |
| P. Schoenfeld Asset Management L.P. |
| Portland Hill Capital LLP |
| Wellington Management Company, LLP |
| York Registered Holdings, L.P. |
82 Semiannual Report
franklintempleton.com
FRANKLIN ALTERNATIVE STRATEGIES FUNDS
NOTES TO CONSOLIDATED FINANCIAL STATEMENTS (UNAUDITED)
Franklin K2 Alternative Strategies Fund (continued)
b. Administrative Fees
Under an agreement with K2 Advisors, FT Services provides administrative services to the Fund and K2 Subsidiary. The fee is paid by K2 Advisors based on the Fund and K2 Subsidiary average daily net assets, and is not an additional expense of the Fund or K2 Subsidiary.
c. Distribution Fees
The Board has adopted distribution plans for each share class, with the exception of Class R6 and Advisor Class shares, pursuant to Rule 12b-1 under the 1940 Act. Under the Fund’s Class A reimbursement distribution plan, the Fund reimburses Distributors for costs incurred in connection with the servicing, sale and distribution of the Fund’s shares up to the maximum annual plan rate. Under the Class A reimbursement distribution plan, costs exceeding the maximum for the current plan year cannot be reimbursed in subsequent periods. In addition, under the Fund’s Class C and R compensation distribution plans, the Fund pays Distributors for costs incurred in connection with the servicing, sale and distribution of the Fund’s shares up to the maximum annual plan rate for each class. The plan year, for purposes of monitoring compliance with the maximum annual plan rates, is February 1 through January 31 for each fund.
The maximum annual plan rates, based on the average daily net assets, for each class, are as follows:
| | |
| Class A | 0.30 | % |
| Class C | 1.00 | % |
| Class R | 0.50 | % |
The Board has set the current rate at 0.25% per year for Class A shares until further notice and approval by the Board.
d. Sales Charges/Underwriting Agreements
Front-end sales charges and contingent deferred sales charges (CDSC) do not represent expenses of the Fund. These charges are deducted from the proceeds of sales of Fund shares prior to investment or from redemption proceeds prior to remittance, as applicable. Distributors has advised the Fund of the following commission transactions related to the sales and redemptions of the Fund’s shares for the period:
| | |
| Sales charges retained net of commissions paid to unaffiliated broker/dealers | $ | 25,394 |
| CDSC retained | $ | 9,861 |
e. Transfer Agent Fees
Each class of shares, except for Class R6, pays transfer agent fees to Investor Services for its performance of shareholder servicing obligations and reimburses Investor Services for out of pocket expenses incurred, including shareholder servicing fees paid to third parties. These fees are allocated daily based upon their relative proportion of such classes’ aggregate net assets. Class R6 pays Investor Services transfer agent fees specific to that class.
For the period ended November 30, 2016, the Fund paid transfer agent fees of $413,698, of which $129,828 was retained by Investor Services.
f. Waiver and Expense Reimbursements
K2 Advisors has contractually agreed in advance to waive or limit its fees and to assume as its own expense certain expenses otherwise payable by the Fund so that the expenses (excluding distribution fees, acquired fund fees and expenses, and expenses related to securities sold short) for each class of the Fund do not exceed 1.95%, and Class R6 does not exceed 1.86% based on the average net assets of each class (other than certain non-routine expenses or costs, including those relating to litigation, indemnification, reorganizations, and liquidations) until September 30, 2017. Total expenses waived or paid are not subject to recapture subsequent to the Fund’s fiscal year end.
franklintempleton.com
Semiannual Report 83
FRANKLIN ALTERNATIVE STRATEGIES FUNDS
NOTES TO CONSOLIDATED FINANCIAL STATEMENTS (UNAUDITED)
| | | |
| Franklin K2 Alternative Strategies Fund (continued) | | | |
| |
| 3. Transactions with Affiliates (continued) | | | |
| g. Other Affiliated Transactions | | | |
| At November 30, 2016, the shares of the Fund were owned by the following entities: | | |
| | | Percentage of | |
| | | Outstanding | |
| | Shares | Shares | |
| Franklin Moderate Allocation Fund | 8,982,455 | 8.64 | % |
| Franklin Conservative Allocation Fund | 5,804,848 | 5.58 | % |
| Franklin Growth Allocation Fund | 5,244,565 | 5.04 | % |
| Franklin LifeSmart 2025 Retirement Target Fund | 325,848 | 0.31 | % |
| Franklin LifeSmart 2035 Retirement Target Fund | 274,251 | 0.26 | % |
| Franklin LifeSmart 2045 Retirement Target Fund | 189,439 | 0.18 | % |
| Franklin LifeSmart 2030 Retirement Target Fund | 98,990 | 0.10 | % |
| Franklin LifeSmart 2020 Retirement Target Fund | 81,812 | 0.08 | % |
| Franklin LifeSmart 2040 Retirement Target Fund | 81,812 | 0.08 | % |
| Franklin LifeSmart 2050 Retirement Target Fund | 62,255 | 0.06 | % |
| Franklin NextStep Moderate Fund | 38,953 | 0.04 | % |
| Franklin NextStep Growth Fund | 14,846 | 0.01 | % |
| Franklin LifeSmart 2055 Retirement Target Fund | 12,709 | 0.01 | % |
| | 21,212,783 | 20.39 | % |
4. Expense Offset Arrangement
The Fund has entered into an arrangement with its custodian whereby credits realized as a result of uninvested cash balances are used to reduce a portion of the Fund’s custodian expenses. During the period ended November 30, 2016, the custodian fees were reduced as noted in the Consolidated Statement of Operations.
5. Income Taxes
For tax purposes, capital losses may be carried over to offset future capital gains, if any. At May 31, 2016, the capital loss carryfor-wards were as follows:
| | |
| Capital loss carryforwards: | | |
| Short term | $ | 35,428,734 |
| Long term | | 6,268,117 |
| Total capital loss carryforwards | $ | 41,696,851 |
At November 30, 2016, the cost of investments and net unrealized appreciation (depreciation) for income tax purposes were as follows:
| | | |
| Cost of investments | $ | 1,064,213,789 | |
| Unrealized appreciation | $ | 65,511,672 | |
| Unrealized depreciation | | (24,580,183 | ) |
| Net unrealized appreciation (depreciation) | $ | 40,931,489 | |
Differences between income and/or capital gains as determined on a book basis and a tax basis are primarily due to differing treatments of foreign currency transactions, passive foreign investment company shares, bond discounts and premiums, commodity-based derivatives, investments in the K2 Subsidiary and wash sales.
84 Semiannual Report
franklintempleton.com
FRANKLIN ALTERNATIVE STRATEGIES FUNDS
NOTES TO CONSOLIDATED FINANCIAL STATEMENTS (UNAUDITED)
Franklin K2 Alternative Strategies Fund (continued)
6. Investment Transactions
Purchases and sales of investments and securities sold short (excluding short term securities) for the period ended November 30, 2016, aggregated $1,167,938,785 and $1,271,648,683, respectively.
| | | | | | | | |
| Transactions in options written during the period ended November 30, 2016, were as follows: | | | | | | | |
| |
| | Number of | | | Notional | | | | |
| | Contracts | | | Amount In $ | | | Premiums | |
| Options outstanding at May 31, 2016 | 8,966 | | $ | 6,200,000 | | $ | 1,021,236 | |
| Options written | 19,438 | | | — | | | 4,293,356 | |
| Options expired | (3,535 | ) | | (6,200,000 | ) | | (376,729 | ) |
| Options exercised | (314 | ) | | — | | | (45,985 | ) |
| Options closed | (21,348 | ) | | — | | | (4,566,567 | ) |
| Options outstanding at November 30, 2016 | 3,207 | | $ | — | | $ | 325,311 | |
The Fund sold certain long positions held in the portfolio and simultaneously entered into total return swaps on the positions, retaining substantially all of the exposure to the economic return and the related risks on the long positions. At November 30, 2016, the transfers of financial assets accounted for as sales were as follows:
| | | | | | | | | |
| | | | | | | | At Period Ended | | |
| | | At Original Transactions Dates | | | November 30, 2016 |
| |
| | | | | Gross | | Fair Value of | Gross | | Gross |
| | | Cost Basis | | Cash Received | | Transferred | Derivative Assets | | Derivative Liabilities |
| | | of Positions Sold | | for Positions Sold | | Assetsa | Recordedb | | Recordedb |
| Sales and total return swaps | $ | 2,398,800 | $ | 3,043,396 | $ | 306,579 | $3,349,975 | $ | 3,043,396 |
a$306,579 of gross derivative assets is included as unrealized appreciation on OTC swap contracts in the Consolidated Statement of Assets and Liabilities. See Note 9 regard-
ing other derivative information.
bBalances are presented on a gross basis, based on each leg of the swap contract, before the application of counterparty and cash collateral offsetting.
See Notes 1(e) and 9 regarding derivative financial instruments and other derivative information, respectively.
7. Credit Risk and Defaulted Securities
The Fund may purchase the pre-default or defaulted debt of distressed companies. Distressed companies are financially troubled and could be or are already involved in financial restructuring or bankruptcy. Risks associated with purchasing these securities include the possibility that the bankruptcy or other restructuring process takes longer than expected, or that distributions in restructuring are less than anticipated, either or both of which may result in unfavorable consequences to the Fund. If it becomes probable that the income on debt securities, including those of distressed companies, will not be collected, the Fund discontinues accruing income and recognizes an adjustment for uncollectible interest.
At November 30, 2016, the aggregate long value of distressed company securities for which interest recognition has been discontinued was $2,459,282, representing 0.2% of the Fund’s net assets. For information as to specific securities, see the accompanying Consolidated Statement of Investments.
8. Unfunded Loan Commitments
The Fund enters into certain credit agreements, all or a portion of which may be unfunded. The Fund is obligated to fund these loan commitments at the borrowers’ discretion. Unfunded loan commitments and funded portions of credit agreements are marked to market daily. Funded portions of credit agreements are presented in the Consolidated Statements of Investments.
franklintempleton.com
Semiannual Report 85
FRANKLIN ALTERNATIVE STRATEGIES FUNDS
NOTES TO CONSOLIDATED FINANCIAL STATEMENTS (UNAUDITED)
| | |
| Franklin K2 Alternative Strategies Fund (continued) | | |
| |
| 8. Unfunded Loan Commitments (continued) | | |
| |
| At November 30, 2016, unfunded commitments were as follows: | | |
| |
| | | Unfunded |
| Borrower | | Commitment |
| AMC Entertainment Holdings Inc., Term Loan B, 2.75%, 12/15/23 | $ | 25,000 |
| Bass Pro Group LLC, Term Loan B, 5.00%, 11/04/23 | | 210,000 |
| Envision Healthcare Holdings Inc., Term Loan B, 3.00%, 11/17/23 | | 75,000 |
| The Men’s Wearhouse Inc., Term Loan B, 4.50%, 6/18/21 | | 99,886 |
| Quikrete Holdings Inc., Term Loan B, 3.25%, 11/15/23 | | 180,000 |
| TransDigm Inc., Term Loan E, 2.75%, 5/14/22 | | 29,240 |
| TransDigm Inc., Term Loan F, 3.75%, 6/09/23 | | 36,456 |
| Xerox Business Services LLC, Term Loan B, 6.25%, 11/22/23 | | 330,000 |
| | $ | 985,582 |
9. Other Derivative Information
At November 30, 2016, the Fund’s investments in derivative contracts are reflected in the Consolidated Statement of Assets and Liabilities as follows:
| | | | | | | | |
| | Asset Derivatives | | | | Liability Derivatives | | | |
| Derivative Contracts | Consolidated Statement | | | | Consolidated Statement | | | |
| Not Accounted for as | of Assets and | | | | of Assets and | | | |
| Hedging Instruments | Liabilities Location | | Fair Value | | Liabilities Location | | Fair Value | |
| Interest rate contracts | Variation margin | $ | 1,499,280 | a | Variation margin | $ | 388,810 | a |
| | Unrealized appreciation on | | 3,292,390 | | Unrealized depreciation on | | 615,267 | |
| | OTC swap contracts | | | | OTC swap contracts | | | |
| Foreign exchange contracts | Investments in securities, | | 49,196 | b | | | | |
| | at value | | | | | | | |
| | Unrealized appreciation on | | 10,967,937 | | Unrealized depreciation on | | 7,426,180 | |
| | OTC forward exchange | | | | OTC forward exchange | | | |
| | contracts | | | | contracts | | | |
| Credit contracts | Variation margin | | 386,706 | a | Variation margin | | 236,754 | a |
| | OTC swap contracts (upfront | | 138,590 | | OTC swap contracts | | 45,502 | |
| | payments) | | | | (upfront receipts) | | | |
| | Unrealized appreciation on | | 577,125 | | Unrealized depreciation on | | 44,210 | |
| | OTC swap contracts | | | | OTC swap contracts | | | |
| Equity contracts | Investments in securities, | | 2,243,353 | b | Options written, at value | | 221,653 | |
| | at value | | | | | | | |
| | Variation margin | | 985,900 | a | Variation margin | | 1,153,527 | a |
| | Unrealized appreciation on | | 4,590,980 | | Unrealized depreciation on | | 3,707,599 | |
| | OTC swap contracts | | | | OTC swap contracts | | | |
| Commodity contracts | Variation margin | | 3,770,040 | a | Variation margin | | 4,968,792 | a |
| Totals | | $ | 28,501,497 | | | $ | 18,808,294 | |
aThis amount reflects the cumulative appreciation (depreciation) of futures contracts and centrally cleared swap contracts as reported in the Consolidated Statement of Invest-
ments. Only the variation margin receivable/payable at period end is separately reported within the Consolidated Statement of Assets and Liabilities. Prior variation margin
movements were recorded to cash upon receipt or payment.
bPurchased option contracts are included in investments in securities, at value in the Consolidated Statement of Assets and Liabilities.
86 Semiannual Report
franklintempleton.com
FRANKLIN ALTERNATIVE STRATEGIES FUNDS
NOTES TO CONSOLIDATED FINANCIAL STATEMENTS (UNAUDITED)
Franklin K2 Alternative Strategies Fund (continued)
For the period ended November 30, 2016, the effect of derivative contracts in the Fund’s Consolidated Statement of Operations was as follows:
| | | | | | | | |
| | | | | | | | Net Change in | |
| | | | | | | | Unrealized | |
| Derivative Contracts | | | Net Realized | | | | Appreciation | |
| Not Accounted for as | Consolidated Statement of | | Gain (Loss) | | Consolidated Statement of | | (Depreciation) | |
| Hedging Instruments | Operations Location | | for the Period | | Operations Location | | for the Period | |
| | Net realized gain (loss) from: | | | | Net change in unrealized | | | |
| | | | | | appreciation (depreciation) on: | | | |
| Interest rate contracts | Investments | $ | (284,464 | )a | Investments | $ | 207,393 | a |
| | Written options | | 84,940 | | Written options | | (84,468 | ) |
| | Futures contracts | | 1,378,914 | | Futures contracts | | (27,348 | ) |
| | Swap contracts | | 914,796 | | Swap contracts | | 1,108,475 | |
| Foreign exchange contracts | Investments | | (17,960 | )a | Investments | | (79,089 | )a |
| | Foreign currency transactions | | 1,554,403 | b | Translation of other assets and | | 3,547,457 | b |
| | | | | | liabilities denominated in | | | |
| | | | | | foreign currencies | | | |
| | Futures contracts | | 20,028 | | | | | |
| Credit contracts | Swap contracts | | (327,429 | ) | Swap contracts | | 561,028 | |
| Equity contracts | Investments | | (4,517,786 | )a | Investments | | (3,472,524 | )a |
| | Written options | | 1,560,414 | | Written options | | (51,449 | ) |
| | Futures contracts | | (381,733 | ) | Futures contracts | | (274,947 | ) |
| | Swap contracts | | (735,243 | ) | Swap contracts | | 1,098,836 | |
| Commodity contracts | Futures contracts | | (6,656,778 | ) | Futures contracts | | (685,896 | ) |
| Totals | | $ | (7,407,898 | ) | | $ | 1,847,468 | |
aPurchased option contracts are included in net realized gain (loss) from investments and net change in unrealized appreciation (depreciation) on investments in the Consoli-
dated Statement of Operations.
bForward exchange contracts are included in net realized gain (loss) from foreign currency transactions and net change in unrealized appreciation (depreciation) translation of
other assets and liabilities denominated in foreign currencies in the Consolidated Statement of Operations.
For the period ended November 30, 2016, the average month end fair value of derivatives represented 2.9% of average month end
net assets. The average month end number of open derivative contracts for the period was 1,025.
At November 30, 2016, the Fund’s OTC derivative assets and liabilities are as follows:
| | | | |
| | | Gross Amounts of Assets |
| | | and Liabilities Presented in |
| | | the Consolidated Statement |
| | | of Assets and Liabilities |
| |
| | | Assetsa | | Liabilitiesa |
| Derivatives | | | | |
| Forward Exchange Contracts | $ | 10,967,937 | $ | 7,426,180 |
| Options Purchased | | 49,196 | | — |
| Swap Contracts | | 8,599,085 | | 4,412,578 |
| Total | $ | 19,616,218 | $ | 11,838,758 |
aAbsent an event of default or early termination, OTC derivative assets and liabilities are presented gross and not offset in the Consolidated Statement of Assets and Liabilities.
franklintempleton.com
Semiannual Report 87
FRANKLIN ALTERNATIVE STRATEGIES FUNDS
NOTES TO CONSOLIDATED FINANCIAL STATEMENTS (UNAUDITED)
Franklin K2 Alternative Strategies Fund (continued)
9. Other Derivative Information (continued)
At November 30, 2016, the Fund’s OTC derivative assets, which may be offset against the Fund’s OTC derivative liabilities and collateral received from the counterparty, are as follows:
| | | | | | | | | | | | | | | | | | | |
| | | | | Amounts Not Offset in the Consolidated | | | | | | |
| | | | | Statement of Assets and Liabilities | | | | | | | |
| |
| | | Gross Amounts of Assets | | | | | Financials | | | | | | | | | | |
| | | Presented in the | | Financial | | | Instruments | | | | Cash | | | | | | |
| | | Consolidated Statement of | | Instruments | | | Collateral | | | Collateral | | | Net Amount (Not |
| | | Assets and Liabilities | | Available for Offset | | | Receiveda | | | Receiveda | | | Less than Zero) |
| Counterparty | | | | | | | | | | | | | | | | | | | |
| BNPP | $ | 99,220 | $ | (99,220 | ) | | $ | | — | | | $ | — | | | $ | | | — |
| BNYM | | 1,078,915 | | (195,844 | ) | | | | (286,283 | ) | | (351,000 | ) | | | | 245,788 |
| BOFA | | 667,063 | | (385,489 | ) | | | | — | | | (245,000 | ) | | | | | 36,574 |
| BZWS | | 68,202 | | (8,438 | ) | | | | — | | | | — | | | | | | 59,764 |
| CBOA | | 28,562 | | — | | | | | — | | | | — | | | | | | 28,562 |
| CITI | | 32,319 | | (29,748 | ) | | | | — | | | | — | | | | | | 2,571 |
| CSFB | | — | | — | | | | | — | | | | — | | | | | | — |
| DBAB | | 5,299,133 | | (3,439,340 | ) | | | | — | | | | (60,000 | ) | | | | 1,799,793 |
| JPHQ | | 493,655 | | (32,413 | ) | | | | — | | | | — | | | | | 461,242 |
| MSCO | | 1,430,066 | | (695,959 | ) | | | | — | | | | — | | | | | 734,107 |
| MSCOb | | 7,177,889 | | (6,131,657 | ) | | | | — | | | | — | | | | | 1,046,232 |
| MSCS | | 3,241,194 | | (786,830 | ) | | | | — | | | | — | | | | | 2,454,364 |
| Total | $ | 19,616,218 | $ | (11,804,938 | ) | $ | (286,283 | ) | $ | (656,000 | ) | $ | 6,868,997 |
| |
| At November 30, 2016, the Fund’s OTC derivative liabilities, which may be offset against the Fund’s OTC derivative assets and |
| collateral pledged to the counterparty, are as follows: | | | | | | | | | | | | | | | | | |
| |
| | | | | Amounts Not Offset in the Consolidated | | | | | | |
| | | | | Statement of Assets and Liabilities | | | | | | | |
| |
| | | Gross Amounts of Liabilities | | | | | Financials | | | | | | | | | | |
| | | Presented in the | | Financial | | | Instruments | | | | Cash | | | | | | |
| | | Consolidated Statement of | | Instruments | | | Collateral | | | Collateral | | | Net Amount (Not |
| | | Assets and Liabilities | | Available for Offset | | | | | Pledgeda | | | Pledgeda | | | Less than Zero) |
| Counterparty | | | | | | | | | | | | | | | | | | | |
| BNPP | $ | 122,273 | $ | (99,220 | ) | | | $ | — | | $ | (23,053 | ) | | | | $ | — |
| BNYM | | 195,844 | | (195,844 | ) | | | | — | | | | — | | | | | | — |
| BOFA | | 385,489 | | (385,489 | ) | | | | — | | | | — | | | | | | — |
| BZWS | | 8,438 | | (8,438 | ) | | | | — | | | | — | | | | | | — |
| CBOA | | — | | — | | | | | — | | | | — | | | | | | — |
| CITI | | 29,748 | | (29,748 | ) | | | | — | | | | — | | | | | | — |
| CSFB | | 10,767 | | — | | | | | — | | | | — | | | | | | 10,767 |
| DBAB | | 3,439,340 | | (3,439,340 | ) | | | | — | | | | — | | | | | | — |
| JPHQ | | 32,413 | | (32,413 | ) | | | | — | | | | — | | | | | | — |
| MSCO | | 695,959 | | (695,959 | ) | | | | — | | | | — | | | | | | — |
| MSCOb | | 6,131,657 | | (6,131,657 | ) | | | | — | | | | — | | | | | | — |
| MSCS | | 786,830 | | (786,830 | ) | | | | — | | | | — | | | | | | — |
| Total | $ | 11,838,758 | $ | (11,804,938 | ) | | | $ | — | | $ | (23,053 | ) | | | $ | 10,767 |
aIn some instances, the collateral amounts disclosed in the table above were adjusted due to the requirement to limit the collateral amounts to avoid the effect of
overcollateralization. Actual collateral received and/or pledged may be more than the amounts disclosed herein.
bRepresents derivatives owned by the K2 Holdings Investment Corp., a wholly-owned subsidiary of the Fund. See Note 1(g).
See Notes 1(e) and 6 regarding derivative financial instruments and investment transactions, respectively.
See Abbreviations on page 91.
88 Semiannual Report
franklintempleton.com
FRANKLIN ALTERNATIVE STRATEGIES FUNDS
NOTES TO CONSOLIDATED FINANCIAL STATEMENTS (UNAUDITED)
Franklin K2 Alternative Strategies Fund (continued)
10. Credit Facility
The Fund, together with other U.S. registered and foreign investment funds (collectively, Borrowers), managed by Franklin Templeton Investments, are borrowers in a joint syndicated senior unsecured credit facility totaling $2 billion (Global Credit Facility) which matures on February 10, 2017. This Global Credit Facility provides a source of funds to the Borrowers for temporary and emergency purposes, including the ability to meet future unanticipated or unusually large redemption requests.
Under the terms of the Global Credit Facility, the Fund shall, in addition to interest charged on any borrowings made by the Fund and other costs incurred by the Fund, pay its share of fees and expenses incurred in connection with the implementation and maintenance of the Global Credit Facility, based upon its relative share of the aggregate net assets of all of the Borrowers, including an annual commitment fee of 0.15% based upon the unused portion of the Global Credit Facility. These fees are reflected in other expenses in the Consolidated Statement of Operations. During the period ended November 30, 2016, the Fund did not use the Global Credit Facility.
11. Fair Value Measurements
The Fund follows a fair value hierarchy that distinguishes between market data obtained from independent sources (observable inputs) and the Fund’s own market assumptions (unobservable inputs). These inputs are used in determining the value of the Fund’s financial instruments and are summarized in the following fair value hierarchy:
- Level 1 – quoted prices in active markets for identical financial instruments
- Level 2 – other significant observable inputs (including quoted prices for similar financial instruments, interest rates, prepay- ment speed, credit risk, etc.)
- Level 3 – significant unobservable inputs (including the Fund’s own assumptions in determining the fair value of financial instruments)
The input levels are not necessarily an indication of the risk or liquidity associated with financial instruments at that level.
For movements between the levels within the fair value hierarchy, the Fund has adopted a policy of recognizing the transfers as of the date of the underlying event which caused the movement.
franklintempleton.com
Semiannual Report 89
FRANKLIN ALTERNATIVE STRATEGIES FUNDS
NOTES TO CONSOLIDATED FINANCIAL STATEMENTS (UNAUDITED)
Franklin K2 Alternative Strategies Fund (continued)
11. Fair Value Measurements (continued)
A summary of inputs used as of November 30, 2016, in valuing the Fund’s assets and liabilities carried at fair value, is as follows:
| | | | | | | | |
| | | Level 1 | | Level 2 | | Level 3 | | Total |
| |
| Assets: | | | | | | | | |
| Investments in Securities:a | | | | | | | | |
| Common Stocks and Other Equity Interests | $ | 361,201,652 | $ | 138 | $ | — | $ | 361,201,790 |
| Exchange Traded Funds | | 409,607 | | — | | — | | 409,607 |
| Convertible Preferred Stocks | | 6,214,710 | | 2,091,600 | | — | | 8,306,310 |
| Preferred Stocks | | 3,101,017 | | — | | — | | 3,101,017 |
| Convertible Bonds | | — | | 191,723,406 | | — | | 191,723,406 |
| Convertible Bonds in Reorganization | | — | | 13,615 | | — | | 13,615 |
| Corporate Bonds and Notes | | — | | 202,698,625 | | — | | 202,698,625 |
| Corporate Bonds and Notes in Reorganization | | — | | 2,445,667 | | — | | 2,445,667 |
| Senior Floating Rate Interests | | — | | 5,952,384 | | — | | 5,952,384 |
| Foreign Government and Agency Securities | | — | | 24,385,055 | | — | | 24,385,055 |
| Asset-Backed Securities and Commercial Mortgage-Backed | | | | | | | | |
| Securities | | — | | 25,616,388 | | — | | 25,616,388 |
| Options Purchased | | 2,243,353 | | 49,196 | | — | | 2,292,549 |
| Short Term Investments | | 244,156,798 | | 32,842,067 | | — | | 276,998,865 |
| Total Investments in Securities | $ | 617,327,137 | $ | 487,818,141 | $ | — | $ | 1,105,145,278 |
| Other Financial Instruments: | | | | | | | | |
| Futures Contracts | $ | 5,764,793 | $ | — | $ | — | $ | 5,764,793 |
| Forward Exchange Contracts | | — | | 10,967,937 | | — | | 10,967,937 |
| Swap Contracts | | — | | 9,337,628 | | — | | 9,337,628 |
| Unfunded Loan Commitments | | — | | 12,345 | | — | | 12,345 |
| Total Other Financial Instruments | $ | 5,764,793 | $ | 20,317,910 | $ | — | $ | 26,082,703 |
| |
| Liabilities: | | | | | | | | |
| Other Financial Instruments: | | | | | | | | |
| Options Written | $ | 221,653 | $ | — | $ | — | $ | 221,653 |
| Securities Sold Short | | 256,389,216 | | 17,745,296 | | — | | 274,134,512 |
| Futures Contracts | | 6,364,816 | | — | | — | | 6,364,816 |
| Forward Exchange Contracts | | — | | 7,426,180 | | — | | 7,426,180 |
| Swap Contracts | | — | | 4,750,143 | | — | | 4,750,143 |
| Total Other Financial Instruments | $ | 262,975,685 | $ | 29,921,619 | $ | — | $ | 292,897,304 |
| |
| aFor detailed categories, see the accompanying Consolidated Statement of Investments. | | | | | | | | |
A reconciliation of assets in which Level 3 inputs are used in determining fair value is presented when there are significant Level 3 financial instruments at the end of the period.
12. Subsequent Events
The Fund has evaluated subsequent events through the issuance of the consolidated financial statements and determined that no events have occurred that require disclosure.
90 Semiannual Report
franklintempleton.com
FRANKLIN ALTERNATIVE STRATEGIES FUNDS
NOTES TO CONSOLIDATED FINANCIAL STATEMENTS (UNAUDITED)
| | | | | | | |
| Franklin K2 Alternative Strategies Fund (continued) | | | | |
| |
| Abbreviations | | | | | | |
| Counterparty/Exchange | Currency | Selected Portfolio | Index | |
| BNPP | BNP Paribas | ARS | Argentine Peso | ADR | American Depositary Receipt | CDX.NA.HY | CDX North |
| | | | | | | | America |
| | | | | | | | High Yield |
| | | | | | | | Index |
| BNYM | The Bank of New York | AUD | Australian Dollar | ARM | Adjustable Rate Mortgage | | |
| | Mellon Corp. | | | | | | |
| BOFA | Bank of America, N.A. | BRL | Brazilian Real | EONIA | Euro Overnight Index Average | |
| BZWS | Barclays Bank PLC | CAD | Canadian Dollar | ETF | Exchange Traded Fund | | |
| CBOA | Commonwealth Bank of | CHF | Swiss Franc | EURIBOR | Euro Interbank Offered Rate | |
| | Australia | | | | | | |
| CITI | Citigroup, Inc. | COP | Colombian Peso | FEDEF | Federal Funds Effective Rate | |
| CME | Chicago Mercantile | CZK | Czech Koruna | FRN | Floating Rate Note | | |
| | Exchange | | | | | | |
| CSFB | Credit Suisse First | EUR | Euro | HONIX | Hong Kong Overnight Index | |
| | Boston | | | | Rate | | |
| DBAB | Deutsche Bank, AG | GBP | British Pound | IDR | International Depositary | | |
| | | | | | Receipt | | |
| ICE | Intercontinental | HKD | Hong Kong Dollar | JIBAR | Johannesburg Interbank | | |
| | Exchange, Inc. | | | | Agreed Rate | | |
| JPHQ | JP Morgan Chase & Co. | JPY | Japanese Yen | LIBOR | London InterBank Offered Rate | |
| MSCO | Morgan Stanley & Co., | MXN | Mexican Peso | MUTSCALM | Bank of Japan Unsecured | | |
| | LLC | | | | Overnight Call Rate | | |
| MSCS | Morgan Stanley Capital | PLN | Polish Zloty | PIK | Payment In-Kind | | |
| | Services LLC | | | | | | |
| | | RUB | Russian Ruble | PRIBOR | Prague Interbank Offered Rate | |
| | | SEK | Swedish Krona | RBACR | Reserve Bank of Australia | | |
| | | | | | Cash Rate | | |
| | | SGD | Singapore Dollar | REIT | Real Estate Investment Trust | |
| | | TRY | Turkish Lira | SAFEX | South African Futures | | |
| | | | | | Exchange | | |
| | | TWD | Taiwan Dollar | SIBOR | Singapore Interbank Offered | |
| | | | | | Rate | | |
| | | USD | United States Dollar | SONIA | Sterling Overnight Index | | |
| | | | | | Average | | |
| | | ZAR | South African Rand | SPDR | Standard & Poor’s Depositary | |
| | | | | | Receipt | | |
| | | | | STIBOR | Stockholm Interbank Offered | |
| | | | | | Rate | | |
| | | | | TOIS | Swiss Tomorrow-Overnight | |
| | | | | | Index Swap Rate | | |
franklintempleton.com
Semiannual Report 91
FRANKLIN ALTERNATIVE STRATEGIES FUNDS
FRANKLIN K2 ALTERNATIVE STRATEGIES FUND
Shareholder Information
Proxy Voting Policies and Procedures
The Fund’s investment manager has established Proxy Voting Policies and Procedures (Policies) that the Fund uses to determine how to vote proxies relating to portfolio securities. Shareholders may view the Fund’s complete Policies online at franklintempleton.com. Alternatively, shareholders may request copies of the Policies free of charge by calling the Proxy Group collect at (954) 527-7678 or by sending a written request to: Franklin Templeton Companies, LLC, 300 S.E. 2nd Street, Fort Lauderdale, FL 33301, Attention: Proxy Group. Copies of the Fund’s proxy voting records are also made available online at franklintempleton.com and posted on the U.S. Securities and Exchange Commission’s website at sec.gov and reflect the most recent 12-month period ended June 30.
Quarterly Statement of Investments
The Trust, on behalf of the Fund, files a complete statement of investments with the U.S. Securities and Exchange Commission for the first and third quarters for each fiscal year on Form N-Q. Shareholders may view the filed Form N-Q by visiting the Commission’s website at sec.gov. The filed form may also be viewed and copied at the Commission’s Public Reference Room in Washington, DC. Information regarding the operations of the Public Reference Room may be obtained by calling (800) SEC-0330.
92 Semiannual Report
franklintempleton.com
| |
| Contents | |
| |
| Semiannual Report | |
| Franklin Pelagos Commodities Strategy Fund | 3 |
| Performance Summary | 7 |
| Your Fund’s Expenses | 9 |
| Consolidated Financial Highlights and Consolidated | |
| Statement of Investments | 10 |
| Consolidated Financial Statements | 17 |
| Notes to Consolidated Financial Statements | 21 |
| Shareholder Information | 32 |
Visit franklintempleton.com for fund updates, to access your account, or to find helpful financial planning tools.
2 Semiannual Report
franklintempleton.com
Semiannual Report
Franklin Pelagos Commodities Strategy Fund
This semiannual report for Franklin Pelagos Commodities Strategy Fund covers the period ended November 30, 2016.
Your Fund’s Goal and Main Investments
The Fund seeks long-term total return. It invests mainly in commodity-linked derivative instruments and securities of the U.S. government, its agencies and instrumentalities and other fixed income securities.
Performance Overview
The Fund’s Class A shares had a -0.77% cumulative total return for the six months under review. In comparison, the benchmark Bloomberg Commodity Index, which measures performance of exchange-traded futures contracts on physical commodities, posted a +0.95% total return for the same period.1 You can find more of the Fund’s performance data in the Performance Summary beginning on page 7.
Performance data represent past performance, which does not guarantee future results. Investment return and principal value will fluctuate, and you may have a gain or loss when you sell your shares. Current performance may differ from figures shown. For most recent month-end performance, go to franklintempleton.com or call (800) 342-5236.
What is a futures contract?
A futures contract is an agreement between the Fund and a counterparty made through a U.S. or foreign futures exchange to buy or sell an underlying instrument or asset at a specific priceonafuturedate.
Economic and Market Overview
The U.S. economy expanded during the six months under review. The economy grew at a faster pace in 2016’s third quarter than in the second quarter, mainly due to personal consumption expenditures, exports, private inventory investment, federal government spending and nonresidential fixed investment. Manufacturing conditions remained volatile but generally expanded, and the services sector continued to grow. The unemployment rate decreased slightly from 4.7% in May to 4.6% at period-end.2 Monthly retail sales were volatile but grew during most of the review period. Inflation, as measured by the Consumer Price Index, remained relatively subdued but rose during the second half of the period.
The U.S. Federal Reserve (Fed) kept its target interest rate at 0.25–0.50% at its November meeting, while setting the stage for an interest rate hike in December. The Fed members generally agreed that it would be appropriate to raise the federal funds rate in the near term, as long as data continued to provide evidence of economic resilience.
U.S. equity markets rose during the review period, benefiting from mostly upbeat economic data and better corporate earnings in the U.S., signs of improvement in the Chinese and European economies, and ongoing expansionary monetary policies from key central banks. A rally in crude oil prices and the Fed’s decision to keep interest rates unchanged at its November meeting further boosted investor confidence. However, the U.K.’s historic vote to leave the European Union (also known as “Brexit”) and global growth concerns weighed on market sentiment. The broad U.S. stock market ended the six-month period higher, as measured by the Standard & Poor’s® 500 Index.
Commodity prices, as measured by the Bloomberg Commodity Index, delivered a slight positive return during the period. Oil prices were low for much of the period, but bounced back near period-end after members of the Organization of the Petroleum Exporting Countries (OPEC) reached a consensus on reductions in crude output in an effort to ease record inventories and stabilize the market. In addition, gold and metal prices fell during the period as orderly U.S. election results and expectations of an interest rate hike led investors to rotate out of safe haven assets in favor of investments typically geared for a cyclical upswing in economic activity. Among agricultural
1. Source: Morningstar.
The index is unmanaged and includes reinvestment of any income or distributions. It does not reflect any fees, expenses or sales charges. One cannot invest directly in an
index, and an index is not representative of the Fund’s portfolio.
2. Source: Bureau of Labor Statistics.
See www.franklintempletondatasources.com for additional data provider information.
The dollar value, number of shares or principal amount, and names of all portfolio holdings are listed in the Fund’s Consolidated Statement of
Investments (SOI). The Consolidated SOI begins on page 15.
franklintempleton.com
Semiannual Report 3
FRANKLIN PELAGOS COMMODITIES STRATEGY FUND
commodities, corn, soybeans and wheat rose in value, while sugar declined.
Investment Strategy
We utilize an actively managed fundamental and quantitative investment process to provide exposure to a variety of commodity sectors and indexes by investing in commodity-linked derivative instruments including commodity-linked total return swaps, commodity futures, commodity index futures and options on commodity futures and commodity index futures, which may provide exposure to foreign and emerging markets. By investing in these derivative instruments, we seek to gain exposure to the returns of real assets that trade in the commodities markets without direct investment in physical commodities. Real assets include such things as industrial and precious metals, gas, oil, livestock, agricultural or meat products and other items.
What is a swap agreement?
A swap agreement, such as a commodity-linked total return swap, is a contract between the Fund and a counterparty to exchange on a future date the returns, or differentials in return, that would have been earned or realized if a notional amount were invested in specific instruments.
What is an option?
An option is a contract to buy or sell a specific financial product known as the option’s underlying instrument at a specific price. The buyer of an option has the right, but not the obligation, to buy or sell the underlying instrument at or until a specified expiration date. Conversely, the seller (“writer”) of an option who opens a transaction is obligated to buy or sell the underlying instrument should the option holder exercise that right.
Manager’s Discussion
During its semiannual period, the Fund obtained its commodities exposure through swaps on commodity indexes and through commodities futures and options on commodities futures. These exposures were supported with U.S. Treasury bills and other fixed income securities.
During the period, the Fund had positive contributions to performance from natural gas, industrial metals and some agriculture commodities affected by El Niño weather patterns. Among the positive contributors to Fund returns, a common theme was tightening of supply. Relative to the benchmark Bloomberg Commodity Index, the Fund underperformed primarily due to positioning outside the energy sector in the third quarter of 2016. U.S. grain prices were lower during the summer months due to near-optimal growing conditions and increased crop yield projections, whereas some agricultural commodities posted positive returns. The Fund’s positioning in agriculture detracted during the summer months, as did positioning in precious metals and crude oil. Fund returns from precious metals also lagged those of its benchmark over the period.
In the energy sector, natural gas returns were strong over the period as U.S. production showed sustained year-over-year declines for the first time since the winter of 2010. Furthermore, the summer months of 2016 were among the hottest recorded for the lower 48 states, according to the National Oceanic and Atmospheric Administration. The Fund’s natural gas positioning benefited performance over the period, while the petroleum sector had negative returns and was volatile with several large price swings. In May, shortly before the period began, crude oil experienced the highest level of unplanned global supply disruptions since at least 2011, according to the U.S. Department of Energy. From the end of May through period-end, West Texas Intermediate crude oil futures fluctuated slightly higher and substantially lower. As the bulk of disruptions eased, oil markets were driven by news about potential OPEC cuts around an extraordinary September 28 meeting in Algeria as well as the scheduled November 30 meeting in Vienna. U.S. commercial crude oil stockpiles grew seasonally and gasoline and diesel inventories remained high.
In metals, industrial metals posted strong returns, while returns for gold were lower. Zinc, nickel and copper all posted strong returns during the period. Tightness in zinc and nickel mine supply supported prices, while aluminum lagged behind with more modest returns. Silver returns were higher, in part due to its industrial use. Gold prices were supported for the first half of the period as total known exchange-traded fund holdings
| | |
| Portfolio Composition* | | |
| 11/30/16 | | |
| | % of Consolidated | |
| | Net Assets | |
| U.S. Treasury Bill | 61.7 | % |
| U.S. Treasury Note | 17.4 | % |
| FFCB | 10.7 | % |
| FHLMC | 7.5 | % |
| Other Assets, less Liabilities** | 2.7 | % |
See Abbreviations on page 32.
*Portfolio composition figures are stated as a percentage of total and may not equal
100% or may be negative due to rounding, use of any derivatives, unsettled trades
or other factors.
**Includes unrealized appreciation/depreciation on open futures and swap
contracts, as well as other assets and liabilities. See supplementary commodity
exposure tables on page 5 for additional information related to the Fund’s economic
exposure to commodities.
4 Semiannual Report
franklintempleton.com
FRANKLIN PELAGOS COMMODITIES STRATEGY FUND
rose, but in November holdings fell by the highest percentage since June 2014, and gold’s price fell in tandem. The results of the U.S. elections hindered gold prices over the remainder of November and helped industrial metals prices as the London Metal Exchange Metals Index rose. Over the period, Fund returns from metals fell short of those of its benchmark due to positioning in both precious and industrial metals.
In agriculture, the U.S. produced record amounts of corn and soybeans, pushing global production to record levels as well. Global production of wheat also stood at record levels. The U.S. had near-ideal weather for growing corn and soybeans and saw yields strongly above trend for the new crop. Grain returns were negative over the period; however, positive returns in soybean oil, which benefited from weather-impacted palm oil production in Asia, fueled soybean outperformance versus corn and wheat. The returns of some agricultural commodities were positive as weather conditions impacted world sugar and coffee production, especially in Southeast Asia where El Niño conditions hit hard. Over the semiannual period, the Fund returns from agriculture outpaced those of the benchmark due to positioning in row crops. Positioning in soft commodities detracted from relative performance over the semiannual period.
Fund Exposure to Commodities
The following table summarizes the Fund’s economic exposure to commodities derived through its investment in commodity-linked total return swap contracts. At November 30, 2016, the Fund’s exposure based on notional value represented 82.7% of consolidated net assets.
Commodity-Linked Total Return Swap Exposure*
| | |
| | % of Consolidated Net Assets | |
| Soybeans | 9.8 | % |
| Brent Crude Oil | 9.4 | % |
| Unleaded Gasoline | 8.7 | % |
| Natural Gas | 7.4 | % |
| Copper | 6.7 | % |
| Gold | 6.7 | % |
| Sugar | 4.8 | % |
| Aluminum | 4.5 | % |
| Zinc | 3.3 | % |
| Corn | 3.1 | % |
| Soybean Meal | 3.0 | % |
| Soybean Oil | 2.8 | % |
| Coffee | 2.6 | % |
| Wheat | 2.5 | % |
| Nickel | 2.4 | % |
| Live Cattle | 2.3 | % |
| Cotton | 1.4 | % |
| Lean Hogs | 1.3 | % |
*Figures are stated as a percentage of total and may not equal 100% or may be
negative due to rounding, use of any derivatives, unsettled trades or other factors.
The Fund’s exposure was calculated using the commodity sector weightings of the
FP Custom Master Index multiplied by the Fund’s percentage notional exposure.
The following table summarizes the Fund’s economic exposure to commodities derived through its investment in futures contracts. At November 30, 2016, the Fund’s exposure based on notional value represented 17.2% of consolidated net assets.
| | |
| Commodity Futures Exposure* | |
| | % of Consolidated Net Assets | |
| | Long | |
| WTI Crude Oil | 8.2 | % |
| Silver | 3.8 | % |
| Gold | 3.5 | % |
| Natural Gas | 1.7 | % |
*Figures are stated as a percentage of total and may not equal 100% or may be
negative due to rounding, use of any derivatives, unsettled trades or other factors.
franklintempleton.com
Semiannual Report 5
FRANKLIN PELAGOS COMMODITIES STRATEGY FUND
Thank you for your continued participation in Franklin Pelagos Commodities Strategy Fund. We look forward to continuing to serve your financial needs.

The foregoing information reflects our analysis, opinions and portfolio holdings as of November 30, 2016, the end of the reporting period. The way we implement our main investment strategies and the resulting portfolio holdings may change depending on factors such as market and economic conditions. These opinions may not be relied upon as investment advice or an offer for a particular security. The information is not a complete analysis of every aspect of any market, country, industry, security or the Fund. Statements of fact are from sources considered reliable, but the investment manager makes no representation or warranty as to their completeness or accuracy. Although historical performance is no guarantee of future results, these insights may help you understand our investment management philosophy.
6 Semiannual Report
franklintempleton.com
FRANKLIN PELAGOS COMMODITIES STRATEGY FUND
Performance Summary as of November 30, 2016
The performance table does not reflect any taxes that a shareholder would pay on Fund dividends, capital gain distributions, if any, or any realized gains on the sale of Fund shares. Total return reflects reinvestment of the Fund’s dividends and capital gain distributions, if any, and any unrealized gains or losses.
Performance as of 11/30/161
Cumulative total return excludes sales charges. Average annual total return includes maximum sales charges. Sales charges will vary depending on the size of the investment and the class of share purchased. The maximum is 5.75% and the minimum is 0%. Class A: 5.75% maximum initial sales charge; Advisor Class: no sales charges. For other share classes, visit franklintempleton.com.
| | | | |
| | Cumulative | | Average Annual | |
| Share Class | Total Return2 | | Total Return3 | |
| A | | | | |
| 6-Month | -0.77 | % | -6.41 | % |
| 1-Year | +9.18 | % | +2.88 | % |
| Since Inception (1/10/14) | -27.70 | % | -12.43 | % |
| Advisor | | | | |
| 6-Month | -0.76 | % | -0.76 | % |
| 1-Year | +9.17 | % | +9.17 | % |
| 3-Year | -26.82 | % | -9.88 | % |
| Since Inception (12/7/11) | -34.50 | % | -8.14 | % |
Performance data represent past performance, which does not guarantee future results. Investment return and principal value will fluctuate, and you may have a gain or loss when you sell your shares. Current performance may differ from figures shown. For most recent month-end performance, go to franklintempleton.com or call (800) 342-5236.
See page 8 for Performance Summary footnotes.
franklintempleton.com
Semiannual Report 7
FRANKLIN PELAGOS COMMODITIES STRATEGY FUND
PERFORMANCE SUMMARY
| | | | |
| Total Annual Operating Expenses4 | | | |
| Share Class | With Waiver | | Without Waiver | |
| A | 1.20 | % | 2.34 | % |
| Advisor | 0.95 | % | 2.09 | % |
All investments involve risks, including possible loss of principal. Investing in physical commodities, either directly or through derivative instruments such as
commodity-linked total return swaps, commodity futures, commodity index futures and options on commodity futures and commodities index futures, presents
unique risks, is speculative and can be extremely volatile. Market prices of commodities may fluctuate rapidly based on numerous factors, including: changes in
supply and demand relationships; weather; agriculture; trade; domestic and foreign political and economic events and policies; diseases; pestilence;
technological developments; currency exchange rate fluctuations; and monetary and other governmental policies, action and inaction. Derivative instruments
involve costs and can create leverage in the Fund’s portfolio, which may result in significant volatility and cause the Fund to participate in losses (as well as
gains) in an amount that significantly exceeds the Fund’s initial investment. The Fund may not achieve the anticipated benefits and may realize losses, which
could be significant. Bond prices generally move in the opposite direction of interest rates. Thus, as prices of bonds in the Fund adjust to a rise in interest rates,
the Fund’s share price may decline. Foreign investing carries additional risks such as currency and market volatility and political, social and economic instability,
risks which are heightened in less developed or emerging market countries. The Fund is actively managed but there is no guarantee that the manager’s
investment decisions will produce the desired results. The Fund’s prospectus also includes a description of the main investment risks.
1. The Fund has an expense reduction contractually guaranteed through 9/30/17 and a fee waiver related to the management fee paid by a subsidiary. The Fund alsohasafee
waiver associated with any investments it makes in a Franklin Templeton money fund and/or other Franklin Templeton fund, contractually guaranteed through its current fiscal
year-end. Fund investment results reflect the expense reduction and fee waivers; without these reductions, the results would have been lower.
2. Cumulative total return represents the change in value of an investment over the periods indicated.
3. Average annual total return represents the average annual change in value of an investment over the periods indicated. Return for less than one year, ifany,hasnotbeen
annualized.
4. Figures are as stated in the Fund’s current prospectus and may differ from the expense ratios disclosed in the Your Fund’s Expenses and Consolidated Financial Highlights
sections in this report. In periods of market volatility, assets may decline significantly, causing total annual Fund operating expenses to become higher than the figures shown.
8 Semiannual Report
franklintempleton.com
FRANKLIN PELAGOS COMMODITIES STRATEGY FUND
Your Fund’s Expenses
As a Fund shareholder, you can incur two types of costs: (1) transaction costs, including sales charges (loads) on Fund purchases and redemptions; and (2) ongoing Fund costs, including management fees, distribution and service (12b-1) fees, and other Fund expenses. All mutual funds have ongoing costs, sometimes referred to as operating expenses. The table below shows ongoing costs of investing in the Fund and can help you understand these costs and compare them with those of other mutual funds. The table assumes a $1,000 investment held for the six months indicated.
Actual Fund Expenses
The table below provides information about actual account values and actual expenses in the columns under the heading “Actual.” In these columns the Fund’s actual return, which includes the effect of Fund expenses, is used to calculate the “Ending Account Value” for each class of shares. You can estimate the expenses you paid during the period by following these steps (of course, your account value and expenses will differ from those in this illustration): Divide your account value by $1,000 (if your account had an $8,600 value, then $8,600 ÷ $1,000 = 8.6). Then multiply the result by the number in the row for your class of shares under the headings “Actual” and “Expenses Paid During Period” (if Actual Expenses Paid During Period were $7.50, then 8.6 x $7.50 = $64.50). In this illustration, the actual expenses paid this period are $64.50.
Hypothetical Example for Comparison with Other Funds
Under the heading “Hypothetical” in the table, information is provided about hypothetical account values and hypothetical expenses based on the Fund’s actual expense ratio and an assumed rate of return of 5% per year before expenses, which is not the Fund’s actual return. This information may not be used to estimate the actual ending account balance or expenses you paid for the period, but it can help you compare ongoing costs of investing in the Fund with those of other funds. To do so, compare this 5% hypothetical example for the class of shares you hold with the 5% hypothetical examples that appear in the shareholder reports of other funds.
Please note that expenses shown in the table are meant to highlight ongoing costs and do not reflect any transactional costs. Therefore, information under the heading “Hypothetical” is useful in comparing ongoing costs only, and will not help you compare total costs of owning different funds. In addition, if transactional costs were included, your total costs would have been higher.
| | | | | | | | | | | | |
| | | | | | | Actual | | Hypothetical | | |
| | | | | (actual return after expenses) | | (5% annual return before expenses) | | |
| | | | | | | Expenses | | | | Expenses | Net | |
| | | Beginning | | Ending | | Paid During | | Ending | | Paid During | Annualized | |
| Share | | Account | | Account | | Period | | Account | | Period | Expense | |
| Class | | Value 6/1/16 | | Value 11/30/16 | | 6/1/16–11/30/161,2 | | Value 11/30/16 | | 6/1/16–11/30/161,2 | Ratio2 | |
| A | $ | 1,000 | $ | 992.30 | $ | 5.99 | $ | 1,019.05 | $ | 6.07 | 1.20 | % |
| C | $ | 1,000 | $ | 987.40 | $ | 9.72 | $ | 1,015.29 | $ | 9.85 | 1.95 | % |
| R | $ | 1,000 | $ | 990.70 | $ | 6.34 | $ | 1,018.70 | $ | 6.43 | 1.27 | % |
| R6 | $ | 1,000 | $ | 995.40 | $ | 3.60 | $ | 1,021.46 | $ | 3.65 | 0.72 | % |
| Advisor | $ | 1,000 | $ | 992.40 | $ | 4.74 | $ | 1,020.31 | $ | 4.81 | 0.95 | % |
1. Expenses are equal to the annualized expense ratio for the six-month period as indicated above–in the far right column–multiplied by the simple average account value
over the period indicated, and then multiplied by 183/365 to reflect the one-half year period.
2. Reflects expenses after fee waivers and expense reimbursements. Does not include acquired fund fees and expenses.
franklintempleton.com
Semiannual Report 9
FRANKLIN ALTERNATIVE STRATEGIES FUNDS
| | | | | | | | | | | | |
| Consolidated Financial Highlights | | | | | | | | | | | | |
| Franklin Pelagos Commodities Strategy Fund | | | | | | | | | | | | |
| | | Six Months Ended | | | | | | | | | | |
| | | November 30, 2016 | | | Year Ended May 31, | | | | |
| | | (unaudited) | | | 2016 | | | 2015 | | | 2014 | a |
| Class A | | | | | | | | | | | | |
| Per share operating performance | | | | | | | | | | | | |
| (for a share outstanding throughout the period) | | | | | | | | | | | | |
| Net asset value, beginning of period | $ | 6.47 | | $ | 7.12 | | $ | 9.44 | | $ | 8.88 | |
| Income from investment operationsb: | | | | | | | | | | | | |
| Net investment income (loss)c | | (0.03 | ) | | (0.08 | ) | | (0.09 | ) | | (0.08 | ) |
| Net realized and unrealized gains (losses) | | (0.02 | ) | | (0.57 | ) | | (2.23 | ) | | 0.64 | |
| Total from investment operations | | (0.05 | ) | | (0.65 | ) | | (2.32 | ) | | 0.56 | |
| Net asset value, end of period | $ | 6.42 | | $ | 6.47 | | $ | 7.12 | | $ | 9.44 | |
| |
| Total returnd | | (0.77 | )% | | (9.13 | )% | | (24.58 | )% | | 6.31 | % |
| |
| Ratios to average net assetse | | | | | | | | | | | | |
| Expenses before waiver and payments by affiliates and expense reduction . | | 1.73 | % | | 2.14 | % | | 2.05 | % | | 3.38 | % |
| Expenses net of waiver and payments by affiliates and expense reductionf . | | 1.20 | % | | 1.21 | % | | 1.25 | % | | 1.25 | % |
| Net investment income (loss) | | (0.69 | )% | | (0.79 | )% | | (0.94 | )% | | (0.94 | )% |
| |
| Supplemental data | | | | | | | | | | | | |
| Net assets, end of period (000’s) | $ | 4,504 | | $ | 3,814 | | $ | 2,080 | | $ | 601 | |
| Portfolio turnover rate | | 42.43 | % | | 28.03 | % | | 62.10 | % | | 34.28 | % |
aFor the period January 10, 2014 (commencement of operations) to May 31, 2014.
bThe amount shown for a share outstanding throughout the period may not correlate with the Consolidated Statement of Operations for the period due to the timing of sales
and repurchases of the Fund’s shares in relation to income earned and/or fluctuating fair value of the investments of the Fund.
cBased on average daily shares outstanding.
dTotal return does not reflect sales commissions or contingent deferred sales charges, if applicable, and is not annualized for periods less than one year.
eRatios are annualized for periods less than one year.
fBenefit of expense reduction rounds to less than 0.01%.
10 Semiannual Report | The accompanying notes are an integral part of these consolidated financial statements. franklintempleton.com
FRANKLIN ALTERNATIVE STRATEGIES FUNDS
CONSOLIDATED FINANCIAL HIGHLIGHTS
| | | | | | | | | | | | |
| Franklin Pelagos Commodities Strategy Fund (continued) | | | | | | | | | | | | |
| | | Six Months Ended | | | | | | | | | | |
| | | November 30, 2016 | | | Year Ended May 31, | | | | |
| | | (unaudited) | | | 2016 | | | 2015 | | | 2014 | a |
| Class C | | | | | | | | | | | | |
| Per share operating performance | | | | | | | | | | | | |
| (for a share outstanding throughout the period) | | | | | | | | | | | | |
| Net asset value, beginning of period | $ | 6.36 | | $ | 7.05 | | $ | 9.41 | | $ | 8.88 | |
| Income from investment operationsb: | | | | | | | | | | | | |
| Net investment income (loss)c | | (0.06 | ) | | (0.16 | ) | | (0.15 | ) | | (0.09 | ) |
| Net realized and unrealized gains (losses) | | (0.02 | ) | | (0.53 | ) | | (2.21 | ) | | 0.62 | |
| Total from investment operations | | (0.08 | ) | | (0.69 | ) | | (2.36 | ) | | 0.53 | |
| Net asset value, end of period | $ | 6.28 | | $ | 6.36 | | $ | 7.05 | | $ | 9.41 | |
| |
| Total returnd | | (1.26 | )% | | (9.79 | )% | | (25.08 | )% | | 5.97 | % |
| |
| Ratios to average net assetse | | | | | | | | | | | | |
| Expenses before waiver and payments by affiliates and expense reduction . | | 2.48 | % | | 2.88 | % | | 2.75 | % | | 4.08 | % |
| Expenses net of waiver and payments by affiliates and expense reductionf . | | 1.95 | % | | 1.95 | % | | 1.95 | % | | 1.95 | % |
| Net investment income (loss) | | (1.44 | )% | | (1.53 | )% | | (1.64 | )% | | (1.64 | )% |
| |
| Supplemental data | | | | | | | | | | | | |
| Net assets, end of period (000’s) | $ | 1,033 | | $ | 862 | | $ | 377 | | $ | 60 | |
| Portfolio turnover rate | | 42.43 | % | | 28.03 | % | | 62.10 | % | | 34.28 | % |
aFor the period January 10, 2014 (commencement of operations) to May 31, 2014.
bThe amount shown for a share outstanding throughout the period may not correlate with the Consolidated Statement of Operations for the period due to the timing of sales
and repurchases of the Fund’s shares in relation to income earned and/or fluctuating fair value of the investments of the Fund.
cBased on average daily shares outstanding.
dTotal return does not reflect sales commissions or contingent deferred sales charges, if applicable, and is not annualized for periods less than one year.
eRatios are annualized for periods less than one year.
fBenefit of expense reduction rounds to less than 0.01%.
franklintempleton.com The accompanying notes are an integral part of these consolidated financial statements. | Semiannual Report 11
| | | | | | | | | | | | |
| FRANKLIN ALTERNATIVE STRATEGIES FUNDS | | | | | | | | | | | | |
| CONSOLIDATED FINANCIAL HIGHLIGHTS | | | | | | | | | | | | |
| |
| |
| Franklin Pelagos Commodities Strategy Fund (continued) | | | | | | | | | | | | |
| | | Six Months Ended | | | | | | | | | | |
| | | November 30, 2016 | | | Year Ended May 31, | | | | |
| | | (unaudited) | | | 2016 | | | 2015 | | | 2014 | a |
| Class R | | | | | | | | | | | | |
| Per share operating performance | | | | | | | | | | | | |
| (for a share outstanding throughout the period) | | | | | | | | | | | | |
| Net asset value, beginning of period | $ | 6.44 | | $ | 7.10 | | $ | 9.44 | | $ | 8.88 | |
| Income from investment operationsb: | | | | | | | | | | | | |
| Net investment income (loss)c | | (0.02 | ) | | (0.06 | ) | | (0.10 | ) | | (0.06 | ) |
| Net realized and unrealized gains (losses) | | (0.04 | ) | | (0.60 | ) | | (2.24 | ) | | 0.62 | |
| Total from investment operations | | (0.06 | ) | | (0.66 | ) | | (2.34 | ) | | 0.56 | |
| Net asset value, end of period | $ | 6.38 | | $ | 6.44 | | $ | 7.10 | | $ | 9.44 | |
| |
| Total returnd | | (0.93 | )% | | (9.30 | )% | | (24.79 | )% | | 6.31 | % |
| |
| Ratios to average net assetse | | | | | | | | | | | | |
| Expenses before waiver and payments by affiliates and expense reduction . | | 1.80 | % | | 2.34 | % | | 2.27 | % | | 3.58 | % |
| Expenses net of waiver and payments by affiliates and expense reductionf . | | 1.27 | % | | 1.41 | % | | 1.47 | % | | 1.45 | % |
| Net investment income (loss) | | (0.76 | )% | | (0.99 | )% | | (1.16 | )% | | (1.14 | )% |
| |
| Supplemental data | | | | | | | | | | | | |
| Net assets, end of period (000’s) | $ | 9 | | $ | 9 | | $ | 4 | | $ | 5 | |
| Portfolio turnover rate | | 42.43 | % | | 28.03 | % | | 62.10 | % | | 34.28 | % |
aFor the period January 10, 2014 (commencement of operations) to May 31, 2014.
bThe amount shown for a share outstanding throughout the period may not correlate with the Consolidated Statement of Operations for the period due to the timing of sales
and repurchases of the Fund’s shares in relation to income earned and/or fluctuating fair value of the investments of the Fund.
cBased on average daily shares outstanding.
dTotal return is not annualized for periods less than one year.
eRatios are annualized for periods less than one year.
fBenefit of expense reduction rounds to less than 0.01%.
12 Semiannual Report | The accompanying notes are an integral part of these consolidated financial statements. franklintempleton.com
FRANKLIN ALTERNATIVE STRATEGIES FUNDS
CONSOLIDATED FINANCIAL HIGHLIGHTS
| | | | | | | | | | | | |
| Franklin Pelagos Commodities Strategy Fund (continued) | | | | | | | | | | | | |
| | | Six Months Ended | | | | | | | | | | |
| | | November 30, 2016 | | | Year Ended May 31, | | | | |
| | | (unaudited) | | | 2016 | | | 2015 | | | 2014 | a |
| Class R6 | | | | | | | | | | | | |
| Per share operating performance | | | | | | | | | | | | |
| (for a share outstanding throughout the period) | | | | | | | | | | | | |
| Net asset value, beginning of period | $ | 6.53 | | $ | 7.16 | | $ | 9.46 | | $ | 8.88 | |
| Income from investment operationsb: | | | | | | | | | | | | |
| Net investment income (loss)c | | (0.01 | ) | | (0.02 | ) | | (0.04 | ) | | (0.03 | ) |
| Net realized and unrealized gains (losses) | | (0.02 | ) | | (0.61 | ) | | (2.26 | ) | | 0.61 | |
| Total from investment operations | | (0.03 | ) | | (0.63 | ) | | (2.30 | ) | | 0.58 | |
| Net asset value, end of period | $ | 6.50 | | $ | 6.53 | | $ | 7.16 | | $ | 9.46 | |
| |
| Total returnd | | (0.46 | )% | | (8.80 | )% | | (24.31 | )% | | 6.53 | % |
| |
| Ratios to average net assetse | | | | | | | | | | | | |
| Expenses before waiver and payments by affiliates and expense reduction . | | 1.02 | % | | 1.10 | % | | 1.53 | % | | 1.58 | % |
| Expenses net of waiver and payments by affiliates and expense reductionf . | | 0.72 | % | | 0.76 | % | | 0.86 | % | | 0.86 | % |
| Net investment income (loss) | | (0.21 | )% | | (0.34 | )% | | (0.55 | )% | | (0.55 | )% |
| |
| Supplemental data | | | | | | | | | | | | |
| Net assets, end of period (000’s) | $ | 125,564 | | $ | 131,500 | | $ | 53,068 | | $ | 67,732 | |
| Portfolio turnover rate | | 42.43 | % | | 28.03 | % | | 62.10 | % | | 34.28 | % |
aFor the period January 10, 2014 (commencement of operations) to May 31, 2014.
bThe amount shown for a share outstanding throughout the period may not correlate with the Consolidated Statement of Operations for the period due to the timing of sales
and repurchases of the Fund’s shares in relation to income earned and/or fluctuating fair value of the investments of the Fund.
cBased on average daily shares outstanding.
dTotal return is not annualized for periods less than one year.
eRatios are annualized for periods less than one year.
fBenefit of expense reduction rounds to less than 0.01%.
franklintempleton.com The accompanying notes are an integral part of these consolidated financial statements. | Semiannual Report 13
| | | | | | | | | | | | | | | | | | |
| FRANKLIN ALTERNATIVE STRATEGIES FUNDS | | | | | | | | | | | | | | | | |
| CONSOLIDATED FINANCIAL HIGHLIGHTS | | | | | | | | | | | | | | | | |
| |
| |
| Franklin Pelagos Commodities Strategy Fund (continued) | | | | | | | | | | | | | | | | |
| | | Six Months Ended | | | | | | | | | | | | | | | | |
| | | November 30, 2016 | | | | | | Year Ended May 31, | | | | | | | |
| | | (unaudited) | | | 2016 | | | 2015 | | | 2014 | | | 2013 | | | 2012 | a |
| Advisor Class | | | | | | | | | | | | | | | | | | |
| Per share operating performance | | | | | | | | | | | | | | | | | | |
| (for a share outstanding throughout the | | | | | | | | | | | | | | | | | | |
| period) | | | | | | | | | | | | | | | | | | |
| Net asset value, beginning of period | $ | 6.60 | | $ | 7.25 | | $ | 9.58 | | $ | 9.43 | | $ | 9.15 | | $ | 10.00 | |
| Income from investment operationsb: | | | | | | | | | | | | | | | | | | |
| Net investment income (loss)c | | (0.02 | ) | | (0.09 | ) | | (0.07 | ) | | (0.05 | ) | | (0.08 | ) | | (0.05 | ) |
| Net realized and unrealized gains (losses) | | (0.03 | ) | | (0.56 | ) | | (2.26 | ) | | 0.20 | | | 0.36 | | | (0.80 | ) |
| Total from investment operations | | (0.05 | ) | | (0.65 | ) | | (2.33 | ) | | 0.15 | | | 0.28 | | | (0.85 | ) |
| Less distributions from net investment income. | | — | | | — | | | — | | | — | | | (—)d | | | — | |
| Net asset value, end of period | $ | 6.55 | | $ | 6.60 | | $ | 7.25 | | $ | 9.58 | | $ | 9.43 | | $ | 9.15 | |
| |
| Total returne | | (0.76 | )% | | (8.97 | )% | | (24.32 | )% | | 1.59 | % | | 3.06 | % | | (8.50 | )% |
| |
| Ratios to average net assetsf | | | | | | | | | | | | | | | | | | |
| Expenses before waiver and payments by | | | | | | | | | | | | | | | | | | |
| affiliates and expense reduction | | 1.48 | % | | 1.88 | % | | 1.75 | % | | 1.88 | % | | 1.14 | % | | 5.08 | % |
| Expenses net of waiver and payments by | | | | | | | | | | | | | | | | | | |
| affiliates and expense reduction | | 0.95 | %g | | 0.95 | %g | | 0.95 | %g | | 1.04 | %g | | 1.10 | % | | 1.10 | % |
| Net investment income (loss) | | (0.44 | )% | | (0.53 | )% | | (0.64 | )% | | (0.70 | )% | | (0.76 | )% | | (1.07 | )% |
| |
| Supplemental data | | | | | | | | | | | | | | | | | | |
| Net assets, end of period (000’s) | $ | 1,294 | | $ | 675 | | $ | 248 | | $ | 126 | | $ | 107,853 | | $ | 14,374 | |
| Portfolio turnover rate. | | 42.43 | % | | 28.03 | % | | 62.10 | % | | 34.28 | % | | 21.47 | % | | —%h | |
aFor the period December 7, 2011 (commencement of operations) to May 31, 2012.
bThe amount shown for a share outstanding throughout the period may not correlate with the Consolidated Statement of Operations for the period due to the timing of sales
and repurchases of the Fund’s shares in relation to income earned and/or fluctuating fair value of the investments of the Fund.
cBased on average daily shares outstanding.
dAmount rounds to less than $0.01 per share.
eTotal return is not annualized for periods less than one year.
fRatios are annualized for periods less than one year.
gBenefit of expense reduction rounds to less than 0.01%.
hFor the period there were no purchases or sales of investments (other than short term securities).
14 Semiannual Report | The accompanying notes are an integral part of these consolidated financial statements. franklintempleton.com
FRANKLIN ALTERNATIVE STRATEGIES FUNDS
| | | | |
| Consolidated Statement of Investments, November 30, 2016 (unaudited) | | | | |
| Franklin Pelagos Commodities Strategy Fund | | | | |
| | | Principal | | |
| | | Amount | | Value |
| |
| U.S. Government and Agency Securities 32.4% | | | | |
| FFCB, 0.96%, 7/27/18 | $ | 10,000,000 | $ | 9,945,080 |
| FHLMC, 1.25%, 7/26/19 | | 10,000,000 | | 9,949,960 |
| U.S. Treasury Note, 0.75%, 10/31/17 | | 23,000,000 | | 22,982,037 |
| Total U.S. Government and Agency Securities (Cost $43,021,607) | | | | 42,877,077 |
| |
| Short Term Investments 64.9% | | | | |
| U.S. Government and Agency Securities 64.9% | | | | |
| a FFCB, 12/01/16 | | 4,175,000 | | 4,175,000 |
| b U.S. Treasury Bill, | | | | |
| a,c 1/05/17 | | 13,000,000 | | 12,996,165 |
| a 4/13/17 | | 12,000,000 | | 11,977,248 |
| 5/25/17 | | 12,550,000 | | 12,514,383 |
| 7/20/17 | | 23,000,000 | | 22,924,923 |
| 10/12/17 | | 21,500,000 | | 21,365,346 |
| Total U.S. Government and Agency Securities (Cost $85,964,430) | | | | 85,953,065 |
| Total Investments (Cost $128,986,037) 97.3% | | | | 128,830,142 |
| d Other Assets, less Liabilities 2.7% | | | | 3,573,588 |
| Net Assets 100.0%. | | | $ | 132,403,730 |
aA portion or all of the security is owned by FPC Holdings Corp., a wholly-owned subsidiary of the Fund. See Note 1(d).
bThe security was issued on a discount basis with no stated coupon rate.
cA portion or all of the security has been segregated as collateral for open futures contracts. At November 30, 2016, the value of this security and/or cash pledged amounted
to $1,899,422, representing 1.4% of net assets.
dIncludes unrealized appreciation/depreciation on open commodity futures and swap contracts, as well as other assets and liabilities.
franklintempleton.com
Semiannual Report 15
FRANKLIN ALTERNATIVE STRATEGIES FUNDS
CONSOLIDATED STATEMENT OF INVESTMENTS (UNAUDITED)
| | | | | | | | | | | | | | |
| Franklin Pelagos Commodities Strategy Fund (continued) | | | | | | | | | | |
| |
| |
| At November 30, 2016, the Fund had the following futures contracts outstanding. See Note 1(b). | | | | | | | |
| |
| Futures Contractsa | | | | | | | | | | | | | | |
| |
| | | | | Number of | | Notional | Expiration | | Unrealized | | Unrealized | |
| Description | | | Type | Contracts | | Value | Date | | Appreciation | | Depreciation | |
| Commodity Contracts | | | | | | | | | | | | | | |
| Gold | | | Long | 40 | $ | 4,695,600 | 2/24/17 | $ | — | | | $ | (346,377 | ) |
| Natural Gas | | | Long | 66 | | 2,212,320 | 12/28/16 | | 58,496 | | | | — | |
| Silver | | | Long | 61 | | 5,027,010 | 3/29/17 | | — | | | | (291,720 | ) |
| WTI Crude Oil | | | Long | 211 | | 10,805,310 | 2/21/17 | | 44,825 | | | | — | |
| Total Futures Contracts | | | | | $ | 22,740,240 | | $ | 103,321 | | | $ | (638,097 | ) |
| Net unrealized appreciation (depreciation) | | | | | | | | | $ | (534,776 | ) |
| |
| At November 30, 2016, the Fund had the following commodity-linked total return swap contracts outstanding. See Note 1(b). | |
| |
| Commodity-Linked Total Return Swap Contractsa | | | | | | | | | | |
| | Pay | | | | | Notional | Expiration | | Unrealized | | Unrealized | |
| Underlying Instruments | Fixed Rate | Counterparty | | | Value | Date | | Appreciation | | Depreciation | |
| OTC Swap Contracts | | | | | | | | | | | | | | |
| Long | | | | | | | | | | | | | | |
| FP Custom Master Indexb | 0.22 | % | MSCS | | $ | 109,501,148 | 12/02/16 | $ | 1,401,148 | | | $ | — | |
| Net unrealized appreciation (depreciation) | | | | | $ | 1,401,148 | | | | | |
| |
| |
| aA portion or all of the contracts are owned by FPC Holdings Corp., a wholly-owned subsidiary of the Fund. See Note 1(d). | | | | | | | |
| bRepresents a custom index comprised of a basket of underlying instruments. Additional information regarding the custom basket’s underlying instruments and their | |
| respective values including fees are as follows: | | | | | | | | | | | | | |
| | | | | | | | | | Unrealized | | Unrealized | |
| Underlying Instruments | | | | | | Notional Valuec | | | Appreciation | | Depreciation | |
| Bloomberg Commodity Aluminum Subindex | | $ | 5,913,062 | | $ | 29,310 | | $ | | — | |
| Bloomberg Commodity Brent Crude Oil Subindex 1 Month Forward | | 12,483,131 | | | 139,764 | | | | — | |
| Bloomberg Commodity Coffee Subindex | | | | | 3,504,037 | | | — | | | | (380,425 | ) |
| Bloomberg Commodity Copper Subindex | | | | | 8,869,593 | | | 1,707,427 | | | | — | |
| Bloomberg Commodity Corn Subindex | | | | | 4,161,044 | | | — | | | | (175,883 | ) |
| Bloomberg Commodity Cotton Subindex | | | | | 1,861,520 | | | 3,073 | | | | — | |
| Bloomberg Commodity Gold Subindex | | | | | 8,869,593 | | | — | | | | (729,729 | ) |
| Bloomberg Commodity Lean Hogs Subindex 3 Month Forward | | | 1,752,018 | | | — | | | | (4,575 | ) |
| Bloomberg Commodity Live Cattle Subindex 3 Month Forward | | | 3,066,032 | | | 216,386 | | | | — | |
| Bloomberg Commodity Natural Gas Subindex | | | 9,745,602 | | | 261,817 | | | | — | |
| Bloomberg Commodity Nickel Subindex | | | | | 3,175,533 | | | 239,157 | | | | — | |
| Bloomberg Commodity Soybean Meal Subindex | | | 3,942,041 | | | — | | | | (9,366 | ) |
| Bloomberg Commodity Soybean Oil Subindex | | | 3,723,039 | | | 139,511 | | | | — | |
| Bloomberg Commodity Soybeans Subindex | | | 12,921,135 | | | 252,535 | | | | — | |
| Bloomberg Commodity Sugar Subindex | | | | | 6,351,067 | | | — | | | | (666,226 | ) |
| Bloomberg Commodity Unleaded Gasoline Subindex 3 Month Forward | | 11,497,621 | | | 22,261 | | | | — | |
| Bloomberg Commodity Wheat Subindex | | | | | 3,285,034 | | | — | | | | (179,584 | ) |
| Bloomberg Commodity Zinc Subindex. | | | | | 4,380,046 | | | 535,695 | | | | — | |
| Total custom index | | | | | $ | 109,501,148 | | $ | 3,546,936 | $ | (2,145,788 | ) |
| Net unrealized appreciation (depreciation) | | | | | $ | 1,401,148 | | | | | |
| |
| cNotional value represents the fair value of each underlying instrument (including the financing rate fee which is calculated based on the custom swap contract’s original | |
| notional value of $108,100,000, allocated to each underlying instrument on a pro-rata basis). | | | | | | | | | | |
| |
| See Abbreviations on page 31. | | | | | | | | | | | | | | |
16 Semiannual Report | The accompanying notes are an integral part of these consolidated financial statements. franklintempleton.com
FRANKLIN ALTERNATIVE STRATEGIES FUNDS
Consolidated Financial Statements
Consolidated Statement of Assets and Liabilities
November 30, 2016 (unaudited)
| | | |
| Franklin Pelagos Commodities Strategy Fund | | | |
| |
| Assets: | | | |
| Investments in securities: | | | |
| Cost. | $ | 128,986,037 | |
| Value | $ | 128,830,142 | |
| Cash | | 1,409,197 | |
| Restricted Cash (Note 1c) | | 2,073,000 | |
| Receivables: | | | |
| Capital shares sold | | 36,163 | |
| Interest. | | 90,151 | |
| Affiliates | | 2,352 | |
| Variation margin | | 744,939 | |
| Unrealized appreciation on OTC swap contracts | | 1,401,148 | |
| Other assets | | 14 | |
| Total assets | | 134,587,106 | |
| Liabilities: | | | |
| Payables: | | | |
| Capital shares redeemed | | 6,198 | |
| Management fees | | 55,153 | |
| Distribution fees | | 1,722 | |
| Professional fees | | 40,040 | |
| Due to brokers | | 2,073,000 | |
| Accrued expenses and other liabilities | | 7,263 | |
| Total liabilities | | 2,183,376 | |
| Net assets, at value | $ | 132,403,730 | |
| Net assets consist of: | | | |
| Paid-in capital | $ | 133,808,983 | |
| Accumulated net investment loss | | (304,910 | ) |
| Net unrealized appreciation (depreciation) | | 710,477 | |
| Accumulated net realized gain (loss) | | (1,810,820 | ) |
| Net assets, at value | $ | 132,403,730 | |
franklintempleton.com The accompanying notes are an integral part of these consolidated financial statements. | Semiannual Report 17
FRANKLIN ALTERNATIVE STRATEGIES FUNDS
CONSOLIDATED FINANCIAL STATEMENTS
Consolidated Statement of Assets and Liabilities (continued) November 30, 2016 (unaudited)
| | |
| Franklin Pelagos Commodities Strategy Fund | | |
| |
| Class A: | | |
| Net assets, at value | $ | 4,503,893 |
| Shares outstanding | | 701,527 |
| Net asset value per sharea | $ | 6.42 |
| Maximum offering price per share (net asset value per share ÷ 94.25%) | $ | 6.81 |
| Class C: | | |
| Net assets, at value | $ | 1,032,544 |
| Shares outstanding | | 164,399 |
| Net asset value and maximum offering price per sharea | $ | 6.28 |
| Class R: | | |
| Net assets, at value | $ | 9,193 |
| Shares outstanding | | 1,440 |
| Net asset value and maximum offering price per share | $ | 6.38 |
| Class R6: | | |
| Net assets, at value | $ | 125,564,430 |
| Shares outstanding | | 19,327,137 |
| Net asset value and maximum offering price per share | $ | 6.50 |
| Advisor Class: | | |
| Net assets, at value | $ | 1,293,670 |
| Shares outstanding | | 197,406 |
| Net asset value and maximum offering price per share | $ | 6.55 |
aRedemption price is equal to net asset value less contingent deferred sales charges, if applicable.
18 Semiannual Report | The accompanying notes are an integral part of these consolidated financial statements. franklintempleton.com
FRANKLIN ALTERNATIVE STRATEGIES FUNDS
CONSOLIDATED FINANCIAL STATEMENTS
Consolidated Statement of Operations
for the six months ended November 30, 2016 (unaudited)
| | | |
| Franklin Pelagos Commodities Strategy Fund | | | |
| |
| Investment income: | | | |
| Interest | $ | 349,856 | |
| Expenses: | | | |
| Management fees (Note 3a) | | 575,663 | |
| Distribution fees: (Note 3c) | | | |
| Class A | | 5,334 | |
| Class C | | 5,124 | |
| Class R | | 15 | |
| Transfer agent fees: (Note 3e) | | | |
| Class A | | 9,918 | |
| Class C | | 2,383 | |
| Class R | | 21 | |
| Class R6 | | 32 | |
| Advisor Class. | | 2,133 | |
| Custodian fees (Note 4) | | 498 | |
| Reports to shareholders | | 5,759 | |
| Registration and filing fees | | 40,580 | |
| Professional fees | | 44,287 | |
| Trustees’ fees and expenses | | 19,017 | |
| Other | | 5,014 | |
| Total expenses. | | 715,778 | |
| Expense reductions (Note 4) | | (575 | ) |
| Expenses waived/paid by affiliates (Note 3f and 3g) | | (214,340 | ) |
| Net expenses. | | 500,863 | |
| Net investment income (loss) | | (151,007 | ) |
| Realized and unrealized gains (losses): | | | |
| Net realized gain (loss) from: | | | |
| Investments | | (271,406 | ) |
| Written options | | 256,385 | |
| Futures contracts | | 1,388,573 | |
| Swap contracts | | (3,008,592 | ) |
| Net realized gain (loss) | | (1,635,040 | ) |
| Net change in unrealized appreciation (depreciation) on: | | | |
| Investments | | (55,583 | ) |
| Futures contracts | | (784,344 | ) |
| Swap contracts | | 1,748,046 | |
| Net change in unrealized appreciation (depreciation) | | 908,119 | |
| Net realized and unrealized gain (loss) | | (726,921 | ) |
| Net increase (decrease) in net assets resulting from operations | $ | (877,928 | ) |
franklintempleton.com The accompanying notes are an integral part of these consolidated financial statements. | Semiannual Report 19
| | | | | | |
| FRANKLIN ALTERNATIVE STRATEGIES FUNDS | | | | | | |
| CONSOLIDATED FINANCIAL STATEMENTS | | | | | | |
| |
| |
| Consolidated Statements of Changes in Net Assets | | | | | | |
| |
| Franklin Pelagos Commodities Strategy Fund | | | | | | |
| |
| | | Six Months Ended | | | | |
| | | November 30, 2016 | | | Year Ended | |
| | | (unaudited) | | | May 31, 2016 | |
| Increase (decrease) in net assets: | | | | | | |
| Operations: | | | | | | |
| Net investment income (loss) | $ | (151,007 | ) | $ | (347,124 | ) |
| Net realized gain (loss) | | (1,635,040 | ) | | (1,003,848 | ) |
| Net change in unrealized appreciation (depreciation) | | 908,119 | | | (646,629 | ) |
| Net increase (decrease) in net assets resulting from operations | | (877,928 | ) | | (1,997,601 | ) |
| Capital share transactions: (Note 2) | | | | | | |
| Class A | | 735,909 | | | 1,805,061 | |
| Class C | | 188,278 | | | 495,022 | |
| Class R | | 669 | | | 4,615 | |
| Class R6 | | (5,122,792 | ) | | 80,347,873 | |
| Advisor Class. | | 620,489 | | | 427,868 | |
| Total capital share transactions | | (3,577,447 | ) | | 83,080,439 | |
| Net increase (decrease) in net assets | | (4,455,375 | ) | | 81,082,838 | |
| Net assets: | | | | | | |
| Beginning of period | | 136,859,105 | | | 55,776,267 | |
| End of period | $ | 132,403,730 | | $ | 136,859,105 | |
| Accumulated net investment loss included in net assets: | | | | | | |
| End of period | $ | (304,910 | ) | $ | (153,903 | ) |
20 Semiannual Report | The accompanying notes are an integral part of these consolidated financial statements. franklintempleton.com
FRANKLIN ALTERNATIVE STRATEGIES FUNDS
Notes to Consolidated Financial Statements (unaudited)
Franklin Pelagos Commodities Strategy Fund
1. Organization and Significant Accounting Policies
Franklin Alternative Strategies Funds (Trust) is registered under the Investment Company Act of 1940 (1940 Act) as an open-end management investment company, consisting of four separate funds and applies the specialized accounting and reporting guidance in U.S. Generally Accepted Accounting Principles (U.S. GAAP). Franklin Pelagos Commodities Strategy Fund (Fund) is included in this report. The financial statements of the remaining funds in the Trust are presented separately. The Fund offers five classes of shares: Class A, Class C, Class R, Class R6 and Advisor Class. Each class of shares differs by its initial sales load, contingent deferred sales charges, voting rights on matters affecting a single class, its exchange privilege and fees primarily due to differing arrangements for distribution and transfer agent fees.
The following summarizes the Fund’s significant accounting policies.
a. Financial Instrument Valuation
The Fund’s investments in financial instruments are carried at fair value daily. Fair value is the price that would be received to sell an asset or paid to transfer a liability in an orderly transaction between market participants on the measurement date. The Fund calculates the net asset value per share as of 4 p.m. Eastern time each day the New York Stock Exchange (NYSE) is open for trading. Under compliance policies and procedures approved by the Trust’s Board of Trustees (the Board), the Fund’s administrator has responsibility for oversight of valuation, including leading the cross-functional Valuation Committee (VC). The VC provides administration and oversight of the Fund’s valuation policies and procedures, which are approved annually by the Board. Among other things, these procedures allow the Fund to utilize independent pricing services, quotations from securities and financial instrument dealers, and other market sources to determine fair value.
Debt securities generally trade in the over-the-counter (OTC) market rather than on a securities exchange. The Fund’s pricing services use multiple valuation techniques to determine fair value. In instances where sufficient market activity exists, the pricing services may utilize a market-based approach through which quotes from market makers are used to determine fair value. In instances where sufficient market activity may not exist or is limited, the pricing services also utilize proprietary valuation models which may consider market characteristics such as benchmark yield curves, credit spreads, estimated default rates, anticipated market interest rate volatility, coupon rates, anticipated timing of principal repayments, underlying collateral, and other unique security features in order to estimate the relevant cash flows, which are then discounted to calculate the fair value.
Derivative financial instruments listed on an exchange are valued at the official closing price of the day. Certain derivative financial instruments trade in the OTC market. The Fund’s pricing services use various techniques including industry standard option pricing models and proprietary discounted cash flow models to determine the fair value of those instruments. The Fund’s net benefit or obligation under the derivative contract, as measured by the fair value of the contract, is included in net assets.
The Fund has procedures to determine the fair value of financial instruments for which market prices are not reliable or readily available. Under these procedures, the VC convenes on a regular basis to review such financial instruments and considers a number of factors, including significant unobservable valuation inputs, when arriving at fair value. The VC primarily employs a market-based approach which may use related or comparable assets or liabilities, recent transactions, market multiples, book values, and other relevant information for the investment to determine the fair value of the investment. An income-based valuation approach may also be used in which the anticipated future cash flows of the investment are discounted to calculate fair value. Discounts may also be applied due to the nature or duration of any restrictions on the disposition of the investments. Due to the inherent uncertainty of valuations of such investments, the fair values may differ significantly from the values that would have been used had an active market existed. The VC employs various methods for calibrating these valuation approaches including a regular review of key inputs and assumptions, transactional back-testing or disposition analysis, and reviews of any related market activity.
b. Derivative Financial Instruments
The Fund invested in derivative financial instruments in order to manage risk or gain exposure to various other investments or markets. Derivatives are financial contracts based on an underlying or notional amount, require no initial investment or an initial net investment that is smaller than would normally be required to have a similar response to changes in market factors, and require or permit net settlement. Derivatives contain various
franklintempleton.com
Semiannual Report 21
FRANKLIN ALTERNATIVE STRATEGIES FUNDS
NOTES TO CONSOLIDATED FINANCIAL STATEMENTS (UNAUDITED)
Franklin Pelagos Commodities Strategy Fund (continued)
1. Organization and Significant Accounting
Policies (continued)
b. Derivative Financial Instruments (continued)
risks including the potential inability of the counterparty to fulfill their obligations under the terms of the contract, the potential for an illiquid secondary market, and/or the potential for market movements which expose the Fund to gains or losses in excess of the amounts shown in the Consolidated Statement of Assets and Liabilities. Realized gain and loss and unrealized appreciation and depreciation on these contracts for the period are included in the Consolidated Statement of Operations.
Derivative counterparty credit risk is managed through a formal evaluation of the creditworthiness of all potential counterparties The Fund attempts to reduce its exposure to counterparty credit risk on OTC derivatives, whenever possible, by entering into International Swaps and Derivatives Association (ISDA) master agreements with certain counterparties. These agreements contain various provisions, including but not limited to collateral requirements, events of default, or early termination. Termination events applicable to the counterparty include certain deteriorations in the credit quality of the counterparty. Termination events applicable to the Fund include failure of the Fund to maintain certain net asset levels and/or limit the decline in net assets over various periods of time. In the event of default or early termination, the ISDA master agreement gives the non-defaulting party the right to net and close-out all transactions traded, whether or not arising under the ISDA agreement, to one net amount payable by one counterparty to the other. However, absent an event of default or early termination, OTC derivative assets and liabilities are presented gross and not offset in the Consolidated Statement of Assets and Liabilities. Early termination by the counterparty may result in an immediate payment by the Fund of any net liability owed to that counterparty under the ISDA agreement.
Collateral requirements differ by type of derivative. Collateral or initial margin requirements are set by the broker or exchange clearing house for exchange traded and centrally cleared derivatives. Initial margin deposited is held at the exchange and can be in the form of cash and/or securities. For OTC derivatives traded under an ISDA master agreement, posting of collateral is required by either the Fund or the applicable counterparty if the total net exposure of all OTC derivatives with the applicable counterparty exceeds the minimum transfer amount, which typically ranges from $100,000 to $250,000, and can vary depending on the counterparty and the type of the agreement. Generally, collateral is determined at the close of Fund business each day and any additional collateral required due to changes in derivative values may be delivered by the Fund or the counterparty within a few business days. Collateral pledged and/or received by the Fund for OTC derivatives, if any, is held in segregated accounts with the Fund’s custodian/counterparty broker and can be in the form of cash and/or securities. Unrestricted cash may be invested according to the Fund’s investment objectives. To the extent that the amounts due to the Fund from its counterparties are not subject to collateralization or are not fully collateralized, the Fund bears the risk of loss from counterparty non-performance.
The Fund entered into exchange traded futures contracts primarily to gain exposure to commodity price risk. A futures contract is an agreement between the Fund and a counterparty to buy or sell an asset at a specified price on a future date. Required initial margins are pledged by the Fund, and the daily change in fair value is accounted for as a variation margin payable or receivable in the Consolidated Statement of Assets and Liabilities.
The Fund entered into OTC commodity-linked total return swap contracts primarily to gain exposure to commodity price risk of an underlying instrument such as a stock, bond, index or basket of securities or indices. A total return swap is an agreement between the Fund and a counterparty to exchange a return linked to an underlying instrument for a floating or fixed rate payment, both based upon a notional amount. Over the term of the contract, contractually required payments to be paid or received are accrued daily and recorded as unrealized appreciation or depreciation until the payments are made, at which time they are recognized as realized gain or loss.
The Fund purchased or wrote exchange traded option contracts primarily to manage and/or gain exposure to commodity price risk. An option is a contract entitling the holder to purchase or sell a specific amount of shares or units of an asset or notional amount of a swap (swaption), at a specified price. When an option is purchased or written, an amount equal to the premium paid or received is recorded as an asset or liability, respectively. Upon exercise of an option, the acquisition cost or sales proceeds of the underlying investment is adjusted by any premium received or paid. Upon expiration of an option, any premium received or paid is recorded as a realized gain or loss.
22 Semiannual Report
franklintempleton.com
FRANKLIN ALTERNATIVE STRATEGIES FUNDS
NOTES TO CONSOLIDATED FINANCIAL STATEMENTS (UNAUDITED)
Franklin Pelagos Commodities Strategy Fund (continued)
Upon closing an option other than through expiration or exercise, the difference between the premium received or paid and the cost to close the position is recorded as a realized gain or loss.
See Notes 6 and 7 regarding investment transactions and other derivative information, respectively.
c. Restricted Cash
At November 30, 2016, the Fund held restricted cash in connection with investments in certain derivative securities. Restricted cash is held in a segregated account with the Fund’s custodian and is reflected in the Consolidated Statement of Assets and Liabilities.
d. Investments in FPC Holdings Corp. (FP Subsidiary)
The Fund invests in certain financial instruments and commodity-linked derivative investments through its investment in the FP Subsidiary. The FP Subsidiary is a Cayman Islands exempted company with limited liability, is a wholly-owned subsidiary of the Fund, and is able to invest in certain financial instruments and commodity-linked derivative investments consistent with the investment objective of the Fund. At November 30, 2016, the FP Subsidiary’s investments, as well as any other assets and liabilities of the FP Subsidiary are reflected in the Fund’s Consolidated Statement of Investments and Consolidated Statement of Assets and Liabilities. The financial statements have been consolidated and include the accounts of the Fund and the FP Subsidiary. All intercompany transactions and balances have been eliminated. At November 30, 2016, the net assets of the FP Subsidiary were $30,584,203, representing 23.1% of the Fund’s consolidated net assets. The Fund’s investment in the FP Subsidiary is limited to 25% of consolidated assets.
The results from operations of the FP Subsidiary for the six months ended November 30, 2016, were as follows:
| | | |
| Net investment income (loss) | $ | (98,234 | ) |
| Net realized gain (loss) | | (1,636,934 | ) |
| Net change in unrealized appreciation (depre- | | | |
| ciation) | | 948,456 | |
| Net increase (decrease) in net assets resulting | | | |
| from operations | $ | (786,712 | ) |
e. Income Taxes
It is the Fund’s policy to qualify as a regulated investment company under the Internal Revenue Code. The Fund intends to distribute to shareholders substantially all of its taxable income and net realized gains to relieve it from federal income and excise taxes. As a result, no provision for U.S. federal income taxes is required.
The Fund may recognize an income tax liability related to its uncertain tax positions under U.S. GAAP when the uncertain tax position has a less than 50% probability that it will be sustained upon examination by the tax authorities based on its technical merits. As of November 30, 2016, the Fund has determined that no tax liability is required in its consolidated financial statements related to uncertain tax positions for any open tax years (or expected to be taken in future tax years). Open tax years are those that remain subject to examination and are based on each tax jurisdiction’s statute of limitation.
f. Security Transactions, Investment Income, Expenses and Distributions
Security transactions are accounted for on trade date. Realized gains and losses on security transactions are determined on a specific identification basis. Interest income and estimated expenses are accrued daily. Amortization of premium and accretion of discount on debt securities are included in interest income. Distributions to shareholders are recorded on the ex-dividend date and are determined according to income tax regulations (tax basis). Distributable earnings determined on a tax basis may differ from earnings recorded in accordance with U.S. GAAP. These differences may be permanent or temporary. Permanent differences are reclassified among capital accounts to reflect their tax character. These reclassifications have no impact on net assets or the results of operations. Temporary differences are not reclassified, as they may reverse in subsequent periods.
Common expenses incurred by the Trust are allocated among the funds based on the ratio of net assets of each fund to the combined net assets of the Trust. Fund specific expenses are charged directly to the fund that incurred the expense.
Realized and unrealized gains and losses and net investment income, not including class specific expenses, are allocated daily to each class of shares based upon the relative proportion
franklintempleton.com
Semiannual Report 23
FRANKLIN ALTERNATIVE STRATEGIES FUNDS
NOTES TO CONSOLIDATED FINANCIAL STATEMENTS (UNAUDITED)
Franklin Pelagos Commodities Strategy Fund (continued)
1. Organization and Significant Accounting
Policies (continued)
f. Security Transactions, Investment Income, Expenses and Distributions (continued)
of net assets of each class. Differences in per share distributions, by class, are generally due to differences in class specific expenses.
g. Accounting Estimates
The preparation of financial statements in accordance with U.S. GAAP requires management to make estimates and assumptions that affect the reported amounts of assets and liabilities at the date of the financial statements and the amounts of income and expenses during the reporting period. Actual results could differ from those estimates.
h. Guarantees and Indemnifications
Under the Trust’s organizational documents, its officers and trustees are indemnified by the Trust against certain liabilities arising out of the performance of their duties to the Trust. Additionally, in the normal course of business, the Trust, on behalf of the Fund, enters into contracts with service providers that contain general indemnification clauses. The Trust’s maximum exposure under these arrangements is unknown as this would involve future claims that may be made against the Trust that have not yet occurred. Currently, the Trust expects the risk of loss to be remote.
2. Shares of Beneficial Interest
At November 30, 2016, there were an unlimited number of shares authorized (without par value). Transactions in the Fund’s shares were as follows:
| | | | | | | | | | | | |
| | Six Months Ended | | Year Ended | | |
| | November 30, 2016 | | May 31, 2016 | |
| | Shares | | | Amount | | Shares | | | Amount | |
| Class A Shares: | | | | | | | | | | | | |
| Shares sold | 207,902 | | $ | 1,350,392 | | 410,630 | | $ | 2,517,563 | |
| Shares redeemed | (95,511 | ) | | (614,483 | ) | (113,450 | ) | | (712,502 | ) |
| Net increase (decrease) | 112,391 | | | $ | 735,909 | | 297,180 | | $ | 1,805,061 | |
| Class C Shares: | | | | | | | | | | | | |
| Shares sold | 63,872 | | | $ | 405,937 | | 97,440 | | | $ | 584,239 | |
| Shares redeemed | (35,170 | ) | | (217,659 | ) | (15,208 | ) | | | (89,217 | ) |
| Net increase (decrease) | 28,702 | | | $ | 188,278 | | 82,232 | | | $ | 495,022 | |
| Class R Shares: | | | | | | | | | | | | |
| Shares sold | 150 | | | $ | 1,104 | | 792 | | | $ | 4,615 | |
| Shares redeemed | (65 | ) | | | (435 | ) | — | | | | — | |
| Net increase (decrease) | 85 | | | $ | 669 | | 792 | | | $ | 4,615 | |
| Class R6 Shares: | | | | | | | | | | | | |
| Shares sold | 144,150 | | | $ | 937,239 | | 14,259,716 | | $ | 89,857,489 | |
| Shares redeemed | (941,155 | ) | | (6,060,031 | ) | (1,547,056 | ) | | (9,509,616 | ) |
| Net increase (decrease) | (797,005 | ) | $ | (5,122,792 | ) | 12,712,660 | | $ | 80,347,873 | |
| Advisor Class Shares: | | | | | | | | | | | | |
| Shares sold | 121,106 | | | $ | 787,376 | | 75,153 | | | $ | 475,789 | |
| Shares redeemed | (25,844 | ) | | (166,887 | ) | (7,203 | ) | | | (47,921 | ) |
| Net increase (decrease) | 95,262 | | | $ | 620,489 | | 67,950 | | | $ | 427,868 | |
24 Semiannual Report
franklintempleton.com
FRANKLIN ALTERNATIVE STRATEGIES FUNDS
NOTES TO CONSOLIDATED FINANCIAL STATEMENTS (UNAUDITED)
Franklin Pelagos Commodities Strategy Fund (continued)
3. Transactions with Affiliates
Franklin Resources, Inc. is the holding company for various subsidiaries that together are referred to as Franklin Templeton Investments. Certain officers and trustees of the Trust are also officers and/or directors of the following subsidiaries:
| |
| Subsidiary | Affiliation |
| Franklin Alternative Strategies Advisers, LLC (FASA) | |
| (formerly Pelagos Capital Management, LLC) | Investment manager |
| Franklin Templeton Services, LLC (FT Services) | Administrative manager |
| Franklin Templeton Distributors, Inc. (Distributors) | Principal underwriter |
| Franklin Templeton Investor Services, LLC (Investor Services) | Transfer agent |
| |
| a. Management Fees | |
The Fund and FP Subsidiary pay an investment management fee to FASA of 0.85% per year of the average daily net assets of the Fund and FP Subsidiary. Management fees paid by the Fund are reduced on assets invested in the FP Subsidiary, in an amount not to exceed the management fees paid by the FP Subsidiary.
b. Administrative Fees
Under an agreement with FASA, FT Services provides administrative services to the Fund and FP Subsidiary. The fee is paid by FASA based on the Fund and FP Subsidiary average daily net assets, and is not an additional expense of the Fund or FP Subsidiary.
c. Distribution Fees
The Board has adopted distribution plans for each share class, with the exception of Class R6 and Advisor Class shares, pursuant to Rule 12b-1 under the 1940 Act. Under the Fund’s Class A reimbursement distribution plan, the Fund reimburses Distributors for costs incurred in connection with the servicing, sale and distribution of the Fund’s shares up to the maximum annual plan rate. Under the Class A reimbursement distribution plan, costs exceeding the maximum for the current plan year cannot be reimbursed in subsequent periods. In addition, under the Fund’s Class C and R compensation distribution plans, the Fund pays Distributors for costs incurred in connection with the servicing, sale and distribution of the Fund’s shares up to the maximum annual plan rate for each class. The plan year, for purposes of monitoring compliance with the maximum annual plan rates, is February 1 through January 31 for each fund.
The maximum annual plan rates, based on the average daily net assets, for each class, are as follows:
| | |
| Class A | 0.30 | % |
| Class C | 1.00 | % |
| Class R | 0.50 | % |
The Board has set the current rate at 0.25% per year for Class A shares until further notice and approval by the Board.
d. Sales Charges/Underwriting Agreements
Front-end sales charges and contingent deferred sales charges (CDSC) do not represent expenses of the Fund. These charges are deducted from the proceeds of sales of Fund shares prior to investment or from redemption proceeds prior to remittance, as applicable. Distributors has advised the Fund of the following commission transactions related to the sales and redemptions of the Fund’s shares for the period:
| | |
| Sales charges retained net of commissions paid to unaffiliated | | |
| broker/dealers. | $ | 2,831 |
| CDSC retained | $ | 45 |
franklintempleton.com
Semiannual Report 25
FRANKLIN ALTERNATIVE STRATEGIES FUNDS
NOTES TO CONSOLIDATED FINANCIAL STATEMENTS (UNAUDITED)
Franklin Pelagos Commodities Strategy Fund (continued)
| 3. | Transactions with Affiliates (continued) |
| e. | Transfer Agent Fees |
Each class of shares, except for Class R6, pays transfer agent fees to Investor Services for its performance of shareholder servicing obligations and reimburses Investor Services for out of pocket expenses incurred, including shareholder servicing fees paid to third parties. These fees are allocated daily based upon their relative proportion of such classes’ aggregate net assets. Class R6 pays Investor Services transfer agent fees specific to that class.
For the period ended November 30, 2016, the Fund paid transfer agent fees of $14,487, of which $7,406 was retained by Investor Services.
f. Investments in Affiliated Management Investment Companies
The Fund invests in one or more affiliated management investment companies for purposes other than exercising a controlling influence over the management or policies. Management fees paid by the Fund are waived on assets invested in the affiliated management investment companies, as noted in the Consolidated Statement of Operations, in an amount not to exceed the management and administrative fees paid directly or indirectly by each affiliate. Prior to June 1, 2013, the waiver was accounted for as a reduction to management fees. During the period ended November 30, 2016, the Fund held investments in affiliated management investment companies as follows:
| | | | | | | | | |
| | | | | | | | | | % of |
| | | | | | | | | | Affiliated |
| | Number of | | | | Number of | | | | Fund Shares |
| | Shares Held | | | | Shares | Value | | | Outstanding |
| | at Beginning | Gross | Gross | | Held at End | at End | Investment | Realized | Held at End |
| | of Period | Additions | Reductions | | of Period | of Period | Income | Gain (Loss) | of Period |
| |
| Non-Controlled Affiliates | | | | | | | | | |
| Institutional Fiduciary Trust Money Market | | | | | | | | | |
| Portfolio | 836,916 | 12,847,178 | (13,684,094 | ) | – | $– | $– | $– | –% |
| |
| |
| g. Waiver and Expense Reimbursements | | | | | | | | |
FASA has contractually agreed in advance to waive or limit its fees and to assume as its own expense certain expenses otherwise payable by the Fund so that the expenses (excluding distribution fees, acquired fund fees and expenses) for each class of the Fund do not exceed 0.95% and Class R6 does not exceed 0.68% based on the average net assets of each class (other than certain non-routine expenses or costs, including those relating to litigation, indemnification, reorganizations, and liquidations) until September 30, 2017. Total expenses waived or paid are not subject to recapture subsequent to the Fund’s fiscal year end. Prior to October 1, 2016, expenses for Class R6 were limited to 0.73%.
26 Semiannual Report
franklintempleton.com
FRANKLIN ALTERNATIVE STRATEGIES FUNDS
NOTES TO CONSOLIDATED FINANCIAL STATEMENTS (UNAUDITED)
| | | |
| Franklin Pelagos Commodities Strategy Fund (continued) | | | |
| |
| h. Other Affiliated Transactions | | | |
| |
| At November 30, 2016, the shares of the Fund were owned by the following entities: | | |
| |
| | | Percentage of | |
| | Shares | Outstanding Sharesa | |
| Franklin Moderate Allocation Fund | 8,105,013 | 39.8 | % |
| Franklin Conservative Allocation Fund | 5,230,885 | 25.7 | % |
| Franklin Growth Allocation Fund | 4,669,018 | 22.9 | % |
| Franklin LifeSmart 2025 Retirement Target Fund | 391,806 | 1.9 | % |
| Franklin LifeSmart 2035 Retirement Target Fund | 314,819 | 1.5 | % |
| Franklin LifeSmart 2045 Retirement Target Fund | 224,286 | 1.1 | % |
| Franklin LifeSmart 2030 Retirement Target Fund | 109,357 | 0.5 | % |
| Franklin LifeSmart 2020 Retirement Target Fund | 106,510 | 0.5 | % |
| Franklin LifeSmart 2040 Retirement Target Fund | 89,669 | 0.4 | % |
| Franklin LifeSmart 2050 Retirement Target Fund | 70,691 | 0.4 | % |
| Franklin LifeSmart 2055 Retirement Target Fund | 15,083 | 0.1 | % |
| Franklin Resources, Inc | 563 | —%b | |
| | 19,327,700 | 94.8 | % |
aInvestment activities of significant shareholders could have a material impact on the Fund.
bRounds to less than 0.01%.
4. Expense Offset Arrangement
The Fund has entered into an arrangement with its custodian whereby credits realized as a result of uninvested cash balances are used to reduce a portion of the Fund’s custodian expenses. During the period ended November 30, 2016, the custodian fees were reduced as noted in the Consolidated Statement of Operations.
5. Income Taxes
For tax purposes, capital losses may be carried over to offset future capital gains, if any. At May 31, 2016, the Fund had long-term capital loss carryforwards of $175,775.
For tax purposes, the Fund may elect to defer any portion of a late-year ordinary loss to the first day of the following fiscal year. At May 31, 2016, the Fund deferred late-year ordinary losses of $72,053.
At November 30, 2016, the cost of investments and net unrealized appreciation (depreciation) for income tax purposes were as follows:
| | | |
| Cost of investments | $ | 129,012,047 | |
| |
| Unrealized appreciation | $ | 20,779 | |
| Unrealized depreciation | | (202,684 | ) |
| Net unrealized appreciation (depreciation) | $ | (181,905 | ) |
Differences between income and/or capital gains as determined on a book basis and a tax basis are primarily due to differing treatments of bond discounts and premiums, investments in the FP Subsidiary and non-deductible expenses.
6. Investment Transactions
Purchases and sales of investments (excluding short term securities) for the period ended November 30, 2016, aggregated $20,000,000 and $18,000,000, respectively.
franklintempleton.com
Semiannual Report 27
| | | | | |
| FRANKLIN ALTERNATIVE STRATEGIES FUNDS | | | | | |
| NOTES TO CONSOLIDATED FINANCIAL STATEMENTS (UNAUDITED) | | | | | |
| |
| |
| |
| Franklin Pelagos Commodities Strategy Fund (continued) | | | | | |
| |
| 6. Investment Transactions (continued) | | | | | |
| Transactions in options written during the period ended November 30, 2016, were as follows: | | | | | |
| | Number of | | | | |
| | Contracts | | | Premiums | |
| Options outstanding at May 31, 2016. | — | | $ | — | |
| Options written | 492 | | | 256,385 | |
| Options expired. | (492 | ) | | (256,385 | ) |
| Options exercised | — | | | — | |
| Options closed | — | | | — | |
| Options outstanding at November 30, 2016 | — | | $ | — | |
| |
| See Notes 1(b) and 7 regarding derivative financial instruments and other derivative information, respectively. | | | | |
7. Other Derivative Information
At November 30, 2016, the Fund’s investments in derivative contracts are reflected in the Consolidated Statement of Assets and Liabilities as follows:
| | | | | | | | |
| | Asset Derivatives | | | | Liability Derivatives | | | |
| Derivative Contracts | Consolidated Statement of | | | | Consolidated Statement of | | | |
| Not Accounted for as | Assets and Liabilities | | | | Assets and Liabilities | | | |
| Hedging Instruments | Location | | Fair Value | | Location | | Fair Value | |
| Commodity contracts | Variation margin | $ | 103,321 | a | Variation margin | $ | 638,097 | a |
| | Unrealized appreciation on OTC | | 1,401,148 | | Unrealized depreciation on OTC | | — | |
| | swap contracts | | | | swap contracts | | | |
| Totals | | $ | 1,504,469 | | | $ | 638,097 | |
aThis amount reflects the cumulative appreciation (depreciation) of futures contracts as reported in the Consolidated Statement of Investments. Only the variation margin receivable/payable at period end is separately reported within the Consolidated Statement of Assets and Liabilities. Prior variation margin movements were recorded to cash upon receipt or payment.
For the period ended November 30, 2016, the effect of derivative contracts in the Fund’s Consolidated Statement of Operations was as follows:
| | | | | | | | |
| | | | | | | | Net Change in | |
| | | | | | | | Unrealized | |
| Derivative Contracts | | | Net Realized | | | | Appreciation | |
| Not Accounted for as | Consolidated Statement of | | Gain (Loss) for | | Consolidated Statement of | | (Depreciation) | |
| Hedging Instruments | Operations Location | | the Period | | Operations Location | | for the Period | |
| | Net realized gain (loss) from: | | | | Net change in unrealized | | | |
| | | | | | appreciation (depreciation) on: | | | |
| Commodity contracts | Investments | $ | (272,959 | )a | | | | |
| | Written options | | 256,385 | | | | | |
| | Futures contracts | | 1,388,573 | | Futures contracts | $ | (784,344 | ) |
| | Swap contracts | | (3,008,592 | ) | Swap contracts | | 1,748,046 | |
| Totals | | $ | (1,636,593 | ) | | $ | 963,702 | |
| |
| aPurchased option contracts are included in net realized gain (loss) from investments in the Consolidated Statement of Operations. | | | |
For the period ended November 30, 2016, the average month end fair value of derivatives represented 1.4% of average month end net assets. The average month end number of open derivative contracts for the period was 6.
28 Semiannual Report
franklintempleton.com
FRANKLIN ALTERNATIVE STRATEGIES FUNDS
NOTES TO CONSOLIDATED FINANCIAL STATEMENTS (UNAUDITED)
Franklin Pelagos Commodities Strategy Fund (continued)
At November 30, 2016, the Fund’s OTC derivative assets and liabilities are as follows:
| | | |
| | | Gross Amounts of | |
| | | Assets and Liabilities Presented |
| | | in the Consolidated Statement of Assets and Liabilities |
| | | Assetsa | Liabilitiesa |
| Derivatives | | | |
| Swap contracts | $ | 1,401,148 | $ — |
aAbsent an event of default or early termination, OTC derivative assets and liabilities are presented gross and not offset in the Consolidated Statement of Assets and Liabilities.
At November 30, 2016, the Fund’s OTC derivative assets, which may be offset against the Fund’s OTC derivative liabilities and collateral received from the counterparty, are as follows:
| | | | | | | | |
| | | | Amounts Not Offset in the | | | | |
| | | | Consolidated Statement of Assets and Liabilities | | |
| |
| | | Gross | | | | | | |
| | | Amounts of | Financial | Financial | | | | |
| | | Assets Presented in | Instruments | Instruments | | Cash | | Net Amount |
| | | the Consolidated Statement of | Available for | Collateral | | Collateral | | (Not less |
| | | Assets and Liabilities | Offseta | Received | | Receivedb | | than zero) |
| |
| Counterparty | | | | | | | | |
| MSCS | $ | 1,401,148 | $ — | $ — | $ | (1,401,148 | ) | $ — |
aAs of November 30, 2016, the Fund had no OTC derivative liabilities.
bIn some instances, the collateral amounts disclosed in the table above were adjusted due to the requirement to limit the collateral amounts to avoid the effect of over
collateralization. Actual collateral received and/or pledged may be more than the amounts disclosed herein.
See Notes 1(b) and 6 regarding derivative financial instruments and investment transactions, respectively.
See Abbreviations on page 31.
8. Credit Facility
The Fund, together with other U.S. registered and foreign investment funds (collectively, Borrowers), managed by Franklin Templeton Investments, are borrowers in a joint syndicated senior unsecured credit facility totaling $2 billion (Global Credit Facility) which matures on February 10, 2017. This Global Credit Facility provides a source of funds to the Borrowers for temporary and emergency purposes, including the ability to meet future unanticipated or unusually large redemption requests.
Under the terms of the Global Credit Facility, the Fund shall, in addition to interest charged on any borrowings made by the Fund and other costs incurred by the Fund, pay its share of fees and expenses incurred in connection with the implementation and maintenance of the Global Credit Facility, based upon its relative share of the aggregate net assets of all of the Borrowers, including an annual commitment fee of 0.15% based upon the unused portion of the Global Credit Facility. These fees are reflected in other expenses in the Consolidated Statement of Operations. During the period ended November 30, 2016, the Fund did not use the Global Credit Facility.
9. Fair Value Measurements
The Fund follows a fair value hierarchy that distinguishes between market data obtained from independent sources (observable inputs) and the Fund’s own market assumptions (unobservable inputs). These inputs are used in determining the value of the Fund’s financial instruments and are summarized in the following fair value hierarchy:
- Level 1 – quoted prices in active markets for identical financial instruments
franklintempleton.com
Semiannual Report 29
FRANKLIN ALTERNATIVE STRATEGIES FUNDS
NOTES TO CONSOLIDATED FINANCIAL STATEMENTS (UNAUDITED)
Franklin Pelagos Commodities Strategy Fund (continued)
| 9. | Fair Value Measurements (continued) |
| | | Level 2 – other significant observable inputs (including quoted prices for similar financial instruments, interest rates, prepayment speed, credit risk, etc.) |
| | | Level 3 – significant unobservable inputs (including the Fund’s own assumptions in determining the fair value of financial instruments) |
The input levels are not necessarily an indication of the risk or liquidity associated with financial instruments at that level.
For movements between the levels within the fair value hierarchy, the Fund has adopted a policy of recognizing the transfers as of the date of the underlying event which caused the movement.
A summary of inputs used as of November 30, 2016, in valuing the Fund’s assets and liabilities carried at fair value, is as follows:
| | | | | | | | |
| | | Level 1 | | Level 2 | | Level 3 | | Total |
| Assets: | | | | | | | | |
| Investments in Securities: | | | | | | | | |
| U.S. Government and Agency Securities | $ | — | $ | 42,877,077 | $ | — | $ | 42,877,077 |
| Short Term Investments | | 81,778,065 | | 4,175,000 | | — | | 85,953,065 |
| Total Investments in Securities | $ | 81,778,065 | $ | 47,052,077 | $ | — | $ | 128,830,142 |
| |
| Other Financial Instruments: | | | | | | | | |
| Futures Contracts | $ | 103,321 | $ | — | $ | — | $ | 103,321 |
| Swap Contracts. | | — | | 1,401,148 | | — | | 1,401,148 |
| Total Other Financial Instruments | $ | 103,321 | $ | 1,401,148 | $ | — | $ | 1,504,469 |
| |
| Liabilities: | | | | | | | | |
| Other Financial Instruments: | | | | | | | | |
| Futures Contracts | $ | 638,097 | $ | — | $ | — | $ | 638,097 |
A reconciliation of assets in which Level 3 inputs are used in determining fair value is presented when there are significant Level 3 financial instruments at the end of the period.
10. Subsequent Events
The Fund has evaluated subsequent events through the issuance of the consolidated financial statements and determined that no events have occurred that require disclosure.
30 Semiannual Report
franklintempleton.com
FRANKLIN ALTERNATIVE STRATEGIES FUNDS
NOTES TO CONSOLIDATED FINANCIAL STATEMENTS (UNAUDITED)
Franklin Pelagos Commodities Strategy Fund (continued)
| | |
| Abbreviations | | |
| Counterparty | Selected Portfolio |
| MSCS Morgan Stanley Capital Services, LLC | FFCB | Federal Farm Credit Bank |
| | FHLMC | Federal Home Loan Mortgage Corp. |
franklintempleton.com
Semiannual Report 31
FRANKLIN ALTERNATIVE STRATEGIES FUNDS FRANKLIN PELAGOS COMMODITIES STRATEGY FUND
Shareholder Information
Proxy Voting Policies and Procedures
The Fund’s investment manager has established Proxy Voting Policies and Procedures (Policies) that the Fund uses to determine how to vote proxies relating to portfolio securities. Shareholders may view the Fund’s complete Policies online at franklintempleton.com. Alternatively, shareholders may request copies of the Policies free of charge by calling the Proxy Group collect at (954) 527-7678 or by sending a written request to: Franklin Templeton Companies, LLC, 300 S.E. 2nd Street, Fort Lauderdale, FL 33301, Attention: Proxy Group. Copies of the Fund’s proxy voting records are also made available online at franklintempleton.com and posted on the U.S. Securities and Exchange Commission’s website at sec.gov and reflect the most recent 12-month period ended June 30.
Quarterly Statement of Investments
The Trust, on behalf of the Fund, files a complete statement of investments with the U.S. Securities and Exchange Commission for the first and third quarters for each fiscal year on Form N-Q. Shareholders may view the filed Form N-Q by visiting the Commission’s website at sec.gov. The filed form may also be viewed and copied at the Commission’s Public Reference Room in Washington, DC. Information regarding the operations of the Public Reference Room may be obtained by calling (800) SEC-0330.
32 Semiannual Report
franklintempleton.com
| |
| Contents | |
| Semiannual Report | |
| Franklin K2 Long Short Credit Fund | 3 |
| Performance Summary | 7 |
| Your Fund’s Expenses | 9 |
| Financial Highlights and Statement of Investments | 10 |
| Financial Statements | 28 |
| Notes to Financial Statements | 32 |
| Shareholder Information | 45 |
Visit franklintempleton.com for fund updates, to access your account, or to find helpful financial planning tools.
2 Semiannual Report
franklintempleton.com
Semiannual Report
Franklin K2 Long Short Credit Fund
We are pleased to bring you Franklin K2 Long Short Credit Fund’s semiannual report for the period ended November 30, 2016.
Your Fund’s Goal and Main Investments
The Fund seeks total return through a combination of current income, capital preservation and capital appreciation. The Fund seeks to achieve its investment goal by allocating its assets across multiple non-traditional or “alternative” strategies, including but not limited to credit long short, structured credit and emerging market fixed income. The Fund is structured as a multi-manager fund, meaning the Fund’s assets are managed by multiple investment advisors (subadvisors), while the Fund’s investment manager has overall responsibility for the Fund’s investments.
Under normal market conditions, the Fund invests at least 80% of its net assets, plus the amount of any borrowings for investment purposes, in credit-related investments. The Fund invests in a wide range of securities and other investments including, but not limited to: corporate bonds, mortgage-backed securities and asset-backed securities, U.S. government and agency securities, collateralized debt and loan obligations, foreign government and supranational debt securities, loans and loan participations and derivatives with similar economic characteristics. The Fund may also invest in mortgage dollar rolls, repurchase agreements, reverse repurchase agreements, mortgage real estate investment trusts (REITs) and other similar transactions.
What is a mortgage dollar roll?
A mortgage dollar roll is a type of repurchase transaction in the mortgage pass-through securities market in which the buy side trade counterparty of a “to be announced” (TBA) trade agrees to a sell off the same TBA trade in the current month and to a buy back the same trade in a future month at a lower price. In a dollar roll, the buy side trade counterparty gets to invest the funds that otherwise would have been required to settle the buy trade in the current month until the agreed upon future buy-back. The sell side trade counterparty benefits by not having to deliver the pass-through securities (which they might otherwise have shorted or committed to another trade) in the current month.
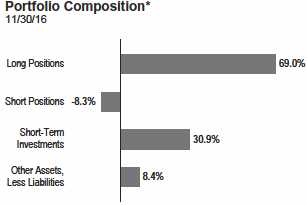
*Figures represent the net Fund exposure and include certain derivatives held in the
portfolio (or their underlying reference assets) or unsettled trades and may not total
100% or may be negative due to rounding, use of any derivatives or other factors.
Performance Overview
The Fund’s Class A shares delivered a +4.43% cumulative total return for the six months under review. For comparison, the Fund’s primary benchmark, the BofA Merrill Lynch 3-Month U.S. Treasury Bill Index, which is an index of short-term U.S. government securities with a remaining term to final maturity of less than three months, posted a +0.18% total return for the same period.1 Also for comparison, the Fund’s secondary benchmark, the HFRX Fixed Income-Credit Index, which measures performance of strategies with exposure to credit across a broad continuum of credit substrategies, generated a +3.27% total return for the same period.2 You can find more of the Fund’s performance data in the Performance Summary beginning on page 7.
Performance data represent past performance, which does not guarantee future results. Investment return and principal value will fluctuate, and you may have a gain or loss when you sell your shares. Current performance may differ from figures shown. For most recent month-end performance, go to franklintempleton.com or call (800) 342-5236.
1. Source: Morningstar.
2. Source: FactSet. Hedge Fund Research, Inc. — www.hedgefundresearch.com. The HFRX Fixed Income-Credit Index is being used under license from Hedge Fund
Research, Inc., which does not endorse or approve of any of the contents of this report.
The indexes are unmanaged and include reinvestment of any income or distributions. They do not reflect any fees, expenses or sales charges. One cannot invest directly in an
index, and an index is not representative of the Fund’s portfolio. Unlike most asset class indexes, HFR Index returns reflect fees and expenses.
See www.franklintempletondatasources.com for additional data provider information.
The dollar value, number of shares or principal amount, and names of all portfolio holdings are listed in the Fund’s Statement of Investments (SOI). The SOI
begins on page 15.
franklintempleton.com
Semiannual Report 3
FRANKLIN K2 LONG SHORT CREDIT FUND
Economic and Market Overview
The global economy expanded during the six months under review. In this environment, global developed and emerging market stocks, as measured by the MSCI All Country World Index, rose. Global markets were aided by accommodative monetary policies of various central banks, an improvement in commodity prices, generally encouraging economic data across regions, expectations of higher interest rates and inflation in the U.S. driven by hopes of expansionary fiscal policies under the new U.S. President Donald Trump, and an Organization of the Petroleum Exporting Countries deal to curb oil production. However, the impact of these factors was partially offset by global economic concerns, the U.K.’s historic referendum to leave the European Union (also known as “Brexit”), uncertainty about the U.S. Federal Reserve’s (Fed’s) timing for raising interest rates and worries about the health of European banks.
The U.S. economy strengthened during the six months under review. The economy grew at a faster pace in 2016’s third quarter compared to the second quarter, mainly due to personal consumption expenditure, exports, private inventory investment, federal government spending and nonresidential fixed investment. Although the Fed kept its target interest rate unchanged during the review period, and lowered its forecast for 2016 U.S. economic growth at the September meeting, it maintained its stance that the case for a U.S. interest rate increase had strengthened. Further, the Fed Chair Janet Yellen, at her testimony to the Congress’ Joint Economic Committee in November, set the stage for an interest rate hike in December, as long as data continued to provide evidence of economic resilience.
In Europe, the U.K.’s economy moderated in the third quarter, supported by growth in services. Immediate effects of the Brexit vote in June materialized as U.K. stocks declined significantly, the pound sterling hit a three-decade low amid intensified selling and the U.K.’s credit rating was downgraded. In the eurozone, despite investors’ concerns about banking sector weakness, low corporate earnings and post-Brexit political repercussions, some regions benefited due to rising consumer spending, resulting from a cheaper euro, low inflation and signs of sustained economic growth. The eurozone’s economic growth held steady in the third quarter from the second quarter, while the region’s annual inflation rate rose to its highest level since April 2014 toward period-end. The European Central Bank cut its benchmark interest rate and expanded its massive bond-buying program in August 2016 to boost the region’s growth.
In Asia, Japan’s economic growth slowed in the second quarter compared to the first quarter, amid falling exports and weak corporate investment. However, the Japanese economy grew significantly in the third quarter, largely due to a rise in exports.
After announcing additional monetary easing measures in July, the Bank of Japan, at its September meeting, overhauled its monetary stimulus program to adjust Japanese government bond purchases with the aim of keeping the 10-year rate near the current level of 0%.
In emerging markets, economic growth generally moderated during the review period. Although the pace of contraction in Brazil’s economy had slowed in 2016’s second quarter, third-quarter gross domestic product declined faster than in the second quarter, despite improved business sentiment near the end of August with the expected impeachment of President Dilma Rousseff. Russia’s economic contraction continued to ease in 2016’s third quarter. The Bank of Russia reduced its key interest rates in June and September in an attempt to revive its economy. China’s economy grew at a stable rate in 2016’s third quarter, and remained within the government’s targeted range. The People’s Bank of China weakened its currency during the review period as the U.S. dollar strengthened. Elsewhere, India’s economic growth marginally increased from July to September due to slower private consumption growth and increasing government spending. Overall, emerging market stocks, as measured by the MSCI Emerging Markets Index, rose for the review period.
Investment Strategy
We manage the Fund using a multi-manager approach. While we are responsible for the Fund’s overall investments, we allocate assets to multiple subadvisors, each of whom independently manages a separate portion of the Fund’s portfolio in accordance with some or all of the following strategies: credit long short, structured credit and emerging market fixed income. We allocate the Fund’s assets among these strategies utilizing a top-down approach, generating the Fund’s strategy weightings by taking into account market conditions, risk factors, diversification, liquidity, transparency, and availability of various subadvisors and other investment options, among other things.
Credit long short strategies seek to isolate issuer-specific exposure, while limiting general market risks, by taking long and/or short positions in debt securities and other related instruments. Structured credit strategies aim to profit from trading in interest-rate sensitive securities such as residential and commercial mortgage-backed securities, real estate investment trusts, credit default swaps on various indexes, collateralized loan obligations and asset-backed securities. Emerging market fixed income strategies invest in corporate and/or sovereign securities in emerging markets countries with a focus on fixed income.
The Fund takes long and/or short positions in a wide range of asset classes, including credit, fixed income, equities and
4 Semiannual Report
franklintempleton.com
FRANKLIN K2 LONG SHORT CREDIT FUND
currencies, among others. The Fund may gain long or short exposure to select instruments by utilizing derivatives, engaging in short sales or entering into a series of purchase and sale contracts or repurchase agreements. Long positions benefit from an increase in the price of the underlying instrument, while short positions benefit from a decrease in that price. The Fund may also use derivatives for hedging and nonhedging (investment) purposes. Such derivative investments may include currency forward contracts; futures contracts; put and call options on currencies, securities, indexes and exchange-traded funds; and swaps. The Fund may engage in active and frequent trading as part of its investment strategies.
What is a currency forward contract?
A currency forward contract is an agreement between the Fund and a counterparty to buy or sell a foreign currency in exchange for another currency at a specific exchange rate on a future date.
What is a futures contract?
A futures contract is an agreement between the Fund and a counterparty made through a U.S. or foreign futures exchange to buy or sell an underlying instrument or asset at a specific price on a future date.
What is an option?
An option is a contract to buy or sell a specific financial product known as the option’s underlying instrument at a specific price. The buyer of an option has the right, but not the obligation, to buy or sell the underlying instrument at or until a specified expiration date. Conversely, the seller (“writer”) of an option who opens a transaction is obligated to buy or sell the underlying instrument should the option holder exercise that right.
What are swap agreements?
Swap agreements, such as interest rate, currency and credit default swaps, are contracts between the Fund and another party (the swap counterparty). In a basic swap transaction, the Fund agrees with the swap counterparty to exchange the returns (or differentials in rates of return) earned or realized on a particular “notional amount” of underlying instruments. The notional amount is the set amount selected by the parties as the basis on which to calculate the obligations that they have agreed to exchange. The parties typically do not actually exchange the notional amount. Instead, they agree to exchange the returns that would be earned or realized if the notional amount were invested in given instruments or at given interest rates.
Manager’s Discussion
The Fund’s subadvisors for the review period were Apollo Credit Management, Chatham Asset Management, Candlewood Investment Group, Ellington Global Asset Management and Emso Asset Management. These subadvisors use credit long short, structured credit or emerging markets fixed income investment strategies, as shown in the table on this page.
All strategies of these five subadvisors strengthened absolute performance for the six-month review period, led by the credit long short strategy. We were encouraged that all five subadvi-sors, including those in the structured credit and emerging market fixed income strategies, delivered positive returns. Despite economic concerns that arose over the period—Brexit, the U.S. presidential election and global growth—overall, a risk-on environment persisted in high-yield credit markets until November, as evidenced by the Credit Suisse High Yield Index returning +7.38% over the review period. In contrast, investment-grade corporate credits experienced lackluster results as investors began to anticipate higher interest rates.
As we approach 2017, we believe we are at the end of a decades-long bull market in fixed income and the “low for longer” search for yield. Although interest rates have recently spiked, overall, yields were still near historical lows at period-end. We also believe, credit strategies that can be nimble and take both long and short positions in credit have healthy performance potential in 2017.
Both credit long short strategy subadvisors delivered positive performance in the review period. On a sector level, communications, basic materials, technology and currency positioning benefited returns. Looking at individual positions, a long position in a U.S. newspaper and magazine publisher’s bonds aided results as the company completed a debt exchange that substantially reduced interest expenses, strengthening the company’s capital structure. Second-lien bonds for a Canadian media publisher also contributed positively based on news that the company planned to exchange most of its equity for the second-lien debt in order to deleverage the company’s capital structure. Bonds issued by a steel company also contributed positively, as the company announced strong earnings.
Subadvisors
11/30/16
Credit Long Short
Apollo Credit Management LLC
Chatham Asset Management, LLC
Structured Credit
Candlewood Investment Group, L.P.
Ellington Global Asset Management, L.L.C.
Emerging Markets Fixed Income
Emso Asset Management Limited
franklintempleton.com
Semiannual Report 5
FRANKLIN K2 LONG SHORT CREDIT FUND
Conversely, hedges in the form of put options on equity indexes, including the Standard &Poor’s 500® Index, detracted from relative performance in the credit long short strategy as equities rose over the review period. Cash and cash-equivalent positions also detracted from returns amid a risk-on investment environment.
In structured credit, subadvisor positioning, along with strength in the asset-backed security and residential and commercial mortgage-backed security (MBS) markets over the review period, helped both structured credit strategy subadvisors register positive returns. Residential MBS markets received a boost in August following a settlement payout from a bank regarding loans made by one of its divisions prior to its being acquired, as investors looked to reinvest cash received from the payout.
Conversely, a short position in a high yield credit index that was used as a portfolio hedge hindered performance, as the bond sector had healthy returns during the review period.
In emerging markets fixed income, the energy sector, currency positioning and sovereign emerging-market government bonds contributed positively to overall results. For example, a long position in a quasi-sovereign oil producer’s credit in Brazil, as well as sovereign government bonds in Argentina and Greece, contributed positively to gains. A short position in the euro versus the U.S. dollar also helped returns, as the euro weakened amid robust monetary accommodation from the European Central Bank.
Conversely, a detractor at the country level was Turkey. Short exposure to the country’s sovereign government bonds detracted from performance as the political environment calmed and investors focused on the government’s commitment to financial stability following a failed military coup.
Thank you for your participation in Franklin K2 Long Short Credit Fund. We look forward to continuing to serve your investment needs.

The foregoing information reflects our analysis, opinions and portfolio holdings as of November 30, 2016, the end of the reporting period. The way we implement our main investment strategies and the resulting portfolio holdings may change depending on factors such as market and economic conditions. These opinions may not be relied upon as investment advice or an offer for a particular security. The information is not a complete analysis of every aspect of any market, country, industry, security or the Fund. Statements of fact are from sources considered reliable, but the investment manager makes no representation or warranty as to their completeness or accuracy. Although historical performance is no guarantee of future results, these insights may help you understand our investment management philosophy.
6 Semiannual Report
franklintempleton.com
FRANKLIN K2 LONG SHORT CREDIT FUND
Performance Summary as of November 30, 2016
The performance table does not reflect any taxes that a shareholder would pay on Fund dividends, capital gain distributions, if any, or any realized gains on the sale of Fund shares. Total return reflects reinvestment of the Fund’s dividends and capital gain distributions, if any, and any unrealized gains or losses.
Performance as of 11/30/161
Cumulative total return excludes sales charges. Average annual total return includes maximum sales charges. Sales charges will vary depending on the size of the investment and the class of share purchased. The maximum is 5.75% and the minimum is 0%. Class A: 5.75% maximum initial sales charge; Advisor Class: no sales charges. For other share classes, visit franklintempleton.com.
| | | | |
| | Cumulative | | Average Annual | |
| Share Class | Total Return2 | | Total Return3 | |
| A | | | | |
| 6-Month | +4.43 | % | -1.49 | % |
| 1-Year | +6.70 | % | +0.61 | % |
| Since Inception (9/8/15) | +7.55 | % | +1.11 | % |
| Advisor | | | | |
| 6-Month | +4.53 | % | +4.53 | % |
| 1-Year | +6.70 | % | +6.70 | % |
| Since Inception (9/8/15) | +7.66 | % | +6.19 | % |
Performance data represent past performance, which does not guarantee future results. Investment return and principal value will fluctuate, and you may have a gain or loss when you sell your shares. Current performance may differ from figures shown. For most recent month-end performance, go to franklintempleton.com or call (800) 342-5236.
See page 8 for Performance Summary footnotes.
franklintempleton.com
Semiannual Report 7
FRANKLIN K2 LONG SHORT CREDIT FUND
PERFORMANCE SUMMARY
| | | | |
| Total Annual Operating Expenses4 | | | |
| Share Class | With Waiver | | Without Waiver | |
| A | 2.60 | % | 3.61 | % |
| Advisor | 2.35 | % | 3.36 | % |
Each class of shares is available to certain eligible investors and has different annual fees and expenses, as described in the prospectus.
All investments involve risks, including possible loss of principal. The market values of securities owned by the Fund will go up or down, sometimes rapidly or
unpredictably. The Fund’s performance depends on the manager’s skill in selecting, overseeing, and allocating Fund assets to the subadvisors. The Fund is
actively managed and could experience losses if the manager’s and subadvisors’ judgment about particular Fund portfolio investments prove to be incorrect.
Some subadvisors may have little or no experience managing the assets of a registered investment company. Bond prices generally move in the opposite direc-
tion of interest rates. Changes in the financial strength of a bond issuer or in a bond’s credit rating may affect its value. Lower rated or high yield debt securities
(junk bonds) involve greater credit risk, including the possibility of default or bankruptcy. Liquidity risk exists when securities become more difficult to sell, or
are unable to be sold, at the price at which they’ve been valued. Investments in derivatives involve costs and create economic leverage, which may result in sig-
nificant volatility and cause the Fund to participate in losses (as well as gains) that significantly exceed the Fund’s initial investment. The Fund may make short
sales of securities, which involves the risk that losses may exceed the original amount invested. The Fund’s prospectus also includes a description of the main
investment risks.
1. The Fund has an expense reduction contractually guaranteed through 9/30/17. Fund investment results reflect the expense reduction; without this reduction, the results
would have been lower.
2. Cumulative total return represents the change in value of an investment over the periods indicated.
3. Average annual total return represents the average annual change in value of an investment over the periods indicated. Return for less than one year, if any, has not
been annualized.
4. Figures are as stated in the Fund’s current prospectus and may differ from the expense ratios disclosed in the Your Fund’s Expenses and Financial Highlights sections in
this report. In periods of market volatility, assets may decline significantly, causing total annual Fund operating expenses to become higher than the figures shown.
8 Semiannual Report
franklintempleton.com
FRANKLIN K2 LONG SHORT CREDIT FUND
Your Fund’s Expenses
As a Fund shareholder, you can incur two types of costs: (1) transaction costs, including sales charges (loads) on Fund purchases and redemptions; and (2) ongoing Fund costs, including management fees, distribution and service (12b-1) fees, and other Fund expenses. All mutual funds have ongoing costs, sometimes referred to as operating expenses. The table below shows ongoing costs of investing in the Fund and can help you understand these costs and compare them with those of other mutual funds. The table assumes a $1,000 investment held for the six months indicated.
Actual Fund Expenses
The table below provides information about actual account values and actual expenses in the columns under the heading “Actual.” In these columns the Fund’s actual return, which includes the effect of Fund expenses, is used to calculate the “Ending Account Value” for each class of shares. You can estimate the expenses you paid during the period by following these steps (of course, your account value and expenses will differ from those in this illustration): Divide your account value by $1,000 (if your account had an $8,600 value, then $8,600 ÷ $1,000 = 8.6). Then multiply the result by the number in the row for your class of shares under the headings “Actual” and “Expenses Paid During Period” (if Actual Expenses Paid During Period were $7.50, then 8.6 x $7.50 =$64.50). In this illustration, the actual expenses paid this period are $64.50.
Hypothetical Example for Comparison with Other Funds
Under the heading “Hypothetical” in the table, information is provided about hypothetical account values and hypothetical expenses based on the Fund’s actual expense ratio and an assumed rate of return of 5% per year before expenses, which is not the Fund’s actual return. This information may not be used to estimate the actual ending account balance or expenses you paid for the period, but it can help you compare ongoing costs of investing in the Fund with those of other funds. To do so, compare this 5% hypothetical example for the class of shares you hold with the 5% hypothetical examples that appear in the shareholder reports of other funds.
Please note that expenses shown in the table are meant to highlight ongoing costs and do not reflect any transactional costs. Therefore, information under the heading “Hypothetical” is useful in comparing ongoing costs only, and will not help you compare total costs of owning different funds. In addition, if transactional costs were included, your total costs would have been higher.
| | | | | | | | | | | | |
| | | | | | | Actual | | Hypothetical | | |
| | | | | (actual return after expenses) | | (5% annual return before expenses) | | |
| | | | | | | Expenses | | | | Expenses | Net | |
| | | Beginning | | Ending | | Paid During | | Ending | | Paid During | Annualized | |
| Share | | Account | | Account | | Period | | Account | | Period | Expense | |
| Class | | Value 6/1/16 | | Value 11/30/16 | | 6/1/16–11/30/161,2 | | Value 11/30/16 | | 6/1/16–11/30/161,2 | Ratio2 | |
| A | $ | 1,000 | $ | 1,045.30 | $ | 12.77 | $ | 1,012.58 | $ | 12.56 | 2.49 | % |
| C | $ | 1,000 | $ | 1,039.70 | $ | 17.69 | $ | 1,007.72 | $ | 17.41 | 3.46 | % |
| R | $ | 1,000 | $ | 1,043.60 | $ | 12.60 | $ | 1,012.73 | $ | 12.41 | 2.46 | % |
| R6 | $ | 1,000 | $ | 1,045.30 | $ | 12.56 | $ | 1,012.78 | $ | 12.36 | 2.45 | % |
| Advisor | $ | 1,000 | $ | 1,045.30 | $ | 12.61 | $ | 1,012.73 | $ | 12.41 | 2.46 | % |
1. Expenses are equal to the annualized expense ratio for the six-month period as indicated above—in the far right column—multiplied by the simple average account value
over the period indicated, and then multiplied by 183/365 to reflect the one-half year period.
2. Reflects expenses after fee waivers and expense reimbursements. Does not include acquired fund fees and expenses.
franklintempleton.com
Semiannual Report 9
| | | | | | |
| Financial Highlights | | | | | | |
| Franklin K2 Long Short Credit Fund | | | | | | |
| | | Six Months Ended | | | | |
| | | November 30, 2016 | | | Period Ended | |
| | | (unaudited) | | | May 31, 2016a | |
| Class A | | | | | | |
| Per share operating performance | | | | | | |
| (for a share outstanding throughout the period) | | | | | | |
| Net asset value, beginning of period | $ | 10.15 | | $ | 10.00 | |
| Income from investment operationsb: | | | | | | |
| Net investment incomec | | 0.11 | | | 0.21 | |
| Net realized and unrealized gains (losses) | | 0.35 | | | 0.08 | |
| Total from investment operations | | 0.46 | | | 0.29 | |
| Less distributions from: | | | | | | |
| Net investment income | | — | | | (0.08 | ) |
| Net realized gains | | — | | | (0.06 | ) |
| Total distributions | | — | | | (0.14 | ) |
| Net asset value, end of period | $ | 10.61 | | $ | 10.15 | |
| |
| Total returnd | | 4.53 | % | | 2.99 | % |
| |
| Ratios to average net assetse | | | | | | |
| Expenses before waiver, payments by affiliates and expense reductionf | | 3.31 | % | | 3.37 | % |
| Expenses net of waiver, payments by affiliates and expense reductionf | | 2.49 | % | | 2.30 | %g |
| Expenses incurred in connection with securities sold short | | 0.55 | % | | 0.40 | % |
| Net investment income | | 2.39 | % | | 2.85 | % |
| |
| Supplemental data | | | | | | |
| Net assets, end of period (000’s) | $ | 37,392 | | $ | 28,198 | |
| Portfolio turnover rate | | 169.41 | % | | 511.62 | % |
aFor the period September 8, 2015 (commencement of operations) to May 31, 2016.
bThe amount shown for a share outstanding throughout the period may not correlate with the Statement of Operations for the period due to the timing of sales and repurchases
of the Fund’s shares in relation to income earned and/or fluctuating fair value of the investments of the Fund.
cBased on average daily shares outstanding.
dTotal return does not reflect sales commissions or contingent deferred sales charges, if applicable, and is not annualized for periods less than one year.
eRatios are annualized for periods less than one year, except for non-recurring expenses, if any.
fIncludes dividend and/or interest expense on securities sold short and security borrowing fees, if any. See below for the ratios of such expenses to average net assets for the
periods presented. See Note 1(f).
gBenefit of expense reduction rounds to less than 0.01%.
10 Semiannual Report | The accompanying notes are an integral part of these financial statements.
franklintempleton.com
FRANKLIN ALTERNATIVE STRATEGIES FUNDS
FINANCIAL H IGHLIGHTS
| | | | | | |
| Franklin K2 Long Short Credit Fund (continued) | | | | | | |
| | | Six Months Ended | | | | |
| | | November 30, 2016 | | | Period Ended | |
| | | (unaudited) | | | May 31, 2016a | |
| Class C | | | | | | |
| Per share operating performance | | | | | | |
| (for a share outstanding throughout the period) | | | | | | |
| Net asset value, beginning of period | $ | 10.07 | | $ | 10.00 | |
| Income from investment operationsb: | | | | | | |
| Net investment incomec | | 0.04 | | | 0.09 | |
| Net realized and unrealized gains (losses) | | 0.36 | | | 0.12 | |
| Total from investment operations | | 0.40 | | | 0.21 | |
| Less distributions from: | | | | | | |
| Net investment income | | — | | | (0.08 | ) |
| Net realized gains | | — | | | (0.06 | ) |
| Total distributions | | — | | | (0.14 | ) |
| Net asset value, end of period | $ | 10.47 | | $ | 10.07 | |
| |
| Total returnd | | 3.97 | % | | 2.20 | % |
| |
| Ratios to average net assetse | | | | | | |
| Expenses before waiver, payments by affiliates and expense reductionf | | 4.28 | % | | 3.62 | % |
| Expenses net of waiver, payments by affiliates and expense reductionf | | 3.46 | % | | 2.55 | %g |
| Expenses incurred in connection with securities sold short | | 0.55 | % | | 0.40 | % |
| Net investment income | | 1.42 | % | | 2.60 | % |
| |
| Supplemental data | | | | | | |
| Net assets, end of period (000’s) | $ | 925 | | $ | 270 | |
| Portfolio turnover rate | | 169.41 | % | | 511.62 | % |
a For the period September 8, 2015 (commencement of operations) to May 31, 2016.
b The amount shown for a share outstanding throughout the period may not correlate with the Statement of Operations for the period due to the timing of sales and
repurchases of the Fund’s shares in relation to income earned and/or fluctuating fair value of the investments of the Fund.
c Based on average daily shares outstanding.
d Total return does not reflect sales commissions or contingent deferred sales charges, if applicable, and is not annualized for periods less than one year.
e Ratios are annualized for periods less than one year, except for non-recurring expenses, if any.
f Includes dividend and/or interest expense on securities sold short and security borrowing fees, if any. See below for the ratios of such expenses to average net assets for the
periods presented. See Note 1(f).
g Benefit of expense reduction rounds to less than 0.01%.
franklintempleton.com
The accompanying notes are an integral part of these financial statements. | Semiannual Report 11
| | | | | | |
| Franklin K2 Long Short Credit Fund (continued) | | | | | | |
| |
| | | Six Months Ended | | | | |
| | | November 30, 2016 | | | Period Ended | |
| | | (unaudited) | | | May 31, 2016a | |
| Class R | | | | | | |
| Per share operating performance | | | | | | |
| (for a share outstanding throughout the period) | | | | | | |
| Net asset value, beginning of period | $ | 10.10 | | $ | 10.00 | |
| Income from investment operationsb: | | | | | | |
| Net investment incomec | | 0.11 | | | 0.08 | |
| Net realized and unrealized gains (losses) | | 0.33 | | | 0.16 | |
| Total from investment operations | | 0.44 | | | 0.24 | |
| Less distributions from: | | | | | | |
| Net investment income | | — | | | (0.08 | ) |
| Net realized gains | | — | | | (0.06 | ) |
| Total distributions | | — | | | (0.14 | ) |
| Net asset value, end of period | $ | 10.54 | | $ | 10.10 | |
| |
| Total returnd | | 4.36 | % | | 2.48 | % |
| |
| Ratios to average net assetse | | | | | | |
| Expenses before waiver, payments by affiliates and expense reductionf | | 3.28 | % | | 3.37 | % |
| Expenses net of waiver, payments by affiliates and expense reductionf | | 2.46 | % | | 2.30 | %g |
| Expenses incurred in connection with securities sold short | | 0.55 | % | | 0.40 | % |
| Net investment income | | 2.42 | % | | 2.85 | % |
| |
| Supplemental data | | | | | | |
| Net assets, end of period (000’s) | $ | 48 | | $ | 12 | |
| Portfolio turnover rate | | 169.41 | % | | 511.62 | % |
aFor the period September 8, 2015 (commencement of operations) to May 31, 2016.
bThe amount shown for a share outstanding throughout the period may not correlate with the Statement of Operations for the period due to the timing of sales and repurchases
of the Fund’s shares in relation to income earned and/or fluctuating fair value of the investments of the Fund.
cBased on average daily shares outstanding.
dTotal return is not annualized for periods less than one year.
eRatios are annualized for periods less than one year, except for non-recurring expenses, if any.
fIncludes dividend and/or interest expense on securities sold short and security borrowing fees, if any. See below for the ratios of such expenses to average net assets for the
periods presented. See Note 1(f).
gBenefit of expense reduction rounds to less than 0.01%.
12 Semiannual Report | The accompanying notes are an integral part of these financial statements.
franklintempleton.com
FRANKLIN ALTERNATIVE STRATEGIES FUNDS
FINANCIAL H IGHLIGHTS
FRANKLIN ALTERNATIVE STRATEGIES FUNDS
FINANCIAL H IGHLIGHTS
| | | | | | |
| Franklin K2 Long Short Credit Fund (continued) | | | | | | |
| |
| | | Six Months Ended | | | | |
| | | November 30, 2016 | | | Period Ended | |
| | | (unaudited) | | | May 31, 2016a | |
| Class R6 | | | | | | |
| Per share operating performance | | | | | | |
| (for a share outstanding throughout the period) | | | | | | |
| Net asset value, beginning of period | $ | 10.15 | | $ | 10.00 | |
| Income from investment operationsb: | | | | | | |
| Net investment incomec | | 0.11 | | | 0.23 | |
| Net realized and unrealized gains (losses) | | 0.35 | | | 0.06 | |
| Total from investment operations | | 0.46 | | | 0.29 | |
| Less distributions from: | | | | | | |
| Net investment income | | — | | | (0.08 | ) |
| Net realized gains | | — | | | (0.06 | ) |
| Total distributions | | — | | | (0.14 | ) |
| Net asset value, end of period | $ | 10.61 | | $ | 10.15 | |
| |
| Total returnd | | 4.53 | % | | 3.01 | % |
| |
| Ratios to average net assetse | | | | | | |
| Expenses before waiver, payments by affiliates and expense reductionf | | 3.27 | % | | 3.35 | % |
| Expenses net of waiver, payments by affiliates and expense reductionf | | 2.45 | % | | 2.28 | %g |
| Expenses incurred in connection with securities sold short | | 0.55 | % | | 0.40 | % |
| Net investment income | | 2.43 | % | | 2.87 | % |
| |
| Supplemental data | | | | | | |
| Net assets, end of period (000’s) | $ | 12,637 | | $ | 12,384 | |
| Portfolio turnover rate | | 169.41 | % | | 511.62 | % |
aFor the period September 8, 2015 (commencement of operations) to May 31, 2016.
bThe amount shown for a share outstanding throughout the period may not correlate with the Statement of Operations for the period due to the timing of sales and repurchases
of the Fund’s shares in relation to income earned and/or fluctuating fair value of the investments of the Fund.
cBased on average daily shares outstanding.
dTotal return is not annualized for periods less than one year.
eRatios are annualized for periods less than one year, except for non-recurring expenses, if any.
fIncludes dividend and/or interest expense on securities sold short and security borrowing fees, if any. See below for the ratios of such expenses to average net assets for the
periods presented. See Note 1(f).
gBenefit of expense reduction rounds to less than 0.01%.
franklintempleton.com
The accompanying notes are an integral part of these financial statements. | Semiannual Report 13
| | | | | | |
| Franklin K2 Long Short Credit Fund (continued) | | | | | | |
| |
| | | Six Months Ended | | | | |
| | | November 30, 2016 | | | Period Ended | |
| | | (unaudited) | | | May 31, 2016a | |
| Advisor Class | | | | | | |
| Per share operating performance | | | | | | |
| (for a share outstanding throughout the period) | | | | | | |
| Net asset value, beginning of period | $ | 10.15 | | $ | 10.00 | |
| Income from investment operationsb: | | | | | | |
| Net investment incomec | | 0.11 | | | 0.20 | |
| Net realized and unrealized gains (losses) | | 0.35 | | | 0.09 | |
| Total from investment operations | | 0.46 | | | 0.29 | |
| Less distributions from: | | | | | | |
| Net investment income | | — | | | (0.08 | ) |
| Net realized gains | | — | | | (0.06 | ) |
| Total distributions | | — | | | (0.14 | ) |
| Net asset value, end of period | $ | 10.61 | | $ | 10.15 | |
| |
| Total returnd | | 4.53 | % | | 2.99 | % |
| |
| Ratios to average net assetse | | | | | | |
| Expenses before waiver, payments by affiliates and expense reductionf | | 3.28 | % | | 3.36 | % |
| Expenses net of waiver, payments by affiliates and expense reductionf | | 2.46 | % | | 2.29 | %g |
| Expenses incurred in connection with securities sold short | | 0.55 | % | | 0.40 | % |
| Net investment income | | 2.42 | % | | 2.86 | % |
| |
| Supplemental data | | | | | | |
| Net assets, end of period (000’s) | $ | 25,063 | | $ | 23,058 | |
| Portfolio turnover rate | | 169.41 | % | | 511.62 | % |
aFor the period September 8, 2015 (commencement of operations) to May 31, 2016.
bThe amount shown for a share outstanding throughout the period may not correlate with the Statement of Operations for the period due to the timing of sales and repurchases
of the Fund’s shares in relation to income earned and/or fluctuating fair value of the investments of the Fund.
cBased on average daily shares outstanding.
dTotal return is not annualized for periods less than one year.
eRatios are annualized for periods less than one year, except for non-recurring expenses, if any.
fIncludes dividend and/or interest expense on securities sold short and security borrowing fees, if any. See below for the ratios of such expenses to average net assets for the
periods presented. See Note 1(f).
gBenefit of expense reduction rounds to less than 0.01%.
14 Semiannual Report | The accompanying notes are an integral part of these financial statements.
franklintempleton.com
FRANKLIN ALTERNATIVE STRATEGIES FUNDS
FINANCIAL H IGHLIGHTS
FRANKLIN ALTERNATIVE STRATEGIES FUNDS
| | | | |
| Statement of Investments, November 30, 2016 (unaudited) | | | | |
| Franklin K2 Long Short Credit Fund | | | | |
| | Country | Shares/Rights | | Value |
| Common Stocks and Other Equity Interests 1.1% | | | | |
| Diversified Telecommunication Services 0.1% | | | | |
| CenturyLink Inc | United States | 1,877 | $ | 44,147 |
| a Level 3 Communications Inc | United States | 362 | | 19,935 |
| | | | | 64,082 |
| Equity Real Estate Investment Trusts (REITs) 0.2% | | | | |
| a,b iStar Inc | United States | 13,256 | | 161,988 |
| Independent Power & Renewable Electricity Producers 0.8% | | | | |
| Atlantica Yield PLC | Spain | 671 | | 12,159 |
| c NRG Yield Inc., A | United States | 23,033 | | 336,052 |
| Pattern Energy Group Inc | United States | 5,956 | | 116,916 |
| a,b TerraForm Power Inc., A | United States | 7,788 | | 98,362 |
| | | | | 563,489 |
| Media 0.0%† | | | | |
| c,a Postmedia Network Canada Corp | Canada | 56,068 | | 27,548 |
| Pharmaceuticals 0.0%† | | | | |
| a Sanofi, Contingent Value, rts., 12/31/20 | France | 26,594 | | 9,335 |
| Total Common Stocks and Other Equity Interests | | | | |
| (Cost $865,145) | | | | 826,442 |
| Management Investment Companies 0.6% | | | | |
| Diversified Financial Services 0.6% | | | | |
| c BlackRock Corporate High Yield Fund Inc | United States | 17,617 | | 184,626 |
| BlackRock Credit Allocation Income Trust | United States | 4,359 | | 54,008 |
| First Trust High Income Long / Short Fund | United States | 3,577 | | 56,230 |
| MFS Multimarket Income Trust | United States | 8,622 | | 51,128 |
| Prudential Global Short Duration High Yield Fund Inc | United States | 4,088 | | 60,176 |
| Wells Fargo Income Opportunities Fund | United States | 6,279 | | 50,860 |
| Total Management Investment Companies (Cost $465,516) | | | | 457,028 |
| Convertible Preferred Stocks (Cost $126,723) 0.2% | | | | |
| Independent Power & Renewable Electricity Producers 0.2% | | | | |
| Dynegy Inc., 7.00%, cvt. pfd | United States | 2,000 | | 130,580 |
| Preferred Stocks (Cost $2,633) 0.0%† | | | | |
| Thrifts & Mortgage Finance 0.0%† | | | | |
| a FNMA, 6.75%, pfd., Q | United States | 585 | | 4,387 |
| |
| | | Principal | | |
| | | Amount* | | |
| Convertible Bonds 1.1% | | | | |
| Energy Equipment & Services 0.2% | | | | |
| Weatherford International Ltd., senior note, 5.875%, 7/01/21 | United States | 117,000 | | 126,945 |
| Independent Power & Renewable Electricity Producers 0.4% | | | | |
| c,e NRG Yield Inc., senior note, 144A, 3.50%, 2/01/19 | United States | 175,000 | | 175,547 |
| Pattern Energy Group Inc., senior note, 4.00%, 7/15/20 | United States | 114,000 | | 111,649 |
| | | | | 287,196 |
| Wireless Telecommunication Services 0.5% | | | | |
| c,e Clearwire Communications LLC / Clearwire Finance Inc., senior bond, 144A, | | | | |
| 8.25%, 12/01/40 | United States | 376,000 | | 394,800 |
| Total Convertible Bonds (Cost $785,604) | | | | 808,941 |
franklintempleton.com
Semiannual Report 15
FRANKLIN ALTERNATIVE STRATEGIES FUNDS
STATEMENT OF INVESTMENTS (UNAUDITED)
| | | | |
| Franklin K2 Long Short Credit Fund (continued) | | | | |
| |
| | | Principal | | |
| | Country | Amount* | | Value |
| |
| Corporate Bonds and Notes 28.2% | | | | |
| Aerospace & Defense 0.3% | | | | |
| e Bombardier Inc., senior note, 144A, 8.75%, 12/01/21 | Canada | 225,000 | $ | 223,875 |
| Capital Markets 0.3% | | | | |
| e Donnelley Financial Solutions Inc., senior note, 144A, 8.25%, 10/15/24 | United States | 197,000 | | 200,940 |
| Commercial Services & Supplies 0.5% | | | | |
| RR Donnelley & Sons Co., | | | | |
| senior bond, 6.50%, 11/15/23 | United States | 67,000 | | 63,650 |
| senior bond, 6.00%, 4/01/24 | United States | 327,000 | | 296,752 |
| senior bond, 6.625%, 4/15/29 | United States | 8,000 | | 6,880 |
| c senior note, 7.00%, 2/15/22 | United States | 4,000 | | 3,880 |
| | | | | 371,162 |
| Communications Equipment 0.0%† | | | | |
| e Avaya Inc., senior note, first lien, 144A, 7.00%, 4/01/19 | United States | 25,000 | | 21,875 |
| Construction & Engineering 0.5% | | | | |
| e Engility Corp., senior note, 144A, 8.875%, 9/01/24 | United States | 375,000 | | 386,719 |
| Construction Materials 0.4% | | | | |
| c,e Standard Industries Inc., senior note, 144A, 5.125%, 2/15/21 | United States | 286,000 | | 298,870 |
| Containers & Packaging 0.7% | | | | |
| c Reynolds Group Issuer Inc. / Reynolds Group Issuer LLC / Reynolds Group Issuer | | | | |
| Luxembourg SA, senior secured note, first lien, 6.875%, 2/15/21 | United States | 486,102 | | 500,686 |
| Diversified Financial Services 2.0% | | | | |
| c Everi Payments Inc., senior note, 10.00%, 1/15/22 | United States | 544,000 | | 522,240 |
| e iPayment Inc., secured note, second lien, 144A, 9.50%, 12/15/19 | United States | 697,594 | | 717,650 |
| e Opal Acquisition Inc., senior note, 144A, 8.875%, 12/15/21 | United States | 383,000 | | 302,570 |
| | | | | 1,542,460 |
| Diversified Telecommunication Services 2.2% | | | | |
| Frontier Communications Corp., senior note, | | | | |
| 10.50%, 9/15/22 | United States | 75,000 | | 77,531 |
| 11.00%, 9/15/25 | United States | 531,000 | | 534,319 |
| e Intelsat Jackson Holdings SA, senior secured note, first lien, 144A, 8.00%, 2/15/24 | Luxembourg | 182,000 | | 184,275 |
| c,e Sprint Spectrum Co. LLC / Sprint Spectrum Co. II LLC, 144A, 3.36%, 9/20/21 | United States | 663,000 | | 666,315 |
| e Telesat Canada / Telesat LLC, senior note, 144A, 8.875%, 11/15/24 | Canada | 219,000 | | 224,201 |
| | | | | 1,686,641 |
| Energy Equipment & Services 0.6% | | | | |
| f Petroleos Mexicanos, senior bond, Reg S, 6.875%, 8/04/26 | Mexico | 114,000 | | 117,876 |
| c,e Transocean Inc., senior note, 144A, 9.00%, 7/15/23 | United States | 343,000 | | 348,145 |
| | | | | 466,021 |
| Equity Real Estate Investment Trusts (REITs) 1.0% | | | | |
| c,e Communications Sales & Leasing Inc., first lien, 144A, 6.00%, 4/15/23 | United States | 271,000 | | 281,840 |
| c iStar Inc., senior note, 5.00%, 7/01/19 | United States | 453,000 | | 446,771 |
| | | | | 728,611 |
| Health Care Equipment & Supplies 0.2% | | | | |
| Universal Hospital Services Inc., senior note, 7.625%, 8/15/20 | United States | 195,000 | | 186,615 |
| Health Care Providers & Services 1.0% | | | | |
| CHS / Community Health Systems Inc., | | | | |
| senior note, 8.00%, 11/15/19 | United States | 133,000 | | 105,403 |
| senior secured, first lien note, 5.125%, 8/15/18 | United States | 387,000 | | 377,364 |
16 Semiannual Report
franklintempleton.com
FRANKLIN ALTERNATIVE STRATEGIES FUNDS
STATEMENT OF INVESTMENTS (UNAUDITED)
| | | | | |
| Franklin K2 Long Short Credit Fund (continued) | | | | | |
| |
| | | Principal | | | |
| | Country | Amount* | | | Value |
| Corporate Bonds and Notes (continued) | | | | | |
| Health Care Providers & Services (continued) | | | | | |
| HCA Inc., senior secured bond, first lien, 5.25%, 4/15/25 | United States | 153,000 | | $ | 154,530 |
| Kindred Healthcare Inc., senior note, 8.75%, 1/15/23 | United States | 158,000 | | | 141,212 |
| | | | | | 778,509 |
| Hotels, Restaurants & Leisure 3.1% | | | | | |
| c,e Downstream Development Authority of the Quapaw Tribe of Oklahoma, | | | | | |
| secured note, 144A, 10.50%, 7/01/19 | United States | 525,000 | | | 538,125 |
| c,e Jack Ohio Finance LLC / Jack Ohio Finance 1 Corp., senior secured note, first lien, | | | | | |
| 144A, 6.75%, 11/15/21 | United States | 401,000 | | | 403,005 |
| e Mohegan Tribal Gaming Authority, senior note, 144A, 7.875%, 10/15/24 | United States | 45,000 | | | 45,225 |
| e Pizzaexpress Financing 2 PLC, senior secured note, first lien, 144A, | | | | | |
| 6.625%, 8/01/21 | United Kingdom | 543,000 GBP | | | 681,033 |
| c Scientific Games International Inc., senior note, 10.00%, 12/01/22 | United States | 607,000 | | | 572,097 |
| e Viking Cruises Ltd., 144A, | | | | | |
| senior bond, 6.25%, 5/15/25 | United States | 50,000 | | | 45,375 |
| senior note, 8.50%, 10/15/22 | United States | 107,000 | | | 109,408 |
| | | | | | 2,394,268 |
| Independent Power & Renewable Electricity Producers 0.3% | | | | | |
| c,e Atlantica Yield PLC, senior note, 144A, 7.00%, 11/15/19 | Spain | 143,000 | | | 145,860 |
| e TerraForm Power Operating LLC, senior note, 144A, | | | | | |
| 6.375%, 2/01/23 | United States | 30,000 | | | 30,834 |
| 6.125%, 6/15/25 | United States | 16,000 | | | 16,680 |
| | | | | | 193,374 |
| Machinery 1.0% | | | | | |
| Navistar International Corp., senior bond, 8.25%, 11/01/21 | United States | 778,000 | | | 781,890 |
| Media 5.2% | | | | | |
| e American Media Inc., 144A, | | | | | |
| secured note, second lien, 5.50%, 9/01/21 | United States | 325,232 | | | 297,587 |
| sub. note, zero cpn., 3/01/22 | United States | 2,452,010 | | | 1,599,937 |
| e Lee Enterprises Inc., senior secured note, first lien, 144A, 9.50%, 3/15/22 | United States | 303,000 | | | 319,665 |
| The McClatchy Co., | | | | | |
| senior bond, 7.15%, 11/01/27 | United States | 33,000 | | | 28,108 |
| senior bond, 6.875%, 3/15/29 | United States | 377,000 | | | 311,025 |
| senior secured note, first lien, 9.00%, 12/15/22 | United States | 98,000 | | | 103,880 |
| c,e,g Postmedia Network Inc., secured, second lien note, 144A, PIK, 10.25%, 7/15/23 | Canada | 448,000 | | | 472,640 |
| e Time Inc., senior note, 144A, 5.75%, 4/15/22 | United States | 654,000 | | | 662,175 |
| e Univision Communications Inc., senior secured note, first lien, 144A, | | | | | |
| 5.125%, 2/15/25 | United States | 180,000 | | | 171,225 |
| | | | | | 3,966,242 |
| Metals & Mining 2.1% | | | | | |
| AK Steel Corp., | | | | | |
| c senior bond, 7.625%, 5/15/20 | United States | 651,000 | | | 668,902 |
| senior bond, 8.375%, 4/01/22 | United States | 222,000 | | | 233,932 |
| senior note, 7.625%, 10/01/21 | United States | 462,000 | | | 483,945 |
| CSN Islands XI Corp., senior note, 6.875%, 9/21/19 | Brazil | 234,000 | | | 193,050 |
| CSN Resources SA, senior note, 6.50%, 7/21/20 | Brazil | 13,000 | | | 10,238 |
| | | | | | 1,590,067 |
franklintempleton.com
Semiannual Report 17
FRANKLIN ALTERNATIVE STRATEGIES FUNDS
STATEMENT OF INVESTMENTS (UNAUDITED)
| | | | |
| Franklin K2 Long Short Credit Fund (continued) | | | | |
| |
| | | Principal | | |
| | Country | Amount* | | Value |
| Corporate Bonds and Notes (continued) | | | | |
| Oil, Gas & Consumable Fuels 4.6% | | | | |
| e California Resources Corp., secured note, second lien, 144A, 8.00%, 12/15/22 | United States | 451,000 | $ | 365,310 |
| Freeport-McMoran Oil & Gas LLC / FCX Oil & Gas Inc., senior bond, | | | | |
| 6.75%, 2/01/22 | United States | 36,000 | | 37,508 |
| c 6.875%, 2/15/23 | United States | 329,000 | | 353,675 |
| c,e NGPL PipeCo LLC, 144A, | | | | |
| secured note, 7.119%, 12/15/17 | United States | 633,000 | | 659,902 |
| senior secured note, 9.625%, 6/01/19 | United States | 745,000 | | 782,250 |
| c,e Permian Resources LLC, senior secured note, first lien, 144A, 13.00%, 11/30/20 | United States | 21,000 | | 24,465 |
| Petrobras Global Finance BV, | | | | |
| senior bond, 5.75%, 1/20/20 | Brazil | 36,000 | | 36,180 |
| senior note, 3.00%, 1/15/19 | Brazil | 164,000 | | 160,056 |
| senior note, 4.875%, 3/17/20 | Brazil | 498,000 | | 488,389 |
| senior note, 8.375%, 5/23/21 | Brazil | 142,000 | | 152,650 |
| f Petroleos de Venezuela SA, Reg S, | | | | |
| senior bond, 6.00%, 11/15/26 | Venezuela | 484,000 | | 179,177 |
| senior note, 6.00%, 5/16/24 | Venezuela | 246,272 | | 92,684 |
| e Seven Generations Energy Ltd., senior note, 144A, 8.25%, 5/15/20 | Canada | 143,000 | | 152,831 |
| | | | | 3,485,077 |
| Paper & Forest Products 1.1% | | | | |
| Resolute Forest Products Inc., senior note, 5.875%, 5/15/23 | United States | 1,034,000 | | 806,520 |
| Road & Rail 0.0%† | | | | |
| e Florida East Coast Holdings Corp., senior secured note, first lien, 144A, | | | | |
| 6.75%, 5/01/19 | United States | 24,000 | | 24,840 |
| Software 0.6% | | | | |
| c,e Open Text Corp., senior bond, 144A, 5.875%, 6/01/26 | Canada | 425,000 | | 443,062 |
| Specialty Retail 0.5% | | | | |
| e,h Conduent Finance Inc. / Xerox Business Services LLC, senior note, 144A, | | | | |
| 10.50%, 12/15/24 | United States | 326,000 | | 339,855 |
| e Guitar Center Inc., senior secured note, first lien, 144A, 6.50%, 4/15/19 | United States | 90,000 | | 79,875 |
| | | | | 419,730 |
| Total Corporate Bonds and Notes (Cost $20,017,005) | | | | 21,498,054 |
| Foreign Government and Agency Securities 3.8% | | | | |
| Argentine Bonos del Tesoro, | | | | |
| 16.00%, 10/17/23 | Argentina | 3,383,803 | ARS | 206,063 |
| senior note, 15.50%, 10/17/26 | Argentina | 846,221 | ARS | 51,666 |
| Government of Argentina, | | | | |
| f Reg S, 5.00%, 1/15/27 | Argentina | 100,000 | EUR | 92,869 |
| 7.82%, 12/31/33 | Argentina | 250,451 | EUR | 262,388 |
| 2.26% to 3/31/19, 3.38% to 3/31/29, 4.74% thereafter, 12/31/38 | Argentina | 328,282 | EUR | 196,320 |
| senior note, 8.75%, 6/02/17 | Argentina | 300,000 | | 311,100 |
| f senior note, Reg S, 3.875%, 1/15/22 | Argentina | 100,000 | EUR | 99,983 |
| f Government of Cyprus, Reg S, 3.875%, 5/06/22 | Cyprus | 62,000 | EUR | 68,130 |
| Government of Hellenic Republic, | | | | |
| f senior bond, Reg S, 3.00% to 2/24/20, 3.65% to 2/24/21, | | | | |
| 4.30% thereafter, 2/24/42 | Greece | 354,580 | EUR | 274,575 |
| e senior note, 144A, 4.75%, 4/17/19 | Greece | 57,000 | EUR | 58,156 |
| f Government of Iraq, senior bond, Reg S, 5.80%, 1/15/28 | Iraq | 250,000 | | 199,375 |
| f Government of Paraguay, senior note, Reg S, 4.625%, 1/25/23 | Paraguay | 200,000 | | 200,122 |
18 Semiannual Report
franklintempleton.com
FRANKLIN ALTERNATIVE STRATEGIES FUNDS
STATEMENT OF INVESTMENTS (UNAUDITED)
| | | | |
| Franklin K2 Long Short Credit Fund (continued) | | | | |
| |
| | | | Principal | | |
| | Country | Amount* | | Value |
| |
| Foreign Government and Agency Securities (continued) | | | | |
| Government of Russia, | | | | |
| 6.40%, 5/27/20 | Russia | 15,197,000 | RUB | $ 222,060 |
| f Reg S, 4.75%, 5/27/26 | Russia | 200,000 | | 204,112 |
| f Government of Ukraine, senior note, Reg S, 7.75%, 9/01/19 | Ukraine | 149,000 | | 144,645 |
| Letras del Banco Central de la Republica Argentina, | | | | |
| Strip, 1/11/17 - 1/25/17 | Argentina | 5,448,234 | i ARS | 332,617 |
| Total Foreign Government and Agency Securities | | | | |
| (Cost $2,916,960) | | | | 2,924,181 |
| |
| Asset-Backed Securities and Commercial Mortgage-Backed | | | | |
| Securities 31.2% | | | | |
| Banks 7.0% | | | | |
| j Wachovia Bank Commercial Mortgage 2007-C30 Trust, AJ, FRN, | | | | |
| 5.413%, 12/15/43 | United States | 1,750,000 | | 1,756,389 |
| j Wachovia Bank Commercial Mortgage 2007-C31 Trust, AJ, FRN, | | | | |
| 5.66%, 4/15/47 | United States | 2,715,000 | | 2,746,539 |
| e Wachovia Bank Commercial Mortgage 2007-C32 Trust, AMFX, 144A, | | | | |
| 5.703%, 6/15/49 | United States | 495,000 | | 500,825 |
| j Washington Mutual Mortgage Pass-Through Certificates, 2006-4, 3A2B, FRN, | | | | |
| 0.672%, 5/25/36 | United States | 499,782 | | 277,420 |
| | | | | 5,281,173 |
| Consumer Finance 1.2% | | | | |
| j Impac CMB 2004-9 Trust, 1A2, FRN, 1.472%, 1/25/35 | United States | 1,037,679 | | 892,679 |
| Diversified Financial Services 19.5% | | | | |
| j American Home Mortgage Assets 2005-1 Trust, 1A1, FRN, 3.393%, 11/25/35 | United States | 307,379 | | 264,334 |
| j American Home Mortgage Assets 2006-4 Trust, 1A11, FRN, 0.774%, 10/25/46 | United States | 357,206 | | 239,522 |
| e Avant Loans Funding 2016-B Trust, A, 144A, 3.92%, 8/15/19 | United States | 619,082 | | 622,054 |
| e Avant Loans Funding 2016-C Trust, A, 144A, 2.96%, 9/16/19 | United States | 215,922 | | 216,129 |
| j Banc of America Funding 2006-G Trust, M1, FRN, 0.862%, 7/20/36 | United States | 3,500,000 | | 2,328,394 |
| j Banc of America Mortgage 2005-L Trust, 3A1, FRN, 2.788%, 1/25/36 | United States | 678,548 | | 637,129 |
| e,j BCAP LLC 2010-RR1 Trust, 1A4, 144A, FRN, 2.944%, 3/26/37 | United States | 745,768 | | 640,367 |
| j Bear Stearns ARM 2006-2 Trust, 4A1, FRN, 3.231%, 7/25/36 | United States | 116,030 | | 101,746 |
| j Bear Stearns ARM 2007-4 Trust, 22A1, FRN, 4.637%, 6/25/47 | United States | 107,659 | | 98,722 |
| e,j Carlyle Global Market Strategies CLO 2014-3A Ltd., C1, 144A, FRN, | | | | |
| 4.586%, 7/27/26 | Cayman Islands | 500,000 | | 503,092 |
| e,j Cornerstone CLO Ltd. 2007-C Trust, 144A, FRN, 3.28%, 7/15/21 | United States | 1,000,000 | | 973,954 |
| j Countrywide Alternative Loan 2005-IM1 Trust, A1, FRN, 0.892%, 1/25/36 | United States | 284,813 | | 250,440 |
| Credit Suisse First Boston Mortgage Securities Corp., 1A2, 7.50%, 3/25/32 | United States | 652,070 | | 701,257 |
| CSMC Mortgage-Backed 2006-4 Trust, 9A1, 6.50%, 5/25/36 | United States | 1,007,900 | | 661,731 |
| j DSLA Mortgage Loan 2006-AR1 Trust, 2A1A, FRN, 1.463%, 4/19/47 | United States | 1,063,962 | | 920,781 |
| j GreenPoint Mortgage Loan 2004-1 Trust, A, FRN, 1.167%, 10/25/34 | United States | 307,689 | | 271,458 |
| j Home Equity Mortgage Loan Asset-Backed 2001-A Trust, AV, FRN, | | | | |
| 1.112%, 3/25/31 | United States | 107,794 | | 96,950 |
| JP Morgan Chase Commercial Mortgage Securities 2006-LDP9 Trust, AM, | | | | |
| 5.372%, 5/15/47 | United States | 500,000 | | 499,829 |
| j JP Morgan Mortgage 2006-A5 Trust, 6A1, FRN, 2.708%, 8/25/36 | United States | 667,536 | | 544,119 |
| j JP Morgan Mortgage 2007-A2 Trust, 2A1, FRN, 3.022%, 4/25/37 | United States | 460,591 | | 409,633 |
| e,j Katonah Ltd. 2007-B1L Trust, 144A, FRN, 3.882%, 4/23/22 | United States | 1,000,000 | | 999,977 |
| j MASTR Seasoned Securitization 2004-1 Trust, 4A1, FRN, 3.05%, 10/25/32 | United States | 99,478 | | 99,737 |
| j National Collegiate Student Loan 2007-1 Trust, A3, FRN, 0.824%, 7/25/30 | United States | 473,799 | | 458,428 |
| j National Collegiate Student Loan 2007-4 Trust, A3A2, FRN, 4.092%, 3/25/38 | United States | 1,250,000 | | 1,162,788 |
| j WaMu Mortgage Pass-Through Certificates 2007-OA3 Trust, 2A1A, FRN, | | | | |
| 1.302%, 4/25/47 | United States | 94,801 | | 85,654 |
franklintempleton.com
Semiannual Report 19
FRANKLIN ALTERNATIVE STRATEGIES FUNDS
STATEMENT OF INVESTMENTS (UNAUDITED)
| | | | |
| Franklin K2 Long Short Credit Fund (continued) | | | | |
| |
| | | Principal | | |
| | Country | Amount* | | Value |
| |
| Asset-Backed Securities and Commercial Mortgage-Backed | | | | |
| Securities (continued) | | | | |
| Diversified Financial Services (continued) | | | | |
| e Willis Engine Securitization Trust II, Series 2012-A, 144A, 5.50%, 9/15/37, A | United States | 1,081,605 | $ | 1,072,141 |
| | | | | 14,860,366 |
| Thrifts & Mortgage Finance 3.5% | | | | |
| j IndyMac INDX Mortgage Loan 2004-AR14 Trust, 2A1A, FRN, 1.312%, 1/25/35 | United States | 815,006 | | 616,231 |
| j IndyMac INDX Mortgage Loan 2005-AR13 Trust, 4A1, FRN, 2.941%, 8/25/35 | United States | 543,956 | | 475,100 |
| j IndyMac INDX Mortgage Loan 2005-AR16IP Trust, A1, FRN, 1.232%, 7/25/45 | United States | 399,474 | | 336,966 |
| j IndyMac INDX Mortgage Loan 2006-AR29 Trust, A2, FRN, 0.672%, 11/25/36 | United States | 279,615 | | 231,797 |
| j LB-UBS Commercial Mortgage 2007-C2 Trust, AM, FRN, 5.493%, 2/15/40 | United States | 1,000,000 | | 1,011,144 |
| | | | | 2,671,238 |
| Total Asset-Backed Securities and Commercial | | | | |
| Mortgage-Backed Securities | | | | |
| (Cost $23,073,063) | | | | 23,705,456 |
| |
| | | Number of | | |
| | | Contracts | | |
| |
| Options Purchased 0.1% | | | | |
| Calls – Exchange-Traded | | | | |
| Auto Components 0.0%† | | | | |
| American Axle & Manufacturing Inc., January Strike Price $15.00, Expires 1/20/17 | United States | 72 | | 9,288 |
| Diversified Financial Services 0.0%† | | | | |
| Chicago Board Options Exchange SPX Volatility Index, December Strike Price | | | | |
| $16.00, Expires 12/21/16 | United States | 34 | | 2,686 |
| Diversified Telecommunication Services 0.0%† | | | | |
| Globalstar Inc., December Strike Price $1.50, Expires 12/16/16 | United States | 66 | | 330 |
| Energy Equipment & Services 0.0%† | | | | |
| Ocean Rig UDW Inc., March Strike Price $2.00, Expires 3/17/17 | Cyprus | 45 | | 1,687 |
| Exchange Traded Funds 0.0%† | | | | |
| iShares 20+ Year Treasury Bond ETF, December Strike Price $125.00, | | | | |
| Expires 12/16/16 | United States | 54 | | 1,242 |
| Household Durables 0.0%† | | | | |
| Beazer Homes USA Inc., May Strike Price $12.00, Expires 5/19/17 | United States | 26 | | 7,085 |
| Puts – Exchange-Traded | | | | |
| Diversified Financial Services 0.0%† | | | | |
| S&P 500 E-Mini Index, December Strike Price $2,100.00, Expires 12/16/16 | United States | 1 | | 180 |
| S&P 500 E-Mini Index, December Strike Price $2,120.00, Expires 12/16/16 | United States | 1 | | 245 |
| S&P 500 Index, December Strike Price $2,000.00, Expires 12/02/16 | United States | 10 | | 50 |
| S&P 500 Index, December Strike Price $2,075.00, Expires 12/16/16 | United States | 12 | | 2,808 |
| S&P 500 Index, December Strike Price $2,075.00, Expires 12/30/16 | United States | 7 | | 3,920 |
| S&P 500 Index, December Strike Price $2,100.00, Expires 12/30/16 | United States | 17 | | 12,920 |
| | | | | 20,123 |
| Energy Equipment & Services 0.0%† | | | | |
| Weatherford International PLC, December Strike Price $4.00, Expires 12/16/16 | United States | 180 | | 720 |
| Exchange Traded Funds 0.0%† | | | | |
| iShares Russell 2000 ETF, January Strike Price $125.00, Expires 1/20/17 | United States | 34 | | 5,542 |
| SPDR S&P 500 ETF Trust, December Strike Price $205.00, Expires 12/16/16 | United States | 25 | | 525 |
| | | | | 6,067 |
20 Semiannual Report
franklintempleton.com
FRANKLIN ALTERNATIVE STRATEGIES FUNDS
STATEMENT OF INVESTMENTS (UNAUDITED)
| | | | | |
| Franklin K2 Long Short Credit Fund (continued) | | | | | |
| |
| | | Number of | | | |
| | Country | Contracts | | Value | |
| Options Purchased (continued) | | | | | |
| Puts – Exchange-Traded (continued) | | | | | |
| Metals & Mining 0.0%† | | | | | |
| Cia Siderurgica Nacional SA, March Strike Price $3.00, Expires 3/17/17 | Brazil | 29 | $ | 943 | |
| Multiline Retail 0.1% | | | | | |
| Sears Holdings Corp., January Strike Price $10.00, Expires 1/19/18 | United States | 77 | | 30,569 | |
| Semiconductors & Semiconductor Equipment 0.0%† | | | | | |
| Advanced Micro Devices Inc., January Strike Price $5.00, Expires 1/20/17 | United States | 99 | | 396 | |
| Specialty Retail 0.0%† | | | | | |
| Tiffany & Co., February Strike Price $70.00, Expires 2/17/17 | United States | 18 | | 1,386 | |
| Total Options Purchased | | | | | |
| (Cost $118,306) | | | | 82,522 | |
| |
| | | Principal | | | |
| | | Amount* | | | |
| U.S. Government and Agency Securities 2.7% | | | | | |
| c U.S. Treasury Note, | | | | | |
| 1.125%, 8/31/21 | United States | 538,000 | | 520,420 | |
| 1.625%, 10/31/23 | United States | 160,000 | | 154,241 | |
| 1.50%, 8/15/26 | United States | 1,466,000 | | 1,351,699 | |
| Total U.S. Government and Agency Securities | | | | | |
| (Cost $2,143,182) | | | | 2,026,360 | |
| Total Investments before Short Term Investments | | | | | |
| (Cost $50,514,137) | | | | 52,463,951 | |
| |
| | | Shares | | | |
| Short Term Investments 30.9% | | | | | |
| Money Market Funds (Cost $19,371,048) 25.5% | | | | | |
| k Fidelity Investments Money Market Funds, 0.268% | United States | 19,371,048 | | 19,371,048 | |
| |
| | | Principal | | | |
| | | Amount* | | | |
| Repurchase Agreements (Cost $4,129,573) 5.4% | | | | | |
| l Joint Repurchase Agreement, 0.265%, 12/01/16 | | | | | |
| (Maturity Value $4,129,603) | United States | 4,129,573 | | 4,129,573 | |
| BNP Paribas Securities Corp. (Maturity Value $1,999,265) | | | | | |
| Deutsche Bank Securities Inc. (Maturity Value $81,105) | | | | | |
| HSBC Securities (USA) Inc. (Maturity Value $1,999,265) | | | | | |
| Merrill Lynch, Pierce, Fenner & Smith Inc. (Maturity Value $49,968) | | | | | |
| Collateralized by U.S. Government Agency Securities, 0.476%, 8/03/17, | | | | | |
| mU.S. Treasury Bill, 4/27/17; U.S. Treasury Note, 0.689% - 1.625%, | | | | | |
| 7/31/18 - 11/30/20; and U.S. Treasury Note, Index Linked, 2.625%, 7/15/17 | | | | | |
| (valued at $4,212,220) | | | | | |
| Total Investments (Cost $74,014,758) 99.9% | | | | 75,964,572 | |
| Options Written (0.0)%† | | | | (3,735 | ) |
| Securities Sold Short (8.3)% | | | | (6,315,529 | ) |
| Other Assets, less Liabilities 8.4% | | | | 6,419,684 | |
| Net Assets 100.0% | | | $ | 76,064,992 | |
franklintempleton.com
Semiannual Report 21
FRANKLIN ALTERNATIVE STRATEGIES FUNDS
STATEMENT OF INVESTMENTS (UNAUDITED)
| | | | | | |
| Franklin K2 Long Short Credit Fund (continued) | | | | | | |
| |
| | | Number of | | | | |
| | Country | Contracts | | | Value | |
| n Options Written (0.0)%† | | | | | | |
| Calls – Exchange-Traded | | | | | | |
| Equity Real Estate Investment Trusts (REITs) (0.0)%† | | | | | | |
| iStar Inc., December Strike Price $12.00, Expires 12/16/16 | United States | 17 | $ | | (1,020 | ) |
| iStar Inc., January Strike Price $12.00, Expires 1/20/17 | United States | 13 | | | (975 | ) |
| iStar Inc., January Strike Price $13.00, Expires 1/20/17 | United States | 15 | | | (450 | ) |
| | | | | | (2,445 | ) |
| Independent Power & Renewable Electricity Producers (0.0)%† | | | | | | |
| TerraForm Power Inc., A, December Strike Price $15.00, Expires 12/16/16 | United States | 38 | | | (950 | ) |
| Puts – Exchange-Traded | | | | | | |
| Independent Power & Renewable Electricity Producers (0.0)%† | | | | | | |
| TerraForm Power Inc., A, December Strike Price $10.00, Expires 12/16/16 | United States | 10 | | | (100 | ) |
| TerraForm Power Inc., A, December Strike Price $11.00, Expires 12/16/16 | United States | 16 | | | (240 | ) |
| | | | | | (340 | ) |
| Total Options Written | | | | | | |
| (Premiums Received $5,136) | | | | | (3,735 | ) |
| |
| | | Shares | | | | |
| o Securities Sold Short (8.3)% | | | | | | |
| Common Stocks (0.2)% | | | | | | |
| Capital Markets (0.0)%† | | | | | | |
| Donnelley Financial Solutions Inc | United States | 863 | | | (16,458 | ) |
| Equity Real Estate Investment Trusts (REITs) (0.1)% | | | | | | |
| iStar Inc | United States | 541 | | | (6,611 | ) |
| Seritage Growth Properties | United States | 900 | | | (42,876 | ) |
| | | | | | (49,487 | ) |
| Independent Power & Renewable Electricity Producers (0.1)% | | | | | | |
| Pattern Energy Group Inc | United States | 3,521 | | | (69,117 | ) |
| Total Common Stocks | | | | | | |
| (Proceeds $136,514) | | | | | (135,062 | ) |
| |
| | | Principal | | | | |
| | | Amount* | | | | |
| Corporate Bonds and Notes (8.0)% | | | | | | |
| Auto Components (0.3)% | | | | | | |
| American Axle & Manufacturing Inc., senior bond, 6.625%, 10/15/22 | United States | 245,000 | | | (247,450 | ) |
| Banks (0.1)% | | | | | | |
| d,j BBVA International Preferred SAU, junior sub. bond, FRN, 5.919%, Perpetual | Spain | 87,000 | | | (85,804 | ) |
| Chemicals (2.7)% | | | | | | |
| CF Industries Inc., senior bond, 3.45%, 6/01/23 | United States | 221,000 | | | (200,668 | ) |
| e CVR Partners LP / CVR Nitrogen Finance Corp., 144A, 9.25%, 6/15/23 | United States | 317,000 | | | (315,019 | ) |
| f K+S AG, senior note, Reg S, | | | | | | |
| 4.125%, 12/06/21 | Germany | 206,000 | EUR | (241,489 | ) |
| 3.00%, 6/20/22 | Germany | 294,000 | EUR | (320,230 | ) |
| Mosaic Co., senior bond, 4.25%, 11/15/23 | United States | 500,000 | | | (499,087 | ) |
| Potash Corp. of Saskatchewan Inc., senior bond, 3.00%, 4/01/25 | Canada | 500,000 | | | (469,654 | ) |
| | | | | | (2,046,147 | ) |
| Commercial Services & Supplies (0.4)% | | | | | | |
| Quad/Graphics Inc., senior note, 7.00%, 5/01/22 | United States | 151,000 | | | (144,583 | ) |
22 Semiannual Report
franklintempleton.com
FRANKLIN ALTERNATIVE STRATEGIES FUNDS
STATEMENT OF INVESTMENTS (UNAUDITED)
| | | | | | |
| Franklin K2 Long Short Credit Fund (continued) | | | | | | |
| |
| | | Principal | | | | |
| | Country | Amount* | | | Value | |
| |
| o Securities Sold Short (continued) | | | | | | |
| Corporate Bonds and Notes (continued) | | | | | | |
| Commercial Services & Supplies (continued) | | | | | | |
| United Rentals North America Inc., senior bond, 5.50%, 5/15/27 | United States | 140,000 | $ | | (139,650 | ) |
| | | | | | (284,233 | ) |
| Diversified Telecommunication Services (0.1)% | | | | | | |
| Windstream Services LLC, senior bond, 7.75%, 10/01/21 | United States | 86,000 | | | (86,000 | ) |
| Electronic Equipment, Instruments & Components (0.2)% | | | | | | |
| e Inception Merger Sub Inc. / Rackspace Hosting Inc., senior note, 144A, | | | | | | |
| 8.625%, 11/15/24 | United States | 117,000 | | | (117,292 | ) |
| Energy Equipment & Services (0.4)% | | | | | | |
| Transocean Inc., senior bond, | | | | | | |
| 8.125%, 12/15/21 | United States | 27,000 | | | (26,865 | ) |
| 5.55%, 10/15/22 | United States | 342,000 | | | (303,525 | ) |
| | | | | | (330,390 | ) |
| Equity Real Estate Investment Trusts (REITs) (0.0)%† | | | | | | |
| Communications Sales & Leasing Inc., 8.25%, 10/15/23 | United States | 32,000 | | | (33,680 | ) |
| Food & Staples Retailing (0.1)% | | | | | | |
| f,j Iglo Foods BondCo PLC, senior secured note, first lien, FRN, Reg S, | | | | | | |
| 4.198%, 6/15/20 | United Kingdom | 71,000 | EUR | (76,160 | ) |
| Food Products (0.4)% | | | | | | |
| f Boparan Finance PLC, senior secured note, first lien, Reg S, 5.50%, 7/15/21 | United Kingdom | 269,000 | GBP | (317,221 | ) |
| Health Care Providers & Services (0.3)% | | | | | | |
| Centene Corp., senior note, 4.75%, 1/15/25 | United States | 115,000 | | | (110,400 | ) |
| CHS / Community Health Systems Inc., senior note, 6.875%, 2/01/22 | United States | 133,000 | | | (89,442 | ) |
| | | | | | (199,842 | ) |
| Hotels, Restaurants & Leisure (0.3)% | | | | | | |
| Scientific Games International Inc., senior sub. note, 6.625%, 5/15/21 | United States | 242,000 | | | (196,020 | ) |
| Independent Power & Renewable Electricity Producers (0.3)% | | | | | | |
| Dynegy Inc., senior note, | | | | | | |
| 7.625%, 11/01/24 | United States | 52,000 | | | (48,100 | ) |
| e 144A, 8.00%, 1/15/25 | United States | 219,000 | | | (202,028 | ) |
| | | | | | (250,128 | ) |
| Machinery (0.5)% | | | | | | |
| John Deere Capital Corp., senior note, 2.80%, 3/06/23 | United States | 179,000 | | | (178,243 | ) |
| f Selecta Group BV, senior secured note, first lien, Reg S, 6.50%, 6/15/20 | Switzerland | 212,000 | EUR | (188,293 | ) |
| | | | | | (366,536 | ) |
| Media (0.0)%† | | | | | | |
| e CCO Holdings LLC / CCO Holdings Capital Corp., senior note, 144A, | | | | | | |
| 5.875%, 4/01/24 | United States | 22,000 | | | (23,347 | ) |
| Metals & Mining (0.6)% | | | | | | |
| Freeport-McMoRan Inc., senior note, | | | | | | |
| 3.55%, 3/01/22 | United States | 419,000 | | | (399,056 | ) |
| 3.875%, 3/15/23 | United States | 41,000 | | | (38,514 | ) |
| | | | | | (437,570 | ) |
| Multiline Retail (0.3)% | | | | | | |
| Dollar Tree Inc., senior note, 5.75%, 3/01/23 | United States | 114,000 | | | (121,695 | ) |
| Kohl’s Corp., senior bond, 4.25%, 7/17/25 | United States | 66,000 | | | (66,522 | ) |
franklintempleton.com
Semiannual Report 23
FRANKLIN ALTERNATIVE STRATEGIES FUNDS
STATEMENT OF INVESTMENTS (UNAUDITED)
| | | | | |
| Franklin K2 Long Short Credit Fund (continued) | | | | | |
| | | Principal | | | |
| | Country | Amount* | | Value | |
| o Securities Sold Short (continued) | | | | | |
| Corporate Bonds and Notes (continued) | | | | | |
| Multiline Retail (continued) | | | | | |
| Nordstrom Inc., senior bond, 5.00%, 1/15/44 | United States | 28,000 | $ | (27,844 | ) |
| | | | | (216,061 | ) |
| Trading Companies & Distributors (0.8)% | | | | | |
| GATX Corp., senior bond, 4.85%, 6/01/21 | United States | 576,000 | | (620,148 | ) |
| Wireless Telecommunication Services (0.2)% | | | | | |
| T-Mobile U.S. Inc., senior bond, 6.50%, 1/15/26 | United States | 138,000 | | (149,385 | ) |
| Total Corporate Bonds and Notes (Proceeds $6,149,046) | | | | (6,083,414 | ) |
| Foreign Government and Agency Securities (0.1)% (Proceeds $110,028) | | | | | |
| Italy Treasury Bond, 1.60%, 6/01/26 | Italy | 94,000 | | (97,053 | ) |
| Total Securities Sold Short (Proceeds $6,395,588) | | | $ | (6,315,529 | ) |
See Abbreviations on page 44.
†Rounds to less than 0.1% of net assets.
*The principal amount is stated in U.S. dollars unless otherwise indicated.
aNon-income producing.
bA portion or all of the security is held in connection with written option contracts open at period end.
cA portion or all of the security has been segregated as collateral for securities sold short, open swap, forward, futures and written option contracts. At November 30, 2016, the
aggregate value of these securities and/or cash pledged amounted to $14,715,367, representing 19.3% of net assets.
dPerpetual security with no stated maturity date.
eSecurity was purchased pursuant to Rule 144A under the Securities Act of 1933 and may be sold in transactions exempt from registration only to qualified institutional buyers
or in public offering registered under the Securities Act of 1933. These securities have been deemed liquid under guidelines approved by the Trust’s Board of Trustees. At
November 30, 2016, the net value of these securities was $17,767,795, representing 23.4% of net assets.
fSecurity was purchased pursuant to Regulation S under the Securities Act of 1933, which exempts from registration securities offered and sold outside of the United States.
Such a security cannot be sold in the United States without either an effective registration statement filed pursuant to the Securities Act of 1933, or pursuant to an exemption
from registration. These securities have been deemed liquid under guidelines approved by the Trust’s Board of Trustees. At November 30, 2016, the net value of these securi-
ties was $530,155, representing 0.7% of net assets.
gIncome may be received in additional securities and/or cash.
hA portion or all of the security purchased on a delayed delivery basis. See Note 1(d).
iPrincipal amount is stated in 1,000 Argentine Peso Units.
jThe coupon rate shown represents the rate at period end.
kThe rate shown is the annualized seven-day yield at period end.
lSee Note 1(c) regarding joint repurchase agreement.
mThe security was issued on a discount basis with no stated coupon rate.
nSee Note 1(e) regarding written options.
oSee Note 1(f) regarding securities sold short.
At November 30, 2016, the Fund had the following futures contracts outstanding. See Note 1(e).
| | | | | | | | | | |
| Futures Contracts | | | | | | | | | | |
| | | Number of | | Notional | Expiration | | Unrealized | | Unrealized | |
| Description | Type | Contracts | | Value | Date | | Appreciation | | Depreciation | |
| Equity Contracts | | | | | | | | | | |
| S&P 500 E-Mini Index | Short | 3 | $ | 329,820 | 12/16/16 | $ | — | $ | (4,595 | ) |
| Interest Rate Contracts | | | | | | | | | | |
| 90 Day Eurodollar | Short | 2 | | 493,025 | 12/18/17 | | 746 | | — | |
| Euro-BTP Italian Government Bond | Short | 1 | | 143,429 | 12/08/16 | | 9,462 | | — | |
| Euro-Buxl 30 Yr. Bond | Short | 1 | | 185,855 | 12/08/16 | | 2,564 | | — | |
| U.S. Treasury 10 Yr. Note | Short | 3 | | 373,547 | 3/22/17 | | 766 | | — | |
| U.S. Treasury Long Bond | Short | 2 | | 302,563 | 3/22/17 | | 1,621 | | — | |
| | | | | 1,498,419 | | | 15,159 | | — | |
| Total Futures Contracts | | | $ | 1,828,239 | | $ | 15,159 | $ | (4,595 | ) |
| Net unrealized appreciation (depreciation) | | | | | | $ | 10,564 | | | |
24 Semiannual Report
franklintempleton.com
FRANKLIN ALTERNATIVE STRATEGIES FUNDS
STATEMENT OF INVESTMENTS (UNAUDITED)
| | | | | | | | | | |
| Franklin K2 Long Short Credit Fund (continued) | | | | | | | | | |
| At November 30, 2016, the Fund had the following forward exchange contracts outstanding. See Note 1(e). | | | | | |
| |
| Forward Exchange Contracts | | | | | | | | | | |
| | | | | Contract | Settlement | | Unrealized | | Unrealized | |
| Currency | Counterpartya Type | Quantity | Amount* | Date | | Appreciation | | Depreciation | |
| OTC Forward Exchange Contracts | | | | | | | | | | |
| South Korean Won | BOFA | Sell | 129,151,374 | 112,796 | 12/05/16 | $ | 2,321 | $ | — | |
| South Korean Won | MSCO | Sell | 130,205,694 | 111,525 | 12/14/16 | | 150 | | — | |
| Chinese Yuan | MSCO | Sell | 5,321,200 | 790,082 | 12/21/16 | | 22,502 | | — | |
| Euro | DBAB | Buy | 152,399 | 164,111 | 12/21/16 | | — | | (2,383 | ) |
| Euro | DBAB | Sell | 119,970 | 127,555 | 12/21/16 | | 327 | | (87 | ) |
| Euro | MSCO | Buy | 587,637 | 649,085 | 12/21/16 | | 227 | | (25,703 | ) |
| Euro | MSCO | Sell | 1,679,748 | 1,884,502 | 12/21/16 | | 101,931 | | — | |
| Japanese Yen | MSCO | Buy | 19,964,793 | 185,116 | 12/21/16 | | — | | (10,356 | ) |
| Japanese Yen | MSCO | Sell | 19,964,793 | 197,175 | 12/21/16 | | 22,415 | | — | |
| Mexican Peso | BOFA | Buy | 6,449,066 | 327,122 | 12/21/16 | | — | | (14,517 | ) |
| Mexican Peso | BOFA | Sell | 6,449,065 | 329,329 | 12/21/16 | | 17,511 | | (786 | ) |
| Mexican Peso | MSCO | Buy | 6,234,286 | 313,979 | 12/21/16 | | — | | (11,786 | ) |
| Mexican Peso | MSCO | Sell | 6,234,286 | 308,302 | 12/21/16 | | 6,108 | | — | |
| Russian Ruble | BOFA | Buy | 7,263,002 | 111,791 | 12/21/16 | | 820 | | — | |
| Russian Ruble | MSCO | Buy | 32,469,448 | 498,309 | 12/21/16 | | 7,059 | | (1,938 | ) |
| Russian Ruble | MSCO | Sell | 16,089,776 | 244,842 | 12/21/16 | | — | | (4,626 | ) |
| South African Rand | MSCO | Sell | 1,589,915 | 111,956 | 12/21/16 | | — | | (475 | ) |
| Turkish Lira | BOFA | Sell | 735,434 | 242,596 | 12/21/16 | | 29,620 | | — | |
| Turkish Lira | MSCO | Buy | 393,240 | 122,753 | 12/21/16 | | — | | (8,874 | ) |
| South Korean Won | BOFA | Sell | 131,426,644 | 111,568 | 12/27/16 | | — | | (850 | ) |
| British Pound | JPHQ | Sell | 940,000 | 1,221,013 | 1/31/17 | | 42,832 | | — | |
| Euro | JPHQ | Sell | 130,000 | 144,236 | 1/31/17 | | 5,993 | | — | |
| Czech Koruna | JPHQ | Sell | 7,545,458 | 279,962 | EUR | 2/28/17 | | 106 | | — | |
| Euro | JPHQ | Sell | 279,762 | 7,482,512 | CZK | 11/29/17 | | 4,702 | | (4,789 | ) |
| Total Forward Exchange Contracts | | | | | | $ | 264,624 | $ | (87,170 | ) |
| Net unrealized appreciation (depreciation) | | | | | $ | 177,454 | | | |
*In U.S. dollars unless otherwise indicated.
aMay be comprised of multiple contracts with the same counterparty, currency and settlement date.
| | | | | | | | | | | | | | | | | |
| At November 30, 2016, the Fund had the following credit default swap contracts outstanding. See Note 1(e). | | | | |
| |
| Credit Default Swap Contracts | | | | | | | | | | | | | | | | | |
| | | | | | | | Unamortized | | | | | | | | | | |
| | Periodic | | | | | | Upfront | | | | | | | | | | |
| | Payment | | Counterparty/ | Notional | Expiration | | Payments | | | Unrealized | | Unrealized | | | | |
| Description | Rate | | Exchange | Amounta | Date | | (Receipts) | | | Appreciation | | Depreciation | | Value | | Ratingb |
| Centrally Cleared Swap Contracts | | | | | | | | | | | | | | | | | |
| Contracts to Buy Protection | | | | | | | | | | | | | | | | | |
| Traded Index | | | | | | | | | | | | | | | | | |
| CDX.NA.HY.25 | 5.00 | % | ICE | 1,445,400 | 12/20/20 | $ | 14,454 | | | $ | — | $ | (101,148) | $(86,694) | | |
| Single Name | | | | | | | | | | | | | | | | | |
| Government of Turkey | 1.00 | % | ICE | 504,000 | 12/20/20 | | 41,464 | | | | — | | (14,306 | ) | 27,158 | | |
| Government of Turkey | 1.00 | % | ICE | 303,000 | 6/20/21 | | 22,054 | | | | — | | (971 | ) | 21,083 | | |
| Government of South Africa | 1.00 | % | ICE | 394,000 | 12/20/21 | | 26,977 | | | | — | | (1,924 | ) | 25,053 | | |
| Government of South Korea | 1.00 | % | ICE | 281,931 | 12/20/21 | | (8,171 | ) | | | 1,313 | | — | | (6,858 | ) | |
| Contracts to Sell Protectionc | | | | | | | | | | | | | | | | | |
| Single Name | | | | | | | | | | | | | | | | | |
| Government of Brazil | 1.00 | % | ICE | 567,000 | 6/20/21 | | (52,982 | ) | | | 12,771 | | — | | (40,211 | ) | BB |
| Government of Russia | 1.00 | % | ICE | 457,000 | 6/20/21 | | (33,432 | ) | | | 12,782 | | — | | (20,650 | ) | BB+ |
| Total Centrally Cleared Swap Contracts | | | | | | $ | 10,364 | | $ | 26,866 | $ | (118,349) $(81,119) | | |
franklintempleton.com
Semiannual Report 25
FRANKLIN ALTERNATIVE STRATEGIES FUNDS
STATEMENT OF INVESTMENTS (UNAUDITED)
| | | | | | | | | | | | | | | | | | | | | | | | | |
| Franklin K2 Long Short Credit Fund (continued) | | | | | | | | | | | | | | | | | | | | | | |
| |
| Credit Default Swap Contracts (continued) | | | | | | | | | | | | | | | | | | | | | | | | |
| | | | | | | | | | | Unamortized | | | | | | | | | | | | | | |
| Periodic | | | | | | | | | | Upfront | | | | | | | | | | | | | | |
| Payment | | Counterparty/ | Notional | Expiration | | Payments | | | Unrealized | | Unrealized | | | | | | | |
| Description | Rate | | Exchange | Amounta | | | Date | | (Receipts) | | | Appreciation | | Depreciation | | Value | | | Ratingb | |
| OTC Swap Contracts | | | | | | | | | | | | | | | | | | | | | | | | | |
| Contracts to Buy Protection | | | | | | | | | | | | | | | | | | | | | | | | | |
| Single Name | | | | | | | | | | | | | | | | | | | | | | | | | |
| American Axle & Manufacturing Inc | 5.00 | % | JPHQ | 565,000 | | | 12/20/21 | $ | (58,987 | ) | $ | 13,817 | | $ | — $ | (45,170 | ) | | | | |
| Catepillar Financial Services Corp | 1.00 | % | JPHQ | 882,000 | | | 6/20/21 | | | 3,403 | | | — | | (17,494 | ) | (14,091 | ) | | | | |
| Galapagos Holding SA | 5.00 | % | JPHQ | 141,000 | EUR | 6/20/21 | | | 19,944 | | | 4,325 | | | | — | | 24,269 | | | | | |
| Government of Argentina | 5.00 | % | MSCO | 308,000 | | | 6/20/17 | | | (6,558 | ) | | — | | | | (3,401 | ) | (9,959 | ) | | | | |
| Itochu Corp | 1.00 | % | GSCO | 20,022,000 | JPY | 6/20/21 | | | (3,903 | ) | | — | | | | (1,694 | ) | (5,597 | ) | | | | |
| Marubeni Corp | 1.00 | % | GSCO | 62,079,000 | JPY | 6/20/21 | | | 3,481 | | | — | | (18,810 | ) | (15,329 | ) | | | | |
| Pizzaexpress Financing 1 PLC | 5.00 | % | JPHQ | 543,000 | EUR | 6/20/21 | | | (25,410 | ) | | 40,187 | | | | — | | 14,777 | | | | | |
| Rallye SA | 5.00 | % | BZWS | 71,000 | EUR | 6/20/19 | | | 6,678 | | | — | | | | (3,850 | ) | 2,828 | | | | | |
| Rallye SA | 5.00 | % | JPHQ | 175,000 | EUR | 6/20/19 | | | 17,487 | | | — | | (10,518 | ) | 6,969 | | | | | |
| Rallye SA | 5.00 | % | GSCO | 10,000 | EUR | 12/20/19 | | | 734 | | | — | | | | (106 | ) | 628 | | | | | |
| Tesco PLC | 1.00 | % | JPHQ | 95,000 | EUR | 12/20/21 | | | 5,352 | | | — | | | | (365 | ) | 4,987 | | | | | |
| |
| Contracts to Sell Protectionc | | | | | | | | | | | | | | | | | | | | | | | | | |
| Single Name | | | | | | | | | | | | | | | | | | | | | | | | | |
| Windstream Services LLC | 5.00 | % | BZWS | 86,000 | | | 12/20/21 | | | (4,612 | ) | | 2,691 | | | | — | | (1,921 | ) | | B+ | |
| Total OTC Swap Contracts | | | | | | | | | $ | (42,391 | ) | $ | 61,020 | $ | (56,238) $ (37,609) | | | | | |
| Total Credit Default Swap Contracts | | | | | | | | | $ | (32,027 | ) | $ | 87,886 | $ | (174,587) $ (118,728) | | |
| Net unrealized appreciation (depreciation) | | | | | | | | | | | | | | | $ | (86,701 | ) | | | | | | |
| |
| a In U.S. dollars unless otherwise indicated. For contracts to sell protection, the notional amount is equal to the maximum potential amount of the future payments and no | | |
| recourse provisions have been entered into in association with the contracts. | | | | | | | | | | | | | | | | | | | | | | |
| b Based on Standard and Poor’s (S&P) Rating for single name swaps. | | | | | | | | | | | | | | | | | | | | | | |
| c The Fund enters contracts to sell protection to create a long credit position. Performance triggers include default, bankruptcy or restructuring for single name swaps and fail- | |
| ure to pay or bankruptcy of the underlying securities for traded index swaps. | | | | | | | | | | | | | | | | | | | | | | |
| See Notes 1(e) and 8 regarding derivative financial instruments and other derivative information, respectively. | | | | | | | | | | | | | | | |
| |
| At November 30, 2016, the Fund had the following interest rate swap contracts outstanding. See Note 1(e). | | | | | | | | | | | |
| |
| Interest Rate Swap Contracts | | | | | | | | | | | | | | | | | | | | | | | | | |
| | | | | Counterparty/ | Notional Expiration | | Unrealized | | Unrealized | |
| Description | | | | Exchange | | Amount | | | Date | | Appreciation | | Depreciation | |
| Centrally Cleared Swap Contracts | | | | | | | | | | | | | | | | | | | | | | | | | |
| Receive Floating rate 6 Month GBP-LIBOR | | | | | | | | | | | | | | | | | | | | | | | | | |
| Pay Fixed rate 1.56% | | | | | CME | 112,459 | GBP | | 11/29/46 | | | $ | 554 | | | | | $ | — | |
| Receive Floating rate 6 Month GBP-LIBOR | | | | | | | | | | | | | | | | | | | | | | | | | |
| Pay Fixed rate 1.55% | | | | | CME | 112,047 | GBP | | 11/28/46 | | | | 590 | | | | | | — | |
| Total Centrally Cleared Swap Contracts | | | | | | | | | | | | | | | | | $ | 1,144 | | | | | $ | — | |
| OTC Swap Contracts | | | | | | | | | | | | | | | | | | | | | | | | | |
| Receive Fixed rate 11.27% | | | | | | | | | | | | | | | | | | | | | | | | | |
| Pay Floating rate BRL-Brazil Cetip DI Interbank Deposit Rate | | BOFA | 369,132 | BRL | | 1/02/20 | | | $ | — | | | | | $ | (775 | ) |
| Receive Fixed rate 11.30% | | | | | | | | | | | | | | | | | | | | | | | | | |
| Pay Floating rate BRL-Brazil Cetip DI Interbank Deposit Rate | | BOFA | 372,377 | BRL | | 1/02/20 | | | | — | | | | | | (706 | ) |
| Receive Fixed rate 12.05% | | | | | | | | | | | | | | | | | | | | | | | | | |
| Pay Floating rate BRL-Brazil Cetip DI Interbank Deposit Rate | | MSCO | 748,000 | BRL | | 1/02/20 | | | | 1,931 | | | | | | — | |
| Total OTC Swap Contracts | | | | | | | | | | | | | | | | | $ | 1,931 | | | | $ | (1,481 | ) |
| Total Interest Rate Swap Contracts | | | | | | | | | | | | | | | | | $ | 3,075 | | | | $ | (1,481 | ) |
| Net unrealized appreciation (depreciation) | | | | | | | | | | | | | | | | $ | 1,594 | | | | | | | |
26 Semiannual Report
franklintempleton.com
FRANKLIN ALTERNATIVE STRATEGIES FUNDS
STATEMENT OF INVESTMENTS (UNAUDITED)
| | | | | | | | | |
| Franklin K2 Long Short Credit Fund (continued) | | | | | | | | |
| At November 30, 2016, the Fund had the following total return swap contracts outstanding. See Note 1(e). | | | | |
| |
| Total Return Swap Contracts | | | | | | | | | |
| | | | | Notional | Expiration | | Unrealized | | Unrealized |
| Underlying Instrument | Financing Rate | Counterparty | | Value | Date | | Appreciation | | Depreciation |
| OTC Swap Contracts | | | | | | | | | |
| Fixed Income Contracts - Short | | | | | | | | | |
| iBoxx USD Liquid Investment Grade Index | LIBOR | JPHQ | $ | 256,000 | 12/20/16 | $ | 7,430 | $ | — |
| iBoxx USD Liquid Investment Grade Index | LIBOR | JPHQ | | 241,000 | 12/20/16 | | 6,560 | | — |
| iBoxx USD Liquid Investment Grade Index | LIBOR | JPHQ | | 255,000 | 12/20/16 | | 7,050 | | — |
| iBoxx USD Liquid Investment Grade Index | LIBOR | JPHQ | | 112,000 | 3/20/17 | | 259 | | — |
| iBoxx USD Liquid Investment Grade Index | LIBOR | JPHQ | | 256,000 | 3/20/17 | | 7,430 | | — |
| iBoxx USD Liquid Investment Grade Index | LIBOR | JPHQ | | 255,000 | 3/20/17 | | 7,050 | | — |
| iBoxx USD Liquid Investment Grade Index | LIBOR | JPHQ | | 128,000 | 3/20/17 | | 3,157 | | — |
| iBoxx USD Liquid Investment Grade Index | LIBOR | MSCO | | 128,000 | 3/20/17 | | 1,502 | | — |
| iBoxx USD Liquid Investment Grade Index | LIBOR | MSCO | | 240,000 | 3/20/17 | | 6,635 | | — |
| iBoxx USD Liquid Investment Grade Index | LIBOR | MSCO | | 128,000 | 3/20/17 | | 1,264 | | — |
| Total Return Swap Contracts | | | | | | $ | 48,337 | $ | — |
| Net unrealized appreciation (depreciation) | | | | | | $ | 48,337 | | |
See Abbreviations on page 44.
franklintempleton.com
The accompanying notes are an integral part of these financial statements. | Semiannual Report 27
FRANKLIN ALTERNATIVE STRATEGIES FUNDS
Financial Statements
Statement of Assets and Liabilities
November 30, 2016 (unaudited)
| | |
| Franklin K2 Long Short Credit Fund | | |
| |
| Assets: | | |
| Investments in securities: | | |
| Cost - Unaffiliated issuers | $ | 69,885,185 |
| Cost - Repurchase agreements | | 4,129,573 |
| Total cost of investments | $ | 74,014,758 |
| Value - Unaffiliated issuers | $ | 71,834,999 |
| Value - Repurchase agreements | | 4,129,573 |
| Total value of investments | | 75,964,572 |
| Cash | | 1,264,923 |
| Foreign currency, at value (cost $576,526) | | 511,197 |
| Receivables: | | |
| Investment securities sold | | 1,154,068 |
| Capital shares sold | | 341,404 |
| Dividends and interest | | 456,155 |
| Due from brokers | | 4,824,690 |
| Variation margin | | 6,221 |
| OTC swap contracts (upfront payments $58,327) | | 57,079 |
| Unrealized appreciation on OTC forward exchange contracts | | 264,624 |
| Unrealized appreciation on OTC swap contracts | | 111,288 |
| Other assets | | 48 |
| Total assets | | 84,956,269 |
| Liabilities: | | |
| Payables: | | |
| Investment securities purchased | | 2,199,003 |
| Management fees | | 40,801 |
| Distribution fees | | 3,548 |
| Transfer agent fees | | 1,837 |
| OTC swap contracts (upfront receipts $105,595) | | 99,470 |
| Options written, at value (premiums received $5,136) | | 3,735 |
| Securities sold short, at value (proceeds $6,395,588) | | 6,315,529 |
| Due to brokers | | 18,243 |
| Unrealized depreciation on OTC forward exchange contracts | | 87,170 |
| Unrealized depreciation on OTC swap contracts | | 57,719 |
| Accrued expenses and other liabilities | | 64,222 |
| Total liabilities | | 8,891,277 |
| Net assets, at value | $ | 76,064,992 |
| Net assets consist of: | | |
| Paid-in capital | $ | 71,773,651 |
| Undistributed net investment income | | 1,322,749 |
| Net unrealized appreciation (depreciation) | | 2,116,912 |
| Accumulated net realized gain (loss) | | 851,680 |
| Net assets, at value | $ | 76,064,992 |
28 Semiannual Report | The accompanying notes are an integral part of these financial statements.
franklintempleton.com
FRANKLIN ALTERNATIVE STRATEGIES FUNDS
FINANCIAL STATEMENTS
Statement of Assets and Liabilities (continued)
November 30, 2016 (unaudited)
| | |
| Franklin K2 Long Short Credit Fund | | |
| |
| Class A: | | |
| Net assets, at value | $ | 37,392,173 |
| Shares outstanding | | 3,525,006 |
| Net asset value per sharea | $ | 10.61 |
| Maximum offering price per share (net asset value per share ÷ 94.25%) | $ | 11.26 |
| Class C: | | |
| Net assets, at value | $ | 925,369 |
| Shares outstanding | | 88,358 |
| Net asset value and maximum offering price per sharea | $ | 10.47 |
| Class R: | | |
| Net assets, at value | $ | 47,872 |
| Shares outstanding | | 4,544 |
| Net asset value and maximum offering price per share | $ | 10.54 |
| Class R6: | | |
| Net assets, at value | $ | 12,636,765 |
| Shares outstanding | | 1,190,887 |
| Net asset value and maximum offering price per share | $ | 10.61 |
| Advisor Class: | | |
| Net assets, at value | $ | 25,062,813 |
| Shares outstanding | | 2,361,624 |
| Net asset value and maximum offering price per share | $ | 10.61 |
aRedemption price is equal to net asset value less contingent deferred sales charges, if applicable.
franklintempleton.com
The accompanying notes are an integral part of these financial statements. | Semiannual Report 29
FRANKLIN ALTERNATIVE STRATEGIES FUNDS
FINANCIAL STATEMENTS
| | | |
| Statement of Operations | | | |
| for the six months ended November 30, 2016 (unaudited) | | | |
| |
| Franklin K2 Long Short Credit Fund | | | |
| |
| Investment income: | | | |
| Dividends | $ | 26,875 | |
| Interest | | 1,518,395 | |
| Paydown gain (loss) | | 129,578 | |
| Total investment income | | 1,674,848 | |
| Expenses: | | | |
| Management fees (Note 3a) | | 702,801 | |
| Distribution fees: (Note 3c) | | | |
| Class A | | 4,244 | |
| Class C | | 2,522 | |
| Transfer agent fees: (Note 3e) | | | |
| Class A | | 1,567 | |
| Class C | | 25 | |
| Class R | | 1 | |
| Class R6 | | 28 | |
| Advisor Class | | 1,205 | |
| Custodian fees (Note 4) | | 49,856 | |
| Reports to shareholders | | 8,660 | |
| Registration and filing fees | | 41,745 | |
| Professional fees | | 52,539 | |
| Trustees’ fees and expenses | | 11,072 | |
| Amortization of offering costs | | 116,489 | |
| Dividends and/or interest on securities sold short | | 148,999 | |
| Security borrowing fees | | 39,886 | |
| Other | | 9,526 | |
| Total expenses | | 1,191,165 | |
| Expense reductions (Note 4) | | (17,962 | ) |
| Expenses waived/paid by affiliates (Note 3f) | | (322,128 | ) |
| Net expenses | | 851,075 | |
| Net investment income | | 823,773 | |
| Realized and unrealized gains (losses): | | | |
| Net realized gain (loss) from: | | | |
| Investments | | 1,073,523 | |
| Written options | | 57,015 | |
| Foreign currency transactions | | 78,878 | |
| Futures contracts | | 21,704 | |
| Securities sold short | | 140,836 | |
| Swap contracts | | (314,998 | ) |
| Net realized gain (loss) | | 1,056,958 | |
| Net change in unrealized appreciation (depreciation) on: | | | |
| Investments | | 882,367 | |
| Translation of other assets and liabilities denominated in foreign currencies | | 90,186 | |
| Written options | | 2,461 | |
| Futures contracts | | 23,606 | |
| Swap contracts | | 107,431 | |
| Net change in unrealized appreciation (depreciation) | | 1,106,051 | |
| Net realized and unrealized gain (loss) | | 2,163,009 | |
| Net increase (decrease) in net assets resulting from operations | $ | 2,986,782 | |
30 Semiannual Report | The accompanying notes are an integral part of these financial statements.
franklintempleton.com
FRANKLIN ALTERNATIVE STRATEGIES FUNDS
FINANCIAL STATEMENTS
| | | | | | |
| Statements of Changes in Net Assets | | | | | | |
| |
| Franklin K2 Long Short Credit Fund | | | | | | |
| |
| | | Six Months Ended | | | | |
| | | November 30, 2016 | | | Period Ended | |
| | | (unaudited) | | | May 31, 2016a | |
| Increase (decrease) in net assets: | | | | | | |
| Operations: | | | | | | |
| Net investment income | $ | 823,773 | | $ | 1,204,284 | |
| Net realized gain (loss) | | 1,056,958 | | | (258,648 | ) |
| Net change in unrealized appreciation (depreciation) | | 1,106,051 | | | 1,010,861 | |
| Net increase (decrease) in net assets resulting from operations | | 2,986,782 | | | 1,956,497 | |
| Distributions to shareholders from: | | | | | | |
| Net investment income: | | | | | | |
| Class A | | — | | | (223,550 | ) |
| Class C | | — | | | (748 | ) |
| Class R | | — | | | (97 | ) |
| Class R6 | | — | | | (99 | ) |
| Advisor Class | | — | | | (199,097 | ) |
| Net realized gains: | | | | | | |
| Class A | | — | | | (175,371 | ) |
| Class C | | — | | | (576 | ) |
| Class R | | — | | | (76 | ) |
| Class R6 | | — | | | (76 | ) |
| Advisor Class | | — | | | (155,996 | ) |
| Total distributions to shareholders | | — | | | (755,686 | ) |
| Capital share transactions: (Note 2) | | | | | | |
| Class A | | 7,839,144 | | | 27,777,884 | |
| Class C | | 638,384 | | | 262,842 | |
| Class R | | 35,030 | | | 10,000 | |
| Class R6 | | (303,948 | ) | | 11,915,470 | |
| Advisor Class | | 947,831 | | | 22,754,762 | |
| Total capital share transactions | | 9,156,441 | | | 62,720,958 | |
| Net increase (decrease) in net assets | | 12,143,223 | | | 63,921,769 | |
| Net assets: | | | | | | |
| Beginning of period | | 63,921,769 | | | — | |
| End of period | $ | 76,064,992 | | $ | 63,921,769 | |
| Undistributed net investment income included in net assets: | | | | | | |
| End of period | $ | 1,322,749 | | $ | 498,976 | |
aFor the period September 8, 2015 (commencement of operations) to May 31, 2016.
franklintempleton.com
The accompanying notes are an integral part of these financial statements. | Semiannual Report 31
FRANKLIN ALTERNATIVE STRATEGIES FUNDS
Notes to Financial Statements (unaudited)
Franklin K2 Long Short Credit Fund
1. Organization and Significant Accounting Policies
Franklin Alternative Strategies Funds (Trust) is registered under the Investment Company Act of 1940 (1940 Act) as an open-end management investment company, consisting of four separate funds and applies the specialized accounting and reporting guidance in U.S. Generally Accepted Accounting Principles (U.S. GAAP). Franklin K2 Long Short Credit Fund (Fund) is included in this report. The financial statements of the remaining funds in the Trust are presented separately. The Fund offers five classes of shares: Class A, Class C, Class R, Class R6 and Advisor Class. Each class of shares differs by its initial sales load, contingent deferred sales charges, voting rights on matters affecting a single class, its exchange privilege and fees primarily due to differing arrangements for distribution and transfer agent fees.
The following summarizes the Fund’s significant accounting policies.
a. Financial Instrument Valuation
The Fund’s investments in financial instruments are carried at fair value daily. Fair value is the price that would be received to sell an asset or paid to transfer a liability in an orderly transaction between market participants on the measurement date. The Fund calculates the net asset value (NAV) per share as of 4 p.m. Eastern time each day the New York Stock Exchange (NYSE) is open for trading. Under compliance policies and procedures approved by the Trust’s Board of Trustees (the Board), the Fund’s administrator has responsibility for oversight of valuation, including leading the cross-functional Valuation Committee (VC). The VC provides administration and oversight of the Fund’s valuation policies and procedures, which are approved annually by the Board. Among other things, these procedures allow the Fund to utilize independent pricing services, quotations from securities and financial instrument dealers, and other market sources to determine fair value.
Equity securities, exchange traded funds and derivative financial instruments (derivatives) listed on an exchange or on the NASDAQ National Market System are valued at the last quoted sale price or the official closing price of the day, respectively. Foreign equity securities are valued as of the close of trading on the foreign stock exchange on which the security is primarily traded or as of 4 p.m. Eastern time. The value is then converted into its U.S. dollar equivalent at the foreign exchange rate in effect at 4 p.m. Eastern time on the day that the value of the security is determined. Over-the-counter (OTC) securities are valued within the range of the most recent quoted bid and ask prices. Securities that trade in multiple markets or on multiple exchanges are valued according to the broadest and most representative market. Certain equity securities are valued based upon fundamental characteristics or relationships to similar securities.
Debt securities generally trade in the OTC market rather than on a securities exchange. The Fund’s pricing services use multiple valuation techniques to determine fair value. In instances where sufficient market activity exists, the pricing services may utilize a market-based approach through which quotes from market makers are used to determine fair value. In instances where sufficient market activity may not exist or is limited, the pricing services also utilize proprietary valuation models which may consider market characteristics such as benchmark yield curves, credit spreads, estimated default rates, anticipated market interest rate volatility, coupon rates, anticipated timing of principal repayments, underlying collateral, and other unique security features in order to estimate the relevant cash flows, which are then discounted to calculate the fair value. Securities denominated in a foreign currency are converted into their U.S. dollar equivalent at the foreign exchange rate in effect at 4 p.m. Eastern time on the date that the values of the foreign debt securities are determined.
Investments in open-end mutual funds are valued at the closing NAV. Investments in repurchase agreements are valued at cost, which approximates fair value.
Certain derivatives trade in the OTC market. The Fund’s pricing services use various techniques including industry standard option pricing models and proprietary discounted cash flow models to determine the fair value of those instruments. The Fund’s net benefit or obligation under the derivative contract, as measured by the fair value of the contract, is included in net assets.
The Fund has procedures to determine the fair value of financial instruments for which market prices are not reliable or readily available. Under these procedures, the VC convenes on a regular basis to review such financial instruments and considers a number of factors, including significant unobservable valuation inputs, when arriving at fair value. The VC primarily employs a market-based approach which may use related or comparable assets or liabilities, recent transactions, market multiples, book values, and other relevant information for the investment to
32 Semiannual Report
franklintempleton.com
FRANKLIN ALTERNATIVE STRATEGIES FUNDS
NOTES TO FINANCIAL STATEMENTS (UNAUDITED)
Franklin K2 Long Short Credit Fund (continued)
determine the fair value of the investment. An income-based valuation approach may also be used in which the anticipated future cash flows of the investment are discounted to calculate fair value. Discounts may also be applied due to the nature or duration of any restrictions on the disposition of the investments. Due to the inherent uncertainty of valuations of such investments, the fair values may differ significantly from the values that would have been used had an active market existed. The VC employs various methods for calibrating these valuation approaches including a regular review of key inputs and assumptions, transactional back-testing or disposition analysis, and reviews of any related market activity.
Trading in securities on foreign securities stock exchanges and OTC markets may be completed before 4 p.m. Eastern time. In addition, trading in certain foreign markets may not take place on every Fund’s business day. Occasionally, events occur between the time at which trading in a foreign security is completed and 4 p.m. Eastern time that might call into question the reliability of the value of a portfolio security held by the Fund. As a result, differences may arise between the value of the Fund’s portfolio securities as determined at the foreign market close and the latest indications of value at 4 p.m. Eastern time. In order to minimize the potential for these differences, the VC monitors price movements following the close of trading in foreign stock markets through a series of country specific market proxies (such as baskets of American Depositary Receipts, futures contracts and exchange traded funds). These price movements are measured against established trigger thresholds for each specific market proxy to assist in determining if an event has occurred that may call into question the reliability of the values of the foreign securities held by the Fund. If such an event occurs, the securities may be valued using fair value procedures, which may include the use of independent pricing services.
When the last day of the reporting period is a non-business day, certain foreign markets may be open on those days that the Fund’s NAV is not calculated, which could result in differences between the value of the Fund’s portfolio securities on the last business day and the last calendar day of the reporting period. Any significant security valuation changes due to an open foreign market are adjusted and reflected by the Fund for financial reporting purposes.
b. Foreign Currency Translation
Portfolio securities and other assets and liabilities denominated in foreign currencies are translated into U.S. dollars based on the exchange rate of such currencies against U.S. dollars on the date of valuation. The Fund may enter into foreign currency exchange contracts to facilitate transactions denominated in a foreign currency. Purchases and sales of securities, income and expense items denominated in foreign currencies are translated into U.S. dollars at the exchange rate in effect on the transaction date. Portfolio securities and assets and liabilities denominated in foreign currencies contain risks that those currencies will decline in value relative to the U.S. dollar. Occasionally, events may impact the availability or reliability of foreign exchange rates used to convert the U.S. dollar equivalent value. If such an event occurs, the foreign exchange rate will be valued at fair value using procedures established and approved by the Board.
The Fund does not separately report the effect of changes in foreign exchange rates from changes in market prices on securities held. Such changes are included in net realized and unrealized gain or loss from investments in the Statement of Operations.
Realized foreign exchange gains or losses arise from sales of foreign currencies, currency gains or losses realized between the trade and settlement dates on securities transactions and the difference between the recorded amounts of dividends, interest, and foreign withholding taxes and the U.S. dollar equivalent of the amounts actually received or paid. Net unrealized foreign exchange gains and losses arise from changes in foreign exchange rates on foreign denominated assets and liabilities other than investments in securities held at the end of the reporting period.
c. Joint Repurchase Agreement
The Fund enters into a joint repurchase agreement whereby its uninvested cash balance is deposited into a joint cash account with other funds managed by the investment manager or an affiliate of the investment manager and is used to invest in one or more repurchase agreements. The value and face amount of the joint repurchase agreement are allocated to the funds based on their pro-rata interest. A repurchase agreement is accounted for as a loan by the Fund to the seller, collateralized by securities which are delivered to the Fund’s custodian. The fair value, including accrued interest, of the initial collateralization is required to be at least 102% of the dollar amount invested by the funds, with the value of the underlying securities marked to market daily to maintain coverage of at least 100%. Repurchase agreements are subject to the terms of Master Repurchase Agreements (MRAs) with approved counterparties (sellers). The MRAs contain various provisions, including but not limited to events of default and maintenance of collateral for repurchase agreements. In the event of default by either the seller or the
franklintempleton.com
Semiannual Report 33
FRANKLIN ALTERNATIVE STRATEGIES FUNDS
NOTES TO FINANCIAL STATEMENTS (UNAUDITED)
Franklin K2 Long Short Credit Fund (continued)
1. Organization and Significant Accounting
Policies (continued)
c. Joint Repurchase Agreement (continued)
Fund, certain MRAs may permit the non-defaulting party to net and close-out all transactions, if any, traded under such agreements. The Fund may sell securities it holds as collateral and apply the proceeds towards the repurchase price and any other amounts owed by the seller to the Fund in the event of default by the seller. This could involve costs or delays in addition to a loss on the securities if their value falls below the repurchase price owed by the seller. The joint repurchase agreement held by the Fund at period end, as indicated in the Statement of Investments, had been entered into on November 30, 2016.
d. Securities Purchased on a Delayed Delivery Basis
The Fund purchases securities on a delayed delivery basis, with payment and delivery scheduled for a future date. These transactions are subject to market fluctuations and are subject to the risk that the value at delivery may be more or less than the trade date purchase price. Although the Fund will generally purchase these securities with the intention of holding the securities, it may sell the securities before the settlement date. Sufficient assets have been segregated for these securities.
e. Derivative Financial Instruments
The Fund invested in derivatives in order to manage risk or gain exposure to various other investments or markets. Derivatives are financial contracts based on an underlying or notional amount, require no initial investment or an initial net investment that is smaller than would normally be required to have a similar response to changes in market factors, and require or permit net settlement. Derivatives contain various risks including the potential inability of the counterparty to fulfill their obligations under the terms of the contract, the potential for an illiquid secondary market, and/or the potential for market movements which expose the Fund to gains or losses in excess of the amounts shown in the Statement of Assets and Liabilities. Realized gain and loss and unrealized appreciation and depreciation on these contracts for the period are included in the Statement of Operations.
Derivative counterparty credit risk is managed through a formal evaluation of the creditworthiness of all potential counterpar-ties. The Fund attempts to reduce its exposure to counterparty credit risk on OTC derivatives, whenever possible, by entering into International Swaps and Derivatives Association (ISDA) master agreements with certain counterparties. These agreements contain various provisions, including but not limited to collateral requirements, events of default, or early termination. Termination events applicable to the counterparty include certain deteriorations in the credit quality of the counterparty. Termination events applicable to the Fund include failure of the Fund to maintain certain net asset levels and/or limit the decline in net assets over various periods of time. In the event of default or early termination, the ISDA master agreement gives the non-defaulting party the right to net and close-out all transactions traded, whether or not arising under the ISDA agreement, to one net amount payable by one counterparty to the other. However, absent an event of default or early termination, OTC derivative assets and liabilities are presented gross and not offset in the Statement of Assets and Liabilities. Early termination by the counterparty may result in an immediate payment by the Fund of any net liability owed to that counterparty under the ISDA agreement.
Collateral requirements differ by type of derivative. Collateral or initial margin requirements are set by the broker or exchange clearing house for exchange traded and centrally cleared derivatives. Initial margin deposited is held at the exchange and can be in the form of cash and/or securities. For OTC derivatives traded under an ISDA master agreement, posting of collateral is required by either the Fund or the applicable counterparty if the total net exposure of all OTC derivatives with the applicable counterparty exceeds the minimum transfer amount, which typically ranges from $100,000 to $250,000, and can vary depending on the counterparty and the type of the agreement. Generally, collateral is determined at the close of Fund business each day and any additional collateral required due to changes in derivative values may be delivered by the Fund or the coun-terparty within a few business days. Collateral pledged and/or received by the Fund for OTC derivatives, if any, is held in segregated accounts with the Fund’s custodian/counterparty broker and can be in the form of cash and/or securities. Unrestricted cash may be invested according to the Fund’s investment objectives. To the extent that the amounts due to the Fund from its counterparties are not subject to collateralization or are not fully collateralized, the Fund bears the risk of loss from counterparty non-performance.
The Fund entered into exchange traded futures contracts primarily to manage and/or gain exposure to interest rate and equity price risk. A futures contract is an agreement between the Fund and a counterparty to buy or sell an asset at a specified price on a future date. Required initial margins are pledged by
34 Semiannual Report
franklintempleton.com
FRANKLIN ALTERNATIVE STRATEGIES FUNDS
NOTES TO FINANCIAL STATEMENTS (UNAUDITED)
Franklin K2 Long Short Credit Fund (continued)
the Fund, and the daily change in fair value is accounted for as a variation margin payable or receivable in the Statement of Assets and Liabilities.
The Fund entered into OTC forward exchange contracts primarily to manage and/or gain exposure to certain foreign currencies. A forward exchange contract is an agreement between the Fund and a counterparty to buy or sell a foreign currency at a specific exchange rate on a future date.
The Fund entered into credit default swap contracts primarily to manage and/or gain exposure to credit risk. A credit default swap is an agreement between the Fund and a counterparty whereby the buyer of the contract receives credit protection and the seller of the contract guarantees the credit worthiness of a referenced debt obligation. These agreements may be privately negotiated in the over-the-counter market (OTC credit default swaps) or may be executed in a multilateral trade facility platform, such as a registered exchange (centrally cleared credit default swaps). The underlying referenced debt obligation may be a single issuer of corporate or sovereign debt, a credit index, a basket of issuers or indices, or a tranche of a credit index or basket of issuers or indices. In the event of a default of the underlying referenced debt obligation, the buyer is entitled to receive the notional amount of the credit default swap contract from the seller in exchange for the referenced debt obligation, a net settlement amount equal to the notional amount of the credit default swap less the recovery value of the referenced debt obligation, or other agreed upon amount. For centrally cleared credit default swaps, required initial margins are pledged by the Fund, and the daily change in fair value is accounted for as a variation margin payable or receivable in the Statement of Assets and Liabilities. Over the term of the contract, the buyer pays the seller a periodic stream of payments, provided that no event of default has occurred. Such periodic payments are accrued daily as an unrealized appreciation or depreciation until the payments are made, at which time they are realized. Upfront payments and receipts are reflected in the Statement of Assets and Liabilities and represent compensating factors between stated terms of the credit default swap agreement and prevailing market conditions (credit spreads and other relevant factors). These upfront payments and receipts are amortized over the term of the contract as a realized gain or loss in the Statement of Operations.
The Fund entered into interest rate swap contracts primarily to manage interest rate risk. An interest rate swap is an agreement between the Fund and a counterparty to exchange cash flows based on the difference between two interest rates, applied to a
notional amount. These agreements may be privately negotiated in the over-the-counter market (OTC interest rate swaps) or may be executed on a registered exchange (centrally cleared interest rate swaps). For centrally cleared interest rate swaps, required initial margins are pledged by the Fund, and the daily change in fair value is accounted for as a variation margin payable or receivable in the Statement of Assets and Liabilities. Over the term of the contract, contractually required payments to be paid and to be received are accrued daily and recorded as unrealized depreciation and appreciation until the payments are made, at which time they are realized.
The Fund entered into OTC total return swap contracts primarily to manage and/or gain exposure to credit risk of an underlying instrument such as a stock, bond, index or basket of securities or indices. A total return swap is an agreement between the Fund and a counterparty to exchange a return linked to an underlying instrument for a floating or fixed rate payment, both based upon a notional amount. Over the term of the contract, contractually required payments to be paid or received are accrued daily and recorded as unrealized appreciation or depreciation until the payments are made, at which time they are recognized as realized gain or loss.
The Fund purchased or wrote exchange traded and/or OTC option contracts primarily to manage and/or gain exposure to equity price and interest rate risk. An option is a contract entitling the holder to purchase or sell a specific amount of shares or units of an asset or notional amount of a swap (swaption), at a specified price. When an option is purchased or written, an amount equal to the premium paid or received is recorded as an asset or liability, respectively. Upon exercise of an option, the acquisition cost or sales proceeds of the underlying investment is adjusted by any premium received or paid. Upon expiration of an option, any premium received or paid is recorded as a realized gain or loss. Upon closing an option other than through expiration or exercise, the difference between the premium received or paid and the cost to close the position is recorded as a realized gain or loss.
See Notes 6 and 8 regarding investment transactions and other derivative information, respectively.
f. Securities Sold Short
The Fund is engaged in selling securities short, which obligates the Fund to replace a borrowed security with the same security at current fair value. The Fund incurs a loss if the price of the security increases between the date of the short sale and the date
franklintempleton.com
Semiannual Report 35
| |
FRANKLIN NOTES TO | ALTERNATIVE STRATEGIES FUNDS FINANCIAL STATEMENTS (UNAUDITED) |
Franklin K2 Long Short Credit Fund (continued)
1. Organization and Significant Accounting
Policies (continued)
f. Securities Sold Short (continued)
on which the Fund replaces the borrowed security. The Fund realizes a gain if the price of the security declines between those dates. Gains are limited to the price at which the Fund sold the security short, while losses are potentially unlimited in size.
The Fund is required to establish a margin account with the broker lending the security sold short. While the short sale is outstanding, the broker retains the proceeds of the short sale to the extent necessary to meet margin requirements until the short position is closed out. A deposit must also be maintained with the Fund’s custodian/counterparty broker consisting of cash and/ or securities having a value equal to a specified percentage of the value of the securities sold short. The Fund is obligated to pay fees for borrowing the securities sold short and is required to pay the counterparty any dividends and/or interest due on securities sold short. Such dividends and/or interest and any security borrowing fees are recorded as an expense to the Fund.
g. Income and Deferred Taxes
It is the Fund’s policy to qualify as a regulated investment company under the Internal Revenue Code. The Fund intends to distribute to shareholders substantially all of its taxable income and net realized gains to relieve it from federal income and excise taxes. As a result, no provision for U.S. federal income taxes is required.
The Fund may be subject to foreign taxation related to income received, capital gains on the sale of securities and certain foreign currency transactions in the foreign jurisdictions in which it invests. Foreign taxes, if any, are recorded based on the tax regulations and rates that exist in the foreign markets in which the Fund invests. When a capital gain tax is determined to apply, the Fund records an estimated deferred tax liability in an amount that would be payable if the securities were disposed of on the valuation date.
The Fund may recognize an income tax liability related to its uncertain tax positions under U.S. GAAP when the uncertain tax position has a less than 50% probability that it will be sustained upon examination by the tax authorities based on its technical merits. As of November 30, 2016, the Fund has determined that no tax liability is required in its financial statements related to uncertain tax positions for any open tax years (or expected to be taken in future tax years). Open tax years are
those that remain subject to examination and are based on each jurisdiction’s statute of limitation.
h. Security Transactions, Investment Income, Expenses and Distributions
Security transactions are accounted for on trade date. Realized gains and losses on security transactions are determined on a specific identification basis. Interest income and estimated expenses are accrued daily. Amortization of premium and accretion of discount on debt securities are included in interest income. Paydown gains and losses are recorded as an adjustment to interest income separately in the Statement of Operations. Dividend income and dividends declared on securities sold short are recorded on the ex-dividend date except for certain dividends from securities where the dividend rate is not available. In such cases, the dividend is recorded as soon as the information is received by the Fund. Distributions to shareholders are recorded on the ex-dividend date and are determined according to income tax regulations (tax basis). Distributable earnings determined on a tax basis may differ from earnings recorded in accordance with U.S. GAAP. These differences may be permanent or temporary. Permanent differences are reclassified among capital accounts to reflect their tax character. These reclassifications have no impact on net assets or the results of operations. Temporary differences are not reclassified, as they may reverse in subsequent periods.
Common expenses incurred by the Trust are allocated among the funds based on the ratio of net assets of each fund to the combined net assets of the Trust. Fund specific expenses are charged directly to the fund that incurred the expense.
Realized and unrealized gains and losses and net investment income, not including class specific expenses, are allocated daily to each class of shares based upon the relative proportion of net assets of each class. Differences in per share distributions, by class, are generally due to differences in class specific expenses.
i. Offering Costs
Offering costs are amortized on a straight line basis over twelve months.
j. Accounting Estimates
The preparation of financial statements in accordance with U.S. GAAP requires management to make estimates and assumptions that affect the reported amounts of assets and liabilities at
36 Semiannual Report
franklintempleton.com
FRANKLIN ALTERNATIVE STRATEGIES FUNDS
NOTES TO FINANCIAL STATEMENTS (UNAUDITED)
Franklin K2 Long Short Credit Fund (continued)
the date of the financial statements and the amounts of income and expenses during the reporting period. Actual results could differ from those estimates.
k. Guarantees and Indemnifications
Under the Trust’s organizational documents, its officers and trustees are indemnified by the Trust against certain liabilities
arising out of the performance of their duties to the Trust. Additionally, in the normal course of business, the Trust, on behalf of the Fund, enters into contracts with service providers that contain general indemnification clauses. The Trust’s maximum exposure under these arrangements is unknown as this would involve future claims that may be made against the Trust that have not yet occurred. Currently, the Trust expects the risk of loss to be remote.
2. Shares of Beneficial Interest
At November 30, 2016, there were an unlimited number of shares authorized (without par value). Transactions in the Fund’s shares were as follows:
| | | | | | | | | | | |
| | Six Months Ended | | Period Ended | |
| | November 30, 2016 | | May 31, 2016a | |
| | Shares | | | Amount | | Shares | | | Amount | |
| |
| Class A Shares: | | | | | | | | | | | |
| Shares sold | 794,918 | | $ | 8,337,469 | | 2,783,146 | | $ | 27,833,801 | |
| Shares issued in reinvestment of distributions | — | | | | — | | 74 | | | 736 | |
| Shares redeemed | (47,734 | ) | | (498,325 | ) | (5,398 | ) | | (56,653 | ) |
| Net increase (decrease) | 747,184 | | $ | 7,839,144 | | 2,777,822 | | $ | 27,777,884 | |
| Class C Shares: | | | | | | | | | | | |
| Shares sold | 73,157 | | $ | 759,359 | | 526,223 | | $ | 5,258,893 | |
| Shares issued in reinvestment of distributions | — | | | | — | | 117 | | | 1,149 | |
| Shares redeemed | (11,606 | ) | | (120,975 | ) | (499,533 | ) | | (4,997,200 | ) |
| Net increase (decrease) | 61,551 | | $ | 638,384 | | 26,807 | | $ | 262,842 | |
| Class R Shares: | | | | | | | | | | | |
| Shares sold | 3,349 | | | $ | 35,030 | | 500,001 | | $ | 5,000,010 | |
| Shares redeemed | — | | | | — | | (498,806 | ) | | (4,990,010 | ) |
| Net increase (decrease) | 3,349 | | | $ | 35,030 | | 1,195 | | $ | 10,000 | |
| Class R6 Shares: | | | | | | | | | | | |
| Shares sold | 41,390 | | $ | 430,605 | | 1,993,087 | | $ | 19,659,680 | |
| Shares redeemed | (70,429 | ) | | (734,553 | ) | (773,161 | ) | | (7,744,210 | ) |
| Net increase (decrease) | (29,039 | ) | $ | (303,948 | ) | 1,219,926 | | $ | 11,915,470 | |
| Advisor Class Shares: | | | | | | | | | | | |
| Shares sold | 92,802 | | $ | 969,683 | | 2,506,772 | | $ | 25,097,674 | |
| Shares issued in reinvestment of distributions | — | | | | — | | 2,934 | | | 29,016 | |
| Shares redeemed | (2,087 | ) | | | (21,852 | ) | (238,797 | ) | | (2,371,928 | ) |
| Net increase (decrease) | 90,715 | | $ | 947,831 | | 2,270,909 | | $ | 22,754,762 | |
| |
| aFor the period September 8, 2015 (commencement of operations) to May 31, 2016. | | | | | | | | | | | |
franklintempleton.com
Semiannual Report 37
| |
FRANKLIN NOTES TO | ALTERNATIVE STRATEGIES FUNDS FINANCIAL STATEMENTS (UNAUDITED) |
Franklin K2 Long Short Credit Fund (continued)
3. Transactions with Affiliates
Franklin Resources, Inc. is the holding company for various subsidiaries that together are referred to as Franklin Templeton Investments. Certain officers and trustees of the Trust are also officers and/or directors of the following subsidiaries:
| | |
| Subsidiary | | Affiliation |
| K2/D&S Management Co., L.L.C. ( | | Investment manager |
| Franklin Templeton Services, LLC (FT Services) | | Administrative manager |
| Franklin Templeton Distributors, Inc. (Distributors) | | Principal underwriter |
| Franklin Templeton Investor Services, LLC (Investor Services) | | Transfer agent |
|
| a. Management Fees |
| The Fund pays an investment management fee to K2 Advisors of 2.05% per year of the average daily net assets of the Fund. |
| |
| Under each subadvisory agreement, the below entities provide subadvisory services to the Fund. The subadvisory fees are paid by |
| K2 Advisors based on the Fund’s average daily net assets, and is not an additional expense of the Fund. |
|
|
|
Subadvisors |
| Apollo Credit Management LLC |
| Candlewood Investment Group, L.P. |
| Chatham Asset Management, LLC |
| Ellington Global Asset Management, L.L.C. |
| Emso Asset Management Limited |
b. Administrative Fees
Under an agreement with K2 Advisors, FT Services provides administrative services to the Fund. The fee is paid by K2 Advisors based on the Fund’s average daily net assets, and is not an additional expense of the Fund.
c. Distribution Fees
The Board has adopted distribution plans for each share class, with the exception of Class R6 and Advisor Class shares, pursuant to Rule 12b-1 under the 1940 Act. Under the Fund’s Class A reimbursement distribution plan, the Fund reimburses Distributors for costs incurred in connection with the servicing, sale and distribution of the Fund’s shares up to the maximum annual plan rate. Under the Class A reimbursement distribution plan, costs exceeding the maximum for the current plan year cannot be reimbursed in subsequent periods. In addition, under the Fund’s Class C and R compensation distribution plans, the Fund pays Distributors for costs incurred in connection with the servicing, sale and distribution of the Fund’s shares up to the maximum annual plan rate for each class. The plan year, for purposes of monitoring compliance with the maximum annual plan rates, is February 1 through January 31 for each fund.
The maximum annual plan rates, based on the average daily net assets, for each class, are as follows:
| | |
| Class A | 0.25 | % |
| Class C | 1.00 | % |
| Class R | 0.50 | % |
d. Sales Charges/Underwriting Agreements
Front-end sales charges and contingent deferred sales charges (CDSC) do not represent expenses of the Fund. These charges are deducted from the proceeds of sales of Fund shares prior to investment or from redemption proceeds prior to remittance, as applicable.
38 Semiannual Report
franklintempleton.com
FRANKLIN ALTERNATIVE STRATEGIES FUNDS
NOTES TO FINANCIAL STATEMENTS (UNAUDITED)
Franklin K2 Long Short Credit Fund (continued)
Distributors has advised the Fund of the following commission transactions related to the sales and redemptions of the Fund’s shares for the period:
| | |
| Sales charges retained net of commissions paid to unaffiliated broker/dealers | $ | 857 |
| CDSC retained | $ | 20 |
e. Transfer Agent Fees
Each class of shares, except for Class R6, pays transfer agent fees to Investor Services for its performance of shareholder servicing obligations and reimburses Investor Services for out of pocket expenses incurred, including shareholder servicing fees paid to third parties. These fees are allocated daily based upon their relative proportion of such classes’ aggregate net assets. Class R6 pays Investor Services transfer agent fees specific to that class.
For the period ended November 30, 2016, the Fund paid transfer agent fees of $2,826, of which $1,332 was retained by Investor Services.
f. Waiver and Expense Reimbursements
K2 Advisors has contractually agreed in advance to waive or limit its fees and to assume as its own expense certain expenses otherwise payable by the Fund so that the expenses (excluding distribution fees, acquired fund fees and expenses, and expenses related to securities sold short) for each class of the Fund do not exceed 1.95%, and Class R6 does not exceed 1.94% based on the average net assets of each class (other than certain non-routine expenses or costs, including those relating to litigation, indemnification, reorganizations, and liquidations) until September 30, 2017. Total expenses waived or paid are not subject to recapture subsequent to the Fund’s fiscal year end. Prior to October 1, 2016, expenses for Class R6 were limited to 1.89%.
| | | |
| g. Other Affiliated Transactions | | | |
| At November 30, 2016, the shares of the Fund were owned by the following entities: | | |
| | | Percentage of | |
| | | Outstanding | |
| | Shares | Sharesa | |
| Franklin Resources, Inc. | 4,999,195 | 69.75 | % |
| Franklin LifeSmart 2025 Retirement Target Fund | 339,829 | 4.74 | % |
| Franklin LifeSmart 2035 Retirement Target Fund | 287,455 | 4.01 | % |
| Franklin LifeSmart 2045 Retirement Target Fund | 197,564 | 2.76 | % |
| Franklin LifeSmart 2030 Retirement Target Fund | 104,956 | 1.46 | % |
| Franklin LifeSmart 2020 Retirement Target Fund | 95,278 | 1.33 | % |
| Franklin LifeSmart 2040 Retirement Target Fund | 86,714 | 1.21 | % |
| Franklin LifeSmart 2050 Retirement Target Fund | 64,648 | 0.90 | % |
| Franklin LifeSmart 2055 Retirement Target Fund | 13,248 | 0.18 | % |
| | 6,188,887 | 86.34 | % |
| aInvestment activities of significant shareholders could have a material impact on the Fund. | | | |
4. Expense Offset Arrangement
The Fund has entered into an arrangement with its custodian whereby credits realized as a result of uninvested cash balances are used to reduce a portion of the Fund’s custodian expenses. During the period ended November 30, 2016, the custodian fees were reduced as noted in the Statement of Operations.
franklintempleton.com
Semiannual Report 39
FRANKLIN ALTERNATIVE STRATEGIES FUNDS
NOTES TO FINANCIAL STATEMENTS (UNAUDITED)
Franklin K2 Long Short Credit Fund (continued)
5. Income Taxes
For tax purposes, capital losses may be carried over to offset future capital gains, if any. At May 31, 2016, the capital loss carryfor-wards were as follows:
| | |
| Capital loss carryforwards: | | |
| Short term | $ | 52,924 |
| Long term | | 9,129 |
| Total capital loss carryforwards | $ | 62,053 |
At November 30, 2016, the cost of investments and net unrealized appreciation (depreciation) for income tax purposes were as follows:
| | | |
| Cost of investments | $ | 74,245,003 | |
| Unrealized appreciation | $ | 2,276,990 | |
| Unrealized depreciation | | (557,421 | ) |
| Net unrealized appreciation (depreciation) | $ | 1,719,569 | |
Differences between income and/or capital gains as determined on a book basis and a tax basis are primarily due to differing treatments of bond discounts and premiums, swaps, offering costs and wash sales.
6. Investment Transactions
Purchases and sales of investments and securities sold short (excluding short term securities) for the period ended November 30, 2016, aggregated $97,730,515 and $100,555,818, respectively.
Transactions in options written during the period ended November 30, 2016, were as follows:
| | | | | |
| | Number of | | | | |
| | Contracts | | | Premiums | |
| Options outstanding at May 31, 2016 | 170 | | $ | 9,583 | |
| Options written | 964 | | | 84,715 | |
| Options expired | (464 | ) | | (23,090 | ) |
| Options exercised | (29 | ) | | (1,725 | ) |
| Options closed | (532 | ) | | (64,347 | ) |
| Options outstanding at November 30, 2016 | 109 | | $ | 5,136 | |
See Notes 1(e) and 8 regarding derivative financial instruments and other derivative information, respectively.
7. Credit Risk
At November 30, 2016, the Fund had 27.2% of its portfolio invested in high yield and other securities rated below investment grade. These securities may be more sensitive to economic conditions causing greater price volatility and are potentially subject to a greater risk of loss due to default than higher rated securities.
40 Semiannual Report
franklintempleton.com
FRANKLIN ALTERNATIVE STRATEGIES FUNDS
NOTES TO FINANCIAL STATEMENTS (UNAUDITED)
Franklin K2 Long Short Credit Fund (continued)
8. Other Derivative Information
At November 30, 2016, the Fund’s investments in derivative contracts are reflected in the Statement of Assets and Liabilities as follows:
| | | | | | | | |
| | Asset Derivatives | | | | Liability Derivatives | |
| Derivative Contracts | | | | | | | | |
| Not Accounted for as | Statement of Assets and | | | | Statement of Assets and | | | |
| Hedging Instruments | Liabilities Location | | Fair Value | | Liabilities Location | | Fair Value | |
| Interest rate contracts | Variation margin | $ | 16,303 | a | Unrealized depreciation on | $ | 1,481 | |
| | | | | | OTC swap contracts | | | |
| | Unrealized appreciation on | | 1,931 | | | | | |
| | OTC swap contracts | | | | | | | |
| Foreign exchange contracts | Unrealized appreciation on | | 264,624 | | Unrealized depreciation on | | 87,170 | |
| | OTC forward exchange | | | | OTC forward exchange | | | |
| | contracts | | | | contracts | | | |
| Credit contracts | Variation margin | | 26,866 | a | Variation margin | | 118,349 | a |
| | OTC swap contracts | | 57,079 | | OTC swap contracts (upfront | | 99,470 | |
| | (upfront payments) | | | | receipts) | | | |
| | Unrealized appreciation on | | 109,357 | | Unrealized depreciation on | | 56,238 | |
| | OTC swap contracts | | | | OTC swap contracts | | | |
| Equity contracts | Investments in securities, at | | 82,522 | b | Options written, at value | | 3,735 | |
| | value | | | | | | | |
| | | | | | Variation margin | | 4,595 | a |
| Totals | | $ | 558,682 | | | $ | 371,038 | |
aThis amount reflects the cumulative appreciation (depreciation) of futures contracts and centrally cleared swap contracts as reported in the Statement of Investments. Only
the variation margin receivable/payable at period end is separately reported within the Statement of Assets and Liabilities. Prior variation margin movements were recorded to
cash upon receipt or payment.
bPurchased option contracts are included in investments in securities, at value in the Statement of Assets and Liabilities.
For the period ended November 30, 2016, the effect of derivative contracts in the Fund’s Statement of Operations was as follows:
| | | | | | | | |
| | | | | | | | Net Change in | |
| | | | | | | | Unrealized | |
| Derivative Contracts | | | Net Realized | | | | Appreciation | |
| Not Accounted for as | Statement of | | Gain (Loss) | | Statement of | | (Depreciation) | |
| Hedging Instruments | Operations Location | | for the Period | | Operations Location | | for the Period | |
| | Net realized gain (loss) | | | | Net change in unrealized | | | |
| | from: | | | | appreciation (depreciation) on: | | | |
| Interest rate contracts | Investments | | $ (18,175)a Investments | $ | 4,096 | a |
| | Futures contracts | | 31,130 | | Futures contracts | | 19,607 | |
| | | | | | Swap contracts | | 1,594 | |
| Foreign exchange contracts | Foreign currency | | 112,423 | b | Translation of other assets and | | 154,055 | b |
| | transactions | | | | liabilities denominated in | | | |
| | | | | | foreign currencies | | | |
| Credit contracts | Swap contracts | | (314,998 | ) | Swap contracts | | 105,837 | |
| Equity contracts | Investments | | (183,897)a Investments | | (19,319 | )a |
| | Written options | | 57,015 | | Written options | | 2,461 | |
| | Futures contracts | | (9,426 | ) | Futures contracts | | 3,999 | |
| Totals | | $ | (325,928 | ) | | $ | 272,330 | |
aPurchased option contracts are included in net realized gain (loss) from investments and net change in unrealized appreciation (depreciation) on investments in the Statement
of Operations.
bForward exchange contracts are included in net realized gain (loss) from foreign currency transactions and net change in unrealized appreciation (depreciation) translation of
other assets and liabilities denominated in foreign currencies in the Statement of Operations.
franklintempleton.com
Semiannual Report 41
FRANKLIN ALTERNATIVE STRATEGIES FUNDS
NOTES TO FINANCIAL STATEMENTS (UNAUDITED)
Franklin K2 Long Short Credit Fund (continued)
8. Other Derivative Information (continued)
For the period ended November 30, 2016, the average month end fair value of derivatives represented 0.9% of average month end net assets. The average month end number of open derivative contracts for the period was 80.
At November 30, 2016, the Fund’s OTC derivative assets and liabilities are as follows:
| | | | |
| | | Gross Amounts |
| | | of Assets and Liabilities |
| | | Presented in the |
| | | Statement of |
| | | Assets and Liabilities |
| |
| | | Assetsa | | Liabilitiesa |
| Derivatives | | | | |
| Forward Exchange Contracts | $ | 264,624 | $ | 87,170 |
| Swap Contracts | | 168,367 | | 157,189 |
| Total | $ | 432,991 | $ | 244,359 |
aAbsent an event of default or early termination, OTC derivative assets and liabilities are presented gross and not offset in the Statement of Assets and Liabilities.
At November 30, 2016, the Fund’s OTC derivative assets, which may be offset against the Fund’s OTC derivative liabilities and collateral received from the counterparty, are as follows:
| | | | | | | | | | | |
| | | | | Amounts Not Offset in the | | | | |
| | | | | Statement of Assets and Liabilities | | | |
| |
| | | | | | | Financial | | | | |
| | | Gross Amounts of Assets | | Financial | | Instruments | Cash | | |
| | | Presented in the Statement | | Instruments | | Collateral | Collateral | | Net Amount (Not |
| | | of Assets and Liabilities | | Available for Offset | | Received | Received | | less than zero) |
| Counterparty | | | | | | | | | | | |
| BOFA | $ | 50,272 | $ | (17,634 | ) | $ | — | $ | — | $ | 32,638 |
| BZWS | | 9,369 | | (8,462 | ) | | — | | — | | 907 |
| DBAB | | 327 | | (327 | ) | | — | | — | | |
| GSCO | | 4,215 | | (4,215 | ) | | — | | — | | |
| JPHQ | | 197,084 | | (117,563 | ) | | — | | — | | 79,521 |
| MSCO | | 171,724 | | (73,717 | ) | | — | | — | | 98,007 |
| Total | $ | 432,991 | $ | (221,918 | ) | $ | — | $ | — | $ | 211,073 |
At November 30, 2016, the Fund’s OTC derivative liabilities, which may be offset against the Fund’s OTC derivative assets and collateral pledged to the counterparty, are as follows:
| | | | | | | | | | | |
| | | | | Amounts Not Offset in the | | | | |
| | | | | Statement of Assets and Liabilities | | | |
| |
| | | | | | | Financial | | | | |
| | | Gross Amounts of Liabilities | | Financial | | Instruments | Cash | | |
| | | Presented in the Statement | | Instruments | | Collateral | Collateral | | Net Amount (Not |
| | | of Assets and Liabilities | | Available for Offset | | Pledgeda,b | Pledgeda | | less than zero) |
| Counterparty | | | | | | | | | | | |
| BOFA | $ | 17,634 | $ | (17,634 | ) | $ | — | $ | — | $ | — |
| BZWS | | 8,462 | | (8,462 | ) | | — | | — | | — |
| DBAB | | 2,470 | | (327 | ) | | — | | — | | 2,143 |
| GSCO | | 24,513 | | (4,215 | ) | | — | | — | | 20,298 |
| JPHQ | | 117,563 | | (117,563 | ) | | — | | — | | — |
| MSCO | | 73,717 | | (73,717 | ) | | — | | — | | — |
| Total | $ | 244,359 | $ | (221,918 | ) | $ | — | $ | — | $ | 22,441 |
aIn some instances, the collateral amounts disclosed in the table above were adjusted due to the requirement to limit the collateral amounts to avoid the effect of over collater-
alization. Actual collateral received and/or pledged may be more than the amounts disclosed herein.
bSee the accompanying Statement of Investments for securities pledged as collateral for derivatives.
42 Semiannual Report
franklintempleton.com
FRANKLIN ALTERNATIVE STRATEGIES FUNDS
NOTES TO FINANCIAL STATEMENTS (UNAUDITED)
Franklin K2 Long Short Credit Fund (continued)
See Notes 1(e) and 6 regarding derivative financial instruments and investment transactions, respectively.
See Abbreviations on page 44.
9. Credit Facility
The Fund, together with other U.S. registered and foreign investment funds (collectively, Borrowers), managed by Franklin Templeton Investments, are borrowers in a joint syndicated senior unsecured credit facility totaling $2 billion (Global Credit Facility) which matures on February 10, 2017. This Global Credit Facility provides a source of funds to the Borrowers for temporary and emergency purposes, including the ability to meet future unanticipated or unusually large redemption requests.
Under the terms of the Global Credit Facility, the Fund shall, in addition to interest charged on any borrowings made by the Fund and other costs incurred by the Fund, pay its share of fees and expenses incurred in connection with the implementation and maintenance of the Global Credit Facility, based upon its relative share of the aggregate net assets of all of the Borrowers, including an annual commitment fee of 0.15% based upon the unused portion of the Global Credit Facility. These fees are reflected in other expenses in the Statement of Operations. During the period ended November 30, 2016, the Fund did not use the Global Credit Facility.
10. Fair Value Measurements
The Fund follows a fair value hierarchy that distinguishes between market data obtained from independent sources (observable inputs) and the Fund’s own market assumptions (unobservable inputs). These inputs are used in determining the value of the Fund’s financial instruments and are summarized in the following fair value hierarchy:
- Level 1 – quoted prices in active markets for identical financial instruments
- Level 2 – other significant observable inputs (including quoted prices for similar financial instruments, interest rates, prepay- ment speed, credit risk, etc.)
- Level 3 – significant unobservable inputs (including the Fund’s own assumptions in determining the fair value of financial instruments)
The input levels are not necessarily an indication of the risk or liquidity associated with financial instruments at that level.
For movements between the levels within the fair value hierarchy, the Fund has adopted a policy of recognizing the transfers as of the date of the underlying event which caused the movement.
A summary of inputs used as of November 30, 2016, in valuing the Fund’s assets and liabilities carried at fair value, is as follows:
| | | | | | | | |
| | | Level 1 | | Level 2 | | Level 3 | | Total |
| |
| Assets: | | | | | | | | |
| Investments in Securities:a | | | | | | | | |
| Common Stocks and Other Equity Interests | $ | 826,442 | $ | — | $ | — | $ | 826,442 |
| Management Investment Companies | | 457,028 | | — | | — | | 457,028 |
| Convertible Preferred Stocks | | 130,580 | | — | | — | | 130,580 |
| Preferred Stocks | | 4,387 | | — | | — | | 4,387 |
| Convertible Bonds | | — | | 808,941 | | — | | 808,941 |
| Corporate Bonds and Notes | | — | | 21,498,054 | | — | | 21,498,054 |
| Foreign Government and Agency Securities | | — | | 2,924,181 | | — | | 2,924,181 |
| Asset-Backed Securities and Commercial Mortgage-Backed | | | | | | | | |
| Securities | | — | | 23,705,456 | | — | | 23,705,456 |
| Options Purchased | | 82,522 | | — | | — | | 82,522 |
| U.S. Government and Agency Securities | | — | | 2,026,360 | | — | | 2,026,360 |
| Short Term Investments | | 19,371,048 | | 4,129,573 | | — | | 23,500,621 |
| Total Investments in Securities | $ | 20,872,007 | $ | 55,092,565 | $ | — | $ | 75,964,572 |
franklintempleton.com
Semiannual Report 43
FRANKLIN ALTERNATIVE STRATEGIES FUNDS
NOTES TO FINANCIAL STATEMENTS (UNAUDITED)
| | | | | | | | |
| Franklin K2 Long Short Credit Fund (continued) | | | | | | | | |
| |
| 10. Fair Value Measurements (continued) | | | | | | | | |
| |
| | | Level 1 | | Level 2 | | Level 3 | | Total |
| |
| Assets: (continued) | | | | | | | | |
| Other Financial Instruments: | | | | | | | | |
| Futures Contracts | $ | 15,159 | $ | — | $ | — | $ | 15,159 |
| Forward Exchange Contracts | | — | | 264,624 | | — | | 264,624 |
| Swap Contracts | | — | | 139,298 | | — | | 139,298 |
| Total Other Financial Instruments | $ | 15,159 | $ | 403,922 | $ | — | $ | 419,081 |
| |
| Liabilities: | | | | | | | | |
| Other Financial Instruments: | | | | | | | | |
| Options Written | $ | 3,735 | $ | — | $ | — | $ | 3,735 |
| Securities Sold Short | | 135,062 | | 6,180,467 | | — | | 6,315,529 |
| Futures Contracts | | 4,595 | | — | | — | | 4,595 |
| Forward Exchange Contracts | | — | | 87,170 | | — | | 87,170 |
| Swap Contracts | | — | | 176,068 | | — | | 176,068 |
| Total Other Financial Instruments | $ | 143,392 | $ | 6,443,705 | $ | — | $ | 6,587,097 |
| |
| aFor detailed categories, see the accompanying Statement of Investments. | | | | | | | | |
A reconciliation of assets in which Level 3 inputs are used in determining fair value is presented when there are significant Level 3 financial instruments at the end of the period.
11. Subsequent Events
The Fund has evaluated subsequent events through the issuance of the financial statements and determined that no events have occurred that require disclosure.
| | | | | | | |
| Abbreviations | | | | | | |
| Counterparty/Exchange | Currency | Selected Portfolio | Index | |
| BOFA | Bank of America, N.A. | ARS | Argentine Peso | ARM | Adjustable Rate | CDX.NA.HY | CDX North America High |
| | | | | | Mortgage | | Yield |
| BZWS | Barclays Bank PLC | BRL | Brazilian Real | CLO | Collateralized Loan | | |
| | | | | | Obligation | | |
| CME | Chicago Mercantile | CZK | Czech Koruna | FNMA | Federal National | | |
| | Exchange | | | | Mortgage Association | | |
| DBAB | Deutsche Bank, A.G. | EUR | Euro | FRN | Floating Rate Note | | |
| GSCO | Goldman Sachs | GBP | British Pound | LIBOR | London InterBank | | |
| | Banks US | | | | Offered Rate | | |
| ICE | Intercontinental | JPY | Japanese Yen | PIK | Payment-In-Kind | | |
| | Exchange, Inc. | | | | | | |
| JPHQ | JP Morgan Chase | RUB | Russian Ruble | REIT | Real Estate Investment | | |
| | Bank, N.A. | | | | Trust | | |
| MSCO | Morgan Stanley & | USD | United States Dollar | SPDR | Standard & Poor’s | | |
| | Co., LLC | | | | Depositary Receipt | | |
44 Semiannual Report
franklintempleton.com
FRANKLIN ALTERNATIVE STRATEGIES FUNDS
FRANKLIN K2 LONG SHORT CREDIT FUND
Shareholder Information
Proxy Voting Policies and Procedures
The Fund’s investment manager has established Proxy Voting
Policies and Procedures (Policies) that the Fund uses to deter-
mine how to vote proxies relating to portfolio securities.
Shareholders may view the Fund’s complete Policies online at
franklintempleton.com. Alternatively, shareholders may request
copies of the Policies free of charge by calling the Proxy Group
collect at (954) 527-7678 or by sending a written request to:
Franklin Templeton Companies, LLC, 300 S.E. 2nd Street, Fort
Lauderdale, FL 33301, Attention: Proxy Group. Copies of the
Fund’s proxy voting records are also made available online at
franklintempleton.com and posted on the U.S. Securities and
Exchange Commission’s website at sec.gov and reflect the most
recent 12-month period ended June 30.
Quarterly Statement of Investments
The Trust, on behalf of the Fund, files a complete statement of
investments with the U.S. Securities and Exchange Commission
for the first and third quarters for each fiscal year on Form N-Q.
Shareholders may view the filed Form N-Q by visiting the
Commission’s website at sec.gov. The filed form may also be
viewed and copied at the Commission’s Public Reference
Room in Washington, DC. Information regarding the operations
of the Public Reference Room may be obtained by calling
(800) SEC-0330.
franklintempleton.com
Semiannual Report 45
This page intentionally left blank
This page intentionally left blank
This page intentionally left blank

Semiannual Report and Shareholder Letter
Franklin K2 Long Short Credit Fund
Investment Manager
K2/D&S Management Co., L.L.C.
Distributor
Franklin Templeton Distributors, Inc.
(800) DIAL BEN® / 342-5236
franklintempleton.com
Shareholder Services
(800) 632-2301
Authorized for distribution only when accompanied or preceded by a summary prospectus and/or prospectus. Investors should carefully consider a fund’s investment goals, risks, charges and expenses before investing. A prospectus contains this and other information; please read it carefully before investing.
To help ensure we provide you with quality service, all calls to and from our service areas are monitored and/or recorded.
| |
| © 2016-2017 Franklin Templeton Investments. All rights reserved. | 948 S 01/17 |
| |
| Contents | |
| Semiannual Report | |
| Franklin K2 Global Macro Opportunities Fund | 3 |
| Performance Summary | 7 |
| Your Fund’s Expenses | 9 |
| Consolidated Financial Highlights and | |
| Consolidated Statement of Investments | 10 |
| Consolidated Financial Statements | 21 |
| Notes to Consolidated Financial Statements | 25 |
| Shareholder Information | 36 |
Visit franklintempleton.com for fund updates, to access your account, or to find helpful financial planning tools.
2 Not part of the semiannual report
franklintempleton.com
Semiannual Report
Franklin K2 Global Macro Opportunities Fund
This semiannual report for Franklin K2 Global Macro Opportunities Fund covers the period since the Fund’s inception on July 11, 2016, through November 30, 2016.
Your Fund’s Goal and Main Investments
The Fund seeks capital appreciation over a full business and economic cycle, which may include periods of rising and declining interest rates. The Fund seeks to achieve its investment goal by allocating its assets across global macro-focused investment strategies, which are “non-traditional” or “alternative” strategies that generally focus on macro-economic opportunities across numerous markets and investments. The Fund is structured as a multi-manager fund, meaning the Fund’s assets are managed by multiple investment advisors (subadvi-sors), while the Fund’s investment manager has overall responsibility for the Fund’s investments. The Fund’s principal investments include both U.S. and foreign (including emerging markets) securities and exchange traded and over-the-counter (“OTC”) derivative instruments, and may include asset classes such as equities, fixed income, interest rates, currencies or commodities. The Fund invests primarily in a wide range of derivative instruments that provide the Fund with broad exposure, either long or short, to these various asset classes. Long positions benefit from an increase in the price of the underlying instrument or asset class, while short positions benefit from a decrease in that price.
Performance Overview
The Fund’s Class A shares had a -4.30% cumulative total return for the period since the Fund’s inception through period-end. For comparison, the Fund’s primary benchmark, the BofA Merrill Lynch 3-Month U.S. Treasury Bill Index, which is an index of short-term U.S. government securities with a remaining term to final maturity of less than three months, produced a +0.13% total return for the same period.1 Also for comparison, the Fund’s secondary benchmark, the HFRX Macro/CTA Index, which measures performance of global macro strategies with exposure to equity, fixed income, hard currency and commodity markets, had a -3.18% total return for the same period.2 You can find more of the Fund’s performance data in the Performance Summary beginning on page 7.
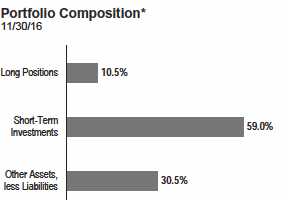
*Figures represent the net Fund exposure and include certain derivatives held in the portfolio (or their underlying reference assets) or unsettled trades and may not total 100% or may be negative due to rounding, use of any derivatives or other factors.
Performance data represent past performance, which does not guarantee future results. Investment return and principal value will fluctuate, and you may have a gain or loss when you sell your shares. Current performance may differ from figures shown. For most recent month-end performance, go to franklintempleton.com or call (800) 342-5236.
Economic and Market Overview
The global economy expanded during the period under review. In this environment, global developed and emerging market stocks, as measured by the MSCI All Country World Index, rose. Global markets were aided by accommodative monetary policies of various central banks, an improvement in commodity prices, generally encouraging economic data across regions, expectations of higher interest rates and inflation in the U.S. driven by hopes of expansionary fiscal policies under the new U.S. President Donald Trump, and an Organization of the Petroleum Exporting Countries deal to curb oil production. However, the impact of these factors was partially offset by global economic concerns, the U.K.’s historic referendum to leave the European Union (also known as “Brexit”), uncertainty about the U.S. Federal Reserve’s (Fed’s) timing for raising interest rates and worries about the health of European banks.
1. Source: Morningstar.
2. Source: FactSet. Hedge Fund Research, Inc. – www.hedgefundresearch.com. The HFRX Macro/CTA Index is being used under license from Hedge Fund Research, Inc.,
which does not endorse or approve of any of the contents of this report.
The indexes are unmanaged and include reinvestment of any income or distributions. They do not reflect any fees, expenses or sales charges. One cannot invest directly in an
index, and an index is not representative of the Fund’s portfolio. Unlike most asset class indexes, HFR Index returns reflect fees and expenses.
See www.franklintempletondatasources.com for additional data provider information.
The dollar value, number of shares or principal amount, and names of all portfolio holdings are listed in the Fund’s Consolidated Statement of Investments (SOI).
The Consolidated SOI begins on page 15.
franklintempleton.com
Semiannual Report 3
FRANKLIN K2 GLOBAL MACRO OPPORTUNITIES FUND
The U.S. economy strengthened during the period under review. The economy grew at a faster pace in 2016’s third quarter compared to the second quarter, mainly due to personal consumption expenditure, exports, private inventory investment, federal government spending and nonresidential fixed investment. Although the Fed kept its target interest rate unchanged during the review period, and lowered its forecast for 2016 U.S. economic growth at the September meeting, it maintained its stance that the case for a U.S. interest rate increase had strengthened. Further, the Fed Chair Janet Yellen, at her testimony to the Congress’ Joint Economic Committee in November, set the stage for an interest rate hike in December, as long as data continued to provide evidence of economic resilience.
In Europe, the U.K.’s economy moderated in the third quarter, supported by growth in services. Immediate effects of the Brexit vote in June materialized as U.K. stocks initially declined, the pound sterling hit a three-decade low amid intensified selling and the U.K.’s credit rating was downgraded. In the eurozone, despite investors’ concerns about banking sector weakness, low corporate earnings and post-Brexit political repercussions, some regions benefited due to rising consumer spending, resulting from a cheaper euro, low inflation and signs of sustained economic growth. The eurozone’s economic growth held steady in the third quarter from the second quarter, while the region’s annual inflation rate rose to its highest level since April 2014 toward period-end. The European Central Bank cut its benchmark interest rate and expanded its massive bond-buying program in August 2016 to boost the region’s growth.
In Asia, Japan’s economic growth slowed in the second quarter compared to the first quarter, amid falling exports and weak corporate investment. However, the Japanese economy grew significantly in the third quarter, largely due to a rise in exports. After announcing additional monetary easing measures in July, the Bank of Japan, at its September meeting, overhauled its monetary stimulus program to adjust Japanese government bond purchases with the aim of keeping the 10-year rate near the current level of 0%.
In emerging markets, economic growth generally moderated during the review period. Although the pace of contraction in Brazil’s economy had slowed in 2016’s second quarter, third-quarter gross domestic product declined faster than in the second quarter, despite improved business sentiment near the end of August with the expected impeachment of President Dilma Rousseff. Russia’s economic contraction continued to ease in 2016’s third quarter. The Bank of Russia reduced its key interest rates in June and September in an attempt to revive its economy. China’s economy grew at a stable rate in 2016’s third quarter, and remained within the government’s targeted range. The People’s Bank of China weakened its currency during the review period as the U.S. dollar strengthened. Elsewhere, India’s economic growth marginally increased from July to September due to slower private consumption growth and increasing government spending. Overall, emerging market stocks, as measured by the MSCI Emerging Markets Index, rose for the review period.
Investment Strategy
We manage the Fund using a multi-manager approach. While we are responsible for the Fund’s overall investments, we allocate assets to multiple subadvisors, each of whom independently manages a separate portion of the Fund’s portfolio in accordance with discretionary and systematic focused global macro strategies. We allocate the Fund’s assets among these strategies utilizing a top-down approach, generating the Fund’s strategy weightings by taking into account market conditions, risk factors, diversification, liquidity, and availability of various subadvisors and other investment options, among other things.
Discretionary global macro strategies seek to profit by tactically investing across different asset classes, markets (including emerging markets) and investment opportunities through a combination of fundamental market analysis and quantitative modeling, whereas systematic global macro strategies seek to profit by utilizing quantitative models to identify investment opportunities across different asset classes and markets in order to construct a portfolio of investments. Quantitative trading models are proprietary systems that rely on mathematical computations to identify trading opportunities. Subadvisors may use strategies which include a combination of discretionary and systematic focused strategies.
The Fund may invest in equities and various debt instruments, such as securities of the U.S. government, its agencies and instrumentalities and sovereign, quasi-sovereign and corporate bonds. Such debt instruments may have variable or fixed interest rates, may be of any maturity, duration or credit rating and may include high yield (junk) bonds and distressed debt securities (securities of companies that are, or are about to be, involved in reorganizations, financial restructurings, or bankruptcy). The Fund will use a variety of derivatives to implement its investment strategies, which may include futures contracts, swaps, currency forward contracts, and options. The Fund may engage in active and frequent trading as part of its investment strategies.
4 Semiannual Report
franklintempleton.com
FRANKLIN K2 GLOBAL MACRO OPPORTUNITIES FUND
What is a futures contract?
A futures contract is an agreement between the Fund and a counterparty made through a U.S. or foreign futures exchange to buy or sell an underlying instrument or asset at a specific price on a future date.
What are swap agreements?
Swap agreements, such as interest rate, currency and credit default swaps, are contracts between the Fund and another party (the swap counterparty). In a basic swap transaction, the Fund agrees with the swap counterparty to exchange the returns (or differentials in rates of return) earned or realized on a particular “notional amount” of underlying instruments. The notional amount is the set amount selected by the parties as the basis on which to calculate the obligations that they have agreed to exchange. The parties typically do not actually exchange the notional amount. Instead, they agree to exchange the returns that would be earned or realized if the notional amount were invested in given instruments or at given interest rates.
What is a currency forward contract?
A currency forward contract is an agreement between the Fund and a counterparty to buy or sell a foreign currency in exchange for another currency at a specific exchange rate on a future date.
What is an option?
An option is a contract to buy or sell a specific financial product known as the option’s underlying instrument at a specific price. The buyer of an option has the right, but not the obligation, to buy or sell the underlying instrument at or until a specified expiration date. Conversely, the seller (“writer”) of an option who opens a transaction is obligated to buy or sell the underlying instrument should the option holder exercise that right.
Manager’s Discussion
The Fund’s subadvisors for the review period covering July 11, 2016, to November 30, 2016, were Emso Asset Management, Aspect Capital and Graham Capital Management. These sub-advisors use systematic or discretionary investment strategies, as shown in the table on this page.
The Fund’s two systematic macro subadvisors, Aspect Capital and Graham Capital Management, experienced negative performance. This global macro strategy faced headwinds in the review period, including an unsure outlook for growth in developed markets, concerns over the effectiveness of unconventional monetary policy and the long-term impact of Brexit. However, conditions were generally more favorable in emerging markets, aside from a setback in November following the U.S. elections, as fundamental and technical conditions appeared supportive. As a result, Emso Asset Management, the discretionary macro subadvisor delivered positive returns.
|
| Subadvisors |
| 11/30/16 |
| Discretionary Macro |
| Emso Asset Management Limited |
| Systematic Macro |
| Aspect Capital Limited |
| Graham Capital Management, L.P. |
Performance for the two systematic subadvisors was hampered by timing surrounding trend reversals in commodities. Short positioning in energy commodities, particularly crude oil and crude oil products, detracted from returns. Also weighing on performance in commodities was a short position in copper and a long position in silver. However, the systematic macro sub-advisors experienced gains due to long positioning in equity indexes, particularly those representing U.S. small-capitalization and Hong Kong stocks due to increased risk appetite following Brexit and, subsequently, the anticipation of higher growth and inflation in the U.S. considering President-elect Donald Trump’s likely policy mix. The continuance of a weakening British pound, in the wake of Brexit, and the euro, amid policy differences of central banks in the eurozone and the U.S., contributed positively to gains from short positioning in the currencies.
Quasi-sovereign credit and currencies strengthened performance for the discretionary macro subadvisor. A long position in Brazilian quasi-sovereign credit performed strongly. Positions in Brazil continued to benefit from broad emerging-market rallies and strong investor demand for most of the review period, particularly with the prospect of economic improvements under President Michel Temer. Long positions in Argentine sovereign bonds and local rates also contributed positively to performance as political progress, led by President Mauricio Macri, continued to aid results following the country’s return to international capital markets in the second quarter, and amid the prospect of increased creditwor-thiness. Also supporting the subadvisor’s returns were long positions in Venezuelan sovereign government bonds and Venezuela credit default swaps. A long position in Venezuelan quasi-sovereign credit performed strongly at the end of the period as a state-owned company announced a swap deal on debt maturing in 2017 for a later maturity in exchange for a higher premium to be paid to investors at the later maturity date. This positively influenced the bonds’ prices across maturities, as the swap deal effectively limited near-term default risk. Long exposure to the U.S. dollar against the euro and the Turkish lira also benefited performance. None of this sub-advisor’s positions meaningfully detracted from returns.
franklintempleton.com
Semiannual Report 5
FRANKLIN K2 GLOBAL MACRO OPPORTUNITIES FUND
Thank you for your participation in Franklin K2 Global Macro Opportunities Fund. We look forward to continuing to serve your investment needs.

The foregoing information reflects our analysis, opinions and portfolio holdings as of November 30, 2016, the end of the reporting period. The way we implement our main investment strategies and the resulting portfolio holdings may change depending on factors such as market and economic conditions. These opinions may not be relied upon as investment advice or an offer for a particular security. The information is not a complete analysis of every aspect of any market, country, industry, security or the Fund. Statements of fact are from sources considered reliable, but the investment manager makes no representation or warranty as to their completeness or accuracy. Although historical performance is no guarantee of future results, these insights may help you understand our investment management philosophy.
Robert Christian is a senior managing director and head of research for K2 Advisors, which he joined in 2010.
Mr. Christian worked at Graham Capital Management, L.P., from 1998 to 2003 as a portfolio manager and researcher of quantitative-based trading strategies. At Julius Baer Investment Management from 2003 to 2005, he was the head of Macro Strategies. From 2005 to 2010, he worked at FRM Americas LLC where he was the global head of directional trading strategies and portfolio advisor to numerous funds.
Brooks Ritchey is a senior managing director and head of portfolio construction for K2 Advisors. He is also a senior vice president and director of investment solutions for the Franklin Templeton Solutions division. Since 1987, Mr. Ritchey has managed multi-asset mutual fund and hedge fund portfolios during his employment with organizations including Steinhardt Partners, Citibank, Finch Asset Management, Paribas, AIG and ING. Mr. Ritchey joined K2 Advisors in 2005.
Anthony Zanolla joined K2 Advisors in October 2014 and serves as senior vice president and portfolio manager.
Mr. Zanolla began his investment career in 1994 at Bankers Trust and worked on the business risk team for senior management. Mr. Zanolla joined Citibank in 1996 as portfolio manager of global equity and balanced investment mandates. In 2000 he joined Scudder Kemper Investments as vice president of venture capital. In 2001 Mr. Zanolla joined former Citigroup colleagues as a founding partner and equity analyst at Norquest Capital, a hedge fund. He joined Allianz Hedge Fund Partners in 2002 as an investment committee member and strategy head responsible for global long-short equity, event driven, distressed and commodity trading advisors. After joining the Hedge Fund group of Northern Trust in October 2005 as co-portfolio manager, in 2007 Mr. Zanolla was promoted to senior vice president and portfolio manager responsible for fund of funds and custom portfolios.
6 Semiannual Report
franklintempleton.com
FRANKLIN K2 GLOBAL MACRO OPPORTUNITIES FUND
Performance Summary as of November 30, 2016
The performance table does not reflect any taxes that a shareholder would pay on Fund dividends, capital gain distributions, if any, or any realized gains on the sale of Fund shares. Total return reflects reinvestment of the Fund’s dividends and capital gain distributions, if any, and any unrealized gains or losses.
Performance as of 11/30/161
Cumulative total return excludes sales charges. Average annual total return includes maximum sales charges. Sales charges will vary depending on the size of the investment and the class of share purchased. The maximum is 5.75% and the minimum is 0%. Class A: 5.75% maximum initial sales charge; Advisor Class: no sales charges. For other share classes, visit franklintempleton.com.
| | | | |
| | Cumulative | | Average Annual | |
| Share Class | Total Return2 | | Total Return3 | |
| |
| A | | | | |
| Since Inception (7/11/16) | -4.30 | % | -9.80 | % |
| |
| Advisor | | | | |
| Since Inception (7/11/16) | -4.20 | % | -4.20 | % |
Performance data represent past performance, which does not guarantee future results. Investment return and principal value will fluctuate, and you may have a gain or loss when you sell your shares. Current performance may differ from figures shown. For most recent month-end performance, go to franklintempleton.com or call (800) 342-5236.
See page 8 for Performance Summary footnotes.
franklintempleton.com
Semiannual Report 7
FRANKLIN K2 GLOBAL MACRO OPPORTUNITIES FUND
PERFORMANCE SUMMARY
| | | | |
| Total Annual Operating Expenses4 | | | |
| Share Class | With Waiver | | Without Waiver | |
| A | 2.25 | % | 4.90 | % |
| Advisor | 2.00 | % | 4.65 | % |
Each class of shares is available to certain eligible investors and has different annual fees and expenses, as described in the prospectus.
All investments involve risks, including possible loss of principal. The Fund is actively managed and could experience losses if the investment manager’s or
subadvisors’ judgment about particular investments made for the Fund prove to be incorrect. Investments in derivatives involve costs and create economic
leverage, which may result in significant volatility and cause the Fund to participate in losses (as well as gains) that significantly exceed the Fund’s initial invest-
ment. The market values of securities owned by the Fund will go up or down, sometimes rapidly or unpredictably. Liquidity risk may exist when securities have
become more difficult to sell, or are unable to be sold, at the price at which they have been valued. The subadvisors may not be successful in maintaining effec-
tive and operational trading models used to implement systematic strategies. An issuer of debt securities may fail to make interest payments or repay principal
when due. Lower rated or high yield debt securities involve greater credit risk, including the possibility of default or bankruptcy. When interest rates rise, debt
security prices tend to fall. Foreign investments are subject to greater investment risk such as political, economic, credit, information and currency fluctuation
risks. Investments in emerging markets are subject to the risks of foreign investing and have additional heightened risks. Commodity and commodity-linked
investments present unique risks, are speculative and can be extremely volatile. The Fund’s prospectus also includes a description of the main investment risks.
1. The Fund has an expense reduction contractually guaranteed through 9/30/17 and a fee waiver related to the management fee paid by a subsidiary. Fund investment
results reflect the expense reduction and fee waiver; without these reductions, the results would have been lower.
2. Cumulative total return represents the change in value of an investment over the periods indicated.
3. Average annual total return represents the average annual change in value of an investment over the periods indicated. Return for less than one year, if any, has not been
annualized.
4. Figures are as stated in the Fund’s current prospectus and may differ from the expense ratios disclosed in the Your Fund’s Expenses and Consolidated Financial Highlights
sections in this report. In periods of market volatility, assets may decline significantly, causing total annual Fund operating expenses to become higher than the figures shown.
8 Semiannual Report
franklintempleton.com
FRANKLIN K2 GLOBAL MACRO OPPORTUNITIES FUND
Your Fund’s Expenses
As a Fund shareholder, you can incur two types of costs: (1) transaction costs, including sales charges (loads) on Fund purchases and redemptions; and (2) ongoing Fund costs, including management fees, distribution and service (12b-1) fees, and other Fund expenses. All mutual funds have ongoing costs, sometimes referred to as operating expenses. The table below shows ongoing costs of investing in the Fund and can help you understand these costs and compare them with those of other mutual funds. The table assumes a $1,000 investment held for the six months indicated.
Actual Fund Expenses
The table below provides information about actual account values and actual expenses in the columns under the heading “Actual.” In these columns the Fund’s actual return, which includes the effect of Fund expenses, is used to calculate the “Ending Account Value” for each class of shares. You can estimate the expenses you paid during the period by following these steps (of course, your account value and expenses will differ from those in this illustration): Divide your account value by $1,000 (if your account had an $8,600 value, then $8,600 ÷ $1,000 = 8.6). Then multiply the result by the number in the row for your class of shares under the headings “Actual” and “Expenses Paid During Period” (if Actual Expenses Paid During Period were $7.50, then 8.6 x $7.50 = $64.50). In this illustration, the actual expenses paid this period are $64.50.
Hypothetical Example for Comparison with Other Funds
Under the heading “Hypothetical” in the table, information is provided about hypothetical account values and hypothetical expenses based on the Fund’s actual expense ratio and an assumed rate of return of 5% per year before expenses, which is not the Fund’s actual return. This information may not be used to estimate the actual ending account balance or expenses you paid for the period, but it can help you compare ongoing costs of investing in the Fund with those of other funds. To do so, compare this 5% hypothetical example for the class of shares you hold with the 5% hypothetical examples that appear in the shareholder reports of other funds.
Please note that expenses shown in the table are meant to highlight ongoing costs and do not reflect any transactional costs. Therefore, information under the heading “Hypothetical” is useful in comparing ongoing costs only, and will not help you compare total costs of owning different funds. In addition, if transactional costs were included, your total costs would have been higher.
| | | | | | | | | | | | | |
| | | | | | | Actual | | | Hypothetical | | |
| | | | | (actual return after expenses) | | (5% annual return before expenses) | | |
| |
| | | | | | | Expenses | | | | Expenses | Net | |
| | | Beginning | | Ending | | Paid During | | Ending | | Paid During | Annualized | |
| Share | | Account | | Account | | Period | | Account | | Period | Expense | |
| Class | | Value1 | | Value 11/30/16 | | 7/11/16–11/30/162,3 Value 11/30/16 | | 6/1/16–11/30/162,3 | Ratio3 | |
| |
| A | $ | 1,000 | $ | 957.00 | | $ | 8.15 | $ | 1,014.34 | $ | 10.81 | 2.14 | % |
| C | $ | 1,000 | $ | 954.00 | $ | 11.14 | $ | 1,010.38 | $ | 14.77 | 2.93 | % |
| R | $ | 1,000 | $ | 957.00 | | $ | 8.22 | $ | 1,014.24 | $ | 10.91 | 2.16 | % |
| R6 | $ | 1,000 | $ | 957.00 | | $ | 7.39 | $ | 1,015.34 | $ | 9.80 | 1.94 | % |
| Advisor | $ | 1,000 | $ | 958.00 | | $ | 7.43 | $ | 1,015.29 | $ | 9.85 | 1.95 | % |
1. 7/11/16 for Actual; 6/1/16 for Hypothetical.
2. Expenses are equal to the annualized expense ratio for the six-month period as indicated above—in the far right column—multiplied by the simple average account value
over the period indicated, and then multiplied by 183/365 to reflect the one-half year period for Hypothetical expenses. For Actual expenses, the multiplier is 142/365 to reflect
the number of days since inception.
3. Reflects expenses after fee waivers and expense reimbursements. Does not include acquired fund fees and expenses.
franklintempleton.com
Semiannual Report 9
FRANKLIN ALTERNATIVE STRATEGIES FUNDS
| | | |
| Consolidated Financial Highlights | | | |
| Franklin K2 Global Macro Opportunities Fund | | | |
| | | Period Ended | |
| | | November 30, 2016a | |
| | | (unaudited) | |
| Class A | | | |
| Per share operating performance | | | |
| (for a share outstanding throughout the period) | | | |
| Net asset value, beginning of period | $ | 10.00 | |
| Income from investment operations b: | | | |
| Net investment income (loss)c | | (0.02 | ) |
| Net realized and unrealized gains (losses) | | (0.41 | ) |
| Total from investment operations | | (0.43 | ) |
| Net asset value, end of period | $ | 9.57 | |
| |
| Total returnd | | (4.30 | )% |
| |
| Ratios to average net assetse | | | |
| Expenses before waiver and payments by affiliates | | 3.63 | % |
| Expenses net of waiver and payments by affiliates | | 2.14 | % |
| Net investment income (loss) | | (1.02 | )% |
| |
| Supplemental data | | | |
| Net assets, end of period (000’s) | $ | 19 | |
| Portfolio turnover rate | | 54.87 | % |
aFor the period July 11, 2016 (commencement of operations) to November 30, 2016.
bThe amount shown for a share outstanding throughout the period may not correlate with the Consolidated Statement of Operations for the period due to the timing of sales
and repurchases of the Fund’s shares in relation to income earned and/or fluctuating fair value of the investments of the Fund.
cBased on average daily shares outstanding.
dTotal return does not reflect sales commissions or contingent deferred sales charges, if applicable, and is not annualized for periods less than one year.
eRatios are annualized for periods less than one year, except for non-recurring expenses, if any.
10 Semiannual Report | The accompanying notes are an integral part of these financial statements.
franklintempleton.com
FRANKLIN ALTERNATIVE STRATEGIES FUNDS
| | | |
| Franklin K2 Global Macro Opportunities Fund (continued) | | | |
| | | Period Ended | |
| | | November 30, 2016a | |
| | | (unaudited) | |
| Class C | | | |
| Per share operating performance | | | |
| (for a share outstanding throughout the period) | | | |
| Net asset value, beginning of period | $ | 10.00 | |
| Income from investment operations b: | | | |
| Net investment income (loss)c | | (0.05 | ) |
| Net realized and unrealized gains (losses) | | (0.41 | ) |
| Total from investment operations | | (0.46 | ) |
| Net asset value, end of period | $ | 9.54 | |
| |
| Total returnd | | (4.60 | )% |
| |
| Ratios to average net assetse | | | |
| Expenses before waiver and payments by affiliates | | 4.42 | % |
| Expenses net of waiver and payments by affiliates | | 2.93 | % |
| Net investment income (loss) | | (1.81 | )% |
| |
| Supplemental data | | | |
| Net assets, end of period (000’s) | $ | 143 | |
| Portfolio turnover rate | | 54.87 | % |
aFor the period July 11, 2016 (commencement of operations) to November 30, 2016.
bThe amount shown for a share outstanding throughout the period may not correlate with the Consolidated Statement of Operations for the period due to the timing of sales
and repurchases of the Fund’s shares in relation to income earned and/or fluctuating fair value of the investments of the Fund.
cBased on average daily shares outstanding.
dTotal return does not reflect sales commissions or contingent deferred sales charges, if applicable, and is not annualized for periods less than one year.
eRatios are annualized for periods less than one year, except for non-recurring expenses, if any.
franklintempleton.com
The accompanying notes are an integral part of these financial statements. | Semiannual Report 11
FRANKLIN ALTERNATIVE STRATEGIES FUNDS
CONSOLIDATED FINANCIAL HIGHLIGHTS
| | | |
| Franklin K2 Global Macro Opportunities Fund (continued) | | | |
| | | Period Ended | |
| | | November 30, 2016a | |
| | | (unaudited) | |
| Class R | | | |
| Per share operating performance | | | |
| (for a share outstanding throughout the period) | | | |
| Net asset value, beginning of period | $ | 10.00 | |
| Income from investment operationsb: | | | |
| Net investment income (loss)c | | (0.02 | ) |
| Net realized and unrealized gains (losses) | | (0.41 | ) |
| Total from investment operations | | (0.43 | ) |
| Net asset value, end of period | $ | 9.57 | |
| |
| Total returnd | | (4.30 | )% |
| |
| Ratios to average net assetse | | | |
| Expenses before waiver and payments by affiliates | | 3.65 | % |
| Expenses net of waiver and payments by affiliates | | 2.16 | % |
| Net investment income (loss) | | (1.04 | )% |
| |
| Supplemental data | | | |
| Net assets, end of period (000’s) | $ | 10 | |
| Portfolio turnover rate | | 54.87 | % |
aFor the period July 11, 2016 (commencement of operations) to November 30, 2016.
bThe amount shown for a share outstanding throughout the period may not correlate with the Consolidated Statement of Operations for the period due to the timing of sales
and repurchases of the Fund’s shares in relation to income earned and/or fluctuating fair value of the investments of the Fund.
cBased on average daily shares outstanding.
dTotal return is not annualized for periods less than one year.
eRatios are annualized for periods less than one year, except for non-recurring expenses, if any.
12 Semiannual Report | The accompanying notes are an integral part of these financial statements.
franklintempleton.com
FRANKLIN ALTERNATIVE STRATEGIES FUNDS
CONSOLIDATED FINANCIAL HIGHLIGHTS
| | | |
| Franklin K2 Global Macro Opportunities Fund (continued) | | | |
| | | Period Ended | |
| | | November 30, 2016a | |
| | | (unaudited) | |
| Class R6 | | | |
| Per share operating performance | | | |
| (for a share outstanding throughout the period) | | | |
| Net asset value, beginning of period | $ | 10.00 | |
| Income from investment operationsb: | | | |
| Net investment income (loss)c | | (0.02 | ) |
| Net realized and unrealized gains (losses) | | (0.41 | ) |
| Total from investment operations | | (0.43 | ) |
| Net asset value, end of period | $ | 9.57 | |
| |
| Total returnd | | (4.30 | )% |
| |
| Ratios to average net assetse | | | |
| Expenses before waiver and payments by affiliates | | 3.43 | % |
| Expenses net of waiver and payments by affiliates | | 1.94 | % |
| Net investment income (loss) | | (0.82 | )% |
| |
| Supplemental data | | | |
| Net assets, end of period (000’s) | $ | 10 | |
| Portfolio turnover rate | | 54.87 | % |
aFor the period July 11, 2016 (commencement of operations) to November 30, 2016.
bThe amount shown for a share outstanding throughout the period may not correlate with the Consolidated Statement of Operations for the period due to the timing of sales
and repurchases of the Fund’s shares in relation to income earned and/or fluctuating fair value of the investments of the Fund.
cBased on average daily shares outstanding.
dTotal return is not annualized for periods less than one year.
eRatios are annualized for periods less than one year, except for non-recurring expenses, if any.
franklintempleton.com
The accompanying notes are an integral part of these financial statements. | Semiannual Report 13
FRANKLIN ALTERNATIVE STRATEGIES FUNDS
CONSOLIDATED FINANCIAL HIGHLIGHTS
| | | |
| Franklin K2 Global Macro Opportunities Fund (continued) | | | |
| | | Period Ended | |
| | | November 30, 2016a | |
| | | (unaudited) | |
| Advisor Class | | | |
| Per share operating performance | | | |
| (for a share outstanding throughout the period) | | | |
| Net asset value, beginning of period | $ | 10.00 | |
| Income from investment operationsb: | | | |
| Net investment income (loss)c | | (0.02 | ) |
| Net realized and unrealized gains (losses) | | (0.40 | ) |
| Total from investment operations | | (0.42 | ) |
| Net asset value, end of period | $ | 9.58 | |
| |
| Total returnd | | (4.20 | )% |
| |
| Ratios to average net assetse | | | |
| Expenses before waiver and payments by affiliates | | 3.44 | % |
| Expenses net of waiver and payments by affiliates | | 1.95 | % |
| Net investment income (loss) | | (0.83 | )% |
| |
| Supplemental data | | | |
| Net assets, end of period (000’s) | $ | 23,930 | |
| Portfolio turnover rate | | 54.87 | % |
aFor the period July 11, 2016 (commencement of operations) to November 30, 2016.
bThe amount shown for a share outstanding throughout the period may not correlate with the Consolidated Statement of Operations for the period due to the timing of sales
and repurchases of the Fund’s shares in relation to income earned and/or fluctuating fair value of the investments of the Fund.
cBased on average daily shares outstanding.
dTotal return is not annualized for periods less than one year.
eRatios are annualized for periods less than one year, except for non-recurring expenses, if any.
14 Semiannual Report | The accompanying notes are an integral part of these financial statements.
franklintempleton.com
FRANKLIN ALTERNATIVE STRATEGIES FUNDS
| | | | | |
| Consolidated Statement of Investments, November 30, 2016 (unaudited) | | | | |
| Franklin K2 Global Macro Opportunities Fund | | | | | |
| | | Principal | | | |
| | Country | Amount* | | | Value |
| Corporate Bonds and Notes 3.8% | | | | | |
| Oil, Gas & Consumable Fuels 3.8% | | | | | |
| Petrobras Global Finance BV, | | | | | |
| senior bond, 5.75%, 1/20/20 | Brazil | 26,000 | $ | | 26,130 |
| senior note, 4.875%, 3/17/20 | Brazil | 500,000 | | | 490,350 |
| senior note, 5.375%, 1/27/21 | Brazil | 84,000 | | | 81,984 |
| a Petroleos de Venezuela SA, Reg S, | | | | | |
| senior bond, 6.00%, 11/15/26 | Venezuela | 141,000 | | | 52,198 |
| senior note, 6.00%, 5/16/24 | Venezuela | 319,304 | | | 120,170 |
| Petroleos Mexicanos, senior note, 6.00%, 3/05/20 | Mexico | 139,000 | | | 145,255 |
| Total Corporate Bonds and Notes (Cost $907,235) | | | | | 916,087 |
| Foreign Government and Agency Securities 6.7% | | | | | |
| Argentine Bonos del Tesoro, | | | | | |
| 16.00%, 10/17/23 | Argentina | 2,354,358 | ARS | 143,373 |
| senior note, 15.50%, 10/17/26 | Argentina | 590,669 | ARS | 36,063 |
| Government of Argentina, | | | | | |
| a Reg S, 5.00%, 1/15/27 | Argentina | 100,000 | EUR | 92,869 |
| 7.82%, 12/31/33 | Argentina | 233,938 | EUR | 245,087 |
| 2.26% to 3/31/19, 3.38% to 3/31/29, 4.74% thereafter, 12/31/38 | Argentina | 228,585 | EUR | 136,699 |
| a Government of Cyprus, Reg S, 3.875%, 5/06/22 | Cyprus | 44,000 | EUR | 48,350 |
| Government of Hellenic Republic, | | | | | |
| a senior bond, Reg S, 3.00% to 2/24/20, 3.65% to 2/24/21, 4.30% thereafter, | | | | | |
| 2/24/42 | Greece | 225,040 | EUR | 174,264 |
| b senior note, 144A, 4.75%, 4/17/19 | Greece | 40,000 | EUR | 40,811 |
| Government of Russia, | | | | | |
| 6.40%, 5/27/20 | Russia | 10,603,000 | RUB | 154,932 |
| a Reg S, 4.75%, 5/27/26 | Russia | 200,000 | | | 204,112 |
| a Government of Ukraine, Reg S, 7.75%, 9/01/19 | Ukraine | 107,000 | | | 103,873 |
| Letras del Banco Central de la Republica Argentina, | | | | | |
| Strip, 1/11/17 - 1/25/17 | Argentina | 3,764,056 | c ARS | 229,794 |
| Total Foreign Government and Agency Securities | | | | | |
| (Cost $1,696,128) | | | | | 1,610,227 |
| |
| | | Number of | | | |
| | | Contracts | | | |
| Options Purchased 0.0%† | | | | | |
| Puts – Exchange-Traded | | | | | |
| Diversified Financial Services 0.0%† | | | | | |
| S&P 500 E-Mini Index, December Strike Price $2,100.00, Expires 12/16/16 | United States | 1 | | | 180 |
| S&P 500 E-Mini Index, December Strike Price $2,120.00, Expires 12/16/16 | United States | 1 | | | 245 |
| Total Options Purchased (Cost $1,880) | | | | | 425 |
| Total Investments before Short Term Investments | | | | | |
| (Cost $2,605,243) | | | | | 2,526,739 |
| |
| | | Shares | | | |
| Short Term Investments 59.0% | | | | | |
| Money Market Funds (Cost $10,087,860) 41.9% | | | | | |
| d Fidelity Investments Money Market Funds, 0.268% | United States | 10,087,860 | | | 10,087,860 |
franklintempleton.com
Semiannual Report 15
FRANKLIN ALTERNATIVE STRATEGIES FUNDS
CONSOLIDATED STATEMENT OF INVESTMENTS (UNAUDITED)
| | | | | |
| Franklin K2 Global Macro Opportunities Fund (continued) | | | | | |
| |
| | | | Principal | | |
| | | Country | Amount* | | Value |
| Repurchase Agreements (Cost $4,131,059) 17.1% | | | | | |
| e Joint Repurchase Agreement, 0.265%, 12/01/16 | | | | | |
| (Maturity Value $4,131,089) | | United States | 4,131,059 | $ | 4,131,059 |
| BNP Paribas Securities Corp. (Maturity Value $1,999,985) | | | | | |
| Deutsche Bank Securities Inc. (Maturity Value $81,134) | | | | | |
| HSBC Securities (USA) Inc. (Maturity Value $1,999,985) | | | | | |
| Merrill Lynch, Pierce, Fenner & Smith Inc. (Maturity Value $49,985) | | | | | |
| Collateralized by U.S. Government Agency Securities, 0.476%, 8/03/17, | | | | | |
| f U.S. Treasury Bill, 4/27/17; U.S. Treasury Note, 0.689% - 1.625%, | | | | | |
| 7/31/18 - 11/30/20; and U.S. Treasury Note, Index Linked, 2.625%, | | | | | |
| 7/15/17 (valued at $4,213,736) | | | | | |
| Total Investments (Cost $16,824,162) 69.5% | | | | | 16,745,658 |
| Other Assets, less Liabilities 30.5% | | | | | 7,365,165 |
| Net Assets 100.0% | | | | $ | 24,110,823 |
See Abbreviations on page 35.
*The principal amount is stated in U.S. dollars unless otherwise indicated.
†Rounds to less than 0.1% of net assets.
aSecurity was purchased pursuant to Regulation S under the Securities Act of 1933, which exempts from registration securities offered and sold outside of the United States.
Such a security cannot be sold in the United States without either an effective registration statement filed pursuant to the Securities Act of 1933, or pursuant to an exemption
from registration. These securities have been deemed liquid under guidelines approved by the Trust’s Board of Trustees. At November 30, 2016, the aggregate value of these
securities was $795,836, representing 3.3% of net assets.
bSecurity was purchased pursuant to Rule 144A under the Securities Act of 1933 and may be sold in transactions exempt from registration only to qualified institutional buyers
or in public offering registered under the Securities Act of 1933. This security has been deemed liquid under guidelines approved by the Trust’s Board of Trustees. At
November 30, 2016, the value of this security was $40,811, representing 0.2% of net assets.
cPrincipal amount is stated in 1,000 Argentine Peso Units.
dThe rate shown is the annualized seven-day yield at period end.
eSee Note 1(c) regarding joint repurchase agreement.
fThe security was issued on a discount basis with no stated coupon rate.
| | | | | | | | | | |
| At November 30, 2016, the Fund had the following futures contracts outstanding. See Note 1(d). | | | | | | |
| Futures Contracts | | | | | | | | | | |
| | | Number of | | Notional | Expiration | | Unrealized | | Unrealized | |
| Description | Type | Contracts | | Value | Date | | Appreciation | | Depreciation | |
| Commodity Contractsa | | | | | | | | | | |
| Aluminum | Long | 7 | $ | 303,319 | 12/19/16 | $ | 10,554 | $ | — | |
| Aluminum | Short | 7 | | 303,319 | 12/19/16 | | — | | (2,317 | ) |
| Aluminum | Long | 4 | | 173,275 | 3/13/17 | | — | | (743 | ) |
| Brent Crude Oil | Short | 7 | | 362,880 | 12/29/16 | | — | | (18,081 | ) |
| Cocoa | Long | 3 | | 73,421 | 3/16/17 | | — | | (2,144 | ) |
| Coffee | Long | 3 | | 169,425 | 3/21/17 | | — | | (18,703 | ) |
| Copper | Long | 8 | | 1,162,850 | 12/19/16 | | 100,911 | | — | |
| Copper | Short | 7 | | 1,017,494 | 12/19/16 | | — | | (204,033 | ) |
| Copper | Long | 3 | | 437,006 | 3/13/17 | | 3,341 | | — | |
| Copper | Long | 2 | | 131,650 | 3/29/17 | | 3,632 | | — | |
| Corn | Short | 7 | | 121,975 | 3/14/17 | | 2,118 | | — | |
| Cotton | Long | 2 | | 71,580 | 3/09/17 | | 2,120 | | — | |
| Gold 100 Oz | Short | 5 | | 586,950 | 2/24/17 | | 23,029 | | — | |
| Kansas City Wheat | Short | 6 | | 123,075 | 3/14/17 | | 5,157 | | — | |
| Low Sulphur Gas Oil | Long | 1 | | 45,200 | 1/12/17 | | 3,123 | | — | |
| Natural Gas | Short | 1 | | 33,520 | 12/28/16 | | — | | (2,012 | ) |
| Nickel | Long | 5 | | 336,307 | 12/19/16 | | 28,965 | | — | |
| Nickel | Short | 5 | | 336,307 | 12/19/16 | | — | | (28,742 | ) |
| Nickel | Long | 1 | | 67,536 | 3/13/17 | | 773 | | — | |
| RBOB Gasoline | Long | 2 | | 124,530 | 12/30/16 | | 10,307 | | — | |
| Soybean Oil | Short | 2 | | 44,700 | 3/14/17 | | — | | (2,417 | ) |
16 Semiannual Report
franklintempleton.com
FRANKLIN ALTERNATIVE STRATEGIES FUNDS
CONSOLIDATED STATEMENT OF INVESTMENTS (UNAUDITED)
| | | | | | | | | | |
| Franklin K2 Global Macro Opportunities Fund (continued) | | | | | | | | |
| |
| Futures Contracts (continued) | | | | | | | | | | |
| | | Number of | | Notional | Expiration | | Unrealized | | Unrealized | |
| Description | Type | Contracts | | Value | Date | | Appreciation | | Depreciation | |
| Commodity Contractsa (continued) | | | | | | | | | | |
| Soybeans | Long | 2 | $ | 103,225 | 1/13/17 | $ | 2,982 | $ | — | |
| Soybeans | Long | 2 | | 104,125 | 3/14/17 | | 95 | | — | |
| Sugar | Long | 5 | | 110,936 | 2/28/17 | | — | | (2,063 | ) |
| Wheat | Short | 10 | | 201,375 | 3/14/17 | | 12,810 | | — | |
| WTI Crude Oil | Short | 7 | | 346,080 | 12/20/16 | | — | | (30,965 | ) |
| Zinc | Long | 5 | | 336,375 | 12/19/16 | | 50,573 | | — | |
| Zinc | Short | 5 | | 336,375 | 12/19/16 | | — | | (17,390 | ) |
| Zinc | Long | 5 | | 338,250 | 3/13/17 | | 17,861 | | — | |
| | | | | 7,903,060 | | | 278,351 | | (329,610 | ) |
| Currency Contracts | | | | | | | | | | |
| AUD/USD | Long | 11 | | 812,460 | 12/19/16 | | — | | (15,976 | ) |
| CAD/USD | Short | 8 | | 596,040 | 12/20/16 | | — | | (384 | ) |
| CHF/USD | Short | 11 | | 1,353,550 | 12/19/16 | | 19,405 | | — | |
| EUR/USD | Short | 4 | | 530,225 | 12/19/16 | | 866 | | — | |
| GBP/USD | Short | 4 | | 312,750 | 12/19/16 | | 19,591 | | — | |
| JPY/USD | Short | 9 | | 984,769 | 12/19/16 | | 43,547 | | — | |
| NZD/USD | Long | 3 | | 212,250 | 12/19/16 | | — | | (4,817 | ) |
| | | | | 4,802,044 | | | 83,409 | | (21,177 | ) |
| Equity Contracts | | | | | | | | | | |
| CAC 40 10 Euro | Long | 1 | | 48,499 | 12/16/16 | | 576 | | — | |
| DJIA Mini E-CBOT Index | Long | 2 | | 191,320 | 12/16/16 | | 5,451 | | — | |
| DJIA Mini E-CBOT Index | Short | 3 | | 286,980 | 12/16/16 | | — | | (14,136 | ) |
| EURO STOXX 50 Index | Long | 2 | | 64,672 | 12/16/16 | | 1,998 | | — | |
| EURO STOXX 50 Index | Short | 3 | | 97,008 | 12/16/16 | | — | | (907 | ) |
| FTSE 100 Index | Long | 3 | | 254,551 | 12/16/16 | | — | | (3,531 | ) |
| FTSE/JSE Africa Top 40 Index | Short | 4 | | 124,536 | 12/15/16 | | 4,259 | | — | |
| H-Shares Index | Long | 2 | | 127,519 | 12/29/16 | | 1,740 | | — | |
| Hang Seng Index | Long | 6 | | 882,692 | 12/29/16 | | 6,107 | | — | |
| Mini MSCI Emerging Market Index | Long | 3 | | 129,450 | 12/16/16 | | — | | (6,301 | ) |
| Nasdaq 100 E-Mini Index | Long | 1 | | 96,320 | 12/16/16 | | 1,044 | | — | |
| Nikkei 225 Index | Long | 2 | | 173,407 | 12/08/16 | | 10,539 | | — | |
| Nikkei 225 Index | Short | 2 | | 321,314 | 12/08/16 | | — | | (21,128 | ) |
| OMX Stockholm 30 Index | Long | 4 | | 64,102 | 12/16/16 | | 566 | | — | |
| Russell 2000 Mini Index | Long | 3 | | 396,690 | 12/16/16 | | 22,529 | | — | |
| S&P 500 E-Mini Index | Long | 1 | | 109,940 | 12/16/16 | | 2,348 | | — | |
| S&P 500 E-Mini Index | Short | 2 | | 219,880 | 12/16/16 | | — | | (2,804 | ) |
| S&P MidCap 400 E-Mini Index | Long | 2 | | 325,380 | 12/16/16 | | 5,611 | | — | |
| S&P/TSX 60 Index | Long | 3 | | 396,278 | 12/15/16 | | 11,759 | | — | |
| SPI 200 Index | Long | 2 | | 200,932 | 12/15/16 | | 3,137 | | — | |
| TOPIX Index | Long | 2 | | 257,681 | 12/08/16 | | 11,943 | | — | |
| TOPIX Index | Short | 4 | | 515,362 | 12/08/16 | | — | | (53,876 | ) |
| | | | | 5,284,513 | | | 89,607 | | (102,683 | ) |
| Interest Rate Contracts | | | | | | | | | | |
| 90 Day Bank Bill | Short | 2 | | 1,470,480 | 3/09/17 | | 125 | | — | |
| 90 Day Bank Bill | Short | 4 | | 2,940,888 | 6/08/17 | | 231 | | — | |
| 90 Day Bank Bill | Short | 4 | | 2,940,527 | 9/07/17 | | 393 | | — | |
| 90 Day Bank Bill | Short | 4 | | 2,940,021 | 12/07/17 | | 741 | | — | |
| 90 Day Bank Bill | Short | 1 | | 734,879 | 3/08/18 | | 236 | | — | |
| 90 Day Eurodollar | Short | 1 | | 247,088 | 6/19/17 | | 961 | | — | |
| 90 Day Eurodollar | Short | 5 | | 1,234,250 | 9/18/17 | | 1,377 | | — | |
| 90 Day Eurodollar | Short | 17 | | 4,190,712 | 12/18/17 | | 10,703 | | — | |
| 90 Day Eurodollar | Short | 1 | | 246,288 | 3/19/18 | | 223 | | — | |
| 90 Day Eurodollar | Short | 2 | | 492,000 | 6/18/18 | | 183 | | — | |
| 90 Day Eurodollar | Short | 2 | | 491,450 | 9/17/18 | | 83 | | — | |
franklintempleton.com
Semiannual Report 17
FRANKLIN ALTERNATIVE STRATEGIES FUNDS
CONSOLIDATED STATEMENT OF INVESTMENTS (UNAUDITED)
| | | | | | | | | | |
| Franklin K2 Global Macro Opportunities Fund (continued) | | | | | | | | |
| |
| Futures Contracts (continued) | | | | | | | | | | |
| | | Number of | | Notional | Expiration | | Unrealized | | Unrealized | |
| Description | Type | Contracts | | Value | Date | | Appreciation | | Depreciation | |
| Interest Rate Contracts (continued) | | | | | | | | | | |
| 90 Day Eurodollar | Short | 1 | $ | 245,425 | 12/17/18 | $ | 236 | $ | — | |
| 90 Day Eurodollar | Short | 1 | | 245,238 | 3/18/19 | | 186 | | — | |
| 90 Day Eurodollar | Short | 1 | | 245,025 | 6/17/19 | | 48 | | — | |
| 90 Day Sterling | Short | 1 | | 155,681 | 6/21/17 | | 76 | | — | |
| 90 Day Sterling | Short | 3 | | 466,856 | 9/20/17 | | 277 | | — | |
| 90 Day Sterling | Short | 4 | | 622,224 | 12/20/17 | | 353 | | — | |
| 90 Day Sterling | Short | 4 | | 621,911 | 3/21/18 | | 370 | | — | |
| 90 Day Sterling | Short | 4 | | 621,536 | 6/20/18 | | 138 | | — | |
| 90 Day Sterling | Short | 5 | | 776,450 | 9/19/18 | | 449 | | — | |
| 90 Day Sterling | Short | 3 | | 465,542 | 12/19/18 | | 185 | | — | |
| 90 Day Sterling | Short | 4 | | 620,347 | 3/20/19 | | 137 | | — | |
| 3 Month Euribor | Short | 1 | | 265,426 | 12/17/18 | | 58 | | — | |
| 3 Month Euribor | Short | 1 | | 265,320 | 3/18/19 | | 86 | | — | |
| 10 Yr. Mini Japan Government Bond | Long | 1 | | 131,559 | 12/12/16 | | — | | (644 | ) |
| Australian 3 Yr. Bond | Short | 12 | | 991,567 | 12/15/16 | | 4,065 | | — | |
| Australian 10 Yr. Bond | Long | 2 | | 190,303 | 12/15/16 | | — | | (1,013 | ) |
| Australian 10 Yr. Bond | Short | 4 | | 380,605 | 12/15/16 | | 8,033 | | — | |
| Euro Schatz | Long | 2 | | 238,032 | 12/08/16 | | 557 | | — | |
| Euro BOBL | Long | 3 | | 417,888 | 12/08/16 | | 18 | | — | |
| Euro-BTP Italian Government Bond | Short | 2 | | 286,859 | 12/08/16 | | 6,856 | | — | |
| Euro-Bund | Long | 3 | | 512,098 | 12/08/16 | | — | | (4,814 | ) |
| Euro-Buxl 30 Yr. Bond | Short | 1 | | 185,855 | 12/08/16 | | 4,914 | | — | |
| Long Gilt | Long | 1 | | 154,336 | 3/29/17 | | 868 | | — | |
| Long Gilt | Short | 2 | | 308,672 | 3/29/17 | | — | | (817 | ) |
| U.S. Treasury 2 Yr. Note | Short | 1 | | 216,813 | 3/31/17 | | — | | (158 | ) |
| U.S. Treasury 5 Yr. Note | Short | 40 | | 4,713,750 | 3/31/17 | | 2,803 | | — | |
| U.S. Treasury 10 Yr. Note | Short | 7 | | 871,609 | 3/22/17 | | 2,933 | | — | |
| U.S. Treasury Long Bond | Short | 5 | | 756,406 | 3/22/17 | | 2,843 | | — | |
| | | | | 33,901,916 | | | 51,745 | | (7,446 | ) |
| Total Futures Contracts | | | $ | 51,891,533 | | $ | 503,112 | $ | (460,916 | ) |
| Net unrealized appreciation (depreciation) | | | | | | $ | 42,196 | | | |
aA portion or all of the contracts are owned by K2 GMOF Holdings Corp., a wholly-owned subsidiary of the Fund. See Note 1(e).
| | | | | | | | | | |
| At November 30, 2016, the Fund had the following forward exchange contracts outstanding. See Note 1(d). | | | | | |
| |
| Forward Exchange Contracts | | | | | | | | | | |
| | | | | Contract | Settlement | | Unrealized | | Unrealized | |
| Currency | Counterpartya Type | Quantity | Amount* | Date | | Appreciation | | Depreciation | |
| OTC Forward Exchange Contracts | | | | | | | | | | |
| South Korean Won | BOFA | Sell | 90,009,366 | 78,611 | 12/05/16 | $ | 1,618 | $ | — | |
| South Korean Won | MSCO | Sell | 90,504,133 | 77,520 | 12/14/16 | | 104 | | — | |
| Chinese Yuan | MSCO | Sell | 2,103,394 | 312,308 | 12/21/16 | | 8,895 | | — | |
| Euro | DBAB | Buy | 104,746 | 112,793 | 12/21/16 | | — | | (1,634 | ) |
| Euro | DBAB | Sell | 240,148 | 261,559 | 12/21/16 | | 6,711 | | — | |
| Euro | MSCO | Buy | 371,606 | 411,991 | 12/21/16 | | 160 | | (17,799 | ) |
| Euro | MSCO | Sell | 992,267 | 1,110,932 | 12/21/16 | | 57,925 | | — | |
| Mexican Peso | BOFA | Buy | 5,838,563 | 297,741 | 12/21/16 | | — | | (14,730 | ) |
| Mexican Peso | BOFA | Sell | 5,838,564 | 295,609 | 12/21/16 | | 13,139 | | (542 | ) |
| Mexican Peso | MSCO | Buy | 1,586,864 | 79,448 | 12/21/16 | | — | | (2,527 | ) |
| Mexican Peso | MSCO | Sell | 1,586,865 | 79,433 | 12/21/16 | | 2,513 | | — | |
| Russian Ruble | BOFA | Buy | 5,087,011 | 78,298 | 12/21/16 | | 574 | | — | |
| Russian Ruble | MSCO | Buy | 21,374,014 | 327,760 | 12/21/16 | | 4,986 | | (1,347 | ) |
| Russian Ruble | MSCO | Sell | 11,455,920 | 174,327 | 12/21/16 | | — | | (3,294 | ) |
| South African Rand | MSCO | Sell | 1,109,430 | 78,122 | 12/21/16 | | — | | (331 | ) |
18 Semiannual Report
franklintempleton.com
FRANKLIN ALTERNATIVE STRATEGIES FUNDS
CONSOLIDATED STATEMENT OF INVESTMENTS (UNAUDITED)
| | | | | | | | | | |
| Franklin K2 Global Macro Opportunities Fund (continued) | | | | | | | |
| |
| Forward Exchange Contracts (continued) | | | | | | | | | |
| | | | | Contract | Settlement | | Unrealized | | Unrealized | |
| Currency | Counterpartya Type | Quantity | Amount* | Date | | Appreciation | | Depreciation | |
| OTC Forward Exchange Contracts (continued) | | | | | | | | | |
| Turkish Lira | BOFA | Sell | 483,259 | 159,412 | 12/21/16 | $ | 19,463 | $ | — | |
| Turkish Lira | MSCO | Buy | 245,220 | 76,548 | 12/21/16 | | — | | (5,533 | ) |
| Japanese Yen | MSCO | Buy | 164,210,000 | 1,604,199 | 12/22/16 | | — | | (166,699 | ) |
| Japanese Yen | MSCO | Sell | 226,338,000 | 2,100,670 | 12/22/16 | | 119,299 | | — | |
| Australian Dollar | MSCO | Buy | 2,207,000 | 1,660,752 | 12/23/16 | | — | | (32,010 | ) |
| Australian Dollar | MSCO | Sell | 2,161,000 | 1,613,647 | 12/23/16 | | 19,572 | | (717 | ) |
| British Pound | MSCO | Buy | 584,000 | 737,563 | 12/23/16 | | 7,459 | | (13,706 | ) |
| British Pound | MSCO | Sell | 1,630,000 | 2,108,143 | 12/23/16 | | 75,877 | | (8,901 | ) |
| Canadian Dollar | MSCO | Buy | 398,000 | 300,430 | 12/23/16 | | 133 | | (4,196 | ) |
| Canadian Dollar | MSCO | Sell | 1,961,000 | 1,484,329 | 12/23/16 | | 24,455 | | (372 | ) |
| Euro | MSCO | Buy | 535,000 | 596,763 | 12/23/16 | | — | | (28,945 | ) |
| Euro | MSCO | Sell | 1,746,000 | 1,930,750 | 12/23/16 | | 77,645 | | — | |
| Mexican Peso | MSCO | Buy | 2,030,000 | 107,936 | 12/23/16 | | 34 | | (9,596 | ) |
| Mexican Peso | MSCO | Sell | 7,761,000 | 390,823 | 12/23/16 | | 14,721 | | (2 | ) |
| New Zealand Dollar | MSCO | Buy | 817,000 | 593,542 | 12/23/16 | | 21 | | (15,426 | ) |
| New Zealand Dollar | MSCO | Sell | 407,000 | 291,421 | 12/23/16 | | 4,643 | | (1,227 | ) |
| Swiss Franc | MSCO | Buy | 1,067,000 | 1,093,571 | 12/23/16 | | — | | (42,084 | ) |
| Swiss Franc | MSCO | Sell | 1,888,000 | 1,930,785 | 12/23/16 | | 70,231 | | — | |
| South Korean Won | BOFA | Sell | 92,172,315 | 78,245 | 12/27/16 | | — | | (596 | ) |
| Czech Koruna | JPHQ | Sell | 5,262,698 | 195,124 | EUR | 2/28/17 | | 73 | | — | |
| Euro | JPHQ | Sell | 195,124 | 5,218,795 | CZK | 11/29/17 | | 3,280 | | (3,341 | ) |
| Total Forward Exchange Contracts | | | | | | $ | 533,531 | $ | (375,555 | ) |
| Net unrealized appreciation (depreciation) | | | | | $ | 157,976 | | | |
*In U.S. dollars unless otherwise indicated.
aMay be comprised of multiple contracts with the same counterparty, currency and settlement date.
| | | | | | | | | | | | | | | | | | |
| At November 30, 2016, the Fund had the following credit default swap contracts outstanding. See Note 1(d). | | | | | | | |
| Credit Default Swap Contracts | | | | | | | | | | | | | | | | | | |
| | | | | | | | | Unamortized | | | | | | | | | | |
| | Periodic | | | | | | | Upfront | | | | | | | | | | |
| | Payment | | Counterparty/ | | Notional | Expiration | | Payments | | | Unrealized | | Unrealized | | | | | |
| Description | Rate | | Exchange | | Amounta | Date | | (Receipts) | | | Appreciation | | Depreciation | | | Value | | Ratingb |
| Centrally Cleared Swap Contracts | | | | | | | | | | | | | | | | | | |
| Contracts to Buy Protection | | | | | | | | | | | | | | | | | | |
| Single Name | | | | | | | | | | | | | | | | | | |
| Government of Turkey | 1.00 | % | ICE | $ | 583,000 | 6/20/21 | $ | 38,013 | | $ | 2,553 | $ | — | | $ | 40,566 | | |
| Government of South Africa | 1.00 | % | ICE | | 275,000 | 12/20/21 | | 18,824 | | | — | | (1,337 | ) | | 17,487 | | |
| Government of South Korea | 1.00 | % | ICE | | 196,232 | 12/20/21 | | (5,688 | ) | | 914 | | — | | | (4,774 | ) | |
| Contracts to Sell Protectionc | | | | | | | | | | | | | | | | | | |
| Single Name | | | | | | | | | | | | | | | | | | |
| Government of Brazil | 1.00 | % | ICE | | 396,000 | 6/20/21 | | (24,929 | ) | | — | | (3,155 | ) | | (28,084 | ) | BB |
| Total Credit Default Swap Contracts | | | | $ | 1,450,232 | | $ | 26,220 | | $ | 3,467 | $ | (4,492 | ) | $ | 25,195 | | |
| Net unrealized appreciation (depreciation) | | | | | | | | | | | $ | (1,025 | ) | | | | |
aFor contracts to sell protection, the notional amount is equal to the maximum potential amount of the future payments and no recourse provisions have been entered into in
association with the contracts.
bBased on Standard and Poor’s (S&P) Rating for single name swaps.
cThe Fund enters contracts to sell protection to create a long credit position. Performance triggers include default, bankruptcy or restructuring for single name swaps and fail-
ure to pay or bankruptcy of the underlying securities for traded index swaps.
See Notes 1(d) and 7 regarding derivative financial instruments and other derivative information, respectively.
franklintempleton.com
Semiannual Report 19
FRANKLIN ALTERNATIVE STRATEGIES FUNDS
CONSOLIDATED STATEMENT OF INVESTMENTS (UNAUDITED)
| | | | | | | | | | |
| Franklin K2 Global Macro Opportunities Fund (continued) | | | | | | | | | |
| At November 30, 2016, the Fund had the following interest rate swap contracts outstanding. See Note 1(d). | | | | | |
| |
| Interest Rate Swap Contracts | | | | | | | | | | |
| | | Counterparty/ | Notional | Expiration | | Unrealized | | Unrealized | |
| Description | Exchange | Amount | | | | Date | | Appreciation | | Depreciation | |
| Centrally Cleared Swap Contracts | | | | | | | | | | |
| Receive Floating rate 6 Month GBP-LIBOR | | | | | | | | | | |
| Pay Fixed rate 1.55% | CME | 78,170 | | GBP | 11/28/46 | $ | 411 | $ | — | |
| Receive Floating rate 6 Month GBP-LIBOR | | | | | | | | | | |
| Pay Fixed rate 1.56% | CME | 78,445 | | GBP | 11/29/46 | | 387 | | — | |
| Total Centrally Cleared Swap Contracts | | | | | | $ | 798 | $ | — | |
| |
| OTC Swap Contracts | | | | | | | | | | |
| Receive Fixed rate 11.27% | | | | | | | | | | |
| Pay Floating rate BRL-Brazil Cetip DI Interbank Deposit Rate | BOFA | 255,661 | | BRL | 1/02/20 | $ | — | $ | (537 | ) |
| Receive Fixed rate 11.30% | | | | | | | | | | |
| Pay Floating rate BRL-Brazil Cetip DI Interbank Deposit Rate | BOFA | 259,220 | | BRL | 1/02/20 | | — | | (491 | ) |
| Receive Fixed rate 12.05% | | | | | | | | | | |
| Pay Floating rate BRL-Brazil Cetip DI Interbank Deposit Rate | MSCO | 522,000 | | BRL | 1/02/20 | | 1,348 | | — | |
| Total OTC Swap Contracts | | | | | | $ | 1,348 | $ | (1,028 | ) |
| Total Interest Rate Swap Contracts | | | | | | $ | 2,146 | $ | (1,028 | ) |
| Net unrealized appreciation (depreciation) | | | | | | $ | 1,118 | | | |
See Abbreviations on page 35.
20 Semiannual Report | The accompanying notes are an integral part of these financial statements.
franklintempleton.com
FRANKLIN ALTERNATIVE STRATEGIES FUNDS
Consolidated Financial Statements
Consolidated Statement of Assets and Liabilities
November 30, 2016 (unaudited)
| | | |
| Franklin K2 Global Macro Opportunities Fund | | | |
| |
| Assets: | | | |
| Investments in securities: | | | |
| Cost - Unaffiliated issuers | $ | 12,693,103 | |
| Cost - Repurchase agreements | | 4,131,059 | |
| Total cost of investments | $ | 16,824,162 | |
| Value - Unaffiliated issuers | $ | 12,614,599 | |
| Value - Repurchase agreements | | 4,131,059 | |
| Total value of investments | | 16,745,658 | |
| Cash | | 5,418,428 | |
| Foreign currency, at value (cost $5,445) | | 5,807 | |
| Receivables: | | | |
| Investment securities sold | | 65,973 | |
| Interest | | 34,671 | |
| Affiliates | | 70,811 | |
| Due from brokers | | 1,579,499 | |
| Variation margin | | 11,832 | |
| Offering costs | | 235,646 | |
| Unrealized appreciation on OTC forward exchange contracts | | 533,531 | |
| Unrealized appreciation on OTC swap contracts | | 1,348 | |
| Total assets | | 24,703,204 | |
| Liabilities: | | | |
| Payables: | | | |
| Investment securities purchased | | 35,649 | |
| Distribution fees | | 106 | |
| Transfer agent fees | | 1,860 | |
| Trustees’ fees and expenses | | 1,383 | |
| Due to brokers | | 134,252 | |
| Unrealized depreciation on OTC forward exchange contracts | | 375,555 | |
| Unrealized depreciation on OTC swap contracts | | 1,028 | |
| Accrued expenses and other liabilities | | 42,548 | |
| Total liabilities | | 592,381 | |
| Net assets, at value | $ | 24,110,823 | |
| Net assets consist of: | | | |
| Paid-in capital | $ | 25,173,994 | |
| Accumulated net investment loss | | (79,873 | ) |
| Net unrealized appreciation (depreciation) | | 120,838 | |
| Accumulated net realized gain (loss) | | (1,104,136 | ) |
| Net assets, at value | $ | 24,110,823 | |
franklintempleton.com
The accompanying notes are an integral part of these financial statements. | Semiannual Report 21
FRANKLIN ALTERNATIVE STRATEGIES FUNDS
CONSOLIDATED FINANCIAL STATEMENTS
| | |
| Consolidated Statement of Assets and Liabilities (continued) | | |
| November 30, 2016 (unaudited) | | |
| |
| Franklin K2 Global Macro Opportunities Fund | | |
| |
| Class A: | | |
| Net assets, at value | $ | 18,961 |
| Shares outstanding | | 1,981 |
| Net asset value per sharea | $ | 9.57 |
| Maximum offering price per share (net asset value per share ÷ 94.25%) | $ | 10.15 |
| Class C: | | |
| Net assets, at value | $ | 143,062 |
| Shares outstanding | | 14,993 |
| Net asset value and maximum offering price per sharea | $ | 9.54 |
| Class R: | | |
| Net assets, at value | $ | 9,570 |
| Shares outstanding | | 1,000 |
| Net asset value and maximum offering price per share | $ | 9.57 |
| Class R6: | | |
| Net assets, at value | $ | 9,572 |
| Shares outstanding | | 1,000 |
| Net asset value and maximum offering price per share | $ | 9.57 |
| Advisor Class: | | |
| Net assets, at value | $ | 23,929,658 |
| Shares outstanding | | 2,498,745 |
| Net asset value and maximum offering price per share | $ | 9.58 |
aRedemption price is equal to net asset value less contingent deferred sales charges, if applicable.
22 Semiannual Report | The accompanying notes are an integral part of these financial statements.
franklintempleton.com
FRANKLIN ALTERNATIVE STRATEGIES FUNDS
CONSOLIDATED FINANCIAL STATEMENTS
Consolidated Statement of Operations
for the period ended November 30, 2016a (unaudited)
| | | |
| Franklin K2 Global Macro Opportunities Fund | | | |
| |
| Investment income: | | | |
| Interest | $ | 107,087 | |
| Expenses: | | | |
| Management fees (Note 3a) | | 195,891 | |
| Distribution fees: (Note 3c) | | | |
| Class A | | 10 | |
| Class C | | 314 | |
| Class R | | 8 | |
| Transfer agent fees: (Note 3d) | | | |
| Class A | | 1 | |
| Class C | | 6 | |
| Class R | | 1 | |
| Class R6 | | 5 | |
| Advisor Class | | 1,902 | |
| Custodian fees (Note 4) | | 23,816 | |
| Reports to shareholders | | 2,052 | |
| Registration and filing fees | | 1,252 | |
| Professional fees | | 40,687 | |
| Trustees’ fees and expenses | | 3,395 | |
| Amortization of offering costs | | 150,054 | |
| Other | | 1,664 | |
| Total expenses | | 421,058 | |
| Expenses waived/paid by affiliates (Note 3e) | | (234,098 | ) |
| Net expenses | | 186,960 | |
| Net investment income (loss) | | (79,873 | ) |
| Realized and unrealized gains (losses): | | | |
| Net realized gain (loss) from: | | | |
| Investments | | 37,960 | |
| Foreign currency transactions | | (27,825 | ) |
| Futures contracts | | (1,110,467 | ) |
| Swap contracts | | (3,804 | ) |
| Net realized gain (loss) | | (1,104,136 | ) |
| Net change in unrealized appreciation (depreciation) on: | | | |
| Investments | | (78,504 | ) |
| Translation of other assets and liabilities denominated in foreign currencies | | 157,053 | |
| Futures contracts | | 42,196 | |
| Swap contracts | | 93 | |
| Net change in unrealized appreciation (depreciation) | | 120,838 | |
| Net realized and unrealized gain (loss) | | (983,298 | ) |
| Net increase (decrease) in net assets resulting from operations | $ | (1,063,171 | ) |
aFor the period July 11, 2016 (commencement of operations) to November 30, 2016.
franklintempleton.com
The accompanying notes are an integral part of these financial statements. | Semiannual Report 23
FRANKLIN ALTERNATIVE STRATEGIES FUNDS
CONSOLIDATED FINANCIAL STATEMENTS
| | | |
| Consolidated Statement of Changes in Net Assets | | | |
| |
| Franklin K2 Global Macro Opportunities Fund | | | |
| |
| | | Period Ended | |
| | | November 30, 2016a | |
| | | (unaudited) | |
| Increase (decrease) in net assets: | | | |
| Operations: | | | |
| Net investment income (loss) | $ | (79,873 | ) |
| Net realized gain (loss) | | (1,104,136 | ) |
| Net change in unrealized appreciation (depreciation) | | 120,838 | |
| Net increase (decrease) in net assets resulting from operations | | (1,063,171 | ) |
| Capital share transactions: (Note 2) | | | |
| Class A | | 19,536 | |
| Class C | | 147,371 | |
| Class R | | 10,000 | |
| Class R6 | | 10,000 | |
| Advisor Class | | 24,987,087 | |
| Total capital share transactions | | 25,173,994 | |
| Net increase (decrease) in net assets | | 24,110,823 | |
| Net assets: | | | |
| End of period | $ | 24,110,823 | |
| Accumulated net investment loss included in net assets: | | | |
| End of period | $ | (79,873 | ) |
aFor the period July 11, 2016 (commencement of operations) to November 30, 2016.
24 Semiannual Report | The accompanying notes are an integral part of these financial statements.
franklintempleton.com
FRANKLIN ALTERNATIVE STRATEGIES FUNDS
Notes to Consolidated Financial Statements (unaudited)
Franklin K2 Global Macro Opportunities Fund
1. Organization and Significant Accounting Policies
Franklin Alternative Strategies Funds (Trust) is registered under the Investment Company Act of 1940 (1940 Act) as an open-end management investment company, consisting of four separate funds and applies the specialized accounting and reporting guidance in U.S. Generally Accepted Accounting Principles (U.S. GAAP). Franklin K2 Global Macro Opportunities Fund (Fund) is included in this report. The financial statements of the remaining funds in the Trust are presented separately. The Fund commenced operations on July 11, 2016, with five classes of shares: Class A, Class C, Class R, Class R6 and Advisor Class. Effective August 1, 2016, the Fund began publicly offering its shares. Each class of shares differs by its initial sales load, contingent deferred sales charges, voting rights on matters affecting a single class, its exchange privilege and fees primarily due to differing arrangements for distribution and transfer agent fees.
The following summarizes the Fund’s significant accounting policies.
a. Financial Instrument Valuation
The Fund’s investments in financial instruments are carried at fair value daily. Fair value is the price that would be received to sell an asset or paid to transfer a liability in an orderly transaction between market participants on the measurement date. The Fund calculates the net asset value (NAV) per share as of 4 p.m. Eastern time each day the New York Stock Exchange (NYSE) is open for trading. Under compliance policies and procedures approved by the Trust’s Board of Trustees (the Board), the Fund’s administrator has responsibility for oversight of valuation, including leading the cross-functional Valuation Committee (VC). The VC provides administration and oversight of the Fund’s valuation policies and procedures, which are approved annually by the Board. Among other things, these procedures allow the Fund to utilize independent pricing services, quotations from securities and financial instrument dealers, and other market sources to determine fair value.
Debt securities generally trade in the OTC market rather than on a securities exchange. The Fund’s pricing services use multiple valuation techniques to determine fair value. In instances where sufficient market activity exists, the pricing services may utilize a market-based approach through which quotes from market makers are used to determine fair value. In instances where sufficient market activity may not exist or is limited, the pricing services also utilize proprietary valuation models which may consider market characteristics such as benchmark yield curves, credit spreads, estimated default rates, anticipated market interest rate volatility, coupon rates, anticipated timing of principal repayments, underlying collateral, and other unique security features in order to estimate the relevant cash flows, which are then discounted to calculate the fair value. Securities denominated in a foreign currency are converted into their U.S. dollar equivalent at the foreign exchange rate in effect at 4 p.m. Eastern time on the date that the values of the foreign
debt securities are determined.
Investments in open-end mutual funds are valued at the closing NAV. Investments in repurchase agreements are valued at cost, which approximates fair value.
Derivative financial instruments (derivatives) listed on an exchange are valued at the official closing price of the day. Certain derivative financial instruments trade in the OTC market. The Fund’s pricing services use various techniques including industry standard option pricing models and proprietary discounted cash flow models to determine the fair value of those instruments. The Fund’s net benefit or obligation under the derivative contract, as measured by the fair value of the contract, is included in net assets.
The Fund has procedures to determine the fair value of financial instruments for which market prices are not reliable or readily available. Under these procedures, the VC convenes on a regular basis to review such financial instruments and considers a number of factors, including significant unobservable valuation inputs, when arriving at fair value. The VC primarily employs a market-based approach which may use related or comparable assets or liabilities, recent transactions, market multiples, book values, and other relevant information for the investment to determine the fair value of the investment. An income-based valuation approach may also be used in which the anticipated future cash flows of the investment are discounted to calculate fair value. Discounts may also be applied due to the nature or duration of any restrictions on the disposition of the investments. Due to the inherent uncertainty of valuations of such investments, the fair values may differ significantly from the values that would have been used had an active market existed. The VC employs various methods for calibrating these valuation approaches including a regular review of key inputs and assumptions, transactional back-testing or disposition analysis, and reviews of any related market activity.
franklintempleton.com
Semiannual Report 25
FRANKLIN ALTERNATIVE STRATEGIES FUNDS
NOTES TO CONSOLIDATED FINANCIAL STATEMENTS (UNAUDITED)
Franklin K2 Global Macro Opportunities Fund (continued)
1. Organization and Significant Accounting
Policies (continued)
b. Foreign Currency Translation
Portfolio securities and other assets and liabilities denominated in foreign currencies are translated into U.S. dollars based on the exchange rate of such currencies against U.S. dollars on the date of valuation. The Fund may enter into foreign currency exchange contracts to facilitate transactions denominated in a foreign currency. Purchases and sales of securities, income and expense items denominated in foreign currencies are translated into U.S. dollars at the exchange rate in effect on the transaction date. Portfolio securities and assets and liabilities denominated in foreign currencies contain risks that those currencies will decline in value relative to the U.S. dollar. Occasionally, events may impact the availability or reliability of foreign exchange rates used to convert the U.S. dollar equivalent value. If such an event occurs, the foreign exchange rate will be valued at fair value using procedures established and approved by the Board.
The Fund does not separately report the effect of changes in foreign exchange rates from changes in market prices on securities held. Such changes are included in net realized and unrealized gain or loss from investments in the Consolidated Statement of Operations.
Realized foreign exchange gains or losses arise from sales of foreign currencies, currency gains or losses realized between the trade and settlement dates on securities transactions and the difference between the recorded amounts of dividends, interest, and foreign withholding taxes and the U.S. dollar equivalent of the amounts actually received or paid. Net unrealized foreign exchange gains and losses arise from changes in foreign exchange rates on foreign denominated assets and liabilities other than investments in securities held at the end of the reporting period.
c. Joint Repurchase Agreement
The Fund enters into a joint repurchase agreement whereby its uninvested cash balance is deposited into a joint cash account with other funds managed by the investment manager or an affiliate of the investment manager and is used to invest in one or more repurchase agreements. The value and face amount of the joint repurchase agreement are allocated to the funds based on their pro-rata interest. A repurchase agreement is accounted for as a loan by the Fund to the seller, collateralized by securities which are delivered to the Fund’s custodian. The fair value, including accrued interest, of the initial collateralization is required to be at least 102% of the dollar amount invested by the funds, with the value of the underlying securities marked to market daily to maintain coverage of at least 100%. Repurchase agreements are subject to the terms of Master Repurchase Agreements (MRAs) with approved counterparties (sellers). The MRAs contain various provisions, including but not limited to events of default and maintenance of collateral for repurchase agreements. In the event of default by either the seller or the Fund, certain MRAs may permit the non-defaulting party to net and close-out all transactions, if any, traded under such agreements. The Fund may sell securities it holds as collateral and apply the proceeds towards the repurchase price and any other amounts owed by the seller to the Fund in the event of default by the seller. This could involve costs or delays in addition to a loss on the securities if their value falls below the repurchase price owed by the seller. The joint repurchase agreement held by the Fund at period end, as indicated in the Consolidated Statement of Investments, had been entered into on November 30, 2016.
d. Derivative Financial Instruments
The Fund invested in derivatives in order to manage risk or gain exposure to various other investments or markets. Derivatives are financial contracts based on an underlying or notional amount, require no initial investment or an initial net investment that is smaller than would normally be required to have a similar response to changes in market factors, and require or permit net settlement. Derivatives contain various risks including the potential inability of the counterparty to fulfill their obligations under the terms of the contract, the potential for an illiquid secondary market, and/or the potential for market movements which expose the Fund to gains or losses in excess of the amounts shown in the Consolidated Statement of Assets and Liabilities. Realized gain and loss and unrealized appreciation and depreciation on these contracts for the period are included in the Consolidated Statement of Operations.
Derivative counterparty credit risk is managed through a formal evaluation of the creditworthiness of all potential counterpar-ties. The Fund attempts to reduce its exposure to counterparty credit risk on OTC derivatives, whenever possible, by entering into International Swaps and Derivatives Association (ISDA) master agreements with certain counterparties. These agreements contain various provisions, including but not limited to collateral requirements, events of default, or early termination. Termination events applicable to the counterparty include
26 Semiannual Report
franklintempleton.com
FRANKLIN ALTERNATIVE STRATEGIES FUNDS
NOTES TO CONSOLIDATED FINANCIAL STATEMENTS (UNAUDITED)
Franklin K2 Global Macro Opportunities Fund (continued)
certain deteriorations in the credit quality of the counterparty. Termination events applicable to the Fund include failure of the Fund to maintain certain net asset levels and/or limit the decline in net assets over various periods of time. In the event of default or early termination, the ISDA master agreement gives the non-defaulting party the right to net and close-out all transactions traded, whether or not arising under the ISDA agreement, to one net amount payable by one counterparty to the other. However, absent an event of default or early termination, OTC derivative assets and liabilities are presented gross and not offset in the Consolidated Statement of Assets and Liabilities. Early termination by the counterparty may result in an immediate payment by the Fund of any net liability owed to that counterparty under the ISDA agreement.
Collateral requirements differ by type of derivative. Collateral or initial margin requirements are set by the broker or exchange clearing house for exchange traded and centrally cleared derivatives. Initial margin deposited is held at the exchange and can be in the form of cash and/or securities. For OTC derivatives traded under an ISDA master agreement, posting of collateral is required by either the Fund or the applicable counterparty if the total net exposure of all OTC derivatives with the applicable counterparty exceeds the minimum transfer amount, which typically ranges from $100,000 to $250,000, and can vary depending on the counterparty and the type of the agreement. Generally, collateral is determined at the close of Fund business each day and any additional collateral required due to changes in derivative values may be delivered by the Fund or the coun-terparty within a few business days. Collateral pledged and/or received by the Fund for OTC derivatives, if any, is held in segregated accounts with the Fund’s custodian/counterparty broker and can be in the form of cash and/or securities. Unrestricted cash may be invested according to the Fund’s investment objectives. To the extent that the amounts due to the Fund from its counterparties are not subject to collateralization or are not fully collateralized, the Fund bears the risk of loss from counter-party non-performance.
The Fund entered into exchange traded futures contracts primarily to manage and/or gain exposure to commodity price, interest rate, certain foreign currencies and equity price risk. A futures contract is an agreement between the Fund and a coun-terparty to buy or sell an asset at a specified price on a future date. Required initial margins are pledged by the Fund, and the daily change in fair value is accounted for as a variation margin payable or receivable in the Consolidated Statement of Assets and Liabilities.
The Fund entered into OTC forward exchange contracts primarily to manage and/or gain exposure to certain foreign currencies. A forward exchange contract is an agreement between the Fund and a counterparty to buy or sell a foreign currency at a specific exchange rate on a future date.
The Fund entered into credit default swap contracts primarily to manage and/or gain exposure to credit risk. A credit default swap is an agreement between the Fund and a counterparty whereby the buyer of the contract receives credit protection and the seller of the contract guarantees the credit worthiness of a referenced debt obligation. These agreements may be privately negotiated in the over-the-counter market (OTC credit default swaps) or may be executed in a multilateral trade facility platform, such as a registered exchange (centrally cleared credit default swaps). The underlying referenced debt obligation may be a single issuer of corporate or sovereign debt, a credit index, a basket of issuers or indices, or a tranche of a credit index or basket of issuers or indices. In the event of a default of the underlying referenced debt obligation, the buyer is entitled to receive the notional amount of the credit default swap contract from the seller in exchange for the referenced debt obligation, a net settlement amount equal to the notional amount of the credit default swap less the recovery value of the referenced debt obligation, or other agreed upon amount. For centrally cleared credit default swaps, required initial margins are pledged by the Fund, and the daily change in fair value is accounted for as a variation margin payable or receivable in the Consolidated Statement of Assets and Liabilities. Over the term of the contract, the buyer pays the seller a periodic stream of payments, provided that no event of default has occurred. Such periodic payments are accrued daily as an unrealized appreciation or depreciation until the payments are made, at which time they are realized. Upfront payments and receipts are reflected in the Consolidated Statement of Assets and Liabilities and represent compensating factors between stated terms of the credit default swap agreement and prevailing market conditions (credit spreads and other relevant factors). These upfront payments and receipts are amortized over the term of the contract as a realized gain or loss in the Consolidated Statement of Operations.
The Fund entered into interest rate swap contracts primarily to manage interest rate risk. An interest rate swap is an agreement between the Fund and a counterparty to exchange cash flows based on the difference between two interest rates, applied to a notional amount. These agreements may be privately negotiated in the over-the-counter market (OTC interest rate swaps) or may be executed on a registered exchange (centrally cleared
franklintempleton.com
Semiannual Report 27
FRANKLIN ALTERNATIVE STRATEGIES FUNDS
NOTES TO CONSOLIDATED FINANCIAL STATEMENTS (UNAUDITED)
Franklin K2 Global Macro Opportunities Fund (continued)
1. Organization and Significant Accounting
Policies (continued)
d. Derivative Financial Instruments (continued)
interest rate swaps). For centrally cleared interest rate swaps, required initial margins are pledged by the Fund, and the daily change in fair value is accounted for as a variation margin payable or receivable in the Consolidated Statement of Assets and Liabilities. Over the term of the contract, contractually required payments to be paid and to be received are accrued daily and recorded as unrealized depreciation and appreciation until the payments are made, at which time they are realized.
The Fund purchased or wrote exchange traded option contracts primarily to manage and/or gain exposure to equity price risk. An option is a contract entitling the holder to purchase or sell a specific amount of shares or units of an asset or notional amount of a swap (swaption), at a specified price. When an option is purchased or written, an amount equal to the premium paid or received is recorded as an asset or liability, respectively. Upon exercise of an option, the acquisition cost or sales proceeds of the underlying investment is adjusted by any premium received or paid. Upon expiration of an option, any premium received or paid is recorded as a realized gain or loss. Upon closing an option other than through expiration or exercise, the difference between the premium received or paid and the cost to close the position is recorded as a realized gain or loss.
See Note 7 regarding other derivative information.
e. Investments in K2 GMOF Holdings Corp. (K2 Subsidiary)
The Fund invests in certain financial instruments and commodity-linked derivative investments through its investment in the K2 Subsidiary. The K2 Subsidiary is a Cayman Islands exempted company with limited liability, is a wholly owned subsidiary of the Fund, and is able to invest in certain financial instruments and commodity-linked derivative investments consistent with the investment objective of the Fund. At November 30, 2016, the K2 Subsidiary’s investments, as well as any other assets and liabilities of the K2 Subsidiary, are reflected in the Fund’s Consolidated Statement of Investments and Consolidated Statement of Assets and Liabilities. The financial statements have been consolidated and include the accounts of the Fund and the K2 Subsidiary. All intercompany transactions and balances have been eliminated. At November 30, 2016, the net assets of the K2 Subsidiary were $5,624,260, representing 23.3% of the Fund’s consolidated net assets. The Fund’s investment in the K2 Subsidiary is limited to 25% of consolidated assets.
The results from operations of the K2 Subsidiary for the period ended November 30, 2016, were as follows:
| | | |
| Net investment income (loss) | $ | (43,391 | ) |
| Net realized gain (loss) | | (481,086 | ) |
| Net change in unrealized appreciation | | | |
| (depreciation) | | (51,263 | ) |
| Net increase (decrease) in net assets resulting | | | |
| from operations | $ | (575,740 | ) |
f. Income and Deferred Taxes
It is the Fund’s policy to qualify as a regulated investment company under the Internal Revenue Code. The Fund intends to distribute to shareholders substantially all of its taxable income and net realized gains to relieve it from federal income and excise taxes. As a result, no provision for U.S. federal income taxes is required.
The Fund may be subject to foreign taxation related to income received, capital gains on the sale of securities and certain foreign currency transactions in the foreign jurisdictions in which it invests. Foreign taxes, if any, are recorded based on the tax regulations and rates that exist in the foreign markets in which the Fund invests. When a capital gain tax is determined to apply, the Fund records an estimated deferred tax liability in an amount that would be payable if the securities were disposed of on the valuation date.
The Fund may recognize an income tax liability related to its uncertain tax positions under U.S. GAAP when the uncertain tax position has a less than 50% probability that it will be sustained upon examination by the tax authorities based on its technical merits. As of November 30, 2016, the Fund has determined that no tax liability is required in its consolidated financial statements related to uncertain tax positions (or expected to be taken in future tax years).
g. Security Transactions, Investment Income, Expenses and Distributions
Security transactions are accounted for on trade date. Realized gains and losses on security transactions are determined on a specific identification basis. Interest income and estimated expenses are accrued daily. Amortization of premium and accretion of discount on debt securities are included in interest income. Distributions to shareholders are recorded on the
28 Semiannual Report
franklintempleton.com
FRANKLIN ALTERNATIVE STRATEGIES FUNDS
NOTES TO CONSOLIDATED FINANCIAL STATEMENTS (UNAUDITED)
Franklin K2 Global Macro Opportunities Fund (continued)
ex-dividend date and are determined according to income tax regulations (tax basis). Distributable earnings determined on a tax basis may differ from earnings recorded in accordance with U.S. GAAP. These differences may be permanent or temporary. Permanent differences are reclassified among capital accounts to reflect their tax character. These reclassifications have no impact on net assets or the results of operations. Temporary differences are not reclassified, as they may reverse in subsequent periods.
Common expenses incurred by the Trust are allocated among the funds based on the ratio of net assets of each fund to the combined net assets of the Trust. Fund specific expenses are charged directly to the fund that incurred the expense.
Realized and unrealized gains and losses and net investment income, not including class specific expenses, are allocated daily to each class of shares based upon the relative proportion of net assets of each class. Differences in per share distributions, by class, are generally due to differences in class specific expenses.
h. Offering Costs
Offering costs are amortized on a straight line basis over twelve months.
2. Shares of Beneficial Interest
i. Accounting Estimates
The preparation of financial statements in accordance with U.S. GAAP requires management to make estimates and assumptions that affect the reported amounts of assets and liabilities at the date of the financial statements and the amounts of income and expenses during the reporting period. Actual results could differ from those estimates.
j. Guarantees and Indemnifications
Under the Trust’s organizational documents, its officers and trustees are indemnified by the Trust against certain liabilities arising out of the performance of their duties to the Trust. Additionally, in the normal course of business, the Trust, on behalf of the Fund, enters into contracts with service providers that contain general indemnification clauses. The Trust’s maximum exposure under these arrangements is unknown as this would involve future claims that may be made against the Trust that have not yet occurred. Currently, the Trust expects the risk of loss to be remote.
At November 30, 2016, there were an unlimited number of shares authorized (without par value). Transactions in the Fund’s shares were as follows:
| | | | | |
| | Period Ended | |
| | November 30, 2016a | |
| | Shares | | | Amount | |
| |
| Class A Shares: | | | | | |
| Shares sold | 2,163 | | $ | 21,294 | |
| Shares redeemed | (182 | ) | | (1,758 | ) |
| Net increase (decrease) | 1,981 | | $ | 19,536 | |
| Class C Shares: | | | | | |
| Shares sold | 14,994 | | $ | 147,381 | |
| Shares redeemed | (1 | ) | | (10 | ) |
| Net increase (decrease) | 14,993 | | $ | 147,371 | |
| Class R Shares: | | | | | |
| Shares sold | 1,001 | | $ | 10,010 | |
| Shares redeemed | (1 | ) | | (10 | ) |
| Net increase (decrease) | 1,000 | | $ | 10,000 | |
franklintempleton.com
Semiannual Report 29
FRANKLIN ALTERNATIVE STRATEGIES FUNDS
NOTES TO CONSOLIDATED FINANCIAL STATEMENTS (UNAUDITED)
| | | | | | |
| Franklin K2 Global Macro Opportunities Fund (continued) | | | | | | |
| |
| 2. Shares of Beneficial Interest (continued) | | | | | | |
| | Period Ended | |
| | November 30, 2016a | |
| | Shares | | | Amount | |
| Class R6 Shares: | | | | | | |
| Shares sold | 1,001 | | | $ | 10,010 | |
| Shares redeemed | (1 | ) | | | (10 | ) |
| Net increase (decrease) | 1,000 | | | $ | 10,000 | |
| Advisor Class Shares: | | | | | | |
| Shares sold | 2,498,746 | | $ | 24,987,097 | |
| Shares redeemed | (1 | ) | | | (10 | ) |
| Net increase (decrease) | 2,498,745 | | $ | 24,987,087 | |
| aFor the period July 11, 2016 (commencement of operations) to November 30, 2016. | | | | | | |
3. Transactions with Affiliates
Franklin Resources, Inc. is the holding company for various subsidiaries that together are referred to as Franklin Templeton Investments. Certain officers and trustees of the Trust are also officers and/or directors of the following subsidiaries:
| | |
| Subsidiary | | Affiliation |
| K2/D&S Management Co., L.L.C. (K2 Advisors) | | Investment manager |
| Franklin Templeton Services, LLC (FT Services) | | Administrative manager |
| Franklin Templeton Distributors, Inc. (Distributors) | | Principal underwriter |
| Franklin Templeton Investor Services, LLC (Investor Services) | | Transfer agent |
a. Management Fees
The Fund and K2 Subsidiary pay an investment management fee to K2 Advisors of 2.05% per year of the average daily net assets of the Fund and K2 Subsidiary. Management fees paid by the Fund are reduced on assets invested in the K2 Subsidiary, in an amount not to exceed the management fees paid by the K2 Subsidiary.
Under each subadvisory agreement, the below entities provide subadvisory services to the Fund or K2 Subsidiary. The subadvisory fees are paid by K2 Advisors based on the Fund and K2 Subsidiary average daily net assets, and is not an additional expense of the Fund or K2 Subsidiary.
| Subadvisors |
|
| Aspect Capital Limited |
| Emso Asset Management Limited |
| Graham Capital Management L.P. |
b. Administrative Fees
Under an agreement with K2 Advisors, FT Services provides administrative services to the Fund and K2 Subsidiary. The fee is paid by K2 Advisors based on the Fund and K2 Subsidiary average daily net assets, and is not an additional expense of the Fund or K2 Subsidiary.
c. Distribution Fees
The Board has adopted distribution plans for each share class, with the exception of Class R6 and Advisor Class shares, pursuant to Rule 12b-1 under the 1940 Act. Under the Fund’s Class A reimbursement distribution plan, the Fund reimburses Distributors for
30 Semiannual Report
franklintempleton.com
FRANKLIN ALTERNATIVE STRATEGIES FUNDS
NOTES TO CONSOLIDATED FINANCIAL STATEMENTS (UNAUDITED)
Franklin K2 Global Macro Opportunities Fund (continued)
costs incurred in connection with the servicing, sale and distribution of the Fund’s shares up to the maximum annual plan rate. Under the Class A reimbursement distribution plan, costs exceeding the maximum for the current plan year cannot be reimbursed in subsequent periods. In addition, under the Fund’s Class C and R compensation distribution plans, the Fund pays Distributors for costs incurred in connection with the servicing, sale and distribution of the Fund’s shares up to the maximum annual plan rate for each class. The plan year, for purposes of monitoring compliance with the maximum annual plan rates, is February 1 through January 31 for each fund.
The maximum annual plan rates, based on the average daily net assets, for each class, are as follows:
| | |
| Class A | 0.25 | % |
| Class C | 1.00 | % |
| Class R | 0.50 | % |
d. Transfer Agent Fees
Each class of shares, except for Class R6, pays transfer agent fees to Investor Services for its performance of shareholder servicing obligations and reimburses Investor Services for out of pocket expenses incurred, including shareholder servicing fees paid to third parties. These fees are allocated daily based upon their relative proportion of such classes’ aggregate net assets. Class R6 pays Investor Services transfer agent fees specific to that class.
For the period ended November 30, 2016, the Fund paid transfer agent fees of $1,915, of which $74 was retained by Investor Services.
e. Waiver and Expense Reimbursements
K2 Advisors has contractually agreed in advance to waive or limit its fees and to assume as its own expense certain expenses otherwise payable by the Fund so that the expenses (excluding distribution fees, acquired fund fees and expenses, and expenses related to securities sold short) for each class of the Fund do not exceed 1.95%, and Class R6 does not exceed 1.94% based on the average net assets of each class (other than certain non-routine expenses or costs, including those relating to litigation, indemnification, reorganizations, and liquidations) until September 30, 2017. Total expenses waived or paid are not subject to recapture subsequent to the Fund’s fiscal year end.
f. Other Affiliated Transactions
At November 30, 2016, Franklin Resources Inc. owned 99.3% of the Fund’s outstanding shares. Investment activities of this shareholder could have a material impact on the Fund.
4. Expense Offset Arrangement
The Fund has entered into an arrangement with its custodian whereby credits realized as a result of uninvested cash balances are used to reduce a portion of the Fund’s custodian expenses. During the period ended November 30, 2016, there were no credits earned.
5. Income Taxes
At November 30, 2016, the cost of investments and net unrealized appreciation (depreciation) for income tax purposes were as follows:
| | | |
| Cost of investments | $ | 16,825,597 | |
| Unrealized appreciation | $ | 31,578 | |
| Unrealized depreciation | | (111,517 | ) |
| Net unrealized appreciation (depreciation) | $ | (79,939 | ) |
franklintempleton.com
Semiannual Report 31
FRANKLIN ALTERNATIVE STRATEGIES FUNDS
NOTES TO CONSOLIDATED FINANCIAL STATEMENTS (UNAUDITED)
Franklin K2 Global Macro Opportunities Fund (continued)
5. Income Taxes (continued)
Differences between income and/or capital gains as determined on a book basis and a tax basis are primarily due to differing treatments of bond discounts and premiums.
6. Investment Transactions
Purchases and sales of investments (excluding short term securities) for the period ended November 30, 2016, aggregated $4,557,786 and $2,249,382, respectively.
7. Other Derivative Information
At November 30, 2016, the Fund’s investments in derivative contracts are reflected in the Consolidated Statement of Assets and Liabilities as follows:
| | | | | | | | |
| | Asset Derivatives | | Liability Derivatives | |
| Derivative Contracts | Consolidated Statement of | | | | Consolidated Statement of | | | |
| Not Accounted for as | Assets and Liabilities | | | | Assets and Liabilities | | | |
| Hedging Instruments | Location | | Fair Value | | Location | | Fair Value | |
| Interest rate contracts | Variation margin | $ | 52,543 | a | Variation margin | $ | 7,446 | a |
| | Unrealized appreciation on | | 1,348 | | Unrealized depreciation on | | 1,028 | |
| | OTC swap contracts | | | | OTC swap contracts | | | |
| Foreign exchange contracts | Variation margin | | 83,409 | a | Variation margin | | 21,177 | a |
| | Unrealized appreciation on | | 533,531 | | Unrealized depreciation on | | 375,555 | |
| | OTC forward exchange | | | | OTC forward exchange | | | |
| | contracts | | | | contracts | | | |
| Credit contracts | Variation margin | | 3,467 | a | Variation margin | | 4,492 | a |
| Equity contracts | Investments in securities, at | | 425 | b | | | | |
| | value | | | | | | | |
| | Variation margin | | 89,607 | a | Variation margin | | 102,683 | a |
| Commodity contracts | Variation margin | | 278,351 | a | Variation margin | | 329,610 | a |
| Totals | | $ | 1,042,681 | | | $ | 841,991 | |
aThis amount reflects the cumulative appreciation (depreciation) of futures contracts and centrally cleared swap contracts as reported in the Consolidated Statement of Invest-
ments. Only the variation margin receivable/payable at period end is separately reported within the Consolidated Statement of Assets and Liabilities. Prior variation margin
movements were recorded to cash upon receipt or payment.
bPurchased option contracts are included in investments in securities, at value in the Consolidated Statement of Assets and Liabilities.
32 Semiannual Report
franklintempleton.com
FRANKLIN ALTERNATIVE STRATEGIES FUNDS
NOTES TO CONSOLIDATED FINANCIAL STATEMENTS (UNAUDITED)
Franklin K2 Global Macro Opportunities Fund (continued)
For the period ended November 30, 2016, the effect of derivative contracts in the Fund’s Consolidated Statement of Operations was as follows:
| | | | | | | | |
| | | | | | | | Net Change | |
| | | | | | | | in Unrealized | |
| Derivative Contracts | | | Net Realized | | | | Appreciation | |
| Not Accounted for as | Consolidated Statement of | | Gain (Loss) | | Consolidated Statement of | | (Depreciation) | |
| Hedging Instruments | Operations Location | | for the Period | | Operations Location | | for the Period | |
| | Net realized gain (loss) from: | | | | Net change in unrealized | | | |
| | | | | | appreciation (depreciation) on: | | | |
| Interest rate contracts | Futures contracts | $ | (418,562 | ) | Futures contracts | $ | 44,299 | |
| | | | | | Swap contracts | | 1,118 | |
| Foreign exchange contracts | Foreign currency transactions | | (26,588 | )a | Translation of other assets and | | 157,976 | a |
| | | | | | liabilities denominated in | | | |
| | | | | | foreign currencies | | | |
| | Futures contracts | | (160,351 | ) | Futures contracts | | 62,231 | |
| Credit contracts | Swap contracts | | (3,804 | ) | Swap contracts | | (1,025 | ) |
| Equity contracts | | | | | Investments | | (1,455 | )b |
| | Futures contracts | | (50,528 | ) | Futures contracts | | (13,075 | ) |
| Commodity contracts | Futures contracts | | (481,026 | ) | Futures contracts | | (51,259 | ) |
| Totals | | $ | (1,140,859 | ) | | $ | 198,810 | |
aForward exchange contracts are included in net realized gain (loss) from foreign currency transactions and net change in unrealized appreciation (depreciation) translation of
other assets and liabilities denominated in foreign currencies in the Consolidated Statement of Operations.
bPurchased option contracts are included in net change in unrealized appreciation (depreciation) on investments in the Consolidated Statement of Operations.
For the period ended November 30, 2016, the average month end fair value of derivatives represented 3.4% of average month end net assets. The average month end number of open derivative contracts for the period was 293.
At November 30, 2016, the Fund’s OTC derivative assets and liabilities are as follows:
| | | | |
| | | Gross Amounts |
| | | of Assets and Liabilities |
| | | Presented in the |
| | | Consolidated Statement of |
| | | Assets and Liabilities |
| |
| | | Assetsa | | Liabilitiesa |
| Derivatives | | | | |
| Forward Exchange Contracts | $ | 533,531 | $ | 375,555 |
| Swap Contracts | | 1,348 | | 1,028 |
| Total | $ | 534,879 | $ | 376,583 |
aAbsent an event of default or early termination, OTC derivative assets and liabilities are presented gross and not offset in the Consolidated Statement of Assets and Liabilities
franklintempleton.com
Semiannual Report 33
FRANKLIN ALTERNATIVE STRATEGIES FUNDS
NOTES TO CONSOLIDATED FINANCIAL STATEMENTS (UNAUDITED)
Franklin K2 Global Macro Opportunities Fund (continued)
7. Other Derivative Information (continued)
At November 30, 2016, the Fund’s OTC derivative assets, which may be offset against the Fund’s OTC derivative liabilities and collateral received from the counterparty, are as follows:
| | | | | | | | | | | |
| | | | | Amounts Not Offset in the Consolidated | | |
| | | | | Statement of Assets and Liabilities | | |
| |
| | | Gross Amounts of Assets | | | | | Financials | | | | |
| | | Presented in the | | Financial | | | Instruments | | Cash | | |
| | | Consolidated Statement of | | Instruments | | | Collateral | | Collateral | | Net Amount (Not |
| | | Assets and Liabilities | | Available for Offset | | | Received | | Received | | Less than Zero) |
| Counterparty | | | | | | | | | | | |
| BOFA | $ | 34,794 | $ | (16,896 | ) | $ | — | $ | — | $ | 17,898 |
| DBAB | | 6,711 | | (1,634 | ) | | — | | — | | 5,077 |
| JPHQ | | 3,353 | | (3,341 | ) | | — | | — | | 12 |
| MSCO | | 490,021 | | (354,712 | ) | | — | | — | | 135,309 |
| Total | $ | 534,879 | $ | (376,583 | ) | $ | — | $ | — | $ | 158,296 |
At November 30, 2016, the Fund’s OTC derivative liabilities, which may be offset against the Fund’s OTC derivative assets and collateral pledged to the counterparty, are as follows:
| | | | | | | | | | | |
| | | | | Amounts Not Offset in the Consolidated | | |
| | | | | Statement of Assets and Liabilities | | |
| |
| | | Gross Amounts of Liabilities | | | | | Financials | | | | |
| | | Presented in the | | Financial | | | Instruments | | Cash | | |
| | | Consolidated Statement of | | Instruments | | | Collateral | | Collateral | | Net Amount (Not |
| | | Assets and Liabilities | | Available for Offset | | | Pledged | | Pledgeda | | Less than Zero) |
| Counterparty | | | | | | | | | | | |
| BOFA | $ | 16,896 | $ | (16,896 | ) | $ | — | $ | — | $ | — |
| DBAB | | 1,634 | | (1,634 | ) | | — | | — | | — |
| JPHQ | | 3,341 | | (3,341 | ) | | — | | — | | — |
| MSCO | | 354,712 | | (354,712 | ) | | — | | — | | — |
| Total | $ | 376,583 | $ | (376,583 | ) | $ | — | $ | — | $ | — |
aIn some instances, the collateral amounts disclosed in the table above were adjusted due to the requirement to the limit collateral amounts to avoid the effect of overcollateral-
ization. Actual collateral received and/or pledged may be more than the amounts disclosed herein.
See Note 1(d) regarding derivative financial instruments.
See Abbreviations on page 35.
8. Fair Value Measurements
The Fund follows a fair value hierarchy that distinguishes between market data obtained from independent sources (observable inputs) and the Fund’s own market assumptions (unobservable inputs). These inputs are used in determining the value of the Fund’s financial instruments and are summarized in the following fair value hierarchy:
- Level 1 – quoted prices in active markets for identical financial instruments
- Level 2 – other significant observable inputs (including quoted prices for similar financial instruments, interest rates, prepay- ment speed, credit risk, etc.)
- Level 3 – significant unobservable inputs (including the Fund’s own assumptions in determining the fair value of financial instruments)
34 Semiannual Report
franklintempleton.com
FRANKLIN ALTERNATIVE STRATEGIES FUNDS
NOTES TO CONSOLIDATED FINANCIAL STATEMENTS (UNAUDITED)
Franklin K2 Global Macro Opportunities Fund (continued)
The input levels are not necessarily an indication of the risk or liquidity associated with financial instruments at that level.
For movements between the levels within the fair value hierarchy, the Fund has adopted a policy of recognizing the transfers as of the date of the underlying event which caused the movement.
A summary of inputs used as of November 30, 2016, in valuing the Fund’s assets and liabilities carried at fair value, is as follows:
| | | | | | | | |
| | | Level 1 | | Level 2 | | Level 3 | | Total |
| |
| Assets: | | | | | | | | |
| Investments in Securities:a | | | | | | | | |
| Corporate Bonds and Notes | $ | — | $ | 916,087 | $ | — | $ | 916,087 |
| Foreign Government and Agency Securities | | — | | 1,610,227 | | — | | 1,610,227 |
| Options Purchased | | 425 | | — | | — | | 425 |
| Short Term Investments | | 10,087,860 | | 4,131,059 | | — | | 14,218,919 |
| Total Investments in Securities | $ | 10,088,285 | $ | 6,657,373 | $ | — | $ | 16,745,658 |
| Other Financial Instruments: | | | | | | | | |
| Futures Contracts | $ | 503,112 | $ | — | $ | — | $ | 503,112 |
| Forward Exchange Contracts | | — | | 533,551 | | — | | 533,551 |
| Swap Contracts | | — | | 5,613 | | — | | 5,613 |
| Total Other Financial Instruments | $ | 503,112 | $ | 539,164 | $ | — | $ | 1,042,276 |
| |
| Liabilities: | | | | | | | | |
| Other Financial Instruments: | | | | | | | | |
| Futures Contracts | $ | 460,916 | $ | — | $ | — | $ | 460,916 |
| Forward Exchange Contracts | | — | | 375,555 | | — | | 375,555 |
| Swap Contracts | | — | | 5,520 | | — | | 5,520 |
| Total Other Financial Instruments | $ | 460,916 | $ | 381,075 | $ | — | $ | 841,991 |
| |
| aFor detailed categories, see the accompanying Consolidated Statement of Investments. | | | | | | | | |
A reconciliation of assets in which Level 3 inputs are used in determining fair value is presented when there are significant Level 3 financial instruments at the end of the period.
9. Subsequent Events
The Fund has evaluated subsequent events through the issuance of the consolidated financial statements and determined that no events have occurred that require disclosure.
| | | | |
| Abbreviations | | | |
| Counterparty/Exchange | Currency | Selected Portfolio |
| BOFA | Bank of America, N.A. | ARS | Argentine Peso | LIBOR London InterBank Offered Rate |
| CME | Chicago Mercantile Exchange | AUD | Australian Dollar | |
| DBAB | Deutsche Bank AG | BRL | Brazilian Real | |
| ICE | Intercontinental Exchange, Inc. | CAD | Canadian Dollar | |
| JPHQ | JP Morgan Chase Bank, N.A. | CHF | Swiss Franc | |
| MSCO | Morgan Stanley & Co., LLC | CZK | Czech Koruna | |
| | | EUR | Euro | |
| | | GBP | British Pound | |
| | | JPY | Japanese Yen | |
| | | NZD | New Zealand Dollar | |
| | | RUB | Russian Ruble | |
| | | USD | United States Dollar | |
franklintempleton.com
Semiannual Report 35
FRANKLIN ALTERNATIVE STRATEGIES FUNDS
FRANKLIN K2 GLOBAL MACRO OPPORTUNITIES FUND
Shareholder Information
Proxy Voting Policies and Procedures
The Fund’s investment manager has established Proxy Voting Policies and Procedures (Policies) that the Fund uses to determine how to vote proxies relating to portfolio securities. Shareholders may view the Fund’s complete Policies online at franklintempleton.com. Alternatively, shareholders may request copies of the Policies free of charge by calling the Proxy Group collect at (954) 527-7678 or by sending a written request to: Franklin Templeton Companies, LLC, 300 S.E. 2nd Street, Fort Lauderdale, FL 33301, Attention: Proxy Group. Copies of the Fund’s proxy voting records are also made available online at franklintempleton.com and posted on the U.S. Securities and Exchange Commission’s website at sec.gov and reflect the most recent 12-month period ended June 30.
Quarterly Statement of Investments
The Trust, on behalf of the Fund, files a complete statement of investments with the U.S. Securities and Exchange Commission for the first and third quarters for each fiscal year on Form N-Q. Shareholders may view the filed Form N-Q by visiting the Commission’s website at sec.gov. The filed form may also be viewed and copied at the Commission’s Public Reference Room in Washington, DC. Information regarding the operations of the Public Reference Room may be obtained by calling (800) SEC-0330.
36 Semiannual Report
franklintempleton.com
Item 2. Code of Ethics.
(a) The Registrant has adopted a code of ethics that applies to its principal executive officers and principal financial and accounting officer.
(c) N/A
(d) N/A
(f) Pursuant to Item 12(a)(1), the Registrant is attaching as an exhibit a copy of its code of ethics that applies to its principal executive officers and principal financial and accounting officer.
Item 3. Audit Committee Financial Expert.
(a)(1) The Registrant has an audit committee financial expert serving on its audit committee.
(2) The audit committee financial expert is Ann Torre Bates and she is “independent” as defined under the relevant Securities and Exchange Commission Rules and Releases.
Item 4. Principal Accountant Fees and Services. N/A
Item 5. Audit Committee of Listed Registrants. N/A
Item 6. Schedule of Investments. N/A
Item 7. Disclosure of Proxy Voting Policies and Procedures for Closed-End Management Investment Companies. N/A
Item 8. Portfolio Managers of Closed-End Management Investment Companies. N/A
Item 9. Purchases of Equity Securities by Closed-End Management Investment Company and Affiliated Purchasers. N/A
Item 10. Submission of Matters to a Vote of Security Holders.
There have been no changes to the procedures by which shareholders may recommend nominees to the Registrant's Board of Trustees that would require disclosure herein.
Item 11. Controls and Procedures.
(a) Evaluation of Disclosure Controls and Procedures. The Registrant maintains disclosure controls and procedures that are designed to ensure that information required to be disclosed in the Registrant’s filings under the Securities Exchange Act of 1934 and the Investment Company Act of 1940 is recorded, processed, summarized and reported within the periods specified in the rules and forms of the Securities and Exchange Commission. Such information is accumulated and communicated to the Registrant’s management, including its principal executive officer and principal financial officer, as appropriate, to allow timely decisions regarding required disclosure. The Registrant’s management, including the principal executive officer and the principal financial officer, recognizes that any set of controls and procedures, no matter how well designed and operated, can provide only reasonable assurance of achieving the desired control objectives.
Within 90 days prior to the filing date of this Shareholder Report on Form N-CSR, the Registrant had carried out an evaluation, under the supervision and with the participation of the Registrant’s management, including the Registrant’s principal executive officer and the Registrant’s principal financial officer, of the effectiveness of the design and operation of the Registrant’s disclosure controls and procedures. Based on such evaluation, the Registrant’s principal executive officer and principal financial officer concluded that the Registrant’s disclosure controls and procedures are effective.
(b) Changes in Internal Controls. There have been no changes in the Registrant’s internal controls or in other factors that could materially affect the internal controls over financial reporting subsequent to the date of their evaluation in connection with the preparation of this Shareholder Report on Form N-CSR.
Item 12. Exhibits.
(a) (1) Code of Ethics
(a)(2) Certifications pursuant to Section 302 of the Sarbanes-Oxley Act of 2002 of Laura F. Fergerson, Chief Executive Officer - Finance and Administration, and Robert G. Kubilis, Chief Financial Officer and Chief Accounting Officer
(b) Certifications pursuant to Section 906 of the Sarbanes-Oxley Act of 2002 of Laura F. Fergerson, Chief Executive Officer - Finance and Administration, and Robert G. Kubilis, Chief Financial Officer and Chief Accounting Officer
SIGNATURES
Pursuant to the requirements of the Securities Exchange Act of 1934 and the Investment Company Act of 1940, the registrant has duly caused this report to be signed on its behalf by the undersigned, thereunto duly authorized.
FRANKLIN ALTERATIVE STRATEGIES FUNDS
By _/s/ Laura F. Fergerson
Laura F. Fergerson
Chief Executive Officer –
Finance and Administration
Date January 26, 2017
Pursuant to the requirements of the Securities Exchange Act of 1934 and the Investment Company Act of 1940, this report has been signed below by the following persons on behalf of the registrant and in the capacities and on the dates indicated.
By __/s/ Laura F. Fergerson
Laura F. Fergerson
Chief Executive Officer –
Finance and Administration
Date January 26, 2017
By _/s/ Robert G. Kubilis
Robert G. Kubilis
Chief Financial Officer and
Chief Accounting Officer
Date January 26, 2017