UNITED STATES
SECURITIES AND EXCHANGE COMMISSION
Washington, DC 20549
FORM N-CSRS
CERTIFIED SHAREHOLDER REPORT OF REGISTERED MANAGEMENT INVESTMENT COMPANIES
Investment Company Act file number_811-22641
__Franklin Alternative Strategies Funds
(Exact name of registrant as specified in charter)
One Franklin Parkway, San Mateo, CA 94403-1906
(Address of principal executive offices) (Zip code)
Craig S. Tyle, One Franklin Parkway, San Mateo, CA 94403-1906
(Name and address of agent for service)
Registrant's telephone number, including area code: 650 312-2000
Date of fiscal year end: 5/31
Date of reporting period: 11/30/15
Item 1. Reports to Stockholders.
| Contents | |
| Semiannual Report | |
| Franklin K2 Alternative Strategies Fund | 3 |
| Performance Summary | 7 |
| Your Fund’s Expenses | 10 |
| Consolidated Financial Highlights and Consolidated | |
| Statement of Investments | 12 |
| Consolidated Financial Statements | 71 |
| Notes to Consolidated Financial Statements | 75 |
| Shareholder Information | 91 |
Visit franklintempleton.com for fund updates, to access your account, or to find helpful financial planning tools.
2 Semiannual Report
franklintempleton.com
Semiannual Report
Franklin K2 Alternative Strategies Fund
This semiannual report for Franklin K2 Alternative Strategies Fund covers the period ended November 30, 2015.
Your Fund’s Goal and Main Investments
The Fund seeks capital appreciation with lower volatility relative to the broad equity markets. The Fund seeks to achieve its investment goal by allocating its assets across multiple non-traditional or “alternative” strategies, including but not limited to relative value, long short equity, global macro and event driven. The Fund is structured as a multi-manager fund, meaning the Fund’s assets are independently managed by multiple investment managers (subadvisors), while the Fund’s investment manager retains overall responsibility for the Fund’s investments. The Fund may invest in a wide range of securities and other investments including, but not limited to: equity securities including common stocks, preferred stocks, convertible securities, rights and warrants, private and registered investment vehicles and exchange-traded funds (ETFs); and debt securities including bonds, notes, debentures, banker’s acceptances and commercial paper; loans and loan participations; and mortgage-backed or other asset-backed securities, including collateralized debt obligations; as well as derivatives, commodities and currencies.
Performance Overview
The Fund’s Class A shares had a -2.24% cumulative total return for the six months under review. For comparison, the Fund’s primary benchmark, the BofA Merrill Lynch 3-Month U.S. Treasury Bill (T-Bill) Index, which tracks the performance of short-term U.S. government securities with a remaining term to final maturity of less than three months, posted a +0.01% total return.1 Also for comparison, the Fund’s secondary benchmark, the HFRX Global Hedge Fund Index, which is designed to be representative of the overall composition of the hedge fund universe, had a -4.77% total return.2 You can find more of the Fund’s performance data in the Performance Summary beginning on page 7.
Performance data represent past performance, which does not guarantee future results. Investment return and principal value will fluctuate, and you may have a gain or loss when you sell your shares. Current performance may differ from figures shown. For most recent month-end performance, go to franklintempleton.com or call (800) 342-5236.
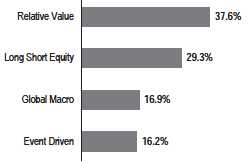
Strategy Allocation
Based on Total Investments as of 11/30/15
Economic and Market Overview
The global economy expanded moderately during the six months under review although growth slowed in some countries. As measured by the MSCI World Index, stocks in global developed markets declined overall during the period. Weighing on global stocks were worries about China’s slowing economy and tumbling stock market, declining commodity prices, geopolitical tensions between Russia and Turkey, and ongoing uncertainty over the U.S. Federal Reserve’s (Fed’s) timing for raising interest rates. Conversely, stocks gained as economic data in the U.S. and certain eurozone countries improved, Greece reached an agreement with its creditors, certain global central banks sought to boost their respective economies and the Fed kept the federal funds target rate unchanged. For the reporting period, oil prices declined sharply largely due to increased global supply and reduced global demand. Gold and other commodity prices also fell. The U.S. dollar appreciated against most currencies during the period, which reduced returns of many foreign assets in U.S. dollar terms.
1. Source: Morningstar.
2. Source: FactSet. Hedge Fund Research, Inc. – www.hedgefundresearch.com.The HFRX Global Hedge Fund Index is being used under license from Hedge Fund
Research, Inc., which does not endorse or approve of any of the contents of this report.
The indexes are unmanaged and include reinvestment of any income or distributions. One cannot invest directly in an index, and an index is not representative of the Fund’s
portfolio.
See www.franklintempletondatasources.com for additional data provider information.
The dollar value, number of shares or principal amount, and names of all portfolio holdings are listed in the Fund’s Consolidated Statement of Investments (SOI).
The Consolidated SOI begins on page 17.
franklintempleton.com
Semiannual Report 3
FRANKLIN K2 ALTERNATIVE STRATEGIES FUND
Amid healthy consumer spending, U.S. economic growth strengthened in the second quarter. The third quarter was less robust as businesses cut back on inventories, exports slowed, and state and local governments reduced their spending. Although global financial markets anticipated a Fed interest rate increase, the Fed kept interest rates unchanged. It said it expected moderate economic expansion but would monitor developments domestically and abroad. The Fed’s October meeting minutes indicated most members acknowledged the possibility of an interest rate increase at their next meeting in December.
Outside the U.S., the U.K. economy’s growth slowed in the third quarter following slight second-quarter growth spurred by the service sector. Weak construction and manufacturing results hampered third-quarter expansion. In the eurozone, despite investor concerns about China’s moderating economy and geopolitical tensions between Russia and Turkey, the region generally benefited during the period from lower oil prices, a weaker euro that supported exports, the European Central Bank’s (ECB’s) accommodative policy, an improved 2015 eurozone growth forecast, and expectations of further ECB stimulus.
After a decline in the second quarter of 2015, Japan’s economy expanded in the third quarter as capital expenditures improved. The Bank of Japan took several actions during the reporting period, including maintaining its monetary policy, lowering its economic growth and inflation forecasts, and increasing its purchases of longer-term debt.
In emerging markets, economic growth generally moderated. At the beginning of the reporting period, Greece’s economic and financial woes weighed on investor sentiment although the country and its creditors reached an agreement for a third bailout package in July. In China, the government’s intervention to cool domestic stock market speculation and its effective currency devaluation led to a severe slump in emerging market stocks from June through August. In October, emerging market equities gained after China expanded its monetary and fiscal stimulus to support its economy, though they retreated in November amid other concerns. In Brazil, falling prices for energy and other commodities coincided with an economic recession, rising unemployment and political uncertainty, leading to equity weakness and currency depreciation. Central bank actions varied across emerging markets during the six months under review, as some banks raised interest rates in response to rising inflation and weakening currencies, while others lowered interest rates to promote economic growth. In the recent global environment, emerging market stocks, as measured by the MSCI Emerging Markets Index, fell significantly for the six-month period.
Investment Strategy
We manage the Fund using a multi-manager approach. While we are responsible for the Fund’s overall investments, we allocate assets to multiple subadvisors, each of whom independently manages a separate portion of the Fund’s portfolio in accordance with some or all of the following strategies: long short equity, relative value, event driven and global macro. We allocate the Fund’s assets among these strategies utilizing a top-down approach, generating the Fund’s strategy weightings by taking into account market conditions, risk factors, diversification, liquidity, transparency, and availability of various subadvisors and other investment options, among other things. The allocations to specific subadvisors may change from time to time based upon our assessment of their correlations to various markets and to each other, their risk profiles and return expectations. Long short equity strategies generally seek to produce returns from investments in the equity markets by taking long and short positions in stocks and common stock indexes (through the use of derivatives or ETFs). Relative value strategies encompass a wide range of investment techniques that are intended to profit from pricing inefficiencies. Event driven strategies generally invest in securities of companies undergoing significant corporate events. Global macro strategies generally focus on broad-based economic opportunities across numerous markets and investments.
The Fund may take long and/or short positions in a wide range of asset classes, including equities, fixed income, commodities and currencies, among others. Long positions benefit from an increase in the price of the underlying instrument or asset class, while short positions benefit from a decrease in that price. The Fund may use derivatives for hedging and nonhedging (investment) purposes. Such derivative investments may include futures contracts, swaps, options and currency forward contracts. The Fund may engage in active and frequent trading as part of its investment strategies.
What is a futures contract?
A futures contract is an agreement between the Fund and a counterparty made through a U.S. or foreign futures exchange to buy or sell an underlying instrument or asset at a specific price on a future date.
What is a swap agreement?
A swap agreement, such as an equity total return swap, is a contract between the Fund and a counterparty to exchange on a future date the returns, or differentials in return, that would have been earned or realized if a notional amount were invested in specific instruments.
4 Semiannual Report
franklintempleton.com
FRANKLIN K2 ALTERNATIVE STRATEGIES FUND
A credit default swap, or CDS, is an agreement between two parties whereby the buyer receives credit protection from the seller. The buyer makes periodic payments over the term of the agreement in return for a payment by the seller in the event of a default or other credit event.
An interest rate swap is an agreement between two parties to exchange interest rate obligations, generally one based on an interest rate fixed to maturity and the other based on an interest rate that changes in accordance with changes in a designated benchmark (for example, LIBOR, prime, commercial paper or other benchmarks).
What is an option?
An option is a contract to buy or sell a specific financial product known as the option’s underlying instrument at a specific price. The buyer of an option has the right, but not the obligation, to buy or sell the underlying instrument at or until a specified expiration date. Conversely, the seller (writer) of an option who opens a transaction is obligated to buy or sell the underlying instrument should the option holder exercise that right.
What is a currency forward contract?
A currency forward contract is an agreement between the Fund and a counterparty to buy or sell a foreign currency at a specific exchange rate on a future date.
Subadvisors
11/30/15
Long Short Equity
Chilton Investment Company, LLC
Impala Asset Management, LLC
Jennison Associates, LLC
Wellington Management Company, LLP
Relative Value
Basso Capital Management, L.P.
Chatham Asset Management, LLC
Lazard Asset Management, LLC
Loomis Sayles & Company, L.P.
Event Driven
P. Schoenfeld Asset Management L.P.
York Registered Holdings, L.P.
Global Macro
EMSO Partners Limited
Graham Capital Management, L.P.
Manager’s Discussion
Two of the four strategies in which the Fund’s assets were allocated, global macro and long short equity, provided positive performance for the period. However, the event driven and relative value strategies declined during the review period, and the Fund’s overall performance was negative.
Our relative value strategy managers were Basso Capital Management, Chatham Asset Management, Lazard Asset Management and Loomis Sayles & Company. While Basso delivered a positive return, the other managers declined for the period, largely due to a notable high yield bond sell-off in the second half of 2015. For Basso, certain corporate bonds in the technology sector benefited returns, as did some consumer noncyclical equity and preferred equity positions. In contrast, certain technology stock positions weighed on performance. Two of Chatham’s corporate bonds, one in the consumer noncyclical sector and one in the financials sector, notably detracted from performance. However, a number of consumer non-cyclical bond positions made positive contributions to returns. For Lazard, long convertible bond positions in renewable energy declined due to increased investor concerns on solar companies. However, since these were set up as convertible arbitrage trades, the losses were partially offset by gains from corresponding short equity positions. For Loomis Sayles, energy sector corporate bonds generally hindered performance. Overall, the relative value strategy managers have noted that the sell-off in late 2015 and increasing volatility provided what they viewed as more robust opportunities. Areas of interest for individual managers included convertibles in Asia, sector differentiation in the broader credit and equity markets, and lower quality issues for high yield bonds.
The Fund’s event driven strategy managers were P. Schoenfeld Asset Management and York Registered Holdings. The managers experienced negative results during the period. As is typical in the event driven space, contributors and detractors tend to be from diverse events, including mergers, restructurings and other corporate events. For P. Schoenfeld, certain basic materials and energy stock positions weighed on performance. A pharmaceutical stock, which had previously been an acquisition target, also detracted from returns. In contrast, select equity swap positions in the basic materials and communications sectors benefited performance. For York, consumer non-cyclical positions declined due to disappointing earnings announcements, restructuring charges and exposure to China’s slowing economy. On the other hand, several equity holdings in the consumer non-cyclical sector rallied with the broader market and added value. Looking forward, both managers expect a robust event driven opportunity set to continue, driven by a combination of corporate need for growth and a potential for increased defaults.
Graham Capital Management and EMSO Partners Limited represented our global macro exposure. EMSO delivered positive performance, while Graham modestly detracted from returns. EMSO benefited from long exposure in Greek and Argentine sovereign bonds. Long exposure in Greece performed
franklintempleton.com
Semiannual Report 5
FRANKLIN K2 ALTERNATIVE STRATEGIES FUND
well throughout the period due to the resolution of the debt crisis and an election that solidified the Syriza party’s power, which stabilized the government. Speculation about further quantitative easing in Europe also helped a rally in Greek bonds. Argentine bonds also performed well due to the anticipation of elections in October and November yielding a new president to replace scandal-plagued Cristina Fernandez de Kirchner. The bonds rallied further when Mauricio Macri, seen as the most pro-market presidential candidate, won the election. Graham suffered losses during the period. Among detractors was short commodity positioning in agricultural commodities in June, which suffered from a price rally due to extreme rain in the Midwest diminishing U.S. crop yields. Graham also experienced significant losses in August and September from long equity positioning, which suffered during the steep market sell-off. The asset manager did not participate in October’s equity market rebound because it had shifted from long to slightly short net positioning in equities.
The Fund’s long short equity strategy managers were Chilton Investment Company, Impala Asset Management, Jennison Associates and Wellington Management Company. Chilton and Wellington contributed positive performance for the period, while Impala’s return was relatively flat. Jennison, which focused on the health care sector, posted negative results given elevated concerns about high valuations and drug pricing practices. For Chilton, select consumer cyclical stocks reported quarterly earnings that exceeded analyst expectations and aided performance. In contrast, select industrials holdings adversely affected results, as one was downgraded in a research report and another reported lower volume in its transportation business. Among the equity positions of Wellington, which focuses on the technology sector, an announced acquisition and positive quarterly earnings surprises notably contributed to performance. Conversely, select holdings with significant revenue exposure in China were challenged by investor concerns about the country’s slowing growth. For Jennison, certain long holdings in pharmaceuticals and biotechnology declined as a U.S. presidential candidate’s comments about regulating drug prices weighed on the industry. In addition, company-specific concerns hampered performance of individual biotechnology and pharmaceutical positions. However, select pharmaceutical long holdings posted gains and helped results, including one company that reported successful results from a Phase 3 trial of a pipeline drug. Among areas the long short equity strategy managers found attractive at period-end were housing/materials, biotechnology, electronic payments and auto parts.
Thank you for your participation in Franklin K2 Alternative Strategies Fund. We look forward to continuing to serve your investment needs.

The foregoing information reflects our analysis, opinions and portfolio holdings as of November 30, 2015, the end of the reporting period. The way we implement our main investment strategies and the resulting portfolio holdings may change depending on factors such as market and economic conditions. These opinions may not be relied upon as investment advice or an offer for a particular security. The information is not a complete analysis of every aspect of any market, country, industry, security or the Fund. Statements of fact are from sources considered reliable, but the investment manager makes no representation or warranty as to their completeness or accuracy. Although historical performance is no guarantee of future results, these insights may help you understand our investment management philosophy.
6 Semiannual Report
franklintempleton.com
FRANKLIN K2 ALTERNATIVE STRATEGIES FUND
Performance Summary as of November 30, 2015
Your dividend income will vary depending on dividends or interest paid by securities in the Fund’s portfolio, adjusted for operating expenses of each class. Capital gain distributions are net profits realized from the sale of portfolio securities. The performance table does not reflect any taxes that a shareholder would pay on Fund dividends, capital gain distributions, if any, or any realized gains on the sale of Fund shares. Total return reflects reinvestment of the Fund’s dividends and capital gain distributions, if any, and any unrealized gains or losses.
| Net Asset Value | ||||||
| Share Class (Symbol) | 11/30/15 | 5/31/15 | Change | |||
| A (FAAAX) | $ | 10.91 | $ | 11.16 | -$ | 0.25 |
| C (FASCX) | $ | 10.80 | $ | 11.09 | -$ | 0.29 |
| R (FSKKX) | $ | 10.84 | $ | 11.15 | -$ | 0.31 |
| R6 (FASRX) | $ | 10.95 | $ | 11.18 | -$ | 0.23 |
| Advisor (FABZX) | $ | 10.94 | $ | 11.18 | -$ | 0.24 |
franklintempleton.com
Semiannual Report 7
| FRANKLIN K2 ALTERNATIVE STRATEGIES FUND |
| PERFORMANCE SUMMARY |
Performance as of 11/30/151
Cumulative total return excludes sales charges. Average annual total returns and value of $10,000 investment include maximum sales charges. Class A: 5.75% maximum initial sales charge; Class C: 1% contingent deferred sales charge in first year only;
Class R/R6/Advisor Class: no sales charges.
| Average Annual | Total Annual Operating Expenses6 | |||||||||||
| Cumulative | Average Annual | Value of $10,000 | Total Return | |||||||||
| Share Class | Total Return2 | Total Return3 | Investment4 | (12/31/15 | )5 | (with waiver) | (without waiver) | |||||
| A | 2.85 | % | 3.49 | % | ||||||||
| 6-Month | -2.24 | % | -7.85 | % | $ | 9,215 | ||||||
| 1-Year | +0.52 | % | -5.29 | % | $ | 9,471 | -5.86 | % | ||||
| Since Inception (10/11/13) | +10.20 | % | +1.79 | % | $ | 10,387 | +1.29 | % | ||||
| C | 3.60 | % | 4.24 | % | ||||||||
| 6-Month | -2.61 | % | -3.59 | % | $ | 9,641 | ||||||
| 1-Year | -0.22 | % | -1.22 | % | $ | 9,878 | -1.82 | % | ||||
| Since Inception (10/11/13) | +8.68 | % | +3.97 | % | $ | 10,868 | +3.34 | % | ||||
| R | 3.10 | % | 3.74 | % | ||||||||
| 6-Month | -2.78 | % | -2.78 | % | $ | 9,722 | ||||||
| 1-Year | -0.18 | % | -0.18 | % | $ | 9,982 | -0.76 | % | ||||
| Since Inception (10/11/13) | +9.23 | % | +4.22 | % | $ | 10,923 | +3.61 | % | ||||
| R6 | 2.51 | % | 3.15 | % | ||||||||
| 6-Month | -2.06 | % | -2.06 | % | $ | 9,794 | ||||||
| 1-Year | +0.79 | % | +0.79 | % | $ | 10,079 | +0.24 | % | ||||
| Since Inception (10/11/13) | +10.90 | % | +4.96 | % | $ | 11,090 | +4.36 | % | ||||
| Advisor | 2.60 | % | 3.24 | % | ||||||||
| 6-Month | -2.15 | % | -2.15 | % | $ | 9,785 | ||||||
| 1-Year | +0.86 | % | +0.86 | % | $ | 10,086 | +0.19 | % | ||||
| Since Inception (10/11/13) | +10.87 | % | +4.95 | % | $ | 11,087 | +4.33 | % | ||||
Performance data represent past performance, which does not guarantee future results. Investment return and principal value will fluctuate, and you may have a gain or loss when you sell your shares. Current performance may differ from figures shown. For most recent month-end performance, go to franklintempleton.com or call (800) 342-5236.
See page 9 for Performance Summary footnotes.
8 Semiannual Report
franklintempleton.com
| FRANKLIN K2 ALTERNATIVE STRATEGIES FUND |
| PERFORMANCE SUMMARY |
All investments involve risks, including possible loss of principal. The market values of securities owned by the Fund will go up or down, sometimes rapidly or unpredictably. The Fund’s performance depends on the manager’s skill in selecting, overseeing and allocating fund assets. The Fund is actively managed and could experience losses if the investment manager’s and subadvisors’ judgment about particular investments made for the Fund’s portfolio prove to be incorrect. Some subadvisors may have little or no experience managing the assets of a registered investment company. Foreign investments are subject to greater investment risk such as political, economic, credit and information risks as well as risk of currency fluctuations. Investments in derivatives involve costs and can create economic leverage, which may result in significant volatility and cause the Fund to participate in losses (as well as gains) that significantly exceed the Fund’s initial investment. Currency management strategies could result in losses to the Fund if currencies do not perform as the investment manager or subadvisor expects. Lower rated or high yield debt securities involve greater credit risk, including the possibility of default or bankruptcy. The Fund may make short sales of securities, which involves the risk that losses may exceed the original amount invested. Merger arbitrage investments risk loss if a proposed reorganization in which the Fund invests is renegotiated or terminated. Liquidity risk exists when securities have become more difficult to sell at the price at which the Fund has valued the securities. The Fund’s prospectus also includes a description of the main investment risks.
Class C: Class R: Class R6: Advisor Class: | These shares have higher annual fees and expenses than Class A shares. Shares are available to certain eligible investors as described in the prospectus. These shares have higher annual fees and expenses than Class A shares. Shares are available to certain eligible investors as described in the prospectus. Shares are available to certain eligible investors as described in the prospectus. |
1. The Fund has an expense reduction contractually guaranteed through at least 9/30/16 and a fee waiver related to the management fee paid by a subsidiary. The transfer
agent has contractually agreed to waive or limit its transfer agency fees for Class R6 shares of the Fund so that transfer agency fees for that class do not exceed 0.01% until
9/30/16. Fund investment results reflect the expense reduction, fee waiver and fee cap, to the extent applicable; without these reductions, the results would have been lower.
2. Cumulative total return represents the change in value of an investment over the periods indicated.
3. Average annual total return represents the average annual change in value of an investment over the periods indicated. Return for less than one year, if any, has not been
annualized.
4. These figures represent the value of a hypothetical $10,000 investment in the Fund over the periods indicated.
5. In accordance with SEC rules, we provide standardized average annual total return information through the latest calendar quarter.
6. Figures are as stated in the Fund’s current prospectus. In periods of market volatility, assets may decline significantly, causing total annual Fund operating expenses to
become higher than the figures shown.
franklintempleton.com
Semiannual Report 9
FRANKLIN K2 ALTERNATIVE STRATEGIES FUND
Your Fund’s Expenses
As a Fund shareholder, you can incur two types of costs:
- Transaction costs, including sales charges (loads) on Fund purchases; and
- Ongoing Fund costs, including management fees, distribution and service (12b-1) fees, and other Fund expenses. All mutual funds have ongoing costs, sometimes referred to as operating expenses.
The following table shows ongoing costs of investing in the Fund and can help you understand these costs and compare them with those of other mutual funds. The table assumes a $1,000 investment held for the six months indicated.
Actual Fund Expenses
The first line (Actual) for each share class listed in the table provides actual account values and expenses. The “Ending Account Value” is derived from the Fund’s actual return, which includes the effect of Fund expenses.
You can estimate the expenses you paid during the period by following these steps. Of course, your account value and expenses will differ from those in this illustration:
1. Divide your account value by $1,000.
If an account had an $8,600 value, then $8,600 ÷ $1,000 = 8.6.
2. Multiply the result by the number under the heading “Expenses Paid During Period.”
If Expenses Paid During Period were $7.50, then 8.6 × $7.50 = $64.50.
In this illustration, the estimated expenses paid this period are $64.50.
Hypothetical Example for Comparison with Other Funds
Information in the second line (Hypothetical) for each class in the table can help you compare ongoing costs of investing in the Fund with those of other mutual funds. This information may not be used to estimate the actual ending account balance or expenses you paid during the period. The hypothetical “Ending Account Value” is based on the actual expense ratio for each class and an assumed 5% annual rate of return before expenses, which does not represent the Fund’s actual return. The figure under the heading “Expenses Paid During Period” shows the hypothetical expenses your account would have incurred under this scenario. You can compare this figure with the 5% hypothetical examples that appear in shareholder reports of other funds.
Please note that expenses shown in the table are meant to highlight ongoing costs and do not reflect any transaction costs, such as sales charges. Therefore, the second line for each class is useful in comparing ongoing costs only, and will not help you compare total costs of owning different funds. In addition, if transaction costs were included, your total costs would have been higher. Please refer to the Fund prospectus for additional information on operating expenses.
10 Semiannual Report
franklintempleton.com
FRANKLIN K2 ALTERNATIVE STRATEGIES FUND
YOUR FUND’S EXPENSES
| Beginning Account | Ending Account | Expenses Paid During | ||||
| Share Class | Value 6/1/15 | Value 11/30/15 | Period* 6/1/15–11/30/15 | |||
| A | ||||||
| Actual | $ | 1,000 | $ | 977.60 | $ | 14.29 |
| Hypothetical (5% return before expenses) | $ | 1,000 | $ | 1,010.55 | $ | 14.53 |
| C | ||||||
| Actual | $ | 1,000 | $ | 973.90 | $ | 17.86 |
| Hypothetical (5% return before expenses) | $ | 1,000 | $ | 1,006.90 | $ | 18.16 |
| R | ||||||
| Actual | $ | 1,000 | $ | 972.20 | $ | 15.38 |
| Hypothetical (5% return before expenses) | $ | 1,000 | $ | 1,009.40 | $ | 15.67 |
| R6 | ||||||
| Actual | $ | 1,000 | $ | 979.40 | $ | 12.57 |
| Hypothetical (5% return before expenses) | $ | 1,000 | $ | 1,012.30 | $ | 12.78 |
| Advisor | ||||||
| Actual | $ | 1,000 | $ | 978.50 | $ | 12.96 |
| Hypothetical (5% return before expenses) | $ | 1,000 | $ | 1,011.90 | $ | 13.18 |
*Expenses are calculated using the most recent six-month expense ratio, net of expense waivers, annualized for each class (A: 2.89%;
C: 3.62%; R: 3.12%; R6: 2.54% and Advisor: 2.62%), multiplied by the average account value over the period, multiplied by 183/366 to reflect
the one-half year period.
franklintempleton.com
Semiannual Report
11
| FRANKLIN ALTERNATIVE STRATEGIES FUNDS | |||||||||
| Consolidated Financial Highlights | |||||||||
| Franklin K2 Alternative Strategies Fund | |||||||||
| Period Ended | Year End May 31, | ||||||||
| November 30, 2015 | |||||||||
| (unaudited) | 2015 | 2014 | a | ||||||
| Class A | |||||||||
| Per share operating performance | |||||||||
| (for a share outstanding throughout the period) | |||||||||
| Net asset value, beginning of period | $ | 11.16 | $ | 10.64 | $ | 10.00 | |||
| Income from investment operationsb: | |||||||||
| Net investment income (loss)c | (0.04 | ) | (0.11 | ) | (0.02 | ) | |||
| Net realized and unrealized gains (losses) | (0.21 | ) | 0.70 | 0.70 | |||||
| Total from investment operations | (0.25 | ) | 0.59 | 0.68 | |||||
| Less distributions from net investment income | — | (0.07 | ) | (0.04 | ) | ||||
| Net asset value, end of period | $ | 10.91 | $ | 11.16 | $ | 10.64 | |||
| Total returnd | (2.24 | )% | 5.53 | % | 6.82 | % | |||
| Ratios to average net assetse | |||||||||
| Expenses before waiver, payments by affiliates and expense reductionf | 3.25 | % | 3.40 | % | 3.33 | % | |||
| Expenses net of waiver, payments by affiliates and expense reductionf | 2.89 | %g | 2.99 | %g | 2.83 | % | |||
| Expenses incurred in connection with securities sold short | 0.67 | % | 0.65 | % | 0.56 | % | |||
| Net investment income (loss) | (0.73 | )% | (0.95 | )% | (0.35 | )% | |||
| Supplemental data | |||||||||
| Net assets, end of period (000’s) | $ | 193,529 | $ | 148,991 | $ | 96,889 | |||
| Portfolio turnover rate | 118.20 | % | 295.81 | % | 181.06 | % | |||
aFor the period October 11, 2013 (commencement of operations) to May 31, 2014.
bThe amount shown for a share outstanding throughout the period may not correlate with the Consolidated Statement of Operations for the period due to the timing of sales
and repurchases of Fund shares in relation to income earned and/or fluctuating fair value of the investments of the Fund.
cBased on average daily shares outstanding.
dTotal return does not reflect sales commissions or contingent deferred sales charges, if applicable, and is not annualized for periods less than one year.
eRatios are annualized for periods less than one year.
fIncludes dividend and/or interest expense on securities sold short and security borrowing fees, if any. See below for the ratios of such expenses to average net assets for the
periods presented. See Note 1(g).
gBenefit of expense reduction rounds to less than 0.01%.
12 Semiannual Report | The accompanying notes are an integral part of these consolidated financial statements. franklintempleton.com
FRANKLIN ALTERNATIVE STRATEGIES FUNDS
CONSOLIDATED FINANCIAL HIGHLIGHTS
| Franklin K2 Alternative Strategies Fund (continued) | |||||||||
| Period Ended | Year End May 31, | ||||||||
| November 30, 2015 | |||||||||
| (unaudited) | 2015 | 2014 | a | ||||||
| Class C | |||||||||
| Per share operating performance | |||||||||
| (for a share outstanding throughout the period) | |||||||||
| Net asset value, beginning of period | $ | 11.09 | $ | 10.60 | $ | 10.00 | |||
| Income from investment operationsb: | |||||||||
| Net investment income (loss)c | (0.08 | ) | (0.17 | ) | (0.08 | ) | |||
| Net realized and unrealized gains (losses) | (0.21 | ) | 0.69 | 0.72 | |||||
| Total from investment operations | (0.29 | ) | 0.52 | 0.64 | |||||
| Less distributions from net investment income | — | (0.03 | ) | (0.04 | ) | ||||
| Net asset value, end of period | $ | 10.80 | $ | 11.09 | $ | 10.60 | |||
| Total returnd | (2.61 | )% | 4.87 | % | 6.42 | % | |||
| Ratios to average net assetse | |||||||||
| Expenses before waiver, payments by affiliates and expense reductionf | 3.98 | % | 4.04 | % | 4.03 | % | |||
| Expenses net of waiver, payments by affiliates and expense reductionf | 3.62 | %g | 3.63 | %g | 3.53 | % | |||
| Expenses incurred in connection with securities sold short | 0.67 | % | 0.65 | % | 0.56 | % | |||
| Net investment income (loss) | (1.46 | )% | (1.59 | )% | (1.05 | )% | |||
| Supplemental data | |||||||||
| Net assets, end of period (000’s) | $ | 73,222 | $ | 37,937 | $ | 16,618 | |||
| Portfolio turnover rate | 118.20 | % | 295.81 | % | 181.06 | % | |||
aFor the period October 11, 2013 (commencement of operations) to May 31, 2014.
bThe amount shown for a share outstanding throughout the period may not correlate with the Consolidated Statement of Operations for the period due to the timing of sales
and repurchases of Fund shares in relation to income earned and/or fluctuating fair value of the investments of the Fund.
cBased on average daily shares outstanding.
dTotal return does not reflect sales commissions or contingent deferred sales charges, if applicable, and is not annualized for periods less than one year.
eRatios are annualized for periods less than one year.
fIncludes dividend and/or interest expense on securities sold short and security borrowing fees, if any. See below for the ratios of such expenses to average net assets for the
periods presented. See Note 1(g).
gBenefit of expense reduction rounds to less than 0.01%.
franklintempleton.com The accompanying notes are an integral part of these consolidated financial statements. | Semiannual Report 13
FRANKLIN ALTERNATIVE STRATEGIES FUNDS
CONSOLIDATED FINANCIAL HIGHLIGHTS
| Franklin K2 Alternative Strategies Fund (continued) | |||||||||
| Period Ended | Year End May 31, | ||||||||
| November 30, 2015 | |||||||||
| (unaudited) | 2015 | 2014 | a | ||||||
| Class R | |||||||||
| Per share operating performance | |||||||||
| (for a share outstanding throughout the period) | |||||||||
| Net asset value, beginning of period | $ | 11.15 | $ | 10.62 | $ | 10.00 | |||
| Income from investment operationsb: | |||||||||
| Net investment income (loss)c | (0.07 | ) | (0.16 | ) | (0.05 | ) | |||
| Net realized and unrealized gains (losses) | (0.24 | ) | 0.73 | 0.71 | |||||
| Total from investment operations | (0.31 | ) | 0.57 | 0.66 | |||||
| Less distributions from net investment income | — | (0.04 | ) | (0.04 | ) | ||||
| Net asset value, end of period | $ | 10.84 | $ | 11.15 | $ | 10.62 | |||
| Total returnd | (2.78 | )% | 5.39 | % | 6.62 | % | |||
| Ratios to average net assetse | |||||||||
| Expenses before waiver, payments by affiliates and expense reductionf | 3.48 | % | 3.57 | % | 3.63 | % | |||
| Expenses net of waiver, payments by affiliates and expense reductionf | 3.12 | %g | 3.16 | %g | 3.13 | % | |||
| Expenses incurred in connection with securities sold short | 0.67 | % | 0.65 | % | 0.56 | % | |||
| Net investment income (loss) | (0.96 | )% | (1.12 | )% | (0.65 | )% | |||
| Supplemental data | |||||||||
| Net assets, end of period (000’s) | $ | 334 | $ | 9,173 | $ | 11,660 | |||
| Portfolio turnover rate | 118.20 | % | 295.81 | % | 181.06 | % | |||
aFor the period October 11, 2013 (commencement of operations) to May 31, 2014.
bThe amount shown for a share outstanding throughout the period may not correlate with the Consolidated Statement of Operations for the period due to the timing of sales
and repurchases of Fund shares in relation to income earned and/or fluctuating fair value of the investments of the Fund.
cBased on average daily shares outstanding.
dTotal return is not annualized for periods less than one year.
eRatios are annualized for periods less than one year.
fIncludes dividend and/or interest expense on securities sold short and security borrowing fees, if any. See below for the ratios of such expenses to average net assets for the
periods presented. See Note 1(g).
gBenefit of expense reduction rounds to less than 0.01%.
14 Semiannual Report | The accompanying notes are an integral part of these consolidated financial statements. franklintempleton.com
FRANKLIN ALTERNATIVE STRATEGIES FUNDS
CONSOLIDATED FINANCIAL HIGHLIGHTS
| Franklin K2 Alternative Strategies Fund (continued) | |||||||||
| Period Ended | Year End May 31, | ||||||||
| November 30, 2015 | |||||||||
| (unaudited) | 2015 | 2014 | a | ||||||
| Class R6 | |||||||||
| Per share operating performance | |||||||||
| (for a share outstanding throughout the period) | |||||||||
| Net asset value, beginning of period | $ | 11.18 | $ | 10.66 | $ | 10.00 | |||
| Income from investment operationsb: | |||||||||
| Net investment income (loss)c | (0.02 | ) | (0.08 | ) | (0.01 | ) | |||
| Net realized and unrealized gains (losses) | (0.21 | ) | 0.70 | 0.71 | |||||
| Total from investment operations | (0.23 | ) | 0.62 | 0.70 | |||||
| Less distributions from net investment income | — | (0.10 | ) | (0.04 | ) | ||||
| Net asset value, end of period | $ | 10.95 | $ | 11.18 | $ | 10.66 | |||
| Total returnd | (2.06 | )% | 5.80 | % | 7.02 | % | |||
| Ratios to average net assetse | |||||||||
| Expenses before waiver, payments by affiliates and expense reductionf | 2.90 | % | 2.98 | % | 3.19 | % | |||
| Expenses net of waiver, payments by affiliates and expense reductionf | 2.54 | %g | 2.60 | %g | 2.69 | % | |||
| Expenses incurred in connection with securities sold short | 0.67 | % | 0.65 | % | 0.56 | % | |||
| Net investment income (loss) | (0.38 | )% | (0.56 | )% | (0.21 | )% | |||
| Supplemental data | |||||||||
| Net assets, end of period (000’s) | $ | 261,042 | $ | 239,754 | $ | 215,526 | |||
| Portfolio turnover rate | 118.20 | % | 295.81 | % | 181.06 | % | |||
aFor the period October 11, 2013 (commencement of operations) to May 31, 2014.
bThe amount shown for a share outstanding throughout the period may not correlate with the Consolidated Statement of Operations for the period due to the timing of sales
and repurchases of Fund shares in relation to income earned and/or fluctuating fair value of the investments of the Fund.
cBased on average daily shares outstanding.
dTotal return is not annualized for periods less than one year.
eRatios are annualized for periods less than one year.
fIncludes dividend and/or interest expense on securities sold short and security borrowing fees, if any. See below for the ratios of such expenses to average net assets for the
periods presented. See Note 1(g).
gBenefit of expense reduction less than 0.01%.
franklintempleton.com The accompanying notes are an integral part of these consolidated financial statements. | Semiannual Report 15
FRANKLIN ALTERNATIVE STRATEGIES FUNDS
CONSOLIDATED FINANCIAL HIGHLIGHTS
| Franklin K2 Alternative Strategies Fund (continued) | |||||||||
| Period Ended | Year End May 31, | ||||||||
| November 30, 2015 | |||||||||
| (unaudited) | 2015 | 2014 | a | ||||||
| Advisor Class | |||||||||
| Per share operating performance | |||||||||
| (for a share outstanding throughout the period) | |||||||||
| Net asset value, beginning of period | $ | 11.18 | $ | 10.65 | $ | 10.00 | |||
| Income from investment operationsb: | |||||||||
| Net investment income (loss)c | (0.02 | ) | (0.02 | ) | (0.02 | ) | |||
| Net realized and unrealized gains (losses) | (0.22 | ) | 0.64 | 0.71 | |||||
| Total from investment operations | (0.24 | ) | 0.62 | 0.69 | |||||
| Less distributions from net investment income | — | (0.09 | ) | (0.04 | ) | ||||
| Net asset value, end of period | $ | 10.94 | $ | 11.18 | $ | 10.65 | |||
| Total returnd | (2.15 | )% | 5.88 | % | 6.92 | % | |||
| Ratios to average net assetse | |||||||||
| Expenses before waiver, payments by affiliates and expense reductionf | 2.98 | % | 3.07 | % | 3.21 | % | |||
| Expenses net of waiver, payments by affiliates and expense reductionf | 2.62 | %g | 2.66 | %g | 2.71 | % | |||
| Expenses incurred in connection with securities sold short | 0.67 | % | 0.65 | % | 0.56 | % | |||
| Net investment income (loss) | (0.46 | )% | (0.62 | )% | (0.23 | )% | |||
| Supplemental data | |||||||||
| Net assets, end of period (000’s) | $ | 646,012 | $ | 329,139 | $ | 54,593 | |||
| Portfolio turnover rate | 118.20 | % | 295.81 | % | 181.06 | % | |||
aFor the period October 11, 2013 (commencement of operations) to May 31, 2014.
bThe amount shown for a share outstanding throughout the period may not correlate with the Consolidated Statement of Operations for the period due to the timing of sales
and repurchases of Fund shares in relation to income earned and/or fluctuating fair value of the investments of the Fund.
cBased on average daily shares outstanding.
dTotal return is not annualized for periods less than one year.
eRatios are annualized for periods less than one year.
fIncludes dividend and/or interest expense on securities sold short and security borrowing fees, if any. See below for the ratios of such expenses to average net assets for the
periods presented. See Note 1(g).
gBenefit of expense reduction less than 0.01%.
16 Semiannual Report | The accompanying notes are an integral part of these consolidated financial statements. franklintempleton.com
FRANKLIN K2 ALTERNATIVE STRATEGIES FUNDS
Consolidated Statement of Investments, November 30, 2015 (unaudited)
| Franklin K2 Alternative Strategies Fund | ||||
| Country | Shares/Warrants | Value | ||
| Common Stocks and Other Equity Interests 36.1% | ||||
| Aerospace & Defense 1.1% | ||||
| Northrop Grumman Corp | United States | 2,353 | $ | 438,505 |
| aPrecision Castparts Corp | United States | 36,542 | 8,460,935 | |
| a,bTransDigm Group Inc | United States | 15,474 | 3,630,664 | |
| 12,530,104 | ||||
| Air Freight & Logistics 0.4% | ||||
| aFedEx Corp | United States | 27,725 | 4,395,521 | |
| Airlines 0.2% | ||||
| bAir Canada | Canada | 16,105 | 125,782 | |
| b,c,dAMR Corp., Contingent Distribution | United States | 3,268 | — | |
| a,eDelta Air Lines Inc | United States | 46,830 | 2,175,722 | |
| b,fWizz Air Holdings PLC, 144A | Switzerland | 16,236 | 431,838 | |
| 2,733,342 | ||||
| Auto Components 0.1% | ||||
| b,fEuropcar Groupe SA, 144A | France | 52,650 | 661,129 | |
| Hota Industrial Manufacturing Co. Ltd | Taiwan | 51,000 | 196,863 | |
| Johnson Controls Inc | United States | 18,029 | 829,334 | |
| 1,687,326 | ||||
| Automobiles 0.4% | ||||
| Daimler AG | Germany | 10,430 | 933,706 | |
| bPeugeot SA | France | 194,851 | 3,481,247 | |
| a,bTesla Motors Inc | United States | 1,525 | 351,146 | |
| 4,766,099 | ||||
| Banks 0.0%† | ||||
| b,fABN AMRO Group NV, 144A | Netherlands | 5,022 | 105,483 | |
| Bank of America Corp | United States | 8,897 | 155,075 | |
| KBC Groep NV | Belgium | 1,950 | 116,405 | |
| 376,963 | ||||
| Beverages 0.6% | ||||
| aBrown-Forman Corp., B | United States | 20,559 | 2,108,120 | |
| Davide Campari-Milano SpA | Italy | 111,885 | 982,930 | |
| Heineken NV | Netherlands | 31,444 | 2,795,967 | |
| a,bMonster Beverage Corp | United States | 6,697 | 1,035,423 | |
| 6,922,440 | ||||
| Biotechnology 2.4% | ||||
| bAdaptimmune Therapeutics PLC, ADR | United States | 6,971 | 63,018 | |
| bAduro Biotech Inc | United States | 5,798 | 179,680 | |
| a,bAgios Pharmaceuticals Inc | United States | 2,321 | 149,913 | |
| a,bAlexion Pharmaceuticals Inc | United States | 10,647 | 1,899,851 | |
| a,bAlnylam Pharmaceuticals Inc | United States | 14,266 | 1,484,520 | |
| bAmicus Therapeutics Inc | United States | 24,281 | 260,535 | |
| bApplied Genetic Technologies Corp | United States | 12,072 | 205,707 | |
| aBaxalta Inc | United States | 44,804 | 1,540,362 | |
| bBioCryst Pharmaceuticals Inc | United States | 16,081 | 170,619 | |
| a,bBiogen Idec Inc | United States | 5,059 | 1,451,225 | |
| a,bBioMarin Pharmaceutical Inc | United States | 33,007 | 3,147,878 | |
| bBluebird Bio Inc | United States | 7,446 | 660,832 | |
| bCara Therapeutics Inc | United States | 7,545 | 124,870 | |
| a,bCelgene Corp | United States | 19,650 | 2,150,692 |
franklintempleton.com
Semiannual Report
17
| FRANKLIN ALTERNATIVE STRATEGIES FUNDS |
| CONSOLIDATED STATEMENT OF INVESTMENTS (UNAUDITED) |
| Franklin K2 Alternative Strategies Fund (continued) | ||||
| Country | Shares/Warrants | Value | ||
| Common Stocks and Other Equity Interests (continued) | ||||
| Biotechnology (continued) | ||||
| bChimerix Inc | United States | 10,468 | $ | 422,907 |
| bCoherus Biosciences Inc | United States | 6,196 | 188,173 | |
| bDBV Technologies SA, ADR | France | 7,201 | 251,099 | |
| bDimension Therapeutics Inc | United States | 6,007 | 90,345 | |
| bDyax Corp | United States | 7,797 | 262,447 | |
| bEPIRUS Biopharmaceuticals Inc | United States | 29,450 | 143,421 | |
| bEpizyme Inc | United States | 11,704 | 188,551 | |
| bExelixis Inc | United States | 83,321 | 476,596 | |
| bFibrocell Science Inc | United States | 33,821 | 199,544 | |
| bFlexion Therapeutics Inc | United States | 9,318 | 181,142 | |
| aGilead Sciences Inc | United States | 8,052 | 853,190 | |
| bGlobal Blood Therapeutics Inc | United States | 4,283 | 201,130 | |
| bImmune Design Corp | United States | 2,878 | 60,237 | |
| a,bIncyte Corp. Ltd | United States | 23,376 | 2,670,474 | |
| bInotek Pharmaceuticals Corp | United States | 20,812 | 249,536 | |
| bInsmed Inc | United States | 15,519 | 253,115 | |
| bInvitae Corp | United States | 476 | 3,660 | |
| bKindred Biosciences Inc | United States | 9,857 | 39,329 | |
| bMacroGenics Inc | United States | 3,412 | 117,987 | |
| bMedgenics Inc | Israel | 23,215 | 160,648 | |
| bMirati Therapeutics Inc | United States | 959 | 36,471 | |
| bNatera Inc | United States | 9,137 | 81,228 | |
| bNeurocrine Biosciences Inc | United States | 6,361 | 345,848 | |
| bNexvet Biopharma PLC | Ireland | 259 | 1,023 | |
| bNivalis Therapeutics Inc | United States | 2,935 | 24,360 | |
| bOtonomy Inc | United States | 16,573 | 437,361 | |
| a,bOvaScience Inc | United States | 27,910 | 263,191 | |
| PDL BioPharma Inc | United States | 2,000 | 7,570 | |
| bPortola Pharmaceuticals Inc | United States | 11,960 | 593,336 | |
| bProQR Therapeutics NV | Netherlands | 5,425 | 56,528 | |
| bProthena Corp. PLC | Ireland | 7,156 | 504,784 | |
| bPTC Therapeutics Inc | United States | 12,794 | 384,332 | |
| bRadius Health Inc | United States | 3,522 | 214,173 | |
| bRegeneron Pharmaceuticals Inc | United States | 2,836 | 1,544,202 | |
| bREGENXBIO Inc | United States | 2,238 | 53,645 | |
| bRetrophin Inc | United States | 10,248 | 229,043 | |
| bSarepta Therapeutics Inc | United States | 8,387 | 308,306 | |
| bSeres Therapeutics Inc | United States | 4,765 | 170,730 | |
| bTesaro Inc | United States | 13,565 | 692,358 | |
| bTrevena Inc | United States | 8,832 | 111,195 | |
| bUltragenyx Pharmaceutical Inc | United States | 10,319 | 1,014,564 | |
| a,bVertex Pharmaceuticals Inc | United States | 6,185 | 800,092 | |
| 28,377,573 | ||||
| Capital Markets 0.2% | ||||
| aSEI Investments Co | United States | 49,822 | 2,709,819 | |
| Chemicals 1.7% | ||||
| aAir Products & Chemicals Inc | United States | 25,686 | 3,516,156 | |
| AirBoss of America Corp | Canada | 2,042 | 29,129 | |
| Akzo Nobel NV | Netherlands | 20,915 | 1,487,615 | |
| LyondellBasell Industries NV, A | United States | 20,709 | 1,984,336 | |
| aPPG Industries Inc | United States | 9,121 | 964,455 | |
18 Semiannual Report
franklintempleton.com
| FRANKLIN ALTERNATIVE STRATEGIES FUNDS |
| CONSOLIDATED STATEMENT OF INVESTMENTS (UNAUDITED) |
| Franklin K2 Alternative Strategies Fund (continued) | ||||
| Country | Shares/Warrants | Value | ||
| Common Stocks and Other Equity Interests (continued) | ||||
| Chemicals (continued) | ||||
| aThe Sherwin-Williams Co | United States | 19,508 | $ | 5,385,574 |
| a,bWR Grace & Co | United States | 66,613 | 6,542,729 | |
| 19,909,994 | ||||
| Commercial Services & Supplies 0.2% | ||||
| bAtento SA | Spain | 64,855 | 712,757 | |
| Edenred | France | 37,201 | 770,959 | |
| West Corp | United States | 18,610 | 474,555 | |
| 1,958,271 | ||||
| Communications Equipment 0.4% | ||||
| bAlcatel-Lucent | France | 31,275 | 123,186 | |
| bArista Networks Inc | United States | 2,905 | 213,576 | |
| a,bCiena Corp | United States | 37,340 | 934,994 | |
| aCisco Systems Inc | United States | 37,850 | 1,031,412 | |
| bNetScout Systems Inc | United States | 5,550 | 183,705 | |
| aNokia Corp., ADR | Finland | 53,061 | 382,570 | |
| Nokia OYJ, A | Finland | 130,347 | 941,300 | |
| QUALCOMM Inc | United States | 17,420 | 849,922 | |
| bRuckus Wireless Inc | United States | 30,370 | 347,736 | |
| 5,008,401 | ||||
| Construction & Engineering 0.1% | ||||
| Fluor Corp | United States | 15,363 | 746,642 | |
| Construction Materials 0.8% | ||||
| Buzzi Unicem SpA | Italy | 97,033 | 1,743,863 | |
| a,bCemex SAB de CV, ADR | Mexico | 16,481 | 103,830 | |
| aEagle Materials Inc | United States | 17,571 | 1,213,805 | |
| Italcementi SpA | Italy | 166,729 | 1,807,370 | |
| aMartin Marietta Materials Inc | United States | 28,659 | 4,510,926 | |
| 9,379,794 | ||||
| Consumer Finance 0.3% | ||||
| a,bSynchrony Financial | United States | 105,706 | 3,364,622 | |
| Diversified Financial Services 0.4% | ||||
| Cerved Information Solutions SpA | Italy | 39,604 | 299,181 | |
| aMoody’s Corp | United States | 36,985 | 3,813,893 | |
| aMSCI Inc | United States | 13,955 | 978,525 | |
| Voya Financial Inc | United States | 2,400 | 97,680 | |
| 5,189,279 | ||||
| Diversified Telecommunication Services 0.1% | ||||
| Swisscom AG | Switzerland | 2,151 | 1,059,977 | |
| b,eTelecom Italia SpA | Italy | 24,847 | 32,132 | |
| Telecom Italia SpA, RSP | Italy | 137,677 | 158,554 | |
| 1,250,663 | ||||
| Electric Utilities 0.1% | ||||
| Pepco Holdings Inc | United States | 25,550 | 655,869 | |
| Electrical Equipment 0.0%† | ||||
| bSolarCity Corp | United States | 6,489 | 186,624 | |
franklintempleton.com
Semiannual Report
19
| FRANKLIN ALTERNATIVE STRATEGIES FUNDS |
| CONSOLIDATED STATEMENT OF INVESTMENTS (UNAUDITED) |
| Franklin K2 Alternative Strategies Fund (continued) | ||||
| Country | Shares/Warrants | Value | ||
| Common Stocks and Other Equity Interests (continued) | ||||
| Energy Equipment & Services 0.6% | ||||
| aBaker Hughes Inc | United States | 74,814 | $ | 4,045,193 |
| bCameron International Corp | United States | 45,616 | 3,115,117 | |
| Halliburton Co | United States | 991 | 39,491 | |
| 7,199,801 | ||||
| Food & Staples Retailing 0.6% | ||||
| aCostco Wholesale Corp | United States | 33,756 | 5,448,894 | |
| aCVS Health Corp | United States | 12,436 | 1,170,103 | |
| 6,618,997 | ||||
| Food Products 0.9% | ||||
| aThe Kraft Heinz Co | United States | 85,389 | 6,292,315 | |
| Lindt & Spruengli AG | Switzerland | 66 | 4,765,972 | |
| 11,058,287 | ||||
| Health Care Equipment & Supplies 1.3% | ||||
| bAlere Inc | United States | 15,257 | 629,656 | |
| Baxter International Inc | United States | 91,978 | 3,462,972 | |
| aBecton Dickinson and Co | United States | 30,059 | 4,516,365 | |
| a,bDerma Sciences Inc | United States | 13,030 | 58,374 | |
| bDexCom Inc | United States | 8,621 | 732,958 | |
| bGenMark Diagnostics Inc | United States | 25,179 | 200,677 | |
| a,bIDEXX Laboratories Inc | United States | 51,704 | 3,661,677 | |
| bInnocoll AG, ADR | Germany | 3,853 | 29,244 | |
| Medtronic PLC | United States | 21,464 | 1,617,098 | |
| bNovadaq Technologies Inc | Canada | 16,778 | 204,356 | |
| bTearLab Corp | United States | 61,366 | 91,435 | |
| 15,204,812 | ||||
| Health Care Providers & Services 1.6% | ||||
| bAcadia Healthcare Co. Inc | United States | 10,364 | 715,220 | |
| aAetna Inc | United States | 14,107 | 1,449,494 | |
| b,fAttendo AB, 144A | Sweden | 5,155 | 41,373 | |
| Celesio AG | Germany | 61,856 | 1,641,032 | |
| a,bCentene Corp | United States | 18,679 | 1,078,712 | |
| aCigna Corp | United States | 27,941 | 3,771,476 | |
| bCommunity Health Systems Inc | United States | 27,875 | 237 | |
| bDaVita HealthCare Partners Inc | United States | 7,796 | 569,420 | |
| a,bHCA Holdings Inc | United States | 4,608 | 313,621 | |
| bHealth Net Inc | United States | 22,836 | 1,444,605 | |
| aHumana Inc | United States | 25,769 | 4,346,200 | |
| bMolina Healthcare Inc | United States | 7,376 | 444,478 | |
| a,bPremier Inc., A | United States | 3,712 | 127,544 | |
| bSurgery Partners Inc | United States | 5,956 | 113,819 | |
| aUnitedHealth Group Inc | United States | 13,810 | 1,556,525 | |
| aUniversal Health Services Inc., B | United States | 6,265 | 761,323 | |
| 18,375,079 | ||||
| Health Care Technology 0.0%† | ||||
| bIMS Health Holdings Inc | United States | 11,545 | 320,027 | |
| bMedAssets Inc | United States | 6,569 | 197,924 | |
| 517,951 | ||||
20 Semiannual Report
franklintempleton.com
| FRANKLIN ALTERNATIVE STRATEGIES FUNDS |
| CONSOLIDATED STATEMENT OF INVESTMENTS (UNAUDITED) |
| Franklin K2 Alternative Strategies Fund (continued) | ||||
| Country | Shares/Warrants | Value | ||
| Common Stocks and Other Equity Interests (continued) | ||||
| Hotels, Restaurants & Leisure 1.9% | ||||
| a,bBuffalo Wild Wings Inc | United States | 25,263 | $ | 4,048,143 |
| Carnival Corp | United States | 57,803 | 2,920,786 | |
| a,bChipotle Mexican Grill Inc | United States | 1,771 | 1,026,383 | |
| aDomino’s Pizza Inc | United States | 30,033 | 3,227,647 | |
| aLas Vegas Sands Corp | United States | 10,558 | 465,185 | |
| aSonic Corp | United States | 142,172 | 4,131,518 | |
| aStarbucks Corp | United States | 76,029 | 4,667,420 | |
| Starwood Hotels & Resorts Worldwide Inc | United States | 18,059 | 1,297,359 | |
| 21,784,441 | ||||
| Household Durables 0.7% | ||||
| a,bCalAtlantic Group Inc | United States | 50,378 | 2,120,914 | |
| D.R. Horton Inc | United States | 13,452 | 434,634 | |
| bHovnanian Enterprises Inc | United States | 2,423 | 4,434 | |
| a,bJarden Corp | United States | 33,122 | 1,546,135 | |
| bMohawk Industries Inc | United States | 8,422 | 1,606,244 | |
| aPulteGroup Inc | United States | 45,168 | 879,872 | |
| Sony Corp., ADR | Japan | 42,941 | 1,113,031 | |
| 7,705,264 | ||||
| Industrial Conglomerates 0.3% | ||||
| CK Hutchison Holdings Ltd | Hong Kong | 73,940 | 969,852 | |
| Danaher Corp | United States | 26,574 | 2,561,468 | |
| 3,531,320 | ||||
| Insurance 0.2% | ||||
| aChubb Corp | United States | 16,967 | 2,214,703 | |
| Internet & Catalog Retail 0.8% | ||||
| a,bAmazon.com Inc | United States | 6,856 | 4,557,869 | |
| aExpedia Inc | United States | 7,915 | 974,416 | |
| Travelport Worldwide Ltd | United States | 6 | 80 | |
| a,bTripAdvisor Inc | United States | 11,365 | 936,135 | |
| a,bWayfair Inc., A | United States | 75,249 | 2,852,689 | |
| 9,321,189 | ||||
| Internet Software & Services 1.0% | ||||
| a,bAkamai Technologies Inc | United States | 15,405 | 887,482 | |
| a,bAlibaba Group Holding Ltd., ADR | China | 14,175 | 1,191,834 | |
| a,bAlphabet Inc., A | United States | 890 | 678,936 | |
| a,bAlphabet Inc., C | United States | 1,051 | 780,473 | |
| a,bBenefitfocus Inc | United States | 14,810 | 600,101 | |
| a,bCoStar Group Inc | United States | 5,295 | 1,107,926 | |
| bDemandware Inc | United States | 4,500 | 230,175 | |
| a,beBay Inc | United States | 14,335 | 424,173 | |
| bEnvestnet Inc | United States | 5 | 162 | |
| a,bFacebook Inc | United States | 9,039 | 942,225 | |
| bMarketo Inc | United States | 13,650 | 413,186 | |
| Tencent Holdings Ltd | China | 13,400 | 266,671 | |
| bTwitter Inc | United States | 1,665 | 42,291 | |
| a,bVeriSign Inc | United States | 6,655 | 595,223 | |
| bYahoo! Inc | United States | 111,891 | 3,783,035 | |
| bZillow Group Inc., A | United States | 2,940 | 76,528 | |
franklintempleton.com
Semiannual Report
21
| FRANKLIN ALTERNATIVE STRATEGIES FUNDS |
| CONSOLIDATED STATEMENT OF INVESTMENTS (UNAUDITED) |
| Franklin K2 Alternative Strategies Fund (continued) | ||||
| Country | Shares/Warrants | Value | ||
| Common Stocks and Other Equity Interests (continued) | ||||
| Internet Software & Services (continued) | ||||
| bZillow Group Inc., C | United States | 5,580 | $ | 137,547 |
| 12,157,968 | ||||
| IT Services 3.3% | ||||
| Accenture PLC, A | United States | 16,460 | 1,764,841 | |
| a,bAlliance Data Systems Corp | United States | 6,945 | 1,992,173 | |
| Amdocs Ltd | United States | 43,106 | 2,438,506 | |
| aAutomatic Data Processing Inc | United States | 26,810 | 2,312,631 | |
| a,bCardtronics Inc | United States | 35,210 | 1,324,248 | |
| a,bCognizant Technology Solutions Corp., A | United States | 19,650 | 1,268,997 | |
| a,bEPAM Systems Inc | United States | 7,500 | 590,475 | |
| bEuronet Worldwide Inc | United States | 7,697 | 598,211 | |
| EVERTEC Inc | Puerto Rico | 38,575 | 662,719 | |
| a,bExlService Holdings Inc | United States | 81,260 | 3,800,530 | |
| Fidelity National Information Services Inc | United States | 2,138 | 136,127 | |
| bGartner Inc | United States | 3,600 | 335,880 | |
| bGenpact Ltd | United States | 135,975 | 3,426,570 | |
| aGlobal Payments Inc | United States | 18,030 | 1,277,426 | |
| aHeartland Payment Systems Inc | United States | 44,760 | 3,551,258 | |
| aMasterCard Inc., A | United States | 31,573 | 3,091,628 | |
| a,bPayPal Holdings Inc | United States | 38,555 | 1,359,449 | |
| bSyntel Inc | United States | 1,500 | 72,645 | |
| a,bVantiv Inc., A | United States | 25,275 | 1,332,245 | |
| a,bVeriFone Systems Inc | United States | 68,750 | 1,971,750 | |
| aVisa Inc., A | United States | 28,075 | 2,218,206 | |
| a,bWEX Inc | United States | 25,897 | 2,441,310 | |
| b,fWorldpay Group PLC, 144A | United Kingdom | 62,471 | 281,320 | |
| 38,249,145 | ||||
| Leisure Products 0.0%† | ||||
| bJAKKS Pacific Inc | United States | 1,830 | 15,061 | |
| Life Sciences Tools & Services 0.4% | ||||
| bFluidigm Corp | United States | 12,600 | 143,262 | |
| a,bIllumina Inc | United States | 7,604 | 1,398,376 | |
| bSequenom Inc | United States | 69,498 | 123,706 | |
| aThermo Fisher Scientific Inc | United States | 18,141 | 2,510,714 | |
| a,bWuXi Pharmatech Cayman Inc., ADR | China | 23,425 | 1,070,523 | |
| 5,246,581 | ||||
| Machinery 0.0%† | ||||
| bNavistar International Corp | United States | 802 | 11,637 | |
| Marine 0.2% | ||||
| Irish Continental Group PLC | Ireland | 335,601 | 1,896,992 | |
| Media 1.9% | ||||
| CBS Corp., B | United States | 19,277 | 973,103 | |
| a,b,eCharter Communications Inc., A, | United States | 3,315 | 621,098 | |
| a,bDish Network Corp., A | United States | 40,301 | 2,527,276 | |
| bImax Corp | Canada | 8,645 | 327,473 | |
| bLiberty Global PLC LiLAC, A | United Kingdom | 5,227 | 196,274 | |
| bLiberty Global PLC LiLAC, C | United Kingdom | 1,299 | 50,947 | |
| bLiberty Global PLC, A | United Kingdom | 9,692 | 411,038 | |
| bLiberty Global PLC, C | United Kingdom | 25,990 | 1,065,590 | |
22 Semiannual Report
franklintempleton.com
| FRANKLIN ALTERNATIVE STRATEGIES FUNDS |
| CONSOLIDATED STATEMENT OF INVESTMENTS (UNAUDITED) |
| Franklin K2 Alternative Strategies Fund (continued) | ||||
| Country | Shares/Warrants | Value | ||
| Common Stocks and Other Equity Interests (continued) | ||||
| Media (continued) | ||||
| a,bLiberty Media Corp., C | United States | 75,706 | $ | 2,960,105 |
| bMarkit Ltd | United States | 31,635 | 933,232 | |
| aNews Corp., B | United States | 88,318 | 1,277,078 | |
| SES SA, IDR | Luxembourg | 24,396 | 677,122 | |
| aTime Warner Cable Inc | United States | 37,427 | 6,915,387 | |
| aThe Walt Disney Co | United States | 34,680 | 3,935,139 | |
| 22,870,862 | ||||
| Metals & Mining 0.1% | ||||
| bImpala Platinum Holdings Ltd | South Africa | 137,721 | 301,241 | |
| ThyssenKrupp AG | Germany | 51,931 | 1,105,306 | |
| 1,406,547 | ||||
| Multi-Utilities 0.0%† | ||||
| TECO Energy Inc | United States | 8,849 | 232,906 | |
| Oil, Gas & Consumable Fuels 0.2% | ||||
| Chesapeake Energy Corp | United States | 2,006 | 10,572 | |
| bCobalt International Energy Inc | United States | 1,106 | 8,151 | |
| bKinder Morgan Inc., wts., 5/25/17 | United States | 23,443 | 7,033 | |
| aOccidental Petroleum Corp | United States | 30,075 | 2,273,369 | |
| bSolazyme Inc | United States | 20,274 | 66,904 | |
| 2,366,029 | ||||
| Paper & Forest Products 0.1% | ||||
| bCanfor Corp | Canada | 82,929 | 1,293,505 | |
| Pharmaceuticals 2.5% | ||||
| bAerie Pharmaceuticals Inc | United States | 34,526 | 947,393 | |
| b,eAllergan PLC | United States | 34,787 | 10,919,291 | |
| bANI Pharmaceuticals Inc | United States | 1,910 | 83,696 | |
| a,bAratana Therapeutics Inc | United States | 26,435 | 154,909 | |
| bAssembly Biosciences Inc | United States | 24,228 | 238,161 | |
| aAstraZeneca PLC, ADR | United Kingdom | 47,988 | 1,633,991 | |
| aBristol-Myers Squibb Co | United States | 36,003 | 2,412,561 | |
| b,fCassiopea SpA, 144A | Italy | 4,129 | 139,660 | |
| bDermira Inc | United States | 5,583 | 172,012 | |
| Eli Lilly & Co | United States | 9,266 | 760,183 | |
| bEndo International PLC | United States | 4,833 | 297,133 | |
| bFlex Pharma Inc | United States | 3,708 | 44,867 | |
| bIntersect ENT Inc | United States | 3,795 | 74,800 | |
| bIntra-Cellular Therapies Inc | United States | 12,126 | 646,680 | |
| Ipsen SA | France | 26,606 | 1,708,273 | |
| bJazz Pharmaceuticals PLC | United States | 3,204 | 469,674 | |
| a,bThe Medicines Co | United States | 16,418 | 689,720 | |
| Novartis AG, ADR | Switzerland | 4,713 | 401,736 | |
| Novo Nordisk AS, ADR | Denmark | 9,019 | 495,774 | |
| bOcular Therapeutix Inc | United States | 8,086 | 76,655 | |
| a,bPacira Pharmaceuticals Inc | United States | 13,578 | 879,176 | |
| Perrigo Co. PLC | United States | 7,855 | 1,173,459 | |
| Pfizer Inc | United States | 79,729 | 2,612,719 | |
| bSCYNEXIS Inc | United States | 5,486 | 37,195 | |
| Shire PLC, ADR | Ireland | 10,675 | 2,224,243 | |
| bSteadymed Ltd | Israel | 6,266 | 19,801 | |
franklintempleton.com
Semiannual Report
23
| FRANKLIN ALTERNATIVE STRATEGIES FUNDS |
| CONSOLIDATED STATEMENT OF INVESTMENTS (UNAUDITED) |
| Franklin K2 Alternative Strategies Fund (continued) | ||||
| Country | Shares/Warrants | Value | ||
| Common Stocks and Other Equity Interests (continued) | ||||
| Pharmaceuticals (continued) | ||||
| Theravance Inc | United States | 16,834 | $ | 155,715 |
| bWave Life Sciences Pte Ltd | United States | 2,830 | 45,988 | |
| 29,515,465 | ||||
| Professional Services 1.1% | ||||
| aEquifax Inc | United States | 13,485 | 1,503,577 | |
| Experian PLC | United Kingdom | 75,854 | 1,406,333 | |
| bFTI Consulting Inc | United States | 18,050 | 674,709 | |
| a,bHuron Consulting Group Inc | United States | 41,530 | 2,409,155 | |
| Korn/Ferry International | United States | 1,244 | 45,779 | |
| aManpowerGroup Inc | United States | 13,370 | 1,207,044 | |
| Nielsen Holdings PLC | United States | 18,850 | 879,918 | |
| aRobert Half International Inc | United States | 8,425 | 431,191 | |
| SThree PLC | United Kingdom | 81,933 | 403,822 | |
| aTowers Watson & Co., A | United States | 9,600 | 1,291,296 | |
| bTransUnion | United States | 7,300 | 186,661 | |
| bTriNet Group Inc | United States | 20,510 | 405,073 | |
| a,bVerisk Analytics Inc | United States | 10,545 | 790,348 | |
| a,bWageWorks Inc | United States | 23,035 | 979,909 | |
| 12,614,815 | ||||
| Real Estate Investment Trusts (REITs) 0.2% | ||||
| aApollo Commercial Real Estate Finance Inc | United States | 1,493 | 26,202 | |
| BioMed Realty Trust Inc | United States | 46,634 | 1,094,500 | |
| Gramercy Property Trust Inc | United States | 75 | 1,792 | |
| Iron Mountain Inc | United States | 15,200 | 422,256 | |
| RAIT Financial Trust | United States | 5,889 | 25,441 | |
| bStrategic Hotels & Resorts Inc | United States | 74,815 | 1,059,380 | |
| 2,629,571 | ||||
| Real Estate Management & Development 0.0%† | ||||
| bForest City Enterprises Inc., A | United States | 939 | 20,883 | |
| Road & Rail 0.7% | ||||
| CSX Corp | United States | 72,082 | 2,049,291 | |
| aNorfolk Southern Corp | United States | 13,732 | 1,305,364 | |
| bSwift Transportation Co | United States | 35,514 | 567,158 | |
| aUnion Pacific Corp | United States | 47,766 | 4,009,956 | |
| 7,931,769 | ||||
| Semiconductors & Semiconductor Equipment 1.9% | ||||
| Advanced Semiconductor Engineering Inc | Taiwan | 187,000 | 196,785 | |
| Altera Corp | United States | 83,821 | 4,425,749 | |
| Avago Technologies Ltd | Singapore | 2,800 | 365,260 | |
| aBroadcom Corp., A | United States | 126,858 | 6,930,253 | |
| aCypress Semiconductor Corp | United States | 104,450 | 1,130,149 | |
| Globalwafers Co. Ltd | Taiwan | 90,678 | 215,291 | |
| bInotera Memories Inc | Taiwan | 297,000 | 201,081 | |
| KLA-Tencor Corp | United States | 19,890 | 1,322,088 | |
| Maxim Integrated Products Inc | United States | 35,104 | 1,360,982 | |
| bNXP Semiconductors NV | Netherlands | 15,452 | 1,444,144 | |
| bON Semiconductor Corp | United States | 126,600 | 1,387,536 | |
| bPMC-Sierra Inc | United States | 117,361 | 1,388,381 | |
| bSiltronic AG | Germany | 5,964 | 149,718 | |
24 Semiannual Report
franklintempleton.com
| FRANKLIN ALTERNATIVE STRATEGIES FUNDS |
| CONSOLIDATED STATEMENT OF INVESTMENTS (UNAUDITED) |
| Franklin K2 Alternative Strategies Fund (continued) | ||||
| Country | Shares/Warrants | Value | ||
| Common Stocks and Other Equity Interests (continued) | ||||
| Semiconductors & Semiconductor Equipment (continued) | ||||
| Sino-American Silicon Products Inc | Taiwan | 143,000 | $ | 191,882 |
| Sumco Corp | Japan | 75,200 | 797,816 | |
| bSunEdison Semiconductor Ltd | United States | 29,935 | 285,879 | |
| Win Semiconductors Corp | Taiwan | 135,000 | 207,616 | |
| 22,000,610 | ||||
| Software 0.9% | ||||
| aActivision Blizzard Inc | United States | 18,355 | 691,249 | |
| bAdobe Systems Inc | United States | 6,270 | 573,454 | |
| bCitrix Systems Inc | United States | 1,747 | 133,942 | |
| bGuidewire Software Inc | United States | 2,375 | 140,909 | |
| bHubSpot Inc | United States | 8,085 | 438,288 | |
| aIntuit Inc | United States | 7,345 | 735,969 | |
| aMicrosoft Corp | United States | 23,850 | 1,296,248 | |
| bPaylocity Holding Corp | United States | 1,000 | 43,940 | |
| bRed Hat Inc | United States | 6,957 | 566,369 | |
| bSalesforce.com Inc | United States | 12,503 | 996,364 | |
| bServiceNow Inc | United States | 700 | 60,907 | |
| Solera Holdings Inc | United States | 42,976 | 2,309,530 | |
| SS&C Technologies Holdings Inc | United States | 6,085 | 437,512 | |
| bTake-Two Interactive Software Inc | United States | 13,494 | 477,283 | |
| a,bVerint Systems Inc | United States | 19,855 | 930,207 | |
| b,eVMware Inc., A | United States | 3,200 | 196,512 | |
| 10,028,683 | ||||
| Specialty Retail 1.9% | ||||
| bAutoNation Inc | United States | 42,748 | 2,732,452 | |
| a,bAutozone Inc | United States | 5,735 | 4,494,921 | |
| aThe Home Depot Inc | United States | 46,639 | 6,244,029 | |
| Inditex SA | Spain | 39,418 | 1,418,495 | |
| aLowe’s Cos. Inc | United States | 19,587 | 1,500,364 | |
| a,bMarineMax Inc | United States | 26,248 | 476,401 | |
| aMonro Muffler Brake Inc | United States | 17,835 | 1,320,504 | |
| a,bO’Reilly Automotive Inc | United States | 8,972 | 2,367,442 | |
| a,eStaples Inc | United States | 99,775 | 1,204,284 | |
| 21,758,892 | ||||
| Technology Hardware, Storage & Peripherals 0.6% | ||||
| EMC Corp | United States | 116,938 | 2,963,209 | |
| aHewlett Packard Enterprise Co | United States | 63,334 | 941,143 | |
| a,bNCR Corp | United States | 82,633 | 2,240,180 | |
| a,bNimble Storage Inc | United States | 12,255 | 128,310 | |
| bPure Storage Inc., A | United States | 25,100 | 324,041 | |
| bViolin Memory Inc | United States | 15,244 | 19,970 | |
| Western Digital Corp | United States | 7,500 | 468,075 | |
| 7,084,928 | ||||
| Textiles, Apparel & Luxury Goods 0.5% | ||||
| Luxottica Group SpA | Italy | 13,024 | 871,037 | |
| Moncler SpA | Italy | 62,088 | 945,935 | |
| aNIKE Inc., B | United States | 30,656 | 4,055,176 | |
| bSkechers USA. Inc., A | United States | 15,253 | 460,641 | |
| 6,332,789 | ||||
franklintempleton.com
Semiannual Report
25
| FRANKLIN ALTERNATIVE STRATEGIES FUNDS |
| CONSOLIDATED STATEMENT OF INVESTMENTS (UNAUDITED) |
| Franklin K2 Alternative Strategies Fund (continued) | ||||
| Country | Shares/Warrants | Value | ||
| Common Stocks and Other Equity Interests (continued) | ||||
| Wireless Telecommunication Services 0.2% | ||||
| NTT DoCoMo Inc | Japan | 36,700 | $ | 694,050 |
| a,bT-Mobile U.S. Inc | United States | 38,796 | 1,377,258 | |
| 2,071,308 | ||||
| Total Common Stocks and Other Equity Interests | ||||
| (Cost $394,668,794) | 423,418,136 | |||
| Exchange Traded Funds 0.2% | ||||
| Financial Select Sector SPDR Fund | United States | 8,477 | 208,195 | |
| iShares MSCI Emerging Markets ETF | United States | 8,908 | 302,783 | |
| SPDR S&P Oil & Gas Exploration & Production ETF | United States | 35,755 | 1,327,583 | |
| Total Exchange Traded Funds (Cost $1,884,415) | 1,838,561 | |||
| Convertible Preferred Stocks 0.5% | ||||
| Capital Markets 0.0%† | ||||
| a,fCowen Group Inc., cvt. pfd., 144A, Series A, 5.625% | United States | 470 | 404,611 | |
| Food Products 0.2% | ||||
| Bunge Ltd., cvt. pfd., 4.875% | United States | 4,466 | 414,311 | |
| aPost Holdings Inc., cvt. pfd., 2.50% | United States | 13,932 | 1,830,316 | |
| 2,244,627 | ||||
| Multi-Utilities 0.0%† | ||||
| Dominion Resources Inc., cvt. pfd., | ||||
| 6.375% | United States | 1,155 | 55,948 | |
| Series A, 6.125% | United States | 137 | 7,348 | |
| 63,296 | ||||
| Oil, Gas & Consumable Fuels 0.2% | ||||
| Chesapeake Energy Corp., cvt. pfd., 5.75% | United States | 341 | 97,185 | |
| bKinder Morgan Inc., cvt. pfd., Series A, 9.75% | United States | 42,363 | 1,859,736 | |
| 1,956,921 | ||||
| Tobacco 0.1% | ||||
| aUniversal Corp., cvt. pfd., 6.75% | United States | 1,068 | 1,353,957 | |
| Total Convertible Preferred Stocks (Cost $5,691,617) | 6,023,412 | |||
| Preferred Stocks 0.3% | ||||
| Consumer Finance 0.0%† | ||||
| fAlly Financial Inc., pfd., 144A, Series G, 7.00% | United States | 202 | 204,411 | |
| Diversified Telecommunication Services 0.0%† | ||||
| Iridium Communications Inc., pfd., 7.00% | United States | 4,063 | 390,048 | |
| Machinery 0.0%† | ||||
| MAN SE, pfd., zero cpn | Germany | 3,542 | 347,284 | |
| Multi-Utilities 0.1% | ||||
| bBlack Hills Corp., pfd., 7.75% | United States | 7,601 | 398,673 | |
| Pharmaceuticals 0.2% | ||||
| Allergan PLC, pfd., 5.50% | United States | 2,120 | 2,220,318 | |
| Total Preferred Stocks (Cost $3,546,136) | 3,560,734 |
26 Semiannual Report
franklintempleton.com
| FRANKLIN ALTERNATIVE STRATEGIES FUNDS |
| CONSOLIDATED STATEMENT OF INVESTMENTS (UNAUDITED) |
| Franklin K2 Alternative Strategies Fund (continued) | |||||
| Principal | |||||
| Country | Amount* | Value | |||
| Convertible Bonds 8.9% | |||||
| Aerospace & Defense 0.1% | |||||
| aAAR Corp., senior note, Series B, 2.25%, 3/01/16 | United States | 781,000 | $ | 783,929 | |
| Air Freight & Logistics 0.0%† | |||||
| Atlas Air Worldwide Holdings Inc., senior note, 2.25%, 6/01/22 | United States | 496,000 | 421,600 | ||
| Biotechnology 0.7% | |||||
| gAblynx NV, senior note, Reg S, Series ABLX, 3.25%, 5/27/20 | Belgium | 200,000 | EUR | 272,272 | |
| aAcorda Therapeutics Inc., senior note, 1.75%, 6/15/21 | United States | 1,070,000 | 1,167,637 | ||
| AMAG Pharmaceuticals Inc., senior note, 2.50%, 2/15/19 | United States | 543,000 | 644,473 | ||
| BioMarin Pharmaceutical Inc., senior sub. note, | |||||
| 0.75%, 10/15/18 | United States | 1,258,000 | 1,550,485 | ||
| 1.50%, 10/15/20 | United States | 70,000 | 89,469 | ||
| Clovis Oncology Inc., senior note, 2.50%, 9/15/21 | United States | 330,000 | 268,537 | ||
| aExelixis Inc., senior sub. note, 4.25%, 8/15/19 | United States | 784,000 | 935,410 | ||
| fIronwood Pharmaceuticals Inc., senior note, 144A, 2.25%, 6/15/22 | United States | 465,000 | 449,597 | ||
| aLigand Pharmaceuticals Inc., senior note, 0.75%, 8/15/19 | United States | 1,171,000 | 1,803,340 | ||
| aPDL BioPharma Inc., senior note, 4.00%, 2/01/18 | United States | 481,000 | 387,506 | ||
| fPTC Therapeutics Inc., senior note, 144A, 3.00%, 8/15/22 | United States | 182,000 | 162,549 | ||
| 7,731,275 | |||||
| Building Products 0.0%† | |||||
| fGriffon Corp., sub. note, 144A, 4.00%, 1/15/17 | United States | 33,000 | 43,746 | ||
| Capital Markets 0.1% | |||||
| aCowen Group Inc., senior note, 3.00%, 3/15/19 | United States | 930,000 | 1,011,375 | ||
| aFXCM Inc., senior note, 2.25%, 6/15/18 | United States | 592,000 | 390,720 | ||
| Prospect Capital Corp., senior note, 6.25%, 12/15/15 | United States | 50,000 | 50,250 | ||
| 1,452,345 | |||||
| Commercial Services & Supplies 0.0%† | |||||
| Cenveo Inc., senior note, 7.00%, 5/15/17 | United States | 665,000 | 543,222 | ||
| Communications Equipment 0.3% | |||||
| fCalAmp Corp., senior note, 144A, 1.625%, 5/15/20 | United States | 483,000 | 465,793 | ||
| fInterDigital Inc., senior note, 144A, 1.50%, 3/01/20 | United States | 201,000 | 200,246 | ||
| aPalo Alto Networks Inc., zero cpn., senior note, 7/01/19 | United States | 1,846,000 | 3,242,038 | ||
| 3,908,077 | |||||
| Construction & Engineering 0.1% | |||||
| fDycom Industries Inc., senior note, 144A, 0.75%, 9/15/21 | United States | 287,000 | 321,081 | ||
| gFomento de Construcciones y Contratas SA, sub. bond, Reg S, 6.50%, 10/30/20 | Spain | 1,100,000 | EUR | 1,117,166 | |
| 1,438,247 | |||||
| Construction Materials 0.1% | |||||
| Cemex SAB de CV, sub. note, | |||||
| 3.25%, 3/15/16 | Mexico | 274,000 | 274,342 | ||
| a3.75%, 3/15/18 | Mexico | 684,000 | 673,740 | ||
| 948,082 | |||||
| Consumer Finance 0.1% | |||||
| Encore Capital Group Inc., senior note, 2.875%, 3/15/21 | United States | 717,000 | 580,770 | ||
| PRA Group Inc., senior note, 3.00%, 8/01/20 | United States | 545,000 | 494,928 | ||
| 1,075,698 | |||||
franklintempleton.com
Semiannual Report
27
| FRANKLIN ALTERNATIVE STRATEGIES FUNDS |
| CONSOLIDATED STATEMENT OF INVESTMENTS (UNAUDITED) |
| Franklin K2 Alternative Strategies Fund (continued) | |||||
| Principal | |||||
| Country | Amount* | Value | |||
| Convertible Bonds (continued) | |||||
| Diversified Consumer Services 0.1% | |||||
| aAscent Capital Group Inc., senior note, 4.00%, 7/15/20 | United States | 725,000 | $ | 470,797 | |
| aCarriage Services Inc., sub. note, 2.75%, 3/15/21 | United States | 665,000 | 808,391 | ||
| 1,279,188 | |||||
| Electric Utilities 0.0%† | |||||
| Emera Inc., sub. bond, 4.00%, 9/29/25 | Canada | 796,000 | CAD | 198,486 | |
| Electrical Equipment 0.1% | |||||
| General Cable Corp., sub. bond, 4.50%, 11/15/29 | United States | 591,000 | 400,033 | ||
| SolarCity Corp., senior note, | |||||
| 1.625%, 11/01/19 | United States | 473,000 | 320,458 | ||
| 2.75%, 11/01/18 | United States | 433,000 | 347,212 | ||
| 1,067,703 | |||||
| Electronic Equipment, Instruments & Components 0.1% | |||||
| aVishay Intertechnology Inc., senior bond, 2.25%, 11/15/40 | United States | 1,262,000 | 1,213,886 | ||
| Energy Equipment & Services 0.1% | |||||
| aSEACOR Holdings Inc., senior bond, 2.50%, 12/15/27 | United States | 612,000 | 583,695 | ||
| Health Care Equipment & Supplies 0.3% | |||||
| Alere Inc., senior sub. note, 3.00%, 5/15/16 | United States | 339,000 | 361,247 | ||
| aHologic Inc., senior bond, zero cpn., 12/15/43 | United States | 728,000 | 941,850 | ||
| Integra LifeSciences Holdings Corp., senior note, 1.625%, 12/15/16 | United States | 256,000 | 316,000 | ||
| aQuidel Corp., senior note, 3.25%, 12/15/20 | United States | 700,000 | 693,000 | ||
| fWright Medical Group Inc., senior note, 144A, 2.00%, 2/15/20 | United States | 705,000 | 696,628 | ||
| 3,008,725 | |||||
| Health Care Providers & Services 0.4% | |||||
| fAceto Corp., senior note, 144A, 2.00%, 11/01/20 | United States | 880,000 | 922,900 | ||
| HealthSouth Corp., senior sub. bond, 2.00%, 12/01/43 | United States | 639,000 | 699,705 | ||
| Molina Healthcare Inc., | |||||
| senior bond, 1.625%, 8/15/44 | United States | 1,656,000 | 2,002,725 | ||
| asenior note, 1.125%, 1/15/20 | United States | 745,000 | 1,165,925 | ||
| 4,791,255 | |||||
| Health Care Technology 0.0%† | |||||
| Allscripts Healthcare Solutions Inc., senior note, 1.25%, 7/01/20 | United States | 349,000 | 376,266 | ||
| Holding Companies 0.0%† | |||||
| RWT Holdings Inc., senior note, 5.625%, 11/15/19 | United States | 357,000 | 339,150 | ||
| Household Durables 0.4% | |||||
| a,fIAS Operating Partnership LP, senior note, 144A, 5.00%, 3/15/18 | United States | 430,000 | 406,619 | ||
| Jarden Corp., | |||||
| senior sub. bond, 1.125%, 3/15/34 | United States | 155,000 | 176,700 | ||
| asenior sub. note, 1.875%, 9/15/18 | United States | 741,000 | 1,145,308 | ||
| asenior sub. note, 1.50%, 6/15/19 | United States | 1,573,000 | 2,049,815 | ||
| K Hovnanian Enterprises Inc., senior note, 6.00%, 12/01/17 | United States | 315,000 | 276,019 | ||
| a,fLGI Homes Inc., sub. note, 144A, 4.25%, 11/15/19 | United States | 483,000 | 784,271 | ||
| 4,838,732 | |||||
| Independent Power & Renewable Electricity Producers 0.1% | |||||
| fPattern Energy Group Inc., senior note, 144A, 4.00%, 7/15/20 | United States | 948,000 | 843,720 | ||
| Insurance 0.1% | |||||
| AmTrust Financial Services Inc., senior bond, 2.75%, 12/15/44 | United States | 629,000 | 595,584 | ||
28 Semiannual Report
franklintempleton.com
| FRANKLIN ALTERNATIVE STRATEGIES FUNDS |
| CONSOLIDATED STATEMENT OF INVESTMENTS (UNAUDITED) |
| Franklin K2 Alternative Strategies Fund (continued) | ||||
| Principal | ||||
| Country | Amount* | Value | ||
| Convertible Bonds (continued) | ||||
| Internet & Catalog Retail 0.3% | ||||
| aCtrip.com International Ltd., senior note, 1.25%, 10/15/18 | China | 1,462,000 | $ | 2,137,261 |
| aPriceline Group Inc., senior note, 1.00%, 3/15/18 | United States | 1,319,000 | 1,865,561 | |
| 4,002,822 | ||||
| Internet Software & Services 0.9% | ||||
| aBlucora Inc., senior note, 4.25%, 4/01/19 | United States | 572,000 | 495,495 | |
| aj2 Global Inc., senior bond, 3.25%, 6/15/29 | United States | 673,000 | 877,003 | |
| aMercadoLibre Inc., senior note, 2.25%, 7/01/19 | Argentina | 1,227,000 | 1,443,259 | |
| Twitter Inc., senior note, 0.25%, 9/15/19 | United States | 780,000 | 679,575 | |
| aVeriSign Inc., junior sub. bond, 4.297%, 8/15/37 | United States | 2,583,000 | 6,794,904 | |
| aWebMD Health Corp., senior note, 1.50%, 12/01/20 | United States | 414,000 | 454,106 | |
| 10,744,342 | ||||
| Leisure Products 0.0%† | ||||
| fJAKKS Pacific Inc., senior note, 144A, 4.875%, 6/01/20 | United States | 460,000 | 463,737 | |
| Life Sciences Tools & Services 0.2% | ||||
| Albany Molecular Research Inc., senior note, 2.25%, 11/15/18 | United States | 985,000 | 1,345,141 | |
| Sequenom Inc., senior note, 5.00%, 1/01/18 | United States | 500,000 | 404,375 | |
| 1,749,516 | ||||
| Machinery 0.3% | ||||
| aAltra Industrial Motion Corp., senior bond, 2.75%, 3/01/31 | United States | 640,000 | 738,400 | |
| aNavistar International Corp., senior sub. note, 4.75%, 4/15/19 | United States | 268,000 | 195,807 | |
| aTrinity Industries Inc., senior sub. bond, 3.875%, 6/01/36 | United States | 1,706,000 | 2,213,535 | |
| Wabash National Corp., senior note, 3.375%, 5/01/18 | United States | 240,000 | 305,400 | |
| 3,453,142 | ||||
| Media 0.0%† | ||||
| Liberty Media Corp., senior bond, 1.375%, 10/15/23 | United States | 225,000 | 231,047 | |
| Metals & Mining 0.0%† | ||||
| RTI International Metals Inc., senior note, 1.625%, 10/15/19 | United States | 145,000 | 150,166 | |
| Oil, Gas & Consumable Fuels 0.5% | ||||
| Aegean Marine Petroleum Network Inc., senior note, 4.00%, 11/01/18 | Greece | 537,000 | 497,732 | |
| aAlon USA Energy Inc., senior note, 3.00%, 9/15/18 | United States | 610,000 | 812,062 | |
| Chesapeake Energy Corp., senior bond, | ||||
| 2.50%, 5/15/37 | United States | 885,000 | 570,825 | |
| 2.25%, 12/15/38 | United States | 319,000 | 145,145 | |
| Cobalt International Energy Inc., senior bond, 3.125%, 5/15/24 | United States | 303,000 | 200,738 | |
| Green Plains Inc., senior note, 3.25%, 10/01/18 | United States | 265,000 | 345,494 | |
| Renewable Energy Group Inc., senior note, 2.75%, 6/15/19 | United States | 495,000 | 417,037 | |
| fScorpio Tankers Inc., senior note, 144A, 2.375%, 7/01/19 | Monaco | 385,000 | 380,428 | |
| gShip Finance International Ltd., senior note, Reg S, 3.75%, 2/10/16 | Norway | 500,000 | 526,000 | |
| aSolazyme Inc., senior sub. note, 5.00%, 10/01/19 | United States | 1,390,000 | 823,575 | |
| fWhiting Petroleum Corp., senior note, 144A, 1.25%, 4/01/20 | United States | 605,000 | 535,425 | |
| 5,254,461 | ||||
| Pharmaceuticals 0.2% | ||||
| ANI Pharmaceuticals Inc., senior note, 3.00%, 12/01/19 | United States | 523,000 | 510,906 | |
| aThe Medicines Co., senior note, 1.375%, 6/01/17 | United States | 954,000 | 1,500,165 | |
| Theravance Inc., senior note, 2.125%, 1/15/23 | United States | 516,000 | 381,517 | |
| 2,392,588 | ||||
franklintempleton.com
Semiannual Report
29
| FRANKLIN ALTERNATIVE STRATEGIES FUNDS |
| CONSOLIDATED STATEMENT OF INVESTMENTS (UNAUDITED) |
| Franklin K2 Alternative Strategies Fund (continued) | ||||
| Principal | ||||
| Country | Amount* | Value | ||
| Convertible Bonds (continued) | ||||
| Professional Services 0.0%† | ||||
| 51job Inc., senior note, 3.25%, 4/15/19 | China | 253,000 | $ | 255,372 |
| Real Estate Investment Trusts (REITs) 1.0% | ||||
| fAmerican Residential Properties Inc., senior note, 144A, 3.25%, 11/15/18 | United States | 510,000 | 510,956 | |
| Apollo Commercial Real Estate Finance Inc., senior note, 5.50%, 3/15/19 | United States | 618,000 | 634,226 | |
| a,fEmpire State Realty OP LP, senior note, 144A, 2.625%, 8/15/19 | United States | 735,000 | 779,559 | |
| a,fGPT Property Trust LP, senior note, 144A, 3.75%, 3/15/19 | United States | 1,975,000 | 2,157,687 | |
| aNational Health Investors Inc., senior note, 3.25%, 4/01/21 | United States | 766,000 | 753,553 | |
| RAIT Financial Trust, senior bond, 4.00%, 10/01/33 | United States | 635,000 | 531,813 | |
| aRedwood Trust Inc., senior note, 4.625%, 4/15/18 | United States | 271,000 | 258,805 | |
| aSpirit Realty Capital Inc., senior note, | ||||
| 2.875%, 5/15/19 | United States | 1,492,000 | 1,420,205 | |
| 3.75%, 5/15/21 | United States | 59,000 | 55,718 | |
| Starwood Property Trust Inc., senior note, | ||||
| a3.75%, 10/15/17 | United States | 2,582,000 | 2,561,021 | |
| 4.55%, 3/01/18 | United States | 215,000 | 218,628 | |
| aStarwood Waypoint Residential Trust, senior note, 3.00%, 7/01/19 | United States | 739,000 | 710,364 | |
| VEREIT Inc., senior note, 3.75%, 12/15/20 | United States | 769,000 | 713,732 | |
| 11,306,267 | ||||
| Real Estate Management & Development 0.0%† | ||||
| aForest City Enterprises Inc., senior note, 3.625%, 8/15/20 | United States | 470,000 | 512,006 | |
| Semiconductors & Semiconductor Equipment 0.9% | ||||
| fIntegrated Device Technology Inc., senior note, 144A, 0.875%, 11/15/22 | United States | 605,000 | 654,913 | |
| aIntel Corp., junior sub. bond, | ||||
| 2.95%, 12/15/35 | United States | 344,000 | 445,265 | |
| 3.25%, 8/01/39 | United States | 1,038,000 | 1,740,601 | |
| Novellus Systems Inc., senior bond, 2.625%, 5/15/41 | United States | 60,000 | 138,525 | |
| aNVIDIA Corp., senior note, 1.00%, 12/01/18 | United States | 1,845,000 | 2,969,297 | |
| fNXP Semiconductors NV, senior note, 144A, 1.00%, 12/01/19 | Netherlands | 737,000 | 854,920 | |
| Photronics Inc., senior note, | ||||
| 3.25%, 4/01/16 | United States | 595,000 | 656,359 | |
| 3.25%, 4/01/19 | United States | 468,000 | 563,940 | |
| SunEdison Inc., senior note, | ||||
| 2.00%, 10/01/18 | United States | 225,000 | 96,188 | |
| 2.75%, 1/01/21 | United States | 945,000 | 369,731 | |
| a,f144A, 0.25%, 1/15/20 | United States | 1,155,000 | 356,606 | |
| f144A, 2.375%, 4/15/22 | United States | 247,000 | 77,342 | |
| aXilinx Inc., senior note, 2.625%, 6/15/17 | United States | 803,000 | 1,378,651 | |
| 10,302,338 | ||||
| Software 1.0% | ||||
| Bottomline Technologies de Inc., senior note, 1.50%, 12/01/17 | United States | 392,000 | 455,700 | |
| BroadSoft Inc., senior note, | ||||
| 1.50%, 7/01/18 | United States | 68,000 | 78,328 | |
| f144A, 1.00%, 9/01/22 | United States | 389,000 | 460,722 | |
| aElectronic Arts Inc., senior note, 0.75%, 7/15/16 | United States | 1,138,000 | 2,421,095 | |
| fFireEye Inc., senior bond, 144A, Series B, 1.625%, 6/01/35 | United States | 683,000 | 558,352 | |
| fInteractive Intelligence Group Inc., senior note, 144A, 1.25%, 6/01/20 | United States | 454,000 | 390,440 | |
| aNetSuite Inc., senior note, 0.25%, 6/01/18 | United States | 840,000 | 846,300 | |
| aProofpoint Inc., senior note, 1.25%, 12/15/18 | United States | 581,000 | 1,115,157 | |
| fRovi Corp., senior note, 144A, 0.50%, 3/01/20 | United States | 880,000 | 650,650 | |
30 Semiannual Report
franklintempleton.com
| FRANKLIN ALTERNATIVE STRATEGIES FUNDS |
| CONSOLIDATED STATEMENT OF INVESTMENTS (UNAUDITED) |
| Franklin K2 Alternative Strategies Fund (continued) | ||||
| Principal | ||||
| Country | Amount* | Value | ||
| Convertible Bonds (continued) | ||||
| Software (continued) | ||||
| Salesforce.com Inc., senior note, 0.25%, 4/01/18 | United States | 697,000 | $ | 910,892 |
| Take-Two Interactive Software Inc., senior note, | ||||
| 1.75%, 12/01/16 | United States | 323,000 | 603,202 | |
| a1.00%, 7/01/18 | United States | 930,000 | 1,565,306 | |
| fTiVo Inc., senior note, 144A, 4.00%, 3/15/16 | United States | 903,000 | 917,674 | |
| aWorkday Inc., senior note, 0.75%, 7/15/18 | United States | 445,000 | 528,994 | |
| 11,502,812 | ||||
| Specialty Retail 0.0%† | ||||
| fRestoration Hardware Holdings Inc., senior note, zero cpn., 144A, 6/15/19 | United States | 225,000 | 222,469 | |
| Technology Hardware, Storage & Peripherals 0.1% | ||||
| aElectronics For Imaging Inc., senior note, 0.75%, 9/01/19 | United States | 508,000 | 561,022 | |
| Violin Memory Inc., senior note, 4.25%, 10/01/19 | United States | 710,000 | 504,988 | |
| 1,066,010 | ||||
| Textiles, Apparel & Luxury Goods 0.1% | ||||
| Iconix Brand Group Inc., senior sub. note, | ||||
| 2.50%, 6/01/16 | United States | 467,000 | 426,137 | |
| 1.50%, 3/15/18 | United States | 278,000 | 184,349 | |
| 610,486 | ||||
| Thrifts & Mortgage Finance 0.1% | ||||
| aMGIC Investment Corp., | ||||
| senior note, 2.00%, 4/01/20 | United States | 213,000 | 314,441 | |
| fjunior sub. bond, 144A, 9.00%, 4/01/63 | United States | 540,000 | 676,688 | |
| 991,129 | ||||
| Tobacco 0.1% | ||||
| aVector Group Ltd., senior note, 1.75%, 4/15/20 | United States | 777,000 | 920,745 | |
| Trading Companies & Distributors 0.0%† | ||||
| a,fKaman Corp., senior note, 144A, 3.25%, 11/15/17 | United States | 397,000 | 504,438 | |
| Total Convertible Bonds (Cost $102,821,065) | 104,118,504 | |||
| Convertible Bonds in Reorganization (Cost $559,046) 0.0%† | ||||
| Oil, Gas & Consumable Fuels 0.0%† | ||||
| a,hAlpha Natural Resources Inc., senior note, 4.875%, 12/15/20 | United States | 1,670,000 | 33,400 | |
| Corporate Bonds and Notes 15.8% | ||||
| Aerospace & Defense 0.2% | ||||
| fBombardier Inc., senior note, 144A, 7.50%, 3/15/18 | Canada | 778,000 | 778,000 | |
| fKLX Inc., senior note, 144A, 5.875%, 12/01/22 | United States | 50,000 | 48,750 | |
| Kratos Defense & Security Solutions Inc., first lien, 7.00%, 5/15/19 | United States | 388,000 | 273,540 | |
| fMeccanica Holdings USA Inc., senior bond, 144A, 6.25%, 1/15/40 | Italy | 555,000 | 539,738 | |
| iRockwell Collins Inc., senior note, FRN, 0.687%, 12/15/16 | United States | 40,000 | 39,987 | |
| 1,680,015 | ||||
| Auto Components 0.0%† | ||||
| f,iDaimler Finance North America LLC, senior note, 144A, FRN, 0.682%, 3/10/17 | Germany | 150,000 | 149,176 | |
| fMidas Intermediate Holdco II LLC/Midas Intermediate Holdco II Finance Inc., | ||||
| senior note, 144A, 7.875%, 10/01/22 | United States | 170,000 | 165,750 | |
| 314,926 | ||||
franklintempleton.com
Semiannual Report
31
| FRANKLIN ALTERNATIVE STRATEGIES FUNDS |
| CONSOLIDATED STATEMENT OF INVESTMENTS (UNAUDITED) |
| Franklin K2 Alternative Strategies Fund (continued) | ||||
| Principal | ||||
| Country | Amount* | Value | ||
| Corporate Bonds and Notes (continued) | ||||
| Banks 0.4% | ||||
| Bank of America Corp., | ||||
| isenior note, FRN, 1.361%, 1/15/19 | United States | 20,000 | $ | 20,127 |
| sub. bond, 4.20%, 8/26/24 | United States | 135,000 | 136,575 | |
| sub. bond, Series L, 3.95%, 4/21/25 | United States | 335,000 | 332,013 | |
| f,iThe Bank of Tokyo-Mitsubishi UFJ Ltd., senior note, 144A, FRN, | ||||
| 1.356%, 9/14/18 | Japan | 335,000 | 336,042 | |
| fIntesa Sanpaolo SpA, sub. bond, 144A, 5.017%, 6/26/24 | Italy | 955,000 | 957,965 | |
| Royal Bank of Scotland Group PLC, sub. bond, 6.125%, 12/15/22 | United Kingdom | 70,000 | 77,129 | |
| Royal Bank of Scotland Group PLC, | ||||
| i,jFRN, 8.00%, Perpetual | United Kingdom | 600,000 | 634,500 | |
| fSantander UK Group Holdings PLC, sub. bond, 144A, 4.75%, 9/15/25 | United Kingdom | 270,000 | 271,007 | |
| i,jSociete Generale SA, FRN, Perpetual | ||||
| fjunior sub., 144A, 7.875% | France | 950,000 | 963,015 | |
| gReg S, 7.875% | France | 425,000 | 430,822 | |
| iToyota Motor Credit Corp., senior note, FRN, 0.705%, 1/17/19 | United States | 40,000 | 39,679 | |
| 4,198,874 | ||||
| Beverages 0.0%† | ||||
| iAnheuser-Busch InBev NV, senior note, FRN, 0.513%, 1/27/17 | Belgium | 45,000 | 44,883 | |
| iThe Coca-Cola Co., senior note, FRN, 0.429%, 11/01/16 | United States | 80,000 | 80,033 | |
| 124,916 | ||||
| Biotechnology 0.0%† | ||||
| fAMAG Pharmaceuticals Inc., senior note, 144A, 7.875%, 9/01/23 | United States | 400,000 | 335,000 | |
| iAmgen Inc., senior note, FRN, 0.758%, 5/22/17 | United States | 125,000 | 124,741 | |
| 459,741 | ||||
| Building Products 0.1% | ||||
| fAtrium Windows & Doors Inc., secured note, 144A, 7.75%, 5/01/19 | United States | 75,000 | 55,875 | |
| fNCI Building Systems Inc., senior note, 144A, 8.25%, 1/15/23 | United States | 50,000 | 53,000 | |
| fNWH Escrow Corp., secured note, 144A, 7.50%, 8/01/21 | United States | 720,000 | 615,600 | |
| Owens Corning, senior bond, 4.20%, 12/01/24 | United States | 65,000 | 64,100 | |
| 788,575 | ||||
| Capital Markets 0.1% | ||||
| Brixmor Operating Partnership LP, senior bond, 3.85%, 2/01/25 | United States | 265,000 | 260,151 | |
| Deutsche Bank AG, sub. bond, 4.50%, 4/01/25 | Germany | 225,000 | 212,672 | |
| Morgan Stanley, sub. bond, 4.35%, 9/08/26 | United States | 150,000 | 153,448 | |
| 626,271 | ||||
| Chemicals 0.0%† | ||||
| Albemarle Corp., senior bond, 4.15%, 12/01/24 | United States | 56,000 | 55,488 | |
| Commercial Services & Supplies 0.4% | ||||
| fiPayment Inc., senior note, 144A, 9.50%, 12/15/19 | United States | 4,330,000 | 4,449,075 | |
| Communications Equipment 0.0%† | ||||
| Alcatel-Lucent USA Inc., senior bond, | ||||
| 6.50%, 1/15/28 | France | 150,000 | 151,313 | |
| 6.45%, 3/15/29 | France | 175,000 | 180,031 | |
| iCisco Systems Inc., senior note, FRN, 0.696%, 3/03/17 | United States | 100,000 | 100,130 | |
| 431,474 | ||||
32 Semiannual Report
franklintempleton.com
| FRANKLIN ALTERNATIVE STRATEGIES FUNDS |
| CONSOLIDATED STATEMENT OF INVESTMENTS (UNAUDITED) |
| Franklin K2 Alternative Strategies Fund (continued) | ||||||
| Principal | ||||||
| Country | Amount* | Value | ||||
| Corporate Bonds and Notes (continued) | ||||||
| Construction Materials 0.0%† | ||||||
| fCemex SAB de CV, senior bond, 144A, 6.125%, 5/05/25 | Mexico | 365,000 | $ | 335,691 | ||
| Consumer Finance 0.1% | ||||||
| iCaterpillar Financial Services Corp., senior note, FRN, | ||||||
| 0.646%, 3/03/17 | United States | 110,000 | 110,007 | |||
| 0.506%, 6/09/17 | United States | 300,000 | 299,558 | |||
| iJohn Deere Capital Corp., senior note, FRN, 0.452%, 12/10/15 | United States | 80,000 | 80,000 | |||
| f,iNissan Motor Acceptance Corp., senior note, 144A, FRN, 0.966%, 3/03/17 | Japan | 105,000 | 104,863 | |||
| 594,428 | ||||||
| Containers & Packaging 0.0%† | ||||||
| fBeverage Packaging Holdings Luxembourg II SA / Beverage Packaging | ||||||
| Holdings II Issuer Inc., senior sub. note, 144A, 6.00%, 6/15/17 | United States | 115,000 | 114,856 | |||
| Diversified Consumer Services 0.1% | ||||||
| fSotheby’s, senior bond, 144A, 5.25%, 10/01/22 | United States | 1,120,000 | 1,080,800 | |||
| Diversified Financial Services 1.6% | ||||||
| iAmerican Honda Finance Corp., senior note, FRN, 0.777%, 9/20/17 | Japan | 180,000 | 180,232 | |||
| fCorp. Financiera de Desarrollo SA, 144A, | ||||||
| senior note, 3.25%, 7/15/19 | Peru | 200,000 | 200,300 | |||
| sub. bond, 5.25% to 7/15/24, FRN thereafter, 7/15/29 | Peru | 200,000 | 198,500 | |||
| fDresdner Funding Trust I, junior sub. bond, 144A, 8.151%, 6/30/31 | Germany | 169,000 | 208,081 | |||
| fFinanciera de Desarrollo Territorial SA Findeter, senior bond, 144A, | ||||||
| 7.875%, 8/12/24 | Colombia | 795,000,000 | COP | 227,986 | ||
| iFord Motor Credit Co. LLC, senior note, FRN, 1.095%, 1/17/17 | United States | 40,000 | 39,781 | |||
| iGeneral Electric Capital Corp., senior note, FRN, 0.551%, 1/14/16 | United States | 20,000 | 20,002 | |||
| fGlobal Cash Access Inc., senior note, 144A, 10.00%, 1/15/22 | United States | 4,577,000 | 4,062,087 | |||
| f,iHyundai Capital Services Inc., senior note, 144A, FRN, 1.14%, 3/18/17 | South Korea | 200,000 | 199,590 | |||
| fLadder Capital Finance Holdings LLP, senior note, 144A, 5.875%, 8/01/21 | United States | 225,000 | 210,094 | |||
| f,i,jLBG Capital No.1 PLC, junior sub., 144A, FRN, 8.00%, Perpetual | United Kingdom | 600,000 | 676,500 | |||
| NewStar Financial Inc., senior note, 7.25%, 5/01/20 | United States | 3,257,000 | 3,236,644 | |||
| fOpal Acquisition Inc., senior note, 144A, 8.875%, 12/15/21 | United States | 1,174,000 | 1,016,977 | |||
| fQuicken Loans Inc., senior note, 144A, 5.75%, 5/01/25 | United States | 350,000 | 339,500 | |||
| a,fROC Finance LLC/ROC Finance 1 Corp., secured note, second lien, 144A, | ||||||
| 12.125%, 9/01/18 | United States | 7,245,000 | 7,679,700 | |||
| iShell International Finance BV, senior note, FRN, | ||||||
| 0.572%, 11/15/16 | Netherlands | 80,000 | 80,037 | |||
| 0.661%, 5/10/17 | Netherlands | 390,000 | 390,030 | |||
| fSolvay Finance America LLC, senior bond, 144A, 4.45%, 12/03/25 | Belgium | 200,000 | 199,760 | |||
| 19,165,801 | ||||||
| Diversified Telecommunication Services 1.1% | ||||||
| Frontier Communications Corp., | ||||||
| senior bond, 9.00%, 8/15/31 | United States | 9,856,000 | 8,402,240 | |||
| a,fsenior note, 144A, 11.00%, 9/15/25 | United States | 1,040,000 | 1,021,800 | |||
| fLevel 3 Financing Inc., senior note, 144A, 5.125%, 5/01/23 | United States | 155,000 | 154,419 | |||
| fOi SA, senior note, 144A, 9.75%, 9/15/16 | Brazil | 300,000 | BRL | 67,630 | ||
| Sprint Capital Corp., senior bond, 8.75%, 3/15/32 | United States | 1,106,000 | 857,150 | |||
| Sprint Communications Inc., senior bond, 6.00%, 12/01/16 | United States | 225,000 | 224,859 | |||
| Telecom Italia Capital SA, senior bond, | ||||||
| 7.20%, 7/18/36 | Italy | 408,000 | 422,280 | |||
| 7.721%, 6/04/38 | Italy | 492,000 | 523,980 | |||
franklintempleton.com
Semiannual Report
33
| FRANKLIN ALTERNATIVE STRATEGIES FUNDS |
| CONSOLIDATED STATEMENT OF INVESTMENTS (UNAUDITED) |
| Franklin K2 Alternative Strategies Fund (continued) | |||||
| Principal | |||||
| Country | Amount* | Value | |||
| Corporate Bonds and Notes (continued) | |||||
| Diversified Telecommunication Services (continued) | |||||
| iVerizon Communications Inc., senior note, FRN, 0.733%, 6/09/17 | United States | 125,000 | $ | 124,761 | |
| fWind Acquisition Finance SA, senior note, 144A, 7.375%, 4/23/21 | Italy | 800,000 | 774,000 | ||
| Windstream Services LLC, senior note, 7.75%, 10/15/20 | United States | 735,000 | 620,156 | ||
| 13,193,275 | |||||
| Electric Utilities 0.3% | |||||
| iDuke Energy Corp., senior note, FRN, 0.704%, 4/03/17 | United States | 100,000 | 99,806 | ||
| iDuke Energy Progress Inc., secured note, FRN, 0.534%, 3/06/17 | United States | 50,000 | 49,865 | ||
| fEnel SpA, sub. bond, 144A, 8.75% to 9/24/23, FRN thereafter, 9/24/73 | Italy | 745,000 | 858,613 | ||
| a,fReal Alloy Holding Inc., senior note, 144A, 10.00%, 1/15/19 | United States | 2,656,000 | 2,695,840 | ||
| 3,704,124 | |||||
| Electronic Equipment, Instruments & Components 0.0%† | |||||
| fFlextronics International Ltd., senior bond, 144A, 4.75%, 6/15/25 | United States | 85,000 | 82,073 | ||
| Keysight Technologies Inc., senior note, 4.55%, 10/30/24 | United States | 400,000 | 382,990 | ||
| 465,063 | |||||
| Energy Equipment & Services 0.3% | |||||
| Diamond Offshore Drilling Inc., senior bond, 4.875%, 11/01/43 | United States | 15,000 | 10,746 | ||
| fParagon Offshore PLC, 144A, | |||||
| senior bond, 7.25%, 8/15/24 | United States | 1,550,000 | 298,375 | ||
| senior note, 6.75%, 7/15/22 | United States | 1,110,000 | 213,675 | ||
| Targa Resources Partners LP/Targa Resources Partners Finance Corp., | |||||
| senior bond, 6.375%, 8/01/22 | United States | 25,000 | 24,375 | ||
| senior bond, 5.25%, 5/01/23 | United States | 15,000 | 13,650 | ||
| senior bond, 4.25%, 11/15/23 | United States | 5,000 | 4,238 | ||
| fsenior note, 144A, 5.00%, 1/15/18 | United States | 125,000 | 123,438 | ||
| Targa Resources Partners LP/Targa Resources Partners Finance Corp., | |||||
| fsenior note, 144A, 6.75%, 3/15/24 | United States | 1,889,000 | 1,799,272 | ||
| Transocean Inc., senior bond, 6.80%, 3/15/38 | United States | 900,000 | 553,500 | ||
| Weatherford International Ltd., senior bond, 5.95%, 4/15/42 | United States | 335,000 | 211,887 | ||
| 3,253,156 | |||||
| Food & Staples Retailing 0.2% | |||||
| New Albertsons Inc., senior bond, | |||||
| 7.45%, 8/01/29 | United States | 1,335,000 | 1,264,913 | ||
| 8.00%, 5/01/31 | United States | 92,000 | 89,700 | ||
| Safeway Inc., senior bond, 7.25%, 2/01/31 | United States | 284,000 | 270,510 | ||
| Tesco PLC, senior bond, 5.125%, 4/10/47 | United Kingdom | 750,000 | EUR | 706,108 | |
| 2,331,231 | |||||
| Gas Utilities 0.0%† | |||||
| NGL Energy Partners LP / NGL Energy Finance Corp., senior note, | |||||
| 5.125%, 7/15/19 | United States | 215,000 | 192,425 | ||
| Health Care Equipment & Supplies 0.5% | |||||
| aUniversal Hospital Services Inc., senior note, 7.625%, 8/15/20 | United States | 6,441,000 | 6,054,540 | ||
| Health Care Providers & Services 0.0%† | |||||
| aCommunity Health Systems Inc., senior note, 7.125%, 7/15/20 | United States | 350,000 | 351,750 | ||
| Hotels, Restaurants & Leisure 1.2% | |||||
| aCaesars Entertainment Resort Properties LLC, secured note, second lien, | |||||
| 11.00%, 10/01/21 | United States | 2,255,000 | 2,080,238 | ||
34 Semiannual Report
franklintempleton.com
| FRANKLIN ALTERNATIVE STRATEGIES FUNDS |
| CONSOLIDATED STATEMENT OF INVESTMENTS (UNAUDITED) |
| Franklin K2 Alternative Strategies Fund (continued) | |||||
| Principal | |||||
| Country | Amount* | Value | |||
| Corporate Bonds and Notes (continued) | |||||
| Hotels, Restaurants & Leisure (continued) | |||||
| Choice Hotels International Inc., senior bond, 5.70%, 8/28/20 | United States | 125,000 | $ | 134,375 | |
| fGolden Nugget Escrow Inc., senior note, 144A, 8.50%, 12/01/21 | United States | 2,105,000 | 2,173,412 | ||
| fGreektown Holdings LLC/Greektown Mothership Corp., secured note, 144A, | |||||
| 8.875%, 3/15/19 | United States | 1,214,000 | 1,253,455 | ||
| fInternational Game Technology PLC, secured note, 144A, 6.50%, 2/15/25 | United States | 1,124,000 | 1,039,700 | ||
| MGM Resorts International, senior note, 6.00%, 3/15/23 | United States | 490,000 | 486,631 | ||
| a,fDownstream Development Authority of the Quapaw Tribe of Oklahoma, secured | |||||
| note, 144A, 10.50%, 7/01/19 | United States | 5,950,000 | 6,217,750 | ||
| Wyndham Worldwide Corp., senior bond, 5.10%, 10/01/25 | United States | 230,000 | 235,073 | ||
| 13,620,634 | |||||
| Household Durables 0.0%† | |||||
| Sharp Corp., senior note, 1.604%, 9/13/19 | Japan | 100,000,000 | JPY | 498,691 | |
| Household Products 0.0%† | |||||
| iThe Procter & Gamble Co., senior note, FRN, 0.414%, 11/04/16 | United States | 80,000 | 80,017 | ||
| Independent Power & Renewable Electricity Producers 0.3% | |||||
| NRG Energy Inc., senior note, | |||||
| 6.625%, 3/15/23 | United States | 1,168,000 | 1,080,400 | ||
| 6.25%, 5/01/24 | United States | 2,984,000 | 2,715,440 | ||
| 3,795,840 | |||||
| Insurance 0.1% | |||||
| g,iAssicurazioni Generali SpA, senior sub. bond, FRN, Reg S, 7.75%, 12/12/42 | Italy | 400,000 | EUR | 526,160 | |
| Old Republic International Corp., senior bond, 4.875%, 10/01/24 | United States | 415,000 | 432,221 | ||
| 958,381 | |||||
| IT Services 0.1% | |||||
| fFirst Data Corp., senior note, 144A, 7.00%, 12/01/23 | United States | 655,000 | 665,644 | ||
| Life Sciences Tools & Services 0.4% | |||||
| inVentiv Health Inc., senior note, 10.00%, 8/15/18 | United States | 4,440,000 | 4,306,800 | ||
| Media 3.2% | |||||
| American Media Inc., first lien, 11.50%, 12/15/17 | United States | 10,073,000 | 10,110,774 | ||
| Cablevision Systems Corp., senior note, 8.625%, 9/15/17 | United States | 150,000 | 158,625 | ||
| Cablevision Systems Corp., senior note, 7.75%, 4/15/18 | United States | 185,000 | 192,862 | ||
| fCCO Holdings LLC/CCO Holdings Capital Corp., senior note, 144A, | |||||
| 5.125%, 5/01/23 | United States | 120,000 | 119,850 | ||
| fCCO Safari II LLC, secured bond, 144A, 6.484%, 10/23/45 | United States | 400,000 | 417,767 | ||
| Clear Channel Worldwide Holdings Inc., senior sub. note, Series B, | |||||
| 7.625%, 3/15/20 | United States | 485,000 | 472,269 | ||
| CSC Holdings LLC, | |||||
| senior bond, 5.25%, 6/01/24 | United States | 45,000 | 38,250 | ||
| senior note, 6.75%, 11/15/21 | United States | 95,000 | 90,013 | ||
| DISH DBS Corp., senior note, | |||||
| 6.75%, 6/01/21 | United States | 430,000 | 433,762 | ||
| 5.875%, 7/15/22 | United States | 170,000 | 158,312 | ||
| 5.875%, 11/15/24 | United States | 605,000 | 542,419 | ||
| fDreamWorks Animation SKG Inc., senior note, 144A, 6.875%, 8/15/20 | United States | 770,000 | 766,150 | ||
| a,fLee Enterprises Inc., senior secured note, first lien, 144A, 9.50%, 3/15/22 | United States | 6,012,000 | 5,598,675 | ||
| The McClatchy Co., senior secured note, first lien, 9.00%, 12/15/22 | United States | 384,000 | 361,569 | ||
| Postmedia Network Inc., secured note, second lien, 12.50%, 7/15/18 | Canada | 3,566,000 | 3,405,530 | ||
franklintempleton.com
Semiannual Report
35
| FRANKLIN ALTERNATIVE STRATEGIES FUNDS |
| CONSOLIDATED STATEMENT OF INVESTMENTS (UNAUDITED) |
| Franklin K2 Alternative Strategies Fund (continued) | ||||
| Principal | ||||
| Country | Amount* | Value | ||
| Corporate Bonds and Notes (continued) | ||||
| Media (continued) | ||||
| fTime Inc., senior note, 144A, 5.75%, 4/15/22 | United States | 5,796,000 | $ | 5,578,650 |
| Time Warner Cable Inc., senior bond, | ||||
| 5.875%, 11/15/40 | United States | 555,000 | 538,688 | |
| 4.50%, 9/15/42 | United States | 140,000 | 114,398 | |
| Viacom Inc., senior bond, 4.875%, 6/15/43 | United States | 1,000,000 | 815,570 | |
| aWideOpenWest Finance LLC/Capital Corp., senior note, 10.25%, 7/15/19 | United States | 7,447,000 | 7,158,429 | |
| 37,072,562 | ||||
| Metals & Mining 0.2% | ||||
| AK Steel Corp., | ||||
| senior bond, 7.625%, 5/15/20 | United States | 796,000 | 344,270 | |
| senior note, 7.625%, 10/01/21 | United States | 1,175,000 | 481,750 | |
| ArcelorMittal, senior bond, 8.00%, 10/15/39 | Luxembourg | 260,000 | 197,634 | |
| Freeport-McMoRan Inc., senior bond, 5.45%, 3/15/43 | United States | 1,100,000 | 695,750 | |
| Teck Resources Ltd., senior bond, 5.40%, 2/01/43 | Canada | 700,000 | 325,500 | |
| 2,044,904 | ||||
| Oil, Gas & Consumable Fuels 2.3% | ||||
| Antero Resources Corp., senior note, | ||||
| 5.375%, 11/01/21 | United States | 50,000 | 46,250 | |
| 5.125%, 12/01/22 | United States | 240,000 | 219,600 | |
| fBaytex Energy Corp., senior note, 144A, | ||||
| 5.125%, 6/01/21 | Canada | 10,000 | 8,400 | |
| 5.625%, 6/01/24 | Canada | 495,000 | 407,137 | |
| fBellatrix Exploration Ltd., senior note, 144A, 8.50%, 5/15/20 | Canada | 150,000 | 124,125 | |
| Bonanza Creek Energy Inc., senior note, | ||||
| 6.75%, 4/15/21 | United States | 45,000 | 35,550 | |
| 5.75%, 2/01/23 | United States | 410,000 | 280,850 | |
| iBP Capital Markets PLC, senior note, FRN, 0.764%, 11/07/16 | United Kingdom | 80,000 | 80,009 | |
| California Resources Corp., senior note, 6.00%, 11/15/24 | United States | 5,401,000 | 3,243,976 | |
| iCanadian Natural Resources Ltd., senior note, FRN, 0.702%, 3/30/16 | Canada | 100,000 | 99,813 | |
| Chesapeake Energy Corp., | ||||
| senior bond, 6.625%, 8/15/20 | United States | 5,000 | 2,375 | |
| senior bond, 6.125%, 2/15/21 | United States | 20,000 | 8,600 | |
| senior note, 5.375%, 6/15/21 | United States | 5,000 | 2,213 | |
| senior note, 4.875%, 4/15/22 | United States | 170,000 | 72,781 | |
| iChevron Corp., senior note, FRN, 0.532%, 11/15/17 | United States | 145,000 | 144,483 | |
| Concho Resources Inc., senior bond, | ||||
| 5.50%, 10/01/22 | United States | 75,000 | 73,125 | |
| 5.50%, 4/01/23 | United States | 300,000 | 294,000 | |
| Continental Resources Inc., | ||||
| senior bond, 5.00%, 9/15/22 | United States | 895,000 | 786,481 | |
| senior note, 4.50%, 4/15/23 | United States | 15,000 | 13,081 | |
| senior note, 3.80%, 6/01/24 | United States | 175,000 | 145,539 | |
| Diamondback Energy Inc., senior note, 7.625%, 10/01/21 | United States | 460,000 | 491,050 | |
| fEclipse Resources Corp., senior note, 144A, 8.875%, 7/15/23 | United States | 335,000 | 236,175 | |
| Energy Transfer Equity LP, senior bond, 5.50%, 6/01/27 | United States | 6,005,000 | 5,059,212 | |
| Energy Transfer Partners LP, senior bond, 6.125%, 12/15/45 | United States | 160,000 | 138,554 | |
| Enterprise Products Operating LLC, senior bond, 3.70%, 2/15/26 | United States | 35,000 | 32,859 | |
| g,iEP PetroEcuador via Noble Sovereign Funding I Ltd., secured note, FRN, Reg S, | ||||
| 5.957%, 9/24/19 | Ecuador | 1,804,632 | 1,506,867 | |
| iExxon Mobil Corp., senior note, FRN, 0.377%, 3/15/17 | United States | 110,000 | 109,942 | |
36 Semiannual Report
franklintempleton.com
| FRANKLIN ALTERNATIVE STRATEGIES FUNDS |
| CONSOLIDATED STATEMENT OF INVESTMENTS (UNAUDITED) |
| Franklin K2 Alternative Strategies Fund (continued) | ||||
| Principal | ||||
| Country | Amount* | Value | ||
| Corporate Bonds and Notes (continued) | ||||
| Oil, Gas & Consumable Fuels (continued) | ||||
| Halcon Resources Corp., | ||||
| fsecured note, second lien, 144A, 8.625%, 2/01/20 | United States | 410,000 | $ | 324,412 |
| senior note, 9.75%, 7/15/20 | United States | 370,000 | 118,400 | |
| Kinder Morgan Inc., senior bond, 8.05%, 10/15/30 | United States | 3,645,000 | 3,655,210 | |
| MarkWest Energy Partners LP/MarkWest Energy Finance Corp., senior bond, | ||||
| 4.875%, 12/01/24 | United States | 430,000 | 383,506 | |
| Matador Resources Co., senior note, 6.875%, 4/15/23 | United States | 392,000 | 392,000 | |
| fMEG Energy Corp., 144A, | ||||
| senior bond, 6.375%, 1/30/23 | Canada | 140,000 | 116,900 | |
| senior bond, 7.00%, 3/31/24 | Canada | 245,000 | 208,863 | |
| senior note, 6.50%, 3/15/21 | Canada | 60,000 | 51,900 | |
| Noble Energy Inc., senior note, | ||||
| 5.625%, 5/01/21 | United States | 447,000 | 451,432 | |
| 5.875%, 6/01/22 | United States | 85,000 | 85,417 | |
| 5.875%, 6/01/24 | United States | 185,000 | 185,770 | |
| Oasis Petroleum Inc., | ||||
| senior bond, 6.875%, 1/15/23 | United States | 70,000 | 60,725 | |
| senior note, 7.25%, 2/01/19 | United States | 10,000 | 9,525 | |
| senior note, 6.875%, 3/15/22 | United States | 345,000 | 295,837 | |
| fPacific Exploration and Production Corp., 144A, | ||||
| senior bond, 5.125%, 3/28/23 | Colombia | 200,000 | 60,000 | |
| senior bond, 5.625%, 1/19/25 | Colombia | 515,000 | 157,075 | |
| senior note, 5.375%, 1/26/19 | Colombia | 175,000 | 56,875 | |
| Petrobras Global Finance BV, | ||||
| senior bond, 6.875%, 1/20/40 | Brazil | 660,000 | 460,350 | |
| senior bond, 6.75%, 1/27/41 | Brazil | 440,000 | 303,600 | |
| senior bond, 5.625%, 5/20/43 | Brazil | 350,000 | 224,836 | |
| senior bond, 7.25%, 3/17/44 | Brazil | 30,000 | 21,482 | |
| senior bond, 6.85%, 6/05/15 | Brazil | 2,520,000 | 1,726,452 | |
| senior note, 4.875%, 3/17/20 | Brazil | 1,262,000 | 1,018,686 | |
| gPetroleos de Venezuela SA, senior bond, Reg S, 6.00%, 11/15/26 | Venezuela | 2,371,000 | 859,487 | |
| Regency Energy Partners LP/Regency Energy Finance Corp., senior note, | ||||
| 5.75%, 9/01/20 | United States | 75,000 | 78,236 | |
| Rice Energy Inc., senior note, 6.25%, 5/01/22 | United States | 165,000 | 141,075 | |
| fRSP Permian Inc., senior note, 144A, 6.625%, 10/01/22 | United States | 970,000 | 968,788 | |
| fSabine Pass Liquefaction LLC, senior secured note, first lien, 144A, | ||||
| 5.625%, 3/01/25 | United States | 455,000 | 416,894 | |
| SM Energy Co., | ||||
| senior bond, 6.50%, 1/01/23 | United States | 25,000 | 24,063 | |
| senior bond, 5.625%, 6/01/25 | United States | 10,000 | 8,938 | |
| senior note, 6.50%, 11/15/21 | United States | 10,000 | 9,775 | |
| senior note, 5.00%, 1/15/24 | United States | 230,000 | 201,825 | |
| Talisman Energy Inc., senior bond, | ||||
| 5.85%, 2/01/37 | Canada | 195,000 | 167,283 | |
| 6.25%, 2/01/38 | Canada | 155,000 | 127,535 | |
| fUltra Petroleum Corp., 144A, senior bond, 6.125%, 10/01/24 | United States | 50,000 | 19,000 | |
| fUltra Petroleum Corp., 144A, senior note, 5.75%, 12/15/18 | United States | 20,000 | 8,500 | |
| Western Refining Logistics LP / WNRL Finance Corp., senior note, | ||||
| 7.50%, 2/15/23 | United States | 80,000 | 81,000 | |
franklintempleton.com
Semiannual Report
37
| FRANKLIN ALTERNATIVE STRATEGIES FUNDS |
| CONSOLIDATED STATEMENT OF INVESTMENTS (UNAUDITED) |
| Franklin K2 Alternative Strategies Fund (continued) | |||||
| Principal | |||||
| Country | Amount* | Value | |||
| Corporate Bonds and Notes (continued) | |||||
| Oil, Gas & Consumable Fuels (continued) | |||||
| Whiting Petroleum Corp., senior note, | |||||
| 6.50%, 10/01/18 | United States | 145,000 | $ | 138,113 | |
| 5.00%, 3/15/19 | United States | 25,000 | 23,625 | ||
| Williams Partners LP, senior bond, 4.00%, 9/15/25 | United States | 125,000 | 102,325 | ||
| 27,408,762 | |||||
| Paper & Forest Products 0.2% | |||||
| Resolute Forest Products Inc., senior note, 5.875%, 5/15/23 | United States | 2,952,000 | 2,177,100 | ||
| Pharmaceuticals 0.3% | |||||
| AbbVie Inc., senior bond, 3.60%, 5/14/25 | United States | 510,000 | 506,399 | ||
| fGreatbatch Ltd., senior note, 144A, 9.125%, 11/01/23 | United States | 320,000 | 320,800 | ||
| iJohnson & Johnson, senior note, FRN, 0.482%, 11/28/16 | United States | 20,000 | 20,011 | ||
| iMerck & Co. Inc., senior note, FRN, 0.466%, 2/10/17 | United States | 165,000 | 164,949 | ||
| fValeant Pharmaceuticals International Inc., senior note, 144A, | |||||
| 5.625%, 12/01/21 | United States | 55,000 | 48,262 | ||
| 5.50%, 3/01/23 | United States | 385,000 | 330,137 | ||
| 4.50%, 5/15/23 | United States | 640,000 | EUR | 569,690 | |
| 5.875%, 5/15/23 | United States | 1,135,000 | 987,450 | ||
| 2,947,698 | |||||
| Professional Services 0.3% | |||||
| a,fAltegrity Inc., senior note, first lien, 144A, 9.50%, 7/01/19 | United States | 3,047,000 | 2,727,065 | ||
| Verisk Analytics Inc., senior bond, 5.50%, 6/15/45 | United States | 210,000 | 201,913 | ||
| 2,928,978 | |||||
| Real Estate 0.0%† | |||||
| fRialto Holdings LLC/Rialto Corp., senior note, 144A, 7.00%, 12/01/18 | United States | 178,000 | 182,450 | ||
| Real Estate Investment Trusts (REITs) 0.6% | |||||
| kEquinix Inc., senior bond, 5.875%, 1/15/26 | United States | 1,080,000 | 1,098,900 | ||
| Ferrellgas LP / Ferrellgas Finance Corp., senior note, | |||||
| 6.50%, 5/01/21 | United States | 1,345,000 | 1,217,225 | ||
| f144A, 6.75%, 6/15/23 | United States | 2,993,000 | 2,693,101 | ||
| Healthcare Realty Trust Inc., senior bond, 3.875%, 5/01/25 | United States | 75,000 | 73,082 | ||
| iStar Inc., senior note, 4.00%, 11/01/17 | United States | 110,000 | 107,250 | ||
| a,fNorthStar Realty Europe Corp., senior note, 144A, 4.625%, 12/15/16 | United States | 1,100,000 | 1,078,064 | ||
| Vereit Operating Partnership LP, senior note, 4.60%, 2/06/24 | United States | 746,000 | 724,041 | ||
| 6,991,663 | |||||
| Real Estate Management & Development 0.0%† | |||||
| fInterval Acquisition Corp., senior note, 144A, 5.625%, 4/15/23 | United States | 205,000 | 206,025 | ||
| Semiconductors & Semiconductor Equipment 0.1% | |||||
| KLA-Tencor Corp., senior note, 4.65%, 11/01/24 | United States | 273,000 | 277,842 | ||
| fMicron Technology Inc., 144A, | |||||
| senior bond, 5.625%, 1/15/26 | United States | 455,000 | 419,169 | ||
| senior note, 5.25%, 1/15/24 | United States | 375,000 | 349,687 | ||
| 1,046,698 | |||||
| Software 0.0%† | |||||
| fOpen Text Corp., senior note, 144A, 5.625%, 1/15/23 | Canada | 220,000 | 218,900 | ||
| iOracle Corp., senior note, FRN, 0.523%, 7/07/17 | United States | 135,000 | 135,030 | ||
| 353,930 | |||||
38 Semiannual Report
franklintempleton.com
| FRANKLIN ALTERNATIVE STRATEGIES FUNDS |
| CONSOLIDATED STATEMENT OF INVESTMENTS (UNAUDITED) |
| Franklin K2 Alternative Strategies Fund (continued) | ||||
| Principal | ||||
| Country | Amount* | Value | ||
| Corporate Bonds and Notes (continued) | ||||
| Specialty Retail 0.8% | ||||
| iLowe’s Cos. Inc., senior note, FRN, 0.936%, 9/14/18 | United States | 255,000 | $ | 256,779 |
| f,lNeiman Marcus Group Ltd. LLC, senior note, PIK, 144A, | ||||
| 8.75% (all cash), 10/15/21 | United States | 7,189,000 | 6,434,155 | |
| Toys R US Property Co. II LLC, senior note, 8.50%, 12/01/17 | United States | 3,291,000 | 3,101,768 | |
| 9,792,702 | ||||
| Technology Hardware, Storage & Peripherals 0.1% | ||||
| fHewlett Packard Enterprise Co., senior bond, 144A, 4.90%, 10/15/25 | United States | 570,000 | 563,861 | |
| Textiles, Apparel & Luxury Goods 0.2% | ||||
| fEmpire Today LLC / Empire Today Finance Corp., senior secured note, first lien, | ||||
| 144A, 11.375%, 2/01/17 | United States | 2,758,000 | 2,647,680 | |
| Thrifts & Mortgage Finance 0.0%† | ||||
| Santander Holdings USA Inc., senior bond, 4.50%, 7/17/25 | United States | 475,000 | 486,694 | |
| Trading Companies & Distributors 0.0%† | ||||
| Air Lease Corp., | ||||
| senior bond, 4.25%, 9/15/24 | United States | 170,000 | 167,025 | |
| senior note, 3.75%, 2/01/22 | United States | 90,000 | 88,948 | |
| Aircastle Ltd., senior note, 5.50%, 2/15/22 | United States | 90,000 | 94,500 | |
| 350,473 | ||||
| Total Corporate Bonds and Notes (Cost $192,437,259) | 185,094,682 | |||
| Corporate Bonds and Notes in Reorganization 0.3% | ||||
| Electric Utilities 0.3% | ||||
| f,hEnergy Future Intermediate Holding Co. LLC / EFIH Finance Inc., senior note, 144A, | ||||
| 11.25%, 12/01/18 | United States | 3,127,000 | 3,392,795 | |
| Oil, Gas & Consumable Fuels 0.0%† | ||||
| hSabine Oil & Gas Corp., senior bond, 7.25%, 6/15/19 | United States | 397,000 | 29,775 | |
| Total Corporate Bonds and Notes in Reorganization | ||||
| (Cost $3,549,128) | 3,422,570 | |||
| i,mSenior Floating Rate Interests 0.4% | ||||
| Aerospace & Defense 0.1% | ||||
| TransDigm Group Inc., | ||||
| Term Loan D, 3.75%, 6/04/21 | United States | 125,954 | 123,190 | |
| Term Loan E, 3.50%, 5/16/22 | United States | 93,738 | 91,336 | |
| Tranche C Term Loan, first lien guaranteed, senior secured, 3.75%, 2/28/20 | United States | 220,062 | 215,355 | |
| 429,881 | ||||
| Air Freight & Logistics 0.0%† | ||||
| Goodpack Ltd., Term Loan, first lien, 4.75%, 9/09/21 | United States | 49,793 | 45,436 | |
| Auto Components 0.0%† | ||||
| Gates Global Inc., Term Loan B, 4.25%, 7/06/21 | United States | 182,906 | 169,783 | |
| Visteon Corp., Term Loan B, 3.50%, 4/09/21 | United States | 43,914 | 43,740 | |
| 213,523 | ||||
| Building Materials 0.0%† | ||||
| Quikrete Holdings Inc., Term Loan, first lien, 4.00%, 9/28/20 | United States | 74,242 | 73,941 | |
| Building Products 0.0%† | ||||
| Continental Building Products Inc., Term Loan, first lien, 4.00%, 8/28/20 | United States | 48,647 | 48,465 | |
| The Hillman Group, Term Loan B, 4.50%, 6/30/21 | United States | 41,224 | 40,863 | |
franklintempleton.com
Semiannual Report
39
| FRANKLIN ALTERNATIVE STRATEGIES FUNDS |
| CONSOLIDATED STATEMENT OF INVESTMENTS (UNAUDITED) |
| Franklin K2 Alternative Strategies Fund (continued) | ||||
| Principal | ||||
| Country | Amount* | Value | ||
| i,mSenior Floating Rate Interests (continued) | ||||
| Building Products (continued) | ||||
| Ply Gem Holdings Inc., Term Loan, 4.00%, 2/01/21 | United States | 44,865 | $ | 44,371 |
| 133,699 | ||||
| Capital Markets 0.0%† | ||||
| Crosby U.S. Acquisition Corp., Term Loan, first lien, 4.00%, 11/23/20 | United States | 19,650 | 15,916 | |
| Chemicals 0.0%† | ||||
| Emerald Performance Materials LLC, Term Loan, first lien, 4.50%, 7/30/21 | United States | 31,680 | 31,515 | |
| Royal Adhesives, Term Loan, first lien, 4.50%, 6/20/22 | United States | 75 | 75 | |
| 31,590 | ||||
| Communications Equipment 0.0%† | ||||
| Presidio Holdings, Term Loan B, 5.25%, 2/02/22 | United States | 189,050 | 188,261 | |
| Containers & Packaging 0.0%† | ||||
| FPC Holdings Inc., Initial Term Loan, senior secured, first lien, 5.25%, 11/19/19 | United States | 6,831 | 5,601 | |
| Diversified Consumer Services 0.0%† | ||||
| The ServiceMaster Co., Term Loan, 4.25%, 7/01/21 | United States | 123,579 | 123,116 | |
| Diversified Financial Services 0.0%† | ||||
| HarbourVest Partners L.P., New Term Loan, 3.25%, 2/04/21 | United States | 8,805 | 8,761 | |
| Diversified Telecommunication Services 0.1% | ||||
| Integra Telecom, Term Loan, 5.25%, 8/14/20 | United States | 124,375 | 121,810 | |
| Level 3 Financing Inc., Term Loan B, 3.50%, 5/31/22 | United States | 101,626 | 100,902 | |
| LTS Buyer LLC, First Lien Term B Loan, 4.00%, 4/13/20 | United States | 32,865 | 32,325 | |
| Zayo Group Holdings Inc., Term Loan, 3.75%, 5/06/21 | United States | 20,221 | 20,037 | |
| 275,074 | ||||
| Electric Utilities 0.0%† | ||||
| Power Buyer LLC, Delayed Draw, Term Loan, 4.25%, 5/06/20 | United States | 66,924 | 66,087 | |
| Health Care Equipment & Supplies 0.0%† | ||||
| Ortho-Clinical Diagnostics Inc., Term Loan B, 4.75%, 6/30/21 | United States | 55,300 | 52,224 | |
| Sterigenics-Nordian Holdings LLC, Term Loan B, 4.25%, 5/16/22 | United States | 40,000 | 39,550 | |
| 91,774 | ||||
| Health Care Providers & Services 0.0%† | ||||
| Universal Services, Delayed Draw, Term Loan, 4.75%, 7/28/22 | United States | 120,000 | 115,900 | |
| Hotels, Restaurants & Leisure 0.0%† | ||||
| La Quinta Intermediate Holdings LLC, Initial Term Loan, 3.75%, 4/14/21 | United States | 92,173 | 90,848 | |
| Independent Power Producers & Energy Traders 0.0%† | ||||
| Calpine Construction Finance Co. LP, | ||||
| Term B-1 Loan, 3.00%, 5/03/20 | United States | 20,579 | 19,799 | |
| Term Loan B, 3.50%, 5/27/22 | United States | 206,548 | 202,072 | |
| 221,871 | ||||
| Insurance 0.0%† | ||||
| Hyperion Insurance Group Ltd., Term Loan B, 5.50%, 4/29/22 | United States | 44,775 | 44,924 | |
| Investment Companies 0.0%† | ||||
| Grosvenor Capital Management Holdings, LLP, Initial Term Loan, 3.75%, 1/04/21 | United States | 9,703 | 9,593 | |
| IT Services 0.0%† | ||||
| Aptean Inc., Term Loan, 5.25%, 2/26/20 | United States | 49,250 | 48,224 | |
40 Semiannual Report
franklintempleton.com
| FRANKLIN ALTERNATIVE STRATEGIES FUNDS |
| CONSOLIDATED STATEMENT OF INVESTMENTS (UNAUDITED) |
| Franklin K2 Alternative Strategies Fund (continued) | ||||
| Principal | ||||
| Country | Amount* | Value | ||
| i,mSenior Floating Rate Interests (continued) | ||||
| IT Services (continued) | ||||
| Sedgwick Claims Management Services Inc., Initial Term Loan, first lien, | ||||
| 3.75%, 3/01/21 | United States | 49,940 | $ | 48,628 |
| 96,852 | ||||
| Leisure Products 0.0%† | ||||
| SRAM LLC, Term Loan, first lien guaranteed, senior secured, 5.25%, 4/10/20 | United States | 35,025 | 30,122 | |
| Life Sciences Tools & Services 0.0%† | ||||
| Pharmaceutical Product Development, Term Loan, 4.25%, 8/18/22 | United States | 159,600 | 155,859 | |
| Machinery 0.1% | ||||
| Generac Power Systems Inc., Term Loan B, 3.50%, 5/31/20 | United States | 272,490 | 267,722 | |
| North American Lifting Holdings Inc., Initial Term Loan, 5.50%, 11/27/20 | United States | 15,737 | 12,118 | |
| Onsite Rental Group Ltd., Term Loan B, 5.50%, 7/30/21 | United States | 117,797 | 107,195 | |
| 387,035 | ||||
| Media 0.1% | ||||
| Charter Communications Operating LLC, senior secured note, first lien guaranteed, | ||||
| 3.00%, 7/01/20 | United States | 114,124 | 112,662 | |
| Time Inc., Term Loan B, 4.25%, 4/26/21 | United States | 88 | 87 | |
| Virgin Media, Term Loan F, 3.50%, 6/30/23 | United States | 288,031 | 284,161 | |
| The Weather Channel, Term Loan, 7.00%, 6/26/20 | United States | 250,000 | 249,687 | |
| William Morris Endeavor Entertainment LLC, Term Loan, first lien, 5.25%, 5/06/21 | United States | 52,338 | 52,089 | |
| 698,686 | ||||
| Metals & Mining 0.0%† | ||||
| ABC Supply, Term Loan B, 3.50%, 4/16/20 | United States | 27,832 | 27,700 | |
| Signode Industrial Group, Initial Term Loan B, 3.75%, 5/01/21 | United States | 52,024 | 50,333 | |
| 78,033 | ||||
| Oil, Gas & Consumable Fuels 0.0%† | ||||
| Energy Transfer Equity LP, Term Loan, 3.25%, 12/02/19 | United States | 33,128 | 31,465 | |
| Energy Transfer Partners LP, Term Loan C, 4.00%, 12/02/19 | United States | 39,998 | 38,808 | |
| OSG Bulk Ships, Term Loan B, 5.25%, 8/05/19 | United States | 10,880 | 10,826 | |
| Southcross Energy Partners LP, senior secured, Term Loan B, first lien guaranteed, | ||||
| 5.25%, 8/04/21 | United States | 29,774 | 25,308 | |
| Western Refining Inc., Term Loan B, 4.25%, 11/12/20 | United States | 74,444 | 72,273 | |
| 178,680 | ||||
| Pharmaceuticals 0.0%† | ||||
| Amneal Pharmaceutical, Term Loan B, senior secured, first lien guaranteed, | ||||
| 5.75%, 11/01/19 | United States | 19,544 | 19,373 | |
| Professional Services 0.0%† | ||||
| iQor Inc., Term Loan B, first lien, 6.00%, 4/01/21 | United States | 68,760 | 55,008 | |
| Real Estate Investment Trusts (REITs) 0.0%† | ||||
| Communications Sales & Leasing Inc., Term Loan B, 5.00%, 10/24/22 | United States | 239,400 | 224,026 | |
| Real Estate Management & Development 0.0%† | ||||
| The Brickman Group Ltd. LLC, Initial Term Loan, 4.00%, 12/18/20 | United States | 6,878 | 6,721 | |
| Retailing 0.0%† | ||||
| Talbots Inc., Term Loan, first lien, 5.50%, 3/19/20 | United States | 67,671 | 65,134 | |
| Semiconductors & Semiconductor Equipment 0.0%† | ||||
| Entegris Inc., Tranche B Term Loan, 3.50%, 4/30/21 | United States | 13,428 | 13,381 | |
franklintempleton.com
Semiannual Report
41
| FRANKLIN ALTERNATIVE STRATEGIES FUNDS |
| CONSOLIDATED STATEMENT OF INVESTMENTS (UNAUDITED) |
| Franklin K2 Alternative Strategies Fund (continued) | |||||
| Principal | |||||
| Country | Amount* | Value | |||
| i,mSenior Floating Rate Interests (continued) | |||||
| Semiconductors & Semiconductor Equipment (continued) | |||||
| NXP BV, Tranche D Term Loan, 3.25%, 1/11/20 | Netherlands | 9,800 | $ | 9,696 | |
| 23,077 | |||||
| Software 0.0%† | |||||
| Infor (US) Inc. (Lawson Software Inc.), Tranche B-5 Term Loan, 3.75%, 6/03/20 | United States | 64,180 | 61,412 | ||
| Micro Focus International PLC, Term Loan B, 5.25%, 11/19/21 | United Kingdom | 55,583 | 55,469 | ||
| Vertafore Inc., Term Loan B, 4.25%, 10/03/19 | United States | 74,425 | 74,351 | ||
| 191,232 | |||||
| Specialty Retail 0.0%† | |||||
| GNC Holdings Inc., Term Loan, 3.25%, 3/04/19 | United States | 87,535 | 85,675 | ||
| PetSmart, Term Loan, 4.25%, 3/11/22 | United States | 108,793 | 107,209 | ||
| 192,884 | |||||
| Technology Hardware, Storage & Peripherals 0.0%† | |||||
| Dell Inc., Term Loan B-2, 4.00%, 4/29/20 | United States | 44,775 | 44,643 | ||
| Trading Companies & Distributors 0.0%† | |||||
| HD Supply, Term Loan B, 3.75%, 8/13/21 | United States | 55,003 | 54,648 | ||
| Wireless Telecommunication Services 0.0%† | |||||
| SBA Senior Finance II LLC, senior secured, Term Loan B, first lien guranteed, | |||||
| 3.25%, 3/24/21 | United States | 153,584 | 150,992 | ||
| Total Senior Floating Rate Interests (Cost $4,925,097) | 4,838,801 | ||||
| Foreign Government and Agency Securities 1.9% | |||||
| gCyprus Government International Bond, Reg S, 3.875%, 5/06/22 | Cyprus | 1,273,000 | EUR | 1,393,376 | |
| gGovernment of Hellenic Republic, | |||||
| senior bond, Reg S, Series PSI, 3.00%, 2/24/23 - 2/24/42 | Greece | 5,044,000 | EUR | 3,548,753 | |
| f senior note, 144A, Reg S, 3.375%, 7/17/17 | Greece | 1,794,000 | EUR | 1,791,617 | |
| f senior note, 144A, Reg S, 4.75%, 4/17/19 | Greece | 3,113,000 | EUR | 3,054,817 | |
| gGovernment of Russia, senior bond, Reg S, 5.625%, 4/04/42 | Russia | 2,600,000 | 2,616,250 | ||
| gKazakhstan Government International Bond, Reg S, 5.125%, 7/21/25 | Kazakhstan | 687,000 | 697,339 | ||
| Mexico Government International Bond, | |||||
| 4.00%, 10/02/23 | Mexico | 1,140,000 | 1,165,650 | ||
| 3.60%, 1/30/25 | Mexico | 1,728,000 | 1,711,584 | ||
| gPakistan Government International Bond, Reg S, 6.75%, 12/03/19 | Pakistan | 1,392,000 | 1,424,315 | ||
| gRepublic of Iraq, Reg S, 5.80%, 1/15/28 | Iraq | 1,314,000 | 959,220 | ||
| gSri Lanka Government International Bond, senior note, Reg S, 6.85%, 11/03/25 | Sri Lanka | 1,008,000 | 987,689 | ||
| gVenezuela Government International Bond, senior bond, Reg S, 5.75%, 2/26/16 | Venezuela | 2,675,000 | 2,454,313 | ||
| Total Foreign Government and Agency Securities | |||||
| (Cost $20,458,782) | 21,804,923 | ||||
| Foreign Government and Agency Securities in | |||||
| Reorganization 0.8% | |||||
| hArgentine Republic Government International Bond, | |||||
| senior bond, 7.82%, 12/31/33 | Argentina | 3,865,475 | 4,204,533 | ||
| senior bond, 8.28%, 12/31/33 | Argentina | 486,544 | 533,982 | ||
| senior bond, Series NY, 8.28%, 12/31/33 | Argentina | 2,773,231 | 3,119,885 | ||
| senior note, Series 1, 8.75%, 6/02/17 | Argentina | 1,843,173 | 2,041,314 | ||
| Total Foreign Government and Agency Securities in | |||||
| Reorganization (Cost $9,127,953) | 9,899,714 | ||||
42 Semiannual Report
franklintempleton.com
| FRANKLIN ALTERNATIVE STRATEGIES FUNDS |
| CONSOLIDATED STATEMENT OF INVESTMENTS (UNAUDITED) |
| Franklin K2 Alternative Strategies Fund (continued) | ||||
| Principal | ||||
| Country | Amount* | Value | ||
| Asset-Backed Securities and Commercial | ||||
| Mortgage-Backed Securities 1.4% | ||||
| Airlines 0.1% | ||||
| fLatam Airlines, 2015-1 Pass Through Trust B, 144A, 4.50%, 11/15/23 | Chile | 980,000 | $ | 907,286 |
| Banks 0.1% | ||||
| Capital One Multi-Asset Execution Trust, | ||||
| 2013-A3, 0.96%, 9/16/19 | United States | 100,000 | 99,987 | |
| 2014-A2, 1.26%, 1/15/20 | United States | 40,000 | 40,071 | |
| 2014-A5, 1.48%, 7/15/20 | United States | 90,000 | 90,240 | |
| 2015-A7, 1.45%, 8/16/21 | United States | 400,000 | 398,542 | |
| National City Mortgage Capital Trust, Series 2008-2A1, 6.00%, 3/25/38 | United States | 85,689 | 90,324 | |
| iWells Fargo Mortgage Backed Securities 2003-J Trust, 1A9, FRN, | ||||
| 2.735%, 10/25/33 | United States | 49,912 | 50,312 | |
| iWells Fargo Mortgage Backed Securities 2003-M Trust, A1, FRN, 2.78%, 12/25/33 | United States | 38,606 | 38,908 | |
| iWells Fargo Mortgage Backed Securities 2004-A Trust, A1, FRN, 2.697%, 2/25/34 | United States | 41,378 | 41,489 | |
| iWells Fargo Mortgage Backed Securities 2004-0 Trust, A1, FRN, 2.743%, 8/25/34 | United States | 17,015 | 16,996 | |
| Wells Fargo Mortgage Backed Securities 2005-16 Trust, A18, 6.00%, 1/25/36 | United States | 8,390 | 8,585 | |
| iWells Fargo Mortgage Backed Securities 2005-AR10 Trust, FRN, | ||||
| 2A2, 2.711%, 6/25/35 | United States | 54,875 | 56,511 | |
| 2A4, 2.711%, 6/25/35 | United States | 24,389 | 24,600 | |
| 956,565 | ||||
| Consumer Finance 0.1% | ||||
| American Express Credit Account Master Trust, | ||||
| i FRN, 0.467%, 1/15/20 | United States | 100,000 | 99,874 | |
| 0.98%, 5/15/19 | United States | 100,000 | 100,063 | |
| Series 2014-A, 1.26%, 1/15/20 | United States | 100,000 | 100,139 | |
| Series 2014-A, 1.49%, 4/15/20 | United States | 100,000 | 100,372 | |
| i Series 2014-A, FRN, 0.487%, 5/15/20 | United States | 100,000 | 99,810 | |
| iBank of America Credit Card Trust, FRN, | ||||
| A, 0.467%, 9/16/19 | United States | 120,000 | 119,857 | |
| A, 0.577%, 6/15/21 | United States | 100,000 | 99,859 | |
| A3, 0.487%, 1/15/20 | United States | 100,000 | 99,935 | |
| 819,909 | ||||
| Diversified Financial Services 0.9% | ||||
| Banc of America Alternative Loan 2003-8 Trust, 1CB1, 5.50%, 10/25/33 | United States | 13,343 | 14,049 | |
| Banc of America Alternative Loan 2004-9 Trust, 2CB1, 6.00%, 10/25/34 | United States | 13,537 | 14,053 | |
| Banc of America Alternative Loan 2005-6 Trust, CB7, 5.25%, 7/25/35 | United States | 26,548 | 24,552 | |
| iBanc of America Funding 2004-B Trust, Series 2004-1A2, FRN, 2.81%, 12/20/34 | United States | 107,278 | 97,501 | |
| Banc of America Funding 2005-5 Trust, 1A1, 5.50%, 9/25/35 | United States | 23,680 | 24,844 | |
| Banc of America Funding 2007-4 Trust, 5A1, 5.50%, 11/25/34 | United States | 27,280 | 27,791 | |
| iBanc of America Mortgage 2005-A Trust, 2A1, FRN, 2.66%, 2/25/35 | United States | 14,425 | 14,141 | |
| iBear Stearns ARM 2004-6 Trust, 2A1, FRN, 2.938%, 9/25/34 | United States | 94,016 | 91,183 | |
| iBear Stearns ARM 2005-12 Trust, 11A1, FRN, 2.701%, 2/25/36 | United States | 29,188 | 23,249 | |
| f,iBLCP Hotel Trust 2014-CLRN, E, 144A, FRN, 3.867%, 8/15/29 | United States | 100,000 | 100,416 | |
| BMW Vehicle Owner Trust, | ||||
| 2013-A3, 0.67%, 11/27/17 | United States | 32,706 | 32,684 | |
| 2014-A3, 0.97%, 11/26/18 | United States | 75,000 | 74,931 | |
| fCAM Mortgage LLC, 144A, | ||||
| 2015-A, 3.375%, 7/15/64 | United States | 183,369 | 183,708 | |
| i2015-1, FRN, 4.75%, 7/15/64 | United States | 100,000 | 99,546 | |
franklintempleton.com
Semiannual Report
43
| FRANKLIN ALTERNATIVE STRATEGIES FUNDS |
| CONSOLIDATED STATEMENT OF INVESTMENTS (UNAUDITED) |
| Franklin K2 Alternative Strategies Fund (continued) | |||||
| Principal | |||||
| Country | Amount* | Value | |||
| Asset-Backed Securities and Commercial | |||||
| Mortgage-Backed Securities (continued) | |||||
| Diversified Financial Services (continued) | |||||
| Chase Issuance Trust, | |||||
| iA3, FRN, 0.397%, 5/15/18 | United States | 110,000 | $ | 109,959 | |
| iA5, FRN, 0.567%, 4/15/21 | United States | 120,000 | 119,605 | ||
| A8, 1.01%, 10/15/18 | United States | 100,000 | 100,079 | ||
| Series 2014-A6, 1.26%, 7/15/19 | United States | 100,000 | 100,105 | ||
| iSeries 2014-A8, FRN, 0.447%, 11/15/18 | United States | 85,000 | 84,960 | ||
| iSeries 2015-A1, FRN, 0.517%, 2/18/20 | United States | 110,000 | 109,838 | ||
| Series 2015-A2, 1.59%, 2/18/20 | United States | 135,000 | 135,439 | ||
| Series 2015-A7, 1.62%, 7/15/20 | United States | 300,000 | 300,798 | ||
| iChase Mortgage Finance 2007-A1 Trust, Series 2007-11M1, FRN, | |||||
| 2.465%, 3/25/37 | United States | 112,003 | 105,094 | ||
| fCLI Funding LLC, 2014-2A, 144A, 3.38%, 10/18/29 | United States | 89,153 | 88,389 | ||
| Citicorp Mortgage Securities 2006-4 Trust, 1A2, 6.00%, 8/25/36 | United States | 29,380 | 29,741 | ||
| fColony American Finance 2015-1 Ltd., D, 144A, 5.649%, 10/15/47 | Cayman Islands | 115,000 | 113,498 | ||
| f,iColony American Homes, FRN, 144A, | |||||
| 2014-1, 2.40%, 5/17/31 | United States | 110,000 | 107,435 | ||
| 2014-2, 2.547%, 7/17/31 | United States | 300,000 | 293,243 | ||
| 2014-2, 3.397%, 7/17/31 | United States | 100,000 | 97,015 | ||
| 2015-D, 2.347%, 7/17/32 | United States | 200,000 | 192,687 | ||
| f,iCOMM 2014-SAVA Mortgage Trust, 2014-C, 144A, FRN, 2.597%, 6/15/34 | United States | 100,000 | 99,563 | ||
| Countrywide Alternative Loan Trust, | |||||
| 2003-2A1, 5.75%, 10/25/33 | United States | 27,905 | 29,209 | ||
| 2003-A7, 5.50%, 7/25/33 | United States | 27,768 | 28,012 | ||
| 2004-A1, 6.00%, 12/25/34 | United States | 99,572 | 99,158 | ||
| 2004-1A1, 5.50%, 4/25/34 | United States | 62,012 | 64,290 | ||
| 2004-5A1, 5.75%, 1/25/35 | United States | 11,430 | 11,581 | ||
| 2005-2A1, 5.50%, 2/25/25 | United States | 12,282 | 12,652 | ||
| i2005-2A1, FRN, 0.431%, 5/25/35 | United States | 67,633 | 56,367 | ||
| iCountrywide Home Loans Mortgage Pass-Through 2004-12 Trust, 8A1, FRN, | |||||
| 2.881%, 8/25/34 | United States | 21,445 | 18,989 | ||
| iCountrywide Home Loans Mortgage Pass-Through 2004-HYB4 Trust, 2A1, FRN, | |||||
| 2.581%, 9/20/34 | United States | 52,465 | 50,432 | ||
| Countrywide Home Loans Mortgage Pass-Through 2005-21 Trust, A17, | |||||
| 5.50%, 10/25/35 | United States | 20,797 | 19,596 | ||
| Deutsche Alt-A Securities Inc. Mortgage Loan 2005-3 Trust, 4A4, 5.25%, 6/25/35 | United States | 4,227 | 4,254 | ||
| iDeutsche Alt-A Securities Inc. Mortgage Loan 2005-5 Trust, 1A4, FRN, | |||||
| 5.50%, 11/25/35 | United States | 14,508 | 13,960 | ||
| iDiscover Card Execution Note Trust, A1, FRN, 0.547%, 8/17/20 | United States | 210,000 | 209,744 | ||
| Ford Credit Auto Owner Trust, | |||||
| 2014-A3, 0.90%, 10/15/18 | United States | 120,000 | 119,916 | ||
| 2014-A3, 1.06%, 5/15/19 | United States | 55,000 | 54,947 | ||
| 2015-A3, 1.28%, 9/15/19 | United States | 85,000 | 85,076 | ||
| 2015-A3, 1.41%, 2/15/20 | United States | 396,000 | 395,503 | ||
| f2014-A, 144A, 2.31%, 4/15/26 | United States | 100,000 | 100,634 | ||
| iFreddie Mac Structured Agency Credit Risk Debt Notes, 2015-M2, FRN, | |||||
| 2.071%, 10/25/27 | United States | 250,000 | 247,376 | ||
| GMAC Mortgage Loan Trust 2003-J7, Series 2003-A7, 5.00%, 11/25/33 | United States | 49,093 | 49,448 | ||
| f,iGP Portfolio Trust 2014-GGP, A, 144A, FRN, 1.147%, 2/15/27 | United States | 87,645 | 87,309 | ||
| GSR Mortgage Loan Trust 2005-4F, 6A1, 6.50%, 2/25/35 | United States | 45,341 | 45,968 | ||
| iGSR Mortgage Loan Trust 2005-AR6, 4A5, FRN, 2.738%, 9/25/35 | United States | 48,841 | 49,305 | ||
44 Semiannual Report
franklintempleton.com
| FRANKLIN ALTERNATIVE STRATEGIES FUNDS |
| CONSOLIDATED STATEMENT OF INVESTMENTS (UNAUDITED) |
| Franklin K2 Alternative Strategies Fund (continued) | ||||
| Principal | ||||
| Country | Amount* | Value | ||
| Asset-Backed Securities and Commercial | ||||
| Mortgage-Backed Securities (continued) | ||||
| Diversified Financial Services (continued) | ||||
| iHarborview Mortgage Loan Trust, 1A, FRN, 0.573%, 10/19/33 | United States | 145,976 | $ | 138,035 |
| Honda Auto Receivables 2013-4 Owner Trust, A3, 0.69%, 9/18/17 | United States | 25,131 | 25,123 | |
| Honda Auto Receivables 2014 Owner Trust, A3, 0.77%, 3/19/18 | United States | 90,000 | 89,876 | |
| Honda Auto Receivables 2014-3 Owner Trust, | ||||
| A3, 0.88%, 6/15/18 | United States | 45,000 | 44,929 | |
| A4, 1.31%, 10/15/20 | United States | 30,000 | 29,974 | |
| Honda Auto Receivables 2014-4 Owner Trust, A3, 0.99%, 9/17/18 | United States | 55,000 | 54,909 | |
| Honda Auto Receivables 2015-1 Owner Trust, A3, 1.05%, 10/15/18 | United States | 60,000 | 59,897 | |
| Honda Auto Receivables 2015-2 Owner Trust, A3, 1.04%, 2/21/19 | United States | 165,000 | 164,420 | |
| Honda Auto Receivables 2015-3 Owner Trust, A3, 1.27%, 4/18/19 | United States | 135,000 | 134,967 | |
| Honda Auto Receivables 2015-4 Owner Trust, A3, 1.23%, 9/23/19 | United States | 390,000 | 388,276 | |
| fHilton USA Trust 2013-HLT, 2013-CFX, 144A, 3.714%, 11/05/30 | United States | 100,000 | 100,127 | |
| Hyundai Auto Receivables 2014-4 Owner Trust, A3, 0.79%, 7/16/18 | United States | 97,388 | 97,321 | |
| Hyundai Auto Receivables 2015-A Owner Trust, A3, 1.05%, 4/15/19 | United States | 55,000 | 54,841 | |
| Hyundai Auto Receivables 2015-B Owner Trust, A3, 1.12%, 11/15/19 | United States | 230,000 | 228,851 | |
| iIndyMac Mortgage Loan Trust, Series 2005-A3, FRN, 2.621%, 8/25/35 | United States | 105,537 | 86,928 | |
| f,iInvitation Homes Trust, B, 144A, FRN, 1.697%, 6/17/31 | United States | 100,000 | 98,379 | |
| iJP Morgan Alternative Loan 2006-A1 Trust, 3A1, FRN, 2.50%, 3/25/36 | United States | 90,887 | 79,434 | |
| f,iJP Morgan Chase Commercial Mortgage Securities Trust 2015-SGP, Series 2015-D, | ||||
| 144A, FRN, 4.697%, 7/15/36 | United States | 180,000 | 181,864 | |
| iJP Morgan Mortgage 2003-A2 Trust, 3A1, FRN, 2.104%, 11/25/33 | United States | 20,011 | 19,508 | |
| iJP Morgan Mortgage 2005-A1 Trust, 6T1, FRN, 2.701%, 2/25/35 | United States | 36,247 | 36,243 | |
| iJP Morgan Mortgage 2005-A3 Trust, 4A1, FRN, 2.786%, 6/25/35 | United States | 15,234 | 15,406 | |
| JP Morgan Mortgage 2005-S3 Trust, 1A11, 6.00%, 1/25/36 | United States | 223,651 | 192,065 | |
| iJP Morgan Mortgage 2006-A1 Trust, FRN, 2.582%, 2/25/36 | United States | 58,616 | 52,283 | |
| iJP Morgan Mortgage 2006-A7 Trust, 2A4, FRN, 2.928%, 1/25/37 | United States | 45,579 | 40,362 | |
| iJP Morgan Mortgage 2007-A1 Trust, 4A2, FRN, 2.727%, 7/25/35 | United States | 11,926 | 12,000 | |
| JP Morgan Mortgage 2007-S1 Trust, 2A22, 5.75%, 3/25/37 | United States | 69,671 | 57,769 | |
| iLehman XS Trust Series, A2A, FRN, 0.441%, 4/25/46 | United States | 104,546 | 76,210 | |
| iMerrill Lynch Mortgage Investors MLCC, FRN, | ||||
| 2006-1A, 2.484%, 2/25/36 | United States | 126,468 | 123,898 | |
| 2006-2A, 2.216%, 5/25/36 | United States | 17,348 | 17,235 | |
| Nissan Auto Lease Trust, 2014-A3, 1.12%, 9/15/17 | United States | 45,000 | 44,955 | |
| Nissan Auto Receivables 2013-C Owner Trust, A3, 0.67%, 8/15/18 | United States | 20,011 | 19,978 | |
| Nissan Auto Receivables 2015-C Owner Trust, A3, 1.37%, 5/15/20 | United States | 400,000 | 398,840 | |
| iNew York Mortgage 2006-1 Trust, 2A2, FRN, 2.645%, 5/25/36 | United States | 41,917 | 38,215 | |
| Ocwen Loan Servicing LLC, MASTR Alternative Loan Trust 2004-8, 2A1, | ||||
| 6.00%, 9/25/34 | United States | 115,509 | 121,986 | |
| Ocwen Loan Servicing LLC, MASTR Alternative Loan Trust 2004-12, 6A2, | ||||
| 5.25%, 12/25/34 | United States | 13,402 | 13,438 | |
| iOcwen Loan Servicing LLC, MASTR Adjustable Rate Mortgages 2004-7 Trust, 3A1, | ||||
| FRN, 2.614%, 7/25/34 | United States | 65,970 | 64,337 | |
| fOneMain Financial Issuance Trust 2015-1, A, 144A, 3.19%, 3/18/26 | United States | 150,000 | 150,340 | |
| fOneMain Financial Issuance Trust 2015-3, B, 144A, 4.16%, 11/20/28 | United States | 155,000 | 154,927 | |
| iStructured Adjustable Rate Mortgage Loan Trust, FRN, | ||||
| Series 2004-7A3, 2.74%, 9/25/34 | United States | 52,071 | 52,063 | |
| 1A, 2.40%, 6/25/34 | United States | 30,343 | 29,640 | |
| Structured Asset Securities Corp. Trust 2005-1, Series 2005-7A7, 5.50%, 2/25/35 | United States | 23,698 | 24,251 | |
| f,iSCG Trust 2013-SRP1, FRN, 144A, | ||||
| A, 1.597%, 11/15/26 | United States | 100,000 | 99,646 | |
| C, 3.447%, 11/15/26 | United States | 100,000 | 100,362 | |
franklintempleton.com
Semiannual Report
45
| FRANKLIN ALTERNATIVE STRATEGIES FUNDS |
| CONSOLIDATED STATEMENT OF INVESTMENTS (UNAUDITED) |
| Franklin K2 Alternative Strategies Fund (continued) | ||||
| Principal | ||||
| Country | Amount* | Value | ||
| Asset-Backed Securities and Commercial | ||||
| Mortgage-Backed Securities (continued) | ||||
| Diversified Financial Services (continued) | ||||
| fShenton Aircraft Investment I Ltd., Series 2015-A, 144A, 4.75%, 10/15/42 | Cayman Islands | 198,922 | $ | 197,243 |
| fSierra Timeshare 2013-3 Receivables Funding LLC, A, 144A, 2.20%, 10/20/30 | United States | 67,857 | 67,667 | |
| fTAL Advantage V LLC, A, 144A, 3.55%, 11/20/38 | United States | 80,000 | 79,699 | |
| Toyota Auto Receivables 2014-C Owner Trust, A3, 0.93%, 7/16/18 | United States | 40,000 | 39,969 | |
| Toyota Auto Receivables 2015-B Owner Trust, A3, 1.27%, 5/15/19 | United States | 255,000 | 254,705 | |
| Toyota Auto Receivables 2015-C Owner Trust, A3, 1.34%, 6/17/19 | United States | 135,000 | 135,126 | |
| USAA Auto Owner Trust 2015-1, A3, 1.20%, 6/17/19 | United States | 150,000 | 149,784 | |
| fUS Residential Opportunity Fund Trust, A, 144A, | ||||
| 3.721%, 1/27/35 | United States | 75,834 | 75,725 | |
| 3.721%, 2/27/35 | United States | 79,233 | 79,096 | |
| fVOLT LLC, 144A, | ||||
| 2015-NPL1 A1, 3.625%, 10/25/57 | United States | 88,806 | 88,663 | |
| 2015-NPL2 A1, 3.375%, 2/25/55 | United States | 86,799 | 86,605 | |
| 2015-NPL4 A1, 3.50%, 2/25/55 | United States | 184,657 | 183,450 | |
| iWaMu Mortgage Pass-Through Certificates Series 2005-AR10 Trust, 1A3, FRN, | ||||
| 2.495%, 9/25/35 | United States | 145,789 | 141,589 | |
| iWaMu Mortgage Pass-Through Certificates Series 2007-HY5 Trust, 2A3, FRN, | ||||
| 2.075%, 5/25/37 | United States | 167,135 | 146,017 | |
| iWells Fargo Bank, N.A., Adjustable Rate Mortgage 2004-4 Trust, 3A1, FRN, | ||||
| 2.874%, 3/25/35 | United States | 59,309 | 58,339 | |
| iWells Fargo Bank, N.A., Adjustable Rate Mortgage 2004-5 Trust, 5A1, FRN, | ||||
| 2.587%, 4/25/35 | United States | 16,487 | 16,031 | |
| World Financial Network Credit Card Master Trust, | ||||
| iSeries 2015-A, FRN, 0.677%, 2/15/22 | United States | 120,000 | 119,466 | |
| Series 2015-C, 1.26%, 3/15/21 | United States | 400,000 | 398,913 | |
| 11,196,017 | ||||
| Other ABS 0.0%† | ||||
| BXHT 2015-DRMZ Mortgage Trust, 8.397%, 7/15/29 | United States | 239,031 | 239,031 | |
| fOak Hill Advisors Residential Loan Trust 2015-NPL2, Series 2015-A1, 144A, | ||||
| 3.721%, 7/25/55 | United States | 123,160 | 122,575 | |
| 361,606 | ||||
| Real Estate Investment Trusts (REITs) 0.1% | ||||
| fAmerican Homes 4 Rent, 144A, | ||||
| iSeries 2014-E, FRN, 2.75%, 6/17/31 | United States | 100,000 | 96,190 | |
| Series 2014-E, 6.418%, 12/17/36 | United States | 100,000 | 104,085 | |
| Series 2015-E, 5.639%, 4/17/52 | United States | 110,000 | 108,303 | |
| iAlly Master Owner Trust, FRN, | ||||
| A1, 0.667%, 1/15/19 | United States | 100,000 | 99,863 | |
| A, 0.567%, 1/16/18 | United States | 135,000 | 135,004 | |
| iCitigroup Mortgage Loan 2005-11 Trust, A2A, FRN, 2.73%, 10/25/35 | United States | 44,278 | 43,933 | |
| iCitigroup Mortgage Loan 2005-2 Trust, 1A4, FRN, 2.621%, 5/25/35 | United States | 28,330 | 27,691 | |
| iCitigroup Mortgage Loan Trust Inc., 2A3, FRN, 2.74%, 8/25/35 | United States | 138,716 | 130,179 | |
| f,iCitigroup Mortgage Loan 2009-10 Trust, 6A2, 144A, FRN, 2.902%, 9/25/34 | United States | 120,000 | 110,050 | |
| f,iCitigroup Mortgage Loan Trust Inc., 2A1, 144A, FRN, 0.337%, 8/25/36 | United States | 89,881 | 81,730 | |
| f,iCitigroup Mortgage Loan 2015-2 Trust, 1A1, 144A, FRN, 0.397%, 6/25/47 | United States | 99,717 | 93,143 | |
| 1,030,171 | ||||
| Thrifts & Mortgage Finance 0.1% | ||||
| Citibank Credit Card Issuance Trust, | ||||
| i 2013-A2, FRN, 0.492%, 5/26/20 | United States | 125,000 | 124,612 | |
46 Semiannual Report
franklintempleton.com
| FRANKLIN ALTERNATIVE STRATEGIES FUNDS |
| CONSOLIDATED STATEMENT OF INVESTMENTS (UNAUDITED) |
| Franklin K2 Alternative Strategies Fund (continued) | ||||
| Principal | ||||
| Country | Amount* | Value | ||
| Asset-Backed Securities and Commercial | ||||
| Mortgage-Backed Securities (continued) | ||||
| Thrifts & Mortgage Finance (continued) | ||||
| Citibank Credit Card Issuance Trust, | ||||
| i2013-A7, FRN, 0.625%, 9/10/20 | United States | 200,000 | $ | 199,823 |
| 2013-A10, 0.73%, 2/07/18 | United States | 100,000 | 100,016 | |
| 2014-A2, 1.02%, 2/22/19 | United States | 100,000 | 100,020 | |
| i2014-A3, FRN, 0.395%, 5/09/18 | United States | 100,000 | 99,966 | |
| 2014-A4, 1.23%, 4/24/19 | United States | 100,000 | 100,128 | |
| i2014-A7, FRN, 0.412%, 8/24/18 | United States | 100,000 | 99,916 | |
| 2014-A8, 1.73%, 4/09/20 | United States | 100,000 | 100,512 | |
| Credit Suisse First Boston Mortgage Securities Corp., | ||||
| 2003-4A4, 5.75%, 11/25/33 | United States | 4,057 | 4,290 | |
| i2003-7A1, FRN, 2.709%, 11/25/33 | United States | 10,683 | 10,334 | |
| i2003-4A1, FRN, 2.792%, 12/25/33 | United States | 6,583 | 6,547 | |
| i2004-3A1, FRN, 2.71%, 5/25/34 | United States | 28,427 | 24,650 | |
| 2005-2A1, 5.25%, 11/25/20 | United States | 69,936 | 70,193 | |
| f,iCredit Suisse Mortgage Capital Certificates, 2015-A, 144A, FRN, | ||||
| 1.447%, 3/15/17 | United States | 110,000 | 109,888 | |
| iGS Mortgage Securities Trust 2007-GG10, AM, FRN, 5.988%, 8/10/45 | United States | 130,000 | 129,865 | |
| 1,280,760 | ||||
| Whole Loan Collateral CMO 0.0%† | ||||
| fFDIC 2013-N1 Trust, A, 144A, 4.50%, 10/25/18 | United States | 2,696 | 2,707 | |
| Total Asset-Backed Securities and Commercial Mortgage- | ||||
| Backed Securities (Cost $16,647,107) | 16,555,021 | |||
| Number of | ||||
| Contracts | ||||
| Options Purchased 0.3% | ||||
| Calls – Exchange-Traded | ||||
| Air Freight & Logistics 0.0%† | ||||
| FedEx Corp., January Strike Price, $145.00, Expires 1/15/16 | United States | 202 | 307,040 | |
| Airlines 0.0%† | ||||
| Delta Air Lines Inc., December Strike Price, $50.00, Expires 12/18/15 | United States | 87 | 1,827 | |
| Banks 0.0%† | ||||
| Citigroup Inc., January Strike Price, $55.00, Expires 1/15/16 | United States | 36 | 5,004 | |
| Chemicals 0.0%† | ||||
| The Dow Chemical Co., March Strike Price, $55.00, Expires 3/18/16 | United States | 71 | 14,555 | |
| The Dow Chemical Co., January Strike Price, $50.00, Expires 1/15/16 | United States | 193 | 66,199 | |
| The Dow Chemical Co., March Strike Price, $52.50, Expires 3/18/16 | United States | 226 | 70,060 | |
| 150,814 | ||||
| Construction Materials 0.0%† | ||||
| Cemex SAB de CV, ADR, April Strike Price, $8.00, Expires 4/15/16 | Mexico | 58 | 1,160 | |
| Diversified Telecommunication Services 0.0%† | ||||
| Telecom Italia SpA, December Strike Price, 1.20 EUR, Expires 12/18/15 | Italy | 363 | 22,091 | |
| Telecom Italia SpA, December Strike Price, 1.30 EUR, Expires 12/18/15 | Italy | 200 | 3,825 | |
| 25,916 | ||||
| Electrical Equipment 0.0%† | ||||
| Alstom SA, December Strike Price, 28.00 EUR, Expires 12/18/15 | France | 92 | 14,775 | |
franklintempleton.com
Semiannual Report
47
| FRANKLIN ALTERNATIVE STRATEGIES FUNDS |
| CONSOLIDATED STATEMENT OF INVESTMENTS (UNAUDITED) |
| Franklin K2 Alternative Strategies Fund (continued) | ||||
| Number of | ||||
| Country | Contracts | Value | ||
| Options Purchased (continued) | ||||
| Calls – Exchange-Traded (continued) | ||||
| Exchange Traded Funds 0.0%† | ||||
| Energy Select Sector SPDR Fund, January Strike Price, $70.00, Expires 1/15/16 | United States | 512 | $ | 72,704 |
| Financial Select Sector SPDR Fund, January Strike Price, $24.00, | ||||
| Expires 1/15/16 | United States | 1,072 | 92,192 | |
| Financial Select Sector SPDR Fund, February Strike Price, $25.00, | ||||
| Expires 2/19/16 | United States | 784 | 38,416 | |
| SPDR S&P Oil & Gas Exploration & Production ETF, January Strike Price, $40.00, | ||||
| Expires 1/15/16 | United States | 857 | 89,128 | |
| SPDR S&P500 ETF Trust, December Strike Price, $209.00, Expires 12/31/15 | United States | 239 | 65,247 | |
| 357,687 | ||||
| Health Care Providers & Services 0.0%† | ||||
| Aetna Inc., April Strike Price, $100.00, Expires 4/15/16 | United States | 221 | 223,210 | |
| Industrial Conglomerates 0.0%† | ||||
| General Electric Co., December Strike Price, $31.00, Expires 12/18/15 | United States | 361 | 4,332 | |
| Internet Software & Services 0.1% | ||||
| eBay Inc., January Strike Price, $50.00, Expires 1/15/16 | United States | 295 | 412,262 | |
| Leisure Products 0.0%† | ||||
| JAKKS Pacific Inc., December Strike Price, $10.00, Expires 12/18/15 | United States | 42 | 210 | |
| Media 0.0%† | ||||
| CBS Corp., B, January Strike Price, $45.00, Expires 1/15/16 | United States | 35 | 20,825 | |
| Dish Network Corp., A, December Strike Price, $65.00, Expires 12/18/15 | United States | 116 | 11,600 | |
| 32,425 | ||||
| Metals & Mining 0.0%† | ||||
| Freeport-McMoRan Inc., January Strike Price, $15.00, Expires 1/15/16 | United States | 217 | 1,953 | |
| Multiline Retail 0.0%† | ||||
| Macy’s Inc., January Strike Price, $75.00, Expires 1/15/16 | United States | 75 | 300 | |
| Oil, Gas & Consumable Fuels 0.0%† | ||||
| Southwestern Energy Co., June Strike Price, $20.00, Expires 6/17/16 | United States | 64 | 1,504 | |
| Pharmaceuticals 0.0%† | ||||
| Allergan PLC, January Strike Price, $315.00, Expires 1/15/16 | United States | 36 | 39,960 | |
| Allergan PLC, May Strike Price, $310.00, Expires 5/20/16 | United States | 24 | 63,696 | |
| Perrigo Co. PLC, January Strike Price, $190.00, Expires 1/15/16 | United States | 22 | 550 | |
| Theravance Inc., December Strike Price, $10.00, Expires 12/18/15 | United States | 43 | 967 | |
| Valeant Pharmaceuticals International Inc., December Strike Price, $115.00, | ||||
| Expires 12/18/15 | United States | 24 | 960 | |
| Valeant Pharmaceuticals International Inc., December Strike Price, $120.00, | ||||
| Expires 12/18/15 | United States | 24 | 720 | |
| 106,853 | ||||
| Semiconductors & Semiconductor Equipment 0.1% | ||||
| Avago Technologies Ltd., January Strike Price, $120.00, Expires 1/15/16 | Singapore | 145 | 200,100 | |
| Avago Technologies Ltd., March Strike Price, $120.00, Expires 3/18/16 | Singapore | 47 | 87,984 | |
| Micron Technology Inc., January Strike Price, $20.00, Expires 1/15/16 | United States | 55 | 715 | |
| NXP Semiconductors NV, January Strike Price, $87.50, Expires 1/15/16 | Netherlands | 174 | 142,680 | |
| Photronics Inc., March Strike Price, $12.50, Expires 3/18/16 | United States | 21 | 630 | |
| 432,109 | ||||
48 Semiannual Report
franklintempleton.com
| FRANKLIN ALTERNATIVE STRATEGIES FUNDS |
| CONSOLIDATED STATEMENT OF INVESTMENTS (UNAUDITED) |
| Franklin K2 Alternative Strategies Fund (continued) | ||||||
| Number of | ||||||
| Country | Contracts | Value | ||||
| Options Purchased (continued) | ||||||
| Calls – Exchange-Traded (continued) | ||||||
| Software 0.0%† | ||||||
| TiVo Inc., January Strike Price, $12.00, Expires 1/15/16 | United States | 56 | $ | 336 | ||
| Technology Hardware, Storage & Peripherals 0.0%† | ||||||
| EMC Corp., January Strike Price, $27.00, Expires 1/15/16 | United States | 722 | 15,884 | |||
| EMC Corp., January Strike Price, $28.00, Expires 1/15/16 | United States | 351 | 4,037 | |||
| HP Inc., January Strike Price, $27.00, Expires 1/15/16 | United States | 35 | 3,290 | |||
| HP Inc., January Strike Price, $31.00, Expires 1/15/16 | United States | 247 | 4,446 | |||
| NCR Corp., January Strike Price, $25.00, Expires 1/15/16 | United States | 142 | 38,340 | |||
| NCR Corp., January Strike Price, $35.00, Expires 1/15/16 | United States | 109 | 109 | |||
| 66,106 | ||||||
| Thrifts & Mortgage Finance 0.0%† | ||||||
| Ocwen Financial Corp., January Strike Price, $10.00, | ||||||
| Expires 1/15/16 | United States | 126 | 630 | |||
| Wireless Telecommunication Services 0.0%† | ||||||
| Vodafone Group PLC, ADR, January Strike Price, $40.00, | ||||||
| Expires 1/20/17 | United Kingdom | 79 | 5,293 | |||
| Vodafone Group PLC, ADR, January Strike Price, $40.00, | ||||||
| Expires 1/19/18 | United Kingdom | 36 | 4,914 | |||
| 10,207 | ||||||
| Notional | ||||||
| Counterparty | Amount* | |||||
| Calls – Over-the-Counter | ||||||
| Currency Options 0.0%† | ||||||
| JPY/USD, December Strike Price, 117.00 JPY, | ||||||
| Expires 12/24/15 | Japan | MSCO | 280,800,000 | JPY | 649 | |
| Number of | ||||||
| Contracts | ||||||
| Puts – Exchange-Traded | ||||||
| Biotechnology 0.0%† | ||||||
| PDL BioPharma Inc., December Strike Price, $4.00, | ||||||
| Expires 12/18/15 | United States | 20 | 800 | |||
| Construction Materials 0.0%† | ||||||
| LafargeHolcim Ltd., December Strike Price, 57.14 CHF, | ||||||
| Expires 12/18/15 | Switzerland | 80 | 24,902 | |||
| Diversified Financial Services 0.0%† | ||||||
| CAC 40 Index., December Strike Price, 4,250.00 EUR, | ||||||
| Expires 12/18/15 | France | 5 | 180 | |||
| EURO STOXX 50 Index, December Strike Price, | ||||||
| 2,950.00 EUR, Expires 12/18/15 | Germany | 106 | 2,464 | |||
| EURO STOXX 50 Index, December Strike Price, | ||||||
| 3,000.00 EUR, Expires 12/18/15 | Germany | 66 | 1,952 | |||
| EURO STOXX 50 Index, December Strike Price, | ||||||
| 3,200.00 EUR, Expires 12/18/15 | Germany | 32 | 3,077 | |||
| EURO STOXX Technology Index, December Strike Price, | ||||||
| 310.00 EUR, Expires 12/18/15 | Germany | 14 | 74 | |||
| EURO STOXX Technology Index, March Strike Price, | ||||||
| 370.00 EUR, Expires 3/18/16 | Germany | 41 | 1,516 | |||
franklintempleton.com
Semiannual Report
49
| FRANKLIN ALTERNATIVE STRATEGIES FUNDS |
| CONSOLIDATED STATEMENT OF INVESTMENTS (UNAUDITED) |
| Franklin K2 Alternative Strategies Fund (continued) | ||||
| Number of | ||||
| Country | Contracts | Value | ||
| Options Purchased (continued) | ||||
| Puts – Exchange-Traded (continued) | ||||
| Diversified Financial Services (continued) | ||||
| S&P 500 Index, December Strike Price, $2,000.00, Expires 12/19/15 | United States | 50 | $ | 40,600 |
| S&P 500 Index, December Strike Price, $2,050.00, Expires 12/19/15 | United States | 41 | 67,855 | |
| S&P 500 Index, December Strike Price, $2,075.00, Expires 12/19/15 | United States | 27 | 64,422 | |
| STOXX Europe 600 Industrial Goods & Services Price Index, March Strike Price, | ||||
| 420.00 EUR, Expires 3/18/16 | Germany | 81 | 36,372 | |
| 218,512 | ||||
| Energy Equipment & Services 0.0%† | ||||
| Baker Hughes Inc., December Strike Price, $50.00, Expires 12/18/15 | United States | 1 | 114 | |
| Exchange Traded Funds 0.0%† | ||||
| iShares U.S. Real Estate ETF, December Strike Price, $75.00, Expires 12/18/15 | United States | 979 | 111,606 | |
| SPDR S&P 500 ETF Trust, December Strike Price, $197.00, Expires 12/31/15 | United States | 167 | 16,867 | |
| 128,473 | ||||
| Health Care Providers & Services 0.0%† | ||||
| Aetna Inc., January Strike Price, $110.00, Expires 1/15/16 | United States | 24 | 21,648 | |
| Independent Power & Renewable Electricity Producers 0.0%† | ||||
| Pattern Energy Group Inc., December Strike Price, $15.00, Expires 12/18/15 | United States | 36 | 900 | |
| Media 0.1% | ||||
| Charter Communications Inc., A, March Strike Price, $210.00, Expires 3/18/16 | United States | 87 | 251,865 | |
| Charter Communications Inc., A, April Strike Price, $210.00, Expires 4/15/16 | United States | 71 | 214,065 | |
| Time Warner Cable Inc., March Strike Price, $165.00, Expires 3/18/16 | United States | 57 | 22,800 | |
| Time Warner Cable Inc., July Strike Price, $180.00, Expires 7/15/16 | United States | 57 | 69,540 | |
| Vivendi SA, March Strike Price, 19.00 EUR, Expires 3/18/16 | France | 901 | 75,204 | |
| 633,474 | ||||
| Metals & Mining 0.0%† | ||||
| Teck Resources Ltd., February Strike Price, $4.00, Expires 2/19/16 | Canada | 79 | 4,266 | |
| ThyssenKrupp AG, December Strike Price, 15.00 EUR, Expires 12/18/15 | Germany | 846 | 894 | |
| 5,160 | ||||
| Oil, Gas & Consumable Fuels 0.0%† | ||||
| Kinder Morgan Inc., January Strike Price, $20.00, Expires 1/15/16 | United States | 108 | 2,916 | |
| Southwestern Energy Co., December Strike Price, $10.00, Expires 12/18/15 | United States | 42 | 5,796 | |
| WPX Energy Inc., February Strike Price, $5.00, Expires 2/19/16 | United States | 35 | 437 | |
| WPX Energy Inc., December Strike Price, $5.00, Expires 12/18/15 | United States | 70 | 700 | |
| 9,849 | ||||
| Pharmaceuticals 0.0%† | ||||
| Perrigo Co. PLC, January Strike Price, $150.00, Expires 1/15/16 | United States | 79 | 48,980 | |
| Semiconductors & Semiconductor Equipment 0.0%† | ||||
| SunEdison Inc., December Strike Price, $5.00, Expires 12/18/15 | United States | 72 | 13,968 | |
| Software 0.0%† | ||||
| VMware Inc., A, September Strike Price, $95.00, Expires 9/16/16 | United States | 32 | 119,040 | |
50 Semiannual Report
franklintempleton.com
FRANKLIN ALTERNATIVE STRATEGIES FUNDS
CONSOLIDATED STATEMENT OF INVESTMENTS (UNAUDITED)
| Franklin K2 Alternative Strategies Fund (continued) | |||||||||
| Notional | |||||||||
| Country | Counterparty | Amount* | Value | ||||||
| Options Purchased (continued) | |||||||||
| Puts – Over-the-Counter | |||||||||
| Currency Options 0.0%† | |||||||||
| CNY/USD, January Strike Price, 6.21 CNY, Expires 1/19/16 | China | BOFA | 14,345,100 | CNY | $ | 909 | |||
| Payer Swaptions – Over-the-Counter | |||||||||
| Interest Rate 0.0%† | |||||||||
| Pay fixed 10 year 2.57%, receive f3-month USD LIBOR, | |||||||||
| Expires 9/19/16 | United States | BOFA | 6,200,000 | 90,984 | |||||
| Receiver Swaptions – Over-the-Counter | |||||||||
| Interest Rate 0.0%† | |||||||||
| Receive fixed 1 year 4.89%, pay float 28 Day TIIE, | |||||||||
| Expires 8/17/16 | Mexico | DBFX | 45,000,000 | MXN | 15,238 | ||||
| Receive fixed 1 year 4.91%, pay float 28 Day TIIE, | |||||||||
| Expires 9/12/17 | Mexico | BOFA | 50,000,000 | MXN | 16,712 | ||||
| 31,950 | |||||||||
| Total Options Purchased (Cost $4,566,975) | 3,506,972 | ||||||||
| Principal | |||||||||
| Amount* | |||||||||
| U.S. Government and Agency Securities | |||||||||
| (Cost $3,875,383) 0.3% | |||||||||
| U.S. Government and Agency Securities 0.3% | |||||||||
| nU.S.Treasury Bond, Index Linked, 0.125%, 4/15/20 | United States | 3,911,870 | 3,882,558 | ||||||
| Total Investments before Short Term | |||||||||
| Investments (Cost $764,758,757) | 787,997,988 | ||||||||
| Short Term Investments (Cost $349,872) 0.0%† | |||||||||
| U.S. Government and Agency Securities 0.0%† | |||||||||
| a,oU.S. Treasury Bill, 3/24/16 | United States | 350,000 | 349,801 | ||||||
| Total Investments before Money Market Funds | |||||||||
| and Repurchase Agreements | |||||||||
| (Cost $765,108,629) | 788,347,789 | ||||||||
| Money Market Funds (Cost $103,478,543) 8.8% | |||||||||
| p,qDreyfus Government Cash Management, Institutional Shares, | |||||||||
| 0.01% | United States | 103,478,543 | 103,478,543 | ||||||
| Repurchase Agreement (Cost $44,783,479) 3.8% | |||||||||
| rJoint Repurchase Agreement, 0.048%, 12/01/15 | |||||||||
| (Maturity Value $44,783,538) | United States | 44,783,479 | 44,783,479 | ||||||
| BNP Paribas Securities Corp. (Maturity Value $8,530,368) | |||||||||
| Credit Suisse Securities (USA) LLC (Maturity Value $25,590,657) | |||||||||
| HSBC Securities (USA) Inc. (Maturity Value $6,397,776) | |||||||||
| Merrill Lynch, Pierce, Fenner & Smith Inc. | |||||||||
| (Maturity Value $4,264,737) | |||||||||
| Collateralized by oU.S. Treasury Bill, 12/03/15 - 11/10/16; | |||||||||
| and U.S. Treasury Note 0.625% - 1.375%, | |||||||||
| 5/31/17 - 2/29/20 (valued at $45,690,409) | |||||||||
| Total Investments (Cost $913,370,651) 79.8% | 936,609,811 | ||||||||
| Options Written (0.0)%† | (384,443 | ) | |||||||
| Securities Sold Short (22.4)% | (262,717,858 | ) | |||||||
| Other Assets, less Liabilities 42.6% | 500,631,771 | ||||||||
| Net Assets 100.0% | $ | 1,174,139,281 | |||||||
| franklintempleton.com | Semiannual Report | 51 | |||||||
| FRANKLIN ALTERNATIVE STRATEGIES FUNDS |
| CONSOLIDATED STATEMENT OF INVESTMENTS (UNAUDITED) |
| Franklin K2 Alternative Strategies Fund (continued) | |||||||
| Number of | |||||||
| Country | Contracts | Value | |||||
| sOptions Written (0.0%)† | |||||||
| Calls – Exchange-Traded | |||||||
| Airlines (0.0)%† | |||||||
| Delta Air Lines Inc., December Strike Price, $60.00, | |||||||
| Expires 12/18/15 | United States | 44 | $ | (308 | ) | ||
| Diversified Financial Services (0.0)%† | |||||||
| EURO STOXX Technology Price Index, March Strike Price, | |||||||
| 430.00 EUR, Expires 3/18/16 | Germany | 41 | (14,295 | ) | |||
| Diversified Telecommunication Services (0.0)%† | |||||||
| Telecom Italia SpA, December Strike Price, 1.50 EUR, | |||||||
| Expires 12/18/15 | Italy | 227 | (648 | ) | |||
| Electrical Equipment (0.0)%† | |||||||
| Alstom SA, December Strike Price, 32.00 EUR, | |||||||
| Expires 12/18/15 | France | 92 | (486 | ) | |||
| Media (0.0)%† | |||||||
| Charter Communications Inc., A, March Strike Price, $210.00, | |||||||
| Expires 3/18/16 | United States | 87 | (34,974 | ) | |||
| Charter Communications Inc., A, April Strike Price, $210.00, | |||||||
| Expires 4/15/16 | United States | 71 | (35,500 | ) | |||
| Vivendi SA, December Strike Price, 26.85 EUR, | |||||||
| Expires 12/18/15 | France | 229 | (252 | ) | |||
| (70,726 | ) | ||||||
| Pharmaceuticals (0.0)%† | |||||||
| Allergan PLC, January Strike Price, $340.00, Expires 1/15/16 | United States | 36 | (10,440 | ) | |||
| Allergan PLC, May Strike Price, $340.00, Expires 5/20/16 | United States | 24 | (30,624 | ) | |||
| (41,064 | ) | ||||||
| Software (0.0)%† | |||||||
| VMware Inc., A, September Strike Price, $95.00, | |||||||
| Expires 9/16/16 | United States | 32 | (2,000 | ) | |||
| Specialty Retail (0.0)%† | |||||||
| Staples Inc., December Strike Price, $13.00, | |||||||
| Expires 12/18/15 | United States | 91 | (2,912 | ) | |||
| Notional | |||||||
| Counterparty | Amount | ||||||
| Payer Swaptions – Over-the-Counter | |||||||
| Interest Rate (0.0%)† | |||||||
| Receive fixed 10 year 3.07%, pay float 3-month USD LIBOR, | |||||||
| Expires 9/19/16 | United States | BOFA | $ | 6,200,000 | (31,260 | ) | |
| Number of | |||||||
| Contracts | |||||||
| Puts – Exchange-Traded | |||||||
| Diversified Financial Services (0.0%)† | |||||||
| S&P 500 Index, December Strike Price, $1,850.00, | |||||||
| Expires 12/19/15 | United States | 15 | (1,575 | ) | |||
| Media (0.0%)† | |||||||
| Time Warner Cable Inc., July Strike Price, $165.00, | |||||||
| Expires 7/15/16 | United States | 57 | (39,900 | ) | |||
52 Semiannual Report
franklintempleton.com
| FRANKLIN ALTERNATIVE STRATEGIES FUNDS |
| CONSOLIDATED STATEMENT OF INVESTMENTS (UNAUDITED) |
| Franklin K2 Alternative Strategies Fund (continued) | |||||
| Number of | |||||
| Country | Contracts | Value | |||
| sOptions Written (continued) | |||||
| Puts – Exchange-Traded (continued) | |||||
| Media (continued) | |||||
| Time Warner Cable Inc., March Strike Price, $180.00, Expires 3/18/16 | United States | 57 | $ | (45,600 | ) |
| Vivendi SA, March Strike Price, 20.00 EUR, Expires 3/18/16 | France | 91 | (11,826 | ) | |
| (97,326 | ) | ||||
| Metals & Mining (0.0%)† | |||||
| Freeport-McMoRan Inc., January Strike Price, $10.00, Expires 1/15/16 | United States | 108 | (22,356 | ) | |
| Pharmaceuticals (0.0%)† | |||||
| Allergan PLC, January Strike Price, $275.00, Expires 1/15/16 | United States | 36 | (7,470 | ) | |
| Allergan PLC, May Strike Price, $275.00, Expires 5/20/16 | United States | 24 | (22,440 | ) | |
| Perrigo Co. PLC, January Strike Price, $135.00, Expires 1/15/16 | United States | 53 | (8,215 | ) | |
| Perrigo Co. PLC, January Strike Price, $140.00, Expires 1/15/16 | United States | 26 | (6,760 | ) | |
| Perrigo Co. PLC, January Strike Price, $145.00, Expires 1/15/16 | United States | 22 | (9,570 | ) | |
| Theravance Inc., December Strike Price, $8.00, Expires 12/18/15 | United States | 43 | (645 | ) | |
| (55,100 | ) | ||||
| Road & Rail (0.0%)† | |||||
| Asciano Ltd., December Strike Price, 8.25 AUD, Expires 12/17/15 | Australia | 226 | (981 | ) | |
| Semiconductors & Semiconductor Equipment (0.0%)† | |||||
| Micron Technology Inc., January Strike Price, $17.00, Expires 1/15/16 | United States | 55 | (9,680 | ) | |
| Software (0.0%)† | |||||
| TiVo Inc., January Strike Price, $10.00, Expires 1/15/16 | United States | 56 | (5,628 | ) | |
| Technology Hardware, Storage & Peripherals (0.0%)† | |||||
| EMC Corp., December Strike Price, $25.00, Expires 12/18/15 | United States | 722 | (24,548 | ) | |
| NCR Corp., January Strike Price, $21.00, Expires 1/15/16 | United States | 142 | (3,550 | ) | |
| (28,098 | ) | ||||
| Total Options Written | |||||
| (Premiums Received $475,094) | (384,443 | ) | |||
| Shares | |||||
| tSecurities Sold Short (22.4)% | |||||
| Common Stocks (8.5)% | |||||
| Air Freight & Logistics (0.0)%† | |||||
| Atlas Air Worldwide Holdings Inc | United States | 4,181 | (172,759 | ) | |
| Airlines (0.2)% | |||||
| American Airlines Group Inc | United States | 9,211 | (380,046 | ) | |
| Deutsche Lufthansa AG | Germany | 61,205 | (877,193 | ) | |
| Hawaiian Holdings Inc | United States | 8,050 | (291,410 | ) | |
| Japan Airlines Co. Ltd | Japan | 23,712 | (810,947 | ) | |
| (2,359,596 | ) | ||||
| Automobiles (0.1)% | |||||
| General Motors Co | United States | 25,075 | (907,715 | ) | |
| Beverages (0.0)%† | |||||
| Brown-Forman Corp., B | United States | 355 | (36,402 | ) | |
| Biotechnology (0.4)% | |||||
| Ablynx NV | Belgium | 10,799 | (160,819 | ) | |
| Acorda Therapeutics Inc | United States | 17,487 | (667,828 | ) | |
franklintempleton.com
Semiannual Report
53
| FRANKLIN ALTERNATIVE STRATEGIES FUNDS |
| CONSOLIDATED STATEMENT OF INVESTMENTS (UNAUDITED) |
| Franklin K2 Alternative Strategies Fund (continued) | |||||
| Country | Shares | Value | |||
| tSecurities Sold Short (continued) | |||||
| Common Stocks (continued) | |||||
| Biotechnology (continued) | |||||
| AMAG Pharmaceuticals Inc | United States | 15,735 | $ | (418,866 | ) |
| BioMarin Pharmaceutical Inc | United States | 9,315 | (888,372 | ) | |
| Clovis Oncology Inc | United States | 3,715 | (116,837 | ) | |
| Exelixis Inc | United States | 190,558 | (1,089,992 | ) | |
| Ironwood Pharmaceuticals Inc | United States | 17,412 | (212,426 | ) | |
| Ligand Pharmaceuticals Inc., B | United States | 13,338 | (1,428,233 | ) | |
| PDL BioPharma Inc | United States | 5,773 | (21,851 | ) | |
| PTC Therapeutics Inc | United States | 2,408 | (72,336 | ) | |
| (5,077,560 | ) | ||||
| Building Products (0.0)%† | |||||
| Griffon Corp | United States | 1,835 | (33,287 | ) | |
| Capital Markets (0.1)% | |||||
| Cowen Group Inc., A | United States | 119,379 | (567,050 | ) | |
| Commercial Services & Supplies (0.0)%† | |||||
| Cenveo Inc | United States | 44,971 | (70,605 | ) | |
| Communications Equipment (0.3)% | |||||
| CalAmp Corp | United States | 10,002 | (184,837 | ) | |
| InterDigital Inc | United States | 1,530 | (80,616 | ) | |
| Palo Alto Networks Inc | United States | 14,456 | (2,708,187 | ) | |
| (2,973,640 | ) | ||||
| Construction & Engineering (0.0)%† | |||||
| Dycom Industries Inc | United States | 2,207 | (192,848 | ) | |
| Construction Materials (0.0)%† | |||||
| Cemex SAB de CV, ADR | Mexico | 32,719 | (206,130 | ) | |
| Lennox International Inc | United States | 311 | (42,271 | ) | |
| (248,401 | ) | ||||
| Consumer Finance (0.0)%† | |||||
| Encore Capital Group Inc | United States | 3,407 | (112,329 | ) | |
| PRA Group Inc | United States | 2,737 | (113,065 | ) | |
| (225,394 | ) | ||||
| Diversified Consumer Services (0.1)% | |||||
| Carriage Services Inc | United States | 22,744 | (561,549 | ) | |
| Diversified Telecommunication Services (0.0)%† | |||||
| AT&T Inc | United States | 1,159 | (39,023 | ) | |
| Cogent Communications Holdings Inc | United States | 1,202 | (40,339 | ) | |
| Iridium Communications Inc | United States | 36,936 | (301,767 | ) | |
| Telecom Italia SpA | Italy | 104,114 | (134,642 | ) | |
| (515,771 | ) | ||||
| Electric Utilities (0.1)% | |||||
| Emera Inc | Canada | 19,018 | (606,804 | ) | |
| Electrical Equipment (0.1)% | |||||
| General Cable Corp | United States | 13,472 | (205,313 | ) | |
| SolarCity Corp | United States | 12,093 | (347,795 | ) | |
| (553,108 | ) | ||||
54 Semiannual Report
franklintempleton.com
| FRANKLIN ALTERNATIVE STRATEGIES FUNDS |
| CONSOLIDATED STATEMENT OF INVESTMENTS (UNAUDITED) |
| Franklin K2 Alternative Strategies Fund (continued) | |||||
| Country | Shares | Value | |||
| tSecurities Sold Short (continued) | |||||
| Common Stocks (continued) | |||||
| Electronic Equipment, Instruments & Components (0.1)% | |||||
| Vishay Intertechnology Inc | United States | 76,325 | $ | (909,794 | ) |
| Energy Equipment & Services (0.5)% | |||||
| Halliburton Co | United States | 71,488 | (2,848,797 | ) | |
| Schlumberger Ltd | United States | 32,661 | (2,519,796 | ) | |
| SEACOR Holdings Inc | United States | 2,925 | (166,081 | ) | |
| (5,534,674 | ) | ||||
| Food & Staples Retailing (0.1)% | |||||
| United Natural Foods Inc | United States | 5,662 | (248,619 | ) | |
| Wal-Mart Stores Inc | United States | 4,842 | (284,903 | ) | |
| (533,522 | ) | ||||
| Food Products (0.2)% | |||||
| Archer-Daniels-Midland Co | United States | 7,703 | (281,082 | ) | |
| Bunge Ltd | United States | 2,860 | (190,505 | ) | |
| The JM Smucker Co | United States | 4,263 | (516,633 | ) | |
| Post Holdings Inc | United States | 24,427 | (1,698,165 | ) | |
| (2,686,385 | ) | ||||
| Health Care Equipment & Supplies (0.1)% | |||||
| Alere Inc | United States | 2,699 | (111,388 | ) | |
| Hologic Inc | United States | 3,302 | (133,236 | ) | |
| Integra LifeSciences Holdings Corp | United States | 4,083 | (256,045 | ) | |
| Quidel Corp | United States | 8,560 | (185,666 | ) | |
| Wright Medical Group NV | United States | 12,651 | (270,984 | ) | |
| (957,319 | ) | ||||
| Health Care Providers & Services (0.5)% | |||||
| Aceto Corp | United States | 15,738 | (443,969 | ) | |
| Aetna Inc | United States | 13,471 | (1,384,145 | ) | |
| Amsurg Corp | United States | 312 | (26,227 | ) | |
| Anthem Inc | United States | 8,153 | (1,062,988 | ) | |
| Centene Corp | United States | 14,198 | (819,935 | ) | |
| HealthSouth Corp | United States | 10,155 | (357,354 | ) | |
| Molina Healthcare Inc | United States | 35,531 | (2,141,098 | ) | |
| (6,235,716 | ) | ||||
| Health Care Technology (0.0)%† | |||||
| Allscripts Healthcare Solutions Inc | United States | 13,202 | (201,066 | ) | |
| Hotels, Restaurants & Leisure (0.0)%† | |||||
| Hyatt Hotels Corp., A | United States | 6,025 | (296,972 | ) | |
| Household Durables (0.3)% | |||||
| Hovnanian Enterprises Inc | United States | 35,064 | (64,167 | ) | |
| Jarden Corp | United States | 52,876 | (2,468,252 | ) | |
| LGI Homes Inc | United States | 18,917 | (629,179 | ) | |
| (3,161,598 | ) | ||||
| Household Products (0.0)%† | |||||
| Kimberly-Clark Corp | United States | 3,877 | (461,945 | ) | |
| Independent Power & Renewable Electricity Producers (0.0)%† | |||||
| Pattern Energy Group Inc | United States | 16,916 | (302,966 | ) | |
franklintempleton.com
Semiannual Report
55
| FRANKLIN ALTERNATIVE STRATEGIES FUNDS |
| CONSOLIDATED STATEMENT OF INVESTMENTS (UNAUDITED) |
| Franklin K2 Alternative Strategies Fund (continued) | |||||
| Country | Shares | Value | |||
| tSecurities Sold Short (continued) | |||||
| Common Stocks (continued) | |||||
| Insurance (0.2)% | |||||
| ACE Ltd | United States | 10,208 | $ | (1,172,389 | ) |
| AmTrust Financial Services Inc | United States | 5,737 | (358,620 | ) | |
| CNP Assurances | France | 52,558 | (731,885 | ) | |
| (2,262,894 | ) | ||||
| Internet & Catalog Retail (0.3)% | |||||
| Ctrip.com International Ltd., ADR | China | 14,973 | (1,602,261 | ) | |
| Netflix Inc | United States | 391 | (48,222 | ) | |
| Priceline Group Inc | United States | 1,139 | (1,422,440 | ) | |
| (3,072,923 | ) | ||||
| Internet Software & Services (1.0)% | |||||
| Alibaba Group Holding Ltd., ADR | China | 40,687 | (3,420,963 | ) | |
| Blucora Inc | United States | 9,954 | (105,811 | ) | |
| j2 Global Inc | United States | 7,313 | (588,477 | ) | |
| MercadoLibre Inc | Argentina | 6,312 | (777,891 | ) | |
| Twitter Inc | United States | 2,254 | (57,251 | ) | |
| VeriSign Inc | United States | 75,081 | (6,715,245 | ) | |
| WebMD Health Corp | United States | 3,965 | (180,368 | ) | |
| (11,846,006 | ) | ||||
| IT Services (0.0)%† | |||||
| The Western Union Co | United States | 22,701 | (428,141 | ) | |
| Leisure Products (0.1)% | |||||
| BRP Inc | Canada | 15,577 | (254,864 | ) | |
| JAKKS Pacific Inc | United States | 37,397 | (307,777 | ) | |
| Polaris Industries Inc | United States | 5,505 | (580,392 | ) | |
| (1,143,033 | ) | ||||
| Life Sciences Tools & Services (0.1)% | |||||
| Albany Molecular Research Inc | United States | 50,512 | (1,006,199 | ) | |
| Sequenom Inc | United States | 95,426 | (169,858 | ) | |
| (1,176,057 | ) | ||||
| Machinery (0.4)% | |||||
| Altra Industrial Motion Corp | United States | 18,502 | (518,426 | ) | |
| Caterpillar Inc | United States | 11,154 | (810,338 | ) | |
| Cummins Inc | United States | 5,678 | (569,901 | ) | |
| Deere & Co | United States | 561 | (44,639 | ) | |
| MAN SE | Germany | 2,923 | (290,083 | ) | |
| Navistar International Corp | United States | 1,390 | (20,169 | ) | |
| PACCAR Inc | United States | 11,206 | (582,264 | ) | |
| Trinity Industries Inc | United States | 45,722 | (1,241,352 | ) | |
| Wabash National Corp | United States | 16,814 | (218,077 | ) | |
| WABCO Holdings Inc | United States | 3,723 | (400,148 | ) | |
| (4,695,397 | ) | ||||
| Media (0.3)% | |||||
| Charter Communications Inc., A | United States | 894 | (167,500 | ) | |
| Liberty Global PLC, A | United Kingdom | 936 | (39,696 | ) | |
| Liberty Media Corp., A | United States | 1,904 | (77,131 | ) | |
56 Semiannual Report
franklintempleton.com
| FRANKLIN ALTERNATIVE STRATEGIES FUNDS |
| CONSOLIDATED STATEMENT OF INVESTMENTS (UNAUDITED) |
| Franklin K2 Alternative Strategies Fund (continued) | |||||
| Country | Shares | Value | |||
| tSecurities Sold Short (continued) | |||||
| Common Stocks (continued) | |||||
| Media (continued) | |||||
| Sirius XM Holdings Inc | United States | 693,503 | $ | (2,850,297 | ) |
| The Walt Disney Co | United States | 388 | (44,026 | ) | |
| (3,178,650 | ) | ||||
| Metals & Mining (0.0)%† | |||||
| Goldcorp Inc | Canada | 2,660 | (31,414 | ) | |
| Newmont Mining Corp | United States | 2,085 | (38,385 | ) | |
| (69,799 | ) | ||||
| Multi-Utilities (0.0)%† | |||||
| Black Hills Corp | United States | 6,650 | (285,418 | ) | |
| Multiline Retail (0.4)% | |||||
| Canadian Tire Corp. Ltd., A | Canada | 40,235 | (3,769,668 | ) | |
| Dollar General Corp | United States | 19,722 | (1,290,016 | ) | |
| (5,059,684 | ) | ||||
| Oil, Gas & Consumable Fuels (0.3)% | |||||
| Aegean Marine Petroleum Network Inc | Greece | 19,443 | (183,153 | ) | |
| Alon USA Energy Inc | United States | 32,937 | (579,362 | ) | |
| Chesapeake Energy Corp | United States | 17,452 | (91,972 | ) | |
| Cobalt International Energy Inc | United States | 8,782 | (64,723 | ) | |
| Golar LNG Ltd | Bermuda | 4,000 | (109,400 | ) | |
| Green Plains Inc | United States | 15,107 | (357,885 | ) | |
| Kinder Morgan Inc | United States | 59,611 | (1,405,031 | ) | |
| Renewable Energy Group Inc | United States | 32,579 | (293,537 | ) | |
| Scorpio Tankers Inc | Monaco | 18,844 | (163,001 | ) | |
| Ship Finance International Ltd | Norway | 10,979 | (190,156 | ) | |
| Solazyme Inc | United States | 94,176 | (310,781 | ) | |
| Southwestern Energy Co | United States | 4,406 | (39,698 | ) | |
| (3,788,699 | ) | ||||
| Pharmaceuticals (0.2)% | |||||
| ANI Pharmaceuticals Inc | United States | 6,638 | (290,877 | ) | |
| The Medicines Co | United States | 27,982 | (1,175,524 | ) | |
| Theravance Inc | United States | 30,785 | (284,761 | ) | |
| (1,751,162 | ) | ||||
| Professional Services (0.0)%† | |||||
| Nielsen Holdings PLC | United States | 655 | (30,576 | ) | |
| 51job Inc., ADR | China | 3,323 | (105,539 | ) | |
| (136,115 | ) | ||||
| Real Estate Investment Trusts (REITs) (0.2)% | |||||
| Apollo Commercial Real Estate Finance Inc | United States | 7,459 | (130,905 | ) | |
| Gramercy Property Trust Inc | United States | 35,408 | (845,897 | ) | |
| Host Hotels & Resorts Inc | United States | 17,680 | (293,488 | ) | |
| National Health Investors Inc | United States | 4,275 | (258,167 | ) | |
| Redwood Trust Inc | United States | 3,016 | (41,561 | ) | |
| Spirit Realty Capital Inc | United States | 24,168 | (237,330 | ) | |
| Starwood Property Trust Inc | United States | 15,196 | (308,935 | ) | |
| Starwood Waypoint Residential Trust | United States | 3,344 | (79,086 | ) | |
| Welltower Inc | United States | 2,160 | (136,490 | ) | |
| (2,331,859 | ) | ||||
franklintempleton.com
Semiannual Report
57
| FRANKLIN ALTERNATIVE STRATEGIES FUNDS |
| CONSOLIDATED STATEMENT OF INVESTMENTS (UNAUDITED) |
| Franklin K2 Alternative Strategies Fund (continued) | |||||
| Country | Shares | Value | |||
| tSecurities Sold Short (continued) | |||||
| Common Stocks (continued) | |||||
| Real Estate Management & Development (0.0)%† | |||||
| Forest City Enterprises Inc., A | United States | 11,618 | $ | (258,384 | ) |
| Semiconductors & Semiconductor Equipment (0.9)% | |||||
| Avago Technologies Ltd | Singapore | 16,068 | (2,096,071 | ) | |
| Integrated Device Technology Inc | United States | 12,660 | (354,986 | ) | |
| Intel Corp | United States | 46,580 | (1,619,587 | ) | |
| Lam Research Corp | United States | 9,943 | (777,543 | ) | |
| Micron Technology Inc | United States | 4,455 | (70,968 | ) | |
| Microsemi Corp | United States | 9,049 | (325,854 | ) | |
| NVIDIA Corp | United States | 81,072 | (2,571,604 | ) | |
| NXP Semiconductors NV | Netherlands | 4,303 | (402,158 | ) | |
| Photronics Inc | United States | 51,161 | (561,236 | ) | |
| SunEdison Inc | United States | 90,919 | (290,032 | ) | |
| Xilinx Inc | United States | 24,908 | (1,237,678 | ) | |
| (10,307,717 | ) | ||||
| Software (0.6)% | |||||
| Bottomline Technologies de Inc | United States | 7,966 | (246,229 | ) | |
| BroadSoft Inc | United States | 7,855 | (314,436 | ) | |
| Electronic Arts Inc | United States | 35,773 | (2,425,052 | ) | |
| FireEye Inc | United States | 4,571 | (104,584 | ) | |
| Interactive Intelligence Group Inc | United States | 4,885 | (168,337 | ) | |
| NetSuite Inc | United States | 3,250 | (277,550 | ) | |
| Proofpoint Inc | United States | 13,494 | (989,245 | ) | |
| Rovi Corp | United States | 3,892 | (45,964 | ) | |
| Salesforce.com Inc | United States | 7,862 | (626,523 | ) | |
| Take-Two Interactive Software Inc | United States | 53,821 | (1,903,649 | ) | |
| TiVo Inc | United States | 12,601 | (113,283 | ) | |
| Workday Inc., A | United States | 3,356 | (280,931 | ) | |
| (7,495,783 | ) | ||||
| Specialty Retail (0.1)% | |||||
| Hennes & Mauritz AB, B | Sweden | 11,437 | (424,210 | ) | |
| Office Depot Inc | United States | 39,407 | (259,692 | ) | |
| Restoration Hardware Holdings Inc | United States | 659 | (59,224 | ) | |
| RONA Inc | Canada | 21,731 | (216,911 | ) | |
| (960,037 | ) | ||||
| Technology Hardware, Storage & Peripherals (0.0)%† | |||||
| Electronics For Imaging Inc | United States | 5,995 | (294,235 | ) | |
| Violin Memory Inc | United States | 106,018 | (138,883 | ) | |
| (433,118 | ) | ||||
| Textiles, Apparel & Luxury Goods (0.1)% | |||||
| Adidas AG | Germany | 6,871 | (664,900 | ) | |
| Iconix Brand Group Inc | United States | 4,639 | (32,659 | ) | |
| Steven Madden Ltd | United States | 8,303 | (264,866 | ) | |
| (962,425 | ) | ||||
| Thrifts & Mortgage Finance (0.0)%† | |||||
| MGIC Investment Corp | United States | 40,431 | (385,712 | ) | |
| Tobacco (0.1)% | |||||
| Universal Corp | United States | 17,633 | (996,970 | ) | |
| Vector Group Ltd | United States | 17,894 | (452,897 | ) | |
| (1,449,867 | ) | ||||
58 Semiannual Report
franklintempleton.com
| FRANKLIN ALTERNATIVE STRATEGIES FUNDS |
| CONSOLIDATED STATEMENT OF INVESTMENTS (UNAUDITED) |
| Franklin K2 Alternative Strategies Fund (continued) | |||||
| Country | Shares | Value | |||
| tSecurities Sold Short (continued) | |||||
| Common Stocks (continued) | |||||
| Trading Companies & Distributors (0.0)%† | |||||
| Kaman Corp | United States | 8,716 | $ | (349,860 | ) |
| Wireless Telecommunication Services (0.0)%† | |||||
| T-Mobile U.S. Inc | United States | 140 | (4,970 | ) | |
| Vodafone Group PLC, ADR | United Kingdom | 2,193 | (73,597 | ) | |
| (78,567 | ) | ||||
| Total Common Stocks (Proceeds $99,444,520) | (100,291,753 | ) | |||
| Exchange Traded Funds (11.8)% | |||||
| Consumer Discretionary Select Sector SPDR Fund | United States | 6,685 | (540,014 | ) | |
| Consumer Staples Select Sector SPDR Fund | United States | 99,806 | (4,932,413 | ) | |
| Financial Select Sector SPDR Fund | United States | 13,247 | (325,346 | ) | |
| Health Care Select Sector SPDR Fund | United States | 165,533 | (11,771,052 | ) | |
| Industrial Select Sector SPDR Fund | United States | 11,051 | (604,932 | ) | |
| iShares 20+ Year Treasury Bond Fund | United States | 7,892 | (958,483 | ) | |
| iShares Core S&P Small-Cap ETF | United States | 30,475 | (3,538,147 | ) | |
| iShares Global Utilities ETF | United States | 24,735 | (1,095,760 | ) | |
| iShares MSCI Brazil Capped ETF | Brazil | 13,385 | (301,430 | ) | |
| iShares MSCI Emerging Markets ETF | United States | 19,950 | (678,100 | ) | |
| iShares MSCI Taiwan ETF | Taiwan | 24,960 | (337,709 | ) | |
| iShares Nasdaq Biotechnology ETF | United States | 25,550 | (8,543,154 | ) | |
| iShares North American Tech ETF | United States | 3,180 | (359,340 | ) | |
| iShares North American Tech-Software ETF | United States | 28,890 | (3,048,762 | ) | |
| iShares PHLX Semiconductor ETF | United States | 14,685 | (1,345,293 | ) | |
| iShares Russell 2000 ETF | United States | 28,565 | (3,401,806 | ) | |
| iShares Russell 2000 Growth ETF | United States | 26,680 | (3,915,824 | ) | |
| iShares Russell Mid-Cap Growth ETF | United States | 14,855 | (1,402,609 | ) | |
| iShares S&P Small-Cap 600 Growth ETF | United States | 10,355 | (1,351,431 | ) | |
| iShares Transportation Average ETF | United States | 14,800 | (2,159,172 | ) | |
| iShares U.S. Consumer Goods ETF | United States | 14,960 | (1,625,853 | ) | |
| iShares U.S. Technology ETF | United States | 24,705 | (2,724,961 | ) | |
| Powershares Dynamic Media Portfolio | United States | 41,700 | (1,092,957 | ) | |
| Powershares Dynamic Retail Portfolio | United States | 42,800 | (1,619,351 | ) | |
| PureFunds ISE Cyber Security ETF | United States | 111,040 | (3,014,736 | ) | |
| SPDR S&P 500 ETF Trust | United States | 325,648 | (67,959,481 | ) | |
| SPDR S&P Retail ETF | United States | 27,700 | (1,234,589 | ) | |
| SPDR S&P Transportation ETF | United States | 56,090 | (2,612,672 | ) | |
| Utilities Select Sector SPDR Fund | United States | 34,369 | (1,471,681 | ) | |
| Vanguard Consumer Staples ETF | United States | 18,765 | (2,384,656 | ) | |
| Vanguard Small-Cap Growth ETF | United States | 12,620 | (1,593,401 | ) | |
| Total Exchange Traded Funds (Proceeds $138,418,390) | (137,945,115 | ) | |||
| Principal | |||||
| Amount* | |||||
| Convertible Bonds and Notes (0.1)% | |||||
| IT Services (0.0)%† | |||||
| Euronet Worldwide Inc., senior bond, 1.50%, 10/01/44 | United States | 230,000 | (287,931 | ) | |
| Machinery (0.0)%† | |||||
| Navistar International Corp., senior sub. note, 4.50%, 10/15/18 | United States | 200,000 | (147,000 | ) | |
franklintempleton.com
Semiannual Report
59
| FRANKLIN ALTERNATIVE STRATEGIES FUNDS |
| CONSOLIDATED STATEMENT OF INVESTMENTS (UNAUDITED) |
| Franklin K2 Alternative Strategies Fund (continued) | |||||
| Principal | |||||
| Amount* | |||||
| tSecurities Sold Short (continued) | |||||
| Convertible Bonds and Notes (continued) | |||||
| Oil, Gas & Consumable Fuels (0.0)%† | |||||
| Cobalt International Energy Inc., senior note, 2.625%, 12/01/19 | United States | 52,000 | $ | (38,025 | ) |
| Software (0.1)% | |||||
| Citrix Systems Inc., senior note, 0.50%, 4/15/19 | United States | 296,000 | (328,375 | ) | |
| Red Hat Inc., senior note, 0.25%, 10/01/19 | United States | 296,000 | (385,170 | ) | |
| (713,545 | ) | ||||
| Total Convertible Bonds and Notes | |||||
| (Proceeds $1,151,724) | (1,186,501 | ) | |||
| Corporate Bonds and Notes (1.9)% | |||||
| Construction Materials (0.0)%† | |||||
| Associated Materials LLC / AMH New Finance Inc., senior secured note, | |||||
| first lien, 9.125%, 11/01/17 | United States | 192,000 | (152,640 | ) | |
| Electronic Equipment, Instruments & Components (0.1)% | |||||
| fItalics Merger Sub Inc., senior note, 144A, 7.125%, 7/15/23 | United States | 1,174,000 | (1,132,910 | ) | |
| Hotels, Restaurants & Leisure (0.3)% | |||||
| Caesars Entertainment Resort Properties LLC, senior secured note, first lien, | |||||
| 8.00%, 10/01/20 | United States | 328,000 | (319,800 | ) | |
| MGM Resorts International, senior note, 6.00%, 3/15/23 | United States | 2,205,000 | (2,189,841 | ) | |
| fWynn Las Vegas LLC / Wynn Las Vegas Capital Corp., senior bond, 144A, | |||||
| 5.50%, 3/01/25 | United States | 1,260,000 | (1,138,725 | ) | |
| (3,648,366 | ) | ||||
| Machinery (0.1)% | |||||
| Navistar International Corp., senior bond, 8.25%, 11/01/21 | United States | 746,000 | (535,255 | ) | |
| Media (0.2)% | |||||
| fAltice Luxembourg SA, senior bond, 144A, 7.625%, 2/15/25 | Luxembourg | 400,000 | (351,000 | ) | |
| fCequel Communications Holdings I LLC / Cequel Capital Corp., senior note, | |||||
| 144A, 5.125%, 12/15/21 | United States | 1,531,000 | (1,420,002 | ) | |
| Sinclair Television Group Inc., senior note, 5.375%, 4/01/21 | United States | 540,000 | (544,725 | ) | |
| (2,315,727 | ) | ||||
| Metals & Mining (0.1)% | |||||
| fFMG Resources August 2006 Pty Ltd., secured note, 144A, 9.75%, 3/01/22 | Australia | 1,186,000 | (1,147,455 | ) | |
| Oil, Gas & Consumable Fuels (0.5)% | |||||
| Noble Energy Inc., senior bond, | |||||
| 4.15%, 12/15/21 | United States | 76,000 | (76,303 | ) | |
| 3.90%, 11/15/24 | United States | 490,000 | (465,271 | ) | |
| Noble Holding International Ltd., senior bond, 4.625%, 3/01/21 | United States | 532,000 | (441,352 | ) | |
| Oasis Petroleum Inc., senior note, 6.875%, 3/15/22 | United States | 6,037,000 | (5,176,728 | ) | |
| (6,159,654 | ) | ||||
| Pharmaceuticals (0.6)% | |||||
| fValeant Pharmaceuticals International Inc., senior bond, 144A, | |||||
| 6.125%, 4/15/25 | United States | 8,466,000 | (7,386,585 | ) | |
| Total Corporate Bonds and Notes | |||||
| (Proceeds $23,115,641) | (22,478,592 | ) | |||
60 Semiannual Report
franklintempleton.com
| FRANKLIN ALTERNATIVE STRATEGIES FUNDS |
| CONSOLIDATED STATEMENT OF INVESTMENTS (UNAUDITED) |
Franklin K2 Alternative Strategies Fund (continued)
| Principal | |||||
| Amount* | |||||
| tSecurities Sold Short (continued) | |||||
| U.S. Government and Agency Securities (0.1%) | |||||
| U.S. Treasury Note, 2.00%, 8/15/25 | United States | 832,000 | $ | (815,897 | ) |
| Total Securities Sold Short (Proceeds $262,955,833) | $ | (262,717,858 | ) |
*The principal/notional amount is stated in U.S. dollars unless otherwise indicated.
†Rounds to less than 0.1% of net assets.
aA portion or all of the security has been segregated as collateral for securities sold short, open swap, forward, futures and written options contracts. At November 30, 2015,
the aggregate value of these securities and/or cash pledged amounted to $462,832,393, representing 39.42% of net assets.
bNon-income producing.
cContingent distributions represent the right to receive additional distributions, if any, during the reorganization of the underlying company.
dSecurity has been deemed illiquid because it may not be able to be sold within seven days.
eA portion or all of the security is held in connection with written option contracts open at period end.
fSecurity was purchased pursuant to Rule 144A under the Securities Act of 1933 and may be sold in transactions exempt from registration only to qualified institutional buyers
or in public offering registered under the Securities Act of 1933. These securities have been deemed liquid under guidelines approved by the Trust’s Board of Trustees. At
November 30, 2015, the net value of these securities was $100,256,488, representing 8.54% of net assets.
gSecurity was purchased pursuant to Regulation S under the Securities Act of 1933, which exempts from registration securities offered and sold outside of the United States.
Such a security cannot be sold in the United States without either an effective registration statement filed pursuant to the Securities Act of 1933, or pursuant to an exemption
from registration. These securities have been deemed liquid under guidelines approved by the Trust’s Board of Trustees. At November 30, 2015, the aggregate value of these
securities was $24,166,463, representing 2.06% of net assets.
hSee Note 7 regarding credit risk and defaulted securities.
iThe coupon rate shown represents the rate at period end.
jPerpetual security with no stated maturity date.
kA portion or all of the security purchased on a when-issued basis. See Note 1(d).
lIncome may be received in additional securities and/or cash.
mSee Note 1(i) regarding senior floating rate interests.
nPrincipal amount of security is adjusted for inflation. See Note 1(k).
oThe security is traded on a discount basis with no stated coupon rate.
pA portion or all of the security is owned by K2 Holdings Investment Corp., a wholly-owned subsidiary of the Fund. See Note 1(h).
qThe rate shown is the annualized seven-day yield at period end.
rSee Note 1(c) regarding joint repurchase agreement.
sSee Note 1(e) regarding written options.
tSee Note 1(g) regarding securities sold short.
franklintempleton.com
Semiannual Report
61
| FRANKLIN ALTERNATIVE STRATEGIES FUNDS |
| CONSOLIDATED STATEMENT OF INVESTMENTS (UNAUDITED) |
| Franklin K2 Alternative Strategies Fund (continued) | ||||||||||
| At November 30, 2015, the Fund had the following futures contracts outstanding. See Note 1(e). | ||||||||||
| Futures Contracts | ||||||||||
| Number of | Notional | Expiration | Unrealized | Unrealized | ||||||
| Description | Type | Contracts | Value | Date | Appreciation | Depreciation | ||||
| Commodity Contractsa | ||||||||||
| Aluminum | Long | 112 | $ | 4,043,900 | 12/14/15 | $ | — | $ | (162,025 | ) |
| Aluminum | Short | 112 | 4,043,900 | 12/14/15 | 354,348 | — | ||||
| Aluminum | Short | 127 | 4,594,225 | 3/14/16 | 128,607 | — | ||||
| Brent Crude Oil | Short | 46 | 2,052,060 | 12/16/15 | 151,870 | — | ||||
| Cocoa | Long | 92 | 3,160,564 | 3/14/16 | 96,524 | — | ||||
| Coffee | Short | 22 | 987,113 | 3/18/16 | 15,484 | — | ||||
| Copper | Long | 45 | 5,177,531 | 12/14/15 | — | (365,133 | ) | |||
| Copper | Short | 45 | 5,177,531 | 12/14/15 | 426,701 | — | ||||
| Copper | Short | 43 | 4,929,144 | 3/14/16 | 186,144 | — | ||||
| Corn | Short | 173 | 3,219,963 | 3/14/16 | 98,090 | — | ||||
| Cotton | Short | 11 | 344,520 | 3/08/16 | 1,870 | — | ||||
| Gold 100 Oz | Short | 119 | 12,677,070 | 2/25/16 | 36,777 | — | ||||
| Low Sulfur Gas Oil | Short | 30 | 1,278,000 | 1/12/16 | 93,154 | — | ||||
| Natural Gas | Short | 147 | 3,285,450 | 12/29/15 | 416,672 | — | ||||
| NY Harbor Ultra-Low Sulfur Diesel | Short | 26 | 1,478,786 | 12/31/15 | 125,297 | — | ||||
| RBOB Gasoline | Short | 41 | 2,250,482 | 12/31/15 | 64,906 | — | ||||
| Silver | Short | 70 | 4,930,100 | 3/29/16 | 429 | — | ||||
| Soybean Oil | Short | 69 | 1,228,338 | 3/14/16 | — | (37,996 | ) | |||
| Soybeans | Short | 90 | 3,974,625 | 3/14/16 | 483 | — | ||||
| Sugar | Long | 87 | 1,454,779 | 2/29/16 | 43,915 | — | ||||
| Wheat | Short | 174 | 4,132,863 | 3/14/16 | 361,962 | — | ||||
| WTI Crude Oil | Short | 13 | 541,450 | 12/21/15 | 14,242 | — | ||||
| Zinc | Long | 60 | 2,328,000 | 12/14/15 | — | (47,579 | ) | |||
| Zinc | Short | 60 | 2,328,000 | 12/14/15 | 287,173 | — | ||||
| Zinc | Short | 74 | 2,894,325 | 3/14/16 | 15,960 | — | ||||
| 82,512,719 | 2,920,608 | (612,733 | ) | |||||||
| Equity Contracts | ||||||||||
| CAC40 10 Euroa | Long | 74 | 3,874,821 | 12/18/15 | 40,691 | — | ||||
| CAC40 10 Euro | Short | 10 | 523,624 | 12/18/15 | — | (6,573 | ) | |||
| DAX Indexa | Long | 13 | 3,907,122 | 12/18/15 | 98,549 | — | ||||
| DAX Index | Short | 1 | 300,548 | 12/18/15 | — | (31,362 | ) | |||
| DJIA Mini E-CBOT Indexa | Long | 99 | 8,768,430 | 12/18/15 | 30,519 | — | ||||
| Euro STOXX 50 Indexa | Long | 70 | 2,592,237 | 12/18/15 | 64,815 | — | ||||
| FTSE 100 Indexa | Short | 122 | 11,672,289 | 12/18/15 | — | (25,190 | ) | |||
| Hang Seng Indexa | Short | 27 | 3,814,708 | 12/30/15 | 67,789 | — | ||||
| Nasdaq 100 E-Mini Indexa | Long | 116 | 10,831,500 | 12/18/15 | 505,319 | — | ||||
| Nikkei 225 Indexa | Long | 42 | 6,738,424 | 12/10/15 | — | (31,374 | ) | |||
| Russell 2000 Mini Indexa | Long | 8 | 956,720 | 12/18/15 | — | (2,526 | ) | |||
| S&P 500 E-Mini Indexa | Long | 130 | 13,518,700 | 12/18/15 | 239,757 | — | ||||
| S&P 500 E-Mini Index | Short | 80 | 8,319,200 | 12/18/15 | — | (511,553 | ) | |||
| TOPIX Indexa | Long | 63 | 8,096,344 | 12/10/15 | 393,890 | — | ||||
| 83,914,667 | 1,441,329 | (608,578 | ) | |||||||
| Interest Rate Contracts | ||||||||||
| 3 Month Euribora | Long | 277 | 73,345,092 | 3/13/17 | 234,410 | — | ||||
| 90 Day Eurodollar | Short | 56 | 13,843,900 | 12/19/16 | — | (31,604 | ) | |||
| 90 Day Eurodollara | Long | 1,175 | 290,063,438 | 3/13/17 | 87,697 | — | ||||
| 90 Day Eurodollar | Short | 56 | 13,770,400 | 12/18/17 | — | (38,861 | ) | |||
| 90 Day Sterlinga | Long | 679 | 126,602,407 | 3/15/17 | 203,222 | — | ||||
| Australian 10 Yr. Bonda | Short | 4 | 366,931 | 12/15/15 | — | (1,615 | ) | |||
| Canadian 10 Yr. Bonda | Short | 42 | 4,365,899 | 3/21/16 | — | (17,117 | ) | |||
| Euro-Bunda | Long | 119 | 19,904,161 | 12/08/15 | 130,903 | — | ||||
| Long Gilta | Long | 37 | 6,560,552 | 3/29/16 | — | (8,337 | ) | |||
| U.S. Treasury Long Bond | Short | 6 | 924,000 | 3/21/16 | 1,911 | — | ||||
62 Semiannual Report
franklintempleton.com
| FRANKLIN ALTERNATIVE STRATEGIES FUNDS |
| CONSOLIDATED STATEMENT OF INVESTMENTS (UNAUDITED) |
| Franklin K2 Alternative Strategies Fund (continued) | |||||||||||
| Futures Contracts (continued) | |||||||||||
| Number of | Notional | Expiration | Unrealized | Unrealized | |||||||
| Description | Type | Contracts | Value | Date | Appreciation | Depreciation | |||||
| Interest Rate Contracts (continued) | |||||||||||
| U.S. Treasury Long Bonda | Long | 20 | $ | 3,080,000 | 3/21/16 | $ | 1,128 | $ | — | ||
| $ | 552,826,780 | $ | 659,271 | $ | (97,534 | ) | |||||
| Total Futures Contracts | $ | 719,254,166 | $ | 5,021,208 | $ | (1,318,845 | ) | ||||
| Net unrealized appreciation (depreciation) | $ | 3,702,363 | |||||||||
| aA portion or all of the contract is owned by K2 Holdings Investment Corp., a wholly-owned subsidiary of the Fund. See Note 1(h). | |||||||||||
| At November 30, 2015, the Fund had the following forward exchange contracts outstanding. See Note 1(e). | |||||||||||
| Forward Exchange Contracts | |||||||||||
| Contract | Settlement | Unrealized | Unrealized | ||||||||
| Currency | Counterpartya Type | Quantity | Amount | Date | Appreciation | Depreciation | |||||
| OTC Forward Exchange Contracts | |||||||||||
| Euro | MLCO | Buy | 1,150,000 | $ | 1,216,884 | 12/01/15 | $ | — | $ | (1,856 | ) |
| Euro | MLCO | Sell | 1,150,000 | 1,273,119 | 12/01/15 | 58,091 | — | ||||
| Brazilian Real | JPHQ | Buy | 5,667,902 | 1,472,642 | 12/02/15 | — | (7,689 | ) | |||
| Brazilian Real | JPHQ | Sell | 2,833,951 | 717,147 | 12/02/15 | — | (15,329 | ) | |||
| Brazilian Real | MSCO | Buy | 5,263,250 | 1,366,971 | 12/02/15 | — | (6,607 | ) | |||
| Brazilian Real | MSCO | Sell | 2,631,625 | 665,678 | 12/02/15 | — | (14,504 | ) | |||
| Brazilian Real | MLCO | Sell | 275,000 | 71,671 | 12/09/15 | 795 | — | ||||
| South Korean Won | MLCO | Sell | 1,400,000,000 | 1,203,783 | 12/14/15 | — | (4,586 | ) | |||
| Euro | BNYM | Buy | 106,245 | 120,832 | 12/16/15 | — | (8,514 | ) | |||
| Euro | BNYM | Sell | 6,880,939 | 7,770,867 | 12/16/15 | 496,584 | (14 | ) | |||
| Euro | JPHQ | Buy | 429,432 | 487,960 | 12/16/15 | — | (33,979 | ) | |||
| Euro | JPHQ | Sell | 1,313,187 | 1,445,774 | 12/16/15 | 57,516 | — | ||||
| Euro | MLCO | Buy | 1,823,134 | 1,978,485 | 12/16/15 | — | (51,130 | ) | |||
| Euro | MLCO | Sell | 1,570,952 | 1,735,033 | 12/16/15 | 74,275 | — | ||||
| Euro | MSCO | Buy | 2,979,823 | 3,274,972 | 12/16/15 | — | (124,802 | ) | |||
| Euro | MSCO | Sell | 14,971,922 | 16,898,634 | 12/16/15 | 1,070,822 | — | ||||
| British Pound | BNYM | Buy | 178,649 | 274,515 | 12/16/15 | — | (5,424 | ) | |||
| British Pound | BNYM | Sell | 303,650 | 468,101 | 12/16/15 | 10,732 | — | ||||
| Japanese Yen | BNYM | Sell | 136,800,000 | 1,135,777 | 12/16/15 | 23,716 | — | ||||
| Mexican Peso | MSCO | Buy | 52,414,791 | 3,147,921 | 12/16/15 | 11,405 | (1,370 | ) | |||
| New Russian Ruble | MLCO | Buy | 93,500,661 | 1,437,090 | 12/16/15 | — | (36,018 | ) | |||
| New Russian Ruble | MSCO | Sell | 93,500,661 | 1,388,692 | 12/16/15 | — | (12,380 | ) | |||
| Swiss Franc | BNYM | Sell | 5,861,084 | 6,040,324 | 12/16/15 | 335,271 | — | ||||
| Turkish Lira | JPHQ | Buy | 4,171,345 | 1,364,567 | 12/16/15 | 59,892 | — | ||||
| Turkish Lira | JPHQ | Sell | 4,171,345 | 1,349,557 | 12/16/15 | — | (74,903 | ) | |||
| Indonesian Rupiah | BOFA | Sell | 11,300,000,000 | 813,828 | 12/17/15 | 386 | — | ||||
| Australian Dollarb | MSCO | Buy | 23,291,000 | 16,708,404 | 12/18/15 | 134,648 | (16,320 | ) | |||
| Australian Dollarb | MSCO | Sell | 26,420,000 | 18,619,734 | 12/18/15 | 1,611 | (469,168 | ) | |||
| Canadian Dollarb | MSCO | Buy | 24,677,000 | 18,680,625 | 12/18/15 | 3,641 | (206,016 | ) | |||
| Canadian Dollarb | MSCO | Sell | 21,823,000 | 16,538,272 | 12/18/15 | 197,288 | (176 | ) | |||
| Eurob | MSCO | Buy | 30,863,000 | 34,779,064 | 12/18/15 | — | (2,149,353 | ) | |||
| Eurob | MSCO | Sell | 20,826,000 | 23,135,185 | 12/18/15 | 1,117,030 | — | ||||
| British Poundb | MSCO | Buy | 18,330,000 | 28,228,824 | 12/18/15 | — | (619,157 | ) | |||
| British Poundb | MSCO | Sell | 23,398,000 | 35,684,829 | 12/18/15 | 450,154 | (8,694 | ) | |||
| Japanese Yenb | MSCO | Buy | 2,270,446,000 | 18,551,554 | 12/18/15 | 5,455 | (98,728 | ) | |||
| Japanese Yenb | MSCO | Sell | 2,969,719,000 | 24,694,173 | 12/18/15 | 551,941 | (997 | ) | |||
| Mexican Pesob | MSCO | Buy | 34,416,000 | 2,068,013 | 12/18/15 | 9,210 | (3,987 | ) | |||
| Mexican Pesob | MSCO | Sell | 150,527,000 | 8,950,080 | 12/18/15 | 1,736 | (119,475 | ) | |||
| New Zealand Dollarb | MSCO | Buy | 8,533,000 | 5,654,819 | 12/18/15 | 18,966 | (64,511 | ) | |||
| New Zealand Dollarb | MSCO | Sell | 14,866,000 | 9,465,227 | 12/18/15 | 11,636 | (318,765 | ) | |||
| Swiss Francb | MSCO | Buy | 16,431,000 | 17,024,013 | 12/18/15 | — | (1,027,512 | ) | |||
| Swiss Francb | MSCO | Sell | 15,263,000 | 15,696,207 | 12/18/15 | 837,430 | (611 | ) | |||
| Canadian Dollar | MSCO | Buy | 4,593,791 | 3,485,976 | 12/22/15 | 46 | (46,177 | ) | |||
franklintempleton.com
Semiannual Report
63
| FRANKLIN ALTERNATIVE STRATEGIES FUNDS |
| CONSOLIDATED STATEMENT OF INVESTMENTS (UNAUDITED) |
| Franklin K2 Alternative Strategies Fund (continued) | |||||||||||
| Forward Exchange Contracts (continued) | |||||||||||
| Contract | Settlement | Unrealized | Unrealized | ||||||||
| Currency | Counterpartya Type | Quantity | Amount | Date | Appreciation | Depreciation | |||||
| OTC Forward Exchange Contracts (continued) | |||||||||||
| Canadian Dollar | MSCO | Sell | 656,968 | $ | 494,028 | 12/22/15 | $ | 2,087 | $ | — | |
| Euro | BNYM | Sell | 7,315,000 | 7,772,188 | 12/22/15 | 37,316 | — | ||||
| Euro | MSCO | Buy | 4,217,186 | 4,570,024 | 12/22/15 | — | (110,778 | ) | |||
| Euro | MSCO | Sell | 12,190,527 | 13,481,106 | 12/22/15 | 590,985 | (127 | ) | |||
| British Pound | MSCO | Buy | 434,169 | 661,190 | 12/22/15 | — | (7,205 | ) | |||
| British Pound | MSCO | Sell | 746,312 | 1,135,712 | 12/22/15 | 12,235 | (687 | ) | |||
| Hong Kong Dollar | BNYM | Sell | 8,497,000 | 1,096,458 | 12/22/15 | 446 | — | ||||
| Japanese Yen | BNYM | Sell | 94,980,000 | 772,823 | 12/22/15 | 521 | — | ||||
| Japanese Yen | MSCO | Buy | 104,569,920 | 850,778 | 12/22/15 | 855 | (1,354 | ) | |||
| South African Rand | MSCO | Buy | 2,455,415 | 173,023 | 12/22/15 | — | (3,928 | ) | |||
| South African Rand | MSCO | Sell | 6,756,442 | 497,320 | 12/22/15 | 32,031 | — | ||||
| Swedish Krona | MSCO | Buy | 3,658,338 | 434,777 | 12/22/15 | — | (14,912 | ) | |||
| Colombian Peso | CSFB | Sell | 780,000,000 | 253,041 | 12/23/15 | 5,224 | — | ||||
| Euro | DBFX | Sell | 613,000 | 657,443 | 12/23/15 | 9,233 | — | ||||
| Mexican Peso | MSCO | Sell | 335,125 | 20,158 | 12/23/15 | — | (23 | ) | |||
| Brazilian Real | MLCO | Sell | 5,700,000 | 1,518,583 | 12/30/15 | 59,308 | — | ||||
| Chilean Peso | MLCO | Buy | 1,114,000,000 | 1,552,613 | 12/30/15 | 9,974 | — | ||||
| Colombian Peso | CSFB | Buy | 3,100,000,000 | 1,005,645 | 12/30/15 | — | (21,003 | ) | |||
| Euro | CSFB | Sell | 500,000 | 530,622 | 12/30/15 | 1,768 | — | ||||
| Hungarian Forint | BOFA | Buy | 360,400,000 | 1,221,198 | 12/30/15 | 3,591 | — | ||||
| Mexican Peso | MLCO | Buy | 16,500,000 | 995,415 | 12/30/15 | — | (2,322 | ) | |||
| Euro | MLCO | Sell | 1,150,000 | 1,218,207 | 1/04/16 | 1,681 | — | ||||
| Brazilian Real | JPHQ | Sell | 2,833,951 | 729,835 | 1/05/16 | 5,758 | — | ||||
| Brazilian Real | MSCO | Sell | 2,631,625 | 677,207 | 1/05/16 | 4,823 | — | ||||
| Taiwan Dollar | BOFA | Sell | 62,050,000 | 1,884,872 | 1/21/16 | — | (16,692 | ) | |||
| Euro | BOFA | Sell | 1,274,000 | 1,373,729 | 5/16/16 | 20,590 | — | ||||
| Chinese Yuan | MSCO | Sell | 21,603,560 | 3,262,301 | 8/22/16 | — | (24,522 | ) | |||
| Chinese Yuan | MLCO | Sell | 11,100,000 | 1,682,838 | 9/19/16 | — | (2,977 | ) | |||
| Total Forward Exchange Contracts unrealized appreciation (depreciation) | $ | 6,338,703 | $ | (5,755,282 | ) | ||||||
| Net unrealized appreciation (depreciation) | $ | 583,421 | |||||||||
aMay be comprised of multiple contracts with the same counterparty, currency and settlement date.
bA portion or all of the contract is owned by K2 Holdings Investment Corp., a wholly-owned subsidiary of the Fund. See Note 1(h).
At November 30, 2015, the Fund had the following credit default swap contracts outstanding. See Note 1(e).
| Credit Default Swap Contracts | |||||||||||||||||||
| Unamortized | |||||||||||||||||||
| Periodic | Upfront | ||||||||||||||||||
| Payment | Counterparty/ | Notional | Expiration | Payments | Unrealized | Unrealized | |||||||||||||
| Description | Rate | Exchange | Amounta | Date | (Receipts) | Appreciation | Depreciation | Value | Ratingb | ||||||||||
| Centrally Cleared Swap Contracts | |||||||||||||||||||
| Contracts to Buy Protection | |||||||||||||||||||
| Single Name | |||||||||||||||||||
| Government of Brazil | 1.00 | % | ICE | $ | 2,829,000 | 6/20/20 | $ | 179,598 | $ | 190,159 | $ | — | $ | 369,757 | |||||
| Government of Russia | 1.00 | % | ICE | 631,000 | 9/20/20 | 52,695 | — | (6,954 | ) | 45,741 | |||||||||
| Government of Turkey | 1.00 | % | ICE | 1,976,000 | 9/20/20 | 157,717 | — | (21,778 | ) | 135,939 | |||||||||
| Government of Turkey | 1.00 | % | ICE | 1,721,000 | 12/20/20 | 104,376 | 24,315 | — | 128,691 | ||||||||||
| Government of Turkey | 1.00 | % | ICE | 1,286,000 | 12/20/20 | 93,792 | 2,371 | — | 96,163 | ||||||||||
| Traded Index | |||||||||||||||||||
| CDX 25 HY | 5.00 | % | ICE | 195,000 | 12/20/20 | 371 | — | (4,475 | ) | (4,104 | ) | ||||||||
| iTraxx Europe Crossover | 5.00 | % | ICE | 697,000 | EUR | 12/20/20 | (40,437 | ) | — | (30,075 | ) | (70,512 | ) |
64 Semiannual Report
franklintempleton.com
| FRANKLIN ALTERNATIVE STRATEGIES FUNDS |
| CONSOLIDATED STATEMENT OF INVESTMENTS (UNAUDITED) |
| Franklin K2 Alternative Strategies Fund (continued) | |||||||||||||||||
| Credit Default Swap Contracts (continued) | |||||||||||||||||
| Unamortized | |||||||||||||||||
| Periodic | Upfront | ||||||||||||||||
| Payment | Counterparty/ | Notional | Expiration | Payments | Unrealized | Unrealized | |||||||||||
| Description | Rate | Exchange | Amounta | Date | (Receipts) | Appreciation | Depreciation | Value | Ratingb | ||||||||
| Centrally Cleared Swap Contracts (continued) | |||||||||||||||||
| Contracts to Sell Protectionc | |||||||||||||||||
| Single Name | |||||||||||||||||
| Government of Russia | 1.00 | % | ICE | 2,048,275 | 9/20/20 | $ | (250,861 | ) | $ | 102,381 | $ | — | $ | (148,480 | ) | BB+ | |
| Total Centrally Cleared Swap Contracts | $ | 297,251 | $ | 319,226 | $ | (63,282 | ) | $ | 553,195 | ||||||||
| OTC Swap Contracts | |||||||||||||||||
| Contracts to Buy Protection | |||||||||||||||||
| Single Name | |||||||||||||||||
| Bombardier Inc | 5.00 | % | MSCS | 748,000 | 12/20/20 | $ | 139,106 | $ | — | $ | (18,869 | ) | $ | 120,237 | |||
| Freeport-McMoRan Inc | 1.00 | % | CITI | 660,000 | 12/20/20 | 120,859 | 68,863 | — | 189,722 | ||||||||
| Government of Turkey | 1.00 | % | BZWS | 325,000 | 9/20/20 | 24,990 | — | (3,273 | ) | 21,717 | |||||||
| Repsol SA | 1.00 | % | BZWS | 600,000 EUR 12/20/20 | 23,241 | 3,327 | — | 26,568 | |||||||||
| Teck Resources Limited | 1.00 | % | MSCS | 585,000 | 12/20/20 | 171,620 | 91,896 | — | 263,516 | ||||||||
| Viacom Inc | 1.00 | % | BOFA | 720,000 | 12/20/20 | 25,779 | — | (4,030 | ) | 21,749 | |||||||
| Weatherford International Limited | 1.00 | % | MSCS | 200,000 | 12/20/20 | 37,520 | 5,021 | — | 42,541 | ||||||||
| Traded Index | |||||||||||||||||
| CDX 24 EM 100 | 1.00 | % | DBFX | 1,176,000 | 12/20/20 | 154,089 | — | (45,896 | ) | 108,193 | |||||||
| CDX 24 EM 100 | 1.00 | % | BZWS | 78,400 | 12/20/20 | 10,311 | — | (2,634 | ) | 7,677 | |||||||
| Contracts to Sell Protectionc | |||||||||||||||||
| Single Name | |||||||||||||||||
| Government of Russia | 1.00 | % | MSCS | 1,868,856 | 9/20/20 | (206,499 | ) | 74,711 | — | (131,788 | ) | BB+ | |||||
| Total OTC Swap Contracts | $ | 501,016 | $ | 243,818 | $ | (74,702 | ) | $ | 670,132 | ||||||||
| Total Credit Default Swap Contracts | 18,344,531 | $ | 798,267 | $ | 563,044 | $ | (137,984 | ) | $ | 1,223,327 | |||||||
| Net unrealized appreciation (depreciation) | $ | 425,060 | |||||||||||||||
See Notes 1(e) and 9 regarding derivative financial instruments and other derivative information, respectively.
aIn U.S. dollars unless otherwise indicated. For contracts to sell protection, the notional amount is equal to the maximum potential amount of the future payments and no
recourse provisions have been entered into in association with the contracts.
bBased on Standard and Poor’s (S&P) Rating for single name swaps and internal ratings for index swaps.
cThe Fund enters contracts to sell protection to create a long credit position. Performance triggers include default, bankruptcy or restructuring for single name swaps and fail-
ure to pay or bankruptcy of the underlying securities for traded index swaps.
| At November 30, 2015, the Fund had the following interest rate swap contracts outstanding. See Note 1(e). | |||||||
| Interest Rate Swap Contracts | |||||||
| Counterparty/ | Notional | Expiration | Unrealized | Unrealized | |||
| Description | Exchange | Amount* | Date | Appreciation | Depreciation | ||
| OTC Swap Contracts | |||||||
| Receive Floating rate 3 Month ZAR-JIBAR-SAFEX | |||||||
| Pay Fixed rate 7.95% | BZWS | 12,500,000 | ZAR | 5/05/25 | $ | 24,409 | $ — |
| Net unrealized appreciation (depreciation) | $ | 24,409 | |||||
| *In U.S. dollars unless otherwise indicated. | |||||||
franklintempleton.com
Semiannual Report
65
| FRANKLIN ALTERNATIVE STRATEGIES FUNDS |
| CONSOLIDATED STATEMENT OF INVESTMENTS (UNAUDITED) |
| Franklin K2 Alternative Strategies Fund (continued) | ||||||||||
| At November 30, 2015, the Fund had the following total return swap contracts outstanding. See Note 1(e). | ||||||||||
| Total Return Swap Contracts | ||||||||||
| Counter- | Expiration | Unrealized | Unrealized | |||||||
| Underlying Instrument | Financing Rate | party | Notional Value* | Date | Appreciation | Depreciation | ||||
| Long | ||||||||||
| AGL Resources Inc | FEDEF + 40 | MSCS | 2,165,673 | 12/17/15 | $ | 14,148 | $ | — | ||
| NCR Corp | FEDEF + 40 | MSCS | 605,014 | 12/17/15 | — | — | ||||
| Targa Resources Partners | FEDEF + 100 | MSCS | 203,938 | 12/17/15 | — | — | ||||
| TECO Energy Inc | FEDEF + 40 | MSCS | 766,280 | 12/17/15 | — | — | ||||
| The Bank of Nagoya Ltd | LIBOR + 85 | DBFX | 323,095 | 12/18/15 | — | (8,217 | ) | |||
| The Gunma Bank Ltd | LIBOR + 85 | DBFX | 107,829 | 12/18/15 | — | (2,370 | ) | |||
| The Oita Bank Ltd | LIBOR + 85 | DBFX | 2,811,250 | 12/18/15 | — | (59,565 | ) | |||
| The Yamagata Bank Ltd | LIBOR + 85 | DBFX | 3,390,597 | 12/18/15 | 33,743 | — | ||||
| Yamaguchi Financial Group Inc | LIBOR + 85 | DBFX | 8,440,040 | 12/18/15 | — | (279,491 | ) | |||
| International Consolidated Airlines Group | ||||||||||
| SA | LIBOR + 40 | DBFX | 96,163 | GBP | 1/11/16 | — | (2,312 | ) | ||
| APERAM SA | LIBOR + 75 | DBFX | 2,005,340 | 1/22/16 | 17,530 | — | ||||
| Amundi SA | LIBOR | DBFX | 66,831 | EUR | 1/30/16 | — | (33 | ) | ||
| SRP Groupe SA | LIBOR + 100 | DBFX | 111,148 | EUR | 1/30/16 | — | (1,464 | ) | ||
| Hengan International Group Co Ltd | LIBOR + 100 | DBFX | 3,183,437 | HKD | 2/08/16 | — | (1,102 | ) | ||
| Acciona SA | LIBOR + 100 | DBFX | 349,450 | EUR | 2/09/16 | 70,759 | — | |||
| ACS Actividades Finance BV | LIBOR + 75 | DBFX | 1,601,062 | EUR | 2/09/16 | — | (2,059 | ) | ||
| Ascent Capital Group Inc | LIBOR + 100 | DBFX | 100,874 | 2/09/16 | — | (37,839 | ) | |||
| Bunge Ltd | LIBOR + 100 | DBFX | 73,500 | 2/09/16 | — | (7,775 | ) | |||
| Green Plains Inc | LIBOR + 100 | DBFX | 290,973 | 2/09/16 | 42,603 | — | ||||
| Nyrstar NV | LIBOR + 75 | DBFX | 331,912 | EUR | 2/09/16 | 12,901 | — | |||
| OCI NV | LIBOR + 75 | DBFX | 1,827,882 | EUR | 2/09/16 | — | (14,577 | ) | ||
| DP World Ltd | LIBOR + 100 | DBFX | 438,723 | 2/10/16 | — | (5,763 | ) | |||
| Bank of Ireland | LIBOR + 50 | DBFX | 73,440 | EUR | 2/11/16 | 5,828 | — | |||
| BG Group PLC | LIBOR + 40 | MSCS | 1,042,983 | GBP | 2/24/16 | — | (43,927 | ) | ||
| Lloyds Banking Group PLC | LIBOR + 40 | MSCS | 372,907 | GBP | 2/24/16 | — | (69,052 | ) | ||
| SABMiller PLC | LIBOR + 40 | MSCS | 1,868,537 | GBP | 2/24/16 | 267,393 | — | |||
| PT Jersey Ltd | LIBOR + 75 | DBFX | 1,860,343 | EUR | 2/26/16 | — | (106,706 | ) | ||
| The Gabriel Finance LP | LIBOR + 75 | DBFX | 635,766 | EUR | 2/26/16 | — | (12,403 | ) | ||
| Fonciere Des Regions | LIBOR + 75 | DBFX | 1,292,953 | EUR | 3/15/16 | 7,239 | — | |||
| Orpar SA | LIBOR + 75 | DBFX | 507,697 | EUR | 3/15/16 | 2,978 | — | |||
| Nyrstar NV | LIBOR + 75 | DBFX | 150,011 | EUR | 3/17/16 | 6,097 | — | |||
| Premier Oil Finance Jersey Ltd | LIBOR + 75 | DBFX | 153,542 | 3/17/16 | 4,378 | — | ||||
| OSIM International Ltd | LIBOR + 100 | DBFX | 236,952 | SGD | 3/18/16 | 481 | — | |||
| iBoxx Liquid High Yield | LIBOR + 20 | JPHQ | 3,900,000 | 3/20/16 | — | (24,803 | ) | |||
| Acciona SA | LIBOR + 75 | DBFX | 2,722,131 | EUR | 4/25/16 | 58,108 | — | |||
| International Consolidated Airlines Group | ||||||||||
| SA | LIBOR + 75 | DBFX | 6,560,899 | EUR | 4/25/16 | — | (72,397 | ) | ||
| Melia Hotels International SA | LIBOR + 75 | DBFX | 2,387,004 | EUR | 4/25/16 | — | (68,158 | ) | ||
| TPK Holding Co. Ltd | LIBOR + 90 | DBFX | 1,301,667 | 5/10/16 | 10,502 | — | ||||
| Allergan PLC | LIBOR + 75 | DBFX | 958,001 | 6/30/16 | 33,242 | — | ||||
| Amsurg Corp | LIBOR + 75 | DBFX | 1,385,348 | 6/30/16 | 41,640 | — | ||||
| Crown Castle International | LIBOR + 75 | DBFX | 247,682 | 6/30/16 | 3,839 | — | ||||
| Dominion Resources Inc | LIBOR + 75 | DBFX | 1,062,747 | 6/30/16 | — | (13,377 | ) | |||
| Frontier Communications | LIBOR + 75 | DBFX | 752,814 | 6/30/16 | 27,799 | — | ||||
| Health Care REIT Inc | LIBOR + 75 | DBFX | 1,063,060 | 6/30/16 | 48,918 | — | ||||
| Nextera Energy | LIBOR + 75 | DBFX | 1,039,113 | 6/30/16 | — | (18,628 | ) | |||
| Ship Finance International Ltd | LIBOR + 75 | DBFX | 2,835,043 | 6/30/16 | 46,624 | — | ||||
| Southwestern Energy Co | LIBOR + 75 | DBFX | 970,256 | 6/30/16 | — | (85,278 | ) | |||
| Stericycle Inc | LIBOR + 75 | DBFX | 1,224,215 | 6/30/16 | — | (14,789 | ) | |||
| T-Mobile U.S. Inc | LIBOR + 75 | DBFX | 239,338 | 6/30/16 | — | (13,307 | ) | |||
| WPX Energy Inc | LIBOR + 75 | DBFX | 528,767 | 6/30/16 | — | (9,905 | ) | |||
| Drillsearch Energy Ltd | LIBOR + 75 | DBFX | 588,144 | 7/15/16 | 5,187 | — | ||||
| Paladin Energy Ltd | LIBOR + 75 | DBFX | 361,200 | 7/15/16 | 4,544 | — | ||||
66 Semiannual Report
franklintempleton.com
| FRANKLIN ALTERNATIVE STRATEGIES FUNDS |
| CONSOLIDATED STATEMENT OF INVESTMENTS (UNAUDITED) |
| Franklin K2 Alternative Strategies Fund (continued) | ||||||||||
| Total Return Swap Contracts (continued) | ||||||||||
| Counter- | Expiration | Unrealized | Unrealized | |||||||
| Underlying Instrument | Financing Rate | party | Notional Value* | Date | Appreciation | Depreciation | ||||
| Long (continued) | ||||||||||
| Aabar Investments PJSC | LIBOR + 100 | DBFX | 1,426,308 | EUR | 7/18/16 | $ | — | $ | (29,104 | ) |
| Inmarsat PLC | LIBOR + 75 | DBFX | 1,502,387 | 7/18/16 | 27,627 | — | ||||
| Alstria Office REIT AG | LIBOR + 75 | DBFX | 2,256,397 | EUR | 7/19/16 | 168,627 | — | |||
| Aroundtown Property Holdings PLC | LIBOR + 75 | DBFX | 121,982 | EUR | 7/19/16 | 3,915 | — | |||
| British Land White 2015 Ltd | LIBOR + 75 | DBFX | 713,650 | GBP | 7/19/16 | — | (8,062 | ) | ||
| Carillion Finance Jersey Ltd | LIBOR + 75 | DBFX | 1,537,097 | GBP | 7/19/16 | 39,669 | — | |||
| Deutsche Post AG | LIBOR + 75 | DBFX | 2,755,423 | EUR | 7/19/16 | 138,068 | — | |||
| Deutsche Wohnen AG | LIBOR + 75 | DBFX | 313,042 | EUR | 7/19/16 | 16,023 | — | |||
| Drillisch AG | LIBOR + 75 | DBFX | 5,067,420 | EUR | 7/19/16 | — | (36,404 | ) | ||
| Enterprise Funding Corp | LIBOR + 75 | DBFX | 172,423 | GBP | 7/19/16 | 433 | — | |||
| Great Portland Estates Capital Jersey | ||||||||||
| Ltd | LIBOR + 75 | DBFX | 2,008,061 | GBP | 7/19/16 | 43,748 | — | |||
| Helical Bar Jersey Ltd | LIBOR + 75 | DBFX | 327,332 | GBP | 7/19/16 | 3,007 | — | |||
| LEG Immobilien AG | LIBOR + 75 | DBFX | 999,847 | EUR | 7/19/16 | 24,294 | — | |||
| Lotte Shopping Co. Ltd | LIBOR + 90 | DBFX | 336,004 | 7/19/16 | 6,201 | — | ||||
| Salzgitter Finance BV | LIBOR + 75 | DBFX | 3,696,992 | EUR | 7/19/16 | 17,048 | — | |||
| St Modwen Properties Securities Jersey | ||||||||||
| Ltd | LIBOR + 75 | DBFX | 103,443 | GBP | 7/19/16 | 1,980 | — | |||
| Unite Jersey Issuer Ltd | LIBOR + 75 | DBFX | 2,000,861 | GBP | 7/19/16 | 121,182 | — | |||
| BW Group Ltd | LIBOR + 75 | DBFX | 900,680 | 7/20/16 | 44,504 | — | ||||
| Golar LNG Ltd | LIBOR + 75 | DBFX | 725,910 | 7/20/16 | — | (4,207 | ) | |||
| Ship Finance International Ltd | LIBOR + 75 | DBFX | 1,455,684 | 7/20/16 | 32,908 | — | ||||
| America Movil SAB de CV | LIBOR + 75 | DBFX | 5,274,205 | EUR | 7/25/16 | — | (6,120 | ) | ||
| Hansteen Jersey Securities Ltd | LIBOR + 75 | DBFX | 1,976,883 | EUR | 7/29/16 | 58,101 | — | |||
| Asia View Ltd | LIBOR + 90 | DBFX | 268,151 | 8/16/16 | — | (2,073 | ) | |||
| CP Foods Holdings | LIBOR + 100 | DBFX | 2,715,947 | 8/16/16 | 4,875 | — | ||||
| PB Issuer No 3 Ltd | LIBOR + 90 | DBFX | 387,821 | 8/16/16 | 849 | — | ||||
| Cahaya Capital Ltd | LIBOR + 100 | DBFX | 2,315,549 | 8/17/16 | 56,835 | — | ||||
| Indah Capital Ltd | LIBOR + 100 | DBFX | 834,535 | SGD | 8/22/16 | — | (5,268 | ) | ||
| Advanced Semiconductor Engineering | ||||||||||
| Inc | LIBOR + 100 | DBFX | 1,880,603 | 8/24/16 | — | (17,417 | ) | |||
| Marine Harvest | LIBOR + 75 | DBFX | 2,411,770 | EUR | 9/19/16 | 53,327 | — | |||
| Ebara Corp | LIBOR + 85 | DBFX | 178,663,500 | JPY | 11/17/16 | 62,752 | — | |||
| EDION Corp | LIBOR + 85 | DBFX | 139,379,759 | JPY | 11/17/16 | 6,710 | — | |||
| Hyundai | LIBOR + 90 | DBFX | 1,342,500 | 11/17/16 | 7,939 | — | ||||
| Japan Airport Terminal Co. Ltd | LIBOR + 85 | DBFX | 231,017,660 | JPY | 11/17/16 | — | (48,151 | ) | ||
| Kato Denki Co | LIBOR + 85 | DBFX | 327,737,180 | JPY | 11/17/16 | — | (22,992 | ) | ||
| LIXIL Group Corp | LIBOR + 85 | DBFX | 93,807,090 | JPY | 11/17/16 | 817 | — | |||
| Maeda Corp | LIBOR + 85 | DBFX | 293,962,470 | JPY | 11/17/16 | — | (116,335 | ) | ||
| Nagoya Railroad Co. Ltd | LIBOR + 85 | DBFX | 39,004,150 | JPY | 11/17/16 | 3,826 | — | |||
| OSG Corp | LIBOR + 85 | DBFX | 172,387,201 | JPY | 11/17/16 | 86,987 | — | |||
| Sankyo Co. Ltd | LIBOR + 85 | DBFX | 160,625,000 | JPY | 11/17/16 | — | (2,721 | ) | ||
| SBI Holdings Inc | LIBOR + 85 | DBFX | 25,130,818 | JPY | 11/17/16 | — | (1,493 | ) | ||
| Siem Industries | LIBOR + 90 | DBFX | 562,101 | 11/17/16 | 1,791 | — | ||||
| Sony Corp | LIBOR + 85 | DBFX | 126,804,990 | JPY | 11/17/16 | — | (11,491 | ) | ||
| Teijin Ltd | LIBOR + 85 | DBFX | 170,785,300 | JPY | 11/17/16 | 33,798 | — | |||
| TOHO Holdings | LIBOR + 85 | DBFX | 192,910,000 | JPY | 11/17/16 | — | (32,242 | ) | ||
| Toppan Printing Co | LIBOR + 85 | DBFX | 408,823,344 | JPY | 11/17/16 | — | (26,818 | ) | ||
| Yamada Denki Co. Ltd | LIBOR + 85 | DBFX | 654,104,455 | JPY | 11/17/16 | — | (121,341 | ) | ||
| Siemens AG | LIBOR + 85 | DBFX | 3,186,300 | 11/18/16 | 36,180 | — | ||||
| Elekta AB, B | LIBOR + 90 | DBFX | 6,010,879 | SEK | 12/02/16 | 7,315 | — | |||
| Wizz Air Holdings PLC | LIBOR + 50 | MSCS | 576,985 | GBP | 1/16/17 | 38,277 | — | |||
| Ryanair Holdings PLC | EURIB + 50 | MSCS | 1,125,039 | EUR | 4/10/17 | 132,753 | — | |||
| Alaska Air Group Inccom | LIBOR + 50 | MSCS | 2,059,116 | 5/22/17 | 167,415 | — | ||||
| Brunswick Corp | LIBOR + 50 | MSCS | 1,048,807 | 5/22/17 | 56,987 | — | ||||
| Constellation Brands Inc., A | LIBOR + 50 | MSCS | 2,754,741 | 5/22/17 | 251,171 | — | ||||
| Costco Wholesale Corp | LIBOR + 50 | MSCS | 2,656,094 | 5/22/17 | 161,815 | — | ||||
franklintempleton.com
Semiannual Report
67
| FRANKLIN ALTERNATIVE STRATEGIES FUNDS |
| CONSOLIDATED STATEMENT OF INVESTMENTS (UNAUDITED) |
| Franklin K2 Alternative Strategies Fund (continued) | ||||||||||
| Total Return Swap Contracts (continued) | ||||||||||
| Counter- | Expiration | Unrealized | Unrealized | |||||||
| Underlying Instrument | Financing Rate | party | Notional Value* | Date | Appreciation | Depreciation | ||||
| Long (continued) | ||||||||||
| Kroger Co | LIBOR + 50 | MSCS | 3,730,313 | 5/22/17 | $ | 38,386 | $ | — | ||
| Louisiana-pacific Corp | LIBOR + 50 | MSCS | 959,413 | 5/22/17 | 92,625 | — | ||||
| Marriott International Inc | LIBOR + 50 | MSCS | 1,257,104 | 5/22/17 | 7,392 | — | ||||
| NVR Inc | LIBOR + 50 | MSCS | 3,163,564 | 5/22/17 | 648,939 | — | ||||
| United Continental Holdings | LIBOR + 50 | MSCS | 2,085,842 | 5/22/17 | — | (75,382 | ) | |||
| Wyndham Worldwide Corp | LIBOR + 50 | MSCS | 1,437,624 | 5/22/17 | — | (151,295 | ) | |||
| LafargeHolcim Ltd | TOIS + 65 | MSCS | 462,000 | CHF | 7/17/17 | — | — | |||
| Carnival Corp | SONIA + 40 | MSCS | 148,594 | GBP | 9/29/17 | 3,245 | — | |||
| Coca-Cola Enterprise | LIBOR + 35 | MSCS | 1,028,306 | 10/05/17 | — | (11,567 | ) | |||
| Chubb Corp | LIBOR + 35 | MSCS | 4,038,154 | 10/05/17 | 8,774 | — | ||||
| TNT Express NV | EONIA + 65 | MSCS | 1,497,567 | EUR | 10/12/17 | — | — | |||
| Amlin PLC | SONIA + 65 | MSCS | 948,064 | GBP | 10/23/17 | — | — | |||
| BG Group PLC | SONIA + 65 | MSCS | 2,974,867 | GBP | 10/23/17 | — | — | |||
| Equiniti Group PLC | SONIA + 65 | MSCS | 129,013 | GBP | 10/23/17 | — | — | |||
| SABMiller PLC | SONIA + 65 | MSCS | 3,117,962 | GBP | 10/23/17 | 21,695 | — | |||
| Telecity Group PLC | SONIA + 65 | MSCS | 1,377,435 | GBP | 10/23/17 | 18 | — | |||
| Alstom SA | EONIA + 65 | MSCS | 2,617,200 | EUR | 10/26/17 | — | — | |||
| Bollore SA | EONIA + 65 | MSCS | 791,976 | EUR | 10/26/17 | — | — | |||
| Nokia OYJ | EONIA + 65 | MSCS | 1,302,614 | EUR | 10/26/17 | — | — | |||
| Poste Italiane SpA | EONIA + 65 | MSCS | 175,477 | EUR | 10/26/17 | — | — | |||
| Telecom Italia SpA | EONIA + 65 | MSCS | 805,208 | EUR | 10/26/17 | — | — | |||
| Vivendi SA | EONIA + 65 | MSCS | 2,458,126 | EUR | 10/26/17 | — | — | |||
| Celesio AG | EONIA + 65 | MSCS | 1,104,865 | EUR | 10/30/17 | — | — | |||
| MAN SE | EONIA + 65 | MSCS | 1,492,642 | EUR | 10/30/17 | — | — | |||
| ThyssenKrupp AG | EONIA + 65 | MSCS | 1,133,156 | EUR | 10/30/17 | — | — | |||
| Asciano Ltd | RBACR + 53 | MSCS | 2,245,239 | AUD | 11/30/17 | — | — | |||
| iProperty Group Ltd | RBACR + 55 | MSCS | 1,114,336 | AUD | 11/30/17 | — | — | |||
| Veda Group Ltd | RBACR + 55 | MSCS | 1,323,729 | AUD | 11/30/17 | — | — | |||
| Short | ||||||||||
| Carillion PLC | LIBOR - 200 | DBFX | 466,494 | GBP | 1/11/16 | — | (29,145 | ) | ||
| Enterprise Funding Corp | LIBOR - 40 | DBFX | 54,230 | GBP | 1/11/16 | — | (924 | ) | ||
| Great Portland Estates PLC | LIBOR - 40 | DBFX | 1,448,447 | GBP | 1/11/16 | — | (62,645 | ) | ||
| ST Modwen Properties PLC | LIBOR - 40 | DBFX | 18,701 | GBP | 1/11/16 | — | (976 | ) | ||
| The UNITE Group PLC | LIBOR - 40 | DBFX | 800,776 | GBP | 1/11/16 | — | (80,101 | ) | ||
| APERAM SA | LIBOR - 40 | DBFX | 1,553,745 | 1/22/16 | — | (12,336 | ) | |||
| H8 Basket | FEDEF - 40 | MSCS | 539,959 | 2/05/16 | — | (7 | ) | |||
| Acciona SA | LIBOR - 75 | DBFX | 271,755 | EUR | 2/09/16 | — | (38,395 | ) | ||
| Royal Dutch Shell PLC | LIBOR - 35 | MSCS | 776,387 | GBP | 2/24/16 | 59,267 | — | |||
| Nyrstar NV | LIBOR - 75 | DBFX | 110,669 | EUR | 3/17/16 | — | (4,896 | ) | ||
| UniCredit SpA | LIBOR - 40 | DBFX | 122,452 | EUR | 3/17/16 | — | (1,320 | ) | ||
| Advanced Semiconductor Engineering | ||||||||||
| Inc | LIBOR - 125 | DBFX | 18,803 | 6/30/16 | 205 | — | ||||
| Allergan PLC | LIBOR - 35 | DBFX | 702,954 | 6/30/16 | — | (22,481 | ) | |||
| Amsurg Corp | LIBOR - 35 | DBFX | 1,229,561 | 6/30/16 | — | (37,322 | ) | |||
| Crown Castle International | LIBOR - 35 | DBFX | 150,130 | 6/30/16 | — | (2,380 | ) | |||
| Dominion Resources Inc | LIBOR - 35 | DBFX | 847,584 | 6/30/16 | 12,078 | — | ||||
| Frontier Communications | LIBOR - 35 | DBFX | 576,874 | 6/30/16 | — | (27,920 | ) | |||
| Health Care REIT Inc | LIBOR - 35 | DBFX | 555,031 | 6/30/16 | — | (37,166 | ) | |||
| Nextera Energy | LIBOR - 35 | DBFX | 691,465 | 6/30/16 | 5,534 | — | ||||
| Ship Finance International Ltd | LIBOR - 35 | DBFX | 2,088,672 | 6/30/16 | — | (30,127 | ) | |||
| Southwestern Energy Co | LIBOR - 35 | DBFX | 579,419 | 6/30/16 | 52,448 | — | ||||
| Stericycle | LIBOR - 35 | DBFX | 801,600 | 6/30/16 | 16,044 | — | ||||
| T-Mobile U.S. Inc | LIBOR - 35 | DBFX | 197,606 | 6/30/16 | 12,351 | — | ||||
| WPX Energy Inc | LIBOR - 35 | DBFX | 413,485 | 6/30/16 | 9,587 | — | ||||
| Inmarsat PLC | LIBOR - 40 | DBFX | 519,833 | 7/18/16 | — | (32,692 | ) | |||
| Alstria Office REIT AG | LIBOR - 40 | DBFX | 1,662,015 | EUR | 7/19/16 | — | (134,787 | ) | ||
68 Semiannual Report
franklintempleton.com
| FRANKLIN ALTERNATIVE STRATEGIES FUNDS |
| CONSOLIDATED STATEMENT OF INVESTMENTS (UNAUDITED) |
| Franklin K2 Alternative Strategies Fund (continued) | |||||||||||
| Total Return Swap Contracts (continued) | |||||||||||
| Counter- | Expiration | Unrealized | Unrealized | ||||||||
| Underlying Instrument | Financing Rate | party | Notional Value* | Date | Appreciation | Depreciation | |||||
| Short (continued) | |||||||||||
| Aurubis AG | LIBOR - 40 | DBFX | 3,328,877 | EUR | 7/19/16 | $ | — | $ | (26,563 | ) | |
| Deutsche Post AG | LIBOR - 35 | DBFX | 1,906,590 | EUR | 7/19/16 | — | (134,322 | ) | |||
| Deutsche Wohnen AG | LIBOR - 40 | DBFX | 113,968 | EUR | 7/19/16 | — | (8,037 | ) | |||
| Drillisch AG | LIBOR - 40 | DBFX | 4,154,702 | EUR | 7/19/16 | 33,576 | — | ||||
| Evonik Industries AG | LIBOR - 40 | DBFX | 225,020 | EUR | 7/19/16 | 503 | — | ||||
| Fonciere Des Regions | LIBOR - 40 | DBFX | 652,779 | EUR | 7/19/16 | — | (28,892 | ) | |||
| Hansteen Holdings PLC | LIBOR - 100 | DBFX | 1,528,176 | EUR | 7/19/16 | — | (63,442 | ) | |||
| Hengan International Group Co. Ltd | LIBOR - 47 | DBFX | 235,950 | HKD | 7/19/16 | 287 | — | ||||
| International Consolidated Airlines Group | |||||||||||
| SA | LIBOR - 40 | DBFX | 6,263,980 | EUR | 7/19/16 | 62,270 | — | ||||
| LEG Immobilien AG | LIBOR - 40 | DBFX | 627,042 | EUR | 7/19/16 | — | (35,588 | ) | |||
| Pacific Basin Shipping Ltd | LIBOR - 150 | DBFX | 135,160 | HKD | 7/19/16 | 1,351 | — | ||||
| Playtech Ltd | LIBOR - 40 | DBFX | 1,235,663 | EUR | 7/19/16 | 78,977 | — | ||||
| Siemens AG | LIBOR - 40 | DBFX | 408,818 | EUR | 7/19/16 | — | (28,013 | ) | |||
| Yuexiu Transport | LIBOR - 150 | DBFX | 831,570 | HKD | 7/19/16 | 1,181 | — | ||||
| Acciona SA | LIBOR - 75 | DBFX | 1,861,910 | EUR | 7/20/16 | — | (41,108 | ) | |||
| Iberdrola SA | LIBOR - 40 | DBFX | 835,255 | EUR | 7/20/16 | — | (25,208 | ) | |||
| Koninklijke KPN NV | LIBOR - 40 | DBFX | 749,629 | EUR | 7/20/16 | — | (25,124 | ) | |||
| Melia Hotels International SA | LIBOR - 175 | DBFX | 2,144,758 | EUR | 7/20/16 | 66,124 | — | ||||
| OCI NV | LIBOR - 40 | DBFX | 579,267 | EUR | 7/20/16 | 8,340 | — | ||||
| Advanced Semiconductor Engineering | |||||||||||
| Inc | LIBOR - 125 | DBFX | 1,069,094 | 8/24/16 | 22,677 | — | |||||
| IHH Healthcare Bhd | LIBOR - 295 | DBFX | 554,162 | SGD | 8/25/16 | 5,331 | — | ||||
| Marine Harvest | LIBOR - 40 | DBFX | 1,455,003 | EUR | 10/19/16 | — | (60,291 | ) | |||
| Tenaga Nasional Bhd | LIBOR - 50 | DBFX | 459,092 | MYR | 10/19/16 | — | (15,690 | ) | |||
| ACE Ltd | LIBOR - 35 | MSCS | 2,138,577 | 10/20/16 | — | (4,930 | ) | ||||
| Avago Technologies Ltd | LIBOR - 34 | MSCS | 1,098,963 | 10/20/16 | — | (96,412 | ) | ||||
| Charter Communications Inc., A | LIBOR - 17 | MSCS | 1,059,402 | 10/20/16 | — | (34,470 | ) | ||||
| eBay Inc | LIBOR - 30 | MSCS | 716,464 | 10/20/16 | — | (156,470 | ) | ||||
| PayPal Holdings Inc | LIBOR - 30 | MSCS | 348,782 | 10/20/16 | 18,982 | — | |||||
| BW LPG Ltd | LIBOR - 40 | DBFX | 233,280 | 11/09/16 | — | (38,909 | ) | ||||
| Ebara Corp | LIBOR - 40 | DBFX | 120,594,637 | JPY | 11/18/16 | — | (65,811 | ) | |||
| EDION Corp | LIBOR - 240 | DBFX | 73,628,381 | JPY | 11/18/16 | — | (8,148 | ) | |||
| Japan Airport Terminal Co. Ltd | LIBOR - 150 | DBFX | 84,608,000 | JPY | 11/18/16 | 40,471 | — | ||||
| K’s Holdings Corp | LIBOR - 40 | DBFX | 221,682,000 | JPY | 11/18/16 | 8,134 | — | ||||
| LIXIL Group Corp | LIBOR - 40 | DBFX | 22,530,800 | JPY | 11/18/16 | — | (1,690 | ) | |||
| Maeda Corp | LIBOR - 40 | DBFX | 117,932,066 | JPY | 11/18/16 | 64,599 | — | ||||
| Nagoya Railroad Co. Ltd | LIBOR - 40 | DBFX | 31,231,285 | JPY | 11/18/16 | — | (4,193 | ) | |||
| OSG Corp | LIBOR - 40 | DBFX | 140,179,920 | JPY | 11/18/16 | — | (68,459 | ) | |||
| Sankyo Co. Ltd | LIBOR - 40 | DBFX | 70,104,500 | JPY | 11/18/16 | — | (4,173 | ) | |||
| SBI Holdings Inc | LIBOR - 40 | DBFX | 12,240,900 | JPY | 11/18/16 | 130 | — | ||||
| Sony Corp | LIBOR - 40 | DBFX | 35,601,100 | JPY | 11/18/16 | 7,886 | — | ||||
| Teijin Ltd | LIBOR - 40 | DBFX | 86,102,463 | JPY | 11/18/16 | — | (34,666 | ) | |||
| The Bank of Nagoya Ltd | LIBOR - 150 | DBFX | 174,495 | 11/18/16 | 5,517 | — | |||||
| The Gunma Bank Ltd | LIBOR - 40 | DBFX | 49,582 | 11/18/16 | 1,553 | — | |||||
| The Oita Bank Ltd | LIBOR - 40 | DBFX | 1,611,529 | 11/18/16 | 43,332 | — | |||||
| The Yamagata Bank Ltd | LIBOR - 150 | DBFX | 783,110 | 11/18/16 | — | (22,152 | ) | ||||
| Toho Holdings Co. Ltd | LIBOR - 40 | DBFX | 147,200,631 | JPY | 11/18/16 | 29,268 | — | ||||
| Toppan Printing Co | LIBOR - 40 | DBFX | 200,745,579 | JPY | 11/18/16 | 7,492 | — | ||||
| Yamada Denki Co Ltd | LIBOR - 100 | DBFX | 348,497,696 | JPY | 11/18/16 | 93,389 | — | ||||
| Yamaguchi Financial Group Inc | LIBOR - 40 | DBFX | 5,530,847 | 11/18/16 | 240,727 | — | |||||
| Elekta AB, B | LIBOR - 125 | DBFX | 984,451 | SEK | 12/02/16 | — | (15,283 | ) | |||
| Equinix Inc | SONIA - 35 | MSCS | 773,093 | GBP | 1/13/17 | — | (6 | ) | |||
| Air China Ltd., H | HONIX - 50 | MSCS | 6,585,211 | HKD | 7/10/17 | 37,348 | — | ||||
| China Southern Airlines Co., H | HONIX - 50 | MSCS | 3,371,380 | HKD | 7/10/17 | 14,817 | — | ||||
| ABB Ltd | TOIS - 40 | MSCS | 37,713 | CHF | 7/17/17 | — | — | ||||
| Schindler Holdings | TOIS - 40 | MSCS | 41,986 | CHF | 7/17/17 | — | — | ||||
franklintempleton.com
Semiannual Report
69
| FRANKLIN ALTERNATIVE STRATEGIES FUNDS |
| CONSOLIDATED STATEMENT OF INVESTMENTS (UNAUDITED) |
| Franklin K2 Alternative Strategies Fund (continued) | ||||||||||
| Total Return Swap Contracts (continued) | ||||||||||
| Counter- | Expiration | Unrealized | Unrealized | |||||||
| Underlying Instrument | Financing Rate | party | Notional Value* | Date | Appreciation | Depreciation | ||||
| Short (continued) | ||||||||||
| Airbus Group SE | EONIA - 40 | MSCS | 789,499 | EUR | 8/21/17 | $ | — | $ | (182,826 | ) |
| Sandvik AB | STIBO - 50 | MSCS | 309,358 | SEK | 8/21/17 | — | — | |||
| Carnival Corp | SONIA - 35 | MSCS | 133,229 | GBP | 10/23/17 | — | (2,821 | ) | ||
| iShares Core FTSE 100 UCITS ETF | SONIA - 63 | MSCS | 51,864 | GBP | 10/23/17 | — | — | |||
| Royal Dutch Shell PLC | SONIA - 35 | MSCS | 2,124,802 | GBP | 10/23/17 | — | (60,259 | ) | ||
| The Sage Group PLC | SONIA - 35 | MSCS | 215,210 | GBP | 10/23/17 | — | — | |||
| Altice NV, A | EONIA - 40 | MSCS | 314,457 | EUR | 10/26/17 | — | — | |||
| Fiat Chrysler Automobiles NV | EONIA - 50 | MSCS | 763,136 | EUR | 10/26/17 | — | — | |||
| Hermes International | EONIA - 40 | MSCS | 32,325 | EUR | 10/26/17 | — | — | |||
| Kone OYJ | EONIA - 88 | MSCS | 300,865 | EUR | 10/26/17 | — | — | |||
| Lyxor ETF FTSE | EONIA - 203 | MSCS | 67,773 | EUR | 10/26/17 | — | — | |||
| Telecom Italia SpA | EONIA - 103 | MSCS | 748,243 | EUR | 10/26/17 | — | — | |||
| Telefonica SA | EONIA - 50 | MSCS | 32,445 | EUR | 10/26/17 | — | — | |||
| TNT Express NV | EONIA - 40 | MSCS | 81,610 | EUR | 10/26/17 | — | — | |||
| Targa Resources Corp | FEDEF - 35 | MSCS | 217,565 | 11/03/17 | — | — | ||||
| STOXX Europe 600 Index | LIBOR - 45 | MSCS | 1,510,628 | EUR | 11/20/17 | — | (19,624 | ) | ||
| Total OTC Swap Contracts | $ | 4,569,085 | $ | (3,574,980 | ) | |||||
| Net unrealized appreciation (depreciation) | $ | 994,105 | ||||||||
| *In U.S. dollars unless otherwise indicated. | ||||||||||
| See Abbreviations on page 90. | ||||||||||
70 Semiannual Report
franklintempleton.com
FRANKLIN ALTERNATIVE STRATEGIES FUNDS
Consolidated Financial Statements
Consolidated Statement of Assets and Liabilities
November 30, 2015 (unaudited)
| Franklin K2 Alternative Strategies Fund | |||
| Assets: | |||
| Investments in securities: | |||
| Cost - Unaffiliated issuers | $ | 868,587,172 | |
| Cost - Repurchase agreements | 44,783,479 | ||
| Total cost of investments | $ | 913,370,651 | |
| Value - Unaffiliated issuers | $ | 891,826,332 | |
| Value - Repurchase agreements | 44,783,479 | ||
| Total value of investments | 936,609,811 | ||
| Cash | 248,531,381 | ||
| Restricted Cash (Note 1f) | 33,978 | ||
| Foreign currency, at value (cost $1,625,507) | 1,583,838 | ||
| Receivables: | |||
| Investment securities sold | 23,185,186 | ||
| Capital shares sold | 17,086,822 | ||
| Dividends and interest | 6,752,635 | ||
| Due from brokers | 230,430,536 | ||
| OTC swap contracts (upfront payments $722,439) | 707,515 | ||
| Unrealized appreciation on OTC forward exchange contracts | 6,338,703 | ||
| Unrealized appreciation on OTC swap contracts | 4,837,312 | ||
| Unrealized appreciation on unfunded loan commitments (Note 8) | 1,292 | ||
| Other assets | 72 | ||
| Total assets | 1,476,099,081 | ||
| Liabilities: | |||
| Payables: | |||
| Investment securities purchased | 24,349,496 | ||
| Capital shares redeemed | 886,224 | ||
| Management fees | 1,429,020 | ||
| Distribution fees | 97,316 | ||
| Transfer agent fees | 57,195 | ||
| Variation margin | 216,830 | ||
| OTC swap contracts (upfront receipts $219,442) | 206,499 | ||
| Options written, at value (premiums received $475,094) | 384,443 | ||
| Securities sold short, at value (proceeds $262,955,833) | 262,717,858 | ||
| Due to brokers | 2,072,026 | ||
| Unrealized depreciation on OTC forward exchange contracts | 5,755,282 | ||
| Unrealized depreciation on OTC swap contracts | 3,649,682 | ||
| Accrued expenses and other liabilities | 137,929 | ||
| Total liabilities | 301,959,800 | ||
| Net assets, at value | $ | 1,174,139,281 | |
| Net assets consist of: | |||
| Paid-in capital | $ | 1,156,179,212 | |
| Undistributed net investment income | 13,217,193 | ||
| Net unrealized appreciation (depreciation) | 29,047,006 | ||
| Accumulated net realized gain (loss) | (24,304,130 | ) | |
| Net assets, at value | $ | 1,174,139,281 | |
franklintempleton.com The accompanying notes are an integral part of these consolidated financial statements. | Semiannual Report 71
FRANKLIN ALTERNATIVE STRATEGIES FUNDS
CONSOLIDATED FINANCIAL STATEMENTS
Consolidated Statement of Assets and Liabilities (continued)
November 30, 2015 (unaudited)
| Franklin K2 Alternative Strategies Fund | ||
| Class A: | ||
| Net assets, at value | $ | 193,528,880 |
| Shares outstanding | 17,741,100 | |
| Net asset value per sharea | $ | 10.91 |
| Maximum offering price per share (net asset value per share ÷ 94.25%) | $ | 11.58 |
| Class C: | ||
| Net assets, at value | $ | 73,222,209 |
| Shares outstanding | 6,781,400 | |
| Net asset value and maximum offering price per sharea | $ | 10.80 |
| Class R: | ||
| Net assets, at value | $ | 334,141 |
| Shares outstanding | 30,824 | |
| Net asset value and maximum offering price per share | $ | 10.84 |
| Class R6: | ||
| Net assets, at value | $ | 261,041,957 |
| Shares outstanding | 23,833,032 | |
| Net asset value and maximum offering price per share | $ | 10.95 |
| Advisor Class: | ||
| Net assets, at value | $ | 646,012,094 |
| Shares outstanding | 59,024,045 | |
| Net asset value and maximum offering price per share | $ | 10.94 |
| aRedemption price is equal to net asset value less contingent deferred sales charges, if applicable. | ||
72 Semiannual Report | The accompanying notes are an integral part of these consolidated financial statements. franklintempleton.com
FRANKLIN ALTERNATIVE STRATEGIES FUNDS
CONSOLIDATED FINANCIAL STATEMENTS
Consolidated Statement of Operations
for the six months ended November 30, 2015 (unaudited)
| Franklin K2 Alternative Strategies Fund | |||
| Investment income: | |||
| Dividends | $ | 1,727,952 | |
| Interest | 8,565,134 | ||
| Total investment income | 10,293,086 | ||
| Expenses: | |||
| Management fees (Note 3a) | 9,764,237 | ||
| Distribution fees: (Note 3c) | |||
| Class A | 215,942 | ||
| Class C | 286,240 | ||
| Class R | 1,203 | ||
| Transfer agent fees: (Note 3e) | |||
| Class A | 63,333 | ||
| Class C | 22,305 | ||
| Class R | 187 | ||
| Class R6 | 140 | ||
| Advisor Class | 188,268 | ||
| Custodian fees (Note 4) | 96,772 | ||
| Reports to shareholders | 44,636 | ||
| Registration and filing fees | 121,948 | ||
| Professional fees | 237,802 | ||
| Trustees’ fees and expenses | 314,134 | ||
| Dividends and/or interest on securities sold short | 2,044,280 | ||
| Security borrowing fees | 1,156,256 | ||
| Other | 63,266 | ||
| Total expenses | 14,620,949 | ||
| Expense reductions (Note 4) | (4,945 | ) | |
| Expenses waived/paid by affiliates (Note 3f) | (1,721,847 | ) | |
| Net expenses | 12,894,157 | ||
| Net investment income (loss) | (2,601,071 | ) | |
| Realized and unrealized gains (losses): | |||
| Net realized gain (loss) from: | |||
| Investments | (16,248,918 | ) | |
| Written options | (119,497 | ) | |
| Foreign currency transactions | 654,262 | ||
| Futures contracts | (1,686,156 | ) | |
| Securities sold short | (58,549 | ) | |
| Swap contracts | (224,534 | ) | |
| Net realized gain (loss) | (17,683,392 | ) | |
| Net change in unrealized appreciation (depreciation) on: | |||
| Investments | (4,224,258 | ) | |
| Translation of other assets and liabilities denominated in foreign currencies | 841,491 | ||
| Written options | 192,755 | ||
| Futures contracts | 3,179,646 | ||
| Swap contracts | 1,428,068 | ||
| Net change in unrealized appreciation (depreciation) | 1,417,702 | ||
| Net realized and unrealized gain (loss) | (16,265,690 | ) | |
| Net increase (decrease) in net assets resulting from operations | $ | (18,866,761 | ) |
franklintempleton.com The accompanying notes are an integral part of these consolidated financial statements. | Semiannual Report 73
| FRANKLIN ALTERNATIVE STRATEGIES FUNDS | ||||||
| CONSOLIDATED FINANCIAL STATEMENTS | ||||||
| Consolidated Statements of Changes in Net Assets | ||||||
| Franklin K2 Alternative Strategies Fund | ||||||
| Period Ended | ||||||
| November 30, 2015 | Year Ended | |||||
| (unaudited) | May 31, 2015 | |||||
| Increase (decrease) in net assets: | ||||||
| Operations: | ||||||
| Net investment income (loss) | $ | (2,601,071 | ) | $ | (3,810,717 | ) |
| Net realized gain (loss) | (17,683,392 | ) | 18,827,021 | |||
| Net change in unrealized appreciation (depreciation) | 1,417,702 | 16,163,590 | ||||
| Net increase (decrease) in net assets resulting from operations | (18,866,761 | ) | 31,179,894 | |||
| Distributions to shareholders from net investment income: | ||||||
| Class A | — | (612,244 | ) | |||
| Class C | — | (65,590 | ) | |||
| Class R | — | (45,777 | ) | |||
| Class R6 | — | (1,926,596 | ) | |||
| Advisor Class | — | (1,393,965 | ) | |||
| Total distributions to shareholders | — | (4,044,172 | ) | |||
| Capital share transactions: (Note 2) | ||||||
| Class A | 47,881,802 | 46,690,910 | ||||
| Class C | 36,643,759 | 20,037,814 | ||||
| Class R | (8,824,119 | ) | (3,054,919 | ) | ||
| Class R6 | 26,373,927 | 13,262,210 | ||||
| Advisor Class | 325,935,972 | 265,636,309 | ||||
| Total capital share transactions | 428,011,341 | 342,572,324 | ||||
| Net increase (decrease) in net assets | 409,144,580 | 369,708,046 | ||||
| Net assets: | ||||||
| Beginning of period | 764,994,701 | 395,286,655 | ||||
| End of period | $ | 1,174,139,281 | $ | 764,994,701 | ||
| Undistributed net investment income included in net assets: | ||||||
| End of period | $ | 13,217,193 | $ | 15,818,264 | ||
74 Semiannual Report | The accompanying notes are an integral part of these consolidated financial statements. franklintempleton.com
FRANKLIN ALTERNATIVE STRATEGIES FUNDS
Notes to Consolidated Financial Statements (unaudited)
Franklin K2 Alternative Strategies Fund
1. Organization and Significant Accounting Policies
Franklin Alternative Strategies Funds (Trust) is registered under the Investment Company Act of 1940 (1940 Act) as an open-end management investment company, consisting of three separate funds and applies the specialized accounting and reporting guidance in U.S. Generally Accepted Accounting Principles (U.S. GAAP). The Franklin K2 Alternative Strategies Fund (Fund) is included in this report. The financial statements of the remaining funds in the Trust are presented separately. The Fund offers five classes of shares: Class A, Class C, Class R, Class R6 and Advisor Class. Each class of shares differs by its initial sales load, contingent deferred sales charges, voting rights on matters affecting a single class, its exchange privilege and fees primarily due to differing arrangements for distribution and transfer agent fees.
The following summarizes the Fund’s significant accounting policies.
a. Financial Instrument Valuation
The Fund’s investments in financial instruments are carried at fair value daily. Fair value is the price that would be received to sell an asset or paid to transfer a liability in an orderly transaction between market participants on the measurement date. The Fund calculates the net asset value (NAV) per share as of 4 p.m. Eastern time each day the New York Stock Exchange (NYSE) is open for trading. Under compliance policies and procedures approved by the Trust’s Board of Trustees (the Board), the Fund’s administrator has responsibility for oversight of valuation, including leading the cross-functional Valuation and Liquidity Oversight Committee (VLOC). The VLOC provides administration and oversight of the Fund’s valuation policies and procedures, which are approved annually by the Board. Among other things, these procedures allow the Fund to utilize independent pricing services, quotations from securities and financial instrument dealers, and other market sources to determine fair value.
Equity securities, exchange traded funds and derivative financial instruments (derivatives) listed on an exchange or on the NASDAQ National Market System are valued at the last quoted sale price or the official closing price of the day, respectively. Foreign equity securities are valued as of the close of trading on the foreign stock exchange on which the security is primarily traded or as of the NYSE close, whichever is earlier. The value is then converted into its U.S. dollar equivalent at the foreign exchange rate in effect at the NYSE close on the day that the value of the security is determined. Over-the-counter (OTC) securities are valued within the range of the most recent quoted bid and ask prices. Securities that trade in multiple markets or on multiple exchanges are valued according to the broadest and most representative market. Certain equity securities are valued based upon fundamental characteristics or relationships to similar securities.
Debt securities generally trade in the OTC market rather than on a securities exchange. The Fund’s pricing services use multiple valuation techniques to determine fair value. In instances where sufficient market activity exists, the pricing services may utilize a market-based approach through which quotes from market makers are used to determine fair value. In instances where sufficient market activity may not exist or is limited, the pricing services also utilize proprietary valuation models which may consider market characteristics such as benchmark yield curves, credit spreads, estimated default rates, anticipated market interest rate volatility, coupon rates, anticipated timing of principal repayments, underlying collateral, and other unique security features in order to estimate the relevant cash flows, which are then discounted to calculate the fair value. Securities denominated in a foreign currency are converted into their U.S. dollar equivalent at the foreign exchange rate in effect at the NYSE close on the date that the values of the foreign debt securities are determined.
Investments in open-end mutual funds are valued at the closing NAV. Repurchase agreements are valued at cost, which approximates fair value.
Certain derivatives trade in the OTC market. The Fund’s pricing services use various techniques including industry standard option pricing models and proprietary discounted cash flow models to determine the fair value of those instruments. The Fund’s net benefit or obligation under the derivative contract, as measured by the fair value of the contract, is included in net assets.
The Fund has procedures to determine the fair value of financial instruments for which market prices are not reliable or readily available. Under these procedures, the VLOC convenes on a regular basis to review such financial instruments and considers a number of factors, including significant unobservable valuation inputs, when arriving at fair value. The VLOC primarily employs a market-based approach which may use related or comparable assets or liabilities, recent transactions, market multiples, book values, and other relevant information for the
franklintempleton.com
Semiannual Report
75
FRANKLIN ALTERNATIVE STRATEGIES FUNDS
NOTES TO CONSOLIDATED FINANCIAL STATEMENTS (UNAUDITED)
Franklin K2 Alternative Strategies Fund (continued)
1. Organization and Significant Accounting
Policies (continued)
a. Financial Instrument Valuation (continued)
investment to determine the fair value of the investment. An income-based valuation approach may also be used in which the anticipated future cash flows of the investment are discounted to calculate fair value. Discounts may also be applied due to the nature or duration of any restrictions on the disposition of the investments. Due to the inherent uncertainty of valuations of such investments, the fair values may differ significantly from the values that would have been used had an active market existed. The VLOC employs various methods for calibrating these valuation approaches including a regular review of key inputs and assumptions, transactional back-testing or disposition analysis, and reviews of any related market activity.
Trading in securities on foreign securities stock exchanges and OTC markets may be completed before the daily NYSE close. In addition, trading in certain foreign markets may not take place on every NYSE business day. Occasionally, events occur between the time at which trading in a foreign security is completed and the close of the NYSE that might call into question the reliability of the value of a portfolio security held by the Fund. As a result, differences may arise between the value of the Fund’s portfolio securities as determined at the foreign market close and the latest indications of value at the close of the NYSE. In order to minimize the potential for these differences, the VLOC monitors price movements following the close of trading in foreign stock markets through a series of country specific market proxies (such as baskets of American Depositary Receipts, futures contracts and exchange traded funds). These price movements are measured against established trigger thresholds for each specific market proxy to assist in determining if an event has occurred that may call into question the reliability of the values of the foreign securities held by the Fund. If such an event occurs, the securities may be valued using fair value procedures, which may include the use of independent pricing services.
When the last day of the reporting period is a non-business day, certain foreign markets may be open on those days that the NYSE is closed, which could result in differences between the value of the Fund’s portfolio securities on the last business day and the last calendar day of the reporting period. Any significant security valuation changes due to an open foreign market are adjusted and reflected by the Fund for financial reporting purposes.
b. Foreign Currency Translation
Portfolio securities and other assets and liabilities denominated in foreign currencies are translated into U.S. dollars based on the exchange rate of such currencies against U.S. dollars on the date of valuation. The Fund may enter into foreign currency exchange contracts to facilitate transactions denominated in a foreign currency. Purchases and sales of securities, income and expense items denominated in foreign currencies are translated into U.S. dollars at the exchange rate in effect on the transaction date. Portfolio securities and assets and liabilities denominated in foreign currencies contain risks that those currencies will decline in value relative to the U.S. dollar. Occasionally, events may impact the availability or reliability of foreign exchange rates used to convert the U.S. dollar equivalent value. If such an event occurs, the foreign exchange rate will be valued at fair value using procedures established and approved by the Board.
The Fund does not separately report the effect of changes in foreign exchange rates from changes in market prices on securities held. Such changes are included in net realized and unrealized gain or loss from investments in the Consolidated Statement of Operations.
Realized foreign exchange gains or losses arise from sales of foreign currencies, currency gains or losses realized between the trade and settlement dates on securities transactions and the difference between the recorded amounts of dividends, interest, and foreign withholding taxes and the U.S. dollar equivalent of the amounts actually received or paid. Net unrealized foreign exchange gains and losses arise from changes in foreign exchange rates on foreign denominated assets and liabilities other than investments in securities held at the end of the reporting period.
c. Joint Repurchase Agreement
The Fund enters into a joint repurchase agreement whereby its uninvested cash balance is deposited into a joint cash account with other funds managed by the investment manager or an affiliate of the investment manager and is used to invest in one or more repurchase agreements. The value and face amount of the joint repurchase agreement are allocated to the funds based on their pro-rata interest. A repurchase agreement is accounted for as a loan by the Fund to the seller, collateralized by securities which are delivered to the Fund’s custodian. The fair value, including accrued interest, of the initial collateralization is required to be at least 102% of the dollar amount invested by the funds, with the value of the underlying securities marked to
76 Semiannual Report
franklintempleton.com
| FRANKLIN ALTERNATIVE STRATEGIES FUNDS |
| NOTES TO CONSOLIDATED FINANCIAL STATEMENTS (UNAUDITED) |
Franklin K2 Alternative Strategies Fund (continued)
market daily to maintain coverage of at least 100%. Repurchase agreements are subject to the terms of Master Repurchase Agreements (MRAs) with approved counterparties (sellers). The MRAs contain various provisions, including but not limited to events of default and maintenance of collateral for repurchase agreements. In the event of default by either the seller or the Fund, certain MRAs may permit the non-defaulting party to net and close-out all transactions, if any, traded under such agreements. The Fund may sell securities it holds as collateral and apply the proceeds towards the repurchase price and any other amounts owed by the seller to the Fund in the event of default by the seller. This could involve costs or delays in addition to a loss on the securities if their value falls below the repurchase price owed by the seller. The joint repurchase agreement held by the Fund at period end, as indicated in the Consolidated Statement of Investments, had been entered into on November 30, 2015.
d. Securities Purchased on a When-Issued Basis
The Fund purchases securities on a when-issued basis, with payment and delivery scheduled for a future date. These transactions are subject to market fluctuations and are subject to the risk that the value at delivery may be more or less than the trade date purchase price. Although the Fund will generally purchase these securities with the intention of holding the securities, it may sell the securities before the settlement date. Sufficient assets have been segregated for these securities.
e. Derivative Financial Instruments
The Fund invested in derivatives in order to manage risk or gain exposure to various other investments or markets. Derivatives are financial contracts based on an underlying or notional amount, require no initial investment or an initial net investment that is smaller than would normally be required to have a similar response to changes in market factors, and require or permit net settlement. Derivatives contain various risks including the potential inability of the counterparty to fulfill their obligations under the terms of the contract, the potential for an illiquid secondary market, and/or the potential for market movements which expose the Fund to gains or losses in excess of the amounts shown in the Consolidated Statement of Assets and Liabilities. Realized gain and loss and unrealized appreciation and depreciation on these contracts for the period are included in the Consolidated Statement of Operations.
Derivative counterparty credit risk is managed through a formal evaluation of the creditworthiness of all potential counter-parties. The Fund attempts to reduce its exposure to counterparty credit risk on OTC derivatives, whenever possible, by entering into International Swaps and Derivatives Association (ISDA) master agreements with certain counterparties. These agreements contain various provisions, including but not limited to collateral requirements, events of default, or early termination. Termination events applicable to the counterparty include certain deteriorations in the credit quality of the counterparty. Termination events applicable to the Fund include failure of the Fund to maintain certain net asset levels and/or limit the decline in net assets over various periods of time. In the event of default or early termination, the ISDA master agreement gives the non-defaulting party the right to net and close-out all transactions traded, whether or not arising under the ISDA agreement, to one net amount payable by one counterparty to the other. However, absent an event of default or early termination, OTC derivative assets and liabilities are presented gross and not offset in the Consolidated Statement of Assets and Liabilities. Early termination by the counterparty may result in an immediate payment by the Fund of any net liability owed to that counterparty under the ISDA agreement.
Collateral requirements differ by type of derivative. Collateral or initial margin requirements are set by the broker or exchange clearing house for exchange traded and centrally cleared derivatives. Initial margin deposited is held at the exchange and can be in the form of cash and/or securities. For OTC derivatives traded under an ISDA master agreement, posting of collateral is required by either the Fund or the applicable coun-terparty if the total net exposure of all OTC derivatives with the applicable counterparty exceeds the minimum transfer amount, which typically ranges from $100,000 to $250,000, and can vary depending on the counterparty and the type of the agreement. Generally, collateral is determined at the close of fund business each day and any additional collateral required due to changes in derivative values may be delivered by the Fund or the counterparty within a few business days. Collateral pledged and/or received by the Fund for OTC derivatives, if any, is held in segregated accounts with the Fund’s custodian/counterparty broker and can be in the form of cash and/or securities. Unrestricted cash may be invested according to the Fund’s investment objectives. To the extent that the amounts due to the Fund from its counterparties are not subject to collateralization or are not fully collateralized, the Fund bears the risk of loss from counterparty non-performance.
The Fund entered into exchange traded futures contracts primarily to manage and/or gain exposure to commodity price, interest rate and equity price risk. A futures contract is an agreement
franklintempleton.com
Semiannual Report
77
FRANKLIN ALTERNATIVE STRATEGIES FUNDS
NOTES TO CONSOLIDATED FINANCIAL STATEMENTS (UNAUDITED)
Franklin K2 Alternative Strategies Fund (continued)
1. Organization and Significant Accounting
Policies (continued)
e. Derivative Financial Instruments (continued)
between the Fund and a counterparty to buy or sell an asset for a specified price on a future date. Required initial margins are pledged by the Fund, and the daily change in fair value is accounted for as a variation margin payable or receivable in the Consolidated Statement of Assets and Liabilities.
The Fund entered into OTC forward exchange contracts primarily to manage and/or gain exposure to certain foreign currencies. A forward exchange contract is an agreement between the Fund and a counterparty to buy or sell a foreign currency at a specific exchange rate on a future date.
The Fund entered into credit default swap contracts primarily to manage and/or gain exposure to credit risk. A credit default swap is an agreement between the Fund and a counterparty whereby the buyer of the contract receives credit protection and the seller of the contract guarantees the credit worthiness of a referenced debt obligation. These agreements may be privately negotiated in the over-the-counter market (OTC credit default swaps) or may be executed in a multilateral trade facility platform, such as a registered exchange (centrally cleared credit default swaps). The underlying referenced debt obligation may be a single issuer of corporate or sovereign debt, a credit index, a basket of issuers or indices, or a tranche of a credit index or basket of issuers or indices. In the event of a default of the underlying referenced debt obligation, the buyer is entitled to receive the notional amount of the credit default swap contract from the seller in exchange for the referenced debt obligation, a net settlement amount equal to the notional amount of the credit default swap less the recovery value of the referenced debt obligation, or other agreed upon amount. For centrally cleared credit default swaps, required initial margins are pledged by the Fund, and the daily change in fair value is accounted for as a variation margin payable or receivable in the Consolidated Statement of Assets and Liabilities. Over the term of the contract, the buyer pays the seller a periodic stream of payments, provided that no event of default has occurred. Such periodic payments are accrued daily as an unrealized appreciation or depreciation until the payments are made, at which time they are realized. Upfront payments and receipts are reflected in the Consolidated Statement of Assets and Liabilities and represent compensating factors between stated terms of the credit default swap agreement and prevailing market conditions (credit spreads and other relevant factors). These upfront payments and receipts are amortized over the term of the contract as a realized gain or loss in the Consolidated Statement of Operations.
The Fund entered into interest rate swap contracts primarily to manage interest rate risk. An interest rate swap is an agreement between the Fund and a counterparty to exchange cash flows based on the difference between two interest rates, applied to a notional amount. These agreements may be privately negotiated in the over-the-counter market (OTC interest rate swaps) or may be executed on a registered exchange (centrally cleared interest rate swaps). For centrally cleared interest rate swaps, required initial margins are pledged by the Fund, and the daily change in fair value is accounted for as a variation margin payable or receivable in the Consolidated Statement of Assets and Liabilities. Over the term of the contract, contractually required payments to be paid and to be received are accrued daily and recorded as unrealized depreciation and appreciation until the payments are made, at which time they are realized.
The Fund entered into OTC total return swap contracts primarily to manage and/or gain exposure to equity price and credit risk of an underlying instrument such as a stock, bond, index or basket of securities or indices. A total return swap is an agreement between the Fund and a counterparty to exchange a return linked to an underlying instrument for a floating or fixed rate payment, both based upon a notional amount. Over the term of the contract, contractually required payments to be paid or received are accrued daily and recorded as unrealized appreciation or depreciation until the payments are made, at which time they are recognized as realized gain or loss.
The Fund purchased or wrote exchange traded and/or OTC option contracts primarily to manage and/or gain exposure to equity price, interest rate and foreign exchange rate risk. An option is a contract entitling the holder to purchase or sell a specific amount of shares or units of an asset or notional amount of a swap (swaption), at a specified price. When an option is purchased or written, an amount equal to the premium paid or received is recorded as an asset or liability, respectively. Upon exercise of an option, the acquisition cost or sales proceeds of the underlying investment is adjusted by any premium received or paid. Upon expiration of an option, any premium received or paid is recorded as a realized gain or loss. Upon closing an option other than through expiration or exercise, the difference between the premium received or paid and the cost to close the position is recorded as a realized gain or loss.
78 Semiannual Report
franklintempleton.com
| FRANKLIN ALTERNATIVE STRATEGIES FUNDS |
| NOTES TO CONSOLIDATED FINANCIAL STATEMENTS (UNAUDITED) |
Franklin K2 Alternative Strategies Fund (continued)
See Notes 6 and 9 regarding investment transactions and other derivative information, respectively.
f. Restricted Cash
At November 30, 2015, the Fund held restricted cash in connection with investments in certain derivative securities. Restricted cash is held in a segregated account with the Fund’s custodian and is reflected in the Consolidated Statement of Assets and Liabilities.
g. Securities Sold Short
The Fund is engaged in selling securities short, which obligates the Fund to replace a borrowed security with the same security at current fair value. The Fund incurs a loss if the price of the security increases between the date of the short sale and the date on which the Fund replaces the borrowed security. The Fund realizes a gain if the price of the security declines between those dates. Gains are limited to the price at which the Fund sold the security short, while losses are potentially unlimited in size.
The Fund is required to establish a margin account with the broker lending the security sold short. While the short sale is outstanding, the broker retains the proceeds of the short sale to the extent necessary to meet margin requirements until the short position is closed out. A deposit must also be maintained with the Fund’s custodian/counterparty broker consisting of cash and/ or securities having a value equal to a specified percentage of the value of the securities sold short. The Fund is obligated to pay fees for borrowing the securities sold short and is required to pay the counterparty any dividends and/or interest due on securities sold short. Such dividends and/or interest and any security borrowing fees are recorded as an expense to the Fund.
h. Investments in K2 Holdings Investment Corp. (K2 Subsidiary)
The Fund invests in certain financial instruments and commodity-linked derivative investments through its investment in the K2 Subsidiary. The K2 Subsidiary is a Cayman Islands exempted company with limited liability, is a wholly-owned subsidiary of the Fund, and is able to invest in certain financial instruments and commodity-linked derivative investments consistent with the investment objective of the Fund. At November 30, 2015, the K2 Subsidiary’s investments, as well as any other assets and liabilities of the K2 Subsidiary, are reflected in the Fund’s Consolidated Statement of Investments and Consolidated Statement of Assets and Liabilities. The financial statements have been consolidated and include the accounts of the Fund and the K2 Subsidiary. All intercompany transactions and balances have been eliminated. At November 30, 2015, the net assets of the K2 Subsidiary were $105,559,787, representing 8.99% of the Fund’s consolidated net assets. The Fund’s investment in the K2 Subsidiary is limited to 25% of consolidated assets.
i. Senior Floating Rate Interests
The Fund invests in senior secured corporate loans that pay interest at rates which are periodically reset by reference to a base lending rate plus a spread. These base lending rates are generally the prime rate offered by a designated U.S. bank or the London InterBank Offered Rate (LIBOR). Senior secured corporate loans often require prepayment of principal from excess cash flows or at the discretion of the borrower. As a result, actual maturity may be substantially less than the stated maturity. Senior secured corporate loans in which the Fund invests are generally readily marketable, but may be subject to certain restrictions on resale.
j. Income and Deferred Taxes
It is the Fund’s policy to qualify as a regulated investment company under the Internal Revenue Code. The Fund intends to distribute to shareholders substantially all of its taxable income and net realized gains to relieve it from federal income and excise taxes. As a result, no provision for U.S. federal income taxes is required.
The Fund may be subject to foreign taxation related to income received, capital gains on the sale of securities and certain foreign currency transactions in the foreign jurisdictions in which it invests. Foreign taxes, if any, are recorded based on the tax regulations and rates that exist in the foreign markets in which the Fund invests. When a capital gain tax is determined to apply, the Fund records an estimated deferred tax liability in an amount that would be payable if the securities were disposed of on the valuation date.
The Fund recognizes the tax benefits of uncertain tax positions only when the position is “more likely than not” to be sustained upon examination by the tax authorities based on the technical merits of the tax position. As of November 30, 2015, and for all open tax years, the Fund has determined that no liability for unrecognized tax benefits is required in the Fund’s consolidated financial statements related to uncertain tax positions taken on a tax return (or expected to be taken on future tax returns). Open tax years are those that remain subject to examination and are based on each tax jurisdiction’s statute of limitation.
franklintempleton.com
Semiannual Report
79
FRANKLIN ALTERNATIVE STRATEGIES FUNDS
NOTES TO CONSOLIDATED FINANCIAL STATEMENTS (UNAUDITED)
Franklin K2 Alternative Strategies Fund (continued)
1. Organization and Significant Accounting
Policies (continued)
k. Security Transactions, Investment Income, Expenses and Distributions
Security transactions are accounted for on trade date. Realized gains and losses on security transactions are determined on a specific identification basis. Interest income and estimated expenses are accrued daily. Amortization of premium and accretion of discount on debt securities are included in interest income. Dividend income and dividends declared on securities sold short are recorded on the ex-dividend date except for certain dividends from foreign securities where the dividend rate is not available. In such cases, the dividend is recorded as soon as the information is received by the Fund. Distributions to shareholders are recorded on the ex-dividend date and are determined according to income tax regulations (tax basis). Distributable earnings determined on a tax basis may differ from earnings recorded in accordance with U.S. GAAP. These differences may be permanent or temporary. Permanent differences are reclassified among capital accounts to reflect their tax character. These reclassifications have no impact on net assets or the results of operations. Temporary differences are not reclassified, as they may reverse in subsequent periods.
Common expenses incurred by the Trust are allocated among the funds based on the ratio of net assets of each fund to the combined net assets of the Trust. Fund specific expenses are charged directly to the fund that incurred the expense.
Realized and unrealized gains and losses and net investment income, not including class specific expenses, are allocated daily to each class of shares based upon the relative proportion of net assets of each class. Differences in per share dis-
tributions, by class, are generally due to differences in class specific expenses.
Inflation-indexed bonds are adjusted for inflation through periodic increases or decreases in the security’s interest accruals, face amount, or principal redemption value, by amounts corresponding to the rate of inflation as measured by an index. Any increase or decrease in the face amount or principal redemption value will be included as interest income on the Consolidated Statement of Operations.
l. Accounting Estimates
The preparation of financial statements in accordance with U.S. GAAP requires management to make estimates and assumptions that affect the reported amounts of assets and liabilities at the date of the financial statements and the amounts of income and expenses during the reporting period. Actual results could differ from those estimates.
m. Guarantees and Indemnifications
Under the Trust’s organizational documents, its officers and trustees are indemnified by the Trust against certain liabilities arising out of the performance of their duties to the Trust. Additionally, in the normal course of business, the Trust, on behalf of the Fund, enters into contracts with service providers that contain general indemnification clauses. The Trust’s maximum exposure under these arrangements is unknown as this would involve future claims that may be made against the Trust that have not yet occurred. Currently, the Trust expects the risk of loss to be remote.
2. Shares of Beneficial Interest
At November 30, 2015, there were an unlimited number of shares authorized (without par value). Transactions in the Fund’s shares were as follows:
| Six Months Ended | Year Ended | |||||||||
| November 30, 2015 | May 31, 2015 | |||||||||
| Shares | Amount | Shares | Amount | |||||||
| Class A Shares: | ||||||||||
| Shares sold | 8,900,799 | $ | 97,504,967 | 11,313,392 | $ | 123,061,270 | ||||
| Shares issued in reinvestment of distributions | — | — | 49,813 | 539,977 | ||||||
| Shares redeemed | (4,510,930 | ) | (49,623,165 | ) | (7,114,359 | ) | (76,910,337 | ) | ||
| Net increase (decrease) | 4,389,869 | $ | 47,881,802 | 4,248,846 | $ | 46,690,910 | ||||
80 Semiannual Report
franklintempleton.com
FRANKLIN ALTERNATIVE STRATEGIES FUNDS
NOTES TO CONSOLIDATED FINANCIAL STATEMENTS (UNAUDITED)
| Franklin K2 Alternative Strategies Fund (continued) | |||||||||||
| Six Months Ended | Year Ended | ||||||||||
| November 30, 2015 | May 31, 2015 | ||||||||||
| Shares | Amount | Shares | Amount | ||||||||
| Class C Shares: | |||||||||||
| Shares sold | 3,773,482 | $ | 41,130,939 | 3,173,984 | $ | 34,546,633 | |||||
| Shares issued in reinvestment of distributions | — | — | 3,444 | 37,196 | |||||||
| Shares redeemed | (413,358 | ) | (4,487,180 | ) | (1,323,981 | ) | (14,546,015 | ) | |||
| Net increase (decrease) | 3,360,124 | $ | 36,643,759 | 1,853,447 | $ | 20,037,814 | |||||
| Class R Shares: | |||||||||||
| Shares sold | 7,593 | $ | 82,601 | 28,828 | $ | 310,648 | |||||
| Shares issued in reinvestment of distributions | — | — | 92 | 1,001 | |||||||
| Shares redeemed | (799,683 | ) | (8,906,720 | ) | (303,567 | ) | (3,366,568 | ) | |||
| Net increase (decrease) | (792,090 | ) | $ | (8,824,119 | ) | (274,647 | ) | $ | (3,054,919 | ) | |
| Class R6 Shares: | |||||||||||
| Shares sold | 2,685,776 | $ | 29,577,398 | 3,740,127 | $ | 41,206,775 | |||||
| Shares issued in reinvestment of distributions | — | — | 167,937 | 1,822,117 | |||||||
| Shares redeemed | (289,193 | ) | (3,203,471 | ) | (2,694,521 | ) | (29,766,682 | ) | |||
| Net increase (decrease) | 2,396,583 | $ | 26,373,927 | 1,213,543 | $ | 13,262,210 | |||||
| Advisor Class Shares: | |||||||||||
| Shares sold | 35,820,299 | $ | 394,088,540 | 30,206,979 | $ | 329,751,933 | |||||
| Shares issued in reinvestment of distributions | — | — | 106,628 | 1,156,912 | |||||||
| Shares redeemed | (6,236,486 | ) | (68,152,568 | ) | (5,999,090 | ) | (65,272,536 | ) | |||
| Net increase (decrease) | 29,583,813 | $ | 325,935,972 | 24,314,516 | $ | 265,636,309 | |||||
3. Transactions with Affiliates
Franklin Resources, Inc. is the holding company for various subsidiaries that together are referred to as Franklin Templeton Investments. Certain officers and trustees of the Trust are also officers and/or directors of the following subsidiaries:
| Subsidiary | Affiliation | |
| K2/D&S Management Co., L.L.C. (K2 Advisors) | Investment manager | |
| Franklin Templeton Services, LLC (FT Services) | Administrative manager | |
| Franklin Templeton Distributors, Inc. (Distributors) | Principal underwriter | |
| Franklin Templeton Investor Services, LLC (Investor Services) | Transfer agent |
a. Management Fees
The Fund and K2 Subsidiary pay an investment management fee to K2 Advisors of 2.05% per year of the average daily net assets of the Fund and K2 Subsidiary. Management fees paid by the Fund are reduced on assets invested in the K2 Subsidiary, in an amount not to exceed the management fees paid by K2 Subsidiary.
Under each subadvisory agreement, the below entities provide subadvisory services to the Fund or K2 Subsidiary. The subadvisory fees are paid by K2 Advisors based on the Fund and K2 Subsidiary average daily net assets, and is not an additional expense of the Fund or K2 Subsidiary.
Subadvisors
Basso Capital Management, L.P.
Chatham Asset Management, LLC
franklintempleton.com
Semiannual Report
81
| FRANKLIN | ALTERNATIVE STRATEGIES | FUNDS |
| NOTES TO | CONSOLIDATED FINANCIAL | STATEMENTS (UNAUDITED) |
| Franklin K2 Alternative Strategies Fund (continued) |
| 3. Transactions with Affiliates (continued) |
| a. Management Fees (continued) |
| Subadvisors (continued) |
| Chilton Investment Company, LLC |
| EMSO Partners Limited |
| Graham Capital Management, L.P. |
| Impala Asset Management, LLC |
| Jennison Associates, LLC |
| Lazard Asset Management, LLC |
| Loomis Sayles & Company, L.P. |
| P. Schoenfeld Asset Management L.P. |
| Wellington Management Company, LLP |
| York Registered Holdings, L.P. |
b. Administrative Fees
Under an agreement with K2 Advisors, FT Services provides administrative services to the Fund and K2 Subsidiary. The fee is paid by K2 Advisors based on the Fund and K2 Subsidiary average daily net assets, and is not an additional expense of the Fund or K2 Subsidiary.
c. Distribution Fees
The Board has adopted distribution plans for each share class, with the exception of Class R6 and Advisor Class shares, pursuant to Rule 12b-1 under the 1940 Act. Under the Fund’s Class A reimbursement distribution plan, the Fund reimburses Distributors for costs incurred in connection with the servicing, sale and distribution of the Fund’s shares up to the maximum annual plan rate. Under the Class A reimbursement distribution plan, costs exceeding the maximum for the current plan year cannot be reimbursed in subsequent periods. In addition, under the Fund’s Class C and R compensation distribution plans, the Fund pays Distributors for costs incurred in connection with the servicing, sale and distribution of the Fund’s shares up to the maximum annual plan rate for each class. The plan year, for purposes of monitoring compliance with the maximum annual plan rates, is February 1 through January 31 for each fund.
The maximum annual plan rates, based on the average daily net assets, for each class, are as follows:
| Class A | 0.30 | % |
| Class C | 1.00 | % |
| Class R | 0.50 | % |
Effective August 1, 2015, the Board has set the current rate at 0.25% per year for Class A shares until further notice and approval by the Board.
d. Sales Charges/Underwriting Agreements
Front-end sales charges and contingent deferred sales charges (CDSC) do not represent expenses of the Fund. These charges are deducted from the proceeds of sales of Fund shares prior to investment or from redemption proceeds prior to remittance, as applicable. Distributors has advised the Fund of the following commission transactions related to the sales and redemptions of the Fund’s shares for the period:
| Sales charges retained net of commissions paid to unaffiliated broker/dealers | $ | 113,287 |
| CDSC retained | $ | 6,562 |
82 Semiannual Report
franklintempleton.com
| FRANKLIN ALTERNATIVE STRATEGIES FUNDS |
| NOTES TO CONSOLIDATED FINANCIAL STATEMENTS (UNAUDITED) |
Franklin K2 Alternative Strategies Fund (continued)
e. Transfer Agent Fees
Each class of shares, except for Class R6, pays transfer agent fees to Investor Services for its performance of shareholder servicing obligations and reimburses Investor Services for out of pocket expenses incurred, including shareholding servicing fees paid to third parties. These fees are allocated daily based upon their relative proportion of such classes’ aggregate net assets. Class R6 pays Investor Services transfer agent fees specific to that class.
For the period ended November 30, 2015, the Fund paid transfer agent fees of $274,233, of which $98,993 was retained by Investor Services.
f. Waiver and Expense Reimbursements
K2 Advisors has contractually agreed in advance to waive or limit its fees and to assume as its own expense certain expenses otherwise payable by the Fund so that the expenses (excluding distribution fees, acquired fund fees and expenses, and dividend expense on securities sold short) for each class of the Fund do not exceed 1.95%, and Class R6 does not exceed 1.86% based on the average net assets of each class (other than certain non-routine expenses or costs, including those relating to litigation, indemnification, reorganizations, and liquidations) until September 30, 2016. Prior to October 1, 2015, expenses for Class R6 were limited to 1.88%.
| g. Other Affiliated Transactions | |||
| At November 30, 2015, the shares of the Fund were owned by the following entities: | |||
| Percentage of | |||
| Outstanding | |||
| Shares | Shares | ||
| Franklin Moderate Allocation Fund | 8,328,626 | 7.75 | % |
| Franklin Conservative Allocation Fund | 5,433,101 | 5.06 | % |
| Franklin Growth Allocation Fund | 4,683,343 | 4.36 | % |
| Franklin LifeSmart 2025 Retirement Target Fund | 692,387 | 0.64 | % |
| Franklin LifeSmart 2035 Retirement Target Fund | 563,739 | 0.52 | % |
| Franklin LifeSmart 2015 Retirement Target Fund | 442,729 | 0.41 | % |
| Franklin LifeSmart 2045 Retirement Target Fund | 373,003 | 0.35 | % |
| Franklin LifeSmart 2030 Retirement Target Fund | 170,849 | 0.16 | % |
| Franklin LifeSmart 2020 Retirement Target Fund | 195,624 | 0.18 | % |
| Franklin Multi-Asset Real Return Fund | 108,367 | 0.10 | % |
| Franklin LifeSmart 2040 Retirement Target Fund | 123,383 | 0.11 | % |
| Franklin LifeSmart 2050 Retirement Target Fund | 94,381 | 0.09 | % |
| Franklin LifeSmart 2055 Retirement Target Fund | 10,894 | 0.01 | % |
| Franklin Resources, Inc. | 895 | —%a | |
| 21,221,321 | 19.74 | % | |
| a Round to less than 0.01%. | |||
4. Expense Offset Arrangement
The Fund has entered into an arrangement with its custodian whereby credits realized as a result of uninvested cash balances are used to reduce a portion of the Fund’s custodian expenses. During the period ended November 30, 2015, the custodian fees were reduced as noted in the Consolidated Statement of Operations.
franklintempleton.com
Semiannual Report
83
| FRANKLIN | ALTERNATIVE STRATEGIES | FUNDS |
| NOTES TO | CONSOLIDATED FINANCIAL | STATEMENTS (UNAUDITED) |
| Franklin K2 Alternative Strategies Fund (continued) | ||||||||||||||||||||
| 5. Income Taxes | ||||||||||||||||||||
| For tax purposes, capital losses may be carried over to offset future capital gains, if any. At May 31, 2015, there were no capital loss | ||||||||||||||||||||
| carryforwards. | ||||||||||||||||||||
| At November 30, 2015, the cost of investments and net unrealized appreciation (depreciation) for income tax purposes were as | ||||||||||||||||||||
| follows: | ||||||||||||||||||||
| Cost of investments | $ | 932,096,569 | ||||||||||||||||||
| Unrealized appreciation | $ | 30,789,640 | ||||||||||||||||||
| Unrealized depreciation | (26,276,398 | ) | ||||||||||||||||||
| Net unrealized appreciation (depreciation) | $ | 4,513,242 | ||||||||||||||||||
| The difference between cost of investments as determined on a book basis and a tax basis are primarily due to differing treatments | ||||||||||||||||||||
| of foreign currency transactions, bond discounts and premiums, and commodity-based derivatives, investments in the K2 Subsidiary | ||||||||||||||||||||
| and futures. | ||||||||||||||||||||
| 6. Investment Transactions | ||||||||||||||||||||
| Purchases and sales of investments and securities sold short (excluding short term securities) for the period ended November 30, 2015, aggregated $1,158,247,680 and $1,026,873,588, respectively. | ||||||||||||||||||||
| Transactions in options written during the period ended November 30, 2015, were as follows: | ||||||||||||||||||||
| Options | ||||||||||||||||||||
| Number of | Notional | Notional | Swaptions | |||||||||||||||||
| Contracts | Amount* | Premiums | Amount* | Premiums | ||||||||||||||||
| Options outstanding at May 31, 2015 | 3,168 | 2,438,000,000 | KRW | $ | 429,543 | 50,000,000 | MXN | $ | 3,293 | |||||||||||
| Options written | 12,294 | — | 2,047,189 | 6,200,000 | 84,940 | |||||||||||||||
| Options expired | (623 | ) | (2,438,000,000) | KRW | (163,802 | ) | — | — | ||||||||||||
| Options exercised | (138 | ) | — | (40,200 | ) | — | — | |||||||||||||
| Options closed | (11,994 | ) | — | (1,882,576 | ) | (50,000,000) | MXN | (3,293 | ) | |||||||||||
| Options outstanding at November 30, 2015 | 2,707 | — | $ | 390,154 | 6,200,000 | $ | 84,940 | |||||||||||||
| *The notional amount is stated in U.S. dollars unless otherwise indicated | ||||||||||||||||||||
| See Notes 1(e) and 9 regarding derivative financial instruments and other derivative information, respectively. | ||||||||||||||||||||
| See Abbreviations on page 90. | ||||||||||||||||||||
| The Fund sold certain long positions held in the portfolio and simultaneously entered into total return swaps on the positions, retain- | ||||||||||||||||||||
| ing substantially all of the exposure to the economic return and the related risks on the long positions. At November 30, 2015, the | ||||||||||||||||||||
| transfers of financial assets accounted for as sales were as follows: | ||||||||||||||||||||
| At Period Ended | ||||||||||||||||||||
| At Original Transactions Dates | November 30, 2015 | |||||||||||||||||||
| Gross | Fair Value of | Gross | Gross | |||||||||||||||||
| Cost Basis | Cash Received | Transferred | Derivative Assets | Derivative Liabilities | ||||||||||||||||
| of Positions Sold | for Positions Sold | Assetsa | Recordedb | Recordedb | ||||||||||||||||
| Sales and total return swaps | $ | 8,849,709 | $ | 10,105,877 | $ | 524,734 | $ 10,629,349 | $ | 10,104,615 | |||||||||||
| a$560,719 and $35,985 are included as unrealized appreciation and depreciation on OTC swap contracts, respectively, in the Consolidated Statement of Assets and Liabilities. | ||||||||||||||||||||
| See Note 9 regarding other derivative information. | ||||||||||||||||||||
| bBalances are presented on a gross basis, based on each leg of the swap contract, before the application of counterparty and cash collateral offsetting. | ||||||||||||||||||||
84 Semiannual Report
franklintempleton.com
| FRANKLIN ALTERNATIVE STRATEGIES FUNDS |
| NOTES TO CONSOLIDATED FINANCIAL STATEMENTS (UNAUDITED) |
Franklin K2 Alternative Strategies Fund (continued)
7. Credit Risk and Defaulted Securities
The Fund may purchase the pre-default or defaulted debt of distressed companies. Distressed companies are financially troubled and are about to be or are already involved in financial restructuring or bankruptcy. Risks associated with purchasing these securities include the possibility that the bankruptcy or other restructuring process takes longer than expected, or that distributions in restructuring are less than anticipated, either or both of which may result in unfavorable consequences to the Fund. If it becomes probable that the income on debt securities, including those of distressed companies, will not be collected, the Fund discontinues accruing income and recognizes an adjustment for uncollectible interest.
At November 30, 2015, the aggregate long value of distressed company securities for which interest recognition has been discontinued was $13,355,684, representing 1.14% of the Fund’s net assets. For information as to specific securities, see the accompanying Consolidated Statement of Investments.
8. Unfunded Loan Commitments
The Fund enters into certain credit agreements, all or a portion of which may be unfunded. The Fund is obligated to fund these loan commitments at the borrowers’ discretion. Unfunded loan commitments and funded portions of credit agreements are marked to market daily and any unrealized appreciation or depreciation is included in the Consolidated Statement of Assets and Liabilities and the Consolidated Statement of Operations. Funded portions of credit agreements are presented in the Consolidated Statement of Investments.
| At November 30, 2015, unfunded commitments were as follows: | ||
| Unfunded | ||
| Borrower | Commitment | |
| Avago Technologies Ltd., Term Loan B, 3.50%,11/11/22 | $ | 205,000 |
| NXP Semiconductors NV, Term Loan B-1, 3.00%,11/05/20 | 145,000 | |
| $ | 350,000 |
9. Other Derivative Information
At November 30, 2015, the Fund’s investments in derivative contracts are reflected in the Consolidated Statement of Assets and Liabilities as follows:
| Asset Derivatives | Liability Derivatives | |||||||
| Derivative Contracts | Consolidated Statement | Consolidated Statement | ||||||
| Not Accounted for as | of Assets and | of Assets and | ||||||
| Hedging Instruments | Liabilities Location | Fair Value | Liabilities Location | Fair Value | ||||
| Interest rate contracts | Investments in securities, at | $ | 122,934 | a | Options written, at value | $ | 31,260 | |
| value | ||||||||
| Variation margin | 659,271 | b | Variation margin | 97,534 | b | |||
| Unrealized appreciation on | 24,409 | |||||||
| OTC swap contracts | ||||||||
| Foreign exchange contracts | Investments in securities, at | 1,558 | a | |||||
| value | ||||||||
| Unrealized appreciation on | 6,338,703 | Unrealized depreciation on | 5,755,282 | |||||
| OTC forward exchange | OTC forward exchange | |||||||
| contracts | contracts | |||||||
franklintempleton.com
Semiannual Report
85
| FRANKLIN | ALTERNATIVE STRATEGIES | FUNDS |
| NOTES TO | CONSOLIDATED FINANCIAL | STATEMENTS (UNAUDITED) |
| Franklin K2 Alternative Strategies Fund (continued) | ||||||||
| 9. Other Derivative Information (continued) | ||||||||
| Asset Derivatives | Liability Derivatives | |||||||
| Derivative Contracts | Consolidated Statement | Consolidated Statement | ||||||
| Not Accounted for as | of Assets and | of Assets and | ||||||
| Hedging Instruments | Liabilities Location | Fair Value | Liabilities Location | Fair Value | ||||
| Credit contracts | Variation margin | $ | 319,226 | b | Variation margin | $ | 63,282 | b |
| OTC swap contracts (upfront | 707,515 | OTC swap contracts (upfront | 206,499 | |||||
| payments) | receipts) | |||||||
| Unrealized appreciation on | 243,818 | Unrealized depreciation on | 99,505 | |||||
| OTC swap contracts | OTC swap contracts | |||||||
| Equity contracts | Investments in securities, at | 3,382,480 | a | Options written, at value | 353,183 | |||
| value | ||||||||
| Variation margin | 1,441,329 | b | Variation margin | 608,578 | b | |||
| Unrealized appreciation on | 4,569,085 | Unrealized depreciation on | 3,550,177 | |||||
| OTC swap contracts | OTC swap contracts | |||||||
| Commodity contracts | Variation margin | 2,920,608 | b | Variation margin | 612,733 | b | ||
| Totals | $ | 20,730,936 | $ | 11,378,033 | ||||
aPurchased option contracts are included in investments in securities, at value in the Consolidated Statement of Assets and Liabilities.
bThis amount reflects the cumulative appreciation (depreciation) of future contracts and centrally cleared swaps contracts as reported in the Consolidated Statement of
Investments. Only the variation margin receivable/payable at period end is separately reported within the Consolidated Statement of Assets and Liabilities. Prior variation
margin movements were recorded to cash upon receipt or payment.
For the period ended November 30, 2015, the effect of derivative contracts in the Fund’s Consolidated Statement of Operations was
as follows:
| Net Change in | ||||||||
| Unrealized | ||||||||
| Derivative Contracts | Net Realized | Appreciation | ||||||
| Not Accounted for as | Consolidated Statement of | Gain (Loss) | Consolidated Statement of | (Depreciation) | ||||
| Hedging Instruments | Operations Location | for the Period | Operations Location | for the Period | ||||
| Net realized gain (loss) from: | Net change in unrealized | |||||||
| appreciation (depreciation) on: | ||||||||
| Interest rate contracts | Investments | $ | (111,169 | )a | Investments | $ | (39,197 | )a |
| Written options | 3,115 | Written options | 52,737 | |||||
| Futures contracts | (357,473 | ) | Futures contracts | 412,280 | ||||
| Swap contracts | 30,965 | Swap contracts | 14,012 | |||||
| Foreign exchange contracts | Investments | 121,913 | a | Investments | (12,479 | )a | ||
| Written options | 201 | Written options | 1,832 | |||||
| Foreign currency | 456,060 | b | Translation of other assets | 1,115,222 | b | |||
| transactions | and liabilities denominated | |||||||
| in foreign currencies | ||||||||
| Credit contracts | Swap contracts | 177,882 | Swap contracts | 443,229 | ||||
| Equity contracts | Investments | (1,107,076 | )a | Investments | (604,048 | )a | ||
| Written options | (122,813 | ) | Written options | 138,186 | ||||
| Futures contracts | (2,960,709 | ) | Futures contracts | 397,362 | ||||
| Swap contracts | (433,381 | ) | Swap contracts | 970,827 | ||||
| Commodity contracts | Futures contracts | 1,632,026 | Futures contracts | 2,370,004 | ||||
| Totals | $ | (2,670,459 | ) | $ | 5,259,967 | |||
86 Semiannual Report
franklintempleton.com
| FRANKLIN ALTERNATIVE STRATEGIES FUNDS |
| NOTES TO CONSOLIDATED FINANCIAL STATEMENTS (UNAUDITED) |
Franklin K2 Alternative Strategies Fund (continued)
a Purchased option contracts are included in net realized gain (loss) from investments and net change in unrealized appreciation (depreciation) on investments in the Con-
solidated Statement of Operations.
b Forward exchange contracts are included in net realized gain (loss) from foreign currency transactions and net change in unrealized appreciation (depreciation) translation of
other assets and liabilities denominated in foreign currencies in the Consolidated Statement of Operations.
For the period ended November 30, 2015, the average month end fair value of derivatives represented 2.25% of average month end
net assets. The average month end number of open derivative contracts for the period was 790.
At November 30, 2015, the Fund’s OTC derivative assets and liabilities are as follows:
| Gross and Net Amounts | ||||
| of Assets and Liabilities | ||||
| Presented in the | ||||
| Consolidated Statement of | ||||
| Assets and Liabilities | ||||
| Assetsa | Liabilitiesa | |||
| Derivatives | ||||
| Forward Exchange Contracts | $ | 6,338,703 | $ | 5,755,282 |
| Options Purchased | 124,492 | — | ||
| Options Written | — | 31,260 | ||
| Swap Contracts | 5,544,827 | 3,856,181 | ||
| Total | $ | 12,008,022 | $ | 9,642,723 |
aAbsent an event of default or early termination, OTC derivative assets and liabilities are presented gross and not offset in the Consolidated Statements of Assets and Liabilities.
At November 30, 2015, the Fund’s OTC derivative assets, which may be offset against the Fund’s OTC derivative liabilities and collateral received from the counterparty, are as follows:
| Amounts Not Offset in the Consolidated | |||||||||||||
| Statement of Assets and Liabilities | |||||||||||||
| Gross and Net | |||||||||||||
| Amounts of Assets | Financials | ||||||||||||
| Presented in the | Financial | Instruments | Cash | ||||||||||
| Consolidated Statement of | Instruments | Collateral | Collateral | Net Amount (Not | |||||||||
| Assets and Liabiliites | Available for Offset | Receiveda | Receiveda | Less than Zero) | |||||||||
| Counterparty | |||||||||||||
| BNYM | $ | 904,586 | $ | — | $ | — | $ | — | $ | 904,586 | |||
| BOFA | 158,951 | (51,982 | ) | — | — | 106,969 | |||||||
| BZWS | 86,278 | (5,907 | ) | — | — | 80,371 | |||||||
| CITI | 189,722 | — | — | — | 189,722 | ||||||||
| CSFB | 6,992 | — | — | — | 6,992 | ||||||||
| DBFX | 2,706,198 | (2,687,025 | ) | — | (19,173 | ) | — | ||||||
| JPHQ | 123,166 | (123,166 | ) | — | — | — | |||||||
| MLCO | 204,124 | — | — | — | 204,124 | ||||||||
| MSCO | 1,725,938 | (369,376 | ) | — | (690,000 | ) | 666,562 | ||||||
| MSCOc | 3,340,746 | (3,340,746 | ) | — | — | — | |||||||
| MSCS | 2,561,321 | (1,134,416 | ) | — | — | 1,426,905 | |||||||
| Total | $ | 12,008,022 | $ | (7,712,618 | ) | $ | — | $ | (709,173 | ) | $ | 3,586,231 | |
franklintempleton.com
Semiannual Report
87
| FRANKLIN | ALTERNATIVE STRATEGIES | FUNDS |
| NOTES TO | CONSOLIDATED FINANCIAL | STATEMENTS (UNAUDITED) |
Franklin K2 Alternative Strategies Fund (continued)
9. Other Derivative Information (continued)
At November 30, 2015, the Fund’s OTC derivative liabilities, which may be offset against the Fund’s OTC derivative assets and collateral pledged to the counterparty, are as follows:
| Amounts Not Offset in the Consolidated | |||||||||||||
| Statement of Assets and Liabilities | |||||||||||||
| Gross and Net | |||||||||||||
| Amounts of Liabilities | Financials | ||||||||||||
| Presented in the | Financial | Instruments | Cash | ||||||||||
| Consolidated Statement of | Instruments | Collateral | Collateral | Net Amount (Not | |||||||||
| Assets and Liabiliites | Available for Offset | Pledgeda,b | Pledgeda | Less than Zero) | |||||||||
| Counterparty | |||||||||||||
| BNYM | $ | 13,952 | $ | — | $ | — | $ | — | $ | 13,952 | |||
| BOFA | 51,982 | (51,982 | ) | — | — | — | |||||||
| BZWS | 5,907 | (5,907 | ) | — | — | — | |||||||
| CITI | — | — | — | — | — | ||||||||
| CSFB | 21,003 | — | — | — | 21,003 | ||||||||
| DBFX | 2,687,025 | (2,687,025 | ) | — | — | — | |||||||
| JPHQ | 156,703 | (123,166 | ) | — | — | 33,537 | |||||||
| MLCO | 98,889 | — | — | — | 98,889 | ||||||||
| MSCO | 369,376 | (369,376 | ) | — | — | — | |||||||
| MSCOc | 5,103,470 | (3,340,746 | ) | — | (1,762,724 | ) | — | ||||||
| MSCS | 1,134,416 | (1,134,416 | ) | — | — | — | |||||||
| Total | $ | 9,642,723 | $ | (7,712,618 | ) | $ | — | $ | (1,762,724 | ) | $ | 167,381 | |
aIn some instances, the collateral amounts disclosed in the table above were adjusted due to the requirement to limit collateral amounts to avoid the effect of over-
collateralization. Actual collateral received and/or pledged may be more than the amounts disclosed herein.
bSee the accompanying Consolidated Statement of Investments for securities pledged as collateral for derivatives.
cRepresents derivatives owned by the K2 Holdings Investment Corp., a wholly-owned subsidiary of the Fund. See Note 1(h).
See Notes 1(e) and 6 regarding derivative financial instruments and investment transactions, respectively.
See Abbreviations on page 90.
10. Credit Facility
The Fund, together with other U.S. registered and foreign investment funds (collectively, Borrowers), managed by Franklin Temple-ton Investments, are borrowers in a joint syndicated senior unsecured credit facility totaling $2 billion (Global Credit Facility) which matures on February 12, 2016. This Global Credit Facility provides a source of funds to the Borrowers for temporary and emergency purposes, including the ability to meet future unanticipated or unusually large redemption requests.
Under the terms of the Global Credit Facility, the Fund shall, in addition to interest charged on any borrowings made by the Fund and other costs incurred by the Fund, pay its share of fees and expenses incurred in connection with the implementation and maintenance of the Global Credit Facility, based upon its relative share of the aggregate net assets of all of the Borrowers, including an annual commitment fee of 0.07% based upon the unused portion of the Global Credit Facility. These fees are reflected in other expenses in the Consolidated Statement of Operations. During the period ended November 30, 2015, the Fund did not use the Global Credit Facility.
88 Semiannual Report
franklintempleton.com
| FRANKLIN ALTERNATIVE STRATEGIES FUNDS |
| NOTES TO CONSOLIDATED FINANCIAL STATEMENTS (UNAUDITED) |
Franklin K2 Alternative Strategies Fund (continued)
11. Fair Value Measurements
The Fund follows a fair value hierarchy that distinguishes between market data obtained from independent sources (observable inputs) and the Fund’s own market assumptions (unobservable inputs). These inputs are used in determining the value of the Fund’s financial instruments and are summarized in the following fair value hierarchy:
- Level 1 – quoted prices in active markets for identical financial instruments
- Level 2 – other significant observable inputs (including quoted prices for similar financial instruments, interest rates, prepay- ment speed, credit risk, etc.)
- Level 3 – significant unobservable inputs (including the Fund’s own assumptions in determining the fair value of financial instruments)
The input levels are not necessarily an indication of the risk or liquidity associated with financial instruments at that level.
For movements between the levels within the fair value hierarchy, the Fund has adopted a policy of recognizing the transfers as of the date of the underlying event which caused the movement.
A summary of inputs used as of November 30, 2015, in valuing the Fund’s assets and liabilities carried at fair value, is as follows:
| Level 1 | Level 2 | Level 3 | Total | |||||
| Assets: | ||||||||
| Investments in Securities: | ||||||||
| Common Stocks and Other Equity Interestsa | $ | 423,418,136 | $ | — | $ | —b | $ | 423,418,136 |
| Exchange Traded Funds | 1,838,561 | — | — | 1,838,561 | ||||
| Convertible Preferred Stocks | 4,193,096 | 1,830,316 | — | 6,023,412 | ||||
| Preferred Stocks | 3,356,323 | 204,411 | — | 3,560,734 | ||||
| Convertible Bonds | — | 104,118,504 | — | 104,118,504 | ||||
| Convertible Bonds in Reorganization | — | 33,400 | — | 33,400 | ||||
| Corporate Bonds and Notes | — | 185,094,682 | — | 185,094,682 | ||||
| Corporate Bonds and Notes in Reorganization | — | 3,392,795 | 29,775 | 3,422,570 | ||||
| Senior Floating Rate Interests | — | 4,838,801 | — | 4,838,801 | ||||
| Foreign Government and Agency Securities | — | 21,804,923 | — | 21,804,923 | ||||
| Foreign Government and Agency Securities in Reorganization | — | 9,899,714 | — | 9,899,714 | ||||
| Asset-Backed Securities and Commercial Mortgage-Backed | ||||||||
| Securities | — | 16,555,021 | — | 16,555,021 | ||||
| Options Purchased | 3,382,480 | 124,492 | — | 3,506,972 | ||||
| U.S. Government and Agency Securities | — | 3,882,558 | — | 3,882,558 | ||||
| Short Term Investments | 103,828,344 | 44,783,479 | — | 148,611,823 | ||||
| Total Investments in Securities | $ | 540,016,940 | $ | 396,563,096 | $ | 29,775 | $ | 936,609,811 |
| Other Financial Instruments | ||||||||
| Futures Contracts | $ | 5,021,208 | $ | — | $ | — | $ | 5,021,208 |
| Forward Exchange Contracts | — | 6,338,703 | — | 6,338,703 | ||||
| Swap Contracts | — | 5,156,538 | — | 5,156,538 | ||||
| Unfunded Loan Commitments | — | 1,292 | — | 1,292 | ||||
| Total Other Financial Instruments | $ | 5,021,208 | $ | 11,496,533 | $ | — | $ | 16,517,741 |
franklintempleton.com
Semiannual Report
89
| FRANKLIN | ALTERNATIVE STRATEGIES | FUNDS |
| NOTES TO | CONSOLIDATED FINANCIAL | STATEMENTS (UNAUDITED) |
| Franklin K2 Alternative Strategies Fund (continued) | ||||||||
| 11. Fair Value Measurements (continued) | ||||||||
| Level 1 | Level 2 | Level 3 | Total | |||||
| Liabilities: | ||||||||
| Other Financial Instruments | ||||||||
| Options Written | $ | 353,183 | $ | 31,260 | $ | — | $ | 384,443 |
| Securities Sold Shorta | 238,236,868 | 24,480,990 | — | 262,717,858 | ||||
| Futures Contracts | 1,318,845 | — | — | 1,318,845 | ||||
| Forward Exchange Contracts | — | 5,755,282 | — | 5,755,282 | ||||
| Swap Contracts | — | 3,712,964 | — | 3,712,964 | ||||
| Total Other Financial Instruments | $ | 239,908,896 | $ | 33,980,496 | $ | — | $ | 273,889,392 |
aFor detailed categories, see the accompanying Consolidated Statement of Investments.
bIncludes securities determined to have no value at November 30, 2015.
A reconciliation of assets in which Level 3 inputs are used in determining fair value is presented when there are significant Level 3
financial instruments at the end of the period.
12. Subsequent Events
The Fund has evaluated subsequent events through the issuance of the consolidated financial statements and determined that no
events have occurred that require disclosure.
| Abbreviations | |||||
| Counterparty/Exchange | Currency | Selected Portfolio | |||
| BNYM | The Bank of New York Mellon | AUD | Australian Dollar | ABS | Asset Backed Security |
| BOFA | Bank of America Corp | BRL | Brazilian Real | ADR | American Depositary Receipt |
| BZWS | Barclays Bank PLC | CAD | Canadian Dollar | ARM | Adjustable Rate Mortgage |
| CITI | Citigroup, Inc. | CHF | Swiss Franc | CMO | Collateralized Mortgage Obligation |
| CSFB | Credit Suisse First Boston | CNY | Chinese Yuan | ETF | Exchange Traded Fund |
| DBFX | Deutsche Bank AG | COP | Colombian Peso | FDIC | Federal Deposit Insurance Corporation |
| ICE | Intercontinental Exchange, Inc. | EUR | Euro | FRN | Floating Rate Note |
| JPHQ | JP Morgan Chase & Co. | GBP | British Pound | FTSE | Financial Times Stock Exchange |
| MLCO | Merrill Lynch & Co., Inc. | HKD | Hong Kong Dollar | PIK | Payment In-Kind |
| MSCO | Morgan Stanley & Co., Inc. | JPY | Japanese Yen | REIT | Real Estate Investment Trust |
| MSCS | Morgan Stanley Capital Services | KRW | Korean Won | SPDR | Standard & Poor’s Depositary Receipt |
| MXN | Mexican Peso | ||||
| MYR | Malaysian Ringgit | ||||
| SEK | Swedish Krona | ||||
| SGD | Singapore Dollar | ||||
| USD | United States Dollar | ||||
| ZAR | South African Rand | ||||
90 Semiannual Report
franklintempleton.com
FRANKLIN ALTERNATIVE STRATEGIES FUNDS
FRANKLIN K2 ALTERNATIVE STRATEGIES FUND
Shareholder Information
Proxy Voting Policies and Procedures
The Fund’s investment manager has established Proxy Voting Policies and Procedures (Policies) that the Fund uses to determine how to vote proxies relating to portfolio securities. Shareholders may view the Fund’s complete Policies online at franklintempleton.com. Alternatively, shareholders may request copies of the Policies free of charge by calling the Proxy Group collect at (954) 527-7678 or by sending a written request to: Franklin Templeton Companies, LLC, 300 S.E. 2nd Street, Fort Lauderdale, FL 33301, Attention: Proxy Group. Copies of the Fund’s proxy voting records are also made available online at franklintempleton.com and posted on the U.S. Securities and Exchange Commission’s website at sec.gov and reflect the most recent 12-month period ended June 30.
Quarterly Statement of Investments
The Fund files a complete statement of investments with the U.S. Securities and Exchange Commission for the first and third quarters for each fiscal year on Form N-Q. Shareholders may view the filed Form N-Q by visiting the Commission’s website at sec.gov. The filed form may also be viewed and copied at the Commission’s Public Reference Room in Washington, DC. Information regarding the operations of the Public Reference Room may be obtained by calling (800) SEC-0330.
franklintempleton.com
Semiannual Report
91
Visit franklintempleton.com for fund updates, to access your account, or to find helpful financial planning tools.
2 Semiannual Report
franklintempleton.com
Semiannual Report
Franklin Pelagos Commodities Strategy Fund
This semiannual report for Franklin Pelagos Commodities Strategy Fund covers the period ended November 30, 2015.
Your Fund’s Goal and Main Investments
The Fund seeks long-term total return. It invests mainly in commodity-linked derivative instruments and securities of the U.S. government, its agencies and instrumentalities and other fixed income securities.
Performance Overview
The Fund’s Class A shares had a -17.42% cumulative total return for the six months under review. In comparison, its benchmark, the Bloomberg Commodity Index, which measures performance of exchange-traded futures contracts on physical commodities, had a -19.66% total return for the same period.1 You can find more of the Fund’s performance data in the Performance Summary beginning on page 7.
Performance data represent past performance, which does not guarantee future results. Investment return and principal value will fluctuate, and you may have a gain or loss when you sell your shares. Current performance may differ from figures shown. For most recent month-end performance, go to franklintempleton.com or call (800) 342-5236.
What is a futures contract?
A futures contract, or a future, is an agreement between the Fund and a counterparty made through a U.S. or foreign futures exchange to buy or sell an underlying instrument or asset at a specific price on a future date.
Economic and Market Overview
U.S. economic growth improved during the six months under review amid healthy consumer spending. The economy strengthened in the second quarter but moderated in the third quarter as businesses cut back on inventories, exports slowed, and state and local governments reduced their spending. Manufacturing activities expanded for most of the period but contracted toward period-end. Non-manufacturing activities, however, increased throughout the six-month period, contributing to new jobs and helping drive down the unemployment rate to 5.0% at period-end, the lowest level in more than seven years.2 Home prices rose as new and existing home sales slowed and mortgage rates remained low. Retail sales grew modestly, driven by automobile and auto component sales. Inflation remained subdued, but after two consecutive declines, monthly inflation, as measured by the Consumer Price Index, rose modestly in October and held steady through November.
During the six-month period, the Federal Reserve (Fed) kept its target interest rate at 0%–0.25% while considering when an increase might be appropriate. Although global financial markets anticipated an increase, the Fed kept interest rates unchanged and said it expected moderate economic expansion, but it would monitor developments domestically and abroad. The Fed’s October meeting minutes indicated that most members acknowledged the possibility of an interest rate increase at their next meeting.
Although U.S. stock markets experienced sell-offs at times during the period, investors generally remained confident as the Fed kept its target interest rate low, the eurozone economy improved, China implemented more stimulus measures and Greece reached an agreement with its creditors. U.S. stocks rallied in the period’s second half amid easing concerns about China’s economy and increased optimism that certain central banks might introduce additional stimulus measures. In this environment, the broad U.S. stock market, as measured by the Standard & Poor’s 500 Index, declined modestly. Commodity prices, as measured by the Bloomberg Commodity Index, were sharply lower for the six-month period. Oil and metal prices fell due to weak global demand and strong supply, while gold prices declined as a result of a strong U.S. dollar. Among agricultural commodities, sugar and corn rose in value while wheat and soybeans declined.
1. Source: Morningstar.
The index is unmanaged and includes reinvestment of any income or distributions. One cannot investment directly in an index, and an index is not representative of the
Fund’s portfolio.
2. Source: Bureau of Labor Statistics.
See www.franklintempletondatasources.com for additional data provider information.
The dollar value, number of shares or principal amount, and names of all portfolio holdings are listed in the Fund’s Consolidated Statement of
Investments (SOI). The Consolidated SOI begins on page 17.
franklintempleton.com
Semiannual Report 3
FRANKLIN PELAGOS COMMODITIES STRATEGY FUND
Investment Strategy
We utilize an actively managed fundamental and quantitative investment process to provide exposure to the commodities markets by investing in commodity-linked derivative instruments including commodity-linked total return swaps, commodity futures, commodity index futures and options on commodity futures and commodity index futures, which may provide exposure to foreign and emerging markets. By investing in these derivative instruments, we seek to gain exposure to the returns of real assets that trade in the commodities markets without direct investment in physical commodities. Real assets include such things as industrial and precious metals, gas, oil, livestock, agricultural or meat products and other items.
What is a swap agreement?
A swap agreement, such as a commodity-linked total return swap, is a contract between the Fund and a counterparty to exchange on a future date the returns, or differentials in rates of return, that would have been earned or realized if a notional amount were invested in specific instruments.
What is an option?
An option is a contract to buy or sell a specific financial product known as the option’s underlying instrument at a specific price. The buyer of an option has the right, but not the obligation, to buy or sell the underlying instrument at or until a specified expiration date. Conversely, the seller (“writer”) of an option who opens a transaction is obligated to buy or sell the underlying instrument should the option holder exercise that right.
Manager’s Discussion
During its semiannual period, the Fund obtained its commodities exposure through swaps on commodity indexes and through commodities futures and options on commodities futures. These exposures were supported with U.S. Treasury bills and other fixed income securities.
During the period under review, overall energy positioning detracted significantly from the Fund’s returns. All other commodity sectors detracted from returns as well. Ample global supplies of commodities across the spectrum were met with deteriorating global growth expectations and a rising U.S. dollar. Relative to the benchmark Bloomberg Commodity Index, however, the Fund performed well due to positioning in energy, metals and livestock. Although the Fund’s energy sector positioning hurt absolute performance, it was a major contributor to relative performance, followed by industrial metals. In contrast, the Fund’s positioning in agriculture detracted from absolute and relative performance.
In the energy sector, a decline in U.S. oil production counteracted by an increase in production by the Organization of the Petroleum Exporting Countries perpetuated the global oversupply of crude oil, despite strong refinery demand. Furthermore, the progression of Iranian sanction relief signaled even more crude oil would reach the water-borne markets, especially in Asia. Gasoline fared relatively better in the petroleum complex over the period given exceptional demand growth and strained U.S. production. Gasoline is a relatively difficult petroleum product to produce, especially summer-grade gasoline. During the period, several factors tightened the U.S. gasoline market. For example, numerous oil refineries experienced unplanned outages, and a major Canadian refinery began lengthy planned maintenance. The Fund’s positioning in petroleum commodities supported relative returns during most of the period as the Fund’s active management strategy looked to seasonal and fundamental influences in the petroleum markets. U.S. natural gas inventory rose to record levels as production peaked amid a benign environment for cooling and heating demand. The Fund’s natural gas positioning benefited relative returns, with most of the differential occurring in November given the Fund’s avoidance of near-term delivery contract exposure because of mild North American weather caused by the weather condition known as El Niño.
In metals, industrial metals prices declined across the board with few signals of production curtailments to curb the declines. A dominant concern was China’s economic slowdown, as it affected demand growth expectations, while
| Portfolio Breakdown* | ||
| 11/30/15 | ||
| % of Consolidated | ||
| Net Assets | ||
| U.S. Treasury Bill | 56.3 | % |
| U.S. Treasury Note | 28.4 | % |
| FFCB | 15.0 | % |
| FHLB | 2.4 | % |
| Institutional Fiduciary Trust Money Market Portfolio | 2.4 | % |
| Other Assets, less Liabilities** | -4.5 | % |
| See Abbreviations on page 32. | ||
| *Portfolio breakdown figures are stated as a percentage of total and may not equal | ||
| 100% or may be negative due to rounding, use of any derivatives, unsettled trades | ||
| or other factors. | ||
| **Includes unrealized appreciation/depreciation on open futures and swap con- | ||
| tracts, as well as other assets and liabilities. See supplementary commodity | ||
| exposure tables on page 5 for additional information related to the Fund’s economic | ||
| exposure to commodities. | ||
4 Semiannual Report
franklintempleton.com
FRANKLIN PELAGOS COMMODITIES STRATEGY FUND
domestic production of copper, aluminum, nickel and zinc showed few signs of adjustment or discipline. Prospects for Fed tightening provided additional headwinds to industrial and precious metals prices. With inflationary concerns sidelined, the total known exchange-traded fund holdings of gold declined moderately over the period, reflecting a major drop from peak levels in 2012. Although the Fund’s overall metals positioning detracted from absolute returns, our use of relative valuation techniques within metals helped deliver positive performance versus the Fund’s benchmark.
In agriculture, the U.S. produced record corn and soybean crops largely due to supportive weather and ample yields. Additionally, world wheat production rose to a record level. Although Fund positioning in grains detracted from absolute and relative returns and soybean prices declined, soybean oil contributed to absolute and relative performance. Soybean oil prices were supported by conditions in Southeast Asia, where El Niño caused concern about a lack of precipitation. El Niño also raised concern for rains in Brazil that impacted sugar prices after a period of ample global supply. Furthermore, the shifting use of sugar toward ethanol production in Brazil additionally supported sugar prices. The Fund’s positioning in sugar contributed to absolute returns over the period. In livestock, the U.S. inventory of cold beef and pork storage rose to seasonally high levels, which pressured prices. Although livestock positioning detracted from absolute Fund returns, we believe active management through using our analysis of seasonal trends and fundamentals contributed to livestock’s positive relative performance.
Fund Exposure to Commodities
The following table summarizes the Fund’s economic exposure to commodities derived through its investment in commodity-linked total return swap contracts. At November 30, 2015, the Fund’s exposure based on notional value represented 79.6% of consolidated net assets.
Commodity-Linked Total Return Swap Exposure*
| % of Consolidated Net Assets | ||
| Unleaded Gasoline | 15.4 | % |
| Natural Gas | 8.3 | % |
| Wheat | 7.2 | % |
| Gold | 6.8 | % |
| Soybean Oil | 5.3 | % |
| Sugar | 5.3 | % |
| Soybean Meal | 5.3 | % |
| Kansas Wheat | 4.9 | % |
| Lean Hogs | 4.9 | % |
| Zinc | 4.6 | % |
| Copper | 4.6 | % |
| Silver | 4.5 | % |
| Coffee | 2.5 | % |
| * Figures are stated as a percentage of total and may not equal 100% or may be | ||
| negative due to rounding, use of any derivatives, unsettled trades or other factors. | ||
| The Fund’s exposure was calculated using the commodity sector weightings of the | ||
| FP Custom Master Index multiplied by the Fund’s percentage notional exposure. | ||
The following table summarizes the Fund’s economic exposure to commodities derived through its investment in futures contracts. At November 30, 2015, the Fund’s exposure based on notional value represented 19.1% of consolidated net assets.
Commodity Futures Exposure*
% of Consolidated Net Assets Long
| Gold 100 Ounce | 11.6 | % |
| WTI Crude Oil | 7.5 | % |
*Figures are stated as a percentage of total and may not equal 100% or may be negative due to rounding, use of any derivatives, unsettled trades or other factors.
franklintempleton.com
Semiannual Report 5
FRANKLIN PELAGOS COMMODITIES STRATEGY FUND
As fellow shareholders, we were disappointed with the Fund’s absolute performance in the recent challenging environment for commodities. However, we remain committed to our active investment process and long-term perspective, keeping in mind that volatility is not uncommon for commodities markets. Thank you for your continued participation in Franklin Pelagos Commodities Strategy Fund. We look forward to continuing to serve your financial needs.

The foregoing information reflects our analysis, opinions and portfolio holdings as of November 30, 2015, the end of the reporting period. The way we implement our main investment strategies and the resulting portfolio holdings may change depending on factors such as market and economic conditions. These opinions may not be relied upon as investment advice or an offer for a particular security. The information is not a complete analysis of every aspect of any market, country, industry, security or the Fund. Statements of fact are from sources considered reliable, but the investment manager makes no representation or warranty as to their completeness or accuracy. Although historical performance is no guarantee of future results, these insights may help you understand our investment management philosophy.
6 Semiannual Report
franklintempleton.com
FRANKLIN PELAGOS COMMODITIES STRATEGY FUND
Performance Summary as of November 30, 2015
Your dividend income will vary depending on dividends or interest paid by securities in the Fund’s portfolio, adjusted for operating expenses of each class. Capital gain distributions are net profits realized from the sale of portfolio securities. The performance table does not reflect any taxes that a shareholder would pay on Fund dividends, capital gain distributions, if any, or any realized gains on the sale of Fund shares. Total return reflects reinvestment of the Fund’s dividends and capital gain distributions, if any, and any unrealized gains or losses.
| Net Asset Value | ||||||
| Share Class (Symbol) | 11/30/15 | 5/31/15 | Change | |||
| A (FLSQX) | $ | 5.88 | $ | 7.12 | -$ | 1.24 |
| C (FLSVX) | $ | 5.80 | $ | 7.05 | -$ | 1.25 |
| R (FLSWX) | $ | 5.86 | $ | 7.10 | -$ | 1.24 |
| R6 (FPELX) | $ | 5.93 | $ | 7.16 | -$ | 1.23 |
| Advisor (FSLPX) | $ | 6.00 | $ | 7.25 | -$ | 1.25 |
franklintempleton.com
Semiannual Report 7
FRANKLIN PELAGOS COMMODITIES STRATEGY FUND
PERFORMANCE SUMMARY
Performance as of 11/30/151
Cumulative total return excludes sales charges. Average annual total returns and value of $10,000 investment include maximum sales charges. Class A: 5.75% maximum initial sales charge; Class C: 1% contingent deferred sales charge in first year only;
Class R/R6/Advisor Class: no sales charges.
| Value of | Average Annual | |||||||||||
| Cumulative | Average Annual | $ | 10,000 | Total Return | Total Annual Operating Expenses6 | |||||||
| Share Class | Total Return2 | Total Return3 | Investment4 | (12/31/15 | )5 | (with waiver) | (without waiver) | |||||
| A | 1.20 | % | 2.19 | % | ||||||||
| 6-Month | -17.42 | % | -22.12 | % | $ | 7,788 | ||||||
| 1-Year | -26.59 | % | -30.82 | % | $ | 6,918 | -26.46 | % | ||||
| Since Inception (1/10/14) | -33.78 | % | -22.09 | % | $ | 6,242 | -21.93 | % | ||||
| C | 1.95 | % | 2.94 | % | ||||||||
| 6-Month | -17.73 | % | -18.55 | % | $ | 8,145 | ||||||
| 1-Year | -27.04 | % | -27.77 | % | $ | 7,223 | -23.36 | % | ||||
| Since Inception (1/10/14) | -34.68 | % | -20.20 | % | $ | 6,532 | -20.20 | % | ||||
| R | 1.45 | % | 2.44 | % | ||||||||
| 6-Month | -17.46 | % | -17.46 | % | $ | 8,254 | ||||||
| 1-Year | -26.66 | % | -26.66 | % | $ | 7,334 | -22.19 | % | ||||
| Since Inception (1/10/14) | -34.01 | % | -19.76 | % | $ | 6,599 | -19.77 | % | ||||
| R6 | 0.73 | % | 1.72 | % | ||||||||
| 6-Month | -17.18 | % | -17.18 | % | $ | 8,282 | ||||||
| 1-Year | -26.24 | % | -26.24 | % | $ | 7,376 | -21.67 | % | ||||
| Since Inception (1/10/14) | -33.22 | % | -19.26 | % | $ | 6,678 | -19.28 | % | ||||
| Advisor | 0.95 | % | 1.94 | % | ||||||||
| 6-Month | -17.24 | % | -17.24 | % | $ | 8,276 | ||||||
| 1-Year | -26.29 | % | -26.29 | % | $ | 7,371 | -21.78 | % | ||||
| 3-Year | -41.63 | % | -16.43 | % | $ | 5,837 | -16.26 | % | ||||
| Since Inception (12/7/11) | -40.00 | % | -12.04 | % | $ | 6,000 | -12.21 | % | ||||
Performance data represent past performance, which does not guarantee future results. Investment return and principal value will fluctuate, and you may have a gain or loss when you sell your shares. Current performance may differ from figures shown. For most recent month-end performance, go to franklintempleton.com or call (800) 342-5236.
See page 9 for Performance Summary footnotes.
8 Semiannual Report
franklintempleton.com
FRANKLIN PELAGOS COMMODITIES STRATEGY FUND
PERFORMANCE SUMMARY
All investments involve risks, including possible loss of principal. Investing in physical commodities, either directly or through complex instruments such as commodity-linked total return swaps, commodity futures, commodity index futures and options on commodity futures and commodities index futures, presents unique risks, is speculative and can be extremely volatile. Market prices of commodities may fluctuate rapidly based on numerous factors, including: changes in supply and demand relationships; weather; agriculture; trade; domestic and foreign political and economic events and policies; diseases; pestilence; technological developments; currency exchange rate fluctuations; and monetary and other governmental policies, action and inaction. Derivative instruments involve costs and can create leverage in the Fund’s portfolio, which may result in significant volatility and cause the Fund to participate in losses (as well as gains) in an amount that significantly exceeds the Fund’s initial investment. The Fund may not achieve the anticipated benefits and may realize losses, which could be significant. Bond prices generally move in the opposite direction of interest rates. Thus, as prices of bonds in the Fund adjust to a rise in interest rates, the Fund’s share price may decline. Foreign investing carries additional risks such as currency and market volatility and political, social and economic instability, risks which are heightened in less developed or emerging market countries. The Fund is actively managed but there is no guarantee that the manager’s investment decisions will produce the desired results. The Fund’s prospectus also includes a description of the main investment risks.
Class C: Class R: Class R6: Advisor Class: | These shares have higher annual fees and expenses than Class A shares. Shares are available to certain eligible investors as described in the prospectus. These shares have higher annual fees and expenses than Class A shares. Shares are available to certain eligible investors as described in the prospectus. Shares are available to certain eligible investors as described in the prospectus. |
1. The Fund has an expense reduction contractually guaranteed through at least 9/30/16, a fee waiver related to the management fee paid by a subsidiary, and a fee waiver
associated with any investment in a Franklin Templeton money fund, contractually guaranteed through at least its current fiscal year-end. Fund investment results reflect the
expense reduction and fee waivers, to the extent applicable; without these reductions, the results would have been lower.
2. Cumulative total return represents the change in value of an investment over the periods indicated.
3. Average annual total return represents the average annual change in value of an investment over the periods indicated. Return for less than one year, if any, has not been
annualized.
4. These figures represent the value of a hypothetical $10,000 investment in the Fund over the periods indicated.
5. In accordance with SEC rules, we provide standardized average annual total return information through the latest calendar quarter.
6. Figures are as stated in the Fund’s current prospectus. In periods of market volatility, assets may decline significantly, causing total annual Fund operating expenses to
become higher than the figures shown.
franklintempleton.com
Semiannual Report 9
FRANKLIN PELAGOS COMMODITIES STRATEGY FUND
Your Fund’s Expenses
As a Fund shareholder, you can incur two types of costs:
- Transaction costs, including sales charges (loads) on Fund purchases; and
- Ongoing Fund costs, including management fees, distribution and service (12b-1) fees, and other Fund expenses. All mutual funds have ongoing costs, sometimes referred to as operating expenses.
The following table shows ongoing costs of investing in the Fund and can help you understand these costs and compare them with those of other mutual funds. The table assumes a $1,000 investment held for the six months indicated.
Actual Fund Expenses
The first line (Actual) for each share class listed in the table provides actual account values and expenses. The “Ending Account Value” is derived from the Fund’s actual return, which includes the effect of Fund expenses.
You can estimate the expenses you paid during the period by following these steps. Of course, your account value and expenses will differ from those in this illustration:
| 1. | Divide your account value by $1,000. |
| If an account had an $8,600 value, then $8,600 ÷ $1,000 = 8.6. | |
| 2. | Multiply the result by the number under the heading “Expenses Paid During Period.” |
| If Expenses Paid During Period were $7.50, then 8.6 x $7.50 = $64.50. |
In this illustration, the estimated expenses paid this period are $64.50.
Hypothetical Example for Comparison with Other Funds
Information in the second line (Hypothetical) for each class in the table can help you compare ongoing costs of investing in the Fund with those of other mutual funds. This information may not be used to estimate the actual ending account balance or expenses you paid during the period. The hypothetical “Ending Account Value” is based on the actual expense ratio for each class and an assumed 5% annual rate of return before expenses, which does not represent the Fund’s actual return. The figure under the heading “Expenses Paid During Period” shows the hypothetical expenses your account would have incurred under this scenario. You can compare this figure with the 5% hypothetical examples that appear in shareholder reports of other funds.
Please note that expenses shown in the table are meant to highlight ongoing costs and do not reflect any transaction costs, such as sales charges. Therefore, the second line for each class is useful in comparing ongoing costs only, and will not help you compare total costs of owning different funds. In addition, if transaction costs were included, your total costs would have been higher. Please refer to the Fund prospectus for additional information on operating expenses.
10 Semiannual Report
franklintempleton.com
FRANKLIN PELAGOS COMMODITIES STRATEGY FUND
YOUR FUND’S EXPENSES
| Beginning Account | Ending Account | Expenses Paid During | ||||
| Share Class | Value 6/1/15 | Value 11/30/15 | Period* 6/1/15–11/30/15 | |||
| A | ||||||
| Actual | $ | 1,000 | $ | 825.80 | $ | 5.57 |
| Hypothetical (5% return before expenses) | $ | 1,000 | $ | 1,018.90 | $ | 6.16 |
| C | ||||||
| Actual | $ | 1,000 | $ | 822.70 | $ | 8.89 |
| Hypothetical (5% return before expenses) | $ | 1,000 | $ | 1,015.25 | $ | 9.82 |
| R | ||||||
| Actual | $ | 1,000 | $ | 825.40 | $ | 6.39 |
| Hypothetical (5% return before expenses) | $ | 1,000 | $ | 1,018.00 | $ | 7.06 |
| R6 | ||||||
| Actual | $ | 1,000 | $ | 828.20 | $ | 3.66 |
| Hypothetical (5% return before expenses) | $ | 1,000 | $ | 1,021.00 | $ | 4.04 |
| Advisor | ||||||
| Actual | $ | 1,000 | $ | 827.60 | $ | 4.34 |
| Hypothetical (5% return before expenses) | $ | 1,000 | $ | 1,020.25 | $ | 4.80 |
*Expenses are calculated using the most recent six-month expense ratio, net of expense waivers, annualized for each class (A: 1.22%;
C: 1.95%; R: 1.40%; R6: 0.80%; and Advisor: 0.95%), multiplied by the average account value over the period, multiplied by 183/366 to reflect
the one-half year period.
franklintempleton.com
Semiannual Report 11
FRANKLIN ALTERNATIVE STRATEGIES FUNDS
| Consolidated Financial Highlights | |||||||||
| Franklin Pelagos Commodities Strategy Fund | |||||||||
| Six Months Ended | |||||||||
| November 30, 2015 | Year Ended May 31, | ||||||||
| (unaudited) | 2015 | 2014 | a | ||||||
| Class A | |||||||||
| Per share operating performance | |||||||||
| (for a share outstanding throughout the period) | |||||||||
| Net asset value, beginning of period | $ | 7.12 | $ | 9.44 | $ | 8.88 | |||
| Income from investment operationsb: | |||||||||
| Net investment income (loss)c | (0.05 | ) | (0.09 | ) | (0.08 | ) | |||
| Net realized and unrealized gains (losses) | (1.19 | ) | (2.23 | ) | 0.64 | ||||
| Total from investment operations | (1.24 | ) | (2.32 | ) | 0.56 | ||||
| Netassetvalue,endofperiod | $ | 5.88 | $ | 7.12 | $ | 9.44 | |||
| Total returnd | (17.42 | )% | (24.58 | )% | 6.31 | % | |||
| Ratios to average net assetse | |||||||||
| Expenses before waiver, payments by affiliates and expense reduction. | 2.00 | % | 2.05 | % | 3.38 | % | |||
| Expenses net of waiver, payments by affiliates and expense reductionf | 1.22 | % | 1.25 | % | 1.25 | % | |||
| Net investment income (loss) | (0.79 | )% | (0.94 | )% | (0.94 | )% | |||
| Supplemental data | |||||||||
| Netassets,endofperiod(000’s) | $ | 2,094 | $ | 2,080 | $ | 601 | |||
| Portfolio turnover rate | —% | 62.10 | % | 34.28 | % | ||||
aFor the period January 10, 2014 (commencement of operations) to May 31, 2014.
bThe amount shown for a share outstanding throughout the period may not correlate with the Consolidated Statement of Operations for the period due to the timing of sales
and repurchases of the Fund’s shares in relation to income earned and/or fluctuating fair value of the investments of the Fund.
cBased on average daily shares outstanding.
dTotal return does not reflect sales commissions or contingent deferred sales charges, if applicable, and is not annualized for periods less than one year.
eRatios are annualized for periods less than one year.
fBenefit of expense reduction rounds to less than 0.01%.
12 Semiannual Report | The accompanying notes are an integral part of these consolidated financial statements. franklintempleton.com
FRANKLIN ALTERNATIVE STRATEGIES FUNDS
CONSOLIDATED FINANCIAL HIGHLIGHTS
| Franklin Pelagos Commodities Strategy Fund (continued) | |||||||||
| Six Months Ended | |||||||||
| November 30, 2015 | Year Ended May 31, | ||||||||
| (unaudited) | 2015 | 2014 | a | ||||||
| Class C | |||||||||
| Per share operating performance | |||||||||
| (for a share outstanding throughout the period) | |||||||||
| Net asset value, beginning of period | $ | 7.05 | $ | 9.41 | $ | 8.88 | |||
| Income from investment operationsb: | |||||||||
| Net investment income (loss)c | (0.13 | ) | (0.15 | ) | (0.09 | ) | |||
| Net realized and unrealized gains (losses) | (1.12 | ) | (2.21 | ) | 0.62 | ||||
| Total from investment operations | (1.25 | ) | (2.36 | ) | 0.53 | ||||
| Netassetvalue,endofperiod | $ | 5.80 | $ | 7.05 | $ | 9.41 | |||
| Total returnd | (17.73 | )% | (25.08 | )% | 5.97 | % | |||
| Ratios to average net assetse | |||||||||
| Expenses before waiver, payments by affiliates and expense reduction. | 2.73 | % | 2.75 | % | 4.08 | % | |||
| Expenses net of waiver, payments by affiliates and expense reductionf | 1.95 | % | 1.95 | % | 1.95 | % | |||
| Net investment income (loss) | (1.52 | )% | (1.64 | )% | (1.64 | )% | |||
| Supplemental data | |||||||||
| Netassets,endofperiod(000’s) | $ | 388 | $ | 377 | $ | 60 | |||
| Portfolio turnover rate | —% | 62.10 | % | 34.28 | % | ||||
aFor the period January 10, 2014 (commencement of operations) to May 31, 2014.
bThe amount shown for a share outstanding throughout the period may not correlate with the Consolidated Statement of Operations for the period due to the timing of sales
and repurchases of the Fund’s shares in relation to income earned and/or fluctuating fair value of the investments of the Fund.
cBased on average daily shares outstanding.
dTotal return does not reflect sales commissions or contingent deferred sales charges, if applicable, and is not annualized for periods less than one year.
eRatios are annualized for periods less than one year.
fBenefit of expense reduction rounds to less than 0.01%.
franklintempleton.com The accompanying notes are an integral part of these consolidated financial statements. | Semiannual Report 13
| FRANKLIN ALTERNATIVE STRATEGIES FUNDS | |||||||||
| CONSOLIDATED FINANCIAL HIGHLIGHTS | |||||||||
| Franklin Pelagos Commodities Strategy Fund (continued) | |||||||||
| Six Months Ended | |||||||||
| November 30, 2015 | Year Ended May 31, | ||||||||
| (unaudited) | 2015 | 2014 | a | ||||||
| Class R | |||||||||
| Per share operating performance | |||||||||
| (for a share outstanding throughout the period) | |||||||||
| Net asset value, beginning of period | $ | 7.10 | $ | 9.44 | $ | 8.88 | |||
| Income from investment operationsb: | |||||||||
| Net investment income (loss)c | (0.02 | ) | (0.10 | ) | (0.06 | ) | |||
| Net realized and unrealized gains (losses) | (1.22 | ) | (2.24 | ) | 0.62 | ||||
| Total from investment operations | (1.24 | ) | (2.34 | ) | 0.56 | ||||
| Netassetvalue,endofperiod | $ | 5.86 | $ | 7.10 | $ | 9.44 | |||
| Total returnd | (17.46 | )% | (24.79 | )% | 6.31 | % | |||
| Ratios to average net assetse | |||||||||
| Expenses before waiver, payments by affiliates and expense reduction. | 2.18 | % | 2.27 | % | 3.58 | % | |||
| Expenses net of waiver, payments by affiliates and expense reductionf | 1.40 | % | 1.47 | % | 1.45 | % | |||
| Net investment income (loss) | (0.97 | )% | (1.16 | )% | (1.14 | )% | |||
| Supplemental data | |||||||||
| Netassets,endofperiod(000’s) | $ | 4 | $ | 4 | $ | 5 | |||
| Portfolio turnover rate | —% | 62.10 | % | 34.28 | % | ||||
aFor the period January 10, 2014 (commencement of operations) to May 31, 2014.
bThe amount shown for a share outstanding throughout the period may not correlate with the Consolidated Statement of Operations for the period due to the timing of sales
and repurchases of the Fund’s shares in relation to income earned and/or fluctuating fair value of the investments of the Fund.
cBased on average daily shares outstanding.
dTotal return is not annualized for periods less than one year.
eRatios are annualized for periods less than one year.
fBenefit of expense reduction rounds to less than 0.01%.
14 Semiannual Report | The accompanying notes are an integral part of these consolidated financial statements. franklintempleton.com
FRANKLIN ALTERNATIVE STRATEGIES FUNDS
CONSOLIDATED FINANCIAL HIGHLIGHTS
| Franklin Pelagos Commodities Strategy Fund (continued) | |||||||||
| Six Months Ended | |||||||||
| November 30, 2015 | Year Ended May 31, | ||||||||
| (unaudited) | 2015 | 2014 | a | ||||||
| Class R6 | |||||||||
| Per share operating performance | |||||||||
| (for a share outstanding throughout the period) | |||||||||
| Net asset value, beginning of period | $ | 7.16 | $ | 9.46 | $ | 8.88 | |||
| Income from investment operationsb: | |||||||||
| Net investment income (loss)c | (0.01 | ) | (0.04 | ) | (0.03 | ) | |||
| Net realized and unrealized gains (losses) | (1.22 | ) | (2.26 | ) | 0.61 | ||||
| Total from investment operations | (1.23 | ) | (2.30 | ) | 0.58 | ||||
| Netassetvalue,endofperiod | $ | 5.93 | $ | 7.16 | $ | 9.46 | |||
| Total returnd | (17.18 | )% | (24.31 | )% | 6.53 | % | |||
| Ratios to average net assetse | |||||||||
| Expenses before waiver, payments by affiliates and expense reduction. | 1.19 | % | 1.53 | % | 1.58 | % | |||
| Expenses net of waiver, payments by affiliates and expense reductionf | 0.80 | % | 0.86 | % | 0.86 | % | |||
| Net investment income (loss) | (0.37 | )% | (0.55 | )% | (0.55 | )% | |||
| Supplemental data | |||||||||
| Netassets,endofperiod(000’s) | $ | 116,718 | $ | 53,068 | $ | 67,732 | |||
| Portfolio turnover rate | —% | 62.10 | % | 34.28 | % | ||||
aFor the period January 10, 2014 (commencement of operations) to May 31, 2014.
bThe amount shown for a share outstanding throughout the period may not correlate with the Consolidated Statement of Operations for the period due to the timing of sales
and repurchases of the Fund’s shares in relation to income earned and/or fluctuating fair value of the investments of the Fund.
cBased on average daily shares outstanding.
dTotal return is not annualized for periods less than one year.
eRatios are annualized for periods less than one year.
fBenefit of expense reduction rounds to less than 0.01%.
franklintempleton.com The accompanying notes are an integral part of these consolidated financial statements. | Semiannual Report 15
| FRANKLIN ALTERNATIVE STRATEGIES FUNDS | |||||||||||||||
| CONSOLIDATED FINANCIAL HIGHLIGHTS | |||||||||||||||
| Franklin Pelagos Commodities Strategy Fund (continued) | |||||||||||||||
| Six Months Ended | |||||||||||||||
| November 30, 2015 | Year Ended May 31, | ||||||||||||||
| (unaudited) | 2015 | 2014 | 2013 | 2012 | a | ||||||||||
| Advisor Class | |||||||||||||||
| Per share operating performance | |||||||||||||||
| (for a share outstanding throughout the period) | |||||||||||||||
| Net asset value, beginning of period | $ | 7.25 | $ | 9.58 | $ | 9.43 | $ | 9.15 | $ | 10.00 | |||||
| Income from investment operationsb: | |||||||||||||||
| Net investment income (loss)c | (0.09 | ) | (0.07 | ) | (0.05 | ) | (0.08 | ) | (0.05 | ) | |||||
| Net realized and unrealized gains (losses) | (1.16 | ) | (2.26 | ) | 0.20 | 0.36 | (0.80 | ) | |||||||
| Total from investment operations | (1.25 | ) | (2.33 | ) | 0.15 | 0.28 | (0.85 | ) | |||||||
| Less distributions from net investment income | — | — | — | (—)d | — | ||||||||||
| Netassetvalue,endofperiod | $ | 6.00 | $ | 7.25 | $ | 9.58 | $ | 9.43 | $ | 9.15 | |||||
| Total returne | (17.24 | )% | (24.32 | )% | 1.59 | % | 3.06 | % | (8.50 | )% | |||||
| Ratios to average net assetsf | |||||||||||||||
| Expenses before waiver, payments by affiliates and expense | |||||||||||||||
| reduction | 1.73 | % | 1.75 | % | 1.88 | % | 1.14 | % | 5.08 | % | |||||
| Expenses net of waiver, payments by affiliates and expense | |||||||||||||||
| reduction | 0.95 | %g | 0.95 | %g | 1.04 | %g | 1.10 | % | 1.10 | % | |||||
| Net investment income (loss) | (0.52 | )% | (0.64 | )% | (0.70 | )% | (0.76 | )% | (1.07 | )% | |||||
| Supplemental data | |||||||||||||||
| Netassets,endofperiod(000’s) | $ | 356 | $ | 248 | $ | 126 | $ | 107,853 | $ | 14,374 | |||||
| Portfolio turnover rate | —% | 62.10 | % | 34.28 | % | 21.47 | % | —%h | |||||||
aFor the period December 7, 2011 (commencement of operations) to May 31, 2012.
bThe amount shown for a share outstanding throughout the period may not correlate with the Consolidated Statement of Operations for the period due to the timing of sales
and repurchases of the Fund’s shares in relation to income earned and/or fluctuating fair value of the investments of the Fund.
cBased on average daily shares outstanding.
dAmount rounds to less than $0.01 per share.
eTotal return is not annualized for periods less than one year.
fRatios are annualized for periods less than one year.
gBenefit of expense reduction rounds to less than 0.01%.
hFor the period there were no purchases or sales of investments (other than short term securities).
16 Semiannual Report | The accompanying notes are an integral part of these consolidated financial statements. franklintempleton.com
FRANKLIN ALTERNATIVE STRATEGIES FUNDS
| Consolidated Statement of Investments, November 30, 2015 (unaudited) | |||||
| Franklin Pelagos Commodities Strategy Fund | |||||
| Principal | |||||
| Amount | Value | ||||
| U.S. Government and Agency Securities 43.4% | |||||
| FFCB, 0.89%, 10/23/17 | $ | 18,000,000 | $ | 18,000,972 | |
| U.S. Treasury Note, | |||||
| 0.25%, 2/29/16 | 11,000,000 | 11,001,078 | |||
| 0.75%, 10/31/17 | 23,000,000 | 22,924,078 | |||
| Total U.S. Government and Agency Securities (Cost $52,043,525) | 51,926,128 | ||||
| Short Term Investments 61.1% | |||||
| U.S. Government and Agency Securities 58.7% | |||||
| a,bFHLB, 12/01/15 | 2,900,000 | 2,900,000 | |||
| aU.S. Treasury Bill, | |||||
| 2/04/16 | 850,000 | 849,816 | |||
| b,c3/03/16 | 7,000,000 | 6,996,150 | |||
| b,c6/23/16 | 7,150,000 | 7,134,577 | |||
| 7/21/16 | 16,300,000 | 16,255,419 | |||
| b10/13/16 | 36,200,000 | 36,074,549 | |||
| Total U.S. Government and Agency Securities (Cost $70,283,975) | 70,210,511 | ||||
| Total Investments before Money Market Funds | |||||
| (Cost $122,327,500) | 122,136,639 | ||||
| Shares | |||||
| Money Market Funds (Cost $2,845,936) 2.4% | |||||
| d,eInstitutional Fiduciary Trust Money Market Portfolio | 2,845,936 | 2,845,936 | |||
| Total Investments (Cost $125,173,436) 104.5% | 124,982,575 | ||||
| fOther Assets, less Liabilities (4.5)% | (5,421,914 | ) | |||
| Net Assets 100.0% | $ | 119,560,661 | |||
aThe security is traded on a discount basis with no stated coupon rate.
bA portion or all of the security is owned by FPC Holdings Corp., a wholly-owned subsidiary of the Fund. See Note 1c.
cA portion or all of the security has been segregated as collateral for open swap and futures contracts. At November 30, 2015, the aggregate value of these securities and/or
cash pledged amounted to $6,332,992, representing 5.30% of net assets.
dNon-income producing.
eSee Note 3f regarding investments in affiliated management investment companies.
fIncludes unrealized appreciation/depreciation on open commodity futures and swap contracts, as well as other assets and liabilities.
franklintempleton.com
Semiannual Report 17
FRANKLIN ALTERNATIVE STRATEGIES FUNDS
CONSOLIDATED STATEMENT OF INVESTMENTS (UNAUDITED)
Franklin Pelagos Commodities Strategy Fund (continued)
At November 30, 2015, the Fund had the following futures contracts outstanding. See Note 1(b).
Futures Contractsa
| Number of | Notional | Expiration | Unrealized | Unrealized | ||||||
| Description | Type | Contracts | Value | Date | Appreciation | Depreciation | ||||
| Commodity Contracts | ||||||||||
| Gold 100 Ounce | Long | 130 | $ | 13,848,900 | 2/25/16 | $ | — | $ | (119,751 | ) |
| WTICrudeOil | Long | 216 | 8,996,400 | 12/21/15 | — | (1,213,911 | ) | |||
| Total Futures Contracts | $ | 22,845,300 | $ | — | $ | (1,333,662 | ) | |||
| Net unrealized appreciation (depreciation) | $ | (1,333,662 | ) |
At November 30, 2015, the Fund had the following commodity-linked total return swap contracts outstanding. See Note 1(b).
| Commodity-Linked Total Return Swap Contractsa | ||||||||||
| Pays | Notional | Expiration | Unrealized | Unrealized | ||||||
| Underlying Instruments | Fixed Rate | Counterparty | Value | Date | Appreciation | Depreciation | ||||
| OTC Swap Contract | ||||||||||
| Long | ||||||||||
| FP Custom Master Indexb | 0.22 | % | MSCS | $ | 95,158,503 | 12/01/15 | $ — | $ | (5,741,497 | ) |
| Net unrealized appreciation (depreciation) | $ | (5,741,497 | ) | |||||||
aA portion or all of the contract is owned by FPC Holdings Corp., a wholly-owned subsidiary of the Fund. See Note 1c.
bRepresents a custom index comprised of a basket of underlying instruments. Additional information regarding the custom basket’s underlying instruments and their
respective values and fees are as follows:
| Unrealized | Unrealized | ||||||
| Description | Notional Valuec | Appreciation | Depreciation | ||||
| Bloomberg Commodity Coffee Subindex | $ | 3,045,072 | $ | — | $ | (126,705 | ) |
| Bloomberg Commodity Copper Subindex | 5,519,193 | — | (703,366 | ) | |||
| Bloomberg Commodity Gold Subindex | 8,183,631 | — | (586,121 | ) | |||
| Bloomberg Commodity Kansas Wheat Subindex | 5,899,827 | — | (454,105 | ) | |||
| Bloomberg Commodity Lean Hogs Subindex | 5,804,669 | — | (473,609 | ) | |||
| Bloomberg Commodity Natural Gas Subindex 3 Month Forward | 9,896,484 | — | (479,657 | ) | |||
| Bloomberg Commodity Silver Subindex. | 5,328,876 | — | (554,120 | ) | |||
| Bloomberg Commodity Soybean Meal Subindex | 6,280,461 | — | (392,325 | ) | |||
| Bloomberg Commodity Soybean Oil Subindex | 6,375,620 | 212,078 | — | ||||
| Bloomberg Commodity Sugar Subindex | 6,280,461 | 186,796 | — | ||||
| Bloomberg Commodity Unleaded Gasoline Subindex 3 Month Forward | 18,460,749 | — | (989,365 | ) | |||
| Bloomberg Commodity Wheat Subindex | 8,564,265 | — | (862,449 | ) | |||
| Bloomberg Commodity Zinc Subindex. | 5,519,193 | — | (518,549 | ) | |||
| Totalcustomindex | $ | 95,158,501 | $ | 398,874 | $ | (6,140,371 | ) |
| Net unrealized appreciation (depreciation) | $ | (5,741,497 | ) |
cNotional value represents the fair value of each underlying instrument (including the financing rate fee which is calculated based on thecustom swap contract’s original notional value of $100,900,000, allocated to each underlying instrument on a pro-rata basis).
18 Semiannual Report | The accompanying notes are an integral part of these consolidated financial statements. franklintempleton.com
FRANKLIN ALTERNATIVE STRATEGIES FUNDS
Consolidated Financial Statements
Consolidated Statement of Assets and Liabilities
November 30, 2015 (unaudited)
| Franklin Pelagos Commodities Strategy Fund | |||
| Assets: | |||
| Investments in securities: | |||
| Cost - Unaffiliated issuers | $ | 122,327,500 | |
| Cost - Non-controlled affiliates (Note 3f) | 2,845,936 | ||
| Total cost of investments | $ | 125,173,436 | |
| Value - Unaffiliated issuers | $ | 122,136,639 | |
| Value - Non-controlled affiliates (Note 3f) | 2,845,936 | ||
| Total value of investments | 124,982,575 | ||
| Cash | 226,101 | ||
| Receivables: | |||
| Capital shares sold | 47,044 | ||
| Interest. | 37,557 | ||
| Affiliates | 10,391 | ||
| Variation margin | 86,737 | ||
| Other assets | 6 | ||
| Total assets | 125,390,411 | ||
| Liabilities: | |||
| Payables: | |||
| Capital shares redeemed | 10,222 | ||
| Management fees | 51,775 | ||
| Distribution fees | 754 | ||
| Trustees’ fees and expenses | 2,681 | ||
| Unrealized depreciation on OTC swap contracts | 5,741,497 | ||
| Accrued expenses and other liabilities | 22,821 | ||
| Total liabilities | 5,829,750 | ||
| Net assets, at value | $ | 119,560,661 | |
| Net assets consist of: | |||
| Paid-incapital | $ | 134,985,366 | |
| Accumulated net investment loss | (243,253 | ) | |
| Net unrealized appreciation (depreciation) | (7,266,020 | ) | |
| Accumulated net realized gain (loss) | (7,915,432 | ) | |
| Net assets, at value | $ | 119,560,661 | |
franklintempleton.com The accompanying notes are an integral part of these consolidated financial statements. | Semiannual Report 19
FRANKLIN ALTERNATIVE STRATEGIES FUNDS
CONSOLIDATED FINANCIAL STATEMENTS
Consolidated Statement of Assets and Liabilities (continued) November 30, 2015 (unaudited)
| Franklin Pelagos Commodities Strategy Fund | ||
| Class A: | ||
| Netassets,atvalue | $ | 2,093,509 |
| Shares outstanding | 355,760 | |
| Net asset value per sharea | $ | 5.88 |
| Maximum offering price per share (net asset value per share ÷ 94.25%) | $ | 6.24 |
| Class C: | ||
| Netassets,atvalue | $ | 388,381 |
| Shares outstanding | 66,964 | |
| Net asset value and maximum offering price per sharea | $ | 5.80 |
| Class R: | ||
| Netassets,atvalue | $ | 4,017 |
| Shares outstanding | 686 | |
| Net asset value and maximum offering price per share | $ | 5.86 |
| Class R6: | ||
| Netassets,atvalue | $ | 116,718,485 |
| Shares outstanding | 19,694,725 | |
| Net asset value and maximum offering price per share | $ | 5.93 |
| Advisor Class: | ||
| Netassets,atvalue | $ | 356,269 |
| Shares outstanding | 59,421 | |
| Net asset value and maximum offering price per share | $ | 6.00 |
aRedemption price is equal to net asset value less contingent deferred sales charges, if applicable.
20 Semiannual Report | The accompanying notes are an integral part of these consolidated financial statements. franklintempleton.com
FRANKLIN ALTERNATIVE STRATEGIES FUNDS
CONSOLIDATED FINANCIAL STATEMENTS
Consolidated Statement of Operations
for the six months ended November 30, 2015 (unaudited)
| Franklin Pelagos Commodities Strategy Fund | |||
| Investment income: | |||
| Interest | $ | 157,804 | |
| Expenses: | |||
| Management fees (Note 3a) | 313,322 | ||
| Distribution fees: (Note 3c) | |||
| ClassA | 2,694 | ||
| ClassC | 2,017 | ||
| ClassR | 8 | ||
| Transfer agent fees: (Note 3e) | |||
| ClassA | 5,472 | ||
| ClassC | 1,098 | ||
| ClassR | 10 | ||
| ClassR6 | 35 | ||
| AdvisorClass | 840 | ||
| Custodian fees (Note 4) | 300 | ||
| Reports to shareholders | 8,271 | ||
| Registration and filing fees | 38,938 | ||
| Professional fees | 48,765 | ||
| Trustees’ fees and expenses | 29,220 | ||
| Other | 2,795 | ||
| Total expenses | 453,785 | ||
| Expense reductions (Note 4) | (45 | ) | |
| Expenses waived/paid by affiliates (Note 3f and 3g) | (150,991 | ) | |
| Net expenses | 302,749 | ||
| Net investment income (loss) | (144,945 | ) | |
| Realized and unrealized gains (losses): | |||
| Net realized gain (loss) from: | |||
| Investments | (118,264 | ) | |
| Written options | 11,592 | ||
| Futurescontracts | (2,354,001 | ) | |
| Swap contracts. | (5,266,377 | ) | |
| Net realized gain (loss) | (7,727,050 | ) | |
| Net change in unrealized appreciation (depreciation) on: | |||
| Investments | (30,739 | ) | |
| Futurescontracts | (1,329,078 | ) | |
| Swap contracts. | (6,355,190 | ) | |
| Net change in unrealized appreciation (depreciation) | (7,715,007 | ) | |
| Net realized and unrealized gain (loss) | (15,442,057 | ) | |
| Net increase (decrease) in net assets resulting from operations | $ | (15,587,002 | ) |
franklintempleton.com The accompanying notes are an integral part of these consolidated financial statements. | Semiannual Report 21
| FRANKLIN ALTERNATIVE STRATEGIES FUNDS | ||||||
| CONSOLIDATED FINANCIAL STATEMENTS | ||||||
| Consolidated Statement of Changes in Net Assets | ||||||
| Franklin Pelagos Commodities Strategy Fund | ||||||
| Six Months Ended | ||||||
| November 30, 2015 | Year Ended | |||||
| (unaudited) | May 31, 2015 | |||||
| Increase (decrease) in net assets: | ||||||
| Operations: | ||||||
| Net investment income (loss) | $ | (144,945 | ) | $ | (347,647 | ) |
| Netrealizedgain(loss) | (7,727,050 | ) | (17,829,683 | ) | ||
| Net change in unrealized appreciation (depreciation) | (7,715,007 | ) | 902,653 | |||
| Net increase (decrease) in net assets resulting from operations. | (15,587,002 | ) | (17,274,677 | ) | ||
| Capital share transactions: (Note 2) | ||||||
| Class A. | 399,782 | 1,790,679 | ||||
| Class C | 89,493 | 355,889 | ||||
| Class R | 724 | — | ||||
| Class R6. | 78,714,500 | 2,216,679 | ||||
| Advisor Class | 166,897 | 163,257 | ||||
| Total capital share transactions | 79,371,396 | 4,526,504 | ||||
| Net increase (decrease) in net assets | 63,784,394 | (12,748,173 | ) | |||
| Net assets: | ||||||
| Beginning of period | 55,776,267 | 68,524,440 | ||||
| Endof period | $ | 119,560,661 | $ | 55,776,267 | ||
| Accumulated net investment loss included in net assets: | ||||||
| End of period | $ | (243,253 | ) | $ | (98,308 | ) |
22 Semiannual Report | The accompanying notes are an integral part of these consolidated financial statements. franklintempleton.com
FRANKLIN ALTERNATIVE STRATEGIES FUNDS
Notes to Consolidated Financial Statements (unaudited)
Franklin Pelagos Commodities Strategy Fund
1. Organization and Significant Accounting Policies
Franklin Alternative Strategies Funds (Trust) is registered under the Investment Company Act of 1940 (1940 Act) as an open-end management investment company, consisting of three separate funds and applies the specialized accounting and reporting guidance in U.S. Generally Accepted Accounting Principles (U.S. GAAP). Franklin Pelagos Commodities Strategy Fund (Fund) is included in this report. The financial statements of the remaining funds in the Trust are presented separately. The Fund offers five classes of shares: Class A, Class C, Class R, Class R6 and Advisor Class. Each class of shares differs by its initial sales load, contingent deferred sales charges, voting rights on matters affecting a single class, its exchange privilege and fees primarily due to differing arrangements for distribution and transfer agent fees.
The following summarizes the Fund’s significant accounting policies.
a. Financial Instrument Valuation
The Fund’s investments in financial instruments are carried at fair value daily. Fair value is the price that would be received to sell an asset or paid to transfer a liability in an orderly transaction between market participants on the measurement date. The Fund calculates the net asset value (NAV) per share as of 4 p.m. Eastern time each day the New York Stock Exchange (NYSE) is open for trading. Under compliance policies and procedures approved by the Trust’s Board of Trustees (the Board), the Fund’s administrator has responsibility for oversight of valuation, including leading the cross-functional Valuation and Liquidity Oversight Committee (VLOC). The VLOC provides administration and oversight of the Fund’s valuation policies and procedures, which are approved annually by the Board. Among other things, these procedures allow the Fund to utilize independent pricing services, quotations from securities and financial instrument dealers, and other market sources to determine fair value.
Debt securities generally trade in the over-the-counter (OTC) market rather than on a securities exchange. The Fund’s pricing services use multiple valuation techniques to determine fair value. In instances where sufficient market activity exists, the pricing services may utilize a market-based approach through which quotes from market makers are used to determine fair value. In instances where sufficient market activity may not exist or is limited, the pricing services also utilize proprietary valuation models which may consider market characteristics such as benchmark yield curves, credit spreads, estimated default rates, anticipated market interest rate volatility, coupon rates, anticipated timing of principal repayments, underlying collateral, and other unique security features in order to estimate the relevant cash flows, which are then discounted to calculate the fair value.
Investments in open-end mutual funds are valued at the closing NAV.
Derivative financial instruments (derivatives) listed on an exchange are valued at the official closing price of the day. Certain derivatives trade in the OTC market. The Fund’s pricing services use various techniques including industry standard option pricing models and proprietary discounted cash flow models to determine the fair value of those instruments. The Fund’s net benefit or obligation under the derivative contract, as measured by the fair value of the contract, is included in net assets.
The Fund has procedures to determine the fair value of financial instruments for which market prices are not reliable or readily available. Under these procedures, the VLOC convenes on a regular basis to review such financial instruments and considers a number of factors, including significant unobservable valuation inputs, when arriving at fair value. The VLOC primarily employs a market-based approach which may use related or comparable assets or liabilities, recent transactions, market multiples, book values, and other relevant information for the investment to determine the fair value of the investment. An income-based valuation approach may also be used in which the anticipated future cash flows of the investment are discounted to calculate fair value. Discounts may also be applied due to the nature or duration of any restrictions on the disposition of the investments. Due to the inherent uncertainty of valuations of such investments, the fair values may differ significantly from the values that would have been used had an active market existed. The VLOC employs various methods for calibrating these valuation approaches including a regular review of key inputs and assumptions, transactional back-testing or disposition analysis, and reviews of any related market activity.
franklintempleton.com
Semiannual Report 23
FRANKLIN ALTERNATIVE STRATEGIES FUNDS
NOTES TO CONSOLIDATED FINANCIAL STATEMENTS (UNAUDITED)
Franklin Pelagos Commodities Strategy Fund (continued)
1. Organization and Significant Accounting
Policies (continued)
b. Derivative Financial Instruments
The Fund invested in derivatives in order to manage risk or gain exposure to various other investments or markets. Derivatives are financial contracts based on an underlying or notional amount, require no initial investment or an initial net investment that is smaller than would normally be required to have a similar response to changes in market factors, and require or permit net settlement. Derivatives contain various risks including the potential inability of the counterparty to fulfill their obligations under the terms of the contract, the potential for an illiquid secondary market, and/or the potential for market movements which expose the Fund to gains or losses in excess of the amounts shown in the Consolidated Statement of Assets and Liabilities. Realized gain and loss and unrealized appreciation and depreciation on these contracts for the period are included in the Consolidated Statement of Operations.
Derivative counterparty credit risk is managed through a formal evaluation of the creditworthiness of all potential counter-parties. The Fund attempts to reduce its exposure to counter-party credit risk on OTC derivatives, whenever possible, by entering into International Swaps and Derivatives Association (ISDA) master agreements with certain counterparties. These agreements contain various provisions, including but not limited to collateral requirements, events of default, or early termination. Termination events applicable to the counterparty include certain deteriorations in the credit quality of the coun-terparty. Termination events applicable to the Fund include failure of the Fund to maintain certain net asset levels and/or limit the decline in net assets over various periods of time. In the event of default or early termination, the ISDA master agreement gives the non-defaulting party the right to net and close-out all transactions traded, whether or not arising under the ISDA agreement, to one net amount payable by one counter-party to the other. However, absent an event of default or early termination, OTC derivative assets and liabilities are presented gross and not offset in the Consolidated Statement of Assets and Liabilities. Early termination by the counterparty may result in an immediate payment by the Fund of any net liability owed to that counterparty under the ISDA agreement.
Collateral requirements differ by type of derivative. Collateral or initial margin requirements are set by the broker or exchange clearing house for exchange traded and centrally cleared derivatives. Initial margin deposited is held at the exchange and can be in the form of cash and/or securities. For OTC derivatives traded under an ISDA master agreement, posting of collateral is required by either the Fund or the applicable counterparty if the total net exposure of all OTC derivatives with the applicable counterparty exceeds the minimum transfer amount, which typically ranges from $100,000 to $250,000, and can vary depending on the counterparty and the type of the agreement. Generally, collateral is determined at the close of Fund business each day and any additional collateral required due to changes in derivative values may be delivered by the Fund or the coun-terparty within a few business days. Collateral pledged and/or received by the Fund for OTC derivatives, if any, is held in segregated accounts with the Fund’s custodian/counterparty broker and can be in the form of cash and/or securities. Unrestricted cash may be invested according to the Fund’s investment objectives. To the extent that the amounts due to the Fund from its counterparties are not subject to collateralization or are not fully collateralized, the Fund bears the risk of loss from counterparty non-performance.
The Fund entered into exchange traded futures contracts primarily to gain exposure to commodity price risk. A futures contract is an agreement between the Fund and a counterparty to buy or sell an asset for a specified price on a future date. Required initial margins are pledged by the Fund, and the daily change in fair value is accounted for as a variation margin payable or receivable in the Consolidated Statement of Assets and Liabilities.
The Fund entered into OTC commodity-linked total return swap contracts primarily to gain exposure to commodity price risk of an underlying instrument such as a stock, bond, index or basket of securities or indices. A total return swap is an agreement between the Fund and a counterparty to exchange a return linked to an underlying instrument for a floating or fixed rate payment, both based upon a notional amount. Over the term of the contract, contractually required payments to be paid or received are accrued daily and recorded as unrealized appreciation or depreciation until the payments are made, at which time they are recognized as realized gain or loss.
The Fund purchased or wrote exchange traded option contracts primarily to manage and/or gain exposure to commodity price risk. An option is a contract entitling the holder to purchase or sell a specific amount of shares or units of an asset or notional amount of a swap (swaption), at a specified price. When an option is purchased or written, an amount equal to the premium paid or received is recorded as an asset or liability, respectively.
24 Semiannual Report
franklintempleton.com
FRANKLIN ALTERNATIVE STRATEGIES FUNDS
NOTES TO CONSOLIDATED FINANCIAL STATEMENTS (UNAUDITED)
Franklin Pelagos Commodities Strategy Fund (continued)
Upon exercise of an option, the acquisition cost or sales proceeds of the underlying investment is adjusted by any premium received or paid. Upon expiration of an option, any premium received or paid is recorded as a realized gain or loss. Upon closing an option other than through expiration or exercise, the difference between the premium received or paid and the cost to close the position is recorded as a realized gain or loss.
See Notes 6 and 7 regarding investment transactions and other derivative information, respectively.
c. Investments in FPC Holdings Corp. (FP Subsidiary)
The Fund invests in certain financial instruments and commodity-linked derivative investments through its investment in the FP Subsidiary. The FP Subsidiary is a Cayman Islands exempted company with limited liability, is a wholly-owned subsidiary of the Fund, and is able to invest in certain financial instruments and commodity-linked derivative investments consistent with the investment objective of the Fund. At November 30, 2015, the FP Subsidiary’s investments, as well as any other assets and liabilities of the FP Subsidiary are reflected in the Fund’s Consolidated Statement of Investments and Consolidated Statement of Assets and Liabilities. The financial statements have been consolidated and include the accounts of the Fund and the FP Subsidiary. All intercompany transactions and balances have been eliminated. At November 30, 2015, the net assets of the FP Subsidiary were $24,532,373, representing 20.52% of the Fund’s consolidated net assets. The Fund’s investment in the FP Subsidiary is limited to 25% of consolidated assets.
d. Income Taxes
It is the Fund’s policy to qualify as a regulated investment company under the Internal Revenue Code. The Fund intends to distribute to shareholders substantially all of its taxable income and net realized gains to relieve it from federal income and excise taxes. As a result, no provision for U.S. federal income taxes is required.
The Fund recognizes the tax benefits of uncertain tax positions only when the position is “more likely than not” to be sustained upon examination by the tax authorities based on the technical merits of the tax position. As of November 30, 2015, and for all open tax years, the Fund has determined that no liability for unrecognized tax benefits is required in the Fund’s consolidated financial statements related to uncertain tax positions taken on a tax return (or expected to be taken on future tax returns). Open tax years are those that remain subject to examination and are based on each tax jurisdiction’s statute of limitation.
e. Security Transactions, Investment Income, Expenses and Distributions
Security transactions are accounted for on trade date. Realized gains and losses on security transactions are determined on a specific identification basis. Interest income and estimated expenses are accrued daily. Amortization of premium and accretion of discount on debt securities are included in interest income. Distributions to shareholders are recorded on the ex-dividend date and are determined according to income tax regulations (tax basis). Distributable earnings determined on a tax basis may differ from earnings recorded in accordance with U.S. GAAP. These differences may be permanent or temporary. Permanent differences are reclassified among capital accounts to reflect their tax character. These reclassifications have no impact on net assets or the results of operations. Temporary differences are not reclassified, as they may reverse in subsequent periods.
Common expenses incurred by the Trust are allocated among the funds based on the ratio of net assets of each fund to the combined net assets of the Trust. Fund specific expenses are charged directly to the fund that incurred the expense.
Realized and unrealized gains and losses and net investment income, not including class specific expenses, are allocated daily to each class of shares based upon the relative proportion of net assets of each class. Differences in per share distributions, by class, are generally due to differences in class specific expenses.
f. Accounting Estimates
The preparation of financial statements in accordance with U.S. GAAP requires management to make estimates and assumptions that affect the reported amounts of assets and liabilities at the date of the financial statements and the amounts of income and expenses during the reporting period. Actual results could differ from those estimates.
g. Guarantees and Indemnifications
Under the Trust’s organizational documents, its officers and trustees are indemnified by the Trust against certain liabilities arising out of the performance of their duties to the Trust. Additionally, in the normal course of business, the Trust, on
franklintempleton.com
Semiannual Report 25
FRANKLIN ALTERNATIVE STRATEGIES FUNDS
NOTES TO CONSOLIDATED FINANCIAL STATEMENTS (UNAUDITED)
Franklin Pelagos Commodities Strategy Fund (continued)
1. Organization and Significant Accounting
Policies (continued)
g. Guarantees and Indemnifications (continued)
behalf of the Fund, enters into contracts with service providers that contain general indemnification clauses. The Trust’s maximum exposure under these arrangements is unknown as this would involve future claims that may be made against the Trust that have not yet occurred. Currently, the Trust expects the risk of loss to be remote.
2. Shares of Beneficial Interest
At November 30, 2015, there were an unlimited number of shares authorized (without par value). Transactions in the Fund’s shares were as follows:
| Six Months Ended | Year Ended | ||||||||||
| November 30, 2015 | May 31, 2015 | ||||||||||
| Shares | Amount | Shares | Amount | ||||||||
| Class A Shares: | |||||||||||
| Shares sold | 128,403 | $ | 820,572 | 320,203 | $ | 2,539,217 | |||||
| Shares redeemed. | (64,599 | ) | (420,790 | ) | (91,847 | ) | (748,538 | ) | |||
| Net increase (decrease) | 63,804 | $ | 399,782 | 228,356 | $ | 1,790,679 | |||||
| Class C Shares: | |||||||||||
| Shares sold | 21,135 | $ | 136,056 | 50,914 | $ | 386,347 | |||||
| Shares redeemed. | (7,636 | ) | (46,563 | ) | (3,870 | ) | (30,458 | ) | |||
| Net increase (decrease) | 13,499 | $ | 89,493 | 47,044 | $ | 355,889 | |||||
| Class R Shares: | |||||||||||
| Shares sold | 123 | $ | 724 | — | $ | — | |||||
| Class R6 Shares: | |||||||||||
| Shares sold | 12,287,288 | $ | 78,742,500 | 394,647 | $ | 3,320,920 | |||||
| Shares redeemed. | (4,045 | ) | (28,000 | ) | (145,850 | ) | (1,104,241 | ) | |||
| Net increase (decrease) | 12,283,243 | $ | 78,714,500 | 248,797 | $ | 2,216,679 | |||||
| Advisor Class Shares: | |||||||||||
| Shares sold | 29,410 | $ | 195,821 | 34,562 | $ | 277,151 | |||||
| Shares redeemed. | (4,183 | ) | (28,924 | ) | (13,531 | ) | (113,894 | ) | |||
| Net increase (decrease) | 25,227 | $ | 166,897 | 21,031 | $ | 163,257 | |||||
3. Transactions with Affiliates
Franklin Resources, Inc. is the holding company for various subsidiaries that together are referred to as Franklin Templeton Investments. Certain officers and trustees of the Trust are also officers and/or directors of the following subsidiaries:
| Subsidiary | Affiliation |
| Franklin Alternative Strategies Advisers, LLC (FASA) | |
| (formerly Pelagos Capital Management, LLC) | Investment manager |
| Franklin Templeton Services, LLC (FT Services) | Administrative manager |
| Franklin Templeton Distributors, Inc. (Distributors) | Principal underwriter |
| Franklin Templeton Investor Services, LLC (Investor Services) | Transfer agent |
26 Semiannual Report
franklintempleton.com
FRANKLIN ALTERNATIVE STRATEGIES FUNDS
NOTES TO CONSOLIDATED FINANCIAL STATEMENTS (UNAUDITED)
Franklin Pelagos Commodities Strategy Fund (continued)
a. Management Fees
The Fund and FP Subsidiary pay an investment management fee to FASA of 0.85% per year of the average daily net assets of the Fund and FP Subsidiary. Management fees paid by the Fund are reduced on assets invested in the FP Subsidiary, in an amount not to exceed the management fees paid by the FP Subsidiary.
b. Administrative Fees
Under an agreement with FASA, FT Services provides administrative services to the Fund and FP Subsidiary. The fee is paid by FASA based on the Fund and FP Subsidiary average daily net assets, and is not an additional expense of the Fund or FP Subsidiary.
c. Distribution Fees
The Board has adopted distribution plans for each share class, with the exception of Class R6 and Advisor Class shares, pursuant to Rule 12b-1 under the 1940 Act. Under the Fund’s Class A reimbursement distribution plan, the Fund reimburses Distributors for costs incurred in connection with the servicing, sale and distribution of the Fund’s shares up to the maximum annual plan rate. Under the Class A reimbursement distribution plan, costs exceeding the maximum for the current plan year cannot be reimbursed in subsequent periods. In addition, under the Fund’s Class C and R compensation distribution plans, the Fund pays Distributors for costs incurred in connection with the servicing, sale and distribution of the Fund’s shares up to the maximum annual plan rate for each class. The plan year, for purposes of monitoring compliance with the maximum annual plan rates, is February 1 through January 31 for each fund.
The maximum annual plan rates, based on the average daily net assets, for each class, are as follows:
| Class A | 0.30 | % |
| Class C | 1.00 | % |
| Class R | 0.50 | % |
Effective August 1, 2015, the Board has set the current rate at 0.25% per year for Class A shares until further notice and approval by the Board.
d. Sales Charges/Underwriting Agreements
Front-end sales charges and contingent deferred sales charges (CDSC) do not represent expenses of the Fund. These charges are deducted from the proceeds of sales of Fund shares prior to investment or from redemption proceeds prior to remittance, as applicable. Distributors has advised the Fund of the following commission transactions related to the sales and redemptions of the Fund’s shares for the period:
| Sales charges retained net of commissions paid to unaffiliated broker/dealers | $ | 2,536 |
| CDSC retained | $ | 75 |
| e. Transfer Agent Fees | ||
Each class of shares, except for Class R6, pays transfer agent fees to Investor Services for its performance of shareholder servicing obligations and reimburses Investor Services for out of pocket expenses incurred, including shareholding servicing fees paid to third parties. These fees are allocated daily based upon their relative proportion of such classes’ aggregate net assets. Class R6 pays Investor Services transfer agent fees specific to that class.
For the period ended November 30, 2015, the Fund paid transfer agent fees of $7,455, of which $3,877 was retained by Investor Services.
franklintempleton.com
Semiannual Report 27
FRANKLIN ALTERNATIVE STRATEGIES FUNDS
NOTES TO CONSOLIDATED FINANCIAL STATEMENTS (UNAUDITED)
Franklin Pelagos Commodities Strategy Fund (continued)
| 3. | Transactions with Affiliates (continued) |
| f. | Investments in Affiliated Management Investment Companies |
The Fund invests in an affiliated management investment company for purposes other than exercising a controlling influence over the management or policies. Management fees paid by the Fund are waived on assets invested in the affiliated management investment company, as noted in the Consolidated Statement of Operations, in an amount not to exceed the management and administrative fees paid directly or indirectly by each affiliate. Prior to June 1, 2013, the waiver was accounted for as a reduction to management fees.
| % of | |||||||||||
| Affiliated | |||||||||||
| Number of | Number of | Fund Shares | |||||||||
| Shares Held | Shares | Value | Outstanding | ||||||||
| at Beginning | Gross | Gross | Held at End | at End | Investment | Realized | Held at End | ||||
| of Period | Additions | Reductions | of Period | of Period | Income | Gain (Loss) | of Period | ||||
| Non-Controlled Affiliates | |||||||||||
| Institutional Fiduciary Trust Money Market | |||||||||||
| Portfolio | 787,280 | 45,344,790 | (43,286,134 | ) | 2,845,936 | $ | 2,845,936 | $ — | $ — | 0.01 | % |
FASA has contractually agreed in advance to waive or limit its fees and to assume as its own expense certain expenses otherwise payable by the Fund so that the expenses (excluding distribution fees, acquired fund fees and expenses) for each class of the Fund do not exceed 0.95%, and Class R6 does not exceed 0.73% based on the average net assets of each class (other than certain non-routine expenses or costs, including those relating to litigation, indemnification, reorganizations, and liquidations) until Sep-tember 30, 2016. Prior to October 1, 2015, expenses for Class R6 were limited to 0.86%.
h. Other Affiliated Transactions
At November 30, 2015, the shares of the Fund were owned by the following entities:
| Percentage of | |||
| Shares | Outstanding Shares | ||
| Franklin Moderate Allocation Fund | 8,074,252 | 40.02 | %a |
| Franklin Conservative Allocation Fund | 5,291,099 | 26.22 | % |
| Franklin Growth Allocation Fund | 4,504,698 | 22.33 | % |
| Franklin LifeSmart 2025 Retirement Target Fund | 414,644 | 2.05 | % |
| Franklin LifeSmart 2035 Retirement Target Fund | 328,621 | 1.63 | % |
| Franklin LifeSmart 2015 Retirement Target Fund | 258,301 | 1.28 | % |
| Franklin Multi-Asset Real Return Fund | 255,399 | 1.27 | % |
| Franklin LifeSmart 2045 Retirement Target Fund | 218,352 | 1.08 | % |
| Franklin LifeSmart 2020 Retirement Target Fund | 115,351 | 0.57 | % |
| Franklin LifeSmart 2030 Retirement Target Fund | 102,100 | 0.51 | % |
| Franklin LifeSmart 2040 Retirement Target Fund | 71,199 | 0.35 | % |
| Franklin LifeSmart 2050 Retirement Target Fund | 54,038 | 0.27 | % |
| Franklin LifeSmart 2055 Retirement Target Fund | 6,672 | 0.03 | % |
| Franklin Resources, Inc | 563 | -%b | |
| 19,695,289 | 97.61 | % | |
| aInvestment activities of this investment company could have a material impact on the Fund. | |||
| bRounds to less than 0.01%. | |||
28 Semiannual Report
franklintempleton.com
FRANKLIN ALTERNATIVE STRATEGIES FUNDS
NOTES TO CONSOLIDATED FINANCIAL STATEMENTS (UNAUDITED)
Franklin Pelagos Commodities Strategy Fund (continued)
4. Expense Offset Arrangement
The Fund has entered into an arrangement with its custodian whereby credits realized as a result of uninvested cash balances are used to reduce a portion of the Fund’s custodian expenses. During the period ended November 30, 2015, the custodian fees were reduced as noted in the Consolidated Statement of Operations.
5. Income Taxes
For tax purposes, capital losses may be carried over to offset future capital gains, if any. At May 31, 2015, the Fund had long-term capital loss carryforwards of $188,382.
For tax purposes, the Fund may elect to defer any portion of a late-year ordinary loss to the first day of the following fiscal year. At May 31, 2015, the Fund deferred late-year ordinary losses of $34,354.
At November 30, 2015, the cost of investments and net unrealized appreciation (depreciation) for income tax purposes were as follows:
| Cost of investments | $ | 125,165,499 | |
| Unrealizedappreciation | $ | 45,211,024 | |
| Unrealized depreciation | (45,393,948 | ) | |
| Net unrealized appreciation (depreciation) | $ | (182,924 | ) |
Differences between income and/or capital gains as determined on a book basis and a tax basis are primarily due to differing treatments of bond discounts and premiums, investments in the FP Subsidiary and non-deductible expenses.
6. Investment Transactions
Purchases of investments (excluding short term securities) for the period ended November 30, 2015, totaled $23,047,617. There were no sales of investments (other than short term securities).
| Transactions in options written during the period ended November 30, 2015, were as follows: | |||||
| Number of | |||||
| Contracts | Premiums | ||||
| Options outstanding at May 31, 2015. | — | $ | — | ||
| Options written | 105 | 11,592 | |||
| Optionsexpired. | (105 | ) | (11,592 | ) | |
| Optionsexercised | — | — | |||
| Optionsclosed | — | — | |||
| Options outstanding at November 30, 2015 | — | $ | — | ||
| See Notes 1(b) and 7 regarding derivative financial instruments and other derivative information, respectively. | |||||
franklintempleton.com
Semiannual Report 29
FRANKLIN ALTERNATIVE STRATEGIES FUNDS
NOTES TO CONSOLIDATED FINANCIAL STATEMENTS (UNAUDITED)
Franklin Pelagos Commodities Strategy Fund (continued)
7. Other Derivative Information
At November 30, 2015, the Fund’s investments in derivative contracts are reflected in the Consolidated Statement of Assets and Liabilities as follows:
| Asset Derivatives | Liability Derivatives | ||||||
| Derivative Contracts | |||||||
| Not Accounted for as | Consolidated Statement of | Consolidated Statement of | |||||
| Hedging Instruments | Assets and Liabilities Location | Fair Value | Assets and Liabilities Location | Fair Value | |||
| Commodity contracts | Variationmargin | $ | — | Variation margin | $ | 1,333,662 | a |
| Unrealized appreciation on OTC | — | Unrealized depreciation on OTC | 5,741,497 | ||||
| swap contracts | swap contracts | ||||||
| Totals | $ | — | $ | 7,075,159 |
aThis amount reflects the cumulative appreciation (depreciation) of future contracts as reported in the Consolidated Statement of Investments. Only the variation margin receivable/payable at period end is separately reported within the Consolidated Statement of Assets and Liabilities. Prior variation margin movements were recorded to cash upon receipt or payment.
For the period ended November 30, 2015, the effect of derivative contracts in the Fund’s Consolidated Statement of Operations was as follows:
| Net Change in | ||||||||
| Net Realized | Unrealized | |||||||
| Derivative Contacts | Consolidated | Gain (Loss) | Consolidated | Appreciation | ||||
| Not Accounted for as | Statement of | for the | Statement of | (Depreciation) | ||||
| Hedging Instruments | Operations Locations | Period | Operations Locations | for the Period | ||||
| Net realized gain (loss) from: | Net change in unrealized | |||||||
| appreciation (depreciation) on: | ||||||||
| Commodity contracts. | Investments | $ | (117,839 | ) | Investments | $ | 74,559 | a |
| Written options | 11,592 | |||||||
| Futures contracts | (2,354,001 | ) | Futures contracts | (1,329,078 | ) | |||
| Swap contracts | (5,266,377 | ) | Swap contracts | (6,355,190 | ) | |||
| Totals | $ | (7,726,625 | ) | $ | (7,609,709 | ) |
aPurchased option contracts are included in net change in unrealized appreciation (depreciation) on investments in the Consolidated Statement of Operations.
For the period ended November 30, 2015, the average month end fair value of derivatives represented 2.21% of average month end net assets. The average month end number of open derivative contracts for the period was 4.
At November 30, 2015, the Fund’s OTC derivative assets and liabilities are as follows:
| Gross and Net Amounts of | |||
| Assets and Liabilities Presented | |||
| in the Consolidated Statement of Assets and Liabilities | |||
| Assetsa | Liabilitiesa | ||
| Derivatives | |||
| Swapcontracts | $ — | $ | 5,741,497 |
aAbsent an event of default or early termination, OTC derivative assets and liabilities are presented gross and not offset in the Consolidated Statement of Assets and Liabilities.
30 Semiannual Report
franklintempleton.com
FRANKLIN ALTERNATIVE STRATEGIES FUNDS
NOTES TO CONSOLIDATED FINANCIAL STATEMENTS (UNAUDITED)
Franklin Pelagos Commodities Strategy Fund (continued)
At November 30, 2015, the Fund’s OTC derivative assets, which may be offset against the Fund’s OTC derivative liabilities and collateral received from the counterparty, are as follows:
| Amounts Not Offset in the | |||||||||
| Consolidated Statement of Assets and Liabilities | |||||||||
| Gross and | |||||||||
| Net Amounts of | Financial | Financial | |||||||
| Assets Presented in the | Instruments | Instruments | Cash | Net Amount | |||||
| Consolidated Statement of | Available for | Collateral | Collateral | (Not less | |||||
| Assets and Liabilities | Offset | Received | Received | than zero) | |||||
| Counterparty | |||||||||
| MSCS | $ | — | $ — | $ | — | $ — | $ | — | |
| At November 30, 2015, the Fund’s OTC derivative liabilities, which may be offset against the Fund’s OTC derivative assets and | |||||||||
| collateral pledged to the counterparty, are as follows: | |||||||||
| Amounts Not Offset in the | |||||||||
| Consolidated Statement of Assets and Liabilities | |||||||||
| Gross and | |||||||||
| Net Amounts of | Financial | Financial | |||||||
| Liabilities Presented in | Instruments | Instruments | Cash | Net Amount | |||||
| the Consolidated Statement of | Available for | Collateral | Collateral | (Not less | |||||
| Assets and Liabilities | Offset | Pledgeda | Pledged | than zero) | |||||
| Counterparty | |||||||||
| MSCS | $ | 5,741,497 | $ — | $ | (4,668,907 | ) | $ — | $ | 1,072,590 |
aSee the accompanying Consolidated Statement of Investments for securities pledged as collateral for derivatives.
See Notes 1(b) and 6 regarding derivative financial instruments and investment transactions, respectively.
See Abbreviations on page 32.
8. Credit Facility
The Fund, together with other U.S. registered and foreign investment funds (collectively, Borrowers), managed by Franklin Templeton Investments, are borrowers in a joint syndicated senior unsecured credit facility totaling $2 billion (Global Credit Facility) which matures on February 12, 2016. This Global Credit Facility provides a source of funds to the Borrowers for temporary and emergency purposes, including the ability to meet future unanticipated or unusually large redemption requests.
Under the terms of the Global Credit Facility, the Fund shall, in addition to interest charged on any borrowings made by the Fund and other costs incurred by the Fund, pay its share of fees and expenses incurred in connection with the implementation and maintenance of the Global Credit Facility, based upon its relative share of the aggregate net assets of all of the Borrowers, including an annual commitment fee of 0.07% based upon the unused portion of the Global Credit Facility. These fees are reflected in other expenses in the Consolidated Statement of Operations. During the period ended November 30, 2015, the Fund did not use the Global Credit Facility.
9. Fair Value Measurements
The Fund follows a fair value hierarchy that distinguishes between market data obtained from independent sources (observable inputs) and the Fund’s own market assumptions (unobservable inputs). These inputs are used in determining the value of the Fund’s financial instruments and are summarized in the following fair value hierarchy:
• Level 1 – quoted prices in active markets for identical financial instruments
franklintempleton.com
Semiannual Report 31
FRANKLIN ALTERNATIVE STRATEGIES FUNDS
NOTES TO CONSOLIDATED FINANCIAL STATEMENTS (UNAUDITED)
Franklin Pelagos Commodities Strategy Fund (continued)
| 9. | Fair Value Measurements (continued) | |
| Level 2 – other significant observable inputs (including quoted prices for similar financial instruments, interest rates, pre- payment speed, credit risk, etc.) | ||
| Level 3 – significant unobservable inputs (including the Fund’s own assumptions in determining the fair value of financial instruments) | ||
| The | input levels are not necessarily an indication of the risk or liquidity associated with financial instruments at that level. | |
For movements between the levels within the fair value hierarchy, the Fund has adopted a policy of recognizing the transfers as of the date of the underlying event which caused the movement.
A summary of inputs used as of November 30, 2015, in valuing the Fund’s assets and liabilities carried at fair value, is as follows:
| Level 1 | Level 2 | Level 3 | Total | |||||
| Assets: | ||||||||
| Investments in Securities: | ||||||||
| U.S. Government and Agency Securities. | $ | — | $ | 51,926,128 | $ | — | $ | 51,926,128 |
| Short Term Investments | 70,156,447 | 2,900,000 | — | 73,056,447 | ||||
| Total Investments in Securities | $ | 70,156,447 | $ | 54,826,128 | $ | — | $ | 124,982,575 |
| Liabilities: | ||||||||
| Other Financial Instruments | ||||||||
| Futures Contracts | $ | 1,333,662 | $ | — | $ | — | $ | 1,333,662 |
| Swap Contracts | — | 5,741,497 | — | 5,741,497 | ||||
| Total Other Financial Instruments | $ | 1,333,662 | $ | 5,741,497 | $ | — | $ | 7,075,159 |
A reconciliation of assets in which Level 3 inputs are used in determining fair value is presented when there are significant Level 3 financial instruments at the end of the period.
10. Subsequent Events
The Fund has evaluated subsequent events through the issuance of the consolidated financial statements and determined that no events have occurred that require disclosure.
| Abbreviations | ||
| Counterparty | Selected Portfolio | |
| MSCS Morgan Stanley Capital Services, LLC | FFCB | Federal Farm Credit Bank |
| FHLB | Federal Home Loan Bank | |
32 Semiannual Report
franklintempleton.com
FRANKLIN ALTERNATIVE STRATEGIES FUNDS
FRANKLIN PELAGOS COMMODITIES STRATEGY FUND
Shareholder Information
Proxy Voting Policies and Procedures
The Fund’s investment manager has established Proxy Voting Policies and Procedures (Policies) that the Fund uses to determine how to vote proxies relating to portfolio securities. Shareholders may view the Fund’s complete Policies online at franklintempleton.com. Alternatively, shareholders may request copies of the Policies free of charge by calling the Proxy Group collect at (954) 527-7678 or by sending a written request to: Franklin Templeton Companies, LLC, 300 S.E. 2nd Street, Fort Lauderdale, FL 33301, Attention: Proxy Group. Copies of the Fund’s proxy voting records are also made available online at franklintempleton.com and posted on the U.S. Securities and Exchange Commission’s website at sec.gov and reflect the most recent 12-month period ended June 30.
Quarterly Statement of Investments
The Fund files a complete statement of investments with the U.S. Securities and Exchange Commission for the first and third quarters for each fiscal year on Form N-Q. Shareholders may view the filed Form N-Q by visiting the Commission’s website at sec.gov. The filed form may also be viewed and copied at the Commission’s Public Reference Room in Wash-ington, DC. Information regarding the operations of the Public Reference Room may be obtained by calling (800) SEC-0330.
franklintempleton.com
Semiannual Report 33
This page intentionally left blank.
This page intentionally left blank.
This page intentionally left blank.
| Contents | |
| Semiannual Report | |
| Franklin K2 Long Short Credit Fund | 3 |
| Performance Summary | 7 |
| Your Fund’s Expenses | 10 |
| Financial Highlights and Statement of Investments | 12 |
| Financial Statements | 22 |
| Notes to Financial Statements | 26 |
| Shareholder Information | 36 |
Visit franklintempleton.com for fund updates, to access your account, or to find helpful financial planning tools.
2 Semiannual Report
franklintempleton.com
Semiannual Report
Franklin K2 Long Short Credit Fund
We are pleased to bring you Franklin K2 Long Short Credit Fund’s semiannual report for the period since the Fund’s inception on September 8, 2015, through November 30, 2015.
Your Fund’s Goal and Main Investments
The Fund seeks total return through a combination of current income, capital preservation and capital appreciation. The Fund seeks to achieve its investment goal by allocating its assets across multiple non-traditional or “alternative” strategies, including but not limited to credit long short, structured credit and emerging market credit. The Fund is structured as a multi-manager fund, meaning the Fund’s assets are managed by multiple investment advisors (subadvisors), while the Fund’s investment manager has overall responsibility for the Fund’s investments.
Under normal market conditions, the Fund invests at least 80% of its net assets, plus the amount of any borrowings for investment purposes, in credit-related investments. The Fund invests in a wide range of securities and other investments including, but not limited to: corporate bonds, mortgage-backed securities and asset-backed securities, U.S. government and agency securities, collateralized debt and loan obligations, foreign government and supranational debt securities, loans and loan participations and derivatives with similar economic characteristics. The Fund may also invest in mortgage dollar rolls, repurchase agreements, reverse repurchase agreements, mortgage real estate investment trusts (REITs) and other similar transactions.
Performance Overview
The Fund’s Class A shares posted a +0.80% cumulative total return for the period since the Fund’s inception on September 8, 2015, through November 30, 2015. For comparison, the Fund’s primary benchmark, the BofA Merrill Lynch 3-Month U.S. Treasury Bill Index, which is an index of short-term U.S. government securities with a remaining term to final maturity of less than three months, produced a +0.01% total return for the same period.1 Also for comparison, the Fund’s secondary benchmark, the HFRX Fixed Income-Credit Index, which measures performance of strategies with exposure to credit across a broad continuum of credit substrategies, had a -4.68% total return for the same period.2 You can find more of the Fund’s performance data in the Performance Summary beginning on page 7.
| Portfolio Breakdown | ||
| 11/30/15 | ||
| % of Total | ||
| Net Assets | ||
| Long Positions | 77.1 | % |
| Short Positions | -7.0 | % |
| Short-Term Investments | 2.2 | % |
| Other Assets, less Liabilities | 27.7 | % |
Performance data represent past performance, which does not guarantee future results. Investment return and principal value will fluctuate, and you may have a gain or loss when you sell your shares. Current performance may differ from figures shown. For most recent month-end performance, go to franklintempleton.com or call (800) 342-5236.
Economic and Market Overview
The global economy moderated during the period under review. As measured by the MSCI World Index, stocks in global developed markets rose overall during the period despite worries about China’s slowing economy and tumbling stock market, declining commodity prices, and ongoing uncertainty over the U.S. Federal Reserve’s (Fed’s) timing for raising interest rates. Certain global central banks sought to boost their respective economies with additional monetary easing and the Fed kept the federal funds target rate unchanged. For the reporting period, oil prices declined sharply largely due to increased global supply and reduced global demand. Other commodity prices also fell. The U.S. dollar appreciated against most currencies during the period, which reduced returns of many foreign assets in U.S. dollar terms.
U.S. economic growth in the third quarter was less robust than in the second quarter as exports slowed, and state and local governments reduced their spending. Although global financial markets anticipated a Fed interest rate increase, the Fed kept interest rates unchanged. It said it expected moderate economic expansion but would monitor developments domestically and abroad. The Fed’s October meeting minutes indicated most members acknowledged the possibility of an interest rate increase at their next meeting in December.
1. Source: Morningstar.
2. Source: FactSet. Hedge Fund Research, Inc. – www.hedgefundresearch.com. The HFRX Fixed Income-Credit Index is being used under license from Hedge Fund
Research, Inc., which does not endorse or approve of any of the contents of this report.
The index is unmanaged and includes reinvestment of any income or distributions. One cannot invest directly in an index, and an index is not representative of the Fund’s
portfolio.
See www.franklintempletondatasources.com for additional data provider information.
The dollar value, number of shares or principal amount, and names of all portfolio holdings are listed in the Fund’s Statement of Investments (SOI). The SOI
begins on page 17.
franklintempleton.com
Semiannual Report 3
FRANKLIN K2 LONG SHORT CREDIT FUND
Outside the U.S., the U.K. economy’s growth slowed in the third quarter following slight second-quarter growth spurred by the service sector. Weak construction and manufacturing results hampered third-quarter expansion. In the eurozone, despite investor concerns about China’s moderating economy and geopolitical tensions between Russia and Turkey, the region generally benefited during the period from lower oil prices, a weaker euro that supported exports, the European Central Bank’s (ECB’s) accommodative policy, an improved 2015 eurozone growth forecast and expectations of further ECB stimulus.
After a decline in the second quarter of 2015, Japan’s economy expanded in the third quarter as capital expenditures improved. The Bank of Japan took several actions during the reporting period, including maintaining its monetary policy, lowering its economic growth and inflation forecasts and increasing its purchases of longer term debt.
In emerging markets, economic growth generally moderated. In October, emerging market equities gained after China expanded its monetary and fiscal stimulus to support its economy, though they retreated in November amid other concerns. In Brazil, falling prices for energy and other commodities coincided with an economic recession, rising unemployment and political uncertainty, leading to equity weakness and currency depreciation. Overall, emerging market stocks, as measured by the MSCI Emerging Markets Index, rose slightly for the period. Central bank actions varied across emerging markets during the period under review, as some banks raised interest rates in response to rising inflation and weakening currencies, while others lowered interest rates to promote economic growth.
Investment Strategy
We manage the Fund using a multi-manager approach. While we are responsible for the Fund’s overall investments, we allocate assets to multiple subadvisors, each of whom independently manages a separate portion of the Fund’s portfolio in accordance with some or all of the following strategies: credit long short, structured credit and emerging market credit. We allocate the Fund’s assets among these strategies utilizing a top-down approach, generating the Fund’s strategy weightings by taking into account market conditions, risk factors, diversification, liquidity, transparency, and availability of various subadvisors and other investment options, among other things.
Credit long short strategies seek to isolate issuer-specific exposure, while limiting general market risks, by taking long and/or short positions in debt securities and other related instruments. Structured credit strategies aim to profit from trading in interest-rate sensitive securities such as residential and commer-
cial mortgage-backed securities including agency residential mortgage-backed securities, REITS, credit default swaps on various indexes, collateralized loan obligations and asset-backed securities. Emerging market credit strategies invest in corporate and/or sovereign securities in emerging market countries with a focus on fixed income.
The Fund may take long and/or short positions in a wide range of asset classes, including credit, fixed income and currencies, among others. The Fund may gain long or short exposure to select instruments by utilizing derivatives, engaging in short sales or entering into a series of purchase and sale contracts or repurchase agreements. Long positions benefit from an increase in the price of the underlying instrument, while short positions benefit from a decrease in that price. The Fund may also use derivatives for hedging and nonhedging (investment) purposes. Such derivative investments may include currency forward contracts; futures contracts; put and call options on currencies, securities and indexes; and swaps. The Fund may engage in active and frequent trading as part of its investment strategies.
What is a currency forward contract?
A currency forward contract is an agreement between the Fund and a counterparty to buy or sell a foreign currency at a specific exchange rate on a future date.
What is a futures contract?
A futures contract is an agreement between the Fund and a counterparty made through a U.S. or foreign futures exchange to buy or sell an underlying instrument or asset at a specific price on a future date.
What is an option?
An option is a contract to buy or sell a specific financial product known as the option’s underlying instrument at a specific price. The buyer of an option has the right, but not the obligation, to buy or sell the underlying instrument at or until a specified expiration date. Conversely, the seller (“writer”) of an option who opens a transaction is obligated to buy or sell the underlying instrument should the option holder exercise that right.
What are swap agreements?
Swap agreements, such as interest rate, currency and credit default swaps, are contracts between the Fund and another party (the swap counterparty). In a basic swap transaction, the Fund agrees with the swap counterparty to exchange the returns (or differentials in return) earned or realized on a particular “notional amount” of underlying instruments. The notional amount is the set amount selected by the parties as the basis on which to calculate the obligations that they have agreed to exchange. The parties typically do not actually exchange the notional amount. Instead, they agree to exchange the returns that would be earned or realized if the notional amount were invested in given instruments or at given interest rates.
4 Semiannual Report
franklintempleton.com
FRANKLIN K2 LONG SHORT CREDIT FUND
Subadvisors
11/30/15
Credit Long Short
Apollo Credit Management LLC
Chatham Asset Management, LLC
Structured Credit
Candlewood Investment Group, L.P. Ellington Global Asset Management, L.L.C.
Manager’s Discussion
The Fund’s four active managers for the period from inception on September 8, 2015, through November 30, 2015, were Apollo Credit Management, Candlewood Investment Group, Chatham Asset Management and Ellington Global Asset Management.
Three of the four active managers contributed to positive performance for the period. The two managers in the structured credit space, Candlewood and Ellington, provided positive results. In the long short sector, Apollo delivered positive performance, while Chatham detracted from absolute returns.
The two structured credit managers were in the process of ramping up exposures during the review period. Given that these managers were establishing positions and the abbreviated period since inception, attribution contributors and detractors tended to be muted. For Ellington, non-agency residential mortgage-backed securities significantly benefited returns. The price mark-up of a non-agency residential mortgage-backed security position in November particularly aided returns. Conversely, a short position initiated later in the period in the high yield index that served as a portfolio hedge declined as the asset class rallied during the period. For Candlewood, overall residential and commercial mortgage-backed and asset-backed securities lifted results for the period.
Among long short managers, Apollo’s long positions added to performance and more than offset losses in short positions. Investments in consumer cyclicals, communications and basic materials provided gains in the review period. A major individual contributor was a short position in a metals engineering and manufacturing company, as the firm’s bonds price declined after news that the company was splitting its upstream and downstream businesses. The debt will be assigned to the upstream business, which is more leveraged. A large detractor from results was a long position in a bond issued by a private equity firm.
Chatham’s performance suffered for the review period, with long and short exposures detracting from absolute returns. Long positions in the energy and communications sectors were the primary detractors, with gains coming from high yield hedges, and the consumer non-cyclicals and financials sectors. A notable individual detractor was the manager’s equity market index short, used as a hedge for the overall portfolio. Also detracting were bonds of a high-end clothing retailer, which suffered after the company retracted its initial public offering and a broad sell-off in the retail sector. Contributors included the manager’s high yield index hedge, as well as a short position on a pharmaceutical firm’s bonds amid increasing investor skepticism around the sector and the company specifically.
At period-end, Chatham cited increased market volatility as providing an opportunity set in the long short sector. Apollo was exploring certain short positions in international markets and equity sectors. In structured credit, Candlewood and Elling-ton were progressing toward full investment.
| Top Five Long Positions | ||
| 11/30/15 | ||
| Company | % of Total | |
| Sector/Industry | Net Assets | |
| EQTY 2014-INNS Mortgage Trust | 4.7 | % |
| Commercial Mortgage-Backed Securities | ||
| Cornerstone CLO Ltd., 2007-C Trust | 4.6 | % |
| Diversified Financial Services | ||
| IndyMac Index Mortgage Loan 2005-AR18 Trust | 4.6 | % |
| Diversified Financial Services | ||
| Banc of America Funding 2006-G Trust | 4.3 | % |
| Diversified Financial Services | ||
| Credit Suisse Mortgage Securities Corp., Trust 2015 | 4.0 | % |
| Diversified Financial Services |
franklintempleton.com
Semiannual Report 5
FRANKLIN K2 LONG SHORT CREDIT FUND
Thank you for your participation in Franklin K2 Long Short Credit Fund. We look forward to continuing to serve your investment needs.

The foregoing information reflects our analysis, opinions and portfolio holdings as of November 30, 2015, the end of the reporting period. The way we implement our main investment strategies and the resulting portfolio holdings may change depending on factors such as market and economic conditions. These opinions may not be relied upon as investment advice or an offer for a particular security. The information is not a complete analysis of every aspect of any market, country, industry, security or the Fund. Statements of fact are from sources considered reliable, but the investment manager makes no representation or warranty as to their completeness or accuracy. Although historical performance is no guarantee of future results, these insights may help you understand our investment management philosophy.
David C. Saunders has been involved in the investment and trading of financial instruments since 1983. He has worked at Tucker Anthony & R.L. Day as an equity trader; First Boston Corp. as vice president on the equity block trading desk; WaterStreet Capital, a hedge fund, as head trader; Tiger Management, as head trader; WorldSec Securities as president and ABN Amro Inc. as a senior managing director. He co-founded K2 Advisors in 1994.
Jeff Schmidt joined K2 in July 2013 and is managing director of portfolio construction. Prior to joining K2, Mr. Schmidt was the head of client solutions, North America for InfraHedge Limited, a subsidiary of State Street Corporation. Other previous positions held include senior vice president and head of business development for WR Platform Advisors, LP; director of Merrill Lynch’s hedge fund development and management group; and managing director and chief operations officer of Marathon Capital Growth Partners, LLC.
Robert Christian is a senior managing director and head of research for K2 Advisors, which he joined in 2010.
Mr. Christian worked at Graham Capital Management, L.P., from 1998 to 2003 as a portfolio manager and researcher of quantitative-based trading strategies. At Julius Baer Investment Management from 2003 to 2005, he was the head of Macro Strategies. From 2005 to 2010, he worked at FRM Americas LLC where he was the global head of directional trading strategies and portfolio advisor to numerous funds.
Charmaine Chin is a managing director at K2, which she joined in March 2008. She heads K2’s credit and event driven manager research and leads the evaluation and selection of hedge fund managers in these strategies. She also oversees manager selection and monitoring for K2’s Asian hedge fund exposure. Before joining K2 Advisors, Ms. Chin worked at Goldman, Sachs & Co. in the special situations group and in the financial institutions group.
6 Semiannual Report
franklintempleton.com
FRANKLIN K2 LONG SHORT CREDIT FUND
Performance Summary as of November 30, 2015
Your dividend income will vary depending on dividends or interest paid by securities in the Fund’s portfolio, adjusted for operating expenses of each class. Capital gain distributions are net profits realized from the sale of portfolio securities. The performance table does not reflect any taxes that a shareholder would pay on Fund dividends, capital gain distributions, if any, or any realized gains on the sale of Fund shares. Total return reflects reinvestment of the Fund’s dividends and capital gain distributions, if any, and any unrealized gains or losses.
| Net Asset Value | |||||
| Share Class (Symbol) | 11/30/15 | 9/8/15 | Change | ||
| A (FKLSX) | $ | 10.08 | $ | 10.00 | +$0.08 |
| C (FKLCX) | $ | 10.06 | $ | 10.00 | +$0.06 |
| R (FKLRX) | $ | 10.07 | $ | 10.00 | +$0.07 |
| R6 (FKLQX) | $ | 10.09 | $ | 10.00 | +$0.09 |
| Advisor (FKLZX) | $ | 10.09 | $ | 10.00 | +$0.09 |
franklintempleton.com
Semiannual Report 7
| FRANKLIN K2 LONG SHORT CREDIT FUND |
| PERFORMANCE SUMMARY |
Performance as of 11/30/151
Cumulative total return excludes sales charges. Average annual total returns and value of $10,000 investment include maximum sales charges. Class A: 5.75% maximum initial sales charge; Class C: 1% contingent deferred sales charge in first year only;
Class R/R6/Advisor Class: no sales charges.
| Average Annual | Total Annual Operating Expenses6 | |||||||||||
| Cumulative | Average Annual | Value of $10,000 | Total Return | |||||||||
| Share Class | Total Return2 | Total Return3 | Investment4 | (12/31/15 | )5 | (with waiver) | (without waiver) | |||||
| A | 2.72 | % | 3.80 | % | ||||||||
| Since Inception (9/8/15) | +0.80 | % | -5.00 | % | $ | 9,500 | -5.42 | % | ||||
| C | 3.47 | % | 4.55 | % | ||||||||
| Since Inception (9/8/15) | +0.60 | % | -0.40 | % | $ | 9,960 | -0.92 | % | ||||
| R | 2.97 | % | 4.05 | % | ||||||||
| Since Inception (9/8/15) | +0.70 | % | +0.70 | % | $ | 10,070 | +0.15 | % | ||||
| R6 | 2.41 | % | 3.49 | % | ||||||||
| Since Inception (9/8/15) | +0.90 | % | +0.90 | % | $ | 10,090 | +0.37 | % | ||||
| Advisor | 2.47 | % | 3.55 | % | ||||||||
| Since Inception (9/8/15) | +0.90 | % | +0.90 | % | $ | 10,090 | +0.45 | % | ||||
Performance data represent past performance, which does not guarantee future results. Investment return and principal value will fluctuate, and you may have a gain or loss when you sell your shares. Current performance may differ from figures shown. For most recent month-end performance, go to franklintempleton.com or call (800) 342-5236.
See page 9 for Performance Summary footnotes.
8 Semiannual Report
franklintempleton.com
| FRANKLIN K2 LONG SHORT CREDIT FUND |
| PERFORMANCE SUMMARY |
All investments involve risks, including possible loss of principal. The market values of securities owned by the Fund will go up or down, sometimes rapidly or unpredictably. The Fund’s performance depends on the manager’s skill in selecting, overseeing, and allocating Fund assets to the subadvisors. The Fund is actively managed and could experience losses if the manager’s and subadvisors’ judgment about particular Fund portfolio investments prove to be incorrect. Some subadvisors may have little or no experience managing the assets of a registered investment company. Bond prices generally move in the opposite direction of interest rates. Changes in the financial strength of a bond issuer or in a bond’s credit rating may affect its value. Lower rated or high yield debt securities (junk bonds) involve greater credit risk, including the possibility of default or bankruptcy. Liquidity risk exists when securities become more difficult to sell, or are unable to be sold, at the price at which they’ve been valued. Investments in derivatives involve costs and create economic leverage, which may result in significant volatility and cause the Fund to participate in losses (as well as gains) that significantly exceed the Fund’s initial investment. The Fund may make short sales of securities, which involves the risk that losses may exceed the original amount invested. The Fund’s prospectus also includes a description of the main investment risks.
Class C: Class R: Class R6: Advisor Class: | These shares have higher annual fees and expenses than Class A shares. Shares are available to certain eligible investors as described in the prospectus. These shares have higher annual fees and expenses than Class A shares. Shares are available to certain eligible investors as described in the prospectus. Shares are available to certain eligible investors as described in the prospectus. |
1. The Fund has an expense reduction contractually guaranteed through at least 9/30/16. The transfer agent has contractually agreed to waive or limit its transfer agency fees
for Class R6 shares of the Fund so that transfer agency fees for that class do not exceed 0.01% until 9/30/16. Fund investment results reflect the expense reduction, fee
waiver and fee cap, to the extent applicable; without these reductions, the results would have been lower.
2. Cumulative total return represents the change in value of an investment over the periods indicated.
3. Average annual total return represents the average annual change in value of an investment over the periods indicated. Return for less than one year, if any, has not been
annualized.
4. These figures represent the value of a hypothetical $10,000 investment in the Fund over the periods indicated.
5. In accordance with SEC rules, we provide standardized average annual total return information through the latest calendar quarter.
6. Figures are as stated in the Fund’s current prospectus. In periods of market volatility, assets may decline significantly, causing total annual Fund operating expenses to
become higher than the figures shown.
franklintempleton.com
Semiannual Report 9
FRANKLIN K2 LONG SHORT CREDIT FUND
Your Fund’s Expenses
As a Fund shareholder, you can incur two types of costs:
- Transaction costs, including sales charges (loads) on Fund purchases; and
- Ongoing Fund costs, including management fees, distribution and service (12b-1) fees, and other Fund expenses. All mutual funds have ongoing costs, sometimes referred to as operating expenses.
The following table shows ongoing costs of investing in the Fund and can help you understand these costs and compare them with those of other mutual funds. The table assumes a $1,000 investment held for the six months indicated.
Actual Fund Expenses
The first line (Actual) for each share class listed in the table provides actual account values and expenses. The “Ending Account Value” is derived from the Fund’s actual return, which includes the effect of Fund expenses.
You can estimate the expenses you paid during the period by following these steps. Of course, your account value and expenses will differ from those in this illustration:
1. Divide your account value by $1,000.
If an account had an $8,600 value, then $8,600 ÷ $1,000 = 8.6.
2. Multiply the result by the number under the heading “Expenses Paid During Period.”
If Expenses Paid During Period were $7.50, then 8.6 × $7.50 = $64.50.
In this illustration, the estimated expenses paid this period are $64.50.
Hypothetical Example for Comparison with Other Funds
Information in the second line (Hypothetical) for each class in the table can help you compare ongoing costs of investing in the Fund with those of other mutual funds. This information may not be used to estimate the actual ending account balance or expenses you paid during the period. The hypothetical “Ending Account Value” is based on the actual expense ratio for each class and an assumed 5% annual rate of return before expenses, which does not represent the Fund’s actual return. The figure under the heading “Expenses Paid During Period” shows the hypothetical expenses your account would have incurred under this scenario. You can compare this figure with the 5% hypothetical examples that appear in shareholder reports of other funds.
Please note that expenses shown in the table are meant to highlight ongoing costs and do not reflect any transaction costs, such as sales charges. Therefore, the second line for each class is useful in comparing ongoing costs only, and will not help you compare total costs of owning different funds. In addition, if transaction costs were included, your total costs would have been higher. Please refer to the Fund prospectus for additional information on operating expenses.
10 Semiannual Report
franklintempleton.com
FRANKLIN K2 LONG SHORT CREDIT FUND
YOUR FUND’S EXPENSES
| Expenses Paid | ||||||
| Beginning | During Period* | |||||
| Account Value | Actual 9/8/15–11/30/15 | |||||
| Actual 9/8/15 | Ending Account | Hypothetical | ||||
| Share Class | Hypothetical 6/1/15 | Value 11/30/15 | 6/1/15–11/30/15 | |||
| A | ||||||
| Actual | $ | 1,000 | $ | 1,008.00 | $ | 6.01 |
| Hypothetical (5% return before expenses) | $ | 1,000 | $ | 1,011.80 | $ | 13.28 |
| C | ||||||
| Actual | $ | 1,000 | $ | 1,006.00 | $ | 5.41 |
| Hypothetical (5% return before expenses) | $ | 1,000 | $ | 1,013.10 | $ | 11.98 |
| R | ||||||
| Actual | $ | 1,000 | $ | 1,007.00 | $ | 5.39 |
| Hypothetical (5% return before expenses) | $ | 1,000 | $ | 1,013.15 | $ | 11.93 |
| R6 | ||||||
| Actual | $ | 1,000 | $ | 1,009.00 | $ | 5.40 |
| Hypothetical (5% return before expenses) | $ | 1,000 | $ | 1,012.85 | $ | 11.93 |
| Advisor | ||||||
| Actual | $ | 1,000 | $ | 1,009.00 | $ | 5.54 |
| Hypothetical (5% return before expenses) | $ | 1,000 | $ | 1,012.85 | $ | 12.23 |
*Expenses are calculated using the most recent six-month expense ratio, net of expense waivers, annualized for each class (A: 2.64%;
C: 2.38%; R: 2.37%; R6: 2.37% and Advisor: 2.43%), multiplied by the average account value over the period, multiplied by 183/366 to reflect
the one-half year period for Hypothetical expenses. For Actual expenses, the multiplier is 83/366 to reflect the number of days since inception.
franklintempleton.com
Semiannual Report 11
| FRANKLIN ALTERNATIVE STRATEGIES FUNDS | |||
| Financial Highlights | |||
| Franklin K2 Long Short Credit Fund | |||
| Period Ended | |||
| November 30, 2015a | |||
| (unaudited) | |||
| Class A | |||
| Per share operating performance | |||
| (for a share outstanding throughout the period) | |||
| Net asset value, beginning of period | $ | 10.00 | |
| Income from investment operationsb: | |||
| Net investment incomec | 0.04 | ||
| Net realized and unrealized gains (losses) | 0.04 | ||
| Total from investment operations | 0.08 | ||
| Net asset value, end of period | $ | 10.08 | |
| Total returnd | 0.80 | % | |
| Ratios to average net assetse | |||
| Expenses before waiver and payments by affiliatesf,g | 3.57 | % | |
| Expenses net of waiver and payments by affiliatesf | 2.64 | % | |
| Expenses incurred in connection with securities sold short | 0.48 | % | |
| Net investment income | 1.42 | % | |
| Supplemental data | |||
| Net assets, end of period (000’s) | $ | 27,753 | |
| Portfolio turnover rate | 209.62 | % | |
aFor the period September 8, 2015 (commencement of operations) to November 30, 2015.
bThe amount shown for a share outstanding throughout the period may not correlate with the Statement of Operations for the period due to the timing of sales and repurchases
of Fund shares in relation to income earned and/or fluctuating fair value of the investments of the Fund.
cBased on average daily shares outstanding.
dTotal return does not reflect sales commissions or contingent deferred sales charges, if applicable, and is not annualized for periods less than one year.
eRatios are annualized for periods less than one year.
fIncludes interest expense on securities sold short and security borrowing fees, if any. See below for the ratios of such expenses to average net assets for the periods pre-
sented. See Note 1(e).
gRatios are adjusted to exclude the effects of annualization for non-recurring expenses.
12 Semiannual Report | The accompanying notes are an integral part of these financial statements.
franklintempleton.com
FRANKLIN ALTERNATIVE STRATEGIES FUNDS
FINANCIAL H IGHLIGHTS
| Franklin K2 Long Short Credit Fund (continued) | |||
| Period Ended | |||
| November 30, 2015a | |||
| (unaudited) | |||
| Class C | |||
| Per share operating performance | |||
| (for a share outstanding throughout the period) | |||
| Net asset value, beginning of period | $ | 10.00 | |
| Income from investment operationsb: | |||
| Net investment incomec | 0.01 | ||
| Net realized and unrealized gains (losses) | 0.05 | ||
| Total from investment operations | 0.06 | ||
| Net asset value, end of period | $ | 10.06 | |
| Total returnd | 0.60 | % | |
| Ratios to average net assetse | |||
| Expenses before waiver and payments by affiliatesf,g | 3.31 | % | |
| Expenses net of waiver and payments by affiliatesf, | 2.38 | % | |
| Expenses incurred in connection with securities sold short | 0.48 | % | |
| Net investment income | 1.68 | % | |
| Supplemental data | |||
| Net assets, end of period (000’s) | $ | 14 | |
| Portfolio turnover rate | 209.62 | % | |
aFor the period September 8, 2015 (commencement of operations) to November 30, 2015.
bThe amount shown for a share outstanding throughout the period may not correlate with the Statement of Operations for the period due to the timing of sales and repurchases
of Fund shares in relation to income earned and/or fluctuating fair value of the investments of the Fund.
cBased on average daily shares outstanding.
dTotal return does not reflect sales commissions or contingent deferred sales charges, if applicable, and is not annualized for periods less than one year.
eRatios are annualized for periods less than one year.
fIncludes interest expense on securities sold short and security borrowing fees, if any. See below for the ratios of such expenses to average net assets for the periods pre-
sented. See Note 1(e).
gRatios are adjusted to exclude the effects of annualization for non-recurring expenses.
franklintempleton.com
The accompanying notes are an integral part of these financial statements. | Semiannual Report 13
FRANKLIN ALTERNATIVE STRATEGIES FUNDS
FINANCIAL H IGHLIGHTS
| Franklin K2 Long Short Credit Fund (continued) | |||
| Period Ended | |||
| November 30, 2015a | |||
| (unaudited) | |||
| Class R | |||
| Per share operating performance | |||
| (for a share outstanding throughout the period) | |||
| Net asset value, beginning of period | $ | 10.00 | |
| Income from investment operationsb: | |||
| Net investment incomec | 0.01 | ||
| Net realized and unrealized gains (losses) | 0.06 | ||
| Total from investment operations | 0.07 | ||
| Net asset value, end of period | $ | 10.07 | |
| Total returnd | 0.70 | % | |
| Ratios to average net assetse | |||
| Expenses before waiver and payments by affiliatesf,g | 3.30 | % | |
| Expenses net of waiver and payments by affiliatesf | 2.37 | % | |
| Expenses incurred in connection with securities sold short | 0.48 | % | |
| Net investment income | 1.69 | % | |
| Supplemental data | |||
| Net assets, end of period (000’s) | $ | 12 | |
| Portfolio turnover rate | 209.62 | % | |
aFor the period September 8, 2015 (commencement of operations) to November 30, 2015.
bThe amount shown for a share outstanding throughout the period may not correlate with the Statement of Operations for the period due to the timing of sales and repurchases
of Fund shares in relation to income earned and/or fluctuating fair value of the investments of the Fund.
cBased on average daily shares outstanding.
dTotal return is not annualized for periods less than one year.
eRatios are annualized for periods less than one year.
fIncludes interest expense on securities sold short and security borrowing fees, if any. See below for the ratios of such expenses to average net assets for the periods pre-
sented. See Note 1(e).
gRatios are adjusted to exclude the effects of annualization for non-recurring expenses.
14 Semiannual Report | The accompanying notes are an integral part of these financial statements.
franklintempleton.com
FRANKLIN ALTERNATIVE STRATEGIES FUNDS
FINANCIAL H IGHLIGHTS
| Franklin K2 Long Short Credit Fund (continued) | |||
| Period Ended | |||
| November 30, 2015a | |||
| (unaudited) | |||
| Class R6 | |||
| Per share operating performance | |||
| (for a share outstanding throughout the period) | |||
| Net asset value, beginning of period | $ | 10.00 | |
| Income from investment operationsb: | |||
| Net investment incomec | 0.01 | ||
| Net realized and unrealized gains (losses) | 0.08 | ||
| Total from investment operations | 0.09 | ||
| Net asset value, end of period | $ | 10.09 | |
| Total returnd | 0.90 | % | |
| Ratios to average net assetse | |||
| Expenses before waiver and payments by affiliatesf,g | 3.30 | % | |
| Expenses net of waiver and payments by affiliatesf | 2.37 | % | |
| Expenses incurred in connection with securities sold short | 0.48 | % | |
| Net investment income | 1.69 | % | |
| Supplemental data | |||
| Net assets, end of period (000’s) | $ | 12 | |
| Portfolio turnover rate | 209.62 | % | |
aFor the period September 8, 2015 (commencement of operations) to November 30, 2015.
bThe amount shown for a share outstanding throughout the period may not correlate with the Statement of Operations for the period due to the timing of sales and repurchases
of Fund shares in relation to income earned and/or fluctuating fair value of the investments of the Fund.
cBased on average daily shares outstanding.
dTotal return is not annualized for periods less than one year.
eRatios are annualized for periods less than one year.
fIncludes interest expense on securities sold short and security borrowing fees, if any. See below for the ratios of such expenses to average net assets for the periods pre-
sented. See Note 1(e).
gRatios are adjusted to exclude the effects of annualization for non-recurring expenses.
franklintempleton.com
The accompanying notes are an integral part of these financial statements. | Semiannual Report 15
FRANKLIN ALTERNATIVE STRATEGIES FUNDS
FINANCIAL H IGHLIGHTS
| Franklin K2 Long Short Credit Fund (continued) | |||
| Period Ended | |||
| November 30, 2015a | |||
| (unaudited) | |||
| Advisor Class | |||
| Per share operating performance | |||
| (for a share outstanding throughout the period) | |||
| Net asset value, beginning of period | $ | 10.00 | |
| Income from investment operationsb: | |||
| Net investment incomec | 0.04 | ||
| Net realized and unrealized gains (losses) | 0.05 | ||
| Total from investment operations | 0.09 | ||
| Net asset value, end of period | $ | 10.09 | |
| Total returnd | 0.90 | % | |
| Ratios to average net assetse | |||
| Expenses before waiver and payments by affiliatesf,g | 3.36 | % | |
| Expenses net of waiver and payments by affiliatesf | 2.43 | % | |
| Expenses incurred in connection with securities sold short | 0.48 | % | |
| Net investment income | 1.63 | % | |
| Supplemental data | |||
| Net assets, end of period (000’s) | $ | 24,895 | |
| Portfolio turnover rate | 209.62 | % | |
aFor the period September 8, 2015 (commencement of operations) to November 30, 2015.
bThe amount shown for a share outstanding throughout the period may not correlate with the Statement of Operations for the period due to the timing of sales and repurchases
of Fund shares in relation to income earned and/or fluctuating fair value of the investments of the Fund.
cBased on average daily shares outstanding.
dTotal return is not annualized for periods less than one year.
eRatios are annualized for periods less than one year.
fIncludes interest expense on securities sold short and security borrowing fees, if any. See below for the ratios of such expenses to average net assets for the periods pre-
sented. See Note 1(e).
gRatios are adjusted to exclude the effects of annualization for non-recurring expenses.
16 Semiannual Report | The accompanying notes are an integral part of these financial statements.
franklintempleton.com
FRANKLIN ALTERNATIVE STRATEGIES FUNDS
| Statement of Investments, November 30, 2015 (unaudited) | ||||
| Franklin K2 Long Short Credit Fund | ||||
| Principal | ||||
| Country | Amount* | Value | ||
| Convertible Bonds (Cost $570,818) 1.1% | ||||
| Real Estate Investment Trusts (REITs) 1.1% | ||||
| iStar Inc., senior note, 3.00%, 11/15/16 | United States | 500,000 | $ | 589,063 |
| Corporate Bonds and Notes 32.2% | ||||
| Commercial Services & Supplies 0.7% | ||||
| aiPayment Inc., senior note, 144A, 9.50%, 12/15/19 | United States | 334,850 | 344,058 | |
| Containers & Packaging 1.5% | ||||
| bReynolds Group Issuer Inc./Reynolds Group Issuer LLC, senior secured note, first lien, | ||||
| 6.875%, 2/15/21 | United States | 750,000 | 778,125 | |
| Diversified Financial Services 3.2% | ||||
| a,bGlobal Cash Access Inc., senior note, 144A, 10.00%, 1/15/22 | United States | 354,000 | 314,175 | |
| NewStar Financial Inc., senior note, 7.25%, 5/01/20 | United States | 261,000 | 259,369 | |
| a,bOpal Acquisition Inc., senior note, 144A, 8.875%, 12/15/21 | United States | 94,000 | 81,427 | |
| aROC Finance LLC/ROC Finance 1 Corp., secured note, second lien, 144A, | ||||
| 12.125%, 9/01/18 | United States | 700,000 | 742,000 | |
| a,cSolvay Finance America LLC, senior bond, 144A, 4.45%, 12/03/25 | Belgium | 259,000 | 258,689 | |
| 1,655,660 | ||||
| Diversified Telecommunication Services 3.7% | ||||
| Frontier Communications Corp., senior bond, 9.00%, 8/15/31 | United States | 762,000 | 649,605 | |
| bSprint Communications Inc., senior note, 8.375%, 8/15/17 | United States | 783,000 | 783,000 | |
| Windstream Services LLC, senior note, 7.875%, 11/01/17 | United States | 500,000 | 524,375 | |
| 1,956,980 | ||||
| Electric Utilities 0.4% | ||||
| a,bReal Alloy Holding Inc., senior note, 144A, 10.00%, 1/15/19 | United States | 215,000 | 218,225 | |
| Energy Equipment & Services 1.6% | ||||
| a,bTarga Resources Partners LP/Targa Resources Partners Finance Corp., senior note, | ||||
| 144A, 6.75%, 3/15/24 | United States | 104,000 | 99,060 | |
| Transocean Inc., senior note, 5.55%, 12/15/16 | United States | 750,000 | 749,062 | |
| 848,122 | ||||
| Health Care Equipment & Supplies 0.8% | ||||
| bUniversal Hospital Services Inc., senior note, 7.625%, 8/15/20 | United States | 468,000 | 439,920 | |
| Hotels, Restaurants & Leisure 1.2% | ||||
| aGolden Nugget Escrow Inc., senior note, 144A, 8.50%, 12/01/21 | United States | 166,000 | 171,395 | |
| a,bDownstream Development Authority of the Quapaw Tribe of Oklahoma, secured note, | ||||
| 144A, 10.50%, 7/01/19 | United States | 460,000 | 480,700 | |
| 652,095 | ||||
| Independent Power & Renewable Electricity Producers 1.0% | ||||
| NRG Energy Inc., senior note, | ||||
| 6.625%, 3/15/23 | United States | 350,000 | 323,750 | |
| b6.25%, 5/01/24 | United States | 231,000 | 210,210 | |
| 533,960 | ||||
| Industrial Conglomerates 1.0% | ||||
| cRoper Technologies Inc., senior bond, 3.85%, 12/15/25 | United States | 517,000 | 516,142 | |
| IT Services 0.1% | ||||
| aFirst Data Corp., senior note, 144A, 7.00%, 12/01/23 | United States | 50,000 | 50,813 | |
| Life Sciences Tools & Services 1.5% | ||||
| inVentiv Health Inc., senior note, 10.00%, 8/15/18 | United States | 300,000 | 291,000 |
franklintempleton.com
Semiannual Report 17
FRANKLIN ALTERNATIVE STRATEGIES FUNDS
STATEMENT OF INVESTMENTS (UNAUDITED)
| Franklin K2 Long Short Credit Fund (continued) | ||||
| Principal | ||||
| Country | Amount* | Value | ||
| Corporate Bonds and Notes (continued) | ||||
| Life Sciences Tools & Services (continued) | ||||
| cThermo Fisher Scientific Inc., senior bond, 3.65%, 12/15/25 | United States | 517,000 | $ | 516,266 |
| 807,266 | ||||
| Media 6.1% | ||||
| American Media Inc., first lien, 11.50%, 12/15/17 | United States | 779,000 | 781,921 | |
| aLee Enterprises Inc., senior secured note, first lien, 144A, 9.50%, 3/15/22 | United States | 444,000 | 413,475 | |
| The McClatchy Co., senior secured note, first lien, 9.00%, 12/15/22 | United States | 30,000 | 28,248 | |
| bPostmedia Network Inc., secured note, second lien, 12.50%, 7/15/18 | Canada | 300,000 | 286,500 | |
| aTime Inc., senior note, 144A, 5.75%, 4/15/22 | United States | 448,000 | 431,200 | |
| aUnivision Communications Inc., senior secured note, first lien, 144A, | ||||
| 5.125%, 2/15/25 | United States | 750,000 | 726,562 | |
| bWideOpenWest Finance LLC/Capital Corp., senior note, 10.25%, 7/15/19 | United States | 576,000 | 553,680 | |
| 3,221,586 | ||||
| Metals & Mining 0.1% | ||||
| AK Steel Corp., | ||||
| bsenior bond, 7.625%, 5/15/20 | United States | 64,000 | 27,680 | |
| senior note, 7.625%, 10/01/21 | United States | 107,000 | 43,870 | |
| 71,550 | ||||
| Oil, Gas & Consumable Fuels 3.1% | ||||
| California Resources Corp., senior note, 6.00%, 11/15/24 | United States | 336,000 | 201,810 | |
| Energy Transfer Equity LP, senior bond, 5.50%, 6/01/27 | United States | 465,000 | 391,762 | |
| Kinder Morgan Inc., senior bond, 8.05%, 10/15/30 | United States | 283,000 | 283,793 | |
| Sabine Pass LNG LP, senior secured note, first lien, 7.50%, 11/30/16 | United States | 750,000 | 768,750 | |
| 1,646,115 | ||||
| Paper & Forest Products 0.3% | ||||
| Resolute Forest Products Inc., senior note, 5.875%, 5/15/23 | United States | 237,000 | 174,788 | |
| Pharmaceuticals 1.5% | ||||
| aConvaTec Healthcare SA, senior note, 144A, 10.50%, 12/15/18 | Luxembourg | 750,000 | 762,187 | |
| Real Estate Investment Trusts (REITs) 1.2% | ||||
| cEquinix Inc., senior bond, 5.875%, 1/15/26 | United States | 80,000 | 81,400 | |
| Ferrellgas LP / Ferrellgas Finance Corp., senior note, | ||||
| 6.50%, 5/01/21 | United States | 100,000 | 90,500 | |
| a,b144A, 6.75%, 6/15/23 | United States | 232,000 | 208,754 | |
| biStar Inc., senior note, 4.00%, 11/01/17 | United States | 250,000 | 243,750 | |
| 624,404 | ||||
| Software 1.4% | ||||
| aInfor U.S. Inc., first lien, 144A, 5.75%, 8/15/20 | United States | 750,000 | 753,750 | |
| Specialty Retail 1.4% | ||||
| a,dNeiman Marcus Group Ltd. LLC, senior note, 144A, PIK, 8.75% (all cash), 10/15/21 | United States | 555,000 | 496,725 | |
| bToys R US Property Co. II LLC, senior note, 8.50%, 12/01/17 | United States | 255,000 | 240,338 | |
| 737,063 | ||||
| Textiles, Apparel & Luxury Goods 0.4% | ||||
| a,bEmpire Today LLC / Empire Today Finance Corp., senior secured note, first lien, 144A, | ||||
| 11.375%, 2/01/17 | United States | 189,000 | 181,440 | |
| Total Corporate Bonds and Notes (Cost $17,370,192) | 16,974,249 | |||
18 Semiannual Report
franklintempleton.com
| FRANKLIN ALTERNATIVE STRATEGIES FUNDS |
| STATEMENT OF INVESTMENTS (UNAUDITED) |
| Franklin K2 Long Short Credit Fund (continued) | |||||
| Principal | |||||
| Country | Amount* | Value | |||
| Asset-Backed Securities and Commercial | |||||
| Mortgage-Backed Securities 43.8% | |||||
| Consumer Finance 0.5% | |||||
| eImpac CMB 2004-11 Trust, 1A2, FRN, 0.741%, 3/25/35 | United States | 333,451 | $ | 251,755 | |
| Diversified Financial Services 34.6% | |||||
| eBanc of America Funding 2006-G Trust, M1, FRN, 0.507%, 7/20/36 | United States | 3,500,000 | 2,272,975 | ||
| eBear Stearns ARM 2006-2 Trust, 4A1, FRN, 4.828%, 7/25/36 | United States | 146,809 | 128,431 | ||
| eBear Stearns ARM 2007-4 Trust, 22A1, FRN, 4.804%, 6/25/47 | United States | 128,588 | 115,379 | ||
| a,eCornerstone CLO Ltd., 2007-C Trust, 144A, FRN, 2.721%, 7/15/21 | United States | 2,500,000 | 2,418,250 | ||
| Credit Suisse First Boston Mortgage Securities Corp., 1A2, 7.50%, 3/25/32 | United States | 688,176 | 706,562 | ||
| a,eCredit Suisse Mortgage Securities Corp., Trust 2015, E, 144A, FRN, 4.197%, 4/15/29 | United States | 2,100,000 | 2,091,090 | ||
| a,eEQTY 2014-INNS Mortgage Trust, E, 144A, FRN, 3.645%, 5/08/31 | United States | 2,500,000 | 2,484,037 | ||
| eIndyMac Index Mortgage Loan 2005-AR13 Trust, 4A1, FRN, 2.538%, 8/25/35 | United States | 651,004 | 573,191 | ||
| eIndyMac Index Mortgage Loan 2005-AR18 Trust, 1A2, FRN, 1.031%, 10/25/36 | United States | 5,728,819 | 2,410,805 | ||
| eHome Equity Mortgage Loan Asset-Backed 2001-A Trust, AV, FRN, 0.741%, 3/25/31 | United States | 121,387 | 103,313 | ||
| eJP Morgan Alternative Loan 2006-3A3 Trust, FRN, 6.03%, 3/25/36 | United States | 2,056,180 | 1,827,467 | ||
| eJP Morgan Mortgage 2007-A2 Trust, 2A1, FRN, 2.642%, 4/25/37 | United States | 475,797 | 420,487 | ||
| a,eKatonah Ltd., 2007-B1L Trust, 144A, FRN, 3.316%, 4/23/22 | United States | 1,000,000 | 997,350 | ||
| eThe Prudential Home Mortgage Securities Co. Inc., A18, FRN, 1.521%, 1/25/24 | United States | 159,710 | 142,510 | ||
| eStructured Asset Mortgage Investments 2003-AR2 Trust, A1, FRN, 0.943%, 12/19/33 | United States | 35,635 | 34,454 | ||
| eWaMu Mortgage Pass-Through Certificates 2007-OA3 Trust, 2A1A, FRN, | |||||
| 1.004%, 4/25/47 | United States | 107,158 | 91,440 | ||
| a,eWaterfall Commercial Mortgage 2015-SBC5 Trust, A, 144A, FRN, 4.104%, 9/19/22 | United States | 1,437,950 | 1,424,628 | ||
| 18,242,369 | |||||
| Thrifts & Mortgage Finance 8.7% | |||||
| Banc of America Commercial Mortgage 2006-6 Trust, AJ, 5.421%, 10/10/45 | United States | 900,000 | 914,219 | ||
| eNational Collegiate Student Loan 2007-4 Trust, FRN, | |||||
| A3A1, 3.682%, 3/25/38 | United States | 1,850,000 | 1,836,061 | ||
| A3A2, 3.697%, 3/25/38 | United States | 2,000,000 | 1,845,299 | ||
| 4,595,579 | |||||
| Total Asset-Backed Securities and Commercial | |||||
| Mortgage-Backed Securities (Cost $22,715,271) | 23,089,703 | ||||
| Total Investments before Repurchase Agreements | |||||
| (Cost $40,656,281) | 40,653,015 | ||||
| Repurchase Agreement (Cost $1,132,438) 2.2% | |||||
| fJoint Repurchase Agreement, 0.048%, 12/01/15 | |||||
| (Maturity Value $1,132,439) | United States | 1,132,438 | 1,132,438 | ||
| BNP Paribas Securities Corp. (Maturity Value $215,707) | |||||
| Credit Suisse Securities (USA) LLC (Maturity Value $647,110) | |||||
| HSBC Securities (USA) Inc. (Maturity Value $161,780) | |||||
| Merrill Lynch, Pierce, Fenner & Smith Inc. (Maturity Value $107,842) | |||||
| Collateralized by gU.S. Treasury Bill, 12/03/15 - 11/10/16; and U.S. | |||||
| Treasury Note, 0.625% - 1.375%, 5/31/17 - 2/29/20 (valued at $1,155,371) | |||||
| Total Investments (Cost $41,788,719) 79.3% | 41,785,453 | ||||
| Securities Sold Short (7.0)% | (3,695,473 | ) | |||
| Other Assets, less Liabilities 27.7% | 14,595,274 | ||||
| Net Assets 100.0% | $ | 52,685,254 | |||
franklintempleton.com
Semiannual Report 19
FRANKLIN ALTERNATIVE STRATEGIES FUNDS
STATEMENT OF INVESTMENTS (UNAUDITED)
| Franklin K2 Long Short Credit Fund (continued) | |||||
| Principal | |||||
| Country | Amount* | Value | |||
| hSecurities Sold Short (7.0)% | |||||
| Corporate Bonds and Notes (4.7)% | |||||
| Chemicals (1.8)% | |||||
| The Mosaic Co., senior bond, 4.25%, 11/15/23 | United States | 500,000 | $ | (502,513 | ) |
| Potash Corp. of Saskatchewan Inc., senior bond, 3.00%, 4/01/25 | Canada | 500,000 | (471,116 | ) | |
| (973,629 | ) | ||||
| Electronic Equipment, Instruments & Components (0.2)% | |||||
| aItalics Merger Sub Inc., senior note, 144A, 7.125%, 7/15/23 | United States | 99,000 | (95,535 | ) | |
| Hotels, Restaurants & Leisure (0.4)% | |||||
| MGM Resorts International, senior note, 6.00%, 3/15/23 | United States | 180,000 | (178,763 | ) | |
| aWynn Las Vegas LLC / Wynn Las Vegas Capital Corp., senior bond, 144A, | |||||
| 5.50%, 3/01/25 | United States | 70,000 | (63,262 | ) | |
| (242,025 | ) | ||||
| Machinery (0.1)% | |||||
| Navistar International Corp., senior bond, 8.25%, 11/01/21 | United States | 60,000 | (43,050 | ) | |
| Media (0.3)% | |||||
| aCequel Communications Holdings I LLC / Cequel Capital Corp., senior note, 144A, | |||||
| 5.125%, 12/15/21 | United States | 117,000 | (108,517 | ) | |
| Sinclair Television Group Inc., senior note, 5.375%, 4/01/21 | United States | 45,000 | (45,394 | ) | |
| (153,911 | ) | ||||
| Oil, Gas & Consumable Fuels (0.8)% | |||||
| Oasis Petroleum Inc., senior note, 6.875%, 3/15/22 | United States | 484,000 | (415,030 | ) | |
| Pharmaceuticals (1.1)% | |||||
| aValeant Pharmaceuticals International Inc., senior bond, 144A, 6.125%, 4/15/25 | United States | 657,000 | (573,233 | ) | |
| Total Corporate Bonds and Notes (Proceeds $2,555,303) | (2,496,413 | ) | |||
| U.S. Government and Agency Securities | |||||
| (Proceeds $1,198,434) (2.3%) | |||||
| U.S. Treasury Note, 2.25%, 11/15/25 | United States | 1,195,000 | (1,199,060 | ) | |
| Total Securities Sold Short (Proceeds $3,753,737) | $ | (3,695,473 | ) | ||
*The principal amount is stated in U.S. dollars unless otherwise indicated.
aSecurity was purchased pursuant to Rule 144A under the Securities Act of 1933 and may be sold in transactions exempt from registration only to qualified institutional buyers
or in public offering registered under the Securities Act of 1933. These securities have been deemed liquid under guidelines approved by the Trust’s Board of Trustees. At
November 30, 2015, the net value of these securities was $15,309,443, representing 29.06% of net assets.
bA portion or all of the security has been segregated as collateral for securities sold short. At November 30, 2015, the aggregate value of these securities and/or cash pledged
amounted to $8,326,643, representing 15.80% of net assets.
cA portion or all of the security purchased on a when-issued and delayed delivery basis. See Note 1(c).
dIncome may be received in additional securities and/or cash.
eThe coupon rate shown represents the rate at period end.
fSee Note 1(b) regarding joint repurchase agreement.
gThe security is traded on a discount basis with no stated coupon rate.
hSee Note 1(e) regarding securities sold short.
20 Semiannual Report
franklintempleton.com
FRANKLIN ALTERNATIVE STRATEGIES FUNDS
STATEMENT OF INVESTMENTS (UNAUDITED)
| Franklin K2 Long Short Credit Fund (continued) | |||||||||||||||||||||
| At November 30, 2015, the Fund had the following credit default swap contracts outstanding. See Note 1(d). | |||||||||||||||||||||
| Credit Default Swap Contracts | |||||||||||||||||||||
| Unamortized | |||||||||||||||||||||
| Periodic | Upfront | ||||||||||||||||||||
| Payment | Counterparty/ | Notional | Expiration | Payments | Unrealized | Unrealized | |||||||||||||||
| Description | Rate | Exchange | Amount | Date | (Receipts) | Appreciation | Depreciation | Value | |||||||||||||
| Centrally Cleared Swap Contracts | |||||||||||||||||||||
| Contracts to Buy Protection | |||||||||||||||||||||
| Traded Index | |||||||||||||||||||||
| CDX 24 HY | 5.00 | % | ICE | $ | 1,014,750 | 6/20/20 | $ | (55,040 | ) | $ | 498 | $ | — | $ | (54,542 | ) | |||||
| Total Centrally Cleared Swap Contracts | $ | (55,040 | ) | $ | 498 | $ | — | $ | (54,542 | ) | |||||||||||
| OTC Swaps | |||||||||||||||||||||
| Contracts to Buy Protection | |||||||||||||||||||||
| Single Name | |||||||||||||||||||||
| American Electric Power Company Inc | 1.00 | % | GSCO | 750,000 | 12/20/20 | (27,293 | ) | — | (3,331 | ) | (30,624 | ) | |||||||||
| Cox Communications Inc | 1.00 | % | GSCO | 750,000 | 12/20/20 | — | — | (4,047 | ) | (4,047 | ) | ||||||||||
| Domtar Corp | 1.00 | % | JPHQ | 750,000 | 9/20/20 | 21,491 | — | (10,055 | ) | 11,436 | |||||||||||
| Eastman Kodak Co | 1.00 | % | GSCO | 750,000 | 12/20/20 | (3,932 | ) | 1,219 | — | (2,713 | ) | ||||||||||
| Expedia Inc | 1.00 | % | GSCO | 750,000 | 12/20/20 | (715 | ) | — | (4,194 | ) | (4,909 | ) | |||||||||
| Loews Corp | 1.00 | % | GSCO | 750,000 | 12/20/20 | (17,251 | ) | — | (10,983 | ) | (28,234 | ) | |||||||||
| National Rural Utilities Cooperative Finance Corp | 1.00 | % | GSCO | 750,000 | 12/20/20 | (23,503 | ) | — | (4,766 | ) | (28,269 | ) | |||||||||
| Whirlpool Corp | 1.00 | % | GSCO | 750,000 | 12/20/20 | (1,426 | ) | — | (1,973 | ) | (3,399 | ) | |||||||||
| Total OTC Swap Contracts | (52,629 | ) | 1,219 | (39,349 | ) | (90,759 | ) | ||||||||||||||
| Total Credit Default Swap Contracts | 7,217,700 | $ | (107,669 | ) | $ | 1,717 | $ | (39,349 | ) | $ | (145,301 | ) | |||||||||
| Net unrealized appreciation (depreciation) | $ | (37,632 | ) | ||||||||||||||||||
| See Notes 1(d) and 8 regarding derivative financial instruments and other derivative information, respectively. | |||||||||||||||||||||
| At November 30, 2015, the Fund had the following total return swap contracts outstanding. See Note 1(d). | |||||||||||||||||||||
| Total Return Swap Contracts | |||||||||||||||||||||
| Counter- | Expiration | Unrealized Unrealized | |||||||||||||||||||
| Underlying Instrument | Financing Rate | Party Notional Value | Date Appreciation | Depreciation | |||||||||||||||||
| Short | |||||||||||||||||||||
| iBoxx USD Liquid High Yield Index | LIBOR | JPHQ | $ | 300,000 | 3/20/16 | $ | — | $ | (1,908 | ) | |||||||||||
| Net unrealized appreciation (depreciation) | $ | (1,908 | ) | ||||||||||||||||||
| See Abbreviations on page 35. | |||||||||||||||||||||
franklintempleton.com
Semiannual Report 21
FRANKLIN ALTERNATIVE STRATEGIES FUNDS
Financial Statements
Statement of Assets and Liabilities
November 30, 2015 (unaudited)
| Franklin K2 Long Short Credit Fund | ||
| Assets: | ||
| Investments in securities: | ||
| Cost - Unaffiliated issuers | $ | 40,656,281 |
| Cost - Repurchase agreements | 1,132,438 | |
| Total cost of investments | $ | 41,788,719 |
| Value - Unaffiliated issuers | $ | 40,653,015 |
| Value - Repurchase agreements | 1,132,438 | |
| Total value of investments | 41,785,453 | |
| Cash | 10,229,052 | |
| Receivables: | ||
| Investment securities sold | 3,387,543 | |
| Capital shares sold | 1,520 | |
| Interest | 429,853 | |
| Due from brokers | 3,882,548 | |
| Offering costs | 293,154 | |
| OTC swap contracts (upfront payments $22,496) | 21,491 | |
| Unrealized appreciation on OTC swap contracts | 1,219 | |
| Total assets | 60,031,833 | |
| Liabilities: | ||
| Payables: | ||
| Investment securities purchased | 3,440,025 | |
| Management fees | 1,807 | |
| Distribution fees | 5,714 | |
| Transfer agent fees | 6,247 | |
| Trustees’ fees and expenses | 5,902 | |
| Variation margin | 12,582 | |
| OTC swap contracts (upfront receipts $76,514) | 74,120 | |
| Securities sold short, at value (proceeds $3,753,737) | 3,695,473 | |
| Unrealized depreciation on OTC swap contracts | 41,257 | |
| Accrued expenses and other liabilities | 63,452 | |
| Total liabilities | 7,346,579 | |
| Net assets, at value | $ | 52,685,254 |
| Net assets consist of: | ||
| Paid-in capital | $ | 52,276,664 |
| Accumulated net investment income | 177,708 | |
| Net unrealized appreciation (depreciation) | 15,458 | |
| Accumulated net realized gain (loss) | 215,424 | |
| Net assets, at value | $ | 52,685,254 |
22 Semiannual Report | The accompanying notes are an integral part of these financial statements.
franklintempleton.com
FRANKLIN ALTERNATIVE STRATEGIES FUNDS
FINANCIAL STATEMENTS
| Statement of Assets and Liabilities (continued) | ||
| November 30, 2015 (unaudited) | ||
| Franklin K2 Long Short Credit Fund | ||
| Class A: | ||
| Net assets, at value | $ | 27,752,947 |
| Shares outstanding | 2,753,076 | |
| Net asset value per sharea | $ | 10.08 |
| Maximum offering price per share (net asset value per share ÷ 94.25%) | $ | 10.69 |
| Class C: | ||
| Net assets, at value | $ | 13,513 |
| Shares outstanding | 1,343 | |
| Net asset value and maximum offering price per sharea | $ | 10.06 |
| Class R: | ||
| Net assets, at value | $ | 12,026 |
| Shares outstanding | 1,195 | |
| Net asset value and maximum offering price per shareb | $ | 10.07 |
| Class R6: | ||
| Net assets, at value | $ | 12,049 |
| Shares outstanding | 1,195 | |
| Net asset value and maximum offering price per shareb | $ | 10.09 |
| Advisor Class: | ||
| Net assets, at value | $ | 24,894,719 |
| Shares outstanding | 2,468,059 | |
| Net asset value and maximum offering price per share | $ | 10.09 |
| aRedemption price is equal to net asset value less contingent deferred sales charges, if applicable. | ||
| bNet asset value and maximum offering price may not recalculate due to rounding of net assets and/or shares outstanding. | ||
franklintempleton.com
The accompanying notes are an integral part of these financial statements. | Semiannual Report 23
FRANKLIN ALTERNATIVE STRATEGIES FUNDS
FINANCIAL STATEMENTS
| Statement of Operations | |||
| for the period ended November 30, 2015a (unaudited) | |||
| Franklin K2 Long Short Credit Fund | |||
| Investment income: | |||
| Interest | $ | 378,702 | |
| Paydown gain (loss) | 91,897 | ||
| Total investment income | 470,599 | ||
| Expenses: | |||
| Management fees (Note 3a) | 237,209 | ||
| Distribution fees: (Note 3c) | |||
| Class A | 12,107 | ||
| Class C | 22 | ||
| Class R | 10 | ||
| Transfer agent fees: (Note 3e) | |||
| Class A | 3,391 | ||
| Class C | 2 | ||
| Class R | 1 | ||
| Class R6 | 4 | ||
| Advisor Class | 2,886 | ||
| Custodian fees (Note 4) | 17,494 | ||
| Reports to shareholders | 9,577 | ||
| Registration and filing fees | 727 | ||
| Professional fees | 29,799 | ||
| Trustees’ fees and expenses | 5,902 | ||
| Amortization of offering costs | 85,811 | ||
| Interest on securities sold short | 50,085 | ||
| Security borrowing fees | 5,040 | ||
| Other | 7,434 | ||
| Total expenses | 467,501 | ||
| Expenses waived/paid by affiliates (Note 3f) | (174,610 | ) | |
| Net expenses | 292,891 | ||
| Net investment income | 177,708 | ||
| Realized and unrealized gains (losses): | |||
| Net realized gain (loss) from: | |||
| Investments | (5,186 | ) | |
| Written options | 1,416 | ||
| Securities sold short | 137,430 | ||
| Swap contracts | 81,764 | ||
| Net realized gain (loss) | 215,424 | ||
| Net change in unrealized appreciation (depreciation) on: | |||
| Investments | 54,998 | ||
| Swap contracts | (39,540 | ) | |
| Net change in unrealized appreciation (depreciation) | 15,458 | ||
| Net realized and unrealized gain (loss) | 230,882 | ||
| Net increase (decrease) in net assets resulting from operations | $ | 408,590 | |
| aFor the period September 8, 2015 (commencement of operations) to November 30, 2015. | |||
24 Semiannual Report | The accompanying notes are an integral part of these financial statements.
franklintempleton.com
FRANKLIN ALTERNATIVE STRATEGIES FUNDS
FINANCIAL STATEMENTS
| Statement of Changes in Net Assets | ||
| Franklin K2 Long Short Credit Fund | ||
| Period Ended | ||
| November 30, 2015a | ||
| (unaudited) | ||
| Increase (decrease) in net assets: | ||
| Operations: | ||
| Net investment income | $ | 177,708 |
| Net realized gain (loss) | 215,424 | |
| Net change in unrealized appreciation (depreciation) | 15,458 | |
| Net increase (decrease) in net assets resulting from operations | 408,590 | |
| Capital share transactions: (Note 2) | ||
| Class A | 27,531,373 | |
| Class C | 11,500 | |
| Class R | 10,000 | |
| Class R6 | 10,000 | |
| Advisor Class | 24,713,791 | |
| Total capital share transactions | 52,276,664 | |
| Net increase (decrease) in net assets | 52,685,254 | |
| Net assets: | ||
| End of period | $ | 52,685,254 |
| Accumulated net investment income included in net assets: | ||
| End of period | $ | 177,708 |
| aFor the period September 8, 2015 (commencement of operations) to November 30, 2015. | ||
franklintempleton.com
The accompanying notes are an integral part of these financial statements. | Semiannual Report 25
FRANKLIN ALTERNATIVE STRATEGIES FUNDS
Notes to Financial Statements (unaudited)
Franklin K2 Long Short Credit Fund
1. Organization and Significant Accounting Policies
Franklin Alternative Strategies Funds (Trust) is registered under the Investment Company Act of 1940 (1940 Act) as an open-end management investment company, consisting of three separate funds and applies the specialized accounting and reporting guidance in U.S. Generally Accepted Accounting Principles (U.S. GAAP). The Franklin K2 Long Short Credit Fund (Fund) is included in this report. The financial statements of the remaining funds in the Trust are presented separately. The Fund commenced operations on September 8, 2015, with five classes of shares: Class A, Class C, Class R, Class R6 and Advisor Class. Effective September 28, 2015, the Fund began publicly offering its shares. Each class of shares differs by its initial sales load, contingent deferred sales charges, voting rights on matters affecting a single class, its exchange privilege and fees primarily due to differing arrangements for distribution and transfer agent fees.
The following summarizes the Fund’s significant accounting policies.
a. Financial Instrument Valuation
The Fund’s investments in financial instruments are carried at fair value daily. Fair value is the price that would be received to sell an asset or paid to transfer a liability in an orderly transaction between market participants on the measurement date. The Fund calculates the net asset value (NAV) per share as of 4 p.m. Eastern time each day the New York Stock Exchange (NYSE) is open for trading. Under compliance policies and procedures approved by the Trust’s Board of Trustees (the Board), the Fund’s administrator has responsibility for oversight of valuation, including leading the cross-functional Valuation and Liquidity Oversight Committee (VLOC). The VLOC provides administration and oversight of the Fund’s valuation policies and procedures, which are approved annually by the Board. Among other things, these procedures allow the Fund to utilize independent pricing services, quotations from securities and financial instrument dealers, and other market sources to determine fair value.
Debt securities generally trade in the over-the-counter (OTC) market rather than on a securities exchange. The Fund’s pricing services use multiple valuation techniques to determine fair value. In instances where sufficient market activity exists, the pricing services may utilize a market-based approach through which quotes from market makers are used to determine fair value. In instances where sufficient market activity may not exist or is limited, the pricing services also utilize proprietary valuation models which may consider market characteristics such as benchmark yield curves, credit spreads, estimated default rates, anticipated market interest rate volatility, coupon rates, anticipated timing of principal repayments, underlying collateral, and other unique security features in order to estimate the relevant cash flows, which are then discounted to calculate the fair value.
Repurchase agreements are valued at cost, which approximates fair value.
Derivative financial instruments (derivatives) listed on an exchange are valued at the official closing price of the day. Certain derivatives trade in the OTC market. The Fund’s pricing services use various techniques including industry standard option pricing models and proprietary discounted cash flow models to determine the fair value of those instruments. The Fund’s net benefit or obligation under the derivative contract, as measured by the fair value of the contract, is included in net assets.
The Fund has procedures to determine the fair value of financial instruments for which market prices are not reliable or readily available. Under these procedures, the VLOC convenes on a regular basis to review such financial instruments and considers a number of factors, including significant unobservable valuation inputs, when arriving at fair value. The VLOC primarily employs a market-based approach which may use related or comparable assets or liabilities, recent transactions, market multiples, book values, and other relevant information for the investment to determine the fair value of the investment. An income-based valuation approach may also be used in which the anticipated future cash flows of the investment are discounted to calculate fair value. Discounts may also be applied due to the nature or duration of any restrictions on the disposition of the investments. Due to the inherent uncertainty of valuations of such investments, the fair values may differ significantly from the values that would have been used had an active market existed. The VLOC employs various methods for calibrating these valuation approaches including a regular review of key inputs and assumptions, transactional back-testing or disposition analysis, and reviews of any related market activity.
b. Joint Repurchase Agreement
The Fund enters into a joint repurchase agreement whereby its uninvested cash balance is deposited into a joint cash account
26 Semiannual Report
franklintempleton.com
| FRANKLIN ALTERNATIVE STRATEGIES FUNDS |
| NOTES TO FINANCIAL STATEMENTS (UNAUDITED) |
Franklin K2 Long Short Credit Fund (continued)
with other funds managed by the investment manager or an affiliate of the investment manager and is used to invest in one or more repurchase agreements. The value and face amount of the joint repurchase agreement are allocated to the funds based on their pro-rata interest. A repurchase agreement is accounted for as a loan by the Fund to the seller, collateralized by securities which are delivered to the Fund’s custodian. The fair value, including accrued interest, of the initial collateralization is required to be at least 102% of the dollar amount invested by the funds, with the value of the underlying securities marked to market daily to maintain coverage of at least 100%. Repurchase agreements are subject to the terms of Master Repurchase Agreements (MRAs) with approved counterparties (sellers). The MRAs contain various provisions, including but not limited to events of default and maintenance of collateral for repurchase agreements. In the event of default by either the seller or the Fund, certain MRAs may permit the non-defaulting party to net and close-out all transactions, if any, traded under such agreements. The Fund may sell securities it holds as collateral and apply the proceeds towards the repurchase price and any other amounts owed by the seller to the Fund in the event of default by the seller. This could involve costs or delays in addition to a loss on the securities if their value falls below the repurchase price owed by the seller. The joint repurchase agreement held by the Fund at period end, as indicated in the Statement of Investments, had been entered into on November 30, 2015.
c. Securities Purchased on a When-Issued and Delayed Delivery Basis
The Fund purchases securities on a when-issued and delayed delivery basis, with payment and delivery scheduled for a future date. These transactions are subject to market fluctuations and are subject to the risk that the value at delivery may be more or less than the trade date purchase price. Although the Fund will generally purchase these securities with the intention of holding the securities, it may sell the securities before the settlement date. Sufficient assets have been segregated for these securities.
d. Derivative Financial Instruments
The Fund invested in derivatives in order to manage risk or gain exposure to various other investments or markets. Derivatives are financial contracts based on an underlying or notional amount, require no initial investment or an initial net investment that is smaller than would normally be required to have a similar response to changes in market factors, and require or permit net settlement. Derivatives contain various risks including the potential inability of the counterparty to fulfill their obligations under the terms of the contract, the potential for an illiquid secondary market, and/or the potential for market movements which expose the Fund to gains or losses in excess of the amounts shown in the Statement of Assets and Liabilities. Realized gain and loss and unrealized appreciation and depreciation on these contracts for the period are included in the Statement of Operations.
Derivative counterparty credit risk is managed through a formal evaluation of the creditworthiness of all potential counterparties. The Fund attempts to reduce its exposure to counterparty credit risk on OTC derivatives, whenever possible, by entering into International Swaps and Derivatives Association (ISDA) master agreements with certain counterparties. These agreements contain various provisions, including but not limited to collateral requirements, events of default, or early termination. Termination events applicable to the counterparty include certain deteriorations in the credit quality of the counterparty. Termination events applicable to the Fund include failure of the Fund to maintain certain net asset levels and/or limit the decline in net assets over various periods of time. In the event of default or early termination, the ISDA master agreement gives the non-defaulting party the right to net and close-out all transactions traded, whether or not arising under the ISDA agreement, to one net amount payable by one counterparty to the other. However, absent an event of default or early termination, OTC derivative assets and liabilities are presented gross and not offset in the Statement of Assets and Liabilities. Early termination by the counterparty may result in an immediate payment by the Fund of any net liability owed to that counterparty under the ISDA agreement.
Collateral requirements differ by type of derivative. Collateral or initial margin requirements are set by the broker or exchange clearing house for exchange traded and centrally cleared derivatives. Initial margin deposited is held at the exchange and can be in the form of cash and/or securities. For OTC derivatives traded under an ISDA master agreement, posting of collateral is required by either the Fund or the applicable coun-terparty if the total net exposure of all OTC derivatives with the applicable counterparty exceeds the minimum transfer amount, which typically ranges from $100,000 to $250,000, and can vary depending on the counterparty and the type of the agreement. Generally, collateral is determined at the close of fund business each day and any additional collateral required due to changes in derivative values may be delivered by the Fund or the counterparty within a few business days. Collateral pledged and/or received by the Fund for OTC derivatives, if any, is held
franklintempleton.com
Semiannual Report 27
FRANKLIN ALTERNATIVE STRATEGIES FUNDS
NOTES TO FINANCIAL STATEMENTS (UNAUDITED)
Franklin K2 Long Short Credit Fund (continued)
1. Organization and Significant Accounting
Policies (continued)
d. Derivative Financial Instruments (continued)
in segregated accounts with the Fund’s custodian/counterparty broker and can be in the form of cash and/or securities. Unrestricted cash may be invested according to the Fund’s investment objectives. To the extent that the amounts due to the Fund from its counterparties are not subject to collateralization or are not fully collateralized, the Fund bears the risk of loss from counterparty non-performance.
The Fund entered into credit default swap contracts primarily to manage and/or gain exposure to credit risk. A credit default swap is an agreement between the Fund and a counterparty whereby the buyer of the contract receives credit protection and the seller of the contract guarantees the credit worthiness of a referenced debt obligation. These agreements may be privately negotiated in the over-the-counter market (OTC credit default swaps) or may be executed in a multilateral trade facility platform, such as a registered exchange (centrally cleared credit default swaps). The underlying referenced debt obligation may be a single issuer of corporate or sovereign debt, a credit index, a basket of issuers or indices, or a tranche of a credit index or basket of issuers or indices. In the event of a default of the underlying referenced debt obligation, the buyer is entitled to receive the notional amount of the credit default swap contract from the seller in exchange for the referenced debt obligation, a net settlement amount equal to the notional amount of the credit default swap less the recovery value of the referenced debt obligation, or other agreed upon amount. For centrally cleared credit default swaps, required initial margins are pledged by the Fund, and the daily change in fair value is accounted for as a variation margin payable or receivable on the Statement of Assets and Liabilities. Over the term of the contract, the buyer pays the seller a periodic stream of payments, provided that no event of default has occurred. Such periodic payments are accrued daily as an unrealized appreciation or depreciation until the payments are made, at which time they are realized. Upfront payments and receipts are reflected in the Statement of Assets and Liabilities and represent compensating factors between stated terms of the credit default swap agreement and prevailing market conditions (credit spreads and other relevant factors). These upfront payments and receipts are amortized over the term of the contract as a realized gain or loss in the Statement of Operations.
The Fund entered into OTC total return swap contracts primarily to manage and/or gain exposure to credit risk of an underlying instrument such as a stock, bond, index or basket of securities or indices. A total return swap is an agreement between the Fund and a counterparty to exchange a return linked to an underlying instrument for a floating or fixed rate payment, both based upon a notional amount. Over the term of the contract, contractually required payments to be paid or received are accrued daily and recorded as unrealized appreciation or depreciation until the payments are made, at which time they are recognized as realized gain or loss.
The Fund purchased or wrote exchange traded and/or OTC option contracts primarily to manage and/or gain exposure to equity price risk. An option is a contract entitling the holder to purchase or sell a specific amount of shares or units of an asset or notional amount of a swap (swaption), at a specified price. When an option is purchased or written, an amount equal to the premium paid or received is recorded as an asset or liability, respectively. Upon exercise of an option, the acquisition cost or sales proceeds of the underlying investment is adjusted by any premium received or paid. Upon expiration of an option, any premium received or paid is recorded as a realized gain or loss. Upon closing an option other than through expiration or exercise, the difference between the premium received or paid and the cost to close the position is recorded as a realized gain or loss.
See Notes 6 and 8 regarding investment transactions and other derivative information, respectively.
e. Securities Sold Short
The Fund is engaged in selling securities short, which obligates the Fund to replace a borrowed security with the same security at current fair value. The Fund incurs a loss if the price of the security increases between the date of the short sale and the date on which the Fund replaces the borrowed security. The Fund realizes a gain if the price of the security declines between those dates. Gains are limited to the price at which the Fund sold the security short, while losses are potentially unlimited in size.
The Fund is required to establish a margin account with the broker lending the security sold short. While the short sale is outstanding, the broker retains the proceeds of the short sale to the extent necessary to meet margin requirements until the short position is closed out. A deposit must also be maintained with the Fund’s custodian/counterparty broker consisting of cash and/ or securities having a value equal to a specified percentage of
28 Semiannual Report
franklintempleton.com
| FRANKLIN ALTERNATIVE STRATEGIES FUNDS |
| NOTES TO FINANCIAL STATEMENTS (UNAUDITED) |
Franklin K2 Long Short Credit Fund (continued)
the value of the securities sold short. The Fund is obligated to pay fees for borrowing the securities sold short and is required to pay the counterparty any dividends and/or interest due on securities sold short. Such dividends and/or interest and any security borrowing fees are recorded as an expense to the Fund.
f. Income Taxes
It is the Fund’s policy to qualify as a regulated investment company under the Internal Revenue Code. The Fund intends to distribute to shareholders substantially all of its taxable income and net realized gains to relieve it from federal income and excise taxes. As a result, no provision for U.S. federal income taxes is required.
The Fund recognizes the tax benefits of uncertain tax positions only when the position is “more likely than not” to be sustained upon examination by the tax authorities based on the technical merits of the tax position. As of November 30, 2015, the Fund has determined that no liability for unrecognized tax benefits is required in the Fund’s financial statements related to uncertain tax positions taken on a tax return (or expected to be taken on future tax returns).
g. Security Transactions, Investment Income, Expenses and Distributions
Security transactions are accounted for on trade date. Realized gains and losses on security transactions are determined on a specific identification basis. Interest income and estimated expenses are accrued daily. Amortization of premium and accretion of discount on debt securities are included in interest income. Paydown gains and losses are recorded as an adjustment to interest income separately in the Statement of Operations. Distributions to shareholders are recorded on the ex-dividend date and are determined according to income tax regulations (tax basis). Distributable earnings determined on a tax basis may differ from earnings recorded in accordance with U.S. GAAP. These differences may be permanent or temporary. Permanent differences are reclassified among capital accounts to reflect their tax character. These reclassifications have no impact on net assets or the results of operations. Temporary differences are not reclassified, as they may reverse in subsequent periods.
Common expenses incurred by the Trust are allocated among the funds based on the ratio of net assets of each fund to the combined net assets of the Trust. Fund specific expenses are charged directly to the fund that incurred the expense.
Realized and unrealized gains and losses and net investment income, not including class specific expenses, are allocated daily to each class of shares based upon the relative proportion of net assets of each class. Differences in per share distributions, by class, are generally due to differences in class specific expenses.
h. Offering Costs
Offering costs are amortized on a straight line basis over twelve months.
i. Accounting Estimates
The preparation of financial statements in accordance with U.S. GAAP requires management to make estimates and assumptions that affect the reported amounts of assets and liabilities at the date of the financial statements and the amounts of income and expenses during the reporting period. Actual results could differ from those estimates.
j. Guarantees and Indemnifications
Under the Trust’s organizational documents, its officers and trustees are indemnified by the Trust against certain liabilities arising out of the performance of their duties to the Trust. Additionally, in the normal course of business, the Trust, on behalf of the Fund, enters into contracts with service providers that contain general indemnification clauses. The Trust’s maximum exposure under these arrangements is unknown as this would involve future claims that may be made against the Trust that have not yet occurred. Currently, the Trust expects the risk of loss to be remote.
franklintempleton.com
Semiannual Report 29
| FRANKLIN ALTERNATIVE STRATEGIES FUNDS |
| NOTES TO FINANCIAL STATEMENTS (UNAUDITED) |
Franklin K2 Long Short Credit Fund (continued)
2. Shares of Beneficial Interest
At November 30, 2015, there were an unlimited number of shares authorized (without par value). Transactions in the Fund’s shares were as follows:
| Period Ended | ||||||
| November 30, 2015a | ||||||
| Shares | Amount | |||||
| Class A Shares: | ||||||
| Shares sold | 2,753,076 | $ | 27,531,373 | |||
| Class C Shares: | ||||||
| Shares sold | 500,150 | $ | 5,001,510 | |||
| Shares redeemed | (498,807 | ) | (4,990,010 | ) | ||
| Net increase (decrease) | 1,343 | $ | 11,500 | |||
| Class R Shares: | ||||||
| Shares sold | 500,001 | $ | 5,000,010 | |||
| Shares redeemed | (498,806 | ) | (4,990,010 | ) | ||
| Net increase (decrease) | 1,195 | $ | 10,000 | |||
| Class R6 Shares: | ||||||
| Shares sold | 500,001 | $ | 5,000,010 | |||
| Shares redeemed | (498,806 | ) | (4,990,010 | ) | ||
| Net increase (decrease) | 1,195 | $ | 10,000 | |||
| Advisor Class Shares: | ||||||
| Shares sold | 2,471,609 | $ | 24,749,754 | |||
| Shares redeemed | (3,550 | ) | (35,963 | ) | ||
| Net increase (decrease) | 2,468,059 | $ | 24,713,791 | |||
aFor the period September 8, 2015 (commencement of operations) to November 30, 2015.
3. Transactions with Affiliates
Franklin Resources, Inc. is the holding company for various subsidiaries that together are referred to as Franklin Templeton Investments. Certain officers and trustees of the Trust are also officers and/or directors of the following subsidiaries:
| Subsidiary | Affiliation |
| K2/D&S Management Co., L.L.C. (K2 Advisors) | Investment manager |
| Franklin Templeton Services, LLC (FT Services) | Administrative manager |
| Franklin Templeton Distributors, Inc. (Distributors) | Principal underwriter |
| Franklin Templeton Investor Services, LLC (Investor Services) | Transfer agent |
| a. Management Fees | |
| The Fund pays an investment management fee to K2 Advisors of 2.05% per year of the average daily net assets of the Fund. | |
| Under each subadvisory agreement, the below entities provide subadvisory services to the Fund. The subadvisory fees are paid by | |
| K2 Advisors based on the Fund’s average daily net assets, and is not an additional expense of the Fund. | |
| Subadvisors | |
| Apollo Credit Management LLC | |
| Candlewood Investment Group, L.P. | |
| Chatham Asset Management, LLC | |
| Ellington Global Asset Management, L.L.C. | |
30 Semiannual Report
franklintempleton.com
| FRANKLIN ALTERNATIVE STRATEGIES FUNDS |
| NOTES TO FINANCIAL STATEMENTS (UNAUDITED) |
Franklin K2 Long Short Credit Fund (continued)
b. Administrative Fees
Under an agreement with K2 Advisors, FT Services provides administrative services to the Fund. The fee is paid by K2 Advisors based on the Fund’s average daily net assets, and is not an additional expense of the Fund.
c. Distribution Fees
The Board has adopted distribution plans for each share class, with the exception of Class R6 and Advisor Class shares, pursuant to Rule 12b-1 under the 1940 Act. Under the Fund’s Class A reimbursement distribution plan, the Fund reimburses Distributors for costs incurred in connection with the servicing, sale and distribution of the Fund’s shares up to the maximum annual plan rate. Under the Class A reimbursement distribution plan, costs exceeding the maximum for the current plan year cannot be reimbursed in subsequent periods. In addition, under the Fund’s Class C and R compensation distribution plans, the Fund pays Distributors for costs incurred in connection with the servicing, sale and distribution of the Fund’s shares up to the maximum annual plan rate for each class. The plan year, for purposes of monitoring compliance with the maximum annual plan rates, is February 1 through January 31 for each fund.
The maximum annual plan rates, based on the average daily net assets, for each class, are as follows:
| Class A | 0.25 | % |
| Class C | 1.00 | % |
| Class R | 0.50 | % |
d. Sales Charges/Underwriting Agreements
Front-end sales charges and contingent deferred sales charges (CDSC) do not represent expenses of the Fund. These charges are deducted from the proceeds of sales of Fund shares prior to investment or from redemption proceeds prior to remittance, as applicable. Distributors has advised the Fund of the following commission transactions related to the sales and redemptions of the Fund’s shares for the period:
| Sales charges retained net of commissions paid to unaffiliated broker/dealers | $ | 159 |
| CDSC retained | $ | — |
e. Transfer Agent Fees
Each class of shares, except for Class R6, pays transfer agent fees to Investor Services for its performance of shareholder servicing obligations and reimburses Investor Services for out of pocket expenses incurred, including shareholding servicing fees paid to third parties. These fees are allocated daily based upon their relative proportion of such classes’ aggregate net assets. Class R6 pays Investor Services transfer agent fees specific to that class.
For the period ended November 30, 2015, the Fund paid transfer agent fees of $6,284, of which $64 was retained by Investor Services.
f. Waiver and Expense Reimbursements
K2 Advisors has contractually agreed in advance to waive or limit its fees and to assume as its own expense certain expenses otherwise payable by the Fund so that the expenses (excluding distribution fees, acquired fund fees and expenses, and expenses related to securities sold short) for each class of the Fund do not exceed 1.95%, and Class R6 does not exceed 1.89% based on the average net assets of each class (other than certain non-routine expenses or costs, including those relating to litigation, indemnification, reorganizations, and liquidations) until September 30, 2016.
g. Other Affiliated Transactions
At November 30, 2015, Franklin Resources, Inc. owned 95.71% of the Fund’s outstanding shares. Investment activities of this shareholder could have a material impact on the Fund.
franklintempleton.com
Semiannual Report 31
FRANKLIN NOTES TO | ALTERNATIVE STRATEGIES FUNDS FINANCIAL STATEMENTS (UNAUDITED) |
Franklin K2 Long Short Credit Fund (continued)
4. Expense Offset Arrangement
The Fund has entered into an arrangement with its custodian whereby credits realized as a result of uninvested cash balances are used to reduce a portion of the Fund’s custodian expenses. During the period ended November 30, 2015, there were no credits earned.
5. Income Taxes
At November 30, 2015, the cost of investments and net unrealized appreciation (depreciation) for income tax purposes were as follows:
| Cost of investments | $ | 41,862,332 | |
| Unrealized appreciation | $ | 408,757 | |
| Unrealized depreciation | (485,636 | ) | |
| Net unrealized appreciation (depreciation) | $ | (76,879 | ) |
Differences between income and/or capital gains as determined on a book basis and a tax basis are primarily due to differing treatments of bond discounts and premiums and wash sales.
6. Investment Transactions
Purchases and sales of investments and securities sold short (excluding short term securities) for the period ended November 30, 2015, aggregated $115,256,680 and $78,712,568, respectively.
Transactions in options written during the period ended November 30, 2015, were as follows:
| Number of | |||||
| Contracts | Premiums | ||||
| Options written | 4 | $ | 4,188 | ||
| Options expired | — | — | |||
| Options exercised | — | — | |||
| Options closed | (4 | ) | (4,188 | ) | |
| Options outstanding at November 30, 2015 | — | $ | — |
See Notes 1(d) and 8 regarding derivative financial instruments and other derivative information, respectively.
7. Credit Risk
At November 30, 2015, the Fund had 34.3% of its portfolio invested in high yield and other securities rated below investment grade. These securities may be more sensitive to economic conditions causing greater price volatility and are potentially subject to a greater risk of loss due to default than higher rated securities.
32 Semiannual Report
franklintempleton.com
| FRANKLIN ALTERNATIVE STRATEGIES FUNDS |
| NOTES TO FINANCIAL STATEMENTS (UNAUDITED) |
Franklin K2 Long Short Credit Fund (continued)
8. Other Derivative Information
At November 30, 2015, the Fund’s investments in derivative contracts are reflected in the Statement of Assets and Liabilities as follows:
| Asset Derivatives | Liability Derivatives | ||||||
| Derivative Contracts | |||||||
| Not Accounted for as | Statement of Assets and | Statement of Assets and | |||||
| Hedging Instruments | Liabilities Location | Fair Value | Liabilities Location | Fair Value | |||
| Credit contracts | Variation margin | $ | 498 | a | |||
| OTC swap contracts | 21,491 | OTC swap contracts | $ | 74,120 | |||
| (upfront payments) | (upfront receipts) | ||||||
| Unrealized appreciation on | 1,219 | Unrealized depreciation on | 41,257 | ||||
| OTC swap contracts | OTC swap contracts | ||||||
| Totals | $ | 23,208 | $ | 115,377 | |||
aThis amount reflects the cumulative appreciation (depreciation) of centrally cleared swaps contracts as reported in the Statement of Investments. Only the variation margin
receivable/payable at period end is separately reported within the Statement of Assets and Liabilities. Prior variation margin movements were recorded to cash upon receipt or
payment.
For the period ended November 30, 2015, the effect of derivative contracts in the Fund’s Statement of Operations was as follows:
| Net Change in | ||||||||
| Unrealized | ||||||||
| Derivative Contracts | Net Realized | Appreciation | ||||||
| Not Accounted for as | Statement of | Gain (Loss) | Statement of | (Depreciation) | ||||
| Hedging Instruments | Operations Locations | for the Period | Operations Locations | for the Period | ||||
| Net realized gain (loss) from: | Net change in unrealized | |||||||
| appreciation (depreciation) on: | ||||||||
| Credit contracts | Swap contracts | $ | 81,764 | Swap contracts | $ | (39,540 | ) | |
| Equity contracts | Investments | (69,810 | )a | |||||
| Written options | 1,416 | |||||||
| Totals | $ | 13,370 | $ | (39,540 | ) | |||
| aPurchased option contracts are included in net realized gain (loss) from investments in the Statement of Operations. | ||||||||
For the period ended November 30, 2015, the average month end fair value of derivatives represented 0.08% of average month end net assets. The average month end number of open derivative contracts for the period was 12.
At November 30, 2015, the Fund’s OTC derivative assets and liabilities are as follows:
| Gross and Net Amounts | ||||
| of Assets and Liabilities | ||||
| Presented in the | ||||
| Statement of | ||||
| Assets and Liabilities | ||||
| Assetsa | Liabilitiesa | |||
| Derivatives | ||||
| Swap Contracts | $ | 22,710 | $ | 115,377 |
aAbsent an event of default or early termination, OTC derivative assets and liabilities are presented gross and not offset in the Statement of Assets and Liabilities.
franklintempleton.com
Semiannual Report 33
FRANKLIN NOTES TO | ALTERNATIVE STRATEGIES FUNDS FINANCIAL STATEMENTS (UNAUDITED) |
Franklin K2 Long Short Credit Fund (continued)
8. Other Derivative Information (continued)
At November 30, 2015, the Fund’s OTC derivative assets, which may be offset against the Fund’s OTC derivative liabilities, and collateral received from the counterparty, are as follows:
| Amounts Not Offset in the | |||||||||||
| Statement of Assets and Liabilities | |||||||||||
| Gross and Net | |||||||||||
| Amounts of Assets | Financial | ||||||||||
| Presented in the | Financial | Instruments | Cash | ||||||||
| Statement of | Instruments | Collateral | Collateral | Net Amount (Not | |||||||
| Assets and Liabilities | Available for Offset | Received | Received | less than zero) | |||||||
| Counterparty | |||||||||||
| GSCO | $ | 1,219 | $ | (1,219 | ) | $ | — | $ | — | $ | — |
| JPHQ | 21,491 | (11,963 | ) | — | — | 9,528 | |||||
| Total | $ | 22,710 | $ | (13,182 | ) | $ | — | $ | — | $ | 9,528 |
At November 30, 2015, the Fund’s OTC derivative liabilities, which may be offset against the Fund’s OTC derivative assets, and collateral pledged to the counterparty, are as follows:
| Amounts Not Offset in the | |||||||||||
| Statement of Assets and Liabilities | |||||||||||
| Gross and Net | |||||||||||
| Amounts of Liabilities | Financial | ||||||||||
| Presented in the | Financial | Instruments | Cash | ||||||||
| Statement of | Instruments | Collateral | Collateral | Net Amount (Not | |||||||
| Assets and Liabilities | Available for Offset | Pledged | Pledged | less than zero) | |||||||
| Counterparty | |||||||||||
| GSCO | $ | 103,414 | $ | (1,219 | ) | $ | — | $ | — | $ | 102,195 |
| JPHQ | 11,963 | (11,963 | ) | — | — | — | |||||
| Total | $ | 115,377 | $ | (13,182 | ) | $ | — | $ | — | $ | 102,195 |
See Notes 1(d) and 6 regarding derivative financial instruments and investment transactions, respectively.
See Abbreviations on page 35.
9. Fair Value Measurements
The Fund follows a fair value hierarchy that distinguishes between market data obtained from independent sources (observable inputs) and the Fund’s own market assumptions (unobservable inputs). These inputs are used in determining the value of the Fund’s financial instruments and are summarized in the following fair value hierarchy:
- Level 1 – quoted prices in active markets for identical financial instruments
- Level 2 – other significant observable inputs (including quoted prices for similar financial instruments, interest rates, prepay- ment speed, credit risk, etc.)
- Level 3 – significant unobservable inputs (including the Fund’s own assumptions in determining the fair value of financial instruments)
The input levels are not necessarily an indication of the risk or liquidity associated with financial instruments at that level.
For movements between the levels within the fair value hierarchy, the Fund has adopted a policy of recognizing the transfers as of the date of the underlying event which caused the movement.
34 Semiannual Report
franklintempleton.com
| FRANKLIN ALTERNATIVE STRATEGIES FUNDS |
| NOTES TO FINANCIAL STATEMENTS (UNAUDITED) |
Franklin K2 Long Short Credit Fund (continued)
A summary of inputs used as of November 30, 2015, in valuing the Fund’s assets and liabilities carried at fair value, is as follows:
| Level 1 | Level 2 | Level 3 | Total | |||||
| Assets: | ||||||||
| Investments in Securities: | ||||||||
| Convertible Bonds | $ | — | $ | 589,063 | $ | — | $ | 589,063 |
| Corporate Bonds and Notes | — | 16,974,249 | — | 16,974,249 | ||||
| Asset-Backed Securities and Commercial Mortgage-Backed Securities | — | 23,089,703 | — | 23,089,703 | ||||
| Short Term Investments | — | 1,132,438 | — | 1,132,438 | ||||
| Total Investments in Securities | $ | — | $ | 41,785,453 | $ | — | $ | 41,785,453 |
| Other Financial Instruments | ||||||||
| Swap Contracts | $ | — | $ | 1,717 | $ | — | $ | 1,717 |
| Liabilities: | ||||||||
| Other Financial Instruments | ||||||||
| Securities Sold Shorta | $ | — | $ | 3,695,473 | $ | — | $ | 3,695,473 |
| Swap Contracts | — | 41,257 | — | 41,257 | ||||
| Total Other Financial Instruments | $ | — | $ | 3,736,730 | $ | — | $ | 3,736,730 |
aFor detailed categories, see the accompanying Statement of Investments.
A reconciliation of assets in which Level 3 inputs are used in determining fair value is presented when there are significant Level 3 financial instruments at the end of the period.
10. Subsequent Events
The Fund has evaluated subsequent events through the issuance of the financial statements and determined that no events have occurred that require disclosure.
| Abbreviations | ||||
| Counterparty/Exchange | Currency | Selected Portfolio | ||
| GSCO | The Goldman Sachs Group, Inc. | USD United States Dollar | ARM | Adjustable Rate Mortgage |
| ICE | Intercontinental Exchange, Inc. | CLO | Collateralized Loan Obligation | |
| JPHQ | JP Morgan Chase & Co. | FRN | Floating Rate Note | |
| LIBOR | London InterBank Offered Rate | |||
| PIK | Payment In-Kind | |||
| REIT | Real Estate Investment Trust | |||
franklintempleton.com
Semiannual Report 35
| FRANKLIN ALTERNATIVE STRATEGIES FUNDS |
| FRANKLIN K2 LONG SHORT CREDIT FUND |
Shareholder Information
Board Approval of Investment Management Agreement and Sub-Advisory Agreements
The Board of Trustees (Board), including the independent trustees, at a Board meeting held on July 14, 2015, unanimously approved the Investment Management Agreement between Franklin Alternatives Strategies Funds (Trust), on behalf of Franklin K2 Long Short Credit Fund (Fund), and K2 Advisors/ D&S Management Co., L.L.C. (K2 Advisors), and each Sub-Advisory Agreement between K2 Advisors and each of Apollo Capital Management, L.P. (Apollo); Candlewood Investment Group, L.P. (Candlewood); Chatham Asset Management LLC (Chatham); Ellington Management Group, L.L.C. (Ellington); EMSO Partners Limited (EMSO); and Logan Circle Partners, L.P. (Logan Circle and, together with Apollo, Candlewood, Chatham, Ellington and EMSO, the Sub-Advisors).
Prior to a meeting of all of the trustees for the purpose of considering such approvals, the trustees participated in two other meetings held in connection with the approval process (those trustees unable to attend in person were present by telephonic conference means). Throughout the process, the independent trustees received assistance and advice from and met separately with independent counsel. The independent trustees met with and interviewed officers of the investment manager and Sub-Advisors (including portfolio managers), the transfer agent and shareholder services group and the distributor. In approving the investment management agreement and the sub-advisory agreements for the Fund, the Board, including the independent trustees, determined that the investment management agreement and the sub-advisory agreements, including the investment management and sub-advisory fee structure provided for in the agreements, were fair and reasonable.
In making the foregoing approvals, the Board considered various materials related to the investment management agreement and the sub-advisory agreements including: (1) a copy of the proposed form of investment management agreement and sub-advisory agreements; (2) information describing the nature, quality and extent of services that K2 Advisors and each Sub-Advisor would provide to the Fund, and the proposed investment management fees and sub-advisory fees payable to K2 Advisors and each Sub-Advisor; (3) reports from K2 Advisors on the diligence conducted on each Sub-Advisor and the reasons for recommending each Sub-Advisor, as a sub-advisor for the Fund, including, but not limited to, each Sub-Advisor’s background, experience, personnel, operations, policies, procedures and compliance functions and plans for the integration of such operations, policies, procedures and compliance functions with those of K2 Advisors; and (4) a report from the Trust’s Chief Compliance Officer regarding K2 Advisors’ and each Sub-Advisor’s compliance program and capabilities, including policies and procedures in place to address potential conflicts of interest, and the diligence undertaken by the Trust’s Chief Compliance Officer with respect thereto.
The Board’s consideration of whether to approve the investment management agreement and each sub-advisory agreement took into account several factors including, but not limited to, the following: (1) the nature and quality of the services to be provided by K2 Advisors and each Sub-Advisor to the Fund under the proposed investment management agreement and sub-advisory agreements, respectively; (2) K2 Advisors’ and each Sub-Advisor’s experience as a manager of other funds and accounts; (3) K2 Advisors’ and each Sub-Advisor’s strength and reputation within the industry; (4) the fairness of the compensation under the proposed investment management agreement and sub-advisory agreements; (5) the pricing structure (including fee waivers and the estimated expense ratio to be borne by shareholders) of the Fund; (6) the personnel, operations, financial condition and investment management capabilities, methodologies and resources of K2 Advisors and each Sub-Advisor, including each management team’s expertise in the management of other alternative strategy funds; (7) profitability matters; (8) reports from K2 Advisors on the diligence conducted on each Sub-Advisor and the reasons for recommending each Sub-Advisor as a sub-advisor for the Fund, including, but not limited to, each Sub-Advisor’s background, experience, personnel, operations, policies, procedures and compliance functions and plans for the integration of such operations, policies, procedures and compliance functions with those of K2 Advisors; and (9) a report from the Trust’s Chief Compliance Officer regarding K2 Advisors’ and each Sub-Advisor’s compliance program and capabilities, including policies and procedures in place to address potential conflicts of interest, and the diligence undertaken by the Trust’s Chief Compliance Officer with respect thereto. Particular attention was given to (1) the diligent risk management program of K2 Advisors, including those aspects of the program related to selecting and overseeing sub-advisors to the Fund, (2) each Sub-Advisor’s risk management program, and (3) derivatives and other complex instruments that are expected to be held by the Fund and how such instruments are expected to be used to carry out the Fund’s investment goals.
The Board was also provided with a report from Lipper, Inc., an independent third party (Lipper), comparing the Fund’s proposed fees with the fees of other funds in the Fund’s Lipper
36 Semiannual Report
franklintempleton.com
FRANKLIN ALTERNATIVE STRATEGIES FUNDS
FRANKLIN K2 LONG SHORT CREDIT FUND
SHAREHOLDER INFORMATION
selected peer group (Lipper Report). The Board reviewed this information and its usefulness in the approval process with respect to matters such as comparative fees and expense ratios. The Board considered that the Lipper Report contains only a limited number of multi-manager funds. The Board concluded that the Lipper Report was helpful in the performance of its duties.
The following sets forth some of the primary information and factors relevant to the Board’s decisions. This discussion of the information and factors considered by the Board (including the information and factors discussed above) is not intended to be exhaustive, but rather summarizes certain factors considered by the Board. In view of the wide variety of factors considered, the Board did not, unless otherwise noted, find it practicable to quantify or otherwise assign relative weights to the foregoing factors. In addition, individual trustees may have assigned different weights to various factors.
NATURE, EXTENT AND QUALITY OF SERVICES. The trustees reviewed the nature, extent and quality of the services to be provided by K2 Advisors and each Sub-Advisor. In this regard, they reviewed the Fund’s proposed investment goal, K2 Advisors’ and each Sub-Advisor’s proposed investment strategy, and K2 Advisors’ and each Sub-Advisor’s ability to implement such investment goal and/or investment strategy, including, but not limited to, K2 Advisors’ and each Sub-Advisor’s trading practices and investment decision processes. The Board noted the responsibilities that K2 Advisors would have as the Fund’s investment manager, including (1) due diligence of the Sub-Advisors, their respective trading strategies, risk management, operations and businesses, (2) oversight and monitoring of the day-to-day investment activities of the Sub-Advisors and the ongoing assessment of their performance, (3) portfolio construction with respect to the allocation of assets among Sub-Advisors, investment funds, cash and other investments, (4) risk management, (5) on-going oversight and monitoring of the Sub-Advisors’ compliance with the investment mandate, compliance policies and procedures and federal securities laws, (6) preparing quarterly reports to the Board, and (7) the implementation of Board directives as they relate to the Fund. The trustees considered the successful performance of K2 Advisors in managing Franklin K2 Alternative Strategies Fund (K2 ASF) and another investment product that is not subject to the Investment Company Act of 1940, as amended (1940 Act), with an investment strategy similar to the investment strategy of the Fund.
With respect to the sub-advisory services to be provided by the Sub-Advisors, the Board noted the responsibilities that each Sub-Advisor would have with respect to the portion of the Fund’s assets allocated to the Sub-Advisor by K2 Advisors (Sub-Advised Portion), including, among others, implementing the investment strategies with respect to the Sub-Advised Portion and ensuring compliance with the investment strategies, policies and limitations of the Sub-Advised Portion. The trustees considered the successful performance of each Sub-Advisor in managing other investment products with investment strategies similar to the investment strategies of its Sub-Advised Portion of the Fund, including, with respect to certain Sub-Advisors, mutual funds with similar investment strategies.
The trustees reviewed the Fund’s portfolio management team at K2 Advisors and each Sub-Advisor, including each such team’s performance, staffing, skills and compensation program. The trustees considered various other products, portfolios and entities that are advised by K2 Advisors and each Sub-Advisor and the allocation of assets and expenses among and within them, as well as their relative fees and reasons for differences with respect thereto and any potential conflicts. The Board also considered a report from the Trust’s Chief Compliance Officer regarding K2 Advisors’ and each Sub-Advisor’s compliance programs as such policies relate to the operations of the Fund. The Board considered the selection and due diligence process employed by K2 Advisors in proposing each Sub-Advisor as a sub-advisor to the Fund, including the due diligence undertaken with respect to the Sub-Advisor’s compliance capabilities, and efforts to integrate each Sub-Advisor’s operations, policies, procedures and compliance functions with those of K2 Advisors. The trustees considered K2 Advisors’ significant efforts in developing and implementing compliance procedures established in accordance with Securities and Exchange Commission and other requirements. They also considered the nature, extent and quality of the services to be provided under the other service agreements with affiliates of K2 Advisors.
Based on their review, the trustees were satisfied with the nature and quality of the overall services to be provided by K2 Advisors, its affiliates and each Sub-Advisor to the Fund and its shareholders and were confident in the abilities of K2 Advisors and each Sub-Advisor to implement their respective proposed investment strategy and to provide quality services to the Fund and its shareholders.
INVESTMENT PERFORMANCE. The Board noted that, as the Fund had not yet commenced investment operations, there was no investment performance for the Fund. As noted earlier, the Board did consider the investment performance of K2 Advisors in managing K2 ASF and another non-1940 Act investment product with a similar investment goal to the
franklintempleton.com
Semiannual Report 37
FRANKLIN ALTERNATIVE STRATEGIES FUNDS
FRANKLIN K2 LONG SHORT CREDIT FUND
SHAREHOLDER INFORMATION
Board Approval of Investment Management Agreement and Sub-Advisory Agreements
(continued)
investment goal of the Fund, as well as the investment performance of each Sub-Advisor in managing other investment products with investment strategies similar to the investment strategies of its Sub-Advised Portion of the Fund, including, with respect to certain Sub-Advisors, mutual funds with similar investment strategies. The Board also considered the proposed performance benchmarks for the Fund and how such benchmarks were selected by K2 Advisors and would be utilized to measure performance of K2 Advisors and each Sub-Advisor.
COMPARATIVE EXPENSES AND PROFITABILITY.
The Board considered the cost of the services to be provided and the profits to be realized by K2 Advisors (and its affiliates) and each Sub-Advisor from their respective relationships with the Fund. The Board noted that K2 Advisors, its affiliates and each Sub-Advisor could not report any financial results from their relationships with the Fund because the Fund had not yet commenced investment operations, and thus, the Board could not evaluate K2 Advisors’, its affiliates’ or each Sub-Advisor’s profitability with respect to the Fund. The Board considered that the Fund is expected to incur considerable expenses in its first year of operation, which will largely be absorbed by K2 Advisors through expense waivers, and is not anticipated to generate significant, if any, profit for K2 Advisors and/or its affiliates for some time.
In considering the appropriateness of the investment management fee charged to the Fund, the Board also reviewed and considered the investment management fees in light of the nature, extent and quality of the investment management services expected to be provided by K2 Advisors and each Sub-Advisor, as more fully discussed above. The Board noted that the sub-advisory fees would be paid by K2 Advisors to each Sub-Advisor and would not be additional fees to be borne by the Fund. The Board also noted that the sub-advisory fees to be paid by K2 Advisors to each Sub-Advisor were the product of arms-length negotiations between K2 Advisors and each Sub-Advisor and the Board considered the allocation of the investment management fee charged to the Fund between K2 Advisors and each Sub-Advisor in light of the nature, extent and quality of the investment management services expected to be provided by K2 Advisors and each Sub-Advisor. The trustees considered various other products, portfolios and entities that are advised by K2 Advisors and each Sub-Advisor and the allocation of assets and expenses among and within them, as well as their relative fees and reasons for differences with respect thereto and any potential conflicts. The Board considered the extent to which K2 Advisors and each Sub-Advisor may derive ancillary benefits from Fund operations.
Consideration was also given to the information provided in the Lipper Report on other alternative credit focused funds determined by Lipper to be in the Fund’s expense group (Comparable Funds). The Board noted that the expected investment management fee (both including and excluding the proposed fee waiver and expense limitation arrangements) of the Fund was within the range of investment management fees charged by the Comparable Funds (both including and excluding the proposed fee waiver and expense limitation arrangements). The Board also noted that the expected total expenses (both including and excluding the proposed fee waiver and expense limitation arrangements) of the Fund were within the range of total expenses of the Comparable Funds (both including and excluding their proposed fee waiver and expense limitation arrangements). It was noted that the Lipper Report presented a limited comparison because, as discussed above, of the limited number of multi-manager funds available for inclusion in the Lipper Report due to the nature of the Fund.
Based upon its consideration of all these factors, the Board determined that the investment management and sub-advisory fee structure was fair and reasonable.
ECONOMIES OF SCALE. The Board considered economies of scale that may be realized by K2 Advisors, its affiliates and each Sub-Advisor as the Fund grows larger and the extent to which they are shared with Fund shareholders, as for example, in the level of the investment management and sub-advisory fees charged, in the quality and efficiency of services rendered and in increased capital commitments benefiting the Fund directly or indirectly. Because the Fund had not yet commenced operations, the Board concluded that economies of scale were difficult to consider at this time.
Proxy Voting Policies and Procedures
The Fund’s investment manager has established Proxy Voting Policies and Procedures (Policies) that the Fund uses to determine how to vote proxies relating to portfolio securities. Shareholders may view the Fund’s complete Policies online at franklintempleton.com. Alternatively, shareholders may request copies of the Policies free of charge by calling the Proxy Group collect at (954) 527-7678 or by sending a written request to: Franklin Templeton Companies, LLC, 300 S.E. 2nd Street, Fort Lauderdale, FL 33301, Attention: Proxy Group. Copies of the Fund’s proxy voting records are also made available online at
38 Semiannual Report
franklintempleton.com
FRANKLIN ALTERNATIVE STRATEGIES FUNDS
FRANKLIN K2 LONG SHORT CREDIT FUND
SHAREHOLDER INFORMATION
franklintempleton.com and posted on the U.S. Securities and Exchange Commission’s website at sec.gov and reflect the most recent 12-month period ended June 30.
Quarterly Statement of Investments
The Fund files a complete statement of investments with the U.S. Securities and Exchange Commission for the first and third quarters for each fiscal year on Form N-Q. Shareholders may view the filed Form N-Q by visiting the Commission’s website at sec.gov. The filed form may also be viewed and copied at the Commission’s Public Reference Room in Washington, DC. Information regarding the operations of the Public Reference Room may be obtained by calling (800) SEC-0330.
franklintempleton.com
Semiannual Report 39
This page intentionally left blank
Item 2. Code of Ethics.
(a) The Registrant has adopted a code of ethics that applies to its principal executive officers and principal financial and accounting officer.
(c) N/A
(d) N/A
(f) Pursuant to Item 12(a)(1), the Registrant is attaching as an exhibit a copy of its code of ethics that applies to its principal executive officers and principal financial and accounting officer.
Item 3. Audit Committee Financial Expert.
(a)(1) The Registrant has an audit committee financial expert serving on its audit committee.
(2) The audit committee financial expert is Ann Torre Bates and she is “independent” as defined under the relevant Securities and Exchange Commission Rules and Releases.
Item 4. Principal Accountant Fees and Services. N/A
Item 5. Audit Committee of Listed Registrants. N/A
Item 6. Schedule of Investments. N/A
Item 7. Disclosure of Proxy Voting Policies and Procedures for Closed-End Management Investment Companies. N/A
Item 8. Portfolio Managers of Closed-End Management Investment Companies. N/A
Item 9. Purchases of Equity Securities by Closed-End Management Investment Company and Affiliated Purchasers. N/A
Item 10. Submission of Matters to a Vote of Security Holders.
There have been no changes to the procedures by which shareholders may recommend nominees to the Registrant's Board of Trustees that would require disclosure herein.
Item 11. Controls and Procedures.
(a) Evaluation of Disclosure Controls and Procedures. The Registrant maintains disclosure controls and procedures that are designed to ensure that information required to be disclosed in the Registrant’s filings under the Securities Exchange Act of 1934 and the Investment Company Act of 1940 is recorded, processed, summarized and reported within the periods specified in the rules and forms of the Securities and Exchange Commission. Such information is accumulated and communicated to the Registrant’s management, including its principal executive officer and principal financial officer, as appropriate, to allow timely decisions regarding required disclosure. The Registrant’s management, including the principal executive officer and the principal financial officer, recognizes that any set of controls and procedures, no matter how well designed and operated, can provide only reasonable assurance of achieving the desired control objectives.
Within 90 days prior to the filing date of this Shareholder Report on Form N-CSR, the Registrant had carried out an evaluation, under the supervision and with the participation of the Registrant’s management, including the Registrant’s principal executive officer and the Registrant’s principal financial officer, of the effectiveness of the design and operation of the Registrant’s disclosure controls and procedures. Based on such evaluation, the Registrant’s principal executive officer and principal financial officer concluded that the Registrant’s disclosure controls and procedures are effective.
(b) Changes in Internal Controls. There have been no changes in the Registrant’s internal controls or in other factors that could materially affect the internal controls over financial reporting subsequent to the date of their evaluation in connection with the preparation of this Shareholder Report on Form N-CSR.
Item 12. Exhibits.
(a) (1) Code of Ethics
(a)(2) Certifications pursuant to Section 302 of the Sarbanes-Oxley Act of 2002 of Laura F. Fergerson, Chief Executive Officer - Finance and Administration, and Robert G. Kubilis, Chief Financial Officer and Chief Accounting Officer
(b) Certifications pursuant to Section 906 of the Sarbanes-Oxley Act of 2002 of Laura F. Fergerson, Chief Executive Officer - Finance and Administration, and Robert G. Kubilis, Chief Financial Officer and Chief Accounting Officer
SIGNATURES
Pursuant to the requirements of the Securities Exchange Act of 1934 and the Investment Company Act of 1940, the registrant has duly caused this report to be signed on its behalf by the undersigned, thereunto duly authorized.
FRANKLIN ALTERATIVE STRATEGIES FUNDS
By /s/ Laura F. Fergerson
Laura F. Fergerson
Chief Executive Officer –
Finance and Administration
Date January 26, 2016
Pursuant to the requirements of the Securities Exchange Act of 1934 and the Investment Company Act of 1940, this report has been signed below by the following persons on behalf of the registrant and in the capacities and on the dates indicated.
By /s/ Laura F. Fergerson
Laura F. Fergerson
Chief Executive Officer –
Finance and Administration
Date January 26, 2016
By /s/ Robert G. Kubilis
Robert G. Kubilis
Chief Financial Officer and
Chief Accounting Officer
Date January 26, 2016