
Oral Testosterone (T) Non Alcoholic Steatohepatitis (NASH) and NASH Cirrhosis 1 Exhibit 99.2
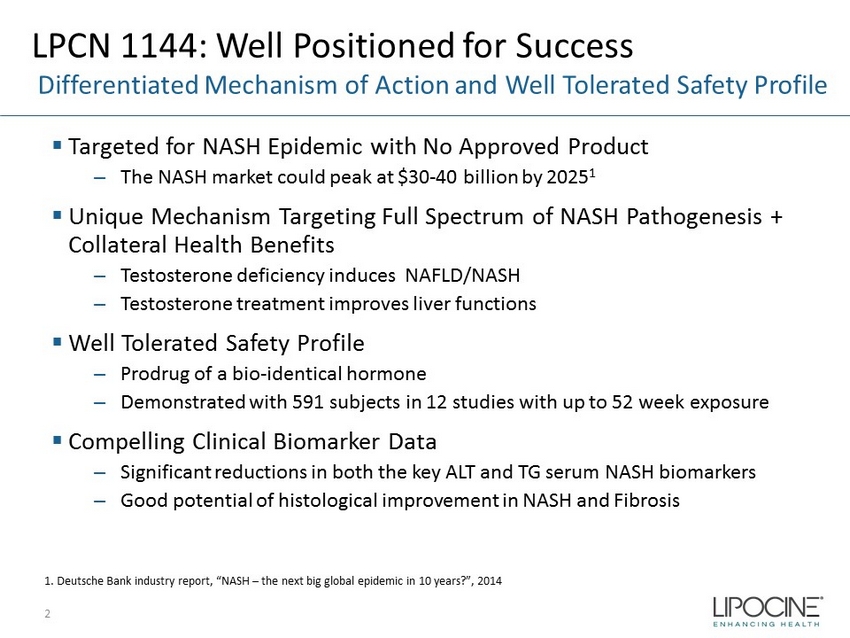
LPCN 1144: Well Positioned for Success Differentiated Mechanism of Action and Well Tolerated Safety Profile ▪ Targeted for NASH Epidemic with No Approved Product – The NASH market could peak at $30 - 40 billion by 2025 1 ▪ Unique Mechanism Targeting Full Spectrum of NASH Pathogenesis + Collateral Health Benefits – Testosterone deficiency induces NAFLD/NASH – Testosterone treatment improves liver functions ▪ Well Tolerated Safety Profile – Prodrug of a bio - identical hormone – Demonstrated with 591 subjects in 12 studies with up to 52 week exposure ▪ Compelling Clinical Biomarker Data – Significant reductions in both the key ALT and TG serum NASH biomarkers – Good potential of histological improvement in NASH and Fibrosis 1. Deutsche Bank industry report, “NASH – the next big global epidemic in 10 years?”, 2014 2
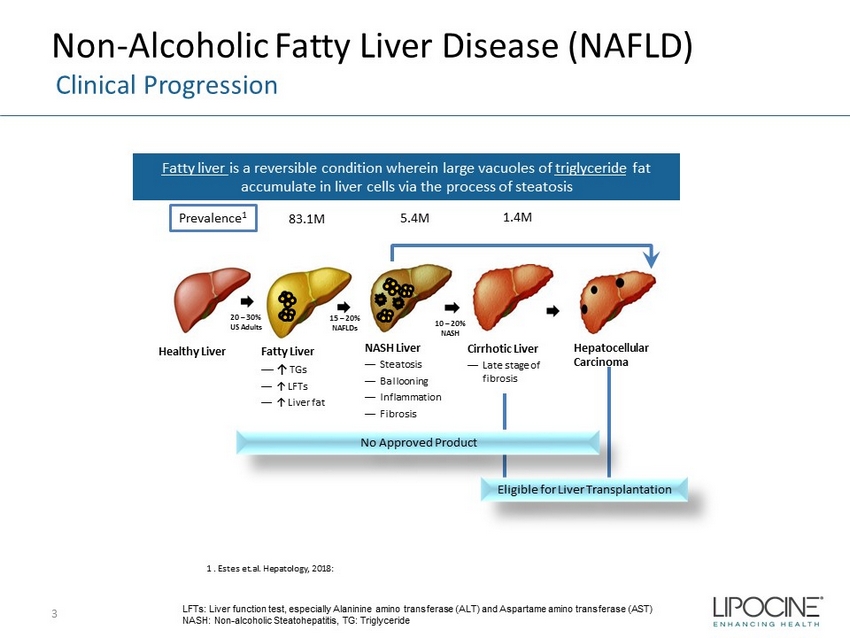
Non - Alcoholic Fatty Liver Disease (NAFLD) Clinical Progression 3 Fatty liver is a reversible condition wherein large vacuoles of triglyceride fat accumulate in liver cells via the process of steatosis LFTs: Liver function test, especially Alaninine amino transferase (ALT) and Aspartame amino transferase (AST) NASH: Non - alcoholic Steatohepatitis, TG: Triglyceride Healthy Liver Fatty Liver — ↑ TGs — ↑ LFTs — ↑ Liver fat NASH Liver — Steatosis — Ballooning — Inflammation — Fibrosis Cirrhotic Liver — Late stage of fibrosis Hepatocellular Carcinoma Eligible for Liver Transplantation 20 – 30% US Adults 15 – 20% NAFLDs 10 – 20% NASH No Approved Product 83.1M 5.4M 1.4M Prevalence 1 1 . Estes et.al. Hepatology, 2018:
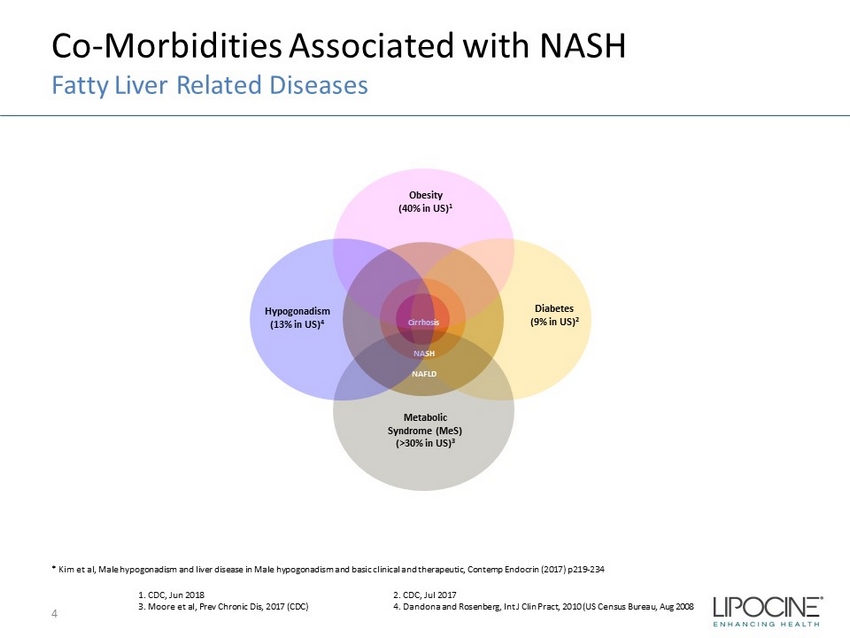
Co - Morbidities Associated with NASH Fatty Liver Related Diseases 4 Obesity (40% in US) 1 Diabetes (9% in US) 2 Metabolic Syndrome ( MeS ) (>30% in US) 3 NAFLD NASH Cirrhosis 1. CDC, Jun 2018 2. CDC, Jul 2017 3. Moore et al, Prev Chronic Dis, 2017 (CDC) 4. Dandona and Rosenberg, Int J Clin Pract , 2010 (US Census Bureau, Aug 2008 Hypogonadism (13% in US) 4 * Kim et al, Male hypogonadism and liver disease in Male hypogonadism and basic clinical and therapeutic, Contemp Endocrin (2017) p219 - 234
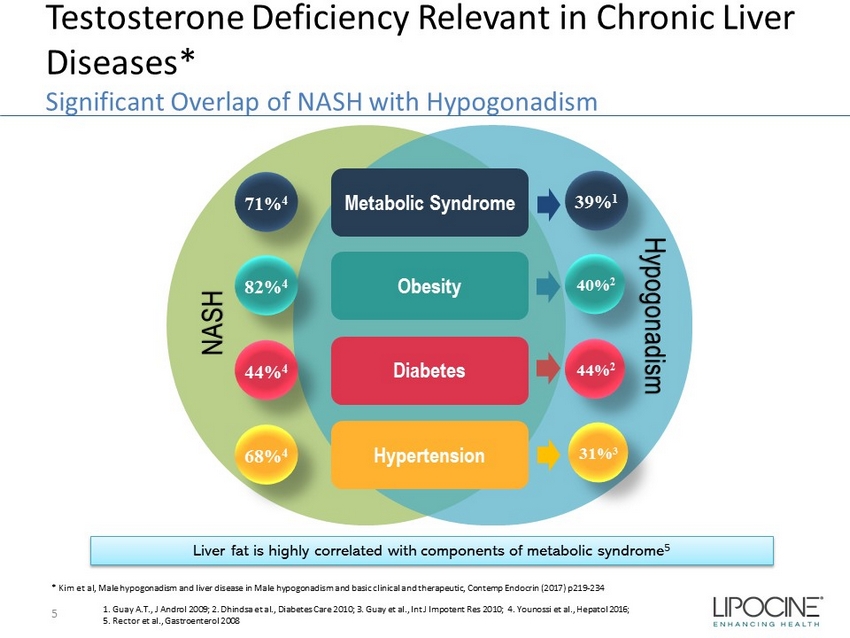
Testosterone Deficiency Relevant in Chronic Liver Diseases* Significant Overlap of NASH with Hypogonadism 5 1. Guay A.T., J Androl 2009; 2. Dhindsa et al., Diabetes Care 2010; 3. Guay et al., Int J Impotent Res 2010; 4. Younossi et al., Hepatol 2016; 5. Rector et al., Gastroenterol 2008 * Kim et al, Male hypogonadism and liver disease in Male hypogonadism and basic clinical and therapeutic, Contemp Endocrin (2017) p219 - 234 Metabolic Syndrome 82% 4 68% 4 44% 4 71% 4 Obesity Diabetes Hypertension 40% 2 31% 3 44% 2 39% 1 Hypogonadism NASH Liver fat is highly correlated with components of metabolic syndrome 5
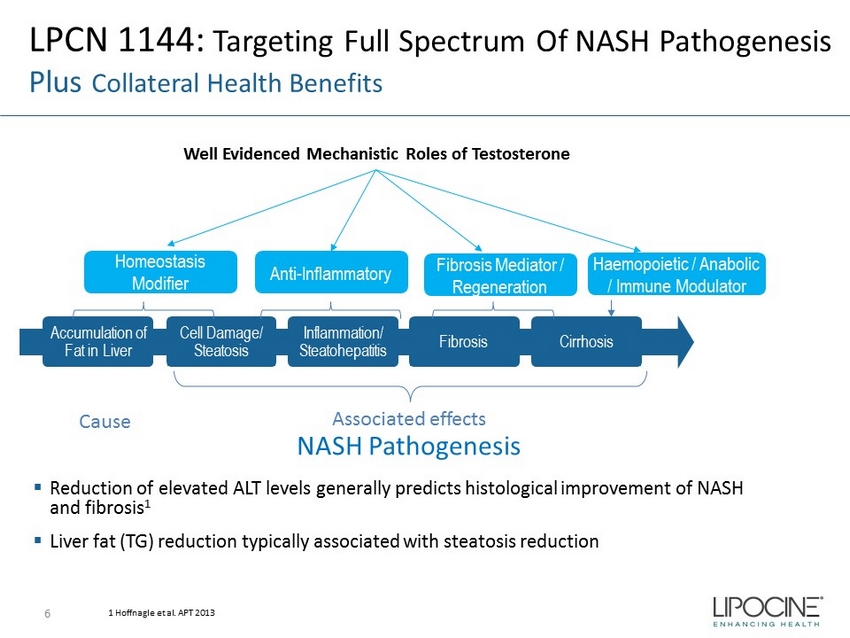
Accumulation of Fat in Liver Cell Damage/ Steatosis Inflammation/ Steatohepatitis Fibrosis Cirrhosis Homeostasis Modifier Anti - Inflammatory Fibrosis Mediator / Regeneration LPCN 1144: Targeting Full Spectrum Of NASH Pathogenesis Plus Collateral Health Benefits ▪ Reduction of elevated ALT levels generally predicts histological improvement of NASH and fibrosis 1 ▪ Liver fat (TG) reduction typically associated with steatosis reduction Haemopoietic / Anabolic / Immune Modulator 1 Hoffnagle et al. APT 2013 Well Evidenced Mechanistic Roles of Testosterone Associated effects Cause NASH Pathogenesis 6

Proposed Mechanism of Androgen Action via Androgen Receptor (AR) in Males* 7 Normal level and signaling of androgens prevent hepatic fat accumulation in males** * Navarro et al, Obesity 2015 ** Shen and Shi, Int J Endocrinol 2015
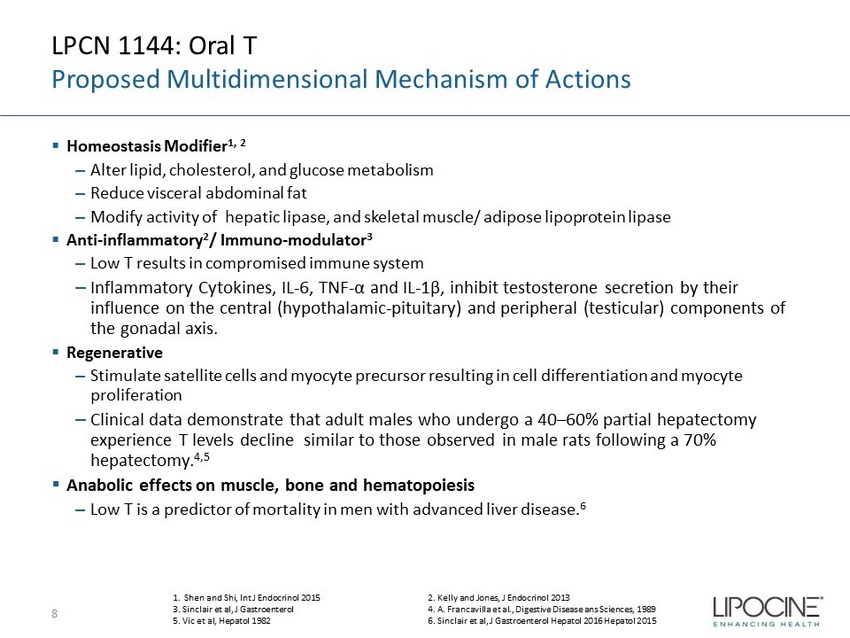
LPCN 1144: Oral T Proposed Multidimensional Mechanism of Actions ▪ Homeostasis Modifier 1, 2 ‒ Alter lipid, cholesterol, and glucose metabolism ‒ Reduce visceral abdominal fat ‒ Modify activity of hepatic lipase, and skeletal muscle/ adipose lipoprotein lipase ▪ Anti - inflammatory 2 / Immuno - modulator 3 ‒ Low T results in compromised immune system ‒ Inflammatory Cytokines, IL - 6, TNF - α and IL - 1β, inhibit testosterone secretion by their influence on the central (hypothalamic - pituitary) and peripheral (testicular) components of the gonadal axis. ▪ Regenerative ‒ Stimulate satellite cells and myocyte precursor resulting in cell differentiation and myocyte proliferation ‒ Clinical data demonstrate that adult males who undergo a 40 – 60% partial hepatectomy experience T levels decline similar to those observed in male rats following a 70% hepatectomy. 4,5 ▪ Anabolic effects on muscle, bone and hematopoiesis ‒ Low T is a predictor of mortality in men with advanced liver disease. 6 8 1. Shen and Shi, Int J Endocrinol 2015 2. Kelly and Jones, J Endocrinol 2013 3. Sinclair et al, J Gastroenterol 4. A. Francavilla et al., Digestive Disease ans Sciences, 1989 5. Vic et al, Hepatol 1982 6. Sinclair et al, J Gastroenterol Hepatol 2016 Hepatol 2015
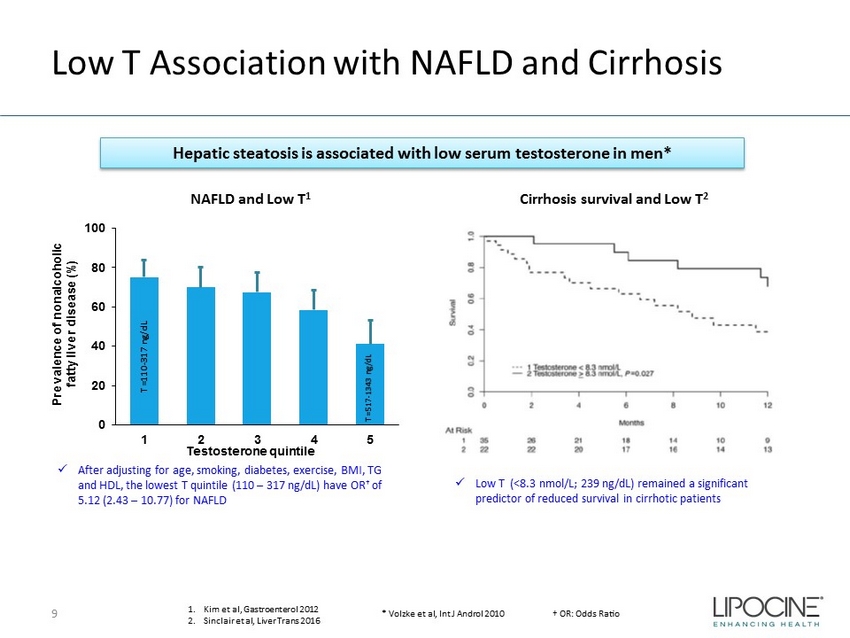
Low T Association with NAFLD and Cirrhosis 9 x After adjusting for age, smoking, diabetes, exercise, BMI, TG and HDL, the lowest T quintile (110 – 317 ng/dL) have OR † of 5.12 (2.43 – 10.77) for NAFLD x Low T (<8.3 nmol/L; 239 ng/dL) remained a significant predictor of reduced survival in cirrhotic patients NAFLD and Low T 1 Cirrhosis survival and Low T 2 0 20 40 60 80 100 1 2 3 4 5 Prevalence of nonalcoholic fatty liver disease (%) Testosterone quintile Hepatic steatosis is associated with low serum testosterone in men* T =110 - 317 ng/dL T =517 - 1343 ng/dL 1. Kim et al, Gastroenterol 2012 2. Sinclair et al, Liver Trans 2016 * Volzke et al, Int J Androl 2010 † OR: Odds Ratio
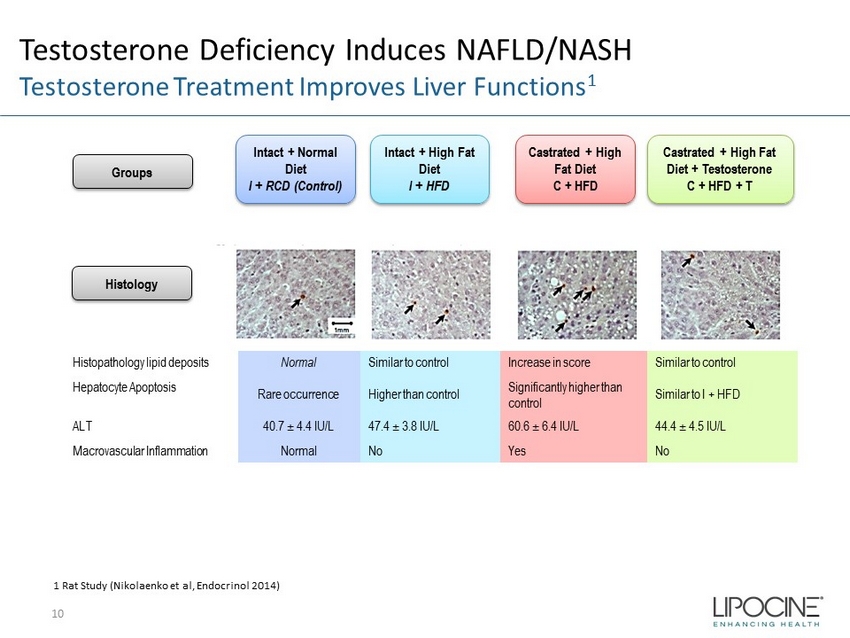
Testosterone Deficiency Induces NAFLD/NASH Testosterone Treatment Improves Liver Functions 1 10 Intact + Normal Diet I + RCD (Control) Intact + High Fat Diet I + HFD Castrated + High Fat Diet C + HFD Castrated + High Fat Diet + Testosterone C + HFD + T 1 Rat Study ( Nikolaenko et al, Endocrinol 2014) Histology Groups Histopathology lipid deposits Normal Similar to control Increase in score Similar to control Hepatocyte Apoptosis Rare occurrence Higher than control Significantly higher than control Similar to I + HFD ALT 40.7 ± 4.4 IU/L 47.4 ± 3.8 IU/L 60.6 ± 6.4 IU/L 44.4 ± 4.5 IU/L Macrovascular Inflammation Normal No Yes No
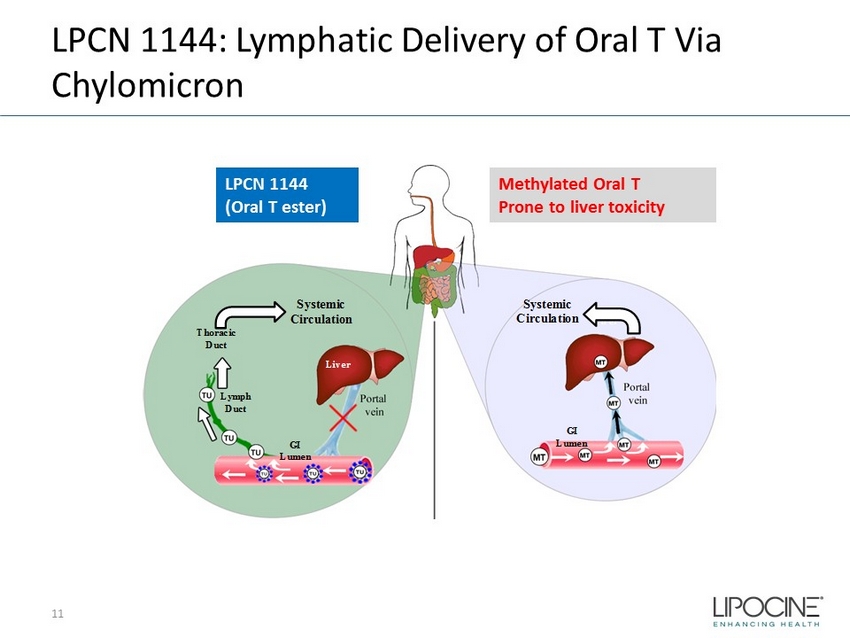
LPCN 1144: Lymphatic Delivery of Oral T Via Chylomicron 11 TLANDO ® (LPCN 1021) Transported via Lymph Not prone to liver issues METHYL TESTOSTERONE (MT) Transported via Liver Prone to liver toxicity Systemic Circulation Thoracic Duct Lymph Duct Liver Liver GI Lumen GI Lumen Systemic Circulation LPCN 1144 (Oral T ester) Methylated Oral T Prone to liver toxicity

LPCN 1144: Study Details for Serum Biomarker Data Analyses ▪ Oral Testosterone, twice daily dosing regimen − Included subjects with typical comorbid conditions associated with NASH − Liver enzymes, lipids and cholesterol (NASH biomarkers) levels were monitored − Key serum NASH biomarkers were evaluated via mean change from baseline − Subjects were not confirmed with biopsy for NASH ▪ M12 - 778 Study (Double Blind Placebo - controlled Study) : 3 week therapy with oral T vs. placebo control in hypogonadal subjects ▪ 13 - 001 Study (Study of Oral Androgen Replacement [SOAR] Trial) : 52 week therapy with oral T and topical T active control in 314 hypogonadal subjects ▪ 16 - 002 Study (Dosing Validation [DV] study) : 3 week therapy with oral T in 94 hypogonadal subjects ▪ Subgroup of subjects are categorized as “potential NASH patients” based on elevation of key NASH biomarkers at baseline − Key NASH biomarkers: Alanine aminotransferase (ALT), Aspartate aminotransferase (AST), Alkaline phosphatase (ALP), Gamma - glutamyl transpeptidase (GGT), Triglyceride (TG) 12
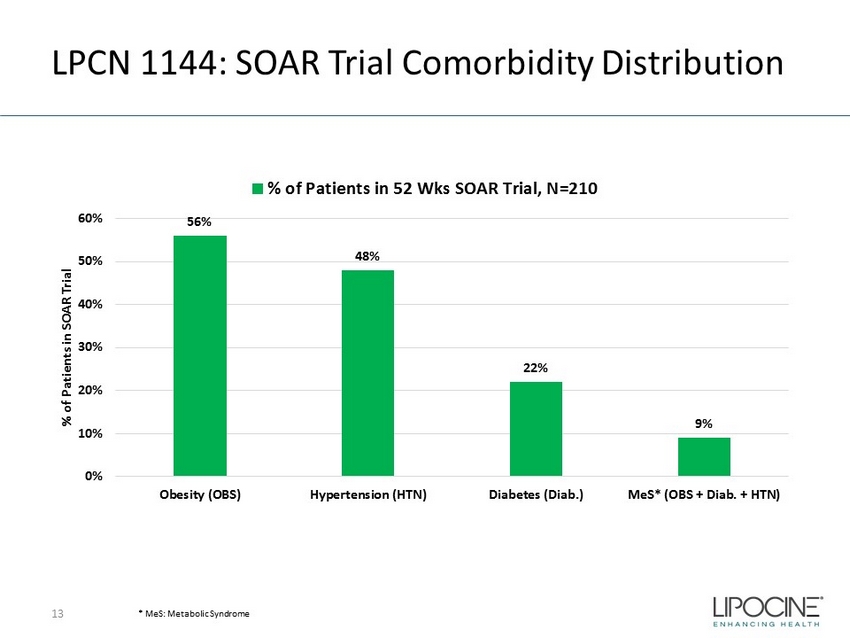
LPCN 1144: SOAR Trial Comorbidity Distribution 13 56% 48% 22% 9% 0% 10% 20% 30% 40% 50% 60% Obesity (OBS) Hypertension (HTN) Diabetes (Diab.) MeS* (OBS + Diab. + HTN) % of Patients in SOAR Trial % of Patients in 52 Wks SOAR Trial, N=210 * MeS : Metabolic Syndrome

LPCN 1144: Liver Enzymes and TG Mean BL Levels in Patients with Comorbidities Typical of NASH 14 SOAR Trial (13 - 001) Overall (N=210) Obesity (N=118) Diabetes (N=46) Hypertension (N=100) OBS + Diab . (N=25) MeS (OBS + Diab + HTN) (N=19) ALT (U/L) 30.5 33.3 29.4 29.0 33.4 30.2 AST (U/L) 24.2 24.7 21.1 23.5 22.3 22.4 ALP (U/L) 71.8 71.7 73.3 69.4 69.2 66.0 GGT (U/L) 36.0 36.8 41.7 34.0 35.2 29.4 TG (mg/ dL ) 192 205 209 187 237 253
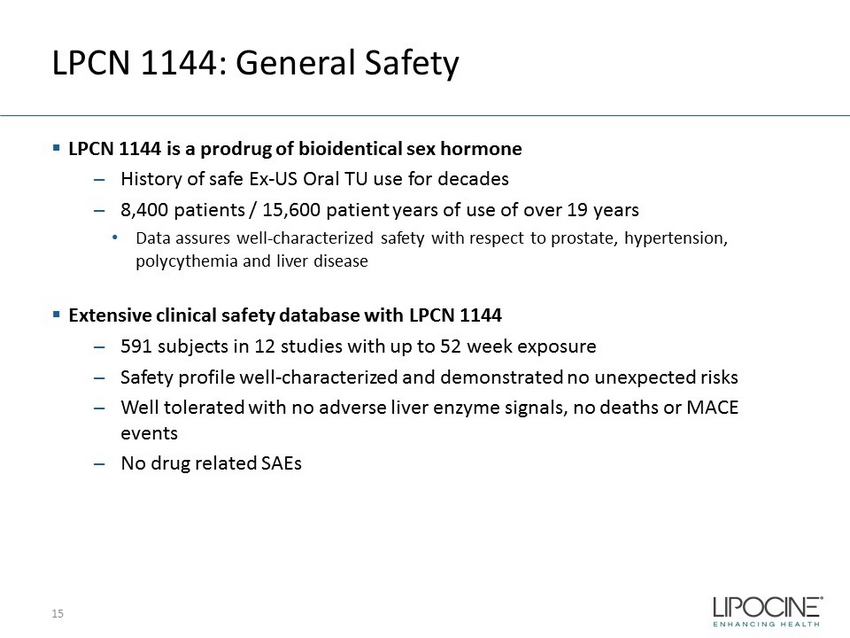
LPCN 1144: General Safety ▪ LPCN 1144 is a prodrug of bioidentical sex hormone – History of safe Ex - US Oral TU use for decades – 8,400 patients / 15,600 patient years of use of over 19 years • Data assures well - characterized safety with respect to prostate, hypertension, polycythemia and liver disease ▪ Extensive clinical safety database with LPCN 1144 – 591 subjects in 12 studies with up to 52 week exposure – Safety profile well - characterized and demonstrated no unexpected risks – Well tolerated with no adverse liver enzyme signals, no deaths or MACE events – No drug related SAEs 15

LPCN 1144: Substantial Reduction of Clinical Biomarker Levels in Cohorts with NASH Risk Factors 16 x2 x5 x2 x5 * N = Total N for subgroup - 15 - 43 - 26 - 52 - 67 - 4.0 - 2.0 - 2.9 - 5.9 - 4.5 -7 -6 -5 -4 -3 -2 -1 0 -80 -70 -60 -50 -40 -30 -20 -10 0 N* = 118 46 100 25 19 Obesity (OBS) Diabetes (Diab) Hypertension (HTN) OBS & Diab. OBS & Diab. & HTN (MeS) ALT Mean Change (U/L) TG Mean Change (mg/dL) TG ALT TG and ALT mean change post 52 week therapy in patients MeS : Metabolic Syndrome

LPCN 1144: Significant Reduction of Clinical Biomarker Levels in Cohort with Elevated ALT and TG at BL 17 * Barritt 4 th et al, Contemp Clin Trials, 2017 ** Sanyal et al, Hepatol , 2015 *** TG normal range 45 – 200 mg/dL x2 x2 x5 TG and ALT mean change post 52 week therapy in patients † N = Total N for subgroup Mean BL: TG ALT 214 44.5 TG ALT 227 53.6 TG ALT 320 34.4 - 20 - 22 - 64 - 7.9 - 11.1 - 4.0 -12 -10 -8 -6 -4 -2 0 -70 -60 -50 -40 -30 -20 -10 0 ALT > 30 U/L* (N=81†) ALT > 40 U/L** (N=42†) TG > 200 mg/dL*** (N=73†) ALT Mean Change (U/L) TG Mean Change (mg/ dL ) TG ALT

LPCN 1144: Consistent Effects on Key Clinical Biomarkers Across Studies 18 Alanine amino transferase (ALT), Aspartate amino transferase (AST), Alkaline phosphatase (ALP), Gamma - glutamyl transpeptidase (GGT), Triglyceride (TG) Liver enzymes and TG mean change post therapy in patients in two separate studies* - 6.5 - 2.9 - 16.5 - 11.7 - 10 - 6.3 - 10.2 - 7 -20 -15 -10 -5 0 5 ALT (U/L) AST (U/L) ALP (U/L) GGT (U/L) Mean Change from Baseline (U/L) 16-002 3 Wks (N=25) 13-001 52 Wks (N=52) - 66 - 85 -90 -80 -70 -60 -50 -40 -30 -20 -10 0 TG (mg/dL) Mean Change from Baseline (mg/ dL ) 16-002 3 Wks (N=25) 13-001 52 Wks (N=52) * Patients are for 4 th Quartile (above or upper normal level) of each lab at baseline Mean BL ALT (U/L) AST (U/L) ALP (U/L) GGT (U/L) 16 - 002 46.5 29.5 92.8 61.9 13 - 001 51.1 35.1 97.6 70.7 TG (mg/ dL ) 346 360
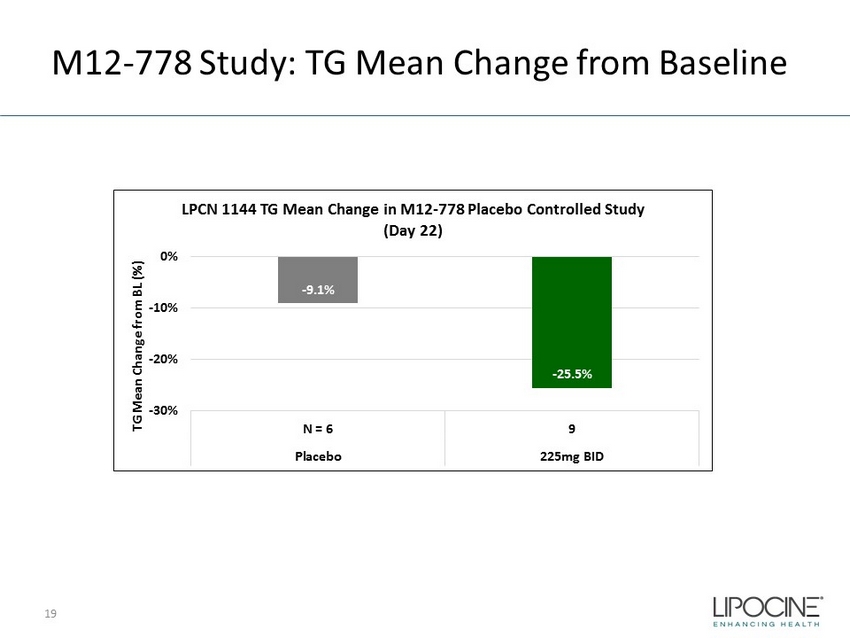
M12 - 778 Study: TG Mean Change from Baseline - 9.1% - 25.5% -30% -20% -10% 0% N = 6 9 Placebo 225mg BID TG Mean Change from BL (%) LPCN 1144 TG Mean Change in M12 - 778 Placebo Controlled Study (Day 22) 19
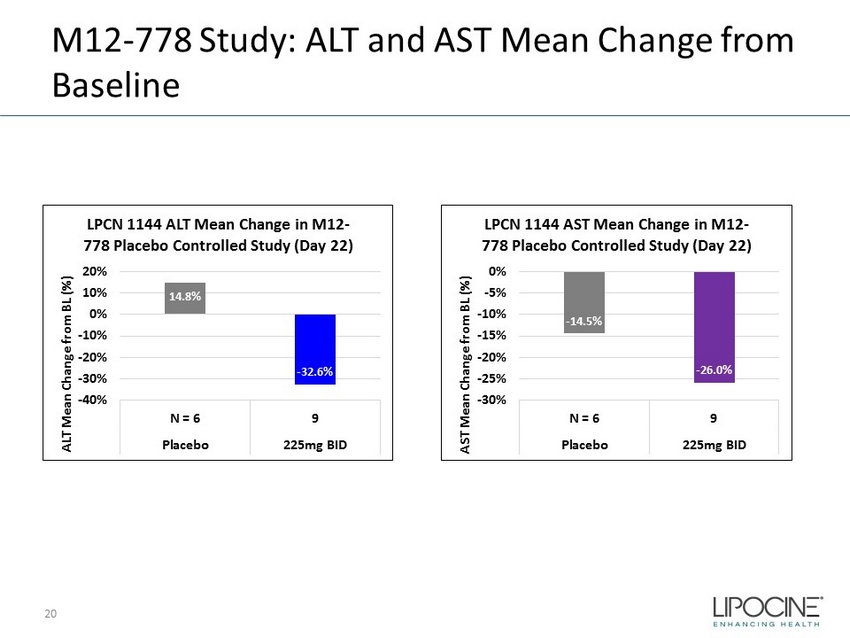
M12 - 778 Study: ALT and AST Mean Change from Baseline 14.8% - 32.6% -40% -30% -20% -10% 0% 10% 20% N = 6 9 Placebo 225mg BID ALT Mean Change from BL (%) LPCN 1144 ALT Mean Change in M12 - 778 Placebo Controlled Study (Day 22) - 14.5% - 26.0% -30% -25% -20% -15% -10% -5% 0% N = 6 9 Placebo 225mg BID AST Mean Change from BL (%) LPCN 1144 AST Mean Change in M12 - 778 Placebo Controlled Study (Day 22) 20
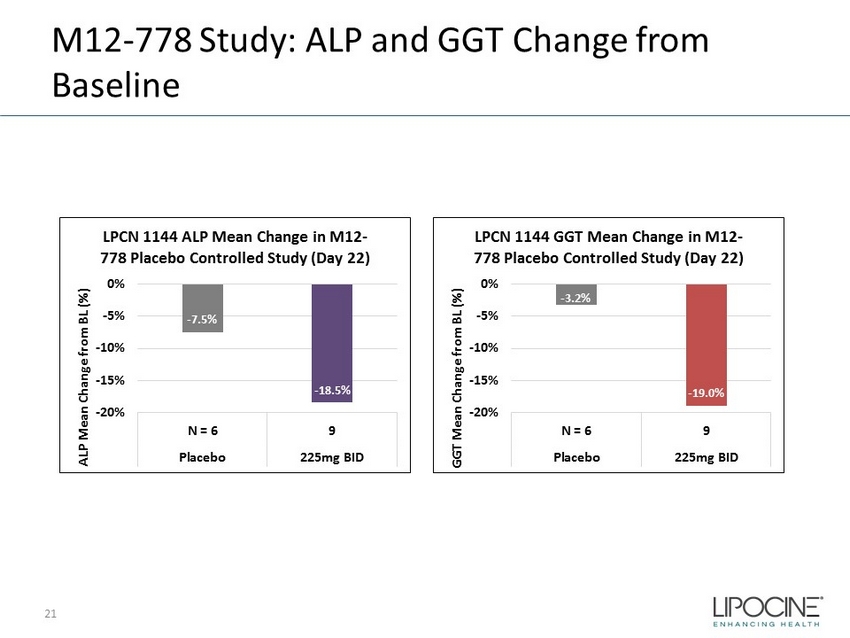
M12 - 778 Study: ALP and GGT Change from Baseline - 7.5% - 18.5% -20% -15% -10% -5% 0% N = 6 9 Placebo 225mg BID ALP Mean Change from BL (%) LPCN 1144 ALP Mean Change in M12 - 778 Placebo Controlled Study (Day 22) - 3.2% - 19.0% -20% -15% -10% -5% 0% N = 6 9 Placebo 225mg BID GGT Mean Change from BL (%) LPCN 1144 GGT Mean Change in M12 - 778 Placebo Controlled Study (Day 22) 21
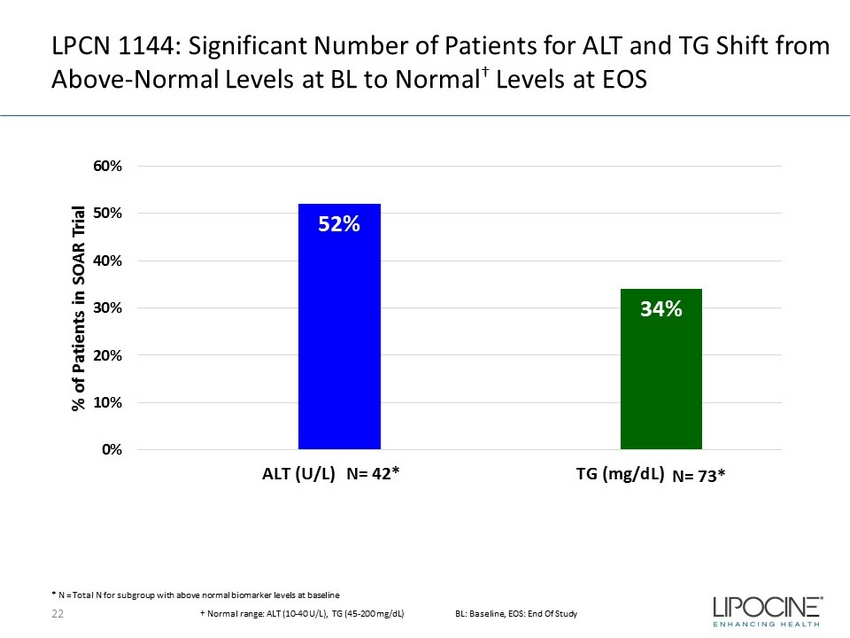
LPCN 1144: Significant Number of Patients for ALT and TG Shift from Above - Normal Levels at BL to Normal † Levels at EOS 22 52% 34% 0% 10% 20% 30% 40% 50% 60% ALT (U/L) TG (mg/dL) % of Patients in SOAR Trial N= 42* * N = Total N for subgroup with above normal biomarker levels at baseline † Normal range: ALT (10 - 40 U/L), TG (45 - 200 mg/ dL ) BL: Baseline, EOS: End Of Study N= 73*
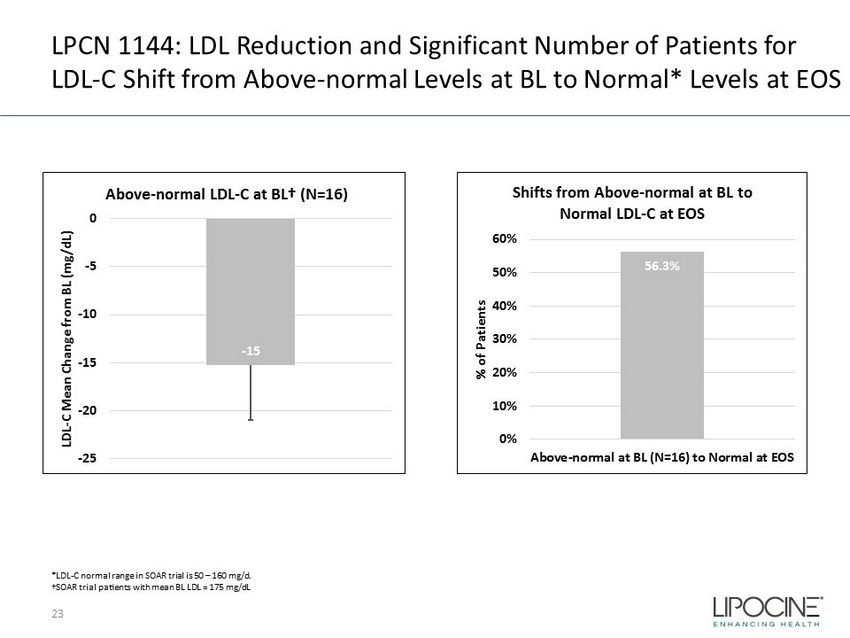
LPCN 1144: LDL Reduction and Significant Number of Patients for LDL - C Shift from Above - normal Levels at BL to Normal* Levels at EOS 23 - 15 -25 -20 -15 -10 -5 0 LDL - C Mean Change from BL (mg/dL) Above - normal LDL - C at BL† (N=16) 56.3% 0% 10% 20% 30% 40% 50% 60% Above-normal at BL (N=16) to Normal at EOS % of Patients Shifts from Above - normal at BL to Normal LDL - C at EOS *LDL - C normal range in SOAR trial is 50 – 160 mg/d. †SOAR trial patients with mean BL LDL = 175 mg/ dL
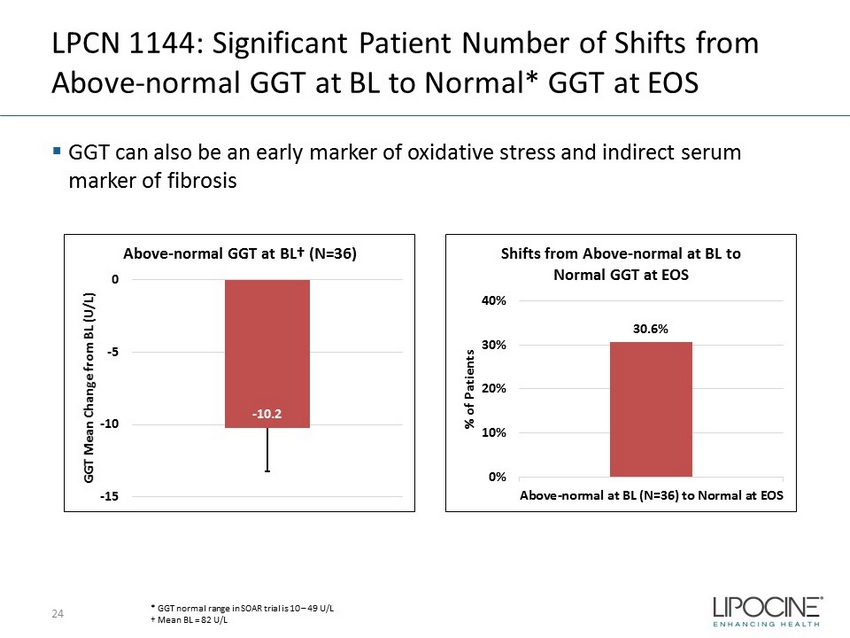
LPCN 1144: Significant Patient Number of Shifts from Above - normal GGT at BL to Normal* GGT at EOS ▪ GGT can also be an early marker of oxidative stress and indirect serum marker of fibrosis 24 - 10.2 -15 -10 -5 0 GGT Mean Change from BL (U/L) Above - normal GGT at BL† (N=36) 30.6% 0% 10% 20% 30% 40% Above-normal at BL (N=36) to Normal at EOS % of Patients Shifts from Above - normal at BL to Normal GGT at EOS * GGT normal range in SOAR trial is 10 – 49 U/L † Mean BL = 82 U/L
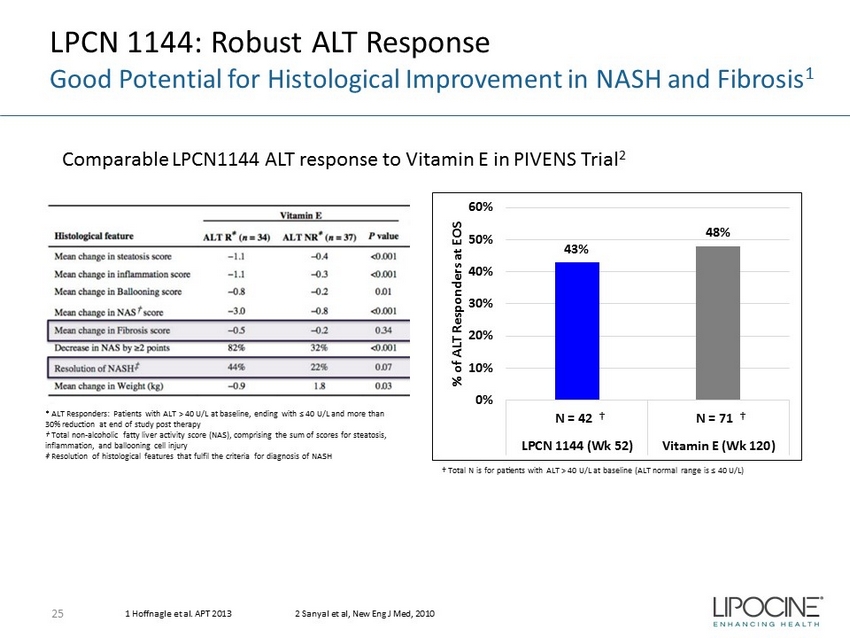
25 † Total N is for patients with ALT > 40 U/L at baseline (ALT normal range is ≤ 40 U/L) 43% 48% 0% 10% 20% 30% 40% 50% 60% N = 42* N = 71* LPCN 1144 (Wk 52) Vitamin E (Wk 120) % of ALT Responders at EOS * ALT Responders: Patients with ALT > 40 U/L at baseline, ending with ≤ 40 U/L and more than 30% reduction at end of study post therapy † Total non - alcoholic fatty liver activity score (NAS), comprising the sum of scores for steatosis, inflammation, and ballooning cell injury ‡ Resolution of histological features that fulfil the criteria for diagnosis of NASH 1 Hoffnagle et al. APT 2013 2 Sanyal et al, New Eng J Med, 2010 Comparable LPCN1144 ALT response to Vitamin E in PIVENS Trial 2 † † LPCN 1144: Robust ALT Response Good Potential for Histological Improvement in NASH and Fibrosis 1
26 LPCN 1144 Comparison with Topical Testosterone
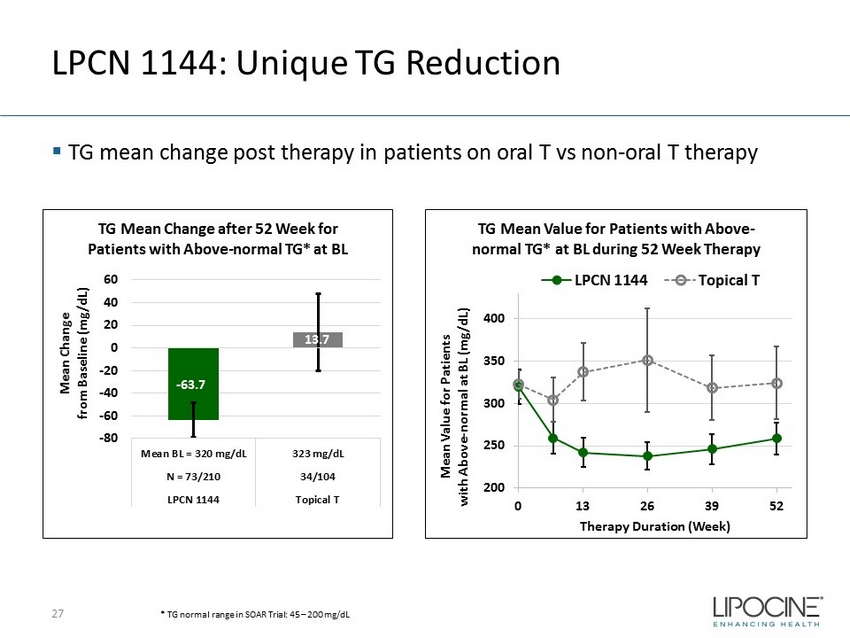
LPCN 1144: Unique TG Reduction ▪ TG mean change post therapy in patients on oral T vs non - oral T therapy 27 - 63.7 13.7 -80 -60 -40 -20 0 20 40 60 Mean BL = 320 mg/dL 323 mg/dL N = 73/210 34/104 LPCN 1144 Topical T Mean Change from Baseline (mg/ dL ) TG Mean Change after 52 Week for Patients with Above - normal TG* at BL 200 250 300 350 400 0 13 26 39 52 Mean Value for Patients with Above - normal at BL (mg/dL) Therapy Duration (Week) TG Mean Value for Patients with Above - normal TG* at BL during 52 Week Therapy LPCN 1144 Topical T * TG normal range in SOAR Trial: 45 – 200 mg/dL
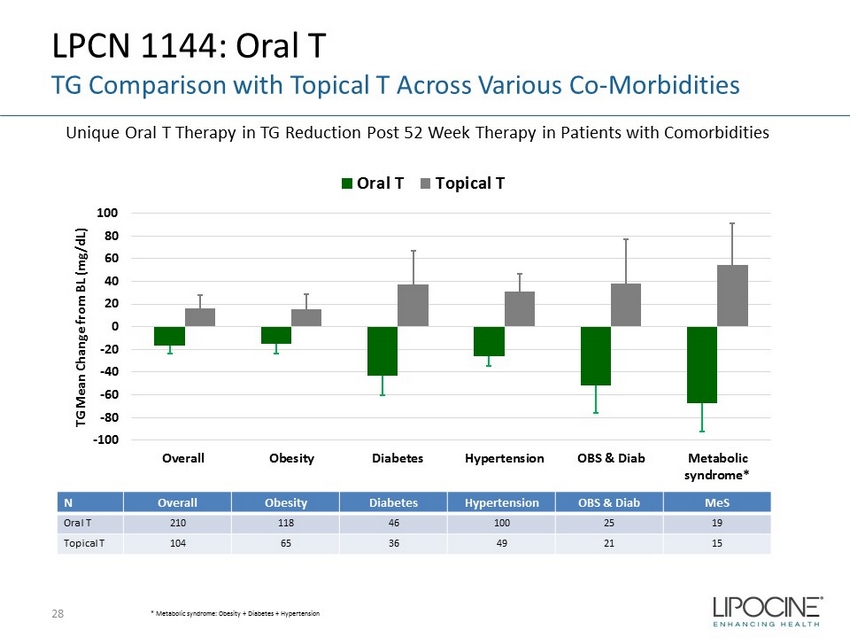
LPCN 1144: Oral T TG Comparison with Topical T Across Various Co - Morbidities 28 -100 -80 -60 -40 -20 0 20 40 60 80 100 Overall Obesity Diabetes Hypertension OBS & Diab Metabolic syndrome* TG Mean Change from BL (mg/dL) Oral T Topical T * Metabolic syndrome: Obesity + Diabetes + Hypertension N Overall Obesity Diabetes Hypertension OBS & Diab MeS Oral T 210 118 46 100 25 19 Topical T 104 65 36 49 21 15 Unique Oral T Therapy in TG Reduction Post 52 Week Therapy in Patients with Comorbidities
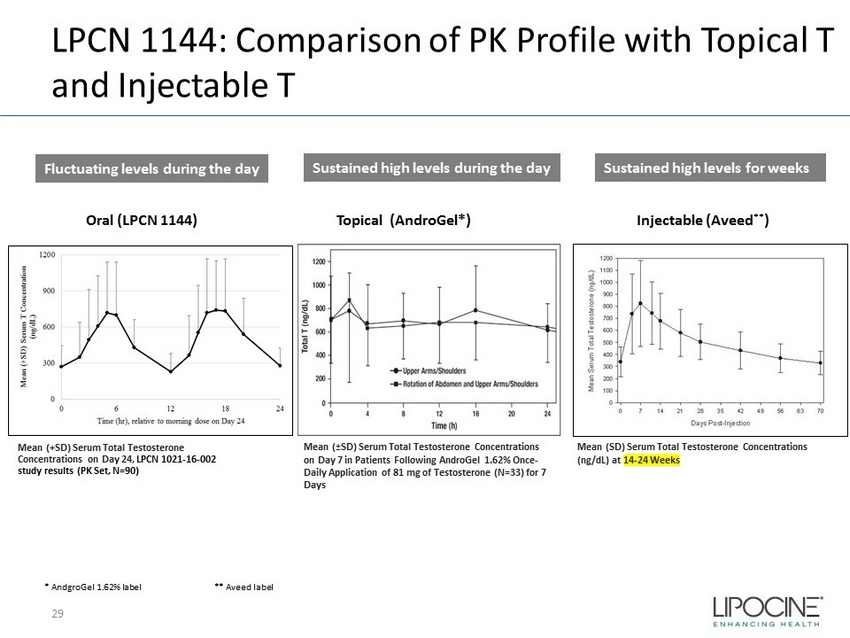
LPCN 1144: Comparison of PK Profile with Topical T and Injectable T Mean (+SD) Serum Total Testosterone Concentrations on Day 24, LPCN 1021 - 16 - 002 study results (PK Set, N=90) Mean (SD) Serum Total Testosterone Concentrations (ng/ dL ) at 14 - 24 Weeks Mean ( ± SD) Serum Total Testosterone Concentrations on Day 7 in Patients Following AndroGel 1.62% Once - Daily Application of 81 mg of Testosterone (N=33) for 7 Days Oral (LPCN 1144) Topical ( AndroGel *) Injectable ( Aveed ** ) * AndgroGel 1.62% label ** Aveed label Sustained high levels for weeks Sustained high levels during the day Fluctuating levels during the day 29
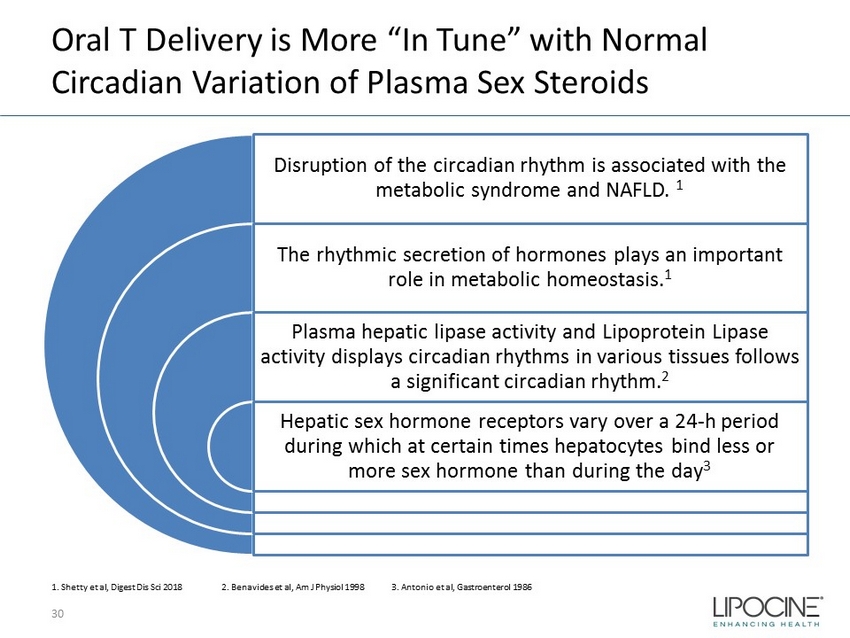
Disruption of the circadian rhythm is associated with the metabolic syndrome and NAFLD. 1 The rhythmic secretion of hormones plays an important role in metabolic homeostasis. 1 Plasma hepatic lipase activity and Lipoprotein Lipase activity displays circadian rhythms in various tissues follows a significant circadian rhythm. 2 Hepatic sex hormone receptors vary over a 24 - h period during which at certain times hepatocytes bind less or more sex hormone than during the day 3 30 Oral T Delivery is More “In Tune” with Normal Circadian Variation of Plasma Sex Steroids 1. Shetty et al, Digest Dis Sci 2018 2. Benavides et al, Am J Physiol 1998 3. Antonio et al, Gastroenterol 1986

LPCN 1144: Oral Testosterone for the Treatment of NASH Summary and Next Steps ▪ Targeted for NASH epidemic with no currently approved product ▪ Unique mechanism targeting full spectrum of NASH pathogenesis + collateral health benefits ▪ Well tolerated safety profile ▪ Compelling clinical biomarker data ▪ Next Steps – In - vivo model Proof - Of - Concept (POC) study in biopsy - confirmed NASH – POC clinical study to assess liver fat changes via MRI - PDFF imaging in confirmed NAFLD/NASH patients 31
32 LPCN 1144 Competitive Biomarker Data Comparison (Separate Studies/Not Head to Head)
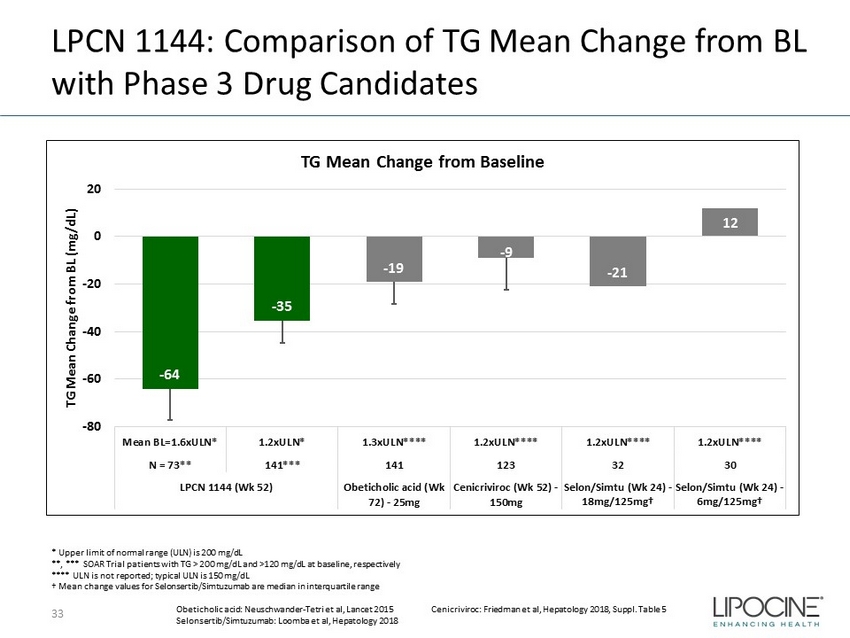
LPCN 1144: Comparison of TG Mean Change from BL with Phase 3 Drug Candidates 33 * Upper limit of normal range (ULN) is 200 mg/dL **, *** SOAR Trial patients with TG > 200 mg/dL and >120 mg/dL at baseline, respectively **** ULN is not reported; typical ULN is 150 mg/dL † Mean change values for Selonsertib / Simtuzumab are median in interquartile range - 64 - 35 - 19 - 9 - 21 12 -80 -60 -40 -20 0 20 Mean BL=1.6xULN* 1.2xULN* 1.3xULN**** 1.2xULN**** 1.2xULN**** 1.2xULN**** N = 73** 141*** 141 123 32 30 LPCN 1144 (Wk 52) Obeticholic acid (Wk 72) - 25mg Cenicriviroc (Wk 52) - 150mg Selon/Simtu (Wk 24) - 18mg/125mg† Selon/Simtu (Wk 24) - 6mg/125mg† TG Mean Change from BL (mg/dL) TG Mean Change from Baseline Obeticholic acid: Neuschwander - Tetri et al, Lancet 2015 Cenicriviroc : Friedman et al, Hepatology 2018, Suppl. Table 5 Selonsertib / Simtuzumab : Loomba et al, Hepatology 2018
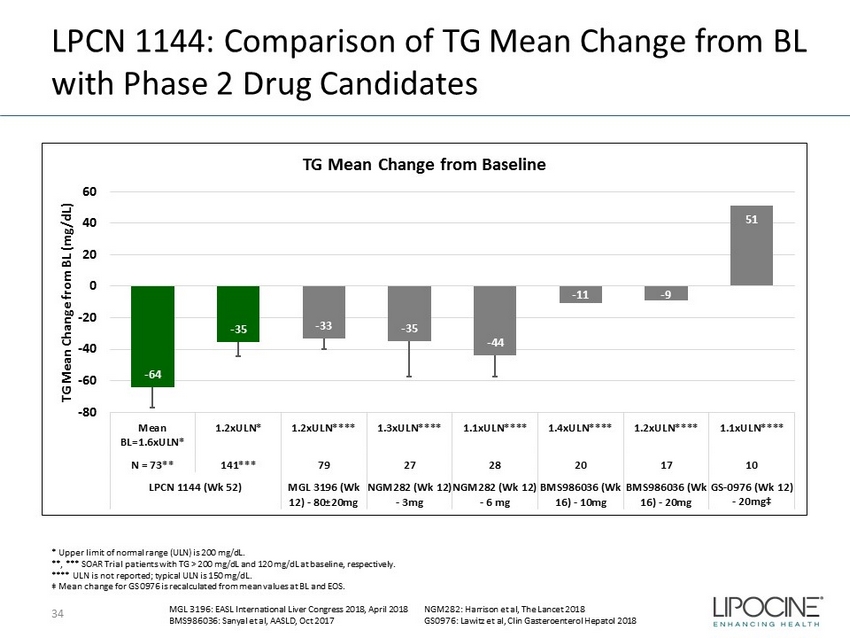
LPCN 1144: Comparison of TG Mean Change from BL with Phase 2 Drug Candidates 34 * Upper limit of normal range (ULN) is 200 mg/ dL . **, *** SOAR Trial patients with TG > 200 mg/dL and 120 mg/dL at baseline, respectively. **** ULN is not reported; typical ULN is 150 mg/ dL . ‡ Mean change for GS 0976 is recalculated from mean values at BL and EOS. - 64 - 35 - 33 - 35 - 44 - 11 - 9 51 -80 -60 -40 -20 0 20 40 60 Mean BL=1.6xULN* 1.2xULN* 1.2xULN**** 1.3xULN**** 1.1xULN**** 1.4xULN**** 1.2xULN**** 1.1xULN**** N = 73** 141*** 79 27 28 20 17 10 LPCN 1144 (Wk 52) MGL 3196 (Wk 12) - 80±20mg NGM282 (Wk 12) - 3mg NGM282 (Wk 12) - 6 mg BMS986036 (Wk 16) - 10mg BMS986036 (Wk 16) - 20mg GS - 0976 (Wk 12) - 20mg‡ TG Mean Change from BL (mg/dL) TG Mean Change from Baseline MGL 3196: EASL International Liver Congress 2018, April 2018 NGM282: Harrison et al, The Lancet 2018 BMS986036: Sanyal et al, AASLD, Oct 2017 GS0976: Lawitz et al, Clin Gasteroenterol Hepatol 2018
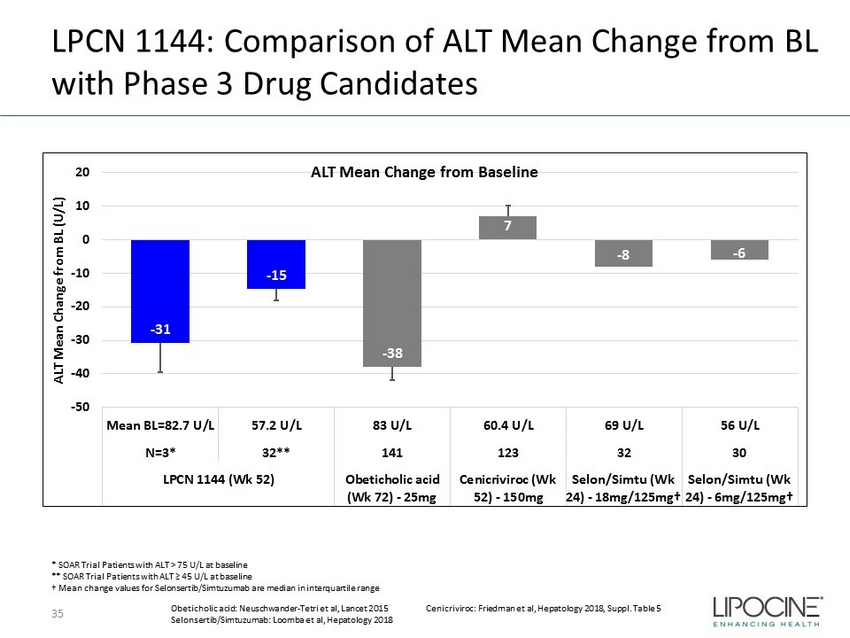
LPCN 1144: Comparison of ALT Mean Change from BL with Phase 3 Drug Candidates 35 - 31 - 15 - 38 7 - 8 - 6 -50 -40 -30 -20 -10 0 10 20 Mean BL=82.7 U/L 57.2 U/L 83 U/L 60.4 U/L 69 U/L 56 U/L N=3* 32** 141 123 32 30 LPCN 1144 (Wk 52) Obeticholic acid (Wk 72) - 25mg Cenicriviroc (Wk 52) - 150mg Selon/Simtu (Wk 24) - 18mg/125mg† Selon/Simtu (Wk 24) - 6mg/125mg† ALT Mean Change from BL (U/L) ALT Mean Change from Baseline * SOAR Trial Patients with ALT > 75 U/L at baseline ** SOAR Trial Patients with ALT ≥ 45 U/L at baseline † Mean change values for Selonsertib / Simtuzumab are median in interquartile range Obeticholic acid: Neuschwander - Tetri et al, Lancet 2015 Cenicriviroc : Friedman et al, Hepatology 2018, Suppl. Table 5 Selonsertib / Simtuzumab : Loomba et al, Hepatology 2018
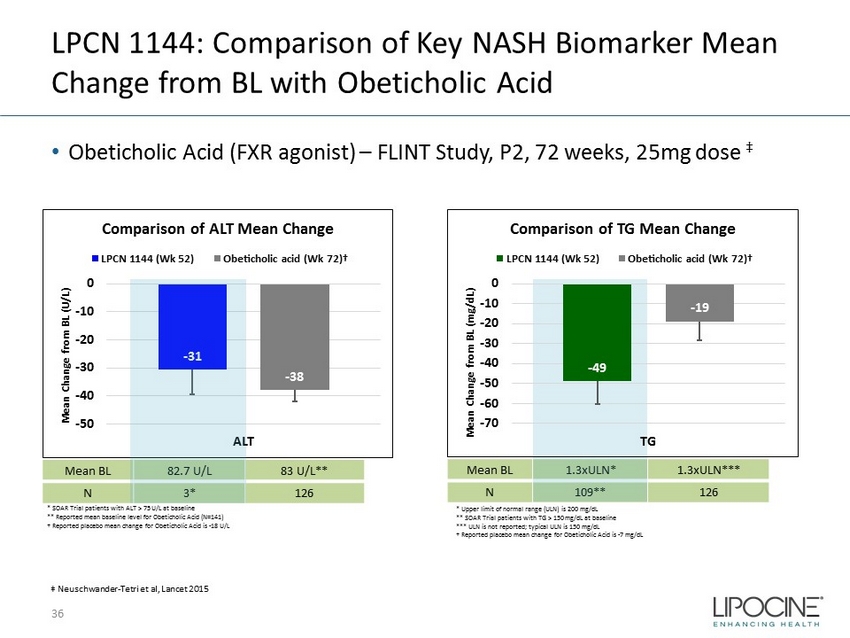
LPCN 1144: Comparison of Key NASH Biomarker Mean Change from BL with Obeticholic Acid • Obeticholic Acid (FXR agonist) – FLINT Study, P2, 72 weeks, 25mg dose ‡ 36 - 31 - 38 -50 -40 -30 -20 -10 0 ALT Mean Change from BL (U/L) Comparison of ALT Mean Change LPCN 1144 (Wk 52) Obeticholic acid (Wk 72)† Mean BL 82.7 U/L 83 U/L** N 3* 126 Mean BL 1.3xULN* 1.3xULN*** N 109** 126 * Upper limit of normal range (ULN) is 200 mg/dL ** SOAR Trial patients with TG > 150 mg/dL at baseline *** ULN is not reported; typical ULN is 150 mg/dL † Reported placebo mean change for Obeticholic Acid is - 7 mg/dL * SOAR Trial patients with ALT > 75 U/L at baseline ** Reported mean baseline level for Obeticholic Acid (N=141) † Reported placebo mean change for Obeticholic Acid is - 18 U/L - 49 - 19 -70 -60 -50 -40 -30 -20 -10 0 TG Mean Change from BL (mg/dL) Comparison of TG Mean Change LPCN 1144 (Wk 52) Obeticholic acid (Wk 72)† ‡ Neuschwander - Tetri et al, Lancet 2015
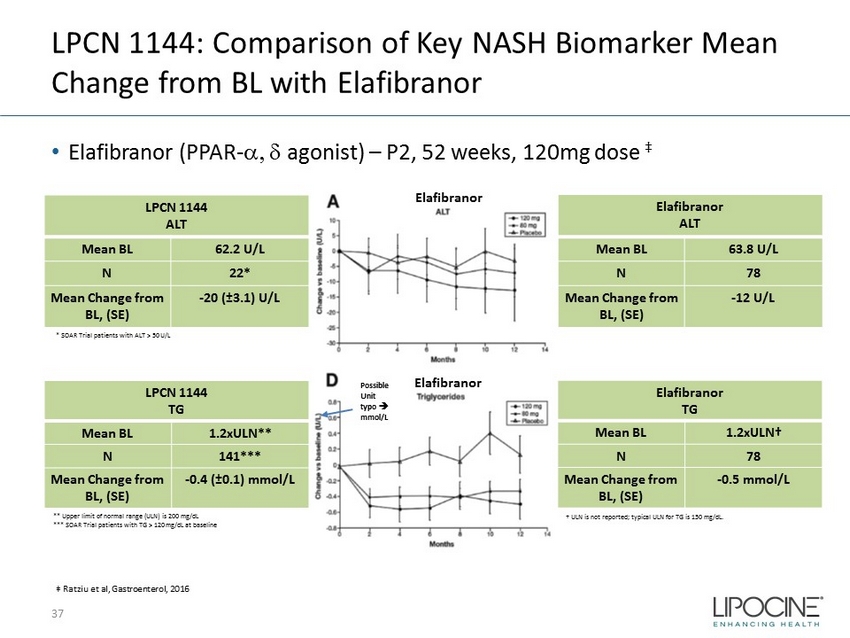
Elafibranor Elafibranor LPCN 1144: Comparison of Key NASH Biomarker Mean Change from BL with Elafibranor • Elafibranor (PPAR - a, d agonist) – P2, 52 weeks, 120mg dose ‡ 37 LPCN 1144 ALT Mean BL 62.2 U/L N 22* Mean Change from BL, (SE) - 20 ( ± 3.1) U/L * SOAR Trial patients with ALT > 50 U/L ‡ Ratziu et al, Gastroenterol, 2016 LPCN 1144 TG Mean BL 1.2xULN** N 141*** Mean Change from BL, (SE) - 0.4 ( ± 0.1) mmol /L ** Upper limit of normal range (ULN) is 200 mg/ dL *** SOAR Trial patients with TG > 120 mg/ dL at baseline † ULN is not reported; typical ULN for TG is 150 mg/ dL . Elafibranor ALT Mean BL 63.8 U/L N 78 Mean Change from BL, (SE) - 12 U/L Possible Unit typo mmol/L Elafibranor TG Mean BL 1.2xULN† N 78 Mean Change from BL, (SE) - 0.5 mmol /L
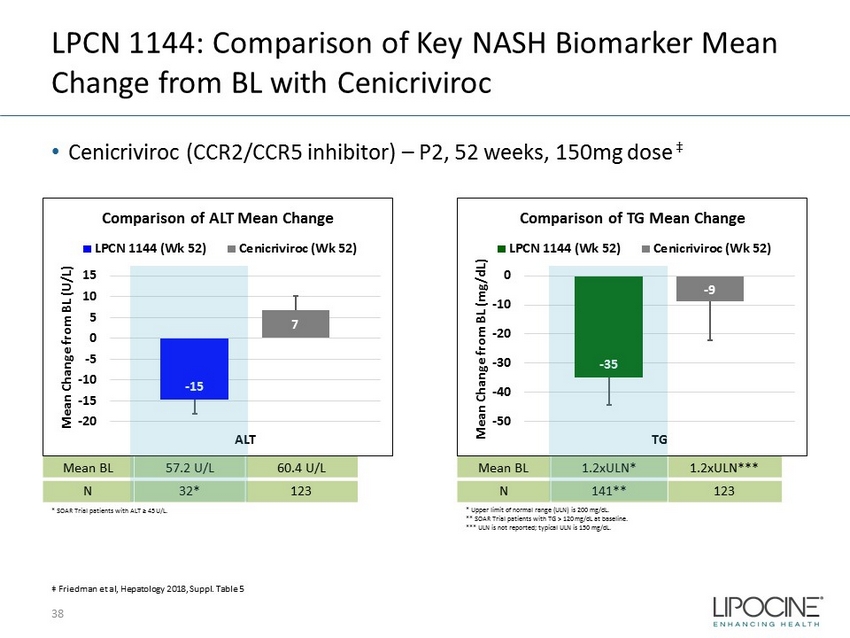
LPCN 1144: Comparison of Key NASH Biomarker Mean Change from BL with Cenicriviroc • Cenicriviroc (CCR2/CCR5 inhibitor) – P2, 52 weeks, 150mg dose ‡ 38 Mean BL 57.2 U/L 60.4 U/L N 32* 123 Mean BL 1.2xULN* 1.2xULN*** N 141** 123 * Upper limit of normal range (ULN) is 200 mg/ dL . ** SOAR Trial patients with TG > 120 mg/dL at baseline. *** ULN is not reported; typical ULN is 150 mg/ dL . * SOAR Trial patients with ALT ≥ 45 U/L. - 15 7 -20 -15 -10 -5 0 5 10 15 ALT Mean Change from BL (U/L) Comparison of ALT Mean Change LPCN 1144 (Wk 52) Cenicriviroc (Wk 52) - 35 - 9 -50 -40 -30 -20 -10 0 TG Mean Change from BL (mg/dL) Comparison of TG Mean Change LPCN 1144 (Wk 52) Cenicriviroc (Wk 52) ‡ Friedman et al, Hepatology 2018, Suppl. Table 5
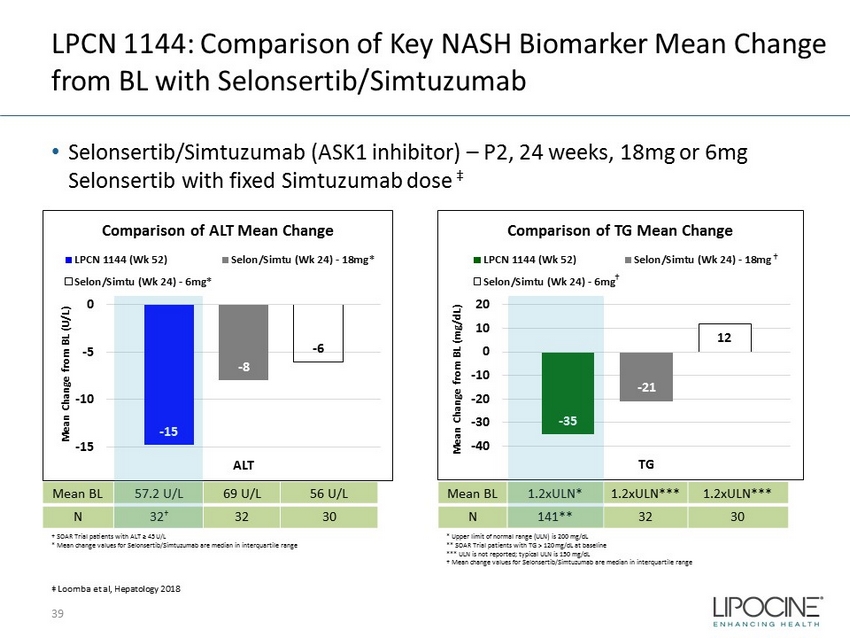
LPCN 1144: Comparison of Key NASH Biomarker Mean Change from BL with Selonsertib / Simtuzumab • Selonsertib / Simtuzumab (ASK1 inhibitor) – P2, 24 weeks, 18mg or 6mg Selonsertib with fixed Simtuzumab dose ‡ 39 - 35 - 21 12 -40 -30 -20 -10 0 10 20 TG Mean Change from BL (mg/dL) Comparison of TG Mean Change LPCN 1144 (Wk 52) Selon/Simtu (Wk 24) - 18mg Selon/Simtu (Wk 24) - 6mg Mean BL 57.2 U/L 69 U/L 56 U/L N 32 † 32 30 † SOAR Trial patients with ALT ≥ 45 U/L * Mean change values for Selonsertib / Simtuzumab are median in interquartile range - 15 - 8 - 6 -15 -10 -5 0 ALT Mean Change from BL (U/L) Comparison of ALT Mean Change LPCN 1144 (Wk 52) Selon/Simtu (Wk 24) - 18mg* Selon/Simtu (Wk 24) - 6mg* Mean BL 1.2xULN* 1.2xULN*** 1.2xULN*** N 141 ** 32 30 * Upper limit of normal range (ULN) is 200 mg/dL ** SOAR Trial patients with TG > 120 mg/dL at baseline *** ULN is not reported; typical ULN is 150 mg/dL † Mean change values for Selonsertib / Simtuzumab are median in interquartile range † † ‡ Loomba et al, Hepatology 2018
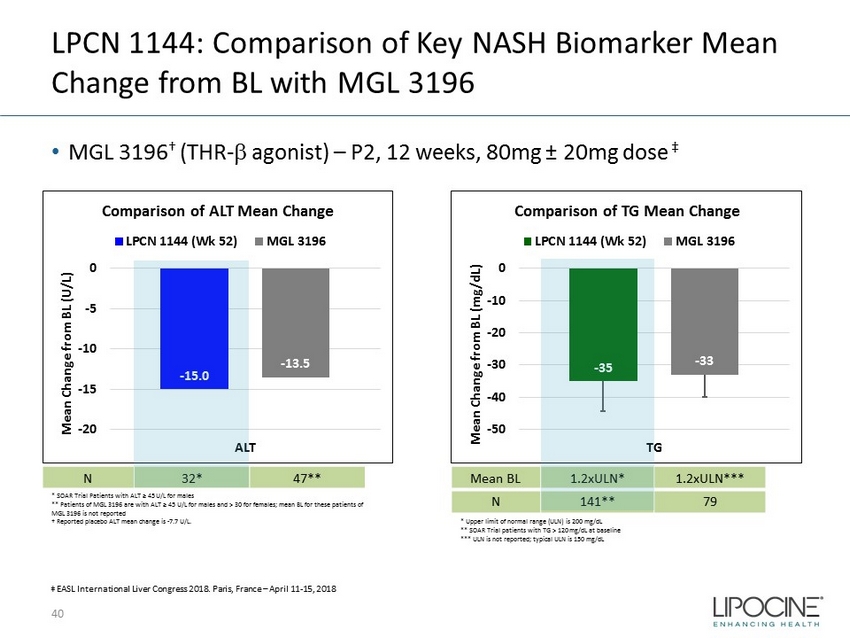
LPCN 1144: Comparison of Key NASH Biomarker Mean Change from BL with MGL 3196 • MGL 3196 † (THR - b agonist) – P2, 12 weeks, 80mg ц 20mg dose ‡ 40 - 15.0 - 13.5 -20 -15 -10 -5 0 ALT Mean Change from BL (U/L) Comparison of ALT Mean Change LPCN 1144 (Wk 52) MGL 3196 N 32* 47** * SOAR Trial Patients with ALT ≥ 45 U/L for males ** Patients of MGL 3196 are with ALT ≥ 45 U/L for males and > 30 for females; mean BL for these patients of MGL 3196 is not reported † Reported placebo ALT mean change is - 7.7 U/L. * Upper limit of normal range (ULN) is 200 mg/dL ** SOAR Trial patients with TG > 120 mg/dL at baseline *** ULN is not reported; typical ULN is 150 mg/dL - 35 - 33 -50 -40 -30 -20 -10 0 TG Mean Change from BL (mg/ dL ) Comparison of TG Mean Change LPCN 1144 (Wk 52) MGL 3196 Mean BL 1.2xULN* 1.2xULN*** N 141** 79 * Upper limit of normal range (ULN) is 200 mg/dL ** SOAR Trial patients with TG > 120 mg/dL at baseline *** ULN is not reported; typical ULN is 150 mg/dL ‡ EASL International Liver Congress 2018. Paris, France – April 11 - 15, 2018
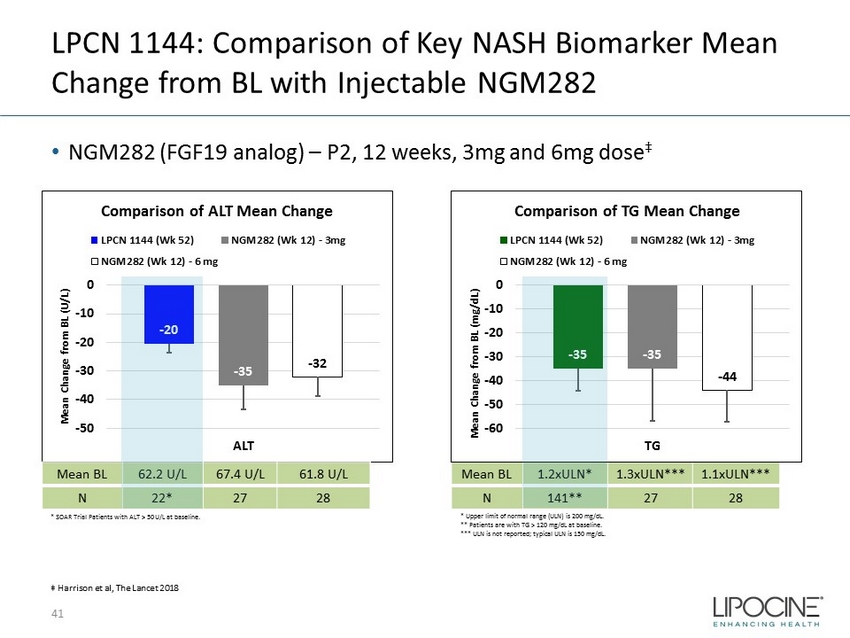
LPCN 1144: Comparison of Key NASH Biomarker Mean Change from BL with Injectable NGM282 • NGM282 (FGF19 analog) – P2, 12 weeks, 3mg and 6mg dose ‡ 41 * Upper limit of normal range (ULN) is 200 mg/ dL . ** Patients are with TG > 120 mg/ dL at baseline. *** ULN is not reported; typical ULN is 150 mg/ dL . Mean BL 1.2xULN* 1.3xULN*** 1.1xULN*** N 141** 27 28 - 20 - 35 - 32 -50 -40 -30 -20 -10 0 ALT Mean Change from BL (U/L) Comparison of ALT Mean Change LPCN 1144 (Wk 52) NGM282 (Wk 12) - 3mg NGM282 (Wk 12) - 6 mg Mean BL 62.2 U/L 67.4 U/L 61.8 U/L N 22* 27 28 - 35 - 35 - 44 -60 -50 -40 -30 -20 -10 0 TG Mean Change from BL (mg/dL) Comparison of TG Mean Change LPCN 1144 (Wk 52) NGM282 (Wk 12) - 3mg NGM282 (Wk 12) - 6 mg * SOAR Trial Patients with ALT > 50 U/L at baseline. ‡ Harrison et al, The Lancet 2018
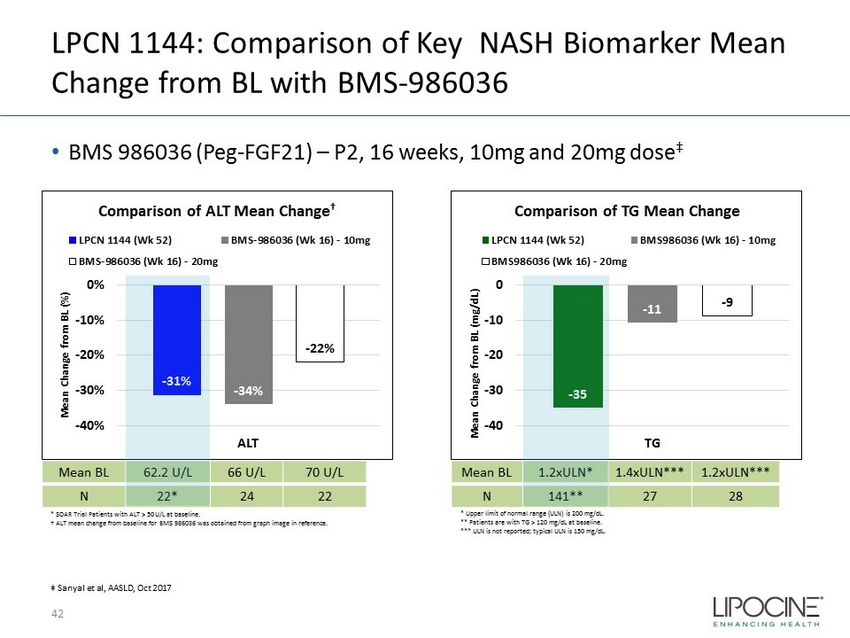
- 35 - 11 - 9 -40 -30 -20 -10 0 TG Mean Change from BL (mg/dL) Comparison of TG Mean Change LPCN 1144 (Wk 52) BMS986036 (Wk 16) - 10mg BMS986036 (Wk 16) - 20mg - 31% - 34% - 22% -40% -30% -20% -10% 0% ALT Mean Change from BL (%) Comparison of ALT Mean Change † LPCN 1144 (Wk 52) BMS-986036 (Wk 16) - 10mg BMS-986036 (Wk 16) - 20mg LPCN 1144: Comparison of Key NASH Biomarker Mean Change from BL with BMS - 986036 • BMS 986036 (Peg - FGF21) – P2, 16 weeks, 10mg and 20mg dose ‡ 42 * Upper limit of normal range (ULN) is 200 mg/ dL . ** Patients are with TG > 120 mg/ dL at baseline. *** ULN is not reported; typical ULN is 150 mg/ dL . Mean BL 1.2xULN* 1.4xULN*** 1.2xULN*** N 141** 27 28 Mean BL 62.2 U/L 66 U/L 70 U/L N 22* 24 22 * SOAR Trial Patients with ALT > 50 U/L at baseline. † ALT mean change from baseline for BMS 986036 was obtained from graph image in reference. ‡ Sanyal et al, AASLD, Oct 2017

- 35 51 -40 -20 0 20 40 60 TG Mean Change from BL (mg/dL) Comparison of TG Mean Change LPCN 1144 (Wk 52) GS - 0976 (Wk 12) - 20mg† - 31 - 44 -50 -40 -30 -20 -10 0 ALT Mean Change from BL (U/L) Comparison of ALT Mean Change LPCN 1144 (Wk 52) GS - 0976 (Wk 12) - 20mg† LPCN 1144: Comparison of Key NASH Biomarker Mean Change from BL with GS 0976 • GS 0976 (ACC inhibitor) – P2, 12 weeks, 20mg dose ‡ 43 * Upper limit of normal range (ULN) is 200 mg/ dL . ** Patients are with TG > 120 mg/ dL at baseline. *** ULN is not reported; typical ULN is 150 mg/ dL . † Mean Change value is obtained from Mean values at BL and EOS. Mean BL 1.2xULN* 1.1xULN*** N 141** 10 Mean BL 82.7 U/L 101 U/L N 3* 10 * SOAR Trial Patients with ALT > 75 U/L at baseline. † Mean Change value is obtained from Mean values at BL and EOS. ‡ Lawitz et al, Clin Gasteroenterol Hepatol 2018

LPCN 1144: Comparison of Key NASH Biomarker Mean Change from BL with Aramchol 44 • LPCN 1144* – 52 weeks, randomized • Aramchol ‡ – P2, 52 weeks, 600mg dose * SOAR Trial patients with ALT > 50 U/L at baseline (Mean BL = 62.2 U/L), N=22 30 40 50 60 70 0 13 26 39 52 Mean Level (U/L) Visit (Wks) ALT Mean Values over 52 weeks Mean change from BL to EOS: - 20 U/L ** Mean BL for 600mg dose: 62.8 U/L, N=98 ‡ Galmed Corp PPT, Jun 2018 Unadjusted mean change from BL**: ~ - 13 U/L
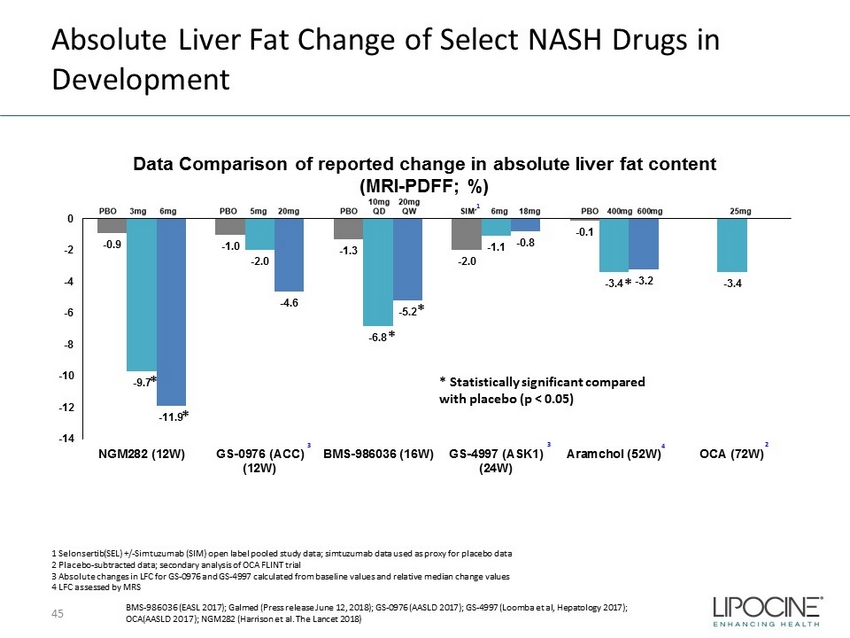
Absolute Liver Fat Change of Select NASH Drugs in Development - 0.9 - 1.0 - 1.3 - 2.0 - 0.1 - 9.7 - 2.0 - 6.8 - 1.1 - 3.4 - 3.4 - 11.9 - 4.6 - 5.2 - 0.8 - 3.2 -14 -12 -10 -8 -6 -4 -2 0 NGM282 (12W) GS-0976 (ACC) (12W) BMS-986036 (16W) GS-4997 (ASK1) (24W) Aramchol (52W) OCA (72W) Data Comparison of reported c hange in absolute liver fat content (MRI - PDFF; %) 1 Selonsertib (SEL) +/ - Simtuzumab (SIM) open label pooled study data; simtuzumab data used as proxy for placebo data 2 Placebo - subtracted data; secondary analysis of OCA FLINT trial 3 Absolute changes in LFC for GS - 0976 and GS - 4997 calculated from baseline values and relative median change values 4 LFC assessed by MRS * * * * * * Statistically significant compared with placebo (p < 0.05) 1 3 4 2 3 45 BMS - 986036 (EASL 2017); Galmed (Press release June 12, 2018); GS - 0976 (AASLD 2017); GS - 4997 (Loomba et al, Hepatology 2017); OCA(AASLD 2017); NGM282 (Harrison et al. The Lancet 2018)
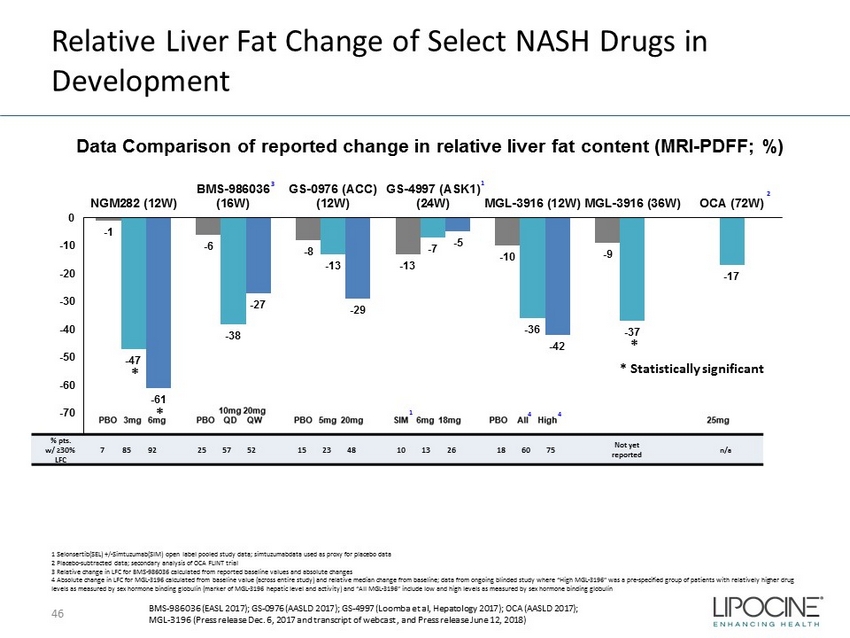
1 Selonsertib (SEL) +/ - Simtuzumab (SIM) open label pooled study data; simtuzumabdata used as proxy for placebo data 2 Placebo - subtracted data; secondary analysis of OCA FLINT trial 3 Relative change in LFC for BMS - 986036 calculated from reported baseline values and absolute changes 4 Absolute change in LFC for MGL - 3196 calculated from baseline value (across entire study) and relative median change from basel ine; data from ongoing blinded study where “High MGL - 3196” was a pre - specified group of patients with relatively higher drug levels as measured by sex hormone binding globulin (marker of MGL - 3196 hepatic level and activity) and “All MGL - 3196” include lo w and high levels as measured by sex hormone binding globulin Relative Liver Fat Change of Select NASH Drugs in Development - 1 - 6 - 8 - 13 - 10 - 9 - 47 - 38 - 13 - 7 - 36 - 37 - 17 - 61 - 27 - 29 - 5 - 42 -80 -70 -60 -50 -40 -30 -20 -10 0 NGM282 (12W) BMS-986036 (16W) GS-0976 (ACC) (12W) GS-4997 (ASK1) (24W) MGL-3916 (12W) MGL-3916 (36W) OCA (72W) % pts. w/ ≥30% LFC 7 85 92 25 57 52 15 23 48 10 13 26 18 60 75 Not yet reported n/a * * Statistically significant * * BMS - 986036 (EASL 2017); GS - 0976 (AASLD 2017); GS - 4997 (Loomba et al, Hepatology 2017); OCA (AASLD 2017); MGL - 3196 (Press release Dec. 6, 2017 and transcript of webcast , and Press release June 12, 2018) 1 3 4 1 4 Data Comparison of reported change in relative liver fat content (MRI - PDFF; %) 46 2
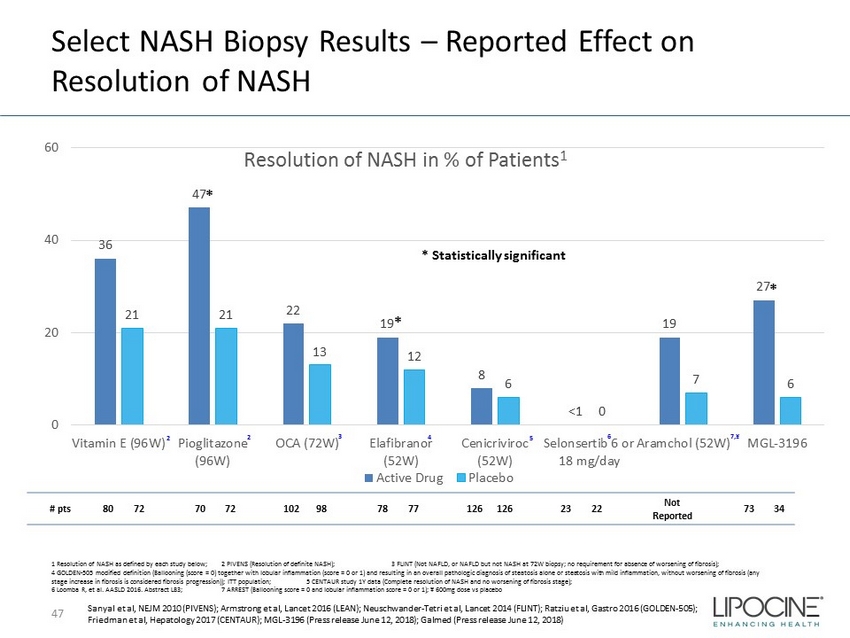
Select NASH Biopsy Results – Reported Effect on Resolution of NASH 36 47 22 19 8 <1 19 27 21 21 13 12 6 0 7 6 0 20 40 60 Vitamin E (96W) Pioglitazone (96W) OCA (72W) Elafibranor (52W) Cenicriviroc (52W) Selonsertib 6 or 18 mg/day Aramchol (52W) MGL-3196 Resolution of NASH in % of Patients 1 Active Drug Placebo 2 2 3 4 5 6 7,¥ * * Statistically significant * * # pts 80 72 70 72 102 98 78 77 126 126 23 22 Not Reported 73 34 1 Resolution of NASH as defined by each study below; 2 PIVENS (Resolution of definite NASH); 3 FLINT (Not NAFLD, or NAFL D but not NASH at 72W biopsy; no requirement for absence of worsening of fibrosis); 4 GOLDEN - 505 modified definition (Ballooning (score = 0) together with lobular inflammation (score = 0 or 1) and resulting in an overall pathologic diagnosis of steatosis alone or steatosis with mild inflammation, without worsening of fibrosis (any stage increase in fibrosis is considered fibrosis progression)); ITT population; 5 CENTAUR study 1Y data (Complete resolutio n of NASH and no worsening of fibrosis stage); 6 Loomba R, et al. AASLD 2016. Abstract LB3; 7 ARREST (Ballooning score = 0 and lobular inflammation score = 0 or 1); ¥ 600mg dose vs placebo Sanyal et al, NEJM 2010 (PIVENS); Armstrong et al, Lancet 2016 (LEAN); Neuschwander - Tetri et al, Lancet 2014 (FLINT); Ratziu et al, Gastro 2016 (GOLDEN - 505); Friedman et al, Hepatology 2017 (CENTAUR); MGL - 3196 (Press release June 12, 2018); Galmed (Press release June 12, 2018) 47
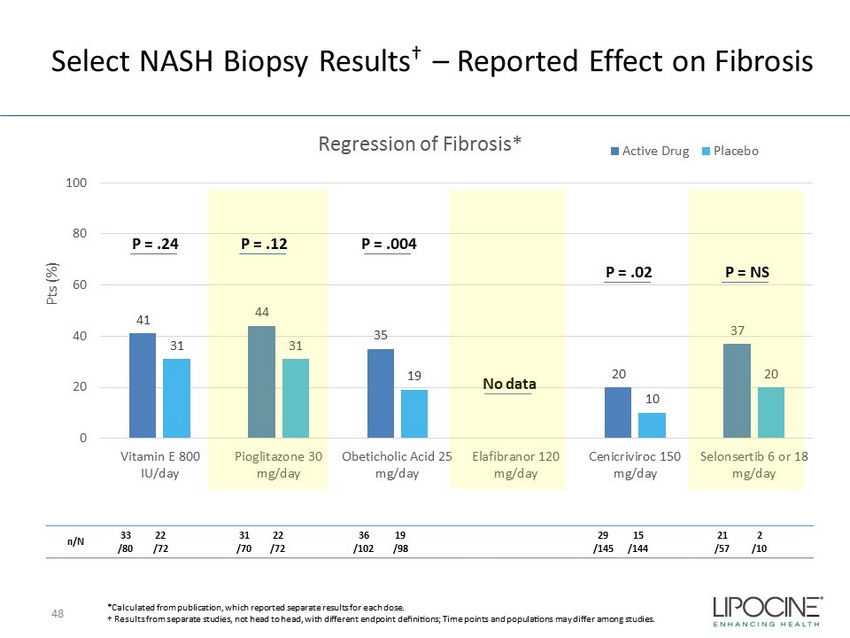
Select NASH Biopsy Results † – Reported Effect on Fibrosis *Calculated from publication, which reported separate results for each dose. † Results from separate studies, not head to head, with different endpoint definitions; Time points and populations may diffe r a mong studies. 48 41 44 35 20 37 31 31 19 10 20 0 20 40 60 80 100 Vitamin E 800 IU/day Pioglitazone 30 mg/day Obeticholic Acid 25 mg/day Elafibranor 120 mg/day Cenicriviroc 150 mg/day Selonsertib 6 or 18 mg/day Pts (%) Regression of Fibrosis* Active Drug Placebo No data n/N 33 /80 22 /72 31 /70 22 /72 36 /102 19 /98 29 /145 15 /144 21 /57 2 /10 P = .24 P = .12 P = .004 P = .02 P = NS
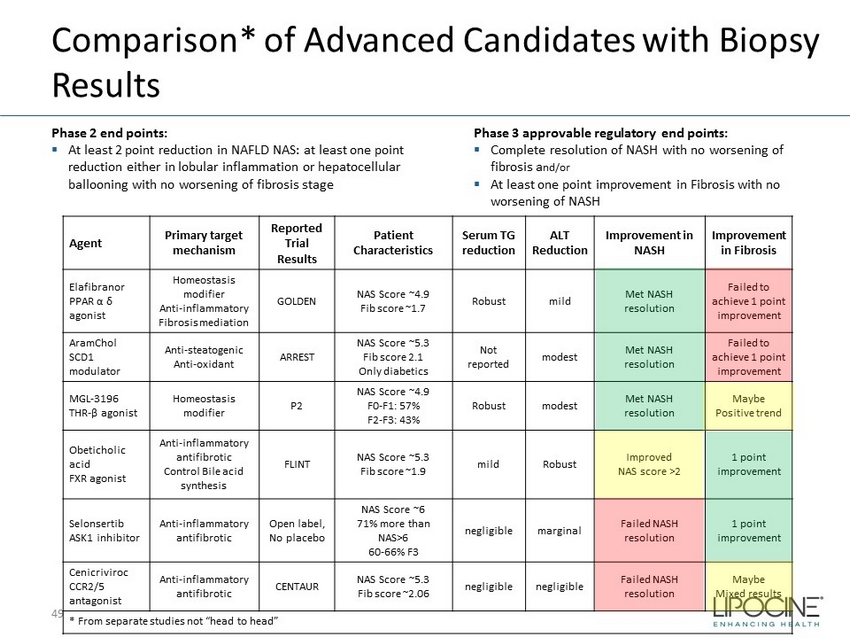
Comparison* of Advanced Candidates with Biopsy Results Phase 2 end points: ▪ At least 2 point reduction in NAFLD NAS: at least one point reduction either in lobular inflammation or hepatocellular ballooning with no worsening of fibrosis stage 49 Agent Primary target mechanism Reported Trial Results Patient Characteristics Serum TG reduction ALT Reduction Improvement in NASH Improvement in Fibrosis Elafibranor PPAR α δ agonist Homeostasis modifier Anti - inflammatory Fibrosis mediation GOLDEN NAS Score ~4.9 Fib score ~1.7 Robust mild Met NASH resolution Failed to achieve 1 point improvement AramChol SCD1 modulator Anti - steatogenic Anti - oxidant ARREST NAS Score ~5.3 Fib score 2.1 Only diabetics Not reported modest Met NASH resolution Failed to achieve 1 point improvement MGL - 3196 THR - β agonist Homeostasis modifier P2 NAS Score ~4.9 F0 - F1: 57% F2 - F3: 43% Robust modest Met NASH resolution Maybe Positive trend Obeticholic acid FXR agonist Anti - inflammatory antifibrotic Control Bile acid synthesis FLINT NAS Score ~5.3 Fib score ~1.9 mild Robust Improved NAS score >2 1 point improvement Selonsertib ASK1 inhibitor Anti - inflammatory antifibrotic Open label, No placebo NAS Score ~6 71% more than NAS>6 60 - 66% F3 negligible marginal Failed NASH resolution 1 point improvement Cenicriviroc CCR2/5 antagonist Anti - inflammatory antifibrotic CENTAUR NAS Score ~5.3 Fib score ~2.06 negligible negligible Failed NASH resolution Maybe Mixed results * From separate studies not “head to head” Phase 3 approvable regulatory end points: ▪ Complete resolution of NASH with no worsening of fibrosis a nd/or ▪ At least one point improvement in Fibrosis with no worsening of NASH