Brookfield Canada Office Properties (BOXC) Inactive
Filed: 8 May 17, 12:00am
Exhibit (c)(2)
PRELIMINARY ANALYSIS
PRIVILEGED AND CONFIDENTIAL – FOR DISCUSSION PURPOSES ONLY
Preliminary Valuation Date of March 31, 2017
Brookfield
Canada Office Properties
Presentation to the Special Committee of the Board of Trustees
Preliminary Valuation Report
March 24, 2017
Greenhill
PRELIMINARY ANALYSIS
PRIVILEGED AND CONFIDENTIAL – FOR DISCUSSION PURPOSES ONLY
Important Information
This presentation is strictly confidential and has been prepared by Greenhill & Co. Canada Ltd.
(“Greenhill”) solely for the internal use of the Special Committee (the “Committee”) of the Board of Trustees of Brookfield Canada Office Properties (the “Company”) in evaluating the potential transaction involving Brookfield Property Partners L.P. and the Company described herein, and may not be used for any other purpose or copied, reproduced, distributed or passed to others at any time or be relied upon by the Company or any other person without the prior written consent of Greenhill.
This presentation was prepared on a confidential basis in connection with an oral presentation to and for use by the Committee and not with a view toward complying with the disclosure standards under any applicable securities laws.
This presentation is for informational purposes only, does not constitute advice and is not intended to be and does not constitute a recommendation to the Company or any other person or entity as to whether to approve or undertake any of the matters described herein or enter into any transaction. This presentation is not and should not be considered as a fairness opinion. The materials contained herein are based solely on information which has not been independently verified by Greenhill. Accordingly, Greenhill does not assume any responsibility or liability therefor. No representation or warranty, express or implied, is made in relation to the accuracy or completeness of the information presented herein or its suitability for any particular purpose.
This presentation is delivered subject to the terms of our engagement letter. This presentation speaks only as of the date given, and subsequent developments may affect the information, analyses, valuations and assumptions contained herein. Greenhill does not undertake and has no obligation to update or revise the information in this presentation.
Greenhill and its affiliates do not provide legal, accounting or tax advice. Each person should seek legal, accounting and tax advice based on his, her or its particular circumstances from independent advisors regarding the impact of the transactions or matters described herein.
Greenhill
2
PRELIMINARY ANALYSIS
PRIVILEGED AND CONFIDENTIAL – FOR DISCUSSION PURPOSES ONLY
Table of Contents
1. Situation Overview
2. BOX Overview
3. Preliminary Valuation Analysis
Appendix
Greenhil
3
PRELIMINARY ANALYSIS
PRIVILEGED AND CONFIDENTIAL – FOR DISCUSSION PURPOSES ONLY
Situation Overview
Situation Overview and Transaction Background
Brookfield Property Partners (“BPY”) currently owns approximately 83.1% of Brookfield Canada Office Properties (“BOX”)
BPY’s majority ownership position in BOX (and its predecessor companies) can be traced back to the early 2000s On January 23, 2017, BPY proposed a $30.10 per unit, all-cash acquisition of the publicly traded units of BOX it does not already own (represents a ~16.9% interest) Greenhill has been engaged as financial advisor to the Special Committee of the Board of Trustees of BOX and has been asked to provide a preliminary valuation analysis of the Company
Brookfield Canada Office Properties (“BOX” or the “Company”) is a public real estate investment trust that owns commercial office properties in Canada
Portfolio is comprised of 27 premier office properties totaling 21.7 million square feet in Toronto, Calgary and Ottawa
– Includes Brookfield Place Calgary East, a 1.4 million square foot development project in Calgary, expected to be completed in late 2017
On January 23, 2017, BPY announced a proposal to acquire the 15.8 million units, or 16.9%, of BOX it does not already own for $30.10 per unit, in cash
Represents a 14.0% premium to BOX’s pre-announcement 30 day VWAP and a 14.8% premium to the unit price on
January 20, 2017, 1-day pre-announcement (the “Unaffected Price”)
Institutional unitholders representing 23% of the unaffiliated minority unitholders have agreed to support the proposal
BPY asked the Board of Trustees of BOX to begin a process to review the proposal and appoint a special independent committee to commission an independent valuation of BOX’s units
As of February 17, 2017, Greenhill & Co. (“Greenhill”) was engaged as financial advisor to the Special Committee of BOX
Greenhill has been asked to provide a valuation of the units of BOX in accordance with the requirements of Multilateral Instrument 61-101 Protection of Minority Security Holders in Special Transactions (“MI 61-101”) of the Ontario Securities Commission and the Autorité des marchés financiers
The following pages contain our preliminary valuation analysis based on the information provided to us by BOX management and our review of publicly available information
We have prepared this report solely for informational purposes for the Special Committee and it is preliminary in nature
Greenhill
Note: All financial figures are displayed in Canadian dollars (C$), unless indicated
| 4 |
PRELIMINARY ANALYSIS
PRIVILEGED AND CONFIDENTIAL – FOR DISCUSSION PURPOSES ONLY
Situation Overview
Work Performed and Diligence to Date
Summary
Greenhill has conducted a preliminary valuation analysis of BOX based on available public market data as well as information provided by BOX
Management in response to
Greenhill’s due diligence requests
Review of BOX’s performance and positioning in the public markets
Unit price performance, liquidity and current and historical trading valuation Key portfolio and trading statistics versus comparable companies Equity research analyst perspectives, target prices, ratings and estimates
Top unitholders of BOX, including a review of voting lock-up agreements for RBC Global Asset Management and Morgan Stanley Investment Management
Assessment of BOX’s business and financial plan and high-level discussions with management regarding the industry and the Company’s strategy, outlook, growth initiatives, potential opportunities and challenges
Greenhill has reviewed BOX’s public filings, investor presentations, earnings call transcripts and confidential information made available by BOX Management covering topics such as the business plan, rent and occupancy forecasts, fair value calculations, lease abstracts and expiration profiles, ground lease documents, external appraisals, retail summaries, material agreements, among other topics Greenhill has reviewed financial projections and operational summaries for each asset Greenhill held an in-person meeting with BOX management on March 6, 2017 to discuss its assets, business plan, financial projections and corporate strategy, among other topics Greenhill has also participated in property tours of key assets in Toronto and Calgary
Preliminary valuation analysis of BOX
Standalone analysis based on historical trading ranges, equity research price targets and NAV estimates, and comparable trading multiples Cash flow based methodologies including a discounted cash flow analysis, distribution discount model and a net asset value analysis based on the Company’s financial plan
Greenhill has also reviewed precedent transaction multiples, premiums paid in comparable transactions, and premiums paid in precedent minority squeeze-out transactions
Greenhill
5
PRELIMINARY ANALYSIS
PRIVILEGED AND CONFIDENTIAL – FOR DISCUSSION PURPOSES ONLY
Situation Overview
Overview of BPY Proposal
Announced on January 23, 2017
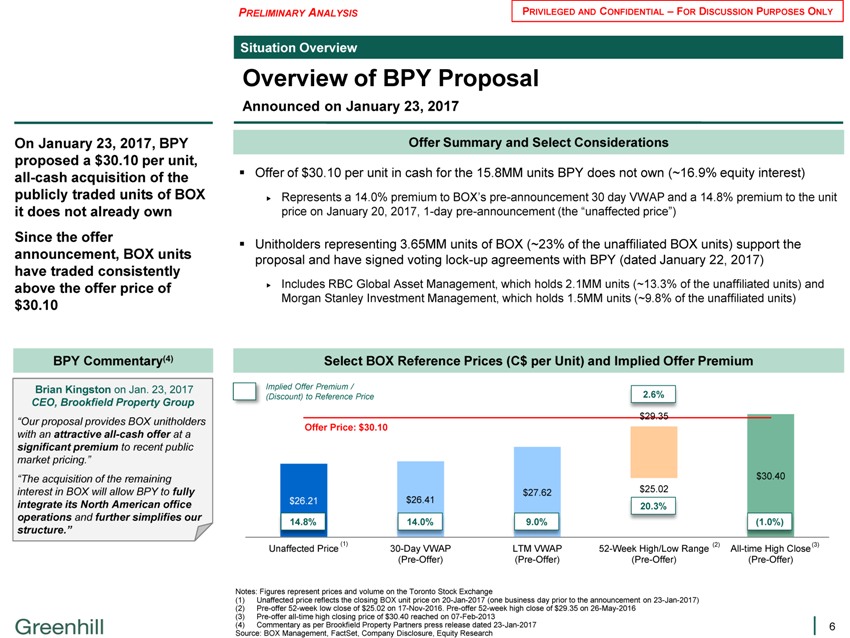
On January 23, 2017, BPY proposed a $30.10 per unit, all-cash acquisition of the publicly traded units of BOX it does not already own Since the offer announcement, BOX units have traded consistently above the offer price of $30.10
Offer Summary and Select Considerations
Offer of $30.10 per unit in cash for the 15.8MM units BPY does not own (~16.9% equity interest)
Represents a 14.0% premium to BOX’s pre-announcement 30 day VWAP and a 14.8% premium to the unit price on January 20, 2017, 1-day pre-announcement (the “unaffected price”)
Unitholders representing 3.65MM units of BOX (~23% of the unaffiliated BOX units) support the proposal and have signed voting lock-up agreements with BPY (dated January 22, 2017)
Includes RBC Global Asset Management, which holds 2.1MM units (~13.3% of the unaffiliated units) and Morgan Stanley Investment Management, which holds 1.5MM units (~9.8% of the unaffiliated units)
BPY Commentary(4)
Brian Kingston on Jan. 23, 2017
CEO, Brookfield Property Group
“Our proposal provides BOX unitholders with an attractive all-cash offer at a significant premium to recent public market pricing.” “The acquisition of the remaining interest in BOX will allow BPY to fully integrate its North American office operations and further simplifies our structure.”
Select BOX Reference Prices (C$ per Unit) and Implied Offer Premium
Implied Offer Premium / 2.6% (Discount) to Reference Price
$29.35
Offer Price: $30.10
$30.40 $27.62 $25.02 $26.21 $26.41
20.3%
14.8% 14.0% 9.0% (1.0%)
(1) (2) (3)
Unaffected Price 30-Day VWAP LTM VWAP 52-Week High/Low Range All-time High Close (Pre-Offer) (Pre-Offer) (Pre-Offer) (Pre-Offer)
Notes: Figures represent prices and volume on the Toronto Stock Exchange
(1) Unaffected price reflects the closing BOX unit price on 20-Jan-2017 (one business day prior to the announcement on 23-Jan-2017) (2) Pre-offer 52-week low close of $25.02 on 17-Nov-2016. Pre-offer 52-week high close of $29.35 on 26-May-2016 (3) Pre-offer all-time high closing price of $30.40 reached on 07-Feb-2013 (4) Commentary as per Brookfield Property Partners press release dated 23-Jan-2017 Source: BOX Management, FactSet, Company Disclosure, Equity Research
Greenhill
6
PRELIMINARY ANALYSIS
PRIVILEGED AND CONFIDENTIAL – FOR DISCUSSION PURPOSES ONLY
Situation Overview
BOX Unit Price Perspectives
Analysis at Various Prices | Based on Publicly Disclosed Information
BOX Unit Price (TSX)
30 Days Prior to Offer
Unit Price (C$) Volume (‘000s)
29.00 80
28.00 60 27.00 40 26.00
25.00 20
24.00 0 12-Dec 24-Dec 5-Jan 17-Jan
BOXC Price (NYSE)
30 Days Prior to Offer
Unit Price (Converted C$)(6) Volume (‘000s)
29.00 80
28.00 60 27.00 40 26.00
25.00 20
24.00 0 12-Dec 24-Dec 5-Jan 17-Jan
Unaffected Pre-offer Pre-offer
BPY Offer Current Price Price(1) 52-week High All-time High(1)
C$MM, unless indicated
Reference Point Date 20-Jan-2017 26-May-2016 23-Jan-2017 07-Feb-2013 23-Mar-2017
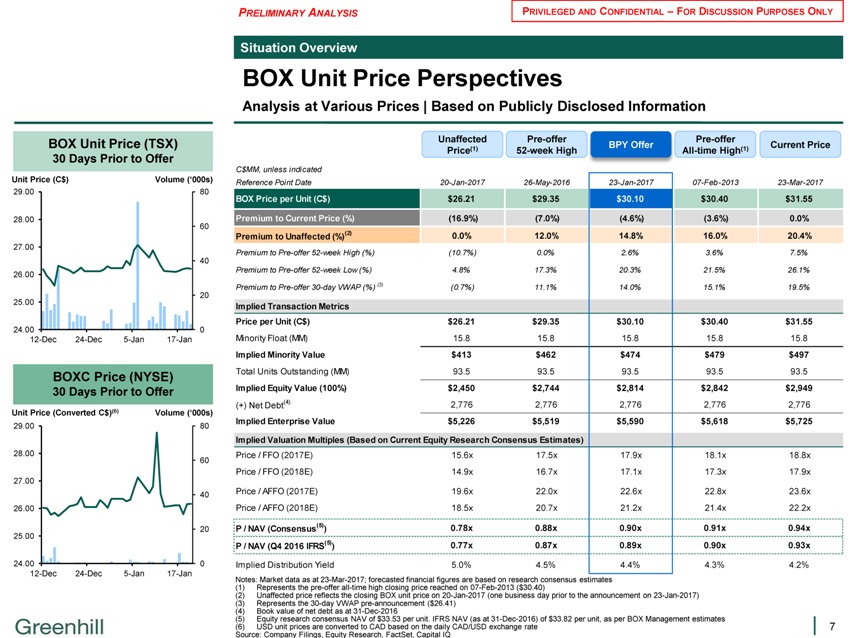
BOX Price per Unit (C$) $26.21 $29.35 $30.10 $30.40 $31.55
Premium to Current Price (%) (16.9%) (7.0%) (4.6%) (3.6%) 0.0% Premium to Unaffected (%)(2) 0.0% 12.0% 14.8% 16.0% 20.4%
Premium to Pre-offer 52-week High (%) (10.7%) 0.0% 2.6% 3.6% 7.5% Premium to Pre-offer 52-week Low (%) 4.8% 17.3% 20.3% 21.5% 26.1% Premium to Pre-offer 30-day VWAP (%) (3) (0.7%) 11.1% 14.0% 15.1% 19.5%
Implied Transaction Metrics
Price per Unit (C$) $26.21 $29.35 $30.10 $30.40 $31.55
Minority Float (MM) 15.8 15.8 15.8 15.8 15.8
Implied Minority Value $413 $462 $474 $479 $497
Total Units Outstanding (MM) 93.5 93.5 93.5 93.5 93.5
Implied Equity Value (100%) $2,450 $2,744 $2,814 $2,842 $2,949
(+) Net Debt(4) 2,776 2,776 2,776 2,776 2,776
Implied Enterprise Value $5,226 $5,519 $5,590 $5,618 $5,725
Implied Valuation Multiples (Based on Current Equity Research Consensus Estimates)
Price / FFO (2017E) 15.6x 17.5x 17.9x 18.1x 18.8x Price / FFO (2018E) 14.9x 16.7x 17.1x 17.3x 17.9x
Price / AFFO (2017E) 19.6x 22.0x 22.6x 22.8x 23.6x Price / AFFO (2018E) 18.5x 20.7x 21.2x 21.4x 22.2x
P / NAV (Consensus(5)) 0.78x 0.88x 0.90x 0.91x 0.94x P / NAV (Q4 2016 IFRS(5)) 0.77x 0.87x 0.89x 0.90x 0.93x
Implied Distribution Yield 5.0% 4.5% 4.4% 4.3% 4.2%
Notes: Market data as at 23-Mar-2017; forecasted financial figures are based on research consensus estimates (1) Represents the pre-offer all-time high closing price reached on 07-Feb-2013 ($30.40)
(2) Unaffected price reflects the closing BOX unit price on 20-Jan-2017 (one business day prior to the announcement on 23-Jan-2017) (3) Represents the 30-day VWAP pre-announcement ($26.41) (4) Book value of net debt as at 31-Dec-2016
(5) Equity research consensus NAV of $33.53 per unit. IFRS NAV (as at 31-Dec-2016) of $33.82 per unit, as per BOX Management estimates (6) USD unit prices are converted to CAD based on the daily CAD/USD exchange rate Source: Company Filings, Equity Research, FactSet, Capital IQ
Greenhill
7
PRELIMINARY ANALYSIS
PRIVILEGED AND CONFIDENTIAL – FOR DISCUSSION PURPOSES ONLY
Situation Overview
BOX Trading Activity Since the Offer
Price Performance and Volume
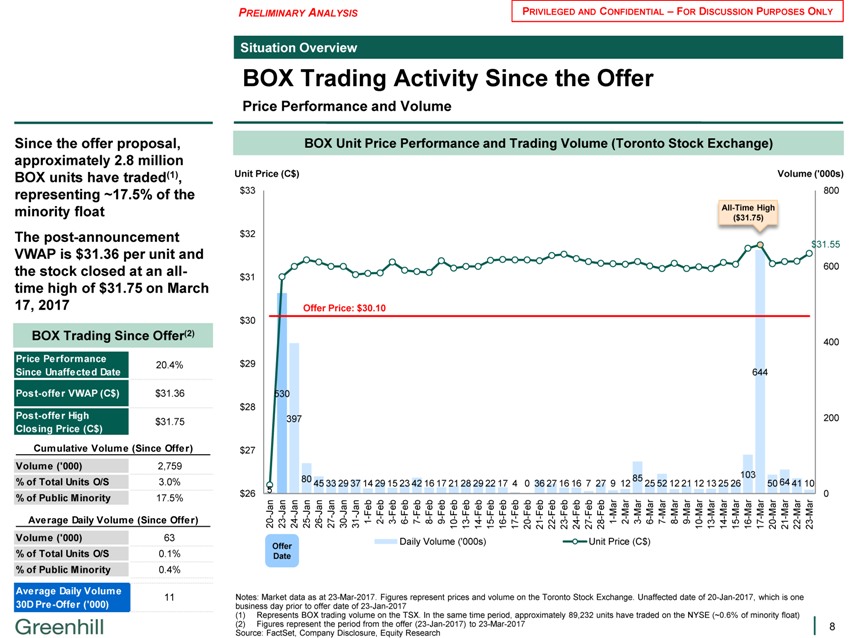
Since the offer proposal, approximately 2.8 million BOX units have traded(1), representing ~17.5% of the minority float The post-announcement VWAP is $31.36 per unit and the stock closed at an all-time high of $31.75 on March 17, 2017
BOX Trading Since Offer(2)
Price Performance
20.4%
Since Unaffected Date
Post-offer VWAP (C$) $31.36
Post-offer High
$31.75
Closing Price (C$)
Cumulative Volume (Since Offer) Volume (‘000) 2,759 % of Total Units O/S 3.0% % of Public Minority 17.5%
Average Daily Volume (Since Offer) Volume (‘000) 63 % of Total Units O/S 0.1% % of Public Minority 0.4%
Average Daily Volume
11
30D Pre-Offer (‘000)
BOX Unit Price Performance and Trading Volume (Toronto Stock Exchange)
Unit Price (C$) Volume (‘000s)
$33 800
All-Time High
($31.75) $32
$31.55
600 $31
Offer Price: $30.10 $30
400
$29 644 530 $28
397 200
$27
85 103
80 64
45 33 29 37 14 29 15 23 42 16 17 21 28 29 22 17 4 0 36 27 16 16 7 27 9 12 25 52 12 21 12 13 25 26 50 41 10
$26 5 0 an an an an an an an an b—J J—J — J—J—J—J—J Feb Feb Feb Feb Feb Feb Feb Feb Feb Feb Feb Feb Feb Feb Feb Feb Feb Feb Feb Fe Mar Mar Mar Mar Mar Mar Mar Mar Mar Mar Mar Mar Mar Mar Mar Mar Mar—1 2 — 3 6—7 — 8 9 — — — — — — — 8 1—2 — 3—6 7—8—9 — — — — — -
20 23 24 25 26 27 30 31 10 13 14 15 16 17 20 21 22 23 24 27 2 10 13 14 15 16 17 20 21 22 23 Daily Volume (‘000s) Unit Price (C$)
Offer Date
Notes: Market data as at 23-Mar-2017. Figures represent prices and volume on the Toronto Stock Exchange. Unaffected date of 20-Jan-2017, which is one business day prior to offer date of 23-Jan-2017 (1) Represents BOX trading volume on the TSX. In the same time period, approximately 89,232 units have traded on the NYSE (~0.6% of minority float) (2) Figures represent the period from the offer (23-Jan-2017) to 23-Mar-2017 Source: FactSet, Company Disclosure, Equity Research
Greenhill
8
PRELIMINARY ANALYSIS
PRIVILEGED AND CONFIDENTIAL – FOR DISCUSSION PURPOSES ONLY
Situation Overview
BOX Equity Research Commentary on the Offer
Select Commentary on the Offer
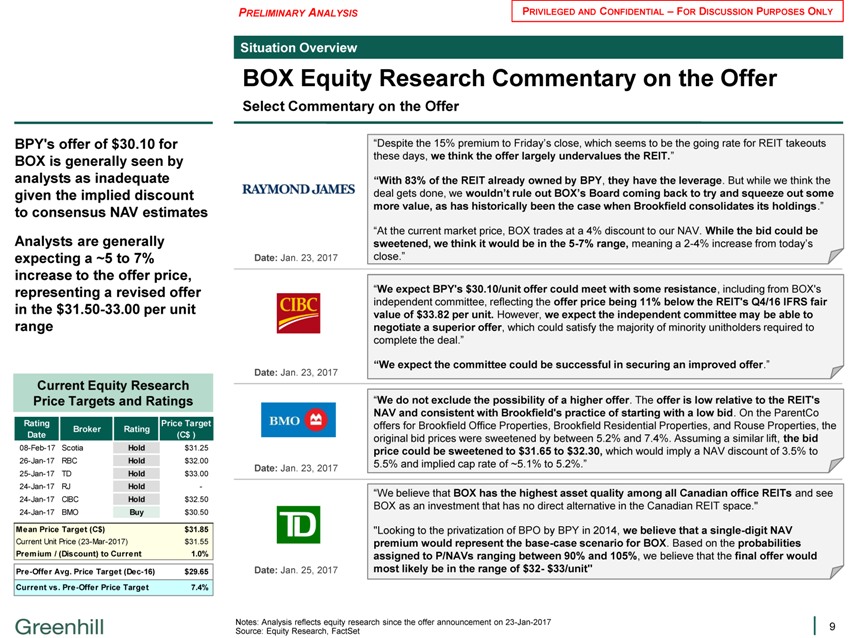
BPY’s offer of $30.10 for BOX is generally seen by analysts as inadequate given the implied discount to consensus NAV estimates
Analysts are generally expecting a ~5 to 7% increase to the offer price, representing a revised offer in the $31.50-33.00 per unit range
Current Equity Research Price Targets and Ratings
Rating Price Target Broker Rating Date (C$ )
08-Feb-17 Scotia Hold $31.25
26-Jan-17 RBC Hold $32.00
25-Jan-17 TD Hold $33.00
24-Jan-17 RJ Hold -
24-Jan-17 CIBC Hold $32.50
24-Jan-17 BMO Buy $30.50
Mean Price Target (C$) $31.85
Current Unit Price (23-Mar-2017) $31.55
Premium / (Discount) to Current 1.0% Pre-Offer Avg. Price Target (Dec-16) $29.65 Current vs. Pre-Offer Price Target 7.4%
RAYMOND JAMES
“Despite the 15% premium to Friday’s close, which seems to be the going rate for REIT takeouts these days, we think the offer largely undervalues the REIT.”
“With 83% of the REIT already owned by BPY, they have the leverage. But while we think the deal gets done, we wouldn’t rule out BOX’s Board coming back to try and squeeze out some more value, as has historically been the case when Brookfield consolidates its holdings.”
“At the current market price, BOX trades at a 4% discount to our NAV. While the bid could be sweetened, we think it would be in the 5-7% range, meaning a 2-4% increase from today’s
Date: Jan. 23, 2017 close.”
CIBC
“We expect BPY’s $30.10/unit offer could meet with some resistance, including from BOX’s independent committee, reflecting the offer price being 11% below the REIT’s Q4/16 IFRS fair value of $33.82 per unit. However, we expect the independent committee may be able to negotiate a superior offer, which could satisfy the majority of minority unitholders required to complete the deal.”
“We expect the committee could be successful in securing an improved offer.”
Date: Jan. 23, 2017
BMO
“We do not exclude the possibility of a higher offer. The offer is low relative to the REIT’s NAV and consistent with Brookfield’s practice of starting with a low bid. On the ParentCo offers for Brookfield Office Properties, Brookfield Residential Properties, and Rouse Properties, the original bid prices were sweetened by between 5.2% and 7.4%. Assuming a similar lift, the bid price could be sweetened to $31.65 to $32.30, which would imply a NAV discount of 3.5% to
Date: Jan. 23, 2017 5.5% and implied cap rate of ~5.1% to 5.2%.”
“We believe that BOX has the highest asset quality among all Canadian office REITs and see
BOX as an investment that has no direct alternative in the Canadian REIT space.”
“Looking to the privatization of BPO by BPY in 2014, we believe that a single-digit NAV premium would represent the base-case scenario for BOX. Based on the probabilities assigned to P/NAVs ranging between 90% and 105%, we believe that the final offer would Date: Jan. 25, 2017 most likely be in the range of $32- $33/unit”
Notes: Analysis reflects equity research since the offer announcement on 23-Jan-2017 Source: Equity Research, FactSet
Greenhill
9
PRELIMINARY ANALYSIS
PRIVILEGED AND CONFIDENTIAL – FOR DISCUSSION PURPOSES ONLY
Situation Overview
Precedent Brookfield Squeeze Out Transactions
Review of Previous Selected Real Estate Acquisitions by Brookfield
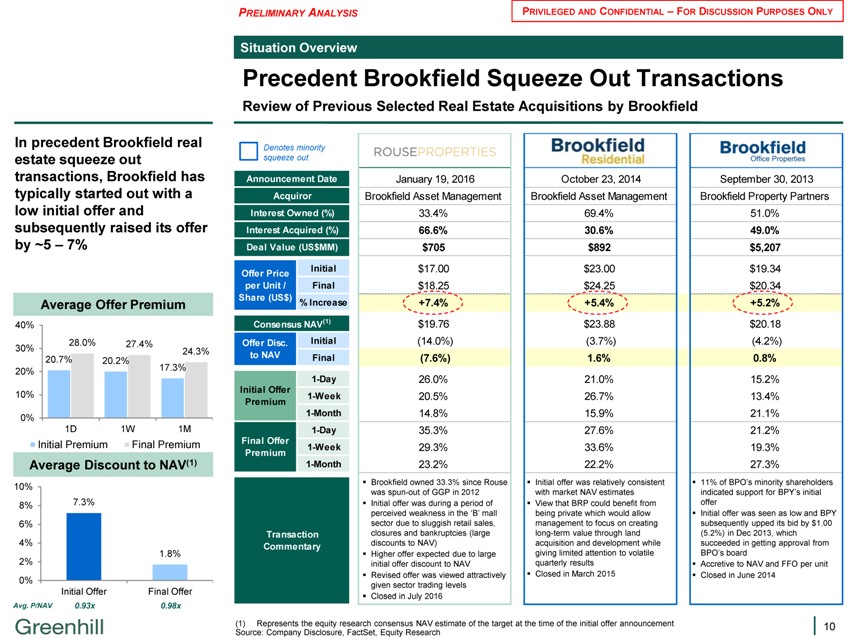
In precedent Brookfield real estate squeeze out transactions, Brookfield has typically started out with a low initial offer and subsequently raised its offer by ~5 – 7%
Average Offer Premium
40%
28.0% 27.4%
30% 24.3%
20.7% 20.2% 17.3% 20%
10%
0%
1D 1W 1M
Initial Premium Final Premium
Average Discount to NAV(1)
10%
8% 7.3% 6%
4%
2% 1.8% 0% Initial Offer Final Offer
Avg. P/NAV 0.93x 0.98x
Denotes minority squeeze out
Announcement Date January 19, 2016 October 23, 2014 September 30, 2013 Acquiror Brookfield Asset Management Brookfield Asset Management Brookfield Property Partners
Interest Owned (%) 33.4% 69.4% 51.0% Interest Acquired (%) 66.6% 30.6% 49.0% Deal Value (US$MM) $705 $892 $5,207
Initial $17.00 $23.00 $19.34
Offer Price per Unit / Final $18.25 $24.25 $20.34
Share (US$)
% Increase +7.4% +5.4% +5.2%
Consensus NAV(1) $19.76 $23.88 $20.18 Offer Disc. Initial (14.0%) (3.7%) (4.2%) to NAV Final (7.6%) 1.6% 0.8%
1-Day 26.0% 21.0% 15.2%
Initial Offer
1-Week 20.5% 26.7% 13.4%
Premium
1-Month 14.8% 15.9% 21.1%
1-Day 35.3% 27.6% 21.2%
Final Offer
1-Week 29.3% 33.6% 19.3%
Premium
1-Month 23.2% 22.2% 27.3%
? Brookfield owned 33.3% since Rouse ? Initial offer was relatively consistent ? 11% of BPO’s minority shareholders was spun-out of GGP in 2012 with market NAV estimates indicated support for BPY’s initial? Initial offer was during a period of ? View that BRP could benefit from offer perceived weakness in the ‘B’ mall being private which would allow ? Initial offer was seen as low and BPY sector due to sluggish retail sales, management to focus on creating subsequently upped its bid by $1.00 Transaction closures and bankruptcies (large long-term value through land (5.2%) in Dec 2013, which Commentary discounts to NAV) acquisition and development while succeeded in getting approval from ? Higher offer expected due to large giving limited attention to volatile BPO’s board initial offer discount to NAV quarterly results ? Accretive to NAV and FFO per unit ? Revised offer was viewed attractively ? Closed in March 2015 ? Closed in June 2014 given sector trading levels ? Closed in July 2016
(1) Represents the equity research consensus NAV estimate of the target at the time of the initial offer announcement Source: Company Disclosure, FactSet, Equity Research
Greenhill
10
PRELIMINARY ANALYSIS
PRIVILEGED AND CONFIDENTIAL – FOR DISCUSSION PURPOSES ONLY
Situation Overview
Other Factors to Consider
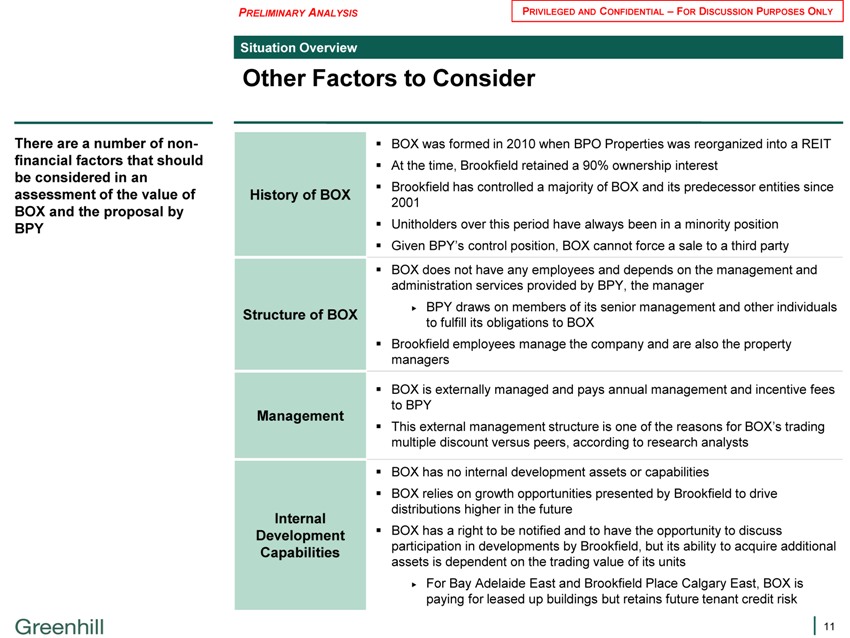
There are a number of non-financial factors that should be considered in an assessment of the value of BOX and the proposal by BPY
BOX was formed in 2010 when BPO Properties was reorganized into a REIT ? At the time, Brookfield retained a 90% ownership interest ? Brookfield has controlled a majority of BOX and its predecessor entities since
History of BOX
2001
Unitholders over this period have always been in a minority position
Given BPY’s control position, BOX cannot force a sale to a third party
BOX does not have any employees and depends on the management and administration services provided by BPY, the manager ? BPY draws on members of its senior management and other individuals
Structure of BOX to fulfill its obligations to BOX
Brookfield employees manage the company and are also the property managers
BOX is externally managed and pays annual management and incentive fees to BPY
Management
This external management structure is one of the reasons for BOX’s trading multiple discount versus peers, according to research analysts
BOX has no internal development assets or capabilities
BOX relies on growth opportunities presented by Brookfield to drive distributions higher in the future Internal BOX has a right to be notified and to have the opportunity to discuss
Development participation in developments by Brookfield, but its ability to acquire additional
Capabilities assets is dependent on the trading value of its units
For Bay Adelaide East and Brookfield Place Calgary East, BOX is paying for leased up buildings but retains future tenant credit risk
Greenhill
11
PRELIMINARY ANALYSIS PRIVILEGED AND CONFIDENTIAL – FOR DISCUSSION PURPOSES ONLY
Table of Contents
1. Situation Overview
2. BOX Overview
3. Preliminary Valuation Analysis
Appendix
Greenhill
12
PRELIMINARY DRAFT PRIVILEGED AND CONFIDENTIAL – FOR DISCUSSION PURPOSES ONLY
BOX Overview
Brookfield Canada Office Properties
Company and Portfolio Overview
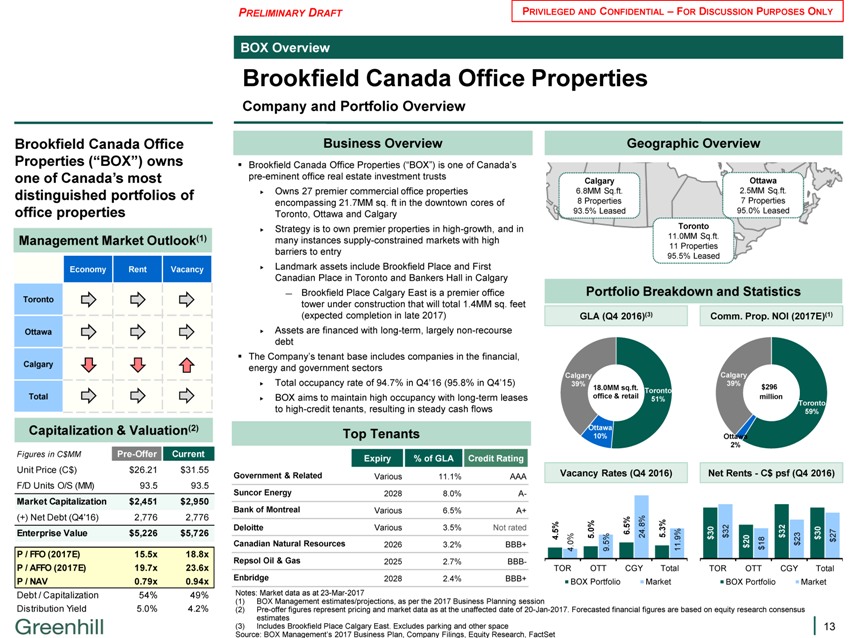
Brookfield Canada Office
Properties (“BOX”) owns one of Canada’s most distinguished portfolios of office properties
Management Market Outlook(1)
Economy Rent Vacancy
Toronto
Ottawa
Calgary
Total
Capitalization & Valuation(2)
Figures in C$MM Pre-Offer Current
Unit Price (C$) $26.21 $31.55 F/D Units O/S (MM) 93.5 93.5
Market Capitalization $2,451 $2,950
(+) Net Debt (Q4’16) 2,776 2,776
Enterprise Value $5,226 $5,726
P / FFO (2017E) 15.5x 18.8x P / AFFO (2017E) 19.7x 23.6x P / NAV 0.79x 0.94x
Debt / Capitalization 54% 49% Distribution Yield 5.0% 4.2%
Business Overview
? Brookfield Canada Office Properties (“BOX”) is one of Canada’s pre-eminent office real estate investment trusts ? Owns 27 premier commercial office properties encompassing 21.7MM sq. ft in the downtown cores of Toronto, Ottawa and Calgary ? Strategy is to own premier properties in high-growth, and in many instances supply-constrained markets with high barriers to entry ? Landmark assets include Brookfield Place and First Canadian Place in Toronto and Bankers Hall in Calgary
— Brookfield Place Calgary East is a premier office tower under construction that will total 1.4MM sq. feet (expected completion in late 2017) ? Assets are financed with long-term, largely non-recourse debt
? The Company’s tenant base includes companies in the financial, energy and government sectors
? Total occupancy rate of 94.7% in Q4’16 (95.8% in Q4’15)
? BOX aims to maintain high occupancy with long-term leases to high-credit tenants, resulting in steady cash flows
Top Tenants
Expiry % of GLA Credit Rating
Government & Related Various 11.1% AAA Suncor Energy 2028 8.0% A- Bank of Montreal Various 6.5% A+
Deloitte Various 3.5% Not rated
Canadian Natural Resources 2026 3.2% BBB+ Repsol Oil & Gas 2025 2.7% BBB-
Enbridge 2028 2.4% BBB+
Geographic Overview
Calgary Ottawa
6.8MM Sq.ft. 2.5MM Sq.ft.
| 8 | Properties 7 Properties 93.5% Leased 95.0% Leased |
Toronto
11.0MM Sq.ft.
11 Properties 95.5% Leased
Portfolio Breakdown and Statistics
GLA (Q4 2016)(3) Comm. Prop. NOI (2017E)(1)
Calgary Calgary 39% 39%
18.0MM sq.ft. $296 Toronto office & retail 51% million
Toronto 59%
Ottawa
10% Ottawa 2%
Vacancy Rates (Q4 2016) Net Rents—C$ psf (Q4 2016)
% 5% . 8%
5% 0 . 3%
. . 6 24 5 . 30 $ 32 $ 32 30 27
| 4 | 5 9% $ 23 $ |
0% 5% . 20 18 $ $ 4 . 9 . 11 $ $
TOR OTT CGY Total TOR OTT CGY Total BOX Portfolio Market BOX Portfolio Market
Notes: Market data as at 23-Mar-2017
| (1) | BOX Management estimates/projections, as per the 2017 Business Planning session |
(2) Pre-offer figures represent pricing and market data as at the unaffected date of 20-Jan-2017. Forecasted financial figures are based on equity research consensus estimates (3) Includes Brookfield Place Calgary East. Excludes parking and other space
Source: BOX Management’s 2017 Business Plan, Company Filings, Equity Research, FactSet
Greenhill
13
PRELIMINARY ANALYSIS PRIVILEGED AND CONFIDENTIAL – FOR DISCUSSION PURPOSES ONLY
BOX Overview
Asset Overview
Income Producing and Development Properties | Figures as at December 31, 2016
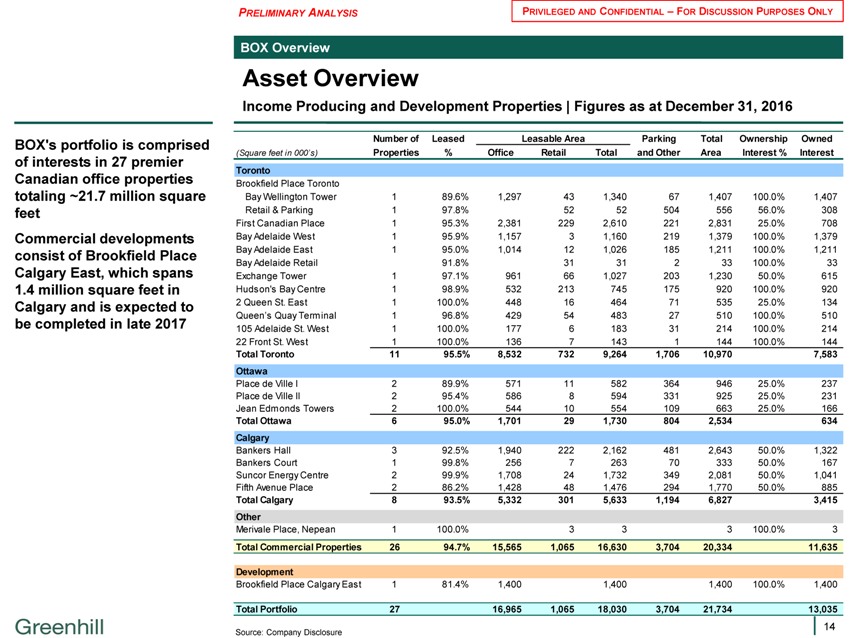
BOX’s portfolio is comprised of interests in 27 premier Canadian office properties totaling ~21.7 million square feet Commercial developments consist of Brookfield Place Calgary East, which spans 1.4 million square feet in Calgary and is expected to be completed in late 2017
Number of Leased Leasable Area Parking Total Ownership Owned (Square feet in 000’s) Properties % Office Retail Total and Other Area Interest % Interest Toronto
Brookfield Place Toronto
Bay Wellington Tower 1 89.6% 1,297 43 1,340 67 1,407 100.0% 1,407 Retail & Parking 1 97.8% 52 52 504 556 56.0% 308 First Canadian Place 1 95.3% 2,381 229 2,610 221 2,831 25.0% 708 Bay Adelaide West 1 95.9% 1,157 3 1,160 219 1,379 100.0% 1,379 Bay Adelaide East 1 95.0% 1,014 12 1,026 185 1,211 100.0% 1,211 Bay Adelaide Retail 91.8% 31 31 2 33 100.0% 33 Exchange Tower 1 97.1% 961 66 1,027 203 1,230 50.0% 615 Hudson’s Bay Centre 1 98.9% 532 213 745 175 920 100.0% 920
2 Queen St. East 1 100.0% 448 16 464 71 535 25.0% 134 Queen’s Quay Terminal 1 96.8% 429 54 483 27 510 100.0% 510 105 Adelaide St. West 1 100.0% 177 6 183 31 214 100.0% 214
22 Front St. West 1 100.0% 136 7 143 1 144 100.0% 144
Total Toronto 11 95.5% 8,532 732 9,264 1,706 10,970 7,583 Ottawa
Place de Ville I 2 89.9% 571 11 582 364 946 25.0% 237 Place de Ville II 2 95.4% 586 8 594 331 925 25.0% 231 Jean Edmonds Towers 2 100.0% 544 10 554 109 663 25.0% 166
Total Ottawa 6 95.0% 1,701 29 1,730 804 2,534 634 Calgary
Bankers Hall 3 92.5% 1,940 222 2,162 481 2,643 50.0% 1,322 Bankers Court 1 99.8% 256 7 263 70 333 50.0% 167 Suncor Energy Centre 2 99.9% 1,708 24 1,732 349 2,081 50.0% 1,041 Fifth Avenue Place 2 86.2% 1,428 48 1,476 294 1,770 50.0% 885
Total Calgary 8 93.5% 5,332 301 5,633 1,194 6,827 3,415 Other
Merivale Place, Nepean 1 100.0% 3 3 3 100.0% 3
Total Commercial Properties 26 94.7% 15,565 1,065 16,630 3,704 20,334 11,635
Development
Brookfield Place Calgary East 1 81.4% 1,400 1,400 1,400 100.0% 1,400
Total Portfolio 27 16,965 1,065 18,030 3,704 21,734 13,035
Source: Company Disclosure
Greenhill
14
PRELIMINARY ANALYSIS PRIVILEGED AND CONFIDENTIAL – FOR DISCUSSION PURPOSES ONLY
BOX Overview
IFRS Net Asset Value Summary (Q4 2016)
Figures as Reported in Q4 2016 | Per BOX Management’s 2017 Business Plan
Figures as reported by BOX Management in Q4 2016
BOX’s reported Q4 2016
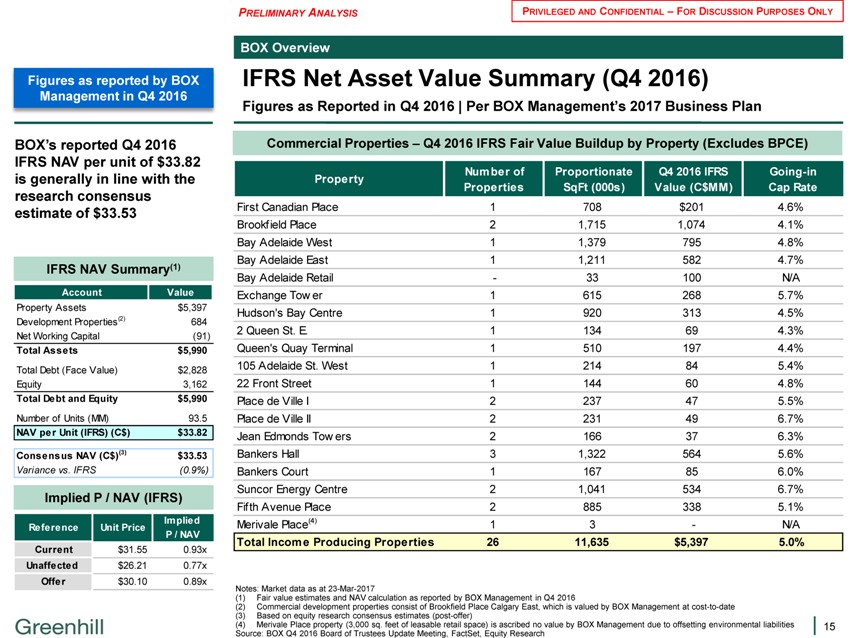
IFRS NAV per unit of $33.82 is generally in line with the research consensus estimate of $33.53
IFRS NAV Summary(1)
Account Value
Property Assets $5,397 Development Properties(2) 684 Net Working Capital (91)
Total Assets $5,990
Total Debt (Face Value) $2,828 Equity 3,162
Total Debt and Equity $5,990
Number of Units (MM) 93.5
NAV per Unit (IFRS) (C$) $33.82
Consensus NAV (C$)(3) $33.53
Variance vs. IFRS (0.9%)
Implied P / NAV (IFRS)
Implied Reference Unit Price P / NAV
Current $31.55 0.93x Unaffected $26.21 0.77x Offer $30.10 0.89x
Commercial Properties – Q4 2016 IFRS Fair Value Buildup by Property (Excludes BPCE)
Number of Proportionate Q4 2016 IFRS Going-in Property Properties SqFt (000s) Value (C$MM) Cap Rate
First Canadian Place 1 708 $201 4.6% Brookfield Place 2 1,715 1,074 4.1% Bay Adelaide West 1 1,379 795 4.8% Bay Adelaide East 1 1,211 582 4.7% Bay Adelaide Retail—33 100 N/A Exchange Tow er 1 615 268 5.7% Hudson’s Bay Centre 1 920 313 4.5%
2 Queen St. E. 1 134 69 4.3% Queen’s Quay Terminal 1 510 197 4.4% 105 Adelaide St. West 1 214 84 5.4%
22 Front Street 1 144 60 4.8% Place de Ville I 2 237 47 5.5% Place de Ville II 2 231 49 6.7% Jean Edmonds Tow ers 2 166 37 6.3% Bankers Hall 3 1,322 564 5.6% Bankers Court 1 167 85 6.0% Suncor Energy Centre 2 1,041 534 6.7% Fifth Avenue Place 2 885 338 5.1% Merivale Place(4) 1 3—N/A
Total Income Producing Properties 26 11,635 $5,397 5.0%
Notes: Market data as at 23-Mar-2017
(1) Fair value estimates and NAV calculation as reported by BOX Management in Q4 2016
(2) Commercial development properties consist of Brookfield Place Calgary East, which is valued by BOX Management at cost-to-date (3) Based on equity research consensus estimates (post-offer)
(4) Merivale Place property (3,000 sq. feet of leasable retail space) is ascribed no value by BOX Management due to offsetting environmental liabilities Source: BOX Q4 2016 Board of Trustees Update Meeting, FactSet, Equity Research
Greenhill
15
PRELIMINARY ANALYSIS PRIVILEGED AND CONFIDENTIAL – FOR DISCUSSION PURPOSES ONLY
Q4 2016 Estimates by BOX Management as of Q3 2016(1)
According to BOX
Management projections,
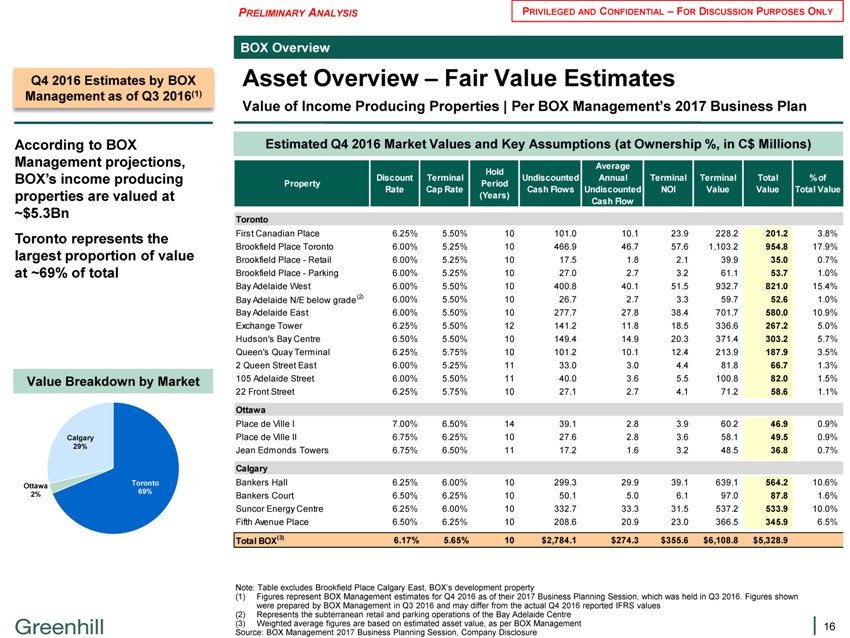
BOX’s income producing properties are valued at
~$5.3Bn
Toronto represents the largest proportion of value at ~69% of total
Value Breakdown by Market
Calgary 29%
Ottawa Toronto
2% 69%
Estimated Q4 2016 Market Values and Key Assumptions (at Ownership %, in C$ Millions)
Average Hold
Discount Terminal Undiscounted Annual Terminal Terminal Total % of Property Period Rate Cap Rate Cash Flows Undiscounted NOI Value Value Total Value (Years) Cash Flow
Toronto
First Canadian Place 6.25% 5.50% 10 101.0 10.1 23.9 228.2 201.2 3.8% Brookfield Place Toronto 6.00% 5.25% 10 466.9 46.7 57.6 1,103.2 954.8 17.9% Brookfield Place—Retail 6.00% 5.25% 10 17.5 1.8 2.1 39.9 35.0 0.7% Brookfield Place—Parking 6.00% 5.25% 10 27.0 2.7 3.2 61.1 53.7 1.0% Bay Adelaide West 6.00% 5.50% 10 400.8 40.1 51.5 932.7 821.0 15.4% Bay Adelaide N/E below grade(2) 6.00% 5.50% 10 26.7 2.7 3.3 59.7 52.6 1.0% Bay Adelaide East 6.00% 5.50% 10 277.7 27.8 38.4 701.7 580.0 10.9% Exchange Tower 6.25% 5.50% 12 141.2 11.8 18.5 336.6 267.2 5.0% Hudson’s Bay Centre 6.50% 5.50% 10 149.4 14.9 20.3 371.4 303.2 5.7% Queen’s Quay Terminal 6.25% 5.75% 10 101.2 10.1 12.4 213.9 187.9 3.5%
2 Queen Street East 6.00% 5.25% 11 33.0 3.0 4.4 81.8 66.7 1.3% 105 Adelaide Street 6.00% 5.50% 11 40.0 3.6 5.5 100.8 82.0 1.5%
22 Front Street 6.25% 5.75% 10 27.1 2.7 4.1 71.2 58.6 1.1%
Ottawa
Place de Ville I 7.00% 6.50% 14 39.1 2.8 3.9 60.2 46.9 0.9% Place de Ville II 6.75% 6.25% 10 27.6 2.8 3.6 58.1 49.5 0.9% Jean Edmonds Towers 6.75% 6.50% 11 17.2 1.6 3.2 48.5 36.8 0.7%
Calgary
Bankers Hall 6.25% 6.00% 10 299.3 29.9 39.1 639.1 564.2 10.6% Bankers Court 6.50% 6.25% 10 50.1 5.0 6.1 97.0 87.8 1.6% Suncor Energy Centre 6.25% 6.00% 10 332.7 33.3 31.5 537.2 533.9 10.0% Fifth Avenue Place 6.50% 6.25% 10 208.6 20.9 23.0 366.5 345.9 6.5%
Total BOX(3) 6.17% 5.65% 10 $2,784.1 $274.3 $355.6 $6,108.8 $5,328.9
Note: Table excludes Brookfield Place Calgary East, BOX’s development property
(1) Figures represent BOX Management estimates for Q4 2016 as of their 2017 Business Planning Session, which was held in Q3 2016. Figures shown were prepared by BOX Management in Q3 2016 and may differ from the actual Q4 2016 reported IFRS values (2) Represents the subterranean retail and parking operations of the Bay Adelaide Centre (3) Weighted average figures are based on estimated asset value, as per BOX Management Source: BOX Management 2017 Business Planning Session, Company Disclosure
Greenhill
16
PRELIMINARY ANALYSIS PRIVILEGED AND CONFIDENTIAL – FOR DISCUSSION PURPOSES ONLY
BOX Overview
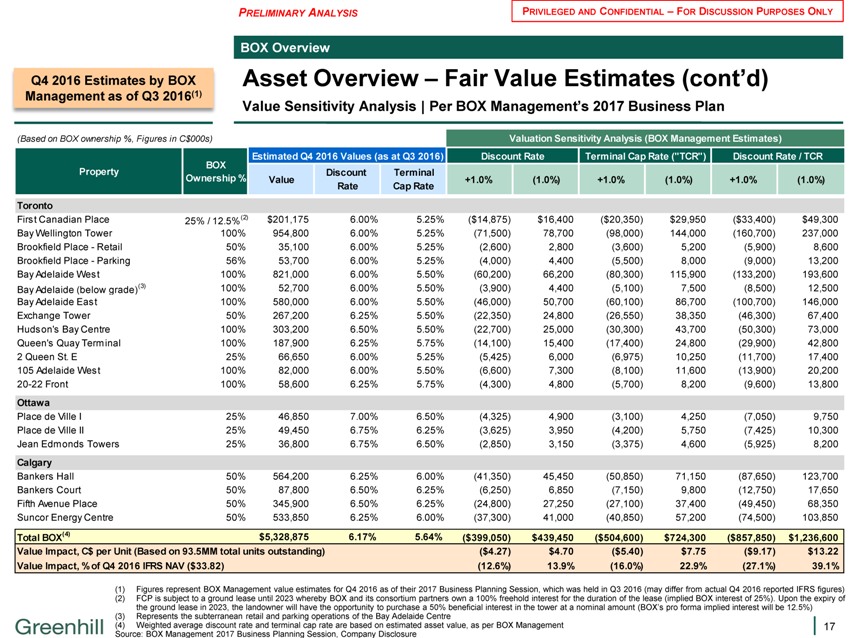
Asset Overview – Fair Value Estimates (cont’d)
Value Sensitivity Analysis | Per BOX Management’s 2017 Business Plan
Q4 2016 Estimates by BOX Management as of Q3 2016(1)
(Based on BOX ownership %, Figures in C$000s) Valuation Sensitivity Analysis (BOX Management Estimates)
BOX Estimated Q4 2016 Values (as at Q3 2016) Discount Rate Terminal Cap Rate (“TCR”) Discount Rate / TCR Property Discount Terminal Ownership % Value Rate Cap Rate +1.0% (1.0%) +1.0% (1.0%) +1.0% (1.0%) Toronto
First Canadian Place 25% / 12.5%(2) $201,175 6.00% 5.25% ($14,875) $16,400 ($20,350) $29,950 ($33,400) $49,300 Bay Wellington Tower 100% 954,800 6.00% 5.25% (71,500) 78,700 (98,000) 144,000 (160,700) 237,000 Brookfield Place—Retail 50% 35,100 6.00% 5.25% (2,600) 2,800 (3,600) 5,200 (5,900) 8,600 Brookfield Place—Parking 56% 53,700 6.00% 5.25% (4,000) 4,400 (5,500) 8,000 (9,000) 13,200 Bay Adelaide West 100% 821,000 6.00% 5.50% (60,200) 66,200 (80,300) 115,900 (133,200) 193,600 Bay Adelaide (below grade)(3) 100% 52,700 6.00% 5.50% (3,900) 4,400 (5,100) 7,500 (8,500) 12,500 Bay Adelaide East 100% 580,000 6.00% 5.50% (46,000) 50,700 (60,100) 86,700 (100,700) 146,000 Exchange Tower 50% 267,200 6.25% 5.50% (22,350) 24,800 (26,550) 38,350 (46,300) 67,400 Hudson’s Bay Centre 100% 303,200 6.50% 5.50% (22,700) 25,000 (30,300) 43,700 (50,300) 73,000 Queen’s Quay Terminal 100% 187,900 6.25% 5.75% (14,100) 15,400 (17,400) 24,800 (29,900) 42,800
2 Queen St. E 25% 66,650 6.00% 5.25% (5,425) 6,000 (6,975) 10,250 (11,700) 17,400 105 Adelaide West 100% 82,000 6.00% 5.50% (6,600) 7,300 (8,100) 11,600 (13,900) 20,200
20-22 Front 100% 58,600 6.25% 5.75% (4,300) 4,800 (5,700) 8,200 (9,600) 13,800
Ottawa
Place de Ville I 25% 46,850 7.00% 6.50% (4,325) 4,900 (3,100) 4,250 (7,050) 9,750 Place de Ville II 25% 49,450 6.75% 6.25% (3,625) 3,950 (4,200) 5,750 (7,425) 10,300 Jean Edmonds Towers 25% 36,800 6.75% 6.50% (2,850) 3,150 (3,375) 4,600 (5,925) 8,200
Calgary
Bankers Hall 50% 564,200 6.25% 6.00% (41,350) 45,450 (50,850) 71,150 (87,650) 123,700 Bankers Court 50% 87,800 6.50% 6.25% (6,250) 6,850 (7,150) 9,800 (12,750) 17,650 Fifth Avenue Place 50% 345,900 6.50% 6.25% (24,800) 27,250 (27,100) 37,400 (49,450) 68,350 Suncor Energy Centre 50% 533,850 6.25% 6.00% (37,300) 41,000 (40,850) 57,200 (74,500) 103,850
Total BOX(4) $5,328,875 6.17% 5.64% ($399,050) $439,450 ($504,600) $724,300 ($857,850) $1,236,600 Value Impact, C$ per Unit (Based on 93.5MM total units outstanding) ($4.27) $4.70 ($5.40) $7.75 ($9.17) $13.22 Value Impact, % of Q4 2016 IFRS NAV ($33.82) (12.6%) 13.9% (16.0%) 22.9% (27.1%) 39.1%
(1) Figures represent BOX Management value estimates for Q4 2016 as of their 2017 Business Planning Session, which was held in Q3 2016 (may differ from actual Q4 2016 reported IFRS figures) (2) FCP is subject to a ground lease until 2023 whereby BOX and its consortium partners own a 100% freehold interest for the duration of the lease (implied BOX interest of 25%). Upon the expiry of the ground lease in 2023, the landowner will have the opportunity to purchase a 50% beneficial interest in the tower at a nominal amount (BOX’s pro forma implied interest will be 12.5%) (3) Represents the subterranean retail and parking operations of the Bay Adelaide Centre (4) Weighted average discount rate and terminal cap rate are based on estimated asset value, as per BOX Management Source: BOX Management 2017 Business Planning Session, Company Disclosure
Greenhill
17
PRELIMINARY ANALYSIS PRIVILEGED AND CONFIDENTIAL – FOR DISCUSSION PURPOSES ONLY
BOX Overview
Ground Lease Summary
Overview of BOX Properties Subject to a Ground Lease
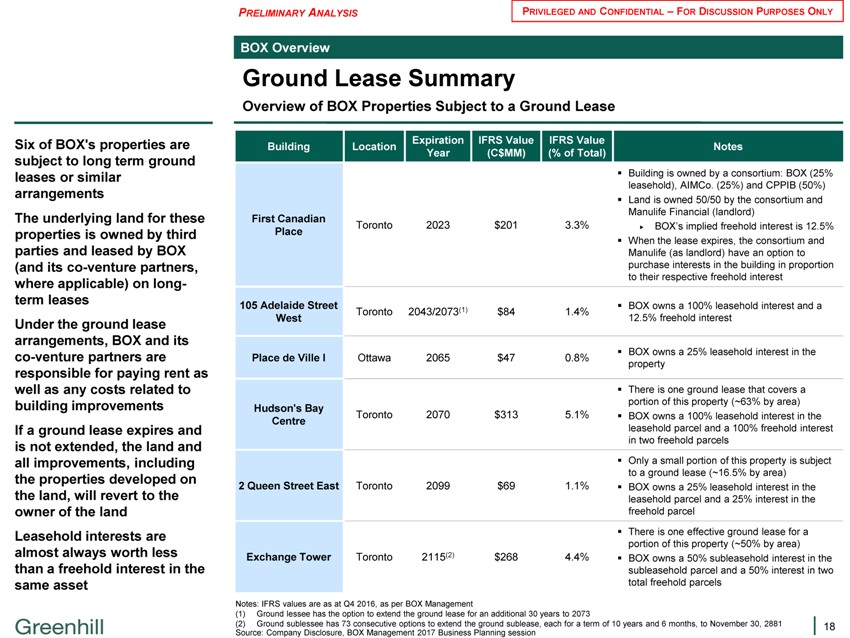
Six of BOX’s properties are subject to long term ground leases or similar arrangements The underlying land for these properties is owned by third parties and leased by BOX (and its co-venture partners, where applicable) on long-term leases Under the ground lease arrangements, BOX and its co-venture partners are responsible for paying rent as well as any costs related to building improvements If a ground lease expires and is not extended, the land and all improvements, including the properties developed on the land, will revert to the owner of the land Leasehold interests are almost always worth less than a freehold interest in the same asset
Expiration IFRS Value IFRS Value
Building Location Notes Year (C$MM) (% of Total)
? Building is owned by a consortium: BOX (25% leasehold), AIMCo. (25%) and CPPIB (50%) ? Land is owned 50/50 by the consortium and Manulife Financial (landlord)
First Canadian
Toronto 2023 $201 3.3% ? BOX’s implied freehold interest is 12.5%
Place ? When the lease expires, the consortium and Manulife (as landlord) have an option to purchase interests in the building in proportion to their respective freehold interest
105 Adelaide Street ? BOX owns a 100% leasehold interest and a
West Toronto 2043/2073(1) $84 1.4% 12.5% freehold interest
? BOX owns a 25% leasehold interest in the
Place de Ville I Ottawa 2065 $47 0.8% property
? There is one ground lease that covers a portion of this property (~63% by area)
Hudson’s Bay
Toronto 2070 $313 5.1% ? BOX owns a 100% leasehold interest in the
Centre leasehold parcel and a 100% freehold interest in two freehold parcels
? Only a small portion of this property is subject to a ground lease (~16.5% by area)
2 Queen Street East Toronto 2099 $69 1.1% ? BOX owns a 25% leasehold interest in the leasehold parcel and a 25% interest in the freehold parcel
? There is one effective ground lease for a portion of this property (~50% by area) Exchange Tower Toronto 2115(2) $268 4.4% ? BOX owns a 50% subleasehold interest in the subleasehold parcel and a 50% interest in two total freehold parcels
Notes: IFRS values are as at Q4 2016, as per BOX Management
(1) Ground lessee has the option to extend the ground lease for an additional 30 years to 2073
(2) Ground sublessee has 73 consecutive options to extend the ground sublease, each for a term of 10 years and 6 months, to November 30, 2881 Source: Company Disclosure, BOX Management 2017 Business Planning session
Greenhill
18

PRELIMINARY ANALYSIS PRIVILEGED AND CONFIDENTIAL – FOR DISCUSSION PURPOSES ONLY BOX Overview Historical Price Performance Price Performance of BOX and Select Canadian and U.S. Office-weighted REIT Peers(2) Prices Prior to Offer Unaffected Date(1) BOX Price Statistics C$ per Unit; Based on TSX closing pricesTime Trading Range Avg. VWAP Period Price(3) Low High Last 30 $25.60 $27.07 $26.27 $26.41Days Last 90 $25.02 $28.28 $26.49 $26.39DaysLTM $25.02 $29.35 $27.58 $27.62 L3Y $23.65 $30.39 $27.19 $27.26 L5Y $23.65 $30.40 $27.22 $27.32Peer Price Performance Cdn US BOXPeers PeersLast 5 Years 5.5% (3.9%) 52.3% Last 3 Years 0.0% (4.4%) 37.1% Last 12 Months 4.8% 23.2% 26.6% Last 6 Months (9.4%) (6.0%) 1.8% Last 3 Months (3.8%) (1.4%) 4.2%BOX – Unit Price Performance (Last 5 Years Prior to Unaffected Date) $32 700 Offer: $30.10$28 $27.26 $27.62 $26.39 350 $24$20 0 Jan-2012 Jan-2013 Jan-2014 Jan-2015 Jan-2016 Jan-2017 Volume (000s) Unit Price (C$) VWAP (90D) VWAP (LTM) VWAP (L3Y)Relative Price Performance (Last 5 Years Prior to Unaffected Date) Indexed to 100180160 US Peers 52% 140120 BOX 5% 100(4%)Cdn Peers 8060Jan-2012 Jan-2013 Jan-2014 Jan-2015 Jan-2016 Jan-2017 Brookfield Canada Office Properties Canadian Office-weighted REIT Peers US Office-weighted REIT Peers(1) Unaffected date of 20-Jan-2017 (one business day prior to the offer announcement on 23-Jan-2017) (2) Based on selected peers with available 5-year historical trading data. Canadian office-weighted REIT peer group includes H&R REIT, Dream Office REIT and Allied Properties. US office-weighted REIT peer group includes Vornado Realty, Boston Properties, SL Green Realty, Douglas Emmett, Kilroy Realty, Alexandria Real Estate Equities and Piedmont Office Realty (3) Calculated as an arithmetic mean of the closing unit prices over each time period Source: FactSet, Capital IQ Greenhill19
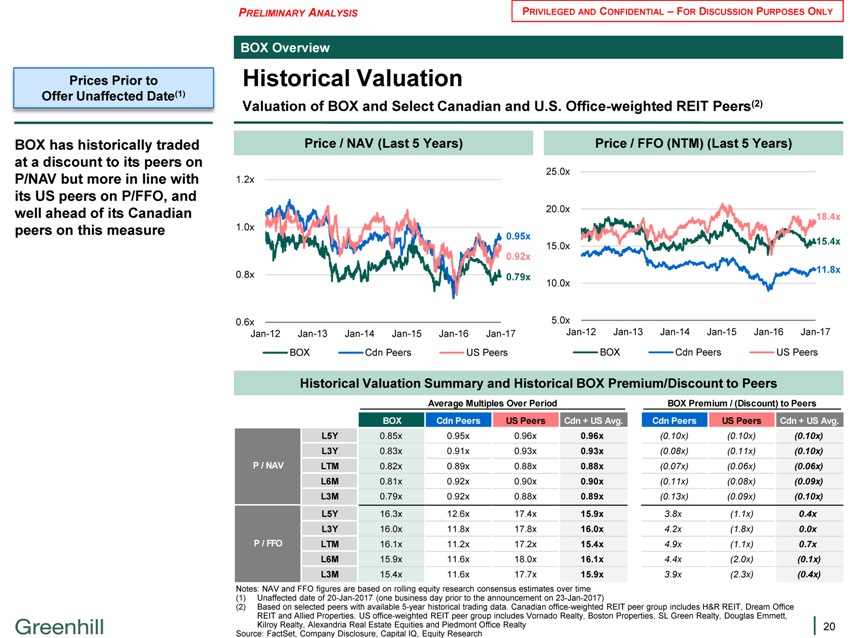
PRELIMINARY ANALYSIS PRIVILEGED AND CONFIDENTIAL – FOR DISCUSSION PURPOSES ONLY BOX Overview Historical Valuation Valuation of BOX and Select Canadian and U.S. Office-weighted REIT Peers(2) Prices Prior to Offer Unaffected Date(1) BOX has historically traded at a discount to its peers on P/NAV but more in line with its US peers on P/FFO, and well ahead of its Canadian peers on this measure Price / NAV (Last 5 Years) Price / FFO (NTM) (Last 5 Years) 25.0x1.2x20.0x18.4x 1.0x0.95x 15.4x 15.0x0.92x 11.8x 0.8x 0.79x 10.0x0.6x 5.0xJan-12 Jan-13 Jan-14 Jan-15 Jan-16 Jan-17 Jan-12 Jan-13 Jan-14 Jan-15 Jan-16 Jan-17 BOX Cdn Peers US Peers BOX Cdn Peers US PeersHistorical Valuation Summary and Historical BOX Premium/Discount to Peers Average Multiples Over Period BOX Premium / (Discount) to Peers BOX Cdn Peers US Peers Cdn + US Avg. Cdn Peers US Peers Cdn + US Avg.L5Y 0.85x 0.95x 0.96x 0.96x (0.10x) (0.10x) (0.10x) L3Y 0.83x 0.91x 0.93x 0.93x (0.08x) (0.11x) (0.10x) P / NAV LTM 0.82x 0.89x 0.88x 0.88x (0.07x) (0.06x) (0.06x) L6M 0.81x 0.92x 0.90x 0.90x (0.11x) (0.08x) (0.09x) L3M 0.79x 0.92x 0.88x 0.89x (0.13x) (0.09x) (0.10x) L5Y 16.3x 12.6x 17.4x 15.9x 3.8x (1.1x) 0.4x L3Y 16.0x 11.8x 17.8x 16.0x 4.2x (1.8x) 0.0x P / FFO LTM 16.1x 11.2x 17.2x 15.4x 4.9x (1.1x) 0.7x L6M 15.9x 11.6x 18.0x 16.1x 4.4x (2.0x) (0.1x) L3M 15.4x 11.6x 17.7x 15.9x 3.9x (2.3x) (0.4x)Notes: NAV and FFO figures are based on rolling equity research consensus estimates over time (1) Unaffected date of 20-Jan-2017 (one business day prior to the announcement on 23-Jan-2017) (2) Based on selected peers with available 5-year historical trading data. Canadian office-weighted REIT peer group includes H&R REIT, Dream Office REIT and Allied Properties. US office-weighted REIT peer group includes Vornado Realty, Boston Properties, SL Green Realty, Douglas Emmett, Kilroy Realty, Alexandria Real Estate Equities and Piedmont Office Realty Source: FactSet, Company Disclosure, Capital IQ, Equity Research Greenhill20
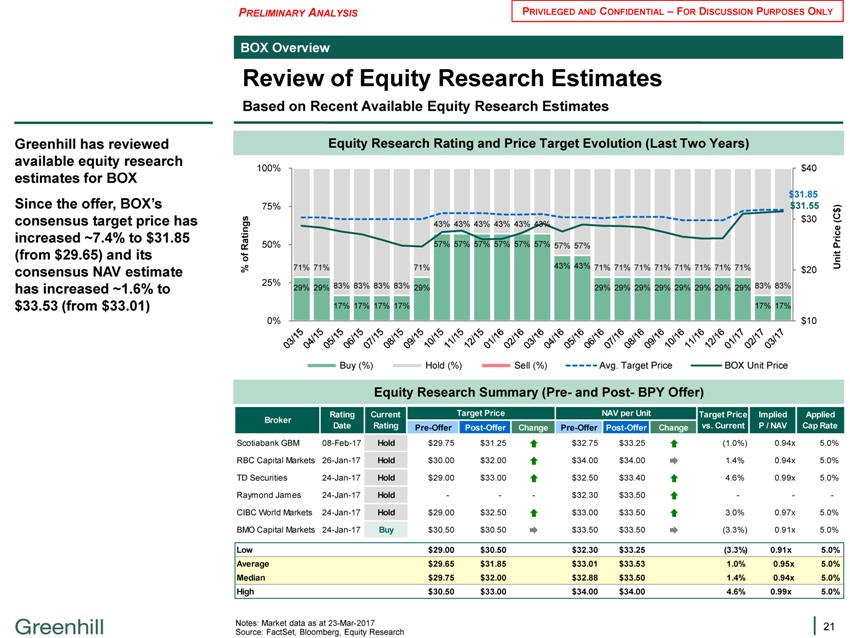
PRELIMINARY ANALYSIS PRIVILEGED AND CONFIDENTIAL – FOR DISCUSSION PURPOSES ONLY BOX Overview Review of Equity Research Estimates Based on Recent Available Equity Research Estimates Greenhill has reviewed available equity research estimates for BOX Since the offer, BOX’s consensus target price has increased ~7.4% to $31.85 (from $29.65) and its consensus NAV estimate has increased ~1.6% to $33.53 (from $33.01) Equity Research Rating and Price Target Evolution (Last Two Years) 100% $40$31.85 75% $31.55 $ )$30(C43% 43% 43% 43% 43% 43% tings c e a 50% 57% 57% 57% 57% 57% 57% Pri R 57% 57% of t ni% 71% 71% 71% 43% 43% 71% 71% 71% 71% 71% 71% 71% 71% $20 U25% 83% 83% 83% 83% 83% 83% 29% 29% 29% 29% 29% 29% 29% 29% 29% 29% 29% 17% 17% 17% 17% 17% 17% 0% $10Buy (%) Hold (%) Sell (%) Avg. Target Price BOX Unit PriceEquity Research Summary (Pre- and Post- BPY Offer) Broker Rating Current Target Price NAV per Unit Target Price Implied Applied Date Rating Pre-Offer Post-Offer Change Pre-Offer Post-Offer Change vs. Current P / NAV Cap RateScotiabank GBM 08-Feb-17 Hold $29.75 $31.25? $32.75 $33.25? (1.0%) 0.94x 5.0% RBC Capital Markets 26-Jan-17 Hold $30.00 $32.00? $34.00 $34.00? 1.4% 0.94x 5.0% TD Securities 24-Jan-17 Hold $29.00 $33.00? $32.50 $33.40? 4.6% 0.99x 5.0% Raymond James 24-Jan-17 Hold ——$32.30 $33.50? — -CIBC World Markets 24-Jan-17 Hold $29.00 $32.50? $33.00 $33.50? 3.0% 0.97x 5.0% BMO Capital Markets 24-Jan-17 Buy $30.50 $30.50? $33.50 $33.50? (3.3%) 0.91x 5.0%Low $29.00 $30.50 $32.30 $33.25 (3.3%) 0.91x 5.0% Average $29.65 $31.85 $33.01 $33.53 1.0% 0.95x 5.0% Median $29.75 $32.00 $32.88 $33.50 1.4% 0.94x 5.0% High $30.50 $33.00 $34.00 $34.00 4.6% 0.99x 5.0%Notes: Market data as at 23-Mar-2017 Source: FactSet, Bloomberg, Equity Research Greenhill21
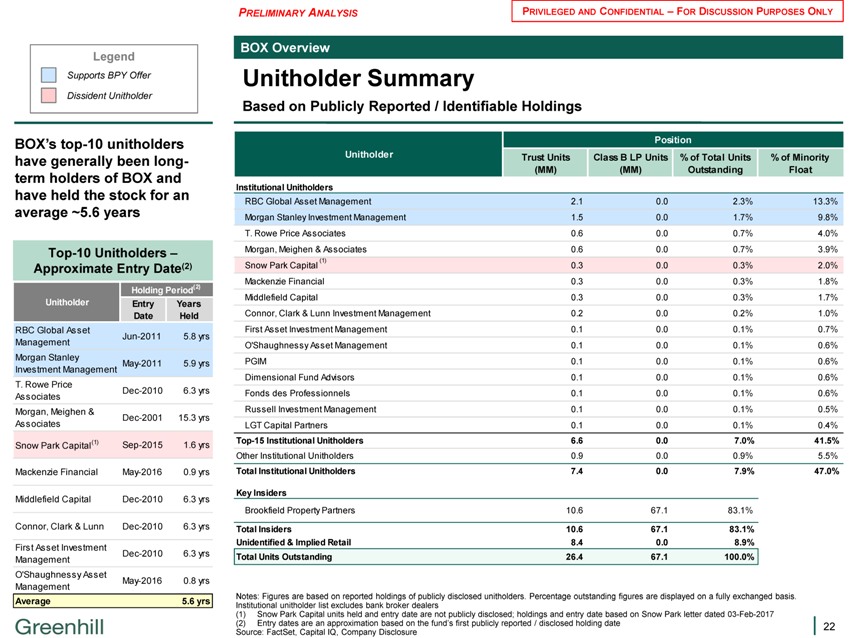
PRELIMINARY ANALYSIS PRIVILEGED AND CONFIDENTIAL – FOR DISCUSSION PURPOSES ONLY BOX Overview Unitholder Summary Based on Publicly Reported / Identifiable Holdings Legend Supports BPY Offer Dissident Unitholder BOX’s top-10 unitholders have generally been long-term holders of BOX and have held the stock for an average ~5.6 years Top-10 Unitholders – Approximate Entry Date(2) Holding Period(2) Unitholder Entry Years Date HeldRBC Global Asset Jun-2011 5.8 yrs Management Morgan Stanley May-2011 5.9 yrs Investment Management T. Rowe Price Dec-2010 6.3 yrs Associates Morgan, Meighen & Dec-2001 15.3 yrs AssociatesSnow Park Capital(1) Sep-2015 1.6 yrsMackenzie Financial May-2016 0.9 yrsMiddlefield Capital Dec-2010 6.3 yrsConnor, Clark & Lunn Dec-2010 6.3 yrsFirst Asset Investment Dec-2010 6.3 yrs Management O’Shaughnessy Asset May-2016 0.8 yrs ManagementAverage 5.6 yrsPositionUnitholder Trust Units Class B LP Units % of Total Units % of Minority (MM) (MM) Outstanding FloatInstitutional UnitholdersRBC Global Asset Management 2.1 0.0 2.3% 13.3% Morgan Stanley Investment Management 1.5 0.0 1.7% 9.8% T. Rowe Price Associates 0.6 0.0 0.7% 4.0% Morgan, Meighen & Associates 0.6 0.0 0.7% 3.9%(1)Snow Park Capital 0.3 0.0 0.3% 2.0% Mackenzie Financial 0.3 0.0 0.3% 1.8% Middlefield Capital 0.3 0.0 0.3% 1.7% Connor, Clark & Lunn Investment Management 0.2 0.0 0.2% 1.0% First Asset Investment Management 0.1 0.0 0.1% 0.7% O’Shaughnessy Asset Management 0.1 0.0 0.1% 0.6% PGIM 0.1 0.0 0.1% 0.6% Dimensional Fund Advisors 0.1 0.0 0.1% 0.6% Fonds des Professionnels 0.1 0.0 0.1% 0.6% Russell Investment Management 0.1 0.0 0.1% 0.5% LGT Capital Partners 0.1 0.0 0.1% 0.4%Top-15 Institutional Unitholders 6.6 0.0 7.0% 41.5%Other Institutional Unitholders 0.9 0.0 0.9% 5.5%Total Institutional Unitholders 7.4 0.0 7.9% 47.0%Key InsidersBrookfield Property Partners 10.6 67.1 83.1%Total Insiders 10.6 67.1 83.1% Unidentified & Implied Retail 8.4 0.0 8.9% Total Units Outstanding 26.4 67.1 100.0%Notes: Figures are based on reported holdings of publicly disclosed unitholders. Percentage outstanding figures are displayed on a fully exchanged basis. Institutional unitholder list excludes bank broker dealers (1) Snow Park Capital units held and entry date are not publicly disclosed; holdings and entry date based on Snow Park letter dated 03-Feb-2017 (2) Entry dates are an approximation based on the fund’s first publicly reported / disclosed holding date Source: FactSet, Capital IQ, Company Disclosure Greenhill22
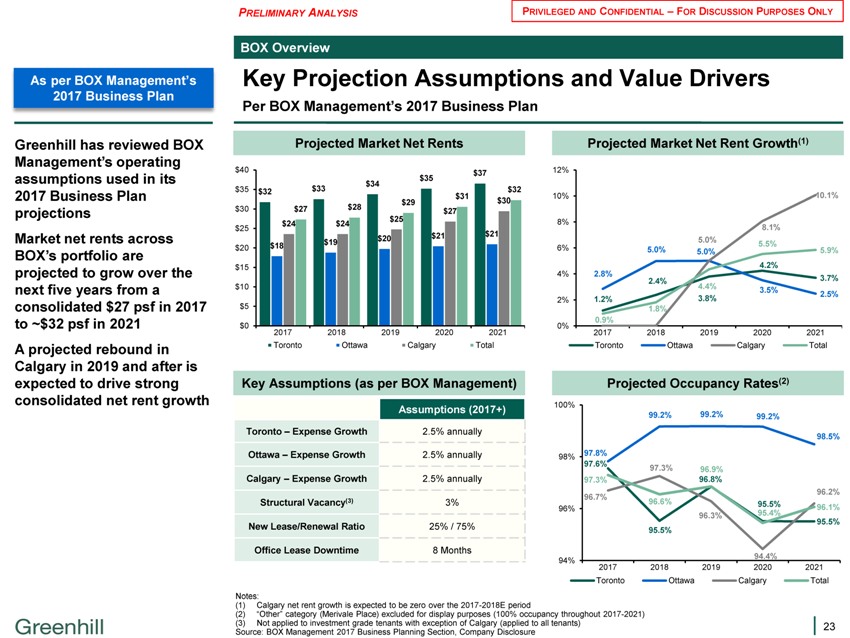
PRELIMINARY ANALYSIS PRIVILEGED AND CONFIDENTIAL – FOR DISCUSSION PURPOSES ONLY BOX Overview Key Projection Assumptions and Value Drivers Per BOX Management’s 2017 Business Plan As per BOX Management’s2017 Business Plan Greenhill has reviewed BOX Management’s operating assumptions used in its 2017 Business Plan projections Market net rents across BOX’s portfolio are projected to grow over the next five years from a consolidated $27 psf in 2017 to ~$32 psf in 2021 A projected rebound in Calgary in 2019 and after is expected to drive strong consolidated net rent growth Projected Market Net Rents $40 $37 $35 $34 $35 $32 $33 $31 $32 $29 $30 $30 $27 $28 $27 $25 $24 $24 $25$21 $21 $20 $18 $19 $20$15 $10 $5$0 2017 2018 2019 2020 2021 Toronto Ottawa Calgary TotalKey Assumptions (as per BOX Management) Assumptions (2017+) Toronto – Expense Growth 2.5% annually Ottawa – Expense Growth 2.5% annually Calgary – Expense Growth 2.5% annually Structural Vacancy(3) 3% New Lease/Renewal Ratio 25% / 75% Office Lease Downtime 8 Months Projected Market Net Rent Growth(1) 12%10% 10.1% 8%8.1% 5.0% 5.5% 6% 5.0% 5.9% 5.0% 4.2% 4% 2.8% 2.4% 3.7% 4.4% 3.5% 2.5% 2% 1.2% 3.8% 1.8% 0.9% 0% 2017 2018 2019 2020 2021 Toronto Ottawa Calgary TotalProjected Occupancy Rates(2) 100%99.2% 99.2% 99.2%98.5%97.8% 98% 97.6%97.3% 96.9% 97.3% 96.8%96.2% 96.7% 96.6% 95.5% 96% 96.1% 96.3% 95.4% 95.5% 95.5%94.4%94% 2017 2018 2019 2020 2021 Toronto Ottawa Calgary TotalNotes: (1) Calgary net rent growth is expected to be zero over the 2017-2018E period (2) “Other” category (Merivale Place) excluded for display purposes (100% occupancy throughout 2017-2021) (3) Not applied to investment grade tenants with exception of Calgary (applied to all tenants) Source: BOX Management 2017 Business Planning Section, Company Disclosure Greenhill23
As per BOX Management’s
2017 Business Plan
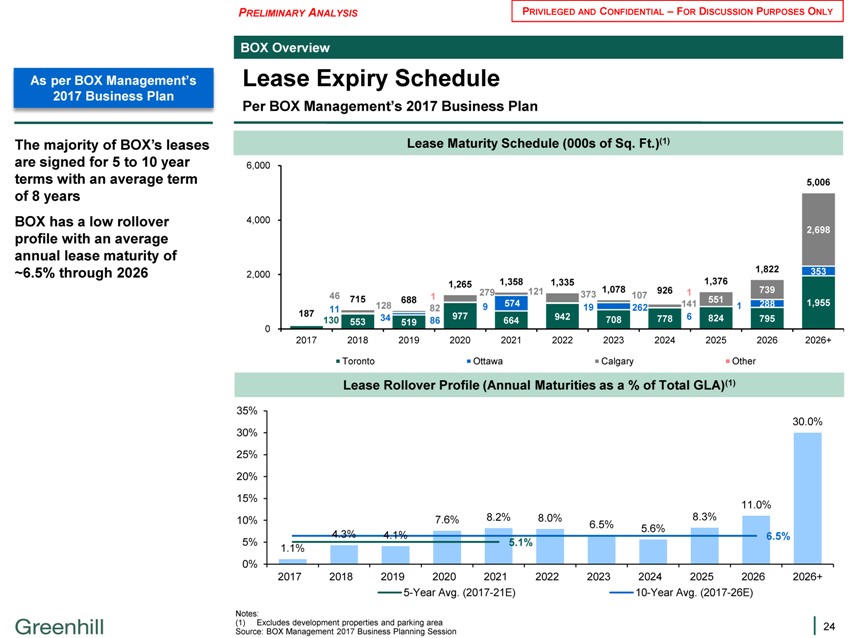
The majority of BOX’s leases are signed for 5 to 10 year terms with an average term of 8 years BOX has a low rollover profile with an average annual lease maturity of ~6.5% through 2026
PRELIMINARY ANALYSIS PRIVILEGED AND CONFIDENTIAL – FOR DISCUSSION PURPOSES ONLY
BOX Overview
Lease Expiry Schedule
Per BOX Management’s 2017 Business Plan
Lease Maturity Schedule (000s of Sq. Ft.)(1)
6,000
5,006
4,000
2,698
2,000 1,822 353
1,265 1,358 1,335 1,376
46 715 1 279 121 373 1,078 107 926 1 739
128 688 82 574 141 551 1 288 1,955
11 9 19 262
187 130 553 34 519 86 977 664 942 708 778 6 824 795
0
2017 2018 2019 2020 2021 2022 2023 2024 2025 2026 2026+
Toronto Ottawa Calgary Other
Lease Rollover Profile (Annual Maturities as a % of Total GLA)(1)
35%
30.0%
30%
25%
20%
15% 11.0%
10% 7.6% 8.2% 8.0% 6.5% 8.3%
5.6%
4.3% 4.1% 6.5%
5% 5.1%
1.1%
0%
2017 2018 2019 2020 2021 2022 2023 2024 2025 2026 2026+
5-Year Avg. (2017-21E) 10-Year Avg. (2017-26E)
Notes:
(1) Excludes development properties and parking area Source: BOX Management 2017 Business Planning Session
24
As per BOX Management’s
2017 Business Plan
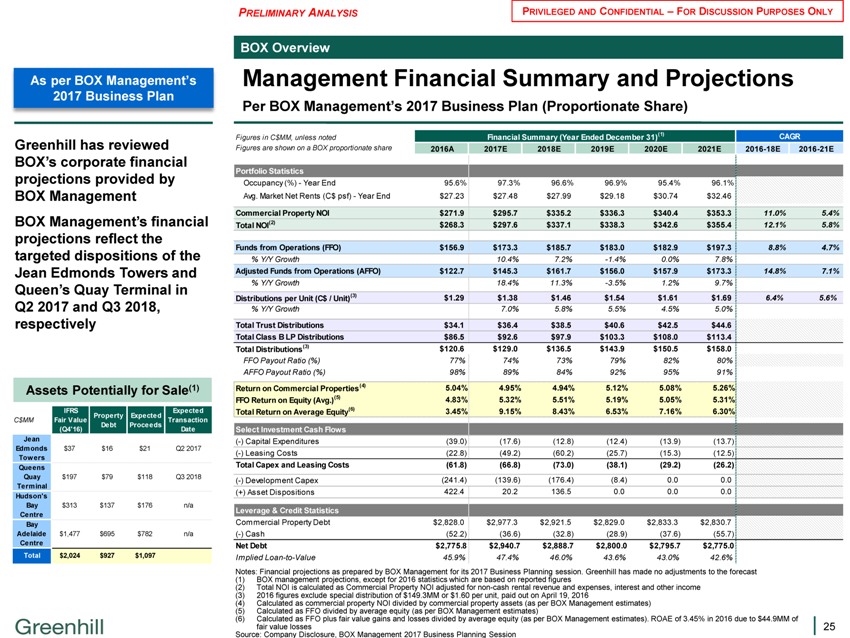
Greenhill has reviewed
BOX’s corporate financial projections provided by BOX Management
BOX Management’s financial projections reflect the targeted dispositions of the Jean Edmonds Towers and
Queen’s Quay Terminal in
Q2 2017 and Q3 2018, respectively
Assets Potentially for Sale(1)
IFRS Expected
Property Expected
C$MM Fair Value Transaction
Debt Proceeds
(Q4’16) Date
Jean
Edmonds $37 $16 $21 Q2 2017
Tow ers
Queens
Quay $197 $79 $118 Q3 2018
Terminal
Hudson’s
Bay $313 $137 $176 n/a
Centre
Bay
Adelaide $1,477 $695 $782 n/a
Centre
Total $2,024 $927 $1,097
PRELIMINARY ANALYSIS
PRIVILEGED AND CONFIDENTIAL – FOR DISCUSSION PURPOSES ONLY
BOX Overview
Management Financial Summary and Projections
Per BOX Management’s 2017 Business Plan (Proportionate Share)
Figures in C$MM, unless noted Financial Summary (Year Ended December 31)(1) CAGR
Figures are shown on a BOX proportionate share 2016A 2017E 2018E 2019E 2020E 2021E 2016-18E 2016-21E
Portfolio Statistics
Occupancy (%)—Year End 95.6% 97.3% 96.6% 96.9% 95.4% 96.1%
Avg. Market Net Rents (C$ psf)—Year End $27.23 $27.48 $27.99 $29.18 $30.74 $32.46
Commercial Property NOI $271.9 $295.7 $335.2 $336.3 $340.4 $353.3 11.0% 5.4%
Total NOI(2) $268.3 $297.6 $337.1 $338.3 $342.6 $355.4 12.1% 5.8%
Funds from Operations (FFO) $156.9 $173.3 $185.7 $183.0 $182.9 $197.3 8.8% 4.7%
% Y/Y Growth 10.4% 7.2% -1.4% 0.0% 7.8%
Adjusted Funds from Operations (AFFO) $122.7 $145.3 $161.7 $156.0 $157.9 $173.3 14.8% 7.1%
% Y/Y Growth 18.4% 11.3% -3.5% 1.2% 9.7%
Distributions per Unit (C$ / Unit)(3) $1.29 $1.38 $1.46 $1.54 $1.61 $1.69 6.4% 5.6%
% Y/Y Growth 7.0% 5.8% 5.5% 4.5% 5.0%
Total Trust Distributions $34.1 $36.4 $38.5 $40.6 $42.5 $44.6
Total Class B LP Distributions $86.5 $92.6 $97.9 $103.3 $108.0 $113.4
Total Distributions(3) $120.6 $129.0 $136.5 $143.9 $150.5 $158.0
FFO Payout Ratio (%) 77% 74% 73% 79% 82% 80%
AFFO Payout Ratio (%) 98% 89% 84% 92% 95% 91%
Return on Commercial Properties(4) 5.04% 4.95% 4.94% 5.12% 5.08% 5.26%
FFO Return on Equity (Avg.)(5) 4.83% 5.32% 5.51% 5.19% 5.05% 5.31%
Total Return on Average Equity(6) 3.45% 9.15% 8.43% 6.53% 7.16% 6.30%
Select Investment Cash Flows
(-) Capital Expenditures(39.0)(17.6)(12.8)(12.4)(13.9)(13.7)
(-) Leasing Costs(22.8)(49.2)(60.2)(25.7)(15.3)(12.5)
Total Capex and Leasing Costs(61.8)(66.8)(73.0)(38.1)(29.2)(26.2)
(-) Development Capex(241.4)(139.6)(176.4)(8.4) 0.0 0.0
(+) Asset Dispositions 422.4 20.2 136.5 0.0 0.0 0.0
Leverage & Credit Statistics
Commercial Property Debt $2,828.0 $2,977.3 $2,921.5 $2,829.0 $2,833.3 $2,830.7
(-) Cash(52.2)(36.6)(32.8)(28.9)(37.6)(55.7)
Net Debt $2,775.8 $2,940.7 $2,888.7 $2,800.0 $2,795.7 $2,775.0
Implied Loan-to-Value 45.9% 47.4% 46.0% 43.6% 43.0% 42.6%
Notes: Financial projections as prepared by BOX Management for its 2017 Business Planning session. Greenhill has made no adjustments to the forecast (1) BOX management projections, except for 2016 statistics which are based on reported figures (2) Total NOI is calculated as Commercial Property NOI adjusted for non-cash rental revenue and expenses, interest and other income (3) 2016 figures exclude special distribution of $149.3MM or $1.60 per unit, paid out on April 19, 2016 (4) Calculated as commercial property NOI divided by commercial property assets (as per BOX Management estimates) (5) Calculated as FFO divided by average equity (as per BOX Management estimates)
(6) Calculated as FFO plus fair value gains and losses divided by average equity (as per BOX Management estimates). ROAE of 3.45% in 2016 due to $44.9MM of fair value losses Source: Company Disclosure, BOX Management 2017 Business Planning Session
25
PRELIMINARY ANALYSIS
PRIVILEGED AND CONFIDENTIAL – FOR DISCUSSION PURPOSES ONLY
Table of Contents
1. Situation Overview
2. BOX Overview
3. Preliminary Valuation Analysis
Appendix
26
PRELIMINARY ANALYSIS PRIVILEGED AND CONFIDENTIAL – FOR DISCUSSION PURPOSES ONLY
Preliminary Valuation Analysis
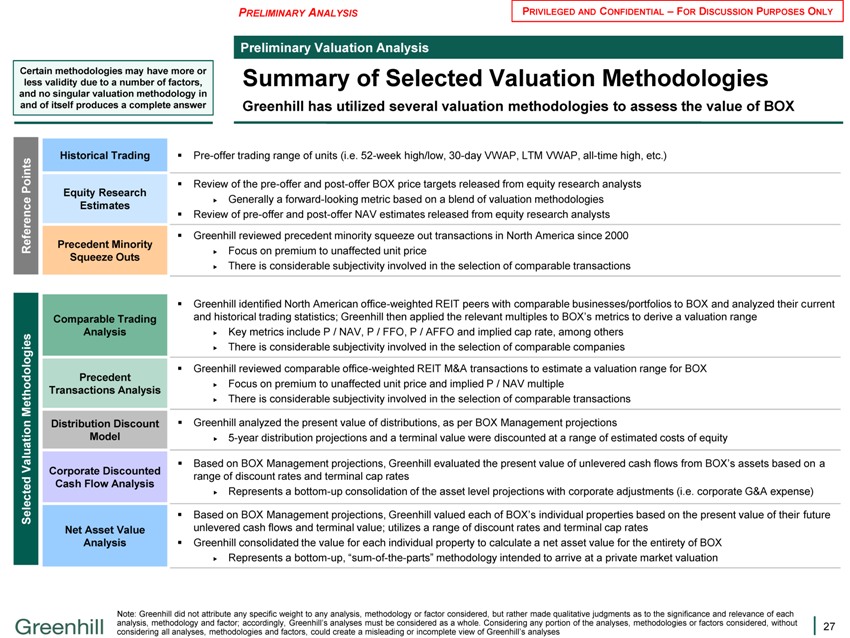
Summary of Selected Valuation Methodologies
Greenhill has utilized several valuation methodologies to assess the value of BOX
Certain methodologies may have more or less validity due to a number of factors, and no singular valuation methodology in and of itself produces a complete answer
Historical Trading Pre-offer trading range of units (i.e. 52-week high/low, 30-day VWAP, LTM VWAP, all-time high, etc.)
Points Review of the pre-offer and post-offer BOX price targets released from equity research analysts
Equity Research
Estimates Generally a forward-looking metric based on a blend of valuation methodologies
Review of pre-offer and post-offer NAV estimates released from equity research analysts
Greenhill reviewed precedent minority squeeze out transactions in North America since 2000
Reference Precedent Minority
Squeeze Outs Focus on premium to unaffected unit price
There is considerable subjectivity involved in the selection of comparable transactions
Greenhill identified North American office-weighted REIT peers with comparable businesses/portfolios to BOX and analyzed their current
Comparable Trading and historical trading statistics; Greenhill then applied the relevant multiples to BOX’s metrics to derive a valuation range
Analysis Key metrics include P / NAV, P / FFO, P / AFFO and implied cap rate, among others
There is considerable subjectivity involved in the selection of comparable companies
Greenhill reviewed comparable office-weighted REIT M&A transactions to estimate a valuation range for BOX
Precedent
Transactions Analysis Focus on premium to unaffected unit price and implied P / NAV multiple
Methodologies There is considerable subjectivity involved in the selection of comparable transactions
Distribution Discount Greenhill analyzed the present value of distributions, as per BOX Management projections
Model 5-year distribution projections and a terminal value were discounted at a range of estimated costs of equity
Valuation Based on BOX Management projections, Greenhill evaluated the present value of unlevered cash flows from BOX’s assets based on a
Corporate Discounted range of discount rates and terminal cap rates
Cash Flow Analysis
Represents a bottom-up consolidation of the asset level projections with corporate adjustments (i.e. corporate G&A expense)
Selected Based on BOX Management projections, Greenhill valued each of BOX’s individual properties based on the present value of their future
Net Asset Value unlevered cash flows and terminal value; utilizes a range of discount rates and terminal cap rates
Analysis Greenhill consolidated the value for each individual property to calculate a net asset value for the entirety of BOX
Represents a bottom-up, “sum-of-the-parts” methodology intended to arrive at a private market valuation
Note: Greenhill did not attribute any specific weight to any analysis, methodology or factor considered, but rather made qualitative judgments as to the significance and relevance of each analysis, methodology and factor; accordingly, Greenhill’s analyses must be considered as a whole. Considering any portion of the analyses, methodologies or factors considered, without considering all analyses, methodologies and factors, could create a misleading or incomplete view of Greenhill’s analyses
27
PRELIMINARY ANALYSIS PRIVILEGED AND CONFIDENTIAL – FOR DISCUSSION PURPOSES ONLY
Preliminary Valuation Analysis
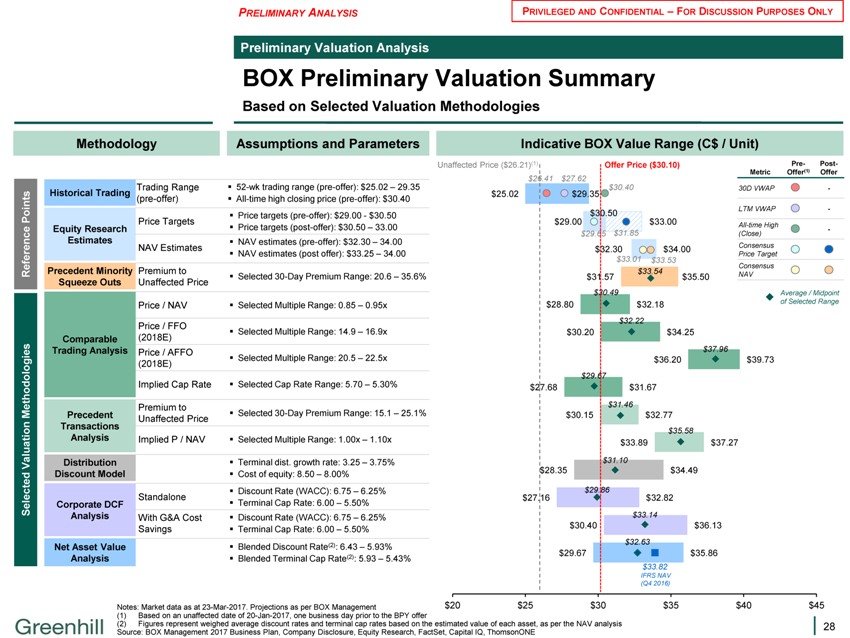
BOX Preliminary Valuation Summary
Based on Selected Valuation Methodologies
Methodology Assumptions and Parameters
Historical Trading Trading Range 52-wk trading range (pre-offer): $25.02 – 29.35
(pre-offer) All-time high closing price (pre-offer): $30.40
Points Price targets (pre-offer): $29.00—$30.50
Price Targets
Equity Research Price targets (post-offer): $30.50 – 33.00
Estimates NAV estimates (pre-offer): $32.30 – 34.00
NAV Estimates NAV estimates (post offer): $33.25 – 34.00
Reference Precedent Minority Premium to Selected 30-Day Premium Range: 20.6 – 35.6%
Squeeze Outs Unaffected Price
Price / NAV Selected Multiple Range: 0.85 – 0.95x
Price / FFO Selected Multiple Range: 14.9 – 16.9x
Comparable(2018E)
Trading Analysis Price / AFFO Selected Multiple Range: 20.5 – 22.5x
(2018E)
Implied Cap Rate Selected Cap Rate Range: 5.70 – 5.30%
Premium to
Methodologies Precedent Unaffected Price Selected 30-Day Premium Range: 15.1 – 25.1%
Transactions
Analysis Implied P / NAV Selected Multiple Range: 1.00x – 1.10x
Valuation Distribution Terminal dist. growth rate: 3.25 – 3.75%
Discount Model Cost of equity: 8.50 – 8.00%
Standalone Discount Rate (WACC): 6.75 – 6.25%
Selected Corporate DCF Terminal Cap Rate: 6.00 – 5.50%
Analysis With G&A Cost Discount Rate (WACC): 6.75 – 6.25%
Savings Terminal Cap Rate: 6.00 – 5.50%
Net Asset Value Blended Discount Rate(2): 6.43 – 5.93%
Analysis Blended Terminal Cap Rate(2): 5.93 – 5.43%
Indicative BOX Value Range (C$ / Unit)
Unaffected Price ($26.21)(1) Offer Price ($30.10) Pre- Post-
Metric Offer(1) Offer
$26.41 $27.62
$30.40 30D VWAP -
$25.02 $29.35
$30.50 LTM VWAP -
$29.00 $33.00 All-time High
$29.65 $31.85(Close) -
$32.30 $34.00 Consensus
Price Target
$33.01 $33.53
Consensus
$33.54
$31.57 $35.50 NAV
$30.49 Average / Midpoint
$28.80 $32.18 of Selected Range
$32.22
$30.20 $34.25
$37.96
$36.20 $39.73
$29.67
$27.68 $31.67
$31.46
$30.15 $32.77
$35.58
$33.89 $37.27
$31.10
$28.35 $34.49
$29.86
$27.16 $32.82
$33.14
$30.40 $36.13
$32.63
$29.67 $35.86
$33.82
IFRS NAV
(Q4 2016)
$20 $25 $30 $35 $40 $45
Notes: Market data as at 23-Mar-2017. Projections as per BOX Management
(1) Based on an unaffected date of 20-Jan-2017, one business day prior to the BPY offer
(2) Figures represent weighed average discount rates and terminal cap rates based on the estimated value of each asset, as per the NAV analysis Source: BOX Management 2017 Business Plan, Company Disclosure, Equity Research, FactSet, Capital IQ, ThomsonONE
28
PRELIMINARY ANALYSIS
PRIVILEGED AND CONFIDENTIAL – FOR DISCUSSION PURPOSES ONLY
Preliminary Valuation Analysis
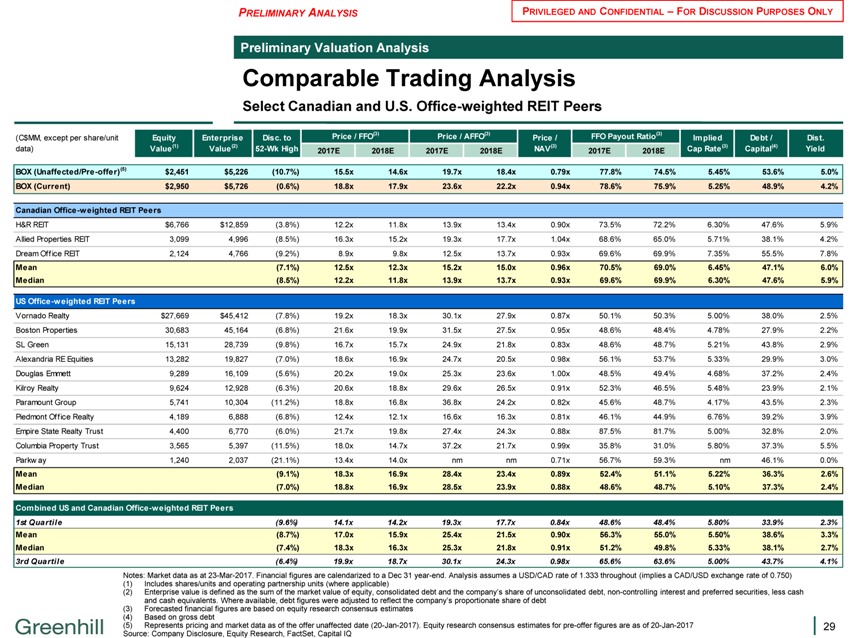
Comparable Trading Analysis
Select Canadian and U.S. Office-weighted REIT Peers
(C$MM, except per share/unit Equity Enterprise Disc. to Price / FFO(3) Price / AFFO(3) Price / FFO Payout Ratio(3) Implied Debt / Dist.
data) Value(1) Value(2) 52-Wk High 2017E 2018E 2017E 2018E NAV(3) 2017E 2018E Cap Rate(3) Capital(4) Yield
BOX (Unaffected/Pre-offer)(5) $2,451 $5,226(10.7%) 15.5x 14.6x 19.7x 18.4x 0.79x 77.8% 74.5% 5.45% 53.6% 5.0%
BOX (Current) $2,950 $5,726(0.6%) 18.8x 17.9x 23.6x 22.2x 0.94x 78.6% 75.9% 5.25% 48.9% 4.2%
Canadian Office-w eighted REIT Peers
H&R REIT $6,766 $12,859(3.8%) 12.2x 11.8x 13.9x 13.4x 0.90x 73.5% 72.2% 6.30% 47.6% 5.9%
Allied Properties REIT 3,099 4,996(8.5%) 16.3x 15.2x 19.3x 17.7x 1.04x 68.6% 65.0% 5.71% 38.1% 4.2%
Dream Office REIT 2,124 4,766(9.2%) 8.9x 9.8x 12.5x 13.7x 0.93x 69.6% 69.9% 7.35% 55.5% 7.8%
Mean(7.1%) 12.5x 12.3x 15.2x 15.0x 0.96x 70.5% 69.0% 6.45% 47.1% 6.0%
Median(8.5%) 12.2x 11.8x 13.9x 13.7x 0.93x 69.6% 69.9% 6.30% 47.6% 5.9%
US Office-w eighted REIT Peers
Vornado Realty $27,669 $45,412(7.8%) 19.2x 18.3x 30.1x 27.9x 0.87x 50.1% 50.3% 5.00% 38.0% 2.5%
Boston Properties 30,683 45,164(6.8%) 21.6x 19.9x 31.5x 27.5x 0.95x 48.6% 48.4% 4.78% 27.9% 2.2%
SL Green 15,131 28,739(9.8%) 16.7x 15.7x 24.9x 21.8x 0.83x 48.6% 48.7% 5.21% 43.8% 2.9%
Alexandria RE Equities 13,282 19,827(7.0%) 18.6x 16.9x 24.7x 20.5x 0.98x 56.1% 53.7% 5.33% 29.9% 3.0%
Douglas Emmett 9,289 16,109(5.6%) 20.2x 19.0x 25.3x 23.6x 1.00x 48.5% 49.4% 4.68% 37.2% 2.4%
Kilroy Realty 9,624 12,928(6.3%) 20.6x 18.8x 29.6x 26.5x 0.91x 52.3% 46.5% 5.48% 23.9% 2.1%
Paramount Group 5,741 10,304(11.2%) 18.8x 16.8x 36.8x 24.2x 0.82x 45.6% 48.7% 4.17% 43.5% 2.3%
Piedmont Office Realty 4,189 6,888(6.8%) 12.4x 12.1x 16.6x 16.3x 0.81x 46.1% 44.9% 6.76% 39.2% 3.9%
Empire State Realty Trust 4,400 6,770(6.0%) 21.7x 19.8x 27.4x 24.3x 0.88x 87.5% 81.7% 5.00% 32.8% 2.0%
Columbia Property Trust 3,565 5,397(11.5%) 18.0x 14.7x 37.2x 21.7x 0.99x 35.8% 31.0% 5.80% 37.3% 5.5%
Parkw ay 1,240 2,037(21.1%) 13.4x 14.0x nm nm 0.71x 56.7% 59.3% nm 46.1% 0.0%
Mean(9.1%) 18.3x 16.9x 28.4x 23.4x 0.89x 52.4% 51.1% 5.22% 36.3% 2.6%
Median(7.0%) 18.8x 16.9x 28.5x 23.9x 0.88x 48.6% 48.7% 5.10% 37.3% 2.4%
Combined US and Canadian Office-w eighted REIT Peers
1st Quartile(9.6%) 14.1avbx 14.2x 19.3x 17.7x 0.84x 48.6% 48.4% 5.80% 33.9% 2.3%
Mean(8.7%) 17.0x 15.9x 25.4x 21.5x 0.90x 56.3% 55.0% 5.50% 38.6% 3.3%
Median(7.4%) 18.3x 16.3x 25.3x 21.8x 0.91x 51.2% 49.8% 5.33% 38.1% 2.7%
3rd Quartile(6.4%) 19.9x 18.7x 30.1x 24.3x 0.98x 65.6% 63.6% 5.00% 43.7% 4.1%
Notes: Market data as at 23-Mar-2017. Financial figures are calendarized to a Dec 31 year-end. Analysis assumes a USD/CAD rate of 1.333 throughout (implies a CAD/USD exchange rate of 0.750) (1) Includes shares/units and operating partnership units (where applicable)
(2) Enterprise value is defined as the sum of the market value of equity, consolidated debt and the company’s share of unconsolidated debt, non-controlling interest and preferred securities, less cash and cash equivalents. Where available, debt figures were adjusted to reflect the company’s proportionate share of debt
(3) Forecasted financial figures are based on equity research consensus estimates (4) Based on gross debt
(5) Represents pricing and market data as of the offer unaffected date (20-Jan-2017). Equity research consensus estimates for pre-offer figures are as of 20-Jan-2017 Source: Company Disclosure, Equity Research, FactSet, Capital IQ
29
PRELIMINARY ANALYSIS PRIVILEGED AND CONFIDENTIAL – FOR DISCUSSION PURPOSES ONLY
Preliminary Valuation Analysis
Comparable Trading Analysis (cont’d)
Preliminary Implied Valuation
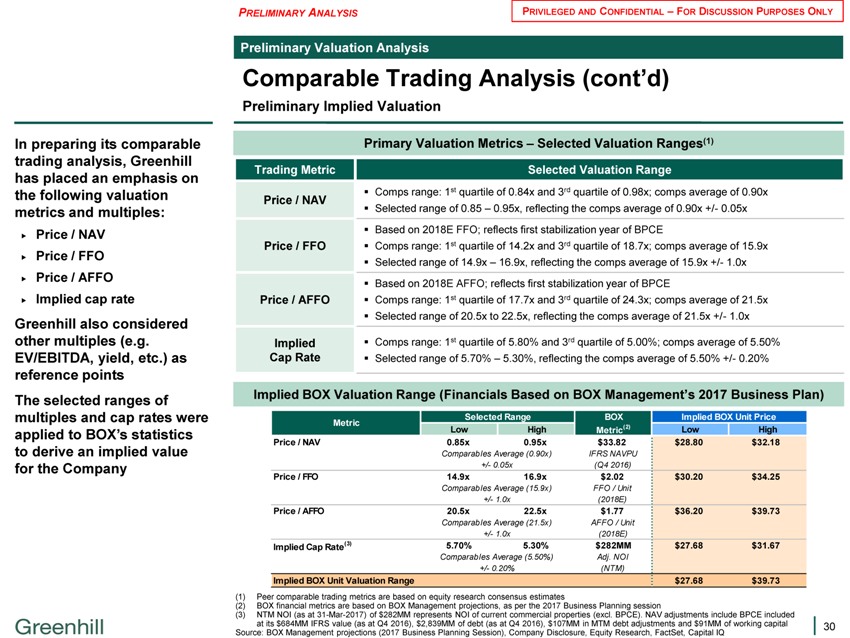
In preparing its comparable trading analysis, Greenhill has placed an emphasis on the following valuation metrics and multiples:
Price / NAV Price / FFO Price / AFFO Implied cap rate
Greenhill also considered other multiples (e.g. EV/EBITDA, yield, etc.) as reference points The selected ranges of multiples and cap rates were applied to BOX’s statistics to derive an implied value for the Company
Primary Valuation Metrics – Selected Valuation Ranges(1)
Trading Metric Selected Valuation Range
Comps range: 1st quartile of 0.84x and 3rd quartile of 0.98x; comps average of 0.90x
Price / NAV
Selected range of 0.85 – 0.95x, reflecting the comps average of 0.90x +/- 0.05x
Based on 2018E FFO; reflects first stabilization year of BPCE
Price / FFO Comps range: 1st quartile of 14.2x and 3rd quartile of 18.7x; comps average of 15.9x
Selected range of 14.9x – 16.9x, reflecting the comps average of 15.9x +/- 1.0x
Based on 2018E AFFO; reflects first stabilization year of BPCE
Price / AFFO Comps range: 1st quartile of 17.7x and 3rd quartile of 24.3x; comps average of 21.5x
Selected range of 20.5x to 22.5x, reflecting the comps average of 21.5x +/- 1.0x
Implied Comps range: 1st quartile of 5.80% and 3rd quartile of 5.00%; comps average of 5.50%
Cap Rate Selected range of 5.70% – 5.30%, reflecting the comps average of 5.50% +/- 0.20%
Implied BOX Valuation Range (Financials Based on BOX Management’s 2017 Business Plan)
Selected Range BOX Implied BOX Unit Price
Metric
Low High Metric(2) Low High
Price / NAV 0.85x 0.95x $33.82 $28.80 $32.18
Comparables Average (0.90x) IFRS NAVPU
+/- 0.05x(Q4 2016)
Price / FFO 14.9x 16.9x $2.02 $30.20 $34.25
Comparables Average (15.9x) FFO / Unit
+/- 1.0x(2018E)
Price / AFFO 20.5x 22.5x $1.77 $36.20 $39.73
Comparables Average (21.5x) AFFO / Unit
+/- 1.0x(2018E)
Implied Cap Rate(3) 5.70% 5.30% $282MM $27.68 $31.67
Comparables Average (5.50%) Adj. NOI
+/- 0.20%(NTM)
Implied BOX Unit Valuation Range $27.68 $39.73
(1) Peer comparable trading metrics are based on equity research consensus estimates
(2) BOX financial metrics are based on BOX Management projections, as per the 2017 Business Planning session
(3) NTM NOI (as at 31-Mar-2017) of $282MM represents NOI of current commercial properties (excl. BPCE). NAV adjustments include BPCE included at its $684MM IFRS value (as at Q4 2016), $2,839MM of debt (as at Q4 2016), $107MM in MTM debt adjustments and $91MM of working capital Source: BOX Management projections (2017 Business Planning Session), Company Disclosure, Equity Research, FactSet, Capital IQ
30
PRELIMINARY ANALYSIS PRIVILEGED AND CONFIDENTIAL – FOR DISCUSSION PURPOSES ONLY
Preliminary Valuation Analysis
Precedent Transactions Analysis
Select North American Office-weighted REIT M&A Transactions(1)
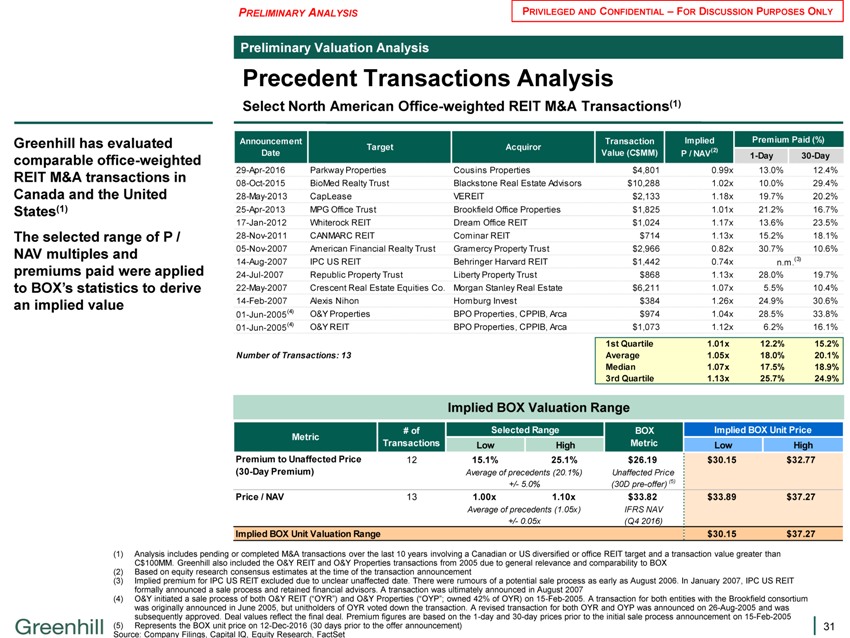
Greenhill has evaluated comparable office-weighted REIT M&A transactions in Canada and the United States(1) The selected range of P / NAV multiples and premiums paid were applied to BOX’s statistics to derive an implied value
Announcement Transaction Implied Premium Paid (%)
Target Acquiror
Date Value (C$MM) P / NAV(2) 1-Day 30-Day
29-Apr-2016 Parkway Properties Cousins Properties $4,801 0.99x 13.0% 12.4%
08-Oct-2015 BioMed Realty Trust Blackstone Real Estate Advisors $10,288 1.02x 10.0% 29.4%
28-May-2013 CapLease VEREIT $2,133 1.18x 19.7% 20.2%
25-Apr-2013 MPG Office Trust Brookfield Office Properties $1,825 1.01x 21.2% 16.7%
17-Jan-2012 Whiterock REIT Dream Office REIT $1,024 1.17x 13.6% 23.5%
28-Nov-2011 CANMARC REIT Cominar REIT $714 1.13x 15.2% 18.1%
05-Nov-2007 American Financial Realty Trust Gramercy Property Trust $2,966 0.82x 30.7% 10.6%
14-Aug-2007 IPC US REIT Behringer Harvard REIT $1,442 0.74x n.m.(3)
24-Jul-2007 Republic Property Trust Liberty Property Trust $868 1.13x 28.0% 19.7%
22-May-2007 Crescent Real Estate Equities Co. Morgan Stanley Real Estate $6,211 1.07x 5.5% 10.4%
14-Feb-2007 Alexis Nihon Homburg Invest $384 1.26x 24.9% 30.6%
01-Jun-2005(4) O&Y Properties BPO Properties, CPPIB, Arca $974 1.04x 28.5% 33.8%
01-Jun-2005(4) O&Y REIT BPO Properties, CPPIB, Arca $1,073 1.12x 6.2% 16.1%
Number of Transactions: 13
1st Quartile 1.01x 12.2% 15.2%
Average 1.05x 18.0% 20.1%
Median 1.07x 17.5% 18.9%
3rd Quartile 1.13x 25.7% 24.9%
Implied BOX Valuation Range
# of Selected Range BOX Implied BOX Unit Price
Metric
Transactions Low High Metric Low High
Premium to Unaffected Price 12 15.1% 25.1% $26.19 $30.15 $32.77
(30-Day Premium) Average of precedents (20.1%) Unaffected Price
+/- 5.0%(30D pre-offer) (5)
Price / NAV 13 1.00x 1.10x $33.82 $33.89 $37.27
Average of precedents (1.05x) IFRS NAV
+/- 0.05x(Q4 2016)
Implied BOX Unit Valuation Range $30.15 $37.27
(1) Analysis includes pending or completed M&A transactions over the last 10 years involving a Canadian or US diversified or office REIT target and a transaction value greater than C$100MM. Greenhill also included the O&Y REIT and O&Y Properties transactions from 2005 due to general relevance and comparability to BOX
(2) Based on equity research consensus estimates at the time of the transaction announcement
(3) Implied premium for IPC US REIT excluded due to unclear unaffected date. There were rumours of a potential sale process as early as August 2006. In January 2007, IPC US REIT formally announced a sale process and retained financial advisors. A transaction was ultimately announced in August 2007
(4) O&Y initiated a sale process of both O&Y REIT (“OYR”) and O&Y Properties (“OYP”; owned 42% of OYR) on 15-Feb-2005. A transaction for both entities with the Brookfield consortium was originally announced in June 2005, but unitholders of OYR voted down the transaction. A revised transaction for both OYR and OYP was announced on 26-Aug-2005 and was subsequently approved. Deal values reflect the final deal. Premium figures are based on the 1-day and 30-day prices prior to the initial sale process announcement on 15-Feb-2005 (5) Represents the BOX unit price on 12-Dec-2016 (30 days prior to the offer announcement) Source: Company Filings, Capital IQ, Equity Research, FactSet
31
PRELIMINARY ANALYSIS PRIVILEGED AND CONFIDENTIAL – FOR DISCUSSION PURPOSES ONLY
Preliminary Valuation Analysis
Precedent Minority Squeeze Out Transactions
Select Transactions Since 2000
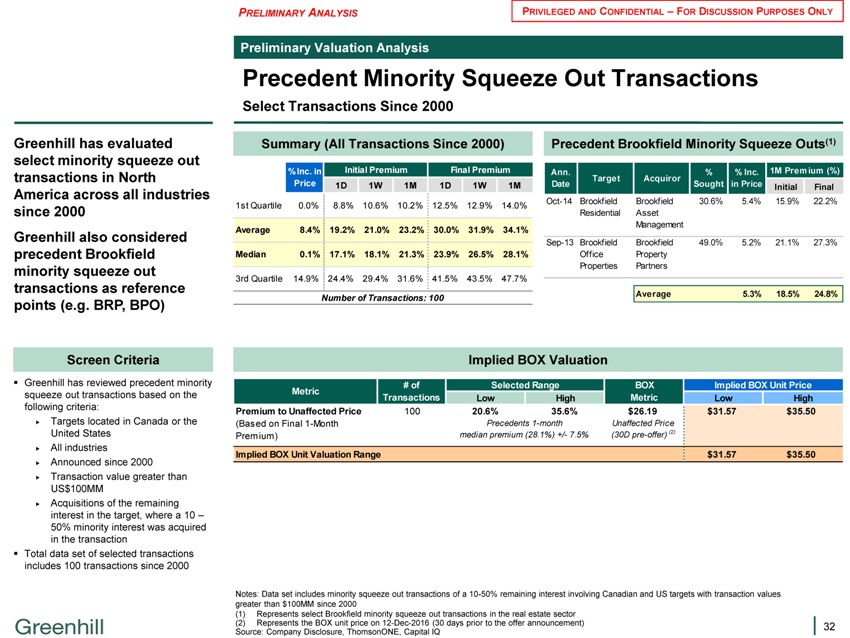
Greenhill has evaluated select minority squeeze out transactions in North America across all industries since 2000 Greenhill also considered precedent Brookfield minority squeeze out transactions as reference points (e.g. BRP, BPO)
Screen Criteria
Greenhill has reviewed precedent minority squeeze out transactions based on the following criteria: Targets located in Canada or the United States All industries Announced since 2000 Transaction value greater than US$100MM
Acquisitions of the remaining interest in the target, where a 10 – 50% minority interest was acquired in the transaction Total data set of selected transactions includes 100 transactions since 2000
Summary (All Transactions Since 2000)
% Inc. in Initial Premium Final Premium
Price 1D 1W 1M 1D 1W 1M
1st Quartile 0.0% 8.8% 10.6% 10.2% 12.5% 12.9% 14.0%
Average 8.4% 19.2% 21.0% 23.2% 30.0% 31.9% 34.1%
Median 0.1% 17.1% 18.1% 21.3% 23.9% 26.5% 28.1%
3rd Quartile 14.9% 24.4% 29.4% 31.6% 41.5% 43.5% 47.7%
Number of Transactions: 100
Precedent Brookfield Minority Squeeze Outs(1)
Ann.%% Inc. 1M Premium (%)
Target Acquiror
Date Sought in Price Initial Final
Oct-14 Brookfield Brookfield 30.6% 5.4% 15.9% 22.2%
Residential Asset
Management
Sep-13 Brookfield Brookfield 49.0% 5.2% 21.1% 27.3%
Office Property
Properties Partners
Average 5.3% 18.5% 24.8%
Implied BOX Valuation
# of Selected Range BOX Implied BOX Unit Price
Metric
Transactions Low High Metric Low High
Premium to Unaffected Price 100 20.6% 35.6% $26.19 $31.57 $35.50
(Based on Final 1-Month Precedents 1-month Unaffected Price
Premium) median premium (28.1%) +/- 7.5%(30D pre-offer) (2)
Implied BOX Unit Valuation Range $31.57 $35.50
Notes: Data set includes minority squeeze out transactions of a 10-50% remaining interest involving Canadian and US targets with transaction values greater than $100MM since 2000 (1) Represents select Brookfield minority squeeze out transactions in the real estate sector (2) Represents the BOX unit price on 12-Dec-2016 (30 days prior to the offer announcement) Source: Company Disclosure, ThomsonONE, Capital IQ
32
PRELIMINARY ANALYSIS PRIVILEGED AND CONFIDENTIAL – FOR DISCUSSION PURPOSES ONLY
Preliminary Valuation Analysis
Weighted Average Cost of Capital (WACC) Analysis
Preliminary Analysis
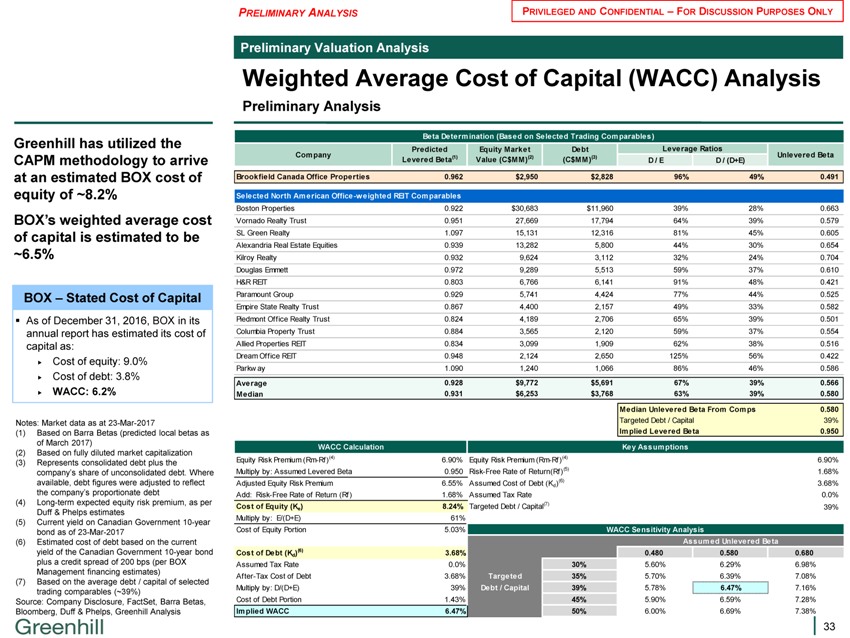
Greenhill has utilized the CAPM methodology to arrive at an estimated BOX cost of equity of ~8.2%
BOX’s weighted average cost of capital is estimated to be ~6.5%
BOX – Stated Cost of Capital
As of December 31, 2016, BOX in its annual report has estimated its cost of capital as: Cost of equity: 9.0% Cost of debt: 3.8%
WACC: 6.2%
Notes: Market data as at 23-Mar-2017
(1) Based on Barra Betas (predicted local betas as of March 2017) (2) Based on fully diluted market capitalization (3) Represents consolidated debt plus the company’s share of unconsolidated debt. Where available, debt figures were adjusted to reflect the company’s proportionate debt
(4) Long-term expected equity risk premium, as per Duff & Phelps estimates (5) Current yield on Canadian Government 10-year bond as of 23-Mar-2017 (6) Estimated cost of debt based on the current yield of the Canadian Government 10-year bond plus a credit spread of 200 bps (per BOX
Management financing estimates)
(7) Based on the average debt / capital of selected trading comparables (~39%) Source: Company Disclosure, FactSet, Barra Betas, Bloomberg, Duff & Phelps, Greenhill Analysis
Beta Determination (Based on Selected Trading Comparables)
Predicted Equity Market Debt Leverage Ratios
Company Unlevered Beta
Levered Beta(1) Value (C$MM)(2)(C$MM)(3) D / E D / (D+E)
Brookfield Canada Office Properties 0.962 $2,950 $2,828 96% 49% 0.491
Selected North American Office-w eighted REIT Comparables
Boston Properties 0.922 $30,683 $11,960 39% 28% 0.663
Vornado Realty Trust 0.951 27,669 17,794 64% 39% 0.579
SL Green Realty 1.097 15,131 12,316 81% 45% 0.605
Alexandria Real Estate Equities 0.939 13,282 5,800 44% 30% 0.654
Kilroy Realty 0.932 9,624 3,112 32% 24% 0.704
Douglas Emmett 0.972 9,289 5,513 59% 37% 0.610
H&R REIT 0.803 6,766 6,141 91% 48% 0.421
Paramount Group 0.929 5,741 4,424 77% 44% 0.525
Empire State Realty Trust 0.867 4,400 2,157 49% 33% 0.582
Piedmont Office Realty Trust 0.824 4,189 2,706 65% 39% 0.501
Columbia Property Trust 0.884 3,565 2,120 59% 37% 0.554
Allied Properties REIT 0.834 3,099 1,909 62% 38% 0.516
Dream Office REIT 0.948 2,124 2,650 125% 56% 0.422
Parkw ay 1.090 1,240 1,066 86% 46% 0.586
Average 0.928 $9,772 $5,691 67% 39% 0.566
Median 0.931 $6,253 $3,768 63% 39% 0.580
Median Unlevered Beta From Comps 0.580
Targeted Debt / Capital 39%
Implied Levered Beta 0.950
WACC Calculation Key Assumptions
Equity Risk Premium (Rm-Rf)(4) 6.90% Equity Risk Premium (Rm-Rf)(4) 6.90%
Multiply by: Assumed Levered Beta 0.950 Risk-Free Rate of Return(Rf)(5) 1.68%
Adjusted Equity Risk Premium 6.55% Assumed Cost of Debt (Kd )(6) 3.68%
Add: Risk-Free Rate of Return (Rf) 1.68% Assumed Tax Rate 0.0%
Cost of Equity (Ke ) 8.24% Targeted Debt / Capital(7) 39%
Multiply by: E/(D+E) 61%
Cost of Equity Portion 5.03% WACC Sensitivity Analysis
Assumed Unlevered Beta
Cost of Debt (Kd )(6) 3.68% 0.480 0.580 0.680
Assumed Tax Rate 0.0% 30% 5.60% 6.29% 6.98%
After-Tax Cost of Debt 3.68% Targeted 35% 5.70% 6.39% 7.08%
Multiply by: D/(D+E) 39% Debt / Capital 39% 5.78% 6.47% 7.16%
Cost of Debt Portion 1.43% 45% 5.90% 6.59% 7.28%
Implied WACC 6.47% 50% 6.00% 6.69% 7.38%
33
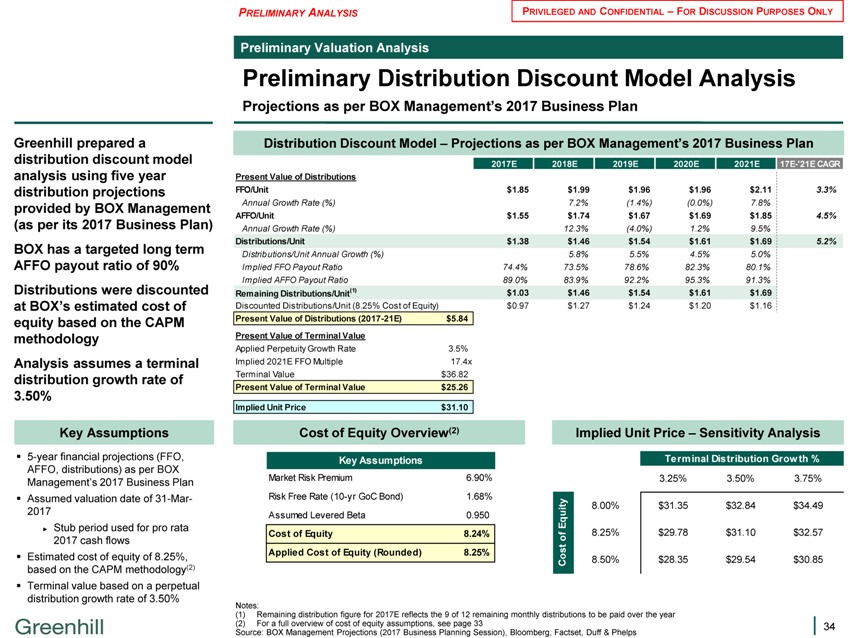
PRELIMINARY ANALYSIS PRIVILEGED AND CONFIDENTIAL – FOR DISCUSSION PURPOSES ONLY
Preliminary Valuation Analysis
Preliminary Distribution Discount Model Analysis
Projections as per BOX Management’s 2017 Business Plan
Greenhill prepared a distribution discount model analysis using five year distribution projections provided by BOX Management (as per its 2017 Business Plan) BOX has a targeted long term AFFO payout ratio of 90% Distributions were discounted at BOX’s estimated cost of equity based on the CAPM methodology Analysis assumes a terminal distribution growth rate of 3.50%
Key Assumptions
5-year financial projections (FFO, AFFO, distributions) as per BOX
Management’s 2017 Business Plan
Assumed valuation date of 31-Mar-2017
Stub period used for pro rata 2017 cash flows Estimated cost of equity of 8.25%, based on the CAPM methodology(2) Terminal value based on a perpetual distribution growth rate of 3.50%
Distribution Discount Model – Projections as per BOX Management’s 2017 Business Plan
2017E 2018E 2019E 2020E 2021E 17E-‘21E CAGR
Present Value of Distributions
FFO/Unit $1.85 $1.99 $1.96 $1.96 $2.11 3.3%
Annual Growth Rate (%) 7.2%(1.4%)(0.0%) 7.8%
AFFO/Unit $1.55 $1.74 $1.67 $1.69 $1.85 4.5%
Annual Growth Rate (%) 12.3%(4.0%) 1.2% 9.5%
Distributions/Unit $1.38 $1.46 $1.54 $1.61 $1.69 5.2%
Distributions/Unit Annual Growth (%) 5.8% 5.5% 4.5% 5.0%
Implied FFO Payout Ratio 74.4% 73.5% 78.6% 82.3% 80.1%
Implied AFFO Payout Ratio 89.0% 83.9% 92.2% 95.3% 91.3%
Remaining Distributions/Unit(1) $1.03 $1.46 $1.54 $1.61 $1.69
Discounted Distributions/Unit (8.25% Cost of Equity) $0.97 $1.27 $1.24 $1.20 $1.16
Present Value of Distributions (2017-21E) $5.84
Present Value of Terminal Value
Applied Perpetuity Growth Rate 3.5%
Implied 2021E FFO Multiple 17.4x
Terminal Value $36.82
Present Value of Terminal Value $25.26
Implied Unit Price $31.10
Cost of Equity Overview(2) Implied Unit Price – Sensitivity Analysis
Key Assumptions Terminal Distribution Grow th %
Market Risk Premium 6.90% $31.10 3.25% 3.50% 3.75%
Risk Free Rate (10-yr GoC Bond) 1.68%
i ty 8.00% $31.35 $32.84 $34.49
Assumed Levered Beta 0.950 Equ
Cost of Equity 8.24% f 8.25% $29.78 $31.10 $32.57
o
Applied Cost of Equity (Rounded) 8.25% ost 8.50% $28.35 $29.54 $30.85
C
Notes:
(1) Remaining distribution figure for 2017E reflects the 9 of 12 remaining monthly distributions to be paid over the year (2) For a full overview of cost of equity assumptions, see page 33 Source: BOX Management Projections (2017 Business Planning Session), Bloomberg, Factset, Duff & Phelps
34
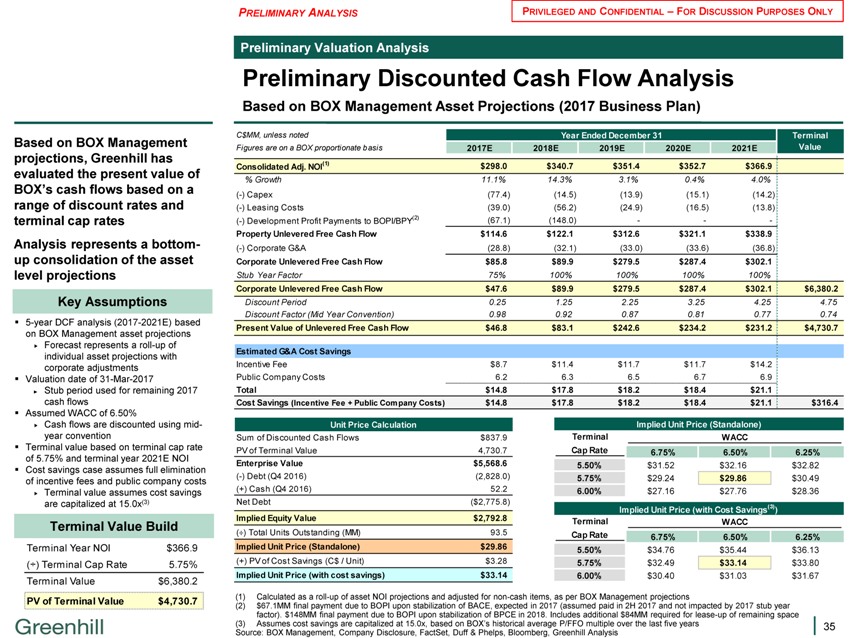
PRELIMINARY ANALYSIS PRIVILEGED AND CONFIDENTIAL – FOR DISCUSSION PURPOSES ONLY
Preliminary Valuation Analysis
Preliminary Discounted Cash Flow Analysis
Based on BOX Management Asset Projections (2017 Business Plan)
Based on BOX Management projections, Greenhill has evaluated the present value of BOX’s cash flows based on a range of discount rates and terminal cap rates Analysis represents a bottom-up consolidation of the asset level projections
Key Assumptions
5-year DCF analysis (2017-2021E) based on BOX Management asset projections Forecast represents a roll-up of individual asset projections with corporate adjustments Valuation date of 31-Mar-2017
Stub period used for remaining 2017 cash flows Assumed WACC of 6.50% Cash flows are discounted using mid-year convention Terminal value based on terminal cap rate of 5.75% and terminal year 2021E NOI Cost savings case assumes full elimination of incentive fees and public company costs Terminal value assumes cost savings are capitalized at 15.0x(3)
Terminal Value Build
Terminal Year NOI $366.9 (÷) Terminal Cap Rate 5.75% Terminal Value $6,380.2
PV of Terminal Value $4,730.7
C$MM, unless noted Year Ended December 31 Terminal
Figures are on a BOX proportionate basis 2017E 2018E 2019E 2020E 2021E Value
Consolidated Adj. NOI(1) $298.0 $340.7 $351.4 $352.7 $366.9
% Growth 11.1% 14.3% 3.1% 0.4% 4.0%
(-) Capex(77.4)(14.5)(13.9)(15.1)(14.2)
(-) Leasing Costs(39.0)(56.2)(24.9)(16.5)(13.8)
(-) Development Profit Payments to BOPI/BPY(2)(67.1)(148.0) — -
Property Unlevered Free Cash Flow $114.6 $122.1 $312.6 $321.1 $338.9
(-) Corporate G&A(28.8)(32.1)(33.0)(33.6)(36.8)
Corporate Unlevered Free Cash Flow $85.8 $89.9 $279.5 $287.4 $302.1
Stub Year Factor 75% 100% 100% 100% 100%
Corporate Unlevered Free Cash Flow $47.6 $89.9 $279.5 $287.4 $302.1 $6,380.2
Discount Period 0.25 1.25 2.25 3.25 4.25 4.75
Discount Factor (Mid Year Convention) 0.98 0.92 0.87 0.81 0.77 0.74
Present Value of Unlevered Free Cash Flow $46.8 $83.1 $242.6 $234.2 $231.2 $4,730.7
Estimated G&A Cost Savings
Incentive Fee $8.7 $11.4 $11.7 $11.7 $14.2
Public Company Costs 6.2 6.3 6.5 6.7 6.9
Total $14.8 $17.8 $18.2 $18.4 $21.1
Cost Savings (Incentive Fee + Public Company Costs) $14.8 $17.8 $18.2 $18.4 $21.1 $316.4
Unit Price Calculation Implied Unit Price (Standalone)
Sum of Discounted Cash Flows $837.9 Terminal WACC
PV of Terminal Value 4,730.7 Cap Rate 6.75% 6.50% 6.25%
Enterprise Value $5,568.6 5.50% $31.52 $32.16 $32.82
(-) Debt (Q4 2016)(2,828.0) 5.75% $29.24 $29.86 $30.49
(+) Cash (Q4 2016) 52.2 6.00% $27.16 $27.76 $28.36
Net Debt($2,775.8)
Implied Unit Price (with Cost Savings(3) )
Implied Equity Value $2,792.8 Terminal WACC
(÷) Total Units Outstanding (MM) 93.5 Cap Rate 6.75% 6.50% 6.25%
Implied Unit Price (Standalone) $29.86 5.50% $34.76 $35.44 $36.13
(+) PV of Cost Savings (C$ / Unit) $3.28 5.75% $32.49 $33.14 $33.80
Implied Unit Price (with cost savings) $33.14 6.00% $30.40 $31.03 $31.67
(1) Calculated as a roll-up of asset NOI projections and adjusted for non-cash items, as per BOX Management projections
(2) $67.1MM final payment due to BOPI upon stabilization of BACE, expected in 2017 (assumed paid in 2H 2017 and not impacted by 2017 stub year factor). $148MM final payment due to BOPI upon stabilization of BPCE in 2018. Includes additional $84MM required for lease-up of remaining space
(3) Assumes cost savings are capitalized at 15.0x, based on BOX’s historical average P/FFO multiple over the last five years
Source: BOX Management, Company Disclosure, FactSet, Duff & Phelps, Bloomberg, Greenhill Analysis
35
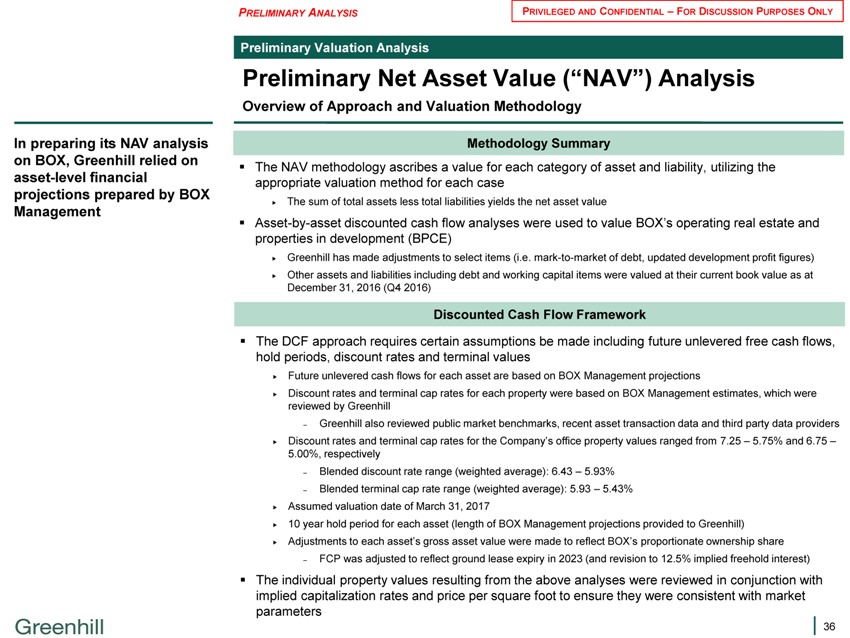
PRELIMINARY ANALYSIS PRIVILEGED AND CONFIDENTIAL – FOR DISCUSSION PURPOSES ONLY
Preliminary Valuation Analysis
Preliminary Net Asset Value (“NAV”) Analysis
Overview of Approach and Valuation Methodology
Methodology Summary
The NAV methodology ascribes a value for each category of asset and liability, utilizing the
appropriate valuation method for each case
The sum of total assets less total liabilities yields the net asset value
Asset-by-asset discounted cash flow analyses were used to value BOX’s operating real estate and
properties in development (BPCE)
Greenhill has made adjustments to select items (i.e. mark-to-market of debt, updated development profit figures)
Other assets and liabilities including debt and working capital items were valued at their current book value as at
December 31, 2016 (Q4 2016)
Discounted Cash Flow Framework
The DCF approach requires certain assumptions be made including future unlevered free cash flows,
hold periods, discount rates and terminal values
Future unlevered cash flows for each asset are based on BOX Management projections
Discount rates and terminal cap rates for each property were based on BOX Management estimates, which were
reviewed by Greenhill
Greenhill also reviewed public market benchmarks, recent asset transaction data and third party data providers
Discount rates and terminal cap rates for the Company’s office property values ranged from 7.25 – 5.75% and 6.75 –
5.00%, respectively
Blended discount rate range (weighted average): 6.43 – 5.93%
Blended terminal cap rate range (weighted average): 5.93 – 5.43%
Assumed valuation date of March 31, 2017
10 year hold period for each asset (length of BOX Management projections provided to Greenhill)
Adjustments to each asset’s gross asset value were made to reflect BOX’s proportionate ownership share
FCP was adjusted to reflect ground lease expiry in 2023 (and revision to 12.5% implied freehold interest)
The individual property values resulting from the above analyses were reviewed in conjunction with
implied capitalization rates and price per square foot to ensure they were consistent with market
parameters
In preparing its NAV analysis on BOX, Greenhill relied on asset-level financial projections prepared by BOX Management
36
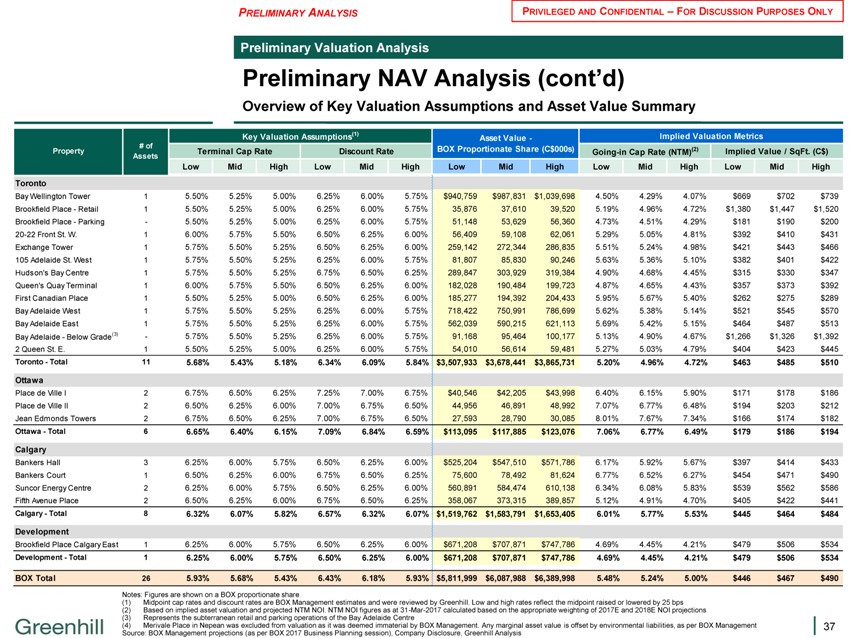
PRELIMINARY ANALYSIS PRIVILEGED AND CONFIDENTIAL – FOR DISCUSSION PURPOSES ONLY
Preliminary Valuation Analysis
Preliminary NAV Analysis (cont’d)
Overview of Key Valuation Assumptions and Asset Value Summary
Key Valuation Assumptions(1) Asset Value—Implied Valuation Metrics
Property # of Terminal Cap Rate Discount Rate BOX Proportionate Share (C$000s) Going-in Cap Rate (NTM)(2) Implied Value / SqFt. (C$)
Assets
Low Mid High Low Mid High Low Mid High Low Mid High Low Mid High
Toronto
Bay Wellington Tower 1 5.50% 5.25% 5.00% 6.25% 6.00% 5.75% $940,759 $987,831 $1,039,698 4.50% 4.29% 4.07% $669 $702 $739
Brookfield Place—Retail 1 5.50% 5.25% 5.00% 6.25% 6.00% 5.75% 35,876 37,610 39,520 5.19% 4.96% 4.72% $1,380 $1,447 $1,520
Brookfield Place—Parking—5.50% 5.25% 5.00% 6.25% 6.00% 5.75% 51,148 53,629 56,360 4.73% 4.51% 4.29% $181 $190 $200
20-22 Front St. W. 1 6.00% 5.75% 5.50% 6.50% 6.25% 6.00% 56,409 59,108 62,061 5.29% 5.05% 4.81% $392 $410 $431
Exchange Tower 1 5.75% 5.50% 5.25% 6.50% 6.25% 6.00% 259,142 272,344 286,835 5.51% 5.24% 4.98% $421 $443 $466
105 Adelaide St. West 1 5.75% 5.50% 5.25% 6.25% 6.00% 5.75% 81,807 85,830 90,246 5.63% 5.36% 5.10% $382 $401 $422
Hudson’s Bay Centre 1 5.75% 5.50% 5.25% 6.75% 6.50% 6.25% 289,847 303,929 319,384 4.90% 4.68% 4.45% $315 $330 $347
Queen’s Quay Terminal 1 6.00% 5.75% 5.50% 6.50% 6.25% 6.00% 182,028 190,484 199,723 4.87% 4.65% 4.43% $357 $373 $392
First Canadian Place 1 5.50% 5.25% 5.00% 6.50% 6.25% 6.00% 185,277 194,392 204,433 5.95% 5.67% 5.40% $262 $275 $289
Bay Adelaide West 1 5.75% 5.50% 5.25% 6.25% 6.00% 5.75% 718,422 750,991 786,699 5.62% 5.38% 5.14% $521 $545 $570
Bay Adelaide East 1 5.75% 5.50% 5.25% 6.25% 6.00% 5.75% 562,039 590,215 621,113 5.69% 5.42% 5.15% $464 $487 $513
Bay Adelaide—Below Grade(3)—5.75% 5.50% 5.25% 6.25% 6.00% 5.75% 91,168 95,464 100,177 5.13% 4.90% 4.67% $1,266 $1,326 $1,392
2 Queen St. E. 1 5.50% 5.25% 5.00% 6.25% 6.00% 5.75% 54,010 56,614 59,481 5.27% 5.03% 4.79% $404 $423 $445
Toronto—Total 11 5.68% 5.43% 5.18% 6.34% 6.09% 5.84% $3,507,933 $3,678,441 $3,865,731 5.20% 4.96% 4.72% $463 $485 $510
Ottawa
Place de Ville I 2 6.75% 6.50% 6.25% 7.25% 7.00% 6.75% $40,546 $42,205 $43,998 6.40% 6.15% 5.90% $171 $178 $186
Place de Ville II 2 6.50% 6.25% 6.00% 7.00% 6.75% 6.50% 44,956 46,891 48,992 7.07% 6.77% 6.48% $194 $203 $212
Jean Edmonds Towers 2 6.75% 6.50% 6.25% 7.00% 6.75% 6.50% 27,593 28,790 30,085 8.01% 7.67% 7.34% $166 $174 $182
Ottawa—Total 6 6.65% 6.40% 6.15% 7.09% 6.84% 6.59% $113,095 $117,885 $123,076 7.06% 6.77% 6.49% $179 $186 $194
Calgary
Bankers Hall 3 6.25% 6.00% 5.75% 6.50% 6.25% 6.00% $525,204 $547,510 $571,786 6.17% 5.92% 5.67% $397 $414 $433
Bankers Court 1 6.50% 6.25% 6.00% 6.75% 6.50% 6.25% 75,600 78,492 81,624 6.77% 6.52% 6.27% $454 $471 $490
Suncor Energy Centre 2 6.25% 6.00% 5.75% 6.50% 6.25% 6.00% 560,891 584,474 610,138 6.34% 6.08% 5.83% $539 $562 $586
Fifth Avenue Place 2 6.50% 6.25% 6.00% 6.75% 6.50% 6.25% 358,067 373,315 389,857 5.12% 4.91% 4.70% $405 $422 $441
Calgary—Total 8 6.32% 6.07% 5.82% 6.57% 6.32% 6.07% $1,519,762 $1,583,791 $1,653,405 6.01% 5.77% 5.53% $445 $464 $484
Development
Brookfield Place Calgary East 1 6.25% 6.00% 5.75% 6.50% 6.25% 6.00% $671,208 $707,871 $747,786 4.69% 4.45% 4.21% $479 $506 $534
Development—Total 1 6.25% 6.00% 5.75% 6.50% 6.25% 6.00% $671,208 $707,871 $747,786 4.69% 4.45% 4.21% $479 $506 $534
BOX Total 26 5.93% 5.68% 5.43% 6.43% 6.18% 5.93% $5,811,999 $6,087,988 $6,389,998 5.48% 5.24% 5.00% $446 $467 $490
(1) Midpoint cap rates and discount rates are BOX Management estimates and were reviewed by Greenhill. Low and high rates reflect the midpoint raised or lowered by 25 bps
(2) Based on implied asset valuation and projected NTM NOI. NTM NOI figures as at 31-Mar-2017 calculated based on the appropriate weighting of 2017E and 2018E NOI projections
(3) Represents the subterranean retail and parking operations of the Bay Adelaide Centre
(4) Merivale Place in Nepean was excluded from valuation as it was deemed immaterial by BOX Management. Any marginal asset value is offset by environmental liabilities, as per BOX Management
Source: BOX Management projections (as per BOX 2017 Business Planning session), Company Disclosure, Greenhill Analysis
37
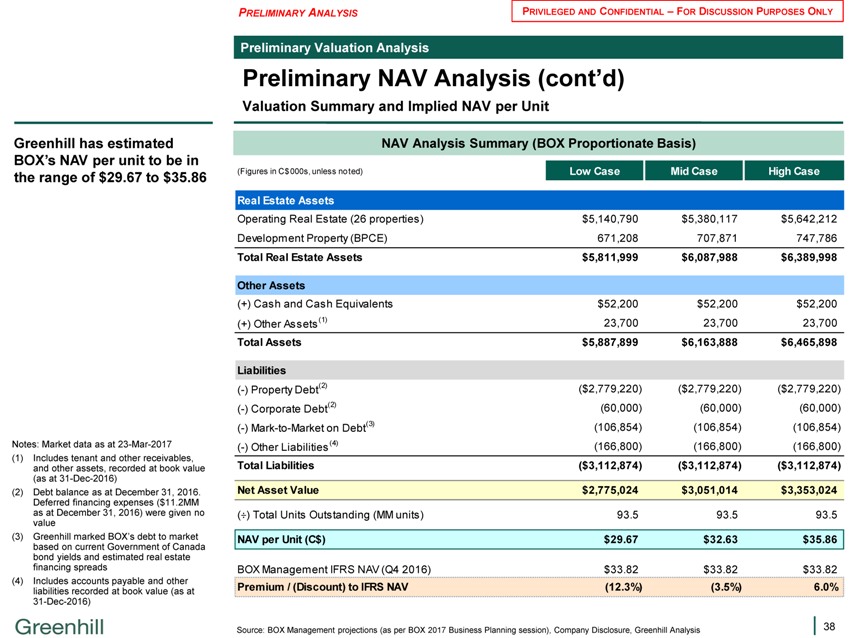
Greenhill has estimated
BOX’s NAV per unit to be in the range of $29.67 to $35.86
Notes: Market data as at 23-Mar-2017 (1) Includes tenant and other receivables, and other assets, recorded at book value (as at 31-Dec-2016) (2) Debt balance as at December 31, 2016.
Deferred financing expenses ($11.2MM as at December 31, 2016) were given no value
(3) Greenhill marked BOX’s debt to market based on current Government of Canada bond yields and estimated real estate financing spreads (4) Includes accounts payable and other liabilities recorded at book value (as at 31-Dec-2016)
PRELIMINARY ANALYSIS PRIVILEGED AND CONFIDENTIAL – FOR DISCUSSION PURPOSES ONLY
Preliminary Valuation Analysis
Preliminary NAV Analysis (cont’d)
Valuation Summary and Implied NAV per Unit
NAV Analysis Summary (BOX Proportionate Basis)
(Figures in C$ 000s, unless noted) Low Case Mid Case High Case
Real Estate Assets
Operating Real Estate (26 properties) $5,140,790 $5,380,117 $5,642,212
Development Property (BPCE) 671,208 707,871 747,786
Total Real Estate Assets $5,811,999 $6,087,988 $6,389,998
Other Assets
(+) Cash and Cash Equivalents $52,200 $52,200 $52,200
(+) Other Assets (1) 23,700 23,700 23,700
Total Assets $5,887,899 $6,163,888 $6,465,898
Liabilities
(-) Property Debt(2)($2,779,220)($2,779,220)($2,779,220)
(-) Corporate Debt(2)(60,000)(60,000)(60,000)
(-) Mark-to-Market on Debt(3)(106,854)(106,854)(106,854)
(-) Other Liabilities (4)(166,800)(166,800)(166,800)
Total Liabilities($3,112,874)($3,112,874)($3,112,874)
Net Asset Value $2,775,024 $3,051,014 $3,353,024
(÷) Total Units Outstanding (MM units) 93.5 93.5 93.5
NAV per Unit (C$) $29.67 $32.63 $35.86
BOX Management IFRS NAV (Q4 2016) $33.82 $33.82 $33.82
Premium / (Discount) to IFRS NAV(12.3%)(3.5%) 6.0%
Source: BOX Management projections (as per BOX 2017 Business Planning session), Company Disclosure, Greenhill Analysis
38
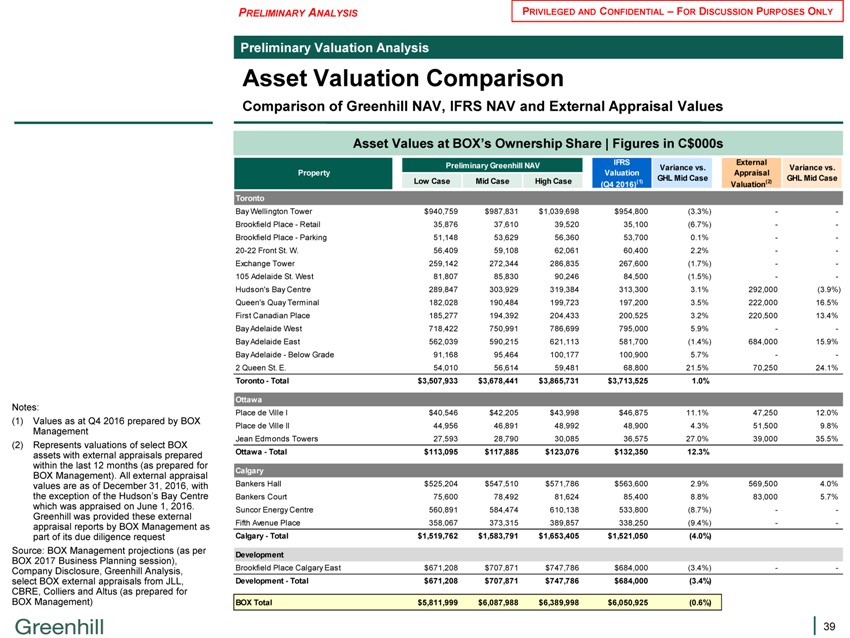
PRELIMINARY ANALYSIS PRIVILEGED AND CONFIDENTIAL – FOR DISCUSSION PURPOSES ONLY
Preliminary Valuation Analysis
Asset Valuation Comparison
Comparison of Greenhill NAV, IFRS NAV and External Appraisal Values
Asset Values at BOX’s Ownership Share | Figures in C$000s
Notes:
(1) Values as at Q4 2016 prepared by BOX Management (2) Represents valuations of select BOX assets with external appraisals prepared within the last 12 months (as prepared for BOX Management). All external appraisal values are as of December 31, 2016, with the exception of the Hudson’s Bay Centre which was appraised on June 1, 2016.
Greenhill was provided these external appraisal reports by BOX Management as part of its due diligence request Source: BOX Management projections (as per BOX 2017 Business Planning session), Company Disclosure, Greenhill Analysis, select BOX external appraisals from JLL, CBRE, Colliers and Altus (as prepared for BOX Management)
Preliminary Greenhill NAV IFRS Variance vs. External Variance vs.
Property Valuation Appraisal
Low Case Mid Case High Case(1) GHL Mid Case(2) GHL Mid Case
(Q4 2016) Valuation
Toronto
Bay Wellington Tower $940,759 $987,831 $1,039,698 $954,800(3.3%) —
Brookfield Place—Retail 35,876 37,610 39,520 35,100(6.7%) —
Brookfield Place—Parking 51,148 53,629 56,360 53,700 0.1% —
20-22 Front St. W. 56,409 59,108 62,061 60,400 2.2% —
Exchange Tower 259,142 272,344 286,835 267,600(1.7%) —
105 Adelaide St. West 81,807 85,830 90,246 84,500(1.5%) —
Hudson’s Bay Centre 289,847 303,929 319,384 313,300 3.1% 292,000(3.9%)
Queen’s Quay Terminal 182,028 190,484 199,723 197,200 3.5% 222,000 16.5%
First Canadian Place 185,277 194,392 204,433 200,525 3.2% 220,500 13.4%
Bay Adelaide West 718,422 750,991 786,699 795,000 5.9% —
Bay Adelaide East 562,039 590,215 621,113 581,700(1.4%) 684,000 15.9%
Bay Adelaide—Below Grade 91,168 95,464 100,177 100,900 5.7% —
2 Queen St. E. 54,010 56,614 59,481 68,800 21.5% 70,250 24.1%
Toronto—Total $3,507,933 $3,678,441 $3,865,731 $3,713,525 1.0%
Ottawa
Place de Ville I $40,546 $42,205 $43,998 $46,875 11.1% 47,250 12.0%
Place de Ville II 44,956 46,891 48,992 48,900 4.3% 51,500 9.8%
Jean Edmonds Towers 27,593 28,790 30,085 36,575 27.0% 39,000 35.5%
Ottawa—Total $113,095 $117,885 $123,076 $132,350 12.3%
Calgary
Bankers Hall $525,204 $547,510 $571,786 $563,600 2.9% 569,500 4.0%
Bankers Court 75,600 78,492 81,624 85,400 8.8% 83,000 5.7%
Suncor Energy Centre 560,891 584,474 610,138 533,800(8.7%) —
Fifth Avenue Place 358,067 373,315 389,857 338,250(9.4%) —
Calgary—Total $1,519,762 $1,583,791 $1,653,405 $1,521,050(4.0%)
Development
Brookfield Place Calgary East $671,208 $707,871 $747,786 $684,000(3.4%) —
Development—Total $671,208 $707,871 $747,786 $684,000(3.4%)
BOX Total $5,811,999 $6,087,988 $6,389,998 $6,050,925(0.6%)
39
PRELIMINARY ANALYSIS PRIVILEGED AND CONFIDENTIAL – FOR DISCUSSION PURPOSES ONLY
Table of Contents
1. Situation Overview
2. BOX Overview
3. Preliminary Valuation Analysis
Appendix
40
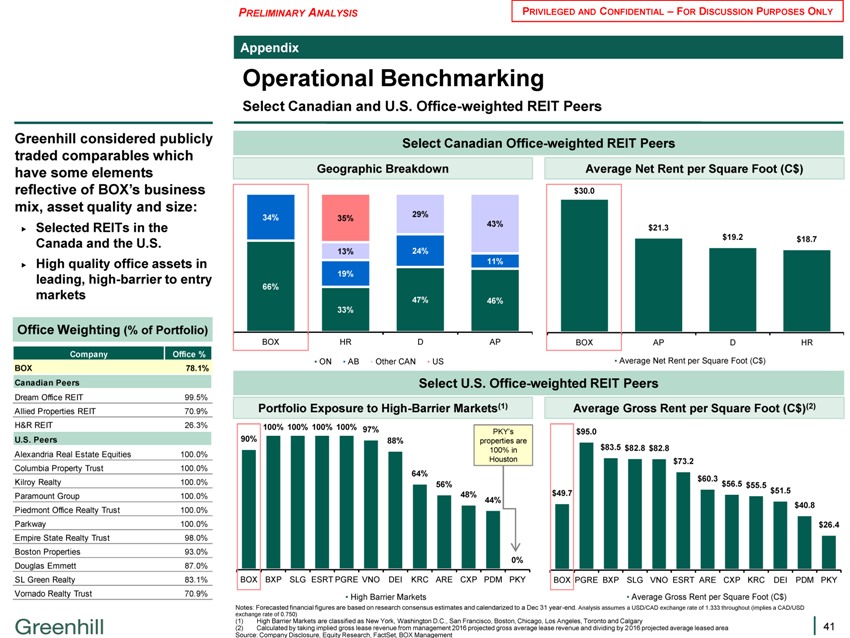
PRELIMINARY ANALYSIS PRIVILEGED AND CONFIDENTIAL – FOR DISCUSSION PURPOSES ONLY
Appendix
Operational Benchmarking
Select Canadian and U.S. Office-weighted REIT Peers
Greenhill considered publicly traded comparables which have some elements reflective of BOX’s business mix, asset quality and size:
Selected REITs in the Canada and the U.S. High quality office assets in leading, high-barrier to entry markets
Office Weighting (% of Portfolio)
Company Office % BOX 78.1% Canadian Peers
Dream Office REIT 99.5% Allied Properties REIT 70.9% H&R REIT 26.3%
U.S. Peers
Alexandria Real Estate Equities 100.0% Columbia Property Trust 100.0% Kilroy Realty 100.0% Paramount Group 100.0% Piedmont Office Realty Trust 100.0% Parkway 100.0% Empire State Realty Trust 98.0% Boston Properties 93.0% Douglas Emmett 87.0% SL Green Realty 83.1% Vornado Realty Trust 70.9%
Select Canadian Office-weighted REIT Peers
Geographic Breakdown Average Net Rent per Square Foot (C$)
$30.0
34% 35% 29%
43% $21.3
$19.2 $18.7
13% 24%
11%
19%
66%
47% 46%
33%
BOX HR D AP BOX AP D HR
ON AB Other CAN US Average Net Rent per Square Foot (C$)
Select U.S. Office-weighted REIT Peers
Portfolio Exposure to High-Barrier Markets(1) Average Gross Rent per Square Foot (C$)(2)
100% 100% 100% 100% 97% PKY’s $95.0
90% 88% properties are
100% in $83.5 $82.8 $82.8
Houston $73.2
64% $60.3
56% $56.5 $55.5
48% $49.7 $51.5
44% $40.8
$26.4
0%
BOX BXP SLG ESRT PGRE VNO DEI KRC ARE CXP PDM PKY BOX PGRE BXP SLG VNO ESRT ARE CXP KRC DEI PDM PKY
High Barrier Markets Average Gross Rent per Square Foot (C$)
Notes: Forecasted financial figures are based on research consensus estimates and calendarized to a Dec 31 year-end. Analysis assumes a USD/CAD exchange rate of 1.333 throughout (implies a CAD/USD exchange rate of 0.750)
(1) High Barrier Markets are classified as New York, Washington D.C., San Francisco, Boston, Chicago, Los Angeles, Toronto and Calgary
(2) Calculated by taking implied gross lease revenue from management 2016 projected gross average lease revenue and dividing by 2016 projected average leased area Source: Company Disclosure, Equity Research, FactSet, BOX Management
41
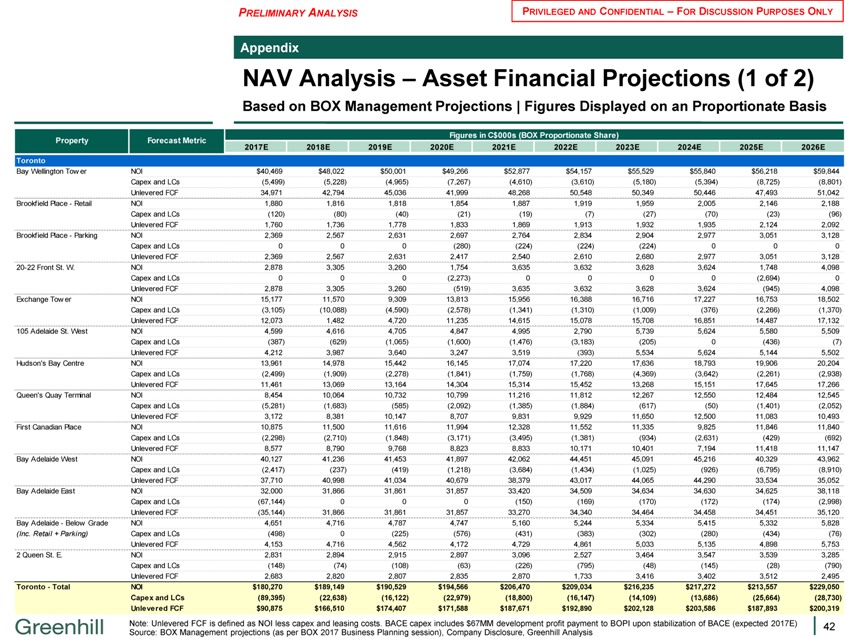
PRELIMINARY ANALYSIS PRIVILEGED AND CONFIDENTIAL – FOR DISCUSSION PURPOSES ONLY
Appendix
NAV Analysis – Asset Financial Projections (1 of 2)
Based on BOX Management Projections | Figures Displayed on an Proportionate Basis
Figures in C$000s (BOX Proportionate Share)
Property Forecast Metric
2017E 2018E 2019E 2020E 2021E 2022E 2023E 2024E 2025E 2026E
Toronto
Bay Wellington Tow er NOI $40,469 $48,022 $50,001 $49,266 $52,877 $54,157 $55,529 $55,840 $56,218 $59,844
Capex and LCs(5,499)(5,228)(4,965)(7,267)(4,610)(3,610)(5,180)(5,394)(8,725)(8,801)
Unlevered FCF 34,971 42,794 45,036 41,999 48,268 50,548 50,349 50,446 47,493 51,042
Brookfield Place—Retail NOI 1,880 1,816 1,818 1,854 1,887 1,919 1,959 2,005 2,146 2,188
Capex and LCs(120)(80)(40)(21)(19)(7)(27)(70)(23)(96)
Unlevered FCF 1,760 1,736 1,778 1,833 1,869 1,913 1,932 1,935 2,124 2,092
Brookfield Place—Parking NOI 2,369 2,567 2,631 2,697 2,764 2,834 2,904 2,977 3,051 3,128
Capex and LCs 0 0 0(280)(224)(224)(224) 0 0 0
Unlevered FCF 2,369 2,567 2,631 2,417 2,540 2,610 2,680 2,977 3,051 3,128
20-22 Front St. W. NOI 2,878 3,305 3,260 1,754 3,635 3,632 3,628 3,624 1,748 4,098
Capex and LCs 0 0 0(2,273) 0 0 0 0(2,694) 0
Unlevered FCF 2,878 3,305 3,260(519) 3,635 3,632 3,628 3,624(945) 4,098
Exchange Tow er NOI 15,177 11,570 9,309 13,813 15,956 16,388 16,716 17,227 16,753 18,502
Capex and LCs(3,105)(10,088)(4,590)(2,578)(1,341)(1,310)(1,009)(376)(2,266)(1,370)
Unlevered FCF 12,073 1,482 4,720 11,235 14,615 15,078 15,708 16,851 14,487 17,132
105 Adelaide St. West NOI 4,599 4,616 4,705 4,847 4,995 2,790 5,739 5,624 5,580 5,509
Capex and LCs(387)(629)(1,065)(1,600)(1,476)(3,183)(205) 0(436)(7)
Unlevered FCF 4,212 3,987 3,640 3,247 3,519(393) 5,534 5,624 5,144 5,502
Hudson’s Bay Centre NOI 13,961 14,978 15,442 16,145 17,074 17,220 17,636 18,793 19,906 20,204
Capex and LCs(2,499)(1,909)(2,278)(1,841)(1,759)(1,768)(4,369)(3,642)(2,261)(2,938)
Unlevered FCF 11,461 13,069 13,164 14,304 15,314 15,452 13,268 15,151 17,645 17,266
Queen’s Quay Terminal NOI 8,454 10,064 10,732 10,799 11,216 11,812 12,267 12,550 12,484 12,545
Capex and LCs(5,281)(1,683)(585)(2,092)(1,385)(1,884)(617)(50)(1,401)(2,052)
Unlevered FCF 3,172 8,381 10,147 8,707 9,831 9,929 11,650 12,500 11,083 10,493
First Canadian Place NOI 10,875 11,500 11,616 11,994 12,328 11,552 11,335 9,825 11,846 11,840
Capex and LCs(2,298)(2,710)(1,848)(3,171)(3,495)(1,381)(934)(2,631)(429)(692)
Unlevered FCF 8,577 8,790 9,768 8,823 8,833 10,171 10,401 7,194 11,418 11,147
Bay Adelaide West NOI 40,127 41,236 41,453 41,897 42,062 44,451 45,091 45,216 40,329 43,962
Capex and LCs(2,417)(237)(419)(1,218)(3,684)(1,434)(1,025)(926)(6,795)(8,910)
Unlevered FCF 37,710 40,998 41,034 40,679 38,379 43,017 44,065 44,290 33,534 35,052
Bay Adelaide East NOI 32,000 31,866 31,861 31,857 33,420 34,509 34,634 34,630 34,625 38,118
Capex and LCs(67,144) 0 0 0(150)(169)(170)(172)(174)(2,998)
Unlevered FCF(35,144) 31,866 31,861 31,857 33,270 34,340 34,464 34,458 34,451 35,120
Bay Adelaide—Below Grade NOI 4,651 4,716 4,787 4,747 5,160 5,244 5,334 5,415 5,332 5,828
(Inc. Retail + Parking) Capex and LCs(498) 0(225)(576)(431)(383)(302)(280)(434)(76)
Unlevered FCF 4,153 4,716 4,562 4,172 4,729 4,861 5,033 5,135 4,898 5,753
2 Queen St. E. NOI 2,831 2,894 2,915 2,897 3,096 2,527 3,464 3,547 3,539 3,285
Capex and LCs(148)(74)(108)(63)(226)(795)(48)(145)(28)(790)
Unlevered FCF 2,683 2,820 2,807 2,835 2,870 1,733 3,416 3,402 3,512 2,495
Toronto—Total NOI $180,270 $189,149 $190,529 $194,566 $206,470 $209,034 $216,235 $217,272 $213,557 $229,050
Capex and LCs(89,395)(22,638)(16,122)(22,979)(18,800)(16,147)(14,109)(13,686)(25,664)(28,730)
Unlevered FCF $90,875 $166,510 $174,407 $171,588 $187,671 $192,890 $202,128 $203,586 $187,893 $200,319
Note: Unlevered FCF is defined as NOI less capex and leasing costs. BACE capex includes $67MM development profit payment to BOPI upon stabilization of BACE (expected 2017E) Source: BOX Management projections (as per BOX 2017 Business Planning session), Company Disclosure, Greenhill Analysis
42
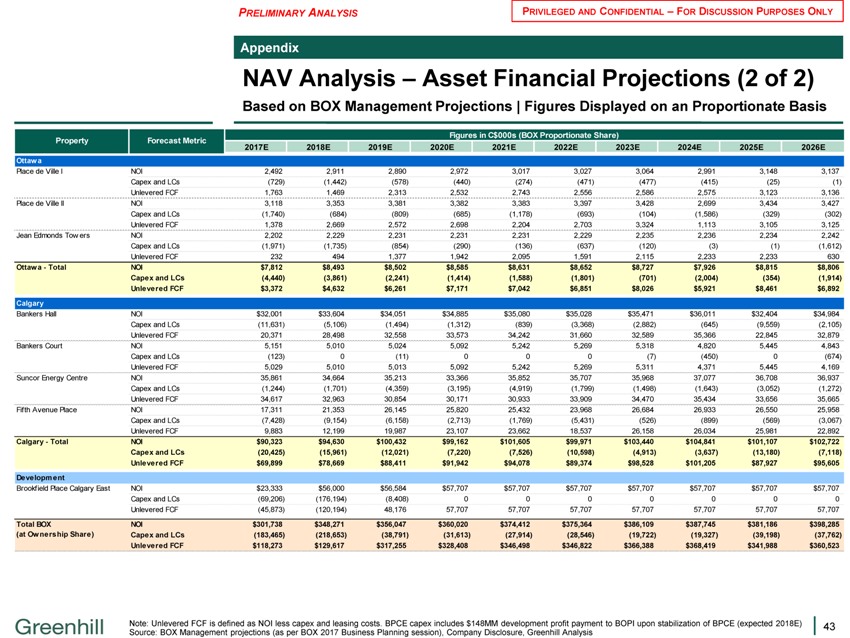
PRELIMINARY ANALYSIS PRIVILEGED AND CONFIDENTIAL – FOR DISCUSSION PURPOSES ONLY
Appendix
NAV Analysis – Asset Financial Projections (2 of 2)
Based on BOX Management Projections | Figures Displayed on an Proportionate Basis
Figures in C$000s (BOX Proportionate Share)
Property Forecast Metric
2017E 2018E 2019E 2020E 2021E 2022E 2023E 2024E 2025E 2026E
Ottaw a
Place de Ville I NOI 2,492 2,911 2,890 2,972 3,017 3,027 3,064 2,991 3,148 3,137
Capex and LCs(729)(1,442)(578)(440)(274)(471)(477)(415)(25)(1)
Unlevered FCF 1,763 1,469 2,313 2,532 2,743 2,556 2,586 2,575 3,123 3,136
Place de Ville II NOI 3,118 3,353 3,381 3,382 3,383 3,397 3,428 2,699 3,434 3,427
Capex and LCs(1,740)(684)(809)(685)(1,178)(693)(104)(1,586)(329)(302)
Unlevered FCF 1,378 2,669 2,572 2,698 2,204 2,703 3,324 1,113 3,105 3,125
Jean Edmonds Tow ers NOI 2,202 2,229 2,231 2,231 2,231 2,229 2,235 2,236 2,234 2,242
Capex and LCs(1,971)(1,735)(854)(290)(136)(637)(120)(3)(1)(1,612)
Unlevered FCF 232 494 1,377 1,942 2,095 1,591 2,115 2,233 2,233 630
Ottaw a—Total NOI $7,812 $8,493 $8,502 $8,585 $8,631 $8,652 $8,727 $7,926 $8,815 $8,806
Capex and LCs(4,440)(3,861)(2,241)(1,414)(1,588)(1,801)(701)(2,004)(354)(1,914)
Unlevered FCF $3,372 $4,632 $6,261 $7,171 $7,042 $6,851 $8,026 $5,921 $8,461 $6,892
Calgary
Bankers Hall NOI $32,001 $33,604 $34,051 $34,885 $35,080 $35,028 $35,471 $36,011 $32,404 $34,984
Capex and LCs(11,631)(5,106)(1,494)(1,312)(839)(3,368)(2,882)(645)(9,559)(2,105)
Unlevered FCF 20,371 28,498 32,558 33,573 34,242 31,660 32,589 35,366 22,845 32,879
Bankers Court NOI 5,151 5,010 5,024 5,092 5,242 5,269 5,318 4,820 5,445 4,843
Capex and LCs(123) 0(11) 0 0 0(7)(450) 0(674)
Unlevered FCF 5,029 5,010 5,013 5,092 5,242 5,269 5,311 4,371 5,445 4,169
Suncor Energy Centre NOI 35,861 34,664 35,213 33,366 35,852 35,707 35,968 37,077 36,708 36,937
Capex and LCs(1,244)(1,701)(4,359)(3,195)(4,919)(1,799)(1,498)(1,643)(3,052)(1,272)
Unlevered FCF 34,617 32,963 30,854 30,171 30,933 33,909 34,470 35,434 33,656 35,665
Fifth Avenue Place NOI 17,311 21,353 26,145 25,820 25,432 23,968 26,684 26,933 26,550 25,958
Capex and LCs(7,428)(9,154)(6,158)(2,713)(1,769)(5,431)(526)(899)(569)(3,067)
Unlevered FCF 9,883 12,199 19,987 23,107 23,662 18,537 26,158 26,034 25,981 22,892
Calgary—Total NOI $90,323 $94,630 $100,432 $99,162 $101,605 $99,971 $103,440 $104,841 $101,107 $102,722
Capex and LCs(20,425)(15,961)(12,021)(7,220)(7,526)(10,598)(4,913)(3,637)(13,180)(7,118)
Unlevered FCF $69,899 $78,669 $88,411 $91,942 $94,078 $89,374 $98,528 $101,205 $87,927 $95,605
Development
Brookfield Place Calgary East NOI $23,333 $56,000 $56,584 $57,707 $57,707 $57,707 $57,707 $57,707 $57,707 $57,707
Capex and LCs(69,206)(176,194)(8,408) 0 0 0 0 0 0 0
Unlevered FCF(45,873)(120,194) 48,176 57,707 57,707 57,707 57,707 57,707 57,707 57,707
Total BOX NOI $301,738 $348,271 $356,047 $360,020 $374,412 $375,364 $386,109 $387,745 $381,186 $398,285
(at Ow nership Share) Capex and LCs(183,465)(218,653)(38,791)(31,613)(27,914)(28,546)(19,722)(19,327)(39,198)(37,762)
Unlevered FCF $118,273 $129,617 $317,255 $328,408 $346,498 $346,822 $366,388 $368,419 $341,988 $360,523
Note: Unlevered FCF is defined as NOI less capex and leasing costs. BPCE capex includes $148MM development profit payment to BOPI upon stabilization of BPCE (expected 2018E) Source: BOX Management projections (as per BOX 2017 Business Planning session), Company Disclosure, Greenhill Analysis
43