Exhibit 99.1
|
|


STANDARD LITHIUM LTD.
NI 43 – 101 Technical Report
Preliminary Economic Assessment of LANXESS Smackover Project
Document No.: 207036-00088-00-PM-REP-0002
Suite 400, 165 – 3rd Avenue South
Saskatoon, SK S7K 1L8
Canada
Date: August 1, 2019
© Copyright 2019 Worley ACN 096 090 158. No part of this document or the information it contains may be reproduced or transmitted in any form or by any means electronic or mechanical, including photocopying, recording, or by any information storage and retrieval system, without permission in writing from Worley.
www.worley.com
Cautionary Note Regarding Forward-Looking Information
Information contained in this report and the documents referred to herein which are not statements of historical facts, may be “forward-looking information” for the purposes of Canadian Securities laws. Such forward looking information involves risks, uncertainties and other factors that could cause actual results, performance, prospects and opportunities to differ materially from those expressed or implied by such forward looking information. The words “expect”, “target”, “estimate”, “may”, “will”, and similar expressions identify forward-looking information.
These forward-looking statements relate to, among other things, resource estimates, grades and recoveries, development plans, mining methods and metrics including recovery process and, mining and production expectations including expected cash flows, capital cost estimates and expected life of mine, operating costs, the expected payback period, receipt of government approvals and licenses, time frame for construction, financial forecasts including net present value and internal rate of return estimates, tax and royalty rates, and other expected costs.
Forward-looking information is necessarily based upon a number of estimates and assumptions that, while considered reasonable, are inherently subject to significant political, business, economic and competitive uncertainties and contingencies. There may be factors that cause results, assumptions, performance, achievements, prospects or opportunities in future periods not to be as anticipated, estimated or intended.
There can be no assurances that forward-looking information and statements will prove to be accurate, as many factors and future events, both known and unknown could cause actual results, performance or achievements to vary or differ materially, from the results, performance or achievements that are or may be expressed or implied by such forward-looking statements contained herein or incorporated by reference. Accordingly, all such factors should be considered carefully when making decisions with respect to the Project, and prospective investors should not place undue reliance on forward-looking information. Forward-looking information in this technical report is as of the issue date, August 1, 2019. Standard Lithium Ltd. assumes no obligation to update or revise forward-looking information to reflect changes in assumptions, changes in circumstances or any other events affecting such forward-looking information, except as required by applicable law.
Important Notice
This Report, following National Instrument 43-101 rules and guidelines, was prepared for Standard Lithium Ltd. (Standard Lithium), by Worley, a division of WorleyParsons.
The quality of information, conclusions and estimates contained herein, is consistent with the level of effort involved in Worley’s services, and is based on the following:
| • | Information available at the time of preparation. |
| • | Data supplied by outside sources. |
| • | Assumptions, conditions, and qualifications set forth in this Report. |
| Preliminary Economic Assessment of LANXESS Smackover Project | 2 |
This Report can be filed as a Technical Report with Canadian Securities Regulatory Authorities pursuant to National Instrument 43 101, Standards of Disclosure for Mineral Projects.
Except for the purposes legislated under Canadian Securities laws, any other uses of this Report by any third party are at that party’s sole risk.
| Preliminary Economic Assessment of LANXESS Smackover Project | 3 |
Certificate of Qualified Person
To Accompany the Report titled “Preliminary Economic Assessment of the LANXESS Smackover Project, NI 43-101 Technical Report”.
I, Marek Dworzanowski, P.Eng., B.Sc. (Hons), FSAIMM, do hereby certify that:
| 1. | I am a self-employed consulting metallurgical engineer based in Trejouls, Department of Tarn & Garonne, France. |
| 2. | I graduated from the University of Leeds with a BSc Honours in Mineral Processing in 1980. |
| 3. | I am a registered Professional with ECSA under Registration No. 870480. |
| 4. | I have practiced as a metallurgical engineer for 38 years. |
| 5. | I have read the definition of “qualified person” set out in the National Instrument 43-101 and certify that, by reason of my education, affiliation with a professional association, and past relevant work experience, I fulfil the requirements to be an independent qualified person for the purposes of NI 43-101. |
| 6. | I am responsible for the preparation Sections 17 of this Technical Report. |
| 7. | I have had no prior involvement with the properties that are the subject of the Technical Report. |
| 8. | I have not visited the project site. |
| 9. | I have no personal knowledge as of the date of this certificate of any material fact or change, which is not reflected in this report. |
| 10. | Neither I, nor any affiliated entity of mine, is at present under an agreement, arrangement or understanding or expects to become an insider, associate, affiliated entity or employee of Standard Lithium Ltd., or any associated or affiliated entities. |
| 11. | Neither I, nor any affiliated entity of mine, own directly or indirectly, nor expect to receive, any interest in the properties or securities of Standard Lithium Ltd.., or any associated or affiliated companies. |
| 12. | I have read NI 43-101 and Form 43-101F1 and have prepared the technical report in compliance with NI 43-101 and Form 43-101F1. |
| 13. | I have prepared the report in conformity with the generally accepted Canadian Mining Industry practices and, as of the date of the certificate, to the best of my knowledge, information and belief, the technical report contains all scientific and technical information that is required to be disclosed to ensure the technical report is not misleading. |
| Preliminary Economic Assessment of LANXESS Smackover Project | 4 |
I consent to the filing of the PEA Report with any stock exchange and other regulatory authority and any publication by them for regulatory purposes, including electronic publication in the public company files on their websites accessible by the public.
Effective Date; 01 August 2019.
Trejouls, Tarn & Galonne, France
| ||
Marek Dworzanowski, P.Eng, B.Sc. (Hons), FSAIMM. |

| Preliminary Economic Assessment of LANXESS Smackover Project | 5 |
Certificate of Qualified Person
To Accompany the Report titled “Preliminary Economic Assessment of the LANXESS Smackover Project, NI 43-101 Technical Report”.
I, D. Roy Eccles, M.Sc., P.Geol., do hereby certify that:
| 1. | I am a Senior Consulting Geologist and Chief Operations Officer of APEX Geoscience Ltd., Suite 110, 8429 – 24th Street, Edmonton, AB, Canada, T6P 1L3. |
| 2. | I graduated from the University of Manitoba in Winnipeg, Manitoba with a B.Sc. in Geology, in1986 and from the University of Alberta in Edmonton, Alberta with a M.Sc. in Geology in 2004. |
| 3. | I am a registered Professional Geologist with the Association of Professional Engineers and Geoscientists (“APEGA”) of Alberta since 2003. under Registration No. 74150. |
| 4. | I have worked as a geologist for more than 25 years since my graduation from University and have been involved in all aspects of mineral exploration, mineral research and mineral resource estimations for metallic, industrial, specialty and rare-earth element mineral projects and deposits in Canada. I have explored for and prepared mineral resource estimates for lithium-brine projects in western Canada. |
| 5. | I have read the definition of “qualified person” set out in the National Instrument 43-101 and certify that, by reason of my education, affiliation with a professional association, and past relevant work experience, I fulfill the requirements to be an independent qualified person for the purposes of NI 43-101. |
| 6. | I am responsible for the preparation Sections 4 – 12 and 14 of this Technical Report |
| 7. | I have had no prior involvement with the properties that are the subject of the Technical Report. |
| 8. | I visited the LANXESS Property on July 24-25, 2018 and can verify the Li-brine mineralization and the infrastructure at the LANXESS Property, including brine supply wells, the pipeline network and tail-brine access points at the bromine operations. |
| 9. | I have no personal knowledge as of the date of this certificate of any material fact or change, which is not reflected in this report. |
| 10. | Neither I, nor any affiliated entity of mine, is at present under an agreement, arrangement or understanding or expects to become an insider, associate, affiliated entity or employee of Standard Lithium Ltd., or any associated or affiliated entities. I am independent of the issuer, the vendor and the Property applying all of the tests in section 1.5 of both NI 43-101 and 43-101CP. |
| 11. | Neither I, nor any affiliated entity of mine, own directly or indirectly, nor expect to receive, any interest in the properties or securities of Standard Lithium Ltd.., or any associated or affiliated companies. |
| 12. | I have read NI 43-101 and Form 43-101F1 and have prepared the technical report in compliance with NI 43-101 and Form 43-101F1. |
| 13. | I have prepared the report in conformity with the generally accepted Canadian Mining Industry practices and, as of the date of the certificate, to the best of my knowledge, information and belief, |
| Preliminary Economic Assessment of LANXESS Smackover Project | 6 |
the technical report contains all scientific and technical information that is required to be disclosed to ensure the technical report is not misleading.
I consent to the filing of the PEA Report with any stock exchange and other regulatory authority and any publication by them for regulatory purposes, including electronic publication in the public company files on their websites accessible by the public.
Effective Date; 01 August 2019.
Edmonton, Alberta, Canada
| ||
D. Roy Eccles, M.Sc., P.Geol. |

| Preliminary Economic Assessment of LANXESS Smackover Project | 7 |
Certificate of Qualified Person
To Accompany the Report titled “Preliminary Economic Assessment of the LANXESS Smackover Project, NI 43-101 Technical Report”.
I, Stanislaw Kotowski, P.Eng, M.Sc. do hereby certify that:
| 1. | I am a Project Director with Worley, 165 3rd Avenue South, Saskatoon, SK, S7K 1L8, Canada. |
| 2. | I graduated from the Warsaw University of Technology, Warsaw, Poland, with a Masters degree in Civil Engineering in 1978. |
| 3. | I am a registered Professional Engineer of the Association of Professional Engineers and Geoscientists of Saskatchewan, under Registration No. 6686. |
| 4. | I have practiced as a Professional Engineer for 25 years. |
| 5. | I have read the definition of “qualified person” set out in the National Instrument 43-101 and certify that, by reason of my education, affiliation with a professional association, and past relevant work experience, I fulfill the requirements to be an independent qualified person for the purposes of NI 43-101. |
| 6. | I am responsible for the preparation Sections 1 – 3, 16, and 18-27 of this Technical Report. |
| 7. | I have had no prior involvement with the properties that are the subject of the Technical Report. |
| 8. | I visited the site between 28-30, May 2019. |
| 9. | I have no personal knowledge as of the date of this certificate of any material fact or change, which is not reflected in this report. |
| 10. | Neither I, nor any affiliated entity of mine, is at present under an agreement, arrangement or understanding or expects to become an insider, associate, affiliated entity or employee of Standard Lithium Ltd., or any associated or affiliated entities. |
| 11. | Neither I, nor any affiliated entity of mine, own directly or indirectly, nor expect to receive, any interest in the properties or securities of Standard Lithium Ltd.., or any associated or affiliated companies. |
| 12. | I have read NI 43-101 and Form 43-101F1 and have prepared the technical report in compliance with NI 43-101 and Form 43-101F1. |
| 13. | I have prepared the report in conformity with the generally accepted Canadian Mining Industry practices and, as of the date of the certificate, to the best of my knowledge, information and belief, the technical report contains all scientific and technical information that is required to be disclosed to ensure the technical report is not misleading. |
| Preliminary Economic Assessment of LANXESS Smackover Project | 8 |
I consent to the filing of the PEA Report with any stock exchange and other regulatory authority and any publication by them for regulatory purposes, including electronic publication in the public company files on their websites accessible by the public.
Effective Date; 01 August 2019.
Saskatoon, Saskatchewan, Canada
|
| |
| Stanislaw Kotowski, P.Eng., M.Sc., Worley |


| Preliminary Economic Assessment of LANXESS Smackover Project | 9 |
Certificate of Qualified Person
To Accompany the Report titled “Preliminary Economic Assessment of the LANXESS Smackover Project, NI 43-101 Technical Report”.
I, Dr. Ronald Molnar, Ph.D., P.Eng., do hereby certify that:
| 1. | I am Owner and President of METNETH2O Inc., 1816 Parkwood Circle, Peterborough, ON, Canada, K9J 8C2 |
| 2. | I graduated with a B.Eng. in Metallurgy from McGill University in 1972 and a Ph.D. in Metallurgy from the Imperial College, Royal School of Mines, London, England in 1980. |
| 3. | I am and have been registered as a Professional Engineer with the Professional Engineers Ontario (PEO) since 2008, under Registration No. 100111288. |
| 4. | I have worked as a hydrometallurgist for over 35 years, including 30 years of experience in extraction of metals from aqueous solutions and purification of metallurgical solutions, since my graduation from university. I currently specialize in solvent extraction and ion exchange, test program design, Demonstration Plant design, and data analysis for bench-scale and Demonstration Plant programs. |
| 5. | I have read the definition of “qualified person” set out in the National Instrument 43-101 and certify that, by reason of my education, affiliation with a professional association, and past relevant work experience, I fulfill the requirements to be an independent qualified person for the purposes of NI 43-101. |
| 6. | I oversaw the preparation and am responsible for the technical information included in Section 13 (Mineral Processing and Metallurgical Testing) of the Technical Report. |
| 7. | I have had no prior involvement with the properties that are the subject of the Technical Report. |
| 8. | I have not visited the LANXESS Property with respect to this Technical Report. |
| 9. | I have no personal knowledge as of the date of this certificate of any material fact or change, which is not reflected in this report. |
| 10. | Neither I, nor any affiliated entity of mine, is at present under an agreement, arrangement or understanding or expects to become an insider, associate, affiliated entity or employee of Standard Lithium Ltd., or any associated or affiliated entities. |
| 11. | Neither I, nor any affiliated entity of mine, own directly or indirectly, nor expect to receive, any interest in the properties or securities of Standard Lithium Ltd.., or any associated or affiliated companies. |
| 12. | I have read NI 43-101 and Form 43-101F1 and have prepared the technical report in compliance with NI 43-101 and Form 43-101F1. |
| 13. | I have prepared the report in conformity with the generally accepted Canadian Mining Industry practices and, as of the date of the certificate, to the best of my knowledge, information and belief, the technical report contains all scientific and technical information that is required to be disclosed to ensure the technical report is not misleading. |
| Preliminary Economic Assessment of LANXESS Smackover Project | 10 |
I consent to the filing of the PEA Report with any stock exchange and other regulatory authority and any publication by them for regulatory purposes, including electronic publication in the public company files on their websites accessible by the public.
Effective Date; 01 August 2019.
Saskatoon, Saskatchewan, Canada

Ronald Molnar, Ph.D., P.Eng.
| Preliminary Economic Assessment of LANXESS Smackover Project | 11 |
Table of Contents
| Cautionary Note Regarding Forward-Looking Information | 2 | |||||||
| Important Notice | 2 | |||||||
1 | Executive Summary | 21 | ||||||
| 1.1 | Property Location and Description | 21 | ||||||
| 1.2 | Ownership and History | 21 | ||||||
| 1.3 | Geology and Mineralization | 21 | ||||||
| 1.4 | Recovery Method and Mineral Processing | 22 | ||||||
| 1.5 | Capital and Operating Cost Estimate | 22 | ||||||
1.5.1 CAPEX | 22 | |||||||
1.5.2 OPEX | 23 | |||||||
| 1.6 | Economic Analysis | 24 | ||||||
| 1.7 | Conclusions and Recommendations | 25 | ||||||
| 1.7.1 Key Study Conclusions | 25 | |||||||
| 1.7.2 Key Study Recommendations | 26 | |||||||
2 | Introduction | 27 | ||||||
| 2.1 | Terms of Reference and Purpose of Report | 27 | ||||||
| 2.2 | Qualified Persons | 27 | ||||||
| 2.3 | Personal Inspection of Property by Qualified Persons | 28 | ||||||
| 2.4 | Sources of Information | 28 | ||||||
| 2.5 | Currency, Abbreviations and Units of Measurement | 29 | ||||||
3 | Reliance on Other Experts | 36 | ||||||
| 3.1 | Taxes and Royalties | 36 | ||||||
4 | Property Description and Location | 37 | ||||||
| 4.1 | Property Description and Location | 37 | ||||||
| 4.2 | History of the LANXESS Property Land Title | 40 | ||||||
| 4.3 | Surface (and Mineral) Rights in Arkansas | 41 | ||||||
| 4.4 | Payments to Lessors | 42 | ||||||
| 4.5 | Overview of the Standard Lithium – LANXESS Agreements | 44 | ||||||
| 4.6 | Permitting and Environmental Approvals | 44 | ||||||
| 4.7 | Risks and Uncertainties | 45 | ||||||
5 | Accessibility, Climate, Local Resources, Infrastructure and Physiography | 46 | ||||||
| 5.1 | Accessibility | 46 | ||||||
| 5.1.1 Airport Access | 46 | |||||||
| 5.1.2 Rail Access | 46 | |||||||
| 5.1.3 Road Access | 46 | |||||||
| 5.2 | Climate | 48 | ||||||
| 5.3 | Local Resources and Infrastructure | 48 | ||||||
| Preliminary Economic Assessment of LANXESS Smackover Project | 12 |
| 5.3.1 Education | 48 | |||||||
| 5.3.2 Local Labour | 49 | |||||||
| 5.3.3 Transport | 49 | |||||||
| 5.3.4 Water | 49 | |||||||
| 5.3.5 Power | 49 | |||||||
| 5.3.6 Services | 49 | |||||||
| 5.4 | Physiography | 49 | ||||||
| 5.5 | Summary | 50 | ||||||
6 | History | 51 | ||||||
| 6.1 | Introduction to Brine Production in Arkansas | 51 | ||||||
| 6.2 | Regional Assessment of the Lithium Potential of the Smackover Formation Brine | 54 | ||||||
| 6.3 | LANXESS (within Property) Historical Infrastructure Summary | 60 | ||||||
| 6.4 | LANXESS (within Property) Historical Brine Analysis | 60 | ||||||
7 | Geological Setting and Mineralization | 63 | ||||||
| 7.1 | Gulf Coast Tectono-Depositional Framework | 63 | ||||||
| 7.2 | Triassic Jurassic Stratigraphy | 65 | ||||||
| 7.3 | Smackover Formation | 68 | ||||||
| 7.4 | Property Geology: Characterization of the Smackover Formation | 71 | ||||||
| 7.5 | Reynolds Member, Smackover Formation, Aquifer | 78 | ||||||
| 7.6 | Mineralization | 78 | ||||||
8 | Deposit Types | 79 | ||||||
9 | Exploration | 82 | ||||||
| 9.1 | Standard Lithium 2018-2019 Brine Sampling Programs | 82 | ||||||
| 9.1.1 Brine Supply Well Lithium Geochemical Results | 82 | |||||||
| 9.1.2 LANXESS Bromine Plant Lithium Geochemical Results | 85 | |||||||
| 9.2 | Preliminary Brine Testing at the Expanded South Unit | 93 | ||||||
10 | Drilling | 95 | ||||||
11 | Sample Preparation, Analysis and Security | 101 | ||||||
| 11.1 | Brine Sample Collection | 101 | ||||||
| 11.2 | Field Duplicate Samples, Sample Blanks and Standard Samples | 102 | ||||||
| 11.3 | Security | 103 | ||||||
| 11.4 | Analytical Methodology | 103 | ||||||
| 11.5 | Quality Control/Quality Assurance | 104 | ||||||
| 11.5.1 Field Duplicate Sample Comparison | 104 | |||||||
| 11.5.2 Standard Sample Blanks | 107 | |||||||
| 11.5.3 Standard Sample Spike Comparison | 107 | |||||||
11.6 | Temporal Assessment of Lithium Data | 112 | ||||||
11.7 | Other Data: LANXESS Proprietary Core Reports | 112 | ||||||
| Preliminary Economic Assessment of LANXESS Smackover Project | 13 |
| 11.8 | Summary | 112 | ||||||
12 | Data Verification | 114 | ||||||
13 | Mineral Processing and Metallurgical Testing | 116 | ||||||
| 13.1 | Introduction | 116 | ||||||
| 13.1.1 Process Selection Rationale | 116 | |||||||
| 13.1.2 Process Overview | 117 | |||||||
| 13.2 | Historical Testing | 119 | ||||||
| 13.3 | Lithium Extraction Bench-Scale Testing | 119 | ||||||
| 13.3.1 Findings from Bench-Scale Testing | 120 | |||||||
| 13.4 | Lithium Extraction Mini-Pilot Testing | 121 | ||||||
| 13.4.1 Findings from Mini-Pilot Testing | 122 | |||||||
| 13.5 | Lithium Chloride Conversion Testing | 123 | ||||||
| 13.5.1 Findings from Lithium Chloride Conversion Testing | 124 | |||||||
| 13.6 | Process Testing QA/QC | 124 | ||||||
| 13.7 | Process Scalability | 125 | ||||||
| 13.8 Process Technical Risks and Mitigation Measures | 125 | |||||||
| 13.9 | Conclusions | 126 | ||||||
14 | Mineral Resource Estimates | 128 | ||||||
| 14.1 Introduction and Resource Estimation Steps | 128 | |||||||
| 14.2 | Data | 130 | ||||||
| 14.2.1 Subsurface Geophysical Wireline and Seismic Data | 130 | |||||||
| 14.2.2 Lithium Assay Data | 130 | |||||||
| 14.2.3 Porosity and Permeability Data | 131 | |||||||
| 14.2.4 Data QA/QC | 131 | |||||||
| 14.3 | Step 1: Geometry of the Reynolds Member Domain | 132 | ||||||
| 14.4 Step 2: Estimate of Total Brine in the Reynolds Member Domain | 133 | |||||||
| 14.5 | Step 3: Hydrogeological Characterization of the Reynolds Member, Smackover Formation | 136 | ||||||
| 14.5.1 Porosity | 136 | |||||||
| 14.5.2 Permeability | 137 | |||||||
| 14.5.3 Dispersivity | 138 | |||||||
| 14.5.4 Anisotropy | 138 | |||||||
| 14.5.5 Groundwater Levels in the Reynolds Member | 140 | |||||||
| 14.5.6 Specific Storage and Storativity | 142 | |||||||
| 14.5.7 Hydraulic Conductivity and Transmissivity | 143 | |||||||
| 14.5.8 Summary of Hydrogeological Conditions | 144 | |||||||
| 14.6 | Step 4: Lithium-Brine Concentration | 144 | ||||||
| 14.7 | Mineral Resource Estimate | 145 | ||||||
| Preliminary Economic Assessment of LANXESS Smackover Project | 14 |
| 14.7.1 Definition of Mineral Resource | 145 | |||||||
| 14.7.2 Resource Classification Methodology | 146 | |||||||
| 14.7.3 Step 5: Evaluation of Reasonable Prospects for Economic Extraction | 148 | |||||||
| 14.7.4 Cut-off | 148 | |||||||
| 14.7.5 Step 6: Mineral Resource Reporting: Indicated LANXESS Lithium-Brine Resource Estimate | 149 | |||||||
15 | Mineral Reserves | 152 | ||||||
16 | Mining Methods | 153 | ||||||
| 16.1 | General Description | 153 | ||||||
| 16.2 | Mining Method | 153 | ||||||
| 16.3 | Brine Production Estimate | 156 | ||||||
17 | Recovery Methods | 159 | ||||||
| 17.1 | Production of Purified Lithium Chloride Solution | 159 | ||||||
| 17.1.1 Preparation of the Feed Solution | 160 | |||||||
| 17.1.2 Lithium Extraction Process | 160 | |||||||
| 17.1.3 Lithium Adsorbent Stripping and Regeneration Process | 162 | |||||||
| 17.1.4 Pregnant Strip Solution (Lithium Chloride) Purification | 162 | |||||||
| 17.2 | Production of Lithium Carbonate | 162 | ||||||
18 | Infrastructure | 165 | ||||||
| 18.1 | Introduction | 165 | ||||||
| 18.2 | Brine Supply | 165 | ||||||
| 18.3 | South Plant | 165 | ||||||
| 18.4 | West Plant | 165 | ||||||
| 18.5 | Central Plant | 167 | ||||||
| 18.6 | Process Control Systems | 168 | ||||||
| 18.7 | On Site Infrastructure and Auxiliaries | 169 | ||||||
| 18.7.1 Feedstock and Return Brine Pipelines | 169 | |||||||
| 18.7.2 Water Supply and Distribution | 169 | |||||||
| 18.7.3 Power Generation | 169 | |||||||
| 18.7.4 Fuel, Chemicals and Reagents | 170 | |||||||
| 18.7.5 Compressed Air | 170 | |||||||
| 18.7.6 Auxiliary Facilities | 170 | |||||||
19 | Market Studies and Contracts | 171 | ||||||
| 19.1 | Lithium Carbonate Applications | 171 | ||||||
| 19.2 | Lithium Carbonate Demand | 171 | ||||||
| 19.3 | Lithium Carbonate Supply | 172 | ||||||
| 19.4 | Lithium Carbonate Price | 173 | ||||||
| 19.5 | Off-Take Contracts | 173 | ||||||
| Preliminary Economic Assessment of LANXESS Smackover Project | 15 |
20 | Environmental Studies, Permitting and Social or Community Impact | 174 | ||||||
| 20.1 | Introduction | 174 | ||||||
| 20.2 | Environmental Considerations | 174 | ||||||
| 20.3 | Permitting Overview | 175 | ||||||
| 20.4 | Operating Permits | 176 | ||||||
| 20.4.1 Title V Air Permits | 179 | |||||||
| 20.4.2 Underground Injection Control (UIC) Permits | 179 | |||||||
| 20.4.3 National Pollution Discharge Elimination System | 180 | |||||||
| 20.4.4 Resource Conservation and Recovery Act Subtitle C Treatment, Storage and Disposal Permit | 180 | |||||||
| 20.5 | Potential Construction Permits, Approvals, and Plans | 180 | ||||||
| 20.6 | Social Impact | 181 | ||||||
| 20.7 | Environmental Management and Closure Plan | 181 | ||||||
21 | Capital and Operating Costs | 182 | ||||||
| 21.1 | Capital Cost Estimate – CAPEX | 182 | ||||||
| 21.1.1 Basis of Estimate | 182 | |||||||
| 21.1.2 CAPEX Estimate | 185 | |||||||
| 21.2 | Operating Expenditures (OPEX) | 187 | ||||||
| 21.2.1 Direct Operational Expenditures | 187 | |||||||
| 21.2.2 OPEX Summary | 198 | |||||||
22 | Economic Analysis | 200 | ||||||
| 22.1 | Evaluation Criteria | 200 | ||||||
| 22.2 | Taxes & Royalties | 200 | ||||||
| 22.2.1 Royalty | 200 | |||||||
| 22.2.2 Mining Licenses | 200 | |||||||
| 22.2.3 Capital Allowance | 201 | |||||||
| 22.2.4 Corporate Taxes | 201 | |||||||
| 22.3 | CAPEX Spend Schedule | 201 | ||||||
| 22.3.1 Lithium Carbonate Production Schedule | 201 | |||||||
| 22.4 | Production Revenues | 201 | ||||||
| 22.5 | Cash-Flow Projection | 201 | ||||||
| 22.6 | Economic Evaluation Results | 203 | ||||||
| 22.7 | Sensitivity Analysis | 203 | ||||||
| 22.8 | Conclusions | 207 | ||||||
23 | Adjacent Properties | 209 | ||||||
24 | Other Relevant Data and Information | 210 | ||||||
| 24.1 | Introduction | 210 | ||||||
| 24.2 | Execution Strategy | 210 | ||||||
| Preliminary Economic Assessment of LANXESS Smackover Project | 16 |
| 24.3 | Project Development Plan | 210 | ||||||||
| 24.4 | Project Schedule | 211 | ||||||||
| 24.5 | Risk Assessment Summary | 211 | ||||||||
25 | Interpretations and Conclusions | 216 | ||||||||
| 25.1 | Geology and Resource Estimate | 216 | ||||||||
| 25.2 | Mineral Processing and Plant Designs | 216 | ||||||||
| 25.2.1 Lithium Chloride Plants | 216 | |||||||||
| 25.2.2 Lithium Carbonate Plant | 217 | |||||||||
| 25.3 | Market and Lithium Carbonate Price | 217 | ||||||||
| 25.4 | CAPEX and OPEX | 217 | ||||||||
| 25.5 | Economic Analysis | 218 | ||||||||
26 | Recommendations | 219 | ||||||||
| 26.1 | Geology and Resource Estimate | 219 | ||||||||
| 26.2 | Mineral Reserves Estimate and Mining Plan | 219 | ||||||||
| 26.3 | Process and Economics | 219 | ||||||||
| 26.4 | Further Work | 220 | ||||||||
27 | References | 221 | ||||||||
List of Tables
Table 1-1 CAPEX Summary | 22 | |||
Table 1-2 Annual Operating Cost Summary | 23 | |||
Table 1-3 Economic Evaluation—Case 1 (Base Case) Summary | 24 | |||
Table 2-1 Qualified Persons and their Responsibilities | 27 | |||
Table 2-2 Contributor Sub-Consultants | 29 | |||
Table 2-3 Abbreviations | 29 | |||
Table 2-4 Units of Measurement | 32 | |||
Table 2-5 Minerals | 34 | |||
Table 4-1 Description of LANXESS Unitized and Non-Unitized Land Holdings | 38 | |||
Table 6-1 Southern Arkansas Brine 2017 Brine Production (AOGC 2018b) | 53 | |||
Table 6-2 LANXESS Annual Brine Production and Injection Data (US BBLS) (AOGC 2018b) | 55 | |||
Table 6-3 Summary of Historical Brine Analyses (LANXESS 1990, 2010 and 2017) | 62 | |||
Table 9-1 WetLab Lithium Analytical Results (mg/L – South Unit Brine Supply Well Geochemical Summary) | 86 | |||
Table 9-2 WetLab Lithium Analytical Results (mg/L) – Central Unit Brine Supply Well Geochemical Summary | 86 | |||
Table 9-3 WetLab Lithium Analytical Results (mg/L) – West Unit Brine Supply Well Geochemical Summary | 87 | |||
Table 9-4 South Plant WetLab Lithium Analytical Results | 89 | |||
Table 9-5 Central Plant WetLab Lithium Analytical Results | 89 |
| Preliminary Economic Assessment of LANXESS Smackover Project | 17 |
Table 9-6 West Plant WetLab Lithium Analytical Results | 90 | |||
Table 9-7 New (2019) Brine Supply Wells in the South Unit Area | 94 | |||
Table 9-8 South Plant Analytical Results with Inclusion of the New Brine Supply Wells Li (mg/L) | 94 | |||
Table 10-1 Description of Brine Supply Wells at the LANXESS Property | 96 | |||
Table 10-2 Summary of Brine Supply Well Completion Intervals at the LANXESS Property | 99 | |||
Table 11-1 Comparison of Lithium Values for 14 Duplicate Pairs | 106 | |||
Table 11-2 UBC Standard | 109 | |||
Table 11-3 Internal Standard | 110 | |||
Table 13-1 Average Tail-Brine Composition from LANXESS Bromine Plants and Standard Lithium Testing Feeds | 120 | |||
Table 14-1 Total Brine Volume within the Reynolds Member Domain at the LANXESS Property | 136 | |||
Table 14-2 Summary of Smackover Formation Porosity (Manager 1963) | 139 | |||
Table 14-3 Summary of Historical Permeability Values for the Smackover Formation | 140 | |||
Table 14-4 Original Reservoir Data from Smackover Formation-Oilfields in Southern Arkansas (Francher and MacKay 1946) | 141 | |||
Table 14-5 Representative Values of Specific Storage for Various Geological Materials (Domenico and Mifflin 1965; Batu 1998) | 142 | |||
Table 14-6 Summary of the 2018-2019 Geochemical Lithium Data at the LANXESS Property (shaded brine supply well data represents the lithium concentrations used in the resource estimation) | 147 | |||
Table 14-7 Indicated LANXESS Lithium-Brine Resource Estimate | 150 | |||
Table 16-1 Annual Brine Well Production Rates | 156 | |||
Table 16-2 Annualized Production Summary (US Units) | 156 | |||
Table 16-3 Annualized Production Summary (metric) | 157 | |||
Table 16-4 Annualized Production Summary (US Units) | 158 | |||
Table 17-1 Composition of the De-Brominated Tail Brine (feed to lithium extraction process) | 160 | |||
Table 20-1 Typical Processing Times for Modification or Issuance of New Permits | 176 | |||
Table 20-2 Existing Permits for Central, South and West Units | 176 | |||
Table 21-1 Lang Factors as per AACE 59R-10 (2011) for “Fluid Processing | 183 | |||
Table 21-2 Phased Production | 184 | |||
Table 21-3 Phase 1 CAPEX | 185 | |||
Table 21-4 Phase 2 CAPEX | 186 | |||
Table 21-5 Phase 3 CAPEX | 186 | |||
Table 21-6 CAPEX Summary | 187 | |||
Table 21-7 Manpower Unit Costs | 188 | |||
Table 21-8 Management Personnel | 189 | |||
Table 21-9 Production Personnel | 189 | |||
Table 21-10 Administration Personnel | 190 | |||
Table 21-11 QC and Lab Personnel | 191 | |||
Table 21-12 Maintenance Personnel | 191 | |||
Table 21-13 Service Personnel | 192 | |||
Table 21-14 Manpower Cost Summary | 192 |
| Preliminary Economic Assessment of LANXESS Smackover Project | 18 |
Table 21-15 Electrical Use and Cost | 192 | |||
Table 21-16 Reagents Cost Per Tonne of Li2CO3 | 194 | |||
Table 21-17 Reagents Cost Summary | 194 | |||
Table 21-18 Process Water Use | 195 | |||
Table 21-19 Natural Gas Use | 195 | |||
Table 21-20 Sustaining Capital Cost | 196 | |||
Table 21-21 Miscellaneous Direct Operational Costs | 197 | |||
Table 21-22 Indirect Operational Costs | 198 | |||
Table 21-23 Annual Operating Cost Summary | 198 | |||
Table 22-1 Annual Operating Cost Summary | 202 | |||
Table 22-2 Economic Evaluation—Case 1 (Base Case) Summary | 203 | |||
Table 22-3 Sensitivity Analysis to CAPEX Variation | 204 | |||
Table 22-4 Sensitivity Analysis to OPEX Variation | 204 | |||
Table 22-5 Sensitivity Analysis to Product Price Variation | 205 | |||
Table 24-1 Risk Review Summary—Threats | 214 | |||
Table 24-2 Risk Review Summary—Opportunities | 215 |
List of figures
Figure 4-1 General Location of LANXESS Property | 37 | |||
Figure 4-2 Overview of the LANXESS Property | 39 | |||
Figure 5-1 LANXESS Project Access Routes | 47 | |||
Figure 5-2 Average Temperature and Precipitation at El Dorado, AR | 48 | |||
Figure 6-1 Summary of South Arkansas Oil, Gas and Brine Production (1960-2017) (AOGC 2018b) | 52 | |||
Figure 6-2 Regional Smackover Formation Lithium Brine Values from the USGS National Produced Waters | ||||
Database (Blondes et. al. 2016) | 57 | |||
Figure 6-3 Smackover Formation Lithium Brine Values Derived within, and Adjacent to, the LANXESS | ||||
Property (Blondes, et.al. 2016) | 59 | |||
Figure 7-1 Tectonic Framework of the Northern Part of the Gulf of Mexico Region (Marcini et.al. 2008, who modified the work of MacRai and Watkins (1996)). | 64 | |||
Figure 7-2 Regional Map of Smackover Lithofacies Belts in the U.S. Gulf Coast Basin (Handford and Baria | ||||
(2007), who modified the work of Ahr (1973) and Bishop (1986)). | 65 | |||
Figure 7-3 Stratigraphic Table of the Late Triassic to Late Jurassic Formations of the Northern U.S. Gulf | ||||
Coast (Heydari and Baria 2005). | 66 | |||
Figure 7-4 Stratigraphic Depositional Environments of the Smackover Formation | 69 | |||
Figure 7-5 Smackover Formation Section Depicting Resource Estimation Zones used in this Technical Report | 73 | |||
Figure 7-6 Wells Selected for Study and Location of Cross-Sections | 74 | |||
Figure 7-7 North-South Cross-Sections of the Smackover Formation and Associated Geological Units in the | ||||
LANXESS Property Area | 75 |
| Preliminary Economic Assessment of LANXESS Smackover Project | 19 |
Figure 7-8 West-East Cross-Section of the Smackover Formation and Associated Geological Units in the LANXESS Property Area | 76 | |||
Figure 7-9 Example of Proprietary 2D Seismic Data, Showing Seismogram Tie (red) and Uniform Horizons Near the Reynolds Member Smackover Formation | 77 | |||
Figure 9-1 Active Brine Supply Wells at the LANXESS Property | 83 | |||
Figure 9-2 Locations of Brine Supply Well Samples Collected during 2018 Brine Sampling Program | 84 | |||
Figure 9-3 Temporal Variation of Lithium in Smackover Brine from the Individual Brine Supply Wells at the LANXESS Property | 88 | |||
Figure 11-1 Graphical Assessment of the Original-Duplicate Sample Pairs. A-D) Bi-variate Plots of the Original versus Duplicate Analytical Results of Selected Elements. E) Half Absolute Relative Difference (HARD) Graph | 105 | |||
Figure 11-2 Control Graphs of Standard Sample Spike Lithium Measurements (solid line) | 111 | |||
Figure 13-1 LANXESS Smackover Lithium Brine Project Flowsheet Schematic | 118 | |||
Figure 14-1 Orthogonal View of Property Boundary (blue line), Drillhole Collars (circles), Drillhole Traces (black lines), and Interpreted Reynolds Member (orange solid). Vertical exaggeration of 5.1 | 134 | |||
Figure 16-1 Typical Brine Supply Well | 154 | |||
Figure 16-2 Oil Separator at Brine Supply Well | 154 | |||
Figure 16-3 Block Flow Diagram of the Process at the Brine Supply Wells | 155 | |||
Figure 16-4 Typical Reinjection Well | 155 | |||
Figure 17-1 Overall BFD of Lithium Carbonate Production from Tail-Brine after Bromine Extraction | 159 | |||
Figure 17-2 BFD of Lithium Extraction Process (Lithium Chloride Plant) | 161 | |||
Figure 17-3 BFD of Lithium Carbonate Plant | 163 | |||
Figure 18-1 Conceptual Layout of Facilities at South Plant | 166 | |||
Figure 18-2 Conceptual Layout of Facilities at West Plant | 167 | |||
Figure 18-3 Conceptual Layout of Facilities at Central Plant | 168 | |||
Figure 19-1 Projected Demand for Lithium (in tonnes of LCE) | 171 | |||
Figure 19-2 Production of Lithium 2008-2018 in tonnes of LCE | 172 | |||
Figure 22-1 NPV Post Tax Sensitivity | 205 | |||
Figure 22-2 NPV Pre-Tax Sensitivity | 206 | |||
Figure 22-3 IRR Post-Tax Sensitivity | 206 | |||
Figure 22-4 IRR Pre-Tax Sensitivity | 207 | |||
Figure 23-1 Location of Brine Producers in Southern Arkansas | 209 | |||
Figure 24-1 Project Schedule | 211 | |||
Figure 24-2 Risk Matrix | 213 |
| Preliminary Economic Assessment of LANXESS Smackover Project | 20 |
| 1 | Executive Summary |
| 1.1 | Property Location and Description |
The LANXESS Property is located south and west of the City of El Dorado in Union County, AR, U.S.A. The southern and western edges of the Property border the State of Louisiana (LA) and Columbia County, respectively. The Property encompasses Townships 16-19 South, and Ranges 15-18, West of the 5th Meridian (W5M). The Property centre is at UTM 520600 Easting, 3670000 Northing, Zone 15N, NAD83.
| 1.2 | Ownership and History |
The LANXESS Property is presently owned by Lanxess Aktiengesellschaft (LANXESS), a specialty chemicals company based in Cologne, Germany. Presently, LANXESS is listed in the Dow Jones Sustainability Index and FTSE4Good Index.
LANXESS owns 100% of the brine leases and brine rights on their properties, either by an executed brine lease or by operation of law, as a result of unitization by the AOGC. The land package, which is indicated on Figure 4-2, consists of 150,081.81 acres that cover over 607 km2. Of the total land package, 142,881.81 acres are ‘Unitized’ and approximately 7,200 acres occur outside the Unit boundaries (Non-Unitized).
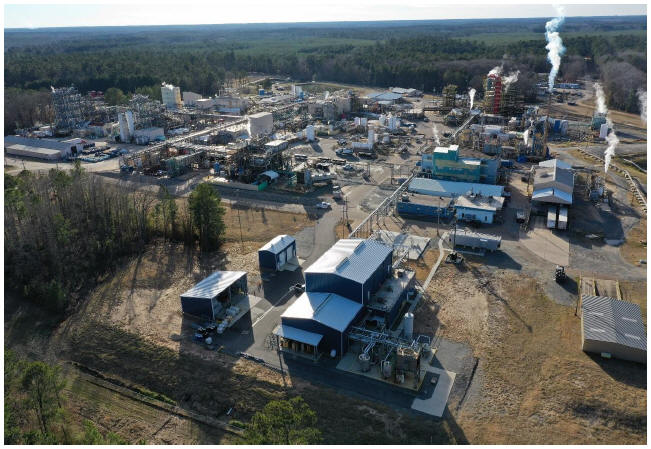
Each Unit (South, Central and West) has their own brine supply wells, pipeline network and bromine processing (separation) infrastructure. The facilities and their locations, which are 100% owned and operated by Great Lakes Chemical Corporation, a wholly-owned subsidiary of LANXESS, are as follows:
South Unit (South Plant): 324 Southfield Cutoff, El Dorado, AR 71730;
Central Unit (Central Plant): 2226 Haynesville Highway (HWY 15S), El Dorado, AR 71731; and
West Unit (West Plant): 5821 Shuler Road, Magnolia, AR 71731.
| 1.3 | Geology and Mineralization |
The authors have reclassified the LANXESS Li-Brine Resource from an Inferred Mineral Resource to an Indicated Mineral Resource in the current Technical Report.
The average lithium concentration used in the resource calculation is 168 mg/L Li. Resources have been estimated using a cut-off grade of 100 mg/L lithium.
The total Indicated LANXESS Li-Brine Resource for the South, Central and West brine units is estimated at 590,000 tonnes of elemental Li. The total lithium carbonate equivalent (LCE) for the main resource is 3,140,000 tonnes LCE. With a planned level of production of 20,900 tonnes per year (tpy) of LCE, the resources will exceed the planned 25 years of operation by a significant margin. Mineral resources are
| Preliminary Economic Assessment of LANXESS Smackover Project | 21 |
not mineral reserves and do not have demonstrated economic viability. There is no guarantee that all, or any part, of the mineral resource will be converted into a mineral reserve.
| 1.4 | Recovery Method and Mineral Processing |
Standard Lithium’s objective is to produce battery-grade lithium carbonate from the tail-brine that exits the LANXESS bromine extraction operations. There are three (3) bromine extraction operations that will be used for lithium extraction (South, Central and West). Each facility will have its own primary lithium chloride extraction plant, which will produce purified and concentrated lithium chloride solutions. These solutions will be conveyed, via pipelines, to one location (Central Plant) for further processing to the final product—lithium carbonate. The total lithium carbonate production is 20,900 tpy. The final product lithium recovery is about 90%.
The production process parameters are supported by bench scale metallurgical testing and mini-pilot plant testing program results.
| 1.5 | Capital and Operating Cost Estimate |
1.5.1 CAPEX
Capital expenditures are based on an operating capacity of 20,900 tpy of battery grade lithium carbonate. Capital equipment costs have been obtained from in-house data and solicited budget price information. The estimate is compliant to the AACE International Class 5 standard. The accuracy of this estimate is expected to be within a -30% / +50% range.
The production process parameters are supported by bench scale metallurgical testing and mini-pilot plant testing program results.
Table 1-1 CAPEX Summary
Stage of | Description | Cost (US$) | ||||
| South Lithium Chloride Plant | 106,886,000 | |||||
Phase 1 | ||||||
| Central Lithium Carbonate Plant – Train No 1 | 27,711,000 | |||||
| Pipelines | 2,340,000 | |||||
| Contingency 25% | 34,234,000 | |||||
|
| |||||
Phase 1 Subtotal | 171,171,000 | |||||
|
| |||||
| Preliminary Economic Assessment of LANXESS Smackover Project | 22 |
Stage of | Description | Cost (US$) | ||||
| West Lithium Chloride Plant | 99,393,000 | |||||
Phase 2 | ||||||
| Central Lithium Carbonate Plant – Train No 2 | 25,769,000 | |||||
| Pipelines | 3,780,000 | |||||
| Contingency 25% | 32,236,000 | |||||
Phase 2 Subtotal | 161,178,000 | |||||
| Central Lithium Chloride Plant | 66,589,000 | |||||
Phase 3 | ||||||
| Central Lithium Carbonate Plant – Train No 3 | 17,261,000 | |||||
| Contingency 25% | 20,963,000 | |||||
|
| |||||
Phase 3 Subtotal | 104,813,000 | |||||
|
| |||||
CAPEX TOTAL | 437,162,000 | |||||
|
| |||||
| 1.5.2 | OPEX |
Operating expenditures are based on a phased development with an increasing lithium carbonate production capacity: Phase 1: 9,700 tpy, Phase 2: 8,200 tpy, Phase 3: 3,000 tpy. The OPEX summary (rounded to ‘000) is presented in Table 1-2.
Table 1-2 Annual Operating Cost Summary
Description | Phase 1 (US$) | Phase 2 (US$) | Phase 3 (US$) | |||||||||
Manpower | 3,745,000 | 5,680,000 | 6,710,000 | |||||||||
Electrical Power | 4,040,000 | 7,306,000 | 9,097,000 | |||||||||
Reagents & Consumables | 30,138,000 | 55,615,000 | 64,936,000 | |||||||||
Water | 496,000 | 916,000 | 1,070,000 | |||||||||
Natural Gas | 582,000 | 1,074,000 | 1,254,000 | |||||||||
Miscellaneous Direct Expenditures | 605,000 | 1,098,000 | 1,299,000 | |||||||||
| Preliminary Economic Assessment of LANXESS Smackover Project | 23 |
Description | Phase 1 | Phase 2 | Phase 3 | |||||||||
| (US$) | (US$) | (US$) | ||||||||||
Sustaining Capital Cost | 1,199,000 | 2,314,000 | 3,061,000 | |||||||||
Brine Transportation | 48,000 | 123,000 | 123,000 | |||||||||
Land lease | 100,000 | 200,000 | 300,000 | |||||||||
Subtotal | 40,953,000 | 74,326,000 | 87,849,000 | |||||||||
Indirect Operational Expenditures | 1,009,000 | 1,901,000 | 2,410,000 | |||||||||
TOTAL | 41,962,000 | 76,227,000 | 90,259,000 | |||||||||
Note: OPEX per one metric tonne of production is US$4,319.
| 1.6 | Economic Analysis |
The project economics assumed a three-year rolling average price of US$13,550/t for the lithium carbonate product. The results for IRR and NPV from the assumed CAPEX, OPEX and price scenario at full production, are presented in Table 1-3.
Table 1-3 Economic Evaluation - Case 1 (Base Case) Summary
Overview | Units | Values | Comments | |||||
Production | tpy | 20,900 | At completion of Phase 3 production | |||||
Plant Operation | years | 25 | From the start of Phase 1 production | |||||
Capital Cost (CAPEX) | US$ | 437,162,000 | ||||||
Annual Operating Cost (OPEX) | US$ | 90,259,000 | At completion of Phase 3 production | |||||
Average Selling Price | US$/t | 13,550 | ||||||
Annual Revenue | US$ | 283,195,000 | ||||||
Discount Rate | % | 8 | ||||||
Net Present Value (NPV) Post-Tax | US$ | 989,432,000 | ||||||
Net Present Value (NPV) Pre-Tax | US$ | 1,304,766,000 | ||||||
| Preliminary Economic Assessment of LANXESS Smackover Project | 24 |
Overview | Units | Values | Comments | |||||||||
Internal Rate of Return (IRR) Post-Tax | % | 36.0 | ||||||||||
Internal Rate of Return (IRR) Pre-Tax % | % | 41.8 | ||||||||||
Post-Tax Sensitivity Analysis:
| • | The sensitivity analysis at discount rate of 8% indicates that the Project is economically viable under the base case conditions where the NPV and IRR are very positive. |
| • | Project economics are sensitive to the variations in the product selling price. A change in the selling price by +/- 20% changes the value of NPV by +/- 43% and value of IRR by +/- 32%. |
| • | The Project is moderately sensitive to variations in the OPEX. A change in the OPEX by +/- 20% changes the value of NPV by +/- 14% and value of IRR by +/-10%. |
| • | The Project economics are relatively insensitive to the increase or decrease of CAPEX. A change in the CAPEX by +/- 20% changes the value of NPV by +/- 1% and value of IRR of less than +/- 1%. |
| • | The cost of reagents is approximately 72% of the OPEX. The remaining components of the operating cost have significantly lower impact on the overall economics. |
| 1.7 | Conclusions and Recommendations |
| 1.7.1 | Key Study Conclusions |
| • | The total Indicated LANXESS Li-Brine Resource is estimated at 3,140,000 tonnes of LCE. The volume of resources will allow the lithium bearing brine extraction operations to continue well beyond the currently assumed 25 years. |
| • | The results of the geological evaluation and resource estimates for the Preliminary Economic Assessment of LANXESS Smackover Project justifies development of the project to further evaluate the feasibility of production of lithium carbonate. |
| • | The experience gained from the long-term operations of the brine extraction and processing facilities on the LANXESS controlled properties decreases the risk related to sustainability of the brine extraction from the Smackover Formation. |
| • | The well-developed infrastructure and availability of a qualified work force will decrease the risks related to construction, and commissioning and operating of the lithium extraction and lithium carbonate processing plants. |
| • | The results of the bench scale testing and mini-plant process testing program increase the level of confidence in the key parameters for the operating cost estimate. |
| • | Improvements made to process efficiency, particularly the reduction of reagents and chemicals consumption, will improve the economics of the Project. |
| Preliminary Economic Assessment of LANXESS Smackover Project | 25 |
| • | The discounted cash flow economic analysis, at a discount rate of 8%, indicates that the Project is economically viable under the base case conditions. The key economic indicators, NPV = US$989,432,000 (post-tax) and IRR = 36% (post-tax), are very positive. |
| 1.7.2 | Key Study Recommendations |
| • | The LANXESS Li-brine resource estimate should be upgraded from the current classification of “Indicated” to “Measured”, as classified according to CIM (2014) definition standards. |
| • | The sampling and testing program should be continued to allow for the most updated calculation of the lithium concentration to be used in the resource estimate calculation. |
| • | The testing program should address the opportunities to reduce the usage of reagents for production of lithium chloride to lower the operating cost. |
| • | The large Demonstration Plant scheduled for deployment in late-2019 at the South Plant should be used to collect as much data as possible to inform the next phases of study. |
| • | Complete an evaluation of the SiFT process to produce battery quality lithium carbonate vs. the traditional OEM process used in this PEA. |
| • | On completion of the PEA, the project should progress to a NI 43-101 compliant PFS. |
| Preliminary Economic Assessment of LANXESS Smackover Project | 26 |
| 2 | Introduction |
| 2.1 | Terms of Reference and Purpose of Report |
This Technical Report was prepared by Worley, at the request of Standard Lithium Ltd. (Standard Lithium), for a Preliminary Economic Assessment (PEA) of the LANXESS Smackover Project, located in Arkansas, USA. Standard Lithium is a publicly traded company, with its head office located in Vancouver, British Columbia.
| 2.2 | Qualified Persons |
Table 2-1 presents the list of Qualified Persons (QPs) for the Technical Report, and their responsibilities.
Table 2-1 Qualified Persons and their Responsibilities
Report Section | Qualified Person | Company | ||
| Section 1 Summary | Stan Kotowski | Worley | ||
| Section 2 Introduction | Stan Kotowski | Worley | ||
| Section 3 Reliance on Other Experts | Stan Kotowski | Worley | ||
| Section 4 Property Description and Location | Roy Eccles | APEX Geoscience Ltd. | ||
| Section 5 Accessibility, Climate, Local Resources, Infrastructure and Physiography | Roy Eccles | APEX Geoscience Ltd. | ||
| Section 6 History | Roy Eccles | APEX Geoscience Ltd. | ||
| Section 7 Geological Setting and Mineralization | Roy Eccles | APEX Geoscience Ltd. | ||
| Section 8 Deposit Types | Roy Eccles | APEX Geoscience Ltd. | ||
| Section 9 Exploration | Roy Eccles | APEX Geoscience Ltd. | ||
| Section 10 Drilling | Roy Eccles | APEX Geoscience Ltd. | ||
| Section 11 Sample Preparation, Analyses and Security | Roy Eccles | APEX Geoscience Ltd. | ||
| Section 12 Data Verification | Roy Eccles | APEX Geoscience Ltd. | ||
| Section 13 Mineral Processing and Metallurgical Testing | Dr. Ron Molnar | METNETH2O Inc. | ||
| Section 14 Mineral Resource Estimate | Roy Eccles | APEX Geoscience Ltd. | ||
| Section 15 Mineral Reserve Estimates | N/A | N/A | ||
| Section 16 Mining Methods | Stan Kotowski | Worley | ||
| Preliminary Economic Assessment of LANXESS Smackover Project | 27 |
Report Section | Qualified Person | Company | ||
| Section 17 Recovery Methods | Marek Dworzanowski | Worley | ||
| Section 18 Infrastructure | Stan Kotowski | Worley | ||
| Section 19 Market Studies and Contracts | Stan Kotowski | Worley | ||
| Section 20 Environmental Studies, Permitting and Social or Community Impact | Stan Kotowski | Worley | ||
| Section 21 Capital and Operating Costs | Stan Kotowski | Worley | ||
| Section 22 Economic Analysis | Stan Kotowski | Worley | ||
| Section 23 Adjacent Properties | Stan Kotowski | Worley | ||
| Section 24 Other Relevant Information | Stan Kotowski | Worley | ||
| Section 25 Interpretation and Conclusions | Stan Kotowski | Worley | ||
| Section 26 Recommendations | Stan Kotowski | Worley | ||
| Section 27 References | Stan Kotowski | Worley | ||
| 2.3 | Personal Inspection of Property by Qualified Persons |
The following QPs personally inspected the Standard Lithium Project site on the dates indicated:
| • | Stan Kotowski, P.Eng., visited the Standard Lithium Project site on May 28 and 29, 2019, where he, along with LANXESS senior management, identified proposed site locations for the lithium chloride (LiCl) and lithium carbonate (Li2CO3) plants at all three LANXESS bromine plant locations. During this visit Stan inspected the LANXESS Property brine extraction wells, supply pipelines, injection wells, feed-brine and tail-brine pipeline tie-in points, LANXESS electrical substation and off-site road access to each plant location. |
| • | Roy Eccles, P.Geo., participated in the July 24-25, 2018 sampling program and confirmed the Li-brine mineralization at the Property. He also validated the Property’s brine infrastructure, including: brine supply and reinjection wells; the brine pipeline network; feed-brine and tail-feed at LANXESS’ bromine production plants; and the proposed site of Standard Lithium’s Demonstration Plant. |
| 2.4 | Sources of Information |
A number of sub-consultants were contracted to carry out specific technical studies/analyses for input into the PEA Report; they are presented in Table 2-2.
| Preliminary Economic Assessment of LANXESS Smackover Project | 28 |
Table 2-2 Contributor Sub-Consultants
Sub-Consultant | Technical Study Subject | |
| Arkansas Analytical Inc., Little Rock, AR | Independent feed-brine and tail-brine sample laboratory analysis (2017) | |
| ALS Houston, Houston, TX | Independent feed-brine and tail-brine sample laboratory analysis (2017) | |
| Environmental Services Laboratory, Little Rock, AR | Independent feed-brine and tail-brine sample laboratory analysis (2017) | |
| Western Environmental Testing Laboratories (WETLab), Sparks, NV | Independent feed-brine and tail-brine sample laboratory analysis (2017) | |
| Hill Geophysical Consulting | Reviewed well log information (S.9.2) and picked formation tops (S.14.2.4), created contoured surface grid files for insertion into 3D model (S.14.3). | |
University of British Columbia – Professor J. Hein | Prepared laboratory semi-certified sample standard ‘spike’, which is chemically similar to Smackover Formation brine from LANXESS Property for comparison of third-party analytical laboratories for accuracy/precision of lithium (Li) reporting in the datasets (S.11.5.3); ‘SiFT’ prototype pilot plant. | |
University of British Columbia – Professor P. Kennepohl | Testwork on lithium adsorbents; | |
Chemionex Inc., Craig Brown | Bench-scale process work; Mini-pilot plant; Mass Balance, Process kinetics data. | |
Zeton | 3D PDF models and fabrication drawings for lithium chloride Demonstration Plant. | |
SGS Canada Inc. | Laboratory testwork, confirmatory assaying and mini-pilot plant operations. | |
| 2.5 | Currency, Abbreviations and Units of Measurement |
Unless otherwise stated, all units used in this report are metric. The United States dollar (US$) is used throughout the Report, unless otherwise specified.
Table 2-3 Abbreviations
Acronym | Definition | |
AACE | American Association of Cost Engineers | |
ADEQ | Arkansas Department of Environmental Quality | |
AOGC | Arkansas Oil and Gas Commission | |
| Preliminary Economic Assessment of LANXESS Smackover Project | 29 |
Acronym | Definition | |
API | Application Programming Interface | |
AR | Arkansas | |
asl | Above Sea Level | |
BFD | Block Flow Diagram | |
BFS | Bankable Feasibility Study | |
bgl | Below Ground Level | |
BOE | Basis of Estimate | |
CAD | Canadian Dollar | |
CAPEX | Capital Expenditures | |
CIM | Canadian Institute of Mining | |
CIT | Corporate Income Tax | |
DCF | Discounted Cash Flow | |
EA | Environmental Assessment | |
EIS | Environmental Impact Statement | |
EMP | Environmental Management Plan | |
EPA | United States Environmental Protection Agency | |
EPC | Engineering, Procurement and Construction | |
EPCM | Engineering, Procurement, Construction Management | |
EV | Electric Vehicle | |
GLCC | Great Lakes Chemical Corporation | |
ICP-MS | Inductively Coupled Plasma Mass Spectrometry | |
ICP-OES | Inductively Coupled Plasma Optical Emission Spectrometry | |
ID | Identification | |
IRR | Internal Rate of Return | |
K | Hydraulic Conductivity | |
LCE | Lithium Carbonate Equivalent | |
LoM | Life of Mine | |
MOU | Memorandum of Understanding | |
| Preliminary Economic Assessment of LANXESS Smackover Project | 30 |
Acronym | Definition | |
MVR | Mechanical Vapor Recompression | |
NEPA | National Environmental Policy Act | |
NI | National Instrument | |
No. | Number | |
NPV | Net Present Value | |
OPEX | Operational Expenditures | |
OSBL | Outside Battery Limits | |
OWC | Oil-Water-Contact | |
P/D | Reservoir Pressure/Depth to Oil water Contact | |
PEA | Preliminary Economic Assessment | |
P.Eng. | Professional Engineer | |
P.Geo. | Professional Geologist | |
PFD | Process Flow Diagram | |
PFS | Pre-Feasibility Study | |
PSS | Pregnant Strip Solution | |
QA/QC | Quality Assurance/Quality Control | |
QP | Qualified Person | |
RCRA | Resource Conservation and Recovery Act | |
RO | Reverse Osmosis | |
RSD | Relative Standard Deviation | |
S | Storativity | |
S-CAPEX | Sustained Capital Costs | |
SDWA | Safe Drinking Water Act | |
Ss | Specific Storage | |
Sy | Specific Yield | |
TDS | Total Dissolved Solids | |
TEC | Total Equipment Cost | |
TIC | Total Installed Cost | |
| Preliminary Economic Assessment of LANXESS Smackover Project | 31 |
Acronym | Definition | |
TPC | Total Plant Cost | |
UBC | University of British Columbia | |
UIC | Underground Injection Control | |
U.S. | United States | |
USA | United States of America | |
US$ | United States Dollar | |
USDW | Underground Source of Drinking Water | |
USGS | United States Geological Survey | |
WBS | Work Breakdown Structure | |
Table 2-4 Units of Measurement
Measurement | Description | |
bbls | barrels | |
cm | centimetre | |
ft | foot | |
g/cm3 | grams per cubic centimetre | |
ha | hectare | |
h | hour | |
km | kilometre | |
km/hr | kilometre per hour | |
km² | square kilometre | |
kW | kilowatt | |
L/s | litres per second | |
m | metre | |
Ma | Million years ago | |
mD | millidarcy | |
min | minute | |
mg/L | milligram per litre | |
| Preliminary Economic Assessment of LANXESS Smackover Project | 32 |
Measurement | Description | |
ml | millilitre | |
mm | millimetre | |
m/s | metres per second | |
m2/d | metres squared per day | |
m³ | cubic metre | |
m3/h | cubic metre per hour | |
m3/y | cubic metres per year | |
M | million | |
mS/cm | millisiemens per centimetre | |
MW | megawatt | |
ppb | parts per billion | |
ppm | parts per million | |
ppt | parts per trillion | |
s | second | |
t | tonne | |
tpy | tonnes per year | |
t/d | tonnes per day | |
t/h | tonnes per hour | |
t/y | tonnes per year | |
US$/m2 | United States Dollar per square metre | |
US$/m3 | United States Dollar per cubic metre | |
US$/tonne | United States Dollar per tonne | |
y | year | |
% | percent | |
°C | Degrees Celsius | |
| Preliminary Economic Assessment of LANXESS Smackover Project | 33 |
Table 2-5 Minerals
Mineral | Description | |
Ag | Silver | |
Al | Aluminum | |
As | Arsenic | |
B | Boron | |
Ba | Barium | |
Be | Beryllium | |
Ca | Calcium | |
CaCl2 | Calcium Chloride | |
Cd | Cadmium | |
Co | Cobalt | |
Cr | Chromium | |
Cu | Copper | |
Fe | Iron | |
Ga | Gallium | |
HCl | Hydrochloric Acid | |
H2O | Water | |
H2S | Hydrogen Sulfide | |
K | Potassium | |
KCl | Potassium Chloride | |
K2SO4 | Potassium Sulfate | |
Li | Lithium | |
Li2CO3 | Lithium Chloride | |
LiOH | Lithium Hydroxide | |
Li2CO3 | Lithium Carbonate | |
Li2O | Lithium Oxide | |
Mg | Magnesium | |
MgCl2 | Magnesium Chloride | |
| Preliminary Economic Assessment of LANXESS Smackover Project | 34 |
Mineral | Description | |
Mn | Manganese | |
Mo | Molybdenum | |
Na | Sodium | |
NaCl | Sodium Chloride (Halite) | |
Ni | Nickel | |
P | Phosphorous | |
Pb | Lead | |
Rb | Rubidium | |
Sb | Antimony | |
Sc | Scandium | |
Se | Selenium | |
Si | Silicon | |
Sn | Tin | |
Sr | Strontium | |
SrCl2 | Strontium Chloride | |
Ti | Titanium | |
V | Vanadium | |
Zn | Zinc | |
| Preliminary Economic Assessment of LANXESS Smackover Project | 35 |
| 3 | Reliance on Other Experts |
In respect to the discussion regarding mineral tenure to the Property, set forth in Section 4.2, the QPs have relied entirely, and without independent investigation, on the title opinion of Standard Lithium’s management and legal representation and information provided by LANXESS.
The list of Property leases (Sections 4.1 to 4.3) was provided by Standard Lithium to Roy Eccles on July 9, 2018. The authors have not reviewed the approximately 10,000 leases owned by LANXESS. A declaration of net mineral acreage for brine production was provided in writing by Dr. Papadourakis, CEO of LANXESS USA, on September 4, 2018.
Information on the brine access agreement with LANXESS (Section 4.5), otherwise known as the Memorandum of Understanding (MOU), was provided by Standard Lithium’s Management and legal representation to the author of Section 4.5, on July 5, 2018, through written and verbal communication.
The author of Section 20 has relied on the verbal statements provided by Standard Lithium and LANXESS management, who indicated that permitting for the Project, including environmental permitting, would fall under the existing permits that LANXESS currently conducts their operations under.
| 3.1 | Taxes and Royalties |
Regarding United States Federal corporate income tax and State of Arkansas corporate income tax rates set forth in Section 22, the QP relied on public domain information.
The QP relied on information provided by Standard Lithium for the discussion on Royalty payments in Section 22.
| Preliminary Economic Assessment of LANXESS Smackover Project | 36 |
| 4 | Property Description and Location |
| 4.1 | Property Description and Location |
The LANXESS Property is located south and west of the City of El Dorado in Union County, AR, U.S.A., as presented in Figure 4-1 [1]. The southern and western edges of the Property border the State of Louisiana (LA) and Columbia County, respectively. The Property encompasses Townships 16-19 South, and Ranges 15-18, West of the 5th Meridian (W5M). The Property centre is at UTM 520600 Easting, 3670000 Northing, Zone 15N, NAD83.

Figure 4-1 General Location of LANXESS Property
| Preliminary Economic Assessment of LANXESS Smackover Project | 37 |
LANXESS owns 100% of the brine leases and brine rights on their properties, either by an executed brine lease or by operation of law, as a result of unitization by the Arkansas Oil and Gas Commission (AOGC). The land package, which is indicated on Figure 4-2, consists of 150,081.81 acres that cover over 607 km2. Of the total land package, 142,881.81 acres are ‘Unitized’ and approximately 7,200 acres occur outside the Unit boundaries (Non-Unitized). Table 4-1 provides a description of the LANXESS Unitized and Non-Unitized land holdings. In Arkansas, a ‘Unit’ is defined as a brine production unit or a brine expansion unit, as follows:
| • | “Brine Production Unit” means each separate composite area of land so designated by order of the AOGC to produce brine and the reinjection of effluent. |
| • | A “Brine Expansion Unit” means each separate composite area of land so designated by order of the AOGC as an expansion area adjacent to an existing brine production unit to produce brine or the reinjection of effluent. |
| • | A “Unit”, in practical terms, is an area of operation, whereby volumes of brine extraction and reinjection are continuously balanced on a per-unit basis. |
Table 4-1 Description of LANXESS Unitized and Non-Unitized Land Holdings
Sub-Property or Unit | Title Holder1 | Area (acres) | AOGC Reference No. | Date Issued | ||||
South Plant Unit | Great Lakes Chemical Corporation | 30,877 | BU 1-95 | 28-Mar-95 | ||||
Central Plant Unit | Great Lakes Chemical Corporation | 42,974 | BU 2-95 | 22-Aug-95 | ||||
West Plant Unit | Great Lakes Chemical Corporation | 60,354 | BU 3-95 | 28-Nov-95 | ||||
West Brine Expansion Unit- H | Great Lakes Chemical Corporation | 1,356 | 048-1-2015-04 | 14-May-15 | ||||
South Expansion Brine Unit | Great Lakes Chemical Corporation | 7,321 | 086-1-2016-11 | 28-Nov-16 | ||||
Unitized Area | 142,882 | |||||||
Non-Unitized Area | 7,200 | |||||||
| ||||||||
Total | 150,082 |
| 1 | Great Lakes Chemical Corporation is now LANXESS. |
Figure 4-2 provides an overview of the LANXESS Property, including the location of the bromine processing facilities in the South, Central and West Units. The TETRA Technologies Inc. calcium chloride (CaCl2) plant, and the proposed site of Standard Lithium’s Demonstration Plant, are also shown.
| Preliminary Economic Assessment of LANXESS Smackover Project | 38 |
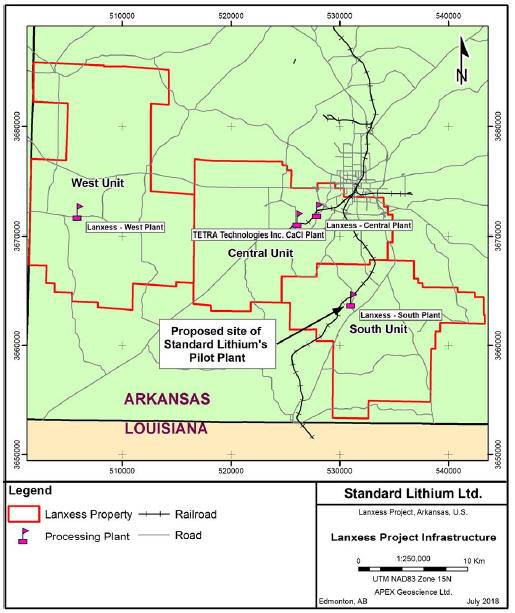
Figure 4-2 Overview of the LANXESS Property
| Preliminary Economic Assessment of LANXESS Smackover Project | 39 |
Each Unit (South, Central and West) has their own brine supply wells, pipeline network and bromine processing (separation) infrastructure. The facilities and their locations, which are 100% owned and operated by Great Lakes Chemical Corporation, a wholly-owned subsidiary of LANXESS, are as follows:
| • | South Unit (South Plant): 324 Southfield Cutoff, El Dorado, AR 71730; |
| • | Central Unit (Central Plant): 2226 Haynesville Highway (HWY 15S), El Dorado, AR 71731; and |
| • | West Unit (West Plant): 5821 Shuler Road, Magnolia, AR 71731. |
| 4.2 | History of the LANXESS Property Land Title |
The LANXESS Property is presently owned by Lanxess Aktiengesellschaft (LANXESS), a specialty chemicals company based in Cologne, Germany. LANXESS was founded September 22, 2004 via the spin-off of the chemical’s division and parts of the polymers business from Bayer Aktiengesellschaft, which was originally founded in 1863. Shares in LANXESS were originally listed in Germany’s DAX from September 24, 2012 to September 21, 2015 and formed part of MDAX, a midcap index. Presently, LANXESS is listed in the Dow Jones Sustainability Index and FTSE4Good Index.
LANXESS is currently represented at 74 production sites worldwide. The core business of LANXESS is the development, manufacturing and marketing of chemical intermediates, additives, specialty chemicals and plastics.
The history of the LANXESS Property, which includes a series of transactions that occurred prior to LANXESS acquiring 100% interest and control of the Property, is summarized as follows:
| • | Great Lakes Chemical Company was founded in Michigan in 1936 to extract bromine from underground salt water brine deposits. It was acquired by McClanahan Oil in 1948 and rechristened Great Lakes Oil and Chemical Company. By 1957, the company ended hydrocarbon production and focused solely on the production of bromine-based chemicals in Arkansas (at what is now referred to in this Technical Report as the LANXESS Property). At about this time, the company assumed its original name (Great Lakes Chemical Corporation). |
| • | Great Lakes Chemical Corporation soon built the world’s largest bromine plant in southern Arkansas. The chemical research, production, sales and distribution company produced specialty chemicals used for polymers, fire suppressants and retardants, pool and spa water purification systems and various other applications. |
| • | In 2005, Great Lakes Chemical Corporation merged with Crompton Corporation (formerly Crompton and Knowles) to become Chemtura. Great Lakes Chemical Corporation remained in existence as a wholly-owned subsidiary of Chemtura to own and operate all the brine production facilities in Union County. |
| • | Net sales in 2014 were $2.2 billion and the company employed approximately 2,700 people for research, manufacturing, logistics, sales and administration. Chemtura’s ‘Great Lakes Solutions’ division employed about 500 people in Union County. |
| • | On April 21, 2017, LANXESS completed the acquisition of Chemtura for $2.5 billion (Magnolia Reporter, 2016; LANXESS, 2017a). |
| Preliminary Economic Assessment of LANXESS Smackover Project | 40 |
| • | As part of the Chemtura acquisition, LANXESS took over all Great Lakes Chemical Corporation and/or Great Lakes Solutions assets, including but not limited to: three Union County bromine plants, covering 150,000 acres; 10,000 brine leases; 400 km of pipelines and 61 brine supply and reinjection wells. These specific assets, rights and associated permits are situated within the LANXESS Property with LANXESS having 100% rights. Great Lakes Chemical Corporation is a wholly-owned subsidiary of LANXESS that continues to own and operate all the brine production facilities in Union County. |
| 4.3 | Surface (and Mineral) Rights in Arkansas |
The definition of minerals is established by Arkansas Code Title 15, Natural Resources and Economic Development § 15-56-301 (the “Brine Statue”), which has been amended to include salt water, or brine, “whose naturally dissolved components or solutes are used as a source of raw material for bromine and other products derived therefrom.” The mineral interest owner has the inherent right to develop the minerals and the right to lease the minerals to others for development. When a company desires to develop the mineral resources in an area, the company will need to secure mineral lease agreements from the mineral owners. The mineral lease is a legal binding contract between the mineral owner (Lessor) and an individual or company (Lessee), which allows for the exploration and extraction of the minerals covered under the lease.
Payments made to the Lessor for brine production are known as “in lieu” royalty payments, because the payments are made annually based on a statutory rate, as opposed to a true royalty based on the amount of the produced brine. The statutory in lieu royalty payment is increased or decreased annually, based on changes in the Producer Price Index. A summary of payment process for brine leases is provided in Section 4.4.
With respect to surface rights, Arkansas law allows the severance of the surface estate from the mineral estate by proper grant or reservation; thereby, creating separate estates. Under the laws of conservation in the State of Arkansas, however, the mineral rights are dominant over the surface rights. In some cases, when the mineral owner leases the right to produce oil, gas and/or brine, the Lessee succeeds to the mineral owner’s right of surface use, subject to lease restrictions. Authority of the mineral estate over the surface is a crucial legal concept for the mineral owner and Lessee because ownership of subsurface minerals without the right to use the surface to explore for and produce them would be practically
worthless. If a Lessor does not want the land surface disturbed, a “No Surface Operations Clause” may be negotiated with the Lessee and included in the mineral Lease agreement. This clause may be used to limit or restrict the use of the Property for drilling activity or long-term production operations. Conflicts arising between the Lessee and surface owner can be avoided by creating Lease agreements that clearly identify the scope of surface use rights.
The Lessee holding the Lease has a legal authority to enter the Property for exploration and production, even if the non-mineral owning surface owner objects to the intrusion on the Property. That does not mean the surface owner will be without compensation. The amount and type of compensation is strictly
| Preliminary Economic Assessment of LANXESS Smackover Project | 41 |
a matter of negotiation between the surface owner and the company entering the Property. If agreement cannot be reached, the surface owner always has the right to seek the advice of an attorney and relief through the court system.
In the State of Arkansas, when a person sells a piece of property the mineral rights automatically transfer with the surface rights, unless otherwise stated in the deed.
| 4.4 | Payments to Lessors |
The AOGC, in accordance with Arkansas law, has established ‘drilling units’ that consist of a set amount of acreage to protect correlative rights and ensure all mineral owners receive proper payment of production royalties (in the case of oil and gas production) and statutory in lieu royalty payment (in the case of brine production). Given that brine production is derived from a common aquifer in the Smackover Formation, the establishment of units with defined boundaries ensures that all mineral owners potentially impacted by the producing well will receive proper compensation.
The AOGC was given the jurisdiction and authority to form brine production units in the Brine Statue. The AOGC’s rules and regulations are available on-line at: www.aogc.state.ar.us/, along with its hearing schedule and production data from 1992 forward. Pertinent provisions of the Brine Statute include the following:
| • | §15-76-308, which identifies who may make application for the establishment of brine production units and states that a brine production unit may consist of no fewer than 1,280 contiguous surface acres (Arkansas Code, 2016a). |
| • | §15-76-309, which prescribes what information must be provided in a petition to form a brine production unit (Arkansas Code, 2016b). |
| • | §15-76-314, which requires each owner of an unleased interest in an established production unit to elect, within 60 days from the effective date of the order, to either participate affirmatively in the operation or to transfer their interest in the brine to the participating producers (Arkansas Code, 2016c). |
| • | §15-76-315 which states the following: |
| (1) | In addition to any other amounts due and owing by the producer or producers of any unit to the owners therein, the producer or producers account separately and on a fair and equitable basis to each owner in the unit for all substances which are found by the commission to be profitably extracted from brine by a producer and which were not extracted by a producer on January 1, 1979. |
| (2) | Whether or not any such substance is extracted profitably shall be determined by the AOGC on the basis of the value at the time of extraction, without interest, after deducting all costs of producing and recovering the same. |
| Preliminary Economic Assessment of LANXESS Smackover Project | 42 |
It is the expectation of the AOGC that entities desiring to drill and operate an oil, gas or brine well in Arkansas will attempt in good faith to negotiate a satisfactory mineral lease with mineral owners before resorting to the integration provisions of Arkansas law. In the case of brine production, the operator will negotiate a per acre bonus consideration, to be paid upon signing of the lease.
Under the Brine Statute, the AOGC will approve a unit for a brine operator when the operator files an application supported by the following elements:
| • | a description of the proposed brine production unit; |
| • | a proposed plan of development and operation; |
| • | geological and engineering data supporting the feasibility of the proposed plan and the efficacy of the boundary lines of the unit; |
| • | a plan of the proposed unit, indicating the tracts or parcels included in the unit and the proposed location of production and injection wells; |
| • | a list of owners within the unit; and |
| • | evidence that the applicant has valid brine leases from at least 75% of the entire area of the proposed brine production unit. |
The AOGC must approve the royalty rate for any “additional substance” profitably extracted from brine produced by an operator of a brine unit. The extraction of lithium from tail brine produced in South Arkansas is an additional substance triggering the royalty analysis. The limited extraction of lithium during the projected phases of the Demonstration Plant for the South Brine Unit will not constitute the profitable extraction of a substance giving rise to an obligation to pay royalties to brine owners on a fair and equitable basis during the demonstration phases. This obligation will kick in when the commercial operations begins.
On October 10, 2018, the AOGC granted an Order approving the deployment of the Demonstration Plant to test the commercial viability of the extraction of lithium from brine processed at the South Unit processing plant operated by Great Lakes Chemical Corporation (LANXESS) and Arkansas Lithium Corporation (a wholly owned subsidiary of Standard Lithium). The Order takes effect November 19, 2018 (AOGC 2018a).
Following deployment of a Demonstration Plant in the second half of 2019, Standard Lithium expects to commission the Demonstration Plant in late-2019. Data derived during the demonstration stage will be used to develop a proposed royalty rate that is fair and equitable to brine owners at the time the extraction of lithium from the brine is demonstrated to be commercially viable.
Once these data are properly assimilated, if LANXESS and Standard Lithium determine that it is feasible to go forward with the commercial extraction of lithium from tail-brine, LANXESS and Standard Lithium will return to the AOGC with a separate application to establish an additional royalty rate attributable to brine, which is processed for the commercial extraction of lithium.
| Preliminary Economic Assessment of LANXESS Smackover Project | 43 |
| 4.5 | Overview of the Standard Lithium – LANXESS Agreements |
Standard Lithium and LANXESS have signed a binding MoU, in which Standard Lithium has paid LANXESS an initial Reservation of Rights Fee of US$3,000,000, to secure access to the tail-brine (Standard Lithium Ltd. 2018a). Assuming the various milestones are adhered to, the MoU is exclusive and binding for a period of five (5) years (i.e. until approximately May 2023). The MoU is essentially a brine access agreement where Standard Lithium is buying into the tail-brine to:
| • | evaluate the lithium content of brine underlying the LANXESS Property; |
| • | provide a geological introduction and maiden mineral resource estimate; and |
| • | advance the development of a modern technology that effectively extracts lithium salts of commercial grade from the tail-brine. |
On November 12, 2018, Standard Lithium announced the Company had signed a Term Sheet with LANXESS for a contemplated joint venture in any future commercial production of battery grade lithium compounds from brine associated with LANXESS’ bromine operation at the LANXESS Property (Standard Lithium Ltd. 2018b). Under the proposed terms of the joint venture, which is subject to due diligence, proof of concept and economic viability studies, LANXESS would contribute lithium extraction rights and grant access to its existing infrastructure to the joint venture. Standard Lithium would contribute existing rights and leases held in the Smackover Formation and the Demonstration Plant being developed on the Property, as well as its proprietary extraction processes and all relevant intellectual property rights.
| 4.6 | Permitting and Environmental Approvals |
Several Federal and State permits and approvals are required for brine production in Arkansas. The following are a few examples:
| • | U.S. Environmental Protection Agency (EPA) and the AOGC – Underground Injection Control Permit and the Clean Air Act; |
| • | AOGC – Operating Agreement; Arkansas Department of Environmental Quality (ADEQ) – Operating Air Permit; and |
| • | Arkansas Department of Pollution Control and Ecology – Arkansas Water and Air Pollution Control Act. |
Standard Lithium is generally covered in the MoU under LANXESS’ current mine plan and associated permitting and environmental approvals.
The Demonstration Plant will be situated within the LANXESS Property and Standard Lithium will be required to adopt and meet LANXESS standards of avoiding harmful emissions into the air, soil and water and ensuring safe handling of chemical products along the value chain. In the past 10-years, LANXESS has reduced their Scope 1 emissions worldwide by more than one-half (LANXESS 2017b).
Standard Lithium will be required to assess their Demonstration Plant emissions and may have to adopt new operating permits. The U.S. EPA approved the state of Arkansas’ plan for administering programs
| Preliminary Economic Assessment of LANXESS Smackover Project | 44 |
related to the National Ambient Air Quality Standards (NAAQS). Pollutants regulated under these standards include ozone, lead, fine particulate matter, nitrogen dioxide and sulfur dioxide.
At present the de-brominated brine is transferred to the tail-brine tanks at each of the respective plants and then pumped to an AOGC-permitted Class V Brine Disposal System (reinjection wells). Personnel monitor both the feed-brine and tail-brine tanks 24-hours a day. Standard Lithium’s tail-brine, from their lithium chloride plants and lithium carbonate plant, will be required to meet all LANXESS demands related to discharge brine, including, but not limited to, meeting the required pH, total suspended solids, density and oxidizer content to eliminate free-chlorine.
| 4.7 | Risks and Uncertainties |
As with any development project, there exists potential risks and uncertainties. Standard Lithium will attempt to reduce risk/uncertainty through effective project management, engagement of technical experts and development of contingency plans.
| Preliminary Economic Assessment of LANXESS Smackover Project | 45 |
| 5 | Accessibility, Climate, Local Resources, Infrastructure and Physiography |
| 5.1 | Accessibility |
The LANXESS Property is situated in Union County, southern Arkansas. Union County is the largest County in the State of Arkansas (2,730 km2) and borders the State of Louisiana (see Figure 4-1). Arkansas Counties are divided into townships. Each township includes unincorporated space; some may have one or more incorporated towns or cities.
The Central Unit is located directly adjacent to, and southwest of the City of El Dorado, AR (see Figure 5-1), El Dorado is the County Seat of Union County and has a population slightly over 18,000. It is considered the population, cultural and business center of the regional area. LANXESS’ South and West units are located approximately 5.5 km and 12.5 km south and west of El Dorado, respectively.
Due to its proximity to El Dorado, which is central to a major oil, gas and brine-producing district, the LANXESS Property can be accessed via plane, rail and an extensive road network.
| 5.1.1 | Airport Access |
International airports are in Little Rock, AR, which is approximately 2.5-hours north of the LANXESS Property, by car, and Shreveport, LA, which is 1.5-hour southwest of the Property, by car.
El Dorado has two airports which are owned by the City; South Arkansas Regional at Goodwin Field, a commercial airport located approximately 14 km west of El Dorado, and El Dorado Downtown Airport, a public-use airport, located on the south edge of the city.
| 5.1.2 | Rail Access |
El Dorado products are shipped by truck and rail; rail lines dissect the Central and South units. Railroad companies and rail lines in the Property area include: Camden & Southern, Union Pacific, Louisiana & North West, and El Dorado & Wesson railroads/railways.
| 5.1.3 | Road Access |
Primary U.S. Highways in the region include the following:
| • | South Unit (South Plant): U.S. Highway 7 and Highway 167; |
| • | Central Unit (Central Plant): U.S. Highway 15, Highway 82 and Highway 335; and |
| • | West Unit (West Plant): U.S. Highway 82, Highway 57 and Highway 160 and Highway 172. |
| Preliminary Economic Assessment of LANXESS Smackover Project | 46 |
The secondary, major, Township and well-pad access roads provide an integrated network that permits year-round access to almost every part of the LANXESS Property and El Dorado has an extensive all-season secondary road network (see Figure 5-1).
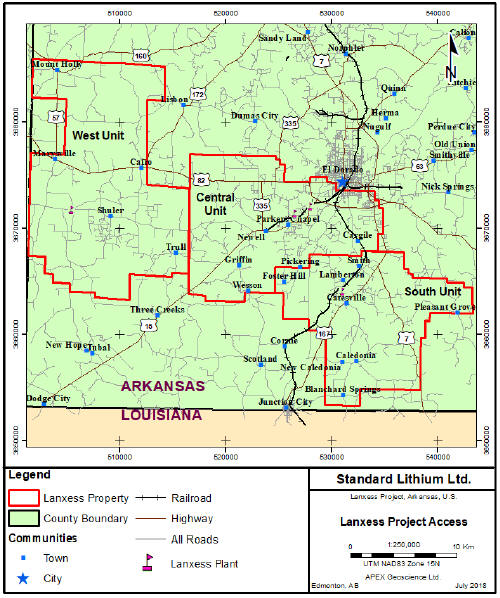
Figure 5-1 LANXESS Project Access Routes
| Preliminary Economic Assessment of LANXESS Smackover Project | 47 |
5.2 Climate
The Project area climate is generally humid. The average annual temperature and precipitation at El Dorado is 23.56°C and 126.7 cm, respectively (see Figure 5-2). Annual rainfall is evenly distributed throughout the year. The wettest month of the year is June, with an average rainfall of 11.7 cm.
The warmest month of the year is July, with an average maximum temperature of 34°C, while the coldest month of the year is January with an average minimum temperature of -2°C.
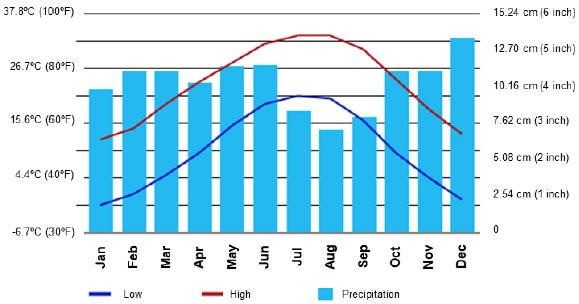
Figure 5-2 Average Temperature and Precipitation at El Dorado, AR
5.3 Local Resources and Infrastructure
5.3.1 Education
El Dorado is known for its locally evolving workforce education. The ‘El Dorado Promise’ is a scholarship program established and funded by Murphy Oil Corporation. It provides a scholarship to graduates of the city’s High School, which covers tuition and mandatory fees that can be used at any accredited two-year or four-year, public or private, educational institution in the U.S. Since its inception in 2007, over 1,200 students have benefited from the offer.
There are five colleges within 80 km of El Dorado: South Arkansas Community College; Southern Arkansas University Tech; Southern Arkansas University Main Campus; Grambling State University and Louisiana Tech University.
| Preliminary Economic Assessment of LANXESS Smackover Project | 48 |
5.3.2 Local Labour
El Dorado is the headquarters of Murphy Oil, Murphy USA, Deltic Timber Corporation and Dalek Refinery. Chemical companies include El Dorado Chemical Co., Future Fuel Chemical Company and Helena Chemical Co. In 1957, production of elemental bromine commenced in Arkansas and bromine companies include LANXESS and Albemarle. The work force supporting these industries has significant knowledge in brine technology, chemical engineering and production.
5.3.3 Transport
Dana Transport Inc., which is located adjacent to the LANXESS Central Plant, provides short and long—haul chemical transportation and is a service provider for the LANXESS facilities.
5.3.4 Water
El Dorado water service is served locally by El Dorado Water Utilities. Current estimates show this private company has annual revenue of US$10 to 20 million and employs a staff of approximately 50 to 99.
5.3.5 Power
The local electric power is provided by Entergy Arkansas, LLC., with the bulk of local generation provided by an 1,800 MW combined cycle gas plant, located approximately 5 km northeast of El Dorado.
5.3.6 Services
There is excellent road access and utilities for the project and the area has a significant amount of businesses that service all aspects of the brine and oil and gas industries.
5.4 Physiography
Union County covers a total area of 2,730 km2, of which, 98.5% (2,690 km2) is comprised of land and 1.5% (41 km2) is comprised of water.
The West Gulf Coastal Plain covers the southeastern and south-central portions of the state along the border of Louisiana. El Dorado, which lies within the West Gulf Coastal Plain, has an elevation of 102 m above sea level (asl). The lowest point in the state is found on the Ouachita River in the West Gulf Coastal Plain of Arkansas.
The area surrounding the Project site is characterized by pine forests and farmlands. Currently exploited natural resources include timber, natural gas, petroleum deposits and bromine. The Felsenthal National Wildlife Refuge, the world’s largest green tree reservoir, is located approximately 45 km east of the City of El Dorado. The LANXESS Property does not infringe on the Wildlife Refuge.
| Preliminary Economic Assessment of LANXESS Smackover Project | 49 |
5.5 Summary
Southern Arkansas, Union County, the City of El Dorado and the LANXESS Property all have significant infrastructure and a knowledgeable workforce available for the development, and continuation of, brine mining and processing in the region. Given the extensive access to local infrastructure and the moderate climate, the LANXESS Property can be accessed and explored year-round. It is important to note that Standard Lithium’s LANXESS Smackover project is not dependent on solar evaporation to beneficiate the brine to higher levels of lithium, and consequently, the project is not dependent on an arid/desert climate, in comparison to other lithium-brine projects.
| Preliminary Economic Assessment of LANXESS Smackover Project | 50 |
6 History
6.1 Introduction to Brine Production in Arkansas
On January 10, 1921, Dr. Samuel T. Busey discovered oil in southern Arkansas with the completion of the Busey No. 1 well, which is located approximately1.6 km south of the City of El Dorado, AR. The discovery led to an oil boom that attracted thousands of explorers and workers. By 1923, the burgeoning petroleum region had attracted 59 oil contracting companies, 13 oil distributors and refiners and 22 oil production companies (The Encyclopedia of Arkansas History & Culture 2018). During World War II, El Dorado became a focal point for several chemical and munitions plants, most of which closed shortly after the war. The hydrocarbon industry in southern Arkansas has been in a steady state of decline since the mid-1980s (oil) and early 2000s (gas). Conversely, brine production steadily increased during the 1980s, with consistent production to the present (see Figure 6-1). These trends are in large part due to dwindling hydrocarbon reserves within the Smackover Formation reservoirs, which as they mature, produce more brine than hydrocarbon. Brine production has continued due to the important realization that the brine contains elements of interest (i.e. bromine).
When oil was first discovered in south Arkansas, the brine was considered a worthless by-product of drilling/pumping. Industry realized that the Smackover Formation reservoir/aquifer brine contained elevated concentrations of elements, such as bromine, in addition to hydrocarbon (e.g. 3,000 - 5,000 mg/L Br; versus 65 mg/L in seawater (Mills et al. 2015, U.S. Geological Survey 2016). Accordingly, the commercial potential of bromine gradually became apparent (McCoy 2014).
Bromine is one of two elements that are liquid at room temperature and are found principally as dissolved species in seawater, evaporitic (salt) lakes and underground brine. The primary uses for bromine compounds include brominated flame retardants, intermediates and industrial uses, drilling fluids and water treatment.
Some historical production of bromine occurred from ocean water, but since 1969, all United States (U.S.) bromine has been produced from subsurface brine. The first commercial recovery of bromine from brine occurred in 1957 in Union County, AR. Bromine-brine production in southern Arkansas has been continuous since that time via a process in which bromine is exchanged for chlorine. After the bromine is extracted from the brine, the bromine-free brine, or tail-brine is returned underground into the production formation via Class V injection wells that are regulated by the AOGC.
The chemical composition of the tail-brine that is injected back into the Smackover Formation is generally similar to its original chemistry. The U.S. EPA (1999) showed that the tail-brine concentration of the target elements, such as bromine and magnesium, is reduced and the concentration of other elements, such as calcium, may have increased through substitution.
| Preliminary Economic Assessment of LANXESS Smackover Project | 51 |
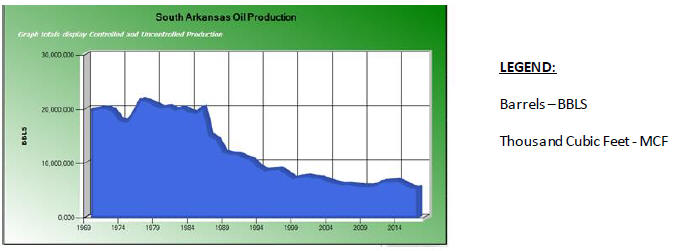
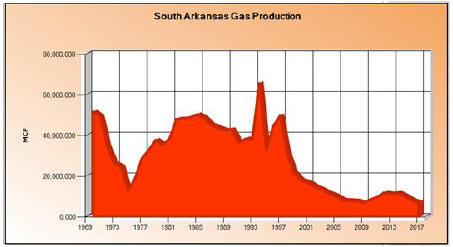
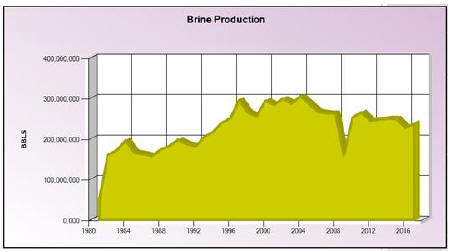
Figure 6-1 Summary of South Arkansas Oil, Gas and Brine Production (1960-2017) (AOGC 2018b)
The U.S. is one of four leading bromine producers in the world, along with China, Israel and Jordan. U.S. production and sold/used bromine values are withheld to avoid disclosing company proprietary data (U.S. Geological Survey 2016). Excluding the U.S., total world bromine production is 345,000 tonnes.
| Preliminary Economic Assessment of LANXESS Smackover Project | 52 |
Bromine produced from Smackover brine supplied over 40% of the world’s bromine supply from 1986 to 1990 (Arkansas Geological Survey 2015) and continues to account for a large portion of global bromine production capacity (Schnebele 2018). At present, there are two active bromine producers in southern Arkansas: LANXESS in Union County and Albemarle Corporation in Columbia County.
According to brine production records maintained by the AOGC, Union and Columbia County’s 2017 brine production produced 37.5 million m3 (236 million barrels) of brine (see Table 6-1). With respect to the LANXESS Property, between 2013 and March 2018, LANXESS produced 105 million m3 (660 million barrels) of brine from the Smackover Formation, to produce bromine and bromine-related chemicals (see Table 6-2). The information in Table 6-2 is based on production information recorded and made publicly available by the AOGC (2018b).
| Table 6-1 Southern Arkansas Brine 2017 Brine Production (AOGC 2018b) | ||||||
Field | Country | 2017 Production (U.S. Barrels) | Cumulative Production (1979-2017; U.S. Barrels) | |||
Atlanta | Columbia | 4,031,068 | 116,873,573 | |||
Big Creek | Columbia | 2,283,859 | 104,853,461 | |||
Burns Pond | Union | 10,558,813 | 208,275,556 | |||
Cairo | Union | 6,451,669 | 337,407,996 | |||
Catesville | Union | 23,071,993 | 1,015,085,713 | |||
Hibank | Union | 11,043,766 | 240,589,321 | |||
Hogg | Columbia | 3,173,086 | 60,394,390 | |||
Kerlin | Columbia | 3,334,437 | 721,531,613 | |||
Kilgore Lodge | Columbia | 34,155,209 | 1,282,438,515 | |||
Lisbon | Union | 8,950,522 | 327,965,505 | |||
Magnolia | Columbia | 6,837,463 | 139,826,117 | |||
Marysville | Union | 42,543,820 | 959,062,930 | |||
Schuler East | Union | 4,252,332 | 168,143,975 | |||
Village | Columbia | 47,359,049 | 565,577,752 | |||
Warnock Springs | Columbia | 17,298,649 | 476,448,432 | |||
Wilks | Union | 10,620,072 | 935,963,963 | |||
|
| |||||
| 235,965,807 | 7,660,438,812 | |||||
|
| |||||
| Preliminary Economic Assessment of LANXESS Smackover Project | 53 |
Field | Country | 2017 Production (U.S. Barrels) | Cumulative Production (1979-2017; U.S. Barrels) | |||
Union | 117,492,987 | 4,192,494,959 | ||||
Columbia | 118,472,820 | 3,467,943,853 |
Note: Highlighted records include those field located within the LANXESS Property. Missing fields include Newell and El Dorado South.
6.2 Regional Assessment of the Lithium Potential of the Smackover Formation Brine
The author of this section of the Technical Report has not been able to verify Li-brine mineralization adjacent to the LANXESS Property, or in the region of southern Arkansas. Accordingly, this discussion of Li-brine information occurring near, or adjacent to, the LANXESS Property is not necessarily indicative of the mineralization on the Property that is the subject of this Technical Report.
Brine aquifers have different characteristics than traditional mineral deposits, such as precious and base metal deposits. Any given aquifer can have enormous sub-surface dimensions; therefore, the scale of the Smackover Formation brine aquifer, i.e. the nature and extent of the lithium-brine (Li-brine) potential of the Smackover Formation, is important background information.
The USGS National Produced Waters Geochemical Database v2.2, contains geochemical information from wellheads across the U.S.
The database includes 165,960 produced water samples that were collected between 1886 and 2013 (Blondes et al. 2016). In addition to the major element data, the database contains trace element, isotope and time-series data that provide spatial coverage for specific formations and/or aquifers. Quality control of the database must be performed by culling the data, based on geochemical criteria (Blondes et al. 2016). For this sub-section, and because the adjacent Property information is disclaimed as being not necessarily indicative of the mineralization on the Property, the QP has not filtered any data and has included Li-brine results directly from the USGS National Produced Waters Geochemical Database.
| Preliminary Economic Assessment of LANXESS Smackover Project | 54 |
Table 6-2 LANXESS Annual Brine Production and Injection Data (US BBLS) (AOGC 2018b)
| ||||||||||||||||
Well Permit | Well Name | 2013 | 2014 | 2015 | 2016 | 2017 | 2018 (Jan-Mar) | Total | ||||||||
South Unit | ||||||||||||||||
21780 | BSW-4S | 8,350,104 | 7,940,156 | 7,630,870 | 5,114,245 | 6,957,869 | 1,912,089 | 37,905,333 | ||||||||
22381 | BSW-5S | 9,961,203 | 10,750,114 | 11,148,719 | 9,900,767 | 11,043,766 | 2,448,005 | 55,252,574 | ||||||||
22777 | BSW-10S | 1,945,759 | 56,717 | 894,677 | 834,155 | 1,587,141 | 515,743 | 5,834,192 | ||||||||
23268 | BSW-20S | 8,627,450 | 8,880,824 | 9,049,866 | 7,058,702 | 8,194,653 | 1,756,657 | 43,568,152 | ||||||||
35955 | BSW-21S | 7,729,849 | 7,195,672 | 7,249,964 | 5,809,940 | 6,332,330 | 1,389,765 | 35,707,520 | ||||||||
Central Unit | ||||||||||||||||
33536 | BSW-13 | 9,366,264 | 9,123,399 | 10,148,621 | 8,695,188 | 8,950,522 | 2,032,711 | 48,316,705 | ||||||||
35391 | BSW-14 | 2,460,100 | 2,489,535 | 2,407,288 | 2,272,963 | 1,873,933 | 505,190 | 12,009,009 | ||||||||
36474 | BSW-15 | 8,226,367 | 7,558,135 | 9,388,625 | 9,306,241 | 8,684,880 | 2,016,621 | 45,180,869 | ||||||||
29795 | Spencer #1 | 2,594,745 | 2,110,446 | 2,671,608 | 3,228,415 | 3,173,086 | 728,622 | 14,506,922 | ||||||||
21278 | H. Carroll #1 | 5,254,283 | 5,194,870 | 4,860,001 | 5,122,202 | 4,252,332 | 1,192,926 | 25,876,614 | ||||||||
34469 | Joy Kadison #2 | 3,100,343 | 3,414,306 | 3,509,954 | 1,679,708 | 3,091,248 | 757,534 | 15,553,093 | ||||||||
West Unit | ||||||||||||||||
23676 | BSW-1M | 3,539,761 | 3,521,152 | 3,255,928 | 3,614,447 | 2,844,344 | 556,153 | 17,331,785 | ||||||||
23837 | BSW-4M | 3,014,209 | 3,064,999 | 3,024,812 | 880,679 | 0 | 0 | 9,984,699 |
| Preliminary Economic Assessment of LANXESS Smackover Project | 55 |
Well Permit | Well Name | 2013 | 2014 | 2015 | 2016 | 2017 | 2018 (Jan-Mar) | Total | ||||||||
24331 | BSW-5M | 4,767,132 | 4,516,964 | 4,842,835 | 1,921,766 | 4,540,532 | 1,096,032 | 21,685,261 | ||||||||
25965 | BSW-6M | 2,731,457 | 2,734,424 | 2,179,037 | 557,232 | 799,966 | 378,924 | 9,381,040 | ||||||||
24723 | BSW-7M | 2,282,140 | 2,913,941 | 1,923,023 | 2,571,751 | 2,560,455 | 541,315 | 12,792,625 | ||||||||
37876 | BSW-A8M | 3,187,829 | 3,003,205 | 3,011,747 | 2,225,566 | 3,235,196 | 756,464 | 15,420,007 | ||||||||
35309 | BSW10-M | 5,581,917 | 6,123,527 | 5,927,675 | 5,991,698 | 5,811,116 | 1,360,484 | 30,796,417 | ||||||||
35739 | BSW12M | 4,705,746 | 4,568,612 | 4,632,252 | 4,697,290 | 4,696,499 | 1,073,134 | 24,737,533 | ||||||||
35784 | BSW 13M | 2,936,860, | 2,967,783 | 3,124,608 | 2,781,382 | 501,663 | 708,044 | 13,020,340 | ||||||||
35786 | BSW 14M | 6,702,818 | 6,632,287 | 6,177,281 | 6,886,539 | 6,764,732 | 1,399,148 | 34,562,805 | ||||||||
36002 | BSW 15M | 4,789,695 | 5,318,105 | 4,400,455 | 4,799,079 | 4,609,229 | 1,115,471 | 25,032,034 | ||||||||
36028 | BSW 16M | 2,921,395 | 3,006,342 | 2,860,348 | 2,935,727 | 2,717,001 | 604,444 | 15,045,257 | ||||||||
35930 | BSW 17M | 4,753,633 | 4,219,302 | 3,462,829 | 4,257,860 | 4,971,163 | 1,169,807 | 22,834,594 | ||||||||
36442 | BSW 18M | 2,985,165 | 6,277,398 | 8,951,047 | 7,465,732 | 7,893,390 | 1,812,241 | 35,384,973 | ||||||||
38113 | BSW 19-M | 7,097,656 | 6,534,549 | 6,348,739 | 6,401,810 | 4,579,027 | 1,686,944 | 32,648,725 | ||||||||
|
|
|
|
|
|
| ||||||||||
| Total | 129,613,880 | 130,116,764 | 133,082,809 | 117,011,084 | 120,666,073 | 29,514,468 | 660,005,078 | |||||||||
|
|
|
|
|
|
|
| Preliminary Economic Assessment of LANXESS Smackover Project | 56 |
Figure 6-2 shows that lithium-enriched brine, specific to the database-searched: “Smackover”, “Upper Smackover” or “Reynolds Member” of the Smackover, occurs throughout southern Arkansas within Union (and the LANXESS Property), Columbia and Lafayette Counties. The highest recorded Li-brine in this USGS-compiled database occurs within the LANXESS Property (1,700 mg/L Li), followed by a sample with 1,430 mg/L Li in Columbia County and 740 mg/L in northern Union County. Brine analyses between 300 mg/L and 500 mg/L Li occur predominantly in Columbia County, with a single recorded sample in Lafayette County. Brine yielding 100-300 mg/L Li occurs across all three Counties.
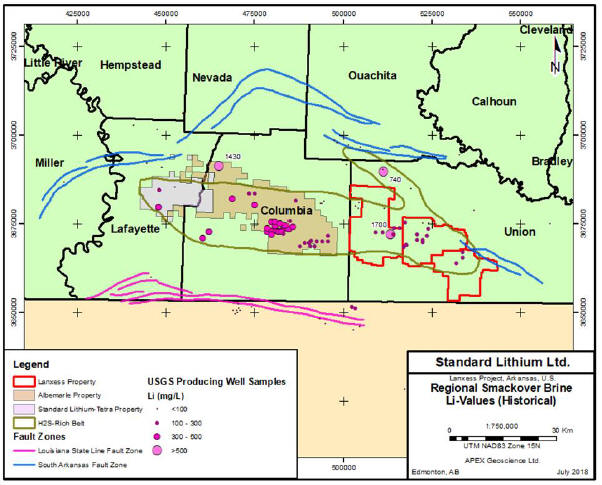
Note: the H2S rich belt and fault zones are from Moldovanyi and Walter (1992).
Figure 6-2 Regional Smackover Formation Lithium Brine Values from the USGS National Produced Waters Database (Blondes et. al. 2016)
| Preliminary Economic Assessment of LANXESS Smackover Project | 57 |
Moldovanyi and Walter (1992), whose brine geochemical data is included in the USGS National Produced Waters Geochemical Database, conducted a regional brine chemical study where Smackover Formation brine samples were collected and analyzed from 87 wells, which were producing from 45 Smackover Formation reservoirs in southwest Arkansas, east Texas and northern Louisiana. The study allowed these authors to hypothesize/conclude the following points with respect to the regional distribution of the elevated Smackover Formation Li-brine:
| • | Boron (B) and alkali metal Li, potassium (K), rubidium (Rb) concentrations in Smackover Formation waters exhibit coherent geochemical relations across the southwest Arkansas shelf. |
| • | In general, the concentration of these elements is greater and more heterogeneous in hydrogen sulfide (H2S)-rich brine than in H2S-free brine (see the H2S-rich polygon shown on Figure 6-2). |
| • | Regional concentration gradients in H2S, B, Li, K and Rb suggest fluids enriched in these elements may have migrated into the Smackover Formation reservoirs from large-scale circulation of deep-seated waters along segments of the South Arkansas and Louisiana State Line graben fault system (Moldovanyi and Walter 1992). |
With respect to the LANXESS Property, the Moldovanyi and Walter (1992) dataset includes 19 brine analyses within the boundaries of the Property (see Figure 6-3). Based on this data, Li-brine values range from 47 mg/L Li to 191 mg/L Li, with an average of 144 mg/L Li.
At the Property-scale, the USGS National Produced Waters Geochemical Database contains an additional seven (7) brine analyses (beyond the dataset published by Moldovanyi and Walter (1992)). Of the seven (7) analyses, five (5) sample locations yield between 122 mg/L and 180 mg/L Li (average of 149.5 mg/L Li). These data are unreferenced in the USGS database. Two outlier analytical results yield 5 mg/L and 1,700 mg/L Li, representing the lowest and highest Li-brine values in the Southern Arkansas historical Li-brine data, respectively. Given the outlying nature within broadly predictable spatial variations in Li-content, the outlier values must be viewed with some skepticism.
These data are theoretical in that Standard Lithium must conduct their own independent sample collection and analysis to verify the lithium content of the Smackover Formation brine underlying the Property and to provide data for resource estimation. Nevertheless, it is worth noting the regional extent of Li-brine in the Smackover Formation with respect to the LANXESS Property, and except for the 1,700 mg/L Li outlier record, these historical datasets show the Smackover Formation at the LANXESS Property has average values of 144-150 mg/L Li.
| Preliminary Economic Assessment of LANXESS Smackover Project | 58 |
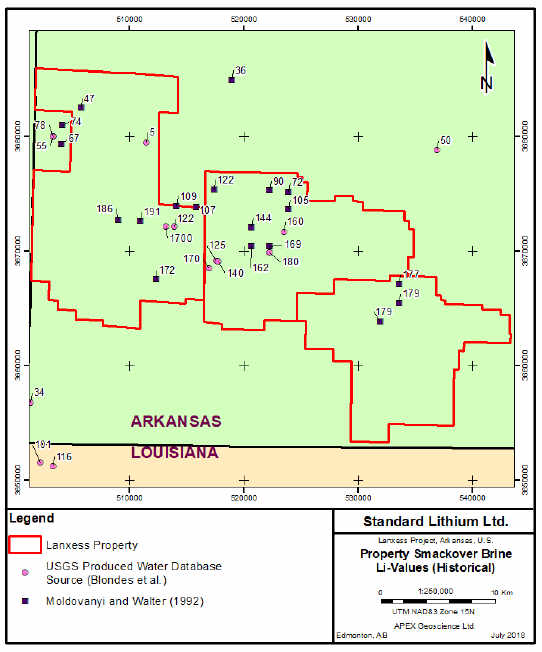
Note: Lithium values are in mg/L.
Figure 6-3 Smackover Formation Lithium Brine Values Derived within, and Adjacent to, the LANXESS Property (Blondes, et.al. 2016)
| Preliminary Economic Assessment of LANXESS Smackover Project | 59 |
6.3 LANXESS (within Property) Historical Infrastructure Summary
All infrastructure on the LANXESS Property is owned 100% by LANXESS. Three (3) bromine plants (within their respective brine units) are in operation and produce bromine. The location of the three (3) plants, and the associated well and pipeline network, is shown in Figure 6-4.
The South Plant represents LANXESS’ first bromine plant and was originally developed by Michigan Chemical/Murphy Oil in 1957. The West Plant represents the smallest of the three (3) LANXESS El Dorado plants, but is the largest bromine producing plant in southern Arkansas. The Central Plant initially began operations with 13 employees, producing bromine, methyl bromide and ethylene dibromide. In the 1970s, the Central Plant was expanded to produce flame retardants and oil field completion fluids.
In addition to the South, Central and West Plants, TETRA operates a by-product plant adjacent to the Central Plant (see Figure 4-2). The TETRA Plant produces liquid calcium chloride, flake calcium chloride and magnesium hydroxide. The TETRA Plant operates in a similar fashion to that proposed by Standard Lithium, in that TETRA processes LANXESS’ tail-brine.
6.4 LANXESS (within Property) Historical Brine Analysis
Upon signing the MoU in May 2018 (Standard Lithium 2018a), LANXESS supplied historical brine analyses from the LANXESS Property. The dataset includes 1990, 2010 and 2017 lithium (and other elements) analytical results from individual wells and pre-bromine feed-brine and post-bromine tail-brine. The data are summarized in Table 6-3. Accounting for all sampling points, there are 157 Li-brine analyses. The minimum, maximum and average lithium values of the 157 analyses completed is 32 mg/L, 588 mg/L and 240 mg/L, respectively. The average value of this Li data is higher than that of the datasets presented by Moldovanyi and Walter (1992) and the USGS National Produced Waters Geochemical Database (144-150 mg/L Li).
Based on historical analysis of brine from the supply wells, the South Unit yields the highest lithium content (average 350 mg/L Li; n=25 analyses), followed by the West Unit (average 239 mg/L Li; n=100 analyses) and the Central Unit (average 158 mg/L Li; n=15 analyses). Pre-bromine feed-brine at the West Plant was 180 mg/L Li (n=1 analysis). Tail-brine at the South, Central and West plants yielded average values of 275 mg/L, 120 mg/L and 124 mg/L Li (n=3, 7 and 6 analyses), respectively.
From a temporal perspective, different sampling/analysis timeframes occur within brine supply wells BSW-4S, BSW-10S, BSW-5M, BSW-6M, BSW-7M, BSW-14M, BSW-15M, BSW-16M, BSW-19M and Spencer #1, and tail-brine samples from the Central and West Plants. In general, the lithium values reported increase over time.
| Preliminary Economic Assessment of LANXESS Smackover Project | 60 |
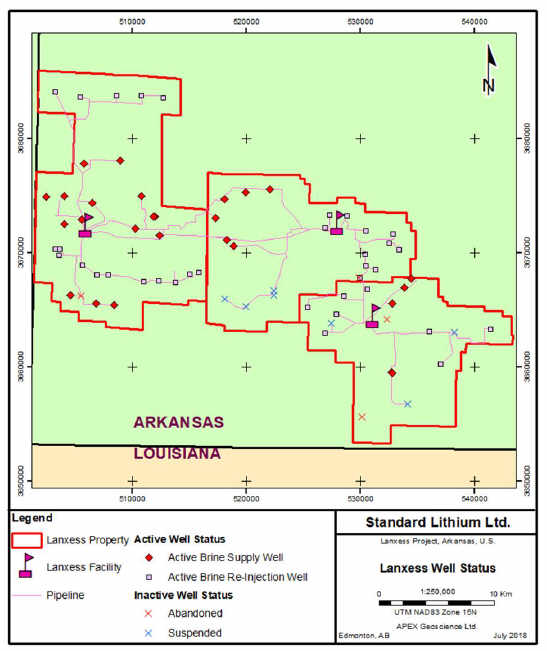
Figure 6-4 Location of Active and Inactive Brine Wells, Including Brine Supply and Brine Re-Injection Wells and Pipeline Network Connecting Well sites to Bromine Plants at the LANXESS Property
| Preliminary Economic Assessment of LANXESS Smackover Project | 61 |
Note: the author was unable to verify the analytical protocol and methods that were adopted by LANXESS (and predecessor companies) to analyze brine at the LANXESS Property. Accordingly, this discussion of Li-brine geochemical results is not necessarily indicative of the mineralization on the Property that is the subject of this Technical Report and the data is not considered to be current by Standard Lithium or the QP. In addition, Standard Lithium has conducted their own sampling program and these results are presented in Section 9, Exploration and used exclusively in the resource estimations presented in this Technical Report.
Table 6-3 Summary of Historical Brine Analyses (LANXESS 1990, 2010 and 2017)
Unit | Sample Source Point | Number of Analyses | Minimum Li (mg/L) | Maximum Li (mg/L) | Average Li (mg/L) | |||||||||||||
South | All wells | 25 | 177.0 | 547.0 | 349.9 | |||||||||||||
| Post-bromine tail | 3 | 206.0 | 356.0 | 274.7 | ||||||||||||||
Central | All wells | 15 | 72.0 | 262.0 | 157.7 | |||||||||||||
| Post-bromine-tail | 7 | 69.8 | 272.0 | 119.6 | ||||||||||||||
West | All wells | 100 | 32.0 | 588.0 | 239.3 | |||||||||||||
| Post-bromine-feed | 1 | 80.0 | 1800 | 180.0 | ||||||||||||||
| Post-bromine-tail | 6 | 79.6 | 229.0 | 123.9 | ||||||||||||||
| All Analyses | 157 | 32.0 | 588.0 | 239.7 | ||||||||||||||
Note: See qualifying note in Section 6.4 LANXESS (within Property) Historical Brine Analysis.
| Preliminary Economic Assessment of LANXESS Smackover Project | 62 |
7 Geological Setting and Mineralization
The Gulf Coast region was formed as part of the complex breakup of the mega-continent Pangea, starting approximately 180 million years ago (Ma). Development of one of the northern supercontinents, Laurentia, involved geological factors that were crucial for the formation of a carbonate platform that hosts vast reservoirs of petroleum products and lithium-bearing brine. The sections below provide a summary of the regional through to detailed-scale geology of the Gulf Coast region. Regional geological information includes a summary of the tectono-depositional framework of the Gulf Coast region and the ensuing Triassic-Jurassic stratigraphic deposition, with emphasis on the Smackover Formation. Detailed geological information is at the Property-scale and introduces the geological and hydrogeological characteristics of the Reynolds Member of the Smackover Formation, which defines the resource interval that is evaluated in this Technical Report.
7.1 Gulf Coast Tectono-Depositional Framework
Deposition of the Late Jurassic Smackover Formation is directly linked to the evolution of the Gulf of Mexico. That is, the central Gulf Coast region is the site of Triassic-Jurassic rifting, which is associated with the opening of the Gulf of Mexico and a divergent margin basin characterized by extensional rift tectonics and wrench faulting (Pilger 1981; Van Siclen 1984; Salvador 1987; Winker and Buffler 1988; Buffler 1991). The history of the interior salt basins in the central and eastern Gulf of Mexico includes a phase of crustal extension and thinning, a phase of rifting and sea-floor spreading and a phase of thermal subsidence (Nunn 1984; Mancini et al. 2008).
A proposed model for the evolution of the Gulf of Mexico and related basin and arch formation in Mississippi, North Louisiana and Arkansas includes the following:
| 1. | Late Triassic-Early Jurassic rifting that developed pronounced half-grabens bounded by listric normal faults. This phase was accompanied by widespread doming, rifting and filling of the rift basin(s) with volcanic and non-marine siliciclastic sedimentary (red beds) rocks as North America separated from Africa-South America (Buffler et al. 1981; Salvador 1991a; Sawyer et al. 1991; Marton and Buffler 2016). |
| 2. | Middle Jurassic rifting, crustal attenuation and the formation of transitional crust is characterized by the evolution of a pattern of alternating basement highs and lows as the Gulf area broke up into a series of separate arches/uplifts and subsiding basins, some of the latter became isolated and filled with thick sequences of evaporite, as shown in Figure 7-1 (Sawyer et al. 1991; MacRae and Watkins 1996; Mancini et al. 2008). |
| 3. | Late Jurassic sea-floor spreading and oceanic crust formation in the deep central Gulf of Mexico characterized by a regional marine transgression related to crustal cooling and subsidence (Sawyer et al. 1991). |
| 4. | Subsidence continued into the Early Cretaceous with a ramping up of a carbonate platform and |
| Preliminary Economic Assessment of LANXESS Smackover Project | 63 |
deposition of shallow to deep-water sedimentary rocks along the margins of the basins.
| 5. | Evolution of the Gulf Coast region ended with a prominent period of igneous activity and global sea-level fall during the Late Cretaceous (mid-Cenomanian), that produced a major lowering of sea level in the region and resulted in the exposure of the shallow Cretaceous platform margin that rimmed the Gulf (Salvador 1991b). This event is defined by a Gulf-wide unconformity that is most pronounced in the northern Gulf of Mexico area. |
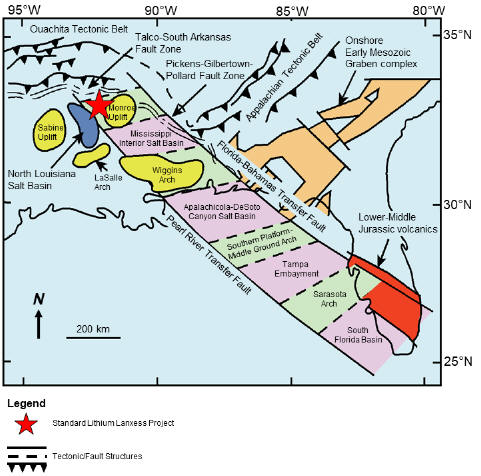
Figure 7-1 Tectonic Framework of the Northern Part of the Gulf of Mexico Region (Marcini et.al. 2008, who modified the work of MacRai and Watkins (1996)).
Given this scenario, Late Jurassic evaporite and sedimentary strata that form the integral geological units in this Technical Report, were deposited across much of the Gulf Coast basin as part of a seaward-dipping wedge of sediment that accumulated in differentially subsiding basins on the passive margin of the North American continent. These units include formations of the Louark Group: 1) the major Li-brine
| Preliminary Economic Assessment of LANXESS Smackover Project | 64 |
and hydrocarbon reservoir/aquifer known as the Smackover Formation; and 2) the Smackover Formation’s overlying and underlying aquitards, the Buckner Anhydrite Member of the Haynesville Formation and the Norphlet Formation and/or Louann salts.
The Smackover Formation is up to 365 m thick with an upper ooidal/oncolitic packstone and grainstone shoaling upward cycle facies that is nearly 100 m thick (Dickinson 1968; Moore and Druckman 1981). The Smackover Formation has been interpreted as a low-gradient slope (<1°) homoclinal ramp succession, due to its series of strike-oriented, relatively narrow depositional lithofacies belts across Texas, Arkansas, Louisiana and Mississippi (Ahr 1973; Bishop 1968; Handford and Baria 2007). Figure 7-2 [10] presents a regional map of the Smackover lithofacies belts in the U.S. Gulf Coast Basin. These belts include evaporite and redbed sequences in the north that change basin-ward into ooidal (inner-ramp beaches and shoals) peloidal-facies belt (mid-outer ramp) and laminated mudstone (basin).
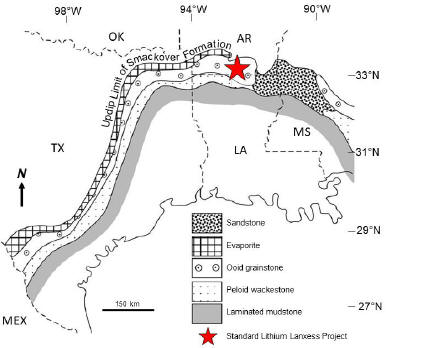
Figure 7-2 Regional Map of Smackover Lithofacies Belts in the U.S. Gulf Coast Basin (Handford and Baria (2007), who modified the work of Ahr (1973) and Bishop (1986)).
7.2 Triassic Jurassic Stratigraphy
During rifting phases, evolving grabens were filled with the earliest Late Triassic-Early Jurassic red-bed sedimentary sequences of the Eagle Mills Formation, as shown in Figure 7-3. This unit comprises a variety of terrestrial sedimentary rocks, including red, reddish-brown, purplish and greenish-gray coloured shale, mudstone, siltstone, and lesser amounts of sandstone and conglomerate. In southern
| Preliminary Economic Assessment of LANXESS Smackover Project | 65 |
Arkansas, the Eagle Mills Formation includes conglomeratic sandstone and red shale, with igneous fragments (diabase). The Late Triassic-Early Jurassic age is based on the study of remnant plants and radiometric dating of intrusive material (Scott et al. 1961; Baldwin and Adams 1971).
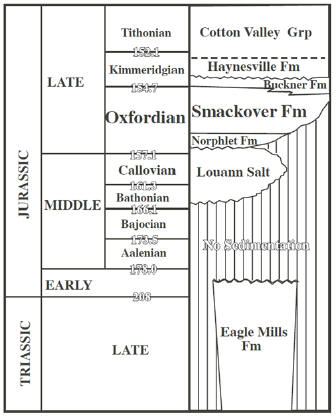
Figure 7-3 Stratigraphic Table of the Late Triassic to Late Jurassic Formations of the Northern U.S. Gulf Coast (Heydari and Baria 2005).
In central-north Louisiana and southern Arkansas, rifting and continental crustal attenuation resulted in a period of non-deposition, as evidenced by a 40-million-year hiatus of the depositional record. Late Middle Jurassic (Bathonian–Callovian) depositional units include evaporite, red clastic and basal conglomerate of the Werner Anhydrite (Hazzard et al. 1947). The Werner-Louann sequence unconformably overlies the Eagle Mills Formation, or older ‘basement’ rocks, and forms the basal unit(s) for the overlying Late Jurassic Louark Group, which includes the Norphlet, Smackover and Haynesville-Buckner formations (see Figure 7-3). More notably, continued basin-wide restriction resulted in deposition of a thick succession of the Louann Salt during the Callovian, which are over 3,050 m thick in some places (Salvador 1990; Zimmerman 1992). The Louann Salt has been estimated to cover as much as 466,000 km2 in the Gulf of Mexico region (Hazzard et al. 1947).
| Preliminary Economic Assessment of LANXESS Smackover Project | 66 |
The South Arkansas fault system and the Louisiana State Line graben are approximately parallel to the regional strike of the Smackover Formation deposition and were active during the Jurassic; likely, resulting from salt tectonics in the underlying Louann Formation (see Figure 6-2); (Bishop 1973; Troell and Robinson 1987). The present up-dip limit of the Louann Salt is generally marked by the South Arkansas fault system, a feature believed to have been produced during the Late Jurassic by downdip gravity sliding of the Louann Salt (Troell and Robinson 1987).
The Late Jurassic Norphlet Formation unconformably overlies the Louann Salt, and older units, near the margins of the basin (Hazzard et al. 1947; Bishop 1967). The Norphlet Formation was deposited during a regional sea-level low and attains a maximum thickness of approximately 45 m and is comprised of alluvial-fan sandstone and conglomerate, channel and interdune red-bed and aeolian sandstone (Wade and Moore 1993; Mancini et al. 2008). Norphlet Formation fluvial deposition in southern Arkansas is characterized by gravel with interbedded red and grey mudstone (Mancini et al. 2008) and is approximately 15 m thick (Zimmerman 1992; Hunt 2013).
Marine deposition resumed during the late Oxfordian, as the Late Jurassic seas transgressed, initiating the deposition of the Smackover Formation, which conformably overlies the Norphlet Formation.
The Smackover Formation carbonate rocks are succeeded by mixed evaporite, siliciclastic and dolomite of the Buckner Formation, and then by a thick Kimmeridgian–Tithonian succession of marine, deltaic and fluvial siliciclastic rocks of the Haynesville Formation and the Cotton Valley Group (Figure 7-4).
The Buckner Formation consists of evaporitic deposits and associated red-beds reflecting a depositional environment that is less marine, or shallower water marine, than those of the underlying Smackover Formation (Salvador 1987). The Buckner Formation is made up of intercalated 2–6 m thick salt/anhydrite and marine limestone and extends from the Florida Panhandle to South Texas (Mann 1988). A distinct facies change occurs along the crests of a line of anticlines, that extend from the Catesville oilfield in Union County, westward to the Dorcheat-Macedonia field in Columbia County. North of this structural trend, the Buckner Formation consists, from top to bottom, of non-marine red shale, anhydrite and dolomite (Akin and Graves 1969). To the south, equivalent beds become sandy. The anhydrite facies indicate the presence of a barrier restricting normal flow of seawater during Buckner Formation deposition.
In southern Arkansas and northern Louisiana, the Late Jurassic Cotton Valley Group lies unconformably on the Louark Group, Haynesville Formation. In ascending order, Swain and Anderson (1993) divided the Cotton Valley Group into the Millerton (siliciclastic, mainly shale, shelf unit), Shongaloo (foreshelf and shelf edge silty shale and sandstone) and Dorcheat (sandstone and siltstone) formations. The Millerton Formation, or Bossier marine shale, pinches out updip in southernmost Arkansas (Mancini et al. 2008). The Haynesville Formation conformably underlies the Bossier, and where the Haynesville is absent, the Bossier rests on the Smackover Formation limestone. In Arkansas, the Dorcheat Formation contains increasing amounts of sandstone before pinching out (Forgotson 1954).
| Preliminary Economic Assessment of LANXESS Smackover Project | 67 |
7.3 Smackover Formation
The Smackover Formation was named after the Smackover field, Union County, AR, where oil was first produced. Hydrocarbons were discovered in the Late Jurassic Smackover Formation in the mid-1920s. Since then, the Smackover has produced large quantities of oil and gas in a production trend that extends over an area of 100 km x 1,000 km, on the margins of the Gulf of Mexico from Texas to Florida (Moore 1984). Consequently, the Smackover Formation has been subject to many investigations that address the unit’s stratigraphy, lithofacies and depositional environment (e.g. Ahr 1973; Akin and Graves 1969; Baria et al 1982; Bishop 1968, 1971a, 1973; Budd and Loucks 1981; Moore and Druckman 1981; Harris and Dodman 1982; Moore 1984; Troell and Robinson 1987; Chimene 1991; Hanford and Baria 2007; Marcini et al. 2008).
Based on ammonite studies from the lower portion of the unit, the Smackover Formation is late Oxfordian (Imlay 1945). The Smackover Formation resulted from carbonate deposition under shoaling conditions, following a relatively rapid transgression over the Norphlet Formation sandstone and Louann Salt. The transgression extended as far northwards in the State of Arkansas to Ouachita County (directly north of Union County). The distribution of facies of the ensuing carbonate deposits was controlled by local paleotopography where 1) high energy facies were deposited in nearshore areas; and 2) low-energy strata were deposited in basin centres.
The Late Jurassic Smackover Formation in Arkansas was traditionally divided into two members: 1) an upper ooidal to chalky porous limestone; and 2) a lower member composed of dense argillaceous limestone and dark calcareous shale (Imlay 1940). Jurassic rocks are not exposed in southern Arkansas. In southern Arkansas, the Smackover Formation oil and gas reservoir pay zone is situated at depths that range from 2,350 to 3,660 m below the Earth’s surface (Moore and Druckman 1981; Marcini et al. 2008). Accordingly, the two Smackover Formation members were divided based on their wire-line electric logs, where the upper member has high self-potential and lower resistivity and the lower member has low self-potential and high resistivity.
More recently (e.g. Dickinson 1968), and in the general context of this Technical Report, the Smackover Formation has been divided into three informal sub-units:
| 1. | The Reynolds Member: an upper, clean, ooidal grainstone member that forms the main reservoir rock type of the region due to its high porosity (this unit correlates with the Mineral Resource estimate interval that is the focus of this Technical Report). |
| 2. | The Middle Smackover: a middle unit composed of brown, dense, laminated, pelletal, lime-mudstone and fossiliferous lime-wackestone. |
| 3. | The Brown Dense: a lower Smackover unit comprised of dark-brown, fine-grained, laminated, argillaceous, lime-mud sequence (Dickinson 1968; Moore and Druckman 1981; Troell and Robinson 1986), as shown in Figure 7-4. |
| Preliminary Economic Assessment of LANXESS Smackover Project | 68 |
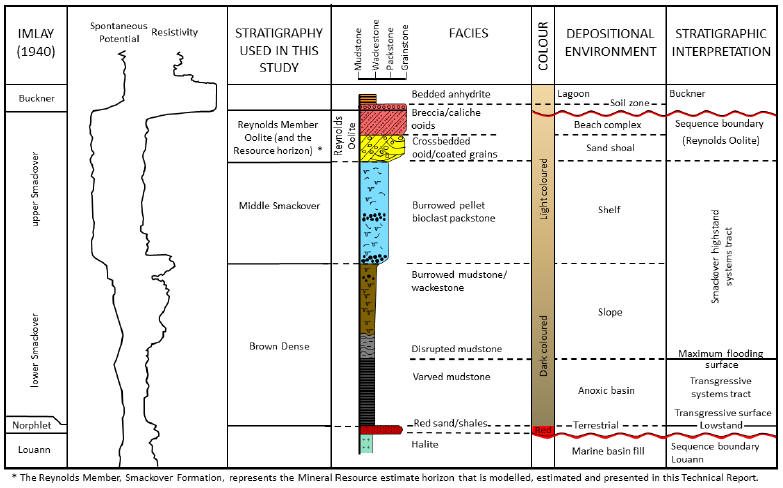
Figure 7-4 Stratigraphic Depositional Environments of the Smackover Formation
| Preliminary Economic Assessment of LANXESS Smackover Project | 69 |
The correlating depositional environment and stratigraphic interpretation of these three Smackover sub-units is shown on Figure 7-4 and from top to bottom as:
| 1. | An ooidal beach complex and/or sand shoal. |
| 2. | A shelf high-stand systems tract deposited at and near the time of maximum transgression, and during/after a period of rapidly-increasing water depth. During middle Smackover-time, prolific production of high-energy carbonate sediment on the flanks of the paleohighs initiated a progradation phase of Smackover Formation deposition. |
| 3. | Transgressive systems tract deposits formed in shallow water during relative-sea-level stillstand. The ooidal deposits are generally arranged in a succession of stacked, upward-shallowing cycles that grade from subtidal strata at their bases to shallower subtidal to supratidal strata at their tops (Benson, 1988; Mancini et al. 1990). |
From southern Arkansas to northern Louisiana, the Smackover Formation ranges from 0 to 365 m thick (Dickinson 1968). The Reynolds Member, which represents the uppermost Smackover Formation lime-grainstone-ooidal strata, maintains a thickness of 90 to 120 m across southern Arkansas (Akin and Graves 1969) and reaches a maximum thickness of almost 300 m near the Arkansas-Louisiana state line (Moore and Druckman 1981). The Smackover Formation thickens to the south of a westward-trending series of anticlines that extend westward from the Catesville oilfield in Union County to the Dorcheat-Macedonia field in Columbia County until it interfingers with the Millerton Formation (Bossier shale) to the south.
Smackover Formation hydrocarbon traps include structural and stratigraphic traps and a combination of the two. Evaporites, which have played a role in Smackover reservoir development are found in the underlying Louann Salt, the overlying Buckner Formation and within the Smackover Formation itself.
Smackover Formation diagenesis was dominated by early cementation, leaching of calcium carbonate allochems and dolomitization. Other processes include pressure solution, late (post-dolomitization) calcite and anhydrite cementation and fracturing; both tectonic and caused by collapse of partially dissolved rock frameworks (Kopaska-Merkel et al. 1992). Early marine-phreatic cementation was followed by leaching of ooids and widespread particle dissolution that vastly increased porosity values to 40% or more but had little direct effect on permeability. Early dolomitization of uppermost Smackover Formation strata by reflux of hypersaline brine was widespread and is responsible for formation and/or preservation of many permeable Smackover pore systems.
The Reynolds Member of the upper Smackover Formation is the target horizon for mineral resource evaluation in this Technical Report. The Reynolds Member was deposited during a high-stand systems tract in response to a decrease in relative sea level; consequently, the upper Smackover Formation Reynolds Member is composed of ooids and non-skeletal carbonate that formed ooidal, chalky limestone (Vestal 1950; Tonietto and Pope 2013).
This carbonate unit is widespread, relatively uniform in thickness and has definite patterns of regional and local lithic changes. The most common Smackover Formation reservoir rocks occur within the
| Preliminary Economic Assessment of LANXESS Smackover Project | 70 |
Reynolds Member, which can comprise a variety of grainstone and grainstone/packstone rock-units that are often dominated by pellets, ooids and oncoids (Akin and Graves 1969; Moore and Druckman 1981; Troell and Robinson 1987). The occurrence of reservoir-grade rocks (porosity of at least 6% and permeability of at least 0.1 millidarcy (mD)) in the Smackover Formation is dependent on: (1) deposition of porous and permeable sediments in a variety of settings; and (2) diagenetic processes that have preserved, enhanced or created porosity and permeability in originally permeable and/or impermeable strata (Kopaska-Merkel et al. 1992).
7.4 Property Geology: Characterization of the Smackover Formation
There are over 3,400 predominantly vertical wells drilled in the general LANXESS Property area. The wells were drilled from the 1950s onwards in search of hydrocarbon reservoirs and brine aquifers. Of the 3,400 wells, 699 wells were drilled deep enough to penetrate some portion of the Smackover Formation within the Property, and more specifically, the uppermost Reynolds Member. Within the Property, 198 wells were drilled and logged through the entire Reynolds Member. Wireline logs in 36 of the 198 wells included density logs. These subsurface well data were entered into a variety of geological interpretation software systems, including PetraTM, Kingdom® and Logscan, to evaluate and show regional trends of the Reynolds Member throughout the LANXESS Property.
Based on analysis of the subsurface well data, it was found that key geologic formations are relatively easy to correlate within the LANXESS Property and surrounding area. The uppermost portion of the Smackover Formation is comprised of a tight calcarenite-carbonate mudstone facies. The Reynolds Member is porous oöidal stratigraphy that is usually well-defined on raster logs and/or log ASCII files (LAS).
To illustrate this, a type log is presented in Figure 7-5. The electric log from this well depicts the formation markers for the Buckner Formation, top of the Smackover Formation, Reynolds Member top and base and Lower Smackover Formations. The Reynolds Member is depicted on the log as having a noticeably lower gamma ray signature and distinct ‘gap’ in resistivity between the medium and deep induction logs and the spherically focused log (light blue highlighted zone on Figure 7-5. On Figure 7-5, the corresponding density porosity log is highlighted in dark blue to indicate the instances where the total porosity is greater than 20% in the Reynolds Member.
Electric logs from 61 wells were used to develop two cross-sections, which were used to determine the continuity and lateral extent of the Reynolds Member within the LANXESS Property. The locations of the wells are shown on Figure 7-6. Figure 7-7 presents a North-South cross-section (A-A’), comprised of five wells with electric and density porosity logs. Figure 7-8 presents a West-East cross-section (B-B’) comprised of seven wells; five wells with electric and density porosity logs and two wells with electric logs only.
The density porosity logs in both cross-sections show that the Smackover Formation Reynolds Member has good porosity (>10%) underlying the entire LANXESS Property. The analysis of the five electric logs,
| Preliminary Economic Assessment of LANXESS Smackover Project | 71 |
of the wells with density porosity logs, shows a qualitative relationship of porosity to resistivity can be established. Ten per cent or greater porosity relates to low resistivity and separation of the resistivity curves on the electric logs. A calculation of true porosity from resistivity was not established; however, the correlation between density porosity logs (true porosity) and Reynolds Member core measurements (effective porosity) is discussed in Section 12 Data Verification.
Observations from the sub-surface interpretations that are evident on the cross-sections include the following:
| • | The Reynolds Member is laterally continuous and underlies the entire LANXESS Property. |
| • | There is no evidence of faulting within the Smackover Formation at the LANXESS Property. |
| • | The thickest section of the Reynolds Member is observed in well Mahony JK-1 at the north end of cross-section A-A’ (see Figure 7-7), where a thickness of 97.2 m is observed. |
| • | The Reynolds Member thins towards the south, where well 14M has a thickness of 14.9 m. |
| • | Cross-section B-B’ shows uniform Reynolds Member thickness across the central part of the Property (see Figure 7-8). For example, the following wells, Brine Supply Well 18M, Brine Supply Well 14, BSW 12, Ruth Glen 1 and Woods SWS 18S, have thicknesses of between 39.0 m (Woods SWS 18S) and 52.4 m (Brine Supply Well 18M). |
| • | The average thickness of the Reynolds Member within the LANXESS Property is 57 m. |
| • | The cross-sections include density porosity logs; a direct correlation between >10% porosity and the stratigraphic picks of the Reynolds Member ooidal zone is evident. |
In addition to the LAS files, 620 line-km of proprietary 2D seismic data was used to create integrated seismic subsurface maps. Synthetic seismograms were generated in wells with sonic logs to make a tie between the seismic and well data. An excellent tie was established for the top of the Reynolds Member throughout the LANXESS Property. A type example of the 2D seismic data is presented in Figure 7-9; the Reynolds Member appears as a strong trough on the seismic data, directly below the distinct Buckner Formation marker.
The subsurface well data review and analysis supports the stratigraphic depiction of the Reynolds Member of the Smackover Formation aquifer within the Property. The upper and lower stratigraphic surface grids define the Reynolds Member domain used in the resource modelling and estimation process (see Sections 14.1, 14.2 and 14.3).
| Preliminary Economic Assessment of LANXESS Smackover Project | 72 |
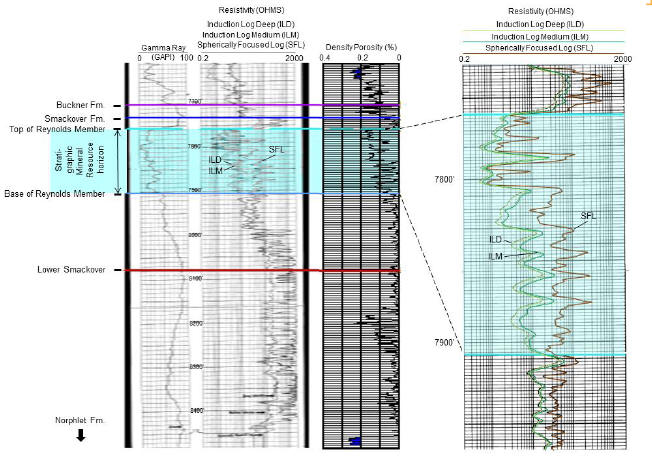
Note: The ASCII log file is for South Ranch Oil Co. Scales 1 (API:03-139-1146-00-00). The well is in Township 18S, Range 17W5 and has a total depth of 2,575 m.
Figure 7-5 Smackover Formation Section Depicting Resource Estimation Zones used in this Technical Report
| Preliminary Economic Assessment of LANXESS Smackover Project | 73 |
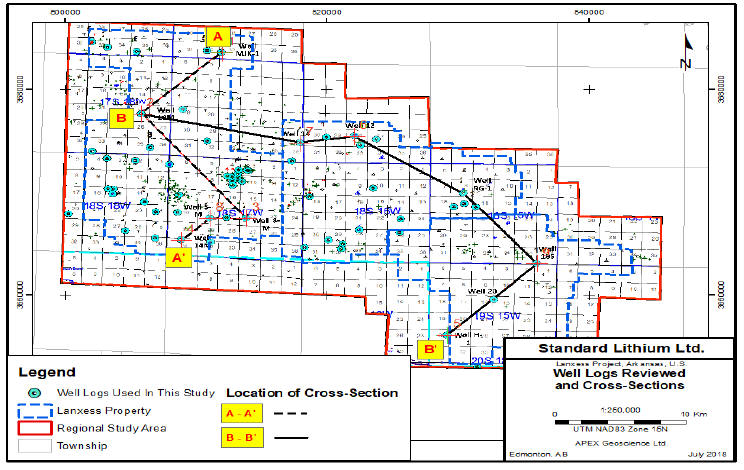
Figure 7-6 Wells Selected for Study and Location of Cross-Sections
| Preliminary Economic Assessment of LANXESS Smackover Project | 74 |
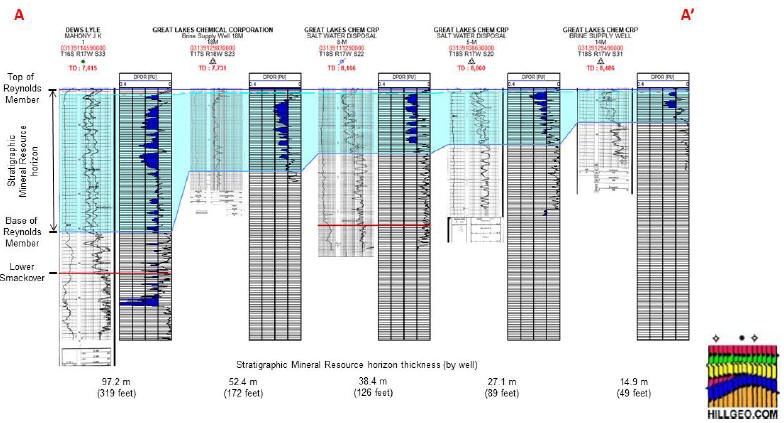
Note: the total porosity log is included and porosity over 10% is shaded in blue.
Figure 7-7 North-South Cross-Sections of the Smackover Formation and Associated Geological Units in the LANXESS Property Area
| Preliminary Economic Assessment of LANXESS Smackover Project | 75 |
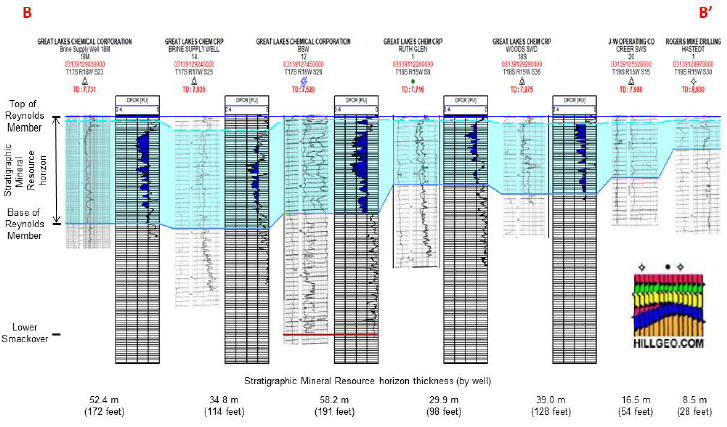
Note: The total porosity log is included and porosity over 10% is shaded in blue.
Figure 7-8 West-East Cross-Section of the Smackover Formation and Associated Geological Units in the LANXESS Property Area
| Preliminary Economic Assessment of LANXESS Smackover Project | 76 |
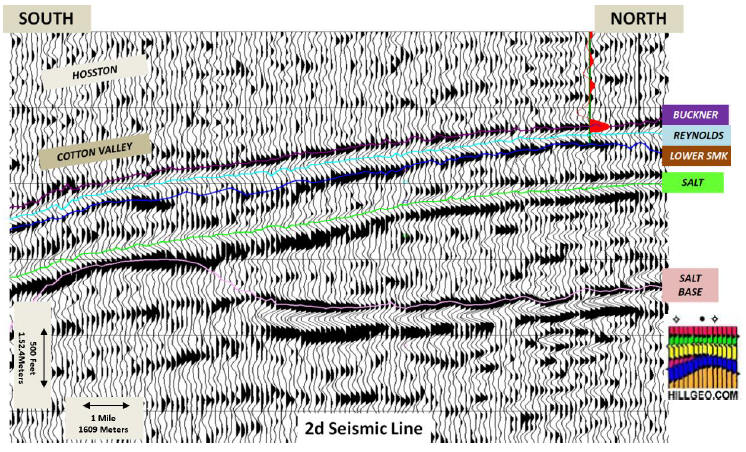
Figure 7-9 Example of Proprietary 2D Seismic Data, Showing Seismogram Tie (red) and Uniform Horizons Near the Reynolds Member Smackover Formation
| Preliminary Economic Assessment of LANXESS Smackover Project | 77 |
7.5 Reynolds Member, Smackover Formation, Aquifer
The aquifer associated with the Reynolds Member is defined by a distinct stratigraphic horizon of the Upper Smackover Formation that consists of clean, porous, ooidal grainstone. This unit forms the main oil, gas and brine reservoir type-rock of the region due to its high porosity and permeability.
The Reynolds Member aquifer is situated within the Reynolds Member, which occurs underneath the entire Property at depths of approximately 1,950-2,645 m beneath the Earth’s surface. The Reynolds Member aquifer has an average thickness of 57 m (see Section 14.3 Geometry of the Reynolds Member Domain).
It is Important to note that the aquifer within the Smackover Formation is defined as a ‘confined aquifer’; the aquifer is sandwiched between two aquitards that include the overlying Buckner Formation anhydrite and shale and the underlying low permeability, Lower Smackover (Brown Dense) and Louann Salt. The Buckner Formation has been an effective seal or cap, preventing the inflow of oil and gas from the oil and gas fields, which are present in the Reynolds Member across Arkansas and on the Property.
For this Technical Report, an extensive dataset has been compiled, that includes: (1) historical porosity analyses (n=1,935 core samples); (2) historical permeability analyses (from six sources); (3) Property specific permeability and porosity analyses (n=2,329 core plug samples); and (4) 14,314 Reynolds Member total porosity values based on publicly available LAS density/porosity logs from wells within the LANXESS Property.
This data, together with Reynolds Member thickness, was used to make inferences on the hydrogeological characteristics of the Reynolds Member aquifer within the LANXESS Property. As per the CIM Best Practice Guidelines for Resource and Reserve Estimation for Lithium Brines (November 1, 2012), the hydrogeological characterization of the Smackover Formation, and specifically the Reynolds Member, is defined and discussed in Section 14.5 Hydrogeological Characterization of the Reynolds Member, Smackover Formation. Sub-sections presented within this section discuss porosity, permeability, dispersivity, anisotropy, groundwater levels and hydraulic conductivity and analysis as they pertain to the Indicated LANXESS Li-Brine Resource Estimate presented in Section 14 of this Technical Report.
7.6 Mineralization
The LANXESS Property is being assessed by Standard Lithium for Li-brine potential; more specifically, to access Li-brine to advance the development of a modern technology that effectively extracts lithium from the brine. The brine is situated within an aquifer associated with the Late Jurassic Smackover Formation.
Hyper-saline brine (Total Dissolved Solids (TDS) of >252,000 mg/L, and up to 413,000 mg/L) with elevated lithium has been verified in preliminary 2017 sampling programs and detailed 2018 and 2019 brine sampling programs conducted by Standard Lithium. The sampling programs and their Li-brine mineralization results are discussed in Section 9.1.
| Preliminary Economic Assessment of LANXESS Smackover Project | 78 |
8 Deposit Types
Lithium is a silver-grey alkali metal that commonly occurs with other alkali metals (sodium, potassium, rubidium, cesium). Lithium’s atomic number is 3 and it has an atomic weight of 6.94, making it the lightest metal and the least dense of all elements that are not gases at 20°C (the density of lithium in solid form at 20°C is 534 kg/m3). Lithium has excellent electrical conductivity (i.e. a low electrical resistivity of 9.5 mW.cm), making it an ideal component for battery manufacturing, where lithium ions move from the negative electrode to the positive electrode during discharge and back when charging. Lithium imparts high mechanical strength and thermal shock resistance in ceramics and glass.
The average crustal abundance of lithium is approximate 17-20 parts per million (ppm), with higher abundances in igneous (28-30 ppm) and sedimentary (53-60 ppm) rocks (Evans 2014; Kunasz 2006). Note: 1 mg/L Li is equivalent to 1 ppm (at a fluid density of 1 g/cm3) and 0.0001%. Lithium does not occur in elemental form in nature because of its reactivity. There are over 100 minerals that contain lithium, but only a few of these are currently economic to extract.
Lithium can be described, priced and quoted as lithium content (Li), lithium oxide (Li2O; 0.464 Li content; conversion is Li x 2.153), lithium carbonate (Li2CO3; 0.188 Li content) and lithium carbonate equivalent (LCE; conversion is Li x 5.323). Resource estimates and production quantities of lithium are most commonly expressed as LCE.
Lithium is extracted from two main categories of deposits: mineral and brine. With respect to mineral deposits, lithium is only extracted commercially from pegmatite deposits. Pegmatite lithium deposits are found globally and account for half of the lithium produced today (Benson et al. 2017). Spodumene is the most abundant Li-bearing mineral found in economic deposits.
Brine deposits include unconfined (i.e. continental) and confined (i.e. geothermal and subsurface aquifer) brine deposits. Continental brine occurs in endorheic basins, where inflowing surface and groundwater is moderately enriched in lithium. All producing lithium brine operations are unconfined, or partially confined, continental deposits. Several first-order characteristics of this type of brine deposit are: (1) arid climate; (2) closed basin containing a playa or salar; (3) tectonically driven subsidence; (4) associated igneous or geothermal activity; (5) suitable lithium source-rocks; (6) one or more adequate aquifers; and (7) sufficient time to concentrate a brine (Bradley et al. 2006).
Economic continental brine deposits typically occur in areas where high solar evaporation results in beneficiating the Li-brine to higher levels of lithium. Geothermal and/or volcanic associations are the favoured mechanisms for introducing lithium into continental basins, because lithium-rich brines often exist in areas of volcanic activity (e.g. Imperial Valley, California; Reykjanes Field, Iceland; Taupo Volcanic Zone, New Zealand). Typical grades are 0.04-0.15 mg/L Li.
Selected continental brine deposit examples include: Salar de Uyuni in Bolivia (Bradley et al. 2017); Salar de Atacama in Chile (Garrett 2004); Salar de Hombre Muerto in Argentina (Tahil 2007); Salar del Rincon and the Salar del Olaroz in Argentina (Pavlovic and Fowler 2004; Houston and Gunn 2011); and the
| Preliminary Economic Assessment of LANXESS Smackover Project | 79 |
Zhabuye Salt Lake in the Tibetan Plateau, the DXC Salt Lake and the Qaidam Basin in China (Shengsong 1986; Zheng et al. 2007). The only active lithium mine in North America is in Silver Peak, Nevada, where lithium brine extraction started in 1966. The lithium occurs in an infilled playa sequence that covers an area of 72 km2 within a closed drainage basin of 1,342 km2 (Munk et al. 2011). Average lithium content at the initiation of production was 360 ppm in 1966, declining to 230 ppm in 2008 (Garrett 2004). The mine currently produces 3,500 tonnes of LCE per year, with the capability to produce 6,000 tonnes of LCE per year.
Deep aquifer Li-brine is frequently pumped as a waste product of hydrocarbon production from confined aquifers at depths of up to 4,000 m. Lithium enrichment of deep saline brine is known to occur worldwide in sedimentary basins of various age, including: the Cambrian Siberian Platform, Russia (Shouakar-Stash et al. 2007); Devonian Michigan Basin (Wilson and Long 1993); Mississippian– Pennsylvanian reservoirs of the Illinois Basin (Stueber et al. 1993); Pennsylvanian Paradox Basin, Utah (Garrett 2004); Triassic strata of the Paris Basin, France (Fontes and Matray 1993); and Jurassic Smackover strata from the Gulf Coast, Arkansas and Texas (Moldovanyi and Walter 1992).
If the aquifer contains elevated concentrations of lithium, deep, confined aquifers associated with mature (or dwindling or dormant) oil and gas fields can be converted to brine producing aquifers. A perfect example of this is bromine production from the Smackover Formation in southern Arkansas. At the LANXESS Property, LANXESS’s predecessors ceased hydrocarbon production in favour of bromine production in 1957 and this production has continued for over 50-years. Accordingly, these deep-seated aquifer brine deposits present enormous opportunity.
The source of lithium in hypersaline brine aquifers, including the Smackover Formation, remains subject to debate. Theories relevant to the Smackover Formation include, but are not limited to, the following:
| • | Smackover Li-brine could be a result of the continental drainage of lithium-enriched solutions into the sea, where the lithium stems from Triassic age volcanic rocks in the Gulf coast (Collins 1976). Continental water from springs or other hydrothermal fluids along fault systems could have leached lithium from Triassic aged volcanic rocks. These lithium-enriched fluids then drained into the Smackover Sea and the water was then concentrated by evaporation. |
| • | In the Smackover brine, radiogenic Sr87/Sr86 are significantly higher than Late Jurassic seawater, suggesting significant strontium contribution from detrital sources, such as the Bossier Formation, which overlies and/or interfingers with the upper Smackover Formation, or suggesting they were acquired during brine migration (Stueber et al. 1984). |
| • | Lithium was mobilized from the Alleghenian-sourced volcaniclastics (including plutonic rocks) and then concentrated in the underlying Norphlet Formation. These fluids could have originated in the Louann Salt and migrated upward through faults or from shallower circulation through the alluvial and wadi facies of the Norphlet (from Chuchla, unpublished, via Daitch 2018). |
| • | The association between B, Li, K, and Rb, coupled with a general lack of clastic sediments in the upper Smackover Formation in southwest Arkansas, suggest that the Smackover Formation brines are mixing with deeper-seated waters that may have been geochemically modified by siliciclastic diagenesis at higher temperature (Walter et al. 1990). |
| Preliminary Economic Assessment of LANXESS Smackover Project | 80 |
| • | Regional trends between H2S and B, Li, K and Rb support the association of a higher temperature, deeper-seated fluid end member; these fluids may have migrated into upper Smackover reservoirs via major fault systems, the South Arkansas fault system and the Louisiana State Line graben, and their associated fractures (Moldovanyi and Walter 1992). |
With respect to resource modelling of confined aquifer Li-brine deposits, important criteria include: defining the boundaries of the subsurface aquifer; brine chemistry; and understanding of the hydrology of the brine. The reader is referred to the CIM Best Practice Guidelines for Resource and Reserve Estimation for Lithium Brine (2012). While the guidelines define issues specific to unconfined continental brine deposits (i.e. salars), they do provide general direction for reporting on confined deep aquifer deposits.
| Preliminary Economic Assessment of LANXESS Smackover Project | 81 |
9 Exploration
9.1 Standard Lithium 2018-2019 Brine Sampling Programs
As discussed in Sections 4.1 and 6.3, the LANXESS Property includes three (3) brine unit areas, each of which has its own bromine processing plant and 26 active brine supply wells that supply Smackover Formation brine to the LANXESS plants (see Figure 9-1). The brine units and plants include the LANXESS South, Central and West Bromine Plants. Once bromine has been recovered from the brine, the brine is pumped back down in the Smackover Formation via reinjection wells (see Figure 9-1).
Between June 2018 and January 2019, Standard Lithium has conducted periodic (now quarterly) brine sampling of the brine supply wells, and monthly brine sampling at the South, Central and West Bromine Plants. The objective of the brine sampling program is to build a geochemical assay database of Smackover Formation brine from the individual supply wells and three (3) brine access points at the Bromine Plants that include the following:
| 1. | Feed brine: The feed-brine sample point is located prior to any processing of the brine to recover bromine (other than H2S mitigation and removal of petro-products, if present). Feed brine is the collective brine derived from the brine supply wells within a Unit area. The brine is amalgamated and directed through a series of pipelines to the respective LANXESS Bromine Plant. |
| 2. | After-brine: The after-brine sample point is located directly after the brine has been processed in the bromine tower. The processed brine has been stripped of bromine at this point. This is the brine that will be used as feed stock for Standard Lithium’s lithium extraction processing plants (lithium chloride and lithium carbonate). |
| 3. | Tail-brine: The tail-brine sample point is located directly before the waste brine is re-injected back down into the Smackover Formation aquifer. At this point, the brine has been diluted with a small amount of freshwater, and the pH has been adjusted for reinjection. |
The temporally-sampled brine supply wells, and their lithium analytical data results, were examined using their average percent relative standard deviation (also known as the % coefficient of variation or average RSD%), which is an estimate of reproducibility of the analytical results. The RSD% values for assays from the individual supply wells is presented in Table 9-1 and range from 0.6% to 8.5% (averaging 4.5%) demonstrating that the brine has good reproducibility from any single brine supply well over time.
9.1.1 Brine Supply Well Lithium Geochemical Results
A total of 90 brine samples were collected from 25 of the 26 brine supply wells at the LANXESS Property during four (4) to five (5) separate sampling programs conducted by Standard Lithium (see Figure 9-2). The sampling process is described in Section 11 Sample Preparation, Analysis and Security. The number of brine supply wells sampled includes five (5) wells in both the South and Central Units, and 15 wells in the West Unit.
| Preliminary Economic Assessment of LANXESS Smackover Project | 82 |
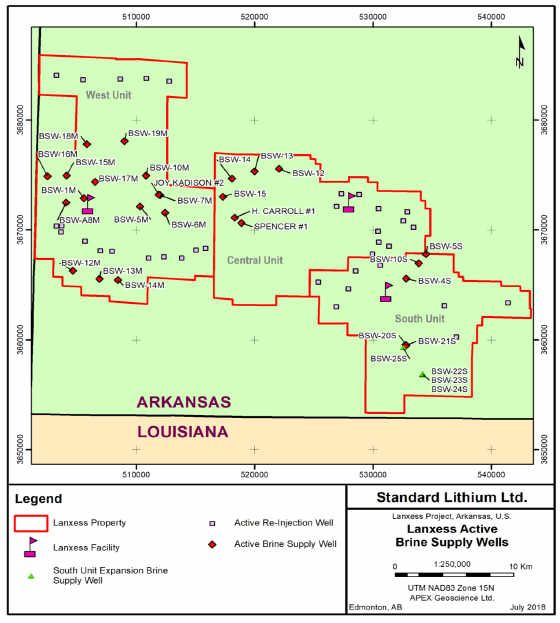
Figure 9-1 Active Brine Supply Wells at the LANXESS Property
| Preliminary Economic Assessment of LANXESS Smackover Project | 83 |
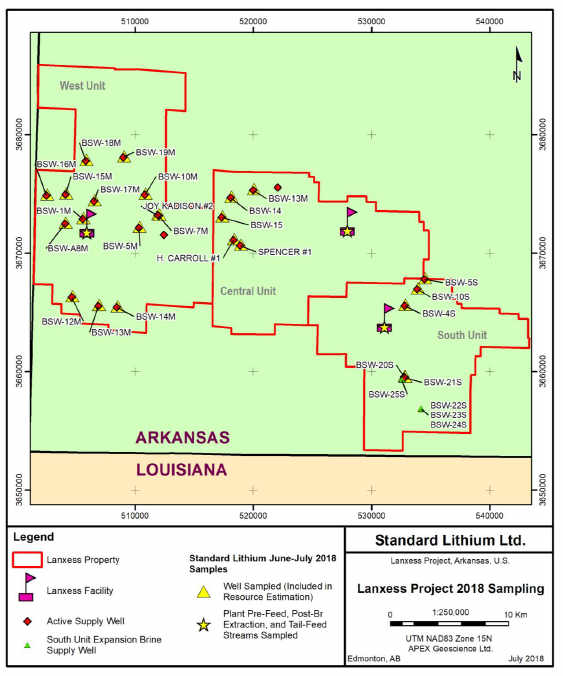
Figure 9-2 Locations of Brine Supply Well Samples Collected during 2018 Brine Sampling Program
| Preliminary Economic Assessment of LANXESS Smackover Project | 84 |
The following brine analytical results are presented in Table 9-1:
| • | Five (5) brine supply wells in the South Unit yield lithium concentrations between 172 mg/L and 258 mg/L, with a combined average of 204.6 mg/L. |
| • | Five (5) brine supply wells in the Central Unit yield lithium concentrations between 90 mg/L and 193 mg/L, with a combined average of 137.7 mg/L. |
| • | Fifteen (15) brine supply wells in the West Unit yield lithium concentrations between 53 mg/L and 299 mg/L, with a combined average of 165.8 mg/L. |
Brine has been collected from 25 brine supply wells on numerous occasions (between three (3) and five (5) times, depending on the well) to investigate the continuity of the lithium concentrations (see Table 9-1). The temporal variation in the lithium analytical results, on a well-by-well basis, is presented in Figure 9-3. The lithium concentration line slopes, per well, are generally flat; the minimum, maximum and average line slopes from all 25 wells are 0.4x, 9.7x and 3.7x, respectively, and show a homogeneous lithium-in-brine content at each brine supply well over time.
Based on brine samples collected and analyzed from the brine supply wells during this seven (7) month period, it is concluded that the Smackover Formation brine underlying the LANXESS Property has a well-defined and temporally homogeneous lithium composition, on a well-by-well basis, throughout the entire Property.
| 9.1.2 | LANXESS Bromine Plant Lithium Geochemical Results |
A total of 87 brine samples were collected from LANXESS Plant brine access points during separate sampling programs conducted by Standard Lithium. Sample numbers from the individual Plant sites include: 9 to10 feed-brine samples; 7 to 10 after-brine (or after bromine tower processing) samples; and 10 to 11 tail-brine samples. The following analytical results are presented in Table 9-2:
| • | The average feed-brine, after-brine and tail-brine from the South Plant yields 195.7, 196.2 and 182.0 mg/L Li, respectively. |
| • | The average feed-brine, after-brine and tail-brine from the Central Plant yields 136.3, 129.9 and 112.6 mg/L Li, respectively. |
| • | The average feed-brine, after-brine and tail-brine from the West Plant yields 158.5, 153.7 and 150.4 mg/L Li, respectively. |
Because the after-brine is being contemplated for additional lithium extraction processing, the following discussion focuses on the after-brine, which is derived immediately after the bromine removal process. As brine production at LANXESS is unitized, the analytical results show the average lithium content is highest in after-brine associated with the South Plant (196.2 mg/L) followed by the West Plant (153.7 mg/L) and Central Plant (129.9 mg/L) units.
Tables 9-1 to 9-3 show the lithium results of Standard Lithium’s 2018 to 2019 brine sampling programs at the brine supply wells within the LANXESS Property.
| Preliminary Economic Assessment of LANXESS Smackover Project | 85 |
Table 9-1 WetLab Lithium Analytical Results (mg/L – South Unit Brine Supply Well Geochemical Summary)
Well ID | 11/12-06-18 | 24/25-07-18 | 16/17-10-18 | 15/16-01-19 | Average Li | RSD% | ||||||||||||||||||
| (mg/L) | ||||||||||||||||||||||||
BSW-4S | 191 | 195 | 190 | 225 | 200.3 | 8.3 | ||||||||||||||||||
BSW-5S | NA | 173 | 172 | 183 | 176.0 | 3.5 | ||||||||||||||||||
BSW-10S | 191 | 191 | 193 | NA | 191.7 | 0.6 | ||||||||||||||||||
BSW-20S | 203 | 208 | NA | 225 | 212.0 | 5.4 | ||||||||||||||||||
BSW-21S | 227 | 221 | 233 | 258 | 234.8 | 6.9 | ||||||||||||||||||
Number of wells sampled | 5 | |||||
Number of analyses | 17 | |||||
Approximate number of analyses per well | 3.4 | |||||
South Unit Average Li (mg/L; all analyses) | 204.6 |
Table 9-2 WetLab Lithium Analytical Results (mg/L) – Central Unit Brine Supply Well Geochemical Summary
Well ID | 11/12-06-18 | 24/25-07-18 | 16/17-10-18 | 15/16-01-19 | Average Li | RSD% | ||||||||||||||||||
| (mg/L) | ||||||||||||||||||||||||
BSW-13 | 107 | 108 | 108 | 126 | 112.3 | 8.2 | ||||||||||||||||||
BSW-14 | 92.4 | 89.8 | 91.9 | 107 | 95.3 | 8.3 | ||||||||||||||||||
BSW-15 | 153 | 145 | 154 | 165 | 154.3 | 5.3 | ||||||||||||||||||
Spencer #1 | 182 | NA | 177 | 193 | 184.0 | 4.4 | ||||||||||||||||||
Number of wells sampled | 5 | |||||
Number of analyses | 17 | |||||
Approximate number of analyses per well | 3.4 | |||||
Central Unit Average Li (mg/L; all analyses) | 137.7 |
| Preliminary Economic Assessment of LANXESS Smackover Project | 86 |
Table 9-3 WetLab Lithium Analytical Results (mg/L) – West Unit Brine Supply Well Geochemical Summary
Well ID | 11/12-06-18 | 24/25-07-18 | 30-08-18 | 16/17-10-18 | 15/16-01-19 | Average Li | RSD% | |||||||||||||||||||||
| (mg/L) | ||||||||||||||||||||||||||||
Joy Kadison #2 | 179 | 176 | NA | NA | 191 | 182.0 | 4.4 | |||||||||||||||||||||
BSW-1M | 179 | 174 | 179 | 179 | 174 | 177.0 | 1.5 | |||||||||||||||||||||
BSW-4M | NA | NA | NA | NA | NA | NA | NA | |||||||||||||||||||||
BSW-5M | 182 | NA | 177 | 193 | 184.0 | 4.4 | ||||||||||||||||||||||
BSW-6M | NA | NA | NA | NA | 192 | 192.0 | NA | |||||||||||||||||||||
BSW-7M | 183 | 175 | NA | 175 | 193 | 181.5 | 4.7 | |||||||||||||||||||||
BSW-8M | 184 | 184 | NA | NA | 200 | 189.3 | 4.9 | |||||||||||||||||||||
BSW-10M | 115 | 104 | 115 | 112 | 113 | 111.8 | 4.1 | |||||||||||||||||||||
BSW-12M | 235 | NA | NA | 254 | 268 | 252.3 | 6.6 | |||||||||||||||||||||
BSW-13M | 273 | 292 | NA | 276 | 299 | 285.0 | 4.4 | |||||||||||||||||||||
BSW-14M | 222 | 237 | NA | 238 | 252 | 237.3 | 5.2 | |||||||||||||||||||||
BSW-15M | 115 | 122 | NA | 116 | 122 | 118.8 | 3.2 | |||||||||||||||||||||
BSW-16M | 159 | 161 | NA | 167 | 170 | 164.3 | 3.1 | |||||||||||||||||||||
BSW-17M | 144 | 140 | NA | 143 | 152 | 144.8 | 3.5 | |||||||||||||||||||||
BSW-18M | 79.1 | 79.5 | NA | 79.5 | 82.3 | 80.1 | 1.8 | |||||||||||||||||||||
BSW-19M | 53.4 | 54.1 | NA | 54.2 | 56.2 | 54.5 | 2.2 | |||||||||||||||||||||
Number of wells sampled | 15 | |||||
Number of analyses | 56 | |||||
Approximate number of analyses per well | 3.7 | |||||
West Unit Average Li (mg/L; all analyses) | 165.8 | |||||
Global Li average (mg/L; of all brine supply well analyses) | 167.8 |
| Preliminary Economic Assessment of LANXESS Smackover Project | 87 |
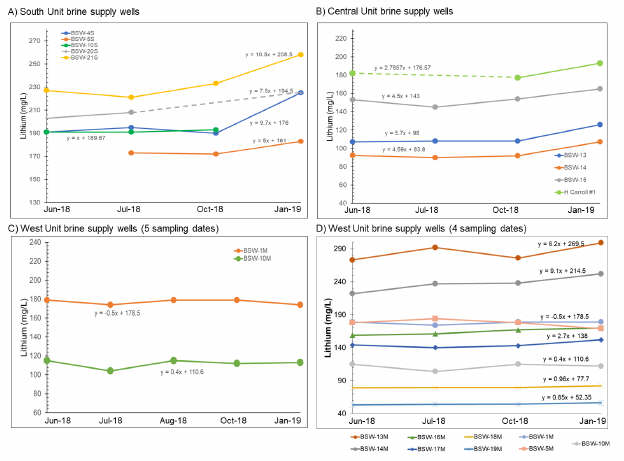
Note: Duplicate samples are not included (see Section 11.5 Quality Control/Quality Assurance).
Figure 9-3 Temporal Variation of Lithium in Smackover Brine from the Individual Brine Supply Wells at the LANXESS Property
Tables 9-4 to 9-6 show the geochemical lithium results of Standard Lithium’s 2018 to 2019 brine sampling programs at the South, Central and West Bromine Plants within the LANXESS Property.
| Preliminary Economic Assessment of LANXESS Smackover Project | 88 |
Table 9-4 South Plant WetLab Lithium Analytical Results
| 11/12- | 24/25- | 30-08- | 20-09- | 09-10- | 16-10- | 17-10- | 13-11- | 10-12- | 15-01- | 16-01- | Sample | Average | ||||||||||||||||||||||||||||||||||||||||||||
| 07-18 | 07-18 | 18 | 18 | 18 | 18 | 18 | 18 | 18 | 19 | 19 | Count | Li (mg/L) | RSD%1 | |||||||||||||||||||||||||||||||||||||||||||
South Plant- | 196 | 198 | — | 189 | 189 | 194 | — | 193 | 193 | 196 | 213 | 9 | 195.7 | 3.7 | ||||||||||||||||||||||||||||||||||||||||||
Feed | ||||||||||||||||||||||||||||||||||||||||||||||||||||||||
South | 200 | 191 | 195 | 189 | 186 | 216 | — | 196 | 203 | 184 | 202 | 10 | 196.2 | 4.9 | ||||||||||||||||||||||||||||||||||||||||||
Plant–After | ||||||||||||||||||||||||||||||||||||||||||||||||||||||||
South | 192 | 180 | 192 | 180 | 178 | 184 | 176 | 184 | 170 | 178 | 188 | 11 | 182.0 | 3.7 | ||||||||||||||||||||||||||||||||||||||||||
Plant–Tail | ||||||||||||||||||||||||||||||||||||||||||||||||||||||||
Table 9-5 Central Plant WetLab Lithium Analytical Results
| 11/12- | 24/25- | 30-08- | 20-09- | 09-10- | 16-10- | 17-10- | 13-11- | 10-12- | 15-01- | 16-01- | Sample | Average Li | ||||||||||||||||||||||||||||||||||||||||||||
| 07-18 | 07-18 | 18 | 18 | 18 | 18 | 18 | 18 | 18 | 19 | 19 | Count | (mg/L) | RSD%1 | |||||||||||||||||||||||||||||||||||||||||||
Central | 138 | 130 | — | 136 | 142 | 124 | — | 137 | 138 | 135 | 147 | 9 | 136.3 | 4.8 | ||||||||||||||||||||||||||||||||||||||||||
Plant-Feed | ||||||||||||||||||||||||||||||||||||||||||||||||||||||||
Central | 137 | — | — | 125 | — | 128 | — | 134 | 126 | 122 | 137 | 7 | 129.9 | 4.7 | ||||||||||||||||||||||||||||||||||||||||||
Plant–After | ||||||||||||||||||||||||||||||||||||||||||||||||||||||||
Central | 109 | 111 | — | 111 | 112 | 115 | 93.3 | 116 | 115 | 122 | 122 | 10 | 112.6 | 7.2 | ||||||||||||||||||||||||||||||||||||||||||
Plant–Tail | ||||||||||||||||||||||||||||||||||||||||||||||||||||||||
| Preliminary Economic Assessment of LANXESS Smackover Project | 89 |
Table 9-6 West Plant WetLab Lithium Analytical Results
| 11/12- 07-18 | 24/25-07-18 | 30-08-18 | 20-09-18 | 09-10-18 | 16-10-18 | 17-10-18 | 13-11-18 | 10-12-18 | 15-01-19 | 16-01-19 | Sample Count | Average Li (mg/L) | RSD%1 | |||||||||||||||||||||||||||||||||||||||||||
West Plant-Feed | 153 | 166 | 153 | 155 | 169 | 155 | — | 152 | 162 | 156 | 164 | 10 | 158.5 | 3.9 | ||||||||||||||||||||||||||||||||||||||||||
West Plant–After | 149 | 161 | 150 | 152 | 152 | 161 | — | 146 | 157 | 148 | 161 | 10 | 153.7 | 3.8 | ||||||||||||||||||||||||||||||||||||||||||
West Plant–Tail | 148 | 160 | 145 | 149 | 146 | 145 | 150 | 154 | 150 | 147 | 160 | 11 | 150.4 | 3.6 | ||||||||||||||||||||||||||||||||||||||||||
1RSD% = Standard Deviation/mean x100
Note: Duplicate samples are not included (see Section 11.5).
| Preliminary Economic Assessment of LANXESS Smackover Project | 90 |
A graphic summary of 27 after-brine lithium analytical results, that were collected at different time intervals, is presented in Figure 9-7. Of the 27 after-brine analyses, all but one (1) analytical result (from an October 16, 2018 sample taken at the South Plant; 216.0 mg/L Li) plot within two standard deviations of the mean. This demonstrates that there is a very minor amount of variation of lithium in the after-brine over time at the individual LANXESS Plants and Unit areas. This is supported by the low RSD% values (<5%) in after-brine analytical results over time (see Tables 9-4 to 9-6).
A Plant-to-Plant comparison of lithium variation between the feed-brine (pre-process) and after-brine (post-process) shows the bromine-production process removes very small amounts of lithium at a predictable rate (see Figure 9-8). This is evident at the Central and West Plants; however, the South Plant, which has the highest lithium values, has feed-brine and after-brine lithium concentrations that straddle the 1:1 correlation line. This comparison shows the bromine recovery process is constant and does not cause major fluctuations in the after-brine lithium content. The geochemical results show the loss of lithium during the bromine extraction process does not affect the reasonable prospects of potential economic extraction of the lithium from the brine and the after-brine still contains significant amounts of lithium.
| Preliminary Economic Assessment of LANXESS Smackover Project | 91 |
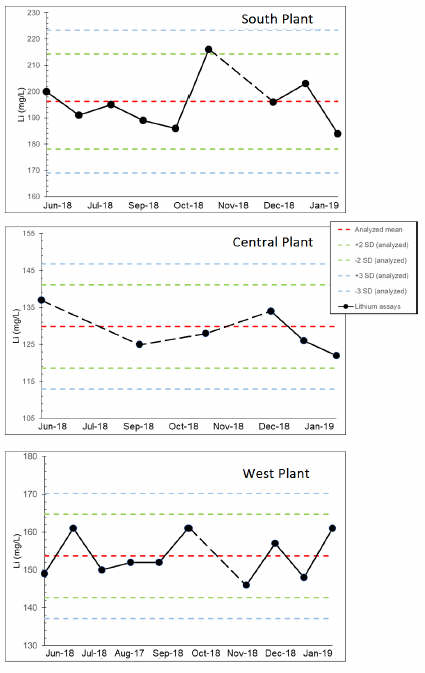
Note: Dashed lines are defined as the mean, and two and three standard deviations from the mean.
Figure 9-7 Temporal Variation of Lithium in the Tail-brine from the South, Central and West Bromine Plants (solid line)
| Preliminary Economic Assessment of LANXESS Smackover Project | 92 |
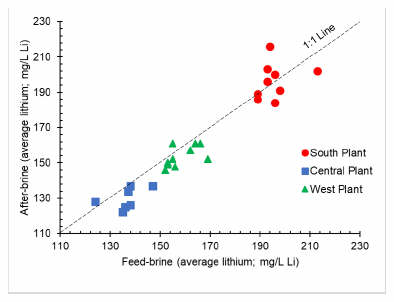
Figure 9-8 Bi-variate Plot of the Lithium Distribution in the Feed-brine versus the After-brine
| 9.2 | Preliminary Brine Testing at the Expanded South Unit |
During late-2018 and 2019, and as part of an expansion of the brine production at the South Unit, LANXESS completed four (4) new brine supply wells (see Figures 9-1 and 9-2). The new wells are now producing brine and were recently incorporated into the LANXESS South Plant bromine production stream. Twenty-six (26) brine supply wells have been operating at the LANXESS Property during the 2013 to 2018 timeframe (see Table 6-2). With (four) newly completed brine supply wells, the total number of brine supply wells is 30.
During April 2019, Standard Lithium collected brine from brine supply wells BSW-22S, BSW-23S and BSW-25S, and from the feed-brine, after-brine and tail-brine access points at the South Plant. The analytical results are presented in Table 9-7. The new South Unit brine supply wells have lithium concentrations between 236 mg/L and 253 mg/L, which is similar to BSW-21S and is higher than most of the brine supply wells producing brine at the LANXESS Property (compare with Tables 9-1 to 9-3).
Integration of brine from the new brine supply wells into the South Plant will increase the overall lithium content in the South Plant production stream. For example, Table 9-8 shows that the South Plant, after-brine collected in April 2019, contained 239 mg/L and 252 mg/L Li, which is significantly higher than the average after-brine lithium content of 197 mg/L, as presented in Table 9-4.
Note: the analytical results presented in Table 9-7 have not been incorporated into the resource estimation presented in this Technical Report. Standard Lithium intends to verify the lithium content of the new brine supply wells and South Plant brine with additional sampling. Based on these preliminary
| Preliminary Economic Assessment of LANXESS Smackover Project | 93 |
results, incorporation of future South Unit Li-brine results could have positive implications for the South Plant lithium grade.
The new South Unit brine supply wells are not discussed in detail in Section 10 Drilling because well specifications and production information are not yet available through the AOGC.
Table 9-7 New (2019) Brine Supply Wells in the South Unit Area
API Well No | Well | Latitude | Longitude | Total | Pool | Field | Li | |||||||||||||||||||||
| Name | depth (m) | (mg/L) | ||||||||||||||||||||||||||
03-139-13549-00-00 | BSW-22S | 33.049389 | -92.633559 | 2,652.1 | Smackover | Catesville | 248 | |||||||||||||||||||||
03-139-13558-00-00 | BSW-23S | 33.049816 | -92.633556 | NA | Smackover | Catesville | 236 | |||||||||||||||||||||
03-139-13562-00-00 | BSW-24S | 33.050249 | -92.633547 | 2,590.8 | Smackover | Catesville | NA | |||||||||||||||||||||
03-139-13560-00-00 | BSW-25S | 33.071953 | -92.650869 | NA | Smackover | Catesville | 253 | |||||||||||||||||||||
NA – Not Available
Table 9-8 South Plant Analytical Results with Inclusion of the New Brine Supply Wells Li (mg/L)
| Date Sample Collected (dd-mm-yy) | ||||||||
Sample Location | 16-04-19 | 17-04-19 | ||||||
South Plant – Feed | 288 | 250 | ||||||
South Plant – After | 252 | 239 | ||||||
South Plant – Tail | 250 | 219 | ||||||
| Preliminary Economic Assessment of LANXESS Smackover Project | 94 |
| 10 | Drilling |
Standard Lithium has access to Smackover Formation brine from LANXESS-owned brine supply wells at the LANXESS Property. There are currently 61 wells at the LANXESS Property; including 26 brine supply wells and 35 reinjection wells (see Figure 9-1). A description of the well collar and depth information is presented in Table 10-1. The well operator is listed as Great Lakes Chemical Corporation (since acquired by LANXESS).
Most of the brine supply wells were drilled vertically with an orientation and dip of 0° and -90°. A smaller proportion of wells such as BSW-21S, BSW-22S and BSW-25S (South Unit), and BSW-15M and BSW-16M (West Unit) were drilled as inclined wells. Directional surveys for these wells show that the wells were drilled vertically (-90°) to a depth of approximately 1,280—1,370 m, whereupon the bore was deviated gradually to an inclination of approximately 45° to 61°, to their final total vertical depths of 2,710—3,395 m (see Table 10-1).
As Smackover Formation brine was collected directly from the brine supply wells, and brine from the supply wells form the feed-brine at the Bromine Plants, it is important to disclose the depths where the brine was accessed prior to being pumped to surface. The brine supply well completion intervals are presented in Table 10-2. The top of the completion interval, or depth to the top of the brine sample interval, ranges between 2,243 m and 2,784 m, with an average depth of 2,424 m. The average thickness of the completion interval is 51 m. The completion intervals correlate well with the depth and thickness of the Reynolds Member, as defined in Sections 7.5.
The brine supply wells pump Smackover Formation brine to surface using electrical submersible pumps. Based on data supplied by LANXESS, the pumps are set in the casing at significantly higher depths than the total depth and/or the open-hole or screened completion zones (pump depths average 1,040 m feet below surface). Despite the shallower pump depth, the brine is still representative of Smackover Formation Reynolds Member brine, as it is within a confined aquifer (completion zone within the Reynolds Member and brine fluid level rising within the cased-in well).
| Preliminary Economic Assessment of LANXESS Smackover Project | 95 |
Table 10-1 Description of Brine Supply Wells at the LANXESS Property
Unit | Well Name | API Well No. | Field | Latitude | Longitude | Status | Ground Elevation (m asl) | Ground Elevation (feet asl) | Total Well Depth (m)1 | Total Well Depth (feet)1 | Total Vertical Depth (m)1 | Total Vertical Depth (feet)1 | ||||||||||||||||||||||||||||||||||
South | BSW-4S | 03-139-10248-00-00 | Catesville | 33.12798 | -92.64810 | Producing | 58.5 | 192 | 2,420.7 | 7,942.0 | 2,420.7 | 7,942.0 | ||||||||||||||||||||||||||||||||||
| BSW-5S | 03-139-10411-00-00 | Hibank | 33.14809 | -92.63022 | Producing | 50.0 | 164 | 2,325.6 | 7,630.0 | 2,325.6 | 7,630.0 | |||||||||||||||||||||||||||||||||||
| BSW-10S | 03-139-10475-00-00 | Catesville | 33.15011 | -92.64726 | Producing | 53.0 | 174 | 2,372.0 | 7,782.0 | 2,372.0 | 7,782.0 | |||||||||||||||||||||||||||||||||||
| BSW-20S | 03-139-10552-00-00 | Catesville | 33.07913 | -92.65075 | Producing | 77.7 | 255 | 2,551.5 | 8,371.0 | 2,551.5 | 8,371.0 | |||||||||||||||||||||||||||||||||||
| BSW-21S | 03-139-12968-00-00 | Catesville | 33.07324 | -92.64828 | Producing | 78.0 | 256 | 2,520.7 | 8,270.0 | 3,396.7 | 11,144.0 | |||||||||||||||||||||||||||||||||||
| BSW-25S | 03-139-13560-00-00 | Catesville | 33.07195 | -92.65087 | Spudded | NA | NA | 2,590.8 | 8,500.0 | 3,208.0 | 10,525.0 | |||||||||||||||||||||||||||||||||||
Central | ||||||||||||||||||||||||||||||||||||||||||||||
| BSW-12 | 03-139-12745-00-00 | Lisbon | 33.21846 | -92.76291 | Producing | NA | NA | 2,294.8 | 7,529.0 | 2,294.8 | 7,529.0 | |||||||||||||||||||||||||||||||||||
| BSW-13 | 03-139-12779-00-00 | Lisbon | 33.21673 | -92.78625 | Producing | 71.9 | 236 | 2,316.5 | 7,600.0 | 2,316.5 | 7,600.0 | |||||||||||||||||||||||||||||||||||
| BSW-14 | 03-139-12924-00-00 | Burns Pond | 33.21063 | -92.80559 | Producing | 76.2 | 250 | 2,388.1 | 7,835.0 | 2,388.1 | 7,835.0 | |||||||||||||||||||||||||||||||||||
| BSW-15 | 03-139-12985-00-00 | Burns Pond | 33.19575 | -92.81398 | Producing | 60.7 | 199 | 2,441.4 | 8,010.0 | 2,441.4 | 8,010.0 | |||||||||||||||||||||||||||||||||||
| Spencer 1 | 03-139-12177-00-00 | Hogg | 33.17412 | -92.79710 | Producing | 63.7 | 209 | 2,375.0 | 7,792.0 | 2,375.0 | 7,792.0 | |||||||||||||||||||||||||||||||||||
| H Carroll #1 | 03-139-10076-00-00 | Shuler East | 33.17840 | -92.80317 | Producing | 72.1 | 236.6 | 2,404.3 | 7,888.0 | 2,404.3 | 7,888.0 | |||||||||||||||||||||||||||||||||||
| Preliminary Economic Assessment of LANXESS Smackover Project | 96 |
Unit | Well Name | API Well No. | Field | Latitude | Longitude | Status | Ground Elevation (m asl) | Ground Elevation (feet asl) | Total Well Depth (m)1 | Total Well Depth (feet)1 | Total Vertical Depth (m)1 | Total Vertical Depth (feet)1 | ||||||||||||||||||||||||||||||||
West | Joy Kadison #2 | 03-139-12864-00-00 | Cairo | 33.19748 | -92.87200 | Producing | 90.5 | 297 | 2,465.2 | 8,088.0 | 2,465.2 | 8,088.0 | ||||||||||||||||||||||||||||||||
| BSW-1M | 03-139-10558-00-00 | Wilks | NA | NA | Producing | 83.1 | 272.7 | 2,449.4 | 8,036.0 | 2,449.4 | 8,036.0 | |||||||||||||||||||||||||||||||||
| BSW-4M | 03-139-10714-00-00 | Wilks | NA | NA | Producing | NA | NA | 2,420.7 | 7,942.0 | 2,420.7 | 7,942.0 | |||||||||||||||||||||||||||||||||
| BSW-5M | 03-139-71205-00-00 | Wilks | 33.18646 | -92.89173 | Producing | 75.0 | 246 | 2,471.9 | 8,110.0 | 2,471.9 | 8,110.0 | |||||||||||||||||||||||||||||||||
| BSW-6M | 03-139-11211-00-00 | Cairo | 33.18420 | -92.85462 | Producing | 85.6 | 281 | 2,461.6 | 8,076.0 | 2,461.6 | 8,076.0 | |||||||||||||||||||||||||||||||||
| BSW-7M | 03-139-72061-00-00 | Cairo | 33.19699 | -92.87095 | Producing | 88.7 | 291 | 2,434.4 | 7,987.0 | 2,434.4 | 7,987.0 | |||||||||||||||||||||||||||||||||
| BSW-A8M | 03-139-13034-00-00 | Wilks | 33.19100 | -92.95600 | Producing | NA | NA | 2,744.7 | 9,005.0 | 2,744.7 | 9,005.0 | |||||||||||||||||||||||||||||||||
| BSW-10M | 03-139-12920-00-00 | Marysville | 33.21313 | -92.88352 | Producing | 77.1 | 253 | 2,467.4 | 8,095.0 | 2,467.4 | 8,095.0 | |||||||||||||||||||||||||||||||||
| BSW-12M | 03-139-12946-00-00 | Marysville | 33.13500 | -92.94998 | Producing | 72.8 | 239 | 2,651.8 | 8,700.0 | 2,651.8 | 8,700.0 | |||||||||||||||||||||||||||||||||
| BSW-13M | 03-139-12948-00-00 | Marysville | 33.12835 | -92.92593 | Producing | 72.5 | 238 | 2,645.4 | 8,679.0 | 2,645.4 | 8,679.0 | |||||||||||||||||||||||||||||||||
| BSW-14M | 03-139-12949-00-00 | Marysville | 33.12730 | -92.90904 | Producing | 58.5 | 192 | 2,586.5 | 8,486.0 | 2,586.5 | 8,486.0 | |||||||||||||||||||||||||||||||||
| BSW-15M | 03-139-12970-00-00 | Marysville | 33.21325 | -92.95566 | Producing | 85.6 | 281 | 2,396.9 | 7,864.0 | 2,710.9 | 8,894.0 | |||||||||||||||||||||||||||||||||
| BSW-16M | 03-139-12971-00-00 | Marysville | 33.21210 | -92.95588 | Producing | 85.6 | 281 | 2,462.5 | 8,079.0 | 2,834.6 | 9,300.0 | |||||||||||||||||||||||||||||||||
| Preliminary Economic Assessment of LANXESS Smackover Project | 97 |
Unit | Well Name | API Well No. | Field | Latitude | Longitude | Status | Ground Elevation (m asl) | Ground Elevation (feet asl) | Total Well Depth (m)1 | Total Well Depth (feet)1 | Total Vertical Depth (m)1 | Total Vertical Depth (feet)1 | ||||||||||||||||||||||||||||||||||||
| BSW-17M | 03-139-12965-00-00 | Marysville | 33.20801 | -92.92978 | Producing | 84.4 | 277 | 2,459.1 | 8,068.0 | 2,459.1 | 8,068.0 | |||||||||||||||||||||||||||||||||||||
| BSW-18M | 03-139-12983-00-00 | Marysville | 33.23885 | -92.93730 | Producing | NA | NA | 2,354.6 | 7,725.0 | 2,354.6 | 7,725.0 | |||||||||||||||||||||||||||||||||||||
| BSW-19M | 03-139-13041-00-00 | Marysville | 33.24142 | -92.90302 | Producing | 80.2 | 263 | 2,331.7 | 7,650.0 | 2,331.7 | 7,650.0 | |||||||||||||||||||||||||||||||||||||
NA—Data not available at time of report preparation
All data obtained from publicly available records
asl—above sea level
1 Grey shaded cells: Total well depth and total vertical depth do not match (i.e. these are inclined wells; all other wells are vertical with depths of -90°).
| Preliminary Economic Assessment of LANXESS Smackover Project | 98 |
Table 10-2 Summary of Brine Supply Well Completion Intervals at the LANXESS Property
Sub- | Well Name | Top of Completion Interval (m) | Top of Completion Interval (feet) | Bottom of Completion Interval (m bgl) | Bottom of Completion Interval (feet bgl) | Completion Length (feet) | Type of Completion | Jan2013 to 1 Mar 2018 Brine Production (U.S. Barrels) | ||||||||||||||||||||||
South | BSW-4S | 2,354.3 | 7,724 | 2,420.7 | 7,942 | 218 | Open Hole | 37,905,333 | ||||||||||||||||||||||
| BSW-5S | NA | NA | NA | NA | NA | NA | 55,252,574 | |||||||||||||||||||||||
| BSW-10S | 2,304.3 | 7,560 | 2,372.0 | 7,782 | 222 | Open Hole | 5,834,192 | |||||||||||||||||||||||
| BSW-20S | 2,485.6 | 8,155 | 2,551.5 | 8,371 | 216 | Open Hole | 43,568,152 | |||||||||||||||||||||||
| BSW-21S | NA | NA | NA | NA | NA | NA | 35,707,520 | |||||||||||||||||||||||
| BSW-25S | NA | NA | NA | NA | NA | NA | NA | |||||||||||||||||||||||
Central | BSW-12 | NA | NA | NA | NA | NA | NA | NA | ||||||||||||||||||||||
| BSW-13 | 2,243.6 | 7,361 | 2,298.2 | 7,540 | 179 | Perforated Screen section | 48,316,705 | |||||||||||||||||||||||
| BSW-14 | 2,276.9 | 7,470 | 2,342.1 | 7,684 | 214 | Perforated Screen section | 12,009,009 | |||||||||||||||||||||||
| BSW-15 | 2,351.2 | 7,714 | 2,414.0 | 7,920 | 206 | Perforated Screen section | 45,180,869 | |||||||||||||||||||||||
| Spencer 1 | 2,357.0 | 7,733 | 2,375.0 | 7,792 | 59 | Open Hole | 14,506,922 | |||||||||||||||||||||||
| H Carroll | #1 | 2,352.4 | 7,718 | 2,404.3 | 7,888 | 170 | Open Hole | 25,876,614 | ||||||||||||||||||||||
West | Joy Kadison | 2,386.0 | 7,828 | 2,403.0 | 7,884 | 56 | Perforated Screen section | 15,553,093 | ||||||||||||||||||||||
| #2 | ||||||||||||||||||||||||||||||
| BSW-1M | NA | NA | NA | NA | NA | NA | 17,331,785 | |||||||||||||||||||||||
| BSW-4M | 2,434.7 | 7,988 | 2,487.2 | 8,160 | 172 | Open Hole | 9,984,699 | |||||||||||||||||||||||
| BSW-5M | 2,411.0 | 7,910 | 2,471.9 | 8,110 | 200 | Open Hole | 21,685,261 | |||||||||||||||||||||||
| Preliminary Economic Assessment of LANXESS Smackover Project | 99 |
Sub- | Well Name | Top of Completion Interval (m) | Top of Completion Interval (feet) | Bottom of Completion Interval (m bgl) | Bottom of Completion Interval (feet bgl) | Completion Length (feet) | Type of Completion | Jan2013 to 1 Mar 2018 Brine Production (U.S. Barrels) | ||||||||||||||||||||||
| BSW-6M | NA | NA | NA | NA | NA | NA | 9,381,040 | |||||||||||||||||||||||
| BSW-7M | NA | NA | NA | NA | NA | NA | 12,792,625 | |||||||||||||||||||||||
| BSW-A8M | NA | NA | NA | NA | NA | NA | 15,420,007 | |||||||||||||||||||||||
| BSW-10M | 2,322.6 | 7,620 | 2,413.4 | 7,918 | 298 | Perforated Screen Section | 30,796,417 | |||||||||||||||||||||||
| BSW-12M | 2,562.5 | 8,407 | 2,612.4 | 8,571 | 164 | Perforated Screen Section | 24,373,533 | |||||||||||||||||||||||
| BSW-13M | 2,586.8 | 8,487 | 2,620.7 | 8,598 | 111 | Perforated Screen Section | 13,020,340 | |||||||||||||||||||||||
| BSW-14M | 2,521.6 | 8,273 | 2,557.3 | 8,390 | 117 | Perforated Screen Section | 34,562,805 | |||||||||||||||||||||||
| BSW-15M | 2,656.0 | 8,714 | 2,690.2 | 8,826 | 112 | Perforated Screen Section | 25,032,034 | |||||||||||||||||||||||
| BSW-16M | 2,784.0 | 9,134 | 2,809.3 | 9,217 | 83 | Perforated Screen Section | 15,045,257 | |||||||||||||||||||||||
| BSW-17M | 2,410.4 | 7,908 | 2,451.5 | 8,043 | 135 | Perforated Screen Section | 22,834,594 | |||||||||||||||||||||||
| BSW-18M | NA | NA | NA | NA | NA | NA | 35,384,973 | |||||||||||||||||||||||
| 2,243.3 | 7,360 | 2,317.7 | 7,604 | 244 | Perforated Screen Section | 32,648,725 | ||||||||||||||||||||||||
NA -Data not available at time of report preparation
All data obtained from publicly available records
| Preliminary Economic Assessment of LANXESS Smackover Project | 100 |
| 11 | Sample Preparation, Analysis and Security |
A total of 215 samples of brine, which includes Quality Assurance/Quality Control (QA/QC) samples, were collected from the Smackover Formation aquifer underlying the LANXESS Property by Standard Lithium during June 2018 and January 2019. A breakdown of the sample types includes the following:
| • | 90 brine samples from individual brine supply wells; |
| • | 87 brine samples from brine access points at the three (3) LANXESS Bromine Plants; |
| • | 14 duplicate brine samples; |
| • | 11 sample blanks; |
| • | Seven (7) UBC semi-certified sample standards; and |
| • | Six (6) Internal Company sample standards. |
The sample preparation, analyses and security of brine assay samples are discussed in the text that follows. All 215 samples were geochemically analysed at an independent laboratory. The lithium analytical results and temporal variations of brine from the individual brine supply wells and LANXESS Unit Plants are discussed in Sections 9.1.1 and 9.1.2, respectively. The analytical results of the duplicate samples, sample blanks and sample standards are discussed in Section 11.5, as part of the Quality Control/Quality Assurance (QA/QC) procedures.
| 11.1 | Brine Sample Collection |
The LANXESS bromine plants and well/pipeline infrastructure were designed specifically for brine collection, processing and production of bromine from Smackover Formation brine; hence, the brine underlying the LANXESS Property is actively pumped as part of the normal LANXESS bromine operations. The brine has been monitored on a regular basis by LANXESS for over 50 years (see Section 6).
Accordingly, and as a brine-specific production-system, brine sample access points are readily available throughout the Property. During 2018 and 2019, Standard Lithium conducted several brine sampling programs. The brine sample collection was completed by Standard Lithium and/or directly by LANXESS operators. LANXESS operators collected samples on behalf of Standard Lithium during the August, September and October 2018 sampling programs. When brine samples were collected by Standard Lithium, LANXESS operators were on hand to assist with LANXESS infrastructure during the brine collection programs. The sampling methodology includes the following:
| • | Travelling by truck/car on paved and all-weather gravel roads to the various brine supply wells and LANXESS Plants. |
| • | Labelling laboratory supplied new, one (1) Litre plastic sample containers with screw-on caps. Standard Lithium’s labelling procedure includes: the sample identification (ID) number; the date and time of sample collection; and the sampler’s initials. |
| Preliminary Economic Assessment of LANXESS Smackover Project | 101 |
| • | Brine access points include brine collection spigots at well sites and at feed-brine, after-brine and tail-brine access points in the Plants. It is common practice to gradually open the sample spigot such that the brine does not spray in an uncontrollable manner. Once a continual stream is achieved, the brine flows for a period of 5-10 seconds to purge the sample point and ensure the spigot is cleared of any stagnant brine and/or oil, dirt, etc. |
| • | The plastic sample container is placed under the brine sample spigots and a small amount of brine is captured, swirled in the container and discharged. This procedure is repeated twice before collection of the brine to ensure that the container is clean of any residue that might affect the analysis. |
| • | The plastic sample container is filled (to capacity or near-capacity) and it is immediately capped with a screw-on cap. |
| • | Two, one (1) litre sample containers are collected at each sample point; one for geochemical analysis at WetLab, and the other for Standard Lithium’s archival storage (at a storage centre in El Dorado, AR). |
| • | The sample is checked to verify that all sample label information is correct, and the sample container is properly closed. The sample container(s) are then stored in a cooler for immediate transport to the analytical laboratory. |
As part of the sample collection, field measured parameters were conducted by Standard Lithium staff using a Myron handheld multiparameter meter (Ultrameter 6PIIFCE). The following information was recorded at the same time as the sample collection and on the same brine that was sampled for geochemical analysis: electrical conductivity, pH, oxidation reduction potential, specific gravity and temperature. Each value is recorded in a spreadsheet. The Ultrameter is calibrated prior to use. If the resulting analysis appears to be significantly high, or low, the Ultrameter is re-calibrated immediately and the sample measurement is repeated.
The physical attributes of the brine sample are also recorded (e.g. colour, smell, contaminants, etc.). The sampling process is completed by recording any sampler comments that might be significant to the sampling site, the sample collection or the sample itself.
| 11.2 | Field Duplicate Samples, Sample Blanks and Standard Samples |
A field duplicate sample was collected, randomly, for approximately every 12.5 field samples. The field duplicate was taken at the same time as the original sample (i.e. back-to-back samples from the same brine sample spigot). Random IDs were given to the duplicate samples. Sequential labelling of the original and duplicate field samples was avoided, such that the original and duplicate samples were randomly presented to the laboratory. The purpose of the field duplicate samples is to measure the precision of the laboratory.
Standard sample blanks were inserted at approximately every 15 field samples as an additional laboratory check. The sample blanks were comprised of deionized water and contained no lithium.
To the best of the author’s knowledge, Certified Reference Materials for Lithium-brine, which have a special classification and are subject to rigorous international testing (e.g. Canmet; CDN Labs; NIST; etc.),
| Preliminary Economic Assessment of LANXESS Smackover Project | 102 |
do not currently exist. As part of Standard Lithium’s QA/QC measures, the Company created two Standard Sample spikes as follows:
| 1. | Semi-certified sample standard: Standard Lithium commissioned the University of British Columbia (UBC) to prepare a UBC Standard Sample spike by manufacturing, in the laboratory, a synthetic brine solution that included 250 mg/L Li with a Total Dissolved Solid (TDS) of 250,000 mg/L. |
| 2. | Standard Lithium created a Property specific Internal Standard Sample (Internal Property Specific Standard) spike by collecting approximately 100 Litres of continuously flowing brine from a single LANXESS Property sample point (West Plant feed-brine taken on July 25, 2018). |
Collectively, the two Standard Samples were inserted into the sample stream randomly at approximately one (1) standard per 13.5 brine samples. The purpose of the Standard Sample is to measure the accuracy and precision of the laboratory.
| 11.3 | Security |
Coolers full of individual sample containers were taken from the field to a secured location to double check the sample IDs and make sure all containers were in good condition prior to shipment to the laboratory. Chain of Custody forms were filled out and included in, or with, the sample cooler.
The coolers were taped closed and hand-delivered to the local courier company (FedEx in El Dorado, AR) for rush delivery to the independent and accredited laboratory: WetLab in Sparks, NV. The laboratory was instructed to confirm receipt of the samples and provide a statement pertaining to the condition of the samples upon receipt. The samples were then coded into the sample stream for analytical work carried out using analytical protocols established between Standard Lithium and WetLab.
| 11.4 | Analytical Methodology |
Standard Lithium has developed, in conjunction with WetLab’s analytical procedures and capabilities, the Company’s own internal analytical protocols. These include the following analytical work (with the associated ASTM, SM and EPA international and national method code):
| 1. | Limited Lithium Brine Analytical Suite. |
| • | General chemistry: density, pH, carbonate, bicarbonate, TDS (ASTM 1963, SM 4500-H+B, SM 2320B and SM 2540C). |
| • | Anions by Ion Chromatography: chlorite, sulfate (EPA 300.0). |
| • | Sample preparation: trace metal digestion (EPA 200.2). |
| • | Trace metals by inductively coupled plasma optical emission spectroscopy (ICP-OES): Ba, B, Ca, Fe, Li, Mg, Mn, K, Na and Sr (EPA 200.7). |
| 2. | Expanded Lithium Brine Analytical Suite. |
| • | General chemistry: density, pH, temperature, carbonate, bicarbonate, TDS, total organic carbon (ASTM 1963, SM 4500-H+B, SM 2550B, SM 2320B, SM 2540C and SM 5310B). |
| Preliminary Economic Assessment of LANXESS Smackover Project | 103 |
| • | Anions by Ion Chromatography: chlorite, sulfate, bromide, fluoride (EPA 300.0). |
| • | Sample preparation: trace metal digestion (EPA 200.2). |
| • | Trace metals by ICP-OES: Al, Sb, As, Ba, Be, B, Cd, Ca, Cr, Co, Cu, Ga, Fe, Li, Pb, Mg, Mn, Mo, Ni, P, K, Sc, Se, Si, silica, Ag, Na, Sr, Sn, Ti, V and Zn (EPA 200.7). |
WetLab completed the analyses using the following corresponding methods: sample preparation by EPA 200.2; density by gravimetric; pH by SM 4500-H+B; temperature at pH by SM 2550B, carbonate and bicarbonate by SM 2320B; chloride and sulfate by EPA 300.0; TDS by SM 2540C; anions by ion chromatography by EPA 300.0; trace metal digestion by EPA 200.2; and trace metals by ICP-OES by EPA 200.7.
The ICP-OES analytical technique measures excited atoms and ions at the wavelength characteristics. The ICP-OES reporting units are mg/L.
The ICP-OES detection limits of the brine samples are typically reported in parts per billion (ppb) and can extend to parts per trillion (ppt). In the U.S., the regulatory compliance monitoring for ICP-OES is governed by EPA Methods 200.5 and 200.7. EPA Method 200.7 was approved for use as axial view of ICP-OES and is therefore the EPA method for compliance monitoring by ICP-OES. EPA Method 200.8 governs regulatory compliance using ICP-MS.
| 11.5 | Quality Control/Quality Assurance |
| 11.5.1 | Field Duplicate Sample Comparison |
Fourteen field duplicate samples were included along with the 215 total samples collected by Standard Lithium in 2018 and 2019.
The original versus duplicate lithium data were examined using their average percent relative standard deviation (also known as the % coefficient of variation or average RSD%), which is an estimate of precision or reproducibility of the analytical results. The higher the RSD%, the less likely the evaluator is able to distinguish real patterns from noise (or the cumulative effect of geological background variation plus sampling error). An average RSD% value of less than 30% is considered to indicate good data quality.
A comparison of selected elements from the duplicate pairs is presented in Figure 11-1 and Table 11-1. Original-duplicate pairs from the Standard Lithium brine sampling programs had minimum, maximum and average lithium RSD%’s of zero, 7.7% and 2.4%, respectively, which denotes very good data quality (see Table 11-1).
Figure 11-1 shows that the multi-element analytical results of the duplicate pairs have high analytical precision with fitted regression lines (coefficient of determination, or R2) of between 0.7305 and 0.9803, which represent good to excellent analytical precision.
| Preliminary Economic Assessment of LANXESS Smackover Project | 104 |
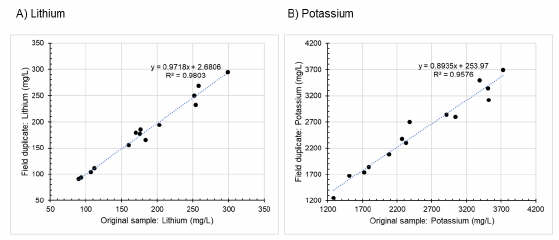
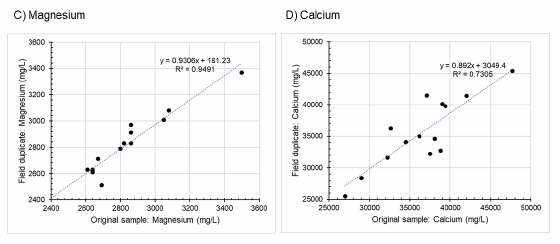
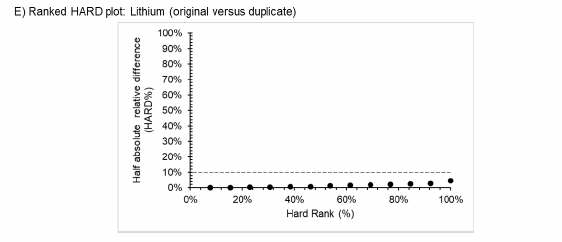
Figure 11-1 Graphical Assessment of the Original-Duplicate Sample Pairs. A-D) Bi-variate Plots of the Original versus Duplicate Analytical Results of Selected Elements. E) Half Absolute Relative Difference (HARD) Graph
| Preliminary Economic Assessment of LANXESS Smackover Project | 105 |
Table 11-1 Comparison of Lithium Values for 14 Duplicate Pairs
Well | Collect Date | Li (mg/L) | Well | Collect Date | Li (mg/L) | |||||||||||||||
BSW-10M | 16-10-18 | 112 | Spencer | 11-06-18 | 184 | |||||||||||||||
BSW-10MA | 16-10-18 | 112 | Spencer | 11-06-18 | 165 | |||||||||||||||
| RSD | %1 | 0.0 | RSD | %1 | 7.7 | |||||||||||||||
BSW-12M | 16-10-18 | 254 | BSW-20S | 11-06-18 | 203 | |||||||||||||||
BSW-12MA | 16-10-18 | 232 | BSW-20S | 11-06-18 | 194 | |||||||||||||||
| RSD | %1 | 6.4 | RSD | %1 | 3.2 | |||||||||||||||
BSW-13M | 15-10-19 | 299 | BSW-14 | 24-07-18 | 89.8 | |||||||||||||||
BSW-13MA | 15-10-19 | 295 | BSW-14D | 24-07-18 | 90.9 | |||||||||||||||
| RSD | %1 | 1.0 | RSD | %1 | 0.9 | |||||||||||||||
BSW-14 | 15-01-19 | 107 | BSW-1M | 12-06-18 | 170 | |||||||||||||||
BSW-14A | 15-01-19 | 104 | BSW-1M | 12-06-18 | 179 | |||||||||||||||
| RSD | %1 | 2.0 | RSD | %1 | 3.6 | |||||||||||||||
BSW-14M | 15-01-19 | 252 | CPTA | 17-10-18 | 93.4 | |||||||||||||||
BSW-14MA | 15-01-19 | 250 | CP-Tails | 17-10-18 | 93.3 | |||||||||||||||
| RSD | %1 | 0.6 | RSD | %1 | 0.1 | |||||||||||||||
BSW-21S | 16-01-19 | 258 | Spencer | 24-07-18 | 176 | |||||||||||||||
BSW-21SA | 16-01-19 | 268 | Spencer D | 24-07-18 | 177 | |||||||||||||||
| RSD | %1 | 2.7 | RSD | %1 | 0.4 | |||||||||||||||
H. Carrol #1 | 17-10-18 | 177 | WP-Tails | 25-07-18 | 160 | |||||||||||||||
HC1A | 17-10-18 | 185 | WP-Tails D | 25-07-18 | 156 | |||||||||||||||
| RSD | %1 | 3.1 | RSD | %1 | 1.8 | |||||||||||||||
| 1 | RSD% = standard deviation/mean x 100 |
Figure 11-1 also includes a HARD graph, which shows Half Absolute Relative Difference of lithium between the original and duplicate analytical results expressed as a percentage and sorted from smallest to largest. This is a useful graph for assessing the precision of a set of duplicate samples. As a rule of thumb, pulp duplicates should have a 90% HARD Rank of less than 10% HARD; coarse split duplicates should have 80% less than 10% difference; and field duplicates should have 70% less than 10% difference. The field duplicates from Standard Lithium’s brine sampling programs have excellent precision with 100% HARD Rank having less than a 5% HARD (see Figure 11-1E).
| Preliminary Economic Assessment of LANXESS Smackover Project | 106 |
To conclude, results of the duplicate pair analysis show that the overall sampling process and analytical precision is excellent, and hence, the sampling uncertainty in the field and laboratory processes is not an issue in this dataset.
| 11.5.2 | Standard Sample Blanks |
A total of 11 sample standard blanks were entered randomly into the sample stream by Standard Lithium. All samples yielded lithium values of below the minimum level of detection (2.0 mg/L Li at WetLab). These sample blank results are accurate, as the Standard Sample blanks were composed of store-purchased deionized water, and therefore, contained no lithium. The positive results of this test show there was no contamination induced during the sampling, sample preparation or the analytical work.
| 11.5.3 | Standard Sample Spike Comparison |
A total of seven (7) UBC Standard and six (6) Internal Property specific spikes were inserted randomly by Standard Lithium into the sample stream. The purpose of the Standard Sample spikes is to assess the analytical laboratory for accuracy.
The UBC Standard spike was designed to be chemically like Smackover Formation brine from the LANXESS Property. The spike was prepared by the University of British Columbia, on behalf of Standard Lithium, and has a lithium content of 250 mg/L Li in a high-TDS brine. The salts used were >99% analytical purity and include (with cation concentration equivalents): CaCl2•2H2O (30,000 mg/L Ca); lithium chloride (anhydrous; 250 mg/L Li); MgCl2•6H2O (2,500 mg/L Mg); KCl (2,000 mg/L K); NaCl (60,000 mg/L Na); and SrCl2 6H2O (2,000 mg/L Sr) (Prof. J. Hein, pers. comm. 2018).
The Internal Property Specific Standard spike was designed by Standard Lithium by collecting approximately 100 L of brine from a single LANXESS Property sample point (West Plant feed-brine taken on July 25, 2018).
The analytical results of the Standard Sample spikes are presented in Tables 11-2 and 11-3. Control plots of the Standard Sample spikes, with the resulting mean and two and three standard deviations, is presented in Figure 11-2.
Tables 11-2 and 11-3 shows that the RSD% of most of the selected elements, and from both the UBC and Internal Standard Sample spikes, is less than 14.4%. Chlorine, with an RSD% of 33% (UBC Standard Sample), is the one exception; but this element is better analyzed using ion chromatography, which can measure anions as well as cations.
The mean of the UBC Standard Sample, as produced in the laboratory, is 250 mg/L Li. In comparison, the mean of the analyzed UBC Standard Samples (n=7) was 262.7 mg/L Li. The Internal Property Specific Standard (WP-feed sample collected July 25, 2018) was not subjected to round robin analysis at a minimum of six (6) participating laboratories (e.g. Smee 2011), and therefore, does not have a certifiable mean. Rather, Figure 11-2 shows that all Standard Sample spike analytical results (UBC and Internal) plot
| Preliminary Economic Assessment of LANXESS Smackover Project | 107 |
within two standard deviations of the mean. In addition, the UBC and Internal Property Specific Standard Sample lithium concentration fitted line slopes are low (0.93x and -0.97x for the UBC and Internal Property Specific Standards, respectively).
It is concluded that the low RSD% values, similar mean comparisons, low fitted line slopes and data results within two (2) standard deviations all show the accuracy and reproducibility of the Standard Samples spike analytical results is good to excellent. There is a limited amount of variation and dispersion of lithium in the Standard Sample spike analytical results. Tables 11-2 and 11-3 provide a summary of the standard sample spike analytical results
| Preliminary Economic Assessment of LANXESS Smackover Project | 108 |
Table 11-2 UBC Standard
Assigned | Sample ID- | Collect Date | Ba (mg/L) | B (mg/L) | Ca (mg/L) | Cl (mg/L) | Li (mg/L) | Mg (mg/L) | Mn (mg/L) | K (mg/L) | Na (mg/L) | Sr (mg/L) | TDS (mg/L) | |||||||||||||||||||||||||||||||||||||||
| Original Lab Prepared Sample | NA | NA | 30,000 | NA | 250 | 2,500 | NA | 2,000 | 60,000 | 2,000 | NA | |||||||||||||||||||||||||||||||||||||||||
1 | BSW-23Z | 24-07-2018 | 0.403 | <2.0 | 25,600 | 189,000 | 266 | 3,000 | <0.10 | 2,290 | 53,200 | 1,900 | 310,000 | |||||||||||||||||||||||||||||||||||||||
2 | UBC | 16-10-2018 | <1.0 | <10 | 29,900 | 142,000 | 235 | 2,230 | <0.50 | 1,880 | 56,900 | 1,940 | 274,000 | |||||||||||||||||||||||||||||||||||||||
3 | UBC | 16-10-2018 | <0.40 | <2.0 | 39,000 | 173,000 | 276 | 2,200 | <0.10 | 2,470 | 73,000 | 2,520 | 250,000 | |||||||||||||||||||||||||||||||||||||||
4 | BSW-13MC | 16-01-2019 | <0.80 | <4.0 | 31,900 | �� | 300,000 | 280 | 2,590 | <0.20 | 2,470 | 68,800 | 2,350 | 256,000 | ||||||||||||||||||||||||||||||||||||||
5 | BSW-14C | 16-01-2019 | <0.80 | <4.0 | 29,400 | 199,000 | 258 | 2,370 | <0.20 | 2,310 | 56,800 | 2,180 | 291,000 | |||||||||||||||||||||||||||||||||||||||
6 | BSW-14MC | 16-01-2019 | <0.80 | <4.0 | 29,200 | 316,000 | 260 | 2,330 | <0.20 | 2,290 | 57,200 | 2,090 | 254,000 | |||||||||||||||||||||||||||||||||||||||
7 | BSW-21SC | 16-01-2019 | <0.80 | <4.0 | 30,500 | 157,000 | 264 | 2,270 | <0.20 | 2,360 | 57,700 | 2,060 | 276,000 | |||||||||||||||||||||||||||||||||||||||
| Mean | NA | NA | 30,688 | 210,857 | 261 | 2,436 | NA | 2,259 | 60,450 | 2,130 | 273,000 | |||||||||||||||||||||||||||||||||||||||||
| Standard Deviation | NA | NA | 3,807 | 69,155 | 14 | 264 | NA | 212 | 6,804 | 212 | 21,917 | |||||||||||||||||||||||||||||||||||||||||
| RSD | % | NA | NA | 12.4 | 32.8 | 5.5 | 10.8 | NA | 9.4 | 11.3 | 10.0 | 8.0 | ||||||||||||||||||||||||||||||||||||||||
NA – No data available
| Preliminary Economic Assessment of LANXESS Smackover Project | 109 |
Table 11-3 Internal Standard
Assigned ID | Sample ID | Collect Date | Ba (mg/L) | B (mg/L) | Ca (mg/L) | Cl (mg/L) | Li (mg/L) | Mg (mg/L) | Mn (mg/L) | K (mg/L) | Na (mg/L) | Sr (mg/L) | TDS (mg/L) | |||||||||||||||||||||||||||||||||||||||
1 | WP-Feed | 25-07-2018 | 9.79 | 144 | 40,000 | 218,000 | 166 | 2,910 | 5.86 | 2,640 | 64,100 | 2,310 | 310,000 | |||||||||||||||||||||||||||||||||||||||
2 | BSW-12ME | 17-10-2018 | 8.93 | 132 | 35,800 | 211,000 | 144 | 2,850 | 5.28 | 2,130 | 67,600 | 2,050 | 335,000 | |||||||||||||||||||||||||||||||||||||||
3 | BSW-12ME | 17-10-2018 | 10.2 | 146 | 45,600 | 201,000 | 151 | 3,040 | 5.72 | 2,340 | 87,500 | 2,760 | 357,000 | |||||||||||||||||||||||||||||||||||||||
4 | CPTE | 17-10-2018 | <40 | 148 | 43,700 | 181,000 | 149 | 3,030 | 5.66 | 2,150 | 88,000 | 2,710 | 314,000 | |||||||||||||||||||||||||||||||||||||||
5 | HC1E | 17-10-2018 | <40 | 155 | 47,000 | 228,000 | 155 | 3,190 | 5.9 | 2,210 | 80,800 | 2,830 | 256,000 | |||||||||||||||||||||||||||||||||||||||
6 | WP-STD | 16-01-2019 | 10.1 | 150 | 33,400 | 174,000 | 153 | 3,180 | 5.56 | 2,340 | 67,600 | 2,080 | 298,000 | |||||||||||||||||||||||||||||||||||||||
| Mean | 9.8 | 146 | 40,917 | 202,167 | 153 | 3,033 | 5.66 | 2,302 | 75,933 | 2,457 | 311,667 | |||||||||||||||||||||||||||||||||||||||||
| Standard Deviation | 0.6 | 8 | 5,481 | 21,160 | 7 | 138 | 0.23 | 189 | 10,789 | 353 | 34,332 | |||||||||||||||||||||||||||||||||||||||||
| RSD | % | 5.9 | 5.3 | 13.4 | 10.5 | 4.8 | 4.5 | 4.0 | 8.2 | 14.2 | 14.4 | 11.0 | ||||||||||||||||||||||||||||||||||||||||
NA – No Data Available
| Preliminary Economic Assessment of LANXESS Smackover Project | 110 |
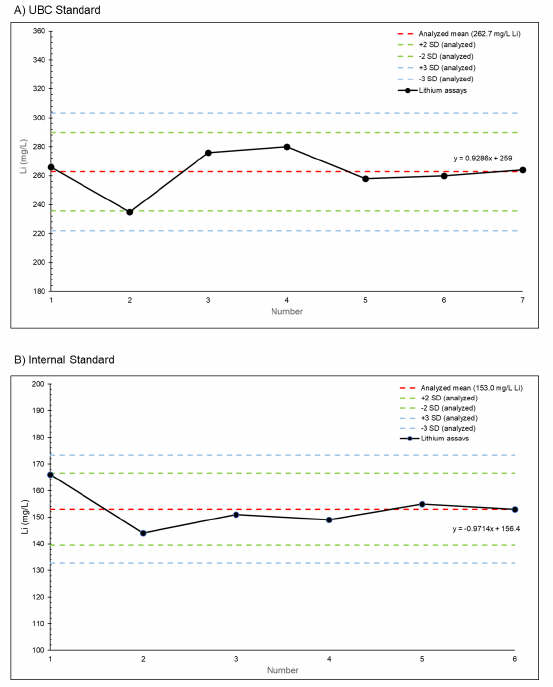
Figure 11-2 Control Graphs of Standard Sample Spike Lithium Measurements (solid line)
Note: Dashed lines are defined as the mean, and two and three standard deviations from the mean. Dotted line in (A) represents the original UBC lithium chloride value of 250 mg/L Li that was used to create the spike.
| Preliminary Economic Assessment of LANXESS Smackover Project | 111 |
| 11.6 | Temporal Assessment of Lithium Data |
Sections 9.1.1 and 9.1.2 provide an assessment of the temporal variation in lithium concentrations from the numerous sampling programs conducted by Standard Lithium between June 2018 and January 2019. In summary, the lithium concentrations from individual brine supply wells and Plant brine samples collected at various time periods correlate very well with one another. The data plot within two standard deviations of the mean and/or fitted lithium concentration line slopes are very low.
It is concluded, therefore, that the Smackover Formation brine underlying the LANXESS Property has a homogeneous lithium composition and there is a very minor amount of lithium variation over the seven (7) month brine sample trial testing period. This contention is true for those samples taken on a well-by-well basis and when comparing data values from specific brine access points at the LANXESS Plants.
| 11.7 | Other Data: LANXESS Proprietary Core Reports |
The author re-iterates from Eccles et al. (2018) that historical proprietary core reports included critical and pertinent information on core plug measurements conducted by independent engineering consultants (Core Laboratories Inc. in Dallas, TX; Delta Core Analysis Inc. in Shreveport, LA; GeoCore Laboratories Inc. in Tyler, TX; GeoCore Laboratories Inc. in Magnolia, AR; and Petroleum Core Services Inc. in Shreveport, LA.). These reports were invaluable in that they included core measurements that included porosity (%) and permeability (mD) on 2,329 core samples collected throughout the LANXESS Property. Some of the core report data also includes: data for oil% in pore space; water% in pore space; bulk oil%; bulk gas%; and bulk water%.
In general terms, the porosity and fluid saturation measurements were obtained for every foot of conventional cores using the Summation of Fluids technique. Horizontal permeabilities were measured on each drilled plug using a steady-state permeameter with nitrogen as the measuring media and a confining pressure of 350 psi.
While these data are proprietary, the author reviewed the data and can confirm the data are statistically relevant in that they show direct correlations between effective porosity and permeability and demonstrate the homogeneous Smackover Formation aquifer conditions underlying the LANXESS Property.
| 11.8 | Summary |
The geochemical analytical and proprietary core report data were prepared by independent and accredited third-party companies. The resulting quantitative data are used to make inferences on the brine analytical values and hydrogeological characterization of the Smackover Formation aquifer.
The analytical methods carried out by WetLab (geochemistry) and the engineering firms (core plug measurements) are standard and routine in the field of Li-brine geochemical analysis and petrophysical core characterization test work.
| Preliminary Economic Assessment of LANXESS Smackover Project | 112 |
With respect to confirming geochemical results at various labs, the author notes that Standard Lithium has used multiple analytical laboratories in the past. Previous multi-lab QA/QC test work, however, directed Standard Lithium to utilize WetLab as their primary lab (see discussion in Eccles et al. 2018). In the author’s opinion, the QA/QC conducted during Standard Lithium’s 2018-2019 assay testing is acceptable to assess the precision and accuracy of the data. Nevertheless, Standard Lithium should consider a second laboratory to act as a check laboratory to Wetlabs for future verification of brine analytical testwork.
The author has reviewed the adequacy of the sampling, sample preparation, security and analytical procedures and found no significant issues or inconsistencies that would cause one to question the validity of the data or its use in resource modelling and estimation. The QA/QC protocol adopted by Standard Lithium helped the author evaluate the precision and accuracy of the laboratory data.
| Preliminary Economic Assessment of LANXESS Smackover Project | 113 |
| 12 | Data Verification |
Data verification procedures were applied by the author on all data pertaining to the resource model and estimate. For completeness, authentication of some of this data is repeated in the current Technical Report from its predecessor report (Eccles et al. 2018). This information, as it pertains to the LANXESS Property, includes: 1) interpretations derived from historical and/or publicly available information, including oil and gas well data; and 2) new information pertinent to recalculating the resource estimate and updating the resource classification, such as multiple rounds of brine sampling and laboratory analyses. These data and the author’s data verification procedures are discussed as follows:
| 1. | Subsurface LAS Logs: Subsurface well data was acquired from three (3) different third-party and Government sources: 1) IHS Markit; 2) AOGC; and 3) ARK-LA-TEX Log Library Inc. A total of 699 electric logs penetrated through the top of the Reynolds Member. A total of 198 electric logs penetrated the entire Reynolds Member. Once geocoded into the proper coordinate space, the existing stratigraphic picks were reviewed for accuracy on a well-by-well basis. The top of the Smackover Formation picks was usually precise. In the few instances where revision was required, the picks were revised by Hill Geophysical Consulting in collaboration with Mr. Eccles (see Eccles et al. 2018). The bottom of the Reynolds Member was almost never picked historically, and hence, this was newly created information specific to this Technical Report. |
| 2. | Subsurface Core Report Effective Porosity and LAS Total Porosity Logs: The individual proprietary core reports were reviewed against the original LAS logs to confirm that the depths of the core intervals matched the depth of the Reynolds Member on the log files; no errors were found. Pertinent data such as porosity and permeability information were converted from hardcopy to electronic files by APEX staff under the supervision of the author. While the individual core plug measurement data are proprietary, the information was helpful in assessing and confirming critical Reynolds Member hydrogeological parameters underlying the LANXESS Property. |
| 3. | With respect to the LAS porosity logs, 36 wells had density logs and/or porosity logs that could be used for porosity calculations of the Reynolds Member (34 logs within the LANXESS Property and two (2) logs directly adjacent to the Property). To validate the LAS porosity logs, the author tested the LAS total porosity data versus those of the proprietary core reports (n=12 wells that had both LAS and core plug porosity measurements extending through the entire Reynolds Member). The correlation between the effective porosity (proprietary core reports) and total porosity (public LAS files) is excellent, and the author concludes that both sets of data are valuable contributions to evaluate the Reynolds Member ooidal limestone porosity. |
| 4. | LANXESS Infrastructure: The author conducted a site inspection at the LANXESS Property on July 24-25, 2018 and visited all brine supply wells on the Property, as well as the South, Central and West Bromine Plants. In addition, the author reviewed brine supply and reinjection well information, including location, depth, brine pumping rates, etc. via files downloaded from the AOGC. |
| Preliminary Economic Assessment of LANXESS Smackover Project | 114 |
Importantly, the author confirmed that the entire brine production circuit, consisting of brine supply wells, pipelines, bromine processing plants and reinjection wells, is solely focused on the brine production cycle. |
| 5. | Li-Brine Sampling Program and Mineralization: The author participated in Standard Lithium’s July 24-25, 2018 sampling program and observed the brine sampling protocol, insertion of QA/QC samples and submission of the chain of custody of the samples to the laboratory. The author accompanied Standard Lithium personnel to a total of 32 brine access points including individual brine supply wells and selected sample points at the South, Central and West Bromine Plants. |
| 6. | During this site inspection, the author collected 10 brine samples from throughout the LANXESS Property for independent analytical testing. The assay results are presented in Eccles et al. (2018). The samples, which were analyzed at ALS in Houston, TX, yielded lithium concentrations between 46 mg/L and 213 mg/L, with an average of 128 mg/L Li. Accordingly, the author was able to verify the Li-brine mineralization at the LANXESS Property. |
| 7. | Security: The author reviewed duplicate copies of Standard Lithium’s Chain of Custody records from the field to the courier and from the courier to the laboratory and found no significant issues or inconsistencies that would cause one to question the validity of the security protocols implemented by Standard Lithium. |
| 8. | Laboratory Analytical Data: The author reviewed Standard Lithium’s analytical results and all geochemical data in their electronic database by comparing data provided by the Standard Lithium against WetLab’s hardcopy analytical reports or laboratory certificates. The author found no significant issues or inconsistencies that would cause one to question the validity of the data. Any mistakes in Standard Lithium’s conversion of the data from the lab certificates to the electronic database were corrected by the author during preparation of this Technical Report. |
To conclude, the author has conducted the necessary due diligence to validate the data used in this report and can confirm the data was generated with proper procedures, has been accurately transcribed from the original source and is suitable for use in this Technical Report. Based on the author’s previous experience and research of Li-brine deposits, and sampling and analytical protocols, the author is satisfied to include this data in the resource modelling, evaluation and estimations as part of the LANXESS Property Li-brine resource estimate.
| Preliminary Economic Assessment of LANXESS Smackover Project | 115 |
| 13 | Mineral Processing and Metallurgical Testing |
| 13.1 | Introduction |
Standard Lithium is continuing the development of a processing route to produce battery-quality lithium chemicals from Smackover Formation brine at the Company’s LANXESS Property. The immediate goal of the past and ongoing work is to define the process and engineering parameters required to design and operate a demonstration-scale integrated plant at the LANXESS property. The objective of the demonstration plant is to further confirm the operating conditions and design criteria for the full-scale commercial plant, which will be operated at the same site using the same feed. It will also enable the examination of some processing options and the optimization of key processing parameters.
| 13.1.1 Process | Selection Rationale |
Standard Lithium’s Smackover Li-brine project has several unique aspects that require a different approach to processing lithium-bearing brine, as compared to traditional South American salar-based projects. The factors, which affect the selected approach, include the following:
| • | The climate and terrain in southern Arkansas are not conducive to the construction and operation of traditional solar evaporation ponds. Despite the high average annual temperature (23.5°C), the average humidity is too high (annual rainfall of 126.7 cm); hence, the net solar evaporation rate is inadequate for operation of a traditional solar evaporation pond system. In addition, because there is little flat ground in the area, high capital investment costs for evaporation pond construction would be required; |
| • | Tail-brine re-injection into the Reynolds Member is needed to maintain aquifer pressurization. Bromine recovery from the aquifer brine has been taking place for over 50 years. Tail-brine has been re-injected to the aquifer for the entire operating history of the LANXESS plant operations. Changing the process to solar evaporation ponds would negatively affect the water balance in the Smackover Formation beneath the Project area; |
| • | The tail-brine must be neutralized to pH 5.5 prior to re-injection into the aquifer; the tail-brine that exits the bromine extraction process is acidic (pH is typically 0.6-1.0) and hot (>65°C); and |
| • | The Smackover Formation brines have much higher background levels of alkaline earth elements, as compared to the brines typically found in salars exploited for lithium recovery in South America. |
Conversely, the southern Arkansas area and the project site have several attributes that are not commonly found at lithium brine development locations; these allow a wider range of lithium extraction and conversion processes to be considered. These project attributes include the following:
| • | An existing brine processing business (LANXESS bromine plants) that is well versed in pumping, processing and reinjecting very large volumes of brine, and has successfully done this for several decades; |
| Preliminary Economic Assessment of LANXESS Smackover Project | 116 |
| • | Access to abundant fresh water for use in chemical processes; |
| • | Immediate access to stable, high capacity and relatively inexpensive electricity; |
| • | Excellent access to low-cost, standard chemical reagents (acids, bases etc.); |
| • | Excellent access to low-cost gas for any required heating operations; and |
| • | An existing large well-trained workforce, skilled in brine handling and processing operations. |
To select technologies that work with the project tail-brine characteristics and local conditions, Standard Lithium evaluated several possible process routes to separate lithium from the tail-brine.
| 13.1.2 | Process Overview |
Based on the initial technology evaluation stage, a process that uses a stable, fine-grained solid adsorbent material to selectively extract lithium from a brine stream that has undergone relatively minimal pre-treatment was found to be the most promising route (Li et al. 2018). This treatment process produces a substantially purified lithium chloride solution that is concentrated in lithium and similar in composition to that which would be produced from an evaporation route, while preserving the barren brine matrix so that it can be re-injected into the aquifer without negative consequences. From the product lithium chloride liquor, commercial lithium products such as lithium carbonate or lithium hydroxide monohydrate (LiOH•H2O) can be readily produced using commercially practiced processing steps.
Brine processing test work is ongoing, with a view to the design, construction and continuous operation of a larger scale demonstration plant to be deployed at one of the existing LANXESS brine processing facilities in southern Arkansas. The demonstration plant will incorporate all processing steps from brine pre-treatment to production of lithium chloride eluate, and both on-site and off-site conversion to lithium carbonate. Circuit deployment is currently targeted for the second half of 2019 (H2), and it is to operate for approximately one (1) year.
Figure 13-1 is a simplified schematic showing the main process steps in the Demonstration Plant.
| Preliminary Economic Assessment of LANXESS Smackover Project | 117 |
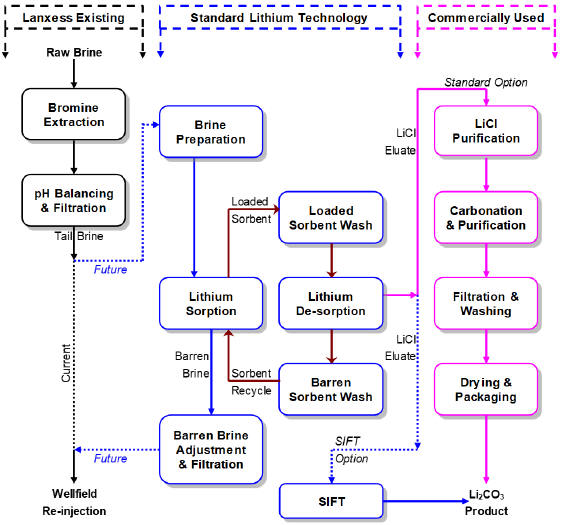
Figure 13-1 LANXESS Smackover Lithium Brine Project Flowsheet Schematic
The intent of this Section is to discuss the LANXESS Property Li-brine mineral processing test work in accordance with CIM Best Practice Guidelines for Mineral Processing (2011). The level of definition is appropriate to the confidence categories of mineral resources being supported and the current stage of project development.
It is the opinion of the author preparing this section, that the discussion includes an objective level of reasonableness and demonstrates competence and due care in the execution of the metallurgical testwork and Li-brine recovery process steps.
| Preliminary Economic Assessment of LANXESS Smackover Project | 118 |
| 13.2 | Historical Testing |
To the best of the author’s knowledge, no historical testing regarding lithium recovery from the tail-brine produced at the LANXESS Property has been performed. All testing discussed below was performed for Standard Lithium as part of the current development program.
| 13.3 | Lithium Extraction Bench-Scale Testing |
The bulk of the bench-scale testing has been carried out by Chemionex Inc., under the direction of Mr. Craig Brown, owner and principal of Chemionex. Mr. Brown has over 40 years of experience in the development and application of ion exchange and adsorption technologies. Ancillary test work, adsorbent synthesis and confirmatory assaying have taken place at SGS Canada Inc.’s (SGS) Lakefield Ontario laboratories. Other discrete phases of bench-scale work (membrane selection/testing, adsorbent characterization and liquid-solid separation) have also taken place at other lab facilities around North America.
The bench-scale testing began in late Q3 2017 and focused initially on technology elimination. Refinement of the selected lithium extraction technology continued throughout 2018, and the ‘bench-scale’ work was scaled-up on multiple occasions and also operated in short-duration semi-continuous campaigns. The main phase of bench-scale work was completed by Q4 of 2018, but certain discrete items of data-gathering continue to be investigated at ‘bench-scale’ in order to refine process parameters.
The bulk of the initial bench-scale testing work was performed on the ‘Tetra-Feed’ brine, whose chemical analysis is shown in Table 13-1 below. This brine was sourced from the project site in southern Arkansas (a small slipstream of tail-brine produced by LANXESS’ West Plant) and was transported in a 1,000 L intermediate bulk container (IBC). No precipitation or other change occurred in the brine during its transport or storage at the testing facilities.
| Preliminary Economic Assessment of LANXESS Smackover Project | 119 |
Table 13-1 Average Tail-Brine Composition from LANXESS Bromine Plants and Standard Lithium Testing Feeds
Parameter | Units | LANXESS Bromine Plants | Tetra Feed | LISTR-2 Feed | ||||||||||||||||||||
| Central | West | South | ||||||||||||||||||||||
Lithium (Li) | mg/L | 130 | 154 | 200 | 152 | 210 | ||||||||||||||||||
Potassium (K) | mg/L | 1,852 | 2,403 | 2,513 | 2,260 | 2,295 | ||||||||||||||||||
Sodium (Na) | mg/L | 60,900 | 67,730 | 66,470 | 70,200 | 67,100 | ||||||||||||||||||
Magnesium (Mg) | mg/L | 2,795 | 2,973 | 2,676 | 3,540 | 2,920 | ||||||||||||||||||
Calcium (Ca) | mg/L | 31,917 | 35,029 | 36,171 | 35,900 | 34,950 | ||||||||||||||||||
Barium (Ba) | mg/L | 3.15 | 10.0 | 6.74 | 11 | 13 | ||||||||||||||||||
Strontium (Sr) | mg/L | 1,813 | 2,149 | 2,161 | 2,180 | 2,105 | ||||||||||||||||||
Chloride (Cl) | mg/L | 160,000 | 183,290 | 172,290 | — | — | ||||||||||||||||||
Sulphate (SO4) | mg/L | <2,000 | <2000 | <2000 | 390 | — | ||||||||||||||||||
Boron (B) | mg/L | 132 | 146 | 168 | 176 | 193 | ||||||||||||||||||
Total Dissolved Solids | mg/L | 290,500 | 301,430 | 305,290 | 317,000 | — | ||||||||||||||||||
pH | pH units | 1.21 | 1.09 | 1.01 | 0.81 | 6.20 | ||||||||||||||||||
Density | g/cm | 3 | 1.18 | 1.19 | 1.18 | 1.19 | 1.17 | |||||||||||||||||
Temperature (field measured) | Celcius | 52.1 | 67.1 | 62.3 | — | — | ||||||||||||||||||
Notes: The test results presented for the South, Central and West Bromine Plants are averages of up to seven sampling events that were conducted between June 2018 and January 2019. Samples were collected from a sampling point located in the pipeline immediately downstream of the bromine-recovery towers and prior to addition of any base. Analysis of tail-brine samples was conducted by WETLAB – Western Environmental Testing Laboratory, located in Reno, NV. Analysis of the two (2) testing feed-brines (Tetra and LiSTR-2) was carried out by SGS in Lakefield, ON.
| 13.3.1 | Findings from Bench-Scale Testing |
Several key findings and outcomes from the bench-scale testing are:
| Preliminary Economic Assessment of LANXESS Smackover Project | 120 |
| • | The solid, inorganic powder adsorbent could be easily prepared at the SGS laboratories in the amount of tens of kilograms, using routine laboratory equipment and reagents; |
| • | The fine-grained, solid, inorganic powder adsorbent preferentially removes lithium ions from the feed brine, at both ambient and elevated temperatures; |
| • | The practical pH range for efficient adsorption of lithium from the tail-brine is 7.0 to 7.8, confirming published literature; |
| • | Base (caustic or ammonia) needs to be added to the loading reactor(s) during the lithium extraction process to maintain the target adsorption pH; |
| • | The lithium-loaded adsorbent solids can be removed as a slurry from the loading reactor tank, separated from the barren brine, and washed using clean water to remove any residual brine entrained by the fine solids; |
| • | The lithium-depleted barren tail-brine can be separated from the loaded adsorbent slurry using submerged microfiltration (0.1 µm to 10 µm) membrane units. This prevents entrainment of the adsorbent solids in the barren tail-brine stream. The membrane filters are commercial units (used at large scale in existing municipal and industrial waste water projects); |
| • | The loaded adsorbent slurry can be pumped to the elution reactor. Lithium is released from the adsorbent by contacting with a hydrochloric acid solution of moderate strength which, at the same time, regenerates the adsorbent; and |
| • | The composition of the lithium chloride eluate solution is broadly similar to that produced by classical evaporation pond processing, with the exception that certain residual contaminants found in the South American resources (e.g. boron), are not further concentrated by the selective extraction process. |
Based on these findings, a provisional patent to protect the lithium extraction process for the Smackover brines was filed in December 2017, and a full, non-provisional US and PCT patent was filed in December 2018.
| 13.4 | Lithium Extraction Mini-Pilot Testing |
The bench-scale lithium extraction process equipment, as discussed in Section 13.3 above, was scaled up by a suitable scaling factor, and was reconstructed at SGS Lakefield Ontario laboratory. The equipment was reconfigured so that it could be operated continuously (i.e. 24 hours/day, 7 days/week). The principal purpose of the mini-pilot plant work was to better understand the continuous solid/liquid handling aspects of the process in order to complete the design of the large-scale demonstration plant.
The tail-brine feed used for the mini-pilot work was sourced from the LANXESS South Plant and shipped in ten IBC’s (total volume 10 m2) from Arkansas to SGS in Q1 of 2019. The composition of the brine is provided as ‘LiSTR-2 Feed’ in Table 13-1. No precipitation or other change occurred in the brine during its transport or storage at the testing facilities.
The brine was used in the mini-pilot plant at ambient temperature, without any prior filtration or pre-treatment. The mini-pilot plant campaign operated during March 2019, and ran continuously for three
| Preliminary Economic Assessment of LANXESS Smackover Project | 121 |
(3) weeks, 112 hours per week, with only short stoppages to address mechanical issues and to change operating conditions. For the first two weeks, one adsorbent sample was used. This was replaced with a second sample that was tested in the third campaign week. The continuous circuit operated at a feed flowrate of 240 L per hour. This would have required a very large volume of brine to be transported and then disposed of; therefore, initially, lithium chloride, via a master solution, was added to the produced barren brine, which was then recirculated to the loading reactor. For the final shifts in the campaign, fresh feed brine was processed on a once-through basis, as would be the case in the on-site operations. Both sodium hydroxide and aqueous ammonia were successfully tested as pH control reagents.
| 13.4.1 Findings | from Mini-Pilot Testing |
Key findings and outcomes from the mini-pilot testing are:
| • | pH can be continuously controlled directly in the adsorption reactor(s) by addition of a base; |
| • | Both sodium hydroxide and ammonia could be used, but ammonia was the preferred reagent for pH control during the loading stage; |
| • | The solid, inorganic powder adsorbent, produced by an independent commercial manufacturer exhibited good lithium selectivity, and excellent settling characteristics; |
| • | From the suite of commercially-produced adsorbent samples, a relationship between physical properties and adsorption capacity was established and this relationship can be used to help monitor the manufacturing process to obtain an adsorbent with the desired properties; |
| • | The required residence time in the loading reactor(s) for the adsorbent is less than one hour at ambient temperature; |
| • | No supplementary heating of the tail-brine or reactor tanks is required for the process; |
| • | The best way to separate the fine loaded adsorbent from the barren brine is to use a combination of membrane filtration and counter-current decantation (CCD) to wash brine out of the loaded adsorbent and to thicken it ahead of the next processing step |
| • | The membrane filters were successful in efficiently separating the loaded adsorbent from the barren brine on a continuous basis, and were found to operate robustly without any signs of blockage by the relatively fine adsorbent material or degradation by the chemical conditions; |
| • | The membrane filters were successful in efficiently washing and providing initial thickening of the lithium-loaded adsorbent; |
| • | Additional thickening of the washed and loaded adsorbent prior to stripping could be achieved by gravity settling in standard thickener/clarifier tanks; |
| • | Vacuum filtration could also be used to dewater the loaded (or eluted) adsorbent slurry; |
| • | The washed and thickened lithium-loaded adsorbent could be pumped as a slurry into the stripping reactor; |
| • | Stripping and regeneration of the adsorbent could be completed under less-acidic conditions than previously understood; |
| • | The regenerated, washed and thickened adsorbent could be pumped as a slurry back to the start of the process to be used in the loading reactor(s); |
| Preliminary Economic Assessment of LANXESS Smackover Project | 122 |
| • | Particle size analysis showed no appreciable change in particle size distribution or particle degradation for the duration of the mini-pilot program; and |
| • | The lithium extraction process could be run in a continuous fashion, could be stopped, and could then be re-started with minimal additional effort. |
Data gathered during the mini-pilot program were used to refine the overall flowsheet, and as a result, several changes were made to the design and construction of the large-scale Demonstration Plant.
13.5 Lithium Chloride Conversion Testing
The concentrated lithium chloride solution, from the stripping stage, undergoes removal of residual hardness (low levels of residual alkali and alkaline earth metals) using industry standard purification methods to produce a high-purity lithium chloride solution. The purified lithium chloride solution produced by polishing is suitable for application of the industry-standard carbonation process. Typically, this involves adding soda-ash (sodium carbonate) to the lithium chloride solution. Heating reduces the solubility of the precipitated lithium carbonate, which is subsequently removed by filtration. The lithium carbonate is further purified through several stages, including further carbonation, bicarbonation and hot washing, followed by sizing, drying and packing, to produce a saleable lithium carbonate product meeting the offtake partner’s specifications. These final product preparation steps are analogous to those currently used in operating lithium brine projects and are typically carried out using equipment and processes provided by Vendors/Original Equipment Manufacturers (OEMs) familiar with the application.
The batch crystallization and purification process was developed by the lithium industry in the 1960s, and was designed for end-uses that did not require very high purities. The global growth in use of lithium chemicals is based predominantly on the adoption of lithium ion batteries, and these end-uses typically require more exacting purity targets.
In order to assess whether alternative crystallization techniques may be helpful in reaching higher levels of purity, Standard Lithium is also in the process of examining an alternative precipitation technology with fewer purification steps. As previously announced, Standard Lithium (Standard Lithium Ltd. 2018d) have been involved in testing a novel continuous crystallization process. This work has been completed in collaboration with researchers from the University of British Columbia (UBC), specifically Professor Jason Hein. This new process, which has been dubbed ‘SIFT’, has the advantage over the conventional purification route in that it can start off with a contaminated (with elements like calcium and magnesium) lithium chloride solution and produce high grade lithium carbonate in fewer process steps and with reduced chemical additions.
The initial proof-of-concept testing work was completed at bench-scale in the Chemistry Department of UBC from late 2017 through to the summer of 2018. This work was then scaled-up by Saltworks Technologies to a prototype-pilot scale and was successfully operated from September to
| Preliminary Economic Assessment of LANXESS Smackover Project | 123 |
December 2018. A larger, Demonstration Plant is currently undergoing engineering design, and it is expected to be deployed to the Arkansas plant site by early Q1 2020.
13.5.1 Findings from Lithium Chloride Conversion Testing
Several key findings and outcomes from the SiFT lithium chloride conversion testing are not available for public disclosure at this time, but the following key points can be made:
| • | Simple washing of lithium carbonate crystals formed from a relatively impure LiCl starting solution resulted in >99.56% pure crystals; and |
| • | Additional dissolution/recrystallisation stages, and/or starting from a purer solution (as is typically done), and/or additional post-crystallisation washing will likely improve end product purity substantially. |
Additional bench-scale testing is being completed to ascertain the most efficient way to improve final product quality. The technology is subject to an assignment agreement between Standard Lithium and UBC, and provisional patent(s) are currently being submitted.
13.6 Process Testing QA/QC
Prior to the mini-pilot plant campaign, analytical determinations were carried out by Chemionex, using standard solution analysis instrumental techniques; principally, atomic absorption spectrometry. For more important determinations, duplicate samples were submitted to SGS for analysis using their standard protocols, which they developed based on their experience working on numerous lithium projects; principally, ICP-OES. All of the samples collected during the mini-pilot plant program were analyzed in the SGS laboratory. Rush control assays were produced within two (2) to four (4) hours of sampling, and for less important streams, results were available within 24 hours. As part of their rigorous internal quality control program, SGS assays one sample from each submitted sample set, twice. These duplicate results, normally used internally by SGS for quality control, were made available to Standard Lithium. Furthermore, Standard Lithium provided a synthetic lithium brine standard solution that was prepared at the University of British Columbia from reagent grade chemicals. Subsamples of this standard brine were included in two (2) of the six (6) sample sets submitted to SGS each day during the mini-pilot plant campaign. All analytical data received by SGS were within acceptable QA/QC parameters for precision and accuracy.
SGS laboratories also provided services to characterize some of the different adsorbent samples that were prepared or procured. The services included particle size analysis (Malvern Laser Particle Size Analyser), optical and scanning electron microscopy to look at particle morphology, and X-ray diffraction to determine crystal structure. The UBC chemistry department carried out advanced XRD studies, which examined the structure of a suite of adsorbent precursor samples.
Metallurgical testing, specifically settling tests, filtration tests and pulp rheology measurements, were carried out by SGS.
| Preliminary Economic Assessment of LANXESS Smackover Project | 124 |
Vacuum belt filtration of loaded adsorbent was tested during the mini-pilot campaign using test filters provided by two filter manufacturers.
Throughout the process test work described, the author made the following visits:
| • | Visited the Chemionex laboratory on several occasions; |
| • | Was present at SGS throughout much of the mini-pilot work; |
| • | Visited the UBC laboratory and the prototype SiFT pilot plant at Saltworks; and |
| • | Visited two commercial adsorbent supplier manufacturing plants. |
13.7 Process Scalability
As the process flowsheet (developed by Standard Lithium and their technical team) deviates from that used by typical arid salar brine operations, some consideration must be given to the potential scalability of the process contemplated. Iterations completed to date, i.e. bench-scale and mini-pilot plant demonstration, have all involved an approximate two (2) orders of magnitude (i.e. 100x) scale change at each step. A similar increase in design scale is contemplated to progress the Demonstration Plant to a commercial facility (i.e. 50 to 5,000 US gpm input flow rate). These scaling factors are acceptable in engineering design.
To date, no issues with process scale-up have been identified. It is feasible, and should not present any processing challenges, to divide the large flows into smaller parallel flows, should that be required for the full-scale plant.
13.8 Process Technical Risks and Mitigation Measures
Similar to all lithium brine processing projects (including those using ‘conventional’ evaporation ponds), there exist several risks that will need to be addressed or resolved as the project moves through the usual development stages:
| • | Security of brine supply and bromine plant operation continuity – discussion of these topics is covered in Section 24; |
| • | Security of adsorbent supply – two commercial suppliers have been identified, one of which is being used to supply the large-scale Demonstration Plant. The production technology to make the adsorbent is analogous to commercial techniques used with other commodities and requires standard equipment and conditions that should be reproducible by a number of custom chemical commodity producers; |
| • | Adsorbent robustness—in the mini-pilot plant test program, adsorbent samples were taken once a day for determination of the particle size distribution. It was found that over the course of more than 10 operating days, there was some loss of very fine material, probably left over from the manufacturing process, and some slight size reduction in very coarse material. In general, there was relatively little change in the cumulative size distribution curves, indicating that physical degradation |
| Preliminary Economic Assessment of LANXESS Smackover Project | 125 |
was not taking place at a measurable rate. It should be noted, that the process has been designed specifically to work with a fine-grained material. If longer term testing during the demonstration phase shows some physical degradation of particle size, this should not affect the fundamental performance of the process. In the mini-pilot plant campaign, two (2) different adsorbents were tested. The adsorbent capacities matched expected values from bench testwork and values predicted from the correlation between adsorbent physical properties and capacity. Loading remained consistent over the ten-plus day operating period using the first adsorbent material, with no evidence of any progressive decline in capacity. Similar results were obtained with the second adsorbent charge, used for over three (3) days. These results increased the level of confidence that the adsorbent could be successfully cycled through the process many times. An important objective of the Demonstration Plant will be to further confirm that the adsorbent retains its capacity and can be cycled indefinitely. The results also showed that the process was robust in terms of sensitivity to adsorbent properties and that process operating conditions could be readily adapted as required by possible variations in adsorbent properties;
| • | Effect of lithium feed concentration on loading—to test the effect of lithium grade variability on the loading/extraction performance, the concentration of lithium in the feed was allowed to vary widely during the mini-pilot plant campaign. The testwork demonstrated that the lithium bite (the difference between the feed and barren brine lithium concentrations) remained quite constant. The bite was more dependent on other operating conditions than on feed lithium concentration; therefore, it is concluded that lithium production will be relatively insensitive to lithium concentration until the point where all lithium is being extracted; |
| • | Effect of operating temperature—bench testwork on adsorption has been carried out at the expected commercial operating temperatures, while mini-pilot plant testwork has only been carried out at ambient temperature. The literature demonstrates that adsorption capacity improves with temperature. Testwork by a filter manufacturer using adsorbent samples supplied by Standard Lithium has shown that filtration also improves with temperature. Meanwhile, settling results are also being generated at the expected operating temperatures. Based on these results, it is anticipated that the operation will be enhanced physically and chemically at higher brine temperatures in the large-scale Demonstration Plant; and, |
| • | Robustness of the membrane separation of adsorbent from brine—over the entire three-week operating period, there was no evidence of membrane filter blockage. Barren brine flux through the membrane did not decrease. Pressure drop across the membrane did not increase. At the end of the campaign, when the membrane filter was removed from the loading reactor, no solids build-up was found. These results significantly increase the level of confidence in the fact that the membrane filters are robust and will continue to operate as designed. |
13.9 Conclusions
Standard Lithium has commissioned testwork to understand the functioning of the selective lithium adsorbent it intends to use, as well as to have a thorough grasp of the conditions and requirements to manufacture good quality adsorbent. This work has been carried out in commercial laboratories, with
| Preliminary Economic Assessment of LANXESS Smackover Project | 126 |
established reputations in the development and testing of hydrometallurgical processes for metal recovery from solution. The QP has visited the facilities performing the work and considers the processing samples representative of the feed brine composition and deposit-type and is confident that the quantity and quality of the test work completed at this stage of project evaluation is sufficient to the level of resource classification presented in this Technical Report.
At present, the testwork continues to further expand the knowledge base and understanding of the underlying processes and contributes to the development of the design parameters for a Demonstration Plant that will be assembled on-site at the source of the feed brine. The purpose of the continuously-operating Demonstration Plant will be to establish process robustness and to evaluate long-term adsorbent life, while further optimizing operating conditions. Most of the design parameters for the Demonstration Plant have been developed from the bench and mini-pilot plant testing and the Demonstration Plant will further define the design parameters and expected capital and operating costs for the commercial operation.
| Preliminary Economic Assessment of LANXESS Smackover Project | 127 |
14 Mineral Resource Estimates
The maiden LANXESS resource estimate prepared by Eccles et al. (2018) is replaced and superseded by this, current, 2019 Technical Report prepared for Standard Lithium and their LANXESS Property.
New information provided by Standard Lithium forms the basis for revising and reclassifying the resource estimate and includes the following:
| 1. | Additional and chronologically repeated LANXESS Property brine assay geochemical results that are discussed in Section 9.1. |
| 2. | Disclosure of lithium extraction technological processing results, as conducted by Standard Lithium on brine from the LANXESS Property, which are discussed in detail in Sections 13 and 17. |
For reporting completeness, the Mineral Resource Estimation presented in this Technical Report utilizes geological information provided in Eccles et al. (2018). To explain to the reader the information repeated from Eccles et al. (2018) versus new information, the authors refer to their six-step confined aquifer Li-brine resource estimation methodology (see Section 14.1) in the ensuing points:
| • | The following Resource Estimation Steps are repeated (i.e. no new information) from Eccles et al. (2018): |
| • | Step 1 (3D geological modelling and definition of the Smackover Formation aquifer; Section 14.3); |
| • | Step 2 (porosity block-modelling; Section 14.4); and |
| • | Step 3 (hydrogeological characterization; Section 14.5). |
| • | The following Resource Estimation Steps are revised and include new data, information and concepts to recalculate and reclassify the Li-brine mineral resource at the LANXESS Property: |
| • | Step 4 (lithium concentration; Section 14.6); |
| • | Step 5 (resource classification and reasonable prospects; Sections14.7.2 and 14.7.3); and |
| • | Step 6 (mineral resource estimate; Section 14.7.5). |
In addition, the reader should note that the geostatistical detail of the Step 2 block modelling is not included in this Technical Report. The reader is invited to review Eccles et al. (2018) for a complete discussion on the block modelling process and parameters.
14.1 Introduction and Resource Estimation Steps
Statistical analysis, 3D modelling and resource estimation were prepared by Mr. Black, M.Sc. P. Geo. of APEX, under the direct supervision of Mr. Eccles, M.Sc. P. Geol. The 3D block model was used to estimate total in-situ brine, to complete the statistical analysis and calculate the resource estimation. The workflow implemented for the calculation of the LANXESS Li-Brine Resource Estimate was completed
| Preliminary Economic Assessment of LANXESS Smackover Project | 128 |
using MICROMINE (v 18.0), a commercial mine planning software. Supplemental data analysis was completed using Anaconda Python distribution (Continuum Analytics Inc.) and contributions made by Mr. Black to the Python module for geostatistical modelling, pygeostat (CCG 2016). Mr. Eccles participated in the estimation process, reviewed all data and methodologies and takes responsibility for the mineral resource presented in this Technical Report.
Critical steps in the determination of this LANXESS Li-brine Resource Estimate include the following:
Step 1: Define the geometry and volume of the Reynolds Member (upper Smackover Formation) aquifer;
Step 2: Develop a block model of porosity within the Reynolds Member to best represent the geology of the aquifer, and robustly calculate the total volume of brine;
Step 3: Characterize the hydrogeology of the Reynolds Member subsurface, confined aquifer;
Step 4: Determine the concentration of lithium in the brine; and
Step 5: Demonstrate that reasonable prospects of economic extraction are justified; and,
Step 6: Estimate the lithium resource of Reynolds Member brine underlying the LANXESS Property using the following relation:
Lithium Resource = Total Volume of Brine-Bearing Aquifer X Average Concentration of Lithium in the Brine X Average Porosity.
Steps 1 and 3 to 6 are common minimum practice steps completed in Li-brine resource modelling and estimation. Step 2 is a value-added geostatistical approach to model the Reynolds Member aquifer that provides a more robust calculation of the total volume of brine used in the resource estimate; the block modelling approach was to best mimic the geology (porosity) of the aquifer, and robustly, calculate the total volume of brine, increasing certainty in the resource estimate.
The LANXESS Li-Brine Resource Estimate is reported in accordance with NI 43-101 and has been estimated using the CIM Estimation of Mineral Resources and Mineral Reserves Best Practice Guidelines (2003) and CIM Definition Standards for Mineral Resources and Mineral Reserves (2014). Mineral resources are not mineral reserves and do not have demonstrated economic viability. There is no guarantee that all, or any part, of the mineral resource will be converted into a mineral reserve.
The Li-brine resource is also reported in compliance with the CIM Best Practice Guidelines for Resource and Reserve Estimation for Lithium Brine (2012). This guideline provides specific criteria for Li-brine modelling and estimation on ‘unconfined’ continental brine deposits (i.e. salars); however, the LANXESS Li-brine resource is a ‘confined’ brine deposit as it occurs at depths >2,130 m, with the aquifer bound by aquitards directly above and below. Accordingly, the author has considered all criteria of the CIM Best Practice for Resource and Reserve Estimation for Lithium Brine and used professional judgement in applying them to a ‘confined’ aquifer.
| Preliminary Economic Assessment of LANXESS Smackover Project | 129 |
14.2 Data
14.2.1 Subsurface Geophysical Wireline and Seismic Data
The subsurface well data was acquired from three (3) different sources: 1) Depth registered logs from IHS Markit (a software program that allows users to access raster and digital logs); 2) the Arkansas Oil and Gas Board; and 3) the ARK-LA-TEX Log Library Inc. These logs were scanned, and depths registered.
The geographic land grid used to format and interpret the well data was from the USGS Topo series, using the NAD 27 Arkansas South 302 projection. The well data were loaded and interpreted in PetraTM geological interpretation software.
Summary statistics of the well data include the following:
| • | 3,412 wells have been drilled into the subsurface in the general LANXESS Property area. |
| • | 1,004 wells were deep enough (2,135 m) to penetrate the Smackover Formation. |
| • | 699 wells had electric logs available within the LANXESS Property that included the top of the Smackover Formation. |
| • | 198 wells had electric logs available within the LANXESS Property that included the base of the Smackover Formation Reynolds Member. |
| • | 36 wells had density logs and/or porosity logs that could be used for porosity calculations of the Smackover Formation Reynolds Member (34 logs within the LANXESS Property and two (2) logs directly adjacent). |
Paper prints of proprietary seismic data were procured, scanned, rasterized and loaded into Kingdom® seismic and geological interpretation software. The seismic lines were corrected for time, phase and amplitude.
14.2.2 Lithium Assay Data
Li-brine assay data, which are pertinent to calculating an average lithium value for the Reynolds Member, include the analytical results of the following:
| • | 90 brine samples collected from 25 of the 26 brine supply wells at the LANXESS Property during four (4) to five (5) separate sampling programs conducted by Standard Lithium; and |
| • | 87 brine samples collected from Bromine Plants brine access points during eight (8) separate sampling programs conducted by, or on behalf of, Standard Lithium. |
The sampling programs and their analytical results are discussed in Section 9.1. The geochemical sampling program results provide a temporal assessment of lithium concentrations in the Smackover Formation (Reynolds Member) brine. For resource assessment, the analytical results provide lithium concentrations of the in-situ Li-brine for resource estimation (via brine supply wells).
| Preliminary Economic Assessment of LANXESS Smackover Project | 130 |
14.2.3 Porosity and Permeability Data
Porosity data available to the authors included:
| • | Historical effective porosity measurements of more than 1,935 Smackover Formation core samples that yielded an average effective porosity of 14.3%; |
| • | Historical permeability data that vary from <0.01 to >5,000 (mD), with an average of 338 mD; |
| • | 2,329 proprietary core plug samples from brine supply wells and injection wells within the Reynolds Member at the LANXESS Property were analyzed for permeability and effective porosity and yielded an overall average permeability of 202 mD and an effective porosity of 11.2%; and |
| • | 14,314 Reynolds Member total porosity values based on publicly available LAS density/porosity logs from wells within the LANXESS Property that have an average porosity of 11.3%. |
As part of resource modelling, the authors included the effective and total porosity data values from the core measurements and LAS log files from wells that were within the boundaries of the LANXESS Property. The spatial and statistical evaluation of this data with respect to resource modelling is presented in Section 14.4 and Section 14.5.1.
14.2.4 Data QA/QC
The well locations were vetted using aerial photos and survey plots, where needed. The well logs were loaded into the workstation and vetted to ensure that the proper logs were attached to the well. Three (3) wells from IHS Markit were incorrect and were fixed. Logs from other sources were vetted before being loaded into the workstation. Formation tops were identified (picked) by Tom Wyche of Hill Geophysical Consulting and Mr. Eccles. The formation top picks were vetted by making grid maps and looking for outlier points. The few outlier’s that were found were corrected before importing the picks back into the working subsurface model.
Thirty-one of the wells had density porosity logs that logged the entire Reynolds Member. These logs were digitized using Logscan software by Hill Geophysical Consulting staff, in collaboration with Mr. Eccles. Logscan allows digitization of raster log images. The raster image is placed in the background as the software traces the log’s curve in automatic mode. The operator then corrects any errors using a manual picker. The density porosity logs from the LANXESS Property were good images and easy to digitize.
The seismic data was vetted upon loading into the Kingdom® software. This involved assigning shot point numbers, as seen on the paper prints, to the digital data traces once they were loaded. No problems were encountered.
With respect to the brine geochemical sampling programs, Standard Lithium implemented QA/QC protocols that included field duplicate samples, field blanks and the random insertion of two sets of Standard Sample spikes to test the precision and accuracy of the laboratory.
| Preliminary Economic Assessment of LANXESS Smackover Project | 131 |
The author has reviewed all geotechnical and geochemical data and found no significant issues or inconsistencies that would cause one to question the validity of the data. Third-party laboratory and/or engineering reports, government and/or data contributed by LANXESS was generated with proper procedures, has been accurately transcribed from the original source and is suitable for use in this Technical Report.
An in-depth investigation of the hydrogeological characterization of the confined aquifer is presented in Section 14.4. The author notes that effective porosity is congruent to specific yield and that the correlation between the effective porosity (proprietary core reports) and total porosity (LAS files) is excellent. As a result, the author concludes that both sets of data are valuable contributions to evaluate the Reynolds Member ooidal limestone porosity.
Mr. Eccles P. Geol. conducted a site inspection of the LANXESS Property on July 24-25, 2018. In addition to collecting brine samples for confirmation of Li-brine mineralization, the site visit validated the LANXESS Property’s brine infrastructure. The results of the author-collected brine samples correlate well with Standard Lithium’s June and July 2018 sample program results. Accordingly, the author was able to verify the Li-brine mineralization at the LANXESS Property and the analytical Li-brine concentrations used in this resource estimation.
14.3 Step 1: Geometry of the Reynolds Member Domain
The subsurface geological modelling and construction of the top and base of the Reynolds Member aquifer model, presented in this Technical Report, utilized electronic geophysical data from the following:
| 1. | 699 wells to make stratigraphic picks to delineate the top of the Reynolds Member domain. |
| 2. | 198 wells to make stratigraphic picks to delineate the base of the Reynolds Member domain. |
The methodology and results of this work is presented in the text that follows.
Once all subsurface data were loaded and vetted, Hill Geophysical Consulting staff, in collaboration with Mr. Eccles, used best practice industry interpretation methods to depict the stratigraphic top and base of the Reynolds Member domain and create contoured surface grid files for insertion into the 3D model.
Multiple cross-sections were generated in the study area to understand and define the key geological horizons (see Section 7.4) and the entire log was viewed for each well. Shallow and deep horizons were picked, and geological correlations were straight forward for defining the Reynolds Member. The top Smackover Formation and base Reynolds Member ooidal massive porosity have distinct, sharp log changes that were consistently picked throughout the study area.
Once the stratigraphic horizons in the logs were picked, to the satisfaction of the loggers, simple grid maps were made to check the picks. Questionable picks were studied and fixed if needed.
| Preliminary Economic Assessment of LANXESS Smackover Project | 132 |
The geological information (logs and formation ‘top’ and ‘base’ picks) were loaded into Kingdom® software. The well data were tied to the seismic data using synthetic seismograms. A good tie was established for the top of the Smackover Formation reflector.
As a complementary approach to mapping the Reynolds Member aquifer, the authors used proprietary seismic data within the boundary of the LANXESS Property to support the regional dip of the reflectors and overall delineation of the Reynolds Member domain. Converting seismic time values to depth values was accomplished using Kingdom’s depth conversion routine. The well formation tops were contoured with the seismic data to establish velocity fields. The velocity fields in this area were simple due to the general nature of gentle regional dip with no faulting.
In the author’s opinion, the contouring of the linear (seismic) and random (well) data stratigraphic picks in Kingdom® resulted in a sufficient representation of the Reynolds Member. The resulting surface grids for the top and base of the Reynolds Member domain required very little editing. Some minor editing of the contours was made to reduce any artefact irregularities in the surface grids, which were minimal.
There were no faults in the study area, making the interpretation straight forward and simple. This observation is important as there are negligible faults to complicate groundwater flow within the Reynolds Member in the LANXESS Property.
Hill Geophysical Consulting provided contour files, representing the top and bottom surfaces of the Reynolds Member ooidal massive porosity at 3 m intervals. These data were reviewed by Mr. Eccles, who takes responsibility for their inclusion in the resource estimation process. The contour files are used to construct a 3D wireframe of the Reynolds Member that is used to define the LANXESS estimation domain (see Figure 14-1). This domain boundary has been clipped to the Property boundary and provides the starting point to evaluate the total volume of brine in the Reynolds Member aquifer underlying the LANXESS Property.
Based on the surface grid layers that define the top and bottom of the Reynolds Member, the total volume of the Reynolds Member aquifer within the LANXESS Property is 30,427 km3.
14.4 Step 2: Estimate of Total Brine in the Reynolds Member Domain
The next step in the resource evaluation is to estimate how much brine is contained within the confined aquifer. Key criteria to calculate this value include: 1) percentage of brine versus other liquids (i.e. hydrocarbons); and 2) porosity of the rock units within the aquifer.
| Preliminary Economic Assessment of LANXESS Smackover Project | 133 |
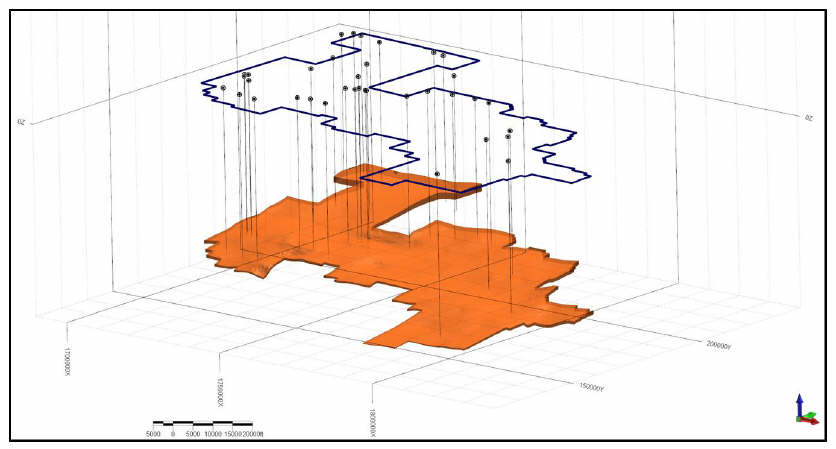
Figure 14-1 Orthogonal View of Property Boundary (blue line), Drillhole Collars (circles), Drillhole Traces (black lines), and Interpreted Reynolds Member (orange solid). Vertical exaggeration of 5.1
| Preliminary Economic Assessment of LANXESS Smackover Project | 134 |
The brine supply wells produce trace (<1%) to no oil, gas and/or condensate. This observation was confirmed during the author’s site inspection and participation in Standard Lithium’s July 2018 brine sampling program. Accordingly, porosity is the main consideration in the estimation of the total brine in the Reynolds Member domain.
Data associated with the LANXESS Property is bolstered by the abundance of effective and total porosity measurements, including the following:
| • | 1,935 historical porosity measurements, many of which are effective measurements; |
| • | 2,329 effective porosity measurements at 0.3 m intervals; and |
| • | 14,314 total porosity values via LAS density and porosity logs. |
In the evaluation of this data, the authors have demonstrated that comparisons between the measured and average values of geophysical wireline logs (total porosity) and proprietary independent core measurements (effective porosity) correlate exceedingly well. The core plug and porosity logs average 11.2% and 11.3% porosity and downhole comparisons are excellent (see Sections 7.5 and 12). Accordingly, the author considers this porosity data to be of high-quality. This is important because in a confined aquifer, the effective porosity is congruent to specific yield (e.g. Johnson 1967; Kruseman and de Ridder 1994); hence, porosity is an effective measurement for hydrogeological modelling (see Section 14.5). Subsequently, the author developed a 3D porosity block model to estimate the total brine in the Reynolds Member domain. Refer to Appendix 2 of Eccles et al. (2018) for geostatistical detail on the development of the porosity block model.
The objective of the porosity block model was to develop a block model of the stratum within the Reynolds Member domain to define horizons/areas of porous rock versus non-porous rock types. As an example, porous strata are equivalent to classic Reynolds Member ooidal grainstone (16-23%) that define geological horizons that are most proficient in releasing brine from storage within the confined aquifer (Manger 1963). Conversely, non-porous strata could be related to clay, mudstone and anhydrite-rich horizons that are not as proficient in storing brine in comparison to the ooidal horizons.
In this instance, rather than assuming that ‘average porosity’ accurately represents the in-situ brine within the Reynolds Member aquifer, a spatial statistics approach has been adopted to estimate brine volume on a block-by-block basis, where each block is assigned a porosity value that best represents the geological substrate.
The total brine volume within the Reynolds Member domain is 3.515 km3 (see Table 14-1). The total volume of brine within the Reynolds Member domain was calculated by multiplying each block’s estimated porosity value by its volume within the Reynolds Member domain (as specified by the calculated block factor). The domains total brine volume was then calculated by summing the volume of brine contained within each block. It is assumed that all pore space is occupied by brine. This is a reasonable assumption because LANXESS’ production focus is on brine and virtually no oil or gas is produced from the brine supply wells.
| Preliminary Economic Assessment of LANXESS Smackover Project | 135 |
Table 14-1 Total Brine Volume within the Reynolds Member Domain at the LANXESS Property
Reporting Parameter | South Unit | Central Unit | West Unit | Total In Situ Volume (km3) | ||||||||||||
Aquifer volume (km3) | 5.828 | 8.289 | 16.310 | 30.427 | ||||||||||||
Brine volume (km3) | 0.689 | 0.995 | 1.835 | 3.515 | ||||||||||||
14.5 Step 3: Hydrogeological Characterization of the Reynolds Member, Smackover Formation
The Reynolds Member of the Jurassic Smackover Formation represents a large-scale confined aquifer that is bounded by two aquitards. The basal aquitard is defined by the Lower Smackover Formation, or Brown Dense, which underlies the Middle Smackover and Reynolds Members. The Brown Dense is composed of fine-grained lime mud (see Section 7.3). Underlying the Brown Dense, basin-wide restriction resulted in deposition of a thick succession of the Louann Salt that covers much of the Gulf of Mexico region (see Section 7.1).
Cross-formational fluid movement above the Smackover Formation is restricted by the Buckner Formation, which consists of anhydrite and shale (Moore and Druckman 1981; Vestal 1950). The overlying Buckner Formation acts as a top seal for hydrocarbons and brine (Parker 1973). The oil, gas and brine are contained within the Reynolds Member creating a confined aquifer.
Because the Smackover Formation has been subject to decades of hydrocarbon and brine exploration, hydrogeological conditions are well studied, with an abundance of information in the public domain. The hydrogeological properties of the Reynolds Member are discussed in more detail in the following sections.
14.5.1 Porosity
Multiple sources of information were used to assess the porosity of the Reynolds Member, including: LAS density and porosity logs; published Government, academic and journal literature; and independent laboratory analysis conducted on well cores from within the boundaries of the LANXESS Property. The authors have reviewed this data on a case-by-case basis and found that total porosity (e.g. LAS porosity logs) and effective porosity (e.g. Summation of Fluids technique on core samples) correlate exceptionally well (see Section 12). As such, porosity is an important part of evaluation the hydrogeology of the Reynolds Member and in resource modelling conducted for this Technical Report.
As discussed previously, the Reynolds Member has economic quantities of oil, gas and brine. Over the years, core samples have been collected and analyzed for porosity and permeability to understand these properties. One extensive study by the USGS summarized more than 1,935 samples collected from the Smackover Formation in Arkansas and analyzed for porosity (Manger 1963; Table 14-2).
| Preliminary Economic Assessment of LANXESS Smackover Project | 136 |
The effective porosity of more than 1,935 core samples varied from 2% to 23.9%, with an average of 14.3% (see Table 14-2). According to the USGS study, porosity measured was either effective porosity or very likely to be effective porosity (this data is referred to as effective porosity in this report). Typically, effective porosity is calculated from core laboratory analysis or through field testing. Effective porosity is an important parameter when assessing the mineral resource, as it is a measure of the interconnectedness of pores through which the brine would flow to production wells.
The Cairo and Schuler Oil Fields in the USGS study are located within the LANXESS Property (Manger 1963). The effective porosity of the Cairo and Schuler Oil Fields were measured to be 17% and 16.7%, respectively. These effective porosities were sufficient to allow the economic extraction of oil from both fields. See Section 6.2 for additional information on these fields such as when they operated, and volume of brine extracted.
Based on the proprietary core reports, a total of 2,329 core plug samples from within the Reynolds Member yielded an average effective porosity of 11.2%.
Within, or directly adjacent to the LANXESS Property, 36 wells contained LAS density and porosity logs. These logs were digitized in stratigraphic sections including, and directly adjacent to the Reynolds Member. In total, there were 42,313 digitized total porosity values, of which 14,314 (or 33%) were contained within the Reynolds Member. Of these data, the highest total porosity occurs within bins 10%-15% (23.5%), 15%-20% (31.8%) and 20%-25% (21.3%). All 14,314 Reynolds Member total porosity values have an average of 11.3%, which matches the effective porosity measured in the 2,239 core plug samples (11.2%).
14.5.2 Permeability
A summary of the published permeability values for the Smackover Formation is presented in Table 14-3. Permeability varied from <0.01 to >5,000 mD, with an average of 338 mD.
Based on the proprietary core reports, a total of 2,329 core plug samples from within the Reynolds Member yielded an average permeability of 202 mD. The author compared the proprietary core plug permeabilities versus their porosities; the result showed the Reynolds Member has good to excellent permeability and porosity. In addition, there is an unequivocal positive relationship between the two datasets, which is a good indicator that porosity can be used as a rough indicator of rock permeability. This is an important observation as permeability can be difficult to decipher in electric wire-line logs.
These permeabilities were high enough to allow for the economic extraction of brine and hydrocarbon from various fields within the Smackover Formation; particularly, the Cairo and Schuler Oil Fields that underlie the LANXESS Property. The current operation at LANXESS’ three brine units extract approximately 55,039 m3/day (346,185 barrels per day or 0.64 m3/sec (4 barrel/sec)). Table 6-2 (in Section 6.2) summarizes the brine extraction volumes for brine supply wells within the LANXESS Property for the period of 2013 to 2018. Brine has been extracted continuously from this Property since the 1957.
| Preliminary Economic Assessment of LANXESS Smackover Project | 137 |
Therefore, the permeability of the Reynolds Member is excellent to allow this significant volume of brine to be continuously extracted over this lengthy period.
14.5.3 Dispersivity
Hydrodynamic dispersion is a phenomenon of groundwater of different solute concentrations mixing through a process of molecular diffusion and mechanical dispersion (Fetter 1988). Mechanical dispersion is a product of the flow velocity (rate of groundwater movement in the aquifer) and the dispersivity (a property of the aquifer). In the future at the Property, mixing would occur when injected tail-brine, free of lithium, combines with in-situ lithium containing brine in the Reynolds Member. The reinjected lithium free brine would mix with brine containing lithium as described by a process of hydrodynamic dispersion.
As the Reynolds Member represents a permeable aquifer, the hydraulic head differences within the unit will result in fluid migration. Based upon the upper and lower layers that bound and restrict vertical flow within the Reynolds Member, most of the flow within the aquifer will be lateral (i.e. upper and lower bounding surfaces include the overlying Buckner Formation anhydrite and underlying Brown Dense and/or Louann Salt). Hydrodynamic dispersion is not currently taking place with respect to lithium at the Property.
During future operation of any lithium brine extraction plant, however, injected brine, free of lithium, would mix with in-situ lithium-containing brine. In the case of the Reynolds Member, the large lateral extent and restricted vertical dimension, means the lithium mixing zone would vary laterally in the aquifer. Dispersivity will result in an increase of the length of the mixing zone along the aquifer as the lithium free brine finds velocity differences at the pore level within the flow system, as well as different flow paths (highest velocities in the largest pore throats and lowest velocities near the grains).
Predicting the migration of brine with different lithium concentrations due to reinjected tail-brine, is beyond the scope of this Technical Report. It should be noted that dispersivities have been measured on the order of tens of metres (Fetter 1988). Based upon the high brine extraction and reinjection volumes associated with the LANXESS brine supply and reinjection wells, dispersivity variations of tens of metres is not an important brine concentration variability factor within the Reynolds Member. That is, the lateral difference between the injected tail-brine and in-situ brine will likely be on the order of tens of meters due to dispersivity alone.
14.5.4 Anisotropy
An assessment was completed of the Reynolds Member anisotropy or the hydraulic properties varying by direction (horizontal versus vertical). All core analyses of the Reynolds Member measured horizontal permeabilities; therefore, it is not possible to quantify anisotropy; however, the horizontal and vertical permeabilities would be anticipated to be similar based upon the depositional environment of strong intertidal currents that formed the Reynolds Member ooidal limestone.
| Preliminary Economic Assessment of LANXESS Smackover Project | 138 |
Table 14-2 Summary of Smackover Formation Porosity (Manager 1963)
Location | Distance to Property (km and direction) | Approximate Depth (m) | Number of Samples | Minimum Effective Porosity (%) | Maximum Effective Porosity (%) | Average Effective Porosity (%) | ||||||||||||||||
Reynolds Unit, Cairo Field, AR* | On Property | ~2,377 | NA | NA | NA | 17 | ||||||||||||||||
Reynolds Unit, Dorcheat Pool, AR* | 26 km East | 2749 –2771 | NA | 2 | 20 | 12 | ||||||||||||||||
Reynolds Unit, Schuler Field, AR* | On Property | 2332 –2365 | NA | NA | 23 | 16.7 | ||||||||||||||||
Reynolds Unit, Various Fields, AR | ~2,393 | 150 | 0 | 23.9 | 14.5 | |||||||||||||||||
Smackover Formation, McKamie-Patoon pool, AR | 45 km East | ~2,835 | 1,767 | NA | NA | 14.2 | ||||||||||||||||
Smackover Formation, McKamie-Patoon pool, AR | 45 km East | 2780 –2860 | 14 | 0 | 16.4 | 7.5 | ||||||||||||||||
| Average Total | 14.3 | |||||||||||||||||||||
| * | According to Manager (1963), the value stated is likely effective porosity. |
| NA | – not available |
| Preliminary Economic Assessment of LANXESS Smackover Project | 139 |
Table 14-3 Summary of Historical Permeability Values for the Smackover Formation
| Permeability (mD)1 | ||||||||||||||||
Formation Name (Field/Pool) | Minimum | Maximum | Average | Source | ||||||||||||
Reynolds Member | 38 | 5520 | 1686 | Fancher and Mackay (1946) | ||||||||||||
Smackover | NA | NA | 100 | Harris and Dodman (1987) | ||||||||||||
Upper Smackover (Mt. Vernon Field) | NA | NA | 120 | Harris and Dodman (1987) | ||||||||||||
Smackover | 1 | 100 | NA | Mancini et al. (2012) | ||||||||||||
Upper Smackover (Southern Zone) | <0.01 | 100 | (?) | NA | Moore and Druckman (1981) | |||||||||||
Smackover (Dolograinstones) | NA | 839 | 69.1 | Prather (1992) | ||||||||||||
Smackover (Sucrosic Dolostones) | NA | 417 | 25.7 | Prather (1992) | ||||||||||||
Smackover (Walker Creek Field) | 0.1 | >5000 | 30 | Bliefnick and Kaldi (1996) | ||||||||||||
Smackover | 1 | 100 | NA | Mancini et al. (2008) | ||||||||||||
1NA – Not available | ||||||||||||||||
14.5.5 Groundwater Levels in the Reynolds Member
At LANXESS, as part of their normal operations, measurements of groundwater levels are collected on a regular basis at the brine supply wells. In most instances, the brine supply wells are operating, thus giving a dynamic groundwater level; however, groundwater levels are also measured when the brine supply wells are not pumping due to maintenance or system upset conditions. Measurements collected when the pumps are not operating provide a quasi-static groundwater level.
It should be noted that the measured groundwater levels do not reflect a true static condition whereby all the brine supply and injection wells are shut in and the field can equilibrate. Rather, the water levels have been collected well-by-well over a period of time; therefore, these groundwater levels could be considered as a semi-qualitative indication of static conditions.
For comparative purposes, we have compiled reservoir data from the Smackover Formation from nearby fields in Arkansas. These data are the ‘original’ reservoir pressures obtained between 1933 to 1943 (Fancher and MacKay 1946). The average reservoir pressure is 3,506 psi and an average calculated groundwater depth of 326 m below the ground surface, assuming a water density of 1.2 g/mL (see Table 14-4).
| Preliminary Economic Assessment of LANXESS Smackover Project | 140 |
Table 14-4 Original Reservoir Data from Smackover Formation-Oilfields in Southern Arkansas (Francher and MacKay 1946)
Field Name | Reservoir Pressure (psi) | Elevation OWC Contact (ft asl) | P/D Ratio (psi/ft asl) | Assumed Ground Elevation (ft) | Head (m) | Calculated Water Depth (m) | ||||||||||||||||||
Atlanta | 3,821 | -8,000 | 0.46 | 256 | -200.39 | 278 | ||||||||||||||||||
Big Creek | 3,733 | -7,731 | 0.46 | 361 | -169.95 | 280 | ||||||||||||||||||
Buckner | 3,195 | -7,010 | 0.44 | 292 | -265.30 | 354 | ||||||||||||||||||
Calhoun | 3,450 | -8,006 | 0.42 | 138 | -419.52 | 462 | ||||||||||||||||||
Columbia | 3,750 | -7,817 | 0.46 | 256 | -186.20 | 264 | ||||||||||||||||||
Magnolia | 3,465 | -7.293 | 0.45 | 341 | -193.41 | 297 | ||||||||||||||||||
Mckamie Patton | 4,365 | -9,042 | 0.47 | 279 | -199.37 | 284 | ||||||||||||||||||
Midway | 2,920 | -6,225 | 0.41 | 889 | -187.10 | 458 | ||||||||||||||||||
Mt. Holly | 3,180 | -6,943 | 0.4 | 272 | -253.66 | 337 | ||||||||||||||||||
Schuler | 3,550 | -7,420 | 0.46 | 249 | -182.34 | 258 | ||||||||||||||||||
Texarkana | 3,296 | -7,062 | 0.44 | 364 | -221.99 | 333 | ||||||||||||||||||
Village | 3,350 | -7,123 | 0.45 | 302 | -208.96 | 301 | ||||||||||||||||||
Average | 3,506 | 0.45 | 326 | |||||||||||||||||||||
In general, the average groundwater level elevations of all brine supply wells are highest in the South Unit (average of -182 msl) and decrease toward the Central Unit (average of -418 msl) and West Unit (average of -704 msl). The lower water levels in the Central and West units are likely due to the higher density of production wells and fluid withdrawal, resulting in greater aquifer drawdown. Average water level elevations in the South Unit, of -182 m, are nearly the same as the calculated groundwater elevation (or hydraulic head) based on the original formation pressure of the Schuler Field, which is 3,550 psi. This value also compares favourably with other Smackover Formation oil fields, which have an average water level elevation of -224 m.
The observed variations in groundwater levels are most probably due to the dynamic fluid level measurements. To obtain true static water levels, requires a field wide shut in that allows the wells to recover and water levels to equalize. Overall, the data suggests that production volumes at the LANXESS
| Preliminary Economic Assessment of LANXESS Smackover Project | 141 |
Property are not having a deleterious effect on the Reynolds Member of the Smackover Formation and that the voidage replacement is providing a relatively steady state condition.
| 14.5.6 | Specific Storage and Storativity |
As the Reynolds Member is a confined aquifer, the specific storage (Ss) was estimated based on the compressibility of water and the compressibility of the aquifer. The relationship between specific storage and compressibility is described by Kruseman and de Ridder (1994) as follows:
Ss = rw g (a + n ß)
where:
rw = density of the brine (M/L3)
g = acceleration due to gravity (Force/L3)
a = compressibility of aquifer skeleton (L2/Force)
n = porosity
ß = compressibility of the brine (L2/Force)
Based on the overall effective porosity of 11.2%, brine density of 1.20 g/cm3 (see Sections 9.1 and 9.3,), aquifer compressibility of 2.63 x 10⁻¹¹ m2/N, and brine compressibility of 6.59 x 10⁻¹¹ m2/N, the specific storage of the Reynolds Member is estimated to be 3.96 x 10⁻⁷ m-1.
Due to the relatively low compressibility of the Reynolds Member, the calculated specific storage is at the lower end of typical aquifer materials, as shown in Table 14-5.
Storativity (S) of the aquifer was determined by multiplying the average aquifer thickness (see Section 14.3) by the specific storage. Using an average Reynolds Member thickness of 56.7 m (186 ft) the storativity (dimensionless) of the aquifer is 2.2 x 10⁻⁵.
Table 14-5 Representative Values of Specific Storage for Various Geological Materials (Domenico and Mifflin 1965; Batu 1998)
Material | Specific Storage (ft)1 | |
Plastic clay | 7.8x10⁻⁴ to 6.2x10⁻³ | |
Stiff clay | 3.9x10⁻⁴ to 7.8x10⁻⁴ | |
Medium hard clay | 2.8x10⁻⁴ to 3.9x10⁻⁴ |
| Preliminary Economic Assessment of LANXESS Smackover Project | 142 |
Loose sand | 1.5x10⁻⁴ to 3.1x10⁻⁴ | |
Dense sand | 3.9x10⁻⁵ to 6.2x10⁻⁵ | |
Dense sandy gravel | 1.5x10⁻⁵ to 3.1x10⁻⁵ | |
Rock, fissured | 1.0x10⁻⁶ to 2.1x10⁻⁵ | |
Rock, sound | <1.0x10⁻⁶ |
| 1 | BSW – Brine Supply Wells |
| 14.5.7 | Hydraulic Conductivity and Transmissivity |
Hydraulic conductivity of the aquifer was calculated from the permeability measurements of the Reynolds Member core analysis on the Property and the physical properties of the brine (density of 1,200 kg/m3 and temperature). The relationship between hydraulic conductivity (K) and permeability is described by Fetter (1988), as follows:
K = Ki (rw g/µ)
where:
Ki = permeability of the aquifer (L2)
rw = density of the brine (M/L3)
g = acceleration due to gravity (L/T2)
µ = dynamic viscosity of the brine (M/(T L).
The dynamic viscosity of the brine is 1.4 centipoise (cP) at a temperature of 70°C and specific gravity of 1,200 kg/m3 (Cabot Corporation 2014).
The average hydraulic conductivity from the analysis of 2,329 core samples was 1.7 x 10⁻⁶ m/s. This hydraulic conductivity is on the higher end of a typical limestone (Freeze and Cherry 1979).
Transmissivity of the aquifer was determined by multiplying the average aquifer thickness (Sections 7.4 and 14.3) by the average hydraulic conductivity of the Property. Using an average Reynolds Member thickness of 56.7 m (186 feet) the average transmissivity of the aquifer is 9.5 x 10⁻⁵ m2/s.
| Preliminary Economic Assessment of LANXESS Smackover Project | 143 |
| 14.5.8 | Summary of Hydrogeological Conditions |
The aquifer associated with the Reynolds Member of the Smackover Formation is a confined aquifer situated between upper- and lower-bounding aquitards. The brine levels within current brine supply wells operated by LANXESS are on average about 1,767 m (5,800 feet) above the top of the Reynolds Member.
The occurrence of reservoir-grade rocks (porosity at least 6% and permeability at least 0.1 mD) in the Smackover Formation is dependent on: 1) deposition of porous and permeable sediments in a variety of settings; and 2) diagenetic processes that have preserved, enhanced, or created porosity and permeability both in originally permeable strata and in originally impermeable or poorly permeable strata (Kopaska-Merkel et al. 1992).
The average porosity and permeability on the Property is 11.2% and 202 mD, respectively. Using an average Reynolds Member thickness of 56.7 m the:
| • | hydraulic conductivity of the aquifer is 1.7 x 10⁻⁶ m/s; |
| • | transmissivity of the aquifer is 9.5 x 10⁻⁵ m2/s; and |
| • | storativity of the aquifer is 2.2 x 10⁻⁵. |
These same aquifer characteristics are present where several oilfields are operated in Arkansas, specifically the Cairo and Schuler Fields. Additionally, LANXESS (and the predecessor companies) has been extracting brine from the aquifer for five decades. Over the last five years (2013 to March 2018) approximately 660 million barrels (105 million m3) of brine has been extracted from brine supply wells within the LANXESS Property. The average brine extraction rate was consistently around 55,039 m3/day (346,185 barrels per day).
It is our conclusion that the Reynolds Member aquifer has excellent reservoir properties and has displayed a long history of consistent fluid yields without appreciable drawdown. The authors have shown that key hydrogeological variables within the Reynolds Member demonstrate and meet the criteria for reasonable prospectivity for ongoing economic extraction. This supposition is supported by the QP who ties this hydrogeological conclusion together with other points and/or assumptions to further demonstrate the prospect for economic extraction in Section 14.7.3.
| 14.6 | Step 4: Lithium-Brine Concentration |
The reader is referred to Sections 9.1 and 11 for a complete discussion on Standard Lithium’s sample programs and analytical results.
Using Western Environmental Testing Laboratory (WETLAB) as the primary lab, a summary of the average Li-brine concentrations at various control points is presented in Table 14-6 and summarized as follows:
| Preliminary Economic Assessment of LANXESS Smackover Project | 144 |
| • | Twenty-five (of 26 total) brine supply wells were sampled (n=90 samples). The combined average total from all wells is 168 mg/L Li. |
| • | In terms of average lithium content, the South Unit has the highest average lithium (205 mg/L Li) followed by the West Unit (166 mg/L Li) and Central Units (138 mg/L Li). |
| • | The feed-brine and after-brine (after-brine value presented in brackets) also vary between brine production units with the South, Central and West units yielding lithium values of: 196 mg/L (196 mg/L); 136 mg/L (130 mg/L); and 159 mg/L (154 mg/L). The amalgamated feed-brine and after-brine of all feed- and tail-brine analyses are both 163 mg/L Li. |
The brine supply wells represent the truest depiction of the in-situ Li-brine resource within the Reynolds Member domain aquifer. It is the QP’s opinion that 168 mg/L Li is most representative of the brine within the Reynolds Member beneath the Project boundary, which is the focus of this Technical Report. Therefore, an average lithium concentration of 168 mg/L Li is used as the average lithium concentration for the total, or global, mineral resource estimation presented in this Technical Report.
| 14.7 | Mineral Resource Estimate |
| 14.7.1 | Definition of Mineral Resource |
The LANXESS Li-Brine Resource Estimate has been classified in accordance with guidelines established by the CIM Estimation of Mineral Resources and Mineral Reserves Best Practice Guidelines, dated November 23, 2003, and the CIM Definition Standards for Mineral Resources and Mineral Reserves, adopted May 10, 2014. The definitions state:
“An Inferred Mineral Resource is that part of a Mineral Resource for which quantity and grade or quality are estimated on the basis of limited geological evidence and sampling. Geological evidence is sufficient to imply but not verify geological and grade or quality continuity.”
“An Indicated Mineral Resource is that part of a Mineral Resource for which quantity, grade or quality, densities, shape and physical characteristics are estimated with sufficient confidence to allow the application of Modifying Factors in sufficient detail to support mine planning and evaluation of the economic viability of the deposit.”
“A Measured Mineral Resource is that part of a Mineral Resource for which quantity, grade or quality, densities, shape, and physical characteristics are estimated with confidence sufficient to allow the application of Modifying Factors to support detailed mine planning and final evaluation of the economic viability of the deposit.”
“Modifying Factors are considerations used to convert Mineral Resources to Mineral Reserves. These include, but are not restricted to, mining, processing, metallurgical, infrastructure, economic, marketing, legal, environmental, social and governmental factors.”
| Preliminary Economic Assessment of LANXESS Smackover Project | 145 |
| 14.7.2 | Resource Classification Methodology |
The authors have reclassified the LANXESS Li-Brine Resource from an Inferred Mineral Resource (Eccles et al. 2018) to an Indicated Mineral Resource in the current Technical Report. In Eccles et al. (2018), it was the author’s opinion that the initial, or maiden, Inferred Mineral Resource classification was “conservative given the abundance of data available regarding geology, hydrogeology, porosity, brine grade and production figures for the LANXESS Property”.
Additional work (since Eccles et al. (2018)), which was conducted by Standard Lithium to support the higher resource classification includes the following:
| 1. | Additional Smackover Formation brine sampling programs and an assessment of the lithium concentration in the Smackover Formation brine over time (see Section 9.1). |
| 2. | Disclosure of Li extraction technological information based on Standard Lithium’s bench-scale and mini-pilot-plant laboratory processing test work (see Section 13). |
| 3. | An update on the Demonstration Plant with some discussion as to the scalability of the technology toward potential commercial production (see Section 13). |
| 4. | Meaningful-disclosure of the risks and uncertainties of the lithium recovery technology (see Section 13). |
To summarize, the nature, quality, quantity and distribution of data associated with the mineralogy are such that the author is confident of the geological framework and continuity of mineralization. The advancement and disclosure of the technical mineral processing parameters, and risks and uncertainties associated with the development of a new technology, enables the author to consider critical Modifying Factors and reasonably assess and assume advancement of the feasibility of the project.
The LANXESS Li-brine project has, therefore, advanced to a stage where the preferred mining method is established, and an effective method of mineral processing is being promoted to the Demonstration Plant stage. It is the author’s opinion, therefore, that reclassification of the LANXESS Resource to an Indicated Mineral Resource is appropriate and justified in that there is an increasing level of geological and technological knowledge and confidence. The Indicated Mineral Resource is of adequate quality to support economic scoping studies that can serve as the basis for major development decisions as per CIM Definition Standards for Mineral Resources and Reserves.
| Preliminary Economic Assessment of LANXESS Smackover Project | 146 |
Table 14-6 Summary of the 2018-2019 Geochemical Lithium Data at the LANXESS Property (shaded brine supply well data represents the lithium concentrations used in the resource estimation)
| Sub-Property or Unit | BSW1 (Li mg/L) | No. of Wells Sampled | No. of Analyses | Feed-brine (Li mg/L) | No. of Analyses | After-brine (Li mg/L) | No. of Analyses | |||||||||||||||||||||
Total LANXESS Property | 168 | 25 | 90 | 163 | 28 | 163 | 27 | |||||||||||||||||||||
South Unit | 205 | 5 | 17 | 196 | 9 | 196 | 10 | |||||||||||||||||||||
Central Unit | 138 | 5 | 17 | 136 | 9 | 130 | 7 | |||||||||||||||||||||
West Unit | 166 | 15 | 56 | 159 | 10 | 154 | 10 | |||||||||||||||||||||
| 1 | BSW – Brine Supply Wells |
| Preliminary Economic Assessment of LANXESS Smackover Project | 147 |
| 14.7.3 | Step 5: Evaluation of Reasonable Prospects for Economic Extraction |
A Mineral Resource is a concentration or occurrence of a material of economic interest in, or on, the Earth’s crust in such form, grade or quality and quantity that there are reasonable prospects for eventual economic extraction. Li-brine mineralization associated with the Indicated LANXESS Li-Brine Resource Estimate has demonstrated and defined prospects for economic extraction. The prospect for economic extraction is supported by the following points and/or assumptions:
| • | Aquifer geometry: The Reynolds Member of the Smackover Formation, averages 57 m, is laterally continuous and underlies the entire LANXESS Property. |
| • | Hydrogeological characterization and effective porosity: The Smackover Formation aquifer represents a large-scale aquifer that is bound above and below by two aquitards. The average effective porosity and permeability on the Property is 11.2% and 202 mD, respectively. The average hydraulic conductivity is 1.7 x 10⁻⁶ m/s, transmissivity is 9.5 x 10⁻⁵ m2/s and storativity of the aquifer is 2.2 x 10⁻⁵. Continuous brine production from the Smackover Formation (although for a different dissolved constituent) has occurred at the LANXESS Property for several decades. |
| • | Brine volume and flow rate: Over the last five (5) years (2013 to 2017) approximately 660 million barrels (105 million m3) of brine has been extracted from brine supply wells within the LANXESS Property to produce bromine and bromine-related chemicals. The average brine extraction rate was consistently around 55,039 m3/day (346,185 barrels per day). |
| • | Lithium brine grade: Samples from various brine sampling points across the LANXESS Property yielded lithium values between 53 and 292 mg/L Li (average supply of 168 mg/L Li). |
| • | At present, the demand for lithium carbonate and hydroxide is expected to increase with the popularity of electric vehicles and analysts remain optimistic about the market (e.g., Barrera, 2019; see Section 19). |
This section of the Technical Report has been prepared by a multi-disciplinary team that include geologists, hydrogeologists and chemical engineers with relevant experience in the Smackover Formation brine geology and brine processing. There is collective agreement that the LANXESS Li-brine project has reasonable prospects for eventual economic extraction, and with respect to the mineral resource, Mr. Eccles, P. Geol. takes responsibility for this statement.
| 14.7.4 | Cut-off |
In establishing a cut-off grade, the author must realistically reflect on the location, deposit scale, continuity of mineralization, assumed mining method, metallurgical processes, costs and reasonable long-term metal prices appropriate for any deposit. The cut-off value must be relevant to the grade distribution modelled for the mineral resource, and represent the lowest grade, or quality, of mineralized material that qualifies as being economically mineable.
Based on this rationale, Eccles et al. (2018) assigned a LANXESS Property Li-brine cut-off of 50 mg/L Li based on these factors:
| Preliminary Economic Assessment of LANXESS Smackover Project | 148 |
| 1. | Access to a ‘blended’ brine mixture from the LANXESS brine supply wells such that the cut-off should include those wells with the lowest concentration of lithium in the resource model (i.e. 54.1 mg/L Li from brine supply well BSW-19M). |
| 2. | Confined aquifer Li-brine deposits traditionally have lower concentrations of lithium in comparison to unconfined Li-brine salars and hard rock lithium deposits. Consequently, several laboratories are experimenting with rapid lithium extraction techniques on low lithium source brine (e.g., ~70 mg/L Li, McEachern 2017; <60 mg/L Li, Xu et al. 2017; 50 mg/L Li, Snydacker 2018). |
A cut-off value of 100 mg/L Li has been established for this Technical Report (Dworzanowski, pers. comm 2019). This cut-off value was derived by using approximately two-thirds of the average lithium concentration used in the mineral resource estimation (168 mg/L Li), which is standard practice for lithium brine projects in South America. While the adjusted cut-off does mitigate brine from a select number of brine supply wells (e.g. BSW-19M), the cut-off does not compromise the lowest grade of amalgamated after-brine from the LANXESS plants that may be economically mineable (Central Plant average of 130 mg/L Li, n=7 samples).
By way of comparison, the author has reviewed several Li-brine resource reports and found that cut-off values are often not included in the resource equation of these deposit types. This perhaps is because the Li-brine resource is represented by a fluid, and therefore, the lithium content mixes and is not highly variable within the deposit. Regardless, the following NI 43-101 Technical Reports have utilized a cut-off of 100 mg/L Li for indicated resource estimations of Argentina salar-type lithium brines, with average lithium values of approximately 450 mg/L to 500 mg/L Li (e.g. Reidel, 2016; Hains and Fourie 2018; Lefaivre and Henchel 2019).
The author recommends that the cut-off value continues to be evaluated, considering Standard Lithium’s pending Demonstration Plant test work results. It is possible that the cut-off will be adjusted in future Technical Reports, with higher levels of resource/reserve classification.
| 14.7.5 | Step 6: Mineral Resource Reporting: Indicated LANXESS Lithium-Brine Resource Estimate |
The LANXESS Li-brine Resource Estimate is classified as ‘Indicated’ according to the CIM (2014) definition standards. The resource estimation is based on the following Li-brine equation:
Lithium Resource = Paverage × Vaquifer × Caverage
where:
Paverage = weighted average porosity
Vaquifer = total volume of the aquifer
Caverage = average concentration of lithium in brine.
Paverage and Vaquifer were calculated by devising a porosity block model within the Reynolds Member domain.
| Preliminary Economic Assessment of LANXESS Smackover Project | 149 |
The average global block model porosity of 11.6% was calculated by using the volume-weighted average porosity of the brine units and their respective unit areas. The total volume of brine within the domain was then calculated by multiplying each block’s estimated porosity value by its volume within the Reynolds Member domain, as specified by the calculated Block Factor (BF). The domains total brine volume is calculated by summing the volume of brine contained within each block. It is assumed that all effective pore space is occupied by brine. This is a reasonable assumption because LANXESS’ production focus is on brine and virtually no oil or gas is produced from the brine supply wells.
The average lithium concentration used in the resource calculation is 168 mg/L Li and represents analytical results of Standard Lithium’s 2018-2019 brine sampling programs from the brine supply wells. Analytical data from the brine supply wells is used, in comparison to tail-brine from the Bromine Plants, to provide the truest representation of the Smackover Formation (Reynolds Member domain aquifer) Li-brine resource underlying the LANXESS Property.
Resources have been estimated using a cut-off grade of 100 mg/L lithium. With respect to units of measurement, 1 mg/L = 1 g/m3. If concentration is in mg/L and volume in m3, then the calculated resource has units of grams. (1 g/m3 x 1 m3 = 1 gram or 0.001 kg).
The total Indicated LANXESS Li-Brine Resource is estimated at 590,000 tonnes of elemental Li (see Table 14-7). The total lithium carbonate equivalent (LCE) for the main resource is 3,140,000 tonnes LCE.
Mineral resources are not mineral reserves and do not have demonstrated economic viability. There is no guarantee that all, or any part, of the mineral resource will be converted into a mineral reserve.
In Table 14-7, the grey-shaded ‘Total’ column represents the main resource. The resource is also subdivided by Unit for the South, Central and West brine units.
Table 14-7 Indicated LANXESS Lithium-Brine Resource Estimate
Reporting Parameter | South Unit | Central Unit | West Unit | Total (and main resource) | ||||||||||||
Aquifer volume (km3) | 5.828 | 8.289 | 16.310 | 30.427 | ||||||||||||
Brine volume (km3) | 0.689 | 0.995 | 1.835 | 3.515 | ||||||||||||
Average lithium concentration (mg/L) | 168 | 168 | 168 | 168 | ||||||||||||
Average Porosity | 11.8 | % | 12.0 | % | 11.2 | % | 11.6 | % | ||||||||
Total elemental Li resources (tonnes) | 116,000 | 167,000 | 308,000 | 590,000 | ||||||||||||
Total LCE (tonnes) | 615,000 | 889,000 | 1,639,000 | 3,140,000 | ||||||||||||
| Preliminary Economic Assessment of LANXESS Smackover Project | 150 |
Note 1: Mineral resources are not mineral reserves and do not have demonstrated economic viability. There is no guarantee that all or any part of the mineral resource will be converted into a mineral reserve. The estimate of mineral resources may be materially affected by geology, environment, permitting, legal, title, taxation, socio-political, marketing or other relevant issues.
Note 2: The weights are reported in tonnes (1,000 kg).
Note 3: Numbers may not add up due to rounding of the resource values percentages (rounded to the nearest 1,000 unit).
Note 4: In a ‘confined’ aquifer (as reported herein), porosity is a proxy for specific yield; especially given the number of effective porosity measurements evaluated in this report and their positive correlation with LAS log total porosity.
Note 5: The grey-shaded ‘Total’ volume and weights are estimated at volume-weighted average porosities of the block-model (i.e. calculated by using the porosity of the brine units and their respective unit areas). It is assumed that all pore space is occupied by brine.
Note 6: The LANXESS estimation was completed and reported using a cutoff of 100 mg/L Li.
Note 7: To describe the resource in terms of industry standard, a conversion factor of 5.323 is used to convert elemental Li to lithium carbonate, or Lithium Carbonate Equivalent (LCE).
Because the LANXESS Property includes three (3) brine Unit areas, the main resource is subdivided to provide relative tonnages for the Units. These include the following:
| • | South Unit: 116,000 tonnes elemental Li, or 615,000 tonnes LCE; |
| • | Central Unit: 167,000 tonnes elemental Li, or 889,000 tonnes LCE; and |
| • | West Unit: 308,000 tonnes elemental Li, or 1,639,000 tonnes LCE. |
The total Indicated Resource Estimate is slightly higher than the maiden Inferred Resource Estimate of Eccles et al. (2018) (e.g. Total resource estimate of 590,000 tonnes versus 580,000 tonnes of elemental lithium). Reconciliation of this variation is attributed solely to the increase in the average lithium concentration used to calculate the resource estimate from 165 mg/L Li to 168 mg/L Li. The increase in the average concentration is justified, as the Indicated Resource Estimate benefits from the analytical results of 90 brine analyses (versus 45 analyses in Eccles et al. (2018)). The doubling of analytical data increases the confidence level of the information used to calculate the Indicated LANXESS Li-Brine Resource Estimate.
| Preliminary Economic Assessment of LANXESS Smackover Project | 151 |
| 15 | Mineral Reserves |
Mineral Reserves have not been estimated.
| Preliminary Economic Assessment of LANXESS Smackover Project | 152 |
| 16 | Mining Methods |
| 16.1 | General Description |
LANXESS and its predecessor companies have been extracting and processing brine from the Property continuously since 1957.
Brine is extracted from three operating well fields. Active brine supply wells for each unit are shown on Figure 9-1. The wells are located in the Central, South and West Units, as follows:
• South Unit: | 9 wells | |
• West Unit: | 16 wells | |
• Central Unit: | 5 wells | |
The major operating infrastructure at the well fields Unit areas includes the following:
| • | Thirty brine supply wells (see Figure 9-3); |
| • | Thirty-five reinjection wells (see Figure 9-3); and |
| • | 400 km of pipelines for the brine gathering and reinjection systems (see Figure 9-3). |
Standard Lithium will access the brine through the existing LANXESS bromine production plants infrastructure.
| 16.2 | Mining Method |
The supply wells extract the raw brine from the Smackover Formation on a continuous, 24-hour, 365 days per year operation. At each supply well, there is typically a 1,100 HP electrical submersible pump that pumps the brine to the surface through 17.8 cm (7 inch) tubing. The pumps are typically set at approximately 1,220 m below ground level. The raw brine from each unit is transferred via a set of pipelines to the LANXESS process plants: Central, South and West for bromine processing. Tail-brine from the bromine processing is the feedstock for lithium carbonate production. Tail-brine flow rates are monitored at each Tail-Brine Transfer Pump location.
As the brine is pumped to the surface, sour gas evolves as the pressure drops. The brine and sour gas are separated at the wellhead by a gas separator (see Figure 16-1). The sour gas is transported in a separate gas pipeline to the Central Plant, where it is sent by pipeline to the Delek Refinery (often referred to as the ‘Lion Oil’ Refinery). In some brine supply wells, very small quantities of oil are produced with the brine. An oil separator is used to remove this oil from the brine (see Figure 16-2). The oil is stored onsite
| Preliminary Economic Assessment of LANXESS Smackover Project | 153 |
and then transported by truck to the Delek Refinery for processing. A block flow diagram of the process at the wellsite is shown on Figure 16-3.
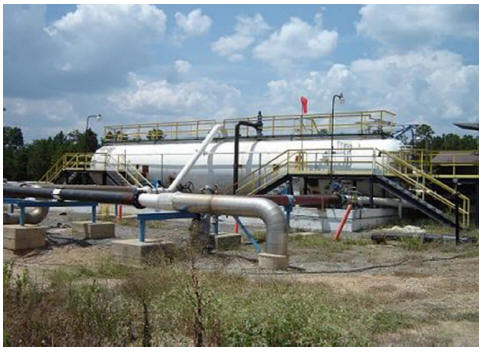
Figure 16-1 Typical Brine Supply Well
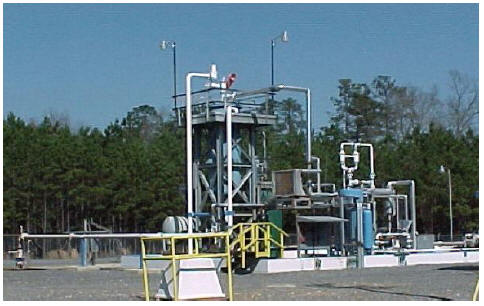
Figure 16-2 Oil Separator at Brine Supply Well
| Preliminary Economic Assessment of LANXESS Smackover Project | 154 |
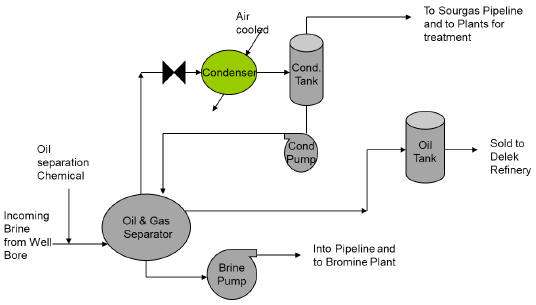
Figure 16-3 Block Flow Diagram of the Process at the Brine Supply Wells
Once the lithium is removed from the brine, lithium-free tail-brine will be disposed of through LANXESS’ existing reinjection well system. A network of pipelines connects the brine supply wells to the Bromine Plants and connects the Bromine Plants to the reinjection wells in the respective brine Unit (see Figure 9-3). The reinjection of the barren brine is necessary to maintain the pressure in the Smackover Formation aquifer. Figure 16-4 shows a typical reinjection well.
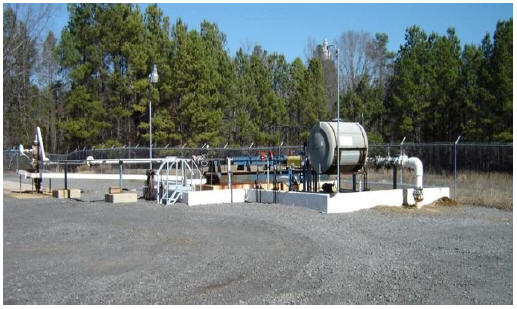
Figure 16-4 Typical Reinjection Well
| Preliminary Economic Assessment of LANXESS Smackover Project | 155 |
| 16.3 | Brine Production Estimate |
Production of the brine at each unit is calculated based on historic performance records from 2013 to March 2018 and is summarized in Table 16-1.
Table 16-1 Annual Brine Well Production Rates
| Annual Brine Production | Number | Brine Production from New Wells | ||||||||||||||||||
| (m3/y) | (bbl/y) | of Wells | (m3/y) | (bbl/y) | ||||||||||||||||
West Unit | 10,339,150 | 65.0 M | 16 | 646,197 | 4.1 M | |||||||||||||||
South Unit | 5,488,023 | 64.5 M | 5 | 1,097,605 | 6.9 M | |||||||||||||||
Central Unit | 4,491,268 | 28.3 M | 5 | 898,254 | 5.7 M | |||||||||||||||
Total | 20,318,441 | 127.8 M | 26 | |||||||||||||||||
The volume of brine extracted from the aquifer, by four (4) additional wells installed at the South Unit during 2018-2019, is estimated based on the average historical productivity of wells in the same area. Table 16-2 shows the estimated brine production from the new wells during 2018 to 2019.
Table 16-2 Annualized Production Summary (US Units)
| Annual Brine Production | Number | Brine Production from New Wells | ||||||||||||||||||
| (m3/y) | (bbl/y) | of Wells | (m3/y) | (bbl/y) | ||||||||||||||||
South Unit | 4,390,420 | 27.6 M | 4 | 1,097,605 | 6.9 M | |||||||||||||||
The current level of brine extraction volume of 24.7 million m3 (155 M bbl) per year, as presented in Table 16-3 and in Table 16-4, is sufficient for the lithium carbonate production operations at a level of 20,900 tpy.
New brine supply wells will be added over the course of the life span of the operations to maintain lithium brine extraction volumes. The location of the new brine supply wells (and reinjection wells) will be assessed as the need arises. The Smackover Formation is a large prolific aquifer whose response to extraction and injection is well understood. As a result of over 60 years of operation, locating new brine supply and reinjection wells on the LANXESS 150,000-acre Property will be a routine operation.
| Preliminary Economic Assessment of LANXESS Smackover Project | 156 |
Table 16-3 Annualized Production Summary (metric)
Plant | Volume of Raw Brine Processed from Wellfield Reserve (m3/y) | Li Concentration in Feed Brine (mg/L) | Lithium Carbonate product in Feedstock (tpy) | Lithium Chloride Brine Production (m3/y) | Li Recovery to Lithium Carbonate (%) | Li Concentration in Lithium Chloride Brine (mg/L) | LC Brine Recycle to Each Lithium Chloride Plant, (m3/y) | Li Concentration in Lithium Carbonate Recycle Brine (mg/L) | Final Lithium Carbonate Product (tpy) | |||||||||||||||||||||||||||
South | 9,878,443 | 205 | 10,780 | 306,342 | 90.0 | 5,949 | 259,200 | 2,080 | 9,700 | |||||||||||||||||||||||||||
West | 10,339,150 | 166 | 9,136 | 304,420 | 90.0 | 5,074 | 252,800 | 2,080 | 8,200 | |||||||||||||||||||||||||||
Central | 4,491,268 | 138 | 3,299 | 117,252 | 90.0 | 4,757 | 114,400 | 2,080 | 3,000 | |||||||||||||||||||||||||||
|
|
|
|
|
|
|
|
|
| |||||||||||||||||||||||||||
Total | 24,708,861 | 23,215 | 728,014 | 24,708,861 | 20,900 | |||||||||||||||||||||||||||||||
|
|
|
|
|
|
|
|
|
| |||||||||||||||||||||||||||
Note: Conversion of m3 to gpm is 4.403.
| Preliminary Economic Assessment of LANXESS Smackover Project | 157 |
Table 16-4 Annualized Production Summary (US Units)
Plant | Volume of Raw Brine Processed from Wellfield Reserve (bbl/y) | Li Concentration in Feed Brine (mg/L) | Lithium Carbonate Product in Feedstock (short ton/y) | Lithium Chloride Brine Production (bbl/y) | Li Recovery to Lithium Carbonate (%) | Li Concentration in Lithium Chloride Brine(mg /L) | Li2CO3 Brine Recycle to each Lithium Chloride Plant, (bbl/y) | Li Concentration in Lithium Carbonate Recycle Brine (mg/L) | Final Lithium Carbonate Product (short ton/y) | |||||||||||||||||||||||||||
South | 62,135,000 | 205 | 11,900 | 1,926,900 | 90.0 | 5,949 | 1,630,368 | 2,080 | 10,700 | |||||||||||||||||||||||||||
West | 65,033,000 | 166 | 10,100 | 1,914,800 | 90.0 | 5,074 | 1,590,112 | 2,080 | 9,000 | |||||||||||||||||||||||||||
Central | 28,250,000 | 138 | 3,600 | 737,500 | 90.0 | 4,757 | 719,576 | 2,080 | 3,300 | |||||||||||||||||||||||||||
|
|
|
|
|
|
|
|
|
| |||||||||||||||||||||||||||
Total | 155,419,000 | 25,600 | 4,579,200 | 155,418,736 | 23,000 | |||||||||||||||||||||||||||||||
|
|
|
|
|
|
|
|
|
| |||||||||||||||||||||||||||
Notes:
Conversion of m3 to bbl is 6.29
Values are rounded
| Preliminary Economic Assessment of LANXESS Smackover Project | 158 |
17 Recovery Methods
Standard Lithium’s objective, at this point of project development, is to produce battery-quality lithium carbonate from the tail-brine that exits the LANXESS bromine extraction operations. There are three (3) bromine extraction operations that will be used for lithium extraction (South, Central and West). Each facility will have its own primary lithium chloride (LiCl) extraction plant, which will produce purified and concentrated solutions. These solutions will be conveyed via pipelines to one location (Central Plant) for further processing to the final product—lithium carbonate (Li2CO3). Total lithium carbonate production is 20,900 tonnes/y. The lithium recovery to the final product is about 90%. The overall process Block Flow Diagram (BFD) is shown in Figure 17-1.
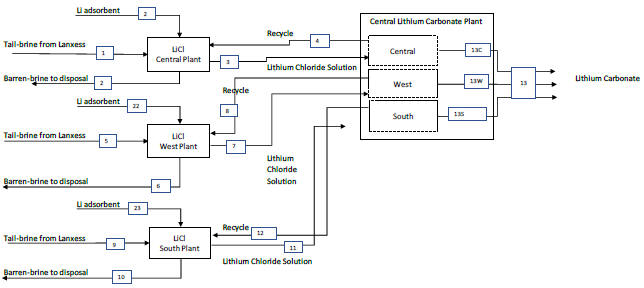
Figure 17-1 Overall BFD of Lithium Carbonate Production from Tail-Brine after Bromine Extraction
17.1 Production of Purified Lithium Chloride Solution
The first step in producing lithium carbonate will be the production of purified and concentrated lithium chloride solution. The same process is used in each of the three (3) lithium chloride plants shown in Figure 17-1.
| Preliminary Economic Assessment of LANXESS Smackover Project | 159 |
17.1.1 Preparation of the Feed Solution
The feed solution to each lithium chloride plant is the de-brominated tail-brine that exits the bromine extraction plants. Each bromine extraction plant produces somewhat different tail-brines with lithium concentrations between 122-216 mg/L (see Table 17-1). The brines are hot (>70°C), highly saline (TDS of 240,000 to 290,000 mg/L), low in sulfate (<2,000 mg/L) and have a density of 1.15 to 1.18 g/cm3. Sodium and calcium chlorides are the main constituents of the brines.
Prior to lithium extraction, the feed brine requires pre-treatment. The principal pre-treatment stage is to increase the pH to near-neutral conditions through the application of anhydrous ammonia.
Following initial pH adjustment, the brine goes through a mixed-media filter to remove any traces of organic liquids and any fine particulates. The filter is periodically backwashed to remove any captured solids. The solids comprise a waste stream.
Table 17-1 Composition of the De-Brominated Tail Brine (feed to lithium extraction process)
Concentration | Units | South Plant | Central Plant | West Plant | ||||||||||||
Li | mg/L | 184-216 | 122-137 | 146-161 | ||||||||||||
17.1.2 Lithium Extraction Process
The key element of the production of purified lithium chloride solution is the selective lithium extraction process. The process includes mixing of the pre-treated tail-brine with a fine-grained, solid, ceramic powder adsorbent that selectively adsorbs lithium ions from the tail-brine. The adsorption process is carried out in two sequential loading reactors. The simplified BFD of the lithium extraction process is presented in Figure 17-2.
Additional base (caustic or ammonia) is added to the loading reactors during the lithium extraction process to maintain the desired pH conditions. The lithium-depleted barren brine is separated from the loaded adsorbent slurry using submerged microfiltration (0.1 to 10 µm) membrane units.
The lithium-loaded adsorbent solids are continuously removed as a slurry from the loading reactor. The adsorbent is washed with water in three (3) stages of counter-current decantation thickeners. The washed and thickened adsorbent is pumped as a slurry to a stripping operation.
| Preliminary Economic Assessment of LANXESS Smackover Project | 160 |
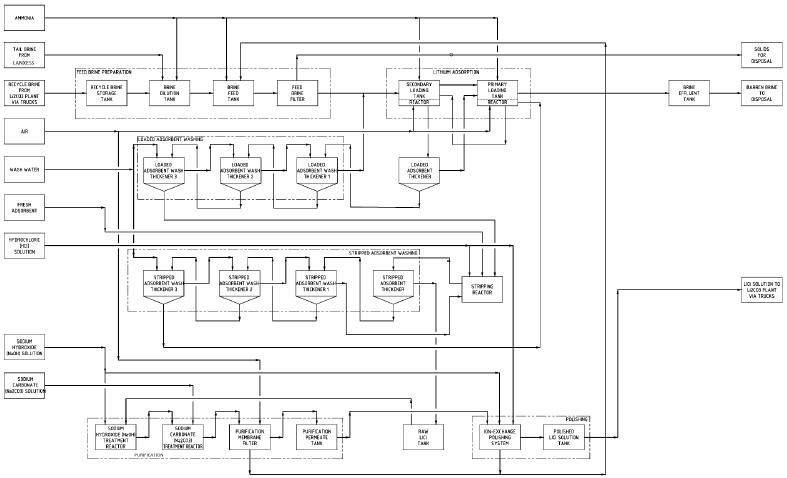
Figure 17-2 BFD of Lithium Extraction Process (Lithium Chloride Plant)
| Preliminary Economic Assessment of LANXESS Smackover Project | 161 |
The waste (Li-barren) brine is pH adjusted with hydrochloric acid (HCl) and filtered, as required, to achieve a final discharge pH of approximately 5.5. The pH of 5.5 is required to match the current Bromine Plant discharge conditions, as follows:
| • | avoid any precipitation issues in the reinjection well network; |
| • | conform with discharge criteria issued by the regulatory agencies (ADEQ and AOGC); and |
| • | meet site-developed best-practice guidelines for reinjection of tail-brine into the Smackover Formation. |
17.1.3 Lithium Adsorbent Stripping and Regeneration Process
Lithium loaded, and washed adsorbent is contacted with dilute hydrochloric acid in a stripping reactor. The stripping process generates lithium pregnant strip solution (PSS). The PSS is separated from the barren adsorbent in a thickener. The adsorbent is washed with fresh water in three (3) stages of counter-current decantation thickeners. The washed adsorbent is recycled back to the lithium loading stage. After washing, the PSS has a high ratio of lithium to the sum of the other dissolved metals and contains 3-5 g/L of lithium. This lithium chloride solution is sent to further purification.
17.1.4 Pregnant Strip Solution (Lithium Chloride) Purification
The concentrated lithium chloride solution from the stripping stage undergoes removal of residual Ca and Mg, using two industry standard purification methods to produce a high-purity lithium chloride solution. The first method is treatment with a combination of sodium carbonate and sodium hydroxide. The second method is a polishing stage that uses an ion-exchange process. The purified lithium chloride solution is pumped through pipelines from the South, Central and West lithium chloride plants to the lithium carbonate processing facility, which will be located at the LANXESS Central Plant. The chemical composition of this purified LiCl solution may vary somewhat from each of the three (3) lithium chloride plants.
17.2 Production of Lithium Carbonate
The purified lithium chloride solution undergoes two additional stages of purification and concentration as shown in the BFD in Figure 17-3.
| Preliminary Economic Assessment of LANXESS Smackover Project | 162 |
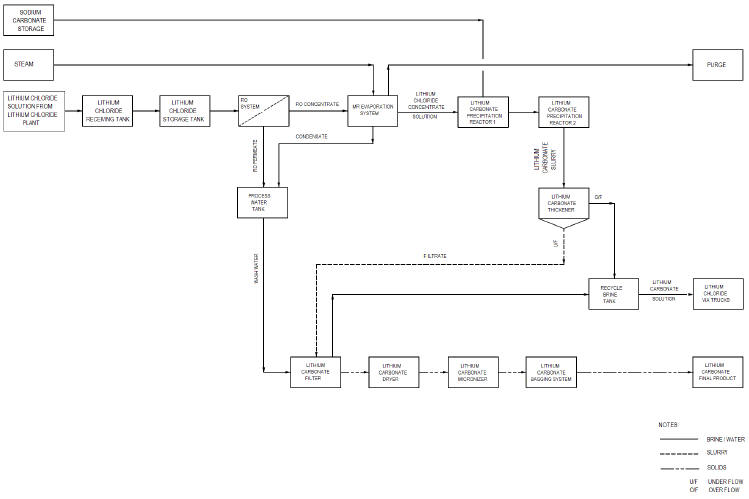
Figure 17-3 BFD of Lithium Carbonate Plant
| Preliminary Economic Assessment of LANXESS Smackover Project | 163 |
A reverse osmosis operation is used to concentrate the received lithium chloride solution. A Mechanical Vapor Recompression (MVR) evaporator further concentrates the lithium chloride solution to make it suitable for the precipitation of lithium carbonate. A soda ash (Na2CO3) solution is used to precipitate the lithium carbonate from the hot lithium chloride solution discharge from the MVR evaporator. The resulting lithium carbonate is removed by filtration where it also undergoes several hot washing stages. The hot washing stage is followed by drying and micronization (reduction of average particle diameters) to produce a battery-quality lithium carbonate product.
The wash liquor and other lithium bearing streams are pumped through pipelines to all three lithium chloride plants for lithium recovery. This operation minimizes lithium loss and avoids any accumulation of impurities in the evaporation circuit.
| Preliminary Economic Assessment of LANXESS Smackover Project | 164 |
18 Infrastructure
18.1 Introduction
A visit to all three of LANXESS’ well fields and operating plants was conducted by Barbara Parr, P.Eng. and Stan Kotowski, P.Eng. from May 28 – 30, 2019. During this visit, proposed locations for the three lithium chloride plants were identified at the South, West and Central LANXESS Plant locations, and the proposed location for the lithium carbonate plant was identified at the Central LANXESS Plant location. The proposed locations were selected in cooperation with LANXESS’ Site Manager, and considered the location of existing facilities, the location of brine extraction and injection locations, and safety and environmental considerations.
18.2 Brine Supply
Tail-brine for the production of lithium chloride will be supplied to each Plant location from the existing LANXESS bromine operations, via surface-run pipelines. The tie-in points will be immediately after the tail-brine exits the LANXESS bromine towers.
18.3 South Plant
Road access from El Dorado to the LANXESS South Plant is via twinned Highway 63 and single lane Highway 6. Plant access is located 1 km from the junction of Highway 63 and Highway 6.
The lithium chloride process plant and auxiliary facilities are proposed to be located east of the existing LANXESS Demonstration Plant and east of the proposed location for the Smackover Demonstration Plant. The Standard Lithium South Plant will be located within the boundaries of the LANXESS South Plant fence line. A conceptual layout showing the proposed location and extent of the South Plant and auxiliary facilities is shown on Figure 18-1.
The South Plant will consist of a lithium chloride plant only. It will produce lithium chloride, which will be used as feedstock for the lithium carbonate plant, which is located at the Central Plant site.
18.4 West Plant
Road access from El Dorado to the LANXESS West Plant is via single lane Highway 10. The process plants and auxiliary facilities will be located east of the existing production facilities. The Standard Lithium West Lithium Extraction Plant will be located within the boundaries of the LANXESS West Plant fence line. A conceptual layout showing the proposed location and extent of the West Plant and auxiliary facilities is shown on Figure 18-2.
The West Plant will consist of a lithium chloride plant only. It will produce lithium chloride, which will be used as feedstock for the lithium carbonate plant.
| Preliminary Economic Assessment of LANXESS Smackover Project | 165 |
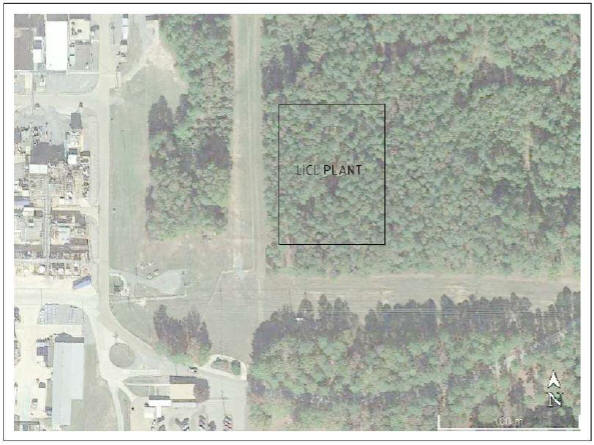
Figure 18-1 Conceptual Layout of Facilities at South Plant
| Preliminary Economic Assessment of LANXESS Smackover Project | 166 |
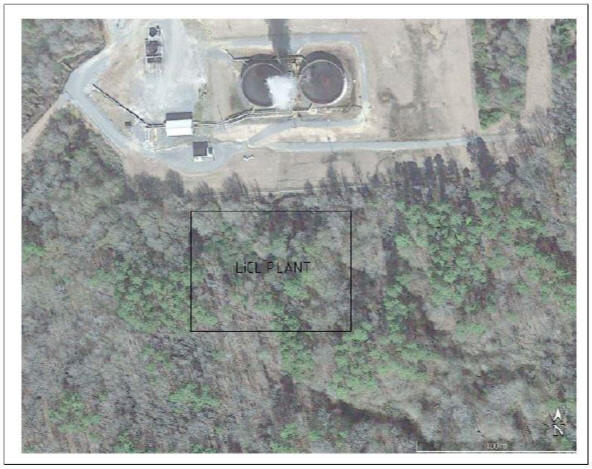
Figure 18-2 Conceptual Layout of Facilities at West Plant
18.5 Central Plant
Road access from El Dorado to the LANXESS Central Plant is via Highway 82 and Highway 15. Plant access is located 1.5 km from the cross-section of Highway 82 and Highway 15. The Standard Lithium Central Plants will be located within the boundaries of the LANXESS Central Plant fence line. A conceptual layout showing the proposed location and extent of the Central Plants and auxiliary facilities is shown on Figure 18-3.
The Central Plant will consist of a lithium chloride plant and a lithium carbonate plant. The lithium chloride plant will produce lithium chloride, which will be used as a feedstock for the lithium carbonate plant.
The facilities that will be included in the lithium carbonate plant are as follows:
| Preliminary Economic Assessment of LANXESS Smackover Project | 167 |
| • | Lithium carbonate production unit, which includes wet area, filtering and drying (three (3) trains). |
| • | A common facility for packaging, product storage and load out. |
18.6 Process Control Systems
Each plant, South, West and Central, will have a process control system (PCS) that will be in a fully modularized and fully prefabricated and equipped central control room. It will be a single story (trailer style) building, located outside of each process plant building. In the case of the Central Plant, there will be one PCS situated between each plant that will provide the necessary process controls. The buildings will come site ready for connection to the control cable junction boxes at each process plant. This concept allows for the control building to be operating at the earliest. They will be equipped with an onsite radio and communication system to provide access to internet and telephones. In addition, each control room building will have small offices, change rooms and a lunch room for the workers.
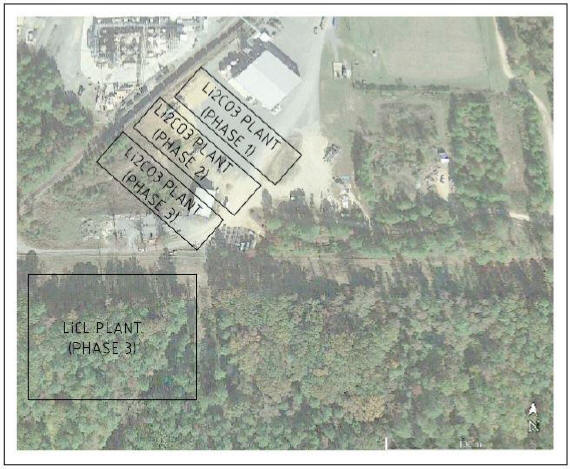
Figure 18-3 Conceptual Layout of Facilities at Central Plant
| Preliminary Economic Assessment of LANXESS Smackover Project | 168 |
18.7 On Site Infrastructure and Auxiliaries
18.7.1 Feedstock and Return Brine Pipelines
Pipeline infrastructure will be installed in the existing LANXESS right-of ways and will include the following:
| • | Central Plant to South Plant: Two (2) 6 in HDPE underground pipelines, which are approximately 13 km long, will transport feedstock lithium chloride from the South Plant to the Central Plant and return spent brine from the Central Plant to the South Plant, where it will be re-introduced to the process. |
| • | Central Plant to West Plant: Two (2) 6 in HDPE underground pipelines, which are approximately 13 km long, will transport feedstock lithium chloride from the West Plant to the Central Plant and return spent brine from the Central Plant to the West Plant, where it will be re-introduced to the process. |
| • | Lithium-free tail-brine from each lithium chloride plant will be transported through above ground pipelines to the existing LANXESS re-injection wells, where it will be returned to the Smackover Formation. |
18.7.2 Water Supply and Distribution
Industrial Water: The industrial water for the project will be obtained from the existing LANXESS distribution network. The process requires two (2) types of water: industrial water and pure water. The industrial water will be used just as it is obtained from the watermains, but the pure water will be obtained from a water treatment plant (through osmosis), which treats the watermains water.
A fire protection system will be required for each plant. Industrial water will be stored in tanks for this purpose.
Potable Water: All drinking water for the Project will be obtained from the existing LANXESS distribution network.
18.7.3 Power Generation
The electrical energy required for each Plant is as follows:
| • | South Plant (lithium chloride): 4.1 MW; |
| • | West Plant (lithium chloride): 7.1 MW; and |
| • | Central Plant (lithium chloride and lithium carbonate): 5.9 MW. |
The power supply to each plant location will be from the Arkansas State grid using the existing LANXESS transmission lines and on-site substations.
The current capacities of the South and West plant LANXESS substations are insufficient. An upgrade to each on-site substation and an upgrade to the nearby high voltage Arkansas grid substation and
| Preliminary Economic Assessment of LANXESS Smackover Project | 169 |
connecting power line will be required. The current capacity of the LANXESS Central Plant substation is sufficient to provide the electrical energy required for the lithium chloride plant (one train) and lithium carbonate plant (three trains).
The electrical rooms at each Plant will be fed from the LANXESS substations and will be prefabricated skid mounted modules, which will be limited in their dimensions to make them transportable. Backup generators will also be considered for the project and defined for the critical equipment of the plant.
18.7.4 Fuel, Chemicals and Reagents
Diesel and gasoline required to fuel light vehicles and mechanical equipment (i.e. trucks, pumps) will be obtained from the existing LANXESS fuel dispersal system.
Chemicals required for each facilities operation, will be stored in an enclosed storage area with controlled access.
Reagents required for production will be stored in designated areas, near each production facility and will have controlled access.
18.7.5 Compressed Air
Compressed air will be supplied to the process plants via compressors. The compressors will be located in a utility room adjacent to each Plant.
18.7.6 Auxiliary Facilities
Each Plant location will utilize the following existing LANXESS infrastructure:
| • | Access/Security Checkpoint; |
| • | Weigh scale; |
| • | Internal access roads to each Plant; |
| • | Communication (phone lines, internet); |
| • | Electrical power distribution lines for energy supply; |
| • | Natural Gas metering stations; |
| • | Plant services, including process and potable water, sanitary waste water and solid waste disposal; |
| • | Rail spur; |
| • | Fire station and medical; and |
| • | Main substation. |
The administrative building (offices and laboratory), warehouses, workshops, storerooms, and product loadouts and shipping facilities related to the Smackover Project, will be located at LANXESS’ Central Plant site.
| Preliminary Economic Assessment of LANXESS Smackover Project | 170 |
19 Market Studies and Contracts
19.1 Lithium Carbonate Applications
Lithium carbonate has a number of applications, as follows:
| • | It is a key component in the formulation of high-performance glass. It reduces the thermal expansion coefficient of the glass, which makes it resistant to high temperatures. |
| • | Historically, it has been used as feedstock for producing lithium hydroxide, which is the most widely used thickening agent in multipurpose greases for automotive and industrial lubrications. |
| • | By far the fastest growing use of lithium carbonate is in battery applications. Lithium carbonate is used as a starting material in electrolyte salts, most cathodes (with the exception of nickel-intensive chemistries) and some anode materials. |
19.2 Lithium Carbonate Demand
The statistic presented below depicts a projection of the total lithium demand worldwide from 2017 to 2025. In 2025, the total demand for lithium is expected to reach 422,614 tonnes of lithium carbonate equivalent (LCE). Increases in battery demand will be a strong driver of lithium consumption.
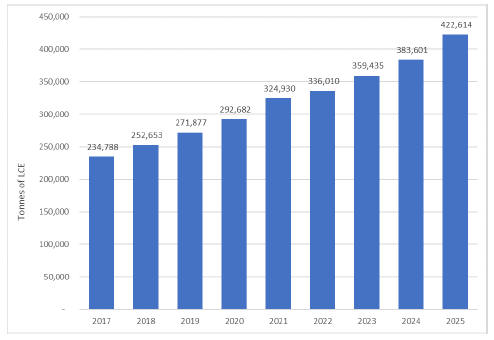
(https://www.statista.com/statistics)
Figure 19-1 Projected Demand for Lithium (in tonnes of LCE)
| Preliminary Economic Assessment of LANXESS Smackover Project | 171 |
19.3 Lithium Carbonate Supply
Raw lithium extraction and the production of final lithium chemicals is geographically concentrated in South America, Australia and China, and is dominated by five companies: Sociedad Química y Minera de Chile (SQM), Albemarle, Livent, Tianqi Lithium and Jiangxi Ganfeng Lithium Company Ltd. Demand forecasts for lithium vary significantly, but at the very lowest end of the range, they are forecast to rise by 20,000 tonnes per year until 2021. The global market for battery chemical lithium is likely to remain “fairly balanced” for the next four to five years with supply rising to meet increased demand from electric vehicles.
However, recent attempts by established brine producers to expand production in Chile have failed to materialise owing to governmental, technical and environmental concerns. Recent increases in lithium chemical production have been fed by hard-rock producers in Australia, though these are currently entering a constrained growth phase, as almost all of the existing conversion capacity is being utilised. Hence, significant future growth in lithium chemicals production will require new resources and integrated conversion to high purity lithium chemicals.
Figure 19-2 shows the production of LCE in 2008-2018.
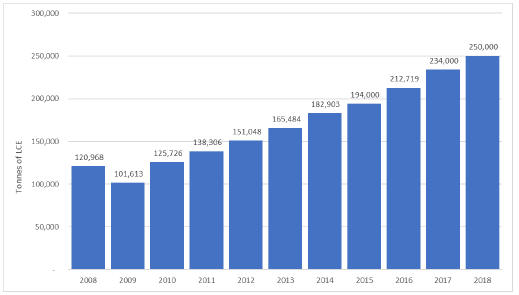
(https://www.statista.com/statistics)
Figure 19-2 Production of Lithium 2008-2018 in tonnes of LCE
| Preliminary Economic Assessment of LANXESS Smackover Project | 172 |
| 19.4 | Lithium Carbonate Price |
No detailed market research for Lithium Carbonate was completed during this phase of the project. The price for Lithium Carbonate has increased in recent years, as shown below:
| • | Year 2015 6,500 US$/tonne (USGS 2019); |
| • | Year 2016 8,650 US$/tonne (USGS 2019); |
| • | Year 2017 15,000 US$/tonne (USGS 2019); and |
| • | Year 2018 17,000 US$/tonne (USGS 2019). |
For this study, the last three-year average of 13,550 US$/tonne is assumed.
| 19.5 | Off-Take Contracts |
Standard Lithium has a binding MoU and a signed JV term sheet with LANXESS. These agreements contemplate the fact that if the joint Standard Lithium/LANXESS project proceeds to commercial production, then LANXESS will purchase 100% of Standard Lithium’s portion of off-take, minus handling charges.
| Preliminary Economic Assessment of LANXESS Smackover Project | 173 |
| 20 | Environmental Studies, Permitting and Social or Community Impact |
| 20.1 | Introduction |
The LANXESS Property includes individual production facilities in the South, Central and West Units (see Figure 4-2). Each unit has dedicated brine supply wells, a pipeline network, and bromine extraction, injection and processing infrastructure, as outlined in Section 4.1 Property Description and Location. The Property and associated facilities have been used for either oil or bromine extraction since 1936 and are located in Union County, AR. Historical land use is detailed in Section 4.2.
Existing permits provided were reviewed and it has been confirmed that the existing facilities comply with local, state, and federal regulations and requirements relating to current activities. The proposed project intends to utilize the existing LANXESS infrastructure, as required. Two process plants, comprised of a lithium chloride and a lithium carbonate production facility, are planned for LANXESS’ Central Plant. Two lithium chloride extraction plants are planned to be constructed within the South and West units, respectively. All of the plants will be built within the existing LANXESS Property boundary. As indicated in Section 4.6, Standard Lithium is generally covered in a MoU under LANXESS’ current mine plan and associated permitting and environmental approvals.
This section summarizes the environmental considerations, anticipated project permitting and environmental approvals, social impact considerations, and environmental management plans for the new plants and modifications to LANXESS’ current mine plan and associated permits and approvals. Standard Lithium understands that additional evaluation of the environmental aspects of the project may be necessary as the Project evolves.
| 20.2 | Environmental Considerations |
Each Standard Lithium plant (carbonate or lithium chloride) is situated in an existing industrial area. Any proposed new developments will be constructed within the existing Property boundaries located in the Central, South, and West LANXESS plant locations. All three existing production facilities are located outside nearby city limits and are not subject to local planning and zoning ordinances. Union County does not regulate industrial siting and construction activities.
Standard Lithium has not yet initiated environmental studies with respect to the new development and no key environmental issues have been identified in this early stage of the project. No discharge is anticipated to the municipal water supply or to the land surface from operation of the proposed new developments. Additionally, there are no anticipated impacts to the existing pipelines.
If triggered, the National Environmental Policy Act, or NEPA, review will assess a project with respect to various environmental, socioeconomic, archaeological, and health impacts that may occur during the
| Preliminary Economic Assessment of LANXESS Smackover Project | 174 |
project lifecycle and it will help to identify what, if any, environmental issues arise from the Project. This process will dictate whether an Environmental Assessment (EA) or an Environmental Impact Statement (EIS) is required for the proposed Project. The new Project activities will include additional processing of tail-brine prior to reinjection to the Smackover Formation at each Unit; therefore, it is not anticipated that the NEPA process will be triggered for this project.
| 20.3 | Permitting Overview |
In Arkansas, the Environmental Protection Agency (EPA) has delegated responsibility for many of the regulatory programs under its jurisdiction to the State, including underground injection control, National Pollutant Discharge Elimination System (NPDES), Title V Air Permit, and other environmental programs. The State has primacy in issuing relevant permits for the construction and operation of the proposed lithium extraction facilities. Most permits are issued by either the Arkansas Department of Environmental Quality (ADEQ) or the AOGC, as indicated in Table 20-2.
Standard Lithium is committed to early consultation with federal and state permitting agencies for the construction and operation of its lithium extraction and carbonate facilities. Standard Lithium may elect to prepare a Project Permitting Plan for agency submittal to facilitate the timely receipt of project air, water, and waste permits and other regulatory approvals prior to discharging new or additional emissions, discharges, effluents or other regulated substance into the environment.
Various permits and regulatory plans exist for the facilities, as currently operating. The intent is to modify/amend existing permits where possible. The MoU between LANXESS and Standard Lithium provides a mechanism for modifying existing permits and for incorporating additional process streams generated by lithium production into the existing regulatory framework. In general, permit modification falls into two categories – minor modification and major modification. Minor modifications typically do not require public notice; whereas, major modifications require public notification, which generally involves a 10 to 30-day public notification period, depending on individual permit requirements. A public hearing is held in cases where the public interest is sufficient and specific issues are identified during the stakeholder comment period.
New plants for lithium extraction and production of lithium carbonate will be situated within the LANXESS Property and Standard Lithium will be required to adopt and meet LANXESS standards of avoiding harmful emissions into the air, soil and water and ensuring safe handling of chemical products along the value chain. Standard Lithium will be required to assess new plant emissions and may have to adopt new operating permits. Air emission sources for the lithium extraction and carbonate facilities will be identified for each of the four potential new lithium plants. The associated Title V Air Operating Permits will be modified to integrate these sources into the existing Title V permits for the South, West and Central operating units. Similarly, permits for industrial wastewater, stormwater, injection wells, and other permits, will be amended as required to incorporate process flows from the lithium processing facilities.
| Preliminary Economic Assessment of LANXESS Smackover Project | 175 |
The new facilities will tie into existing LANXESS infrastructure. Based on the current design, there will be minimal increase to effluent discharge rates and quality; therefore, it is assumed that these amendments can be addressed as modifications to the existing permits without the need for new permit applications.
Table 20-1 presents typical processing times related to new and modified permit applications for select regulatory approvals associated with the existing LANXESS facilities. Under current project guidelines, Standard Lithium will incorporate new emissions, surface water discharges, and waste injections into the existing permits held by LANXESS.
Table 20-1 Typical Processing Times for Modification or Issuance of New Permits
Permit | Modification | New Application | ||
Class I Underground Injection Control (UIC) well [non-hazardous waste] | > 3 mo < 6 mo | > 6 mo < 9 mo | ||
Class I UIC well [hazardous waste] | > 18 mo < 30 mo | > 24 mo < 48 mo | ||
Class V UIC injection well | > 3 mo < 6 mo | > 6 mo < 9 mo | ||
NPDES Industrial Wastewater Discharge | > 3 mo < 6 mo | > 6 mo < 9 mo | ||
Title V Air Operating Permit | > 3 mo < 6 mo | > 6mo < 12mo |
| 20.4 | Operating Permits |
A representative list of existing permits and supplemental information required to modify the permits to accommodate the new plants are provided in Table 20-2. The validity periods for these permits range between two (2) years to 10 years. The renewal cycle varies; this has not been noted in Table 20-2. The majority of these permits are effective for a five-year period from the issue date.
Table 20-2 Existing Permits for Central, South and West Units
Unit | Agency | Permit | Rationale | Supplemental Documentation for Permit Amendment | ||||
| Central | ADEQ EPA | UIC Class I hazardous injection wells 0011-UR-2 | Operation of underground injection well for hazardous waste disposal. | Updated engineering plan as related to waste streams entering WDW-5S, WDW-6S and WDW-7S (proposed). | ||||
| ADEQ | Title V 1077-AOP-R5 | Construction, operation and maintenance of facility equipment and control apparatus to operate within compliance limits for waste streams (air, water, solids). | Updated emission inventory and conditions from each of the sources. | |||||
| Preliminary Economic Assessment of LANXESS Smackover Project | 176 |
Unit | Agency | Permit | Rationale | Supplemental Documentation for Permit Amendment | ||||
Brine 3204-WR-3 | Authorization to operate the surface impoundments associated with the process water treatment unit. | Updated engineering plan as related to Central process water treatment unit. | ||||||
Brine 3883-WR-5 | Authorization to operate and maintain the surface facilities associated with the brine disposal system. | Updated engineering plan as related to Central Plant brine disposal system surface facilities. | ||||||
Cooling Water AR 72219-8913 | Authorization to discharge cooling water through the outfalls. | Updated engineering plan as related to outfalls 001, 002, 003, and 004. | ||||||
Industrial Stormwater ARR001377 | Authorization to discharge stormwater through the outfalls. | Updated engineering plan as related to outfalls 006 and 007. | ||||||
Storm Runoff AR156173 | Authorization for stormwater discharges associated with construction activity. | Updated engineering plan as related to the construction of pipeline replacement. | ||||||
| AOGC | Class V UIC Brine Injection Wells 39 permitted wells* | Authorization for underground injection of spent tail-brines. | Modification required due to: 1) changes in injection volume; or 2) increase or decrease in rate of pressure. | |||||
| ADEQ | Brine Supply Wells 34 permitted wells* | Authorization for brine supply withdrawals for bromine extraction. | Updated engineering plan as brine supply obtained from each of the 34 permitted wells depending on permit conditions. | |||||
| Waste Disposal Wells Eight (8) permitted wells* | Drilling permits for Class I wells regulated by ADEQ. | No modification required for drilling permit. Updated engineering plan as related to all Class I UIC permitted wells. | ||||||
| Hazardous Waste Permit 18H-RN2 | Authorizations for RCRA Subtitle C Treatment, Storage, and Disposal Facility. | Updated engineering plan per Treatment, Storage, and Disposal Facility (TSDF) permit conditions. | ||||||
| South | ADEQ EPA | UIC Class I 0010-UR-4 | Authorization for the operation of UIC hazardous waste. | Updated engineering plan as related to waste streams entering WDW-6S, -7S and -8S (proposed). | ||||
| Preliminary Economic Assessment of LANXESS Smackover Project | 177 |
Unit | Agency | Permit | Rationale | Supplemental Documentation for Permit Amendment | ||||
| ADEQ | Title V 0873-AOP-R10 | Authorization to construction, operate and maintain the equipment and/or control apparatus as set in the application to maintain compliance for equipment emissions. | Updated emission inventory and conditions from each of the sources. | |||||
Waste Storage 5048-WR-2 | Authorization to operate the surface impoundments associated with the South Plant brine disposal system. | Updated engineering plan as related to South Plant brine disposal system. | ||||||
Waste Storage 5175-WR-1 | Authorization to operate the surface impoundments associated with the South Plant Water Treatment Unit. | Updated engineering plan as related to South Plan Water Treatment Unit. | ||||||
| Cooling Water AR0000680 | Authorization to discharge wastewater. | Updated engineering plan as related to outfalls 001, 002 and 003. | ||||||
| Industrial ARR001376 | Authorization to discharge industrial stormwater. | Updated engineering plan as related to outfalls 004, 005, 006, 007, 008, 009, 010, 011, 012, 013, and 014. | ||||||
| West | ADEQ | UIC Class I 0009-UR-1 | Authorization for a no-discharge water permit, for waste disposal system that does not discharge directly into the waters of the State. | Updated engineering plan as related to SWD-14M well. | ||||
Title V Air Operating Permit 0286-AOP-R13 | Authorization to construct, operate and maintain the equipment and/or control apparatus as set in the application to maintain compliance for equipment emissions. | Updated emission inventory and conditions from each of the sources. | ||||||
Brine 1755-WR-7 | Authorization to operate and maintain the storage and surface impoundments associated with the West Plant brine disposal system. | Updated engineering plan as related to the West Plant brine disposal system. | ||||||
Industrial AR0043516 | Authorization to discharge contaminated stormwater runoff. | Updated engineering plan as related to outfall 001. | ||||||
| Preliminary Economic Assessment of LANXESS Smackover Project | 178 |
Unit | Agency | Permit | Rationale | Supplemental Documentation for Permit Amendment | ||||
Industrial ARR0B870 | Authorization to discharge stormwater. | Updated engineering plan as related to outfalls 002, 003, 004, 005, 006, 007, 008, 009, 010, and 011. | ||||||
Storm Runoff ARR153261 | Authorization for the construction of brine pipeline replacement. | Updated engineering plan as related to the construction of pipeline replacement. | ||||||
Note: ADEQ = Arkansas Department of Environmental Quality.
EPA = Environmental Protection Agency.
AOGC = Arkansas Oil and Gas Commission.
| * | These wells identified are from Central, South and West units and are not distinguished. |
| 20.4.1 | Title V Air Permits |
The ADEQ, Office of Air Quality, issues new permits and permit modifications to existing facilities after reviewing and evaluating permit applications for administrative and technical completeness and ensuring that each application meets regulatory adequacy, as required by title V of the Clean Air Act. It is a legally-enforceable document designed to improve compliance by clarifying what facilities (sources) must do to control air pollution. EPA Region 6 provides oversight for air regulatory programs in Arkansas.
| 20.4.2 | Underground Injection Control (UIC) Permits |
LANXESS is currently permitted for Class I and Class V underground injection wells. ADEQ is the primary enforcement authority to regulate Class I, Class III, Class IV, Class V (other than spent brine from bromine production wells), and Class VI UIC wells.
Class I wells are used to inject hazardous and non-hazardous wastes into deep, confined rock formations. Class I wells are typically drilled thousands of feet below the lowermost underground source of drinking water (USDW) via injection well. The Class I well depths for this project range from 1,151 m (3,775 feet) to 1,646 m (5,400 feet) below ground level elevation. Class I well permits are issued for any waste disposal system that does not discharge directly into the waters of the State.
LANXESS injects non-hazardous and hazardous waste through Class I wells. Class I hazardous wells are strictly regulated under the Resource Conservation and Recovery Act (RCRA), and the Safe Drinking Water Act (SDWA). Construction, permitting, operating, and monitoring requirements are more stringent for Class I hazardous waste disposal wells than for other Class I injection well categories.
The AOGC issues Class V Permits for brine injection wells under Director Order 359-2006-10. This Order provides for modification of existing and new permit applications in accordance with Class II well requirements with differing permit conditions attached to well construction, operation and maintenance. Unlike most regulatory permits, Class V wells do not expire until well closure.
| Preliminary Economic Assessment of LANXESS Smackover Project | 179 |
| 20.4.3 | National Pollution Discharge Elimination System |
The National Pollutant Discharge Elimination System (NPDES) permit program was created in 1972 by the Clean Water Act (CWA). This program helps to mitigate water pollution by regulating point sources that discharge pollutants to waters of the United States. Point source discharges can include discharges from industrial process wastewater discharges and runoff conveyed through a storm sewer system.
The Ouachita River Joint Pipeline is currently permitted through the ADEQ, NPDES Permit No. AR0050296, which covers the LANXESS facilities. The permit expired on November 30, 2018, and an application was submitted to request a renewal of the existing NPDES permit. The “Joint Pipeline” allows the discharge of a combined effluent from four entities, including the Great Lakes Chemical Corporation (GLCC) and the City of El Dorado, with a permitted maximum flow rate for the (combined) effluent at 20 million gallons per day (MGD).
| 20.4.4 | Resource Conservation and Recovery Act Subtitle C Treatment, Storage and Disposal Permit |
A Resource Conservation and Recovery Act (RCRA) Hazardous Waste Permit (Permit No. 18H-RN2) was issued to the Great Lakes Chemical Corporation (LANXESS) in September 2016. LANXESS maintains the permit for post closure of a hazardous waste landfill and treatment of hazardous wastes in tanks. Any storage, treatment, or disposal of hazardous waste, which requires a Permit and is not specifically authorized in this Permit, is prohibited; therefore, any new hazardous waste that is introduced by the new facilities may need to be permitted under this authorization.
| 20.5 | Potential Construction Permits, Approvals, and Plans |
Potential permits will be identified as the project design progresses into the Pre-Feasibility and Feasibility stages of project development. Based on the current information, potential new permits will be related to construction of the lithium extraction facilities. These permits may include, but are not limited to the following:
| • | Construction Storm Water Permit; |
| • | Construction Storm Water Pollution Prevention Plan; |
| • | Sedimentation and Erosion Control Plan; |
| • | Construction Reclamation and Monitoring Plan; |
| • | Dust Management Plan; |
| • | Detailed design of buildings; and |
| • | Detailed design of electrical. |
| Preliminary Economic Assessment of LANXESS Smackover Project | 180 |
| 20.6 | Social Impact |
To date, Standard Lithium has not conducted socio-economic studies to assess potential impacts from this Project. It is assumed that following construction of the new plants, employment will be only moderately changed.
Standard Lithium is committed to conducting its future Project activities with best management practices and intends to maintain an excellent reputation within the local communities that the Project may impact. As such, any required public or stakeholder meetings will be conducted prior to construction.
| 20.7 | Environmental Management and Closure Plan |
Updated Environmental Management Plans (EMPs), as well as a Closure Plan, may be required for the new Project scope. An EMP addresses the various aspects of the design, construction, commissioning, and operation phases of a project, identifies the key environmental issues from the various project phases and provides plans and actions that will be undertaken to manage them effectively. A Closure Plan addresses how a project will be decommissioned with minimal need of further maintenance and minimal impact to the environment, as well as address any reclamation or rehabilitation effort that is required.
Existing plans for operations of the current facility should be modified to address newly constructed plants and should include discussions on safety, waste management, material handling, and emergency response with respect to lithium processing and handling.
| Preliminary Economic Assessment of LANXESS Smackover Project | 181 |
| 21 | Capital and Operating Costs |
The cost estimate for the Project is divided into Capital Expenditures (CAPEX) and Operational Expenditures (OPEX). Sustaining capital expenditures (S-CAPEX) over the life of mine (LoM) are included in the OPEX. The CAPEX, OPEX AND S-CAPEX will be discussed in the following sections.
The CAPEX and OPEX are compliant with a Class 5 Estimate, as defined in American Association of Cost Engineers (AACE) International Recommended Practice No. 18R-97 Cost Estimate Classification System as Applied in Engineering, Procurement, And Construction for The Process Industries. AACE has devised a Class 1 – 5 system, where a Class 1 Estimate is the most accurate and a Class 5 Estimate is the least accurate.
All estimated costs are based on North American and South American prices from 2013-2019 comparable projects.
An AACE Class 5 estimate is used for preliminary comparison of alternatives and generally describes a hypothetical installation. The estimate is suitable to identify potential fatal flaws and identify the work that needs to be done at further stages of a project, leading to positive acceptance of a project.
At this stage of the project, the accuracy of the cost estimation is -30% to +50%. The Toronto Stock Exchange (TSX) and Ontario Securities Commission (OSC) indicated (presentation at PDAC on March 7, 2018) that for the PEA level of studies, a 35% contingency is acceptable. Taking into consideration the relatively advanced development of this Project, a less conservative 25% contingency is included in the CAPEX.
| 21.1 | Capital Cost Estimate – CAPEX |
| 21.1.1 | Basis of Estimate |
The Basis of Estimate (BoE) is a description of how a cost estimate was obtained for each Work Breakdown Structure (WBS) element for which a cost is estimated.
A Class 5 study is carried out after drilling of a mineral deposit has permitted the creation of a simple geological model, which includes the orientation and possible dimensions, as well as estimated grade of the mineralization; limited geotechnical and hydrogeological, or other back up studies are available. In this instance, the project is significantly more advanced than is typical for a Class 5 study, because the brine resource has been in production for greater than 40 years, and much of the enabling infrastructure is already in place.
A PEA is usually based on limited data to establish that there could be a viable project and assesses whether its potential value is sufficient to justify investing a significant sum of money in additional metallurgical test work, evaluation studies, etc. In this instance, significantly more information relating
| Preliminary Economic Assessment of LANXESS Smackover Project | 182 |
to the resource, hydrometallurgical testwork and existing infrastructure was made available to the authors than is typical for a PEA, hence, the authors have accordingly higher confidence in the findings of this study.
For the PEA of the LANXESS Smackover Project, the BoE is as follows:
| • | Product specifications are assumed: lithium carbonate battery grade (99.4%). |
| • | A visit to the project site was conducted by two team members. |
| • | No design drawings were prepared beyond “scratch pad” sketches. |
| • | A simple mining plan was developed, based on existing brine production from the operating wells and based on long term (multi-year) yield data and a hydrogeological field-testing program. |
| • | Gross production schedules are estimated to form the basis of nominal process facilities capacity, using assumed flow sheets, assumed process requirements and updated metallurgical tests. |
| • | The Lang factor is one of the factored estimating techniques that is recommended by AACE International for Class 4 and Class 5 estimates. This method was proposed by Hans J. Lang in the 1940s, using a simple formula that consists of a set of factors multiplied by the Total Equipment Cost (TEC) to obtain the Total Plant Cost (TPC). These factors are derived from historical data, by using statistical inferential or modelling. Several types of factored estimating that are used, especially in process industries, are capacity factored estimates, equipment factored estimates and parametric cost estimates. |
| • | For the lithium chloride and lithium carbonate process plants, Lang factors, as recommended by AACE 59R-10 (2011) for “Fluid Processing” 5.05, have been used to calculate Total Plant Cost. For calculation of Direct Cost, a factor of 3.0 is used. The Indirect Costs are factored as a percentage (%) of Direct Cost to account for Owner Costs, Engineering, Procurement, Construction Management (EPCM) and other miscellaneous costs (see Table 21-1). |
Table 21-1 Lang Factors as per AACE 59R-10 (2011) for “Fluid Processing
Description | Lang Factor % Values | |||
Direct Costs | ||||
Purchased Equipment Cost | 100 | |||
Equipment Setting | 4 | |||
Site Development | 5 | |||
Concrete | 8 | |||
Structural Steel | 13 | |||
Buildings | 2 | |||
| Preliminary Economic Assessment of LANXESS Smackover Project | 183 |
Piping | 97 | |||
I&C | 42 | |||
Electrical | 16 | |||
Insulation | 7 | |||
Painting | 6 | |||
|
| |||
Total Direct Plant Cost | 300 | |||
|
| |||
Indirect Costs | ||||
Labour Indirects & Field Costs | 72 | |||
Contractor Engineering & Fees | 91 | |||
Owner’s Engineering & Oversight | 42 | |||
|
| |||
Total Indirect Cost | 205 | |||
|
| |||
Total Installed Cost (TIC) | 505 | |||
|
|
| • | Equipment lists were prepared, based on assumed process flow diagrams (PFDs) and are priced based on updated former quotations, telephone quotes from vendors’ representatives and a limited number of budgetary quotations for major pieces of equipment. |
| • | Simplified major equipment data sheets were prepared for budgetary quotations. Vendors’ budgetary quotations were solicited for selected equipment only. |
| • | The project is developed at a well-serviced, developed industrial site; Outside Battery Limits (OSBL) infrastructure items, such as high voltage power lines, access roads and general civil works, are not included in the estimate. |
| • | Percentage factors (Table 21-1) are used for process piping, electrical and instrumentation costs; motors and substations are estimated on a percent basis of the process equipment purchasing cost. |
| • | Percentage factors (Table 21-1) are used for contractor’s field overhead, construction plant, construction camp, contractor’s profit, engineering and procurement and construction management. |
Equipment size and related cost was developed for the level of lithium carbonate production at 5,346 tpy. The cost of equipment for Phase 1, 2, and 3 was factored using AACE Recommended Practice 59R-10 using the rule: CostB/CostA=(CapB/CapA)r where r=0.6.
The project will be developed in three (3) sequential phases, with increased production, as shown in Table 21-2.
Table 21-2 Phased Production
| Preliminary Economic Assessment of LANXESS Smackover Project | 184 |
Project Phase | Raw Brine Source | Lithium Carbonate Production Increase (tpy) | Lithium Carbonate Production (tpy) | |||||||
Phase 1 | South Unit | 9,700 | 9,700 | |||||||
Phase 2 | West Unit | 8,200 | 17,900 | |||||||
Phase 3 | Central Unit | 3,000 | 20,900 | |||||||
| • | Exchange rates used to convert other currencies to US Dollar (US$) are as follows: |
- 1 US$ = 1.30 CAD (Canadian Dollar)
| • | The cost of equipment for Lithium Carbonate production is based on 5,346 tpy process train and then scaled accordingly. |
| 21.1.2 | CAPEX Estimate |
| 21.1.2.1 | Phase 1 |
Phase 1 of project execution will include construction of two (2) production plants at LANXESS’ properties:
| 1. | South Lithium Chloride Plant producing 306,000 tpy of lithium chloride, as a feedstock for the production of lithium carbonate. |
| 2. | Central Lithium Carbonate Plant Train No 1, producing 9,700 tpy of lithium carbonate. |
The capital cost (rounded to ‘000) for Phase 1 is shown in Table 21-3.
Table 21-3 Phase 1 CAPEX
Description | Values US$ | Factor | Cost US$ | |||||||||
South Lithium Chloride Plant Equipment Cost | 21,165,612 | 5.05 | 106,886,000 | |||||||||
Central Lithium Carbonate Plant Train No 1 Equipment Cost | 5,487,397 | 5.05 | 27,711,000 | |||||||||
Pipeline | 2,340,000 | |||||||||||
|
| |||||||||||
TOTAL | 136,937,000 | |||||||||||
|
| |||||||||||
| 21.1.2.2 | Phase 2 |
Phase 2 of project execution will include construction of two production plants:
| 1. | West Lithium Chloride Plant producing 304,420 tpy of lithium chloride at LANXESS’ West Plant, as a feedstock for the production of lithium chloride. |
| Preliminary Economic Assessment of LANXESS Smackover Project | 185 |
| 2. | Central Lithium Carbonate Plant Train No 2, producing 8,200 tpy of lithium chloride. |
The capital cost (rounded to ‘000) for Phase 2 is shown in Table 21-4.
Table 21-4 Phase 2 CAPEX
Description | Values US$ | Factor | Cost US$ | |||||||||
South Lithium Chloride Plant Equipment Cost | 19,681,838 | 5.05 | 99,393,000 | |||||||||
Central Lithium Carbonate Plant Train No 2 Equipment Cost | 5,102,714 | 5.05 | 25,769,000 | |||||||||
Pipelines | 3,780,000 | |||||||||||
|
| |||||||||||
TOTAL | 128,942,000 | |||||||||||
|
| |||||||||||
| 21.1.2.3 | Phase 3 |
Phase 3 of project execution will include construction of two production plants:
| 1. | Central Lithium Chloride Plant producing 117,152 tpy of lithium chloride at LANXESS’ Central Plant as a feedstock for the production of lithium carbonate. |
| 2. | Central Lithium Carbonate Plant Train No 3, producing 3,000 tpy of lithium carbonate. |
The capital cost (rounded to ‘000) for Phase 3 is shown in Table 21-5.
Table 21-5 Phase 3 CAPEX
Description | Values US$ | Factor | Cost US$ | |||||||||
Central Lithium Chloride Plant Equipment Cost | 13,186,000 | 5.05 | 66,589,000 | |||||||||
Central Lithium Carbonate Plant Train No 3 Equipment Cost | 3,418,000 | 5.05 | 17,261,000 | |||||||||
|
| |||||||||||
TOTAL | 83,850,000 | |||||||||||
�� |
| |||||||||||
| 21.1.2.4 | CAPEX Summary |
The capital cost (rounded to ‘000) for the three phases of Project development is shown in Table 21-6.
Contingency is applied at 25%.
| Preliminary Economic Assessment of LANXESS Smackover Project | 186 |
Table 21-6 CAPEX Summary
Project Phase | Cost US$ | Contingency US$ | CAPEX US$ (incl. contingency) | |||||||||
Phase 1 | 136,937,000 | 34,234,000 | 171,171,000 | |||||||||
Phase 2 | 128,942,000 | 32,236,000 | 161,178,000 | |||||||||
Phase 3 | 83,850,000 | 20,963,000 | 104,813,000 | |||||||||
|
|
|
|
|
| |||||||
TOTAL | 349,729,000 | 87,433,000 | 437,162,000 | |||||||||
|
|
|
|
|
| |||||||
| 21.2 | Operating Expenditures (OPEX) |
Operating expenditures will vary during the staged development, as the production will increase after each phase is completed. The operating costs presented below are for full production after completion of the Phase 3 expansion.
Operating costs for Phase 1 and for Phase 2 are calculated using the same methodology, but only summary tables are presented.
The OPEX is divided into two categories: direct operating costs and indirect operating costs. The total estimated average annual OPEX for each phase of project development is shown in Table 21-23.
For the calculation of the average annual OPEX, the assumption is that the Smackover lithium processing complex will operate at three (3) main locations, as follows:
| 1. | LANXESS Central Plant |
| • | Central Lithium Chloride Plant; |
| • | Central Lithium Carbonate Train No 1; |
| • | Central Lithium Carbonate Train No 2; and |
| • | Central Lithium Carbonate Train No 3. |
| 2. | LANXESS South Plant: |
| • | South Lithium Chloride Plant. |
| 3. | LANXESS West Plant: |
| • | West Lithium Chloride Plant. |
| 21.2.1 | Direct Operational Expenditures |
The following cost elements are taken into account for the direct OPEX estimation:
| • | Manpower; |
| Preliminary Economic Assessment of LANXESS Smackover Project | 187 |
| • | Electric Power; |
| • | Reagents and Consumables; |
| • | Water; |
| • | Natural Gas; |
| • | Miscellaneous Costs; |
| • | Sustaining Capital; |
| • | Product Transportation; and |
| • | Land leases. |
| 21.2.1.1 | Manpower |
Labour levels are based on experience and reported data from facilities operating in the region. Salary and wage estimates are based on published data for various trades prevailing in the City of El Dorado, Arkansas.
The annual costs for personnel have been estimated for the different parts of the plant, based on an estimate of the required personnel for each plant, and taking into account a two shifts system for most operations combined, with subdividing of the personnel into four (4) categories. The salaries for these categories have been estimated based on information provided for typical salaries in the region and are summarized in Table 21-7.
Table 21-7 Manpower Unit Costs
Category | Cost to Company US$/Year | Comments | ||||
Higher Management | 180,000 | Manpower costs include direct pay, social insurance expenditures and labour-related taxes | ||||
Management | 130,000 | |||||
Skilled Worker | 85,000 | |||||
Worker | 65,000 | |||||
Personnel and staffing requirements, for the different parts of the operation, are discussed in the following sections. Personnel have been classified in different groups, with different salary levels, based on the required skill sets.
| 21.2.1.2 | Management |
Management includes higher management, for different sections of the operation, who are responsible for supervising their respective sections. The management level is not assigned to shift systems; therefore, all jobs are calculated as number of jobs and summarized in Table 21-8.
| Preliminary Economic Assessment of LANXESS Smackover Project | 188 |
Table 21-8 Management Personnel
Position | Category | No. of Positions | Comments | |||||||||
General Manager | Higher Management | 1 | 1 shift | |||||||||
General Superintendent Process | Higher Management | 1 | 1 shift | |||||||||
Chief Engineer Production | Higher Management | 1 | 1 shift | |||||||||
Administration Superintendent | Management | 1 | 1 shift | |||||||||
HSEC* Manager | Management | 1 | 1 shift | |||||||||
LCS** Superintendent | Management | 1 | 1 shift | |||||||||
|
| |||||||||||
Subtotal | 6 | |||||||||||
|
| |||||||||||
| * | Health and Safety Superintendent |
| ** | Logistics Superintendent |
| 21.2.1.3 | Production Personnel |
Production personnel include the staff for the lithium chloride plants (South and West) and the integrated operations (lithium chloride and lithium carbonate) at the Central Plant. The estimate presented in Table 21-9 is based on experience from operations on similar projects. The production personnel, as listed in Table 21-9, are mostly assigned within a two-shift system, with an additional shift to account for holidays and sickness.
During start-up and acceleration of the operations, increased personnel may be required. At that time, start-up staff from different suppliers and installation companies will be engaged.
Table 21-9 Production Personnel
Position | Category | No. of Positions | Comments | |||||
Central Lithium Chloride and Lithium Carbonate Plants | ||||||||
Plant Foreman | Management | 1 | 1 shift | |||||
Process Engineer | Management | 2 | 2 shifts | |||||
Plant Operator | Skilled Worker | 6 | 3 shifts | |||||
Loading Operator | Worker | 6 | 2 shifts | |||||
Labourers | Worker | 6 | 2 shifts | |||||
| Preliminary Economic Assessment of LANXESS Smackover Project | 189 |
Position | Category | No. of Positions | Comments | |||||||||
Subtotal | 21 | |||||||||||
South Lithium Chloride Plant | ||||||||||||
Plant Foreman | Management | 1 | 1 shift | |||||||||
Plant Operator | Skilled Worker | 6 | 3 shifts | |||||||||
Loading Operator | Worker | 2 | 2 shifts | |||||||||
Labourers | Worker | 4 | 2 shifts | |||||||||
|
| |||||||||||
Subtotal | 13 | |||||||||||
|
| |||||||||||
West Lithium Chloride Plant | ||||||||||||
Plant Foreman | Management | 1 | 1 shift | |||||||||
Plant Operator | Skilled Worker | 6 | 3 shifts | |||||||||
Loading Operator | Worker | 2 | 2 shifts | |||||||||
Labourers | Worker | 4 | 2 shifts | |||||||||
|
| |||||||||||
Subtotal | 13 | |||||||||||
|
| |||||||||||
| 21.2.1.4 | Administration Personnel |
Administration personnel are not assigned within shift systems; therefore, all jobs are calculated only for single shifts. The staffing tiers conform to skilled worker and worker levels, as shown in Table 21-10. These personnel are included as logistics, procurement, accounting and human resource management.
Table 21-10 Administration Personnel
Position | Category | No. of Positions | Comments | |||||||||
Logistics Coordinator | Skilled Worker | 1 | 1 shift | |||||||||
Plans and Business | Skilled Worker | 1 | 1 shift | |||||||||
Clerk/Reception | Worker | 1 | 1 shift | |||||||||
HR / Data Clerk | Worker | 1 | 1 shift | |||||||||
Driver/Assistant | Worker | 1 | 1 shift | |||||||||
|
| |||||||||||
Subtotal | 5 | |||||||||||
|
| |||||||||||
| Preliminary Economic Assessment of LANXESS Smackover Project | 190 |
21.2.1.5 Quality Control & Laboratory Personnel
Quality Control (QC) and laboratory personnel are assigned within a two-shift system, as continuous control of brines and crystal crops are required during operation. There is no additional shift to cover holidays and sickness. The staffing tiers conform to lower management and skilled worker levels, as shown in Table 21-11. They are included in the OPEX as plant costs.
Table 21-11 QC and Lab Personnel
Position | Category | No. of Positions | Comments | |||||||||
Lab Technician | Management | 2 | 2 shifts | |||||||||
Lab Assistant | Skilled Worker | 2 | 2 shifts | |||||||||
|
| |||||||||||
Subtotal | 4 | |||||||||||
|
| |||||||||||
| 21.2.1.6 | Maintenance Personnel |
Maintenance personnel are assigned with a two-shift system and there is no additional shift to cover holidays and sickness. The staff for maintenance will conform to skilled worker and worker levels and are detailed in Table 21-12.
Table 21-12 Maintenance Personnel
Position | Category | No. of Positions | Comments | |||||||||
Maintenance Foreman | Skilled Worker | 1 | 1 shift | |||||||||
Mechanics | Skilled Worker | 4 | 2 shifts | |||||||||
Electrician/Instrument Technician | Skilled Worker | 2 | 2 shifts | |||||||||
Labourers | Worker | 4 | 2 shifts | |||||||||
|
| |||||||||||
Subtotal | 11 | |||||||||||
|
| |||||||||||
| 21.2.1.7 | Service Personnel |
Service personnel are partly assigned within a two-shift system and are responsible for safety and security at the plant. Even though security services may be provided by LANXESS existing operations, the cost provisions need to be captured in the OPEX. These staff conform to the worker level, as detailed in Table 21-13.
| Preliminary Economic Assessment of LANXESS Smackover Project | 191 |
Table 21-13 Service Personnel
Position | Category | No. of Positions | Comments | |||||||||
Security/Watchman | Worker | 6 | 3 shifts | |||||||||
|
| |||||||||||
Subtotal | 6 | |||||||||||
|
| |||||||||||
A cost summary of manpower in all categories at full production (Phase 3) is given in Table 21-14.
Table 21-14 Manpower Cost Summary
Category | No. of Positions | Unit Cost US$ | Cost US$ | |||||||||
Higher Management | 3 | 180,000 | 540,000 | |||||||||
Management | 10 | 130,000 | 1,300,000 | |||||||||
Skilled Workers | 29 | 85,000 | 2,465,000 | |||||||||
Worker | 37 | 65,000 | 2,405,000 | |||||||||
|
|
|
| |||||||||
Total | 79 | 6,710,000 | ||||||||||
|
|
|
| |||||||||
The estimated annual cost of manpower is US$ 6,710,000.
| 21.2.1.8 | Electrical Power |
Electrical energy will be delivered to the sites from the Arkansas power grid. The Industrial rate for the operation is 0.053 US$/kWh.
The electrical energy use and cost summary is shown in Table 21-15.
Table 21-15 Electrical Use and Cost
Description | Phase 1 | Phase 2 | Phase 3 | |||||||||
Central Plant Location | ||||||||||||
Buildings & Structures (kW) | 768 | |||||||||||
Utilities (kW) | 2,027 | |||||||||||
Lithium Chloride Plant (kW) | 675 | |||||||||||
Reagents (kW) | 281 | |||||||||||
| Preliminary Economic Assessment of LANXESS Smackover Project | 192 |
Description | Phase 1 | Phase 2 | Phase 3 | |||||||||
Central Lithium Carbonate Plant Train 1 (kW) | 473 | |||||||||||
Central Lithium Carbonate Plant Train 2 (kW) | 611 | |||||||||||
Central Lithium Carbonate Plant Train 3 (kW) | 1,940 | |||||||||||
South Plant Location | ||||||||||||
Buildings & Structures (kW) | 990 | |||||||||||
Utilities (kW) | 4,831 | |||||||||||
South Lithium Chloride Plant (kW) | 1,608 | |||||||||||
Reagents (kW) | 160 | |||||||||||
West Plant Location | ||||||||||||
Buildings & Structures (kW) | 925 | |||||||||||
Utilities (kW) | 4,513 | |||||||||||
West Lithium Chloride Plant (kW) | 1,503 | |||||||||||
Reagents (kW) | 150 | |||||||||||
Electrical Energy Demand (kW) | 9,529 | 7,702 | 4,224 | |||||||||
Operating Time (hrs) | 8,000 | 8,000 | 8,000 | |||||||||
Electrical Energy Use (kWh) | 76,232,000 | 61,616,000 | 33,792,000 | |||||||||
Unit Cost (US$ per kWh) | 0.053 | 0.053 | 0.053 | |||||||||
Sub-Total | 4,040,000 | 3,266,000 | 1,791,000 | |||||||||
|
|
|
|
|
| |||||||
Annual Cost of Electricity (US$) | $ | 4,040,000 | $ | 7,306,000 | $ | 9,097,000 | ||||||
|
|
|
|
|
| |||||||
| 21.2.1.9 | Reagents and Consumables |
Items under this budget line include reagents and other additions that are required in the production process of lithium chloride semi-product and lithium carbonate final product. The cost of reagents is estimated on a per tonne of battery grade lithium carbonate base.
The cost of reagents required for one (1) tonne of lithium carbonate production is US$ 3,107, as shown in Table 21-16. Initial analysis suggests that a substantial portion of the reagent costs could be reduced if
| Preliminary Economic Assessment of LANXESS Smackover Project | 193 |
some process optimization is completed, and/or, some reagent recovery is contemplated; see Section 26.
Table 21-16 Reagents Cost Per Tonne of Li2CO3
Description | Consumption per tonne of Li2CO3 | Unit Cost US$ | Cost US$ | |||||||||
Ammonia | 1039 kg | 435/tonne | 452 | |||||||||
25% NaOH | 3117 kg | 345/tonne | 1,075 | |||||||||
Adsorbent | 90 kg | 5,020/tonne | 452 | |||||||||
31.5% HCl | 5,729 kg | 155/tonne | 888 | |||||||||
Na2CO3 | 77 kg | 300/tonne | 23 | |||||||||
Membrane Replacement | 164 m2 | 1.324 | 217 | |||||||||
|
| |||||||||||
Total | 3,107 | |||||||||||
|
| |||||||||||
The reagents cost summary is provided in Table 21-17.
Table 21-17 Reagents Cost Summary
Description | Phase 1 | Phase 2 | Phase 3 | |||||||||
Lithium Carbonate Production Increase (tpy) | 9,700 | 8,200 | 3,000 | |||||||||
Reagents cost per tonne (US$) | 3,107 | 3,107 | 3,107 | |||||||||
Total (US$) | $ | 30,138,000 | $ | 25,477,000 | $ | 9,321,000 | ||||||
|
|
|
|
|
| |||||||
Annual Cost of Reagents (US$) | $ | 30,138,000 | $ | 55,615,000 | $ | 64,936,000 | ||||||
|
|
|
|
|
| |||||||
| 21.2.1.10 | Water |
The estimated cost of process and domestic water is based on the supply of water from an on-site existing distribution network. The unit cost rate of water use is for industrial users in Arkansas. The process water usage for the project is provided in Table 21-18.
| Preliminary Economic Assessment of LANXESS Smackover Project | 194 |
Table 21-18 Process Water Use
Description | Phase 1 | Phase 2 | Phase 3 | |||||||||
Annual Production of lithium carbonate (tpy) | 9,700 | 17,900 | 20,900 | |||||||||
Annual Water Use per tonne of lithium carbonate | 119 | 119 | 119 | |||||||||
Annual Water Use (m3) | 1,154,300 | 2,130,100 | 2,487,100 | |||||||||
Water Unit Cost US$/m3 | 0.43 | 0.43 | 0.43 | |||||||||
|
|
|
|
|
| |||||||
Annual Total Cost (US$) | $ | 496,000 | $ | 916,000 | $ | 1,070,000 | ||||||
|
|
|
|
|
| |||||||
| 21.2.1.11 | Natural Gas |
The estimated cost of natural gas is based on the supply from an on-site existing distribution network. The unit cost rate of natural gas use is for large industrial users in Arkansas. Table 21-19 shows the annual total cost for natural gas use.
Table 21-19 Natural Gas Use
Description | Phase 1 | Phase 2 | Phase 3 | |||||||||
Annual Production of lithium carbonate (tpy) | 9,700 | 17,900 | 20,900 | |||||||||
Annual Natural Gas Use per tonne of lithium carbonate | 250 | 250 | 250 | |||||||||
Annual Natural Gas Use (m3) | 2,425,000 | 4,475,000 | 5,225,000 | |||||||||
Unit Cost US$/m3 | 0.24 | 0.24 | 0.24 | |||||||||
|
|
|
|
|
| |||||||
Annual Total Cost (US$) | $ | 582,000 | $ | 1,074,000 | $ | 1,254,000 | ||||||
|
|
|
|
|
| |||||||
| 21.2.1.12 | Sustaining Capital |
Sustaining capital expenditures (S-CAPEX) are investments for replacement of large equipment not covered by maintenance costs that are required to keep all equipment for the operation in good shape (e.g. replacement of a main distribution pipeline section). The estimate is based on an estimation of the averaged aggressiveness of the environment and the expected lifetime of main equipment.
| Preliminary Economic Assessment of LANXESS Smackover Project | 195 |
| 21.2.1.13 | Plant Facilities |
Sustaining CAPEX is estimated as a percentage of the direct CAPEX. The S-CAPEX for the plant and on-site supporting facilities, is taken as 1.5% of direct CAPEX and is shown in Table 21-20.
Table 21-20 Sustaining Capital Cost
Area Name | Equipment Cost (US$) | Direct Cost Lang Factor | Direct Cost (US$) | Indirect OPEX Factor | Indirect OPEX (US$) | |||||||||||||||
Phase 1 | ||||||||||||||||||||
South Lithium Chloride Plant | 21,165,612 | |||||||||||||||||||
Central Lithium Carbonate Plant | 5,487,397 | |||||||||||||||||||
Train No.1 | ||||||||||||||||||||
|
|
|
|
|
|
|
|
|
| |||||||||||
Sub-Total | 26,653,000 | 3.00 | 79,959,000 | 1.50 | % | 1,199,000 | ||||||||||||||
|
|
|
|
|
|
|
|
|
| |||||||||||
Phase 2 | ||||||||||||||||||||
West Lithium Chloride Plant | 19,681,838 | |||||||||||||||||||
Central Lithium Carbonate Plant | 5,102,714 | |||||||||||||||||||
Train No.2 | ||||||||||||||||||||
|
|
|
|
|
|
|
|
|
| |||||||||||
Sub-Total | 24,785,000 | 3.00 | 74,355,000 | 1.50 | % | 1,115,000 | ||||||||||||||
|
|
|
|
|
|
|
|
|
| |||||||||||
Phase 3 | ||||||||||||||||||||
Central Lithium Chloride Plant | 13,186,000 | |||||||||||||||||||
Central Lithium Carbonate Plant | 3,418,000 | |||||||||||||||||||
Train No.3 | ||||||||||||||||||||
|
|
|
|
|
|
|
|
|
| |||||||||||
Sub-Total | 16,604,000 | 3.00 | 49,812,000 | 1.50 | % | 747,000 | ||||||||||||||
|
|
|
|
|
|
|
|
|
| |||||||||||
The estimated annual cost of sustaining capital S-CAPEX is:
| • | Phase 1 US$1,199,000; |
| • | Phase 2 US$2,314,000; and |
| • | Phase 3 US$3,061,000. |
| 21.2.1.14 | Products Transportation |
The lithium chloride and reclaim brine between the South Plant and Central Plant, and between West Plant and Central Plant is transported using dedicated 6” HDPE u/g pipeline laid in the LANXESS right of way.
| Preliminary Economic Assessment of LANXESS Smackover Project | 196 |
The annual cost of operating the pipelines is estimated at:
| • | Phase 1 US$48,000; and |
| • | Phase 2 US$48,000+US$75,000=US$123,000. |
| 21.2.1.15 | Miscellaneous Costs |
Miscellaneous operating costs include costs that may be required but cannot be detailed at this stage of the project. For these reasons, these costs are estimated at 1.5% of the other direct costs (See Table 21-23). Miscellaneous Direct Operational Costs are provided in Table 21-21.
Table 21-21 Miscellaneous Direct Operational Costs
Description | Unit | Phase 1 | Phase 2 | Phase 3 | ||||||||||||
Direct Operational Costs | US$ | 40,348,000 | 73,228,000 | 86,551,000 | ||||||||||||
Cost as a Percentage of Direct Operational Costs | % | 1.5 | 1.5 | 1.5 | ||||||||||||
|
|
|
|
|
| |||||||||||
TOTAL | US$ | 605,000 | 1,098,000 | 1,298,000 | ||||||||||||
|
|
|
|
|
| |||||||||||
The estimated annual cost of miscellaneous direct expenditures at full operation is US$1,298,000.
| 21.2.1.16 | Indirect Operational Expenditures |
Indirect operational expenditures are not directly related with production, but are services required for monitoring and optimizing the operation, and for activities related to community and customer satisfaction. Indirect OPEX components are usually given as a percentage of the direct OPEX, except for insurance and plant closure fund, which are calculated as percentage of direct CAPEX, as follows:
| • | Insurance during the operation phase will cover Property, general liability and risk of business interruption. The annual premium insurance has been estimated at 0.5% of direct CAPEX. |
| • | The annual cost of sales, marketing and customer relations is estimated as 0.15% of direct OPEX. |
| • | The cost for plant optimization and project development is estimated as 0.25% of direct OPEX to cover salaries for consultants and contractors for studies on development tasks. |
| • | Environmental monitoring contains the annual cost of environmental assessment and monitoring, including air, water, waste, noise, and changes to the environment. The annual cost for environmental monitoring is estimated as 0.5% of direct OPEX. |
| • | The annual cost for community benefits is estimated as 0.1 % of direct OPEX and covers funds set up for education and community development. |
| Preliminary Economic Assessment of LANXESS Smackover Project | 197 |
| • | The cost for a closure fund was not incorporated in the CAPEX. Closure fund accumulation is planned to start in year-1, by paying annual instalments into a savings fund until it reaches the required capital of 5% of direct CAPEX. |
The indirect operational cost summary is provided in Table 21-22.
Table 21-22 Indirect Operational Costs
Cost Category | % | Phase 1 | Phase 2 | Phase 2 | ||||||||||||
Insurance (% of Direct CAPEX) | 0.50 | 400,000 | 772,000 | 1,021,000 | ||||||||||||
Sales Marketing and Customers Relations | 0.15 | 61,000 | 111,000 | 132,000 | ||||||||||||
Plant Optimizations and Development | 0.25 | 102,000 | 186,000 | 220,000 | ||||||||||||
Environmental Monitoring | 0.50 | 204,000 | 372,000 | 439,000 | ||||||||||||
Community Benefits | 0.10 | 41,000 | 74,000 | 88,000 | ||||||||||||
Mine Closure Fund (% of Direct CAPEX) | 0.25 | 200,000 | 386,000 | 510,000 | ||||||||||||
|
|
|
|
|
| |||||||||||
TOTAL | 1,008,000 | 1,901,000 | 2,410,000 | |||||||||||||
|
|
|
|
|
| |||||||||||
The estimated annual cost indirect expenses operation is US$2,405,000.
| 21.2.2 | OPEX Summary |
Annual operating cost summary is given in Table 21-23.
Table 21-23 Annual Operating Cost Summary
Description | Phase 1 US$ | Phase 2 US$ | Phase 3 US$ | |||||||||
Direct Operational Expenditures | ||||||||||||
Manpower | 3,745,000 | 5,680,000 | 6,710,000 | |||||||||
Electrical Power | 4,040,000 | 7,306,000 | 9,097,000 | |||||||||
Reagents & Consumables | 30,138,000 | 55,615,000 | 64,936,000 | |||||||||
Water | 496,000 | 916,000 | 1,070,000 | |||||||||
Natural Gas | 582,000 | 1,074,000 | 1,254,000 | |||||||||
| Preliminary Economic Assessment of LANXESS Smackover Project | 198 |
Description | Phase 1 US$ | Phase 2 US$ | Phase 3 US$ | |||||||||
Miscellaneous Direct Expenditures | 605,000 | 1,098,000 | 1,299,000 | |||||||||
Sustaining Capital Cost | 1,199,000 | 2,314,000 | 3,061,000 | |||||||||
Brine Transportation | 48,000 | 123,000 | 123,000 | |||||||||
Land lease | 100,000 | 200,000 | 300,000 | |||||||||
|
|
|
|
|
| |||||||
Subtotal | 40,953,000 | 74,326,000 | 87,849,000 | |||||||||
|
|
|
|
|
| |||||||
Indirect Operational Expenditures | 1,009,000 | 1,901,000 | 2,410,000 | |||||||||
|
|
|
|
|
| |||||||
TOTAL | 41,962,000 | 76,227,000 | 90,259,000 | |||||||||
|
|
|
|
|
| |||||||
Note: All-in OPEX per one metric tonne of production is US$4,319.
| Preliminary Economic Assessment of LANXESS Smackover Project | 199 |
| 22 | Economic Analysis |
The objective of this section is to present an economic analysis of the Project to determine its financial viability. The analysis was prepared using an economic model and assesses a discounted after-tax cash flow scenario. Capital (CAPEX) and Operational (OPEX) Expenditures presented in previous sections have been used in this analysis. The model includes all taxes, government and commercial royalties/payments and community engagement contributions. The results include Net Present Value (NPV) for an 8% discount rate, Internal Rate of Return (IRR) and sensitivity analysis of key inputs.
| 22.1 | Evaluation Criteria |
The following criteria have been used to develop the economic model:
| • | Project life: engineering and construction for each phase of the project development is estimated at 18 months (1 1⁄2 years). |
| • | Operating life span of the process plants is estimated at 25 years from the start of production of Phase 1. |
| • | Pricing for battery grade lithium carbonate is as per conclusions in Section 19 Market Studies and Contracts, which assumes a three-year rolling average price of US$13,550/t. |
| • | The Discounted Cash Flow (DCF) economic evaluation was carried out on a constant money basis, so there is no provision for escalation or inflation on costs or revenue. |
| • | Equity basis: for project DCF evaluation purposes, it has been assumed that 100% of capital expenditures, including pre-production expenses, are financed with owners’ equity. |
| • | Pre-construction expenses are treated as sunk costs and not included in DCF analysis. |
| • | The exchange rate assumed is 1 US$ = 1.30 CAD. |
| 22.2 | Taxes & Royalties |
The following royalties and taxes have been applied to the economic analysis of the Project.
| 22.2.1 | Royalty |
Brine used for lithium production is tail-brine from the existing LANXESS operations. No government royalties are to be applied. Brine lease fees, in lieu of royalties, will be applicable, but are yet to be determined. Brine lease fees are not included in this analysis.
| 22.2.2 | Mining Licenses |
No separate mining license is required. The Project will process the tail-brine that exits the LANXESS operations.
| Preliminary Economic Assessment of LANXESS Smackover Project | 200 |
| 22.2.3 | Capital Allowance |
A capital cost allowance of 3% is used for this analysis.
| 22.2.4 | Corporate Taxes |
The US Federal Corporate Income Tax (CIT) rate of 21%, and the State Arkansas CIT rate of 6.5%, are used for this analysis.
| 22.3 | CAPEX Spend Schedule |
The economic model assumes that capital investment disbursements will be spread over three (3) phases of development. Each phase will be 18 months (1 1⁄2 years).
| 22.3.1 | Lithium Carbonate Production Schedule |
Production of lithium carbonate will start at the end of Phase 1 and will increase incrementally after completion of each phase.
| • | Phase 1 9,700 tpy; |
| • | Phase 2 (9,700+8,200) = 17,900 tpy; and |
| • | Phase 3 (9,700+8,200+3,000) = 20,900 tpy. |
| 22.4 | Production Revenues |
Production revenues have been estimated based on a single price scenario for battery grade lithium carbonate, as identified in Section 19 Market Studies and Contracts.
| 22.5 | Cash-Flow Projection |
Table 22-1 summarizes the Discounted Cash Flow (DCF) for the assumed Base Case (Case 1) price and production level scenario.
| Preliminary Economic Assessment of LANXESS Smackover Project | 201 |
Table 22-1 Annual Operating Cost Summary
| Year | 2021 | 2022 | 2023 | 2024 | 2025 | 2026 | 2027 | 2028 | 2044 | 2045 | 2046 | |||||||||||||||||||||||||||||||||||||||||
Table 22-1 | 0 | 1 | 2 | 3 | 4 | 5 | 6 | 7 | 23 | 24 | 25 | |||||||||||||||||||||||||||||||||||||||||
Price LC ($/t ) - Phase 1 South | 13,550 | 9,700 | 4,850 | 9,700 | 9,700 | 9,700 | 9,700 | 9,700 | 9,700 | 9,700 | 9,700 | 9,700 | ||||||||||||||||||||||||||||||||||||||||
Price LC ($/t) - Phase 2 West | 13,550 | 8,200 | 8,200 | 8,200 | 8,200 | 8,200 | 8,200 | 8,200 | 8,200 | 8,200 | ||||||||||||||||||||||||||||||||||||||||||
Price LC ($/t) - Phase 3 Central | 13,550 | 3,000 | 1,500 | 3,000 | 3,000 | 3,000 | 3,000 | 3,000 | 3,000 | |||||||||||||||||||||||||||||||||||||||||||
Discount Rate (i) | 8 | % | Production: | 4,850 | 9,700 | 17,900 | 19,400 | 20,900 | 20,900 | 20,900 | 20,900 | 20,900 | 20,900 | |||||||||||||||||||||||||||||||||||||||
100% | 13,550 | |||||||||||||||||||||||||||||||||||||||||||||||||||
Gross Revenue | — | 65,717,500 | 131,435,000 | 242,545,000 | 262,870,000 | 283,195,000 | 283,195,000 | 283,195,000 | 283,195,000 | 283,195,000 | 283,195,000 | |||||||||||||||||||||||||||||||||||||||||
Operating Costs (OPEX) | — | 20,981,000 | 41,962,000 | 76,227,000 | 83,243,000 | 90,259,000 | 90,259,000 | 90,259,000 | 90,259,000 | 90,259,000 | 90,259,000 | |||||||||||||||||||||||||||||||||||||||||
Operating EBITDA | — | 44,736,500 | 89,473,000 | 166,318,000 | 179,627,000 | 192,936,000 | 192,936,000 | 192,936,000 | 192,936,000 | 192,936,000 | 192,936,000 | |||||||||||||||||||||||||||||||||||||||||
Development Capital Expenditure | -437,163,000 | 100 | % | -114,684,670 | -109,675,170 | -107,989,260 | -70,225,380 | -34,588,620 | — | — | — | — | — | 1 | ||||||||||||||||||||||||||||||||||||||
Capital Allowance | 3.00 | % | 0 | -3,440,537 | -3,440,537 | -3,440,537 | -3,440,537 | -13,114,890 | -13,114,890 | -13,114,890 | -13,114,890 | -13,114,890 | -13,114,890 | |||||||||||||||||||||||||||||||||||||||
Taxable Expenses | -114,684,570 | -113,115,707 | -111,429,797 | -73,665,917 | -38,029,157 | -13,114,890 | -13,114,890 | -13,114,890 | -13,114,890 | -13,114,890 | 13,114,889 | |||||||||||||||||||||||||||||||||||||||||
Net Taxable Income | -114,684,570 | -68,379,207 | -21,956,797 | 92,652,083 | 141,597,843 | 179,821,110 | 179,821,110 | 179,821,110 | 179,821,110 | 179,821,110 | 179,821,111 | |||||||||||||||||||||||||||||||||||||||||
US Federal Corp. Income Tax | 21.0 | % | 21.0 | % | — | — | — | -19,456,937 | -29,735,547 | -37,762,433 | -37,762,433 | -37,762,433 | -37,762,433 | -37,762,433 | -37,762,433 | |||||||||||||||||||||||||||||||||||||
State Arknasas Corp. Income Tax | 6.5 | % | 65 | % | — | — | — | -6,022,385 | -9,203,860 | -11,688,372 | -11,688,372 | -11,688,372 | -11,688,372 | -11,688,372 | -11,688,372 | |||||||||||||||||||||||||||||||||||||
Profit after Taxes and Royalties | -114,684,570 | -68,379,207 | -21,956,797 | 67,172,760 | 102,658,436 | 130,370,305 | 130,370,305 | 130,370,305 | 130,370,305 | 130,370,305 | 130,370,305 | |||||||||||||||||||||||||||||||||||||||||
Net Cash Flow | -114,684,570 | -68,379,207 | -21,956,797 | 73,195,145 | 111,862,296 | 142,058,677 | 142,058,677 | 142,058,677 | 142,058,677 | 142,058,677 | 142,058,678 | |||||||||||||||||||||||||||||||||||||||||
NPV | $ | 989,432,000 | ||||||||||||||||||||||||||||||||||||||||||||||||||
IRR | 36.0 | % | ||||||||||||||||||||||||||||||||||||||||||||||||||
| Preliminary Economic Assessment of LANXESS Smackover Project | 202 |
| 22.6 | Economic Evaluation Results |
The Project economics resulting from the assumed price scenario at full production, which was used in the economic model, are presented in Table 22-2. CAPEX, OPEX and NPV values are rounded to the nearest ‘000 for clarity. Values of NPV were also calculated for a discount rate of 8%.
Table 22-2 Economic Evaluation—Case 1 (Base Case) Summary
Overview | Units | Values | Comments | |||||||
Production | tpy | 20,900 | At completion of Phase 3 production | |||||||
Plant Operation | years | 25 | From the start of Phase 1 production | |||||||
Capital Cost (CAPEX) | US$ | 437,162,000 | ||||||||
Annual Operating Cost (OPEX) | US$ | 90,259,000 | ||||||||
Average Selling Price | US$/t | 13,550 | ||||||||
Annual Revenue | US$ | 283,195,000 | ||||||||
Discount Rate | % | 8 | ||||||||
Net Present Value (NPV) Post-Tax | US$ | 989,432,000 | ||||||||
Net Present Value (NPV) Pre-Tax | US$ | 1,304,766,000 | ||||||||
Internal Rate of Return (IRR) Post-Tax | % | 36.0 | ||||||||
Internal Rate of Return (IRR) Pre-Tax % | % | 41.8 | ||||||||
| 22.7 | Sensitivity Analysis |
A sensitivity analysis methodology, using one-factor-at-a-time (OAT), involves changing one input variable, keeping others at their baseline (nominal) values, and then, returning the variable to its nominal value. This is repeated for each of the other inputs in the same way.
OAT sensitivity analysis of the project key variables (CAPEX, OPEX, Selling Price changing +/- 20%) was conducted to illustrate the impact of changes on the corresponding values of NPV and IRR.
The results of the sensitivity analysis, at an 8% discount rate, are presented in Table 22-3 to Table 22-5, and Figures 22-1 to 22-4.
Sensitivity of NPV and IRR to the CAPEX increase and decrease by 20% from the Base Case, is shown in Table 22-3.
| Preliminary Economic Assessment of LANXESS Smackover Project | 203 |
Table 22-3 Sensitivity Analysis to CAPEX Variation
Overview | Case 1 (Base Case) (US$) | Case 2 CAPEX -20%(US$) | Case 3 CAPEX +20%(US$) | |||||||||
Capital Cost (CAPEX) | 437,162,000 | 349,730,440 | 524,596,000 | |||||||||
Net Present Value (NPV) Post-Tax | 989,432,000 | 1,003,337,000 | 975,526,000 | |||||||||
Net Present Value (NPV) Pre-Tax | 1,304,766,000 | 1,326,357,000 | 1,283,174,000 | |||||||||
Internal Rate of Return (IRR) Post-Tax | 36.0 | 36.2 | 35.8 | |||||||||
Internal Rate of Return (IRR) Pre-Tax | 41.8 | 42.2 | 41.4 | |||||||||
Sensitivity of NPV and IRR to the OPEX increase and decrease by 20% from the Base Case, is shown in Table 22-4.
Table 22-4 Sensitivity Analysis to OPEX Variation
Overview | Case 1 (Base Case) (US$) | Case 4 OPEX -20% (US$) | Case 5 OPEX +20%(US$) | |||||||||
Operating Cost (OPEX) | 90,259,000 | 72,207,000 | 108,311,000 | |||||||||
Net Present Value (NPV) Post-Tax | 989,432,000 | 1,124,739,000 | 854,125,000 | |||||||||
Net Present Value (NPV) Pre-Tax | 1,304,766,000 | 1,473,095,000 | 1,136,436,000 | |||||||||
Internal Rate of Return (IRR) Post-Tax | 36.0 | 39.7 | 32.4 | |||||||||
Internal Rate of Return (IRR) Pre-Tax | 41.8 | 45.9 | 37.7 | |||||||||
Sensitivity of NPV and IRR to the products selling price increase and decrease by 20% from the Base Case, is shown in Table 22-5.
| Preliminary Economic Assessment of LANXESS Smackover Project | 204 |
Table 22-5 Sensitivity Analysis to Product Price Variation
Overview | Case 1 (Base Case) | Case 6 Revenue -20% | Case 7 Revenue +20% | |||||||||
Average Selling Price US$/t of Li2CO3 | 13,550 | 10,840 | 16,260 | |||||||||
Net Present Value (NPV) Post-Tax (US$) | 989,432,000 | 564,335,000 | 1,414,529,000 | |||||||||
Net Present Value (NPV) Post-Tax (US$) | 1,304,766,000 | 775,894,000 | 1,833,637,000 | |||||||||
Internal Rate of Return (IRR) Post-Tax | 36.0 | 24.5 | 47.5 | |||||||||
Internal Rate of Return (IRR) Pre-Tax | 41.8 | 28.9 | 54.5 | |||||||||
Sensitivity of Post-Tax NPV to the changes in the CAPEX, OPEX, and Selling Price by +/- 20% is illustrated in Figure 22-1.
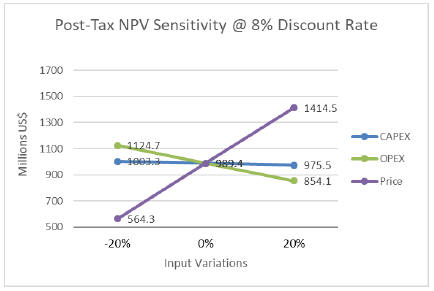
Figure 22-1 NPV Post Tax Sensitivity
Sensitivity of Pre-Tax NPV to the changes in the CAPEX, OPEX, and Selling Price by +/- 20% is illustrated in Figure 22-2.
| Preliminary Economic Assessment of LANXESS Smackover Project | 205 |
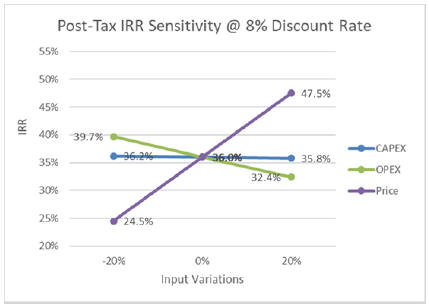
Figure 22-2 NPV Pre-Tax Sensitivity
Sensitivity of Post-Tax IRR to the changes in the CAPEX, OPEX, and Selling Price by +/- 20% is illustrated in Figure 22-3.
Figure 22-3 IRR Post-Tax Sensitivity
Sensitivity of Pre-Tax IRR to the changes in the CAPEX, OPEX, and Selling Price by +/- 20% is illustrated in Figure 22-4.
| Preliminary Economic Assessment of LANXESS Smackover Project | 206 |
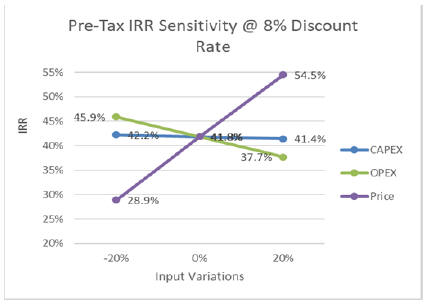
Figure 22-4 IRR Pre-Tax Sensitivity
The OAT sensitivity analysis indicates that the project is as follows:
| • | Very sensitive to the product selling price variation; |
| • | Moderately sensitive to the OPEX variation; and |
| • | Relatively insensitive to the CAPEX increase and decrease. |
The project is shown to be less sensitive to variations in capital expenditures than to variations in operating cost when measuring IRR and NPV.
| 22.8 | Conclusions |
The Project’s economics resulting from the assumed price scenario used in the economic model is presented in Table 22-1. A sensitivity analysis was conducted to illustrate the impact of +/- 20% changes in key variables on the project’s NPV and IRR (Table 22-3 to Table 22-5).
| • | CAPEX: Capital investment for the 20,900 tpy of battery grade lithium carbonate, including equipment, materials, indirect costs and contingencies at 25%, is estimated to be US$437.2 M. This total excludes interest expenses that might be capitalized during the same period. |
| • | OPEX: The operating cost for the Project is estimated at US$90.3 M, annually. This figure includes plant chemicals, energy, labour, brine waste removal, maintenance, sustaining capital and transportation. |
| • | Cash Flow: Cash flow is calculated according to the production ramp up that will reach 100% in year-6 after start of construction and in year-4 after start of operations. |
| Preliminary Economic Assessment of LANXESS Smackover Project | 207 |
| • | Post-Tax Sensitivity Analysis: |
| • | The Sensitivity analysis at a discount rate of 8% indicates that the project is economically viable under the base case conditions where the NPV and IRR are very positive. |
| • | Project economics is very sensitive to the variations in the product selling price. A change in selling price by +/- 20% changes the value of the NPV by +/- 43% and the value of IRR by +/- 32%. |
| • | The Project is moderately sensitive to variations in the OPEX. A change in the OPEX by +/- 20% changes the value of the NPV by +/- 14% and the value of IRR by +/-10%. |
| • | The project economics is relatively insensitive to the increase or decrease of CAPEX. A change in the CAPEX by +/-20% changes the value of the NPV by +/-1% and the value of IRR by less than +/- 1%. |
| • | The cost of reagents is approximately 72% of the OPEX. The remaining components of the operating costs have significantly lower impact on the overall economics. |
| • | Improvements made to process efficiency, particularly the reduction of reagents and chemicals consumption, will improve the economics of the project. |
| Preliminary Economic Assessment of LANXESS Smackover Project | 208 |
| 23 | Adjacent Properties |
There are two major bromine producers in Arkansas: LANXESS and Albemarle Corporation (see Figure 23-1). LANXESS has its Arkansas headquarters in El Dorado, Arkansas. Albemarle’s Arkansas headquarters are at the center of its Property in Magnolia, Arkansas. Albemarle’s Property is situated approximately 3 km from the western boundary of the LANXESS Property.
Like LANXESS, Albemarle produces bromine (Albemarle Corporation 2017) and chemical derivatives therefrom. In 2011, Albemarle announced it had developed a proprietary technology for lithium extraction from brine that would allow the company to recover lithium that is present in the brines at its Magnolia, Arkansas bromine facility and utilize it to produce lithium carbonate (Albemarle Corporation 2011). Albemarle has successfully produced lithium carbonate in a laboratory setting and has operated a Pilot Plant to optimize the process. Previously, it was reported that commercial production could begin in 2013 (Albemarle Corporation 2011; Magnolia Reporter 2011), but to the best of the author’s knowledge, Albemarle has not commenced any commercial production of lithium chemicals from its Smackover Formation brine.
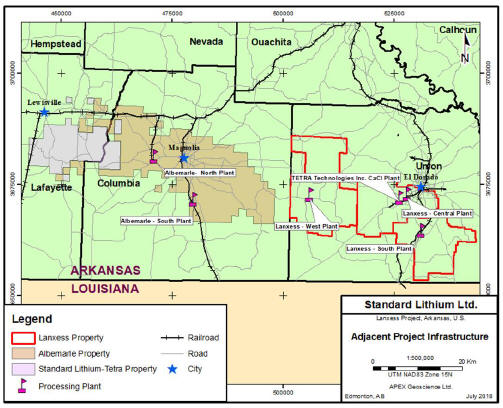
Figure 23-1 Location of Brine Producers in Southern Arkansas
| Preliminary Economic Assessment of LANXESS Smackover Project | 209 |
| 24 | Other Relevant Data and Information |
| 24.1 | Introduction |
It is assumed that the lithium chloride and carbonate production units will be built at the existing LANXESS bromine operations and will be mostly covered by the current operating permits. Some additional works will be required in respect to the modification of existing permits and negotiations with regulators.
It is assumed that Engineering, Procurement and Construction Management (EPCM) of the plant and brine field development will take approximately 18 months for each site. Production will ramp-up from mechanical completion of each site to reach the nameplate capacity within 12 weeks.
The tentative project schedule in this PEA report is developed on the assumption that the project will be fully funded, regulatory permits will be granted without delays, external agencies and suppliers will be cooperative and management of the execution will be by competent EPCM / EPC organization. Preliminary development schedule is given in Figure 24-1.
| 24.2 | Execution Strategy |
The PEA for the Smackover Lithium project execution strategy is based on the hybrid model mixing the conventional EPCM and Engineering Procurement Construction (EPC) approach. This type of hybrid model will allow for extensive participation of the local contractors where possible. The preliminary schedule includes typical durations for major activities based on experience with similar size projects.
A more detailed execution plan is to be developed during Pre-Feasibility Study (PFS) and later Bankable Feasibility Study (BFS) phases of the project.
Schedule is developed based on the assumption that the project will be fully financed as per Standard Lithium’s agreements with LANXESS; that is, LANXESS will provide 100% of project finance.
Project is to be executed in phases, as follows:
| • | Phase 1 – South Plant Lithium Chloride Unit, Central Plant Lithium Carbonate Unit No 1; |
| • | Phase 2 – West Plant Lithium Chloride Unit, Central Plant Lithium Carbonate Unit No 2; and |
| • | Phase 3 – Central Plant Lithium Chloride Unit and Lithium Carbonate Unit No 3. |
Project permitting will cover all three plants at once.
| 24.3 | Project Development Plan |
Project developments include the following major phases:
| Preliminary Economic Assessment of LANXESS Smackover Project | 210 |
| • | Preliminary Economic Assessment (PEA); |
| • | Pre-Feasibility Study (PFS); |
| • | Feasibility Study (FS); |
| • | Environmental Impact Statement (if required; although initial review suggests it will not be) and Permitting; and |
| • | EPCM/EPC |
| • | South Plant |
| • | West Plant |
| • | Central Plant. |
| 24.4 | Project Schedule |
The schedule of Project execution Level 1, developed for the PEA phase, is a graphical snapshot of the driving summary activities and logic. The intent is to demonstrate major Project execution activities and key milestones. The schedule covers the entire Project life cycle from the start of the PEA study until commissioning and nameplate production capacity is reached.
The Level 1 Project execution schedule is presented in Figure 24-1.
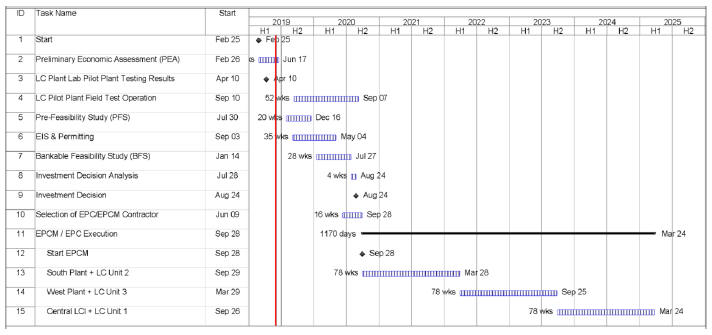
Figure 24-1 Project Schedule
| 24.5 | Risk Assessment Summary |
A risk analysis workshop was held with key stakeholders to identify potential external factors that may impact the Project in future phases of development. The external factors identified include the following:
| Preliminary Economic Assessment of LANXESS Smackover Project | 211 |
| • | political; |
| • | design/engineering; |
| • | environmental; |
| • | finance; |
| • | procurement; and |
| • | community/cultural. |
Within each of these external factor categories, risks (threats) and opportunities were identified and classified by their consequence and the likelihood that they may occur. The risks and opportunities were categorized as: low, medium, high and very high. Figure 24-2 presents the Risk Matrix with associated consequence and likelihood tables and control effectiveness guide.
The consequence of an event occurring, were evaluated by looking at the potential effects on health and safety, environment, financial, schedule or production, operations, Project delivery and legal and regulatory compliance.
During the risk review, seven risks were identified; one (1) very high, five (5) high, and one (1) medium. Three (3) opportunities were identified, which were categorized as high. The threats and opportunities were assessed, and potential risk treatment plans/strategies were identified. These were aimed at reducing the level of the risk as much as possible, or in the case of the opportunity, enhancing the outcome. Following the identification of the treatment plans/strategies, one (1) of the risks was reduced to medium, and six (6) of the risks were reduced to low. Table 24-1 shows the initial risks, existing controls, the initial risk ranking, followed by the risk treatment plan and the residual risk, or treated risk ranking. Table 24-2 presents the opportunities and the existing controls that are in place to enhance the opportunities.
| Preliminary Economic Assessment of LANXESS Smackover Project | 212 |
Risk Matrix with associated Consequence and Likelihood tables and Control Effectiveness guide
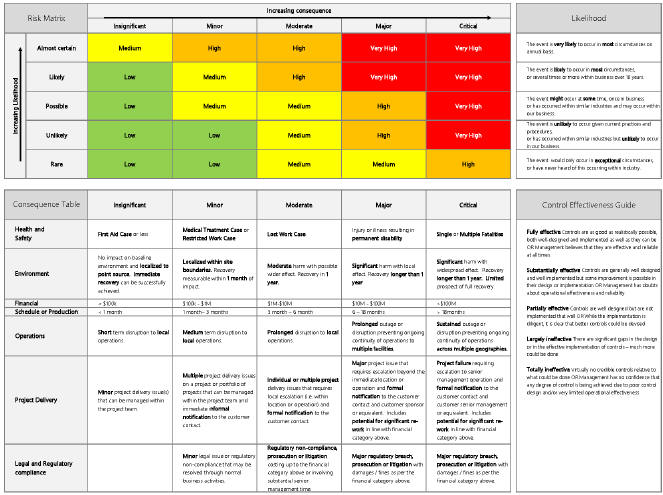
Figure 24-2 Risk Matrix
| Preliminary Economic Assessment of LANXESS Smackover Project | 213 |
Table 24-1 Risk Review Summary - Threats
Risk No. | Risk Description | Existing Controls | Initial Risk | Risk Treatment Plan | Residual Risk | |||||
| 1 | If sufficient power is not available, will have higher capital cost for plants. | There is surplus power available to meet electrical demand in the El Dorado area. | Very High | Do a power supply study during the PFS phase. Upgrade the power infrastructure for one or more of the plant sites. | Low | |||||
| 2 | If LANXESS reduces/ceases production of brine, could result in reduced availability of tail-brine. | LANXESS has a risk plan for plant failures. Commercial agreement in place incentivises brine supply | High | Install a bypass and use pre- conditioned brine | Low | |||||
| 6 | If innovative lithium extraction process does not perform as expected, could result in higher OPEX and CAPEX. | Mini-pilot tests completed. | High | Demonstration Plant operation scheduled for one year, | Low | |||||
| 7 | If market price of lithium carbonate drops, project economics will be negatively affected. | Demand is increasing faster than supply is coming to the market. | High | Phased approach for construction. Add different lithium products to product offerings. | Low | |||||
| 8 | If specialty adsorbent isn’t readily available, would require additional development costs to self-produce. | Identified more than one manufacturer of product. | High | Develop geographically diverse manufacturing options/ supply. | Low | |||||
| 10 | If tornados occur, could result in loss of production. | LANXESS Tornado risk control plan in place. Forested area around plant reduces tornado strength. | High | Provide shelter for personnel. Design critical facilities to withstand moderate tornados. Carry special insurance. | Medium | |||||
| 9 | If unknowing infringement of adsorbent patents occurs, could result in licensing claims. | Conducted freedom to operate searches. | Medium | Continue patent research. Ensure contingency funds in place to cover licensing fees | Low | |||||
214
Table 24-2 Risk Review Summary - Opportunities
| ||||||
Risk | Opportunity Description | Existing Controls | Initial Opportunity | |||
3 | If bypass installed before bromine processing, production rates could increase. | Existing infrastructure can allow a bypass. | High | |||
4 | If additional well fields developed, production could be increased. | Additional brine leases are established. Hydrogeology is well understood. | High | |||
5 | If consumption of reagents is reduced, OPEX could be reduced. | Testing program implemented to optimize the process. | High | |||
215
| 25 | Interpretations and Conclusions |
| 25.1 | Geology and Resource Estimate |
Based on the results of the geological evaluation and resource estimates, the authors conclude that the Smackover Lithium Project justifies the continued development of the project to evaluate the feasibility of the production of lithium carbonate, in addition to the following interpretations and conclusions:
| • | The LANXESS Li-brine resource estimate is classified as “Indicated” according to CIM (2014) definition standards. The average lithium concentration used in the resource estimate calculation is 168 mg /L and represents the results of the 2018-2019 sampling program from the LANXESS brine supply wells. |
| • | The cut-off grade of 100 mg/L of lithium concentration was used for the resource estimate in this Technical Report. |
| • | The total Indicated LANXESS Li-brine resource is estimated at 590,000 tonnes of elemental lithium. The total lithium carbonate equivalent (LCE) for the resource is 3,140,000 tonnes. Mineral resources are not mineral reserves and do not have demonstrated economic viability. There is no guarantee that all, or any part, of the mineral resource will be converted into a mineral reserve. |
| • | The resource classification is conservative, given the volume of data available regarding the geology, hydrogeology, porosity, brine grade and production records for the LANXESS Property. |
| • | The historical production wells pumping data indicate that the production wells located at the Property should be able to yield a sufficient volume of brine to support the nameplate production level of 20,900 tpy of lithium carbonate. |
| • | The LANXESS Li-brine project has strong prospects for economic extraction, based on aquifer geometry, hydrogeological characterization, effective porosity, brine access, brine volume and flow rate, lithium concentration, and Mini-Pilot recoverability tests conducted to date. |
| 25.2 | Mineral Processing and Plant Designs |
The lithium chloride and lithium carbonate process plants, that are planned for this project, will be located at the three existing LANXESS bromine production operations sites. These sites are located in the vicinity of the City of El Dorado, AR. All three sites have well developed infrastructure for the continuous supply of feedstock brine to the lithium chloride plants and for the chemical processing operations. Some upgrades required for the power supply infrastructure can be easily implemented.
| 25.2.1 | Lithium Chloride Plants |
The production of lithium chloride, a feedstock semi-product, which is used in the production of lithium carbonate, will be at three locations: South Plant, West Plant and Central Plant. The production process will be the same at each location. Tail-brine will be diverted from each LANXESS Bromine Tower tail-brine tie-in point, to each of the Smackover lithium chloride plants. The key element of the production of purified lithium chloride solution, is the selective lithium extraction – adsorption process.
216
The technical solutions included in this report are based on conventional chemical engineering solutions, which are supported by the results of bench tests and mini-pilot plant operations. This approach provides a solid, workable base case to which other design alternatives can be related and compared. To improve the project economics and mitigate the risks, a number of alternative designs should be evaluated during the next phase of the project, Pre-Feasibility Study, including the following:
| • | An additional circuit to allow for the processing of additional raw brine directly from the well fields; |
| • | An additional circuit, which will allow for the recirculation and reduction of use of hydrochloric acid; and |
| • | Optimization of the adsorbent washing circuit, supported by laboratory testing. |
| 25.2.2 | Lithium Carbonate Plant |
At the lithium carbonate plant, lithium chloride solution undergoes two additional operations: purification and concentration. The resulting lithium carbonate is removed by filtration, followed by several stages of washing and drying. Reduction of particle sizes (micronization) is the final stage of production of battery grade lithium carbonate.
To improve the project economics and to mitigate potential risks, the results from the mini-pilot plant operations will be included in the design. Also, at the PFS stage, there should be an evaluation of the SiFT process to produce battery quality lithium carbonate vs. the traditional OEM process used in this study.
| 25.3 | Market and Lithium Carbonate Price |
A number of proponents of new developments published their projections of lithium carbonate in the last 18 months. For example: (PEA) Millenium Lithium – US$14,800/t; (PEA) Advantage Lithium – US$15,300/t. Some proponents, such as the Neo-Lithium project (PFS, May 8th, 2019) has a price of US$11,882/t. The average projected price of similar projects is in the range of US$13,400/t. Taking into consideration that the published spot prices for the US market in July 2019 are in the range of US$11/kg-US$13/kg, a three-years rolling average is more representative at this stage.
| 25.4 | CAPEX and OPEX |
The CAPEX and OPEX for the Standard Lithium lithium processing facility, was estimated using bench scale tested and mini-pilot plant tested technology, with a level of accuracy of (-30/+50%), and includes equipment, materials, indirect costs and contingencies.
The CAPEX for all three phases of development, resulting in the nameplate production capacity of 20,900 tpy of battery grade lithium carbonate, is estimated to be US$437.2 M.
The AACE International Recommended Practice No. 47R-11 Cost Estimate Classification System – As Applied In The Mining And Mineral Processing Industries—Cost Estimating and Budgeting and AACE International Recommended Practice No. 59R-10 Development Of Factored Cost Estimates – As Applied In Engineering, Procurement, And Construction For The Process Industries, specifies in detail the breakdown of capital cost components. The AACE Recommended practice includes “Labour Indirects & Field Costs” as an Indirect Cost category. This recommended practice is not always followed by authors of other PEA studies. In many PEA/PFS
217
level studies, the “Labour Indirects & Field Costs” are not shown separately but included as elements of Direct Cost. With the great variety and no consistency of CAPEX elements breakdown, even an attempt to compare single elements with other similar projects is not feasible. For this very reason, only the final CAPEX value with contingency should be used as an indicator of the estimated initial capital expenditures. Only the final CAPEX values are used in the calculations of NPV and IRR.
Securities Regulators, like the Ontario Security Commission (OSC), endorse a contingency at a 35% level for PEA level studies. As the Smackover Lithium Project has higher level of definition it is justifiable to use lower level of contingency at 25%.
The capital intensity ratio (CIR) per unit of production at US$20,900/t is comparable with other lithium carbonate projects where the IRR is around US$20,200/t.
The OPEX is calculated for the assumed process route. Consumption of the reagents comprise 72% of the OPEX and hydrochloric acid and sodium hydroxide are the two largest components. Introduction of recirculation/recuperation of hydrochloric acid and sodium hydroxide will reduce the OPEX in the range of US$500/tonne. With the reduction of reagents consumption, the operating unit cost will be reduced to the range of US$3,700-US$3,800 per tonne.
25.5 Economic Analysis
The Smackover Project resource estimate indicates that there is a large volume of lithium bearing brine at grades and depths that will be amenable to long term extraction and economical processing to produce battery grade lithium carbonate products.
The main conclusions of the economic analysis are as follows:
| • | Proprietary and public lithium marketing studies indicate that future demand for this product will continue to increase strongly, driven mainly by demand for batteries for hybrid and electric vehicles and energy storage facilities. Materialization of this demand should allow commercialization of growing volumes of lithium carbonate in a favourable pricing environment. |
| • | The 25 years life of mine (LoM) operation is planned for producing: 20,900 tpy of battery grade lithium carbonate. |
| • | The Project economic analysis indicates that, for the base case, post-tax NPV (8%) is US$989.4 M and post-tax IRR is 36.0%. The IRR at 36% is relatively high in comparison with other lithium carbonate projects where the IRR is around 28%. |
| • | The Project economic sensitivity analysis shows that the product’s price variations have the highest impact on economic results. Project economic indicators, NPV and IRR, are less sensitive to OPEX and less so to CAPEX. |
| • | The Project results remain positive, even with important 20% negative variations on the key (CAPEX, OPEX, Price) variables, indicating project strength and resilience; therefore, the PEA study completed by Worley indicates that Standard Lithium’s proposed 20,900 tpy LCE operation has the potential to generate strong economic returns over an extended period. |
| • | Recommendations to proceed with further development of the project are outlined in Section 26. |
218
26 Recommendations
26.1 Geology and Resource Estimate
Based on the results of the geological evaluation and resource estimates, the authors conclude that the Smackover Lithium Project justifies continued development to evaluate the feasibility of production of lithium carbonate, in addition to the following interpretations and conclusions:
| • | The LANXESS Li-brine resource estimate should be upgraded from the current classification of “Indicated” to the “Measured”, as classified according to CIM (2014) definition standards. |
| • | The sampling and testing program should be continued to allow for the most updated calculation of the lithium concentration to be used in the resource estimate calculation. |
26.2 Mineral Reserves Estimate and Mining Plan
The Mineral Reserves estimate is to be developed during the PFS phase, to the “Probable” category, as defined by CIM definition standard (2014). The application of Modifying Factors should be included, as appropriate.
26.3 Process and Economics
The lithium market assessment and price projection, which is summarized in Section 19 of this report, assumes a three year (2016-2018) rolling average price for lithium carbonate. A more detailed lithium products market study should be undertaken during the PFS stage, by specialized market research professionals. The marketing study should assess the following:
| • | The impact on the lithium carbonate price when new projects, that are currently in various stages of development, will come into production. |
| • | Projected price and demand for other lithium products (lithium hydroxide, lithium metal, lithium electrolyte salts, etc.). |
The next phase (PFS) of project execution should include the following:
| • | Development of Base Case Process Flow Diagrams (PFDs) for the whole Phase 1 production cycle for the South Lithium Chloride Plant and for the Central Lithium Carbonate Plant (Train No.1); |
| • | Development of Base Case: Utility Flow Diagrams (UFDs) for the Phase 1 development (as above); |
| • | Completion of a Study to reduce the use/consumption of reagents; particularly, the maximization of hydrochloric acid recycling at the lithium chloride plants; |
| • | Complete an evaluation of the SiFT process to produce battery quality lithium carbonate vs. the traditional OEM process used in this study; and, |
| • | Adding a raw brine pre-treatment circuit, which will allow for the use of raw brine directly from the well field when/if LANXESS’ production of bromine is halted, and/or additional brine in excess of that being processed for bromine extraction is contemplated. |
219
26.4 Further Work
On completion of the PEA, the project should progress to a NI 43-101 compliant Pre-Feasibility Study.
A Demonstration Plant will be located at the LANXESS South Plant and is planned to start operation in the second half of 2019. Experience and data obtained from the demonstration-scale plant should be included in the PFS.
Technical data and information developed during the PFS should be of sufficient detail to satisfy the requirements of the permitting authorities.
The Pre-Feasibility Study should include the following:
| • | Location and description of the project; |
| • | Regional and local geology; |
| • | Mineral resource estimate and model; |
| • | Reserve conversion; |
| • | Preliminary studies completed on geotechnical, environmental and infrastructure requirements (power supply studies). |
| • | Geotechnical testing for the proposed locations of the lithium chloride and lithium carbonate production facilities at the Central, South and West plants; |
| • | Mine (brine field) design based on a Resource model, with best alternatives selected from a range of alternatives; |
| • | Mining method(s) and extraction sequence; |
| • | Brine handling; |
| • | Process Flow Sheets; |
| • | Discussion and analysis of preferred lithium carbonate crystallisation process (SiFT vs. OEM); |
| • | Process plants layouts; |
| • | Pre-production construction schedule; |
| • | Production schedule; |
| • | Capital and operating cost estimate; and |
| • | Preliminary financial evaluation and risk analysis. |
The indicative cost of a Pre-Feasibility Study typically varies between 0.2% and 0.8% of the CAPEX. Taking into consideration the work already completed during the PEA phase and the well-developed infrastructure at the LANXESS sites, the budget for a NI 43-101 compliant PFS for the Smackover Lithium Project should be at 0.3% of CAPEX level (US$1.3 M).
220
27 References
AACE (2012): AACE International Recommended Practice No. 47R-1COST ESTIMATE CLASSIFICATION SYSTEM – AS APPLIED IN THE MINING AND MINERAL PROCESSING INDUSTRIES Rev. July 6, 2012.
AACE (2011a): AACE International Recommended Practice No. 18R-97 COST ESTIMATE CLASSIFICATION SYSTEM – AS APPLIED IN ENGINEERING,PROCUREMENT, AND CONSTRUCTION FOR THE PROCESS INDUSTRIES Rev. November 29, 2011.
AACE (2011b): AACE International Recommended Practice No. 59R-10 DEVELOPMENT OF FACTORED COST ESTIMATES – AS APPLIED IN ENGINEERING,PROCUREMENT, AND CONSTRUCTION FOR THE PROCESS INDUSTRIES. June 18, 2011.
Ahr, W. M. (1973): The carbonate ramp – an alternative to the shelf model. Gulf Coast Association of Geological Societies Transactions, v. 23, p. 221–225.
Albemarle Corporation (2011): Albemarle Corporation Announces Discovery in Lithium Carbonate Production; Albemarle Corporation News Release, April 29, 2011, < Available on 5 July 2018 at: https://www.prnewswire.com/news-releases/albemarle-corporation-announces-discovery-in-lithium-carbonate-production-120969289.html >.
Albemarle Corporation (2017): Albemarle Corporation 2017 Form 10K; Annual Report pursuant to Section 13 or 15(d) of the Securities Exchange Act, For the fiscal year ending December 31, 2017. 147 p.
Albemarle Corporation (2018): Albemarle Corporation: Investor Presentation and Non-GAAP Reconciliations, September 2018, < Available on 219 November 2018 at: https://investors.albemarle.com/static-files/3146e48f-5901-4224-8c8c-b81d2559c7c6 >.
Akin, R.H. and Graves, R.W. (1969): Reynolds oolite of southern Arkansas; The American Association of Petroleum Geologists, Bulletin v. 53, no. 9, p. 1909-1922.
Argus Media (2018): Argus White Paper: Lithium pricing at a crossroads; 4 p. < Available on 2 October 2018 at: https://www.argusmedia.com%2F-%2Fmedia%2FFiles%2Fwhite-papers%2Fargus-white-paper-lithium-pricing-at-a-crossroads.ashx&usg=AOvVaw1pyKk8ozwuEXKJaiTYCLRu >.
Arkansas Code (2016a): § 15-76-308. Formation of a Brine Unit; Title 15 – Natural Resources and Economic Development, Subtitle 6 – Oil, Gas and Brine, Chapter 76 – Brine, Subchapter 3 – Brine Production, < Available on 9 July 2018 at: https://law.justia.com/codes/arkansas/2016/title-15/subtitle-6/chapter-76/subchapter-3/section-15-76-308/ >.
Arkansas Code (2016b): § 15-76-309. Petition for formation of a brine production unit or a brine expansion unit; Title 15 – Natural Resources and Economic Development, Subtitle 6 – Oil, Gas and Brine, Chapter 76 – Brine, Subchapter 3 – Brine Production, < Available on 9 July 2018 at: https://law.justia.com/codes/arkansas/2016/title-15/subtitle-6/chapter-76/subchapter-3/section-15-76-309/ >.
Arkansas Code (2016c): § 15-76-314. Participation by owners and royalties; Title 15 – Natural Resources and Economic Development, Subtitle 6 – Oil, Gas and Brine, Chapter 76 – Brine, Subchapter 3 – Brine Production, < Available on 9 July 2018 at: https://law.justia.com/codes/arkansas/2016/title-15/subtitle-6/chapter-76/subchapter-3/section-15-76-314/ >.
221
Arkansas Code (2016d): § 15-76-315. Valuation of brine; Title 15 – Natural Resources and Economic Development, Subtitle 6 – Oil, Gas and Brine, Chapter 76 – Brine, Subchapter 3 – Brine Production, < Available on 9 July 2018 at: https://law.justia.com/codes/arkansas/2016/title-15/subtitle-6/chapter-76/subchapter-3/section-15-76-315/ >.
Arkansas Code (2016e): § 15-76-318. Drilling permits – fees; Title 15 – Natural Resources and Economic Development, Subtitle 6 – Oil, Gas and Brine, Chapter 76 – Brine, Subchapter 3 – Brine Production, < Available on 9 July 2018 at: https://law.justia.com/codes/arkansas/2016/title-15/subtitle-6/chapter-76/subchapter-3/section-15-76-318/ >.
Arkansas Geological Survey (2018): Brine Resources; Arkansas Geological Survey, < Available on 14 July 2018 at: http://www.geology.ar.gov/energy/brine_resources.htm >.
Arkansas Oil and Gas Commission (2018a): Order No. 057-2018-10: South Brine Unit & South Expansion Brine Unit; < Available on 14 November 2018 at: http://www.aogc.state.ar.us/Hearing/Orders/2018/10-October/057-2018-10.pdf >.
Arkansas Oil and Gas Commission (2018b): Various information (e.g., brine production data, well data, AOGC Reports) researched by the authors of this Technical Report, < Available in September and October 2018 at: http://www.aogc.state.ar.us/ >.
Baria, L. R., Stoudt, D. L., Harris, P. M. and Crevello, P. D. (1982): Late Jurassic reefs of Smackover Formation, United States Gulf Coast. American Association of Petroleum Geologists Bulletin, v. 66, p. 1449–1482.
Baldwin, O. D., and Adams, J. A. S. (1971): KI0/ArI0 ages of the alkalic igneous rocks of the Balcones fault trend of Texas: Texas Journal of Science, v. 22, no. 2 & 3, p. 223-231.
Barrera, P. (2019): Lithium Market Update: Q1 2019; Lithium Investing News, April 2019, < Available on 28 May 2019 at: https://investingnews.com/daily/resource-investing/battery-metals-investing/lithium-investing/lithium-market-update/ >.
Batu, V. (1998): Aquifer Hydraulics: A Comprehensive Guide to Hydrogeologic Data Analysis, John Wiley & Sons, New York, 727 p.
Benchmark Mineral Intelligence (2017): Into the Light: Lithium ion battery supply chain in 2018; Benchmark Mineral Intelligence, 17 Bank of America Merrill Lynch, 17 January 2018, New York, 34 p.
Benchmark Mineral Intelligence (2018a): Lithium Price Assessment, March 2018 Review; Benchmark Mineral Intelligence, 7 p.
Benchmark Mineral Intelligence (2018b): Benchmark Mineral Price Assessment – Subscription Guide: Lithium; Benchmark Mineral Intelligence, H1 2018, 7 p.
Benson, D.J. (1988): Depositional history of the Smackover Formation in southwest Alabama: Gulf Coast Association of Geological Societies Transactions, v. 38, p. 197-205.
Benson, T.R., Coble, M.A., Rutyba, J.J. and Mahood, G.A. (2017): Lithium enrichment in intracontinental rhyolite magmas leads to lithium deposits in caldera basins; Nature Communications, v. 8, no. 270, p. 1–9.
Bishop, W.F. (1967): Age of pre-Smackover Formations, North Louisiana and South Arkansas; AAPG Bulletin v. 51, p. 244-250.
Bishop, W. F. (1968): Petrology of upper Smackover limestone in North Haynesville field, Claiborne Parish, Louisiana. American Association of Petroleum Geologists Bulletin, v. 52, p. 92–128.
222
Bishop, W. F. (1971a): Geology of a Smackover stratigraphic trap. American Association of Petroleum Geologists Bulletin, v. 55, p. 51–63.
Bishop, W. F. (1971b): Geology of upper member of Buckner Formation, Haynesville Field area, Claiborne Parish, Louisiana. American Association of Petroleum Geologists Bulletin, v. 55, p. 566–580.
Bishop, W. F. (1973): Late Jurassic contemporaneous faults in north Louisiana and south Arkansas. American Association of Petroleum Geologists Bulletin, v. 57, p. 566–580.
Blondes, M.S., Gans, K.D., Rowan, E.L., Thordsen, J.J., Reidy, M.E., Engle, M.A., Kharaka, Y.K. and Thomas B. (2016): U.S. Geological Survey National Produced Waters Geochemical Database v2.2 (PROVISIONAL) Documentation; USGS Energy Resources Program: Produced Waters, 16 Feb 2016, < Available on 14 July 2018 at: https://archive.org/stream/USGSProducedWatersV2.2c/USGS%20Produced%20Waters%20Database%20v2.2%20Documentation_djvu.txt >.
Bradley, D., Munk, L., Jochens, H., Hynek, S. and Labay, K (2006): A Preliminary Deposit Model for Lithium Brines; USGS Open-File Report 2013–1006, 9 p.
Bradley, D.C., Stillings, L.L., Jaskula, B.W., Munk, LeeAnn, and McCauley, A.D. (2017): Lithium, Schulz, K.J., DeYoung, J.H., Jr., Seal, R.R., II, and Bradley, D.C. (eds.), Critical mineral resources of the United States— Economic and environmental geology and prospects for future supply, U.S. Geological Survey Professional Paper 1802, p. K1–K21.
Budd, D. A. and Loucks, R. G. (1981): Smackover and lower Buckner formations, south Texas. Depositional systems on a carbonate ramp. Bureau of Economic Geology, The University of Texas at Austin, Report of Investigations, 112 p.
Buffler, R.T. (1991): Early evolution of the Gulf of Mexico basin; In: D. Goldthwaite, (ed.), An Introduction to Central Gulf Coast Geology, New Orleans: New Orleans Geological Society, p. 1-15.
Buffler, R.T., Shaub, F.J., Huerta, R., Ibrahim, A.B.K. and Watkins, J.S. (1981): A model for the early evolution of the Gulf of Mexico; Oceanologica Acta, No. SP, p 129-136.
Cabot Corporation (2014): Formate Technical Manual, Chemical and Physical Properties Section A4 Viscosity of Formation Brines. www.formatebine.com\manual.
CCG (2016): Use and Support of Software from the Centre for Computational Geostatistics (CCG); < Available on 18 September 2018 at: http://www.ccgalberta.com/software-terms-of-use/ >.
Chimene, C. A. (1991): Walker Creek field. In: Foster, N. H. and Beaumont, E. A. (eds) Stratigraphic Traps II. Treatise of Petroleum Geology, Atlas of Oil and Gas Fields. American Association of Petroleum Geologists, p. 55–116.
Chuchla, R.J. (In Preparation, 2018): Some ideas regarding the controls on lithium concentration in Smackover Brine; In preparation, 2018.
Collins, A. G. (1976): Lithium abundance in oilfield waters; Lithium Resources and Requirements by the Year 2000, U.S. Geol. Survey Prof. Paper 1005, p. 116–123.
Daitch, P.J. (2018): Lithium extraction from oilfield brine; MSc/MBA Thesis, University of Texas at Austin, May 2018, 141 p.
223
Dickinson, K. A. (1968): Late Jurassic stratigraphy of some adjacent parts of Texas, Louisiana and Arkansas; U.S. Geol. Survey Prof. Paper, 594E, 25 p.
Domenico, P. A. and Mifflin, M. D. (1965): Water from low-permeability sediments and land subsidence. Water Resources Research, 1, p. 563-576.
Dworzanowski, M. (2019) Person commun.
The Encyclopedia of Arkansas History & Culture (2018): The Encyclopedia of Arkansas History & Culture (EOA) is a project of the Butler Center for Arkansas Studies at the Central Arkansas Library System (CALS) in Little Rock, Arkansas, < Accessed on 12 July 2018 at: http://www.encyclopediaofarkansas.net/about/ >.
Eccles, D.R., Molnar, R. and Rakhit, K. (2018): Geological introduction and maiden inferred resource estimate for Standard Lithium Ltd.’s LANXESS Smackover Lithium-Brine Property in Arkansas, United States; Technical Report prepared for Standard Lithium Ltd., Effective date of November 19, 2018, 161 p.
Evans, R.K. (2014): Lithium; In: A.G. Gunn (Ed.), Critical Metals Handbook, John Wiley & Sones td., Chichester, UK.
Fancher, G.H. and Mackay, D. K. (1946): Secondary recovery of petroleum in Arkansas—A survey: A report to the 56th General Assembly of the State of Arkansas under the auspices of the Arkansas Oil and Gas Commission, 264 p.
Fetter, C.W. (1988): Applied Hydrogeology (4th Edition); Prentice-Hall Inc., Upper Saddle River, New Jersey, 592 p.
Fontes, J-C. and Matray, J.M. (1993): Geochemistry and origin of formation brines from the Paris Basin, France; Chemical Geology, v. 109, p. 149–175.
Forgotson, J.M. (1954): Regional stratigraphic analysis of Cotton Valley Group of Upper Gulf Coastal Plain: AAPG Bulletin, v. 38, p. 2476-2499.
Freeze, R.A. and J.A. Cherry (1979): Groundwater; Prentice Hall; 1 edition (May 18, 1979), 604 p.
Garrett, D.E. (2004): Handbook of Lithium and Natural Calcium Chloride: Their Deposits, Processing, Uses and Properties. Elsevier. 476 p.
Hains, D.H. and Fourie, L.F. (2018): Technical Report on the Pastos Grandes Lithium Project; NI 43-101 Technical Report prepared by Hains Engineering Company Limited for LSC Lithium Corporation, dated October 25, 2018 with an effective date of October 19, 2018, 160 p., < Available on 14 May 2019 at: www.sedar.com >.
Hanford, and Baria (2007): Geometry and seismic geomorphology of carbonate shoreface clinoforms, Jurassic Smackover Formation, north LouisianaIn: In: Davies, R. J., Posamentier, H. W., Wood, L. J. and Cartwright, J. A. (eds) Seismic Geomorphology: Applications to Hydrocarbon Exploration and Production. Geological Society, London, Special Publications, v. 277, 171–185.
Harris, P.M. and Dodman, C.A. (1982): Jurassic evaporites of the U.S. Gulf Coast: the Smackover-Buckner contact; In: Handford, C. R., R. G. Loucks, and G. R. Davies (eds.), Depositional and diagenetic spectra of evaporites — a core workshop: Society of Economic Paleontologists and Mineralogists Core Workshop 3, p. 174-192.
224
Harris, P. M. and Dodman, C. A. (1987): Jurassic evaporites of the U.S. Gulf Coast: the Smackover-Buckner contact; Society of Economic Paleontologists and Mineralogists, Depositional and Diagenetic Spectra of Evaporites (CW3), p. 174–192.
Hazzard, R.T., W.C. Spooner, and Blanpied, B.W. (1947): Notes on the stratigraphy of the formations which underlie the Smackover Limestone in south Arkansas, northeast Texas, and north Louisiana; Shreveport Geological Society 1945 Reference Report, v. 2, p. 483-503.
Heydari, E. and Baria, L. (2005): A microbial Smackover Formation and the dual reservoir–seal system at the Little Cedar Creek Field in Conecuh County of Alabama; Gulf Coast Association of Geological Societies Transactions, v. 55, p. 294-320.
Houston, J. and Gunn, M. (2011): Technical report on the Salar De Olaroz lithium-potash project, Jujuy Province, Argentina; National Instrument 43-101 report prepared for Orocobre Ltd.
Hunt, B.W. (2013): Regional Norphlet Facies Correlation, Analysis and Implications for Paleostructure and Provenance, Eastern Gulf of Mexico; ProQuest Dissertations Publishing (1539948).
Imlay, R.W. (1940): Lower Cretaceous and Jurassic formations of southern Arkansas and their oil and gas possibilities; Arkansas Geological Survey, Information Circular 12, 64 p.
International Bureau of Weights and Measurements (2006): The International System of Units (SI); Bureau International des Poids et Mesures, 8th Edition, < Available on 9 September 2018 at: https://www.bipm.org/utils/common/pdf/si_brochure_8_en.pdf >.
Johnson, A.I. (1967): Specific yield – compilation of specific yields for various materials; USGS, Geological Survey Water-Supply Paper 1662-D; 80 p.
Kopaska-Merkel, D.C., Mann, S.D. and Tew, B.H. (1992): Geological setting, petrophysical characteristics, and regional heterogeneity patterns of the Smackover in southwest Alabama; Geological Survey of Alabama, Contract No. DE-FG22-89BC14425, 215 p.
Kruseman, G.P. and de Riddler, N.A. (1994): Analysis and evaluation of pumping test data; Second Edition, ILRI Publication no. 47, 372 p.
Kunasz, I. (2006): Lithium Resources; In: J.E. Kogel, N.C. Trivedi, J.M. Barker and S.T. Kurkowski (Eds)., Industrial Minerals and Rocks, 7th Edition Society of Mining, Metallurgy and Exploration Inc., Little Colorado, U.S., p. 599-613.
LANXESS (2016): Qualität in Zahlen, Daten und Fakten, 2016 Geschäftsbericht (Translation, Quality in Numbers, Dates and Facts), 16 March 2017, < Available on 6 July 2018 at: https://web.archive.org/web/20180117131428/https://lanxess.de/fileadmin/user_upload/lxs_gb2016_d _Stand_1705.pdf >.
LANXESS (2017a): Lanxess successfully completed acquisition of Chemtura; Lanxess Press Release, 21 April 2017, < Available on 5 July 2018 at: https://lanxess.com/en/corporate/media/press-releases/2017-00035e/ >.
LANXESS (2017b): LANXESS Annual Report 2017, < Available on 5 July 2018 at: https://lanxess.com/fileadmin/user_upload/Downloads/Annual_Reports_PDF/LXS_GB2017_E_web.pdf>.
Lefaivre, A. and Henchel, L.D. (2019): Preliminary Economic Assessment (PEA)—Pozuelos -Pastos Grandes Project, Salta, Argentina; NI 43-101 Technical Report prepared by GHD for LSC Lithium Corporation, dated January 18, 2019 with an effective date of December 4, 2018, 273 p., < Available on 14 Reidel, F. (2016):
225
Technical Report—Resource estimate for lithium and potassium, Sal de Los Angeles Project (Salta, Argentina); NI 43-101 Technical Report prepared by FloSolutions for Lithium X Energy Corporation, Effective date of August 29, 2016, 117 p., < Available on 14 May 2019 at: www.sedar.com >. May 2019 at: www.sedar.com >.
Li, L., Deshmane, V.G., Paranthaman, M.P., Bhave, R., Moyer, B.A. and Harrison, S. (2018): Lithium recovery from aqueous resources and batteries: a brief review; Johnson Matthey Technol. Rev., 2018, v. 62, (2), pp. 161–176.
MacRae, G., and Watkins, J.S. (1996): Desoto Canyon Salt Basin: tectonic evolution and salts structural styles; In: J.O. Jones, and R.L. Freed, (Eds.), Structural Framework of the Northern Gulf of Mexico: A Special Publication of GCAGS, Austin, GCAGS, p. 53-61.
Magnolia Reporter (2011): Albemarle Corporation’s South Arkansas brine may soon power cars with lithium; Magnolia Reporter, April 20, 2011 < Article available on 5 July 2018 at: http://www.magnoliareporter.com/news_and_business/local_business/article_ee29b4de-7363-11e0-a004-001cc4c002e0.html >
Magnolia Reporter (2016): Achtung! German-based Lanxess acquires Chemtura Corporation; Magnolia Reporter, September 26, 2016, < Available on 5 July 2018 at: http://www.magnoliareporter.com/news_and_business/local_business/article_5c3dfeb4-83a6-11e6-8588-8f7f83067bea.html >.
Mancini, E. A., Mink, R. M., Tew, B. H., and Bearden, B. L. (1990): Natural gas plays in Jurassic reservoirs of southwestern Alabama and the Florida panhandle area; Gulf Coast Association of Geological Societies Transactions, v. 40, p. 513-519.
Mancini, E.A., Aharon, P., Goddard, D.A., Horn, M. and Barnaby, R. (2008): Basin analysis and petroleum system characterization and modelling, interior salt basins, central and eastern Gulf of Mexico, Part 3: tectonic / depositional history, resource assessment; Adapted from Final Report, issued June 30, 2008, for period May 1, 2003 to April 30, 2008, prepared for U.S. Department of Energy, for DOE Award Number DE-FC26- 03NT15395 and available at Texas A&M University (http://berg-hughes.tamu.edu/research/sedimentary-basin-analysis-studies).
Mancini, E.A., Aharon, P., Goddard, D.A., Horn, M. and Barnaby, R. (2012): Basin Analysis and Petroleum System Characterization and Modelling, Interior Salt Basins, Central and Eastern Gulf of Mexico; Search and Discovery Article #10395 (2012), Posted March 19, 2012, < Available on 3 August 2018 at: http://www.searchanddiscovery.com/pdfz/documents/2012/10396mancini/mancini-part3.pdf.html >.
Manger, G.E. (1963): Porosity and Bulk Density of Sedimentary Rocks; In: Contributions to Geochemistry, Geological Survey Bulletin 1144-E.
Mann, S.D. (1988): Subaqueous evaporites of the Buckner Formation, Haynesville Formation, Northeastern Mobile County, Alabama. Gulf Coast Association of Geological Societies Transactions 38, 187–196.
Marton, G.L. and Buffler, R.T. (2016): Jurassic-Cretaceous Tectonic Evolution of the Southeastern Gulf of Mexico, Constrains on the Style and Timing of Gulf of Mexico Rift-Drift Development; AAPG 2016 International Convention and Exhibition, Cancun, Mexico, September 6-9, 2016.
McCoy, M. (2014): Betting on bromine in Arkansas; Chemical Engineering News, v. 92 (21), p. 31-32.
226
McEachern, P. (2017): Lithium recovery from oilfield produced water brine and wastewater treatment; Report prepared for MGX Minerals Inc., 21 p. < available on 2 August 2018 at: https://rockstone-research.com/images/pdfs/MGX_TechnicalReportRapidLithiumExtractionProcess.pdf >.
McKinsey (2019): Lithium and Cobalt A Tale of Two Commodities < Available on 16 April 2019 at: https://www.mckinsey.com/~/media/mckinsey/industries/metals%20and%20mining/our%20insights/lithium%20and%20cobalt%20a%20tale%20of%20two%20commodities/lithium-and-cobalt-a-tale-of-two-commodities.ashx/ >.
Mills, J., Frim, R., Ukeles, S.l, and Yoffe, D. (2015): Bromine— Ullmann’s encyclopedia of industrial chemistry; Hoboken, NJ, John Wiley & Sons, Inc., p. 1–20.
Moore, C.H. and Druckman (1981): Burial diagenesis and porosity evolution, Late Jurassic Smackover, Arkansas and Louisiana; The American Association of Petroleum Geologists, 1981, p. 597-628.
Moore, C. H. (1984): The upper Smackover of the Gulf rim: depositional systems, diagenesis, porosity evolution and hydrocarbon production; In: W. P. S. Ventress, D. G. Bebout, B. F. Perkins, and C. H. Moore (eds.), The Jurassic of the Gulf rim: Gulf Coast Section SEPM, 3rd Annual Research Symposium, Program and Abstracts, p. 283–307.
Moldovanyi, E.P. and Walter, L.M. (1992): Regional trends in water chemistry, Smackover Formation, southwest Arkansas: Geochemical and physical controls; The American Association of Petroleum Geologists, Bulletin, v. 76, no. 6., p. 864-894.
Munk, L., Jochens, H., Jennings, M., Bradley, D. Hynek, S. and Godfrey, L. (2011): Geochemistry of lithium-rich brines in Clayton Valley, Nevada, USA; Presentation and paper from the 11th Biennial Meeting of the Society for Geology Applied to Mineral Deposits, 26-29 September 2011, Antofagasta, Chile.
Nunn, J.A. (1984): Subsidence histories for the Jurassic sediments of the northern Gulf Coast: thermal-mechanical model; Third Annual Research Conf., Gulf Coast Section, SEPM Foundation, p. 309-322.
Parker, A. P. (1973): Geopressure in the Deep Smackover of Mississippi; Journal of Petroleum Technology, pp. 971-979.
Pavlovic, P. and Fowler, J. (2004): Evaluation of the potential of Salar de Ricon brine deposits as a source of lithium, potash, boron and other mineral resources; Final report prepared for Admiralty Resources NL and Argentina Diamonds Ltd., 15 December 2004.
Pilger, R.H., Jr. (1981): The opening of the Gulf of Mexico: implications for the tectonic evolution of the northern Gulf Coast; GCAGS Transactions, v. 31, p. 377-381.
Reidel, F. (2016): Technical Report—Resource estimate for lithium and potassium, Sal de Los Angeles Project (Salta, Argentina); NI 43-101 Technical Report prepared by FloSolutions for Lithium X Energy Corporation, Effective date of August 29, 2016, 117 p., < Available on 14 May 2019 at: www.sedar.com >.
Salier, B. (2018): How we look at lithium projects; Sprott Capital Partners; Abstract at The Geological Society of London Conference, Lithium: From Exploration to End-User, April 2018.
Salvador, A. (1987): Late Triassic-Jurassic paleography and origin of Gulf of Mexico basin; AAPG Bulletin, v. 71, p. 419-451.
Salvador, A. (1990): Triassic-Jurassic; In: Salvador, A., (ed.), The Geology of North America, v. J., The Gulf of Mexico Basin; Boulder, Geological Society of America, p. 131–180.
227
Salvador, A. (1991a): The Gulf of Mexico Basin: Decade of North American geology; v. DNAG, v. J: Boulder, Colorado, GSA, 568 p.
Salvador, A. (1991b): Triassic-Jurassic; In: A. Salvador, (ed.), The Gulf of Mexico Basin, Boulder, Colorado, GSA, p. 131-180.
Sawyer, D.S., R.T. Buffler, and R.H. Pilger, Jr. (1991): The crust under the Gulf of Mexico, in A. Salvadore, (ed.), The Gulf of Mexico Basin: Decade of North American Geology, Boulder, GSA, p. 53-72.
Schnebele, Emily K. (2018): Bromine; Mineral Commodity Summaries 2018, U.S. Geological Survey, p. 38-39.
Scott, K.R., W.E. Hayes and Fietz, R.P. (1961): Geology of the Eagle Mills Formation; GCAGS Transactions, v. 11, p. 1-14.
Shengsong, Y. (1986): the hydrochemical features of salt lakes in Qaidam Basin; Chinese Journal of Oceanology and Limnology, v. 4, no. 3, p. 383-403.
Shouakar-Stash, O., Alexeev, S.V., Frape, S.K., Alexeeva, L.P. and Drimmie, R.J. (2007): Geochemistry and stable isotopic signatures, including chlorine and bromine isotopes, of the deep groundwaters of the Siberian Platform, Russia; Applied Geochemistry, v. 22, p. 589–605.
Simbol Materials (2011): Simbol Materials, < Available on 14 July 2018 at: http://www.simbolmaterials.com/who_we_are.htm >.
Smee, B.W. (2011): Quality control and regulatory overview; Short course presented to the Calgary Mineral Exploration Group, Calgary, AB, April 2011, 14 p
Snydacker, D. (2018): Industry Presentation by Lilac Solutions: Lithium Mineral Exploration in Alberta, Government/Industry Workshop, March 28, 2018, Calgary, Alberta.
Standard Lithium Ltd. (2018a): Standard Lithium signs MoU with global specialty chemical company LANXESS for the development of commercially viable extraction of lithium from operational Smackover brine resource; Standard Lithium Press Release, May 9, 2018, < Available on 5 July 2018 at: http://standardlithium.com/2018/05/09/standard-lithium-signs-mou-with-global-specialty-chemical-company-lanxess-for-the-development-of-commercially-viable-extraction-of-lithium-from-operational-smackover-brine-resource/ >.
Standard Lithium Ltd. (2018b): Standard Lithium plans JV with LANXESS; Standard Lithium Press Release, November 12, 2018, < Available on 13 November 2018 at: https://standardlithium.com/standard-lithium-plans-jv-with-lanxess/ >.
Standard Lithium Ltd. (2018c): Standard Lithium provides Pilot Plant and Process Testing update; Standard Lithium Press Release, June 6, 2018, < Available on 26 March 2018 at: http://standardlithium.com/2018/03/26/standard-lithium-provides-pilot-plant-and-process-testing-update/ >.
Standard Lithium Ltd. (2018d): Standard Lithium Commissions Saltworks for Design & Build of Selective Crystallization Portion of Its Pilot Plant; Standard Lithium Press Release, June 6, 2018, < Available on 11 July 2018 at: http://standardlithium.com/2018/06/06/standard-lithium-commissions-saltworks-for-design-build-of-selective-crystallization-portion-of-its-pilot-plant/ >.
Standard Lithium (2018e): Standard Lithium Commissions Hunt Guillot & Associates LLC for Engineering Services for Arkansas Pilot Plant; Standard Lithium Press Release, June 14, 2018, < Available on 9 July
228
2018 at: http://standardlithium.com/2018/06/14/standard-lithium-commissions-hunt-guillot-associates-llc-for-engineering-services-for-arkansas-pilot-plant/ >.
Statisa (2019a): Projection of Global Lithium Supply 2018-2025. < Available on 15 April 2019 at: https://www.statista.com/statistics/ >.
Statisa (2019b): Global Lithium Mining Production 2010-2018. < Available on 24 May2019 at: https://www.statista.com/statistics/ >.
Stueber, A. M., Pushkar, P. and Hetherington, E.A. (1984): A Strontium Isotopic Study of Smackover Brines and Associated Solids, Southern Arkansas; Geochimica et Cosmochimica Acta, v. 48, p. 1637-1649.
Swain F.M. and Anderson, E.G. (1993): Stratigraphy and Ostracoda of the Cotton Valley Group, north central Louisiana; Louisiana Geological Survey, Geological Bulletin no. 45, 239 p.
Tahil, W. (2007); The trouble with lithium; Meridian International Research, January 2007>.
Tonietto, S.N. and Pope, M.C. (2013): Diagenetic evolution and its influence on petrophysical properties of the Jurassic Smackover Formation thrombolite and grainstone units of Little Cedar Creek Field, Alabama; GCAGS Journal, v. 2, p. 68-84.
Troell, A. R. and Robinson, J. D. (1987): Regional stratigraphy of the Smackover limestone (Jurassic) in south Arkansas and north Louisiana, and the geology of Chalybeat Springs oil field. Gulf Coast Association of Geological Societies Transactions, v. 37, p. 225–262.
USGS (2019): National Minerals Information Center. Lithium Statistics and Information. < Available on 24 July 2019 at: https://www.usgs.gov/centers/nmic/lithium-statistics-and-information/ >.
Van Siclen, D.C. (1984): Early opening of initially-closed Gulf of Mexico and central North Atlantic Ocean; GCAGS Transactions, v. 34, p. 265-275.
Verma, R., M.M. Foss, S.G. Gülen, C.-H. Tsai, D. Quijano, B. Elliott (2016): Battery materials value chains: Demand, capacity and challenges; Think Corner Research Note, Center for Energy Economics, p. 1-30.
Vestal, Jack H. (1950): Petroleum geology of the Smackover Formation of southern Arkansas; State of Arkansas Geological Commission, p. 1-37.
U.S. Environmental Protection Agency (1999): Spent brine return flow wells, in The class V underground injection control study; U.S. Environmental Protection Agency, EPA/816–R–99–014i, v. 9, 27 p, < Accessed 12 July 2018, at: https://www.epa.gov/sites/production/files/2015-08/documents/classvstudy_volume09-spentbrinereturnflow_0.pdf >.
U.S. Geological Survey (2016): 2016 Mineral Yearbook: Bromine [Advance Release]; U.S. Department of the Interior, U.S. Geological Survey, June 2018, 8 p.
Wade, W.J., and Moore, C.H. (1993): Jurassic sequence stratigraphy of southwest Alabama; Gulf Coast Association of Geological Societies Transactions, v. 43, p. 431–443.
Walter, L.M., Molclovanyi, E.P. and Land, L.S. (1990): Boron isotopic composition of subsurface brines (Smackover Formation, southwest Arkansas): Implications for chemical evolution and migration; Geological Society of America 1990 Annual Meeting Abstracts with Programs, p. A62.
Winker, C.D. and Buffler, R.T. (1988): Paleogeographic evolution of early deep-water Gulf of Mexico and margins, Jurassic to Middle Cretaceous (Comanchaean): AAPG Bulletin, v. 72, p. 318-346.
229
Xu, X., Zhou, Y., Fan, M., Lv, Z., Tang, Y., Sun, Y., Chen, Y. and Wan, P. (2017): Lithium adsorption performance of a three-dimensional porous H2TiO3-type lithium ion-sieve in strong alkaline Bayer liquor; RSC Advances, v. 7, p. 18883—18891.
Zheng, M., Yuan, H., Liu, J., Li, Y., Ma, Z. and Sun, Q. (2007): Sedimentary characteristics and paleoenvironmental records of Zabuye Salt Lake, Tibetan Plateay, since 128 ka BP; Acta Geological Sinica, v. 81, no. 5, p. 681-879.
Zimmerman, R. K. (1992): Fractured Smackover limestone in northeast Louisiana; Implications for hydrocarbon exploitation; AAPG Datapages/Archives, GCAGS Transactions, v. 42, p. 401-412.
230