united states
securities and exchange commission
washington, d.c. 20549
form n-csr
certified shareholder report of registered management
investment companies
Investment Company Act file number 811-22655
Northern Lights Fund Trust III
(Exact name of registrant as specified in charter)
225 Pictoria Dr, Ste 450 Cincinnati, OH 45246
(Address of principal executive offices) (Zip code)
The Corporation Trust Company
1209 Orange Street Wilmington, DE 19801
(Name and address of agent for service)
Registrant's telephone number, including area code: 631-470-2600
Date of fiscal year end: 3/31
Date of reporting period: 3/31/2023
Item 1. Reports to Stockholders.
 |
| ANNUAL REPORT |
| March 31, 2023 |
| 1-866-209-1964 |
| WWW.TEBERGFUND.COM |
| Distributed by Northern Lights Distributors, LLC |
| Member FINRA/SIPC |
Dear fellow shareholder,
There were many headlines about the market’s ups and downs throughout the period from April 1, 2022 through March 31, 2023, which is covered in this report. One signal that might have been somewhat under the radar was the three major market indices dropping more than 20.00% from their peaks in the upward bullish market into downward bear territory. In September 2022, the Dow Jones Industrial Average (Dow) was the last to fall into a bearish position. The S&P 500® Index (S&P) and NASDAQ Composite Index (NASDAQ) met that milestone earlier in the year.
While the terms bull and bear are somewhat obscure, and the timing of upward and downward periods can be debated, many of us might remember the overheated bullish period when the Dow gained more than 12,000 points in 12 months. This was the period from April 1, 2020 through April 1, 2021 when The Teberg Fund (Fund) achieved an historic 64.61% gain.
A year later, the Fund’s 7.83% return for the period from April 1, 2021 through March 31, 2022 was considerably lower but still positive.
Unfortunately, the Fund wasn’t immune from the market’s decline into bear territory in the current period and is now reporting a disappointing return of -8.02% for the 12 months ended March 31, 2023.
The Fund’s share price dropped from $18.27 at the close of the first day of the period (April 1, 2022) to $16.85 at the end of the last day of the period (March 31, 2023).
Much of the Fund’s loss occurred in the first two quarters of the period with returns of -19.21% as of June 30, 2022 and -5.81% as of September 30, 2022. Every holding was in the red at the end of both quarters.
This downturn reversed in the last two quarters of the period when most Fund holdings were in the black. There were positive returns of 8.68% for the quarter ended December 31, 2022 and 11.22% for the quarter ended March 31, 2023.
Unfortunately, that wasn’t enough to lift the one-year return out of the red. It did, however, help minimize the loss and supported the strategy of staying invested throughout the period rather than selling holdings at a loss. Clearly, this took patience as the Fund’s share price dropped to the period low of $13.77 on October 12, 2022.
The portfolio report card . . .
The Fund’s holdings remained nearly unchanged throughout the period, and there was minimal trading. Despite the rally in the last half, every holding ended in the red as of the period end on March 31, 2023. This was a distinct change from the last reporting period ended March 31, 2022 when all but four holdings had gained in value (seven with double-digit growth).
There’s a much greater contrast when looking back one year earlier during the aforementioned roaring bull market. For the 12-months ended March 31, 2021, there were two holdings with returns greater than 100.00%, and the lowest return was slightly above 18.00%. Clearly, these were considered exceptional numbers not expected to be repeated any time soon, if ever.
Still, it’s disappointing to have given up some of that gain and discuss the following negative results:
| ● | It may seem logical that the fastest-rising, star performers in the portfolio in past periods suffered the greatest fall in the first half of the current period when the market was struggling. These were the two exchange-traded funds (ETFs) tracking the semiconductor industry, which boomed in 2021 when there were changes in the supply and demand for chips to power many everyday items like personal computers, electronics, smartphones and cars. |
This surge was exceptional because it occurred in the midst of the COVID-19 pandemic when many other industries were suffering. The good fortune of the semiconductor ETFs made them the highest achievers in the 12-month period ended March 31, 2021 with returns of more than 100.00% each. Their gains in the following 2022 period were far more modest but still in the double-digit range.
1
This growth ended rather abruptly later in 2022 when the industry ended up with excess inventories as consumer demand declined, and increased international tensions impacted trade. Both ETFs lost more than 20.00% in value in the quarter ended June 30, 2022 and each dropped approximately 9.00% more in the next quarter ended September 30, 2022.
Both improved in the quarter ended December 31, 2022 with returns in the black. This turnaround accelerated in the last three months of the period when they achieved positive returns of nearly 28.00% and 30.00% for the quarter ending March 31, 2023, thus reducing their period losses with approximate returns of -2.00% and -6.00%.
| ● | Another major reversal of fortune was the portfolio’s sole equity holding, which had gained more than 37.00% in the previous period ended March 31, 2022. Unlike the semiconductor ETFs, it didn’t make a comeback in the first quarter of 2023 and ended with an approximate 12.00% loss as of March 31. |
| ● | The ETF tracking the financial sector wasn’t among the aforementioned top performers in the previous period but had posted a positive return of more than 12.00% as of March 31, 2022. It lost approximately $6.00 per share during the current period and ended with an approximate return of -16.00% as of March 31, 2023. Its descent didn’t coincide with the Silicon Valley Bank collapse early that month, which launched concerns about the banking industry. Instead, its low share price for the period was in October 2022. |
| ● | Other holdings with approximate double-digit losses were as follows: |
| ETF tracking the Russell 2000 Index | -13.00% |
| ETF tracking the NASDAQ Index | -11.00% |
| ETF tracking the S&P Small Cap Index | -10.00%. |
| ● | The remaining holdings represent those with approximate single-digit losses: |
| ETF tracking the S&P 500 Index | - 9.00% |
| ETF tracking the S&P Midcap Index | - 6.50% |
| ETF tracking the Dow Index | - 4.00% |
| Low priced stock mutual fund | - 4.00%. |
| ● | There were sales of high-yield bond fund holdings during the period, so they represented a small percentage of the Fund’s portfolio. That meant the general decline of bond fund values due to rising interest rates aimed at reducing inflation didn’t seriously impact the Fund’s overall return. |
Inflation at the wheel of market drama . . .
Efforts to cool record-high inflation appear to have been the dominate force in moving the markets both up and down during the period. It seemed every comment from Federal Reserve (Fed) Chair Jerome Powell was analyzed for clues as to where rates were headed. The same applied to economic reports, which were judged on the basis of how the numbers might impact inflation. Clearly, other challenges to the market carried over from past periods, such as the continuing war in Ukraine and slowing global growth, but the laser focus on inflation appeared to get top billing.
The Fed had started its fight against inflation with a 25-basis-point interest rate hike in March 2022, just before the current period began. There were eight more rate hikes during the current period, which boosted the Fed interest rate (Federal Funds Rate) from near zero to between 4.75% and 5.00% by March 2023. This rapid rise after years of unchanged low rates was certainly newsworthy.
Again, our discussion of market performance during the period is mainly focused on the Dow, which is generally considered the most widely-watched index.
The Dow closed at 34,818 on April 1, 2022 (the first day of the period). Its close of 33,274 on March 31, 2023 (last day of the period) wasn’t far from the starting point and belied the volatility that occurred between those dates. The most volatile days, with the largest point changes in the Dow, all occurred from April to December 2022.
2
Following is a summary of some of those notable 2022 days (with point changes rounded to the nearest whole number as of the day’s close):
| ● | April started strong, and the Dow hit its period peak of 35,161 on April 20, 2022. This rise halted on April 22, when the Dow dropped 981 points, its worst day since October 2020 in the throes of the pandemic. The drop appeared to be fueled by disappointing corporate earnings and comments from Fed Chair Powell that a 50-basis-point interest rate increase was a possibility as inflation had reached 40-year highs. |
| ● | Just four days later, on April 26, the Dow fell another 809 points, with a decline in tech stocks and growing global unrest adding to investor worries. |
| ● | The selloff continued on April 29, when the Dow plunged 939 points, and the S&P and NASDAQ also posted heavy losses. This ended a challenging April, which had traditionally been considered a good month for the markets, given typical seasonal surges in consumer spending, and cast doubt on the outlook for the remainder of the year. |
| ● | May started strong with a 932-point rise on the 4th on positive speculation about interest rates. This time, it appeared that talk of a 75-basis-point hike might be off the table. |
| ● | This uptick ended abruptly a day later when on May 5 the Dow dropped 1,063 points followed by an even greater drop of 1,165 points on May 18, which represented a 3.57% loss. The S&P and NASDAQ indices had even greater percentage drops on the 18th. This was the worst day for the Dow since June 2020, going back further than the October 2020 record low, which had previously been broken by the drop on April 22. The driving force again appeared to be inflation, as retailers reported lower-than-expected earnings due to rising costs. |
| ● | June also had some major selloffs, with the Dow dropping 880 points on the 10th and another 876 points on the 13th. Again, inflation was considered one of the main culprits. May’s Consumer Price Index report showed U.S. inflation was higher than expected, which fueled fears of a recession. |
| ● | July was the start of three calmer months, with only one day each with a change greater than 700 points. On July 19, the Dow gained 754 points, due in part to some strong corporate earnings reports. |
| ● | August’s one notable day was the third of five in the period with a point change greater than 1,000. On the 26th, the Dow fell 1,008 points following remarks by Fed Chair Powell that the Fed would keep up the fight against inflation, even at the expense of economic growth. |
| ● | Although September also logged only one major point change, it was the largest in the period, with the Dow plunging 1,276 points on the 13th. The August Consumer Price Index report of an 8.30% annualized rate for the month was considered the main driver of this downturn. |
| ● | The market rebounded in October after what was believed to be the worst three-quarter decline since 2009. There were five days in the month with Dow increases greater than 700 points, ranging from 765 on the 3rd to 828 points on the 28th. Not all days in October were positive, but the net Dow gain was approximately 4,007 points. In a twist, declining economic data appeared to be behind the start of the rally on October 3. This slowdown seemed to indicate that the Fed might lower the pace of interest rate hikes, eventually easing pressure on the economy. |
| ● | November was another positive month, with the Dow gaining 1,201 points on the 10th and another 737 on the 30th. The last push brought the Dow to 34,590. Again, slightly better inflation numbers were credited in part for this uptick. |
| ● | The rally had a hiccup on December 15, when the Dow lost 764 points. Not surprisingly, inflation was again the driver, as the Fed appeared hawkish toward rate hikes. |
The absence of top point-changing days in the final quarter of the period doesn’t mean there was no excitement at the start of 2023. One of the most memorable days was March 10 when regulators closed Silicon Valley Bank (SVB),
3
the 16th largest bank in the U.S., after outflows and securities losses forced it into crisis. This was the largest bank collapse since 2008, which had triggered one of the worst financial crises in U.S. history and sent the market into a prolonged nosedive.
The headlines about the SVB collapse appeared to cast doubt on the entire banking system, and two other banks catering to the tech industry were closed after increased scrutiny. Days later, several government agencies stepped in and agreed to guarantee all deposits at SVB, as well as another bank that was closed shortly afterward, above and beyond the limit on insured deposits of $250,000. The Fed also initiated an emergency lending program aimed at strengthening confidence in the nation’s financial system. These measures appeared to avert a potential crisis and a strong market correction, at least in the short term.
Better days . . .
This report marks the first since 2020 which hasn’t included multiple mentions of the COVID-19 pandemic. It dominated our 2020 report when we were quarantined and fearful of this new threat. It was often mentioned in discussion of market performance in our 2021 report and still hadn’t been entirely discounted in last year’s report. While it hasn’t entirely disappeared, and there are other challenges today, it seems we might be enjoying the better days we hoped for in the dark days of 2020. This might help put in prospective the historic winter we’re still enduring as we prepare this message.
We appreciate your continued confidence as The Teberg Fund marks its 21st anniversary on April 1.
Curtis A. Teberg
Portfolio Manager
The Dow Jones Industrial Average (Dow) is an unmanaged index of common stocks comprised of major industrial companies and assumes reinvestment of dividends. The S&P 500® Index is a broad based unmanaged index of 500 stocks, which is widely recognized as representative of the equity market in general. The NASDAQ Composite Index is a market capitalization-weighted index that is designed to represent the performance of the National Market System which includes over 5,000 stocks traded only over-the-counter and not on an exchange. The Russell 2000 Index is an index measuring the performance of approximately 2,000 small-cap companies in the Russell 3000 Index, which is made up of 3,000 of the biggest U.S. stocks.
The S&P SmallCap 600 Index is composed of 600 constituent companies and measures the performance of the small-cap segment of the market. The S&P MidCap 400 Index is composed of 400 constituent companies and measures the performance of the mid-cap segment of the market.
The indices shown are for informational purposes only and are not reflective of any investment. As it is not possible to invest in the indices, the data shown does not reflect or compare features of an actual investment, such as its objectives, costs and expenses, liquidity, safety, guarantees or insurance, fluctuation of principal or return, or tax features. Past performance is no guarantee of future results.
This report must be preceded or accompanied by a prospectus.
The Teberg Fund is distributed by Northern Lights Distributors, LLC, member FINRA/SIPC.
7373-NLD 05/02/2023
4
| THE TEBERG FUND |
| PORTFOLIO REVIEW (UNAUDITED) |
| March 31, 2023 |
Comparison of the change in value of a hypothetical $10,000 investment in The Teberg Fund versus
the S&P 500® Total Return Index and the Dow Jones Industrial Average.
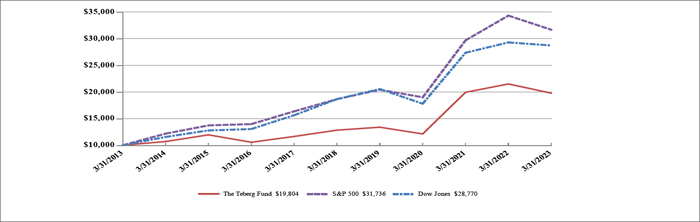
The Fund’s performance figures for the periods ended March 31, 2023, compared to its benchmarks:
| Five Year | Ten Year | |||||
| One Year | (Annualized) | (Annualized) | ||||
| The Teberg Fund | (8.02)% | 9.05% | 7.07% | |||
| S&P 500® Index(a) | (7.73)% | 11.19% | 12.24% | |||
| Dow Jones Industrial Average(b) | (1.98)% | 9.01% | 11.15% | |||
Performance data quoted represents past performance; past performance does not guarantee future results. The investment return and principal value of an investment will fluctuate so that an investor’s shares, when redeemed, may be worth more or less than their original cost. Current performance of the Fund may be lower or higher than the performance quoted. The Fund’s total annual operating expenses are 2.27%, before any fee waivers, per the August 1, 2022 prospectus. Performance data current to the most recent month end may be obtained by calling 1-866-209-1964.
Returns reflect reinvestment of dividends and capital gains distributions. Fee waivers are in effect. In the absence of fee waivers, returns would be reduced.
The performance data and graph do not reflect the deduction of taxes that a shareholder may pay on dividends, capital gains distributions, or redemption of Fund shares. Indices do not incur expenses and are not available for investment.
| (a) | The S&P 500® Total Return Index is an unmanaged capitalization-weighted index of 500 stocks designed to represent the broad domestic economy. Investors may not invest in the index directly. |
| (b) | The Dow Jones Industrial Average is a price-weighted average of 30 blue-chip stocks that are generally the leaders in their industry. It has been a widely followed indicator of the stock market since October 1, 1928. Investors may not invest in the index directly. |
5
| THE TEBERG FUND |
| DISCLOSURE OF FUND EXPENSES (UNAUDITED) |
| March 31, 2023 |
As a shareholder of the Fund, you incur ongoing costs, including management fees; distribution and/or service (12b-1) fees, and other Fund expenses. This example is intended to help you understand your ongoing costs (in dollars) of investing in the Fund and to compare these costs with the ongoing costs of investing in other mutual funds.
The example below illustrates an investment of $1,000 invested at the beginning of the period October 1, 2022 and held for the entire period through March 31, 2023.
Actual Expenses
The first line of the table provides information about actual account values and actual expenses. You may use the information in this line, together with the amount you invested, to estimate the expenses that you paid over the period. Simply divide your account value by $1,000 (for example, an $8,600 account value divided by $1,000 = 8.6), then multiply the result by the number in the first line under the heading entitled “Expenses Paid During the Period” to estimate the expenses you paid on your account during the period.
Hypothetical Example for Comparison Purposes
The second line of the table below provides information about hypothetical account values and hypothetical expenses based on the Fund’s actual expense ratio and an assumed rate of return of 5% per year before expenses, which is not the Fund’s actual return. The hypothetical account values and expenses may not be used to estimate the actual ending account balance or expenses you paid for the period. You may use this information to compare the ongoing costs of investing in the Fund and other funds. To do so, compare this 5% hypothetical example with the 5% hypothetical examples that appear in the shareholder reports of the other funds.
Please note that the expenses shown in the table are meant to highlight your ongoing costs only and do not reflect any transactional costs, such as sales charges (loads). Therefore, the table is useful in comparing ongoing costs only, and will not help you determine the relative total costs of owning different funds. In addition, if these transactional costs were included, your costs would have been higher.
| Beginning Account Value (10/1/2022) | Ending Account Value (3/31/2023) | Expenses Paid During Period (10/1/2022 to 3/31/2023)(a) | Annualized Expense Ratio | |
| Actual | $1,000.00 | $1,208.80 | $9.64 | 1.75% |
| Hypothetical (5% return before expenses) | $1,000.00 | $1,016.21 | $8.80 | 1.75% |
| (a) | Expenses are equal to the Fund’s annualized expense ratio, multiplied by the average account value over the period, multiplied by 182/365 (to reflect the one-half year period). |
6
| THE TEBERG FUND |
| ALLOCATION OF PORTFOLIO ASSETS (UNAUDITED) |
| March 31, 2023 |
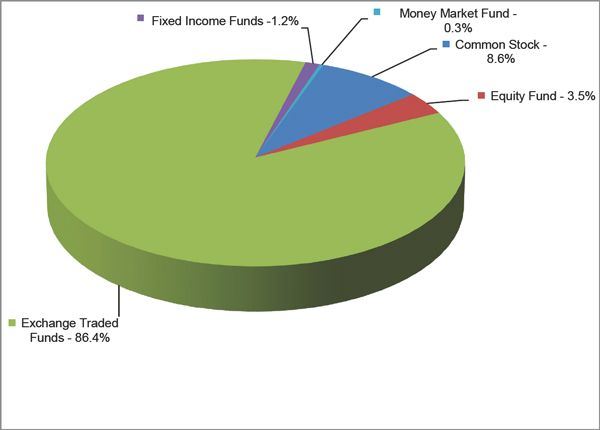
Percentages represent market value as a percentage of total investments as of March 31, 2023.
Please refer to the Schedule of Investments for a detailed listing of the Fund’s holdings.
7
| THE TEBERG FUND |
| SCHEDULE OF INVESTMENTS |
| March 31, 2023 |
| Shares | Fair Value | |||||||
| COMMON STOCKS — 8.6% | ||||||||
| INSURANCE - 8.6% | ||||||||
| 6 | Berkshire Hathaway, Inc., Class A(a) | $ | 2,793,600 | |||||
| TOTAL COMMON STOCKS (Cost $714,296) | 2,793,600 | |||||||
| EXCHANGE-TRADED FUNDS — 86.8% | ||||||||
| EQUITY - 86.8% | ||||||||
| 37,625 | Financial Select Sector SPDR Fund | 1,209,644 | ||||||
| 17,400 | Invesco QQQ Trust Series 1 | 5,584,182 | ||||||
| 22,549 | iShares Core S&P Small-Cap ETF | 2,180,488 | ||||||
| 8,674 | iShares Russell 2000 ETF | 1,547,442 | ||||||
| 7,850 | iShares Semiconductor ETF | 3,490,660 | ||||||
| 11,400 | SPDR Dow Jones Industrial Average ETF Trust | 3,791,868 | ||||||
| 9,800 | SPDR S&P 500 ETF Trust | 4,012,022 | ||||||
| 750 | SPDR S&P MidCap 400 ETF Trust | 343,808 | ||||||
| 22,500 | VanEck Semiconductor ETF | 5,921,774 | ||||||
| 28,081,888 | ||||||||
| TOTAL EXCHANGE-TRADED FUNDS (Cost $13,069,564) | 28,081,888 | |||||||
| OPEN END FUNDS — 4.7% | ||||||||
| EQUITY - 3.5% | ||||||||
| 24,788 | Fidelity Low-Priced Stock Fund | 1,157,846 | ||||||
| FIXED INCOME - 1.2% | ||||||||
| 165,776 | Franklin Income Fund Advisor Class | 377,969 | ||||||
| 42 | John Hancock High Yield Fund Class I | 124 | ||||||
| 120 | PIMCO High Yield Fund Institutional Class | 923 | ||||||
| 379,016 | ||||||||
| TOTAL OPEN END FUNDS (Cost $1,437,214) | 1,536,862 | |||||||
| SHORT-TERM INVESTMENTS — 0.3% | ||||||||
| MONEY MARKET FUNDS - 0.3% | ||||||||
| 107,095 | STIT - Government & Agency Portfolio, Institutional Class, 4.74% (Cost $107,095) (b) | 107,095 | ||||||
| TOTAL INVESTMENTS - 100.4% (Cost $15,328,169) | $ | 32,519,445 | ||||||
| LIABILITIES IN EXCESS OF OTHER ASSETS - (0.4)% | (133,929 | ) | ||||||
| NET ASSETS - 100.0% | $ | 32,385,516 | ||||||
ETF - Exchange-Traded Fund
SPDR - Standard & Poor’s Depositary Receipt
| (a) | Non-income producing security. |
| (b) | Rate disclosed is the seven day effective yield as of March 31, 2023. |
See accompanying notes to financial statements.
8
| THE TEBERG FUND |
| STATEMENT OF ASSETS AND LIABILITIES |
| March 31, 2023 |
| ASSETS: | ||||
| Investments in securities at cost | $ | 15,328,169 | ||
| Investments in securities at value | $ | 32,519,445 | ||
| Dividends and interest receivable | 34,223 | |||
| Prepaid expenses and other assets | 35,170 | |||
| TOTAL ASSETS | 32,588,838 | |||
| LIABILITIES: | ||||
| Payable for Fund shares redeemed | 115,575 | |||
| Accrued advisory fees | 21,892 | |||
| Blue sky fees | 30,299 | |||
| Payable to related parties | 9,015 | |||
| Distribution (12b-1) fees payable | 6,667 | |||
| Payable to auditors | 16,012 | |||
| Other accrued expenses | 3,862 | |||
| TOTAL LIABILITIES | 203,322 | |||
| NET ASSETS | $ | 32,385,516 | ||
| NET ASSETS CONSIST OF: | ||||
| Paid in capital | $ | 16,699,935 | ||
| Accumulated earnings | 15,685,581 | |||
| NET ASSETS | $ | 32,385,516 | ||
| NET ASSET VALUE PER SHARE: | ||||
| Net Assets | $ | 32,385,516 | ||
| Shares of beneficial interest outstanding ($0.01 par value, unlimited shares authorized) | 1,922,519 | |||
| Net asset value (net assets / shares outstanding), offering and redemption price per share | $ | 16.85 | ||
See accompanying notes to financial statements.
9
| THE TEBERG FUND |
| STATEMENT OF OPERATIONS |
| For the Year Ended March 31, 2023 |
| INVESTMENT INCOME | ||||
| Dividend income | $ | 445,217 | ||
| Interest income | 3,000 | |||
| TOTAL INVESTMENT INCOME | 448,217 | |||
| EXPENSES | ||||
| Investment advisory fees | 394,718 | |||
| Distribution (12b-1) fees | 78,944 | |||
| Administrative services fees | 48,261 | |||
| Transfer agent fees | 30,948 | |||
| Fund accounting fees | 29,467 | |||
| Compliance officer | 24,199 | |||
| Legal fees | 16,601 | |||
| Audit fees | 16,102 | |||
| Trustees’ fees and expenses | 15,001 | |||
| Printing and postage expenses | 11,402 | |||
| Registration fees | 11,201 | |||
| Custody fees | 5,847 | |||
| Insurance expense | 2,699 | |||
| Third party administrative servicing fees | 51 | |||
| Miscellaneous expenses | 2,500 | |||
| TOTAL EXPENSES | 687,941 | |||
| Less: Fees waived by the Advisor | (134,840 | ) | ||
| NET EXPENSES | 553,101 | |||
| NET INVESTMENT LOSS | (104,884 | ) | ||
| NET REALIZED AND UNREALIZED GAIN (LOSS) ON INVESTMENTS | ||||
| Net realized loss from security transactions | (129,136 | ) | ||
| Capital gain distributions from regulated investment companies | 100,388 | |||
| Net change in unrealized depreciation of investments | (2,998,544 | ) | ||
| NET REALIZED AND UNREALIZED LOSS ON INVESTMENTS | (3,027,292 | ) | ||
| NET DECREASE IN NET ASSETS RESULTING FROM OPERATIONS | $ | (3,132,176 | ) | |
See accompanying notes to financial statements.
10
| THE TEBERG FUND |
| STATEMENTS OF CHANGES IN NET ASSETS |
| Year Ended | Year Ended | |||||||
| March 31, 2023 | March 31, 2022 | |||||||
| FROM OPERATIONS: | ||||||||
| Net investment loss | $ | (104,884 | ) | $ | (220,645 | ) | ||
| Net realized gain/(loss) from investments | (129,136 | ) | 538,408 | |||||
| Capital gain distributions from regulated investment companies | 100,388 | 160,685 | ||||||
| Net change in unrealized appreciation/(depreciation) on investments | (2,998,544 | ) | 2,640,601 | |||||
| Net increase/(decrease) in net assets resulting from operations | (3,132,176 | ) | 3,119,049 | |||||
| FROM SHARES OF BENEFICIAL INTEREST: | ||||||||
| Proceeds from shares sold | 1,620,234 | 7,274,292 | ||||||
| Payments for shares redeemed | (3,452,334 | ) | (9,144,839 | ) | ||||
| Net decrease in net assets resulting from shares of beneficial interest | (1,832,100 | ) | (1,870,547 | ) | ||||
| TOTAL INCREASE (DECREASE) IN NET ASSETS | (4,964,276 | ) | 1,248,502 | |||||
| NET ASSETS | ||||||||
| Beginning of year | 37,349,792 | 36,101,290 | ||||||
| End of year | $ | 32,385,516 | $ | 37,349,792 | ||||
| SHARE ACTIVITY: | ||||||||
| Shares sold | 101,912 | 402,988 | ||||||
| Shares redeemed | (217,793 | ) | (489,857 | ) | ||||
| Net decrease in shares of beneficial interest outstanding | (115,881 | ) | (86,869 | ) | ||||
See accompanying notes to financial statements.
11
| THE TEBERG FUND |
| FINANCIAL HIGHLIGHTS |
| Per Share Data and Ratios for a Share of Beneficial Interest Outstanding Throughout Each Year Presented |
| Year Ended | Year Ended | Year Ended | Year Ended | Year Ended | ||||||||||||||||
| March 31, 2023 | March 31, 2022 | March 31, 2021 | March 31, 2020 | March 31, 2019 | ||||||||||||||||
| Net asset value, beginning of year | $ | 18.32 | $ | 16.99 | $ | 10.37 | $ | 11.52 | $ | 11.13 | ||||||||||
| Activity from investment operations: | ||||||||||||||||||||
| Net investment income (loss)(a),(b) | (0.05 | ) | (0.10 | ) | (0.01 | ) | 0.07 | 0.07 | ||||||||||||
| Net realized and unrealized gain (loss) on investments | (1.42 | ) | 1.43 | 6.70 | (1.14 | ) | 0.40 | |||||||||||||
| Total from investment operations | (1.47 | ) | 1.33 | 6.69 | (1.07 | ) | 0.47 | |||||||||||||
| Less distributions from: | ||||||||||||||||||||
| Net investment income | — | — | (0.07 | ) | (0.08 | ) | (0.08 | ) | ||||||||||||
| Net asset value, end of year | $ | 16.85 | $ | 18.32 | $ | 16.99 | $ | 10.37 | $ | 11.52 | ||||||||||
| Total Return (c) | (8.02 | )% | 7.83 | % | 64.61 | % | (9.44 | )% | 4.31 | % | ||||||||||
| Ratios and Supplemental Data: | ||||||||||||||||||||
| Net assets, end of year (000 omitted) | $ | 32,386 | $ | 37,350 | $ | 36,101 | $ | 23,946 | $ | 27,732 | ||||||||||
| Ratio of expenses to average net assets:(d) | ||||||||||||||||||||
| Before expense waiver | 2.18 | % | 2.03 | % | 2.16 | % | 2.22 | % | 2.21 | % | ||||||||||
| After expense waiver | 1.75 | % | 1.75 | % | 1.75 | % | 1.75 | % | 1.75 | % | ||||||||||
| Ratio of net investment income/(loss) to average net assets:(b)(d) | ||||||||||||||||||||
| Before expense waiver | (0.76 | )% | (0.83 | )% | (0.45 | )% | 0.09 | % | 0.17 | % | ||||||||||
| After expense waiver | (0.33 | )% | (0.55 | )% | (0.04 | )% | 0.56 | % | 0.63 | % | ||||||||||
| Portfolio turnover rate | 0.60 | % | 3.52 | % | 1.13 | % | 1.44 | % | 1.80 | % | ||||||||||
| (a) | Per share amounts are calculated using the average shares method, which more appropriately presents the per share data for the year. |
| (b) | Recognition of net investment income (loss) by the Fund is affected by the timing of the declaration of dividends by the underlying investment companies in which the Fund invests. |
| (c) | Total return assumes reinvestment of all dividends and distributions, if any. |
| (d) | Does not include expenses of the investment companies in which the Fund invests. statements |
See accompanying notes to financial statements.
12
| THE TEBERG FUND | |
| NOTES TO FINANCIAL STATEMENTS | |
| March 31, 2023 | ANNUAL REPORT |
| 1. | ORGANIZATION |
The Teberg Fund (the “Fund”) is a diversified series of shares of beneficial interest of Northern Lights Fund Trust III (the “Trust”), a statutory trust organized under the laws of the state of Delaware. The Trust is registered under the Investment Company Act of 1940, as amended (the “1940 Act”), as an open-end management investment company. The Fund began operations on April 1, 2002 as a series of the Advisors Series Trust and reorganized into the Trust on December 13, 2013. The investment objective of the Fund is to maximize total return (capital appreciation plus income).
| 2. | SUMMARY OF SIGNIFICANT ACCOUNTING POLICIES |
The following is a summary of significant accounting policies followed by the Fund in the preparation of its financial statements. These policies are in conformity with accounting principles generally accepted in the United States of America (“GAAP”). The preparation of financial statements in accordance with GAAP requires management to make estimates and assumptions that affect the reported amounts of assets and liabilities and disclosure of contingent assets and liabilities at the date of the financial statements and the reported amounts of income and expenses for the period. Actual results could differ from those estimates. The Fund is an investment company and accordingly follows the investment company accounting and reporting guidance of the Financial Accounting Standards Board (“FASB”) Accounting Standard Codification Topic 946 “Financial Services – Investment Companies” including FASB Accounting Standard Update (“ASU”) 2013-08.
Securities Valuation – Securities listed on an exchange are valued at the last reported sale price at the close of the regular trading session of the primary exchange on the business day the value is being determined, or in the case of securities listed on NASDAQ, at the NASDAQ Official Closing Price (“NOCP”). In the absence of a sale, such securities shall be valued at the mean between the current bid and ask prices on the day of valuation. Debt securities (other than short-term obligations) are valued each day by an independent pricing service approved by the Trust’s Board of Trustees (the “Board”) based on methods which include consideration of: yields or prices of securities of comparable quality, coupon, maturity and type; indications as to values from dealers; and general market conditions or market quotations from a major market maker in the securities. The independent pricing service does not distinguish between smaller-sized bond positions known as “odd lots” and larger institutional-sized bond positions known as “round lots”. The Fund may fair value a particular bond if the adviser does not believe that the round lot value provided by the independent pricing service reflects fair value of the Fund’s holding. Investments valued in currencies other than the U.S. dollar are converted to U.S. dollars using exchange rates obtained from pricing services. Short-term debt obligations having 60 days or less remaining until maturity, at time of purchase, may be valued at amortized cost. Investments in open-end investment companies are valued at net asset value.
The Fund may hold securities, such as private investments, interests in commodity pools, other non-traded securities or temporarily illiquid securities, for which market quotations are not readily available or are determined to be unreliable. These securities will be valued using the “fair value” procedures approved by the Board. The Board has delegated execution of these procedures to the adviser as its valuation designee (the “Valuation Designee”). The Board may also enlist third party consultants such as a valuation specialist at a public accounting firm, valuation consultant or financial officer of a security issuer on an as-needed basis to assist the Valuation Designee in determining a security-specific fair value. The Board is responsible for reviewing and approving fair value methodologies utilized by the Valuation Designee, which approval shall be based upon whether the Valuation Designee followed the valuation procedures established by the Board.
Fair Valuation Process –Applicable investments are valued by the Valuation Designee pursuant to valuation procedures established by the Board. For example, fair value determinations are required for the following securities: (i) securities for which market quotations are insufficient or not readily available on a particular business day (including securities for which there is a short and temporary lapse in the provision of a price by the regular pricing source); (ii) securities for which, in the judgment of the Valuation Designee, the prices or values available do not represent the fair value of the instrument; factors which may cause the Valuation Designee to make such a judgment include, but are not limited to, the following: only a bid price or an asked price is available; the spread between bid and asked prices is substantial; the frequency of sales; the thinness of the market; the size of reported trades; and actions of the securities markets, such as the suspension or limitation of trading; (iii) securities determined to be illiquid; and (iv) securities with respect to which an event that will affect the value thereof has occurred (a “significant event”) since the closing prices were established on the principal exchange on which they are traded, but prior to a Fund’s calculation of its net asset value. Specifically, interests in commodity pools or managed futures pools are valued on a daily basis by reference to the closing market prices of each futures contract or other asset
13
| THE TEBERG FUND | |
| NOTES TO FINANCIAL STATEMENTS (Continued) | |
| March 31, 2023 | ANNUAL REPORT |
held by a pool, as adjusted for pool expenses. Restricted or illiquid securities, such as private investments or non-traded securities are valued based upon the current bid for the security from two or more independent dealers or other parties reasonably familiar with the facts and circumstances of the security (who should take into consideration all relevant factors as may be appropriate under the circumstances). If a current bid from such independent dealers or other independent parties is unavailable, the Valuation Designee shall determine, the fair value of such security using the following factors: (i) the type of security; (ii) the cost at date of purchase; (iii) the size and nature of the Fund’s holdings; (iv) the discount from market value of unrestricted securities of the same class at the time of purchase and subsequent thereto; (v) information as to any transactions or offers with respect to the security; (vi) the nature and duration of restrictions on disposition of the security and the existence of any registration rights; (vii) how the yield of the security compares to similar securities of companies of similar or equal creditworthiness; (viii) the level of recent trades of similar or comparable securities; (ix) the liquidity characteristics of the security; (x) current market conditions; and (xi) the market value of any securities into which the security is convertible or exchangeable.
The Fund utilizes various methods to measure the fair value of all of its investments on a recurring basis. GAAP establishes a hierarchy that prioritizes inputs to valuation methods. The three levels of input are:
Level 1 – Unadjusted quoted prices in active markets for identical assets and liabilities that the Fund has the ability to access.
Level 2 – Observable inputs other than quoted prices included in Level 1 that are observable for the asset or liability, either directly or indirectly. These inputs may include quoted prices for the identical instrument in an inactive market, prices for similar instruments, interest rates, prepayment speeds, credit risk, yield curves, default rates and similar data.
Level 3 – Unobservable inputs for the asset or liability, to the extent relevant observable inputs are not available, representing the Fund’s own assumptions about the assumptions a market participant would use in valuing the asset or liability, and would be based on the best information available.
The availability of observable inputs can vary from security to security and is affected by a wide variety of factors, including, for example, the type of security, whether the security is new and not yet established in the marketplace, the liquidity of markets, and other characteristics particular to the security. To the extent that valuation is based on models or inputs that are less observable or unobservable in the market, the determination of fair value requires more judgment. Accordingly, the degree of judgment exercised in determining fair value is greatest for instruments categorized in Level 3.
The inputs used to measure fair value may fall into different levels of the fair value hierarchy. In such cases, for disclosure purposes, the level in the fair value hierarchy within which the fair value measurement falls in its entirety, is determined based on the lowest level input that is significant to the fair value measurement in its entirety.
The inputs or methodology used for valuing securities are not necessarily an indication of the risk associated with investing in those securities. The following tables summarize the inputs used as of March 31, 2023 for the Fund’s investments measured at fair value:
| Assets* | Level 1 | Level 2 | Level 3 | Total | ||||||||||||
| Common Stocks | $ | 2,793,600 | $ | — | $ | — | $ | 2,793,600 | ||||||||
| Exchange-Traded Funds | 28,081,888 | — | — | 28,081,888 | ||||||||||||
| Open End Funds | 1,536,862 | — | — | 1,536,862 | ||||||||||||
| Short-Term Investment | 107,095 | — | — | 107,095 | ||||||||||||
| Total | $ | 32,519,445 | $ | — | $ | — | $ | 32,519,445 | ||||||||
The Fund did not hold any Level 2 or 3 securities during the year. Please refer to the Schedule of Investments for industry classifications.
| * | Please refer to the Fund’s Schedule of Investments for additional detail. |
Federal Income Tax – The Fund intends to continue to qualify as a “regulated investment company” under Subchapter M of the Internal Revenue Code of 1986, as amended, and, if so qualified, will not be liable for federal income taxes to the extent all earnings are distributed to shareholders on a timely basis. Therefore, no federal income tax provision has been recorded.
14
| THE TEBERG FUND | |
| NOTES TO FINANCIAL STATEMENTS (Continued) | |
| March 31, 2023 | ANNUAL REPORT |
The Fund recognizes the tax benefits of uncertain tax positions only where the position is “more likely than not” to be sustained assuming examination by tax authorities. Management has analyzed the Fund’s tax positions and has concluded that no liability for unrecognized tax benefits should be recorded related to uncertain tax positions taken on returns filed for open tax years ended March 31, 2021 to March 31, 2023, or expected to be taken in the Fund’s March 31, 2023 year-end tax returns. The Fund identifies its current major tax jurisdictions as U.S. federal and the state of Ohio. The Fund is not aware of any tax positions for which it is reasonably possible that the total amounts of unrecognized tax benefits will change materially in the next twelve months.
Security Transactions and Related Income – Investment security transactions are accounted for on a trade date basis. Realized gains and losses from sales of securities are based upon the specific identification method for both financial statement and federal income tax purposes. Dividend income is recorded on the ex-dividend date and interest income is recorded on the accrual basis. Purchase discounts and premiums on securities are accreted and amortized over the life of the respective securities.
Distributions to Shareholders – Distributions from investment income and net realized capital gains, if any, are declared and paid at least annually and are recorded on the ex-dividend date. The character of income and gains to be distributed is determined in accordance with income tax regulations, which may differ from GAAP. These “book/tax” differences are considered either temporary (i.e., deferred losses, capital loss carry forwards) or permanent in nature. To the extent these differences are permanent in nature, such amounts are reclassified within the composition of net assets based on their federal tax-basis treatment. Temporary differences do not require reclassification. These reclassifications have no effect on net assets, results from operations or net asset value per share of the Fund.
Valuation of Fund of Funds – The Fund may invest in portfolios of open-end or closed-end investment companies (the “Underlying Funds”). The Underlying Funds value securities in their portfolios for which market quotations are readily available at their market values (generally the last reported sale price) and all other securities and assets at their fair value to the methods established by the board of directors of the Underlying Funds.
Expenses – Expenses of the Trust that are directly identifiable to a specific fund are charged to that fund. Expenses, which are not readily identifiable to a specific fund, are allocated in such a manner as deemed equitable, taking into consideration the nature and type of expense and the relative sizes of the funds in the Trust.
Indemnification – The Trust indemnifies its officers and Trustees for certain liabilities that may arise from the performance of their duties to the Trust. Additionally, in the normal course of business, the Fund enters into contracts that contain a variety of representations and warranties and which provide general indemnities. The Fund’s maximum exposure under these arrangements is unknown, as this would involve future claims that may be made against the Fund that have not yet occurred. However, based on experience, the risk of loss due to these warranties and indemnities appears to be remote.
Exchange-Traded Funds – The Fund may invest in exchange-traded funds (“ETFs”). ETFs are a type of index fund bought and sold on a securities exchange. An ETF trades like common stock and represents a fixed portfolio of securities. The Fund may purchase an ETF to temporarily gain exposure to a portion of the U.S. or a foreign market. The risks of owning an ETF generally reflect the risks of owning the underlying securities it is designed to track, although the lack of liquidity on an ETF could result in it being more volatile. Additionally, ETFs have fees and expenses that reduce their value.
| 3. | PURCHASES AND SALES OF SECURITIES |
The cost of purchases and proceeds from the sale of securities, other than short-term securities and U.S. government securities, for the year ended March 31, 2023, amounted to $191,698 and $2,005,611, respectively.
| 4. | INVESTMENT ADVISORY AGREEMENT AND TRANSACTIONS WITH RELATED PARTIES |
First Associated Investment Advisors, Inc. (the “Adviser”) serves as investment adviser to the Fund. Subject to the oversight of the Board, the Adviser is responsible for the Fund’s investment portfolio. Pursuant to an advisory agreement with the Trust, on behalf of the Fund, the Adviser directs the daily operations of the Fund and supervises the performance of administrative and professional services provided by others. As compensation for its services and the related expenses borne by the Adviser, the Fund pays the Adviser a fee,
15
| THE TEBERG FUND | |
| NOTES TO FINANCIAL STATEMENTS (Continued) | |
| March 31, 2023 | ANNUAL REPORT |
computed and accrued daily and paid monthly at an annual rate of 1.25% of the Fund’s average daily net assets. For the fiscal year ended March 31, 2023, the Adviser earned advisory fees of $394,718.
Pursuant to a written contract (the “Waiver Agreement”), the Adviser has agreed at least until August 1, 2023, to waive a portion of its advisory fee and to reimburse the Fund for other expenses to the extent necessary so that the total operating expenses incurred by the Fund (exclusive of any front-end contingent or deferred loads, brokerage fees and commissions, acquired fund fees and expenses, borrowing costs (such as interest and dividend expense on securities sold short), taxes, and extraordinary expenses, such as litigation expenses (which may include indemnification of Fund officers and Trustees, and contractual indemnification of Fund service providers (other than the Adviser))) do not exceed 1.75% of the Fund’s daily average net assets (the “expense limitation”). For the fiscal year ended March 31, 2023, the Adviser waived $134,840 in fees under the Waiver Agreement.
If the Adviser waives any fee or reimburses any expense pursuant to the Waiver Agreement, and the Fund’s operating expenses are subsequently less than the lesser of the expense limitation then in place or in place at time of waiver, the Adviser shall be entitled to reimbursement by the Fund for such waived fees or reimbursed expenses provided that such reimbursement does not cause the Fund’s expenses to exceed the expense limitation. If the Fund’s operating expenses subsequently exceed the expense limitation, the reimbursements shall be suspended. The Adviser may seek reimbursement only for expenses waived or paid by it during the three years prior to such reimbursement; provided, however, that such expenses may only be reimbursed to the extent they were waived or paid after the date of the Waiver Agreement (or any similar agreement). As of March 31, 2023, the total amount of expense reimbursement subject to recapture amounted to $374,418, of which $127,699 will expire on March 31, 2024, $111,879 will expire on March 31, 2025, and $134,840 will expire on March 31, 2026.
Distributor – The Board has adopted, on behalf of the Fund, the Trust’s Master Distribution and Shareholder Servicing Plan (the “Plan”) pursuant to Rule 12b-1 of the 1940 Act. The Plan provides that a monthly service and/or distribution fee is calculated by the Fund at an annual rate of 0.25% of the average daily net assets and is paid to Northern Lights Distributors, LLC (the “Distributor”) to provide compensation for ongoing distribution-related activities or services and/or maintenance of the Fund’s shareholder accounts, not otherwise required to be provided by the Adviser. Pursuant to the Plan, $78,944 in distribution fees were incurred during the fiscal year ended March 31, 2023.
In addition, certain affiliates of the Distributor provide services to the Fund as follows:
Ultimus Fund Solutions, LLC (“UFS”) – UFS, an affiliate of the Distributor, provides administration, fund accounting, and transfer agent services to the Trust. Pursuant to separate servicing agreements with UFS, the Fund pays UFS customary fees for providing administration, fund accounting and transfer agency services to the Fund. Certain officers of the Trust are also officers of UFS, and are not paid any fees directly by the Trust for serving in such capacities.
Northern Lights Compliance Services, LLC (“NLCS”) – an affiliate of UFS and the Distributor, provides a Chief Compliance Officer to the Trust, as well as related compliance services, pursuant to a consulting agreement between NLCS and the Trust. Under the terms of such agreement, NLCS receives customary fees from the Fund.
Blu Giant, LLC (“Blu Giant”) – an affiliate of UFS and the Distributor, provides EDGAR conversion and filing services as well as print management services for the Fund on an ad-hoc basis. For the provision of these services, Blu Giant receives customary fees from the Fund.
16
| THE TEBERG FUND | |
| NOTES TO FINANCIAL STATEMENTS (Continued) | |
| March 31, 2023 | ANNUAL REPORT |
| 5. | DISTRIBUTIONS TO SHAREHOLDERS AND TAX COMPONENTS OF CAPITAL |
There were no Fund distributions for the years ended March 31, 2023 and March 31, 2022.
As of March 31, 2023, the components of distributable earnings/(deficit) on a tax basis were as follows:
| Unrealized | ||||||||||||||||||||||||||
| Undistributed | Undistributed | Post October | appreciation | Total | ||||||||||||||||||||||
| ordinary | long-term | loss and late | Capital loss | Other book/ | on | accumulated | ||||||||||||||||||||
| income | capital gains | year loss | carry forwards | tax differences | investments | earnings | ||||||||||||||||||||
| $ | — | $ | — | $ | (53,426 | ) | $ | (1,449,546 | ) | $ | — | $ | 17,188,553 | $ | 15,685,581 | |||||||||||
The difference between book basis and tax basis unrealized appreciation and accumulated net realized losses from security transactions is primarily attributable to the tax deferral of losses on wash sales.
Late year losses incurred after December 31 within the fiscal year are deemed to arise on the first business day of the following fiscal year for tax purposes. The Fund incurred and elected to defer such late year losses of $53,426.
At March 31, 2023, the Fund had capital loss carryforwards for federal income tax purposes available to offset future capital gains and utilized capital loss carryforwards as follows:
| Short-Term | Long-Term | |||||||||||||
| Non-Expiring | Non-Expiring | Total | CLCF Utilized | |||||||||||
| $ | 1,430,531 | $ | 19,015 | $ | 1,449,546 | $ | — | |||||||
At March 31, 2023, the tax cost of investments and unrealized appreciation/(depreciation) are as follows:
| Net unrealized | ||||||||||||||
| Tax cost of | Gross unrealized | Gross unrealized | appreciation on | |||||||||||
| investments | appreciation | depreciation | investments | |||||||||||
| $ | 15,330,892 | $ | 17,191,285 | $ | (2,732 | ) | $ | 17,188,553 | ||||||
Permanent book and tax differences, primarily attributable to the reclass of net operating losses, resulted in reclassifications for the Fund for the fiscal year ended March 31, 2023 as follows:
| Paid-In Capital | Distributable Earnings | |||||
| $ | (130,149 | ) | $ | 130,149 | ||
| 6. | BENEFICIAL OWNERSHIP |
The beneficial ownership, either directly or indirectly, of more than 25% of the voting securities of a Fund creates presumption of control of the Fund, under Section 2(a)(9) of the 1940 Act. As of March 31, 2023, Constellation Trust held approximately 50.2% of the voting securities of the Fund.
| 7. | SUBSEQUENT EVENTS |
Subsequent events after the date of the Statement of Assets and Liabilities have been evaluated through the date the financial statements were issued. Management has determined that no events or transactions occurred requiring adjustment or disclosure in the financial statements.
17

REPORT OF INDEPENDENT REGISTERED PUBLIC ACCOUNTING FIRM
To the Shareholders of The Teberg Fund
and the Board of Trustees of Northern Lights Fund Trust III
Opinion on the Financial Statements
We have audited the accompanying statement of assets and liabilities, including the schedule of investments, of Northern Lights Fund Trust III, comprising of The Teberg Fund (the “Fund”), as of March 31, 2023, and the related statements of operations and changes in net assets for the year then ended, the related notes, and the financial highlights for the year then ended (collectively referred to as the “financial statements”). In our opinion, the financial statements present fairly, in all material respects, the financial position of the Fund as of March 31, 2023, and the results of its operations, changes in net assets and the financial highlights for the year then ended, in conformity with accounting principles generally accepted in the United States of America.
The Fund’s financial statements and financial highlights for the year ended March 31, 2022, and prior, were audited by other auditors whose report dated May 26, 2022, expressed an unqualified opinion on those financial statements and financial highlights.
Basis for Opinion
These financial statements are the responsibility of the Fund’s management. Our responsibility is to express an opinion on the Fund’s financial statements based on our audit. We are a public accounting firm registered with the Public Company Accounting Oversight Board (United States) (“PCAOB”) and are required to be independent with respect to the Fund in accordance with the U.S. federal securities laws and the applicable rules and regulations of the Securities and Exchange Commission and the PCAOB.
We conducted our audit in accordance with the standards of the PCAOB. Those standards require that we plan and perform the audit to obtain reasonable assurance about whether the financial statements are free of material misstatement whether due to error or fraud.
Our audit included performing procedures to assess the risks of material misstatement of the financial statements, whether due to error or fraud, and performing procedures that respond to those risks. Such procedures included examining, on a test basis, evidence regarding the amounts and disclosures in the financial statements. Our procedures included confirmation of securities owned as of March 31, 2023, by correspondence with the custodian. Our audit also included evaluating the accounting principles used and significant estimates made by management, as well as evaluating the overall presentation of the financial statements. We believe that our audit provides a reasonable basis for our opinion.
We have served as the Fund’s auditor since 2023.
COHEN & COMPANY, LTD.
Philadelphia, Pennsylvania
May 30, 2023
COHEN & COMPANY, LTD.
800.229.1099 | 866.818.4538 fax | cohencpa.com
Registered with the Public Company Accounting Oversight Board
18
| THE TEBERG FUND |
| SUPPLEMENTAL INFORMATION (UNAUDITED) |
| March 31, 2023 |
LIQUIDITY RISK MANAGEMENT PROGRAM
The Fund has adopted and implemented a written liquidity risk management program as required by Rule 22e-4 (the “Liquidity Rule”) under the 1940 Act. The program is reasonably designed to assess and manage the Fund’s liquidity risk, taking into consideration, among other factors, the Fund’s investment strategy and the liquidity of its portfolio investments during normal and reasonably foreseeable stressed conditions; its short and long-term cash flow projections; and its cash holdings and access to other funding sources.
During the year ended March 31, 2023, the Trust’s Liquidity Risk Management Program Committee (the “Committee”) reviewed the Fund’s investments and determined that the Fund held adequate levels of cash and highly liquid investments to meet shareholder redemption activities in accordance with applicable requirements. Accordingly, the Committee concluded that (i) the Fund’s liquidity risk management program is reasonably designed to prevent violations of the Liquidity Rule and (ii) the Fund’s liquidity risk management program has been effectively implemented.
19
| THE TEBERG FUND |
| SUPPLEMENTAL INFORMATION (UNAUDITED) |
| March 31, 2023 |
Renewal of Advisory Agreement – The Teberg Fund*
In connection with a meeting held on November 29-30, 2022, the Board, including a majority of the Trustees who are not “interested persons,” as that term is defined in the Investment Company Act of 1940, as amended, discussed the renewal of the investment advisory agreement (the “Advisory Agreement”) between the adviser and the Trust, with respect to The Teberg Fund (“Teberg”). In considering the renewal of the Advisory Agreement, the Board received materials specifically relating to Teberg and the Advisory Agreement.
The Board relied upon the advice of independent legal counsel and its own business judgment in determining the material factors to be considered in evaluating the Advisory Agreement and the weight to be given to each such factor. The Board’s conclusions were based on an evaluation of all of the information provided and were not the result of any one factor. Moreover, each Trustee may have afforded different weight to the various factors in reaching conclusions with respect to the Advisory Agreement.
Nature, Extent & Quality of Services. The Board noted the Adviser was founded in 1988 and had approximately $31 million in assets under management. The Board reviewed the background information of key investment personnel responsible for Teberg and noted the portfolio manager’s financial industry experience. The Board noted that the Adviser evaluated economic and market indicators to assist in investment decision making and applied its own research of historical market patterns and theories to identify what it believed to be the optimal time to invest in certain types of instruments. The Board discussed that the Adviser took a conservative approach to risk management through portfolio sector diversification and the use of stop-loss orders when it deemed appropriate. The Board remarked that the Adviser monitored compliance with Teberg’s investment limitations using pre- and post-trade checklists and tracked each holding in Teberg’s portfolio using a software program. The Board observed that the Adviser maintained an adequate risk management and compliance culture. It acknowledged that Teberg was the longest-operating fund within its peer group and that the Adviser had cultivated a loyal shareholder base. The Board commented that the Adviser reported no material compliance, litigation, or cybersecurity concerns in the past year. The Board concluded that it expected the Adviser to continue to provide satisfactory service to Teberg and its shareholders.
Performance. The Board remarked that Teberg earned a three-star Morningstar rating. The Board observed that Teberg underperformed its Morningstar category over the 1-year period but outperformed the category across all other periods. The Board further noted that Teberg underperformed its peer group over the 1-year period and outperformed its peer group over the 3-year and 5-year periods. The Board remarked that Teberg underperformed the S&P 500 Total Return Index across periods. The Board acknowledged that the Adviser attributed its underperformance over the 1-year period to holding onto the investments that had provided strong returns in the prior year. The Board recognized that Teberg ranked in the top quartile for net returns over the 3-year, 5-year, and since inception periods. The Board concluded that overall, the Adviser delivered solid performance to Teberg and its shareholders.
Fees and Expenses. The Board acknowledged that the Adviser’s advisory fee for Teberg was equal to the high of its peer group and Morningstar category. The Board noted that the Adviser’s net expense ratio was higher than the Morningstar category average and median but slightly lower than the peer group average and median. The Board discussed the impact of the expense limitation agreement on the advisory fee actually paid, and the Adviser’s position that it would be difficult to provide high quality service and maintain a compliant operation with lower fees. Given these and other considerations, the Board concluded that the Adviser’s advisory fee for Teberg was not unreasonable.
Economies of Scale. The Board discussed the asset size of Teberg and its prospects for continued growth, concluding that it had not yet achieved meaningful economies that would necessitate the establishment of breakpoints. The Board recognized that the Adviser agreed to discuss the implementation of breakpoints as Teberg’s assets grew and the Adviser achieved material economies of scale related to its operation. The Board agreed to monitor and revisit the issue at the appropriate time.
Profitability. The Board reviewed the Adviser’s profitability analysis in connection with its management of Teberg and acknowledged that the Adviser earned a modest profit. The Board concluded that the Adviser’s profitability was not excessive.
20
| THE TEBERG FUND |
| SUPPLEMENTAL INFORMATION (UNAUDITED) (Continued) |
| March 31, 2023 |
Conclusion. Having requested and reviewed such information from the Adviser as the Board believed to be reasonably necessary to evaluate the terms of the Advisory Agreement, and as assisted by the advice of independent counsel, the Board concluded that renewal of the Advisory Agreement was in the best interests of Teberg and its shareholders.
| * | Due to timing of the contract renewal schedule, these deliberations may or may not relate to the current performance results of Teberg |
21
| THE TEBERG FUND |
| SUPPLEMENTAL INFORMATION (UNAUDITED) |
| March 31, 2023 |
CHANGE IN INDEPENDENT REGISTERED PUBLIC ACCOUNTING FIRM
Effective March 6, 2023, BBD LLP (“BBD”) ceased to serve as the independent registered public accounting firm of the Fund. The Audit Committee of the Board approved the replacement of BBD as a result of Cohen & Company, Ltd.’s (“Cohen”) acquisition of BBD’s investment management group.
The report of BBD on the financial statements of the Fund as of and for the fiscal year ended March 31, 2022 did not contain an adverse opinion or a disclaimer of opinion, and were not qualified or modified as to uncertainties, audit scope or accounting principles. During the fiscal year ended March 31, 2022, and during the subsequent interim period through March 6, 2023: (i) there were no disagreements between the registrant and BBD on any matter of accounting principles or practices, financial statement disclosure, or auditing scope or procedure, which disagreements, if not resolved to the satisfaction of BBD, would have caused it to make reference to the subject matter of the disagreements in its report on the financial statements of the Fund for such years or interim period; and (ii) there were no “reportable events,” as defined in Item 304(a)(1)(v) of Regulation S-K under the Securities Exchange Act of 1934, as amended.
The registrant requested that BBD furnish it with a letter addressed to the U.S. Securities and Exchange Commission stating that it agrees with the above statements. A copy of such letter is filed as an exhibit to Form N-CSR.
Effective February 22, 2023, the Audit Committee of the Board also recommended and approved the appointment of Cohen as the Fund’s independent registered public accounting firm for the fiscal year ended March 31, 2023.
During the fiscal year ended March 31, 2022, and during the subsequent interim period through March 6, 2023, neither the registrant, nor anyone acting on its behalf, consulted with Cohen on behalf of the Fund regarding the application of accounting principles to a specified transaction (either completed or proposed), the type of audit opinion that might be rendered on the Fund’s financial statements, or any matter that was either: (i) the subject of a “disagreement,” as defined in Item 304(a)(1)(iv) of Regulation S-K and the instructions thereto; or (ii) “reportable events,” as defined in Item 304(a)(1)(v) of Regulation S-K.
22
| THE TEBERG FUND |
| SUPPLEMENTAL INFORMATION (Unaudited) |
| March 31, 2023 |
The Trustees and officers of the Trust, together with information as to their principal business occupations during the past five years and other information, are shown below. Unless otherwise noted, the address of each Trustee and officer is 225 Pictoria Drive, Suite 450, Cincinnati, OH 45246.
| Independent Trustees | |||||
| Name, Address, Year of Birth | Position(s) Held with Registrant | Length of Service and Term | Principal Occupation(s) During Past 5 Years | Number of Funds Overseen In The Fund Complex* | Other Directorships Held During Past 5 Years** |
| Patricia Luscombe 1961 | Trustee | Since January 2015, Indefinite | Managing Director of the Valuations and Opinions Group, Lincoln International LLC (since August 2007). | 1 | Northern Lights Fund Trust III (for series not affiliated with the Fund since 2015); Monetta Mutual Funds (since November 2015). |
| John V. Palancia 1954 | Trustee, Chairman | Trustee, since February 2012, Indefinite; Chairman of the Board since May 2014. | Retired (since 2011); Formerly, Director of Global Futures Operations Control, Merrill Lynch, Pierce, Fenner & Smith, Inc. (1975-2011). | 1 | Northern Lights Fund Trust III (for series not affiliated with the Fund since 2012); Northern Lights Fund Trust (since 2011); Northern Lights Variable Trust (since 2011); Alternative Strategies Fund (since 2012). |
| Mark H. Taylor 1964 | Trustee, Chairman of the Audit Committee | Since February 2012, Indefinite | PhD (Accounting), CPA; Professor and Director, Lynn Pippenger School of Accountancy, Muma College of Business, University of South Florida (2019 – present); Professor and Department of Accountancy Chair, Case Western Reserve University (2009-2019); President, American Accounting Association (AAA) commencing August 2022 (President- Elect 2022-2023, President 2023-2024; Past President 2024-2025). AAA Vice President-Finance (2017-2020); President, Auditing Section of the AAA; Member, AICPA Auditing Standards Board (2009-2012); Academic Fellow, Office of the Chief Accountant, United States Securities Exchange Commission (2005-2006); Center for Audit Quality research grants (2014, 2012). | 1 | Northern Lights Fund Trust III (for series not affiliated with the Fund since 2012); Northern Lights Fund Trust (since 2007); Northern Lights Variable Trust (since 2007); Alternative Strategies Fund (since June 2010). |
| Jeffery D. Young 1956 | Trustee | Since January 2015, Indefinite | Co-owner and Vice President, Latin America Agriculture Development Corp. (since May 2015); President, Celeritas Rail Consulting (since June 2014); Asst. Vice President - Transportation Systems, Union Pacific Railroad Company (June 1976 to April 2014). | 1 | Northern Lights Fund Trust III (for series not affiliated with the Fund since 2015). |
| * | As of March 31, 2023, the Trust was comprised of 31 active portfolios managed by 15 unaffiliated investment advisers. The term “Fund Complex” applies only to the Fund. The Fund does not hold itself out as related to any other series within the Trust for investment purposes, nor does it share the same investment adviser with any other series. |
| ** | Only includes directorships held within the past 5 years in a company with a class of securities registered pursuant to Section 12 of the Securities Exchange Act of 1934 or subject to the requirements of Section 15(d) of the Securities Exchange Act of 1934, or any company registered as an investment company under the 1940 Act. |
23
| THE TEBERG FUND |
| SUPPLEMENTAL INFORMATION (Unaudited) (Continued) |
| March 31, 2023 |
| Officers of the Trust | |||
| Name, Address, Year of Birth | Position(s) Held with Registrant | Length of Service and Term | Principal Occupation(s) During Past 5 Years |
| Eric Kane 1981 | President | Since August 2022, indefinite | Vice President and Senior Managing Counsel, Ultimus Fund Solutions, LLC (since 2022); Vice President and Managing Counsel, Ultimus Fund Solutions, LLC (2020-2022); Vice President and Counsel, Gemini Fund Services, LLC (2017-2020). |
| Brian Curley 1970 | Treasurer | Since February 2013, indefinite | Vice President, UltimusFund Solutions, LLC (since 2020); Vice President, Gemini Fund Services, LLC (2015-2020). |
| Viktoriya Pallino 1995 | Secretary | Since August 2022, indefinite | Legal Administrator II, Ultimus Fund Solutions, LLC (since 2021); Legal Administrator I, Ultimus Fund Solutions, LLC (2019-2021); Legal Administration Associate, Gemini Fund Services, LLC (2017-2019). |
| William Kimme 1962 | Chief Compliance Officer | Since February 2012, indefinite | Senior Compliance Officer of Northern Lights Compliance Services, LLC (since 2011); Due Diligence and Compliance Consultant, Mick & Associates (2009- 2011); Assistant Director, FINRA (2000-2009). |
The Fund’s Statement of Additional Information includes additional information about the Trustees and is available free of charge, upon request, by calling toll-free at 1-866-209-1964.
24
PRIVACY NOTICE
NORTHERN LIGHTS FUND TRUST III
Rev. June 2021
| FACTS | WHAT DOES NORTHERN LIGHTS FUND TRUST III DO WITH YOUR PERSONAL INFORMATION? | |||
| Why? | Financial companies choose how they share your personal information. Federal law gives consumers the right to limit some but not all sharing. Federal law also requires us to tell you how we collect, share, and protect your personal information. Please read this notice carefully to understand what we do. | |||
| What? | The types of personal information we collect and share depends on the product or service you have with us. This information can include: | |||
| ■ | Social Security number | ■ | Purchase History | |
| ■ | Assets | ■ | Account Balances | |
| ■ | Retirement Assets | ■ | Account Transactions | |
| ■ | Transaction History | ■ | Wire Transfer Instructions | |
| ■ | Checking Account Information | |||
| When you are no longer our customer, we continue to share your information as described in this notice. | ||||
| How? | All financial companies need to share customers’ personal information to run their everyday business. In the section below, we list the reasons financial companies can share their customers’ personal information; the reasons Northern Lights Fund Trust III chooses to share; and whether you can limit this sharing. | |||
| Reasons we can share your personal information | Does Northern Lights Fund Trust III share? | Can you limit this sharing? |
For our everyday business purposes – such as to process your transactions, maintain your account(s), respond to court orders and legal investigations, or report to credit bureaus. | YES | NO |
For our marketing purposes – to offer our products and services to you | NO | We don’t share |
| For joint marketing with other financial companies | NO | We don’t share |
For our affiliates’ everyday business purposes – information about your transactions and experiences. | NO | We don’t share |
For our affiliates’ everyday business purposes – information about your credit worthiness | NO | We don’t share |
| For non-affiliates to market to you | NO | We don’t share |
| QUESTIONS? | Call (631)-490-4300 | ||||
25
PRIVACY NOTICE
NORTHERN LIGHTS FUND TRUST III
| Who we are | |||||
Who is providing this notice?
| Northern Lights Fund Trust III | ||||
| What we do | |||||
| How does Northern Lights Fund Trust III protect my personal information? | To protect your personal information from unauthorized access and use, we use security measures that comply with federal law. These measures include computer safeguards and secured files and buildings.
Our service providers are held accountable for adhering to strict policies and procedures to prevent any misuse of your nonpublic personal information. | ||||
| How does Northern Lights Fund Trust III collect my personal information? | We collect your personal information, for example, when you
■ open an account
■ Provide account information
■ Give us your contact information
■ Make deposits or withdrawals from your account
■ Make a wire transfer
■ Tell us where to send the money
■ Tell us who receives the money
■ Show your government-issued ID
■ Show your driver’s license
We also collect your personal information from other companies. | ||||
| Why can’t I limit all sharing? | Federal law gives you the right to limit only
■ sharing for affiliates’ everyday business purposes – information about your creditworthiness ■ affiliates from using your information to market to you
■ sharing for non-affiliates to market to you
State laws and individual companies may give you additional rights to limit sharing. | ||||
| Definitions | |||||
| Affiliates | Companies related by common ownership or control. They can be financial and non-financial companies.
■ Northern Lights Fund Trust III does not share with our affiliates. | ||||
| Non-affiliates | Companies not related by common ownership or control. They can be financial and non-financial companies. ■ Northern Lights Fund Trust III doesn’t share with non-affiliates so they can market to you. | ||||
| Joint Marketing | A formal agreement between nonaffiliated financial companies that together market financial products or services to you.
■ Northern Lights Fund Trust III doesn’t jointly market. | ||||
26
| INVESTMENT ADVISER |
| First Associated Investment Advisors, Inc. |
| 5161 Miller Trunk Highway |
| Duluth, Minnesota 55811 |
| ADMINISTRATOR |
| Ultimus Fund Solutions, LLC |
| 225 Pictoria Drive, Suite 450 |
| Cincinnati, Ohio 45246 |
| The Fund files its complete schedule of portfolio holdings with the SEC for the first and third quarters of each fiscal year on Form N-PORT. Form N-PORT is available on the SEC’s website at http://www.sec.gov. The information on Form N-PORT is available without charge, upon request, by calling 1-866-209-1964. |
| Information regarding how the Fund voted proxies relating to portfolio securities during the most recent 12-month period ended June 30 as well as a description of the policies and procedures that the Fund uses to determine how to vote proxies is available without charge, upon request, by calling 1-866-209-1964; and on the Commission’s website at http://www.sec.gov. |
| Teberg - AR23 |
(a) Include a copy of the report transmitted to stockholders pursuant to Rule 30e-1 under the Act (17 CFR 270.30e-1).
(b) Include a copy of each notice transmitted to stockholders in reliance on Rule 30e-3 under the Act (17 CFR 270.30e-3) that contains disclosures specified by paragraph (c)(3) of that rule. Not applicable.
Item 2. Code of Ethics.
(a) As of the end of the period covered by this report, the registrant has adopted a code of ethics that applies to the registrant's principal executive officer, principal financial officer, principal accounting officer or controller, or persons performing similar functions, regardless of whether these individuals are employed by the registrant or a third party.
(b) For purposes of this item, “code of ethics” means written standards that are reasonably designed to deter wrongdoing and to promote:
| (1) | Honest and ethical conduct, including the ethical handling of actual or apparent conflicts of interest between personal and professional relationships; |
| (2) | Full, fair, accurate, timely, and understandable disclosure in reports and documents that a registrant files with, or submits to, the Commission and in other public communications made by the registrant; |
(3) Compliance with applicable governmental laws, rules, and regulations;
| (4) | The prompt internal reporting of violations of the code to an appropriate person or persons identified in the code; and |
(5) Accountability for adherence to the code.
(c) Amendments: During the period covered by the report, there have not been any amendments to the provisions of the code of ethics.
(d) Waivers: During the period covered by the report, the registrant has not granted any express or implicit waivers from the provisions of the code of ethics.
(e) The Code of Ethics is not posted on Registrant’ website.
(f) A copy of the Code of Ethics is attached as an exhibit.
Item 3. Audit Committee Financial Expert.
(a)(1)ii The Registrant’s board of trustees has determined that Mark H. Taylor is an audit committee financial expert, as defined in Item 3 of Form N-CSR. Mr. Taylor is independent for purposes of this Item 3.
(a)(2) Not applicable.
(a)(3) In this regard, no member of the audit committee was identified as having all of the required technical attributes identified in instruction 2 (b) to item 3 of Form N-CSR to qualify as an “audit committee financial expert,” whether through the type of specialized education or experience required by that instruction. At this time, the board believes the experience provided by each member of the audit committee collectively offers the fund adequate oversight by its audit committee given the fund’s level of financial complexity. The board will from time to time reexamine such belief.
Item 4. Principal Accountant Fees and Services.
| (a) | Audit Fees |
2022 – $13,000
2023 – $13,150
| (b) | Audit-Related Fees |
2022 – None
2023 – None
| (c) | Tax Fees |
2022 – $3,000
2023 – $3,100
Preparation of Federal & State income tax returns, assistance with calculation of required income, capital gain and excise distributions and preparation of Federal excise tax returns.
| (d) | All Other Fees |
2022 – None
2023 – None
| (e) | (1) Audit Committee’s Pre-Approval Policies |
The registrant’s Audit Committee is required to pre-approve all audit services and, when appropriate, any non-audit services (including audit-related, tax and all other services) to the registrant. The registrant’s Audit Committee also is required to pre-approve, when appropriate, any non-audit services (including audit-related, tax and all other services) to its adviser, or any entity controlling, controlled by or under common control with the adviser that provides ongoing services to the registrant, to the extent that the services may be determined to have an impact on the operations or financial reporting of the registrant. Services are reviewed on an engagement by engagement basis by the Audit Committee.
| (2) | Percentages of Services Approved by the Audit Committee |
2022 2023
Audit-Related Fees: 0.00% 0.00%
Tax Fees: 0.00% 0.00%
All Other Fees: 0.00% 0.00%
| (f) | During the audit of registrant's financial statements for the most recent fiscal year, less than 50 percent of the hours expended on the principal accountant's engagement were attributed to work performed by persons other than the principal accountant's full-time, permanent employees. |
| (g) | The aggregate non-audit fees billed by the registrant's accountant for services rendered to the registrant, and rendered to the registrant's investment adviser (not including any sub-adviser whose role is primarily portfolio management and is subcontracted with or overseen by another investment adviser), and any entity controlling, controlled by, or under common control with the adviser that provides ongoing services to the registrant: |
2022 - $3,000
2023 - $3,150
(h) The registrant's audit committee has considered whether the provision of non-audit services to the registrant's investment adviser (not including any sub-adviser whose role is primarily portfolio management and is subcontracted with or overseen by another investment adviser), and any entity controlling, controlled by, or under common control with the investment adviser that provides ongoing services to the registrant, that were not pre-approved pursuant to paragraph (c)(7)(ii) of Rule 2-01 of Regulation S-X, is compatible with maintaining the principal accountant's independence.
(i) Not applicable.
(j) Not applicable.
Item 5. Audit Committee of Listed Companies. Not applicable to open-end investment companies.
Item 6. Schedule of Investments. Schedule of investments in securities of unaffiliated issuers is included under Item 1.
Item 7. Disclosure of Proxy Voting Policies and Procedures for Closed-End Funds. Not applicable to open-end investment companies.
Item 8. Portfolio Managers of Closed-End Management Investment Companies. Not applicable to open-end investment companies.
Item 9. Purchases of Equity Securities by Closed-End Funds. Not applicable to open-end investment companies.
Item 10. Submission of Matters to a Vote of Security Holders. None
Item 11. Controls and Procedures.
(a) Based on an evaluation of the Registrant’s disclosure controls and procedures as of a date within 90 days of filing date of this Form N-CSR, the principal executive officer and principal financial officer of the Registrant have concluded that the disclosure controls and procedures of the Registrant are reasonably designed to ensure that the information required in filings on Form N-CSR is recorded, processed, summarized, and reported by the filing date, including that information required to be disclosed is accumulated and communicated to the Registrant’s management, including the Registrant’s principal executive officer and principal financial officer, as appropriate to allow timely decisions regarding required disclosure.
(b) There were no significant changes in the Registrant’s internal control over financial reporting that occurred during the period covered by this report that have materially affected, or are reasonably likely to materially affect, the Registrant’s internal control over financial reporting.
Item 12. Disclosure of securities lending activities for closed-end management investment companies.
Not applicable to open-end investment companies.
Item 13. Exhibits.
(a)(1) Code of Ethics filed herewith.
(a)(3) Not applicable for open-end investment companies.
SIGNATURES
Pursuant to the requirements of the Securities Exchange Act of 1934 and the Investment Company Act of 1940, the registrant has duly caused this report to be signed on its behalf by the undersigned, thereunto duly authorized.
(Registrant) Northern Lights Fund Trust III
By (Signature and Title)
/s/ Brian Curley
Brian Curley, Principal Executive Officer/President
Date 6/6/2023
Pursuant to the requirements of the Securities Exchange Act of 1934 and the Investment Company Act of 1940, this report has been signed below by the following persons on behalf of the registrant and in the capacities and on the dates indicated.
By (Signature and Title)
/s/ Brian Curley
Brian Curley, Principal Executive Officer/President
Date 6/6/2023
By (Signature and Title)
/s/ Rich Gleason
Rich Gleason, Principal Financial Officer/Treasurer
Date 6/6/2023