united states
securities and exchange commission
washington, d.c. 20549
form n-csr
certified shareholder report of registered management
investment companies
Investment Company Act file number 811-22655
Northern Lights Fund Trust III
(Exact name of registrant as specified in charter)
225 Pictoria Drive, Suite 450, Cincinnati, Ohio 45246
(Address of principal executive offices) (Zip code)
The Corporation Trust Company
1209 Orange Street, Wilmington, DE 19801
(Name and address of agent for service)
Registrant's telephone number, including area code: 631-490-4300
Date of fiscal year end: 6/30
Date of reporting period: 6/30/2023
Item 1. Reports to Stockholders.
| (a) |

Boyd Watterson Limited Duration
Enhanced Income Fund
Class A Shares – BWDAX
Class C Shares – BWDCX
Class I Shares – BWDIX
Class I2 Shares – BWDTX
Annual Report
June 30, 2023
1-877-345-9597
www.boydwattersonfunds.com
Boyd Watterson Asset Management, LLC
1301 East 9th Street, Suite 2900
Cleveland, Ohio 44114
Distributed by Northern Lights Distributors, LLC
Member FINRA
Limited Duration Enhanced Income Fund
June 30, 2023
Dear Investors and Consultants,
Thank you for your confidence in Boyd Watterson Asset Management (“Boyd Watterson”) and for allowing us to manage a portion of your assets in the Boyd Watterson Limited Duration Enhanced Income Fund.
Fund Objectives:
The Boyd Watterson Limited Duration Enhanced Income Fund (the “Fund”) seeks (i) income generation as a principal objective and (ii) capital preservation and total return as secondary objectives.
Performance Discussion:
The Fund’s net return was 7.74% for the fiscal year ended June 30, 2023. The Fund’s benchmark, the Bloomberg 1-3 Year Government/Credit Index(1) returned 0.53% over the same period.
The last twelve months can be characterized by the overwhelming theme of higher interest rates. For perspective, as of June 30, 2022, the Federal Funds overnight interest rate was 1.75%. The rate had been at 0.25% since the Federal Reserve lowered it at the onset of the COVID pandemic in 2020. But beginning in March 2022 the Federal Reserve embarked on a campaign to increase their Fed Funds rate. The markets expected the Federal Reserve to slowly and gradually increase rates from their near zero level. However, that expectation changed dramatically as inflation surged and became less “transitory”. Instead, the Federal Reserve accelerated rate increases on the fastest trajectory in nearly 40 years. From 1.75% as of June 30, 2022, the Fed Funds overnight rate sat at 5.25% as of June 30, 2023. Correspondingly, interest rates moved higher across the curve, highlighted by the 2-Year Treasury Note increasing from 2.96% to 4.90% in the year ended June 30, 2023, and the 10-Year Treasury Note increasing from 3.01% to 3.84% over the same period. These interest rate increases were the primary driver of US Government indices struggling to generate small positive returns over the one-year period ended June 30, 2023.
In contrast to US Government Indices, other broad-based fixed income indices generally posted stronger total returns over the one-year period, but experienced material volatility. As of June 30, 2023, the Bloomberg Aggregate Index returned -0.94%, the ICE BofA High Yield Index(2) returned 8.87% and the ICE BofA US Investment Grade Corporate Index(3) returned 1.41%.
Thematically, Boyd Watterson’s economic expectations over the last year centered around the beliefs that the Federal Reserve would keep interest rates higher for longer than the market was forecasting, and that growth was decelerating, increasing the chance of a future recession; be it shallow or deep. To align with those expectations, the Fund maintained a significant amount of floating rate exposure (nearly 40%) but altered the composition of that exposure. Over the course of the year, Boyd Watterson sold more than half of the Fund’s floating rate bank loans, most of them carrying a high yield rating and reinvested the proceeds in investment grade rated CLOs. These trades maintained floating rate exposure but selectively improved the overall credit quality of the Fund. At quarter end, the Fund had approximately 43% exposure to high yield securities and an overall credit rating of BBB. In fact, AAA and AA-rated exposure constituted almost 25% of the Fund. In contrast, the Fund had 55% high yield exposure as of June 30, 2022.
Opportunistically over the year, Boyd Watterson selectively added to the Fund’s exposure in the financial sector in the wake of some well publicized bank failures in Q1, 2023. The Fund focused mainly
1
Limited Duration Enhanced Income Fund
June 30, 2023
on increased exposure to the largest domestic banks as opposed to regional banks. The Fund now has slightly less than 5% total exposure to the banking sector. Boyd Watterson also materially increased the Fund’s exposure to secured Structured Products (CLOs and Auto Loan ABS) at the expense of unsecured corporate bonds. Boyd Watterson believes that with increased economic uncertainty, the secured nature of CLOs and ABS will better protect against principal deterioration. As of June 30, 2023, CLOs and ABS combined constituted more than 40% of the Fund’s total holdings. With materially higher interest rates for US Treasuries over the course of the year and increased economic uncertainty, the Fund took exposure to US Treasuries for the first time in over three years. Initially the Fund took approximately 5% exposure to shorter maturity Treasury Bills as those yields crossed the 5% threshold. But as longer -term interest rates rose to the upper end of our expectations in 2023, the Fund sold its position in short maturity Treasury Bills and purchased longer maturity Treasury Notes.
The Fund remains a credit focused, income generating Fund. As such, the expectation is for income generation to continue to be the primary driver of returns for the Fund. From a credit perspective, the Fund continues to experience more credit agency upgrades than downgrades and does not have any individual holdings trading at distressed levels. Boyd Watterson meticulously applies its credit process to every security before the Fund purchases it, recognizing that it may likely hold the security during future, tumultuous times, and want to feel comfortable with every security as a long-term holder.
The Fund continues to seek income from a diversified set of sectors including various segments of the securitized market, bank loans, preferred stock and corporate bonds. Boyd Watterson remains keenly focused on inflation and the labor markets as it evaluates future actions from the Federal Reserve and will actively adjust the Fund’s portfolio positioning as warranted.
| (1) | The Bloomberg 1-3 Year Govt/Credit Index is an unmanaged index which is a component of the US Government/Credit Index, which includes Treasury and agency securities (US Government Bond Index) and publicly issued US corporate and foreign debentures and secured notes (US Credit Bond Index). The bonds in the index are investment grade with a maturity between one and three years. Formerly known as Bloomberg Barclays Capital U.S. 1-3 Year Govt/Credit Bond Index. Investors cannot invest directly in an index. |
| (2) | The ICE BofAML U.S. High Yield Index is an unmanaged index that tracks the performance of U.S. dollar denominated, below investment-grade rated corporate debt publicly issued in the U.S. domestic market. |
| (3) | The ICE BofA US Investment Grade Corporate Index provides a broad measure of the USD-denominated investment grade corporate debt securities publicly issued in the US domestic market. |
7585-NLD 07/18/2023
2
Boyd Watterson Limited Duration Enhanced Income Fund
PORTFOLIO REVIEW (Unaudited)
June 30, 2023
Average Annual Total Return through June 30, 2023*, as compared to its benchmarks:
| One | Three | Five | Since | Since | Since | |
| Year | Year | Year | Inception (e) | Inception (f) | Inception (g) | |
| Boyd Watterson Limited Duration Enhanced Income Fund - Class A | 7.33% | 1.97% | N/A | N/A | N/A | 2.46% |
| Boyd Watterson Limited Duration Enhanced Income Fund - Class A with load | 4.94% | 1.19% | N/A | N/A | N/A | 1.92% |
| Boyd Watterson Limited Duration Enhanced Income Fund - Class C | 6.52% | 1.18% | N/A | N/A | N/A | 1.74% |
| Boyd Watterson Limited Duration Enhanced Income Fund - Class I | 7.50% | 2.17% | 2.80% | 2.72% | N/A | N/A |
| Boyd Watterson Limited Duration Enhanced Income Fund - Class I2 (a) | 7.74% | 2.39% | 3.01% | N/A | 3.12% | N/A |
| Bloomberg 1-3 Year Govt/Credit Index (b) | 0.53% | -0.88% | 1.13% | 0.97% | 0.98% | 0.83% |
| Bloomberg 1-5 Year Govt/Credit Index (c) | 0.19% | -1.57% | 1.15% | 0.92% | 1.13% | 0.78% |
| Bloomberg U.S. Treasury 1-3 Years (d) | 0.15% | -1.12% | 0.93% | 0.75% | 0.75% | 0.64% |
| * | The performance data quoted here represents past performance. Current performance may be lower or higher than the performance data quoted above. Investment return and principal value will fluctuate so that shares, when redeemed, may be worth more or less than their original cost. The returns shown do not reflect the deduction of taxes that a shareholder would pay on Fund distributions or on the redemptions of Fund shares. Past performance is no guarantee of future results. Performance figures for periods greater than 1 year are annualized. The Fund’s advisor has contractually agreed to waive its fees and/or reimburse expenses of the Fund, until at least October 31, 2023, to ensure that Total Annual Fund Operating Expenses After Fee Waiver and/or Reimbursement (exclusive of any front-end or contingent deferred loads; brokerage fees and commissions, acquired fund fees and expenses; borrowing costs (such as interest and dividend expense on securities sold short); taxes; and extraordinary expenses, such as litigation expenses (which may include indemnification of Fund officers and the Board, contractual indemnification of Fund service providers (other than the advisor))) will not exceed 0.89%, 1.59%, 0.60%, and 0.40% of the daily average net assets attributable to Class A, Class C, Class I and Class I2 shares, respectively. Class A, Class C, Class I, and Class I2’s total annual expense ratios, after fee waiver, are 0.87%, 1.61%, 0.62%, and 0.42%, respectively, per the Fund’s most recent prospectus. Without waiver the expense ratios are 0.87%, 1.62%, 0.62%, and 0.62% for Class A, Class C, Class I and Class I2, respectively. For performance information current to the most recent month-end, please call toll-free 1-877-345-9597. |
| (a) | The Fund is the successor to the Boyd Watterson Limited Duration Mid-Grade Fund, LLC (the “Predecessor Fund”), which transferred its assets to the Fund in connection with the Fund’s commencement of operations. The Predecessor Fund was managed by the same advisor who currently manages the Fund, and had substantially similar investment objectives and strategies to those of the Fund. The performance includes the performance of the Predecessor Fund prior to the commencement of the Fund’s operations. The Predecessor Fund’s performance has been adjusted to reflect the annual deduction of fees and expenses applicable to the Class I2 Shares. The Predecessor Fund was not registered as a mutual fund under the Investment Company Act of 1940, as amended (the “1940 Act”), and therefore was not subject to certain investment restrictions, limitations and diversification requirements imposed by the 1940 Act and the Internal Revenue Code of 1986, as amended (the “Code”). |
| (b) | The Bloomberg 1-3 Year Govt/Credit Index is an unmanaged index which is a component of the US Government/Credit Index, which includes Treasury and agency securities (US Government Bond Index) and publicly issued US corporate and foreign debentures and secured notes (US Credit Bond Index). The bonds in the index are investment grade with a maturity between one and three years. Formerly known as Bloomberg Barclays Capital U.S. 1-3 Year Govt/Credit Bond Index. Investors cannot invest directly in an index. |
| (c) | The Bloomberg 1-5 Year Govt/Credit Index is an unmanaged index which is a component of the US Government/Credit Index, which includes Treasury and agency securities (US Government Bond Index) and publicly issued US corporate and foreign debentures and secured notes (US Credit Bond Index). The bonds in the index are investment grade with a maturity between one and five years. Formerly known as Bloomberg Barclays 1-5 Year Govt/Credit Bond Index. Investors cannot invest directly in an index. |
| (d) | The Bloomberg U.S. Treasury 1-3 Years Index is an unmanaged index measures the performance of the US government bond market and includes public obligations of the U.S. Treasury with a maturity between 1 and up to (but not including) 3 years. Formerly known as Bloomberg Barclays U.S. Treasury 1-3 Years Index. Investors cannot invest directly in an index. |
| (e) | Class I inception date is April 13, 2017. |
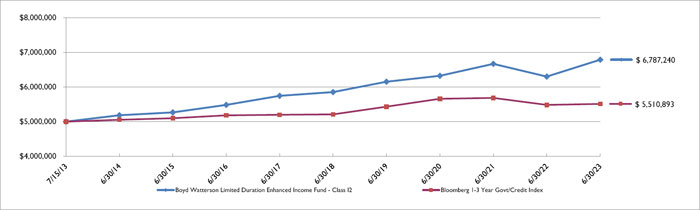
| (f) | Class I2 inception date is July 15, 2013. |
| (g) | Class A and C inception date is February 28, 2019. |
Comparison of the Change in Value of a $5,000,000 Investment
3
| Boyd Watterson Limited Duration Enhanced Income Fund |
| PORTFOLIO REVIEW (Unaudited) (Continued) |
| June 30, 2023 |
| Portfolio Composition | Percentage of Net Assets | |||
| CLO | 26.6 | % | ||
| Auto Loan | 17.0 | % | ||
| Oil & Gas Producers | 6.7 | % | ||
| U.S Treasury Bills | 5.1 | % | ||
| Banking | 2.7 | % | ||
| Chemicals | 2.3 | % | ||
| Consumer Services | 1.9 | % | ||
| Biotech & Pharma | 1.7 | % | ||
| Engineering & Construction | 1.7 | % | ||
| Construction Materials | 1.7 | % | ||
| Metals & Mining | 1.7 | % | ||
| Other Assets in Excess of Other Liabilities | 30.9 | % | ||
| 100.0 | % | |||
Please refer to the Schedule of Investments in this annual report for a detailed listing of the Fund’s holdings.
4
| BOYD WATTERSON LIMITED DURATION ENHANCED INCOME FUND |
| SCHEDULE OF INVESTMENTS |
| June 30, 2023 |
| Coupon Rate | ||||||||||||||
| Shares | (%) | Maturity | Fair Value | |||||||||||
| PREFERRED STOCKS — 1.9% | ||||||||||||||
| ASSET MANAGEMENT — 0.6% | ||||||||||||||
| 1 20,000 | Charles Schwab Corporation (The) - Series J | 1.113 | 06/01/26 | $ | 2,364,000 | |||||||||
| AUTOMOTIVE — 0.2% | ||||||||||||||
| 3 3,908 | Ford Motor Company | 1.625 | 814,470 | |||||||||||
| BANKING — 1.1% | ||||||||||||||
| 1 17,000 | Huntington Bancshares, Inc. - Series H | 1.125 | 04/15/26 | 2,070,900 | ||||||||||
| 1 22,135 | US Bancorp, B - Series M | 1.000 | 04/15/26 | 2,055,532 | ||||||||||
| 4,126,432 | ||||||||||||||
| TOTAL PREFERRED STOCKS (Cost $9,865,184) | 7,304,902 | |||||||||||||
| Principal | Coupon Rate | |||||||||||||
| Amount ($) | Spread | (%) | Maturity | Fair Value | ||||||||||
| ASSET BACKED SECURITIES — 44.0% | ||||||||||||||
| AUTO LOAN — 17.0% | ||||||||||||||
| 2,500,000 | AmeriCredit Automobile Receivables Trust 2020-2 Series 2 C | 1.4800 | 02/18/26 | 2,410,534 | ||||||||||
| 2,030,000 | AmeriCredit Automobile Receivables Trust 2020-2 Series 2020-2 D | 2.1300 | 03/18/26 | 1,923,228 | ||||||||||
| 745,000 | CarMax Auto Owner Trust 2019-3 Series 3 D | 2.8500 | 01/15/26 | 739,278 | ||||||||||
| 2,000,000 | CarMax Auto Owner Trust 2020-2 Series 2020-2 D | 5.7500 | 05/17/27 | 1,989,003 | ||||||||||
| 1,342,926 | Exeter Automobile Receivables Trust 2021-1 Series 2021-1A C | 0.7400 | 01/15/26 | 1,325,873 | ||||||||||
| 1,932,000 | Exeter Automobile Receivables Trust 2021-3 Series 3A C | 0.9600 | 10/15/26 | 1,862,156 | ||||||||||
| 2,645,000 | Exeter Automobile Receivables Trust 2021-3 Series 2021-3A D | 1.5500 | 06/15/27 | 2,426,042 | ||||||||||
| 4,000,000 | Exeter Automobile Receivables Trust 2022-1 Series 1A E(a) | 5.0200 | 10/15/29 | 3,479,984 | ||||||||||
| 2,000,000 | First Investors Auto Owner Trust Series 2021-1A E(a) | 3.3500 | 04/15/27 | 1,844,492 | ||||||||||
| 1,555,000 | First Investors Auto Owner Trust 2019-1 Series 2019-1A E(a) | 4.5300 | 06/16/25 | 1,553,396 | ||||||||||
| 2,000,000 | First Investors Auto Owner Trust 2019-2 Series 2019-2A E(a) | 3.8800 | 01/15/26 | 1,974,531 | ||||||||||
| 1,000,000 | First Investors Auto Owner Trust 2020-1 Series 2020-1A E(a) | 4.6300 | 06/16/26 | 983,687 | ||||||||||
| 1,005,000 | First Investors Auto Owner Trust 2021-1 Series 1A C(a) | 1.1700 | 03/15/27 | 954,886 | ||||||||||
| 1,250,000 | First Investors Auto Owner Trust 2021-1 Series 1A D(a) | 1.6200 | 03/15/27 | 1,159,013 | ||||||||||
| 2,230,000 | First Investors Auto Owner Trust 2021-2 Series 2021-2A D(a) | 1.6600 | 12/15/27 | 1,999,660 | ||||||||||
| 2,000,000 | First Investors Auto Owner Trust 2022-1 Series 1A E(a) | 5.4100 | 06/15/29 | 1,806,336 | ||||||||||
| 2,000,000 | First Investors Auto Owner Trust 2022-2 Series 2A D(a) | 8.7100 | 10/16/28 | 2,074,250 | ||||||||||
| 1,100,000 | Flagship Credit Auto Trust 2019-3 Series 3 D (a) | 2.8600 | 12/15/25 | 1,075,285 | ||||||||||
See accompanying notes to financial statements.
5
| BOYD WATTERSON LIMITED DURATION ENHANCED INCOME FUND |
| SCHEDULE OF INVESTMENTS (Continued) |
| June 30, 2023 |
| Principal | Coupon Rate | |||||||||||||
| Amount ($) | Spread | (%) | Maturity | Fair Value | ||||||||||
| ASSET BACKED SECURITIES — 44.0% (Continued) | ||||||||||||||
| AUTO LOAN — 17.0% (Continued) | ||||||||||||||
| 1,026,432 | Flagship Credit Auto Trust 2019-4 Series 2019-4 C(a) | 2.7700 | 12/15/25 | $ | 1,019,895 | |||||||||
| 4,200,000 | GM Financial Leasing Trust Series 2021-1 D | 1.0100 | 07/21/25 | 4,187,859 | ||||||||||
| 230,831 | Santander Drive Auto Receivables Trust 2019-2 Series 2019-2 D | 3.2200 | 07/15/25 | 230,219 | ||||||||||
| 1,501,228 | Santander Drive Auto Receivables Trust 2020-3 Series 2020-3 D | 1.6400 | 11/16/26 | 1,463,354 | ||||||||||
| 873,389 | Santander Drive Auto Receivables Trust 2021-1 Series 2021-1 C | 0.7500 | 02/17/26 | 866,299 | ||||||||||
| 3,990,000 | Santander Drive Auto Receivables Trust 2021-3 Series 2021-3 D | 1.3300 | 09/15/27 | 3,726,638 | ||||||||||
| 1,500,000 | Westlake Automobile Receivables Trust 2019-3 Series 2019-3A E(a) | 3.5900 | 03/17/25 | 1,495,279 | ||||||||||
| 2,000,000 | Westlake Automobile Receivables Trust 2019-3 Series 2019-3A F(a) | 4.7200 | 04/15/26 | 1,994,655 | ||||||||||
| 1,000,000 | Westlake Automobile Receivables Trust 2020-2 Series 2020-2A D(a) | 2.7600 | 01/15/26 | 984,010 | ||||||||||
| 3,000,000 | Westlake Automobile Receivables Trust 2020-3 Series 2020-3A F(a) | 5.1100 | 05/17/27 | 2,918,994 | ||||||||||
| 3,675,000 | Westlake Automobile Receivables Trust 2021-1 Series 2021-1A E(a) | 2.3300 | 08/17/26 | 3,410,875 | ||||||||||
| 2,000,000 | Westlake Automobile Receivables Trust 2021-2 Series 2021-2A E(a) | 2.3800 | 03/15/27 | 1,840,880 | ||||||||||
| 3,000,000 | Westlake Automobile Receivables Trust 2021-2 Series 2021-2A F(a) | 3.6600 | 12/15/27 | 2,684,441 | ||||||||||
| 1,305,000 | Westlake Automobile Receivables Trust 2021-3 Series 2021-3A C(a) | 1.5800 | 01/15/27 | 1,234,629 | ||||||||||
| 1,830,000 | Westlake Automobile Receivables Trust 2021-3 Series 2021-3A E(a) | 3.4200 | 04/15/27 | 1,675,729 | ||||||||||
| 3,250,000 | Westlake Automobile Receivables Trust 2023-1 Series 1A D(a) | 6.7900 | 11/15/28 | 3,244,110 | ||||||||||
| 64,559,500 | ||||||||||||||
| CLO — 26.6% | ||||||||||||||
| 3,000,000 | AGL CLO 25 Ltd. Series 25 A D(a) (b) | TSFR3M + 5.300% | 10.5520 | 07/21/36 | 3,000,000 | |||||||||
| 1,141,926 | Allegro CLO II-S Ltd. Series 2014-1RA A1(a),(b) | US0003M + 1.080% | 6.3410 | 10/21/28 | 1,134,322 | |||||||||
| 700,000 | Allegro CLO II-S Ltd. Series 2014-1RA B(a),(b) | US0003M + 2.150% | 7.4110 | 10/21/28 | 689,177 | |||||||||
| 5,050,000 | ALM 2020 Ltd. Series 2020-1A A2(a),(b) | US0003M + 1.850% | 7.1100 | 10/15/29 | 5,012,125 | |||||||||
| 2,650,000 | Apidos CLO XXVII Series 27A CR(a),(b) | US0003M + 3.150% | 8.4100 | 07/17/30 | 2,529,682 | |||||||||
| 3,500,000 | Apidos CLO XXXV Series 2021-35A E(a),(b) | US0003M + 5.750% | 11.0000 | 04/20/34 | 3,171,000 | |||||||||
| 1,260,950 | Ares XL CLO Ltd. Series 2016-40A A1RR(a),(b) | US0003M + 0.870% | 6.1300 | 01/15/29 | 1,252,312 | |||||||||
| 3,675,000 | Ares XL CLO Ltd. Series 2016-40A BRR(a),(b) | US0003M + 1.800% | 7.0600 | 01/15/29 | 3,590,666 | |||||||||
| 7,000,000 | Ares XLIX CLO Ltd. Series 49A B(a),(b) | US0003M + 1.650% | 6.9230 | 07/22/30 | 6,896,981 | |||||||||
| 750,000 | Carlyle US CLO 2016-4 Ltd. Series 2016-4A CR(a),(b) | US0003M + 2.800% | 8.0500 | 10/20/27 | 706,267 | |||||||||
| 2,250,000 | Carlyle US CLO 2019-2 Ltd. Series 2019-2A A2R(a),(b) | US0003M + 1.650% | 6.9100 | 07/15/32 | 2,215,773 | |||||||||
| 1,144,253 | CIFC Funding 2014-II-R Ltd. Series 2014-2RA A1(a),(b) | US0003M + 1.050% | 6.3230 | 04/24/30 | 1,137,254 | |||||||||
| 2,200,000 | CIFC Funding 2017-IV Ltd. Series 2017-4A A2R(a),(b) | US0003M + 1.550% | 6.8230 | 10/24/30 | 2,157,657 | |||||||||
| 3,000,000 | CIFC Funding 2017-IV Ltd. Series 2017-4A CR(a),(b) | US0003M + 3.150% | 8.4230 | 10/24/30 | 2,848,659 | |||||||||
| 1,000,000 | Dryden 30 Senior Loan Fund Series 2013-30A CR(a),(b) | US0003M + 1.700% | 7.0210 | 11/15/28 | 978,288 | |||||||||
| 3,500,000 | Dryden 30 Senior Loan Fund Series 2013-30A DR(a),(b) | US0003M + 2.600% | 7.9210 | 11/15/28 | 3,245,483 | |||||||||
| 206,150 | Dryden Senior Loan Fund Series 2017-47A A1R(a),(b) | US0003M + 0.980% | 6.2400 | 04/15/28 | 204,927 | |||||||||
See accompanying notes to financial statements.
6
| BOYD WATTERSON LIMITED DURATION ENHANCED INCOME FUND |
| SCHEDULE OF INVESTMENTS (Continued) |
| June 30, 2023 |
| Principal | Coupon Rate | |||||||||||||
| Amount ($) | Spread | (%) | Maturity | Fair Value | ||||||||||
| ASSET BACKED SECURITIES — 44.0% (Continued) | ||||||||||||||
| CLO — 26.6% (Continued) | ||||||||||||||
| 1,174,464 | Elevation CLO 2014-2 Ltd. Series 2014-2A A1R (a),(b) | TSFR3M + 1.492% | 6.4780 | 10/15/29 | $ | 1,170,098 | ||||||||
| 1,700,000 | Elmwood CLO 20 Ltd. Series 2022-7A B1(a),(b) | TSFR3M + 2.750% | 7.7360 | 10/17/34 | 1,699,925 | |||||||||
| 2,750,000 | Goldentree Loan Management US CLO 1 Ltd. Series 2017-1A DR2(a),(b) | US0003M + 3.150% | 8.4000 | 04/20/34 | 2,610,567 | |||||||||
| 4,500,000 | Goldentree Loan Management US CLO 17 Ltd. Series 17A B(a),(b) | TSFR3M + 2.450% | 7.6970 | 07/20/36 | 4,500,000 | |||||||||
| 2,500,000 | GoldenTree Loan Opportunities IX Ltd. Series 2014-9A DR2(a),(b) | US0003M + 3.000% | 8.2990 | 10/29/29 | 2,472,825 | |||||||||
| 4,053,800 | Halseypoint CLO II Ltd. Series 2A A1(a),(b) | US0003M + 1.100% | 6.3500 | 07/20/31 | 4,028,573 | |||||||||
| 5,000,000 | ICG US CLO 2014-3 Ltd. Series 3A A2RR(a),(b) | TSFR3M + 1.762% | 6.8290 | 04/25/31 | 4,932,375 | |||||||||
| 4,250,000 | Jay Park CLO Ltd. Series 2016-1A BR(a),(b) | US0003M + 2.000% | 7.2500 | 10/20/27 | 4,172,467 | |||||||||
| 3,420,000 | JFIN CLO 2016 Ltd. Series 2016-1A DR(a),(b) | US0003M + 3.400% | 8.6920 | 10/27/28 | 3,420,000 | |||||||||
| 4,000,000 | LCM XX, L.P. Series 20A ER(a),(b) | US0003M + 5.450% | 10.7000 | 10/20/27 | 3,832,984 | |||||||||
| 500,000 | LCM XXI, L.P. Series 21A DR(a),(b) | US0003M + 2.800% | 8.0500 | 04/20/28 | 500,037 | |||||||||
| 867,624 | LCM XXII Ltd. Series 22A A1R(a),(b) | US0003M + 1.160% | 6.4100 | 10/20/28 | 863,640 | |||||||||
| 2,000,000 | Madison Park Funding XXIV Ltd. Series 2016-24A BR(a),(b) | TSFR3M + 2.012% | 7.0600 | 10/20/29 | 1,990,946 | |||||||||
| 316,935 | Magnetite VII Ltd. Series 2012-7A A1R2(a),(b) | US0003M + 0.800% | 6.0600 | 01/15/28 | 315,121 | |||||||||
| 950,000 | Magnetite XVIII Ltd. Series 2016-18A BR(a),(b) | US0003M + 1.500% | 6.8210 | 11/15/28 | 937,277 | |||||||||
| 2,000,000 | Neuberger Berman CLO XV Series 2013-15A CR2(a),(b) | US0003M + 1.850% | 7.1100 | 10/15/29 | 1,951,572 | |||||||||
| 6,000,000 | Neuberger Berman CLO XVII Ltd. Series 2014-17A CR2(a),(b) | US0003M + 2.000% | 7.2730 | 04/22/29 | 5,849,526 | |||||||||
| 2,000,000 | Neuberger Berman Loan Advisers CLO 32 Ltd. Series 2019-32A DR(a),(b) | US0003M + 2.700% | 7.9650 | 01/19/32 | 1,890,146 | |||||||||
| 3,165,000 | OCP CLO 2014-7 Ltd. Series 2014-7A CRR(a),(b) | US0003M + 3.100% | 8.3500 | 07/20/29 | 3,020,065 | |||||||||
| 215,214 | Race Point VIII CLO Ltd. Series 2013-8A AR2(a),(b) | US0003M + 1.040% | 6.4190 | 02/20/30 | 213,249 | |||||||||
| 2,000,000 | Regatta IX Funding Ltd. Series 2017-1A E(a),(b) | US0003M + 6.000% | 11.2600 | 04/17/30 | 1,749,716 | |||||||||
| 2,250,000 | Regatta XIII Funding Ltd. Series 2018-2A C(a),(b) | US0003M + 3.100% | 8.3600 | 07/15/31 | 2,125,611 | |||||||||
| 137,500 | Riserva Clo Ltd. Series 2016-3A XRR(a),(b) | US0003M + 0.800% | 6.0620 | 01/18/34 | 137,394 | |||||||||
| 850,000 | Silver Creek CLO Ltd. Series 2014-1A CR(a),(b) | US0003M + 2.300% | 7.5500 | 07/20/30 | 838,506 | |||||||||
| 2,000,000 | Venture XVII CLO Ltd. Series 2014-17A DRR(a),(b) | US0003M + 2.820% | 8.0800 | 04/15/27 | 1,864,818 | |||||||||
| 1,390,000 | Wellfleet CLO 2016-1 Ltd. Series 2016-1A DR(a),(b) | US0003M + 2.900% | 8.1500 | 04/20/28 | 1,389,978 | |||||||||
| 500,000 | Wind River 2021-2 CLO Ltd. Series 2021-2A D(a),(b) | US0003M + 3.150% | 8.4000 | 07/20/34 | 437,555 | |||||||||
| 1,500,000 | Wind River CLO Ltd. Series 2021-1A C(a),(b) | US0003M + 1.950% | 7.2000 | 04/20/34 | 1,412,819 | |||||||||
| 101,098,363 | ||||||||||||||
| NON AGENCY CMBS — 0.1% | ||||||||||||||
| 401,653 | COMM 2012-CCRE5 Mortgage Trust Series 2012-CR5 C(a),(c) | 4.4840 | 12/10/45 | 373,190 | ||||||||||
See accompanying notes to financial statements.
7
| BOYD WATTERSON LIMITED DURATION ENHANCED INCOME FUND |
| SCHEDULE OF INVESTMENTS (Continued) |
| June 30, 2023 |
| Principal | Coupon Rate | |||||||||||||
| Amount ($) | Spread | (%) | Maturity | Fair Value | ||||||||||
| ASSET BACKED SECURITIES — 44.0% (Continued) | ||||||||||||||
| Other ABS – 0.2% | ||||||||||||||
| 642,214 | MVW Owner Trust 2017-1 Series 2017 -1A A(a) | 2.4200 | 12/20/34 | $ | 638,312 | |||||||||
| RESIDENTIAL MORTGAGE — 0.1% | ||||||||||||||
| 139,516 | Towd Point Mortgage Trust 2017-5 Series 2017-5 A1(a),(b) | US0001M + 0.600% | 4.6040 | 02/25/57 | 139,387 | |||||||||
| 244,669 | Towd Point Mortgage Trust 2017-6 Series 2017-6 A1(a),(c) | 2.7500 | 10/25/57 | 232,304 | ||||||||||
| 371,691 | ||||||||||||||
| TOTAL ASSET BACKED SECURITIES (Cost $169,979,776) | 167,041,056 | |||||||||||||
| Principal | Coupon Rate | |||||||||||||
| Amount ($) | Spread | (%) | Maturity | Fair Value | ||||||||||
| CORPORATE BONDS — 36.6% | ||||||||||||||
| ASSET MANAGEMENT — 0.6% | ||||||||||||||
| 1,815,000 | Oaktree Specialty Lending Corporation | 3.5000 | 02/25/25 | 1,719,061 | ||||||||||
| 850,000 | Oaktree Specialty Lending Corporation | 2.7000 | 01/15/27 | 734,526 | ||||||||||
| 2,453,587 | ||||||||||||||
| AUTOMOTIVE — 0.3% | ||||||||||||||
| 975,000 | Adient Global Holdings Ltd.(a) | 4.8750 | 08/15/26 | 927,531 | ||||||||||
| 250,000 | Dana, Inc. | 5.3750 | 11/15/27 | 237,043 | ||||||||||
| 1,164,574 | ||||||||||||||
| BANKING — 1.6% | ||||||||||||||
| 3,995,000 | Bank of America Corporation Series FF(c) | US0003M + 2.931% | 5.8750 | Perpetual | 3,665,413 | |||||||||
| 2,400,000 | JPMorgan Chase & Company(c) | US0003M + 3.300% | 6.0000 | Perpetual | 2,407,728 | |||||||||
| 6,073,141 | ||||||||||||||
| CABLE & SATELLITE — 1.0% | ||||||||||||||
| 3,000,000 | CCO Holdings, LLC / CCO Holdings Capital(a) | 5.1250 | 05/01/27 | 2,796,879 | ||||||||||
| 1,000,000 | CCO Holdings, LLC/CCO Holdings Capital Corporation(a) | 5.0000 | 02/01/28 | 912,193 | ||||||||||
| 3,709,072 | ||||||||||||||
| CHEMICALS — 1.5% | ||||||||||||||
| 3,000,000 | Avient Corporation(a) | 5.7500 | 05/15/25 | 2,966,529 | ||||||||||
| 492,000 | HB Fuller Company | 4.0000 | 02/15/27 | 461,619 | ||||||||||
| 770,000 | HB Fuller Company | 4.2500 | 10/15/28 | 686,278 | ||||||||||
| 2,000,000 | Ingevity Corporation(a) | 3.8750 | 11/01/28 | 1,709,375 | ||||||||||
See accompanying notes to financial statements.
8
| BOYD WATTERSON LIMITED DURATION ENHANCED INCOME FUND |
| SCHEDULE OF INVESTMENTS (Continued) |
| June 30, 2023 |
| Principal | Coupon Rate | |||||||||||||
| Amount ($) | Spread | (%) | Maturity | Fair Value | ||||||||||
| CORPORATE BONDS — 36.6% (Continued) | ||||||||||||||
| CHEMICALS — 1.5% (Continued) | ||||||||||||||
| $ | 5,823,801 | |||||||||||||
| COMMERCIAL SUPPORT SERVICES — 1.2% | ||||||||||||||
| 2,000,000 | AMN Healthcare, Inc.(a) | 4.6250 | 10/01/27 | 1,853,224 | ||||||||||
| 2,945,000 | Korn Ferry(a) | 4.6250 | 12/15/27 | 2,769,664 | ||||||||||
| 4,622,888 | ||||||||||||||
| CONSTRUCTION MATERIALS — 0.9% | ||||||||||||||
| 3,592,000 | Advanced Drainage Systems, Inc.(a) | 5.0000 | 09/30/27 | 3,402,754 | ||||||||||
| CONSUMER SERVICES — 1.9% | ||||||||||||||
| 3,775,000 | Rent-A-Center, Inc.(a) | 6.3750 | 02/15/29 | 3,353,993 | ||||||||||
| 3,885,000 | Service Corp International | 5.1250 | 06/01/29 | 3,682,903 | ||||||||||
| 7,036,896 | ||||||||||||||
| CONTAINERS & PACKAGING — 1.4% | ||||||||||||||
| 2,420,000 | Silgan Holdings, Inc. | 4.1250 | 02/01/28 | 2,222,649 | ||||||||||
| 3,350,000 | TriMas Corporation(a) | 4.1250 | 04/15/29 | 2,988,401 | ||||||||||
| 5,211,050 | ||||||||||||||
| DIVERSIFIED INDUSTRIALS — 0.2% | ||||||||||||||
| 919,000 | General Electric Company(c) | US0003M + 3.330% | 8.8820 | Perpetual | 922,445 | |||||||||
| ELECTRIC UTILITIES — 0.8% | ||||||||||||||
| 2,940,000 | National Rural Utilities Cooperative Finance(c) | H15T5Y + 3.533% | 7.1250 | 09/15/53 | 2,946,153 | |||||||||
| ENGINEERING & CONSTRUCTION — 1.7% | ||||||||||||||
| 2,035,000 | Installed Building Products, Inc.(a) | 5.7500 | 02/01/28 | 1,920,307 | ||||||||||
| 4,975,000 | MasTec, Inc.(a) | 4.5000 | 08/15/28 | 4,591,288 | ||||||||||
| 6,511,595 | ||||||||||||||
| FOOD — 1.4% | ||||||||||||||
| 4,009,000 | Darling Ingredients, Inc.(a) | 5.2500 | 04/15/27 | 3,895,576 | ||||||||||
| 1,264,000 | Post Holdings, Inc.(a) | 5.7500 | 03/01/27 | 1,235,575 | ||||||||||
| 5,131,151 | ||||||||||||||
| FORESTRY, PAPER & WOOD PRODUCTS — 0.8% | ||||||||||||||
| 3,472,000 | Louisiana-Pacific Corporation(a) | 3.6250 | 03/15/29 | 3,042,948 | ||||||||||
See accompanying notes to financial statements.
9
| BOYD WATTERSON LIMITED DURATION ENHANCED INCOME FUND |
| SCHEDULE OF INVESTMENTS (Continued) |
| June 30, 2023 |
| Principal | Coupon Rate | |||||||||||||
| Amount ($) | Spread | (%) | Maturity | Fair Value | ||||||||||
| CORPORATE BONDS — 36.6% (Continued) | ||||||||||||||
| GAS & WATER UTILITIES — 0.7% | ||||||||||||||
| 2,700,000 | AmeriGas Partners, L.P. / AmeriGas Finance(a) | 9.3750 | 06/01/28 | $ | 2,744,712 | |||||||||
| HEALTH CARE FACILITIES & SERVICES — 0.6% | ||||||||||||||
| 2,500,000 | Molina Healthcare, Inc.(a) | 4.3750 | 06/15/28 | 2,308,067 | ||||||||||
| HOME CONSTRUCTION — 1.3% | ||||||||||||||
| 2,000,000 | LGI Homes, Inc.(a) | 4.0000 | 07/15/29 | 1,665,589 | ||||||||||
| 1,210,000 | Meritage Homes Corporation | 6.0000 | 06/01/25 | 1,209,212 | ||||||||||
| 2,120,000 | Patrick Industries, Inc.(a) | 7.5000 | 10/15/27 | 2,053,008 | ||||||||||
| 4,927,809 | ||||||||||||||
| HOUSEHOLD PRODUCTS — 1.1% | ||||||||||||||
| 3,907,000 | Central Garden & Pet Company | 5.1250 | 02/01/28 | 3,672,596 | ||||||||||
| 342,000 | Prestige Brands, Inc.(a) | 5.1250 | 01/15/28 | 325,170 | ||||||||||
| 3,997,766 | ||||||||||||||
| INSTITUTIONAL FINANCIAL SERVICES — 0.9% | ||||||||||||||
| 3,485,000 | Goldman Sachs Group, Inc. (The) Series P(c) | US0003M + 2.874% | 8.2110 | Perpetual | 3,455,726 | |||||||||
| LEISURE FACILITIES & SERVICES — 0.8% | ||||||||||||||
| 3,560,000 | Boyne USA, Inc.(a) | 4.7500 | 05/15/29 | 3,210,550 | ||||||||||
| MACHINERY — 0.9% | ||||||||||||||
| 4,000,000 | ATS Automation Tooling Systems, Inc.(a) | 4.1250 | 12/15/28 | 3,584,192 | ||||||||||
| METALS & MINING — 1.7% | ||||||||||||||
| 3,603,000 | Freeport-McMoRan, Inc. | 5.0000 | 09/01/27 | 3,512,639 | ||||||||||
| 2,767,000 | Mineral Resources Ltd.(a) | 8.1250 | 05/01/27 | 2,768,665 | ||||||||||
| 6,281,304 | ||||||||||||||
| OIL & GAS PRODUCERS — 5.7% | ||||||||||||||
| 2,775,000 | Cheniere Energy Partners, L.P. | 4.5000 | 10/01/29 | 2,548,773 | ||||||||||
| 3,250,000 | Hess Midstream Operations, L.P.(a) | 5.6250 | 02/15/26 | 3,200,113 | ||||||||||
| 638,000 | Murphy Oil Corporation | 5.7500 | 08/15/25 | 630,807 | ||||||||||
| 3,240,000 | Murphy Oil USA, Inc. | 5.6250 | 05/01/27 | 3,155,320 | ||||||||||
| 750,000 | Murphy Oil USA, Inc. | 4.7500 | 09/15/29 | 689,258 | ||||||||||
| 2,000,000 | Oasis Petroleum, Inc.(a) | 6.3750 | 06/01/26 | 1,981,039 | ||||||||||
See accompanying notes to financial statements.
10
| BOYD WATTERSON LIMITED DURATION ENHANCED INCOME FUND |
| SCHEDULE OF INVESTMENTS (Continued) |
| June 30, 2023 |
| Principal | Coupon Rate | |||||||||||||
| Amount ($) | Spread | (%) | Maturity | Fair Value | ||||||||||
| CORPORATE BONDS — 36.6% (Continued) | ||||||||||||||
| OIL & GAS PRODUCERS — 5.7% (Continued) | ||||||||||||||
| 4,200,000 | Plains All American Pipeline, L.P. Series B(c) | US0003M + 4.110% | 6.1250 | Perpetual | $ | 3,759,539 | ||||||||
| 2,825,000 | Sunoco, L.P./Sunoco Finance Corporation | 6.0000 | 04/15/27 | 2,788,674 | ||||||||||
| 2,909,000 | Targa Resources Partners, L.P./Targa Resources | 5.0000 | 01/15/28 | 2,778,817 | ||||||||||
| 21,532,340 | ||||||||||||||
| PUBLISHING & BROADCASTING — 0.4% | ||||||||||||||
| 1,500,000 | Nexstar Broadcasting, Inc.(a) | 5.6250 | 07/15/27 | 1,399,912 | ||||||||||
| REAL ESTATE INVESTMENT TRUSTS — 1.3% | ||||||||||||||
| 3,000,000 | HAT Holdings I, LLC/HAT Holdings II, LLC(a) | 6.0000 | 04/15/25 | 2,963,130 | ||||||||||
| 2,000,000 | Iron Mountain, Inc.(a) | 5.2500 | 03/15/28 | 1,870,250 | ||||||||||
| 4,833,380 | ||||||||||||||
| RETAIL - CONSUMER STAPLES — 1.0% | ||||||||||||||
| 3,910,000 | SEG Holding, LLC/S.E.G Finance Corporation(a) | 5.6250 | 10/15/28 | 3,738,195 | ||||||||||
| RETAIL - DISCRETIONARY — 0.9% | ||||||||||||||
| 1,400,000 | Asbury Automotive Group, Inc. | 4.5000 | 03/01/28 | 1,284,997 | ||||||||||
| 2,250,000 | Penske Automotive Group, Inc. | 3.5000 | 09/01/25 | 2,140,439 | ||||||||||
| 3,425,436 | ||||||||||||||
| SEMICONDUCTORS — 1.6% | ||||||||||||||
| 2,180,000 | Amkor Technology, Inc.(a) | 6.6250 | 09/15/27 | 2,185,873 | ||||||||||
| 2,075,000 | ON Semiconductor Corporation(a) | 3.8750 | 09/01/28 | 1,890,792 | ||||||||||
| 2,200,000 | Synaptics, Inc.(a) | 4.0000 | 06/15/29 | 1,849,285 | ||||||||||
| 5,925,950 | ||||||||||||||
| SOFTWARE — 0.1% | ||||||||||||||
| 500,000 | NortonLifeLock, Inc.(a) | 6.7500 | 09/30/27 | 499,066 | ||||||||||
| SPECIALTY FINANCE — 0.7% | ||||||||||||||
| 3,000,000 | FirstCash, Inc.(a) | 4.6250 | 09/01/28 | 2,679,495 | ||||||||||
| TECHNOLOGY SERVICES — 0.6% | ||||||||||||||
| 2,500,000 | Booz Allen Hamilton, Inc.(a) | 3.8750 | 09/01/28 | 2,274,350 | ||||||||||
| TRANSPORTATION EQUIPMENT — 1.0% | ||||||||||||||
| 2,000,000 | Allison Transmission, Inc.(a) | 4.7500 | 10/01/27 | 1,886,163 | ||||||||||
See accompanying notes to financial statements.
11
| BOYD WATTERSON LIMITED DURATION ENHANCED INCOME FUND |
| SCHEDULE OF INVESTMENTS (Continued) |
| June 30, 2023 |
| Principal | Coupon Rate | |||||||||||||
| Amount ($) | Spread | (%) | Maturity | Fair Value | ||||||||||
| CORPORATE BONDS — 36.6% (Continued) | ||||||||||||||
| TRANSPORTATION EQUIPMENT — 1.0% (Continued) | ||||||||||||||
| 2,000,000 | Allison Transmission, Inc.(a) | 5.8750 | 06/01/29 | $ | 1,934,278 | |||||||||
| 3,820,441 | ||||||||||||||
| TOTAL CORPORATE BONDS (Cost $148,177,198) | 138,690,746 | |||||||||||||
| Principal | Coupon Rate | |||||||||||||
| Amount ($) | Spread | (%) | Maturity | Fair Value | ||||||||||
| TERM LOANS — 8.8% | ||||||||||||||
| AUTOMOTIVE — 0.0%(d) | ||||||||||||||
| 3,125 | Adient US, LLC(b) | SOFR1M + 3.250% | 8.3500 | 04/08/28 | 3,129 | |||||||||
| BIOTECH & PHARMA — 1.7% | ||||||||||||||
| 3,000,000 | Horizon Pharma USA, Inc.(b) | SOFR1M + 2.000% | 7.1900 | 05/22/26 | 2,999,460 | |||||||||
| 984,887 | Horizon Therapeutics USA, Inc.(b) | SOFR1M + 1.750% | 6.9400 | 03/15/28 | 983,193 | |||||||||
| 2,636,992 | Organon & Company(b) | US0001M + 3.000% | 8.0000 | 06/02/28 | 2,636,175 | |||||||||
| 14,506 | Prestige Brands, Inc.(b) | US0001M + 2.000% | 7.0200 | 07/01/28 | 14,538 | |||||||||
| 6,633,366 | ||||||||||||||
| CHEMICALS — 0.8% | ||||||||||||||
| 2,992,500 | HB Fuller Company(b) | SOFR1M + 2.500% | 7.6500 | 02/15/30 | 3,008,540 | |||||||||
| CONSTRUCTION MATERIALS — 0.8% | ||||||||||||||
| 2,931,646 | Quikrete Holdings, Inc.(b) | SOFR1M + 2.625% | 7.7800 | 01/31/27 | 2,930,912 | |||||||||
| LEISURE FACILITIES & SERVICES — 0.8% | ||||||||||||||
| 2,954,887 | Hilton Grand Vacations Borrower, LLC(b) | SOFR1M + 3.000% | 8.1500 | 08/02/28 | 2,951,799 | |||||||||
| LEISURE PRODUCTS — 1.0% | ||||||||||||||
| 2,940,000 | Hayward Industries, Inc.(b) | SOFR1M + 2.750% | 7.9900 | 05/28/28 | 2,904,470 | |||||||||
| 992,500 | Hayward Industries, Inc.(b) | SOFR1M + 3.250% | 8.5000 | 05/28/28 | 976,372 | |||||||||
| 3,880,842 | ||||||||||||||
| MEDICAL EQUIPMENT & DEVICES — 0.4% | ||||||||||||||
| 1,577,356 | Avantor Funding, Inc.(b) | SOFR1M + 2.250% | 7.5000 | 11/06/27 | 1,578,838 | |||||||||
See accompanying notes to financial statements.
12
| BOYD WATTERSON LIMITED DURATION ENHANCED INCOME FUND |
| SCHEDULE OF INVESTMENTS (Continued) |
| June 30, 2023 |
| Principal | Coupon Rate | |||||||||||||
| Amount ($) | Spread | (%) | Maturity | Fair Value | ||||||||||
| TERM LOANS — 8.8% (Continued) | ||||||||||||||
| OIL & GAS PRODUCERS — 1.0% | ||||||||||||||
| 3,910,000 | Pilot Travel Centers, LLC(b) | SOFR1M + 2.000% | 7.2500 | 08/06/28 | $ | 3,906,950 | ||||||||
| PUBLISHING & BROADCASTING — 0.4% | ||||||||||||||
| 1,549,070 | Nexstar Broadcasting, Inc.(b) | SOFR1M + 2.500% | 7.6500 | 09/19/26 | 1,547,908 | |||||||||
| REAL ESTATE INVESTMENT TRUSTS — 0.3% | ||||||||||||||
| 966,837 | Iron Mountain, Inc.(b) | US0001 M + 1.750% | 6.9000 | 01/02/26 | 958,377 | |||||||||
| SOFTWARE — 1.0% | ||||||||||||||
| 3,874,955 | Open Text Corporation(b) | SOFR1M + 1.750% | 6.9000 | 05/30/25 | 3,886,620 | |||||||||
| TECHNOLOGY HARDWARE — 0.6% | ||||||||||||||
| 2,244,375 | Ciena Corporation(b) | SOFR1M + 2.500% | 7.5800 | 01/12/30 | 2,249,290 | |||||||||
| TOTAL TERM LOANS (Cost $33,464,585) | 33,536,571 | |||||||||||||
| Principal | Coupon Rate | |||||||||||||
| Amount ($) | (%) | Maturity | Fair Value | |||||||||||
| U.S. TREASURY BONDS & AGENCIES — 5.1% | ||||||||||||||
| U.S. TREASURY BILLS — 5.1% | ||||||||||||||
| 20,000,000 | United States Treasury Note (Cost $19,557,383) | 3.5000 | 02/15/33 | 19,475,000 | ||||||||||
| Shares | Fair Value | |||||||||||||
| SHORT-TERM INVESTMENTS — 1.0% | ||||||||||||||
| MONEY MARKET FUNDS - 1.0% | ||||||||||||||
| 3,698,387 | First American Government Obligations Fund Class X, 5.01% (Cost $3,698,387)(e) | 3,698,387 | ||||||||||||
| TOTAL INVESTMENTS - 97.5% (Cost $384,742,513) | $ | 369,746,662 | ||||||||||||
| OTHER ASSETS IN EXCESS OF LIABILITIES- 2.5% | 9,643,337 | |||||||||||||
| NET ASSETS - 100.0% | $ | 379,389,999 | ||||||||||||
| CLO | - Collateralized Loan Obligation |
| LLC | - Limited Liability Company |
| LTD | - Limited Company |
| H15T5Y | US Treasury Yield Curve Rate T Note Constant Maturity 5 Year |
| SOFR1M | CME Term SOFR. (Secured Overnight Financing Rate) 1 Month |
| SOFR3M | CME Term SOFR. (Secured Overnight Financing Rate) 3 Month |
| US0001M | ICE LIBOR USD 1 Month |
| US0003M | ICE LIBOR USD 3 Month |
| (a) | Security exempt from registration under Rule 144A or Section 4(2) of the Securities Act of 1933. The security may be resold in transactions exempt from registration, normally to qualified institutional buyers. As of June 30, 2023 the total market value of 144A securities is $231,268,704 or 61.0% of net assets. |
| (b) | Floating rate security, the interest rate of which adjusts periodically based on changes in current interest rates and prepayments on the underlying pool of assets. |
| (c) | Variable rate security; the rate shown represents the rate on June 30, 2023. |
| (d) | Percentage rounds to less than 0.1%. |
| (e) | Rate disclosed is the seven day effective yield as of June 30, 2023. |
See accompanying notes to financial statements.
13
| Boyd Watterson Limited Duration Enhanced Income Fund |
| STATEMENT OF ASSETS AND LIABILITIES |
| June 30, 2023 |
| ASSETS | ||||
| Investment securities: | ||||
| At cost | $ | 384,742,513 | ||
| At fair value | $ | 369,746,662 | ||
| Cash at broker for bank loans | 414,841 | |||
| Dividends and interest receivable | 3,925,505 | |||
| Receivable for securities sold | 5,451,215 | |||
| Receivable for fund shares sold | 557 | |||
| Prepaid expenses | 14,324 | |||
| TOTAL ASSETS | 379,553,104 | |||
| LIABILITIES | ||||
| Investment advisory fees payable | 68,472 | |||
| Distributions (12b-1) fees payable | 1,778 | |||
| Payable to related parties | 35,625 | |||
| Accrued expenses and other liabilities | 57,230 | |||
| TOTAL LIABILITIES | 163,105 | |||
| NET ASSETS | $ | 379,389,999 | ||
| Net Assets Consist Of: | ||||
| Paid in capital ($0 par value, unlimited shares authorized) | $ | 398,333,693 | ||
| Accumulated losses | (18,943,694 | ) | ||
| NET ASSETS | $ | 379,389,999 | ||
| Net Asset Value Per Share: | ||||
| Class A Shares: | ||||
| Net Assets | $ | 2,034,566 | ||
| Shares of beneficial interest outstanding * | 215,578 | |||
| Net asset value (Net Assets ÷ Shares Outstanding), offering price and redemption price per share | $ | 9.44 | ||
| Maximum offering price per share (net asset value plus maximum sales charge of 2.25%) | $ | 9.66 | ||
| Class C Shares: | ||||
| Net Assets | $ | 1,646,494 | ||
| Shares of beneficial interest outstanding * | 174,163 | |||
| Net asset value (Net Assets ÷ Shares Outstanding), offering price and redemption price per share | $ | 9.45 | ||
| Class I Shares: | ||||
| Net Assets | $ | 64,312,974 | ||
| Shares of beneficial interest outstanding * | 6,824,332 | |||
| Net asset value (Net Assets ÷ Shares Outstanding), offering price and redemption price per share | $ | 9.42 | ||
| Class I2 Shares: | ||||
| Net Assets | $ | 311,395,965 | ||
| Shares of beneficial interest outstanding * | 32,594,311 | |||
| Net asset value (Net Assets ÷ Shares Outstanding), offering price and redemption price per share | $ | 9.55 |
| * | Unlimited number of shares of beneficial interest authorized, no par value. |
See accompanying notes to financial statements.
14
| Boyd Watterson Limited Duration Enhanced Income Fund |
| STATEMENT OF OPERATIONS |
| For the Year Ended June 30, 2023 |
| INVESTMENT INCOME | ||||
| Dividends | $ | 489,170 | ||
| Interest, net of amortization and accretion | 18,623,675 | |||
| TOTAL INVESTMENT INCOME | 19,112,845 | |||
| EXPENSES | ||||
| Investment advisory fees | 1,476,546 | |||
| Distribution (12b-1) fees | ||||
| Class A | 5,485 | |||
| Class C | 16,458 | |||
| Administrative services fees | 367,300 | |||
| Transfer agent fees | 91,562 | |||
| Third party administration servicing fees | 76,467 | |||
| Custodian fees | 45,991 | |||
| Registration fees | 31,500 | |||
| Compliance officer fees | 30,820 | |||
| Audit fees | 23,501 | |||
| Legal Fees | 21,195 | |||
| Printing and postage expenses | 17,886 | |||
| Trustees’ fees and expenses | 15,253 | |||
| Insurance expense | 7,300 | |||
| Other expenses | 11,049 | |||
| TOTAL EXPENSES | 2,238,313 | |||
| Less: Fees waived by the advisor | (597,100 | ) | ||
| NET EXPENSES | 1,641,213 | |||
| NET INVESTMENT INCOME | 17,471,632 | |||
| REALIZED AND UNREALIZED GAIN (LOSS) FROM INVESTMENTS | ||||
| Net realized loss from investments | (1,576,329 | ) | ||
| Net change in unrealized appreciation on investments | 11,562,739 | |||
| NET REALIZED AND UNREALIZED GAIN FROM INVESTMENTS | 9,986,410 | |||
| NET INCREASE IN NET ASSETS RESULTING FROM OPERATIONS | $ | 27,458,042 |
See accompanying notes to financial statements.
15
| Boyd Watterson Limited Duration Enhanced Income Fund |
| STATEMENTS OF CHANGES IN NET ASSETS |
| For the | For the | |||||||
| Year Ended | Year Ended | |||||||
| June 30, 2023 | June 30, 2022 | |||||||
| FROM OPERATIONS | ||||||||
| Net investment income | $ | 17,471,632 | $ | 10,355,365 | ||||
| Net realized loss from investments | (1,576,329 | ) | (1,474,915 | ) | ||||
| Net change in unrealized appreciation (depreciation) on investments | 11,562,739 | (30,368,429 | ) | |||||
| Net increase (decrease) in net assets resulting from operations | 27,458,042 | (21,487,979 | ) | |||||
| DISTRIBUTIONS TO SHAREHOLDERS | ||||||||
| Total distribution paid | ||||||||
| Class A | (100,605 | ) | (115,350 | ) | ||||
| Class C | (62,934 | ) | (49,488 | ) | ||||
| Class I | (3,203,757 | ) | (2,313,837 | ) | ||||
| Class I2 | (14,400,992 | ) | (9,201,854 | ) | ||||
| Net decrease in net assets from distributions to shareholders | (17,768,288 | ) | (11,680,529 | ) | ||||
| FROM SHARES OF BENEFICIAL INTEREST | ||||||||
| Proceeds from shares sold: | ||||||||
| Class A | 133,855 | 73,338 | ||||||
| Class C | — | 134,969 | ||||||
| Class I | 7,076,118 | 46,015,914 | ||||||
| Class I2 | 35,903,661 | 82,767,861 | ||||||
| Reinvestment of distributions to shareholders: | ||||||||
| Class A | 100,541 | 115,349 | ||||||
| Class C | 62,934 | 49,488 | ||||||
| Class I | 3,171,926 | 2,174,098 | ||||||
| Class I2 | 12,219,313 | 7,971,898 | ||||||
| Payments for shares redeemed: | ||||||||
| Class A | (377,099 | ) | (2,543,372 | ) | ||||
| Class C | (126,967 | ) | (1,142,711 | ) | ||||
| Class I | (13,763,130 | ) | (62,495,371 | ) | ||||
| Class I2 | (31,524,089 | ) | (37,136,094 | ) | ||||
| Net increase in net assets from shares of beneficial interest | 12,877,063 | 35,985,367 | ||||||
| TOTAL INCREASE IN NET ASSETS | 22,566,817 | 2,816,859 | ||||||
| NET ASSETS | ||||||||
| Beginning of Year | 356,823,182 | 354,006,323 | ||||||
| End of Year | $ | 379,389,999 | $ | 356,823,182 | ||||
See accompanying notes to financial statements.
16
| Boyd Watterson Limited Duration Enhanced Income Fund |
| STATEMENTS OF CHANGES IN NET ASSETS (Continued) |
| For the | For the | |||||||
| Year Ended | Year Ended | |||||||
| June 30, 2023 | June 30, 2022 | |||||||
| SHARE ACTIVITY | ||||||||
| Class A: | ||||||||
| Shares Sold | 14,244 | 7,225 | ||||||
| Shares Reinvested | 10,790 | 11,743 | ||||||
| Shares Redeemed | (40,171 | ) | (263,430 | ) | ||||
| Net decrease in shares of beneficial interest outstanding | (15,137 | ) | (244,462 | ) | ||||
| Class C: | ||||||||
| Shares Sold | — | 13,359 | ||||||
| Shares Reinvested | 6,740 | 5,051 | ||||||
| Shares Redeemed | (13,620 | ) | (116,349 | ) | ||||
| Net decrease in shares of beneficial interest outstanding | (6,880 | ) | (97,939 | ) | ||||
| Class I: | ||||||||
| Shares Sold | 751,307 | 4,655,627 | ||||||
| Shares Reinvested | 341,035 | 223,382 | ||||||
| Shares Redeemed | (1,459,809 | ) | (6,263,961 | ) | ||||
| Net decrease in shares of beneficial interest outstanding | (367,467 | ) | (1,384,952 | ) | ||||
| Class I2: | ||||||||
| Shares Sold | 3,749,670 | 8,249,587 | ||||||
| Shares Reinvested | 1,295,925 | 812,036 | ||||||
| Shares Redeemed | (3,304,822 | ) | (3,768,054 | ) | ||||
| Net increase in shares of beneficial interest outstanding | 1,740,773 | 5,293,569 | ||||||
See accompanying notes to financial statements.
17
| Boyd Watterson Limited Duration Enhanced Income Fund |
| FINANCIAL HIGHLIGHTS |
Per Share Data and Ratios for a Share of Beneficial Interest Outstanding Throughout the Years/Period Presented
| Class A | ||||||||||||||||||||
| For the | For the | For the | For the | For the | ||||||||||||||||
| Year Ended | Year Ended | Year Ended | Year Ended | Period Ended | ||||||||||||||||
| June 30, 2023 | June 30, 2022 | June 30, 2021 | June 30, 2020 | June 30, 2019 (1) | ||||||||||||||||
| Net asset value, beginning of year/period | $ | 9.21 | $ | 10.09 | $ | 9.89 | $ | 9.96 | $ | 9.89 | ||||||||||
| Activity from investment operations: | ||||||||||||||||||||
| Net investment income (2) | 0.41 | 0.23 | 0.26 | 0.28 | 0.10 | |||||||||||||||
| Net realized and unrealized gain (loss) on investments | 0.26 | (0.82 | ) | 0.23 | (0.05 | ) | 0.14 | |||||||||||||
| Total from investment operations | 0.67 | (0.59 | ) | 0.49 | 0.23 | 0.24 | ||||||||||||||
| Less distributions from: | ||||||||||||||||||||
| Net investment income | (0.43 | ) | (0.27 | ) | (0.29 | ) | (0.30 | ) | (0.17 | ) | ||||||||||
| Net realized gains | (0.00 | ) (3) | (0.02 | ) | — | — | — | |||||||||||||
| Total distributions | (0.43 | ) | (0.29 | ) | (0.29 | ) | (0.30 | ) | (0.17 | ) | ||||||||||
| Net asset value, end of year/period | $ | 9.44 | $ | 9.21 | $ | 10.09 | $ | 9.89 | $ | 9.96 | ||||||||||
| Total return (4) | 7.33 | % | (5.94 | )% | 5.02 | % | 2.34 | % | 2.41 | % (6) | ||||||||||
| Net assets, end of year/period (000s) | $ | 2,035 | $ | 2,125 | $ | 4,796 | $ | 2,481 | $ | 9,585 | ||||||||||
| Ratio of gross expenses to average net assets (5) | 0.85 | % | 0.85 | % | 0.85 | % | 0.88 | % | 0.83 | % (7) | ||||||||||
| Ratio of net expenses to average net assets (5) | 0.85 | % | 0.85 | % | 0.85 | % | 0.88 | % | 0.83 | % (7) | ||||||||||
| Ratio of net investment income to average net assets | 4.31 | % | 2.39 | % | 2.64 | % | 2.78 | % | 3.28 | % (7) | ||||||||||
| Portfolio Turnover Rate | 35 | % | 47 | % | 73 | % | 70 | % | 47 | % (8) | ||||||||||
| (1) | The Boyd Watterson Limited Duration Enhanced Income Fund Class A commenced operations on February 28, 2019. |
| (2) | Per share amounts calculated using the average shares method, which more appropriately represents the per share data for the year or period. |
| (3) | Amount is less than $0.005 per share. |
| (4) | Total returns shown exclude the effect of applicable sales charges and redemption fees and assumes reinvestment of all distributions. |
| (5) | Does not include the expenses of other investment companies in which the Fund invests. |
| (6) | Not annualized. |
| (7) | Annualized. |
| (8) | Portfolio turnover is based on the Fund as a whole. |
See accompanying notes to financial statements.
18
| Boyd Watterson Limited Duration Enhanced Income Fund |
| FINANCIAL HIGHLIGHTS |
Per Share Data and Ratios for a Share of Beneficial Interest Outstanding Throughout the Years/Period Presented
| Class C | ||||||||||||||||||||
| For the | For the | For the | For the | For the | ||||||||||||||||
| Year Ended | Year Ended | Year Ended | Year Ended | Period Ended | ||||||||||||||||
| June 30, 2023 | June 30, 2022 | June 30, 2021 | June 30, 2021 | June 30, 2019 (1) | ||||||||||||||||
| Net asset value, beginning of year/period | $ | 9.22 | $ | 10.10 | $ | 9.90 | $ | 9.97 | $ | 9.89 | ||||||||||
| Activity from investment operations: | ||||||||||||||||||||
| Net investment income (2) | 0.34 | 0.17 | 0.19 | 0.21 | 0.10 | |||||||||||||||
| Net realized and unrealized gain (loss) on investments | 0.25 | (0.84 | ) | 0.22 | (0.06 | ) | 0.14 | |||||||||||||
| Total from investment operations | 0.59 | (0.67 | ) | 0.41 | 0.15 | 0.24 | ||||||||||||||
| Less distributions from: | ||||||||||||||||||||
| Net investment income | (0.36 | ) | (0.19 | ) | (0.21 | ) | (0.22 | ) | (0.16 | ) | ||||||||||
| Net realized gains | (0.00 | ) (3) | (0.02 | ) | — | — | — | |||||||||||||
| Total distributions | (0.36 | ) | (0.21 | ) | (0.21 | ) | (0.22 | ) | (0.16 | ) | ||||||||||
| Net asset value, end of year/period | $ | 9.45 | $ | 9.22 | $ | 10.10 | $ | 9.90 | $ | 9.97 | ||||||||||
| Total return (4) | 6.52 | % | (6.67 | )% | 4.19 | % | 1.56 | % | 2.46 | % (6) | ||||||||||
| Net assets, end of year/period (000s) | $ | 1,646 | $ | 1,670 | $ | 2,818 | $ | 3,683 | $ | 3,351 | ||||||||||
| Ratio of gross expenses to average net assets (5) | 1.60 | % | 1.60 | % | 1.60 | % | 1.63 | % | 1.58 | % (7) | ||||||||||
| Ratio of net expenses to average net assets (5) | 1.59 | % | 1.59 | % | 1.59 | % | 1.59 | % | 1.58 | % (7) | ||||||||||
| Ratio of net investment income to average net assets | 3.57 | % | 1.67 | % | 1.93 | % | 2.08 | % | 2.68 | % (7) | ||||||||||
| Portfolio Turnover Rate | 35 | % | 47 | % | 73 | % | 70 | % | 47 | % (8) | ||||||||||
| (1) | The Boyd Watterson Limited Duration Enhanced Income Fund Class C commenced operations on February 28, 2019. |
| (2) | Per share amounts calculated using the average shares method, which more appropriately represents the per share data for the year or period. |
| (3) | Amount is less than $0.005 per share. |
| (4) | Total returns shown exclude the effect of applicable sales charges and redemption fees and assumes reinvestment of all distributions. |
| (5) | Does not include the expenses of other investment companies in which the Fund invests. |
| (6) | Not annualized. |
| (7) | Annualized. |
| (8) | Portfolio turnover is based on the Fund as a whole. |
See accompanying notes to financial statements.
19
| Boyd Watterson Limited Duration Enhanced Income Fund |
| FINANCIAL HIGHLIGHTS |
Per Share Data and Ratios for a Share of Beneficial Interest Outstanding Throughout the Years Presented
| Class I | ||||||||||||||||||||
| For the | For the | For the | For the | For the | ||||||||||||||||
| Year Ended | Year Ended | Year Ended | Year Ended | Year Ended | ||||||||||||||||
| June 30, 2023 | June 30, 2022 | June 30, 2021 | June 30, 2020 | June 30, 2019 | ||||||||||||||||
| Net asset value, beginning of year | $ | 9.20 | $ | 10.08 | $ | 9.89 | $ | 9.97 | $ | 9.88 | ||||||||||
| Activity from investment operations: | ||||||||||||||||||||
| Net investment income (1) | 0.42 | 0.27 | 0.29 | 0.30 | 0.34 | |||||||||||||||
| Net realized and unrealized gain (loss) on investments | 0.25 | (0.83 | ) | 0.22 | (0.05 | ) | 0.14 | |||||||||||||
| Total from investment operations | 0.67 | (0.56 | ) | 0.51 | 0.25 | 0.48 | ||||||||||||||
| Less distributions from: | ||||||||||||||||||||
| Net investment income | (0.45 | ) | (0.30 | ) | (0.32 | ) | (0.33 | ) | (0.39 | ) | ||||||||||
| Net realized gains | (0.00 | ) (2) | (0.02 | ) | — | — | — | |||||||||||||
| Total distributions | (0.45 | ) | (0.32 | ) | (0.32 | ) | (0.33 | ) | (0.39 | ) | ||||||||||
| Net asset value, end of year | $ | 9.42 | $ | 9.20 | $ | 10.08 | $ | 9.89 | $ | 9.97 | ||||||||||
| Total return (3) | 7.50 | % | (5.69 | )% | 5.19 | % | 2.58 | % | 4.93 | % | ||||||||||
| Net assets, end of year (000s) | $ | 64,313 | $ | 66,146 | $ | 86,471 | $ | 33,653 | $ | 17,561 | ||||||||||
| Ratio of gross expenses to average net assets (4,5) | 0.60 | % | 0.60 | % | 0.60 | % | 0.63 | % | 0.62 | % | ||||||||||
| Ratio of net expenses to average net assets (5) | 0.60 | % | 0.60 | % | 0.60 | % | 0.60 | % | 0.59 | % | ||||||||||
| Ratio of net investment income to average net assets | 4.57 | % | 2.67 | % | 2.89 | % | 3.07 | % | 3.43 | % | ||||||||||
| Portfolio Turnover Rate | 35 | % | 47 | % | 73 | % | 70 | % | 47 | % | ||||||||||
| (1) | Per share amounts calculated using the average shares method, which more appropriately represents the per share data for the year or period. |
| (2) | Amount is less than $0.005 per share. |
| (3) | Total returns shown exclude the effect of applicable sales charges and redemption fees and assumes reinvestment of all distributions. |
| (4) | Represents the ratio of expenses to average net assets absent fee waivers and/or expense reimbursements by the advisor. |
| (5) | Does not include the expenses of other investment companies in which the Fund invests. |
See accompanying notes to financial statements.
20
| Boyd Watterson Limited Duration Enhanced Income Fund |
| FINANCIAL HIGHLIGHTS |
Per Share Data and Ratios for a Share of Beneficial Interest Outstanding Throughout the Years Presented
| Class I2 | ||||||||||||||||||||
| For the | For the | For the | For the | For the | ||||||||||||||||
| Year Ended | Year Ended | Year Ended | Year Ended | Year Ended | ||||||||||||||||
| June 30, 2023 | June 30, 2022 | June 30, 2021 | June 30, 2020 | June 30, 2019 | ||||||||||||||||
| Net asset value, beginning of year | $ | 9.30 | $ | 10.17 | $ | 9.95 | $ | 10.01 | $ | 9.90 | ||||||||||
| Activity from investment operations: | ||||||||||||||||||||
| Net investment income (1) | 0.45 | 0.29 | 0.32 | 0.33 | 0.36 | |||||||||||||||
| Net realized and unrealized gain (loss) on investments | 0.25 | (0.84 | ) | 0.22 | (0.06 | ) | 0.14 | |||||||||||||
| Total from investment operations | 0.70 | (0.55 | ) | 0.54 | 0.27 | 0.50 | ||||||||||||||
| Less distributions from: | ||||||||||||||||||||
| Net investment income | (0.45 | ) | (0.30 | ) | (0.32 | ) | (0.33 | ) | (0.39 | ) | ||||||||||
| Net realized gains | (0.00 | ) (2) | (0.02 | ) | — | — | — | |||||||||||||
| Total distributions | (0.45 | ) | (0.32 | ) | (0.32 | ) | (0.33 | ) | (0.39 | ) | ||||||||||
| Net asset value, end of year | $ | 9.55 | $ | 9.30 | $ | 10.17 | $ | 9.95 | $ | 10.01 | ||||||||||
| Total return (3) | 7.74 | % | (5.54 | )% | 5.46 | % | 2.77 | % | 5.12 | % | ||||||||||
| Net assets, end of year (000s) | $ | 311,396 | $ | 286,882 | $ | 259,922 | $ | 227,338 | $ | 202,028 | ||||||||||
| Ratio of gross expenses to average net assets (4,5) | 0.60 | % | 0.60 | % | 0.60 | % | 0.63 | % | 0.61 | % | ||||||||||
| Ratio of net expenses to average net assets (5) | 0.40 | % | 0.40 | % | 0.40 | % | 0.40 | % | 0.40 | % | ||||||||||
| Ratio of net investment income to average net assets | 4.78 | % | 2.88 | % | 3.10 | % | 3.27 | % | 3.60 | % | ||||||||||
| Portfolio Turnover Rate | 35 | % | 47 | % | 73 | % | 70 | % | 47 | % | ||||||||||
| (1) | Per share amounts calculated using the average shares method, which more appropriately represents the per share data for the year or period. |
| (2) | Amount is less than $0.005 per share. |
| (3) | Total returns shown exclude the effect of applicable sales charges and redemption fees and assumes reinvestment of all distributions. |
| (4) | Represents the ratio of expenses to average net assets absent fee waivers and/or expense reimbursements by the advisor. |
| (5) | Does not include the expenses of other investment companies in which the Fund invests. |
See accompanying notes to financial statements.
21
| Boyd Watterson Limited Duration Enhanced Income Fund |
| NOTES TO FINANCIAL STATEMENTS |
| June 30, 2023 |
| 1. | ORGANIZATION |
Boyd Watterson Limited Duration Enhanced Income Fund (the ’‘Fund’’) is a diversified series of shares of beneficial interest of Northern Lights Fund Trust III, a Delaware statutory trust organized on December 5, 2011 (the “Trust”). The Trust is an open-end management investment company registered under the Investment Company Act of 1940, as amended (the ’’1940 Act’’). The Fund currently consists of four classes of shares. The Fund’s Class I2 is the successor to the Boyd Watterson Limited Duration Mid-Grade Fund, LLC, (the “Predecessor Fund”). The Predecessor Fund was organized under the laws of the State of Delaware as a limited liability company effective July 19, 2012 and commenced operations on July 15, 2013. Class I commenced operations on April 13, 2017. Class A and Class C commenced operations on February 28, 2019. The Predecessor Fund’s investment objective was to generate current income consistent with a strategy that focuses on capital preservation, without taking significant duration risk. The Fund seeks (i) income generation as a principal objective and (ii) capital preservation and total return as secondary objectives.
Each share class represents an interest in the same assets of the Fund, has the same rights and is identical in all material respects except that (i) each class of shares may bear different distribution fees; (ii) each class of shares may be subject to different (or no) sales charges; (iii) certain other class specific expenses will be borne solely by the class to which such expenses are attributable; and (iv) each class has exclusive voting rights with respect to matters relating to its own distribution arrangements. The Fund’s income, expenses (other than class specific distribution fees) and realized and unrealized gains and losses are allocated proportionately each day based upon the relative net assets of each class.
| 2. | SUMMARY OF SIGNIFICANT ACCOUNTING POLICIES |
The following is a summary of significant accounting policies consistently followed by the Fund in the preparation of its financial statements. The policies are in conformity with accounting principles generally accepted in the United States of America (’‘GAAP”), which require management to make estimates and assumptions that affect the reported amounts of assets and liabilities and disclosure of contingent assets and liabilities at the date of the financial statements and the reported amounts of increases and decreases in net assets from operations during the reporting period. Actual results could differ from those estimates. The Fund is an investment company and accordingly follows the investment company accounting and reporting guidance of the Financial Accounting Standards Board (“FASB”) Accounting Standards Codification Topic 946 “Financial Services – Investment Companies” including Accounting Standards Update (“ASU”) 2013-08.
Security Valuation – Securities listed on an exchange are valued at the last reported sale price at the close of the regular trading session of the primary exchange on the business day the value is being determined, or in the case of securities listed on NASDAQ at the NASDAQ Official Closing Price. In the absence of a sale, such securities shall be valued at the mean between the current bid and ask prices on the day of valuation. Debt securities (other than short-term obligations) are valued each day by an independent pricing service approved by the Trust’s Board of Trustees (the “Board”) using methods which include current market quotations from a major market maker in the securities and based on methods which include the consideration of yields or prices of securities- of comparable quality, coupon, maturity and type. The independent- pricing service does not distinguish between smaller sized bond positions known as “odd lots” and larger institutional sized bond positions known as “round lots”. The Fund may fair value a particular bond if the advisor does not believe that the round lot value provided by the independent pricing service reflects fair value of the Fund’s holding. Short-term debt obligations having 60 days or less remaining until maturity, at the time of purchase, may be valued at amortized cost. Investments in open-end investment companies are valued at net asset value.
The Fund may hold securities, such as private investments, interests in commodity pools, other non-traded securities or temporarily illiquid securities, for which market quotations are not readily available or are determined to be unreliable. These securities will be valued using the “fair value” procedures approved by the Board. The Board has delegated execution of these procedures to the advisor as its valuation designee (the “Valuation Designee”). The Board may also enlist third party consultants such a valuation specialist at a public accounting firm, valuation consultant or financial officer of a security issuer on an as-needed basis to assist the Valuation Designee in determining a security-specific fair value. The Board is responsible for reviewing and approving fair value methodologies utilized by the Valuation Designee, which approval shall be based upon whether the Valuation Designee followed the valuation procedures established by the Board.
22
| Boyd Watterson Limited Duration Enhanced Income Fund |
| NOTES TO FINANCIAL STATEMENTS (Continued) |
| June 30, 2023 |
Fair Valuation Process – Applicable investments are valued by the Valuation Designee pursuant to valuation procedures established by the Board. For example, fair value determinations are required for the following securities: (i) securities for which market quotations are insufficient or not readily available on a particular business day (including securities for which there is a short and temporary lapse in the provision of a price by the regular pricing source); (ii) securities for which, in the judgment of the Valuation Designee, the prices or values available do not represent the fair value of the instrument; factors which may cause the Valuation Designee to make such a judgment include, but are not limited to, the following: only a bid price or an asked price is available; the spread between bid and asked prices is substantial; the frequency of sales; the thinness of the market; the size of reported trades; and actions of the securities markets, such as the suspension or limitation of trading; (iii) securities determined to be illiquid; and (iv) securities with respect to which an event that will affect the value thereof has occurred (a “significant event”) since the closing prices were established on the principal exchange on which they are traded, but prior to a Fund’s calculation of its net asset value. Specifically, interests in commodity pools or managed futures pools are valued on a daily basis by reference to the closing market prices of each futures contract or other asset held by a pool, as adjusted for pool expenses. Restricted or illiquid investments, such as private investments or non-traded securities are valued based upon the current bid for the security from two or more independent dealers or other parties reasonably familiar with the facts and circumstances of the security (who should take into consideration all relevant factors as may be appropriate under the circumstances). If a current bid from such independent dealers or other independent parties is unavailable, the Valuation Designee shall determine, the fair value of such security using the following factors: (i) the type of security; (ii) the cost at date of purchase; (iii) the size and nature of the Fund’s holdings; (iv) the discount from market value of unrestricted securities of the same class at the time of purchase and subsequent thereto; (v) information as to any transactions or offers with respect to the security; (vi) the nature and duration of restrictions on disposition of the security and the existence of any registration rights; (vii) how the yield of the security compares to similar securities of companies of similar or equal creditworthiness; (viii) the level of recent trades of similar or comparable securities; (ix) the liquidity characteristics of the security; (x) current market conditions; and (xi) the market value of any securities into which the security is convertible or exchangeable.
Valuation of Fund of Funds – The Fund may invest in portfolios of open-end or closed-end investment companies (the “Underlying Funds”). Underlying open-end investment companies are valued at their respective net asset values as reported by such investment companies. The Underlying Funds value securities in their portfolios for which market quotations are readily available at their market values (generally the last reported sale price) and all other securities and assets at their fair value by the methods established by the board of directors of the Underlying Funds. The shares of many closed-end investment companies, after their initial public offering, frequently trade at a price per share, which is different than the net asset value per share. The difference represents a market premium or market discount of such shares. There can be no assurances that the market discount or market premium on shares of any closed-end investment company purchased by the Fund will not change.
The Fund utilizes various methods to measure the fair value of all of its investments on a recurring basis. GAAP establishes a hierarchy that prioritizes inputs to valuation methods. The three levels of inputs are:
Level 1 – Unadjusted quoted prices in active markets for identical assets and liabilities that the Fund has the ability to access.
Level 2 – Observable inputs other than quoted prices included in Level 1 that are observable for the asset or liability, either directly or indirectly. These inputs may include quoted prices for the identical instrument on an inactive market, prices for similar instruments, interest rates, prepayment speeds, credit risk, yield curves, default rates and similar data.
Level 3 – Unobservable inputs for the asset or liability, to the extent relevant observable inputs are not available, representing the Fund’s own assumptions about the assumptions a market participant would use in valuing the asset or liability, and would be based on the best information available.
The availability of observable inputs can vary from security to security and is affected by a wide variety of factors, including, for example, the type of security, whether the security is new and not yet established in the marketplace, the liquidity of markets, and other characteristics particular to the security. To the extent that valuation is based on models or inputs that are less observable or unobservable in the market, the determination of fair value requires more judgment. Accordingly, the degree of judgment exercised in determining fair value is greatest for instruments categorized in Level 3.
The inputs used to measure fair value may fall into different levels of the fair value hierarchy. In such cases, for disclosure purposes, the level in the fair value hierarchy within which the fair value measurement falls in its entirety, is determined based on the lowest level input that is significant to the fair value measurement in its entirety.
23
| Boyd Watterson Limited Duration Enhanced Income Fund |
| NOTES TO FINANCIAL STATEMENTS (Continued) |
| June 30, 2023 |
The inputs or methodology used for valuing securities are not necessarily an indication of the risk associated with investing in those securities. The following table summarizes the inputs used as of June 30, 2023 for the Fund’s investments measured at fair value:
| Assets* | Level 1 | Level 2 | Level 3 | Total | ||||||||||||
| Preferred Stocks | $ | 7,304,902 | $ | — | $ | — | $ | 7,304,902 | ||||||||
| Asset Backed Securities | — | 167,041,056 | — | 167,041,056 | ||||||||||||
| Corporate Bonds | — | 138,690,746 | — | 138,690,746 | ||||||||||||
| Term Loans | — | 33,536,571 | — | 33,536,571 | ||||||||||||
| U.S. Treasury Bonds & Agencies | — | 19,475,000 | — | 19,475,000 | ||||||||||||
| Short-Term Investments | 3,698,387 | — | — | 3,698,387 | ||||||||||||
| Total | $ | 11,003,289 | $ | 358,743,373 | $ | — | $ | 369,746,662 | ||||||||
The Fund did not hold any Level 3 securities during the year.
| * | Refer to the Schedule of Investments for industry classifications. |
Security Transactions and Related Income – Security transactions are accounted for on the trade date. Interest income is recognized on an accrual basis. Discounts are accreted and premiums are amortized on securities purchased over the lives of the respective securities using the effective interest method, except certain securities that are held at premium and will be amortized to the earliest call date. Dividend income is recorded on the ex-dividend date. Realized gains or losses from sales of securities are determined by comparing the identified cost of the security lot sold with the net sales proceeds. Gains and losses realized on principal payments of asset-backed securities and bank loans (paydown gains and losses) are classified as part of investment income.
Dividends and Distributions to Shareholders – Dividends from net investment income are declared and paid quarterly. Distributions from net realized capital gains, if any, are declared and paid annually. Dividends and distributions to shareholders are recorded on the ex -dividend date and are determined in accordance with federal income tax regulations, which may differ from GAAP. These “book/tax” differences are considered either temporary (e.g., deferred losses, capital loss carryforwards) or permanent in nature. To the extent these differences are permanent in nature, such amounts are reclassified within the composition of net assets based on their federal tax -basis treatment; temporary differences do not require reclassification. These reclassifications have no effect on net assets, results from operations or net asset values per share of the Fund.
Federal Income Taxes – It is the Fund’s policy to qualify as a regulated investment company by complying with the provisions of the Internal Revenue Code of 1986, as amended that are applicable to regulated investment companies and to distribute substantially all of its taxable income and net realized gains to shareholders. Therefore, no federal income tax provision has been recorded. The Fund recognizes the tax benefits of uncertain tax positions only where the position is “more likely than not” to be sustained assuming examination by tax authorities. Management has analyzed the Fund’s tax positions and has concluded that no liability for unrecognized tax benefits should be recorded related to uncertain tax positions taken on returns filed for open tax years ended June 30, 2020, through June 30, 2022 or expected to be taken in the Fund’s June 30, 2023 tax returns. The Fund identifies its major tax jurisdictions as U.S. federal, Ohio and foreign jurisdictions where the Fund makes significant investments. The Fund is not aware of any tax positions for which it is reasonably possible that the total amounts of unrecognized tax benefits will change materially in the next twelve months. The Fund recognizes interest and penalties, if any, related to unrecognized tax benefits as income tax expense of the Statement of Operations. During the year ended June 30, 2023, the Fund did not incur any interest or penalties.
Fixed Income Risk – When the Fund invests in fixed income securities, the value of your investment in the Fund will fluctuate with changes in interest rates. Typically, a rise in interest rates causes a decline in the value of fixed income securities owned by the Fund. In general, the market price of fixed income securities with longer maturities will increase or decrease more in response to changes in interest rates than shorter- term securities. Other risk factors include credit risk (the debtor may default) and prepayment risk (the debtor may pay its obligation early, reducing the amount of interest
24
| Boyd Watterson Limited Duration Enhanced Income Fund |
| NOTES TO FINANCIAL STATEMENTS (Continued) |
| June 30, 2023 |
payments). These risks could affect the value of a particular investment by the Fund, possibly causing the Fund’s share price and total return to be reduced and fluctuate more than other types of investments.
Counterparty Credit Risk – The stability and liquidity of many security transactions depends in large part on the creditworthiness of the parties to the transactions. If a counterparty to such a transaction defaults, exercising contractual rights may involve delays or costs for the Fund. Furthermore, there is a risk that a counterparty could become the subject of insolvency proceedings, and that the recovery of securities and other assets from such counterparty will be delayed or be of a value less than the value of the securities or assets originally entrusted to such counterparty.
Bank Loans Risk – The market for bank loans may not be highly liquid and the Fund may have difficulty selling them. These investments expose the Fund to the credit risk of both the financial institution and the underlying borrower. Bank loans settle on a delayed basis, potentially leading to the sale proceeds of such loans not being available to meet redemptions for a substantial period of time after the sale of the bank loans. The Fund may need a line of credit in order to meet redemptions during these periods, which may increase the Fund’s expenses. Certain bank loans may not be considered “securities,” and purchasers, such as the Fund, therefore may not be entitled to rely on the protections of federal securities laws, including anti-fraud provisions.
Market and Geopolitical Risk – The increasing interconnectivity between global economies and financial markets increases the likelihood that events or conditions in one region or financial market may adversely impact issuers in a different country, region or financial market. Securities in the Fund’s portfolio may underperform due to inflation (or expectations for inflation), interest rates, global demand for particular products or resources, natural disasters, climate-change and climate-related events, pandemics, epidemics, terrorism, regulatory events and governmental or quasi-governmental actions. The occurrence of global events similar to those in recent years, such as terrorist attacks around the world, natural disasters, social and political discord or debt crises and downgrades, among others, may result in market volatility and may have long term effects on both the U.S. and global financial markets. It is difficult to predict when similar events affecting the U.S. or global financial markets may occur, the effects that such events may have and the duration of those effects. Any such event(s) could have a significant adverse impact on the value and risk profile of the Fund’s portfolio. The COVID-19 global pandemic had negative impacts, and in many cases severe negative impacts, on markets worldwide. It is not known how long such impacts, or any future impacts of other significant events described above, will or would last, but there could be a prolonged period of global economic slowdown, which may impact your Fund investment. Therefore, the Fund could lose money over short periods due to short-term market movements and over longer periods during more prolonged market downturns. During a general market downturn, multiple asset classes may be negatively affected. Changes in market conditions and interest rates can have the same impact on all types of securities and instruments. In times of severe market disruptions, you could lose your entire investment.
Expenses – Expenses of the Trust that are directly identifiable to a specific fund are charged to that fund. Expenses, which are not readily identifiable to a specific fund, are allocated in such a manner as deemed equitable, taking into consideration the nature and type of expense and the relative sizes of the funds in the Trust.
Indemnification – The Trust indemnifies its officers and the Board for certain liabilities that may arise from the performance of their duties to the Trust. Additionally, in the normal course of business, the Fund enters into contracts that contain a variety of representations and warranties and which provide general indemnities. The Fund’s maximum exposure under these arrangements is unknown, as this would involve future claims that may be made against the Fund that have not yet occurred. However, based on experience, the risk of loss due to these warranties and indemnities appears to be remote.
| 3. | INVESTMENT TRANSACTIONS |
For the year ended June 30, 2023, cost of purchases and proceeds from sales of portfolio securities, excluding short-term investments and U.S. government securities, amounted to $115,103,577 and $110,651,987 respectively. Cost of purchases and proceeds from sales of U.S. government securities, amounted to $28,568,125 and $9,017,302, respectively.
25
| Boyd Watterson Limited Duration Enhanced Income Fund |
| NOTES TO FINANCIAL STATEMENTS (Continued) |
| June 30, 2023 |
| 4. | INVESTMENT ADVISORY AGREEMENT AND TRANSACTIONS WITH RELATED PARTIES |
Boyd Watterson Asset Management, LLC serves as the Fund’s investment advisor (the “Advisor”). Pursuant to an advisory agreement with the Trust on behalf of the Fund, the Advisor, under the oversight of the Board, directs the daily operations of the Fund and supervises the performance of administrative and professional services provided by others. As compensation for its services and the related expenses borne by the Advisor, the Fund pays the Advisor a fee computed and accrued daily and paid monthly, based on the Fund’s average daily net assets and is computed at the annual rate of 0.40%. Pursuant to the advisory agreement, the Fund accrued $1,476,546 in advisory fees for the year ended June 30, 2023.
The Advisor has contractually agreed to reduce its fees and/or absorb expenses of the Fund (“Waiver Agreement”) until at least October 31, 2023, to ensure that Total Annual Fund Operating Expenses After Fee Waiver and/or Reimbursement (exclusive of any front-end or contingent deferred loads; brokerage fees and commissions, acquired fund fees and expenses; borrowing costs (such as interest and dividend expense on securities sold short); taxes; and extraordinary expenses, such as litigation expenses (which may include indemnification of Fund officers and the Board, contractual indemnification of Fund service providers (other than the Advisor)), will not exceed 0.89%, 1.59%, 0.60%, and 0.40%, of the daily average net assets attributable to Class A, Class C, Class I, and Class I2 shares, respectively. These fee waivers and expense reimbursements are subject to possible recoupment from the Fund within the three years after the fees have been waived or reimbursed, if such recoupment can be achieved within the foregoing expense limits or within the expense limits in place at the time of the recoupment, whichever is lower. For the year ended June 30, 2023, the Advisor waived fees in the amount of $597,100 pursuant to the Waiver Agreement.
The Board may terminate this expense reimbursement arrangement at any time. For the year ended June 30, 2021, the Advisor waived fees in the amount of $471,412 which is subject to recapture through June 30, 2024, pursuant to the Waiver Agreement. For the year ended June 30, 2022, the Advisor waived fees in the amount of $576,426, which is subject to recapture through June 30, 2025, pursuant to the Waiver Agreement. For the year ended June 30, 2023, the Advisor waived fees in the amount of $597,100, which is subject to recapture through June 30, 2026, pursuant to the Waiver Agreement.
The Trust, on behalf of the Fund, has adopted the Trust’s Master Distribution and Shareholder Servicing Plan for Class A and Class C shares pursuant to Rule 12b-1 under the 1940 Act (the “Plans”). The Plans provide that a monthly service fee is calculated at an annual rate of 0.25% and 1.00% of its average daily net assets attributable the Fund’s Class A and Class C shares, respectively. Pursuant to the Plans, the Fund may compensate the securities dealers or other financial intermediaries, financial institutions, investment advisors, and others for activities primarily intended to result in the sale of Fund shares and for maintenance and personal service provided to existing shareholders. The Plans further provide for periodic payments to brokers, dealers and other financial intermediaries, including insurance companies, for providing shareholder services and for promotional and other sales-related costs. Pursuant to the Plans, the table below shows the fees incurred during the year ended June 30, 2023:
| Class | Distribution (12b-1) fee | |||
| Class A | $ | 5,485 | ||
| Class C | 16,458 | |||
Northern Lights Distributors, LLC (the “Distributor”) acts as the Fund’s principal underwriter in a continuous public offering of the Fund shares. During the year ended June 30, 2023, the Distributor received $271 in underwriting commissions.
In addition, certain affiliates of the Distributor provide services to the Fund as follows:
Ultimus Fund Solutions, LLC (“UFS”) an affiliate of the Distributor, provides administration, fund accounting, and transfer agent services to the Trust. Pursuant to an administrative servicing agreement with UFS, the Fund pays UFS customary fees based on aggregate net assets of the Fund as described in the servicing agreement for providing administration, fund accounting, and transfer agency services to the Fund. Certain officers of the Trust are also officers of UFS and are not paid any fees directly by the Fund for serving in such capacities.
Northern Lights Compliance Services, LLC (“NLCS”) an affiliate of UFS and the Distributor, provides a chief compliance officer to the Trust, as well as related compliance services, pursuant to a consulting agreement between NLCS and the Trust. Under the terms of such agreement, NLCS receives customary fees from the Fund.
26
| Boyd Watterson Limited Duration Enhanced Income Fund |
| NOTES TO FINANCIAL STATEMENTS (Continued) |
| June 30, 2023 |
BluGiant, LLC (“BluGiant”) an affiliate of UFS and the Distributor, provides EDGAR conversion and filing services as well as print management services for the Fund on an ad-hoc basis. For the provision of these services, BluGiant receives customary fees from the Fund.
| 5. | DISTRIBUTIONS TO SHAREHOLDERS AND TAX COMPONENTS OF CAPITAL |
The Statement of Assets and Liabilities represents cost for financial reporting purposes. Aggregate cost for federal tax purposes is $384,714,779 for the Fund, and differs from fair value by net unrealized appreciation (depreciation) of securities as follows:
| Unrealized appreciation | $ | 916,032 | ||
| Unrealized depreciation | (15,884,149 | ) | ||
| Net unrealized depreciation | $ | (14,968,117 | ) |
The tax character of distributions paid for the years ended June 30, 2023 and June 30, 2022 was as follows:
| Fiscal Year Ended June | Fiscal Year Ended June | |||||||
| 30, 2023 | 30, 2022 | |||||||
| Ordinary Income | $ | 17,685,281 | $ | 10,917,545 | ||||
| Long-Term Capital Gain | 83,007 | 762,984 | ||||||
| Return of Capital | — | — | ||||||
| $ | 17,768,288 | $ | 11,680,529 | |||||
As of June 30, 2023 the components of accumulated earnings on a tax basis were as follows:
| Unrealized | Total | |||||||||||||||||||||||||
| Undistributed | Undistributed | Post October Loss | Capital Loss Carry | Other Book/Tax | Appreciation/ | Accumulated | ||||||||||||||||||||
| Ordinary Income | Long-Term Gains | and Late Year Loss | Forwards | Differences | (Deprecation) | Earnings/(Deficits) | ||||||||||||||||||||
| $ | — | $ | — | $ | (1,077,053 | ) | $ | (2,898,524 | ) | $ | — | $ | (14,968,117 | ) | $ | (18,943,694 | ) | |||||||||
The difference between book basis and tax basis undistributed net investment income and unrealized appreciation from investments is primarily attributable to tax adjustments for perpetual bonds.
Capital losses incurred after October 31 within the fiscal year are deemed to arise on the first business day of the following fiscal year for tax purposes. The Fund incurred and elected to defer such capital losses of $1,077,053.
At June 30, 2023, the Fund had capital loss carry forwards for federal income tax purposes available to offset future capital gains, as follows:
| Short-Term | Long-Term | Total | CLCF Utilized | |||||||||||
| $ | 808,459 | $ | 2,090,065 | $ | 2,898,524 | $ | — | |||||||
27
| Boyd Watterson Limited Duration Enhanced Income Fund |
| NOTES TO FINANCIAL STATEMENTS (Continued) |
| June 30, 2023 |
Permanent book and tax differences, primarily attributable to tax adjustments for distributions in excess, resulted in reclassifications for the Fund for the fiscal year ended June 30, 2023, as follows:
| Paid | ||||||
| In | Accumulated | |||||
| Capital | Losses | |||||
| $ | (465 | ) | $ | 465 | ||
| 6. | LINE OF CREDIT |
The Fund has a committed revolving line of credit agreement with PNC Bank for investment purposes and to help maintain the Fund’s liquidity, subject to the limitations of the 1940 Act for borrowings. The maximum amount of borrowing allowed under the agreement is $7,000,000. Borrowings are secured by assets held by the Fund at the custodian. The Fund has granted PNC Bank a first priority perfected security interest in the collateral pledged by the Fund. Borrowings under the PNC Bank agreement bear interest at a rate equal to the Daily Bloomberg Short-Term Bank Yield Index plus applicable margin of 2.50%, per annum, on the outstanding principal balance. The PNC Bank agreement matures on October 31, 2023. For the year ended June 30, 2023, there were no borrowings for the Fund and no balance outstanding as of period-end.
| 7. | SUBSEQUENT EVENTS |
Subsequent events after the date of the Statement of Assets and Liabilities have been evaluated through the date the financial statements were issued. Management has determined that no events or transactions occurred requiring adjustment or disclosure in the financial statements.
28

REPORT OF INDEPENDENT REGISTERED PUBLIC ACCOUNTING FIRM
To the Shareholders of Boyd Watterson Limited Duration Enhanced Income Fund and
Board of Trustees of Northern Lights Fund Trust III
Opinion on the Financial Statements
We have audited the accompanying statement of assets and liabilities, including the schedule of investments, of Boyd Watterson Limited Duration Enhanced Income Fund (the “Fund”), a series of Northern Lights Fund Trust III, as of June 30, 2023, the related statement of operations for the year then ended, the statements of changes in net assets for each of the two years in the period then ended, the related notes, and the financial highlights for each of the five years in the period then ended (collectively referred to as the “financial statements”). In our opinion, the financial statements present fairly, in all material respects, the financial position of the Fund as of June 30, 2023, the results of its operations for the year then ended, the changes in net assets for each of the two years in the period then ended, and the financial highlights for each of the five years in the period then ended, in conformity with accounting principles generally accepted in the United States of America.
Basis for Opinion
These financial statements are the responsibility of the Fund’s management. Our responsibility is to express an opinion on the Fund’s financial statements based on our audits. We are a public accounting firm registered with the Public Company Accounting Oversight Board (United States) (“PCAOB”) and are required to be independent with respect to the Fund in accordance with the U.S. federal securities laws and the applicable rules and regulations of the Securities and Exchange Commission and the PCAOB.
We conducted our audits in accordance with the standards of the PCAOB. Those standards require that we plan and perform the audit to obtain reasonable assurance about whether the financial statements are free of material misstatement whether due to error or fraud.
Our audits included performing procedures to assess the risks of material misstatement of the financial statements, whether due to error or fraud, and performing procedures that respond to those risks. Such procedures included examining, on a test basis, evidence regarding the amounts and disclosures in the financial statements. Our procedures included confirmation of securities owned as of June 30, 2023, by correspondence with the custodian and agent banks. Our audits also included evaluating the accounting principles used and significant estimates made by management, as well as evaluating the overall presentation of the financial statements. We believe that our audits provide a reasonable basis for our opinion.
We have served as the Fund’s auditor since 2016.

COHEN & COMPANY, LTD.
Cleveland, Ohio
August 29, 2023
COHEN & COMPANY, LTD.
800.229.1099 | 866.818.4538 fax | cohencpa.com
Registered with the Public Company Accounting Oversight Board
29
| Boyd Watterson Limited Duration Enhanced Income Fund |
| SUPPLEMENTAL INFORMATION (Unaudited) (Continued) |
| June 30, 2023 |
LIQUIDITY RISK MANAGEMENT PROGRAM
The Fund has adopted and implemented a written liquidity risk management program as required by Rule 22e-4 (the “Liquidity Rule”) under the 1940 Act. The program is reasonably designed to assess and manage the Fund’s liquidity risk, taking into consideration, among other factors, the Fund’s investment strategy and the liquidity of its portfolio investments during normal and reasonably foreseeable stressed conditions; its short and long-term cash flow projections; and its cash holdings and access to other funding sources.
During the year ended June 30, 2023, the Trust’s Liquidity Risk Management Program Committee (the “Committee”) reviewed the Fund’s investments and determined that the Fund held adequate levels of cash and highly liquid investments to meet shareholder redemption activities in accordance with applicable requirements. Accordingly, the Committee concluded that (i) the Fund’s liquidity risk management program is reasonably designed to prevent violations of the Liquidity Rule and (ii) the Fund’s liquidity risk management program has been effectively implemented.
30
| Boyd Watterson Limited Duration Enhanced Income Fund |
| EXPENSE EXAMPLES (Unaudited) |
| June 30, 2023 |
As a shareholder of the Fund, you incur two types of costs: (1) transaction costs, including reinvested dividends, or other distributions; redemption fees; and exchange fees; and (2) ongoing costs, including management fees; distribution (12b-1) fees; and other Fund expenses. This example is intended to help you understand your ongoing costs (in dollars) of investing in the Fund and to compare these costs with the ongoing costs of investing in other mutual funds.
The Example is based on an investment of $1,000 invested at the beginning of the period and held for the entire period from January 1, 2023 to June 30, 2023 (the ’‘period’’).
Actual Expenses
The actual table below provides information about actual account values and actual expenses. You may use the information in this table, together with the amount you invested, to estimate the expenses that you paid over the period. Simply divide your account value by $1,000 (for example, an $8,600 account value divided by $1,000 = 8.6), then multiply the result by the number in the column under the heading entitled ’‘Expenses Paid During the Period’’ to estimate the expenses you paid on your account during the period.
Hypothetical Example for Comparison Purposes
The hypothetical table below provides information about hypothetical account values and hypothetical expenses based on the Fund’s actual expense ratio and an assumed rate of return of 5% per year before expenses, which is not the Fund’s actual return. The hypothetical account values and expenses may not be used to estimate the actual ending account balance or expenses you paid for the period. You may use this information to compare the ongoing costs of investing in the Fund and other funds. To do so, compare this 5% hypothetical example with the 5% hypothetical examples that appear in the shareholder reports of the other funds. Please note that the expenses shown in the table are meant to highlight your ongoing costs only and do not reflect any transactional costs. Therefore, the hypothetical table is useful in comparing ongoing costs only, and will not help you determine the relative total costs of owning different funds. In addition, if these transactional costs were included, your costs would have been higher.
| Beginning | Ending | Expenses Paid | Expense Ratio | |
| Account Value | Account Value | During Period | During the Period | |
| Actual | 1/1/23 | 6/30/23 | 1/1/23 – 6/30/23 * | 1/1/23 – 6/30/23 |
| Class A | $1,000.00 | $1,040.10 | $4.28 | 0.85% |
| Class C | $1,000.00 | $1,035.10 | $8.02 | 1.59% |
| Class I | $1,000.00 | $1,040.30 | $3.04 | 0.60% |
| Class I2 | $1,000.00 | $1,042.00 | $2.03 | 0.40% |
| Beginning | Ending | Expenses Paid | Expense Ratio | |
| Hypothetical | Account Value | Account Value | During Period | During the Period |
| (5% return before expenses) | 1/1/23 | 6/30/23 | 1/1/23 – 6/30/23 * | 1/1/23 – 6/30/23 |
| Class A | $1,000.00 | $1,020.58 | $4.25 | 0.85% |
| Class C | $1,000.00 | $1,016.91 | $7.95 | 1.59% |
| Class I | $1,000.00 | $1,021.82 | $3.00 | 0.60% |
| Class I2 | $1,000.00 | $1,022.81 | $2.01 | 0.40% |
| * | Expenses are equal to the average account value over the period, multiplied by the Fund’s annualized expense ratio, multiplied by the number of days in the period (181) divided by the number of days in the fiscal year (365). |
31
| Boyd Watterson Limited Duration Enhanced Income Fund |
| SUPPLEMENTAL INFORMATION (Unaudited) |
| June 30, 2023 |
Renewal of Advisory Agreement – Boyd Watterson Limited Duration Enhanced Income Fund*
In connection with a meeting held on May 24-25, 2023, the Board, including a majority of the Trustees who are not “interested persons,” as that term is defined in the Investment Company Act of 1940, as amended, discussed the renewal of the investment advisory agreement (the “Advisory Agreement”) between Boyd Watterson Asset Management, LLC (the “Adviser”) and the Trust, with respect to the Boyd Watterson Limited Duration Enhanced Income Fund (“BWLD”). In considering the renewal of the Advisory Agreement, the Board received materials specifically relating to BWLD and the Advisory Agreement.
The Board relied upon the advice of independent legal counsel and its own business judgment in determining the material factors to be considered in evaluating the Advisory Agreement and the weight to be given to each such factor. The Board’s conclusions were based on an evaluation of all of the information provided and were not the result of any one factor. Moreover, each Trustee may have afforded different weight to the various factors in reaching conclusions with respect to the Advisory Agreement.
Nature, Extent and Quality of Services. The Board recognized that the Adviser was among the oldest independent investment firms in the nation and founded in 1928, managed approximately $17.7 billion in assets, and offered an array of fixed income, real estate, and equity investment strategies to its clients. The Board considered the backgrounds of the Adviser’s key investment personnel, noting their education and financial industry experience. The Board acknowledged that the Adviser utilized its proprietary methodology to seek to capitalize on inefficiencies in the public trading markets for fixed income securities and bank loans. The Board noted that the methodology involved performing ongoing macroeconomic research that analyzed interest rates, economic growth, inflation, fiscal and monetary policy, and the credit cycle. The Board noted that the Adviser maintained a comprehensive risk management program that utilized qualitative, quantitative, fundamental and valuation measures to ensure the Adviser invested within its investment limitations. The Board discussed that the Adviser’s credit team monitored and discussed security ratings and market conditions. The Board reviewed the factors that the Adviser’s best execution committee took into consideration when approving broker-dealers. The Board noted that the Adviser maintained a cybersecurity program. The Board concluded that the Adviser could be expected to continue providing high quality service to BWLD and its shareholders.
Performance. The Board noted that BWLD was a four-star Morningstar rated fund that outperformed its peer group, Morningstar category, and benchmark across all periods. The Board observed BWLD’s standard deviation and Sharpe ratio ranked in the first quartile among its peer group and Morningstar category across all periods. The Board discussed that the Adviser attributed BWLD’s 1-year performance to BWLD’s exposure to floating rate securities. The Board concluded that it expected the Adviser to continue providing reasonable returns to BWLD.
Fees and Expenses. The Board noted that the Adviser’s advisory fee for BWLD was lower than the averages and medians of its peer group and Morningstar category. The Board also
32
| Boyd Watterson Limited Duration Enhanced Income Fund |
| SUPPLEMENTAL INFORMATION (Unaudited) |
| June 30, 2023 |
acknowledged that BWLD’s net expense ratio was below the averages and medians of its peer group and Morningstar category. The Board considered that the Adviser had an expense limitation agreement in place. Given these considerations, the Board concluded that the Adviser’s advisory fee for BWLD was not unreasonable.
Economies of Scale. The Board considered whether the Adviser had achieved economies of scale with respect to its management of BWLD. The Board noted that the Adviser had indicated its willingness to discuss the matter of breakpoints with the Board as BWLD reached a specified asset level. The Board agreed that, in light of the expense limitation agreement, which effectively provided shareholders with some benefits of scale, and the Adviser’s willingness to consider breakpoints as BWLD grew, the absence of breakpoints at this time was acceptable.
Profitability. The Board reviewed the profitability analysis provided by the Adviser for its services to BWLD. The Board noted that the Adviser reported a modest profit with respect to BWLD and acknowledged the Adviser’s assertion that the profit was reasonable due to the complexity of managing BWLD. The Board acknowledged the resources required to maintain and manage BWLD’s investment program and determined the Adviser’s profit was not excessive.
Conclusion. Having requested and reviewed such information from the Adviser as the Board believed to be reasonably necessary to evaluate the terms of the Advisory Agreement, and as assisted by the advice of independent counsel, the Board concluded that renewal of the Advisory Agreement was in the best interests of BWLD and its shareholders.
| * | Due to timing of the contract renewal schedule, these deliberations may or may not relate to the current performance results of BWLD. |
33
| Boyd Watterson Limited Duration Enhanced Income Fund |
| SUPPLEMENTAL INFORMATION (Unaudited) |
| June 30, 2023 |
The Trustees and officers of the Trust, together with information as to their principal business occupations during the past five years and other information, are shown below. Unless otherwise noted, the address of each Trustee and officer is 225 Pictoria Drive, Suite 450, Cincinnati, Ohio 45246.
| Independent Trustees | |||||
| Name, Address, Year of Birth | Position(s) Held with Registrant | Length of Service and Term | Principal Occupation(s) During Past 5 Years | Number of Funds Overseen In The Fund Complex* | Other Directorships Held During Past 5 Years** |
| Patricia Luscombe 1961 | Trustee | Since January 2015, Indefinite | Managing Director of the Valuations and Opinions Group, Lincoln International LLC (since August 2007). | 1 | Northern Lights Fund Trust III (for series notaffiliated with the Fund since 2015); Monetta Mutual Funds (since November 2015). |
| John V. Palancia 1954 | Trustee, Chairman | Trustee, since February 2012, Indefinite; Chairman of the Board since May 2014. | Retired (since 2011); formerly, Director of Global Futures Operations Control, Merrill Lynch, Pierce, Fenner & Smith, Inc. (1975-2011). | 1 | Northern Lights Fund Trust III (for series notaffiliated with the Fund since 2012); Northern Lights Fund Trust (since 2011); Northern Lights Variable Trust (since 2011); Alternative Strategies Fund (since 2012). |
| Mark H. Taylor 1964 | Trustee, Chairman of the Audit Committee | Since February 2012, Indefinite | PhD (Accounting), CPA; Professor and Director, Lynn Pippenger School of Accountancy, Muma College of Business, University of South Florida (2019 – present); Professor and Department of Accountancy Chair, Case Western Reserve University (2009-2019); President, American Accounting Association (AAA) commencing August 2022 (President-Elect 2022-2023, President 2023-2024; Past President 2024-2025). AAA Vice President-Finance (2017-2020); President, Auditing Section of the AAA;Member, AICPA Auditing Standards Board (2009-2012); Academic Fellow, Office of the Chief Accountant, United States Securities Exchange Commission (2005-2006); Center for Audit Quality research grants (2014, 2012). | 1 | Northern Lights Fund Trust III (for series notaffiliated with the Fund since 2012); Northern Lights Fund Trust (since 2007); Northern Lights Variable Trust (since 2007); Alternative Strategies Fund (since June 2010). |
| Jeffery D. Young 1956 | Trustee | Since January 2015, Indefinite | Co-owner and Vice President, Latin America Agriculture Development Corp. (since May 2015); President, Celeritas Rail Consulting (since June 2014); Asst. Vice President -Transportation Systems, Union Pacific Railroad Company (June 1976 to April 2014). | 1 | Northern Lights Fund Trust III (for series notaffiliated with the Fund since 2015). |
| * | As of June 30, 2023, the Trust was comprised of 29 active portfolios managed by 14 unaffiliated investment advisers. The term “Fund Complex” applies only to the Fund. The Fund does not hold itself out as related to any other series within the Trust for investment purposes, nor does it share the same investment adviser with any other series. |
| ** | Only includes directorships held within the past 5 years in a company with a class of securities registered pursuant to Section 12 of the Securities Exchange Act of 1934 or subject to the requirements of Section 15(d) of the Securities Exchange Act of 1934, or any company registered as an investment company under the 1940 Act. |
6/30/23-NLFT III-v3
34
| Boyd Watterson Limited Duration Enhanced Income Fund |
| SUPPLEMENTAL INFORMATION (Unaudited) (Continued) |
| June 30, 2023 |
Officers of the Trust
| Name, Address, Year of Birth | Position(s) Held with Registrant | Length of Service and Term | Principal Occupation(s) During Past 5 Years |
| Brian Curley 1970 | President | Since May 2023,indefinite | Vice President, Ultimus Fund Solutions, LLC (since 2020); Vice President, Gemini Fund Services, LLC (2015-2020). |
| Timothy Burdick 1986 | Vice President | Since May 2023, indefinite | Vice President and Senior Managing Counsel, Ultimus Fund Solutions, LLC (2023 – present); Vice President and Managing Counsel, Ultimus Fund Solutions, LLC (2022 – 2023); Assistant Vice President and Counsel, Ultimus Fund Solutions, LLC (2019 – 2022). |
| Richard Gleason 1977 | Treasurer | Since May 2023, indefinite | Assistant Vice President, Ultimus Fund Solutions, LLC (since 2020); Assistant Vice President, Gemini Fund Services, LLC (2015-2020). |
| Viktoriya Pallino 1995 | Secretary | Since August 2022, indefinite | Senior Legal Administrator, Ultimus Fund Solutions, LLC (since 2023); Legal Administrator II, Ultimus Fund Solutions, LLC (2021-2023); Legal Administrator I, Ultimus Fund Solutions, LLC (2019-2021); Legal Administration Associate, Gemini Fund Services, LLC (2017-2019). |
| William Kimme 1962 | Chief Compliance Officer | Since February 2012, indefinite | Senior Compliance Officer of Northern Lights Compliance Services, LLC (since 2011). |
The Fund’s Statement of Additional Information includes additional information about the Trustees and is available free of charge, upon request, by calling toll-free at 1-877-345-9597.
6/30/23-NLFT III-v3
35
PRIVACY NOTICE | ||||
| Rev. June 2021 | ||||
| FACTS | WHAT DOES NORTHERN LIGHTS FUND TRUST III DO WITH YOUR PERSONAL INFORMATION? | |||
| Why? | Financial companies choose how they share your personal information. Federal law gives consumers the right to limit some but not all sharing. Federal law also requires us to tell you how we collect, share, and protect your personal information. Please read this notice carefully to understand what we do. | |||
| What? | The types of personal information we collect and share depend on the product or service you have with us. This information can include: | |||
■ Social Security number
■ Assets
■ Retirement Assets
■ Transaction History
■ Checking Account Information | ■ Purchase History
■ Account Balances
■ Account Transactions
■ Wire Transfer Instructions
| |||
| When you are no longer our customer, we continue to share your information as described in this notice. | ||||
| How? | All financial companies need to share customers’ personal information to run their everyday business. In the section below, we list the reasons financial companies can share their customers’ personal information; the reasons Northern Lights Fund Trust III chooses to share; and whether you can limit this sharing. | |||
| Reasons we can share your personal information | Does Northern Lights Fund Trust III share? | Can you limit this sharing? | ||
For our everyday business purposes – such as to process your transactions, maintain your account(s), respond to court orders and legal investigations, or report to credit bureaus | Yes | No | ||
For our marketing purposes – to offer our products and services to you | No | We don’t share | ||
| For joint marketing with other financial companies | No | We don’t share | ||
For our affiliates’ everyday business purposes – information about your transactions and experiences | No | We don’t share | ||
For our affiliates’ everyday business purposes – information about your creditworthiness | No | We don’t share | ||
| For nonaffiliates to market to you | No | We don’t share | ||
| Questions? | Call (631) 490-4300 | |||
36
| Who we are | |
| Who is providing this notice? | Northern Lights Fund Trust III
|
| What we do | |
| How does Northern Lights Fund Trust III protect my personal information? | To protect your personal information from unauthorized access and use, we use security measures that comply with federal law. These measures include computer safeguards and secured files and buildings.
Our service providers are held accountable for adhering to strict policies and procedures to prevent any misuse of your nonpublic personal information. |
| How does Northern Lights Fund Trust III collect my personal information? | We collect your personal information, for example, when you
■ Open an account
■ Provide account information
■ Give us your contact information
■ Make deposits or withdrawals from your account
■ Make a wire transfer
■ Tell us where to send the money
■ Tells us who receives the money
■ Show your government-issued ID
■ Show your driver’s license
We also collect your personal information from other companies. |
| Why can’t I limit all sharing? | Federal law gives you the right to limit only
■ Sharing for affiliates’ everyday business purposes – information about your creditworthiness
■ Affiliates from using your information to market to you
■ Sharing for nonaffiliates to market to you
State laws and individual companies may give you additional rights to limit sharing. |
| Definitions | |
| Affiliates | Companies related by common ownership or control. They can be financial and nonfinancial companies.
■ Northern Lights Fund Trust III does not share with our affiliates. |
| Nonaffiliates | Companies not related by common ownership or control. They can be financial and nonfinancial companies
■ Northern Lights Fund Trust III does not share with nonaffiliates so they can market to you. |
| Joint marketing | A formal agreement between nonaffiliated financial companies that together market financial products or services to you.
■ Northern Lights Fund Trust III doesn’t jointly market. |
37
PROXY VOTING POLICY
Information regarding how the Fund voted proxies relating to portfolio securities for the most recent twelve month period ended June 30 as well as a description of the policies and procedures that the Fund uses to determine how to vote proxies is available without charge, upon request, by calling 1-877-345-9597 or by referring to the Securities and Exchange Commission’s (“SEC”) website at http://www.sec.gov.
PORTFOLIO HOLDINGS
The Fund files its complete schedule of portfolio holdings with the SEC for the first and third quarters of each fiscal year as an exhibit to its reports on Form N-PORT, within sixty days after the end of the period. Form N-PORT reports are available on the SEC’s website at http://www.sec.gov. The information on Form N-PORT is available without charge, upon request, by calling 1-877-345-9597.
| INVESTMENT ADVISOR |
| Boyd Watterson Asset Management, LLC |
| 1301 East 9th Street, Suite 2900 |
| Cleveland, OH 44114 |
| ADMINISTRATOR |
| Ultimus Fund Solutions, LLC |
| 225 Pictoria Drive, Suite 450 |
| Cincinnati, OH 45246 |
| BWD-AR23 |
| (b) | Not Applicable |
Item 2. Code of Ethics.
(a) The registrant has, as of the end of the period covered by this report, adopted a code of ethics that applies to the registrant's principal executive officer, principal financial officer, principal accounting officer or controller, or persons performing similar functions, regardless of whether these individuals are employed by the registrant or a third party.
(b) During the period covered by this report, there were no amendments to any provision of the code of ethics.
(c) During the period covered by this report, there were no waivers or implicit waivers of a provision of the code of ethics.
Item 3. Audit Committee Financial Expert.
(a)(1)ii The Registrant’s board of trustees has determined that Mark H. Taylor is an audit committee financial expert, as defined in Item 3 of Form N-CSR. Mr. Taylor is independent for purposes of this Item 3.
(a)(2) Not applicable.
(a)(3) In this regard, no member of the audit committee was identified as having all of the required technical attributes identified in instruction 2 (b) to item 3 of Form N-CSR to qualify as an “audit committee financial expert,” whether through the type of specialized education or experience required by that instruction. At this time, the board believes the experience provided by each member of the audit committee collectively offers the fund adequate oversight by its audit committee given the fund’s level of financial complexity. The board will from time to time reexamine such belief.
Item 4. Principal Accountant Fees and Services.
| (a) | Audit Fees |
2023 - $21,000
2022 - $20,000
| (b) | Audit-Related Fees |
2023 - None
2022 – None
| (c) | Tax Fees |
2023 - $3,750
2022 - $3,500
Preparation of Federal & State income tax returns, assistance with calculation of required income, capital gain and excise distributions and preparation of Federal excise tax returns.
| (d) | All Other Fees |
2023 - None
2022 – None
| (e) | (1) Audit Committee’s Pre-Approval Policies |
The registrant’s Audit Committee is required to pre-approve all audit services and, when appropriate, any non-audit services (including audit-related, tax and all other services) to the registrant. The registrant’s Audit Committee also is required to pre-approve, when appropriate, any non-audit services (including audit-related, tax and all other services) to its adviser, or any entity controlling, controlled by or under common control with the adviser that provides ongoing services to the registrant, to the extent that the services may be determined to have an impact on the operations or financial reporting of the registrant. Services are reviewed on an engagement by engagement basis by the Audit Committee.
| (2) | Percentages of Services Approved by the Audit Committee |
| 2023 | 2022 | |||||
| Audit-Related Fees: | 0.00 | % | 0.00% | |||
| Tax Fees: | 0.00 | % | 0.00% | |||
| All Other Fees: | 0.00 | % | 0.00% | |||
| (f) | During the audit of registrant's financial statements for the most recent fiscal year, less than 50 percent of the hours expended on the principal accountant's engagement were attributed to work performed by persons other than the principal accountant's full-time, permanent employees. |
| (g) | The aggregate non-audit fees billed by the registrant's accountant for services rendered to the registrant, and rendered to the registrant's investment adviser (not including any sub-adviser whose role is primarily portfolio management and is subcontracted with or overseen by another investment adviser), and any entity controlling, controlled by, or under common control with the adviser that provides ongoing services to the registrant: |
2023 - $3,750
2022 - $3,500
(h) The registrant's audit committee has considered whether the provision of non-audit services to the registrant's investment adviser (not including any sub-adviser whose role is primarily portfolio management and is subcontracted with or overseen by another investment adviser), and any entity controlling, controlled by, or under common control with the investment adviser that provides ongoing services to the registrant, that were not pre-approved pursuant to paragraph (c)(7)(ii) of Rule 2-01 of Regulation S-X, is compatible with maintaining the principal accountant's independence.
(i) Not applicable.
(j) Not applicable.
Item 5. Audit Committee of Listed Companies. Not applicable to open-end investment companies.
Item 6. Schedule of Investments. Schedule of investments in securities of unaffiliated issuers is included under Item 1.
Item 7. Disclosure of Proxy Voting Policies and Procedures for Closed-End Management Investment Companies. Not applicable to open-end investment companies.
Item 8. Portfolio Managers of Closed-End Management Investment Companies. Not applicable to open-end investment companies.
Item 9. Purchases of Equity Securities by Closed-End Management Investment Company and Affiliated Purchasers. Not applicable to open-end investment companies.
Item 10. Submission of Matters to a Vote of Security Holders. None
Item 11. Controls and Procedures.
(a) Based on an evaluation of the Registrant’s disclosure controls and procedures as of a date within 90 days of filing date of this Form N-CSR, the principal executive officer and principal financial officer of the Registrant have concluded that the disclosure controls and procedures of the Registrant are reasonably designed to ensure that the information required in filings on Form N-CSR is recorded, processed, summarized, and reported by the filing date, including that information required to be disclosed is accumulated and communicated to the Registrant’s management, including the Registrant’s principal executive officer and principal financial officer, as appropriate to allow timely decisions regarding required disclosure.
(b) There were no significant changes in the Registrant’s internal control over financial reporting that occurred during the period covered by this report that have materially affected, or are reasonably likely to materially affect, the Registrant’s internal control over financial reporting.
Item 12. Disclosure of Securities Lending Activities for Closed-End Management Investment Companies. Not applicable to open-end investment companies.
Item 13. Exhibits.
(a)(1) Code of Ethics filed herewith.
(a)(3) Not applicable for open-end investment companies.
(a)(4) Not applicable.
SIGNATURES
Pursuant to the requirements of the Securities Exchange Act of 1934 and the Investment Company Act of 1940, the registrant has duly caused this report to be signed on its behalf by the undersigned, thereunto duly authorized.
(Registrant) Northern Lights Fund Trust III
By (Signature and Title)
/s/ Brian Curley
Brian Curley, Principal Executive Officer/President
Date 9/6/2023
Pursuant to the requirements of the Securities Exchange Act of 1934 and the Investment Company Act of 1940, this report has been signed below by the following persons on behalf of the registrant and in the capacities and on the dates indicated.
By (Signature and Title)
/s/ Brian Curley
Brian Curley, Principal Executive Officer/President
Date 9/6/2023
By (Signature and Title)
/s/ Rich Gleason
Rich Gleason, Principal Financial Officer/Treasurer
Date 9/6/2023