united states
securities and exchange commission
washington, d.c. 20549
form n-csr
certified shareholder report of registered management
investment companies
Investment Company Act file number 811-22655
Northern Lights Fund Trust III
(Exact name of registrant as specified in charter)
225 Pictoria Dr, Ste 450 Cincinnati, Ohio 45246
(Address of principal executive offices) (Zip code)
The Corporation Trust Company
1209 Orange Street, Wilmington, DE 19801
(Name and address of agent for service)
Registrant's telephone number, including area code: 631-470-2600
Date of fiscal year end: 9/30
Date of reporting period: 9/30/23
EXPLANATORY NOTE
Filed late due to late receipt of broker confirmations.
Item 1. Reports to Stockholders.
 |
| Counterpoint Tactical Income Fund |
| Class A – CPATX |
| Class C – CPCTX |
| Class I – CPITX |
| Counterpoint Tactical Equity Fund |
| Class A – CPAEX |
| Class C – CPCEX |
| Class I – CPIEX |
| Counterpoint Tactical Municipal Fund |
| Class A – TMNAX |
| Class C – TMNCX |
| Class I – TMNIX |
| Annual Report |
| September 30, 2023 |
| 1-844-273-8637 |
| www.counterpointmutualfunds.com |
| Distributed by Northern Lights Distributors, LLC |
| Member FINRA |
Performance Discussion
Following a “risk -on” signal late in October 2022, the Counterpoint Tactical Income Fund (the “Tactical Income Fund”) spent the vast majority of its ninth fiscal year invested in high yield and floating rate bonds. That initial signal was the fiscal year’s key event, prompting the Tactical Income Fund to earn returns analogous to an even split between those two asset classes. In past years, a typical “risk-on” position for the fund has consisted of 100% investment in high yield bonds. However, given that a key driver of downside in fixed income markets had been rising interest rates and inflation, the portfolio management team sought to minimize interest rate risk within the high yield portfolio by including floating rate funds alongside high yield.
Over the year, the Tactical Income Fund’s Class I shares exceeded the returns of its benchmark, the Bloomberg U.S. Aggregate Bond Index, by 4.97 percentage points. The Tactical Income Fund’s outperformance owes largely to its risk-on position in high yield and floating rate bonds and lower interest rate risk compared to the index. (The Tactical Income Fund’s weighted duration – a measure of interest rate risk - when “risk-on” in 2023 has been close to two, vs. duration of around 6 years for the benchmark.) Interest rates continued their 2022 rise into 2023, creating significant drag for the investment grade bonds that Tactical Income Fund’s benchmark is designed to track. The Tactical Income Fund remained in a “risk-on” position from mid-January through the end of the fiscal year.
The Counterpoint Tactical Municipal Fund (the “Tactical Municipal Fund) spent the large majority of the past fiscal year in a “risk-on” position, fully invested in high yield municipal bond mutual funds. The “risk-on” signal, received early in the fiscal year, enabled the Tactical Municipal Fund to largely track alongside high yield municipal markets for much of the year, until a “risk-off” signal in late August prompted an exit from high yield municipal that enabled the fund to sidestep some downside to close out the year. Sideways volatility during the initial “risk-on” period and fund fees and expenses drove modest outperformance by the benchmark. For the fiscal year, the Tactical Municipal Fund’s Class I shares returned -0.40%, vs. 2.66% for the benchmark.
Like high yield corporate and municipal credit markets, the U.S. stock market rallied for much of the past year. The trend-following component of the Counterpoint Tactical Equity Fund (the “Tactical Equity Fund”) experienced a key “risk-on” signal at the end of January 2023, prompting the Tactical Equity Fund to target a stock market beta of 0.8. A more challenging period for the Tactical Equity Fund’s global market neutral portfolio provided dragged on returns somewhat. This result owed in part to the portfolio’s natural short exposure to richly valued, money-losing technology companies that enjoyed a modest 2023 reprise of the enormous rally they experienced in 2020. The Tactical Equity Fund’s Class I shares delivered a full fiscal year return of 5.29%. The Tactical Equity Fund’s benchmark, a blend of 50% S&P 500 Index and 50% Bloomberg 1-3 Month U.S. Treasury Bill Index, returned 13.16% on the year.
We continue to believe the Tactical Equity Fund’s strategy’s exposure to smaller capitalization companies maximizes per-dollar exposure to factor strategy returns. Relative valuations between expensive and cheap stocks remain somewhat wide relative to history, and spreads for other academically validated sources stock returns are consistent with the historical average, indicating a reasonable chance to earn uncorrelated sources of return by investing in factor-oriented strategies. Additionally, the team is excited about enhancements made to its market neutral model, both improving existing and adding extra machine learning models as well as new variables to help improve potential returns on the long side of the portfolio while better managing downside risk characteristics of the Tactical Equity Fund.
1
Overall, we are encouraged to see the Funds’ strategies meet their objectives to deliver reasonable returns while systematically targeting reduction in portfolio downside risk. Each strategy has shown limited correlation to its index, indicating strong diversification potential over full market cycles.
Relatively few investors have correctly predicted financial markets’ responses to inflationary dynamics that have driven the post- COVID financial markets. The ones that did may simply have been lucky. We believe predictions of future market performance from here to be equally futile. However, we also believe that consistent exposure to systematic diversifier strategies continues to be a suitable risk management decision for most investors, especially those looking for consistent ways to mitigate downside risk within fixed income portfolios and valuation risk within equity markets.
Sincerely,
Michael Krause, CFA and Joseph Engelberg, Ph.D.
Portfolio Managers
7901-NLD 11/01/2023
2
| COUNTERPOINT TACTICAL INCOME FUND |
| PORTFOLIO REVIEW (Unaudited) |
| September 30, 2023 |
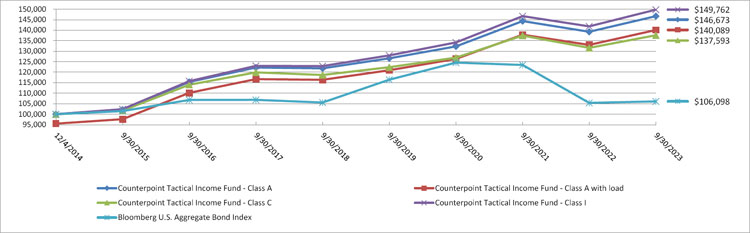
The Fund’s performance figures* for the periods ended September 30, 2023, as compared to its benchmark:
| Annualized | Annualized | ||
| One Year | Five Year | Since Inception (a) | |
| Counterpoint Tactical Income Fund - Class A | 5.33% | 3.78% | 4.44% |
| Counterpoint Tactical Income Fund - Class A with Load | 0.58% | 2.83% | 3.90% |
| Counterpoint Tactical Income Fund - Class C | 4.56% | 3.01% | 3.68% |
| Counterpoint Tactical Income Fund - Class I | 5.61% | 4.03% | 4.68% |
| Bloomberg U.S. Aggregate Bond Index (b) | 0.64% | 0.10% | 0.67% |
Comparison of the Change in Value of a $100,000 Investment
| * | Total returns are calculated using the traded net asset value (“NAV”) on September 29, 2023. The performance data quoted is historical. Past performance is no guarantee of future results. Current performance may be higher or lower than the performance data quoted. The principal value and investment return of an investment will fluctuate so that your shares, when redeemed, may be worth more or less than their original cost. The returns shown do not reflect the deduction of taxes that a shareholder would pay on Fund distributions or on the redemptions of Fund shares. The total annual operating expenses as stated in the fee table in the Fund’s prospectus dated February 1, 2023 are 1.94%, 2.69% and 1.69% for the Class A, C and I shares, respectively. Class A shares are subject to a maximum sales charge of up to 4.50% imposed on purchases. The Fund’s advisor has contractually agreed to waive a portion of its advisory fee and has agreed to reimburse the Fund for other expenses, until at least February 1, 2024, to ensure that Total Annual Fund Operating Expenses After Fee Waiver (but does not include: (i) any front-end or contingent deferred loads; (ii) brokerage fees and commissions; (iii) acquired fund fees and expenses; (iv) borrowing costs (such as interest and dividend expense on securities sold short); (v) taxes; and (vi) extraordinary expenses, such as litigation expenses (which may include indemnification of Fund officers and Trustees, contractual indemnification of Fund service providers (other than the advisor))) do not exceed 2.00%, 2.75% and 1.75% of the daily average net assets attributable to Class A, Class C and Class I shares of the Fund, respectively. Fee waivers and expense reimbursements are subject to possible recoupment from the Fund in future years on a rolling three year basis (within the three years after the fees have been waived or reimbursed) if such recoupment can be achieved within the expense limits then in place and in place at the time of waiver. The Board may terminate this expense reimbursement arrangement at any time upon 60 days written notice to the Fund’s advisor. For performance information current to the most recent month-end, please call 1-844-273-8637. |
| (a) | Inception date is December 4, 2014. |
| (b) | The Bloomberg U.S. Aggregate Bond Index is an unmanaged index comprised of U.S. investment grade, fixed rate bond market securities, including government, government agency, corporate and mortgage-backed securities between one and ten years. Index returns assume reinvestment of dividends. Investors may not invest in the Index directly. Unlike the Fund’s returns, the Index does not reflect any fees or expenses. |
| Portfolio Composition as of September 30, 2023 | ||||
| Holdings by Asset Type | % of Net Assets | |||
| Open End Funds | 80.7 | % | ||
| Exchanged-Traded Funds | 8.3 | % | ||
| Short-Term Investment | 7.7 | % | ||
| U.S. Government & Agencies | 0.2 | % | ||
| Other Assets In Excess Of Liabilities ^ | 3.1 | % | ||
| 100.0 | % | |||
| ^ | Includes unrealized appreciation on credit default swaps. |
Please refer to the Schedule of Investments in this shareholder report for a detailed listing of the Fund’s holdings.
3
| COUNTERPOINT TACTICAL EQUITY FUND |
| PORTFOLIO REVIEW (Unaudited) |
| September 30, 2023 |
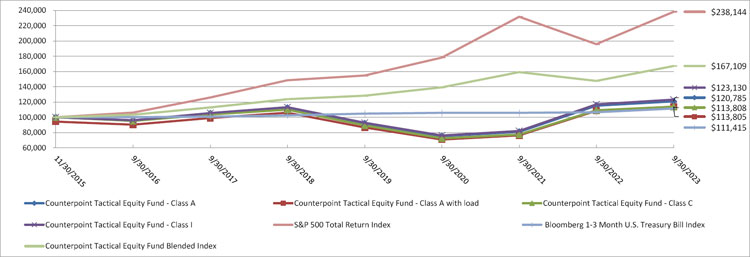
The Fund’s performance figures* for the periods ended September 30, 2023, as compared to its benchmarks:
| Annualized | Annualized | ||
| One Year | Five Year | Since Inception (a) | |
| Counterpoint Tactical Equity Fund - Class A | 4.99% | 1.45% | 2.44% |
| Counterpoint Tactical Equity Fund - Class A with Load | (1.04)% | 0.26% | 1.66% |
| Counterpoint Tactical Equity Fund - Class C | 4.25% | 0.68% | 1.66% |
| Counterpoint Tactical Equity Fund - Class I | 5.29% | 1.70% | 2.69% |
| S&P 500 Total Return Index (b) | 21.62% | 9.92% | 11.71% |
| Bloomberg 1-3 Month U.S. Treasury Bill Index (c) | 4.62% | 1.71% | 1.39% |
| Counterpoint Tactical Equity Fund Blended Index (d) | 13.16% | 6.21% | 6.77% |
Comparison of the Change in Value of a $100,000 Investment
| * | Total returns are calculated using the traded net asset value (“NAV”) on September 29, 2023. The performance data quoted is historical. Past performance is no guarantee of future results. Current performance may be higher or lower than the performance data quoted. The principal value and investment return of an investment will fluctuate so that your shares, when redeemed, may be worth more or less than their original cost. The returns shown do not reflect the deduction of taxes that a shareholder would pay on Fund distributions or on the redemptions of Fund shares. The total annual operating expenses before any fee waivers, as stated in the fee table in the Fund’s prospectus dated February 1, 2023 are 2.13%, 2.88% and 1.88% for the Class A, C and I shares, respectively. Class A shares are subject to a maximum sales charge of up to 5.75% imposed on purchases. The Fund’s advisor has contractually agreed to waive a portion of its advisory fee and has agreed to reimburse the Fund for other expenses, until at least February 1, 2024, ensure that Total Annual Fund Operating Expenses After Fee Waiver (but does not include: (i) any front-end or contingent deferred loads; (ii) brokerage fees and commissions; (iii) acquired fund fees and expenses; (iv) borrowing costs (such as interest and dividend expense on securities sold short); (v) taxes; and (vi) extraordinary expenses, such as litigation expenses (which may include indemnification of Fund officers and Trustees, contractual indemnification of Fund service providers (other than the advisor))) do not exceed 2.00%, 2.75% and 1.75% of the daily average net assets attributable to Class A, Class C and Class I shares of the Fund, respectively. Fee waivers and expense reimbursements are subject to possible recoupment from the Fund in future years on a rolling three year basis (within the three years after the fees have been waived or reimbursed) if such recoupment can be achieved within the expense limits then in place and in place at the time of waiver. The Board may terminate this expense reimbursement arrangement at any time upon 60 days written notice to the Fund’s advisor. Total returns would have been lower had the advisor not waived a portion of its fees. For performance information current to the most recent month-end, please call 1-844-273-8637. |
| (a) | Inception date is November 30, 2015. |
| (b) | The S&P 500 Total Return Index is an unmanaged free-float capitalization-weighted index which measures the performance of 500 large-cap common stocks actively traded in the United States. Index returns assume reinvestment of dividends. Investors may not invest in the Index directly. Unlike the Fund’s returns, the Index does not reflect any fees or expenses. |
| (c) | The Bloomberg 1-3 Month U.S. Treasury Bill Index is designed to measure the performance of public obligations of the U.S. Treasury that have a remaining maturity of greater than or equal to 1 month and less than 3 months. Index returns assume reinvestment of dividends. Investors may not invest in the Index directly. Unlike the Fund’s returns, the Index does not reflect any fees or expenses. |
| (d) | The Counterpoint Tactical Equity Fund Blended Index is a composite of 50% of the S&P 500 Total Return Index and 50% of the Bloomberg 1-3 Month U.S. Treasury Bill Index. Index returns assume reinvestment of dividends. Investors may not invest in the Index directly. Unlike the Fund’s returns, the Index does not reflect any fees or expenses Index returns assume reinvestment of dividends. Investors may not invest in the Index directly. Unlike the Fund’s returns, the Index does not reflect any fees or expenses. |
| Portfolio Composition as of September 30, 2023 | ||||
| Holdings by Asset Type | % of Net Assets | |||
| Common Stocks | 56.0 | % | ||
| U.S. Government & Agencies | 18.8 | % | ||
| Short-Term Investment | 0.5 | % | ||
| Future Options Purchased | 0.3 | % | ||
| Other Assets In Excess of Liabilities ^ | 24.4 | % | ||
| 100.0 | % | |||
| ^ | Includes fair value of common stocks sold short and net unrealized appreciation on futures contracts and total return swaps. |
Please refer to the Schedule of Investments in this shareholder report for a detailed listing of the Fund’s holdings.
4
| COUNTERPOINT TACTICAL MUNICIPAL FUND |
| PORTFOLIO REVIEW (Unaudited) |
| September 30, 2023 |
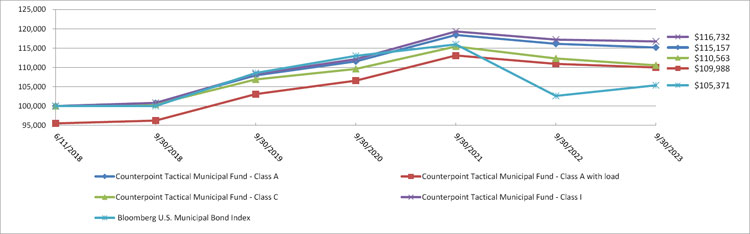
The Fund’s performance figures* for the periods ended September 30, 2023, as compared to its benchmark:
| Annualized | Annualized | ||
| One Year | Five Year | Since Inception (a) | |
| Counterpoint Tactical Municipal Fund - Class A | (0.84)% | 2.70% | 2.70% |
| Counterpoint Tactical Municipal Fund - Class A with Load | (5.27)% | 1.77% | 1.81% |
| Counterpoint Tactical Municipal Fund - Class C | (1.56)% | 1.93% | 1.91% |
| Counterpoint Tactical Municipal Fund - Class I | (0.40)% | 2.97% | 2.96% |
| Bloomberg U.S. Municipal Bond Index (b) | 2.66% | 1.05% | 0.99% |
Comparison of the Change in Value of a $100,000 Investment
| * | Total returns are calculated using the traded net asset value (“NAV”) on September 29, 2023. The performance data quoted is historical. Past performance is no guarantee of future results. Current performance may be higher or lower than the performance data quoted. The principal value and investment return of an investment will fluctuate so that your shares, when redeemed, may be worth more or less than their original cost. The returns shown do not reflect the deduction of taxes that a shareholder would pay on Fund distributions or on the redemptions of Fund shares. The total annual operating expenses as stated in the fee table in the Fund’s prospectus dated February 1, 2023 are 1.47%, 2.22% and 1.22% for the Class A, C and I shares, respectively. Class A shares are subject to a maximum sales charge of up to 4.50% imposed on purchases. The Fund’s advisor has contractually agreed to waived portion of its expenses and has agreed to reimburse the Fund, at least until February 1, 2024 to ensure that Total Annual Fund Operating Expenses After Fee Waiver (but does not include: (i) any front-end or contingent deferred loads; (ii) brokerage fees and commissions; (iii) acquired fund fees and expenses; (iv) borrowing costs (such as interest and dividend expense on securities sold short); (v) taxes; and (vi) extraordinary expenses, such as litigation expenses (which may include indemnification of Fund officers and Trustees, contractual indemnification of Fund service providers (other than the advisor)) does not exceed 1.25%, 2.00% and 1.00% of average daily net assets attributable to Class A, Class C, and Class I shares, respectively. Fee waivers and expense reimbursements are subject to possible recoupment from the Fund in future years on a rolling three year basis (within the three years after the fees have been waived or reimbursed) if such recoupment can be achieved within the expense limits then in place and in place at the time of waiver. The Board may terminate this expense reimbursement arrangement at any time upon 60 days written notice to the Fund’s advisor. Total returns would have been lower had the advisor not waived a portion of its fees. For performance information current to the most recent month-end, please call 1-844-273-8637. |
| (a) | Inception date is June 11, 2018. |
| (b) | The Bloomberg U.S. Municipal Bond Index covers the USD-denominated long-term tax exempt bond market. The index has four main sectors: state and local general obligation bonds, revenue bonds, insured bonds and prerefunded bonds. Index returns assume reinvestment of dividends. Investors may not invest in the Index directly. Unlike the Fund’s returns, the Index does not reflect any fees or expenses. |
| Portfolio Composition as of September 30, 2023 | ||||
| Holdings by Asset Type | % of Net Assets | |||
| Short-Term Investment | 72.0 | % | ||
| Open End Funds | 23.3 | % | ||
| Future Options Purchased | 0.7 | % | ||
| Other Assets In Excess of Liabilities ^ | 4.0 | % | ||
| 100.0 | % | |||
| ^ | Includes the fair value of swaptions purchased and swaptions written. |
Please refer to the Schedule of Investments in this shareholder report for a detailed listing of the Fund’s holdings.
5
| COUNTERPOINT TACTICAL INCOME FUND |
| SCHEDULE OF INVESTMENTS |
| September 30, 2023 |
| Shares | Fair Value | |||||||
| EXCHANGE-TRADED FUNDS — 8.3% | ||||||||
| FIXED INCOME - 8.3% | ||||||||
| 2,268,347 | Invesco Senior Loan ETF | $ | 47,612,604 | |||||
| 800,268 | iShares Broad USD High Yield Corporate Bond ETF | 27,777,302 | ||||||
| 593,258 | SPDR Blackstone Senior Loan ETF | 24,875,308 | ||||||
| TOTAL EXCHANGE-TRADED FUNDS (Cost $100,218,315) | 100,265,214 | |||||||
| OPEN END FUNDS — 80.7% | ||||||||
| FIXED INCOME - 80.7% | ||||||||
| 13,383,298 | BlackRock Floating Rate Income Portfolio, Institutional Class | 129,014,989 | ||||||
| 4,204 | BlackRock High Yield Bond Portfolio, Institutional Class | 28,207 | ||||||
| 25,139,665 | Fidelity Advisor Floating Rate High Income Fund, Class I | 232,290,503 | ||||||
| 10,868,723 | Goldman Sachs High Yield Floating Rate Fund, Institutional Class | 96,188,195 | ||||||
| 17,109,235 | JPMorgan High Yield Fund, Class I | 105,050,701 | ||||||
| 1,808 | Lord Abbett Floating Rate Fund, Class I | 14,645 | ||||||
| 569,120 | Lord Abbett High Yield Fund, Class I | 3,443,176 | ||||||
| 606,783 | MainStay MacKay High Yield Corporate Bond Fund, Class I | 3,015,713 | ||||||
| 82,057,893 | PGIM High Yield Fund, Class Z | 372,542,833 | ||||||
| 3,719 | PIMCO High Yield Fund, Institutional Class | 28,078 | ||||||
| 1,000 | TIAA-CREF High Yield Fund, Institutional Class | 8,230 | ||||||
| 3,990,704 | Transamerica High Yield Bond, Class I | 30,808,235 | ||||||
| TOTAL OPEN END FUNDS (Cost $963,931,633) | 972,433,505 | |||||||
| Principal | Coupon Rate | |||||||||||
| Amount ($) | (%) | Maturity | ||||||||||
| U.S. GOVERNMENT & AGENCIES — 0.2% | ||||||||||||
| U.S. TREASURY BILLS — 0.2% | ||||||||||||
| 2,500,000 | United States Treasury Bill(a) | 5.315 | 12/07/23 | 2,475,674 | ||||||||
| TOTAL U.S. GOVERNMENT & AGENCIES (Cost $2,475,855) | ||||||||||||
See accompanying notes to financial statements.
6
| COUNTERPOINT TACTICAL INCOME FUND |
| SCHEDULE OF INVESTMENTS (Continued) |
| September 30, 2023 |
| Shares | Fair Value | |||||||
| SHORT-TERM INVESTMENT — 7.7% | ||||||||
| MONEY MARKET FUND – 7.7% | ||||||||
| 92,755,130 | Goldman Sachs Financial Square Government Fund, Class FST, 5.23% (Cost $92,755,130)(b) | $ | 92,755,130 | |||||
| TOTAL INVESTMENTS – 96.9% (Cost $1,159,380,933) | $ | 1,167,929,523 | ||||||
| OTHER ASSETS IN EXCESS OF LIABILITIES – 3.1% | 36,842,865 | |||||||
| NET ASSETS - 100.0% | $ | 1,204,772,388 | ||||||
| ETF | - Exchange-Traded Fund |
| SPDR | - Standard & Poor’s Depositary Receipt |
| (a) | Zero coupon bond. Rate shown is discount rate at time of purchase. |
| (b) | Rate disclosed is the seven day effective yield as of September 30, 2023. |
See accompanying notes to financial statements.
7
| COUNTERPOINT TACTICAL INCOME FUND |
| SCHEDULE OF INVESTMENTS (Continued) |
| September 30, 2023 |
| CREDIT DEFAULT SWAP | ||||||||||||||||||||||||||
| Payement | Buy/Sell | Fixed Rate | Maturity | Notional | Premiums | Unrealized | ||||||||||||||||||||
| Description | Counterparty | Frequency | Protection | Received | Date | Amount | Paid (Received) | Value * | Appreciation | |||||||||||||||||
| CDX North American High Yield Index Version 1, Series 41 ** | Wells Fargo | Quarterly | Sell | 5.00% | 12/20/2028 | $ | 105,000,000 | $ | 712,879 | $ | 1,139,185 | $ | 426,306 | |||||||||||||
| * | Includes interest receivable. |
| ** | The underlying holdings of this security can be found at https://www.markit.com/Company/Files/DownloadFiles?CMSID=591aa9b991e24e82aa89263bae9a2e79 |
See accompanying notes to financial statements.
8
| COUNTERPOINT TACTICAL EQUITY FUND |
| SCHEDULE OF INVESTMENTS |
| September 30, 2023 |
| Shares | Fair Value | |||||||
| COMMON STOCKS — 56.0% | ||||||||
| ADVERTISING & MARKETING - 0.2% | ||||||||
| 17,379 | Magnite, Inc.(a) | $ | 131,038 | |||||
| AEROSPACE & DEFENSE - 0.9% | ||||||||
| 1,826 | AAR Corporation(a) | 108,702 | ||||||
| 2,425 | Barnes Group, Inc. | 82,377 | ||||||
| 1,751 | Howmet Aerospace, Inc. | 80,984 | ||||||
| 4,772 | Kaman Corporation | 93,770 | ||||||
| 8,531 | Spirit AeroSystems Holdings, Inc. | 137,690 | ||||||
| 17,652 | Triumph Group, Inc.(a) | 135,214 | ||||||
| 638,737 | ||||||||
| APPAREL & TEXTILE PRODUCTS - 0.9% | ||||||||
| 33,259 | Hanesbrands, Inc. | 131,706 | ||||||
| 3,311 | Steven Madden Ltd. | 105,190 | ||||||
| 35,328 | Under Armour, Inc., Class A(a) | 241,997 | ||||||
| 7,501 | VF Corporation | 132,543 | ||||||
| 611,436 | ||||||||
| ASSET MANAGEMENT - 0.5% | ||||||||
| 7,984 | Blue Owl Capital, Inc. | 103,472 | ||||||
| 3,100 | Victory Capital Holdings, Inc. | 103,354 | ||||||
| 4,211 | XP, Inc., Class A | 97,064 | ||||||
| 303,890 | ||||||||
| AUTOMOTIVE - 0.8% | ||||||||
| 5,763 | Dana, Inc. | 84,543 | ||||||
| 3,709 | General Motors Company | 122,287 | ||||||
| 3,662 | Gentex Corporation | 119,161 | ||||||
| 20,091 | Holley, Inc.(a) | 100,254 | ||||||
| 825 | Lear Corporation | 110,715 | ||||||
| 536,960 | ||||||||
| BANKING - 0.6% | ||||||||
| 621 | Credicorp Ltd. | 79,469 | ||||||
| 2,511 | Customers Bancorp, Inc.(a) | 86,504 | ||||||
| 16,397 | PacWest Bancorp | 129,700 | ||||||
| 1,839 | Pathward Financial, Inc. | 84,760 | ||||||
| 380,433 | ||||||||
See accompanying notes to financial statements.
9
| COUNTERPOINT TACTICAL EQUITY FUND |
| SCHEDULE OF INVESTMENTS (Continued) |
| September 30, 2023 |
| Shares | Fair Value | |||||||
| COMMON STOCKS — 56.0% (Continued) | ||||||||
| CABLE & SATELLITE - 0.6% | ||||||||
| 75,094 | Altice USA, Inc., Class A(a) | $ | 245,557 | |||||
| 21,589 | DISH Network Corporation, Class A(a) | 126,512 | ||||||
| 372,069 | ||||||||
| COMMERCIAL SUPPORT SERVICES - 0.5% | ||||||||
| 45,820 | Advantage Solutions, Inc.(a) | 130,129 | ||||||
| 13,710 | BrightView Holdings, Inc.(a) | 106,253 | ||||||
| 1,905 | Cimpress PLC(a) | 133,368 | ||||||
| 369,750 | ||||||||
| CONSTRUCTION MATERIALS - 0.2% | ||||||||
| 2,677 | Knife River Corporation(a) | 130,718 | ||||||
| CONSUMER SERVICES - 0.9% | ||||||||
| 26,430 | Chegg, Inc.(a) | 235,756 | ||||||
| 6,147 | Coursera, Inc.(a) | 114,887 | ||||||
| 8,016 | Laureate Education, Inc., Class A | 113,026 | ||||||
| 11,561 | WW International, Inc.(a) | 127,980 | ||||||
| 591,649 | ||||||||
| CONTAINERS & PACKAGING - 0.2% | ||||||||
| 2,860 | Westrock Company | 102,388 | ||||||
| E-COMMERCE DISCRETIONARY - 1.2% | ||||||||
| 7,247 | Chewy, Inc.(a) | 132,330 | ||||||
| 2,075 | Etsy, Inc.(a) | 134,004 | ||||||
| 24,872 | Leslie’s, Inc.(a) | 140,775 | ||||||
| 7,728 | Overstock.com, Inc.(a) | 122,257 | ||||||
| 9,763 | Revolve Group, Inc.(a) | 132,874 | ||||||
| 2,237 | Wayfair, Inc., Class A(a) | 135,495 | ||||||
| 797,735 | ||||||||
| ELECTRIC UTILITIES - 0.5% | ||||||||
| 16,059 | ReNew Energy Global PLC(a) | 87,200 | ||||||
| 7,300 | Vistra Corporation | 242,214 | ||||||
| 329,414 | ||||||||
| ELECTRICAL EQUIPMENT - 0.6% | ||||||||
| 27,610 | Evolv Technologies Holdings, Inc.(a) | 134,185 | ||||||
See accompanying notes to financial statements.
10
| COUNTERPOINT TACTICAL EQUITY FUND |
| SCHEDULE OF INVESTMENTS (Continued) |
| September 30, 2023 |
| Shares | Fair Value | |||||||
| COMMON STOCKS — 56.0% (Continued) | ||||||||
| ELECTRICAL EQUIPMENT - 0.6% (Continued) | ||||||||
| 1,231 | Generac Holdings, Inc.(a) | $ | 134,130 | |||||
| 3,619 | Vertiv Holdings Company | 134,626 | ||||||
| 402,941 | ||||||||
| ENGINEERING & CONSTRUCTION - 0.2% | ||||||||
| 3,026 | Frontdoor, Inc.(a) | 92,565 | ||||||
| 2,283 | Montrose Environmental Group, Inc.(a) | 66,801 | ||||||
| 159,366 | ||||||||
| ENTERTAINMENT CONTENT - 0.9% | ||||||||
| 6,567 | AppLovin Corporation(a) | 262,417 | ||||||
| 11,781 | Playtika Holding Corporation(a) | 113,451 | ||||||
| 4,831 | ROBLOX Corporation, Class A(a) | 139,906 | ||||||
| 7,636 | Warner Bros Discovery, Inc.(a) | 82,927 | ||||||
| 598,701 | ||||||||
| FOOD - 0.7% | ||||||||
| 13,390 | Beyond Meat, Inc.(a) | 128,812 | ||||||
| 23,320 | Hain Celestial Group, Inc. (The)(a) | 241,828 | ||||||
| 9,676 | Herbalife Ltd.(a) | 135,367 | ||||||
| 506,007 | ||||||||
| FORESTRY, PAPER & WOOD PRODUCTS - 0.2% | ||||||||
| 2,347 | Louisiana-Pacific Corporation | 129,719 | ||||||
| GAS & WATER UTILITIES - 0.1% | ||||||||
| 4,049 | UGI Corporation | 93,127 | ||||||
| HEALTH CARE FACILITIES & SERVICES - 1.6% | ||||||||
| 8,038 | Accolade, Inc.(a) | 85,042 | ||||||
| 14,877 | AdaptHealth Corporation(a) | 135,381 | ||||||
| 19,343 | Agiliti, Inc.(a) | 125,536 | ||||||
| 1,456 | Cardinal Health, Inc. | 126,410 | ||||||
| 7,257 | Fulgent Genetics, Inc.(a) | 194,052 | ||||||
| 6,612 | Pediatrix Medical Group, Inc.(a) | 84,039 | ||||||
| 11,824 | Teladoc Health, Inc.(a) | 219,808 | ||||||
| 1,687 | Tenet Healthcare Corporation(a) | 111,156 | ||||||
| 1,081,424 | ||||||||
See accompanying notes to financial statements.
11
| COUNTERPOINT TACTICAL EQUITY FUND |
| SCHEDULE OF INVESTMENTS (Continued) |
| September 30, 2023 |
| Shares | Fair Value | |||||||
| COMMON STOCKS — 56.0% (Continued) | ||||||||
| HOME & OFFICE PRODUCTS - 0.4% | ||||||||
| 14,826 | Newell Brands, Inc. | $ | 133,879 | |||||
| 3,042 | SharkNinja, Inc.(a) | 141,027 | ||||||
| 274,906 | ||||||||
| HOME CONSTRUCTION - 0.6% | ||||||||
| 3,153 | Beazer Homes USA, Inc.(a) | 78,541 | ||||||
| 18,732 | Masterbrand, Inc.(a) | 227,594 | ||||||
| 4,715 | Tri Pointe Homes, Inc.(a) | 128,955 | ||||||
| 435,090 | ||||||||
| HOUSEHOLD PRODUCTS - 0.2% | ||||||||
| 5,836 | Nu Skin Enterprises, Inc., Class A | 123,782 | ||||||
| INDUSTRIAL INTERMEDIATE PROD - 0.5% | ||||||||
| 8,186 | Janus International Group, Inc.(a) | 87,590 | ||||||
| 8,478 | Proto Labs, Inc.(a) | 223,819 | ||||||
| 311,409 | ||||||||
| INDUSTRIAL SUPPORT SERVICES - 0.2% | ||||||||
| 1,201 | MSC Industrial Direct Company, Inc. | 117,878 | ||||||
| INSTITUTIONAL FINANCIAL SERVICES - 0.5% | ||||||||
| 587 | Cboe Global Markets, Inc. | 91,695 | ||||||
| 3,280 | Lazard Ltd., Class A | 101,713 | ||||||
| 2,675 | Nasdaq, Inc. | 129,978 | ||||||
| 323,386 | ||||||||
| INSURANCE - 1.5% | ||||||||
| 10,374 | Ambac Financial Group, Inc.(a) | 125,110 | ||||||
| 5,253 | Corebridge Financial, Inc. | 103,747 | ||||||
| 8,856 | Fidelis Insurance Holdings Ltd.(a) | 130,006 | ||||||
| 11,144 | Lemonade, Inc.(a) | 129,493 | ||||||
| 4,228 | Lincoln National Corporation | 104,389 | ||||||
| 3,084 | Mercury General Corporation | 86,445 | ||||||
| 3,350 | Radian Group, Inc. | 84,119 | ||||||
| 12,085 | SiriusPoint Ltd.(a) | 122,904 | ||||||
| 2,603 | Unum Group | 128,042 | ||||||
| 1,014,255 | ||||||||
See accompanying notes to financial statements.
12
| COUNTERPOINT TACTICAL EQUITY FUND |
| SCHEDULE OF INVESTMENTS (Continued) |
| September 30, 2023 |
| Shares | Fair Value | |||||||
| COMMON STOCKS — 56.0% (Continued) | ||||||||
| INTERNET MEDIA & SERVICES - 2.6% | ||||||||
| 1,189 | DoorDash, Inc., Class A(a) | $ | 94,490 | |||||
| 9,520 | Fiverr International Ltd.(a) | 232,954 | ||||||
| 41,366 | GoodRx Holdings, Inc.(a) | 232,891 | ||||||
| 24,215 | Lyft, Inc.(a) | 255,226 | ||||||
| 5,674 | Match Group, Inc.(a) | 222,279 | ||||||
| 37,760 | Opendoor Technologies, Inc.(a) | 99,686 | ||||||
| 3,121 | Roku, Inc.(a) | 220,311 | ||||||
| 27,060 | Rumble, Inc.(a) | 138,006 | ||||||
| 15,549 | Snap, Inc., Class A(a) | 138,542 | ||||||
| 4,785 | TechTarget, Inc.(a) | 145,273 | ||||||
| 1,779,658 | ||||||||
| LEISURE FACILITIES & SERVICES - 0.6% | ||||||||
| 16,672 | Bally’s Corporation(a) | 218,570 | ||||||
| 9,536 | Everi Holdings, Inc.(a) | 126,066 | ||||||
| 2,018 | MGM Resorts International | 74,182 | ||||||
| 418,818 | ||||||||
| LEISURE PRODUCTS - 0.4% | ||||||||
| 27,968 | Peloton Interactive, Inc., Class A(a) | 141,239 | ||||||
| 4,119 | Vista Outdoor, Inc.(a) | 136,421 | ||||||
| 277,660 | ||||||||
| MACHINERY - 0.8% | ||||||||
| 4,416 | Crane NXT Company | 245,397 | ||||||
| 485 | Curtiss-Wright Corporation | 94,881 | ||||||
| 8,823 | Manitowoc Company, Inc. (The)(a) | 132,786 | ||||||
| 902 | Oshkosh Corporation | 86,078 | ||||||
| 559,142 | ||||||||
| MEDICAL EQUIPMENT & DEVICES - 2.2% | ||||||||
| 5,177 | 10X Genomics, Inc., Class A(a) | 213,551 | ||||||
| 476 | ABIOMED, Inc. - CVR(a) | 486 | ||||||
| 5,611 | Baxter International, Inc. | 211,759 | ||||||
| 2,815 | DENTSPLY SIRONA, Inc. | 96,160 | ||||||
| 829 | Insulet Corporation(a) | 132,217 | ||||||
| 6,844 | Nevro Corporation(a) | 131,542 | ||||||
| 7,471 | Novocure Ltd.(a) | 120,657 | ||||||
See accompanying notes to financial statements.
13
| COUNTERPOINT TACTICAL EQUITY FUND |
| SCHEDULE OF INVESTMENTS (Continued) |
| September 30, 2023 |
| Shares | Fair Value | |||||||
| COMMON STOCKS — 56.0% (Continued) | ||||||||
| MEDICAL EQUIPMENT & DEVICES - 2.2% (Continued) | ||||||||
| 15,615 | Pacific Biosciences of California, Inc.(a) | $ | 130,385 | |||||
| 1,446 | QuidelOrtho Corporation(a) | 105,616 | ||||||
| 908 | ResMed, Inc. | 134,266 | ||||||
| 8,175 | Silk Road Medical, Inc.(a) | 122,543 | ||||||
| 6,393 | Tandem Diabetes Care, Inc.(a) | 132,783 | ||||||
| 1,531,965 | ||||||||
| METALS & MINING – 1.1% | ||||||||
| 4,977 | Alcoa Corporation | 144,632 | ||||||
| 4,351 | Alliance Resource Partners, L.P. | 98,028 | ||||||
| 6,780 | Cleveland-Cliffs, Inc.(a) | 105,971 | ||||||
| 6,796 | Constellium S.E.(a) | 123,687 | ||||||
| 19,909 | Equinox Gold Corporation(a) | 84,215 | ||||||
| 19,871 | Kinross Gold Corporation | 90,612 | ||||||
| 20,392 | SilverCrest Metals, Inc.(a) | 89,929 | ||||||
| 737,074 | ||||||||
| MORTGAGE FINANCE - 0.1% | ||||||||
| 9,904 | MFA Financial, Inc. | 95,177 | ||||||
| OIL & GAS PRODUCERS - 4.0% | ||||||||
| 8,099 | Antero Midstream Corporation | 97,026 | ||||||
| 3,121 | APA Corporation | 128,273 | ||||||
| 6,672 | Black Stone Minerals, L.P. | 114,959 | ||||||
| 8,238 | Delek US Holdings, Inc. | 234,042 | ||||||
| 847 | Hess Corporation | 129,591 | ||||||
| 4,085 | HF Sinclair Corporation | 232,559 | ||||||
| 4,879 | Marathon Oil Corporation | 130,513 | ||||||
| 1,599 | Marathon Petroleum Corporation | 241,993 | ||||||
| 7,265 | Par Pacific Holdings, Inc.(a) | 261,105 | ||||||
| 4,853 | PBF Energy, Inc., Class A | 259,781 | ||||||
| 1,962 | Phillips 66 | 235,734 | ||||||
| 8,104 | Plains All American Pipeline, L.P. | 124,152 | ||||||
| 7,175 | Plains GP Holdings, L.P., Class A | 115,661 | ||||||
| 2,368 | Sunoco, L.P. | 115,914 | ||||||
| 1,025 | Targa Resources Corporation | 87,863 | ||||||
See accompanying notes to financial statements.
14
| COUNTERPOINT TACTICAL EQUITY FUND |
| SCHEDULE OF INVESTMENTS (Continued) |
| September 30, 2023 |
| Shares | Fair Value | |||||||
| COMMON STOCKS — 56.0% (Continued) | ||||||||
| OIL & GAS PRODUCERS - 4.0% (Continued) | ||||||||
| 1,709 | Valero Energy Corporation | $ | 242,182 | |||||
| 2,751,348 | ||||||||
| OIL & GAS SERVICES & EQUIPMENT - 2.3% | ||||||||
| 9,442 | Archrock, Inc. | 118,969 | ||||||
| 12,534 | Borr Drilling Ltd.(a) | 88,991 | ||||||
| 7,323 | Diamond Offshore Drilling, Inc.(a) | 107,502 | ||||||
| 9,718 | Helix Energy Solutions Group, Inc.(a) | 108,550 | ||||||
| 12,906 | Kodiak Gas Services, Inc.(a) | 230,760 | ||||||
| 2,380 | Noble Corp PLC | 120,547 | ||||||
| 15,474 | Oil States International, Inc.(a) | 129,517 | ||||||
| 2,143 | Seadrill Ltd.(a) | 95,985 | ||||||
| 6,192 | TechnipFMC PLC | 125,945 | ||||||
| 41,006 | TETRA Technologies, Inc.(a) | 261,619 | ||||||
| 11,290 | Transocean Ltd.(a) | 92,691 | ||||||
| 1,430 | Valaris Ltd.(a) | 107,221 | ||||||
| 1,588,297 | ||||||||
| REAL ESTATE INVESTMENT TRUSTS - 0.2% | ||||||||
| 9,230 | CoreCivic, Inc.(a) | 103,838 | ||||||
| REAL ESTATE SERVICES - 0.6% | ||||||||
| 13,618 | Anywhere Real Estate, Inc.(a) | 87,564 | ||||||
| 7,845 | eXp World Holdings, Inc. | 127,403 | ||||||
| 584 | FirstService Corporation | 84,995 | ||||||
| 18,946 | Redfin Corporation(a) | 133,380 | ||||||
| 433,342 | ||||||||
| RENEWABLE ENERGY - 0.8% | ||||||||
| 3,920 | Canadian Solar, Inc.(a) | 96,471 | ||||||
| 34,183 | Cleanspark, Inc.(a) | 130,237 | ||||||
| 19,142 | Enviva, Inc. | 142,991 | ||||||
| 592 | First Solar, Inc.(a) | 95,661 | ||||||
| 2,798 | Green Plains, Inc.(a) | 84,220 | ||||||
| 549,580 | ||||||||
| RETAIL - CONSUMER STAPLES - 0.3% | ||||||||
| 1,219 | Dollar General Corporation | 128,970 | ||||||
See accompanying notes to financial statements.
15
| COUNTERPOINT TACTICAL EQUITY FUND |
| SCHEDULE OF INVESTMENTS (Continued) |
| September 30, 2023 |
| Shares | Fair Value | |||||||
| COMMON STOCKS — 56.0% (Continued) | ||||||||
| RETAIL - CONSUMER STAPLES - 0.3% (Continued) | ||||||||
| 677 | Target Corporation | $ | 74,856 | |||||
| 203,826 | ||||||||
| RETAIL - DISCRETIONARY - 3.2% | ||||||||
| 2,066 | Abercrombie & Fitch Company, Class A(a) | 116,460 | ||||||
| 3,583 | Advance Auto Parts, Inc. | 200,397 | ||||||
| 6,348 | American Eagle Outfitters, Inc. | 105,440 | ||||||
| 1,175 | Beacon Roofing Supply, Inc.(a) | 90,675 | ||||||
| 1,047 | Builders FirstSource, Inc.(a) | 130,341 | ||||||
| 1,493 | Burlington Stores, Inc.(a) | 202,003 | ||||||
| 10,083 | Driven Brands Holdings, Inc.(a) | 126,945 | ||||||
| 9,700 | Gap, Inc. (The) | 103,111 | ||||||
| 10,202 | Kohl’s Corporation | 213,834 | ||||||
| 8,040 | National Vision Holdings, Inc.(a) | 130,087 | ||||||
| 140 | O’Reilly Automotive, Inc.(a) | 127,240 | ||||||
| 50,738 | Petco Health & Wellness Company, Inc.(a) | 207,518 | ||||||
| 4,821 | PetIQ, Inc.(a) | 94,974 | ||||||
| 9,283 | Sleep Number Corporation(a) | 228,269 | ||||||
| 7,569 | Victoria’s Secret & Company(a) | 126,251 | ||||||
| 2,203,545 | ||||||||
| SEMICONDUCTORS - 1.2% | ||||||||
| 7,716 | ACM Research, Inc., Class A(a) | 139,699 | ||||||
| 3,821 | Alpha & Omega Semiconductor Ltd.(a) | 114,019 | ||||||
| 5,943 | MaxLinear, Inc.(a) | 132,232 | ||||||
| 1,078 | MKS Instruments, Inc. | 93,290 | ||||||
| 1,018 | Qorvo, Inc.(a) | 97,188 | ||||||
| 1,385 | Synaptics, Inc.(a) | 123,874 | ||||||
| 5,274 | Tower Semiconductor Ltd.(a) | 129,529 | ||||||
| 829,831 | ||||||||
| SOFTWARE - 8.6% | ||||||||
| 1,144 | Akamai Technologies, Inc.(a) | 121,882 | ||||||
| 12,456 | Asana, Inc., Class A(a) | 228,069 | ||||||
| 18,743 | AvePoint, Inc.(a) | 125,953 | ||||||
| 13,348 | BigCommerce Holdings, Inc.(a) | 131,745 | ||||||
| 24,533 | BlackBerry Ltd.(a) | 115,550 | ||||||
See accompanying notes to financial statements.
16
| COUNTERPOINT TACTICAL EQUITY FUND |
| SCHEDULE OF INVESTMENTS (Continued) |
| September 30, 2023 |
| Shares | Fair Value | |||||||
| COMMON STOCKS — 56.0% (Continued) | ||||||||
| SOFTWARE - 8.6% (Continued) | ||||||||
| 8,683 | Bumble, Inc., Class A(a) | $ | 129,550 | |||||
| 17,604 | Cellebrite DI Ltd.(a) | 134,671 | ||||||
| 11,011 | Cerence, Inc.(a) | 224,294 | ||||||
| 18,199 | Clarivate PLC(a) | 122,115 | ||||||
| 21,535 | Digital Turbine, Inc.(a) | 130,287 | ||||||
| 5,805 | DocuSign, Inc.(a) | 243,810 | ||||||
| 1,853 | Elastic N.V.(a) | 150,538 | ||||||
| 5,745 | Everbridge, Inc.(a) | 128,803 | ||||||
| 1,588 | Five9, Inc.(a) | 102,108 | ||||||
| 6,833 | Freshworks, Inc.(a) | 136,113 | ||||||
| 24,086 | Health Catalyst, Inc.(a) | 243,750 | ||||||
| 4,117 | Intapp, Inc.(a) | 138,002 | ||||||
| 15,511 | Lightspeed Commerce, Inc.(a) | 217,619 | ||||||
| 1,659 | Okta, Inc.(a) | 135,225 | ||||||
| 39,759 | Olo, Inc.(a) | 240,940 | ||||||
| 4,588 | Omnicell, Inc.(a) | 206,644 | ||||||
| 37,748 | Oscar Health, Inc.(a) | 210,256 | ||||||
| 2,098 | Pegasystems, Inc. | 91,074 | ||||||
| 7,358 | Phreesia, Inc.(a) | 137,447 | ||||||
| 3,019 | Q2 Holdings, Inc.(a) | 97,423 | ||||||
| 1,897 | Rapid7, Inc.(a) | 86,845 | ||||||
| 8,912 | RingCentral, Inc., Class A(a) | 264,063 | ||||||
| 2,032 | Shopify, Inc., Class A(a) | 110,886 | ||||||
| 13,480 | SolarWinds Corporation(a) | 127,251 | ||||||
| 560 | SPS Commerce, Inc.(a) | 95,542 | ||||||
| 4,301 | Twilio, Inc., Class A(a) | 251,738 | ||||||
| 5,324 | Verint Systems, Inc.(a) | 122,399 | ||||||
| 68,444 | Vimeo, Inc.(a) | 242,292 | ||||||
| 1,177 | Wix.com Ltd.(a) | 108,049 | ||||||
| 20,959 | Yext, Inc.(a) | 132,670 | ||||||
| 3,731 | Zoom Video Communications, Inc., Class A(a) | 260,946 | ||||||
| 8,126 | ZoomInfo Technologies, Inc.(a) | 133,266 | ||||||
| 5,879,815 | ||||||||
See accompanying notes to financial statements.
17
| COUNTERPOINT TACTICAL EQUITY FUND |
| SCHEDULE OF INVESTMENTS (Continued) |
| September 30, 2023 |
| Shares | Fair Value | |||||||
| COMMON STOCKS — 56.0% (Continued) | ||||||||
| SPECIALTY FINANCE - 1.6% | ||||||||
| 2,302 | Enova International, Inc.(a) | $ | 117,103 | |||||
| 4,161 | Flywire Corporation(a) | 132,694 | ||||||
| 3,097 | FTAI Aviation Ltd. | 110,098 | ||||||
| 21,130 | LendingClub Corporation(a) | 128,893 | ||||||
| 14,706 | MGIC Investment Corporation | 245,444 | ||||||
| 4,093 | Mr. Cooper Group, Inc.(a) | 219,221 | ||||||
| 3,572 | PROG Holdings, Inc.(a) | 118,626 | ||||||
| 1,072,079 | ||||||||
| STEEL - 0.0%(b) | ||||||||
| 22,935 | Mechel PJSC - ADR(a),(c) | — | ||||||
| TECHNOLOGY HARDWARE - 1.7% | ||||||||
| 28,939 | 3D Systems Corporation(a) | 142,090 | ||||||
| 2,707 | Avnet, Inc. | 130,450 | ||||||
| 11,642 | Celestica, Inc.(a) | 285,463 | ||||||
| 40,826 | CommScope Holding Company, Inc.(a) | 137,175 | ||||||
| 30,558 | GoPro, Inc., Class A(a) | 95,952 | ||||||
| 6,898 | Kornit Digital Ltd.(a) | 130,441 | ||||||
| 3,774 | NCR Corporation(a) | 101,785 | ||||||
| 8,047 | TTM Technologies, Inc.(a) | 103,645 | ||||||
| 1,127,001 | ||||||||
| TECHNOLOGY SERVICES - 4.4% | ||||||||
| 6,467 | Affirm Holdings, Inc.(a) | 137,553 | ||||||
| 4,900 | Block, Inc.(a) | 216,874 | ||||||
| 10,053 | Dun & Bradstreet Holdings, Inc. | 100,429 | ||||||
| 1,978 | Fidelity National Information Services, Inc. | 109,324 | ||||||
| 16,658 | Green Dot Corporation, Class A(a) | 232,046 | ||||||
| 15,535 | Kyndryl Holdings, Inc.(a) | 234,579 | ||||||
| 8,683 | Nuvei Corporation | 130,245 | ||||||
| 33,222 | Open Lending Corporation(a) | 243,185 | ||||||
| 15,493 | Pagseguro Digital Ltd., Class A(a) | 133,395 | ||||||
| 4,091 | PayPal Holdings, Inc.(a) | 239,160 | ||||||
| 20,913 | Paysafe Ltd.(a) | 250,746 | ||||||
| 5,333 | Remitly Global, Inc.(a) | 134,498 | ||||||
See accompanying notes to financial statements.
18
| COUNTERPOINT TACTICAL EQUITY FUND |
| SCHEDULE OF INVESTMENTS (Continued) |
| September 30, 2023 |
| Shares | Fair Value | |||||||
| COMMON STOCKS — 56.0% (Continued) | ||||||||
| TECHNOLOGY SERVICES - 4.4% (Continued) | ||||||||
| 11,966 | Repay Holdings Corporation(a) | $ | 90,822 | |||||
| 29,602 | Sabre Corporation(a) | 132,913 | ||||||
| 21,648 | StoneCompany Ltd.(a) | 230,984 | ||||||
| 17,532 | TELUS International CDA, Inc.(a) | 133,594 | ||||||
| 4,998 | TTEC Holdings, Inc. | 131,048 | ||||||
| 8,759 | Western Union Company (The) | 115,444 | ||||||
| 2,996,839 | ||||||||
| TELECOMMUNICATIONS - 0.9% | ||||||||
| 2,749 | Iridium Communications, Inc. | 125,052 | ||||||
| 7,751 | Millicom International Cellular S.A.(a) | 119,753 | ||||||
| 5,280 | Shenandoah Telecommunications Company | 108,821 | ||||||
| 13,850 | Telephone and Data Systems, Inc. | 253,593 | ||||||
| 607,219 | ||||||||
| TRANSPORTATION & LOGISTICS - 1.7% | ||||||||
| 947 | Allegiant Travel Company | 72,786 | ||||||
| 11,650 | DHT Holdings, Inc. | 119,995 | ||||||
| 4,701 | Frontline PLC | 88,285 | ||||||
| 2,503 | International Seaways, Inc. | 112,635 | ||||||
| 1,242 | Matson, Inc. | 110,190 | ||||||
| 7,847 | Navigator Holdings Ltd. | 115,900 | ||||||
| 3,098 | SkyWest, Inc.(a) | 129,931 | ||||||
| 17,730 | Teekay Corporation(a) | 109,394 | ||||||
| 2,341 | Teekay Tankers Ltd., Class A | 97,456 | ||||||
| 4,674 | TORM PLC | 128,629 | ||||||
| 4,390 | Tsakos Energy Navigation Ltd. | 91,224 | ||||||
| 1,176,425 | ||||||||
| TRANSPORTATION EQUIPMENT - 0.2% | ||||||||
| 1,827 | Allison Transmission Holdings, Inc. | 107,903 | ||||||
| WHOLESALE - CONSUMER STAPLES - 0.1% | ||||||||
| 4,685 | United Natural Foods, Inc.(a) | 66,246 | ||||||
See accompanying notes to financial statements.
19
| COUNTERPOINT TACTICAL EQUITY FUND |
| SCHEDULE OF INVESTMENTS (Continued) |
| September 30, 2023 |
| Shares | Fair Value | |||||||
| COMMON STOCKS — 56.0% (Continued) | ||||||||
| WHOLESALE - DISCRETIONARY - 0.2% | ||||||||
| 5,354 | G-III Apparel Group Ltd.(a) | $ | 133,422 | |||||
| TOTAL COMMON STOCKS (Cost $37,665,637) | 38,098,258 | |||||||
| Principal | Coupon Rate | |||||||||||
| Amount ($) | (%) | Maturity | ||||||||||
| U.S. GOVERNMENT & AGENCIES — 18.8% | ||||||||||||
| U.S. TREASURY BILLS — 18.8% | ||||||||||||
| 2,500,000 | United States Treasury Bill(d),(e) | 5.315 | 12/07/23 | 2,475,674 | ||||||||
| 10,500,000 | United States Treasury Bill(d),(e) | 5.270 | 01/25/24 | 10,322,338 | ||||||||
| TOTAL U.S. GOVERNMENT & AGENCIES (Cost $12,798,249) | 12,798,012 | |||||||||||
| Shares | ||||||||
| SHORT-TERM INVESTMENT — 0.5% | ||||||||
| MONEY MARKET FUND – 0.5% | ||||||||
| 372,320 | Fidelity Treasury Portfolio, Class I, 5.22% (Cost $372,320)(f) | 372,320 | ||||||
| Contracts(g) | Counterparty | Expiration Date | Exercise Price | Notional Value | ||||||||||||||||
| FUTURE OPTIONS PURCHASED - 0.3% | ||||||||||||||||||||
| PUT OPTIONS PURCHASED - 0.3% | ||||||||||||||||||||
| 75 | S&P Emini 2nd Week Future | Goldman Sachs | 11/10/2023 | $ | 4,250 | $ | 16,220,625 | 236,250 | ||||||||||||
| TOTAL PUT OPTIONS PURCHASED (Cost - $260,625) | ||||||||||||||||||||
| TOTAL INVESTMENTS – 75.6% (Cost $51,096,831) | $ | 51,504,840 | ||||||||||||||||||
| OTHER ASSETS IN EXCESS OF LIABILITIES - 24.4% | 16,574,179 | |||||||||||||||||||
| NET ASSETS - 100.0% | $ | 68,079,019 | ||||||||||||||||||
| Shares | Fair Value | |||||||
| COMMON STOCKS SOLD SHORT— (0.4)% | ||||||||
| LEISURE FACILITIES & SERVICES - (0.2)% | ||||||||
| (5,600 | ) | Dutch Bros, Inc. | $ | (130,200 | ) | |||
| METALS & MINING – (0.0)% (a) | ||||||||
| (1,795 | ) | Ivanhoe Electric, Inc. / US | (21,361 | ) | ||||
See accompanying notes to financial statements.
20
| COUNTERPOINT TACTICAL EQUITY FUND |
| SCHEDULE OF INVESTMENTS (Continued) |
| September 30, 2023 |
| Shares | Fair Value | |||||||
| COMMON STOCKS SOLD SHORT - (0.4)% | ||||||||
| TECHNOLOGY SERVICES - (0.2)% | ||||||||
| (1,700 | ) | Coinbase Global, Inc., Class A | $ | (127,636 | ) | |||
| TOTAL SECURITIES SOLD SHORT - (Proceeds - $252,613) | (279,197 | ) | ||||||
| OPEN FUTURES CONTRACTS | ||||||||||||||||||
| Number of Contracts | Description | Counterparty | Long/Short | Expiration Date | Notional Amount(h) | Value and Unrealized Depreciation | ||||||||||||
| 163 | CME E-Mini Standard & Poor’s 500 Index Future | Goldman Sachs | Long | 12/15/2023 | $ | 35,252,825 | $ | (1,531,793 | ) | |||||||||
| TOTAL FUTURES CONTRACTS | ||||||||||||||||||
| ADR | - American Depositary Receipt |
| CVR | - Contingent Value Right |
| L.P. | - Limited Partnership |
| Ltd. | - Limited Company |
| N.V. | - Naamioze Vennootschap |
| PJSC | - Public Joint -Stock Company |
| PLC | - Public Limited Company |
| S.A. | - Société Anonyme |
| S.E. | - Societas Europeae |
| (a) | Non-income producing security. |
| (b) | Percentage rounds to less than 0.1%. |
| (c) | The value of this security has been determined in good faith pursuant to valuation policies established by the Board of Trustees. |
| (d) | Zero coupon bond. Rate shown is discount rate at time of purchase. |
| (e) | All or a portion of this security is pledged as collateral for total return swaps. As of September 30, 2023, the value of the pledged portion is 12,798,012. |
| (f) | Rate disclosed is the seven day effective yield as of September 30, 2023. |
| (g) | Each contract is equivalent to one futures contract. |
| (h) | The amount shown is the underlying reference notional amounts to stock exchange indices and equities upon which the fair value of the futures contracts held by the Fund are based. Notional values do not represent the current fair value of, and are not necessarily indicative of the future cash flows of the Fund’s futures contracts. Further, the underlying price changes in relation to the variables specified by the notional values affects the fair value of these derivative financial instruments. The notional values as set forth within this schedule do not purport to represent economic value at risk to the Fund. |
See accompanying notes to financial statements.
21
| COUNTERPOINT TACTICAL EQUITY FUND |
| SCHEDULE OF INVESTMENTS (Continued) |
| September 30, 2023 |
| TOTAL RETURN SWAPS | ||||||||||||||||||||||||||
| Payment | Number Of | Maturity | Notional | Upfront Payments/ | Unrealized Appreciation/ | |||||||||||||||||||||
| Description/Received | Frequency | Long/Short | Currency | Rate Paid | Counterparty | Contracts | Date | Amount | Receipts | (Depreciation) | ||||||||||||||||
| JP Morgan International Long Index Basket * | Monthly | Long | USD | OBFR + 0.45% | JP Morgan | 312,153 | 5/27/2025 | $ | 26,807,856 | $ | — | $ | 178,095 | |||||||||||||
| JP Morgan International Long Index Basket 2 * | Monthly | Long | USD | OBFR + 0.45% | JP Morgan | 296,339 | 5/27/2025 | 26,549,544 | — | 65,267 | ||||||||||||||||
| SPDR S&P 500 ETF | Monthly | Long | USD | OBFR + 0.35% | JP Morgan | 44,903 | 4/20/2026 | 18,508,312 | — | 725,852 | ||||||||||||||||
| 969,214 | ||||||||||||||||||||||||||
| Payment | Number Of | Maturity | Notional | Upfront Payments/ | Unrealized Appreciation/ | |||||||||||||||||||||
| Description/Paid | Frequency | Long/Short | Currency | Rate Received | Counterparty | Contracts | Date | Amount | Receipts | (Depreciation) | ||||||||||||||||
| JP Morgan International Short Index Basket * | Monthly | Short | USD | OBFR - 1.25% | JP Morgan | 432,473 | 5/27/2025 | 26,787,507 | — | (434,120 | ) | |||||||||||||||
| JP Morgan International Short Index Basket 2 * | Monthly | Short | USD | OBFR - 1.25% | JP Morgan | 349,324 | 5/27/2025 | 26,519,001 | — | 887,147 | ||||||||||||||||
| JP Morgan U.S. Short Index Basket * | Monthly | Short | USD | OBFR - 0.90% | JP Morgan | 280,414 | 3/7/2025 | 18,794,524 | — | 748,657 | ||||||||||||||||
| JP Morgan U.S. Short Index Basket 2 * | Monthly | Short | USD | OBFR - 1.15% | JP Morgan | 490,783 | 4/26/2024 | 19,031,289 | — | (313,351 | ) | |||||||||||||||
| $ | 888,333 | |||||||||||||||||||||||||
| OBFR - Overnight Bank Funding Rate | $ | 1,857,547 | ||||||||||||||||||||||||
| * | The underlying holdings of this security can be found at https://counterpointfunds.com/tactical-equity-fund/ |
See accompanying notes to financial statements.
22
| COUNTERPOINT TACTICAL MUNICIPAL FUND |
| SCHEDULE OF INVESTMENTS |
| September 30, 2023 |
| Shares | Fair Value | |||||||
| OPEN END FUNDS — 23.3% | ||||||||
| FIXED INCOME - 23.3% | ||||||||
| 12,792 | American Century High-Yield Municipal Fund, Class I | $ | 105,154 | |||||
| 6,935 | American High-Income Municipal Bond Fund | 97,157 | ||||||
| 723 | BlackRock High Yield Municipal Fund, Institutional Class | 5,898 | ||||||
| 2,473,285 | Delaware National High-Yield Municipal Bond Fund | 23,051,016 | ||||||
| 58,817 | Eaton Vance High Yield Municipal Income Fund, Class I | 447,007 | ||||||
| 53,077 | Franklin High Yield Tax-Free Income Fund, Advisor Class | 439,476 | ||||||
| 110,497 | Goldman Sachs High Yield Municipal Fund, Institutional Class | 939,227 | ||||||
| 68,169 | Invesco AMT-Free Municipal Fund, Class Y | 441,738 | ||||||
| 12,077 | Invesco High Yield Municipal Fund, Class Y | 96,135 | ||||||
| 145,985 | Invesco Rochester Municipal Opportunities Fund, Class Y | 928,467 | ||||||
| 984 | MainStay MacKay High Yield Municipal Bond Fund | 10,695 | ||||||
| 1,348,593 | Nuveen High Yield Municipal Bond Fund, Class I | 18,570,127 | ||||||
| 12,111 | PGIM Muni High Income Fund, Class Z | 105,488 | ||||||
| 120,192 | PIMCO High Yield Municipal Bond Fund, Institutional Class | 953,125 | ||||||
| 9,524 | T Rowe Price Tax-Free High Yield Fund, Inc., Class I | 97,048 | ||||||
| TOTAL OPEN END FUNDS (Cost $50,268,474) | 46,287,758 | |||||||
| SHORT-TERM INVESTMENT — 72.0% | ||||||||
| MONEY MARKET FUND - 72.0% | ||||||||
| 142,722,004 | BlackRock Liquidity Funds MuniCash, Institutional Class, 3.95% (Cost $142,722,004)(a) | 142,722,004 | ||||||
| Contracts(b) | Counterparty | Expiration Date | Exercise Price | Notional Value | ||||||||||||||||
| FUTURE OPTIONS PURCHASED - 0.7% | ||||||||||||||||||||
| PUT OPTIONS PURCHASED - 0.7% | ||||||||||||||||||||
| 150 | U.S. Long Bond Future | Wells Fargo | 10/27/2023 | $ | 120 | $ | 16,987,500 | $ | 958,594 | |||||||||||
| 100 | U.S. Long Bond Future | Wells Fargo | 11/24/2023 | 116 | 11,325,000 | 384,375 | ||||||||||||||
| TOTAL FUTURE OPTIONS PURCHASED (Cost - $642,188) | 1,342,969 | |||||||||||||||||||
| TOTAL INVESTMENTS - 96.0% (Cost $193,632,666) | $ | 190,352,731 | ||||||||||||||||||
| OTHER ASSETS IN EXCESS OF LIABILITIES - 4.0% | 7,934,358 | |||||||||||||||||||
| NET ASSETS - 100.0% | $ | 198,287,089 | ||||||||||||||||||
| (a) | Rate disclosed is the seven day effective yield as of September 30, 2023. |
| (b) | Each contract is equivalent to one futures contract. |
See accompanying notes to financial statements.
23
| COUNTERPOINT TACTICAL MUNICIPAL FUND |
| SCHEDULE OF INVESTMENTS (Continued) |
| September 30, 2023 |
| SWAPTIONS PURCHASED | ||||||||||||||||||||||||||
| Exercise | Number Of | Expiration | Notional | Fair | Premiums | Unrealized Appreciation/ | ||||||||||||||||||||
| Description | Put/Call | Counterparty | Rate | Contracts | Date | Amount | Value | Paid | (Depreciation) | |||||||||||||||||
| CDX North Amergican High Yield Index Version 1 Series 40 Strike Payer Index Option | Put | JP Morgan | 101.5 | 45 | 12/20/2023 | $ | 45,000,000 | $ | 763,783 | $ | 747,000 | $ | 16,783 | |||||||||||||
| SWAPTIONS WRITTEN | ||||||||||||||||||||||||||
| Exercise | Number Of | Expiration | Notional | Fair | Premiums | Unrealized Appreciation/ | ||||||||||||||||||||
| Description | Put/Call | Counterparty | Rate | Contracts | Date | Amount | Value | Paid | (Depreciation) | |||||||||||||||||
| CDX North Amergican High Yield Index Version 1 Series 40 Strike Payer Index Option | Put | JP Morgan | 95 | 45 | 12/20/2023 | $ | (45,000,000 | ) | $ | (136,160 | ) | $ | (153,000 | ) | $ | 16,840 | ||||||||||
24
| COUNTERPOINT FUNDS |
| STATEMENTS OF ASSETS AND LIABILITIES |
| September 30, 2023 |
| Counterpoint | Counterpoint | Counterpoint | ||||||||||
| Tactical Income | Tactical Equity | Tactical Municipal | ||||||||||
| Fund | Fund | Fund | ||||||||||
| ASSETS | ||||||||||||
| Investment securities: | ||||||||||||
| At cost | $ | 1,159,380,933 | $ | 51,096,831 | $ | 193,632,666 | ||||||
| At value | $ | 1,167,929,523 | $ | 51,504,840 | $ | 190,352,731 | ||||||
| Cash | 20,000,000 | 2,498,832 | 3,999,873 | |||||||||
| Cash held for collateral at broker (a) | 8,596,855 | 10,928,872 | 2,266,954 | |||||||||
| Receivable for Fund shares sold | 2,799,245 | — | 536,499 | |||||||||
| Dividends and interest receivable | 6,380,957 | 64,475 | 676,138 | |||||||||
| Unrealized appreciation on credit default swap | 426,306 | — | — | |||||||||
| Premiums paid on open swap contracts | 712,879 | — | — | |||||||||
| Swaptions Purchased, at fair value (Premium $0, $0, $747,000) | — | — | 763,783 | |||||||||
| Due from broker - swaps | — | 3,622,320 | — | |||||||||
| Unrealized appreciation on total return swaps | — | 1,857,547 | — | |||||||||
| Prepaid expenses and other assets | 103,456 | 43,211 | 49,988 | |||||||||
| TOTAL ASSETS | 1,206,949,221 | 70,520,097 | 198,645,966 | |||||||||
| LIABILITIES | ||||||||||||
| Securities sold short (Proceeds $0, $252,613 and $0) | — | 279,197 | — | |||||||||
| Swaptions Written, at fair value (Proceeds $0, $0, $153,000) | — | — | 136,160 | |||||||||
| Due to broker - swaps | — | 520,423 | — | |||||||||
| Investment advisory fees payable | 1,224,521 | 54,242 | 122,214 | |||||||||
| Payable for Fund shares redeemed | 666,606 | 18,131 | 37,183 | |||||||||
| Distribution (12b-1) fees payable | 61,350 | 2,232 | 2,062 | |||||||||
| Payable to related parties | 94,826 | 9,853 | 17,081 | |||||||||
| Unrealized depreciation on futures contracts | — | 1,531,793 | — | |||||||||
| Accrued expenses and other liabilities | 129,530 | 25,207 | 44,177 | |||||||||
| TOTAL LIABILITIES | 2,176,833 | 2,441,078 | 358,877 | |||||||||
| NET ASSETS | $ | 1,204,772,388 | $ | 68,079,019 | $ | 198,287,089 | ||||||
| NET ASSETS CONSIST OF: | ||||||||||||
| Paid in capital | $ | 1,219,539,495 | $ | 65,999,809 | $ | 207,994,955 | ||||||
| Accumulated earnings (losses) | $ | (14,767,107 | ) | $ | 2,079,210 | $ | (9,707,866 | ) | ||||
| NET ASSETS | $ | 1,204,772,388 | $ | 68,079,019 | $ | 198,287,089 | ||||||
| NET ASSET VALUE PER SHARE: | ||||||||||||
| Class A Shares: | ||||||||||||
| Net Assets | $ | 74,725,746 | $ | 6,520,990 | $ | 3,508,967 | ||||||
| Shares of beneficial interest outstanding ($0 par value, unlimited shares authorized) | 6,796,070 | 407,173 | 346,709 | |||||||||
| Net asset value (Net Assets ÷ Shares Outstanding) and redemption price per share | $ | 11.00 | (b) | $ | 16.02 | (b) | $ | 10.12 | (b) | |||
| Maximum offering price per share (maximum sales charge of 4.50%, 5.75% and 4.50%, respectively) | $ | 11.52 | (b) | $ | 17.00 | (b) | $ | 10.60 | (b) | |||
| Class C Shares : | ||||||||||||
| Net Assets | $ | 55,541,291 | $ | 1,060,471 | $ | 1,350,584 | ||||||
| Shares of beneficial interest outstanding ($0 par value, unlimited shares authorized) | 5,083,888 | 70,516 | 135,310 | |||||||||
| Net asset value (Net Assets ÷ Shares Outstanding), redemption price and offering price per share | $ | 10.92 | $ | 15.04 | (b) | $ | 9.98 | (b) | ||||
| Class I Shares: | ||||||||||||
| Net Assets | $ | 1,074,505,351 | $ | 60,497,558 | $ | 193,427,538 | ||||||
| Shares of beneficial interest outstanding ($0 par value, unlimited shares authorized) | 97,849,632 | 3,702,146 | 19,079,513 | |||||||||
| Net asset value (Net Assets ÷ Shares Outstanding), redemption price and offering price per share | $ | 10.98 | $ | 16.34 | (b) | $ | 10.14 | |||||
| (a) | Represents collateral for futures contracts, options purchased, and swaps. |
| (b) | The NAV and offering price shown above differs from the traded NAV on September 29, 2023 due to financial statement rounding and or financial statement adjustments. |
See accompanying notes to financial statements.
25
| COUNTERPOINT FUNDS |
| STATEMENTS OF OPERATIONS |
| For the Year Ended September 30, 2023 |
| Counterpoint | Counterpoint | Counterpoint | ||||||||||
| Tactical Income | Tactical Equity | Tactical Municipal | ||||||||||
| Fund | Fund | Fund | ||||||||||
| INVESTMENT INCOME | ||||||||||||
| Dividends (including foreign dividend tax withholding of $0, $9,201 and $0, respectively) | $ | 73,129,542 | $ | 540,206 | $ | 7,098,883 | ||||||
| Interest | 5,520,678 | 1,513,528 | 1,395,108 | |||||||||
| TOTAL INVESTMENT INCOME | 78,650,220 | 2,053,734 | 8,493,991 | |||||||||
| EXPENSES | ||||||||||||
| Investment advisory fees | 13,811,972 | 970,750 | 1,415,798 | |||||||||
| Distribution (12b-1) fees: | ||||||||||||
| Class A | 193,915 | 14,582 | 11,498 | |||||||||
| Class C | 542,662 | 10,076 | 16,797 | |||||||||
| Administrative services fees | 595,973 | 83,098 | 122,356 | |||||||||
| Third party administrative servicing fees | 666,222 | 29,744 | 118,667 | |||||||||
| Transfer agent fees | 488,475 | 83,954 | 77,157 | |||||||||
| Accounting services fees | 181,991 | 18,634 | 37,677 | |||||||||
| Registration fees | 129,602 | 59,506 | 68,280 | |||||||||
| Custodian fees | 152,993 | 59,110 | 35,726 | |||||||||
| Printing and postage expenses | 91,330 | 9,001 | 12,001 | |||||||||
| Compliance officer fees | 34,499 | 12,457 | 14,957 | |||||||||
| Audit fees | 21,696 | 13,196 | 21,196 | |||||||||
| Trustees’ fees and expenses | 17,502 | 15,001 | 15,001 | |||||||||
| Legal fees | 15,501 | 16,001 | 16,501 | |||||||||
| Insurance expense | 6,001 | 495 | 1,489 | |||||||||
| Other expenses | 23,889 | 10,946 | 13,446 | |||||||||
| TOTAL EXPENSES | 16,974,223 | 1,406,551 | 1,998,547 | |||||||||
| Fees (waived)/recaptured by the Advisor | — | (23,169 | ) | 53,019 | ||||||||
| TOTAL NET EXPENSES | 16,974,223 | 1,383,382 | 2,051,566 | |||||||||
| NET INVESTMENT INCOME | 61,675,997 | 670,352 | 6,442,425 | |||||||||
| REALIZED AND UNREALIZED GAIN (LOSS) ON INVESTMENTS | ||||||||||||
| Net realized gain (loss) on investments | (398,313 | ) | 2,013,074 | (5,707,287 | ) | |||||||
| Net realized loss on foreign currency transactions | — | (97 | ) | — | ||||||||
| Net realized gain (loss) on futures contracts | — | 1,863,897 | (30,100 | ) | ||||||||
| Net realized gain (loss) on future options purchased | (4,324,254 | ) | (2,962,649 | ) | 676,116 | |||||||
| Net realized gain (loss) on outperformance option | — | (51,539 | ) | — | ||||||||
| Net realized gain (loss) on swap contracts | (127,768 | ) | 2,960,988 | (471,665 | ) | |||||||
| Net realized loss on swaptions purchased | (12,626,000 | ) | — | (173,250 | ) | |||||||
| Net realized gain on swaptions written | 4,490,000 | — | 67,500 | |||||||||
| (12,986,335 | ) | 3,823,674 | (5,638,686 | ) | ||||||||
| Net change in unrealized appreciation (depreciation) on investments | 10,620,339 | 5,746,836 | (3,016,184 | ) | ||||||||
| Net change in unrealized depreciation on futures contracts | — | (900,622 | ) | — | ||||||||
| Net change in unrealized appreciation (depreciation) on future options purchased | — | (59,422 | ) | 700,781 | ||||||||
| Net change in unrealized appreciation (depreciation) on outperformance option | — | (62,112 | ) | — | ||||||||
| Net change in unrealized depreciation on securities sold short | — | (26,584 | ) | — | ||||||||
| Net change in unrealized appreciation (depreciation) on swap contracts | 570,566 | (6,067,346 | ) | — | ||||||||
| Net change in unrealized appreciation on swaptions purchased | — | — | 16,783 | |||||||||
| Net change in unrealized appreciation on swaptions written | — | — | 16,840 | |||||||||
| 11,190,905 | (1,369,250 | ) | (2,281,780 | ) | ||||||||
| NET REALIZED AND UNREALIZED GAIN (LOSS) ON INVESTMENTS | (1,795,430 | ) | 2,454,424 | (7,920,466 | ) | |||||||
| NET INCREASE (DECREASE) IN NET ASSETS RESULTING FROM OPERATIONS | $ | 59,880,567 | $ | 3,124,776 | $ | (1,478,041 | ) | |||||
See accompanying notes to financial statements.
26
| COUNTERPOINT TACTICAL INCOME FUND |
| STATEMENTS OF CHANGES IN NET ASSETS |
| For the | For the | |||||||
| Year Ended | Year Ended | |||||||
| September 30, 2023 | September 30, 2022 | |||||||
| FROM OPERATIONS | ||||||||
| Net investment income | $ | 61,675,997 | $ | 21,291,127 | ||||
| Net realized loss on investments, swap contracts, options purchased, swaptions purchased and swaptions written | (12,986,335 | ) | (9,079,259 | ) | ||||
| Net change in unrealized appreciation (depreciation) on investments, swap contracts and swaptions purchased | 11,190,905 | (42,248,396 | ) | |||||
| Net increase (decrease) in net assets resulting from operations | 59,880,567 | (30,036,528 | ) | |||||
| DISTRIBUTIONS TO SHAREHOLDERS | ||||||||
| From return of capital: | ||||||||
| Class A | — | (7,067 | ) | |||||
| Class C | — | (5,030 | ) | |||||
| Class I | — | (82,742 | ) | |||||
| Distributions paid: | ||||||||
| Class A | (4,211,600 | ) | (1,605,722 | ) | ||||
| Class C | (2,573,577 | ) | (880,600 | ) | ||||
| Class I | (56,390,479 | ) | (18,331,075 | ) | ||||
| Net decrease in net assets resulting from distributions to shareholders | (63,175,656 | ) | (20,912,236 | ) | ||||
| FROM SHARES OF BENEFICIAL INTEREST | ||||||||
| Proceeds from shares sold: | ||||||||
| Class A | 20,821,911 | 18,908,259 | ||||||
| Class C | 19,416,101 | 16,015,075 | ||||||
| Class I | 463,252,395 | 483,677,539 | ||||||
| Net asset value of shares issued in reinvestment of distributions: | ||||||||
| Class A | 4,152,564 | 1,592,303 | ||||||
| Class C | 2,166,079 | 717,888 | ||||||
| Class I | 50,060,901 | 16,011,312 | ||||||
| Payments for shares redeemed: | ||||||||
| Class A | (25,323,300 | ) | (13,036,492 | ) | ||||
| Class C | (19,114,798 | ) | (11,065,210 | ) | ||||
| Class I | (319,027,700 | ) | (342,532,167 | ) | ||||
| Net increase in net assets from shares of beneficial interest | 196,404,153 | 170,288,507 | ||||||
| TOTAL INCREASE IN NET ASSETS | 193,109,064 | 119,339,743 | ||||||
| NET ASSETS | ||||||||
| Beginning of Year | 1,011,663,324 | 892,323,581 | ||||||
| End of Year | $ | 1,204,772,388 | $ | 1,011,663,324 | ||||
| SHARE ACTIVITY | ||||||||
| Class A: | ||||||||
| Shares Sold | 1,885,049 | 1,676,093 | ||||||
| Shares Reinvested | 377,015 | 141,423 | ||||||
| Shares Redeemed | (2,287,807 | ) | (1,155,663 | ) | ||||
| Net increase (decrease) in shares of beneficial interest outstanding | (25,743 | ) | 661,853 | |||||
| Class C: | ||||||||
| Shares Sold | 1,767,342 | 1,421,987 | ||||||
| Shares Reinvested | 197,883 | 64,017 | ||||||
| Shares Redeemed | (1,742,544 | ) | (990,187 | ) | ||||
| Net increase in shares of beneficial interest outstanding | 222,681 | 495,817 | ||||||
| Class I: | ||||||||
| Shares Sold | 41,961,909 | 43,129,322 | ||||||
| Shares Reinvested | 4,552,415 | 1,424,567 | ||||||
| Shares Redeemed | (28,920,631 | ) | (30,233,832 | ) | ||||
| Net increase in shares of beneficial interest outstanding | 17,593,693 | 14,320,057 | ||||||
See accompanying notes to financial statements.
27
| COUNTERPOINT TACTICAL EQUITY FUND |
| STATEMENTS OF CHANGES IN NET ASSETS |
| For the | For the | |||||||
| Year Ended | Year Ended | |||||||
| September 30, 2023 | September 30, 2022 | |||||||
| FROM OPERATIONS | ||||||||
| Net investment income (loss) | $ | 670,352 | $ | (183,188 | ) | |||
| Net realized gain on investments, foreign currency transactions, futures contracts, swap contracts and options purchased | 3,823,674 | 3,310,834 | ||||||
| Net change in unrealized appreciation (depreciation) on investments, futures contracts, future options purchased, outperformance option securities sold short and swap contracts | (1,369,250 | ) | 2,015,273 | |||||
| Net increase in net assets resulting from operations | 3,124,776 | 5,142,919 | ||||||
| DISTRIBUTIONS TO SHAREHOLDERS | ||||||||
| From return of capital: | ||||||||
| Class A | (37,272 | ) | — | |||||
| Class C | (7,623 | ) | — | |||||
| Class I | (531,395 | ) | — | |||||
| Distributions paid: | ||||||||
| Class A | (124,811 | ) | — | |||||
| Class C | (25,526 | ) | — | |||||
| Class I | (1,779,467 | ) | — | |||||
| Net decrease in net assets resulting from distributions to shareholders | (2,506,094 | ) | — | |||||
| FROM SHARES OF BENEFICIAL INTEREST | ||||||||
| Proceeds from shares sold: | ||||||||
| Class A | 1,852,682 | 4,805,347 | ||||||
| Class C | 107,050 | 430,100 | ||||||
| Class I | 25,386,467 | 77,875,437 | ||||||
| Net asset value of shares issued in reinvestment of distributions: | ||||||||
| Class A | 159,118 | — | ||||||
| Class C | 29,544 | — | ||||||
| Class I | 2,043,042 | — | ||||||
| Payments for shares redeemed: | ||||||||
| Class A | (862,279 | ) | (738,510 | ) | ||||
| Class C | (105,466 | ) | (136,556 | ) | ||||
| Class I | (37,405,244 | ) | (23,389,511 | ) | ||||
| Net increase (decrease) in net assets from shares of beneficial interest | (8,795,086 | ) | 58,846,307 | |||||
| TOTAL INCREASE (DECREASE) IN NET ASSETS | (8,176,404 | ) | 63,989,226 | |||||
| NET ASSETS | ||||||||
| Beginning of Year | 76,255,423 | 12,266,197 | ||||||
| End of Year | $ | 68,079,019 | $ | 76,255,423 | ||||
| SHARE ACTIVITY | ||||||||
| Class A: | ||||||||
| Shares Sold | 123,241 | 303,481 | ||||||
| Shares Reinvested | 10,200 | — | ||||||
| Shares Redeemed | (56,420 | ) | (49,109 | ) | ||||
| Net increase in shares of beneficial interest outstanding | 77,021 | 254,372 | ||||||
| Class C: | ||||||||
| Shares Sold | 7,367 | 29,330 | ||||||
| Shares Reinvested | 2,006 | — | ||||||
| Shares Redeemed | (7,400 | ) | (9,555 | ) | ||||
| Net increase in shares of beneficial interest outstanding | 1,973 | 19,775 | ||||||
| Class I: | ||||||||
| Shares Sold | 1,604,374 | 4,884,870 | ||||||
| Shares Reinvested | 128,655 | — | ||||||
| Shares Redeemed | (2,399,653 | ) | (1,486,493 | ) | ||||
| Net increase (decrease) in shares of beneficial interest outstanding | (666,624 | ) | 3,398,377 | |||||
See accompanying notes to financial statements.
28
| COUNTERPOINT TACTICAL MUNICIPAL FUND |
| STATEMENTS OF CHANGES IN NET ASSETS |
| For the | For the | |||||||
| Year Ended | Year Ended | |||||||
| September 30, 2023 | September 30, 2022 | |||||||
| FROM OPERATIONS | ||||||||
| Net investment income (loss) | $ | 6,442,425 | $ | (179,376 | ) | |||
| Net realized gain (loss) on investments, futures, options purchased, swap contracts, swaptions purchased and swaptions written | (5,638,686 | ) | 1,344,677 | |||||
| Net change in unrealized depreciation on investments and options purchased swaptions purchased and swaptions written | (2,281,780 | ) | (3,241,260 | ) | ||||
| Net decrease in net assets resulting from operations | (1,478,041 | ) | (2,075,959 | ) | ||||
| DISTRIBUTIONS TO SHAREHOLDERS | ||||||||
| From return of capital: | ||||||||
| Class A | (4,168 | ) | (498 | ) | ||||
| Class C | (1,373 | ) | — | |||||
| Class I | (193,227 | ) | (15,983 | ) | ||||
| Distributions paid: | ||||||||
| Class A | (127,649 | ) | (68,073 | ) | ||||
| Class C | (34,239 | ) | (52,690 | ) | ||||
| Class I | (5,960,214 | ) | (2,233,441 | ) | ||||
| Net decrease in net assets resulting from distributions to shareholders | (6,320,870 | ) | (2,370,685 | ) | ||||
| FROM SHARES OF BENEFICIAL INTEREST | ||||||||
| Proceeds from shares sold: | ||||||||
| Class A | 2,039,246 | 4,684,962 | ||||||
| Class C | 712,790 | 1,886,647 | ||||||
| Class I | 112,072,472 | 139,981,280 | ||||||
| Net asset value of shares issued in reinvestment of distributions: | ||||||||
| Class A | 131,635 | 64,858 | ||||||
| Class C | 31,200 | 52,690 | ||||||
| Class I | 4,653,877 | 2,046,130 | ||||||
| Payments for shares redeemed: | ||||||||
| Class A | (2,979,750 | ) | (2,012,351 | ) | ||||
| Class C | (1,749,604 | ) | (331,027 | ) | ||||
| Class I | (80,063,812 | ) | (59,737,524 | ) | ||||
| Net increase in net assets from shares of beneficial interest | 34,848,054 | 86,635,665 | ||||||
| TOTAL INCREASE IN NET ASSETS | 27,049,143 | 82,189,021 | ||||||
| NET ASSETS | ||||||||
| Beginning of Year | 171,237,946 | 89,048,925 | ||||||
| End of Year | $ | 198,287,089 | $ | 171,237,946 | ||||
| SHARE ACTIVITY | ||||||||
| Class A: | ||||||||
| Shares Sold | 194,745 | 441,501 | ||||||
| Shares Reinvested | 12,652 | 6,073 | ||||||
| Shares Redeemed | (288,182 | ) | (190,539 | ) | ||||
| Net increase (decrease) in shares of beneficial interest outstanding | (80,785 | ) | 257,035 | |||||
| Class C: | ||||||||
| Shares Sold | 68,248 | 175,491 | ||||||
| Shares Reinvested | 3,036 | 4,966 | ||||||
| Shares Redeemed | (169,656 | ) | (31,391 | ) | ||||
| Net increase (decrease) in shares of beneficial interest outstanding | (98,372 | ) | 149,066 | |||||
| Class I: | ||||||||
| Shares Sold | 10,689,679 | 13,196,110 | ||||||
| Shares Reinvested | 447,036 | 191,585 | ||||||
| Shares Redeemed | (7,701,334 | ) | (5,596,678 | ) | ||||
| Net increase in shares of beneficial interest outstanding | 3,435,381 | 7,791,017 | ||||||
See accompanying notes to financial statements.
29
| COUNTERPOINT TACTICAL INCOME FUND |
| FINANCIAL HIGHLIGHTS |
| Per Share Data and Ratios for a Share of Beneficial Interest Outstanding Throughout Each Year |
| Class A | ||||||||||||||||||||
| For the | For the | For the | For the | For the | ||||||||||||||||
| Year Ended | Year Ended | Year Ended | Year Ended | Year Ended | ||||||||||||||||
| September 30, 2023 | September 30, 2022 | September 30, 2021 | September 30, 2020 | September 30, 2019 | ||||||||||||||||
| Net asset value, beginning of year | $ | 11.02 | $ | 11.68 | $ | 11.04 | $ | 10.79 | $ | 10.91 | ||||||||||
| Activity from investment operations: | ||||||||||||||||||||
| Net investment income (1) | 0.59 | 0.26 | 0.35 | 0.23 | 0.35 | |||||||||||||||
| Net realized and unrealized gain (loss) (2) | (0.01 | ) | (0.67 | ) | 0.65 | 0.25 | 0.05 | |||||||||||||
| Total from investment operations | 0.58 | (0.41 | ) | 1.00 | 0.48 | 0.40 | ||||||||||||||
| Less distributions from: | ||||||||||||||||||||
| Net investment income | (0.60 | ) | (0.25 | ) | (0.36 | ) | (0.23 | ) | (0.38 | ) | ||||||||||
| Return of Capital | — | (0.00 | ) (3) | — | — | — | ||||||||||||||
| Net realized gains | — | — | — | — | (0.14 | ) | ||||||||||||||
| Total distributions | (0.60 | ) | (0.25 | ) | (0.36 | ) | (0.23 | ) | (0.52 | ) | ||||||||||
| Net asset value, end of year | $ | 11.00 | $ | 11.02 | $ | 11.68 | $ | 11.04 | $ | 10.79 | ||||||||||
| Total return (4) | 5.43 | % (8) | (3.53 | )% | 9.14 | % | 4.47 | % | 3.89 | % | ||||||||||
| Net assets, at end of year (000’s) | $ | 74,726 | $ | 75,164 | $ | 71,948 | $ | 66,244 | $ | 69,747 | ||||||||||
| Ratio of gross expenses to average net assets before waiver (5,6) | 1.72 | % | 1.71 | % | 1.73 | % | 1.78 | % | 1.79 | % | ||||||||||
| Ratio of net expenses to average net assets after waiver (5) | 1.72 | % | 1.71 | % | 1.73 | % | 1.78 | % | 1.79 | % | ||||||||||
| Ratio of net investment income before waiver to average net assets (5,7) | 5.38 | % | 2.32 | % | 3.03 | % | 2.12 | % | 3.27 | % | ||||||||||
| Ratio of net investment income after waiver to average net assets (5,7) | 5.38 | % | 2.32 | % | 3.03 | % | 2.12 | % | 3.27 | % | ||||||||||
| Portfolio Turnover Rate | 1 | % | 493 | % | 36 | % | 232 | % | 353 | % | ||||||||||
| (1) | Per share amounts calculated using the average shares method, which more appropriately presents the per share data for the period. |
| (2) | Realized and unrealized gain (loss) per share in this caption are balancing amounts necessary to reconcile the change in net asset value per share for the period, and may not reconcile with aggregate gains and losses in the Statement of Operations due to timing of share transactions during the year. |
| (3) | Amount is less than $0.01. |
| (4) | Total return assumes reinvestment of all dividends and distributions, if any. |
| (5) | Does not include the expenses of other investment companies in which the Fund invests. |
| (6) | Represents the ratio of expenses to average net assets absent fee waivers and/or expense reimbursements by the advisor. |
| (7) | Recognition of investment income by the Fund is affected by the timing and declaration of dividends by the underlying investment companies in which the Fund invests. |
| (8) | Includes adjustments in accordance with accounting principles generally accepted in the United States and, consequently, the net asset value for financial reporting purposes and the returns based upon those net asset values may differ from the net asset values and returns for shareholder transactions. |
See accompanying notes to financial statements.
30
| COUNTERPOINT TACTICAL INCOME FUND |
| FINANCIAL HIGHLIGHTS |
| Per Share Data and Ratios for a Share of Beneficial Interest Outstanding Throughout Each Year |
| Class C | ||||||||||||||||||||
| For the | For the | For the | For the | For the | ||||||||||||||||
| Year Ended | Year Ended | Year Ended | Year Ended | Year Ended | ||||||||||||||||
| September 30, 2023 | September 30, 2022 | September 30, 2021 | September 30, 2020 | September 30, 2019 | ||||||||||||||||
| Net asset value, beginning of year | $ | 10.95 | $ | 11.63 | $ | 11.00 | $ | 10.76 | $ | 10.89 | ||||||||||
| Activity from investment operations: | ||||||||||||||||||||
| Net investment income (1) | 0.50 | 0.18 | 0.26 | 0.15 | 0.27 | |||||||||||||||
| Net realized and unrealized gain (loss) (2) | (0.01 | ) | (0.67 | ) | 0.65 | 0.25 | 0.05 | |||||||||||||
| Total from investment operations | 0.49 | (0.49 | ) | 0.91 | 0.40 | 0.32 | ||||||||||||||
| Less distributions from: | ||||||||||||||||||||
| Net investment income | (0.52 | ) | (0.19 | ) | (0.28 | ) | (0.16 | ) | (0.31 | ) | ||||||||||
| Return of capital | — | (0.00 | ) (3) | — | — | — | ||||||||||||||
| Net realized gains | — | — | — | — | (0.14 | ) | ||||||||||||||
| Total distributions | (0.52 | ) | (0.19 | ) | (0.28 | ) | (0.16 | ) | (0.45 | ) | ||||||||||
| Net asset value, end of year | $ | 10.92 | $ | 10.95 | $ | 11.63 | $ | 11.00 | $ | 10.76 | ||||||||||
| Total return (4) | 4.56 | % | (4.26 | )% | 8.30 | % | 3.73 | % | 3.11 | % | ||||||||||
| Net assets, at end of year (000’s) | $ | 55,541 | $ | 53,229 | $ | 50,772 | $ | 37,748 | $ | 32,578 | ||||||||||
| Ratio of gross expenses to average net assets before waiver (5,6) | 2.47 | % | 2.46 | % | 2.48 | % | 2.53 | % | 2.54 | % | ||||||||||
| Ratio of net expenses to average net assets after waiver (5) | 2.47 | % | 2.46 | % | 2.48 | % | 2.53 | % | 2.54 | % | ||||||||||
| Ratio of net investment income before waiver to average net assets (5,7) | 4.64 | % | 1.56 | % | 2.27 | % | 1.40 | % | 2.52 | % | ||||||||||
| Ratio of net investment income after waiver to average net assets (5,7) | 4.64 | % | 1.56 | % | 2.27 | % | 1.40 | % | 2.52 | % | ||||||||||
| Portfolio Turnover Rate | 1 | % | 493 | % | 36 | % | 232 | % | 353 | % | ||||||||||
| (1) | Per share amounts calculated using the average shares method, which more appropriately presents the per share data for the period. |
| (2) | Realized and unrealized gain (loss) per share in this caption are balancing amounts necessary to reconcile the change in net asset value per share for the period, and may not reconcile with aggregate gains and losses in the Statement of Operations due to timing of share transactions during the year. |
| (3) | Amount is less than $0.01. |
| (4) | Total return assumes reinvestment of all dividends and distributions, if any. |
| (5) | Does not include the expenses of other investment companies in which the Fund invests. |
| (6) | Represents the ratio of expenses to average net assets absent fee waivers and/or expense reimbursements by the advisor. |
| (7) | Recognition of investment income by the Fund is affected by the timing and declaration of dividends by the underlying investment companies in which the Fund invests. |
See accompanying notes to financial statements.
31
| COUNTERPOINT TACTICAL INCOME FUND |
| FINANCIAL HIGHLIGHTS |
| Per Share Data and Ratios for a Share of Beneficial Interest Outstanding Throughout Each Year |
| Class I | ||||||||||||||||||||
| For the | For the | For the | For the | For the | ||||||||||||||||
| Year Ended | Year Ended | Year Ended | Year Ended | Year Ended | ||||||||||||||||
| September 30, 2023 | September 30, 2022 | September 30, 2021 | September 30, 2020 | September 30, 2019 | ||||||||||||||||
| Net asset value, beginning of year | $ | 11.01 | $ | 11.67 | $ | 11.04 | $ | 10.78 | $ | 10.90 | ||||||||||
| Activity from investment operations: | ||||||||||||||||||||
| Net investment income (1) | 0.62 | 0.28 | 0.37 | 0.26 | 0.37 | |||||||||||||||
| Net realized and unrealized gain (loss) (2) | (0.02 | ) | (0.66 | ) | 0.65 | 0.26 | 0.05 | |||||||||||||
| Total from investment operations | 0.60 | (0.38 | ) | 1.02 | 0.52 | 0.42 | ||||||||||||||
| Less distributions from: | ||||||||||||||||||||
| Net investment income | (0.63 | ) | (0.28 | ) | (0.39 | ) | (0.26 | ) | (0.40 | ) | ||||||||||
| Return of capital | — | (0.00 | ) (3) | — | — | — | ||||||||||||||
| Net realized gains | — | — | — | — | (0.14 | ) | ||||||||||||||
| Total distributions | (0.63 | ) | (0.28 | ) | (0.39 | ) | (0.26 | ) | (0.54 | ) | ||||||||||
| Net asset value, end of year | $ | 10.98 | $ | 11.01 | $ | 11.67 | $ | 11.04 | $ | 10.78 | ||||||||||
| Total return (4) | 5.61 | % | (3.31 | )% | 9.32 | % | 4.83 | % | 4.13 | % | ||||||||||
| Net assets, at end of year (000s) | $ | 1,074,505 | $ | 883,270 | $ | 769,603 | $ | 400,046 | $ | 246,454 | ||||||||||
| Ratio of gross expenses to average net assets before waiver (5,6) | 1.47 | % | 1.46 | % | 1.48 | % | 1.53 | % | 1.54 | % | ||||||||||
| Ratio of net expenses to average net assets after waiver (5) | 1.47 | % | 1.46 | % | 1.48 | % | 1.53 | % | 1.54 | % | ||||||||||
| Ratio of net investment income before waiver to average net assets (5,7) | 5.66 | % | 2.51 | % | 3.23 | % | 2.38 | % | 3.49 | % | ||||||||||
| Ratio of net investment income after waiver to average net assets (5,7) | 5.66 | % | 2.51 | % | 3.23 | % | 2.38 | % | 3.49 | % | ||||||||||
| Portfolio Turnover Rate | 1 | % | 493 | % | 36 | % | 232 | % | 353 | % | ||||||||||
| (1) | Per share amounts calculated using the average shares method, which more appropriately presents the per share data for the period. |
| (2) | Realized and unrealized gain (loss) per share in this caption are balancing amounts necessary to reconcile the change in net asset value per share for the period, and may not reconcile with aggregate gains and losses in the Statement of Operations due to timing of share transactions during the year. |
| (3) | Amount is less than $0.01. |
| (4) | Total return assumes reinvestment of all dividends and distributions, if any. |
| (5) | Does not include the expenses of other investment companies in which the Fund invests. |
| (6) | Represents the ratio of expenses to average net assets absent fee waivers and/or expense reimbursements by the advisor. |
| (7) | Recognition of investment income by the Fund is affected by the timing and declaration of dividends by the underlying investment companies in which the Fund invests. |
See accompanying notes to financial statements.
32
| COUNTERPOINT TACTICAL EQUITY FUND |
| FINANCIAL HIGHLIGHTS |
| Per Share Data and Ratios for a Share of Beneficial Interest Outstanding Throughout Each Year |
| Class A | ||||||||||||||||||||
| For the | For the | For the | For the | For the | ||||||||||||||||
| Year Ended | Year Ended | Year Ended | Year Ended | Year Ended | ||||||||||||||||
| September 30, 2023 | September 30, 2022 | September 30, 2021 | September 30, 2020 | September 30, 2019 | ||||||||||||||||
| Net asset value, beginning of year | $ | 15.76 | $ | 11.08 | $ | 10.30 | $ | 12.60 | $ | 15.92 | ||||||||||
| Activity from investment operations: | ||||||||||||||||||||
| Net investment income (loss) (1) | 0.11 | (0.09 | ) | (0.09 | ) | (0.05 | ) | (0.06 | ) | |||||||||||
| Net realized and unrealized gain (loss) (2) | 0.63 | 4.77 | 0.87 | (2.25 | ) | (2.77 | ) | |||||||||||||
| Total from investment operations | 0.74 | 4.68 | 0.78 | (2.30 | ) | (2.83 | ) | |||||||||||||
| Less distributions from: | ||||||||||||||||||||
| Return of capital | (0.11 | ) | — | — | — | — | ||||||||||||||
| Net realized gains | (0.37 | ) | — | — | — | (0.49 | ) | |||||||||||||
| Total distributions | (0.48 | ) | — | — | — | (0.49 | ) | |||||||||||||
| Net asset value, end of year | $ | 16.02 | $ | 15.76 | $ | 11.08 | $ | 10.30 | $ | 12.60 | ||||||||||
| Total return (3) | 4.80 | % (8) | 42.24 | % | 7.57 | % | (18.25 | )% | (18.15 | )% | ||||||||||
| Net assets, at end of year (000s) | $ | 6,521 | $ | 5,203 | $ | 839 | $ | 2,074 | $ | 3,369 | ||||||||||
| Ratio of gross expenses to average net assets before waiver/recapture (4,5,6) | 2.03 | % | 2.10 | % | 3.74 | % | 2.82 | % | 2.37 | % | ||||||||||
| Ratio of net expenses to average net assets after waiver/recapture (4,5) | 2.00 | % | 2.00 | % | 2.04 | % | 2.00 | % | 2.08 | % | ||||||||||
| Ratio of net investment income (loss) before waiver/recapture to average net assets (4,7) | 0.69 | % | (0.69 | )% | (2.66 | )% | (1.27 | )% | (0.81 | )% | ||||||||||
| Ratio of net investment income (loss) after waiver/recapture to average net assets (4,7) | 0.72 | % | (0.59 | )% | (0.96 | )% | (0.45 | )% | (0.52 | )% | ||||||||||
| Portfolio Turnover Rate | 391 | % | 350 | % | 230 | % | 259 | % | 296 | % | ||||||||||
| (1) | Per share amounts calculated using the average shares method, which more appropriately presents the per share data for the period. |
| (2) | Realized and unrealized gain (loss) per share in this caption are balancing amounts necessary to reconcile the change in net asset value per share for the period, and may not reconcile with aggregate gains and losses in the Statement of Operations due to timing of share transactions during the year. |
| (3) | Total return assumes reinvestment of all dividends and distributions, if any. Had the advisor not waived a portion of its fees, total returns would have been lower. |
| (4) | Does not include the expenses of other investment companies in which the Fund invests. |
| (5) | Excluding interest expense and dividends on securities sold short, the following ratios would have been: |
| Gross expenses to average net assets (6) | N/A | N/A | 3.70 | % | 2.82 | % | 2.29 | % | ||||||||||||
| Net expenses to average net assets | N/A | N/A | 2.00 | % | 2.00 | % | 2.00 | % | ||||||||||||
| (6) | Represents the ratio of expenses to average net assets absent fee waivers or expense reimbursements by the advisor. |
| (7) | Recognition of investment income (loss) by the Fund is affected by the timing and declaration of dividends by the underlying investment companies in which the Fund invests. |
| (8) | Includes adjustments in accordance with accounting principles generally accepted in the United States and, consequently, the net asset value for financial reporting purposes and the returns based upon those net asset values may differ from the net asset values and returns for shareholder transactions. |
See accompanying notes to financial statements.
33
| COUNTERPOINT TACTICAL EQUITY FUND |
| FINANCIAL HIGHLIGHTS |
| Per Share Data and Ratios for a Share of Beneficial Interest Outstanding Throughout Each Year |
| Class C | ||||||||||||||||||||
| For the | For the | For the | For the | For the | ||||||||||||||||
| Year Ended | Year Ended | Year Ended | Year Ended | Year Ended | ||||||||||||||||
| September 30, 2023 | September 30, 2022 | September 30, 2021 | September 30, 2020 | September 30, 2019 | ||||||||||||||||
| Net asset value, beginning of year | $ | 14.93 | $ | 10.58 | $ | 9.91 | $ | 12.22 | $ | 15.57 | ||||||||||
| Activity from investment operations: | ||||||||||||||||||||
| Net investment loss (1) | (0.01 | ) | (0.22 | ) | (0.16 | ) | (0.15 | ) | (0.19 | ) | ||||||||||
| Net realized and unrealized gain (loss) (2) | 0.60 | 4.57 | 0.83 | (2.16 | ) | (2.67 | ) | |||||||||||||
| Total from investment operations | 0.59 | 4.35 | 0.67 | (2.31 | ) | (2.86 | ) | |||||||||||||
| Less distributions from: | ||||||||||||||||||||
| Return of capital | (0.11 | ) | — | — | — | — | ||||||||||||||
| Net realized gains | (0.37 | ) | — | — | — | (0.49 | ) | |||||||||||||
| Total distributions | (0.48 | ) | — | — | — | (0.49 | ) | |||||||||||||
| Net asset value, end of year | $ | 15.04 | $ | 14.93 | $ | 10.58 | $ | 9.91 | $ | 12.22 | ||||||||||
| Total return (3) | 4.04 | % (8) | 41.12 | % | 6.76 | % | (18.90 | )% | (18.77 | )% | ||||||||||
| Net assets, at end of year (000s) | $ | 1,060 | $ | 1,024 | $ | 516 | $ | 581 | $ | 1,181 | ||||||||||
| Ratio of gross expenses to average net assets before waiver/recapture (4,5,6) | 2.78 | % | 2.85 | % | 4.49 | % | 3.57 | % | 3.12 | % | ||||||||||
| Ratio of net expenses to average net assets after waiver/recapture (4,5) | 2.75 | % | 2.75 | % | 2.79 | % | 2.75 | % | 2.83 | % | ||||||||||
| Ratio of net investment loss before waiver/recapture to average net assets (4,7) | (0.10 | )% | (1.61 | )% | (3.43 | )% | (2.08 | )% | (1.75 | )% | ||||||||||
| Ratio of net investment loss after waiver/recapture to average net assets (4,7) | (0.07 | )% | (1.51 | )% | (1.73 | )% | (1.26 | )% | (1.46 | )% | ||||||||||
| Portfolio Turnover Rate | 391 | % | 350 | % | 230 | % | 259 | % | 296 | % | ||||||||||
| (1) | Per share amounts calculated using the average shares method, which more appropriately presents the per share data for the period. |
| (2) | Realized and unrealized gain (loss) per share in this caption are balancing amounts necessary to reconcile the change in net asset value per share for the period, and may not reconcile with aggregate gains and losses in the Statement of Operations due to timing of share transactions during the year. |
| (3) | Total return assumes reinvestment of all dividends and distributions, if any. Had the advisor not waived a portion of its fees, total returns would have been lower. |
| (4) | Does not include the expenses of other investment companies in which the Fund invests. |
| (5) | Excluding interest expense and dividends on securities sold short, the following ratios would have been: |
| Gross expenses to average net assets (6) | N/A | N/A | 4.45 | % | 3.57 | % | 3.04 | % | ||||||||||||
| Net expenses to average net assets | N/A | N/A | 2.75 | % | 2.75 | % | 2.75 | % | ||||||||||||
| (6) | Represents the ratio of expenses to average net assets absent fee waivers or expense reimbursements by the advisor. |
| (7) | Recognition of investment loss by the Fund is affected by the timing and declaration of dividends by the underlying investment companies in which the Fund invests. |
| (8) | Includes adjustments in accordance with accounting principles generally accepted in the United States and, consequently, the net asset value for financial reporting purposes and the returns based upon those net asset values may differ from the net asset values and returns for shareholder transactions. |
See accompanying notes to financial statements.
34
| COUNTERPOINT TACTICAL EQUITY FUND |
| FINANCIAL HIGHLIGHTS |
| Per Share Data and Ratios for a Share of Beneficial Interest Outstanding Throughout Each Year |
| Class I | ||||||||||||||||||||
| For the | For the | For the | For the | For the | ||||||||||||||||
| Year Ended | Year Ended | Year Ended | Year Ended | Year Ended | ||||||||||||||||
| September 30, 2023 | September 30, 2022 | September 30, 2021 | September 30, 2020 | September 30, 2019 | ||||||||||||||||
| Net asset value, beginning of year | $ | 16.03 | $ | 11.24 | $ | 10.43 | $ | 12.73 | $ | 16.04 | ||||||||||
| Activity from investment operations: | ||||||||||||||||||||
| Net investment income (loss) (1) | 0.14 | (0.06 | ) | (0.06 | ) | (0.03 | ) | (0.01 | ) | |||||||||||
| Net realized and unrealized gain (loss) (2) | 0.65 | 4.85 | 0.87 | (2.27 | ) | (2.81 | ) | |||||||||||||
| Total from investment operations | 0.79 | 4.79 | 0.81 | (2.30 | ) | (2.82 | ) | |||||||||||||
| Less distributions from: | ||||||||||||||||||||
| Return of capital | (0.11 | ) | — | — | — | — | ||||||||||||||
| Net realized gains | (0.37 | ) | — | — | — | (0.49 | ) | |||||||||||||
| Total distributions | (0.48 | ) | — | — | — | (0.49 | ) | |||||||||||||
| Net asset value, end of year | $ | 16.34 | $ | 16.03 | $ | 11.24 | $ | 10.43 | $ | 12.73 | ||||||||||
| Total return (3) | 5.03 | %(8) | 42.62 | % | 7.77 | % | (18.07 | )% | (17.95 | )% | ||||||||||
| Net assets, at end of year (000s) | $ | 60,498 | $ | 70,029 | $ | 10,911 | $ | 8,121 | $ | 15,851 | ||||||||||
| Ratio of gross expenses to average net assets before waiver/recapture (4,5,6) | 1.78 | % | 1.85 | % | 3.49 | % | 2.57 | % | 2.12 | % | ||||||||||
| Ratio of net expenses to average net assets after waiver/recapture (4,5) | 1.75 | % | 1.75 | % | 1.79 | % | 1.75 | % | 1.83 | % | ||||||||||
| Ratio of net investment income (loss) before waiver/recapture to average net assets (4,7) | 0.88 | % | (0.50 | )% | (2.34 | )% | (1.07 | )% | (0.45 | )% | ||||||||||
| Ratio of net investment income (loss) after waiver/recapture to average net assets (4,7) | 0.91 | % | (0.40 | )% | (0.64 | )% | (0.25 | )% | (0.16 | )% | ||||||||||
| Portfolio Turnover Rate | 391 | % | 350 | % | 230 | % | 259 | % | 296 | % | ||||||||||
| (1) | Per share amounts calculated using the average shares method, which more appropriately presents the per share data for the period. |
| (2) | Realized and unrealized gain (loss) per share in this caption are balancing amounts necessary to reconcile the change in net asset value per share for the period, and may not reconcile with aggregate gains and losses in the Statement of Operations due to timing of share transactions during the year. |
| (3) | Total return assumes reinvestment of all dividends and distributions, if any. Had the advisor not waived a portion of its fees, total returns would have been lower. |
| (4) | Does not include the expenses of other investment companies in which the Fund invests. |
| (5) | Excluding interest expense and dividends on securities sold short, the following ratios would have been: |
| Gross expenses to average net assets (6) | N/A | N/A | 3.45 | % | 2.57 | % | 2.04 | % | ||||||||||||
| Net expenses to average net assets | N/A | N/A | 1.75 | % | 1.75 | % | 1.75 | % | ||||||||||||
| (6) | Represents the ratio of expenses to average net assets absent fee waivers or expense reimbursements by the advisor. |
| (7) | Recognition of investment income (loss) by the Fund is affected by the timing and declaration of dividends by the underlying investment companies in which the Fund invests. |
| (8) | Includes adjustments in accordance with accounting principles generally accepted in the United States and, consequently, the net asset value for financial reporting purposes and the returns based upon those net asset values may differ from the net asset values and returns for shareholder transactions. |
See accompanying notes to financial statements.
35
| COUNTERPOINT TACTICAL MUNICIPAL FUND |
| FINANCIAL HIGHLIGHTS |
| Per Share Data and Ratios for a Share of Beneficial Interest Outstanding Throughout Each Year |
| Class A | ||||||||||||||||||||
| For the | For the | For the | For the | For the | ||||||||||||||||
| Year Ended | Year Ended | Year Ended | Year Ended | Year Ended | ||||||||||||||||
| September 30, 2023 | September 30, 2022 | September 30, 2021 | September 30, 2020 | September 30, 2019 | ||||||||||||||||
| Net asset value, beginning of year | $ | 10.49 | $ | 10.98 | $ | 10.65 | $ | 10.47 | $ | 10.00 | ||||||||||
| Activity from investment operations: | ||||||||||||||||||||
| Net investment income (loss) (1) | 0.31 | (0.03 | ) | 0.23 | 0.19 | 0.26 | ||||||||||||||
| Net realized and unrealized gain (loss) (2) | (0.39 | ) | (0.18 | ) | 0.42 | 0.16 | 0.44 | |||||||||||||
| Total from investment operations | (0.08 | ) | (0.21 | ) | 0.65 | 0.35 | 0.70 | |||||||||||||
| Less distributions from: | ||||||||||||||||||||
| Net investment income | (0.28 | ) | (0.01 | ) | (0.23 | ) | (0.17 | ) | (0.23 | ) | ||||||||||
| Return of capital | (0.01 | ) | (0.00 | ) (3) | — | — | — | |||||||||||||
| Net realized gains | — | (0.27 | ) | (0.09 | ) | — | — | |||||||||||||
| Total distributions | (0.29 | ) | (0.28 | ) | (0.32 | ) | (0.17 | ) | (0.23 | ) | ||||||||||
| Net asset value, end of year | $ | 10.12 | $ | 10.49 | $ | 10.98 | $ | 10.65 | $ | 10.47 | ||||||||||
| Total return (4) | (0.75 | )% (8) | (1.93 | )% | 6.13 | % | 3.37 | % | 7.12 | % | ||||||||||
| Net assets, at end of year (000s) | $ | 3,509 | $ | 4,483 | $ | 1,872 | $ | 1,373 | $ | 1,871 | ||||||||||
| Ratio of gross expenses to average net assets before waiver/recapture (5,6) | 1.22 | % | 1.23 | % | 1.40 | % | 1.61 | % | 2.03 | % | ||||||||||
| Ratio of net expenses to average net assets after waiver/recapture (5) | 1.25 | % | 1.25 | % | 1.25 | % | 1.25 | % | 1.25 | % | ||||||||||
| Ratio of net investment income (loss) before waiver/recapture to average net assets (5,7) | 2.96 | % | (0.30 | )% | 1.94 | % | 1.44 | % | 1.79 | % | ||||||||||
| Ratio of net investment income (loss) after waiver/ recapture to average net assets (5,7) | 2.93 | % | (0.32 | )% | 2.09 | % | 1.80 | % | 2.57 | % | ||||||||||
| Portfolio Turnover Rate | 289 | % | 563 | % | 12 | % | 123 | % | 125 | % | ||||||||||
| (1) | Per share amounts calculated using the average shares method, which more appropriately presents the per share data for the period. |
| (2) | Realized and unrealized gain (loss) per share in this caption are balancing amounts necessary to reconcile the change in net asset value per share for the period, and may not reconcile with aggregate gains and losses in the Statement of Operations due to timing of share transactions during the year. |
| (3) | Amount is less than $0.01. |
| (4) | Total return assumes reinvestment of all dividends and distributions, if any. Had the advisor not waived a portion of its fees, total returns would have been lower. |
| (5) | Does not include the expenses of other investment companies in which the Fund invests. |
| (6) | Represents the ratio of expenses to average net assets absent fee waivers or expense reimbursements by the advisor. |
| (7) | Recognition of investment income (loss) by the Fund is affected by the timing and declaration of dividends by the underlying investment companies in which the Fund invests. |
| (8) | Includes adjustments in accordance with accounting principles generally accepted in the United States and, consequently, the net asset value for financial reporting purposes and the returns based upon those net asset values may differ from the net asset values and returns for shareholder transactions. |
See accompanying notes to financial statements.
36
| COUNTERPOINT TACTICAL MUNICIPAL FUND |
| FINANCIAL HIGHLIGHTS |
| Per Share Data and Ratios for a Share of Beneficial Interest Outstanding Throughout Each Year |
| Class C | ||||||||||||||||||||
| For the | For the | For the | For the | For the | ||||||||||||||||
| Year Ended | Year Ended | Year Ended | Year Ended | Year Ended | ||||||||||||||||
| September 30, 2023 | September 30, 2022 | September 30, 2021 | September 30, 2020 | September 30, 2019 | ||||||||||||||||
| Net asset value, beginning of year | $ | 10.35 | $ | 10.91 | $ | 10.59 | $ | 10.46 | $ | 10.00 | ||||||||||
| Activity from investment operations: | ||||||||||||||||||||
| Net investment income (loss) (1) | 0.22 | (0.12 | ) | 0.15 | 0.08 | 0.20 | ||||||||||||||
| Net realized and unrealized gain (loss) (2) | (0.37 | ) | (0.17 | ) | 0.41 | 0.18 | 0.42 | |||||||||||||
| Total from investment operations | (0.15 | ) | (0.29 | ) | 0.56 | 0.26 | 0.62 | |||||||||||||
| Less distributions from: | ||||||||||||||||||||
| Net investment income | (0.21 | ) | — | (0.15 | ) | (0.13 | ) | (0.16 | ) | |||||||||||
| Return of capital | (0.01 | ) | — | — | — | — | ||||||||||||||
| Net realized gains | — | (0.27 | ) | (0.09 | ) | — | — | |||||||||||||
| Total distributions | (0.22 | ) | (0.27 | ) | (0.24 | ) | (0.13 | ) | (0.16 | ) | ||||||||||
| Net asset value, end of year | $ | 9.98 | $ | 10.35 | $ | 10.91 | $ | 10.59 | $ | 10.46 | ||||||||||
| Total return (3) | (1.47 | )% (7) | (2.70 | )% | 5.31 | % | 2.54 | % | 6.29 | % | ||||||||||
| Net assets, at end of year (000s) | $ | 1,351 | $ | 2,419 | $ | 923 | $ | 669 | $ | 222 | ||||||||||
| Ratio of gross expenses to average net assets before waiver/recapture (4,5) | 1.97 | % | 1.98 | % | 2.15 | % | 2.36 | % | 2.78 | % | ||||||||||
| Ratio of net expenses to average net assets after waiver/recapture (4) | 2.00 | % | 2.00 | % | 2.00 | % | 2.00 | % | 2.00 | % | ||||||||||
| Ratio of net investment income (loss) before waiver/recapture to average net assets (4,6) | 2.14 | % | (1.08 | )% | 1.20 | % | 0.39 | % | 1.21 | % | ||||||||||
| Ratio of net investment income (loss) after waiver/ recapture to average net assets (4,6) | 2.11 | % | (1.10 | )% | 1.35 | % | 0.75 | % | 1.99 | % | ||||||||||
| Portfolio Turnover Rate | 289 | % | 563 | % | 12 | % | 123 | % | 125 | % | ||||||||||
| (1) | Per share amounts calculated using the average shares method, which more appropriately presents the per share data for the period. |
| (2) | Realized and unrealized gain (loss) per share in this caption are balancing amounts necessary to reconcile the change in net asset value per share for the period, and may not reconcile with aggregate gains and losses in the Statement of Operations due to timing of share transactions during the year. |
| (3) | Total return assumes reinvestment of all dividends and distributions, if any. Had the advisor not waived a portion of its fees, total returns would have been lower. |
| (4) | Does not include the expenses of other investment companies in which the Fund invests. |
| (5) | Represents the ratio of expenses to average net assets absent fee waivers or expense reimbursements by the advisor. |
| (6) | Recognition of investment income (loss) by the Fund is affected by the timing and declaration of dividends by the underlying investment companies in which the Fund invests. |
| (7) | Includes adjustments in accordance with accounting principles generally accepted in the United States and, consequently, the net asset value for financial reporting purposes and the returns based upon those net asset values may differ from the net asset values and returns for shareholder transactions. |
See accompanying notes to financial statements.
37
| COUNTERPOINT TACTICAL MUNICIPAL FUND |
| FINANCIAL HIGHLIGHTS |
| Per Share Data and Ratios for a Share of Beneficial Interest Outstanding Throughout Each Year |
| Class I | ||||||||||||||||||||
| For the | For the | For the | For the | For the | ||||||||||||||||
| Year Ended | Year Ended | Year Ended | Year Ended | Year Ended | ||||||||||||||||
| September 30, 2023 | September 30, 2022 | September 30, 2021 | September 30, 2020 | September 30, 2019 | ||||||||||||||||
| Net asset value, beginning of year | $ | 10.50 | $ | 10.98 | $ | 10.65 | $ | 10.47 | $ | 10.00 | ||||||||||
| Activity from investment operations: | ||||||||||||||||||||
| Net investment income (loss) (1) | 0.33 | (0.01 | ) | 0.26 | 0.19 | 0.28 | ||||||||||||||
| Net realized and unrealized gain (loss) (2) | (0.37 | ) | (0.18 | ) | 0.41 | 0.18 | 0.45 | |||||||||||||
| Total from investment operations | (0.04 | ) | (0.19 | ) | 0.67 | 0.37 | 0.73 | |||||||||||||
| Less distributions from: | ||||||||||||||||||||
| Net investment income | (0.31 | ) | (0.02 | ) | (0.25 | ) | (0.19 | ) | (0.26 | ) | ||||||||||
| Return of capital | (0.01 | ) | (0.00 | ) (3) | — | — | — | |||||||||||||
| Net realized gains | — | (0.27 | ) | (0.09 | ) | — | — | |||||||||||||
| Total distributions | (0.32 | ) | (0.29 | ) | (0.34 | ) | (0.19 | ) | (0.26 | ) | ||||||||||
| Net asset value, end of year | $ | 10.14 | $ | 10.50 | $ | 10.98 | $ | 10.65 | $ | 10.47 | ||||||||||
| Total return (4) | (0.40 | )% | (1.78 | )% | 6.39 | % | 3.60 | % | 7.39 | % | ||||||||||
| Net assets, at end of year (000s) | $ | 193,428 | $ | 164,336 | $ | 86,253 | $ | 44,840 | $ | 24,149 | ||||||||||
| Ratio of gross expenses to average net assets before waiver/recapture (5,6) | 0.97 | % | 0.98 | % | 1.15 | % | 1.36 | % | 1.78 | % | ||||||||||
| Ratio of net expenses to average net assets after waiver/recapture (5) | 1.00 | % | 1.00 | % | 1.00 | % | 1.00 | % | 1.00 | % | ||||||||||
| Ratio of net investment income (loss) before waiver/recapture to average net assets (5,7) | 3.23 | % | (0.10 | )% | 2.18 | % | 1.45 | % | 1.98 | % | ||||||||||
| Ratio of net investment income (loss) after waiver/ recapture to average net assets (5,7) | 3.20 | % | (0.12 | )% | 2.33 | % | 1.81 | % | 2.76 | % | ||||||||||
| Portfolio Turnover Rate | 289 | % | 563 | % | 12 | % | 123 | % | 125 | % | ||||||||||
| (1) | Per share amounts calculated using the average shares method, which more appropriately presents the per share data for the period. |
| (2) | Realized and unrealized gain (loss) per share in this caption are balancing amounts necessary to reconcile the change in net asset value per share for the period, and may not reconcile with aggregate gains and losses in the Statement of Operations due to timing of share transactions during the year. |
| (3) | Amount is less than $0.01. |
| (4) | Total return assumes reinvestment of all dividends and distributions, if any. Had the advisor not waived a portion of its fees, total returns would have been lower. |
| (5) | Does not include the expenses of other investment companies in which the Fund invests. |
| (6) | Represents the ratio of expenses to average net assets absent fee waivers or expense reimbursements by the advisor. |
| (7) | Recognition of investment income by the Fund is affected by the timing and declaration of dividends by the underlying investment companies in which the Fund invests. |
See accompanying notes to financial statements.
38
| COUNTERPOINT FUNDS |
| NOTES TO FINANCIAL STATEMENTS |
| September 30, 2023 |
| 1. | ORGANIZATION |
Counterpoint Tactical Income Fund, Counterpoint Tactical Equity Fund and Counterpoint Tactical Municipal Fund (collectively, the “Funds”) are each a diversified series of shares of beneficial interest of Northern Lights Fund Trust III (the “Trust”), a Delaware statutory trust organized on December 5, 2011. The Trust is registered under the Investment Company Act of 1940, as amended (the “1940 Act”), as an open-end management investment company. The investment objectives of the Funds are as follows:
Counterpoint Tactical Income Fund - seeks income and capital preservation.
Counterpoint Tactical Equity Fund - seeks capital appreciation and preservation.
Counterpoint Tactical Municipal Fund – seeks tax-free income and capital preservation.
Counterpoint Tactical Income Fund and Counterpoint Tactical Municipal Fund are “fund of funds” in that each Fund will generally invest in other investment companies. Each Fund offers three classes of shares: Class A, Class C and Class I shares. Counterpoint Tactical Income Fund commenced operations on December 4, 2014. Counterpoint Tactical Equity Fund commenced operations on November 30, 2015. Counterpoint Tactical Municipal Fund commenced operations on June 11, 2018. Class A shares of the Counterpoint Tactical Income Fund and Class A shares of the Counterpoint Tactical Municipal Fund are offered at net asset value plus a maximum sales charge of 4.50%. Class A shares of the Counterpoint Tactical Equity Fund are offered at net asset value plus a maximum sales charge of 5.75%. Class C and Class I shares of each Fund are offered at net asset value. Each class of each Fund represents an interest in the same assets of that Fund and classes are identical except for differences in their distribution and sales charges. All classes of shares have equal voting privileges except that each class has exclusive voting rights with respect to its service and/or distribution plans. Each Fund’s income, expenses (other than class specific distribution fees) and realized and unrealized gains and losses are allocated proportionately each day based upon the relative net assets of each class.
| 2. | SUMMARY OF SIGNIFICANT ACCOUNTING POLICIES |
The following is a summary of significant accounting policies followed by the Funds in preparation of their financial statements. These policies are in conformity with accounting principles generally accepted in the United States of America (“GAAP”). The preparation of financial statements in conformity with GAAP requires management to make estimates and assumptions that affect the reported amounts of assets and liabilities and disclosure of contingent assets and liabilities at the date of the financial statements and the reported amounts of increases and decreases in net assets from operations during the reporting period. Actual results could differ from those estimates. The Funds are investment companies and accordingly follow the investment company accounting and reporting guidance of the Financial Accounting Standards Board (“FASB”) Accounting Standards Codification Topic 946 “Financial Services – Investment Companies” and Accounting Standards Update (“ASU”) 2013-08.
Securities Valuation – Securities listed on an exchange are valued at the last reported sale price at the close of the regular trading session of the primary exchange on the business day the value is being determined, or in the case of securities listed on NASDAQ at the NASDAQ Official Closing Price (“NOCP”). In the absence of a sale, such securities shall be valued at the mean between the current bid and ask prices on the day of valuation. Futures and future options are valued at the final settled price or, in the absence of a settled price, at the last sale price on the day of valuation. Debt securities (other than short-term obligations) are valued each day by an independent pricing service approved by the Trust’s Board of Trustees (the “Board”) based on methods that include consideration of: yields or prices of securities of comparable quality, coupon, maturity and type, indications as to values from dealers, and general market conditions or market quotations from a major market maker in the securities. Investments valued in currencies other than the U.S. dollar are converted to U.S. dollars using exchange rates obtained from pricing services. The independent pricing service does not distinguish between smaller-sized bond positions known as “odd lots” and larger institutional-sized bond positions known as “round lots”. A Fund may fair value a particular bond if the advisor does not believe that the round lot value provided by the independent pricing service reflects fair value of the Fund’s holding. Short-term debt obligations having 60 days or less remaining until maturity, at time of purchase, may be valued at amortized cost, which approximates fair value. Investments in open-end investment companies are valued at net asset value.
Valuation of Underlying Funds – Each Fund may invest in portfolios of open-end or closed-end investment companies (the “underlying funds”). Underlying open-end investment companies are valued at their respective net asset values as reported by such investment companies. The underlying funds value securities in their portfolios for which market quotations are readily available at
39
| COUNTERPOINT FUNDS |
| NOTES TO FINANCIAL STATEMENTS (Continued) |
| September 30, 2023 |
their market values (generally the last reported sale price) and all other securities and assets at their fair value by the methods established by the boards of the underlying funds. The shares of many closed-end investment companies, after their initial public offering, frequently trade at a price per share, which is different than the net asset value per share. The difference represents a market premium or market discount of such shares. There can be no assurances that the market discount or market premium on shares of any closed-end investment company purchased by the Funds will not change.
Each Fund may hold securities, such as private investments, interests in commodity pools, other non-traded securities or temporarily illiquid securities, for which market quotations are not readily available or are determined to be unreliable. These securities will be valued using the “fair value” procedures approved by the Board. The Board has delegated execution of these procedures to the advisor as its valuation designee (the “Valuation Designee”). The Board may also enlist third party consultants such as a valuation specialist at a public accounting firm, valuation consultant or financial officer of a security issuer on an as-needed basis to assist the Valuation Designee in determining a security-specific fair value. The Board is responsible for reviewing and approving fair value methodologies utilized by the Valuation Designee, which approval shall be based upon whether the Valuation Designee followed the valuation procedures established by the Board.
Fair Valuation Process – Applicable investments are valued by the Valuation Designee pursuant to valuation procedures established by the Board. For example, fair value determinations are required for the following securities: (i) securities for which market quotations are insufficient or not readily available on a particular business day (including securities for which there is a short and temporary lapse in the provision of a price by the regular pricing source); (ii) securities for which, in the judgment of the Valuation Designee, the prices or values available do not represent the fair value of the instrument; factors which may cause the Valuation Designee to make such a judgment include, but are not limited to, the following: only a bid price or an asked price is available; the spread between bid and asked prices is substantial; the frequency of sales; the thinness of the market; the size of reported trades; and actions of the securities markets, such as the suspension or limitation of trading; (iii) securities determined to be illiquid; and (iv) securities with respect to which an event that will affect the value thereof has occurred (a “significant event”) since the closing prices were established on the principal exchange on which they are traded, but prior to a Fund’s calculation of its net asset value. Specifically, interests in commodity pools or managed futures pools are valued on a daily basis by reference to the closing market prices of each futures contract or other asset held by a pool, as adjusted for pool expenses. Restricted or illiquid investments, such as private investments or non-traded securities are valued based upon the current bid for the security from two or more independent dealers or other parties reasonably familiar with the facts and circumstances of the security (who should take into consideration all relevant factors as may be appropriate under the circumstances). If a current bid from such independent dealers or other independent parties is unavailable, the Valuation Designee shall determine, the fair value of such security using the following factors: (i) the type of security; (ii) the cost at date of purchase; (iii) the size and nature of the Fund’s holdings; (iv) the discount from market value of unrestricted securities of the same class at the time of purchase and subsequent thereto; (v) information as to any transactions or offers with respect to the security; (vi) the nature and duration of restrictions on disposition of the security and the existence of any registration rights; (vii) how the yield of the security compares to similar securities of companies of similar or equal creditworthiness; (viii) the level of recent trades of similar or comparable securities; (ix) the liquidity characteristics of the security; (x) current market conditions; and (xi) the market value of any securities into which the security is convertible or exchangeable.
The Funds utilize various methods to measure the fair value of all of their investments on a recurring basis. GAAP establishes a hierarchy that prioritizes inputs to valuation methods. The three levels of input are:
Level 1 – Unadjusted quoted prices in active markets for identical assets and liabilities that a Fund has the ability to access.
Level 2 – Observable inputs other than quoted prices included in Level 1 that are observable for the asset or liability, either directly or indirectly. These inputs may include quoted prices for the identical instrument on an inactive market, prices for similar instruments, interest rates, prepayment speeds, credit risk, yield curves, default rates and similar data.
Level 3 – Unobservable inputs for the asset or liability, to the extent relevant observable inputs are not available, representing a Fund’s own assumptions about the assumptions a market participant would use in valuing the asset or liability, and would be based on the best information available.
40
| COUNTERPOINT FUNDS |
| NOTES TO FINANCIAL STATEMENTS (Continued) |
| September 30, 2023 |
The availability of observable inputs can vary from security to security and is affected by a wide variety of factors, including, for example, the type of security, whether the security is new and not yet established in the marketplace, the liquidity of markets, and other characteristics particular to the security. To the extent that valuation is based on models or inputs that are less observable or unobservable in the market, the determination of fair value requires more judgment. Accordingly, the degree of judgment exercised in determining fair value is greatest for instruments categorized in Level 3.
The inputs used to measure fair value may fall into different levels of the fair value hierarchy. In such cases, for disclosure purposes, the level in the fair value hierarchy within which the fair value measurement falls in its entirety, is determined based on the lowest level input that is significant to the fair value measurement in its entirety.
The inputs or methodology used for valuing securities are not necessarily an indication of the risk associated with investing in those securities. The following tables summarize the inputs used as of September 30, 2023 for the Funds’ investments measured at fair value:
| Counterpoint Tactical Income Fund | ||||||||||||||||
| Assets * | Level 1 | Level 2 | Level 3 | Total | ||||||||||||
| Exchange Traded Funds | $ | 100,265,214 | $ | — | $ | — | $ | 100,265,214 | ||||||||
| Open End Funds | 972,433,505 | — | — | 972,433,505 | ||||||||||||
| U.S. Government & Agencies | — | 2,475,674 | — | 2,475,674 | ||||||||||||
| Short-Term Investments | 92,755,130 | — | — | 92,755,130 | ||||||||||||
| Credit Default Swap | — | 426,306 | — | 426,306 | ||||||||||||
| Total | $ | 1,165,453,849 | $ | 2,901,980 | $ | — | $ | 1,168,355,829 | ||||||||
| Counterpoint Tactical Equity Fund | ||||||||||||||||
| Assets * | Level 1 | Level 2 | Level 3 | Total | ||||||||||||
| Common Stocks | $ | 38,098,258 | $ | — | $ | — | $ | 38,098,258 | ||||||||
| U.S. Government & Agencies | — | 12,798,012 | — | 12,798,012 | ||||||||||||
| Short-Term Investment | 372,320 | — | — | 372,320 | ||||||||||||
| Future Options Purchased | 236,250 | — | — | 236,250 | ||||||||||||
| Long Total Return Swaps | — | 969,214 | — | 969,214 | ||||||||||||
| Short Total Return Swaps | — | 888,333 | — | 888,333 | ||||||||||||
| Total | $ | 38,706,828 | $ | 14,655,559 | $ | — | $ | 53,362,387 | ||||||||
| Liabilities * | ||||||||||||||||
| Common Stocks Sold Short | $ | 279,197 | $ | — | $ | — | $ | 279,197 | ||||||||
| Long Futures Contracts | 1,531,793 | — | — | 1,531,793 | ||||||||||||
| Total | $ | 1,810,990 | $ | — | $ | — | $ | 1,810,990 | ||||||||
| Counterpoint Tactical Municipal Fund | ||||||||||||||||
| Assets * | Level 1 | Level 2 | Level 3 | Total | ||||||||||||
| Open End Funds | $ | 46,287,758 | $ | — | $ | — | $ | 46,287,758 | ||||||||
| Short-Term Investments | 142,722,004 | — | — | 142,722,004 | ||||||||||||
| Future Option Purchased | 1,342,969 | — | — | 1,342,969 | ||||||||||||
| Swaptions Purchased | — | 763,783 | — | 763,783 | ||||||||||||
| Total | $ | 190,352,731 | $ | 763,783 | $ | — | $ | 191,116,514 | ||||||||
| Liabilities * | ||||||||||||||||
| Swaptions Written | $ | — | $ | 136,160 | $ | — | $ | 136,160 | ||||||||
| Total | $ | — | $ | 136,160 | $ | — | $ | 136,160 | ||||||||
There were no transfers between levels during the period other than Counterpoint Tactical Equity Fund’s transfer disclosed below.
| * | Please refer to the Schedule of Investments for industry classifications. |
41
| COUNTERPOINT FUNDS |
| NOTES TO FINANCIAL STATEMENTS (Continued) |
| September 30, 2023 |
The following is a reconciliation for the Counterpoint Tactical Equity Fund for which Level 3 inputs were used in determining value:
| Beginning | ||||||||||||||||||||||||||||||||
| balance | Net transfers | Change in | Ending balance | |||||||||||||||||||||||||||||
| September 30, | in/(out) of | Total Realized | unrealized | September 30, | ||||||||||||||||||||||||||||
| 2022 | Conversion | Net Purchases | Net Sales | Level 3 | Gain/(Loss) | appreciation | 2023 | |||||||||||||||||||||||||
| Common Stock | $ | — | $ | — | $ | — | $ | — | $ | — | $ | — | $ | — | $ | — | ||||||||||||||||
Quantitative disclosures of unobservable inputs and assumptions used by the Counterpoint Tactical Equity Fund are below:
| Common Stock | Fair Value | Valuation Techniques | Unobservable Input | Input | ||||||||
| Mechel PJSC | $ | — | Market Approach | Discount for lack of marketability (DLOM) | 100 | % | ||||||
Security Transactions and Investment Income – Investment security transactions are accounted for on a trade date basis. Cost is determined and gains and losses are based upon the specific identification method for both financial statement and federal income tax purposes. Dividend income is recorded on the ex-dividend date and interest income is recorded on an accrual basis. Purchase discounts and premiums on securities are accreted and amortized over the life of the respective securities.
Exchange Traded Funds – The Funds may invest in exchange traded funds (“ETFs”). ETFs are a type of fund bought and sold on a securities exchange. An ETF trades like common stock and represents a fixed portfolio of securities. Each Fund may purchase an ETF to gain exposure to a portion of the U.S. or a foreign market. The risks of owning an ETF generally reflect the risks of owning the underlying securities they are designed to track, although the lack of liquidity on an ETF could result in it being more volatile. Additionally, ETFs have fees and expenses that reduce their value.
Foreign Currency Translations – The accounting records of the Funds are maintained in U.S. dollars. Investment securities and other assets and liabilities denominated in a foreign currency, and income receipts and expense payments are translated into U.S. dollars using the prevailing exchange rate at the London market close. Purchases and sales of securities are translated into U.S. dollars at the contractual currency rates established at the approximate time of the trade.
Futures Contracts – The Funds are subject to equity price risk in the normal course of pursuing their investment objectives. A Fund may each purchase or sell futures contracts to hedge against market risk and to reduce return volatility. During the period the futures contracts are open, changes in the value of the contracts are recognized as unrealized gains or losses by “marking to market” on a daily basis to reflect the market value of the contracts at the end of each day’s trading. Variation margin payments are received or made depending upon whether unrealized gains or losses are incurred. When the contracts are closed, a Fund recognizes a realized gain or loss equal to the difference between the proceeds from, or cost of, the closing transaction and the Fund’s basis in the contract. If the Fund was unable to liquidate a futures contract and/or enter into an offsetting closing transaction, the Fund would continue to be subject to market risk with respect to the value of the contracts and continue to be required to maintain the margin deposits on the futures contracts. Risks may exceed amounts recognized in the Statement of Assets and Liabilities. With futures, there is minimal counterparty credit risk to the Funds since futures are exchange traded and the exchange’s clearinghouse, as counterparty to all exchange traded futures, guarantees the futures against default.
Option Transactions – The Funds are subject to equity price risk and commodity price risk in the normal course of pursuing their investment objectives and each Fund may purchase or sell options to help hedge against risk. When Fund writes a call option, an amount equal to the premium received is included in the Statement of Assets and Liabilities as a liability. The amount of the liability is subsequently marked-to-market to reflect the current market value of the option. If an option expires on its stipulated expiration date or if a Fund enters into a closing purchase transaction, a gain or loss is realized. If a written call option is exercised, a gain or loss is realized for the sale of the underlying security and the proceeds from the sale are increased by the premium originally received. As writer of an option, a Fund has no control over whether the option will be exercised and, as a result, retains the market risk of an unfavorable change in the price of the security underlying the written option.
Each Fund may purchase put and call options. Put options are purchased to hedge against a decline in the value of securities held in a Fund’s portfolio. If such a decline occurs, the put options will permit a Fund to sell the securities underlying such options at the exercise price, or to close out the options at a profit. The premium paid for a put or call option plus any transaction costs will reduce
42
| COUNTERPOINT FUNDS |
| NOTES TO FINANCIAL STATEMENTS (Continued) |
| September 30, 2023 |
the benefit, if any, realized by a Fund upon exercise of the option, and, unless the price of the underlying security rises or declines sufficiently, the option may expire worthless to the Fund. In addition, in the event that the price of the security in connection with which an option was purchased moves in a direction favorable to a Fund, the benefits realized by the Fund as a result of such favorable movement will be reduced by the amount of the premium paid for the option and related transaction costs. Written and purchased options are non-income producing securities. With purchased options, there is minimal counterparty risk to each Fund since these options are exchange traded and the exchange’s clearinghouse, as counterparty to all exchange traded options, guarantees against a possible default.
Short Sales – A “short sale” is a transaction in which a Fund sells a security it does not own but has borrowed in anticipation that the market price of that security will decline. Each Fund is obligated to replace the security borrowed by purchasing it on the open market at a later date. If the price of the security sold short increases between the time of the short sale and the time a Fund replaces the borrowed security, the Fund will incur a loss, unlimited in size. Conversely, if the price declines, the Fund will realize a gain, limited to the price at which the Fund sold the security short. Certain cash and securities are held as collateral.
Credit Default Swaptions – Credit default swaptions may be written or purchased to hedge exposure to the credit risk of an investment without making a commitment to the underlying instrument. A credit default swaption is an option to sell or buy credit protection on a specific reference by entering into a pre-defined swap agreement by some specified date in the future.
Credit Default Swaps – Certain Funds may enter into credit default swaps (“CDS”). CDS are two-party contracts that transfer credit exposure between the parties. One party (the “buyer”) receives credit protection and the other party (the “seller”) takes on credit risk. The buyer typically makes predetermined period payments to the seller in exchange for the seller’s commitment to purchase the underlying reference obligation if a defined credit event occurs, such as default, bankruptcy or failure to pay interest or principal on a reference debt instrument, with respect to a specified issuer or one of the reference issuers in a CDS portfolio. If the defined credit event occurs, the seller must pay the agreed-upon value of a reference obligation to the counterparty or perform pursuant to the agreement. The buyer must then surrender the reference obligation to the seller. As a seller of credit protection in a CDS, a Fund would be liable for the notional amount of the swap.
Swap Agreements – The Funds may hold equities subject to equity price risk. Each Fund may enter into various swap transactions for investment purposes or to manage interest rate, equity, foreign exchange (currency) or credit risk. These would be two-party contracts entered into primarily to exchange the returns (or differentials in rates of returns) earned or realized on particular pre-determined investments or instruments.
The gross returns to be exchanged or “swapped” between parties are calculated with respect to a notional amount, i.e., the return on or increase in value of a particular dollar amount invested at a particular interest rate, in a particular foreign currency, or in a “basket” of securities representing a particular index or market segment. Changes in the value of swap agreements are recognized as unrealized gains or losses in the Statement of Operations by “marking to market” on a daily basis to reflect the value of the swap agreement at the end of each trading day. Payments received or paid at the beginning of the agreement are reflected as such on the Statement of Assets and Liabilities and may be referred to as upfront payments. The Funds amortize upfront payments and/or accrue for the fixed payment stream on swap agreements on a daily basis with the net amount recorded as a component of unrealized gain or loss on the Statement of Operations. A liquidation payment received or made at the termination of the swap agreement is recorded as a realized gain or loss on the Statement of Operations. Entering into these agreements involves, to varying degrees, lack of liquidity and elements of credit, market, and counterparty risk in excess of amounts recognized on the Statement of Assets and Liabilities. A Fund’s maximum risk of loss from counterparty credit risk is the discounted net value of the cash flows to be received from the counterparty over the contract’s remaining life, to the extent that that amount is positive. The fair value of these financial instruments are located under unrealized appreciation (depreciation) on total return swaps on the Statement of Assets and Liabilities. The realized gain (loss) on swap contracts and change in unrealized appreciation (depreciation) on swap contracts are located on the Statement of Operations.
Market Risk – Overall market risks may also affect the value of the Funds. The market values of securities or other investments owned by the Funds will go up or down, sometimes rapidly or unpredictably. Factors such as economic growth and market conditions, interest rate levels, exchange rates and political events affect the securities markets. Changes in market conditions and interest rates generally do not have the same impact on all types of securities and instruments. Unexpected local, regional or global
43
| COUNTERPOINT FUNDS |
| NOTES TO FINANCIAL STATEMENTS (Continued) |
| September 30, 2023 |
events and their aftermath, such as war; acts of terrorism; financial, political or social disruptions; natural, environmental or man-made disasters; the spread of infectious illnesses or other public health issues; climate change and climate-related events; recessions and depressions; or other tragedies, catastrophes and events could have a significant impact on the Funds and their investments and could result in increased premiums or discounts to the Funds’ net asset value, and may impair market liquidity, thereby increasing liquidity risk. Such events can cause investor fear and panic, which can adversely affect the economies of many companies, sectors, nations, regions and the market in general, in ways that cannot necessarily be foreseen. The Funds could lose money over short periods due to short-term market movements and over longer periods during more prolonged market downturns. During a general market downturn, multiple asset classes may be negatively affected.
Distributions to Shareholders – Distributions from net investment income, if any, are declared and paid at least annually and are recorded on the ex-dividend date. The Funds will declare and pay net realized capital gains, if any, annually. The character of income and gains to be distributed is determined in accordance with federal income tax regulations, which may differ from GAAP. These “book/tax” differences are considered either temporary (i.e., deferred losses, capital loss carry forwards) or permanent in nature. To the extent these differences are permanent in nature, such amounts are reclassified within the composition of net assets based on their federal tax-basis treatment; temporary differences do not require classification.
Federal Income Taxes – It is the Funds’ policy to comply with the requirements of the Internal Revenue Code applicable to regulated investment companies and to distribute all of its taxable income to its shareholders. Therefore, no provision for federal income tax is required. The Funds recognize the tax benefits of uncertain tax positions only where the position is “more likely than not” to be sustained assuming examination by tax authorities. Management has analyzed the Funds’ tax positions and has concluded that no liability for unrecognized tax benefits should be recorded related to uncertain tax positions taken on returns filed for open tax years ended September 30, 2020 through September 30, 2022, or expected to be taken in the Funds’ September 30, 2023 tax returns.
Each Fund identifies its major tax jurisdictions as U.S. federal, Ohio, and foreign jurisdictions where the Fund makes significant investments. The Funds are not aware of any tax positions for which it is reasonably possible that the total amounts of unrecognized tax benefits will change materially in the next twelve months. The Funds recognize interest and penalties, if any, related to unrecognized tax benefits as income tax expense in the Statements of Operations. During the year, the Funds did not incur any interest or penalties.
Expenses – Expenses of the Trust that are directly identifiable to a specific fund are charged to that fund. Expenses that are not readily identifiable to a specific fund are allocated in such a manner as deemed equitable, taking into consideration the nature and type of expense and the relative sizes of the funds in the Trust.
Indemnification – The Trust indemnifies its Officers and Trustees for certain liabilities that may arise from the performance of their duties to the Trust. Additionally, in the normal course of business, the Funds enter into contracts that contain a variety of representations and warranties and which provide general indemnities. The Funds’ maximum exposure under these arrangements is unknown, as this would involve future claims that may be made against the Funds that have not yet occurred. However, based on experience, the Funds expect the risk of loss due to these warranties and indemnities to be remote.
| 3. | INVESTMENT ADVISORY AGREEMENT AND TRANSACTIONS WITH RELATED PARTIES |
Counterpoint Mutual Funds, LLC (the “Advisor”) serves as investment advisor to the Funds. Subject to the oversight of the Board, the Advisor is responsible for the management of the Funds’ investment portfolios. Pursuant to an advisory agreement with the Trust, on behalf of the Funds, the Advisor directs the daily operations of the Funds and supervises the performance of administrative and professional services provided by others. As compensation for its services and the related expenses borne by the Advisor, the Counterpoint Tactical Income Fund and Counterpoint Tactical Equity Fund pay the Advisor a fee, computed and accrued daily and paid monthly at an annual rate of 1.25% of each Fund’s average daily net assets. As compensation for its services and the related expenses borne by the Advisor, the Counterpoint Tactical Municipal Fund pays the Advisor a fee, computed and accrued daily and paid monthly at an annual rate of 0.70% of the Fund’s average daily net assets.
44
| COUNTERPOINT FUNDS |
| NOTES TO FINANCIAL STATEMENTS (Continued) |
| September 30, 2023 |
For the year ended September 30, 2023, the Advisor earned advisory fees as follows:
| Advisory Fee | ||||
| Counterpoint Tactical Income Fund | $ | 13,811,972 | ||
| Counterpoint Tactical Equity Fund | $ | 970,750 | ||
| Counterpoint Tactical Municipal Fund | $ | 1,415,798 | ||
Pursuant to a series of written contracts (the “Waiver Agreements”), the Advisor has contractually agreed to waive a portion of its advisory fee and has agreed to reimburse the Funds for other expenses, until at least February 1, 2024, to ensure that Total Annual Fund Operating Expenses After Fee Waiver (but does not include: (i) any front-end or contingent deferred loads; (ii) brokerage fees and commissions; (iii) acquired fund fees and expenses; (iii) borrowing costs (such as interest and dividend expense on securities sold short); (iv) taxes; and (v) extraordinary expenses, such as litigation expenses (which may include indemnification of Fund officers and Trustees, contractual indemnification of Fund service providers (other than the advisor))) do not exceed 2.00%, 2.75% and 1.75% of the daily average net assets attributable to Class A, Class C and Class I shares, respectively, of the Counterpoint Tactical Income Fund and Counterpoint Tactical Equity Fund and 1.25%, 2.00% and 1.00% of average daily net assets attributable to Class A, Class C, and Class I shares, respectively, of the Counterpoint Tactical Municipal Fund. Fee waivers and expense reimbursements are subject to possible recoupment from the Funds in future years on a rolling three year basis (within the three years after the fees have been waived or reimbursed) if such recoupment can be achieved within the expense limits then in place and in place at the time of waiver. The Board may terminate this expense reimbursement arrangement at any time upon 60 days written notice to the Advisor.
During the year ended September 30, 2023, the Advisor waived/recaptured advisory fees pursuant to the Waiver Agreements as follows:
| Advisory Fee Waiver | Advisory Fee Recapture | |||||||
| Counterpoint Tactical Income Fund | $ | — | $ | — | ||||
| Counterpoint Tactical Equity Fund | $ | 23,169 | $ | — | ||||
| Counterpoint Tactical Municipal Fund | $ | — | $ | 53,019 | ||||
As of September 30, 2023, the amount of fees waived/expenses reimbursed subject to potential recapture by date of expiration were as follows:
| September 30, 2024 | September 30, 2025 | September 30, 2026 | Total | |||||||||||||
| Counterpoint Tactical Income Fund | $ | — | $ | — | $ | — | $ | — | ||||||||
| Counterpoint Tactical Equity Fund | $ | 131,492 | $ | 42,239 | $ | 23,169 | $ | 196,900 | ||||||||
| Counterpoint Tactical Municipal Fund | $ | 87,657 | $ | — | $ | — | $ | 87,657 | ||||||||
Distributor – The distributor of the Funds is Northern Lights Distributors, LLC (the “Distributor”). The Board has adopted, on behalf of each Fund, the Trust’s Master Distribution and Shareholder Servicing Plan for Class A and Class C shares (the “Plans”), as amended, pursuant to Rule 12b-1 under the 1940 Act, to pay for certain distribution activities and shareholder services. Under the Plans, the Funds may pay 0.25% per year of the average daily net assets of Class A shares and 1.00% of the average daily net assets for Class C shares for such distribution and shareholder service activities. For the year ended September 30, 2023 the Funds incurred distributions fees as follows:
| Class A | Class C | |||||||
| Counterpoint Tactical Income Fund | $ | 193,915 | $ | 542,662 | ||||
| Counterpoint Tactical Equity Fund | $ | 14,582 | $ | 10,076 | ||||
| Counterpoint Tactical Municipal Fund | $ | 11,498 | $ | 16,797 | ||||
45
| COUNTERPOINT FUNDS |
| NOTES TO FINANCIAL STATEMENTS (Continued) |
| September 30, 2023 |
The Distributor acts as the Funds’ principal underwriter in a continuous public offering of the Funds’ shares. During the year ended September 30, 2023, the Distributor received underwriting commissions for sales of Class A shares as follows:
| Amount Retained by | ||||||||
| Underwriter Commissions | Principal Underwriter | |||||||
| Counterpoint Tactical Income Fund | $ | 74,150 | $ | 10,339 | ||||
| Counterpoint Tactical Equity Fund | $ | 7,678 | $ | 1,325 | ||||
| Counterpoint Tactical Municipal Fund | $ | 18,492 | $ | 3,003 | ||||
In addition, certain affiliates of the Distributor provide services to the Funds as follows:
Ultimus Fund Solutions, LLC (“UFS”) – an affiliate of the Distributor, provides administration, fund accounting, and transfer agent services to the Trust. Pursuant to separate servicing agreements with UFS, the Funds pay UFS customary fees for providing administration, fund accounting and transfer agency services to the Funds. Certain officers of the Trust are also officers of UFS, and are not paid any fees directly by the Funds for serving in such capacities.
Northern Lights Compliance Services, LLC (“NLCS”) – an affiliate of UFS and the Distributor, provides a Chief Compliance Officer to the Trust, as well as related compliance services, pursuant to a consulting agreement between NLCS and the Trust. Under the terms of such agreement, NLCS receives customary fees from the Funds.
Blu Giant, LLC (“Blu Giant”) – an affiliate of UFS and the Distributor, provides EDGAR conversion and filing services as well as print management services for the Funds on an ad-hoc basis. For the provision of these services, Blu Giant receives customary fees from the Funds.
| 4. | INVESTMENT TRANSACTIONS |
For the year ended September 30, 2023, cost of purchases and proceeds from sales of portfolio securities, other than short-term investments were as follows:
| Purchases | Sales | |||||||
| Counterpoint Tactical Income Fund | $ | 1,041,210,980 | $ | 9,981,368 | ||||
| Counterpoint Tactical Equity Fund | $ | 156,526,232 | $ | 159,648,926 | ||||
| Counterpoint Tactical Municipal Fund | $ | 404,577,859 | $ | 353,854,092 | ||||
| 5. | DERIVATIVE TRANSACTIONS |
The following is a summary of the effect of derivative instruments on the Funds’ Statement of Assets and Liabilities as of September 30, 2023.
| Counterpoint Tactical Income Fund | ||||||
| Contract Type/Primary Risk Exposure | Statements of Assets and Liabilities | Value | ||||
| Fixed Income Contracts/Credit risk | Unrealized appreciation on credit default swap | $ | 426,306 | |||
| Fixed Income Contracts/Credit risk | Premiums paid on open swap contracts | 712,879 | ||||
46
| COUNTERPOINT FUNDS |
| NOTES TO FINANCIAL STATEMENTS (Continued) |
| September 30, 2023 |
| Counterpoint Tactical Equity Fund | ||||||
| Contract Type/Primary Risk Exposure | Statements of Assets and Liabilities | Value | ||||
| Equity Contract/Equity Price Risk | Unrealized appreciation on total return swaps | $ | 1,857,547 | |||
| Equity Contract/Equity Price Risk | Investment securities at value - future options purchased | 236,250 | ||||
| Equity Contract/Equity Price Risk | Unrealized depreciation on futures contracts | (1,531,793 | ) | |||
| Counterpoint Municipal Income Fund | ||||||
| Contract Type/Primary Risk Exposure | Statements of Assets and Liabilities | Value | ||||
| Interest Rate Contracts/Interest Rate Risk | Investment securities at value - future options purchased | $ | 1,342,969 | |||
| Fixed Income Contracts/Credit Risk | Swaptions Purchased | 763,783 | ||||
| Fixed Income Contracts/Credit Risk | Swaptions Written | (136,160 | ) | |||
The following is a summary of the effect of derivative instruments on the Funds’ Statement of Operations for the year ended September 30, 2023.
| Counterpoint Tactical Income Fund | ||||||||
| Change in Unrealized | ||||||||
| Contract type/ | Realized Loss | Appreciation | ||||||
| Primary Risk Exposure | On Swap Contracts | On Swap Contracts | ||||||
| Fixed Income Contracts/Credit Risk | $ | (127,768 | ) | $ | 570,566 | |||
| Change In Unrealized | ||||||||
| Contract type/ | Realized Loss | Appreciation | ||||||
| Primary Risk Exposure | On Future Options Purchased | On Future Options Purchased | ||||||
| Interest rate contracts/Interest Rate Risk | $ | (4,324,254 | ) | $ | — | |||
| Change In Unrealized | ||||||||
| Contract type/ | Realized Loss | Appreciation | ||||||
| Primary Risk Exposure | On Swaptions Purchased | On Swaptions Purchased | ||||||
| Credit Contracts/Credit Risk | $ | (12,626,000 | ) | $ | — | |||
| Change In Unrealized | ||||||||
| Contract type/ | Realized Gain | Appreciation | ||||||
| Primary Risk Exposure | On Swaptions Written | On Swaptions Written | ||||||
| Credit Contracts/Credit Risk | $ | 4,490,000 | $ | — | ||||
47
| COUNTERPOINT FUNDS |
| NOTES TO FINANCIAL STATEMENTS (Continued) |
| September 30, 2023 |
| Counterpoint Tactical Equity Fund | ||||||||
| Change in Unrealized | ||||||||
| Contract type/ | Realized Gain | Depreciation | ||||||
| Primary Risk Exposure | On Futures Contracts | On Futures Contracts | ||||||
| Equity Contracts/Equity Price Risk | $ | 2,599,496 | $ | (1,531,793 | ) | |||
| Interest Rate Contracts/Interest Rate Risk | (735,599 | ) | 631,171 | |||||
| $ | 1,863,897 | $ | (900,622 | ) | ||||
| Change In Unrealized | ||||||||
| Contract type/ | Realized Loss | Depreciation | ||||||
| Primary Risk Exposure | On Future Options Purchased | On Future Options Purchased | ||||||
| Equity Contracts/Equity Price Risk | $ | (2,962,649 | ) | $ | (59,422 | ) | ||
| Change In Unrealized | ||||||||
| Contract type/ | Realized Loss | Depreciation | ||||||
| Primary Risk Exposure | On Outperformance Option Purchased | On Outperformance Option Purchased | ||||||
| Equity Contracts/Equity Price Risk | $ | (51,539 | ) | $ | (62,112 | ) | ||
| Change In Unrealized | ||||||||
| Contract type/ | Realized Gain | Depreciation | ||||||
| Primary Risk Exposure | On Swap Contracts | On Swap Contracts | ||||||
| Equity Contracts/Equity Price Risk | $ | 2,960,988 | $ | (6,067,346 | ) | |||
48
| COUNTERPOINT FUNDS |
| NOTES TO FINANCIAL STATEMENTS (Continued) |
| September 30, 2023 |
| Counterpoint Tactical Municipal Fund | ||||||||
| Change In Unrealized | ||||||||
| Contract type/ | Realized Loss | Appreciation | ||||||
| Primary Risk Exposure | On Futures Contracts | On Futures Contracts | ||||||
| Interest Rate Contracts/Interest Rate Risk | $ | (30,100 | ) | $ | — | |||
| Change In Unrealized | ||||||||
| Contract type/ | Realized Loss On Future | Appreciation | ||||||
| Primary Risk Exposure | Options Purchased | On Future Options Purchased | ||||||
| Equity Contracts/Equity Price Risk | $ | (179,100 | ) | $ | — | |||
| Interest Rate Contracts/Interest Rate Risk | 855,216 | 700,781 | ||||||
| $ | 676,116 | $ | 700,781 | |||||
| Change In Unrealized | ||||||||
| Contract type/ | Realized Loss | Appreciation | ||||||
| Primary Risk Exposure | On Swaptions Purchased | On Swaptions Purchased | ||||||
| Fixed Income Contracts/Credit Risk | $ | (173,250 | ) | $ | 16,783 | |||
| Change In Unrealized | ||||||||
| Contract type/ | Realized Gain | Appreciation | ||||||
| Primary Risk Exposure | On Swaptions Written | On Swaptions Written | ||||||
| Fixed Income Contracts/Credit Risk | $ | 67,500 | $ | 16,840 | ||||
| Change In Unrealized | ||||||||
| Contract type/ | Realized Loss | Appreciation | ||||||
| Primary Risk Exposure | On Swap Contracts | On Swap Contracts | ||||||
| Interest Rate Contracts/Interest Rate Risk | $ | (471,665 | ) | $ | — | |||
The notional value of the derivative instruments outstanding as of September 30, 2023 as disclosed in the Schedule of Investments and the amounts realized and changes in unrealized gains and losses on derivative instruments during the period as disclosed above and within the Statement of Operations serve as indicators of the volume of derivative activity for the Funds.
During the year ended September 30, 2023, the Funds were not subject to any master netting arrangements. The following table shows additional information regarding the offsetting of assets and liabilities at September 30, 2023 for the Funds.
| Counterpoint Tactical Income Fund | ||||||||||||||||||||||||||
| Net Amounts | Financial | Cash | Net | |||||||||||||||||||||||
| Gross Amounts of | Gross Amounts of | Presented in the | Instruments | Collateral | Amount | |||||||||||||||||||||
| Description | Counterparty | Recognized Assets | Recognized Liabilities | Statement of Assets & Liabilities | Pledged | Pledged | of Assets & Liabilities | |||||||||||||||||||
| Unrealized appreciation on credit default swap | Wells Fargo | $ | 426,306 | (1) | $ | — | $ | 426,306 | $ | — | $ | — | $ | 426,306 | ||||||||||||
| $ | 426,306 | $ | — | $ | 426,306 | $ | — | $ | — | $ | 426,306 | |||||||||||||||
49
| COUNTERPOINT FUNDS |
| NOTES TO FINANCIAL STATEMENTS (Continued) |
| September 30, 2023 |
| Counterpoint Tactical Equity Fund | ||||||||||||||||||||||||||
| Net Amounts | Financial | Cash | Net | |||||||||||||||||||||||
| Gross Amounts of | Gross Amounts of | Presented in the | Instruments | Collateral | Amount | |||||||||||||||||||||
| Description | Counterparty | Recognized Assets | Recognized Liabilities | Statement of Assets & Liabilities | Pledged | Pledged | of Assets & Liabilities | |||||||||||||||||||
| Unrealized appreciation (depreciation) on total return swaps | JP Morgan | $ | 2,605,018 | (1) | $ | (747,471 | ) (1) | $ | 1,857,547 | $ | — | $ | — | $ | 1,857,547 | |||||||||||
| Investment in future options purchased | Goldman Sachs | 236,250 | (1) | — | 236,250 | — | — | 236,250 | ||||||||||||||||||
| Futures Contracts | Goldman Sachs | — | (1,531,793 | ) (1) | (1,531,793 | ) | — | 1,531,793 | (2) | — | ||||||||||||||||
| $ | 2,841,268 | $ | (2,279,264 | ) | $ | 562,004 | $ | — | $ | 1,531,793 | $ | 2,093,797 | ||||||||||||||
| Counterpoint Tactical Municipal Fund | ||||||||||||||||||||||||||
| Net Amounts | Financial | Cash | Net | |||||||||||||||||||||||
| Gross Amounts of | Gross Amounts of | Presented in the | Instruments | Collateral | Amount | |||||||||||||||||||||
| Description | Counterparty | Recognized Assets | Recognized Liabilities | Statement of Assets & Liabilities | Pledged | Pledged | of Assets & Liabilities | |||||||||||||||||||
| Investments in future options purchased | Wells Fargo | $ | 1,342,969 | (1) | $ | — | $ | 1,342,969 | $ | — | $ | — | $ | 1,342,969 | ||||||||||||
| Swaptions Purchased | JP Morgan | 763,783 | (1) | — | 763,783 | — | — | 763,783 | ||||||||||||||||||
| Swaptions Written | JP Morgan | — | (136,160 | ) (1) | (136,160 | ) | — | 136,160 | (2) | — | �� | |||||||||||||||
| $ | 2,106,752 | $ | (136,160 | ) | $ | 1,970,592 | $ | — | $ | 136,160 | $ | 2,106,752 | ||||||||||||||
| (1) | Value as presented in the Schedule of Investments. |
| (2) | The amount is limited to the derivative liability balance and does not include excess collateral pledged to the counterparty. Total collateral amounts are presented in the Statements of Assets and Liabilities. |
| 6. | AGGREGATE UNREALIZED APPRECIATION AND DEPRECIATION – TAX BASIS |
The identified cost of investments in securities owned by each Fund for federal income tax purposes, and its respective gross unrealized appreciation and depreciation at September 30, 2023, were as follows:
| Gross | Gross | Net Unrealized | ||||||||||||||
| Tax | Unrealized | Unrealized | Appreciation | |||||||||||||
| Fund | Cost | Appreciation | Depreciation | (Depreciation) | ||||||||||||
| Counterpoint Tactical Income Fund | $ | 1,161,271,544 | $ | 13,588,730 | $ | (5,791,566 | ) | $ | 7,797,164 | |||||||
| Counterpoint Tactical Equity Fund | $ | 51,003,980 | $ | 165,886,595 | $ | (163,807,385 | ) | $ | 2,079,210 | |||||||
| Counterpoint Tactical Municipal Fund | $ | 194,927,534 | $ | 33,623 | $ | (3,980,803 | ) | $ | (3,947,180 | ) | ||||||
| 7. | DISTRIBUTIONS TO SHAREHOLDERS AND TAX COMPONENTS OF CAPITAL |
The tax character of Fund distributions paid for the fiscal years ended September 30, 2023 and September 30, 2022 was as follows:
| For the year ended September 30, 2023: | ||||||||||||||||||||
| Ordinary | Long-Term | Return of | ||||||||||||||||||
| Income | Capital Gains | Exempt Income | Capital | Total | ||||||||||||||||
| Counterpoint Tactical Income Fund | $ | 63,175,656 | $ | — | $ | — | $ | — | $ | 63,175,656 | ||||||||||
| Counterpoint Tactical Equity Fund | 1,929,804 | — | — | 576,290 | 2,506,094 | |||||||||||||||
| Counterpoint Tactical Municipal Fund | 542,599 | — | 5,579,503 | 198,768 | 6,320,870 | |||||||||||||||
| For the year ended September 30, 2022: | ||||||||||||||||||||
| Ordinary | Long-Term | Return of | ||||||||||||||||||
| Income | Capital Gains | Exempt Income | Capital | Total | ||||||||||||||||
| Counterpoint Tactical Income Fund | $ | 20,817,397 | $ | — | $ | — | $ | 94,839 | $ | 20,912,236 | ||||||||||
| Counterpoint Tactical Equity Fund | — | — | — | — | — | |||||||||||||||
| Counterpoint Tactical Municipal Fund | 16,531 | 2,237,191 | 100,482 | 16,481 | 2,370,685 | |||||||||||||||
50
| COUNTERPOINT FUNDS |
| NOTES TO FINANCIAL STATEMENTS (Continued) |
| September 30, 2023 |
As of September 30, 2023, the components of accumulated earnings/(deficit) on a tax basis were as follows:
| Undistributed | Undistributed | Undistributed | Post October Loss | Capital Loss | Other | Unrealized | Total | |||||||||||||||||||||||||
| Ordinary | Ordinary | Long-Term | and | Carry | Book/Tax | Appreciation | Accumulated | |||||||||||||||||||||||||
| Tax-Exempt Income | Income | Capital Gains | Late Year Loss | Forwards | Differences | (Depreciation) | Earnings/(Deficits) | |||||||||||||||||||||||||
| Counterpoint Tactical Income Fund | $ | — | $ | 1,105,685 | $ | — | $ | (13,059,044 | ) | $ | (10,610,912 | ) | $ | — | $ | 7,797,164 | $ | (14,767,107 | ) | |||||||||||||
| Counterpoint Tactical Equity Fund | — | — | — | — | — | — | 2,079,210 | 2,079,210 | ||||||||||||||||||||||||
| Counterpoint Tactical Municipal Fund | — | — | — | (4,911,655 | ) | (849,031 | ) | — | (3,947,180 | ) | (9,707,866 | ) | ||||||||||||||||||||
The difference between book basis and tax basis undistributed net investment income (loss), accumulated net realized gain/(loss), and unrealized appreciation/(depreciation) from investments is primarily attributable to the mark-to-market treatment on swaps, options, futures contracts, and passive foreign investment companies, adjustments for partnerships, C-Corporation return of capital distributions, and the tax deferral of losses on wash sales.
Capital losses incurred after October 31 within the fiscal year are deemed to arise on the first business day of the following fiscal year for tax purposes. The funds incurred and elected to defer such late year losses as follows:
| Post October | ||||
| Losses | ||||
| Counterpoint Tactical Income Fund | $ | 13,059,044 | ||
| Counterpoint Tactical Equity Fund | — | |||
| Counterpoint Tactical Municipal Fund | 4,911,655 | |||
At September 30, 2023, the Funds had capital loss carry forwards for federal income tax purposes available to offset future capital gains, along with capital loss carry forwards utilized, as follows:
| Non-Expiring | Capital Loss Carry | |||||||||||||||
| Short-Term | Long-Term | Total | Forward Utilized | |||||||||||||
| Counterpoint Tactical Income Fund | $ | 10,610,912 | $ | — | $ | 10,610,912 | $ | — | ||||||||
| Counterpoint Tactical Equity Fund | — | — | — | 789,959 | ||||||||||||
| Counterpoint Tactical Municipal Fund | 849,031 | — | 849,031 | — | ||||||||||||
Permanent book and tax differences, primarily attributable to distributions in excess resulted in reclassification for the year ended September 30, 2023 for the Funds as follows:
| Paid | ||||||||
| In | Accumulated | |||||||
| Capital | Earnings (Losses) | |||||||
| Counterpoint Tactical Income Fund | $ | (135,302 | ) | $ | 135,302 | |||
| Counterpoint Tactical Equity Fund | — | — | ||||||
| Counterpoint Tactical Municipal Fund | — | — | ||||||
51
| COUNTERPOINT FUNDS |
| NOTES TO FINANCIAL STATEMENTS (Continued) |
| September 30, 2023 |
| 8. | UNDERLYING INVESTMENT IN OTHER INVESTMENT COMPANIES |
The Counterpoint Tactical Income Fund (the “Income Fund”) currently invests a significant portion of its assets in the PGIM High Yield Fund, Class Z (the “PGIM Fund”). The Income Fund may redeem its investment from the PGIM Fund at any time if the Advisor determines that it is in the best interest of the Income Fund and its shareholders to do so. The performance of the Income Fund will be directly affected by the performance of the PGIM Fund. The financial statements of the PGIM Fund, including the portfolio of investments, can be found at the SEC’s website www.sec.gov and should be read in conjunction with the Income Fund’s financial statements. As of September 30, 2023, the percentage of the Income Fund’s net assets invested in the PGIM Fund was 30.9%.
The Counterpoint Tactical Municipal Fund (the “Municipal Fund”) currently invests a significant portion of its assets in the BlackRock Liquidity Funds MuniCash (the “BlackRock”). The Municipal Fund may redeem its investment from the BlackRock Fund at any time if the Advisor determines that it is in the best interest of the Municipal Fund and its shareholders to do so. The performance of the Municipal Fund will be directly affected by the performance of the BlackRock Fund. The financial statements of the BlackRock Fund, including the portfolio of investments, can be found at the SEC’s website www.sec.gov and should be read in conjunction with the Municipal Fund’s financial statements. As of September 30, 2023, the percentage of the Municipal Fund’s net assets invested in the BlackRock Fund was 72.0%.
| 9. | CONTROL OWNERSHIP |
The beneficial ownership, either directly or indirectly, of more than 25% of the voting securities of a Fund creates presumption of control of the Fund, under Section 2(a)(9) of the 1940 Act. As of September 30, 2023, the shareholders listed below held more than 25% of an individual Fund and may be deemed to control that Fund. The Funds have no knowledge as to whether all or any portion of the shares owned of record within the omnibus accounts listed below are also owned beneficially.
| Shareholder | Fund | Percent | ||
| Charles Schwab & Co., Inc. | Counterpoint Tactical Income Fund | 34.49% | ||
| National Financial Services LLC | Counterpoint Tactical Income Fund | 27.16% | ||
| Charles Schwab & Co., Inc. | Counterpoint Tactical Equity Fund | 25.33% | ||
| National Financial Services LLC | Counterpoint Tactical Equity Fund | 53.40% | ||
| Charles Schwab & Co., Inc. | Counterpoint Tactical Municipal Fund | 30.73% | ||
| National Financial Services LLC | Counterpoint Tactical Municipal Fund | 32.52% |
| 10. | RECENT REGULATORY UPDATES |
On January 24, 2023, the SEC adopted rule and form amendments to require mutual funds and ETFs to transmit concise and visually engaging streamlined annual and semiannual reports to shareholders that highlight key information. Other information, including financial statements, will not appear in a streamlined shareholder report but must be available online, delivered free of charge upon request, and filed on a semiannual basis on Form N-CSR. The rule and form amendments have a compliance date of July 24, 2024. At this time, management is evaluating the impact of these amendments on the shareholder reports for the Funds.
| 11. | SUBSEQUENT EVENTS |
Subsequent events after the date of the Statements of Assets and Liabilities have been evaluated through the date the financial statements were issued. Management has determined that no events or transactions occurred requiring adjustment or disclosure in the financial statements.
52
Report of Independent Registered Public Accounting Firm
To the Board of Trustees of Northern Lights Fund Trust III
and the Shareholders of Counterpoint Tactical Income Fund, Counterpoint Tactical Equity Fund
and Counterpoint Tactical Municipal Fund
Opinion on the Financial Statements
We have audited the accompanying statements of assets and liabilities of Counterpoint Tactical Income Fund, Counterpoint Tactical Equity Fund and Counterpoint Tactical Municipal Fund (collectively, the Funds), including the schedules of investments, as of September 30, 2023, the related statements of operations for the year then ended, the statements of changes in net assets for each of the two years in the period then ended, and the related notes to the financial statements (collectively, the financial statements), and the financial highlights for each of the five years in the period then ended. In our opinion, the financial statements and financial highlights present fairly, in all material respects, the financial position of the Funds as of September 30, 2023, the results of their operations for the year then ended, the changes in net assets for each of the two years in the period then ended, and the financial highlights for each of the five years in the period then ended, in conformity with accounting principles generally accepted in the United States of America.
Basis for Opinion
These financial statements are the responsibility of the Funds’ management. Our responsibility is to express an opinion on the Funds’ financial statements and financial highlights based on our audits. We are a public accounting firm registered with the Public Company Accounting Oversight Board (United States) (PCAOB) and are required to be independent with respect to the Funds in accordance with U.S. federal securities laws and the applicable rules and regulations of the Securities and Exchange Commission and the PCAOB.
We conducted our audits in accordance with the standards of the PCAOB. Those standards require that we plan and perform the audit to obtain reasonable assurance about whether the financial statements are free of material misstatement, whether due to error or fraud. The Funds are not required to have, nor were we engaged to perform, an audit of their internal control over financial reporting. As part of our audits, we are required to obtain an understanding of internal control over financial reporting but not for the purpose of expressing an opinion on the effectiveness of the Funds’ internal control over financial reporting. Accordingly, we express no such opinion.
Our audits included performing procedures to assess the risks of material misstatement of the financial statements, whether due to error or fraud, and performing procedures that respond to those risks. Such procedures included examining, on a test basis, evidence regarding the amounts and disclosures in the financial statements. Our procedures included confirmation of investments owned as of September 30, 2023, by correspondence with the custodians, brokers or counterparties. Our audits also included evaluating the accounting principles used and significant estimates made by management, as well as evaluating the overall presentation of the financial statements. We believe that our audits provide a reasonable basis for our opinion.
/s/ RSM US LLP
We have served as the auditor of one or more Counterpoint Mutual Funds, LLC investment companies since 2015.
Denver, Colorado
December 12, 2023
53
| COUNTERPOINT FUNDS |
| EXPENSE EXAMPLES (Unaudited) |
| September 30, 2023 |
As a shareholder of a Fund, you incur two types of costs: (1) transaction costs, including sales charges (loads) on purchases; and (2) ongoing costs, including management fees; distribution and/or service (12b-1) fees; and other Fund expenses. This example is intended to help you understand your ongoing costs (in dollars) of investing in the Funds and to compare these costs with the ongoing costs of investing in other mutual funds.
The example is based on an investment of $1,000 invested at the beginning of the period and held for the entire period from April 1, 2023 to September 30, 2023.
Actual Expenses
The “Actual” table below provides information about actual account values and actual expenses. You may use the information below; together with the amount you invested, to estimate the expenses that you paid over the period. Simply divide your account value by $1,000 (for example, an $8,600 account value divided by $1,000 = 8.6), then multiply the result by the number in the table under the heading entitled “Expenses Paid During Period” to estimate the expenses you paid on your account during this period.
Hypothetical Example for Comparison Purposes
The “Hypothetical” table below provides information about hypothetical account values and hypothetical expenses based on the respective Fund’s actual expense ratio and an assumed rate of return of 5% per year before expenses, which is not the Fund’s actual return. The hypothetical account values and expenses may not be used to estimate the actual ending account balances or expenses you paid for the period. You may use this information to compare this 5% hypothetical example with the 5% hypothetical examples that appear in the shareholder reports of other funds.
Please note that the expenses shown in the table are meant to highlight your ongoing costs only and do not reflect any transactional costs, such as sales charges (loads). Therefore, the table is useful in comparing ongoing costs only, and will not help you determine the relative total costs of owning different funds. In addition, if these transactional costs were included, your costs would have been higher.
| Actual | Beginning Account Value 4/1/23 | Ending Account Value 9/30/23 | Expenses Paid* During Period 4/1/23 – 9/30/23 | Expense Ratio During* the Period 4/1/23 – 9/30/23 |
| Counterpoint Tactical Income Fund | ||||
| Class A | $1,000.00 | $1,028.70 | $8.75 | 1.72% |
| Class C | $1,000.00 | $1,025.10 | $12.54 | 2.47% |
| Class I | $1,000.00 | $1,031.00 | $7.48 | 1.47% |
| Counterpoint Tactical Equity Fund | ||||
| Class A | $1,000.00 | $1,070.00 | $10.38 | 2.00% |
| Class C | $1,000.00 | $1,066.50 | $14.25 | 2.75% |
| Class I | $1,000.00 | $1,072.00 | $9.09 | 1.75% |
| Counterpoint Tactical Municipal Fund | ||||
| Class A | $1,000.00 | $979.00 | $6.20 | 1.25% |
| Class C | $1,000.00 | $976.00 | $9.91 | 2.00% |
| Class I | $1,000.00 | $982.20 | $4.97 | 1.00% |
| Hypothetical (5% return before expenses) | Beginning Account Value 4/1/23 | Ending Account Value 9/30/23 | Expenses Paid During Period 4/1/23 – 9/30/23 | Expense Ratio During* the Period 4/1/23 – 9/30/23 |
| Counterpoint Tactical Income Fund | ||||
| Class A | $1,000.00 | $1,016.44 | $8.69 | 1.72% |
| Class C | $1,000.00 | $1,012.68 | $12.46 | 2.47% |
| Class I | $1,000.00 | $1,017.70 | $7.44 | 1.47% |
| Counterpoint Tactical Equity Fund | ||||
| Class A | $1,000.00 | $1,015.04 | $10.10 | 2.00% |
| Class C | $1,000.00 | $1,011.28 | $13.87 | 2.75% |
| Class I | $1,000.00 | $1,016.29 | $8.85 | 1.75% |
| Counterpoint Tactical Municipal Fund | ||||
| Class A | $1,000.00 | $1,018.80 | $6.33 | 1.25% |
| Class C | $1,000.00 | $1,015.04 | $10.10 | 2.00% |
| Class I | $1,000.00 | $1,020.05 | $5.06 | 1.00% |
| * | Expenses are equal to the average account value over the period, multiplied by the Fund’s annualized expense ratio, multiplied by the number of days in the period (183) divided by the number of days in the fiscal year (365). |
54
| COUNTERPOINT FUNDS |
| SUPPLEMENTAL INFORMATION (Unaudited) |
| September 30, 2023 |
Renewal of Advisory Agreements – Counterpoint Tactical Equity Fund, Counterpoint Tactical Income Fund and Counterpoint Tactical Municipal Fund*
In connection with a meeting held on August 23-24, 2023, the Board, comprised entirely of Trustees who are not “interested persons,” as that term is defined in the 1940 Act, discussed the renewal of the investment advisory agreements (the “Advisory Agreements”) between the Adviser and the Trust, with respect to Counterpoint Tactical Equity Fund (“Counterpoint TE”), Counterpoint Tactical Income Fund (“Counterpoint TI”) and Counterpoint Tactical Municipal Fund (“Counterpoint TM”) (collectively, the “Counterpoint Funds”). In considering the renewal of the Advisory Agreements, the Board received materials specifically relating to the Counterpoint Funds and the Advisory Agreements.
The Board relied upon the advice of independent legal counsel and its own business judgment in determining the material factors to be considered in evaluating the Advisory Agreements and the weight to be given to each such factor. The Board’s conclusions were based on an evaluation of all of the information provided and were not the result of any one factor. Moreover, each Trustee may have afforded different weight to the various factors in reaching his or her conclusions with respect to the Advisory Agreements.
Nature, Extent and Quality of Services. The Board recognized that the Adviser was established in 2014 and managed approximately $1.4 billion in assets. The Board reviewed the Adviser’s investment personnel, taking into consideration their education, association with academia, financial industry experience, and technology expertise. The Board remarked that the Adviser monitored each Counterpoint Fund on a daily basis to ensure its compliance with the investment guidelines and restrictions in each Counterpoint Fund’s prospectus. The Board commented that the Adviser developed a checklist of limitations and procedures for each Counterpoint Fund to evaluate each Counterpoint Fund’s compliance with its investment guidelines. The Board noted that the Adviser used Bloomberg AIM to automate trade compliance functions. The Board acknowledged that the Adviser was attentive to cybersecurity matters and enhancing its cybersecurity protocols and procedures. The Board noted that the Adviser reported no regulatory, compliance or litigation issues in the past year and that it selected broker-dealers on the basis of best execution and trading costs.
The Board noted that the Adviser utilized technology to analyze historical market data to create and manage proprietary quantitative models that directed portfolio risk exposures but maintained discretion to adjust such exposures based on market dynamics. The Board observed that the Adviser routinely enhanced its models with timely research and incorporating new data from academia and internal studies. The Board also noted that the Adviser was careful about security selection and had developed mechanisms to reduce the signal frequency to reduce whipsaws. The Board remarked that the Adviser had programmed the investment limitations of each Counterpoint Fund into its models. The Board observed that risk management principles informed the Adviser’s security selection.
The Board agreed that the Adviser dedicated adequate resources and technology to support the investment process, risk management and compliance for each of the Counterpoint Funds. The Board concluded that it could expect the Adviser to continue providing high quality service to the Counterpoint Funds and their respective shareholders.
Performance.
Counterpoint TE—The Board noted that Counterpoint TE had earned a 3-star Morningstar rating and underperformed its peer group, Morningstar category, and benchmark over the 1-year, 5-year, and since inception periods. The Board observed that Counterpoint TE outperformed its peer group, Morningstar category, and benchmark over the 3-year period. The Board recalled that the Adviser attributed the 1-year underperformance to the lagging returns of value-oriented strategies, whereas the 3-year outperformance was attributable to a resurgence of value-oriented stocks. The Board concluded that the Adviser could be expected to provide reasonable returns to Counterpoint TE and its shareholders.
Counterpoint TI—The Board discussed that Counterpoint TI had earned a 5-star Morningstar rating and outperformed its peer group, Morningstar category, and benchmark across all periods. The Board noted that Counterpoint TI was in the top quartile for performance among its peer group and Morningstar category across all periods. The Board observed that Counterpoint TI ranked in the first quartile for Sharpe ratio over all periods relative to its Morningstar category and first quartile for Standard Deviation for all periods among its peer group except for the since inception period when it ranked in the second quartile. The Board concluded that the Adviser could be expected to provide reasonable returns to Counterpoint TI and its shareholders.
55
| COUNTERPOINT FUNDS |
| SUPPLEMENTAL INFORMATION (Unaudited) (Continued) |
| September 30, 2023 |
Counterpoint TM—The Board acknowledged that Counterpoint TM had earned a 4-star Morningstar rating and outperformed its benchmark, peer group and Morningstar category across all periods. The Board observed that Counterpoint TM ranked in the first quartile for standard deviation and net return among its peer group and Morningstar category across all periods. The Board stated Counterpoint TM ranked in the third quartile for Sharpe Ratio over the 1-year period and in the first quartile for the other time periods. The Board noted that the Adviser attributed Counterpoint TM’s long-term outperformance to adherence to the tactical models which helped the Fund avoid large drawdowns during challenging periods by reducing exposures at the appropriate times. The Board concluded that the Adviser could be expected to provide reasonable returns to Counterpoint TM and its shareholders.
Fees and Expenses.
Counterpoint TE—The Board noted that the Adviser’s advisory fee for Counterpoint TE was equal to the medians of its peer group and Morningstar category and below the averages of its peer group and Morningstar category. The Board commented that Counterpoint TE’s net expense ratio was higher than the peer group and Morningstar category medians and averages, but well below the category high. The Board acknowledged the Adviser’s position that the net expense ratio should more closely align with its peers when Counterpoint TE achieved meaningful economies of scale. Given these considerations, the Board concluded that the advisory fee for Counterpoint TE was not unreasonable.
Counterpoint TI—The Board discussed that the advisory fee and net expense ratio of Counterpoint TI was higher than the averages and medians of its peer group and Morningstar category. The Board acknowledged the Adviser’s justifications for the fees including that Counterpoint TI’s investment strategy offered higher Sharpe ratio potential than many of its peers and avoided the heavy use of exchange traded funds and derivatives relied on by its competitors. The Board recalled the Adviser’s assertion that the net expense ratio included acquired fund fees and expenses. Given these considerations, the Board concluded that the advisory fee for Counterpoint TI was not unreasonable.
Counterpoint TM—The Board noted that the Adviser’s advisory fee for Counterpoint TM and net expense ratio were higher than the averages and medians of its peer group and Morningstar category. The Board noted the Adviser’s justifications for the advisory fee including the value attributable to the Adviser’s proprietary models in executing Counterpoint TM’s strategy. Given these considerations, the Board concluded that the advisory fee for Counterpoint TM was not unreasonable.
Economies of Scale. The Board considered whether economies of scale had been realized in connection with the advisory services provided to the Counterpoint Funds. The Board acknowledged the Adviser’s willingness to consider breakpoints at a future date and the Adviser’s general concerns regarding capacity constraints with respect to certain Counterpoint Funds. The Board considered the protection from higher fees offered to shareholders from the expense limitation agreements. The Board agreed to monitor and revisit the issue with the Adviser at the time of the six-month review.
Profitability.
The Board reviewed the Adviser’s profitability analysis in connection with its management of each Counterpoint Fund. The Board examined the Adviser’s responses and noted that the Adviser’s calculations demonstrated a degree of profitability that was not insignificant for each Counterpoint Fund. The Board considered factors cited by the Adviser to support the level of profits, including, without limitation, the resources required in light of the sophistication of the strategies, as well as the business, operational, and regulatory risks involved in managing the Counterpoint Funds. The Board also considered the benefits that the Adviser could derive from its soft dollar arrangements. The Board concluded that the Adviser’s profitability for each Counterpoint Fund was not excessive.
Conclusion. Having requested and reviewed such information from the Adviser as the Board believed to be reasonably necessary to evaluate the terms of the Advisory Agreements, and as assisted by the advice of independent counsel, the Board concluded that renewal of the Advisory Agreements was in the best interests of each Counterpoint Fund and its respective shareholders.
| * | Due to timing of the contract renewal schedule, these deliberations may or may not relate to the current performance results of the Counterpoint Funds. |
56
| COUNTERPOINT FUNDS |
| SUPPLEMENTAL INFORMATION (Unaudited) |
| September 30, 2023 |
The Trustees and officers of the Trust, together with information as to their principal business occupations during the past five years and other information, are shown below. Unless otherwise noted, the address of each Trustee and officer is 225 Pictoria Drive, Suite 450, Cincinnati, Ohio 45246.
| Independent Trustees | |||||
| Name, Address, Year of Birth | Position(s) Held with Registrant | Length of Service and Term | Principal Occupation(s) During Past 5 Years | Number of Funds Overseen In The Fund Complex* | Other Directorships Held During Past 5 Years** |
| Patricia Luscombe 1961 | Trustee | Since January 2015, Indefinite | Managing Director of the Valuations and Opinions Group, Lincoln International LLC (since August 2007). | 4 | Northern Lights Fund Trust III (for series not affiliated with the Fund since 2015); Monetta Mutual Funds (since November 2015). |
| John V. Palancia 1954 | Trustee, Chairman | Trustee, since February 2012, Indefinite; Chairman of the Board since May 2014. | Retired (since 2011); formerly, Director of Global Futures Operations Control, Merrill Lynch, Pierce, Fenner & Smith, Inc. (1975-2011). | 4 | Northern Lights Fund Trust III (for series not affiliated with the Fund since 2012); Northern Lights Fund Trust (since 2011); Northern Lights Variable Trust (since 2011); Alternative Strategies Fund (since 2012). |
| Mark H. Taylor 1964 | Trustee, Chairman of the Audit Committee | Since February 2012, Indefinite | PhD (Accounting), CPA; Professor and Director, Lynn Pippenger School of Accountancy, Muma College of Business, University of South Florida (2019 – present); Professor and Department of Accountancy Chair, Case Western Reserve University (2009-2019); President, American Accounting Association (AAA) since August 2022 (President-Elect 2022-2023,President 2023-2024; Past President 2024-2025). AAA Vice President-Finance (2017-2020); President, Auditing Section of the AAA; Member, AICPA Auditing Standards Board (2009-2012); Academic Fellow, Office of the Chief Accountant, United States Securities Exchange Commission (2005-2006); Center for Audit Quality research grants (2014, 2012). | 4 | Northern Lights Fund Trust III (for series not affiliated with the Fund since 2012); Northern Lights Fund Trust (since 2007); Northern Lights Variable Trust (since 2007); Alternative Strategies Fund (since June 2010). |
| Jeffery D. Young 1956 | Trustee | Since January 2015, Indefinite | Co-owner and Vice President, Latin America Agriculture Development Corp. (since May 2015); President, Celeritas Rail Consulting (since June 2014); Asst. Vice President -Transportation Systems, Union Pacific Railroad Company (June 1976 to April 2014). | 4 | Northern Lights Fund Trust III (for series not affiliated with the Fund since 2015). |
| * | As of September 30, 2023, the Trust was comprised of 29 active portfolios managed by 14 unaffiliated investment advisers. The term “Fund Complex” applies only to the Funds. The Funds do not hold themselves out as related to any other series within the Trust for investment purposes, nor do they share the same investment adviser with any other series. |
| ** | Only includes directorships held within the past 5 years in a company with a class of securities registered pursuant to Section 12 of the Securities Exchange Act of 1934 or subject to the requirements of Section 15(d) of the Securities Exchange Act of 1934, or any company registered as an investment company under the 1940 Act. |
9/30/23-NLFT III-v1
57
| COUNTERPOINT FUNDS |
| SUPPLEMENTAL INFORMATION (Unaudited) (Continued) |
| September 30, 2023 |
Officers of the Trust
| Name, Address, Year of Birth | Position(s) Held with Registrant | Length of Service and Term | Principal Occupation(s) During Past 5 Years |
| Brian Curley 1970 | President | Since May 2023, indefinite | Vice President, Ultimus Fund Solutions, LLC (since 2020); Vice President, Gemini Fund Services, LLC (2015-2020). |
| Timothy Burdick 1986 | Vice President | Since May 2023, indefinite | Vice President and Senior Managing Counsel, Ultimus Fund Solutions, LLC (2023 – present); Vice President and Managing Counsel, Ultimus Fund Solutions, LLC (2022 – 2023); Assistant Vice President and Counsel, Ultimus Fund Solutions, LLC (2019 – 2022). |
| Richard Gleason 1977 | Treasurer | Since May 2023, indefinite | Assistant Vice President, Ultimus Fund Solutions, LLC (since 2020); Assistant Vice President, Gemini Fund Services, LLC (2012-2020). |
| Viktoriya Pallino 1995 | Secretary | Since August 2022, indefinite | Senior Legal Administrator, Ultimus Fund Solutions, LLC (since 2023); Legal Administrator II, Ultimus Fund Solutions, LLC (2021-2023); Legal Administrator I, Ultimus Fund Solutions, LLC (2019-2021); Legal Administration Associate,Gemini Fund Services, LLC (2017-2019). |
| William Kimme 1962 | Chief Compliance Officer | Since February 2012, indefinite | Senior Compliance Officer of Northern Lights Compliance Services, LLC (since 2011). |
The Funds’ Statement of Additional Information includes additional information about the Trustees and is available free of charge, upon request, by calling toll-free at 1-844-273-8637.
9/30/23-NLFT III-v1
58
PRIVACY NOTICE | ||||
| Rev. June 2021 | ||||
| FACTS | WHAT DOES NORTHERN LIGHTS FUND TRUST III DO WITH YOUR PERSONAL INFORMATION? | |||
| Why? | Financial companies choose how they share your personal information. Federal law gives consumers the right to limit some but not all sharing. Federal law also requires us to tell you how we collect, share, and protect your personal information. Please read this notice carefully to understand what we do. | |||
| What? | The types of personal information we collect and share depend on the product or service you have with us. This information can include: | |||
■ Social Security number
■ Assets
■ Retirement Assets
■ Transaction History
■ Checking Account Information | ■ Purchase History
■ Account Balances
■ Account Transactions
■ Wire Transfer Instructions
| |||
| When you are no longer our customer, we continue to share your information as described in this notice. | ||||
| How? | All financial companies need to share customers’ personal information to run their everyday business. In the section below, we list the reasons financial companies can share their customers’ personal information; the reasons Northern Lights Fund Trust III chooses to share; and whether you can limit this sharing. | |||
| Reasons we can share your personal information | Does Northern Lights Fund Trust III share? | Can you limit this sharing? | ||
For our everyday business purposes – such as to process your transactions, maintain your account(s), respond to court orders and legal investigations, or report to credit bureaus | Yes | No | ||
For our marketing purposes – to offer our products and services to you | No | We don’t share | ||
| For joint marketing with other financial companies | No | We don’t share | ||
For our affiliates’ everyday business purposes – information about your transactions and experiences | No | We don’t share | ||
For our affiliates’ everyday business purposes – information about your creditworthiness | No | We don’t share | ||
| For nonaffiliates to market to you | No | We don’t share | ||
| Questions? | Call (631) 490-4300 | |||
59
| Who we are | |
| Who is providing this notice? | Northern Lights Fund Trust III
|
| What we do | |
| How does Northern Lights Fund Trust III protect my personal information? | To protect your personal information from unauthorized access and use, we use security measures that comply with federal law. These measures include computer safeguards and secured files and buildings.
Our service providers are held accountable for adhering to strict policies and procedures to prevent any misuse of your nonpublic personal information. |
| How does Northern Lights Fund Trust III collect my personal information? | We collect your personal information, for example, when you
■ Open an account
■ Provide account information
■ Give us your contact information
■ Make deposits or withdrawals from your account
■ Make a wire transfer
■ Tell us where to send the money
■ Tells us who receives the money
■ Show your government-issued ID
■ Show your driver’s license
We also collect your personal information from other companies. |
| Why can’t I limit all sharing? | Federal law gives you the right to limit only
■ Sharing for affiliates’ everyday business purposes – information about your creditworthiness
■ Affiliates from using your information to market to you
■ Sharing for nonaffiliates to market to you
State laws and individual companies may give you additional rights to limit sharing. |
| Definitions | |
| Affiliates | Companies related by common ownership or control. They can be financial and nonfinancial companies.
■ Northern Lights Fund Trust III does not share with our affiliates. |
| Nonaffiliates | Companies not related by common ownership or control. They can be financial and nonfinancial companies
■ Northern Lights Fund Trust III does not share with nonaffiliates so they can market to you. |
| Joint marketing | A formal agreement between nonaffiliated financial companies that together market financial products or services to you.
■ Northern Lights Fund Trust III doesn’t jointly market. |
60
PROXY VOTING POLICY
Information regarding how each Fund voted proxies relating to portfolio securities for the most recent twelve month period ended June 30 as well as a description of the policies and procedures that the Funds use to determine how to vote proxies is or will be available without charge, upon request, by calling 1-844-273-8637 or by referring to the Securities and Exchange Commission’s (“SEC”) website at http://www.sec.gov.
PORTFOLIO HOLDINGS
Each Fund files its complete schedule of portfolio holdings with the SEC for the first and third quarters of each fiscal year on Form N-PORT. Form N-PORT is available on the SEC’s website at http://www.sec.gov. The information on Form N-PORT is available without charge, upon request, by calling 1-844-273-8637.
| INVESTMENT ADVISOR |
| Counterpoint Mutual Funds, LLC |
| 12760 High Bluff Drive, Suite 280 |
| San Diego, California 92130 |
| ADMINISTRATOR |
| Ultimus Fund Solutions, LLC |
| 225 Pictoria Drive, Suite 450 |
| Cincinnati, Ohio 45246 |
| Counterpoint-AR23 |
(a) Include a copy of the report transmitted to stockholders pursuant to Rule 30e-1 under the Act (17 CFR 270.30e-1).
(b) Include a copy of each notice transmitted to stockholders in reliance on Rule 30e-3 under the Act (17 CFR 270.30e-3) that contains disclosures specified by paragraph (c)(3) of that rule. Not applicable.
Item 2. Code of Ethics.
(a) As of the end of the period covered by this report, the registrant has adopted a code of ethics that applies to the registrant's principal executive officer, principal financial officer, principal accounting officer or controller, or persons performing similar functions, regardless of whether these individuals are employed by the registrant or a third party.
(b) For purposes of this item, “code of ethics” means written standards that are reasonably designed to deter wrongdoing and to promote:
| (1) | Honest and ethical conduct, including the ethical handling of actual or apparent conflicts of interest between personal and professional relationships; |
| (2) | Full, fair, accurate, timely, and understandable disclosure in reports and documents that a registrant files with, or submits to, the Commission and in other public communications made by the registrant; |
(3) Compliance with applicable governmental laws, rules, and regulations;
| (4) | The prompt internal reporting of violations of the code to an appropriate person or persons identified in the code; and |
(5) Accountability for adherence to the code.
(c) Amendments: During the period covered by the report, there have not been any amendments to the provisions of the code of ethics.
(d) Waivers: During the period covered by the report, the registrant has not granted any express or implicit waivers from the provisions of the code of ethics.
(e) The Code of Ethics is not posted on Registrant’ website.
(f) A copy of the Code of Ethics is attached as an exhibit.
Item 3. Audit Committee Financial Expert.
(a)(1)ii The board of directors of the fund has determined that the fund does not have an audit committee financial expert serving on its audit committee.
(a)(2) Not applicable.
(a)(3) In this regard, no member of the audit committee was identified as having all of the required technical attributes identified in instruction 2 (b) to item 3 of Form N-CSR to qualify as an “audit committee financial expert,” whether through the type of specialized education or experience required by that instruction. At this time, the board believes the experience provided by each member of the audit committee collectively offers the fund adequate oversight by its audit committee given the fund’s level of financial complexity. The board will from time to time reexamine such belief.
Item 4. Principal Accountant Fees and Services.
(a)
| Audit Fees | 2023 | 2022 | |
| Counterpoint Tactical Income Fund | $17,500 | $16,625 | |
| Counterpoint Tactical Equity Fund | $17,750 | $16,500 | |
| Counterpoint Tactical Municipal Fund | $17,250 | $16,500 |
(b)
| Audit-Related Fees | 2023 | 2022 | |
| Counterpoint Tactical Income Fund | $0 | $0 | |
| Counterpoint Tactical Equity Fund | $0 | $0 | |
| Counterpoint Tactical Municipal Fund | $0 | $0 |
(c)
| Tax Fees | 2023 | 2022 | |
| Counterpoint Tactical Income Fund | $4,000 | $3,700 | |
| Counterpoint Tactical Equity Fund | $4,000 | $3,700 | |
| Counterpoint Tactical Municipal Fund | $4,000 | $3,700 |
Preparation of Federal & State income tax returns, assistance with calculation of required income, capital gain and excise distributions and preparation of Federal excise tax returns.
(d)
| All Other Fees | 2023 | 2022 | |
| Counterpoint Tactical Income Fund | $0 | $0 | |
| Counterpoint Tactical Equity Fund | $0 | $0 | |
| Counterpoint Tactical Municipal Fund | $0 | $0 |
| (e) | (1) Audit Committee’s Pre-Approval Policies |
The registrant’s Audit Committee is required to pre-approve all audit services and, when appropriate, any non-audit services (including audit-related, tax and all other services) to the registrant. The registrant’s Audit Committee also is required to pre-approve, when appropriate, any non-audit services (including audit-related, tax and all other services) to its adviser, or any entity controlling, controlled by or under common control with the adviser that provides ongoing services to the registrant, to the extent that the services may be determined to have an impact on the operations or financial reporting of the registrant. Services are reviewed on an engagement by engagement basis by the Audit Committee.
| (2) | Percentages of Services Approved by the Audit Committee |
Counterpoint Tactical Income Fund
2023 2022
Audit-Related Fees: 0.00% 0.00%
Tax Fees: 0.00% 0.00%
All Other Fees: 0.00% 0.00%
Counterpoint Tactical Equity Fund
2023 2022
Audit-Related Fees: 0.00% 0.00%
Tax Fees: 0.00% 0.00%
All Other Fees: 0.00% 0.00%
Counterpoint Tactical Municipal Fund
2023 2022
Audit-Related Fees: 0.00% 0.00%
Tax Fees: 0.00% 0.00%
All Other Fees: 0.00% 0.00%
| (f) | During the audit of registrant's financial statements for the most recent fiscal year, less than 50 percent of the hours expended on the principal accountant's engagement were attributed to work performed by persons other than the principal accountant's full-time, permanent employees. |
| (g) | The aggregate non-audit fees billed by the registrant's accountant for services rendered to the registrant, and rendered to the registrant's investment adviser (not including any sub-adviser whose role is primarily portfolio management and is subcontracted with or overseen by another investment adviser), and any entity controlling, controlled by, or under common control with the adviser that provides ongoing services to the registrant: |
2023 | 2022 | |||||||
| Counterpoint Tactical Income Fund | $ | 4,000 | $ | 3,700 | ||||
| Counterpoint Tactical Equity Fund | $ | 4,000 | $ | 3,700 | ||||
| Counterpoint Tactical Municipal Fund | $ | 4,000 | $ | 3,700 |
(h) The registrant's audit committee has considered whether the provision of non-audit services to the registrant's investment adviser (not including any sub-adviser whose role is primarily portfolio management and is subcontracted with or overseen by another investment adviser), and any entity controlling, controlled by, or under common control with the investment adviser that provides ongoing services to the registrant, that were not pre-approved pursuant to paragraph (c)(7)(ii) of Rule 2-01 of Regulation S-X, is compatible with maintaining the principal accountant's independence.
(i) Not applicable.
(j) Not applicable.
Item 5. Audit Committee of Listed Companies. Not applicable to open-end investment companies.
Item 6. Schedule of Investments. Schedule of investments in securities of unaffiliated issuers is included under Item 1.
Item 7. Disclosure of Proxy Voting Policies and Procedures for Closed-End Funds. Not applicable to open-end investment companies.
Item 8. Portfolio Managers of Closed-End Management Investment Companies. Not applicable to open-end investment companies.
Item 9. Purchases of Equity Securities by Closed-End Funds. Not applicable to open-end investment companies.
Item 10. Submission of Matters to a Vote of Security Holders. None
Item 11. Controls and Procedures.
(a) Based on an evaluation of the Registrant’s disclosure controls and procedures as of a date within 90 days of filing date of this Form N-CSR, the principal executive officer and principal financial officer of the Registrant have concluded that the disclosure controls and procedures of the Registrant are reasonably designed to ensure that the information required in filings on Form N-CSR is recorded, processed, summarized, and reported by the filing date, including that information required to be disclosed is accumulated and communicated to the Registrant’s management, including the Registrant’s principal executive officer and principal financial officer, as appropriate to allow timely decisions regarding required disclosure.
(b) There were no significant changes in the Registrant’s internal control over financial reporting that occurred during the period covered by this report that have materially affected, or are reasonably likely to materially affect, the Registrant’s internal control over financial reporting.
Item 12. Disclosure of securities lending activities for closed-end management investment companies.
Not applicable to open-end investment companies.
Item 13. Exhibits.
(a)(1) Not applicable.
(a)(3) Not applicable for open-end investment companies.
SIGNATURES
Pursuant to the requirements of the Securities Exchange Act of 1934 and the Investment Company Act of 1940, the registrant has duly caused this report to be signed on its behalf by the undersigned, thereunto duly authorized.
(Registrant) Northern Lights Fund Trust III
By (Signature and Title)
/s/ Brian Curley
Brian Curley, Principal Executive Officer/President
Date 12/12/23
Pursuant to the requirements of the Securities Exchange Act of 1934 and the Investment Company Act of 1940, this report has been signed below by the following persons on behalf of the registrant and in the capacities and on the dates indicated.
By (Signature and Title)
/s/ Brian Curley
Brian Curley, Principal Executive Officer/President
Date 12/12/23
By (Signature and Title)
/s/ Rich Gleason
Rich Gleason, Principal Financial Officer/Treasurer
Date 12/12/23