UNITED STATES
SECURITIES AND EXCHANGE COMMISSION
Washington, D.C. 20549
FORM N-CSR
CERTIFIED SHAREHOLDER REPORT OF REGISTERED MANAGEMENT INVESTMENT COMPANIES
Investment Company Act file number 811-22652
First Trust Variable Insurance Trust
(Exact name of registrant as specified in charter)
120 East Liberty Drive, Suite 400
Wheaton, IL 60187
(Address of principal executive offices) (Zip code)
W. Scott Jardine, Esq.
First Trust Portfolios L.P.
120 East Liberty Drive, Suite 400
Wheaton, IL 60187
(Name and address of agent for service)
registrant’s telephone number, including area code: 630-765-8000
Date of fiscal year end: December 31
Date of reporting period: June 30, 2023
Form N-CSR is to be used by management investment companies to file reports with the Commission not later than 10 days after the transmission to stockholders of any report that is required to be transmitted to stockholders under Rule 30e-1 under the Investment Company Act of 1940 (17 CFR 270.30e-1). The Commission may use the information provided on Form N-CSR in its regulatory, disclosure review, inspection, and policymaking roles.
A registrant is required to disclose the information specified by Form N-CSR, and the Commission will make this information public. A registrant is not required to respond to the collection of information contained in Form N-CSR unless the Form displays a currently valid Office of Management and Budget (“OMB”) control number. Please direct comments concerning the accuracy of the information collection burden estimate and any suggestions for reducing the burden to Secretary, Securities and Exchange Commission, 100 F Street, NE, Washington, DC 20549. The OMB has reviewed this collection of information under the clearance requirements of 44 U.S.C. § 3507.
Item 1. Reports to Stockholders.
| (a) | | The Report to Shareholders is attached herewith. |
First Trust Variable Insurance Trust
Semi-Annual Report
For the Period Ended
June 30, 2023
First Trust Variable Insurance Trust
Semi-Annual Report
June 30, 2023
Caution Regarding Forward-Looking Statements
This report contains certain forward-looking statements within the meaning of the Securities Act of 1933, as amended, and the Securities Exchange Act of 1934, as amended. Forward-looking statements include statements regarding the goals, beliefs, plans or current expectations of First Trust Advisors L.P. (“First Trust” or the “Advisor”), Energy Income Partners, LLC (“EIP” or the “Sub-Advisor”), and/or Stonebridge Advisors LLC (“Stonebridge” or the “Sub-Advisor”) and their respective representatives, taking into account the information currently available to them. Forward-looking statements include all statements that do not relate solely to current or historical fact. For example, forward-looking statements include the use of words such as “anticipate,” “estimate,” “intend,” “expect,” “believe,” “plan,” “may,” “should,” “would” or other words that convey uncertainty of future events or outcomes.
Forward-looking statements involve known and unknown risks, uncertainties and other factors that may cause the actual results, performance or achievements of any series of First Trust Variable Insurance Trust (the “Trust”) to be materially different from any future results, performance or achievements expressed or implied by the forward-looking statements. When evaluating the information included in this report, you are cautioned not to place undue reliance on these forward-looking statements, which reflect the judgment of the Advisor and/or Sub-Advisor and their respective representatives only as of the date hereof. We undertake no obligation to publicly revise or update these forward-looking statements to reflect events and circumstances that arise after the date hereof.
Performance and Risk Disclosure
There is no assurance that any series (individually called a “Fund” and collectively the “Funds”) of the Trust will achieve its investment objectives. Each Fund is subject to market risk, which is the possibility that the market values of securities owned by the Fund will decline and that the value of the Fund’s shares may therefore be less than what you paid for them. Accordingly, you can lose money by investing in a Fund. See “Risk Considerations” in the Additional Information section of this report for a discussion of certain other risks of investing in the Funds.
Performance data quoted represents past performance, which is no guarantee of future results, and current performance may be lower or higher than the figures shown. For the most recent month-end performance figures, please visit www.ftportfolios.com or speak with your financial advisor. Investment returns and net asset value will fluctuate and Fund shares, when sold, may be worth more or less than their original cost.
The Advisor may also periodically provide additional information on Fund performance on each Fund’s web page at www.ftportfolios.com.
How to Read This Report
This report contains information that may help you evaluate your investment. It includes details about each Fund and presents data and analysis that provide insight into each Fund’s performance.
The statistical information that follows may help you understand each Fund’s performance compared to that of relevant market benchmarks.
It is important to keep in mind that the opinions expressed by personnel of the Advisor and/or Sub-Advisors are just that: informed opinions. They should not be considered to be promises or advice. The opinions, like the statistics, cover the period through the date on the cover of this report. The material risks of investing in each Fund are spelled out in the prospectus, the statement of additional information, this report and other Fund regulatory filings.
First Trust Variable Insurance Trust
Semi-Annual Letter from the Chairman and CEO
June 30, 2023
Dear Shareholders,
First Trust is pleased to provide you with the semi-annual report for the First Trust Variable Insurance Trust (the “Funds”), which contains detailed information about the Funds for the six months ended June 30, 2023. Please note that the First Trust Growth Strength Portfolio was incepted on May 16, 2023, so information contained in this letter and the report prior to that Fund’s inception date will not apply to that Fund.
One economic topic that continues to dominate headlines is whether the Federal Reserve (the “Fed”) will be able to pull off a “soft landing” for the U.S. economy, raising interest rates just high enough to curb inflation, but not so high that they stunt economic growth and cause a recession. Historically, soft landings are exceedingly rare. Over the past 60 years, the Fed has only been able to orchestrate this phenomenon once. This occurred between February 1994 and February 1995 when the Fed doubled the Federal Funds target rate (upper bound), raising it from 3.0% to 6.0%. For comparative purposes, the Federal Funds target rate (upper bound) stood at 5.25% on June 30, 2023, a full 500 basis points above its most recent low of 0.25% on March 15, 2022. Inflation, as measured by the rate of change in the Consumer Price Index (“CPI”), appears to be declining. The CPI stood at 3.0% on June 30, 2023, substantially lower than its most recent peak of 9.1% on June 30, 2022. Despite the Fed’s tighter monetary policy, the U.S. economy continues to show resilience, with gross domestic product (“GDP”) growing in each of the past three quarters.
I am continually amazed by the efficiencies that technological advances can have on production. Take, for example, the recent interest in artificial intelligence (“AI”). The U.S. Census Bureau reported that construction spending by manufacturers in the U.S. has more than doubled in the past year, reaching an annual rate of nearly $190 billion in April 2023, according to Bloomberg. Manufacturing now accounts for close to 13% of all non-government construction, its highest share on record. A portion of the growth in U.S. manufacturing is due to the CHIPS and Science Act, which provided nearly $280 billion in funding to boost domestic research and manufacturing of semiconductors in the U.S. We have also seen the excitement regarding developments in AI drive the S&P 500® Index (the “Index”) higher this year. Year-to-date through June 30, 2023, the Index posted a total return of 16.89%. When the stock market increases by 20% or more from its most recent low, it is often referred to as a “bull market.” On June 8, 2023, the Index closed at 4,293.93, 20.04% above its most recent low of 3,577.03 (which occurred on October 12, 2022).
The U.S. economy has been resilient, posting positive changes to GDP even as monetary policy tightened significantly. That said, there are also economic indicators that point to the potential for weakness over the coming quarters. The Conference Board, a non-profit business membership and research group organization, reported that its Leading Economic Index, which is composed of 10 economic indicators whose changes tend to precede changes in the overall economy, fell by 0.7% to a reading of 106.1 in June 2023, according to Reuters. The result represents the fifteenth consecutive monthly decline in the index, the longest streak of month-over-month decreases since just before the financial crisis in 2007. From our perspective, even if the Fed can pull off a soft landing, it is likely to be a very bumpy ride.
Thank you for giving First Trust the opportunity to play a role in your financial future. We value our relationship with you and will report on the Funds again in six months.
Sincerely,
James A. Bowen
Chairman of the Board of Trustees
Chief Executive Officer of First Trust Advisors L.P.
Fund Performance Overview
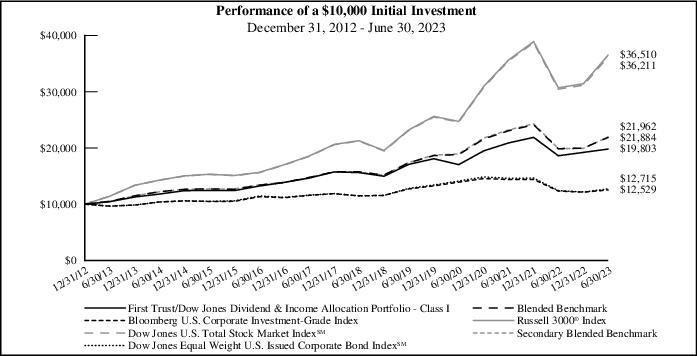
First Trust/Dow Jones Dividend & Income Allocation Portfolio
Semi-Annual Report
June 30, 2023 (Unaudited)
| Return Comparison | | | | | |
| | | | Average Annual Total Returns |
| | 6 Months Ended
6/30/23 | 1 Year Ended
6/30/23 | 5 Years Ended
6/30/23 | 10 Years Ended
6/30/23 | Inception
(5/1/12)
to 6/30/23 |
| Fund Performance | | | | | |
| First Trust/Dow Jones Dividend & Income Allocation Portfolio - Class I | 3.09% | 6.38% | 4.86% | 6.60% | 6.72% |
| Index Performance | | | | | |
| Blended Benchmark(1) | 9.57% | 10.20% | 6.80% | 7.61% | 7.73% |
| Bloomberg U.S. Corporate Investment-Grade Index(2) | 3.21% | 1.55% | 1.76% | 2.63% | 2.60% |
| Russell 3000® Index(3) | 16.17% | 18.95% | 11.39% | 12.34% | 12.62% |
| Secondary Blended Benchmark(4) | 10.21% | 10.62% | 6.91% | 7.66% | 7.78% |
| Dow Jones Equal Weight U.S. Issued Corporate Bond IndexSM(5) | 4.38% | 2.41% | 2.09% | 2.81% | 2.77% |
| Dow Jones U.S. Total Stock Market IndexSM(6) | 16.24% | 18.90% | 11.26% | 12.23% | 12.53% |
| Return Comparison | | | | |
| | | | Average Annual
Total Returns |
| | 6 Months
Ended
6/30/23 | 1 Year
Ended
6/30/23 | 5 Years
Ended
6/30/23 | Inception
(5/1/14)
to 6/30/23 |
| Fund Performance | | | | |
| First Trust/Dow Jones Dividend & Income Allocation Portfolio - Class II | 3.20% | 6.63% | 5.11% | 6.34% |
| Index Performance | | | | |
| Blended Benchmark(1) | 9.57% | 10.20% | 6.80% | 6.89% |
| Bloomberg U.S. Corporate Investment-Grade Index(2) | 3.21% | 1.55% | 1.76% | 2.17% |
| Russell 3000® Index(3) | 16.17% | 18.95% | 11.39% | 11.34% |
| Secondary Blended Benchmark(4) | 10.21% | 10.62% | 6.91% | 6.95% |
| Dow Jones Equal Weight U.S. Issued Corporate Bond IndexSM(5) | 4.38% | 2.41% | 2.09% | 2.35% |
| Dow Jones U.S. Total Stock Market IndexSM(6) | 16.24% | 18.90% | 11.26% | 11.24% |
The returns for the Fund do not reflect the deduction of expenses associated with variable products, such as mortality and expense risk charges, separate account charges, and sales charges or the effect of taxes. These expenses would reduce the overall returns shown.
| (1) | The Blended Benchmark returns are a 50/50 split between the Russell 3000® Index and the Bloomberg U.S. Corporate Investment-Grade Index returns. The Blended Benchmark returns are calculated by using the monthly return of the two indices during each period shown above. At the beginning of each month the two indices are rebalanced to a 50-50 ratio to account for divergence from that ratio that occurred during the course of each month. The monthly returns are then compounded for each period shown above, giving the performance for the Blended Benchmark for each period shown above. |
| (2) | Bloomberg U.S. Corporate Investment-Grade Index measures the performance of investment grade U.S. corporate bonds. The index includes all publicly issued, dollar-denominated corporate bonds with a minimum of $250 million par outstanding that are investment grade-rated (Baa3/BBB- or higher). The index excludes bonds having less than one year to final maturity as well as floating rate bonds, non-registered private placements, structured notes, hybrids, and convertible securities. (Bloomberg). (The index reflects no deduction for fees, expenses or taxes). |
| (3) | The Russell 3000® Index is composed of 3,000 large U.S. companies, as determined by market capitalization. This index represents approximately 98% of the investable U.S. equity market. (Bloomberg). (The index reflects no deduction for fees, expenses or taxes). |
| (4) | The Secondary Blended Benchmark return is a 50/50 split between the Dow Jones U.S. Total Stock Market IndexSM and the Dow Jones Equal Weight U.S. Issued Corporate Bond IndexSM returns. The Secondary Blended Benchmark returns are calculated by using the monthly return of the two indices during each period shown above. At the beginning of each month the two indices are rebalanced to a 50-50 ratio to account for divergence from that ratio that occurred during the course of each month. The monthly returns are then compounded for each period shown above, giving the performance for the Secondary Blended Benchmark for each period shown above. |
| (5) | The Dow Jones Equal Weight U.S. Issued Corporate Bond IndexSM measures the return of readily tradable, high-grade U.S. corporate bonds. The index includes an equally weighted basket of 96 recently issued investment-grade corporate bonds with laddered maturities. (The index reflects no deduction for fees, expenses or taxes). |
| (6) | The Dow Jones U.S. Total Stock Market IndexSM measures all U.S. equity securities that have readily available prices. (The index reflects no deduction for fees, expenses or tax es). |
Fund Performance Overview (Continued)
First Trust/Dow Jones Dividend & Income Allocation Portfolio (Continued)
Semi-Annual Report
June 30, 2023 (Unaudited)
Fund Performance Overview (Continued)
First Trust/Dow Jones Dividend & Income Allocation Portfolio (Continued)
Semi-Annual Report
June 30, 2023 (Unaudited)
| Credit Quality(7) | % of Total
Fixed-Income
Investments |
| AAA | 5.6% |
| AA | 0.2 |
| AA- | 13.9 |
| A+ | 13.9 |
| A | 15.2 |
| A- | 13.4 |
| BBB+ | 16.1 |
| BBB | 11.7 |
| BBB- | 8.0 |
| NR | 2.0 |
| Total | 100.0% |
| Top Equity Holdings | % of Total
Investments |
| Boise Cascade Co. | 0.5% |
| American Equity Investment Life Holding Co. | 0.5 |
| Owens Corning | 0.4 |
| Matson, Inc. | 0.4 |
| Eagle Materials, Inc. | 0.4 |
| Allison Transmission Holdings, Inc. | 0.4 |
| UFP Industries, Inc. | 0.4 |
| Booz Allen Hamilton Holding Corp. | 0.4 |
| Watsco, Inc. | 0.4 |
| Lennar Corp., Class A | 0.4 |
| Total | 4.2% |
| Top Fixed-Income Holdings by Issuer | % of Total
Investments |
| U.S. Treasury | 4.0% |
| Bank of America Corp. | 3.1 |
| Goldman Sachs Group (The), Inc. | 3.0 |
| Morgan Stanley | 2.6 |
| JPMorgan Chase & Co. | 2.1 |
| Pfizer, Inc. | 2.1 |
| Duke Energy Corp. | 1.9 |
| Amgen, Inc. | 1.9 |
| Oracle Corp. | 1.7 |
| T-Mobile USA, Inc. | 1.5 |
| Total | 23.9% |
| Sector Allocation | % of Total
Investments% |
| Corporate Bonds and Notes | |
| Financials | 14.0% |
| Utilities | 9.3 |
| Health Care | 8.0 |
| Communication Services | 4.9 |
| Industrials | 3.5 |
| Energy | 2.7 |
| Information Technology | 2.3 |
| Consumer Staples | 1.0 |
| Consumer Discretionary | 0.4 |
| Real Estate | 0.1 |
| Total Corporate Bonds and Notes | 46.2% |
| Common Stocks | |
| Industrials | 16.1 |
| Financials | 15.9 |
| Health Care | 3.3 |
| Consumer Discretionary | 2.9 |
| Materials | 2.2 |
| Consumer Staples | 2.1 |
| Information Technology | 2.0 |
| Energy | 0.9 |
| Total Common Stocks | 45.4% |
| U.S. Government Bonds and Notes | 4.1% |
| Foreign Corporate Bonds and Notes | |
| Health Care | 2.3 |
| Financials | 1.1 |
| Energy | 0.2 |
| Industrials | 0.1 |
| Total Foreign Corporate Bonds and Notes | 3.7% |
| Real Estate Investment Trusts | 0.6% |
| Total | 100.0% |
| (7) | The credit quality and ratings information presented above reflect the ratings assigned by one or more nationally recognized statistical rating organizations (NRSROs), including S&P Global Ratings, Moody’s Investors Service, Inc., Fitch Ratings or a comparably rated NRSRO. For situations in which a security is rated by more than one NRSRO and the ratings are not equivalent, the highest rating is used. Sub-investment grade ratings are those rated BB+/Ba1 or lower. Investment grade ratings are those rated BBB-/Baa3 or higher. The credit ratings shown relate to the creditworthiness of the issuers of the underlying securities in the Fund, and not to the Fund or its shares. Credit ratings are subject to change. |
Fund Performance Overview (Continued)
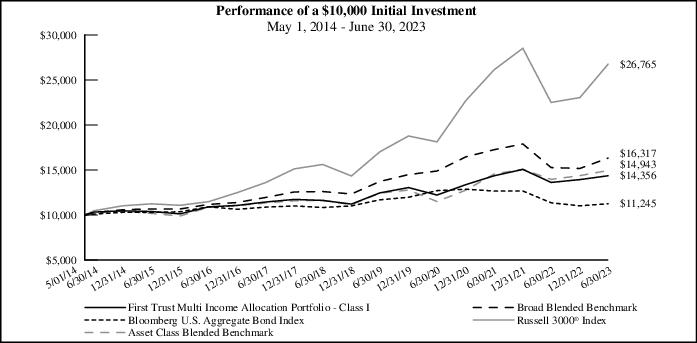
First Trust Multi Income Allocation Portfolio
Semi-Annual Report
June 30, 2023 (Unaudited)
| Return Comparison | | | | |
| | | | Average Annual
Total Returns |
| | 6 Months
Ended
6/30/23 | 1 Year
Ended
6/30/23 | 5 Years
Ended
6/30/23 | Inception
(5/1/14)
to 6/30/23 |
| Fund Performance | | | | |
| First Trust Multi Income Allocation Portfolio - Class I | 3.08% | 5.48% | 4.34% | 4.02% |
| First Trust Multi Income Allocation Portfolio - Class II | 3.29% | 5.74% | 4.60% | 4.28% |
| Index Performance | | | | |
| Broad Blended Benchmark(1) | 7.59% | 6.91% | 5.30% | 5.49% |
| Bloomberg U.S. Aggregate Bond Index(2) | 2.09% | -0.94% | 0.77% | 1.29% |
| Russell 3000® Index(3) | 16.17% | 18.95% | 11.39% | 11.34% |
| Asset Class Blended Benchmark(4) | 3.99% | 7.12% | 5.14% | 4.48% |
The returns for the Fund do not reflect the deduction of expenses associated with variable products, such as mortality and expense risk charges, separate account charges, and sales charges or the effect of taxes. These expenses would reduce the overall returns shown.
| (1) | The Broad Blended Benchmark returns are split between the Bloomberg U.S. Aggregate Bond Index (60%) and the Russell 3000® Index (40%). The Broad Blended Benchmark returns are calculated by using the monthly return of the two indices during each month shown above. At the beginning of each month the two indices are rebalanced to a 60% and 40% ratio, respectively, to account for divergence from that ratio that occurred during the course of each month. The monthly returns are then compounded for each period shown above, giving the performance for the Broad Blended Benchmark for each period shown above. |
| (2) | The Bloomberg U.S. Aggregate Bond Index represents the U.S. investment grade fixed rate bond market, with index components for government and corporate securities, mortgage pass-through securities, and asset-backed securities. Bonds included in the index are U.S. dollar denominated; have a fixed rate coupon; carry an investment-grade rating; have at least one year to final maturity; and meet certain criteria for minimum amount of outstanding par value. (The index reflects no deduction for fees, expenses or taxes). |
| (3) | The Russell 3000® Index is composed of 3,000 large U.S. companies, as determined by market capitalization. This index represents approximately 98% of the investable U.S. equity market. (Bloomberg). (The index reflects no deduction for fees, expenses or taxes). |
| (4) | The Asset Class Blended Benchmark is weighted to include nine indexes: Dow Jones U.S. Select Dividend TM Index (15%), ICE BofA Fixed Rate Preferred Securities Index (8%), Alerian MLP Index (15%), S&P U.S. REIT Index (15%), ICE BofA U.S. High Yield Constrained Index (8%), Morningstar® LSTA® U.S. Leveraged Loan Index (15%), Bloomberg U.S. Corporate Investment-Grade Index (8%), ICE BofA U.S. MBS Index (8%), and ICE BofA U.S. Inflation-Linked Treasury Index (8%).The Asset Class Benchmark returns are calculated by using the monthly return of the nine indices during each period shown above. At the beginning of each month the nine indices are rebalanced to a 15%, 8%, 15%, 15%, 8%, 15%, 8%, 8% and 8% ratio, respectively, to account for divergence from that ratio that occurred during the course of each month. The monthly returns are then compounded for each period shown above, giving the performance for the Asset Class Blended Benchmark for each period shown above. |
Fund Performance Overview (Continued)
First Trust Multi Income Allocation Portfolio (Continued)
Semi-Annual Report
June 30, 2023 (Unaudited)
| Top Ten Holdings | % of Total
Investments |
| First Trust Senior Loan ETF | 13.0% |
| iShares iBoxx $ Investment Grade Corporate Bond ETF | 7.6 |
| First Trust Institutional Preferred Securities and Income ETF | 7.6 |
| First Trust Tactical High Yield ETF | 6.9 |
| iShares 7-10 Year Treasury Bond ETF | 4.3 |
| iShares MBS ETF | 3.5 |
| First Trust Preferred Securities and Income ETF | 2.4 |
| First Trust Limited Duration Investment Grade Corporate ETF | 2.4 |
| First Trust Low Duration Opportunities ETF | 2.0 |
| Magellan Midstream Partners, L.P. | 1.4 |
| Total | 51.1% |
| Sector Allocation | % of Total
Investments |
| Exchange-Traded Funds | 50.5% |
| Common Stocks | |
| Utilities | 5.1 |
| Energy | 4.4 |
| Information Technology | 3.1 |
| Health Care | 2.4 |
| Financials | 1.8 |
| Industrials | 1.7 |
| Consumer Discretionary | 1.0 |
| Consumer Staples | 0.9 |
| Communication Services | 0.2 |
| Materials | 0.1 |
| Total Common Stocks | 20.7% |
| Real Estate Investment Trusts | 12.1% |
| U.S. Government Bonds and Notes | 8.9% |
| Master Limited Partnerships | |
| Energy | 6.2 |
| Utilities | 0.5 |
| Materials | 0.2 |
| Total Master Limited Partnerships | 6.9% |
| U.S. Government Agency Mortgage-Backed Securities | 0.9% |
| Mortgage-Backed Securities | 0.0% * |
| Total | 100.0% |
| * | Amount is less than 0.1%. |
Fund Performance Overview (Continued)
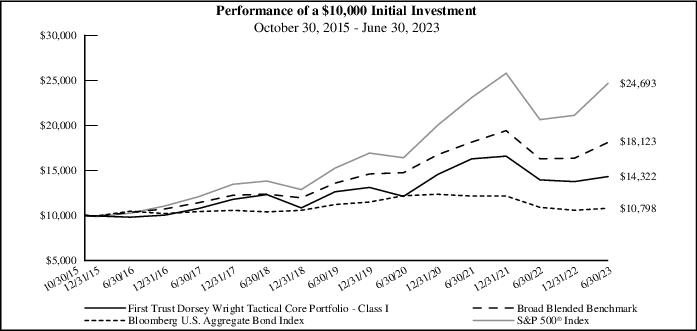
First Trust Dorsey Wright Tactical Core Portfolio
Semi-Annual Report
June 30, 2023 (Unaudited)
| Return Comparison | | | | |
| | | | Average Annual
Total Returns |
| | 6 Months
Ended
6/30/23 | 1 Year
Ended
6/30/23 | 5 Years
Ended
6/30/23 | Inception
(10/30/15)
to 6/30/23 |
| Fund Performance | | | | |
| First Trust Dorsey Wright Tactical Core Portfolio - Class I | 4.09% | 2.66% | 3.06% | 4.80% |
| First Trust Dorsey Wright Tactical Core Portfolio - Class II | 4.25% | 3.04% | 3.18% | 4.97% |
| Index Performance | | | | |
| Broad Blended Benchmark(1) | 10.81% | 11.24% | 7.94% | 8.06% |
| Bloomberg U.S. Aggregate Bond Index(2) | 2.09% | -0.94% | 0.77% | 1.01% |
| S&P 500® Index(3) | 16.89% | 19.59% | 12.31% | 12.52% |
The returns for the Fund do not reflect the deduction of expenses associated with variable products, such as mortality and expense risk charges, separate account charges, and sales charges or the effect of taxes. These expenses would reduce the overall returns shown.
| (1) | The Broad Blended Benchmark return is split between the Bloomberg U.S. Aggregate Bond Index (40%) and the S&P 500® Index (60%). The Broad Blended Benchmark returns are calculated by using the monthly return of the two indices during each period shown above. At the beginning of each month the two indices are rebalanced to a 40% and 60% ratio, respectively, to account for divergence from that ratio that occurred during the course of each month. The monthly returns are then compounded for each period shown above, giving the performance for the Broad Blended Benchmark for each period shown above. |
| (2) | The Bloomberg U.S. Aggregate Bond Index represents the U.S. investment grade fixed rate bond market, with index components for government and corporate securities, mortgage pass-through securities, and asset-backed securities. Bonds included in the index are U.S. dollar denominated; have a fixed rate coupon; carry an investment-grade rating; have at least one year to final maturity; and meet certain criteria for minimum amount of outstanding par value. (The index reflects no deduction for fees, expenses or taxes). |
| (3) | The S&P 500® Index is an unmanaged index of 500 stocks used to measure large-cap U.S. stock market performance. (The index reflects no deduction for fees, expenses or taxes). |
Fund Performance Overview (Continued)
First Trust Dorsey Wright Tactical Core Portfolio (Continued)
Semi-Annual Report
June 30, 2023 (Unaudited)
| Top Ten Holdings | % of Total
Investments |
| First Trust Mid Cap Core AlphaDEX® Fund | 7.5% |
| First Trust Mid Cap Value AlphaDEX® Fund | 7.4 |
| First Trust Large Cap Growth AlphaDEX® Fund | 7.4 |
| First Trust Nasdaq Semiconductor ETF | 6.9 |
| First Trust Industrials/Producer Durables AlphaDEX® Fund | 6.9 |
| First Trust Consumer Discretionary AlphaDEX® Fund | 6.8 |
| First Trust Dow Jones Internet Index Fund | 6.5 |
| First Trust Nasdaq Food & Beverage ETF | 6.4 |
| First Trust Developed Markets ex-US AlphaDEX® Fund | 6.2 |
| First Trust Emerging Markets AlphaDEX® Fund | 6.1 |
| Total | 68.1% |
Fund Performance Overview (Continued)
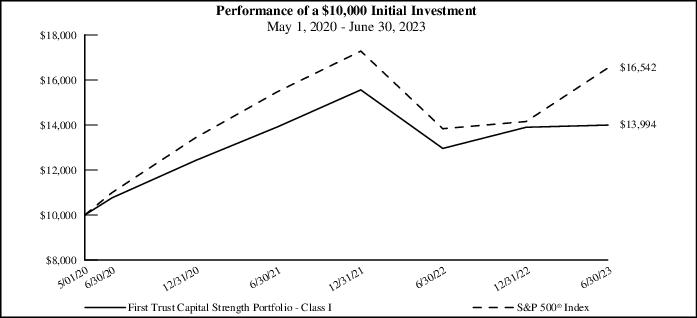
First Trust Capital Strength Portfolio
Semi-Annual Report
June 30, 2023 (Unaudited)
| Return Comparison | | | |
| | | | Average Annual
Total Returns |
| | 6 Months Ended
6/30/23 | 1 Year Ended
6/30/23 | Inception (5/1/20)
to 6/30/23 |
| Fund Performance | | | |
| First Trust Capital Strength Portfolio - Class I | 0.70% | 8.00% | 11.20% |
| First Trust Capital Strength Portfolio - Class II | 0.89% | 8.27% | 11.49% |
| Index Performance | | | |
| S&P 500® Index(1) | 16.89% | 19.59% | 17.24% |
The returns for the Fund do not reflect the deduction of expenses associated with variable products, such as mortality and expense risk charges, separate account charges, and sales charges or the effect of taxes. These expenses would reduce the overall returns shown.
| Top Ten Holdings | % of Total
Investments |
| Eli Lilly & Co. | 2.4% |
| NetApp, Inc. | 2.4 |
| Copart, Inc. | 2.3 |
| AmerisourceBergen Corp. | 2.3 |
| PACCAR, Inc. | 2.2 |
| Brown & Brown, Inc. | 2.2 |
| Amphenol Corp., Class A | 2.2 |
| Cisco Systems, Inc. | 2.2 |
| Molina Healthcare, Inc. | 2.1 |
| Monster Beverage Corp. | 2.1 |
| Total | 22.4% |
| Sector Allocation | % of Total
Investments |
| Health Care | 28.9% |
| Industrials | 22.2 |
| Financials | 16.1 |
| Consumer Staples | 13.8 |
| Information Technology | 8.7 |
| Consumer Discretionary | 6.3 |
| Materials | 2.0 |
| Communication Services | 2.0 |
| Total | 100.0% |
| (1) | The S&P 500® Index is an unmanaged index of 500 stocks used to measure large-cap U.S. stock market performance. (The index reflects no deduction for fees, expenses or taxes). |
Fund Performance Overview (Continued)
First Trust International Developed Capital Strength Portfolio
Semi-Annual Report
June 30, 2023 (Unaudited)
| Return Comparison | | | |
| | | | Average Annual
Total Returns |
| | 6 Months Ended
6/30/23 | 1 Year Ended
6/30/23 | Inception (5/1/20)
to 6/30/23 |
| Fund Performance | | | |
| First Trust International Developed Capital Strength Portfolio - Class I | 11.94% | 14.71% | 12.80% |
| First Trust International Developed Capital Strength Portfolio - Class II | 12.07% | 14.85% | 13.01% |
| Index Performance | | | |
| MSCI World ex USA Index(1) | 11.29% | 17.41% | 11.92% |
The returns for the Fund do not reflect the deduction of expenses associated with variable products, such as mortality and expense risk charges, separate account charges, and sales charges or the effect of taxes. These expenses would reduce the overall returns shown.
| Top Ten Holdings | % of Total
Investments |
| Sage Group (The) PLC | 2.4% |
| Chugai Pharmaceutical Co., Ltd. | 2.3 |
| Yamaha Motor Co., Ltd. | 2.2 |
| Industria de Diseno Textil S.A. | 2.2 |
| ABB Ltd. | 2.2 |
| Samsung Electronics Co., Ltd. | 2.2 |
| Nintendo Co., Ltd. | 2.2 |
| Shin-Etsu Chemical Co., Ltd. | 2.2 |
| Compass Group PLC | 2.2 |
| Capcom Co., Ltd. | 2.2 |
| Total | 22.3% |
| Sector Allocation | % of Total
Investments |
| Industrials | 19.7% |
| Information Technology | 16.4 |
| Consumer Staples | 15.4 |
| Health Care | 15.4 |
| Consumer Discretionary | 14.7 |
| Materials | 6.1 |
| Communication Services | 4.4 |
| Financials | 3.9 |
| Real Estate | 2.1 |
| Utilities | 1.9 |
| Total | 100.0% |
| (1) | The MSCI World ex USA Index includes developed markets and is designed to provide a broad measure of stock performance throughout the world, with the exception of U.S.-based companies. |
Fund Performance Overview (Continued)
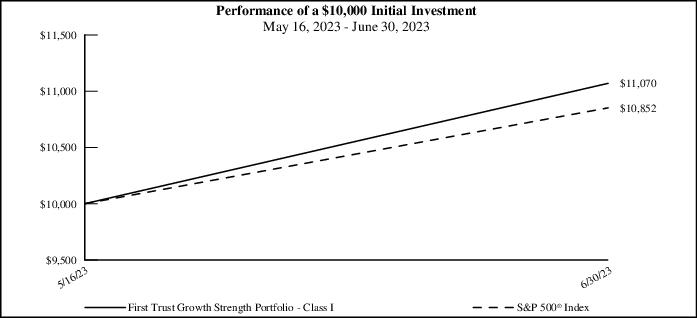
First Trust Growth Strength Portfolio
Semi-Annual Report
June 30, 2023 (Unaudited)
| Return Comparison | | |
| | | Cumulative
Total Returns |
| | | Inception (5/16/23)
to 6/30/23 |
| Fund Performance | | |
| First Trust Growth Strength Portfolio - Class I | | 10.70% |
| Index Performance | | |
| S&P 500® Index(1) | | 8.52% |
The returns for the Fund do not reflect the deduction of expenses associated with variable products, such as mortality and expense risk charges, separate account charges, and sales charges or the effect of taxes. These expenses would reduce the overall returns shown.
| Top Ten Holdings | % of Total
Investments |
| Tesla, Inc. | 3.0% |
| NVIDIA Corp. | 2.9 |
| Broadcom, Inc. | 2.6 |
| KLA Corp. | 2.5 |
| Adobe, Inc. | 2.4 |
| ON Semiconductor Corp. | 2.4 |
| Applied Materials, Inc. | 2.4 |
| Lam Research Corp. | 2.3 |
| NXP Semiconductors N.V. | 2.3 |
| Apple, Inc. | 2.2 |
| Total | 25.0% |
| Sector Allocation | % of Total
Investments |
| Information Technology | 33.0% |
| Health Care | 21.3 |
| Consumer Discretionary | 11.5 |
| Energy | 10.7 |
| Industrials | 7.9 |
| Materials | 7.7 |
| Communication Services | 2.1 |
| Real Estate | 2.0 |
| Financials | 1.9 |
| Consumer Staples | 1.9 |
| Total | 100.0% |
| (1) | The S&P 500® Index is an unmanaged index of 500 stocks used to measure large-cap U.S. stock market performance. (The index reflects no deduction for fees, expenses or taxes). |
Portfolio Management
First Trust/Dow Jones Dividend & Income Allocation Portfolio
Semi-Annual Report
June 30, 2023 (Unaudited)
Advisor
First Trust Advisors L.P. (“First Trust”) is a registered investment advisor based in Wheaton, IL and is the investment advisor to First Trust/Dow Jones Dividend & Income Allocation Portfolio (the “Fund”). In this capacity, First Trust is responsible for the selection and ongoing monitoring of the securities in the Fund’s portfolio and certain other services necessary for the management of the Fund.
Portfolio Management Team
Daniel J. Lindquist, Chairman of the Investment Committee and Managing Director of First Trust
David G. McGarel, Chief Investment Officer, Chief Operating Officer and Managing Director of First Trust
Jon C. Erickson, Senior Vice President of First Trust
Roger F. Testin, Senior Vice President of First Trust
Todd Larson, Senior Vice President of First Trust
Chris A. Peterson, Senior Vice President of First Trust
Eric Maisel, Senior Vice President of First Trust
Scott Skowronski, Senior Vice President of First Trust
Portfolio Management (Continued)
First Trust Multi Income Allocation Portfolio
Semi-Annual Report
June 30, 2023 (Unaudited)
Advisor
First Trust is a registered investment advisor based in Wheaton, IL and is the investment advisor to the First Trust Multi Income Allocation Portfolio (the “Fund”). In this capacity, First Trust is responsible for the selection and ongoing monitoring of the securities in the Fund’s portfolio and certain other services necessary for the management of the Fund. First Trust manages the Fund’s fixed income investments, as well as a portion of the Fund’s equity investments.
Sub-Advisors
Stonebridge Advisors LLC (“Stonebridge” or the “Sub-Advisor“) is a sub-advisor to the Fund and is a registered investment advisor based in Wilton, CT. Stonebridge specializes in the management of preferred securities and North American equity income securities.
Energy Income Partners, LLC (“EIP” or the “Sub-Advisor”) is a sub-advisor to the Fund and is a registered investment advisor based in Westport, CT. EIP was founded in 2003 to provide professional asset management services in publicly traded energy-related infrastructure companies with above average dividend payout ratios operating pipeline and related storage and handling facilities, electric power transmission and distribution as well as long contracted or regulated power generation from renewables and other sources. The corporate structure of the portfolio companies include C-corporations, partnerships and energy infrastructure real estate investment trusts.
Portfolio Management Team
First Trust
Daniel J. Lindquist, Chairman of the Investment Committee and Managing Director of First Trust
David G. McGarel, Chief Investment Officer, Chief Operating Officer and Managing Director of First Trust
Jon C. Erickson, Senior Vice President of First Trust
Roger F. Testin, Senior Vice President of First Trust
William Housey, Senior Vice President of First Trust
Chris A. Peterson, Senior Vice President of First Trust
Todd Larson, Senior Vice President of First Trust
James Snyder, Senior Vice President of First Trust
Jeremiah Charles, Senior Vice President of First Trust
Stonebridge
Scott Fleming, Portfolio Manager, President and Chief Investment Officer of Stonebridge
Robert Wolf, Senior Portfolio Manager and Senior Vice President of Stonebridge
EIP
James J. Murchie, Co-Portfolio Manager, Co-Founder, Principal and CEO of EIP
Eva Pao, Co-Portfolio Manager, Co-Founder, Principal of EIP
John Tysseland, Co-Portfolio Manager, Principal of EIP
Portfolio Management (Continued)
First Trust Dorsey Wright Tactical Core Portfolio
Semi-Annual Report
June 30, 2023 (Unaudited)
Advisor
First Trust is a registered investment advisor based in Wheaton, IL and is the investment advisor to First Trust Dorsey Wright Tactical Core Portfolio (the “Fund”). In this capacity, First Trust is responsible for the selection and ongoing monitoring of the securities in the Fund’s portfolio and certain other services necessary for the management of the Fund.
Portfolio Management Team
Daniel J. Lindquist, Chairman of the Investment Committee and Managing Director of First Trust
David G. McGarel, Chief Investment Officer, Chief Operating Officer and Managing Director of First Trust
Jon C. Erickson, Senior Vice President of First Trust
Roger F. Testin, Senior Vice President of First Trust
Todd Larson, Senior Vice President of First Trust
Chris A. Peterson, Senior Vice President of First Trust
Eric R. Maisel, Senior Vice President of First Trust
Scott Skowronski, Senior Vice President of First Trust
Portfolio Management (Continued)
First Trust Capital Strength Portfolio
Semi-Annual Report
June 30, 2023 (Unaudited)
Advisor
First Trust is a registered investment advisor based in Wheaton, IL and is the investment advisor to First Trust Capital Strength Portfolio (the “Fund”). In this capacity, First Trust is responsible for the selection and ongoing monitoring of the securities in the Fund’s portfolio and certain other services necessary for the management of the Fund.
Portfolio Management Team
Daniel J. Lindquist, Chairman of the Investment Committee and Managing Director of First Trust
David G. McGarel, Chief Investment Officer, Chief Operating Officer and Managing Director of First Trust
Jon C. Erickson, Senior Vice President of First Trust
Roger F. Testin, Senior Vice President of First Trust
Chris A. Peterson, Senior Vice President of First Trust
Portfolio Management (Continued)
First Trust International Developed Capital Strength Portfolio
Semi-Annual Report
June 30, 2023 (Unaudited)
Advisor
First Trust is a registered investment advisor based in Wheaton, IL and is the investment advisor to First Trust International Developed Capital Strength Portfolio (the “Fund”). In this capacity, First Trust is responsible for the selection and ongoing monitoring of the securities in the Fund’s portfolio and certain other services necessary for the management of the Fund.
Portfolio Management Team
Daniel J. Lindquist, Chairman of the Investment Committee and Managing Director of First Trust
David G. McGarel, Chief Investment Officer, Chief Operating Officer and Managing Director of First Trust
Jon C. Erickson, Senior Vice President of First Trust
Roger F. Testin, Senior Vice President of First Trust
Chris A. Peterson, Senior Vice President of First Trust
Portfolio Management (Continued)
First Trust Growth Strength Portfolio
Semi-Annual Report
June 30, 2023 (Unaudited)
Advisor
First Trust Advisors L.P. (“First Trust”) is a registered investment advisor based in Wheaton, IL and is the investment advisor to First Trust Growth Strength Portfolio (the “Fund”). In this capacity, First Trust is responsible for the selection and ongoing monitoring of the securities in the Fund’s portfolio and certain other services necessary for the management of the Fund.
Portfolio Management Team
Daniel J. Lindquist, Chairman of the Investment Committee and Managing Director of First Trust
David G. McGarel, Chief Investment Officer, Chief Operating Officer and Managing Director of First Trust
Jon C. Erickson, Senior Vice President of First Trust
Roger F. Testin, Senior Vice President of First Trust
Chris A. Peterson, Senior Vice President of First Trust
First Trust Variable Insurance Trust
Understanding Your Fund Expenses
June 30, 2023 (Unaudited)
As a shareholder of First Trust Dow/Jones Dividend & Income Allocation Portfolio, First Trust Multi Income Allocation Portfolio, First Trust Dorsey Wright Tactical Core Portfolio, First Trust Capital Strength Portfolio, First Trust International Developed Capital Strength Portfolio, or First Trust Growth Strength Portfolio (each a “Fund” and collectively, the “Funds”), you incur two types of costs: (1) transaction costs; and (2) ongoing costs, including management fees, distribution and/or service (12b-1) fees, if any, and other Fund expenses. This Example is intended to help you understand your ongoing costs of investing in the Funds and to compare these costs with the ongoing costs of investing in other funds.
The Example is based on an investment of $1,000 invested at the beginning of the period (or since inception) and held through the six-month (or shorter) period ended June 30, 2023.
Actual Expenses
The first three columns of the table below provide information about actual account values and actual expenses. You may use the information in these columns, together with the amount you invested, to estimate the expenses that you paid over the period. Simply divide your account value by $1,000 (for example, an $8,600 account value divided by $1,000 = 8.6), then multiply the result by the number in the third column under the heading entitled “Expenses Paid During Period” to estimate the expenses you paid on your account during this six-month period.
Hypothetical Example for Comparison Purposes
The next three columns of the table below provide information about hypothetical account values and hypothetical expenses based on each Fund’s actual expense ratio and an assumed rate of return of 5% per year before expenses, which is not each Fund’s actual return. The hypothetical account values and expenses may not be used to estimate the actual ending account balance or expenses you paid for the period. You may use this information to compare the ongoing costs of investing in the Funds and other funds. To do so, compare this 5% hypothetical example with the 5% hypothetical examples that appear in the shareholder reports of the other funds.
Please note that the expenses shown in the table are meant to highlight your ongoing costs only and do not reflect any transactional costs such as sales charges (loads) or contingent deferred sales charges. Therefore, the hypothetical section of the table is useful in comparing ongoing costs only, and will not help you determine the relative total costs of owning different funds. In addition, if these transactional costs were included, your costs would have been higher.
| | Actual Expenses | | Hypothetical
(5% Return Before Expenses) | |
| | Beginning
Account
Value
1/1/2023 | Ending
Account
Value
6/30/2023 | Expenses Paid
During Period
1/1/2023 -
6/30/2023 (a) | | Beginning
Account
Value
1/1/2023 | Ending
Account
Value
6/30/2023 | Expenses Paid
During Period
1/1/2023 -
6/30/2023 (a) | Annualized
Expense
Ratios (b) |
First Trust/Dow Jones Dividend
& Income Allocation Portfolio |
Class I
| $ 1,000.00 | $ 1,030.90 | $ 6.04 | | $ 1,000.00 | $ 1,018.84 | $ 6.01 | 1.20% |
Class II
| $ 1,000.00 | $ 1,032.00 | $ 4.74 | | $ 1,000.00 | $ 1,020.13 | $ 4.71 | 0.94% |
First Trust Multi Income Allocation
Portfolio (c) |
Class I
| $ 1,000.00 | $ 1,030.80 | $ 4.18 | | $ 1,000.00 | $ 1,020.68 | $ 4.16 | 0.83% |
Class II
| $ 1,000.00 | $ 1,032.90 | $ 2.92 | | $ 1,000.00 | $ 1,021.92 | $ 2.91 | 0.58% |
First Trust Dorsey Wright Tactical
Core Portfolio (c) |
Class I
| $ 1,000.00 | $ 1,040.90 | $ 4.35 | | $ 1,000.00 | $ 1,020.53 | $ 4.31 | 0.86% |
Class II
| $ 1,000.00 | $ 1,042.50 | $ 3.09 | | $ 1,000.00 | $ 1,021.77 | $ 3.06 | 0.61% |
| First Trust Capital Strength Portfolio |
Class I
| $ 1,000.00 | $ 1,007.00 | $ 5.47 | | $ 1,000.00 | $ 1,019.34 | $ 5.51 | 1.10% |
Class II
| $ 1,000.00 | $ 1,008.90 | $ 4.23 | | $ 1,000.00 | $ 1,020.58 | $ 4.26 | 0.85% |
First Trust International Developed
Capital Strength Portfolio |
Class I
| $ 1,000.00 | $ 1,119.40 | $ 6.31 | | $ 1,000.00 | $ 1,018.84 | $ 6.01 | 1.20% |
Class II
| $ 1,000.00 | $ 1,120.70 | $ 5.00 | | $ 1,000.00 | $ 1,020.08 | $ 4.76 | 0.95% |
First Trust Variable Insurance Trust
Understanding Your Fund Expenses (Continued)
June 30, 2023 (Unaudited)
| | Actual Expenses | | Hypothetical
(5% Return Before Expenses) | |
| | Beginning
Account
Value
5/16/2023 (d) | Ending
Account
Value
6/30/2023 | Expenses Paid
During Period
5/16/2023 (d) -
6/30/2023 (e) | | Beginning
Account
Value
5/16/2023 (d) | Ending
Account
Value
6/30/2023 | Expenses Paid
During Period
5/16/2023 (d) -
6/30/2023 (e) | Annualized
Expense
Ratios (b) |
| First Trust Growth Strength Portfolio |
Class I
| $ 1,000.00 | $ 1,107.00 | $ 1.59 | | $ 1,000.00 | $ 1,018.84 | $ 6.01 | 1.20% |
| (a) | Expenses are equal to the annualized expense ratios as indicated in the table multiplied by the average account value over the period (January 1, 2023 through June 30, 2023), multiplied by 181/365 (to reflect the six-month period). |
| (b) | These expense ratios reflect expense caps. First Trust Multi Income Allocation Portfolio expense ratios reflect an additional waiver. See Note 3 in the Notes to Financial Statements. |
| (c) | Annualized expense ratio and expenses paid during the six-month period do not include fees and expenses of the underlying funds in which the Fund invests. |
| (d) | Inception date. |
| (e) | Actual expenses are equal to the annualized expense ratio as indicated in the table multiplied by the average account value over the period (May 16, 2023 through June 30, 2023), multiplied by 46/365. Hypothetical expenses are assumed for the most recent six-month period. |
First Trust/Dow Jones Dividend & Income Allocation Portfolio
Portfolio of Investments
June 30, 2023 (Unaudited)
Principal
Value | | Description | | Stated
Coupon | | Stated
Maturity | | Value |
| CORPORATE BONDS AND NOTES – 45.8% |
| | | Aerospace & Defense – 2.4% | | | | | | |
| $1,000,000 | | Boeing (The) Co.
| | 2.20% | | 02/04/26 | | $918,229 |
| 500,000 | | Boeing (The) Co.
| | 2.70% | | 02/01/27 | | 457,271 |
| 500,000 | | Boeing (The) Co.
| | 3.25% | | 02/01/28 | | 459,400 |
| 250,000 | | Boeing (The) Co.
| | 3.20% | | 03/01/29 | | 223,691 |
| 500,000 | | Boeing (The) Co.
| | 2.95% | | 02/01/30 | | 434,940 |
| 1,000,000 | | Boeing (The) Co.
| | 5.71% | | 05/01/40 | | 998,266 |
| 1,000,000 | | Lockheed Martin Corp.
| | 5.10% | | 11/15/27 | | 1,017,643 |
| 2,000,000 | | Lockheed Martin Corp.
| | 5.25% | | 01/15/33 | | 2,072,762 |
| 1,000,000 | | Lockheed Martin Corp.
| | 5.70% | | 11/15/54 | | 1,111,156 |
| 1,000,000 | | Lockheed Martin Corp.
| | 5.90% | | 11/15/63 | | 1,139,425 |
| 500,000 | | Northrop Grumman Corp.
| | 2.93% | | 01/15/25 | | 480,740 |
| 500,000 | | Northrop Grumman Corp.
| | 3.25% | | 01/15/28 | | 466,635 |
| 500,000 | | Northrop Grumman Corp.
| | 4.70% | | 03/15/33 | | 490,985 |
| 750,000 | | Northrop Grumman Corp.
| | 4.03% | | 10/15/47 | | 645,263 |
| 250,000 | | Northrop Grumman Corp.
| | 5.25% | | 05/01/50 | | 254,390 |
| 1,000,000 | | Northrop Grumman Corp.
| | 4.95% | | 03/15/53 | | 975,168 |
| 500,000 | | Raytheon Technologies Corp.
| | 5.00% | | 02/27/26 | | 499,580 |
| 1,000,000 | | Raytheon Technologies Corp.
| | 3.13% | | 05/04/27 | | 937,351 |
| 1,873,000 | | Raytheon Technologies Corp.
| | 2.38% | | 03/15/32 | | 1,535,903 |
| 2,500,000 | | Raytheon Technologies Corp.
| | 5.15% | | 02/27/33 | | 2,535,268 |
| 1,500,000 | | Raytheon Technologies Corp.
| | 3.13% | | 07/01/50 | | 1,087,925 |
| 1,000,000 | | Raytheon Technologies Corp.
| | 2.82% | | 09/01/51 | | 672,519 |
| 2,500,000 | | Raytheon Technologies Corp.
| | 5.38% | | 02/27/53 | | 2,598,638 |
| | | | | 22,013,148 |
| | | Air Freight & Logistics – 0.1% | | | | | | |
| 1,750,000 | | FedEx Corp.
| | 3.25% | | 05/15/41 | | 1,308,451 |
| | | Banks – 7.2% | | | | | | |
| 2,050,000 | | Bank of America Corp. (a)
| | 1.84% | | 02/04/25 | | 1,997,603 |
| 750,000 | | Bank of America Corp. (a)
| | 2.02% | | 02/13/26 | | 702,710 |
| 2,500,000 | | Bank of America Corp. (a)
| | 3.38% | | 04/02/26 | | 2,397,657 |
| 950,000 | | Bank of America Corp.
| | 3.50% | | 04/19/26 | | 911,819 |
| 1,000,000 | | Bank of America Corp. (a)
| | 1.20% | | 10/24/26 | | 900,201 |
| 2,500,000 | | Bank of America Corp. (a)
| | 5.08% | | 01/20/27 | | 2,462,486 |
| 500,000 | | Bank of America Corp. (a)
| | 3.56% | | 04/23/27 | | 474,268 |
| 450,000 | | Bank of America Corp. (a)
| | 2.55% | | 02/04/28 | | 406,488 |
| 475,000 | | Bank of America Corp. (a)
| | 4.38% | | 04/27/28 | | 456,370 |
| 1,000,000 | | Bank of America Corp. (a)
| | 4.95% | | 07/22/28 | | 982,911 |
| 1,105,000 | | Bank of America Corp. (a)
| | 5.20% | | 04/25/29 | | 1,093,614 |
| 1,000,000 | | Bank of America Corp. (a)
| | 2.09% | | 06/14/29 | | 853,822 |
| 500,000 | | Bank of America Corp. (a)
| | 4.27% | | 07/23/29 | | 474,767 |
| 500,000 | | Bank of America Corp. (a)
| | 3.97% | | 02/07/30 | | 463,338 |
| 500,000 | | Bank of America Corp. (a)
| | 3.19% | | 07/23/30 | | 441,119 |
| 500,000 | | Bank of America Corp. (a)
| | 2.88% | | 10/22/30 | | 430,879 |
| 500,000 | | Bank of America Corp. (a)
| | 1.90% | | 07/23/31 | | 398,392 |
| 1,000,000 | | Bank of America Corp. (a)
| | 1.92% | | 10/24/31 | | 791,901 |
| 500,000 | | Bank of America Corp. (a)
| | 2.57% | | 10/20/32 | | 407,443 |
| 750,000 | | Bank of America Corp. (a)
| | 2.97% | | 02/04/33 | | 625,485 |
| 500,000 | | Bank of America Corp. (a)
| | 4.57% | | 04/27/33 | | 470,357 |
| 1,000,000 | | Bank of America Corp. (a)
| | 5.02% | | 07/22/33 | | 978,802 |
| 3,500,000 | | Bank of America Corp. (a)
| | 5.29% | | 04/25/34 | | 3,469,045 |
| 1,500,000 | | Bank of America Corp. (a)
| | 2.48% | | 09/21/36 | | 1,148,227 |
| 500,000 | | Bank of America Corp. (a)
| | 4.08% | | 04/23/40 | | 429,991 |
| 1,000,000 | | Bank of America Corp. (a)
| | 2.68% | | 06/19/41 | | 702,778 |
See Notes to Financial Statements
Page 21
First Trust/Dow Jones Dividend & Income Allocation Portfolio
Portfolio of Investments (Continued)
June 30, 2023 (Unaudited)
Principal
Value | | Description | | Stated
Coupon | | Stated
Maturity | | Value |
| CORPORATE BONDS AND NOTES (Continued) |
| | | Banks (Continued) | | | | | | |
| $2,000,000 | | Bank of America Corp. (a)
| | 3.31% | | 04/22/42 | | $1,525,502 |
| 500,000 | | Bank of America Corp. (a)
| | 3.95% | | 01/23/49 | | 406,020 |
| 500,000 | | Bank of America Corp. (a)
| | 4.33% | | 03/15/50 | | 430,612 |
| 500,000 | | Bank of America Corp. (a)
| | 2.83% | | 10/24/51 | | 328,815 |
| 750,000 | | Bank of America Corp. (a)
| | 2.97% | | 07/21/52 | | 510,661 |
| 1,000,000 | | Citigroup, Inc. (a)
| | 2.98% | | 11/05/30 | | 867,392 |
| 500,000 | | Citigroup, Inc. (a)
| | 2.67% | | 01/29/31 | | 423,442 |
| 2,000,000 | | Citigroup, Inc. (a)
| | 2.56% | | 05/01/32 | | 1,633,910 |
| 1,000,000 | | Citigroup, Inc. (a)
| | 3.06% | | 01/25/33 | | 835,334 |
| 500,000 | | Citigroup, Inc. (a)
| | 3.88% | | 01/24/39 | | 418,910 |
| 1,500,000 | | Citigroup, Inc. (a)
| | 2.90% | | 11/03/42 | | 1,063,765 |
| 500,000 | | Citigroup, Inc.
| | 4.65% | | 07/23/48 | | 453,352 |
| 2,000,000 | | JPMorgan Chase & Co. (a)
| | 0.82% | | 06/01/25 | | 1,901,829 |
| 500,000 | | JPMorgan Chase & Co. (a)
| | 2.30% | | 10/15/25 | | 476,652 |
| 500,000 | | JPMorgan Chase & Co. (a)
| | 2.60% | | 02/24/26 | | 474,362 |
| 1,000,000 | | JPMorgan Chase & Co. (a)
| | 4.08% | | 04/26/26 | | 972,177 |
| 500,000 | | JPMorgan Chase & Co. (a)
| | 1.05% | | 11/19/26 | | 448,073 |
| 500,000 | | JPMorgan Chase & Co. (a)
| | 1.04% | | 02/04/27 | | 445,510 |
| 500,000 | | JPMorgan Chase & Co. (a)
| | 1.58% | | 04/22/27 | | 449,356 |
| 1,000,000 | | JPMorgan Chase & Co. (a)
| | 1.47% | | 09/22/27 | | 883,427 |
| 550,000 | | JPMorgan Chase & Co. (a)
| | 2.95% | | 02/24/28 | | 505,403 |
| 975,000 | | JPMorgan Chase & Co. (a)
| | 4.32% | | 04/26/28 | | 941,687 |
| 500,000 | | JPMorgan Chase & Co. (a)
| | 4.85% | | 07/25/28 | | 493,616 |
| 500,000 | | JPMorgan Chase & Co. (a)
| | 3.51% | | 01/23/29 | | 462,637 |
| 1,000,000 | | JPMorgan Chase & Co. (a)
| | 2.07% | | 06/01/29 | | 858,382 |
| 500,000 | | JPMorgan Chase & Co. (a)
| | 4.20% | | 07/23/29 | | 475,631 |
| 500,000 | | JPMorgan Chase & Co. (a)
| | 3.70% | | 05/06/30 | | 458,666 |
| 1,000,000 | | JPMorgan Chase & Co. (a)
| | 2.58% | | 04/22/32 | | 830,973 |
| 1,000,000 | | JPMorgan Chase & Co. (a)
| | 2.96% | | 01/25/33 | | 842,746 |
| 1,000,000 | | JPMorgan Chase & Co. (a)
| | 4.59% | | 04/26/33 | | 953,683 |
| 1,000,000 | | JPMorgan Chase & Co. (a)
| | 4.91% | | 07/25/33 | | 977,561 |
| 1,000,000 | | JPMorgan Chase & Co. (a)
| | 2.53% | | 11/19/41 | | 688,838 |
| 2,000,000 | | JPMorgan Chase & Co. (a)
| | 3.16% | | 04/22/42 | | 1,511,725 |
| 500,000 | | JPMorgan Chase & Co. (a)
| | 4.26% | | 02/22/48 | | 432,052 |
| 750,000 | | JPMorgan Chase & Co. (a)
| | 3.96% | | 11/15/48 | | 617,569 |
| 500,000 | | JPMorgan Chase & Co. (a)
| | 3.90% | | 01/23/49 | | 404,801 |
| 2,000,000 | | JPMorgan Chase & Co. (a)
| | 3.33% | | 04/22/52 | | 1,459,235 |
| 1,175,000 | | PNC Financial Services Group (The), Inc. (a)
| | 5.81% | | 06/12/26 | | 1,168,554 |
| 1,000,000 | | PNC Financial Services Group (The), Inc. (a)
| | 5.58% | | 06/12/29 | | 996,017 |
| 1,000,000 | | PNC Financial Services Group (The), Inc. (a)
| | 5.07% | | 01/24/34 | | 959,317 |
| 1,000,000 | | Truist Financial Corp. (a)
| | 4.87% | | 01/26/29 | | 961,820 |
| 1,000,000 | | Truist Financial Corp. (a)
| | 5.12% | | 01/26/34 | | 948,008 |
| 2,000,000 | | US Bancorp (a)
| | 5.78% | | 06/12/29 | | 2,000,739 |
| 3,500,000 | | US Bancorp (a)
| | 4.84% | | 02/01/34 | | 3,270,919 |
| 2,000,000 | | US Bancorp (a)
| | 5.84% | | 06/12/34 | | 2,015,389 |
| | | | | 65,057,542 |
| | | Beverages – 0.7% | | | | | | |
| 875,000 | | Anheuser-Busch Cos., LLC/Anheuser-Busch InBev Worldwide, Inc.
| | 4.70% | | 02/01/36 | | 851,671 |
| 1,100,000 | | Anheuser-Busch Cos., LLC/Anheuser-Busch InBev Worldwide, Inc.
| | 4.90% | | 02/01/46 | | 1,052,296 |
| 750,000 | | Anheuser-Busch InBev Worldwide, Inc.
| | 4.38% | | 04/15/38 | | 695,243 |
| 250,000 | | Anheuser-Busch InBev Worldwide, Inc.
| | 4.35% | | 06/01/40 | | 230,152 |
| 1,182,000 | | Anheuser-Busch InBev Worldwide, Inc.
| | 4.60% | | 04/15/48 | | 1,098,297 |
Page 22
See Notes to Financial Statements
First Trust/Dow Jones Dividend & Income Allocation Portfolio
Portfolio of Investments (Continued)
June 30, 2023 (Unaudited)
Principal
Value | | Description | | Stated
Coupon | | Stated
Maturity | | Value |
| CORPORATE BONDS AND NOTES (Continued) |
| | | Beverages (Continued) | | | | | | |
| $250,000 | | Anheuser-Busch InBev Worldwide, Inc.
| | 5.55% | | 01/23/49 | | $263,740 |
| 250,000 | | Anheuser-Busch InBev Worldwide, Inc.
| | 5.80% | | 01/23/59 | | 272,841 |
| 2,000,000 | | Constellation Brands, Inc.
| | 4.90% | | 05/01/33 | | 1,965,875 |
| | | | | 6,430,115 |
| | | Biotechnology – 2.5% | | | | | | |
| 1,000,000 | | AbbVie, Inc.
| | 2.60% | | 11/21/24 | | 959,953 |
| 500,000 | | AbbVie, Inc.
| | 3.80% | | 03/15/25 | | 486,386 |
| 2,000,000 | | AbbVie, Inc.
| | 2.95% | | 11/21/26 | | 1,869,388 |
| 1,225,000 | | AbbVie, Inc.
| | 4.05% | | 11/21/39 | | 1,067,173 |
| 275,000 | | AbbVie, Inc.
| | 4.40% | | 11/06/42 | | 246,413 |
| 300,000 | | AbbVie, Inc.
| | 4.70% | | 05/14/45 | | 274,301 |
| 250,000 | | AbbVie, Inc.
| | 4.88% | | 11/14/48 | | 236,531 |
| 1,000,000 | | AbbVie, Inc.
| | 4.25% | | 11/21/49 | | 863,772 |
| 1,000,000 | | Amgen, Inc.
| | 5.51% | | 03/02/26 | | 998,338 |
| 5,000,000 | | Amgen, Inc.
| | 5.15% | | 03/02/28 | | 4,999,070 |
| 500,000 | | Amgen, Inc.
| | 2.45% | | 02/21/30 | | 428,955 |
| 500,000 | | Amgen, Inc.
| | 5.25% | | 03/02/30 | | 501,380 |
| 1,000,000 | | Amgen, Inc.
| | 2.00% | | 01/15/32 | | 790,159 |
| 500,000 | | Amgen, Inc.
| | 3.35% | | 02/22/32 | | 440,864 |
| 1,000,000 | | Amgen, Inc.
| | 5.25% | | 03/02/33 | | 1,001,753 |
| 750,000 | | Amgen, Inc.
| | 3.15% | | 02/21/40 | | 574,135 |
| 1,000,000 | | Amgen, Inc.
| | 2.80% | | 08/15/41 | | 707,388 |
| 3,000,000 | | Amgen, Inc.
| | 5.60% | | 03/02/43 | | 3,011,134 |
| 750,000 | | Amgen, Inc.
| | 3.38% | | 02/21/50 | | 550,144 |
| 500,000 | | Amgen, Inc.
| | 4.20% | | 02/22/52 | | 414,253 |
| 2,500,000 | | Amgen, Inc.
| | 5.65% | | 03/02/53 | | 2,533,575 |
| | | | | 22,955,065 |
| | | Capital Markets – 6.0% | | | | | | |
| 2,500,000 | | Bank of New York Mellon (The) Corp. (a)
| | 4.97% | | 04/26/34 | | 2,442,427 |
| 500,000 | | Goldman Sachs Group (The), Inc.
| | 3.63% | | 02/20/24 | | 492,770 |
| 600,000 | | Goldman Sachs Group (The), Inc.
| | 4.00% | | 03/03/24 | | 592,448 |
| 965,000 | | Goldman Sachs Group (The), Inc.
| | 3.00% | | 03/15/24 | | 944,809 |
| 3,000,000 | | Goldman Sachs Group (The), Inc. (a)
| | 0.93% | | 10/21/24 | | 2,949,614 |
| 1,925,000 | | Goldman Sachs Group (The), Inc.
| | 5.70% | | 11/01/24 | | 1,922,823 |
| 500,000 | | Goldman Sachs Group (The), Inc. (a)
| | 1.76% | | 01/24/25 | | 486,926 |
| 500,000 | | Goldman Sachs Group (The), Inc.
| | 3.50% | | 04/01/25 | | 480,629 |
| 500,000 | | Goldman Sachs Group (The), Inc. (a)
| | 0.86% | | 02/12/26 | | 461,036 |
| 550,000 | | Goldman Sachs Group (The), Inc.
| | 3.75% | | 02/25/26 | | 528,203 |
| 500,000 | | Goldman Sachs Group (The), Inc.
| | 3.50% | | 11/16/26 | | 469,076 |
| 750,000 | | Goldman Sachs Group (The), Inc.
| | 3.85% | | 01/26/27 | | 713,550 |
| 1,000,000 | | Goldman Sachs Group (The), Inc. (a)
| | 1.43% | | 03/09/27 | | 894,003 |
| 1,000,000 | | Goldman Sachs Group (The), Inc. (a)
| | 1.54% | | 09/10/27 | | 879,549 |
| 1,500,000 | | Goldman Sachs Group (The), Inc. (a)
| | 1.95% | | 10/21/27 | | 1,334,857 |
| 950,000 | | Goldman Sachs Group (The), Inc. (a)
| | 2.64% | | 02/24/28 | | 862,705 |
| 5,000,000 | | Goldman Sachs Group (The), Inc. (a)
| | 4.48% | | 08/23/28 | | 4,837,349 |
| 500,000 | | Goldman Sachs Group (The), Inc. (a)
| | 3.81% | | 04/23/29 | | 464,559 |
| 500,000 | | Goldman Sachs Group (The), Inc. (a)
| | 4.22% | | 05/01/29 | | 472,566 |
| 500,000 | | Goldman Sachs Group (The), Inc.
| | 2.60% | | 02/07/30 | | 426,312 |
| 1,000,000 | | Goldman Sachs Group (The), Inc. (a)
| | 1.99% | | 01/27/32 | | 787,620 |
| 1,000,000 | | Goldman Sachs Group (The), Inc. (a)
| | 2.62% | | 04/22/32 | | 820,399 |
| 1,500,000 | | Goldman Sachs Group (The), Inc. (a)
| | 2.65% | | 10/21/32 | | 1,223,187 |
| 1,000,000 | | Goldman Sachs Group (The), Inc. (a)
| | 3.10% | | 02/24/33 | | 845,206 |
| 500,000 | | Goldman Sachs Group (The), Inc. (a)
| | 4.02% | | 10/31/38 | | 423,734 |
See Notes to Financial Statements
Page 23
First Trust/Dow Jones Dividend & Income Allocation Portfolio
Portfolio of Investments (Continued)
June 30, 2023 (Unaudited)
Principal
Value | | Description | | Stated
Coupon | | Stated
Maturity | | Value |
| CORPORATE BONDS AND NOTES (Continued) |
| | | Capital Markets (Continued) | | | | | | |
| $500,000 | | Goldman Sachs Group (The), Inc. (a)
| | 4.41% | | 04/23/39 | | $436,760 |
| 1,000,000 | | Goldman Sachs Group (The), Inc. (a)
| | 3.21% | | 04/22/42 | | 740,015 |
| 1,000,000 | | Goldman Sachs Group (The), Inc. (a)
| | 2.91% | | 07/21/42 | | 707,162 |
| 500,000 | | Goldman Sachs Group (The), Inc. (a)
| | 3.44% | | 02/24/43 | | 380,902 |
| 1,500,000 | | Morgan Stanley (a)
| | 3.62% | | 04/17/25 | | 1,470,652 |
| 1,000,000 | | Morgan Stanley (a)
| | 0.86% | | 10/21/25 | | 930,351 |
| 1,000,000 | | Morgan Stanley (a)
| | 1.16% | | 10/21/25 | | 935,101 |
| 800,000 | | Morgan Stanley
| | 3.88% | | 01/27/26 | | 772,525 |
| 500,000 | | Morgan Stanley (a)
| | 2.19% | | 04/28/26 | | 469,577 |
| 1,000,000 | | Morgan Stanley (a)
| | 4.68% | | 07/17/26 | | 981,718 |
| 500,000 | | Morgan Stanley (a)
| | 5.05% | | 01/28/27 | | 495,975 |
| 1,000,000 | | Morgan Stanley (a)
| | 1.59% | | 05/04/27 | | 895,708 |
| 1,000,000 | | Morgan Stanley (a)
| | 2.48% | | 01/21/28 | | 903,214 |
| 1,050,000 | | Morgan Stanley (a)
| | 4.21% | | 04/20/28 | | 1,009,544 |
| 500,000 | | Morgan Stanley (a)
| | 3.77% | | 01/24/29 | | 467,175 |
| 1,000,000 | | Morgan Stanley (a)
| | 5.12% | | 02/01/29 | | 986,834 |
| 2,000,000 | | Morgan Stanley (a)
| | 5.16% | | 04/20/29 | | 1,977,074 |
| 500,000 | | Morgan Stanley (a)
| | 4.43% | | 01/23/30 | | 476,119 |
| 500,000 | | Morgan Stanley (a)
| | 2.70% | | 01/22/31 | | 425,455 |
| 1,000,000 | | Morgan Stanley (a)
| | 1.93% | | 04/28/32 | | 781,103 |
| 2,500,000 | | Morgan Stanley (a)
| | 2.24% | | 07/21/32 | | 1,987,991 |
| 1,000,000 | | Morgan Stanley (a)
| | 2.51% | | 10/20/32 | | 808,170 |
| 1,000,000 | | Morgan Stanley (a)
| | 2.94% | | 01/21/33 | | 831,747 |
| 1,000,000 | | Morgan Stanley (a)
| | 4.89% | | 07/20/33 | | 963,013 |
| 2,000,000 | | Morgan Stanley (a)
| | 5.25% | | 04/21/34 | | 1,975,838 |
| 1,000,000 | | Morgan Stanley (a)
| | 2.48% | | 09/16/36 | | 759,169 |
| 500,000 | | Morgan Stanley
| | 3.97% | | 07/22/38 | | 426,177 |
| 500,000 | | Morgan Stanley (a)
| | 4.46% | | 04/22/39 | | 445,870 |
| 1,000,000 | | Morgan Stanley (a)
| | 3.22% | | 04/22/42 | | 759,507 |
| 1,000,000 | | Morgan Stanley (a)
| | 2.80% | | 01/25/52 | | 657,312 |
| 1,000,000 | | Nasdaq, Inc.
| | 5.55% | | 02/15/34 | | 1,004,388 |
| 250,000 | | Nasdaq, Inc.
| | 5.95% | | 08/15/53 | | 256,152 |
| | | | | 53,874,655 |
| | | Diversified Telecommunication Services – 1.8% | | | | | | |
| 3,000,000 | | AT&T, Inc.
| | 1.70% | | 03/25/26 | | 2,735,550 |
| 500,000 | | AT&T, Inc.
| | 2.30% | | 06/01/27 | | 449,922 |
| 500,000 | | AT&T, Inc.
| | 1.65% | | 02/01/28 | | 429,974 |
| 462,000 | | AT&T, Inc.
| | 4.30% | | 02/15/30 | | 438,761 |
| 500,000 | | AT&T, Inc.
| | 2.75% | | 06/01/31 | | 422,043 |
| 500,000 | | AT&T, Inc.
| | 2.25% | | 02/01/32 | | 397,299 |
| 1,392,000 | | AT&T, Inc.
| | 2.55% | | 12/01/33 | | 1,093,863 |
| 1,186,000 | | AT&T, Inc.
| | 3.50% | | 09/15/53 | | 840,428 |
| 504,000 | | AT&T, Inc.
| | 3.55% | | 09/15/55 | | 353,203 |
| 1,044,000 | | AT&T, Inc.
| | 3.65% | | 09/15/59 | | 727,595 |
| 1,500,000 | | Verizon Communications, Inc.
| | 1.45% | | 03/20/26 | | 1,360,717 |
| 500,000 | | Verizon Communications, Inc.
| | 2.10% | | 03/22/28 | | 439,488 |
| 1,119,000 | | Verizon Communications, Inc.
| | 4.02% | | 12/03/29 | | 1,048,326 |
| 500,000 | | Verizon Communications, Inc.
| | 1.75% | | 01/20/31 | | 394,663 |
| 500,000 | | Verizon Communications, Inc.
| | 2.55% | | 03/21/31 | | 417,614 |
| 2,003,000 | | Verizon Communications, Inc.
| | 2.36% | | 03/15/32 | | 1,611,668 |
| 500,000 | | Verizon Communications, Inc.
| | 2.65% | | 11/20/40 | | 348,024 |
| 500,000 | | Verizon Communications, Inc.
| | 3.40% | | 03/22/41 | | 386,207 |
| 500,000 | | Verizon Communications, Inc.
| | 2.88% | | 11/20/50 | | 326,183 |
| 1,000,000 | | Verizon Communications, Inc.
| | 3.55% | | 03/22/51 | | 746,553 |
Page 24
See Notes to Financial Statements
First Trust/Dow Jones Dividend & Income Allocation Portfolio
Portfolio of Investments (Continued)
June 30, 2023 (Unaudited)
Principal
Value | | Description | | Stated
Coupon | | Stated
Maturity | | Value |
| CORPORATE BONDS AND NOTES (Continued) |
| | | Diversified Telecommunication Services (Continued) | | | | | | |
| $1,000,000 | | Verizon Communications, Inc.
| | 3.88% | | 03/01/52 | | $789,506 |
| | | | | 15,757,587 |
| | | Electric Utilities – 8.2% | | | | | | |
| 500,000 | | AEP Texas, Inc.
| | 4.70% | | 05/15/32 | | 479,267 |
| 1,000,000 | | AEP Texas, Inc.
| | 3.45% | | 05/15/51 | | 713,073 |
| 500,000 | | AEP Texas, Inc.
| | 5.25% | | 05/15/52 | | 472,733 |
| 900,000 | | AEP Transmission Co., LLC
| | 4.25% | | 09/15/48 | | 775,497 |
| 2,000,000 | | AEP Transmission Co., LLC
| | 2.75% | | 08/15/51 | | 1,292,549 |
| 500,000 | | AEP Transmission Co., LLC
| | 5.40% | | 03/15/53 | | 514,887 |
| 1,980,000 | | Alabama Power Co.
| | 3.75% | | 09/01/27 | | 1,893,956 |
| 500,000 | | Alabama Power Co.
| | 3.45% | | 10/01/49 | | 366,953 |
| 1,000,000 | | Alabama Power Co.
| | 3.13% | | 07/15/51 | | 693,319 |
| 1,282,000 | | American Electric Power Co., Inc.
| | 2.03% | | 03/15/24 | | 1,247,095 |
| 1,000,000 | | American Electric Power Co., Inc.
| | 5.70% | | 08/15/25 | | 994,490 |
| 2,500,000 | | American Electric Power Co., Inc.
| | 1.00% | | 11/01/25 | | 2,258,438 |
| 1,000,000 | | American Electric Power Co., Inc.
| | 5.75% | | 11/01/27 | | 1,022,275 |
| 500,000 | | American Electric Power Co., Inc.
| | 5.95% | | 11/01/32 | | 521,721 |
| 2,500,000 | | American Electric Power Co., Inc.
| | 5.63% | | 03/01/33 | | 2,543,345 |
| 2,542,000 | | American Transmission Systems, Inc. (b)
| | 2.65% | | 01/15/32 | | 2,106,050 |
| 1,000,000 | | Appalachian Power Co.
| | 2.70% | | 04/01/31 | | 833,658 |
| 2,000,000 | | Appalachian Power Co.
| | 4.50% | | 08/01/32 | | 1,875,869 |
| 1,000,000 | | Commonwealth Edison Co.
| | 2.55% | | 06/15/26 | | 934,737 |
| 500,000 | | Commonwealth Edison Co.
| | 4.90% | | 02/01/33 | | 498,181 |
| 500,000 | | Commonwealth Edison Co.
| | 4.00% | | 03/01/49 | | 414,772 |
| 1,000,000 | | Commonwealth Edison Co.
| | 5.30% | | 02/01/53 | | 1,018,451 |
| 500,000 | | Duke Energy Carolinas LLC
| | 2.85% | | 03/15/32 | | 425,368 |
| 2,000,000 | | Duke Energy Carolinas LLC
| | 4.95% | | 01/15/33 | | 1,986,200 |
| 500,000 | | Duke Energy Carolinas LLC
| | 3.55% | | 03/15/52 | | 381,891 |
| 2,000,000 | | Duke Energy Carolinas LLC
| | 5.35% | | 01/15/53 | | 2,029,061 |
| 2,000,000 | | Duke Energy Corp.
| | 5.00% | | 12/08/25 | | 1,986,746 |
| 2,000,000 | | Duke Energy Corp.
| | 5.00% | | 12/08/27 | | 1,987,825 |
| 500,000 | | Duke Energy Corp.
| | 4.30% | | 03/15/28 | | 480,687 |
| 1,000,000 | | Duke Energy Corp.
| | 4.50% | | 08/15/32 | | 943,132 |
| 2,500,000 | | Duke Energy Corp.
| | 3.30% | | 06/15/41 | | 1,844,971 |
| 2,000,000 | | Duke Energy Corp.
| | 3.50% | | 06/15/51 | | 1,451,383 |
| 2,500,000 | | Duke Energy Corp.
| | 5.00% | | 08/15/52 | | 2,287,716 |
| 500,000 | | Duke Energy Ohio, Inc.
| | 5.25% | | 04/01/33 | | 503,963 |
| 1,000,000 | | Duke Energy Progress LLC
| | 4.00% | | 04/01/52 | | 812,981 |
| 2,000,000 | | Exelon Corp.
| | 2.75% | | 03/15/27 | | 1,831,448 |
| 1,000,000 | | Exelon Corp.
| | 3.35% | | 03/15/32 | | 869,804 |
| 1,500,000 | | Exelon Corp.
| | 4.10% | | 03/15/52 | | 1,211,851 |
| 2,900,000 | | FirstEnergy Transmission LLC (b)
| | 4.35% | | 01/15/25 | | 2,829,344 |
| 1,250,000 | | Florida Power & Light Co.
| | 4.80% | | 05/15/33 | | 1,241,675 |
| 1,000,000 | | Georgia Power Co.
| | 4.65% | | 05/16/28 | | 980,576 |
| 1,000,000 | | Georgia Power Co.
| | 4.95% | | 05/17/33 | | 987,615 |
| 500,000 | | Indiana Michigan Power Co.
| | 3.75% | | 07/01/47 | | 392,379 |
| 500,000 | | Indiana Michigan Power Co.
| | 3.25% | | 05/01/51 | | 348,981 |
| 1,000,000 | | Indiana Michigan Power Co.
| | 5.63% | | 04/01/53 | | 1,028,196 |
| 500,000 | | NextEra Energy Capital Holdings, Inc.
| | 4.20% | | 06/20/24 | | 492,576 |
| 2,500,000 | | Northern States Power Co.
| | 5.10% | | 05/15/53 | | 2,464,057 |
| 3,000,000 | | Ohio Edison Co. (b)
| | 5.50% | | 01/15/33 | | 3,007,930 |
| 2,500,000 | | Ohio Power Co.
| | 2.90% | | 10/01/51 | | 1,663,574 |
| 500,000 | | PECO Energy Co.
| | 3.90% | | 03/01/48 | | 412,067 |
| 4,000,000 | | PECO Energy Co.
| | 4.38% | | 08/15/52 | | 3,543,588 |
See Notes to Financial Statements
Page 25
First Trust/Dow Jones Dividend & Income Allocation Portfolio
Portfolio of Investments (Continued)
June 30, 2023 (Unaudited)
Principal
Value | | Description | | Stated
Coupon | | Stated
Maturity | | Value |
| CORPORATE BONDS AND NOTES (Continued) |
| | | Electric Utilities (Continued) | | | | | | |
| $3,000,000 | | Public Service Co. of Colorado
| | 5.25% | | 04/01/53 | | $2,885,124 |
| 1,000,000 | | Southern (The) Co.
| | 5.15% | | 10/06/25 | | 994,435 |
| 500,000 | | Southwestern Electric Power Co.
| | 2.75% | | 10/01/26 | | 458,877 |
| 3,480,000 | | Trans-Allegheny Interstate Line Co. (b)
| | 3.85% | | 06/01/25 | | 3,347,586 |
| 1,382,000 | | Virginia Electric & Power Co.
| | 2.95% | | 11/15/26 | | 1,281,889 |
| 500,000 | | Virginia Electric & Power Co.
| | 3.75% | | 05/15/27 | | 479,200 |
| 500,000 | | Virginia Electric & Power Co.
| | 4.60% | | 12/01/48 | | 446,246 |
| 500,000 | | Virginia Electric & Power Co.
| | 4.63% | | 05/15/52 | | 443,218 |
| | | | | 74,235,476 |
| | | Gas Utilities – 0.1% | | | | | | |
| 500,000 | | Southern Co. Gas Capital Corp.
| | 4.40% | | 05/30/47 | | 415,945 |
| | | Ground Transportation – 0.6% | | | | | | |
| 3,000,000 | | CSX Corp.
| | 4.10% | | 11/15/32 | | 2,840,128 |
| 1,500,000 | | CSX Corp.
| | 4.50% | | 11/15/52 | | 1,356,683 |
| 1,500,000 | | Union Pacific Corp.
| | 4.95% | | 05/15/53 | | 1,494,649 |
| | | | | 5,691,460 |
| | | Health Care Equipment & Supplies – 0.3% | | | | | | |
| 1,000,000 | | Alcon Finance Corp. (b)
| | 5.38% | | 12/06/32 | | 1,014,015 |
| 1,000,000 | | Baxter International, Inc.
| | 2.27% | | 12/01/28 | | 857,647 |
| 1,000,000 | | Baxter International, Inc.
| | 3.13% | | 12/01/51 | | 660,559 |
| | | | | 2,532,221 |
| | | Health Care Providers & Services – 3.6% | | | | | | |
| 1,143,000 | | Centene Corp.
| | 4.25% | | 12/15/27 | | 1,069,745 |
| 2,000,000 | | Centene Corp.
| | 2.45% | | 07/15/28 | | 1,711,442 |
| 1,000,000 | | Centene Corp.
| | 2.50% | | 03/01/31 | | 798,465 |
| 800,000 | | CVS Health Corp.
| | 1.75% | | 08/21/30 | | 638,806 |
| 1,000,000 | | CVS Health Corp.
| | 5.25% | | 02/21/33 | | 996,556 |
| 500,000 | | CVS Health Corp.
| | 2.70% | | 08/21/40 | | 349,399 |
| 1,250,000 | | CVS Health Corp.
| | 5.05% | | 03/25/48 | | 1,153,070 |
| 1,000,000 | | CVS Health Corp.
| | 5.63% | | 02/21/53 | | 994,842 |
| 1,000,000 | | Elevance Health, Inc.
| | 5.35% | | 10/15/25 | | 998,160 |
| 500,000 | | Elevance Health, Inc.
| | 2.55% | | 03/15/31 | | 420,415 |
| 500,000 | | Elevance Health, Inc.
| | 4.10% | | 05/15/32 | | 466,296 |
| 1,000,000 | | Elevance Health, Inc.
| | 3.60% | | 03/15/51 | | 765,903 |
| 500,000 | | Elevance Health, Inc.
| | 4.55% | | 05/15/52 | | 447,236 |
| 1,000,000 | | Elevance Health, Inc.
| | 6.10% | | 10/15/52 | | 1,096,468 |
| 1,000,000 | | HCA, Inc.
| | 2.38% | | 07/15/31 | | 800,375 |
| 2,500,000 | | HCA, Inc.
| | 5.50% | | 06/01/33 | | 2,497,122 |
| 2,500,000 | | HCA, Inc.
| | 3.50% | | 07/15/51 | | 1,732,119 |
| 2,500,000 | | HCA, Inc.
| | 5.90% | | 06/01/53 | | 2,478,981 |
| 2,500,000 | | UnitedHealth Group, Inc.
| | 5.25% | | 02/15/28 | | 2,550,445 |
| 1,000,000 | | UnitedHealth Group, Inc.
| | 4.25% | | 01/15/29 | | 972,160 |
| 3,500,000 | | UnitedHealth Group, Inc.
| | 5.30% | | 02/15/30 | | 3,588,105 |
| 1,000,000 | | UnitedHealth Group, Inc.
| | 5.35% | | 02/15/33 | | 1,039,732 |
| 2,000,000 | | UnitedHealth Group, Inc.
| | 5.88% | | 02/15/53 | | 2,223,603 |
| 1,000,000 | | UnitedHealth Group, Inc.
| | 6.05% | | 02/15/63 | | 1,131,826 |
| 500,000 | | UnitedHealth Group, Inc.
| | 5.20% | | 04/15/63 | | 500,673 |
| 500,000 | | Universal Health Services, Inc.
| | 2.65% | | 10/15/30 | | 408,740 |
| 1,000,000 | | Universal Health Services, Inc.
| | 2.65% | | 01/15/32 | | 788,947 |
| | | | | 32,619,631 |
Page 26
See Notes to Financial Statements
First Trust/Dow Jones Dividend & Income Allocation Portfolio
Portfolio of Investments (Continued)
June 30, 2023 (Unaudited)
Principal
Value | | Description | | Stated
Coupon | | Stated
Maturity | | Value |
| CORPORATE BONDS AND NOTES (Continued) |
| | | Hotels, Restaurants & Leisure – 0.1% | | | | | | |
| $600,000 | | Hyatt Hotels Corp.
| | 5.75% | | 01/30/27 | | $598,706 |
| | | Insurance – 0.7% | | | | | | |
| 1,000,000 | | Aon Corp / Aon Global Holdings PLC
| | 5.35% | | 02/28/33 | | 1,008,104 |
| 1,000,000 | | Arthur J. Gallagher & Co.
| | 5.50% | | 03/02/33 | | 1,002,558 |
| 1,000,000 | | Arthur J. Gallagher & Co.
| | 5.75% | | 03/02/53 | | 1,006,590 |
| 700,000 | | Brown & Brown, Inc.
| | 4.20% | | 09/15/24 | | 683,896 |
| 750,000 | | Brown & Brown, Inc.
| | 2.38% | | 03/15/31 | | 605,061 |
| 1,000,000 | | Marsh & McLennan Cos., Inc.
| | 5.75% | | 11/01/32 | | 1,051,766 |
| 1,000,000 | | Marsh & McLennan Cos., Inc.
| | 6.25% | | 11/01/52 | | 1,125,980 |
| | | | | 6,483,955 |
| | | Life Sciences Tools & Services – 0.9% | | | | | | |
| 2,000,000 | | IQVIA, Inc. (b)
| | 5.70% | | 05/15/28 | | 1,982,500 |
| 3,775,000 | | Thermo Fisher Scientific, Inc.
| | 4.80% | | 11/21/27 | | 3,794,250 |
| 500,000 | | Thermo Fisher Scientific, Inc.
| | 4.95% | | 11/21/32 | | 509,283 |
| 2,000,000 | | Thermo Fisher Scientific, Inc.
| | 2.80% | | 10/15/41 | | 1,492,547 |
| | | | | 7,778,580 |
| | | Media – 1.6% | | | | | | |
| 2,500,000 | | Charter Communications Operating LLC/Charter Communications Operating Capital
| | 2.25% | | 01/15/29 | | 2,082,920 |
| 500,000 | | Charter Communications Operating LLC/Charter Communications Operating Capital
| | 2.30% | | 02/01/32 | | 378,787 |
| 1,000,000 | | Charter Communications Operating LLC/Charter Communications Operating Capital
| | 3.50% | | 06/01/41 | | 677,227 |
| 2,500,000 | | Charter Communications Operating LLC/Charter Communications Operating Capital
| | 3.50% | | 03/01/42 | | 1,674,395 |
| 1,000,000 | | Charter Communications Operating LLC/Charter Communications Operating Capital
| | 3.70% | | 04/01/51 | | 632,641 |
| 2,000,000 | | Charter Communications Operating LLC/Charter Communications Operating Capital
| | 3.90% | | 06/01/52 | | 1,310,555 |
| 1,000,000 | | Charter Communications Operating LLC/Charter Communications Operating Capital
| | 4.40% | | 12/01/61 | | 675,881 |
| 500,000 | | Charter Communications Operating LLC/Charter Communications Operating Capital
| | 5.50% | | 04/01/63 | | 403,026 |
| 2,000,000 | | Comcast Corp.
| | 5.35% | | 11/15/27 | | 2,036,755 |
| 1,000,000 | | Comcast Corp.
| | 4.55% | | 01/15/29 | | 982,530 |
| 1,500,000 | | Comcast Corp.
| | 5.50% | | 11/15/32 | | 1,559,236 |
| 500,000 | | Comcast Corp.
| | 3.25% | | 11/01/39 | | 397,051 |
| 1,000,000 | | Comcast Corp.
| | 3.75% | | 04/01/40 | | 843,176 |
| 500,000 | | Comcast Corp.
| | 4.00% | | 08/15/47 | | 417,186 |
| 500,000 | | Comcast Corp.
| | 3.45% | | 02/01/50 | | 381,033 |
| 543,000 | | Comcast Corp.
| | 2.94% | | 11/01/56 | | 353,997 |
| | | | | 14,806,396 |
| | | Multi-Utilities – 0.6% | | | | | | |
| 2,000,000 | | Consolidated Edison Co. of New York, Inc.
| | 6.15% | | 11/15/52 | | 2,202,730 |
| 1,185,000 | | Dominion Energy, Inc.
| | 3.07% | | 08/15/24 | | 1,144,963 |
| 2,500,000 | | Dominion Energy, Inc.
| | 3.30% | | 04/15/41 | | 1,860,150 |
| | | | | 5,207,843 |
| | | Oil, Gas & Consumable Fuels – 2.7% | | | | | | |
| 500,000 | | BP Capital Markets America, Inc.
| | 3.41% | | 02/11/26 | | 480,638 |
| 500,000 | | BP Capital Markets America, Inc.
| | 3.94% | | 09/21/28 | | 478,829 |
See Notes to Financial Statements
Page 27
First Trust/Dow Jones Dividend & Income Allocation Portfolio
Portfolio of Investments (Continued)
June 30, 2023 (Unaudited)
Principal
Value | | Description | | Stated
Coupon | | Stated
Maturity | | Value |
| CORPORATE BONDS AND NOTES (Continued) |
| | | Oil, Gas & Consumable Fuels (Continued) | | | | | | |
| $500,000 | | BP Capital Markets America, Inc.
| | 1.75% | | 08/10/30 | | $409,750 |
| 2,500,000 | | BP Capital Markets America, Inc.
| | 2.72% | | 01/12/32 | | 2,123,947 |
| 500,000 | | BP Capital Markets America, Inc.
| | 4.81% | | 02/13/33 | | 492,969 |
| 1,000,000 | | BP Capital Markets America, Inc.
| | 3.06% | | 06/17/41 | | 758,472 |
| 1,000,000 | | BP Capital Markets America, Inc.
| | 3.00% | | 03/17/52 | | 691,099 |
| 1,000,000 | | Cheniere Energy Partners L.P. (b)
| | 5.95% | | 06/30/33 | | 1,004,160 |
| 500,000 | | Diamondback Energy, Inc.
| | 3.50% | | 12/01/29 | | 450,520 |
| 2,151,000 | | Energy Transfer L.P.
| | 4.50% | | 04/15/24 | | 2,126,797 |
| 663,000 | | Energy Transfer L.P.
| | 3.90% | | 05/15/24 | | 651,966 |
| 250,000 | | Energy Transfer L.P.
| | 4.20% | | 04/15/27 | | 238,869 |
| 500,000 | | Energy Transfer L.P.
| | 4.00% | | 10/01/27 | | 468,595 |
| 500,000 | | Energy Transfer L.P.
| | 5.55% | | 02/15/28 | | 499,083 |
| 1,250,000 | | Energy Transfer L.P.
| | 5.25% | | 04/15/29 | | 1,221,133 |
| 1,000,000 | | Energy Transfer L.P.
| | 5.75% | | 02/15/33 | | 1,007,921 |
| 250,000 | | Energy Transfer L.P.
| | 5.30% | | 04/15/47 | | 217,786 |
| 500,000 | | Energy Transfer L.P.
| | 5.40% | | 10/01/47 | | 441,403 |
| 250,000 | | Energy Transfer L.P.
| | 6.00% | | 06/15/48 | | 237,439 |
| 2,250,000 | | Energy Transfer L.P.
| | 6.25% | | 04/15/49 | | 2,199,934 |
| 1,000,000 | | Enterprise Products Operating LLC
| | 5.05% | | 01/10/26 | | 998,678 |
| 1,360,000 | | Enterprise Products Operating LLC
| | 5.35% | | 01/31/33 | | 1,383,570 |
| 500,000 | | Kinder Morgan, Inc.
| | 5.20% | | 06/01/33 | | 484,777 |
| 500,000 | | Pioneer Natural Resources Co.
| | 1.13% | | 01/15/26 | | 450,483 |
| 250,000 | | Plains All American Pipeline L.P./PAA Finance Corp.
| | 3.80% | | 09/15/30 | | 222,007 |
| 1,000,000 | | Plains All American Pipeline L.P./PAA Finance Corp.
| | 4.90% | | 02/15/45 | | 806,266 |
| 500,000 | | Sabine Pass Liquefaction LLC
| | 5.00% | | 03/15/27 | | 492,453 |
| 250,000 | | Sabine Pass Liquefaction LLC
| | 4.20% | | 03/15/28 | | 237,087 |
| 250,000 | | Williams (The) Cos., Inc.
| | 3.50% | | 11/15/30 | | 223,666 |
| 1,000,000 | | Williams (The) Cos., Inc.
| | 2.60% | | 03/15/31 | | 829,271 |
| 625,000 | | Williams (The) Cos., Inc.
| | 4.90% | | 01/15/45 | | 546,205 |
| 270,000 | | Williams (The) Cos., Inc.
| | 5.10% | | 09/15/45 | | 243,113 |
| 1,000,000 | | Williams (The) Cos., Inc.
| | 4.85% | | 03/01/48 | | 867,071 |
| | | | | 23,985,957 |
| | | Personal Care Products – 0.2% | | | | | | |
| 1,000,000 | | Kenvue, Inc. (b)
| | 5.05% | | 03/22/28 | | 1,008,724 |
| 1,000,000 | | Kenvue, Inc. (b)
| | 5.10% | | 03/22/43 | | 1,017,324 |
| | | | | 2,026,048 |
| | | Pharmaceuticals – 0.7% | | | | | | |
| 500,000 | | Astrazeneca Finance LLC
| | 1.75% | | 05/28/28 | | 433,534 |
| 1,000,000 | | Astrazeneca Finance LLC
| | 2.25% | | 05/28/31 | | 844,303 |
| 1,000,000 | | Eli Lilly & Co.
| | 4.70% | | 02/27/33 | | 1,013,490 |
| 500,000 | | Eli Lilly & Co.
| | 4.95% | | 02/27/63 | | 510,704 |
| 2,000,000 | | Zoetis, Inc.
| | 5.40% | | 11/14/25 | | 2,006,649 |
| 1,000,000 | | Zoetis, Inc.
| | 5.60% | | 11/16/32 | | 1,045,674 |
| | | | | 5,854,354 |
| | | Professional Services – 0.2% | | | | | | |
| 1,000,000 | | Fiserv, Inc.
| | 3.20% | | 07/01/26 | | 938,679 |
| 500,000 | | Fiserv, Inc.
| | 3.50% | | 07/01/29 | | 456,621 |
| 250,000 | | Fiserv, Inc.
| | 2.65% | | 06/01/30 | | 213,204 |
| 500,000 | | Fiserv, Inc.
| | 4.40% | | 07/01/49 | | 422,866 |
| | | | | 2,031,370 |
Page 28
See Notes to Financial Statements
First Trust/Dow Jones Dividend & Income Allocation Portfolio
Portfolio of Investments (Continued)
June 30, 2023 (Unaudited)
Principal
Value | | Description | | Stated
Coupon | | Stated
Maturity | | Value |
| CORPORATE BONDS AND NOTES (Continued) |
| | | Semiconductors & Semiconductor Equipment – 0.4% | | | | | | |
| $500,000 | | Broadcom, Inc. (b)
| | 1.95% | | 02/15/28 | | $432,747 |
| 500,000 | | Broadcom, Inc. (b)
| | 2.45% | | 02/15/31 | | 406,859 |
| 250,000 | | Broadcom, Inc.
| | 4.30% | | 11/15/32 | | 229,419 |
| 250,000 | | Broadcom, Inc. (b)
| | 2.60% | | 02/15/33 | | 195,552 |
| 383,000 | | Broadcom, Inc. (b)
| | 3.42% | | 04/15/33 | | 320,464 |
| 500,000 | | Broadcom, Inc. (b)
| | 3.47% | | 04/15/34 | | 410,333 |
| 642,000 | | Broadcom, Inc. (b)
| | 4.93% | | 05/15/37 | | 581,374 |
| 500,000 | | Broadcom, Inc. (b)
| | 3.50% | | 02/15/41 | | 374,370 |
| 500,000 | | Broadcom, Inc. (b)
| | 3.75% | | 02/15/51 | | 368,197 |
| | | | | 3,319,315 |
| | | Software – 1.9% | | | | | | |
| 1,000,000 | | Oracle Corp.
| | 2.50% | | 04/01/25 | | 949,568 |
| 787,000 | | Oracle Corp.
| | 5.80% | | 11/10/25 | | 796,050 |
| 1,000,000 | | Oracle Corp.
| | 4.50% | | 05/06/28 | | 973,414 |
| 750,000 | | Oracle Corp.
| | 6.15% | | 11/09/29 | | 781,672 |
| 1,500,000 | | Oracle Corp.
| | 4.65% | | 05/06/30 | | 1,450,226 |
| 2,500,000 | | Oracle Corp.
| | 6.25% | | 11/09/32 | | 2,654,801 |
| 500,000 | | Oracle Corp.
| | 4.90% | | 02/06/33 | | 485,535 |
| 500,000 | | Oracle Corp.
| | 6.50% | | 04/15/38 | | 532,572 |
| 1,900,000 | | Oracle Corp.
| | 5.38% | | 07/15/40 | | 1,814,784 |
| 500,000 | | Oracle Corp.
| | 3.65% | | 03/25/41 | | 385,541 |
| 500,000 | | Oracle Corp.
| | 3.60% | | 04/01/50 | | 357,570 |
| 500,000 | | Oracle Corp.
| | 3.95% | | 03/25/51 | | 378,344 |
| 2,000,000 | | Oracle Corp.
| | 6.90% | | 11/09/52 | | 2,246,780 |
| 1,000,000 | | Oracle Corp.
| | 5.55% | | 02/06/53 | | 969,066 |
| 1,250,000 | | Salesforce, Inc.
| | 2.70% | | 07/15/41 | | 919,311 |
| 500,000 | | VMware, Inc.
| | 1.40% | | 08/15/26 | | 441,766 |
| 500,000 | | VMware, Inc.
| | 1.80% | | 08/15/28 | | 419,360 |
| 1,000,000 | | VMware, Inc.
| | 2.20% | | 08/15/31 | | 786,192 |
| | | | | 17,342,552 |
| | | Specialized REITs – 0.1% | | | | | | |
| 500,000 | | Crown Castle, Inc.
| | 1.05% | | 07/15/26 | | 438,107 |
| 500,000 | | Crown Castle, Inc.
| | 2.10% | | 04/01/31 | | 400,498 |
| | | | | 838,605 |
| | | Specialty Retail – 0.4% | | | | | | |
| 1,462,000 | | AutoZone, Inc.
| | 4.50% | | 02/01/28 | | 1,425,755 |
| 2,000,000 | | AutoZone, Inc.
| | 4.75% | | 02/01/33 | | 1,916,804 |
| | | | | 3,342,559 |
| | | Water Utilities – 0.3% | | | | | | |
| 2,920,000 | | American Water Capital Corp.
| | 3.85% | | 03/01/24 | | 2,883,121 |
| | | Wireless Telecommunication Services – 1.5% | | | | | | |
| 2,500,000 | | T-Mobile USA, Inc.
| | 3.50% | | 04/15/25 | | 2,404,884 |
| 1,000,000 | | T-Mobile USA, Inc.
| | 1.50% | | 02/15/26 | | 903,955 |
| 500,000 | | T-Mobile USA, Inc.
| | 3.75% | | 04/15/27 | | 473,544 |
| 2,000,000 | | T-Mobile USA, Inc.
| | 4.75% | | 02/01/28 | | 1,944,743 |
| 750,000 | | T-Mobile USA, Inc.
| | 2.05% | | 02/15/28 | | 650,740 |
| 750,000 | | T-Mobile USA, Inc.
| | 2.55% | | 02/15/31 | | 623,642 |
| 500,000 | | T-Mobile USA, Inc.
| | 2.25% | | 11/15/31 | | 400,308 |
| 1,500,000 | | T-Mobile USA, Inc.
| | 5.20% | | 01/15/33 | | 1,490,999 |
| 1,500,000 | | T-Mobile USA, Inc.
| | 3.00% | | 02/15/41 | | 1,097,540 |
See Notes to Financial Statements
Page 29
First Trust/Dow Jones Dividend & Income Allocation Portfolio
Portfolio of Investments (Continued)
June 30, 2023 (Unaudited)
Principal
Value | | Description | | Stated
Coupon | | Stated
Maturity | | Value |
| CORPORATE BONDS AND NOTES (Continued) |
| | | Wireless Telecommunication Services (Continued) | | | | | | |
| $1,000,000 | | T-Mobile USA, Inc.
| | 3.30% | | 02/15/51 | | $702,383 |
| 1,500,000 | | T-Mobile USA, Inc.
| | 5.65% | | 01/15/53 | | 1,524,190 |
| 1,000,000 | | T-Mobile USA, Inc.
| | 5.80% | | 09/15/62 | | 1,017,232 |
| | | | | 13,234,160 |
| | | Total Corporate Bonds and Notes
| | 412,624,817 |
| | | (Cost $450,659,010) | | | | | | |
| U.S. GOVERNMENT BONDS AND NOTES – 4.1% |
| 650,000 | | Federal Home Loan Bank Discount Notes
| | | | 07/03/23 | | 650,000 |
| 600,000 | | U. S. Treasury Bond
| | 3.88% | | 05/15/43 | | 585,563 |
| 2,580,000 | | U. S. Treasury Bond
| | 3.63% | | 02/15/53 | | 2,476,800 |
| 2,950,000 | | U. S. Treasury Note
| | 4.63% | | 06/30/25 | | 2,936,690 |
| 18,930,000 | | U. S. Treasury Note
| | 4.13% | | 06/15/26 | | 18,740,700 |
| 9,275,000 | | U. S. Treasury Note
| | 4.00% | | 06/30/28 | | 9,225,002 |
| 2,295,000 | | U. S. Treasury Note
| | 3.38% | | 05/15/33 | | 2,213,599 |
| | | Total U.S. Government Bonds and Notes
| | 36,828,354 |
| | | (Cost $36,867,538) | | | | | | |
| FOREIGN CORPORATE BONDS AND NOTES – 3.6% |
| | | Banks – 0.9% | | | | | | |
| 1,500,000 | | Barclays PLC (a)
| | 1.01% | | 12/10/24 | | 1,462,619 |
| 3,250,000 | | Toronto-Dominion (The) Bank
| | 5.10% | | 01/09/26 | | 3,237,813 |
| 3,250,000 | | Toronto-Dominion (The) Bank
| | 5.16% | | 01/10/28 | | 3,229,181 |
| | | | | 7,929,613 |
| | | Biotechnology – 0.0% | | | | | | |
| 500,000 | | CSL Finance PLC (b)
| | 4.75% | | 04/27/52 | | 466,197 |
| | | Capital Markets – 0.2% | | | | | | |
| 500,000 | | UBS Group AG (a) (b)
| | 1.36% | | 01/30/27 | | 438,396 |
| 1,250,000 | | UBS Group AG (a) (b)
| | 1.49% | | 08/10/27 | | 1,074,395 |
| 1,000,000 | | UBS Group AG (a) (b)
| | 2.10% | | 02/11/32 | | 758,058 |
| | | | | 2,270,849 |
| | | Commercial Services & Supplies – 0.1% | | | | | | |
| 1,000,000 | | Waste Connections, Inc.
| | 3.20% | | 06/01/32 | | 872,406 |
| | | Ground Transportation – 0.0% | | | | | | |
| 500,000 | | Canadian Pacific Railway Co.
| | 3.10% | | 12/02/51 | | 355,375 |
| | | Oil, Gas & Consumable Fuels – 0.2% | | | | | | |
| 500,000 | | Canadian Natural Resources Ltd.
| | 6.25% | | 03/15/38 | | 509,526 |
| 1,000,000 | | Enbridge, Inc.
| | 1.60% | | 10/04/26 | | 890,858 |
| | | | | 1,400,384 |
| | | Pharmaceuticals – 2.2% | | | | | | |
| 1,000,000 | | AstraZeneca PLC
| | 3.00% | | 05/28/51 | | 742,657 |
| 5,000,000 | | Pfizer Investment Enterprises Pte. Ltd.
| | 4.65% | | 05/19/25 | | 4,958,355 |
| 5,000,000 | | Pfizer Investment Enterprises Pte. Ltd.
| | 4.45% | | 05/19/26 | | 4,941,211 |
| 3,000,000 | | Pfizer Investment Enterprises Pte. Ltd.
| | 4.45% | | 05/19/28 | | 2,950,084 |
| 2,000,000 | | Pfizer Investment Enterprises Pte. Ltd.
| | 4.75% | | 05/19/33 | | 1,993,242 |
| 2,000,000 | | Pfizer Investment Enterprises Pte. Ltd.
| | 5.11% | | 05/19/43 | | 2,005,823 |
| 1,000,000 | | Pfizer Investment Enterprises Pte. Ltd.
| | 5.30% | | 05/19/53 | | 1,040,466 |
Page 30
See Notes to Financial Statements
First Trust/Dow Jones Dividend & Income Allocation Portfolio
Portfolio of Investments (Continued)
June 30, 2023 (Unaudited)
Principal
Value | | Description | | Stated
Coupon | | Stated
Maturity | | Value |
| FOREIGN CORPORATE BONDS AND NOTES (Continued) |
| | | Pharmaceuticals (Continued) | | | | | | |
| $1,000,000 | | Pfizer Investment Enterprises Pte. Ltd.
| | 5.34% | | 05/19/63 | | $1,012,784 |
| | | | | 19,644,622 |
| | | Total Foreign Corporate Bonds and Notes
| | 32,939,446 |
| | | (Cost $34,291,373) | | | | | | |
| Shares | | Description | | Value |
| COMMON STOCKS – 45.0% |
| | | Aerospace & Defense – 0.9% | | |
| 12,609 | | General Dynamics Corp.
| | 2,712,826 |
| 6,086 | | Lockheed Martin Corp.
| | 2,801,873 |
| 6,232 | | Northrop Grumman Corp.
| | 2,840,546 |
| | | | | 8,355,245 |
| | | Air Freight & Logistics – 1.3% | | |
| 28,957 | | CH Robinson Worldwide, Inc.
| | 2,732,093 |
| 26,129 | | Expeditors International of Washington, Inc.
| | 3,165,006 |
| 26,700 | | Forward Air Corp.
| | 2,833,137 |
| 14,833 | | United Parcel Service, Inc., Class B
| | 2,658,815 |
| | | | | 11,389,051 |
| | | Banks – 7.0% | | |
| 82,091 | | Atlantic Union Bankshares Corp.
| | 2,130,261 |
| 29,201 | | BancFirst Corp.
| | 2,686,492 |
| 52,921 | | Banner Corp.
| | 2,311,060 |
| 13,603 | | City Holding Co.
| | 1,224,134 |
| 49,310 | | Commerce Bancshares, Inc.
| | 2,401,397 |
| 54,816 | | Community Bank System, Inc.
| | 2,569,774 |
| 27,315 | | Cullen/Frost Bankers, Inc.
| | 2,937,182 |
| 172,499 | | CVB Financial Corp.
| | 2,290,787 |
| 43,153 | | Eagle Bancorp, Inc.
| | 913,117 |
| 51,843 | | East West Bancorp, Inc.
| | 2,736,792 |
| 22,405 | | Enterprise Financial Services Corp.
| | 876,036 |
| 41,207 | | FB Financial Corp.
| | 1,155,856 |
| 251,951 | | First BanCorp
| | 3,078,841 |
| 90,197 | | First Financial Bankshares, Inc.
| | 2,569,713 |
| 25,816 | | Heartland Financial USA, Inc.
| | 719,492 |
| 67,196 | | International Bancshares Corp.
| | 2,970,063 |
| 20,500 | | Lakeland Financial Corp.
| | 994,660 |
| 24,720 | | NBT Bancorp, Inc.
| | 787,332 |
| 239,176 | | Northwest Bancshares, Inc.
| | 2,535,266 |
| 29,502 | | OFG Bancorp
| | 769,412 |
| 12,484 | | Park National Corp.
| | 1,277,363 |
| 50,118 | | Popular, Inc.
| | 3,033,141 |
| 46,770 | | Prosperity Bancshares, Inc.
| | 2,641,570 |
| 155,027 | | Regions Financial Corp.
| | 2,762,581 |
| 110,748 | | Sandy Spring Bancorp, Inc.
| | 2,511,765 |
| 52,668 | | ServisFirst Bancshares, Inc.
| | 2,155,175 |
| 164,510 | | Simmons First National Corp., Class A
| | 2,837,798 |
| 57,105 | | Towne Bank
| | 1,327,120 |
| 49,849 | | UMB Financial Corp.
| | 3,035,804 |
| 14,144 | | Westamerica BanCorp
| | 541,715 |
See Notes to Financial Statements
Page 31
First Trust/Dow Jones Dividend & Income Allocation Portfolio
Portfolio of Investments (Continued)
June 30, 2023 (Unaudited)
| Shares | | Description | | Value |
| COMMON STOCKS (Continued) |
| | | Banks (Continued) | | |
| 96,133 | | Zions Bancorp N.A.
| | $2,582,132 |
| | | | | 63,363,831 |
| | | Building Products – 1.5% | | |
| 12,728 | | Carlisle Cos., Inc.
| | 3,265,114 |
| 30,036 | | Owens Corning
| | 3,919,698 |
| 15,639 | | Trane Technologies PLC
| | 2,991,115 |
| 36,204 | | UFP Industries, Inc.
| | 3,513,598 |
| | | | | 13,689,525 |
| | | Capital Markets – 3.3% | | |
| 9,388 | | Ameriprise Financial, Inc.
| | 3,118,318 |
| 4,300 | | BlackRock, Inc.
| | 2,971,902 |
| 15,021 | | CME Group, Inc.
| | 2,783,241 |
| 24,937 | | Evercore, Inc., Class A
| | 3,081,964 |
| 32,886 | | Houlihan Lokey, Inc.
| | 3,233,023 |
| 39,856 | | PJT Partners, Inc., Class A
| | 2,775,572 |
| 30,848 | | Raymond James Financial, Inc.
| | 3,201,097 |
| 49,996 | | SEI Investments Co.
| | 2,980,761 |
| 48,693 | | Stifel Financial Corp.
| | 2,905,511 |
| 25,486 | | T. Rowe Price Group, Inc.
| | 2,854,942 |
| | | | | 29,906,331 |
| | | Chemicals – 1.1% | | |
| 23,560 | | FMC Corp.
| | 2,458,251 |
| 105,165 | | Huntsman Corp.
| | 2,841,558 |
| 17,013 | | Stepan Co.
| | 1,625,762 |
| 24,808 | | Westlake Corp.
| | 2,963,812 |
| | | | | 9,889,383 |
| | | Commercial Services & Supplies – 1.1% | | |
| 6,219 | | Cintas Corp.
| | 3,091,341 |
| 76,667 | | Rollins, Inc.
| | 3,283,648 |
| 19,587 | | Tetra Tech, Inc.
| | 3,207,175 |
| | | | | 9,582,164 |
| | | Construction & Engineering – 0.4% | | |
| 17,698 | | EMCOR Group, Inc.
| | 3,270,236 |
| | | Construction Materials – 0.4% | | |
| 19,608 | | Eagle Materials, Inc.
| | 3,655,323 |
| | | Consumer Staples Distribution & Retail – 0.6% | | |
| 13,672 | | Dollar General Corp.
| | 2,321,232 |
| 58,280 | | Kroger (The) Co.
| | 2,739,160 |
| | | | | 5,060,392 |
| | | Containers & Packaging – 0.3% | | |
| 20,725 | | Packaging Corp. of America
| | 2,739,016 |
| | | Electrical Equipment – 0.4% | | |
| 19,799 | | AMETEK, Inc.
| | 3,205,062 |
| | | Electronic Equipment, Instruments & Components – 0.3% | | |
| 35,209 | | Amphenol Corp., Class A
| | 2,991,005 |
| | | Financial Services – 1.8% | | |
| 71,844 | | Essent Group Ltd.
| | 3,362,299 |
Page 32
See Notes to Financial Statements
First Trust/Dow Jones Dividend & Income Allocation Portfolio
Portfolio of Investments (Continued)
June 30, 2023 (Unaudited)
| Shares | | Description | | Value |
| COMMON STOCKS (Continued) |
| | | Financial Services (Continued) | | |
| 19,090 | | Jack Henry & Associates, Inc.
| | $3,194,330 |
| 214,403 | | MGIC Investment Corp.
| | 3,385,424 |
| 130,193 | | Radian Group, Inc.
| | 3,291,279 |
| 12,759 | | Visa, Inc., Class A
| | 3,030,007 |
| | | | | 16,263,339 |
| | | Food Products – 1.2% | | |
| 36,120 | | Archer-Daniels-Midland Co.
| | 2,729,227 |
| 30,122 | | Bunge Ltd.
| | 2,842,011 |
| 11,310 | | Hershey (The) Co.
| | 2,824,107 |
| 48,502 | | Tyson Foods, Inc., Class A
| | 2,475,542 |
| | | | | 10,870,887 |
| | | Ground Transportation – 1.8% | | |
| 16,398 | | JB Hunt Transport Services, Inc.
| | 2,968,530 |
| 50,855 | | Knight-Swift Transportation Holdings, Inc.
| | 2,825,504 |
| 16,049 | | Landstar System, Inc.
| | 3,090,074 |
| 57,820 | | Marten Transport Ltd.
| | 1,243,130 |
| 8,442 | | Old Dominion Freight Line, Inc.
| | 3,121,430 |
| 63,252 | | Werner Enterprises, Inc.
| | 2,794,473 |
| | | | | 16,043,141 |
| | | Health Care Equipment & Supplies – 0.3% | | |
| 28,415 | | Abbott Laboratories
| | 3,097,803 |
| | | Health Care Providers & Services – 1.3% | | |
| 5,348 | | Chemed Corp.
| | 2,896,851 |
| 11,260 | | Cigna (The) Group
| | 3,159,556 |
| 5,927 | | Humana, Inc.
| | 2,650,140 |
| 6,088 | | UnitedHealth Group, Inc.
| | 2,926,136 |
| | | | | 11,632,683 |
| | | Household Durables – 0.7% | | |
| 28,511 | | Garmin Ltd.
| | 2,973,412 |
| 27,374 | | Lennar Corp., Class A
| | 3,430,236 |
| | | | | 6,403,648 |
| | | Household Products – 0.3% | | |
| 19,352 | | Procter & Gamble (The) Co.
| | 2,936,472 |
| | | Industrial Conglomerates – 0.3% | | |
| 27,374 | | 3M Co.
| | 2,739,864 |
| | | Insurance – 3.6% | | |
| 44,597 | | Aflac, Inc.
| | 3,112,871 |
| 78,851 | | American Equity Investment Life Holding Co.
| | 4,108,926 |
| 82,372 | | Fidelity National Financial, Inc.
| | 2,965,392 |
| 26,151 | | Globe Life, Inc.
| | 2,866,673 |
| 41,287 | | Hartford Financial Services Group (The), Inc.
| | 2,973,490 |
| 115,230 | | Old Republic International Corp.
| | 2,900,339 |
| 38,716 | | Principal Financial Group, Inc.
| | 2,936,221 |
| 21,649 | | RLI Corp.
| | 2,954,439 |
| 23,817 | | Safety Insurance Group, Inc.
| | 1,708,155 |
| 16,784 | | Travelers (The) Cos., Inc.
| | 2,914,709 |
| 46,212 | | W.R. Berkley Corp.
| | 2,752,387 |
| | | | | 32,193,602 |
See Notes to Financial Statements
Page 33
First Trust/Dow Jones Dividend & Income Allocation Portfolio
Portfolio of Investments (Continued)
June 30, 2023 (Unaudited)
| Shares | | Description | | Value |
| COMMON STOCKS (Continued) |
| | | IT Services – 0.7% | | |
| 10,066 | | Accenture PLC, Class A
| | $3,106,166 |
| 47,222 | | Cognizant Technology Solutions Corp., Class A
| | 3,082,652 |
| | | | | 6,188,818 |
| | | Leisure Products – 0.2% | | |
| 25,244 | | Sturm Ruger & Co., Inc.
| | 1,336,922 |
| | | Life Sciences Tools & Services – 0.6% | | |
| 11,415 | | Danaher Corp.
| | 2,739,600 |
| 4,991 | | Thermo Fisher Scientific, Inc.
| | 2,604,054 |
| | | | | 5,343,654 |
| | | Machinery – 5.2% | | |
| 21,282 | | AGCO Corp.
| | 2,796,880 |
| 14,691 | | Alamo Group, Inc.
| | 2,701,822 |
| 63,599 | | Allison Transmission Holdings, Inc.
| | 3,590,800 |
| 12,044 | | Cummins, Inc.
| | 2,952,707 |
| 6,969 | | Deere & Co.
| | 2,823,769 |
| 30,577 | | Franklin Electric Co., Inc.
| | 3,146,373 |
| 39,411 | | Graco, Inc.
| | 3,403,140 |
| 33,340 | | ITT, Inc.
| | 3,107,621 |
| 17,015 | | Lincoln Electric Holdings, Inc.
| | 3,379,690 |
| 39,158 | | Mueller Industries, Inc.
| | 3,417,710 |
| 12,947 | | Nordson Corp.
| | 3,213,187 |
| 39,306 | | PACCAR, Inc.
| | 3,287,947 |
| 11,652 | | Snap-on, Inc.
| | 3,357,990 |
| 25,885 | | Toro (The) Co.
| | 2,631,210 |
| 17,092 | | Watts Water Technologies, Inc., Class A
| | 3,140,313 |
| | | | | 46,951,159 |
| | | Marine Transportation – 0.4% | | |
| 48,219 | | Matson, Inc.
| | 3,748,063 |
| | | Metals & Mining – 0.3% | | |
| 11,207 | | Reliance Steel & Aluminum Co.
| | 3,043,709 |
| | | Oil, Gas & Consumable Fuels – 0.9% | | |
| 21,886 | | Arch Resources, Inc.
| | 2,467,865 |
| 117,249 | | Coterra Energy, Inc.
| | 2,966,400 |
| 14,088 | | Pioneer Natural Resources Co.
| | 2,918,752 |
| | | | | 8,353,017 |
| | | Pharmaceuticals – 1.0% | | |
| 18,562 | | Johnson & Johnson
| | 3,072,382 |
| 27,045 | | Merck & Co., Inc.
| | 3,120,723 |
| 17,286 | | Zoetis, Inc.
| | 2,976,822 |
| | | | | 9,169,927 |
| | | Professional Services – 1.4% | | |
| 12,925 | | Automatic Data Processing, Inc.
| | 2,840,786 |
| 31,043 | | Booz Allen Hamilton Holding Corp.
| | 3,464,399 |
| 13,969 | | Kforce, Inc.
| | 875,297 |
| 25,109 | | Paychex, Inc.
| | 2,808,944 |
| 35,712 | | Robert Half International, Inc.
| | 2,686,257 |
| | | | | 12,675,683 |
Page 34
See Notes to Financial Statements
First Trust/Dow Jones Dividend & Income Allocation Portfolio
Portfolio of Investments (Continued)
June 30, 2023 (Unaudited)
| Shares | | Description | | Value |
| COMMON STOCKS (Continued) |
| | | Semiconductors & Semiconductor Equipment – 0.6% | | |
| 24,391 | | Skyworks Solutions, Inc.
| | $2,699,840 |
| 15,469 | | Texas Instruments, Inc.
| | 2,784,729 |
| | | | | 5,484,569 |
| | | Software – 0.4% | | |
| 9,981 | | Microsoft Corp.
| | 3,398,930 |
| | | Specialty Retail – 1.2% | | |
| 23,661 | | Advance Auto Parts, Inc.
| | 1,663,368 |
| 36,763 | | Best Buy Co., Inc.
| | 3,012,728 |
| 20,289 | | Penske Automotive Group, Inc.
| | 3,380,756 |
| 12,242 | | Tractor Supply Co.
| | 2,706,706 |
| | | | | 10,763,558 |
| | | Textiles, Apparel & Luxury Goods – 0.9% | | |
| 40,008 | | Carter’s, Inc.
| | 2,904,581 |
| 31,883 | | Columbia Sportswear Co.
| | 2,462,643 |
| 157,832 | | Levi Strauss & Co., Class A
| | 2,277,516 |
| | | | | 7,644,740 |
| | | Trading Companies & Distributors – 1.3% | | |
| 45,488 | | Boise Cascade Co.
| | 4,109,841 |
| 53,343 | | Fastenal Co.
| | 3,146,703 |
| 19,853 | | Rush Enterprises, Inc., Class A
| | 1,205,871 |
| 9,042 | | Watsco, Inc.
| | 3,449,252 |
| | | | | 11,911,667 |
| | | Total Common Stocks
| | 405,292,419 |
| | | (Cost $371,481,372) | | |
| REAL ESTATE INVESTMENT TRUSTS – 0.6% |
| | | Specialized REITs – 0.6% | | |
| 58,126 | | PotlatchDeltic Corp.
| | 3,071,959 |
| 9,523 | | Public Storage
| | 2,779,573 |
| | | Total Real Estate Investment Trusts
| | 5,851,532 |
| | | (Cost $5,480,049) | | |
| | Total Investments – 99.1%
| | 893,536,568 |
| | (Cost $898,779,342) | | |
| | Net Other Assets and Liabilities – 0.9%
| | 8,131,358 |
| | Net Assets – 100.0%
| | $901,667,926 |
| (a) | Fixed-to-floating or fixed-to-variable rate security. The interest rate shown reflects the fixed rate in effect at June 30, 2023. At a predetermined date, the fixed rate will change to a floating rate or a variable rate. |
| (b) | This security, sold within the terms of a private placement memorandum, is exempt from registration upon resale under Rule 144A of the Securities Act of 1933, as amended, and may be resold in transactions exempt from registration, normally to qualified institutional buyers. Pursuant to procedures adopted by the Trust’s Board of Trustees, this security has been determined to be liquid by First Trust Advisors L.P., the Fund’s advisor. Although market instability can result in periods of increased overall market illiquidity, liquidity for each security is determined based on security specific factors and assumptions, which require subjective judgment. At June 30, 2023, securities noted as such amounted to $23,144,575 or 2.6% of net assets. |
See Notes to Financial Statements
Page 35
First Trust/Dow Jones Dividend & Income Allocation Portfolio
Portfolio of Investments (Continued)
June 30, 2023 (Unaudited)
Valuation Inputs
A summary of the inputs used to value the Fund’s investments as of June 30, 2023 is as follows (see Note 2A - Portfolio Valuation in the Notes to Financial Statements):
| | Total
Value at
6/30/2023 | Level 1
Quoted
Prices | Level 2
Significant
Observable
Inputs | Level 3
Significant
Unobservable
Inputs |
Corporate Bonds and Notes*
| $ 412,624,817 | $ — | $ 412,624,817 | $ — |
U.S. Government Bonds and Notes
| 36,828,354 | — | 36,828,354 | — |
Foreign Corporate Bonds and Notes*
| 32,939,446 | — | 32,939,446 | — |
Common Stocks*
| 405,292,419 | 405,292,419 | — | — |
Real Estate Investment Trusts*
| 5,851,532 | 5,851,532 | — | — |
Total Investments
| $ 893,536,568 | $ 411,143,951 | $ 482,392,617 | $— |
| * | See Portfolio of Investments for industry breakout. |
Page 36
See Notes to Financial Statements
First Trust Multi Income Allocation Portfolio
Portfolio of Investments
June 30, 2023 (Unaudited)
| Shares | | Description | | Value |
| COMMON STOCKS – 20.2% |
| | | Aerospace & Defense – 0.2% | | |
| 176 | | Northrop Grumman Corp.
| | $80,221 |
| | | Banks – 0.5% | | |
| 1,277 | | JPMorgan Chase & Co.
| | 185,727 |
| | | Beverages – 0.3% | | |
| 532 | | PepsiCo, Inc.
| | 98,537 |
| | | Capital Markets – 0.3% | | |
| 918 | | Intercontinental Exchange, Inc.
| | 103,807 |
| | | Communications Equipment – 0.4% | | |
| 1,736 | | Cisco Systems, Inc.
| | 89,821 |
| 202 | | Motorola Solutions, Inc.
| | 59,242 |
| | | | | 149,063 |
| | | Construction & Engineering – 0.3% | | |
| 582 | | Quanta Services, Inc.
| | 114,334 |
| | | Consumer Finance – 0.3% | | |
| 643 | | American Express Co.
| | 112,011 |
| | | Consumer Staples Distribution & Retail – 0.3% | | |
| 739 | | Walmart, Inc.
| | 116,156 |
| | | Containers & Packaging – 0.1% | | |
| 382 | | Packaging Corp. of America
| | 50,485 |
| | | Electric Utilities – 2.1% | | |
| 1,267 | | Alliant Energy Corp.
| | 66,492 |
| 1,447 | | American Electric Power Co., Inc.
| | 121,837 |
| 146 | | Constellation Energy Corp.
| | 13,366 |
| 297 | | Duke Energy Corp.
| | 26,653 |
| 4,116 | | Enel S.p.A., ADR
| | 27,536 |
| 134 | | Entergy Corp.
| | 13,047 |
| 458 | | Evergy, Inc.
| | 26,756 |
| 192 | | Eversource Energy
| | 13,617 |
| 339 | | Exelon Corp.
| | 13,811 |
| 536 | | Iberdrola S.A., ADR
| | 28,017 |
| 386 | | IDACORP, Inc.
| | 39,604 |
| 2,284 | | NextEra Energy, Inc.
| | 169,473 |
| 4,039 | | PPL Corp.
| | 106,872 |
| 767 | | Southern (The) Co.
| | 53,882 |
| 643 | | Xcel Energy, Inc.
| | 39,975 |
| | | | | 760,938 |
| | | Electrical Equipment – 0.3% | | |
| 497 | | Eaton Corp PLC
| | 99,947 |
| | | Energy Equipment & Services – 0.5% | | |
| 6,163 | | Archrock, Inc.
| | 63,171 |
| 3,479 | | Halliburton Co.
| | 114,772 |
| | | | | 177,943 |
| | | Financial Services – 0.4% | | |
| 589 | | Visa, Inc., Class A
| | 139,876 |
| | | Food Products – 0.3% | | |
| 1,022 | | Ingredion, Inc.
| | 108,281 |
See Notes to Financial Statements
Page 37
First Trust Multi Income Allocation Portfolio
Portfolio of Investments (Continued)
June 30, 2023 (Unaudited)
| Shares | | Description | | Value |
| COMMON STOCKS (Continued) |
| | | Gas Utilities – 0.8% | | |
| 1,465 | | AltaGas Ltd. (CAD)
| | $26,320 |
| 695 | | Atmos Energy Corp.
| | 80,856 |
| 2,578 | | National Fuel Gas Co.
| | 132,406 |
| 273 | | New Jersey Resources Corp.
| | 12,886 |
| 666 | | ONE Gas, Inc.
| | 51,155 |
| | | | | 303,623 |
| | | Ground Transportation – 0.2% | | |
| 379 | | Union Pacific Corp.
| | 77,551 |
| | | Health Care Equipment & Supplies – 0.5% | | |
| 780 | | Abbott Laboratories
| | 85,036 |
| 1,242 | | Medtronic PLC
| | 109,420 |
| | | | | 194,456 |
| | | Health Care Providers & Services – 1.0% | | |
| 791 | | AmerisourceBergen Corp.
| | 152,212 |
| 1,293 | | CVS Health Corp.
| | 89,385 |
| 243 | | UnitedHealth Group, Inc.
| | 116,796 |
| | | | | 358,393 |
| | | Hotels, Restaurants & Leisure – 0.4% | | |
| 504 | | Darden Restaurants, Inc.
| | 84,208 |
| 725 | | Starbucks Corp.
| | 71,818 |
| | | | | 156,026 |
| | | Independent Power & Renewable Electricity Producers – 0.5% | | |
| 1,926 | | AES (The) Corp.
| | 39,926 |
| 4,686 | | Clearway Energy, Inc., Class A
| | 126,522 |
| | | | | 166,448 |
| | | Industrial Conglomerates – 0.1% | | |
| 228 | | Honeywell International, Inc.
| | 47,310 |
| | | Insurance – 0.2% | | |
| 405 | | Chubb, Ltd.
| | 77,987 |
| | | IT Services – 0.4% | | |
| 439 | | Accenture PLC, Class A
| | 135,467 |
| | | Machinery – 0.5% | | |
| 387 | | Caterpillar, Inc.
| | 95,221 |
| 171 | | Parker-Hannifin Corp.
| | 66,697 |
| | | | | 161,918 |
| | | Media – 0.2% | | |
| 1,723 | | Comcast Corp., Class A
| | 71,591 |
| | | Multi-Utilities – 1.6% | | |
| 1,768 | | Atco Ltd., Class I (CAD)
| | 52,636 |
| 936 | | CenterPoint Energy, Inc.
| | 27,284 |
| 673 | | CMS Energy Corp.
| | 39,539 |
| 3,373 | | Public Service Enterprise Group, Inc.
| | 211,184 |
| 1,280 | | Sempra Energy
| | 186,355 |
| 744 | | WEC Energy Group, Inc.
| | 65,651 |
| | | | | 582,649 |
Page 38
See Notes to Financial Statements
First Trust Multi Income Allocation Portfolio
Portfolio of Investments (Continued)
June 30, 2023 (Unaudited)
| Shares | | Description | | Value |
| COMMON STOCKS (Continued) |
| | | Oil, Gas & Consumable Fuels – 3.8% | | |
| 732 | | Cheniere Energy, Inc.
| | $111,527 |
| 1,155 | | ConocoPhillips
| | 119,670 |
| 5,022 | | DT Midstream, Inc.
| | 248,941 |
| 1,437 | | Enbridge, Inc.
| | 53,385 |
| 1,294 | | Hess Corp.
| | 175,919 |
| 6,449 | | Keyera Corp. (CAD)
| | 148,720 |
| 9,519 | | Kinder Morgan, Inc.
| | 163,917 |
| 1,106 | | ONEOK, Inc.
| | 68,262 |
| 2,081 | | Targa Resources Corp.
| | 158,364 |
| 1,318 | | TC Energy Corp.
| | 53,260 |
| 1,766 | | Williams (The) Cos., Inc.
| | 57,625 |
| | | | | 1,359,590 |
| | | Pharmaceuticals – 0.8% | | |
| 1,501 | | AstraZeneca PLC, ADR
| | 107,427 |
| 545 | | Johnson & Johnson
| | 90,208 |
| 897 | | Merck & Co., Inc.
| | 103,505 |
| | | | | 301,140 |
| | | Semiconductors & Semiconductor Equipment – 0.4% | | |
| 163 | | Broadcom, Inc.
| | 141,391 |
| | | Software – 1.6% | | |
| 277 | | Intuit, Inc.
| | 126,919 |
| 543 | | Microsoft Corp.
| | 184,913 |
| 1,373 | | Oracle Corp.
| | 163,510 |
| 626 | | SAP SE, ADR
| | 85,643 |
| | | | | 560,985 |
| | | Specialty Retail – 0.4% | | |
| 1,631 | | TJX (The) Cos., Inc.
| | 138,292 |
| | | Technology Hardware, Storage & Peripherals – 0.3% | | |
| 498 | | Apple, Inc.
| | 96,597 |
| | | Textiles, Apparel & Luxury Goods – 0.2% | | |
| 566 | | NIKE, Inc., Class B
| | 62,469 |
| | | Total Common Stocks
| | 7,291,209 |
| | | (Cost $6,460,806) | | |
| REAL ESTATE INVESTMENT TRUSTS – 11.8% |
| | | Health Care REITs – 2.4% | | |
| 8,757 | | CareTrust REIT, Inc.
| | 173,914 |
| 5,573 | | Omega Healthcare Investors, Inc.
| | 171,035 |
| 14,674 | | Sabra Health Care REIT, Inc.
| | 172,713 |
| 3,659 | | Ventas, Inc.
| | 172,961 |
| 2,177 | | Welltower, Inc.
| | 176,098 |
| | | | | 866,721 |
| | | Hotel & Resort REITs – 1.0% | | |
| 11,016 | | Apple Hospitality REIT, Inc.
| | 166,452 |
| 10,153 | | Host Hotels & Resorts, Inc.
| | 170,875 |
| | | | | 337,327 |
| | | Industrial REITs – 1.4% | | |
| 992 | | EastGroup Properties, Inc.
| | 172,211 |
| 1,378 | | Prologis, Inc.
| | 168,984 |
See Notes to Financial Statements
Page 39
First Trust Multi Income Allocation Portfolio
Portfolio of Investments (Continued)
June 30, 2023 (Unaudited)
| Shares | | Description | | Value |
| REAL ESTATE INVESTMENT TRUSTS (Continued) |
| | | Industrial REITs (Continued) | | |
| 4,733 | | STAG Industrial, Inc.
| | $169,820 |
| | | | | 511,015 |
| | | Residential REITs – 1.4% | | |
| 1,553 | | Camden Property Trust
| | 169,075 |
| 4,992 | | Invitation Homes, Inc.
| | 171,725 |
| 1,119 | | Mid-America Apartment Communities, Inc.
| | 169,931 |
| | | | | 510,731 |
| | | Retail REITs – 1.9% | | |
| 8,762 | | Kimco Realty Corp.
| | 172,787 |
| 8,203 | | Kite Realty Group Trust
| | 183,255 |
| 2,719 | | Realty Income Corp.
| | 162,569 |
| 1,527 | | Simon Property Group, Inc.
| | 176,338 |
| | | | | 694,949 |
| | | Specialized REITs – 3.7% | | |
| 846 | | American Tower Corp.
| | 164,073 |
| 3,719 | | CubeSmart
| | 166,090 |
| 224 | | Equinix, Inc.
| | 175,603 |
| 1,104 | | Extra Space Storage, Inc.
| | 164,330 |
| 3,303 | | Gaming and Leisure Properties, Inc.
| | 160,063 |
| 545 | | Public Storage
| | 159,075 |
| 5,239 | | VICI Properties, Inc.
| | 164,662 |
| 5,684 | | Weyerhaeuser Co.
| | 190,471 |
| | | | | 1,344,367 |
| | | Total Real Estate Investment Trusts
| | 4,265,110 |
| | | (Cost $4,253,863) | | |
| MASTER LIMITED PARTNERSHIPS – 6.7% |
| | | Chemicals – 0.2% | | |
| 3,703 | | Westlake Chemical Partners, L.P.
| | 80,318 |
| | | Independent Power & Renewable Electricity Producers – 0.5% | | |
| 3,031 | | NextEra Energy Partners, L.P. (a)
| | 177,738 |
| | | Oil, Gas & Consumable Fuels – 6.0% | | |
| 3,846 | | Cheniere Energy Partners, L.P.
| | 177,454 |
| 27,484 | | Energy Transfer, L.P.
| | 349,047 |
| 17,590 | | Enterprise Products Partners, L.P.
| | 463,497 |
| 5,474 | | Hess Midstream, L.P., Class A (a)
| | 167,942 |
| 6,592 | | Holly Energy Partners, L.P.
| | 121,952 |
| 7,639 | | Magellan Midstream Partners, L.P.
| | 476,063 |
| 4,560 | | MPLX, L.P.
| | 154,766 |
| 17,174 | | Plains GP Holdings, L.P., Class A
| | 254,690 |
| | | | | 2,165,411 |
| | | Total Master Limited Partnerships
| | 2,423,467 |
| | | (Cost $1,831,870) | | |
Principal
Value | | Description | | Stated
Coupon | | Stated
Maturity | | Value |
| U.S. GOVERNMENT BONDS AND NOTES – 8.7% |
| $98,631 | | U.S. Treasury Inflation Indexed Bond (b)
| | 0.13% | | 07/15/24 | | 95,684 |
| 81,586 | | U.S. Treasury Inflation Indexed Bond (b)
| | 0.13% | | 10/15/24 | | 78,703 |
| 134,484 | | U.S. Treasury Inflation Indexed Bond (b)
| | 0.25% | | 01/15/25 | | 128,936 |
Page 40
See Notes to Financial Statements
First Trust Multi Income Allocation Portfolio
Portfolio of Investments (Continued)
June 30, 2023 (Unaudited)
Principal
Value | | Description | | Stated
Coupon | | Stated
Maturity | | Value |
| U.S. GOVERNMENT BONDS AND NOTES (Continued) |
| $8,047 | | U.S. Treasury Inflation Indexed Bond (b)
| | 2.38% | | 01/15/25 | | $7,964 |
| 91,608 | | U.S. Treasury Inflation Indexed Bond (b)
| | 0.13% | | 04/15/25 | | 87,159 |
| 110,015 | | U.S. Treasury Inflation Indexed Bond (b)
| | 0.38% | | 07/15/25 | | 105,297 |
| 87,687 | | U.S. Treasury Inflation Indexed Bond (b)
| | 0.13% | | 10/15/25 | | 83,147 |
| 108,521 | | U.S. Treasury Inflation Indexed Bond (b)
| | 0.63% | | 01/15/26 | | 103,497 |
| 52,731 | | U.S. Treasury Inflation Indexed Bond (b)
| | 2.00% | | 01/15/26 | | 52,039 |
| 89,071 | | U.S. Treasury Inflation Indexed Bond (b)
| | 0.13% | | 04/15/26 | | 83,539 |
| 88,591 | | U.S. Treasury Inflation Indexed Bond (b)
| | 0.13% | | 07/15/26 | | 83,236 |
| 81,042 | | U.S. Treasury Inflation Indexed Bond (b)
| | 0.13% | | 10/15/26 | | 75,782 |
| 108,003 | | U.S. Treasury Inflation Indexed Bond (b)
| | 0.38% | | 01/15/27 | | 101,365 |
| 30,086 | | U.S. Treasury Inflation Indexed Bond (b)
| | 2.38% | | 01/15/27 | | 30,245 |
| 80,583 | | U.S. Treasury Inflation Indexed Bond (b)
| | 0.13% | | 04/15/27 | | 74,608 |
| 85,570 | | U.S. Treasury Inflation Indexed Bond (b)
| | 0.38% | | 07/15/27 | | 80,238 |
| 78,854 | | U.S. Treasury Inflation Indexed Bond (b)
| | 1.63% | | 10/15/27 | | 77,720 |
| 95,928 | | U.S. Treasury Inflation Indexed Bond (b)
| | 0.50% | | 01/15/28 | | 89,757 |
| 41,994 | | U.S. Treasury Inflation Indexed Bond (b)
| | 1.75% | | 01/15/28 | | 41,520 |
| 37,421 | | U.S. Treasury Inflation Indexed Bond (b)
| | 1.25% | | 04/15/28 | | 36,222 |
| 39,388 | | U.S. Treasury Inflation Indexed Bond (b)
| | 3.63% | | 04/15/28 | | 42,291 |
| 106,351 | | U.S. Treasury Inflation Indexed Bond (b)
| | 0.75% | | 07/15/28 | | 100,815 |
| 85,302 | | U.S. Treasury Inflation Indexed Bond (b)
| | 0.88% | | 01/15/29 | | 80,773 |
| 38,150 | | U.S. Treasury Inflation Indexed Bond (b)
| | 2.50% | | 01/15/29 | | 39,303 |
| 47,979 | | U.S. Treasury Inflation Indexed Bond (b)
| | 3.88% | | 04/15/29 | | 53,027 |
| 109,109 | | U.S. Treasury Inflation Indexed Bond (b)
| | 0.25% | | 07/15/29 | | 99,670 |
| 91,970 | | U.S. Treasury Inflation Indexed Bond (b)
| | 0.13% | | 01/15/30 | | 82,535 |
| 98,206 | | U.S. Treasury Inflation Indexed Bond (b)
| | 0.13% | | 07/15/30 | | 88,111 |
| 96,725 | | U.S. Treasury Inflation Indexed Bond (b)
| | 0.13% | | 01/15/31 | | 86,005 |
| 101,867 | | U.S. Treasury Inflation Indexed Bond (b)
| | 0.13% | | 07/15/31 | | 90,378 |
| 108,343 | | U.S. Treasury Inflation Indexed Bond (b)
| | 0.13% | | 01/15/32 | | 95,430 |
| 13,673 | | U.S. Treasury Inflation Indexed Bond (b)
| | 3.38% | | 04/15/32 | | 15,556 |
| 98,146 | | U.S. Treasury Inflation Indexed Bond (b)
| | 0.63% | | 07/15/32 | | 90,262 |
| 93,695 | | U.S. Treasury Inflation Indexed Bond (b)
| | 1.13% | | 01/15/33 | | 89,827 |
| 40,703 | | U.S. Treasury Inflation Indexed Bond (b)
| | 2.13% | | 02/15/40 | | 43,707 |
| 62,061 | | U.S. Treasury Inflation Indexed Bond (b)
| | 2.13% | | 02/15/41 | | 66,649 |
| 58,804 | | U.S. Treasury Inflation Indexed Bond (b)
| | 0.75% | | 02/15/42 | | 50,013 |
| 57,529 | | U.S. Treasury Inflation Indexed Bond (b)
| | 0.63% | | 02/15/43 | | 47,242 |
| 57,013 | | U.S. Treasury Inflation Indexed Bond (b)
| | 1.38% | | 02/15/44 | | 53,755 |
| 55,782 | | U.S. Treasury Inflation Indexed Bond (b)
| | 0.75% | | 02/15/45 | | 46,149 |
| 49,932 | | U.S. Treasury Inflation Indexed Bond (b)
| | 1.00% | | 02/15/46 | | 43,362 |
| 45,242 | | U.S. Treasury Inflation Indexed Bond (b)
| | 0.88% | | 02/15/47 | | 38,001 |
| 44,287 | | U.S. Treasury Inflation Indexed Bond (b)
| | 1.00% | | 02/15/48 | | 38,138 |
| 34,962 | | U.S. Treasury Inflation Indexed Bond (b)
| | 1.00% | | 02/15/49 | | 30,101 |
| 35,399 | | U.S. Treasury Inflation Indexed Bond (b)
| | 0.25% | | 02/15/50 | | 24,790 |
| 39,617 | | U.S. Treasury Inflation Indexed Bond (b)
| | 0.13% | | 02/15/51 | | 26,470 |
| 40,321 | | U.S. Treasury Inflation Indexed Bond (b)
| | 0.13% | | 02/15/52 | | 26,788 |
| 21,432 | | U.S. Treasury Inflation Indexed Bond (b)
| | 1.50% | | 02/15/53 | | 20,828 |
| | | Total U.S. Government Bonds and Notes
| | 3,126,634 |
| | | (Cost $3,410,854) | | | | | | |
| U.S. GOVERNMENT AGENCY MORTGAGE-BACKED SECURITIES – 0.9% |
| | | Collateralized Mortgage Obligations – 0.6% | | | | | | |
| | | Fannie Mae REMICS | | | | | | |
| 0 | | Series 1993-119, Class H
| | 6.50% | | 07/01/23 | | 0 |
| 24 | | Series 1993-178, Class PK
| | 6.50% | | 09/01/23 | | 24 |
| 464 | | Series 1999-56, Class Z
| | 7.00% | | 12/01/29 | | 470 |
| 538 | | Series 2002-67, Class PE
| | 5.50% | | 11/01/32 | | 540 |
| 12,719 | | Series 2002-9, Class MS, IO, 1 Mo. LIBOR x -1 + 8.10% (c)
| | 2.95% | | 03/25/32 | | 1,300 |
See Notes to Financial Statements
Page 41
First Trust Multi Income Allocation Portfolio
Portfolio of Investments (Continued)
June 30, 2023 (Unaudited)
Principal
Value | | Description | | Stated
Coupon | | Stated
Maturity | | Value |
| U.S. GOVERNMENT AGENCY MORTGAGE-BACKED SECURITIES (Continued) |
| | | Collateralized Mortgage Obligations (Continued) | | | | | | |
| | | Fannie Mae REMICS (Continued) | | | | | | |
| $2,391 | | Series 2002-90, Class A1
| | 6.50% | | 06/01/42 | | $2,448 |
| 777 | | Series 2003-14, Class AQ
| | 3.50% | | 03/01/33 | | 745 |
| 781 | | Series 2003-41, Class OA
| | 4.00% | | 05/01/33 | | 759 |
| 17,354 | | Series 2004-10, Class ZB
| | 6.00% | | 02/01/34 | | 17,504 |
| 6,215 | | Series 2005-79, Class NF, 1 Mo. LIBOR + 0.41% (d)
| | 5.56% | | 09/25/35 | | 6,111 |
| 8,628 | | Series 2007-10, Class Z
| | 6.00% | | 02/01/37 | | 8,779 |
| 574 | | Series 2012-35, Class PL
| | 2.00% | | 11/01/41 | | 518 |
| 215 | | Series 2013-14, Class QE
| | 1.75% | | 03/01/43 | | 182 |
| 8,215 | | Series 2013-31, Class NT
| | 3.00% | | 04/01/43 | | 7,409 |
| | | FHLMC-GNMA | | | | | | |
| 19 | | Series 1994-27, Class D
| | 7.00% | | 03/01/24 | | 19 |
| | | Freddie Mac REMICS | | | | | | |
| 119 | | Series 1994-1673, Class FB, 10 Yr. Constant Maturity Treasury Rate - 0.50% (d)
| | 3.09% | | 02/01/24 | | 119 |
| 11 | | Series 1996-1847, Class LL
| | 7.50% | | 04/01/26 | | 11 |
| 3,690 | | Series 1998-2033, Class IA, IO
| | 7.00% | | 02/01/28 | | 277 |
| 1,083 | | Series 1999-2130, Class KB
| | 6.38% | | 03/01/29 | | 1,092 |
| 16,305 | | Series 1999-2174, Class PN
| | 6.00% | | 07/01/29 | | 16,272 |
| 2,162 | | Series 2001-2277, Class B
| | 7.50% | | 01/01/31 | | 2,306 |
| 20,869 | | Series 2003-2647, Class LS, 1 Mo. LIBOR x -2.5 + 14.00% (c)
| | 1.07% | | 07/01/33 | | 18,731 |
| 13,997 | | Series 2004-2768, Class PW
| | 4.25% | | 03/01/34 | | 13,456 |
| 2,000 | | Series 2004-2778, Class MM
| | 5.25% | | 04/01/34 | | 1,997 |
| 15,022 | | Series 2006-3199, Class DS, IO, 1 Mo. LIBOR x -1 + 7.15% (c)
| | 1.96% | | 08/15/36 | | 1,243 |
| 8,237 | | Series 2010-3775, Class KZ
| | 4.00% | | 08/01/25 | | 7,801 |
| 24,323 | | Series 2013-4178, Class ZN
| | 3.50% | | 03/01/43 | | 19,470 |
| | | Government National Mortgage Association | | | | | | |
| 33,783 | | Series 2007-35, Class NE
| | 6.00% | | 06/01/37 | | 34,131 |
| 49,000 | | Series 2009-61, Class QE
| | 5.50% | | 08/01/39 | | 48,938 |
| 2,291 | | Series 2011-136, Class GB
| | 2.50% | | 05/01/40 | | 2,283 |
| | | | | 214,935 |
| | | Pass-through Security – 0.3% | | | | | | |
| | | Federal Home Loan Mortgage Corporation | | | | | | |
| 2,856 | | Pool C01252
| | 6.50% | | 11/01/31 | | 2,945 |
| 16,066 | | Pool G01731
| | 6.50% | | 12/01/29 | | 16,451 |
| 11,377 | | Pool G06358
| | 4.00% | | 04/01/41 | | 10,959 |
| | | Federal National Mortgage Association | | | | | | |
| 6,529 | | Pool 890383
| | 4.00% | | 01/01/42 | | 6,282 |
| 9,545 | | Pool AL0791
| | 4.00% | | 02/01/41 | | 9,183 |
| 14,716 | | Pool AU4289
| | 4.00% | | 09/01/43 | | 14,152 |
| 2,187 | | Pool MA0561
| | 4.00% | | 11/01/40 | | 2,104 |
| 10,617 | | Pool MA1028
| | 4.00% | | 04/01/42 | | 10,214 |
| | | Government National Mortgage Association | | | | | | |
| 9,932 | | Pool 667422
| | 5.00% | | 10/01/39 | | 9,994 |
| 5,336 | | Pool 706201
| | 5.50% | | 04/01/39 | | 5,364 |
| 8,466 | | Pool 736558
| | 5.00% | | 02/01/40 | | 8,434 |
| 9,864 | | Pool 759248
| | 4.00% | | 02/01/41 | | 9,553 |
| | | | | 105,635 |
| | | Total U.S. Government Agency Mortgage-Backed Securities
| | 320,570 |
| | | (Cost $355,367) | | | | | | |
Page 42
See Notes to Financial Statements
First Trust Multi Income Allocation Portfolio
Portfolio of Investments (Continued)
June 30, 2023 (Unaudited)
Principal
Value | | Description | | Stated
Coupon | | Stated
Maturity | | Value |
| MORTGAGE-BACKED SECURITIES – 0.0% |
| | | Collateralized Mortgage Obligations – 0.0% | | | | | | |
| | | Credit Suisse First Boston Mortgage Securities Corp. | | | | | | |
| $299 | | Series 2004-6, Class 2A1
| | 4.75% | | 09/25/19 | | $0 |
| | | MASTR Alternative Loan Trust | | | | | | |
| 593 | | Series 2004-10, Class 2A1
| | 5.50% | | 10/01/19 | | 549 |
| 27 | | Series 2005-1, Class 5A1
| | 5.50% | | 01/01/20 | | 24 |
| | | MASTR Asset Securitization Trust | | | | | | |
| 4,132 | | Series 2004-1, Class 5A4
| | 5.50% | | 02/01/34 | | 3,747 |
| | | Structured Asset Mortgage Investments Trust | | | | | | |
| 3,307 | | Series 1999-1, Class 2A (e)
| | 3.91% | | 06/01/29 | | 3,087 |
| | | Total Mortgage-Backed Securities
| | 7,407 |
| | | (Cost $8,351) | | | | | | |
| Shares | | Description | | Value |
| EXCHANGE-TRADED FUNDS – 49.3% |
| 158,429 | | First Trust Institutional Preferred Securities and Income ETF (f)
| | 2,669,529 |
| 44,804 | | First Trust Limited Duration Investment Grade Corporate ETF (f)
| | 834,250 |
| 5,750 | | First Trust Long Duration Opportunities ETF (f)
| | 127,938 |
| 15,000 | | First Trust Low Duration Opportunities ETF (f)
| | 715,050 |
| 53,862 | | First Trust Preferred Securities and Income ETF (f)
| | 860,176 |
| 101,167 | | First Trust Senior Loan ETF (f)
| | 4,582,865 |
| 61,781 | | First Trust Tactical High Yield ETF (f)
| | 2,448,381 |
| 750 | | iShares 20+ Year Treasury Bond ETF
| | 77,205 |
| 500 | | iShares 3-7 Year Treasury Bond ETF
| | 57,630 |
| 15,800 | | iShares 7-10 Year Treasury Bond ETF
| | 1,526,280 |
| 24,899 | | iShares iBoxx $ Investment Grade Corporate Bond ETF
| | 2,692,578 |
| 13,075 | | iShares MBS ETF
| | 1,219,440 |
| | | Total Exchange-Traded Funds
| | 17,811,322 |
| | | (Cost $19,210,503) | | |
| | Total Investments – 97.6%
| | 35,245,719 |
| | (Cost $35,531,614) | | |
| | Net Other Assets and Liabilities – 2.4%
| | 867,356 |
| | Net Assets – 100.0%
| | $36,113,075 |
| (a) | This security is taxed as a “C” corporation for federal income tax purposes. |
| (b) | Security whose principal value is adjusted in accordance with changes to the country’s Consumer Price Index. Interest is calculated on the basis of the current adjusted principal value. |
| (c) | Inverse floating rate security. |
| (d) | Floating or variable rate security. |
| (e) | Collateral Strip Rate security. Coupon is based on the weighted net interest rate of the investment’s underlying collateral. The interest rate resets periodically. |
| (f) | Investment in an affiliated fund. |
| Abbreviations throughout the Portfolio of Investments: |
| ADR | American Depositary Receipt |
| CAD | Canadian Dollar |
| IO | Interest-Only Security - Principal amount shown represents par value on which interest payments are based. |
| LIBOR | London Interbank Offered Rate |
See Notes to Financial Statements
Page 43
First Trust Multi Income Allocation Portfolio
Portfolio of Investments (Continued)
June 30, 2023 (Unaudited)
Valuation Inputs
A summary of the inputs used to value the Fund’s investments as of June 30, 2023 is as follows (see Note 2A - Portfolio Valuation in the Notes to Financial Statements):
| | Total
Value at
6/30/2023 | Level 1
Quoted
Prices | Level 2
Significant
Observable
Inputs | Level 3
Significant
Unobservable
Inputs |
Common Stocks*
| $ 7,291,209 | $ 7,291,209 | $ — | $ — |
Real Estate Investment Trusts*
| 4,265,110 | 4,265,110 | — | — |
Master Limited Partnerships*
| 2,423,467 | 2,423,467 | — | — |
U.S. Government Bonds and Notes
| 3,126,634 | — | 3,126,634 | — |
U.S. Government Agency Mortgage-Backed Securities
| 320,570 | — | 320,570 | — |
Mortgage-Backed Securities
| 7,407 | — | 7,407 | — |
Exchange-Traded Funds
| 17,811,322 | 17,811,322 | — | — |
Total Investments
| $ 35,245,719 | $ 31,791,108 | $ 3,454,611 | $— |
| * | See Portfolio of Investments for industry breakout. |
Page 44
See Notes to Financial Statements
First Trust Dorsey Wright Tactical Core Portfolio
Portfolio of Investments
June 30, 2023 (Unaudited)
| Shares | | Description | | Value |
| EXCHANGE-TRADED FUNDS – 98.3% |
| | | Capital Markets – 98.3% | | |
| 57,963 | | First Trust Consumer Discretionary AlphaDEX® Fund (a)
| | $3,200,137 |
| 56,225 | | First Trust Developed Markets ex-US AlphaDEX® Fund (a)
| | 2,887,154 |
| 52,237 | | First Trust Dow Jones Global Select Dividend Index Fund (a)
| | 1,119,961 |
| 18,777 | | First Trust Dow Jones Internet Index Fund (a) (b)
| | 3,060,463 |
| 134,683 | | First Trust Emerging Markets AlphaDEX® Fund (a)
| | 2,852,586 |
| 25,078 | | First Trust India NIFTY 50 Equal Weight ETF (a)
| | 1,199,481 |
| 53,713 | | First Trust Industrials/Producer Durables AlphaDEX® Fund (a)
| | 3,227,614 |
| 23,907 | | First Trust Japan AlphaDEX® Fund (a)
| | 1,146,986 |
| 34,334 | | First Trust Large Cap Growth AlphaDEX® Fund (a)
| | 3,477,691 |
| 60,768 | | First Trust Latin America AlphaDEX® Fund (a)
| | 1,154,896 |
| 36,501 | | First Trust Mid Cap Core AlphaDEX® Fund (a)
| | 3,515,776 |
| 76,448 | | First Trust Mid Cap Value AlphaDEX® Fund (a)
| | 3,493,674 |
| 114,090 | | First Trust Nasdaq Food & Beverage ETF (a)
| | 2,991,440 |
| 45,492 | | First Trust Nasdaq Semiconductor ETF (a)
| | 3,238,575 |
| 18,816 | | First Trust Switzerland AlphaDEX® Fund (a)
| | 1,129,713 |
| 28,010 | | iShares Core U.S. Aggregate Bond ETF
| | 2,743,580 |
| 76,260 | | SPDR Bloomberg Emerging Markets Local Bond ETF
| | 1,613,662 |
| 57,448 | | SPDR Bloomberg International Corporate Bond ETF
| | 1,630,374 |
| 52,487 | | SPDR Bloomberg Investment Grade Floating Rate ETF
| | 1,610,826 |
| 38,832 | | SPDR FTSE International Government Inflation-Protected Bond ETF
| | 1,621,624 |
| | Total Investments – 98.3%
| | 46,916,213 |
| | (Cost $46,064,886) | | |
| | Net Other Assets and Liabilities – 1.7%
| | 802,817 |
| | Net Assets – 100.0%
| | $47,719,030 |
| (a) | Investment in an affiliated fund. |
| (b) | Non-income producing security. |
Valuation Inputs
A summary of the inputs used to value the Fund’s investments as of June 30, 2023 is as follows (see Note 2A - Portfolio Valuation in the Notes to Financial Statements):
| | Total
Value at
6/30/2023 | Level 1
Quoted
Prices | Level 2
Significant
Observable
Inputs | Level 3
Significant
Unobservable
Inputs |
Exchange-Traded Funds*
| $ 46,916,213 | $ 46,916,213 | $ — | $ — |
| * | See Portfolio of Investments for industry breakout. |
See Notes to Financial Statements
Page 45
First Trust Capital Strength Portfolio
Portfolio of Investments
June 30, 2023 (Unaudited)
| Shares | | Description | | Value |
| COMMON STOCKS – 98.0% |
| | | Aerospace & Defense – 5.5% | | |
| 8,625 | | General Dynamics Corp. | | $1,855,669 |
| 4,022 | | Lockheed Martin Corp. | | 1,851,648 |
| 4,112 | | Northrop Grumman Corp. | | 1,874,250 |
| | | | | 5,581,567 |
| | | Air Freight & Logistics – 1.8% | | |
| 9,942 | | United Parcel Service, Inc., Class B | | 1,782,103 |
| | | Beverages – 5.8% | | |
| 30,300 | | Coca-Cola (The) Co. | | 1,824,666 |
| 36,569 | | Monster Beverage Corp. (a) | | 2,100,523 |
| 10,467 | | PepsiCo, Inc. | | 1,938,698 |
| | | | | 5,863,887 |
| | | Biotechnology – 5.0% | | |
| 11,950 | | AbbVie, Inc. | | 1,610,024 |
| 7,958 | | Amgen, Inc. | | 1,766,835 |
| 22,418 | | Gilead Sciences, Inc. | | 1,727,755 |
| | | | | 5,104,614 |
| | | Capital Markets – 1.7% | | |
| 34,066 | | Nasdaq, Inc. | | 1,698,190 |
| | | Chemicals – 2.0% | | |
| 6,679 | | Air Products and Chemicals, Inc. | | 2,000,561 |
| | | Commercial Services &
Supplies – 2.2% | | |
| 24,757 | | Copart, Inc. (a) | | 2,258,086 |
| | | Communications Equipment – 2.1% | | |
| 41,266 | | Cisco Systems, Inc. | | 2,135,103 |
| | | Consumer Staples
Distribution & Retail – 4.0% | | |
| 3,833 | | Costco Wholesale Corp. | | 2,063,611 |
| 12,791 | | Walmart, Inc. | | 2,010,489 |
| | | | | 4,074,100 |
| | | Electronic Equipment,
Instruments & Components – 2.1% | | |
| 25,257 | | Amphenol Corp., Class A | | 2,145,582 |
| | | Financial Services – 4.0% | | |
| 5,172 | | Mastercard, Inc., Class A | | 2,034,148 |
| 8,292 | | Visa, Inc., Class A | | 1,969,184 |
| | | | | 4,003,332 |
| | | Food Products – 1.8% | | |
| 24,108 | | Archer-Daniels-Midland Co. | | 1,821,600 |
| | | Ground Transportation – 2.1% | | |
| 60,991 | | CSX Corp. | | 2,079,793 |
| Shares | | Description | | Value |
|
| | | Health Care Equipment &
Supplies – 3.7% | | |
| 17,381 | | Abbott Laboratories | | $1,894,877 |
| 23,087 | | Hologic, Inc. (a) | | 1,869,354 |
| | | | | 3,764,231 |
| | | Health Care Providers &
Services – 9.9% | | |
| 11,640 | | AmerisourceBergen Corp. | | 2,239,885 |
| 4,306 | | Elevance Health, Inc. | | 1,913,113 |
| 3,951 | | Humana, Inc. | | 1,766,611 |
| 7,043 | | Molina Healthcare, Inc. (a) | | 2,121,633 |
| 4,011 | | UnitedHealth Group, Inc. | | 1,927,847 |
| | | | | 9,969,089 |
| | | Household Durables – 4.1% | | |
| 19,858 | | Garmin Ltd. | | 2,070,991 |
| 328 | | NVR, Inc. (a) | | 2,083,003 |
| | | | | 4,153,994 |
| | | Household Products – 1.9% | | |
| 12,435 | | Procter & Gamble (The) Co. | | 1,886,887 |
| | | Industrial Conglomerates – 2.0% | | |
| 9,898 | | Honeywell International, Inc. | | 2,053,835 |
| | | Insurance – 10.2% | | |
| 29,414 | | Aflac, Inc. | | 2,053,097 |
| 5,818 | | Aon PLC, Class A | | 2,008,374 |
| 31,608 | | Brown & Brown, Inc. | | 2,175,895 |
| 10,784 | | Marsh & McLennan Cos., Inc. | | 2,028,255 |
| 33,740 | | W.R. Berkley Corp. | | 2,009,554 |
| | | | | 10,275,175 |
| | | Machinery – 4.2% | | |
| 8,334 | | Cummins, Inc. | | 2,043,164 |
| 26,531 | | PACCAR, Inc. | | 2,219,318 |
| | | | | 4,262,482 |
| | | Media – 2.0% | | |
| 51,753 | | Interpublic Group of (The) Cos., Inc. | | 1,996,631 |
| | | Pharmaceuticals – 9.7% | | |
| 27,532 | | Bristol-Myers Squibb Co. | | 1,760,671 |
| 5,038 | | Eli Lilly & Co. | | 2,362,721 |
| 11,929 | | Johnson & Johnson | | 1,974,488 |
| 16,822 | | Merck & Co., Inc. | | 1,941,091 |
| 48,265 | | Pfizer, Inc. | | 1,770,360 |
| | | | | 9,809,331 |
| | | Professional Services – 3.9% | | |
| 9,018 | | Automatic Data Processing, Inc. | | 1,982,066 |
| 17,720 | | Paychex, Inc. | | 1,982,337 |
| | | | | 3,964,403 |
Page 46
See Notes to Financial Statements
First Trust Capital Strength Portfolio
Portfolio of Investments (Continued)
June 30, 2023 (Unaudited)
| Shares | | Description | | Value |
| COMMON STOCKS (Continued) |
| | | Semiconductors &
Semiconductor Equipment – 1.9% | | |
| 10,963 | | Texas Instruments, Inc. | | $1,973,559 |
| | | Specialty Retail – 2.1% | | |
| 24,745 | | TJX (The) Cos., Inc. | | 2,098,129 |
| | | Technology Hardware,
Storage & Peripherals – 2.3% | | |
| 30,703 | | NetApp, Inc. | | 2,345,709 |
| | | Total Investments – 98.0% | | 99,101,973 |
| | | (Cost $95,959,912) | | |
| | | Net Other Assets and Liabilities – 2.0% | | 2,018,886 |
| | | Net Assets – 100.0% | | $101,120,859 |
| (a) | Non-income producing security. |
Valuation Inputs
A summary of the inputs used to value the Fund’s investments as of June 30, 2023 is as follows (see Note 2A - Portfolio Valuation in the Notes to Financial Statements):
| | Total
Value at
6/30/2023 | Level 1
Quoted
Prices | Level 2
Significant
Observable
Inputs | Level 3
Significant
Unobservable
Inputs |
| Common Stocks* | $ 99,101,973 | $ 99,101,973 | $ — | $ — |
| * | See Portfolio of Investments for industry breakout. |
See Notes to Financial Statements
Page 47
First Trust International Developed Capital Strength Portfolio
Portfolio of Investments
June 30, 2023 (Unaudited)
| Shares | | Description | | Value |
| COMMON STOCKS – 95.7% |
| | | Aerospace & Defense – 3.7% | | |
| 12,790 | | BAE Systems PLC (a) | | $150,810 |
| 1,031 | | Thales S.A. (a) | | 154,474 |
| | | | | 305,284 |
| | | Automobiles – 2.2% | | |
| 6,300 | | Yamaha Motor Co., Ltd. (a) | | 181,114 |
| | | Beverages – 3.7% | | |
| 989 | | Carlsberg A.S., Class B (a) | | 158,370 |
| 3,462 | | Diageo PLC (a) | | 148,835 |
| | | | | 307,205 |
| | | Biotechnology – 1.8% | | |
| 391 | | Genmab A.S. (a) (b) | | 148,172 |
| | | Capital Markets – 1.8% | | |
| 793 | | Deutsche Boerse AG (a) | | 146,399 |
| | | Chemicals – 4.0% | | |
| 46 | | Givaudan S.A. (a) | | 152,579 |
| 5,300 | | Shin-Etsu Chemical Co., Ltd. (a) | | 177,115 |
| | | | | 329,694 |
| | | Communications Equipment – 1.9% | | |
| 37,951 | | Nokia Oyj (a) | | 159,009 |
| | | Consumer Staples
Distribution & Retail – 3.9% | | |
| 3,227 | | Alimentation Couche-Tard, Inc. | | 165,473 |
| 4,660 | | Koninklijke Ahold Delhaize N.V. (a) | | 158,873 |
| | | | | 324,346 |
| | | Electrical Equipment – 4.3% | | |
| 4,578 | | ABB Ltd. (a) | | 180,102 |
| 1,741 | | Legrand S.A. (a) | | 172,714 |
| | | | | 352,816 |
| | | Electronic Equipment,
Instruments & Components – 3.5% | | |
| 3,000 | | Hamamatsu Photonics K.K. (a) | | 147,280 |
| 300 | | Keyence Corp. (a) | | 142,547 |
| | | | | 289,827 |
| | | Entertainment – 4.3% | | |
| 4,400 | | Capcom Co., Ltd. (a) | | 174,418 |
| 3,900 | | Nintendo Co., Ltd. (a) | | 177,794 |
| | | | | 352,212 |
| | | Food Products – 1.8% | | |
| 1,243 | | Nestle S.A. (a) | | 149,522 |
| | | Ground Transportation – 1.9% | | |
| 1,312 | | Canadian National Railway Co. | | 158,876 |
| Shares | | Description | | Value |
|
| | | Health Care Equipment &
Supplies – 1.7% | | |
| 8,900 | | Olympus Corp. (a) | | $140,846 |
| | | Hotels, Restaurants &
Leisure – 4.1% | | |
| 6,379 | | Aristocrat Leisure Ltd. (a) | | 165,043 |
| 6,272 | | Compass Group PLC (a) | | 175,636 |
| | | | | 340,679 |
| | | Household Products – 1.8% | | |
| 2,012 | | Reckitt Benckiser Group PLC (a) | | 151,204 |
| | | Independent Power &
Renewable Electricity Producers – 1.9% | | |
| 3,568 | | RWE AG (a) | | 155,480 |
| | | Insurance – 2.0% | | |
| 1,074 | | Intact Financial Corp. | | 165,824 |
| | | IT Services – 4.0% | | |
| 1,627 | | CGI, Inc. (b) | | 171,574 |
| 1,000 | | Obic Co., Ltd. (a) | | 160,508 |
| | | | | 332,082 |
| | | Leisure Products – 2.0% | | |
| 7,200 | | Bandai Namco Holdings, Inc. (a) | | 166,733 |
| | | Machinery – 1.9% | | |
| 2,938 | | Kone Oyj, Class B (a) | | 153,495 |
| | | Metals & Mining – 2.0% | | |
| 5,313 | | BHP Group Ltd. (a) | | 159,719 |
| | | Personal Care Products – 3.8% | | |
| 331 | | L’Oreal S.A. (a) | | 154,404 |
| 2,965 | | Unilever PLC (a) | | 154,400 |
| | | | | 308,804 |
| | | Pharmaceuticals – 11.6% | | |
| 6,600 | | Chugai Pharmaceutical Co., Ltd. (a) | | 187,961 |
| 8,850 | | GSK PLC (a) | | 156,845 |
| 938 | | Novo Nordisk A.S., Class B (a) | | 151,524 |
| 8,100 | | Ono Pharmaceutical Co., Ltd. (a) | | 146,152 |
| 514 | | Roche Holding AG (a) | | 157,012 |
| 3,600 | | Shionogi & Co., Ltd. (a) | | 151,846 |
| | | | | 951,340 |
| | | Professional Services – 5.6% | | |
| 5,498 | | Bureau Veritas S.A. (a) | | 150,838 |
| 1,713 | | SGS S.A. (a) | | 162,052 |
| 1,193 | | Wolters Kluwer N.V. (a) | | 151,479 |
| | | | | 464,369 |
| | | Software – 4.4% | | |
| 83 | | Constellation Software, Inc. | | 171,968 |
Page 48
See Notes to Financial Statements
First Trust International Developed Capital Strength Portfolio
Portfolio of Investments (Continued)
June 30, 2023 (Unaudited)
| Shares | | Description | | Value |
| COMMON STOCKS (Continued) |
| | | Software (Continued) | | |
| 16,154 | | Sage Group (The) PLC (a) | | $189,760 |
| | | | | 361,728 |
| | | Specialty Retail – 2.2% | | |
| 4,662 | | Industria de Diseno Textil S.A. (a) | | 180,829 |
| | | Technology Hardware,
Storage & Peripherals – 2.2% | | |
| 3,249 | | Samsung Electronics Co., Ltd. (a) | | 178,901 |
| | | Textiles, Apparel & Luxury
Goods – 3.8% | | |
| 73 | | Hermes International (a) | | 158,681 |
| 163 | | LVMH Moet Hennessy Louis Vuitton SE (a) | | 153,695 |
| | | | | 312,376 |
| | | Trading Companies &
Distributors – 1.9% | | |
| 4,054 | | Bunzl PLC (a) | | 154,490 |
| | | Total Common Stocks | | 7,883,375 |
| | | (Cost $7,469,203) | | |
| REAL ESTATE INVESTMENT TRUSTS – 2.0% |
| | | Industrial REITs – 2.0% | | |
| 12,524 | | Goodman Group (a) | | 168,358 |
| | | (Cost $160,731) | | |
| | | Total Investments – 97.7% | | 8,051,733 |
| | | (Cost $7,629,934) | | |
| | | Net Other Assets and Liabilities – 2.3% | | 186,167 |
| | | Net Assets – 100.0% | | $8,237,900 |
| (a) | This security is fair valued by the Advisor’s Pricing Committee in accordance with procedures approved by the Trust’s Board of Trustees and in accordance with provisions of the Investment Company Act of 1940 and rules thereunder, as amended. At June 30, 2023, securities noted as such are valued at $7,218,018 or 87.6% of net assets. Certain of these securities are fair valued using a factor provided by a third-party pricing service due to the change in value between the foreign markets’ close and the New York Stock Exchange close exceeding a certain threshold. On days when this threshold is not exceeded, these securities are typically valued at the last sale price on the exchange on which they are principally traded. |
| (b) | Non-income producing security. |
| Country Allocation† | % of Net
Assets |
| Japan | 23.7% |
| United Kingdom | 15.5 |
| France | 11.5 |
| Canada | 10.1 |
| Switzerland | 9.7 |
| Australia | 6.0 |
| Denmark | 5.5 |
| Finland | 3.8 |
| Netherlands | 3.8 |
| Germany | 3.7 |
| Spain | 2.2 |
| South Korea | 2.2 |
| Total Investments | 97.7 |
| Net Other Assets and Liabilities | 2.3 |
| Total | 100.0% |
† Portfolio securities are categorized based upon their country of incorporation.
Currency Exposure
Diversification | % of Total
Investments |
| Euro | 25.5% |
| Japanese Yen | 24.3 |
| British Pound Sterling | 15.9 |
| Canadian Dollar | 10.4 |
| Swiss Franc | 9.9 |
| Australian Dollar | 6.1 |
| Danish Krone | 5.7 |
| South Korean Won | 2.2 |
| Total | 100.0% |
See Notes to Financial Statements
Page 49
First Trust International Developed Capital Strength Portfolio
Portfolio of Investments (Continued)
June 30, 2023 (Unaudited)
Valuation Inputs
A summary of the inputs used to value the Fund’s investments as of June 30, 2023 is as follows (see Note 2A - Portfolio Valuation in the Notes to Financial Statements):
| | Total
Value at
6/30/2023 | Level 1
Quoted
Prices | Level 2
Significant
Observable
Inputs | Level 3
Significant
Unobservable
Inputs |
| Common Stocks: | | | | |
| Consumer Staples Distribution & Retail | $ 324,346 | $ 165,473 | $ 158,873 | $ — |
| Ground Transportation | 158,876 | 158,876 | — | — |
| Insurance | 165,824 | 165,824 | — | — |
| IT Services | 332,082 | 171,574 | 160,508 | — |
| Software | 361,728 | 171,968 | 189,760 | — |
| Other Industry Categories* | 6,540,519 | — | 6,540,519 | — |
| Real Estate Investment Trusts* | 168,358 | — | 168,358 | — |
| Total Investments | $ 8,051,733 | $ 833,715 | $ 7,218,018 | $— |
| * | See Portfolio of Investments for industry breakout. |
Page 50
See Notes to Financial Statements
First Trust Growth Strength Portfolio
Portfolio of Investments
June 30, 2023 (Unaudited)
| Shares | | Description | | Value |
| COMMON STOCKS – 96.7% |
| | | Air Freight & Logistics – 3.7% | | |
| 146 | | Expeditors International of Washington, Inc. | | $17,685 |
| 83 | | United Parcel Service, Inc., Class B | | 14,878 |
| | | | | 32,563 |
| | | Automobiles – 2.9% | | |
| 99 | | Tesla, Inc. (a) | | 25,915 |
| | | Biotechnology – 5.1% | | |
| 100 | | AbbVie, Inc. | | 13,473 |
| 20 | | Regeneron Pharmaceuticals, Inc. (a) | | 14,371 |
| 49 | | Vertex Pharmaceuticals, Inc. (a) | | 17,243 |
| | | | | 45,087 |
| | | Chemicals – 1.7% | | |
| 219 | | CF Industries Holdings, Inc. | | 15,203 |
| | | Commercial Services &
Supplies – 2.2% | | |
| 208 | | Copart, Inc. (a) | | 18,972 |
| | | Electronic Equipment,
Instruments & Components – 2.1% | | |
| 212 | | Amphenol Corp., Class A | | 18,009 |
| | | Food Products – 1.8% | | |
| 171 | | Bunge Ltd. | | 16,134 |
| | | Health Care Equipment &
Supplies – 5.5% | | |
| 146 | | Abbott Laboratories | | 15,917 |
| 131 | | DexCom, Inc. (a) | | 16,835 |
| 194 | | Hologic, Inc. (a) | | 15,708 |
| | | | | 48,460 |
| | | Health Care Providers &
Services – 2.0% | | |
| 59 | | Molina Healthcare, Inc. (a) | | 17,773 |
| | | Household Durables – 6.4% | | |
| 153 | | DR Horton, Inc. | | 18,619 |
| 146 | | Lennar Corp., Class A | | 18,295 |
| 3 | | NVR, Inc. (a) | | 19,052 |
| | | | | 55,966 |
| | | Insurance – 1.9% | | |
| 283 | | W.R. Berkley Corp. | | 16,855 |
| | | Interactive Media & Services – 2.1% | | |
| 154 | | Alphabet, Inc., Class A (a) | | 18,434 |
| | | IT Services – 1.5% | | |
| 58 | | EPAM Systems, Inc. (a) | | 13,036 |
| Shares | | Description | | Value |
|
| | | Life Sciences Tools &
Services – 5.0% | | |
| 117 | | Agilent Technologies, Inc. | | $14,069 |
| 64 | | Danaher Corp. | | 15,360 |
| 28 | | Thermo Fisher Scientific, Inc. | | 14,609 |
| | | | | 44,038 |
| | | Machinery – 1.9% | | |
| 42 | | Deere & Co. | | 17,018 |
| | | Metals & Mining – 5.8% | | |
| 106 | | Nucor Corp. | | 17,382 |
| 65 | | Reliance Steel & Aluminum Co. | | 17,653 |
| 148 | | Steel Dynamics, Inc. | | 16,122 |
| | | | | 51,157 |
| | | Oil, Gas & Consumable Fuels – 10.6% | | |
| 96 | | Chevron Corp. | | 15,106 |
| 159 | | ConocoPhillips | | 16,474 |
| 303 | | Devon Energy Corp. | | 14,647 |
| 139 | | EOG Resources, Inc. | | 15,907 |
| 140 | | Exxon Mobil Corp. | | 15,015 |
| 136 | | Valero Energy Corp. | | 15,953 |
| | | | | 93,102 |
| | | Pharmaceuticals – 3.4% | | |
| 231 | | Bristol-Myers Squibb Co. | | 14,773 |
| 405 | | Pfizer, Inc. | | 14,855 |
| | | | | 29,628 |
| | | Semiconductors &
Semiconductor Equipment – 20.4% | | |
| 143 | | Applied Materials, Inc. | | 20,669 |
| 26 | | Broadcom, Inc. | | 22,553 |
| 73 | | Enphase Energy, Inc. (a) | | 12,226 |
| 44 | | KLA Corp. | | 21,341 |
| 31 | | Lam Research Corp. | | 19,929 |
| 60 | | NVIDIA Corp. | | 25,381 |
| 96 | | NXP Semiconductors N.V. | | 19,649 |
| 221 | | ON Semiconductor Corp. (a) | | 20,902 |
| 138 | | QUALCOMM, Inc. | | 16,428 |
| | | | | 179,078 |
| | | Software – 6.5% | | |
| 43 | | Adobe, Inc. (a) | | 21,026 |
| 84 | | Autodesk, Inc. (a) | | 17,187 |
| 43 | | Synopsys, Inc. (a) | | 18,723 |
| | | | | 56,936 |
| | | Technology Hardware,
Storage & Peripherals – 2.2% | | |
| 99 | | Apple, Inc. | | 19,203 |
See Notes to Financial Statements
Page 51
First Trust Growth Strength Portfolio
Portfolio of Investments (Continued)
June 30, 2023 (Unaudited)
| Shares | | Description | | Value |
| COMMON STOCKS (Continued) |
| | | Textiles, Apparel & Luxury
Goods – 2.0% | | |
| 33 | | Deckers Outdoor Corp. (a) | | $17,413 |
| | | Total Common Stocks | | 849,980 |
| | | (Cost $792,902) | | |
| REAL ESTATE INVESTMENT TRUSTS – 2.0% |
| | | Specialized REITs – 2.0% | | |
| 524 | | Weyerhaeuser Co. | | 17,559 |
| | | (Cost $15,418) | | |
| | | Total Investments – 98.7% | | 867,539 |
| | | (Cost $808,320) | | |
| | | Net Other Assets and Liabilities – 1.3% | | 11,528 |
| | | Net Assets – 100.0% | | $879,067 |
| (a) | Non-income producing security. |
Valuation Inputs
A summary of the inputs used to value the Fund’s investments as of June 30, 2023 is as follows (see Note 2A - Portfolio Valuation in the Notes to Financial Statements):
| | Total
Value at
6/30/2023 | Level 1
Quoted
Prices | Level 2
Significant
Observable
Inputs | Level 3
Significant
Unobservable
Inputs |
| Common Stocks* | $ 849,980 | $ 849,980 | $ — | $ — |
| Real Estate Investment Trusts* | 17,559 | 17,559 | — | — |
| Total Investments | $ 867,539 | $ 867,539 | $— | $— |
| * | See Portfolio of Investments for industry breakout. |
Page 52
See Notes to Financial Statements
This page intentionally left blank
First Trust Variable Insurance Trust
Statements of Assets and Liabilities
June 30, 2023 (Unaudited)
| | First Trust/Dow
Jones Dividend
& Income
Allocation
Portfolio | | First Trust
Multi Income
Allocation
Portfolio | | First Trust
Dorsey Wright
Tactical Core
Portfolio |
| ASSETS: | | | | | |
Investments, at value - Unaffiliated
| $ 893,536,568 | | $ 23,007,530 | | $ 9,220,066 |
Investments, at value - Affiliated
| — | | 12,238,189 | | 37,696,147 |
Total investments, at value
| 893,536,568 | | 35,245,719 | | 46,916,213 |
Cash
| 2,547,352 | | 1,077,839 | | 893,754 |
Foreign currency
| — | | 2,763 | | — |
| Receivables: | | | | | |
Investment securities sold
| 16,267,159 | | 489,393 | | — |
Interest
| 5,223,584 | | 9,937 | | — |
Dividends
| 454,785 | | 26,983 | | — |
Fund shares sold
| 80,210 | | 569 | | 459 |
Dividend reclaims
| 2,561 | | 1,017 | | — |
From investment advisor
| — | | 12,723 | | 12,450 |
Prepaid expenses
| 2,447 | | 109 | | — |
Total Assets
| 918,114,666 | | 36,867,052 | | 47,822,876 |
| LIABILITIES: | | | | | |
| Payables: | | | | | |
Investment securities purchased
| 15,428,663 | | 652,041 | | — |
Investment advisory fees
| 439,706 | | — | | — |
12b-1 distribution and service fees
| 182,890 | | 7,316 | | 9,641 |
Administrative service fees
| 146,569 | | 5,877 | | 7,742 |
Licensing fees
| 62,676 | | — | | 11,638 |
Administrative fees
| 53,138 | | 1,412 | | 11,318 |
Shareholder reporting fees
| 45,203 | | 1,722 | | 75 |
Custodian fees
| 27,373 | | 9,983 | | 11,400 |
Fund shares redeemed
| 22,842 | | 33,689 | | 32,136 |
Audit and tax fees
| 18,264 | | 29,750 | | 13,523 |
Transfer agent fees
| 16,071 | | 9,759 | | 4,099 |
Legal fees
| 1,161 | | 28 | | 84 |
Financial reporting fees
| 732 | | 732 | | 732 |
Trustees’ fees and expenses
| 73 | | 103 | | 1,245 |
Other liabilities
| 1,379 | | 1,565 | | 213 |
Total Liabilities
| 16,446,740 | | 753,977 | | 103,846 |
NET ASSETS
| $901,667,926 | | $36,113,075 | | $47,719,030 |
| NET ASSETS consist of: | | | | | |
Paid-in capital
| $ 898,341,693 | | $ 35,702,589 | | $ 50,239,191 |
Accumulated distributable earnings (loss)
| 3,326,233 | | 410,486 | | (2,520,161) |
NET ASSETS
| $901,667,926 | | $36,113,075 | | $47,719,030 |
Investments, at cost - Unaffiliated
| $898,779,342 | | $22,097,037 | | $9,766,081 |
Investments, at cost - Affiliated
| $— | | $13,434,577 | | $36,298,805 |
Total investments, at cost
| $898,779,342 | | $35,531,614 | | $46,064,886 |
Foreign currency, at cost
| $— | | $2,778 | | $— |
| Class I Shares: | | | | | |
NET ASSETS
| $900,081,326 | | $35,965,053 | | $47,464,058 |
NET ASSET VALUE, per share
| $12.50 | | $10.92 | | $10.82 |
Number of Shares outstanding
| 72,029,009 | | 3,293,128 | | 4,385,106 |
| Class II Shares: | | | | | |
NET ASSETS
| $1,586,600 | | $148,022 | | $254,972 |
NET ASSET VALUE, per share
| $12.53 | | $10.92 | | $10.74 |
Number of Shares outstanding
| 126,611 | | 13,556 | | 23,743 |
Page 54
See Notes to Financial Statements
First Trust
Capital Strength
Portfolio | | First Trust
International
Developed
Capital Strength
Portfolio | | First Trust
Growth Strength
Portfolio |
| | | | | |
| $ 99,101,973 | | $ 8,051,733 | | $ 867,539 |
| — | | — | | — |
| 99,101,973 | | 8,051,733 | | 867,539 |
| 2,287,617 | | 170,310 | | 51,620 |
| — | | 3,047 | | — |
| | | | | |
| — | | — | | — |
| — | | — | | — |
| 58,252 | | 11,428 | | 449 |
| — | | 5 | | — |
| — | | 16,102 | | — |
| — | | 15,902 | | 11,758 |
| 149 | | 3,798 | | 3,011 |
| 101,447,991 | | 8,272,325 | | 934,377 |
| | | | | |
| | | | | |
| — | | — | | 38,676 |
| 28,682 | | — | | — |
| 19,964 | | 1,335 | | 147 |
| 16,214 | | 1,226 | | 143 |
| 7,165 | | 859 | | 21 |
| 4,917 | | 298 | | — |
| 1,360 | | 1,365 | | 1,830 |
| 2,261 | | 1,549 | | 1,303 |
| 221,548 | | 1,601 | | 21 |
| 14,070 | | 15,676 | | 4,786 |
| 9,707 | | 9,484 | | 7,352 |
| 93 | | 189 | | 99 |
| 732 | | 732 | | 760 |
| 295 | | 103 | | — |
| 124 | | 8 | | 172 |
| 327,132 | | 34,425 | | 55,310 |
| $ 101,120,859 | | $ 8,237,900 | | $ 879,067 |
| | | | | |
| $ 100,668,565 | | $ 8,141,983 | | $ 819,600 |
| 452,294 | | 95,917 | | 59,467 |
| $ 101,120,859 | | $ 8,237,900 | | $ 879,067 |
| $95,959,912 | | $7,629,934 | | $808,320 |
| $— | | $— | | $— |
| $95,959,912 | | $7,629,934 | | $808,320 |
| $— | | $3,064 | | $— |
| | | | | |
| $ 99,608,156 | | $ 7,263,564 | | $ 879,067 |
| $12.73 | | $11.95 | | $11.07 |
| 7,821,999 | | 608,049 | | 79,413 |
| | | | | |
| $ 1,512,703 | | $ 974,336 | | $— |
| $12.74 | | $11.95 | | $— |
| 118,750 | | 81,503 | | — |
See Notes to Financial Statements
Page 55
First Trust Variable Insurance Trust
Statements of Operations
For the Period Ended June 30, 2023 (Unaudited)
| | First Trust/Dow
Jones Dividend
& Income
Allocation
Portfolio | | First Trust
Multi Income
Allocation
Portfolio | | First Trust
Dorsey Wright
Tactical Core
Portfolio |
| INVESTMENT INCOME: | | | | | |
Interest
| $ 9,907,667 | | $ 78,004 | | $ 19,045 |
Dividends - Unaffiliated
| 5,247,487 | | 303,642 | | 186,149 |
Dividends - Affiliated
| — | | 402,891 | | 644,177 |
Foreign withholding tax on dividend income
| (13,227) | | (1,873) | | — |
Other
| — | | 6 | | — |
Total investment income
| 15,141,927 | | 782,670 | | 849,371 |
| EXPENSES: | | | | | |
Investment advisory fees
| 2,707,851 | | 108,828 | | 82,554 |
| 12b-1 distribution and/or service fees: | | | | | |
Class I
| 1,126,306 | | 45,164 | | 58,610 |
Administrative service fees
| 902,608 | | 36,154 | | 47,092 |
Administrative fees
| 249,096 | | 8,008 | | 28,015 |
Licensing fees
| 135,393 | | — | | 23,585 |
Legal fees
| 64,668 | | 4,227 | | 3,168 |
Transfer agent fees
| 48,430 | | 29,714 | | 31,311 |
Custodian fees
| 45,038 | | 21,373 | | 6,354 |
Commitment fees
| 35,323 | | 13,994 | | — |
Shareholder reporting fees
| 23,675 | | 9,223 | | 6,162 |
Audit and tax fees
| 18,336 | | 30,422 | | 14,214 |
Expenses previously waived or reimbursed
| 15,254 | | — | | — |
Trustees’ fees and expenses
| 9,640 | | 9,375 | | 10,521 |
Financial reporting fees
| 4,587 | | 4,587 | | 4,587 |
Other
| 7,721 | | 706 | | 790 |
Total expenses
| 5,393,926 | | 321,775 | | 316,963 |
Fees waived and expenses reimbursed by the investment advisor
| — | | (171,411) | | (114,569) |
Net expenses
| 5,393,926 | | 150,364 | | 202,394 |
NET INVESTMENT INCOME (LOSS)
| 9,748,001 | | 632,306 | | 646,977 |
| NET REALIZED AND UNREALIZED GAIN (LOSS): | | | | | |
| Net realized gain (loss) on: | | | | | |
Investments - Unaffiliated
| 8,724,706 | | 758,901 | | (375,336) |
Investments - Affiliated
| — | | (124,167) | | (427,185) |
Futures contracts
| (137,916) | | — | | — |
Foreign currency transactions
| (53) | | (155) | | — |
Net realized gain (loss)
| 8,586,737 | | 634,579 | | (802,521) |
| Net change in unrealized appreciation (depreciation) on: | | | | | |
Investments - Unaffiliated
| 9,554,471 | | (173,941) | | 302,341 |
Investments - Affiliated
| — | | 43,787 | | 1,783,914 |
Futures contracts
| (4,289) | | — | | — |
Foreign currency translation
| — | | (18) | | — |
Net change in unrealized appreciation (depreciation)
| 9,550,182 | | (130,172) | | 2,086,255 |
NET REALIZED AND UNREALIZED GAIN (LOSS)
| 18,136,919 | | 504,407 | | 1,283,734 |
NET INCREASE (DECREASE) IN NET ASSETS RESULTING FROM OPERATIONS
| $ 27,884,920 | | $ 1,136,713 | | $ 1,930,711 |
Page 56
See Notes to Financial Statements
| | First Trust
Capital Strength
Portfolio | | First Trust
International
Developed
Capital Strength
Portfolio | | First Trust
Growth Strength
Portfolio (a) |
| | | | | | |
| | $18,989 | | $2,299 | | $— |
| | 926,042 | | 111,487 | | 1,118 |
| | — | | — | | — |
| | — | | (15,165) | | (12) |
| | — | | — | | — |
| | 945,031 | | 98,621 | | 1,106 |
| | | | | | |
| | 228,491 | | 20,698 | | 429 |
| | | | | | |
| | 112,420 | | 7,452 | | 179 |
| | 91,259 | | 5,522 | | 143 |
| | 19,001 | | 5,720 | | (586) |
| | 13,709 | | 4,754 | | 21 |
| | 6,351 | | 674 | | 99 |
| | 30,563 | | 29,016 | | 7,352 |
| | 5,780 | | 3,573 | | 1,303 |
| | — | | — | | — |
| | 9,810 | | 9,675 | | 2,159 |
| | 14,745 | | 16,416 | | 4,786 |
| | — | | — | | — |
| | 9,589 | | 9,365 | | 1,776 |
| | 4,587 | | 4,587 | | 1,140 |
| | 1,076 | | 628 | | 237 |
| | 547,381 | | 118,080 | | 19,038 |
| | (46,527) | | (77,855) | | (18,180) |
| | 500,854 | | 40,225 | | 858 |
| | 444,177 | | 58,396 | | 248 |
| | | | | | |
| | | | | | |
| | 387,457 | | 275,771 | | — |
| | — | | — | | — |
| | — | | — | | — |
| | — | | (5,450) | | — |
| | 387,457 | | 270,321 | | — |
| | | | | | |
| | 321,422 | | 428,968 | | 59,219 |
| | — | | — | | — |
| | — | | — | | — |
| | — | | 265 | | — |
| | 321,422 | | 429,233 | | 59,219 |
| | 708,879 | | 699,554 | | 59,219 |
| | $1,153,056 | | $757,950 | | $59,467 |
| (a) | The Fund’s shares were seeded on May 15, 2023, and commenced operations on May 16, 2023. |
See Notes to Financial Statements
Page 57
First Trust Variable Insurance Trust
Statements of Changes in Net Assets
| | First Trust/Dow Jones Dividend
& Income Allocation Portfolio | | First Trust Multi Income
Allocation Portfolio |
| | Six Months
Ended
6/30/2023
(Unaudited) | | Year
Ended
12/31/2022 | | Six Months
Ended
6/30/2023
(Unaudited) | | Year
Ended
12/31/2022 |
| OPERATIONS: | | | | | | | |
Net investment income (loss)
| $ 9,748,001 | | $ 13,619,154 | | $ 632,306 | | $ 1,002,077 |
Net realized gain (loss)
| 8,586,737 | | 14,609,267 | | 634,579 | | 1,264,505 |
Net change in unrealized appreciation (depreciation)
| 9,550,182 | | (159,663,670) | | (130,172) | | (5,376,408) |
Net increase (decrease) in net assets resulting from operations
| 27,884,920 | | (131,435,249) | | 1,136,713 | | (3,109,826) |
| DISTRIBUTIONS TO SHAREHOLDERS FROM INVESTMENT OPERATIONS: | | | | | | | |
Class I Shares
| (24,702,118) | | (131,536,646) | | (1,710,666) | | (1,663,388) |
Class II Shares
| (45,189) | | (224,108) | | (7,250) | | (7,380) |
Total distributions to shareholders from investment operations
| (24,747,307) | | (131,760,754) | | (1,717,916) | | (1,670,768) |
| CAPITAL TRANSACTIONS: | | | | | | | |
Proceeds from shares sold
| 19,747,722 | | 49,426,948 | | 2,343,646 | | 5,865,430 |
Proceeds from shares reinvested
| 24,747,307 | | 131,760,754 | | 1,717,916 | | 1,670,768 |
Cost of shares redeemed
| (55,536,891) | | (90,334,579) | | (4,632,039) | | (5,910,244) |
Net increase (decrease) in net assets resulting from capital transactions
| (11,041,862) | | 90,853,123 | | (570,477) | | 1,625,954 |
Total increase (decrease) in net assets
| (7,904,249) | | (172,342,880) | | (1,151,680) | | (3,154,640) |
| NET ASSETS: | | | | | | | |
Beginning of period
| 909,572,175 | | 1,081,915,055 | | 37,264,755 | | 40,419,395 |
End of period
| $ 901,667,926 | | $ 909,572,175 | | $ 36,113,075 | | $ 37,264,755 |
Page 58
See Notes to Financial Statements
First Trust Dorsey Wright
Tactical Core Portfolio | | First Trust
Capital Strength
Portfolio | | First Trust
International
Developed
Capital Strength
Portfolio | | First Trust
Growth Strength
Portfolio |
Six Months
Ended
6/30/2023
(Unaudited) | | Year
Ended
12/31/2022 | | Six Months
Ended
6/30/2023
(Unaudited) | | Year
Ended
12/31/2022 | | Six Months
Ended
6/30/2023
(Unaudited) | | Year
Ended
12/31/2022 | | Period
Ended
6/30/2023
(Unaudited) (a) |
| | | | | | | | | | | | | |
| $ 646,977 | | $ 862,615 | | $ 444,177 | | $ 465,978 | | $ 58,396 | | $ 49,900 | | $ 248 |
| (802,521) | | (2,805,365) | | 387,457 | | (3,113,168) | | 270,321 | | (588,287) | | — |
| 2,086,255 | | (8,881,454) | | 321,422 | | (3,232,212) | | 429,233 | | (363,663) | | 59,219 |
| 1,930,711 | | (10,824,204) | | 1,153,056 | | (5,879,402) | | 757,950 | | (902,050) | | 59,467 |
| | | | | | | | | | | | | |
| (425,234) | | (8,220,598) | | (371,809) | | (622,719) | | (45,199) | | (44,922) | | — |
| (2,605) | | (110,833) | | (7,388) | | (14,736) | | (7,869) | | (12,172) | | — |
| (427,839) | | (8,331,431) | | (379,197) | | (637,455) | | (53,068) | | (57,094) | | — |
| | | | | | | | | | | | | |
| 2,336,869 | | 4,818,002 | | 25,750,126 | | 41,605,287 | | 2,183,505 | | 3,507,677 | | 821,935 |
| 427,839 | | 8,331,431 | | 379,197 | | 637,455 | | 53,068 | | 57,094 | | — |
| (4,315,408) | | (15,030,017) | | (12,881,250) | | (9,029,288) | | (707,056) | | (661,741) | | (2,335) |
| (1,550,700) | | (1,880,584) | | 13,248,073 | | 33,213,454 | | 1,529,517 | | 2,903,030 | | 819,600 |
| (47,828) | | (21,036,219) | | 14,021,932 | | 26,696,597 | | 2,234,399 | | 1,943,886 | | 879,067 |
| | | | | | | | | | | | | |
| 47,766,858 | | 68,803,077 | | 87,098,927 | | 60,402,330 | | 6,003,501 | | 4,059,615 | | — |
| $ 47,719,030 | | $ 47,766,858 | | $ 101,120,859 | | $ 87,098,927 | | $ 8,237,900 | | $ 6,003,501 | | $ 879,067 |
| (a) | The Fund’s shares were seeded on May 15, 2023, and commenced operations on May 16, 2023. |
See Notes to Financial Statements
Page 59
First Trust/Dow Jones Dividend & Income Allocation Portfolio
Financial Highlights
For a Share outstanding throughout each period
| | Six Months
Ended
6/30/2023
(Unaudited) | | Year Ended December 31, |
| Class I Shares | 2022 | | 2021 | | 2020 | | 2019 | | 2018 |
Net asset value, beginning of period
| $ 12.47 | | $ 16.63 | | $ 15.07 | | $ 14.68 | | $ 12.82 | | $ 13.73 |
| Income from investment operations: | | | | | | | | | | | |
Net investment income (loss)
| 0.14 | | 0.20 | | 0.16 (a) | | 0.21 (a) | | 0.23 | | 0.21 |
Net realized and unrealized gain (loss)
| 0.24 | | (2.32) | | 1.67 | | 0.85 | | 2.39 | | (0.88) |
Total from investment operations
| 0.38 | | (2.12) | | 1.83 | | 1.06 | | 2.62 | | (0.67) |
| Distributions paid to shareholders from: | | | | | | | | | | | |
Net investment income
| (0.13) | | (0.19) | | (0.15) | | (0.21) | | (0.22) | | (0.21) |
Net realized gain
| (0.22) | | (1.85) | | (0.12) | | (0.46) | | (0.54) | | (0.03) |
Total distributions
| (0.35) | | (2.04) | | (0.27) | | (0.67) | | (0.76) | | (0.24) |
Net asset value, end of period
| $12.50 | | $12.47 | | $16.63 | | $15.07 | | $14.68 | | $12.82 |
Total return (b) (c)
| 3.09% | | (12.20)% | | 12.25% | | 7.81% | | 20.77% | | (4.92)% |
| Ratios to average net assets/supplemental data: | | | | | | | | | | | |
Net assets, end of period (in 000’s)
| $ 900,081 | | $ 907,939 | | $ 1,080,143 | | $ 1,000,640 | | $ 961,210 | | $ 767,616 |
Ratio of total expenses to average net assets
| 1.20% (d) | | 1.20% | | 1.19% | | 1.21% | | 1.21% | | 1.22% |
Ratio of net expenses to average net assets
| 1.20% (d) | | 1.20% | | 1.19% | | 1.20% | | 1.20% | | 1.20% |
Ratio of net investment income (loss) to average net assets
| 2.16% (d) | | 1.44% | | 0.99% | | 1.49% | | 1.65% | | 1.56% |
Portfolio turnover rate
| 71% | | 119% | | 120% | | 105% | | 89% | | 76% |
| (a) | Based on average shares outstanding. |
| (b) | Total return is based on the combination of reinvested dividends, capital gain and return of capital distributions, if any. Total return is not annualized for periods of less than one year. The returns for the Fund do not reflect the deduction of expenses associated with variable products, such as mortality and expense risk charges, separate account charges, and sales charges or the effect of taxes. These expenses would reduce the overall returns above. |
| (c) | Total returns would have been lower if certain fees had not been waived and expenses reimbursed by the investment advisor. |
| (d) | Annualized. |
Page 60
See Notes to Financial Statements
First Trust/Dow Jones Dividend & Income Allocation Portfolio
Financial Highlights (Continued)
For a Share outstanding throughout each period
| | Six Months
Ended
6/30/2023
(Unaudited) | | Year Ended December 31, |
| Class II Shares | 2022 | | 2021 | | 2020 | | 2019 | | 2018 |
Net asset value, beginning of period
| $ 12.50 | | $ 16.67 | | $ 15.11 | | $ 14.71 | | $ 12.85 | | $ 13.75 |
| Income from investment operations: | | | | | | | | | | | |
Net investment income (loss)
| 0.15 | | 0.24 | | 0.20 (a) | | 0.24 (a) | | 0.28 (a) | | 0.25 (a) |
Net realized and unrealized gain (loss)
| 0.25 | | (2.33) | | 1.67 | | 0.86 | | 2.38 | | (0.88) |
Total from investment operations
| 0.40 | | (2.09) | | 1.87 | | 1.10 | | 2.66 | | (0.63) |
| Distributions paid to shareholders from: | | | | | | | | | | | |
Net investment income
| (0.15) | | (0.23) | | (0.19) | | (0.24) | | (0.26) | | (0.24) |
Net realized gain
| (0.22) | | (1.85) | | (0.12) | | (0.46) | | (0.54) | | (0.03) |
Total distributions
| (0.37) | | (2.08) | | (0.31) | | (0.70) | | (0.80) | | (0.27) |
Net asset value, end of period
| $12.53 | | $12.50 | | $16.67 | | $15.11 | | $14.71 | | $12.85 |
Total return (b) (c)
| 3.20% | | (12.02)% | | 12.50% | | 8.13% | | 21.02% | | (4.60)% |
| Ratios to average net assets/supplemental data: | | | | | | | | | | | |
Net assets, end of period (in 000’s)
| $ 1,587 | | $ 1,633 | | $ 1,772 | | $ 1,524 | | $ 1,318 | | $ 44 |
Ratio of total expenses to average net assets
| 0.94% (d) | | 0.95% | | 0.94% | | 0.96% | | 0.97% | | 0.97% |
Ratio of net expenses to average net assets
| 0.94% (d) | | 0.95% | | 0.94% | | 0.95% | | 0.95% | | 0.95% |
Ratio of net investment income (loss) to average net assets
| 2.40% (d) | | 1.71% | | 1.24% | | 1.74% | | 2.00% | | 1.79% |
Portfolio turnover rate
| 71% | | 119% | | 120% | | 105% | | 89% | | 76% |
| (a) | Based on average shares outstanding. |
| (b) | Total return is based on the combination of reinvested dividends, capital gain and return of capital distributions, if any. Total return is not annualized for periods of less than one year. The returns for the Fund do not reflect the deduction of expenses associated with variable products, such as mortality and expense risk charges, separate account charges, and sales charges or the effect of taxes. These expenses would reduce the overall returns above. |
| (c) | Total returns would have been lower if certain fees had not been waived and expenses reimbursed by the investment advisor. |
| (d) | Annualized. |
See Notes to Financial Statements
Page 61
First Trust Multi Income Allocation Portfolio
Financial Highlights (Continued)
For a Share outstanding throughout each period
| | Six Months
Ended
6/30/2023
(Unaudited) | | Year Ended December 31, |
| Class I Shares | 2022 | | 2021 | | 2020 | | 2019 | | 2018 |
Net asset value, beginning of period
| $ 11.13 | | $ 12.60 | | $ 11.44 | | $ 11.55 | | $ 10.17 | | $ 10.89 |
| Income from investment operations: | | | | | | | | | | | |
Net investment income (loss)
| 0.20 | | 0.31 | | 0.27 (a) | | 0.22 | | 0.26 | | 0.23 |
Net realized and unrealized gain (loss)
| 0.14 | | (1.27) | | 1.17 | | 0.05 | | 1.40 | | (0.71) |
Total from investment operations
| 0.34 | | (0.96) | | 1.44 | | 0.27 | | 1.66 | | (0.48) |
| Distributions paid to shareholders from: | | | | | | | | | | | |
Net investment income
| (0.21) | | (0.34) | | (0.28) | | (0.24) | | (0.27) | | (0.24) |
Net realized gain
| (0.34) | | (0.17) | | — | | (0.14) | | (0.01) | | — |
Total distributions
| (0.55) | | (0.51) | | (0.28) | | (0.38) | | (0.28) | | (0.24) |
Net asset value, end of period
| $10.92 | | $11.13 | | $12.60 | | $11.44 | | $11.55 | | $10.17 |
Total return (b) (c)
| 3.08% | | (7.52)% | | 12.69% | | 2.49% | | 16.38% | | (4.44)% |
| Ratios to average net assets/supplemental data: | | | | | | | | | | | |
Net assets, end of period (in 000’s)
| $ 35,965 | | $ 37,121 | | $ 40,243 | | $ 32,345 | | $ 31,012 | | $ 24,451 |
Ratio of total expenses to average net assets (d)
| 1.78% (e) | | 1.73% | | 1.81% | | 1.77% | | 1.80% | | 2.09% |
Ratio of net expenses to average net assets (d)
| 0.83% (e) | | 0.83% | | 0.83% | | 0.83% | | 0.83% | | 0.83% |
Ratio of net investment income (loss) to average net assets
| 3.49% (e) | | 2.61% | | 2.22% | | 2.04% | | 2.42% | | 2.29% |
Portfolio turnover rate
| 28% | | 50% | | 36% | | 49% | | 30% | | 40% |
| (a) | Based on average shares outstanding. |
| (b) | Total return is based on the combination of reinvested dividends, capital gain and return of capital distributions, if any. Total return is not annualized for periods of less than one year. The returns for the Fund do not reflect the deduction of expenses associated with variable products, such as mortality and expense risk charges, separate account charges, and sales charges or the effect of taxes. These expenses would reduce the overall returns above. |
| (c) | Total returns would have been lower if certain fees had not been waived and expenses reimbursed by the investment advisor. |
| (d) | The Fund indirectly bears its proportionate share of fees and expenses incurred by the underlying funds in which the Fund invests. This ratio does not include these indirect fees and expenses. |
| (e) | Annualized. |
Page 62
See Notes to Financial Statements
First Trust Multi Income Allocation Portfolio
Financial Highlights (Continued)
For a Share outstanding throughout each period
| | Six Months
Ended
6/30/2023
(Unaudited) | | Year Ended December 31, |
| Class II Shares | 2022 | | 2021 | | 2020 | | 2019 | | 2018 |
Net asset value, beginning of period
| $ 11.12 | | $ 12.60 | | $ 11.43 | | $ 11.54 | | $ 10.17 | | $ 10.88 |
| Income from investment operations: | | | | | | | | | | | |
Net investment income (loss)
| 0.21 | | 0.33 | | 0.30 (a) | | 0.24 (a) | | 0.30 | | 0.26 |
Net realized and unrealized gain (loss)
| 0.15 | | (1.27) | | 1.18 | | 0.05 | | 1.38 | | (0.70) |
Total from investment operations
| 0.36 | | (0.94) | | 1.48 | | 0.29 | | 1.68 | | (0.44) |
| Distributions paid to shareholders from: | | | | | | | | | | | |
Net investment income
| (0.22) | | (0.37) | | (0.31) | | (0.26) | | (0.30) | | (0.27) |
Net realized gain
| (0.34) | | (0.17) | | — | | (0.14) | | (0.01) | | — |
Total distributions
| (0.56) | | (0.54) | | (0.31) | | (0.40) | | (0.31) | | (0.27) |
Net asset value, end of period
| $10.92 | | $11.12 | | $12.60 | | $11.43 | | $11.54 | | $10.17 |
Total return (b) (c)
| 3.29% | | (7.37)% | | 13.07% | | 2.74% | | 16.57% | | (4.11)% |
| Ratios to average net assets/supplemental data: | | | | | | | | | | | |
Net assets, end of period (in 000’s)
| $ 148 | | $ 143 | | $ 177 | | $ 115 | | $ 150 | | $ 142 |
Ratio of total expenses to average net assets (d)
| 1.53% (e) | | 1.48% | | 1.56% | | 1.49% | | 1.56% | | 1.83% |
Ratio of net expenses to average net assets (d)
| 0.58% (e) | | 0.58% | | 0.58% | | 0.58% | | 0.58% | | 0.58% |
Ratio of net investment income (loss) to average net assets
| 3.75% (e) | | 2.84% | | 2.50% | | 2.25% | | 2.66% | | 2.49% |
Portfolio turnover rate
| 28% | | 50% | | 36% | | 49% | | 30% | | 40% |
| (a) | Based on average shares outstanding. |
| (b) | Total return is based on the combination of reinvested dividends, capital gain and return of capital distributions, if any. Total return is not annualized for periods of less than one year. The returns for the Fund do not reflect the deduction of expenses associated with variable products, such as mortality and expense risk charges, separate account charges, and sales charges or the effect of taxes. These expenses would reduce the overall returns above. |
| (c) | Total returns would have been lower if certain fees had not been waived and expenses reimbursed by the investment advisor. |
| (d) | The Fund indirectly bears its proportionate share of fees and expenses incurred by the underlying funds in which the Fund invests. This ratio does not include these indirect fees and expenses. |
| (e) | Annualized. |
See Notes to Financial Statements
Page 63
First Trust Dorsey Wright Tactical Core Portfolio
Financial Highlights (Continued)
For a Share outstanding throughout each period
| | Six Months
Ended
6/30/2023
(Unaudited) | | Year Ended December 31, |
| Class I Shares | 2022 | | 2021 | | 2020 | | 2019 | | 2018 |
Net asset value, beginning of period
| $ 10.49 | | $ 15.10 | | $ 13.68 | | $ 12.37 | | $ 10.45 | | $ 11.41 |
| Income from investment operations: | | | | | | | | | | | |
Net investment income (loss)
| 0.15 | | 0.20 | | 0.06 | | 0.06 | | 0.08 | | 0.04 |
Net realized and unrealized gain (loss)
| 0.28 | | (2.75) | | 1.83 | | 1.31 | | 2.10 | | (0.95) |
Total from investment operations
| 0.43 | | (2.55) | | 1.89 | | 1.37 | | 2.18 | | (0.91) |
| Distributions paid to shareholders from: | | | | | | | | | | | |
Net investment income
| (0.10) | | (0.18) | | (0.06) | | (0.06) | | (0.08) | | (0.03) |
Net realized gain
| — | | (1.88) | | (0.41) | | — | | (0.18) | | (0.02) |
Total distributions
| (0.10) | | (2.06) | | (0.47) | | (0.06) | | (0.26) | | (0.05) |
Net asset value, end of period
| $10.82 | | $10.49 | | $15.10 | | $13.68 | | $12.37 | | $10.45 |
Total return (a) (b)
| 4.09% | | (17.05)% | | 13.87% | | 11.09% | | 20.87% | | (8.00)% |
| Ratios to average net assets/supplemental data: | | | | | | | | | | | |
Net assets, end of period (in 000’s)
| $ 47,464 | | $ 47,164 | | $ 67,914 | | $ 49,762 | | $ 50,843 | | $ 38,277 |
Ratio of total expenses to average net assets (c)
| 1.28% (d) | | 1.21% | | 1.16% | | 1.35% | | 1.23% | | 1.40% |
Ratio of net expenses to average net assets (c)
| 0.86% (d) | | 0.83% | | 0.72% | | 0.83% | | 0.77% | | 0.74% |
Ratio of net investment income (loss) to average net assets
| 2.74% (d) | | 1.58% | | 0.39% | | 0.48% | | 0.62% | | 0.48% |
Portfolio turnover rate
| 91% | | 220% | | 78% | | 284% | | 34% | | 70% |
| (a) | Total return is based on the combination of reinvested dividends, capital gain and return of capital distributions, if any. Total return is not annualized for periods of less than one year. The returns for the Fund do not reflect the deduction of expenses associated with variable products, such as mortality and expense risk charges, separate account charges, and sales charges or the effect of taxes. These expenses would reduce the overall returns above. |
| (b) | Total returns would have been lower if certain fees had not been waived and expenses reimbursed by the investment advisor. |
| (c) | The Fund indirectly bears its proportionate share of fees and expenses incurred by the underlying funds in which the Fund invests. This ratio does not include these indirect fees and expenses. |
| (d) | Annualized. |
Page 64
See Notes to Financial Statements
First Trust Dorsey Wright Tactical Core Portfolio
Financial Highlights (Continued)
For a Share outstanding throughout each period
| | Six Months
Ended
6/30/2023
(Unaudited) | | Year Ended December 31, |
| Class II Shares | 2022 | | 2021 | | 2020 | | 2019 | | 2018 |
Net asset value, beginning of period
| $ 10.41 | | $ 15.00 | | $ 13.63 | | $ 12.37 | | $ 10.44 | | $ 11.40 |
| Income from investment operations: | | | | | | | | | | | |
Net investment income (loss)
| 0.20 | | 0.25 | | 0.08 | | 0.09 | | 0.10 | | 0.07 |
Net realized and unrealized gain (loss)
| 0.24 | | (2.75) | | 1.79 | | 1.26 | | 2.12 | | (0.95) |
Total from investment operations
| 0.44 | | (2.50) | | 1.87 | | 1.35 | | 2.22 | | (0.88) |
| Distributions paid to shareholders from: | | | | | | | | | | | |
Net investment income
| (0.11) | | (0.21) | | (0.09) | | (0.09) | | (0.11) | | (0.06) |
Net realized gain
| — | | (1.88) | | (0.41) | | — | | (0.18) | | (0.02) |
Total distributions
| (0.11) | | (2.09) | | (0.50) | | (0.09) | | (0.29) | | (0.08) |
Net asset value, end of period
| $10.74 | | $10.41 | | $15.00 | | $13.63 | | $12.37 | | $10.44 |
Total return (a) (b)
| 4.25% | | (16.81)% | | 13.84% | | 10.96% | | 21.29% | | (7.77)% |
| Ratios to average net assets/supplemental data: | | | | | | | | | | | |
Net assets, end of period (in 000’s)
| $ 255 | | $ 603 | | $ 889 | | $ 104 | | $ 109 | | $ 84 |
Ratio of total expenses to average net assets (c)
| 11.00% (d) | | 4.92% | | 6.52% | | 34.33% | | 26.37% | | 32.62% |
Ratio of net expenses to average net assets (c)
| 0.61% (d) | | 0.58% | | 0.47% | | 0.57% | | 0.52% | | 0.49% |
Ratio of net investment income (loss) to average net assets
| 2.50% (d) | | 1.80% | | 0.97% | | 0.72% | | 0.87% | | 0.73% |
Portfolio turnover rate
| 91% | | 220% | | 78% | | 284% | | 34% | | 70% |
| (a) | Total return is based on the combination of reinvested dividends, capital gain and return of capital distributions, if any. Total return is not annualized for periods of less than one year. The returns for the Fund do not reflect the deduction of expenses associated with variable products, such as mortality and expense risk charges, separate account charges, and sales charges or the effect of taxes. These expenses would reduce the overall returns above. |
| (b) | Total returns would have been lower if certain fees had not been waived and expenses reimbursed by the investment advisor. |
| (c) | The Fund indirectly bears its proportionate share of fees and expenses incurred by the underlying funds in which the Fund invests. This ratio does not include these indirect fees and expenses. |
| (d) | Annualized. |
See Notes to Financial Statements
Page 65
First Trust Capital Strength Portfolio
Financial Highlights (Continued)
For a Share outstanding throughout each period
| | Six Months
Ended
6/30/2023
(Unaudited) | | Year Ended | | Period
Ended
12/31/2020 (a) |
| Class I Shares | 12/31/2022 | | 12/31/2021 | |
Net asset value, beginning of period
| $ 12.69 | | $ 14.33 | | $ 12.06 | | $ 10.00 |
| Income from investment operations: | | | | | | | |
Net investment income (loss)
| 0.06 | | 0.08 | | 0.07 | | 0.02 |
Net realized and unrealized gain (loss)
| 0.03 | | (1.61) | | 2.95 | | 2.39 |
Total from investment operations
| 0.09 | | (1.53) | | 3.02 | | 2.41 |
| Distributions paid to shareholders from: | | | | | | | |
Net investment income
| (0.05) | | (0.08) | | (0.07) | | (0.02) |
Net realized gain
| — | | (0.03) | | (0.68) | | (0.33) |
Total distributions
| (0.05) | | (0.11) | | (0.75) | | (0.35) |
Net asset value, end of period
| $12.73 | | $12.69 | | $14.33 | | $12.06 |
Total return (b) (c)
| 0.70% | | (10.68)% | | 25.29% | | 24.17% |
| Ratios to average net assets/supplemental data: | | | | | | | |
Net assets, end of period (in 000’s)
| $ 99,608 | | $ 85,561 | | $ 59,093 | | $ 14,831 |
Ratio of total expenses to average net assets
| 1.20% (d) | | 1.27% | | 1.52% | | 4.37% (d) |
Ratio of net expenses to average net assets
| 1.10% (d) | | 1.10% | | 1.10% | | 1.10% (d) |
Ratio of net investment income (loss) to average net assets
| 0.97% (d) | | 0.67% | | 0.65% | | 0.60% (d) |
Portfolio turnover rate
| 58% | | 133% | | 115% | | 79% |
| (a) | The Fund’s shares were seeded on April 30, 2020, and commenced operations on May 1, 2020. |
| (b) | Total return is based on the combination of reinvested dividends, capital gain and return of capital distributions, if any. Total return is not annualized for periods of less than one year. The returns for the Fund do not reflect the deduction of expenses associated with variable products, such as mortality and expense risk charges, separate account charges, and sales charges or the effect of taxes. These expenses would reduce the overall returns above. |
| (c) | Total returns would have been lower if certain fees had not been waived and expenses reimbursed by the investment advisor. |
| (d) | Annualized. |
Page 66
See Notes to Financial Statements
First Trust Capital Strength Portfolio
Financial Highlights (Continued)
For a Share outstanding throughout each period
| | Six Months
Ended
6/30/2023
(Unaudited) | | Year Ended | | Period
Ended
12/31/2020 (a) |
| Class II Shares | 12/31/2022 | | 12/31/2021 | |
Net asset value, beginning of period
| $ 12.69 | | $ 14.33 | | $ 12.06 | | $ 10.00 |
| Income from investment operations: | | | | | | | |
Net investment income (loss)
| 0.07 | | 0.11 | | 0.10 | | 0.04 |
Net realized and unrealized gain (loss)
| 0.04 | | (1.61) | | 2.95 | | 2.39 |
Total from investment operations
| 0.11 | | (1.50) | | 3.05 | | 2.43 |
| Distributions paid to shareholders from: | | | | | | | |
Net investment income
| (0.06) | | (0.11) | | (0.10) | | (0.04) |
Net realized gain
| — | | (0.03) | | (0.68) | | (0.33) |
Total distributions
| (0.06) | | (0.14) | | (0.78) | | (0.37) |
Net asset value, end of period
| $12.74 | | $12.69 | | $14.33 | | $12.06 |
Total return (b) (c)
| 0.89% | | (10.46)% | | 25.60% | | 24.33% |
| Ratios to average net assets/supplemental data: | | | | | | | |
Net assets, end of period (in 000’s)
| $ 1,513 | | $ 1,538 | | $ 1,309 | | $ 629 |
Ratio of total expenses to average net assets
| 0.95% (d) | | 1.03% | | 1.33% | | 6.90% (d) |
Ratio of net expenses to average net assets
| 0.85% (d) | | 0.85% | | 0.85% | | 0.85% (d) |
Ratio of net investment income (loss) to average net assets
| 1.22% (d) | | 0.90% | | 0.91% | | 0.84% (d) |
Portfolio turnover rate
| 58% | | 133% | | 115% | | 79% |
| (a) | The Fund’s shares were seeded on April 30, 2020, and commenced operations on May 1, 2020. |
| (b) | Total return is based on the combination of reinvested dividends, capital gain and return of capital distributions, if any. Total return is not annualized for periods of less than one year. The returns for the Fund do not reflect the deduction of expenses associated with variable products, such as mortality and expense risk charges, separate account charges, and sales charges or the effect of taxes. These expenses would reduce the overall returns above. |
| (c) | Total returns would have been lower if certain fees had not been waived and expenses reimbursed by the investment advisor. |
| (d) | Annualized. |
See Notes to Financial Statements
Page 67
First Trust International Developed Capital Strength Portfolio
Financial Highlights (Continued)
For a Share outstanding throughout each period
| | Six Months
Ended
6/30/2023
(Unaudited) | | Year Ended | | Period
Ended
12/31/2020 (a) |
| Class I Shares | 12/31/2022 | | 12/31/2021 | |
Net asset value, beginning of period
| $ 10.75 | | $ 13.50 | | $ 12.68 | | $ 10.00 |
| Income from investment operations: | | | | | | | |
Net investment income (loss)
| 0.09 | | 0.14 | | 0.16 | | 0.01 |
Net realized and unrealized gain (loss)
| 1.19 | | (2.76) | | 2.22 | | 3.57 |
Total from investment operations
| 1.28 | | (2.62) | | 2.38 | | 3.58 |
| Distributions paid to shareholders from: | | | | | | | |
Net investment income
| (0.08) | | (0.09) | | (0.25) | | (0.06) |
Net realized gain
| — | | (0.04) | | (1.31) | | (0.84) |
Total distributions
| (0.08) | | (0.13) | | (1.56) | | (0.90) |
Net asset value, end of period
| $11.95 | | $10.75 | | $13.50 | | $12.68 |
Total return (b) (c)
| 11.94% | | (19.38)% | | 19.24% | | 36.03% |
| Ratios to average net assets/supplemental data: | | | | | | | |
Net assets, end of period (in 000’s)
| $ 7,264 | | $ 5,049 | | $ 3,059 | | $ 1,199 |
Ratio of total expenses to average net assets
| 3.46% (d) | | 5.00% | | 7.59% | | 20.98% (d) |
Ratio of net expenses to average net assets
| 1.20% (d) | | 1.20% | | 1.20% | | 1.20% (d) |
Ratio of net investment income (loss) to average net assets
| 1.67% (d) | | 1.02% | | 0.89% | | 0.14% (d) |
Portfolio turnover rate
| 49% | | 76% | | 83% | | 52% |
| (a) | The Fund’s shares were seeded on April 30, 2020, and commenced operations on May 1, 2020. |
| (b) | Total return is based on the combination of reinvested dividends, capital gain and return of capital distributions, if any. Total return is not annualized for periods of less than one year. The returns for the Fund do not reflect the deduction of expenses associated with variable products, such as mortality and expense risk charges, separate account charges, and sales charges or the effect of taxes. These expenses would reduce the overall returns above. |
| (c) | Total returns would have been lower if certain fees had not been waived and expenses reimbursed by the investment advisor. |
| (d) | Annualized. |
Page 68
See Notes to Financial Statements
First Trust International Developed Capital Strength Portfolio
Financial Highlights (Continued)
For a Share outstanding throughout each period
| | Six Months
Ended
6/30/2023
(Unaudited) | | Year Ended | | Period
Ended
12/31/2020 (a) |
| Class II Shares | 12/31/2022 | | 12/31/2021 | |
Net asset value, beginning of period
| $ 10.75 | | $ 13.50 | | $ 12.69 | | $ 10.00 |
| Income from investment operations: | | | | | | | |
Net investment income (loss)
| 0.11 | | 0.16 | | 0.21 | | 0.03 |
Net realized and unrealized gain (loss)
| 1.19 | | (2.77) | | 2.19 | | 3.58 |
Total from investment operations
| 1.30 | | (2.61) | | 2.40 | | 3.61 |
| Distributions paid to shareholders from: | | | | | | | |
Net investment income
| (0.10) | | (0.10) | | (0.25) | | (0.08) |
Net realized gain
| — | | (0.04) | | (1.34) | | (0.84) |
Total distributions
| (0.10) | | (0.14) | | (1.59) | | (0.92) |
Net asset value, end of period
| $11.95 | | $10.75 | | $13.50 | | $12.69 |
Total return (b) (c)
| 12.07% | | (19.28)% | | 19.44% | | 36.31% |
| Ratios to average net assets/supplemental data: | | | | | | | |
Net assets, end of period (in 000’s)
| $ 974 | | $ 954 | | $ 1,000 | | $ 739 |
Ratio of total expenses to average net assets
| 3.21% (d) | | 4.75% | | 8.07% | | 20.95% (d) |
Ratio of net expenses to average net assets
| 0.95% (d) | | 0.95% | | 0.95% | | 0.95% (d) |
Ratio of net investment income (loss) to average net assets
| 1.85% (d) | | 1.27% | | 1.51% | | 0.37% (d) |
Portfolio turnover rate
| 49% | | 76% | | 83% | | 52% |
| (a) | The Fund’s shares were seeded on April 30, 2020, and commenced operations on May 1, 2020. |
| (b) | Total return is based on the combination of reinvested dividends, capital gain and return of capital distributions, if any. Total return is not annualized for periods of less than one year. The returns for the Fund do not reflect the deduction of expenses associated with variable products, such as mortality and expense risk charges, separate account charges, and sales charges or the effect of taxes. These expenses would reduce the overall returns above. |
| (c) | Total returns would have been lower if certain fees had not been waived and expenses reimbursed by the investment advisor. |
| (d) | Annualized. |
See Notes to Financial Statements
Page 69
First Trust Growth Strength Portfolio
Financial Highlights (Continued)
For a Share outstanding throughout the period
| Class I Shares | Period
Ended
6/30/2023 (a)
(Unaudited) |
Net asset value, beginning of period
| $ 10.00 |
| Income from investment operations: | |
Net investment income (loss)
| — |
Net realized and unrealized gain (loss)
| 1.07 |
Total from investment operations
| 1.07 |
Net asset value, end of period
| $11.07 |
Total return (b) (c)
| 10.70% |
| Ratios to average net assets/supplemental data: | |
Net assets, end of period (in 000’s)
| $ 879 |
Ratio of total expenses to average net assets
| 26.63% (d) |
Ratio of net expenses to average net assets
| 1.20% (d) |
Ratio of net investment income (loss) to average net assets
| 0.35% (d) |
Portfolio turnover rate
| —% |
| (a) | The Fund’s shares were seeded on May 15, 2023, and commenced operations on May 16, 2023. |
| (b) | Total return is based on the combination of reinvested dividends, capital gain and return of capital distributions, if any. Total return is not annualized for periods of less than one year. The returns for the Fund do not reflect the deduction of expenses associated with variable products, such as mortality and expense risk charges, separate account charges, and sales charges or the effect of taxes. These expenses would reduce the overall returns above. |
| (c) | Total returns would have been lower if certain fees had not been waived and expenses reimbursed by the investment advisor. |
| (d) | Annualized. |
Page 70
See Notes to Financial Statements
Notes to Financial Statements
First Trust Variable Insurance Trust
June 30, 2023 (Unaudited)
1. Organization
First Trust Variable Insurance Trust (the “Trust”) is an open-end management investment company organized as a Massachusetts business trust on December 14, 2011 and is registered with the Securities and Exchange Commission under the Investment Company Act of 1940, as amended (the “1940 Act”). The Trust currently offers shares of six series (each a “Fund” and collectively, the “Funds”), First Trust/Dow Jones Dividend & Income Allocation Portfolio (“First Trust Dow Jones”), which commenced investment operations on May 1, 2012, First Trust Multi Income Allocation Portfolio (“First Trust Multi Income”), which commenced investment operations on May 1, 2014, First Trust Dorsey Wright Tactical Core Portfolio (“First Trust Dorsey Wright”), which commenced investment operations on October 30, 2015, First Trust Capital Strength Portfolio (“First Trust Capital Strength”), which commenced operations on May 1, 2020, First Trust International Developed Capital Strength Portfolio (“First Trust International”), which commenced operations on May 1, 2020, and First Trust Growth Strength Portfolio (“First Trust Growth Strength”), which commenced operations on May 16, 2023. Each Fund’s shares are sold only to variable insurance accounts (each an “Account”) to fund the benefits of the variable annuity and variable life insurance contracts (each a “Contract” and collectively, the “Contracts”) issued by life insurance companies writing variable annuity contracts and variable life insurance contracts with which the Trust has a contract (each a “Participating Insurance Company”).
First Trust Dow Jones’ investment objective seeks to provide total return by allocating among dividend-paying stocks and investment grade bonds. First Trust Dow Jones seeks to achieve its investment objective by investing, under normal market conditions, approximately 40-60% of its net assets in equity securities and approximately 40-60% of its net assets in fixed-income securities at the time of purchase. Under normal market conditions, at the time of purchase at least 80% of the Fund’s net assets (including investment borrowings) will be invested in securities of issuers included in a Dow Jones index. The equity portion of the portfolio will be derived from a quantitative process that seeks to provide total return through investing generally in dividend-paying stocks included in the Dow Jones U.S. Total Stock Market IndexSM. First Trust Advisors L.P. (“First Trust” or the “Advisor”) reserves the right to over-weight, under-weight or exclude certain securities from the portfolio that would otherwise be selected pursuant to the quantitative process in certain instances.
First Trust Dow Jones’ fixed-income component seeks to provide income and preserve capital through investing in a diversified investment-grade debt portfolio. Investment-grade debt securities are those long-term debt securities rated “BBB–” or higher by Standard & Poor’s Financial Services LLC or Fitch Ratings, Inc. or “Baa3” or higher by Moody’s Investors Service, Inc., and those short-term debt securities rated “A-3” or higher by Standard & Poor’s Financial Services LLC, “F3” or higher by Fitch Ratings, Inc. or “Prime 3” or higher by Moody’s Investor Service, Inc. at the time of purchase. Under normal market conditions, at the time of purchase approximately 80% of the net assets of the Fund allocated to corporate debt will be invested in investment-grade debt securities included in the Dow Jones Equal Weight U.S. Issued Corporate Bond IndexSM (the “Bond Index”) and other investment-grade debt securities of issuers whose securities are included in the Bond Index; and investment-grade debt securities of issuers included in the Dow Jones Composite AverageTM. The Fund may also invest in U.S. government and agency securities, including mortgage-backed securities. The Fund may, at certain times, also hold exchange-traded funds (“ETFs”) that invest in investment-grade corporate debt securities and U.S. government bonds in lieu of investing directly in such securities. The Fund may also invest in companies with various market capitalizations and when-issued, to-be-announced (“TBA”) and delayed delivery securities.
First Trust Multi Income’s primary investment objective is to maximize current income, with a secondary objective of capital appreciation. First Trust Multi Income seeks to achieve its objectives through diversified exposure to nine income generating asset classes: dividend paying stocks, preferred stocks, energy infrastructure companies and master limited partnerships (“MLPs”), real estate investment trusts (“REITs”), high yield or “junk” bonds, floating-rate loans, corporate bonds, mortgage-backed securities and Treasury Inflation Protected Securities (“TIPS”). The Fund is actively managed by First Trust and implementing the strategy involves multiple portfolio management teams.
The Advisor tactically adjusts allocation weights in a manner deemed to offer attractive levels of total return relative to the level of expected risk. The Advisor intends to adjust asset allocation weights quarterly but may do so more or less frequently depending upon market conditions. The maximum weight of any asset class, at the time of adjustment, is 20%. The minimum weight of any asset class, at the time of adjustment, is 5%.
First Trust Multi Income may, at certain times, invest in ETFs that generally provide exposure to the nine asset classes in lieu of investing directly in such asset classes. Certain of the ETFs may be advised by First Trust. As a result, First Trust will also earn advisory fees on the underlying ETFs.
In general, the U.S. dollar-denominated fixed-income securities in which First Trust Multi Income invests may be issued by U.S. and non-U.S. issuers, of any credit quality, including high yield securities. The high yield securities in which the Fund invests are rated below investment-grade at the time of purchase or unrated and deemed by the Advisor to be of comparable quality, commonly referred
Notes to Financial Statements (Continued)
First Trust Variable Insurance Trust
June 30, 2023 (Unaudited)
to as “junk” bonds. The Fund also invests in the equity securities of domestic and foreign issuers (including emerging markets) listed on a U.S. or foreign securities exchange and non-U.S. securities that are listed on a U.S. securities exchange in the form of American Depository Receipts (“ADRs”) and Global Depository Receipts (“GDRs”). The Fund may invest in equity securities issued by small, mid or large capitalization companies. The Fund may also invest in bank loans, covenant-lite loans, hybrid capital securities, senior loans and when-issued, TBA and delayed delivery securities.
First Trust Dorsey Wright’s investment objective seeks to provide total return. First Trust Dorsey Wright seeks to achieve its investment objective by investing, under normal market conditions, at least 80% of its net assets (including investment borrowings) in ETFs that comprise the Dorsey Wright Tactical Tilt Moderate CoreTM Index. It is expected that a majority of the ETFs in which the Fund invests will be advised by First Trust.
First Trust Capital Strength seeks to provide capital appreciation. First Trust Capital Strength seeks to achieve its investment objective by investing, under normal market conditions, at least 80% of its net assets (including investment borrowings) in the common stocks and REITs that comprise The Capital StrengthTM Index which is developed, maintained and sponsored by Nasdaq, Inc.
First Trust International seeks to provide capital appreciation. First Trust International seeks to achieve its investment objective by investing, under normal market conditions, at least 80% of its net assets (including investment borrowings) in the common stocks that comprise The International Developed Capital StrengthTM Index which is developed, maintained and sponsored by Nasdaq, Inc.
First Trust Growth Strength seeks to provide long-term capital appreciation. First Trust Growth Strength seeks to achieve its investment objective by investing, under normal market conditions, at least 80% of its net assets (plus any borrowings for investment purposes) in the common stocks and REITs that comprise The Growth Strength™ Index which is developed, maintained and sponsored by Nasdaq, Inc.
First Trust Dow Jones, First Trust Multi Income, First Trust Dorsey Wright, First Trust Capital Strength, and First Trust International offer two classes of shares: Class I and Class II. First Trust Growth Strength offers once class of shares: Class I. Each class represents an interest in the same portfolio of investments but with a different combination of service (12b-1) fees, eligibility requirements and other features.
2. Significant Accounting Policies
The Funds are each considered an investment company and follow accounting and reporting guidance under Financial Accounting Standards Board Accounting Standards Codification Topic 946, “Financial Services-Investment Companies.” The following is a summary of significant accounting policies consistently followed by the Funds in the preparation of the financial statements. The preparation of the financial statements in accordance with accounting principles generally accepted in the United States of America (“U.S. GAAP”) requires management to make estimates and assumptions that affect the reported amounts and disclosures in the financial statements. Actual results could differ from those estimates.
A. Portfolio Valuation
The net asset value (“NAV”) for each class of shares in each Fund is determined daily as of the close of regular trading on the New York Stock Exchange (“NYSE”), normally 4:00 p.m. Eastern time, on each day the NYSE is open for trading. If the NYSE closes early on a valuation day, the NAV is determined as of that time. Domestic debt securities and foreign securities are priced using data reflecting the earlier closing of the principal markets for those securities. The NAV for each class is calculated by dividing the value of each Fund’s total assets attributable to such class (including accrued interest and dividends), less all liabilities attributable to such class (including accrued expenses, dividends declared but unpaid, and any borrowings of each Fund) by the total number of shares of the class outstanding. Differences in the NAV of each class of each Fund’s shares are generally expected to be due to the daily expense accruals of the specified service (12b-1) fees, if any, and transfer agency costs applicable to such class of shares and the resulting differential in the dividends that may be paid on each class of shares.
Each Fund’s investments are valued daily at market value or, in the absence of market value with respect to any portfolio securities, at fair value. Market value prices represent readily available market quotations such as last sale or official closing prices from a national or foreign exchange (i.e., a regulated market) and are primarily obtained from third-party pricing services. Fair value prices represent any prices not considered market value prices and are either obtained from a third-party pricing service or are determined by the Advisor’s Pricing Committee, in accordance with valuation procedures approved by the Trust’s Board of Trustees (the “Board”), and in accordance with provisions of the 1940 Act and rules thereunder. Investments valued by the Advisor’s Pricing Committee, if any, are footnoted as such in the footnotes to the Portfolio of Investments. Each Fund’s investments are valued as follows:
Common stocks, preferred stocks, MLPs, ETFs, REITs and other equity securities listed on any national or foreign exchange (excluding The Nasdaq Stock Market LLC (“Nasdaq”) and the London Stock Exchange Alternative Investment Market (“AIM”))
Notes to Financial Statements (Continued)
First Trust Variable Insurance Trust
June 30, 2023 (Unaudited)
are valued at the last sale price on the exchange on which they are principally traded or, for Nasdaq and AIM securities, the official closing price. Securities traded on more than one securities exchange are valued at the last sale price or official closing price, as applicable, at the close of the securities exchange representing the primary exchange for such securities.
Securities trading on foreign exchanges or over-the-counter markets that close prior to the NYSE close may be valued using a systematic fair valuation model provided by a third-party pricing service. If these foreign securities meet certain criteria in relation to the valuation model, their valuation is systematically adjusted to reflect the impact of movement in the U.S. market after the close of the foreign markets.
Equity securities traded in an over-the-counter market are valued at the close price or the last trade price.
Corporate bonds, corporate notes, U.S. government securities and other debt securities are fair valued on the basis of valuations provided by a third-party pricing service approved by the Advisor’s Pricing Committee, which may use the following valuation inputs when available:
| 1) | benchmark yields; |
| 2) | reported trades; |
| 3) | broker/dealer quotes; |
| 4) | issuer spreads; |
| 5) | benchmark securities; |
| 6) | bids and offers; and |
| 7) | reference data including market research publications. |
Exchange-traded futures contracts are valued at the end of the day settlement price.
Commercial paper, fixed income and other debt securities having a remaining maturity of sixty days or less when purchased are fair valued at cost adjusted for amortization of premiums and accretion of discounts (amortized cost), provided the Advisor’s Pricing Committee has determined that the use of amortized cost is an appropriate reflection of fair value given market and issuer-specific conditions existing at the time of the determination. Factors that may be considered in determining the appropriateness of the use of amortized cost include, but are not limited to, the following:
| 1) | the credit conditions in the relevant market and changes thereto; |
| 2) | the liquidity conditions in the relevant market and changes thereto; |
| 3) | the interest rate conditions in the relevant market and changes thereto (such as significant changes in interest rates); |
| 4) | issuer-specific conditions (such as significant credit deterioration); and |
| 5) | any other market-based data the Advisor’s Pricing Committee considers relevant. In this regard, the Advisor’s Pricing Committee may use last-obtained market-based data to assist it when valuing portfolio securities using amortized cost. |
Certain securities may not be able to be priced by pre-established pricing methods. Such securities may be valued by the Advisor’s Pricing Committee at fair value. These securities generally include, but are not limited to, restricted securities (securities which may not be publicly sold without registration under the Securities Act of 1933, as amended) for which a third-party pricing service is unable to provide a market price; securities whose trading has been formally suspended; a security whose market or fair value price is not available from a pre-established pricing source; a security with respect to which an event has occurred that is likely to materially affect the value of the security after the market has closed but before the calculation of a Fund’s NAV or make it difficult or impossible to obtain a reliable market quotation; and a security whose price, as provided by the third-party pricing service, does not reflect the security’s fair value. As a general principle, the current fair value of a security would appear to be the amount which the owner might reasonably expect to receive for the security upon its current sale. When fair value prices are used, generally they will differ from market quotations or official closing prices on the applicable exchanges. A variety of factors may be considered in determining the fair value of such securities.
Fair valuation of a debt security will be based on the consideration of all available information, including, but not limited to, the following:
| 1) | the most recent price provided by a pricing service; |
| 2) | the fundamental business data relating to the borrower/issuer; |
| 3) | an evaluation of the forces which influence the market in which these securities are purchased and sold; |
| 4) | the type, size and cost of the security; |
| 5) | the financial statements of the borrower/issuer, or the financial condition of the country of issue; |
Notes to Financial Statements (Continued)
First Trust Variable Insurance Trust
June 30, 2023 (Unaudited)
| 6) | the credit quality and cash flow of the borrower/issuer, or country of issue, based on the Pricing Committee’s, sub-advisor’s or portfolio manager’s analysis, as applicable, or external analysis; |
| 7) | the information as to any transactions in or offers for the security; |
| 8) | the price and extent of public trading in similar securities (or equity securities) of the borrower/issuer, or comparable companies; |
| 9) | the coupon payments; |
| 10) | the quality, value and salability of collateral, if any, securing the security; |
| 11) | the business prospects of the borrower/issuer, including any ability to obtain money or resources from a parent or affiliate and an assessment of the borrower’s/issuer’s management; |
| 12) | the prospects for the borrower’s/issuer’s industry, and multiples (of earnings and/or cash flows) being paid for similar businesses in that industry; |
| 13) | borrower’s/issuer’s competitive position within the industry; |
| 14) | borrower’s/issuer’s ability to access additional liquidity through public and/or private markets; and |
| 15) | other relevant factors. |
Fair valuation of an equity security will be based on the consideration of all available information, including, but not limited to, the following:
| 1) | the last sale price on the exchange on which they are principally traded or, for Nasdaq and AIM securities, the official closing price; |
| 2) | the type of security; |
| 3) | the size of the holding; |
| 4) | the initial cost of the security; |
| 5) | transactions in comparable securities; |
| 6) | price quotes from dealers and/or third-party pricing services; |
| 7) | relationships among various securities; |
| 8) | information obtained by contacting the issuer, analysts, or the appropriate stock exchange; |
| 9) | an analysis of the issuer’s financial statements; |
| 10) | the existence of merger proposals or tender offers that might affect the value of the security; and |
| 11) | other relevant factors. |
If the securities in question are foreign securities, the following additional information may be considered:
| 1) | the value of similar foreign securities traded on other foreign markets; |
| 2) | ADR trading of similar securities; |
| 3) | closed-end fund or exchange-traded fund trading of similar securities; |
| 4) | foreign currency exchange activity; |
| 5) | the trading prices of financial products that are tied to baskets of foreign securities; |
| 6) | factors relating to the event that precipitated the pricing problem; |
| 7) | whether the event is likely to recur; |
| 8) | whether the effects of the event are isolated or whether they affect entire markets, countries or regions; and |
| 9) | other relevant factors. |
The Funds are subject to fair value accounting standards that define fair value, establish the framework for measuring fair value and provide a three-level hierarchy for fair valuation based upon the inputs to the valuation as of the measurement date. The three levels of the fair value hierarchy are as follows:
| • | Level 1 – Level 1 inputs are quoted prices in active markets for identical investments. An active market is a market in which transactions for the investment occur with sufficient frequency and volume to provide pricing information on an ongoing basis. |
| • | Level 2 – Level 2 inputs are observable inputs, either directly or indirectly, and include the following: |
| o | Quoted prices for similar investments in active markets. |
| o | Quoted prices for identical or similar investments in markets that are non-active. A non-active market is a market where there are few transactions for the investment, the prices are not current, or price quotations vary substantially either over time or among market makers, or in which little information is released publicly. |
Notes to Financial Statements (Continued)
First Trust Variable Insurance Trust
June 30, 2023 (Unaudited)
| o | Inputs other than quoted prices that are observable for the investment (for example, interest rates and yield curves observable at commonly quoted intervals, volatilities, prepayment speeds, loss severities, credit risks, and default rates). |
| o | Inputs that are derived principally from or corroborated by observable market data by correlation or other means. |
| • | Level 3 – Level 3 inputs are unobservable inputs. Unobservable inputs may reflect the reporting entity’s own assumptions about the assumptions that market participants would use in pricing the investment. |
The inputs or methodologies used for valuing investments are not necessarily an indication of the risk associated with investing in those investments. A summary of the inputs used to value each Fund’s investments as of June 30, 2023, is included with each Fund’s Portfolio of Investments.
B. Securities Transactions and Investment Income
Securities transactions are recorded as of the trade date. Realized gains and losses from securities transactions are recorded on the identified cost basis. Dividend income is recorded on the ex-dividend date. Interest income is recorded daily on the accrual basis. Amortization of premiums and accretion of discounts are recorded using the effective interest method.
Distributions received from a Fund’s investments in MLPs generally are comprised of return of capital and investment income. A Fund records estimated return of capital and investment income based on historical information available from each MLP. These estimates may subsequently be revised based on information received from the MLPs after their tax reporting periods are concluded.
Distributions received from a Fund’s investments in REITs may be comprised of return of capital, capital gains, and income. The actual character of the amounts received during the year are not known until after the REITs’ fiscal year end. A Fund records the character of distributions received from the REITs during the year based on estimates available. The characterization of distributions received by a Fund may be subsequently revised based on information received from the REITs after their tax reporting periods conclude.
The United Kingdom’s Financial Conduct Authority (the “FCA”), which regulates the London Interbank Offered Rates (“LIBOR”), announced on March 5, 2021 that it intended to phase-out all LIBOR reference rates, beginning December 31, 2021. Since that announcement, the FCA has ceased publication of all non-USD LIBOR reference rates and the 1-week and 2-month USD LIBOR reference rates as of December 31, 2021. The remaining USD LIBOR settings will cease to be published or no longer be representative immediately after June 30, 2023. The International Swaps and Derivatives Association, Inc. (“ISDA”) confirmed that the FCA’s March 5, 2021 announcement of its intention to cease providing LIBOR reference rates, constituted an index cessation event under the Interbank Offered Rates (“IBOR”) Fallbacks Supplement and the ISDA 2020 IBOR Fallbacks Protocol for all 35 LIBOR settings and confirmed that the spread adjustment to be used in ISDA fallbacks was fixed as of the date of the announcement.
In the United States, the Alternative Reference Rates Committee (the “ARRC”), a group of market participants convened by the Board of Governors of the Federal Reserve System and the Federal Reserve Bank of New York in cooperation with other federal and state government agencies, has since 2014 undertaken efforts to identify U.S. dollar reference interest rates as alternatives to LIBOR and to facilitate the mitigation of LIBOR-related risks. In June 2017, the ARRC identified the Secured Overnight Financing Rate (“SOFR”), a broad measure of the cost of cash overnight borrowing collateralized by U.S. Treasury securities, as the preferred alternative for U.S. dollar LIBOR. The Federal Reserve Bank of New York began daily publishing of SOFR in April 2018. There is no assurance that any alternative reference rate, including SOFR, will be similar to or produce the same value or economic equivalence as LIBOR or that instruments using an alternative rate will have the same volume or liquidity.
At this time, it is not possible to predict the full impact of the elimination of LIBOR and the establishment of an alternative reference rate on each Fund or its investments.
C. Cash and Cash Equivalents
Normally, the Funds invest substantially all of their assets to meet their investment objectives. The Funds may invest the remainder of their assets in securities with maturities of less than one year or cash equivalents, or they may hold cash. The investment in such instruments is not a principal investment strategy of First Trust Dow Jones, First Trust Multi Income, First Trust Capital Strength, First Trust International, or First Trust Growth Strength. The percentage of each Fund’s net assets invested in such holdings varies and depends on several factors, including market conditions. For temporary defensive purposes and during periods of high cash inflows or outflows, the Funds may depart from their principal investment strategies and invest part or all of their assets in these securities, or they may hold cash.
Notes to Financial Statements (Continued)
First Trust Variable Insurance Trust
June 30, 2023 (Unaudited)
D. Foreign Currency
The books and records of the Funds are maintained in U.S. dollars. Foreign currencies, investments and other assets and liabilities are translated into U.S. dollars at the exchange rates prevailing at the end of the period. Purchases and sales of investments and items of income and expense are translated on the respective dates of such transactions. Unrealized gains and losses on assets and liabilities, other than investments in securities, which result from changes in foreign currency exchange rates have been included in “Net change in unrealized appreciation (depreciation) on foreign currency translation” on the Statements of Operations. Unrealized gains and losses on investments in securities which result from changes in foreign exchange rates are included with fluctuations arising from changes in market price and are included in “Net change in unrealized appreciation (depreciation) on investments” on the Statements of Operations. Net realized foreign currency gains and losses include the effect of changes in exchange rates between trade date and settlement date on investment security transactions, foreign currency transactions and interest and dividends received and are included in “Net realized gain (loss) on foreign currency transactions” on the Statements of Operations. The portion of foreign currency gains and losses related to fluctuations in exchange rates between the initial purchase settlement date and subsequent sale trade date is included in “Net realized gain (loss) on investments” on the Statements of Operations.
E. Futures Contracts
First Trust Dow Jones purchases or sells (i.e., is long or short) futures contracts to hedge against changes in interest rates (interest rate risk). Futures contracts are agreements between the Fund and a counterparty to buy or sell a specific quantity of an underlying instrument at a specified price and at a specified date. Depending on the terms of the contract, futures contracts are settled either through physical delivery of the underlying instrument on the settlement date or by payment of a cash settlement amount on the settlement date. Open futures contracts can also be closed out prior to settlement by entering into an offsetting transaction in a matching futures contract. If the Fund is not able to enter into an offsetting transaction, the Fund will continue to be required to maintain margin deposits on the futures contract. When the contract is closed or expires, the Fund records a realized gain or loss equal to the difference between the value of the contract at the time it was opened and the value at the time it was closed or expired. This gain or loss is included in “Net realized gain (loss) on futures contracts” on the Statements of Operations.
Upon entering into a futures contract, the Fund must deposit funds, called margin, with its custodian in the name of the clearing broker equal to a specified percentage of the current value of the contract. Open futures contracts are marked-to-market daily with the change in value recognized as a component of “Net change in unrealized appreciation (depreciation) on futures contracts” on the Statements of Operations. Pursuant to the contract, the Fund agrees to receive from or pay to the broker an amount of cash equal to the daily fluctuation in value of the contract. Such receipts or payments are known as variation margin and are included in “Variation margin” payable or receivable on the Statements of Assets and Liabilities. If market conditions change unexpectedly, the Fund may not achieve the anticipated benefits of the futures contract and may realize a loss. The use of futures contracts involves the risk of imperfect correlation in movements in the price of the futures contracts, interest rates and the underlying instruments.
F. Principal-Only Securities
A principal-only security (“PO Security”) is the principal-only portion of a mortgage-backed security that does not receive any interest, is priced at a deep discount to its redemption value and ultimately receives the redemption value. Generally speaking, when interest rates are falling and prepayment rates are increasing, the value of a PO Security will rise. Conversely, when interest rates are rising and prepayment rates are decreasing, generally the value of a PO Security will fall. These securities, if any, are identified on the Portfolio of Investments.
G. Interest-Only Securities
An interest-only security (“IO Security”) is the interest-only portion of a mortgage-backed security that receives some or all of the interest portion of the underlying mortgage-backed security and little or no principal. A reference principal value called a notional value is used to calculate the amount of interest due to the IO Security. IO Securities are sold at a deep discount to their notional principal amount. Generally speaking, when interest rates are falling and prepayment rates are increasing, the value of an IO Security will fall. Conversely, when interest rates are rising and prepayment rates are decreasing, generally the value of an IO Security will rise. These securities, if any, are identified on the Portfolio of Investments.
H. Affiliated Transactions
First Trust Multi Income and First Trust Dorsey Wright invest in securities of affiliated funds. Dividend income and realized gains and losses from affiliated funds are presented on the Statements of Operations. Each Fund’s investment performance and risks are directly related to the investment performance and risks of the affiliated funds.
Notes to Financial Statements (Continued)
First Trust Variable Insurance Trust
June 30, 2023 (Unaudited)
Amounts relating to these investments in First Trust Multi Income at June 30, 2023, and for the six month period then ended are:
| Security Name | Shares at
6/30/2023 | Value at
12/31/2022 | | Purchases | | Sales | | Change in
Unrealized
Appreciation
(Depreciation) | | Realized
Gain
(Loss) | | Value at
6/30/2023 | | Dividend
Income |
| First Trust Institutional Preferred Securities and Income ETF | 158,429 | $2,211,272 | | $766,236 | | $ (162,695) | | $ (137,875) | | $ (7,409) | | $2,669,529 | | $80,546 |
| First Trust Limited Duration Investment Grade Corporate ETF | 44,804 | 975,489 | | 173,590 | | (313,908) | | (1,071) | | 150 | | 834,250 | | 17,885 |
| First Trust Long Duration Opportunities ETF | 5,750 | 10,943 | | 668,860 | | (530,833) | | (1,065) | | (19,967) | | 127,938 | | 5,180 |
| First Trust Low Duration Opportunities ETF | 15,000 | 1,173,397 | | 481,109 | | (947,528) | | 58,247 | | (50,175) | | 715,050 | | 17,989 |
| First Trust Preferred Securities and Income ETF | 53,862 | 709,162 | | 246,586 | | (52,873) | | (45,627) | | 2,928 | | 860,176 | | 27,250 |
| First Trust Senior Loan ETF | 101,167 | 4,663,534 | | 120,563 | | (276,803) | | 91,199 | | (15,628) | | 4,582,865 | | 177,734 |
| First Trust Tactical High Yield ETF | 61,781 | 2,530,360 | | 46,156 | | (174,048) | | 79,979 | | (34,066) | | 2,448,381 | | 76,307 |
| | | $12,274,157 | | $2,503,100 | | $(2,458,688) | | $43,787 | | $(124,167) | | $12,238,189 | | $402,891 |
Notes to Financial Statements (Continued)
First Trust Variable Insurance Trust
June 30, 2023 (Unaudited)
Amounts relating to these investments in First Trust Dorsey Wright at June 30, 2023, and for the six month period then ended are:
| Security Name | Shares at
6/30/2023 | Value at
12/31/2022 | | Purchases | | Sales | | Change in
Unrealized
Appreciation
(Depreciation) | | Realized
Gain
(Loss) | | Value at
6/30/2023 | | Dividend
Income |
| First Trust Brazil AlphaDEX® Fund | — | $477,453 | | $ — | | $ (476,074) | | $26,836 | | $ (28,215) | | $ — | | $ — |
| First Trust Consumer Discretionary AlphaDEX® Fund | 57,963 | — | | 3,031,668 | | (52,233) | | 217,126 | | 3,576 | | 3,200,137 | | 3,449 |
| First Trust Developed Markets ex-US AlphaDEX® Fund | 56,225 | 1,223,034 | | 1,752,658 | | (180,274) | | 102,909 | | (11,173) | | 2,887,154 | | 61,406 |
| First Trust Dow Jones Global Select Dividend Index Fund | 52,237 | — | | 1,242,661 | | (35,899) | | (85,423) | | (1,378) | | 1,119,961 | | 37,909 |
| First Trust Dow Jones Internet Index Fund | 18,777 | — | | 2,991,441 | | (32,312) | | 100,081 | | 1,253 | | 3,060,463 | | — |
| First Trust Emerging Markets AlphaDEX® Fund | 134,683 | 1,218,079 | | 1,829,079 | | (219,151) | | 49,907 | | (25,328) | | 2,852,586 | | 74,027 |
| First Trust Energy AlphaDEX® Fund | — | 1,158,087 | | — | | (1,168,814) | | 39,303 | | (28,576) | | — | | — |
| First Trust Enhanced Short Maturity ETF | — | 23,181,600 | | 297,950 | | (23,507,527) | | (31,200) | | 59,177 | | — | | 310,243 |
| First Trust Financials AlphaDEX® Fund | — | — | | 1,130,430 | | (883,056) | | — | | (247,374) | | — | | 5,211 |
| First Trust India NIFTY 50 Equal Weight ETF | 25,078 | 467,662 | | 799,826 | | (168,962) | | 88,441 | | 12,514 | | 1,199,481 | | 1,939 |
| First Trust Industrials/Producer Durables AlphaDEX® Fund | 53,713 | 1,150,476 | | 1,982,286 | | (191,707) | | 272,772 | | 13,787 | | 3,227,614 | | 7,279 |
| First Trust Japan AlphaDEX® Fund | 23,907 | 499,924 | | 717,403 | | (187,121) | | 98,114 | | 18,666 | | 1,146,986 | | 15,567 |
| First Trust Large Cap Growth AlphaDEX® Fund | 34,334 | — | | 3,346,192 | | — | | 131,499 | | — | | 3,477,691 | | 4,553 |
| First Trust Latin America AlphaDEX® Fund | 60,768 | 484,687 | | 732,606 | | (182,509) | | 127,290 | | (7,178) | | 1,154,896 | | 34,109 |
| First Trust Materials AlphaDEX® Fund | — | 1,115,644 | | 15,719 | | (1,165,507) | | 39,404 | | (5,260) | | — | | 4,046 |
| First Trust Mid Cap Core AlphaDEX® Fund | 36,501 | 1,272,832 | | 2,234,740 | | (195,735) | | 199,261 | | 4,678 | | 3,515,776 | | 11,113 |
| First Trust Mid Cap Value AlphaDEX® Fund | 76,448 | 1,274,146 | | 2,292,704 | | (226,690) | | 142,626 | | 10,888 | | 3,493,674 | | 18,066 |
| First Trust Nasdaq Food & Beverage ETF | 114,090 | 1,156,820 | | 1,969,760 | | (87,539) | | (47,364) | | (237) | | 2,991,440 | | 15,048 |
| First Trust Nasdaq Oil & Gas ETF | — | 1,204,069 | | — | | (1,097,326) | | (25,408) | | (81,335) | | — | | 6,249 |
| First Trust Nasdaq Semiconductor ETF | 45,492 | — | | 3,035,227 | | (56,311) | | 255,640 | | 4,019 | | 3,238,575 | | 4,668 |
| First Trust Small Cap Value AlphaDEX® Fund | — | 1,265,282 | | 2,319,463 | | (3,489,090) | | 44,739 | | (140,394) | | — | | 3,340 |
| First Trust Switzerland AlphaDEX® Fund | 18,816 | 503,524 | | 678,941 | | (110,818) | | 37,361 | | 20,705 | | 1,129,713 | | 25,955 |
| | | $37,653,319 | | $32,400,754 | | $(33,714,655) | | $1,783,914 | | $(427,185) | | $37,696,147 | | $644,177 |
I. Dividends and Distributions to Shareholders
Distributions from net investment income of each Fund, if any, are declared and paid semi-annually. Each Fund distributes its net realized capital gains, if any, to shareholders at least annually. All dividends payable by each Fund will be reinvested in the Fund. A Fund may also designate a portion of the amount paid to redeeming shareholders as a distribution for tax purposes.
Notes to Financial Statements (Continued)
First Trust Variable Insurance Trust
June 30, 2023 (Unaudited)
Distributions from income and capital gains are determined in accordance with federal income tax regulations, which may differ from U.S. GAAP. Certain capital accounts in the financial statements are periodically adjusted for permanent differences in order to reflect their tax character. These permanent differences are primarily due to the varying treatment of income and gain/loss on portfolio securities held by the Funds and have no impact on net assets or NAV per share. Temporary differences, which arise from recognizing certain items of income, expense and gain/loss in different periods for financial statement and tax purposes, will reverse at some time in the future.
The tax character of distributions paid by each Fund listed below during the fiscal year ended December 31, 2022, were as follows:
| | Distributions
paid from
Ordinary
Income | | Distributions
paid from
Capital
Gains | | Distributions
paid from
Return of
Capital |
First Trust Dow Jones
| $ 67,241,853 | | $ 64,518,901 | | $ — |
First Trust Multi Income
| 1,102,314 | | 568,454 | | — |
First Trust Dorsey Wright
| 4,400,647 | | 3,930,784 | | — |
First Trust Capital Strength
| 550,585 | | 86,870 | | — |
First Trust International
| 37,960 | | 19,134 | | — |
As of December 31, 2022, the components of distributable earnings on a tax basis for each Fund listed below were as follows:
| | Undistributed
Ordinary
Income | | Accumulated
Capital and
Other
Gain (Loss) | | Net
Unrealized
Appreciation
(Depreciation) |
First Trust Dow Jones
| $ 1,022,064 | | $ 15,461,571 | | $ (16,295,015) |
First Trust Multi Income
| 35,147 | | 1,201,528 | | (244,986) |
First Trust Dorsey Wright
| 73,926 | | (2,809,590) | | (1,287,369) |
First Trust Capital Strength
| — | | (3,045,004) | | 2,723,439 |
First Trust International
| — | | (570,289) | | (38,676) |
J. Income Taxes
Each Fund intends to qualify or continue to qualify as a regulated investment company by complying with the requirements under Subchapter M of the Internal Revenue Code of 1986, as amended, which includes distributing substantially all of its net investment income and net realized gains to shareholders. Accordingly, no provision has been made for federal and state income taxes. However, due to the timing and amount of distributions, each Fund may be subject to an excise tax of 4% of the amount by which approximately 98% of each Fund’s taxable income exceeds the distributions from such taxable income for the calendar year.
The Funds are subject to accounting standards that establish a minimum threshold for recognizing, and a system for measuring, the benefits of a tax position taken or expected to be taken in a tax return. Taxable years ended 2019, 2020, 2021 and 2022 remain open to federal and state audit for First Trust Dow Jones, First Trust Multi Income and First Trust Dorsey Wright. The taxable years ended 2020, 2021 and 2022 remain open to federal and state audit for First Trust Capital Strength and First Trust International. As of June 30, 2023, management has evaluated the application of these standards to the Funds and has determined that no provision for income tax is required in the Funds’ financial statements for uncertain tax positions.
The Funds intend to utilize provisions of the federal income tax laws, which allow them to carry a realized capital loss forward indefinitely following the year of the loss and offset such loss against any future realized capital gains. The Funds are subject to certain limitations under U.S. tax rules on the use of capital loss carryforwards and net unrealized built-in losses. These limitations apply when there has been a 50% change in ownership. At December 31, 2022, for federal income tax purposes, the Funds had capital loss carryforwards available as shown in the following table, to the extent provided by regulations, to offset future capital gains. To the extent that these loss carryforwards are used to offset future capital gains, it is probable that the capital gains so offset will not be distributed to each applicable Fund’s shareholders.
Notes to Financial Statements (Continued)
First Trust Variable Insurance Trust
June 30, 2023 (Unaudited)
| | Non-Expiring
Capital Loss
Carryforward |
First Trust/Dow Jones Dividend & Income Allocation Portfolio
| $ — |
First Trust Multi Income Allocation Portfolio
| — |
First Trust Dorsey Wright Tactical Core Portfolio
| 2,809,590 |
First Trust Capital Strength Portfolio
| 3,045,004 |
First Trust International Developed Capital Strength Portfolio
| 570,289 |
As of June 30, 2023, the aggregate cost, gross unrealized appreciation, gross unrealized depreciation, and net unrealized appreciation/(depreciation) on investments (including short positions and derivatives, if any) for federal income tax purposes were as follows:
| | Tax Cost | | Gross
Unrealized
Appreciation | | Gross
Unrealized
(Depreciation) | | Net Unrealized
Appreciation
(Depreciation) |
First Trust Dow Jones
| $ 898,779,342 | | $ 59,824,068 | | $ (65,066,842) | | $ (5,242,774) |
First Trust Multi Income
| 35,531,614 | | 1,788,794 | | (2,074,689) | | (285,895) |
First Trust Dorsey Wright
| 46,064,886 | | 1,571,486 | | (720,159) | | 851,327 |
First Trust Capital Strength
| 95,959,912 | | 5,807,033 | | (2,664,972) | | 3,142,061 |
First Trust International
| 7,629,934 | | 590,761 | | (168,962) | | 421,799 |
First Trust Growth Strength
| 808,320 | | 61,360 | | (2,141) | | 59,219 |
K. Expenses
Each Fund will pay all expenses directly related to its operations.
Each Participating Insurance Company performs certain administrative services for the Funds, their Accounts and the Contracts. Each Fund pays an administrative services fee of 0.20% of average daily net assets to cover expenses incurred by Participating Insurance Companies in connection with these services.
First Trust has entered into various licensing agreements, which allow First Trust to use certain trademarks and trade names of the applicable licensors (see Licensing Information in the Additional Information section of this report). The Trust, on behalf of First Trust Dow Jones, First Trust Dorsey Wright, First Trust Capital Strength, First Trust International and First Trust Growth Strength, is a sub-licensee to these license agreements and is required to pay licensing fees, which are shown on the Statements of Operations.
3. Investment Advisory Fee, Affiliated Transactions and Other Fee Arrangements
First Trust, the investment advisor to the Funds, is a limited partnership with one limited partner, Grace Partners of DuPage L.P., and one general partner, The Charger Corporation. The Charger Corporation is an Illinois corporation controlled by James A. Bowen, Chief Executive Officer of First Trust. First Trust provides each Fund with discretionary investment services and certain administrative services necessary for the management of the Funds. For its investment advisory and management services, First Trust is entitled to a monthly fee calculated at an annual rate of 0.60% of the average daily net assets for First Trust Dow Jones, First Trust Multi Income, First Trust International, and First Trust Growth Strength, 0.35% of the average daily net assets for First Trust Dorsey Wright, and 0.50% of the average daily net assets for First Trust Capital Strength. First Trust also provides fund reporting services to the Funds for a flat annual fee in the amount of $9,250 per Fund.
In addition, First Trust Multi Income and First Trust Dorsey Wright incur their respective pro rata share of fees and expenses attributable to each Fund’s investments in other investment companies (“acquired fund fees and expenses”). The total of net expenses and acquired fund fees and expenses represents each Fund’s total net annual operating expenses.
First Trust Multi Income and First Trust have retained Energy Income Partners, LLC (“EIP”) and Stonebridge Advisors LLC (“Stonebridge”) (collectively, the “Sub-Advisors”), affiliates of First Trust, to serve as investment sub-advisors. In this capacity, the Sub-Advisors provide recommendations to the Advisor regarding the selection and ongoing monitoring of certain securities in First Trust Multi Income’s investment portfolio. EIP acts as sub-advisor for, and manages on a discretionary basis the investment and reinvestment of, only the assets of First Trust Multi Income allocated to EIP by the Advisor and furnishes an investment program in
Notes to Financial Statements (Continued)
First Trust Variable Insurance Trust
June 30, 2023 (Unaudited)
respect of and makes investment decisions only with respect to the portion of First Trust Multi Income’s investment portfolio allocated to it by the Advisor. EIP, an affiliate of the Advisor, has been retained by First Trust Multi Income and the Advisor to provide recommendations regarding the selection and ongoing monitoring of the MLP, MLP affiliate and energy infrastructure securities in First Trust Multi Income’s investment portfolio and to exercise discretion only with respect to assets of First Trust Multi Income allocated to EIP. Stonebridge serves as a nondiscretionary sub-advisor. Stonebridge has been retained by First Trust Multi Income and the Advisor to provide recommendations regarding the selection and ongoing monitoring of the preferred and hybrid securities in First Trust Multi Income’s investment portfolio.
For the services provided and the expenses assumed pursuant to the investment sub-advisory agreement, First Trust will pay EIP a sub-advisory fee equal to 40% monthly in arrears of any remaining monthly investment management fee paid to the Advisor for the average daily net assets allocated to EIP after First Trust’s waiver of any of its investment management fee to comply with the then-current expense cap, as defined below. For the services provided and the expenses assumed pursuant to the investment sub-advisory agreement, First Trust will pay Stonebridge a portfolio management fee equal to an annual rate of 0.20% of the Fund’s average daily net assets allocated to Stonebridge.
First Trust Capital Partners, LLC (“FTCP”), an affiliate of First Trust, owns, through a wholly-owned subsidiary, a 15% ownership interest in each of EIP and EIP Partners, LLC, an affiliate of EIP. FTCP also owns, through a wholly-owned subsidiary, a 51% ownership interest in Stonebridge.
First Trust has agreed to waive fees and/or pay First Trust Dow Jones’, First Trust Multi Income’s and First Trust International’s expenses to the extent necessary to prevent the annual operating expenses of Class I shares and Class II shares (excluding interest expense, brokerage commissions and other trading expenses, acquired fund fees and expenses, if any, taxes and extraordinary expenses) from exceeding 1.20% and 0.95% (each an “Expense Cap”), respectively, of each Fund’s average daily net assets per year at least until May 1, 2024. First Trust has agreed to waive fees and/or pay First Trust Dorsey Wright’s expenses to the extent necessary to prevent the operating expenses of Class I shares and Class II shares (excluding interest expense, brokerage commissions and other trading expenses, taxes and extraordinary expenses) from exceeding 1.30% and 1.05% (each an “Expense Cap”), respectively, of the Fund’s average daily net assets per year at least until May 1, 2024. For First Trust Dorsey Wright, because acquired fund fees and expenses are estimated, First Trust will periodically adjust the amount of the fee waiver and expense reimbursement in order to attempt to meet the Expense Caps. However, total net annual fund expenses may be higher or lower than the Expense Caps. First Trust has agreed to waive fees and/or pay First Trust Capital Strength’s expenses to the extent necessary to prevent the annual operating expenses of Class I shares and Class II shares (excluding interest expense, brokerage commissions and other trading expenses, acquired fund fees and expenses, if any, taxes and extraordinary expenses) from exceeding 1.10% and 0.85% (each an “Expense Cap”), respectively, of the Fund’s average daily net assets per year at least until May 1, 2024. First Trust has agreed to waive fees and/or pay First Trust Growth Strength’s expenses to the extent necessary to prevent the annual operating expenses of Class I shares (excluding interest expense, brokerage commissions and other trading expenses, acquired fund fees and expenses, if any, taxes and extraordinary expenses) from exceeding 1.20% (the “Expense Cap”) of the Fund’s average daily net assets per year at least until May 12, 2025.
Expenses borne and fees waived by First Trust are subject to reimbursement by each Fund for up to three years from the date the fee or expense was incurred by the Fund, but no reimbursement payment will be made by the Fund at any time if it would result in the Fund’s expenses exceeding (i) the Expense Cap in place for the most recent fiscal year for which such expense limitation was in place, (ii) the Expense Cap in place at the time the fees were waived or expenses reimbursed, or (iii) the current Expense Cap. These amounts, if any, are included in “Expenses previously waived or reimbursed” on the Statements of Operations.
The advisory fee waivers and expense reimbursements for the period ended June 30, 2023, and the expenses borne and fees waived by First Trust subject to recovery from the applicable Fund at June 30, 2023, are included in the following table:
Notes to Financial Statements (Continued)
First Trust Variable Insurance Trust
June 30, 2023 (Unaudited)
| | | | | | Fees Waived or Expenses Borne by First Trust Subject to Recovery |
| | Fees
Waived | | Expenses
Reimbursed | | Six Months
Ended
December 31,
2020 | | Year
Ended
December 31,
2021 | | Year
Ended
December 31,
2022 | | Period
Ended
June 30,
2023 | | Total |
| First Trust Dow Jones | $ — | | $ — | | $ — | | $ — | | $ — | | $ — | | $ — |
| First Trust Multi Income | 104,300 | | — | | 90,484 | | 216,153 | | 203,330 | | 104,300 | | 614,267 |
| First Trust Dorsey Wright | 82,554 | | 32,015 | | 157,277 | | 301,093 | | 236,543 | | 114,569 | | 809,482 |
| First Trust Capital Strength | 46,527 | | — | | 116,847 | | 147,773 | | 118,374 | | 46,527 | | 429,521 |
| First Trust International | 20,698 | | 57,157 | | 143,664 | | 188,132 | | 176,656 | | 77,855 | | 586,307 |
| First Trust Growth Strength | 429 | | 17,751 | | — | | — | | — | | 18,180 | | 18,180 |
During the six months ended June 30, 2023, First Trust recovered $15,254 in fees that were previously waived or reimbursed in First Trust Dow Jones.
First Trust agreed to waive fees in the amount of 0.37% of the First Trust Multi Income’s average daily net assets through May 1, 2024. During the six months ended June 30, 2023, First Trust reimbursed First Trust Multi Income $67,111 of fees that are not subject to recovery.
BNY Mellon Investment Servicing (US) Inc. (“BNYM IS”) serves as each Fund’s transfer agent in accordance with certain fee arrangements. As transfer agent, BNYM IS is responsible for maintaining shareholder records for the Funds. BNYM IS is a subsidiary of The Bank of New York Mellon Corporation, a financial holding company.
The Bank of New York Mellon (“BNYM”) serves as First Trust Dow Jones’, First Trust Multi Income’s, First Trust Capital Strength’s, First Trust International’s and First Trust Growth Strength’s administrator, fund accountant and custodian in accordance with certain fee arrangements. As administrator and fund accountant, BNYM is responsible for providing certain administrative and accounting services to the Funds, including maintaining the Funds’ books of account, records of the Funds’ securities transactions, and certain other books and records. As custodian, BNYM is responsible for custody of each Fund’s assets. BNYM is a subsidiary of The Bank of New York Mellon Corporation, a financial holding company.
Brown Brothers Harriman & Co. (“BBH”) serves as First Trust Dorsey Wright’s administrator, fund accountant and custodian. As custodian, BBH is responsible for custody of the Fund’s assets. As administrator and fund accountant, BBH is responsible for providing certain administrative and accounting services to the Fund, including maintaining the Fund’s books of account, records of the Fund’s securities transactions, and certain other books and records.
Each Trustee who is not an officer or employee of First Trust, any sub-advisor or any of their affiliates (“Independent Trustees”) is paid a fixed annual retainer that is allocated equally among each fund in the First Trust Fund Complex. Each Independent Trustee is also paid an annual per fund fee that varies based on whether the fund is a closed-end or other actively managed fund, a target outcome fund or an index fund.
Additionally, the Lead Independent Trustee and the Chairs of the Audit Committee, Nominating and Governance Committee and Valuation Committee are paid annual fees to serve in such capacities, with such compensation allocated pro rata among each fund in the First Trust Fund Complex based on net assets. Independent Trustees are reimbursed for travel and out-of-pocket expenses in connection with all meetings. The Lead Independent Trustee and Committee Chairs rotate every three years. The officers and “Interested” Trustee receive no compensation from the Trust for acting in such capacities.
Notes to Financial Statements (Continued)
First Trust Variable Insurance Trust
June 30, 2023 (Unaudited)
4. Capital Share Transactions
Capital transactions for First Trust Dow Jones were as follows:
| | Six Months Ended
June 30, 2023 | | Year Ended
December 31, 2022 |
| | Shares | | Value | | Shares | | Value |
| Sales: | | | | | | | |
| Class I | 1,551,882 | | $ 19,719,171 | | 3,590,571 | | $ 49,301,276 |
| Class II | 2,223 | | 28,551 | | 9,992 | | 125,672 |
| Total Sales | 1,554,105 | | $ 19,747,722 | | 3,600,563 | | $ 49,426,948 |
| Dividend Reinvestment: | | | | | | | |
| Class I | 1,993,714 | | $ 24,702,117 | | 10,887,598 | | $ 131,536,646 |
| Class II | 3,636 | | 45,190 | | 18,494 | | 224,108 |
| Total Dividend Reinvestment | 1,997,350 | | $ 24,747,307 | | 10,906,092 | | $ 131,760,754 |
| Redemptions: | | | | | | | |
| Class I | (4,343,275) | | $ (55,405,783) | | (6,602,723) | | $ (90,278,746) |
| Class II | (9,890) | | (131,108) | | (4,150) | | (55,833) |
| Total Redemptions | (4,353,165) | | $ (55,536,891) | | (6,606,873) | | $ (90,334,579) |
Capital transactions for First Trust Multi Income were as follows:
| | Six Months Ended
June 30, 2023 | | Year Ended
December 31, 2022 |
| | Shares | | Value | | Shares | | Value |
| Sales: | | | | | | | |
| Class I | 208,734 | | $ 2,343,646 | | 498,581 | | $ 5,865,419 |
| Class II | — | | — | | 1 | | 11 |
| Total Sales | 208,734 | | $ 2,343,646 | | 498,582 | | $ 5,865,430 |
| Dividend Reinvestment: | | | | | | | |
| Class I | 157,665 | | $ 1,710,665 | | 151,056 | | $ 1,663,388 |
| Class II | 669 | | 7,251 | | 670 | | 7,380 |
| Total Dividend Reinvestment | 158,334 | | $ 1,717,916 | | 151,726 | | $ 1,670,768 |
| Redemptions: | | | | | �� | | |
| Class I | (409,691) | | $ (4,631,999) | | (507,883) | | $ (5,890,139) |
| Class II | (4) | | (40) | | (1,808) | | (20,105) |
| Total Redemptions | (409,695) | | $ (4,632,039) | | (509,691) | | $ (5,910,244) |
Capital transactions for First Trust Dorsey Wright were as follows:
| | Six Months Ended
June 30, 2023 | | Year Ended
December 31, 2022 |
| | Shares | | Value | | Shares | | Value |
| Sales: | | | | | | | |
| Class I | 220,369 | | $ 2,333,620 | | 378,561 | | $ 4,751,605 |
| Class II | 307 | | 3,249 | | 4,874 | | 66,397 |
| Total Sales | 220,676 | | $ 2,336,869 | | 383,435 | | $ 4,818,002 |
Notes to Financial Statements (Continued)
First Trust Variable Insurance Trust
June 30, 2023 (Unaudited)
| | Six Months Ended
June 30, 2023 | | Year Ended
December 31, 2022 |
| | Shares | | Value | | Shares | | Value |
| Dividend Reinvestment: | | | | | | | |
| Class I | 39,778 | | $ 425,234 | | 762,186 | | $ 8,220,598 |
| Class II | 246 | | 2,605 | | 10,364 | | 110,833 |
| Total Dividend Reinvestment | 40,024 | | $ 427,839 | | 772,550 | | $ 8,331,431 |
| Redemptions: | | | | | | | |
| Class I | (370,211) | | $ (3,947,175) | | (1,141,990) | | $ (14,816,981) |
| Class II | (34,744) | | (368,233) | | (16,542) | | (213,036) |
| Total Redemptions | (404,955) | | $ (4,315,408) | | (1,158,532) | | $ (15,030,017) |
Capital transactions for First Trust Capital Strength were as follows:
| | Six Months Ended
June 30, 2023 | | Year Ended
December 31, 2022 |
| | Shares | | Value | | Shares | | Value |
| Sales: | | | | | | | |
| Class I | 2,061,362 | | $ 25,660,043 | | 3,256,626 | | $ 41,033,791 |
| Class II | 7,348 | | 90,083 | | 45,798 | | 571,496 |
| Total Sales | 2,068,710 | | $ 25,750,126 | | 3,302,424 | | $ 41,605,287 |
| Dividend Reinvestment: | | | | | | | |
| Class I | 29,697 | | $ 371,809 | | 50,788 | | $ 622,719 |
| Class II | 590 | | 7,388 | | 1,200 | | 14,736 |
| Total Dividend Reinvestment | 30,287 | | $ 379,197 | | 51,988 | | $ 637,455 |
| Redemptions: | | | | | | | |
| Class I | (1,011,982) | | $ (12,751,392) | | (688,055) | | $ (8,809,025) |
| Class II | (10,392) | | (129,858) | | (17,145) | | (220,263) |
| Total Redemptions | (1,022,374) | | $ (12,881,250) | | (705,200) | | $ (9,029,288) |
Capital transactions for First Trust International were as follows:
| | Six Months Ended
June 30, 2023 | | Year Ended
December 31, 2022 |
| | Shares | | Value | | Shares | | Value |
| Sales: | | | | | | | |
| Class I | 184,559 | | $ 2,150,122 | | 297,294 | | $ 3,339,095 |
| Class II | 2,852 | | 33,383 | | 14,642 | | 168,582 |
| Total Sales | 187,411 | | $ 2,183,505 | | 311,936 | | $ 3,507,677 |
| Dividend Reinvestment: | | | | | | | |
| Class I | 3,785 | | $ 45,199 | | 4,353 | | $ 44,922 |
| Class II | 658 | | 7,869 | | 1,179 | | 12,172 |
| Total Dividend Reinvestment | 4,443 | | $ 53,068 | | 5,532 | | $ 57,094 |
Notes to Financial Statements (Continued)
First Trust Variable Insurance Trust
June 30, 2023 (Unaudited)
| | Six Months Ended
June 30, 2023 | | Year Ended
December 31, 2022 |
| | Shares | | Value | | Shares | | Value |
| Redemptions: | | | | | | | |
| Class I | (50,159) | | $ (586,524) | | (58,466) | | $ (649,249) |
| Class II | (10,767) | | (120,532) | | (1,171) | | (12,492) |
| Total Redemptions | (60,926) | | $ (707,056) | | (59,637) | | $ (661,741) |
Capital transactions for First Trust Growth Strength were as follows:
| | Period Ended
June 30, 2023 |
| | Shares | | Value |
| Sales: | | | |
| Class I | 79,628 | | $ 821,935 |
| Total Sales | 79,628 | | $ 821,935 |
| Dividend Reinvestment: | | | |
| Class I | — | | $ — |
| Total Dividend Reinvestment | — | | $ — |
| Redemptions: | | | |
| Class I | (215) | | $ (2,335) |
| Total Redemptions | (215) | | $ (2,335) |
5. Purchases and Sales of Securities
For the period ended June 30, 2023, the cost of purchases and proceeds from sales of investment securities for each Fund, excluding U.S. Government investment securities and short-term investments, were as follows:
| | Purchases | | Sales |
| First Trust Dow Jones | $ 323,117,043 | | $ 347,649,169 |
| First Trust Multi Income | 8,799,014 | | 11,285,543 |
| First Trust Dorsey Wright | 42,713,464 | | 44,398,645 |
| First Trust Capital Strength | 66,049,605 | | 52,912,363 |
| First Trust International | 4,952,729 | | 3,301,249 |
| First Trust Growth Strength | 808,320 | | — |
| | | | |
For the period ended June 30, 2023, the cost of purchases and proceeds from sales of U.S. government investment securities for each Fund, excluding short-term investments, were as follows:
| | Purchases | | Sales |
| First Trust Dow Jones | $ 314,220,042 | | $ 313,722,628 |
| First Trust Multi Income | 1,101,379 | | 542,532 |
| First Trust Dorsey Wright | — | | — |
| First Trust Capital Strength | — | | — |
| First Trust International | — | | — |
| First Trust Growth Strength | — | | — |
Notes to Financial Statements (Continued)
First Trust Variable Insurance Trust
June 30, 2023 (Unaudited)
6. Derivative Transactions
The following table presents the amount of net realized gain (loss) and change in net unrealized appreciation (depreciation) recognized for the six months ended June 30, 2023, on derivative instruments held by First Trust Dow Jones, as well as the primary underlying risk exposure associated with each instrument.
| Statement of Operations Location | |
| Interest Rate Risk Exposure | |
| Net realized gain (loss) on futures contracts | $(137,916) |
| Net change in unrealized appreciation (depreciation) on futures contracts | (4,289) |
During the six months ended June 30, 2023, the notional value of futures contracts opened and closed were 34,704,162 and 52,355,670, respectively.
First Trust Dow Jones does not have the right to offset financial assets and liabilities related to futures contracts on the Statements of Assets and Liabilities.
7. 12b-1 Service Plan
The Trust has adopted a plan (the “Plan”) pursuant to Rule 12b-1 under the 1940 Act, which provides that Class I shares of each of the Funds will be subject to an annual service fee.
First Trust Portfolios L.P. (“FTP”), an affiliate of First Trust, serves as the selling agent and distributor of shares of the Funds. FTP uses the service fee to compensate each Participating Insurance Company for providing account services to contract owners. These services include establishing and maintaining Contract owners’ accounts, supplying information to Contract owners, delivering Fund materials to Contract owners, answering inquiries, and providing other personal services to Contract owners. Each Fund may spend up to 0.25% per year of the average daily net assets of its Class I shares as a service fee under the Plan. In addition, the Plan permits First Trust to use a portion of its advisory fee to compensate FTP for expenses incurred in connection with the sale of a Fund’s Class I shares including, without limitation, compensation of its sales force, expenses of printing and distributing the Prospectus to persons other than Contract owners, expenses of preparing, printing and distributing advertising and sales literature and reports to Contract owners used in connection with the sale of a Fund’s Class I shares, certain other expenses associated with the servicing of Class I shares of a Fund, and any service-related expenses that may be authorized from time to time by the Board.
During the period ended June 30, 2023, all service fees received by FTP were paid to the Participating Insurance Companies, with no portion of such fees retained by FTP. The Plan may be renewed from year to year if approved by a vote of the Trust’s Board and a vote of the Independent Trustees, who have no direct or indirect financial interest in the Plan, cast in person at a meeting called for the purpose of voting on the Plan.
8. Borrowings
The Trust, on behalf of First Trust Dow Jones and First Trust Multi Income, along with First Trust Series Fund and First Trust Exchange-Traded Fund IV, has a $200 million Credit Agreement (the “BNYM Line of Credit”) with BNYM to be a liquidity backstop during periods of high redemption volume. The borrowing rate is the applicable Term SOFR rate plus 125 basis points. A commitment fee of 0.25% of the daily amount of the excess of the commitment amount over the outstanding principal balance of the loans will be charged by BNYM, which First Trust will allocate amongst the funds that have access to the BNYM Line of Credit. These fees are reflected in the Statements of Operations in the “Commitment fees” line item. To the extent that either fund accesses the BNYM Line of Credit, there would also be an interest fee charged. Neither First Trust Dow Jones or First Trust Multi Income drew on the BNYM Line of Credit during the six months ended June 30, 2023.
9. Indemnification
The Trust, on behalf of the Funds, has a variety of indemnification obligations under contracts with its service providers. The Trust’s maximum exposure under these arrangements is unknown. However, the Trust has not had prior claims or losses pursuant to these contracts and expects the risk of loss to be remote.
10. Other Matters
By operation of law, the First Trust Capital Strength and First Trust International portfolios now operate as diversified open-end management investment companies as defined in Section 5(b) of the 1940 Act.
Notes to Financial Statements (Continued)
First Trust Variable Insurance Trust
June 30, 2023 (Unaudited)
11. Subsequent Events
Management has evaluated the impact of all subsequent events on the Funds through the date the financial statements were issued and has determined that there were no subsequent events requiring recognition or disclosure in the financial statements that have not already been disclosed.
Additional Information
First Trust Variable Insurance Trust
June 30, 2023 (Unaudited)
Proxy Voting Policies and Procedures
A description of the policies and procedures that each Fund uses to determine how to vote proxies and information on how each Fund voted proxies relating to portfolio investments during the most recent 12-month period ended June 30 is available (1) without charge, upon request, by calling (800) 988-5891; (2) on each Fund’s website at www.ftportfolios.com; and (3) on the Securities and Exchange Commission’s (“SEC”) website at www.sec.gov.
Portfolio Holdings
Each Fund files portfolio holdings information for each month in a fiscal quarter within 60 days after the end of the relevant fiscal quarter on Form N-PORT. Portfolio holdings information for the third month of each fiscal quarter will be publicly available on the SEC’s website at www.sec.gov. Each Fund’s complete schedule of portfolio holdings for the second and fourth quarters of each fiscal year is included in the semi-annual and annual reports to shareholders, respectively, and is filed with the SEC on Form N-CSR. The semi-annual and annual report for each Fund is available to investors within 60 days after the period to which it relates. Each Fund’s Forms N-PORT and Forms N-CSR are available on the SEC’s website listed above.
Licensing Information
S&P® is a registered trademark of Standard & Poor’s Financial Services LLC (“S&P”) and Dow Jones® is a registered trademark of Dow Jones Trademark Holdings LLC (“Dow Jones”). The trademarks have been licensed to S&P Dow Jones Indices LLC and have been sublicensed for use for certain purposes by First Trust Advisors L.P. (“First Trust”). The DOW JONES EQUAL WEIGHT U.S. ISSUED CORPORATE BOND INDEXSM, DOW JONES U.S. TOTAL STOCK MARKET INDEXSM and DOW JONES COMPOSITE AVERAGETM are products of S&P Dow Jones Indices LLC and have been licensed for use by First Trust. The First Trust/Dow Jones Dividend & Income Allocation Portfolio is not sponsored, endorsed, sold or promoted by S&P Dow Jones Indices LLC, Dow Jones, S&P, or any of their respective affiliates (collectively, “S&P Dow Jones Indices”). Neither S&P Dow Jones Indices nor its affiliates make any representation or warranty, express or implied, to the owners of the First Trust/Dow Jones Dividend & Income Allocation Portfolio or any member of the public regarding the advisability of investing in securities generally or in the First Trust/Dow Jones Dividend & Income Allocation Portfolio particularly or the ability of the DOW JONES EQUAL WEIGHT U.S. ISSUED CORPORATE BOND INDEXSM, DOW JONES U.S. TOTAL STOCK MARKET INDEXSM and DOW JONES COMPOSITE AVERAGETM to track general market performance. S&P Dow Jones Indices’ only relationship to First Trust with respect to the DOW JONES EQUAL WEIGHT U.S. ISSUED CORPORATE BOND INDEXSM, DOW JONES U.S. TOTAL STOCK MARKET INDEXSM and DOW JONES COMPOSITE AVERAGETM is the licensing of the Indexes and certain trademarks, service marks and/or trade names of S&P Dow Jones Indices. The DOW JONES EQUAL WEIGHT U.S. ISSUED CORPORATE BOND INDEXSM, DOW JONES U.S. TOTAL STOCK MARKET INDEXSM and DOW JONES COMPOSITE AVERAGETM are determined, composed and calculated by S&P Dow Jones Indices without regard to First Trust or the First Trust/Dow Jones Dividend & Income Allocation Portfolio. S&P Dow Jones Indices has no obligation to take the needs of First Trust or the owners of the First Trust/Dow Jones Dividend & Income Allocation Portfolio into consideration in determining, composing or calculating the DOW JONES EQUAL WEIGHT U.S. ISSUED CORPORATE BOND INDEXSM, DOW JONES U.S. TOTAL STOCK MARKET INDEXSM and DOW JONES COMPOSITE AVERAGETM. Neither S&P Dow Jones Indices nor its affiliates are responsible for and have not participated in the determination of the prices, and amount of the First Trust/Dow Jones Dividend & Income Allocation Portfolio or the timing of the issuance or sale of the First Trust/Dow Jones Dividend & Income Allocation Portfolio or in the determination or calculation of the equation by which the First Trust/Dow Jones Dividend & Income Allocation Portfolio is to be managed. S&P Dow Jones Indices has no obligation or liability in connection with the administration, marketing or trading of the First Trust/Dow Jones Dividend & Income Allocation Portfolio. There is no assurance that investment products based on the DOW JONES EQUAL WEIGHT U.S. ISSUED CORPORATE BOND INDEXSM, DOW JONES U.S. TOTAL STOCK MARKET INDEXSM and DOW JONES COMPOSITE AVERAGETM will accurately track index performance or provide positive investment returns. S&P Dow Jones Indices LLC is not an investment advisor. Inclusion of a security within an index is not a recommendation by S&P Dow Jones Indices to buy, sell, or hold such security, nor is it considered to be investment advice.
NEITHER S&P DOW JONES INDICES NOR ITS AFFILIATES GUARANTEES THE ADEQUACY, ACCURACY, TIMELINESS AND/OR THE COMPLETENESS OF THE DOW JONES EQUAL WEIGHT U.S. ISSUED CORPORATE BOND INDEXSM, DOW JONES U.S. TOTAL STOCK MARKET INDEXSM AND DOW JONES COMPOSITE AVERAGETM OR ANY DATA RELATED THERETO OR ANY COMMUNICATION, INCLUDING BUT NOT LIMITED TO, ORAL OR WRITTEN COMMUNICATION (INCLUDING ELECTRONIC COMMUNICATIONS) WITH RESPECT THERETO. S&P DOW JONES INDICES SHALL NOT BE SUBJECT TO ANY DAMAGES OR LIABILITY FOR ANY ERRORS, OMISSIONS, OR DELAYS THEREIN. S&P DOW JONES INDICES MAKES NO EXPRESS OR IMPLIED WARRANTIES, AND EXPRESSLY DISCLAIMS ALL WARRANTIES, OF MERCHANTABILITY OR FITNESS FOR A PARTICULAR PURPOSE OR USE OR AS TO RESULTS TO BE OBTAINED BY FIRST TRUST, OWNERS OF THE FIRST TRUST/DOW JONES DIVIDEND & INCOME ALLOCATION PORTFOLIO, OR ANY OTHER PERSON OR ENTITY FROM THE USE OF THE DOW JONES EQUAL WEIGHT U.S. ISSUED CORPORATE BOND
Additional Information (Continued)
First Trust Variable Insurance Trust
June 30, 2023 (Unaudited)
INDEXSM, DOW JONES U.S. TOTAL STOCK MARKET INDEXSM AND DOW JONES COMPOSITE AVERAGETM OR WITH RESPECT TO ANY DATA RELATED THERETO. WITHOUT LIMITING ANY OF THE FOREGOING, IN NO EVENT WHATSOEVER SHALL S&P DOW JONES INDICES BE LIABLE FOR ANY INDIRECT, SPECIAL, INCIDENTAL, PUNITIVE, OR CONSEQUENTIAL DAMAGES INCLUDING BUT NOT LIMITED TO, LOSS OF PROFITS, TRADING LOSSES, LOST TIME OR GOODWILL, EVEN IF THEY HAVE BEEN ADVISED OF THE POSSIBILITY OF SUCH DAMAGES, WHETHER IN CONTRACT, TORT, STRICT LIABILITY, OR OTHERWISE. THERE ARE NO THIRD-PARTY BENEFICIARIES OF ANY AGREEMENTS OR ARRANGEMENTS BETWEEN S&P DOW JONES INDICES AND FIRST TRUST, OTHER THAN THE LICENSORS OF S&P DOW JONES INDICES.
The First Trust Dorsey Wright Tactical Core Portfolio (the “Portfolio”) is not sponsored, endorsed, sold or promoted by Dorsey Wright & Associates, LLC or its affiliates (“Licensor”). Licensor makes no representation or warranty, express or implied, to the owners of the Portfolio or any member of the public regarding the advisability of trading in the Portfolio. Licensor’s only relationship to First Trust Advisors L.P. (“First Trust”) is the licensing of certain trademarks and trade names of Licensor and of the Dorsey Wright Tactical Tilt Moderate CoreTM Index which is determined, composed and calculated by Licensor without regard to First Trust or the Portfolio, Licensor has no obligation to take the needs of First Trust or the owners of the Portfolio into consideration in determining, composing or calculating Dorsey Wright Tactical Tilt Moderate CoreTM Index. Licensor is not responsible for and has not participated in the determination of the timing of, prices at, or quantities of the Portfolio to be listed or in the determination or calculation of the equation by which the Portfolio are to be converted into cash. Licensor has no obligation or liability in connection with the administration, marketing or trading of the Portfolio.
LICENSOR DOES NOT GUARANTEE THE ACCURACY AND/OR THE COMPLETENESS OF THE DORSEY WRIGHT TACTICAL TILT MODERATE CORETM INDEX OR ANY DATA INCLUDED THEREIN AND LICENSOR SHALL HAVE NO LIABILITY FOR ANY ERRORS, OMISSIONS, OR INTERRUPTIONS THEREIN. LICENSOR MAKES NO WARRANTY, EXPRESS OR IMPLIED, AS TO RESULTS TO BE OBTAINED BY FIRST TRUST, OWNERS OF THE FIRST TRUST DORSEY WRIGHT TACTICAL CORE PORTFOLIO, OR ANY OTHER PERSON OR ENTITY FROM THE USE OF THE DORSEY WRIGHT TACTICAL TILT MODERATE CORETM INDEX OR ANY DATA INCLUDED THEREIN. LICENSOR MAKES NO EXPRESS OR IMPLIED WARRANTIES, AND EXPRESSLY DISCLAIMS ALL WARRANTIES, OF MERCHANTABILITY OR FITNESS FOR A PARTICULAR PURPOSE OR USE WITH RESPECT TO THE DORSEY WRIGHT TACTICAL TILT MODERATE CORETM INDEX OR ANY DATA INCLUDED THEREIN, WITHOUT LIMITING ANY OF THE FOREGOING, IN NO EVENT SHALL LICENSOR HAVE ANY LIABILITY FOR ANY LOST PROFITS OR INDIRECT, PUNITIVE, SPECIAL OR CONSEQUENTIAL DAMAGES (INCLUDING LOST PROFITS), EVEN IF NOTIFIED OF THE POSSIBILITY OF SUCH DAMAGES. THERE ARE NO THIRD-PARTY BENEFICIARIES OF ANY AGREEMENTS OR ARRANGEMENTS BETWEEN LICENSOR AND FIRST TRUST.
First Trust does not guarantee the accuracy and/or the completeness of The Capital StrengthTM Index, The International Capital StrengthTM Index and/or The Growth StrengthTM Index (together, the “Indexes”) or any data included therein, and First Trust shall have no liability for any errors, omissions or interruptions therein. First Trust makes no warranty, express or implied, as to results to be obtained by the Fund, owners of the shares of the Fund or any other person or entity from the use of the Indexes or any data included therein. First Trust makes no express or implied warranties, and expressly disclaims all warranties of merchantability or fitness for a particular purpose or use with respect to the Indexes or any data included therein. Without limiting any of the foregoing, in no event shall First Trust have any liability for any special, punitive, direct, indirect or consequential damages (including lost profits) arising out of matters relating to the use of the Indexes, even if notified of the possibility of such damages.
The First Trust Capital Strength Portfolio, the First Trust International Developed Capital Strength Portfolio and the First Trust Growth Strength Portfolio (the “Capital Strength Funds”) are not sponsored, endorsed, sold or promoted by Nasdaq, Inc. (“Nasdaq”) or its affiliates (Nasdaq with its affiliates are referred to as the “Corporations”). The Corporations have not passed on the legality or suitability of, or the accuracy or adequacy of descriptions and disclosures relating to, the Capital Strength Funds. The Corporations make no representation or warranty, express or implied, to the owners of the Capital Strength Funds or any member of the public regarding the advisability of investing in securities generally or in the Capital Strength Funds particularly, or the ability of the Indexes to track general stock market performance. The Corporations’ only relationship to First Trust with respect to the Capital Strength Funds is in the licensing of the Indexes, and certain trade names of the Corporations and the use of the Indexes, which are determined, composed and calculated by Nasdaq without regard to First Trust or the Capital Strength Funds. Nasdaq has no obligation to take the needs of First Trust or the owners of the Capital Strength Funds into consideration in determining, composing or calculating the Indexes. The Corporations are not responsible for and have not participated in the determination of the timing of, prices at, or quantities of Capital Strength Fund Shares to be issued or in the determination or calculation of the equation by which the Capital Strength Fund Shares are to be converted into cash. The Corporations have no liability in connection with the administration, marketing or trading of the Capital Strength Funds.
Additional Information (Continued)
First Trust Variable Insurance Trust
June 30, 2023 (Unaudited)
THE CORPORATIONS DO NOT GUARANTEE THE ACCURACY AND/OR UNINTERRUPTED CALCULATION OF THE INDEXES OR ANY DATA INCLUDED THEREIN. THE CORPORATIONS MAKE NO WARRANTY, EXPRESS OR IMPLIED, AS TO RESULTS TO BE OBTAINED BY LICENSEE, OWNERS OF THE PRODUCT(S) OR ANY OTHER PERSON OR ENTITY FROM THE USE OF THE INDEXES OR ANY DATA INCLUDED THEREIN. THE CORPORATIONS MAKE NO EXPRESS OR IMPLIED WARRANTIES, AND EXPRESSLY DISCLAIM ALL WARRANTIES OF MERCHANTABILITY OR FITNESS FOR A PARTICULAR PURPOSE OR USE WITH RESPECT TO THE INDEXES OR ANY DATA INCLUDED THEREIN. WITHOUT LIMITING ANY OF THE FOREGOING, IN NO EVENT SHALL THE CORPORATIONS HAVE ANY LIABILITY FOR ANY LOST PROFITS OR SPECIAL, INCIDENTAL, PUNITIVE, INDIRECT OR CONSEQUENTIAL DAMAGES, EVEN IF NOTIFIED OF THE POSSIBILITY OF SUCH DAMAGES.
Risk Considerations
Risks are inherent in all investing. Certain general risks that may be applicable to a Fund are identified below, but not all of the material risks relevant to each Fund are included in this report and not all of the risks below apply to each Fund. The material risks of investing in each Fund are spelled out in its prospectus, statement of additional information and other regulatory filings. Before investing, you should consider each Fund’s investment objective, risks, charges and expenses, and read each Fund’s prospectus and statement of additional information carefully. You can download each Fund’s prospectus at www.ftportfolios.com or contact First Trust Portfolios L.P. at (800) 621-1675 to request a prospectus, which contains this and other information about each Fund.
ASSET-BACKED SECURITIES RISK. Asset-backed securities are debt securities typically created by buying and pooling loans or other receivables other than mortgage loans and creating securities backed by those similar type assets. As with other debt securities, asset-backed securities are subject to credit risk, extension risk, interest rate risk, liquidity risk and valuation risk. These securities are generally not backed by the full faith and credit of the U.S. government and are subject to the risk of default on the underlying asset or loan, particularly during periods of economic downturn. The impairment of the value of collateral or other assets underlying an asset-backed security, such as a result of non-payment of loans or non-performance of underlying assets, may result in a reduction in the value of such asset-backed securities and losses to an underlying ETF.
BANK LOANS RISK. Investments in bank loans are subject to the same risks as investments in other types of debt securities, including credit risk, interest rate risk, liquidity risk and valuation risk that may be heightened because of the limited public information available regarding bank loans and because loan borrowers may be leveraged and tend to be more adversely affected by changes in market or economic conditions. If an underlying ETF holds a bank loan through another financial institution or relies on a financial institution to administer the loan, its receipt of principal and interest on the loan may be subject to the credit risk of that financial institution. It is possible that any collateral securing a loan may be insufficient or unavailable to the underlying ETF, and that the underlying ETF’s rights to collateral may be limited by bankruptcy or insolvency laws. Additionally, there is no central clearinghouse for loan trades and the loan market has not established enforceable settlement standards or remedies for failure to settle. As such, the secondary market for bank loans may be subject to irregular trading activity, wide bid/ask spreads and extended trade settlement periods (in some cases longer than 7 days) which may cause the underlying ETF to be unable to realize the full value of its investment. In addition, bank loans are generally not registered with the Securities Exchange Commission under the Securities Act of 1933, as amended, and may not be considered “securities,” and an underlying ETF may not be entitled to rely on the anti-fraud protections of the federal securities laws.
CALL RISK. Some debt securities may be redeemed, or “called,” at the option of the issuer before their stated maturity date. In general, an issuer will call its debt securities if they can be refinanced by issuing new debt securities which bear a lower interest rate. An underlying ETF is subject to the possibility that during periods of falling interest rates an issuer will call its high yielding debt securities. An underlying ETF would then be forced to invest the proceeds at lower interest rates, likely resulting in a decline in the underlying ETF’s income.
CONSUMER DISCRETIONARY COMPANIES RISK. Consumer discretionary companies, such as retailers, media companies and consumer services companies, provide non-essential goods and services. These companies manufacture products and provide discretionary services directly to the consumer, and the success of these companies is tied closely to the performance of the overall domestic and international economy, interest rates, competition and consumer confidence. Success depends heavily on disposable household income and consumer spending. Changes in demographics and consumer tastes can also affect the demand for, and success of, consumer discretionary products in the marketplace.
COUNTERPARTY RISK. Underlying fund transactions involving a counterparty are subject to the risk that the counterparty will not fulfill its obligation to the underlying fund. Counterparty risk may arise because of the counterparty’s financial condition (i.e., financial difficulties, bankruptcy, or insolvency), market activities and developments, or other reasons, whether foreseen or not. A counterparty’s inability to fulfill its obligation may result in significant financial loss to an underlying fund. An underlying fund may be unable to recover its investment from the counterparty or may obtain a limited recovery, and/or recovery may be delayed.
Additional Information (Continued)
First Trust Variable Insurance Trust
June 30, 2023 (Unaudited)
COVENANT-LITE LOANS RISK. Covenant-lite loans contain fewer maintenance covenants, or no maintenance covenants at all, than traditional loans and may not include terms that allow the lender to monitor the financial performance of the borrower and declare a default if certain criteria are breached. This may hinder an underlying ETF’s ability to reprice credit risk associated with the borrower and reduce a Fund’s ability to restructure a problematic loan and mitigate potential loss. As a result, an underlying ETF’s exposure to losses on such investments is increased, especially during a downturn in the credit cycle.
CREDIT RISK. An issuer or other obligated party of a debt security held by an underlying ETF may be unable or unwilling to make dividend, interest and/or principal payments when due. In addition, the value of a debt security may decline because of concerns about the issuer’s ability or unwillingness to make such payments.
CURRENCY RISK. Changes in currency exchange rates affect the value of investments denominated in a foreign currency, and therefore the value of such investments in an underlying ETF’s portfolio. An underlying ETF’s net asset value could decline if a currency to which an underlying ETF has exposure depreciates against the U.S. dollar or if there are delays or limits on repatriation of such currency. Currency exchange rates can be very volatile and can change quickly and unpredictably. As a result, the value of an investment in such an underlying ETF may change quickly and without warning.
CURRENT MARKET CONDITIONS RISK. Current market conditions risk is the risk that a particular investment, or shares of a Fund in general, may fall in value due to current market conditions. As a means to fight inflation, which remains at elevated levels, the Federal Reserve and certain foreign central banks have raised interest rates and expect to continue to do so, and the Federal Reserve has announced that it intends to reverse previously implemented quantitative easing. U.S. regulators have proposed several changes to market and issuer regulations which would directly impact the Funds, and any regulatory changes could adversely impact a Fund’s ability to achieve its investment strategies or make certain investments. Recent and potential future bank failures could result in disruption to the broader banking industry or markets generally and reduce confidence in financial institutions and the economy as a whole, which may also heighten market volatility and reduce liquidity. The ongoing adversarial political climate in the United States, as well as political and diplomatic events both domestic and a broad, have and may continue to have an adverse impact the U.S. regulatory landscape, markets and investor behavior, which could have a negative impact on a Fund’s investments and operations. Other unexpected political, regulatory and diplomatic events within the U.S. and abroad may affect investor and consumer confidence and may adversely impact financial markets and the broader economy. For example, in February 2022, Russia invaded Ukraine which has caused and could continue to cause significant market disruptions and volatility within the markets in Russia, Europe, and the United States. The hostilities and sanctions resulting from those hostilities have and could continue to have a significant impact on certain Fund investments as well as Fund performance and liquidity. The economies of the United States and its trading partners, as well as the financial markets generally, may be adversely impacted by trade disputes and other matters. For example, the United States has imposed trade barriers and restrictions on China. In addition, the Chinese government is engaged in a longstanding dispute with Taiwan, continually threatening an invasion. If the political climate between the United States and China does not improve or continues to deteriorate, if China were to attempt invading Taiwan, or if other geopolitical conflicts develop or worsen, economies, markets and individual securities may be adversely affected, and the value of a Fund’s assets may go down. The COVID-19 global pandemic, or any future public health crisis, and the ensuing policies enacted by governments and central banks have caused and may continue to cause significant volatility and uncertainty in global financial markets, negatively impacting global growth prospects. While vaccines have been developed, there is no guarantee that vaccines will be effective against emerging future variants of the disease. As this global pandemic illustrated, such events may affect certain geographic regions, countries, sectors and industries more significantly than others. Advancements in technology may also adversely impact markets and the overall performance of a Fund. For instance, the economy may be significantly impacted by the advanced development and increased regulation of artificial intelligence. These events, and any other future events, may adversely affect the prices and liquidity of a Fund’s portfolio investments and could result in disruptions in the trading markets.
CYBER SECURITY RISK. A Fund is susceptible to operational risks through breaches in cyber security. A breach in cyber security refers to both intentional and unintentional events that may cause a Fund to lose proprietary information, suffer data corruption or lose operational capacity. Such events could cause a Fund to incur regulatory penalties, reputational damage, additional compliance costs associated with corrective measures and/or financial loss. Cyber security breaches may involve unauthorized access to a Fund’s digital information systems through “hacking” or malicious software coding but may also result from outside attacks such as denial-of-service attacks through efforts to make network services unavailable to intended users. In addition, cyber security breaches of the issuers of securities in which a Fund invests or a Fund’s third-party service providers, such as its administrator, transfer agent, custodian, or sub-advisor, as applicable, can also subject a Fund to many of the same risks associated with direct cyber security breaches. Although a Fund has established risk management systems designed to reduce the risks associated with cyber security, there is no guarantee that such efforts will succeed, especially because a Fund does not directly control the cyber security systems of issuers or third-party service providers.
Additional Information (Continued)
First Trust Variable Insurance Trust
June 30, 2023 (Unaudited)
DEBT SECURITIES RISK. Investments in debt securities subject the holder to the credit risk of the issuer. Credit risk refers to the possibility that the issuer or other obligor of a security will not be able or willing to make payments of interest and principal when due. Generally, the value of debt securities will change inversely with changes in interest rates. To the extent that interest rates rise, certain underlying obligations may be paid off substantially slower than originally anticipated and the value of those securities may fall sharply. During periods of falling interest rates, the income received by an underlying ETF may decline. If the principal on a debt security is prepaid before expected, the prepayments of principal may have to be reinvested in obligations paying interest at lower rates. Debt securities generally do not trade on a securities exchange making them generally less liquid and more difficult to value than common stock.
DEPOSITARY RECEIPTS RISK. Depositary receipts may be less liquid than the underlying shares in their primary trading market. Any distributions paid to the holders of depositary receipts are usually subject to a fee charged by the depositary. Holders of depositary receipts may have limited voting rights, and investment restrictions in certain countries may adversely impact the value of depositary receipts because such restrictions may limit the ability to convert the equity shares into depositary receipts and vice versa. Such restrictions may cause the equity shares of the underlying issuer to trade at a discount or premium to the market price of the depositary receipts.
DIVIDENDS RISK. A Fund’s investment in dividend-paying securities could cause a Fund to underperform similar funds that invest without consideration of an issuer’s track record of paying dividends. Companies that issue dividend-paying securities are not required to continue to pay dividends on such securities. Therefore, there is the possibility that such companies could reduce or eliminate the payment of dividends in the future, which could negatively affect a Fund’s performance.
EMERGING MARKETS RISK. A Fund may invest in ETFs that hold investments in securities issued by emerging market governments and companies operating in emerging market countries. Investments in securities issued by governments and companies operating in emerging market countries involve additional risks relating to political, economic, or regulatory conditions not associated with investments in securities and instruments issued by U.S. companies or by companies operating in other developed market countries. Investments in emerging markets securities are generally considered speculative in nature and are subject to the following heightened risks: smaller market capitalization of securities markets which may suffer periods of relative illiquidity; significant price volatility; restrictions on foreign investment; possible repatriation of investment income and capital; rapid inflation; and currency convertibility issues. Emerging market countries also often have less uniformity in accounting and reporting requirements, unsettled securities laws, unreliable securities valuation and greater risk associated with custody of securities. Financial and other reporting by companies and government entities also may be less reliable in emerging market countries. Shareholder claims that are available in the U.S., as well as regulatory oversight and authority that is common in the U.S., including for claims based on fraud, may be difficult or impossible for shareholders of securities in emerging market countries or for U.S. authorities to pursue. For funds that track an index or are managed based upon a benchmark, the index may not weight the securities in emerging market countries on the basis of investor protection limitations, financial reporting quality or available oversight mechanisms. Furthermore, investors may be required to register the proceeds of sales and future economic or political crises could lead to price controls, forced mergers, expropriation or confiscatory taxation, seizure, nationalization or creation of government monopolies.
ENERGY INFRASTRUCTURE COMPANIES RISK. Energy infrastructure companies, including MLPs and utility companies, are subject to risks specific to the energy and energy-related industries. This includes but is not limited to: fluctuations in commodity prices impacting the volume of energy commodities transported, processed, stored or distributed; reductions in volumes of natural gas or other energy commodities being available for transporting, processing, storing or distributing; slowdowns in new construction and acquisitions limiting growth potential; reduced demand for oil, natural gas and petroleum products, particularly for a sustained period of time; depletion of natural gas reserves or other commodities; rising interest rates resulting in higher costs of capital, increased operating costs; counterparties to contracts defaulting or going bankrupt; and an inability to execute acquisitions or expansion projects in a cost-effect manner; extreme weather events and environmental hazards; and threats of attack by terrorists on energy assets. Energy infrastructure companies may also face counterparty risk, such that long-term contracts may be declared void if the counterparty to those contracts enters bankruptcy proceedings. In addition, energy infrastructure companies are subject to significant federal, state and local government regulation in virtually every aspect of their operations, including how facilities are constructed, maintained and operated, environmental and safety controls, and the prices they may charge for products and services. Various governmental authorities have the power to enforce compliance with these regulations and the permits issued under them and violators are subject to administrative, civil and criminal penalties, including civil fines, injunctions or both. Stricter laws, regulations or enforcement policies could be enacted in the future which would likely increase compliance costs and may adversely affect the financial performance of energy infrastructure companies. Natural disasters, such as hurricanes in the Gulf of Mexico, also may impact the energy infrastructure companies.
Certain energy infrastructure companies in the utilities industry are subject to the imposition of rate caps, increased competition due to deregulation, the difficulty in obtaining an adequate return on invested capital or in financing large construction projects, the
Additional Information (Continued)
First Trust Variable Insurance Trust
June 30, 2023 (Unaudited)
limitations on operations and increased costs and delays attributable to environmental considerations, and the capital market’s ability to absorb utility debt. In addition, taxes, government regulation, international politics, price and supply fluctuations, volatile interest rates and energy conservation may cause difficulties for these companies. Such issuers have been experiencing certain of these problems in varying degrees.
EQUITY SECURITIES RISK. The value of an underlying ETF’s shares will fluctuate with changes in the value of the equity securities in which it invests. Equity securities prices fluctuate for several reasons, including changes in investors’ perceptions of the financial condition of an issuer or the general condition of the relevant equity market, such as market volatility, or when political or economic events affecting an issuer occur. Common stock prices may be particularly sensitive to rising interest rates, as the cost of capital rises and borrowing costs increase. Equity securities may decline significantly in price over short or extended periods of time, and such declines may occur in the equity market as a whole, or they may occur in only a particular country, company, industry or sector of the market.
ETF RISK. A Fund’s investment in shares of ETFs subjects it to the risks of owning the securities underlying the ETF, as well as certain structural risks, including authorized participant concentration risk, market maker risk, premium/discount risk and trading issues risk. As a shareholder in another ETF, a Fund bears its proportionate share of the ETF’s expenses, subjecting Fund shareholders to duplicative expenses.
EUROPE RISK. A Fund is subject to certain risks specifically associated with investments in the securities of European issuers. Political or economic disruptions in European countries, even in countries in which a Fund is not invested, may adversely affect security values and thus a Fund’s holdings. A significant number of countries in Europe are member states in the European Union (the “EU”), and the member states no longer control their own monetary policies by directing independent interest rates for their currencies. In these member states, the authority to direct monetary policies, including money supply and official interest rates for the Euro, is exercised by the European Central Bank. In a 2016 referendum, the United Kingdom elected to withdraw from the EU (“Brexit”). After years of negotiations between the United Kingdom and the EU, the United Kingdom formally left the EU. As the second largest economy among EU members, the implications of the United Kingdom’s withdrawal are difficult to gauge and cannot be fully known. Its departure may negatively impact the EU and Europe as a whole by causing volatility within the EU, triggering prolonged economic downturns in certain European countries or sparking additional member states to contemplate departing the EU (thereby perpetuating political instability in the region).
EXTENSION RISK. Extension risk is the risk that, when interest rates rise, certain obligations will be paid off by the issuer (or other obligated party) more slowly than anticipated, causing the value of these debt securities to fall. Rising interest rates tend to extend the duration of debt securities, making their market value more sensitive to changes in interest rates. The value of longer-term debt securities generally changes more in response to changes in interest rates than shorter-term debt securities. As a result, in a period of rising interest rates, securities may exhibit additional volatility and may lose value.
FINANCIAL COMPANIES RISK. Financial companies, such as retail and commercial banks, insurance companies and financial services companies, are especially subject to the adverse effects of economic recession, currency exchange rates, extensive government regulation, decreases in the availability of capital, volatile interest rates, portfolio concentrations in geographic markets, industries or products (such as commercial and residential real estate loans), competition from new entrants and blurred distinctions in their fields of business.
FLOATING RATE DEBT INSTRUMENTS RISK. Investments in floating rate debt instruments are subject to the same risks as investments in other types of debt securities, including credit risk, interest rate risk, liquidity risk and valuation risk. Floating rate debt instruments include debt securities issued by corporate and governmental entities, as well bank loans, mortgage-backed securities and asset-backed securities. Floating rate debt instruments are structured so that the security’s coupon rate fluctuates based upon the level of a reference rate. Most commonly, the coupon rate of a floating rate debt instrument is set at the level of a widely followed interest rate, plus a fixed spread. As a result, the coupon on floating rate debt instrument will generally decline in a falling interest rate environment, causing an underlying ETF to experience a reduction in the income it receives from the instrument. A floating rate debt instrument’s coupon rate resets periodically according to its terms. Consequently, in a rising interest rate environment, floating rate debt instruments with coupon rates that reset infrequently may lag behind the changes in market interest rates. Floating rate debt instruments may also contain terms that impose a maximum coupon rate the issuer will pay, regardless of the level of the reference rate. To the extent an underlying ETF invests in floating rate loans, such instruments may be subject to legal or contractual restrictions on resale, may trade infrequently, and their value may be impaired when the underlying ETF needs to liquidate such securities. It is possible that the collateral securing a floating rate loan may be insufficient or unavailable to the underlying ETF, and that the underlying ETF’s rights to collateral may be limited by bankruptcy or insolvency laws. Additionally, floating rate loans may not be considered “securities” under federal securities laws, and purchasers, such as an underlying ETF, therefore may not be entitled to rely on the anti-fraud protections of the federal securities laws.
Additional Information (Continued)
First Trust Variable Insurance Trust
June 30, 2023 (Unaudited)
HIGH YIELD SECURITIES RISK. High yield securities, or “junk” bonds, are subject to greater market fluctuations, are less liquid and provide a greater risk of loss than investment grade securities, and therefore, are considered to be highly speculative. In general, high yield securities may have a greater risk of default than other types of securities and could cause income and principal losses for a Fund.
HYBRID CAPITAL SECURITIES RISK. Hybrid capital securities are subject to the risks of equity securities and debt securities. The claims of holders of hybrid capital securities of an issuer are generally subordinated to those of holders of traditional debt securities in bankruptcy, and thus hybrid capital securities may be more volatile and subject to greater risk than traditional debt securities, and may in certain circumstances be even more volatile than traditional equity securities. At the same time, hybrid capital securities may not fully participate in gains of their issuer and thus potential returns of such securities are generally more limited than traditional equity securities, which would participate in such gains. The terms of hybrid capital securities may vary substantially and the risks of a particular hybrid capital security will depend upon the terms of the instrument, but may include the credit risk of the issuer, as well as liquidity risk, since they often are customized to meet the needs of an issuer or a particular investor, and therefore the number of investors that buy such instruments in the secondary market may be small.
INCOME RISK. A Fund may invest in ETFs that hold debt securities. An underlying ETF’s income may decline when interest rates fall or if there are defaults in its portfolio. This decline can occur because an underlying ETF may subsequently invest in lower-yielding securities as debt securities in its portfolio mature, are near maturity or are called, or the ETF otherwise needs to purchase additional debt securities.
INDEX CONCENTRATION RISK. A Fund that tracks an index will be concentrated in an industry or a group of industries to the extent that the Index is so concentrated. To the extent that a Fund invests a significant percentage of its assets in a single asset class or the securities of issuers within the same country, state, region, industry or sector, an adverse economic, business or political development may affect the value of the Fund’s investments more than if the Fund were more broadly diversified. A significant exposure makes the Fund more susceptible to any single occurrence and may subject the Fund to greater market risk than a fund that is more broadly diversified.
INDEX PROVIDER RISK. There is no assurance that an Index Provider, or any agents that act on its behalf, will compile an Index accurately, or that an Index will be determined, maintained, constructed, reconstituted, rebalanced, composed, calculated or disseminated accurately. An Index Provider and its agents do not provide any representation or warranty in relation to the quality, accuracy or completeness of data in an Index, and do not guarantee that an Index will be calculated in accordance with its stated methodology. The Advisor’s mandate as described in this prospectus is to manage a Fund consistently with the Index provided by the Index Provider. The Advisor relies upon the Index provider and its agents to accurately compile, maintain, construct, reconstitute, rebalance, compose, calculate and disseminate an Index accurately. Therefore, losses or costs associated with any Index Provider or agent errors generally will be borne by a Fund and its shareholders. To correct any such error, the Index Provider or its agents may carry out an unscheduled rebalance of an Index or other modification of Index constituents or weightings. When a Fund in turn rebalances its portfolio, any transaction costs and market exposure arising from such portfolio rebalancing will be borne by a Fund and its shareholders. Unscheduled rebalances also expose a Fund to additional tracking error risk. Errors in respect of the quality, accuracy and completeness of the data used to compile an Index may occur from time to time and may not be identified and corrected by the Index Provider for a period of time or at all, particularly where an Index is less commonly used as a benchmark by funds or advisors. For example, during a period where an Index contains incorrect constituents, a Fund tracking the Index would have market exposure to such constituents and would be underexposed to the Index’s other constituents. Such errors may negatively impact a Fund and its shareholders.
An Index Provider and its agents rely on various sources of information to assess the criteria of issuers included in an Index, including information that may be based on assumptions and estimates. Neither a Fund nor the Advisor can offer assurances that an Index’s calculation methodology or sources of information will provide an accurate assessment of included issuers. Unusual market conditions may cause an Index Provider to postpone a scheduled rebalance, which could cause an Index to vary from its normal or expected composition. The postponement of a scheduled rebalance in a time of market volatility could mean that constituents that would otherwise be removed at rebalance due to changes in market capitalizations, issuer credit ratings, or other reasons may remain, causing the performance and constituents of an Index to vary from those expected under normal conditions. Apart from scheduled rebalances, an Index Provider or its agents may carry out additional ad hoc rebalances to an Index due to unusual market conditions or in order, for example, to correct an error in the selection of index constituents.
INDEX REBALANCE RISK. Pursuant to the methodology that the Index Provider uses to calculate and maintain the Index, a Fund may own a significant number of the outstanding shares of ETFs included in a Fund. Any such ETF may be removed from the Index in the event that it does not comply with the eligibility requirements of the Index. As a result, a Fund may be forced to sell shares of certain ETFs at inopportune times or for prices other than at current market values or may elect not to sell such shares on the day that they are removed from the Index, due to market conditions or otherwise. Due to these factors, the variation between a Fund’s annual
Additional Information (Continued)
First Trust Variable Insurance Trust
June 30, 2023 (Unaudited)
return and the return of the Index may increase significantly. Apart from scheduled rebalances, the Index Provider may carry out additional ad hoc rebalances to the Index to, for example, correct an error in the selection of constituents. When a Fund in turn rebalances its portfolio, any transaction costs and market exposure arising from such portfolio rebalancing will be borne by a Fund and its shareholders. Unscheduled rebalances may also expose a Fund to additional tracking error risk. Therefore, errors and additional ad hoc rebalances carried out by the Index Provider may increase a Fund’s costs and market exposure.
INDUSTRIALS COMPANIES RISK. Industrials companies convert unfinished goods into finished durables used to manufacture other goods or provide services. Examples of industrials companies include companies involved in the production of electrical equipment and components, industrial products, manufactured housing and telecommunications equipment, as well as defense and aerospace companies. General risks of industrials companies include the general state of the economy, exchange rates, commodity prices, intense competition, consolidation, domestic and international politics, government regulation, import controls, excess capacity, consumer demand and spending trends. In addition, industrials companies may also be significantly affected by overall capital spending levels, economic cycles, rapid technological changes, delays in modernization, labor relations, environmental liabilities, governmental and product liability and e-commerce initiatives.
INFLATION RISK. Inflation risk is the risk that the value of assets or income from investments will be less in the future as inflation decreases the value of money. As inflation increases, the present value of a Fund’s assets and distributions may decline.
INFLATION-INDEXED SECURITIES RISK. Inflation-indexed debt securities, such as TIPS, are subject to the same risks as other types of debt securities, including credit risk, interest rate risk, liquidity risk and valuation risk. The principal amount of an inflation-indexed security typically increases with inflation and decreases with deflation, as measured by a specified index. Although the holders of TIPS receive no less than the par value of the security at maturity, if a Fund purchases TIPS in the secondary market whose principal values have previously been adjusted upward and there is a period of subsequent declining inflation rates, a Fund may receive at maturity less than it invested and incur a loss.
INTEREST RATE RISK. Interest rate risk is the risk that the value of the debt securities in an underlying ETF’s portfolio will decline because of rising market interest rates. Interest rate risk is generally lower for shorter term debt securities and higher for longer-term debt securities. An underlying ETF may be subject to a greater risk of rising interest rates than would normally be the case due to the current period of historically low rates and the effect of potential government fiscal policy initiatives and resulting market reaction to those initiatives. Duration is a reasonably accurate measure of a debt security’s price sensitivity to changes in interest rates and a common measure of interest rate risk. Duration measures a debt security’s expected life on a present value basis, taking into account the debt security’s yield, interest payments and final maturity. In general, duration represents the expected percentage change in the value of a security for an immediate 1% change in interest rates. For example, the price of a debt security with a three-year duration would be expected to drop by approximately 3% in response to a 1% increase in interest rates. Therefore, prices of debt securities with shorter durations tend to be less sensitive to interest rate changes than debt securities with longer durations. As the value of a debt security changes over time, so will its duration.
JAPAN RISK. A Fund is subject to certain risks specifically associated with investments in the securities of Japanese issuers. The Japanese economy may be subject to considerable degrees of economic, political and social instability, which could have a negative impact on Japanese securities. Japan’s economy is characterized by government intervention and protectionism, reliance on oil imports, an unstable financial services sector and relatively high unemployment. Since 2000 Japan has experienced relatively low economic growth, and it may remain low in the future. Its economy is heavily dependent on international trade and has been adversely affected by trade tariffs and competition from emerging economies. As such, economic growth is heavily dependent on continued growth in international trade, relatively low commodities prices, government support of the financial services sector and other government policies. Any changes or trends in these economic factors could have a significant impact on Japanese markets overall and may negatively affect a Fund’s investments. Japan’s economy and equity market also share a strong correlation with U.S. markets and the Japanese economy may be affected by economic problems in the U.S. Despite a strengthening in the economic relationship between Japan and China, the countries’ political relationship has at times been strained. Should political tension increase, it could adversely affect the economy and destabilize the region as a whole. Additionally, escalated tensions involving North Korea and any outbreak of hostilities involving North Korea could have a severe adverse effect on Japan’s economy. Japan’s geography also subjects it to an increased risk of natural disasters, such as earthquakes, volcanic eruptions, typhoons and tsunamis, all of which could negatively impact a Fund’s investments.
LARGE CAPITALIZATION COMPANIES RISK. Large capitalization companies may grow at a slower rate and be less able to adapt to changing market conditions than smaller capitalization companies. Thus, the return on investment in securities of large capitalization companies may be less than the return on investment in securities of small and/or mid capitalization companies. The performance of large capitalization companies also tends to trail the overall market during different market cycles.
Additional Information (Continued)
First Trust Variable Insurance Trust
June 30, 2023 (Unaudited)
LIBOR TRANSITION RISK. The United Kingdom’s Financial Conduct Authority (“FCA”), which regulates LIBOR, intends to cease making LIBOR available as a reference rate over a phase-out period that began on January 1, 2022. However, subsequent announcements by the FCA, the LIBOR administrators, and other regulators indicate that it is possible that the most widely used LIBOR rates will continue until at least mid-2023. The unavailability or replacement of LIBOR may affect the value, liquidity or return on certain Fund investments and may result in costs incurred in connection with closing out positions and entering into new trades. Any potential effects of the transition away from LIBOR on an underlying ETP or on certain instruments in which an underlying ETP invests can be difficult to ascertain, and they may vary depending on a variety of factors. In the United States, it is anticipated that in many instances the Secured Overnight Financing Rate (“SOFR”) will replace LIBOR as the reference rate for many of the floating rate instruments held by an underlying ETP. There is no assurance that the composition or characteristics of SOFR, or any alternative reference rate, will be similar to or produce the same value or economic equivalence as LIBOR or that instruments using an alternative rate will have the same volume or liquidity. As a result, the transition process might lead to increased volatility and reduced liquidity in markets that currently rely on LIBOR to determine interest rates; a reduction in the value of some LIBOR-based investments; increased difficulty in borrowing or refinancing and diminished effectiveness of any applicable hedging strategies against instruments whose terms currently include LIBOR; and/or costs incurred in connection with temporary borrowings and closing out positions and entering into new agreements. Any such effects (as well as other unforeseen effects) of the transition away from LIBOR and the adoption of alternative reference rates could result in losses to the Fund.
LIQUIDITY RISK. A Fund, and certain underlying ETFs, may hold certain investments that may be subject to restrictions on resale, trade over-the-counter or in limited volume, or lack an active trading market. Accordingly, a Fund, and certain underlying ETFs, may not be able to sell or close out of such investments at favorable times or prices (or at all), or at the prices approximating those at which a Fund currently values them. Illiquid securities may trade at a discount from comparable, more liquid investments and may be subject to wide fluctuations in market value.
LOW VOLATILITY RISK. Although subject to the risks of common stocks, low volatility stocks are seen as having a lower risk profile than the overall markets. However, a portfolio comprised of low volatility stocks may not produce investment exposure that has lower variability to changes in such stocks’ price levels. Low volatility stocks are likely to underperform the broader market during periods of rapidly rising stock prices when market volatility is high. Low volatility stocks also may not protect against market declines.
MANAGEMENT RISK. A Fund is subject to management risk because it is an actively managed portfolio. In managing a Fund’s investment portfolio, the portfolio managers will apply investment techniques and risk analyses that may not produce the desired result. There can be no guarantee that a Fund will meet its investment objective.
MARKET RISK. Market risk is the risk that a particular investment, or shares of a Fund in general, may fall in value. Securities are subject to market fluctuations caused by real or perceived adverse economic, political, and regulatory factors or market developments, changes in interest rates and perceived trends in securities prices. Shares of a Fund could decline in value or underperform other investments. In addition, local, regional or global events such as war, acts of terrorism,market manipulation, government defaults, government shutdowns, regulatory actions, political changes, diplomatic developments, the imposition of sanctions and other similar measures, spread of infectious diseases or other public health issues, recessions, natural disasters, or other events could have a significant negative impact on a Fund and its investments.
Any of such circumstances could have a materially negative impact on the value of a Fund’s shares, the liquidity of an investment, and may result in increased market volatility. During any such events, a Fund’s shares may trade at increased premiums or discounts to their net asset value, the bid/ask spread on a Fund’s shares may widen and the returns on investment may fluctuate.
MLP RISK. Investments in securities of MLPs involve certain risks different from or in addition to the risks of investing in common stocks. MLP common units can be affected by macro-economic factors and other factors unique to the partnership or company and the industry or industries in which the MLP operates. Certain MLP securities may trade in relatively low volumes due to their smaller capitalizations or other factors, which may cause them to have a high degree of price volatility and illiquidity. The structures of MLPs create certain risks, including, for example, risks related to the limited ability of investors to control an MLP and to vote on matters affecting the MLP, risks related to potential conflicts of interest between an MLP and the MLP’s general partner, the risk that an MLP will generate insufficient cash flow to meet its current operating requirements, the risk that an MLP will issue additional securities or engage in other transactions that will have the effect of diluting the interests of existing investors, and risks related to the general partner’s right to require unit-holders to sell their common units at an undesirable time or price. On March 15, 2018, the Federal Energy Regulatory Commission (“FERC”) changed its long-standing tax allowance policy which no longer permits MLPs to include in their cost of service an income tax allowance. This has had a negative impact on the performance of some MLPs affected by this decision. This policy change and any similar policy changes in the future could adversely impact an MLP’s business, financial condition, results of operations and cash flows and ability to pay cash distributions or dividends.
Additional Information (Continued)
First Trust Variable Insurance Trust
June 30, 2023 (Unaudited)
MLP TAX RISK. A Fund’s ability to meet its investment objective relies in part upon the level of taxable income it receives from the MLPs in which it invests, a factor over which a Fund has no control. The benefit a Fund derives from its investment in MLPs is largely dependent on their being treated as partnerships for U.S. federal income tax purposes. Partnerships do not pay U.S. federal income tax at the partnership level. Rather, each partner is allocated a share of the partnership’s income, gains, losses, deductions and expenses. A change in current tax law or a change in the underlying business mix of a given MLP could result in an MLP being treated as a corporation for U.S. federal income tax purposes, which would result in the MLP being required to pay U.S. federal income tax (as well as state and local income taxes) on its taxable income at the applicable corporate tax rate. This would have the effect of reducing the amount of cash available for distribution by an MLP and could result in a significant reduction in the value of a Fund’s investment. The classification of an MLP as a corporation for U. S. federal income tax purposes would have the effect of reducing the amount of cash available for distribution by the MLP and causing any such distributions received by a Fund to be taxed as dividend income to the extent of the MLP’s current or accumulated earnings and profits. To the extent a distribution received by a Fund from an MLP is treated as a return of capital, a Fund’s adjusted tax basis in the interests of the MLP may be reduced, which will result in an increase in the amount of income or gain (or decrease in the amount of loss) that will be recognized by a Fund for tax purposes upon the sale of any such interests or upon subsequent distributions in respect of such interests. Furthermore, any return of capital distribution received from an MLP may require a Fund to restate the character of its distributions and amend any shareholder tax reporting previously issued.
MOMENTUM INVESTING RISK. A Fund employs a “momentum” style of investing that emphasizes selecting stocks that have had higher recent price performance compared to other stocks. Momentum can change quickly and stocks that previously exhibited high momentum characteristics may not experience positive momentum or may experience more volatility than the market as a whole. In addition, there may be periods when the momentum style of investing is out of favor and the investment performance of a Fund may suffer.
MORTGAGE-RELATED SECURITIES RISK. Mortgage-related securities are subject to the same risks as investments in other types of debt securities, including credit risk, interest rate risk, liquidity risk and valuation risk. However, these investments make an underlying ETF more susceptible to adverse economic, political or regulatory events that affect the value of real estate. Mortgage-related securities are also significantly affected by the rate of prepayments and modifications of the mortgage loans underlying those securities, as well as by other factors such as borrower defaults, delinquencies, realized or liquidation losses and other shortfalls. The incidence of borrower defaults or delinquencies may rise significantly during financial downturns and could adversely affect the value of mortgage-related securities held by a Fund. Events such as war, acts of terrorism, spread of infectious diseases or other public health issues, recessions, or other events that result in broad and simultaneous financial hardships for individuals and businesses could have a significant negative impact on the value of mortgage-related securities. Mortgage-related securities are particularly sensitive to prepayment risk, given that the term to maturity for mortgage loans is generally substantially longer than the expected lives of those securities. As the timing and amount of prepayments cannot be accurately predicted, the timing of changes in the rate of prepayments of the mortgage loans may significantly affect an underlying ETF’s actual yield to maturity on any mortgage-related securities. Along with prepayment risk, mortgage-related securities are significantly affected by interest rate risk.
MUNICIPAL SECURITIES RISK. Issuers, including governmental issuers, may be unable to pay their obligations as they come due. The values of municipal securities that depend on a specific revenue source to fund their payment obligations may fluctuate as a result of actual or anticipated changes in the cash flows generated by the revenue source or changes in the priority of the municipal obligation to receive the cash flows generated by the revenue source. The values of municipal securities held by a Fund may be adversely affected by local political and economic conditions and developments. Adverse conditions in an industry significant to a local economy could have a correspondingly adverse effect on the financial condition of local issuers. In addition, income from municipal securities held by a Fund could be declared taxable because of, among other things, unfavorable changes in tax laws, adverse interpretations by the Internal Revenue Service or state tax authorities, or noncompliant conduct of an issuer or other obligated party. Loss of tax-exempt status may cause interest received and distributed to shareholders by a Fund to be taxable and may result in a significant decline in the values of such municipal securities. Due to the COVID-19 pandemic, the risks of the municipal securities market have been magnified. The costs associated with combating the pandemic and the negative impact on tax revenues has adversely affected the financial condition of many states and political subdivisions. These risks may also adversely affect several sectors of the municipal bond market, such as airports, toll roads, hospitals and colleges, among many others. The full impact of the COVID-19 pandemic on state and political subdivisions’ ability to make payments on debt obligations is impossible to predict, but could negatively impact the value of bonds, the ability of state and political subdivisions to make payments when due and the performance of a Fund.
NON-AGENCY SECURITIES RISK. Investments in asset-backed or mortgage-backed securities offered by non-governmental issuers, such as commercial banks, savings and loans, private mortgage insurance companies, mortgage bankers and other secondary market issuers are subject to additional risks. There are no direct or indirect government or agency guarantees of payments in loan pools created by non-government issuers. Securities issued by private issuers are subject to the credit risks of the issuers. An
Additional Information (Continued)
First Trust Variable Insurance Trust
June 30, 2023 (Unaudited)
unexpectedly high rate of defaults on the loan pool may adversely affect the value of a non-agency security and could result in losses to a Fund. The risk of such defaults is generally higher in the case of pools that include subprime loans. Non-agency securities are typically traded “over-the-counter” rather than on a securities exchange and there may be a limited market for the securities, especially when there is a perceived weakness in the mortgage and real estate market sectors. Without an active trading market, the non-agency mortgage-related securities held by a Fund may be particularly difficult to value because of the complexities involved in assessing the value of the underlying loans.
NON-CORRELATION RISK. A Fund’s return may not match the return of the Index for a number of reasons. A Fund incurs operating expenses not applicable to the Index, and may incur costs in buying and selling securities, especially when rebalancing a Fund’s portfolio holdings to reflect changes in the composition of the Index. In addition, a Fund’s portfolio holdings may not exactly replicate the securities included in the Index or the ratios between the securities included in the Index.
NON-DIVERSIFICATION RISK. A Fund is classified as “non-diversified” under the 1940 Act. As a result, a Fund is only limited as to the percentage of its assets which may be invested in the securities of any one issuer by the diversification requirements imposed by the Internal Revenue Code of 1986, as amended. A Fund may invest a relatively high percentage of its assets in a limited number of issuers. As a result, a Fund may be more susceptible to a single adverse economic or regulatory occurrence affecting one or more of these issuers, experience increased volatility and be highly invested in certain issuers.
NON-U.S. SECURITIES RISK. Non-U.S. securities are subject to higher volatility than securities of domestic issuers due to possible adverse political, social or economic developments, restrictions on foreign investment or exchange of securities, capital controls, lack of liquidity, currency exchange rates, excessive taxation, government seizure of assets, the imposition of sanctions by foreign governments, different legal or accounting standards, and less government supervision and regulation of securities exchanges in foreign countries.
OPERATIONAL RISK. Each Fund is subject to risks arising from various operational factors, including, but not limited to, human error, processing and communication errors, errors of a Fund’s service providers, counterparties or other third-parties, failed or inadequate processes and technology or systems failures. Each Fund relies on third-parties for a range of services, including custody. Any delay or failure relating to engaging or maintaining such service providers may affect each Fund’s ability to meet its investment objective. Although the Funds and the Funds’ investment advisor seek to reduce these operational risks through controls and procedures, there is no way to completely protect against such risks.
PASSIVE INVESTMENT RISK. A Fund that tracks an index is not actively managed. A Fund invests in securities included in or representative of the Index regardless of investment merit. A Fund generally will not attempt to take defensive positions in declining markets. In the event that the Index is no longer calculated, the Index license is terminated or the identity or character of the Index is materially changed, a Fund will seek to engage a replacement index.
PORTFOLIO TURNOVER RISK. High portfolio turnover may result in a Fund paying higher levels of transaction costs and may generate greater tax liabilities for shareholders. Portfolio turnover risk may cause a Fund’s performance to be less than expected.
PREFERRED SECURITIES RISK. Preferred securities combine some of the characteristics of both common stocks and bonds. Preferred securities are typically subordinated to bonds and other debt securities in a company’s capital structure in terms of priority to corporate income, subjecting them to greater credit risk than those debt securities. Generally, holders of preferred securities have no voting rights with respect to the issuing company unless preferred dividends have been in arrears for a specified number of periods, at which time the preferred security holders may obtain limited rights. In certain circumstances, an issuer of preferred securities may defer payment on the securities and, in some cases, redeem the securities prior to a specified date. Preferred securities may also be substantially less liquid than other securities, including common stock.
PREPAYMENT RISK. Prepayment risk is the risk that the issuer of a debt security will repay principal prior to the scheduled maturity date. Debt securities allowing prepayment may offer less potential for gains during a period of declining interest rates, as an underlying ETF may be required to reinvest the proceeds of any prepayment at lower interest rates. These factors may cause the value of an investment in an underlying ETF to change.
REIT RISK. REITs typically own and operate income-producing real estate, such as residential or commercial buildings, or real-estate related assets, including mortgages. As a result, investments in REITs are subject to the risks associated with investing in real estate, which may include, but are not limited to: fluctuations in the value of underlying properties; defaults by borrowers or tenants; market saturation; changes in general and local operating expenses; and other economic, political or regulatory occurrences affecting companies in the real estate sector. REITs are also subject to the risk that the real estate market may experience an economic downturn generally, which may have a material effect on the real estate in which the REITs invest and their underlying portfolio securities. REITs may have also a relatively small market capitalization which may result in their shares experiencing less market liquidity and greater price volatility than larger companies. Increases in interest rates typically lower the present value of a REIT’s
Additional Information (Continued)
First Trust Variable Insurance Trust
June 30, 2023 (Unaudited)
future earnings stream, and may make financing property purchases and improvements more costly. Because the market price of REIT stocks may change based upon investors’ collective perceptions of future earnings, the value of a Fund will generally decline when investors anticipate or experience rising interest rates.
SENIOR LOAN RISK. Senior loans represent debt obligations of sub-investment grade corporate borrowers, similar to high yield bonds; however, senior loans are different from traditional high yield bonds in that senior loans are typically senior to other obligations of the borrower and generally secured by a lien on all or some portion of the assets of the borrower. The senior loan market has seen a significant increase in loans with weaker lender protections including, but not limited to, limited financial maintenance covenants or, in some cases, no financial maintenance covenants (i.e., “covenant-lite loans”) that would typically be included in a traditional loan agreement and general weakening of other restrictive covenants applicable to the borrower such as limitations on incurrence of additional debt, restrictions on payments of junior debt or restrictions on dividends and distributions. Weaker lender protections such as the absence of financial maintenance covenants in a loan agreement and the inclusion of “borrower-favorable” terms may impact recovery values and/or trading levels of senior loans in the future. The absence of financial maintenance covenants in a loan agreement generally means that the lender may not be able to declare a default if financial performance deteriorates. This may hinder an underlying ETF’s ability to reprice credit risk associated with a particular borrower and reduce an underlying ETF’s ability to restructure a problematic loan and mitigate potential loss. As a result, an underlying ETF’s exposure to losses on investments in senior loans may be increased, especially during a downturn in the credit cycle or changes in market or economic conditions.
Senior loans are also subject to the same risks as investments in other types of debt securities, including credit risk, interest rate risk, liquidity risk and valuation risk that may be heightened because of the limited public information available regarding senior loans. If an underlying ETF holds a senior loan through another financial institution or relies on a financial institution to administer the loan, its receipt of principal and interest on the loan may be subject to the credit risk of that financial institution. Although senior loans are generally secured by specific collateral, there can be no assurance that liquidation of such collateral would satisfy the borrower’s obligation in the event of non-payment of scheduled interest or principal or that such collateral could be readily liquidated.
No active trading market may exist for certain senior loans, which may impair the ability of an underlying ETF to realize full value in the event of the need to sell its position in a senior loan and which may make it difficult to accurately value senior loans. Lastly, senior loans may not be considered “securities,” and an underlying ETF may not be entitled to rely on the anti-fraud protections of the federal securities laws.
SIGNIFICANT EXPOSURE RISK. To the extent that a Fund invests a large percentage of its assets in a single asset class or the securities of issuers within the same country, state, region, industry or sector, an adverse economic, business or political development may affect the value of a Fund’s investments more than if a Fund were more broadly diversified. A significant exposure makes a Fund more susceptible to any single occurrence and may subject a Fund to greater market risk than a fund that is more broadly diversified.
SMALLER COMPANIES RISK. Small and/or mid capitalization companies may be more vulnerable to adverse general market or economic developments, and their securities may be less liquid and may experience greater price volatility than larger, more established companies as a result of several factors, including limited trading volumes, fewer products or financial resources, management inexperience and less publicly available information. Accordingly, such companies are generally subject to greater market risk than larger, more established companies.
TBA TRANSACTIONS RISK. Certain ETFs in which a Fund may invest may purchase securities via to-be-announced transactions (“TBA Transactions”). In such a transaction, the purchase price of the securities is typically fixed at the time of the commitment, but delivery and payment can take place a month or more after the date of the commitment. At the time of delivery of the securities, the value may be more or less than the purchase or sale price. Purchasing securities in a TBA Transaction may give rise to investment leverage and may increase an underlying ETF’s volatility. Default by, or bankruptcy of, a counterparty to a TBA Transaction would expose an underlying ETF to possible losses because of an adverse market action, expenses or delays in connection with the purchase or sale of the pools specified in such transaction.
U.S. GOVERNMENT SECURITIES RISK. U.S. government securities are subject to interest rate risk but generally do not involve the credit risks associated with investments in other types of debt securities. As a result, the yields available from U.S. government securities are generally lower than the yields available from other debt securities. U.S. government securities are guaranteed only as to the timely payment of interest and the payment of principal when held to maturity. While securities issued or guaranteed by U.S. federal government agencies (such as Ginnie Mae) are backed by the full faith and credit of the U.S. Department of the Treasury, securities issued by government sponsored entities (such as Fannie Mae and Freddie Mac) are solely the obligation of the issuer and generally do not carry any guarantee from the U.S. government.
VALUATION RISK. A Fund or an underlying ETF may hold securities or other assets that may be valued on the basis of factors other than market quotations. This may occur because the asset or security does not trade on a centralized exchange, or in times of market
Additional Information (Continued)
First Trust Variable Insurance Trust
June 30, 2023 (Unaudited)
turmoil or reduced liquidity. There are multiple methods that can be used to value a portfolio holding when market quotations are not readily available. The value established for any portfolio holding at a point in time might differ from what would be produced using a different methodology or if it had been priced using market quotations. Portfolio holdings that are valued using techniques other than market quotations, including “fair valued” assets or securities, may be subject to greater fluctuation in their valuations from one day to the next than if market quotations were used. In addition, there is no assurance that a Fund or an underlying ETF could sell or close out a portfolio position for the value established for it at any time, and it is possible that a Fund or an underlying ETF would incur a loss because a portfolio position is sold or closed out at a discount to the valuation established by a Fund or an underlying ETF at that time. A Fund’s ability to value investments may be impacted by technological issues or errors by pricing services or other third-party service providers.
| NOT FDIC INSURED | NOT BANK GUARANTEED | MAY LOSE VALUE |
Board Considerations Regarding Approval of Continuation of Investment Management and Investment Sub-Advisory Agreements
The Board of Trustees of First Trust Variable Insurance Trust (the “Trust”), including the Independent Trustees, unanimously approved the continuation of the Investment Management Agreement (the “Advisory Agreement”) with First Trust Advisors L.P. (the “Advisor”) on behalf of the following series of the Trust (each a “Fund” and collectively, the “Funds”):
First Trust/Dow Jones Dividend & Income Allocation Portfolio
First Trust Multi Income Allocation Portfolio
First Trust Dorsey Wright Tactical Core Portfolio
First Trust Capital Strength Portfolio
First Trust International Developed Capital Strength Portfolio
The Board, including the Independent Trustees, also unanimously approved the continuation of the Investment Sub-Advisory Agreement (the “Stonebridge Sub-Advisory Agreement”) among the Trust, on behalf of First Trust Multi Income Allocation Portfolio, the Advisor and Stonebridge Advisors LLC (“Stonebridge”); and the Investment Sub-Advisory Agreement (the “Energy Income Partners Sub-Advisory Agreement”) among the Trust, on behalf of First Trust Multi Income Allocation Portfolio, the Advisor and Energy Income Partners, LLC (“Energy Income Partners”). The Stonebridge Sub-Advisory Agreement and the Energy Income Partners Sub-Advisory Agreement are collectively referred to as the “Sub-Advisory Agreements.” Stonebridge and Energy Income Partners are individually referred to as a “Sub-Advisor” and are collectively referred to as the “Sub-Advisors.” The Sub-Advisory Agreements together with the Advisory Agreement are referred to as the “Agreements.” The Board approved the continuation of the Agreements for a one-year period ending June 30, 2024 at a meeting held on June 4–5, 2023. The Board determined that the continuation of the Advisory Agreement is in the best interests of each Fund and the continuation of the Sub-Advisory Agreements is in the best interests of First Trust Multi Income Allocation Portfolio in light of the nature, extent and quality of the services provided and such other matters as the Board considered to be relevant in the exercise of its business judgment.
To reach this determination, the Board considered its duties under the Investment Company Act of 1940, as amended (the “1940 Act”), as well as under the general principles of state law, in reviewing and approving advisory contracts; the requirements of the 1940 Act in such matters; the fiduciary duty of investment advisors with respect to advisory agreements and compensation; the standards used by courts in determining whether investment company boards have fulfilled their duties; and the factors to be considered by the Board in voting on such agreements. At meetings held on April 17, 2023 and June 4–5, 2023, the Board, including the Independent Trustees, reviewed materials provided by the Advisor and each of the Sub-Advisors responding to requests for information from counsel to the Independent Trustees, submitted on behalf of the Independent Trustees, that, among other things, outlined: the services provided by the Advisor to the Funds and by the Sub-Advisors to First Trust Multi Income Allocation Portfolio (including the relevant personnel responsible for these services and their experience); the advisory fee rate payable by each Fund and the sub-advisory fee rates for First Trust Multi Income Allocation Portfolio as compared to fees charged to a peer group of funds (the “Expense Group”) and a broad peer universe of funds (the “Expense Universe”), each assembled by Broadridge Financial Solutions, Inc. (“Broadridge”), an independent source, and as compared to fees charged to other clients of the Advisor and the Sub-Advisor; the expense ratio of each Fund as compared to expense ratios of the funds in each Fund’s Expense Group and Expense Universe; performance information for each Fund, including comparisons of each Fund’s performance to that of one or more relevant benchmark indexes and to that of a performance group of funds and a broad performance universe of funds (the “Performance Universe”), each assembled by Broadridge; the nature of expenses incurred in providing services to the Funds and the potential for the Advisor and each Sub-Advisor to realize economies of scale, if any; profitability and other financial data for the Advisor; financial data for each Sub-Advisor; any indirect benefits to the Advisor and its affiliates, First Trust Portfolios L.P. (“FTP”) and First Trust Capital Partners, LLC (“FTCP”), and the Sub-Advisors; and information on the Advisor’s and each Sub-Advisor’s compliance programs. The Board reviewed initial materials with the Advisor at the meeting held on April 17, 2023, prior to which the Independent Trustees and their counsel met separately to
Additional Information (Continued)
First Trust Variable Insurance Trust
June 30, 2023 (Unaudited)
discuss the information provided by the Advisor and each of the Sub-Advisors. Following the April meeting, counsel to the Independent Trustees, on behalf of the Independent Trustees, requested certain clarifications and supplements to the materials provided, and the information provided in response to those requests was considered at an executive session of the Independent Trustees and their counsel held prior to the June 4–5, 2023 meeting, as well as at the June meeting. The Board applied its business judgment to determine whether the arrangements between the Trust and the Advisor continue to be reasonable business arrangements from the Funds’ perspective. Similarly, the Board applied its business judgment to determine whether the arrangements among the Trust, the Advisor and each of the Sub-Advisors continue to be reasonable business arrangements from the perspective of First Trust Multi Income Allocation Portfolio. The Board determined that, given the totality of the information provided with respect to the Agreements, the Board had received sufficient information to renew the Agreements. The Board considered that shareholders chose to invest or remain invested in the Funds knowing that the Advisor manages the Funds, knowing that the Sub-Advisors serve as such for First Trust Multi Income Allocation Portfolio and knowing each Fund’s advisory fee.
In reviewing the Agreements, the Board considered the nature, extent and quality of the services provided by the Advisor and each Sub-Advisor under the Agreements. With respect to the Advisory Agreement, the Board considered that the Advisor is responsible for the overall management and administration of the Trust and the Funds and reviewed all of the services provided by the Advisor to the Funds, including the oversight of the Sub-Advisors for First Trust Multi Income Allocation Portfolio, as well as the background and experience of the persons responsible for such services. The Board noted that the Advisor oversees the Sub-Advisors’ management of portions of First Trust Multi Income Allocation Portfolio’s investment portfolio, including risk monitoring and performance review. In reviewing the services provided, the Board noted the compliance program that had been developed by the Advisor and considered that it includes a robust program for monitoring the Advisor’s, the Sub-Advisors’ and the Funds’ compliance with the 1940 Act, as well as each Fund’s compliance with its investment objective or objectives, policies and restrictions. The Board also considered a report from the Advisor with respect to its risk management functions related to the operation of the Funds. Finally, as part of the Board’s consideration of the Advisor’s services, the Advisor, in its written materials and at the April 17, 2023 meeting, described to the Board the scope of its ongoing investment in additional personnel and infrastructure to maintain and improve the quality of services provided to the Funds and the other funds in the First Trust Fund Complex. With respect to the Sub-Advisory Agreements for First Trust Multi Income Allocation Portfolio, the Board reviewed the materials provided by each Sub-Advisor and considered the services that each Sub-Advisor provides to the Fund, noting that Energy Income Partners is responsible for the day-to-day management of a portion of the Fund’s investments and that Stonebridge serves in a non-discretionary capacity for a portion of the Fund’s investments. In considering each Sub-Advisor’s services to the Fund, the Board noted the background and experience of each Sub-Advisor’s portfolio management team, including the Board’s prior meetings with members of each portfolio management team. The Board also received a presentation from representatives of Stonebridge at the April 17, 2023 meeting. In light of the information presented and the considerations made, the Board concluded that the nature, extent and quality of the services provided to the Funds by the Advisor and to First Trust Multi Income Allocation Portfolio by the Sub-Advisors under the Agreements have been and are expected to remain satisfactory and that the Advisor and, for First Trust Multi Income Allocation Portfolio, the Sub-Advisors, have managed the Funds consistent with each Fund’s respective investment objective or objectives, policies and restrictions.
The Board considered the advisory fee rate payable by each Fund under the Advisory Agreement and, for First Trust Multi Income Allocation Portfolio, considered the sub-advisory fee rates payable under the Sub-Advisory Agreements for the services provided, noting that the sub-advisory fees are paid by the Advisor from its advisory fee. The Board considered that the Advisor agreed to extend the current expense caps for Class I and Class II shares of each Fund at least until May 1, 2024. For each Fund, the Board noted that expenses borne by the Advisor are subject to reimbursement by the Fund for up to three years from the date the fee or expense was incurred, but no reimbursement payment will be made by the Fund at any time if it would result in Class I share and Class II share expenses (excluding interest expense, brokerage commissions and other trading expenses, taxes, and extraordinary expenses and acquired fund fees and expenses for First Trust Multi Income Allocation Portfolio and First Trust/Dow Jones Dividend & Income Allocation Portfolio) exceeding (i) the applicable expense limitation in place for the most recent fiscal year for which such expense limitation was in place, (ii) the applicable expense limitation in place at the time the fees were waived or expenses were reimbursed, or (iii) the current expense limitation. The Board also noted that the Advisor had extended through May 1, 2024 its agreement to reduce the advisory fee payable by First Trust Multi Income Allocation Portfolio in the amount of 0.37% of the Fund’s average daily net assets, which is intended to offset the acquired fund fees and expenses associated with the Fund’s investments in underlying ETFs, including ETFs in the First Trust Fund Complex. The Board received and reviewed information showing the fee rates and expense ratios of the peer funds in the Expense Groups, as well as advisory and unitary fee rates charged by the Advisor and the Sub-Advisors to other fund and non-fund clients, as applicable. With respect to the Expense Groups, the Board, at the April 17, 2023 meeting, discussed with Broadridge its methodology for assembling peer groups and discussed with the Advisor limitations in creating relevant peer groups for the Funds. The Board also noted that not all peer funds in First Trust Multi Income Allocation Portfolio’s Expense Group employ an advisor/sub-advisor management structure. The Board took these limitations into account in considering the peer data. The Board noted that because First Trust Dorsey Wright Tactical Core Portfolio invests in underlying ETFs, including ETFs in the First Trust Fund Complex, such Fund will incur acquired fund fees and expenses, and that such acquired fund
Additional Information (Continued)
First Trust Variable Insurance Trust
June 30, 2023 (Unaudited)
fees and expenses will change over time as assets are reallocated among the underlying ETFs. Based on the information provided, the Board noted that the contractual advisory fee rate payable by First Trust/Dow Jones Dividend & Income Allocation Portfolio was equal to the median contractual advisory fee of the peer funds in the Fund’s Expense Group and that the contractual advisory fee rate payable by each of the other Funds was below the median contractual advisory fee of the peer funds in the Fund’s respective Expense Group. The Board also noted that with respect to the total (net) expense ratio of each Fund’s Class I shares, the net expense ratio (excluding acquired fund fees and expenses, as applicable) of each of First Trust Capital Strength Portfolio, First Trust International Developed Capital Strength Portfolio and First Trust/Dow Jones Dividend & Income Allocation Portfolio was above the median net expense ratio (excluding acquired fund fees and expenses) of the peer funds in the Fund’s respective Expense Group and that the net expense ratio (excluding acquired fund fees and expenses) of each of First Trust Dorsey Wright Tactical Core Portfolio and First Trust Multi Income Allocation Portfolio was below the median net expense ratio (excluding acquired fund fees and expenses) of the peer funds in the Fund’s respective Expense Group. With respect to fees charged to other clients, the Board considered differences between the Funds and other clients that limited their comparability. In considering the advisory fee rates overall, the Board also considered the Advisor’s statement that it seeks to meet investor needs through innovative and value-added investment solutions and the Advisor’s demonstrated long-term commitment to each Fund and the other funds in the First Trust Fund Complex.
The Board considered performance information for the Funds. The Board noted the process it has established for monitoring the Funds’ performance and portfolio risk on an ongoing basis, which includes quarterly performance reporting from the Advisor for the Funds and the Sub-Advisors for First Trust Multi Income Allocation Portfolio. The Board determined that this process continues to be effective for reviewing the Funds’ performance. The Board received and reviewed information comparing each Fund’s performance for one or more periods ended December 31, 2022 to the performance of the funds in the Fund’s respective Performance Universe and to that of a benchmark index or blended benchmark index, as applicable. Based on the information provided, the Board noted that First Trust Capital Strength Portfolio (Class I shares) outperformed its Performance Universe median and benchmark index for the one-year period ended December 31, 2022. The Board noted that First Trust Dorsey Wright Tactical Core Portfolio (Class I shares) underperformed its Performance Universe median for the one-year period ended December 31, 2022, outperformed its Performance Universe median for the three- and five-year periods ended December 31, 2022 and underperformed its blended benchmark index for the one-, three- and five-year periods ended December 31, 2022. The Board noted that First Trust International Developed Capital Strength Portfolio (Class I Shares) outperformed its Performance Universe median and underperformed its benchmark index for the one-year period ended December 31, 2022. The Board noted that First Trust Multi Income Allocation Portfolio (Class I shares) outperformed its Performance Universe median for the one-, three- and five-year periods ended December 31, 2022, outperformed its blended benchmark index for the one- and three-year periods ended December 31, 2022 and underperformed its blended benchmark index for the five-year period ended December 31, 2022. The Board noted that First Trust/Dow Jones Dividend & Income Allocation Portfolio (Class I shares) outperformed its Performance Universe median for the one-, three-, five- and ten-year periods ended December 31, 2022, outperformed its blended benchmark index for the one-year period ended December 31, 2022 and underperformed its blended benchmark index for the three-, five- and ten-year periods ended December 31, 2022.
On the basis of all the information provided on the fees, expenses and performance of the Funds and the ongoing oversight by the Board, the Board concluded that the advisory fee for each Fund and the sub-advisory fees for First Trust Multi Income Allocation Portfolio continue to be reasonable and appropriate in light of the nature, extent and quality of the services provided by the Advisor to each Fund under the Advisory Agreement and provided by the Sub-Advisors to First Trust Multi Income Allocation Portfolio under the respective Sub-Advisory Agreements.
The Board considered information and discussed with the Advisor whether there were any economies of scale in connection with providing advisory services to the Funds at current asset levels and whether the Funds may benefit from any economies of scale. The Board noted the Advisor’s statement that it believes that its expenses relating to providing advisory services to the Funds will increase during the next twelve months as the Advisor continues to build infrastructure and add new staff. The Board concluded that the advisory fee rate for each Fund reflects an appropriate level of sharing of any economies of scale that may be realized in the management of the Fund at current asset levels. The Board considered the revenues and allocated costs (including the allocation methodology) of the Advisor in serving as investment advisor to each Fund for the twelve months ended December 31, 2022 and the estimated profitability level for each Fund calculated by the Advisor based on such data, as well as complex-wide and product-line profitability data, for the same period. The Board noted the inherent limitations in the profitability analysis and concluded that, based on the information provided, the Advisor’s profitability level for each Fund was not unreasonable. In addition, the Board considered indirect benefits described by the Advisor that may be realized from its relationship with the Funds. The Board considered that the Advisor had identified as an indirect benefit to the Advisor and FTP their exposure to investors and brokers who, absent their exposure to the Funds, may have had no dealings with the Advisor or FTP. The Board considered the ownership interests of FTCP in Stonebridge and Energy Income Partners and potential indirect benefits to the Advisor from such ownership interests. The Board noted that FTP is compensated for services provided to the Funds through Rule 12b-1 distribution and service fees payable by Class I shares, and that the Advisor receives compensation from each Fund for providing fund reporting services pursuant to a separate Fund Reporting Services Agreement. The Board also noted that the Advisor does not utilize soft dollars in connection with the Funds. In
Additional Information (Continued)
First Trust Variable Insurance Trust
June 30, 2023 (Unaudited)
addition, the Board considered that the Advisor, as the investment advisor to certain underlying ETFs in which First Trust Dorsey Wright Tactical Core Portfolio and First Trust Multi Income Allocation Portfolio invest, will recognize additional revenue from the underlying ETFs if investment by such Funds causes the assets of the underlying ETFs to grow. The Board concluded that the character and amount of potential indirect benefits to the Advisor were not unreasonable.
With respect to the Stonebridge Sub-Advisory Agreement, the Board considered Stonebridge’s expenses in providing sub-advisory services to First Trust Multi Income Allocation Portfolio and noted Stonebridge’s hiring of additional personnel and Stonebridge’s statement that it would add resources as needed if it experiences enough asset growth. The Board noted that the Advisor pays Stonebridge from its advisory fee and its understanding that First Trust Multi Income Allocation Portfolio’s sub-advisory fee rate was the product of an arm’s length negotiation. The Board did not review the profitability of Stonebridge with respect to the Fund. The Board concluded that the profitability analysis for the Advisor was more relevant. The Board considered indirect benefits that may be realized by Stonebridge from its relationship with First Trust Multi Income Allocation Portfolio, including potential indirect benefits to Stonebridge from the ownership interest of FTCP in Stonebridge. The Board noted Stonebridge’s statement that its relationship with the Advisor has helped it build relationships with Wall Street firms that have preferred and hybrid securities trading desks, which may lead to access to those firms’ research reports, analysts and investment bankers on new issues. The Board noted that Stonebridge acts as a non-discretionary manager providing model portfolio recommendations to the Advisor and does not provide trade execution services to First Trust Multi Income Allocation Portfolio. The Board concluded that the character and amount of potential indirect benefits to Stonebridge were not unreasonable.
With respect to the Energy Income Partners Sub-Advisory Agreement, the Board considered that Energy Income Partners anticipates that its expenses will continue to rise due to additions to personnel and system upgrades. The Board noted that the Advisor pays Energy Income Partners from its advisory fee and its understanding that First Trust Multi Income Allocation Portfolio’s sub-advisory fee rate was the product of an arm’s length negotiation. The Board did not review the profitability of Energy Income Partners with respect to First Trust Multi Asset Income Allocation Portfolio. The Board concluded that the profitability analysis for the Advisor was more relevant. The Board considered indirect benefits that may be realized by Energy Income Partners from its relationship with First Trust Multi Income Allocation Portfolio, including the potential indirect benefits to Energy Income Partners from the ownership interest of FTCP in Energy Income Partners. The Board noted that Energy Income Partners does not provide trade execution services on behalf of First Trust Multi Income Allocation Portfolio. The Board concluded that the character and amount of potential indirect benefits to Energy Income Partners were not unreasonable.
Based on all of the information considered and the conclusions reached, the Board, including the Independent Trustees, unanimously determined that the terms of the Agreements continue to be fair and reasonable and that the continuation of the Agreements is in the best interests of the applicable Funds. No single factor was determinative in the Board’s analysis.
Board Considerations Regarding Approval of Investment Management Agreement for First Trust Growth Strength Portfolio
The Board of Trustees of First Trust Variable Insurance Trust (the “Trust”), including the Independent Trustees, approved the Investment Management Agreement (the “Agreement”) with First Trust Advisors L.P. (the “Advisor”), on behalf of First Trust Growth Strength Portfolio (the “Fund”), for an initial two-year term at a meeting held on March 6, 2023. The Board determined that the Agreement is in the best interests of the Fund in light of the nature, extent and quality of the services expected to be provided and such other matters as the Board considered to be relevant in the exercise of its business judgment.
To reach this determination, the Board considered its duties under the Investment Company Act of 1940, as amended (the “1940 Act”), as well as under the general principles of state law, in reviewing and approving advisory contracts; the requirements of the 1940 Act in such matters; the fiduciary duty of investment advisors with respect to advisory agreements and compensation; the standards used by courts in determining whether investment company boards have fulfilled their duties; and the factors to be considered by the Board in voting on such agreements. To assist the Board in its evaluation of the Agreement for the Fund, the Independent Trustees received a report from the Advisor in advance of the Board meeting responding to a request for information from counsel to the Independent Trustees, submitted on behalf of the Independent Trustees, that, among other things, outlined: the services to be provided by the Advisor to the Fund (including the relevant personnel responsible for these services and their experience); the proposed advisory fee rate payable by the Fund as compared to fees charged to a peer group of funds (the “Expense Group”) and a broad peer universe of funds (the “Expense Universe”), each assembled by Broadridge Financial Solutions, Inc. (“Broadridge”), an independent source, and as compared to fees charged to other clients of the Advisor; the estimated expense ratio of the Fund’s Class I shares as compared to expense ratios of the funds in the Fund’s Expense Group and Expense Universe; the nature of expenses to be incurred in providing services to the Fund and the potential for the Advisor to realize economies of scale, if any; profitability and other financial data for the Advisor; any indirect benefits to the Advisor and its affiliate, First Trust Portfolios L.P. (“FTP”); and information on the Advisor’s compliance program. The Independent Trustees and their counsel also met separately to discuss the information provided by the
Additional Information (Continued)
First Trust Variable Insurance Trust
June 30, 2023 (Unaudited)
Advisor. The Board applied its business judgment to determine whether the arrangement between the Trust and the Advisor is a reasonable business arrangement from the Fund’s perspective.
In evaluating whether to approve the Agreement for the Fund, the Board considered the nature, extent and quality of the services to be provided by the Advisor under the Agreement and considered that employees of the Advisor provide management services to five other series of the Trust as well as other funds in the First Trust Fund Complex with diligence and care. The Board considered that the Advisor will be responsible for the overall management and administration of the Fund and reviewed all of the services to be provided by the Advisor to the Fund, as well as the background and experience of the persons responsible for such services. The Board noted that the Advisor’s Investment Committee will be responsible for the day-to-day management of the Fund’s investments and considered the background and experience of the members of the Investment Committee. In reviewing the services to be provided, the Board noted the compliance program that had been developed by the Advisor and considered that it includes a robust program for monitoring the Advisor’s and the Fund’s compliance with the 1940 Act, as well as the Fund’s compliance with its investment objective, policies and restrictions. At the March 6, 2023 meeting, the Trustees received a presentation from representatives of the Advisor and were able to ask questions about the proposed investment strategy for the Fund. Because the Fund had yet to commence investment operations, the Board could not consider the historical investment performance of the Fund. In light of the information presented and the considerations made, the Board concluded that the nature, extent and quality of the services to be provided to the Fund by the Advisor under the Agreement are expected to be satisfactory.
The Board considered the proposed advisory fee rate payable by the Fund under the Agreement for the services to be provided. The Board noted that, under the Agreement, the Fund would pay the Advisor an advisory fee equal to an annual rate of 0.60% of its average daily net assets. The Board considered that, pursuant to an Expense Reimbursement, Fee Waiver and Recovery Agreement, the Advisor would contractually agree for at least a two-year period beginning upon the effectiveness of the Fund’s registration statement to waive fees and/or reimburse Fund expenses to the extent necessary to prevent the total annual operating expenses of the Fund (excluding taxes, interest, all brokerage commissions, other normal charges incident to the purchase and sale of portfolio securities, and extraordinary expenses) from exceeding 1.20% of the average daily net assets for Class I shares of the Fund and 0.95% of the average daily net assets for Class II shares of the Fund. The Board noted that fees waived or expenses borne by the Advisor pursuant to the Expense Reimbursement, Fee Waiver and Recovery Agreement are proposed to be subject to reimbursement by the Fund for up to three years from the date the fee was waived or expense was incurred, but no reimbursement payment would be made by the Fund at any time if it would result in the total annual operating expenses of the Fund (excluding taxes, interest, all brokerage commissions, other normal charges incident to the purchase and sale of portfolio securities, and extraordinary expenses) exceeding: (i) the applicable expense limitation in place for the most recent fiscal year for which such expense limitation was in place, (ii) the applicable expense limitation in place at the time the fees were waived, or (iii) the current expense limitation. The Board received and reviewed information showing the fee rates and expense ratios of the peer funds in the Expense Group, as well as advisory and unitary fee rates charged by the Advisor to other fund and non-fund clients, as applicable. With respect to the Expense Group, the Board discussed with representatives of the Advisor how the Expense Group was assembled and how the Fund compared and differed from the peer funds. The Board took this information into account in considering the peer data. Based on the information provided, the Board noted that the advisory fee rate payable by the Fund was below the median total (net) advisory fee of the peer funds in the Expense Group. The Board also noted that the Fund’s total (net) expense ratio (Class I shares) was above the median total (net) expense ratio of the peer funds in the Expense Group. With respect to fees charged to other clients, the Board considered differences between the Fund and other clients that limited their comparability; however, the Board considered the Advisor’s statement that the Fund’s investment objective and policies are similar to those of an index-based exchange-traded fund in the First Trust Fund Complex managed by the Advisor that has a unitary fee rate schedule starting at an annual rate of 0.60% of its average daily net assets. In light of the information considered and the nature, extent and quality of the services expected to be provided to the Fund under the Agreement, the Board determined that the proposed advisory fee was fair and reasonable.
The Board considered whether there are any potential economies of scale to be achieved in connection with the Advisor providing investment advisory services to the Fund and whether the Fund may benefit from any economies of scale. The Board noted that the Advisor has continued to build infrastructure and add new staff to improve the services to the funds in the First Trust Fund Complex. The Board concluded that the proposed advisory fee rate for the Fund reflects an appropriate level of sharing of any economies of scale that may be realized in the management of the Fund at reasonably foreseeable future asset levels. The Board took into consideration the types of costs to be borne by the Advisor in connection with its services to be performed for the Fund under the Agreement. The Board considered the Advisor’s estimate of the asset level for the Fund at which the Advisor expects the Agreement to be profitable to the Advisor and the Advisor’s estimate of the profitability of the Agreement if the Fund’s assets reach $100 million. The Board noted the inherent limitations in the profitability analysis and concluded that, based on the information provided, the Advisor’s estimated profitability level for the Fund was not unreasonable. In addition, the Board considered indirect benefits described by the Advisor that may be realized from its relationship with the Fund. The Board considered that the Advisor had identified as an indirect benefit to the Advisor and FTP their exposure to investors and brokers who, absent their exposure to the Fund, may have had no dealings with the Advisor or FTP. The Board also considered FTP’s compensation for services to be provided to the
Additional Information (Continued)
First Trust Variable Insurance Trust
June 30, 2023 (Unaudited)
Fund through Rule 12b-1 distribution and service fees payable by Class I shares and the Advisor’s compensation for fund reporting services to be provided to the Fund pursuant to a separate Fund Reporting Services Agreement. The Board noted that the Advisor will not utilize soft dollars in connection with the Fund. The Board concluded that the character and amount of potential indirect benefits to the Advisor were not unreasonable.
Based on all of the information considered and the conclusions reached, the Board, including the Independent Trustees, determined that the terms of the Agreement are fair and reasonable and that the approval of the Agreement is in the best interests of the Fund. No single factor was determinative in the Board’s analysis.
Liquidity Risk Management Program
In accordance with Rule 22e-4 under the Investment Company Act of 1940, as amended (the “1940 Act”), the Funds and each other fund in the First Trust Fund Complex, other than the closed-end funds, have adopted and implemented a liquidity risk management program (the “Program”) reasonably designed to assess and manage the funds’ liquidity risk, i.e., the risk that a fund could not meet requests to redeem shares issued by the fund without significant dilution of remaining investors’ interests in the fund. The Board of Trustees of the First Trust Funds has appointed First Trust Advisors L.P. (the “Advisor”) as the person designated to administer the Program, and in this capacity the Advisor performs its duties primarily through the activities and efforts of the First Trust Liquidity Committee (the “Liquidity Committee”).
Pursuant to the Program, the Liquidity Committee classifies the liquidity of each fund’s portfolio investments into one of the four liquidity categories specified by Rule 22e-4: highly liquid investments, moderately liquid investments, less liquid investments and illiquid investments. The Liquidity Committee determines certain of the inputs for this classification process, including reasonably anticipated trade sizes and significant investor dilution thresholds. The Liquidity Committee also determines and periodically reviews a highly liquid investment minimum for certain funds, monitors the funds’ holdings of assets classified as illiquid investments to seek to ensure they do not exceed 15% of a fund’s net assets and establishes policies and procedures regarding redemptions in kind.
At the April 17, 2023 meeting of the Board of Trustees, as required by Rule 22e-4 and the Program, the Advisor provided the Board with a written report prepared by the Advisor that addressed the operation of the Program during the period from March 17, 2022 through the Liquidity Committee’s annual meeting held on March 23, 2023 and assessed the Program’s adequacy and effectiveness of implementation during this period, including the operation of the highly liquid investment minimum for each fund that is required under the Program to have one, and any material changes to the Program. Note that because the Funds primarily hold assets that are highly liquid investments, the Funds have not adopted any highly liquid investment minimums.
As stated in the written report, during the review period, two funds breached the 15% limitation on illiquid investments for one day each, as a result of an unscheduled week-long closure of the stock exchange in Istanbul following devastating earthquakes in February, causing all Turkish equities to be re-classified as “illiquid” for one day. Each fund filed a Form N-RN on the day after the breach occurred, and one day later after the breach was cured. No fund with a highly liquid investment minimum breached that minimum during the reporting period. The Advisor concluded that each fund’s investment strategy is appropriate for an open-end fund; that the Program operated effectively in all material respects during the review period; and that the Program is reasonably designed to assess and manage the liquidity risk of each fund and to maintain compliance with Rule 22e-4.
This page intentionally left blank
This page intentionally left blank
This page intentionally left blank
INVESTMENT ADVISOR
First Trust Advisors L.P.
120 East Liberty Drive, Suite 400
Wheaton, IL 60187
INVESTMENT SUB-ADVISORS
First Trust Multi Income Allocation Portfolio
Energy Income Partners, LLC
10 Wright Street
Westport, CT 06880
Stonebridge Advisors LLC
10 Westport Road, Suite C101
Wilton, CT 06897
ADMINISTRATOR,
FUND ACCOUNTANT,
AND CUSTODIAN
First Trust/Dow Jones Dividend & Income Allocation Portfolio
First Trust Multi Income Allocation Portfolio
First Trust Capital Strength Portfolio
First Trust International Developed Capital Strength Portfolio
First Trust Growth Strength Portfolio
The Bank of New York Mellon
240 Greenwich Street
New York, NY 10286
First Trust Dorsey Wright Tactical Core Portfolio
Brown Brothers Harriman & Co.
50 Post Office Square
Boston, MA 02110
TRANSFER AGENT
BNY Mellon Investment Servicing (US) Inc.
301 Bellevue Parkway
Wilmington, DE 19809
INDEPENDENT REGISTERED
PUBLIC ACCOUNTING FIRM
Deloitte & Touche LLP
111 South Wacker Drive
Chicago, IL 60606
LEGAL COUNSEL
Chapman and Cutler LLP
320 South Canal Street
Chicago, IL 60606
Item 2. Code of Ethics.
Not applicable.
Item 3. Audit Committee Financial Expert.
Not applicable.
Item 4. Principal Accountant Fees and Services.
Not applicable.
Item 5. Audit Committee of Listed registrants.
Not applicable.
Item 6. Investments.
| (a) | | Schedule of Investments in securities of unaffiliated issuers as of the close of the reporting period is included as part of the report to shareholders filed under Item 1 of this form. |
Item 7. Disclosure of Proxy Voting Policies and Procedures for Closed-End Management Investment Companies.
Not applicable.
Item 8. Portfolio Managers of Closed-End Management Investment Companies.
Not applicable.
Item 9. Purchases of Equity Securities by Closed-End Management Investment Company and Affiliated Purchasers.
Not applicable.
Item 10. Submission of Matters to a Vote of Security Holders.
There have been no material changes to the procedures by which the shareholders may recommend nominees to the registrant’s board of directors, where those changes were implemented after the registrant last provided disclosure in response to the requirements of Item 407(c)(2)(iv) of Regulation S-K (17 CFR 229.407) (as required by Item 22(b)(15) of Schedule 14A (17 CFR 240.14a-101)), or this Item.
Item 11. Controls and Procedures.
| (a) | | The registrant’s principal executive and principal financial officers, or persons performing similar functions, have concluded that the registrant’s disclosure controls and procedures (as defined in Rule 30a-3(c) under the Investment Company Act of 1940, as amended (the “1940 Act”) (17 CFR 270.30a-3(c))) are effective, as of a date within 90 days of the filing date of the report that includes the disclosure required by this paragraph, based on their evaluation of these controls and procedures required by Rule 30a-3(b) under the 1940 Act (17 CFR 270.30a-3(b)) and Rules 13a-15(b) or 15d-15(b) under the Securities Exchange Act of 1934, as amended (17 CFR 240.13a-15(b) or 240.15d-15(b)). |
| (b) | | There were no changes in the registrant’s internal control over financial reporting (as defined in Rule 30a-3(d) under the 1940 Act (17 CFR 270.30a-3(d)) that occurred during the period covered by this report that has materially affected, or is reasonably likely to materially affect, the registrant’s internal control over financial reporting. |
Item 12. Disclosure of Securities Lending Activities for Closed-End Management Investment Companies.
Not applicable.
Item 13. Exhibits.
SIGNATURES
Pursuant to the requirements of the Securities Exchange Act of 1934 and the Investment Company Act of 1940, the registrant has duly caused this report to be signed on its behalf by the undersigned, thereunto duly authorized.
| (registrant) | | First Trust Variable Insurance Trust |
| By (Signature and Title)* | | /s/ James M. Dykas |
| | | James M. Dykas, President and Chief Executive Officer
(principal executive officer) |
Pursuant to the requirements of the Securities Exchange Act of 1934 and the Investment Company Act of 1940, this report has been signed below by the following persons on behalf of the registrant and in the capacities and on the dates indicated.
| By (Signature and Title)* | | /s/ James M. Dykas |
| | | James M. Dykas, President and Chief Executive Officer
(principal executive officer) |
| By (Signature and Title)* | | /s/ Derek D. Maltbie |
| | | Derek D. Maltbie, Treasurer, Chief Financial Officer
and Chief Accounting Officer
(principal financial officer) |
* Print the name and title of each signing officer under his or her signature.