Exhibit 99.2
Disclaimer This presentation contains forward-looking statements within the meaning of Section 27A of the Securities Act of 1933, as amended, or the Securities Act, and Section 21E of the Securities Exchange Act of 1934, as amended, or the Exchange Act. Such forward-looking statements include, without limitation, statements concerning our business and growth strategies, investment, financing and leasing activities and trends in our business, including trends in the market for long-term, triple-net leases of freestanding, single-tenant properties. Words such as “expects,” “anticipates,” “intends,” “plans,” “likely,” “will,” “believes,” “seeks,” “estimates,” and variations of such words and similar expressions are intended to identify such forward-looking statements. Such statements involve known and unknown risks, uncertainties and other factors which may cause our actual results, performance or achievements to be materially different from the results of operations or plans expressed or implied by such forward-looking statements. Although we believe that the assumptions underlying the forward-looking statements contained herein are reasonable, any of the assumptions could be inaccurate, and therefore such statements included in this presentation may not prove to be accurate. In light of the significant uncertainties inherent in the forward-looking statements included herein, the inclusion of such information should not be regarded as a representation by us or any other person that the results or conditions described in such statements or our objectives and plans will be achieved. Furthermore, actual results may differ materially from those described in the forward-looking statements and may be affected by a variety of risks and factors including, without limitation, the risks described in our Annual Report on Form 10-K for the fiscal year ended December 31, 2017 and subsequent quarterly reports on form 10-Q.Forward-looking statements set forth herein speak only as of the date hereof, and we expressly disclaim any obligation or undertaking to update or revise any forward-looking statement contained herein, to reflect any change in our expectations with regard thereto, or any other change in events, conditions or circumstances on which any such statement is based, except to the extent otherwise required by law.THIS PRESENTATION CONTAINS HISTORICAL PERFORMANCE INFORMATION REGARDING STORE CAPITAL, AS WELL AS OTHER COMPANIES PREVIOUSLY MANAGED BY OUR SENIOR EXECUTIVE TEAM. SUCH PAST PERFORMANCE IS NOT A GUARANTEE OF FUTURE RESULTS.This presentation contains references to our copyrights, trademarks and service marks and to those belonging to other entities. Solely for convenience, copyrights, trademarks, trade names and service marks referred to in this presentation may appear without the “© “ or “TM” OR “sm” Symbols, but such references are not intended to indicate, in any way, that we will not assert, to the fullest extent under applicable law, our rights or the rights of the applicable licensor to these copyrights, trademarks, trade names and service marks. We do not intend our use or display of other companies’ trade names, copyrights, trademarks or service marks to imply a relationship with, or endorsement or sponsorship of us by, any other companies.Definitions and footnotes for data provided herein are provided in the appendix section of this presentation. Unless otherwise indicated, data provided herein is as of June 30, 2018. 2

3 STORE CAPITAL SNAPSHOT 4 VALUES ADDED BY DESIGN (How We Uniquely Built S|T|O|R|E) 5 Our Market. Our Investment Strategy and Customers. Our Approach to Risk. Our Capital Structure. Our Internal Growth. Our Leadership. Our Governance. PERFORMANCE (How We Have Performed) 18 Our Many Key Achievements. Our Portfolio at a Glance. Our High Investment Diversity. Our Contract Quality. Our Investment Pipeline Activity. Our Growth and Performance. Our Comparative Stock Return Profile. Our Many Margins of Safety. APPENDIX (Important Supporting Information) 29 Prior Leadership Investment Performance. Contract Quality Trends. Peer Group Comparisons. Market Value Added Performance. Servicing Case Study. Our Approach to Asset Dispositions. FINANCIAL INFORMATION 42 DEFINITIONS AND FOOTNOTES 51 Table of Contents
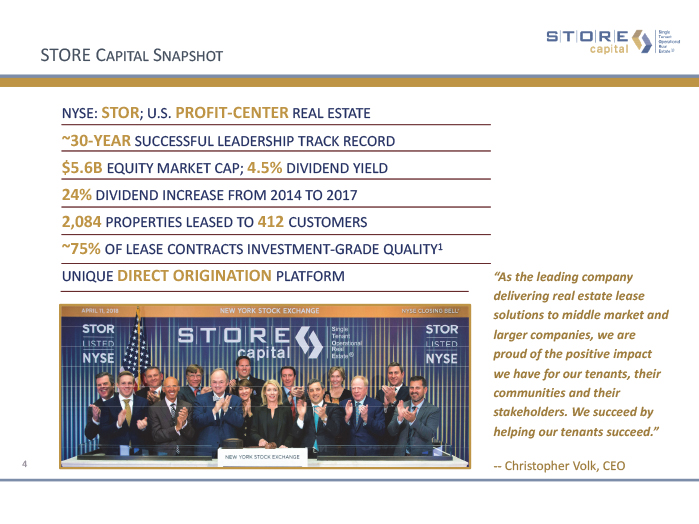
STORE Capital Snapshot NYSE: STOR; U.S. PROFIT-CENTER REAL ESTATE ~30-YEAR SUCCESSFUL LEADERSHIP TRACK RECORD $5.6B EQUITY MARKET CAP; 4.5% DIVIDEND YIELD24% DIVIDEND INCREASE FROM 2014 TO 20172,084 PROPERTIES LEASED TO 412 CUSTOMERS ~75% OF LEASE CONTRACTS INVESTMENT-GRADE QUALITY1 UNIQUE DIRECT ORIGINATION PLATFORM 4 “As the leading company delivering real estate lease solutions to middle market and larger companies, we are proud of the positive impact we have for our tenants, their communities and their stakeholders. We succeed by helping our tenants succeed.” -- Christopher Volk, CEO
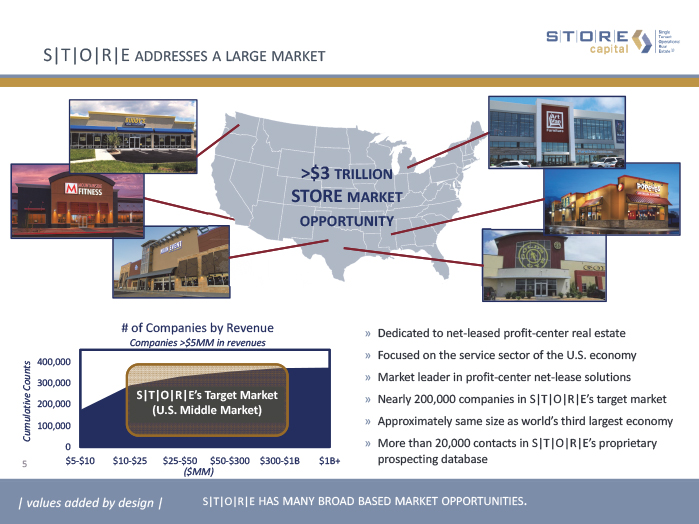
S|T|O|R|E addresses a large market S|T|O|R|E has many broad based market opportunities. >$3 trillionSTORE market opportunity Dedicated to net-leased profit-center real estateFocused on the service sector of the U.S. economyMarket leader in profit-center net-lease solutionsNearly 200,000 companies in S|T|O|R|E’s target marketApproximately same size as world’s third largest economyMore than 20,000 contacts in S|T|O|R|E’s proprietary prospecting database | values added by design | 5 Cumulative Counts ($MM) S|T|O|R|E’s Target Market(U.S. Middle Market)
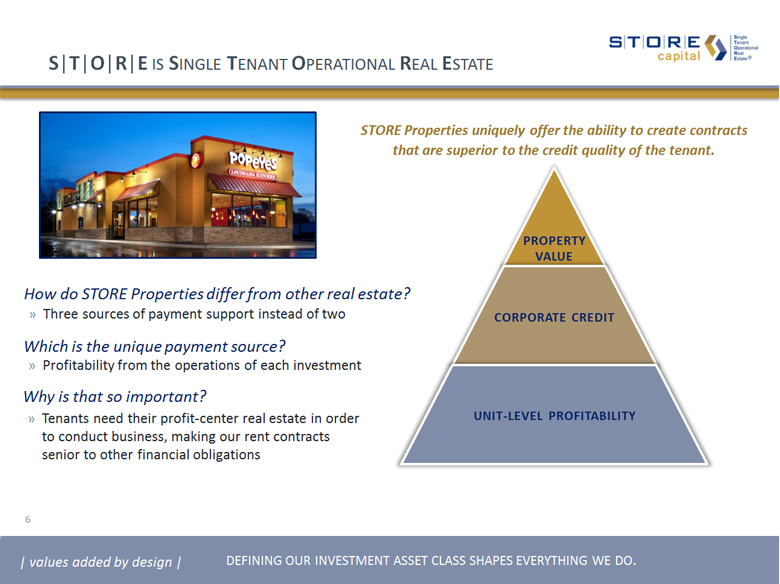
S|T|O|R|E is Single Tenant Operational Real Estate defining our investment asset class shapes everything we do. Why is that so important?Tenants need their profit-center real estate in order to conduct business, making our rent contracts senior to other financial obligations Which is the unique payment source?Profitability from the operations of each investment How do STORE Properties differ from other real estate?Three sources of payment support instead of two PROPERTY VALUE CORPORATE CREDIT UNIT-LEVEL PROFITABILITY | values added by design | STORE Properties uniquely offer the ability to create contracts that are superior to the credit quality of the tenant. 6
Filling A Broad-Based Market Need Rated S|T|O|R|E’s tenants choose to rent because….Long term real estate funding solutions are lackingLeasing real estate replaces both debt and equityLower cost of capitalUnparalleled product flexibility S|T|O|R|E is landlord of choice because….Customer-centric and solutions-orientedAdministrative ease through responsive servicing Development and renovation opportunitiesA focus on corporate flexibility and wealth creation our customers choose to have a landlord rather than a banker. 7 S|T|O|R|E is important and fundamental to creating opportunities for our clients,their employees and other stakeholders What we do is impactful….Year-over-year tenant revenue growth of 15.1%1S|T|O|R|E customers added ~325,000 employees in 20172Exclusive educational event: Inside Track Forum Online educational opportunities: STORE UniversityIntegrated real estate capital: Master Funding Solutions | values added by design |

Internal OwnershipDirect calling efforts on thousands of companies and financial sponsors ~80% ~20% B2B Benefits + Higher Lease Rates+ Lower Real Estate Prices+ Longer Lease Terms+ Smaller Transaction Sizes + Greater Investment Diversity+ Stronger Contracts Our unique platform has multiple origination channels enabling us to efficiently cover a very large market opportunity.All channels result in a B2B approach. our origination platform is key to greater investment returns and lower risk. “B2B” Origination Platform Virtual SalesforceTenant introductions through intermediary relationships = Value for Stockholders 8 | values added by design |
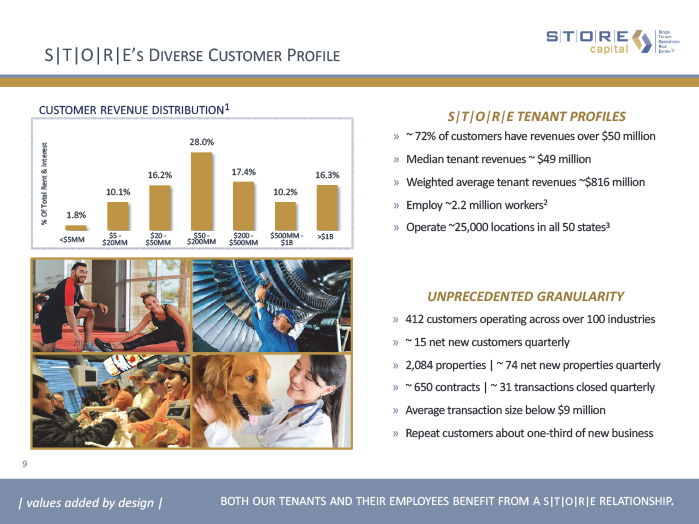
S|T|O|R|E’s Diverse Customer Profile UNPRECEDENTED GRANULARITY customer revenue distribution1 % Of Total Rent & Interest 412 customers operating across over 100 industries~ 15 net new customers quarterly 2,084 properties | ~ 74 net new properties quarterly ~ 650 contracts | ~ 31 transactions closed quarterlyAverage transaction size below $9 millionRepeat customers about one-third of new business <$5MM $5 -$20MM $20 -$50MM $50 -$200MM $200 -$500MM $500MM -$1B >$1B ~ 72% of customers have revenues over $50 millionMedian tenant revenues ~ $49 millionWeighted average tenant revenues ~$816 millionEmploy ~2.2 million workers2Operate ~25,000 locations in all 50 states3 S|T|O|R|E TENANT PROFILES | values added by design | 9 both our tenants and their employees benefit from a S|T|O|R|E relationship.
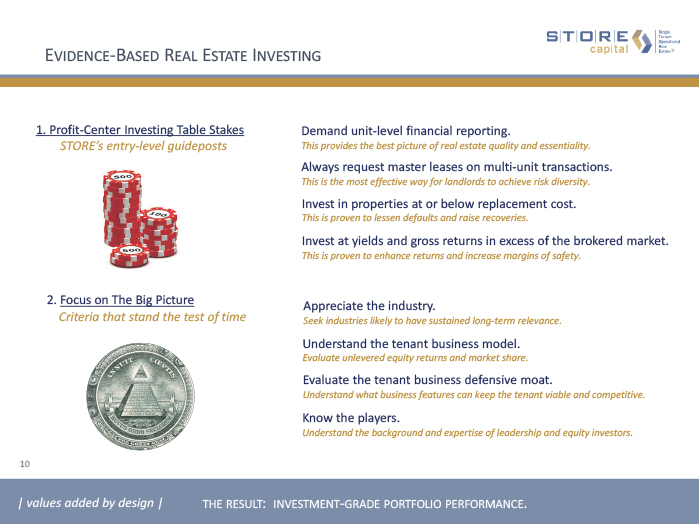
Evidence-Based Real Estate Investing the result: investment-grade portfolio performance. 10 Demand unit-level financial reporting.This provides the best picture of real estate quality and essentiality. Always request master leases on multi-unit transactions.This is the most effective way for landlords to achieve risk diversity. Invest in properties at or below replacement cost.This is proven to lessen defaults and raise recoveries. Invest at yields and gross returns in excess of the brokered market.This is proven to enhance returns and increase margins of safety. Appreciate the industry.Seek industries likely to have sustained long-term relevance. Understand the tenant business model.Evaluate unlevered equity returns and market share. Evaluate the tenant business defensive moat.Understand what business features can keep the tenant viable and competitive. Know the players.Understand the background and expertise of leadership and equity investors. 1. Profit-Center Investing Table Stakes STORE’s entry-level guideposts 2. Focus on The Big Picture Criteria that stand the test of time 10 | values added by design |

Evidence-Based Real Estate Investing 11 3. Numbers and Analysis Know the deal. Evaluate the real estate.Look to local area market rents and estimate recoveries from alternate uses. Evaluate the corporate credit.Assess the corporate credit and know where we stand in capital stack priority. Evaluate unit-level financial performance.Look to long-term unit-level rent coverage reliability. Understand the corporate structure and recourse.Look for parent and affiliate company recourse and potential guarantors. 11 | values added by design | the result: investment-grade portfolio performance.

Capital Structure Leadership an effective capital structure must be established at the outset. ��12 Effective Liquidity Management $600 million unsecured multi-year revolving credit facilityA+ asset-backed and Baa2/BBB unsecured borrowing optionsVirtually all borrowings are long-term and fixed rate Effective Asset/Liability Management Intelligent, laddered investment-grade borrowingsTarget long-term annual debt maturities below 2.5% of assetsMinimize gap between free cash flow1 and debt maturities strategic liability management ($MM) Our structural aim is to have the annual gap between our free cash flow after dividends and our annual debt maturities be 1.5% of assets or less. The smaller the gap, the less sensitive our balance sheet is to changes in interest rates. Median debt maturities 1 4.8% 3.0% 4.2% 3.5% 4.4% 5.1% 5.1% 4.2% 4.4% 4.3% 4.5% N/A Avg Rate 2 | values added by design |

Complementary Investment-Grade Debt Options growing unencumbered asset pool ($MM) STORE Master Funding ($1.5 billion) S&P rated A+Dedicated asset-backed securities conduit Unsecured Term Borrowings ($925 million) our access to multiple borrowing sources optimizes our cost of capital. Moody’s rated Baa2, stable outlookS&P and Fitch Ratings rated BBB, stable outlook Q3 2011 Q2 2018 13 Non-recourse with minimal covenantsComplete portfolio management flexibilityEfficient leverage of 70% at time of issuanceBBB rated notes retained for flexibilityEnables superior unsecured debt ratiosProvides leading term borrowing diversity BBB+/Baa1 Net STORE Unencumbered Select Ratios Lease Average1 Assets2 Debt/EBITDA ~5x 3.9x Unencumbered assets/unsecured debt ~3x 3.7x Debt service coverage ~5x 6.2x Cash flow support from encumbered assets NO YES Investment-grade borrowing diversity with resultant improved unsecured credit metrics. $3.8B $0.3B $2.6B | values added by design | $4.2B $2.6B $0.3B Q4 2018 Target3
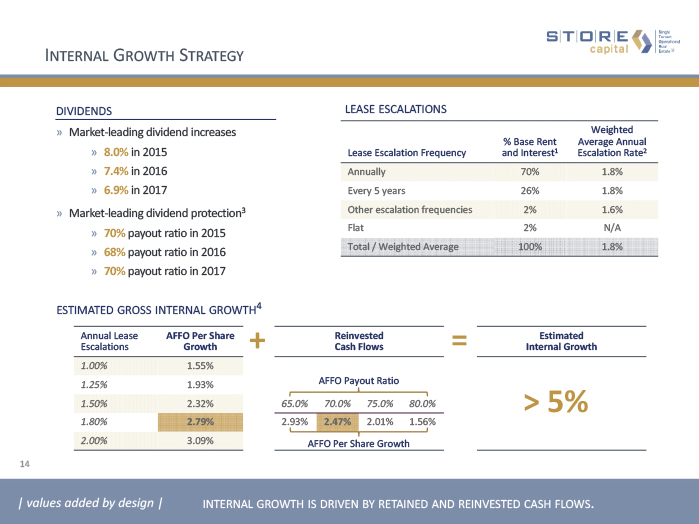
Internal Growth Strategy Lease Escalation Frequency % Base Rent and Interest1 Weighted Average Annual Escalation Rate2 Annually 70% 1.8% Every 5 years 26% 1.8% Other escalation frequencies 2% 1.6% Flat 2% N/A Total / Weighted Average 100% 1.8% lease escalations dividends Market-leading dividend increases 8.0% in 20157.4% in 20166.9% in 2017Market-leading dividend protection370% payout ratio in 201568% payout ratio in 201670% payout ratio in 2017 Annual Lease Escalations AFFO Per Share Growth 1.00% 1.55% 1.25% 1.93% 1.50% 2.32% 1.80% 2.79% 2.00% 3.09% + ReinvestedCash Flows 65.0% 70.0% 75.0% 80.0% 2.93% 2.47% 2.01% 1.56% = EstimatedInternal Growth > 5% internal growth is driven by retained and reinvested cash flows. 14 estimated gross internal growth4 AFFO Payout Ratio AFFO Per Share Growth | values added by design |

Unrivaled Leadership Over Decades Experienced….Built & managed three net-lease real estate investment companiesInvested over $16 billion in profit-center real estate (9,400+ properties)Consistently outperformed broader REIT market returns over multiple decades*Navigated platforms through multiple economic cycles & interest rate environmentsThought leadership through primary and published research Groundbreaking….Investment-grade corporate net-lease rating (1995)Net-lease real estate master trust conduit (2005)NYSE-listed public company sales (2001 & 2007)Private institutional investor sponsorship (1999 & 2011) a progression of innovation and thought leadership over three decades. 15 1980 Q2 2018 > $16 B We have successfully invested and managed more in STORE Properties and over a longer period of time than anyone. 82 employees in one office, ~40% of which drive our origination activity. | values added by design |
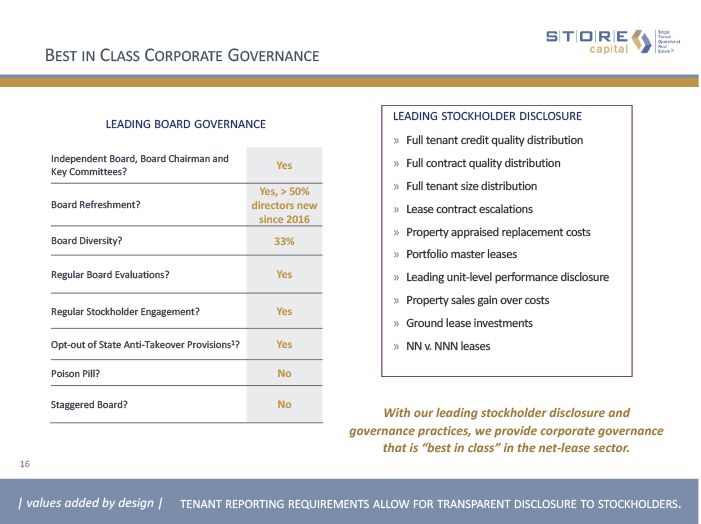
Best in Class Corporate Governance Independent Board, Board Chairman and Key Committees? Yes Board Refreshment? Yes, > 50% directors new since 2016 Board Diversity? 33% Regular Board Evaluations? Yes Regular Stockholder Engagement? Yes Opt-out of State Anti-Takeover Provisions1? Yes Poison Pill? No Staggered Board? No leading board governance leading stockholder disclosure Full tenant credit quality distributionFull contract quality distributionFull tenant size distributionLease contract escalationsProperty appraised replacement costsPortfolio master leasesLeading unit-level performance disclosureProperty sales gain over costsGround lease investmentsNN v. NNN leases With our leading stockholder disclosure and governance practices, we provide corporate governance that is “best in class” in the net-lease sector. | values added by design | 16 tenant reporting requirements allow for transparent disclosure to stockholders.
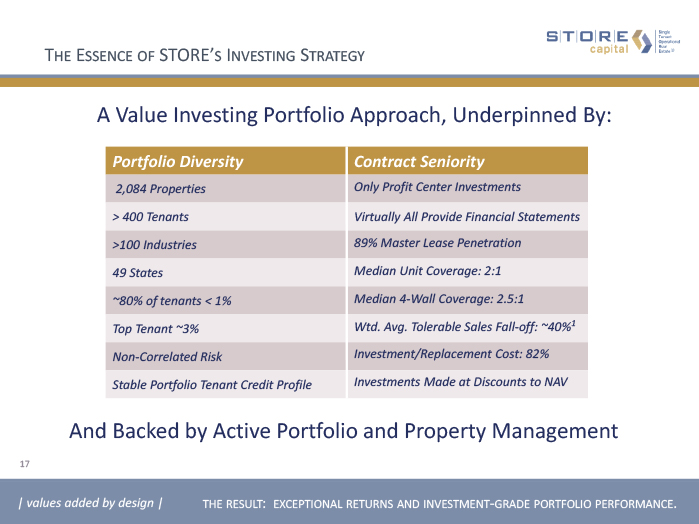
Portfolio Diversity Contract Seniority 2,084 Properties Only Profit Center Investments > 400 Tenants Virtually All Provide Financial Statements >100 Industries 89% Master Lease Penetration 49 States Median Unit Coverage: 2:1 ~80% of tenants < 1% Median 4-Wall Coverage: 2.5:1 Top Tenant ~3% Wtd. Avg. Tolerable Sales Fall-off: ~40%1 Non-Correlated Risk Investment/Replacement Cost: 82% Stable Portfolio Tenant Credit Profile Investments Made at Discounts to NAV The Essence of STORE’s Investing Strategy 17 A Value Investing Portfolio Approach, Underpinned By: 17 | values added by design | the result: exceptional returns and investment-grade portfolio performance. And Backed by Active Portfolio and Property Management

Key Achievements As A Public Company EXCEPTIONAL PERFORMANCEMore than doubled our pipeline of investment opportunities1 to $12 Billion since IPORealized average monthly investment activity in excess of $100 million since 2015.Raised our dividends to shareholders 24% (6.9% in 2017)Delivered AFFO per share growth of ~28%2 Realized compound annual shareholder returns greater than 16% vs. just under 5.9% for Equity REITsCreated exceptional Market Value Added with our equity valuation exceeding equity cost by 28%3 INVESTMENT SAFETYHave been amongst the industry leaders in dividend protection4Have realized approximate A-rated portfolio performance since inception Maintained a consistent real estate occupancy5 level of 99% or betterMARKET RECOGNITIONGarnered investor interest from well-known investors, including Berkshire Hathaway, a 9.8% shareholderAmongst the highest credit ratings relative to our peer group from all three agencies (BBB, BBB, Baa2) | performance | 18

19 Portfolio at a Glance As of June 30, 2018 2017 2016 Investment property locations 2,084 1,770 1,508 States 49 48 48 Customers 412 371 331 Industries in which our customers operate 105 102 95 Proportion of portfolio from direct origination ~80% ~80% ~75% Contracts with STORE-preferred terms*1 93% 92% 90% Weighted average annual lease escalation2 1.8% 1.8% 1.7% Weighted average remaining lease contract term ~14 years ~14 years ~14 years Occupancy3 99.7% 99.5% 99.8% Properties not operating but subject to a lease4 20 13 7 Investment locations subject to a ground lease 20 18 15 Investment portfolio subject to NNN leases* 98% 97% 97% Investment portfolio subject to Master Leases*5 89% 86% 80% Average investment amount / replacement cost (new)6 82% 82% 82% Locations subject to unit-level financial reporting 97% 97% 97% Median unit FCCR / 4-wall FCCR7 2.0x / 2.5x 2.1x / 2.6x 2.2x / 2.6x Contracts rated investment grade8 ~75% ~75% ~75% | performance | industry leading growth and portfolio consistency.

Diversification Across Industry Groups Building % Base Rent and Interest1 # ofProperties Sq. Ft. (in thousands) As of June 30, Customer Industry Groups 2018 2017 2016 Restaurants – Full Service 410 2,743 12.8% 13.7% 14.5% Restaurants – Limited Service 411 1,084 6.8% 7.9% 9.0% Early Childhood Education 176 1,912 6.0% 7.1% 7.6% Movie Theaters 39 1,916 5.6% 6.6% 7.2% Health Clubs 71 1,985 5.5% 5.6% 6.2% Family Entertainment 34 1,082 4.1% 3.8% 4.0% Automotive Repair and Maintenance 121 568 3.8% 2.7% 2.2% Pet Care 139 1,382 3.5% 2.9% 1.9% Medical and Dental 56 552 2.2% 1.5% 0.9% Lumber & Construction Materials Wholesalers 53 2,541 1.9% 1.4% 0.1% Career Education 7 584 1.8% 2.1% 2.4% Behavioral Health 32 462 1.7% 1.9% 1.3% Elementary and Secondary Schools 6 222 1.4% 1.5% 1.5% Equipment Sales and Leasing 18 570 1.3% 1.5% 1.2% Wholesale Automobile Auction 6 224 1.1% 1.2% 0.7% Consumer Goods Rental 44 593 1.0% 1.1% 1.0% All Other Service (20 industry groups) 92 4,438 5.6% 6.6% 7.9% Total Service 1,715 22,858 66.1% 69.1% 69.6% SERVICE (~66%) Located near target customers Not readily available onlineBroad array of everyday services As of June 30, 2018, our portfolio is diversified across 105 different industries in the service, retail and manufacturing sectors of the U.S. economy. We group these industries into 75 different industry groups as shown in the following tables. 20 | performance | service industries account for more than half of the u.s. employment and gdp.

Diversification Across Industry Groups (continued) 21 Building % Base Rent and Interest1 # ofProperties Sq. Ft. (in thousands) As of June 30, Customer Industry Groups 2018 2017 2016 Furniture 55 3,316 6.4% 6.7% 4.0% Farm and Ranch Supply 24 2,048 3.3% 3.2% 3.3% Hunting and Fishing 17 1,292 3.0% 1.9% 2.4% Recreational Vehicle Dealers 10 259 1.0% 1.1% 1.2% Home Furnishings 5 691 0.9% 1.0% 1.3% Used Car Dealers 17 212 0.7% 0.6% 0.3% Electronics and Appliances 7 331 0.7% 0.8% 1.0% All Other Retail (10 industry groups) 47 1,857 2.0% 2.1% 3.4% Total Retail 182 10,006 18.0% 17.4% 16.9% Metal Fabrication 54 5,922 4.0% 3.5% 3.3% Plastic and Rubber Products 32 3,997 2.9% 2.8% 2.3% Furniture Manufacturing 4 1,385 1.0% 0.0% 0.0% Aerospace Product and Parts 10 952 0.9% 0.4% 0.2% Medical and Pharmaceutical 6 431 0.8% 0.9% 0.8% Electronics Equipment 6 664 0.7% 0.8% 0.6% Paper and Packaging 6 969 0.7% 0.8% 0.6% All Other Manufacturing (15 industry groups) 69 6,163 4.9% 4.3% 5.7% Total Manufacturing 187 20,483 15.9% 13.5% 13.5% Total Portfolio 2,084 53,347 100.0% 100.0% 100.0% RETAIL MANUFACTURING Primarily located in industrial parksStrategically near customersBroad array of industriesMaking everyday necessities (~16%) Located in retail corridorsInternet resistantHigh experiential component (~18%) | performance | S|T|O|R|E’s retail exposure has high experiential component.

22 Top 10 Customers1 AMC Entertainment (NYSE:AMC), is the largest movie exhibition company in the world with over 1,000 theatres and 11,000 screens across the globe, AMC operates among the most productive theatres in the United States’ top markets, having the #1 or #2 market share positions in 22 of the 25 largest metropolitan areas of the United States, including the top three markets (NY, LA, Chicago). Cadence Education is a Morgan Stanley Global private equity owned company and is one of the premier early childhood educators in the U.S. The Company’s national platform of more than 170 schools has the capacity to serve more than 20,000 students across 21 states. Mills Fleet Farm is a full-service merchant with more than 37 locations in four mid-western states, offering a broad assortment of goods from hunting gear to lawn, garden and farm supplies. In 2016 Mills was purchased by the private equity firm KKR & Co. Zips Holdings is the second largest car wash operator in the US with 112 locations in operation. In 2015, founder Brett Overman partnered with Equity Investment Group and Britton Hill Partners to help identify acquisition opportunities and provide management support for onboarding operations at new units. % Base Rent and Interest2 3.3% 2.4% 2.0% 2.3% 1.8% 1.6% 1.7% 1.4% 1.5% 1.2% 19.2% Total Top 10 Customers Art Van Furniture is the Midwest’s largest furniture retailer and a top ten national furniture retailer based on sales. Founded in 1959, the company operates approximately 176 stores throughout nine states with expected annual sales of $1.3 billion. Art Van Furniture is majority owned by Boston based private equity firm Thomas H. Lee Partners. CWGS Group, dba Camping World, is the nation’s largest retailer of recreational vehicles and related accessories, operating over 140 locations. In 2017, Camping World won a bankruptcy auction to acquire sporting goods retailer Gander Mountain, planning to build on its existing outdoor and camping brand. The Gander Mountain moniker was rebranded to Gander Outdoors. National Veterinary Associates is a consolidator and operator of animal hospitals, clinics and veterinary practices with over 550 hospitals and boarding facilities in the US and Canada. Private equity firm Ares Management acquired the business in 2014. # ofProperties 24 9 14 8 32 37 41 16 43 16 240 Bass Pro Group operates retail locations under the Bass Pro Shops and Cabela’s monikers, offering outdoor gear and apparel in an immersive setting. These two iconic brands, combined, operate more than 180 retail and marine centers. Both concepts are market leaders and highly respected within their respective niche of outdoor products.. U.S. LBM Holdings, founded in 2009, is a collection of leading building material distributors across 29 states with more than 230 locations. The company serves as a critical link in the building materials supply chain, supplying more than 60,000 stock keeping units (“SKUs”) for custom homebuilders and specialty contractors. US LBM has filed an S-1 with the SEC as it intends to raise additional equity from an IPO. Proceeds from the IPO are expected to payoff outstanding indebtedness under its Second Lien Term Loan. Dufresne Spencer Group is the largest Ashley’s Furniture HomeStore licensee. DSG entered our top 10 with their ownership of Hill Country Holdings, another existing STORE customer and a top Ashley licensee. DSG is backed by a seasoned management team with a strong operating history and garnered an investment from Ashley Corporate in December 2017. | performance | top ten tenants represent less than 19% of annual rent & interest.

Diversification Across Geographies1 23 OCCUPANCY2 | performance | geographically dispersed portfolio with consistently high occupancy rates.
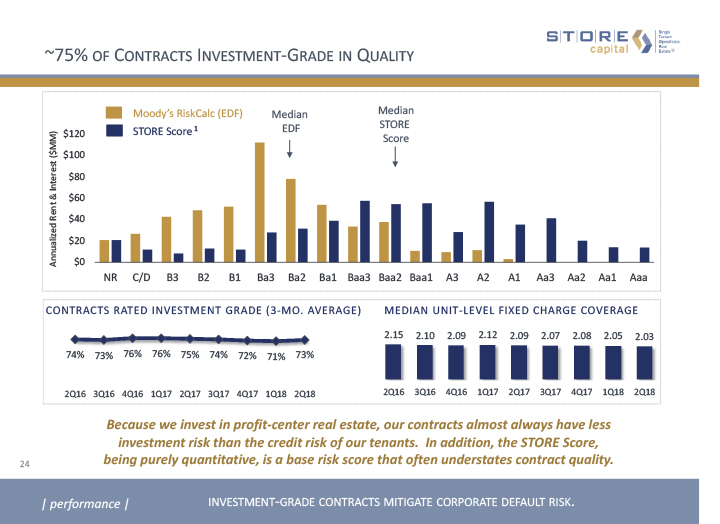
~75% of Contracts Investment-Grade in Quality Because we invest in profit-center real estate, our contracts almost always have less investment risk than the credit risk of our tenants. In addition, the STORE Score, being purely quantitative, is a base risk score that often understates contract quality. Moody’s RiskCalc (EDF) STORE Score 1 24 CONTRACTS RATED INVESTMENT GRADE (3-MO. AVERAGE) MEDIAN UNIT-LEVEL FIXED CHARGE COVERAGE Median EDF MedianSTORE Score investment-grade contracts mitigate corporate default risk. | performance |

25 Investment Pipeline Activity PIPELINE VELOCITY DURING Q2 2018 PIPELINE SECTOR DISTRIBUTION AS OF 6/30/18 PIPELINE SIZE ($B) Starting Pipeline $12.3 B Ending Pipeline $12.6 B New Deals Added $3.8 B Deals Passed or Closed $3.5 B Our pipeline continues to mirror STORE’s current portfolio. Emphasis on Service, Manufacturing and Select Retail sectors having high potential for long-term relevance | performance | S|T|O|R|E’s pipeline remains robust and diverse.

26 NOI, AFFO AND NET INCOME ($MM)2 Growth and Performance | performance | PER SHARE ANNUAL GROWTH NET INCOME:13.8% DIVIDENDS:6.6% AFFO:7.2% Average Annual Growth Rate ACQUISITION AND DISPOSITION VOLUME ($MM)1 GROSS RATE OF RETURN 3 5.6% 5.3% 5.4% 5.6% 4.4% 4.1% 3.6% 8.1% 7.9% 7.8% 9.8% 9.7% 9.6% 9.6% 7.8% 3.7% S|T|O|R|E has consistently performed year over year. 4.5% 7.9% 9.7%

Total Return Built on Both Yield & Growth | performance | 27 500 companies 29 companies(6%) 5 companies(1%) Only 1% of companies in the S&P 500 have S|T|O|R|E’s combination of dividend yield and EPS growth offering a superior investment opportunity. 139% Price-to-Total Return Discount S&P 500 INDEX2 S&P Multiple 24.2 x Dividend Yield 1.8% LTM EPS Growth 7.7% Total Return 9.5% PEGY 2.5 x STORE CAPITAL AFFO Multiple 16.0 x Dividend Yield 4.5% LTM AFFO Growth Rate 4.3% Total Return 8.8% STOR PEGY 1.8 x attractive total return relative to the broader market.
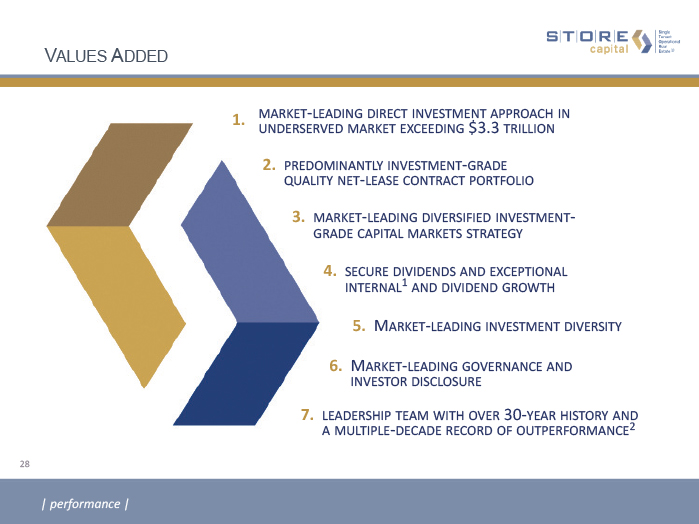
Values Added market-leading direct investment approach in underserved market exceeding $3.3 trillion 1. predominantly investment-grade quality net-lease contract portfolio 2. market-leading diversified investment-grade capital markets strategy 3. secure dividends and exceptional internal1 and dividend growth 4. Market-leading investment diversity 5. leadership team with over 30-year history and a multiple-decade record of outperformance2 7. | performance | 28 Market-leading governance and investor disclosure 6.

Appendix
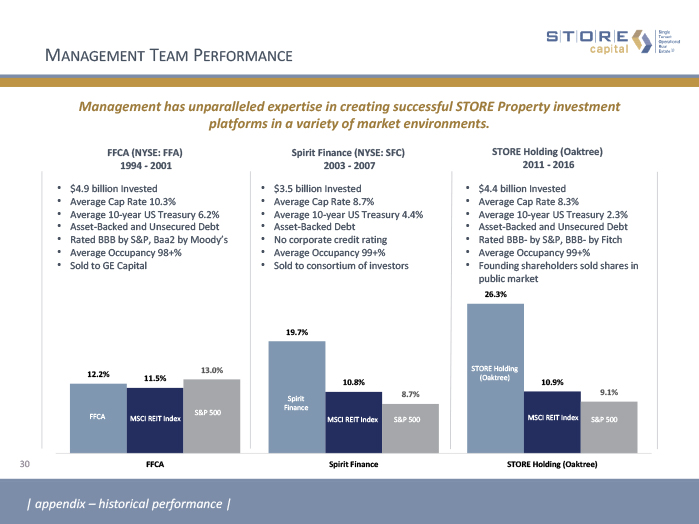
FFCA (NYSE: FFA) 1994 - 2001 Spirit Finance (NYSE: SFC) 2003 - 2007 STORE Holding (Oaktree) 2011 - 2016 Management Team Performance | appendix – historical performance | Management has unparalleled expertise in creating successful STORE Property investment platforms in a variety of market environments. 30 $4.9 billion Invested Average Cap Rate 10.3%Average 10-year US Treasury 6.2%Asset-Backed and Unsecured DebtRated BBB by S&P, Baa2 by Moody’sAverage Occupancy 98+%Sold to GE Capital $3.5 billion InvestedAverage Cap Rate 8.7%Average 10-year US Treasury 4.4%Asset-Backed DebtNo corporate credit ratingAverage Occupancy 99+%Sold to consortium of investors $4.4 billion InvestedAverage Cap Rate 8.3%Average 10-year US Treasury 2.3%Asset-Backed and Unsecured DebtRated BBB- by S&P, BBB- by FitchAverage Occupancy 99+%Founding shareholders sold shares in public market

31 1994 2017 Stable and Attractive Lease Rates and Risk-Adjusted Returns Excess Return relative to Market Risk 2 | appendix – historical performance | S|T|O|R|E and predecessors’ average Lease Rates vs. 10-Year Treasuries 3.9% 2.0% ÷ Δ = .51 23-Year Interest Rate Correlation (Cap Rate) (Treasury)
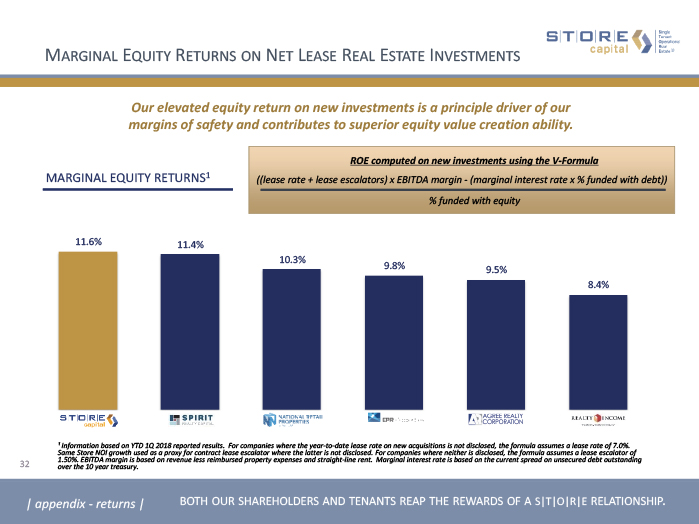
¹ Information based on YTD 1Q 2018 reported results. For companies where the year-to-date lease rate on new acquisitions is not disclosed, the formula assumes a lease rate of 7.0%. Same Store NOI growth used as a proxy for contract lease escalator where the latter is not disclosed. For companies where neither is disclosed, the formula assumes a lease escalator of 1.50%. EBITDA margin is based on revenue less reimbursed property expenses and straight-line rent. Marginal interest rate is based on the current spread on unsecured debt outstanding over the 10 year treasury. | appendix - returns | Our elevated equity return on new investments is a principle driver of our margins of safety and contributes to superior equity value creation ability. Marginal Equity Returns on Net Lease Real Estate Investments 32 Marginal Equity RETURNS1 ((lease rate + lease escalators) x EBITDA margin - (marginal interest rate x % funded with debt)) % funded with equity ROE computed on new investments using the V-Formula both our shareholders and tenants reap the rewards of a S|T|O|R|E relationship.

| appendix - returns | 33 ADCONNNEPRSRC GROSS Cap Rate SPREAD over the cost of debt1 MVA Growth Rate2 CURRENT AFFO Multiple3 S|T|O|R|E S|T|O|R|E S|T|O|R|E Elevated gross cap rates and EBITDA margins have contributed to higher equity rates of return, leading to a higher spread between shareholder historic cost and market valuation, or Market Value Added (MVA). SRCEPRNNNO ADC ¹ For the YTD period ended March 31, 2018. Gross cap is Initial cap rate on new acquisitions plus contract bumps. For companies where the year-to-date lease rate on new acquisitions is not disclosed, the formula assumes a lease rate of 7.0%. Same Store NOI growth used as a proxy for contract lease escalator where the latter is not disclosed. For companies where neither is disclosed, the formula assumes a lease escalator of 1.50%. Cost of debt is the current spread on unsecured debt outstanding over the 10 year treasury.2 Calculated using the formula: [market capitalization / computed equity cost]^(1 / weighted average age of equity) 3 Calculated as of March 29, 2018 SRCADCNNNEPRO Comparative Value Creation S|T|O|R|E vs. Peers
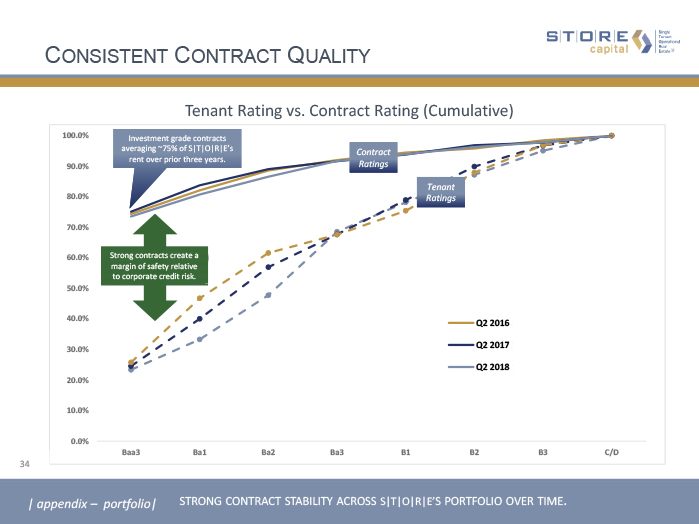
Consistent Contract Quality 34 Investment grade contracts averaging ~75% of S|T|O|R|E’s rent over prior three years. Tenant Rating vs. Contract Rating (Cumulative) Strong contracts create a margin of safety relative to corporate credit risk. Contract Ratings | appendix – portfolio| Tenant Ratings strong contract stability across S|T|O|R|E’s portfolio over time.
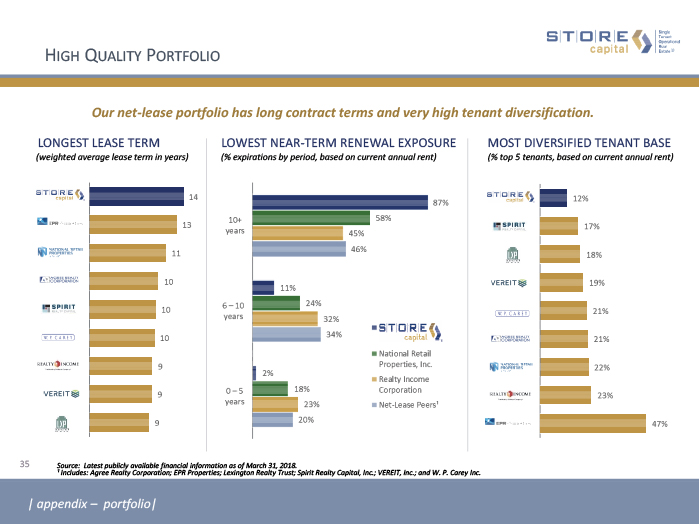
Most Diversified Tenant Base Source: Latest publicly available financial information as of March 31, 2018. ¹ Includes: Agree Realty Corporation; EPR Properties; Lexington Realty Trust; Spirit Realty Capital, Inc.; VEREIT, Inc.; and W. P. Carey Inc. (weighted average lease term in years) Longest Lease Term Lowest Near-Term Renewal Exposure (% top 5 tenants, based on current annual rent) (% expirations by period, based on current annual rent) Our net-lease portfolio has long contract terms and very high tenant diversification. High Quality Portfolio 35 | appendix – portfolio|
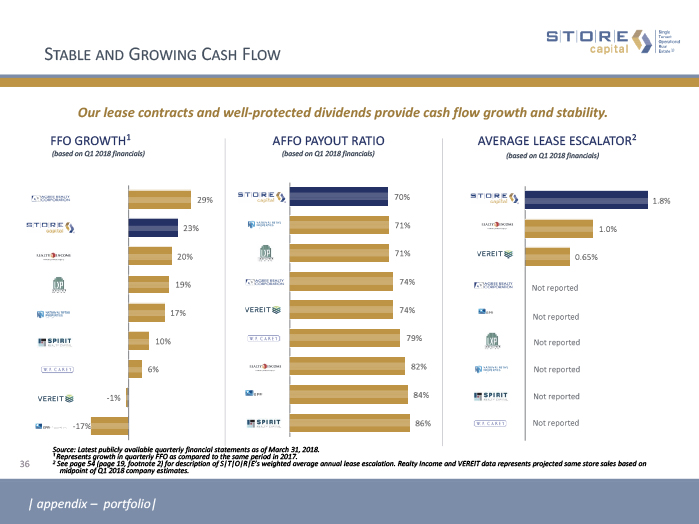
ffo growth1 Average Lease escalator2 Source: Latest publicly available quarterly financial statements as of March 31, 2018. ¹ Represents growth in quarterly FFO as compared to the same period in 2017.2 See page 54 (page 19, footnote 2) for description of S|T|O|R|E’s weighted average annual lease escalation. Realty Income and VEREIT data represents projected same store sales based on midpoint of Q1 2018 company estimates. (based on Q1 2018 financials) affo payout ratio (based on Q1 2018 financials) Stable and Growing Cash Flow Our lease contracts and well-protected dividends provide cash flow growth and stability. 36 (based on Q1 2018 financials) | appendix – portfolio|

Case Study: National Restaurant Chain Bankruptcy Investment Overview National restaurant chain that operated over 200 stores.At the time of S|T|O|R|E’s investment: Moody’s RiskCalc EDF – B3Acquired two properties subject to existing individual leases as part of a diversified portfolio acquisition.S|T|O|R|E proactively sold one of the locations due to underperformance for a 14% gain on investmentSubsequently acquired eight properties in a direct sale leaseback with the company.15-year master lease with annual rent escalations of 2%Average sales of almost $3.0 million and a master lease FCC of 2.3x (STORE Score – Baa3) investment risk is governed by the quality of the lease contract. Bankruptcy & Result Tenant filed for bankruptcy protection.Tenant exited bankruptcy after a few months.Closed 34 storesNegotiated $4.0 million in rent savings Converted $300 million in debt to equity S|T|O|R|E’s master lease was assumed in bankruptcy.No modification to master leaseLease payments brought current.Limited rent reduction (13%) on the individual lease. 100% recovery on the eight unit master leaseFollowing the restructure, S|T|O|R|E sold the unit that was on the individual lease for a 9.0% gain on investment. Therefore, after the acceptance of S|T|O|R|E’s master lease in full and the disposition of the individual lease for a gain, the final recovery was over 100%. Tenant Moody’s RiskCalc EDF MasterLeaseSTOREScore 37 IndividualLeaseSTOREScore | appendix – portfolio|

Value Added Through Portfolio Management we seek embedded gains in each asset we buy. | appendix – portfolio| Opportunistic Sales(~40% of Sales) Property Management(~35% of Sales) Net Gains over Cost StrategicSales(~25% of Sales) + - = 5.0% of the Portfolio was Sold in 2017Opportunistic Sales were sold at > 160 bps spread over the marketStrategic Sales were sold at > 80 bps spread over the marketWe recovered 91% on Property Management Sales Active portfolio management is a strong complement to our property management activity to minimize portfolio investment risk +21% +8% (9%) +5% 38

39 Internal Growth in Perspective Attractive internal growth components based on more than $6.5 billion of investments over 6.5 years Ave. Property Sales 0.8 %Ave. Gains Over Cost ~12% PORTFOLIO MANAGEMENTAbility to realize gains Recycled Gains +0.1 % | appendix – portfolio| margins of safety, investment-grade performance and built-in growth. Annual RentIncrease +1.8 %ReinvestedCash Flow1 +1.8 % INTERNAL GROWTHGrowth by design Base Int. Growth +3.6 % Gross Shareholder Internal Growth >5% +3.6% (0.2%) +0.1% (0.4%) PROPERTY MANAGEMENTWork in Process (WIP) WIP Drag (0.4)% WIP (0.4)%(Added drag from unresolved credit events) 3.1% Gross Shareholder Internal Growth >5% Growth Adjusted for Equity Capitalization (~58% at cost) Gross Int. Growth2 3.1% ResolvedCredit Events (0.8)%Recovery (~70%) +0.6 % PROPERTY MANAGEMENTAbility to manage losses Net Credit Loss (0.2)%
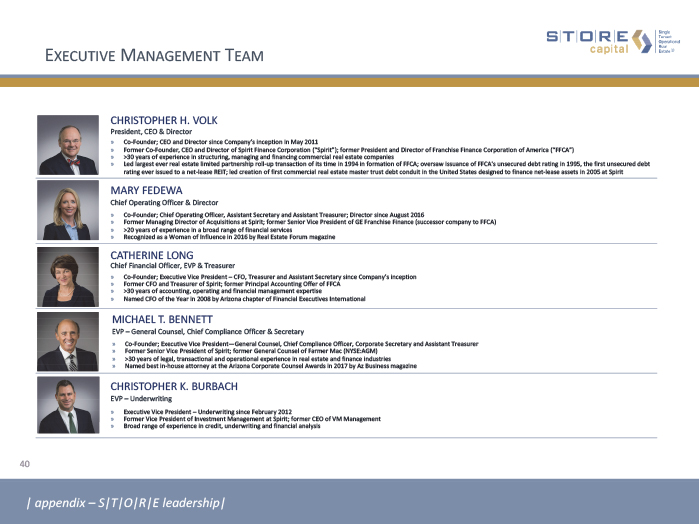
40 Executive Management Team | appendix – S|T|O|R|E leadership| MARY FEDEWAChief Operating Officer & DirectorCo-Founder; Chief Operating Officer, Assistant Secretary and Assistant Treasurer; Director since August 2016Former Managing Director of Acquisitions at Spirit; former Senior Vice President of GE Franchise Finance (successor company to FFCA)>20 years of experience in a broad range of financial servicesRecognized as a Woman of Influence in 2016 by Real Estate Forum magazine CHRISTOPHER H. VOLKPresident, CEO & DirectorCo-Founder; CEO and Director since Company’s inception in May 2011Former Co-Founder, CEO and Director of Spirit Finance Corporation (“Spirit”); former President and Director of Franchise Finance Corporation of America (“FFCA”)>30 years of experience in structuring, managing and financing commercial real estate companiesLed largest ever real estate limited partnership roll-up transaction of its time in 1994 in formation of FFCA; oversaw issuance of FFCA's unsecured debt rating in 1995, the first unsecured debt rating ever issued to a net-lease REIT; led creation of first commercial real estate master trust debt conduit in the United States designed to finance net-lease assets in 2005 at Spirit CATHERINE LONGChief Financial Officer, EVP & TreasurerCo-Founder; Executive Vice President – CFO, Treasurer and Assistant Secretary since Company’s inceptionFormer CFO and Treasurer of Spirit; former Principal Accounting Offer of FFCA>30 years of accounting, operating and financial management expertise Named CFO of the Year in 2008 by Arizona chapter of Financial Executives International CHRISTOPHER K. BURBACHEVP – UnderwritingExecutive Vice President – Underwriting since February 2012Former Vice President of Investment Management at Spirit; former CEO of VM ManagementBroad range of experience in credit, underwriting and financial analysis MICHAEL T. BENNETTEVP – General Counsel, Chief Compliance Officer & SecretaryCo-Founder; Executive Vice President—General Counsel, Chief Compliance Officer, Corporate Secretary and Assistant TreasurerFormer Senior Vice President of Spirit; former General Counsel of Farmer Mac (NYSE:AGM)>30 years of legal, transactional and operational experience in real estate and finance industriesNamed best in-house attorney at the Arizona Corporate Counsel Awards in 2017 by Az Business magazine

41 Board of Directors MORTON H. FLEISCHERChairmanChairman since inception in May 2011. Former Co-Founder and Chairman of Spirit and FFCA MARY FEDEWAChief Operating Officer & DirectorCo-Founder of S|T|O|R|E; COO since September 2017 (previously EVP – Acquisitions since inception in May 2011); Director since 2016 William F. HippDirectorDirector since 2016. Former head of real estate for Key Bank, BankBoston and FleetBoston with over 35 years in commercial banking Einar A. SeadlerDirectorDirector since 2016. Founder and President of EAS Advisors LLC; Former Managing Director of Accenture Strategy Joseph M. DonovanDirectorDirector since 2014. Chairman of Fly Leasing Limited (NYSE: FLY) Mark N. SklarDirectorDirector since August 2016. Founding partner and Director of DMB and its affiliated companies Quentin P. Smith, JrDirectorDirector since 2014. Founder and President of Cadre Business Advisors LLC; Director of Banner Health System CHRISTOPHER H. VOLKChief Executive Officer & DirectorCo-Founder of S|T|O|R|E; CEO and Director since inception in May 2011. Former Co-Founder, CEO and Director of Spirit and President and Director of FFCA Catherine D. riceDirectorDirector since October 2017. Former Senior Managing Director and CFO of W.P. Carey; Partner at Parmenter Realty Partners | appendix – S|T|O|R|E leadership|
Financial Information
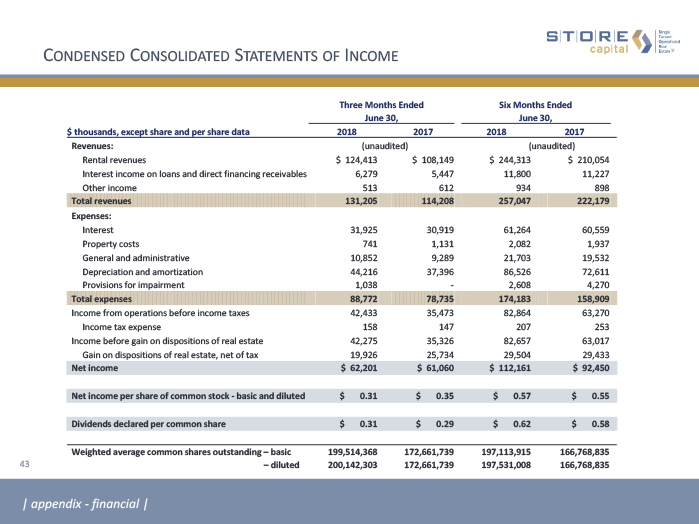
43 Condensed Consolidated Statements of Income Three Months Ended Six Months Ended June 30, June 30, $ thousands, except share and per share data 2018 2017 2018 2017 Revenues: (unaudited) (unaudited) Rental revenues $ 124,413 $ 108,149 $ 244,313 $ 210,054 Interest income on loans and direct financing receivables 6,279 5,447 11,800 11,227 Other income 513 612 934 898 Total revenues 131,205 114,208 257,047 222,179 Expenses: Interest 31,925 30,919 61,264 60,559 Property costs 741 1,131 2,082 1,937 General and administrative 10,852 9,289 21,703 19,532 Depreciation and amortization 44,216 37,396 86,526 72,611 Provisions for impairment 1,038 - 2,608 4,270 Total expenses 88,772 78,735 174,183 158,909 Income from operations before income taxes 42,433 35,473 82,864 63,270 Income tax expense 158 147 207 253 Income before gain on dispositions of real estate 42,275 35,326 82,657 63,017 Gain on dispositions of real estate, net of tax 19,926 25,734 29,504 29,433 Net income $ 62,201 $ 61,060 $ 112,161 $ 92,450 Net income per share of common stock - basic and diluted $ 0.31 $ 0.35 $ 0.57 $ 0.55 Dividends declared per common share $ 0.31 $ 0.29 $ 0.62 $ 0.58 Weighted average common shares outstanding – basic 199,514,368 172,661,739 197,113,915 166,768,835 – diluted 200,142,303 172,661,739 197,531,008 166,768,835 | appendix - financial |
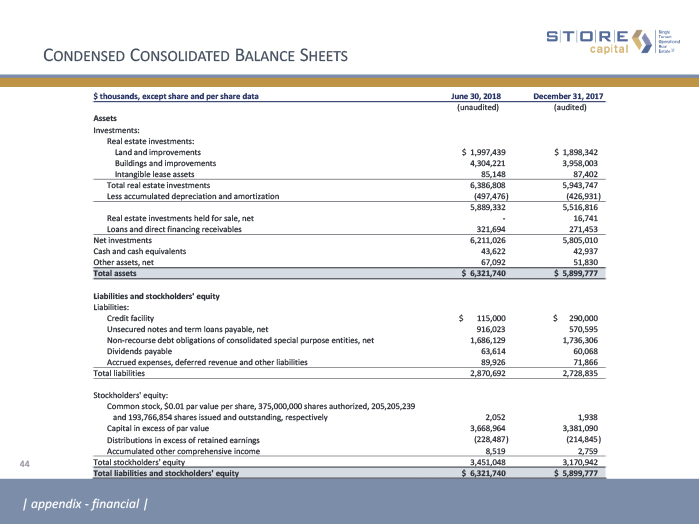
Condensed Consolidated Balance Sheets $ thousands, except share and per share data June 30, 2018 December 31, 2017 (unaudited) (audited) Assets Investments: Real estate investments: Land and improvements $ 1,997,439 $ 1,898,342 Buildings and improvements 4,304,221 3,958,003 Intangible lease assets 85,148 87,402 Total real estate investments 6,386,808 5,943,747 Less accumulated depreciation and amortization (497,476 ) (426,931 ) 5,889,332 5,516,816 Real estate investments held for sale, net - 16,741 Loans and direct financing receivables 321,694 271,453 Net investments 6,211,026 5,805,010 Cash and cash equivalents 43,622 42,937 Other assets, net 67,092 51,830 Total assets $ 6,321,740 $ 5,899,777 Liabilities and stockholders' equity Liabilities: Credit facility $ 115,000 $ 290,000 Unsecured notes and term loans payable, net 916,023 570,595 Non-recourse debt obligations of consolidated special purpose entities, net 1,686,129 1,736,306 Dividends payable 63,614 60,068 Accrued expenses, deferred revenue and other liabilities 89,926 71,866 Total liabilities 2,870,692 2,728,835 Stockholders' equity: Common stock, $0.01 par value per share, 375,000,000 shares authorized, 205,205,239 and 193,766,854 shares issued and outstanding, respectively 2,052 1,938 Capital in excess of par value 3,668,964 3,381,090 Distributions in excess of retained earnings (228,487 ) (214,845 ) Accumulated other comprehensive income 8,519 2,759 Total stockholders' equity 3,451,048 3,170,942 Total liabilities and stockholders' equity $ 6,321,740 $ 5,899,777 44 | appendix - financial |
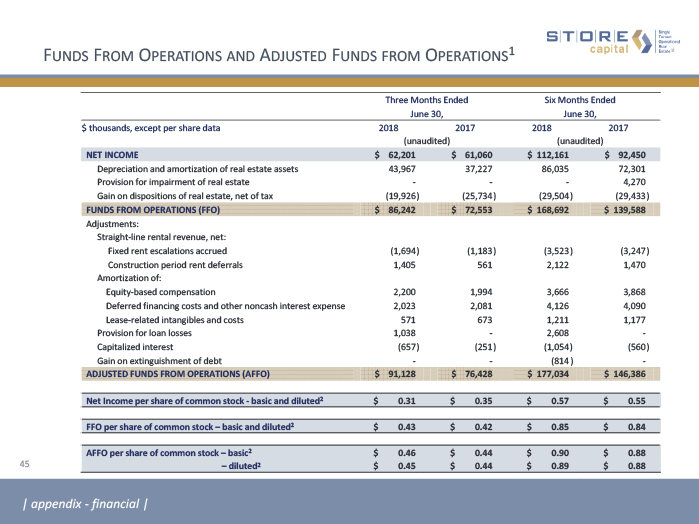
Funds From Operations and Adjusted Funds from Operations1 Three Months Ended Six Months Ended June 30, June 30, $ thousands, except per share data 2018 2017 2018 2017 (unaudited) (unaudited) NET INCOME $ 62,201 $ 61,060 $ 112,161 $ 92,450 Depreciation and amortization of real estate assets 43,967 37,227 86,035 72,301 Provision for impairment of real estate - - - 4,270 Gain on dispositions of real estate, net of tax (19,926 ) (25,734 ) (29,504 ) (29,433 ) FUNDS FROM OPERATIONS (FFO) $ 86,242 $ 72,553 $ 168,692 $ 139,588 Adjustments: Straight-line rental revenue, net: Fixed rent escalations accrued (1,694 ) (1,183 ) (3,523 ) (3,247 ) Construction period rent deferrals 1,405 561 2,122 1,470 Amortization of: Equity-based compensation 2,200 1,994 3,666 3,868 Deferred financing costs and other noncash interest expense 2,023 2,081 4,126 4,090 Lease-related intangibles and costs 571 673 1,211 1,177 Provision for loan losses 1,038 - 2,608 - Capitalized interest (657 ) (251 ) (1,054 ) (560 ) Gain on extinguishment of debt - - (814 ) - ADJUSTED FUNDS FROM OPERATIONS (AFFO) $ 91,128 $ 76,428 $ 177,034 $ 146,386 Net Income per share of common stock - basic and diluted2 $ 0.31 $ 0.35 $ 0.57 $ 0.55 FFO per share of common stock – basic and diluted2 $ 0.43 $ 0.42 $ 0.85 $ 0.84 AFFO per share of common stock – basic2 $ 0.46 $ 0.44 $ 0.90 $ 0.88 – diluted2 $ 0.45 $ 0.44 $ 0.89 $ 0.88 45 | appendix - financial |

GAAP Reconciliations: Net Income to FFO and AFFO 46 Year Ended Six Months Ended December 31, June 30, $ millions 2015 2016 2017 2017 2018 NET INCOME $ 83.8 $ 123.3 $ 162.0 $ 92.4 $ 112.2 Depreciation and amortization of real estate assets 88.3 119.1 149.6 72.3 86.0 Provision for impairment of real estate 1.0 1.7 11.9 4.3 - Gain on dispositions of real estate, net of tax (1.3) (13.2) (39.6) (29.4) (29.5) FUNDS FROM OPERATIONS (FFO) $ 171.7 $ 230.9 $ 283.9 $ 139.6 $ 168.7 Adjustments: Straight-line rental revenue, net: Fixed rent escalations accrued (4.8) (5.5) (6.4) (3.2) (3.5) Construction period rent deferrals 2.7 3.1 3.1 1.5 2.1 Transaction costs 1.2 0.5 - - - Amortization of: Equity-based compensation 4.7 7.0 7.9 3.9 3.7 Deferred financing costs and other noncash interest expense 6.5 7.3 10.0 4.1 4.1 Lease-related intangibles and costs 2.1 2.5 7.0 1.2 1.2 Provision for loan losses - - 1.5 - 2.6 Capitalized interest (0.8) (0.8) (1.2) (0.6) (1.1) Accrued severance costs - - 0.3 - - Selling stockholder costs - 0.8 - - - Gain on extinguishment of debt - - - - (0.8) ADJUSTED FUNDS FROM OPERATIONS (AFFO) $ 183.5 $ 245.8 $ 306.1 $ 146.4 $ 177.0 | appendix - financial |

GAAP Reconciliations: Net Income to NOI 47 Year Ended Six Months Ended December 31, June 30, $ millions 2015 2016 2017 2017 2018 NET INCOME $83.8 $123.3 $162.0 $92.4 $112.2 Adjustments: Interest 81.8 105.2 120.5 60.6 61.3 Transaction costs 1.2 0.5 - - - General and administrative 28.0 34.0 41.0 19.5 21.7 Selling stockholder costs - 0.8 - - - Depreciation and amortization 88.6 119.6 150.3 72.6 86.5 Provisions for impairment 1.0 1.7 13.4 4.3 2.6 Income tax expense 0.3 0.4 0.5 0.3 0.2 Gain on dispositions of real estate, net of tax (1.3) (13.2) (39.6) (29.4) (29.5) NET OPERATING INCOME $283.2 $372.3 $448.1 $220.2 $255.0 | appendix - financial |
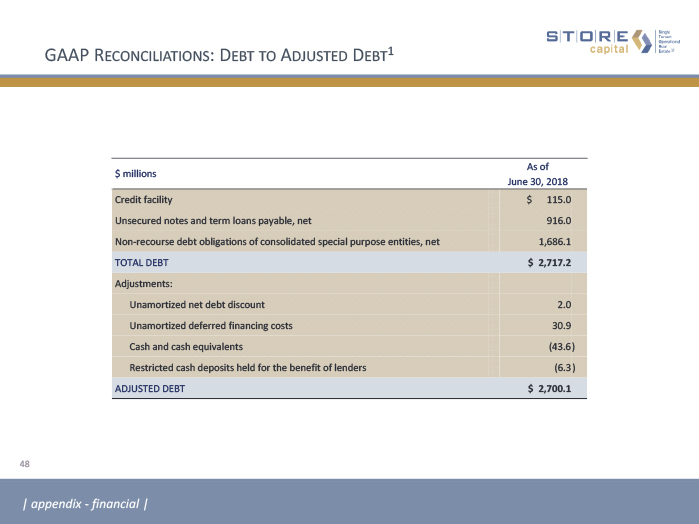
GAAP Reconciliations: Debt to Adjusted Debt1 48 $ millions As of June 30, 2018 Credit facility $ 115.0 Unsecured notes and term loans payable, net 916.0 Non-recourse debt obligations of consolidated special purpose entities, net 1,686.1 TOTAL DEBT $ 2,717.2 Adjustments: Unamortized net debt discount 2.0 Unamortized deferred financing costs 30.9 Cash and cash equivalents (43.6 ) Restricted cash deposits held for the benefit of lenders (6.3 ) ADJUSTED DEBT $ 2,700.1 | appendix - financial |
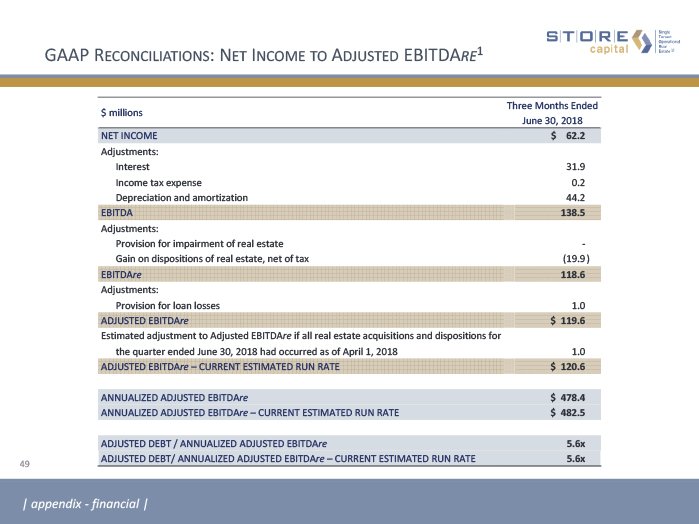
GAAP Reconciliations: Net Income to Adjusted EBITDAre1 49 $ millions Three Months Ended June 30, 2018 NET INCOME $ 62.2 Adjustments: Interest 31.9 Income tax expense 0.2 Depreciation and amortization 44.2 EBITDA 138.5 Adjustments: Provision for impairment of real estate - Gain on dispositions of real estate, net of tax (19.9 ) EBITDAre 118.6 Adjustments: Provision for loan losses 1.0 ADJUSTED EBITDAre $ 119.6 Estimated adjustment to Adjusted EBITDAre if all real estate acquisitions and dispositions for the quarter ended June 30, 2018 had occurred as of April 1, 2018 1.0 ADJUSTED EBITDAre – CURRENT ESTIMATED RUN RATE $ 120.6 ANNUALIZED ADJUSTED EBITDAre $ 478.4 ANNUALIZED ADJUSTED EBITDAre – CURRENT ESTIMATED RUN RATE $ 482.5 ADJUSTED DEBT / ANNUALIZED ADJUSTED EBITDAre 5.6x ADJUSTED DEBT/ ANNUALIZED ADJUSTED EBITDAre – CURRENT ESTIMATED RUN RATE 5.6x | appendix - financial |
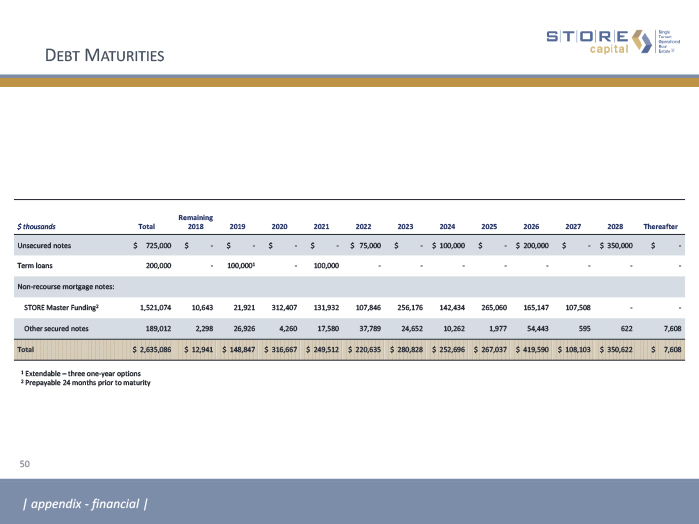
Debt Maturities 50 | appendix - financial | $ thousands Total Remaining2018 2019 2020 2021 2022 2023 2024 2025 2026 2027 2028 Thereafter Unsecured notes $ 725,000 $ - $ - $ - $ - $ 75,000 $ - $ 100,000 $ - $ 200,000 $ - $ 350,000 $ - Term loans 200,000 - 100,0001 - 100,000 - - - - - - - - Non-recourse mortgage notes: STORE Master Funding2 1,521,074 10,643 21,921 312,407 131,932 107,846 256,176 142,434 265,060 165,147 107,508 - - Other secured notes 189,012 2,298 26,926 4,260 17,580 37,789 24,652 10,262 1,977 54,443 595 622 7,608 Total $ 2,635,086 $ 12,941 $ 148,847 $ 316,667 $ 249,512 $ 220,635 $ 280,828 $ 252,696 $ 267,037 $ 419,590 $ 108,103 $ 350,622 $ 7,608 1 Extendable – three one-year options2 Prepayable 24 months prior to maturity
51 Supplemental Reporting Measures Funds from Operations, or FFO, and Adjusted Funds from Operations, or AFFO Our reported results are presented in accordance with U.S. generally accepted accounting principles, or GAAP. We also disclose Funds from Operations, or FFO, and Adjusted Funds from Operations, or AFFO, both of which are non‑GAAP measures. We believe these two non‑GAAP financial measures are useful to investors because they are widely accepted industry measures used by analysts and investors to compare the operating performance of REITs. FFO and AFFO do not represent cash generated from operating activities and are not necessarily indicative of cash available to fund cash requirements; accordingly, they should not be considered alternatives to net income as a performance measure or to cash flows from operations as reported on a statement of cash flows as a liquidity measure and should be considered in addition to, and not in lieu of, GAAP financial measures. We compute FFO in accordance with the definition adopted by the Board of Governors of the National Association of Real Estate Investment Trusts, or NAREIT. NAREIT defines FFO as GAAP net income, excluding gains (or losses) from extraordinary items and sales of depreciable property, real estate impairment losses, and depreciation and amortization expense from real estate assets, including the pro rata share of such adjustments of unconsolidated subsidiaries. To derive AFFO, we modify the NAREIT computation of FFO to include other adjustments to GAAP net income related to certain non‑cash revenues and expenses that have no impact on our long-term operating performance, such as straight‑line rents, amortization of deferred financing costs and stock‑based compensation. In addition, in deriving AFFO, we exclude certain other costs not related to our ongoing operations, such as the amortization of lease-related intangibles. FFO is used by management, investors and analysts to facilitate meaningful comparisons of operating performance between periods and among our peers primarily because it excludes the effect of real estate depreciation and amortization and net gains on sales, which are based on historical costs and implicitly assume that the value of real estate diminishes predictably over time, rather than fluctuating based on existing market conditions. Management believes that AFFO provides more useful information to investors and analysts because it modifies FFO to exclude certain additional non-cash revenues and expenses such as straight‑line rents, including construction period rent deferrals, and the amortization of deferred financing costs, stock‑based compensation and lease-related intangibles as such items may cause short-term fluctuations in net income but have no impact on long-term operating performance. We believe that these costs are not an ongoing cost of the portfolio in place at the end of each reporting period and, for these reasons, the portion expensed is added back when computing AFFO. As a result, we believe AFFO to be a more meaningful measurement of ongoing performance that allows for greater performance comparability. Therefore, we disclose both FFO and AFFO and reconcile them to the most appropriate GAAP performance metric, which is net income. STORE Capital’s FFO and AFFO may not be comparable to similarly titled measures employed by other companies. | appendix |
52 Supplemental Reporting Measures Note: In 2017, NAREIT issued a white paper recommending that companies that report EBITDA also report EBITDAre for all periods beginning after December 31, 2017. STORE’s presentation of Adjusted EBITDAre matches our previous presentation of Adjusted EBITDA.We believe that presenting supplemental reporting measures, or non-GAAP measures, such as EBITDA, EBITDAre and Adjusted EBITDAre, is useful to investors and analysts because it provides important supplemental information concerning our operating performance exclusive of certain non-cash and other costs. These non-GAAP measures have limitations as they do not include all items of income and expense that affect operations. Accordingly, they should not be considered alternatives to net income as a performance measure and should be considered in addition to, and not in lieu of, GAAP financial measures. Our presentation of such non-GAAP measures may not be comparable to similarly titled measures employed by other companies. EBITDA, EBITDAre and Adjusted EBITDAre EBITDA represents earnings (GAAP net income) plus interest expense, income tax expense, depreciation and amortization.We compute EBITDAre in accordance with the definition adopted by NAREIT. NAREIT defines EBITDAre as EBITDA (as defined above) excluding gains (or losses) from the sales of depreciable property and real estate impairment losses.To derive Adjusted EBITDAre we modify the NAREIT definition of EBITDAre to exclude other items included in GAAP net income, such as provisions for loan losses, as such items are not related to our ongoing performance.Annualized Adjusted EBITDAre and Adjusted DebtAnnualized Adjusted EBITDAre is calculated by multiplying Adjusted EBITDAre for the most recently completed fiscal quarter by four. Annualized Adjusted EBITDAre – Current Estimated Run Rate is based on an estimated Adjusted EBITDAre calculated as if all leases and loans in place as of the last date of the most recently completed fiscal quarter had been in place as of the beginning of such quarter; then annualizing that estimated Adjusted EBITDAre for the quarter by multiplying it by four. You should not unduly rely on this metric as it is based on several assumptions and estimates that may prove to be inaccurate. Our actual reported Adjusted EBITDAre for future periods may be significantly less than that implied by our reported Annualized Adjusted EBITDAre – Current Estimated Run Rate for a variety of reasons.Adjusted Debt represents our outstanding debt obligations excluding unamortized deferred financing costs and net debt premium, further reduced for cash and cash equivalents and restricted cash deposits held for the benefit of lenders. We believe excluding unamortized deferred financing costs and net debt premium, cash and cash equivalents and restricted cash deposits held for the benefit of lenders provides an estimate of the net contractual amount of borrowed capital to be repaid, which we believe is a beneficial disclosure to investors and analysts. Adjusted Debt to Annualized Adjusted EBITDAre Adjusted Debt to Annualized Adjusted EBITDAre, or leverage, is a supplemental non-GAAP financial measure we use to evaluate the level of borrowed capital being used to increase the potential return of our real estate investments. We calculate leverage by dividing Adjusted Debt by Annualized Adjusted EBITDAre. Because our portfolio growth level is significant to the overall size of the Company, we believe that presenting this leverage metric on a run rate basis is more meaningful than presenting the metric for the historical quarterly period, and we refer to this metric as Adjusted Debt to Annualized Adjusted EBITDAre—Current Estimated Run Rate. Leverage should be considered as a supplemental measure of the level of risk to which stockholder value may be exposed. Our computation of leverage may differ from the methodology employed by other companies and, therefore, may not be comparable to other measures. | appendix |
53 Footnotes Page 4:1 Reflects the percentage of our contracts that have a STORE Score that is investment grade. We measure the credit quality of our portfolio on a contract-by-contract basis using the STORE Score, which is a proprietary risk measure reflective of both the credit risk of our tenants and the profitability of the operations at the properties.Page 7:1 Represents the weighted average percentage change (by annualized base rent and interest) in reported corporate revenues for the trailing 12-month (or nine-month if 12-month is not available) period as reported to STORE Capital for the period ended December 31, 2017 as compared to the same period ended December 31, 2016. Excludes customers representing 7.5% of annualized base rent and interest because sufficient comparable data is not available.2 Estimated based on total revenue per employee for all companies in the middle market (based on data reported by the National Center for the Middle Market for 2017) extrapolated to the aggregate total revenue of S|T|O|R|E’s customers and the growth rate as described in footnote 1 above.Page 9:1 Represents reported corporate revenues for financial statements received by STORE Capital through June 30, 2018. Excludes customers, representing approximately 3.8% of annualized base rent and interest, that do not report corporate revenues. 2 Estimated based on total revenue per employee for all companies in the middle market (based on data reported by the National Center for the Middle Market for 2017) extrapolated to the aggregate total revenue of S|T|O|R|E’s customers.3 Represents the number of locations operated by STORE’s customers as reported to STORE Capital through December 31, 2017. Page 12:1 Free cash flow approximates Adjusted Funds from Operations less dividends paid.2 Represents the weighted average interest rate on balloon payments due in the respective years.Page 13:1 Based on average of ratios of Realty Income and National Retail Properties as of March 31, 2018.2 Ratios as of June 30, 2018; Unencumbered EBITDA based on NOI from Unencumbered Assets less an allocation of general and administrative expenses based on assets.3 Amounts shown for Q4 2018 represent targeted figures and are shown for illustrative purposes only, assuming net acquisition volume for 2018 equal to $900 million and no additional assets are encumbered during the remainder of the year. Our actual future debt levels and unencumbered asset pool are subject to numerous uncertainties and may be significantly different from these targeted levels.Page 14: 1 Shown by percentage of annualized base rent and interest (annualized based on rates in effect on June 30, 2018, for all leases, loans and direct financing receivables in place as of that date). Excludes contracts representing less than 0.2% of annualized base rent and interest where there are no further escalations remaining in the current lease term and there are no extension options. Of our contracts in place as of June 30, 2018, 82% increase based on changes in CPI, 16% increase based on fixed rates in the contract and only 2% do not increase.2 Represents the weighted average annual escalation rate of the entire portfolio as if all escalations occurred annually. For escalations based on a formula including CPI, assumes the stated fixed percentage in the contract or assumes 1.5% if no fixed percentage is in the contract. For contracts with no escalations remaining in the current lease term, assumes the escalation in the extension term. | appendix | 3 Dividend protection refers to the percentage difference between our AFFO per share and our dividend per share. The wider the relative gap between AFFO per share and dividends per share, the greater the implied dividend protection. All dividends are declared at the discretion of our Board of Directors and future dividends will depend upon our actual funds from operations, financial condition and capital requirements, the annual distribution requirements under the REIT provisions of the Code and other factors.4 S|T|O|R|E defines internal growth as the combination of high average lease escalators and a low AFFO payout ratio, which allows us to reinvest a growing amount of free cash flow back into our business. Page 15:* See chart, page 30.Page 16:1 Our Board of Directors has opted out of provisions of the Maryland Unsolicited Takeover Act (or “MUTA”), the business combination statute, the control share acquisition statute and provisions otherwise granting us the right to adopt a stockholder rights plan and we may not opt back into any of these statutes or provisions without stockholder approval or, in the case of a stockholder rights plan, stockholder ratification within 12 months of adoption of such a plan.Page 17:1 Represents the tolerable fall-off in unit sales so that EBITDAR after overhead will still cover the unit’s fixed charges (which includes S|T|O|R|E’s rent and interest) weighted by the unit’s fixed charges (based on currently available results representing 90% of the properties in our investment portfolio). If the variable profit coefficient for an individual unit was unavailable, we assumed the average long-term variable profit coefficient for the entire portfolio in the calculation of the fall-off amount.

Footnotes | appendix | 54 Page 18: 1 S|T|O|R|E’s pipeline from 2014 through June 30, 2018. See slide 25 for more information about S|T|O|R|E's pipeline, including its composition. S|T|O|R|E may never acquire properties in its pipeline for a variety of reasons as described in the Company’s Annual Report on Form 10-K for the fiscal year ended December 31, 2017.2 Growth rate in quarterly AFFO per share since IPO in Q4 2014.3 Data as of March 31, 2018.4 See footnote 3 to page 14 on page 53.5 S|T|O|R|E defines occupancy as a property being subject to a lease or loan contract. Page 19: * Based on annualized base rent and interest.1 Represents the percentage of our lease contracts that were created by S|T|O|R|E Capital or contain preferred contract terms such as unit-level financial reporting, triple-net lease provisions and, when applicable, master lease provisions.2 Weighted average annual lease escalation represents the weighted average annual escalation rate of the entire portfolio as if all escalations occurred annually. For escalations based on a formula including CPI, assumes the stated fixed percentage in the contract or assumes 1.5% if no fixed percentage is in the contract. For contracts with no escalations remaining in the current lease term, assumes the escalation in the extension term. Calculation excludes contracts representing less than 0.2% of annualized base rent and interest where there are no further escalations remaining in the current lease term and there are no extension options.3 S|T|O|R|E defines occupancy as a property being subject to a lease or loan contract. 4 The number of properties not currently operating but subject to a lease represents the number of our investment locations that have been closed by the tenant but remain subject to a lease. 5 The percentage of investment portfolio subject to master leases represents the percentage of the investment portfolio in multiple properties with a single customer subject to master leases. Based on annualized base rent and interest, 85% of the investment portfolio involves multiple properties with a single customer, whether or not subject to a master lease.6 The average investment amount/replacement cost (new) represents the ratio of purchase price to replacement cost (new) at acquisition.7 S|T|O|R|E calculates unit fixed charge coverage ratio generally as the ratio of (i) the unit’s EBITDAR, less a standardized corporate overhead expense based on estimated industry standards, to (ii) the unit’s total fixed charges, which are its lease expense, interest expense and scheduled principal payments on indebtedness. The 4-Wall coverage ratio refers to a unit’s FCCR before taking into account standardized corporate overhead expense. The average unit FCCR and 4-Wall coverage ratios were 2.9x and 3.6x, respectively, as of June 30, 2018, 2.8x and 3.6x, respectively, as of June 30, 2017 and 2.9x and 3.5x, respectively, as of June 30, 2016.8 The proportion of investment contracts rated investment grade represents the percentage of our contracts that have a STORE Score that is investment grade. We measure the credit quality of our portfolio on a contract-by-contract basis using the STORE Score, which is a risk measure reflective of both the credit risk of our tenants and the profitability of the operations at the properties. Pages 20 and 21: 1 Data as of June 30, 2018, 2017 and 2016, by percentage of annualized base rent and interest (annualized based on rates in effect on June 30, 2018, 2017 and 2016, for all leases, loans and direct financing receivables in place as of those dates). Page 22:1 Data based on information available on customer websites, news releases and/or SEC filings.2 Data as of June 30, 2018, by percentage of annualized base rent and interest (annualized based on rates in effect on June 30, 2018, for all leases, loans and direct financing receivables in place as of that date).Page 23:1 Based on annualized base rent and interest.2 Represents the percentage of our properties that are occupied. S|T|O|R|E defines occupancy as a property being subject to a lease or loan contract. As of September 30, 2017, the Company owned 19 properties that were vacant and not subject to a contract; subsequent to September 30, 2017, eight of these properties were re-leased, one was sold and the Company’s occupancy rate improved from 99.0% to 99.5%.Page 24:1 We measure the credit quality of our portfolio on a contract-by-contract basis using the STORE Score, which is a proprietary risk measure reflective of both the credit risk of our tenants and the profitability of the operations at our properties. The STORE Score is a quantitative measurement of contract risk computed by multiplying tenant default probabilities (using Moody’s RiskCalc) and estimated store closure probabilities (using a simple algorithm we developed that has closure probabilities ranging from 100% to 10%, depending on unit-level profitability). Qualitative features can also impact investment risk, such as low property investment amounts, favorable tenant debt capital stacks, the presence of third party guarantors, or other factors. Such qualitative factors are not included in the STORE Score and may serve to mitigate investment risk even further.
Footnotes | appendix | 55 Page 26:1 Acquisitions represent the total of acquisitions of real estate and investment in loans and direct financing receivables. Dispositions represent the original acquisition cost of real estate sold and loan repayments received in conjunction with real estate sales.2 Refer to pages 45 through 51 for definitions of these non-GAAP financial measures and reconciliation to GAAP net income.3 Gross Rate of Return represents initial cap rate plus weighted average annual lease escalators. Gross returns do not represent the actual returns we may earn on properties.Page 27:1 Source: IBES Thomson Reuters. Data as of December 31, 2017. Represents 3-year historical normalized diluted EPS growth of five companies: CME Group Inc., Macerich Company, PPL Corporation, Ventas Inc., and Welltower Inc.2 Market data as of June 29, 2018; P/E multiple and EPS growth per CapIQ.Page 28:1 See footnote 4 to page 14 on page 53. 2 Based on annualized total returns earned by management’s prior investment vehicles while operating as a public company, compared to annualized total returns on the MSCI US REIT Index during the same periods. The past performance of these investment vehicles is not an indicator of S|T|O|R|E’s future performance, and S|T|O|R|E’s performance may be significantly less favorable than the past performance data included in this presentation. Moreover, some of the past performance data covers periods with economic characteristics and cycles and interest rate environments that are significantly different from those S|T|O|R|E faces today and may face in the future.Page 31:Source: Green Street Advisors, U.S. Treasury, Company data and with respect to FFCA and Spirit, publicly available SEC company filings¹ Risk for each sector measured as the standard deviation of capitalization rates during the periods of operation of FFCA, Spirit and S|T|O|R|E from January 1994 to December 2017. 2 The Sharpe Ratio measures the ratio of excess returns to risk, using the spread between capitalization or lease rates and the 10-year U.S. Treasury yields to measure excess returns, and using the standard deviation of returns to measure risk. All ratios are calculated using capitalization or lease rate data during which FFCA and Spirit were publicly traded companies and the period since S|T|O|R|E’s inception. The ratio is calculated based on historical data from January 1994 to December 2017, and future returns and risk may not be consistent with this historical data. Page 39:Note: Data through December 31, 2017.¹ Growth from reinvested cash flow is equal to (i) the incremental cash flow added from reinvesting retained cash assuming a prior period payout ratio of 72%, leveraged at 45% with a borrowing cost of 4.25% and amortization of 45 years, reinvested at 7.75% less incremental operating costs of 0.25% divided by (ii) prior period rents assuming assets were acquired at 7.75%.2 Represents an unlevered growth rate.Page 45:1 See page 51 for discussion regarding use of Funds From Operations and Adjusted Funds from Operations.2 Under the two-class method, earnings attributable to unvested restricted stock are deducted from earnings in the computation of per share amounts where applicable.Page 48:1 See page 52 for discussion regarding use of EBITDAre, Adjusted EBITDAre and Adjusted Debt.Page 49:1 See page 52 for discussion regarding use of EBITDAre, Adjusted EBITDAre and Adjusted Debt.
Investor and Media ContactsFinancial Profiles, Inc.Moira Conlon, 310.622.8220Tricia Ross, 310.622.8226STORECapital@finprofiles.com Corporate Headquarters8377 East Hartford Drive, Suite 100Scottsdale, Arizona 85255480.256.1100www.STOREcapital.com