Exhibit 99.2
![](https://capedge.com/proxy/8-K/0001140361-19-003590/ex99_2slide1.jpg)
![](https://capedge.com/proxy/8-K/0001140361-19-003590/ex99_2slide2.jpg)
Disclaimer This presentation contains forward-looking statements within the meaning of Section 27A of the Securities Act of 1933, as amended, or the Securities Act, and Section 21E of the Securities Exchange Act of 1934, as amended, or the Exchange Act. Such forward-looking statements include, without limitation, statements concerning our business and growth strategies, investment, financing and leasing activities and trends in our business, including trends in the market for long-term, triple-net leases of freestanding, single-tenant properties. Words such as “expects,” “anticipates,” “intends,” “plans,” “likely,” “will,” “believes,” “seeks,” “estimates,” and variations of such words and similar expressions are intended to identify such forward-looking statements. Such statements involve known and unknown risks, uncertainties and other factors which may cause our actual results, performance or achievements to be materially different from the results of operations or plans expressed or implied by such forward-looking statements. Although we believe that the assumptions underlying the forward-looking statements contained herein are reasonable, any of the assumptions could be inaccurate, and therefore such statements included in this presentation may not prove to be accurate. In light of the significant uncertainties inherent in the forward-looking statements included herein, the inclusion of such information should not be regarded as a representation by us or any other person that the results or conditions described in such statements or our objectives and plans will be achieved. Furthermore, actual results may differ materially from those described in the forward-looking statements and may be affected by a variety of risks and factors including, without limitation, the risks described in our Annual Reports on Form 10-K and quarterly reports on form 10-Q.Forward-looking statements set forth herein speak only as of the date hereof, and we expressly disclaim any obligation or undertaking to update or revise any forward-looking statement contained herein, to reflect any change in our expectations with regard thereto, or any other change in events, conditions or circumstances on which any such statement is based, except to the extent otherwise required by law.THIS PRESENTATION CONTAINS HISTORICAL PERFORMANCE INFORMATION REGARDING STORE CAPITAL, AS WELL AS OTHER COMPANIES PREVIOUSLY MANAGED BY OUR SENIOR EXECUTIVE TEAM. SUCH PAST PERFORMANCE IS NOT A GUARANTEE OF FUTURE RESULTS.This presentation contains references to our copyrights, trademarks and service marks and to those belonging to other entities. Solely for convenience, copyrights, trademarks, trade names and service marks referred to in this presentation may appear without the “© “ or “TM” OR “sm” Symbols, but such references are not intended to indicate, in any way, that we will not assert, to the fullest extent under applicable law, our rights or the rights of the applicable licensor to these copyrights, trademarks, trade names and service marks. We do not intend our use or display of other companies’ trade names, copyrights, trademarks or service marks to imply a relationship with, or endorsement or sponsorship of us by, any other companies.Definitions and footnotes for data provided herein are provided in the appendix section of this presentation. Unless otherwise indicated, data provided herein is as of December 31, 2018. 2
![](https://capedge.com/proxy/8-K/0001140361-19-003590/image00002.jpg)
3 STORE CAPITAL SNAPSHOT 4 DESIGNED TO PERFORM (How We Uniquely Built S|T|O|R|E) 5 Our Market. Our Approach to Real Estate Investing. Our Investment Strategy and Customers. Our Capital Structure. Our Internal Growth. Our Leadership. Our Governance. PERFORMANCE (How We Have Performed) 17 Our Many Key Achievements. Our Portfolio at a Glance. Our High Investment Diversity. Our Contract Quality. Our Investment Pipeline Activity. Our Growth and Performance. Our Comparative Stock Return Profile. Proof of our Design. APPENDIX (Important Supporting Information) 29 Prior Leadership Investment Performance. Market Value Added Performance. Peer Group Comparisons. Contract Quality Trends. Contract Seniority Importance. Portfolio Management Approach. Our Growth. FINANCIAL INFORMATION 43 DEFINITIONS AND FOOTNOTES 52 Table of Contents
![](https://capedge.com/proxy/8-K/0001140361-19-003590/ex99_2slide4.jpg)
STORE Capital Snapshot NYSE: STOR; U.S. PROFIT-CENTER REAL ESTATE ~30-YEAR SUCCESSFUL LEADERSHIP TRACK RECORD $6.3B EQUITY MARKET CAP; 4.7% DIVIDEND YIELD32% DIVIDEND INCREASE FROM 2014 TO 2018FOUR CONSECUTIVE YEARS OF DOUBLE-DIGIT INVESTOR RETURNS2,255 PROPERTIES LEASED TO 434 CUSTOMERS ~75% OF LEASE CONTRACTS INVESTMENT-GRADE QUALITY1 UNIQUE DIRECT ORIGINATION PLATFORM 4 “We often use a real estate term – “brick by brick” – to explain how we have been building S|T|O|R|E and our durable business model. The result is a substantial, nearly irreplaceable, trophy investment portfolio designed to deliver consistent and dependable performance.” -- Christopher Volk, CEO
![](https://capedge.com/proxy/8-K/0001140361-19-003590/ex99_2slide5.jpg)
S|T|O|R|E addresses a large market S|T|O|R|E has many broad based market opportunities. >$3 trillionSTORE market opportunity Dedicated to net-leased profit-center real estateFocused on the service sector of the U.S. economyMarket leader in profit-center net-lease solutionsNearly 200,000 companies in S|T|O|R|E’s target marketApproximately same size as world’s fourth largest economyOver 20,000 contacts in proprietary prospecting database | designed to perform | 5 Cumulative Counts ($MM) S|T|O|R|E’sTarget Market(U.S. Middle Market)
![](https://capedge.com/proxy/8-K/0001140361-19-003590/image00003.jpg)
S|T|O|R|E is Single Tenant Operational Real Estate defining our investment asset class shapes everything we do. Why is that so important?Tenants need their profit-center real estate in order to conduct business, making our rent contracts senior to other financial obligations Which is the unique payment source?Profitability from the operations of each investment How do STORE Properties differ from other real estate?Three sources of payment support instead of two PROPERTY VALUE CORPORATE CREDIT UNIT-LEVEL PROFITABILITY STORE Properties uniquely offer the ability to create contracts that are superior to the credit quality of the tenant. 6 | designed to perform |
![](https://capedge.com/proxy/8-K/0001140361-19-003590/ex99_2slide7.jpg)
Filling A Broad-Based Market Need Rated S|T|O|R|E’s tenants choose to rent because….Long term real estate funding solutions are lackingLeasing real estate replaces both debt and equityLower cost of capitalUnparalleled product flexibility S|T|O|R|E is landlord of choice because….Customer-centric and solutions-orientedAdministrative ease through responsive servicing Development and renovation opportunitiesA focus on corporate flexibility and wealth creation our customers choose to have a landlord rather than a banker. 7 S|T|O|R|E is important and fundamental to creating opportunities for our clients,their employees and other stakeholders What we do is impactful….Year-over-year tenant revenue growth of 15.1%1S|T|O|R|E customers added ~325,000 employees in 20172Exclusive educational event: Inside Track Forum Online educational opportunities: STORE UniversityIntegrated real estate capital: Master Funding Solutions | designed to perform |
![](https://capedge.com/proxy/8-K/0001140361-19-003590/image00004.jpg)
Internal OwnershipDirect calling efforts on thousands of companies and financial sponsors ~80% ~20% B2B Benefits + Higher Lease Rates+ Lower Real Estate Prices+ Longer Lease Terms+ Smaller Transaction Sizes + Greater Investment Diversity+ Stronger Contracts Our unique platform has multiple origination channels enabling us to efficiently cover a very large market opportunity.All channels result in a B2B approach. our origination platform is key to greater investment returns and lower risk. “B2B” Origination Platform Virtual SalesforceTenant introductions through intermediary relationships = Value for Stockholders 8 | designed to perform |
![](https://capedge.com/proxy/8-K/0001140361-19-003590/ex99_2slide9.jpg)
S|T|O|R|E’s Diverse Customer Profile UNPRECEDENTED GRANULARITY customer revenue distribution1 % Of Total Rent & Interest 434 customers operating across more than 100 industries~ 15 net new customers quarterly 2,255 properties | ~ 75 net new properties quarterly ~ 680 contracts | ~ 32 transactions closed quarterlyAverage transaction size below $9 millionRepeat customers about one-third of new business <$5MM $5 -$20MM $20 -$50MM $50 -$200MM $200 -$500MM $500MM -$1B >$1B ~ 73% of customers have revenues over $50 millionMedian tenant revenues ~ $54 millionWeighted average tenant revenues ~$862 millionEmploy ~2.2 million workers2Operate ~25,000 locations in all 50 states3 S|T|O|R|E TENANT PROFILES 9 both our customers and their employees benefit from a S|T|O|R|E relationship. | designed to perform |
![](https://capedge.com/proxy/8-K/0001140361-19-003590/image00007.jpg)
10 Profit-Center Investing Table Stakes S|T|O|R|E’s entry-level guideposts Demand unit-level financial reporting.This provides the best picture of real estate quality and essentiality. Always request master leases on multi-unit transactions.This is the most effective way for landlords to achieve risk diversity. Invest in properties at or below replacement cost.This is proven to lessen defaults and raise recoveries. Invest at yields and gross returns in excess of the brokered market.This is proven to enhance returns and increase margins of safety. Evidence-Based Real Estate Investing the result: investment-grade portfolio performance. 10 Focus on The Big PictureCriteria that stand the test of time Appreciate the industry.Seek industries likely to have sustained long-term relevance. Understand the tenant business model.Evaluate unlevered equity returns and market share. Evaluate the tenant business defensive moat.Understand features that make tenants viable and competitive. Know the players.Understand background of leadership and equity investors. Numbers and Analysis Know the deal Evaluate the real estate.Look to local market rents and estimates. Evaluate the corporate credit.Assess corporate credit and know where we stand in capital stack priority. Evaluate unit-level financial performance.Look to long-term unit-level rent coverage reliability. Understand the corporate structure and recourse.Look for parent and affiliate company recourse and potential guarantors. | designed to perform |
![](https://capedge.com/proxy/8-K/0001140361-19-003590/ex99_2slide11.jpg)
Portfolio Diversity 2,255 Properties > 400 Tenants >100 Industries 49 States ~80% of tenants < 1% Top Tenant <3% Non-Correlated Risk Stable Portfolio Tenant Credit Profile The Essence of S|T|O|R|E’s Investing Strategy 11 A Value Investing Portfolio Approach, Driven ByEstablished AAA/A+ Securitization Principles 11 the result: exceptional returns and investment-grade portfolio performance. Together with Active Portfolio and Property Management Contract Seniority Virtually All Profit Center Investments Virtually All Provide Financial Statements 91% Master Lease Penetration Median Unit Coverage: 2.1:1 Median 4-Wall Coverage: 2.5:1 Wtd. Avg. Tolerable Sales Fall-off: ~40%1 Investment/Replacement Cost: 81% Investments Made at Discounts to NAV & | designed to perform |
![](https://capedge.com/proxy/8-K/0001140361-19-003590/ex99_2slide12.jpg)
Capital Structure Leadership our liability structure is designed to withstand interest rate volatility. 12 Virtually all borrowings are long-term and fixed rate strategic liability management ($MM) S|T|O|R|E’s annual free cash flow generally exceeds current debt maturities, making us effectively asset/liability neutral. Median debt maturities 2 2.7% 4.2% 3.5% 4.4% 5.1% 4.7% 4.2% 4.4% 4.4% 4.5% N/A Avg Rate 1 AAA/A+ asset-backed and Baa2/BBB unsecured borrowing options $600 million unsecured multi-year revolving credit facility | designed to perform |
![](https://capedge.com/proxy/8-K/0001140361-19-003590/ex99_2slide13.jpg)
Complementary Investment-Grade Debt Options growing unencumbered asset pool ($MM) AAA & A+ STORE Master Funding Dedicated asset-backed securities conduit$1.9 billion outstanding Baa2/BBB Unsecured Term Borrowings Rated by Moody’s, S&P and Fitch Ratings, stable outlook$925 million outstanding Q3 2011 2018 13 Non-recourse with minimal covenantsComplete portfolio management flexibilityEfficient leverage of 70% at time of issuanceBBB rated notes retained for flexibilityEnables superior unsecured debt ratiosProvides leading term borrowing diversity A-/BBB+ STOREUnencumbered Select Ratios Net Lease Avg1 Assets2 Debt/EBITDA ~5x 3.2x Unencumbered assets/unsecured debt ~3x 4.4x Debt service coverage ~5x 7.5x Cash flow support from encumbered assets NO YES Investment-grade borrowing diversity with resultant improved unsecured credit metrics. $4.6B $2.7B $0.3B 2016 2017 ~61% ~35% ~4% $3.3B $2.5B $0.4B $2.2B $2.5B $0.4B | designed to perform | liability efficiencies enhanced through multiple borrowing options.
![](https://capedge.com/proxy/8-K/0001140361-19-003590/ex99_2slide14.jpg)
Internal Growth Strategy Lease Escalation Frequency % Base Rent and Interest1 Weighted Average Annual Escalation Rate2 Annually 73% 1.8% Every 5 years 23% 1.8% Other escalation frequencies 2% 1.7% Flat 2% N/A Total / Weighted Average 100% 1.8% lease escalations dividends Market-leading dividend increases 8.0% in 2015 7.4% in 2016 6.9% in 2017 6.5% in 2018 Market-leading dividend protection3 70% payout ratio in 2015 68% payout ratio in 2016 70% payout ratio in 2017 70% payout ratio in 2018 Annual Lease Escalations AFFO Per Share Growth 1.00% 1.55% 1.25% 1.93% 1.50% 2.32% 1.80% 2.79% 2.00% 3.09% + ReinvestedCash Flows 65.0% 70.0% 75.0% 80.0% 2.93% 2.47% 2.01% 1.56% = EstimatedInternal Growth > 5% internal growth is driven by retained and reinvested cash flows. 14 estimated gross internal growth4 AFFO Payout Ratio AFFO Per Share Growth 32% INCREASE SINCE IPO | designed to perform |
![](https://capedge.com/proxy/8-K/0001140361-19-003590/ex99_2slide15.jpg)
Unrivaled Leadership Over Decades Experienced….Built & managed three net-lease real estate investment companiesInvested over $17 billion in profit-center real estate (9,600+ properties)Consistently outperformed broader REIT market returns over multiple decades1Navigated platforms through multiple economic cycles & interest rate environmentsThought leadership through primary and published research Groundbreaking….Investment-grade corporate net-lease rating (1995)Net-lease real estate master trust conduit (2005)NYSE-listed public company sales (2001 & 2007)Private institutional investor sponsorship (1999 & 2011)Inaugural issuance of AAA rated net-lease notes (2018) a progression of innovation and thought leadership over three decades. 15 1980 Q4 2018 > $17 B We have successfully invested and managed more in STORE Properties and over a longer period of time than anyone. 90 employees in one office, ~40% of which drive our origination activity. | designed to perform |
![](https://capedge.com/proxy/8-K/0001140361-19-003590/image00005.jpg)
Best in Class Corporate Governance Independent Board, Board Chairman and Key Committees? Yes Board Refreshment? Yes, 50% directors new since 2016 Board Diversity? 33% Regular Board Evaluations? Yes Regular Stockholder Engagement? Yes Opt-out of State Anti-Takeover Provisions1? Yes Poison Pill? No Staggered Board? No leading board governance leading stockholder disclosure Full tenant credit quality distributionFull contract quality distributionFull tenant size distributionLease contract escalationsProperty appraised replacement costsPortfolio master leasesLeading unit-level performance disclosureProperty sales gain over costsGround lease investmentsNN v. NNN leases With our leading stockholder disclosure and governance practices, we provide corporate governance that is “best in class” in the net-lease sector. 16 our best in class corporate governance is key to creating shareholder value. | designed to perform |
![](https://capedge.com/proxy/8-K/0001140361-19-003590/ex99_2slide17.jpg)
Key Achievements As A Public Company EXCEPTIONAL PERFORMANCEMore than doubled our pipeline of investment opportunities1 to $13 Billion since IPORealized average monthly investment activity in excess of $100 million since 2015Raised our dividends to shareholders 32% (6.5% in 2018)Delivered AFFO per share growth of ~37%2 (7.6% in 2018)Realized compound annual shareholder returns greater than 16% vs. just under 3.8% for Equity REITsCreated exceptional Market Value Added with our equity valuation exceeding equity cost by 37%3 Delivered four consecutive years of double digit stockholder returnsINVESTMENT SAFETYHave been amongst the industry leaders in dividend protection4Have realized approximate A-rated portfolio performance since inception Maintained a consistent real estate occupancy5 level of 99% or betterMARKET RECOGNITIONGarnered investor interest from well-known investors, including Berkshire Hathaway, an 8.4% shareholderInstituted programmatic ability to uniquely issue AAA rated structured finance notesAmongst the highest corporate net-lease credit ratings from all three agencies (BBB, BBB, Baa2) | performance | 17
![](https://capedge.com/proxy/8-K/0001140361-19-003590/ex99_2slide18.jpg)
18 Portfolio at a Glance As of December 31, 2018 2017 2016 Investment property locations 2,255 1,921 1,660 States 49 48 48 Customers 434 397 360 Industries in which our customers operate 106 104 106 Proportion of portfolio from direct origination ~80% ~80% ~80% Contracts with STORE-preferred terms*1 94% 93% 91% Weighted average annual lease escalation2 1.8% 1.8% 1.8% Weighted average remaining lease contract term ~14 years ~14 years ~14 years Occupancy3 99.6% 99.6% 99.5% Properties not operating but subject to a lease4 23 16 9 Investment locations subject to a ground lease 21 20 17 Investment portfolio subject to NNN leases* 98% 98% 97% Investment portfolio subject to Master Leases*5 91% 87% 82% Average investment amount / replacement cost (new)6 81% 82% 82% Locations subject to unit-level financial reporting7 98% 97% 97% Median unit FCCR / 4-wall FCCR8 2.1x / 2.5x 2.1x / 2.6x 2.1x / 2.6x Contracts rated investment grade9 ~75% ~75% ~75% | performance | industry leading growth and portfolio consistency.
![](https://capedge.com/proxy/8-K/0001140361-19-003590/ex99_2slide19.jpg)
Diversification Across Industry Groups SERVICE (~65%) Located near target customers Not readily available onlineBroad array of everyday services As of December 31, 2018, our portfolio is diversified across 106 different industries in the service, retail and manufacturing sectors of the U.S. economy. We group these industries into 74 different industry groups as shown in the following tables. 19 | performance | service industries account for more than half of the u.s. employment and gdp. Building % Base Rent and Interest1 # ofProperties Sq. Ft. (in thousands) As of December 31, Customer Industry Groups 2018 2017 2016 Restaurants – Full Service 403 2,719 11.2% 13.1% 13.8% Restaurants – Limited Service 395 1,040 5.8% 7.2% 8.4% Early Childhood Education 185 2,082 5.9% 6.6% 7.4% Health Clubs 76 2,267 5.3% 5.9% 6.2% Movie Theaters 38 1,879 4.8% 6.0% 6.9% Family Entertainment 38 1,290 4.0% 4.2% 3.8% Automotive Repair and Maintenance 139 643 3.8% 3.1% 2.9% Pet Care 157 1,539 3.5% 3.0% 2.8% Lumber & Construction Materials Wholesalers 105 4,375 2.9% 2.0% 1.0% Medical and Dental 59 618 2.2% 1.4% 0.9% Behavioral Health 38 603 1.7% 1.8% 1.9% Career Education 7 584 1.6% 1.9% 2.2% Elementary and Secondary Schools 6 278 1.4% 1.4% 1.5% Equipment Sales and Leasing 19 619 1.2% 1.5% 1.2% Metal and Mineral Merchant Wholesalers 20 1,698 1.0% 0.8% 1.0% Wholesale Automobile Auction 6 224 1.0% 1.1% 0.9% All Other Service (19 industry groups) 149 6,008 7.5% 7.7% 8.0% Total Service 1,840 28,466 64.8% 68.7% 70.8%
![](https://capedge.com/proxy/8-K/0001140361-19-003590/image00008.jpg)
Diversification Across Industry Groups (continued) 20 RETAIL MANUFACTURING Primarily located in industrial parksStrategically near customersBroad array of industriesMaking everyday necessities (~17%) Located in retail corridorsInternet resistantHigh experiential componentSelling merchandise (~18%) | performance | S|T|O|R|E’s retail exposure has high experiential component. Building % Base Rent and Interest1 # ofProperties Sq. Ft. (in thousands) As of December 31, Customer Industry Groups 2018 2017 2016 Furniture 54 3,224 5.5% 6.7% 3.8% Farm and Ranch Supply 41 3,914 4.3% 3.1% 3.2% Hunting and Fishing 9 758 2.2% 2.6% 2.2% Recreational Vehicle Dealers 21 954 1.6% 1.0% 1.1% Used Car Dealers 19 229 1.2% 0.9% 0.6% Home Furnishings 5 691 0.7% 0.9% 1.1% New Car Dealers 8 236 0.7% 0.0% 0.2% All Other Retail (9 industry groups) 51 2,102 2.2% 2.7% 3.4% Total Retail 208 12,108 18.4% 17.9% 15.6% Metal Fabrication 57 6,894 3.9% 3.2% 2.9% Plastic and Rubber Products 30 3,855 2.5% 2.4% 2.9% Furniture Manufacturing 12 3,688 2.0% 0.6% 0.0% Electronics Equipment 10 1,060 1.4% 0.7% 0.6% Aerospace Product and Parts 11 992 0.8% 0.6% 0.2% Chemical Products 9 820 0.8% 0.4% 0.6% Automotive Parts and Accessories 12 1,533 0.8% 0.5% 0.1% All Other Manufacturing (16 industry groups) 66 5,849 4.6% 5.0% 6.3% Total Manufacturing 207 24,691 16.8% 13.4% 13.6% Total Portfolio 2,255 65,265 100.0% 100.0% 100.0%
![](https://capedge.com/proxy/8-K/0001140361-19-003590/ex99_2slide21.jpg)
Retail Portfolio Vitality in the Age of E-Commerce 21 VITAL COMPONENTS COMBINE TO CREATE AN ESSENTIAL RETAIL BUSINESS MOAT. S|T|O|R|E’s Retail Tenants are Thriving in the Age of E-CommerceVital Experiential Components Distinguish Our Largest Consumer Goods Industry Segments S|T|O|R|E invests in retail businesses having experiential components combined with strong online presence. The 8 Components of Retail Vitality in the Age of E-Commerce Treasure Hunt Price Match Vertical Integration Private Label Loyalty Programs Immediacy Project Based Consumer Financing Customer Industry Groups # of Props. In-store experience; Expert sales consultation; Buyer interactionwith products Affirms online value proposition; Buyers confirm online selection; Product interaction In-store returns, Ship-to-store for assembly; local delivery and installation Differentiated products: Exclusive Products only available in branded store Strong Loyalty programs: Top retailers have 90% sales via loyalties programs. Immediate product delivery to consumers: “Owning the last mile" Project-based; Buyer requires both expert consultation and physical confirmation Consumerfinancing program available on location Furniture 54 Farm/Ranch Supply 41 Hunting and Fishing 9 RV Dealers 21 Used Car Dealers 19 Home Furnishings 5 New Car Dealers 8 | performance |
![](https://capedge.com/proxy/8-K/0001140361-19-003590/ex99_2slide22.jpg)
22 Top 10 Customers1 AMC Entertainment (NYSE:AMC), is the largest movie exhibition company in the world with over 1,000 theatres and 11,000 screens across the globe, AMC operates among the most productive theatres in the United States’ top markets, having the #1 or #2 market share positions in 22 of the 25 largest metropolitan areas of the United States, including the top three markets (NY, LA, Chicago). Cadence Education is a Morgan Stanley Global private equity owned company and is one of the premier early childhood educators in the U.S. The Company’s national platform of more than 170 schools has the capacity to serve more than 20,000 students across 21 states. Mills Fleet Farm dba Fleet Farm is a full-service merchant with more than 40 locations in four mid-western states, offering a broad assortment of goods from hunting gear to lawn, garden and farm supplies. In 2016 Mills was purchased by the private equity firm KKR & Co. Zips Holdings is the second largest car wash operator in the US with over 135 locations in operation. In 2015, founder Brett Overman partnered with Equity Investment Group and Britton Hill Partners to help identify acquisition opportunities and provide management support for onboarding operations at new units. % Base Rent and Interest2 2.7% 2.4% 1.7% 2.2% 1.6% 1.6% 1.6% 1.5% 1.5% 1.3% 18.1% Total Top 10 Customers Art Van Furniture is the Midwest’s largest furniture retailer and a top ten national furniture retailer based on sales. Founded in 1959, the company operates approximately 190 stores throughout nine states with expected annual sales of $1.3 billion. Art Van Furniture is majority owned by Boston based private equity firm Thomas H. Lee Partners. CWGS Group, dba Camping World, is the nation’s largest retailer of recreational vehicles and related accessories, operating over 220 locations. In 2017, Camping World won a bankruptcy auction to acquire sporting goods retailer Gander Mountain, planning to build on its existing outdoor and camping brand. The Gander Mountain moniker was rebranded to Gander Outdoors. # ofProperties 23 8 14 9 17 42 32 19 16 46 226 Bass Pro Group operates retail locations under the Bass Pro Shops and Cabela’s monikers, offering outdoor gear and apparel in an immersive setting. These two iconic brands, combined, operate more than 170 retail and marine centers. Both concepts are market leaders and highly respected within their respective niche of outdoor products. U.S. LBM Holdings, founded in 2009, is a collection of leading building material distributors across 29 states with more than 230 locations. The company serves as a critical link in the building materials supply chain, supplying more than 60,000 stock keeping units (“SKUs”) for custom homebuilders and specialty contractors. US LBM has filed an S-1 with the SEC as it intends to raise additional equity from an IPO. Proceeds from the IPO are expected to payoff outstanding indebtedness under its Second Lien Term Loan. Dufresne Spencer Group is the largest Ashley’s Furniture HomeStore licensee. DSG entered our top 10 with their ownership of Hill Country Holdings, another existing STORE customer and a top Ashley licensee. DSG is backed by a seasoned management team with a strong operating history and garnered an investment from Ashley Corporate in December 2017. | performance | top ten tenants represent less than 19% of annual rent & interest. Stratford School dba Spring Education is the largest pure play US platform focused on PreK-12 education. Spring’s diversified collection of brands operates 227 schools in 18 states & D.C. The company is owned by Asia-based investment firm, Primavera Capital. STORE’s investment in Stratford increased with their acquisition of Nobel Learning Communities, another existing STORE customer.
![](https://capedge.com/proxy/8-K/0001140361-19-003590/ex99_2slide23.jpg)
Diversification Across Geographies1 23 OCCUPANCY2 | performance | geographically dispersed portfolio with consistently high occupancy rates.
![](https://capedge.com/proxy/8-K/0001140361-19-003590/ex99_2slide24.jpg)
~75% of Contracts Investment-Grade in Quality Because we invest in profit-center real estate, our contracts almost always have less investment risk than the credit risk of our tenants. In addition, the STORE Score, being purely quantitative, is a base risk score that often understates contract quality. Moody’s RiskCalc (EDF) STORE Score 1 24 CONTRACTS RATED INVESTMENT GRADE (3-MO. AVERAGE) MEDIAN UNIT-LEVEL FIXED CHARGE COVERAGE Median EDF MedianSTORE Score investment-grade contracts mitigate corporate default risk. | performance |
![](https://capedge.com/proxy/8-K/0001140361-19-003590/ex99_2slide25.jpg)
25 25 Investment Pipeline Activity PIPELINE VELOCITY DURING Q4 2018 PIPELINE SECTOR DISTRIBUTION AS OF 12/31/18 PIPELINE SIZE ($B) Starting Pipeline $12.5 B Ending Pipeline $13.2 B New Deals Added $2.0 B Deals Passed or Closed $1.3 B Our pipeline continues to mirror STORE’s current portfolio. Emphasis on Service, Manufacturing and Select Retail sectors having high potential for long-term relevance | performance | S|T|O|R|E’s pipeline remains robust and diverse.
![](https://capedge.com/proxy/8-K/0001140361-19-003590/ex99_2slide26.jpg)
26 NOI, AFFO AND NET INCOME ($MM)2 Growth and Performance | performance | PER SHARE ANNUAL GROWTH NET INCOME:15.9% DIVIDENDS:7.2% AFFO:7.3% Compound Annual Growth Rate ACQUISITION AND DISPOSITION VOLUME ($MM)1 GROSS RATE OF RETURN 3 5.6% 5.3% 5.4% 5.6% 4.4% 4.1% 8.1% 7.9% 9.8% 9.7% 9.6% 7.8% 3.6% S|T|O|R|E’S consistent performance has driven stockholder returns. 4.4% 7.9% 9.7%
![](https://capedge.com/proxy/8-K/0001140361-19-003590/image00006.jpg)
Total Return Built on Both Yield & Growth | performance | 27 500 companies 48 companies(10%) 20 companies(4%) S|T|O|R|E’s combination of dividend yield and EPS growth offers a superior investment opportunity that has delivered 37% AFFO per share and 32% dividend growth since our IPO. S|T|O|R|E provides an attractive total return relative to the broader market. Comparative Annual Return Performance Rare Earnings and Growth Combination Comparative Cumulative Return Performance
![](https://capedge.com/proxy/8-K/0001140361-19-003590/ex99_2slide28.jpg)
Proof of our Design market-leading direct investment approach in underserved market exceeding $3.4 trillion 1. market-leading value creation and investment-grade portfolio performance 2. market-leading diversified investment-grade capital markets strategy 3. market-leading secure dividends and dividend growth 4. market-leading investment diversity 5. leadership team with over 30-year history and a multiple-decade record of outperformance1 8. | performance | 28 market-leading governance and investor disclosure 6. 7. four consecutive years of double-digit stockholder returns driven by financial performance
![](https://capedge.com/proxy/8-K/0001140361-19-003590/ex99_2slide29.jpg)
Appendix
![](https://capedge.com/proxy/8-K/0001140361-19-003590/ex99_2slide30.jpg)
FFCA (NYSE: FFA) 1994 - 2001 Spirit Finance (NYSE: SFC) 2003 - 2007 STORE Holding (Oaktree) 2011 - 2016 Management Team Performance | appendix – historical performance | Management has unparalleled expertise in creating successful STORE Property investment platforms in a variety of market environments. 30 $4.9 billion Invested Average Cap Rate 10.3%Average 10-year US Treasury 6.2% $3.5 billion InvestedAverage Cap Rate 8.7%Average 10-year US Treasury 4.4% $4.4 billion InvestedAverage Cap Rate 8.3%Average 10-year US Treasury 2.3% Excess Return relative to Market Risk1 Annualized total return S|T|O|R|E leadership has a proven record of risk-adjusted outperformance.
![](https://capedge.com/proxy/8-K/0001140361-19-003590/ex99_2slide31.jpg)
31 Stable and Attractive Lease Rate Spreads to Treasury Rates S|T|O|R|E and predecessors’ average Lease Rates vs. 10-Year Treasuries1 1994 2018 3.9% 2.0% ÷ Δ = .51 24-Year Interest Rate Correlation (Cap Rate) (Treasury) net lease sensitivity to interest rates limits interest rate exposure. Net lease contracts are financial instruments, with yields that move with interest rates. Assuming borrowing costs rise with interest rates and lease rates rise by half of borrowing cost rates, shareholder returns will be little changed. | appendix – historical performance |
![](https://capedge.com/proxy/8-K/0001140361-19-003590/ex99_2slide32.jpg)
¹ Information based on YTD 3Q 2018 reported results. For companies where the year-to-date lease rate on new acquisitions is not disclosed, the formula assumes a lease rate of 7.0%. Same Store NOI growth used as a proxy for contract lease escalator where the latter is not disclosed. For companies where neither is disclosed, the formula assumes a lease escalator of 1.50%. EBITDA margin is based on revenue less reimbursed property expenses and straight-line rent. Marginal interest rate is based on the current spread on unsecured debt outstanding over the 10 year treasury. | appendix - returns | Our elevated equity return on new investments is a principle driver of our margins of safety and contributes to superior equity value creation ability. Marginal Equity Returns on Net Lease Real Estate Investments 32 Marginal Equity RETURNS1 ((lease rate + lease escalators) x EBITDA margin - (marginal interest rate x % funded with debt)) % funded with equity ROE computed on new investments using the V-Formula elevated returns contribute to performance and capital access.
![](https://capedge.com/proxy/8-K/0001140361-19-003590/ex99_2slide33.jpg)
| appendix - returns | 33 ADCONNNEPRSRC GROSS Cap Rate SPREAD over the cost of debt1 MVA Growth Rate2 CURRENT AFFO Multiple3 S|T|O|R|E S|T|O|R|E S|T|O|R|E Elevated gross cap rates and EBITDA margins have contributed to higher equity rates of return, leading to a higher spread between shareholder historic cost and market valuation, or Market Value Added (MVA). EPRSRCNNNO ADC ¹ For the YTD period ended September 30, 2018. Gross cap is Initial cap rate on new acquisitions plus contract bumps. For companies where the year-to-date lease rate on new acquisitions is not disclosed, the formula assumes a lease rate of 7.0%. Same Store NOI growth used as a proxy for contract lease escalator where the latter is not disclosed. For companies where neither is disclosed, the formula assumes a lease escalator of 1.50%. Cost of debt is the current spread on unsecured debt outstanding over the 10 year treasury.2 Calculated using the formula: [market capitalization / computed equity cost]^(1 / weighted average age of equity) 3 Calculated as of September 28, 2018 ADCNNNSRCEPRO Comparative Value Creation S|T|O|R|E vs. Peers S|T|O|R|E leads on shareholder value creation.
![](https://capedge.com/proxy/8-K/0001140361-19-003590/ex99_2slide34.jpg)
Most Diversified Tenant Base Source: Latest publicly available financial information as of September 30, 2018. ¹ Includes: Agree Realty Corporation; EPR Properties; Lexington Realty Trust; Spirit Realty Capital, Inc.; VEREIT, Inc.; and W. P. Carey Inc. (weighted average lease term in years) Longest Lease Term Lowest Near-Term Renewal Exposure (% top 5 tenants, based on current annual rent) (% expirations by period, based on current annual rent) Our net-lease portfolio has long contract terms and very high tenant diversification. High Quality Portfolio 34 | appendix – portfolio| S|T|O|R|E leads on lease term and tenant diversity.
![](https://capedge.com/proxy/8-K/0001140361-19-003590/ex99_2slide35.jpg)
DIVIDEND PER SHARE growth1 (Since Q1 2015) affo payout ratio2 Strong Protected Dividend Growth Our dividend growth is the highest amongst our net-lease peers….. 35 | appendix – portfolio| …and our dividends are the most protected. STORE’s dividend growth rate is 37% higher than its nearest peer. 1 Source: Historical dividend data from Nasdaq.com. VEREIT established its quarterly dividend in Q3 2015. Data for Spirit was not included following the spin-off of SMTA.2 Represents consensus 2019 analyst estimate from CapIQ. S|T|O|R|E has posted strong dividend growth and dividend protection.
![](https://capedge.com/proxy/8-K/0001140361-19-003590/ex99_2slide36.jpg)
Consistent Contract Quality 36 Investment grade contracts averaging ~75% of S|T|O|R|E’s rent over prior three years. Tenant Rating vs. Contract Rating (Cumulative) Strong contracts create a margin of safety relative to corporate credit risk. Contract Ratings | appendix – portfolio| Tenant Ratings strong contract stability across S|T|O|R|E’s portfolio over time.
![](https://capedge.com/proxy/8-K/0001140361-19-003590/ex99_2slide37.jpg)
Senior Contract Importance profit center lease contract seniority greatly lowers investment risk. WAvg. STORERecovery ~70%3 Avg. Loan Recovery~56%2 Avg. CMBS Recovery~34%1 STORE Capital Normalized Recovery Distribution Vs. Other Credit Sectors Because we invest in profit-center real estate, our recoveries of underperforming assets have a distribution towards elevated recoveries as a result of lease contract seniority. 37 | appendix – portfolio|
![](https://capedge.com/proxy/8-K/0001140361-19-003590/ex99_2slide38.jpg)
Asset Sales Impact on Internal Growth actively managing the portfolio creates accretive internal growth. Portfolio Management Impact on Growth Active portfolio management is a strong complement to our property management activity to minimize portfolio investment risk. Opportunistic Sales(39%) Property Management(19%) Net Gains over Cost StrategicSales(42%) +20% +5% +2% +10% Gains/Losses on Dispositions 2018 ($MM) $228MM (orig. cost), 3.7% of BOY PortfolioOpportunistic Sales 6.81% CapStrategic Sales 7.14% Cap102% Recovery on Property Mgmt. $0.7 Because STORE is levered at ~40% of our asset cost and we have generated gains on asset sales above our initial cost, we can add to our growth by leveraging those gains. 38 | appendix – portfolio|
![](https://capedge.com/proxy/8-K/0001140361-19-003590/ex99_2slide39.jpg)
39 Internal Growth in Perspective Attractive internal growth components based on approximately $8.4 billion of investments over 7.5 years Avg. Rent Related to Property Sales ~0.9%Avg. Rent Gain on Sales ~8.0% PORTFOLIO MANAGEMENTAbility to realize gains AFFO Impact ~0.1% | appendix – portfolio| margins of safety, investment-grade performance and built-in growth. Annual RentIncrease +1.8 %ReinvestedCash Flow1 +1.9 % INTERNAL GROWTHGrowth by design Base Int. Growth +3.7 % +3.7% (0.3%) +0.1% PROPERTY MANAGEMENTWork in Process (WIP) WIP Drag (0.2)% WIP (0.2)%(Added drag from unresolved credit events) 3.3% Internal Growth (Unleveraged) 3.3% Growth Adjusted for Equity Capitalization (~60% at cost) Shareholder Internal Growth (Leveraged) >5% ResolvedCredit Events (1.0)%Recovery (~70%) +0.7% PROPERTY MANAGEMENTAbility to manage losses Net Credit Loss (0.3)% (0.2%) Shareholder Internal Growth(Leveraged) >5% Internal Growth(Unleveraged)
![](https://capedge.com/proxy/8-K/0001140361-19-003590/ex99_2slide40.jpg)
As of December 31, 2018 Unencumbered Asset Pool Total Portfolio Investment Property Locations 1,245 2,255 Total Investment Amount $4,628MM $7,605MM Weighted Average Remaining Lease Contract Term ~15 Years ~14 Years % of Portfolio Subject to NNN Leases (by ABR) 98% 98% % of Portfolio Subject to Master Leases (by ABR)1 90% 91% Avg. Investment Amount / Replacement Cost (New)2 80% 81% % of Locations Providing Unit-Level Financial Reporting 98% 98% Median Expected Default Frequency (Tenant Risk) 1.68% (Ba3) 1.55% (Ba2) Median STORE Score (Contract Risk) 0.39% (Baa2) 0.41% (Baa2) Median Unit-Level Fixed Charge Coverage Ratio (FCCR) / 4-Wall Coverage Ratio3 2.35x / 2.82x 2.10x / 2.53x Top Tenant Exposure (% ABR) 4.7% 2.7% Top 5 Tenant Exposures (% ABR) 14.9% 10.6% Industry Diversification (by ABR) Comparison of Key Metrics: Unencumbered Pool vs. Total Portfolio Unencumbered and Secured Asset Pools Have Consistent Credit Profiles Consistent Asset Quality Across Portfolio granular and diverse assets allow us to create comparable asset pools. 40 Total Portfolio Unencumbered Asset Pool | appendix – portfolio|
![](https://capedge.com/proxy/8-K/0001140361-19-003590/ex99_2slide41.jpg)
41 Executive Management Team | appendix – S|T|O|R|E leadership| MARY FEDEWAChief Operating Officer & DirectorCo-Founder; Chief Operating Officer, Assistant Secretary and Assistant Treasurer; Director since August 2016Former Managing Director of Acquisitions at Spirit; former Senior Vice President of GE Franchise Finance (successor company to FFCA)>20 years of experience in a broad range of financial servicesRecognized as a Woman of Influence in 2016 by Real Estate Forum magazine CHRISTOPHER H. VOLKPresident, CEO & DirectorCo-Founder; CEO and Director since Company’s inception in May 2011Former Co-Founder, CEO and Director of Spirit Finance Corporation (“Spirit”); former President and Director of Franchise Finance Corporation of America (“FFCA”)>30 years of experience in structuring, managing and financing commercial real estate companiesLed largest ever real estate limited partnership roll-up transaction of its time in 1994 in formation of FFCA; oversaw issuance of FFCA's unsecured debt rating in 1995, the first unsecured debt rating ever issued to a net-lease REIT; led creation of first commercial real estate master trust debt conduit in the United States designed to finance net-lease assets in 2005 at Spirit CATHERINE LONGChief Financial Officer, EVP & TreasurerCo-Founder; Executive Vice President – CFO, Treasurer and Assistant Secretary since Company’s inceptionFormer CFO and Treasurer of Spirit; former Principal Accounting Offer of FFCA>30 years of accounting, operating and financial management expertise Named CFO of the Year in 2008 by Arizona chapter of Financial Executives International MICHAEL T. BENNETTEVP – General Counsel, Chief Compliance Officer & SecretaryCo-Founder; Executive Vice President—General Counsel, Chief Compliance Officer, Corporate Secretary and Assistant TreasurerFormer Senior Vice President of Spirit; former General Counsel of Farmer Mac (NYSE:AGM)>30 years of legal, transactional and operational experience in real estate and finance industriesNamed best in-house attorney at the Arizona Corporate Counsel Awards in 2017 by Az Business magazine
![](https://capedge.com/proxy/8-K/0001140361-19-003590/ex99_2slide42.jpg)
42 Board of Directors MORTON H. FLEISCHERChairmanChairman since inception in May 2011. Former Co-Founder and Chairman of Spirit and FFCA MARY FEDEWAChief Operating Officer & DirectorCo-Founder of S|T|O|R|E; COO since September 2017 (previously EVP – Acquisitions since inception in May 2011); Director since 2016 William F. HippDirectorDirector since 2016. Former head of real estate for Key Bank, BankBoston and FleetBoston with over 35 years in commercial banking Einar A. SeadlerDirectorDirector since 2016. Founder and President of EAS Advisors LLC; Former Managing Director of Accenture Strategy Joseph M. DonovanDirectorDirector since 2014. Chairman of Fly Leasing Limited (NYSE: FLY) Quentin P. Smith, JrDirectorDirector since 2014. Founder and President of Cadre Business Advisors LLC; Director of Banner Health System CHRISTOPHER H. VOLKChief Executive Officer & DirectorCo-Founder of S|T|O|R|E; CEO and Director since inception in May 2011. Former Co-Founder, CEO and Director of Spirit and President and Director of FFCA Catherine D. riceDirectorDirector since October 2017. Lead Independent Director, Colony Northstar Credit Real Estate (NYSE: CLNC); Former Senior Managing Director and CFO of W.P. Carey | appendix – S|T|O|R|E leadership| Rajath shourieDirectorDirector since February 2019. Managing Director and co-portfolio manager within Oaktree Capital Management’s Distressed Debt Group
![](https://capedge.com/proxy/8-K/0001140361-19-003590/ex99_2slide43.jpg)
Financial Information
![](https://capedge.com/proxy/8-K/0001140361-19-003590/ex99_2slide44.jpg)
44 Condensed Consolidated Statements of Income Three Months Ended Year Ended December 31, December 31, $ thousands, except share and per share data 2018 2017 2018 2017 Revenues: (unaudited) (unaudited) (audited) Rental revenues $ 139,211 $ 113,850 $ 513,302 $ 427,943 Interest income on loans and direct financing receivables 7,074 5,836 25,741 22,565 Other income 419 438 1,713 2,339 Total revenues 146,704 120,124 540,756 452,847 Expenses: Interest 35,964 28,540 129,061 120,478 Property costs 1,413 1,501 4,250 4,773 General and administrative 12,513 11,203 45,725 40,990 Depreciation and amortization 49,519 40,079 181,826 150,279 Provisions for impairment 5,202 1,500 7,810 13,440 Total expenses 104,611 82,823 368,672 329,960 Gain on dispositions of real estate 14,676 3,826 45,528 39,609 Income from operations before income taxes 56,769 41,127 217,612 162,496 Income tax expense 185 119 642 458 Net income $ 56,584 $ 41,008 $ 216,970 $ 162,038 Net income per share of common stock - basic and diluted $ 0.26 $ 0.21 $ 1.06 $ 0.90 Dividends declared per common share $ 0.33 $ 0.31 $ 1.28 $ 1.20 Weighted average common shares outstanding – basic 215,660,467 190,765,946 204,322,298 178,586,266 – diluted 216,477,667 191,302,717 204,933,292 178,656,676 | appendix - financial |
![](https://capedge.com/proxy/8-K/0001140361-19-003590/ex99_2slide45.jpg)
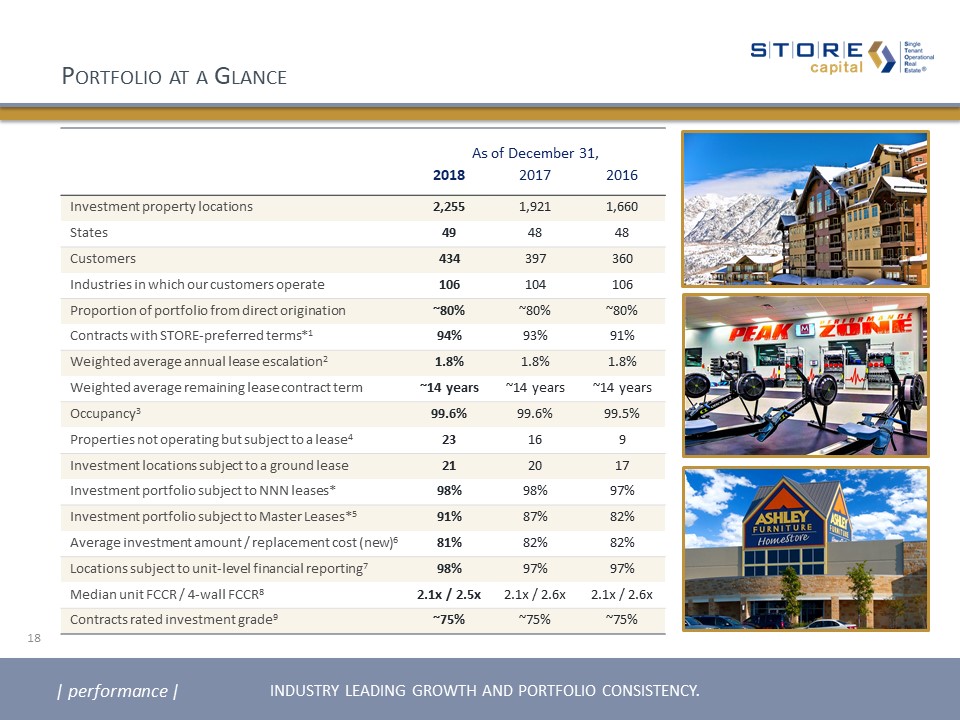
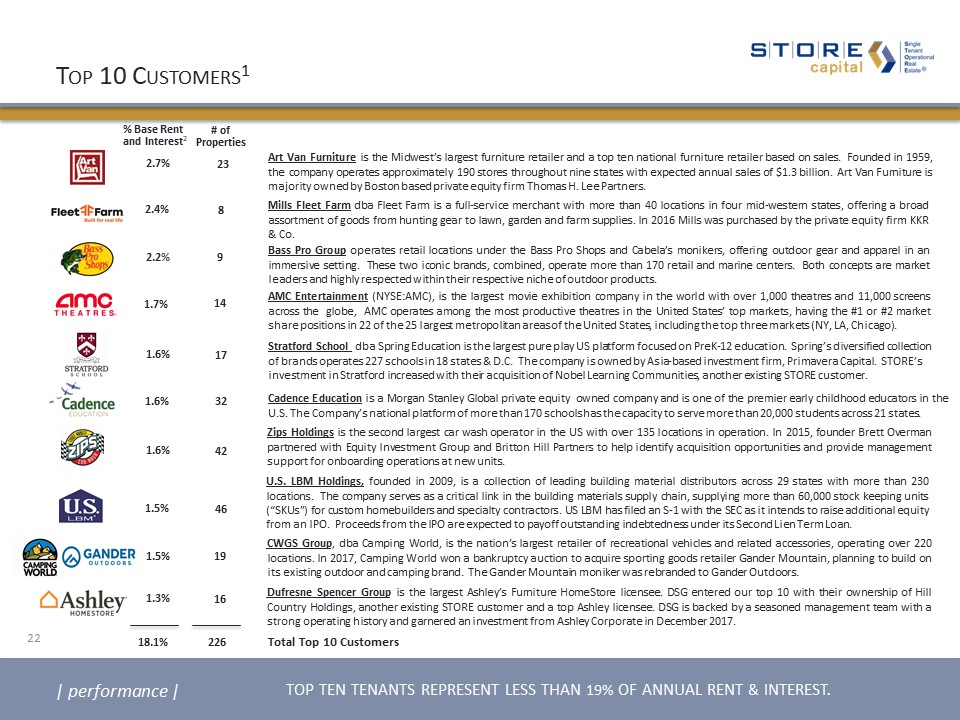
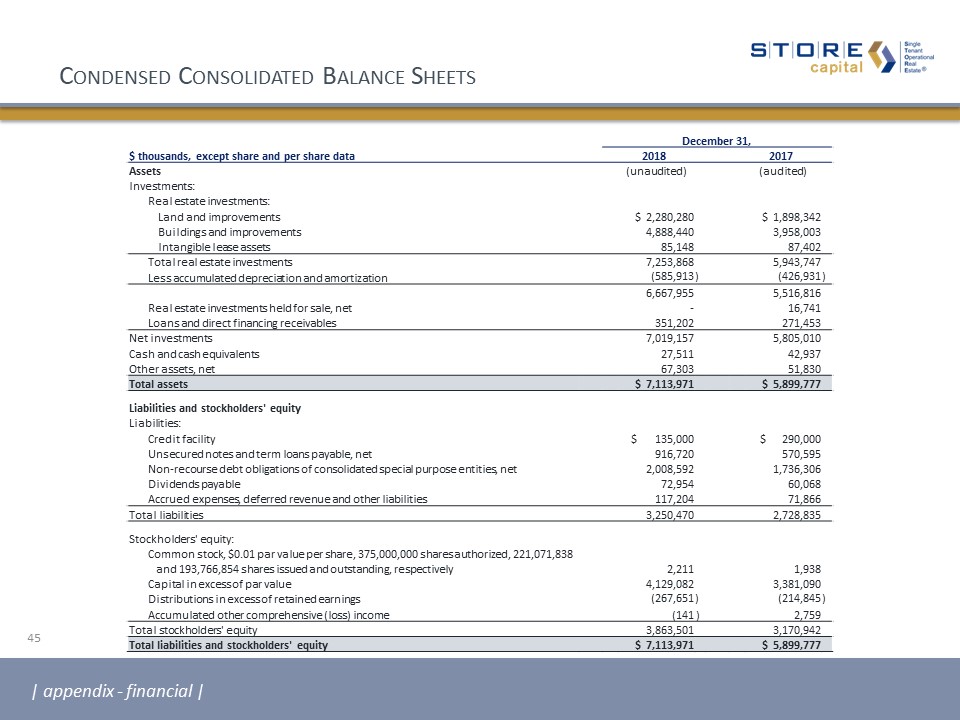
Condensed Consolidated Balance Sheets December 31, $ thousands, except share and per share data 2018 2017 Assets (unaudited) (audited) Investments: Real estate investments: Land and improvements $ 2,280,280 $ 1,898,342 Buildings and improvements 4,888,440 3,958,003 Intangible lease assets 85,148 87,402 Total real estate investments 7,253,868 5,943,747 Less accumulated depreciation and amortization (585,913 ) (426,931 ) 6,667,955 5,516,816 Real estate investments held for sale, net - 16,741 Loans and direct financing receivables 351,202 271,453 Net investments 7,019,157 5,805,010 Cash and cash equivalents 27,511 42,937 Other assets, net 67,303 51,830 Total assets $ 7,113,971 $ 5,899,777 Liabilities and stockholders' equity Liabilities: Credit facility $ 135,000 $ 290,000 Unsecured notes and term loans payable, net 916,720 570,595 Non-recourse debt obligations of consolidated special purpose entities, net 2,008,592 1,736,306 Dividends payable 72,954 60,068 Accrued expenses, deferred revenue and other liabilities 117,204 71,866 Total liabilities 3,250,470 2,728,835 Stockholders' equity: Common stock, $0.01 par value per share, 375,000,000 shares authorized, 221,071,838 and 193,766,854 shares issued and outstanding, respectively 2,211 1,938 Capital in excess of par value 4,129,082 3,381,090 Distributions in excess of retained earnings (267,651 ) (214,845 ) Accumulated other comprehensive (loss) income (141 ) 2,759 Total stockholders' equity 3,863,501 3,170,942 Total liabilities and stockholders' equity $ 7,113,971 $ 5,899,777 45 | appendix - financial |
![](https://capedge.com/proxy/8-K/0001140361-19-003590/ex99_2slide46.jpg)
Funds From Operations and Adjusted Funds from Operations1 Three Months Ended Year Ended December 31, December 31, $ thousands, except per share data 2018 2017 2018 2017 (unaudited) (unaudited) NET INCOME $ 56,584 $ 41,008 $ 216,970 $ 162,038 Depreciation and amortization of real estate assets 49,295 39,858 180,851 149,556 Provision for impairment of real estate 5,202 - 5,202 11,940 Gain on dispositions of real estate, net of tax2 (14,666 ) (3,826 ) (45,398 ) (39,604 ) FUNDS FROM OPERATIONS (FFO) $ 96,415 $ 77,040 $ 357,625 $ 283,930 Adjustments: Straight-line rental revenue, net: Fixed rent escalations accrued (1,296 ) (1,361 ) (6,121 ) (6,414 ) Construction period rent deferrals 2,116 965 6,622 3,056 Amortization of: Equity-based compensation 2,659 2,051 8,608 7,931 Deferred financing costs and other noncash interest expense3 3,578 1,851 9,549 9,978 Lease-related intangibles and costs4 601 573 2,433 7,043 Provision for loan losses - 1,500 2,608 1,500 Capitalized interest (681 ) (415 ) (2,641 ) (1,243 ) Gain on extinguishment of debt - - (814 ) - Accrued severance costs - - - 296 ADJUSTED FUNDS FROM OPERATIONS (AFFO) $ 103,392 $ 82,204 $ 377,869 $ 306,077 Net Income per share of common stock - basic and diluted5 $ 0.26 $ 0.21 $ 1.06 $ 0.90 FFO per share of common stock – basic5 $ 0.45 $ 0.40 $ 1.75 $ 1.59 – diluted5 $ 0.44 $ 0.40 $ 1.74 $ 1.59 AFFO per share of common stock – basic5 $ 0.48 $ 0.43 $ 1.85 $ 1.71 – diluted5 $ 0.48 $ 0.43 $ 1.84 $ 1.71 46 | appendix - financial |
![](https://capedge.com/proxy/8-K/0001140361-19-003590/ex99_2slide47.jpg)
GAAP Reconciliations: Net Income to FFO and AFFO1 47 $ millions (unaudited) Year Ended December 31, 2015 2016 2017 2018 NET INCOME $ 83.8 $ 123.3 $ 162.0 $ 217.0 Depreciation and amortization of real estate assets 88.3 119.1 149.6 180.9 Provision for impairment of real estate 1.0 1.7 11.9 5.2 Gain on dispositions of real estate, net of tax2 (1.3) (13.2) (39.6) (45.4) FUNDS FROM OPERATIONS (FFO) $ 171.7 $ 230.9 $ 283.9 $ 357.6 Adjustments: Straight-line rental revenue, net: Fixed rent escalations accrued (4.8) (5.5) (6.4) (6.1) Construction period rent deferrals 2.7 3.1 3.1 6.6 Transaction costs 1.2 0.5 - - Amortization of: Equity-based compensation 4.7 7.0 7.9 8.6 Deferred financing costs and other noncash interest expense3 6.5 7.3 10.0 9.5 Lease-related intangibles and costs4 2.1 2.5 7.0 2.4 Provision for loan losses - - 1.5 2.6 Capitalized interest (0.8) (0.8) (1.2) (2.6) Gain on extinguishment of debt - - - (0.8) Accrued severance costs - - 0.3 - Selling stockholder costs - 0.8 - - ADJUSTED FUNDS FROM OPERATIONS (AFFO) $ 183.5 $ 245.8 $ 306.1 $ 377.9 | appendix - financial |
![](https://capedge.com/proxy/8-K/0001140361-19-003590/ex99_2slide48.jpg)
GAAP Reconciliations: Net Income to NOI 48 $ millions (unaudited) Year Ended December 31, 2015 2016 2017 2018 NET INCOME $83.8 $123.3 $162.0 $217.0 Adjustments: Interest 81.8 105.2 120.5 129.1 Transaction costs 1.2 0.5 - - General and administrative 28.0 34.0 41.0 45.7 Selling stockholder costs - 0.8 - - Depreciation and amortization 88.6 119.6 150.3 181.8 Provisions for impairment 1.0 1.7 13.4 7.8 Gain on dispositions of real estate (1.3) (13.3) (39.6) (45.5) Income tax expense 0.3 0.4 0.5 0.6 NET OPERATING INCOME $283.2 $372.3 $448.1 $536.5 | appendix - financial |
![](https://capedge.com/proxy/8-K/0001140361-19-003590/ex99_2slide49.jpg)
GAAP Reconciliations: Debt to Adjusted Debt1 49 $ millions (unaudited) As of December 31, 2018 Credit facility $ 135.0 Unsecured notes and term loans payable, net 916.7 Non-recourse debt obligations of consolidated special purpose entities, net 2,008.6 TOTAL DEBT $ 3,060.3 Adjustments: Unamortized net debt discount 2.0 Unamortized deferred financing costs 35.5 Cash and cash equivalents (27.5 ) Restricted cash deposits held for the benefit of lenders (14.6 ) ADJUSTED DEBT $ 3,055.7 | appendix - financial |
![](https://capedge.com/proxy/8-K/0001140361-19-003590/ex99_2slide50.jpg)
GAAP Reconciliations: Net Income to Adjusted EBITDAre1 50 $ millions (unaudited) Three Months Ended December 31, 2018 NET INCOME $ 56.6 Adjustments: Interest 36.0 Income tax expense 0.2 Depreciation and amortization 49.5 EBITDA 142.3 Adjustments: Provision for impairment of real estate 5.2 Gain on dispositions of real estate (14.7 ) EBITDAre 132.8 Adjustments: Provision for loan losses - ADJUSTED EBITDAre $ 132.8 Estimated adjustment to Adjusted EBITDAre if all real estate acquisitions and dispositions for the quarter ended December 31, 2018 had occurred as of October 1, 2018 5.9 ADJUSTED EBITDAre – CURRENT ESTIMATED RUN RATE $ 138.7 ANNUALIZED ADJUSTED EBITDAre $ 531.1 ANNUALIZED ADJUSTED EBITDAre – CURRENT ESTIMATED RUN RATE $ 554.8 ADJUSTED DEBT / ANNUALIZED ADJUSTED EBITDAre 5.8x ADJUSTED DEBT/ ANNUALIZED ADJUSTED EBITDAre – CURRENT ESTIMATED RUN RATE 5.5x | appendix - financial |
![](https://capedge.com/proxy/8-K/0001140361-19-003590/ex99_2slide51.jpg)
Long-Term Debt Maturities 51 | appendix - financial | $ thousands Total 2019 2020 2021 2022 2023 2024 2025 2026 2027 2028 Thereafter Unsecured notes $ 725,000 $ - $ - $ - $ 75,000 $ - $ 100,000 $ - $ 200,000 $ - $ 350,000 $ - Term loans 200,000 100,0001 - 100,000 - - - - - - - - Non-recourse mortgage notes: STORE Master Funding2 1,868,466 25,694 93,415 137,853 113,767 262,096 333,322 268,979 169,067 464,273 - - Other secured notes 169,405 9,617 4,260 17,580 37,788 24,652 10,263 1,978 54,443 595 622 7,607 Total $ 2,962,871 $ 135,311 $ 97,675 $ 255,433 $ 226,555 $ 286,748 $ 443,585 $ 270,957 $ 423,510 $ 464,868 $ 350,622 $ 7,607 1 Extendable – three one-year options.2 Prepayable 24 or 36 months prior to maturity.
![](https://capedge.com/proxy/8-K/0001140361-19-003590/ex99_2slide52.jpg)
52 Supplemental Reporting Measures Funds from Operations, or FFO, and Adjusted Funds from Operations, or AFFO Our reported results are presented in accordance with U.S. generally accepted accounting principles, or GAAP. We also disclose Funds from Operations, or FFO, and Adjusted Funds from Operations, or AFFO, both of which are non‑GAAP measures. We believe these two non‑GAAP financial measures are useful to investors because they are widely accepted industry measures used by analysts and investors to compare the operating performance of REITs. FFO and AFFO do not represent cash generated from operating activities and are not necessarily indicative of cash available to fund cash requirements; accordingly, they should not be considered alternatives to net income as a performance measure or to cash flows from operations as reported on a statement of cash flows as a liquidity measure and should be considered in addition to, and not in lieu of, GAAP financial measures. We compute FFO in accordance with the definition adopted by the Board of Governors of the National Association of Real Estate Investment Trusts, or NAREIT. NAREIT defines FFO as GAAP net income, excluding gains (or losses) from extraordinary items and sales of depreciable property, real estate impairment losses, and depreciation and amortization expense from real estate assets, including the pro rata share of such adjustments of unconsolidated subsidiaries. To derive AFFO, we modify the NAREIT computation of FFO to include other adjustments to GAAP net income related to certain non‑cash revenues and expenses that have no impact on our long-term operating performance, such as straight‑line rents, amortization of deferred financing costs and stock‑based compensation. In addition, in deriving AFFO, we exclude certain other costs not related to our ongoing operations, such as the amortization of lease-related intangibles. FFO is used by management, investors and analysts to facilitate meaningful comparisons of operating performance between periods and among our peers primarily because it excludes the effect of real estate depreciation and amortization and net gains on sales, which are based on historical costs and implicitly assume that the value of real estate diminishes predictably over time, rather than fluctuating based on existing market conditions. Management believes that AFFO provides more useful information to investors and analysts because it modifies FFO to exclude certain additional non-cash revenues and expenses such as straight‑line rents, including construction period rent deferrals, and the amortization of deferred financing costs, stock‑based compensation and lease-related intangibles as such items may cause short-term fluctuations in net income but have no impact on long-term operating performance. We believe that these costs are not an ongoing cost of the portfolio in place at the end of each reporting period and, for these reasons, the portion expensed is added back when computing AFFO. As a result, we believe AFFO to be a more meaningful measurement of ongoing performance that allows for greater performance comparability. Therefore, we disclose both FFO and AFFO and reconcile them to the most appropriate GAAP performance metric, which is net income. STORE Capital’s FFO and AFFO may not be comparable to similarly titled measures employed by other companies. | appendix |
![](https://capedge.com/proxy/8-K/0001140361-19-003590/ex99_2slide53.jpg)
53 Supplemental Reporting Measures Note: In 2017, NAREIT issued a white paper recommending that companies that report EBITDA also report EBITDAre for all periods beginning after December 31, 2017. STORE’s presentation of Adjusted EBITDAre matches our previous presentation of Adjusted EBITDA.We believe that presenting supplemental reporting measures, or non-GAAP measures, such as EBITDA, EBITDAre and Adjusted EBITDAre, is useful to investors and analysts because it provides important supplemental information concerning our operating performance exclusive of certain non-cash and other costs. These non-GAAP measures have limitations as they do not include all items of income and expense that affect operations. Accordingly, they should not be considered alternatives to net income as a performance measure and should be considered in addition to, and not in lieu of, GAAP financial measures. Our presentation of such non-GAAP measures may not be comparable to similarly titled measures employed by other companies. EBITDA, EBITDAre and Adjusted EBITDAre EBITDA represents earnings (GAAP net income) plus interest expense, income tax expense, depreciation and amortization.We compute EBITDAre in accordance with the definition adopted by NAREIT. NAREIT defines EBITDAre as EBITDA (as defined above) excluding gains (or losses) from the sales of depreciable property and real estate impairment losses.To derive Adjusted EBITDAre we modify the NAREIT definition of EBITDAre to exclude other items included in GAAP net income, such as provisions for loan losses, as such items are not related to our ongoing performance.Note: The adjustments to derive Adjusted EBITDAre may not exist in every quarter, therefore EBITDAre and Adjusted EBITDAre may be equal.Annualized Adjusted EBITDAre and Adjusted DebtAnnualized Adjusted EBITDAre is calculated by multiplying Adjusted EBITDAre for the most recently completed fiscal quarter by four. Annualized Adjusted EBITDAre – Current Estimated Run Rate is based on an estimated Adjusted EBITDAre calculated as if all leases and loans in place as of the last date of the most recently completed fiscal quarter had been in place as of the beginning of such quarter; then annualizing that estimated Adjusted EBITDAre for the quarter by multiplying it by four. You should not unduly rely on this metric as it is based on several assumptions and estimates that may prove to be inaccurate. Our actual reported Adjusted EBITDAre for future periods may be significantly less than that implied by our reported Annualized Adjusted EBITDAre – Current Estimated Run Rate for a variety of reasons.Adjusted Debt represents our outstanding debt obligations excluding unamortized deferred financing costs and net debt premium, further reduced for cash and cash equivalents and restricted cash deposits held for the benefit of lenders. We believe excluding unamortized deferred financing costs and net debt premium, cash and cash equivalents and restricted cash deposits held for the benefit of lenders provides an estimate of the net contractual amount of borrowed capital to be repaid, which we believe is a beneficial disclosure to investors and analysts. Adjusted Debt to Annualized Adjusted EBITDAre Adjusted Debt to Annualized Adjusted EBITDAre, or leverage, is a supplemental non-GAAP financial measure we use to evaluate the level of borrowed capital being used to increase the potential return of our real estate investments. We calculate leverage by dividing Adjusted Debt by Annualized Adjusted EBITDAre. Because our portfolio growth level is significant to the overall size of the Company, we believe that presenting this leverage metric on a run rate basis is more meaningful than presenting the metric for the historical quarterly period, and we refer to this metric as Adjusted Debt to Annualized Adjusted EBITDAre—Current Estimated Run Rate. Leverage should be considered as a supplemental measure of the level of risk to which stockholder value may be exposed. Our computation of leverage may differ from the methodology employed by other companies and, therefore, may not be comparable to other measures. | appendix |
![](https://capedge.com/proxy/8-K/0001140361-19-003590/ex99_2slide54.jpg)
54 Footnotes Page 4:1 Reflects the percentage of our contracts (based on annualized base rent and interest) that have a STORE Score that is investment grade. We measure the credit quality of our portfolio on a contract-by-contract basis using the STORE Score, which is a proprietary risk measure reflective of both the credit risk of our tenants and the profitability of the operations at the properties.Page 7:1 Represents the weighted average percentage change (by annualized base rent and interest) in reported corporate revenues for the trailing 12-month (or nine-month if 12-month is not available) period as reported to STORE Capital for the period ended December 31, 2017 as compared to the same period ended December 31, 2016. Excludes customers representing 7.5% of annualized base rent and interest because sufficient comparable data is not available.2 Estimated based on total revenue per employee for all companies in the middle market (based on data reported by the National Center for the Middle Market for 2017) extrapolated to the aggregate total revenue of S|T|O|R|E’s customers and the growth rate as described in footnote 1 above.Page 9:1 Represents reported corporate revenues for financial statements received by STORE Capital through December 31, 2018. Excludes customers, representing approximately 2.0% of annualized base rent and interest, that do not report corporate revenues. 2 Estimated based on total revenue per employee for all companies in the middle market (based on data reported by the National Center for the Middle Market for 2017) extrapolated to the aggregate total revenue of S|T|O|R|E’s customers.3 Represents the number of locations operated by S|T|O|R|E’s customers as reported to STORE Capital through December 31, 2017. Page 11:1 Represents the tolerable fall-off in unit sales so that EBITDAR after overhead will still cover the unit’s fixed charges (which includes S|T|O|R|E’s rent and interest) weighted by the unit’s fixed charges (based on currently available results for approximately 86% of the properties in our investment portfolio). If the variable profit coefficient for an individual unit was unavailable, we assumed the average long-term variable profit coefficient for the entire portfolio in the calculation of the fall-off amount.Page 12:1 Represents the weighted average interest rate on balloon payments due in the respective years.2 Free cash flow approximates Adjusted Funds from Operations less dividends paid.Page 13:1 Based on average of ratios of Realty Income and National Retail Properties as of September 30, 2018.2 Ratios as of December 31, 2018; Unencumbered EBITDA based on NOI from Unencumbered Assets less an allocation of general and administrative expenses based on assets.Page 14: 1 Shown by percentage of annualized base rent and interest (annualized based on rates in effect on December 31, 2018, for all leases, loans and direct financing receivables in place as of that date). Excludes contracts representing less than 0.2% of annualized base rent and interest where there are no further escalations remaining in the current lease term and there are no extension options. Of our contracts in place as of December 31, 2018, 84% increase based on changes in CPI, 14% increase based on fixed rates in the contract and only 2% do not increase. 2 Represents the weighted average annual escalation rate of the entire portfolio as if all escalations occurred annually. For escalations based on a formula including CPI, assumes the stated fixed percentage in the contract or assumes 1.5% if no fixed percentage is in the contract. For contracts with no escalations remaining in the current lease term, assumes the escalation in the extension term. | appendix | 3 Dividend protection refers to the percentage difference between our AFFO per share and our dividend per share. The wider the relative gap between AFFO per share and dividends per share, the greater the implied dividend protection. All dividends are declared at the discretion of our Board of Directors and future dividends will depend upon our actual funds from operations, financial condition and capital requirements, the annual distribution requirements under the REIT provisions of the Code and other factors.4 S|T|O|R|E defines internal growth as the combination of high average lease escalators and a low AFFO payout ratio, which allows us to reinvest a growing amount of free cash flow back into our business. Page 15:1 See chart, page 30.Page 16:1 Our Board of Directors has opted out of provisions of the Maryland Unsolicited Takeover Act (or “MUTA”), the business combination statute, the control share acquisition statute and provisions otherwise granting us the right to adopt a stockholder rights plan and we may not opt back into any of these statutes or provisions without stockholder approval or, in the case of a stockholder rights plan, stockholder ratification within 12 months of adoption of such a plan.Page 17: 1 S|T|O|R|E’s pipeline from 2014 through December 31, 2018. See slide 25 for more information about S|T|O|R|E's pipeline, including its composition. S|T|O|R|E may never acquire properties in its pipeline for a variety of reasons as described in the Company’s Annual Report on Form 10-K for the fiscal year ended December 31, 2017.2 Growth rate in quarterly AFFO per share since IPO in Q4 2014.3 Data as of September 30, 2018.4 See footnote 3 to page 14.5 S|T|O|R|E defines occupancy as a property being subject to a lease or loan contract.
![](https://capedge.com/proxy/8-K/0001140361-19-003590/ex99_2slide55.jpg)
Footnotes | appendix | 55 Page 18: * Based on annualized base rent and interest.1 Represents the percentage of our lease contracts that were created by S|T|O|R|E Capital or contain preferred contract terms such as unit-level financial reporting, triple-net lease provisions and, when applicable, master lease provisions.2 Weighted average annual lease escalation represents the weighted average annual escalation rate of the entire portfolio as if all escalations occurred annually. For escalations based on a formula including CPI, assumes the stated fixed percentage in the contract or assumes 1.5% if no fixed percentage is in the contract. For contracts with no escalations remaining in the current lease term, assumes the escalation in the extension term. Calculation excludes contracts representing less than 0.2% of annualized base rent and interest where there are no further escalations remaining in the current lease term and there are no extension options.3 S|T|O|R|E defines occupancy as a property being subject to a lease or loan contract. 4 The number of properties not currently operating but subject to a lease represents the number of our investment locations that have been closed by the tenant but remain subject to a lease.5 The percentage of investment portfolio subject to master leases represents the percentage of the investment portfolio in multiple properties with a single customer subject to master leases. Based on annualized base rent and interest, 84% of the investment portfolio involves multiple properties with a single customer, whether or not subject to a master lease.6 The average investment amount/replacement cost (new) represents the ratio of purchase price to replacement cost (new) at acquisition.7 Of the 98% of our properties that are required to provide unit-level reporting, 99% have provided current obligated statements as of February 4, 2019. 8 S|T|O|R|E calculates unit fixed charge coverage ratio generally as the ratio of (i) the unit’s EBITDAR, less a standardized corporate overhead expense based on estimated industry standards, to (ii) the unit’s total fixed charges, which are its lease expense, interest expense and scheduled principal payments on indebtedness. The 4-Wall coverage ratio refers to a unit’s FCCR before taking into account standardized corporate overhead expense. The weighted average unit FCCR and 4-Wall coverage ratios were 2.6x and 3.2x, respectively, as of December 31, 2018, 2.4x and 3.1x, respectively, as of December 31, 2017 and 2.9x and 3.5x, respectively, as of December 31, 2016.9 The proportion of investment contracts rated investment grade represents the percentage of our contracts (based on annualized base rent and interest) that have a STORE Score that is investment grade. We measure the credit quality of our portfolio on a contract-by-contract basis using the STORE Score, which is a risk measure reflective of both the credit risk of our tenants and the profitability of the operations at the properties. Pages 19 and 20: 1 Data as of December 31, 2018, 2017 and 2016, by percentage of annualized base rent and interest (annualized based on rates in effect on December 31, 2018, 2017 and 2016, for all leases, loans and direct financing receivables in place as of those dates). The industry group classification for certain customers as of December 31, 2017 and 2016 have been changed to conform to December 31, 2018 presentation.Page 22:1 Data based on information available on customer websites, news releases and/or SEC filings.2 Data as of December 31, 2018, by percentage of annualized base rent and interest (annualized based on rates in effect on December 31, 2018, for all leases, loans and direct financing receivables in place as of that date). Page 23:1 Based on annualized base rent and interest.2 Represents the percentage of our properties that are occupied. S|T|O|R|E defines occupancy as a property being subject to a lease or loan contract. As of September 30, 2017, the Company owned 19 properties that were vacant and not subject to a contract; subsequent to September 30, 2017, eight of these properties were re-leased, one was sold and the Company’s occupancy rate improved from 99.0% to 99.5%.Page 24:1 We measure the credit quality of our portfolio on a contract-by-contract basis using the STORE Score, which is a proprietary risk measure reflective of both the credit risk of our tenants and the profitability of the operations at our properties. The STORE Score is a quantitative measurement of contract risk computed by multiplying tenant default probabilities (using Moody’s RiskCalc) and estimated store closure probabilities (using a simple algorithm we developed that has closure probabilities ranging from 100% to 10%, depending on unit-level profitability). Qualitative features can also impact investment risk, such as low property investment amounts, favorable tenant debt capital stacks, the presence of third party guarantors, or other factors. Such qualitative factors are not included in the STORE Score and may serve to mitigate investment risk even further.Page 26:1 Acquisitions represent the total of acquisitions of real estate and investment in loans and direct financing receivables. Dispositions represent the original acquisition cost of real estate sold and loan repayments received in conjunction with real estate sales.2 Refer to pages 46 through 48 and page 52 for definitions of these non-GAAP financial measures and reconciliation to GAAP net income.3 Gross Rate of Return represents initial cap rate plus weighted average annual lease escalators. Gross returns do not represent the actual returns we may earn on properties.
![](https://capedge.com/proxy/8-K/0001140361-19-003590/ex99_2slide56.jpg)
Footnotes | appendix | 56 Page 27:1 Source: CapIQ. Data as of December 31, 2018. Page 28:1 Based on annualized total returns earned by management’s prior investment vehicles while operating as a public company, compared to annualized total returns on the MSCI US REIT Index during the same periods. The past performance of these investment vehicles is not an indicator of S|T|O|R|E’s future performance, and S|T|O|R|E’s performance may be significantly less favorable than the past performance data included in this presentation. Moreover, some of the past performance data covers periods with economic characteristics and cycles and interest rate environments that are significantly different from those S|T|O|R|E faces today and may face in the future.Page 30:1 Source: Green Street Advisors, Company data and, with respect to FFCA and Spirit Finance, publicly available SEC company filings. The Sharpe Ratio measures the ratio of excess returns to risk, using the spread between capitalization or lease rates and the 10-year U.S. Treasury yields to measure excess returns, and using the standard deviation of returns to measure risk. All ratios are calculated using capitalization or lease rate data during which FFCA and Spirit were publicly traded companies and the period since S|T|O|R|E’s inception. The ratio is calculated based on historical data from January 1994 to December 2018, and future returns and risk may not be consistent with this historical data. Page 31:1 Source: U.S. Treasury, Company data and, with respect to FFCA and Spirit Finance, publicly available SEC company filings. Page 37:1 Converted to Recovery on Original Value. Average CMBS recovery 49.6% and Average LTV is 69.2% (1995-2018) Source: Kroll.2 Converted to Recovery on Original Value. Average Loan recovery is 80.4% and Average LTV is 70% (1987-2017) Sources: Moody’s & Loans.com.3 Weighted Average STORE recovery based on rents. Recovery to Original Value will tend to be higher.Page 39:Note: Data through December 31, 2018.¹ Growth from reinvested cash flow is equal to (i) the incremental cash flow added from reinvesting retained cash assuming a prior period payout ratio of 70%, leveraged at 45% with a borrowing cost of 4.50% and amortization of 45 years, reinvested at 7.85% less incremental operating costs of 0.25% divided by (ii) prior period rents assuming assets were acquired at 7.85%.Page 40:Note: Data as of December 31, 2018. “ABR” is annualized base rent and interest.1 Percentage of investment portfolio in multiple properties with a single customer subject to master leases. Based on annualized base rent & interest of S|T|O|R|E’s total investment portfolio as of December 31, 2018.2 Represents the ratio of purchase price to replacement cost (new) at acquisition.3 S|T|O|R|E calculates a unit’s FCCR generally as the ratio of (i) the unit’s EBITDAR, less a standardized corporate overhead expense based on estimated industry standards, to (ii) the unit’s total fixed charges, which are its lease expense, interest expense and scheduled principal payments on indebtedness. The 4-Wall coverage ratio refers to a unit’s FCCR before taking into account standardized corporate overhead expense. Page 46:1 See page 52 for discussion regarding use of Funds From Operations and Adjusted Funds from Operations.2 For the three months ended December 31, 2018 includes $10,000 and for the years ended December 31, 2018 and 2017, includes $130,000 and $5,000, respectively, of income tax expense associated with gains recognized on the dispositions of certain properties.3 For the three months ended December 31, 2018 includes $1.7 million and for the years ended December 31, 2018 and 2017, includes $2.1 million and $2.0 million, respectively, of accelerated amortization of deferred financing costs primarily related to the prepayment of debt.4 For the year ended December 31, 2017, includes a $4.6 million charge related to accelerated amortization of lease incentives associated with terminated lease contracts.5 Under the two-class method, earnings attributable to unvested restricted stock are deducted from earnings in the computation of per share amounts where applicable.Page 47:1 See page 52 for discussion regarding use of Funds From Operations and Adjusted Funds from Operations.2 For the years ended December 31, 2016, 2017 and 2018, includes $76,000, $5,000 and $130,000, respectively, of income tax expense associated with gains recognized on the dispositions of certain properties.3 See footnote 3 to page 46.4 See footnote 4 to page 46. Page 49:1 See page 53 for discussion regarding use of EBITDAre, Adjusted EBITDAre and Adjusted Debt.Page 50:1 See page 53 for discussion regarding use of EBITDAre, Adjusted EBITDAre and Adjusted Debt.
![](https://capedge.com/proxy/8-K/0001140361-19-003590/ex99_2slide57.jpg)
Investor and Media ContactsFinancial Profiles, Inc.Moira Conlon, 310.622.8220Tricia Ross, 310.622.8226STORECapital@finprofiles.com Corporate Headquarters8377 East Hartford Drive, Suite 100Scottsdale, Arizona 85255480.256.1100www.STOREcapital.com