202 2 second quarter investor presentation a leader in real estate capital solutions |
2022 second quarter investor presentation 2 disclaimer This presentation contains forward - looking statements within the meaning of Section 27A of the Securities Act of 1933, as amended, or the Securities Act, and Section 21E of the Securities Exchange Act of 1934, as amended, or the Exchange Act. Such forward - looking statements include, without limitation, statements concerning our business and growth strategies, investment, financing and leasing activities and trends in our business, including trends in the market for long - term, triple - net leases of freestanding, single - tenant properties. Words such as “expects,” “anticipates,” “intends,” “plans,” “likely,” “will,” “believes,” “seeks,” “estimates,” and variations of such words and similar expressions are intended to identify such forward - looking statements. Such statements involve known and unknown risks, uncertainties and other factors which may cause our actual results, performance or achievements to be materially different from the results of operations or plans expressed or implied by such forward - looking statements. Although we believe that the assumptions underlying the forward - looking statements contained herein are reasonable, any of the assumptions could be inaccurate, and therefore such statements included in this presentation may not prove to be accurate. In light of the significant uncertainties inherent in the forward - looking statements included herein, the inclusion of such information should not be regarded as a representation by us or any other person that the results or conditions described in such statements or our objectives and plans will be achieved. Furthermore, actual results may differ materially from those described in the forward - looking statements and may be affected by a variety of risks and factors including, without limitation, the risks described in our Annual Reports on Form 10 - K, quarterly reports on form 10 - Q, and current reports on form 8 - K. Forward - looking statements set forth herein speak only as of the date hereof, and we expressly disclaim any obligation or undertaking to update or revise any forward - looking statement contained herein, to reflect any change in our expectations with regard thereto, or any other change in events, conditions or circumstances on which any such statement is based, except to the extent otherwise required by law. THIS PRESENTATION CONTAINS HISTORICAL PERFORMANCE INFORMATION REGARDING STORE CAPITAL AS WELL AS OTHER COMPANIES PREVIOUSLY MANAGED BY MEMBERS OF OUR SENIOR MANAGEMENT TEAM. SUCH PAST PERFORMANCE IS NOT A GUARANTEE OF FUTURE RESULTS. This presentation contains references to our copyrights, trademarks and service marks and to those belonging to other entities. Solely for convenience, copyrights, trademarks, trade names and service marks referred to in this presentation may appear without the “© “ or “ TM” OR “sm” Symbols, but such references are not intended to indicate, in any way, that we will not assert, to the fullest extent under applicable law, our rights or the rights of the applicable licensor to these copyrights, trademarks, trade names and service marks. We do not intend our use or display of other companies’ trade names, copyrights, trademarks or service marks to imply a relationship with, or endorsement or sponsorship of us by, any other companies. Definitions and footnotes for data provided herein are provided in the appendix section of this presentation. Unless otherwise indicated, data provided herein is as of June 30, 2022. |
2022 second quarter investor presentation 3 overview STORE has the platform, the data and the analytics to drive superior risk - adjusted returns profit center real estate direct origination diversified portfolio scalable platform distinctive balance sheet corporate responsibility focus on unit - level profitability 4.7x rent c overage 1 5.9% AFFO/share CAGR (since IPO) expansive addressable market $3.9 trillion ~ 2 million locations 9.8% - 10.7% AFFO/share growth guidance 5 2021 – 2022 $13.2 billion acquisition pipeline customer - centric approach ~1/3 new business from existing customers 124 industries multiple borrowing sources secured/ unsecured flexible structure favorable prepayment options/well - laddered ability to leverage talent, systems, etc. access to capital NYSE: STOR BBB (+) $11.4 billion AUM 3 … and growing 6.1% dividend/share CAGR (since IPO) 2.9% largest customer 2 579 # of customers 5.7x adj. debt/adj. run rate EBITDA 4 17.7% top ten customers 2 value creation 92% of tenant respondents to survey implemented energy efficiency measures 2 years named to Bloomberg’s Gender - Equality Index 55% of board is diverse in terms of gender or ethnicity |
2022 second quarter investor presentation owning profit center real estate is the core to STORE’s investment approach and creates a level of “certainty” for STORE across all economic environments Single Tenant Operational Real Estate (STORE) is a real estate investment asset class of its own with three payment sources all real estate investors have the first two….. 1 corporate credit quality 2 real estate value …but the third is unique to STORE 3 unit - level profitability a focused approach on acquiring profitable locations, resulting in superior portfolio performance profit center real estate 4 unit - level profitability real estate value corporate credit quality |
2022 second quarter investor presentation 5 broad - based market need total addressable market $3.9 trillion of single tenant properties providing tailored financial solutions for our customers the depth of the market allows STORE to be selective in its investment decisions selective investing target market * STORE’s targeted market is large, consisting of nearly 215,000 companies direct relationships direct customer relationships account for ~80% of STORE’s acquisitions * companies with over $10MM in annual revenue |
2022 second quarter investor presentation STORE customer profile 43,000 locations STORE’s customers consist of regional and national companies with a strong track record of growth 1.8MM ~40% ~$1.2B ~1/3 ~50% new business from existing customers number of locations operated by customers 3 number of workers employed by customers 2 2021 customer revenue growth 1 weighted average customer revenues customers with revenues over $200 million customer profile 6 |
2022 second quarter investor presentation direct origination model STORE’s pipeline is robust and diverse storage , 4% auto maintenance , 5% entertainment , 5% specialty med , 11% restaurants , 7% education , 5% health clubs , 2% all other service , 19% manufacturing , 22% RV/auto dealers , 6% all other service - oriented retail , 14% service - oriented retail service manufacturing $13.2 billion STORE’s direct origination model creates a strong and active investment pipeline STORE’s emphasis is on service, manufacturing and service - oriented retail industries which are essential and vital 7 |
2022 second quarter investor presentation investment activity & portfolio management REAL ESTATE VALUE acquisitions 1 : # of properties 85 103 57 21 52 84 66 95 75 100 111 62 # of new customers 15 19 9 9 10 13 10 9 9 18 19 11 number of transactions 29 43 21 18 23 40 24 37 24 51 39 32 average transaction size ($MM) $13.6 $12.5 $12.6 $7.5 $10.9 $10.9 $11.3 $9.2 $17.2 $9.5 $13.1 $12.2 initial cap rate 7.7% 7.7% 7.5% 8.7% 8.3% 8.1% 7.8% 7.8% 7.4% 7.2% 7.1% 7.2% lease escalation 1.9% 1.8% 2.5% 1.8% 1.9% 1.7% 1.9% 1.9% 1.8% 1.9% 1.8% 2.0% weighted avg. lease term (years) 17 17 16 17 18 18 18 17 16 17 17 18 dispositions 1 : # nonperforming properties 2 8 5 6 10 7 12 19 6 9 9 3 4 proceeds - nonperforming ($MM) $30.7 $5.6 $7.8 $25.4 $21.0 $11.7 $12.7 $19.6 $27.1 $26.7 $9.0 $21.1 # performing properties 46 10 3 6 11 22 25 7 16 12 8 9 proceeds - performing ($MM) $284.1 $32.0 $11.1 $19.5 $19.3 $99.4 $124.8 $15.4 $73.1 $58.4 $47.3 $44.0 cap rate – performing 7.4% 7.5% 7.0% 7.8% 7.0% 7.0% 7.8% 6.1% 6.7% 6.6% 7.0% 6.4% 395 537 264 135 251 436 271 341 412 486 513 392 315 38 19 45 40 111 137 35 100 85 56 65 $0 $100 $200 $300 $400 $500 $600 Q3 2019 Q4 2019 Q1 2020 Q2 2020 Q3 2020 Q4 2020 Q1 2021 Q2 2021 Q3 2021 Q4 2021 Q1 2022 Q2 2022 volume ($MM) 8 gross acquisitions proceeds from dispositions |
2022 second quarter investor presentation stable and attractive spreads we continue to operate with a wide spread between our acquisition cap rates and our cost of debt -1.0% 1.0% 3.0% 5.0% 7.0% 9.0% 11.0% 13.0% 15.0% WA annual lease rate (acquisitions) cost of new debt ten year treasury 2011 2022 1994 2007 1 1 9 STORE predecessor companies STORE capital ~350 bps |
2022 second quarter investor presentation 10 As of June 30, 2022 2021 2020 customers 579 529 503 investment property locations 3,012 2,738 2,554 investment portfolio subject to master leases 2 94% 94% 93% average investment amount / replacement cost (new) 3 80% 80% 81% weighted average annual lease escalation 4 1.8% 1.9% 1.9% occupancy 5 99.5% 99.6% 99.5% locations subject to unit - level financial reporting 6 99% 99% 98% weighted average 4 - wall FCCR 7 4.7x 4.1x 3.9x weighted average unit FCCR 7 3.6x 3.1x 3.0x diversification AUM 1 $11.4 billion WA lease term 13.2 years # of states 49 direct origination ~80% portfolio management origination portfolio at a glance |
2022 second quarter investor presentation % base rent and interest 1 # of properties 1 2.9% 28 2 2.8% 156 3 2.1% 9 4 2.0% 76 5 1.6% 30 6 1.4% 20 7 1.3% 46 8 1.3% 8 9 1.2% 14 10 1.1% 11 total top 10 customers 17.7% 398 % base rent and interest 1 # of properties 1 restaurants – full service 6.9% 356 2 early childhood education 6.0% 279 3 metal fabrication 5.8% 114 4 automotive repair & maintenance 5.8% 253 5 health clubs 5.1% 94 6 restaurants – limited service 4.8% 403 7 food processing 3.4% 33 8 pet care 3.3% 185 9 medical and dental 3.3% 168 10 lumber and construction material wholesalers 3.2% 167 total top 10 industries 47.6% 2,052 diversified profile top customers 11 top industries |
2022 second quarter investor presentation diversification by industry service manufacturing 12 building % base rent and interest 1 # of sq. ft. as of June 30, customer industry groups properties (in thousands) 2022 2021 2020 restaurants - full service 356 2,520 6.9% 7.4% 8.5% restaurants - limited service 403 1,278 4.8% 4.6% 5.1% early childhood education 279 2,927 6.0% 6.0% 6.1% automotive repair and maintenance 253 1,461 5.8% 5.2% 4.8% health clubs 94 3,286 5.1% 5.1% 5.3% pet care 185 1,758 3.3% 3.6% 3.5% medical and dental 168 1,533 3.3% 2.9% 2.9% lumber & construction materials wholesalers 167 6,877 3.2% 3.4% 2.8% behavioral health 89 1,713 3.2% 3.2% 2.9% movie theaters 35 1,807 3.1% 3.6% 4.0% family entertainment 40 1,575 3.1% 3.1% 3.6% elementary and secondary schools 15 816 2.8% 2.8% 1.4% equipment sales and leasing 61 1,473 1.9% 1.9% 1.9% logistics 34 4,227 1.7% 1.2% 1.2% wholesale automobile auction 8 428 1.0% 1.2% 1.3% all other service (26 industry groups) 236 14,446 8.6% 9.2% 9.1% total service 2,423 48,125 63.8% 64.4% 64.4% building % base rent and interest 1 # of sq. ft. as of June 30, customer industry groups properties (in thousands) 2022 2021 2020 metal fabrication 114 14,720 5.8% 5.0% 4.6% food processing 33 4,532 3.4% 2.6% 2.1% automotive parts and accessories 27 4,901 1.9% 1.4% 1.0% plastic and rubber products 18 3,260 1.6% 1.8% 1.6% furniture manufacturing 12 2,980 1.2% 1.3% 1.3% aerospace product and parts 25 1,806 1.0% 1.1% 0.8% all other manufacturing (15 industry groups) 100 10,682 5.9% 5.6% 5.9% total manufacturing 329 42,881 20.8% 18.8% 17.3% total portfolio service - oriented retail building % base rent and interest 1 # of sq. ft. as of June 30, customer industry groups properties (in thousands) 2022 2021 2020 farm and ranch supply 41 4,137 3.2% 3.1% 4.5% furniture 65 3,650 3.2% 4.2% 4.7% recreational vehicle dealers 31 1,247 2.0% 2.1% 1.9% home furnishings 28 2,475 1.9% 1.2% 1.1% used car dealers 28 274 1.5% 1.7% 1.7% hunting and fishing 8 631 1.2% 1.7% 1.8% new car dealers 14 505 1.0% 1.1% 0.7% all other retail (11 industry groups) 45 1,905 1.4% 1.7% 1.9% total service - oriented retail 260 14,824 15.4% 16.8% 18.3% 21% 15% 64% 3,012 properties > 100 MM square feet |
2022 second quarter investor presentation diversification by geography STORE’s portfolio is geographically diverse across the United States 13 0.0% - 2.5% 2.5% - 5.0% 5.0% - 7.5% 7.5% - 13.0% % of base rent and interest |
2022 second quarter investor presentation 75% 9% 8% 8% REAL ESTATE VALUE CORPORATE CREDIT QUALITY 0% 5% 10% 15% 20% NR C/D B3 B2 B1 Ba3 Ba2 Ba1 Baa3 Baa2 Baa1 A3 A2 A1 Aa3 Aa2 Aa1 Aaa % of rent & interest Moody’s RiskCalc (EDF) STORE score 3 99% locations subject to unit - level financial reporting 2 median STORE score median EDF strong unit - level FCCRs creating a superior portfolio profitability at the property level improves the credit profile of our portfolio 14 4.7x weighted average 4 - wall FCCR 1 1.51x > 2.00x > 2.01x 1.01x > 1.50x < 1.00x |
2022 second quarter investor presentation 15 $0 $200 $400 $600 $800 $1,000 Thousands prepayable portion - able to maintain constant leverage at 70% - complete portfolio management flexibility - non - recourse with minimal covenants - provides borrowing diversity & prepayment flexibility multiple debt sources that are well - laddered with prepayment flexibility distinctive balance sheet master funding debt STORE’s unencumbered assets 2 A - /BBB+ peer net lease avg. 3 debt/EBITDA 4.6x ~5x u n e n c u m b ere d a ss e t s / un s ec u re d d e bt 3.1x ~3x debt service coverage 5.7x ~5x Baa2/BBB/BBB unsecured term borrowings rated by Moody’s, S&P and Fitch Ratings ~59% leverage (vs cost); ~31% of AUM 4 STORE ratios compare favorably to peers total long - term debt ~ 41% leverage unsecured IG notes and loans payable - unsecured long - term borrowings - BBB rating - S&P positive outlook - efficient execution and pricing 32% leverage (vs cost); ~66% of AUM 4 are unencumbered ($MM) 1 |
2022 second quarter investor presentation growth by design >2.5% lease escalations on a leveraged basis, our “built - in” contractual lease escalations lead to AFFO per share growth of over 2.5 % dividend protection reinvesting cash flows from operations through the management of our dividend payout ratio allows for growth of about 3% ~3% internal growth target our model was built to provide consistent and reliable internal growth of over 5% >5% consistent, dependable internal growth $0.00 $0.50 $1.00 $1.50 $2.00 $2.50 5.9% 8.1% per share growth compound annual growth rate 1 6.1% internal growth enables STORE to generate attractive and consistent shareholder returns 16 AFFO dividends net income |
2022 second quarter investor presentation PEER COMPARISON superior dividend growth our dividend growth is consistent and strong and our dividends are highly protected 81% 76% 73% 70% 68% 68% 67% FCPT O SRC ADC EPRT STOR NNN AFFO payout ratio 2 3.2% 3.6% 5.0% 5.9% 6.1% EPRT SRC NNN O FCPT STOR ADC compound quarterly dividend growth (2015 – present) 1 N/A N/A STORE’s Dividend Per Share Growth 1 0% 10% 20% 30% 40% 50% 60% 2015 2016 2017 2018 2019 2020 2021 STORE’s dividend per share growth 60% 65% 70% 75% 80% 85% Q3 '20 Q4 '20 Q1 '21 Q2 '21 Q3 '21 Q4 '21 Q1 '22 Q2 '22 STORE’s historical AFFO payout ratio 17 |
2022 second quarter investor presentation PEER COMPARISON STORE’s investment approach results in attractive cap rates, diversification & lease duration 5.6% 6.3% 6.4% 6.5% 6.8% 7.0% 7.7% O ADC NNN FCPT SRC EPRT STOR weighted average acquisition cap rate 1 24.1% 18.1% 18.0% 16.1% 8.7% 4.9% 4.4% O SRC NNN ADC FCPT EPRT STOR leases expiring in next 5 years 2 peer comparison diversified tenant base (% top 10 tenants, based on ABRI) 2 78.5% 36.0% 32.9% 28.2% 21.3% 19.2% 18.0% FCPT ADC NNN O SRC EPRT STORE 18 weighted average lease term (acquisitions) 1 N/R 8.9 11.1 13.1 15.1 15.8 17.2 NNN FCPT ADC O SRC EPRT STOR |
2022 second quarter investor presentation corporate responsibility our definition of success: making a positive difference for all our stakeholders STORE seeks to deliver stable, predictable, and investment - grade stockholder performance stockholders STORE real estate capital solutions enable improved customer wealth creation and increased workforce and leadership opportunities customers STORE promotes employee opportunity, education, engagement and diversity employees STORE provides opportunities to professional, supplier and service vendors to prosper through fair business practices and dependable engagements b usiness partners STORE contributes to communities across the country through our multiple investments and associated career opportunities communities STORE works to promote and improve environmental conscientiousness through our attention to and promotion of environmental stewardship environment Environmental, Social, Governance (ESG) ratings reported by Institutional Shareholder Services (ISS) provide insight for investors on how companies perform in key areas of sustainability Governance 3* Social 3* 5* Environmental *’1‘ represents the highest quality and lowest risk. 19 |
2022 second quarter investor presentation corporate responsibility STORE maintains its strong commitment to sustainability, community, social responsibility and governance Environmental Projects and Initiatives In order to help customers reduce their carbon footprint and operating expense, STORE has partnered with specialists in: Published third annual Corporate Responsibility Report in 2022 To view the report, visit: https://www.storecapital.com/wp - content/uploads/STORE_2022_CorporateResponsibilityReport.pdf Enhanced Corporate Governance Tawn Kelley, a seasoned executive in the real estate finance industry, is our first female Chairman of the Board. We are one of only three public companies with a female Chairman, CEO and CFO. Also, she and our other independent directors comprise 89% of the Board; 55% of our board is diverse in terms of gender or ethnicity. LPGA Sponsorship In May, we announced our sponsorship of a team of professional golfers on the LPGA Tour. The STORE team includes Stacy Lewis, Lauren Stephenson, Fatima Fernandez Cano, Brooke Matthews and Sarah Schmelzel .. The LPGA Tour has a long history of successfully raising charitable dollars for initiatives that expand opportunities for women and girls and creating a positive impact on the communities hosting their tournaments. • energy management • energy optimization • renewable energy • energy audit and benchmarking • financing for sustainability projects Volta charging station at a STORE - owned property 2022 Bloomberg GEI Member For the second consecutive year STORE has been named to Bloomberg’s Gender - Equality Index (GEI) In 2021, STORE Capital received an ESG Risk Rating of 16.3 from Sustainalytics and was assessed to be at LOW risk of experiencing material financial impacts from ESG factors. 20 ESG RISK RATING 16.3 LOW RISK CERTIFIED 2022 - 2023 94% of employees at STORE say it is a great place to work compared to 59% of employees at a typical U.S. - based company STORE Capital is a proud sponsor of five LPGA Tour Professionals |
supplemental information and footnotes |
2022 second quarter investor presentation supplemental reporting measures Funds from Operations, or FFO, and Adjusted Funds from Operations, or AFFO Our reported results are presented in accordance with U.S. generally accepted accounting principles, or GAAP. We also disclose Funds from Operations, or FFO, and Adjusted Funds from Operations, or AFFO, both of which are non - GAAP measures. We believe these two non - GAAP financial measures are useful to investors because they are widely accepted industry measures used by analysts and investors to compare the operating performance of REITs. FFO and AFFO do not represent cash generated from operating activities and are not necessarily indicative of cash available to fund cash requirements; accordingly, they should not be considered alternatives to net income as a performance measure or to cash flows from operations as reported on a statement of cash flows as a liquidity measure and should be considered in addition to, and not in lieu of, GAAP financial measures. We compute FFO in accordance with the definition adopted by the Board of Governors of the National Association of Real Estate Investment Trusts, or NAREIT. NAREIT defines FFO as GAAP net income, excluding gains (or losses) from extraordinary items and sales of depreciable property, real estate impairment losses, and depreciation and amortization expense from real estate assets, including the pro rata share of such adjustments of unconsolidated subsidiaries. To derive AFFO, we modify the NAREIT computation of FFO to include other adjustments to GAAP net income related to certain revenues and expenses that have no impact on our long - term operating performance, such as straight - line rents, amortization of deferred financing costs and stock - based compensation. In addition, in deriving AFFO, we exclude certain other costs not related to our ongoing operations, such as the amortization of lease - related intangibles and executive severance and transition costs. FFO is used by management, investors and analysts to facilitate meaningful comparisons of operating performance between periods and among our peers primarily because it excludes the effect of real estate depreciation and amortization and net gains (or losses) on sales, which are based on historical costs and implicitly assume that the value of real estate diminishes predictably over time, rather than fluctuating based on existing market conditions. Management believes that AFFO provides more useful information to investors and analysts because it modifies FFO to exclude certain additional revenues and expenses such as, as applicable, straight - line rents, including construction period rent deferrals, and the amortization of deferred financing costs, stock - based compensation, lease - related intangibles, and executive severance and transition costs as such items have no impact on long - term operating performance. As a result, we believe AFFO to be a more meaningful measurement of ongoing performance that allows for greater performance comparability. Therefore, we disclose both FFO and AFFO and reconcile them to the most appropriate GAAP performance metric, which is net income. STORE Capital’s FFO and AFFO may not be comparable to similarly titled measures employed by other companies. 22 |
2022 second quarter investor presentation supplemental reporting measures We believe that presenting supplemental reporting measures, or non - GAAP measures, such as EBITDA, EBITDA re and Adjusted EBITDA re , is useful to investors and analysts because it provides important supplemental information concerning our operating performance exclusive of certain non - cash and other costs. These non - GAAP measures have limitations as they do not include all items of income and expense that affect operations. Accordingly, they should not be considered alternatives to net income as a performance measure and should be considered in addition to, and not in lieu of, GAAP financial measures. Our presentation of such non - GAAP measures may not be comparable to similarly titled measures employed by other companies. EBITDA, EBITDA re and Adjusted EBITDA re EBITDA represents earnings (GAAP net income) plus interest expense, income tax expense, depreciation and amortization. We compute EBITDAre in accordance with the definition adopted by NAREIT. NAREIT defines EBITDA re as EBITDA (as defined above) excluding gains (or losses) from the sales of depreciable property and real estate impairment losses. To derive Adjusted EBITDAre we modify the NAREIT definition of EBITDA re to exclude other items included in GAAP net income, such as provisions for loan losses and executive severance, as such items are not related to our ongoing performance. Note: The adjustments to derive Adjusted EBITDAre may not exist in every quarter, therefore EBITDAre and Adjusted EBITDAre may be equal. Annualized Adjusted EBITDA re and Adjusted Debt Annualized Adjusted EBITDAre is calculated by multiplying Adjusted EBITDA re for the most recently completed fiscal quarter by four. Annualized Adjusted EBITDAre – Current Estimated Run Rate is based on an estimated Adjusted EBITDA re calculated as if all leases and loans in place as of the last date of the most recently completed fiscal quarter had been in place as of the beginning of such quarter; then annualizing that estimated Adjusted EBITDA re for the quarter by multiplying it by four. You should not unduly rely on this metric as it is based on several assumptions and estimates that may prove to be inaccurate. Our actual reported Adjusted EBITDA re for future periods may be significantly less than that implied by our reported Annualized Adjusted EBITDA re – Current Estimated Run Rate for a variety of reasons. Adjusted Debt represents our outstanding debt obligations excluding unamortized deferred financing costs and net debt premium, further reduced for cash and cash equivalents and restricted cash deposits held for the benefit of lenders. We believe excluding unamortized deferred financing costs and net debt premium, cash and cash equivalents and restricted cash deposits held for the benefit of lenders provides an estimate of the net contractual amount of borrowed capital to be repaid, which we believe is a beneficial disclosure to investors and analysts. Adjusted Debt to Annualized Adjusted EBITDA re Adjusted Debt to Annualized Adjusted EBITDAre , or leverage, is a supplemental non - GAAP financial measure we use to evaluate the level of borrowed capital being used to increase the potential return of our real estate investments. We calculate leverage by dividing Adjusted Debt by Annualized Adjusted EBITDA re .. Because our portfolio growth level is significant to the overall size of the Company, we believe that presenting this leverage metric on a run rate basis is more meaningful than presenting the metric for the historical quarterly period, and we refer to this metric as Adjusted Debt to Annualized Adjusted EBITDA re — Current Estimated Run Rate. Leverage should be considered as a supplemental measure of the level of risk to which stockholder value may be exposed. Our computation of leverage may differ from the methodology employed by other companies and, therefore, may not be comparable to other measures. Note: NAREIT issued a white paper in 2017 recommending that companies that report EBITDA also report EBITDA re .. 23 |
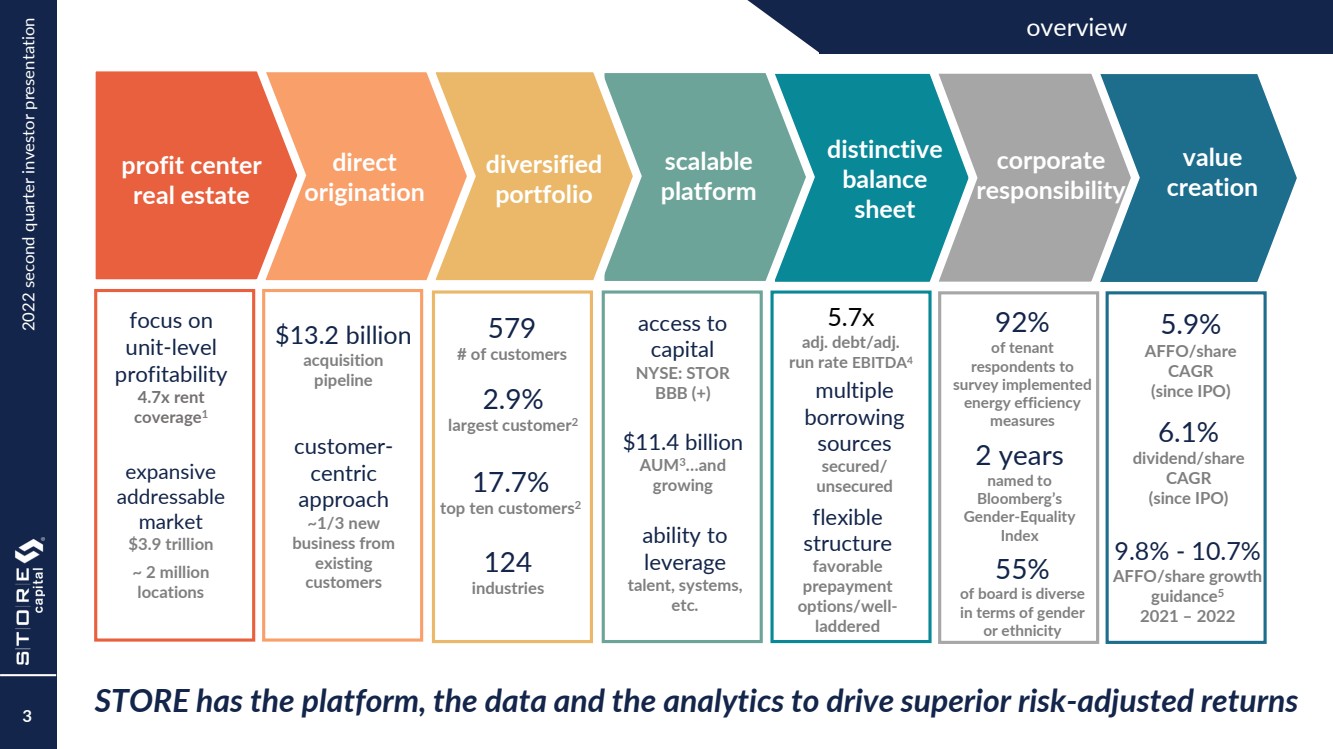
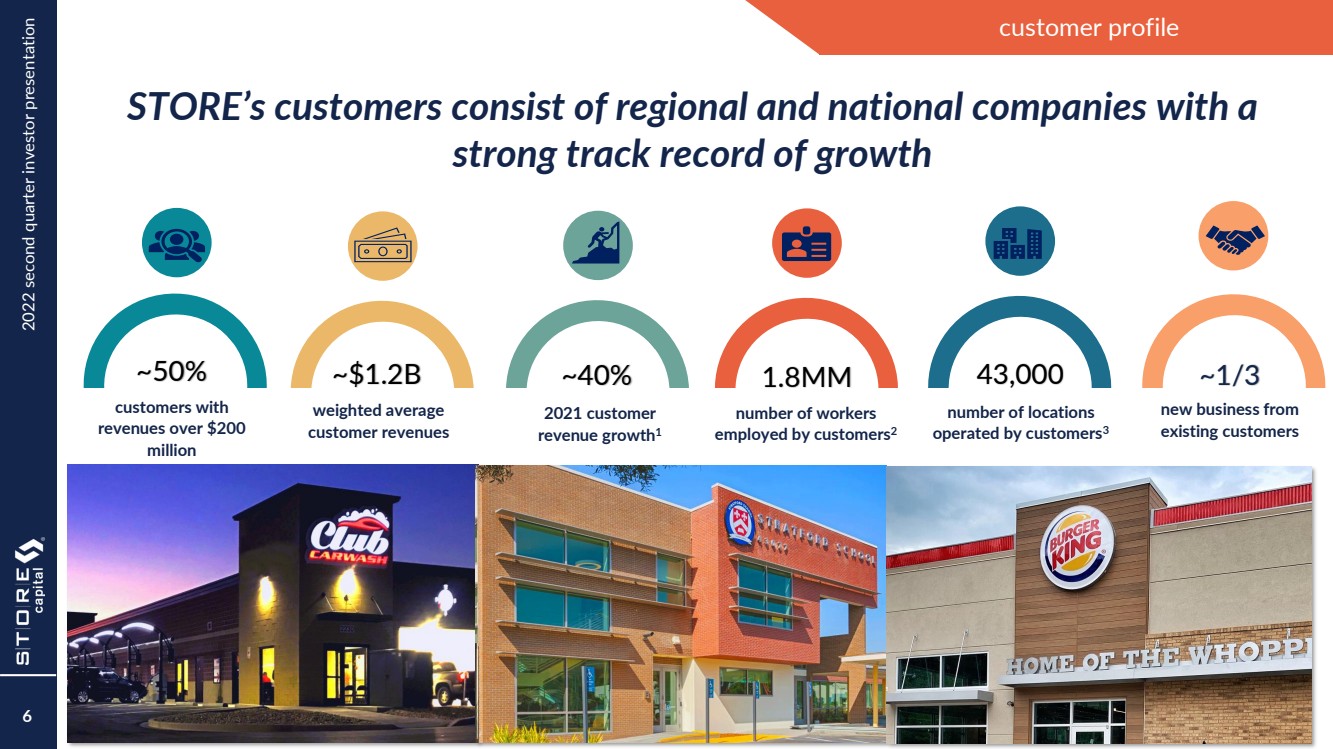
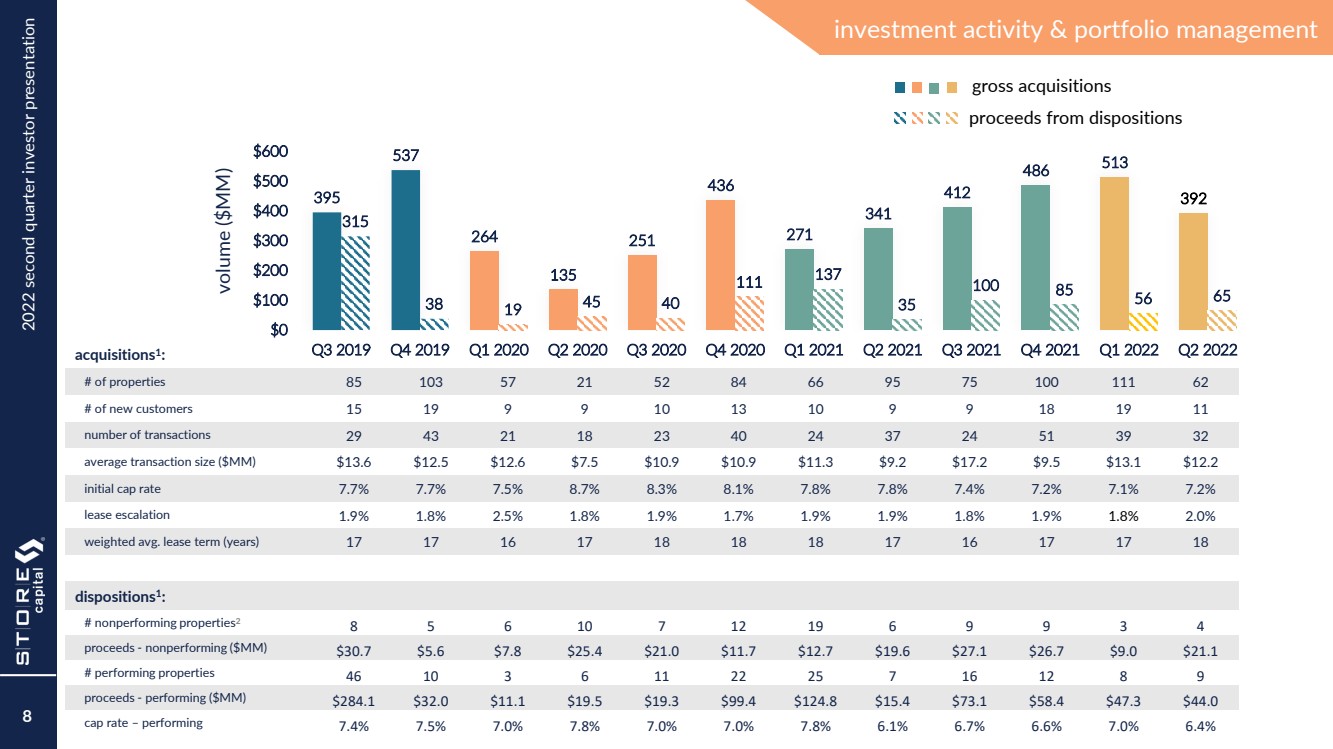
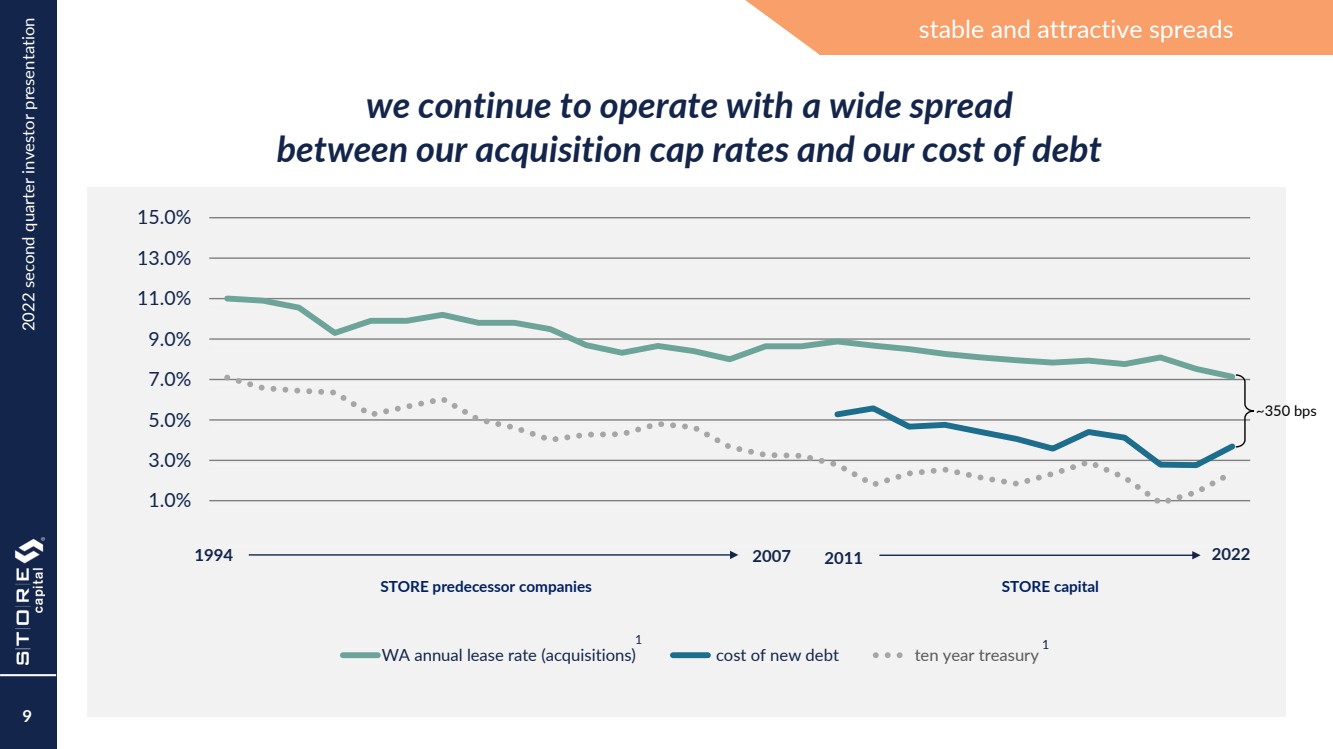
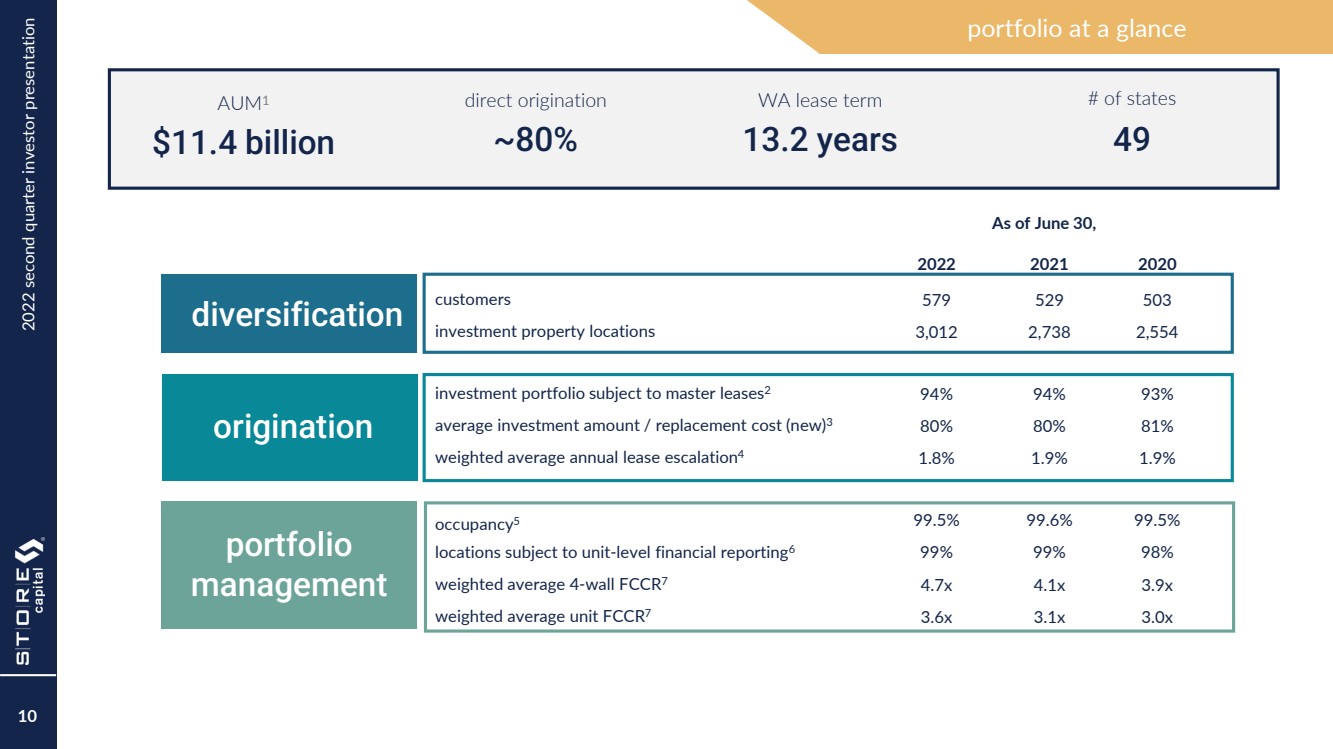
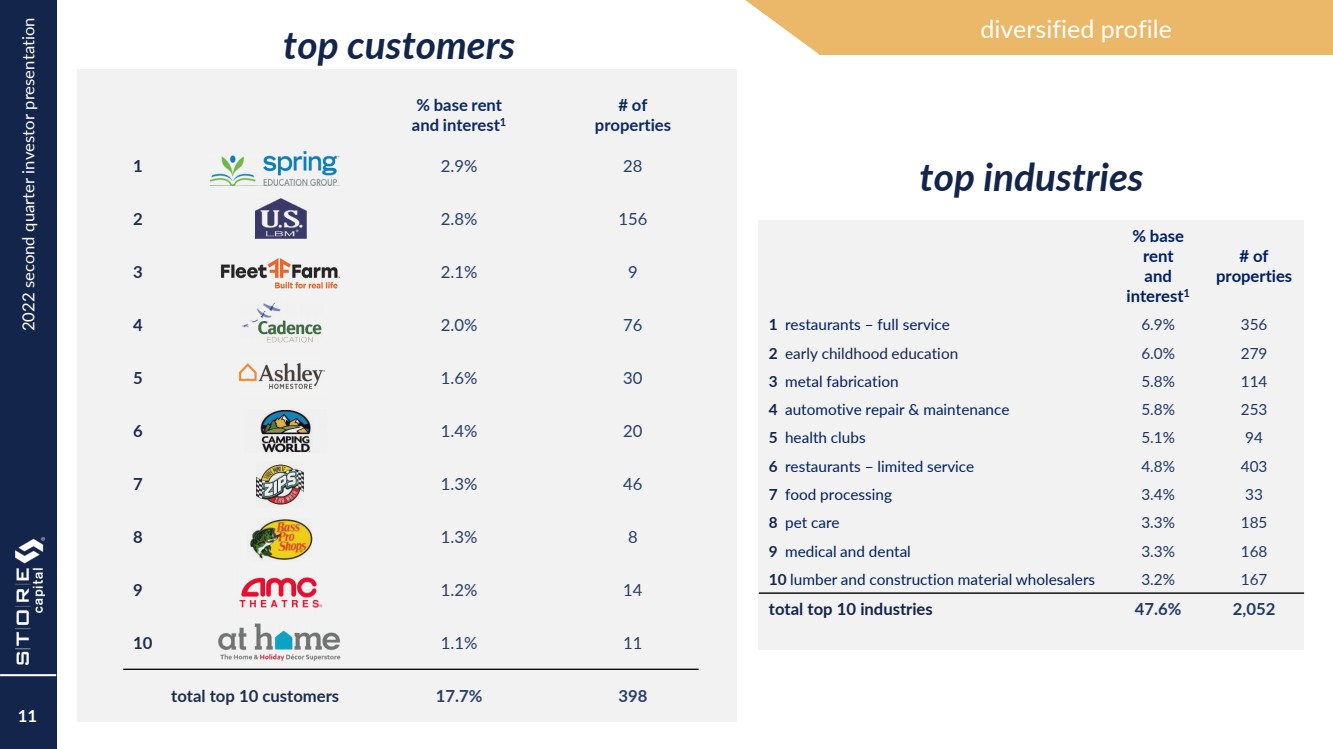
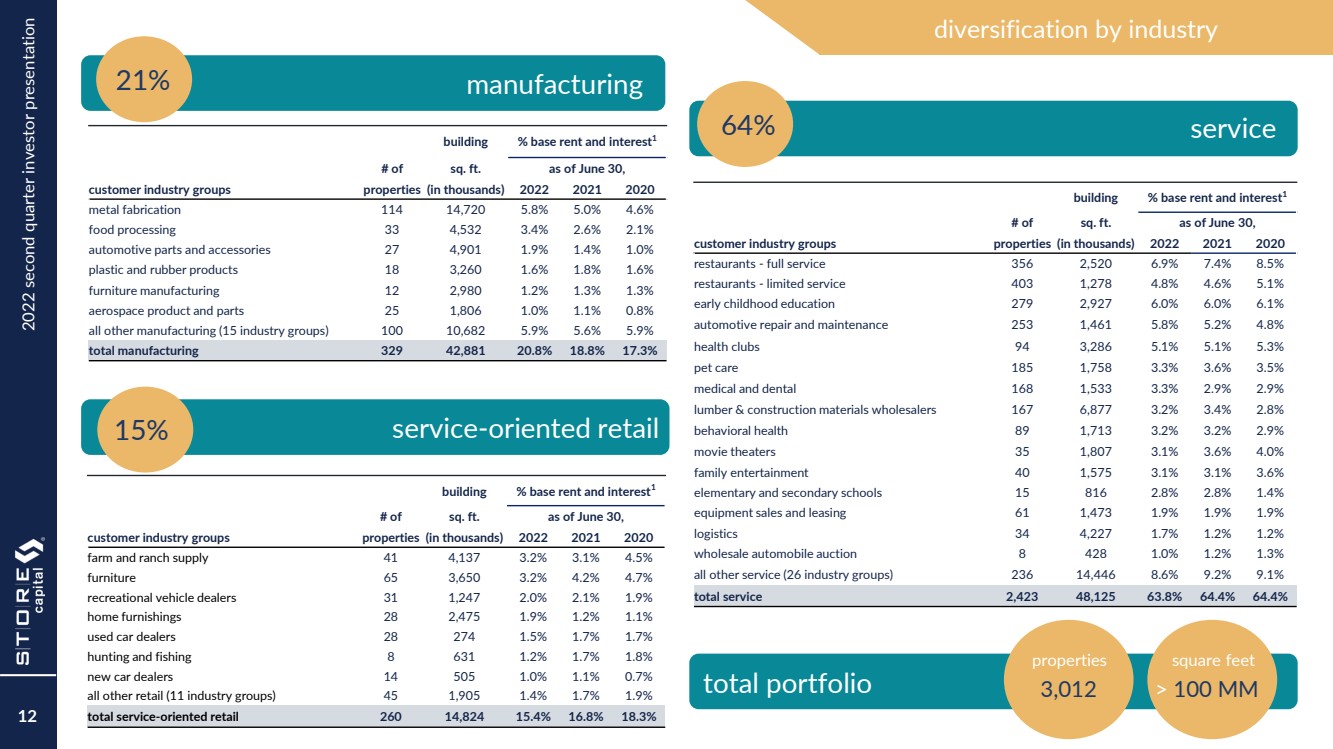
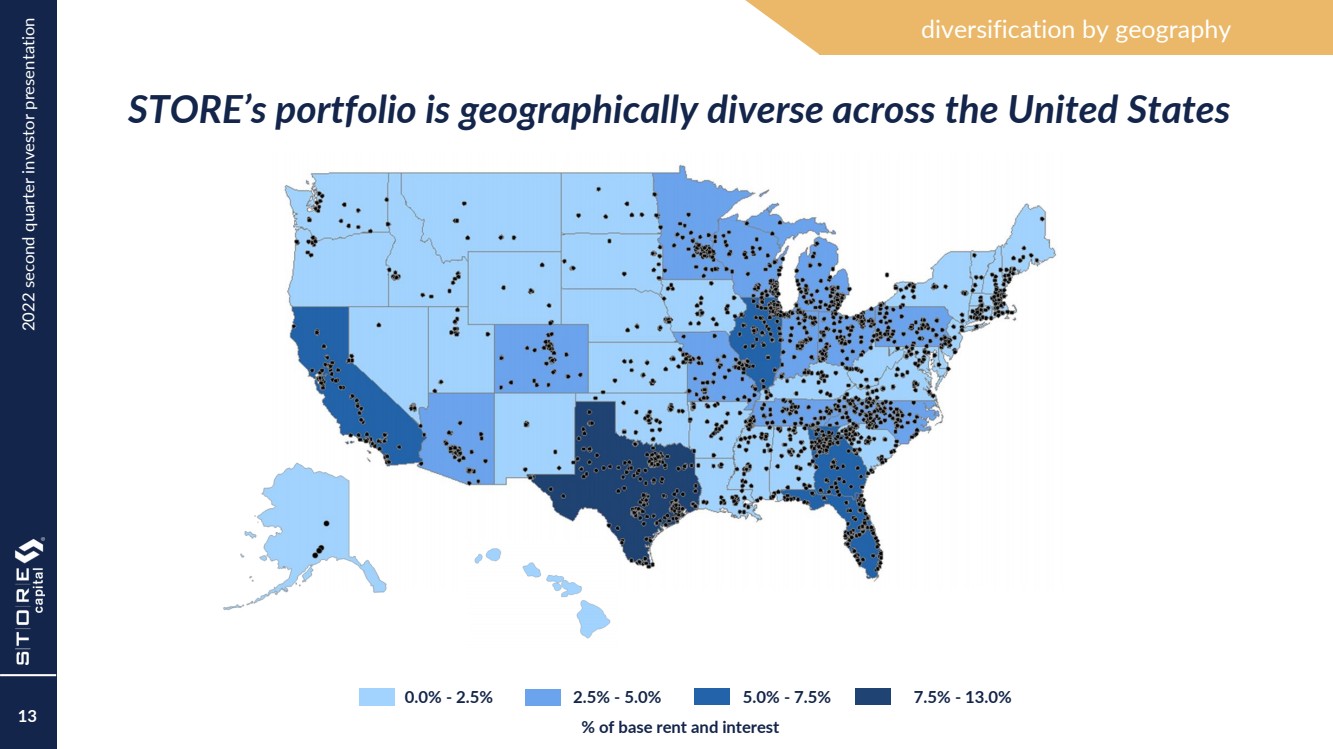
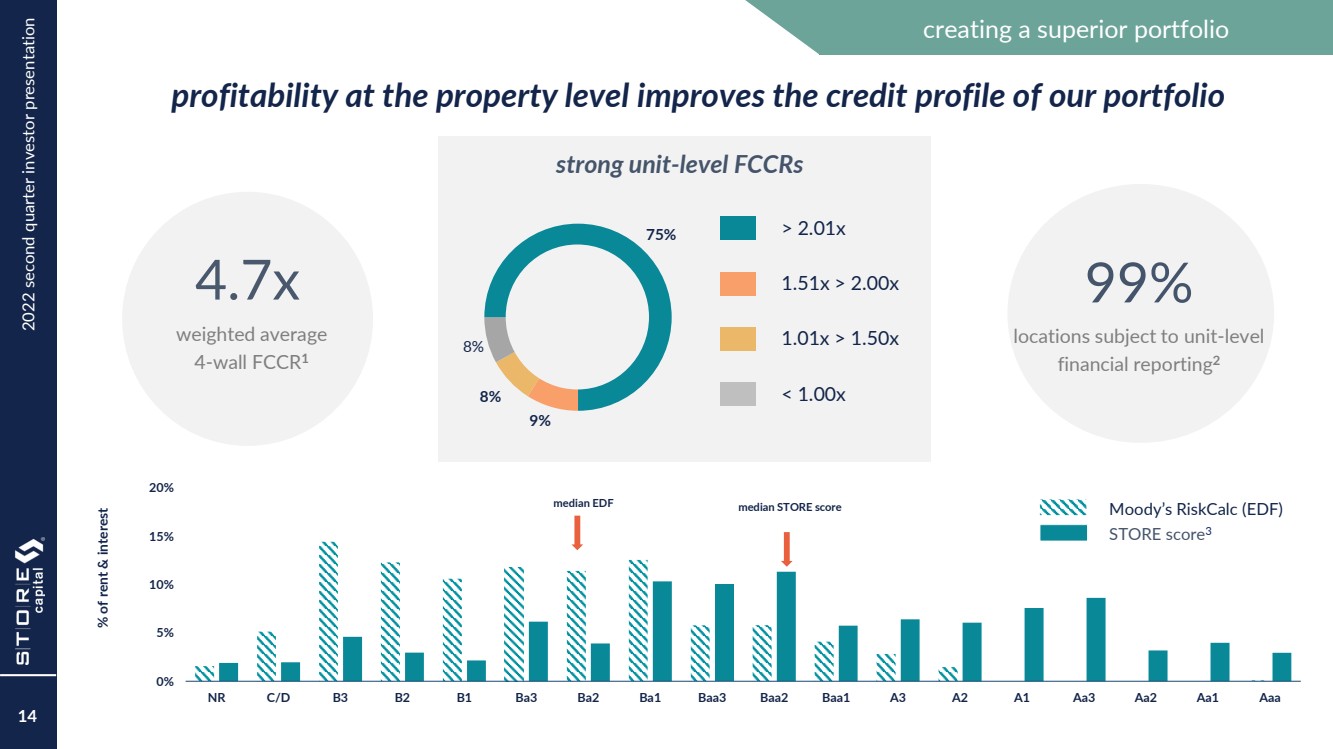
2022 second quarter investor presentation footnotes 24 Page 3: 1 Represents the weighted - average 4 - Wall coverage ratio of the portfolio as of June 30, 2022. The 4 - Wall coverage ratio refers to a unit’s FCCR before taking into account standardized corporate overhead expense. STORE also calculates a unit fixed charge coverage ratio generally as the ratio of (i) the unit’s EBITDAR, less a standardized corporate overhead expense based on estimated industry standards, to (ii) the unit’s total fixed charges, which are its lease expense, interest expense and scheduled principal payments on indebtedness (if applicable). The weighted average unit FCCR was 3.6x as of June 30, 2022. The median 4 - Wall coverage ratio and unit FCCR were 3.1x and 2.5x, respectively, as of June 30, 2022. 2 Denotes the percentage our largest customer or our top ten largest customers represent of our total base rent and interest as of June 30, 2022. See Page 11 for listing of top ten customers. 3 Assets Under Management (AUM) represents our total investment in real estate assets (gross of accumulated depreciation and amortization) as of June 30, 2022. 4 Refer to page 23 for definitions of non - GAAP financial measures and page 7 of the Company’s Earnings Supplement filed as Exhibit 99.2 to the Company’s Form 8 - K filed with the SEC on August 3, 2022 for a reconciliation to net income. 5 Represents the estimated growth rate in AFFO per diluted share based on the low - and high - points of our 2022 guidance as compared to AFFO per diluted share of $2.05 for the year ended December 31, 2021. See page 22 for discussion regarding use of Adjusted Funds from Operations. Page 6: 1 Represents the weighted average percentage change (by base rent and interest) in reported corporate revenues for the trailing 12 - month (or nine - month if 12 - month was not available) period as reported to STORE Capital for the fiscal periods ended at or near December 31, 2021 as compared to the same periods ended December 31, 2020. Excludes customers representing 5% of base rent and interest because applicable comparable data was not available. 2 Estimated based on total revenue per employee for all companies in the middle market (based on data reported by the National Center for the Middle Market for 2021) extrapolated to the aggregate total revenue of STORE’s customers. 3 Represents the number of locations operated by STORE’s customers as reported to STORE Capital as of December 31, 2021. Page 8: 1 Acquisitions represent both acquisitions of real estate and investment in loans and financing receivables. Dispositions represent the net proceeds received from the sale of real estate and lease termination fees received in conjunction with those sales. 2 Includes the number of properties sold that were vacant or not performing at the time of sale. Page 9: 1 Source: U.S. Treasury and Company Data. With respect to the STORE Predecessor Companies (FFCA and Spirit Finance) data, publicly available Company filings with the SEC. Page 10: 1 Assets Under Management (AUM) represents the Company’s total investment in real estate assets (gross of accumulated depreciation and amortization) as of June 30, 2022. 2 The percentage of investment portfolio subject to master leases represents the percentage (based on base rent and interest) of the investment portfolio in multiple properties with a single customer subject to master leases. Approximately 87% of the investment portfolio involves multiple properties with a single customer, whether or not subject to a master lease. 3 The average investment amount/replacement cost (new) represents the ratio of purchase price to replacement cost (new) at acquisition. 4 Weighted average annual lease escalation represents the weighted average annual escalation rate of the entire portfolio as if all escalations occurred annually. For escalations based on a formula including CPI, assumes the stated fixed percentage in the contract or assumes 1.5% if no fixed percentage is in the contract. For contracts with no escalations remaining in the current lease term, assumes the escalation in the extension term. Calculation excludes contracts representing less than 0.1% of base rent and interest where there are no further escalations remaining in the current lease term and there are no extension options. 5 STORE defines occupancy as a property being subject to a lease or loan contract. As of June 30, 2022, sixteen of our properties were vacant and not subject to a contract. 6 Of the 99% of our properties that are required to provide unit - level reporting, 93% have provided current obligated statements as of July 25, 2022. Page 10 – continued: 7 Represents the weighted - average 4 - Wall and unit fixed charge coverage ratio of the portfolio as of June 30, 2022, 2021 and 2020. The 4 - Wall coverage ratio refers to a unit’s FCCR before taking into account standardized corporate overhead expense. STORE also calculates a unit fixed charge coverage ratio generally as the ratio of (i) the unit’s EBITDAR, less a standardized corporate overhead expense based on estimated industry standards, to (ii) the unit’s total fixed charges, which are its lease expense, interest expense and scheduled principal payments on indebtedness (if applicable). The median 4 - Wall coverage ratio and unit FCCR were 3.1x and 2.5x, respectively, as of June 30, 2022, 3.0x and 2.4x, respectively, as of June 30, 2021 and 2.5x and 2.1x, respectively, as of June 30, 2020. Page 11: 1 Data as of June 30, 2022, by percentage of base rent and interest (based on rates in effect on June 30, 2022, for all leases, loans and financing receivables in place as of that date). Page 12: 1 Data as of June 30, 2022, 2021 and 2020, by percentage of base rent and interest (based on rates in effect on those dates, for all leases, loans and financing receivables in place as of those dates). Page 14: 1 Represents the weighted - average 4 - Wall coverage ratio of the portfolio as of June 30, 2022. The 4 - Wall coverage ratio refers to a unit’s FCCR before taking into account standardized corporate overhead expense. STORE also calculates a unit fixed charge coverage ratio generally as the ratio of (i) the unit’s EBITDAR, less a standardized corporate overhead expense based on estimated industry standards, to (ii) the unit’s total fixed charges, which are its lease expense, interest expense and scheduled principal payments on indebtedness (if applicable). The weighted average unit FCCR was 3.6x as of June 30, 2022. The median 4 - Wall coverage ratio and unit FCCR were 3.1x and 2.5x, respectively , as of June 30, 2022. 2 Of the 99% of our properties that are required to provide unit - level reporting, 93% have provided current obligated statements as of July 25, 2022. .. |
2022 second quarter investor presentation footnotes 25 Page 14 - continued: 3 We measure the credit quality of our portfolio on a contract - by - contract basis using the STORE Score, which is a proprietary risk measure reflective of both the credit risk of our tenants and the profitability of the operations at our properties. The STORE Score is a quantitative measurement of contract risk computed by multiplying tenant default probabilities (using Moody’s RiskCalc ) and estimated store closure probabilities (using a simple algorithm we developed that has closure probabilities ranging from 100% to 10%, depending on unit - level profitability). Qualitative features can also impact investment risk, such as low property investment amounts, favorable tenant debt capital stacks, the presence of third - party guarantors, or other factors. Such qualitative factors are not included in the STORE Score and may serve to mitigate investment risk even further. Page 15: 1 Indicates the prepayable portion of STORE Master Funding net - lease mortgage note maturities, which are prepayable 24 or 36 months prior to maturity, and bank term loans of $400 million maturing in 2027 and $200 million maturing in 2029; the bank term loans are prepayable at any time subject to the termination of any related interest rate swap(s). 2 Ratios as of June 30, 2022; Unencumbered EBITDA based on NOI from Unencumbered Assets less an allocation of G&A expenses based on assets. 3 Based on average of ratios of Realty Income and National Retail Properties as of March 31, 2022. 4 Assets Under Management (AUM) represents our total investment in real estate assets (gross of accumulated depreciation and amortization) as of June 30, 2022. Page 16: 1 Represents rolling 12 - month values for AFFO, Dividends and Net Income per share beginning with the 12 - month period ended June 30, 2016. Refer to page 22 for definitions of non - GAAP financial measures and page 4 of the Company’s Earnings Supplement filed as Exhibit 99.2 to the Company’s Form 8 - K filed with the SEC on August 3, 2022 for a reconciliation to net income. Page 17: 1 Source: Historical dividend data from Nasdaq.com. Compound growth rates for the period beginning in Q1 2015 through Q1 2022. 2 Represents actual AFFO payout ratios obtained from publicly available financial information for the quarter ended March 31, 2022. .. Page 18: 1 Source: Weighted average acquisition cap rates and lease durations for acquisitions from publicly available financial information for the eight quarters ended March 31, 2022. 2 Source: Tenant information and lease expiration data by annualized rent from publicly available financial information as of March 31, 2022. |
Investor and Media Contacts Financial Profiles, Inc. Moira Conlon, 310.622.8220 Megan McGrath, 310.622.8248 STORECapital@finprofiles.com Corporate Headquarters 8377 East Hartford Drive, Suite 100 Scottsdale, Arizona 85255 480.256.1100 www.STOREcapital.com |