ETF Series Solutions
ClearShares OCIO ETF (Ticker: OCIO)
ClearShares Piton Intermediate Fixed Income ETF (Ticker: PIFI)
ClearShares Ultra-Short Maturity ETF (Ticker: OPER)
Semi-Annual Financial Statements and Additional Information
November 30, 2024
UNITED STATES
SECURITIES AND EXCHANGE COMMISSION
Washington, D.C. 20549
FORM N-CSR
CERTIFIED SHAREHOLDER REPORT OF REGISTERED
MANAGEMENT INVESTMENT COMPANIES
Investment Company Act file number 811-22668
ETF Series Solutions
(Exact name of registrant as specified in charter)
615 East Michigan Street
Milwaukee, WI 53202
(Address of principal executive offices) (Zip code)
Kristina R. Nelson
ETF Series Solutions
615 East Michigan Street
Milwaukee, WI 53202
(Name and address of agent for service)
414-516-1645
Registrant’s telephone number, including area code
Date of fiscal year end: May 31
Date of reporting period: November 30, 2024
Item 1. Reports to Stockholders.
| (a) |
 | ClearShares OCIO ETF |  |
| OCIO (Principal U.S. Listing Exchange: NYSE) | ||
| Semi-Annual Shareholder Report | November 30, 2024 |
Fund Name | Costs of a $10,000 investment | Costs paid as a percentage of a $10,000 investment |
| ClearShares OCIO ETF | $28 | 0.54% |
Net Assets | $149,515,666 |
Number of Holdings | 43 |
Portfolio Turnover | 11% |
30-Day SEC Yield | 1.64% |
30-Day SEC Yield Unsubsidized | 1.64% |

Top 10 Issuers | (%) |
Mount Vernon Liquid Assets Portfolio, LLC | 31.9% |
Vanguard Growth ETF | 6.1% |
Invesco QQQ Trust Series 1 | 5.9% |
Technology Select Sector SPDR Fund | 5.4% |
Invesco S&P 500 Momentum ETF | 5.3% |
SPDR Portfolio S&P 1500 Composite Stock Market ETF | 4.9% |
Vanguard Total Stock Market ETF | 4.6% |
iShares 3-7 Year Treasury Bond ETF | 4.4% |
SPDR Bloomberg 1-3 Month T-Bill ETF | 4.4% |
iShares Core S&P 500 ETF | 4.3% |
Top Sectors | (%) |
Domestic Equity | 54.0% |
Fixed Income | 25.0% |
Global Equity | 20.8% |
Money Market Funds | 0.4% |
Written Options | -0.2% |
| * | Excludes securities lending collateral. |
| ClearShares OCIO ETF | PAGE 1 | TSR-SAR-26922A727 |
| ClearShares OCIO ETF | PAGE 2 | TSR-SAR-26922A727 |
 | ClearShares Piton Intermediate Fixed Income ETF |  |
| PIFI (Principal U.S. Listing Exchange: NYSE) | ||
| Semi-Annual Shareholder Report | November 30, 2024 |
Fund Name | Costs of a $10,000 investment | Costs paid as a percentage of a $10,000 investment |
| ClearShares Piton Intermediate Fixed Income ETF | $23 | 0.45% |
Net Assets | $100,902,708 |
Number of Holdings | 74 |
Portfolio Turnover | 13% |
Average Credit Quality | AA S&P / Aa1 Moody |
Effective Duration | 3.64 Years |
30-Day SEC Yield | 3.96% |
30-Day SEC Yield Unsubsidized | 3.96% |

Top 10 Issuers | (%) |
United States Treasury Note/Bond | 55.4% |
Federal Home Loan Banks | 4.8% |
Resolution Funding Corporation | 2.1% |
Tennessee Valley Authority | 1.8% |
Federal Farm Credit Banks Funding Corporation | 1.4% |
MetLife, Inc. | 1.4% |
Goldman Sachs Group, Inc. | 1.2% |
Anheuser-Busch InBev Worldwide, Inc. | 1.2% |
Bank of New York Mellon Corporation | 1.2% |
Cisco Systems, Inc. | 1.2% |
| ClearShares Piton Intermediate Fixed Income ETF | PAGE 1 | TSR-SAR-26922A131 |
| ClearShares Piton Intermediate Fixed Income ETF | PAGE 2 | TSR-SAR-26922A131 |
 | ClearShares Ultra-Short Maturity ETF |  |
| OPER (Principal U.S. Listing Exchange: NYSE) | ||
| Semi-Annual Shareholder Report | November 30, 2024 |
Fund Name | Costs of a $10,000 investment | Costs paid as a percentage of a $10,000 investment |
| ClearShares Ultra-Short Maturity ETF | $10 | 0.20% |
Net Assets | $135,160,191 |
Number of Holdings | 6 |
Portfolio Turnover | 0% |
Effective Duration | 4.18 Days |
30-Day SEC Yield | 4.62% |
30-Day SEC Yield Unsubsidized | 4.62% |

Top Issuers | (%) |
Cantor Fitzgerald & Co., 4.75%, 12/02/2024 | 37.0% |
Cantor Fitzgerald & Co., 4.75%, 12/06/2024 | 29.6% |
Marex Capital Markets Inc., 4.63%, 12/02/2024 | 18.5% |
Buckler Securities LLC, 4.64%, 12/02/2024 | 14.8% |
Clear Street LLC, 4.64%, 12/02/2024 | 14.8% |
First American Government Obligations Fund - Class X | 0.0% |
| ClearShares Ultra-Short Maturity ETF | PAGE 1 | TSR-SAR-26922A453 |
| (b) | Not applicable. |
Item 2. Code of Ethics.
Not applicable for semi-annual reports.
Item 3. Audit Committee Financial Expert.
Not applicable for semi-annual reports.
Item 4. Principal Accountant Fees and Services.
Not applicable for semi-annual reports.
Item 5. Audit Committee of Listed Registrants.
Not applicable for semi-annual reports.
Item 6. Investments.
| (a) | Schedule of Investments is included within the financial statements filed under Item 7 of this Form. |
| (b) | Not Applicable. |
Item 7. Financial Statements and Financial Highlights for Open-End Investment Companies.
| (a) |
Page | |||
Shares | Value | |||||
EXCHANGE-TRADED FUNDS - 99.8%(a) | ||||||
Domestic Equity - 54.0% | ||||||
Invesco QQQ Trust Series 1(b) | 17,237 | $ 8,786,388 | ||||
Invesco S&P 500 Momentum ETF(c) | 81,188 | 7,861,434 | ||||
iShares Core S&P 500 ETF(b) | 10,753 | 6,506,318 | ||||
Schwab 1000 Index ETF(c) | 159,662 | 4,665,324 | ||||
SPDR Portfolio S&P 1500 Composite Stock Market ETF(c) | 100,296 | 7,396,830 | ||||
SPDR S&P 500 ETF Trust(b) | 5,118 | 3,083,851 | ||||
Technology Select Sector SPDR Fund(b) | 34,700 | 8,110,431 | ||||
Vanguard Growth ETF(b) | 22,211 | 9,087,186 | ||||
Vanguard Information Technology ETF(b) | 9,578 | 5,959,911 | ||||
Vanguard S&P 500 ETF(b) | 11,026 | 6,102,340 | ||||
Vanguard Total Stock Market ETF(b) | 22,920 | 6,872,791 | ||||
Vanguard Value ETF(c) | 34,774 | 6,324,347 | ||||
80,757,151 | ||||||
Fixed Income - 25.0% | ||||||
ClearShares Ultra-Short Maturity ETF(d) | 59,587 | 5,966,714 | ||||
iShares 1-3 Year Treasury Bond ETF(c) | 46,600 | 3,836,112 | ||||
iShares 3-7 Year Treasury Bond ETF(c) | 55,833 | 6,539,719 | ||||
iShares Core U.S. Aggregate Bond ETF | 33,185 | 3,291,952 | ||||
iShares Intermediate Government/Credit Bond ETF | 43,602 | 4,597,395 | ||||
SPDR Bloomberg 1-3 Month T-Bill ETF(c) | 71,000 | 6,516,380 | ||||
Vanguard Intermediate-Term Treasury ETF(c) | 33,185 | 1,958,911 | ||||
Vanguard Short-Term Corporate Bond ETF(c) | 23,530 | 1,850,634 | ||||
Vanguard Total Bond Market ETF | 39,343 | 2,895,645 | ||||
37,453,462 | ||||||
Global Equity - 20.8% | ||||||
Cambria Emerging Shareholder Yield ETF | 40,132 | 1,313,520 | ||||
Conductor Global Equity Value ETF | 54,568 | 719,266 | ||||
iShares Core MSCI Total International Stock ETF | 20,637 | 1,426,842 | ||||
iShares Currency Hedged MSCI EAFE ETF | 133,094 | 4,683,578 | ||||
iShares MSCI EAFE ETF(b) | 61,600 | 4,864,552 | ||||
iShares MSCI Emerging Markets ex China ETF | 18,428 | 1,064,586 | ||||
iShares MSCI USA Min Vol Factor ETF | 60,786 | 5,747,316 | ||||
Schwab International Equity ETF(c) | 233,288 | 4,574,778 | ||||
Vanguard FTSE Developed Markets ETF(c) | 93,217 | 4,688,815 | ||||
Vanguard FTSE Emerging Markets ETF(b)(c) | 43,070 | 1,962,700 | ||||
31,045,953 | ||||||
TOTAL EXCHANGE-TRADED FUNDS (Cost $111,766,104) | 149,256,566 | |||||
Units | ||||||
SHORT-TERM INVESTMENTS - 32.3% | ||||||
Investments Purchased with Proceeds from Securities Lending - 31.9% | ||||||
Mount Vernon Liquid Assets Portfolio, LLC, 5.50%(e)(f) | 47,701,980 | 47,701,980 | ||||
1 |
Shares | Value | |||||
SHORT-TERM INVESTMENTS - (Continued) | ||||||
Money Market Funds - 0.4% | ||||||
First American Government Obligations Fund - Class X, 4.56%(e) | 544,690 | $544,690 | ||||
TOTAL SHORT-TERM INVESTMENTS (Cost $48,246,670) | 48,246,670 | |||||
TOTAL INVESTMENTS - 132.1% (Cost $160,012,774) | $197,503,236 | |||||
Liabilities in Excess of Other Assets - (32.1)% | (47,987,570) | |||||
TOTAL NET ASSETS - 100.0% | $149,515,666 | |||||
(a) | The risks of investing in investment companies, such as the underlying ETFs, typically reflect the risks of the types of investments in which the investment companies invest. |
(b) | Held in connection with written option contracts. See Schedule of Written Options for further information. |
(c) | All or a portion of this security is on loan as of November 30, 2024. The total market value of these securities was $46,864,433 which represented 31.3% of net assets. |
(d) | Affiliated company as defined by the Investment Company Act of 1940. |
(e) | The rate shown represents the 7-day annualized effective yield as of November 30, 2024. |
(f) | Privately offered liquidity fund. |
2 |
Notional Amount | Contracts | Value | |||||||
WRITTEN OPTIONS - (0.2)% | |||||||||
Call Options - (0.2)% | |||||||||
Invesco QQQ Trust Series 1, Expiration: 12/20/2024; Exercise Price: $525.00(a)(b) | $(8,767,528) | (172) | $(32,680) | ||||||
iShares Core S&P 500 ETF, Expiration: 12/20/2024; Exercise Price: $620.00(a)(b) | (6,474,249) | (107) | (11,770) | ||||||
iShares MSCI EAFE ETF, Expiration: 12/20/2024; Exercise Price: $81.00(a)(b) | (4,864,552) | (616) | (28,336) | ||||||
SPDR S&P 500 ETF, Expiration: 12/20/2024; Exercise Price: $614.00(a)(b) | (3,073,005) | (51) | (9,206) | ||||||
Technology Select Sector SPDR Fund, Expiration: 12/20/2024; Exercise Price: $245.00(a)(b) | (8,110,431) | (347) | (26,719) | ||||||
Vanguard FTSE Emerging Markets ETF, Expiration: 12/20/2024; Exercise Price: $48.00(a)(b) | (1,959,510) | (430) | (5,375) | ||||||
Vanguard Growth ETF, Expiration: 12/20/2024; Exercise Price: $420.00(a)(b) | (9,082,686) | (222) | (37,185) | ||||||
Vanguard Information Technology ETF, Expiration: 12/20/2024; Exercise Price: $635.00(a)(b) | (5,911,375) | (95) | (41,325) | ||||||
Vanguard S&P 500 ETF, Expiration: 12/20/2024; Exercise Price: $570.00(a)(b) | (6,087,950) | (110) | (6,875) | ||||||
Vanguard Total Stock Market ETF, Expiration: 12/20/2024; Exercise Price: $305.00(a)(b) | (6,866,794) | (229) | (30,915) | ||||||
Total Call Options | (230,386) | ||||||||
TOTAL WRITTEN OPTIONS (Premiums received $166,809) | $(230,386) | ||||||||
(a) | Exchange-traded. |
(b) | 100 shares per contract. |
3 |
Par | Value | |||||
U.S. TREASURY SECURITIES - 55.4% | ||||||
United States Treasury Note/Bond | ||||||
2.63%, 04/15/2025 | $1,525,000 | $1,515,297 | ||||
2.75%, 05/15/2025 | 1,835,000 | 1,821,476 | ||||
3.50%, 09/15/2025 | 1,000,000 | 993,256 | ||||
4.50%, 03/31/2026 | 1,000,000 | 1,002,656 | ||||
4.88%, 04/30/2026 | 1,200,000 | 1,209,797 | ||||
4.13%, 06/15/2026 | 5,000,000 | 4,990,918 | ||||
4.50%, 07/15/2026 | 1,000,000 | 1,004,082 | ||||
3.50%, 09/30/2026 | 1,125,000 | 1,111,113 | ||||
2.25%, 02/15/2027 | 600,000 | 576,141 | ||||
4.13%, 02/15/2027 | 1,650,000 | 1,648,421 | ||||
2.75%, 04/30/2027 | 3,000,000 | 2,905,430 | ||||
4.50%, 05/15/2027 | 2,200,000 | 2,217,961 | ||||
4.38%, 07/15/2027 | 1,350,000 | 1,358,332 | ||||
2.75%, 07/31/2027 | 2,026,000 | 1,955,604 | ||||
3.38%, 09/15/2027 | 2,000,000 | 1,961,484 | ||||
3.63%, 05/31/2028 | 1,500,000 | 1,476,211 | ||||
4.13%, 07/31/2028 | 2,275,000 | 2,275,489 | ||||
1.13%, 08/31/2028 | 1,150,000 | 1,031,451 | ||||
3.75%, 12/31/2028 | 1,700,000 | 1,676,990 | ||||
1.88%, 02/28/2029 | 1,967,000 | 1,797,730 | ||||
4.13%, 10/31/2029 | 975,000 | 976,638 | ||||
4.00%, 02/28/2030 | 2,060,000 | 2,049,700 | ||||
3.50%, 04/30/2030 | 1,500,000 | 1,456,318 | ||||
3.75%, 05/31/2030 | 2,500,000 | 2,455,762 | ||||
4.13%, 03/31/2031 | 1,350,000 | 1,349,736 | ||||
4.13%, 07/31/2031 | 2,000,000 | 1,999,297 | ||||
1.38%, 11/15/2031 | 3,000,000 | 2,502,363 | ||||
1.88%, 02/15/2032 | 2,775,000 | 2,385,091 | ||||
3.50%, 02/15/2033 | 3,025,000 | 2,885,212 | ||||
3.38%, 05/15/2033 | 2,500,000 | 2,358,203 | ||||
4.00%, 02/15/2034 | 1,000,000 | 985,156 | ||||
TOTAL U.S. TREASURY SECURITIES (Cost $57,224,203) | 55,933,315 | |||||
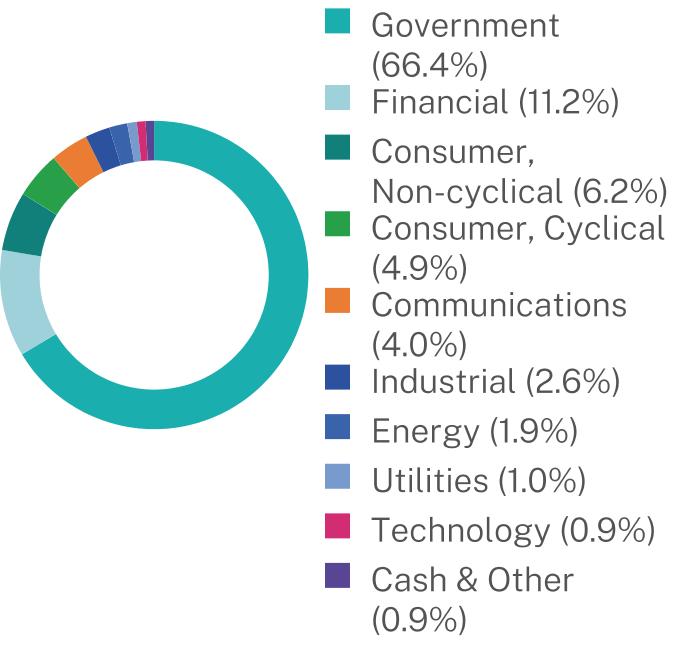
CORPORATE BONDS - 32.7% | ||||||
Communications - 4.0% | ||||||
Alphabet, Inc., 2.00%, 08/15/2026 | 1,000,000 | 962,287 | ||||
Amazon.com, Inc., 3.60%, 04/13/2032 | 1,000,000 | 940,518 | ||||
Cisco Systems, Inc., 5.05%, 02/26/2034 | 1,169,000 | 1,192,421 | ||||
Verizon Communications, Inc., 3.15%, 03/22/2030 | 1,000,000 | 925,737 | ||||
4,020,963 | ||||||
Consumer, Cyclical - 4.9% | ||||||
Costco Wholesale Corporation, 1.38%, 06/20/2027 | 1,000,000 | 929,881 | ||||
Home Depot, Inc., 2.88%, 04/15/2027 | 1,000,000 | 968,695 | ||||
McDonald’s Corporation, 4.80%, 08/14/2028 | 1,000,000 | 1,008,829 | ||||
4 |
Par | Value | |||||
CORPORATE BONDS - (Continued) | ||||||
Consumer, Cyclical - (Continued) | ||||||
NIKE, Inc., 2.75%, 03/27/2027 | $1,000,000 | $966,337 | ||||
Target Corporation, 3.38%, 04/15/2029 | 1,100,000 | 1,054,511 | ||||
4,928,253 | ||||||
Consumer, Non-cyclical - 6.2% | ||||||
Anheuser-Busch InBev Worldwide, Inc., 5.00%, 06/15/2034 | 1,200,000 | 1,222,367 | ||||
Bristol-Myers Squibb Company, 3.25%, 02/27/2027 | 1,000,000 | 976,214 | ||||
J M Smucker Company, 3.50%, 03/15/2025 | 1,000,000 | 995,024 | ||||
Pfizer, Inc., 2.75%, 06/03/2026 | 1,000,000 | 975,604 | ||||
Sysco Corporation, 5.95%, 04/01/2030 | 1,000,000 | 1,052,755 | ||||
Yale University, Series 2020, 0.87%, 04/15/2025 | 1,000,000 | 984,780 | ||||
6,206,744 | ||||||
Energy - 1.9% | ||||||
Chevron Corp., 2.24%, 05/11/2030 | 1,000,000 | 888,809 | ||||
Exxon Mobil Corp., 2.99%, 03/19/2025 | 1,000,000 | 995,255 | ||||
1,884,064 | ||||||
Financial - 11.2% | ||||||
American Express Company, 4.05%, 05/03/2029 | 1,000,000 | 983,729 | ||||
Bank of America Corporation, Series MTN, 5.02% to 07/22/2032 then SOFR + 2.16%, 07/22/2033 | 1,000,000 | 1,004,212 | ||||
Bank of New York Mellon Corporation, Series MTN, 6.47% to 10/25/2033 then SOFR + 1.85%, 10/25/2034 | 1,100,000 | 1,213,999 | ||||
Berkshire Hathaway, Inc., 3.13%, 03/15/2026 | 1,000,000 | 984,120 | ||||
BlackRock, Inc., 3.20%, 03/15/2027 | 1,000,000 | 975,262 | ||||
Citigroup, Inc., 4.60%, 03/09/2026 | 1,000,000 | 997,235 | ||||
Goldman Sachs Group, Inc., 3.80%, 03/15/2030 | 1,313,000 | 1,249,841 | ||||
JPMorgan Chase & Company, 4.91% to 07/25/2032 then SOFR + 2.08%, 07/25/2033 | 1,075,000 | 1,074,512 | ||||
MetLife, Inc., 4.55%, 03/23/2030 | 1,400,000 | 1,401,177 | ||||
Private Export Funding Corporation, Series PP, 1.40%, 07/15/2028 | 685,000 | 618,640 | ||||
US Bancorp, Series MTN, 2.22% to 01/27/2027 then SOFR + 0.73%, 01/27/2028 | 880,000 | 834,150 | ||||
11,336,877 | ||||||
Industrial - 2.6% | ||||||
General Dynamics Corporation, 1.15%, 06/01/2026 | 1,000,000 | 954,824 | ||||
Honeywell International, Inc., 1.75%, 09/01/2031 | 1,000,000 | 837,129 | ||||
Waste Management, Inc., 1.50%, 03/15/2031 | 1,000,000 | 830,156 | ||||
2,622,109 | ||||||
Technology - 0.9% | ||||||
Apple, Inc., 3.35%, 08/08/2032 | 1,000,000 | 936,367 | ||||
Utilities - 1.0% | ||||||
Florida Power & Light Company, 4.80%, 05/15/2033 | 1,000,000 | 999,176 | ||||
TOTAL CORPORATE BONDS (Cost $33,634,083) | 32,934,553 | |||||
5 |
Par | Value | |||||
U.S. GOVERNMENT AGENCY ISSUES - 10.0% | ||||||
Federal Farm Credit Banks Funding Corporation, 4.50%, 08/14/2026 | $1,400,000 | $1,407,043 | ||||
Federal Home Loan Banks | ||||||
1.00%, 03/23/2026 | 1,696,500 | 1,624,736 | ||||
0.90%, 02/26/2027 | 300,000 | 278,691 | ||||
3.25%, 11/16/2028 | 3,000,000 | 2,916,418 | ||||
Resolution Funding Corporation, 0.00%, 01/15/2030(a) | 2,600,000 | 2,082,134 | ||||
Tennessee Valley Authority | ||||||
3.88%, 03/15/2028 | 250,000 | 247,684 | ||||
Series A, 2.88%, 02/01/2027 | 1,565,000 | 1,523,332 | ||||
TOTAL U.S. GOVERNMENT AGENCY ISSUES (Cost $10,255,808) | 10,080,038 | |||||
MUNICIPAL BONDS - 1.0% | ||||||
City of Austin, TX Electric Utility Revenue, Class A, 2.68%, 11/15/2025 | 325,000 | 318,953 | ||||
Massachusetts School Building Authority, Class B, 1.75%, 08/15/2030 | 785,000 | 695,979 | ||||
TOTAL MUNICIPAL BONDS (Cost $1,056,047) | 1,014,932 | |||||
Shares | ||||||
SHORT-TERM INVESTMENTS - 0.1% | ||||||
Money Market Funds - 0.1% | ||||||
First American Government Obligations Fund - Class X, 4.56%(b) | 144,797 | 144,797 | ||||
TOTAL SHORT-TERM INVESTMENTS (Cost $144,797) | 144,797 | |||||
TOTAL INVESTMENTS - 99.2% (Cost $102,314,938) | $100,107,635 | |||||
Other Assets in Excess of Liabilities - 0.8% | 795,073 | |||||
TOTAL NET ASSETS - 100.0% | $100,902,708 | |||||
(a) | Zero coupon bonds make no periodic interest payments. |
(b) | The rate shown represents the 7-day annualized effective yield as of November 30, 2024. |
6 |
Par | Value | |||||
REPURCHASE AGREEMENTS - 99.9% | ||||||
Repurchase Agreements - 99.9% | ||||||
Buckler Securities LLC, 4.64%, dated 11/22/2024, matures 12/02/2024, repurchase price $10,012,889 (collateralized by various U.S. government treasury notes, and mortgage-backed securities: total value $10,227,250) | $10,000,000 | $10,000,000 | ||||
Cantor Fitzgerald & Co., 4.75%, dated 11/22/2024, matures 12/02/2024, repurchase price $50,065,972 (collateralized by various U.S. government mortgage-backed securities: total value $55,044,858) | 50,000,000 | 50,000,000 | ||||
Cantor Fitzgerald & Co., 4.75%, dated 11/22/2024, matures 12/06/2024, repurchase price $40,073,889 (collateralized by various U.S. government mortgage-backed securities: total value $44,051,194) | 40,000,000 | 40,000,000 | ||||
Clear Street LLC, 4.64%, dated 11/22/2024, matures 12/02/2024, repurchase price $10,012,889 (collateralized by various U.S. government mortgage-backed securities: total value $10,313,276) | 10,000,000 | 10,000,000 | ||||
Marex Capital Markets Inc., 4.63%, dated 11/29/2024, matures 12/02/2024, repurchase price $25,009,646 (collateralized by various U.S. government mortgage-backed securities: total value $25,759,936) | 25,000,000 | 25,000,000 | ||||
135,000,000 | ||||||
TOTAL REPURCHASE AGREEMENTS (Cost $135,000,000) | 135,000,000 | |||||
Shares | ||||||
SHORT-TERM INVESTMENTS – 0.0%(a) | ||||||
Money Market Funds - 0.0%(a) | ||||||
First American Government Obligations Fund - Class X, 4.56%(b) | 41,600 | 41,600 | ||||
TOTAL SHORT-TERM INVESTMENTS (Cost $41,600) | 41,600 | |||||
TOTAL INVESTMENTS - 99.9% (Cost $135,041,600) | $135,041,600 | |||||
Other Assets in Excess of Liabilities - 0.1% | 118,591 | |||||
TOTAL NET ASSETS - 100.0% | $135,160,191 | |||||
(a) | Represents less than 0.05% of net assets. |
(b) | The rate shown represents the 7-day annualized effective yield as of November 30, 2024. |
7 |
ClearShares OCIO ETF | ClearShares Piton Intermediate Fixed Income ETF | ClearShares Ultra-Short Maturity ETF | |||||||
ASSETS: | |||||||||
Investments in unaffiliated securities, at value | $191,536,522 | $100,107,635 | $135,041,600 | ||||||
Investments in affiliated securities, at value | 5,966,714 | — | |||||||
Securities lending income receivable | 8,141 | — | — | ||||||
Interest receivable | 2,381 | 832,143 | 140,377 | ||||||
Total assets | 197,513,758 | 100,939,778 | 135,181,977 | ||||||
LIABILITIES: | |||||||||
Written option contracts, at value | 230,386 | — | — | ||||||
Payable upon return of securities loaned (See Note 4) | 47,701,980 | — | — | ||||||
Payable to adviser, net of waiver | 65,726 | 37,070 | 21,786 | ||||||
Total liabilities | 47,998,092 | 37,070 | 21,786 | ||||||
NET ASSETS | $149,515,666 | $100,902,708 | $135,160,191 | ||||||
Net Assets Consists of: | |||||||||
Paid-in capital | $113,232,396 | $108,981,225 | $134,950,695 | ||||||
Total distributable earnings/(accumulated losses) | 36,283,270 | (8,078,517) | 209,496 | ||||||
Total net assets | $149,515,666 | $100,902,708 | $135,160,191 | ||||||
Net assets | $149,515,666 | $100,902,708 | $135,160,191 | ||||||
Shares issued and outstanding | 4,300,000 | 1,075,000 | 1,350,000 | ||||||
Net asset value per share | $34.77 | $93.86 | $100.12 | ||||||
Cost: | |||||||||
Investments in unaffiliated securities, at cost | $154,044,525 | $102,314,938 | $135,041,600 | ||||||
Investments in affiliated securities, at cost | $5,968,249 | $— | $— | ||||||
Proceeds: | |||||||||
Written options premium | $166,809 | $— | $— | ||||||
Loaned Securities: | |||||||||
at value (included in investments) | $46,864,433 | $— | $— | ||||||
8 |
ClearShares OCIO ETF | ClearShares Piton Intermediate Fixed Income ETF | ClearShares Ultra-Short Maturity ETF | |||||||
INVESTMENT INCOME: | |||||||||
Dividend income - unaffiliated securities | $1,346,941 | $— | $— | ||||||
Dividend income - affiliated securities | 151,435 | — | — | ||||||
Interest income | 16,942 | 1,722,015 | 3,773,494 | ||||||
Securities lending income, net (See Note 4) | 73,451 | — | — | ||||||
Total investment income | 1,588,769 | 1,722,015 | 3,773,494 | ||||||
EXPENSES: | |||||||||
Investment advisory fee | 395,885 | 224,012 | 141,443 | ||||||
Total expenses | 395,885 | 224,012 | 141,443 | ||||||
Less advisory fee waived (See Note 3) | (5,971) | — | — | ||||||
Net expenses | 389,914 | 224,012 | 141,443 | ||||||
Net investment income | 1,198,855 | 1,498,003 | 3,632,051 | ||||||
REALIZED AND UNREALIZED GAIN | |||||||||
Net realized loss from: | |||||||||
Investments - unaffiliates | (637,296) | (487,727) | — | ||||||
In-kind redemptions - affiliated securities | 114 | — | — | ||||||
In-kind redemptions - unaffiliated securities | 396,905 | — | — | ||||||
Written option contracts expired or closed | 119,860 | — | — | ||||||
Net realized loss | (120,417) | (487,727) | — | ||||||
Net change in unrealized appreciation on: | |||||||||
Investments - unaffiliated securities | 11,283,592 | 2,496,387 | — | ||||||
Investments - affiliated securities | 709 | — | — | ||||||
Written option contracts | (63,576) | — | — | ||||||
Net change in unrealized appreciation | 11,220,725 | 2,496,387 | — | ||||||
Net realized and unrealized gain | 11,100,308 | 2,008,660 | — | ||||||
NET INCREASE IN NET ASSETS RESULTING FROM OPERATIONS | $12,299,163 | $3,506,663 | $3,632,051 | ||||||
9 |
ClearShares OCIO ETF | ClearShares Piton Intermediate Fixed Income ETF | |||||||||||
Period Ended November 30, 2024 (Unaudited) | Year Ended May 31, 2024 | Period Ended November 30, 2024 (Unaudited) | Year Ended May 31, 2024 | |||||||||
OPERATIONS: | ||||||||||||
Net investment income | $1,198,855 | $3,072,537 | $1,498,003 | $2,536,095 | ||||||||
Net realized loss | (120,417) | (151,844) | (487,727) | (4,796,458) | ||||||||
Net change in unrealized appreciation | 11,220,725 | 14,109,119 | 2,496,387 | 3,785,902 | ||||||||
Net increase in net assets from operations | 12,299,163 | 17,029,812 | 3,506,663 | 1,525,539 | ||||||||
DISTRIBUTIONS TO SHAREHOLDERS: | ||||||||||||
Distributions to shareholders | (956,175) | (3,036,818) | (942,862) | (2,451,890) | ||||||||
Total distributions to shareholders | (956,175) | (3,036,818) | (942,862) | (2,451,890) | ||||||||
CAPITAL TRANSACTIONS: | ||||||||||||
Subscriptions | 4,950,920 | 1,540,855 | 2,390,370 | 2,292,098 | ||||||||
Redemptions | (1,694,465) | (6,078,430) | — | (38,911,125) | ||||||||
ETF transaction fees (See Note 10) | — | — | 718 | 12,360 | ||||||||
Net increase (decrease) in net assets from capital transactions | 3,256,455 | (4,537,575) | 2,391,088 | (36,606,667) | ||||||||
Net increase (decrease) in net assets | 14,599,443 | 9,455,419 | 4,954,889 | (37,533,018) | ||||||||
NET ASSETS: | ||||||||||||
Beginning of the period | 134,916,223 | 125,460,804 | 95,947,819 | 133,480,837 | ||||||||
End of the period | $149,515,666 | $134,916,223 | $100,902,708 | $95,947,819 | ||||||||
SHARES TRANSACTIONS | ||||||||||||
Subscriptions | 150,000 | 50,000 | 25,000 | 25,000 | ||||||||
Redemptions | (50,000) | (200,000) | — | (425,000) | ||||||||
Total increase/(decrease) in shares outstanding | 100,000 | (150,000) | 25,000 | (400,000) | ||||||||
10 |
ClearShares Ultra-Short Maturity ETF | ||||||
Period Ended November 30, 2024 (Unaudited) | Year Ended May 31, 2024 | |||||
OPERATIONS: | ||||||
Net investment income | $3,632,051 | $10,301,594 | ||||
Net change in unrealized appreciation | — | 1,999 | ||||
Net increase in net assets from operations | 3,632,051 | 10,303,593 | ||||
DISTRIBUTIONS TO SHAREHOLDERS: | ||||||
Distributions to shareholders | (3,543,000) | (10,424,424) | ||||
Total distributions to shareholders | (3,543,000) | (10,424,424) | ||||
CAPITAL TRANSACTIONS: | ||||||
Subscriptions | 15,023,645 | 70,236,250 | ||||
Redemptions | (35,097,720) | (155,473,230) | ||||
Net decrease in net assets from capital transactions | (20,074,075) | (85,236,980) | ||||
Net decrease in net assets | (19,985,024) | (85,357,811) | ||||
NET ASSETS: | ||||||
Beginning of the period | 155,145,215 | 240,503,026 | ||||
End of the period | $135,160,191 | $155,145,215 | ||||
SHARES TRANSACTIONS | ||||||
Subscriptions | 150,000 | 700,000 | ||||
Redemptions | (350,000) | (1,550,000) | ||||
Total decrease in shares outstanding | (200,000) | (850,000) | ||||
11 |
Period Ended November 30, 2024 (Unaudited) | Year Ended May 31, | |||||||||||||||||
2024 | 2023 | 2022 | 2021 | 2020 | ||||||||||||||
PER SHARE DATA: | ||||||||||||||||||
Net asset value, beginning of period | $32.12 | $28.84 | $29.76 | $32.12 | $26.46 | $25.66 | ||||||||||||
INVESTMENT OPERATIONS: | ||||||||||||||||||
Net investment income(a)(b) | 0.28 | 0.72 | 0.58 | 0.46 | 0.42 | 0.59 | ||||||||||||
Net realized and unrealized gain (loss) on investments(h) | 2.59 | 3.27 | (0.49) | (1.88) | 5.96 | 1.04 | ||||||||||||
Total from investment operations | 2.87 | 3.99 | 0.09 | (1.42) | 6.38 | 1.63 | ||||||||||||
LESS DISTRIBUTIONS FROM: | ||||||||||||||||||
Net investment income | (0.22) | (0.71) | (0.53) | (0.49) | (0.48) | (0.83) | ||||||||||||
Net realized gains | — | — | (0.48) | (0.45) | (0.24) | — | ||||||||||||
Total distributions | (0.22) | (0.71) | (1.01) | (0.94) | (0.72) | (0.83) | ||||||||||||
ETF transaction fees per share | — | — | — | — | — | 0.00(c) | ||||||||||||
Net asset value, end of period | $34.77 | $32.12 | $28.84 | $29.76 | $32.12 | $26.46 | ||||||||||||
Total return(d) | 8.96% | 13.98% | 0.47% | −4.65% | 24.38% | 6.34% | ||||||||||||
SUPPLEMENTAL DATA AND RATIOS: | ||||||||||||||||||
Net assets, end of period (in thousands) | $149,516 | $134,916 | $125,461 | $126,481 | $126,865 | $104,532 | ||||||||||||
Ratio of expenses to average net assets: | ||||||||||||||||||
Before expense reimbursement/recoupment(e)(f) | 0.55% | 0.55% | 0.55% | 0.55% | 0.55% | 0.55% | ||||||||||||
After expense reimbursement/recoupment(e)(f) | 0.54% | 0.54% | 0.54% | 0.54% | 0.54% | 0.54% | ||||||||||||
Ratio of net investment income to average net assets: | | | | | | | ||||||||||||
Before expense reimbursement/recoupment(e)(f) | 1.66% | 2.36% | 2.01% | 1.44% | 1.43% | 2.17% | ||||||||||||
After expense reimbursement/recoupment(e)(f) | 1.67% | 2.37% | 2.02% | 1.45% | 1.44% | 2.18% | ||||||||||||
Portfolio turnover rate(d)(g) | 11% | 70% | 36% | 51% | 24% | 50% | ||||||||||||
(a) | Net investment income per share has been calculated based on average shares outstanding during the year. |
(b) | Recognition of net investment income by the Fund is affected by the timing of the declaration of dividends by the underlying exchange-traded funds in which the Fund invests. The ratio does not include net investment income of the exchange-traded funds in which the Fund invests. |
(c) | Amount represents less than $0.005 per share. |
(d) | Not annualized for periods less than one year. |
(e) | Annualized for periods less than one year. |
(f) | These ratios exclude the impact of expenses of the underlying exchange-traded funds as represented in the Schedule of Investments. Recognition of net investment income by the Fund is affected by the timing of the underlying exchange-traded funds in which the Fund invests. |
(g) | Portfolio turnover rate excludes in-kind transactions. |
(h) | Realized and unrealized gains and losses per share in the caption are balancing amounts necessary to reconcile the change in net asset value per share for the period, and may not reconcile with the aggregate gains and losses in the Statement of Operations due to share transactions for the period. |
12 |
Period Ended November 30, 2024 (Unaudited) | Year Ended May 31, | Period Ended May 31, 2021(a) | |||||||||||||
2024 | 2023 | 2022 | |||||||||||||
PER SHARE DATA: | |||||||||||||||
Net asset value, beginning of period | $91.38 | $92.06 | $93.80 | $99.19 | $100.00 | ||||||||||
INVESTMENT OPERATIONS: | |||||||||||||||
Net investment income(b) | 1.41 | 2.33 | 1.42 | 0.71 | 0.07 | ||||||||||
Net realized and unrealized gain (loss) on investments(g) | 1.95 | (0.71) | (1.86) | (5.75) | (0.94) | ||||||||||
Total from investment operations | 3.36 | 1.62 | (0.44) | (5.04) | (0.87) | ||||||||||
LESS DISTRIBUTIONS FROM: | |||||||||||||||
Net investment income | (0.88) | (2.31) | (1.30) | (0.40) | (0.02) | ||||||||||
Total distributions | (0.88) | (2.31) | (1.30) | (0.40) | (0.02) | ||||||||||
ETF transaction fees per share | 0.00(c) | 0.01 | 0.00(c) | 0.05 | 0.08 | ||||||||||
Net asset value, end of period | $93.86 | $91.38 | $92.06 | $93.80 | $99.19 | ||||||||||
Total return(d) | 3.68% | 1.81% | −0.45% | −5.05% | −0.79% | ||||||||||
SUPPLEMENTAL DATA AND RATIOS: | |||||||||||||||
Net assets, end of period (in thousands) | $100,903 | $95,948 | $133,481 | $133,668 | $32,237 | ||||||||||
Ratio of expenses to average net assets: | |||||||||||||||
Before expense reimbursement/recoupment(e) | 0.45% | 0.45% | 0.45% | 0.45% | 0.45% | ||||||||||
After expense reimbursement/recoupment(e) | 0.45% | 0.45% | 0.45% | 0.45% | 0.44% | ||||||||||
Ratio of net investment income to average net assets: | | | | | | ||||||||||
Before expense reimbursement/recoupment(e) | 3.01% | 2.56% | 1.55% | 0.73% | 0.10% | ||||||||||
After expense reimbursement/recoupment(e) | 3.01% | 2.56% | 1.55% | 0.73% | 0.11% | ||||||||||
Portfolio turnover rate(d)(f) | 13% | 34% | 21% | 42% | 80% | ||||||||||
(a) | Inception date of the Fund was October 1, 2020. |
(b) | Net investment income per share has been calculated based on average shares outstanding during the year. |
(c) | Amount represents less than $0.005 per share. |
(d) | Not annualized for periods less than one year. |
(e) | Annualized for periods less than one year. |
(f) | Portfolio turnover rate excludes in-kind transactions. |
(g) | Realized and unrealized gains and losses per share in the caption are balancing amounts necessary to reconcile the change in net asset value per share for the period, and may not reconcile with the aggregate gains and losses in the Statement of Operations due to share transactions for the period. |
13 |
Period Ended November 30, 2024 (Unaudited) | Year Ended May 31, | |||||||||||||||||
2024 | 2023 | 2022 | 2021 | 2020 | ||||||||||||||
PER SHARE DATA: | ||||||||||||||||||
Net asset value, beginning of period | $100.09 | $100.21 | $100.10 | $100.08 | $100.09 | $100.48 | ||||||||||||
INVESTMENT OPERATIONS: | ||||||||||||||||||
Net investment income(a) | 2.58 | 5.29 | 3.53 | 0.39 | 0.42 | 1.25 | ||||||||||||
Net realized and unrealized gain (loss) on investments(e) | — | 0.01 | (0.05) | — | — | 0.29 | ||||||||||||
Total from investment operations | 2.58 | 5.30 | 3.48 | 0.39 | 0.42 | 1.54 | ||||||||||||
LESS DISTRIBUTIONS FROM: | ||||||||||||||||||
Net investment income | (2.55) | (5.42) | (3.37) | (0.37) | (0.43) | (1.93) | ||||||||||||
Total distributions | (2.55) | (5.42) | (3.37) | (0.37) | (0.43) | (1.93) | ||||||||||||
Net asset value, end of period | $100.12 | $100.09 | $100.21 | $100.10 | $100.08 | $100.09 | ||||||||||||
Total return(b) | 2.60% | 5.43% | 3.54% | 0.39% | 0.42% | 1.56% | ||||||||||||
SUPPLEMENTAL DATA AND RATIOS: | ||||||||||||||||||
Net assets, end of period (in thousands) | $135,160 | $155,145 | $240,503 | $200,198 | $120,099 | $115,109 | ||||||||||||
Ratio of expenses to average net assets(c) | 0.20% | 0.20% | 0.20% | 0.20% | 0.20% | 0.20% | ||||||||||||
Ratio of net investment income to average net assets(c) | 5.14% | 5.27% | 3.52% | 0.39% | 0.42% | 1.25% | ||||||||||||
Portfolio turnover rate(b)(d) | 0% | 0% | 0% | 0% | 0% | 0% | ||||||||||||
(a) | Net investment income per share has been calculated based on average shares outstanding during the year. |
(b) | Not annualized for periods less than one year. |
(c) | Annualized for periods less than one year. |
(d) | Portfolio turnover rate excludes in-kind transactions. |
(e) | Realized and unrealized gains and losses per share in the caption are balancing amounts necessary to reconcile the change in net asset value per share for the period, and may not reconcile with the aggregate gains and losses in the Statement of Operations due to share transactions for the period. |
14 |
| A. | Security Valuation. All equity securities, including domestic and foreign common stocks, preferred stocks, and exchange-traded funds that are traded on a national securities exchange, except those listed on the Nasdaq Global Market® Nasdaq Global Select Market® and Nasdaq Capital Market Exchange® (collectively “Nasdaq”) are valued at the last reported sale price on the exchange on which the security is principally traded. Securities traded on Nasdaq will be valued at the Nasdaq Official Closing Price (“NOCP”). If, on a particular day, an exchange-traded or Nasdaq security does not trade, then the mean between the most recent quoted bid and asked prices will be used. All equity securities that are not traded on a listed exchange are valued at the last sale price in the over-the-counter market. If a non-exchange traded security does not trade on a particular day, then the mean between the last quoted closing bid and asked price will be used. Prices denominated in foreign currencies are converted to U.S. dollar equivalents at the current exchange rate, which approximates fair value. |
15 |
| Level 1 – | Unadjusted quoted prices in active markets for identical assets or liabilities that the Funds have the ability to access. |
| Level 2 – | Observable inputs other than quoted prices included in Level 1 that are observable for the asset or liability, either directly or indirectly. These inputs may include quoted prices for the identical instrument on an inactive market, prices for similar instruments, interest rates, prepayment speeds, credit risk, yield curves, default rates and similar data. |
| Level 3 – | Unobservable inputs for the asset or liability, to the extent relevant observable inputs are not available; representing the Funds’ own assumptions about the assumptions a market participant would use in valuing the asset or liability and would be based on the best information available. |
Level 1 | Level 2 | Level 3 | Total | |||||||||
Assets^ | ||||||||||||
Exchange-Traded Funds | $149,256,566 | $— | $ — | $149,256,566 | ||||||||
Investments Purchased with Proceeds from Securities Lending | — | — | — | 47,701,980(a) | ||||||||
Money Market Funds | 544,690 | — | — | 544,690 | ||||||||
Total Investments | $149,801,256 | $— | $— | $197,503,236 | ||||||||
Liabilities^ | ||||||||||||
Written Options | $— | $(230,386) | $— | $(230,386) | ||||||||
Total Investments | $— | $(230,386) | $— | $(230,386) | ||||||||
(a) | Certain investments that are measured at fair value using the net asset value per share (or its equivalent) practical expedient have not been categorized in the fair value hierarchy. The fair value amounts presented in the table are intended to permit reconciliation of the fair value hierarchy to the amounts listed in the Schedule of Investments. |
16 |
Level 1 | Level 2 | Level 3 | Total | |||||||||
Assets^ | ||||||||||||
U.S. Treasury Securities | $— | $55,933,315 | $ — | $55,933,315 | ||||||||
Corporate Bonds | — | 32,934,553 | — | 32,934,553 | ||||||||
U.S. Government Agency Issues | — | 10,080,038 | — | 10,080,038 | ||||||||
Municipal Bonds | — | 1,014,932 | — | 1,014,932 | ||||||||
Money Market Funds | 144,797 | — | — | 144,797 | ||||||||
Total Investments | $144,797 | $99,962,838 | $— | $100,107,635 | ||||||||
Level 1 | Level 2 | Level 3 | Total | |||||||||
Assets^ | ||||||||||||
Repurchase Agreements | $— | $135,000,000 | $ — | $135,000,000 | ||||||||
Money Market Funds | 41,600 | — | — | 41,600 | ||||||||
Total Investments | $41,600 | $135,000,000 | $— | $135,041,600 | ||||||||
| ^ | See Schedule of Investments for further disaggregation of investment categories. |
| B. | Federal Income Taxes. The Funds’ policy is to comply with the requirements of Subchapter M of the Internal Revenue Code of 1986, as amended, applicable to regulated investment companies and to distribute substantially all of their net investment income and net capital gains to shareholders. Therefore, no federal income tax provision is required. The Funds plan to file U.S. Federal and various state and local tax returns. |
| C. | Foreign Currency. Investment securities and other assets and liabilities denominated in foreign currencies are translated into U.S. dollar amounts at the date of valuation. Purchases and sales of investment securities and income and expense items denominated in foreign currencies are translated into U.S. dollar amounts on the respective dates of such transactions. The Funds do not isolate that portion of the results of operations resulting from changes in foreign exchange rates on investments and currency gains or losses realized between trade and settle dates on security transactions from the fluctuations arising from changes in market prices of securities held. Such fluctuations are included with the net realized and unrealized gain or loss from investments. The Funds report net realized foreign exchange gains or losses that arise from sales of foreign currencies, currency gains or losses realized between the trade and settlement dates on foreign currency transactions, and the difference between the amounts of dividends, interest, and foreign withholding taxes recorded on the Funds’ books and the U.S. dollar equivalent of the amounts actually received or paid. Net unrealized foreign exchange gains and losses arise from the changes in the fair values of assets and liabilities, other than investments in securities at fiscal period end, resulting from changes in exchange rates. |
| D. | Security Transactions and Investment Income. Investment transactions are accounted for on the trade date. Gains and losses realized from investment transactions are determined on a specific identification basis. Dividend income is recorded on the ex-dividend date. Non-cash dividends included in dividend income or separately disclosed, if any, are recorded at the fair value of the security received. Withholding taxes on foreign dividends, if any, have been provided for in accordance with the Funds’ understanding of the |
17 |
| E. | Distributions to Shareholders. Distributions to shareholders from net investment income on securities are declared and paid by ClearShares Ultra-Short Maturity ETF on a monthly basis and by ClearShares OCIO ETF and ClearShares Piton Intermediate Fixed Income ETF on a quarterly basis. Distributions to shareholders from net realized gains on securities are declared and paid by the Funds on an annual basis. Distributions are recorded on the ex-dividend date. |
| F. | Use of Estimates. The preparation of financial statements in conformity with U.S. GAAP requires management to make estimates and assumptions that affect the reported amounts of assets and liabilities and disclosure of contingent assets and liabilities at the date of the financial statements, as well as the reported amounts of revenues and expenses during the period. Actual results could differ from those estimates. |
| G. | Share Valuation. The NAV per share of each Fund is calculated by dividing the sum of the value of the securities held by the Fund, plus cash and other assets, minus all liabilities (including estimated accrued expenses) by the total number of shares outstanding of each Fund, rounded to the nearest cent. The Funds’ shares will not be priced on the days on which the New York Stock Exchange (“NYSE”) is closed for trading. The offering and redemption price per share of each Fund is equal to the Fund’s NAV per share. |
| H. | Guarantees and Indemnifications. In the normal course of business, the Funds enter into contracts with service providers that contain general indemnification clauses. Each Fund’s maximum exposure under these arrangements is unknown as this would involve future claims that may be against the Funds that have not yet occurred. However, based on experience, the Funds expect the risk of loss to be remote. |
| I. | Reclassification of Capital Accounts. U.S. GAAP requires that certain components of net assets relating to permanent differences be reclassified between financial and tax reporting. These reclassifications have no effect on net assets or NAV per share and primarily relate to differing book and tax treatments of redemptions in-kind. |
Distributable Earnings (Accumulated Losses) | Paid-In Capital | |||||
ClearShares OCIO ETF | $(1,056,942) | $1,056,942 | ||||
ClearShares Piton Intermediate Fixed Income ETF | — | — | ||||
ClearShares Ultra-Short Maturity ETF | — | — | ||||
| J. | Subsequent Events. In preparing these financial statements, management has evaluated events and transactions for potential recognition or disclosure through the date the financial statements were issued. There were no events or transactions that occurred during the period subsequent to the end of the current fiscal period, that materially impacted the amounts or disclosures in the Funds’ financial statements. |
18 |
ClearShares OCIO ETF | 0.55% | ||
ClearShares Piton Intermediate Fixed Income ETF | 0.45% | ||
ClearShares Ultra-Short Maturity ETF | 0.20% | ||
19 |
Value of Securities on Loan | Payable for Collateral Received* | ||
$46,864,433 | $47,701,980 | ||
| * | The cash collateral received was invested in Mount Vernon Liquid Assets Portfolio, LLC as shown on the Schedule of Investments, a short-term investment portfolio with an overnight and continuous maturity. The investment objective is to seek to maximize current income to the extent consistent with the preservation of capital and liquidity and maintain a stable NAV of $1.00 per unit. |
20 |
Fund Name | Seller | Weighted Average Days to Maturity | ||||
ClearShares OCIO ETF | N/A | N/A | ||||
ClearShares Piton Intermediate Fixed Income ETF | N/A | N/A | ||||
ClearShares Ultra-Short Maturity ETF | Buckler Securities LLC | 0.15 | ||||
Cantor Fitgerald & Co. | 2.52 | |||||
Clear Street LLC | 0.15 | |||||
Marex Capital Markets Inc. | 0.37 | |||||
Purchases | Sales | |||||
ClearShares OCIO ETF | $16,502,864 | $15,560,951 | ||||
ClearShares Piton Intermediate Fixed Income ETF | $16,163,968 | $12,994,344 | ||||
ClearShares Ultra-Short Maturity ETF | $— | $— | ||||
Creations | Redemptions | |||||
ClearShares OCIO ETF | $4,920,862 | $1,686,374 | ||||
ClearShares Piton Intermediate Fixed Income ETF | — | — | ||||
ClearShares Ultra-Short Maturity ETF | — | — | ||||
Investments in ClearShares Ultra-Short Maturity ETF | ClearShares OCIO ETF | ||
Value at May 31, 2024 | $5,827,284 | ||
Purchases at Cost | 207,934 | ||
Proceeds from Sales | (69,327) | ||
Net Realized Gain (Loss) | 114 | ||
Change in Unrealized Appreciation (Depreciation) | 709 | ||
Value at November 30, 2024 | 5,966,714 | ||
Shares held at November 30, 2024 | 59,587 | ||
Dividend Income | $151,435 | ||
21 |
ClearShares OCIO ETF | ClearShares Piton Intermediate Fixed Income ETF | ClearShares Ultra-Short Maturity ETF | |||||||
Tax cost of investments | $153,146,910 | $100,063,233 | $155,099,226 | ||||||
Gross tax unrealized appreciation | $27,149,377 | $109,829 | $— | ||||||
Gross tax unrealized depreciation | (953,020) | (4,869,002) | — | ||||||
Net tax unrealized appreciation (depreciation) | 26,196,357 | (4,759,173) | — | ||||||
Undistributed ordinary income | 236,153 | 525,630 | 120,445 | ||||||
Undistributed long-term capital gains | — | — | — | ||||||
Other accumulated gain (loss) | (1,492,228) | (6,408,775) | — | ||||||
Distributable Earnings (accumulated deficit) | $24,940,282 | $(10,642,318) | $120,445 | ||||||
Short Term | Long Term | Expires | |||||||
ClearShares OCIO ETF | $1,375,935 | $116,293 | Indefinite | ||||||
ClearShares Piton Intermediate Fixed Income ETF | $875,690 | $5,533,085 | Indefinite | ||||||
ClearShares Ultra-Short Maturity ETF | $— | $— | N/A | ||||||
Year Ended May 31, 2024 | Year Ended May 31, 2023 | |||||||||||
Ordinary Income | Capital Gains | Ordinary Income | Capital Gains | |||||||||
ClearShares OCIO ETF | $3,036,818 | $ — | $2,324,680 | $2,110,016 | ||||||||
ClearShares Piton Intermediate Fixed Income ETF | $2,451,890 | $— | $1,851,816 | $— | ||||||||
ClearShares Ultra-Short Maturity ETF | $10,424,424 | $— | $8,282,598 | $— | ||||||||
22 |
Written Options | Average Value | ||
ClearShares OCIO ETF | $(57,967) | ||
Liability Derivatives | ||||||||||||
Fund | Derivatives Investment Type | Statement of Assets and Liabilities Location | Value | |||||||||
ClearShares OCIO ETF | Equity Contracts - Written Options | Written option contracts, at value | $(230,386) | |||||||||
Fund | Derivatives Investment Type | Net Realized Gain (Loss) | Change in Unrealized Appreciation (Depreciation) | ||||||
ClearShares OCIO ETF | Equity Contracts - Written Options | $119,860 | $(63,576) | ||||||
23 |
24 |
ClearShares OCIO ETF | 41.99% | ||
ClearShares Piton Intermediate Fixed Income ETF | 0.00% | ||
ClearShares Ultra-Short Maturity ETF | 0.00% | ||
ClearShares OCIO ETF | 2.38% | ||
ClearShares Piton Intermediate Fixed Income ETF | 0.00% | ||
ClearShares Ultra-Short Maturity ETF | 0.00% | ||
ClearShares OCIO ETF | 0.00% | ||
ClearShares Piton Intermediate Fixed Income ETF | 0.00% | ||
ClearShares Ultra-Short Maturity ETF | 0.00% | ||
Creditable Foreign Taxes Paid | Per Share Amount | Portion of Ordinary Income Distribution Derived from Foreign Sourced Income | |||||||
ClearShares OCIO ETF | $43,870 | 0.01044524 | 12.67% | ||||||
ClearShares Piton Intermediate Fixed Income ETF | — | — | — | ||||||
ClearShares Ultra-Short Maturity ETF | — | — | — | ||||||
25 |
26 |
27 |
28 |
| (b) | Financial Highlights are included within the financial statements filed under Item 7 of this Form. |
Item 8. Changes in and Disagreements with Accountants for Open-End Investment Companies.
There were no changes in or disagreements with accountants during the period covered by this report.
Item 9. Proxy Disclosure for Open-End Investment Companies.
There were no matters submitted to a vote of shareholders during the period covered by this report.
Item 10. Remuneration Paid to Directors, Officers, and Others of Open-End Investment Companies.
All fund expenses, including Trustee compensation is paid by the Investment Adviser pursuant to the Investment Advisory Agreement. Additional information related to those fees is available in the Funds’ Statement of Additional Information.
Item 11. Statement Regarding Basis for Approval of Investment Advisory Contract.
Not Applicable.
Item 12. Disclosure of Proxy Voting Policies and Procedures for Closed-End Management Investment Companies.
Not applicable to open-end investment companies.
Item 13. Portfolio Managers of Closed-End Management Investment Companies.
Not applicable to open-end investment companies.
Item 14. Purchases of Equity Securities by Closed-End Management Investment Company and Affiliated Purchasers.
Not applicable to open-end investment companies.
Item 15. Submission of Matters to a Vote of Security Holders.
There have been no material changes to the procedures by which shareholders may recommend nominees to the registrant’s board of trustees.
Item 16. Controls and Procedures.
| (a) | The Registrant’s President (principal executive officer) and Treasurer (principal financial officer) have reviewed the Registrant’s disclosure controls and procedures (as defined in Rule 30a-3(c) under the Investment Company Act of 1940 (the “Act”)) as of a date within 90 days of the filing of this report, as required by Rule 30a-3(b) under the Act and Rules 13a-15(b) or 15d-15(b) under the Securities Exchange Act of 1934. Based on their review, such officers have concluded that the disclosure controls and procedures are effective in ensuring that information required to be disclosed in this report is appropriately recorded, processed, summarized and reported and made known to them by others within the Registrant and by the Registrant’s service provider. |
| (b) | There were no changes in the Registrant’s internal control over financial reporting (as defined in Rule 30a-3(d) under the Act) that occurred during the period covered by this report that have materially affected, or are reasonably likely to materially affect, the Registrant’s internal control over financial reporting. |
Item 17. Disclosure of Securities Lending Activities for Closed-End Management Investment Companies
Not applicable to open-end investment companies.
Item 18. Recovery of Erroneously Awarded Compensation.
(a) Not Applicable.
(b) Not Applicable.
Item 19. Exhibits.
| (a) | (1) Any code of ethics or amendment thereto, that is the subject of the disclosure required by Item 2, to the extent that the registrant intends to satisfy Item 2 requirements through filing an exhibit. Not Applicable. |
(2) Any policy required by the listing standards adopted pursuant to Rule 10D-1 under the Exchange Act (17 CFR 240.10D-1) by the registered national securities exchange or registered national securities association upon which the registrant’s securities are listed. Not Applicable.
(4) Any written solicitation to purchase securities under Rule 23c-1 under the Act sent or given during the period covered by the report by or on behalf of the registrant to 10 or more persons. Not applicable to open-end investment companies.
(5) Change in the registrant’s independent public accountant. Not applicable to open-end investment companies and ETFs.
| (b) | Certifications pursuant to Section 906 of the Sarbanes-Oxley Act of 2002. Furnished herewith. |
SIGNATURES
Pursuant to the requirements of the Securities Exchange Act of 1934 and the Investment Company Act of 1940, the registrant has duly caused this report to be signed on its behalf by the undersigned, thereunto duly authorized.
| (Registrant) | ETF Series Solutions |
| By (Signature and Title)* | /s/ Kristina R. Nelson | ||
| Kristina R. Nelson, President (principal executive officer) |
| Date | 2/7/2025 |
Pursuant to the requirements of the Securities Exchange Act of 1934 and the Investment Company Act of 1940, this report has been signed below by the following persons on behalf of the registrant and in the capacities and on the dates indicated.
| By (Signature and Title)* | /s/ Kristina R. Nelson | ||
| Kristina R. Nelson, President (principal executive officer) |
| Date | 2/7/2025 |
| By (Signature and Title)* | /s/ Kristen M. Weitzel | ||
| Kristen M. Weitzel, Treasurer (principal financial officer) |
| Date | 2/7/2025 |
* Print the name and title of each signing officer under his or her signature.