UNITED STATES
SECURITIES AND EXCHANGE COMMISSION
WASHINGTON, D.C. 20549
FORMN-CSR
CERTIFIED SHAREHOLDER REPORT OF REGISTERED
MANAGEMENT INVESTMENT COMPANIES
Investment Company Act file number:811-22671
AB MULTI-MANAGER ALTERNATIVE FUND, INC.
(Exact name of registrant as specified in charter)
1345 Avenue of the Americas, New York, New York 10105
(Address of principal executive offices) (Zip code)
Joseph J. Mantineo
AllianceBernstein L.P.
1345 Avenue of the Americas
New York, New York 10105
(Name and address of agent for service)
Registrant’s telephone number, including area code: (800)221-5672
Date of fiscal year end: March 31, 2020
Date of reporting period: September 30, 2019
ITEM 1. REPORTS TO STOCKHOLDERS.
SEP 09.30.19

SEMI-ANNUAL REPORT
AB MULTI-MANAGER ALTERNATIVE FUND

Beginning January 1, 2021, as permitted by new regulations adopted by the Securities and Exchange Commission, the Fund’s annual and semi-annual shareholder reports will no longer be sent by mail, unless you specifically request paper copies of the reports. Instead, the reports will be made available on a website, and you will be notified by mail each time a report is posted and provided with a website address to access the report.
If you already elected to receive shareholder reports electronically, you will not be affected by this change and you need not take any action. You may elect to receive shareholder reports and other communications from the Fund electronically at any time by contacting your Bernstein financial advisor or by calling the Fund at (212) 486 5800.
You may elect to receive all future reports in paper form free of charge. You can contact your Bernstein financial advisor to request that you continue to receive paper copies of your shareholder reports or you can call the Fund at (212) 486 5800. Your election to receive reports in paper form will apply to all funds held in your Bernstein account.
| | |
| |
| Investment Products Offered | | • Are Not FDIC Insured• May Lose Value• Are Not Bank Guaranteed |
You may obtain a description of the Fund’s proxy voting policies and procedures, and information regarding how the Fund voted proxies relating to portfolio securities during the most recent12-month period ended June 30, without charge. Simply visit AB’s website at www.abfunds.com, or go to the Securities and Exchange Commission’s (the “Commission”) website at www.sec.gov, or call AB at (800) 227 4618.
The Fund files its complete schedule of portfolio holdings with the Commission for the first and third quarters of each fiscal year as an exhibit to its reports onForm N-PORT. The Fund’sForm N-PORT reports are available on the Commission’s website at www.sec.gov. The Fund’s Forms N-PORT may also be reviewed and copied at the Commission’s Public Reference Room in Washington, DC; information on the operation of the Public Reference Room may be obtained by calling (800) SEC 0330.
The [A/B] logo is a registered service mark of AllianceBernstein and AllianceBernstein® is a registered service mark used by permission of the owner, AllianceBernstein L.P.
SEMI-ANNUAL REPORT
November 19, 2019
This report provides certain performance data for AB Multi-Manager Alternative Fund (the “Fund”) for the semi-annual reporting period ended September 30, 2019.
The Fund’s investment objective is to seek long-term capital appreciation.
RETURNS AS OF SEPTEMBER 30, 2019(unaudited)
| | | | | | | | |
| | |
| | | 6 Months | | | 12 Months | |
| | |
| AB MULTI-MANAGER ALTERNATIVE FUND | | | 0.80% | | | | 0.53% | |
| | |
| Benchmark: HFRI FOF Composite Index | | | 0.40% | | | | -0.18% | |
| | |
| MSCI World Index (net) | | | 4.56% | | | | 1.83% | |
| | |
| Bloomberg Barclays US Aggregate Bond Index | | | 5.42% | | | | 10.30% | |
INVESTMENT RESULTS
The table above provides performance data for the Fund and its benchmark, the HFRI Fund of Funds (“HFRI FOF”) Composite Index, for thesix- and12-month periods ended September 30, 2019. The table also includes the performance of the Morgan Stanley Capital International (“MSCI”) World Index (net) and the Bloomberg Barclays US Aggregate Bond Index.
During both periods, the Fund outperformed its benchmark, the HFRI FOF Composite Index, but underperformed the MSCI World Index (net) and the Bloomberg Barclays US Aggregate Index.
During thesix-month period, Global Macro, Event Driven, Multi-Strategy and Long/Short Equity Underlying Portfolios contributed to absolute performance, while Credit/Distressed detracted. Global Macro benefited from positive macro trends in interest rates and precious metals, relative value positioning across interest-rate curves and cross-country rates, as well as tactical positioning across developed-market equity indices. Event Driven and Long/Short Equity benefited from a positive equity market environment, and in certain cases outperformed the equity index, while only taking a fraction of the net market exposure. Outperformance was primarily driven by long positions, while short positions were mixed during the period. As to Credit/Distressed, market events weighed on sentiment during the most recent quarter.
For the12-month period, Long/Short Equity, Event Driven, Global Macro, and Multi-Strategy Underlying Portfolios contributed to absolute performance while Credit/Distressed detracted. Long/Short Equity and Event Driven benefited from a broadly supportive backdrop for both equities and
| | |
| |
| abfunds.com | | AB MULTI-MANAGER ALTERNATIVE FUND | 1 |
corporate fixed-income securities. Repositioning was also a benefit following the volatile fourth quarter of 2018, as Underlying Portfolios rotated exposure into oversold sectors and securities that generated outsized gains, as the market backdrop improved over the subsequent quarters. Global Macro benefited from positive macro trends, most notably lower interest rates globally and a rally in precious metals. Credit/Distressed was the sole detractor during the12-month period, as gains in structured credits were more than offset by declining sentiment in select stressed and distressed positions.
For both periods, the Fund utilized total return swaps for hedging and investment purposes, which detracted from absolute performance. The Fund also used currency forwards for hedging purposes, which had no material impact on absolute performance.
As a result of changes to the Fund’s investment policies that were effective July 31, 2018, including changes to allow for greater direct investment in securities and other financial instruments (in addition to investment in Underlying Portfolios), the portfolio composition evolved over time, and increasingly the Fund’s performance is a reflection of those changes.
MARKET REVIEW AND INVESTMENT STRATEGY
US and European stocks gained during thesix-month period ended September 30, 2019, while Asian and emerging-market stocks declined. In fixed income, developed-market treasuries rallied and outpaced the positive returns of global high-yield and investment-grade securities. The pursuit of yield combined with the mixed global economic outlook led to global bond markets outperforming their respective equity markets, but only by a small margin. As a result, more than 25% of the global government bond market traded at negative yields. While generally supportive, equity markets had more persistent volatility during this period. Further, equity volatility made its way into the microstructure of the markets with historically significant rotations in market leadership in September. These rotations led to negative alpha contributions from stock selection and mixed results from equity-focused hedge funds. However, this feature served as a tailwind for the Fund’s non-equity strategies (particularly relative value and global macro), which represented more than half of the portfolio allocation.
During the12-month period, the volatility trends were even more pronounced, starting with steep declines from the fourth quarter of 2018 that even the strong rally between January through September was barely able to overcome. Comparatively, fixed income was steadily bid higher, leading to double-digit positive returns during the period. But while challenging for managers to navigate at times, especially for more directional funds, the volatility also led to increased dispersion within the equity market and created opportunities to trade both long and short, which benefited the Fund’s lower net market exposure and market neutral strategies. These
| | |
| |
| 2 | AB MULTI-MANAGER ALTERNATIVE FUND | | abfunds.com |
types of strategies were increased throughout the period and produced gains that more than offset the impact from the directional component.
INVESTMENT POLICIES
There can be no assurance that the Fund will achieve its investment objective, be able to structure its investments as anticipated, or that its returns will be positive over any period of time. The Fund is not intended as a complete investment program for investors.
The Fund seeks to achieve its investment objective primarily by allocating its assets among investments in a diversified portfolio of private investment vehicles commonly referred to as hedge funds (“Underlying Portfolios”). The Fund will invest primarily in Underlying Portfolios pursuing the following strategies: Long/Short Equity, Event Driven, Credit/Distressed, Emerging Markets, Global Macro and Multi-Strategy. For more information on these strategies, please see “Consolidated Portfolio of Investments” on pages 8–21. As a secondary strategy, the Fund will generally also make direct investments in securities and other financial instruments. For more information regarding the Fund’s risks, please see “Disclosures and Risks” on pages 4–6 and “Note E—Risks Involved in Investing in the Fund” of the Notes to Consolidated Financial Statements on pages 40–43.
| | |
| |
| abfunds.com | | AB MULTI-MANAGER ALTERNATIVE FUND | 3 |
DISCLOSURES AND RISKS
Benchmark Disclosure
All indices are unmanaged and do not reflect fees and expenses associated with the active management of a mutual fund portfolio.The HFRI FOF Composite Index is an equal-weighted performance index that includes over 650 constituent funds of hedge funds that report their monthlynet-of-fee returns to Hedge Fund Research, have at least $50 million under management and have been actively trading for at least 12 months. The MSCI World Index (net, free float-adjusted, market capitalization weighted) represents the equity market performance of developed markets. The Bloomberg Barclays US Aggregate Index represents the performance of securities within the US investment-grade fixed-rate bond market, with index components for government and corporate securities, mortgage pass-through securities, asset-backed securities and commercial mortgage-backed securities. MSCI makes no express or implied warranties or representations, and shall have no liability whatsoever with respect to any MSCI data contained herein. The MSCI data may not be further redistributed or used as a basis for other indices, any securities or financial products. This report is not approved, reviewed or produced by MSCI. Net returns include the reinvestment of dividends after deduction ofnon-US withholding tax. An investor cannot invest directly in an index, and its results are not indicative of the performance for any specific investment, including the Fund.
A Word about Risk
An investment in the Fund’s shares involves a high degree of risk and should not constitute a complete investment program. Before making an investment decision, you should carefully consider the following risk factors, together with the other information contained in the prospectus. At any point in time, an investment in the Fund’s shares may be worth less than the original amount invested, even after taking into account the distributions paid, if any, and the ability of shareholders to reinvest distributions. If any of the risks discussed below occurs, the Fund’s results of operations could be materially and adversely affected. If this were to happen, the price of Fund shares could decline significantly and you could lose all or a part of your investment.
Investment in this Fund is highly speculative and involves substantial risk, including loss of principal, and therefore may not be suitable for all investors.
General Risk Factors:Underlying Portfolios and the Fund’s direct investments may exhibit high volatility, and investors may lose all or substantially all of their investment. Investments by Underlying Portfolios and the Fund in illiquid assets and foreign markets and the use of short sales, options, leverage, futures, swaps and other derivative instruments may
| | |
| |
| 4 | AB MULTI-MANAGER ALTERNATIVE FUND | | abfunds.com |
DISCLOSURES AND RISKS(continued)
create special risks and substantially increase the impact and likelihood of adverse price movements. Interests in Underlying Portfolios are subject to limitations on transferability and are illiquid, and no secondary market for interests typically exists or is likely to develop. Underlying Portfolios are typically not registered with securities regulators and are therefore generally subject to little or no regulatory oversight. Performance compensation payable to an Underlying Portfolio investment advisor may create an incentive to make riskier or more speculative investments. Underlying Portfolios typically charge higher fees than many other types of investments, which can offset trading profits, if any. There can be no assurance that any Underlying Portfolio will achieve its investment objectives.
Tax Risks:The Fund intends to be treated as a regulated investment company (“RIC”) under the Internal Revenue Code. However, in order to qualify as a RIC and also to avoid having to pay an “excise tax,” the Fund will be subject to certain limitations on its investments and operations, including a requirement that a specified proportion of its income come from qualifying sources, an asset diversification requirement and minimum distribution requirements. Satisfaction of the various requirements requires significant support and information from the Underlying Portfolios, and such support and information may not be available, sufficient, verifiable, or provided on a timely basis.
Limited Liquidity: The Fund’s shares are not listed on any securities exchange or traded in any other market, and are subject to substantial restrictions on transfer. Although the Fund has offered to repurchase shares on a quarterly basis, such periodic repurchase offers are at the sole discretion of the Fund’s Board of Trustees, and there is no assurance that these repurchase offers will continue. It will normally be four to six months between the time an investor tenders shares for repurchase (i.e., requests that the Fund repurchase shares as part of a repurchase offer) and the investor’s receipt of any cash proceeds associated with the repurchase.
Fund of Funds Considerations: The Fund will have no control rights over and limited transparency into the investment programs of the Underlying Portfolios in which it invests. In valuing the Fund’s holdings, the Investment Manager will generally rely on financial information provided by Underlying Portfolios, which may be unaudited, estimated and/or may not involve third parties. The Fund’s investment opportunities may be limited as a result of withdrawal terms or anticipated liquidity needs (e.g., withdrawal restrictions imposed by underlying hedge funds may delay, preclude or involve expense in connection with portfolio adjustments by the Investment Manager).
These risks are fully discussed in the Fund’s prospectus. As with all investments, you may lose money by investing in the Fund.
| | |
| |
| abfunds.com | | AB MULTI-MANAGER ALTERNATIVE FUND | 5 |
DISCLOSURES AND RISKS(continued)
An Important Note About Historical Performance
The performance shown in this report represents past performance and does not guarantee future results. Current performance may be lower or higher than the performance information shown. All fees and expenses related to the operation of the Fund have been deducted. Performance assumes reinvestment of distributions and does not account for taxes.
| | |
| |
| 6 | AB MULTI-MANAGER ALTERNATIVE FUND | | abfunds.com |
PORTFOLIO SUMMARY
September 30, 2019(unaudited)
Net Assets ($mil): $982.1
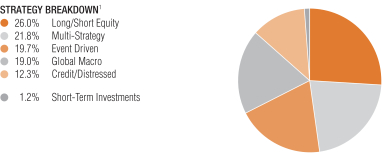
| 1 | All data are as of September 30, 2019. The Fund’s portfolio strategy breakdown is based on the Investment Manager’s internal classification and is expressed as a percentage of total investment exposure, including exposure from derivatives (see “Consolidated Portfolio of Investments” section of the report for additional details). |
| | |
| |
| abfunds.com | | AB MULTI-MANAGER ALTERNATIVE FUND | 7 |
CONSOLIDATED PORTFOLIO OF INVESTMENTS
September 30, 2019 (unaudited)
| | | | | | | | | | | | | | |
Underlying
Portfolios | | Shares | | | Fair Value ($) | | | % Net Assets | | | Liquidity* |
|
Long/Short Equity | | | | | | | | | | | | | | |
Coatue Offshore Fund, Ltd. | | | 144,099 | | | $ | 34,990,943 | | | | 3.6 | % | | Quarterly |
Darsana Overseas Fund Ltd. | | | 16,260 | | | | 26,690,416 | | | | 2.7 | | | Quarterly |
Janchor PartnersPan-Asian Fund | | | 264,641 | | | | 33,268,294 | | | | 3.4 | | | Triennially |
Luminus Energy Partners QP, LP | | | 9,708 | | | | 34,293,920 | | | | 3.5 | | | Quarterly |
Nokota Capital Offshore Fund, Ltd. | | | 2,589 | | | | 3,383,995 | | | | 0.3 | | | Quarterly |
Nokota LC, LLC | | | 1,249 | | | | 1,094,282 | | | | 0.1 | | | At Fund’s Discretion |
PFM Healthcare Offshore Fund, Ltd. | | | 30,698 | | | | 27,452,136 | | | | 2.8 | | | Quarterly |
Schonfeld Fundamental Equity Offshore Fund Ltd. | | | 30,000 | | | | 32,284,981 | | | | 3.3 | | | Quarterly |
The Children’s Investment Fund | | | 161,000 | | | | 24,890,600 | | | | 2.5 | | | Triennially |
Think Investments Offshore Ltd. | | | 22,314 | | | | 37,162,982 | | | | 3.8 | | | Semi-Annual |
Two Creeks Capital Offshore Fund, Ltd. | | | 7,839 | | | | 10,801,081 | | | | 1.1 | | | Quarterly |
Tybourne Equity (Offshore) Fund | | | 9,956 | | | | 14,561,368 | | | | 1.5 | | | Quarterly |
| | | | | | | | | | | | | | |
Total | | | | | | | 280,874,998 | | | | 28.6 | | | |
| | | | | | | | | | | | | | |
| | | | |
Global Macro | | | | | | | | | | | | | | |
Alphadyne International Partners, LP | | | 62,221 | | | | 74,844,924 | | | | 7.6 | | | Quarterly |
Autonomy Global Macro Fund LP | | | 210,557 | | | | 28,987,138 | | | | 2.9 | | | Monthly |
Brevan Howard AS Macro Fund Limited | | | 280,000 | | | | 28,823,200 | | | | 2.9 | | | Monthly |
Rokos Global Macro Fund LP | | | 401,922 | | | | 24,285,836 | | | | 2.5 | | | Monthly |
Tudor BVI Global Fund LP | | | 15,205 | | | | 48,796,925 | | | | 5.0 | | | Quarterly |
| | | | | | | | | | | | | | |
Total | | | | | | | 205,738,023 | | | | 20.9 | | | |
| | | | | | | | | | | | | | |
| | |
| |
| 8 | AB MULTI-MANAGER ALTERNATIVE FUND | | abfunds.com |
CONSOLIDATED PORTFOLIO OF INVESTMENTS(continued)
| | | | | | | | | | | | | | |
Underlying
Portfolios | | Shares | | | Fair Value ($) | | | % Net Assets | | | Liquidity* |
|
| | | | |
Multi-Strategy | | | | | | | | | | | | | | |
Elliott International Limited | | | 33,772 | | | $ | 49,372,900 | | | | 5.0 | % | | Quarterly |
LMR Fund Limited | | | 400,000 | | | | 40,559,311 | | | | 4.2 | | | Quarterly |
Myriad Opportunities US Fund Limited | | | 27,081 | | | | 29,435,819 | | | | 3.0 | | | Quarterly |
Renaissance Institutional Diversified Global Equities Onshore Fund LP | | | 39,844 | | | | 42,299,480 | | | | 4.3 | | | Monthly |
Schonfeld Strategic Partners Offshore Fund Ltd. | | | 20,000 | | | | 21,583,617 | | | | 2.2 | | | Monthly |
| | | | | | | | | | | | | | |
Total | | | | | | | 183,251,127 | | | | 18.7 | | | |
| | | | | | | | | | | | | | |
| | | | |
Event Driven | | | | | | | | | | | | | | |
Empyrean Capital Overseas Fund, Ltd. | | | 34,984 | | | | 38,955,404 | | | | 4.0 | | | Quarterly |
Governors Lane Offshore Fund Ltd. | | | 13,774 | | | | 15,385,000 | | | | 1.6 | | | Quarterly |
Indaba Capital Partners (Cayman), LP | | | 31,293 | | | | 38,326,797 | | | | 3.9 | | | Quarterly |
Lion Point International, Ltd. | | | 29,565 | | | | 32,492,820 | | | | 3.3 | | | Semi-Annual |
Luxor Capital Partners Liquidating SPV, LLC | | | 2,317 | | | | 2,852,047 | | | | 0.3 | | | At Fund’s Discretion |
Senator Global Opportunity Fund LP | | | 24,746 | | | | 29,706,211 | | | | 3.0 | | | Quarterly |
Starboard Leaders Fund LP | | | 1,199 | | | | 1,115,769 | | | | 0.1 | | | At Fund’s Discretion |
| | | | | | | | | | | | | | |
Total | | | | | | | 158,834,048 | | | | 16.2 | | | |
| | | | | | | | | | | | | | |
| | | | |
Credit/Distressed | | | | | | | | | | | | | | |
Caius Capital International Fund | | | 30,036 | | | | 35,130,125 | | | | 3.6 | | | Quarterly |
King Street Capital, Ltd. | | | 248,296 | | | | 25,148,953 | | | | 2.5 | | | Quarterly |
Silver Point Capital Offshore Fund, Ltd. | | | 2,685 | | | | 40,581,291 | | | | 4.1 | | | Annual |
| | |
| |
| abfunds.com | | AB MULTI-MANAGER ALTERNATIVE FUND | 9 |
CONSOLIDATED PORTFOLIO OF INVESTMENTS(continued)
| | | | | | | | | | | | | | |
Underlying
Portfolios | | Shares | | | Fair Value ($) | | | % Net Assets | | | Liquidity* |
|
Waterfall Eden Fund, LP | | | 30,000 | | | $ | 31,044,644 | | | | 3.2 | % | | Quarterly |
Wingspan Overseas Fund, Ltd. | | | 953 | | | | 628,568 | | | | 0.1 | | | Fund in Liquidation |
| | | | | | | | | | | | | | |
Total | | | | | | | 132,533,581 | | | | 13.5 | | | |
| | | | | | | | | | | | | | |
| | | | |
Total Underlying Portfolios
(cost $846,712,821) | | | | | | | 961,231,777 | | | | 97.9 | | | |
| | | | | | | | | | | | | | |
| | | | | | | | | | | | | | |
Short-Term Investments | | | | | | | | | | | | | | |
Investment Companies | | | | | | | | | | | | | | |
AB Fixed Income Shares, Inc. – Government Money Market Portfolio – Class AB, 1.89%(a)(b)(c)
(cost $12,500,000) | | | 12,500,000 | | | | 12,500,000 | | | | 1.2 | | | |
| | | | | | | | | | | | | | |
| | | | |
Total Investments
(cost $859,212,821) | | | | | | | 973,731,777 | | | | 99.1 | | | |
Other assets less liabilities | | | | | | | 8,348,460 | | | | 0.9 | | | |
| | | | | | | | | | | | | | |
| | | | |
Net Assets | | | | | | $ | 982,080,237 | | | | 100.0 | % | | |
| | | | | | | | | | | | | | |
TOTAL RETURN SWAPS (see Note C)
| | | | | | | | | | | | | | | | | | | | |
Counterparty &
Referenced Obligation | | Rate Paid/
Received | | Payment
Frequency | | Current Notional
(000) | | | Maturity
Date | | | Unrealized
Appreciation/
(Depreciation) | |
Receive Total Return on Reference Obligation | |
Barclays Bank PLC | | | | | | | | | | | | | | | | | | | | |
Barclays Commodity Hedging Insights 2 | | 0.02% | | Quarterly | | | USD | | | | 3,694 | | | | 10/15/19 | | | $ | (22,691 | ) |
Barclays Commodity Strategy 1673 Index | | 0.30% | | Quarterly | | | USD | | | | 2,495 | | | | 10/15/19 | | | | (42,225 | ) |
| | |
| |
| 10 | AB MULTI-MANAGER ALTERNATIVE FUND | | abfunds.com |
CONSOLIDATED PORTFOLIO OF INVESTMENTS(continued)
| | | | | | | | | | | | | | | | | | | | | | |
Counterparty &
Referenced Obligation | | Rate Paid/
Received | | Payment
Frequency | | | Current Notional
(000) | | | Maturity
Date | | | Unrealized
Appreciation/
(Depreciation) | |
Credit Suisse International | | | | | | | | | | | | | | | | | | | | | | |
Credit Suisse Managed Futures Liquid Index (Net Excess) | | 0.35% | | | Quarterly | | | | USD | | | | 7,537 | | | | 3/16/20 | | | $ | (1,905 | ) |
Goldman Sachs & Co. | | | | | | | | | | | | | | | | | | | | | | |
Advanced Disposal Services | | 1 Month LIBOR Plus 0.35% | | | Maturity | | | | USD | | | | 2,127 | | | | 1/15/21 | | | | (6,997 | ) |
Inmarsat PLC | | 1 Month LIBOR Plus 0.35% | | | Maturity | | | | GBP | | | | 1,778 | | | | 1/05/21 | | | | 192,085 | |
Mellanox Technologies Ltd. | | 1 Month LIBOR Plus 0.35% | | | Maturity | | | | USD | | | | 891 | | | | 1/05/21 | | | | (60,239 | ) |
Spark Therapeutics Inc. | | 1 Month LIBOR Plus 0.35% | | | Maturity | | | | USD | | | | 1,093 | | | | 1/05/21 | | | | (173,921 | ) |
SunTrust Banks Inc. | | 1 Month LIBOR Plus 0.35% | | | Maturity | | | | USD | | | | 2,224 | | | | 1/05/21 | | | | 127,048 | |
Versum Materials Inc. | | 1 Month LIBOR Plus 0.35% | | | Maturity | | | | USD | | | | 2,153 | | | | 1/05/21 | | | | 495,105 | |
Wabco Holdings Inc. | | 1 Month LIBOR Plus 0.35% | | | Maturity | | | | USD | | | | 2,155 | | | | 1/05/21 | | | | 1,979 | |
Wellcare Health Plans Inc. | | 1 Month LIBOR Plus 0.35% | | | Maturity | | | | USD | | | | 2,007 | | | | 1/05/21 | | | | (84,636 | ) |
Goldman Sachs International | | | | | | | | | | | | | | | | | | | | | | |
Cross Asset Trend Basket Series 2 10% Volatility Target ER Strategy(1) | | 0.00% | | | Quarterly | | | | USD | | | | 12,340 | | | | 5/15/20 | | | | (17,588 | ) |
GSISM49E(2) | | 0.00% | | | Quarterly | | | | USD | | | | 18,309 | | | | 5/15/20 | | | | – 0 | – |
RP Equity Carry Series 1 Excess Return Strategy | | 0.00% | | | Quarterly | | | | USD | | | | 1,761 | | | | 10/15/19 | | | | (12,728 | ) |
JPMorgan Chase Bank, NA | | | | | | | | | | | | | | | | | | | | | | |
AVON Products Inc. | | 1 Month LIBOR Plus 0.40% | | | Maturity | | | | USD | | | | 1,788 | | | | 8/14/20 | | | | 170,502 | |
Carbon Black Inc. CFD | | 1 Month LIBOR Plus 0.40% | | | Maturity | | | | USD | | | | 42 | | | | 8/14/20 | | | | 128 | |
Carrizo Oil & Gas Inc. | | 1 Month LIBOR Plus 0.40% | | | Maturity | | | | USD | | | | 1,753 | | | | 8/14/20 | | | | (308,544 | ) |
Cobham PLC CFD | | 1 Month LIBOR Plus 0.40% | | | Maturity | | | | USD | | | | 717 | | | | 8/14/20 | | | | (12,196 | ) |
Gannett Co. Inc. | | 1 Month LIBOR Plus 0.40% | | | Maturity | | | | USD | | | | 1,857 | | | | 8/14/20 | | | | 121,960 | |
Grandvision NV | | 1 Month EURIBOR Plus 0.40% | | | Maturity | | | | EUR | | | | 1,124 | | | | 8/14/20 | | | | 6,220 | |
Greene King PLC | | 1 Month LIBOR Plus 0.40% | | | Maturity | | | | GBP | | | | 1,522 | | | | 8/14/20 | | | | 10,283 | |
J.P.Morgan RCI – 24 Alpha | | 0.50% | | | Quarterly | | | | USD | | | | 2,266 | | | | 10/15/19 | | | | (9,349 | ) |
| | |
| |
| abfunds.com | | AB MULTI-MANAGER ALTERNATIVE FUND | 11 |
CONSOLIDATED PORTFOLIO OF INVESTMENTS(continued)
| | | | | | | | | | | | | | | | | | | | | | |
Counterparty &
Referenced Obligation | | Rate Paid/
Received | | Payment
Frequency | | | Current Notional
(000) | | | Maturity
Date | | | Unrealized
Appreciation/
(Depreciation) | |
JMABRCX4 | | 0.72% | | | Quarterly | | | | USD | | | | 3,073 | | | | 3/16/20 | | | $ | 5,516 | |
JMABRG34(3) | | 0.60% | | | Quarterly | | | | USD | | | | 2,182 | | | | 10/15/19 | | | | (31,158 | ) |
JPABGERP(4) | | 0.43% | | | Maturity | | | | USD | | | | 12,525 | | | | 12/16/19 | | | | (3,132 | ) |
JPABSAA1(5) | | 0.00% | | | Maturity | | | | USD | | | | 22,483 | | | | 8/14/20 | | | | 1,661 | |
JPMorgan Alternative FX Mean Reversion JPM 2RM1 Index | | 0.00% | | | Maturity | | | | USD | | | | 3,967 | | | | 8/14/20 | | | | (2,002 | ) |
Kinder Morgan Canada Ltd. | | 1 Month CDOR Plus 0.40% | | | Maturity | | | | CAD | | | | 1,594 | | | | 8/14/20 | | | | 13,137 | |
Old Line Bancshares | | 1 Month LIBOR Plus 0.40% | | | Maturity | | | | USD | | | | 1,517 | | | | 8/14/20 | | | | 67,417 | |
Transat A.T. Inc. | | 1 Month CDOR Plus 0.40% | | | Maturity | | | | CAD | | | | 1,234 | | | | 8/14/20 | | | | (127,086 | ) |
United Community Financial CFD | | 1 Month LIBOR Plus 0.40% | | | Maturity | | | | USD | | | | 128 | | | | 8/14/20 | | | | 5,134 | |
United Financial Bancorp Inc. | | 1 Month LIBOR Plus 0.40% | | | Maturity | | | | USD | | | | 790 | | | | 8/14/20 | | | | (31,906 | ) |
Viacom Inc. – Class B | | 1 Month LIBOR Plus 0.40% | | | Maturity | | | | USD | | | | 1,975 | | | | 8/14/20 | | | | (137,991 | ) |
Morgan Stanley Capital Services, LLC | | | | | | | | | | | | | | | | | | | | | | |
Acacia Communications Inc. | | 1 Month LIBOR Plus 0.30% | | | Maturity | | | | USD | | | | 2,157 | | | | 12/11/19 | | | | 3,921 | |
Allergan PLC | | 1 Month LIBOR Plus 0.30% | | | Maturity | | | | USD | | | | 2,152 | | | | 12/11/19 | | | | 44,115 | |
Altran Technologies SA | | 1 Month EURIBOR Plus 0.50% | | | Maturity | | | | EUR | | | | 299 | | | | 12/11/19 | | | | 9,888 | |
C&J Enery Services Inc. | | 1 Month LIBOR Plus 0.30% | | | Maturity | | | | USD | | | | 1,184 | | | | 12/11/19 | | | | (271,497 | ) |
Caesars Entertainment Corp. | | 1 Month LIBOR Plus 0.30% | | | Maturity | | | | USD | | | | 2,143 | | | | 12/11/19 | | | | (2,556 | ) |
Celgene Corp. | | 1 Month LIBOR Plus 0.30% | | | Maturity | | | | USD | | | | 2,219 | | | | 12/11/19 | | | | 273,991 | |
Connecticut Water Service Inc. | | 1 Month LIBOR Plus 0.30% | | | Maturity | | | | USD | | | | 354 | | | | 12/11/19 | | | | (2,145 | ) |
Cypress Semiconductor Corp. | | 1 Month LIBOR Plus 0.30% | | | Maturity | | | | USD | | | | 2,220 | | | | 12/11/19 | | | | 102,682 | |
LegacyTexas Financial Group | | 1 Month LIBOR Plus 0.30% | | | Maturity | | | | USD | | | | 1,924 | | | | 12/11/19 | | | | 160,197 | |
Medidata Solutions Inc. | | 1 Month LIBOR Plus 0.30% | | | Maturity | | | | USD | | | | 2,133 | | | | 12/11/19 | | | | (8,707 | ) |
Mellanox Technologies Ltd. | | 1 Month LIBOR Plus 0.30% | | | Maturity | | | | USD | | | | 1,040 | | | | 12/11/19 | | | | (106,802 | ) |
Milacron Holdings Corp. | | 1 Month LIBOR Plus 0.30% | | | Maturity | | | | USD | | | | 1,733 | | | | 12/11/19 | | | | (46,871 | ) |
Morgan Stanley Volume B3U Index | | 0.50% | | | Quarterly | | | | USD | | | | 4,091 | | | | 10/15/19 | | | | 5,863 | |
MSABFLSU | | 0.65% | | | Maturity | | | | USD | | | | 4,377 | | | | 12/16/19 | | | | (1,815 | ) |
MSCBRMF4(6) | | 0.60% | | | Quarterly | | | | USD | | | | 4,299 | | | | 10/15/19 | | | | 195,283 | |
MSUSABDM(7) | | 0.00% | | | Quarterly | | | | USD | | | | 33,403 | | | | 12/11/19 | | | | (1,732 | ) |
MSUSABEM(8) | | 0.00% | | | Quarterly | | | | USD | | | | 37,061 | | | | 12/11/19 | | | | (9,804 | ) |
| | |
| |
| 12 | AB MULTI-MANAGER ALTERNATIVE FUND | | abfunds.com |
CONSOLIDATED PORTFOLIO OF INVESTMENTS(continued)
| | | | | | | | | | | | | | | | | | | | | | |
Counterparty &
Referenced Obligation | | Rate Paid/
Received | | Payment
Frequency | | | Current Notional
(000) | | | Maturity
Date | | | Unrealized
Appreciation/
(Depreciation) | |
MSUSABEQ | | 0.00% | | | Quarterly | | | | USD | | | | 10,521 | | | | 12/11/19 | | | $ | (903 | ) |
OMNOVA Solutions Inc. | | 1 Month LIBOR Plus 0.30% | | | Maturity | | | | USD | | | | 1,327 | | | | 12/11/19 | | | | 5,849 | |
Pacific Biosciences of California Inc. | | 1 Month LIBOR Plus 0.30% | | | Maturity | | | | USD | | | | 901 | | | | 12/11/19 | | | | (395,111 | ) |
Rudolph Technologies Inc. | | 1 Month LIBOR Plus 0.30% | | | Maturity | | | | USD | | | | 943 | | | | 12/11/19 | | | | (56,238 | ) |
Sprint Nextel Corp. | | 1 Month LIBOR Plus 0.30% | | | Maturity | | | | USD | | | | 1,216 | | | | 12/11/19 | | | | (68,862 | ) |
Valley National Bancorp | | 1 Month LIBOR Plus 0.30% | | | Maturity | | | | USD | | | | 1,145 | | | | 12/11/19 | | | | 24,059 | |
|
Pay Total Return on Reference Obligation | |
Goldman Sachs & Co. | | | | | | | | | | | | | | | | | | | | | | |
BB&T Corp. | | 1 Month LIBOR Plus 0.35% | | | Maturity | | | | USD | | | | 2,234 | | | | 1/05/21 | | | | (117,139 | ) |
Centene Corp. | | 1 Month LIBOR Minus 0.30% | | | Maturity | | | | USD | | | | 1,132 | | | | 1/05/21 | | | | 248,898 | |
JPMorgan Chase Bank, NA | | | | | | | | | | | | | | | | | | | | | | |
Callon Petroleum Corp. | | 1 Month LIBOR Minus 0.29% | | | Maturity | | | | USD | | | | 1,817 | | | | 8/14/20 | | | | 311,296 | |
CBS Corp. – Class B | | 1 Month LIBOR Plus 0.40% | | | Maturity | | | | USD | | | | 1,978 | | | | 8/14/20 | | | | 144,053 | |
First Defiance FINL Corp. CFD | | 1 Month LIBOR Minus 0.29% | | | Maturity | | | | USD | | | | 128 | | | | 8/14/20 | | | | (3,841 | ) |
Natura Cosmeticos SA | | 1 Month LIBOR Minus 6.50% | | | Maturity | | | | USD | | | | 1,982 | | | | 8/14/20 | | | | (158,118 | ) |
New Media Investment Group | | 1 Month LIBOR Minus 0.30% | | | Maturity | | | | USD | | | | 827 | | | | 8/14/20 | | | | (93,730 | ) |
People’s United Financial Inc. | | 1 Month LIBOR Minus 0.30% | | | Maturity | | | | USD | | | | 790 | | | | 8/14/20 | | | | 37,289 | |
PPL Corporation | | 1 Month CDOR Minus 0.48% | | | Maturity | | | | CAD | | | | 1,610 | | | | 8/14/20 | | | | (8,985 | ) |
Wesbanco Inc. | | 1 Month LIBOR Minus 0.30% | | | Maturity | | | | USD | | | | 1,533 | | | | 8/14/20 | | | | (76,945 | ) |
Morgan Stanley Capital Services, LLC | | | | | | | | | | | | | | | | | | | | | | |
Abbvie Inc. | | 1 Month LIBOR Minus 2.36% | | | Maturity | | | | USD | | | | 838 | | | | 12/11/19 | | | | (93,272 | ) |
Bristol-Myers Squibb Co. | | 1 Month LIBOR Minus 0.30% | | | Maturity | | | | USD | | | | 1,133 | | | | 12/11/19 | | | | (91,517 | ) |
Eldorado Resorts Inc. | | 1 Month LIBOR Plus 0.30% | | | Maturity | | | | USD | | | | 659 | | | | 12/11/19 | | | | 105,701 | |
Hillenbrand Inc. | | 1 Month LIBOR Plus 0.30% | | | Maturity | | | | USD | | | | 518 | | | | 12/11/19 | | | | 74,780 | |
Keane Group Inc. | | 1 Month LIBOR Minus 2.36% | | | Maturity | | | | USD | | | | 1,080 | | | | 12/11/19 | | | | 270,953 | |
Nanometrics Inc. | | 1 Month LIBOR Minus 2.36% | | | Maturity | | | | USD | | | | 939 | | | | 12/11/19 | | | | 63,123 | |
Oritani Financial Corp. | | 1 Month LIBOR Minus 2.36% | | | Maturity | | | | USD | | | | 1,165 | | | | 12/11/19 | | | | (14,182 | ) |
| | |
| |
| abfunds.com | | AB MULTI-MANAGER ALTERNATIVE FUND | 13 |
CONSOLIDATED PORTFOLIO OF INVESTMENTS(continued)
| | | | | | | | | | | | | | | | | | | | | | |
Counterparty &
Referenced Obligation | | Rate Paid/
Received | | Payment
Frequency | | | Current Notional
(000) | | | Maturity
Date | | | Unrealized
Appreciation/
(Depreciation) | |
Prosperity Bancshares Inc. | | 1 Month LIBOR Minus 2.36% | | | Maturity | | | | USD | | | | 1,648 | | | | 12/11/19 | | | $ | (166,159 | ) |
T-Mobile US Inc. | | 1 Month LIBOR Minus 0.22% | | | Maturity | | | | USD | | | | 1,592 | | | | 12/11/19 | | | | (182,788 | ) |
| | | | | | | | | | | | | | | | | | | | | | |
| | | | | | | | | | | | | | | | | | | | $ | 234,103 | |
| | | | | | | | | | | | | | | | | | | | | | |
| (a) | Affiliated investments. |
| (b) | The rate shown represents the7-day yield as of period end. |
| (c) | To obtain a copy of the fund’s shareholder report, please go to the Securities and Exchange Commission’s website at www.sec.gov, or call AB at (800)227-4618. |
| * | The investment strategies and liquidity of the Underlying Portfolios in which the Fund invests are as follows: |
Long/Short Equity Underlying Portfolios seek to buy securities with the expectation that they will increase in value (called “going long”) and sell securities short in the expectation that they will decrease in value (“going short”). Underlying Portfolios within this strategy are generally subject to 45 – 120 day redemption notice periods. The majority of the Underlying Portfolios are no longer subject to initial lockups. Certain Underlying Portfolios have lock up periods of up to three years.
Event Driven Underlying Portfolios seek to take advantage of information inefficiencies resulting from a particular corporate event, such as a takeover, liquidation, bankruptcy, tender offer, buyback, spin(off, exchange offer, merger or other type of corporate reorganization. Underlying Portfolios within this strategy are generally subject to 60 – 90 day redemption notice periods. The majority of the Underlying Portfolios are no longer subject to initial lockups. Certain Underlying Portfolios have lock up periods of up to one year.
Global Macro Underlying Portfolios aim to identify and exploit imbalances in global economics and asset classes, typically utilizing macroeconomic and technical market factors rather than“bottom-up” individual security analysis. The Underlying Portfolios within this strategy are subject to 30 – 90 day redemption notice periods. Certain Underlying Portfolios have lock up periods of up to one year.
Credit/Distressed Underlying Portfolios invest in a variety of fixed income and other securities, including bonds (corporate and government), bank debt, asset-backed financial instruments, mortgage-backed securities and mezzanine and distressed securities, as well as securities of distressed companies and high yield securities. Underlying Portfolios within this strategy are generally subject to 60 – 90 day redemption notice periods. The majority of the Underlying Portfollios are no longer subject to initial lockups. Certain Underlying Portfolios may have lock up periods of two years.
Multi-Strategy Underlying Portfolios invest across multiple strategies, including long/short equity, event driven, global macro, credit/distressed and emerging markets, in which the investment process is predicated on movements in underlying economic variables and the impact these variables have on equity, fixed income, currency, commodity and other financial instrument markets. Underlying Portfolios within this strategy are generally subject to 45 – 90 day redemption notice periods. Certain Underlying Portfolios may have lock up periods of up to two years.
The Fund may also make direct investments in securities (other than securities of Underlying Portfolios), options, futures, options on futures, swap contracts, or other derivative or financial instruments.
Currency Abbreviations:
AUD – Australian Dollar
BRL – Brazilian Real
CAD – Canadian Dollar
CHF – Swiss Franc
CLP – Chilean Peso
CNH – Chinese Yuan Renminbi (Offshore)
CNY – Chinese Yuan Renminbi
COP – Colombian Peso
| | |
| |
| 14 | AB MULTI-MANAGER ALTERNATIVE FUND | | abfunds.com |
CONSOLIDATED PORTFOLIO OF INVESTMENTS(continued)
CZK – Czech Koruna
EUR – Euro
GBP – Great British Pound
HUF – Hungarian Forint
IDR – Indonesian Rupiah
ILS – Israeli Shekel
INR – Indian Rupee
JPY – Japanese Yen
KRW – South Korean Won
MXN – Mexican Peso
NOK – Norwegian Krone
NZD – New Zealand Dollar
PEN – Peruvian Sol
PHP – Philippine Peso
PLN – Polish Zloty
RUB – Russian Ruble
SEK – Swedish Krona
SGD – Singapore Dollar
THB – Thailand Baht
TRY – Turkish Lira
TWD – New Taiwan Dollar
USD – United States Dollar
ZAR – South African Rand
Glossary:
BOBL – Bundesobligationen
CBT – Chicago Board of Trade
EAFE – Europe, Australia, and Far East
EURIBOR – Euro Interbank Offered Rate
KC HRW – Kansas City Hard Red Winter
LIBOR – London Interbank Offered Rates
LME – London Metal Exchange
MSCI – Morgan Stanley Capital International
OAT – Obligations Assimables du Trésor
OSE – Osaka Securities Exchange
RBOB – Reformulated Gasoline Blend-Stock for Oxygen Blending (Unleaded Gas)
REIT – Real Estate Investment Trust
SPI – Share Price Index
TSX – Toronto Stock Exchange
ULSD –Ultra-Low Sulfur Diesel
WTI – West Texas Intermediate
| (1) | The following table represents the 50 largest (long/(short)) basket holdings underlying the total return swap with Cross Asset Trend Basket Series 2 10% Volatility Target ER Strategy as of September 30, 2019. |
| | | | | | | | |
| Security Description | | Current Notional | | | Percent of
Basket’s Value | |
3 Month EURIBOR 12/20 | | $ | 6,017,701 | | | | 48.7 | % |
3 Month EURIBOR 3/21 | | | 6,017,222 | | | | 48.7 | % |
3 Month EURIBOR 6/20 | | | 6,015,967 | | | | 48.7 | % |
3 Month EURIBOR 3/20 | | | 6,014,770 | | | | 48.7 | % |
90 Day Sterling Futures 3/21 | | | 5,949,620 | | | | 48.1 | % |
90 Day Sterling Futures 12/20 | | | 5,948,290 | | | | 48.1 | % |
90 Day Sterling Futures 6/20 | | | 5,947,206 | | | | 48.1 | % |
90 Day Sterling Futures 3/20 | | | 5,945,759 | | | | 48.1 | % |
90 Day Euro Futures 6/20 | | | 5,914,380 | | | | 47.9 | % |
90 Day Euro Futures 3/20 | | | 5,907,887 | | | | 47.8 | % |
90 Day Euro Futures 3/21 | | | 5,710,936 | | | | 46.2 | % |
| | |
| |
| abfunds.com | | AB MULTI-MANAGER ALTERNATIVE FUND | 15 |
CONSOLIDATED PORTFOLIO OF INVESTMENTS(continued)
| | | | | | | | |
| Security Description | | Current Notional | | | Percent of
Basket’s Value | |
90 Day Euro Futures 12/20 | | $ | 5,705,399 | | | | 46.2 | % |
U.S. 2 Yr Note (CBT) 12/19 | | | 5,064,182 | | | | 41.0 | % |
Euro-SCHATZ Futures 12/19 | | | 3,674,224 | | | | 29.7 | % |
Euro-BOBL Futures 12/19 | | | 3,173,020 | | | | 25.7 | % |
Japan 10 Yr Bond (OSE) 12/19 | | | 2,400,371 | | | | 19.4 | % |
U.S. 5 Yr Note (CBT) 12/19 | | | 2,312,993 | | | | 18.7 | % |
USD/SGD 10/19 | | | (1,731,073 | ) | | | (14.0 | )% |
Euro-Bund Futures 12/19 | | | 1,588,982 | | | | 12.9 | % |
U.S. 10 Yr Note (CBT) 12/19 | | | 1,516,663 | | | | 12.3 | % |
Long Gilt Futures 12/19 | | | 1,288,124 | | | | 10.4 | % |
USD/TWD 10/31/19 | | | (1,279,489 | ) | | | (10.4 | )% |
USD/EUR 10/31/19 | | | (1,017,902 | ) | | | (8.2 | )% |
USD/PHP 10/31/19 | | | 1,016,065 | | | | 8.2 | % |
USD/IDR 10/31/19 | | | 978,433 | | | | 7.9 | % |
USD/ILS 10/31/19 | | | 898,956 | | | | 7.3 | % |
USD/KRW 10/31/19 | | | (865,537 | ) | | | (7.0 | )% |
U.S. Long Bond (CBT) 12/19 | | | 862,943 | | | | 7.0 | % |
USD/CZK 10/31/19 | | | (851,643 | ) | | | (6.9 | )% |
USD/CNH 10/31/19 | | | (827,905 | ) | | | (6.7 | )% |
USD/AUD 10/31/19 | | | (763,427 | ) | | | (6.2 | )% |
USD/NZD 10/31/19 | | | (721,014 | ) | | | (5.8 | )% |
USD/CHF 10/31/19 | | | (721,014 | ) | | | (5.8 | )% |
USD/PLN 10/31/19 | | | (709,702 | ) | | | (5.7 | )% |
USD/CAD 10/31/19 | | | (678,601 | ) | | | (5.5 | )% |
USD/HUF 10/31/19 | | | (662,389 | ) | | | (5.4 | )% |
USD/SEK 10/31/19 | | | (636,189 | ) | | | (5.1 | )% |
USD/GBP 10/31/19 | | | (636,189 | ) | | | (5.1 | )% |
USD/NOK 10/31/19 | | | (636,189 | ) | | | (5.1 | )% |
USD/CLP 10/31/19 | | | (567,762 | ) | | | (4.6 | )% |
LME PRI Aluminum Futures 11/19 | | | (510,387 | ) | | | (4.1 | )% |
Gold 100 Oz. Futures 12/19 | | | 479,948 | | | | 3.9 | % |
S&P/TSX 60 Index Futures 12/19 | | | 464,100 | | | | 3.8 | % |
USD/BRL 10/31/19 | | | (425,821 | ) | | | (3.4 | )% |
USD/MXN 10/31/19 | | | 425,821 | | | | 3.4 | % |
LME Copper Futures 11/19 | | | (410,000 | ) | | | (3.3 | )% |
Swiss Market Index Futures 12/19 | | | 383,517 | | | | 3.1 | % |
SPI 200 Futures 10/19 | | | 382,390 | | | | 3.1 | % |
USD/RUB 10/31/19 | | | 378,508 | | | | 3.1 | % |
USD/TRY 10/31/19 | | | 378,508 | | | | 3.1 | % |
Other Long | | | 5,432,378 | | | | 44.0 | % |
Other (Short) | | | (4,194,665 | ) | | | (33.9 | )% |
| (2) | The following table represents the 50 largest (long/(short)) equity basket holdings underlying the total return swap with GSISM49E as of September 30, 2019. |
| | | | | | | | | | | | |
| Security Description | | Shares | | | Current Notional | | | Percent of
Basket’s Value | |
Apple, Inc. | | | (3,513 | ) | | $ | (786,813 | ) | | | (4.3 | )% |
Microsoft Corp. | | | (4,510 | ) | | | (627,053 | ) | | | (3.4 | )% |
Amazon.com, Inc. | | | (323 | ) | | | (559,938 | ) | | | (3.1 | )% |
Alphabet, Inc. | | | (220 | ) | | | (268,287 | ) | | | (1.5 | )% |
Nestle SA | | | (2,291 | ) | | | (248,743 | ) | | | (1.4 | )% |
Proctor & Gamble Co. (The) | | | (1,907 | ) | | | (237,194 | ) | | | (1.3 | )% |
Visa, Inc. | | | (1,341 | ) | | | (230,653 | ) | | | (1.3 | )% |
| | |
| |
| 16 | AB MULTI-MANAGER ALTERNATIVE FUND | | abfunds.com |
CONSOLIDATED PORTFOLIO OF INVESTMENTS(continued)
| | | | | | | | | | | | |
| Security Description | | Shares | | | Current Notional | | | Percent of
Basket’s Value | |
Berkshire Hathaway, Inc. | | | (991 | ) | | $ | (206,179 | ) | | | (1.1 | )% |
Facebook, Inc. | | | (1,145 | ) | | | (203,931 | ) | | | (1.1 | )% |
JPMorgan Chase & Co. | | | (1,705 | ) | | | (200,624 | ) | | | (1.1 | )% |
Home Depot, Inc. (The) | | | (835 | ) | | | (193,819 | ) | | | (1.1 | )% |
MasterCard, Inc. | | | (691 | ) | | | (187,735 | ) | | | (1.0 | )% |
Walt Disney Co. (The) | | | (1,393 | ) | | | (181,513 | ) | | | (1.0 | )% |
Exxon Mobil Corp. | | | (2,571 | ) | | | (181,513 | ) | | | (1.0 | )% |
Bank of America Corp. | | | (5,838 | ) | | | (170,300 | ) | | | (0.9 | )% |
Intel Corp. | | | (3,279 | ) | | | (168,951 | ) | | | (0.9 | )% |
Coca-Cola Co. (The) | | | (3,086 | ) | | | (168,010 | ) | | | (0.9 | )% |
Cypress Semiconductor Corp. | | | 7,073 | | | | 165,072 | | | | 0.9 | % |
Wells Fargo & Co. | | | (3,204 | ) | | | (161,626 | ) | | | (0.9 | )% |
United Health Group | | | (740 | ) | | | (160,874 | ) | | | (0.9 | )% |
Cisco Systems, Inc. | | | (3,150 | ) | | | (155,660 | ) | | | (0.9 | )% |
HollyFrontier Corp. | | | 2,891 | | | | 155,079 | | | | 0.8 | % |
Boeing Co. (The) | | | (403 | ) | | | (153,351 | ) | | | (0.8 | )% |
United Airlines Holdings, Inc. | | | 1,692 | | | | 149,561 | | | | 0.8 | % |
Jacobs Engineering Group, Inc. | | | 1,630 | | | | 149,161 | | | | 0.8 | % |
Universal Health Services, Inc. | | | 1,000 | | | | 148,679 | | | | 0.8 | % |
Alphabet, Inc. | | | (122 | ) | | | (148,423 | ) | | | (0.8 | )% |
Akami Technologies, Inc. | | | 1,622 | | | | 148,226 | | | | 0.8 | % |
Hormel Foods Corp. | | | 3,383 | | | | 147,949 | | | | 0.8 | % |
Bridgestone Corp. | | | 3,816 | | | | 147,746 | | | | 0.8 | % |
Ameren Corp. | | | 1,830 | | | | 146,514 | | | | 0.8 | % |
Seagate Technology PLC | | | 2,708 | | | | 145,677 | | | | 0.8 | % |
ANSYS, Inc. | | | 656 | | | | 145,263 | | | | 0.8 | % |
Discovery, Inc. | | | 5,890 | | | | 145,009 | | | | 0.8 | % |
AGNC Investment Corp. | | | 8,947 | | | | 143,963 | | | | 0.8 | % |
Delta Air Lines, Inc. | | | 2,496 | | | | 143,765 | | | | 0.8 | % |
Swiss Life Holding AG | | | 300 | | | | 143,319 | | | | 0.8 | % |
Nucor Corp. | | | 2,780 | | | | 141,541 | | | | 0.8 | % |
Cincinnati Financial Corp. | | | 1,212 | | | | 141,378 | | | | 0.8 | % |
Leidos Holdings, Inc. | | | 1,643 | | | | 141,079 | | | | 0.8 | % |
Telstra Corp. Ltd. | | | 59,592 | | | | 141,074 | | | | 0.8 | % |
Chipotle Mexican Grill, Inc. | | | 166 | | | | 139,494 | | | | 0.8 | % |
Ally Financial, Inc. | | | 4,206 | | | | 139,475 | | | | 0.8 | % |
EPAM Systems, Inc. | | | 763 | | | | 139,077 | | | | 0.8 | % |
Booz Allen Hamilton Holding Co. | | | 1,939 | | | | 137,709 | | | | 0.8 | % |
Bio-Rad Laboratories, Inc. | | | 414 | | | | 137,639 | | | | 0.8 | % |
Fifth Third Bancorp | | | 5,026 | | | | 137,602 | | | | 0.8 | % |
Cummins, Inc. | | | 844 | | | | 137,257 | | | | 0.7 | % |
T-Mobile US, Inc. | | | 1,741 | | | | 137,126 | | | | 0.7 | % |
Synchrony Financial | | | 4,013 | | | | 136,803 | | | | 0.7 | % |
Other Long | | | 1,269,835 | | | | 24,274,573 | | | | 132.6 | % |
Other (Short) | | | (531,252 | ) | | | (18,454,817 | ) | | | (100.8 | )% |
| (3) | The following table represents the (long/(short)) basket holdings underlying the total return swap with JMABRG34 as of September 30, 2019. |
| | | | | | | | |
| Security Description | | Current Notional | | | Percent of
Basket’s Value | |
Gasoline RBOB Futures 11/19 | | $ | (659,249 | ) | | | (30.3 | )% |
NY Harbor ULSD Futures 11/19 | | | (642,487 | ) | | | (29.5 | )% |
Gasoline RBOB Futures 3/20 | | | 641,362 | | | | 29.5 | % |
| | |
| |
| abfunds.com | | AB MULTI-MANAGER ALTERNATIVE FUND | 17 |
CONSOLIDATED PORTFOLIO OF INVESTMENTS(continued)
| | | | | | | | |
| Security Description | | Current Notional | | | Percent of
Basket’s Value | |
NY Harbor ULSD Futures 3/20 | | $ | 630,083 | | | | 29.0 | % |
Brent Crude Futures 1/20 | | | (629,647 | ) | | | (28.9 | )% |
Brent Crude Futures 5/20 | | | 625,557 | | | | 28.8 | % |
WTI Crude Futures 3/20 | | | 615,993 | | | | 28.3 | % |
WTI Crude Futures 11/19 | | | (615,094 | ) | | | (28.3 | )% |
Natural Gas Futures 3/20 | | | 605,522 | | | | 27.8 | % |
Natural Gas Futures 11/19 | | | (594,473 | ) | | | (27.3 | )% |
LME Zinc Futures 11/19 | | | (572,514 | ) | | | (26.3 | )% |
LME Zinc Futures 3/20 | | | 565,726 | | | | 26.0 | % |
Corn Futures 12/19 | | | (563,407 | ) | | | (25.9 | )% |
Corn Futures 3/20 | | | 559,568 | | | | 25.7 | % |
Coffee ‘C’ Futures 12/19 | | | (554,923 | ) | | | (25.5 | )% |
Coffee ‘C’ Futures 3/20 | | | 554,382 | | | | 25.5 | % |
Soybean Futures 11/19 | | | (546,835 | ) | | | (25.1 | )% |
Soybean Futures 3/20 | | | 544,700 | | | | 25.0 | % |
Copper Futures 3/20 | | | 535,048 | | | | 24.6 | % |
Copper Futures 12/19 | | | (534,672 | ) | | | (24.6 | )% |
LME PRI Aluminum Futures 11/19 | | | (515,591 | ) | | | (23.7 | )% |
LME PRI Aluminum Futures 3/20 | | | 514,923 | | | | 23.7 | % |
LME Nickel Futures 11/19 | | | (498,282 | ) | | | (22.9 | )% |
LME Nickel Futures 3/20 | | | 496,536 | | | | 22.8 | % |
Live Cattle Futures 4/20 | | | 370,382 | | | | 17.0 | % |
Live Cattle Futures 12/19 | | | (367,401 | ) | | | (16.9 | )% |
Lean Hogs Futures 4/20 | | | 275,502 | | | | 12.7 | % |
Lean Hogs Futures 12/19 | | | (274,399 | ) | | | (12.6 | )% |
Wheat Futures (CBT) 12/19 | | | (191,013 | ) | | | (8.8 | )% |
Wheat Futures (CBT) 3/20 | | | 190,981 | | | | 8.8 | % |
KC HRW Wheat Futures 12/19 | | | (189,704 | ) | | | (8.7 | )% |
KC HRW Wheat Futures 3/20 | | | 187,778 | | | | 8.6 | % |
Cotton No.2 Futures 12/19 | | | (183,703 | ) | | | (8.4 | )% |
Cotton No.2 Futures 3/20 | | | 183,655 | | | | 8.4 | % |
Soybean Meal Futures 3/20 | | | 179,121 | | | | 8.2 | % |
Soybean Meal Futures 12/19 | | | (178,833 | ) | | | (8.2 | )% |
Soybean Oil Futures 3/20 | | | 174,852 | | | | 8.0 | % |
Soybean Oil Futures 12/19 | | | (174,674 | ) | | | (8.0 | )% |
Sugar #11 (World) Futures 3/20 | | | 3,671 | | | | 0.2 | % |
| (4) | The following table represents the 50 largest (long/(short)) equity basket holdings underlying the total return swap with JPABGERP as of September 30, 2019. |
| | | | | | | | | | | | |
| Security Description | | Shares | | | Current Notional | | | Percent of
Basket’s Value | |
JPMorgan Cash Index | | | (10,963 | ) | | $ | (3,301,741 | ) | | | (26.4 | )% |
iA Financial Corp., Inc. | | | 3,436 | | | | 156,460 | | | | 1.2 | % |
Western Union Co. (The) | | | 6,509 | | | | 150,822 | | | | 1.2 | % |
Hongkong Land Holdings Ltd. | | | (26,747 | ) | | | (150,317 | ) | | | (1.2 | )% |
Jardine Matheson Holdings Ltd. | | | (2,753 | ) | | | (147,283 | ) | | | (1.2 | )% |
Jardine Strategic Holdings Ltd. | | | (4,869 | ) | | | (145,489 | ) | | | (1.2 | )% |
Dairy Farm International Holdings | | | (22,008 | ) | | | (138,649 | ) | | | (1.1 | )% |
Concho Resources, Inc. | | | (1,851 | ) | | | (125,667 | ) | | | (1.0 | )% |
Teijin Ltd. | | | 6,138 | | | | 117,903 | | | | 0.9 | % |
Atco Ltd./Canada | | | 3,215 | | | | 117,726 | | | | 0.9 | % |
Uber Technologies, Inc. | | | (3,784 | ) | | | (115,284 | ) | | | (0.9 | )% |
| | |
| |
| 18 | AB MULTI-MANAGER ALTERNATIVE FUND | | abfunds.com |
CONSOLIDATED PORTFOLIO OF INVESTMENTS(continued)
| | | | | | | | | | | | |
| Security Description | | Shares | | | Current Notional | | | Percent of
Basket’s Value | |
Direct Line Insurance Group PLC | | | 311 | | | $ | 114,992 | | | | 0.9 | % |
Air Canada | | | 3,518 | | | | 114,807 | | | | 0.9 | % |
EssilorLuxottica SA | | | (791 | ) | | | (114,017 | ) | | | (0.9 | )% |
Juniper Networks, Inc. | | | 4,588 | | | | 113,561 | | | | 0.9 | % |
Fortescue Metals Group Ltd. | | | 19,048 | | | | 113,052 | | | | 0.9 | % |
Lida Group Holdings Co. Ltd. | | | 6,916 | | | | 112,491 | | | | 0.9 | % |
Compass Group PLC | | | 44 | | | | 112,331 | | | | 0.9 | % |
Koninklijke Philips NV | | | 2,416 | | | | 111,950 | | | | 0.9 | % |
Mitsubishi Materials Corp. | | | 4,044 | | | | 109,081 | | | | 0.9 | % |
H&R Block, Inc. | | | 4,612 | | | | 108,934 | | | | 0.9 | % |
Heineken Holding NV | | | 1,078 | | | | 107,313 | | | | 0.9 | % |
Tesla, Inc. | | | (426 | ) | | | (102,635 | ) | | | (0.8 | )% |
Intesa Sanpaolo SpA | | | (42,287 | ) | | | (100,293 | ) | | | (0.8 | )% |
Ryanair Holdings PLC | | | (8,711 | ) | | | (100,233 | ) | | | (0.8 | )% |
Sumitomo Chemical Co. Ltd. | | | 22,239 | | | | 99,801 | | | | 0.8 | % |
International Flavors & Fragrances | | | (794 | ) | | | (97,412 | ) | | | (0.8 | )% |
Kraft Heinz Co. (The) | | | (3,443 | ) | | | (96,184 | ) | | | (0.8 | )% |
Brookfield Property REIT, Inc. | | | 4,688 | | | | 95,581 | | | | 0.8 | % |
Worldline SA/France | | | (1,507 | ) | | | (95,101 | ) | | | (0.8 | )% |
Suzuki Motor Corp. | | | (2,195 | ) | | | (93,163 | ) | | | (0.7 | )% |
Continental Resources, Inc./OK | | | (3,018 | ) | | | (92,939 | ) | | | (0.7 | )% |
Aker BP ASA | | | (3,468 | ) | | | (92,905 | ) | | | (0.7 | )% |
Lundin Petroleum AB | | | (3,092 | ) | | | (92,871 | ) | | | (0.7 | )% |
Cimarex Energy Co. | | | (1,921 | ) | | | (92,071 | ) | | | (0.7 | )% |
Nektar Therapeutics | | | (4,923 | ) | | | (89,673 | ) | | | (0.7 | )% |
Murata Manufacturing Co. Ltd. | | | (1,859 | ) | | | (89,186 | ) | | | (0.7 | )% |
Delivery Hero SE | | | (2,000 | ) | | | (88,872 | ) | | | (0.7 | )% |
Varian Medical Systems, Inc. | | | 731 | | | | 87,003 | | | | 0.7 | % |
Fresnillo PLC | | | (100 | ) | | | (84,171 | ) | | | (0.7 | )% |
Credit Saison Co. Ltd. | | | 6,171 | | | | 82,734 | | | | 0.7 | % |
Keikyu Corp. | | | 4,262 | | | | 82,616 | | | | 0.7 | % |
NIKE, Inc. | | | (875 | ) | | | (82,169 | ) | | | (0.7 | )% |
Eurazeo SE | | | 1,100 | | | | 81,840 | | | | 0.7 | % |
Atmos Energy Corp. | | | (714 | ) | | | (81,296 | ) | | | (0.6 | )% |
Kikkoman Corp. | | | (1,696 | ) | | | (80,988 | ) | | | (0.6 | )% |
HollyFrontier Corp. | | | 1,509 | | | | 80,928 | | | | 0.6 | % |
Trend Micro, Inc./Japan | | | 1,694 | | | | 80,586 | | | | 0.6 | % |
Dollar Tree, Inc. | | | (705 | ) | | | (80,460 | ) | | | (0.6 | )% |
Acom Co. Ltd. | | | (20,503 | ) | | | (80,436 | ) | | | (0.6 | )% |
Other Long | | | 1,872,103 | | | | 22,332,683 | | | | 178.3 | % |
Other (Short) | | | (923,969 | ) | | | (18,408,487 | ) | | | (146.9 | )% |
| (5) | The following table represents the 50 largest (long/(short)) equity basket holdings underlying the total return swap in JPABSAA1 as of September 30, 2019. |
| | | | | | | | | | | | |
| Security Description | | Shares | | | Current Notional | | | Percent of
Basket’s Value | |
S&P 500 Total Return | | | (1,736 | ) | | $ | (10,431,010 | ) | | | (46.4 | )% |
MSCI Daily TR Gross EAFE | | | (803 | ) | | | (6,415,412 | ) | | | (28.5 | )% |
JPMorgan Cash Index | | | (17,966 | ) | | | (5,410,853 | ) | | | (24.1 | )% |
MSCI Daily TR Gross Canada | | | (84 | ) | | | (644,789 | ) | | | (2.9 | )% |
Roche Holding AG | | | 1,977 | | | | 575,965 | | | | 2.6 | % |
Fidelity National Financial, Inc. | | | 11,598 | | | | 515,058 | | | | 2.3 | % |
| | |
| |
| abfunds.com | | AB MULTI-MANAGER ALTERNATIVE FUND | 19 |
CONSOLIDATED PORTFOLIO OF INVESTMENTS(continued)
| | | | | | | | | | | | |
| Security Description | | Shares | | | Current Notional | | | Percent of
Basket’s Value | |
Microsoft Corp. | | | 3,685 | | | $ | 512,279 | | | | 2.3 | % |
Nice Ltd. | | | 438,913 | | | | 438,913 | | | | 2.0 | % |
Apple, Inc. | | | 1,916 | | | | 429,217 | | | | 1.9 | % |
Merck & Co., Inc. | | | 5,087 | | | | 428,183 | | | | 1.9 | % |
Walmart, Inc. | | | 3,502 | | | | 415,630 | | | | 1.8 | % |
Dollar General Corp. | | | 2,522 | | | | 400,838 | | | | 1.8 | % |
Royal Dutch Shell PLC | | | 134 | | | | 395,502 | | | | 1.8 | % |
Automatic Data Processing, Inc. | | | 2,367 | | | | 382,046 | | | | 1.7 | % |
Ross Stores, Inc. | | | 3,412 | | | | 374,790 | | | | 1.7 | % |
Bank LeumiLe-Israel BM | | | 372,272 | | | | 372,272 | | | | 1.7 | % |
RELX PLC | | | 15,501 | | | | 368,907 | | | | 1.6 | % |
Oracle Corp. | | | 6,662 | | | | 366,592 | | | | 1.6 | % |
Oracle Corp. Japan | | | 4,196 | | | | 363,810 | | | | 1.6 | % |
Eli Lilly & Co. | | | 3,166 | | | | 354,071 | | | | 1.6 | % |
Paychex, Inc. | | | 4,138 | | | | 342,541 | | | | 1.5 | % |
Check Point Software Technology | | | 3,034 | | | | 332,268 | | | | 1.5 | % |
Nippon Building Fund, Inc. | | | 42 | | | | 322,624 | | | | 1.4 | % |
Comcast Corp. | | | 7,114 | | | | 320,692 | | | | 1.4 | % |
Toronto-Dominion Bank (The) | | | 5,343 | | | | 311,758 | | | | 1.4 | % |
adidas AG | | | 994 | | | | 309,588 | | | | 1.4 | % |
Procter & Gamble Co. (The) | | | 2,358 | | | | 293,326 | | | | 1.3 | % |
Salmar ASA | | | 6,622 | | | | 290,814 | | | | 1.3 | % |
AutoZone, Inc. | | | 260 | | | | 281,706 | | | | 1.3 | % |
Royal Bank of Canada | | | 3,468 | | | | 281,524 | | | | 1.3 | % |
Home Depot, Inc. (The) | | | 1,211 | | | | 281,085 | | | | 1.3 | % |
United Health Group, Inc. | | | 1,293 | | | | 281,037 | | | | 1.3 | % |
Enel SpA | | | 37,175 | | | | 277,656 | | | | 1.2 | % |
Wolters Kluwer NV | | | 3,791 | | | | 276,800 | | | | 1.2 | % |
Booz Allen Hamilton Holding Co. | | | 3,859 | | | | 274,033 | | | | 1.2 | % |
Aristocrat Leisure Ltd. | | | 13,193 | | | | 272,286 | | | | 1.2 | % |
Qantas Airways Ltd. | | | 63,644 | | | | 269,998 | | | | 1.2 | % |
L3Harris Technologies, Inc. | | | 1,263 | | | | 263,486 | | | | 1.2 | % |
Pfizer, Inc. | | | 7,126 | | | | 256,031 | | | | 1.1 | % |
Compass Group PLC | | | 99 | | | | 255,088 | | | | 1.1 | % |
CME Group, Inc. | | | 1,194 | | | | 252,414 | | | | 1.1 | % |
Nippon Telegraph & Telephone Co. | | | 5,276 | | | | 251,693 | | | | 1.1 | % |
Novo Nordisk A/S | | | 4,816 | | | | 247,619 | | | | 1.1 | % |
Bristol-Myers Squibb Co. | | | 4,871 | | | | 246,995 | | | | 1.1 | % |
HKT Trust & HKT Ltd. | | | 154,976 | | | | 245,925 | | | | 1.1 | % |
McDonald’s Corp. | | | 1,132 | | | | 243,061 | | | | 1.1 | % |
Visa, Inc. | | | 1,413 | | | | 243,032 | | | | 1.1 | % |
PNC Financial Services Group, Inc. | | | 1,733 | | | | 242,938 | | | | 1.1 | % |
Unilever PLC | | | 40 | | | | 239,089 | | | | 1.1 | % |
Merlin Properties Socimi SA | | | 17,097 | | | | 238,771 | | | | 1.1 | % |
Other Long | | | 125,228 | | | | 7,875,129 | | | | 35.0 | % |
| (6) | The following table represents the (long/(short)) basket holdings underlying the total return swap with MSCBRMF4 as of September 30, 2019. |
| | | | | | | | |
| Security Description | | Current Notional | | | Percent of
Basket’s Value | |
Euro-BTP Futures 12/19 | | $ | 5,080,086 | | | | 118.2 | % |
Euro-Schatz Futures 12/19 | | | 4,226,669 | | | | 98.3 | % |
| | |
| |
| 20 | AB MULTI-MANAGER ALTERNATIVE FUND | | abfunds.com |
CONSOLIDATED PORTFOLIO OF INVESTMENTS(continued)
| | | | | | | | |
| Security Description | | Current Notional | | | Percent of
Basket’s Value | |
U.S. 2 Yr Note (CBT) 12/19 | | $ | (3,678,935 | ) | | | (85.6 | )% |
Long Gilt Futures 12/19 | | | (2,811,761 | ) | | | (65.4 | )% |
U.S. 10 Yr Note (CBT) 12/19 | | | 2,513,817 | | | | 58.5 | % |
Euro-Bund Futures 12/19 | | | (2,304,870 | ) | | | (53.6 | )% |
Canada 10 Yr Bond Futures 12/19 | | | (2,258,867 | ) | | | (52.5 | )% |
Australia 10 Yr Bond Futures 12/19 | | | 1,422,218 | | | | 33.1 | % |
Euro-BOBL Futures 12/19 | | | 1,403,301 | | | | 32.6 | % |
Euro-OAT Futures 12/19 | | | (477,655 | ) | | | (11.1 | )% |
U.S. Long Bond (CBT) Futures 12/19 | | | 427,353 | | | | 9.9 | % |
U.S. 5 Yr Note (CBT) Futures 12/19 | | | 403,277 | | | | 9.4 | % |
Euro BUXL 30 Yr Bond Futures 12/19 | | | (104,474 | ) | | | (2.4 | )% |
| (7) | The following table represents the (long/(short)) basket holdings underlying the total return swap with MSUSABDM as of September 30, 2019. |
| | | | | | | | |
| Security Description | | Current Notional | | | Percent of
Basket’s Value | |
CAD/USD 10/31/19 | | $ | 3,881,661 | | | | 11.6 | % |
NZD/USD 10/31/19 | | | 3,504,185 | | | | 10.5 | % |
SEK/USD 10/31/19 | | | (2,281,562 | ) | | | (6.8 | )% |
CHF/USD 10/31/19 | | | (1,660,229 | ) | | | (5.0 | )% |
AUD/USD 10/31/19 | | | 1,499,885 | | | | 4.5 | % |
EUR/USD 10/31/19 | | | (744,932 | ) | | | (2.2 | )% |
JPY/USD 10/31/19 | | | 307,326 | | | | 0.9 | % |
NOK/USD 10/31/19 | | | (250,538 | ) | | | (0.8 | )% |
| (8) | The following table represents the (long/(short)) basket holdings underlying the total return swap with MSUSABEM as of September 30, 2019. |
| | | | | | | | |
| Security Description | | Current Notional | | | Percent of
Basket’s Value | |
CLP/USD 10/30/19 | | $ | (3,859,091 | ) | | | (10.4 | )% |
HUF/USD 10/31/19 | | | (3,117,671 | ) | | | (8.4 | )% |
RUB/USD 10/31/19 | | | 2,498,585 | | | | 6.7 | % |
MXN/USD 10/31/19 | | | 2,491,171 | | | | 6.7 | % |
BRL/USD 10/31/19 | | | (1,972,177 | ) | | | (5.3 | )% |
TWD/USD 10/31/19 | | | 1,875,793 | | | | 5.1 | % |
PHP/USD 10/31/19 | | | (1,868,378 | ) | | | (5.0 | )% |
PEN/USD 10/30/19 | | | (1,720,094 | ) | | | (4.6 | )% |
IDR/USD 10/31/19 | | | 1,653,367 | | | | 4.5 | % |
INR/USD 10/31/19 | | | 1,519,911 | | | | 4.1 | % |
CZK/USD 10/31/19 | | | 1,301,192 | | | | 3.5 | % |
KRW/USD 10/31/19 | | | (1,297,485 | ) | | | (3.5 | )% |
TRY/USD 10/31/19 | | | 1,075,059 | | | | 2.9 | % |
ZAR/USD 10/31/19 | | | 1,023,160 | | | | 2.8 | % |
CNY/USD 10/31/19 | | | 915,654 | | | | 2.5 | % |
THB/USD 10/31/19 | | | (344,760 | ) | | | (0.9 | )% |
COP/USD 10/31/19 | | | (211,305 | ) | | | (0.6 | )% |
PLN/USD 10/31/19 | | | 3,707 | | | | 0.0 | % |
See notes to consolidated financial statements.
| | |
| |
| abfunds.com | | AB MULTI-MANAGER ALTERNATIVE FUND | 21 |
CONSOLIDATED STATEMENT OF ASSETS & LIABILITIES
September 30, 2019(unaudited)
| | | | |
| Assets | |
Investments in unaffiliated Underlying Portfolios, at value (cost $846,712,821) | | $ | 961,231,777 | |
Investments in affiliated Underlying Portfolios, at value (cost $12,500,000) | | | 12,500,000 | |
Cash | | | 36,313,902 | |
Cash collateral due from broker | | | 14,560,000 | |
Foreign currencies, at value (cost $22,043) | | | 21,735 | |
Unrealized appreciation on total return swaps | | | 3,300,116 | |
Receivable for investments sold | | | 705,236 | |
Receivable for terminated total return swaps | | | 578,837 | |
Affiliated dividends receivable | | | 17,482 | |
| | | | |
Total assets | | | 1,029,229,085 | |
| | | | |
| Liabilities | |
Payable for shares of beneficial interest redeemed | | | 36,919,610 | |
Subscriptions received in advance | | | 4,530,000 | |
Unrealized depreciation on total return swaps | | | 3,066,013 | |
Payable for terminated total return swaps | | | 1,174,500 | |
Management fee payable | | | 852,792 | |
Administrative fee payable | | | 180,650 | |
Transfer Agent fee payable | | | 30,073 | |
Trustees’ fees payable | | | 1,800 | |
Accrued expenses | | | 393,410 | |
| | | | |
Total liabilities | | | 47,148,848 | |
| | | | |
Net Assets | | $ | 982,080,237 | |
| | | | |
| Composition of Net Assets | |
Shares of beneficial interest, at par | | $ | 86,564 | |
Additionalpaid-in capital | | | 940,539,382 | |
Distributable earnings | | | 41,454,291 | |
| | | | |
Net Assets | | $ | 982,080,237 | |
| | | | |
Shares of beneficial interest outstanding—unlimited shares authorized, with par value of $.001 (based on 86,564,054 shares outstanding) | | $ | 11.35 | |
| | | | |
See notes to consolidated financial statements.
| | |
| |
| 22 | AB MULTI-MANAGER ALTERNATIVE FUND | | abfunds.com |
CONSOLIDATED STATEMENT OF OPERATIONS
Six Months Ended September 30, 2019(unaudited)
| | | | | | | | |
| Investment Income | | | | | | | | |
Dividends—Affiliated issuers | | | | | | $ | 341,850 | |
| | | | | | | | |
| Expenses | | | | | | | | |
Management fee (see Note B) | | $ | 5,193,801 | | | | | |
Custodian | | | 237,784 | | | | | |
Administrative | | | 169,137 | | | | | |
Credit facility fees | | | 127,083 | | | | | |
Transfer agency | | | 109,876 | | | | | |
Audit and tax | | | 59,212 | | | | | |
Legal | | | 55,394 | | | | | |
Registration fees | | | 42,070 | | | | | |
Trustees’ fees | | | 17,186 | | | | | |
Printing | | | 16,078 | | | | | |
Amortization of offering expenses | | | 14,033 | | | | | |
Miscellaneous | | | 48,577 | | | | | |
| | | | | | | | |
Total expenses before interest expense | | | 6,090,231 | | | | | |
Interest expense | | | 11,441 | | | | | |
| | | | | | | | |
Total expenses | | | 6,101,672 | | | | | |
Less: expenses waived and reimbursed by the Investment Manager (see Note B) | | | (14,762 | ) | | | | |
| | | | | | | | |
Net expenses | | | | | | | 6,086,910 | |
| | | | | | | | |
Net investment loss | | | | | | | (5,745,060 | ) |
| | | | | | | | |
| Realized and Unrealized Gain (Loss) on Investment and Foreign Currency Transactions | | | | | | | | |
Net realized gain (loss) on: | | | | | | | | |
Investment transactions | | | | | | | 30,646,057 | |
Forward currency exchange contracts | | | | | | | 74,724 | |
Swaps | | | | | | | (675,402 | ) |
Foreign currency transactions | | | | | | | 10,158 | |
Net change in unrealized appreciation/depreciation of: | | | | | | | | |
Investments | | | | | | | (15,694,925 | ) |
Forward currency exchange contracts | | | | | | | 29,748 | |
Swaps | | | | | | | (739,358 | ) |
Foreign currency denominated assets and liabilities | | | | | | | 21,466 | |
| | | | | | | | |
Net gain on investment and foreign currency transactions | | | | | | | 13,672,468 | |
| | | | | | | | |
Contributions from Affiliates (see Note B) | | | | | | | 1,871 | |
| | | | | | | | |
Net Increase in Net Assets from Operations | | | | | | $ | 7,929,279 | |
| | | | | | | | |
See notes to consolidated financial statements.
| | |
| |
| abfunds.com | | AB MULTI-MANAGER ALTERNATIVE FUND | 23 |
CONSOLIDATED STATEMENT OF CHANGES IN NET ASSETS
| | | | | | | | |
| | | Six Months Ended
September 30, 2019
(unaudited) | | | Year Ended
March 31,
2019 | |
| Increase (Decrease) in Net Assets from Operations | | | | | | | | |
Net investment loss | | $ | (5,745,060 | ) | | $ | (13,006,387 | ) |
Net realized gain on investment transactions | | | 30,055,537 | | | | 59,748,305 | |
Net change in unrealized appreciation/depreciation of investments and foreign currency denominated assets and liabilities | | | (16,383,069 | ) | | | (40,578,976 | ) |
Contributions from Affiliates (see Note B) | | | 1,871 | | | | – 0 | – |
| | | | | | | | |
Net increase in net assets from operations | | | 7,929,279 | | | | 6,162,942 | |
| Transactions in Shares of Beneficial Interest | | | | | | | | |
Net decrease (see Note D) | | | (65,434,918 | ) | | | (121,636,894 | ) |
| | | | | | | | |
Total decrease | | | (57,505,639 | ) | | | (115,473,952 | ) |
| Net Assets | | | | | | | | |
Beginning of period | | | 1,039,585,876 | | | | 1,155,059,828 | |
| | | | | | | | |
End of period | | $ | 982,080,237 | | | $ | 1,039,585,876 | |
| | | | | | | | |
See notes to consolidated financial statements.
| | |
| |
| 24 | AB MULTI-MANAGER ALTERNATIVE FUND | | abfunds.com |
CONSOLIDATED STATEMENT OF CASH FLOWS
For the six months ended September 30, 2019(unaudited)
| | | | | | | | |
| Cash flows from operating activities | | | | | | | | |
Net increase in net assets from operations | | | | | | $ | 7,929,279 | |
| Reconciliation of net increase in net assets from operations to net increase in cash from operating activities | | | | | | | | |
Purchases of Underlying Portfolio shares | | $ | (100,393,238 | ) | | | | |
Purchases of short-term investments | | | (150,398,640 | ) | | | | |
Sales of Underlying Portfolio shares | | | 161,672,846 | | | | | |
Proceeds from disposition of short-term investments | | | 153,465,270 | | | | | |
Net realized gain on investment transactions and foreign currency transactions | | | (30,055,537 | ) | | | | |
Net realized gain on forward currency exchange contracts | | | 74,724 | | | | | |
Net change in unrealized appreciation/depreciation of investments and foreign currency denominated assets and liabilities | | | 16,383,069 | | | | | |
Decrease in deferred offering cost | | | 14,033 | | | | | |
Decrease in receivable for investments sold | | | 5,934,902 | | | | | |
Decrease in affiliated dividends receivable | | | 11,505 | | | | | |
Increase in cash collateral due from broker | | | (1,880,000 | ) | | | | |
Decrease in investments in Underlying Portfolios received in advance | | | (120,000 | ) | | | | |
Decrease in management fee payable | | | (35,400 | ) | | | | |
Decrease in administrative fee payable | | | (4,704 | ) | | | | |
Increase in Transfer Agent fee payable | | | 5,285 | | | | | |
Increase in Trustees’ fee payable | | | 1,800 | | | | | |
Decrease in accrued expenses | | | (71,739 | ) | | | | |
Proceeds on swaps, net | | | 1,231,889 | | | | | |
| | | | | | | | |
Total adjustments | | | | | | | 55,836,065 | |
| | | | | | | | |
Net cash provided by (used in) operating activities | | | | | | | 63,765,344 | |
| Cash flows from financing activities | | | | | | | | |
Subscriptions, including change in subscriptions received in advance | | | 24,203,039 | | | | | |
Redemptions, net of payable for shares of beneficial interest redeemed | | | (91,777,276 | ) | | | | |
| | | | | | | | |
Net cash provided by (used in) financing activities | | | | | | | (67,574,237 | ) |
Effect of exchange rate on cash | | | | | | | 31,624 | |
| | | | | | | | |
Net decrease in cash | | | | | | | (3,777,269 | ) |
Cash at beginning of period | | | | | | | 40,112,906 | |
| | | | | | | | |
Cash at end of period | | | | | | $ | 36,335,637 | |
| | | | | | | | |
| Supplemental disclosure of cash flow information | | | | | | | | |
Interest expense paid during the period | | $ | 11,441 | | | | | |
See notes to consolidated financial statements.
| | |
| |
| abfunds.com | | AB MULTI-MANAGER ALTERNATIVE FUND | 25 |
NOTES TO CONSOLIDATED FINANCIAL STATEMENTS
September 30, 2019(unaudited)
NOTE A
Significant Accounting Policies
AB Multi-Manager Alternative Fund (the “Fund”) is a statutory trust formed under the laws of the State of Delaware and registered under the Investment Company Act of 1940 as a diversified,closed-end management investment company. The Fund commenced operations on October 1, 2012. The Fund’s investment objective is to seek long-term capital appreciation. There can be no assurance that the Fund will achieve its investment objective, be able to structure its investments as anticipated, or that its returns will be positive over any period of time. The Fund is not intended as a complete investment program for investors. The Fund seeks to achieve its investment objective primarily by allocating its assets among investments in private investment vehicles (“Underlying Portfolios”), commonly referred to as hedge funds, that are managed by unaffiliated asset managers that employ a broad range of investment strategies. As a secondary strategy, the Fund will generally also make direct investments in securities and other financial instruments. As part of the Fund’s investment strategy, the Fund seeks exposure to commodities and commodities-related instruments and derivatives primarily through investments in AB Multi-Manager Alternative Fund (Cayman), Ltd., a wholly-owned subsidiary of the Fund organized under the laws of the Cayman Islands (the “Subsidiary”). The Subsidiary commenced operations on September 21, 2018. The Fund is the sole shareholder of the Subsidiary and it is intended that the Fund will remain the sole shareholder and will continue to control the Subsidiary. Under the Articles of Association of the Subsidiary, shares issued by the Subsidiary confer upon a shareholder the right to receive notice of, to attend and to vote at general meetings of the Subsidiary and shall confer upon the shareholder rights in awinding-up or repayment of capital and the right to participate in the profits or assets of the Subsidiary. As of September 30, 2019, net assets of the Fund were $982,080,237, of which $10,869,527, or approximately 1%, represented the Fund’s ownership of all issued shares and voting rights of the Subsidiary. This report presents the consolidated financial statements of the Fund and the Subsidiary. All intercompany transactions and balances have been eliminated in consolidation. The consolidated financial statements have been prepared in conformity with U.S. generally accepted accounting principles (“U.S. GAAP”) which require management to make certain estimates and assumptions that affect the reported amounts of assets and liabilities in the consolidated financial statements and amounts of income and expenses during the reporting period. Actual results could differ from those estimates. The Fund is an investment company under U.S. GAAP and follows the accounting and reporting guidance applicable to investment companies. The following is a summary of significant accounting policies followed by the Fund.
| | |
| |
| 26 | AB MULTI-MANAGER ALTERNATIVE FUND | | abfunds.com |
NOTES TO CONSOLIDATED FINANCIAL STATEMENTS(continued)
1. Valuation of Investments
The Fund’s Board of Trustees (the “Board”) has approved pricing and valuation policies and procedures pursuant to which the Fund’s investments in Underlying Portfolios are valued at fair value (the “Valuation Procedures”). Among other matters, the Valuation Procedures set forth the Fund’s valuation policies and the mechanisms and processes to be employed on a monthly basis to implement such policies. In accordance with the Valuation Procedures, fair value of an Underlying Portfolio as of each valuation time ordinarily is the value determined as of suchmonth-end for each Underlying Portfolio in accordance with the Underlying Portfolio’s valuation policies and reported at the time of the Fund’s valuation.
On a monthly basis, the Fund generally uses the net asset value (“NAV”), provided by the Underlying Portfolios, to determine the fair value of all Underlying Portfolios which (a) do not have readily determinable fair values and (b) either have the attributes of an investment company or prepare their financial statements consistent with measurement principles of an investment company. As a general matter, the fair value of the Fund’s interest in an Underlying Portfolio represents the amount that the Fund could reasonably expect to receive from an Underlying Portfolio if its interest were redeemed at the time of valuation. In the unlikely event that an Underlying Portfolio does not report amonth-end value to the Fund on a timely basis, the Fund would determine the fair value of such Underlying Portfolio based on the most recent value reported by the Underlying Portfolio, and any other relevant information available at the time the Fund values its portfolio. In making a fair value determination, the Fund will consider all appropriate information reasonably available to it at the time and that AllianceBernstein L.P. (the “Investment Manager”) believes to be reliable. The Fund may consider factors such as, among others: (i) the price at which recent subscriptions for or redemptions of the Underlying Portfolio’s interests were effected; (ii) information provided to the Fund by the manager of an Underlying Portfolio, or the failure to provide such information as the Underlying Portfolio manager agreed to provide in the Underlying Portfolio’s offering materials or other agreements with the Fund; (iii) relevant news and other sources; and (iv) market events. In addition, when an Underlying Portfolio imposes extraordinary restrictions on redemptions, or when there have been no recent subscriptions for Underlying Portfolio interests, the Fund may determine that it is appropriate to apply a discount to the NAV reported by the Underlying Portfolio. The use of different factors and estimation methodologies could have a significant effect on the estimated fair value and could be material to the consolidated financial statements.
Swaps and other derivatives are valued daily, primarily using independent pricing services, independent pricing models using market inputs, as well as third party broker-dealers or counterparties. Open end mutual funds are valued at the closing net asset value per share, while exchange traded funds are valued at the closing market price per share.
| | |
| |
| abfunds.com | | AB MULTI-MANAGER ALTERNATIVE FUND | 27 |
NOTES TO CONSOLIDATED FINANCIAL STATEMENTS(continued)
The Investment Manager has established a Valuation Committee (the “Committee”) made up of representatives of portfolio management, fund accounting, compliance and risk management which operates under the Valuation Procedures and is responsible for overseeing the pricing and valuation of all securities held in the Fund. The Committee’s responsibilities include: 1) fair value determinations (and oversight of any third parties to whom any responsibility for fair value determinations is delegated), and 2) regular monitoring of the Valuation Procedures and modification or enhancement of the Valuation Procedures (or recommendation of the modification of the Valuation Procedures) as the Committee believes appropriate. Prior to investing in any Underlying Portfolio, and periodically thereafter, the Investment Manager will conduct a due diligence review of the valuation methodology utilized by the Underlying Portfolio. In addition, there are several processes outside of the pricing process that are used to monitor valuation issues including: 1) performance and performance attribution reports are monitored for anomalous impacts based upon benchmark performance, and 2) portfolio managers review all portfolios for performance and analytics.
U.S. GAAP establishes a framework for measuring fair value, and a three-level hierarchy for fair value measurements based upon the transparency of inputs to the valuation of an asset or liability. Inputs may be observable or unobservable and refer broadly to the assumptions that market participants would use in pricing the asset or liability. Observable inputs reflect the assumptions market participants would use in pricing the asset or liability based on market data obtained from sources independent of the Fund. Unobservable inputs reflect the Fund’s own assumptions about the assumptions that market participants would use in pricing the asset or liability based on the best information available in the circumstances. Each investment is assigned a level based upon the observability of the inputs which are significant to the overall valuation. The three-tier hierarchy of inputs is summarized below.
| | • | | Level 1—quoted prices in active markets for identical investments |
| | • | | Level 2—other significant observable inputs |
| | • | | Level 3—significant unobservable inputs |
The fair value of debt instruments, such as bonds, andover-the-counter derivatives is generally based on market price quotations, recently executed market transactions (where observable) or industry recognized modeling techniques and are generally classified as Level 2. Pricing vendor inputs to Level 2 valuations may include quoted prices for similar investments in active markets, interest rate curves, coupon rates, currency rates, yield curves, option adjusted spreads, default rates, credit spreads and other unique security features in order to estimate the relevant cash flows which is then discounted to calculate fair values. If these inputs are unobservable and significant to the fair value, these investments will be classified as Level 3.
| | |
| |
| 28 | AB MULTI-MANAGER ALTERNATIVE FUND | | abfunds.com |
NOTES TO CONSOLIDATED FINANCIAL STATEMENTS(continued)
Valuations reflected in this report are as of the report date. As a result, changes in valuation due to market events and/or issuer related events after the report date and prior to issuance of the report are not reflected herein.
The following table summarizes the valuation of the Fund’s investments by the above fair value hierarchy levels as of September 30, 2019:
| | | | | | | | | | | | | | | | |
Investments in
Securities: | | Level 1 | | | Level 2 | | | Level 3 | | | Total | |
Assets: | | | | | | | | | | | | | | | | |
Short-Term Investments: | | | | | | | | | | | | | | | | |
Investment Companies | | $ | 12,500,000 | | | $ | – 0 | – | | $ | – 0 | – | | $ | 12,500,000 | |
Investments valued at NAV* | | | | | | | | | | | | | | | 961,231,777 | |
| | | | | | | | | | | | | | | | |
Total Investments in Securities | | | 12,500,000 | | | | – 0 | – | | | – 0 | – | | | 973,731,777 | |
Other Financial Instruments(a): | | | | | | | | | | | | | | | | |
Assets: | | | | | | | | | | | | | | | | |
Total Return Swaps | | | – 0 | – | | | 3,300,116 | | | | – 0 | – | | | 3,300,116 | |
Liabilities: | | | | | | | | | | | | | | | | |
Total Return Swaps | | | – 0 | – | | | (3,066,013 | ) | | | – 0 | – | | | (3,066,013 | ) |
| | | | | | | | | | | | | | | | |
Total | | $ | 12,500,000 | | | $ | 234,103 | | | $ | – 0 | – | | $ | 973,965,880 | |
| | | | | | | | | | | | | | | | |
| (a) | Other financial instruments are derivative instruments, such as futures, forwards and swaps, which are valued at the unrealized appreciation/(depreciation) on the instrument. Other financial instruments may also include swaps with upfront premiums, options written and swaptions written which are valued at market value. |
| * | In May 2015, the Financial Accounting Standards Board issued an Accounting Standards Update, ASU2015-07 (the “ASU”) which removed the requirement to categorize within the fair value hierarchy all investments for which fair value is measured using the net asset value per share practical expedient. The ASU was effective for annual periods beginning after December 15, 2015 and interim periods within those annual periods, with application of the amendments noted above retrospectively to all periods presented. The retrospective approach requires that an investment for which fair value is measured using the net asset value per share practical expedient be removed from the fair value hierarchy in all periods presented herein. Accordingly, the total investments of the Underlying Portfolios with a fair value of $961,231,777 have not been categorized in the fair value hierarchy. |
2. Cash Committed
As of September 30, 2019, the Fund had no open commitments to purchase Underlying Portfolios.
3. Currency Translation
Assets and liabilities denominated in foreign currencies and commitments under forward currency exchange contracts are translated into U.S. dollars at the mean of the quoted bid and ask prices of such currencies against the U.S. dollar. Purchases and sales of portfolio securities are translated into U.S. dollars at the rates of exchange prevailing when such securities were acquired or sold. Income and expenses are translated into U.S. dollars at rates of exchange prevailing when accrued.
Net realized gain or loss on foreign currency transactions represents foreign exchange gains and losses from sales and maturities of foreign fixed income investments, holding of foreign currencies, currency gains or
| | |
| |
| abfunds.com | | AB MULTI-MANAGER ALTERNATIVE FUND | 29 |
NOTES TO CONSOLIDATED FINANCIAL STATEMENTS(continued)
losses realized between the trade and settlement dates on foreign investment transactions, and the difference between the amounts of dividends, interest and foreign withholding taxes recorded on the Fund’s books and the U.S. dollar equivalent amounts actually received or paid. Net unrealized currency gains and losses from valuing foreign currency denominated assets and liabilities at period end exchange rates are reflected as a component of net unrealized appreciation or depreciation of foreign currency denominated assets and liabilities.
4. Taxes
It is the Fund’s policy to meet the requirements of the Internal Revenue Code applicable to regulated investment companies and to distribute all of its investment company taxable income and net realized gains, if any, to shareholders. Therefore, no provisions for federal income or excise taxes are required. The Fund intends to continue to comply with the requirements of Subchapter M of the Internal Revenue Code of 1986 as they apply to regulated investment companies. By so complying, the Fund will not be subject to federal and state income taxes to the extent that all of its income is distributed.
For Federal tax purposes, taxable income for the Consolidated Fund and its Subsidiary are calculated separately. The Subsidiary is classified as a controlled foreign corporation (“CFC”) under the Code and its taxable income is included in the calculation of the Consolidated Fund’s taxable income. Net losses of the Subsidiary are not deductible by the Consolidated Fund either in the current period or future periods. The CFC has a taxable fiscal year end of March 31st.
In accordance with U.S. GAAP requirements regarding accounting for uncertainties in income taxes, management has analyzed the Fund’s tax positions taken or expected to be taken on federal and state income tax returns for all open tax years (the current and the prior three tax years) and has concluded that no provision for income tax is required in the Fund’s consolidated financial statements.
5. Investment Income and Investment Transactions
Income and capital gain distributions, if any, are recorded on theex-dividend date. Investment transactions are accounted for on the trade date or effective date. Investment gains and losses are determined on the identified cost basis.
6. Expenses
Expenses included in the accompanying consolidated statement of operations do not include any expenses of the Underlying Portfolios.
| | |
| |
| 30 | AB MULTI-MANAGER ALTERNATIVE FUND | | abfunds.com |
NOTES TO CONSOLIDATED FINANCIAL STATEMENTS(continued)
7. Dividends and Distributions
Dividends and distributions to shareholders, if any, are recorded on theex-dividend date. Income dividends and capital gains distributions are determined in accordance with federal tax regulations and may differ from those determined in accordance with U.S. GAAP. To the extent these differences are permanent, such amounts are reclassified within the capital accounts based on their federal tax basis treatment; temporary differences do not require such reclassification.
8. Offering Expenses
Offering expenses of $33,679 were deferred and amortized on a straight line basis over a one year period starting from September 21, 2018 (Subsidiary’s commencement of operations).
NOTE B
Management Fee and Other Transactions with Affiliates
Under the terms of the investment advisory agreement in effect as of November 1, 2018 (the “Advisory Agreement”), the Fund pays the Investment Manager a management fee at an annual rate of 1.00% of an aggregate of the Fund’s net assets determined as of the last day of a calendar month and adjusted for subscriptions and repurchases accepted as of the first day of the subsequent month (the “Management Fee”). Prior to November 1, 2018, the Fund paid a management fee at an annual rate of 1.50% of the Fund’s net assets determined as of the last day of a calendar month and adjusted for subscriptions and repurchases accepted as of the first day of the subsequent month. The Management Fee is payable in arrears as of the last day of the subsequent month.
In addition, from June 1, 2018 to October 31, 2018, the Investment Manager waived a portion of its management fee so that the Fund paid management fees at an annual rate of 1.00% of the Fund’s net assets determined as of the last day of a calendar month and adjusted for subscriptions and repurchases accepted as of the first day of the subsequent month.
Under a separate administrative agreement, the Fund may use the Investment Manager and its personnel to provide certain administrative services to the Fund and, in such event, the services and payments will be subject to approval by the Fund’s Board. For the six months ended September 30, 2019, the reimbursement for such fees amounted to $169,137.
The Fund may engage one or more distributors to solicit investments in the Fund. Sanford C. Bernstein & Company LLC (“Bernstein”) and AllianceBernstein Investments, Inc. (“ABI”), each an affiliate of the Investment Manager, have been selected as distributors of the Fund under Distribution Services Agreements. The Distribution Services Agreements do not call for any payments to be made to Bernstein or ABI by the Fund.
| | |
| |
| abfunds.com | | AB MULTI-MANAGER ALTERNATIVE FUND | 31 |
NOTES TO CONSOLIDATED FINANCIAL STATEMENTS(continued)
The Fund compensates AllianceBernstein Investor Services, Inc. (“ABIS”), a wholly-owned subsidiary of the Investment Manager, under a Transfer Agency Agreement for providing personnel and facilities to perform transfer agency services for the Fund. Such compensation paid to ABIS amounted to $109,876 for the six months ended September 30, 2019.
The Fund may invest in AB Government Money Market Portfolio (the “Government Money Market Portfolio”) which has a contractual annual advisory fee rate of .20% of the portfolio’s average daily net assets and bears its own expenses. Effective August 1, 2018, the Investment Manager has contractually agreed to waive .10% of the advisory fee of Government Money Market Portfolio (resulting in a net advisory fee of .10%) until August 31, 2020. In connection with the investment by the Fund in Government Money Market Portfolio, the Investment Manager has contractually agreed to waive its advisory fee from the Fund in an amount equal to the Fund’s pro rata share of the effective advisory fee of Government Money Market Portfolio, as borne indirectly by the Fund as an acquired fund fee and expense. For the six months ended September 30, 2019, such waiver amounted to $14,762.
A summary of the Fund’s transactions in AB mutual funds for the six months ended September 30, 2019 is as follows:
| | | | | | | | | | | | | | | | | | | | |
Fund | | Market Value
3/31/19
(000) | | | Purchases
at Cost
(000) | | | Sales
Proceeds
(000) | | | Market Value
9/30/19
(000) | | | Dividend
Income
(000) | |
Government Money Market Portfolio | | $ | 15,500 | | | $ | 148,500 | | | $ | 151,500 | | | $ | 12,500 | | | $ | 342 | |
During the six months ended September 30, 2019, the Investment Manager reimbursed the Fund $1,871 for trading losses incurred due to a trade entry error.
During the second quarter of 2018, AXA S.A. (“AXA”), a French holding company for the AXA Group, a worldwide leader in life, property and casualty and health insurance and asset management, completed the sale of a minority stake in its subsidiary, AXA Equitable Holdings, Inc. (“AXA Equitable”), through an initial public offering. AXA Equitable is the holding company for a diverse group of financial services companies, including an approximately 65.3% economic interest in the Adviser and a 100% interest in AllianceBernstein Corporation, the general partner of the Adviser. Since the initial sale, AXA has completed additional offerings, most recently during the fourth quarter of 2019. As a result, AXA owned 10.1% of the outstanding shares of common stock of AXA Equitable as of
| | |
| |
| 32 | AB MULTI-MANAGER ALTERNATIVE FUND | | abfunds.com |
NOTES TO CONSOLIDATED FINANCIAL STATEMENTS(continued)
November 13, 2019, and no longer owns a controlling interest in AXA Equitable. AXA previously announced its intention to sell its entire interest in AXA Equitable over time, subject to market conditions and other factors (the “Plan”). Most of AXA’s remaining AXA Equitable shares are to be delivered on redemption of AXA bonds mandatorily exchangeable into AXA Equitable shares and maturing in May 2021. AXA retains sole discretion to determine the timing of any future sales of its remaining shares of AXA Equitable common stock.
The latest transaction under the Plan, which occurred on November 13, 2019, resulted in the indirect transfer of a “controlling block” of voting securities of the Adviser (a “Change of Control Event”) and was deemed an “assignment” causing a termination of the Fund’s investment advisory agreement. In order to ensure that investment advisory services could continue uninterrupted in the event of a Change of Control Event, the Board previously approved a new investment advisory agreement with the Adviser. Shareholders of the Fund subsequently approved the new investment advisory agreement, which became effective on November 13, 2019.
NOTE C
Investment Transactions
1. Purchases and Sales
Purchases and sales of investments in the Underlying Portfolios, aggregated $100,393,238 and $161,602,952, respectively, for the six months ended September 30, 2019.
The cost of investments for federal income tax purposes was substantially the same as the cost for financial reporting purposes. Accordingly, gross unrealized appreciation and unrealized depreciation are as follows:
| | | | |
Gross unrealized appreciation | | $ | 127,449,365 | |
Gross unrealized depreciation | | | (12,696,306 | ) |
| | | | |
Net unrealized appreciation | | $ | 114,753,059 | |
| | | | |
2. Derivative Financial Instruments
The Fund may use derivatives in an effort to earn income and enhance returns, to replace more traditional direct investments, to obtain exposure to otherwise inaccessible markets (collectively, “investment purposes”), or to hedge or adjust the risk profile of its portfolio.
The principal types of derivatives utilized by the Fund, as well as the methods in which they may be used are:
| | • | | Forward Currency Exchange Contracts |
The Fund may enter into forward currency exchange contracts in order to hedge its exposure to changes in foreign currency exchange
| | |
| |
| abfunds.com | | AB MULTI-MANAGER ALTERNATIVE FUND | 33 |
NOTES TO CONSOLIDATED FINANCIAL STATEMENTS(continued)
rates on its foreign portfolio holdings, to hedge certain firm purchase and sale commitments denominated in foreign currencies and fornon-hedging purposes as a means of making direct investments in foreign currencies, as described below under “Currency Transactions”.
A forward currency exchange contract is a commitment to purchase or sell a foreign currency at a future date at a negotiated forward rate. The gain or loss arising from the difference between the original contract and the closing of such contract would be included in net realized gain or loss on forward currency exchange contracts. Fluctuations in the value of open forward currency exchange contracts are recorded for financial reporting purposes as unrealized appreciation and/or depreciation by the Fund. Risks may arise from the potential inability of a counterparty to meet the terms of a contract and from unanticipated movements in the value of a foreign currency relative to the U.S. dollar.
During the six months ended September 30, 2019, the Fund held forward currency exchange contracts for hedging purposes.
The Fund may enter into swaps to hedge its exposure to interest rates, credit risk, equity markets or currencies. The Fund may also enter into swaps fornon-hedging purposes as a means of gaining market exposures, including by making direct investments in foreign currencies, as described below under “Currency Transactions” or in order to take a “long” or “short” position with respect to an underlying referenced asset described below under “Total Return Swaps”. A swap is an agreement that obligates two parties to exchange a series of cash flows at specified intervals based upon or calculated by reference to changes in specified prices or rates for a specified amount of an underlying asset. The payment flows are usually netted against each other, with the difference being paid by one party to the other. In addition, collateral may be pledged or received by the Fund in accordance with the terms of the respective swaps to provide value and recourse to the Fund or its counterparties in the event of default, bankruptcy or insolvency by one of the parties to the swap.
Risks may arise as a result of the failure of the counterparty to the swap to comply with the terms of the swap. The loss incurred by the failure of a counterparty is generally limited to the net interim payment to be received by the Fund, and/or the termination value at the end of the contract. Therefore, the Fund considers the creditworthiness of each counterparty to a swap in evaluating potential counterparty risk. This risk is mitigated by having a netting arrangement between the Fund and the counterparty and by the posting of collateral by the counterparty to the Fund to cover the Fund’s exposure to the
| | |
| |
| 34 | AB MULTI-MANAGER ALTERNATIVE FUND | | abfunds.com |
NOTES TO CONSOLIDATED FINANCIAL STATEMENTS(continued)
counterparty. Additionally, risks may arise from unanticipated movements in interest rates or in the value of the underlying securities. The Fund accrues for the interim payments on swaps on a daily basis, with the net amount recorded within unrealized appreciation/depreciation of swaps on the consolidated statement of assets and liabilities, where applicable. Once the interim payments are settled in cash, the net amount is recorded as realized gain/(loss) on swaps on the consolidated statement of operations, in addition to any realized gain/(loss) recorded upon the termination of swaps. Upfront premiums paid or received for OTC swaps are recognized as cost or proceeds on the consolidated statement of assets and liabilities and are amortized on a straight line basis over the life of the contract. Amortized upfront premiums are included in net realized gain/(loss) from swaps on the consolidated statement of operations. Fluctuations in the value of swaps are recorded as a component of net change in unrealized appreciation/depreciation of swaps on the consolidated statement of operations.
Total Return Swaps:
The Fund may enter into total return swaps in order to take a “long” or “short” position with respect to an underlying referenced asset. The Fund is subject to market price volatility of the underlying referenced asset. A total return swap involves commitments to pay interest in exchange for a market linked return based on a notional amount. To the extent that the total return of the security, group of securities or index underlying the transaction exceeds or falls short of the offsetting interest obligation, the Fund will receive a payment from or make a payment to the counterparty.
During the six months ended September 30, 2019, the Fund held total return swaps for hedging andnon-hedging purposes.
The Fund and the Subsidiary typically enter into International Swaps and Derivatives Association, Inc. Master Agreements (“ISDA Master Agreement”) with their OTC derivative contract counterparties in order to, among other things, reduce their credit risk to OTC counterparties. ISDA Master Agreements include provisions for general obligations, representations, collateral and events of default or termination. Under an ISDA Master Agreement, the Fund and the Subsidiary typically may offset with the OTC counterparty certain derivative financial instruments’ payables and/or receivables with collateral held and/or posted and create one single net payment(close-out netting) in the event of default or termination. In the event of a default by an OTC counterparty, the return of collateral with market value in excess of the Fund’s and the Subsidiary’s net liability, held by the defaulting party, may be delayed or denied.
| | |
| |
| abfunds.com | | AB MULTI-MANAGER ALTERNATIVE FUND | 35 |
NOTES TO CONSOLIDATED FINANCIAL STATEMENTS(continued)
The Fund’s and Subsidiary’s ISDA Master Agreements may contain provisions for early termination of OTC derivative transactions in the event the net assets of the Fund or the Subsidiary decline below specific levels (“net asset contingent features”). If these levels are triggered, the Fund’s and the Subsidiary’s OTC counterparty has the right to terminate such transaction and require the Fund or the Subsidiary to pay or receive a settlement amount in connection with the terminated transaction. For additional details, please refer to netting arrangements by the OTC counterparty tables below.
During the six months ended September 30, 2019, the Fund had entered into the following derivatives:
| | | | | | | | | | | | |
| | | Asset Derivatives | | | Liability Derivatives | |
Derivative Type | | Consolidated
Statement of
Assets and
Liabilities
Location | | Fair Value | | | Consolidated
Statement of
Assets and
Liabilities
Location | | Fair Value | |
Interest contracts | | Unrealized appreciation on total return swaps | | $ | 195,283 | | | Unrealized depreciation on total return swaps | | $ | 17,588 | |
| | | | |
Foreign exchange contracts | | | | | | | | Unrealized depreciation on total return swaps | | | 13,538 | |
| | | | |
Commodity contracts | | Unrealized appreciation on total return swaps | | | 11,379 | | | Unrealized depreciation on total return swaps | | | 96,074 | |
| | | | |
Equity contracts | | Unrealized appreciation on total return swaps | | | 3,093,454 | | | Unrealized depreciation on total return swaps | | | 2,938,813 | |
| | | | | | | | | | | | |
Total | | | | $ | 3,300,116 | | | | | $ | 3,066,013 | |
| | | | | | | | | | | | |
| | | | | | | | | | |
Derivative Type | | Location of Gain
or (Loss) on
Derivatives Within
Consolidated
Statement of
Operations | | Realized Gain
or (Loss) on
Derivatives | | | Change in
Unrealized
Appreciation or
(Depreciation) | |
Foreign currency contracts | | Net realized gain (loss) on forward currency exchange contracts; Net change in unrealized appreciation/depreciation of forward currency exchange contracts | | $ | 74,724 | | | $ | 29,748 | |
| | |
| |
| 36 | AB MULTI-MANAGER ALTERNATIVE FUND | | abfunds.com |
NOTES TO CONSOLIDATED FINANCIAL STATEMENTS(continued)
| | | | | | | | | | |
Derivative Type | | Location of Gain
or (Loss) on
Derivatives Within
Consolidated
Statement of
Operations | | Realized Gain
or (Loss) on
Derivatives | | | Change in
Unrealized
Appreciation or
(Depreciation) | |
| | | |
Interest rate contracts | | Net realized gain (loss) on swaps; Net change in unrealized appreciation/depreciation of swaps | | $ | (648,330 | ) | | $ | 142,012 | |
| | | |
Commodity contracts | | Net realized gain (loss) on swaps; Net change in unrealized appreciation/depreciation of swaps | | | (641,104 | ) | | | (527,000 | ) |
| | | |
Foreign exchange contracts | | Net realized gain (loss) on swaps; Net change in unrealized appreciation/depreciation of swaps | | | – 0 | – | | | (13,538 | ) |
| | | |
Equity contracts | | Net realized gain (loss) on swaps; Net change in unrealized appreciation/depreciation of swaps | | | 614,032 | | | | (340,832 | ) |
| | | | | | | | | | |
Total | | | | $ | (600,678 | ) | | $ | (709,610 | ) |
| | | | | | | | | | |
The following table represents the average monthly volume of the Fund’s derivative transactions during the six months ended September 30, 2019:
| | | | |
Forward Currency Exchange Contracts: | | | | |
Average principal amount of buy contracts | | $ | 3,694,286 | (a) |
Average principal amount of sale contracts | | $ | 2,705,113 | (a) |
Total Return Swaps: | | | | |
Average notional amount | | $ | 254,127,652 | |
| (a) | Positions were open for five months during the period. |
For financial reporting purposes, the Fund does not offset derivative assets and derivative liabilities that are subject to netting arrangements in the consolidated statement of assets and liabilities.
All OTC derivatives held at period end were subject to netting arrangements. The following tables present the Fund’s derivative assets and liabilities by OTC counterparty net of amounts available for offset under ISDA Master Agreements (“MA”) and net of the related collateral received/pledged by the Fund as of September 30, 2019. Exchange-traded derivatives and centrally cleared swaps are not subject to netting arrangements and as such are excluded from the tables.
| | |
| |
| abfunds.com | | AB MULTI-MANAGER ALTERNATIVE FUND | 37 |
NOTES TO CONSOLIDATED FINANCIAL STATEMENTS(continued)
AB Multi-Manager Alternative Fund
| | | | | | | | | | | | | | | | | | | | |
Counterparty | | Derivative
Assets
Subject to
a MA | | | Derivatives
Available
for Offset | | | Cash
Collateral
Received* | | | Security
Collateral
Received* | | | Net Amount
of Derivative
Assets | |
Goldman Sachs & Co./Goldman Sachs International | | $ | 1,065,115 | | | $ | (455,660 | ) | | $ | – 0 | – | | $ | – 0 | – | | $ | 609,455 | |
JPMorgan Chase Bank, NA | | | 889,080 | | | | (889,080 | ) | | | – 0 | – | | | – 0 | – | | | – 0 | – |
Morgan Stanley Capital Services, LLC | | | 1,334,542 | | | | (1,334,542 | ) | | | – 0 | – | | | – 0 | – | | | – 0 | – |
| | | | | | | | | | | | | | | | | | | | |
Total | | $ | 3,288,737 | | | $ | (2,679,282 | ) | | $ | – 0 | – | | $ | – 0 | – | | $ | 609,455 | ^ |
| | | | | | | | | | | | | | | | | | | | |
| | | | | |
Counterparty | | Derivative
Liabilities
Subject to
a MA | | | Derivatives
Available
for Offset | | | Cash
Collateral
Pledged* | | | Security
Collateral
Pledged* | | | Net Amount
of Derivative
Liabilities | |
Goldman Sachs & Co./Goldman Sachs International | | $ | 455,660 | | | $ | (455,660 | ) | | $ | – 0 | – | | $ | – 0 | – | | $ | – 0 | – |
JPMorgan Chase Bank, NA | | | 964,476 | | | | (889,080 | ) | | | (75,396 | ) | | | – 0 | – | | | – 0 | – |
Morgan Stanley Capital Services, LLC | | | 1,520,961 | | | | (1,334,542 | ) | | | (186,419 | ) | | | – 0 | – | | | – 0 | – |
| | | | | | | | | | | | | | | | | | | | |
Total | | $ | 2,941,097 | | | $ | (2,679,282 | ) | | $ | (261,815 | ) | | $ | – 0 | – | | $ | – 0 | –^ |
| | | | | | | | | | | | | | | | | | | | |
| * | The actual collateral received/pledged may be more than the amount reported due to over-collateralization. |
| ^ | Net amount represents the net receivable/payable that would be due from/to the counterparty in the event of default or termination. The net amount from OTC financial derivative instruments can only be netted across transactions governed under the same master agreement with the same counterparty. |
AB Multi-Manager Alternative Fund (Cayman), Ltd.
| | | | | | | | | | | | | | | | | | | | |
Counterparty | | Derivative
Assets
Subject to
a MA | | | Derivatives
Available
for Offset | | | Cash
Collateral
Received* | | | Security
Collateral
Received* | | | Net Amount
of Derivative
Assets | |
JPMorgan Chase Bank, NA | | $ | 5,516 | | | $ | (5,516 | ) | | $ | – 0 | – | | $ | – 0 | – | | $ | – 0 | – |
Morgan Stanley Capital Services, LLC | | | 5,863 | | | | – 0 | – | | | – 0 | – | | | – 0 | – | | | 5,863 | |
| | | | | | | | | | | | | | | | | | | | |
Total | | $ | 11,379 | | | $ | (5,516 | ) | | $ | – 0 | – | | $ | – 0 | – | | $ | 5,863 | ^ |
| | | | | | | | | | | | | | | | | | | | |
| | |
| |
| 38 | AB MULTI-MANAGER ALTERNATIVE FUND | | abfunds.com |
NOTES TO CONSOLIDATED FINANCIAL STATEMENTS(continued)
| | | | | | | | | | | | | | | | | | | | |
| | | | | |
Counterparty | | Derivative
Liabilities
Subject to
a MA | | | Derivatives
Available
for Offset | | | Cash
Collateral
Pledged* | | | Security
Collateral
Pledged* | | | Net Amount
of Derivative
Liabilities | |
Barclays Bank PLC | | $ | 64,916 | | | $ | – 0 | – | | $ | (64,916 | ) | | $ | – 0 | – | | $ | – 0 | – |
Credit Suisse International | | | 1,905 | | | | – 0 | – | | | (1,905 | ) | | | – 0 | – | | | – 0 | – |
Goldman Sachs & Co | | | 17,588 | | | | – 0 | – | | | – 0 | – | | | – 0 | – | | | 17,588 | |
JPMorgan Chase Bank, NA | | | 40,507 | | | | (5,516 | ) | | | (34,991 | ) | | | – 0 | – | | | – 0 | – |
| | | | | | | | | | | | | | | | | | | | |
Total | | $ | 124,916 | | | $ | (5,516 | ) | | $ | (101,812 | ) | | $ | – 0 | – | | $ | 17,588 | ^ |
| | | | | | | | | | | | | | | | | | | | |
| * | The actual collateral received/pledged may be more than the amount reported due to over-collateralization. |
| ^ | Net amount represents the net receivable/payable that would be due from/to the counterparty in the event of default or termination. The net amount from OTC financial derivative instruments can only be netted across transactions governed under the same master agreement with the same counterparty. |
3. Currency Transactions
The Fund may invest innon-U.S. Dollar-denominated securities on a currency hedged or unhedged basis through its investments in an Underlying Portfolio. The Fund or an Underlying Portfolio may seek investment opportunities by taking long or short positions in currencies through the use of currency-related derivatives, including forward currency exchange contracts, futures and options on futures, swaps, and other options. The Fund or an Underlying Portfolio may enter into transactions for investment opportunities when it anticipates that a foreign currency will appreciate or depreciate in value but securities denominated in that currency are not held by the Fund or the Underlying Portfolio and do not present attractive investment opportunities. Such transactions may also be used when the Investment Manager or the manager of an Underlying Portfolio believes that it may be more efficient than a direct investment in a foreign currency-denominated security. The Fund or an Underlying Portfolio may also conduct currency exchange contracts on a spot basis (i.e., for cash at the spot rate prevailing in the currency exchange market for buying or selling currencies).
NOTE D
Shares of Beneficial Interest
Generally, initial and additional subscriptions for shares may be accepted as of the first day of each month. The Fund reserves the right to reject any subscription for shares. The Fund intends to repurchase shares from shareholders in accordance with written tenders by shareholders at those times, in those amounts, and on such terms and conditions as the Board may determine in its sole discretion. When a repurchase offer occurs, a shareholder will generally be required to provide notice of their tender of shares for repurchase to the Fund more than three months in advance of the date that the shares will be valued for repurchase (the “Valuation Date”). Valuation Dates are generally expected to be the last business days
| | |
| |
| abfunds.com | | AB MULTI-MANAGER ALTERNATIVE FUND | 39 |
NOTES TO CONSOLIDATED FINANCIAL STATEMENTS(continued)
of March, June, September or December, and payment for tendered shares will generally be made by the Fund approximately 45 days following the Valuation Date.
Transactions in shares of beneficial interest were as follows for the six months ended September 30, 2019 and the year ended March 31, 2019:
| | | | | | | | | | | | | | | | | | | | | | | | |
| | | | | | | | | | | | | | | | | | | | | | | | |
| | | Shares | | | | | | Amount | | | | |
| | | Six Months Ended
September 30, 2019
(unaudited) | | | Year Ended
March 31,
2019 | | | | | | Six Months Ended
September 30, 2019
(unaudited) | | | Year Ended
March 31,
2019 | | | | |
| | | | | | | | |
Shares sold | | | 1,930,031 | | | | 3,527,147 | | | | | | | $ | 21,929,039 | | | $ | 39,382,943 | | | | | |
| | | | | |
Shares redeemed | | | (7,650,767 | ) | | | (14,403,506 | ) | | | | | | | (87,363,957 | ) | | | (161,019,837 | ) | | | | |
| | | | | |
Net decrease | | | (5,720,736 | ) | | | (10,876,359 | ) | | | | | | $ | (65,434,918) | | | $ | (121,636,894 | ) | | | | |
| | | | | |
NOTE E
Risks Involved in Investing in the Fund
Limitations on the Fund’s ability to withdraw its assets from Underlying Portfolios may limit the Fund’s ability to repurchase its shares. For example, many Underlying Portfolios imposelock-up periods prior to allowing withdrawals, which can be two years or longer. After expiration of thelock-up period, withdrawals typically are permitted only on a limited basis, such as monthly, quarterly, semi-annually or annually. Many Underlying Portfolios may also indefinitely suspend redemptions or establish restrictions on the ability to fully receive proceeds from redemptions through the application of a redemption restriction or “gate”. In instances where the primary source of funds to repurchase shares will be withdrawals from Underlying Portfolios, the application of theselock-ups and withdrawal limitations may significantly limit the Fund’s ability to repurchase its shares. Although the Investment Manager will seek to select Underlying Portfolios that offer the opportunity to have their shares or units redeemed within a reasonable timeframe, there can be no assurance that the liquidity of the investments of such Underlying Portfolios will always be sufficient to meet redemption requests as, and when, made.
The Fund invests primarily in Underlying Portfolios that are not registered under the 1940 Act and invest in and actively trade securities and other financial instruments using different strategies and investment techniques that may involve significant risks. As a secondary strategy, the Fund will also generally make direct investments in securities and other financial instruments. The risks associated with these investments include those related to the volatility of the equity, credit, and currency markets, the use of leverage associated with certain investment strategies, derivative contracts and in connection with short positions, the potential illiquidity of certain instruments and counterparty and broker arrangements.
| | |
| |
| 40 | AB MULTI-MANAGER ALTERNATIVE FUND | | abfunds.com |
NOTES TO CONSOLIDATED FINANCIAL STATEMENTS(continued)
Some of the Underlying Portfolios in which the Fund invests may invest all or a portion of their assets in securities that are illiquid or are subject to an anticipated event. These Underlying Portfolios may create “side pockets” in which to hold these securities. Side pockets are series or classes of shares which are not redeemable by the investors but which are automatically redeemed or converted back into the Underlying Portfolio’s regular series or classes of shares upon the realization of those securities or the happening of some other liquidity event with respect to those securities.
These “side pockets” can often be held for long periods before they are realized, and may therefore be much less liquid than the general liquidity offered on the Underlying Portfolio’s regular series or classes of shares. Should the Fund seek to liquidate its investment in an Underlying Portfolio that maintains investments in a side pocket arrangement or that holds a substantial portion of its assets in illiquid securities, the Fund might not be able to fully liquidate its investments without delay, which could be considerable. In such cases, during the period until the Fund is permitted to fully liquidate the investment in the Underlying Portfolio, the value of the investment could fluctuate.
The Underlying Portfolios generally utilize leverage in pursuit of achieving a potentially greater investment return and the Fund may take on additional leverage in connection with its direct investment strategies. The use of leverage exposes an Underlying Portfolio and the Fund to additional risk including (i) greater losses from investments than would otherwise have been the case had the leverage not been used; (ii) margin calls or interim margin requirements may force premature liquidations of investment positions; and (iii) losses on investments where the investment fails to earn a return that equals or exceeds the cost of leverage related to such investment. In the event of a sudden, precipitous drop in the value of an Underlying Portfolio’s assets, the Underlying Portfolio might not be able to liquidate assets quickly enough to repay its borrowings, further magnifying the losses incurred by the Underlying Portfolio.
The Underlying Portfolios or the Fund may invest in securities of foreign companies that involve special risks and considerations not typically associated with investments in the United States. Such investments may be concentrated in a limited number of countries or regions, which may vary over time. Such investments may subject the Underlying Portfolios and the Fund to additional risks resulting from political or economic conditions in such countries or regions, and the possible imposition of adverse governmental laws or currency exchange restrictions could cause the securities and their markets to be less liquid and their prices to be more volatile than those of comparable U.S. securities.
| | |
| |
| abfunds.com | | AB MULTI-MANAGER ALTERNATIVE FUND | 41 |
NOTES TO CONSOLIDATED FINANCIAL STATEMENTS(continued)
There is the risk that changes in foreign currency exchange rates may negatively affect the value of the Fund’s or the Underlying Portfolios’ investments and reduce the returns of the Fund. For example, the value of the Fund’s or an Underlying Portfolio’s investments in foreign currency-denominated securities may decrease if the U.S. dollar is strong (i.e., gaining value relative to other currencies) and other currencies are weak (i.e., losing value relative to the U.S. dollar). Currency markets are generally not as regulated as securities markets. Independent of the Fund’s or an Underlying Portfolio’s investments denominated in foreign currencies, positions in foreign currencies themselves may cause the Fund or an Underlying Portfolio to experience investment losses due to the changes in exchange rates and interest rates.
The Underlying Portfolios may invest a higher percentage of their assets in specific sectors of the market in order to achieve a potentially greater investment return. As a result, the Underlying Portfolios may be more susceptible to economic, political and regulatory developments in a particular sector of the market, positive or negative, and may experience increased volatility of the Underlying Portfolio’s net asset value.
The Fund invests in a limited number of Underlying Portfolios. Such concentration may result in additional risk. Various risks are also associated with an investment in the Fund, including risks relating to compensation arrangements and risks relating to limited liquidity of the interests.
The Fund and the Underlying Portfolios may enter into derivative transactions such as forwards, options, futures and swaps. Derivatives may be illiquid, difficult to price, and leveraged so that small changes may produce disproportionate losses, and subject to counterparty risk to a greater degree than more traditional investments. Derivatives may result in significant losses, including losses that are far greater than the value of the derivatives reflected in the statement of assets and liabilities.
The Fund is subject to credit risk arising from its transactions with its custodian, State Street Bank and Trust, related to holding the Fund’s cash. This credit risk arises to the extent that the custodian may be unable to fulfill its obligation to return the Fund’s cash held in its custody.
A Fund or Underlying Portfolio may invest in certain debt securities, derivatives or other financial instruments that utilize the London Interbank Offered Rate, or “LIBOR,” as a “benchmark” or “reference rate” for various interest rate calculations. In July 2017, the United Kingdom Financial Conduct Authority, which regulates LIBOR, announced a desire to phase out the use of LIBOR by the end of 2021. Although financial regulators and industry working groups have suggested alternative reference rates, such as European Interbank Offer Rate (“EURIBOR”), Sterling Overnight Interbank Average Rate (“SONIA”) and Secured Overnight Financing Rate (“SOFR”),
| | |
| |
| 42 | AB MULTI-MANAGER ALTERNATIVE FUND | | abfunds.com |
NOTES TO CONSOLIDATED FINANCIAL STATEMENTS(continued)
global consensus on alternative rates is lacking and the process for amending existing contracts or instruments to transition away from LIBOR remains unclear. The elimination of LIBOR or changes to other reference rates or any other changes or reforms to the determination or supervision of reference rates could have an adverse impact on the market for, or value of, any securities or payments linked to those reference rates, which may adversely affect the Fund’s performance and/or net asset value. Uncertainty and risk also remain regarding the willingness and ability of issuers and lenders to include revised provisions in new and existing contracts or instruments. Consequently, the transition away from LIBOR to other reference rates may lead to increased volatility and illiquidity in markets that are tied to LIBOR, fluctuations in values of LIBOR-related investments or investments in issuers that utilize LIBOR, increased difficulty in borrowing or refinancing and diminished effectiveness of hedging strategies, adversely affecting the Fund’s performance. Furthermore, the risks associated with the expected discontinuation of LIBOR and transition may be exacerbated if the work necessary to effect an orderly transition to an alternative reference rate is not completed in a timely manner. Because the usefulness of LIBOR as a benchmark could deteriorate during the transition period, these effects could occur prior to the end of 2021.
In the ordinary course of business, the Fund enters into contracts that contain a variety of indemnifications. The Fund’s maximum exposure under these arrangements is unknown. However, the Fund has not had prior claims or losses pursuant to these indemnification provisions and expects the risk of loss thereunder to be remote. Therefore, the Fund has not accrued any liability in connection with these indemnification provisions.
NOTE F
Tax Information
The tax character of fiscalyear-end distributions for 2019 is based on estimated tax information provided by certain Underlying Portfolios. The character may materially change as the Fund receives final 2018 tax reporting from Underlying Portfolios. The tax character of distributions paid during the fiscal years ended March 31, 2019 and March 31, 2018 were as follows:
| | | | | | | | |
| | | 2019 | | | 2018 | |
Distributions paid from: | | | | | | | | |
Ordinary income | | $ | – 0 | – | | $ | 12,605,284 | |
Return of capital | | | – 0 | – | | | 2,494,217 | |
Long-term capital gains | | | – 0 | – | | | – 0 | – |
| | | | | | | | |
Total distributions paid | | $ | – 0 | – | | $ | 15,099,501 | |
| | | | | | | | |
| | |
| |
| abfunds.com | | AB MULTI-MANAGER ALTERNATIVE FUND | 43 |
NOTES TO CONSOLIDATED FINANCIAL STATEMENTS(continued)
As of March 31, 2019, the components of accumulated earnings/(deficit) on a tax basis were as follows:
| | | | |
Undistributed net investment income | | $ | – 0 | – |
Accumulated capital gains and other losses | | | 14,582,421 | (a) |
Unrealized appreciation/(depreciation) | | | 18,944,462 | (b) |
| | | | |
Total accumulated earnings/(deficit) | | $ | 33,526,883 | |
| | | | |
| (a) | As of March 31, 2019, the Fund had a qualified late-year ordinary loss deferral of $2,611,420. The loss is deemed to arise on April 1, 2019. |
| (b) | The differences between book-basis andtax-basis unrealized appreciation/(depreciation) are attributable primarily to the tax treatment of passive foreign investment companies (PFICs), swaps and partnerships. |
For tax purposes, net capital losses may be carried over to offset future capital gains, if any. Funds are permitted to carry forward capital losses for an indefinite period, and such losses will retain their character as either short-term or long-term capital losses. As of March 31, 2019, the Fund did not have any carry forward capital losses.
NOTE G
Credit Facility
The Fund is a party to a $50 million revolving credit facility (the “Facility”) intended to provide short term financing, if necessary, subject to certain restrictions in connection with, among other matters, abnormal redemption activity. Borrowings under the Facility are secured by the assets of the Fund. Credit Facility fees are paid by the Fund and are included in the consolidated statement of operations. For the six months ended September 30, 2019, the Fund did not utilize the Facility.
NOTE H
Subsequent Events
Management has evaluated subsequent events for possible recognition or disclosure in the consolidated financial statements through the date the consolidated financial statements are issued. Management has determined that there are no material events that would require disclosure in the Fund’s consolidated financial statements through this date.
| | |
| |
| 44 | AB MULTI-MANAGER ALTERNATIVE FUND | | abfunds.com |
CONSOLIDATED FINANCIAL HIGHLIGHTS
Selected Data For A Share Of Beneficial Interest Outstanding Throughout Each Period
| | | | | | | | | | | | | | | | | | | | | | | | |
| | | Six Months
Ended
September 30,
2019‡ (unaudited) | | | Year Ended March 31, | |
| | | 2019‡ | | | 2018 | | | 2017 | | | 2016 | | | 2015 | |
| | | | |
| | | | | | | | | | | | | | | | | | | | | | | | |
Net asset value, beginning of period | | | $ 11.26 | | | | $ 11.20 | | | | $ 10.87 | | | | $ 10.05 | | | | $ 11.64 | | | | $ 11.41 | |
| | | | |
Income From Investment Operations | | | | | | | | | | | | | | | | | | | | | | | | |
| | | | | | |
Net investment loss(a) | | | (.06 | )(b) | | | (.13 | )(b) | | | (.19 | )(b) | | | (.18 | ) | | | (.19 | ) | | | (.20 | )(b) |
| | | | | | |
Net realized and unrealized gain (loss) on investment transactions | | | .15 | | | | .19 | | | | .66 | | | | 1.09 | | | | (1.12 | ) | | | .56 | |
| | | | | | |
Contributions from affiliates | | | .00 | (c) | | | – 0 | – | | | – 0 | – | | | – 0 | – | | | – 0 | – | | | – 0 | – |
| | | | |
Net increase (decrease) in net asset value from operations | | | .09 | | | | .06 | | | | .47 | | | | .91 | | | | (1.31 | ) | | | .36 | |
| | | | |
Less: Dividends and Distributions | | | | | | | | | | | | | | | | | | | | | | | | |
| | | | | | |
Dividends from net investment income | | | – 0 | – | | | – 0 | – | | | (.12 | ) | | | (.02 | ) | | | (.01 | ) | | | (.02 | ) |
| | | | | | |
Distributions from net realized gain on investment transactions | | | – 0 | – | | | – 0 | – | | | – 0 | – | | | (.07 | ) | | | (.27 | ) | | | (.11 | ) |
| | | | | | |
Return of capital | | | – 0 | – | | | – 0 | – | | | (.02 | ) | | | – 0 | – | | | – 0 | – | | | – 0 | – |
| | | | |
Total dividends and distributions | | | – 0 | – | | | – 0 | – | | | (.14 | ) | | | (.09 | ) | | | (.28 | ) | | | (.13 | ) |
| | | | |
Net asset value, end of period | | | $ 11.35 | | | | $ 11.26 | | | | $ 11.20 | | | | $ 10.87 | | | | $ 10.05 | | | | $ 11.64 | |
| | | | |
Total Return | | | | | | | | | | | | | | | | | | | | | | | | |
| | | | | | |
Total investment return based on net asset value(d) | | | .80 | % | | | .54 | % | | | 4.33 | % | | | 9.06 | % | | | (11.38 | )% | | | 3.16 | % |
| | | | | | |
Ratios/Supplemental Data | | | | | | | | | | | | | | | | | | | | | | | | |
| | | | | | |
Net assets, end of period (000’s omitted) | | | $982,080 | | | | $1,039,586 | | | | $1,155,060 | | | | $1,248,818 | | | | $1,310,647 | | | | $1,376,552 | |
| | | | | | |
Ratio to average net assets of: | | | | | | | | | | | | | | | | | | | | | | | | |
| | | | | | |
Expenses, net of waivers/reimbursements(e)(f)(g) | | | 1.17 | %^ | | | 1.28 | % | | | 1.68 | % | | | 1.67 | % | | | 1.66 | % | | | 1.75 | %(b) |
| | | | | | |
Expenses, before waivers/reimbursements(e)(f)(g) | | | 1.17 | %^ | | | 1.50 | % | | | 1.68 | % | | | 1.67 | % | | | 1.66 | % | | | 1.75 | % |
| | | | | | |
Net investment loss(f) | | | (1.11 | )%(b)^ | | | (1.17 | )%(b) | | | (1.66 | )%(b) | | | (1.67 | )% | | | (1.66 | )% | | | (1.75 | )%(b) |
| | | | | | |
Portfolio turnover rate | | | 10 | % | | | 33 | % | | | 19 | % | | | 3 | % | | | 7 | % | | | 8 | % |
| | | | | | |
Asset coverage ratio | | | N/A | | | | N/A | | | | N/A | | | | N/A | | | | N/A | | | | 33,674 | % |
| | | | | | |
Bank borrowing outstanding (in millions) | | | N/A | | | | N/A | | | | N/A | | | | N/A | | | | N/A | | | | $4 | |
See footnote summary on page 46.
| | |
| |
| abfunds.com | | AB MULTI-MANAGER ALTERNATIVE FUND | 45 |
CONSOLIDATED FINANCIAL HIGHLIGHTS(continued)
Selected Data For A Share Of Beneficial Interest Outstanding Throughout Each Period
| (a) | Based on average shares outstanding. |
| (b) | Net of expenses waived/reimbursed by the Investment Manager. |
| (c) | Amount is less than $.005. |
| (d) | Total investment return is calculated assuming a purchase of beneficial shares on the opening of the first day and a sale on the closing of the last day of each period reported. Dividends and distributions, if any, are assumed for purposes of this calculation, to be reinvested at prices obtained under the Fund’s dividend reinvestment plan. Total investment return calculated for a period of less than one year is not annualized. |
| (e) | The expense ratios presented below exclude interest expense: |
| | | | | | | | | | | | | | | | | | | | | | | | |
| | | Six Months Ended
September 30, 2019
(unaudited) | | | Year Ended March 31, | |
| | | 2019 | | | 2018 | | | 2017 | | | 2016 | | | 2015 | |
Net of waivers/reimbursements | | | 1.17% | | | | 1.28% | | | | 1.68% | | | | 1.66% | | | | 1.66% | | | | 1.75% | |
Before waivers/reimbursements | | | 1.17% | | | | 1.50% | | | | 1.68% | | | | 1.66% | | | | 1.66% | | | | 1.75% | |
| (f) | The expense and net investment income loss ratios do not include earned income or expenses incurred by the Fund through its Underlying Portfolios. |
| (g) | In connection with the Fund’s investments in affiliated underlying portfolios, the Fund incurs no direct expenses, but bears proportionate shares of the fees and expenses (i.e., operating, administrative and investment advisory fees) of the affiliated underlying portfolios. The Investment Manager has contractually agreed to waive its fees from the Fund in an amount equal to the Fund’s pro rata share of certain acquired fund fees and expenses, and for the year ended March 31, 2019, such waiver amounted to .01%. |
| ‡ | Consolidated (see Note A). |
See notes to consolidated financial statements.
| | |
| |
| 46 | AB MULTI-MANAGER ALTERNATIVE FUND | | abfunds.com |
BOARD OF TRUSTEES
| | |
Debra Perry(1),Chair Kathleen M. Fisher*,President Bart Friedman(1),** R. Jay Gerken(1) | | Jeffrey R. Holland(1) William Kristol(1) Michelle McCloskey(1) Donald K. Peterson(1) |
OFFICERS
| | |
Stuart Davies(2)Vice President Vikas Kapoor(2) Vice President Emilie D. WrappSecretary Michael B. ReyesSenior Analyst Joseph J. MantineoTreasurer and Chief Financial Officer | | Stephen M. WoetzelController Vincent S. NotoChief Compliance Officer |
| | |
Custodian State Street Bank and Trust Company State Street Corporation CCB/5 1 Iron Street Boston, MA 02210 Distributors Sanford C. Bernstein & Co., LLC 1345 Avenue of the Americas New York, NY 10105 AllianceBernstein Investments, Inc. 1345 Avenue of the Americas New York, NY 10105 Transfer Agent AllianceBernstein Investor Services, Inc. P.O. Box 786003 San Antonio, TX 78278-6003 Toll-Free (800) 221-5672 | | Legal Counsel Willkie Farr & Gallagher LLP 787 Seventh Avenue New York, NY 10019 Independent Registered Public Accounting Firm PricewaterhouseCoopers LLP 300 Madison Avenue New York, NY 10017 |
| 1 | Member of the Audit Committee, the Governance, Nominating and Compensation Committee, and the Independent Directors Committee. |
| 2 | The day-to-day management of, and investment decisions for, the Fund’s portfolio are made by the Investment Manager’s Custom Alternative Solutions Group. Messrs. Davies and Kapoor are the investment professionals with the most significant responsibility for the day-to-day management of the Fund’s portfolio. |
| * | Ms. Fisher is expected to retire on or about March 31, 2020. |
| ** | Mr. Friedman is expected to retire on or about December 31, 2019. |
| | |
| |
| abfunds.com | | AB MULTI-MANAGER ALTERNATIVE FUND | 47 |
Information Regarding Review and Approval of the Fund’s
Advisory Agreement
AB Multi-Manager Alternative Fund (the “Fund”) is subject to Section 15 of the Investment Company Act of 1940, as amended. Section 15 provides that any investment advisory agreement with a registered investment company such as the Fund may continue in effect for a period of more than two years from the date of its execution, only so long as such continuance is specifically approved at least annually by the board of trustees (or by vote of a majority of the outstanding voting securities of the investment company). Pursuant to this requirement, the Fund’s Board of Trustees, including the Trustees who are not interested persons of the Fund (the “Independent Trustees”), unanimously approved the continuation of the Advisory Agreement between the Fund and AllianceBernstein L.P. (the “Adviser”)(the “Advisory Agreement”) at a meeting held on October29-30, 2019.
The following discussion describes the considerations in connection with the Board’s review of the Advisory Agreement.
In connection with the annual review of the continuation of the Advisory Agreement between the Fund and the Adviser, counsel to the Independent Trustees sent a letter to the Adviser dated August 14, 2019, that contained a list of information requested by the Independent Trustees to conduct their annual review. The Board of Trustees, including the Independent Trustees, met in person and received and evaluated extensive materials relating to the continuation of the Advisory Agreement from the Adviser during meetings in September and October 2019. In addition, the Board received materials from the Senior Analyst and an independent fee consultant as described below. On September 26, 2019, the Board of Trustees held anin-person meeting to discuss its review of the Advisory Agreement and the materials the Trustees had been provided. At that meeting, the Independent Trustees met separately with their independent counsel and the Senior Analyst and the independent fee consultant in executive sessions. Following the September 26, 2019 meeting, the Independent Trustees, through counsel, requested certain additional information by means of a letter from their independent counsel dated October 2, 2019, and the Adviser provided certain additional information by means of a letter dated October 17, 2019. The Independent Trustees held a telephonic meeting on October 21, 2019 with their independent counsel and the Senior Analyst to discuss the contract renewal materials and supplemental materials provided in response to the Board’s request. On October29-30, 2019, the Board of Trustees held anin-person meeting to continue their review of the Advisory Agreement. During this meeting, the Adviser provided further information to the Board relating to contract renewal, and the Independent Trustees also met separately with counsel to the Independent Trustees as well as the Senior Analyst to review the contract renewal materials provided by the Adviser and
| | |
| |
| 48 | AB MULTI-MANAGER ALTERNATIVE FUND | | abfunds.com |
the materials prepared by the Senior Analyst. At the conclusion of this meeting, the Board approved the continuation of the Advisory Agreement for an additional annual term as described below.
In approving the Advisory Agreement, the Board, including the Independent Trustees, considered all information it deemed reasonably necessary to evaluate the terms of the Advisory Agreement and considered whether the Agreement would be in the best interests of the Fund. In particular, the Board considered the information that was provided to them by the Adviser in response to their requests, as well as information prepared by the Senior Analyst and the independent fee consultant at the request of the Board. The Fund’s Senior Analyst assists the Board (as well as the boards of other funds sponsored by the Adviser) in evaluating advisory agreements and certain other agreements pursuant to which the Adviser or its affiliates provide services to the Fund. The Board also considered other information provided to the Board in connection with the September 26, 2019 and October29-30, 2019 meetings and throughout the past year.
The information considered by the Board included information with respect to the nature, extent and quality of services provided, investment performance, fees and expenses, profitability, economies of scale, andfall-out benefits and other revenue.
In the Board’s consideration of the factors discussed below, no single factor was considered in isolation or to be determinative to the decision of the Board to approve the Advisory Agreement. Rather, the Board concluded, in light of a weighing and balancing of all factors considered and in the exercise of the Trustees’ business judgment, that it was in the best interests of the Fund to approve the Advisory Agreement including the fees to be charged for services thereunder, as summarized below.
Fees and Expenses
The Board, including the Independent Trustees, compared the fees and expense ratios of the Fund against fees and expense ratios of a peer group of funds with similar investment objectives (“peer group”). Both the peer group and the funds within the peer group, with respect to the fee and expense data, were available from Strategic Insight, an independent provider of investment company data. The Trustees noted that the Fund’s advisory fee was below the median of the peer group and that the Fund’s total expense ratio (excluding interest expense and underlying fund expenses) was below the peer group median in the Strategic Insight report. The Senior Analyst also performed analyses of the advisory fees and other Portfolio expenses, and compared such analyses to the Fund’s peer group. In addition, the Board received and considered information from an independent fee consultant regarding the Fund’s fees and expenses as well as its investment performance.
| | |
| |
| abfunds.com | | AB MULTI-MANAGER ALTERNATIVE FUND | 49 |
On the basis of its review and consideration of the fees as described above and the Board’s consideration of the other factors described below, and in light of the Adviser’s recent reduction of the Fund’s advisory fee, the Board concluded that the contractual advisory fee as proposed was reasonable.
Nature, Extent and Quality of Services Provided
The Board, including the Independent Trustees, considered the nature, quality and extent of services performed by the Adviser and its affiliates gained from their experience as directors or trustees of the Fund and certain other funds advised by the Adviser, their overall confidence in the Adviser’s integrity and competence they have gained from that experience, and the Adviser’s initiative in identifying and raising potential issues with the Trustees. The Board also considered the Adviser’s responsiveness, frankness and attention to concerns raised by the Trustees from time to time, including the Adviser’s willingness to consider and implement organizational changes designed to improve investment results and the services provided to the funds. The Board also considered the scope and quality of the Adviser’s investment management capabilities, other resources dedicated to performing its services, the quality of its compliance, administrative and other services provided to the Fund and the background and experience of the Adviser’s senior management. The Board reviewed the qualifications, backgrounds and responsibilities of the investment staff primarily responsible forday-to-day portfolio management services for the Fund and noted the Adviser’s commitment to strong research and investment management capabilities throughout changing market environments.
In addition to the investment advisory services provided to the Fund, the Trustees considered that the Adviser and its affiliates also provide certain administrative services necessary for the operations of the Fund on an “at cost” basis pursuant to a separate Administrative Reimbursement Agreement. The Board reviewed the compliance and administrative services of the Adviser that support the investment advisory services provided to the Fund.
The Board also considered how the organizational capabilities and financial condition of the Adviser may affect the nature and quality of its services. In that regard, the Board considered the ongoing impacts of the relocation of substantial operations of the Adviser from the New York City area to Nashville, Tennessee. The Board further reviewed updated information about the ongoing divestiture of AXA, S.A. of its holdings of AXA Equitable Holdings, Inc. (“AXA Equitable”). AXA formerly owned all of the outstanding shares of common stock of AXA Equitable, which is an indirect parent of AllianceBernstein Corporation, the general partner of the Adviser, and AXA is in the process of divesting those shares. The Board considered the statements of the Adviser that it has continued to operate as an independent, publicly-traded US asset manager, that the ongoing divestiture has not materially changed the Adviser’s current management
| | |
| |
| 50 | AB MULTI-MANAGER ALTERNATIVE FUND | | abfunds.com |
structure or strategy, and that the Adviser does not believe that the ongoing divestiture will have a material impact on the Adviser with respect to its operations, personnel, organizational structure, or capitalization, financial and other resources.
In considering the nature and quality of the services provided by the Adviser, the Board, including the Independent Trustees, received and considered information about the Fund’s investment performance, as well as the performance of its peer group and the performance of an appropriate benchmark index. The Board was provided with performance data versus the Fund’s benchmark index for the1-year,3-year, 5-year and since inception periods ended July 31, 2019, and versus the Fund’s peer group, for the fiscal year ended March 31, 2019 and for each of the prior fiscal years since inception. The Board also received certain updated performance information as of August 31, 2019. In addition, the Trustees considered information showing performance compared to peer groups and benchmarks for rolling calendar year periods and the year to date. The Trustees also receive detailed comparative performance information for the Fund at each regular Board meeting during the year. The Board noted that in this case the benchmark index is an index of other funds which reflects the fees of such other funds.
The Trustees noted that the Fund’s performance for the year ended March 31, 2019 was below the median of the performance group of comparable funds selected by Strategic Insight. The Trustees took note that certain changes to the Fund’s investment policies took effect on July 31, 2018 and were implemented in the succeeding months and that more recent performance as of August 31, 2019 had shown improvement. The Trustees considered the Adviser’s explanations for performance and measures the Adviser had taken or proposed to take to improve performance. The Trustees noted generally the Adviser’s continued efforts to enhance the services provided to the Fund. The Trustees also noted that they would continue to monitor investment performance closely.
The Board concluded that the Adviser had the experience and resources necessary to provide services of appropriate nature, quality and scope with respect to the Fund.
Profitability
The Board, including the Independent Trustees, considered the level of the Adviser’s profits in respect of its management of the Fund. The materials provided to the Independent Trustees included information indicating the profitability of the Fund to the Adviser for calendar years 2017 and 2018, which had been reviewed by an independent consultant. The Trustees reviewed the assumptions and methods of allocation used by the Adviser in preparing fund-specific profitability data and noted that there are many potentially acceptable allocation methodologies for information of this type.
| | |
| |
| abfunds.com | | AB MULTI-MANAGER ALTERNATIVE FUND | 51 |
The Trustees noted that they received information regarding all revenues and expenses of the Adviser’s relationship with the Fund and that they had focused on profitability before taxes and distribution expenses. The Trustees noted that an affiliate of the Adviser provided distribution services to the Fund at no cost. The amounts recently reimbursed to the Adviser by the Fund were also noted, along with how the reimbursement was accounted for in determining profitability. The Trustees also considered the recent reduction of the management fee from 1.50% to 1.00% and then discussed the services and costs associated with the Fund’s Administrative Reimbursement Agreement with the Adviser.
The Trustees had also received a presentation at the July 24, 2019 Board meeting from the independent consultant who reviewed the Adviser’s method of calculating profitability. The Trustees reviewed comparative information regarding profitability for other publicly-traded advisers, recognizing that it is difficult to make comparisons of profitability among fund advisory contracts because only limited comparative information is publicly available and the comparisons are affected by numerous factors including different cost accounting methodologies.
After reviewing all relevant factors, the Trustees, including the Independent Trustees, concluded that the levels of the Adviser’s profits in respect of its management of the Fund were not excessive.
Economies of Scale
The Board, including the Independent Trustees, considered whether there have been economies of scale in respect of the management of the Fund, whether the Fund has appropriately benefited from any economies of scale, and whether there is potential for realization of any further economies of scale. The Trustees discussed possible ways in which any such economies of scale may be shared with the Fund, including by investment in enhanced services.
The Trustees also considered the Senior Analyst materials which they received in connection with the review of the Advisory Agreement, which included information reflecting changes in asset levels of the Fund and in the profitability of the Adviser over various periods.
After reviewing the profitability and economies of scale information provided by the Adviser, the Board concluded that the benefits of any economies of scale were appropriately being shared with Fund investors by way of, among other things and as applicable, recent fee reductions for the Fund and the Adviser’s continued reinvestment in the business, including by researching and implementing new product enhancements, although the Adviser decreased its operating expenses and staff in recent years. The Trustees also noted that they would continue to monitor the Fund’s growth.
| | |
| |
| 52 | AB MULTI-MANAGER ALTERNATIVE FUND | | abfunds.com |
Fall-Out Benefits and Other Revenue
The Board, including the Independent Trustees, also took into accountso-called“fall-out benefits” to the Adviser. They also considered other benefits potentially derived from an increase in the Adviser’s business as a result of its relationship with the Fund. The Trustees recognized that the Adviser’s profitability could be lower without these benefits. The Trustees concluded that thesefall-out benefits to the Adviser were acceptable.
Advisory Fee Rate Schedule
On the basis of the information considered, the Board determined to approve the Advisory Agreement for an additional annual term, without change to the Fund’s contractual fee schedule at an annual rate of 1.00% of the Fund’s net assets.
Subsequent Event
As a result of the divestiture by AXA of a substantial portion of its holdings in AXA Equitable, the Investment Management Agreement has automatically terminated as of November 13, 2019, and a new Investment Management Agreement (approved by the Board and the shareholders of the Fund in 2018) has come into effect. The new Investment Management Agreement is identical to the prior Investment Management Agreement other than as to its date.
| | |
| |
| abfunds.com | | AB MULTI-MANAGER ALTERNATIVE FUND | 53 |
This page is not part of the Shareholder Report or the Financial Statements.
AB FAMILY OF FUNDS
US EQUITY
US CORE
Core Opportunities Fund
FlexFee™ US Thematic Portfolio
Select US Equity Portfolio
US GROWTH
Concentrated Growth Fund
Discovery Growth Fund
FlexFee™ Large Cap Growth Portfolio
Growth Fund
Large Cap Growth Fund
Small Cap Growth Portfolio
US VALUE
Discovery Value Fund
Equity Income Fund
Relative Value Fund
Small Cap Value Portfolio
Value Fund
INTERNATIONAL/ GLOBAL EQUITY
INTERNATIONAL/ GLOBAL CORE
FlexFee™ International Strategic Core Portfolio
Global Core Equity Portfolio
International Portfolio
International Strategic Core Portfolio
Sustainable Global Thematic Fund
Tax-Managed International Portfolio
Tax-Managed Wealth Appreciation Strategy
Wealth Appreciation Strategy
INTERNATIONAL/ GLOBAL GROWTH
Concentrated International Growth Portfolio
FlexFee™ Emerging Markets Growth Portfolio
INTERNATIONAL/ GLOBAL EQUITY(continued)
Sustainable International Thematic Fund
INTERNATIONAL/ GLOBAL VALUE
All China Equity Portfolio
International Value Fund
FIXED INCOME
MUNICIPAL
High Income Municipal Portfolio
Intermediate California Municipal Portfolio
Intermediate Diversified Municipal Portfolio
Intermediate New York Municipal Portfolio
Municipal Bond Inflation Strategy
Tax-Aware Fixed Income Portfolio
National Portfolio
Arizona Portfolio
California Portfolio
Massachusetts Portfolio
Minnesota Portfolio
New Jersey Portfolio
New York Portfolio
Ohio Portfolio
Pennsylvania Portfolio
Virginia Portfolio
TAXABLE
Bond Inflation Strategy
FlexFee™ High Yield Portfolio
FlexFee™ International Bond Portfolio
Global Bond Fund
High Income Fund
Income Fund
Intermediate Duration Portfolio
Limited Duration High Income Portfolio
Short Duration Portfolio
Total Return Bond Portfolio1
ALTERNATIVES
All Market Real Return Portfolio
Global Real Estate Investment Fund
Select US Long/Short Portfolio
Unconstrained Bond Fund
MULTI-ASSET
All Market Income Portfolio
All Market Total Return Portfolio
Conservative Wealth Strategy
Emerging Markets Multi-Asset Portfolio
Global Risk Allocation Fund
Tax-Managed All Market Income Portfolio
TARGET-DATE
Multi-Manager Select Retirement Allocation Fund
Multi-Manager Select 2010 Fund
Multi-Manager Select 2015 Fund
Multi-Manager Select 2020 Fund
Multi-Manager Select 2025 Fund
Multi-Manager Select 2030 Fund
Multi-Manager Select 2035 Fund
Multi-Manager Select 2040 Fund
Multi-Manager Select 2045 Fund
Multi-Manager Select 2050 Fund
Multi-Manager Select 2055 Fund
Multi-Manager Select 2060 Fund
CLOSED-END FUNDS
AllianceBernstein Global High Income Fund
AllianceBernstein National Municipal Income Fund
We also offer Government Money Market Portfolio, which serves as the money market fund exchange vehicle for the AB mutual funds. You could lose money by investing in the Fund. Although the Fund seeks to preserve the value of your investment at $1.00 per share, it cannot guarantee it will do so. The Fund may impose a fee upon sale of your shares or may temporarily suspend your ability to sell shares if the Fund’s liquidity falls below required minimums because of market conditions or other factors. An investment in the Fund is not insured or guaranteed by the Federal Deposit Insurance Corporation or any other government agency. The Fund’s sponsor has no legal obligation to provide financial support to the Fund, and you should not expect that the sponsor will provide financial support to the Fund at any time.
Investors should consider the investment objectives, risks, charges and expenses of the Fund carefully before investing. For copies of our prospectus or summary prospectus, which contain this and other information, visit us online at www.abfunds.com or contact your AB representative. Please read the prospectus and/or summary prospectus carefully before investing.
| 1 | Prior to July 12, 2019, Total Return Bond Portfolio was named Intermediate Bond Portfolio. |
| | |
| |
| 54 | AB MULTI-MANAGER ALTERNATIVE FUND | | abfunds.com |
NOTES
| | |
| |
| abfunds.com | | AB MULTI-MANAGER ALTERNATIVE FUND | 55 |
NOTES
| | |
| |
| 56 | AB MULTI-MANAGER ALTERNATIVE FUND | | abfunds.com |
NOTES
| | |
| |
| abfunds.com | | AB MULTI-MANAGER ALTERNATIVE FUND | 57 |
NOTES
| | |
| |
| 58 | AB MULTI-MANAGER ALTERNATIVE FUND | | abfunds.com |
NOTES
| | |
| |
| abfunds.com | | AB MULTI-MANAGER ALTERNATIVE FUND | 59 |
NOTES
| | |
| |
| 60 | AB MULTI-MANAGER ALTERNATIVE FUND | | abfunds.com |
Privacy Notice
AllianceBernstein and its affiliates (collectively referred to as “AllianceBernstein”, “we”, “our”, and similar pronouns) understand the importance of maintaining the confidentiality and security of our clients’ nonpublic personal information. Nonpublic personal information is personally identifiable financial information about our clients who are natural persons. To provide financial products and services to our clients, we collect nonpublic personal information from a variety of sources, including: (1) information we receive from clients, such as through applications or other forms, which can include a client’s name, address, phone number, social security number, assets, income and other household information, (2) information about client transactions with us, our affiliates andnon-affiliated third parties, which can include account balances and transactions history, and (3) information from visitors to our websites provided through online forms, site visitorship data and online information-collecting devices known as “cookies.”
We may disclose all of the nonpublic personal information that we collect about our current and former clients, as described above, tonon-affiliated third parties to manage our business and as otherwise required or permitted by law, including those that perform transaction processing or servicing functions, marketing services providers that provide marketing services on our behalf pursuant to a joint marketing agreement, and professional services firms that provide knowledge-based services such as accountants, consultants, lawyers and auditors to help manage client accounts. We require all the third-party providers to adhere to our privacy policy or a functional equivalent.
We may also disclose the nonpublic personal information that we collect about current and former clients, as described above, to our affiliated investment, brokerage, service and insurance companies for the purpose of marketing their products or services to clients under circumstances that are permitted by law, such as if our affiliate has its own relationship with you. We have policies and procedures to ensure that certain conditions are met before an AllianceBernstein affiliated company may use information obtained from another affiliate to solicit clients for marketing purposes.
We will also use nonpublic personal information about our clients for our own internal analysis, analytics, research and development, and to improve and add to our client offerings.
We have policies and procedures designed to safeguard the confidentiality and security of nonpublic personal information about our clients that include restricting access to nonpublic personal information to personnel that have been screened and undergone security and privacy training; to personnel who need it to perform their work functions such as our operations, customer service, account management, finance, quality, vendor management and compliance teams as required to provide services, communicate with you and fulfill our legal obligations.
We employ reasonably designed physical, electronic and procedural safeguards to secure and protect client nonpublic personal information.
If you are in the European Economic Area (“EEA”) or Switzerland, we will comply with applicable legal requirements providing adequate protection for the transfer of personal information to recipients in countries outside of the EEA and Switzerland.
For more information, our Privacy Policy statement can be viewed here: https://www.alliancebernstein.com/abcom/Privacy_Terms/PrivacyPolicy.htm.
AB MULTI-MANAGER ALTERNATIVE FUND
1345 Avenue of the Americas
New York, NY 10105
800 221 5672
MMAF-0152-0919 
ITEM 2. CODE OF ETHICS.
(a) The registrant has adopted a code of ethics that applies to its principal executive officer, principal financial officer and principal accounting officer. A copy of the registrant’s code of ethics is filed herewith as Exhibit 12(a)(1).
(b) During the period covered by this report, no material amendments were made to the provisions of the code of ethics adopted in 2(a) above.
(c) During the period covered by this report, no implicit or explicit waivers to the provisions of the code of ethics adopted in 2(a) above were granted.
ITEM 3. AUDIT COMMITTEE FINANCIAL EXPERT.
The registrant’s Board of Directors has determined that independent directors Donald K. Peterson, Debra Perry and R. Jay Gerken qualify as audit committee financial experts.
ITEM 4. PRINCIPAL ACCOUNTANT FEES AND SERVICES.
Not applicable when filing a semi-annual report to shareholders.
ITEM 5. AUDIT COMMITTEE OF LISTED REGISTRANTS.
Not applicable when filing a semi-annual report to shareholders.
ITEM 6. SCHEDULE OF INVESTMENTS.
Please see Schedule of Investments contained in the Report to Shareholders included under Item 1 of this FormN-CSR.
ITEM 7. DISCLOSURE OF PROXY VOTING POLICIES AND PROCEDURES FORCLOSED-END MANAGEMENT INVESTMENT COMPANIES.
Not applicable when filing a semi-annual report to shareholders.
ITEM 8. PORTFOLIO MANAGERS OFCLOSED-END MANAGEMENT INVESTMENT COMPANIES.
Not applicable when filing a semi-annual report to shareholders.
ITEM 9. PURCHASES OF EQUITY SECURITIES BYCLOSED-END MANAGEMENT INVESTMENT COMPANY AND AFFILIATED PURCHASERS.
Not applicable when filing a semi-annual report to shareholders.
ITEM 10. SUBMISSION OF MATTERS TO A VOTE OF SECURITY HOLDERS.
There have been no material changes to the procedures by which shareholders may recommend nominees to the Fund’s Board of Directors since the Fund last provided disclosure in response to this item.
ITEM 11. CONTROLS AND PROCEDURES.
(a) The registrant’s principal executive officer and principal financial officer have concluded that the registrant’s disclosure controls and procedures (as defined in Rule30a-2(c) under the Investment Company Act of 1940, as amended) are effective at the reasonable assurance level based on their evaluation of these controls and procedures as of a date within 90 days of the filing date of this document.
(b) There were no changes in the registrant’s internal controls over financial reporting that occurred during the second fiscal quarter of the period that has materially affected, or is reasonably likely to materially affect, the registrant’s internal control over financial reporting.
ITEM 12. EXHIBITS.
The following exhibits are attached to this FormN-CSR:
| | |
EXHIBIT NO. | | DESCRIPTION OF EXHIBIT |
| |
12 (b) (1) | | Certification of Principal Executive Officer Pursuant to Section 302 of the Sarbanes-Oxley Act of 2002 |
| |
12 (b) (2) | | Certification of Principal Financial Officer Pursuant to Section 302 of the Sarbanes-Oxley Act of 2002 |
| |
12 (c) | | Certification of Principal Executive Officer and Principal Financial Officer Pursuant to Section 906 of theSarbanes-Oxley Act of 2002 |
SIGNATURES
Pursuant to the requirements of the Securities Exchange Act of 1934 and the Investment Company Act of 1940, the registrant has duly caused this report to be signed on its behalf by the undersigned, thereunto duly authorized.
(Registrant): AB Multi-Manager Alternative Fund, Inc.
| | |
| By: | | /s/ Kathleen M. Fisher |
| | Kathleen M. Fisher |
| | President |
|
| Date: November 26, 2019 |
Pursuant to the requirements of the Securities Exchange Act of 1934 and the Investment Company Act of 1940, this report has been signed below by the following persons on behalf of the registrant and in the capacities and on the dates indicated.
| | |
| By: | | /s/ Kathleen M. Fisher |
| | Kathleen M. Fisher |
| | President |
|
| Date: November 26, 2019 |
| |
| By: | | /s/ Joseph J. Mantineo |
| | Joseph J. Mantineo |
| | Treasurer and Chief Financial Officer |
|
| Date: November 26, 2019 |